|
| UNITED STATES |
| SECURITIES AND EXCHANGE COMMISSION |
| Washington, D.C. 20549 |
| |
| FORM N-CSR |
| |
| CERTIFIED SHAREHOLDER REPORT OF REGISTERED MANAGEMENT INVESTMENT |
| COMPANIES |
| Investment Company Act file number 811-21779 |
| |
| JOHN HANCOCK FUNDS II |
| --------------------------------------------------------- |
| (Exact name of registrant as specified in charter) |
| |
| 601 CONGRESS STREET, BOSTON, MA 02210-2805 |
| ------------------------------------------------------------- |
| (Address of principal executive offices) (Zip code) |
| |
| SALVATORE SCHIAVONE, 601 CONGRESS STREET, BOSTON, MA 02210-2805 |
| ------------------------------------------------------------------------------------------ |
| (Name and address of agent for service) |
| |
| Registrant's telephone number, including area code: (617) 663-4497 |
| -------------- |
| Date of fiscal year end: 12/31 |
| ------ |
| |
| Date of reporting period: 12/31/13 |
| ------ |
| |
| ITEM 1. REPORTS TO STOCKHOLDERS. |

Management’s discussion of
Portfolio performance
By the Portfolio Management Team at John Hancock Asset Management
John Hancock
Lifestyle Portfolios
Market review
With a sharp rally in the fourth quarter of 2013, the U.S. stock market put the finishing touches on its best year of gains since the late 1990s, as the S&P 500 Index’s annual return of 32.39% marked its best calendar-year performance since 1997. Core U.S. bonds, however, ended in negative territory for the first time since 1999, as the Barclays U.S. Aggregate Bond Index posted an anemic annual return of –2.03%.
As central banks around the globe took aggressive steps to stimulate their respective economies, major equity markets pushed higher for the year, with the U.S. economy demonstrating more sustainable growth, efforts to turn around Japan’s stagnant economy beginning to take hold, and Europe finally starting to show some resilience in dealing with its sovereign debt issues.
A key divergence from that generally improving growth profile was the ongoing transformation of the Chinese economy and its impact on many of the emerging-market economies of the world, including those in Latin America, such as Brazil, as well as others in Asia.
The interest-rate-sensitive fixed-income market was challenged throughout 2013. This was particularly true during the May–September period, when market participants began to aggressively price in the increasing odds of the U.S. Federal Reserve (Fed) beginning to scale back in its aggressive quantitative easing program. In mid-December, the Fed announced it would begin trimming its program beginning in January 2014.
Within the global equity markets, U.S. equities delivered stellar performance, with large-, mid-, and small-capitalization stocks all delivering returns north of 30% for the year. Meanwhile, returns from non-U.S. equities were for the most part positive, but less robust than their U.S. counterparts. The MSCI EAFE Index rose 23.29% for the year, while the MSCI Emerging Markets Index actually ended in negative territory, posting a -2.27% return.
U.S. equities widely outperformed U.S. bonds during the year. The Barclays U.S. Aggregate Bond Index, a proxy for intermediate-term government debt, put up a modestly negative return, as core bonds began to experience heightened selling pressure amid rising interest rates. By comparison, credit-oriented sectors of the bond market fared better, led by high-yield bonds, multi-sector bonds, and bank loans, all of which finished the year with low-single-digit gains.
| | | | |
| | For the | | | |
| Market index | year ended | | | |
| total returns | December 31, 2013 | | | |
| | | |
| | | | |
| U.S. Stocks | | | | |
| | | |
| S&P 500 Index | 32.39% | | | |
| Russell Midcap Index | 34.76% | | | |
| Russell 2000 Index | 38.82% | | | |
| FTSE NAREIT All Equity REIT Index | 2.86% | | | |
| | | | |
| International Stocks | | | | |
| | | |
| MSCI EAFE Index | 23.29% | | | |
| MSCI Emerging Markets Index | –2.27% | | | |
| MSCI EAFE Small Cap Index | 29.69% | | | |
| | | | |
| Fixed Income | | | | |
| | | |
| Barclays U.S. Aggregate Bond Index | –2.03% | | | |
| Bank of America Merrill Lynch US High | | | | |
| Yield Master II Index | 7.42% | | | |
| JPM Global Government Bonds | | | | |
| Unhedged Index | –4.40% | | | |
| |
| 2 | Lifestyle Portfolios | Annual report |
Portfolio performance
The John Hancock Lifestyle Portfolios performed generally as expected, given their blended exposures to equity and fixed-income assets. It is important to note that the portfolios’ holdings in these two asset classes are global and multi-sector in nature, which is a key element of their diversification strategy. By comparison, the benchmarks against which the portfolios measure their performance—the S&P 500 Index for equities and the Barclays U.S. Aggregate Bond Index for fixed income—are U.S.-centric and represent no exposure to global stocks or to bond sectors other than investment-grade securities.
The performance of the U.S. stock market during 2013 was extraordinarily strong. The S&P 500 Index outperformed virtually all other asset classes. Given that the Lifestyle Portfolios’ equity holdings are more broadly based, containing both global and domestic U.S. exposure, their results versus their respective U.S.-centric benchmarks were in line with what might be expected during a period when one asset class (U.S. equities) surpasses the performance of all others.

Lifestyle Aggressive Portfolio
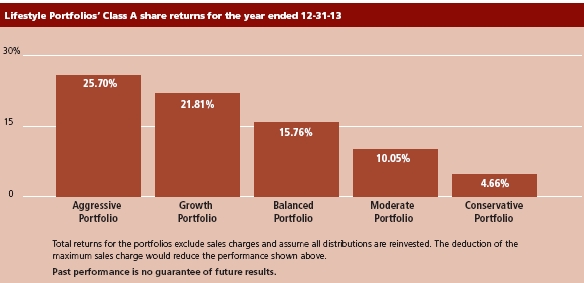
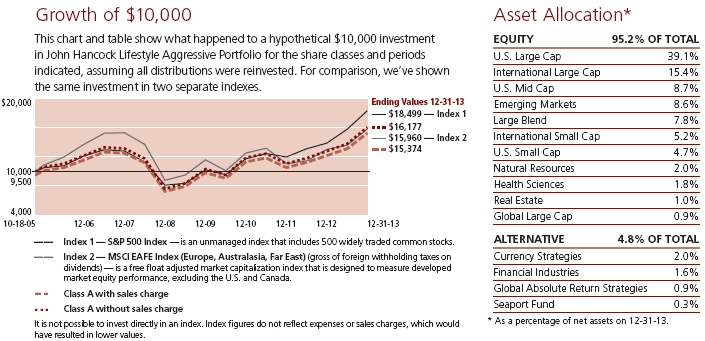
For the 12 months ended December 31, 2013, the portfolio’s Class A shares returned 25.70%, excluding sales charges. In comparison, the benchmark S&P 500 Index returned 32.39% for the year, and the Morningstar, Inc. large blend fund category returned an average of 31.50%.1
Most of the portfolio’s shortfall versus the benchmark was driven by its out-of-index allocations to non-U.S. equities—predominantly international large-cap and emerging-market stocks—whose results, while positive, were not as strong as the overall performance of U.S. stocks.
Allocations to healthcare and information technology stocks helped, but the portfolio’s positions in global natural resources and global real estate stocks hurt its relative results.
Among the underlying funds that detracted most from performance were Capital Appreciation Value Fund (T. Rowe Price), China Emerging Leaders Fund (Atlantis), and Natural Resources Fund (RS Investments/Wellington).
Top contributors included Blue Chip Growth Fund (T. Rowe Price), Technical Opportunities Fund (Wellington), and Science & Technology Fund (T. Rowe Price/Allianz).
| |
| Annual report | Lifestyle Portfolios | 3 |
Lifestyle Growth Portfolio
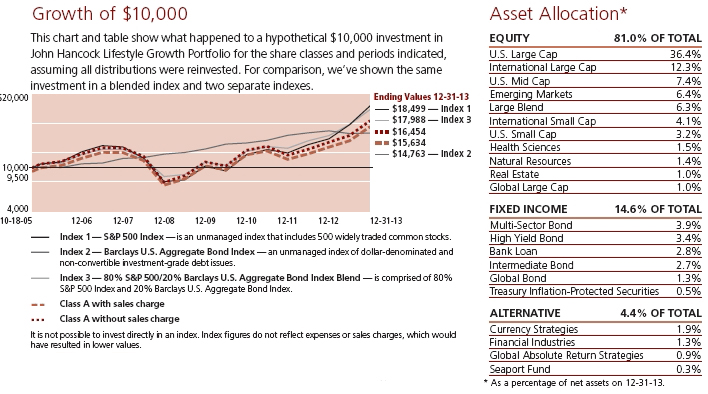
For the 12 months ended December 31, 2013, the portfolio’s Class A shares returned 21.81%, excluding sales charges. In comparison, the S&P 500 Index returned 32.39% over the same period, and the Barclays U.S. Aggregate Bond Index returned -2.03%. A blended index comprising 80% S&P 500 Index and 20% Barclays U.S. Aggregate Bond Index returned 24.78% for the year, and the Morningstar, Inc. aggressive allocation fund category returned an average of 21.31%.1
Most of the portfolio’s modest shortfall versus the blended index was driven by its allocations to non-U.S. equities—predominantly international large-cap and emerging-market stocks—whose results, while positive, were not as strong as the overall performance of U.S. stocks. The portfolio’s allocations to information technology stocks helped, but its positions in global natural resources and global real estate stocks hurt relative results.
Credit-oriented fixed-income instruments helped offset the drag from non-U.S. and sector-oriented equities, with the portfolio’s allocations to high-yield bonds, bank loans, and multi-sector bonds all making positive contributions to its relative results.
Among the underlying funds that detracted most from performance were Capital Appreciation Value Fund (T. Rowe Price) and China Emerging Leaders Fund (Atlantis).
Top contributors included Blue Chip Growth Fund (T. Rowe Price), Technical Opportunities Fund (Wellington), and Capital Appreciation Fund (Jennison).
Lifestyle Balanced Portfolio
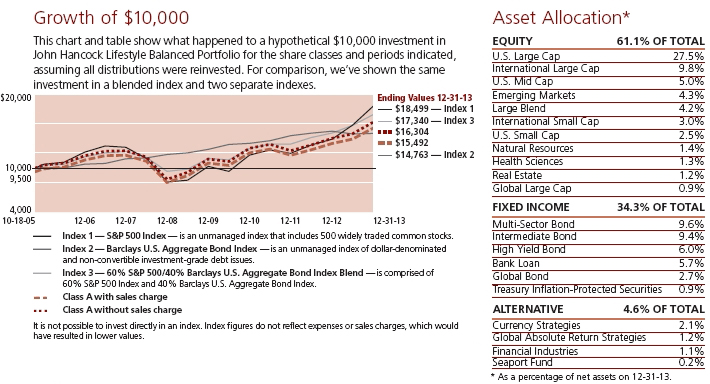
For the 12 months ended December 31, 2013, the portfolio’s Class A shares returned 15.76%, excluding sales charges. In comparison, the S&P 500 Index returned 32.39% over the same period, and the Barclays U.S. Aggregate Bond Index returned -2.03%. A blended index comprising 60% S&P 500 Index and 40% Barclays U.S. Aggregate Bond Index returned 17.55% for the year, and the Morningstar, Inc. moderate allocation fund category returned an average of 16.48%.1
Most of the portfolio’s modest shortfall versus the blended index was driven by its allocations to non-U.S. equities—predominantly international large-cap and emerging-market stocks—whose results, while positive, were not as strong as the overall performance of U.S. stocks. The portfolio’s allocations to healthcare stocks helped, but its positions in global natural resources and global real estate stocks hurt relative results.
Credit-oriented fixed-income instruments helped offset the drag from non-U.S. and sector-oriented equities, with the portfolio’s allocations to high-yield bonds, multi-sector bonds, and bank loans all making positive contributions to its relative results.
Among the underlying funds that detracted most from performance were Capital Appreciation Value Fund (T. Rowe Price), Global Shareholder Yield Fund (Epoch), and China Emerging Leaders Fund (Atlantis).
Top contributors included Blue Chip Growth Fund (T. Rowe Price), Technical Opportunities Fund (Wellington), and Active Bond Fund (Declaration/John Hancock).
| |
| 4 | Lifestyle Portfolios | Annual report |
Lifestyle Moderate Portfolio
For the 12 months ended December 31, 2013, the portfolio’s Class A shares returned 10.05%, excluding sales charges. In comparison, the S&P 500 Index returned 32.39% over the same period, and the Barclays U.S. Aggregate Bond Index returned -2.03%. A blended index comprising 40% S&P 500 Index and 60% Barclays U.S. Aggregate Bond Index returned 10.69%. The Morningstar, Inc. conservative allocation fund category returned an average 7.23%.1
The portfolio’s annual return was slightly behind that of its blended composite index. The portfolio’s allocations to non-U.S. equities—predominantly international large-cap and emerging-market stocks—were slight detractors, as their results, while positive, were not as strong as the overall performance of U.S. stocks. The portfolio’s allocations to global natural resources, global real estate, and U.S. real estate stocks also hurt relative results.
Offsetting most of the drags were the portfolio’s allocations to credit-oriented fixed-income instruments, with its allocations to high-yield bonds, bank loans, and multi-sector bonds all making positive contributions to its relative results.
Top contributors included Active Bond Fund (Declaration/John Hancock), Blue Chip Growth Fund (T. Rowe Price), and Capital Appreciation Fund (Jennison).
Among the underlying funds that detracted most from performance were Capital Appreciation Value Fund (T. Rowe Price) and Global High Yield Fund (Stone Harbor).
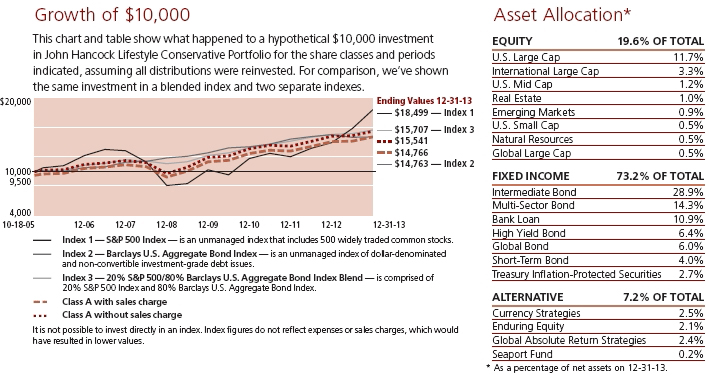
Lifestyle Conservative Portfolio
For the 12 months ended December 31, 2013, the portfolio’s Class A shares returned 4.66%, excluding sales charges. In comparison, the S&P 500 Index returned 32.39% over the same period, and the Barclays U.S. Aggregate Bond Index returned -2.03%. A blended index comprising 20% S&P 500 Index and 80% Barclays U.S. Aggregate Bond Index returned 4.16%. The Morningstar, Inc. conservative allocation fund category returned an average 7.23%.1
The portfolio modestly outperformed its blended composite index. The portfolio’s excess performance was entirely attributable to its out-of-index allocations to credit-oriented fixed-income instruments, including high-yield bonds, bank loans, and multi-sector bonds, which widely outperformed most other fixed-income asset categories.
In terms of relative performance versus the blended benchmark, the portfolio’s fixed-income allocations more than offset the drag from its non-U.S. equity allocations—predominantly international large-cap and emerging-market stocks—where results, while positive, were not as strong as the overall performance of U.S. stocks.
Top contributors to the portfolio’s relative outperformance included Active Bond Fund (Declaration/John Hancock), Blue Chip Growth Fund (T. Rowe Price), and Global Absolute Return Strategies Fund (Standard Life).
Among the underlying funds that detracted most from performance were Capital Appreciation Value Fund (T. Rowe Price) and Global High Yield Fund (Stone Harbor).
This commentary reflects the views of the portfolio management team through the end of the period discussed in this report. As such, they are in no way a guarantee of future events and are not intended to be used as investment advice or a recommendation regarding any specific security. They are also subject to change at any time as market and other conditions warrant. Past performance is no guarantee of future results.
The portfolios’ performance depends on the subadvisors’ skill in determining the strategic asset class allocations, the mix of underlying funds, and the performance of those underlying funds. The underlying funds’ performance may be lower than the performance of the asset class that they were selected to represent. The portfolios are subject to the same risks as the underlying funds in which they invest, which include the following: Stocks and bonds can decline due to adverse issuer, market, regulatory, or economic developments; foreign investing, especially in emerging markets, has additional risks, such as currency and market volatility and political and social instability; the securities of small-capitalization companies are subject to higher volatility than larger, more established companies; and high-yield bonds are subject to additional risks, such as increased risk of default. For additional information on these and other risk considerations, please see the portfolios’ prospectuses.
1 Figures from Morningstar, Inc. include reinvested distributions and do not take into account sales charges. Actual load-adjusted performance is lower.
| |
| Annual report | Lifestyle Portfolios | 5 |
John Hancock Lifestyle Aggressive Portfolio
Performance chart
Total returns with maximum sales charge for the period ended 12-31-13
| | | | | | | | | | | | |
| | Class A | Class B | Class C | Class R11 | Class R21,2 | Class R31 | Class R41 | Class R51 | Class R61,2 | Class 11 | Index 13 | Index 23 |
|
| Start date | 10-18-05 | 10-18-05 | 10-18-05 | 9-18-06 | 10-18-05 | 10-18-05 | 10-18-05 | 10-18-05 | 10-15-05 | 10-15-05 | 10-18-05 | 10-18-05 |
|
| Average annual total returns | | | | | | | | | | | |
|
| 1 year | 19.43% | 19.73% | 23.90% | 25.18% | 25.66% | 25.29% | 25.76% | 26.08% | 26.30% | 26.23% | 32.39% | 23.29% |
|
| 5 years | 15.09% | 15.16% | 15.45% | 15.83% | 15.41% | 15.93% | 16.30% | 16.65% | 15.53% | 16.82% | 17.94% | 12.96% |
|
| Since inception | 5.38% | 5.27% | 5.30% | 4.84% | 5.07% | 5.78% | 6.09% | 6.40% | 4.96% | 6.54% | 7.78% | 5.86% |
|
| Cumulative returns | | | | | | | | | | | | |
|
| 1 year | 19.43% | 19.73% | 23.90% | 25.18% | 25.66% | 25.29% | 25.76% | 26.08% | 26.30% | 26.23% | 32.39% | 23.29% |
|
| 5 years | 101.96% | 102.57% | 105.11% | 108.50% | 104.72% | 109.37% | 112.79% | 116.03% | 105.82% | 117.53% | 128.19% | 83.91% |
|
| Since inception | 53.74% | 52.45% | 52.82% | 41.20% | 50.10% | 58.64% | 62.45% | 66.41% | 48.78% | 68.26% | 84.99% | 59.60% |
|
Performance figures assume all distributions have been reinvested. Returns with maximum sales charge reflect a sales charge on Class A shares of 5%, and the applicable contingent deferred sales charge (CDSC) on Class B and Class C shares. The Class B shares’ CDSC declines annually between years 1–6 according to the following schedule: 5%, 4%, 3%, 3%, 2%, 1%. No sales charges will be assessed after the sixth year. Class C shares held for less than one year are subject to a 1% CDSC. Sales charges are not applicable to Class R1, Class R2, Class R3, Class R4, Class R5, Class R6, Class 1, and Class 5 shares.
Performance of the classes will vary based on the difference in sales charges paid by shareholders investing in the different classes and the fee structure of those classes.
The expense ratios of the portfolio, both net (including any fee waivers or expense limitations) and gross (excluding any fee waivers or expense limitations), are set forth according to the most recent publicly available prospectuses for the portfolio and may differ from those disclosed in the Financial highlights tables in this report. The fee waivers and expense limitations are contractual at least until 4-30-15 for Class A shares and 4-30-14 for Class R2, Class R4, and Class R6 shares. Had the fee waivers and expense limitations not been in place, gross expenses would apply. For all other classes, the net expenses equal the gross expenses. The following expense ratios include expenses of the underlying affiliated funds in which the portfolio invests. The expense ratios are as follows:
| | | | | | | | | | | | | | |
| | Class A | Class B | Class C | Class R1 | Class R2 | Class R3 | Class R4* | Class R5 | Class R6 | Class 1 | | | | |
| Net (%) | 1.40 | 2.28 | 2.20 | 1.93 | 1.54 | 1.80 | 1.42 | 1.19 | 1.04 | 1.04 | | | | |
| Gross (%) | 1.50 | 2.28 | 2.20 | 1.93 | 17.46 | 1.80 | 1.52 | 1.19 | 3.49 | 1.04 | | | | |
* The portfolio’s distributor has contractually agreed to waive 0.10% of Rule 12b-1 fees for Class R4 shares. The current waiver agreement will remain in effect through 4-30-14.
The returns reflect past results and should not be considered indicative of future performance. The return and principal value of an investment will fluctuate so that shares, when redeemed, may be worth more or less than their original cost. Due to market volatility, the portfolio’s current performance may be higher or lower than the performance shown. For performance data current to the most recent month end, please call 800-225-5291 or visit the portfolio’s website at jhinvestments.com.
This performance information does not reflect the deduction of taxes that a shareholder may pay on portfolio distributions or the redemption of portfolio shares. The portfolio’s performance results reflect any applicable fee waivers or expense reductions, without which the expenses would increase and results would have been less favorable.
1 For certain types of investors as described in the portfolio’s prospectuses.
2 Class R2 shares were first offered on 3-1-12. The returns prior to this date are those of Class A shares that have been recalculated to apply the gross fees and expenses of Class R2 shares. Class R6 shares were first offered on 9-1-11. The returns prior to this date are those of Class 1 shares that have been recalculated to apply the gross fees and expenses of Class R6 shares.
3 Index 1 and Index 2 returns at 12-31-13 for the period beginning 10-15-05 (inception date for Class 1 and Class R6 shares) are 7.82% and 5.80% (respectively, annualized), and 85.54% and 58.84% (respectively, cumulative). Index 1 and Index 2 returns at 12-31-13 for the period beginning 9-18-06 (inception date for Class R1 shares) are 7.01% and 3.79% (respectively, annualized) and 63.87% and 31.13% (respectively, cumulative).
| |
| 6 | Lifestyle Portfolios | Annual report |
John Hancock Lifestyle Growth Portfolio
Performance chart
Total returns with maximum sales charge for the period ended 12-31-13
| | | | | | | | | | | | | | |
| | Class A | Class B | Class C | Class R11 | Class R21,2 | Class R31 | Class R41 | Class R51 | Class R61,2 | Class 11 | Class 51 | Index 13 | Index 23 | Index 33 |
|
| Start date | 10-18-05 | 10-18-05 | 10-18-05 | 9-18-06 | 10-18-05 | 10-18-05 | 10-18-05 | 10-18-05 | 10-15-05 | 10-15-05 | 7-3-06 | 10-18-05 | 10-18-05 | 10-18-05 |
|
| Average annual total returns | | | | | | | | | | | | | |
|
| 1 year | 15.74% | 15.93% | 19.88% | 21.36% | 21.67% | 21.45% | 21.99% | 22.29% | 22.31% | 22.31% | 22.31% | 32.39% | –2.03% | 24.78% |
|
| 5 years | 14.24% | 14.34% | 14.61% | 15.03% | 14.65% | 15.15% | 15.54% | 15.84% | 15.21% | 15.96% | 16.02% | 17.94% | 4.44% | 15.35% |
|
| Since inception | 5.60% | 5.50% | 5.52% | 5.31% | 5.41% | 6.01% | 6.34% | 6.64% | 5.79% | 6.73% | 6.23% | 7.78% | 4.86% | 7.42% |
|
| Cumulative returns | | | | | | | | | | | | | | |
|
| 1 year | 15.74% | 15.93% | 19.88% | 21.36% | 21.67% | 21.45% | 21.99% | 22.29% | 22.31% | 22.31% | 22.31% | 32.39% | –2.03% | 24.78% |
|
| 5 years | 94.61% | 95.44% | 97.79% | 101.42% | 98.10% | 102.42% | 105.94% | 108.61% | 102.98% | 109.68% | 110.17% | 128.19% | 24.27% | 104.26% |
|
| Since inception | 56.34% | 55.20% | 55.38% | 45.85% | 54.08% | 61.47% | 65.64% | 69.47% | 58.76% | 70.77% | 57.38% | 84.99% | 47.63% | 79.88% |
|
Performance figures assume all distributions have been reinvested. Returns with maximum sales charge reflect a sales charge on Class A shares of 5%, and the applicable contingent deferred sales charge (CDSC) on Class B and Class C shares. The Class B shares’ CDSC declines annually between years 1–6 according to the following schedule: 5%, 4%, 3%, 3%, 2%, 1%. No sales charges will be assessed after the sixth year. Class C shares held for less than one year are subject to a 1% CDSC. Sales charges are not applicable to Class R1, Class R2, Class R3, Class R4, Class R5, Class R6, Class 1, and Class 5 shares.
Performance of the classes will vary based on the difference in sales charges paid by shareholders investing in the different classes and the fee structure of those classes.
The expense ratios of the portfolio, both net (including any fee waivers or expense limitations) and gross (excluding any fee waivers or expense limitations), are set forth according to the most recent publicly available prospectuses for the portfolio and may differ from those disclosed in the Financial highlights tables in this report. The fee waivers and expense limitations are contractual at least until 4-30-15 for Class A shares and 4-30-14 for Class R2, Class R4, and Class R6 shares. Had the fee waivers and expense limitations not been in place, gross expenses would apply. For all other classes, the net expenses equal the gross expenses. The following expense ratios include expenses of the underlying affiliated funds in which the portfolio invests. The expense ratios are as follows:
| | | | | | | | | | | | | | |
| | Class A | Class B | Class C | Class R1 | Class R2 | Class R3 | Class R4* | Class R5 | Class R6 | Class 1 | Class 5 | | | |
| Net (%) | 1.35 | 2.16 | 2.15 | 1.81 | 1.50 | 1.69 | 1.29 | 1.07 | 0.99 | 0.99 | 0.94 | | | |
| Gross (%) | 1.45 | 2.16 | 2.15 | 1.81 | 17.33 | 1.69 | 1.39 | 1.07 | 3.11 | 0.99 | 0.94 | | | |
* The portfolio’s distributor has contractually agreed to waive 0.10% of Rule 12b-1 fees for Class R4 shares. The current waiver agreement will remain in effect through 4-30-14.
The returns reflect past results and should not be considered indicative of future performance. The return and principal value of an investment will fluctuate so that shares, when redeemed, may be worth more or less than their original cost. Due to market volatility, the portfolio’s current performance may be higher or lower than the performance shown. For performance data current to the most recent month end, please call 800-225-5291 or visit the portfolio’s website at jhinvestments.com.
This performance information does not reflect the deduction of taxes that a shareholder may pay on portfolio distributions or the redemption of portfolio shares. The portfolio’s performance results reflect any applicable fee waivers or expense reductions, without which the expenses would increase and results would have been less favorable.
1 For certain types of investors as described in the portfolio’s prospectuses.
2 Class R2 shares were first offered on 3-1-12. The returns prior to this date are those of Class A shares that have been recalculated to apply the gross fees and expenses of Class R2 shares. Class R6 shares were first offered on 9-1-11. The returns prior to this date are those of Class 1 shares that have been recalculated to apply the gross fees and expenses of Class R6 shares.
3 Index 1, Index 2, and Index 3 returns at 12-31-13 for the period beginning 10-15-05 (inception date for Class 1 and Class R6 shares) are 7.82%, 4.86%, and 7.44% (respectively, annualized), and 85.54%, 47.69%, and 80.32% (respectively, cumulative). Index 1, Index 2, and Index 3 returns at 12-31-13 for the period beginning 7-3-06 (inception date for Class 5 shares) are 7.42%, 5.27%, and 7.22% (respectively, annualized), and 70.99%, 47.02%, and 68.72% (respectively, cumulative). Index 1, Index 2, and Index 3 returns at 12-31-13 for the period beginning 9-16-06 (inception date of Class R1 shares) are 7.01%, 5.02%, and 6.85% (respectively, annualized) and 63.87%, 42.92%, and 62.14% (respectively, cumulative).
| |
| Annual report | Lifestyle Portfolios | 7 |
John Hancock Lifestyle Balanced Portfolio
Performance chart
Total returns with maximum sales charge for the period ended 12-31-13
| | | | | | | | | | | | | | |
| | Class A | Class B | Class C | Class R11 | Class R21,2 | Class R31 | Class R41 | Class R51 | Class R61,2 | Class 11 | Class 51 | Index 13 | Index 23 | Index 33 |
|
| Start date | 10-18-05 | 10-18-05 | 10-18-05 | 9-18-06 | 10-18-05 | 10-18-05 | 10-18-05 | 10-18-05 | 10-15-05 | 10-15-05 | 7-3-06 | 10-18-05 | 10-18-05 | 10-18-05 |
|
| Average annual total returns | | | | | | | | | | | | | |
|
| 1 year | 9.95% | 9.84% | 13.93% | 15.23% | 15.59% | 15.43% | 15.90% | 16.20% | 16.26% | 16.18% | 16.31% | 32.39% | –2.03% | 17.55% |
|
| 5 years | 12.82% | 12.92% | 13.22% | 13.56% | 13.20% | 13.75% | 14.13% | 14.42% | 13.77% | 14.51% | 14.58% | 17.94% | 4.44% | 12.71% |
|
| Since inception | 5.48% | 5.36% | 5.41% | 5.21% | 5.27% | 5.90% | 6.22% | 6.51% | 5.65% | 6.59% | 6.31% | 7.78% | 4.86% | 6.94% |
|
| Cumulative returns | | | | | | | | | | | | | | |
|
| 1 year | 9.95% | 9.84% | 13.93% | 15.23% | 15.59% | 15.43% | 15.90% | 16.20% | 16.26% | 16.18% | 16.31% | 32.39% | –2.03% | 17.55% |
|
| 5 years | 82.77% | 83.56% | 86.05% | 88.87% | 85.87% | 90.43% | 93.65% | 96.12% | 90.62% | 96.89% | 97.49% | 128.19% | 24.27% | 81.85% |
|
| Since inception | 54.92% | 53.44% | 54.06% | 44.87% | 52.40% | 60.04% | 64.13% | 67.84% | 57.08% | 68.89% | 58.26% | 84.99% | 47.63% | 73.40% |
|
Performance figures assume all distributions have been reinvested. Returns with maximum sales charge reflect a sales charge on Class A shares of 5%, and the applicable contingent deferred sales charge (CDSC) on Class B and Class C shares. The Class B shares’ CDSC declines annually between years 1–6 according to the following schedule: 5%, 4%, 3%, 3%, 2%, 1%. No sales charges will be assessed after the sixth year. Class C shares held for less than one year are subject to a 1% CDSC. Sales charges are not applicable to Class R1, Class R2, Class R3, Class R4, Class R5, Class R6, Class 1, and Class 5 shares.
Performance of the classes will vary based on the difference in sales charges paid by shareholders investing in the different classes and the fee structure of those classes.
The expense ratios of the portfolio, both net (including any fee waivers or expense limitations) and gross (excluding any fee waivers or expense limitations), are set forth according to the most recent publicly available prospectuses for the portfolio and may differ from those disclosed in the Financial highlights tables in this report. The fee waivers and expense limitations are contractual at least until 4-30-15 for Class A shares and 4-30-14 for Class R2, Class R4, and Class R6 shares. Had the fee waivers and expense limitations not been in place, gross expenses would apply. For all other classes, the net expenses equal the gross expenses. The following expense ratios include expenses of the underlying affiliated funds in which the portfolio invests. The expense ratios are as follows:
| | | | | | | | | | | | | | |
| | Class A | Class B | Class C | Class R1 | Class R2 | Class R3 | Class R4* | Class R5 | Class R6 | Class 1 | Class 5 | | | |
| Net (%) | 1.32 | 2.14 | 2.11 | 1.77 | 1.46 | 1.63 | 1.22 | 1.02 | 0.96 | 0.96 | 0.91 | | | |
| Gross (%) | 1.41 | 2.14 | 2.11 | 1.77 | 17.43 | 1.63 | 1.32 | 1.02 | 2.00 | 0.96 | 0.91 | | | |
* The portfolio’s distributor has contractually agreed to waive 0.10% of Rule 12b-1 fees for Class R4 shares. The current waiver agreement will remain in effect through 4-30-14.
The returns reflect past results and should not be considered indicative of future performance. The return and principal value of an investment will fluctuate so that shares, when redeemed, may be worth more or less than their original cost. Due to market volatility, the portfolio’s current performance may be higher or lower than the performance shown. For performance data current to the most recent month end, please call 800-225-5291 or visit the portfolio’s website at jhinvestments.com.
This performance information does not reflect the deduction of taxes that a shareholder may pay on portfolio distributions or the redemption of portfolio shares. The portfolio’s performance results reflect any applicable fee waivers or expense reductions, without which the expenses would increase and results would have been less favorable.
1 For certain types of investors as described in the portfolio’s prospectuses.
2 Class R2 shares were first offered on 3-1-12. The returns prior to this date are those of Class A shares that have been recalculated to apply the gross fees and expenses of Class R2 shares. Class R6 shares were first offered on 9-1-11. The returns prior to this date are those of Class 1 shares that have been recalculated to apply the gross fees and expenses of Class R6 shares.
3 Index 1, Index 2, and Index 3 returns at 12-31-13 for the period beginning 10-15-05 (inception date for Class 1 and Class R6 shares) are 7.82%, 4.86%, and 6.96% (respectively, annualized), and 85.54%, 47.69%, and 73.74% (respectively, cumulative). Index 1, Index 2, and Index 3 returns at 12-31-13 for the period beginning 7-3-06 (inception date for Class 5 shares) are 7.42%, 5.27%, and 7.22% (respectively, annualized), and 70.99%, 47.02%, and 68.72% (respectively, cumulative). Index 1, Index 2, and Index 3 returns at 12-31-13 for the period beginning 9-16-06 (inception date of Class R1 shares) are 7.01%, 5.02%, and 6.57% (respectively, annualized) and 63.87%, 42.92%, and 59.08% (respectively, cumulative).
| |
| 8 | Lifestyle Portfolios | Annual report |
John Hancock Lifestyle Moderate Portfolio

Performance chart
Total returns with maximum sales charge for the period ended 12-31-13
| | | | | | | | | | | | | | |
| | Class A | Class B | Class C | Class R11 | Class R21,2 | Class R31 | Class R41 | Class R51 | Class R61,2 | Class 11 | Class 51 | Index 13 | Index 23 | Index 33 |
|
| Start date | 10-18-05 | 10-18-05 | 10-18-05 | 9-18-06 | 10-18-05 | 10-18-05 | 10-18-05 | 10-18-05 | 10-15-05 | 10-15-05 | 7-3-06 | 10-18-05 | 10-18-05 | 10-18-05 |
|
| Average annual total returns | | | | | | | | | | | | | |
|
| 1 year | 4.57% | 4.23% | 8.34% | 9.55% | 9.92% | 9.70% | 10.17% | 10.39% | 10.49% | 10.55% | 10.54% | 32.39% | –2.03% | 10.69% |
|
| 5 years | 11.02% | 11.06% | 11.39% | 11.70% | 11.38% | 11.81% | 12.15% | 12.49% | 11.39% | 12.68% | 12.71% | 17.94% | 4.44% | 10.00% |
|
| Since inception | 5.26% | 5.14% | 5.19% | 5.26% | 5.06% | 5.63% | 5.93% | 6.25% | 4.74% | 6.38% | 6.35% | 7.78% | 4.86% | 6.35% |
|
| Cumulative returns | | | | | | | | | | | | | | |
|
| 1 year | 4.57% | 4.23% | 8.34% | 9.55% | 9.92% | 9.70% | 10.17% | 10.39% | 10.49% | 10.55% | 10.54% | 32.39% | –2.03% | 10.69% |
|
| 5 years | 68.69% | 68.95% | 71.50% | 73.87% | 71.43% | 74.76% | 77.43% | 80.12% | 71.45% | 81.68% | 81.90% | 128.19% | 24.27% | 61.04% |
|
| Since inception | 52.35% | 50.83% | 51.46% | 45.37% | 49.97% | 56.78% | 60.42% | 64.47% | 46.28% | 66.20% | 58.70% | 84.99% | 47.63% | 65.73% |
|
Performance figures assume all distributions have been reinvested. Returns with maximum sales charge reflect a sales charge on Class A shares of 5%, and the applicable contingent deferred sales charge (CDSC) on Class B and Class C shares. The Class B shares’ CDSC declines annually between years 1–6 according to the following schedule: 5%, 4%, 3%, 3%, 2%, 1%. No sales charges will be assessed after the sixth year. Class C shares held for less than one year are subject to a 1% CDSC. Sales charges are not applicable to Class R1, Class R2, Class R3, Class R4, Class R5, Class R6, Class 1, and Class 5 shares.
Performance of the classes will vary based on the difference in sales charges paid by shareholders investing in the different classes and the fee structure of those classes.
The expense ratios of the portfolio, both net (including any fee waivers or expense limitations) and gross (excluding any fee waivers or expense limitations), are set forth according to the most recent publicly available prospectuses for the portfolio and may differ from those disclosed in the Financial highlights tables in this report. The fee waivers and expense limitations are contractual at least until 4-30-15 for Class A shares and 4-30-14 for Class R2, Class R4, and Class R6 shares. Had the fee waivers and expense limitations not been in place, gross expenses would apply. For all other classes, the net expenses equal the gross expenses. The following expense ratios include expenses of the underlying affiliated funds in which the portfolio invests. The expense ratios are as follows:
| | | | | | | | | | | | | | |
| | Class A | Class B | Class C | Class R1 | Class R2 | Class R3 | Class R4* | Class R5 | Class R6 | Class 1 | Class 5 | | | |
| Net (%) | 1.27 | 2.10 | 2.08 | 1.80 | 1.42 | 1.68 | 1.28 | 1.07 | 0.91 | 0.91 | 0.86 | | | |
| Gross (%) | 1.37 | 2.10 | 2.08 | 1.80 | 17.08 | 1.68 | 1.38 | 1.07 | 5.59 | 0.91 | 0.86 | | | |
* The portfolio’s distributor has contractually agreed to waive 0.10% of Rule 12b-1 fees for Class R4 shares. The current waiver agreement will remain in effect through 4-30-14.
The returns reflect past results and should not be considered indicative of future performance. The return and principal value of an investment will fluctuate so that shares, when redeemed, may be worth more or less than their original cost. Due to market volatility, the portfolio’s current performance may be higher or lower than the performance shown. For performance data current to the most recent month end, please call 800-225-5291 or visit the portfolio’s website at jhinvestments.com.
This performance information does not reflect the deduction of taxes that a shareholder may pay on portfolio distributions or the redemption of portfolio shares. The portfolio’s performance results reflect any applicable fee waivers or expense reductions, without which the expenses would increase and results would have been less favorable.
1 For certain types of investors as described in the portfolio’s prospectuses.
2 Class R2 shares were first offered on 3-1-12. The returns prior to this date are those of Class A shares that have been recalculated to apply the gross fees and expenses of Class R2 shares. Class R6 shares were first offered on 9-1-11. The returns prior to this date are those of Class 1 shares that have been recalculated to apply the gross fees and expenses of Class R6 shares.
3 Index 1, Index 2, and Index 3 returns at 12-31-13 for the period beginning 10-15-05 (inception date for Class 1 and Class R6 shares) are 7.82%, 4.86%, and 6.36% (respectively, annualized), and 85.54%, 47.69%, and 65.97% (respectively, cumulative). Index 1, Index 2, and Index 3 returns at 12-31-13 for the period beginning 7-3-06 (inception date for Class 5 shares) are 7.42%, 5.27%, and 6.48% (respectively, annualized), and 70.99%, 47.02%, and 60.13% (respectively, cumulative). Index 1, Index 2, and Index 3 returns at 12-31-13 for the period beginning 9-16-06 (inception date of Class R1 shares) are 7.01%, 5.02%, and 6.17% (respectively, annualized) and 63.87%, 42.92%, and 54.77% (respectively, cumulative).
| |
| Annual report | Lifestyle Portfolios | 9 |
John Hancock Lifestyle Conservative Portfolio
Performance chart
Total returns with maximum sales charge for the period ended 12-31-13
| | | | | | | | | | | | | |
| | Class A | Class B | Class C | Class R11 | Class R21,2 | Class R31 | Class R41 | Class R51 | Class R61,2 | Class 11 | Index 13 | Index 23 | Index 33 |
|
| Start date | 10-18-05 | 10-18-05 | 10-18-05 | 9-18-06 | 10-18-05 | 10-18-05 | 10-18-05 | 10-18-05 | 10-15-05 | 10-15-05 | 10-18-05 | 10-18-05 | 10-18-05 |
|
| Average annual total returns | | | | | | | | | | | | |
|
| 1 year | –0.59% | –1.13% | 2.98% | 4.31% | 4.67% | 4.39% | 4.72% | 5.03% | 5.05% | 5.12% | 32.39% | –2.03% | 4.16% |
|
| 5 years | 8.65% | 8.66% | 9.01% | 9.26% | 9.02% | 9.40% | 9.71% | 10.08% | 8.78% | 10.25% | 17.94% | 4.44% | 7.24% |
|
| Since inception | 4.86% | 4.76% | 4.78% | 5.03% | 4.67% | 5.24% | 5.50% | 5.85% | 4.09% | 5.98% | 7.78% | 4.86% | 5.66% |
|
| Cumulative returns | | | | | | | | | | | | | |
|
| 1 year | –0.59% | –1.13% | 2.98% | 4.31% | 4.67% | 4.39% | 4.72% | 5.03% | 5.05% | 5.12% | 32.39% | –2.03% | 4.16% |
|
| 5 years | 51.41% | 51.45% | 53.93% | 55.72% | 54.02% | 56.69% | 58.92% | 61.62% | 52.34% | 62.92% | 128.19% | 24.27% | 41.85% |
|
| Since inception | 47.66% | 46.42% | 46.65% | 43.06% | 45.38% | 52.01% | 55.21% | 59.43% | 38.95% | 61.08% | 84.99% | 47.63% | 57.07% |
|
Performance figures assume all distributions have been reinvested. Returns with maximum sales charge reflect a sales charge on Class A shares of 5%, and the applicable contingent deferred sales charge (CDSC) on Class B and Class C shares. The Class B shares’ CDSC declines annually between years 1–6 according to the following schedule: 5%, 4%, 3%, 3%, 2%, 1%. No sales charges will be assessed after the sixth year. Class C shares held for less than one year are subject to a 1% CDSC. Sales charges are not applicable to Class R1, Class R2, Class R3, Class R4, Class R5, Class R6, Class 1, and Class 5 shares.
Performance of the classes will vary based on the difference in sales charges paid by shareholders investing in the different classes and the fee structure of those classes.
The expense ratios of the portfolio, both net (including any fee waivers or expense limitations) and gross (excluding any fee waivers or expense limitations), are set forth according to the most recent publicly available prospectuses for the portfolio and may differ from those disclosed in the Financial highlights tables in this report. The fee waivers and expense limitations are contractual at least until 4-30-15 for Class A shares and 4-30-14 for Class R2, Class R4, and Class R6 shares. Had the fee waivers and expense limitations not been in place, gross expenses would apply. For all other classes, the net expenses equal the gross expenses. The following expense ratios include expenses of the underlying affiliated funds in which the portfolio invests. The expense ratios are as follows:
| | | | | | | | | | | | | | |
| | Class A | Class B | Class C | Class R1 | Class R2 | Class R3 | Class R4* | Class R5 | Class R6 | Class 1 | | | | |
| Net (%) | 1.23 | 2.06 | 2.02 | 1.84 | 1.37 | 1.73 | 1.26 | 1.07 | 0.87 | 0.87 | | | | |
| Gross (%) | 1.32 | 2.06 | 2.02 | 1.84 | 11.40 | 1.73 | 1.36 | 1.07 | 3.26 | 0.87 | | | | |
* The portfolio’s distributor has contractually agreed to waive 0.10% of the Rule 12b-1 fees for Class R4 shares. The current waiver agreement will remain in effect through 4-30-14.
The returns reflect past results and should not be considered indicative of future performance. The return and principal value of an investment will fluctuate so that shares, when redeemed, may be worth more or less than their original cost. Due to market volatility, the portfolio’s current performance may be higher or lower than the performance shown. For performance data current to the most recent month end, please call 800-225-5291 or visit the portfolio’s website at jhinvestments.com.
This performance information does not reflect the deduction of taxes that a shareholder may pay on portfolio distributions or the redemption of portfolio shares. The portfolio’s performance results reflect any applicable fee waivers or expense reductions, without which the expenses would increase and results would have been less favorable.
1 For certain types of investors as described in the portfolio’s prospectuses.
2 Class R2 shares were first offered on 3-1-12. The returns prior to this date are those of Class A shares that have been recalculated to apply the gross fees and expenses of Class R2 shares. Class R6 shares were first offered on 9-1-11. The returns prior to this date are those of Class 1 shares that have been recalculated to apply the gross fees and expenses of Class R6 shares.
3Index 1, Index 2, and Index 3 returns at 12-31-13 for the period beginning 10-15-05 (inception date for Class 1 and Class R6 shares) are 7.82%, 4.86%, and 5.66% (respectively, annualized), and 85.54%, 47.69%, and 57.22% (respectively, cumulative). Index 1, Index 2, and Index 3 returns at 12-31-13 for the period beginning 9-16-06 (inception date of Class R1 shares) are 7.01%, 5.02% and 5.65% (respectively, annualized) and 63.87%, 42.92%, and 49.33% (respectively, cumulative).
| |
| 10 | Lifestyle Portfolios | Annual report |
Your expenses
As a shareholder of a John Hancock Funds II Lifestyle Portfolio, you incur ongoing costs, such as management fees, distribution and service (Rule 12b-1) fees and other expenses. In addition to the operating expenses which the portfolio bears directly, the portfolio indirectly bears a pro rata share of the operating expenses of the affiliated underlying funds in which the portfolio invests. Because the affiliated underlying funds have varied operating expenses and transaction costs and the portfolio may own different proportions of the underlying funds at different times, the amount of expenses incurred indirectly by the portfolio will vary. Had these indirect expenses been reflected in the following analysis, total expenses would have been higher than the amounts shown.
This example is intended to help you understand your ongoing costs (in dollars) of investing in the portfolio so you can compare these costs with the ongoing costs of investing in other mutual funds. The example is based on an investment of $1,000 at the beginning of the period and held for the entire period (July 1, 2013 through December 31, 2013).
Actual expenses:
The first line of each share class in the table on the following page provides information about actual account values and actual expenses. You may use the information in this line, together with the amount you invested, to estimate the expenses that you paid over the period. Simply divide your account value by $1,000 (for example, an $8,600 account value divided by $1,000 = 8.6), then multiply the result by the number in the first line under the heading entitled “Expenses paid during period” to estimate the expenses you paid on your account during this period.
Hypothetical example for comparison purposes:
The second line of each share class in the table on the following page provides information about hypothetical account values and hypothetical expenses based on the actual expense ratio for the share class and an assumed annualized rate of return of 5% per year before expenses, which is not the actual return of the share class. The hypothetical account values and expenses may not be used to estimate the actual ending account balance or expenses you paid for the period. You may use this information to compare the ongoing costs of investing in the portfolio and other funds. To do so, compare this 5% hypothetical example with the 5% hypothetical examples that appear in the shareholder reports of the other funds.
Please note that the expenses shown in the table are meant to highlight your ongoing costs only and do not reflect any transactional costs and insurance-related charges. Therefore, the second line of each share class in the table is useful in comparing ongoing costs only, and will not help you determine the relative total costs of owning different funds. In addition, if these transactional costs were included, your costs would have been higher.
| |
| Annual report | Lifestyle Portfolios | 11 |
Shareholder expense example chart
| | | | | |
| | | Beginning | Ending | Expenses Paid | |
| | | Account Value | Account Value | During Period1 | Annualized |
| | | 7-1-13 | 12-31-13 | 7-1-13–12-31-13 | Expense Ratio2 |
|
| Lifestyle Aggressive Portfolio | | | | |
|
| Class A | Actual | $1,000.00 | $1,166.10 | $2.68 | 0.49% |
| | Hypothetical (5% annualized return before expenses) | 1,000.00 | 1,022.70 | 2.50 | 0.49% |
|
| Class B | Actual | 1,000.00 | 1,161.40 | 7.03 | 1.29% |
| | Hypothetical (5% annualized return before expenses) | 1,000.00 | 1,018.70 | 6.56 | 1.29% |
|
| Class C | Actual | 1,000.00 | 1,162.10 | 6.59 | 1.21% |
| | Hypothetical (5% annualized return before expenses) | 1,000.00 | 1,019.70 | 6.16 | 1.21% |
|
| Class R1 | Actual | 1,000.00 | 1,163.90 | 4.91 | 0.90% |
| | Hypothetical (5% annualized return before expenses) | 1,000.00 | 1,020.70 | 4.58 | 0.90% |
|
| Class R2 | Actual | 1,000.00 | 1,166.20 | 3.39 | 0.62% |
| | Hypothetical (5% annualized return before expenses) | 1,000.00 | 1,022.10 | 3.16 | 0.62% |
|
| Class R3 | Actual | 1,000.00 | 1,163.80 | 4.47 | 0.82% |
| | Hypothetical (5% annualized return before expenses) | 1,000.00 | 1,021.10 | 4.18 | 0.82% |
|
| Class R4 | Actual | 1,000.00 | 1,166.30 | 2.57 | 0.47% |
| | Hypothetical (5% annualized return before expenses) | 1,000.00 | 1,022.80 | 2.40 | 0.47% |
|
| Class R5 | Actual | 1,000.00 | 1,168.50 | 1.20 | 0.22% |
| | Hypothetical (5% annualized return before expenses) | 1,000.00 | 1,024.10 | 1.12 | 0.22% |
|
| Class R6 | Actual | 1,000.00 | 1,168.70 | 0.60 | 0.11% |
| | Hypothetical (5% annualized return before expenses) | 1,000.00 | 1,024.70 | 0.56 | 0.11% |
|
| Class 1 | Actual | 1,000.00 | 1,168.90 | 0.60 | 0.11% |
| | Hypothetical (5% annualized return before expenses) | 1,000.00 | 1,024.70 | 0.56 | 0.11% |
|
| Lifestyle Growth Portfolio | | | | |
|
| Class A | Actual | $1,000.00 | $1,140.60 | $2.64 | 0.49% |
| | Hypothetical (5% annualized return before expenses) | 1,000.00 | 1,022.70 | 2.50 | 0.49% |
|
| Class B | Actual | 1,000.00 | 1,137.20 | 6.57 | 1.22% |
| | Hypothetical (5% annualized return before expenses) | 1,000.00 | 1,019.10 | 6.21 | 1.22% |
|
| Class C | Actual | 1,000.00 | 1,136.70 | 6.52 | 1.21% |
| | Hypothetical (5% annualized return before expenses) | 1,000.00 | 1,019.10 | 6.16 | 1.21% |
|
| Class R1 | Actual | 1,000.00 | 1,138.80 | 4.69 | 0.87% |
| | Hypothetical (5% annualized return before expenses) | 1,000.00 | 1,020.80 | 4.43 | 0.87% |
|
| Class R2 | Actual | 1,000.00 | 1,140.50 | 3.35 | 0.62% |
| | Hypothetical (5% annualized return before expenses) | 1,000.00 | 1,022.10 | 3.16 | 0.62% |
|
| Class R3 | Actual | 1,000.00 | 1,139.50 | 4.15 | 0.77% |
| | Hypothetical (5% annualized return before expenses) | 1,000.00 | 1,021.30 | 3.92 | 0.77% |
|
| Class R4 | Actual | 1,000.00 | 1,142.10 | 2.16 | 0.40% |
| | Hypothetical (5% annualized return before expenses) | 1,000.00 | 1,023.20 | 2.04 | 0.40% |
|
| Class R5 | Actual | 1,000.00 | 1,143.40 | 0.97 | 0.18% |
| | Hypothetical (5% annualized return before expenses) | 1,000.00 | 1,024.30 | 0.92 | 0.18% |
|
| Class R6 | Actual | 1,000.00 | 1,143.30 | 0.59 | 0.11% |
| | Hypothetical (5% annualized return before expenses) | 1,000.00 | 1,024.70 | 0.56 | 0.11% |
|
| Class 1 | Actual | 1,000.00 | 1,143.30 | 0.59 | 0.11% |
| | Hypothetical (5% annualized return before expenses) | 1,000.00 | 1,024.70 | 0.56 | 0.11% |
|
| Class 5 | Actual | 1,000.00 | 1,143.20 | 0.32 | 0.06% |
| | Hypothetical (5% annualized return before expenses) | 1,000.00 | 1,024.90 | 0.31 | 0.06% |
|
| |
| 12 | Lifestyle Portfolios | Annual report |
Shareholder expense example chart, continued
| | | | | |
| | | Beginning | Ending | Expenses Paid | |
| | | Account Value | Account Value | During Period1 | Annualized |
| | | 7-1-13 | 12-31-13 | 7-1-13–12-31-13 | Expense Ratio2 |
|
| Lifestyle Balanced Portfolio | | | | |
|
| Class A | Actual | $1,000.00 | $1,107.50 | $2.60 | 0.49% |
| | Hypothetical (5% annualized return before expenses) | 1,000.00 | 1,022.70 | 2.50 | 0.49% |
|
| Class B | Actual | 1,000.00 | 1,103.30 | 6.63 | 1.25% |
| | Hypothetical (5% annualized return before expenses) | 1,000.00 | 1,018.90 | 6.36 | 1.25% |
|
| Class C | Actual | 1,000.00 | 1,103.40 | 6.42 | 1.21% |
| | Hypothetical (5% annualized return before expenses) | 1,000.00 | 1,019.10 | 6.16 | 1.21% |
|
| Class R1 | Actual | 1,000.00 | 1,104.90 | 4.77 | 0.90% |
| | Hypothetical (5% annualized return before expenses) | 1,000.00 | 1,020.70 | 4.58 | 0.90% |
|
| Class R2 | Actual | 1,000.00 | 1,105.90 | 3.29 | 0.62% |
| | Hypothetical (5% annualized return before expenses) | 1,000.00 | 1,022.10 | 3.16 | 0.62% |
|
| Class R3 | Actual | 1,000.00 | 1,106.30 | 4.03 | 0.76% |
| | Hypothetical (5% annualized return before expenses) | 1,000.00 | 1,021.40 | 3.87 | 0.76% |
|
| Class R4 | Actual | 1,000.00 | 1,108.50 | 1.81 | 0.34% |
| | Hypothetical (5% annualized return before expenses) | 1,000.00 | 1,023.50 | 1.73 | 0.34% |
|
| Class R5 | Actual | 1,000.00 | 1,109.40 | 0.85 | 0.16% |
| | Hypothetical (5% annualized return before expenses) | 1,000.00 | 1,024.40 | 0.82 | 0.16% |
|
| Class R6 | Actual | 1,000.00 | 1,109.50 | 0.58 | 0.11% |
| | Hypothetical (5% annualized return before expenses) | 1,000.00 | 1,024.70 | 0.56 | 0.11% |
|
| Class 1 | Actual | 1,000.00 | 1,109.50 | 0.58 | 0.11% |
| | Hypothetical (5% annualized return before expenses) | 1,000.00 | 1,024.70 | 0.56 | 0.11% |
|
| Class 5 | Actual | 1,000.00 | 1,109.70 | 0.32 | 0.06% |
| | Hypothetical (5% annualized return before expenses) | 1,000.00 | 1,024.90 | 0.31 | 0.06% |
|
| Lifestyle Moderate Portfolio | | | | |
|
| Class A | Actual | $1,000.00 | $1,072.80 | 2.56 | 0.49% |
| | Hypothetical (5% annualized return before expenses) | 1,000.00 | 1,022.70 | 2.50 | 0.49% |
|
| Class B | Actual | 1,000.00 | 1,068.70 | 6.41 | 1.23% |
| | Hypothetical (5% annualized return before expenses) | 1,000.00 | 1,019.00 | 6.26 | 1.23% |
|
| Class C | Actual | 1,000.00 | 1,069.60 | 6.36 | 1.22% |
| | Hypothetical (5% annualized return before expenses) | 1,000.00 | 1,019.10 | 6.21 | 1.22% |
|
| Class R1 | Actual | 1,000.00 | 1,070.60 | 4.91 | 0.94% |
| | Hypothetical (5% annualized return before expenses) | 1,000.00 | 1,020.50 | 4.79 | 0.94% |
|
| Class R2 | Actual | 1,000.00 | 1,072.50 | 3.24 | 0.62% |
| | Hypothetical (5% annualized return before expenses) | 1,000.00 | 1,022.10 | 3.16 | 0.62% |
|
| Class R3 | Actual | 1,000.00 | 1,071.80 | 4.28 | 0.82% |
| | Hypothetical (5% annualized return before expenses) | 1,000.00 | 1,021.10 | 4.18 | 0.82% |
|
| Class R4 | Actual | 1,000.00 | 1,073.50 | 2.40 | 0.46% |
| | Hypothetical (5% annualized return before expenses) | 1,000.00 | 1,022.90 | 2.35 | 0.46% |
|
| Class R5 | Actual | 1,000.00 | 1,075.10 | 1.15 | 0.22% |
| | Hypothetical (5% annualized return before expenses) | 1,000.00 | 1,024.10 | 1.12 | 0.22% |
|
| Class R6 | Actual | 1,000.00 | 1,075.20 | 0.58 | 0.11% |
| | Hypothetical (5% annualized return before expenses) | 1,000.00 | 1,024.70 | 0.56 | 0.11% |
|
| Class 1 | Actual | 1,000.00 | 1,075.90 | 0.58 | 0.11% |
| | Hypothetical (5% annualized return before expenses) | 1,000.00 | 1,024.70 | 0.56 | 0.11% |
|
| Class 5 | Actual | 1,000.00 | 1,075.50 | 0.31 | 0.06% |
| | Hypothetical (5% annualized return before expenses) | 1,000.00 | 1,024.90 | 0.31 | 0.06% |
|
| |
| Annual report | Lifestyle Portfolios | 13 |
Shareholder expense example chart, continued
| | | | | |
| | | Beginning | Ending | Expenses Paid | |
| | | Account Value | Account Value | During Period1 | Annualized |
| | | 7-1-13 | 12-31-13 | 7-1-13–12-31-13 | Expense Ratio2 |
|
| Lifestyle Conservative Portfolio | | | | |
|
| Class A | Actual | $1,000.00 | $1,041.60 | $2.57 | 0.50% |
| | Hypothetical (5% annualized return before expenses) | 1,000.00 | 1,022.70 | 2.55 | 0.50% |
|
| Class B | Actual | 1,000.00 | 1,037.50 | 6.37 | 1.24% |
| | Hypothetical (5% annualized return before expenses) | 1,000.00 | 1,019.00 | 6.31 | 1.24% |
|
| Class C | Actual | 1,000.00 | 1,038.50 | 6.27 | 1.22% |
| | Hypothetical (5% annualized return before expenses) | 1,000.00 | 1,019.10 | 6.21 | 1.22% |
|
| Class R1 | Actual | 1,000.00 | 1,039.50 | 4.63 | 0.90% |
| | Hypothetical (5% annualized return before expenses) | 1,000.00 | 1,020.70 | 4.58 | 0.90% |
|
| Class R2 | Actual | 1,000.00 | 1,041.10 | 3.19 | 0.62% |
| | Hypothetical (5% annualized return before expenses) | 1,000.00 | 1,022.10 | 3.16 | 0.62% |
|
| Class R3 | Actual | 1,000.00 | 1,040.40 | 3.75 | 0.73% |
| | Hypothetical (5% annualized return before expenses) | 1,000.00 | 1,021.50 | 3.72 | 0.73% |
|
| Class R4 | Actual | 1,000.00 | 1,041.90 | 2.47 | 0.48% |
| | Hypothetical (5% annualized return before expenses) | 1,000.00 | 1,022.80 | 2.45 | 0.48% |
|
| Class R5 | Actual | 1,000.00 | 1,043.50 | 0.88 | 0.17% |
| | Hypothetical (5% annualized return before expenses) | 1,000.00 | 1,024.30 | 0.87 | 0.17% |
|
| Class R6 | Actual | 1,000.00 | 1,043.80 | 0.57 | 0.11% |
| | Hypothetical (5% annualized return before expenses) | 1,000.00 | 1,024.70 | 0.56 | 0.11% |
|
| Class 1 | Actual | 1,000.00 | 1,043.80 | 0.57 | 0.11% |
| | Hypothetical (5% annualized return before expenses) | 1,000.00 | 1,024.70 | 0.56 | 0.11% |
|
1 Expenses are equal to the annualized expense ratio, multiplied by the average account value over the period, multiplied by the number of days in the period (184) and divided by 365 (to reflect the one-half year period).
2 The portfolios’ expense ratios do not include fees and expenses indirectly incurred by the underlying funds whose expense ratios can vary based on the mix of underlying funds held by portfolios. The range of expense ratios of the underlying funds held by the portfolios was as follows:
| | | | | |
| | Lifestyle | Lifestyle | Lifestyle | Lifestyle | Lifestyle |
| Period ended | Aggressive | Growth | Balanced | Moderate | Conservative |
| 12-31-13 | 0.69%–3.11% | 0.63%–3.11% | 0.62%–3.11% | 0.62%–3.11% | 0.62%–3.11% |
| |
| 14 | Lifestyle Portfolios | Annual report |
Portfolios’ investments
Investment companies
Underlying Funds’ Investment Managers
| | | |
| Allianz Life Insurance Company of New York | (Allianz) | | |
| | | | |
| Atlantis Investment Management | | | |
| (Hong Kong) Ltd. | (Atlantis) | | |
| | | | |
| Baillie Gifford Overseas, Ltd. | (Baillie Gifford) | | |
| | | | |
| Davis Selected Advisers, L.P. | (Davis) | | |
| | | | |
| Declaration Management & Research, LLC | (Declaration) | | |
| | | | |
| Deutsche Investment Management | | | |
| Americas Inc. | (Deutsche) | | |
| | | | |
| Dimensional Fund Advisors LP | (DFA) | | |
| | | | |
| Epoch Investment Partners, Inc. | (Epoch) | | |
| | | | |
| First Quadrant, L.P. | (First Quadrant) | | |
| | | | |
| Franklin Mutual Advisers, LLC | (Franklin) | | |
| | | | |
| Franklin Templeton Investments Corp. | (Franklin Templeton) | | |
| | | | |
| Templeton Investment Counsel, LLC | (Templeton) | | |
| | | | |
| Grantham, Mayo, Van Otterloo & Co. LLC | (GMO) | | |
| | | | |
| Invesco Advisers, Inc. | (Invesco) | | |
| | | | |
| Jennison Associates LLC | (Jennison) | | |
| | | | |
| John Hancock Asset Management | (John Hancock) | | |
| | | | |
| Pacific Investment Management | | | |
| Company LLC | (PIMCO) | | |
| | | | |
| QS Investors, Inc. | (QS Investors) | | |
| | | | |
| Rainier Investment Management, Inc. | (Rainier) | | |
| | | | |
| Robeco Investment Management, Inc. | (Robeco) | | |
| | | | |
| RS Investment Management Company LLC | (RS Investment) | | |
| | | | |
| Standard Life Investments | | | |
| (Corporate Funds) Limited | (Standard Life) | | |
| | | | |
| Stone Harbor Investment Partners LP | (Stone Harbor) | | |
| | | | |
| T. Rowe Price Associates, Inc | (T. Rowe Price) | | |
| | | | |
| Wellington Management Company, LLP | (Wellington) | | |
| | | | |
| Wells Capital Management, Incorporated | (Wells Capital) | | |
| | | | |
| Western Asset Management Company | (WAMCO) | | |
Lifestyle Aggressive Portfolio
Securities owned by the portfolio on 12-31-13
| | |
| | Shares | Value |
| |
| AFFILIATED INVESTMENT COMPANIES — 100.00% | |
|
| EQUITY 95.2% | | |
| | | |
| John Hancock Funds (G) 0.5% | | |
|
| Small Cap Core, Class NAV (Wellington) (I) | 2,129,000 | $21,737,090 |
| | | |
| John Hancock Funds II (G) 82.0% | | |
|
| All Cap Core, Class NAV (QS Investors) | 10,740,970 | 140,814,122 |
|
| Alpha Opportunities, Class NAV (Wellington) | 22,266,556 | 282,785,261 |
|
| Blue Chip Growth, Class NAV (T. Rowe Price) | 6,730,939 | 226,967,263 |
|
| Capital Appreciation, Class NAV (Jennison) | 11,283,343 | 191,139,832 |
|
| Capital Appreciation Value, Class NAV | | |
| (T. Rowe Price) | 12,913,744 | 151,478,212 |
|
| China Emerging Leaders, Class NAV (Atlantis) | 6,727,149 | 59,938,896 |
|
| Emerging Markets, Class NAV (DFA) | 32,849,499 | 336,050,374 |
|
| Equity-Income, Class NAV (T. Rowe Price) | 9,131,813 | 183,823,386 |
|
| Fundamental Global Franchise, Class NAV | | |
| (John Hancock1) (A) | 3,131,399 | 40,708,186 |
|
| Fundamental Large Cap Value, Class NAV | | |
| (John Hancock1) (A) | 11,220,450 | 145,865,850 |
|
| Fundamental Value, Class NAV (Davis) | 7,380,391 | 156,169,073 |
|
| Global Equity, Class NAV (John Hancock1) (A) | 4,179,298 | 46,306,619 |
|
| Global Real Estate, Class NAV (Deutsche) | 2,780,108 | 22,880,288 |
|
| Health Sciences, Class NAV (T. Rowe Price) | 4,775,285 | 81,036,583 |
|
| International Growth Opportunities Fund, | | |
| Class NAV (Baillie Gifford) | 5,569,576 | 78,531,016 |
|
| International Growth Stock, Class NAV (Invesco) | 7,844,279 | 105,662,443 |
|
| International Small Cap, Class NAV | | |
| (Franklin Templeton) | 4,691,062 | 88,473,426 |
|
| International Small Company, Class NAV (DFA) | 8,604,385 | 89,399,559 |
|
| International Value, Class NAV (Templeton) | 12,857,868 | 226,684,212 |
|
| Mid Cap Stock, Class NAV (Wellington) | 8,968,063 | 191,737,187 |
|
| Mid Value, Class NAV (T. Rowe Price) | 9,159,551 | 150,033,446 |
|
| Mutual Shares, Class NAV (Franklin) | 4,635,411 | 63,273,364 |
|
| Natural Resources, Class NAV | | |
| (RS Investments/Wellington) | 5,389,280 | 91,779,442 |
|
| Real Estate Equity, Class NAV (T. Rowe Price) | 2,359,054 | 22,670,511 |
|
| Redwood, Class NAV (Allianz) | 2,869,272 | 32,422,779 |
|
| Science & Technology, Class NAV | | |
| (T. Rowe Price/Allianz) | 10,735,692 | 138,919,857 |
|
| Small Cap Growth, Class NAV (Wellington) | 3,400,439 | 36,350,696 |
|
| Small Cap Opportunities, Class NAV (Invesco/DFA) | 857,814 | 25,931,707 |
|
| Small Cap Value, Class NAV (Wellington) | 1,636,162 | 31,447,027 |
|
| Small Company Growth, Class NAV (Invesco) | 1,633,411 | 33,109,233 |
|
| Small Company Value, Class NAV (T. Rowe Price) | 1,256,859 | 47,232,751 |
|
| Technical Opportunities, Class NAV (Wellington) | 9,442,552 | 133,423,262 |
|
| U.S. Equity, Class NAV (GMO) | 5,593,724 | 71,543,726 |
|
| Value, Class NAV (Invesco) | 5,424,714 | 63,903,134 |
| | | |
| John Hancock Funds III (G) 12.2% | | |
|
| Disciplined Value, Class NAV (Robeco) | 4,634,521 | 83,421,374 |
|
| Global Shareholder Yield, Class NAV (Epoch) | 4,071,789 | 47,232,751 |
|
| International Core, Class NAV (GMO) | 3,637,145 | 124,972,304 |
|
| International Value Equity, Class NAV | | |
| (John Hancock1) (A) | 7,493,712 | 68,717,338 |
|
| Rainier Growth, Class NAV (Rainier) | 2,542,755 | 70,205,465 |
|
| Strategic Growth, Class NAV | | |
| (John Hancock1) (A) | 10,964,212 | 169,945,292 |
| | |
| John Hancock Investment Trust (G) 0.5% | |
|
| Small Cap Intrinsic Value, Class NAV | | |
| (John Hancock1) (A)(I) | 1,419,707 | 21,764,111 |
| | |
| | Annual report | Lifestyle Portfolios | 15 |
| See notes to financial statements | | |
Lifestyle Aggressive Portfolio (continued)
| | |
| | Shares | Value |
| | | |
| ALTERNATIVE 4.8% | | |
| | | |
| John Hancock Funds (G) 1.9% | | |
|
| Financial Industries, Class NAV | | |
| (John Hancock1) (A) | 4,393,692 | $72,979,232 |
|
| Seaport Fund, Class NAV (Wellington) (I) | 1,360,396 | 13,671,977 |
| | | |
| John Hancock Funds II (G) 2.9% | | |
|
| Currency Strategies, Class NAV (First Quadrant) | 9,665,807 | 90,085,317 |
|
| Global Absolute Return Strategies, Class NAV | | |
| (Standard Life) | 3,878,237 | 42,854,522 |
| |
| Total Investments (Lifestyle Aggressive Portfolio) |
| (Cost $3,400,601,658) 100.0% | | $4,616,079,496 |
| | | |
| Other assets and liabilities, net 0.0% | | 856,086 |
|
| TOTAL NET ASSETS 100.0% | | $4,616,935,582 |
Percentages are based upon net assets.
Lifestyle Growth Portfolio
Securities owned by the portfolio on 12-31-13
| | |
| | Shares | Value |
| |
| AFFILIATED INVESTMENT COMPANIES — 100.00% | |
|
| EQUITY 81.0% | | |
| | | |
| John Hancock Funds (G) 0.3% | | |
|
| Small Cap Core, Class NAV (Wellington) (I) | 4,357,000 | $44,484,970 |
| | | |
| John Hancock Funds II (G) 69.5% | | |
|
| All Cap Core, Class NAV (QS Investors) | 25,221,090 | 330,648,483 |
|
| Alpha Opportunities, Class NAV (Wellington) | 55,341,787 | 702,840,695 |
|
| Blue Chip Growth, Class NAV (T. Rowe Price) | 18,374,636 | 619,592,724 |
|
| Capital Appreciation, Class NAV (Jennison) | 30,817,367 | 522,046,205 |
|
| Capital Appreciation Value, Class NAV | | |
| (T. Rowe Price) | 49,993,014 | 586,418,055 |
|
| China Emerging Leaders, Class NAV (Atlantis) | 14,926,735 | 132,997,207 |
|
| Emerging Markets, Class NAV (DFA) | 75,282,677 | 770,141,789 |
|
| Equity-Income, Class NAV (T. Rowe Price) | 24,618,611 | 495,572,645 |
|
| Fundamental Global Franchise, Class NAV | | |
| (John Hancock1) (A) | 10,752,239 | 139,779,112 |
|
| Fundamental Large Cap Value, Class NAV | | |
| (John Hancock1) (A) | 29,498,703 | 383,483,141 |
|
| Fundamental Value, Class NAV (Davis) | 17,593,526 | 372,279,005 |
|
| Global Equity, Class NAV (John Hancock1) (A) | 10,784,412 | 119,491,286 |
|
| Global Real Estate, Class NAV (Deutsche) | 9,751,091 | 80,251,482 |
|
| Health Sciences, Class NAV (T. Rowe Price) | 12,672,859 | 215,058,419 |
|
| International Growth Opportunities, | | |
| Class NAV (Baillie Gifford) | 13,429,163 | 189,351,193 |
|
| International Growth Stock, Class NAV (Invesco) | 18,796,662 | 253,191,038 |
|
| International Small Cap, Class NAV | | |
| (Franklin Templeton) | 10,496,595 | 197,965,774 |
|
| International Small Company, Class NAV (DFA) | 19,757,497 | 205,280,396 |
|
| International Value, Class NAV (Templeton) | 30,602,312 | 539,518,764 |
|
| Mid Cap Stock, Class NAV (Wellington) | 22,955,273 | 490,783,734 |
|
| Mid Value, Class NAV (T. Rowe Price) | 23,448,448 | 384,085,575 |
|
| Mutual Shares, Class NAV (Franklin) | 12,435,148 | 169,739,768 |
|
| Natural Resources, Class NAV | | |
| (RS Investments/Wellington) | 12,031,955 | 204,904,201 |
|
| Real Estate Equity, Class NAV (T. Rowe Price) | 6,934,216 | 66,637,817 |
|
| Redwood, Class NAV (Allianz) | 8,783,508 | 99,253,640 |
|
| Science & Technology, Class NAV | | |
| (T. Rowe Price/Allianz) | 28,191,857 | 364,802,632 |
|
| Small Cap Growth, Class NAV (Wellington) | 7,154,379 | 76,480,308 |
|
| Small Cap Opportunities, Class NAV (Invesco/DFA) | 1,803,849 | 54,530,367 |
|
| Small Cap Value, Class NAV (Wellington) | 3,415,388 | 65,643,755 |
|
| Small Company Growth, Class NAV (Invesco) | 3,414,440 | 69,210,704 |
|
| Small Company Value, Class NAV (T. Rowe Price) | 2,676,607 | 100,586,900 |
|
| Technical Opportunities, Class NAV (Wellington) | 25,320,745 | 357,782,126 |
|
| U.S. Equity, Class NAV (GMO) | 23,843,956 | 304,964,203 |
|
| Value, Class NAV (Invesco) | 13,901,217 | 163,756,331 |
Lifestyle Growth Portfolio (continued)
| | |
| | Shares | Value |
| | | |
| John Hancock Funds III (G) 10.9% | | |
|
| Disciplined Value, Class NAV (Robeco) | 12,587,035 | $226,566,638 |
|
| Global Shareholder Yield, Class NAV (Epoch) | 17,451,324 | 202,435,356 |
|
| International Core, Class NAV (GMO) | 8,672,183 | 297,976,210 |
|
| International Value Equity, Class NAV | | |
| (John Hancock1) (A) | 17,654,407 | 161,890,912 |
|
| Rainier Growth, Class NAV (Rainier) | 6,975,795 | 192,601,691 |
|
| Strategic Growth, Class NAV (John Hancock1) (A) | 29,299,270 | 454,138,680 |
| | |
| John Hancock Investment Trust (G) 0.3% | |
|
| Small Cap Intrinsic Value, Class NAV | | |
| (John Hancock1) (A)(I) | 3,084,821 | 47,290,313 |
| | | |
| FIXED INCOME 14.6% | | |
| | | |
| John Hancock Funds (G) 1.2% | | |
|
| Focused High Yield Fund, Class NAV | | |
| (John Hancock1) (A) | 37,588,679 | 145,468,189 |
|
| Global Short Duration Fund, Class NAV | | |
| (John Hancock1) (A) | 2,677,394 | 26,532,977 |
| | | |
| John Hancock Funds II (G) 13.4% | | |
|
| Active Bond, Class NAV | | |
| (John Hancock1/Declaration) (A) | 17,949,240 | 179,492,403 |
|
| Asia Total Return Bond, Class NAV | | |
| (John Hancock1) (A) | 9,527,005 | 86,886,288 |
|
| Emerging Markets Debt Fund, Class NAV | | |
| (John Hancock1) (A) | 4,760,225 | 44,936,522 |
|
| Floating Rate Income, Class NAV (WAMCO) | 41,787,811 | 393,223,298 |
|
| Global Bond, Class NAV (PIMCO) (I) | 4,359,107 | 52,091,330 |
|
| Global High Yield, Class NAV (Stone Harbor) | 9,807,662 | 96,997,773 |
|
| High Yield, Class NAV (WAMCO) | 13,822,387 | 128,686,422 |
|
| Real Return Bond, Class NAV (PIMCO) | 5,829,988 | 65,354,162 |
|
| Short Duration Credit Opportunities, Class NAV | | |
| (Stone Harbor) | 16,012,710 | 162,368,881 |
|
| Spectrum Income, Class NAV (T. Rowe Price) | 13,587,127 | 146,876,839 |
|
| Strategic Income Opportunities, Class NAV | | |
| (John Hancock1) (A) | 21,715,687 | 234,312,260 |
|
| Total Return, Class NAV (PIMCO) | 13,227,148 | 179,492,403 |
|
| U.S. High Yield Bond, Class NAV (Wells Capital) | 9,440,552 | 115,552,354 |
| | | |
| ALTERNATIVE 4.4% | | |
| | | |
| John Hancock Funds (G) 1.6% | | |
|
| Financial Industries, Class NAV (John Hancock1) (A) | 11,298,725 | 187,671,817 |
|
| Seaport Fund, Class NAV (Wellington) (I) | 4,131,000 | 41,516,550 |
| | | |
| John Hancock Funds II (G) 2.8% | | |
|
| Currency Strategies, Class NAV (First Quadrant) | 28,410,723 | 264,787,942 |
|
| Global Absolute Return Strategies, | | |
| Class NAV (Standard Life) | 11,790,615 | 130,286,290 |
| |
| Total Investments (Lifestyle Growth Portfolio) | |
| (Cost $10,917,675,743) 100.0% | $14,138,988,944 |
| | | |
| Other assets and liabilities, net 0.0% | | 2,504,904 |
|
| TOTAL NET ASSETS 100.0% | | $14,141,493,848 |
Percentages are based upon net assets.
Lifestyle Balanced Portfolio
Securities owned by the portfolio on 12-31-13
| | |
| | Shares | Value |
| |
| AFFILIATED INVESTMENT COMPANIES — 100.00% | |
|
| EQUITY 61.1% | | |
| | | |
| John Hancock Funds (G) 0.2% | | |
|
| Small Cap Core, Class NAV (Wellington) (I) | 3,513,000 | $35,867,730 |
| | | |
| John Hancock Funds II (G) 52.1% | | |
|
| All Cap Core, Class NAV (QS Investors) | 13,502,863 | 177,022,534 |
|
| Alpha Opportunities, Class NAV (Wellington) | 35,946,457 | 456,520,005 |
|
| Blue Chip Growth, Class NAV (T. Rowe Price) | 14,346,925 | 483,778,303 |
|
| Capital Appreciation, Class NAV (Jennison) | 24,099,493 | 408,245,403 |
|
| Capital Appreciation Value, Class NAV | | |
| (T. Rowe Price) | 48,400,931 | 567,742,916 |
| | |
| 16 | Lifestyle Portfolios | Annual report | |
| | | See notes to financial statements |
Lifestyle Balanced Portfolio (continued)
| | |
| | Shares | Value |
| | | |
| John Hancock Funds II (G) (continued) | | |
|
| China Emerging Leaders, Class NAV (Atlantis) | 11,154,351 | $99,385,265 |
|
| Emerging Markets, Class NAV (DFA) | 52,545,210 | 537,537,496 |
|
| Equity-Income, Class NAV (T. Rowe Price) | 19,314,494 | 388,800,771 |
|
| Fundamental Global Franchise, Class NAV | | |
| (John Hancock1) (A) | 10,484,183 | 136,294,373 |
|
| Fundamental Large Cap Value, Class NAV | | |
| (John Hancock1) (A) | 23,277,150 | 302,602,949 |
|
| Fundamental Value, Class NAV (Davis) | 12,409,358 | 262,582,015 |
|
| Global Equity, Class NAV (John Hancock1) (A) | 10,105,276 | 111,966,460 |
|
| Global Real Estate, Class NAV (Deutsche) | 13,033,316 | 107,264,193 |
|
| Health Sciences, Class NAV (T. Rowe Price) | 11,367,555 | 192,907,414 |
|
| International Growth Opportunities, Class NAV | | |
| (Baillie Gifford) | 11,986,251 | 169,006,142 |
|
| International Growth Stock, Class NAV (Invesco) | 15,547,742 | 209,428,091 |
|
| International Small Cap, Class NAV | | |
| (Franklin Templeton) | 8,179,910 | 154,273,111 |
|
| International Small Company, Class NAV (DFA) | 15,290,257 | 158,865,771 |
|
| International Value, Class NAV (Templeton) | 25,750,510 | 453,981,491 |
|
| Mid Cap Stock, Class NAV (Wellington) | 16,392,650 | 350,474,857 |
|
| Mid Value, Class NAV (T. Rowe Price) | 16,799,673 | 275,178,647 |
|
| Mutual Shares, Class NAV (Franklin) | 9,681,942 | 132,158,503 |
|
| Natural Resources, Class NAV | | |
| (RS Investments/Wellington) | 12,160,253 | 207,089,108 |
|
| Real Estate Equity, Class NAV (T. Rowe Price) | 7,378,553 | 70,907,893 |
|
| Redwood, Class NAV (Allianz) | 9,429,503 | 106,553,379 |
|
| Science & Technology, Class NAV | | |
| (T. Rowe Price/Allianz) | 24,128,912 | 312,228,120 |
|
| Small Cap Growth, Class NAV (Wellington) | 5,758,824 | 61,561,824 |
|
| Small Cap Opportunities, Class NAV (Invesco/DFA) | 1,442,930 | 43,619,767 |
|
| Small Cap Value, Class NAV (Wellington) | 2,889,524 | 55,536,658 |
|
| Small Company Growth, Class NAV (Invesco) | 2,730,099 | 55,339,097 |
|
| Small Company Value, Class NAV (T. Rowe Price) | 2,186,745 | 82,177,871 |
|
| Technical Opportunities, Class NAV (Wellington) | 15,973,575 | 225,706,619 |
|
| U.S. Equity, Class NAV (GMO) | 23,193,826 | 296,649,028 |
|
| Value, Class NAV (Invesco) | 10,884,372 | 128,217,899 |
| | | |
| John Hancock Funds III (G) 8.5% | | |
|
| Disciplined Value, Class NAV (Robeco) | 9,798,346 | 176,370,222 |
|
| Global Shareholder Yield, Class NAV (Epoch) | 17,986,904 | 208,648,091 |
|
| International Core, Class NAV (GMO) | 7,154,400 | 245,825,177 |
|
| International Value Equity, Class NAV | | |
| (John Hancock1) (A) | 15,124,627 | 138,692,829 |
|
| Rainier Growth, Class NAV (Rainier) | 5,549,868 | 153,231,850 |
|
| Strategic Growth, Class NAV (John Hancock1) (A) | 22,873,214 | 354,534,819 |
| | |
| John Hancock Investment Trust (G) 0.3% | |
|
| Small Cap Intrinsic Value, Class NAV | | |
| (John Hancock1) (A)(I) | 2,467,353 | 37,824,518 |
| | | |
| FIXED INCOME 34.3% | | |
| | | |
| John Hancock Funds (G) 1.9% | | |
|
| Focused High Yield Fund, Class NAV | | |
| (John Hancock1) (A) | 64,588,717 | 249,958,334 |
|
| Global Short Duration Credit Fund, Class NAV | | |
| (John Hancock1) (A) | 3,709,765 | 36,763,773 |
| | | |
| John Hancock Funds II (G) 32.4% | | |
|
| Active Bond, Class NAV | | |
| (John Hancock1/Declaration) (A) | 54,179,498 | 541,794,977 |
|
| Asia Total Return Bond, Class NAV | | |
| (John Hancock1) (A) | 16,877,923 | 153,926,657 |
|
| Core Bond, Class NAV (Wells Capital) | 14,224,143 | 178,370,749 |
|
| Emerging Markets Debt Fund, Class NAV | | |
| (John Hancock1) (A) | 7,511,608 | 70,909,575 |
|
| Floating Rate Income, Class NAV (WAMCO) | 90,308,447 | 849,802,488 |
|
| Global Bond, Class NAV (PIMCO) (I) | 14,806,860 | 176,941,975 |
|
| Global High Yield, Class NAV (Stone Harbor) | 17,907,645 | 177,106,611 |
|
| High Yield, Class NAV (WAMCO) | 26,324,143 | 245,077,770 |
|
| Investment Quality Bond, Class NAV (Wellington) | 8,823,193 | 106,937,104 |
|
| Real Return Bond, Class NAV (PIMCO) | 12,719,251 | 142,582,806 |
|
| Short Duration Credit Opportunities, Class NAV | | |
| (Stone Harbor) | 45,224,324 | 458,574,645 |
Lifestyle Balanced Portfolio (continued)
| | |
| | Shares | Value |
| | | |
| John Hancock Funds II (G) (continued) | | |
|
| Spectrum Income, Class NAV (T. Rowe Price) | 41,273,530 | $446,166,860 |
|
| Strategic Income Opportunities, Class NAV | | |
| (John Hancock1) (A) | 48,755,430 | 526,071,085 |
|
| Total Return, Class NAV (PIMCO) | 39,925,938 | 541,794,977 |
|
| U.S. High Yield Bond, Class NAV (Wells Capital) | 17,782,417 | 217,656,786 |
| | | |
| ALTERNATIVE 4.6% | | |
| | | |
| John Hancock Funds (G) 1.3 % | | |
|
| Financial Industries, Class NAV | | |
| (John Hancock1) (A) | 9,389,263 | 155,955,658 |
|
| Seaport Fund, Class NAV (Wellington) (I) | 3,658,000 | 36,762,900 |
| | | |
| John Hancock Funds II (G) 3.3% | | |
|
| Currency Strategies, Class NAV (First Quadrant) | 34,429,152 | 320,879,700 |
|
| Global Absolute Return Strategies, Class NAV | | |
| (Standard Life) | 15,973,662 | 176,508,969 |
| |
| Total Investments (Lifestyle Balanced Portfolio) | |
| (Cost $12,175,177,476) 100.0% | $14,943,143,608 |
| | | |
| Other assets and liabilities, net 0.0% | | 1,997,743 |
|
| TOTAL NET ASSETS 100.0% | | $14,945,141,351 |
Percentages are based upon net assets.
Lifestyle Moderate Portfolio
Securities owned by the portfolio on 12-31-13
| | |
| | Shares | Value |
| |
| AFFILIATED INVESTMENT COMPANIES — 100.00% | |
|
| EQUITY 40.4% | | |
| | | |
| John Hancock Funds II (G) 35.3% | | |
|
| Alpha Opportunities, Class NAV (Wellington) | 7,180,683 | $91,194,678 |
|
| Blue Chip Growth, Class NAV (T. Rowe Price) | 3,353,680 | 113,086,073 |
|
| Capital Appreciation, Class NAV (Jennison) | 5,679,352 | 96,208,215 |
|
| Capital Appreciation Value, Class NAV | | |
| (T. Rowe Price) | 14,088,558 | 165,258,781 |
|
| Emerging Markets, Class NAV (DFA) | 10,208,970 | 104,437,765 |
|
| Equity-Income, Class NAV (T. Rowe Price) | 6,887,664 | 138,648,681 |
|
| Fundamental Global Franchise, Class NAV | | |
| (John Hancock1) (A) | 2,588,198 | 33,646,580 |
|
| Fundamental Large Cap Value, Class NAV | | |
| (John Hancock1) (A) | 8,741,738 | 113,642,595 |
|
| Fundamental Value, Class NAV (Davis) | 3,254,206 | 68,858,995 |
|
| Global Equity, Class NAV (John Hancock1) (A) | 2,532,482 | 28,059,900 |
|
| Global Real Estate, Class NAV (Deutsche) | 2,805,404 | 23,088,474 |
|
| International Growth Opportunities, Class NAV | | |
| (Baillie Gifford) | 2,439,792 | 34,401,068 |
|
| International Growth Stock, Class NAV (Invesco) | 3,102,490 | 41,790,544 |
|
| International Small Cap, Class NAV | | |
| (Franklin Templeton) | 1,648,978 | 31,099,722 |
|
| International Small Company, Class NAV (DFA) | 2,993,236 | 31,099,722 |
|
| International Value, Class NAV (Templeton) | 5,544,415 | 97,748,042 |
|
| Mid Cap Stock, Class NAV (Wellington) | 3,368,588 | 72,020,410 |
|
| Mid Value, Class NAV (T. Rowe Price) | 4,766,389 | 78,073,451 |
|
| Natural Resources, Class NAV | | |
| (RS Investments/Wellington) | 2,746,124 | 46,766,500 |
|
| Real Estate Equity, Class NAV (T. Rowe Price) | 2,365,485 | 22,732,313 |
|
| Redwood, Class NAV (Allianz) | 3,624,647 | 40,958,510 |
|
| Small Cap Growth, Class NAV (Wellington) | 1,465,554 | 15,666,777 |
|
| Small Cap Value, Class NAV (Wellington) | 750,638 | 14,427,260 |
|
| Small Company Growth, Class NAV (Invesco) | 680,618 | 13,796,117 |
|
| Small Company Value, Class NAV (T. Rowe Price) | 570,855 | 21,452,746 |
|
| U.S. Equity, Class NAV (GMO) | 7,459,238 | 95,403,660 |
| | | |
| John Hancock Funds III (G) 5.1% | | |
|
| Global Shareholder Yield, Class NAV (Epoch) | 4,273,491 | 49,572,490 |
|
| International Core, Class NAV (GMO) | 1,386,254 | 47,631,680 |
|
| International Value Equity, Class NAV | | |
| (John Hancock1) (A) | 3,015,598 | 27,653,031 |
| | |
| | Annual report | Lifestyle Portfolios | 17 |
| See notes to financial statements | | |
Lifestyle Moderate Portfolio (continued)
| | |
| | Shares | Value |
| | | |
| John Hancock Funds III (G) (continued) | | |
|
| Rainier Growth, Class NAV (Rainier) | 1,369,776 | $37,819,525 |
|
| Strategic Growth, Class NAV | | |
| (John Hancock1) (A) | 4,734,380 | 73,382,886 |
| | | |
| FIXED INCOME 54.8% | | |
| | | |
| John Hancock Funds (G) 2.4% | | |
|
| Focused High Yield Fund, Class NAV | | |
| (John Hancock1) (A) | 25,047,142 | 96,932,438 |
|
| Global Short Duration Credit Fund, Class NAV | | |
| (John Hancock1) (A) | 1,410,244 | 13,975,522 |
| | | |
| John Hancock Funds II (G) 52.4% | | |
|
| Active Bond, Class NAV | | |
| (John Hancock1/Declaration) (A) | 35,260,537 | 352,605,374 |
|
| Asia Total Return Bond, Class NAV | | |
| (John Hancock1) (A) | 7,511,087 | 68,501,113 |
|
| Core Bond, Class NAV (Wells Capital) | 9,364,692 | 117,433,231 |
|
| Emerging Markets Debt Fund, Class NAV | | |
| (John Hancock1) (A) | 3,684,020 | 34,777,148 |
|
| Floating Rate Income, Class NAV (WAMCO) | 44,538,067 | 419,103,207 |
|
| Global Bond, Class NAV (PIMCO) (I) | 9,256,918 | 110,620,173 |
|
| Global High Yield, Class NAV (Stone Harbor) | 7,533,511 | 74,506,423 |
|
| High Yield, Class NAV (WAMCO) | 10,191,230 | 94,880,348 |
|
| Investment Quality Bond, Class NAV (Wellington) | 6,844,414 | 82,954,292 |
|
| Real Return Bond, Class NAV (PIMCO) | 5,511,023 | 61,778,565 |
|
| Short Duration Credit Opportunities, Class NAV | | |
| (Stone Harbor) | 18,367,393 | 186,245,365 |
|
| Spectrum Income, Class NAV (T. Rowe Price) | 16,359,209 | 176,843,052 |
|
| Strategic Income Opportunities, Class NAV | | |
| (John Hancock1) (A) | 19,824,535 | 213,906,737 |
|
| Total Return, Class NAV (PIMCO) | 25,973,293 | 352,457,582 |
|
| U.S. High Yield Bond, Class NAV (Wells Capital) | 6,819,554 | 83,471,343 |
| | | |
| ALTERNATIVE 4.8% | | |
| | | |
| John Hancock Funds (G) 0.7% | | |
|
| Enduring Equity, Class NAV (Wellington) | 2,339,153 | 23,765,793 |
|
| Seaport Fund, Class NAV (Wellington) (I) | 917,000 | 9,215,850 |
| | | |
| John Hancock Funds II (G) 4.1% | | |
|
| Currency Strategies, Class NAV (First Quadrant) | 11,765,147 | 109,651,169 |
|
| Global Absolute Return Strategies, Class NAV | | |
| (Standard Life) | 7,033,630 | 77,721,611 |
| |
| Total Investments (Lifestyle Moderate Portfolio) | |
| (Cost $4,081,213,234) 100.0% | | $4,630,973,527 |
| | | |
| Other assets and liabilities, net 0.0% | | 1,164,754 |
|
| TOTAL NET ASSETS 100.0% | | $4,632,138,281 |
Percentages are based upon net assets.
Lifestyle Conservative Portfolio
Securities owned by the portfolio on 12-31-13
| | |
| | Shares | Value |
| |
| AFFILIATED INVESTMENT COMPANIES — 100.0% | |
|
| EQUITY 19.6% | | |
| | | |
| John Hancock Funds II (G) 18.5% | | |
|
| Blue Chip Growth, Class NAV (T. Rowe Price) | 3,167,576 | $106,810,675 |
|
| Capital Appreciation Value, Class NAV | | |
| (T. Rowe Price) | 6,676,949 | 78,320,614 |
|
| Emerging Markets, Class NAV (DFA) | 3,345,812 | 34,227,657 |
|
| Equity-Income, Class NAV (T. Rowe Price) | 4,032,914 | 81,182,552 |
|
| Fundamental Global Franchise, Class NAV | | |
| (John Hancock1) (A) | 1,372,979 | 17,848,723 |
|
| Fundamental Large Cap Value, Class NAV | | |
| (John Hancock1) (A) | 895,188 | 11,637,440 |
|
| Fundamental Value, Class NAV (Davis) | 2,487,184 | 52,628,822 |
|
| Global Equity, Class NAV (John Hancock1) (A) | 1,640,844 | 18,180,547 |
|
| Global Real Estate, Class NAV (Deutsche) | 2,214,537 | 18,225,640 |
|
| International Growth Stock, Class NAV (Invesco) | 2,050,923 | 27,625,938 |
|
| International Value, Class NAV (Templeton) | 3,474,403 | 61,253,721 |
Lifestyle Conservative Portfolio (continued)
| | |
| | Shares | Value |
| | | |
| John Hancock Funds II (G) (continued) | | |
|
| Mid Cap Stock, Class NAV (Wellington) | 1,280,412 | $27,375,211 |
|
| Mid Value, Class NAV (T. Rowe Price) | 1,175,141 | 19,248,813 |
|
| Natural Resources, Class NAV | | |
| (RS Investments/Wellington) | 1,071,888 | 18,254,258 |
|
| Real Estate Equity, Class NAV (T. Rowe Price) | 1,878,647 | 18,053,795 |
|
| Redwood, Class NAV (Allianz) | 2,887,902 | 32,633,293 |
|
| Small Cap Growth, Class NAV (Wellington) | 852,002 | 9,107,902 |
|
| Small Company Value, Class NAV (T. Rowe Price) | 255,175 | 9,589,479 |
|
| U.S. Equity, Class NAV (GMO) | 3,821,891 | 48,881,991 |
| | | |
| John Hancock Funds III (G) 1.1% | | |
|
| Global Shareholder Yield, Class NAV (Epoch) | 2,153,105 | 24,976,014 |
|
| International Core, Class NAV (GMO) | 536,010 | 18,417,292 |
| | | |
| FIXED INCOME 73.2% | | |
| | | |
| John Hancock Funds (G) 2.2% | | |
|
| Focused High Yield Fund, Class NAV | | |
| (John Hancock1) (A) | 17,934,976 | 69,408,358 |
|
| Global Short Duration Credit Fund, Class NAV | | |
| (John Hancock1) (A) | 1,341,092 | 13,290,223 |
| | | |
| John Hancock Funds II (G) 71.0% | | |
|
| Active Bond, Class NAV | | |
| (John Hancock1/Declaration) (A) | 36,237,059 | 362,370,590 |
|
| Asia Total Return Bond, Class NAV | | |
| (John Hancock1) (A) | 7,008,351 | 63,916,161 |
|
| Core Bond, Class NAV (Wells Capital) | 12,532,573 | 157,158,467 |
|
| Emerging Markets Debt Fund, Class NAV | | |
| (John Hancock1) (A) | 3,980,655 | 37,577,384 |
|
| Floating Rate Income, Class NAV (WAMCO) | 43,383,054 | 408,234,538 |
|
| Global Bond, Class NAV (PIMCO) (I) | 10,167,615 | 121,502,996 |
|
| Global High Yield, Class NAV (Stone Harbor) | 4,665,857 | 46,145,326 |
|
| High Yield, Class NAV (WAMCO) | 7,070,830 | 65,829,430 |
|
| Investment Quality Bond, Class NAV (Wellington) | 15,565,168 | 188,649,836 |
|
| Real Return Bond, Class NAV (PIMCO) | 8,950,118 | 100,330,823 |
|
| Short Duration Credit Opportunities, Class NAV | | |
| (Stone Harbor) | 16,938,653 | 171,757,944 |
|
| Short Term Government Income, Class NAV | | |
| (John Hancock1) (A) | 15,513,265 | 151,254,337 |
|
| Spectrum Income, Class NAV (T. Rowe Price) | 15,400,666 | 166,481,195 |
|
| Strategic Income Opportunities, Class NAV | | |
| (John Hancock1) (A) | 18,321,296 | 197,686,788 |
|
| Total Return, Class NAV (PIMCO) | 26,579,840 | 360,688,429 |
|
| U.S. High Yield Bond, Class NAV (Wells Capital) | 4,600,572 | 56,311,004 |
| | | |
| ALTERNATIVE 7.2% | | |
| | | |
| John Hancock Funds (G) 2.3% | | |
|
| Enduring Equity, Class NAV (Wellington) | 7,665,778 | 77,884,305 |
|
| Seaport Fund, Class NAV (Wellington) (I) | 751,000 | 7,547,550 |
| | | |
| John Hancock Funds II (G) 4.9% | | |
|
| Currency Strategies, Class NAV (First Quadrant) | 10,113,841 | 94,261,000 |
|
| Global Absolute Return Strategies, Class NAV | | |
| (Standard Life) | 7,924,301 | 87,563,531 |
| |
| Total Investments (Lifestyle Conservative Portfolio) |
| (Cost $3,457,122,977) 100.0% | | $3,740,330,592 |
| | | |
| Other assets and liabilities, net 0.0% | | 64,959 |
|
| TOTAL NET ASSETS 100.0% | | $3,740,395,551 |
Percentages are based upon net assets.
Footnote Legend:
| |
| 1 | Manulife Asset Management (US) LLC is doing business as John Hancock Asset Management. |
| (A) | The subadvisor is an affiliate of the advisor. |
| (G) | The underlying fund’s subadvisor is shown parenthetically. |
| (I) | Non-income producing. |
| | |
| 18 | Lifestyle Portfolios | Annual report | |
| | | See notes to financial statements |
FINANCIAL STATEMENTS
Financial statements
Statements of assets and liabilities 12-31-13
These Statements of assets and liabilities are the portfolios’ balance sheets. They show the value of what each portfolio owns, is due and owes. You’ll also find the net asset value and the maximum offering price per share for each portfolio. Net asset value is calculated by dividing the net assets of each class of shares by the number of outstanding shares in the class.
| | | | |
| | | Lifestyle | Lifestyle | Lifestyle |
| | | Aggressive | Growth | Balanced |
|
| Assets | | | | |
|
| Investments in affiliated underlying funds, at value | | $4,616,079,496 | $14,138,988,944 | $14,943,143,608 |
| Cash | | 1,210 | 4,735 | 4,446 |
| Receivable for investments sold | | 28,226,151 | 68,425,291 | 67,816,550 |
| Receivable for fund shares sold | | 2,067,226 | 6,347,076 | 7,256,762 |
| Dividends and interest receivable | | 19,547 | 5,517,039 | 11,601,304 |
| Receivable due from advisor | | 547 | 316 | 119 |
| Other assets | | 80,886 | 113,720 | 128,449 |
| Total assets | | 4,646,475,063 | 14,219,397,121 | 15,029,951,238 |
|
| Liabilities | | | | |
|
| Payable for investments purchased | | — | 5,622,619 | 11,892,054 |
| Payable for fund shares repurchased | | 29,324,433 | 71,634,563 | 72,212,900 |
| Distributions payable | | — | 551 | 130 |
| Payable to affiliates: Accounting and legal services fees | | 83,513 | 258,509 | 273,965 |
| Transfer agent fees | | 57,966 | 226,141 | 262,396 |
| Trustees’ fees | | 1,666 | 5,148 | 5,599 |
| Distribution and service fees | | 13,789 | 37,097 | 51,744 |
| Other liabilities and accrued expenses | | 58,114 | 118,645 | 111,099 |
| Total liabilities | | 29,539,481 | 77,903,273 | 84,809,887 |
| | | | | |
| Net assets | | $4,616,935,582 | $14,141,493,848 | $14,945,141,351 |
|
| Net assets consist of | | | | |
|
| Paid-in capital | | $3,643,652,995 | $11,468,827,200 | $12,829,562,722 |
| Accumulated undistributed net realized gain (loss) on investments | | (242,195,251) | (548,646,553) | (652,387,503) |
| Net unrealized appreciation (depreciation) on investments | | 1,215,477,838 | 3,221,313,201 | 2,767,966,132 |
| Net assets | | $4,616,935,582 | $14,141,493,848 | $14,945,141,351 |
| Investments in affiliated underlying funds, at cost | | $3,400,601,658 | $10,917,675,743 | $12,175,177,476 |
|
| Net asset value per share | | | | |
|
| The portfolios have an unlimited number of shares authorized with par value of $0.01 | | | | |
| per share. Net asset value is calculated by dividing the net assets of each class of | | | | |
| shares by the number of outstanding shares in the class. | | | | |
| Class A:1 Net assets | | $336,962,960 | $1,273,705,395 | $1,460,645,600 |
| Shares outstanding | | 21,135,370 | 79,140,240 | 95,095,022 |
| Net asset value and redemption price per share | | $15.94 | $16.09 | $15.36 |
| Class B:1 Net assets | | $26,872,786 | $118,984,292 | $115,812,624 |
| Shares outstanding | | 1,681,407 | 7,372,795 | 7,544,169 |
| Net asset value, offering price and redemption price per share | | $15.98 | $16.14 | $15.35 |
| Class C:1 Net assets | | $159,447,596 | $646,108,313 | $767,036,043 |
| Shares outstanding | | 9,973,312 | 40,072,397 | 49,907,990 |
| Net asset value, offering price and redemption price per share | | $15.99 | $16.12 | $15.37 |
| Class R1: Net assets | | $10,325,721 | $22,964,832 | $19,182,143 |
| Shares outstanding | | 646,010 | 1,421,598 | 1,253,407 |
| Net asset value, offering price and redemption price per share | | $15.98 | $16.15 | $15.30 |
| Class R2: Net assets | | $2,329,120 | $8,661,349 | $5,320,983 |
| Shares outstanding | | 146,712 | 540,734 | 347,912 |
| Net asset value, offering price and redemption price per share | | $15.88 | $16.02 | $15.29 |
| Class R3: Net assets | | $8,746,144 | $23,763,646 | $34,894,979 |
| Shares outstanding | | 549,249 | 1,477,884 | 2,276,664 |
| Net asset value, offering price and redemption price per share | | $15.92 | $16.08 | $15.33 |
| Class R4: Net assets | | $7,682,493 | $23,642,267 | $77,420,361 |
| Shares outstanding | | 483,142 | 1,470,528 | 5,050,384 |
| Net asset value, offering price and redemption price per share | | $15.90 | $16.08 | $15.33 |
| Class R5: Net assets | | $11,191,307 | $37,160,184 | $41,173,281 |
| Shares outstanding | | 703,134 | 2,308,788 | 2,682,676 |
| Net asset value, offering price and redemption price per share | | $15.92 | $16.10 | $15.35 |
| Class R6: Net assets | | $5,395,175 | $19,058,587 | $21,165,438 |
| Shares outstanding | | 339,551 | 1,189,152 | 1,384,682 |
| Net asset value, offering price and redemption price per share | | $15.89 | $16.03 | $15.29 |
| Class 1: Net assets | | $4,047,982,280 | $11,766,359,940 | $12,284,421,135 |
| Shares outstanding | | 254,911,600 | 733,937,440 | 803,954,602 |
| Net asset value, offering price and redemption price per share | | $15.88 | $16.03 | $15.28 |
| Class 5: Net assets | | — | $201,085,043 | $118,068,764 |
| Shares outstanding | | — | 12,557,201 | 7,724,069 |
| Net asset value, offering price and redemption price per share | | — | $16.01 | $15.29 |
|
| Maximum public offering price per share | | | | |
|
| Class A (net asset value per share ÷ 95%)2 | | $16.78 | $16.94 | $16.17 |
1 Redemption price per share is equal to net asset value less any applicable contingent deferred sales charge.
2 On single retail sales of less than $50,000. On sales of $50,000 or more and on group sales the offering price is reduced.
| | |
| | Annual report | Lifestyle Portfolios | 19 |
| See notes to financial statements | | |
F I N A N C I A L S T A T E M E N T S
Statements of assets and liabilities 12-31-13
Continued
| | | | |
| | Lifestyle | Lifestyle | | |
| | Moderate | Conservative | | |
| | |
| Assets | | | | |
| | |
| Investments in affiliated underlying funds, at value | $4,630,973,527 | $3,740,330,592 | | |
| Cash | 2,401 | 3,404 | | |
| Receivable for investments sold | 15,748,185 | 14,475,747 | | |
| Receivable for fund shares sold | 3,489,522 | 1,464,683 | | |
| Dividends and interest receivable | 5,065,600 | 4,671,850 | | |
| Receivable due from advisor | 4,509 | 6,159 | | |
| Other assets | 88,432 | 98,268 | | |
| Total assets | 4,655,372,176 | 3,761,050,703 | | |
| | |
| Liabilities | | | | |
| | |
| Payable for investments purchased | 5,197,226 | 4,790,392 | | |
| Payable for fund shares repurchased | 17,757,287 | 15,600,388 | | |
| Distributions payable | 295 | 99 | | |
| Payable to affiliates: Accounting and legal services fees | 86,469 | 73,088 | | |
| Transfer agent fees | 107,811 | 105,513 | | |
| Trustees’ fees | 1,853 | 1,828 | | |
| Distribution and service fees | 15,734 | 14,182 | | |
| Other liabilities and accrued expenses | 67,220 | 69,662 | | |
| Total liabilities | 23,233,895 | 20,655,152 | | |
| | | | | |
| Net assets | $4,632,138,281 | $3,740,395,551 | | |
| | |
| Net assets consist of | | | | |
| | |
| Paid-in capital | $4,090,570,318 | $3,455,179,196 | | |
| Accumulated undistributed net realized gain (loss) on investments | (8,192,330) | 2,008,740 | | |
| Net unrealized appreciation (depreciation) on investments | 549,760,293 | 283,207,615 | | |
| Net assets | $4,632,138,281 | $3,740,395,551 | | |
| Investments in affiliated underlying funds, at cost | $4,081,213,234 | $3,457,122,977 | | |
| | |
| Net asset value per share | | | | |
| | |
| The portfolios have an unlimited number of shares authorized with par value of $0.01 | | | | |
| per share. Net asset value is calculated by dividing the net assets of each class of | | | | |
| shares by the number of outstanding shares in the class. | | | | |
| Class A:1 Net assets | $550,653,364 | $530,175,800 | | |
| Shares outstanding | 38,523,068 | 38,758,578 | | |
| Net asset value and redemption price per share | $14.29 | $13.68 | | |
| Class B:1 Net assets | $45,454,569 | $46,985,420 | | |
| Shares outstanding | 3,182,082 | 3,433,486 | | |
| Net asset value, offering price and redemption price per share | $14.28 | $13.68 | | |
| Class C:1 Net assets | $365,602,986 | $354,797,829 | | |
| Shares outstanding | 25,574,746 | 25,941,901 | | |
| Net asset value, offering price and redemption price per share | $14.30 | $13.68 | | |
| Class R1: Net assets | $10,290,557 | $8,720,862 | | |
| Shares outstanding | 720,393 | 637,630 | | |
| Net asset value, offering price and redemption price per share | $14.28 | $13.68 | | |
| Class R2: Net assets | $2,472,171 | $1,631,052 | | |
| Shares outstanding | 173,444 | 119,346 | | |
| Net asset value, offering price and redemption price per share | $14.25 | $13.67 | | |
| Class R3: Net assets | $11,431,621 | $11,238,668 | | |
| Shares outstanding | 801,180 | 823,182 | | |
| Net asset value, offering price and redemption price per share | $14.27 | $13.65 | | |
| Class R4: Net assets | $12,722,279 | $8,987,760 | | |
| Shares outstanding | 892,986 | 657,947 | | |
| Net asset value, offering price and redemption price per share | $14.25 | $13.66 | | |
| Class R5: Net assets | $12,893,369 | $14,746,308 | | |
| Shares outstanding | 904,313 | 1,078,513 | | |
| Net asset value, offering price and redemption price per share | $14.26 | $13.67 | | |
| Class R6: Net assets | $10,763,336 | $4,803,548 | | |
| Shares outstanding | 755,753 | 351,851 | | |
| Net asset value, offering price and redemption price per share | $14.24 | $13.65 | | |
| Class 1: Net assets | $3,562,116,135 | $2,758,308,304 | | |
| Shares outstanding | 249,841,085 | 201,998,012 | | |
| Net asset value, offering price and redemption price per share | $14.26 | $13.66 | | |
| Class 5: Net assets | $47,737,894 | — | | |
| Shares outstanding | 3,351,384 | — | | |
| Net asset value, offering price and redemption price per share | $14.24 | — | | |
| | |
| Maximum public offering price per share | | | | |
| | |
| Class A (net asset value per share ÷ 95%)2 | $15.04 | $14.40 | | |
1 Redemption price per share is equal to net asset value less any applicable contingent deferred sales charge.
2 On single retail sales of less than $50,000. On sales of $50,000 or more and on group sales the offering price is reduced.
| | |
| 20 | Lifestyle Portfolios | Annual report | |
| | | See notes to financial statements |
F I N A N C I A L S T A T E M E N T S
Statements of operations For the year ended 12-31-13
These Statements of operations summarize the portfolios’ investment income earned and expenses directly incurred in operating each portfolio. They also show net gains (losses) for the period stated.
| | | | | |
| | Lifestyle | Lifestyle | Lifestyle | Lifestyle | Lifestyle |
| | Aggressive | Growth | Balanced | Moderate | Conservative |
|
| Investment income | | | | | |
|
| Income distributions received from affiliated | | | | | |
| underlying funds | $43,454,997 | $204,820,225 | $298,679,643 | $118,802,016 | $113,709,633 |
| Other | 1,222 | 2,350 | 1,128 | — | — |
| Total investment income | 43,456,219 | 204,822,575 | 298,680,771 | 118,802,016 | 113,709,633 |
|
| Expenses | | | | | |
|
| Investment management fees | 2,008,152 | 6,148,679 | 6,543,156 | 1,948,605 | 1,700,211 |
| Distribution and service fees | 4,543,390 | 15,891,556 | 18,103,811 | 7,145,540 | 7,209,842 |
| Transfer agent fees | 712,334 | 2,762,967 | 3,225,613 | 1,346,740 | 1,449,502 |
| Accounting and legal services fees | 536,977 | 1,655,751 | 1,778,883 | 573,260 | 505,485 |
| State registration fees | 113,185 | 172,891 | 197,339 | 157,632 | 165,160 |
| Professional fees | 85,564 | 177,073 | 190,307 | 91,706 | 87,843 |
| Printing and postage | 39,688 | 125,773 | 119,329 | 55,907 | 57,458 |
| Custodian fees | 12,001 | 12,001 | 12,001 | 12,001 | 12,001 |
| Trustees’ fees | 44,250 | 137,175 | 148,600 | 47,926 | 43,192 |
| Registration and filing fees | 25,329 | 25,320 | 45,008 | 36,311 | 49,369 |
| Expense recapture | 11,511 | 303 | 61 | 65 | — |
| Other | 28,334 | 71,388 | 76,482 | 30,607 | 27,826 |
| Total expenses before reductions | 8,160,715 | 27,180,877 | 30,440,590 | 11,446,300 | 11,307,889 |
| | | | | | |
| Net expense reductions | (349,141) | (890,740) | (878,775) | (155,898) | (155,484) |
| Total expenses | 7,811,574 | 26,290,137 | 29,561,815 | 11,290,402 | 11,152,405 |
| | | | | | |
| Net investment income (loss) | 35,644,645 | 178,532,438 | 269,118,956 | 107,511,614 | 102,557,228 |
|
| Realized and unrealized gain (loss) | | | | | |
|
| Net realized gain (loss) on | | | | | |
| Investments in affiliated underlying funds | 165,135,143 | 444,409,752 | 358,162,208 | 77,681,546 | 53,882,764 |
| Capital gain distributions received from affiliated | | | | | |
| underlying funds | 203,569,697 | 578,571,690 | 503,780,248 | 121,714,435 | 52,254,139 |
| | 368,704,840 | 1,022,981,442 | 861,942,456 | 199,395,981 | 106,136,903 |
| Change in net unrealized appreciation | | | | | |
| (depreciation) of | | | | | |
| Investments in affiliated underlying funds | 578,414,860 | 1,414,701,976 | 963,605,452 | 134,909,315 | (22,161,643) |
| Net realized and unrealized gain (loss) | 947,119,700 | 2,437,683,418 | 1,825,547,908 | 334,305,296 | 83,975,260 |
| | | | | | |
| Increase (decrease) in net assets | | | | | |
| from operations | $982,764,345 | $2,616,215,856 | $2,094,666,864 | $441,816,910 | $186,532,488 |
| | |
| | Annual report | Lifestyle Portfolios | 21 |
| See notes to financial statements | | |
F I N A N C I A L S T A T E M E N T S
Statements of changes in net assets
These Statements of changes in net assets show how the value of the portfolios’ net assets have changed during the last two periods. They reflect earnings less expenses, any investment gains and losses, distributions, if any, paid to shareholders and the net of portfolio share transactions.
| | | | |
| | Lifestyle Aggressive | Lifestyle Growth |
| | Year Ended 12-31-13 | Year Ended 12-31-12 | Year Ended 12-31-13 | Year Ended 12-31-12 |
|
| Increase (decrease) in net assets | | | | |
|
| From operations | | | | |
| Net investment income (loss) | $35,644,645 | $36,836,695 | $178,532,438 | $181,449,624 |
| Net realized gain (loss) | 368,704,840 | 116,364,569 | 1,022,981,442 | 351,493,880 |
| Change in net unrealized appreciation (depreciation) | 578,414,860 | 407,908,728 | 1,414,701,976 | 1,108,277,322 |
| Increase (decrease) in net assets resulting | 982,764,345 | 561,109,992 | 2,616,215,856 | 1,641,220,826 |
| from operations | | | | |
| |
| Distributions to shareholders | | | | |
| | | | | |
| From net investment income | | | | |
| Class A | (1,829,862) | (1,426,449) | (13,356,130) | (10,466,105) |
| Class B | — | — | (380,853) | (544,450) |
| Class C | — | — | (2,125,033) | (2,485,677) |
| Class R1 | (12,551) | (25,162) | (154,920) | (179,049) |
| Class R2 | (9,861) | (584) | (79,681) | (1,195) |
| Class R3 | (17,687) | (32,965) | (181,436) | (179,360) |
| Class R4 | (40,346) | (56,166) | (258,741) | (263,146) |
| Class R5 | (81,440) | (78,266) | (487,021) | (480,706) |
| Class R6 | (46,494) | (22,535) | (261,721) | (56,542) |
| Class 1 | (35,154,943) | (35,346,570) | (163,090,608) | (164,805,425) |
| Class 5 | — | — | (2,858,963) | (2,351,186) |
| From net realized gain | | | | |
| Class A | (5,116,141) | (1,090,597) | (16,666,435) | (4,053,265) |
| Class B | (347,082) | (79,362) | (1,570,541) | (493,776) |
| Class C | (2,164,511) | (462,271) | (8,521,014) | (2,212,540) |
| Class R1 | (156,956) | (40,909) | (296,805) | (87,024) |
| Class R2 | (35,636) | (476) | (114,185) | (479) |
| Class R3 | (140,301) | (46,474) | (320,115) | (85,296) |
| Class R4 | (116,571) | (38,683) | (307,031) | (90,259) |
| Class R5 | (170,063) | (39,818) | (489,670) | (143,388) |
| Class R6 | (82,241) | (9,914) | (249,329) | (15,876) |
| Class 1 | (62,184,875) | (15,550,928) | (155,368,856) | (46,274,429) |
| Class 5 | — | — | (2,636,727) | (641,401) |
| | | | | |
| Total distributions | (107,707,561) | (54,348,129) | (369,775,815) | (235,910,574) |
| | | | | |
| From portfolio share transactions | (55,880,079) | (246,993,721) | 71,568,089 | (399,018,075) |
| |
| Total increase | 819,176,705 | 259,768,142 | 2,318,008,130 | 1,006,292,177 |
|
| Net assets | | | | |
|
| Beginning of year | 3,797,758,877 | 3,537,990,735 | 11,823,485,718 | 10,817,193,541 |
| | | | | |
| End of year | $4,616,935,582 | $3,797,758,877 | $14,141,493,848 | $11,823,485,718 |
| | | | | |
| Undistributed net investment income (loss) | — | — | — | — |
| | |
| | |
| 22 | Lifestyle Portfolios |Annual report | See notes to financial statements |
F I N A N C I A L S T A T E M E N T S
Statements of changes in net assets
Continued
| | | | |
| | Lifestyle Balanced | Lifestyle Moderate |
| | Year Ended 12-31-13 | Year Ended 12-31-12 | Year Ended 12-31-13 | Year Ended 12-31-12 |
|
| Increase (decrease) in net assets | | | | |
|
| From operations |
|
| Net investment income (loss) | $269,118,956 | $276,162,385 | $107,511,614 | $110,726,829 |
| Net realized gain (loss) | 861,942,456 | 287,199,896 | 199,395,981 | 88,903,673 |
| Change in net unrealized appreciation | 963,605,452 | 1,030,528,139 | 134,909,315 | 261,491,409 |
| (depreciation) | | | | |
| Increase (decrease) in net assets resulting | 2,094,666,864 | 1,593,890,420 | 441,816,910 | 461,121,911 |
| from operations | | | | |
| |
| Distributions to shareholders | | | | |
| | | | | |
| From net investment income | | | | |
| Class A | (21,376,136) | (17,759,117) | (10,758,926) | (8,731,847) |
| Class B | (961,209) | (1,169,470) | (615,216) | (700,988) |
| Class C | (6,453,447) | (6,391,268) | (4,876,047) | (4,597,803) |
| Class R1 | (226,393) | (266,292) | (173,924) | (177,204) |
| Class R2 | (64,137) | (1,816) | (38,097) | (2,375) |
| Class R3 | (474,210) | (592,809) | (202,575) | (211,712) |
| Class R4 | (1,301,359) | (1,356,479) | (282,178) | (254,303) |
| Class R5 | (777,921) | (889,211) | (287,371) | (312,381) |
| Class R6 | (345,883) | (65,425) | (199,116) | (18,232) |
| Class 1 | (240,212,611) | (246,402,108) | (90,626,992) | (94,937,676) |
| Class 5 | (2,223,201) | (1,790,407) | (1,174,103) | (1,015,929) |
| From net realized gain | | | | |
| Class A | (13,910,498) | (5,017,754) | (3,542,509) | (2,228,251) |
| Class B | (1,109,045) | (519,957) | (294,845) | (250,939) |
| Class C | (7,326,092) | (2,801,537) | (2,368,701) | (1,611,104) |
| Class R1 | (185,331) | (85,281) | (66,525) | (53,353) |
| Class R2 | (50,816) | (507) | (16,001) | (584) |
| Class R3 | (343,479) | (179,741) | (76,008) | (57,754) |
| Class R4 | (741,492) | (341,854) | (84,389) | (61,612) |
| Class R5 | (393,895) | (189,156) | (85,285) | (53,383) |
| Class R6 | (202,606) | (21,516) | (69,977) | (8,247) |
| Class 1 | (118,365,069) | (53,477,967) | (23,163,384) | (19,188,839) |
| Class 5 | (1,128,595) | (404,478) | (308,248) | (216,562) |
| | | | | |
| Total distributions | (418,173,425) | (339,724,150) | (139,310,417) | (134,691,078) |
| | | | | |
| From portfolio share transactions | 316,441,678 | 375,745,437 | 102,689,663 | 215,103,733 |
| |
| Total increase | 1,992,935,117 | 1,629,911,707 | 405,196,156 | 541,534,566 |
|
| Net assets | | | | |
|
| Beginning of year | 12,952,206,234 | 11,322,294,527 | 4,226,942,125 | 3,685,407,559 |
| | | | | |
| End of year | $14,945,141,351 | $12,952,206,234 | $4,632,138,281 | $4,226,942,125 |
| | | | | |
| Undistributed net investment income (loss) | — | — | — | — |
| | |
| | Annual report | Lifestyle Portfolios | 23 |
| See notes to financial statements | | |
F I N A N C I A L S T A T E M E N T S
Statements of changes in net assets
Continued
| | | | |
| | Lifestyle Conservative | | |
| | Year Ended 12-31-13 | Year Ended 12-31-12 | | |
| | |
| Increase (decrease) in net assets | | | | |
| | |
| From operations | | | | |
| Net investment income (loss) | $102,557,228 | $113,727,389 | | |
| Net realized gain (loss) | 106,136,903 | 54,728,458 | | |
| Change in net unrealized appreciation | (22,161,643) | 185,828,952 | | |
| (depreciation) | | | | |
| Increase in net assets resulting from | 186,532,488 | 354,284,799 | | |
| operations | | | | |
| | 1 | | | |
| Distributions to shareholders | | | | |
| | | | | |
| From net investment income | | | | |
| Class A | (12,659,360) | (11,673,446) | | |
| Class B | (813,589) | (916,465) | | |
| Class C | (6,135,530) | (6,368,376) | | |
| Class R1 | (183,436) | (189,440) | | |
| Class R2 | (29,444) | (2,752) | | |
| Class R3 | (255,650) | (268,491) | | |
| Class R4 | (237,534) | (252,422) | | |
| Class R5 | (419,211) | (456,826) | | |
| Class R6 | (114,023) | (31,303) | | |
| Class 1 | (83,143,027) | (93,810,074) | | |
| From net realized gain | | | | |
| Class A | (1,722,677) | (2,813,285) | | |
| Class B | (153,456) | (290,353) | | |
| Class C | (1,158,964) | (2,009,193) | | |
| Class R1 | (28,299) | (54,987) | | |
| Class R2 | (5,296) | (622) | | |
| Class R3 | (37,573) | (66,658) | | |
| Class R4 | (29,650) | (48,823) | | |
| Class R5 | (47,914) | (89,119) | | |
| Class R6 | (15,631) | (9,255) | | |
| Class 1 | (9,032,983) | (18,514,941) | | |
| | | | | |
| Total distributions | (116,223,247) | (137,866,831) | | |
| | | | | |
| From portfolio share transactions | (320,084,684) | 474,723,107 | | |
| | | |
| Total increase (decrease) | (249,775,443) | 691,141,075 | | |
| | |
| Net assets | | | | |
| | |
| Beginning of year | 3,990,170,994 | 3,299,029,919 | | |
| | | | | |
| End of year | $3,740,395,551 | $3,990,170,994 | | |
| | | | | |
| Undistributed net investment income (loss) | — | — | | |
| | |
| 24 | Lifestyle Portfolios | Annual report | |
| | | See notes to financial statements |
Financial highlights
These Financial highlights show how each portfolio’s net asset value for a share has changed since the end of the previous period.
Lifestyle Aggressive
| | | | | | | | | | | | | | | | | | | | | | | | | | | | | | |
|
| Per share operating performance for a share outstanding throughout the period | | | | | | Ratios and supplemental data | | |
|
| | | | | Income (loss) from | | | | | | | | | | | | | | | | | | | | | | | | |
| | | | | investment operations | | | | Less distributions | | | | | | | | | | Ratios to average net assets |
| | |
| | | |
| | | |
| | |
| | | | | | Net | | | | | | | | | | | | | | | | | | | | | | | | |
| | | | | | | realized | | Total | | | | | | | | | | | | | | | | | | | | Net | | |
| | | Net asset | | Net | | and | | from | | From net | | | | | | | | | | | | | | | | | | assets, | | |
| | | value, | | invest- | | unrealized | | invest- | | invest- | | | | | | | | Net asset | | | | Expenses | | Expenses | | Net | | end of | | |
| | | beginning | | ment in- | | gain (loss) | | ment | | ment | | From net | | From tax | | Total | | value, end | | Total | | before | | including | | investment | | period (in | | Portfolio |
| | | of period | | come (loss) | | on invest- | | operations | | income | | realized | | return of | | distribu- | | of period | | return | | reductions | | reductions | | income | | millions) | | turnover |
| Period ended | | ($) | | ($)1,2 | | ments ($) | | ($) | | ($) | | gain ($) | | capital ($) | | tions ($) | | ($) | | (%)3,4 | | (%)5 | | (%)5 | | (loss) (%)1 | | ($) | | (%) |
|
| CLASS A | | | | | | | | | | | | | | | | | | | | | | | | | | | | | | |
|
| 12-31-2013 | | 12.95 | | 0.09 | | 3.24 | | 3.33 | | (0.09) | | (0.25) | | — | | (0.34) | | 15.94 | | 25.70 | | 0.54 | | 0.52 | | 0.58 | | 337 | | 21 |
| 12-31-2012 | | 11.30 | | 0.08 | | 1.71 | | 1.79 | | (0.08) | | (0.06) | | — | | (0.14) | | 12.95 | | 15.83 | | 0.58 | | 0.57 | | 0.66 | | 239 | | 21 |
| 12-31-2011 | | 12.34 | | 0.05 | | (0.92) | | (0.87) | | (0.05) | | (0.12) | | — | | (0.17) | | 11.30 | | (7.09) | | 0.58 | | 0.58 | | 0.39 | | 200 | | 25 |
| 12-31-2010 | | 10.82 | | 0.04 | | 1.64 | | 1.68 | | (0.04) | | (0.12) | | — | | (0.16) | | 12.34 | | 15.50 | | 0.626,15 | | 0.61 | | 0.34 | | 185 | | 19 |
| 12-31-2009 | | 8.02 | | 0.06 | | 2.83 | | 2.89 | | (0.05) | | (0.04) | | — | | (0.09) | | 10.82 | | 36.04 | | 0.72 | | 0.65 | | 0.70 | | 138 | | 23 |
|
| CLASS B | | | | | | | | | | | | | | | | | | | | | | | | | | | | | | |
|
| 12-31-2013 | | 12.98 | | (0.05) | | 3.26 | | 3.21 | | — | | (0.21) | | — | | (0.21) | | 15.98 | | 24.73 | | 1.326 | | 1.32 | | (0.33) | | 27 | | 21 |
| 12-31-2012 | | 11.33 | | (0.02) | | 1.71 | | 1.69 | | — | | (0.04) | | — | | (0.04) | | 12.98 | | 14.94 | | 1.376,15 | | 1.35 | | (0.18) | | 24 | | 21 |
| 12-31-2011 | | 12.37 | | (0.05) | | (0.92) | | (0.97) | | — | | (0.07) | | — | | (0.07) | | 11.33 | | (7.83) | | 1.386,15 | | 1.35 | | (0.45) | | 23 | | 25 |
| 12-31-2010 | | 10.86 | | (0.05) | | 1.64 | | 1.59 | | — | | (0.08) | | — | | (0.08) | | 12.37 | | 14.61 | | 1.406,15 | | 1.35 | | (0.46) | | 24 | | 19 |
| 12-31-2009 | | 8.06 | | (0.01) | | 2.84 | | 2.83 | | — | | (0.03) | | — | | (0.03) | | 10.86 | | 35.09 | | 1.60 | | 1.35 | | (0.15) | | 22 | | 23 |
|
| CLASS C | | | | | | | | | | | | | | | | | | | | | | | | | | | | | | |
|
| 12-31-2013 | | 12.98 | | (0.02) | | 3.25 | | 3.23 | | — | | (0.22) | | — | | (0.22) | | 15.99 | | 24.90 | | 1.24 | | 1.23 | | (0.17) | | 159 | | 21 |
| 12-31-2012 | | 11.33 | | (0.01) | | 1.71 | | 1.70 | | — | | (0.05) | | — | | (0.05) | | 12.98 | | 15.00 | | 1.28 | | 1.27 | | (0.11) | | 121 | | 21 |
| 12-31-2011 | | 12.37 | | (0.04) | | (0.92) | | (0.96) | | — | | (0.08) | | — | | (0.08) | | 11.33 | | (7.76) | | 1.29 | | 1.28 | | (0.36) | | 112 | | 25 |
| 12-31-2010 | | 10.86 | | (0.04) | | 1.63 | | 1.59 | | — | | (0.08) | | — | | (0.08) | | 12.37 | | 14.61 | | 1.346,15 | | 1.33 | | (0.39) | | 111 | | 19 |
| 12-31-2009 | | 8.06 | | (0.01) | | 2.84 | | 2.83 | | — | | (0.03) | | — | | (0.03) | | 10.86 | | 35.09 | | 1.43 | | 1.35 | | (0.14) | | 89 | | 23 |
|
| CLASS R1 | | | | | | | | | | | | | | | | | | | | | | | | | | | | | | |
|
| 12-31-2013 | | 12.98 | | 0.01 | | 3.26 | | 3.27 | | (0.02) | | (0.25) | | — | | (0.27) | | 15.98 | | 25.18 | | 0.95 | | 0.94 | | 0.10 | | 10 | | 21 |
| 12-31-2012 | | 11.33 | | 0.02 | | 1.73 | | 1.75 | | (0.04) | | (0.06) | | — | | (0.10) | | 12.98 | | 15.42 | | 0.97 | | 0.96 | | 0.19 | | 9 | | 21 |
| 12-31-2011 | | 12.38 | | (0.02) | | (0.91) | | (0.93) | | — | | (0.12) | | — | | (0.12) | | 11.33 | | (7.49) | | 0.99 | | 0.98 | | (0.14) | | 8 | | 25 |
| 12-31-2010 | | 10.87 | | —7 | | 1.63 | | 1.63 | | — | | (0.12) | | — | | (0.12) | | 12.38 | | 14.99 | | 0.966,15 | | 0.96 | | (0.03) | | 8 | | 19 |
| 12-31-2009 | | 8.05 | | 0.08 | | 2.79 | | 2.87 | | (0.01) | | (0.04) | | — | | (0.05) | | 10.87 | | 35.66 | | 1.16 | | 1.05 | | 0.81 | | 6 | | 23 |
|
| CLASS R2 | | | | | | | | | | | | | | | | | | | | | | | | | | | | | | |
|
| 12-31-2013 | | 12.89 | | 0.13 | | 3.18 | | 3.31 | | (0.07) | | (0.25) | | — | | (0.32) | | 15.88 | | 25.66 | | 1.59 | | 0.62 | | 0.89 | | 2 | | 21 |
| 12-31-20128 | | 12.49 | | 0.09 | | 0.44 | | 0.53 | | (0.07) | | (0.06) | | — | | (0.13) | | 12.89 | | 4.279 | | 16.2910 | | 0.6210 | | 0.699 | | —11 | | 2112 |
|
| CLASS R3 | | | | | | | | | | | | | | | | | | | | | | | | | | | | | | |
|
| 12-31-2013 | | 12.93 | | —7 | | 3.27 | | 3.27 | | (0.03) | | (0.25) | | — | | (0.28) | | 15.92 | | 25.29 | | 0.85 | | 0.85 | | 0.02 | | 9 | | 21 |
| 12-31-2012 | | 11.28 | | 0.03 | | 1.72 | | 1.75 | | (0.04) | | (0.06) | | — | | (0.10) | | 12.93 | | 15.53 | | 0.88 | | 0.88 | | 0.27 | | 10 | | 21 |
| 12-31-2011 | | 12.33 | | (0.01) | | (0.90) | | (0.91) | | (0.02) | | (0.12) | | — | | (0.14) | | 11.28 | | (7.41) | | 0.87 | | 0.87 | | (0.06) | | 10 | | 25 |
| 12-31-2010 | | 10.82 | | 0.01 | | 1.63 | | 1.64 | | (0.01) | | (0.12) | | — | | (0.13) | | 12.33 | | 15.21 | | 0.85 | | 0.84 | | 0.06 | | 12 | | 19 |
| 12-31-2009 | | 8.03 | | 0.03 | | 2.83 | | 2.86 | | (0.03) | | (0.04) | | — | | (0.07) | | 10.82 | | 35.59 | | 0.95 | | 0.95 | | 0.31 | | 10 | | 23 |
|
| CLASS R4 | | | | | | | | | | | | | | | | | | | | | | | | | | | | | | |
|
| 12-31-2013 | | 12.91 | | 0.07 | | 3.25 | | 3.32 | | (0.08) | | (0.25) | | — | | (0.33) | | 15.90 | | 25.76 | | 0.59 | | 0.48 | | 0.45 | | 8 | | 21 |
| 12-31-2012 | | 11.27 | | 0.06 | | 1.73 | | 1.79 | | (0.09) | | (0.06) | | — | | (0.15) | | 12.91 | | 15.86 | | 0.59 | | 0.53 | | 0.52 | | 8 | | 21 |
| 12-31-2011 | | 12.32 | | 0.04 | | (0.92) | | (0.88) | | (0.05) | | (0.12) | | — | | (0.17) | | 11.27 | | (7.13) | | 0.61 | | 0.61 | | 0.33 | | 8 | | 25 |
| 12-31-2010 | | 10.81 | | 0.04 | | 1.64 | | 1.68 | | (0.05) | | (0.12) | | — | | (0.17) | | 12.32 | | 15.56 | | 0.55 | | 0.55 | | 0.34 | | 8 | | 19 |
| 12-31-2009 | | 8.01 | | 0.06 | | 2.83 | | 2.89 | | (0.05) | | (0.04) | | — | | (0.09) | | 10.81 | | 36.09 | | 0.62 | | 0.62 | | 0.68 | | 9 | | 23 |
|
| CLASS R5 | | | | | | | | | | | | | | | | | | | | | | | | | | | | | | |
|
| 12-31-2013 | | 12.92 | | 0.12 | | 3.25 | | 3.37 | | (0.12) | | (0.25) | | — | | (0.37) | | 15.92 | | 26.08 | | 0.25 | | 0.25 | | 0.81 | | 11 | | 21 |
| 12-31-2012 | | 11.27 | | 0.08 | | 1.75 | | 1.83 | | (0.12) | | (0.06) | | — | | (0.18) | | 12.92 | | 16.22 | | 0.27 | | 0.26 | | 0.62 | | 9 | | 21 |
| 12-31-2011 | | 12.31 | | 0.08 | | (0.91) | | (0.83) | | (0.09) | | (0.12) | | — | | (0.21) | | 11.27 | | (6.76) | | 0.26 | | 0.25 | | 0.67 | | 12 | | 25 |
| 12-31-2010 | | 10.80 | | 0.08 | | 1.63 | | 1.71 | | (0.08) | | (0.12) | | — | | (0.20) | | 12.31 | | 15.84 | | 0.26 | | 0.25 | | 0.68 | | 11 | | 19 |
| 12-31-2009 | | 8.00 | | 0.09 | | 2.83 | | 2.92 | | (0.08) | | (0.04) | | — | | (0.12) | | 10.80 | | 36.51 | | 0.32 | | 0.32 | | 0.97 | | 10 | | 23 |
|
| | |
| | Annual report | Lifestyle Portfolios | 25 |
| See notes to financial statements | | |
Financial highlights
Continued
Lifestyle Aggressive continued | | | | | | | | | | | | | | | | | | | | | | | | | | | | | | |
|
| Per share operating performance for a share outstanding throughout the period | | | | | | Ratios and supplemental data | | |
|
| | | | Income (loss) from | | | | | | | | | | | | | | | | | | | | | | | | |
| | | | investment operations | | | | Less distributions | | | | | | Ratios to average net assets | | | | |
| | |
| | | |
| | | |
| | |
| | | | | | | Net | | | | | | | | | | | | | | | | | | | | | | | | |
| | | | | | | realized | | Total | | | | | | | | | | | | | | | | | | | | Net | | |
| | | Net asset | | Net | | and | | from | | From net | | | | | | | | | | | | | | | | | | assets, | | |
| | | value, | | invest- | | unrealized | | invest- | | invest- | | | | | | | | Net asset | | | | Expenses | | Expenses | | Net | | end of | | |
| | | beginning | | ment in- | | gain (loss) | | ment | | ment | | From net | | From tax | | Total | | value, end | | Total | | before | | including | | investment | | period (in | | Portfolio |
| | | of period | | come (loss) | | on invest- | | operations | | income | | realized | | return of | | distribu- | | of period | | return | | reductions | | reductions | | income | | millions) | | turnover |
| Period ended | | ($) | | ($)1,2 | | ments ($) | | ($) | | ($) | | gain ($) | | capital ($) | | tions ($) | | ($) | | (%)3,4 | | (%)5 | | (%)5 | | (loss) (%)1 | | ($) | | (%) |
|
| CLASS R6 | | | | | | | | | | | | | | | | | | | | | | | | | | | | | | |
|
| 12-31-2013 | | 12.89 | | 0.18 | | 3.21 | | 3.39 | | (0.14) | | (0.25) | | — | | (0.39) | | 15.89 | | 26.30 | | 0.38 | | 0.11 | | 1.26 | | 5 | | 21 |
| 12-31-2012 | | 11.24 | | 0.36 | | 1.49 | | 1.85 | | (0.14) | | (0.06) | | — | | (0.20) | | 12.89 | | 16.43 | | 2.57 | | 0.11 | | 2.88 | | 2 | | 21 |
| 12-31-201113 | | 11.68 | | 0.11 | | (0.33) | | (0.22) | | (0.10) | | (0.12) | | — | | (0.22) | | 11.24 | | (1.87)9 | | 16.5610 | | 0.1110 | | 0.9510 | | —11 | | 2514 |
|
| CLASS 1 | | | | | | | | | | | | | | | | | | | | | | | | | | | | | | |
|
| 12-31-2013 | | 12.89 | | 0.13 | | 3.25 | | 3.38 | | (0.14) | | (0.25) | | — | | (0.39) | | 15.88 | | 26.23 | | 0.11 | | 0.11 | | 0.91 | | 4,048 | | 21 |
| 12-31-2012 | | 11.24 | | 0.13 | | 1.72 | | 1.85 | | (0.14) | | (0.06) | | — | | (0.20) | | 12.89 | | 16.43 | | 0.12 | | 0.11 | | 1.05 | | 3,375 | | 21 |
| 12-31-2011 | | 12.28 | | 0.10 | | (0.92) | | (0.82) | | (0.10) | | (0.12) | | — | | (0.22) | | 11.24 | | (6.66) | | 0.11 | | 0.11 | | 0.78 | | 3,164 | | 25 |
| 12-31-2010 | | 10.77 | | 0.09 | | 1.63 | | 1.72 | | (0.09) | | (0.12) | | — | | (0.21) | | 12.28 | | 16.01 | | 0.12 | | 0.11 | | 0.79 | | 3,499 | | 19 |
| 12-31-2009 | | 7.98 | | 0.10 | | 2.83 | | 2.93 | | (0.10) | | (0.04) | | — | | (0.14) | | 10.77 | | 36.70 | | 0.11 | | 0.11 | | 1.11 | | 3,052 | | 23 |
|
1 Recognition of net investment income by the portfolio is affected by the timing and frequency of the declaration of dividends by the underlying funds in which the
portfolio invests.
2 Based on the average daily shares outstanding.
3 Does not reflect the effect of sales charges, if any.
4 Total returns would have been lower had certain expenses not been reduced during the applicable periods.
5 Ratios do not include expenses indirectly incurred from underlying funds whose expense ratios can vary based on the mix of underlying funds held by the portfolio. The
range of expense ratios of the underlying funds held by the portfolio was as follows: 0.69%–3.11%, 0.73%–1.48%, 0.48%–1.40%, 0.48%–1.39% and 0.49%–1.40% for
the years ended 12-31-13, 12-31-12, 12-31-11, 12-31-10 and 12-31-09, respectively.
6 Includes the impact of expense recapture for the following periods ended: 12-31-13: 0.04% of average net assets for Class B shares. 12-31-12: 0.04% of average net as-
sets for Class B shares. 12-31-11: 0.05% of average net assets for Class B shares. 12-31-10: 0.03%, 0.03%, 0.05% and 0.05% of average net assets for Class A, Class B,
Class C and Class R1 shares, respectively.
7 Less than $0.005 per share.
8 The inception date for Class R2 shares is 3-1-12.
9 Not annualized.
10 Annualized.
11 Less than $500,000.
12 Portfolio turnover is shown for the period from 1-1-12 to 12-31-12.
13 The inception date for Class R6 shares is 9-1-11.
14 Portfolio turnover is shown for the period from 1-1-11 to 12-31-11.
15 Expense ratio has been revised to conform with current year presentation of expense recapture and net expense reductions.
Lifestyle Growth
| | | | | | | | | | | | | | | | | | | | | | | | | | | | | | |
|
| Per share operating performance for a share outstanding throughout the period | | | | | | Ratios and supplemental data | | |
|
| | | | Income (loss) from | | | | | | | | | | | | | | | | | | | | | | | | |
| | | | | investment operations | | | | Less distributions | | | | | | Ratios to average net assets | | | | |
| | |
| | | |
| | | |
| | |
| | | | | | Net | | | | | | | | | | | | | | | | | | | | | | | | |
| | | | | | | realized | | Total | | | | | | | | | | | | | | | | | | | | Net | | |
| | | Net asset | | Net | | and | | from | | From net | | | | | | | | | | | | | | | | | | assets, | | |
| | | value, | | invest- | | unrealized | | invest- | | invest- | | | | | | | | Net asset | | | | Expenses | | Expenses | | Net | | end of | | |
| | | beginning | | ment in- | | gain (loss) | | ment | | ment | | From net | | From tax | | Total | | value, end | | Total | | before | | including | | investment | | period (in | | Portfolio |
| | | of period | | come (loss) | | on invest- | | operations | | income | | realized | | return of | | distribu- | | of period | | return | | reductions | | reductions | | income | | millions) | | turnover |
| Period ended | | ($) | | ($)1,2 | | ments ($) | | ($) | | ($) | | gain ($) | | capital ($) | | tions ($) | | ($) | | (%)3,4 | | (%)5 | | (%)5 | | (loss) (%)1 | | ($) | | (%) |
|
| CLASS A | | | | | | | | | | | | | | | | | | | | | | | | | | | | | | |
|
| 12-31-2013 | | 13.53 | | 0.17 | | 2.78 | | 2.95 | | (0.17) | | (0.22) | | — | | (0.39) | | 16.09 | | 21.81 | | 0.53 | | 0.52 | | 1.13 | | 1,274 | | 20 |
| 12-31-2012 | | 11.96 | | 0.17 | | 1.62 | | 1.79 | | (0.16) | | (0.06) | | — | | (0.22) | | 13.53 | | 15.01 | | 0.57 | | 0.56 | | 1.28 | | 890 | | 23 |
| 12-31-2011 | | 12.89 | | 0.15 | | (0.83) | | (0.68) | | (0.14) | | (0.11) | | — | | (0.25) | | 11.96 | | (5.30) | | 0.58 | | 0.57 | | 1.14 | | 699 | | 24 |
| 12-31-2010 | | 11.50 | | 0.19 | | 1.51 | | 1.70 | | (0.18) | | (0.13) | | — | | (0.31) | | 12.89 | | 14.77 | | 0.56 | | 0.55 | | 1.58 | | 593 | | 19 |
| 12-31-2009 | | 8.73 | | 0.21 | | 2.81 | | 3.02 | | (0.21) | | (0.04) | | — | | (0.25) | | 11.50 | | 34.54 | | 0.64 | | 0.62 | | 2.17 | | 417 | | 26 |
|
| CLASS B | | | | | | | | | | | | | | | | | | | | | | | | | | | | | | |
|
| 12-31-2013 | | 13.57 | | 0.04 | | 2.80 | | 2.84 | | (0.05) | | (0.22) | | — | | (0.27) | | 16.14 | | 20.93 | | 1.24 | | 1.24 | | 0.29 | | 119 | | 20 |
| 12-31-2012 | | 12.00 | | 0.06 | | 1.64 | | 1.70 | | (0.07) | | (0.06) | | — | | (0.13) | | 13.57 | | 14.18 | | 1.28 | | 1.28 | | 0.50 | | 108 | | 23 |
| 12-31-2011 | | 12.92 | | 0.05 | | (0.81) | | (0.76) | | (0.05) | | (0.11) | | — | | (0.16) | | 12.00 | | (5.91) | | 1.316,14 | | 1.30 | | 0.37 | | 93 | | 24 |
| 12-31-2010 | | 11.54 | | 0.08 | | 1.51 | | 1.59 | | (0.08) | | (0.13) | | — | | (0.21) | | 12.92 | | 13.81 | | 1.366,14 | | 1.35 | | 0.69 | | 89 | | 19 |
| 12-31-2009 | | 8.77 | | 0.13 | | 2.81 | | 2.94 | | (0.13) | | (0.04) | | — | | (0.17) | | 11.54 | | 33.53 | | 1.48 | | 1.35 | | 1.32 | | 75 | | 26 |
|
| | |
| 26 | Lifestyle Portfolios | Annual report | |
| | | See notes to financial statements |
Financial highlights
Continued
Lifestyle Growth continued
| | | | | | | | | | | | | | | | | | | | | | | | | | | | | |
|
| Per share operating performance for a share outstanding throughout the period | | | | | Ratios and supplemental data | | |
|
| | | | Income (loss) from | | | | | | | | | | | | | | | | | | | | | | | |
| | | | investment operations | | | | Less distributions | | | | | Ratios to average net assets | | | | |
| | | |
| | | |
| | |
| | |
| | | | | | | Net | | | | | | | | | | | | | | | | | | | | | | | |
| | | | | | | realized | | Total | | | | | | | | | | | | | | | | | | | Net | | |
| | | Net asset | | Net | | and | | from | | From net | | | | | | | | | | | | | | | | | assets, | | |
| | | value, | | invest- | | unrealized | | invest- | | invest- | | | | | | | Net asset | | | | Expenses | | Expenses | | Net | | end of | | |
| | | beginning | | ment in- | | gain (loss) | | ment | | ment | | From net | | From tax | | Total | value, end | | Total | | before | | including | | investment | | period (in | | Portfolio |
| | | of period | | come (loss) | | on invest- | | operations | | income | | realized | | return of | | distribu- | of period | | return | | reductions | | reductions | | income | | millions) | | turnover |
| Period ended | | ($) | | ($)1,2 | | ments ($) | | ($) | | ($) | | gain ($) | | capital ($) | | tions ($) | ($) | | (%)3,4 | | (%)5 | | (%)5 | | (loss) (%)1 | | ($) | | (%) |
|
| CLASS C | | | | | | | | | | | | | | | | | | | | | | | | | | | | | |
|
| 12-31-2013 | | 13.56 | | 0.06 | | 2.77 | | 2.83 | | (0.05) | | (0.22) | | — | | (0.27) | 16.12 | | 20.88 | | 1.23 | | 1.23 | | 0.39 | | 646 | | 20 |
| 12-31-2012 | | 11.99 | | 0.07 | | 1.63 | | 1.70 | | (0.07) | | (0.06) | | — | | (0.13) | 13.56 | | 14.21 | | 1.27 | | 1.26 | | 0.52 | | 485 | | 23 |
| 12-31-2011 | | 12.91 | | 0.05 | | (0.81) | | (0.76) | | (0.05) | | (0.11) | | — | | (0.16) | 11.99 | | (5.90) | | 1.28 | | 1.27 | | 0.38 | | 422 | | 24 |
| 12-31-2010 | | 11.53 | | 0.10 | | 1.51 | | 1.61 | | (0.10) | | (0.13) | | — | | (0.23) | 12.91 | | 13.93 | | 1.25 | | 1.25 | | 0.84 | | 404 | | 19 |
| 12-31-2009 | | 8.76 | | 0.14 | | 2.81 | | 2.95 | | (0.14) | | (0.04) | | — | | (0.18) | 11.53 | | 33.63 | | 1.35 | | 1.34 | | 1.37 | | 305 | | 26 |
|
| CLASS R1 | | | | | | | | | | | | | | | | | | | | | | | | | | | | | |
|
| 12-31-2013 | | 13.58 | | 0.10 | | 2.80 | | 2.90 | | (0.11) | | (0.22) | | — | | (0.33) | 16.15 | | 21.36 | | 0.88 | | 0.88 | | 0.69 | | 23 | | 20 |
| 12-31-2012 | | 12.01 | | 0.13 | | 1.63 | | 1.76 | | (0.13) | | (0.06) | | — | | (0.19) | 13.58 | | 14.67 | | 0.87 | | 0.86 | | 0.97 | | 19 | | 23 |
| 12-31-2011 | | 12.95 | | 0.09 | | (0.81) | | (0.72) | | (0.11) | | (0.11) | | — | | (0.22) | 12.01 | | (5.59) | | 0.92 | | 0.92 | | 0.70 | | 16 | | 24 |
| 12-31-2010 | | 11.57 | | 0.15 | | 1.50 | | 1.65 | | (0.14) | | (0.13) | | — | | (0.27) | 12.95 | | 14.28 | | 0.87 | | 0.86 | | 1.24 | | 15 | | 19 |
| 12-31-2009 | | 8.77 | | 0.25 | | 2.75 | | 3.00 | | (0.16) | | (0.04) | | — | | (0.20) | 11.57 | | 34.15 | | 1.02 | | 1.02 | | 2.45 | | 11 | | 26 |
|
| CLASS R2 | | | | | | | | | | | | | | | | | | | | | | | | | | | | | |
|
| 12-31-2013 | | 13.47 | | 0.26 | | 2.66 | | 2.92 | | (0.15) | | (0.22) | | — | | (0.37) | 16.02 | | 21.67 | | 0.906 | | 0.62 | | 1.72 | | 9 | | 20 |
| 12-31-20127 | | 13.05 | | 0.16 | | 0.48 | | 0.64 | | (0.16) | | (0.06) | | — | | (0.22) | 13.47 | | 4.908 | | 16.209 | | 0.629 | | 1.218 | | —10 | | 2311 |
|
| CLASS R3 | | | | | | | | | | | | | | | | | | | | | | | | | | | | | |
|
| 12-31-2013 | | 13.52 | | 0.12 | | 2.78 | | 2.90 | | (0.12) | | (0.22) | | — | | (0.34) | 16.08 | | 21.45 | | 0.79 | | 0.79 | | 0.79 | | 24 | | 20 |
| 12-31-2012 | | 11.95 | | 0.11 | | 1.65 | | 1.76 | | (0.13) | | (0.06) | | — | | (0.19) | 13.52 | | 14.77 | | 0.81 | | 0.81 | | 0.83 | | 19 | | 23 |
| 12-31-2011 | | 12.88 | | 0.10 | | (0.81) | | (0.71) | | (0.11) | | (0.11) | | — | | (0.22) | 11.95 | | (5.50) | | 0.81 | | 0.81 | | 0.80 | | 22 | | 24 |
| 12-31-2010 | | 11.50 | | 0.15 | | 1.51 | | 1.66 | | (0.15) | | (0.13) | | — | | (0.28) | 12.88 | | 14.46 | | 0.81 | | 0.81 | | 1.24 | | 23 | | 19 |
| 12-31-2009 | | 8.73 | | 0.18 | | 2.81 | | 2.99 | | (0.18) | | (0.04) | | — | | (0.22) | 11.50 | | 34.26 | | 0.88 | | 0.88 | | 1.77 | | 19 | | 26 |
|
| CLASS R4 | | | | | | | | | | | | | | | | | | | | | | | | | | | | | |
|
| 12-31-2013 | | 13.51 | | 0.18 | | 2.79 | | 2.97 | | (0.18) | | (0.22) | | — | | (0.40) | 16.08 | | 21.99 | | 0.50 | | 0.40 | | 1.20 | | 24 | | 20 |
| 12-31-2012 | | 11.95 | | 0.16 | | 1.65 | | 1.81 | | (0.19) | | (0.06) | | — | | (0.25) | 13.51 | | 15.11 | | 0.50 | | 0.44 | | 1.21 | | 19 | | 23 |
| 12-31-2011 | | 12.88 | | 0.14 | | (0.81) | | (0.67) | | (0.15) | | (0.11) | | — | | (0.26) | 11.95 | | (5.18) | | 0.52 | | 0.52 | | 1.08 | | 17 | | 24 |
| 12-31-2010 | | 11.50 | | 0.19 | | 1.51 | | 1.70 | | (0.19) | | (0.13) | | — | | (0.32) | 12.88 | | 14.80 | | 0.48 | | 0.48 | | 1.57 | | 19 | | 19 |
| 12-31-2009 | | 8.72 | | 0.21 | | 2.82 | | 3.03 | | (0.21) | | (0.04) | | — | | (0.25) | 11.50 | | 34.73 | | 0.54 | | 0.54 | | 2.11 | | 16 | | 26 |
|
| CLASS R5 | | | | | | | | | | | | | | | | | | | | | | | | | | | | | |
|
| 12-31-2013 | | 13.52 | | 0.21 | | 2.80 | | 3.01 | | (0.21) | | (0.22) | | — | | (0.43) | 16.10 | | 22.29 | | 0.18 | | 0.18 | | 1.40 | | 37 | | 20 |
| 12-31-2012 | | 11.95 | | 0.21 | | 1.63 | | 1.84 | | (0.21) | | (0.06) | | — | | (0.27) | 13.52 | | 15.43 | | 0.18 | | 0.18 | | 1.58 | | 32 | | 23 |
| 12-31-2011 | | 12.88 | | 0.19 | | (0.82) | | (0.63) | | (0.19) | | (0.11) | | — | | (0.30) | 11.95 | | (4.92) | | 0.21 | | 0.20 | | 1.49 | | 26 | | 24 |
| 12-31-2010 | | 11.50 | | 0.21 | | 1.52 | | 1.73 | | (0.22) | | (0.13) | | — | | (0.35) | 12.88 | | 15.06 | | 0.21 | | 0.21 | | 1.80 | | 22 | | 19 |
| 12-31-2009 | | 8.72 | | 0.25 | | 2.81 | | 3.06 | | (0.24) | | (0.04) | | — | | (0.28) | 11.50 | | 35.09 | | 0.26 | | 0.26 | | 2.48 | | 18 | | 26 |
|
| CLASS R6 | | | | | | | | | | | | | | | | | | | | | | | | | | | | | |
|
| 12-31-2013 | | 13.47 | | 0.29 | | 2.71 | | 3.00 | | (0.22) | | (0.22) | | — | | (0.44) | 16.03 | | 22.31 | | 0.19 | | 0.11 | | 1.95 | | 19 | | 20 |
| 12-31-2012 | | 11.90 | | 0.58 | | 1.27 | | 1.85 | | (0.22) | | (0.06) | | — | | (0.28) | 13.47 | | 15.60 | | 2.23 | | 0.11 | | 4.39 | | 3 | | 23 |
| 12-31-201112 | | 12.34 | | 0.19 | | (0.32) | | (0.13) | | (0.20) | | (0.11) | | — | | (0.31) | 11.90 | | (1.07)8 | | 15.949 | | 0.109 | | 1.588 | | —10 | | 2413 |
|
| CLASS 1 | | | | | | | | | | | | | | | | | | | | | | | | | | | | | |
|
| 12-31-2013 | | 13.47 | | 0.22 | | 2.78 | | 3.00 | | (0.22) | | (0.22) | | — | | (0.44) | 16.03 | | 22.31 | | 0.11 | | 0.11 | | 1.45 | | 11,766 | | 20 |
| 12-31-2012 | | 11.91 | | 0.21 | | 1.63 | | 1.84 | | (0.22) | | (0.06) | | — | | (0.28) | 13.47 | | 15.50 | | 0.11 | | 0.11 | | 1.64 | | 10,106 | | 23 |
| 12-31-2011 | | 12.84 | | 0.19 | | (0.81) | | (0.62) | | (0.20) | | (0.11) | | — | | (0.31) | 11.91 | | (4.84) | | 0.11 | | 0.11 | | 1.50 | | 9,411 | | 24 |
| 12-31-2010 | | 11.45 | | 0.23 | | 1.52 | | 1.75 | | (0.23) | | (0.13) | | — | | (0.36) | 12.84 | | 15.30 | | 0.11 | | 0.11 | | 1.92 | | 10,305 | | 19 |
| 12-31-2009 | | 8.68 | | 0.25 | | 2.81 | | 3.06 | | (0.25) | | (0.04) | | — | | (0.29) | 11.45 | | 35.27 | | 0.11 | | 0.11 | | 2.55 | | 8,903 | | 26 |
|
| CLASS 5 | | | | | | | | | | | | | | | | | | | | | | | | | | | | | |
|
| 12-31-2013 | | 13.46 | | 0.24 | | 2.76 | | 3.00 | | (0.23) | | (0.22) | | — | | (0.45) | 16.01 | | 22.31 | | 0.06 | | 0.06 | | 1.60 | | 201 | | 20 |
| 12-31-2012 | | 11.90 | | 0.23 | | 1.62 | | 1.85 | | (0.23) | | (0.06) | | — | | (0.29) | 13.46 | | 15.57 | | 0.06 | | 0.06 | | 1.78 | | 142 | | 23 |
| 12-31-2011 | | 12.82 | | 0.21 | | (0.81) | | (0.60) | | (0.21) | | (0.11) | | — | | (0.32) | 11.90 | | (4.72) | | 0.06 | | 0.06 | | 1.63 | | 111 | | 24 |
| 12-31-2010 | | 11.44 | | 0.25 | | 1.50 | | 1.75 | | (0.24) | | (0.13) | | — | | (0.37) | 12.82 | | 15.28 | | 0.06 | | 0.06 | | 2.07 | | 98 | | 19 |
| 12-31-2009 | | 8.67 | | 0.27 | | 2.80 | | 3.07 | | (0.26) | | (0.04) | | — | | (0.30) | 11.44 | | 35.37 | | 0.07 | | 0.07 | | 2.70 | | 68 | | 26 |
|
| | |
| | Annual report | Lifestyle Portfolios | 27 |
| See notes to financial statements | | |
Financial highlights
Continued
Lifestyle Growth continued
1 Recognition of net investment income by the portfolio is affected by the timing and frequency of the declaration of dividends by the underlying funds in which the
portfolio invests.
2 Based on the average daily shares outstanding.
3 Does not reflect the effect of sales charges, if any.
4 Total returns would have been lower had certain expenses not been reduced during the applicable periods.
5 Ratios do not include expenses indirectly incurred from underlying funds whose expense ratios can vary based on the mix of the underlying funds held by the portfolio. The
range of expense ratios of the underlying funds held by the portfolio was as follows: 0.63%–3.11%, 0.63%–1.48%, 0.48%–1.40%, 0.48%–1.39% and 0.49%–1.40% for
the years ended 12-31-13, 12-31-12, 12-31-11, 12-31-10 and 12-31-09, respectively.
6 Includes the impact of expense recapture for the following periods ended: 12-31-13: 0.01% of average net assets for Class R2 shares. 12-31-11: 0.02% of average net
assets for Class B shares. 12-31-10: 0.07% of average net assets for Class B shares.
7 The inception date for Class R2 shares is 3-1-12.
8 Not annualized.
9 Annualized.
10 Less than $500,000.
11 Portfolio turnover is shown for the period from 1-1-12 to 12-31-12.
12 The inception date for Class R6 shares is 9-1-11.
13 Portfolio turnover is shown for the period from 1-1-11 to 12-31-11.
14 Expense ratio has been revised to conform with current year presentation of expense recapture and net expense reduction.
Lifestyle Balanced
| | | | | | | | | | | | | | | | | | | | | | | | | | | | | | |
|
| Per share operating performance for a share outstanding throughout the period | | | | | | Ratios and supplemental data |
|
| | | | | Income (loss) from | | | | | | | | | | | | | | | | | | | | | | | | |
| | | | | investment operations | | | | Less distributions | | | | | | Ratios to average net assets | | | | |
| | | | |
| | | |
| | | |
| | |
| | | | | | | Net | | | | | | | | | | | | | | | | | | | | | | | | |
| | | | | | | realized | | Total | | | | | | | | | | | | | | | | | | | | Net | | |
| | | Net asset | | Net | | and | | from | | From net | | | | | | | | | | | | | | | | | | assets, | | |
| | | value, | | invest- | | unrealized | | invest- | | invest- | | | | | | | | Net asset | | | | Expenses | | Expenses | | Net | | end of | | |
| | | beginning | | ment in- | | gain (loss) | | ment | | ment | | From net | | From tax | | Total | | value, end | | Total | | before | | including | | investment | | period (in | | Portfolio |
| | | of period | | come (loss) | | on invest- | | operations | | income | | realized | | return of | | distribu- | | of period | | return | | reductions | | reductions | | income | | millions) | | turnover |
| Period ended | | ($) | | ($)1,2 | | ments ($) | | ($) | | ($) | | gain ($) | | capital ($) | | tions ($) | | ($) | | (%)3,4 | | (%)5 | | (%)5 | | (loss) (%)1 | | ($) | | (%) |
|
| CLASS A | | | | | | | | | | | | | | | | | | | | | | | | | | | | | | |
|
| 12-31-2013 | | 13.61 | | 0.25 | | 1.89 | | 2.14 | | (0.24) | | (0.15) | | — | | (0.39) | | 15.36 | | 15.76 | | 0.53 | | 0.51 | | 1.69 | | 1,461 | | 19 |
| 12-31-2012 | | 12.26 | | 0.26 | | 1.40 | | 1.66 | | (0.24) | | (0.07) | | — | | (0.31) | | 13.61 | | 13.59 | | 0.56 | | 0.56 | | 1.96 | | 1,043 | | 20 |
| 12-31-2011 | | 12.96 | | 0.28 | | (0.62) | | (0.34) | | (0.26) | | (0.10) | | — | | (0.36) | | 12.26 | | (2.62) | | 0.57 | | 0.57 | | 2.17 | | 751 | | 23 |
| 12-31-2010 | | 11.85 | | 0.31 | | 1.23 | | 1.54 | | (0.30) | | (0.13) | | — | | (0.43) | | 12.96 | | 13.13 | | 0.54 | | 0.54 | | 2.55 | | 588 | | 19 |
| 12-31-2009 | | 9.22 | | 0.35 | | 2.65 | | 3.00 | | (0.33) | | (0.04) | | — | | (0.37) | | 11.85 | | 32.87 | | 0.57 | | 0.56 | | 3.35 | | 408 | | 316 |
|
| CLASS B | | | | | | | | | | | | | | | | | | | | | | | | | | | | | | |
|
| 12-31-2013 | | 13.61 | | 0.12 | | 1.90 | | 2.02 | | (0.13) | | (0.15) | | — | | (0.28) | | 15.35 | | 14.84 | | 1.28 | | 1.28 | | 0.81 | | 116 | | 19 |
| 12-31-2012 | | 12.26 | | 0.16 | | 1.41 | | 1.57 | | (0.15) | | (0.07) | | — | | (0.22) | | 13.61 | | 12.80 | | 1.29 | | 1.28 | | 1.18 | | 107 | | 20 |
| 12-31-2011 | | 12.96 | | 0.18 | | (0.61) | | (0.43) | | (0.17) | | (0.10) | | — | | (0.27) | | 12.26 | | (3.30) | | 1.29 | | 1.29 | | 1.41 | | 85 | | 23 |
| 12-31-2010 | | 11.85 | | 0.20 | | 1.24 | | 1.44 | | (0.20) | | (0.13) | | — | | (0.33) | | 12.96 | | 12.23 | | 1.317,15 | | 1.31 | | 1.67 | | 74 | | 19 |
| 12-31-2009 | | 9.21 | | 0.25 | | 2.68 | | 2.93 | | (0.25) | | (0.04) | | — | | (0.29) | | 11.85 | | 31.99 | | 1.40, | | 1.35 | | 2.44 | | 64 | | 316 |
|
| CLASS C | | | | | | | | | | | | | | | | | | | | | | | | | | | | | | |
|
| 12-31-2013 | | 13.62 | | 0.14 | | 1.89 | | 2.03 | | (0.13) | | (0.15) | | — | | (0.28) | | 15.37 | | 14.93 | | 1.23 | | 1.23 | | 0.96 | | 767 | | 19 |
| 12-31-2012 | | 12.27 | | 0.16 | | 1.41 | | 1.57 | | (0.15) | | (0.07) | | — | | (0.22) | | 13.62 | | 12.81 | | 1.26 | | 1.26 | | 1.19 | | 579 | | 20 |
| 12-31-2011 | | 12.97 | | 0.18 | | (0.61) | | (0.43) | | (0.17) | | (0.10) | | — | | (0.27) | | 12.27 | | (3.29) | | 1.27 | | 1.27 | | 1.37 | | 484 | | 23 |
| 12-31-2010 | | 11.86 | | 0.22 | | 1.23 | | 1.45 | | (0.21) | | (0.13) | | — | | (0.34) | | 12.97 | | 12.34 | | 1.24 | | 1.24 | | 1.82 | | 448 | | 19 |
| 12-31-2009 | | 9.22 | | 0.27 | | 2.67 | | 2.94 | | (0.26) | | (0.04) | | — | | (0.30) | | 11.86 | | 32.08 | | 1.27 | | 1.26 | | 2.63 | | 327 | | 316 |
|
| CLASS R1 | | | | | | | | | | | | | | | | | | | | | | | | | | | | | | |
|
| 12-31-2013 | | 13.57 | | 0.18 | | 1.88 | | 2.06 | | (0.18) | | (0.15) | | — | | (0.33) | | 15.30 | | 15.23 | | 0.90 | | 0.90 | | 1.21 | | 19 | | 19 |
| 12-31-2012 | | 12.22 | | 0.20 | | 1.42 | | 1.62 | | (0.20) | | (0.07) | | — | | (0.27) | | 13.57 | | 13.29 | | 0.86 | | 0.86 | | 1.52 | | 17 | | 20 |
| 12-31-2011 | | 12.92 | | 0.22 | | (0.60) | | (0.38) | | (0.22) | | (0.10) | | — | | (0.32) | | 12.22 | | (2.94) | | 0.94 | | 0.94 | | 1.68 | | 16 | | 23 |
| 12-31-2010 | | 11.82 | | 0.26 | | 1.23 | | 1.49 | | (0.26) | | (0.13) | | — | | (0.39) | | 12.92 | | 12.75 | | 0.88 | | 0.88 | | 2.17 | | 15 | | 19 |
| 12-31-2009 | | 9.20 | | 0.43 | | 2.51 | | 2.94 | | (0.28) | | (0.04) | | — | | (0.32) | | 11.82 | | 32.21 | | 1.07 | | 1.07 | | 3.96 | | 10 | | 316 |
|
| CLASS R2 | | | | | | | | | | | | | | | | | | | | | | | | | | | | | | |
|
| 12-31-2013 | | 13.56 | | 0.34 | | 1.76 | | 2.10 | | (0.22) | | (0.15) | | — | | (0.37) | | 15.29 | | 15.59 | | 1.097 | | 0.62 | | 2.30 | | 5 | | 19 |
| 12-31-20128 | | 13.15 | | 0.24 | | 0.48 | | 0.72 | | (0.24) | | (0.07) | | — | | (0.31) | | 13.56 | | 5.489 | | 16.3310 | | 0.6110 | | 1.789 | | —11 | | 2012 |
|
| CLASS R3 | | | | | | | | | | | | | | | | | | | | | | | | | | | | | | |
|
| 12-31-2013 | | 13.59 | | 0.19 | | 1.90 | | 2.09 | | (0.20) | | (0.15) | | — | | (0.35) | | 15.33 | | 15.43 | | 0.77 | | 0.77 | | 1.31 | | 35 | | 19 |
| 12-31-2012 | | 12.24 | | 0.21 | | 1.42 | | 1.63 | | (0.21) | | (0.07) | | — | | (0.28) | | 13.59 | | 13.38 | | 0.78 | | 0.77 | | 1.62 | | 33 | | 20 |
| 12-31-2011 | | 12.94 | | 0.23 | | (0.59) | | (0.36) | | (0.24) | | (0.10) | | — | | (0.34) | | 12.24 | | (2.82) | | 0.79 | | 0.78 | | 1.79 | | 36 | | 23 |
| 12-31-2010 | | 11.83 | | 0.28 | | 1.23 | | 1.51 | | (0.27) | | (0.13) | | — | | (0.40) | | 12.94 | | 12.89 | | 0.79 | | 0.79 | | 2.28 | | 39 | | 19 |
| 12-31-2009 | | 9.20 | | 0.30 | | 2.67 | | 2.97 | | (0.30) | | (0.04) | | — | | (0.34) | | 11.83 | | 32.62 | | 0.84 | | 0.84 | | 2.94 | | 30 | | 316 |
|
| | |
| 28 | Lifestyle Portfolios | Annual report | |
| | | See notes to financial statements |
Financial highlights
Continued
Lifestyle Balanced continued
| | | | | | | | | | | | | | | | | | | | | | | | | | | | | | |
|
| Per share operating performance for a share outstanding throughout the period | | | | | | Ratios and supplemental data | | |
|
| | | | Income (loss) from | | | | | | | | | | | | | | | | | | | | | | | | |
| | | | investment operations | | | | Less distributions | | | | | | Ratios to average net assets | | | | |
| | | |
| | | |
| | | |
| | |
| | | | | | | Net | | | | | | | | | | | | | | | | | | | | | | | | |
| | | | | | | realized | | Total | | | | | | | | | | | | | | | | | | | | Net | | |
| | | Net asset | | Net | | and | | from | | From net | | | | | | | | | | | | | | | | | | assets, | | |
| | | value, | | invest- | | unrealized | | invest- | | invest- | | | | | | | | Net asset | | | | Expenses | | Expenses | | Net | | end of | | |
| | | beginning | | ment in- | | gain (loss) | | ment | | ment | | From net | | From tax | | Total | | value, end | | Total | | before | | including | | investment | | period (in | | Portfolio |
| | | of period | | come | | (loss) on invest- | | operations | | income | | realized | | return of | | distribu- | | of period | | return | | reductions | | reductions | | income | | millions) | | turnover |
| Period ended | | ($) | | ($)1,2 | | ments ($) | | ($) | | ($) | | gain ($) | | capital ($) | | tions ($) | | ($) | | (%)3,4 | | (%)5 | | (%)5 | | (loss) (%)1 | | ($) | | (%) |
|
| CLASS R4 | | | | | | | | | | | | | | | | | | | | | | | | | | | | | | |
|
| 12-31-2013 | | 13.59 | | 0.26 | | 1.89 | | 2.15 | | (0.26) | | (0.15) | | — | | (0.41) | | 15.33 | | 15.90 | | 0.46 | | 0.35 | | 1.76 | | 77 | | 19 |
| 12-31-2012 | | 12.24 | | 0.28 | | 1.40 | | 1.68 | | (0.26) | | (0.07) | | — | | (0.33) | | 13.59 | | 13.77 | | 0.46 | | 0.39 | | 2.10 | | 70 | | 20 |
| 12-31-2011 | | 12.94 | | 0.28 | | (0.60) | | (0.32) | | (0.28) | | (0.10) | | — | | (0.38) | | 12.24 | | (2.52) | | 0.50 | | 0.50 | | 2.13 | | 26 | | 23 |
| 12-31-2010 | | 11.84 | | 0.31 | | 1.23 | | 1.54 | | (0.31) | | (0.13) | | — | | (0.44) | | 12.94 | | 13.19 | | 0.45 | | 0.45 | | 2.53 | | 29 | | 19 |
| 12-31-2009 | | 9.20 | | 0.35 | | 2.66 | | 3.01 | | (0.33) | | (0.04) | | — | | (0.37) | | 11.84 | | 33.10 | | 0.53 | | 0.53 | | 3.37 | | 24 | | 316 |
|
| CLASS R5 | | | | | | | | | | | | | | | | | | | | | | | | | | | | | | |
|
| 12-31-2013 | | 13.60 | | 0.28 | | 1.91 | | 2.19 | | (0.29) | | (0.15) | | — | | (0.44) | | 15.35 | | 16.20 | | 0.17 | | 0.17 | | 1.93 | | 41 | | 19 |
| 12-31-2012 | | 12.26 | | 0.28 | | 1.42 | | 1.70 | | (0.29) | | (0.07) | | — | | (0.36) | | 13.60 | | 13.96 | | 0.17 | | 0.17 | | 2.13 | | 39 | | 20 |
| 12-31-2011 | | 12.96 | | 0.31 | | (0.60) | | (0.29) | | (0.31) | | (0.10) | | — | | (0.41) | | 12.26 | | (2.23) | | 0.18 | | 0.18 | | 2.42 | | 42 | | 23 |
| 12-31-2010 | | 11.85 | | 0.35 | | 1.23 | | 1.58 | | (0.34) | | (0.13) | | — | | (0.47) | | 12.96 | | 13.52 | | 0.18 | | 0.18 | | 2.89 | | 38 | | 19 |
| 12-31-2009 | | 9.21 | | 0.39 | | 2.65 | | 3.04 | | (0.36) | | (0.04) | | — | | (0.40) | | 11.85 | | 33.45 | | 0.22 | | 0.22 | | 3.74 | | 27 | | 316 |
|
| CLASS R6 | | | | | | | | | | | | | | | | | | | | | | | | | | | | | | |
|
| 12-31-2013 | | 13.55 | | 0.36 | | 1.83 | | 2.19 | | (0.30) | | (0.15) | | — | | (0.45) | | 15.29 | | 16.26 | | 0.17 | | 0.11 | | 2.49 | | 21 | | 19 |
| 12-31-2012 | | 12.21 | | 0.46 | | 1.25 | | 1.71 | | (0.30) | | (0.07) | | — | | (0.37) | | 13.55 | | 14.09 | | 1.15 | | 0.11 | | 3.50 | | 5 | | 20 |
| 12-31-201113 | | 12.56 | | 0.21 | | (0.24) | | (0.03) | | (0.22) | | (0.10) | | — | | (0.32) | | 12.21 | | (0.22)9 | | 16.3610 | | 0.1010 | | 1.699 | | —11 | | 2314 |
|
| CLASS 1 | | | | | | | | | | | | | | | | | | | | | | | | | | | | | | |
|
| 12-31-2013 | | 13.55 | | 0.29 | | 1.89 | | 2.18 | | (0.30) | | (0.15) | | — | | (0.45) | | 15.28 | | 16.18 | | 0.11 | | 0.11 | | 2.00 | | 12,284 | | 19 |
| 12-31-2012 | | 12.21 | | 0.30 | | 1.41 | | 1.71 | | (0.30) | | (0.07) | | — | | (0.37) | | 13.55 | | 14.09 | | 0.11 | | 0.11 | | 2.31 | | 10,974 | | 20 |
| 12-31-2011 | | 12.90 | | 0.32 | | (0.59) | | (0.27) | | (0.32) | | (0.10) | | — | | (0.42) | | 12.21 | | (2.10) | | 0.11 | | 0.11 | | 2.49 | | 9,822 | | 23 |
| 12-31-2010 | | 11.80 | | 0.35 | | 1.23 | | 1.58 | | (0.35) | | (0.13) | | — | | (0.48) | | 12.90 | | 13.57 | | 0.11 | | 0.11 | | 2.88 | | 10,003 | | 19 |
| 12-31-2009 | | 9.17 | | 0.38 | | 2.66 | | 3.04 | | (0.37) | | (0.04) | | — | | (0.41) | | 11.80 | | 33.59 | | 0.11 | | 0.11 | | 3.65 | | 8,557 | | 316 |
|
| CLASS 5 | | | | | | | | | | | | | | | | | | | | | | | | | | | | | | |
|
| 12-31-2013 | | 13.55 | | 0.31 | | 1.89 | | 2.20 | | (0.31) | | (0.15) | | — | | (0.46) | | 15.29 | | 16.31 | | 0.06 | | 0.06 | | 2.15 | | 118 | | 19 |
| 12-31-2012 | | 12.21 | | 0.33 | | 1.39 | | 1.72 | | (0.31) | | (0.07) | | — | | (0.38) | | 13.55 | | 14.14 | | 0.06 | | 0.06 | | 2.49 | | 85 | | 20 |
| 12-31-2011 | | 12.91 | | 0.34 | | (0.61) | | (0.27) | | (0.33) | | (0.10) | | — | | (0.43) | | 12.21 | | (2.13) | | 0.06 | | 0.06 | | 2.65 | | 60 | | 23 |
| 12-31-2010 | | 11.80 | | 0.37 | | 1.23 | | 1.60 | | (0.36) | | (0.13) | | — | | (0.49) | | 12.91 | | 13.71 | | 0.06 | | 0.06 | | 3.07 | | 49 | | 19 |
| 12-31-2009 | | 9.17 | | 0.40 | | 2.65 | | 3.05 | | (0.38) | | (0.04) | | — | | (0.42) | | 11.80 | | 33.66 | | 0.07 | | 0.07 | | 3.89 | | 32 | | 316 |
|
1 Recognition of net investment income by the portfolio is affected by the timing and frequency of the declaration of dividends by the underlying funds in which the
portfolio invests.
2 Based on the average daily shares outstanding.
3 Does not reflect the effect of sales charges, if any.
4 Total returns would have been lower had certain expenses not been reduced during the applicable periods.
5 Ratios do not include expenses indirectly incurred from underlying funds whose expense ratios can vary based on the mix of underlying funds held by the portfolio. The
range of expense ratios of the underlying funds held by the portfolio was as follows: 0.62%–3.11%, 0.63%–1.48%, 0.48%–1.40%, 0.48%–1.39% and 0.49%–1.40% for
the years ended 12-31-13, 12-31-12, 12-31-11, 12-31-10 and 12-31-09, respectively.
6 Excludes merger activity.
7 Includes the impact of expense recapture for the following periods 12-31-13: less than 0.005% of average net assets for Class R2. 12-31-10: 0.03% of average net assets
for Class B shares.
8 The inception date for Class R2 shares is 3-1-12.
9 Not annualized.
10 Annualized.
11 Less than $500,000.
12 Portfolio turnover is shown for the period from 1-1-12 to 12-31-12.
13 The inception date for Class R6 shares is 9-1-11.
14 Portfolio turnover is shown for the period from 1-1-11 to 12-31-11.
15 Expense ratio has been revised to conform with current year presentation of expense recapture and net expense reductions.
| | |
| | Annual report | Lifestyle Portfolios | 29 |
| See notes to financial statements | | |
Financial highlights
Continued
Lifestyle Moderate
| | | | | | | | | | | | | | | | | | | | | | | | | | | | | | |
|
| Per share operating performance for a share outstanding throughout the period | | | | | | Ratios and supplemental data | | |
|
| | | | | Income (loss) from | | | | | | | | | | | | | | | | | | | | | | | | |
| | | | | investment operations | | | | Less distributions | | | | | | Ratios to average net assets | | | | |
| | | | |
| | | |
| | | |
| | |
| | | | | | | Net | | | | | | | | | | | | | | | | | | | | | | | | |
| | | | | | | realized | | Total | | | | | | | | | | | | | | | | | | | | Net | | |
| | | Net asset | | Net | | and | | from | | From net | | | | | | | | | | | | | | | | | | assets, | | |
| | | value, | | invest- | | unrealized | | invest- | | invest- | | | | | | | | Net asset | | | | Expenses | | Expenses | | Net | | end of | | |
| | | beginning | | ment in- | | gain (loss) | | ment | | ment | | From net | | From tax | | Total | | value, end | | Total | | before | | including | | investment | | period (in | | Portfolio |
| | | of period | | come (loss) | | on invest- | | operations | | income | | realized | | return of | | distribu- | | of period | | return | | reductions | | reductions | | income | | millions) | | turnover |
| Period ended | | ($) | | ($)1,2 | | ments ($) | | ($) | | ($) | | gain ($) | | capital ($) | | tions ($) | | ($) | | (%)3,4 | | (%)5 | | (%)5 | | (loss) (%)1 | | ($) | | (%) |
|
| CLASS A | | | | | | | | | | | | | | | | | | | | | | | | | | | | | | |
|
| 12-31-2013 | | 13.35 | | 0.31 | | 1.02 | | 1.33 | | (0.30) | | (0.09) | | — | | (0.39) | | 14.29 | | 10.05 | | 0.53 | | 0.52 | | 2.22 | | 551 | | 17 |
| 12-31-2012 | | 12.28 | | 0.33 | | 1.13 | | 1.46 | | (0.31) | | (0.08) | | — | | (0.39) | | 13.35 | | 11.94 | | 0.57 | | 0.57 | | 2.50 | | 399 | | 18 |
| 12-31-2011 | | 12.63 | | 0.38 | | (0.29) | | 0.09 | | (0.35) | | (0.09) | | — | | (0.44) | | 12.28 | | 0.73 | | 0.58 | | 0.58 | | 2.96 | | 299 | | 19 |
| 12-31-2010 | | 11.77 | | 0.41 | | 0.97 | | 1.38 | | (0.39) | | (0.13) | | — | | (0.52) | | 12.63 | | 11.85 | | 0.55 | | 0.55 | | 3.37 | | 220 | | 20 |
| 12-31-2009 | | 9.59 | | 0.45 | | 2.19 | | 2.64 | | (0.42) | | (0.04) | | — | | (0.46) | | 11.77 | | 27.88 | | 0.54 | | 0.54 | | 4.27 | | 146 | | 29 |
|
| CLASS B | | | | | | | | | | | | | | | | | | | | | | | | | | | | | | |
|
| 12-31-2013 | | 13.34 | | 0.19 | | 1.04 | | 1.23 | | (0.20) | | (0.09) | | — | | (0.29) | | 14.28 | | 9.23 | | 1.26 | | 1.25 | | 1.36 | | 45 | | 17 |
| 12-31-2012 | | 12.27 | | 0.23 | | 1.14 | | 1.37 | | (0.22) | | (0.08) | | — | | (0.30) | | 13.34 | | 11.14 | | 1.30 | | 1.30 | | 1.74 | | 45 | | 18 |
| 12-31-2011 | | 12.63 | | 0.28 | | (0.29) | | (0.01) | | (0.26) | | (0.09) | | — | | (0.35) | | 12.27 | | (0.08) | | 1.32 | | 1.32 | | 2.22 | | 35 | | 19 |
| 12-31-2010 | | 11.76 | | 0.30 | | 0.99 | | 1.29 | | (0.29) | | (0.13) | | — | | (0.42) | | 12.63 | | 11.05 | | 1.346,14 | | 1.34 | | 2.50 | | 26 | | 20 |
| 12-31-2009 | | 9.58 | | 0.35 | | 2.20 | | 2.55 | | (0.33) | | (0.04) | | — | | (0.37) | | 11.76 | | 26.91 | | 1.41 | | 1.35 | | 3.33 | | 20 | | 29 |
|
| CLASS C | | | | | | | | | | | | | | | | | | | | | | | | | | | | | | |
|
| 12-31-2013 | | 13.35 | | 0.20 | | 1.04 | | 1.24 | | (0.20) | | (0.09) | | — | | (0.29) | | 14.30 | | 9.34 | | 1.23 | | 1.23 | | 1.47 | | 366 | | 17 |
| 12-31-2012 | | 12.28 | | 0.23 | | 1.14 | | 1.37 | | (0.22) | | (0.08) | | — | | (0.30) | | 13.35 | | 11.17 | | 1.27 | | 1.27 | | 1.77 | | 288 | | 18 |
| 12-31-2011 | | 12.64 | | 0.28 | | (0.29) | | (0.01) | | (0.26) | | (0.09) | | — | | (0.35) | | 12.28 | | (0.05) | | 1.28 | | 1.28 | | 2.21 | | 227 | | 19 |
| 12-31-2010 | | 11.77 | | 0.32 | | 0.98 | | 1.30 | | (0.30) | | (0.13) | | — | | (0.43) | | 12.64 | | 11.15 | | 1.25 | | 1.25 | | 2.67 | | 183 | | 20 |
| 12-31-2009 | | 9.59 | | 0.38 | | 2.18 | | 2.56 | | (0.34) | | (0.04) | | — | | (0.38) | | 11.77 | | 27.00 | | 1.25 | | 1.25 | | 3.58 | | 116 | | 29 |
|
| CLASS R1 | | | | | | | | | | | | | | | | | | | | | | | | | | | | | | |
|
| 12-31-2013 | | 13.35 | | 0.23 | | 1.04 | | 1.27 | | (0.25) | | (0.09) | | — | | (0.34) | | 14.28 | | 9.55 | | 0.94 | | 0.94 | | 1.68 | | 10 | | 17 |
| 12-31-2012 | | 12.27 | | 0.27 | | 1.15 | | 1.42 | | (0.26) | | (0.08) | | — | | (0.34) | | 13.35 | | 11.58 | | 0.96 | | 0.96 | | 2.10 | | 10 | | 18 |
| 12-31-2011 | | 12.63 | | 0.30 | | (0.27) | | 0.03 | | (0.30) | | (0.09) | | — | | (0.39) | | 12.27 | | 0.21 | | 1.03 | | 1.03 | | 2.32 | | 7 | | 19 |
| 12-31-2010 | | 11.76 | | 0.33 | | 1.00 | | 1.33 | | (0.33) | | (0.13) | | — | | (0.46) | | 12.63 | | 11.45 | | 0.986,14 | | 0.98 | | 2.72 | | 7 | | 20 |
| 12-31-2009 | | 9.58 | | 0.50 | | 2.09 | | 2.59 | | (0.37) | | (0.04) | | — | | (0.41) | | 11.76 | | 27.35 | | 1.14 | | 1.06 | | 4.57 | | 6 | | 29 |
|
| CLASS R2 | | | | | | | | | | | | | | | | | | | | | | | | | | | | | | |
|
| 12-31-2013 | | 13.32 | | 0.39 | | 0.92 | | 1.31 | | (0.29) | | (0.09) | | — | | (0.38) | | 14.25 | | 9.92 | | 1.686 | | 0.62 | | 2.82 | | 2 | | 17 |
| 12-31-20127 | | 12.96 | | 0.30 | | 0.45 | | 0.75 | | (0.31) | | (0.08) | | — | | (0.39) | | 13.32 | | 5.808 | | 16.039 | | 0.629 | | 2.29 | | —10 | | 1811 |
|
| CLASS R3 | | | | | | | | | | | | | | | | | | | | | | | | | | | | | | |
|
| 12-31-2013 | | 13.33 | | 0.25 | | 1.04 | | 1.29 | | (0.26) | | (0.09) | | — | | (0.35) | | 14.27 | | 9.70 | | 0.84 | | 0.84 | | 1.82 | | 11 | | 17 |
| 12-31-2012 | | 12.26 | | 0.27 | | 1.16 | | 1.43 | | (0.28) | | (0.08) | | — | | (0.36) | | 13.33 | | 11.64 | | 0.88 | | 0.88 | | 2.08 | | 10 | | 18 |
| 12-31-2011 | | 12.62 | | 0.32 | | (0.27) | | 0.05 | | (0.32) | | (0.09) | | — | | (0.41) | | 12.26 | | 0.38 | | 0.88 | | 0.88 | | 2.54 | | 10 | | 19 |
| 12-31-2010 | | 11.76 | | 0.35 | | 0.99 | | 1.34 | | (0.35) | | (0.13) | | — | | (0.48) | | 12.62 | | 11.56 | | 0.87 | | 0.87 | | 2.87 | | 10 | | 20 |
| 12-31-2009 | | 9.58 | | 0.39 | | 2.21 | | 2.60 | | (0.38) | | (0.04) | | — | | (0.42) | | 11.76 | | 27.43 | | 0.95 | | 0.95 | | 3.72 | | 8 | | 29 |
|
| CLASS R4 | | | | | | | | | | | | | | | | | | | | | | | | | | | | | | |
|
| 12-31-2013 | | 13.31 | | 0.31 | | 1.03 | | 1.34 | | (0.31) | | (0.09) | | — | | (0.40) | | 14.25 | | 10.17 | | 0.55 | | 0.44 | | 2.19 | | 13 | | 17 |
| 12-31-2012 | | 12.24 | | 0.33 | | 1.14 | | 1.47 | | (0.32) | | (0.08) | | — | | (0.40) | | 13.31 | | 12.02 | | 0.57 | | 0.51 | | 2.51 | | 11 | | 18 |
| 12-31-2011 | | 12.60 | | 0.36 | | (0.28) | | 0.08 | | (0.35) | | (0.09) | | — | | (0.44) | | 12.24 | | 0.65 | | 0.63 | | 0.63 | | 2.81 | | 8 | | 19 |
| 12-31-2010 | | 11.74 | | 0.40 | | 0.97 | | 1.37 | | (0.38) | | (0.13) | | — | | (0.51) | | 12.60 | | 11.84 | | 0.606,14 | | 0.60 | | 3.30 | | 7 | | 20 |
| 12-31-2009 | | 9.57 | | 0.40 | | 2.22 | | 2.62 | | (0.41) | | (0.04) | | — | | (0.45) | | 11.74 | | 27.71 | | 0.70 | | 0.66 | | 3.83 | | 5 | | 29 |
|
| CLASS R5 | | | | | | | | | | | | | | | | | | | | | | | | | | | | | | |
|
| 12-31-2013 | | 13.32 | | 0.35 | | 1.02 | | 1.37 | | (0.34) | | (0.09) | | — | | (0.43) | | 14.26 | | 10.39 | | 0.25 | | 0.25 | | 2.53 | | 13 | | 17 |
| 12-31-2012 | | 12.26 | | 0.31 | | 1.19 | | 1.50 | | (0.36) | | (0.08) | | — | | (0.44) | | 13.32 | | 12.26 | | 0.27 | | 0.27 | | 2.41 | | 9 | | 18 |
| 12-31-2011 | | 12.62 | | 0.41 | | (0.28) | | 0.13 | | (0.40) | | (0.09) | | — | | (0.49) | | 12.26 | | 1.00 | | 0.24 | | 0.24 | | 3.21 | | 15 | | 19 |
| 12-31-2010 | | 11.75 | | 0.46 | | 0.97 | | 1.43 | | (0.43) | | (0.13) | | — | | (0.56) | | 12.62 | | 12.35 | | 0.24 | | 0.24 | | 3.75 | | 11 | | 20 |
| 12-31-2009 | | 9.58 | | 0.46 | | 2.19 | | 2.65 | | (0.44) | | (0.04) | | — | | (0.48) | | 11.75 | | 28.10 | | 0.32 | | 0.32 | | 4.39 | | 8 | | 29 |
|
| CLASS R6 | | | | | | | | | | | | | | | | | | | | | | | | | | | | | | |
|
| 12-31-2013 | | 13.31 | | 0.45 | | 0.93 | | 1.38 | | (0.36) | | (0.09) | | — | | (0.45) | | 14.24 | | 10.49 | | 0.32 | | 0.11 | | 3.22 | | 11 | | 17 |
| 12-31-2012 | | 12.24 | | 0.62 | | 0.90 | | 1.52 | | (0.37) | | (0.08) | | — | | (0.45) | | 13.31 | | 12.50 | | 4.79 | | 0.11 | | 4.66 | | 2 | | 18 |
| 12-31-201112 | | 12.51 | | 0.24 | | (0.17) | | 0.07 | | (0.25) | | (0.09) | | — | | (0.34) | | 12.24 | | 0.608 | | 16.249 | | 0.119 | | 1.948 | | —10 | | 1913 |
|
| | |
| 30 | Lifestyle Portfolios | Annual report | |
| | | See notes to financial statements |
Financial highlights
Continued
Lifestyle Moderate continued
| | | | | | | | | | | | | | | | | | | | | | | | | | | | | | |
|
| Per share operating performance for a share outstanding throughout the period | | | | | | Ratios and supplemental data | | |
|
| | | | | Income (loss) from | | | | | | | | | | | | | | | | | | | | | | | | |
| | | | | investment operations | | | | Less distributions | | | | | | Ratios to average net assets | | | | |
| | | |
| | | |
| | | |
| | |
| | | | | | | Net | | | | | | | | | | | | | | | | | | | | | | | | |
| | | | | | | realized | | Total | | | | | | | | | | | | | | | | | | | | Net | | |
| | | Net asset | | Net | | and | | from | | From net | | | | | | | | | | | | | | | | | | assets, | | |
| | | value, | | invest- | | unrealized | | invest- | | invest- | | | | | | | | Net asset | | | | Expenses | | Expenses | | Net | | end of | | |
| | | beginning | | ment in- | | gain (loss) | | ment | | ment | | From net | | From tax | | Total | | value, end | | Total | | before | | including | | investment | | period (in | | Portfolio |
| | | of period | | come (loss) | | on invest- | | operations | | income | | realized | | return of | | distribu- | | of period | | return | | reductions | | reductions | | income | | millions) | | turnover |
| Period ended | | ($) | | ($)1,2 | | ments ($) | | ($) | | ($) | | gain ($) | | capital ($) | | tions ($) | | ($) | | (%)3,4 | | (%)5 | | (%)5 | | (loss) (%)1 | | ($) | | (%) |
|
| CLASS 1 | | | | | | | | | | | | | | | | | | | | | | | | | | | | | | |
|
| 12-31-2013 | | 13.32 | | 0.35 | | 1.04 | | 1.39 | | (0.36) | | (0.09) | | — | | (0.45) | | 14.26 | | 10.55 | | 0.11 | | 0.11 | | 2.51 | | 3,562 | | 17 |
| 12-31-2012 | | 12.25 | | 0.37 | | 1.15 | | 1.52 | | (0.37) | | (0.08) | | — | | (0.45) | | 13.32 | | 12.49 | | 0.11 | | 0.11 | | 2.87 | | 3,414 | | 18 |
| 12-31-2011 | | 12.61 | | 0.41 | | (0.27) | | 0.14 | | (0.41) | | (0.09) | | — | | (0.50) | | 12.25 | | 1.12 | | 0.11 | | 0.11 | | 3.26 | | 3,057 | | 19 |
| 12-31-2010 | | 11.74 | | 0.44 | | 1.00 | | 1.44 | | (0.44) | | (0.13) | | — | | (0.57) | | 12.61 | | 12.43 | | 0.11 | | 0.11 | | 3.66 | | 3,026 | | 20 |
| 12-31-2009 | | 9.56 | | 0.47 | | 2.21 | | 2.68 | | (0.46) | | (0.04) | | — | | (0.50) | | 11.74 | | 28.49 | | 0.11 | | 0.11 | | 4.49 | | 2,503 | | 29 |
|
| CLASS 5 | | | | | | | | | | | | | | | | | | | | | | | | | | | | | | |
|
| 12-31-2013 | | 13.31 | | 0.36 | | 1.03 | | 1.39 | | (0.37) | | (0.09) | | — | | (0.46) | | 14.24 | | 10.54 | | 0.06 | | 0.06 | | 2.62 | | 48 | | 17 |
| 12-31-2012 | | 12.24 | | 0.39 | | 1.14 | | 1.53 | | (0.38) | | (0.08) | | — | | (0.46) | | 13.31 | | 12.56 | | 0.06 | | 0.06 | | 3.03 | | 39 | | 18 |
| 12-31-2011 | | 12.60 | | 0.44 | | (0.29) | | 0.15 | | (0.42) | | (0.09) | | — | | (0.51) | | 12.24 | | 1.17 | | 0.06 | | 0.06 | | 3.43 | | 27 | | 19 |
| 12-31-2010 | | 11.73 | | 0.47 | | 0.97 | | 1.44 | | (0.44) | | (0.13) | | — | | (0.57) | | 12.60 | | 12.50 | | 0.06 | | 0.06 | | 3.87 | | 22 | | 20 |
| 12-31-2009 | | 9.56 | | 0.51 | | 2.17 | | 2.68 | | (0.47) | | (0.04) | | — | | (0.51) | | 11.73 | | 28.45 | | 0.07 | | 0.07 | | 4.78 | | 14 | | 29 |
|
1 Recognition of net investment income by the portfolio is affected by the timing and frequency of the declaration of dividends by the underlying funds in which the
portfolio invests.
2 Based on the average daily shares outstanding.
3 Does not reflect the effect of sales charges, if any.
4 Total returns would have been lower had certain expenses not been reduced during the applicable periods.
5 Ratios do not include expenses indirectly incurred from underlying funds whose expense ratios can vary based on the mix of underlying funds held by the portfolio. The
range of expense ratios of the underlying funds held by the portfolios was as follows: 0.62%–3.11%, 0.63%–1.48%, 0.48%–1.40%, 0.48%–1.14% and 0.49%–1.17%
for the years ended 12-31-13, 12-31-12, 12-31-11, 12-31-10 and 12-31-09, respectively.
6 Includes the impact of expense recapture for the following periods: 12-31-13: 0.01% for Class R2. 12-31-10: 0.04%, 0.05% and 0.02% for Class B, Class R1 and Class R4,
respectively, of average net assets.
7 The inception date for Class R2 shares is 3-1-12.
8 Not annualized.
9 Annualized.
10 Less than $500,000.
11 Portfolio turnover is shown for the period from 1-1-12 to 12-31-12.
12 The inception date for Class R6 shares is 9-1-11.
13 Portfolio turnover is shown for the period from 1-1-11 to 12-31-11.
14 Expense ratio has been revised to conform with current year presentation of expense recapture and net expense reduction.
Lifestyle Conservative
| | | | | | | | | | | | | | | | | | | | | | | | | | | | | | |
|
|
| Per share operating performance for a share outstanding throughout the period | | | | | | Ratios and supplemental data | | |
|
| | | | | Income (loss) from | | | | | | | | | | | | | | | | | | | | | | | | |
| | | | | investment operations | | | | Less distributions | | | | | | Ratios to average net assets | | | | |
| | | |
| | | |
| | | |
| | |
| | | | | | | Net | | | | | | | | | | | | | | | | | | | | | | | | |
| | | | | | | realized | | Total | | | | | | | | | | | | | | | | | | | | Net | | |
| | | Net asset | | Net | | and | | from | | From net | | | | | | | | | | | | | | | | | | assets, | | |
| | | value, | | invest- | | unrealized | | invest- | | invest- | | | | | | | | Net asset | | | | Expenses | | Expenses | | Net | | end of | | |
| | | beginning | | ment in- | | gain (loss) | | ment | | ment | | From net | | From tax | | Total | | value, end | | Total | | before | | including | | investment | | period (in | | Portfolio |
| | | of period | | come (loss) | | on invest- | | operations | | income | | realized | | return of | | distribu- | | of period | | return | | reductions | | reductions | | income | | millions) | | turnover |
| Period ended | | ($) | | ($)1,2 | | ments ($) | | ($) | | ($) | | gain ($) | | capital ($) | | tions ($) | | ($) | | (%)3,4 | | (%)5 | | (%)5 | | (loss) (%)1 | | ($) | | (%) |
|
| CLASS A | | | | | | | | | | | | | | | | | | | | | | | | | | | | | | |
|
| 12-31-2013 | | 13.44 | | 0.33 | | 0.29 | | 0.62 | | (0.33) | | (0.05) | | — | | (0.38) | | 13.68 | | 4.66 | | 0.54 | | 0.52 | | 2.44 | | 530 | | 17 |
| 12-31-2012 | | 12.63 | | 0.38 | | 0.88 | | 1.26 | | (0.37) | | (0.08) | | — | | (0.45) | | 13.44 | | 10.03 | | 0.56 | | 0.56 | | 2.89 | | 472 | | 14 |
| 12-31-2011 | | 12.77 | | 0.46 | | (0.11) | | 0.35 | | (0.43) | | (0.06) | | — | | (0.49) | | 12.63 | | 2.75 | | 0.58 | | 0.58 | | 3.61 | | 340 | | 15 |
| 12-31-2010 | | 12.15 | | 0.48 | | 0.71 | | 1.19 | | (0.45) | | (0.12) | | — | | (0.57) | | 12.77 | | 9.96 | | 0.55 | | 0.55 | | 3.78 | | 218 | | 24 |
| 12-31-2009 | | 10.39 | | 0.54 | | 1.77 | | 2.31 | | (0.50) | | (0.05) | | — | | (0.55) | | 12.15 | | 22.53 | | 0.52 | | 0.52 | | 4.80 | | 141 | | 24 |
|
| CLASS B | | | | | | | | | | | | | | | | | | | | | | | | | | | | | | |
|
| 12-31-2013 | | 13.44 | | 0.22 | | 0.30 | | 0.52 | | (0.23) | | (0.05) | | — | | (0.28) | | 13.68 | | 3.87 | | 1.26 | | 1.26 | | 1.65 | | 47 | | 17 |
| 12-31-2012 | | 12.63 | | 0.28 | | 0.88 | | 1.16 | | (0.27) | | (0.08) | | — | | (0.35) | | 13.44 | | 9.24 | | 1.30 | | 1.30 | | 2.13 | | 48 | | 14 |
| 12-31-2011 | | 12.77 | | 0.35 | | (0.10) | | 0.25 | | (0.33) | | (0.06) | | — | | (0.39) | | 12.63 | | 2.01 | | 1.31 | | 1.31 | | 2.75 | | 37 | | 15 |
| 12-31-2010 | | 12.15 | | 0.37 | | 0.73 | | 1.10 | | (0.36) | | (0.12) | | — | | (0.48) | | 12.77 | | 9.16 | | 1.296,14 | | 1.29 | | 2.96 | | 28 | | 24 |
| 12-31-2009 | | 10.40 | | 0.44 | | 1.77 | | 2.21 | | (0.41) | | (0.05) | | — | | (0.46) | | 12.15 | | 21.46 | | 1.35 | | 1.35 | | 3.88 | | 21 | | 24 |
|
| | |
| | Annual report | Lifestyle Portfolios | 31 |
| See notes to financial statements | | |
Financial highlights
Continued
Lifestyle Conservative continued
| | | | | | | | | | | | | | | | | | | | | | | | | | | | | | |
|
| Per share operating performance for a share outstanding throughout the period | | | | | | Ratios and supplemental data | | |
|
| | | | Income (loss) from | | | | | | | | | | | | | | | | | | | | | | | | |
| | | | | investment operations | | | | Less distributions | | | | | | Ratios to average net assets | | | | |
| | | | |
| | | |
| | | |
| | |
| | | | | | | Net | | | | | | | | | | | | | | | | | | | | | | | | |
| | | | | | | realized | | Total | | | | | | | | | | | | | | | | | | | | Net | | |
| | | Net asset | | Net | | and | | from | | From net | | | | | | | | | | | | | | | | | | assets, | | |
| | | value, | | invest- | | unrealized | | invest- | | invest- | | | | | | | | Net asset | | | | Expenses | | Expenses | | Net | | end of | | |
| | | beginning | | ment in- | | gain (loss) | | ment | | ment | | From net | | From tax | | Total | | value, end | | Total | | before | | including | | investment | | period (in | | Portfolio |
| | | of period | | come(loss) | | on invest- | | operations | | income | | realized | | return of | | distribu- | | of period | | return | | reductions | | reductions | | income | | millions) | | turnover |
| Period ended | | ($) | | ($)1,2 | | ments ($) | | ($) | | ($) | | gain ($) | | capital ($) | | tions ($) | | ($) | | (%)3,4 | | (%)5 | | (%)5 | | (loss) (%)1 | | ($) | | (%) |
|
| CLASS C | | | | | | | | | | | | | | | | | | | | | | | | | | | | | | |
|
| 12-31-2013 | | 13.43 | | 0.23 | | 0.30 | | 0.53 | | (0.23) | | (0.05) | | — | | (0.28) | | 13.68 | | 3.98 | | 1.24 | | 1.24 | | 1.71 | | 355 | | 17 |
| 12-31-2012 | | 12.62 | | 0.29 | | 0.88 | | 1.17 | | (0.28) | | (0.08) | | — | | (0.36) | | 13.43 | | 9.28 | | 1.26 | | 1.26 | | 2.17 | | 335 | | 14 |
| 12-31-2011 | | 12.77 | | 0.36 | | (0.11) | | 0.25 | | (0.34) | | (0.06) | | — | | (0.40) | | 12.62 | | 1.95 | | 1.28 | | 1.28 | | 2.81 | | 254 | | 15 |
| 12-31-2010 | | 12.14 | | 0.39 | | 0.72 | | 1.11 | | (0.36) | | (0.12) | | — | | (0.48) | | 12.77 | | 9.28 | | 1.24 | | 1.24 | | 3.10 | | 189 | | 24 |
| 12-31-2009 | | 10.39 | | 0.46 | | 1.76 | | 2.22 | | (0.42) | | (0.05) | | — | | (0.47) | | 12.14 | | 21.58 | | 1.24 | | 1.24 | | 4.08 | | 119 | | 24 |
|
| CLASS R1 | | | | | | | | | | | | | | | | | | | | | | | | | | | | | | |
|
| 12-31-2013 | | 13.43 | | 0.27 | | 0.30 | | 0.57 | | (0.27) | | (0.05) | | — | | (0.32) | | 13.68 | | 4.31 | | 0.91 | | 0.91 | | 1.97 | | 9 | | 17 |
| 12-31-2012 | | 12.62 | | 0.31 | | 0.88 | | 1.19 | | (0.30) | | (0.08) | | — | | (0.38) | | 13.43 | | 9.52 | | 1.07 | | 1.07 | | 2.36 | | 9 | | 14 |
| 12-31-2011 | | 12.78 | | 0.33 | | (0.05) | | 0.28 | | (0.38) | | (0.06) | | — | | (0.44) | | 12.62 | | 2.19 | | 1.06 | | 1.06 | | 2.57 | | 7 | | 15 |
| 12-31-2010 | | 12.15 | | 0.41 | | 0.74 | | 1.15 | | (0.40) | | (0.12) | | — | | (0.52) | | 12.78 | | 9.56 | | 0.936,14 | | 0.93 | | 3.24 | | 8 | | 24 |
| 12-31-2009 | | 10.41 | | 0.57 | | 1.66 | | 2.23 | | (0.44) | | (0.05) | | — | | (0.49) | | 12.15 | | 21.74 | | 1.16 | | 1.06 | | 5.00 | | 7 | | 24 |
|
| CLASS R2 | | | | | | | | | | | | | | | | | | | | | | | | | | | | | | |
|
| 12-31-2013 | | 13.42 | | 0.39 | | 0.23 | | 0.62 | | (0.32) | | (0.05) | | — | | (0.37) | | 13.67 | | 4.67 | | 2.55 | | 0.625 | | 2.86 | | 2 | | 17 |
| 12-31-20127 | | 13.12 | | 0.35 | | 0.39 | | 0.74 | | (0.36) | | (0.08) | | — | | (0.44) | | 13.42 | | 5.738 | | 10.399 | | 0.625,9 | | 2.648 | | —10 | | 1411 |
|
| CLASS R3 | | | | | | | | | | | | | | | | | | | | | | | | | | | | | | |
|
| 12-31-2013 | | 13.41 | | 0.30 | | 0.28 | | 0.58 | | (0.29) | | (0.05) | | — | | (0.34) | | 13.65 | | 4.39 | | 0.75 | | 0.75 | | 2.18 | | 11 | | 17 |
| 12-31-2012 | | 12.60 | | 0.31 | | 0.91 | | 1.22 | | (0.33) | | (0.08) | | — | | (0.41) | | 13.41 | | 9.71 | | 0.97 | | 0.97 | | 2.38 | | 11 | | 14 |
| 12-31-2011 | | 12.76 | | 0.40 | | (0.11) | | 0.29 | | (0.39) | | (0.06) | | — | | (0.45) | | 12.60 | | 2.30 | | 0.88 | | 0.88 | | 3.08 | | 10 | | 15 |
| 12-31-2010 | | 12.14 | | 0.42 | | 0.74 | | 1.16 | | (0.42) | | (0.12) | | — | | (0.54) | | 12.76 | | 9.68 | | 0.86 | | 0.86 | | 3.36 | | 11 | | 24 |
| 12-31-2009 | | 10.40 | | 0.46 | | 1.79 | | 2.25 | | (0.46) | | (0.05) | | — | | (0.51) | | 12.14 | | 21.94 | | 0.92 | | 0.92 | | 4.14 | | 8 | | 24 |
|
| CLASS R4 | | | | | | | | | | | | | | | | | | | | | | | | | | | | | | |
|
| 12-31-2013 | | 13.42 | | 0.34 | | 0.29 | | 0.63 | | (0.34) | | (0.05) | | — | | (0.39) | | 13.66 | | 4.72 | | 0.58 | | 0.48 | | 2.51 | | 9 | | 17 |
| 12-31-2012 | | 12.61 | | 0.36 | | 0.90 | | 1.26 | | (0.37) | | (0.08) | | — | | (0.45) | | 13.42 | | 10.06 | | 0.60 | | 0.54 | | 2.72 | | 8 | | 14 |
| 12-31-2011 | | 12.76 | | 0.45 | | (0.11) | | 0.34 | | (0.43) | | (0.06) | | — | | (0.49) | | 12.61 | | 2.65 | | 0.63 | | 0.63 | | 3.50 | | 9 | | 15 |
| 12-31-2010 | | 12.13 | | 0.47 | | 0.72 | | 1.19 | | (0.44) | | (0.12) | | — | | (0.56) | | 12.76 | | 9.90 | | 0.676,14 | | 0.67 | | 3.77 | | 7 | | 24 |
| 12-31-2009 | | 10.39 | | 0.52 | | 1.75 | | 2.27 | | (0.48) | | (0.05) | | — | | (0.53) | | 12.13 | | 22.22 | | 0.77 | | 0.66 | | 4.60 | | 4 | | 24 |
|
| CLASS R5 | | | | | | | | | | | | | | | | | | | | | | | | | | | | | | |
|
| 12-31-2013 | | 13.43 | | 0.37 | | 0.30 | | 0.67 | | (0.38) | | (0.05) | | — | | (0.43) | | 13.67 | | 5.03 | | 0.17 | | 0.17 | | 2.70 | | 15 | | 17 |
| 12-31-2012 | | 12.62 | | 0.41 | | 0.89 | | 1.30 | | (0.41) | | (0.08) | | — | | (0.49) | | 13.43 | | 10.37 | | 0.31 | | 0.31 | | 3.11 | | 15 | | 14 |
| 12-31-2011 | | 12.77 | | 0.50 | | (0.12) | | 0.38 | | (0.47) | | (0.06) | | — | | (0.53) | | 12.62 | | 3.00 | | 0.24 | | 0.24 | | 3.91 | | 16 | | 15 |
| 12-31-2010 | | 12.15 | | 0.50 | | 0.74 | | 1.24 | | (0.50) | | (0.12) | | — | | (0.62) | | 12.77 | | 10.34 | | 0.23 | | 0.23 | | 3.96 | | 9 | | 24 |
| 12-31-2009 | | 10.40 | | 0.57 | | 1.75 | | 2.32 | | (0.52) | | (0.05) | | — | | (0.57) | | 12.15 | | 22.67 | | 0.33 | | 0.33 | | 5.08 | | 9 | | 24 |
|
| CLASS R6 | | | | | | | | | | | | | | | | | | | | | | | | | | | | | | |
|
| 12-31-2013 | | 13.42 | | 0.43 | | 0.24 | | 0.67 | | (0.39) | | (0.05) | | — | | (0.44) | | 13.65 | | 5.05 | | 0.43 | | 0.11 | | 3.19 | | 5 | | 17 |
| 12-31-2012 | | 12.61 | | 0.51 | | 0.81 | | 1.32 | | (0.43) | | (0.08) | | — | | (0.51) | | 13.42 | | 10.56 | | 2.50 | | 0.11 | | 3.83 | | 2 | | 14 |
| 12-31-201112 | | 12.81 | | 0.27 | | (0.12) | | 0.15 | | (0.29) | | (0.06) | | — | | (0.35) | | 12.61 | | 1.168 | | 16.169 | | 0.119 | | 2.138 | | —10 | | 1513 |
|
| CLASS 1 | | | | | | | | | | | | | | | | | | | | | | | | | | | | | | |
|
| 12-31-2013 | | 13.42 | | 0.38 | | 0.30 | | 0.68 | | (0.39) | | (0.05) | | — | | (0.44) | | 13.66 | | 5.12 | | 0.11 | | 0.11 | | 2.77 | | 2,758 | | 17 |
| 12-31-2012 | | 12.61 | | 0.43 | | 0.89 | | 1.32 | | (0.43) | | (0.08) | | — | | (0.51) | | 13.42 | | 10.56 | | 0.11 | | 0.11 | | 3.28 | | 3,090 | | 14 |
| 12-31-2011 | | 12.76 | | 0.50 | | (0.10) | | 0.40 | | (0.49) | | (0.06) | | — | | (0.55) | | 12.61 | | 3.16 | | 0.11 | | 0.11 | | 3.85 | | 2,626 | | 15 |
| 12-31-2010 | | 12.13 | | 0.51 | | 0.75 | | 1.26 | | (0.51) | | (0.12) | | — | | (0.63) | | 12.76 | | 10.51 | | 0.11 | | 0.11 | | 4.08 | | 2,391 | | 24 |
| 12-31-2009 | | 10.38 | | 0.56 | | 1.78 | | 2.34 | | (0.54) | | (0.05) | | — | | (0.59) | | 12.13 | | 22.96 | | 0.12 | | 0.12 | | 4.99 | | 1,931 | | 24 |
|
| | | |
| 32 | Lifestyle Portfolios | Annual report | See notes to financial statements | |
| | | | |
Financial highlights
Continued
|
| Lifestyle Conservative continued |
1 Recognition of net investment income by the portfolio is affected by the timing and frequency of the declaration of dividends by the underlying funds in which the
portfolio invests.
2 Based on the average daily shares outstanding.
3 Does not reflect the effect of sales charges, if any.
4 Total returns would have been lower had certain expenses not been reduced during the applicable periods.
5 Ratios do not include expenses indirectly incurred from underlying funds whose expense ratios can vary based on the mix of underlying funds held by the portfolio. The
range of expense ratios of the underlying funds held by the portfolio was as follows: 0.62%–3.11, 0.63%–1.48%, 0.48%–1.40%, 0.48%–1.13% and 0.49%–1.09% for
the years ended 12-31-13, 12-31-12, 12-31-11, 12-31-10 and 12-31-09, respectively.
6 Includes the impact of expense recapture, which amounted to less than 0.005%, 0.05% and 0.06% of average net assets for Class B, Class R1 and Class R4 shares,
respectively.
7 The inception date for Class R2 shares is 3-1-12.
8 Not annualized.
9 Annualized.
10 Less than $500,000.
11 Portfolio turnover is shown for the period from 1-1-12 to 12-31-12.
12 The inception date for Class R6 shares is 9-1-11.
13 Portfolio turnover is shown for the period from 1-1-11 to 12-31-11.
14 Expense ratio has been revised to conform with current year presentation of expense recapture and net expense reduction.
| |
| Annual report | Lifestyle Portfolios | 33 |
Notes to financial statements
Note 1 — Organization
John Hancock Funds II (the Trust) is an open-end management investment company organized as a Massachusetts business trust and registered under the Investment Company Act of 1940, as amended (the 1940 Act). The Trust is a series company, which means it has several funds, each with a stated investment objective that it pursues through separate investment policies. The Trust currently offers multiple investment funds, five of which (collectively, Lifestyle Portfolios or the portfolios, and individually the portfolio) are presented in this report. The Lifestyle Portfolios are series of the Trust and operate as “funds of funds” that invest in Class NAV shares of underlying funds of the Trust, John Hancock Funds III (JHF III) and also in other affiliated funds of the John Hancock funds complex.
The portfolios may offer multiple classes of shares. The shares currently offered by the Trust are detailed in the Statements of assets and liabilities. Class A and Class C shares are open to all investors. Class B shares are closed to new investors. Class R1, Class R2, Class R3, Class R4 and Class R5 shares are available only to certain retirement plans. Class R6 shares are only available to certain retirement plans, institutions and other investors. Class 1 shares are offered only to certain affiliates of Manulife Financial Corporation (MFC). Class 5 shares are available only to the John Hancock Freedom 529 Plan. Class B shares convert to Class A shares eight years after purchase. Shareholders of each class have exclusive voting rights to matters that affect that class. The distribution and service fees, if any, transfer agent fees, printing and postage and state registration fees for each class may differ.
The accounting policies of the John Hancock underlying funds in which the portfolios invest are outlined in the underlying funds’ shareholder reports, which include the underlying funds’ financial statements, available without charge by calling 800-344-1029 or visiting jhinvestments.com, on the Securities and Exchange Commission (SEC) website at sec.gov or at the SEC’s public reference room in Washington, D.C. The underlying funds are not covered by this report.
Note 2 — Significant accounting policies
The financial statements have been prepared in conformity with accounting principles generally accepted in the United States of America, which require management to make certain estimates and assumptions as of the date of the financial statements. Actual results could differ from those estimates and those differences could be significant. Events or transactions occurring after the end of the fiscal period through the date that the financial statements were issued have been evaluated in the preparation of the financial statements. The following summarizes the significant accounting policies of the portfolios:
Security valuation. Investments are stated at value as of the close of regular trading on the New York Stock Exchange (NYSE), normally at 4:00 P.M., Eastern Time (ET). In order to value the securities, the portfolios use the following valuation techniques: Investments by the portfolios in underlying affiliated funds and/or other open-end management investment companies are valued at their respective net asset values each business day.
The portfolios use a three-tier hierarchy to prioritize the pricing assumptions, referred to as inputs, used in valuation techniques to measure fair value. Level 1 includes securities valued using quoted prices in active markets for identical securities, including registered investment companies. Level 2 includes securities valued using other significant observable inputs. Observable inputs may include quoted prices for similar securities, interest rates, prepayment speeds and credit risk. Prices for securities valued using these inputs are received from independent pricing vendors and brokers and are based on an evaluation of the inputs described. Level 3 includes securities valued using significant unobservable inputs when market prices are not readily available or reliable, including the portfolios’ own assumptions in determining the fair value of investments. Factors used in determining value may include market or issuer specific events or trends, changes in interest rates and credit quality. The inputs or methodology used for valuing securities are not necessarily an indication of the risks associated with investing in those securities. Changes in valuation techniques may result in transfers into or out of an assigned level within the disclosure hierarchy. As of December 31, 2013, all investments are categorized as Level 1 under the hierarchy described above.
Security transactions and related investment income. Investment security transactions are accounted for on a trade date plus one basis for daily net asset value calculations. However, for financial reporting purposes, investment transactions are reported on trade date. Income and capital gain distributions from underlying funds are recorded on ex-date. Gains and losses on securities sold are determined on the basis of identified cost and may include proceeds from litigation.
Line of credit. The portfolios may borrow from banks for temporary or emergency purposes, including meeting redemption requests that otherwise might require the untimely sale of securities. Pursuant to the portfolios’ custodian agreement, the custodian may loan money to the portfolios to make properly authorized payments. The portfolios are obligated to repay the custodian for any overdraft, including any related costs or expenses. The custodian may have a lien, security interest or security entitlement in any portfolio property that is not otherwise segregated or pledged, to the maximum extent permitted by law, to the extent of any overdraft.
| |
| 34 | Lifestyle Portfolios | Annual report |
In addition, the portfolios and other affiliated funds have entered into an agreement with Citibank N.A. that enables them to potentially participate in a $300 million unsecured committed line of credit. A commitment fee, payable at the end of each calendar quarter, based on the average daily unused portion of the line of credit, is charged to each participating fund on a pro rata basis and is reflected in other expenses on the Statements of operations. Prior to March 27, 2013, the portfolios participated in a $200 million unsecured line of credit, also with Citibank N.A., with terms otherwise similar to the existing agreement. For the year ended December 31, 2013, the portfolios had no borrowings under either line of credit.
Commitment fees for the year ended December 31, 2013 were as follows:
| | | |
| Portfolio | Commitment fees | | |
| | |
| Lifestyle Aggressive | $1,755 | | |
| Lifestyle Growth | 4,595 | | |
| Lifestyle Balanced | 5,007 | | |
| Lifestyle Moderate | 1,893 | | |
| Lifestyle Conservative | 1,717 | | |
Expenses. Within the John Hancock funds complex, expenses that are directly attributable to an individual fund are allocated to such fund. Expenses that are not readily attributable to a specific fund are allocated among all portfolios in an equitable manner, taking into consideration, among other things, the nature and type of expense and the portfolios’ relative net assets. Expense estimates are accrued in the period to which they relate and adjustments are made when actual amounts are known.
Class allocations. Income, common expenses and realized and unrealized gains (losses) are determined at the fund level and allocated daily to each class of shares based on the net assets of the class. Class-specific expenses, such as distribution and service fees, if any, transfer agent fees, state registration fees and printing and postage expenses, for all classes, are calculated daily at the class level based on the appropriate net assets of each class and the specific expense rates applicable to each class.
Federal income taxes. The portfolios intend to continue to qualify as regulated investment companies by complying with the applicable provisions of the Internal Revenue Code and will not be subject to federal income tax on taxable income that is distributed to shareholders. Therefore, no federal income tax provision is required.
Under the Regulated Investment Company Modernization Act of 2010, the portfolios are permitted to carry forward capital losses incurred in taxable years beginning after December 22, 2010 for an unlimited period. Any losses incurred during those taxable years will be required to be utilized prior to the losses incurred in pre-enactment taxable years. As a result of this ordering rule, pre-enactment capital loss carryforwards may be more likely to expire unused. Additionally, post-enactment capital losses that are carried forward will retain their character as either short-term or long-term capital losses rather than being considered all short-term as under previous law.
For federal income tax purposes, as of December 31, 2013, certain portfolios have a capital loss carryforward available to offset future net realized capital gains. The following table details the capital loss carryforward available as of December 31, 2013.
| | | |
| |
| Capital Loss Carryforward | |
| Expiring at December 31, | |
| |
| Portfolio | 2017 | 2018 | |
| |
| Lifestyle Aggressive | $68,293,433 | $69,388,579 | |
| Lifestyle Growth | 230,655,177 | — | |
| Lifestyle Balanced | 261,979,127 | 57,148,343 | |
As of December 31, 2013, the portfolios had no uncertain tax positions that would require financial statement recognition, derecognition or disclosure. The portfolios’ federal tax returns are subject to examination by the Internal Revenue Service for a period of three years.
The costs of investments owned on December 31, 2013, including short-term investments, for federal income tax purposes, were as follows:
| | | | |
| | | | | Net Unrealized |
| | | Unrealized | Unrealized | Appreciation/ |
| Portfolio | Aggregate Cost | Appreciation | Depreciation | (Depreciation) |
|
| Lifestyle Aggressive | $3,505,114,897 | $1,116,482,181 | ($5,517,582) | $1,110,964,599 |
| Lifestyle Growth | 11,235,667,119 | 2,930,755,050 | (27,433,225) | 2,903,321,825 |
| Lifestyle Balanced | 12,508,437,509 | 2,473,675,738 | (38,969,639) | 2,434,706,099 |
| Lifestyle Moderate | 4,135,800,721 | 518,131,216 | (22,958,410) | 495,172,806 |
| Lifestyle Conservative | 3,509,840,885 | 255,756,616 | (25,266,909) | 230,489,707 |
Distribution of income and gains. Distributions to shareholders from net investment income and net realized gains, if any, are recorded on the ex-date. The Lifestyle Aggressive and Lifestyle Growth portfolios generally declare and pay income dividends and capital gain distributions, if any, at least annually. The Lifestyle Balanced, Lifestyle Moderate and Lifestyle Conservative portfolios generally declare and pay income dividends quarterly and capital gain distributions, if any, at least annually.
| |
| Annual report | Lifestyle Portfolios | 35 |
During the year ended December 31, 2013, the tax character of distributions paid was as follows:
| | | | | |
| | 2013 Distributions | |
| |
| | | Long Term | Return of | | |
| Portfolio | Ordinary Income | Capital Gains | Capital | Total | |
| |
| Lifestyle Aggressive | $107,707,561 | — | — | $107,707,561 | |
| Lifestyle Growth | 369,775,815 | — | — | 369,775,815 | |
| Lifestyle Balanced | 418,173,425 | — | — | 418,173,425 | |
| Lifestyle Moderate | 137,590,466 | $1,719,951 | — | 139,310,417 | |
| Lifestyle Conservative | 111,532,776 | 4,690,471 | — | 116,223,247 | |
During the year ended December 31, 2012, the tax character of distributions paid was as follows:
| | | | | |
| | 2012 Distributions | |
| |
| | | Long Term | Return of | | |
| Portfolio | Ordinary Income | Capital Gains | Capital | Total | |
| |
| Lifestyle Aggressive | $54,348,129 | — | — | $54,348,129 | |
| Lifestyle Growth | 235,910,574 | — | — | 235,910,574 | |
| Lifestyle Balanced | 339,724,150 | — | — | 339,724,150 | |
| Lifestyle Moderate | 134,691,078 | — | — | 134,691,078 | |
| Lifestyle Conservative | 137,866,831 | — | — | 137,866,831 | |
Distributions paid by the portfolios with respect to each class of shares are calculated in the same manner, at the same time and in the same amount, except for the effect of class level expenses that may be applied differently to each class. Net capital losses that are a result of security transactions occurring after October 31, 2013, are treated as occurring on January 1, 2014, the first day of the portfolio’s next taxable year. As of December 31, 2013, the components of distributable earnings on a tax basis were as follows:
| | | | |
| | Undistributed | Undistributed Long | Capital Loss | Post-October |
| Portfolio | Ordinary Income | Term Capital Gains | Carryforward | Deferral |
|
| Lifestyle Aggressive | — | — | $137,682,012 | — |
| Lifestyle Growth | — | — | 230,655,177 | — |
| Lifestyle Balanced | — | — | 319,127,470 | — |
| Lifestyle Moderate | — | $46,395,157 | — | — |
| Lifestyle Conservative | — | 54,726,648 | — | — |
Such distributions and distributable earnings, on a tax basis, are determined in conformity with income tax regulations, which may differ from accounting principles generally accepted in the United States of America. Material distributions in excess of tax basis earnings and profits, if any, are reported in the portfolios’ financial statements as a return of capital. Short-term gains from underlying funds are treated as ordinary income for tax purposes.
Capital accounts within the financial statements are adjusted for permanent book-tax differences. These adjustments have no impact on net assets or the results of operations. Temporary book-tax differences, if any, will reverse in a subsequent period. Book-tax differences are primarily attributable to wash sale loss deferrals for all portfolios and characterization of distributions for Lifestyle Moderate and Lifestyle Conservative.
Note 3 — Guarantees and indemnifications
Under the Trust’s organizational documents, its Officers and Trustees are indemnified against certain liabilities arising out of the performance of their duties to the Trust, including the portfolios. Additionally, in the normal course of business, the Trust enters into contracts with service providers that contain general indemnification clauses. The Trust’s maximum exposure under these arrangements is unknown, as this would involve future claims that may be made against the Trust that have not yet occurred. The risk of material loss from such claims is considered remote.
Note 4 — Fees and transactions with affiliates
John Hancock Investment Management Services, LLC (the Advisor or JHIMS) served as investment advisor for the portfolios through December 31, 2013. John Hancock Funds, LLC (the Distributor), an affiliate of the Advisor, serves as principal underwriter of the portfolios. The Advisor and the Distributor are indirect, wholly owned subsidiaries of Manulife Financial Corporation (MFC). Effective January 1, 2014, John Hancock Advisers, LLC (JHA) replaced JHIMS as the investment advisor to the Lifestyle Portfolios. JHA and JHIMS have common officers, directors and other personnel, and share common facilities and resources. In this report, depending on the context, the term “Advisor” shall refer either to JHA in its current capacity as the Lifestyle Portfolios’ investment advisor, or to JHIMS in its capacity as investment advisor prior to January 1, 2014.
Management fee. The portfolios have an investment management agreement with the Advisor under which the portfolios pay a daily management fee to the Advisor equivalent, on an annual basis, as detailed below. Aggregate net assets include the net assets of the portfolios and the net assets of similar funds of John Hancock Variable Insurance Trust (JHVIT) and net assets of similar funds of John Hancock Funds II (JHF II). The portfolios are advised by the Advisor and are distributed by an affiliate of the
| |
| 36 | Lifestyle Portfolios | Annual report |
Advisor, John Hancock Funds, LLC. The Advisor has subadvisory agreements with John Hancock Asset Management, a division of Manulife Asset management (North America) Limited and John Hancock Asset Management, a division of Manulife Asset Management (US) LLC, which are indirect owned subsidiaries of MFC and affiliates of the Advisor. In addition, the Advisor has a subadvisory agreement with QS Investors, LLC. The portfolios are not responsible for payment of the subadvisory fees.
The advisory fee has two components: (a) a fee on assets invested in affiliated funds (Affiliated Fund Assets) and (b) a fee on assets not invested in affiliated funds (Other Assets). Affiliated funds are any funds of the Trust, JHVIT and John Hancock Funds III (JHFIII) excluding John Hancock Money Market Trust B, John Hancock 500 Index Trust B, John Hancock Total Bond Market Trust B and John Hancock International Equity Index Trust B.
Under the advisory agreement, the portfolios pay a daily management fee to the Advisor. The fees on Affiliated Fund Assets and Other Assets are stated as an annual percentage of the current value of the aggregate net assets of the portfolios and similar funds of JFH II and JHVIT. The rates, outlined below, are applied to the Affiliated Fund Assets and Other Assets of each portfolio.
| | | |
| | First $7.5 billion of aggregate net assets | Excess over $7.5 billion of aggregate net assets | |
| |
| Affiliated Fund Assets | 0.05% | 0.04% | |
| Other Assets | 0.50% | 0.49% | |
Expense reimbursements. Effective May 1, 2013, the Advisor contractually agreed to reduce its management fee for each portfolio, in an amount equal to the amount by which the expenses, excluding portfolio level expenses such as advisory fees, taxes, brokerage commissions, interest expense, litigation and indemnification expenses and other extraordinary expenses, acquired fund fees and short dividend expense and expenses for Class R2 and Class R6 shares, to the extent that fees/expenses for each class exceed 0.56% and 0.05%, respectively, of the average daily net assets attributable to the classes. In addition, the Advisor contractually agreed to reduce its management fee for Lifestyle Aggressive Portfolio for Class B shares, to the extent that the above expenses exceed 1.29% of the average daily net assets. The current fee waivers will continue in effect until at least April 30, 2014, unless renewed by mutual agreement of the portfolios and the Advisor. Effective October 1, 2013, the Advisor agreed to contractually limit certain class-specific expenses to 0.41% for Class A shares. These expense limitations are subject to certain exclusions, such as portfolio level and advisory fees, taxes, brokerage commissions, interest expense, litigation and indemnification expenses, short dividend expenses and other extraordinary expenses not incurred in the ordinary course of the portfolio’s business and acquired portfolio fees and expenses. The current expense limitation agreement expires on April 30, 2015 unless renewed by mutual agreement of the portfolio and the Advisor based on a determination that this is appropriate under the circumstances at that time.
The Advisor voluntarily agreed to reduce its management fee for each portfolio, in an amount equal to the amount by which the expenses, excluding portfolio level expenses such as advisory fees, taxes, brokerage commissions, interest expense, litigation and indemnification expenses and other extraordinary expenses, acquired fund fees, Rule 12b-1 fees, transfer agent fees and service fees, state registration fees, printing and postage fees and short dividend expense and expenses of the portfolio exceed 0.10% of the average net assets of the portfolio. This voluntary expense reimbursement will continue in effect until terminated at any time by the Advisor on notice to the Trust.
Additionally, the Advisor voluntarily agreed to waive its advisory fee or reimburse each portfolio so that the aggregate advisory fee retained by the Advisor with respect to both the portfolio and the underlying investments (after payment of any subadvisory fees) does not exceed 0.50% of the portfolio’s first $7.5 billion of average daily net assets and 0.49% of the portfolio’s average daily net assets in excess of $7.5 billion. This voluntary waiver may terminate at any time by the Advisor upon notice to the Trust.
For the year ended December 31, 2013, the expense reductions related to these plans amounted to the following and are reflected as a reduction of total expenses in the Statements of operations:
| | | | | | | | | | | | |
| | | | | | Expense Reimbursement by Class | | | | |
| |
|
| Portfolio | Class A | Class B | Class C | Class R1 | Class R2 | Class R3 | Class R4 | Class R5 | Class R6 | Class 1 | Class 5 | Total |
|
| Lifestyle Aggressive | $51,254 | $1,720 | $9,550 | $620 | $13,374 | $651 | $499 | $669 | $9,953 | $253,197 | — | $341,487 |
| Lifestyle Growth | 175,147 | 6,329 | 32,173 | 1,173 | 12,460 | 1,249 | 1,191 | 1,896 | 9,494 | 618,925 | $9,787 | 869,824 |
| Lifestyle Balanced | 178,192 | 5,281 | 32,870 | 863 | 12,620 | 1,645 | 3,454 | 1,854 | 8,430 | 555,445 | 4,974 | 805,628 |
| Lifestyle Moderate | 62,129 | 622 | 4,950 | 139 | 13,502 | 162 | 177 | 175 | 11,854 | 48,871 | 643 | 143,224 |
| Lifestyle Conservative | 68,335 | 713 | 5,330 | 129 | 18,519 | 178 | 135 | 220 | 10,644 | 42,031 | — | 146,234 |
| |
| Annual report | Lifestyle Portfolios | 37 |
Expense recapture. The Advisor may recapture operating expenses reimbursed or fees waived under previous expense limitation or waiver arrangements for a period of three years following the month in which the reimbursements or waivers occurred to the extent that the portfolio is below its expense limitation during this period. The table below outlines the amounts recovered during the year ended December 31, 2013, and the amount of waived or reimbursed expenses subject to potential recovery and the respective expiration dates. Certain reimbursements or waivers are not subject to recapture. The following portfolios recaptured operating expenses during the period and/or have amounts eligible for recovery going forward:
| | | | |
| | Amounts eligible for | Amounts eligible for | Amounts eligible for | Amount recovered |
| | recovery through | recovery through | recovery through | during the period ended |
| Portfolio | December 1, 2014 | December 1, 2015 | June 1, 2016 | December 31, 2013 |
|
| Lifestyle Aggressive | $5,276 | $31,646 | $54,786 | $11,511 |
| Lifestyle Growth | 5,277 | 31,791 | 133,997 | 303 |
| Lifestyle Balanced | 5,276 | 32,035 | 136,703 | 61 |
| Lifestyle Moderate | 5,276 | 30,386 | 79,955 | 65 |
| Lifestyle Conservative | 5,276 | 27,378 | 89,494 | — |
Amounts recovered by class
| | | | |
| Portfolio | Class B | Class R2 | | |
| | |
| Lifestyle Aggressive | $11,511 | — | | |
| Lifestyle Growth | — | $303 | | |
| Lifestyle Balanced | — | 61 | | |
| Lifestyle Moderate | — | 65 | | |
The investment management fees incurred for the year ended December 31, 2013 were equivalent to a net annual effective rate of the portfolios’ average daily net assets as follows:
| | | | |
| Portfolio | Annual Effective Rate | | | |
| | | |
| Lifestyle Aggressive | 0.04% | | | |
| Lifestyle Growth | 0.04% | | | |
| Lifestyle Balanced | 0.04% | | | |
| Lifestyle Moderate | 0.04% | | | |
| Lifestyle Conservative | 0.04% | | | |
Accounting and legal services. Pursuant to a service agreement, the portfolios reimburse the Advisor for all expenses associated with providing the administrative, financial, legal, accounting and recordkeeping services to the portfolios, including the preparation of all tax returns, periodic reports to shareholders and regulatory reports, among other services. These expenses are allocated to each share class based on its relative net assets at the time the expense was incurred. These accounting and legal services fees incurred for the year ended December 31, 2013, amounted to an annual rate of 0.01% of the portfolio’s average daily net assets.
Distribution and service plans. The portfolio has a distribution agreement with the Distributor. The portfolios have adopted distribution and service plans with respect to Class A, Class B, Class C, Class R1, Class R2, Class R3, Class R4 and Class 1 shares pursuant to Rule 12b-1 under the 1940 Act, to pay the Distributor for services provided as the distributor of shares of the portfolio. In addition, under a service plan for Class R1, Class R2, Class R3, Class R4 and Class R5 shares, the portfolios pay for certain other services. The portfolios may pay up to the following contractual rates of distribution and service fees under these arrangements, expressed as an annual percentage of average daily net assets for each class of the portfolio’s shares.
| | | | |
| Class | Rule 12b-1 Fee | Service Fee | | |
| | |
| Class A | 0.30% | — | | |
| Class B | 1.00% | — | | |
| Class C | 1.00% | — | | |
| Class R1 | 0.50% | 0.25% | | |
| Class R2 | 0.25% | 0.25% | | |
| Class R3 | 0.50% | 0.15% | | |
| Class R4 | 0.25% | 0.10% | | |
| Class R5 | — | 0.05% | | |
| Class 1 | 0.05% | — | | |
The Distributor has contractually agreed to waive 0.10% of Rule 12b-1 fees for Class R4 shares to limit the Rule 12b-1 fees on Class R4 shares to 0.15% of the average daily net assets of Class R4 shares, until at least April 30, 2014, unless renewed by mutual agreement of the portfolios and the Distributor based upon a determination that this is appropriate under the circumstances at the time.
| |
| 38 | Lifestyle Portfolios | Annual report |
Accordingly, these fee limitations amounted to the following for Class R4 shares, for the year ended December 31, 2013:
| | | | |
| | Class R4 | | | |
| Portfolio | Rule 12b-1 Reimbursement | | | |
| | | |
| Lifestyle Aggressive | $7,654 | | | |
| Lifestyle Growth | 20,916 | | | |
| Lifestyle Balanced | 73,147 | | | |
| Lifestyle Moderate | 12,674 | | | |
| Lifestyle Conservative | 9,250 | | | |
Sales charges. Class A shares are assessed up-front sales charges of up to 5% of the net asset value of such shares. The following summarizes the net up-front sales charges received by the Distributor during the year ended December 31, 2013:
| | | | | |
| Lifestyle Aggressive | Lifestyle Growth | Lifestyle Balanced | Lifestyle Moderate | Lifestyle Conservative |
|
| Net sales charges | $878,680 | $6,412,634 | $8,208,062 | $3,372,479 | $3,020,619 |
| Retained for printing prospectuses, | | | | | |
| advertising and sales literature | 138,501 | 1,030,216 | 1,348,209 | 562,685 | 508,863 |
| Sales commission to unrelated broker-dealers | 715,718 | 5,308,614 | 6,763,613 | 2,757,633 | 2,441,896 |
| Sales commission to affiliated sales personnel | 24,461 | 73,804 | 96,240 | 52,161 | 69,860 |
Class A, Class B and Class C shares may be subject to contingent deferred sales charges (CDSCs). Certain Class A shares that are acquired through purchases of $1 million or more and are redeemed within one year of purchase are subject to a 1.00% sales charge. Class B shares that are redeemed within six years of purchase are subject to CDSCs, at declining rates, beginning at 5.00%. Class C shares that are redeemed within one year of purchase are subject to a 1.00% CDSC. CDSCs are applied to the lesser of the current market value at the time of redemption or the original purchase cost of the shares being redeemed. Proceeds from CDSCs are used to compensate the Distributor for providing distribution-related services in connection with the sale of these shares. During the year ended December 31, 2013, CDSCs received by the Distributor were as follows:
| | | | |
| Portfolio | Class A | Class B | Class C | |
| |
| Lifestyle Aggressive | $419 | $45,181 | $14,956 | |
| Lifestyle Growth | 17,983 | 157,342 | 60,041 | |
| Lifestyle Balanced | 1,140 | 151,945 | 69,016 | |
| Lifestyle Moderate | 591 | 96,120 | 52,896 | |
| Lifestyle Conservative | 662 | 89,710 | 74,192 | |
Transfer agent fees. The portfolios have a transfer agent agreement with John Hancock Signature Services, Inc. (Signature Services), an affiliate of the Advisor. The transfer agent fees paid to Signature Services are determined based on the cost to Signature Services (Signature Services Cost) of providing recordkeeping services. The Signature Services Cost includes a component of allocated John Hancock corporate overhead for providing transfer agent services to the portfolios and to all other John Hancock affiliated funds. It also includes out-of-pocket expenses including payments made to third-parties for recordkeeping services provided to their clients who invest in one or more John Hancock funds. In addition, Signature Services Cost may be reduced by certain fees that Signature Services receives in connection with retirement and small accounts. Signature Services Cost is calculated monthly and allocated, as applicable, to five categories of share classes: Retail Share and Institutional Classes of Non-Municipal Bond Funds, Class R6 Shares, Retirement Share Classes and Municipal Bond Share Classes. Within each of these categories, the applicable costs are allocated to the affected John Hancock affiliated funds and/or classes, based on the relative average daily net assets.
Prior to October 1, 2013, Signature Services Cost were calculated monthly and allocated, as applicable, to four categories of share classes: Institutional Share Classes, Retirement Share Classes, Municipal Bond Share Classes and all other Retail Share Classes. Within each of these categories, the applicable costs were allocated to the affected John Hancock affiliated funds and/or classes, based on the relative average daily net assets.
Class level expenses. Class level expenses for the year ended December 31, 2013 were:
| | | | | |
| | | Distribution and | Transfer | State | Printing and |
| Portfolio | Share class | service fees | agent fee | registration fees | postage |
|
| Lifestyle Aggressive | Class A | $845,147 | $441,687 | $21,147 | $21,119 |
| | Class B | 257,283 | 40,659 | 11,517 | 2,944 |
| | Class C | 1,397,113 | 219,349 | 13,858 | 12,277 |
| | Class R1 | 68,540 | 2,361 | 10,165 | 716 |
| | Class R2 | 6,356 | 327 | 14,224 | 56 |
| | Class R3 | 64,604 | 2,557 | 10,762 | 677 |
| | Class R4 | 26,686 | 1,982 | 10,905 | 541 |
| | Class R5 | 4,838 | 2,521 | 10,768 | 592 |
| | Class R6 | — | 891 | 9,839 | 766 |
| | Class 1 | 1,872,823 | — | — | — |
| | Total | $4,543,390 | $712,334 | $113,185 | $39,688 |
|
| |
| Annual report | Lifestyle Portfolios | 39 |
| | | | | |
| | | Distribution and | Transfer | State | Printing and |
| Portfolio | Share class | service fees | agent fee | registration fees | postage |
|
| Lifestyle Growth | Class A | $3,205,253 | $1,673,416 | $56,987 | $72,317 |
| | Class B | 1,140,533 | 180,185 | 14,209 | 10,759 |
| | Class C | 5,610,685 | 880,685 | 27,372 | 37,487 |
| | Class R1 | 154,085 | 5,331 | 11,187 | 1,170 |
| | Class R2 | 20,906 | 1,042 | 14,814 | 76 |
| | Class R3 | 141,417 | 5,582 | 12,479 | 1,009 |
| | Class R4 | 73,514 | 5,324 | 12,562 | 878 |
| | Class R5 | 17,570 | 8,652 | 12,394 | 1,273 |
| | Class R6 | — | 2,750 | 10,887 | 804 |
| | Class 1 | 5,527,593 | — | — | — |
| | Total | $15,891,556 | $2,762,967 | $172,891 | $125,773 |
|
| Lifestyle Balanced | Class A | $3,727,707 | $1,946,658 | $31,135 | $63,684 |
| | Class B | 1,128,479 | 178,408 | 59,735 | 8,878 |
| | Class C | 6,715,819 | 1,054,121 | 32,503 | 41,427 |
| | Class R1 | 135,861 | 4,656 | 11,819 | 703 |
| | Class R2 | 11,985 | 621 | 14,650 | 44 |
| | Class R3 | 230,282 | 9,087 | 11,190 | 1,065 |
| | Class R4 | 254,166 | 18,671 | 13,698 | 1,675 |
| | Class R5 | 19,535 | 10,219 | 12,349 | 1,062 |
| | Class R6 | — | 3,172 | 10,260 | 791 |
| | Class 1 | 5,879,977 | — | — | — |
| | Total | $18,103,811 | $3,225,613 | $197,339 | $119,329 |
|
| Lifestyle Moderate | Class A | $1,426,514 | $745,214 | $41,944 | $27,063 |
| | Class B | 454,723 | 72,033 | 12,727 | 3,904 |
| | Class C | 3,286,575 | 516,428 | 27,259 | 21,271 |
| | Class R1 | 74,217 | 2,566 | 11,143 | 763 |
| | Class R2 | 5,436 | 301 | 14,802 | 30 |
| | Class R3 | 71,228 | 2,821 | 12,253 | 703 |
| | Class R4 | 44,956 | 3,231 | 12,369 | 821 |
| | Class R5 | 5,193 | 2,790 | 12,640 | 663 |
| | Class R6 | — | 1,356 | 12,495 | 689 |
| | Class 1 | 1,776,698 | — | — | — |
| | Total | $7,145,540 | $1,346,740 | $157,632 | $55,907 |
|
| Lifestyle Conservative | Class A | $1,524,844 | $802,025 | $58,036 | $26,983 |
| | Class B | 491,436 | 77,931 | 13,682 | 4,092 |
| | Class C | 3,523,258 | 556,825 | 39,451 | 22,701 |
| | Class R1 | 69,344 | 2,362 | 6,017 | 726 |
| | Class R2 | 4,192 | 228 | 19,430 | 31 |
| | Class R3 | 75,883 | 3,009 | 2,061 | 707 |
| | Class R4 | 32,819 | 2,341 | 11,896 | 615 |
| | Class R5 | 7,971 | 3,957 | 3,799 | 959 |
| | Class R6 | — | 824 | 10,788 | 644 |
| | Class 1 | 1,480,095 | — | — | — |
| | Total | $7,209,842 | $1,449,502 | $165,160 | $57,458 |
|
Trustee expenses. The portfolios compensate each Trustee who is not an employee of the Advisor or its affiliates. The costs of paying Trustee compensation and expenses are allocated to each portfolio based on its net assets relative to other funds within the John Hancock funds complex.
Note 5 — Portfolio share transactions
Transactions in portfolios shares for the years ended December 31, 2013 and 2012 were as follows:
Lifestyle Aggressive
| | | | |
| | | Year ended 12-31-13 | | Year ended 12-31-12 |
| | Shares | Amount | Shares | Amount |
| Class A shares | | | | |
|
| Sold | 7,248,824 | $105,384,716 | 6,546,618 | $81,230,963 |
| Distributions reinvested | 433,414 | 6,873,941 | 189,811 | 2,441,000 |
| Repurchased | (5,001,569) | (72,174,752) | (6,006,478) | (74,601,304) |
| | | | | |
| Net increase | 2,680,669 | $40,083,905 | 729,951 | $9,070,659 |
| |
| 40 | Lifestyle Portfolios | Annual report |
| | | | |
| | | Year ended 12-31-13 | | Year ended 12-31-12 |
| | Shares | Amount | Shares | Amount |
|
| Class B shares | | | | |
|
| Sold | 112,444 | $1,567,517 | 238,596 | $2,949,711 |
| Distributions reinvested | 21,069 | 334,999 | 5,888 | 75,895 |
| Repurchased | (336,433) | (4,821,339) | (359,517) | (4,419,877) |
| | | | | |
| Net decrease | (202,920) | ($2,918,823) | (115,033) | ($1,394,271) |
| |
| Class C shares | | | | |
|
| Sold | 2,038,199 | $29,535,841 | 1,477,006 | $18,287,544 |
| Distributions reinvested | 132,154 | 2,102,563 | 34,428 | 444,120 |
| Repurchased | (1,534,039) | (22,276,862) | (2,028,905) | (25,079,212) |
| | | | | |
| Net increase (decrease) | 636,314 | $9,361,542 | (517,471) | ($6,347,548) |
| |
| Class R1 shares | | | | |
|
| Sold | 146,442 | $2,144,284 | 198,848 | $2,431,323 |
| Distributions reinvested | 9,154 | 145,553 | 4,049 | 52,186 |
| Repurchased | (192,809) | (2,743,924) | (267,568) | (3,279,369) |
| | | | | |
| Net decrease | (37,213) | ($454,087) | (64,671) | ($795,860) |
| |
| Class R2 shares1 | | | | |
|
| Sold | 148,691 | $2,119,387 | 8,006 | $100,000 |
| Distributions reinvested | 1,826 | 28,829 | — | — |
| Repurchased | (11,811) | (176,874) | — | — |
| | | | | |
| Net increase | 138,706 | $1,971,342 | 8,006 | $100,000 |
| |
| Class R3 shares | | | | |
|
| Sold | 140,389 | $2,009,684 | 202,975 | $2,501,105 |
| Distributions reinvested | 9,974 | 157,988 | 5,910 | 75,890 |
| Repurchased | (360,254) | (5,328,578) | (316,823) | (3,900,193) |
| | | | | |
| Net decrease | (209,891) | ($3,160,906) | (107,938) | ($1,323,198) |
| |
| Class R4 shares | | | | |
|
| Sold | 132,176 | $1,905,212 | 470,635 | $5,762,193 |
| Distributions reinvested | 9,919 | 156,912 | 7,398 | 94,846 |
| Repurchased | (316,280) | (4,459,290) | (558,684) | (6,943,072) |
| | | | | |
| Net decrease | (174,185) | ($2,397,166) | (80,651) | ($1,086,033) |
| |
| Class R5 shares | | | | |
|
| Sold | 198,709 | $2,856,277 | 417,659 | $5,182,054 |
| Distributions reinvested | 15,888 | 251,503 | 9,200 | 118,042 |
| Repurchased | (188,190) | (2,692,806) | (842,458) | (10,587,042) |
| | | | | |
| Net increase (decrease) | 26,407 | $414,974 | (415,599) | ($5,286,946) |
| |
| Class R6 shares | | | | |
|
| Sold | 234,620 | $3,420,694 | 179,670 | $2,262,958 |
| Distributions reinvested | 7,932 | 125,407 | 2,404 | 30,777 |
| Repurchased | (70,647) | (1,045,417) | (22,990) | (285,963) |
| | | | | |
| Net increase | 171,905 | $2,500,684 | 159,084 | $2,007,772 |
| |
| Class 1 shares | | | | |
|
| Sold | 7,744,533 | $110,537,983 | 4,755,717 | $58,815,078 |
| Distributions reinvested | 6,160,748 | 97,339,818 | 3,976,367 | 50,897,498 |
| Repurchased | (20,898,344) | (309,159,345) | (28,314,394) | (351,650,872) |
| | | | | |
| Net decrease | (6,993,063) | ($101,281,544) | (19,582,310) | ($241,938,296) |
| |
| Total net decrease | (3,963,271) | ($55,880,079) | (19,986,632) | ($246,993,721) |
|
| |
| |
| Lifestyle Growth | | | | |
| | | Year ended 12-31-13 | | Year ended 12-31-12 |
| | Shares | Amount | Shares | Amount |
|
| Class A shares | | | | |
|
| Sold | 25,861,877 | $387,369,709 | 21,617,347 | $282,729,682 |
| Distributions reinvested | 1,841,188 | 29,514,244 | 1,047,720 | 14,102,737 |
| Repurchased | (14,289,068) | (213,814,731) | (15,385,999) | (201,129,161) |
| | | | | |
| Net increase | 13,413,997 | $203,069,222 | 7,279,068 | $95,703,258 |
| |
| Annual report | Lifestyle Portfolios | 41 |
| | | | |
| | | Year ended 12-31-13 | | Year ended 12-31-12 |
| | Shares | Amount | Shares | Amount |
|
| Class B shares | | | | |
|
| Sold | 440,811 | $6,422,574 | 1,428,655 | $18,526,780 |
| Distributions reinvested | 115,775 | 1,860,502 | 72,488 | 978,594 |
| Repurchased | (1,145,297) | (17,046,176) | (1,315,668) | (17,132,556) |
| | | | | |
| Net increase (decrease) | (588,711) | ($8,763,100) | 185,475 | $2,372,818 |
| |
| Class C shares | | | | |
|
| Sold | 9,343,437 | $139,334,044 | 6,989,144 | $91,188,127 |
| Distributions reinvested | 638,850 | 10,259,930 | 331,572 | 4,469,588 |
| Repurchased | (5,722,774) | (84,999,876) | (6,714,814) | (87,411,788) |
| | | | | |
| Net increase | 4,259,513 | $64,594,098 | 605,902 | $8,245,927 |
| |
| Class R1 shares | | | | |
|
| Sold | 410,301 | $6,134,014 | 527,633 | $6,872,767 |
| Distributions reinvested | 24,065 | 387,212 | 15,702 | 212,144 |
| Repurchased | (426,245) | (6,357,338) | (439,681) | (5,699,950) |
| | | | | |
| Net increase | 8,121 | $163,888 | 103,654 | $1,384,961 |
| |
| Class R2 shares1 | | | | |
|
| Sold | 558,402 | $8,250,777 | 7,663 | $100,000 |
| Distributions reinvested | 10,747 | 171,412 | — | — |
| Repurchased | (36,078) | (549,106) | — | — |
| | | | | |
| Net increase | 533,071 | $7,873,083 | 7,663 | $100,000 |
| |
| Class R3 shares | | | | |
|
| Sold | 445,811 | $6,577,020 | 348,629 | $4,518,692 |
| Distributions reinvested | 31,223 | 499,885 | 19,624 | 263,747 |
| Repurchased | (385,371) | (5,818,482) | (785,497) | (10,143,064) |
| | | | | |
| Net increase (decrease) | 91,663 | $1,258,423 | (417,244) | ($5,360,625) |
| |
| Class R4 shares | | | | |
|
| Sold | 402,741 | $5,988,210 | 1,207,245 | $15,441,879 |
| Distributions reinvested | 35,339 | 565,772 | 25,659 | 344,864 |
| Repurchased | (402,085) | (5,916,844) | (1,209,750) | (15,997,180) |
| | | | | |
| Net increase (decrease) | 35,995 | $637,138 | 23,154 | ($210,437) |
| |
| Class R5 shares | | | | |
|
| Sold | 589,166 | $8,799,018 | 1,317,356 | $17,284,507 |
| Distributions reinvested | 60,454 | 969,083 | 46,280 | 622,462 |
| Repurchased | (683,479) | (10,144,431) | (1,219,079) | (16,168,117) |
| | | | | |
| Net increase (decrease) | (33,859) | ($376,330) | 144,557 | $1,738,852 |
| |
| Class R6 shares | | | | |
|
| Sold | 1,044,309 | $15,454,198 | 253,307 | $3,395,751 |
| Distributions reinvested | 31,796 | 507,458 | 5,232 | 70,109 |
| Repurchased | (146,499) | (2,211,473) | (10,608) | (141,624) |
| | | | | |
| Net increase | 929,606 | $13,750,183 | 247,931 | $3,324,236 |
| |
| Class 1 shares | | | | |
|
| Sold | 15,128,727 | $221,078,194 | 11,077,067 | $144,086,192 |
| Distributions reinvested | 19,953,601 | 318,459,464 | 15,752,228 | 211,079,854 |
| Repurchased | (51,257,683) | (780,921,125) | (66,902,791) | (877,159,860) |
| | | | | |
| Net decrease | (16,175,355) | ($241,383,467) | (40,073,496) | ($521,993,814) |
| |
| Class 5 shares | | | | |
|
| Sold | 1,823,740 | $27,435,361 | 1,378,974 | $17,921,927 |
| Distributions reinvested | 344,774 | 5,495,690 | 223,661 | 2,992,587 |
| Repurchased | (146,610) | (2,186,100) | (400,947) | (5,237,765) |
| | | | | |
| Net increase | 2,021,904 | $30,744,951 | 1,201,688 | $15,676,749 |
| |
| Total net increase (decrease) | 4,495,945 | $71,568,089 | (30,691,648) | ($399,018,075) |
|
| |
| 42 | Lifestyle Portfolios | Annual report |
| | | | |
| Lifestyle Balanced | | | | |
| | | Year ended 12-31-13 | | Year ended 12-31-12 |
| | Shares | Amount | Shares | Amount |
|
| Class A shares | | | | |
|
| Sold | 32,728,984 | $478,490,015 | 29,799,585 | $393,896,550 |
| Distributions reinvested | 2,294,348 | 34,687,506 | 1,648,142 | 22,203,029 |
| Repurchased | (16,568,898) | (242,325,668) | (16,076,799) | (212,815,312) |
| | | | | |
| Net increase | 18,454,434 | $270,851,853 | 15,370,928 | $203,284,267 |
| |
| Class B shares | | | | |
|
| Sold | 501,290 | $7,188,350 | 1,870,452 | $24,518,316 |
| Distributions reinvested | 128,999 | 1,968,624 | 117,766 | 1,591,417 |
| Repurchased | (982,792) | (14,315,624) | (1,002,770) | (13,220,061) |
| | | | | |
| Net increase (decrease) | (352,503) | ($5,158,650) | 985,448 | $12,889,672 |
| |
| Class C shares | | | | |
|
| Sold | 13,345,844 | $194,859,654 | 10,170,971 | $134,241,530 |
| Distributions reinvested | 872,227 | 13,326,297 | 648,794 | 8,772,999 |
| Repurchased | (6,788,520) | (99,221,501) | (7,790,575) | (102,765,426) |
| | | | | |
| Net increase | 7,429,551 | $108,964,450 | 3,029,190 | $40,249,103 |
| |
| Class R1 shares | | | | |
|
| Sold | 353,880 | $5,143,674 | 510,563 | $6,683,784 |
| Distributions reinvested | 20,565 | 310,966 | 19,161 | 257,539 |
| Repurchased | (395,172) | (5,755,044) | (581,101) | (7,660,314) |
| | | | | |
| Net decrease | (20,727) | ($300,404) | (51,377) | ($718,991) |
| |
| Class R2 shares1 | | | | |
|
| Sold | 347,787 | $5,046,216 | 7,605 | $100,000 |
| Distributions reinvested | 6,428 | 97,398 | — | — |
| Repurchased | (13,908) | (206,709) | — | — |
| | | | | |
| Net increase | 340,307 | $4,936,905 | 7,605 | $100,000 |
| |
| Class R3 shares | | | | |
|
| Sold | 590,748 | $8,540,214 | 788,988 | $10,363,332 |
| Distributions reinvested | 53,781 | 812,248 | 57,078 | 767,299 |
| Repurchased | (795,388) | (11,718,257) | (1,350,324) | (17,819,887) |
| | | | | |
| Net decrease | (150,859) | ($2,365,795) | (504,258) | ($6,689,256) |
| |
| Class R4 shares | | | | |
|
| Sold | 997,086 | $14,463,192 | 6,336,522 | $83,595,716 |
| Distributions reinvested | 135,844 | 2,042,851 | 126,337 | 1,697,241 |
| Repurchased | (1,268,179) | (18,337,618) | (3,411,704) | (45,323,645) |
| | | | | |
| Net increase (decrease) | (135,249) | ($1,831,575) | 3,051,155 | $39,969,312 |
| |
| Class R5 shares | | | | |
|
| Sold | 736,112 | $10,736,001 | 1,450,309 | $19,171,138 |
| Distributions reinvested | 77,648 | 1,166,404 | 80,278 | 1,077,660 |
| Repurchased | (1,010,533) | (14,681,830) | (2,067,688) | (27,326,993) |
| | | | | |
| Net decrease | (196,773) | ($2,779,425) | (537,101) | ($7,078,195) |
| |
| Class R6 shares | | | | |
|
| Sold | 1,285,202 | $18,524,246 | 353,784 | $4,657,544 |
| Distributions reinvested | 36,206 | 544,913 | 6,223 | 83,976 |
| Repurchased | (281,778) | (4,134,229) | (23,203) | (310,274) |
| | | | | |
| Net increase | 1,039,630 | $14,934,930 | 336,804 | $4,431,246 |
| |
| Class 1 shares | | | | |
|
| Sold | 22,941,372 | $330,852,814 | 34,176,951 | $448,550,959 |
| Distributions reinvested | 23,983,813 | 358,577,680 | 22,417,405 | 299,880,075 |
| Repurchased | (53,061,837) | (781,840,473) | (51,222,941) | (676,975,779) |
| | | | | |
| Net increase (decrease) | (6,136,652) | ($92,409,979) | 5,371,415 | $71,455,255 |
| |
| Annual report | Lifestyle Portfolios | 43 |
| | | | |
| | | Year ended 12-31-13 | | Year ended 12-31-12 |
| | Shares | Amount | Shares | Amount |
|
| Class 5 shares | | | | |
|
| Sold | 1,514,684 | $22,062,827 | 1,434,898 | $18,976,047 |
| Distributions reinvested | 223,765 | 3,351,796 | 163,876 | 2,194,885 |
| Repurchased | (262,216) | (3,815,255) | (256,469) | (3,317,908) |
| | | | | |
| Net increase | 1,476,233 | $21,599,368 | 1,342,305 | $17,853,024 |
| |
| Total net increase | 21,747,392 | $316,441,678 | 28,402,114 | $375,745,437 |
|
| Lifestyle Moderate | | | | |
| | | Year ended 12-31-13 | | Year ended 12-31-12 |
| | Shares | Amount | Shares | Amount |
|
| Class A shares | | | | |
|
| Sold | 14,826,532 | $206,678,122 | 12,585,088 | $164,396,073 |
| Distributions reinvested | 964,927 | 13,598,153 | 788,832 | 10,431,025 |
| Repurchased | (7,170,672) | (100,016,375) | (7,794,657) | (101,628,949) |
| | | | | |
| Net increase | 8,620,787 | $120,259,900 | 5,579,263 | $73,198,149 |
| |
| Class B shares | | | | |
|
| Sold | 294,059 | $4,057,235 | 877,166 | $11,392,653 |
| Distributions reinvested | 58,169 | 822,083 | 63,761 | 843,884 |
| Repurchased | (525,265) | (7,301,121) | (408,443) | (5,320,085) |
| | | | | |
| Net increase (decrease) | (173,037) | ($2,421,803) | 532,484 | $6,916,452 |
| |
| Class C shares | | | | |
|
| Sold | 7,777,521 | $108,324,332 | 6,493,158 | $84,645,234 |
| Distributions reinvested | 479,636 | 6,786,733 | 438,826 | 5,811,808 |
| Repurchased | (4,261,662) | (59,441,419) | (3,837,488) | (50,036,708) |
| | | | | |
| Net increase | 3,995,495 | $55,669,646 | 3,094,496 | $40,420,334 |
| |
| Class R1 shares | | | | |
|
| Sold | 241,266 | $3,343,225 | 334,547 | $4,340,072 |
| Distributions reinvested | 13,658 | 192,651 | 12,333 | 163,215 |
| Repurchased | (248,798) | (3,450,270) | (204,333) | (2,654,134) |
| | | | | |
| Net increase | 6,126 | $85,606 | 142,547 | $1,849,153 |
| |
| Class R2 shares1 | | | | |
|
| Sold | 167,376 | $2,322,345 | 7,716 | $100,000 |
| Distributions reinvested | 2,735 | 38,662 | — | — |
| Repurchased | (4,383) | (61,601) | — | — |
| | | | | |
| Net increase | 165,728 | $2,299,406 | 7,716 | $100,000 |
| |
| Class R3 shares | | | | |
|
| Sold | 301,483 | $4,195,741 | 260,175 | $3,374,916 |
| Distributions reinvested | 19,788 | 278,583 | 20,123 | 265,626 |
| Repurchased | (260,135) | (3,633,567) | (376,016) | (4,863,415) |
| | | | | |
| Net increase (decrease) | 61,136 | $840,757 | (95,718) | ($1,222,873) |
| |
| Class R4 shares | | | | |
|
| Sold | 369,483 | $5,072,818 | 570,862 | $7,382,594 |
| Distributions reinvested | 26,123 | 366,567 | 23,965 | 315,915 |
| Repurchased | (328,519) | (4,559,492) | (418,916) | (5,497,168) |
| | | | | |
| Net increase | 67,087 | $879,893 | 175,911 | $2,201,341 |
| |
| Class R5 shares | | | | |
|
| Sold | 412,176 | $5,758,292 | 416,723 | $5,420,537 |
| Distributions reinvested | 26,500 | 372,158 | 27,676 | 363,887 |
| Repurchased | (246,044) | (3,425,338) | (989,460) | (12,870,594) |
| | | | | |
| Net increase (decrease) | 192,632 | $2,705,112 | (545,061) | ($7,086,170) |
| |
| Class R6 shares | | | | |
|
| Sold | 690,699 | $9,613,967 | 132,468 | $1,768,610 |
| Distributions reinvested | 18,857 | 265,469 | 1,723 | 22,882 |
| Repurchased | (81,851) | (1,132,929) | (14,137) | (189,742) |
| | | | | |
| Net increase | 627,705 | $8,746,507 | 120,054 | $1,601,750 |
| |
| 44 | Lifestyle Portfolios | Annual report |
| | | | |
| | | Year ended 12-31-13 | | Year ended 12-31-12 |
| | Shares | Amount | Shares | Amount |
|
| Class 1 shares | | | | |
|
| Sold | 8,819,831 | $122,155,454 | 13,540,901 | $175,499,000 |
| Distributions reinvested | 8,117,045 | 113,790,376 | 8,662,040 | 114,126,515 |
| Repurchased | (23,387,758) | (328,031,760) | (15,429,208) | (201,695,879) |
| | | | | |
| Net increase (decrease) | (6,450,882) | ($92,085,930) | 6,773,733 | $87,929,636 |
| |
| Class 5 shares | | | | |
|
| Sold | 534,627 | $7,419,524 | 887,000 | $11,536,611 |
| Distributions reinvested | 105,801 | 1,482,351 | 93,554 | 1,232,491 |
| Repurchased | (228,376) | (3,191,306) | (276,740) | (3,573,141) |
| | | | | |
| Net increase | 412,052 | $5,710,569 | 703,814 | $9,195,961 |
| |
| Total net increase | 7,524,829 | $102,689,663 | 16,489,239 | $215,103,733 |
|
| |
| Lifestyle Conservative | | | | |
| | | Year ended 12-31-13 | | Year ended 12-31-12 |
| | Shares | Amount | Shares | Amount |
|
| Class A shares | | | | |
|
| Sold | 14,063,064 | $192,153,150 | 16,485,132 | $218,406,695 |
| Distributions reinvested | 998,535 | 13,568,931 | 1,019,305 | 13,597,012 |
| Repurchased | (11,417,560) | (155,775,563) | (9,311,796) | (122,976,803) |
| | | | | |
| Net increase | 3,644,039 | $49,946,518 | 8,192,641 | $109,026,904 |
| |
| Class B shares | | | | |
|
| Sold | 395,018 | $5,378,629 | 1,085,716 | $14,340,232 |
| Distributions reinvested | 60,192 | 818,745 | 75,238 | 1,004,631 |
| Repurchased | (627,921) | (8,570,316) | (475,249) | (6,288,066) |
| | | | | |
| Net increase (decrease) | (172,711) | ($2,372,942) | 685,705 | $9,056,797 |
| |
| Class C shares | | | | |
|
| Sold | 8,222,570 | $112,110,099 | 8,677,376 | $114,808,866 |
| Distributions reinvested | 460,918 | 6,264,365 | 533,856 | 7,123,334 |
| Repurchased | (7,685,348) | (104,631,662) | (4,407,940) | (58,316,268) |
| | | | | |
| Net increase | 998,140 | $13,742,802 | 4,803,292 | $63,615,932 |
| |
| Class R1 shares | | | | |
|
| Sold | 222,908 | $3,037,258 | 355,693 | $4,723,573 |
| Distributions reinvested | 13,617 | 185,052 | 15,971 | 213,057 |
| Repurchased | (283,022) | (3,858,968) | (207,657) | (2,757,838) |
| | | | | |
| Net increase (decrease) | (46,497) | ($636,658) | 164,007 | $2,178,792 |
| |
| Class R2 shares1 | | | | |
|
| Sold | 122,142 | $1,660,334 | 7,622 | $100,000 |
| Distributions reinvested | 2,089 | 28,401 | — | — |
| Repurchased | (12,507) | (171,044) | — | — |
| | | | | |
| Net increase | 111,724 | $1,517,691 | 7,622 | $100,000 |
| |
| Class R3 shares | | | | |
|
| Sold | 309,500 | $4,225,920 | 332,721 | $4,381,713 |
| Distributions reinvested | 21,616 | 293,223 | 24,838 | 330,471 |
| Repurchased | (327,431) | (4,465,290) | (355,405) | (4,671,166) |
| | | | | |
| Net increase | 3,685 | $53,853 | 2,154 | $41,018 |
| |
| Class R4 shares | | | | |
|
| Sold | 364,325 | $4,980,305 | 498,780 | $6,562,898 |
| Distributions reinvested | 19,695 | 267,184 | 22,529 | 299,530 |
| Repurchased | (330,472) | (4,504,829) | (611,503) | (8,087,876) |
| | | | | |
| Net increase (decrease) | 53,548 | $742,660 | (90,194) | ($1,225,448) |
| |
| Class R5 shares | | | | |
|
| Sold | 450,416 | $6,163,109 | 943,275 | $12,427,797 |
| Distributions reinvested | 33,932 | 460,773 | 40,401 | 537,917 |
| Repurchased | (524,285) | (7,148,003) | (1,115,453) | (14,626,308) |
| | | | | |
| Net decrease | (39,937) | ($524,121) | (131,777) | ($1,660,594) |
| |
| Annual report | Lifestyle Portfolios | 45 |
| | | | |
| | | Year ended 12-31-13 | | Year ended 12-31-12 |
| | Shares | Amount | Shares | Amount |
|
| Class R6 shares | | | | |
|
| Sold | 340,501 | $4,623,579 | 125,404 | $1,659,520 |
| Distributions reinvested | 9,305 | 126,225 | 2,732 | 36,576 |
| Repurchased | (118,439) | (1,614,492) | (15,458) | (207,702) |
| | | | | |
| Net increase | 231,367 | $3,135,312 | 112,678 | $1,488,394 |
| |
| Class 1 shares | | | | |
|
| Sold | 3,779,128 | $51,527,793 | 25,753,594 | $341,811,558 |
| Distributions reinvested | 6,795,937 | 92,176,010 | 8,441,260 | 112,325,015 |
| Repurchased | (38,851,350) | (529,393,602) | (12,200,592) | (162,035,261) |
| | | | | |
| Net increase (decrease) | (28,276,285) | ($385,689,799) | 21,994,262 | $292,101,312 |
| |
| Total net increase (decrease) | (23,492,927) | ($320,084,684) | 35,740,390 | $474,723,107 |
|
| 1 The inception date for Class R2 shares is 3-1-12. | | | |
Affiliates of the Trust owned shares of beneficial interest of the following portfolios on December 31, 2013.
| | | | |
| Portfolio | Class | % by Class | | |
| | |
| Lifestyle Aggressive | R2 | 5% | | |
| Lifestyle Aggressive | R6 | 3% | | |
| Lifestyle Growth | R2 | 1% | | |
| Lifestyle Growth | R6 | 1% | | |
| Lifestyle Balanced | R2 | 2% | | |
| Lifestyle Balanced | R6 | 1% | | |
| Lifestyle Moderate | R2 | 4% | | |
| Lifestyle Moderate | R6 | 1% | | |
| Lifestyle Conservative | R2 | 6% | | |
| Lifestyle Conservative | R6 | 2% | | |
Affiliates of the Trust owned 100% of shares of beneficial interest of Class 1 in each portfolio and 100% of Class 5 for Lifestyle Growth, Lifestyle Balanced and Lifestyle Moderate on December 31, 2013.
Note 6 — Purchase and sale of securities
The following summarizes the purchases and sales of the affiliated underlying funds for the year ended December 31, 2013:
| | | | |
| Portfolio | Purchases | Sales | | |
| | |
| Lifestyle Aggressive | $943,341,633 | $868,122,095 | | |
| Lifestyle Growth | 3,028,078,902 | 2,570,216,109 | | |
| Lifestyle Balanced | 3,348,856,911 | 2,678,953,085 | | |
| Lifestyle Moderate | 953,278,282 | 761,514,823 | | |
| Lifestyle Conservative | 665,835,717 | 946,795,831 | | |
Note 7 — Investment in affiliated underlying funds
The portfolios invest primarily in affiliated underlying funds that are managed by the Advisor and its affiliates. The portfolios do not invest in the affiliated underlying funds for the purpose of exercising management or control; however, the portfolios’ investment may represent a significant portion of each underlying fund’s net assets. For the year ended December 31, 2013, the following portfolios held 5% or more of an underlying fund’s net assets:
| |
| | Percent of Underlying |
| Portfolio Affiliate Class NAV | Funds’ Net Assets |
|
| Lifestyle Aggressive | |
| John Hancock Funds | |
| Financial Industries | 8.2% |
| Seaport | 10.4% |
| Small Cap Core | 21.3% |
| John Hancock Funds II | |
| All Cap Core | 21.7% |
| Alpha Opportunities | 16.7% |
| Blue Chip Growth | 8.9% |
| Capital Appreciation Value | 8.3% |
| Capital Appreciation | 8.9% |
| China Emerging Leaders | 17.0% |
| Currency Strategies | 6.9% |
| Emerging Markets | 14.6% |
| |
| | Percent of Underlying |
| Portfolio Affiliate Class NAV | Funds’ Net Assets |
|
| Lifestyle Aggressive (continued) | |
| Equity-Income | 10.3% |
| Fundamental Global Franchise | 9.4% |
| Fundamental Large Cap Value | 13.7% |
| Fundamental Value | 14.4% |
| Global Equity | 12.0% |
| Global Real Estate | 7.3% |
| Health Sciences | 13.7% |
| International Growth Opportunities | 10.0% |
| International Growth Stock | 15.1% |
| International Small Cap | 12.7% |
| International Small Company | 15.1% |
| International Value | 11.1% |
| Mid Cap Stock | 11.7% |
| |
| 46 | Lifestyle Portfolios | Annual report |
| |
| | Percent of Underlying |
| Portfolio Affiliate Class NAV | Funds’ Net Assets |
|
| Lifestyle Aggressive (continued) | |
| Mid Value | 14.7% |
| Mutual Shares | 15.6% |
| Natural Resources | 10.9% |
| Real Estate Equity | 9.5% |
| Redwood | 6.9% |
| Science & Technology | 14.2% |
| Small Cap Growth | 15.9% |
| Small Cap Opportunities | 12.7% |
| Small Cap Value | 17.4% |
| Small Company Growth | 17.3% |
| Small Company Value | 11.0% |
| Technical Opportunities | 15.0% |
| U.S. Equity | 6.2% |
| Value | 16.0% |
| John Hancock Funds III | |
| International Core | 8.5% |
| International Value Equity | 15.1% |
| Rainier Growth | 6.7% |
| Strategic Growth | 11.6% |
| John Hancock Investment Trust | |
| Small Cap Intrinsic Value | 11.4% |
| Lifestyle Growth | |
| John Hancock Funds | |
| Financial Industries | 21.1% |
| Global Short Duration Credit | 26.1% |
| Seaport | 31.6% |
| Small Cap Core | 43.5% |
| John Hancock Funds II | |
| Active Bond | 10.6% |
| All Cap Core | 51.0% |
| Alpha Opportunities | 41.6% |
| Asia Total Return Bond | 20.7% |
| Blue Chip Growth | 24.3% |
| Capital Appreciation Value | 32.1% |
| Capital Appreciation | 24.3% |
| China Emerging Leaders | 37.8% |
| Currency Strategies | 20.2% |
| Emerging Markets | 33.5% |
| Emerging Markets Debt | 21.2% |
| Equity-Income | 27.9% |
| Floating Rate Income | 10.6% |
| Focused High Yield Fund | 12.0% |
| Fundamental Global Franchise | 32.2% |
| Fundamental Large Cap Value | 36.0% |
| Fundamental Value | 34.4% |
| Global Bond | 9.0% |
| Global Equity | 30.9% |
| Global High Yield | 17.8% |
| Global Real Estate | 25.5% |
| Health Sciences | 36.4% |
| High Yield | 11.7% |
| International Growth Opportunities | 24.1% |
| International Growth Stock | 36.1% |
| International Small Cap | 28.5% |
| International Small Company | 34.7% |
| International Value | 26.4% |
| Mid Cap Stock | 30.0% |
| Mid Value | 37.6% |
| Mutual Shares | 41.9% |
| Natural Resources | 24.3% |
| Real Estate Equity | 28.0% |
| Real Return Bond | 12.3% |
| Redwood | 21.1% |
| Science & Technology | 37.2% |
| Short Duration Credit Opportunities | 13.5% |
| |
| | Percent of Underlying |
| Portfolio Affiliate Class NAV | Funds’ Net Assets |
|
| Lifestyle Growth (continued) | |
| Small Cap Growth | 33.4% |
| Small Cap Opportunities | 26.7% |
| Small Cap Value | 36.3% |
| Small Company Growth | 36.3% |
| Small Company Value | 23.4% |
| Spectrum Income | 14.1% |
| Strategic Income Opportunities | 5.7% |
| Technical Opportunities | 40.4% |
| Total Return | 7.2% |
| U.S. Equity | 26.4% |
| U.S. High Yield Bond | 17.6% |
| Value | 40.9% |
| John Hancock Funds III | |
| Global Shareholder Yield | 9.4% |
| International Core | 20.2% |
| International Value Equity | 35.5% |
| Rainier Growth | 18.4% |
| Strategic Growth | 31.0% |
| John Hancock Investment Trust | |
| Small Cap Intrinsic Value | 24.7% |
| Lifestyle Balanced | |
| John Hancock Funds | |
| Financial Industries | 17.5% |
| Global Short Duration Credit | 36.2% |
| Seaport | 28.0% |
| Small Cap Core | 35.1% |
| John Hancock Funds II | |
| Active Bond | 32.1% |
| All Cap Core | 27.3% |
| Alpha Opportunities | 27.0% |
| Asia Total Return Bond | 36.7% |
| Blue Chip Growth | 19.0% |
| Capital Appreciation | 19.0% |
| Capital Appreciation Value | 31.1% |
| China Emerging Leaders | 28.3% |
| Core Bond | 33.3% |
| Currency Strategies | 24.5% |
| Emerging Markets | 23.4% |
| Emerging Markets Debt | 33.4% |
| Equity-Income | 21.9% |
| Floating Rate Income | 22.9% |
| Focused High Yield | 20.6% |
| Fundamental Global Franchise | 31.4% |
| Fundamental Large Cap Value | 28.4% |
| Fundamental Value | 24.3% |
| Global Bond | 30.6% |
| Global Equity | 29.0% |
| Global High Yield | 32.5% |
| Global Real Estate | 34.0% |
| Health Sciences | 32.7% |
| High Yield | 22.4% |
| International Growth Opportunities | 21.5% |
| International Growth Stock | 29.9% |
| International Small Cap | 22.2% |
| International Small Company | 26.9% |
| International Value | 22.2% |
| Investment Quality Bond | 24.5% |
| Mid Cap Stock | 21.4% |
| Mid Value | 26.9% |
| Mutual Shares | 32.6% |
| Natural Resources | 24.5% |
| Real Estate Equity | 29.8% |
| Real Return Bond | 26.7% |
| Redwood | 22.7% |
| Science & Technology | 31.8% |
| |
| Annual report | Lifestyle Portfolios | 47 |
| |
| | Percent of Underlying |
| Portfolio Affiliate Class NAV | Funds’ Net Assets |
|
| Lifestyle Balanced (continued) | |
| Short Duration Credit Opportunities | 38.2% |
| Small Cap Growth | 26.9% |
| Small Cap Opportunities | 21.4% |
| Small Cap Value | 30.7% |
| Small Company Growth | 29.0% |
| Small Company Value | 19.1% |
| Spectrum Income | 42.8% |
| Strategic Income Opportunities | 12.7% |
| Technical Opportunities | 25.5% |
| Total Return | 21.8% |
| U.S. Equity | 25.7% |
| U.S. High Yield Bond | 33.2% |
| Value | 32.0% |
| John Hancock Funds III | |
| Global Shareholder Yield | 9.7% |
| International Core | 16.7% |
| International Value Equity | 30.4% |
| Rainier Growth | 14.6% |
| Strategic Growth | 24.2% |
| John Hancock Investment Trust | |
| Small Cap Intrinsic Value | 19.8% |
| Lifestyle Moderate | |
| John Hancock Funds | |
| Enduring Equity | 23.3% |
| Global Short Duration Credit | 13.8% |
| Seaport | 7.0% |
| John Hancock Funds II | |
| Active Bond | 20.9% |
| Alpha Opportunities | 5.4% |
| Asia Total Return Bond | 16.3% |
| Capital Appreciation Value | 9.0% |
| Core Bond | 22.0% |
| Currency Strategies | 8.4% |
| Emerging Markets Debt Fund | 16.4% |
| Equity-Income | 7.8% |
| Floating Rate Income | 11.3% |
| Focused High Yield Fund | 8.0% |
| Fundamental Global Franchise | 7.8% |
| Fundamental Large Cap Value | 10.7% |
| Fundamental Value | 6.4% |
| Global Bond | 19.2% |
| Global Equity | 7.3% |
| Global High Yield | 13.7% |
| Global Real Estate | 7.3% |
| High Yield | 8.7% |
| International Growth Stock | 6.0% |
| |
| Percent of Underlying |
| Portfolio Affiliate Class NAV | Funds’ Net Assets |
|
| Lifestyle Moderate (continued) | |
| International Small Company | 5.3% |
| Investment Quality Bond | 19.0% |
| Mid Value | 7.6% |
| Natural Resources | 5.5% |
| Real Estate Equity | 9.5% |
| Real Return Bond | 11.6% |
| Redwood | 8.7% |
| Short Duration Credit Opportunities Fund | 15.5% |
| Small Cap Growth | 6.9% |
| Small Cap Value | 8.0% |
| Small Company Growth | 7.2% |
| Small Company Value | 5.0% |
| Spectrum Income | 17.0% |
| Strategic Income Opportunities | 5.2% |
| Total Return | 14.2% |
| U.S. Equity | 8.2% |
| U.S. High Yield Bond | 12.7% |
| John Hancock Funds III | |
| International Value Equity | 6.1% |
| Strategic Growth | 5.0% |
| Lifestyle Conservative | |
| John Hancock Funds | |
| Enduring Equity | 76.4% |
| Global Short Duration Credit | 13.1% |
| Seaport | 5.7% |
| John Hancock Funds II | |
| Active Bond | 21.5% |
| Asia Total Return Bond | 15.2% |
| Core Bond | 29.4% |
| Currency Strategies | 7.2% |
| Emerging Markets Debt | 17.7% |
| Floating Rate Income | 11.0% |
| Focused High Yield Fund | 5.7% |
| Global Bond | 21.0% |
| Global High Yield | 8.5% |
| Global Real Estate | 5.8% |
| High Yield | 6.0% |
| Investment Quality Bond | 43.3% |
| Real Estate Equity | 7.6% |
| Real Return Bond | 18.8% |
| Redwood | 6.9% |
| Short Duration Credit Opportunities | 14.3% |
| Short Term Government Income | 64.7% |
| Spectrum Income | 16.0% |
| Total Return | 14.5% |
| U.S. High Yield Bond | 8.6% |
Information regarding the portfolios’ fiscal year to date purchases and sales of the affiliated underlying funds as well as income and capital gains earned by the portfolios’ from their investments in affiliated underlying funds as follows:
| | | | | | | | |
|
| | | | | | Dividends And Distributions | | |
| |
| |
| | | | | | Income | Capital Gains | | |
| | Beginning | Shares | | Ending Share | Distributions | Distributions | Realized | |
| Security | Share Amount | Purchased | Shares Sold | Amount | Received | Received | Gain (Loss) | Ending Value |
|
| Lifestyle Aggressive | | | | | | | | |
| All Cap Core | 11,150,015 | 227,263 | (636,308) | 10,740,970 | $1,627,085 | — | $800,947 | $140,814,122 |
| All Cap Value | 8,411,073 | 1,056,922 | (9,467,995) | — | 446,315 | $12,310,728 | 16,523,684 | — |
| Alpha Opportunities | 18,963,750 | 4,371,178 | (1,068,372) | 22,266,556 | 1,389,602 | 32,207,189 | 383,911 | 282,785,261 |
| Blue Chip Growth | 8,337,408 | 328,759 | (1,935,228) | 6,730,939 | — | 5,065,503 | 22,262,324 | 226,967,263 |
| Capital Appreciation | 13,301,748 | 1,109,125 | (3,127,530) | 11,283,343 | 206,665 | 10,201,836 | 16,208,815 | 191,139,832 |
| Capital Appreciation | | | | | | | | |
| Value | 16,845,586 | 2,229,838 | (6,161,680) | 12,913,744 | 2,006,230 | 17,604,606 | 9,928,529 | 151,478,212 |
| China Emerging Leaders | 5,296,110 | 1,431,039 | — | 6,727,149 | 287,696 | 1,665,804 | — | 59,938,896 |
| Currency Strategies | 7,845,499 | 3,200,222 | (1,379,914) | 9,665,807 | — | 5,793,441 | 372,131 | 90,085,317 |
| |
| 48 | Lifestyle Portfolios | Annual report |
| | | | | | | | |
|
| | | | | | Dividends And Distributions | | |
| |
| | |
| | | | | | Income | Capital Gains | | |
| | Beginning | Shares | | Ending Share | Distributions | Distributions | Realized | |
| Security | Share Amount | Purchased | Shares Sold | Amount | Received | Received | Gain (Loss) | Ending Value |
|
| Lifestyle Aggressive (continued) | | | | | | | |
| Disciplined Value | 5,421,675 | 266,063 | (1,053,217) | 4,634,521 | $718,397 | $3,897,801 | $4,358,314 | $83,421,374 |
| Emerging Markets | 33,173,820 | 1,031,834 | (1,356,155) | 32,849,499 | 6,421,989 | — | (2,108,411) | 336,050,374 |
| Equity-Income | 10,169,521 | 385,340 | (1,423,048) | 9,131,813 | 4,082,723 | 1,167,460 | 6,928,211 | 183,823,386 |
| Financial Industries | — | 4,564,140 | (170,448) | 4,393,692 | 552,681 | — | 60,724 | 72,979,232 |
| Fundamental | | | | | | | | |
| Global Franchise | 3,295,866 | 223,184 | (387,651) | 3,131,399 | 378,342 | 1,755,042 | 769,584 | 40,708,186 |
| Fundamental | | | | | | | | |
| Large Cap Value | 10,136,797 | 2,299,785 | (1,216,132) | 11,220,450 | 1,708,765 | 13,145,613 | 835,461 | 145,865,850 |
| Fundamental Value | 9,735,686 | 53,227 | (2,408,522) | 7,380,391 | 1,111,909 | — | 9,612,294 | 156,169,073 |
| Global Absolute | | | | | | | | |
| Return Strategies | 3,540,759 | 419,142 | (81,664) | 3,878,237 | 659,700 | — | 1,473 | 42,854,522 |
| Global Equity | — | 4,220,203 | (40,905) | 4,179,298 | 349,598 | 220,877 | 5,390 | 46,306,619 |
| Global Real Estate | 5,693,554 | 755,393 | (3,668,839) | 2,780,108 | 877,777 | — | 2,903,583 | 22,880,288 |
| Global Shareholder | | | | | | | | |
| Yield | 8,200,838 | 341,346 | (4,470,395) | 4,071,789 | 2,025,405 | 1,728,243 | 7,025,718 | 47,232,751 |
| Health Sciences | 4,753,051 | 848,098 | (825,864) | 4,775,285 | — | 13,731,422 | 3,040,485 | 81,036,583 |
| Heritage | 3,257,608 | 12,152 | (3,269,760) | — | — | — | 7,352,492 | — |
| International Core | 3,300,090 | 374,253 | (37,198) | 3,637,145 | 4,009,037 | — | 53,194 | 124,972,304 |
| International Growth | | | | | | | | |
| Opportunities Fund | 4,804,712 | 764,864 | — | 5,569,576 | 624,164 | 865,517 | — | 78,531,016 |
| International | | | | | | | | |
| Growth Stock | 7,121,693 | 815,265 | (92,679) | 7,844,279 | 1,657,271 | — | 21,316 | 105,662,443 |
| International Small Cap | 2,926,660 | 1,833,538 | (69,136) | 4,691,062 | 1,305,856 | — | 31,803 | 88,473,426 |
| International | | | | | | | | |
| Small Company | 5,573,191 | 3,208,210 | (177,016) | 8,604,385 | 1,155,830 | — | 87,473 | 89,399,559 |
| International Value | 11,429,998 | 1,427,870 | — | 12,857,868 | 3,434,214 | — | — | 226,684,212 |
| International | | | | | | | | |
| Value Equity | 5,735,726 | 1,757,986 | — | 7,493,712 | 980,452 | 2,699,539 | — | 68,717,338 |
| Mid Cap Stock | 5,874,205 | 3,490,013 | (396,155) | 8,968,063 | 2,666 | 21,919,162 | 188,949 | 191,737,187 |
| Mid Cap Value Equity | 1,790,226 | 8,116 | (1,798,342) | — | — | — | 5,724,068 | — |
| Mid Value | 6,954,992 | 2,744,305 | (539,746) | 9,159,551 | 784,187 | 4,699,063 | 381,433 | 150,033,446 |
| Mutual Shares | 4,978,543 | 420,567 | (763,699) | 4,635,411 | 996,974 | 4,123,238 | 1,811,006 | 63,273,364 |
| Natural Resources | 4,522,074 | 1,084,154 | (216,948) | 5,389,280 | 652,126 | — | (460,204) | 91,779,442 |
| Rainier Growth | 2,991,115 | 345,119 | (793,479) | 2,542,755 | 81,032 | 7,098,152 | 6,864,319 | 70,205,465 |
| Real Estate Equity | 1,991,241 | 496,229 | (128,416) | 2,359,054 | 348,335 | — | 52,098 | 22,670,511 |
| Redwood | 3,403,217 | 516,667 | (1,050,612) | 2,869,272 | — | 588,378 | 574,969 | 32,422,779 |
| Science & Technology | — | 11,532,371 | (796,679) | 10,735,692 | 120,961 | 2,691,525 | 745,959 | 138,919,857 |
| Seaport | — | 1,360,396 | — | 1,360,396 | — | — | — | 13,671,977 |
| Small Cap Core | — | 2,129,000 | — | 2,129,000 | — | — | — | 21,737,090 |
| Small Cap Growth | 2,578,742 | 1,314,129 | (492,432) | 3,400,439 | — | 3,450,273 | 432,466 | 36,350,696 |
| Small Cap | | | | | | | | |
| Intrinsic Value | 3,064,577 | — | (1,644,870) | 1,419,707 | — | — | 3,124,940 | 21,764,111 |
| Small Cap | | | | | | | | |
| Opportunities | 893,397 | 99,288 | (134,871) | 857,814 | 57,179 | 2,287,077 | 1,603,844 | 25,931,707 |
| Small Cap Value | 1,420,493 | 362,210 | (146,541) | 1,636,162 | 57,971 | 2,950,654 | 164,589 | 31,447,027 |
| Small Company Growth | 1,225,458 | 632,354 | (224,401) | 1,633,411 | — | 1,475,173 | 549,878 | 33,109,233 |
| Small Company Value | 1,180,615 | 182,232 | (105,988) | 1,256,859 | 83,015 | 238,538 | 301,942 | 47,232,751 |
| Smaller Company | | | | | | | | |
| Growth | 2,037,198 | — | (2,037,198) | — | — | — | 5,170,733 | — |
| Strategic Growth | 11,362,924 | 441,571 | (840,283) | 10,964,212 | 617,857 | 5,748,122 | 2,123,231 | 169,945,292 |
| Technical Opportunities | 7,816,614 | 2,543,065 | (917,127) | 9,442,552 | — | 11,664,871 | 323,161 | 133,423,262 |
| U.S. Equity | 11,776,511 | 836,488 | (7,019,275) | 5,593,724 | 1,352,398 | 7,226,693 | 27,876,474 | 71,543,726 |
| Value | 2,489,784 | 3,184,997 | (250,067) | 5,424,714 | 282,593 | 3,348,157 | 121,843 | 63,903,134 |
| | | | | | $43,454,997 | $203,569,697 | $165,135,143 | $4,616,079,496 |
|
| Lifestyle Growth | | | | | | | | |
| Active Bond | 18,067,384 | 7,546,311 | (7,664,455) | 17,949,240 | $7,840,288 | $1,075,750 | ($1,632,339) | $179,492,403 |
| All Cap Value | 22,399,611 | 2,746,486 | (25,146,097) | — | 1,159,782 | 31,990,299 | 74,547,577 | — |
| All Cape Core | 26,604,478 | 440,213 | (1,823,601) | 25,221,090 | 3,820,592 | — | 1,701,852 | 330,648,483 |
| Alpha Opportunities | 46,763,927 | 10,678,968 | (2,101,108) | 55,341,787 | 3,432,788 | 79,562,688 | 2,131,120 | 702,840,695 |
| Asia Total Return Bond | — | 9,527,005 | — | 9,527,005 | 3,038,162 | 188,601 | — | 86,886,288 |
| Blue Chip Growth | 22,395,737 | 450,580 | (4,471,681) | 18,374,636 | — | 13,772,876 | 56,009,203 | 619,592,724 |
| Capital Appreciation | 35,656,398 | 2,154,363 | (6,993,394) | 30,817,367 | 561,748 | 27,730,205 | 30,473,314 | 522,046,205 |
| |
| Annual report | Lifestyle Portfolios | 49 |
| | | | | | | | |
|
| | | | | | Dividends And Distributions | | |
| |
| | |
| | | | | | Income | Capital Gains | | |
| | Beginning | Shares | | Ending Share | Distributions | Distributions | Realized | |
| Security | Share Amount | Purchased | Shares Sold | Amount | Received | Received | Gain (Loss) | Ending Value |
|
| Lifestyle Growth (continued) | | | | | | | |
| Capital Appreciation | | | | | | | | |
| Value | 59,158,582 | 6,570,626 | (15,736,194) | 49,993,014 | $7,760,840 | $68,101,145 | $25,018,365 | $586,418,055 |
| China Emerging Leaders | 12,385,789 | 2,540,946 | — | 14,926,735 | 638,363 | 3,696,219 | — | 132,997,207 |
| Currency Strategies | 24,504,379 | 6,105,013 | (2,198,669) | 28,410,723 | — | 17,359,474 | 987,689 | 264,787,942 |
| Disciplined Value | 14,390,201 | 711,531 | (2,514,697) | 12,587,035 | 1,921,206 | 10,423,866 | 8,169,115 | 226,566,638 |
| Emerging Markets | 77,217,408 | 2,863,353 | (4,798,084) | 75,282,677 | 14,717,562 | — | (8,936,942) | 770,141,789 |
| Emerging Markets | | | | | | | | |
| Debt Fund | — | 4,814,967 | (54,742) | 4,760,225 | 979,678 | 195,994 | (25,729) | 44,936,522 |
| Equity-Income | 27,160,127 | 1,496,401 | (4,037,917) | 24,618,611 | 10,952,370 | 3,131,845 | 9,244,141 | 495,572,645 |
| Financial Industries | — | 11,577,527 | (278,802) | 11,298,725 | 1,402,846 | — | 102,768 | 187,671,817 |
| Floating Rate Income | 34,092,995 | 8,980,643 | (1,285,827) | 41,787,811 | 17,675,544 | 1,010,380 | (375,371) | 393,223,298 |
| Focused High Yield Fund | — | 37,588,679 | — | 37,588,679 | 2,036,868 | — | — | 145,468,189 |
| Fundamental | | | | | | | | |
| Global Franchise | 11,259,584 | 598,819 | (1,106,164) | 10,752,239 | 1,299,107 | 6,026,262 | 2,697,272 | 139,779,112 |
| Fundamental Large | | | | | | | | |
| Cap Value | 27,082,742 | 4,002,684 | (1,586,723) | 29,498,703 | 4,454,069 | 34,265,373 | 1,180,232 | 383,483,141 |
| Fundamental Value | 23,373,657 | 125,487 | (5,905,618) | 17,593,526 | 2,621,429 | — | 22,593,836 | 372,279,005 |
| Global Absolute | | | | | | | | |
| Return Strategies | 10,930,297 | 885,738 | (25,420) | 11,790,615 | 2,005,621 | — | 2,752 | 130,286,290 |
| Global Bond | 5,990,011 | 1,012,473 | (2,643,377) | 4,359,107 | — | — | 18,781 | 52,091,330 |
| Global Equity | — | 10,792,556 | (8,144) | 10,784,412 | 894,135 | 564,918 | 326 | 119,491,286 |
| Global High Yield | 8,840,204 | 1,313,679 | (346,221) | 9,807,662 | 5,559,412 | 662,090 | (255,798) | 96,997,773 |
| Global Real Estate | 17,777,367 | 1,087,388 | (9,113,664) | 9,751,091 | 3,143,077 | — | 10,195,504 | 80,251,482 |
| Global Shareholder Yield | 28,390,488 | 1,365,993 | (12,305,157) | 17,451,324 | 7,714,820 | 7,335,793 | 19,761,124 | 202,435,356 |
| Global Short Duration | | | | | | | | |
| Credit Fund | — | 2,827,658 | (150,264) | 2,677,394 | 269,862 | — | (7,436) | 26,532,977 |
| Health Sciences | 12,790,614 | 2,152,362 | (2,270,117) | 12,672,859 | — | 36,310,340 | 9,428,334 | 215,058,419 |
| Heritage | 8,269,472 | — | (8,269,472) | — | — | — | 17,214,150 | — |
| High Income | 13,404,791 | 4,615,422 | (18,020,213) | — | 8,778,413 | — | 23,700,944 | — |
| High Yield | 12,866,134 | 2,131,102 | (1,174,849) | 13,822,387 | 8,801,758 | — | (39,423) | 128,686,422 |
| International Core | 7,769,257 | 902,926 | — | 8,672,183 | 9,462,127 | — | — | 297,976,210 |
| International | | | | | | | | |
| Growth Opportunities | 11,385,024 | 2,044,139 | — | 13,429,163 | 1,495,110 | 2,073,243 | — | 189,351,193 |
| International | | | | | | | | |
| Growth Stock | 16,738,534 | 2,058,128 | — | 18,796,662 | 3,924,823 | — | — | 253,191,038 |
| International Small Cap | 6,057,878 | 4,438,717 | — | 10,496,595 | 2,879,511 | — | — | 197,965,774 |
| International | | | | | | | | |
| Small Company | 11,533,629 | 8,223,868 | — | 19,757,497 | 2,600,530 | — | — | 205,280,396 |
| International Value | 26,977,265 | 3,625,047 | — | 30,602,312 | 8,173,625 | — | — | 539,518,764 |
| International Value Equity | 13,465,959 | 4,188,448 | — | 17,654,407 | 2,317,385 | 6,380,602 | — | 161,890,912 |
| Mid Cap Stock | 14,952,250 | 8,293,787 | (290,764) | 22,955,273 | 6,716 | 55,219,069 | 427,105 | 490,783,734 |
| Mid Cap Value Equity | 4,471,795 | — | (4,471,795) | — | — | — | 13,907,835 | — |
| Mid Value | 17,718,109 | 6,529,487 | (799,148) | 23,448,448 | 1,992,043 | 11,936,869 | 819,379 | 384,085,575 |
| Mutual Shares | 13,240,973 | 1,016,007 | (1,821,832) | 12,435,148 | 2,670,709 | 11,045,392 | 4,707,303 | 169,739,768 |
| Natural Resources | 10,581,387 | 2,053,407 | (602,839) | 12,031,955 | 1,456,641 | — | (878,139) | 204,904,201 |
| Rainer Growth | 7,992,102 | 803,893 | (1,820,200) | 6,975,795 | 220,244 | 19,292,612 | 20,249,802 | 192,601,691 |
| Real Estate Equity | 6,217,385 | 1,009,401 | (292,570) | 6,934,216 | 1,047,752 | — | 173,957 | 66,637,817 |
| Real Return Bond | 4,589,517 | 1,393,308 | (152,837) | 5,829,988 | 1,158,555 | — | (202,040) | 65,354,162 |
| Redwood | 10,684,529 | 867,839 | (2,768,860) | 8,783,508 | — | 1,825,691 | 1,577,206 | 99,253,640 |
| Science & Technology | — | 29,740,789 | (1,548,932) | 28,191,857 | 315,009 | 7,009,304 | 1,482,015 | 364,802,632 |
| Seaport | — | 4,131,000 | — | 4,131,000 | — | — | — | 41,516,550 |
| Short Duration Credit | | | | | | | | |
| Opportunities Fund | 15,546,416 | 2,773,734 | (2,307,440) | 16,012,710 | 5,725,892 | 1,973,857 | 165,956 | 162,368,881 |
| Small Cap Core | — | 4,357,000 | — | 4,357,000 | — | — | — | 44,484,970 |
| Small Cap Growth | 5,391,817 | 2,617,874 | (855,312) | 7,154,379 | — | 7,177,149 | 456,967 | 76,480,308 |
| Small Cap Intrinsic Value | 6,334,368 | — | (3,249,547) | 3,084,821 | — | — | 3,794,444 | 47,290,313 |
| Small Cap Opportunities | 1,867,977 | 179,962 | (244,090) | 1,803,849 | 118,785 | 4,751,210 | 2,482,291 | 54,530,367 |
| Small Cap Value | 2,956,868 | 730,686 | (272,166) | 3,415,388 | 121,010 | 6,159,310 | 288,562 | 65,643,755 |
| Small Company Growth | 2,537,872 | 1,258,618 | (382,050) | 3,414,440 | — | 3,045,949 | 940,842 | 69,210,704 |
| Small Company Value | 2,457,543 | 375,435 | (156,371) | 2,676,607 | 175,801 | 505,151 | 915,172 | 100,586,900 |
| Smaller Company Growth | 4,223,730 | — | (4,223,730) | — | — | — | 12,555,046 | — |
| Spectrum Income | 14,685,432 | 1,799,637 | (2,897,942) | 13,587,127 | 4,940,149 | 3,628,414 | 1,232,433 | 146,876,839 |
| Strategic Growth | 30,759,336 | 1,150,220 | (2,610,286) | 29,299,270 | 1,639,440 | 15,252,227 | 6,600,126 | 454,138,680 |
| |
| 50 | Lifestyle Portfolios | Annual report |
| | | | | | | | |
|
| | | | | | Dividends And Distributions | | |
| |
| | |
| | | | | | Income | Capital Gains | | |
| | Beginning | Shares | | Ending Share | Distributions | Distributions | Realized | |
| Security | Share Amount | Purchased | Shares Sold | Amount | Received | Received | Gain (Loss) | Ending Value |
|
| Lifestyle Growth (continued) | | | | | | | |
| Strategic Income | | | | | | | | |
| Opportunities | 21,118,114 | 3,473,902 | (2,876,329) | 21,715,687 | $11,112,120 | $2,603,620 | $(109,176) | $234,312,260 |
| Technical Opportunities | 20,941,273 | 6,127,841 | (1,748,369) | 25,320,745 | — | 30,915,391 | 1,027,984 | 357,782,126 |
| Total Return | 13,280,734 | 5,468,561 | (5,522,147) | 13,227,148 | 3,614,428 | 2,926,208 | (698,366) | 179,492,403 |
| U.S. Equity | 40,731,026 | 2,882,455 | (19,769,525) | 23,843,956 | 5,743,451 | 30,690,782 | 67,982,618 | 304,964,203 |
| U.S. High Yield Bond | 9,258,304 | 1,324,735 | (1,142,487) | 9,440,552 | 7,707,434 | 2,217,934 | (217,283) | 115,552,354 |
| Value | 6,372,147 | 8,010,598 | (481,528) | 13,901,217 | 720,595 | 8,537,588 | 237,813 | 163,756,331 |
| | | | | | $204,820,225 | $578,571,690 | $443,825,213 | $14,138,988,944 |
|
| Lifestyle Balanced | | | | | | | | |
| Active Bond | 51,498,893 | 13,473,902 | (10,793,297) | 54,179,498 | $21,890,958 | $2,896,831 | ($1,589,422) | $541,794,977 |
| All Cap Core | 14,951,580 | 356,149 | (1,804,866) | 13,502,863 | 2,045,468 | — | 6,851,760 | 177,022,534 |
| All Cap Value | 18,046,388 | 2,583,339 | (20,629,727) | — | 1,090,889 | 30,090,013 | 56,214,805 | — |
| Alpha Opportunities | 29,773,903 | 7,587,411 | (1,414,857) | 35,946,457 | 2,226,944 | 51,614,519 | 1,377,912 | 456,520,005 |
| Asia Total Return Bond | — | 16,877,923 | — | 16,877,923 | 5,382,369 | 334,123 | — | 153,926,657 |
| Blue Chip Growth | 18,005,919 | 321,522 | (3,980,516) | 14,346,925 | — | 10,761,348 | 32,638,616 | 483,778,303 |
| Capital Appreciation | 28,733,528 | 1,362,610 | (5,996,645) | 24,099,493 | 442,019 | 21,819,856 | 15,071,757 | 408,245,403 |
| Capital Appreciation | | | | | | | | |
| Value | 51,954,484 | 6,309,800 | (9,863,353) | 48,400,931 | 7,513,688 | 65,932,388 | 16,471,830 | 567,742,916 |
| China Emerging Leaders | 9,109,814 | 2,044,537 | — | 11,154,351 | 477,032 | 2,762,086 | — | 99,385,265 |
| Core Bond | 17,094,390 | 1,735,220 | (4,605,467) | 14,224,143 | 4,278,578 | 660,156 | (1,731,734) | 178,370,749 |
| Currency Strategies | 30,370,888 | 6,905,090 | (2,846,826) | 34,429,152 | — | 20,846,481 | 1,184,478 | 320,879,700 |
| Disciplined Value | 11,626,473 | 553,377 | (2,381,504) | 9,798,346 | 1,494,172 | 8,106,913 | 7,440,862 | 176,370,222 |
| Emerging Markets | 55,734,007 | 2,525,459 | (5,714,256) | 52,545,210 | 10,272,448 | — | (6,117,129) | 537,537,496 |
| Emerging Markets | | | | | | | | |
| Debt Fund | — | 7,552,134 | (40,526) | 7,511,608 | 1,558,162 | 309,277 | (19,047) | 70,909,575 |
| Equity-Income | 21,862,696 | 1,864,907 | (4,413,109) | 19,314,494 | 8,592,666 | 2,457,084 | 13,984,926 | 388,800,771 |
| Financial Industries | — | 9,551,860 | (162,597) | 9,389,263 | 1,163,819 | — | 62,874 | 155,955,658 |
| Floating Rate Income | 77,931,674 | 14,367,220 | (1,990,447) | 90,308,447 | 39,077,338 | 2,191,532 | (899,250) | 849,802,488 |
| Focused High | | | | | | | | |
| Yield Fund | — | 64,588,717 | — | 64,588,717 | 3,467,680 | — | — | 249,958,334 |
| Fundamental | | | | | | | | |
| Global Franchise | 11,131,987 | 586,509 | (1,234,313) | 10,484,183 | 1,266,720 | 5,876,026 | 2,841,428 | 136,294,373 |
| Fundamental | | | | | | | | |
| Large Cap Value | 21,767,588 | 3,115,698 | (1,606,136) | 23,277,150 | 3,514,664 | 27,038,484 | 1,903,947 | 302,602,949 |
| Fundamental Value | 15,411,831 | 88,511 | (3,090,984) | 12,409,358 | 1,848,990 | — | 15,063,962 | 262,582,015 |
| Global Absolute | | | | | | | | |
| Return Strategies | 15,067,759 | 905,903 | — | 15,973,662 | 2,717,170 | — | — | 176,508,969 |
| Global Bond | 20,362,205 | 2,832,262 | (8,387,607) | 14,806,860 | — | — | (1,293,441) | 176,941,975 |
| Global Equity | — | 10,127,733 | (22,457) | 10,105,276 | 837,828 | 529,343 | (8,309) | 111,966,460 |
| Global High Yield | 15,816,090 | 2,200,341 | (108,786) | 17,907,645 | 9,908,995 | 1,218,816 | (98,016) | 177,106,611 |
| Global Real Estate | 19,577,922 | 974,351 | (7,518,957) | 13,033,316 | 4,201,039 | — | 6,987,892 | 107,264,193 |
| Global Shareholder Yield | 28,694,161 | 1,387,338 | (12,094,595) | 17,986,904 | 7,729,415 | 7,565,860 | 19,890,899 | 208,648,091 |
| Global Short Duration | | | | | | | | |
| Credit Fund | — | 3,788,284 | (78,519) | 3,709,765 | 373,530 | — | (5,431) | 36,763,773 |
| Health Sciences | 11,768,434 | 1,930,668 | (2,331,547) | 11,367,555 | — | 32,570,377 | 12,604,267 | 192,907,414 |
| Heritage | 5,812,382 | 58,156 | (5,870,538) | — | — | — | 12,173,070 | — |
| High Income | 21,327,055 | 8,653,037 | (29,980,092) | — | 14,454,002 | — | 30,797,435 | — |
| High Yield | 23,387,105 | 4,402,896 | (1,465,858) | 26,324,143 | 16,070,079 | — | (26,019) | 245,077,770 |
| International Core | 6,354,992 | 799,408 | — | 7,154,400 | 7,806,090 | — | — | 245,825,177 |
| International Growth | | | | | | | | |
| Opportunities Fund | 9,394,721 | 2,591,530 | — | 11,986,251 | 1,343,259 | 1,862,673 | — | 169,006,142 |
| International Growth Stock | 13,634,650 | 1,913,092 | — | 15,547,742 | 3,246,435 | — | — | 209,428,091 |
| International Small Cap | 4,375,823 | 3,804,087 | — | 8,179,910 | 2,243,979 | — | — | 154,273,111 |
| International | | | | | | | | |
| Small Company | 8,331,155 | 6,959,102 | — | 15,290,257 | 2,012,541 | — | — | 158,865,771 |
| International Value | 22,136,156 | 3,614,354 | — | 25,750,510 | 6,877,749 | — | — | 453,981,491 |
| International Value Equity | 11,023,873 | 4,100,754 | — | 15,124,627 | 1,985,317 | 5,466,297 | — | 138,692,829 |
| Investment Quality Bond | 7,497,473 | 1,472,469 | (146,749) | 8,823,193 | 3,077,882 | 694,030 | (138,956) | 106,937,104 |
| Mid Cap Stock | 10,465,482 | 6,174,438 | (247,270) | 16,392,650 | 4,796 | 39,432,634 | 344,693 | 350,474,857 |
| Mid Cap Value Equity | 3,118,986 | 2,267 | (3,121,253) | — | — | — | 9,442,253 | — |
| Mid Value | 12,408,052 | 4,905,499 | (513,878) | 16,799,673 | 1,424,650 | 8,536,891 | 317,140 | 275,178,647 |
| Mutual Shares | 10,667,170 | 791,058 | (1,776,286) | 9,681,942 | 2,079,400 | 8,599,885 | 4,991,321 | 132,158,503 |
| Natural Resources | 11,040,258 | 1,608,648 | (488,653) | 12,160,253 | 1,472,173 | — | (453,291) | 207,089,108 |
| |
| Annual report | Lifestyle Portfolios | 51 |
| | | | | | | | |
|
| | | | | | Dividends And Distributions | | |
| |
| | |
| | | | | | Income | Capital Gains | | |
| | Beginning | Shares | | Ending Share | Distributions | Distributions | Realized | |
| Security | Share Amount | Purchased | Shares Sold | Amount | Received | Received | Gain (Loss) | Ending Value |
|
| Lifestyle Balanced (continued) | | | | | | | |
| Rainier Growth | 6,455,592 | 583,252 | (1,488,976) | 5,549,868 | $175,246 | $15,350,931 | $11,261,288 | $153,231,850 |
| Real Estate Equity | 6,847,104 | 911,178 | (379,729) | 7,378,553 | 1,109,675 | — | 218,260 | 70,907,893 |
| Real Return Bond | 15,189,135 | 2,578,122 | (5,048,006) | 12,719,251 | 3,009,547 | — | (3,590,635) | 142,582,806 |
| Redwood | 11,802,244 | 700,111 | (3,072,852) | 9,429,503 | — | 1,959,964 | 1,760,277 | 106,553,379 |
| Science & Technology | — | 25,361,281 | (1,232,369) | 24,128,912 | 270,476 | 6,018,398 | 976,184 | 312,228,120 |
| Seaport | — | 3,658,000 | — | 3,658,000 | — | — | — | 36,762,900 |
| Short Duration Credit | | | | | | | | |
| Opportunities Fund | 42,862,702 | 6,606,081 | (4,244,459) | 45,224,324 | 15,929,220 | 5,640,534 | 11,075 | 458,574,645 |
| Small Cap Core | — | 3,513,000 | — | 3,513,000 | — | — | — | 35,867,730 |
| Small Cap Growth | 4,433,646 | 2,166,659 | (841,481) | 5,758,824 | — | 5,817,034 | 684,101 | 61,561,824 |
| Small Cap Intrinsic Value | 5,077,995 | — | (2,610,642) | 2,467,353 | — | — | 4,960,888 | 37,824,518 |
| Small Cap Opportunities | 1,536,022 | 148,767 | (241,859) | 1,442,930 | 95,430 | 3,817,071 | 1,489,867 | 43,619,767 |
| Small Cap Value | 2,442,263 | 628,707 | (181,446) | 2,889,524 | 102,378 | 5,210,968 | 265,146 | 55,536,658 |
| Small Company Growth | 2,063,939 | 1,017,946 | (351,786) | 2,730,099 | — | 2,442,657 | 916,833 | 55,339,097 |
| Small Company Value | 2,029,839 | 331,921 | (175,015) | 2,186,745 | 143,626 | 412,700 | 1,148,451 | 82,177,871 |
| Smaller Company Growth | 3,423,755 | — | (3,423,755) | — | — | — | 6,894,151 | — |
| Spectrum Income | 40,449,244 | 4,603,274 | (3,778,988) | 41,273,530 | 14,291,799 | 11,068,951 | 704,282 | 446,166,860 |
| Strategic Growth | 24,372,418 | 1,095,388 | (2,594,592) | 22,873,214 | 1,279,870 | 11,907,036 | 5,226,799 | 354,534,819 |
| Strategic Income | | | | | | | | |
| Opportunities | 46,506,512 | 6,595,052 | (4,346,134) | 48,755,430 | 24,510,883 | 5,847,917 | (122,784) | 526,071,085 |
| Technical Opportunities | 11,686,455 | 5,328,802 | (1,041,682) | 15,973,575 | — | 19,515,855 | 1,857,864 | 225,706,619 |
| Total Return | 37,855,124 | 9,917,849 | (7,847,035) | 39,925,938 | 10,161,278 | 7,879,836 | (2,241,421) | 541,794,977 |
| U.S. Equity | 40,965,891 | 2,803,862 | (20,575,927) | 23,193,826 | 5,586,850 | 29,853,965 | 69,026,884 | 296,649,028 |
| U.S. High Yield Bond | 16,820,696 | 2,034,869 | (1,073,148) | 17,782,417 | 13,978,223 | 4,177,746 | (281,522) | 217,656,786 |
| Value | 4,489,148 | 6,659,138 | (263,914) | 10,884,372 | 564,209 | 6,684,762 | 207,191 | 128,217,899 |
| | | | | | $298,679,643 | $503,780,248 | $357,651,261 | $14,943,143,608 |
|
| Lifestyle Moderate | | | | | | | | |
| Active Bond | 33,358,416 | 3,251,692 | (1,349,571) | 35,260,537 | $13,497,110 | $1,771,233 | ($182,971) | $352,605,374 |
| All Cap Value | 5,603,175 | 882,942 | (6,486,117) | — | 372,715 | 10,280,599 | 8,792,651 | — |
| Alpha Opportunities | 6,645,833 | 1,350,394 | (815,544) | 7,180,683 | 447,938 | 10,381,985 | 1,107,912 | 91,194,678 |
| Asia Total Return Bond | — | 7,511,087 | — | 7,511,087 | 2,395,285 | 148,693 | — | 68,501,113 |
| Blue Chip Growth | 4,129,292 | 75,295 | (850,907) | 3,353,680 | — | 2,520,093 | 15,230,504 | 113,086,073 |
| Capital Appreciation | 6,582,228 | 355,013 | (1,257,889) | 5,679,352 | 104,115 | 5,139,549 | 3,999,132 | 96,208,215 |
| Capital Appreciation Value | 13,739,659 | 1,849,075 | (1,500,176) | 14,088,558 | 2,189,582 | 19,213,515 | 2,842,405 | 165,258,781 |
| Core Bond | 11,444,217 | 1,048,788 | (3,128,313) | 9,364,692 | 2,805,773 | 435,607 | (936,008) | 117,433,231 |
| Currency Strategies | 10,568,467 | 2,081,313 | (884,633) | 11,765,147 | — | 7,188,721 | 262,513 | 109,651,169 |
| Emerging Markets | 10,497,669 | 633,697 | (922,396) | 10,208,970 | 1,995,826 | — | (1,666,769) | 104,437,765 |
| Emerging Markets Debt Fund | — | 3,720,116 | (36,096) | 3,684,020 | 764,089 | 151,680 | (12,117) | 34,777,148 |
| Enduring Equity | — | 2,339,153 | — | 2,339,153 | 11,667 | — | — | 23,765,793 |
| Equity-Income | 6,860,771 | 1,049,211 | (1,022,318) | 6,887,664 | 3,064,195 | 876,211 | 2,628,386 | 138,648,681 |
| Floating Rate Income | 38,120,268 | 6,740,334 | (322,535) | 44,538,067 | 19,138,765 | 1,084,554 | (187,916) | 419,103,207 |
| Focused High Yield Fund | — | 27,628,780 | (2,581,638) | 25,047,142 | 1,465,602 | — | 40,098 | 96,932,438 |
| Fundamental | | | | | | | | |
| Global Franchise | 2,870,952 | 154,627 | (437,381) | 2,588,198 | 312,711 | 1,450,597 | 1,012,175 | 33,646,580 |
| Fundamental | | | | | | | | |
| Large Cap Value | 6,774,118 | 3,139,175 | (1,171,555) | 8,741,738 | 1,323,097 | 10,178,651 | 1,422,669 | 113,642,595 |
| Fundamental Value | 3,817,982 | 23,366 | (587,142) | 3,254,206 | 488,115 | — | 3,171,511 | 68,858,995 |
| Global Absolute | | | | | | | | |
| Return Strategies | 5,340,411 | 1,693,219 | — | 7,033,630 | 1,196,443 | — | — | 77,721,611 |
| Global Bond | 10,005,631 | 1,221,474 | (1,970,187) | 9,256,918 | — | — | (809,869) | 110,620,173 |
| Global Equity | — | 2,619,207 | (86,725) | 2,532,482 | 211,298 | 133,499 | 39,318 | 28,059,900 |
| Global High Yield | 6,802,459 | 939,967 | (208,915) | 7,533,511 | 4,264,727 | 510,090 | (179,597) | 74,506,423 |
| Global Real Estate | 5,098,103 | 284,105 | (2,576,804) | 2,805,404 | 904,268 | — | 6,744,300 | 23,088,474 |
| Global Shareholder Yield | 7,388,719 | 366,032 | (3,481,260) | 4,273,491 | 1,892,335 | 1,817,309 | 6,289,861 | 49,572,490 |
| Global Short Duration | | | | | | | | |
| Credit Fund | — | 1,418,440 | (8,196) | 1,410,244 | 141,366 | — | (738) | 13,975,522 |
| High Income | 9,132,773 | 3,682,744 | (12,815,517) | — | 6,231,771 | — | 9,913,447 | — |
| High Yield | 9,999,319 | 1,575,765 | (1,383,854) | 10,191,230 | 6,700,341 | — | (548,936) | 94,880,348 |
| International Core | 1,348,886 | 225,053 | (187,685) | 1,386,254 | 1,717,309 | — | 659,587 | 47,631,680 |
| International Growth | | | | | | | | |
| Opportunities | 1,983,116 | 456,676 | — | 2,439,792 | 273,419 | 379,146 | — | 34,401,068 |
| International Growth Stock | 2,888,238 | 491,560 | (277,308) | 3,102,490 | 705,716 | — | 361,709 | 41,790,544 |
| International Small Cap | 713,757 | 1,053,059 | (117,838) | 1,648,978 | 484,687 | — | 174,066 | 31,099,722 |
| |
| 52 | Lifestyle Portfolios | Annual report |
| | | | | | | | |
|
| | | | | | Dividends And Distributions | | |
| |
| | |
| | | | | | Income | Capital Gains | | |
| | Beginning | Shares | | Ending Share | Distributions | Distributions | Realized | |
| Security | Share Amount | Purchased | Shares Sold | Amount | Received | Received | Gain (Loss) | Ending Value |
|
| Lifestyle Moderate (continued) | | | | | | | |
| International | | | | | | | | |
| Small Company | 1,358,926 | 1,893,290 | (258,980) | 2,993,236 | $428,065 | — | $287,256 | $31,099,722 |
| International Value | 4,664,896 | 879,519 | — | 5,544,415 | 1,480,868 | — | — | 97,748,042 |
| International Value Equity | 2,327,011 | 783,085 | (94,498) | 3,015,598 | 408,243 | $1,124,042 | 33,074 | 27,653,031 |
| Investment Quality Bond | 6,922,108 | 749,226 | (826,920) | 6,844,414 | 2,624,029 | 541,258 | (577,165) | 82,954,292 |
| Mid Cap Stock | 2,679,956 | 1,039,774 | (351,142) | 3,368,588 | 995 | 8,183,605 | 346,977 | 72,020,410 |
| Mid Value | 3,664,261 | 1,455,472 | (353,344) | 4,766,389 | 404,953 | 2,426,588 | 252,468 | 78,073,451 |
| Natural Resources | 2,530,713 | 450,842 | (235,431) | 2,746,124 | 335,518 | — | (1,437,019) | 46,766,500 |
| Rainer Growth | 1,479,204 | 149,525 | (258,953) | 1,369,776 | 43,545 | 3,814,421 | 1,355,874 | 37,819,525 |
| Real Estate Equity | 2,228,738 | 230,640 | (93,893) | 2,365,485 | 357,422 | — | 79,674 | 22,732,313 |
| Real Return Bond | 6,648,094 | 994,738 | (2,131,809) | 5,511,023 | 1,294,241 | — | (1,430,911) | 61,778,565 |
| Redwood | 3,858,590 | 415,482 | (649,425) | 3,624,647 | — | 753,399 | 276,176 | 40,958,510 |
| Seaport | — | 917,000 | — | 917,000 | — | — | — | 9,215,850 |
| Short Duration Credit | | | | | | | | |
| Opportunities Fund | 17,595,722 | 2,594,108 | (1,822,437) | 18,367,393 | 6,488,532 | 2,301,043 | 45,141 | 186,245,365 |
| Small Cap Growth | 1,236,990 | 601,288 | (372,724) | 1,465,554 | — | 1,478,059 | 155,147 | 15,666,777 |
| Small Cap Value | 662,465 | 221,488 | (133,315) | 750,638 | 26,604 | 1,354,103 | 172,633 | 14,427,260 |
| Small Company Growth | 559,845 | 277,809 | (157,036) | 680,618 | — | 608,854 | 282,633 | 13,796,117 |
| Small Company Value | 543,254 | 129,070 | (101,469) | 570,855 | 37,497 | 107,744 | 333,743 | 21,452,746 |
| Smaller Company Growth | 935,857 | — | (935,857) | — | — | — | 1,702,037 | — |
| Spectrum Income | 16,562,097 | 1,541,568 | (1,744,456) | 16,359,209 | 5,707,561 | 4,387,298 | 390,236 | 176,843,052 |
| Strategic Growth | 5,572,521 | 226,006 | (1,064,147) | 4,734,380 | 266,186 | 2,476,408 | 3,149,420 | 73,382,886 |
| Strategic Income | | | | | | | | |
| Opportunities | 19,067,434 | 2,381,834 | (1,624,733) | 19,824,535 | 10,014,706 | 2,386,057 | 275,260 | 213,906,737 |
| Total Return | 24,520,663 | 2,563,429 | (1,110,799) | 25,973,293 | 6,169,476 | 4,823,732 | (787,693) | 352,457,582 |
| U.S. Equity | 10,621,776 | 917,664 | (4,080,202) | 7,459,238 | 1,813,752 | 9,691,991 | 12,681,304 | 95,403,660 |
| U.S. High Yield Bond | 7,258,590 | 792,432 | (1,231,468) | 6,819,554 | 5,799,558 | 1,594,101 | (80,277) | 83,471,343 |
| | | | | | $118,802,016 | $121,714,435 | $77,673,311 | $4,630,973,527 |
|
| Lifestyle Conservative | | | | | | | | |
| Active Bond | 39,008,210 | 1,834,702 | (4,605,853) | 36,237,059 | $14,628,264 | $1,820,286 | ($895,242) | $362,370,590 |
| All Cap Value | 631,498 | 99,949 | (731,447) | — | 36,626 | 1,010,256 | 883,750 | — |
| Asia Total Return Bond | — | 7,008,351 | — | 7,008,351 | 2,234,963 | 138,740 | — | 63,916,161 |
| Blue Chip Growth | 4,742,963 | 447,968 | (2,023,355) | 3,167,576 | — | 2,397,093 | 13,240,863 | 106,810,675 |
| Capital Appreciation Value | 8,208,136 | 988,702 | (2,519,889) | 6,676,949 | 1,051,763 | 9,229,191 | 3,659,293 | 78,320,614 |
| Core Bond | 15,894,814 | 543,037 | (3,905,278) | 12,532,573 | 3,792,736 | 582,963 | (2,508,869) | 157,158,467 |
| Currency Strategies | 10,570,890 | 1,583,631 | (2,040,680) | 10,113,841 | — | 6,179,743 | 333,172 | 94,261,000 |
| Emerging Markets | 3,940,463 | 209,735 | (804,386) | 3,345,812 | 654,097 | — | (421,901) | 34,227,657 |
| Emerging Markets | | | | | | | | |
| Debt Fund | — | 4,039,785 | (59,130) | 3,980,655 | 857,526 | 163,896 | (7,542) | 37,577,384 |
| Enduring Equity | — | 7,665,778 | — | 7,665,778 | 38,233 | — | — | 77,884,305 |
| Equity-Income | 5,524,683 | 360,543 | (1,852,312) | 4,032,914 | 1,815,208 | 519,061 | 7,409,825 | 81,182,552 |
| Floating Rate Income | 42,514,012 | 4,206,019 | (3,336,977) | 43,383,054 | 20,021,495 | 1,056,413 | (1,715,738) | 408,234,538 |
| Focused High Yield Fund | — | 24,797,463 | (6,862,487) | 17,934,976 | 1,262,963 | — | 115,442 | 69,408,358 |
| Fundamental | | | | | | | | |
| Global Franchise | 1,833,649 | 141,324 | (601,994) | 1,372,979 | 168,333 | 780,857 | 1,210,853 | 17,848,723 |
| Fundamental | | | | | | | | |
| Large Cap Value | 683,642 | 431,897 | (220,351) | 895,188 | 136,984 | 1,053,824 | 279,258 | 11,637,440 |
| Fundamental Value | 3,560,629 | 93,585 | (1,167,030) | 2,487,184 | 375,443 | — | 5,819,829 | 52,628,822 |
| Global Absolute | | | | | | | | |
| Return Strategies | 5,404,757 | 2,638,426 | (118,882) | 7,924,301 | 1,347,948 | — | 10,623 | 87,563,531 |
| Global Bond | 12,662,660 | 760,767 | (3,255,812) | 10,167,615 | — | — | (2,428,242) | 121,502,996 |
| Global Equity | — | 1,882,305 | (241,461) | 1,640,844 | 138,422 | 87,456 | 143,412 | 18,180,547 |
| Global High Yield | 6,591,028 | 564,107 | (2,489,278) | 4,665,857 | 3,823,005 | 320,772 | (711,780) | 46,145,326 |
| Global Real Estate | 3,600,566 | 276,563 | (1,662,592) | 2,214,537 | 719,104 | — | 4,013,252 | 18,225,640 |
| Global Shareholder Yield | 4,787,967 | 196,885 | (2,831,747) | 2,153,105 | 1,097,674 | 947,554 | 8,072,962 | 24,976,014 |
| Global Short Duration | | | | | | | | |
| Credit Fund | — | 1,343,811 | (2,719) | 1,341,092 | 134,750 | — | (245) | 13,290,223 |
| High Income | 8,848,911 | 3,433,557 | (12,282,468) | — | 5,727,585 | — | 6,006,808 | — |
| High Yield | 9,730,389 | 1,186,115 | (3,845,674) | 7,070,830 | 5,744,594 | — | 1,439,952 | 65,829,430 |
| International Core | 743,470 | 25,478 | (232,938) | 536,010 | 838,991 | — | 1,586,037 | 18,417,292 |
| International Growth Stock | 1,805,846 | 674,011 | (428,934) | 2,050,923 | 517,805 | — | 617,122 | 27,625,938 |
| International Value | 3,014,699 | 459,704 | — | 3,474,403 | 927,984 | — | — | 61,253,721 |
| Investment Quality Bond | 16,255,722 | 786,275 | (1,476,829) | 15,565,168 | 5,894,699 | 1,230,899 | (1,158,165) | 188,649,836 |
| |
| Annual report | Lifestyle Portfolios | 53 |
| | | | | | | | |
|
| | | | | | Dividends And Distributions | | |
| |
| | |
| | | | | | Income | Capital Gains | | |
| | Beginning | Shares | | Ending Share | Distributions | Distributions | Realized | |
| Security | Share Amount | Purchased | Shares Sold | Amount | Received | Received | Gain (Loss) | Ending Value |
|
| Lifestyle Conservative (continued) | | | | | | | |
| Mid Cap Stock | 841,216 | 787,244 | (348,048) | 1,280,412 | $381 | $3,133,379 | $300,831 | $27,375,211 |
| Mid Value | 1,150,181 | 308,006 | (283,046) | 1,175,141 | 101,294 | 606,981 | 65,140 | 19,248,813 |
| Natural Resources | 1,191,554 | 190,667 | (310,333) | 1,071,888 | 132,557 | — | (408,153) | 18,254,258 |
| Real Estate Equity | 2,098,746 | 455,940 | (676,039) | 1,878,647 | 283,861 | — | 565,360 | 18,053,795 |
| Real Return Bond | 11,009,978 | 728,062 | (2,787,922) | 8,950,118 | 2,004,284 | — | (3,445,502) | 100,330,823 |
| Redwood | 3,648,134 | 111,571 | (871,803) | 2,887,902 | — | 599,427 | 619,383 | 32,633,293 |
| Seaport | — | 751,000 | — | 751,000 | — | — | — | 7,547,550 |
| Short Duration Credit | | | | | | | | |
| Opportunities Fund | 18,807,670 | 953,165 | (2,822,182) | 16,938,653 | 6,494,867 | 2,122,022 | (12,676) | 171,757,944 |
| Short Term Government | | | | | | | | |
| Income | 15,983,598 | 512,064 | (982,397) | 15,513,265 | 2,469,509 | — | (222,504) | 151,254,337 |
| Small Cap Growth | 1,213,378 | 189,360 | (550,736) | 852,002 | — | 867,282 | 374,721 | 9,107,902 |
| Small Company Value | 345,654 | 48,385 | (138,864) | 255,175 | 17,066 | 49,037 | 882,896 | 9,589,479 |
| Spectrum Income | 17,750,499 | 921,282 | (3,271,115) | 15,400,666 | 5,669,471 | 4,130,231 | 875,830 | 166,481,195 |
| Strategic Income | | | | | | | | |
| Opportunities | 20,319,327 | 1,184,519 | (3,182,550) | 18,321,296 | 9,986,664 | 2,205,095 | 152,438 | 197,686,788 |
| Total Return | 28,665,563 | 1,081,746 | (3,167,469) | 26,579,840 | 6,694,601 | 4,949,191 | (1,827,010) | 360,688,429 |
| U.S. Equity | 6,901,594 | 478,095 | (3,557,798) | 3,821,891 | 932,819 | 4,984,623 | 10,786,540 | 48,881,991 |
| U.S. High Yield Bond | 7,063,084 | 486,904 | (2,949,416) | 4,600,572 | 4,935,064 | 1,087,867 | 179,926 | 56,311,004 |
| | | | | | $113,709,633 | $52,254,139 | $53,881,949 | $3,740,330,592 |
| |
| 54 | Lifestyle Portfolios | Annual report |
Auditors’ report
Report of Independent Registered Public Accounting Firm
To the Board of Trustees and Shareholders of John Hancock Funds II:
In our opinion, the accompanying statements of assets and liabilities, including the portfolios of investments, and the related statements of operations and of changes in net assets and the financial highlights present fairly, in all material respects, the financial position of Lifestyle Aggressive Portfolio, Lifestyle Growth Portfolio, Lifestyle Balanced Portfolio, Lifestyle Moderate Portfolio, and Lifestyle Conservative Portfolio, each a portfolio of John Hancock Funds II (the “Trust”) at December 31, 2013, the results of each of their operations for the year then ended, the changes in each of their net assets for each of the two years in the period then ended and the financial highlights for each of the periods indicated, in conformity with accounting principles generally accepted in the United States of America. These financial statements and financial highlights (hereafter referred to as “financial statements”) are the responsibility of the Trust’s management; our responsibility is to express an opinion on these financial statements based on our audits. We conducted our audits of these financial statements in accordance with the standards of the Public Company Accounting Oversight Board (United States). Those standards require that we plan and perform the audit to obtain reasonable assurance about whether the financial statements are free of material misstatement. An audit includes examining, on a test basis, evidence supporting the amounts and disclosures in the financial statements, assessing the accounting principles used and significant estimates made by management, and evaluating the overall financial statement presentation. We believe that our audits, which included confirmation of securities at December 31, 2013 by correspondence with the custodian and transfer agent, provide a reasonable basis for our opinion.
PricewaterhouseCoopers LLP
Boston, Massachusetts
February 25, 2014
| |
| Annual report | Lifestyle Portfolios | 55 |
Tax information
Unaudited
For federal income tax purposes, the following information is furnished with respect to the distributions of the portfolios, if any, paid during its taxable year ended December 31, 2013.
The portfolios report the maximum amount allowable of its net taxable income as eligible for the corporate dividends-received deduction.
The portfolios report the maximum amount allowable of its net taxable income as qualified dividend income as provided in the Jobs and Growth Tax Relief Reconciliation Act of 2003.
The portfolios below have the following amounts as foreign tax credits, which represent taxes paid on the income derived from foreign sources.
| | | | |
| Portfolio | Foreign Sourced Income | Foreign Tax Credit | | |
| | |
| Lifestyle Aggressive | $18,336,274 | $1,935,987 | | |
| Lifestyle Growth | 46,160,540 | 4,576,891 | | |
| Lifestyle Balanced | 40,114,597 | 3,649,030 | | |
| Lifestyle Moderate | 9,572,165 | 762,518 | | |
| Lifestyle Conservative | 5,203,217 | 323,931 | | |
The portfolios below paid the following amounts in capital gain dividends.
| | | | |
| Portfolio | Capital Gain | | | |
| | | |
| Lifestyle Moderate | $1,719,951 | | | |
| Lifestyle Conservative | 4,690,471 | | | |
Eligible shareholders will be mailed a Form 1099-DIV in early 2014. This will reflect the tax character of all distributions paid in calendar year 2013.
Please consult a tax advisor regarding the tax consequences of your investment in the portfolios.
| |
| 56 | Lifestyle Portfolios | Annual report |
Trustees and Officers
This chart provides information about the Trustees and Officers who oversee your John Hancock fund. Officers elected by the Trustees manage the day-to-day operations of each portfolio and execute policies formulated by the Trustees.
Independent Trustees
| | |
| | | Number of |
| Name, year of birth | Trustee of | John Hancock |
| Position(s) held with fund | the Trust | funds overseen |
| Principal occupation(s) and other directorships during past 5 years | since1 | by Trustee |
| |
| James M. Oates, Born: 1946 | 2005 | 230 |
|
| Managing Director, Wydown Group (financial consulting firm) (since 1994); Chairman and | | |
| Director, Emerson Investment Management, Inc. (since 2000); Independent Chairman, | | |
| Hudson Castle Group, Inc. (formerly IBEX Capital Markets, Inc.) (financial services company) | | |
| (1997–2011); Director, Stifel Financial (since 1996); Director, Investor Financial Services | | |
| Corporation (1995–2007); Director, Connecticut River Bancorp (since 1998); Director, Virtus | | |
| Funds (formerly Phoenix Mutual Funds) (since 1988). | | |
| |
| Trustee and Chairperson of the Board, John Hancock retail funds3 (since 2012); Trustee, | | |
| (2005–2006 and since 2012) and Chairperson of the Board (since 2012), John Hancock Funds | | |
| III; Trustee (since 2004) and Chairperson of the Board (since 2005), John Hancock Variable | | |
| Insurance Trust; Trustee and Chairperson of the Board, John Hancock Funds II (since 2005). | | |
|
| |
| Charles L. Bardelis,2 Born: 1941 | 2005 | 230 |
|
| Director, Island Commuter Corp. (marine transport). | | |
| |
| Trustee, John Hancock retail funds3 (since 2012); Trustee, John Hancock Funds III (2005– | | |
| 2006 and since 2012); Trustee, John Hancock Variable Insurance Trust (since 1988); Trustee, | | |
| John Hancock Funds II (since 2005). | | |
|
| |
| Peter S. Burgess,2 Born: 1942 | 2005 | 230 |
|
| Consultant (financial, accounting, and auditing matters) (since 1999); Certified Public | | |
| Accountant; Partner, Arthur Andersen (independent public accounting firm) (prior to | | |
| 1999); Director, Lincoln Educational Services Corporation (since 2004); Director, | | |
| Symetra Financial Corporation (since 2010); Director, PMA Capital | | |
| Corporation (2004–2010). | | |
| |
| Trustee, John Hancock retail funds3 (since 2012); Trustee, John Hancock Funds III | | |
| (2005–2006 and since 2012); Trustee, John Hancock Variable Insurance Trust and | | |
| John Hancock Funds II (since 2005). | | |
|
| |
| William H. Cunningham, Born: 1944 | 2012 | 230 |
|
| Professor, University of Texas, Austin, Texas (since 1971); former Chancellor, University | | |
| of Texas System and former President of the University of Texas, Austin, Texas; Director, | | |
| LIN Television (since 2009); Chairman (since 2009) and Director (since 2006), Lincoln | | |
| National Corporation (insurance); Director, Resolute Energy Corporation (since 2009); | | |
| Director, Southwest Airlines (since 2000); former Director, Introgen (manufacturer of | | |
| biopharmaceuticals) (until 2008); former Director, Hicks Acquisition Company I, Inc. | | |
| (until 2007); former Director, Texas Exchange Bank, SSB (formerly Bank of Crowley) | | |
| (until 2009); former Advisory Director, JPMorgan Chase Bank (formerly Texas Commerce | | |
| Bank–Austin) (until 2009). | | |
| |
| Trustee, John Hancock retail funds3 (since 1986); Trustee, John Hancock Variable Insurance | | |
| Trust (since 2012); Trustee, John Hancock Funds II (2005–2006 and since 2012). | | |
| |
| Annual report | Lifestyle Portfolios | 57 |
Independent Trustees (continued)
| | |
| | | Number of |
| Name, year of birth | Trustee of | John Hancock |
| Position(s) held with fund | the Trust | funds overseen |
| Principal occupation(s) and other directorships during past 5 years | since | by Trustee |
| |
| Grace K. Fey, Born: 1946 | 2008 | 230 |
|
| Chief Executive Officer, Grace Fey Advisors (since 2007); Director and Executive Vice | | |
| President, Frontier Capital Management Company (1988–2007); Director, Fiduciary | | |
| Trust (since 2009). | | |
| |
| Trustee, John Hancock retail funds3 (since 2012); Trustee, John Hancock Variable Insurance | | |
| Trust and John Hancock Funds II (since 2008). | | |
|
| |
| Theron S. Hoffman,2 Born: 1947 | 2008 | 230 |
|
| Chief Executive Officer, T. Hoffman Associates, LLC (consulting firm) (since 2003); Director, | | |
| The Todd Organization (consulting firm) (2003–2010); President, Westport Resources | | |
| Management (investment management consulting firm) (2006–2008); Senior Managing | | |
| Director, Partner, and Operating Head, Putnam Investments (2000–2003); Executive Vice | | |
| President, The Thomson Corp. (financial and legal information publishing) (1997–2000). | | |
| |
| Trustee, John Hancock retail funds3 (since 2012); Trustee, John Hancock Variable Insurance | | |
| Trust and John Hancock Funds II (since 2008). | | |
|
| |
| Deborah C. Jackson, Born: 1952 | 2012 | 230 |
|
| President, Cambridge College, Cambridge, Massachusetts (since 2011); Chief Executive | | |
| Officer, American Red Cross of Massachusetts Bay (2002–2011); Board of Directors of | | |
| Eastern Bank Corporation (since 2001); Board of Directors of Eastern Bank Charitable | | |
| Foundation (since 2001); Board of Directors of American Student Assistance Corporation | | |
| (1996–2009); Board of Directors of Boston Stock Exchange (2002–2008); Board of | | |
| Directors of Harvard Pilgrim Healthcare (health benefits company) (2007–2011). | | |
| |
| Trustee, John Hancock retail funds3 (since 2008); Trustee, John Hancock Variable Insurance | | |
| Trust and John Hancock Funds II (since 2012). | | |
|
| |
| Hassell H. McClellan, Born: 1945 | 2005 | 230 |
|
| Trustee, Virtus Variable Insurance Trust (formerly Phoenix Edge Series Funds) (since 2008); | | |
| Director, The Barnes Group (since 2010); Associate Professor, The Wallace E. Carroll | | |
| School of Management, Boston College (retired 2013). | | |
| |
| Trustee, John Hancock retail funds3 (since 2012); Trustee, John Hancock Funds III | | |
| (2005–2006 and since 2012); Trustee, John Hancock Variable Insurance Trust and | | |
| John Hancock Funds II (since 2005). | | |
|
| |
| Steven R. Pruchansky, Born: 1944 | 2012 | 230 |
|
| Chairman and Chief Executive Officer, Greenscapes of Southwest Florida, Inc. (since 2000); | | |
| Director and President, Greenscapes of Southwest Florida, Inc. (until 2000); Member, Board | | |
| of Advisors, First American Bank (until 2010); Managing Director, Jon James, LLC (real estate) | | |
| (since 2000); Director, First Signature Bank & Trust Company (until 1991); Director, Mast | | |
| Realty Trust (until 1994); President, Maxwell Building Corp. (until 1991). | | |
| |
| Trustee (since 1992) and Chairperson of the Board (2011–2012), John Hancock retail funds3 ; | | |
| Trustee and Vice Chairperson of the Board, John Hancock retail funds, John Hancock Variable | | |
| Insurance Trust and John Hancock Funds II (since 2012). | | |
|
| |
| Gregory A. Russo, Born: 1949 | 2012 | 230 |
|
| Director and Audit Committee Chairman (since 2012) and Member, Audit Committee and | | |
| Finance Committee (since 2011), NCH Healthcare System, Inc. (holding company for multi- | | |
| entity healthcare system); Director and Member of Finance Committee, The Moorings, Inc. | | |
| (nonprofit continuing care community) (since 2012); Vice Chairman, Risk & Regulatory Matters, | | |
| KPMG LLP (KPMG) (2002–2006); Vice Chairman, Industrial Markets, KPMG (1998–2002); | | |
| Chairman and Treasurer, Westchester County, New York, Chamber of Commerce (1986–1992); | | |
| Director, Treasurer and Chairman of Audit and Finance Committees, Putnam Hospital Center | | |
| (1989–1995); Director and Chairman of Fundraising Campaign, United Way of Westchester and | | |
| Putnam Counties, New York (1990–1995). | | |
| |
| Trustee, John Hancock retail funds3 (since 2008); Trustee, John Hancock Variable Insurance Trust | | |
| and John Hancock Funds II (since 2012). | | |
| |
| 58 | Lifestyle Portfolios | Annual report |
Non-Independent Trustees4
| | |
| | | Number of |
| Name, year of birth | Trustee of | John Hancock |
| Position(s) held with fund | the Trust | funds overseen |
| Principal occupation(s) and other directorships during past 5 years | since | by Trustee |
| |
| Craig Bromley, Born: 1966 | 2012 | 230 |
|
| President, John Hancock Financial Services (since 2012); Senior Executive Vice President and | | |
| General Manager, U.S. Division, John Hancock Financial Services (since 2012); President | | |
| and Chief Executive Officer, Manulife Insurance Company (Manulife (Japan) (2005–2012) | | |
| including prior positions). | | |
| |
| Trustee, John Hancock retail funds3 (since 2012); Trustee, John Hancock Variable Insurance | | |
| Trust and John Hancock Funds II (since 2012). | | |
|
| |
| Warren A. Thomson, Born: 1955 | 2012 | 230 |
|
| Senior Executive Vice President and Chief Investment Officer, Manulife Financial | | |
| Corporation and The Manufacturers Life Insurance Company (since 2009); Chairman | | |
| and Chief Executive Officer, Manulife Asset Management (since 2001, including prior | | |
| positions); Director (since 2006), and President and Chief Executive Officer (since 2013), | | |
| Manulife Asset Management Limited; Director and Chairman, Hancock Natural Resources | | |
| Group, Inc. (since 2013). | | |
| |
| Trustee, John Hancock retail funds3, John Hancock Variable Insurance Trust and | | |
| John Hancock Funds II (since 2012). | | |
Principal officers who are not Trustees
| |
| | Officer |
| Name, year of birth | of the |
| Position(s) held with fund | Trust |
| Principal occupation(s) and other directorships during past 5 years | since |
| |
| Hugh McHaffie, Born: 1959 | 2009 |
|
| President | |
| Executive Vice President, John Hancock Financial Services (since 2006, including prior positions); Chairman | |
| and Director, John Hancock Advisers, LLC, John Hancock Investment Management Services, LLC, and | |
| John Hancock Funds, LLC (since 2010); President, John Hancock Advisers, LLC (since 2012); President, | |
| John Hancock Investment Management Services, LLC (since 2010). President (since 2012) and former | |
| Trustee (2010–2012), John Hancock retail funds3; President, John Hancock Variable Insurance Trust and | |
| John Hancock Funds II (since 2009). | |
|
| |
| Andrew G. Arnott, Born: 1971 | 2009 |
|
| Executive Vice President | |
| Senior Vice President, John Hancock Financial Services (since 2009); Director and Executive Vice President, | |
| John Hancock Advisers, LLC (since 2005, including prior positions); Director and Executive Vice President, | |
| John Hancock Investment Management Services, LLC (since 2006, including prior positions); President, | |
| John Hancock Funds, LLC (since 2004, including prior positions); Executive Vice President, John Hancock | |
| retail funds3, John Hancock Variable Insurance Trust and John Hancock Funds II (since 2007, including | |
| prior positions). | |
|
| |
| Thomas M. Kinzler, Born: 1955 | 2006 |
|
| Secretary and Chief Legal Officer | |
| Vice President, John Hancock Financial Services (since 2006); Secretary and Chief Legal Counsel, | |
| John Hancock Funds, LLC (since 2007); Secretary and Chief Legal Officer, John Hancock retail funds3, | |
| John Hancock Variable Insurance Trust and John Hancock Funds II (since 2006). | |
|
| |
| Francis V. Knox, Jr., Born: 1947 | 2005 |
|
| Chief Compliance Officer | |
| Vice President, John Hancock Financial Services (since 2005); Chief Compliance Officer, John Hancock retail | |
| funds3, John Hancock Variable Insurance Trust, John Hancock Funds II, John Hancock Advisers, LLC, and | |
| John Hancock Investment Management Services, LLC (since 2005). | |
| |
| Annual report | Lifestyle Portfolios | 59 |
Principal officers who are not Trustees (continued)
| |
| | Officer |
| Name, year of birth | of the |
| Position(s) held with fund | Trust |
| Principal occupation(s) and other directorships during past 5 years | since |
| |
| Charles A. Rizzo, Born: 1957 | 2007 |
|
| Chief Financial Officer | |
| Vice President, John Hancock Financial Services (since 2008); Senior Vice President, John Hancock Advisers, | |
| LLC and John Hancock Investment Management Services, LLC (since 2008); Chief Financial Officer, | |
| John Hancock retail funds3, John Hancock Variable Insurance Trust and John Hancock Funds II (since 2007). | |
|
| |
| Salvatore Schiavone, Born: 1965 | 2009 |
|
| Treasurer | |
| Assistant Vice President, John Hancock Financial Services (since 2007); Vice President, John Hancock | |
| Advisers, LLC and John Hancock Investment Management Services, LLC (since 2007); Treasurer, | |
| John Hancock retail funds3 (since 2007, including prior positions); Treasurer, John Hancock Variable | |
| Insurance Trust and John Hancock Funds II (2007–2009 and since 2010, including prior position). | |
The business address for all Trustees and Officers is 601 Congress Street, Boston, Massachusetts 02210–2805.
The Statement of Additional Information of the portfolios includes additional information about members of the Board of Trustees of the Trust and is available without charge, upon request, by calling 800–225-5291.
1 Each Trustee holds office until his or her successor is elected and qualified, or until the Trustee’s death, retirement, resignation or removal.
2 Member of Audit Committee.
3 John Hancock retail funds is composed of John Hancock Funds III and 33 other John Hancock funds consisting of 23 series of other John Hancock trusts and 10 closed-end funds.
4 Because Messrs. Bromley and Thomson are senior executives or directors with the Advisor and/or its affiliates, each of them is considered an “interested person,” as defined in the Investment Company Act of 1940, of the Trust.
| |
| 60 | Lifestyle Portfolios | Annual report |
More information
| |
| Trustees | Investment advisor |
| James M. Oates, Chairperson | John Hancock Investment Management Services, LLC |
| Steven R. Pruchansky, Vice Chairperson | |
| Charles L. Bardelis* | Subadvisors |
| Craig Bromley† | John Hancock Asset Management a division of |
| Peter S. Burgess* | Manulife Asset Management (US) LLC |
| William H. Cunningham | |
| Grace K. Fey | John Hancock Asset Management a division of |
| Theron S. Hoffman* | Manulife Asset Management (North America) |
| Deborah C. Jackson | Limited |
| Hassell H. McClellan | |
| Gregory A. Russo | QS Investors, Inc. (Subadvisor Consultant) |
| Warren A. Thomson† | |
| | Principal distributor |
| Officers | John Hancock Funds, LLC |
| Hugh McHaffie | |
| President | Custodian |
| | State Street Bank and Trust Company |
| Andrew G. Arnott | |
| Executive Vice President | Transfer agent |
| | John Hancock Signature Services, Inc. |
| Thomas M. Kinzler | |
| Secretary and Chief Legal Officer | Legal counsel |
| | K&L Gates LLP |
| Francis V. Knox, Jr. | |
| Chief Compliance Officer | Independent registered public accounting firm |
| | PricewaterhouseCoopers LLP |
| Charles A. Rizzo | |
| Chief Financial Officer | |
| | |
| Salvatore Schiavone | |
| Treasurer | |
| | |
| *Member of the Audit Committee | |
| †Non-Independent Trustee | |
The portfolios’ proxy voting policies and procedures, as well as the portfolios’ proxy voting record for the most recent twelve-month period ended June 30, are available free of charge on the Securities and Exchange Commission (SEC) website at sec.gov or on our website.
The portfolios’ complete list of portfolio holdings, for the first and third fiscal quarters, is filed with the SEC on Form N-Q. The portfolios’ Form N-Q is available on our website and the SEC’s website, sec.gov, and can be reviewed and copied (for a fee) at the SEC’s Public Reference Room in Washington, DC. Call 202-551-8090 to receive information on the operation of the SEC’s Public Reference Room.
We make this information on your portfolio, as well as monthly portfolio holdings, and other portfolio details available on our website at jhinvestments.com or by calling 800-225-5291.
| | |
| You can also contact us: | | |
| 800-225-5291 | Regular mail: | Express mail: |
| jhinvestments.com | Investment Operations | Investment Operations |
| | John Hancock Signature Services, Inc. | John Hancock Signature Services, Inc. |
| | P.O. Box 55913 | 30 Dan Road |
| | Boston, MA 02205-5913 | Canton, MA 02021 |
|
| |
| Annual report | Lifestyle Portfolios | 61 |

800-225-5291
800-231-5469
800-338-8080 EASI-Line
jhinvestments.com

| |
| This report is for the information of the shareholders of John Hancock Lifestyle Portfolios. | |
| It is not authorized for distribution to prospective investors unless preceded or accompanied by a prospectus. | LSA 12/13 |
| MF170907 | 2/14 |
ITEM 2. CODE OF ETHICS.
(a) As of the end of the fiscal year, December 31, 2013, the registrant has adopted a code of ethics, as defined in Item 2 of Form N-CSR), that applies to its Chief Executive Officer and Chief Financial Officer (respectively, the principal executive officer, the principal financial officer, the “Covered Officers”). A copy of the code of ethics is filed as an exhibit to this Form N-CSR.
(b) Not applicable
(c) Not applicable
(d) Not applicable
(e) Not applicable
(f)(1) A copy of the Code of Ethics is attached hereto.
(f)(2) Not applicable
(f)(3) The Registrant will provide a copy of the Code of Ethics to any person without charge, upon request by calling the following toll free number (800) 344-1029.
ITEM 3. AUDIT COMMITTEE FINANCIAL EXPERT.
The Board of Trustees of the Registrant has determined that it has one “audit committee financial expert” as that term is defined in Item 3(b) of Form N-CSR: Peter S. Burgess, who is “independent” as that term is defined in Item 3(a) (2) of Form N-CSR.
ITEM 4. PRINCIPAL ACCOUNTANT FEES AND SERVICES.
(a) AUDIT FEES:
2013: $127,418
2012: $131,796
These fees represent aggregate fees billed for the last two fiscal years (the “Reporting Periods”) for professional services rendered by the principal accountant for the audits of the Registrant’s annual financial statements or services that are normally provided by the accountant in connection with statutory and regulatory filing or engagements for such Reporting Periods.
(b) AUDIT RELATED FEES:
2013: $39,111
2012: $41,776
These fees represent the aggregate fees billed for the Reporting Periods for assurance and related services by the principal accountant that are reasonably related to the performance of the audit of the Registrant’s financial statements and are not reported under paragraph (a) of this Item. Such fees relate to professional services rendered by PwC for separate audit reports in connection with security counts pursuant to Rule 17f-2 under the Investment Company Act of 1940 and affiliated service provider internal controls reviews.
(c) TAX FEES:
2013: $0
2012: $0
These fees represent aggregate fees billed for the Reporting Periods for professional services rendered by the principal accountant for tax compliance, tax advice and tax planning. The tax fees for the years ended December 31, 2013 and December 31, 2012 were $0 and $0 as the tax services were provided by a service provider other than the principal accountant.
(d) ALL OTHER FEES:
2013: $835
2012: $3,005
These fees represent other fees for John Hancock Funds II billed to the registrant or to control affiliates.
(e) (1) Audit Committee Pre-Approval Policies and Procedures:
The Trust’s Audit Committee must pre-approve all audit and non-audit services provided by the independent registered public accounting firm (the “Auditor”) relating to the operations or financial reporting of the funds. Prior to the commencement of any audit or non-audit services to a fund, the Audit Committee reviews the services to determine whether they are appropriate and permissible under applicable law.
The Trust’s Audit Committee has adopted policies and procedures to, among other purposes, provide a framework for the Committee’s consideration of audit-related and non-audit services by the Auditor. The policies and procedures require that any audit-related and non-audit service provided by the Auditor and any non-audit service provided by the Auditor to a fund service provider that relates directly to the operations and financial reporting of a fund are subject to approval by the Audit Committee before such service is provided. Audit-related services provided by the Auditor that are expected to exceed $25,000 per instance/per fund are subject to specific pre-approval by the Audit Committee. Tax services provided by the Auditor that are expected to exceed $30,000 per instance/per fund are subject to specific pre-approval by the Audit Committee.
All audit services, as well as the audit-related and non-audit services that are expected to exceed the amounts stated above, must be approved in advance of provision of the service by formal resolution of the Audit Committee. At the regularly scheduled Audit Committee meetings, the Committee reviews a report summarizing the services, including fees, provided by the Auditor.
(2) Amount approved by the Audit Committee pursuant paragraph (c) (7) (i) (C) of Rule 2-01 of Regulation S-X: None.
(f) Not Applicable.
(g) The aggregate non-audit fees billed by PwC for services rendered to the registrant and rendered to the registrant's control affiliates for each of the last two fiscal years of the registrant were $5,949,479 for the fiscal year ended December 31, 2013 and $2,875,747 for the fiscal year ended December 31, 2012.
(h) The Registrant’s audit committee of the Board of Trustees has considered the provision of non-audit services that were rendered to the Registrant’s investment adviser and service affiliates that were not pre-approved pursuant to paragraph (c) (7ii) of Rule 2-01 of Regulation S-X, to be compatible with maintaining PwC’s independence.
ITEM 5. AUDIT COMMITTEE OF LISTED REGISTRANTS
Peter S. Burgess - Chairman
Charles L. Bardelis
Theron S. Hoffman
ITEM 6. SCHEDULE OF INVESTMENTS.
(a) Included with Item 1.
(b) Not Applicable.
ITEM 7. DISCLOSURE OF PROXY VOTING POLICIES AND PROCEDURES FOR CLOSED-END MANAGEMENT INVESTMENT COMPANIES. Not Applicable.
ITEM 8. PORTFOLIO MANAGERS OF CLOSED-END MANAGEMENT INVESTMENT COMPANIES. Not Applicable.
ITEM 9. PURCHASE OF EQUITY SECURITIES BY CLOSED-END MANAGEMENT INVESTMENT COMPANIES AND AFFILIATED PURCHASERS. Not Applicable.
ITEM 10. SUBMISSION OF MATTERS TO VOTE OF SECURITY HOLDERS. Not Applicable.
ITEM 11. CONTROLS AND PROCEDURES.
(a) EVALUATION OF DISCLOSURE CONTROLS AND PROCEDURES. The Registrant maintains disclosure controls and procedures that are designed to ensure that information required to be disclosed in this Form N-CSR is recorded, processed, summarized and reported within the periods specified in the rules and forms of the Securities and Exchange Commission. Such disclosure controls and procedures include controls and procedures designed to ensure that such information is accumulated and communicated to the Registrant's management, including its principal executive officer and principal financial officer, as appropriate, to allow timely decisions regarding required disclosure.
Within 90 days prior to the filing date of this Form N-CSR, the Registrant had carried out an evaluation, under the supervision and with the participation of the Registrant's management, including the Registrant's principal executive officer and the Registrant's principal financial officer, of the effectiveness of the design and operation of the Registrant's disclosure controls and procedures relating to information required to be disclosed on Form N-CSR. Based on such evaluation, the Registrant's principal executive officer and principal financial officer concluded that the Registrant's disclosure controls and procedures are operating effectively to ensure that:
(i) information required to be disclosed in this Form N-CSR is recorded, processed, summarized and reported within the periods specified in the rules and forms of the Securities and Exchange Commission, and
(ii) information is accumulated and communicated to the Registrant’s management, including its principal executive officer and principal financial officer, as appropriate, to allow timely decisions regarding required disclosure.
(b) CHANGE IN REGISTRANT’S INTERNAL CONTROL: Not Applicable.
ITEM 12. EXHIBITS.
(a)(1) SEE ATTACHED CODE OF ETHICS.
(a)(2)(i) CERTIFICATION OF PRINCIPAL EXECUTIVE OFFICER.
(a)(2)(ii) CERTIFICATION OF PRINCIPAL FINANCIAL OFFICER.
(b) CERTIFICATION PURSUANT TO Rule 30a-2(b) OF THE INVESTMENT COMPANY ACT OF 1940
(c) CONTACT PERSON AT THE REGISTRANT.
SIGNATURES
Pursuant to the requirements of the Securities Exchange Act of 1934 and the Investment Company Act of 1940, the registrant has duly caused this report to be signed on its behalf by the undersigned, thereunto duly authorized.
|
| JOHN HANCOCK FUNDS II |
| |
| |
| |
| |
| /s/ Hugh McHaffie ____________ |
| Hugh McHaffie |
| President |
| Date: February 19, 2014 |
Pursuant to the requirements of the Securities Exchange Act of 1934 and the Investment Company Act of 1940, this report has been signed below by the following persons on behalf of the registrant and in the capacities and on the dates indicated.
|
| /s/ Hugh McHaffie ____________ |
| Hugh McHaffie |
| President |
| Date: February 19, 2014 |
| |
| |
| |
| |
| /s/ Charles A. Rizzo ___________ |
| Charles A. Rizzo |
| Chief Financial Officer |
| Date: February 19, 2014 |