|
| UNITED STATES |
| SECURITIES AND EXCHANGE COMMISSION |
| Washington, D.C. 20549 |
| |
| FORM N-CSR |
| |
| CERTIFIED SHAREHOLDER REPORT OF REGISTERED MANAGEMENT INVESTMENT |
| COMPANIES |
| Investment Company Act file number 811-21779 |
| |
| JOHN HANCOCK FUNDS II |
| --------------------------------------------------------- |
| (Exact name of registrant as specified in charter) |
| |
| 601 CONGRESS STREET, BOSTON, MA 02210-2805 |
| ------------------------------------------------------------- |
| (Address of principal executive offices) (Zip code) |
| |
| SALVATORE SCHIAVONE, 601 CONGRESS STREET, BOSTON, MA 02210-2805 |
| ------------------------------------------------------------------------------------------ |
| (Name and address of agent for service) |
| |
| Registrant's telephone number, including area code: (617) 663-4490 |
| -------------- |
| Date of fiscal year end: 7/31 |
| ------ |
| |
| Date of reporting period: 7/31/14 |
| ------- |
ITEM 1. REPORTS TO STOCKHOLDERS.
The Registrant prepared eleven annual reports to shareholders for the year ended July 31, 2014 for series of John Hancock Funds II with July 31 fiscal year end. The first report applies to the Technical Opportunities Fund, the second report applies to the Global Income Fund (formerly Global High Yield Fund), the third report applies to Short Duration Credit Opportunities Fund, the fourth report applies to Absolute Return Currency Fund (formerly Currency Strategies Fund), the fifth report applies Fundamental All Cap Core Fund, the sixth report applies to Fundamental Large Cap Core Fund, the seventh report applies to Fundamental Large Cap Value Fund, the eight report applies to the China Emerging Leaders Fund, the ninth report applies to the Diversified Strategies Fund, the tenth report applies to the Global Absolute Return Strategy Fund, and the eleventh report applies to the International Growth Equity Fund.

A look at performance
Total returns for the period ended July 31, 2014
| | | | | | | | | |
| | Average annual total returns (%) | | Cumulative total returns (%) | |
| | with maximum sales charge | | | with maximum sales charge | |
|
| | 1-year | 5-year | 10-year | Since
inception1 | | 1-year | 5-year | 10-year | Since
inception1 |
|
| Class A | 9.13 | 8.45 | — | 8.45 | | 9.13 | 50.00 | — | 50.00 |
|
| Class I2 | 15.17 | 9.95 | — | 9.95 | | 15.17 | 60.72 | — | 60.72 |
|
| Class NAV2 | 15.38 | 10.14 | — | 10.14 | | 15.38 | 62.08 | — | 62.08 |
|
| Index† | 16.50 | 12.68 | — | 12.69 | | 16.50 | 81.64 | — | 81.64 |
|
Performance figures assume all distributions have been reinvested. Figures reflect maximum sales charges on Class A shares of 5.00%. Sales charges are not applicable to Class I and Class NAV shares.
The expense ratios of the fund, both net (including any fee waivers and/or expense limitations) and gross (excluding any fee waivers and/or expense limitations), are set forth according to the most recent publicly available prospectuses for the fund and may differ from those disclosed in the Financial highlights tables in this report. The expense ratios are as follows:
| | | | | | |
| | Class A | Class I | Class NAV | | | |
| Gross/Net (%) | 1.76 | 1.52 | 1.24 | | | |
Please refer to the most recent prospectus and annual report for more information on expenses and any expense limitation arrangements for each class.
The returns reflect past results and should not be considered indicative of future performance. The return and principal value of an investment will fluctuate so that shares, when redeemed, may be worth more or less than their original cost. Due to market volatility, the fund’s current performance may be higher or lower than the performance shown. For current to the most recent month-end performance data, please call 800-225-5291 or visit the fund’s website at jhinvestments.com.
The performance table above and the chart on the next page do not reflect the deduction of taxes that a shareholder may pay on fund distributions or on the redemption of fund shares. The fund’s performance results reflect any applicable fee waivers or expense reductions, without which the expenses would increase and results would have been less favorable.
† Index is the MSCI All Country World Index.
See the following page for footnotes.
| |
| 6 | Technical Opportunities Fund | Annual report |

| | | | |
| | | With maximum | Without | |
| | Start date | sales charge | sales charge | Index |
|
| Class I2 | 8-3-09 | $16,072 | $16,072 | $18,164 |
|
| Class NAV2 | 8-3-09 | 16,208 | 16,208 | 18,164 |
|
MSCI All Country World Index (gross of foreign withholding tax on dividends) is a free float-adjusted market capitalization weighted index that is designed to measure the equity market performance of developed and emerging markets.
It is not possible to invest directly in an index. Index figures do not reflect expenses or sales charges, which would have resulted in lower values.
Footnotes related to performance pages
1 From 8-3-09.
2 For certain types of investors as described in the fund’s prospectuses.
| |
| Annual report | Technical Opportunities Fund | 7 |
Management’s discussion of
Fund performance
Wellington Management Company, LLP
Global equities climbed higher during the 12-month period ended July 31, 2014, as measured by the MSCI All Country World Index. Bullish sentiment was aided by robust merger and acquisition activity, which some view as a sign of confidence in the recovery, and by accommodative monetary policy from central banks around the globe. The European Central Bank introduced measures to fight disinflationary forces and rekindle growth in the eurozone. Still, there were moments when things looked less upbeat.
For the 12-month period ended July 31, 2014, John Hancock Technical Opportunities Fund’s Class A shares posted a total return of 14.86%, excluding sales changes, underperforming the 16.50% return of the MSCI All Country World Index.
During the first half of the fiscal year, investment performance was solid as a strong, multi-year relative uptrend continued. We positioned the fund well to participate during the sustained uptrend with exposure to the most technically attractive stocks in leadership sectors (that is, those sectors that had been outperforming the broader market). Security selection contributed significantly to initial outperformance, especially within the healthcare, information technology, and consumer discretionary sectors.
Stock selection and overall results were less favorable in the second half of the fund’s fiscal year. Strong contributors during the first half of the period, such as Alnylam Pharmaceuticals, Inc., Isis Pharmaceuticals, Inc., and Pandora Media, Inc., subsequently suffered because of the shift in momentum, which contributed to underperformance for these stocks during the second half of the period. We eliminated the positions in Isis Pharmaceuticals and Pandora Media during the period. During this time, most indexes were resilient. As money flowed out of leadership sectors, it appeared to rotate right back into other areas of the market. We viewed this as good news as bear markets are generally associated with money leaving the stock market entirely, rather than rotating into new areas within it.
Another important rotational change appears to be investors’ deliberate move away from consumer discretionary stocks and into energy-related shares. We reduced the fund’s exposure to consumer discretionary and biotech and redeployed some of the proceeds to the energy sector, a long-standing underweight in the fund. At the close of the period, the fund remained heavily overweight in healthcare, but less concentrated in biotech stocks relative to the recent past.
This commentary reflects the views of the portfolio manager through the end of the period discussed in this report. As such, they are in no way guarantees of future events and are not intended to be used as investment advice or a recommendation regarding any specific security. They are also subject to change at any time as market and other conditions warrant.
Past performance does not guarantee future results.
| |
| 8 | Technical Opportunities Fund | Annual report |
Your expenses
These examples are intended to help you understand your ongoing operating expenses of investing in the fund so you can compare these costs with the ongoing costs of investing in other mutual funds.
Understanding fund expenses
As a shareholder of the fund, you incur two types of costs:
■ Transaction costs, which include sales charges (loads) on purchases or redemptions (varies by share class), minimum account fee charge, etc.
■ Ongoing operating expenses, including management fees, distribution and service fees (if applicable), and other fund expenses.
We are going to present only your ongoing operating expenses here.
Actual expenses/actual returns
This example is intended to provide information about the fund’s actual ongoing operating expenses and is based on the fund’s actual return. It assumes an account value of $1,000.00 on February 1, 2014, with the same investment held until July 31, 2014.
| | | | |
| | | | Expenses paid | |
| | Account value | Ending value | during period | Annualized |
| | on 2-1-2014 | on 7-31-2014 | ended 7-31-20141 | expense ratio |
|
| Class A | $1,000.00 | $985.00 | $8.42 | 1.71% |
|
| Class I | 1,000.00 | 986.60 | 7.04 | 1.43% |
|
| Class NAV | 1,000.00 | 986.80 | 6.01 | 1.22% |
|
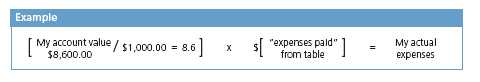
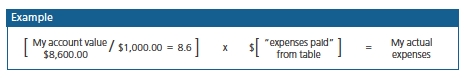
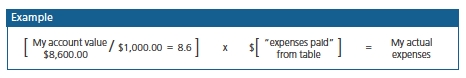
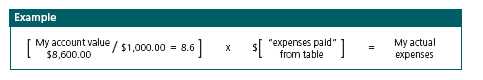
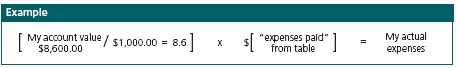
Together with the value of your account, you may use this information to estimate the operating expenses that you paid over the period. Simply divide your account value at July 31, 2014, by $1,000.00, then multiply it by the “expenses paid” for your share class from the table above. For example, for an account value of $8,600.00, the operating expenses should be calculated as follows:
| |
| Annual report | Technical Opportunities Fund | 9 |
Your expenses
Hypothetical example for comparison purposes
This table allows you to compare the fund’s ongoing operating expenses with those of any other fund. It provides an example of the fund’s hypothetical account values and hypothetical expenses based on each class’s actual expense ratio and an assumed 5% annualized return before expenses (which is not the fund’s actual return). It assumes an account value of $1,000.00 on February 1, 2014, with the same investment held until July 31, 2014. Look in any other fund shareholder report to find its hypothetical example and you will be able to compare these expenses. Please remember that these hypothetical account values and expenses may not be used to estimate the actual ending account balance or expenses you paid for the period.
| | | | |
| | | | Expenses paid | |
| | Account value | Ending value | during period | Annualized |
| | on 2-1-2014 | on 7-31-2014 | ended 7-31-20141 | expense ratio |
|
| Class A | $1,000.00 | $1,016.30 | $8.55 | 1.71% |
|
| Class I | 1,000.00 | 1,017.70 | 7.15 | 1.43% |
|
| Class NAV | 1,000.00 | 1,018.70 | 6.11 | 1.22% |
|
Remember, these examples do not include any transaction costs, therefore, these examples will not help you to determine the relative total costs of owning different funds. If transaction costs were included, your expenses would have been higher. See the prospectus for details regarding transaction costs.
1 Expenses are equal to the fund’s annualized expense ratio, multiplied by the average account value over the period, multiplied by 181/365 (to reflect the one-half year period).
| |
| 10 | Technical Opportunities Fund | Annual report |
Portfolio summary
| | | | |
| Top 10 Holdings (20.7% of Net Assets on 7-31-14)1,2 | | | |
|
| Keurig Green Mountain, Inc. | 2.8% | | Facebook, Inc., Class A | 1.9% |
| |
|
| Salix Pharmaceuticals, Ltd. | 2.5% | | Actavis PLC | 1.8% |
| |
|
| The Priceline Group, Inc. | 2.3% | | HCA Holdings, Inc. | 1.8% |
| |
|
| Apple, Inc. | 2.2% | | Jazz Pharmaceuticals PLC | 1.8% |
| |
|
| Eli Lilly & Company | 1.9% | | Google, Inc., Class A | 1.7% |
| |
|
| |
| Sector Composition1,3 | | | | |
|
| Health Care | 28.8% | | Consumer Staples | 8.2% |
| |
|
| Information Technology | 23.5% | | Materials | 3.4% |
| |
|
| Consumer Discretionary | 13.5% | | Financials | 1.8% |
| |
|
| Industrials | 9.5% | | Telecommunication Services | 1.0% |
| |
|
| Energy | 9.0% | | Short-Term Investments & Other | 1.3% |
| |
|
1 As a percentage of net assets on 7-31-14.
2 Cash and cash equivalents are not included.
3 Foreign investing, especially in emerging markets, has additional risks, such as currency and market volatility and
political and social instability. Hedging and other strategic transactions may increase volatility and result in losses
if not successful. The fund may invest its assets in a small number of issuers. Performance could suffer significantly
from adverse events affecting these issuers. A portfolio concentrated in one sector or that holds a limited number
of securities may fluctuate more than a diversified portfolio. Frequent trading may increase fund transaction costs.
Owning an ETF generally reflects the risks of owning the underlying securities it is designed to track. The fund may
invest in IPOs, which are frequently volatile in price and may lead to increased portfolio turnover. The fund can
invest up to 100% of its assets in cash, which may cause the fund to not meet its investment objective. Please see
the fund’s prospectuses for additional risks.
| |
| Annual report | Technical Opportunities Fund | 11 |
Fund’s investments
As of 7-31-14
| | |
| | Shares | Value |
|
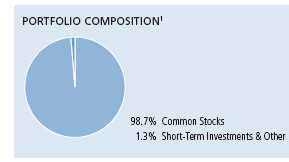
| Common Stocks 98.7% | | $860,737,702 |
|
| (Cost $791,473,400) | | |
| | | |
| Consumer Discretionary 13.5% | | 117,964,026 |
| | | |
| Automobiles 1.5% | | |
|
| Tesla Motors, Inc. (L) | 57,705 | 12,885,527 |
| | | |
| Household Durables 0.7% | | |
|
| Harman International Industries, Inc. | 58,154 | 6,312,617 |
| | | |
| Internet & Catalog Retail 5.7% | | |
|
| Ctrip.com International, Ltd., ADR (L) | 102,525 | 6,564,676 |
|
| Expedia, Inc. | 133,757 | 10,622,981 |
|
| Rakuten, Inc. | 335,818 | 4,410,286 |
|
| The Priceline Group, Inc. (I) | 16,090 | 19,991,021 |
|
| TripAdvisor, Inc. | 63,924 | 6,062,552 |
|
| Vipshop Holdings, Ltd., ADR (L) | 10,891 | 2,238,536 |
| | | |
| Media 1.6% | | |
|
| CyberAgent, Inc. | 148,165 | 4,966,680 |
|
| Dentsu, Inc. | 107,118 | 4,242,521 |
|
| Time Warner, Inc. | 52,165 | 4,330,738 |
| | | |
| Textiles, Apparel & Luxury Goods 4.0% | | |
|
| ANTA Sports Products, Ltd. | 4,105,545 | 6,747,963 |
|
| Asics Corp. | 277,415 | 5,887,436 |
|
| Kate Spade & Company (I) | 98,200 | 3,714,906 |
|
| Skechers U.S.A., Inc., Class A | 154,651 | 8,068,143 |
|
| Under Armour, Inc., Class A (L) | 95,921 | 6,402,727 |
|
| Vince Holding Corp. | 133,611 | 4,514,716 |
| | | |
| Consumer Staples 8.2% | | 71,634,863 |
| | | |
| Food & Staples Retailing 1.3% | | |
|
| Seven & I Holdings Company, Ltd. | 142,028 | 5,910,577 |
|
| Walgreen Company | 74,658 | 5,134,231 |
| | | |
| Food Products 5.1% | | |
|
| Archer-Daniels-Midland Company | 74,831 | 3,472,158 |
|
| Keurig Green Mountain, Inc. | 202,827 | 24,193,205 |
|
| Mead Johnson Nutrition Company | 38,452 | 3,516,051 |
|
| Mondelez International, Inc., Class A | 221,928 | 7,989,408 |
|
| Sanderson Farms, Inc. (L) | 56,322 | 5,130,371 |
| | | |
| Personal Products 0.3% | | |
|
| Kao Corp. | 65,671 | 2,700,668 |
| | |
| 12 | Technical Opportunities Fund | Annual report | See notes to financial statements |
| | |
| | Shares | Value |
| Tobacco 1.5% | | |
|
| Lorillard, Inc. | 114,595 | $6,930,706 |
|
| Reynolds American, Inc. | 119,203 | 6,657,488 |
| | | |
| Energy 9.0% | | 78,127,363 |
| | | |
| Energy Equipment & Services 1.4% | | |
|
| Patterson-UTI Energy, Inc. | 129,712 | 4,455,607 |
|
| Schlumberger, Ltd. | 73,896 | 8,009,587 |
| | | |
| Oil, Gas & Consumable Fuels 7.6% | | |
|
| Anadarko Petroleum Corp. | 81,866 | 8,747,382 |
|
| Athlon Energy, Inc. | 97,055 | 4,625,641 |
|
| Concho Resources, Inc. | 38,705 | 5,449,664 |
|
| Continental Resources, Inc. (L) | 39,971 | 5,866,943 |
|
| Diamondback Energy, Inc. | 67,418 | 5,543,782 |
|
| Energen Corp. | 99,348 | 8,109,777 |
|
| Golar LNG, Ltd. (L) | 70,448 | 4,340,301 |
|
| Pioneer Natural Resources Company | 50,244 | 11,127,036 |
|
| Whiting Petroleum Corp. | 133,932 | 11,851,643 |
| | | |
| Financials 1.8% | | 16,120,730 |
| | | |
| Diversified Financial Services 0.4% | | |
|
| Japan Exchange Group, Inc. | 152,826 | 3,477,016 |
| | | |
| Insurance 0.5% | | |
|
| FNF Group | 159,656 | 4,328,274 |
| | | |
| Real Estate Management & Development 0.9% | | |
|
| CBRE Group, Inc., Class A | 141,323 | 4,358,401 |
|
| Jones Lang LaSalle, Inc. | 31,989 | 3,957,039 |
| | | |
| Health Care 28.8% | | 250,710,005 |
| | | |
| Biotechnology 6.7% | | |
|
| Alkermes PLC | 93,401 | 3,993,827 |
|
| Alnylam Pharmaceuticals, Inc. | 161,527 | 8,730,534 |
|
| Biogen Idec, Inc. (I) | 20,645 | 6,903,482 |
|
| Gilead Sciences, Inc. | 79,025 | 7,234,739 |
|
| Incyte Corp., Ltd. | 92,300 | 4,390,711 |
|
| Medivation, Inc. | 57,206 | 4,246,401 |
|
| NPS Pharmaceuticals, Inc. | 314,705 | 8,792,858 |
|
| Regeneron Pharmaceuticals, Inc. | 26,842 | 8,487,977 |
|
| Vertex Pharmaceuticals, Inc. | 62,252 | 5,534,825 |
| | | |
| Health Care Providers & Services 9.0% | | |
|
| Aetna, Inc. | 113,755 | 8,819,425 |
|
| Envision Healthcare Holdings, Inc. | 199,833 | 7,144,030 |
|
| HCA Holdings, Inc. | 237,063 | 15,482,585 |
|
| Humana, Inc. | 75,835 | 8,921,988 |
|
| LifePoint Hospitals, Inc. (I) | 191,024 | 13,700,241 |
|
| Tenet Healthcare Corp. (I) | 216,184 | 11,408,030 |
|
| Universal Health Services, Inc., Class B | 121,899 | 12,994,433 |
| | | |
| Life Sciences Tools & Services 1.4% | | |
|
| Illumina, Inc. (I) | 74,148 | 11,857,007 |
| | |
| See notes to financial statements | Annual report | Technical Opportunities Fund | 13 |
| | |
| | Shares | Value |
| Pharmaceuticals 11.7% | | |
|
| Actavis PLC (I) | 74,334 | $15,926,803 |
|
| Astellas Pharma, Inc. | 221,810 | 3,007,877 |
|
| Eli Lilly & Company | 275,467 | 16,820,015 |
|
| Jazz Pharmaceuticals PLC (I) | 110,784 | 15,479,848 |
|
| Merck & Company, Inc. | 152,119 | 8,631,232 |
|
| Novo Nordisk A/S, Class B | 182,227 | 8,388,301 |
|
| Ono Pharmaceutical Company, Ltd. | 86,164 | 7,288,550 |
|
| Pacira Pharmaceuticals, Inc. (I)(L) | 56,067 | 5,158,164 |
|
| Salix Pharmaceuticals, Ltd. (I) | 161,975 | 21,366,122 |
| | | |
| Industrials 9.5% | | 82,528,312 |
| | | |
| Aerospace & Defense 1.7% | | |
|
| Curtiss-Wright Corp. | 65,710 | 4,173,242 |
|
| Esterline Technologies Corp. (I) | 37,605 | 4,082,023 |
|
| General Dynamics Corp. | 58,539 | 6,835,599 |
| | | |
| Air Freight & Logistics 1.5% | | |
|
| FedEx Corp. | 90,935 | 13,356,533 |
| | | |
| Airlines 0.4% | | |
|
| JetBlue Airways Corp. (I)(L) | 277,091 | 2,970,416 |
| | | |
| Building Products 1.1% | | |
|
| Daikin Industries, Ltd. | 71,721 | 4,925,723 |
|
| Geberit AG | 12,896 | 4,321,138 |
| | | |
| Electrical Equipment 2.8% | | |
|
| Enphase Energy, Inc. (I)(L) | 182,699 | 1,881,800 |
|
| Hubbell, Inc., Class B | 96,746 | 11,313,477 |
|
| Nidec Corp. | 50,530 | 3,290,850 |
|
| SolarCity Corp. (I)(L) | 110,880 | 7,931,246 |
| | | |
| Machinery 0.4% | | |
|
| SMC Corp. | 13,217 | 3,648,930 |
| | | |
| Professional Services 1.1% | | |
|
| ManpowerGroup, Inc. | 63,072 | 4,912,678 |
|
| Robert Half International, Inc. | 94,153 | 4,580,543 |
| | | |
| Road & Rail 0.5% | | |
|
| Hertz Global Holdings, Inc. (I) | 152,520 | 4,304,114 |
| | | |
| Information Technology 23.5% | | 204,872,763 |
| | | |
| Communications Equipment 1.7% | | |
|
| ARRIS Group, Inc. (I) | 130,065 | 4,444,321 |
|
| F5 Networks, Inc. (I) | 54,027 | 6,082,900 |
|
| Palo Alto Networks, Inc. (I) | 54,999 | 4,447,219 |
| | | |
| Internet Software & Services 6.9% | | |
|
| 58.com, Inc., ADR (I) | 26,900 | 1,322,135 |
|
| Akamai Technologies, Inc. (I) | 147,601 | 8,711,411 |
|
| Baidu, Inc., ADR (I) | 22,195 | 4,795,230 |
|
| Facebook, Inc., Class A (I) | 223,282 | 16,221,437 |
|
| Google, Inc., Class A (I) | 26,161 | 15,161,608 |
|
| Tencent Holdings, Ltd. | 290,622 | 4,715,951 |
| | |
| 14 | Technical Opportunities Fund | Annual report | See notes to financial statements |
| | | | |
| | | | Shares | Value |
| Internet Software & Services (continued) | | | | |
|
| Yelp, Inc. (I)(L) | | | 70,595 | $4,741,160 |
|
| Zillow, Inc., Class A (I)(L) | | | 29,723 | 4,266,142 |
| | | | | |
| IT Services 2.0% | | | | |
|
| Fidelity National Information Services, Inc. | | | 54,305 | 3,062,802 |
|
| Science Applications International Corp. | | | 107,868 | 4,505,646 |
|
| VeriFone Systems, Inc. (I) | | | 190,628 | 6,387,944 |
|
| Xerox Corp. | | | 272,680 | 3,615,737 |
| | | | | |
| Semiconductors & Semiconductor Equipment 6.1% | | | | |
|
| First Solar, Inc. (I) | | | 159,107 | 10,041,243 |
|
| GT Advanced Technologies, Inc. (I)(L) | | | 737,235 | 10,203,332 |
|
| Infineon Technologies AG | | | 456,086 | 5,025,394 |
|
| SunEdison, Inc. (I) | | | 615,208 | 12,304,160 |
|
| SunPower Corp. (I)(L) | | | 329,550 | 12,104,372 |
|
| Synaptics, Inc. (I)(L) | | | 50,301 | 3,633,241 |
| | | | | |
| Software 4.1% | | | | |
|
| Activision Blizzard, Inc. | | | 506,373 | 11,332,627 |
|
| Adobe Systems, Inc. (I) | | | 108,340 | 7,487,377 |
|
| Fortinet, Inc. (I) | | | 126,061 | 3,094,798 |
|
| Microsoft Corp. | | | 150,328 | 6,488,156 |
|
| Solera Holdings, Inc. | | | 108,365 | 6,935,360 |
| | | | | |
| Technology Hardware, Storage & Peripherals 2.7% | | | | |
|
| Apple, Inc. | | | 200,532 | 19,164,843 |
|
| Super Micro Computer, Inc. (I) | | | 174,865 | 4,576,217 |
| | | | | |
| Materials 3.4% | | | | 29,883,995 |
| | | | | |
| Chemicals 0.9% | | | | |
|
| Ashland, Inc. | | | 74,978 | 7,846,448 |
| | | | | |
| Construction Materials 0.6% | | | | |
|
| Vulcan Materials Company | | | 80,928 | 5,108,985 |
| | | | | |
| Containers & Packaging 1.9% | | | | |
|
| Graphic Packaging Holding Company (I) | | | 926,457 | 11,117,484 |
|
| MeadWestvaco Corp. | | | 139,021 | 5,811,078 |
| | | | | |
| Telecommunication Services 1.0% | | | | 8,895,645 |
| | | | | |
| Wireless Telecommunication Services 1.0% | | | | |
|
| T-Mobile US, Inc. (I) | | | 270,056 | 8,895,645 |
| |
| | | Yield (%) | Shares | Value |
| Securities Lending Collateral 8.8% | | | | $76,422,833 |
|
| (Cost $76,415,856) | | | | |
| John Hancock Collateral Investment | | | | |
| Trust (W)(Y) | | 0.0965 | 7,636,785 | 76,422,833 |
| | |
| See notes to financial statements | Annual report | Technical Opportunities Fund | 15 |
| | |
| | Par value | Value |
|
| Short-Term Investments 0.6% | | $5,700,000 |
|
| (Cost $5,700,000) | | |
| | | |
| Repurchase Agreement 0.6% | | 5,700,000 |
| Bank of America Tri-Party Repurchase Agreement dated 7-31-14 at 0.080% | | |
| to be repurchased at $5,700,013 on 8-1-14, collateralized by $5,815,000 | | |
| Federal Home Loan Bank 0.000% due 8-6-14 (valued at $5,815,000, | | |
| including interest) | $5,700,000 | 5,700,000 |
|
| |
| Total investments (Cost $873,589,256)† 108.1% | | $942,860,535 |
|
| |
| Other assets and liabilities, net (8.1%) | | ($70,883,017) |
|
| |
| Total net assets 100.0% | | $871,977,518 |
|
The percentage shown for each investment category is the total value of the category as a percentage of the net assets of the fund.
ADR American Depositary Receipts
(I) Non-income producing security.
(L) All or a portion of this security is on loan as of 7-31-14.
(W) Investment is an affiliate of the fund, the advisor and/or subadvisor. This investment represents collateral received for securities lending.
(Y) The rate shown is the annualized seven-day yield as of 7-31-14.
† At 7-31-14, the aggregate cost of investment securities for federal income tax purposes was $879,466,180. Net unrealized appreciation aggregated $63,394,355, of which $77,648,087 related to appreciated investment securities and $14,253,732 related to depreciated investment securities.
The fund has the following country concentration as a percentage of net assets on 7-31-14:
| | |
| United States | 87.7% | |
| Japan | 6.2% | |
| China | 3.0% | |
| Denmark | 1.0% | |
| Germany | 0.6% | |
| Bermuda | 0.5% | |
| Switzerland | 0.5% | |
| Ireland | 0.5% | |
|
| |
| Total | 100.0% | |
| | |
| 16 | Technical Opportunities Fund | Annual report | See notes to financial statements |
F I N A N C I A L S T A T E M E N T S
Financial statements
Statement of assets and liabilities 7-31-14
This Statement of assets and liabilities is the fund’s balance sheet. It shows the value of what the fund owns, is due and owes. You’ll also find the net asset value and the maximum offering price per share.
| |
| Assets | |
|
| Investments in unaffiliated issuers, at value (Cost $797,173,400) including | |
| $72,401,927 of securities loaned | $866,437,702 |
| Investments in affiliated funds, at value (Cost $76,415,856) | 76,422,833 |
| Total investments, at value (Cost $873,589,256) | 942,860,535 |
| Cash | 137 |
| Receivable for investments sold | 12,987,870 |
| Receivable for fund shares sold | 1,071,733 |
| Dividends and interest receivable | 109,789 |
| Receivable for securities lending income | 27,472 |
| Other receivables and prepaid expenses | 36,788 |
| | |
| Total assets | 957,094,324 |
| |
| Liabilities | |
|
| Payable for investments purchased | 8,372,865 |
| Payable for fund shares repurchased | 132,169 |
| Payable upon return of securities loaned | 76,467,237 |
| Payable to affiliates | |
| Accounting and legal services fees | 17,320 |
| Transfer agent fees | 9,899 |
| Other liabilities and accrued expenses | 117,316 |
| | |
| Total liabilities | 85,116,806 |
| | |
| Net assets | $871,977,518 |
| |
| Net assets consist of | |
|
| Paid-in capital | $691,038,310 |
| Accumulated net investment income (loss) | 2,464 |
| Accumulated net realized gain (loss) on investments and options written | 111,664,914 |
| Net unrealized appreciation (depreciation) on investments and translation | |
| of assets and liabilities in foreign currencies | 69,271,830 |
| | |
| Net assets | $871,977,518 |
| |
| Net asset value per share | |
|
| Based on net asset values and shares outstanding — the fund has an | |
| unlimited number of shares authorized with no par value | |
| Class A ($58,707,849 ÷ 4,267,721 shares)1 | $13.76 |
| Class I ($30,476,155 ÷ 2,172,628 shares) | $14.03 |
| Class NAV ($782,793,514 ÷ 55,264,041 shares) | $14.16 |
| |
| Maximum offering price per share | |
|
| Class A (net asset value per share ÷ 95%)2 | $14.48 |
1 Redemption price per share is equal to net asset value less any applicable contingent deferred sales charge.
2 On single retail sales of less than $50,000. On sales of $50,000 or more and on group sales the offering price
is reduced.
| | |
| See notes to financial statements | Annual report | Technical Opportunities Fund | 17 |
F I N A N C I A L S T A T E M E N T S
Statement of operations For the year ended 7-31-14
This Statement of operations summarizes the fund’s investment income earned and expenses incurred in operating the fund. It also shows net gains (losses) for the period stated.
| |
| Investment income | |
|
| Dividends | $5,213,843 |
| Securities lending | 545,589 |
| Interest | 25,724 |
| Less foreign taxes withheld | (135,133) |
| | |
| Total investment income | 5,650,023 |
| |
| Expenses | |
|
| Investment management fees | 9,767,533 |
| Distribution and service fees | 179,130 |
| Accounting and legal services fees | 103,681 |
| Transfer agent fees | 113,433 |
| Trustees’ fees | 11,025 |
| State registration fees | 42,275 |
| Printing and postage | 19,999 |
| Professional fees | 48,293 |
| Custodian fees | 239,352 |
| Registration and filing fees | 42,820 |
| Other | 16,199 |
| | |
| Total expenses | 10,583,740 |
| Less expense reductions | (52,486) |
| | |
| Net expenses | 10,531,254 |
| | |
| Net investment loss | (4,881,231) |
| |
| Realized and unrealized gain (loss) | |
|
| Net realized gain (loss) on | |
| Investments in unaffiliated issuers and foreign currency transactions | 157,920,570 |
| Investments in affiliated issuers | 1,704 |
| Written options | (808,666) |
| | 157,113,608 |
| Change in net unrealized appreciation (depreciation) of | |
| Investments in unaffiliated issuers and translation of assets and liabilities in | |
| foreign currencies | (39,528,048) |
| Investments in affiliated issuers | (471) |
| | (39,528,519) |
| Net realized and unrealized gain | 117,585,089 |
| | |
| Increase in net assets from operations | $112,703,858 |
| | |
| 18 | Technical Opportunities Fund | Annual report | See notes to financial statements |
F I N A N C I A L S T A T E M E N T S
Statements of changes in net assets
These Statements of changes in net assets show how the value of the fund’s net assets has changed during the last two periods. The difference reflects earnings less expenses, any investment gains and losses, distributions, if any, paid to shareholders and the net of fund share transactions.
| | |
| | Year | Year |
| | ended | ended |
| | 7-31-14 | 7-31-13 |
|
| Increase (decrease) in net assets | | |
|
| From operations | | |
| Net investment loss | ($4,881,231) | ($1,139,273) |
| Net realized gain | 157,113,608 | 114,891,240 |
| Change in net unrealized appreciation (depreciation) | (39,528,519) | 61,324,427 |
| | | |
| Increase in net assets resulting from operations | 112,703,858 | 175,076,394 |
| | | |
| Distributions to shareholders | | |
| From net realized gain | | |
| Class A | (5,373,130) | — |
| Class I | (2,431,447) | — |
| Class NAV | (69,367,006) | — |
| | | |
| Total distributions | (77,171,583) | — |
| | | |
| From fund share transactions | 166,627,235 | (5,916,914) |
| | | |
| Total increase | 202,159,510 | 169,159,480 |
| |
| Net assets | | |
|
| Beginning of year | 669,818,008 | 500,658,528 |
| | | |
| End of year | $871,977,518 | $669,818,008 |
| | | |
| Accumulated net investment income (loss) | $2,464 | ($3,517) |
| | |
| See notes to financial statements | Annual report | Technical Opportunities Fund | 19 |
Financial highlights
The Financial highlights show how the fund’s net asset value for a share has changed during the period.
| | | | | |
| CLASS A SHARES Period ended | 7-31-14 | 7-31-13 | 7-31-12 | 7-31-11 | 7-31-101 |
| |
| Per share operating performance | | | | | |
|
| Net asset value, beginning of period | $13.15 | $9.65 | $11.33 | $9.86 | $10.00 |
| Net investment loss2 | (0.14) | (0.08) | (0.10) | (0.09) | (0.13) |
| Net realized and unrealized gain (loss) on investments | 2.09 | 3.58 | (1.17) | 1.56 | (0.01) |
| Total from investment operations | 1.95 | 3.50 | (1.27) | 1.47 | (0.14) |
| Less distributions | | | | | |
| From net realized gain | (1.34) | — | (0.41) | — | — |
| Net asset value, end of period | $13.76 | $13.15 | $9.65 | $11.33 | $9.86 |
| Total return (%)3,4 | 14.86 | 36.27 | (10.93) | 14.91 | (1.40)5 |
| |
| Ratios and supplemental data | | | | | |
|
| Net assets, end of period (in millions) | $59 | $45 | $51 | $125 | $165 |
| Ratios (as a percentage of average net assets): | | | | | |
| Expenses before reductions | 1.72 | 1.78 | 1.88 | 1.90 | 1.876 |
| Expenses including reductions | 1.71 | 1.78 | 1.88 | 1.90 | 1.876 |
| Net investment loss | (1.03) | (0.69) | (1.04) | (0.79) | (1.23)6 |
| Portfolio turnover (%) | 306 | 391 | 507 | 361 | 389 |
1 Period from 8-3-09 (commencement of operations) to 7-31-10.
2 Based on average daily shares outstanding.
3 Does not reflect the effect of sales charges, if any.
4 Total returns would have been lower had certain expenses not been reduced during the applicable periods.
5 Not annualized.
6 Annualized.
| | | | | |
| CLASS I SHARES Period ended | 7-31-14 | 7-31-13 | 7-31-12 | 7-31-11 | 7-31-101 |
| |
| Per share operating performance | | | | | |
|
| Net asset value, beginning of period | $13.35 | $9.77 | $11.42 | $9.89 | $10.00 |
| Net investment loss2 | (0.11) | (0.04) | (0.07) | (0.04) | (0.09) |
| Net realized and unrealized gain (loss) on investments | 2.13 | 3.62 | (1.17) | 1.57 | (0.02) |
| Total from investment operations | 2.02 | 3.58 | (1.24) | 1.53 | (0.11) |
| Less distributions | | | | | |
| From net realized gain | (1.34) | — | (0.41) | — | — |
| Net asset value, end of period | $14.03 | $13.35 | $9.77 | $11.42 | $9.89 |
| Total return (%)3 | 15.17 | 36.64 | (10.57) | 15.47 | (1.10)4 |
| |
| Ratios and supplemental data | | | | | |
|
| Net assets, end of period (in millions) | $30 | $18 | $17 | $63 | $79 |
| Ratios (as a percentage of average net assets): | | | | | |
| Expenses before reductions | 1.44 | 1.48 | 1.55 | 1.49 | 1.525 |
| Expenses including reductions | 1.43 | 1.47 | 1.51 | 1.49 | 1.525 |
| Net investment loss | (0.75) | (0.39) | (0.69) | (0.37) | (0.89)5 |
| Portfolio turnover (%) | 306 | 391 | 507 | 361 | 389 |
1 Period from 8-3-09 (commencement of operations) to 7-31-10.
2 Based on average daily shares outstanding.
3 Total returns would have been lower had certain expenses not been reduced during the applicable periods.
4 Not annualized.
5 Annualized.
| | |
| 20 | Technical Opportunities Fund | Annual report | See notes to financial statements |
| | | | | |
| CLASS NAV SHARES Period ended | 7-31-14 | 7-31-13 | 7-31-12 | 7-31-11 | 7-31-101 |
| |
| Per share operating performance | | | | | |
|
| Net asset value, beginning of period | $13.44 | $9.81 | $11.45 | $9.90 | $10.00 |
| Net investment loss2 | (0.08) | (0.02) | (0.04) | (0.03) | (0.07) |
| Net realized and unrealized gain (loss) on investments | 2.14 | 3.65 | (1.19) | 1.58 | (0.03) |
| Total from investment operations | 2.06 | 3.63 | (1.23) | 1.55 | (0.10) |
| Less distributions | | | | | |
| From net realized gain | (1.34) | — | (0.41) | — | — |
| Net asset value, end of period | $14.16 | $13.44 | $9.81 | $11.45 | $9.90 |
| Total return (%)3 | 15.38 | 37.00 | (10.45) | 15.66 | (1.00)4 |
| |
| Ratios and supplemental data | | | | | |
|
| Net assets, end of period (in millions) | $783 | $606 | $433 | $535 | $349 |
| Ratios (as a percentage of average net assets): | | | | | |
| Expenses before reductions | 1.22 | 1.24 | 1.32 | 1.37 | 1.395 |
| Expenses including reductions | 1.21 | 1.23 | 1.32 | 1.37 | 1.395 |
| Net investment loss | (0.54) | (0.16) | (0.46) | (0.31) | (0.72)5 |
| Portfolio turnover (%) | 306 | 391 | 507 | 361 | 389 |
1 Period from 8-3-09 (commencement of operations) to 7-31-10.
2 Based on average daily shares outstanding.
3 Total returns would have been lower had certain expenses not been reduced during the applicable periods.
4 Not annualized.
5 Annualized.
| | |
| See notes to financial statements | Annual report | Technical Opportunities Fund | 21 |
Notes to financial statements
Note 1 — Organization
John Hancock Technical Opportunities Fund (the fund) is a series of John Hancock Funds II (the Trust), an open-end management investment company organized as a Massachusetts business trust and registered under the Investment Company Act of 1940, as amended (the 1940 Act). The investment objective of the fund is to seek long-term capital appreciation.
The fund may offer multiple classes of shares. The shares currently offered are detailed in the Statement of assets and liabilities. Class A shares are offered to all investors. Class I shares are offered to institutions and certain investors. Class NAV shares are offered to John Hancock affiliated funds of funds and certain 529 plans. Shareholders of each class have exclusive voting rights to matters that affect that class. The distribution and service fees, if any, transfer agent fees, state registration fees and printing and postage for each class may differ.
Note 2 — Significant accounting policies
The financial statements have been prepared in conformity with accounting principles generally accepted in the United States of America (US GAAP), which require management to make certain estimates and assumptions as of the date of the financial statements. Actual results could differ from those estimates and those differences could be significant. The fund intends to qualify as an investment company under Topic 946 of Accounting Standards Codification of US GAAP.
Events or transactions occurring after the end of the fiscal period through the date that the financial statements were issued have been evaluated in the preparation of the financial statements. The following summarizes the significant accounting policies of the fund:
Security valuation. Investments are stated at value as of the close of regular trading on the New York Stock Exchange (NYSE), normally at 4:00 PM., Eastern Time. In order to value the securities, the fund uses the following valuation techniques: Equity securities held by the fund are valued at the last sale price or official closing price on the exchange where the security was acquired or most likely will be sold. In the event there were no sales during the day or closing prices are not available, the securities are valued using the last available bid price. Investments by the fund in open-end mutual funds, including John Hancock Collateral Investment Trust (JHCIT), are valued at their respective net asset values each business day. Foreign securities and currencies are valued in U.S. dollars, based on foreign currency exchange rates supplied by an independent pricing vendor. Securities that trade only in the over-the-counter (OTC) market are valued using bid prices. Certain short-term securities with maturities of 60 days or less at the time of purchase are valued at amortized cost.
Other fund securities and assets, for which reliable market quotations are not readily available, are valued at fair value as determined in good faith by the fund’s Pricing Committee following procedures established by the Board of Trustees. The frequency with which these fair valuation procedures are used cannot be predicted and fair value of securities may differ significantly from the value that would have been used had a ready market for such securities existed. Trading in foreign securities may be completed before the daily close of trading on the NYSE. Significant events at the issuer or market level may affect the values of securities between the time when the valuation of the securities is generally determined and the close of the NYSE. If a significant event occurs, these securities may be fair valued, as determined in good faith by the fund’s Pricing Committee, following procedures established by the Board of Trustees. The fund uses fair value adjustment
| |
| 22 | Technical Opportunities Fund | Annual report |
factors provided by an independent pricing vendor to value certain foreign securities in order to adjust for events that may occur between the close of foreign exchanges or markets and the close of the NYSE.
The fund uses a three-tier hierarchy to prioritize the pricing assumptions, referred to as inputs, used in valuation techniques to measure fair value. Level 1 includes securities valued using quoted prices in active markets for identical securities. Level 2 includes securities valued using other significant observable inputs. Observable inputs may include quoted prices for similar securities, interest rates, prepayment speeds and credit risk. Prices for securities valued using these inputs are received from independent pricing vendors and brokers and are based on an evaluation of the inputs described. Level 3 includes securities valued using significant unobservable inputs when market prices are not readily available or reliable, including the fund’s own assumptions in determining the fair value of investments. Factors used in determining value may include market or issuer specific events or trends, changes in interest rates and credit quality. The inputs or methodology used for valuing securities are not necessarily an indication of the risks associated with investing in those securities. Changes in valuation techniques may result in transfers into or out of an assigned level within the disclosure hierarchy.
The following is a summary of the values by input classification of the fund’s investments as of July 31, 2014, by major security category or type:
| | | | |
| | | | | LEVEL 3 |
| | | | LEVEL 2 | SIGNIFICANT |
| | TOTAL MARKET | LEVEL 1 | SIGNIFICANT | UNOBSERVABLE |
| | VALUE AT 7-31-14 | QUOTED PRICE | OBSERVABLE INPUTS | INPUTS |
|
| Common Stocks | | | | |
| Consumer Discretionary | $117,964,026 | $91,709,140 | $26,254,886 | — |
| Consumer Staples | 71,634,863 | 63,023,618 | 8,611,245 | — |
| Energy | 78,127,363 | 78,127,363 | — | — |
| Financials | 16,120,730 | 12,643,714 | 3,477,016 | — |
| Health Care | 250,710,005 | 232,025,277 | 18,684,728 | — |
| Industrials | 82,528,312 | 66,341,671 | 16,186,641 | — |
| Information Technology | 204,872,763 | 195,131,418 | 9,741,345 | — |
| Materials | 29,883,995 | 29,883,995 | — | — |
| Telecommunication | | | | |
| Services | 8,895,645 | 8,895,645 | — | — |
| Securities Lending | | | | |
| Collateral | 76,422,833 | 76,422,833 | — | — |
| Short-Term Investments | 5,700,000 | — | 5,700,000 | |
| |
|
| Total Investments in | | | | |
| Securities | $942,860,535 | $854,204,674 | $88,655,861 | — |
Repurchase agreements. The fund may enter into repurchase agreements. When the fund enters into a repurchase agreement, it receives collateral that is held in a segregated account by the fund’s custodian, or for tri-party repurchase agreements, collateral is held at a third-party custodian bank in a segregated account for the benefit of the fund. The collateral amount is marked-to-market and monitored on a daily basis to ensure that the collateral held is in an amount not less than the principal amount of the repurchase agreement plus any accrued interest. Collateral received by the fund for repurchase agreements is disclosed in the Fund’s investments as part of the caption related to the repurchase agreement.
Repurchase agreements are typically governed by the terms and conditions of the Master Repurchase Agreement and/or Global Master Repurchase Agreement (collectively, MRA). Upon an event of default, the non-defaulting party may close out all transactions traded under the MRA and net amounts owed. Absent an event of default, the MRA does not result in an offset of the reported
| |
| Annual report | Technical Opportunities Fund | 23 |
amounts of assets and liabilities in the Statement of assets and liabilities. In the event of a default by the counterparty, realization of the collateral proceeds could be delayed, during which time the collateral value may decline or the counterparty may have insufficient assets to pay back claims resulting from close-out of the transactions.
Security transactions and related investment income. Investment security transactions are accounted for on a trade date plus one basis for daily net asset value calculations. However, for financial reporting purposes, investment transactions are reported on trade date. Interest income is accrued as earned. Dividend income is recorded on the ex-date, except for dividends of foreign securities where the dividend may not be known until after the ex-date. In those cases, dividend income, net of withholding taxes, is recorded when the fund becomes aware of the dividends. Gains and losses on securities sold are determined on the basis of identified cost and may include proceeds from litigation.
Securities lending. The fund may lend its securities to earn additional income. The fund receives cash collateral from the borrower in an amount not less than the market value of the loaned securities. The fund will invest its collateral in JHCIT, an affiliate of the fund, which has a floating net asset value and is registered with the Securities and Exchange Commission (SEC) as an investment company. JHCIT invests cash received as collateral as part of the securities lending program in short-term money market investments. The fund will receive the benefit of any gains and bear any losses generated by JHCIT with respect to the cash collateral.
If a borrower fails to return loaned securities when due, then the lending agent is responsible and indemnifies the fund for the lent securities. The lending agent uses the collateral received from the borrower to purchase replacement securities of the same issue, type, class and series of the loaned securities. If the value of the collateral is less than the purchase cost of replacement securities, the lending agent is responsible for satisfying the shortfall but only to the extent that the shortfall is not due to any decrease in the value of JHCIT.
Although the risk of the loss of the securities lent is mitigated by receiving collateral from the borrower and through lending agent indemnification, the fund could experience a delay in recovering securities or could experience a lower than expected return if the borrower fails to return the securities on a timely basis. The fund may receive compensation for lending its securities by retaining a portion of the return on the investment of the collateral and compensation from fees earned from borrowers of the securities. Net income received from JHCIT is a component of securities lending income as recorded on the Statement of operations.
Obligations to repay collateral received by the fund is shown on the Statement of assets and liabilities as Payable upon return of securities loaned.
Foreign currency translation. Assets, including investments and liabilities denominated in foreign currencies, are translated into U.S. dollar values each day at the prevailing exchange rate. Purchases and sales of securities, income and expenses are translated into U.S. dollars at the prevailing exchange rate on the date of the transaction. The effect of changes in foreign currency exchange rates on the value of securities is reflected as a component of the realized and unrealized gains (losses) on investments.
Funds that invest internationally generally carry more risk than funds that invest strictly in U.S. securities. These risks are heightened for investments in emerging markets. Risks can result from differences in economic and political conditions, regulations, market practices (including higher transaction costs), accounting standards and other factors. Foreign investments are also subject to a decline in the value of a foreign currency versus the U.S. dollar, which reduces the dollar value of securities denominated in that currency.
| |
| 24 | Technical Opportunities Fund | Annual report |
Foreign taxes. The fund may be subject to withholding tax on income and/or capital gains or repatriation taxes imposed by certain countries in which the fund invests. Taxes are accrued based upon investment income, realized gains or unrealized appreciation.
Line of credit. The fund may borrow from banks for temporary or emergency purposes, including meeting redemption requests that otherwise might require the untimely sale of securities. Pursuant to the fund’s custodian agreement, the custodian may loan money to the fund to make properly authorized payments. The fund is obligated to repay the custodian for any overdraft, including any related costs or expenses. The custodian may have a lien, security interest or security entitlement in any fund property that is not otherwise segregated or pledged, to the maximum extent permitted by law, to the extent of any overdraft.
In addition, the fund and other affiliated funds have entered into an agreement with Citibank N.A. that enables them to potentially participate in a $300 million unsecured committed line of credit. A commitment fee, payable at the end of each calendar quarter, based on the average daily unused portion of the line of credit, is charged to each participating fund on a pro rata basis and is reflected in other expenses on the Statement of operations. Commitment fees for the year ended July 31, 2014 were $764. For the year ended July 31, 2014, the fund had no borrowings under the line of credit.
Expenses. Within the John Hancock group of funds complex, expenses that are directly attributable to an individual fund are allocated to such fund. Expenses that are not readily attributable to a specific fund are allocated among all funds in an equitable manner, taking into consideration, among other things, the nature and type of expense and the fund’s relative net assets. Expense estimates are accrued in the period to which they relate and adjustments are made when actual amounts are known.
Class allocations. Income, common expenses and realized and unrealized gains (losses) are determined at the fund level and allocated daily to each class of shares based on the net assets of the class. Class-specific expenses, such as distribution and service fees, if any, transfer agent fees, state registration fees and printing and postage, for all classes, are calculated daily at the class level based on the appropriate net assets of each class and the specific expense rates applicable to each class.
Federal income taxes. The fund intends to continue to qualify as a regulated investment company by complying with the applicable provisions of the Internal Revenue Code and will not be subject to federal income tax on taxable income that is distributed to shareholders. Therefore, no federal income tax provision is required.
As of July 31, 2014, the fund had no uncertain tax positions that would require financial statement recognition, derecognition or disclosure. The fund’s federal tax returns are subject to examination by the Internal Revenue Service for a period of three years.
Distribution of income and gains. Distributions to shareholders from net investment income and net realized gains, if any, are recorded on the ex-date. The fund generally declares and pays dividends and capital gain distributions, if any, annually.
The tax character of distributions for the years ended July 31, 2014 and 2013 was as follows:
| | | | |
| | JULY 31, 2014 | JULY 31, 2013 | | |
| | |
| Ordinary Income | $40,919,436 | — | | |
| Long-Term Capital Gain | $36,252,147 | — | | |
| Total | $77,171,583 | — | | |
| |
| Annual report | Technical Opportunities Fund | 25 |
Distributions paid by the fund with respect to each class of shares are calculated in the same manner, at the same time and in the same amount, except for the effect of class level expenses that may be applied differently to each class. As of July 31, 2014, the components of distributable earnings on a tax basis consisted of $57,536,591 of undistributed ordinary income and $60,005,247 of long-term capital gains.
Such distributions and distributable earnings, on a tax basis, are determined in conformity with income tax regulations, which may differ from US GAAP. Distributions in excess of tax basis earnings and profits, if any, are reported in the fund’s financial statements as a return of capital.
Capital accounts within the financial statements are adjusted for permanent book-tax differences. These adjustments have no impact on net assets or the results of operations. Temporary book-tax differences, if any, will reverse in a subsequent period. Book-tax differences are primarily attributable to net operating losses and wash sale loss deferrals.
Note 3 — Derivative Instruments
The fund may invest in derivatives in order to meet its investment objective. Derivatives include a variety of different instruments that may be traded in the OTC market, on a regulated exchange or through a clearing facility. The risks in using derivatives vary depending upon the structure of the instruments, including the use of leverage, optionality, the liquidity or lack of liquidity of the contract, the creditworthiness of the counterparty or clearing organization and the volatility of the position. Some derivatives involve risks that are potentially greater than the risks associated with investing directly in the referenced securities or other referenced underlying instrument. Specifically, the fund is exposed to the risk that the counterparty to an OTC derivatives contract will be unable or unwilling to make timely settlement payments or otherwise honor its obligations. OTC derivatives transactions typically can only be closed out with the other party to the transaction.
Certain options are traded or cleared on an exchange or central clearinghouse. Exchange-traded or cleared transactions generally present less counterparty risk to a fund than OTC transactions. The exchange or clearinghouse stands between the fund and the broker to the contract and therefore, credit risk is generally limited to the failure of the exchange or clearinghouse and the clearing member.
Options. There are two types of options, put options and call options. Options are traded either over-the-counter or on an exchange. A call option gives the purchaser of the option the right to buy (and the seller the obligation to sell) the underlying instrument at the exercise price. A put option gives the purchaser of the option the right to sell (and the writer the obligation to buy) the underlying instrument at the exercise price. Writing puts and buying calls may increase the fund’s exposure to changes in the value of the underlying instrument. Buying puts and writing calls may decrease the fund’s exposure to such changes. Risks related to the use of options include the loss of premiums, possible illiquidity of the options markets, trading restrictions imposed by an exchange and movements in underlying security values, and for written options, potential losses in excess of the amounts recognized on the Statement of assets and liabilities. In addition, over-the-counter options are subject to the risks of all over-the-counter derivatives contracts.
When the fund writes an option, the premium received is included as a liability and subsequently “marked-to-market” to reflect the current market value of the option written. Premiums received from writing options that expire unexercised are recorded as realized gains. Premiums received from writing options which are exercised or are closed are added to or offset against the proceeds or amount paid on the transaction to determine the realized gain or loss. If a put option on a security is exercised, the premium received reduces the cost basis of the securities purchased by the fund.
| |
| 26 | Technical Opportunities Fund | Annual report |
During the year ended July 31, 2014, the fund wrote option contracts to manage against anticipated changes in securities markets. There were no open options contracts as of July 31, 2014.
| | |
| | NUMBER OF | |
| | CONTRACTS | PREMIUMS |
|
| Outstanding, beginning of year | — | — |
| Options written | 4,139 | 665,567 |
| Option closed | (4,139) | (665,567) |
| Options exercised | — | — |
| Options expired | — | — |
| Outstanding, end of year | — | — |
Effect of derivative instruments on the Statement of operations
The table below summarizes the net realized gain (loss) included in the net increase (decrease) in net assets from operations, classified by derivative instrument and risk category, for the year ended July 31, 2014:
| | | |
| | | INVESTMENTS IN | |
| | | UNAFFILIATED ISSUERS | |
| | STATEMENT OF | AND FOREIGN CURRENCY | |
| RISK | OPERATIONS LOCATION | TRANSACTIONS | WRITTEN OPTIONS |
|
| Equity contracts | Net realized gain (loss) | ($505,032) | ($808,666) |
Note 4 — Guarantees and indemnifications
Under the Trust’s organizational documents, its Officers and Trustees are indemnified against certain liabilities arising out of the performance of their duties to the Trust, including the fund. Additionally, in the normal course of business, the fund enters into contracts with service providers that contain general indemnification clauses. The fund’s maximum exposure under these arrangements is unknown, as this would involve future claims that may be made against the fund that have not yet occurred. The risk of material loss from such claims is considered remote.
Note 5 — Fees and transactions with affiliates
John Hancock Advisers, LLC (the Advisor or JHA) serves as investment advisor for the fund. Prior to January 1, 2014, John Hancock Investment Management Services, LLC (JHIMS) served as investment advisor for the fund. JHIMS and JHA have identical officers, directors and other personnel, and share common facilities and resources. Terms of the investment management contract with JHA are substantially identical to the former contract with JHIMS. In this report, depending on the context, the term “Advisor” shall refer to either JHA in its current capacity as investment advisor, or to JHIMS in its capacity as investment advisor prior to January 1, 2014. John Hancock Funds, LLC (the Distributor), an affiliate of the Advisor, serves as principal underwriter of the fund. The Advisor and the Distributor are indirect, wholly owned subsidiaries of Manulife Financial Corporation (MFC).
Management fee. The fund has an investment management agreement with the Advisor under which the fund pays a daily management fee to the Advisor equivalent, on an annual basis, to the sum of: a)1.20% of the first $250 million of the fund’s average daily net assets and b) 1.15% of the fund’s average daily net assets in excess of $250 million.
The Advisor has contractually agreed to waive a portion of its management fee and/or reimbursement expense for certain funds of the John Hancock funds complex, including the fund (the participating funds). The waiver equals, on an annualized basis, 0.01% of that portion of the aggregate net assets of all the participating funds that exceeds $75 billion but is less than or equal to $125 billion; 0.0125% of that portion of the aggregate net assets of all the participating funds
| |
| Annual report | Technical Opportunities Fund | 27 |
that exceeds $125 billion but is less than or equal to $150 billion; and 0.015% of that portion of the aggregate net assets of all the participating funds that exceeds $150 billion. The amount of the reimbursement is calculated daily and allocated among all the participating funds in proportion to the daily net assets of each fund. This arrangement may be amended or terminated at any time by the Advisor upon notice to the funds and with the approval of the Board of Trustees.
The expense reductions described above amounted to $3,739, $1,695 and $47,052 for Class A, Class I and Class NAV shares, respectively, for the year ended July 31, 2014.
The investment management fees incurred for the year ended July 31, 2014 were equivalent to a net annual effective rate of 1.16% of the fund’s average daily net assets.
Expense recapture. The Advisor may recapture operating expenses reimbursed or fees waived under previous expense limitation or waiver arrangements for a period of three years following the month in which the reimbursements or waivers occurred to the extent that the fund is below its expense limitation during this period. As of year ended July 31, 2014 there were no amounts eligible for recapture.
Accounting and legal services. Pursuant to a service agreement, the fund reimburses the Advisor for all expenses associated with providing the administrative, financial, legal, accounting and recordkeeping services to the fund, including the preparation of all tax returns, periodic reports to shareholders and regulatory reports, among other services. These expenses are allocated to each share class based on its relative net assets at the time the expense was incurred. These accounting and legal services fees incurred for the year ended July 31, 2014 amounted to an annual rate of 0.01% of the fund’s average daily net assets.
Distribution and service plans. The fund has a distribution agreement with the Distributor. The fund has adopted distribution and service plans with respect to Class A shares pursuant to Rule 12b-1 under the 1940 Act, to pay the Distributor for services provided as the distributor of shares of the fund. The fund pays 0.30% for Class A shares distribution and service fees under these arrangements, expressed as an annual percentage of average daily net assets for the fund’s Class A shares.
Sales charges. Class A shares are assessed up-front sales charges, which resulted in payments to the Distributor amounting to $165,102 for the year ended July 31, 2014. Of this amount, $26,508 was retained and used for printing prospectuses, advertising, sales literature and other purposes, $138,025 was paid as sales commissions to broker-dealers and $569 was paid as sales commissions to sales personnel of Signator Investors, Inc., a broker-dealer affiliate of the Advisor.
Class A shares may be subject to contingent deferred sales charges (CDSCs). Certain Class A shares that are acquired through purchases of $1 million or more and are redeemed within one year of purchase are subject to a 1.00% sales charge. CDSCs are applied to the lesser of the current market value at the time of redemption or the original purchase cost of the shares being redeemed. Proceeds from CDSCs are used to compensate the Distributor for providing distribution-related services in connection with the sale of these shares. During the year ended July 31, 2014, there were no CDSCs received by the Distributor for Class A shares.
Transfer agent fees. The fund has a transfer agent agreement with John Hancock Signature Services, Inc. (Signature Services), an affiliate of the Advisor. The transfer agent fees paid to Signature Services are determined based on the cost to Signature Services (Signature Services Cost) of providing recordkeeping services. The Signature Services Cost includes a component of allocated John Hancock corporate overhead for providing transfer agent services to the fund and to all other John Hancock affiliated funds. It also includes out-of-pocket expenses, including payments made
| |
| 28 | Technical Opportunities Fund | Annual report |
to third-parties for recordkeeping services provided to their clients who invest in one or more John Hancock funds. In addition, Signature Services Cost may be reduced by certain fees that Signature Services receives in connection with retirement and small accounts. Signature Services Cost is calculated monthly and allocated, as applicable, to five categories of share classes: Retail Share and Institutional Classes of Non-Municipal Bond Funds, Class R6 Shares, Retirement Share Classes and Municipal Bond Share Classes. Within each of these categories, the applicable costs are allocated to the affected John Hancock affiliated funds and/or classes, based on the relative average daily net assets.
Prior to October 1, 2013, Signature Services Cost was calculated monthly and allocated, as applicable, to four categories of share classes: Institutional Share Classes, Retirement Share Classes, Municipal Bond Share Classes and all other Retail Share Classes. Within each of these categories, the applicable costs were allocated to the affected John Hancock affiliated funds and/or classes, based on the relative average daily net assets.
Class level expenses. Class level expenses for the year ended July 31, 2014 were:
| | | | |
| | DISTRIBUTION | TRANSFER | STATE REGISTRATION | PRINTING AND |
| CLASS | AND SERVICE FEES | AGENT FEES | FEES | POSTAGE |
|
| Class A | $179,130 | $81,737 | $22,775 | $13,373 |
| Class I | — | 31,696 | 19,500 | 6,626 |
| Total | $179,130 | $113,433 | $42,275 | $19,999 |
Trustee expenses. The fund compensates each Trustee who is not an employee of the Advisor or its affiliates. The costs of paying Trustee compensation and expenses are allocated to each fund based on its net assets relative to other funds within the John Hancock group of funds complex.
Note 6 — Fund share transactions
Transactions in fund shares for the years ended July 31, 2014 and 2013 were as follows:
| | | | |
| | | Year ended 7-31-14 | Year ended 7-31-13 |
| | Shares | Amount | Shares | Amount |
| Class A shares | | | | |
|
| Sold | 2,206,615 | $31,058,487 | 665,826 | $7,731,533 |
| Distributions reinvested | 389,040 | 5,325,964 | — | — |
| Repurchased | (1,786,477) | (24,594,639) | (2,509,969) | (26,860,100) |
| | | | | |
| Net increase (decrease) | 809,178 | $11,789,812 | (1,844,143) | ($19,128,567) |
| |
| Class I shares | | | | |
|
| Sold | 1,659,902 | $23,701,365 | 625,607 | $7,282,687 |
| Distributions reinvested | 166,347 | 2,318,883 | — | — |
| Repurchased | (1,023,095) | (14,372,274) | (963,137) | (10,567,533) |
| | | | | |
| Net increase (decrease) | 803,154 | $11,647,974 | (337,530) | ($3,284,846) |
| |
| Class NAV shares | | | | |
|
| Sold | 11,508,682 | $164,442,778 | 7,047,702 | $84,734,367 |
| Distributions reinvested | 4,937,153 | 69,367,006 | — | — |
| Repurchased | (6,260,362) | (90,620,335) | (6,069,547) | (68,237,868) |
| | | | | |
| Net increase | 10,185,473 | $143,189,449 | 978,155 | $16,496,499 |
| |
| Total net increase (decrease) | 11,797,805 | $166,627,235 | (1,203,518) | ($5,916,914) |
|
Affiliates of the fund owned 100% of shares of beneficial interest of Class NAV on July 31, 2014.
| |
| Annual report | Technical Opportunities Fund | 29 |
Note 7 — Purchase and sale of securities
Purchases and sales of securities, other than short-term investments, amounted to $2,491,357,204 and $2,406,638,354, respectively, for the year ended July 31, 2014.
Note 8 — Investment by affiliated funds
Certain investors in the fund are affiliated funds that are managed by the Advisor and its affiliates. The affiliated funds do not invest in the fund for the purpose of exercising management or control; however, this investment may represent a significant portion of the fund’s net assets. At July 31, 2014, funds within the John Hancock group of funds complex held 89.3% of the fund’s net assets. The following funds had an affiliate ownership of 5% or more of the fund’s net assets:
| | | |
| | AFFILIATED | | |
| FUND | CONCENTRATION | | |
| | |
| John Hancock Funds II Lifestyle Growth Fund | 41.4% | | |
| John Hancock Funds II Lifestyle Balanced Fund | 25.9% | | |
| John Hancock Funds II Lifestyle Aggressive Fund | 15.3% | | |
| John Hancock Funds II Alternative Asset Allocation | 6.7% | | |
| |
| 30 | Technical Opportunities Fund | Annual report |
Auditor’s report
Report of Independent Registered Public Accounting Firm
To the Board of Trustees of John Hancock Funds II and Shareholders of
John Hancock Technical Opportunities Fund:
In our opinion, the accompanying statement of assets and liabilities, including the schedule of investments, and the related statements of operations and of changes in net assets and the financial highlights present fairly, in all material respects, the financial position of the John Hancock Technical Opportunities Fund (the “Fund”) at July 31, 2014, the results of its operations for the year then ended, the changes in its net assets for each of the two years in the period then ended and the financial highlights for each of the periods indicated, in conformity with accounting principles generally accepted in the United States of America. These financial statements and financial highlights (hereafter referred to as “financial statements”) are the responsibility of the Fund’s management. Our responsibility is to express an opinion on these financial statements based on our audits. We conducted our audits of these financial statements in accordance with the standards of the Public Company Accounting Oversight Board (United States). Those standards require that we plan and perform the audit to obtain reasonable assurance about whether the financial statements are free of material misstatement. An audit includes examining, on a test basis, evidence supporting the amounts and disclosures in the financial statements, assessing the accounting principles used and significant estimates made by management, and evaluating the overall financial statement presentation. We believe that our audits, which included confirmation of securities at July 31, 2014 by correspondence with the custodian, transfer agent, and brokers, and the application of alternative auditing procedures where securities purchased confirmations had not been received, provide a reasonable basis for our opinion.
PricewaterhouseCoopers LLP
Boston, Massachusetts
September 17, 2014
| |
| Annual report | Technical Opportunities Fund | 31 |
Tax information
Unaudited
For federal income tax purposes, the following information is furnished with respect to the distributions of the fund, if any, paid during its taxable year ended July 31, 2014.
The fund reports the maximum amount allowable of its net taxable income as eligible for the corporate dividends-received deduction.
The fund reports the maximum amount allowable of its net taxable income as qualified dividend income as provided in the Jobs and Growth Tax Relief Reconciliation Act of 2003.
The fund paid $36,252,147 in capital gain dividends.
Eligible shareholders will be mailed a 2014 Form 1099-DIV in early 2015. This will reflect the tax character of all distributions paid in calendar year 2014.
Please consult a tax advisor regarding the tax consequences of your investment in the fund.
| |
| 32 | Technical Opportunities Fund | Annual report |
Continuation of Investment Advisory and Subadvisory Agreements
Evaluation of Advisory and Subadvisory Agreements by the Board of Trustees
This section describes the evaluation by the Board of Trustees (the Board) of John Hancock Funds II (the Trust) of the Advisory Agreement (the Advisory Agreement) with John Hancock Advisers, LLC (the Advisor) and the Subadvisory Agreement (the Subadvisory Agreement) with Wellington Management Company, LLP (the Subadvisor), for John Hancock Technical Opportunities Fund (the fund). The Advisory Agreement and Subadvisory Agreement are collectively referred to as the Agreements. Prior to the June 23–25, 2014 meeting at which the Agreements were approved, the Board also discussed and considered information regarding the proposed continuation of the Agreements at an in-person meeting held on May 27–29, 2014.
Approval of Advisory and Subadvisory Agreements
At in-person meetings held on June 23–25, 2014, the Board, including the Trustees who are not considered to be interested persons of the Trust under the Investment Company Act of 1940, as amended (the 1940 Act) (the Independent Trustees), reapproved for an annual period the continuation of the Advisory Agreement between the Trust and the Advisor and the Subadvisory Agreement between the Advisor and the Subadvisor with respect to the fund.
In considering the Advisory Agreement and the Subadvisory Agreement, the Board received in advance of the meetings a variety of materials relating to the fund, the Advisor and the Subadvisor, including comparative performance, fee and expense information for a peer group of similar funds prepared by an independent third-party provider of fund data, performance information for an applicable benchmark index; and, with respect to the Subadvisor, comparative performance information for comparably managed accounts, as applicable, and other information provided by the Advisor and the Subadvisor regarding the nature, extent and quality of services provided by the Advisor and the Subadvisor under their respective Agreements, as well as information regarding the Advisor’s revenues and costs of providing services to the fund and any compensation paid to affiliates of the Advisor. At the meetings at which the renewal of the Advisory Agreement and Subadvisory Agreement are considered, particular focus is given to information concerning fund performance, comparability of fees and total expenses, and profitability. However, the Board notes that the evaluation process with respect to the Advisor and the Subadvisor is an ongoing one. In this regard, the Board also took into account discussions with management and information provided to the Board at prior meetings with respect to the services provided by the Advisor and the Subadvisor to the fund, including quarterly performance reports prepared by management containing reviews of investment results and prior presentations from the Subadvisor with respect to the fund. The Board also considered the nature, quality, and extent of non-advisory services, if any, to be provided to the fund by the Advisor’s affiliates, including distribution services.
Throughout the process, the Board asked questions of and requested additional information from management. The Board is assisted by counsel for the Trust and the Independent Trustees are also separately assisted by independent legal counsel throughout the process. The Independent Trustees also received a memorandum from their independent legal counsel discussing the legal standards for their consideration of the proposed continuation of the Agreements and discussed the proposed continuation of the Agreements in private sessions with their independent legal counsel at which no representatives of management were present.
Approval of Advisory Agreement
In approving the Advisory Agreement with respect to the fund, the Board, including the Independent Trustees, considered a variety of factors, including those discussed below. The Board also considered other factors (including conditions and trends prevailing generally in the economy, the securities markets, and the industry) and does not treat any single factor as determinative, and each Trustee
| |
| Annual report | Technical Opportunities Fund | 33 |
may attribute different weights to different factors. The Board’s conclusions may be based in part on its consideration of the advisory and subadvisory arrangements in prior years and on the Board’s ongoing regular review of fund performance and operations throughout the year.
Nature, extent, and quality of services. Among the information received by the Board from the Advisor relating to the nature, extent, and quality of services provided to the fund, the Board reviewed information provided by the Advisor relating to its operations and personnel, descriptions of its organizational and management structure, and information regarding the Advisor’s compliance and regulatory history, including its Form ADV. The Board also noted that on a regular basis it receives and reviews information from the Trust’s Chief Compliance Officer (CCO) regarding the fund’s compliance policies and procedures established pursuant to Rule 38a-1 under the 1940 Act. The Board also considered the Advisor’s risk management processes. The Board considered that the Advisor is responsible for the management of the day-to-day operations of the fund, including, but not limited to, general supervision of and coordination of the services provided by the Subadvisor, and is also responsible for monitoring and reviewing the activities of the Subadvisor and other third-party service providers.
In considering the nature, extent, and quality of the services provided by the Advisor, the Trustees also took into account their knowledge of the Advisor’s management and the quality of the performance of the Advisor’s duties, through Board meetings, discussions and reports during the preceding year and through each Trustee’s experience as a Trustee of the Trust and of the other trusts in the complex.
In the course of their deliberations regarding the Advisory Agreement, the Board considered, among other things:
(a) the skills and competency with which the Advisor has in the past managed the Trust’s affairs and its subadvisory relationship, the Advisor’s oversight and monitoring of the Subadvisor’s investment performance and compliance programs, such as the Subadvisor’s compliance with fund policies and objectives, review of brokerage matters, including with respect to trade allocation and best execution and the Advisor’s timeliness in responding to performance issues;
(b) the background, qualifications and skills of the Advisor’s personnel;
(c) the Advisor’s compliance policies and procedures and its responsiveness to regulatory changes and mutual fund industry developments;
(d) the Advisor’s administrative capabilities, including its ability to supervise the other service providers for the fund;
(e) the financial condition of the Advisor and whether it has the financial wherewithal to provide a high level and quality of services to the fund; and
(f) the Advisor’s reputation and experience in serving as an investment advisor to the Trust and the benefit to shareholders of investing in funds that are part of a family of funds offering a variety of investments.
The Board concluded that the Advisor may reasonably be expected to continue to provide a high quality of services under the Advisory Agreement with respect to the fund.
| |
| 34 | Technical Opportunities Fund | Annual report |
Investment performance. In considering the fund’s performance, the Board noted that it reviews at its regularly scheduled meetings information about the fund’s performance results. In connection with the consideration of the Advisory Agreement, the Board:
(a) reviewed information prepared by management regarding the fund’s performance;
(b) considered the comparative performance of an applicable benchmark index;
(c) considered the performance of comparable funds, if any, as included in the report prepared by an independent third-party provider of fund data; and
(d) took into account the Advisor’s analysis of the fund’s performance and its plans and recommendations regarding the Trust’s subadvisory arrangements generally.
The Board noted that the fund outperformed its benchmark index and peer group average for the one- and three-year periods ended December 31, 2013. The Board also noted the fund’s favorable performance relative to the benchmark index and the peer group average for the one- and three-year periods.
The Board concluded that the fund’s performance has generally outperformed the historical performance of comparable funds and the fund’s benchmark.
Fees and expenses. The Board reviewed comparative information prepared by an independent third-party provider of mutual fund data, including, among other data, the fund’s contractual and net management fees (and subadvisory fees, to the extent available) and total expenses as compared to similarly situated investment companies deemed to be comparable to the fund. The Board considered the fund’s ranking within a smaller group of peer funds chosen by the independent third-party provider, as well as the fund’s ranking within a broader group of funds. In comparing the fund’s contractual and net management fees to those of comparable funds, the Board noted that such fees include both advisory and administrative costs.
The Board noted that net management fees and total expenses for the fund are higher than the peer group median.
The Board took into account management’s discussion of the fund’s expenses, noting that year-over-year, the fund’s net total expenses have decreased due to the advisory and subadvisory fee rate decreases in September 2011 and April 2012. The Board also took into account management’s discussion with respect to the advisory/subadvisory fee structure, including the amount of the advisory fee retained by the Advisor after payment of the subadvisory fee. The Board noted that the Advisor pays the subadvisory fee, and that such fees are negotiated at arm’s length with respect to the Subadvisor. In addition, the Board took into account that management had agreed, effective July 1, 2014, to implement an overall fee waiver across the complex, including the fund, which is discussed further below. The Board also noted actions taken over the past several years to reduce the fund’s operating expenses. In addition, the Board noted that the fund has breakpoints in its contractual management fee schedule that reduces management fees as assets increase. The Board reviewed information provided by the Advisor concerning the investment advisory fee charged by the Advisor or one of its advisory affiliates to other clients (including other funds in the complex) having similar investment mandates, if any. The Board considered any differences between the Advisor’s and Subadvisor’s services to the fund and the services they provide to other comparable clients or funds. The Board concluded that the advisory fee paid with respect to the fund is reasonable.
| |
| Annual report | Technical Opportunities Fund | 35 |
Profitability/indirect benefits. In considering the costs of the services to be provided and the profits to be realized by the Advisor and its affiliates from the Advisor’s relationship with the Trust, the Board:
(a) reviewed financial information of the Advisor;
(b) reviewed and considered information presented by the Advisor regarding the net profitability to the Advisor and its affiliates with respect to the fund;
(c) received and reviewed profitability information with respect to the John Hancock fund complex as a whole;
(d) received information with respect to the Advisor’s allocation methodologies used in preparing the profitability data;
(e) considered that the John Hancock insurance companies that are affiliates of the Advisor, as shareholders of the Trust directly or through their separate accounts, receive certain tax credits or deductions relating to foreign taxes paid and dividends received by certain funds of the Trust and noted that these tax benefits, which are not available to participants in qualified retirement plans under applicable income tax law, are reflected in the profitability analysis reviewed by the Board;
(f) considered that the Advisor also provides administrative services to the fund on a cost basis pursuant to an administrative services agreement;
(g) noted that affiliates of the Advisor provide transfer agency services and distribution services to the fund, and that the fund’s distributor also receives Rule 12b-1 payments to support distribution of the fund;
(h) noted that the Advisor also derives reputational and other indirect benefits from providing advisory services to the fund;
(i) noted that the subadvisory fee for the fund is paid by the Advisor and is negotiated at arm’s length; and
(j) considered that the Advisor should be entitled to earn a reasonable level of profits in exchange for the level of services it provides to the fund and the entrepreneurial risk that it assumes as Advisor.
Based upon its review, the Board concluded that the level of profitability, if any, of the Advisor and its affiliates from their relationship with the fund was reasonable and not excessive.
Economies of scale. In considering the extent to which economies of scale would be realized as the fund grows and whether fee levels reflect these economies of scale for the benefit of fund shareholders, the Board:
(a) considered that the Advisor has agreed, effective July 1, 2014, to waive a portion of its management fee for the fund and each of the other John Hancock funds in the complex (except for those discussed below) (the Participating Portfolios) or otherwise reimburse the expenses of the Participating Portfolios as follows (the Reimbursement):
| |
| 36 | Technical Opportunities Fund | Annual report |
The Reimbursement shall equal, on an annualized basis, 0.01% of that portion of the aggregate net assets of all the Participating Portfolios that exceed $75 billion but is less than or equal to $125 billion, 0.0125% of that portion of the aggregate net assets of all the Participating Portfolios that exceed $125 billion but is less than or equal to $150 billion and 0.015% of that portion of the aggregate net assets of all the Participating Portfolios that exceeds $150 billion. (The funds that are not Participating Portfolios are the funds of funds in the complex, which benefit from such overall management fee waiver through their investment in underlying portfolios that include Participating Portfolios, which are subject to the Reimbursement.)
(b) reviewed the fund’s advisory fee structure and concluded that: (i) the fund’s fee structure contains breakpoints at the subadvisory fee level and that such breakpoints are reflected as breakpoints in the advisory fees for the fund; and (ii) although economies of scale cannot be measured with precision, these arrangements permit shareholders of the fund to benefit from economies of scale if the fund grows. The Board also took into account management’s discussion of the fund’s advisory fee structure; and
(c) the Board also considered the effect of the fund’s growth in size on its performance and fees. The Board also noted that if the fund’s assets increase over time, the fund may realize other economies of scale.
Approval of Subadvisory Agreement
In making its determination with respect to approval of the Subadvisory Agreement, the Board reviewed:
(1) information relating to the Subadvisor’s business, including current subadvisory services to the Trust (and other funds in the John Hancock family of funds);
(2) the historical and current performance of the fund and comparative performance information relating to an applicable benchmark index and comparable funds;
(3) the subadvisory fee for the fund, including any breakpoints, and to the extent available, comparable fee information prepared by an independent third party provider of fund data; and
(4) information relating to the nature and scope of any material relationships and their significance to the Trust’s Advisor and Subadvisors.
Nature, extent, and quality of services. With respect to the services provided by the Subadvisor, the Board received information provided to the Board by the Subadvisor, including the Subadvisor’s Form ADV, as well as took into account information presented throughout the past year. The Board considered the Subadvisor’s current level of staffing and its overall resources, as well as received information relating to the Subadvisor’s compensation program. The Board reviewed the Subadvisor’s history and investment experience, as well as information regarding the qualifications, background, and responsibilities of the Subadvisor’s investment and compliance personnel who provide services to the fund. The Board also considered, among other things, the Subadvisor’s compliance program and any disciplinary history. The Board also considered the Subadvisor’s risk assessment and monitoring process. The Board reviewed the Subadvisor’s regulatory history, including whether it was involved in any regulatory actions or investigations as well as material litigation, and any settlements and amelioratory actions undertaken, as appropriate. The Board noted that the Advisor conducts regular, periodic reviews of the Subadvisor and its operations, including regarding investment processes and organizational and staffing matters. The Board also noted that the Trust’s CCO and his staff conduct regular, periodic compliance reviews with the Subadvisor and present reports to the
| |
| Annual report | Technical Opportunities Fund | 37 |
Independent Trustees regarding the same, which includes evaluating the regulatory compliance systems of the Subadvisor and procedures reasonably designed to assure compliance with the federal securities laws. The Board also took into account the financial condition of the Subadvisor.
The Board considered the Subadvisor’s investment process and philosophy. The Board took into account that the Subadvisor’s responsibilities include the development and maintenance of an investment program for the fund that is consistent with the fund’s investment objective, the selection of investment securities and the placement of orders for the purchase and sale of such securities, as well as the implementation of compliance controls related to performance of these services. The Board also received information with respect to the Subadvisor’s brokerage policies and practices, including with respect to best execution and soft dollars.
Subadvisor compensation. In considering the cost of services to be provided by the Subadvisor and the profitability to the Subadvisor of its relationship with the fund, the Board noted that the fees under the Subadvisory Agreement are paid by the Advisor and not the fund.
The Board also relied on the ability of the Advisor to negotiate the Subadvisory Agreement with the Subadvisor, which is not affiliated with the Advisor, and the fees thereunder at arm’s length. As a result, the costs of the services to be provided and the profits to be realized by the Subadvisor from its relationship with the Trust were not a material factor in the Board’s consideration of the Subadvisory Agreement.
The Board also received information regarding the nature and scope (including their significance to the Advisor and its affiliates and to the Subadvisor) of any material relationships, if any, with respect to the Subadvisor, which include arrangements in which the Subadvisor or its affiliates provide advisory, distribution, or management services in connection with financial products sponsored by the Advisor or its affiliates, and may include other registered investment companies, a 529 education savings plan, managed separate accounts and exempt group annuity contracts sold to qualified plans. The Board also received information and took into account any other potential conflicts of interest the Advisor might have in connection with the Subadvisory Agreement.
In addition, the Board considered other potential indirect benefits that the Subadvisor and its affiliates may receive from the Subadvisor’s relationship with the fund, such as the opportunity to provide advisory services to additional funds in the John Hancock fund complex and reputational benefits.
Subadvisory fee. The Board considered that the fund pays an advisory fee to the Advisor and that, in turn, the Advisor pays a subadvisory fee to the Subadvisor. As noted above, the Board also considered the fund’s subadvisory fee as compared to similarly situated investment companies deemed to be comparable to the fund as included in the report prepared by the independent third party provider of fund data, to the extent available. The Board noted that the subadvisor fees for this fund are higher than the peer group median. The Board also took into account the subadvisory fee paid by the Advisor to the Subadvisor with respect to the fund to fees charged by the Subadvisor to manage other subadvised portfolios and portfolios not subject to regulation under the 1940 Act, as applicable.
Subadvisor performance. As noted above, the Board considered the fund’s performance as compared to the fund’s peer group and the benchmark index and noted that the Board reviews information about the fund’s performance results at its regularly scheduled meetings. The Board noted the Advisor’s expertise and resources in monitoring the performance, investment style and risk-adjusted performance of the Subadvisor. The Board was mindful of the Advisor’s focus on the Subadvisor’s performance. The Board also noted the Subadvisor’s long-term performance record for similar accounts, as applicable.
| |
| 38 | Technical Opportunities Fund | Annual report |
The Board’s decision to approve the Subadvisory Agreement was based on a number of determinations, including the following:
(1) the Subadvisor has extensive experience and demonstrated skills as a manager;
(2) the performance of the fund generally has outperformed the historical performance of comparable funds and the fund’s benchmark;
(3) the subadvisory fee is reasonable in relation to the level and quality of services being provided; and
(4) subadvisory fee breakpoints are reflected as breakpoints in the advisory fees for the fund in order to permit shareholders to benefit from economies of scale if the fund grows.
Based on the Board’s evaluation of all factors that the Board deemed to be material, including those factors described above, the Board, including the Independent Trustees, concluded that renewal of the Advisory Agreement and the Subadvisory Agreement would be in the best interest of the fund and its shareholders. Accordingly, the Board, and the Independent Trustees voting separately, approved the Advisory Agreement and Subadvisory Agreement for an additional one-year period.
| |
| Annual report | Technical Opportunities Fund | 39 |
Trustees and Officers
This chart provides information about the Trustees and Officers who oversee your John Hancock fund. Officers elected by the Trustees manage the day-to-day operations of the fund and execute policies formulated by the Trustees.
Independent Trustees
| | |
| Name, year of birth | Trustee | Number of John |
| Position(s) held with fund | of the | Hancock funds |
| Principal occupation(s) and other | Trust | overseen by |
| directorships during past 5 years | since1 | Trustee |
| |
| James M. Oates, Born: 1946 | 2005 | 230 |
|
| Managing Director, Wydown Group (financial consulting firm) (since 1994); Chairman and Director, |
| Emerson Investment Management, Inc. (since 2000); Independent Chairman, Hudson Castle Group, Inc. |
| (formerly IBEX Capital Markets, Inc.) (financial services company) (1997–2011); Director, Stifel Financial |
| (since 1996); Director, Investor Financial Services Corporation (1995–2007); Director, Connecticut River |
| Bancorp (since 1998); Director, Virtus Funds (formerly Phoenix Mutual Funds) (since 1988). | |
| |
| Trustee and Chairperson of the Board, John Hancock retail funds3 (since 2012); Trustee (2005–2006 and |
| since 2012) and Chairperson of the Board (since 2012), John Hancock Funds III; Trustee (since 2004) and |
| Chairperson of the Board (since 2005), John Hancock Variable Insurance Trust; Trustee and Chairperson |
| of the Board, John Hancock Funds II (since 2005). | | |
| |
| Charles L. Bardelis,2 Born: 1941 | 2005 | 230 |
|
| Director, Island Commuter Corp. (marine transport). | | |
| |
| Trustee, John Hancock retail funds3 (since 2012); Trustee, John Hancock Funds III (2005–2006 and |
| since 2012); Trustee, John Hancock Variable Insurance Trust (since 1988); Trustee, John Hancock |
| Funds II (since 2005). | | |
| |
| Peter S. Burgess,2 Born: 1942 | 2005 | 230 |
|
| Consultant (financial, accounting, and auditing matters) (since 1999); Certified Public Accountant; |
| Partner, Arthur Andersen (independent public accounting firm) (prior to 1999); Director, Lincoln |
| Educational Services Corporation (since 2004); Director, Symetra Financial Corporation (since 2010); |
| Director, PMA Capital Corporation (2004–2010). | | |
| |
| Trustee, John Hancock retail funds3 (since 2012); Trustee, John Hancock Funds III (2005–2006 and |
| since 2012); Trustee, John Hancock Variable Insurance Trust and John Hancock Funds II (since 2005). |
| |
| William H. Cunningham, Born: 1944 | 2012 | 230 |
|
| Professor, University of Texas, Austin, Texas (since 1971); former Chancellor, University of Texas System |
| and former President of the University of Texas, Austin, Texas; Director, LIN Television (since 2009); |
| Chairman (since 2009) and Director (since 2006), Lincoln National Corporation (insurance); Director, |
| Resolute Energy Corporation (since 2009); Director, Southwest Airlines (since 2000); former Director, |
| Introgen (manufacturer of biopharmaceuticals) (until 2008); former Director, Hicks Acquisition Company I, |
| Inc. (until 2007); former Director, Texas Exchange Bank, SSB (formerly Bank of Crowley) (until 2009); |
| former Advisory Director, JP Morgan Chase Bank (formerly Texas Commerce Bank–Austin) (until 2009). |
| |
| Trustee, John Hancock retail funds3 (since 1986); Trustee, John Hancock Variable Insurance Trust |
| (since 2012); Trustee, John Hancock Funds II (2005–2006 and since 2012). | | |
| |
| 40 | Technical Opportunities Fund | Annual report |
Independent Trustees (continued)
| | |
| Name, Year of Birth | Trustee | Number of John |
| Position(s) held with Fund | of the | Hancock funds |
| Principal occupation(s) and other | Trust | overseen by |
| directorships during past 5 years | since1 | Trustee |
| |
| Grace K. Fey, Born: 1946 | 2008 | 230 |
|
| Chief Executive Officer, Grace Fey Advisors (since 2007); Director and Executive Vice President, Frontier |
| Capital Management Company (1988–2007); Director, Fiduciary Trust (since 2009). | |
| |
| Trustee, John Hancock retail funds3 (since 2012); Trustee, John Hancock Variable Insurance Trust and |
| John Hancock Funds II (since 2008). | | |
| |
| Theron S. Hoffman,2 Born: 1947 | 2008 | 230 |
|
| Chief Executive Officer, T. Hoffman Associates, LLC (consulting firm) (since 2003); Director, The Todd |
| Organization (consulting firm) (2003–2010); President, Westport Resources Management (investment |
| management consulting firm) (2006–2008); Senior Managing Director, Partner, and Operating Head, |
| Putnam Investments (2000–2003); Executive Vice President, The Thomson Corp. (financial and legal |
| information publishing) (1997–2000). | | |
| |
| Trustee, John Hancock retail funds3 (since 2012); Trustee, John Hancock Variable Insurance Trust and |
| John Hancock Funds II (since 2008). | | |
| |
| Deborah C. Jackson, Born: 1952 | 2012 | 230 |
|
| President, Cambridge College, Cambridge, Massachusetts (since 2011); Chief Executive Officer, |
| American Red Cross of Massachusetts Bay (2002–2011); Board of Directors of Eastern Bank Corporation |
| (since 2001); Board of Directors of Eastern Bank Charitable Foundation (since 2001); Board of Directors |
| of American Student Assistance Corporation (1996–2009); Board of Directors of Boston Stock Exchange |
| (2002–2008); Board of Directors of Harvard Pilgrim Healthcare (health benefits company) (2007–2011). |
| |
| Trustee, John Hancock retail funds3 (since 2008); Trustee of John Hancock Variable Insurance Trust and |
| John Hancock Funds II (since 2012). | | |
| |
| Hassell H. McClellan, Born: 1945 | 2005 | 230 |
|
| Trustee, Virtus Variable Insurance Trust (formerly Phoenix Edge Series Funds) (since 2008); Director, The |
| Barnes Group (since 2010); Associate Professor, The Wallace E. Carroll School of Management, Boston |
| College (retired 2013). | | |
| |
| Trustee, John Hancock retail funds3 (since 2012); Trustee, John Hancock Funds III (2005–2006 and |
| since 2012); Trustee, John Hancock Variable Insurance Trust and John Hancock Funds II (since 2005). |
| |
| Steven R. Pruchansky, Born: 1944 | 2012 | 230 |
|
| Chairman and Chief Executive Officer, Greenscapes of Southwest Florida, Inc. (since 2000); Director |
| and President, Greenscapes of Southwest Florida, Inc. (until 2000); Member, Board of Advisors, First |
| American Bank (until 2010); Managing Director, Jon James, LLC (real estate) (since 2000); Director, |
| First Signature Bank & Trust Company (until 1991); Director, Mast Realty Trust (until 1994); President, |
| Maxwell Building Corp. (until 1991). | | |
| |
| Trustee (since 1992) and Chairperson of the Board (2011–2012), John Hancock retail funds3; Trustee and |
| Vice Chairperson of the Board, John Hancock retail funds,3 John Hancock Variable Insurance Trust, and |
| John Hancock Funds II (since 2012). | | |
| |
| Annual report | Technical Opportunities Fund | 41 |
Independent Trustees (continued)
| | |
| Name, Year of Birth | Trustee | Number of John |
| Position(s) held with Fund | of the | Hancock funds |
| Principal occupation(s) and other | Trust | overseen by |
| directorships during past 5 years | since1 | Trustee |
| |
| Gregory A. Russo, Born: 1949 | 2012 | 230 |
|
| Director and Audit Committee Chairman (since 2012), and Member, Audit Committee and Finance |
| Committee (since 2011), NCH Healthcare System, Inc. (holding company for multi-entity healthcare |
| system); Director and Member of Finance Committee, The Moorings, Inc. (nonprofit continuing care |
| community) (since 2012); Vice Chairman, Risk & Regulatory Matters, KPMG LLP (KPMG) (2002–2006); |
| Vice Chairman, Industrial Markets, KPMG (1998–2002); Chairman and Treasurer, Westchester County, |
| New York, Chamber of Commerce (1986–1992); Director, Treasurer, and Chairman of Audit and |
| Finance Committees, Putnam Hospital Center (1989–1995); Director and Chairman of Fundraising |
| Campaign, United Way of Westchester and Putnam Counties, New York (1990–1995). | |
| |
| Trustee, John Hancock retail funds3 (since 2008); Trustee, John Hancock Variable Insurance Trust and |
| John Hancock Funds II (since 2012). | | |
Non-Independent Trustees4
| | |
| Name, year of birth | Trustee | Number of John |
| Position(s) held with fund | of the | Hancock funds |
| Principal occupation(s) and other | Trust | overseen by |
| directorships during past 5 years | since1 | Trustee |
| |
| Craig Bromley, Born: 1966 | 2012 | 230 |
|
| President, John Hancock Financial Services (since 2012); Senior Executive Vice President and General |
| Manager, U.S. Division, Manulife Financial Corporation (since 2012); President and Chief Executive |
| Officer, Manulife Insurance Company (Manulife Japan) (2005–2012, including prior positions). |
| |
| Trustee, John Hancock retail funds,3 John Hancock Variable Insurance Trust, and John Hancock |
| Funds II (since 2012). | | |
| |
| Warren A. Thomson, Born: 1955 | 2012 | 230 |
|
| Senior Executive Vice President and Chief Investment Officer, Manulife Financial Corporation and The |
| Manufacturers Life Insurance Company (since 2009); Chairman and Chief Executive Officer, Manulife |
| Asset Management (since 2001, including prior positions); Director (since 2006), and President and |
| Chief Executive Officer (since 2013), Manulife Asset Management Limited; Director and Chairman, |
| Hancock Natural Resources Group, Inc. (since 2013). | | |
| |
| Trustee, John Hancock retail funds,3 John Hancock Variable Insurance Trust, and John Hancock |
| Funds II (since 2012). | | |
| |
| |
| Principal officers who are not Trustees | | |
| | | |
| Name, year of birth | | Officer |
| Position(s) held with fund | | of the |
| Principal occupation(s) and other | | Trust |
| directorships during past 5 years | | since |
| |
| Andrew G. Arnott, Born: 1971 | | 2009 |
|
| President | | |
| Senior Vice President, John Hancock Financial Services (since 2009); Director and Executive Vice |
| President, John Hancock Advisers, LLC (since 2005, including prior positions); Director and Executive |
| Vice President, John Hancock Investment Management Services, LLC (since 2006, including prior |
| positions); President, John Hancock Funds, LLC (since 2004, including prior positions); President |
| (effective 3-13-14) and Executive Vice President, John Hancock retail funds,3 John Hancock Variable |
| Insurance Trust, and John Hancock Funds II (since 2007, including prior positions). | |
| |
| 42 | Technical Opportunities Fund | Annual report |
Principal officers who are not Trustees (continued)
| |
| Name, Year of Birth | Officer |
| Position(s) held with Fund | of the |
| Principal occupation(s) and other | Trust |
| directorships during past 5 years | since |
| |
| John J. Danello, Born: 1955 | 2006 |
|
| Senior Vice President, Secretary, and Chief Legal Officer | |
| Vice President and Chief Counsel, John Hancock Wealth Management (since 2005); Senior Vice | |
| President (since 2007) and Chief Legal Counsel (2007–2010), John Hancock Funds, LLC and The | |
| Berkeley Financial Group, LLC; Senior Vice President (since 2006, including prior positions) and Chief |
| Legal Officer and Secretary (since 2014), John Hancock retail funds3 and John Hancock Variable | |
| Insurance Trust; Vice President, John Hancock Life & Health Insurance Company (since 2009); | |
| Vice President, John Hancock Life Insurance Company (USA) and John Hancock Life Insurance | |
| Company of New York (since 2010); and Senior Vice President, Secretary, and Chief Legal Counsel | |
| (2007–2014, including prior positions) of John Hancock Advisers, LLC and John Hancock Investment |
| Management Services, LLC. | |
| |
| Francis V. Knox, Jr., Born: 1947 | 2005 |
|
| Chief Compliance Officer | |
| Vice President, John Hancock Financial Services (since 2005); Chief Compliance Officer, John Hancock |
| retail funds,3 John Hancock Variable Insurance Trust, John Hancock Funds II, John Hancock Advisers, |
| LLC, and John Hancock Investment Management Services, LLC (since 2005). | |
| |
| Charles A. Rizzo, Born: 1957 | 2007 |
|
| Chief Financial Officer | |
| Vice President, John Hancock Financial Services (since 2008); Senior Vice President, John Hancock | |
| Advisers, LLC and John Hancock Investment Management Services, LLC (since 2008); Chief Financial |
| Officer, John Hancock retail funds,3 John Hancock Variable Insurance Trust and John Hancock | |
| Funds II (since 2007). | |
| |
| Salvatore Schiavone, Born: 1965 | 2009 |
|
| Treasurer | |
| Assistant Vice President, John Hancock Financial Services (since 2007); Vice President, John Hancock |
| Advisers, LLC and John Hancock Investment Management Services, LLC (since 2007); Treasurer, | |
| John Hancock retail funds3 (since 2007, including prior positions); Treasurer, John Hancock Variable |
| Insurance Trust and John Hancock Funds II (since 2010 and 2007–2009, including prior positions). | |
The business address for all Trustees and Officers is 601 Congress Street, Boston, Massachusetts 02210-2805.
1 Each Trustee holds office until his or her successor is elected and qualified, or until the Trustee’s death, retirement,
resignation, or removal.
2 Member of the Audit Committee.
3 “John Hancock retail funds” comprises John Hancock Funds III and 37 other John Hancock funds consisting of
27 series of other John Hancock trusts and 10 closed-end funds.
4 Because Messrs. Bromley and Thomson are senior executives or directors of the advisor and/or its affiliates, each of
them is considered an “interested person of the fund,” as defined in the Investment Company Act of 1940.
| |
| Annual report | Technical Opportunities Fund | 43 |
More information
| |
| Trustees | Investment advisor |
| James M. Oates, Chairperson | John Hancock Advisers, LLC |
| Steven R. Pruchansky, Vice Chairperson | |
| Charles L. Bardelis* | Subadvisor |
| Craig Bromley† | Wellington Management Company LLP |
| Peter S. Burgess* | |
| William H. Cunningham | Principal distributor |
| Grace K. Fey | John Hancock Funds, LLC |
| Theron S. Hoffman* | |
| Deborah C. Jackson | Custodian |
| Hassell H. McClellan | State Street Bank and Trust Company |
| Gregory A. Russo | |
| Warren A. Thomson† | Transfer agent |
| | John Hancock Signature Services, Inc. |
| Officers | |
| Andrew G. Arnott | Legal counsel |
| President | K&L Gates LLP |
| | |
| John J. Danello | Independent registered |
| Senior Vice President, Secretary, | public accounting firm |
| and Chief Legal Officer | PricewaterhouseCoopers LLP |
| | |
| Francis V. Knox, Jr. | |
| Chief Compliance Officer | |
| | |
| Charles A. Rizzo | |
| Chief Financial Officer | |
| | |
| Salvatore Schiavone | |
| Treasurer | |
| |
| *Member of the Audit Committee | |
| †Non-Independent Trustee | |
The fund’s proxy voting policies and procedures, as well as the fund’s proxy voting record for the most recent twelve-month period ended June 30, are available free of charge on the Securities and Exchange Commission (SEC) website at sec.gov or on our website.
The fund’s complete list of portfolio holdings, for the first and third fiscal quarters, is filed with the SEC on Form N-Q. The fund’s Form N-Q is available on our website and the SEC’s website, sec.gov, and can be reviewed and copied (for a fee) at the SEC’s Public Reference Room in Washington, DC. Call 800-SEC-0330 to receive information on the operation of the SEC’s Public Reference Room.
We make this information on your fund, as well as monthly portfolio holdings, and other fund details available on our website at jhinvestments.com or by calling 800-225-5291.
| | |
| You can also contact us: | | |
| 800-225-5291 | Regular mail: | Express mail: |
| jhinvestments.com | John Hancock Signature Services, Inc. | John Hancock Signature Services, Inc. |
| | P.O. Box 55913 | 30 Dan Road |
| | Boston, MA 02205-5913 | Canton, MA 02021 |
| |
| 44 | Technical Opportunities Fund | Annual report |

800-225-5291
800-231-5469 TDD
800-338-8080 EASI-Line
jhinvestments.com
| |
| This report is for the information of the shareholders of John Hancock Technical Opportunities Fund. | |
| It is not authorized for distribution to prospective investors unless preceded or accompanied by a prospectus. | 347A 7/14 |
| MF195348 | 9/14 |

A look at performance
Total returns for the period ended July 31, 2014
| | | | | | | | | | | | | |
| | | | | | | | | | | | SEC 30-day | | SEC 30-day |
| | Average annual total returns (%) | | Cumulative total returns (%) | | yield (%) | | yield (%) |
| | with maximum sales charge | | | with maximum sales charge | | subsidized | | unsubsidized1 |
|
| | 1-year | 5-year | 10-year | Since inception2 | | 1-year | 5-year | 10-year | Since inception2 | | as of 7-31-14 | | as of 7-31-14 |
|
| Class A | 1.21 | — | — | 4.04 | | 1.21 | — | — | 20.69 | | 2.51 | | 2.49 |
|
| Class I3 | 3.98 | — | — | 4.89 | | 3.98 | — | — | 25.45 | | 2.93 | | 2.93 |
|
| Class NAV3 | 4.26 | — | — | 5.09 | | 4.26 | — | — | 26.58 | | 3.09 | | 3.08 |
|
| Index† | 2.66 | — | — | 3.69 | | 2.66 | — | — | 18.79 | | — | | — |
|
Performance figures assume all distributions are reinvested. Figures reflect maximum sales charges on Class A shares of 2.5%. The returns for Class A shares have been adjusted to reflect the reduction in the maximum sales charge from 4.5% to 2.5%, effective 2-3-14. Sales charges are not applicable to Class I and Class NAV shares.
The expense ratios of the fund, both net (including any fee waivers and/or expense limitations) and gross (excluding any fee waivers and/or expense limitations), are set forth according to the most recent publicly available prospectuses for the fund and may differ from those disclosed in the Financial highlights tables in this report. Had the fee waivers and expense limitations not been in place, gross expenses would apply. The expense ratios are as follows:
| | | | | | | | |
| | Class A | Class I | Class NAV | | | | | |
| Gross (%) | 4.63 | 4.16 | 0.75 | | | | | |
| Net (%) | 1.21 | 0.90 | 0.75 | | | | | |
Please refer to the most recent prospectus and annual report for more information on expenses and any expense limitation agreement for each class.
The returns reflect past results and should not be considered indicative of future performance. The return and principal value of an investment will fluctuate so that shares, when redeemed, may be worth more or less than their original cost. Due to market volatility, the fund’s current performance may be higher or lower than the performance shown. For current to the most recent month-end performance data, please call 800-225-5291 or visit the fund’s website at jhinvestments.com.
The performance table above and the chart on the next page do not reflect the deduction of taxes that a shareholder may pay on fund distributions or on the redemption of fund shares. The fund’s performance results reflect any applicable fee waivers or expense reductions, without which the expenses would increase and results would have been less favorable.
† Index is the Barclays 1-5 Year U.S. Credit Index.
See the following page for footnotes.
| |
| 6 | Short Duration Credit Opportunities Fund | Annual report |
| | | | |
| | | With maximum | Without | |
| | Start date | sales charge | sales charge | Index |
|
| Class I3 | 11-2-09 | $12,545 | $12,545 | $11,879 |
|
| Class NAV3 | 11-2-09 | 12,658 | 12,658 | 11,879 |
|
The values shown in the chart for “Class A with maximum sales charge” have been adjusted to reflect the reduction in the Class A maximum sales charge from 4.5% to 2.5%, which became effective on 2-3-14.
Barclays 1-5 Year U.S. Credit Index includes investment-grade corporate and international dollar-denominated bonds with maturities of 1 to 5 years.
It is not possible to invest directly in an index. Index figures do not reflect expenses or sales charges, which would have resulted in lower values.
Footnotes related to performance pages
1 Unsubsidized yield reflects what the yield would have been without the effects of waivers and reimbursements.
2 From 11-2-09.
3 For certain types of investors as described in the fund’s prospectuses.
| |
| Annual report | Short Duration Credit Opportunities Fund | 7 |
Management’s discussion of
Fund performance
From the Portfolio Management Team
Stone Harbor Investment Partners LP
The global bond markets recovered from their sharp downturn of May-June 2013 to post healthy returns during the past twelve months. Bond prices rose (as yields fell), reflecting the environment of slow economic growth, persistent uncertainty about the economic outlook overseas, and the accommodative policies of the world’s central banks. For the twelve-month period ended July 31, 2014, John Hancock Short Duration Credit Opportunities Fund’s Class A shares produced a total return of 3.76%, excluding sales charges. For the same twelve-month period, the fund’s benchmark—the Barclays 1–5 Year U.S. Credit Index—gained 2.66%.
The primary factor in the fund’s outperformance was our allocation decision with respect to the various segments of the bond market. Whereas the benchmark is comprised entirely of government and investment-grade corporate bonds, our broad mandate gives the ability to capitalize on opportunities anywhere in the market. We used this flexibility to invest in a variety of areas where we saw opportunity, including high-yield bonds, senior loans, and emerging-markets debt. Within the investment-grade space, we held a healthy allocation to nonagency mortgage-backed securities and commercial mortgage-backed securities. These market segments outperformed during the past twelve months, so the fund’s out-of-benchmark allocations proved very helpful for its relative performance. Individual issue selection was also a positive for performance, particularly within the investment-grade space. Our selection was especially strong among mortgage-backed securities and bonds issued by companies in the banking sector. This positive contribution was partially offset by selection in the emerging markets, where the fund’s position in local-currency bonds detracted from returns.
This commentary reflects the views of the portfolio managers through the end of the period discussed in this report. As such, they are in no way guarantees of future events and are not intended to be used as investment advice or a recommendation regarding any specific security. They are also subject to change at any time as market and other conditions warrant.
Past performance does not guarantee future results.
| |
| 8 | Short Duration Credit Opportunities Fund | Annual report |
Your expenses
These examples are intended to help you understand your ongoing operating expenses of investing in the fund so you can compare these costs with the ongoing costs of investing in other mutual funds.
Understanding fund expenses
As a shareholder of the fund, you incur two types of costs:
▪ Transaction costs, which include sales charges (loads) on purchases or redemptions (varies by share class), minimum account fee charge, etc.
▪ Ongoing operating expenses, including management fees, distribution and service fees (if applicable), and other fund expenses.
We are going to present only your ongoing operating expenses here.
Actual expenses/actual returns
This example is intended to provide information about the fund’s actual ongoing operating expenses and is based on the fund’s actual return. It assumes an account value of $1,000.00 on February 1, 2014, with the same investment held until July 31, 2014.
| | | | |
| | | | Expenses paid | |
| | Account value | Ending value | during period | Annualized |
| | on 2-1-2014 | on 7-31-2014 | ended 7-31-20141 | expense ratio |
|
| Class A | $1,000.00 | $1,030.30 | $6.09 | 1.21% |
|
| Class C2 | 1,000.00 | 998.20 | 1.86 | 2.00% |
|
| Class I | 1,000.00 | 1,031.90 | 4.53 | 0.90% |
|
| Class NAV | 1,000.00 | 1,032.80 | 3.78 | 0.75% |
|
Together with the value of your account, you may use this information to estimate the operating expenses that you paid over the period. Simply divide your account value at July 31, 2014, by $1,000.00, then multiply it by the “expenses paid” for your share class from the table above. For example, for an account value of $8,600.00, the operating expenses should be calculated as follows:
| |
| Annual report | Short Duration Credit Opportunities Fund | 9 |
Your expenses
Hypothetical example for comparison purposes
This table allows you to compare the fund’s ongoing operating expenses with those of any other fund. It provides an example of the fund’s hypothetical account values and hypothetical expenses based on each class’s actual expense ratio and an assumed 5% annualized return before expenses (which is not the fund’s actual return). It assumes an account value of $1,000.00 on February 1, 2014, with the same investment held until July 31, 2014. Look in any other fund shareholder report to find its hypothetical example and you will be able to compare these expenses. Please remember that these hypothetical account values and expenses may not be used to estimate the actual ending account balance or expenses you paid for the period.
| | | | |
| | | | Expenses paid | |
| | Account value | Ending value | during period | Annualized |
| | on 2-1-2014 | on 7-31-2014 | ended 7-31-20141 | expense ratio |
|
| Class A | $1,000.00 | $1,018.80 | $6.06 | 1.21% |
|
| Class C | 1,000.00 | 1,014.90 | 9.99 | 2.00% |
|
| Class I | 1,000.00 | 1,020.30 | 4.51 | 0.90% |
|
| Class NAV | 1,000.00 | 1,021.10 | 3.76 | 0.75% |
|
Remember, these examples do not include any transaction costs, therefore, these examples will not help you to determine the relative total costs of owning different funds. If transaction costs were included, your expenses would have been higher. See the prospectus for details regarding transaction costs.
1 Expenses are equal to the fund’s annualized expense ratio, multiplied by the average account value over the period, multiplied by 181/365 (to reflect the one-half year period).
2 The inception date for Class C shares is 6-27-14. Expenses are equal to the fund’s annualized expense ratio, multiplied by the average account value over the period, multiplied by 34/365 (to reflect the period).
| |
| 10 | Short Duration Credit Opportunities Fund | Annual report |
Portfolio summary
| | | | |
| Portfolio Composition1 | | | | |
|
| Corporate Bonds | 42.6% | | U.S. Government Agency | 0.8% |
| |
|
| Term Loans | 19.0% | | Capital Preferred Securities | 0.3% |
| |
|
| Collateralized Mortgage Obligations | 13.6% | | Common Stocks | 0.2% |
| |
|
| Foreign Government Obligations | 11.0% | | Preferred Securities | 0.1% |
| |
|
| Asset Backed Securities | 4.5% | | U.S. Government | 0.1% |
| |
|
| Convertible Bonds | 1.8% | | Short-Term Investments & Other | 6.0% |
| |
|
| |
| Quality Composition1,2 | | | | |
|
| U.S. Government | 0.1% | | BB | 13.5% |
| |
|
| U.S. Government Agency | 0.8% | | B | 18.5% |
| |
|
| AAA | 4.2% | | CCC & Below | 4.9% |
| |
|
| AA | 2.8% | | Equity | 0.3% |
| |
|
| A | 10.6% | | Not Rated | 6.6% |
| |
|
| BBB | 31.7% | | Short-Term Investments & Other | 6.0% |
| |
|
Fixed-income investments are subject to interest-rate and credit risk; their value will normally decline as interest rates rise or if the creditor is unable or unwilling to make principal or interest payments. Investments concentrated in one sector may fluctuate more widely than investments diversified across sectors. Investments in higher-yielding, lower-rated securities involve additional risks as these securities include a higher risk of default and loss of principal. Foreign investing, especially in emerging markets, has additional risks, such as currency and market volatility and political and social instability. Currency transactions are impacted by fluctuations in exchange rates, which may adversely affect the U.S. dollar value of a fund’s investments. Events in the financial markets have resulted, and may continue to result, in an unusually high degree of volatility in the financial markets, both domestic and foreign. In addition, reduced liquidity in credit and fixed-income markets may adversely affect issuers worldwide. The use of hedging and derivatives transactions could produce disproportionate gains or losses and may increase volatility and costs. Mortgage- and asset-backed securities may be sensitive to changes in interest rates and subject to early repayment risk, and their value may fluctuate in response to the market’s perception of issuer creditworthiness. If the fund invests in illiquid securities, it may be difficult to sell them at a price approximating their value. Loan participations and assignments involve special types of risks, including credit risk, interest-rate risk, counterparty risk, liquidity risk, and the risks of being a lender. Please see the fund’s prospectuses for additional risks.
1 As a percentage of net assets on 7-31-14.
2 Ratings are from Moody’s Investors Service, Inc. If not available, we have used Standard & Poor’s Ratings Services. In the absence of ratings from these agencies, we have used Fitch Ratings, Inc. “Not Rated” securities are those with no ratings available from these agencies. All ratings are as of 7-31-14 and do not reflect subsequent downgrades or upgrades, if any.
| |
| Annual report | Short Duration Credit Opportunities Fund | 11 |
Fund’s investments
As of 7-31-14
| | | | | |
| | | | Maturity | | |
| | Rate (%) | | date | Par value^ | Value |
| Corporate Bonds 42.6% | | | | $641,289,559 |
|
| (Cost $628,829,871) | | | | | |
| | | | | | |
| Consumer Discretionary 6.0% | | | | 90,869,971 |
| | | | | |
| Auto Components 0.0% | | | | | |
|
| The Goodyear Tire & Rubber Company | 6.500 | | 03-01-21 | 415,000 | 438,863 |
|
| The Goodyear Tire & Rubber Company | 7.000 | | 05-15-22 | 190,000 | 206,150 |
| | | | | | |
| Automobiles 0.7% | | | | | |
|
| Chrysler Group LLC | 8.250 | | 06-15-21 | 730,000 | 801,175 |
|
| Ford Motor Credit Company LLC | 4.250 | | 09-20-22 | 4,875,000 | 5,162,087 |
|
| Hyundai Capital America (S) | 4.000 | | 06-08-17 | 600,000 | 636,829 |
|
| Hyundai Capital Services, Inc. (S) | 4.375 | | 07-27-16 | 3,125,000 | 3,306,963 |
| | | | | | |
| Hotels, Restaurants & Leisure 0.6% | | | | | |
|
| Hilton Worldwide Finance LLC (S) | 5.625 | | 10-15-21 | 625,000 | 654,688 |
|
| Isle of Capri Casinos, Inc. | 5.875 | | 03-15-21 | 980,000 | 1,004,500 |
|
| Landry’s, Inc. (S) | 9.375 | | 05-01-20 | 585,000 | 634,725 |
|
| MAF Global Securities, Ltd. (7.125% to | | | | | |
| 10-29-18, then 5 year U.S. Swap Rate + | | | | | |
| 5.702%) (Q) | 7.125 | | 10-29-18 | 200,000 | 215,500 |
|
| Marriott International, Inc. | 3.000 | | 03-01-19 | 3,250,000 | 3,352,388 |
|
| MGM Resorts International | 6.625 | | 12-15-21 | 965,000 | 1,043,406 |
|
| Pinnacle Entertainment, Inc. | 6.375 | | 08-01-21 | 1,225,000 | 1,261,750 |
|
| RHP Hotel Properties LP | 5.000 | | 04-15-21 | 640,000 | 635,200 |
| | | | | | |
| Household Durables 0.3% | | | | | |
|
| Lennar Corp. | 4.750 | | 11-15-22 | 730,000 | 700,800 |
|
| Newell Rubbermaid, Inc. | 4.000 | | 06-15-22 | 3,200,000 | 3,324,906 |
|
| RSI Home Products, Inc. (S) | 6.875 | | 03-01-18 | 385,000 | 408,100 |
| | | | | | |
| Media 3.3% | | | | | |
|
| 21st Century Fox America, Inc. | 6.650 | | 11-15-37 | 3,150,000 | 3,888,297 |
|
| Altice SA (S) | 7.750 | | 05-15-22 | 885,000 | 904,913 |
|
| AMC Entertainment, Inc. | 5.875 | | 02-15-22 | 903,000 | 916,545 |
|
| Cablevision Systems Corp. | 5.875 | | 09-15-22 | 1,180,000 | 1,162,300 |
|
| Cablevision Systems Corp. | 8.000 | | 04-15-20 | 440,000 | 496,100 |
|
| CBS Corp. | 4.850 | | 07-01-42 | 3,650,000 | 3,579,646 |
|
| CBS Outdoor Americas Capital LLC (S) | 5.250 | | 02-15-22 | 730,000 | 728,175 |
|
| CCO Holdings LLC | 5.125 | | 02-15-23 | 500,000 | 482,500 |
|
| CCO Holdings LLC | 6.625 | | 01-31-22 | 695,000 | 729,750 |
|
| Cequel Communications Holdings I LLC (S) | 5.125 | | 12-15-21 | 730,000 | 702,625 |
| | |
| 12 | Short Duration Credit Opportunities Fund | Annual report | See notes to financial statements |
| | | | | |
| | | | Maturity | | |
| | Rate (%) | | date | Par value^ | Value |
| Media (continued) | | | | | |
|
| Comcast Corp. | 4.250 | | 01-15-33 | 4,200,000 | $4,260,047 |
|
| DIRECTV Holdings LLC | 6.000 | | 08-15-40 | 3,100,000 | 3,532,090 |
|
| Discovery Communications LLC | 3.300 | | 05-15-22 | 3,750,000 | 3,708,428 |
|
| DISH DBS Corp. | 5.000 | | 03-15-23 | 2,275,000 | 2,229,500 |
|
| Gannett Company, Inc. (S) | 6.375 | | 10-15-23 | 885,000 | 933,675 |
|
| Gray Television, Inc. | 7.500 | | 10-01-20 | 1,160,000 | 1,213,650 |
|
| Mediacom Broadband LLC (S) | 5.500 | | 04-15-21 | 130,000 | 131,300 |
|
| Mediacom LLC | 7.250 | | 02-15-22 | 925,000 | 994,375 |
|
| NBCUniversal Media LLC | 4.375 | | 04-01-21 | 2,800,000 | 3,065,415 |
|
| Nexstar Broadcasting, Inc. | 6.875 | | 11-15-20 | 775,000 | 821,500 |
|
| Numericable Group SA (S) | 6.000 | | 05-15-22 | 460,000 | 460,000 |
|
| Numericable Group SA (S) | 6.250 | | 05-15-24 | 350,000 | 351,750 |
|
| Omnicom Group, Inc. | 3.625 | | 05-01-22 | 3,925,000 | 3,994,331 |
|
| Ono Finance II PLC (S) | 10.875 | | 07-15-19 | 440,000 | 477,400 |
|
| Quebecor Media, Inc. | 5.750 | | 01-15-23 | 900,000 | 909,000 |
|
| Sinclair Television Group, Inc. (S) | 5.625 | | 08-01-24 | 310,000 | 301,475 |
|
| Sinclair Television Group, Inc. | 6.125 | | 10-01-22 | 1,300,000 | 1,342,250 |
|
| SiTV LLC (S) | 10.375 | | 07-01-19 | 145,000 | 145,725 |
|
| The Interpublic Group of Companies, Inc. | 4.000 | | 03-15-22 | 3,250,000 | 3,322,010 |
|
| Time Warner, Inc. | 6.100 | | 07-15-40 | 3,175,000 | 3,687,988 |
| | | | | | |
| Multiline Retail 0.3% | | | | | |
|
| Macy’s Retail Holdings, Inc. | 3.875 | | 01-15-22 | 4,400,000 | 4,597,274 |
|
| Macy’s Retail Holdings, Inc. | 6.900 | | 04-01-29 | 175,000 | 220,171 |
|
| The Bon-Ton Department Stores, Inc. | 8.000 | | 06-15-21 | 325,000 | 295,750 |
| | | | | | |
| Specialty Retail 0.6% | | | | | |
|
| Advance Auto Parts, Inc. | 4.500 | | 12-01-23 | 3,775,000 | 3,960,379 |
|
| Guitar Center, Inc. (S) | 6.500 | | 04-15-19 | 215,000 | 204,250 |
|
| Guitar Center, Inc. (S) | 9.625 | | 04-15-20 | 355,000 | 327,488 |
|
| Outerwall, Inc. | 6.000 | | 03-15-19 | 610,000 | 623,725 |
|
| Petco Holdings Inc., PIK (S) | 8.500 | | 10-15-17 | 350,000 | 353,500 |
|
| The TJX Companies, Inc. | 2.750 | | 06-15-21 | 4,000,000 | 3,972,584 |
| | | | | | |
| Textiles, Apparel & Luxury Goods 0.2% | | | | | |
|
| Hot Topic, Inc. (S) | 9.250 | | 06-15-21 | 605,000 | 665,500 |
|
| Levi Strauss & Company | 6.875 | | 05-01-22 | 1,020,000 | 1,096,500 |
|
| Quiksilver, Inc. (S) | 7.875 | | 08-01-18 | 505,000 | 464,600 |
|
| Quiksilver, Inc. | 10.000 | | 08-01-20 | 300,000 | 256,500 |
|
| The William Carter Company (C) | 5.250 | | 08-15-21 | 549,000 | 570,960 |
| | | | | | |
| Consumer Staples 2.3% | | | | 34,743,552 |
| | | | | |
| Beverages 0.4% | | | | | |
|
| Diageo Investment Corp. | 2.875 | | 05-11-22 | 1,625,000 | 1,609,498 |
|
| SABMiller Holdings, Inc. (S) | 3.750 | | 01-15-22 | 3,833,000 | 3,968,190 |
| | | | | | |
| Food & Staples Retailing 0.5% | | | | | |
|
| Cencosud SA (S) | 5.500 | | 01-20-21 | 150,000 | 157,984 |
|
| CVS Pass-Through Trust | 6.036 | | 12-10-28 | 3,489,904 | 4,008,235 |
|
| R&R PLC, PIK | 9.250 | | 05-15-18 | EUR 525,000 | 719,873 |
|
| The Kroger Company | 5.150 | | 08-01-43 | 3,250,000 | 3,484,588 |
| | |
| See notes to financial statements | Annual report | Short Duration Credit Opportunities Fund | 13 |
| | | | | |
| | | | Maturity | | |
| | Rate (%) | | date | Par value^ | Value |
| Food Products 0.5% | | | | | |
|
| Chiquita Brands International, Inc. | 7.875 | | 02-01-21 | 1,165,000 | $1,246,550 |
|
| ConAgra Foods, Inc. | 3.200 | | 01-25-23 | 3,225,000 | 3,138,789 |
|
| ESAL GmbH (S) | 6.250 | | 02-05-23 | 200,000 | 195,500 |
|
| HJ Heinz Company | 4.250 | | 10-15-20 | 510,000 | 506,813 |
|
| Post Holdings, Inc. | 7.375 | | 02-15-22 | 945,000 | 996,975 |
|
| Premier Foods PLC | 6.500 | | 03-15-21 | GBP 400,000 | 656,748 |
|
| Smithfield Foods, Inc. | 6.625 | | 08-15-22 | 935,000 | 1,012,138 |
| | | | | | |
| Household Products 0.2% | | | | | |
|
| Reynolds Group Issuer, Inc. | 8.250 | | 02-15-21 | 1,035,000 | 1,097,100 |
|
| Spectrum Brands, Inc. | 6.375 | | 11-15-20 | 656,000 | 690,440 |
|
| The Sun Products Corp. (S) | 7.750 | | 03-15-21 | 835,000 | 684,700 |
| | | | | | |
| Personal Products 0.0% | | | | | |
|
| Prestige Brands, Inc. (S) | 5.375 | | 12-15-21 | 465,000 | 465,000 |
| | | | | | |
| Tobacco 0.7% | | | | | |
|
| Altria Group, Inc. | 2.850 | | 08-09-22 | 4,000,000 | 3,821,524 |
|
| Lorillard Tobacco Company | 6.875 | | 05-01-20 | 2,650,000 | 3,121,499 |
|
| Philip Morris International, Inc. | 1.125 | | 08-21-17 | 3,175,000 | 3,161,408 |
| | | | | | |
| Energy 7.0% | | | | 105,060,687 |
| | | | | |
| Energy Equipment & Services 0.5% | | | | | |
|
| GeoPark Latin America, Ltd. Agencia en | | | | | |
| Chile (S) | 7.500 | | 02-11-20 | 200,000 | 215,750 |
|
| Hornbeck Offshore Services, Inc. | 5.000 | | 03-01-21 | 550,000 | 539,000 |
|
| Offshore Group Investment, Ltd. | 7.125 | | 04-01-23 | 1,085,000 | 1,071,438 |
|
| Pacific Drilling SA (S) | 5.375 | | 06-01-20 | 935,000 | 890,588 |
|
| Parker Drilling Company (S) | 6.750 | | 07-15-22 | 745,000 | 759,900 |
|
| Transocean, Inc. | 6.375 | | 12-15-21 | 3,275,000 | 3,732,206 |
|
| Trinidad Drilling, Ltd. (S) | 7.875 | | 01-15-19 | 475,000 | 498,750 |
| | | | | | |
| Oil, Gas & Consumable Fuels 6.5% | | | | | |
|
| Access Midstream Partners LP | 4.875 | | 05-15-23 | 440,000 | 453,200 |
|
| Access Midstream Partners LP | 4.875 | | 03-15-24 | 260,000 | 267,800 |
|
| Adaro Indonesia PT | 7.625 | | 10-22-19 | 150,000 | 156,000 |
|
| Anadarko Petroleum Corp. | 4.500 | | 07-15-44 | 4,000,000 | 3,965,192 |
|
| Apache Corp. | 4.750 | | 04-15-43 | 3,775,000 | 3,879,888 |
|
| Arch Coal, Inc. | 7.250 | | 06-15-21 | 1,010,000 | 656,500 |
|
| Atlas Pipeline Partners LP | 4.750 | | 11-15-21 | 565,000 | 533,925 |
|
| Bonanza Creek Energy, Inc. | 5.750 | | 02-01-23 | 255,000 | 249,900 |
|
| Bonanza Creek Energy, Inc. | 6.750 | | 04-15-21 | 945,000 | 982,800 |
|
| BP Capital Markets PLC | 2.750 | | 05-10-23 | 5,400,000 | 5,150,266 |
|
| Calumet Specialty Products Partners LP (S) | 6.500 | | 04-15-21 | 705,000 | 719,100 |
|
| Calumet Specialty Products Partners LP | 9.625 | | 08-01-20 | 280,000 | 319,200 |
|
| Cloud Peak Energy Resources LLC | 6.375 | | 03-15-24 | 570,000 | 588,525 |
|
| Cloud Peak Energy Resources LLC | 8.500 | | 12-15-19 | 505,000 | 534,669 |
|
| CONSOL Energy, Inc. | 8.250 | | 04-01-20 | 805,000 | 857,325 |
|
| Continental Resources, Inc. (S) | 3.800 | | 06-01-24 | 3,800,000 | 3,817,108 |
|
| Cosan Luxembourg SA (S) | 5.000 | | 03-14-23 | 200,000 | 189,000 |
|
| Denbury Resources, Inc. | 5.500 | | 05-01-22 | 845,000 | 830,213 |
| | |
| 14 | Short Duration Credit Opportunities Fund | Annual report | See notes to financial statements |
| | | | | |
| | | | Maturity | | |
| | Rate (%) | | date | Par value^ | Value |
| Oil, Gas & Consumable Fuels (continued) | | | | | |
|
| El Paso Pipeline Partners Operating | | | | | |
| Company LLC | 4.700 | | 11-01-42 | 3,625,000 | $3,356,322 |
|
| EP Energy LLC | 6.875 | | 05-01-19 | 385,000 | 403,288 |
|
| EP Energy LLC | 9.375 | | 05-01-20 | 545,000 | 603,588 |
|
| EQT Corp. | 4.875 | | 11-15-21 | 3,225,000 | 3,511,177 |
|
| FTS International, Inc. (S) | 6.250 | | 05-01-22 | 725,000 | 737,688 |
|
| Halcon Resources Corp. | 9.750 | | 07-15-20 | 850,000 | 905,250 |
|
| Intergas Finance BV | 6.375 | | 05-14-17 | 269,000 | 293,210 |
|
| KazMunayGas National Company (S) | 4.400 | | 04-30-23 | 2,152,000 | 2,146,620 |
|
| KazMunayGas National Company | 5.750 | | 04-30-43 | 2,760,000 | 2,719,152 |
|
| KazMunayGas National Company (S) | 6.375 | | 04-09-21 | 200,000 | 226,290 |
|
| KazMunayGas National Company | 6.375 | | 04-09-21 | 350,000 | 396,008 |
|
| KazMunayGas National Company | 7.000 | | 05-05-20 | 521,000 | 601,755 |
|
| KazMunayGas National Company (S) | 9.125 | | 07-02-18 | 1,876,000 | 2,269,960 |
|
| KazMunayGas National Company | 11.750 | | 01-23-15 | 215,000 | 225,307 |
|
| Kinder Morgan Energy Partners LP | 3.450 | | 02-15-23 | 3,800,000 | 3,646,670 |
|
| Kodiak Oil & Gas Corp. | 5.500 | | 01-15-21 | 550,000 | 577,500 |
|
| Laredo Petroleum, Inc. | 5.625 | | 01-15-22 | 365,000 | 371,388 |
|
| Laredo Petroleum, Inc. | 7.375 | | 05-01-22 | 400,000 | 436,000 |
|
| Linn Energy LLC | 7.750 | | 02-01-21 | 965,000 | 1,010,838 |
|
| Marathon Petroleum Corp. | 6.500 | | 03-01-41 | 3,225,000 | 3,916,524 |
|
| MEG Energy Corp. (S) | 6.375 | | 01-30-23 | 300,000 | 308,250 |
|
| MEG Energy Corp. (S) | 6.500 | | 03-15-21 | 260,000 | 267,150 |
|
| MEG Energy Corp. (S) | 7.000 | | 03-31-24 | 220,000 | 232,650 |
|
| Midstates Petroleum Company, Inc. | 10.750 | | 10-01-20 | 695,000 | 748,863 |
|
| Oasis Petroleum, Inc. (S) | 6.875 | | 03-15-22 | 400,000 | 433,000 |
|
| Oasis Petroleum, Inc. | 7.250 | | 02-01-19 | 590,000 | 616,550 |
|
| Oleoducto Central SA (S) | 4.000 | | 05-07-21 | 200,000 | 202,250 |
|
| Pacific Rubiales Energy Corp. (S) | 5.125 | | 03-28-23 | 123,000 | 121,155 |
|
| Peabody Energy Corp. | 6.250 | | 11-15-21 | 1,460,000 | 1,383,350 |
|
| Pertamina Persero PT | 6.000 | | 05-03-42 | 200,000 | 196,750 |
|
| Petroleos de Venezuela SA | 5.000 | | 10-28-15 | 1,777,463 | 1,668,593 |
|
| Petroleos de Venezuela SA | 5.250 | | 04-12-17 | 2,603,800 | 2,193,702 |
|
| Petroleos de Venezuela SA | 5.375 | | 04-12-27 | 5,336,100 | 3,196,324 |
|
| Petroleos de Venezuela SA | 6.000 | | 05-16-24 | 214,266 | 139,809 |
|
| Petroleos de Venezuela SA | 6.000 | | 11-15-26 | 536,588 | 330,807 |
|
| Petroleos de Venezuela SA | 8.500 | | 11-02-17 | 3,895,800 | 3,634,781 |
|
| Petroleos de Venezuela SA | 9.750 | | 05-17-35 | 3,146,880 | 2,541,106 |
|
| Phillips 66 | 4.300 | | 04-01-22 | 3,675,000 | 3,909,333 |
|
| Pioneer Natural Resources Company | 3.950 | | 07-15-22 | 3,300,000 | 3,444,009 |
|
| Plains Exploration & Production Company | 6.875 | | 02-15-23 | 2,433,000 | 2,816,198 |
|
| PTT Exploration & Production PCL (4.875% to | | | | | |
| 6-18-19, then 5 year CMT + 3.177%) (Q)(S) | 4.875 | | 06-18-19 | 303,000 | 306,333 |
|
| QEP Resources, Inc. | 5.375 | | 10-01-22 | 960,000 | 976,800 |
|
| Sabine Pass Liquefaction LLC | 5.625 | | 02-01-21 | 590,000 | 610,650 |
|
| Samson Investment Company (S) | 10.750 | | 02-15-20 | 925,000 | 936,563 |
|
| SandRidge Energy, Inc. | 7.500 | | 03-15-21 | 1,155,000 | 1,201,200 |
| | |
| See notes to financial statements | Annual report | Short Duration Credit Opportunities Fund | 15 |
| | | | | |
| | | | Maturity | | |
| | Rate (%) | | date | Par value^ | Value |
| Oil, Gas & Consumable Fuels (continued) | | | | | |
|
| Sinopec Group Overseas Development | | | | | |
| 2012, Ltd. | 3.900 | | 05-17-22 | 200,000 | $201,821 |
|
| Sinopec Group Overseas Development | | | | | |
| 2012, Ltd. (S) | 4.875 | | 05-17-42 | 200,000 | 203,410 |
|
| Sinopec Group Overseas Development | | | | | |
| 2014, Ltd. (S) | 4.375 | | 04-10-24 | 278,000 | 288,474 |
|
| Spectra Energy Partners LP | 4.750 | | 03-15-24 | 3,300,000 | 3,541,441 |
|
| State Oil Company of the Azerbaijan Republic | 4.750 | | 03-13-23 | 1,569,000 | 1,565,078 |
|
| State Oil Company of the Azerbaijan Republic | 5.450 | | 02-09-17 | 200,000 | 212,000 |
|
| Tesoro Logistics LP | 5.875 | | 10-01-20 | 350,000 | 360,500 |
|
| Tesoro Logistics LP | 6.125 | | 10-15-21 | 450,000 | 468,000 |
|
| Tullow Oil PLC (S) | 6.000 | | 11-01-20 | 75,000 | 76,125 |
|
| Ultra Petroleum Corp. (S) | 5.750 | | 12-15-18 | 450,000 | 468,000 |
|
| Venoco, Inc. | 8.875 | | 02-15-19 | 775,000 | 751,750 |
|
| Williams Partners LP | 4.500 | | 11-15-23 | 3,750,000 | 3,950,944 |
|
| YPF SA (S) | 8.750 | | 04-04-24 | 126,000 | 131,040 |
|
| Zhaikmunai LP (S) | 7.125 | | 11-13-19 | 196,000 | 213,150 |
| | | | | | |
| Financials 11.2% | | | | 168,049,242 |
| | | | | |
| Banks 4.7% | | | | | |
|
| Bancolombia SA | 5.125 | | 09-11-22 | 185,000 | 185,278 |
|
| BPCE SA (S) | 5.700 | | 10-22-23 | 5,050,000 | 5,496,420 |
|
| CIT Group, Inc. | 5.000 | | 08-15-22 | 310,000 | 320,075 |
|
| CIT Group, Inc. | 5.250 | | 03-15-18 | 520,000 | 548,600 |
|
| Fifth Third Bancorp | 3.625 | | 01-25-16 | 3,200,000 | 3,331,504 |
|
| First Republic Bank | 2.375 | | 06-17-19 | 3,575,000 | 3,583,587 |
|
| Grupo Aval, Ltd. (S) | 4.750 | | 09-26-22 | 200,000 | 199,500 |
|
| HBOS PLC (S) | 6.750 | | 05-21-18 | 4,100,000 | 4,686,628 |
|
| HSBC Holdings PLC | 6.500 | | 09-15-37 | 3,200,000 | 3,968,272 |
|
| Intesa Sanpaolo SpA | 3.125 | | 01-15-16 | 5,000,000 | 5,129,685 |
|
| Itau Unibanco Holding SA (S) | 5.650 | | 03-19-22 | 200,000 | 205,760 |
|
| Mizuho Bank, Ltd. (S) | 2.950 | | 10-17-22 | 3,500,000 | 3,433,931 |
|
| PNC Bank NA | 2.700 | | 11-01-22 | 3,000,000 | 2,887,395 |
|
| PNC Financial Services Group, Inc. | 3.900 | | 04-29-24 | 5,025,000 | 5,075,954 |
|
| Santander Holdings USA, Inc. | 3.000 | | 09-24-15 | 3,775,000 | 3,869,753 |
|
| Santander UK PLC (S) | 5.000 | | 11-07-23 | 3,700,000 | 3,970,344 |
|
| Skandinaviska Enskilda Banken AB (S) | 2.375 | | 03-25-19 | 3,725,000 | 3,746,568 |
|
| Societe Generale SA (S) | 5.750 | | 04-20-16 | 3,325,000 | 3,552,942 |
|
| Standard Chartered PLC (6.409% to 1-30-17, | | | | | |
| then 3 month LIBOR + 1.510%) (Q)(S) | 6.409 | | 01-30-17 | 2,850,000 | 3,081,563 |
|
| Sumitomo Mitsui Banking Corp. | 2.450 | | 01-10-19 | 4,000,000 | 4,045,084 |
|
| The Royal Bank of Scotland Group PLC | 6.000 | | 12-19-23 | 3,475,000 | 3,691,294 |
|
| Wells Fargo & Company | 4.125 | | 08-15-23 | 4,700,000 | 4,859,997 |
| | | | | | |
| Capital Markets 0.7% | | | | | |
|
| Boparan Finance PLC (S) | 5.500 | | 07-15-21 | GBP 300,000 | 472,089 |
|
| Morgan Stanley | 4.875 | | 11-01-22 | 5,125,000 | 5,454,107 |
|
| Nomura Holdings, Inc. | 2.750 | | 03-19-19 | 3,925,000 | 3,963,830 |
| | |
| 16 | Short Duration Credit Opportunities Fund | Annual report | See notes to financial statements |
| | | | | |
| | | | Maturity | | |
| | Rate (%) | | date | Par value^ | Value |
| Consumer Finance 0.5% | | | | | |
|
| Capital One Bank USA NA | 3.375 | | 02-15-23 | 3,775,000 | $3,693,162 |
|
| Capital One Financial Corp. | 6.150 | | 09-01-16 | 3,635,000 | 4,001,652 |
| | | | | | |
| Diversified Financial Services 2.9% | | | | | |
|
| Aviation Capital Group Corp. (S) | 6.750 | | 04-06-21 | 2,925,000 | 3,293,790 |
|
| Bank of America Corp. | 4.125 | | 01-22-24 | 5,750,000 | 5,882,009 |
|
| Bank of America Corp. | 6.050 | | 05-16-16 | 3,530,000 | 3,821,084 |
|
| CIMPOR Financial Operations BV (S) | 5.750 | | 07-17-24 | 500,000 | 493,125 |
|
| Citigroup, Inc. | 2.500 | | 09-26-18 | 1,900,000 | 1,921,550 |
|
| Citigroup, Inc. | 4.050 | | 07-30-22 | 5,225,000 | 5,320,252 |
|
| Citigroup, Inc. | 5.000 | | 09-15-14 | 2,350,000 | 2,361,889 |
|
| Citigroup, Inc. | 5.300 | | 05-06-44 | 2,250,000 | 2,329,493 |
|
| Countrywide Financial Corp. | 6.250 | | 05-15-16 | 1,325,000 | 1,438,730 |
|
| Discover Bank | 4.250 | | 03-13-26 | 3,800,000 | 3,901,844 |
|
| JPMorgan Chase & Company | 3.250 | | 09-23-22 | 3,500,000 | 3,479,287 |
|
| Provident Funding Associates LP (S) | 6.750 | | 06-15-21 | 200,000 | 198,500 |
|
| Provident Funding Associates LP (S) | 10.125 | | 02-15-19 | 350,000 | 376,250 |
|
| Rabobank Nederland NV | 3.950 | | 11-09-22 | 5,750,000 | 5,792,803 |
|
| Voya Financial, Inc. | 2.900 | | 02-15-18 | 3,275,000 | 3,374,730 |
| | | | | | |
| Insurance 1.4% | | | | | |
|
| AXA SA | 8.600 | | 12-15-30 | 2,070,000 | 2,784,150 |
|
| Boardwalk Pipelines LP | 3.375 | | 02-01-23 | 4,275,000 | 3,973,604 |
|
| Burlington Northern Santa Fe LLC | 4.400 | | 03-15-42 | 3,840,000 | 3,807,533 |
|
| Genworth Holdings, Inc. | 7.625 | | 09-24-21 | 2,575,000 | 3,188,442 |
|
| Hartford Financial Services Group, Inc. | 6.000 | | 01-15-19 | 2,850,000 | 3,275,938 |
|
| Reinsurance Group of America, Inc. | 4.700 | | 09-15-23 | 2,975,000 | 3,178,683 |
| | | | | | |
| Real Estate Investment Trusts 1.0% | | | | | |
|
| Boston Properties LP | 3.850 | | 02-01-23 | 3,200,000 | 3,297,392 |
|
| Corporate Office Properties LP | 3.600 | | 05-15-23 | 3,625,000 | 3,468,248 |
|
| DDR Corp. | 7.875 | | 09-01-20 | 2,600,000 | 3,265,631 |
|
| Kimco Realty Corp. | 4.300 | | 02-01-18 | 2,975,000 | 3,210,578 |
|
| Rayonier AM Products, Inc. (S) | 5.500 | | 06-01-24 | 860,000 | 847,100 |
|
| Simon Property Group LP | 3.375 | | 03-15-22 | 1,450,000 | 1,482,473 |
| | | | | | |
| Real Estate Management & Development 0.0% | | | | |
|
| Country Garden Holdings Company, Ltd. | 11.125 | | 02-23-18 | 250,000 | 272,500 |
|
| Kaisa Group Holdings, Ltd. (S) | 8.875 | | 03-19-18 | 100,000 | 104,625 |
| | | | | | |
| Thrifts & Mortgage Finance 0.0% | | | | | |
|
| Alfa Bank OJSC (S) | 7.500 | | 09-26-19 | 34,000 | 32,810 |
|
| Ocwen Financial Corp. (S) | 6.625 | | 05-15-19 | 410,000 | 419,225 |
| | | | | | |
| Health Care 2.4% | | | | 36,597,631 |
| | | | | |
| Health Care Equipment & Supplies 0.2% | | | | | |
|
| Biomet, Inc. | 6.500 | | 08-01-20 | 535,000 | 577,078 |
|
| Hologic, Inc. | 6.250 | | 08-01-20 | 450,000 | 469,125 |
|
| Kinetic Concepts, Inc. | 10.500 | | 11-01-18 | 530,000 | 586,975 |
|
| Kinetic Concepts, Inc. | 12.500 | | 11-01-19 | 575,000 | 643,310 |
| | |
| See notes to financial statements | Annual report | Short Duration Credit Opportunities Fund | 17 |
| | | | | |
| | | | Maturity | | |
| | Rate (%) | | date | Par value^ | Value |
| Health Care Providers & Services 1.5% | | | | | |
|
| Community Health Systems, Inc. (S) | 6.875 | | 02-01-22 | 495,000 | $506,138 |
|
| Community Health Systems, Inc. | 8.000 | | 11-15-19 | 470,000 | 504,169 |
|
| DaVita Healthcare Partners, Inc. | 5.125 | | 07-15-24 | 795,000 | 783,075 |
|
| Express Scripts Holding Company | 3.900 | | 02-15-22 | 3,300,000 | 3,445,936 |
|
| HCA Holdings, Inc. | 7.750 | | 05-15-21 | 440,000 | 474,650 |
|
| HCA, Inc. | 7.500 | | 02-15-22 | 400,000 | 453,000 |
|
| HealthSouth Corp. | 5.750 | | 11-01-24 | 510,000 | 532,950 |
|
| Humana, Inc. | 4.625 | | 12-01-42 | 4,075,000 | 4,006,328 |
|
| IASIS Healthcare LLC | 8.375 | | 05-15-19 | 660,000 | 697,950 |
|
| LifePoint Hospitals, Inc. (S) | 5.500 | | 12-01-21 | 1,000,000 | 1,022,500 |
|
| McKesson Corp. | 3.796 | | 03-15-24 | 3,925,000 | 3,983,082 |
|
| Prospect Medical Holdings, Inc. (S) | 8.375 | | 05-01-19 | 540,000 | 584,550 |
|
| Tenet Healthcare Corp. | 6.000 | | 10-01-20 | 330,000 | 346,500 |
|
| Tenet Healthcare Corp. | 8.125 | | 04-01-22 | 455,000 | 508,463 |
|
| UnitedHealth Group, Inc. | 4.625 | | 11-15-41 | 475,000 | 496,034 |
|
| UnitedHealth Group, Inc. | 5.800 | | 03-15-36 | 3,755,000 | 4,558,401 |
| | | | | | |
| Life Sciences Tools & Services 0.2% | | | | | |
|
| Thermo Fisher Scientific, Inc. | 1.300 | | 02-01-17 | 3,325,000 | 3,322,666 |
| | | | | | |
| Pharmaceuticals 0.5% | | | | | |
|
| AbbVie, Inc. | 1.750 | | 11-06-17 | 3,050,000 | 3,050,573 |
|
| Actavis Funding SCS (S) | 3.850 | | 06-15-24 | 3,925,000 | 3,914,253 |
|
| Grifols Worldwide Operations, Ltd. (S) | 5.250 | | 04-01-22 | 560,000 | 562,100 |
|
| Mallinckrodt International Finance SA (C)(S) | 5.750 | | 08-01-22 | 565,000 | 567,825 |
| | | | | | |
| Industrials 3.8% | | | | 56,987,587 |
| | | | | |
| Aerospace & Defense 0.7% | | | | | |
|
| Bombardier, Inc. (S) | 6.000 | | 10-15-22 | 740,000 | 725,200 |
|
| Bombardier, Inc. (S) | 6.125 | | 01-15-23 | 375,000 | 369,375 |
|
| Erickson, Inc. | 8.250 | | 05-01-20 | 769,000 | 772,845 |
|
| L-3 Communications Corp. | 4.750 | | 07-15-20 | 1,700,000 | 1,835,701 |
|
| Northrop Grumman Corp. | 1.750 | | 06-01-18 | 3,100,000 | 3,075,935 |
|
| Textron, Inc. | 3.650 | | 03-01-21 | 3,700,000 | 3,784,020 |
| | | | | | |
| Air Freight & Logistics 0.4% | | | | | |
|
| FedEx Corp. | 2.625 | | 08-01-22 | 2,675,000 | 2,577,716 |
|
| FedEx Corp. | 4.000 | | 01-15-24 | 2,525,000 | 2,631,260 |
| | | | | | |
| Airlines 0.0% | | | | | |
|
| Allegiant Travel Company | 5.500 | | 07-15-19 | 475,000 | 480,344 |
| | | | | | |
| Building Products 0.2% | | | | | |
|
| Cleaver-Brooks, Inc. (S) | 8.750 | | 12-15-19 | 520,000 | 577,200 |
|
| Griffon Corp. | 5.250 | | 03-01-22 | 1,060,000 | 1,037,475 |
|
| Owens Corning | 7.000 | | 12-01-36 | 1,600,000 | 1,928,830 |
| | | | | | |
| Commercial Services & Supplies 0.4% | | | | | |
|
| ACCO Brands Corp. | 6.750 | | 04-30-20 | 1,221,000 | 1,269,840 |
|
| Clean Harbors, Inc. | 5.250 | | 08-01-20 | 460,000 | 463,450 |
|
| Pitney Bowes, Inc. | 4.625 | | 03-15-24 | 3,900,000 | 3,989,786 |
| | | | | | |
| Construction & Engineering 0.1% | | | | | |
|
| MasTec, Inc. | 4.875 | | 03-15-23 | 1,320,000 | 1,295,250 |
| | |
| 18 | Short Duration Credit Opportunities Fund | Annual report | See notes to financial statements |
| | | | | |
| | | | Maturity | | |
| | Rate (%) | | date | Par value^ | Value |
| Electrical Equipment 0.3% | | | | | |
|
| ABB Finance USA, Inc. | 2.875 | | 05-08-22 | 3,375,000 | $3,333,616 |
|
| Artesyn Escrow, Inc. (S) | 9.750 | | 10-15-20 | 625,000 | 615,625 |
|
| CeramTec Group GmbH | 8.250 | | 08-15-21 | EUR 800,000 | 1,175,686 |
| | | | | | |
| Industrial Conglomerates 0.1% | | | | | |
|
| CITIC Pacific, Ltd. | 6.375 | | 04-10-20 | 200,000 | 223,500 |
|
| CITIC Pacific, Ltd. (7.875% to 4-15-16, then | | | | | |
| 5 year CMT + 5.545%) (Q) | 7.875 | | 04-15-16 | 200,000 | 212,750 |
|
| Odebrecht Drilling Norbe VIII/IX, Ltd. | 6.350 | | 06-30-21 | 175,000 | 185,010 |
|
| Odebrecht Offshore Drilling Finance, Ltd. (S) | 6.750 | | 10-01-22 | 192,840 | 202,482 |
|
| Tenedora Nemak SA de CV (S) | 5.500 | | 02-28-23 | 200,000 | 207,000 |
| | | | | | |
| Machinery 0.1% | | | | | |
|
| Trinseo Materials Operating SCA | 8.750 | | 02-01-19 | 1,141,000 | 1,200,903 |
|
| Xerium Technologies, Inc. | 8.875 | | 06-15-18 | 550,000 | 583,000 |
| | | | | | |
| Road & Rail 1.0% | | | | | |
|
| Canadian National Railway Company | 2.850 | | 12-15-21 | 2,050,000 | 2,063,087 |
|
| ERAC USA Finance LLC (S) | 3.850 | | 11-15-24 | 3,775,000 | 3,784,709 |
|
| Penske Truck Leasing Company LP (S) | 2.500 | | 03-15-16 | 3,300,000 | 3,384,721 |
|
| Ryder System, Inc. | 2.450 | | 09-03-19 | 1,900,000 | 1,895,356 |
|
| Ryder System, Inc. | 2.550 | | 06-01-19 | 2,000,000 | 2,014,102 |
|
| Union Pacific Corp. | 3.750 | | 03-15-24 | 1,550,000 | 1,609,126 |
| | | | | | |
| Trading Companies & Distributors 0.5% | | | | | |
|
| Air Lease Corp. | 3.875 | | 04-01-21 | 2,375,000 | 2,395,781 |
|
| Aircastle, Ltd. | 6.750 | | 04-15-17 | 500,000 | 544,375 |
|
| American Builders & Contractors Supply | | | | | |
| Company, Inc. (S) | 5.625 | | 04-15-21 | 345,000 | 345,863 |
|
| GATX Corp. | 2.500 | | 03-15-19 | 3,250,000 | 3,261,902 |
|
| International Lease Finance Corp. | 8.250 | | 12-15-20 | 501,000 | 602,453 |
|
| WESCO Distribution, Inc. | 5.375 | | 12-15-21 | 325,000 | 332,313 |
| | | | | | |
| Information Technology 1.5% | | | | 22,513,244 |
| | | | | |
| Communications Equipment 0.1% | | | | | |
|
| Alcatel-Lucent USA, Inc. (S) | 6.750 | | 11-15-20 | 400,000 | 409,000 |
|
| Cisco Systems, Inc. | 2.900 | | 03-04-21 | 1,575,000 | 1,590,980 |
| | | | | | |
| Electronic Equipment, Instruments & Components 0.0% | | |
|
| CPI International, Inc. | 8.750 | | 02-15-18 | 465,000 | 485,925 |
| | | | | | |
| Internet Software & Services 0.4% | | | | | |
|
| Tencent Holdings, Ltd. (S) | 3.375 | | 05-02-19 | 6,000,000 | 6,093,828 |
| | | | | | |
| Semiconductors & Semiconductor Equipment 0.4% | | | | |
|
| Altera Corp. | 1.750 | | 05-15-17 | 4,000,000 | 4,027,212 |
|
| Amkor Technology, Inc. | 6.375 | | 10-01-22 | 745,000 | 774,800 |
|
| Magnachip Semiconductor Corp. | 6.625 | | 07-15-21 | 505,000 | 489,850 |
|
| STATS ChipPAC, Ltd. (S) | 4.500 | | 03-20-18 | 54,000 | 54,743 |
| | | | | | |
| Software 0.1% | | | | | |
|
| BMC Software Finance, Inc. (S) | 8.125 | | 07-15-21 | 460,000 | 457,700 |
|
| First Data Corp. (S) | 6.750 | | 11-01-20 | 241,000 | 254,858 |
|
| First Data Corp. | 12.625 | | 01-15-21 | 450,000 | 539,156 |
|
| Nuance Communications, Inc. (S) | 5.375 | | 08-15-20 | 500,000 | 505,000 |
| | |
| See notes to financial statements | Annual report | Short Duration Credit Opportunities Fund | 19 |
| | | | | |
| | | | Maturity | | |
| | Rate (%) | | date | Par value^ | Value |
| Technology Hardware, Storage & Peripherals 0.5% | | | | |
|
| Apple, Inc. | 3.850 | | 05-04-43 | 6,500,000 | $5,966,129 |
|
| NCR Corp. | 5.000 | | 07-15-22 | 875,000 | 864,063 |
| | | | | | |
| Materials 3.0% | | | | 44,671,625 |
| | | | | |
| Chemicals 1.3% | | | | | |
|
| Chemtura Corp. | 5.750 | | 07-15-21 | 1,220,000 | 1,238,300 |
|
| Eastman Chemical Company | 4.650 | | 10-15-44 | 3,750,000 | 3,694,069 |
|
| INEOS Group Holdings SA (S) | 5.875 | | 02-15-19 | 645,000 | 651,450 |
|
| LyondellBasell Industries NV | 6.000 | | 11-15-21 | 3,300,000 | 3,908,827 |
|
| OCP SA (S) | 5.625 | | 04-25-24 | 701,000 | 734,298 |
|
| Sinochem Offshore Capital Company, Ltd. (S) | 3.250 | | 04-29-19 | 1,493,000 | 1,512,849 |
|
| Sinochem Overseas Capital Company, Ltd. (S) | 4.500 | | 11-12-20 | 2,607,000 | 2,776,434 |
|
| Sinochem Overseas Capital Company, Ltd. | 4.500 | | 11-12-20 | 236,000 | 251,338 |
|
| SPCM SA (S) | 6.000 | | 01-15-22 | 825,000 | 878,625 |
|
| The Mosaic Company | 4.250 | | 11-15-23 | 3,000,000 | 3,142,059 |
| | | | | | |
| Construction Materials 0.0% | | | | | |
|
| Cementos Pacasmayo SAA (S) | 4.500 | | 02-08-23 | 200,000 | 189,000 |
|
| Cemex Finance LLC (S) | 9.375 | | 10-12-22 | 200,000 | 228,000 |
|
| Cemex SAB de CV (S) | 9.500 | | 06-15-18 | 200,000 | 223,000 |
| | | | | | |
| Containers & Packaging 0.4% | | | | | |
|
| Ardagh Finance Holdings SA, PIK (S) | 8.625 | | 06-15-19 | 310,000 | 312,325 |
|
| Ardagh Packaging Finance PLC (S) | 4.250 | | 01-15-22 | EUR 275,000 | 360,506 |
|
| Ardagh Packaging Finance PLC (S) | 6.000 | | 06-30-21 | 355,000 | 339,025 |
|
| Cascades, Inc. (S) | 5.500 | | 07-15-22 | 640,000 | 632,000 |
|
| Packaging Corp. of America | 3.900 | | 06-15-22 | 1,375,000 | 1,408,391 |
|
| Packaging Corp. of America | 4.500 | | 11-01-23 | 1,525,000 | 1,621,955 |
|
| Sealed Air Corp. (S) | 8.375 | | 09-15-21 | 645,000 | 720,788 |
| | | | | | |
| Metals & Mining 1.2% | | | | | |
|
| Aperam (S) | 7.375 | | 04-01-16 | 275,000 | 281,188 |
|
| Aperam (S) | 7.750 | | 04-01-18 | 435,000 | 457,838 |
|
| ArcelorMittal | 6.750 | | 02-25-22 | 830,000 | 898,475 |
|
| ArcelorMittal | 7.500 | | 10-15-39 | 605,000 | 630,713 |
|
| Cia Minera Ares SAC (S) | 7.750 | | 01-23-21 | 330,000 | 357,225 |
|
| Constellium NV (S) | 5.750 | | 05-15-24 | 525,000 | 540,750 |
|
| Corporacion Nacional del Cobre de Chile (S) | 3.000 | | 07-17-22 | 3,031,000 | 2,911,627 |
|
| Corporacion Nacional del Cobre de Chile (S) | 4.250 | | 07-17-42 | 200,000 | 182,593 |
|
| Corporacion Nacional del Cobre de Chile (S) | 4.500 | | 08-13-23 | 2,513,000 | 2,657,442 |
|
| Corporacion Nacional del Cobre de Chile | 6.150 | | 10-24-36 | 803,000 | 940,676 |
|
| Fresnillo PLC (S) | 5.500 | | 11-13-23 | 200,000 | 210,500 |
|
| Newmont Mining Corp. | 6.250 | | 10-01-39 | 3,450,000 | 3,624,053 |
|
| Samarco Mineracao SA (S) | 4.125 | | 11-01-22 | 200,000 | 189,200 |
|
| Signode Industrial Group Lux SA (S) | 6.375 | | 05-01-22 | 340,000 | 334,900 |
|
| Vale Overseas, Ltd. | 5.625 | | 09-15-19 | 2,950,000 | 3,330,550 |
|
| Vedanta Resources PLC (S) | 6.000 | | 01-31-19 | 225,000 | 231,188 |
|
| Vedanta Resources PLC | 6.750 | | 06-07-16 | 50,000 | 52,475 |
|
| Vedanta Resources PLC (S) | 8.250 | | 06-07-21 | 204,000 | 231,030 |
| | |
| 20 | Short Duration Credit Opportunities Fund | Annual report | See notes to financial statements |
| | | | | |
| | | | Maturity | | |
| | Rate (%) | | date | Par value^ | Value |
| Paper & Forest Products 0.1% | | | | | |
|
| Louisiana-Pacific Corp. | 7.500 | | 06-01-20 | 600,000 | $655,500 |
|
| Mercer International, Inc. | 9.500 | | 12-01-17 | 500,000 | 530,000 |
|
| Norbord, Inc. (S) | 5.375 | | 12-01-20 | 605,000 | 600,463 |
| | | | | | |
| Telecommunication Services 2.4% | | | | 36,295,116 |
| | | | | |
| Diversified Telecommunication Services 1.6% | | | | |
|
| CenturyLink, Inc. | 5.800 | | 03-15-22 | 590,000 | 604,750 |
|
| CenturyLink, Inc. | 6.750 | | 12-01-23 | 225,000 | 244,125 |
|
| Cincinnati Bell, Inc. | 8.375 | | 10-15-20 | 460,000 | 499,100 |
|
| Cincinnati Bell, Inc. | 8.750 | | 03-15-18 | 470,000 | 492,090 |
|
| Columbus International, Inc. (S) | 7.375 | | 03-30-21 | 200,000 | 211,000 |
|
| CyrusOne LP | 6.375 | | 11-15-22 | 690,000 | 727,950 |
|
| Frontier Communications Corp. | 9.000 | | 08-15-31 | 759,000 | 808,335 |
|
| Indosat Palapa Company BV | 7.375 | | 07-29-20 | 50,000 | 53,500 |
|
| Level 3 Escrow II, Inc. (C)(S) | 5.375 | | 08-15-22 | 310,000 | 306,125 |
|
| Level 3 Financing, Inc. | 7.000 | | 06-01-20 | 725,000 | 768,500 |
|
| Mobile Challenger Intermediate Group SA, PIK | 8.750 | | 03-15-19 | EUR 400,000 | 546,332 |
|
| T-Mobile USA, Inc. | 6.500 | | 01-15-24 | 600,000 | 624,000 |
|
| T-Mobile USA, Inc. | 6.731 | | 04-28-22 | 840,000 | 879,900 |
|
| Telefonica Emisiones SAU | 5.134 | | 04-27-20 | 5,000,000 | 5,543,155 |
|
| Turk Telekomunikasyon AS (S) | 4.875 | | 06-19-24 | 404,000 | 398,344 |
|
| UPC Holding BV | 6.375 | | 09-15-22 | EUR 750,000 | 1,084,631 |
|
| Verizon Communications, Inc. | 2.450 | | 11-01-22 | 5,875,000 | 5,499,617 |
|
| Verizon Communications, Inc. | 6.400 | | 09-15-33 | 1,975,000 | 2,445,767 |
|
| Wind Acquisition Finance SA (S) | 4.000 | | 07-15-20 | EUR 298,000 | 399,536 |
|
| Wind Acquisition Finance SA (S) | 4.750 | | 07-15-20 | 44,000 | 43,010 |
|
| Wind Acquisition Finance SA (S) | 6.500 | | 04-30-20 | 410,000 | 435,625 |
|
| Wind Acquisition Finance SA (S) | 7.375 | | 04-23-21 | 305,000 | 317,963 |
|
| Windstream Corp. | 7.500 | | 04-01-23 | 1,195,000 | 1,272,675 |
| | | | | | |
| Wireless Telecommunication Services 0.8% | | | | | |
|
| America Movil SAB de CV | 3.125 | | 07-16-22 | 3,100,000 | 3,008,522 |
|
| Bharti Airtel International Netherlands BV (S) | 5.125 | | 03-11-23 | 375,000 | 387,694 |
|
| Comcel Trust (S) | 6.875 | | 02-06-24 | 200,000 | 215,000 |
|
| Matterhorn Mobile Holdings SA | 8.250 | | 02-15-20 | EUR 450,000 | 653,791 |
|
| Millicom International Cellular SA (S) | 6.625 | | 10-15-21 | 275,000 | 292,188 |
|
| Rogers Communications, Inc. | 5.450 | | 10-01-43 | 4,875,000 | 5,391,141 |
|
| Sprint Capital Corp. | 8.750 | | 03-15-32 | 1,675,000 | 1,859,250 |
|
| VimpelCom Holdings BV (S) | 5.200 | | 02-13-19 | 100,000 | 96,000 |
|
| VimpelCom Holdings BV (S) | 5.950 | | 02-13-23 | 200,000 | 185,500 |
| | | | | | |
| Utilities 3.0% | | | | 45,500,904 |
| | | | | |
| Electric Utilities 1.7% | | | | | |
|
| Georgia Power Company | 4.300 | | 03-15-42 | 6,000,000 | 6,011,112 |
|
| NextEra Energy Capital Holdings, Inc. | 2.700 | | 09-15-19 | 3,250,000 | 3,293,212 |
|
| NSTAR Electric Company | 4.400 | | 03-01-44 | 5,000,000 | 5,174,140 |
|
| Oncor Electric Delivery Company LLC | 4.100 | | 06-01-22 | 3,700,000 | 3,978,210 |
|
| PacifiCorp | 2.950 | | 02-01-22 | 3,950,000 | 3,980,897 |
|
| PPL Energy Supply LLC | 4.600 | | 12-15-21 | 3,150,000 | 2,986,786 |
|
| RJS Power Holdings LLC (S) | 5.125 | | 07-15-19 | 880,000 | 866,800 |
| | |
| See notes to financial statements | Annual report | Short Duration Credit Opportunities Fund | 21 |
| | | | | |
| | | | Maturity | | |
| | Rate (%) | | date | Par value^ | Value |
| Independent Power and Renewable Electricity Producers 0.6% | | |
|
| AES Corp. | 4.875 | | 05-15-23 | 500,000 | $471,250 |
|
| AES Corp. | 7.375 | | 07-01-21 | 375,000 | 427,500 |
|
| Calpine Corp. | 5.375 | | 01-15-23 | 120,000 | 117,300 |
|
| Calpine Corp. | 5.750 | | 01-15-25 | 685,000 | 666,163 |
|
| Calpine Corp. (S) | 7.875 | | 01-15-23 | 688,000 | 748,200 |
|
| Exelon Generation Company LLC | 5.600 | | 06-15-42 | 3,675,000 | 3,927,491 |
|
| GenOn Energy, Inc. | 9.500 | | 10-15-18 | 1,775,000 | 1,854,875 |
|
| Listrindo Capital BV (S) | 6.950 | | 02-21-19 | 200,000 | 215,000 |
|
| NRG Energy, Inc. (S) | 6.250 | | 07-15-22 | 825,000 | 849,750 |
| | | | | | |
| Multi-Utilities 0.7% | | | | | |
|
| Dominion Gas Holdings LLC (S) | 4.800 | | 11-01-43 | 5,625,000 | 5,999,271 |
|
| DTE Energy Company | 3.850 | | 12-01-23 | 3,800,000 | 3,932,947 |
| |
| U.S. Government & Agency Obligations 0.9% | | | $14,289,515 |
|
| (Cost $14,259,015) | | | | | |
| |
| U.S. Government 0.1% | | | | | 1,505,976 |
| | | | | | |
| U.S. Treasury Note | 2.125 | | 08-31-20 | 1,500,000 | 1,505,976 |
| |
| U.S. Government Agency 0.8% | | | | 12,783,539 |
|
| Federal Home Loan Mortgage Corp. | | | | | |
| 30 Yr Pass Thru (P) | 2.368 | | 01-01-37 | 311,350 | 333,826 |
| 30 Yr Pass Thru (P) | 2.375 | | 11-01-36 | 374,763 | 401,709 |
|
| Federal National Mortgage Association | | | | | |
| 10 Yr Pass Thru | 5.000 | | 01-01-16 | 243,894 | 257,615 |
| 10 Yr Pass Thru | 5.000 | | 01-01-19 | 3,109 | 3,283 |
| 15 Yr Pass Thru (C) | 3.500 | | TBA | 400,000 | 421,450 |
| 15 Yr Pass Thru | 4.000 | | 08-01-25 | 372,274 | 396,208 |
| 30 Yr Pass Thru (P) | 2.132 | | 04-01-37 | 1,459,416 | 1,555,081 |
| 30 Yr Pass Thru (P) | 2.373 | | 11-01-35 | 344,028 | 368,863 |
| 30 Yr Pass Thru (P) | 2.532 | | 01-01-37 | 172,011 | 184,428 |
| 30 Yr Pass Thru (P) | 2.653 | | 10-01-38 | 582,813 | 624,885 |
| 30 Yr Pass Thru (P) | 2.781 | | 12-01-42 | 372,701 | 380,433 |
| 30 Yr Pass Thru (C) | 3.000 | | TBA | 725,000 | 709,934 |
| 30 Yr Pass Thru (C) | 3.500 | | TBA | 400,000 | 407,313 |
| 30 Yr Pass Thru (C) | 4.000 | | TBA | 900,000 | 945,914 |
| 30 Yr Pass Thru (C) | 4.500 | | TBA | 1,400,000 | 1,506,859 |
| 30 Yr Pass Thru (C) | 5.000 | | TBA | 850,000 | 937,723 |
| 30 Yr Pass Thru (C) | 5.500 | | TBA | 1,000,000 | 1,108,910 |
| 30 Yr Pass Thru | 6.500 | | 01-01-37 | 513,944 | 578,017 |
|
| Government National Mortgage Association | | | | | |
| 30 Yr Pass Thru (C) | 3.500 | | TBA | 675,000 | 694,828 |
| 30 Yr Pass Thru (C) | 4.000 | | TBA | 400,000 | 423,531 |
| 30 Yr Pass Thru (C) | 4.500 | | TBA | 300,000 | 325,055 |
| 30 Yr Pass Thru | 6.000 | | 08-15-35 | 194,522 | 217,674 |
| |
| Foreign Government Obligations 11.0% | | | $165,311,207 |
|
| (Cost $163,745,880) | | | | | |
| |
| Argentina 0.6% | | | | | 9,046,881 |
|
| Republic of Argentina | | | | | |
| Bond (H) | 6.000 | | 03-31-23 | 611,000 | 690,430 |
| Bond | 7.000 | | 10-03-15 | 2,911,119 | 2,809,230 |
| Bond | 7.000 | | 04-17-17 | 5,020,153 | 4,580,890 |
| Bond | 8.750 | | 06-02-17 | 1,093,135 | 966,331 |
| | |
| 22 | Short Duration Credit Opportunities Fund | Annual report | See notes to financial statements |
| | | | | |
| | | | Maturity | | |
| | Rate (%) | | date | Par value^ | Value |
| Azerbaijan 0.1% | | | | $1,306,113 |
|
| Republic of Azerbaijan | | | | |
| Bond (S) | 4.750 | | 03-18-24 | 1,265,000 | 1,306,113 |
| |
| Brazil 0.8% | | | | 11,946,141 |
|
| Brazil Minas SPE | | | | |
| Bond | 5.333 | | 02-15-28 | 575,000 | 570,688 |
|
| Federative Republic of Brazil | | | | |
| Bond | 2.625 | | 01-05-23 | 6,455,000 | 5,899,870 |
| Bond | 4.250 | | 01-07-25 | 4,610,000 | 4,621,525 |
| Bond | 7.125 | | 01-20-37 | 584,000 | 731,460 |
| Bond | 8.250 | | 01-20-34 | 89,000 | 122,598 |
| |
| Colombia 0.7% | | | | 10,058,238 |
|
| Bogota Distrito Capital | | | | |
| Note | 9.750 | | 07-26-28 | COP 1,355,000,000 | 902,854 |
|
| Republic of Colombia | | | | |
| Bond | 2.625 | | 03-15-23 | 1,300,000 | 1,215,500 |
| Bond | 4.000 | | 02-26-24 | 1,169,000 | 1,195,303 |
| Bond | 4.375 | | 07-12-21 | 1,548,000 | 1,648,620 |
| Bond | 7.375 | | 03-18-19 | 360,000 | 432,900 |
| Bond | 7.375 | | 09-18-37 | 1,478,000 | 1,995,300 |
| Bond | 7.750 | | 04-14-21 | COP 129,000,000 | 77,170 |
| Bond | 8.125 | | 05-21-24 | 476,000 | 640,220 |
| Bond | 9.850 | | 06-28-27 | COP 1,702,000,000 | 1,169,978 |
| Bond | 11.750 | | 02-25-20 | 541,000 | 780,393 |
| |
| Costa Rica 0.2% | | | | 2,945,503 |
|
| Republic of Costa Rica | | | | |
| Bond | 4.250 | | 01-26-23 | 2,578,000 | 2,429,765 |
| Bond (S) | 4.375 | | 04-30-25 | 295,000 | 272,138 |
| Bond (S) | 7.000 | | 04-04-44 | 232,000 | 243,600 |
| |
| Croatia 0.3% | | | | 5,091,245 |
|
| Republic of Croatia | | | | |
| Bond | 5.500 | | 04-04-23 | 1,236,000 | 1,279,260 |
| Bond | 6.000 | | 01-26-24 | 450,000 | 480,375 |
| Bond (S) | 6.000 | | 01-26-24 | 1,610,000 | 1,718,675 |
| Bond (S) | 6.375 | | 03-24-21 | 273,000 | 298,935 |
| Bond | 6.375 | | 03-24-21 | 1,200,000 | 1,314,000 |
| |
| Dominican Republic 0.4% | | | | 6,764,014 |
|
| Government of Dominican Republic | | | | |
| Bond (S) | 5.875 | | 04-18-24 | 608,000 | 629,280 |
| Bond (S) | 7.450 | | 04-30-44 | 329,000 | 350,385 |
| Bond | 7.500 | | 05-06-21 | 5,040,000 | 5,758,200 |
| Bond | 9.040 | | 01-23-18 | 23,718 | 26,149 |
| |
| El Salvador 0.2% | | | | 3,332,086 |
|
| Republic of El Salvador | | | | |
| Bond | 5.875 | | 01-30-25 | 439,000 | 437,903 |
| Bond (S) | 5.875 | | 01-30-25 | 1,008,000 | 1,005,480 |
| Bond (S) | 7.375 | | 12-01-19 | 180,000 | 199,800 |
| Bond | 7.650 | | 06-15-35 | 1,347,000 | 1,468,230 |
| Bond | 8.250 | | 04-10-32 | 189,000 | 220,673 |
| |
| Gabon 0.0% | | | | 309,631 |
|
| Republic of Gabon | | | | |
| Bond | 8.200 | | 12-12-17 | 271,000 | 309,631 |
| | |
| See notes to financial statements | Annual report | Short Duration Credit Opportunities Fund | 23 |
| | | | | |
| | | | Maturity | | |
| | Rate (%) | | date | Par value^ | Value |
| Ghana 0.0% | | | | $243,128 |
|
| Republic of Ghana | | | | |
| Bond | 8.500 | | 10-04-17 | 231,000 | 243,128 |
| |
| Hungary 0.3% | | | | 4,264,036 |
|
| Republic of Hungary | | | | |
| Bond | 4.125 | | 02-19-18 | 154,000 | 159,775 |
| Bond | 4.375 | | 07-04-17 | EUR 158,000 | 227,967 |
| Bond | 5.000 | | 03-30-16 | GBP 37,000 | 65,213 |
| Bond | 5.375 | | 03-25-24 | 72,000 | 76,140 |
| Bond | 5.750 | | 11-22-23 | 1,458,000 | 1,585,575 |
| Bond | 6.250 | | 01-29-20 | 664,000 | 747,166 |
| Bond | 6.375 | | 03-29-21 | 1,230,000 | 1,402,200 |
| |
| Indonesia 0.9% | | | | 14,178,920 |
|
| Republic of Indonesia | | | | |
| Bond (S) | 3.375 | | 04-15-23 | 1,984,000 | 1,879,840 |
| Bond | 4.875 | | 05-05-21 | 3,032,000 | 3,217,710 |
| Bond | 5.375 | | 10-17-23 | 3,299,000 | 3,579,415 |
| Bond | 5.625 | | 05-15-23 | IDR 3,564,000,000 | 260,893 |
| Bond | 5.875 | | 03-13-20 | 104,000 | 116,220 |
| Bond | 6.875 | | 01-17-18 | 729,000 | 829,238 |
| Bond | 7.000 | | 05-15-22 | IDR 310,000,000 | 25,170 |
| Bond | 7.750 | | 01-17-38 | 598,000 | 774,410 |
| Bond | 7.875 | | 04-15-19 | IDR 3,290,000,000 | 284,030 |
| Bond | 8.375 | | 03-15-24 | IDR 9,532,000,000 | 842,669 |
| Bond | 8.500 | | 10-12-35 | 420,000 | 580,650 |
| Bond | 9.000 | | 03-15-29 | IDR 2,500,000,000 | 225,005 |
| Bond | 11.625 | | 03-04-19 | 579,000 | 784,545 |
| Bond (S) | 11.625 | | 03-04-19 | 575,000 | 779,125 |
| |
| Iraq 0.1% | | | | 2,003,390 |
|
| Republic of Iraq | | | | |
| Bond | 5.800 | | 01-15-28 | 2,251,000 | 2,003,390 |
| |
| Ivory Coast 0.2% | | | | 2,323,536 |
|
| Republic of Ivory Coast | | | | |
| Bond (S) | 5.375 | | 07-23-24 | 314,000 | 307,720 |
| Bond | 5.750 | | 12-31-32 | 2,054,000 | 2,015,816 |
| |
| Jamaica 0.1% | | | | 955,500 |
|
| Government of Jamaica | | | | |
| Bond | 7.625 | | 07-09-25 | 910,000 | 955,500 |
| |
| Kenya 0.0% | | | | 660,222 |
|
| Republic of Kenya | | | | |
| Bond (S) | 6.875 | | 06-24-24 | 622,000 | 660,222 |
| |
| Lithuania 0.1% | | | | 927,360 |
|
| Republic of Lithuania | | | | |
| Bond | 6.625 | | 02-01-22 | 768,000 | 927,360 |
| |
| Mexico 0.8% | | | | 12,774,962 |
|
| Government of Mexico | | | | |
| Bond | 4.000 | | 10-02-23 | 1,484,000 | 1,544,844 |
| Bond | 4.750 | | 03-08-44 | 750,000 | 751,875 |
| Bond | 5.550 | | 01-21-45 | 395,000 | 445,165 |
| Bond | 6.050 | | 01-11-40 | 4,010,000 | 4,837,063 |
| Bond | 6.250 | | 06-16-16 | MXN 9,479,000 | 754,863 |
| Bond | 8.000 | | 12-07-23 | MXN 26,069,000 | 2,282,611 |
| Bond | 8.500 | | 12-13-18 | MXN 20,960,000 | 1,821,343 |
| Bond | 9.500 | | 12-18-14 | MXN 1,453,000 | 112,485 |
| Bond | 10.000 | | 12-05-24 | MXN 2,252,000 | 224,713 |
| | |
| 24 | Short Duration Credit Opportunities Fund | Annual report | See notes to financial statements |
| | | | | |
| | | | Maturity | | |
| | Rate (%) | | date | Par value^ | Value |
| Morocco 0.1% | | | | $883,894 |
|
| Kingdom of Morocco | | | | |
| Bond (S) | 4.250 | | 12-11-22 | 885,000 | 883,894 |
| |
| Netherlands 0.0% | | | | 476,425 |
|
| Republic of Mozambique | | | | |
| Bond | 6.305 | | 09-11-20 | 473,000 | 476,425 |
| |
| Nigeria 0.1% | | | | 1,993,049 |
|
| Federal Republic of Nigeria | | | | |
| Bond | 6.375 | | 07-12-23 | 1,083,000 | 1,174,568 |
| Bond (S) | 6.375 | | 07-12-23 | 232,000 | 251,616 |
| Bond | 6.750 | | 01-28-21 | 513,000 | 566,865 |
| |
| Panama 0.3% | | | | 4,733,504 |
|
| Republic of Panama | | | | |
| Bond | 4.875 | | 02-05-21 | 2,000,000 | 2,118,101 |
| Bond | 6.700 | | 01-26-36 | 231,000 | 283,553 |
| Bond | 9.375 | | 04-01-29 | 1,565,000 | 2,331,850 |
| |
| Paraguay 0.0% | | | | 405,983 |
|
| Republic of Paraguay | | | | |
| Bond | 4.625 | | 01-25-23 | 399,000 | 405,983 |
| |
| Peru 0.3% | | | | 4,330,726 |
|
| Republic of Peru | | | | |
| Bond | 7.125 | | 03-30-19 | 186,000 | 224,781 |
| Bond | 7.350 | | 07-21-25 | 1,016,000 | 1,341,120 |
| Bond | 8.750 | | 11-21-33 | 1,813,000 | 2,764,825 |
| |
| Philippines 0.2% | | | | 3,100,830 |
|
| Republic of Philippines | | | | |
| Bond | 7.750 | | 01-14-31 | 1,587,000 | 2,205,930 |
| Bond | 9.500 | | 02-02-30 | 570,000 | 894,900 |
| |
| Poland 0.2% | | | | 2,332,943 |
|
| Republic of Poland | | | | |
| Bond | 4.000 | | 01-22-24 | 98,000 | 101,553 |
| Bond | 5.000 | | 03-23-22 | 1,654,000 | 1,842,143 |
| Bond | 5.125 | | 04-21-21 | 347,000 | 389,247 |
| |
| Romania 0.3% | | | | 4,557,052 |
|
| Government of Romania | | | | |
| Bond | 4.375 | | 08-22-23 | 1,214,000 | 1,249,024 |
| Bond (S) | 4.875 | | 01-22-24 | 574,000 | 610,593 |
| Bond | 6.750 | | 02-07-22 | 2,262,000 | 2,697,435 |
| |
| Russia 1.1% | | | | 16,389,599 |
|
| Government of Russia | | | | |
| Bond (S) | 4.875 | | 09-16-23 | 1,600,000 | 1,590,400 |
| Bond | 7.000 | | 08-16-23 | RUB 87,200,000 | 2,114,790 |
| Bond | 7.500 | | 03-31-30 | 10,384,008 | 11,754,697 |
| Bond | 12.750 | | 06-24-28 | 560,000 | 929,712 |
| |
| Serbia 0.2% | | | | 2,340,142 |
|
| Republic of Serbia | | | | |
| Bond | 4.875 | | 02-25-20 | 355,000 | 362,988 |
| Bond | 5.875 | | 12-03-18 | 1,547,000 | 1,649,489 |
| Bond | 7.250 | | 09-28-21 | 284,000 | 327,665 |
| | |
| See notes to financial statements | Annual report | Short Duration Credit Opportunities Fund | 25 |
| | | | | |
| | | | Maturity | | |
| | Rate (%) | | date | Par value^ | Value |
| Slovakia 0.0% | | | | | $537,828 |
|
| Republic of Slovakia | | | | | |
| Bond (S) | 4.375 | | 05-21-22 | 503,000 | 537,828 |
| |
| Slovenia 0.1% | | | | | 1,811,519 |
|
| Republic of Slovenia | | | | | |
| Bond (S) | 5.250 | | 02-18-24 | 961,000 | 1,027,674 |
| Bond | 5.850 | | 05-10-23 | 703,000 | 783,845 |
| |
| South Africa 0.5% | | | | | 7,131,149 |
|
| Republic of South Africa | | | | | |
| Bond | 4.665 | | 01-17-24 | 453,000 | 462,060 |
| Bond | 5.500 | | 03-09-20 | 919,000 | 999,413 |
| Bond | 5.875 | | 09-16-25 | 5,130,000 | 5,669,676 |
| |
| Trinidad And Tobago 0.1% | | | | | 792,788 |
|
| Republic of Trinidad & Tobago | | | | | |
| Bond (S) | 4.375 | | 01-16-24 | 729,000 | 792,788 |
| |
| Turkey 0.7% | | | | | 9,876,261 |
|
| Republic of Turkey | | | | | |
| Bond | 3.250 | | 03-23-23 | 818,000 | 761,108 |
| Bond | 5.125 | | 03-25-22 | 226,000 | 239,052 |
| Bond | 6.250 | | 09-26-22 | 961,000 | 1,094,291 |
| Bond | 7.000 | | 09-26-16 | 108,000 | 118,935 |
| Bond | 7.000 | | 03-11-19 | 300,000 | 345,000 |
| Bond | 7.000 | | 06-05-20 | 83,000 | 96,881 |
| Bond | 7.375 | | 02-05-25 | 5,914,000 | 7,220,994 |
| |
| Ukraine 0.4% | | | | | 5,650,415 |
|
| Republic of Ukraine | | | | | |
| Bond | 4.950 | | 10-13-15 | EUR 507,000 | 638,165 |
| Bond | 6.580 | | 11-21-16 | 2,700,000 | 2,578,500 |
| Bond (S) | 6.875 | | 09-23-15 | 100,000 | 96,900 |
| Bond | 9.250 | | 07-24-17 | 2,308,000 | 2,336,850 |
| |
| Uruguay 0.2% | | | | | 2,623,547 |
|
| Republic of Uruguay | | | | | |
| Bond | 4.500 | | 08-14-24 | 321,601 | 338,485 |
| Bond | 5.100 | | 06-18-50 | 2,325,763 | 2,285,062 |
| |
| Venezuela 0.4% | | | | | 6,212,647 |
|
| Republic of Venezuela | | | | | |
| Bond | 5.750 | | 02-26-16 | 1,573,000 | 1,478,620 |
| Bond | 6.000 | | 12-09-20 | 161,000 | 121,153 |
| Bond | 8.250 | | 10-13-24 | 1,063,200 | 823,980 |
| Bond | 9.000 | | 05-07-23 | 585,900 | 487,762 |
| Bond | 11.750 | | 10-21-26 | 2,166,200 | 2,055,724 |
| Bond | 11.950 | | 08-05-31 | 575,000 | 540,500 |
| Bond | 12.750 | | 08-23-22 | 370,800 | 374,508 |
| Bond | 13.625 | | 08-15-18 | 320,000 | 330,400 |
| |
| Capital Preferred Securities 0.3% | | | | $3,976,970 |
|
| (Cost $4,018,035) | | | | | |
| |
| Financials 0.3% | | | | | 3,976,970 |
| | | | | | |
| Goldman Sachs Capital I | 6.345 | | 02-15-34 | 3,500,000 | 3,976,970 |
| | |
| 26 | Short Duration Credit Opportunities Fund | Annual report | See notes to financial statements |
| | | | | |
| | | | Maturity | | |
| | Rate (%) | | date | Par value^ | Value |
| Convertible Bonds 1.8% | | | | $26,953,892 |
|
| (Cost $25,178,244) | | | | | |
| | | | | | |
| Consumer Discretionary 0.4% | | | | | 5,180,794 |
| | | | | | |
| Auto Components 0.1% | | | | | |
|
| TRW Automotive, Inc. | 3.500 | | 12-01-15 | 414,000 | 1,431,664 |
| | | | | | |
| Hotels, Restaurants & Leisure 0.0% | | | | | |
|
| Home Inns & Hotels Management, Inc. | 2.000 | | 12-15-15 | 98,000 | 96,653 |
| | | | | | |
| Household Durables 0.2% | | | | | |
|
| Jarden Corp. (S) | 1.125 | | 03-15-34 | 1,452,000 | 1,433,850 |
|
| The Ryland Group, Inc. | 0.250 | | 06-01-19 | 1,797,000 | 1,655,486 |
| | | | | | |
| Internet & Catalog Retail 0.1% | | | | | |
|
| HomeAway, Inc. (S) | 0.125 | | 04-01-19 | 575,000 | 563,141 |
| | | | | | |
| Energy 0.3% | | | | | 4,863,642 |
| | | | | | |
| Energy Equipment & Services 0.2% | | | | | |
|
| Hornbeck Offshore Services, Inc. | 1.500 | | 09-01-19 | 2,936,000 | 3,411,265 |
| | | | | | |
| Oil, Gas & Consumable Fuels 0.1% | | | | | |
|
| Cobalt International Energy, Inc. | 2.625 | | 12-01-19 | 500,000 | 444,375 |
|
| Stone Energy Corp. | 1.750 | | 03-01-17 | 877,000 | 1,008,002 |
| | | | | | |
| Industrials 0.1% | | | | | 1,791,551 |
| | | | | | |
| Machinery 0.1% | | | | | |
|
| Altra Industrial Motion Corp. | 2.750 | | 03-01-31 | 806,000 | 1,041,251 |
|
| The Greenbrier Companies, Inc. | 3.500 | | 04-01-18 | 410,000 | 750,300 |
| | | | | | |
| Information Technology 0.8% | | | | 12,121,801 |
| | | | | |
| Communications Equipment 0.2% | | | | | |
|
| Ciena Corp. | 0.875 | | 06-15-17 | 674,000 | 667,681 |
|
| Ciena Corp. (S) | 4.000 | | 03-15-15 | 2,132,000 | 2,375,848 |
|
| Palo Alto Networks, Inc. (S) | 0.000 | | 07-01-19 | 168,000 | 170,520 |
| | | | | | |
| Semiconductors & Semiconductor Equipment 0.1% | | | | |
|
| Intel Corp. | 2.950 | | 12-15-35 | 976,000 | 1,248,060 |
| | | | | | |
| Software 0.3% | | | | | |
|
| Netsuite, Inc. | 0.250 | | 06-01-18 | 1,149,000 | 1,165,517 |
|
| Nuance Communications, Inc. | 2.750 | | 11-01-31 | 1,838,000 | 1,828,810 |
|
| ServiceNow, Inc. (S) | 0.020 | | 11-01-18 | 1,665,000 | 1,787,794 |
| | | | | | |
| Technology Hardware, Storage & Peripherals 0.2% | | | | |
|
| SanDisk Corp. (S) | 0.500 | | 10-15-20 | 2,474,000 | 2,877,571 |
| | | | | | |
| Materials 0.2% | | | | | 2,996,104 |
| | | | | | |
| Metals & Mining 0.2% | | | | | |
|
| RTI International Metals, Inc. | 1.625 | | 10-15-19 | 494,000 | 481,341 |
|
| RTI International Metals, Inc. | 3.000 | | 12-01-15 | 2,443,000 | 2,514,763 |
| | |
| See notes to financial statements | Annual report | Short Duration Credit Opportunities Fund | 27 |
| | | | | |
| | | | Maturity | | |
| | Rate (%) | | date | Par value^ | Value |
| Term Loans (M) 19.0% | | | | $285,857,258 |
|
| (Cost $286,635,849) | | | | | |
| | | | | | |
| Consumer Discretionary 5.4% | | | | 80,893,621 |
| | | | | |
| Auto Components 0.7% | | | | | |
|
| Allison Transmission, Inc. | 3.750 | | 08-23-19 | 3,509,419 | 3,508,324 |
|
| The Goodyear Tire & Rubber Company | 4.750 | | 04-30-19 | 2,250,000 | 2,266,875 |
|
| TI Group Automotive Systems LLC | 4.250 | | 07-01-21 | 990,000 | 990,000 |
|
| Visteon Corp. | 3.500 | | 04-09-21 | 2,830,000 | 2,816,736 |
| | | | | | |
| Automobiles 0.2% | | | | | |
|
| Chrysler Group LLC | 3.250 | | 12-31-18 | 2,512,703 | 2,500,589 |
| | | | | | |
| Diversified Consumer Services 0.1% | | | | | |
|
| The ServiceMaster Company LLC | 4.250 | | 07-01-21 | 1,901,000 | 1,887,338 |
| | | | | | |
| Hotels, Restaurants & Leisure 0.7% | | | | | |
|
| CityCenter Holdings LLC | 4.250 | | 10-16-20 | 2,589,735 | 2,594,052 |
|
| Four Seasons Holdings, Inc. | 3.500 | | 06-27-20 | 2,227,055 | 2,215,225 |
|
| Hilton Worldwide Finance LLC | 3.500 | | 10-26-20 | 2,884,992 | 2,869,967 |
|
| Scientific Games International, Inc. | 4.250 | | 10-18-20 | 2,893,460 | 2,849,540 |
| | | | | | |
| Household Durables 0.5% | | | | | |
|
| Alliance Laundry Systems LLC | 4.250 | | 12-10-18 | 2,967,107 | 2,976,380 |
|
| Libbey Glass, Inc. | 3.750 | | 04-09-21 | 2,180,000 | 2,166,375 |
|
| Norcraft Companies LP | 5.250 | | 12-13-20 | 2,885,205 | 2,885,205 |
| | | | | | |
| Leisure Products 0.1% | | | | | |
|
| Bauer Performance Sports, Ltd. | 4.000 | | 04-15-21 | 2,044,791 | 2,037,764 |
| | | | | | |
| Media 2.4% | | | | | |
|
| Advantage Sales & Marketing, Inc. | 4.250 | | 06-26-21 | 935,806 | 930,626 |
|
| AMC Entertainment, Inc. | 3.500 | | 04-30-20 | 2,457,340 | 2,450,030 |
|
| Atlantic Broadband Penn LLC | 3.250 | | 12-02-19 | 1,847,126 | 1,836,159 |
|
| Cumulus Media Holdings, Inc. | 4.250 | | 12-23-20 | 2,638,084 | 2,639,968 |
|
| Hubbard Broadcasting, Inc. | 4.500 | | 04-29-19 | 3,411,440 | 3,417,127 |
|
| LIN Television Corp. | 4.000 | | 12-21-18 | 960,403 | 960,403 |
|
| Media General, Inc. | 4.250 | | 07-31-20 | 3,355,432 | 3,364,827 |
|
| Mission Broadcasting, Inc. | 3.750 | | 10-01-20 | 1,505,731 | 1,504,790 |
|
| Nexstar Broadcasting, Inc. | 3.750 | | 10-01-20 | 1,707,058 | 1,705,991 |
|
| Numericable US LLC | 4.500 | | 05-21-20 | 2,815,000 | 2,821,599 |
|
| Tribune Company | 4.000 | | 12-27-20 | 5,882,325 | 5,873,502 |
|
| Univision Communications, Inc. | 4.000 | | 03-01-20 | 2,983,370 | 2,961,740 |
|
| Univision Communications, Inc. | 4.000 | | 03-02-20 | 2,460,353 | 2,441,900 |
|
| Virgin Media Investment Holdings, Ltd. | 3.500 | | 06-07-20 | 3,721,000 | 3,684,370 |
| | | | | | |
| Multiline Retail 0.6% | | | | | |
|
| Hudson’s Bay Company | 4.750 | | 11-04-20 | 1,889,475 | 1,902,596 |
|
| J Crew Group, Inc. | 4.000 | | 03-05-21 | 3,288,758 | 3,206,539 |
|
| JC Penney Company, Inc. | 5.000 | | 06-20-19 | 1,230,000 | 1,233,678 |
|
| Michaels Stores, Inc. | 4.000 | | 01-28-20 | 1,908,000 | 1,897,268 |
| | | | | | |
| Specialty Retail 0.1% | | | | | |
|
| The Men’s Wearhouse, Inc. | 4.500 | | 06-18-21 | 1,485,000 | 1,496,138 |
| | |
| 28 | Short Duration Credit Opportunities Fund | Annual report | See notes to financial statements |
| | | | | |
| | | | Maturity | | |
| | Rate (%) | | date | Par value^ | Value |
| Consumer Staples 2.3% | | | | $34,974,944 |
| | | | | |
| Food & Staples Retailing 0.5% | | | | | |
|
| AdvancePierre Foods, Inc. | 5.750 | | 07-10-17 | 1,502,314 | 1,503,879 |
|
| Aramark Services, Inc. | 3.250 | | 02-24-21 | 3,529,155 | 3,496,069 |
|
| Hearthside Group Holdings LLC | 4.500 | | 06-02-21 | 2,303,000 | 2,304,918 |
|
| Rite Aid Corp. | 4.875 | | 06-21-21 | 1,198,000 | 1,208,483 |
| | | | | | |
| Food Products 1.1% | | | | | |
|
| Del Monte Foods, Inc. | 4.254 | | 02-18-21 | 2,988,646 | 2,963,431 |
|
| Del Monte Foods, Inc. | 8.250 | | 08-18-21 | 1,954,000 | 1,901,893 |
|
| Diamond Foods, Inc. | 4.250 | | 08-20-18 | 2,378,050 | 2,373,097 |
|
| HJ Heinz Company | 3.500 | | 06-05-20 | 2,880,900 | 2,879,356 |
|
| Hostess Brands, Inc. | 6.750 | | 04-09-20 | 2,081,960 | 2,144,419 |
|
| Pinnacle Foods Finance LLC | 3.250 | | 04-29-20 | 1,663,098 | 1,648,777 |
|
| Post Holdings, Inc. | 3.750 | | 06-02-21 | 699,000 | 700,748 |
|
| Shearer’s Foods LLC | 4.500 | | 06-30-21 | 1,710,000 | 1,702,519 |
| | | | | | |
| Household Products 0.5% | | | | | |
|
| Reynolds Group Holdings, Inc. | 4.000 | | 12-01-18 | 3,607,527 | 3,597,004 |
|
| The Sun Products Corp. | 5.500 | | 03-23-20 | 3,638,845 | 3,511,486 |
| | | | | | |
| Personal Products 0.2% | | | | | |
|
| Revlon Consumer Products Corp. | 4.000 | | 10-08-19 | 3,038,865 | 3,038,865 |
| | | | | | |
| Energy 1.2% | | | | 18,477,271 |
| | | | | |
| Energy Equipment & Services 0.6% | | | | | |
|
| Offshore Group Investment, Ltd. | 5.000 | | 10-25-17 | 3,945,596 | 3,924,223 |
|
| Pacific Drilling SA | 4.500 | | 06-04-18 | 3,150,973 | 3,155,699 |
|
| Paragon Offshore Finance Company | 3.750 | | 06-19-21 | 1,500,000 | 1,491,563 |
| | | | | | |
| Oil, Gas & Consumable Fuels 0.6% | | | | | |
|
| Arch Coal, Inc. | 6.250 | | 05-16-18 | 3,188,403 | 3,126,847 |
|
| EP Energy LLC | 3.500 | | 05-24-18 | 2,855,491 | 2,840,023 |
|
| FTS International, Inc. | 5.750 | | 04-16-21 | 1,666,909 | 1,681,196 |
|
| Samson Investment Company | 5.000 | | 09-25-18 | 2,265,000 | 2,257,720 |
| | | | | | |
| Financials 1.1% | | | | 16,368,780 |
| | | | | |
| Capital Markets 0.5% | | | | | |
|
| La Quinta Intermediate Holdings LLC | 4.000 | | 04-14-21 | 4,922,933 | 4,919,857 |
|
| Sequa Corp. | 5.250 | | 06-19-17 | 2,932,190 | 2,891,872 |
| | | | | | |
| Diversified Financial Services 0.2% | | | | | |
|
| Compass Diversified Holdings | 4.250 | | 06-04-21 | 745,000 | 744,534 |
|
| Grede Holdings LLC | 4.750 | | 06-02-21 | 1,407,000 | 1,411,104 |
|
| Vantiv LLC | 3.750 | | 05-12-21 | 595,000 | 596,488 |
| | | | | | |
| Insurance 0.2% | | | | | |
|
| CNO Financial Group, Inc. | 3.750 | | 09-20-18 | 2,649,261 | 2,645,950 |
| | | | | | |
| Real Estate Management & Development 0.2% | | | | |
|
| Realogy Group LLC | 3.750 | | 03-05-20 | 3,159,961 | 3,158,975 |
| | | | | | |
| Health Care 2.1% | | | | 31,175,426 |
| | | | | |
| Health Care Equipment & Supplies 0.4% | | | | | |
|
| Air Medical Group Holdings, Inc. | 5.000 | | 06-30-18 | 2,721,650 | 2,721,650 |
|
| Kinetic Concepts, Inc. | 4.000 | | 05-04-18 | 3,754,094 | 3,750,043 |
| | |
| See notes to financial statements | Annual report | Short Duration Credit Opportunities Fund | 29 |
| | | | | |
| | | | Maturity | | |
| | Rate (%) | | date | Par value^ | Value |
| Health Care Providers & Services 1.1% | | | | | |
|
| Amsurg Corp. | 3.750 | | 07-16-21 | 1,000,000 | $998,958 |
|
| Community Health Systems, Inc. | 4.250 | | 01-27-21 | 2,371,124 | 2,375,733 |
|
| DaVita HealthCare Partners, Inc. | 3.500 | | 06-24-21 | 2,385,000 | 2,379,464 |
|
| Drumm Investors LLC | 6.750 | | 05-04-18 | 1,762,074 | 1,760,973 |
|
| IASIS Healthcare LLC | 4.500 | | 05-03-18 | 3,375,287 | 3,379,507 |
|
| Ortho-Clinical Diagnostics, Inc. | 4.750 | | 06-30-21 | 1,389,000 | 1,387,264 |
|
| US Renal Care, Inc. | 4.250 | | 07-03-19 | 3,443,253 | 3,432,492 |
| | | | | | |
| Pharmaceuticals 0.6% | | | | | |
|
| Pharmaceutical Product Development, Inc. | 4.000 | | 12-05-18 | 3,602,035 | 3,602,035 |
|
| Salix Pharmaceuticals, Ltd. | 4.250 | | 01-02-20 | 1,268,475 | 1,272,439 |
|
| Surgical Care Affiliates LLC | 4.000 | | 06-29-18 | 2,678,839 | 2,668,793 |
|
| Valeant Pharmaceuticals International, Inc. | 3.750 | | 08-05-20 | 1,449,901 | 1,446,075 |
| | | | | | |
| Industrials 1.2% | | | | 18,023,035 |
| | | | | |
| Aerospace & Defense 0.2% | | | | | |
|
| Accudyne Industries Borrower SCA | 4.000 | | 12-13-19 | 2,916,107 | 2,902,894 |
| | | | | | |
| Construction & Engineering 0.2% | | | | | |
|
| RBS Global, Inc. | 4.000 | | 08-21-20 | 2,974,701 | 2,966,851 |
| | | | | | |
| Machinery 0.6% | | | | | |
|
| Doosan Infracore Company, Ltd. | 4.500 | | 05-28-21 | 2,620,000 | 2,628,732 |
|
| Gates Global LLC | 4.250 | | 07-05-21 | 3,305,000 | 3,280,804 |
|
| Husky Injection Molding Systems, Ltd. | 4.250 | | 06-30-21 | 2,668,000 | 2,670,503 |
|
| Husky Injection Molding Systems, Ltd. | 7.250 | | 06-30-22 | 959,000 | 962,996 |
| | | | | | |
| Professional Services 0.2% | | | | | |
|
| TransUnion LLC | 4.000 | | 04-09-21 | 2,618,438 | 2,610,255 |
| | | | | | |
| Information Technology 2.1% | | | | 30,915,948 |
| | | | | |
| Communications Equipment 0.5% | | | | | |
|
| Avaya, Inc. | 4.727 | | 10-26-17 | 2,045,949 | 1,975,620 |
|
| Avaya, Inc. | 6.500 | | 03-30-18 | 2,110,610 | 2,094,122 |
|
| Ciena Corp. | 3.750 | | 07-15-19 | 2,859,000 | 2,853,639 |
| | | | | | |
| Electronic Equipment, Instruments & Components 0.5% | | |
|
| CPI International, Inc. | 4.250 | | 11-17-17 | 2,632,403 | 2,625,821 |
|
| Dell International LLC | 4.500 | | 04-29-20 | 4,962,052 | 4,964,617 |
| | | | | | |
| Internet Software & Services 0.2% | | | | | |
|
| Fibertech Networks LLC | 4.000 | | 12-18-19 | 3,051,700 | 3,051,700 |
| | | | | | |
| Semiconductors & Semiconductor Equipment 0.3% | | | | |
|
| Freescale Semiconductor, Inc. | 4.250 | | 02-28-20 | 3,359,461 | 3,338,465 |
|
| Freescale Semiconductor, Inc. | 5.000 | | 01-15-21 | 550,838 | 550,838 |
| | | | | | |
| Software 0.6% | | | | | |
|
| BMC Software Finance, Inc. | 5.000 | | 09-10-20 | 2,501,186 | 2,482,037 |
|
| First Data Corp. | 3.666 | | 03-23-18 | 3,121,632 | 3,086,514 |
|
| Infor US, Inc. | 3.750 | | 06-03-20 | 3,928,795 | 3,892,575 |
| | | | | | |
| Materials 1.4% | | | | 21,489,092 |
| | | | | |
| Chemicals 1.1% | | | | | |
|
| Axalta Coating Systems US Holdings, Inc. | 4.000 | | 02-01-20 | 3,857,223 | 3,834,724 |
|
| AZ Chem US, Inc. | 4.500 | | 06-12-21 | 1,964,938 | 1,977,834 |
|
| INEOS US Finance LLC | 3.750 | | 05-04-18 | 3,542,665 | 3,523,053 |
| | |
| 30 | Short Duration Credit Opportunities Fund | Annual report | See notes to financial statements |
| | | | | |
| | | | Maturity | | |
| | Rate (%) | | date | Par value^ | Value |
| Chemicals (continued) | | | | | |
|
| MacDermid, Inc. | 4.000 | | 06-07-20 | 3,426,066 | $3,421,783 |
|
| OXEA Sarl | 4.250 | | 01-15-20 | 2,967,575 | 2,961,394 |
|
| OXEA Sarl | 8.250 | | 07-15-20 | 1,106,000 | 1,112,451 |
| | | | | | |
| Metals & Mining 0.3% | | | | | |
|
| FMG Resources August 2006 Pty, Ltd. | 3.750 | | 06-30-19 | 1,763,044 | 1,756,433 |
|
| Signode Industrial Group US, Inc. | 4.000 | | 05-01-21 | 2,916,000 | 2,901,420 |
| | | | | | |
| Telecommunication Services 1.2% | | | | 18,463,947 |
| | | | | |
| Diversified Telecommunication Services 0.9% | | | | |
|
| Consolidated Communications, Inc. | 4.250 | | 12-23-20 | 772,120 | 775,394 |
|
| Intelsat Jackson Holdings SA | 3.750 | | 06-30-19 | 3,720,116 | 3,711,746 |
|
| Level 3 Financing, Inc. | 4.000 | | 01-15-20 | 3,414,000 | 3,403,331 |
|
| Syniverse Holdings, Inc. | 4.000 | | 04-23-19 | 3,231,509 | 3,222,422 |
|
| XO Communications LLC | 4.250 | | 03-17-21 | 2,714,198 | 2,718,559 |
| | | | | | |
| Wireless Telecommunication Services 0.3% | | | | | |
|
| LTS Buyer LLC | 4.000 | | 04-13-20 | 2,353,164 | 2,342,135 |
|
| SBA Senior Finance II LLC | 3.250 | | 03-24-21 | 2,316,000 | 2,290,360 |
| | | | | | |
| Utilities 1.0% | | | | 15,075,194 |
| | | | | |
| Electric Utilities 0.7% | | | | | |
|
| La Frontera Generation LLC | 4.500 | | 09-30-20 | 3,278,048 | 3,286,243 |
|
| Texas Competitive Electric Holdings | | | | | |
| Company LLC | 3.750 | | 05-05-16 | 1,357,277 | 1,362,367 |
|
| Texas Competitive Electric Holdings | | | | | |
| Company LLC | 4.646 | | 10-10-17 | 8,486,597 | 6,449,814 |
| | | | | | |
| Independent Power and Renewable Electricity Producers 0.3% | | |
|
| Calpine Corp. | 4.000 | | 04-01-18 | 2,006,791 | 2,009,300 |
|
| Dynegy, Inc. | 4.000 | | 04-23-20 | 1,969,933 | 1,967,470 |
| |
| Collateralized Mortgage Obligations 13.6% | | | $204,137,872 |
|
| (Cost $191,911,710) | | | | | |
| | | | | | |
| Commercial & Residential 13.5% | | | | 202,461,505 |
| | | | | |
| 7 WTC Depositor LLC Trust | | | | | |
| Series 2012-7WTC, Class A (S) | 4.082 | | 03-13-31 | 1,136,051 | 1,180,025 |
|
| American General Mortgage Loan Trust | | | | | |
| Series 2010-1A, Class A2 (P)(S) | 5.650 | | 03-25-58 | 7,000,000 | 7,071,414 |
|
| American Home Mortgage Assets | | | | | |
| Series 2007-1, Class A1 (P) | 0.818 | | 02-25-47 | 4,982,507 | 3,205,715 |
|
| BAMLL-DB Trust | | | | | |
| Series 2012-OSI, Class A1 (S) | 2.343 | | 04-13-29 | 2,259,041 | 2,287,677 |
|
| BCAP LLC Trust | | | | | |
| Series 2009-RR14, Class 7A1 (P)(S) | 5.903 | | 08-26-36 | 661,859 | 672,966 |
| Series 2011-RR11, Class 21A5 (P)(S) | 2.652 | | 06-26-34 | 2,136,313 | 2,163,034 |
| Series 2012-RR9, Class 2A5 (P)(S) | 0.332 | | 08-26-46 | 2,748,098 | 2,702,763 |
|
| BCRR Trust | | | | | |
| Series 2009-1, Class 2A1 (P)(S) | 5.858 | | 07-17-40 | 7,679,811 | 8,107,338 |
|
| Citigroup Commercial Mortgage Trust | | | | | |
| Series 2014-388G, Class B (P)(S) | 1.200 | | 06-15-33 | 8,075,000 | 8,104,441 |
| | |
| See notes to financial statements | Annual report | Short Duration Credit Opportunities Fund | 31 |
| | | | | |
| | | | Maturity | | |
| | Rate (%) | | date | Par value^ | Value |
| Commercial & Residential (continued) | | | | | |
| | | | | | |
| Citigroup Mortgage Loan Trust | | | | | |
| Series 2010-8, Class 5A6 (S) | 4.000 | | 11-25-36 | 2,795,711 | $2,880,841 |
| Series 2010-8, Class 6A6 (S) | 4.500 | | 12-25-36 | 2,714,239 | 2,794,914 |
| Series 2012-1, Class 1A1 (P)(S) | 0.525 | | 06-25-35 | 3,310,115 | 3,211,914 |
| Series 2013-2, Class 3A1 (P)(S) | 0.336 | | 04-25-37 | 9,048,155 | 8,519,815 |
| Series 2013-2, Class 5A1 (P)(S) | 0.296 | | 07-25-36 | 5,414,397 | 5,090,400 |
|
| Commercial Mortgage Pass Through Certificates | | | | | |
| Series 2006-C8, Class AJ | 5.377 | | 12-10-46 | 2,075,000 | 2,092,600 |
| Series 2007-C9, Class A4 (P) | 5.796 | | 12-10-49 | 2,475,000 | 2,751,779 |
| Series 2013-THL, Class A2 (P)(S) | 1.204 | | 06-08-30 | 5,175,000 | 5,192,295 |
| Series 2014-KYO, Class B (P)(S) | 1.453 | | 06-11-27 | 6,025,000 | 6,025,669 |
|
| Countrywide Home Loan Mortgage Pass Through Trust | | | | |
| Series 2006-3, Class 3A1 (P) | 0.405 | | 02-25-36 | 2,350,725 | 2,029,809 |
| Series 2004-25, Class 1A1 (P) | 0.485 | | 02-25-35 | 3,467,449 | 3,263,615 |
| Series 2004-25, Class 2A1 (P) | 0.495 | | 02-25-35 | 4,933,286 | 4,475,531 |
|
| Credit Suisse Commercial Mortgage Trust | | | | | |
| Series 2007-C1, Class AMF (P) | 0.344 | | 02-15-40 | 2,300,000 | 1,971,215 |
|
| Credit Suisse Mortgage Capital Certificates | | | | | |
| Series 2010-16, Class A3 (P)(S) | 3.657 | | 06-25-50 | 2,450,000 | 2,500,276 |
| Series 2010-20R, Class 5A6 (P)(S) | 3.500 | | 09-27-35 | 2,103,751 | 2,121,681 |
| Series 2010-RR5, Class 1A (P)(S) | 5.467 | | 12-16-43 | 2,872,203 | 3,070,009 |
|
| Deutsche Alt-A Securities Mortgage Loan Trust | | | | | |
| Series 2007-OA2, Class A1 (P) | 0.888 | | 04-25-47 | 2,394,903 | 2,135,835 |
|
| First Horizon Alternative Mortgage Securities | | | | | |
| Series 2005-AA12, Class 1A1 (P) | 2.221 | | 02-25-36 | 2,488,135 | 1,979,110 |
|
| FREMF Mortgage Trust | | | | | |
| Series 2011-K701, Class C (P)(S) | 4.286 | | 07-25-48 | 6,125,000 | 6,371,764 |
|
| GS Mortgage Securities Corp. II | | | | | |
| Series 2007, Class G10 (P) | 5.803 | | 08-10-45 | 3,325,000 | 3,484,617 |
|
| HarborView Mortgage Loan Trust | | | | | |
| Series 2007-3, Class 2A1A (P) | 0.356 | | 05-19-47 | 3,605,072 | 3,118,590 |
|
| Hilton USA Trust | | | | | |
| Series 2013-HLF, Class BFL (P)(S) | 1.656 | | 11-05-30 | 5,075,000 | 5,087,825 |
| Series 2013-HLT, Class BFX (S) | 3.367 | | 11-05-30 | 4,825,000 | 4,903,170 |
|
| IndyMac INDA Mortgage Loan Trust | | | | | |
| Series 2005-AR2, Class 1A1 (P) | 2.621 | | 01-25-36 | 1,366,194 | 1,293,534 |
|
| IndyMac INDX Mortgage Loan Trust | | | | | |
| Series 2005-16IP, Class A1 (P) | 0.795 | | 07-25-45 | 2,812,783 | 2,646,610 |
|
| Jefferies & Company, Inc. | | | | | |
| Series 2009-R2, Class 4A (P)(S) | 2.549 | | 05-26-37 | 1,178,873 | 1,187,345 |
| Series 2009-R9, Class 1A1 (P)(S) | 2.314 | | 08-26-46 | 1,027,074 | 1,038,332 |
|
| JPMorgan Chase Commercial Mortgage Securities Trust | | | | |
| Series 2006-LDP9, Class AJ | 5.411 | | 05-15-47 | 2,800,000 | 2,430,742 |
| Series 2010-C1, Class A1 (S) | 3.853 | | 06-15-43 | 1,839,162 | 1,873,383 |
| Series 2014-INN, Class A (P)(S) | 1.072 | | 06-15-29 | 4,000,000 | 4,005,516 |
|
| JPMorgan Resecuritization Trust | | | | | |
| Series 2009-12, Class 1A1 (P)(S) | 5.750 | | 07-26-37 | 235,667 | 242,333 |
| Series 2011-2, Class 1A3 (P)(S) | 0.805 | | 08-26-37 | 1,544,925 | 1,547,668 |
|
| LB–UBS Commercial Mortgage Trust | | | | | |
| Series 2006-C6, Class A4 | 5.372 | | 09-15-39 | 526,000 | 566,619 |
|
| Lehman XS Trust | | | | | |
| Series 2007-4N, Class 3A2A (P) | 0.873 | | 03-25-47 | 746,066 | 649,400 |
|
| Merrill Lynch/Countrywide Commercial Mortgage Trust | | | | |
| Series 2006-4, Class A (P) | 0.272 | | 12-12-49 | 471,336 | 471,264 |
| Series 2007-8, Class AMA (P) | 5.883 | | 08-12-49 | 3,800,000 | 3,959,524 |
| | |
| 32 | Short Duration Credit Opportunities Fund | Annual report | See notes to financial statements |
| | | | | |
| | | | Maturity | | |
| | Rate (%) | | date | Par value^ | Value |
| Commercial & Residential (continued) | | | | | |
| | | | | | |
| Morgan Stanley Re-REMIC Trust | | | | | |
| Series 2011-KEYA, Class 1A (S) | 4.250 | | 12-19-40 | 1,184,149 | $1,185,610 |
|
| Nomura Resecuritization Trust | | | | | |
| Series 2011-1RA, Class 1A5 (P)(S) | 2.556 | | 03-26-36 | 2,449,018 | 2,451,369 |
|
| OBP Depositor LLC Trust | | | | | |
| Series 2010-OBP, Class A (S) | 4.646 | | 07-15-45 | 2,500,000 | 2,765,755 |
|
| RBS Commercial Funding, Inc. Trust | | | | | |
| Series 2013-GSP, Class A (P)(S) | 3.834 | | 01-13-32 | 4,250,000 | 4,416,689 |
|
| RBSSP Resecuritization Trust | | | | | |
| Series 2012-6, Class 10A1 (P)(S) | 0.302 | | 08-26-36 | 3,138,851 | 2,912,035 |
| Series 2012-6, Class 4A1 (P)(S) | 0.482 | | 01-26-36 | 4,206,864 | 3,861,254 |
| Series 2012-6, Class 6A1 (P)(S) | 0.492 | | 11-26-35 | 4,717,697 | 4,314,933 |
| Series 2012-6, Class 8A1 (P)(S) | 0.652 | | 04-26-35 | 4,004,327 | 3,793,291 |
| Series 2013-1, Class 4A1 (P)(S) | 0.325 | | 01-26-37 | 6,311,916 | 5,719,353 |
|
| Structured Asset Mortgage Investments, Inc. | | | | | |
| Series 2005-AR5, Class A3 (P) | 0.406 | | 07-19-35 | 2,196,740 | 2,127,110 |
| Series 2005-AR6, Class 2A1 (P) | 0.465 | | 09-25-45 | 3,577,498 | 3,122,512 |
|
| WaMu Mortgage Pass Through Certificates | | | | | |
| Series 2005-11, Class A1 (P) | 0.475 | | 08-25-45 | 4,056,985 | 3,876,343 |
| Series 2005-AR1, Class A1A (P) | 0.475 | | 01-25-45 | 1,652,352 | 1,585,266 |
| Series 2005-AR6, Class 2A1A (P) | 0.385 | | 04-25-45 | 4,599,612 | 4,389,166 |
| Series 2005-AR8, Class 1A (P) | 0.425 | | 07-25-45 | 4,124,117 | 3,899,431 |
| Series 2005-AR9, Class A1A (P) | 0.475 | | 07-25-45 | 2,232,693 | 2,124,135 |
|
| WaMu Mortgage Pass-Through Certificates | | | | | |
| Series 2005-AR19, Class A1A1 (P) | 0.425 | | 12-25-45 | 4,212,657 | 4,032,624 |
|
| Wells Fargo Mortgage Backed Securities Trust | | | | | |
| Series 2005-AR12, Class 2A6 (P) | 2.618 | | 06-25-35 | 1,185,359 | 1,195,897 |
| Series 2005-AR4, Class 2A2 (P) | 2.613 | | 04-25-35 | 2,172,264 | 2,207,815 |
| |
| U.S. Government Agency 0.1% | | | | | 1,676,367 |
|
| Federal Home Loan Mortgage Corp. | | | | | |
| Series 3733, Class A | 4.000 | | 04-15-28 | 15,360 | 15,380 |
| Series 3829, Class IO | 4.500 | | 08-15-39 | 5,644,798 | 686,780 |
|
| Government National Mortgage Association | | | | | |
| Series 2014-80, Class XA | 3.000 | | 06-20-40 | 949,256 | 974,207 |
| |
| Asset Backed Securities 4.5% | | | | $67,759,583 |
|
| (Cost $67,026,271) | | | | | |
| | | | | | |
| Bayview Opportunity Master Fund Trust IIB LP | | | | | |
| Series 2014-18NP, Class A (S) | 3.228 | | 07-28-34 | 5,480,461 | 5,494,031 |
|
| Brazil Loan Trust 1 | | | | | |
| Senior Secured Pass-Through Notes (S) | 5.477 | | 07-24-23 | 1,093,953 | 1,129,506 |
|
| Cabela’s Master Credit Card Trust | | | | | |
| Series 2010-2A, Class A1 (S) | 2.290 | | 09-17-18 | 3,000,000 | 3,054,675 |
|
| Carrington Mortgage Loan Trust | | | | | |
| Series 2006-FRE1, Class A2 (P) | 0.265 | | 07-25-36 | 4,010,374 | 3,927,415 |
|
| Colony American Homes | | | | | |
| Series 2014-2A, Class A (P)(S) | 1.104 | | 07-17-31 | 3,600,712 | 3,600,853 |
|
| Ellington Loan Acquisition Trust | | | | | |
| Series 2007-1, Class A2B (P)(S) | 1.055 | | 05-28-37 | 2,091,703 | 2,052,329 |
|
| First Franklin Mortgage Loan Trust | | | | | |
| Series 2006-FF2, Class A4 (P) | 0.352 | | 02-25-36 | 2,228,863 | 2,128,163 |
|
| GMAT Trust | | | | | |
| Series 2014-1A, Class A (S) | 3.721 | | 02-25-44 | 3,681,136 | 3,690,232 |
| | |
| See notes to financial statements | Annual report | Short Duration Credit Opportunities Fund | 33 |
| | | | | |
| | | | Maturity | | |
| | Rate (%) | | date | Par value^ | Value |
| GSAMP Trust | | | | | |
| Series 2006-NC1, Class A2 (P) | 0.335 | | 02-25-36 | 2,453,424 | $2,386,291 |
|
| Invitation Homes Trust | | | | | |
| Series 2013-SFR1, Class A (P)(S) | 1.400 | | 12-17-30 | 4,009,384 | 4,027,603 |
| Series 2014-SFR1, Class A (P)(S) | 1.152 | | 06-17-31 | 3,200,000 | 3,204,819 |
|
| Long Beach Mortgage Loan Trust | | | | | |
| Series 2005-WL2, Class M1 (P) | 0.625 | | 08-25-35 | 2,500,476 | 2,478,480 |
|
| Morgan Stanley ABS Capital I | | | | | |
| Series 2004-WMC3, Class M2 (P) | 0.062 | | 01-25-35 | 3,298,872 | 2,940,572 |
|
| Oak Hill Advisors Residential Loan Trust | | | | | |
| Series 2014-NPL1, Class A (S) | 2.883 | | 05-25-54 | 3,443,307 | 3,443,066 |
|
| RAAC Series Trust | | | | | |
| Series 2006-SP2, Class A3 (P) | 0.425 | | 02-25-36 | 2,794,603 | 2,696,616 |
|
| SLC Student Loan Trust | | | | | |
| Series 2010-B, Class A1 (P)(S) | 4.000 | | 07-15-42 | 1,273,635 | 1,346,253 |
|
| SLM Student Loan Trust | | | | | |
| Series 2011-1, Class A1 (P) | 0.675 | | 03-25-26 | 3,030,800 | 3,050,270 |
| Series 2012-C, Class A1 (P)(S) | 1.252 | | 08-15-23 | 885,812 | 892,210 |
|
| Soundview Home Equity Loan Trust | | | | | |
| Series 2005-OPT3, Class A4 (P) | 0.455 | | 11-25-35 | 837,715 | 829,241 |
|
| Structured Asset Securities Corp. | | | | | |
| Series 2007-BC3, Class 2A1 (P) | 0.215 | | 05-25-47 | 954,283 | 949,527 |
| Series 2008-BC4, Class A3 (P) | 0.402 | | 11-25-37 | 2,283,531 | 2,232,022 |
|
| TAL Advantage V LLC | | | | | |
| Series 2013-2A, Class A (S) | 3.550 | | 11-20-38 | 4,666,667 | 4,731,963 |
|
| US Residential Opportunity Fund Trust | | | | | |
| Series 2014-1, Class A (S) | 3.466 | | 03-25-34 | 1,107,394 | 1,125,456 |
|
| Vericrest Opportunity Loan Transferee | | | | | |
| Series 2013-NPL5, Class A1 (S) | 3.625 | | 04-25-55 | 4,390,721 | 4,412,775 |
| Series 2014-NPL2, Class A1 (S) | 3.625 | | 11-25-53 | 1,917,340 | 1,935,215 |
| |
| | | | | Shares | Value |
| Common Stocks 0.2% | | | | $2,955,463 |
|
| (Cost $3,771,379) | | | | | |
| | | | | | |
| Energy 0.0% | | | | | 469,746 |
| | | | | | |
| Energy Equipment & Services 0.0% | | | | | |
|
| Subsea 7 SA | | | | 28,612 | 469,746 |
| | | | | | |
| Industrials 0.0% | | | | | 4 |
| | | | | | |
| Air Freight & Logistics 0.0% | | | | | |
|
| General Maritime Corp. (I) | | | | 417 | 4 |
| | | | | | |
| Information Technology 0.2% | | | | | 2,170,501 |
| | | | | | |
| Communications Equipment 0.2% | | | | | |
|
| Comtech Telecommunications Corp. | | | | 64,216 | 2,170,501 |
| | | | | | |
| Utilities 0.0% | | | | | 315,212 |
| | | | | | |
| Electric Utilities 0.0%�� | | | | | |
|
| EME Reorganization Trust | | | | 1,327,835 | 180,054 |
| | | | | | |
| Independent Power and Renewable Electricity Producers 0.0% | | |
|
| NRG Energy, Inc. | | | | 4,366 | 135,158 |
| | |
| 34 | Short Duration Credit Opportunities Fund | Annual report | See notes to financial statements |
| | | |
| | | Shares | Value |
| Preferred Securities 0.1% | | | $1,789,766 |
|
| (Cost $1,771,104) | | | |
| | | | |
| Energy 0.1% | | | 1,789,766 |
| | | | |
| Oil, Gas & Consumable Fuels 0.1% | | | |
|
| SandRidge Energy, Inc., 8.500% | | 17,230 | 1,789,766 |
| | | | |
| | Yield (%) | Shares | Value |
| Short-Term Investments 5.6% | | $83,967,119 |
|
| (Cost $83,967,119) | | | |
| | | | |
| Money Market Funds 5.6% | | | 83,967,119 |
| | | | |
| State Street Institutional Liquid Reserves Fund | 0.0682 (Y) | 83,967,119 | 83,967,119 |
| |
| Total investments (Cost $1,471,114,477)† 99.6% | $1,498,288,204 |
|
| Other assets and liabilities, net 0.4% | | | $6,437,913 |
|
| Total net assets 100.0% | | $1,504,726,117 |
|
The percentage shown for each investment category is the total value of that category as a percentage of the net assets of the fund.
^ All par values are denominated in U.S. dollars unless otherwise indicated.
| |
| Currency Abbreviations |
| COP | Colombian Peso |
| EUR | Euro |
| GBP | Pound Sterling |
| IDR | Indonesian Rupiah |
| MXN | Mexican Peso |
| RUB | Russian Ruble |
Notes to Portfolio of Investments
CMT Constant Maturity Treasury
IO Interest-Only Security — (Interest Tranche of Stripped Mortgage Pool). The coupon rate shown represents the rate at period end.
LIBOR London Interbank Offered Rate
PIK Paid-in-kind
TBA To Be Announced. A forward mortgage-backed securities trade issued by a U.S. Government Agency, to be delivered at an agreed-upon future settlement date.
(C) Security purchased on a when-issued or delayed delivery basis.
(H) Non-income producing — Bond is in default.
(I) Non-income producing security.
(M) Term loans are variable rate obligations. The coupon rate shown represents the rate at period end.
(P) Variable rate obligation. The coupon rate shown represents the rate at period end.
(Q) Perpetual bonds have no stated maturity date. Date shown as maturity date is next call date.
(S) These securities are exempt from registration under Rule 144A of the Securities Act of 1933. Such securities may be resold, normally to qualified institutional buyers, in transactions exempt from registration. Rule 144A securities amounted to $325,558,262 or 21.6% of the fund’s net assets as of 7-31-14.
(Y) The rate shown is the annualized seven-day yield as of 7-31-14.
| | |
| See notes to financial statements | Annual report | Short Duration Credit Opportunities Fund | 35 |
† At 7-31-14, the aggregate cost of investment securities for federal income tax purposes was $1,475,166,945. Net unrealized appreciation aggregated $23,121,259, of which $32,860,480 related to appreciated investment securities and $9,739,221 related to depreciated investment securities.
The fund had the following country concentration as a percentage of net assets on 7-31-14:
| | |
| United States | 75.7% | |
| United Kingdom | 2.0% | |
| Luxembourg | 1.8% | |
| Canada | 1.3% | |
| Venezuela | 1.3% | |
| Mexico | 1.1% | |
| Russia | 1.1% | |
| Cayman Islands | 1.1% | |
| Brazil | 1.0% | |
| Indonesia | 1.0% | |
| Other Countries | 12.6% | |
| |
| |
| Total | 100.0% | |
| | |
| 36 | Short Duration Credit Opportunities Fund | Annual report | See notes to financial statements |
F I N A N C I A L S T A T E M E N T S
Financial statements
Statement of assets and liabilities 7-31-14
This Statement of assets and liabilities is the fund’s balance sheet. It shows the value of what the fund owns, is due and owes. You’ll also find the net asset value and the maximum public offering price per share.
| |
| Assets | |
|
| Investments, at value (Cost $1,471,114,477) | $1,498,288,204 |
| Cash held at broker for futures contracts | 4,850,100 |
| Cash collateral for swap contracts | 285,000 |
| Receivable for investments sold | 8,881,328 |
| Receivable for delayed delivery securities sold | 671,463 |
| Receivable for fund shares sold | 541,136 |
| Receivable for forward foreign currency exchange contracts | 655,780 |
| Dividends and interest receivable | 12,077,000 |
| Receivable for futures variation margin | 185,016 |
| Receivable for exchange cleared swaps | 4,651,887 |
| Other receivables and prepaid expenses | 51,737 |
| | |
| Total assets | 1,531,138,651 |
| |
| Liabilities | |
|
| Due to custodian | 1,653,410 |
| Foreign currency overdraft, at value (cost $16,383) | 16,383 |
| Payable for investments purchased | 14,446,360 |
| Payable for delayed delivery securities purchased | 9,125,594 |
| Payable for forward foreign currency exchange contracts | 217,561 |
| Payable for fund shares repurchased | 159,863 |
| Swap contracts, at value | 503,906 |
| Distributions payable | 697 |
| Payable to affiliates | |
| Accounting and legal services fees | 31,623 |
| Transfer agent fees | 3,762 |
| Investment management fees | 4,806 |
| Other liabilities and accrued expenses | 248,569 |
| | |
| Total liabilities | 26,412,534 |
| | |
| Net assets | $1,504,726,117 |
| |
| Net assets consist of | |
|
| Paid-in capital | $1,493,026,480 |
| Undistributed net investment income | (3,255,766) |
| Accumulated net realized gain (loss) on investments, futures contracts, | |
| foreign currency transactions and swap agreements | (16,004,830) |
| Net unrealized appreciation (depreciation) on investments, futures | |
| contracts, translation of assets and liabilities in foreign currencies and | |
| swap agreements | 30,960,233 |
| | |
| Net assets | $1,504,726,117 |
| | |
| See notes to financial statements | Annual report | Short Duration Credit Opportunities Fund | 37 |
F I N A N C I A L S T A T E ME N T S
Statement of assets and liabilities (continued)
| |
| Net asset value per share | |
|
| Based on net asset values and shares outstanding — the fund has an | |
| unlimited number of shares authorized with no par value | |
| Class A ($18,287,315 ÷ 1,784,268 shares)1 | $10.25 |
| Class C ($732,077 ÷ 71,422 shares)1 | $10.25 |
| Class I ($17,147,960 ÷ 1,674,984 shares) | $10.24 |
| Class NAV ($1,468,558,765 ÷ 143,226,830 shares) | $10.25 |
| |
| Maximum offering price per share | |
|
| Class A (net asset value per share ÷ 97.5%)2 | $10.51 |
1 Redemption price per share is equal to net asset value less any applicable contingent deferred sales charge.
2 On single retail sales of less than $100,000. On sales of $100,000 or more and on group sales the offering price is reduced.
| | |
| 38 | Short Duration Credit Opportunities Fund | Annual report | See notes to financial statements |
F I N A N C I A L S T A T E M E N T S
Statement of operations For the year ended 7-31-14
This Statement of operations summarizes the fund’s investment income earned and expenses incurred in operating the fund. It also shows net gains (losses) for the period stated.
| |
| Investment income | |
|
| Interest | $54,430,909 |
| Dividends | 269,058 |
| Less foreign taxes withheld | (44,309) |
| | |
| Total investment income | 54,655,658 |
| |
| Expenses | |
|
| Investment management fees | 8,787,364 |
| Distribution and service fees | 29,090 |
| Accounting and legal services fees | 157,662 |
| Transfer agent fees | 18,098 |
| Trustees’ fees | 15,727 |
| State registration fees | 48,688 |
| Printing and postage | 7,103 |
| Professional fees | 119,419 |
| Custodian fees | 302,051 |
| Registration and filing fees | 93,446 |
| Expense recapture | 1,040 |
| Other | 19,631 |
| | |
| Total expenses | 9,599,319 |
| Less expense reductions | (130,239) |
| | |
| Net expenses | 9,469,080 |
| | |
| Net investment income | 45,186,578 |
| |
| Realized and unrealized gain (loss) | |
|
| Net realized gain (loss) on | |
| Investments in unaffiliated issuers and foreign currency transactions | (399,980) |
| Futures contracts | (4,012,729) |
| Swap contracts | (2,702,982) |
| | |
| | (7,115,691) |
| Change in net unrealized appreciation (depreciation) of | |
| Investments in unaffiliated issuers and translation of assets and liabilities in | |
| foreign currencies | 22,150,612 |
| Futures contracts | (8,658,111) |
| Swap contracts | 2,001,349 |
| | |
| | 15,493,850 |
| | |
| Net realized and unrealized gain | 8,378,159 |
| | |
| Increase in net assets from operations | $53,564,737 |
| | |
| See notes to financial statements | Annual report | Short Duration Credit Opportunities Fund | 39 |
F I N A N C I A L S T A T E M E N T S
Statements of changes in net assets
These Statements of changes in net assets show how the value of the fund’s net assets has changed during the last two periods. The difference reflects earnings less expenses, any investment gains and losses, distributions, if any, paid to shareholders and the net of fund share transactions.
| | |
| | Year | Year |
| | ended | ended |
| | 7-31-14 | 7-31-13 |
| |
| Increase (decrease) in net assets | | |
|
| From operations | | |
| Net investment income | $45,186,578 | $42,572,787 |
| Net realized gain (loss) | (7,115,691) | 9,672,379 |
| Change in net unrealized appreciation (depreciation) | 15,493,850 | (9,637,854) |
| | | |
| Increase in net assets resulting from operations | 53,564,737 | 42,607,312 |
| | | |
| Distributions to shareholders | | |
| From net investment income | | |
| Class A | (285,864) | (7,298) |
| Class C | (595) | — |
| Class I | (148,463) | (7,645) |
| Class NAV | (44,864,530) | (40,597,558) |
| From net realized gain | | |
| Class A | (82,888) | — |
| Class I | (2,590) | — |
| Class NAV | (14,630,523) | — |
| | | |
| Total distributions | (60,015,453) | (40,612,501) |
| | | |
| From fund share transactions | 353,072,157 | 86,514,756 |
| | | |
| Total increase | 346,621,441 | 88,509,567 |
| | | |
| Net assets | | |
|
| Beginning of year | 1,158,104,676 | 1,069,595,109 |
| | | |
| End of year | $1,504,726,117 | $1,158,104,676 |
| | | |
| Accumulated distributions in excess of net | | |
| investment income | ($3,255,766) | ($941,946) |
| | |
| 40 | Short Duration Credit Opportunities Fund | Annual report | See notes to financial statements |
Financial highlights
The Financial highlights show how the fund’s net asset value for a share has changed during the period.
| | | | | |
| CLASS A SHARES Period ended | 7-31-14 | 7-31-13 | 7-31-12 | 7-31-11 | 7-31-101 |
| |
| Per share operating performance | | | | | |
|
| Net asset value, beginning of period | $10.32 | $10.30 | $10.41 | $10.25 | $10.00 |
| Net investment income2 | 0.30 | 0.36 | 0.38 | 0.39 | 0.25 |
| Net realized and unrealized gain (loss) on investments | 0.08 | (0.01) | (0.05) | 0.26 | 0.25 |
| Total from investment operations | 0.38 | 0.35 | 0.33 | 0.65 | 0.50 |
| Less distributions | | | | | |
| From net investment income | (0.32) | (0.33) | (0.39) | (0.46) | (0.25) |
| From net realized gain | (0.13) | — | (0.05) | (0.03) | — |
| Total distributions | (0.45) | (0.33) | (0.44) | (0.49) | (0.25) |
| Net asset value, end of period | $10.25 | $10.32 | $10.30 | $10.41 | $10.25 |
| Total return (%)3,4 | 3.76 | 3.41 | 3.27 | 6.37 | 5.065 |
| |
| Ratios and supplemental data | | | | | |
|
| Net assets, end of period (in millions) | $18 | $2 | —6 | —6 | —6 |
| Ratios (as a percentage of average net assets): | | | | | |
| Expenses before reductions | 1.47 | 4.65 | 1.25 | 1.24 | 1.197 |
| Expenses including reductions | 1.21 | 1.21 | 1.25 | 1.24 | 1.197 |
| Net investment income | 2.93 | 3.58 | 3.81 | 3.75 | 3.267 |
| Portfolio turnover (%) | 65 | 77 | 60 | 80 | 68 |
1 Period from 11-2-09 (commencement of operations) to 7-31-10.
2 Based on average daily shares outstanding.
3 Does not reflect the effect of sales charges, if any.
4 Total returns would have been lower had certain expenses not been reduced during the applicable periods.
5 Not annualized.
6 Less than $500,000.
7 Annualized.
| | |
| See notes to financial statements | Annual report | Short Duration Credit Opportunities Fund | 41 |
| |
| CLASS C SHARES Period ended | 7-31-141 |
| |
| Per share operating performance | |
|
| Net asset value, beginning of period | $10.29 |
| Net investment income2 | —3 |
| Net realized and unrealized gain on investments | (0.02) |
| Total from investment operations | (0.02) |
| Less distributions | |
| From net investment income | (0.02) |
| Total distributions | (0.02) |
| Net asset value, end of period | $10.25 |
| Total return (%)4,5 | (0.18)6 |
| |
| Ratios and supplemental data | |
|
| Net assets, end of period (in millions) | $1 |
| Ratios (as a percentage of average net assets): | |
| Expenses before reductions | 7.957 |
| Expenses including reductions | 2.007 |
| Net investment income | (0.52)7 |
| Portfolio turnover (%) | 658 |
1 The inception date for Class C shares is 6-27-14.
2 Based on average daily shares outstanding.
3 Less than $0.005 per share.
4 Does not reflect the effect of sales charges, if any.
5 Total returns would have been lower had certain expenses not been reduced during the applicable periods.
6 Not annualized.
7 Annualized.
8 The portfolio turnover is shown for the period from 8-1-13 to 7-31-14.
| | | | | |
| CLASS I SHARES Period ended | 7-31-14 | 7-31-13 | 7-31-12 | 7-31-11 | 7-31-101 |
| |
| Per share operating performance | | | | | |
|
| Net asset value, beginning of period | $10.32 | $10.30 | $10.41 | $10.24 | $10.00 |
| Net investment income2 | 0.32 | 0.38 | 0.42 | 0.42 | 0.26 |
| Net realized and unrealized gain (loss) on investments | 0.08 | —3 | (0.06) | 0.26 | 0.25 |
| Total from investment operations | 0.40 | 0.38 | 0.36 | 0.68 | 0.51 |
| Less distributions | | | | | |
| From net investment income | (0.35) | (0.36) | (0.42) | (0.48) | (0.27) |
| From net realized gain | (0.13) | — | (0.05) | (0.03) | — |
| Total distributions | (0.48) | (0.36) | (0.47) | (0.51) | (0.27) |
| Net asset value, end of period | $10.24 | $10.32 | $10.30 | $10.41 | $10.24 |
| Total return (%)4 | 3.98 | 3.73 | 3.64 | 6.70 | 5.185 |
| |
| Ratios and supplemental data | | | | | |
|
| Net assets, end of period (in millions) | $17 | $1 | —6 | —6 | —6 |
| Ratios (as a percentage of average net assets): | | | | | |
| Expenses before reductions | 1.46 | 4.14 | 0.888 | 0.958 | 1.207 |
| Expenses including reductions | 0.90 | 0.90 | 0.88 | 0.95 | 0.957 |
| Net investment income | 3.23 | 3.76 | 4.16 | 4.01 | 3.487 |
| Portfolio turnover (%) | 65 | 77 | 60 | 80 | 68 |
1 Period from 11-2-09 (commencement of operations) to 7-31-10.
2 Based on average daily shares outstanding.
3 Less than $0.005 per share.
4 Total returns would have been lower had certain expenses not been reduced during the applicable periods.
5 Not annualized.
6 Less than $500,000.
7 Annualized.
8 Expense ratio has been revised to conform with current year presentation of expense recapture and net expense reductions.
| | |
| 42 | Short Duration Credit Opportunities Fund | Annual report | See notes to financial statements |
| | | | | |
| CLASS NAV SHARES Period ended | 7-31-14 | 7-31-13 | 7-31-12 | 7-31-11 | 7-31-101 |
| |
| Per share operating performance | | | | | |
|
| Net asset value, beginning of period | $10.32 | $10.30 | $10.41 | $10.24 | $10.00 |
| Net investment income2 | 0.37 | 0.40 | 0.43 | 0.44 | 0.29 |
| Net realized and unrealized gain (loss) on investments | 0.06 | —3 | (0.05) | 0.26 | 0.24 |
| Total from investment operations | 0.43 | 0.40 | 0.38 | 0.70 | 0.53 |
| Less distributions | | | | | |
| From net investment income | (0.37) | (0.38) | (0.44) | (0.50) | (0.29) |
| From net realized gain | (0.13) | — | (0.05) | (0.03) | — |
| Total distributions | (0.50) | (0.38) | (0.49) | (0.53) | (0.29) |
| Net asset value, end of period | $10.25 | $10.32 | $10.30 | $10.41 | $10.24 |
| Total return (%)4 | 4.26 | 3.88 | 3.78 | 6.92 | 5.325 |
| |
| Ratios and supplemental data | | | | | |
|
| Net assets, end of period (in millions) | $1,469 | $1,155 | $1,070 | $1,023 | $684 |
| Ratios (as a percentage of average net assets): | | | | | |
| Expenses before reductions | 0.75 | 0.75 | 0.75 | 0.77 | 0.786 |
| Expenses including reductions | 0.75 | 0.74 | 0.75 | 0.77 | 0.776 |
| Net investment income | 3.59 | 3.79 | 4.29 | 4.21 | 3.906 |
| Portfolio turnover (%) | 65 | 77 | 60 | 80 | 68 |
1 Period from 11-2-09 (commencement of operations) to 7-31-10.
2 Based on average daily shares outstanding.
3 Less than $0.005 per share.
4 Total returns would have been lower had certain expenses not been reduced during the applicable periods.
5 Not annualized.
6 Annualized.
| | |
| See notes to financial statements | Annual report | Short Duration Credit Opportunities Fund | 43 |
Notes to financial statements
Note 1 — Organization
John Hancock Short Duration Credit Opportunities Fund (the fund) is a series of John Hancock Funds II (the Trust), an open-end management investment company organized as a Massachusetts business trust and registered under the Investment Company Act of 1940, as amended (the 1940 Act). The investment objective of the fund is to seek maximum total return, which consists of income on its investments and capital appreciation.
The fund may offer multiple classes of shares. The shares currently offered are detailed in the Statement of assets and liabilities. Class A and Class C shares are offered to all investors. Class I shares are offered to institutions and certain investors. Class NAV shares are offered to John Hancock affiliated funds of funds and certain 529 plans. Shareholders of each class have exclusive voting rights to matters that affect that class. The distribution and service fees, if any, and transfer agent fees, state registration fees and printing and postage for each class may differ.
Note 2 — Significant accounting policies
The financial statements have been prepared in conformity with accounting principles generally accepted in the United States of America (US GAAP), which require management to make certain estimates and assumptions as of the date of the financial statements. Actual results could differ from those estimates and those differences could be significant. The fund intends to qualify as an investment company under Topic 946 of Accounting Standards Codification of US GAAP.
Events or transactions occurring after the end of the fiscal period through the date that the financial statements were issued have been evaluated in the preparation of the financial statements. The following summarizes the significant accounting policies of the fund:
Security valuation. Investments are stated at value as of the close of regular trading on the New York Stock Exchange (NYSE), normally at 4:00 P.M., Eastern Time. In order to value the securities, the fund uses the following valuation techniques: Equity securities held by the fund are valued at the last sale price or official closing price on the exchange where the security was acquired or most likely will be sold. In the event there were no sales during the day or closing prices are not available, the securities are valued using the last available bid price. Investments by the fund in open-end mutual funds are valued at their respective net asset values each business day. Debt obligations are valued based on the evaluated prices provided by an independent pricing vendor or from broker-dealers. Independent pricing vendors utilize matrix pricing which takes into account factors such as institutional-size trading in similar groups of securities, yield, quality, coupon rate, maturity, type of issue, trading characteristics and other market data, as well as broker supplied prices. Swaps are valued using evaluated prices obtained from an independent pricing vendor. Futures contracts are valued at settlement prices, which are the official closing prices published by the exchange on which they trade. Foreign securities and currencies, including forward foreign currency contracts, are valued in U.S. dollars, based on foreign currency exchange rates supplied by an independent pricing vendor. Securities that trade only in the over-the-counter (OTC) market are valued using bid prices. Certain short-term securities with maturities of 60 days or less at the time of purchase are valued at amortized cost.
Other fund securities and assets, for which reliable market quotations are not readily available, are valued at fair value as determined in good faith by the fund’s Pricing Committee following procedures established by the Board of Trustees. The frequency with which these fair valuation
| |
| 44 | Short Duration Credit Opportunities Fund | Annual report |
procedures are used cannot be predicted and fair value of securities may differ significantly from the value that would have been used had a ready market for such securities existed. Trading in foreign securities may be completed before the daily close of trading on the NYSE. Significant events at the issuer or market level may affect the values of securities between the time when the valuation of the securities is generally determined and the close of the NYSE. If a significant event occurs, these securities may be fair valued, as determined in good faith by the fund’s Pricing Committee, following procedures established by the Board of Trustees. The fund uses fair value adjustment factors provided by an independent pricing vendor to value certain foreign securities in order to adjust for events that may occur between the close of foreign exchanges or markets and the close of the NYSE.
The fund uses a three-tier hierarchy to prioritize the pricing assumptions, referred to as inputs, used in valuation techniques to measure fair value. Level 1 includes securities valued using quoted prices in active markets for identical securities. Level 2 includes securities valued using other significant observable inputs. Observable inputs may include quoted prices for similar securities, interest rates, prepayment speeds and credit risk. Prices for securities valued using these inputs are received from independent pricing vendors and brokers and are based on an evaluation of the inputs described. Level 3 includes securities valued using significant unobservable inputs when market prices are not readily available or reliable, including the fund’s own assumptions in determining the fair value of investments. Factors used in determining value may include market or issuer specific events or trends, changes in interest rates and credit quality. The inputs or methodology used for valuing securities are not necessarily an indication of the risks associated with investing in those securities. Changes in valuation techniques may result in transfers into or out of an assigned level within the disclosure hierarchy.
The following is a summary of the values by input classification of the fund’s investments as of July 31, 2014, by major security category or type:
| | | | |
| | | | | LEVEL 3 |
| | | | LEVEL 2 | SIGNIFICANT |
| | TOTAL MARKET | LEVEL 1 | SIGNIFICANT | UNOBSERVABLE |
| | VALUE AT 7-31-14 | QUOTED PRICE | OBSERVABLE INPUTS | INPUTS |
|
| Corporate Bonds | $641,289,559 | — | $641,289,559 | — |
| U.S. Government & | | | | |
| Agency Obligations | 14,289,515 | — | 14,289,515 | — |
| Foreign Government | | | | |
| Obligations | 165,311,207 | — | 165,311,207 | — |
| Capital Preferred | | | | |
| Securities | 3,976,970 | — | 3,976,970 | — |
| Convertible Bonds | 26,953,892 | — | 26,953,892 | — |
| Term Loans | 285,857,258 | — | 285,857,258 | — |
| Collateralized Mortgage | | | | |
| Obligations | 204,137,872 | — | 204,137,872 | — |
| Asset Backed Securities | 67,759,583 | — | 67,759,583 | — |
| Common Stocks | 2,955,463 | $2,955,459 | — | $4 |
| Preferred Securities | 1,789,766 | — | 1,789,766 | — |
| Short-Term Investments | 83,967,119 | 83,967,119 | — | — |
|
|
| Total Investments in | | | | |
| Securities | $1,498,288,204 | $86,922,578 | $1,411,365,622 | $4 |
| Other Financial | | | | |
| Instruments: | | | | |
| Futures | $1,167,963 | $1,167,963 | — | — |
| Forward Foreign | | | | |
| Currency Contracts | $438,219 | — | $438,219 | — |
| Credit Default Swaps | ($8,486,788) | — | ($8,486,788) | — |
| |
| Annual report | Short Duration Credit Opportunities Fund | 45 |
When-issued/delayed-delivery securities. The fund may purchase or sell debt securities on a when-issued or delayed-delivery basis, or in a “To Be Announced” (TBA) or “forward commitment” transaction, with delivery or payment to occur at a later date beyond the normal settlement period. TBA securities purchased are included in the Fund’s investments. At the time a fund enters into a commitment to purchase a security, the transaction is recorded and the value of the security is reflected in the fund’s net asset value. The price of such security and the date that the security will be delivered and paid for are fixed at the time the transaction is negotiated. The value of the security may vary with market fluctuations. No interest accrues to the fund until settlement takes place. At the time that the fund enters into this type of transaction, the fund is required to have sufficient cash and/or liquid securities to cover its commitments.
Certain risks may arise upon entering into when-issued or delayed-delivery securities transactions, including the potential inability of counterparties to meet the terms of their contracts, and the issuer’s failure to issue the securities due to political, economic or other factors. Additionally, losses may arise due to declines in the value of the securities purchased or increase in the value of securities sold prior to settlement date.
Term loans (Floating rate loans). The fund may invest in term loans, which often include debt securities that are rated below investment grade at the time of purchase. Term loans are generally subject to legal or contractual restrictions on resale. The liquidity of term loans, including the volume and frequency of secondary market trading in such loans, varies significantly over time and among individual loans. During periods of infrequent trading, valuing a term loan can be more difficult and buying and selling a term loan at an acceptable price can be more difficult and delayed, which could result in a loss.
The fund’s ability to receive payments of principal, interest and other amounts in connection with term loans will depend primarily on the financial condition of the borrower. The fund’s failure to receive scheduled payments on a term loan due to a default, bankruptcy or other reason, would adversely affect the fund’s income and would likely reduce the value of its assets. Because many term loans are not rated by independent credit rating agencies, a decision to invest in a particular loan could depend exclusively on the subadvisor’s credit analysis of the borrower and/or term loan agents. The fund may have limited rights to enforce the terms of an underlying loan.
At July 31, 2014, the fund had $9,421,194 in unfunded loan commitments outstanding.
Security transactions and related investment income. Investment security transactions are accounted for on a trade date plus one basis for daily net asset value calculations. However, for financial reporting purposes, investment transactions are reported on trade date. Interest income is accrued as earned. Interest income includes coupon interest and amortization/accretion of premiums/discounts on debt securities. Debt obligations may be placed in a non-accrual status and related interest income may be reduced by stopping current accruals and writing off interest receivable when the collection of all or a portion of interest has become doubtful. Dividend income is recorded on the ex-date, except for dividends of foreign securities where the dividend may not be known until after the ex-date. In those cases, dividend income, net of withholding taxes, is recorded when the fund becomes aware of the dividends. Foreign taxes are provided for based on the fund’s understanding of the tax rules and rates that exist in the foreign markets in which it invests. Gains and losses on securities sold are determined on the basis of identified cost and may include proceeds from litigation.
Foreign currency translation. Assets, including investments and liabilities denominated in foreign currencies, are translated into U.S. dollar values each day at the prevailing exchange rate. Purchases and sales of securities, income and expenses are translated into U.S. dollars at the prevailing
| |
| 46 | Short Duration Credit Opportunities Fund | Annual report |
exchange rate on the date of the transaction. The effect of changes in foreign currency exchange rates on the value of securities is reflected as a component of the realized and unrealized gains (losses) on investments.
Funds that invest internationally generally carry more risk than funds that invest strictly in U.S. securities. These risks are heightened for investments in emerging markets. Risks can result from differences in economic and political conditions, regulations, market practices (including higher transaction costs), accounting standards and other factors. Foreign investments are also subject to a decline in the value of a foreign currency versus the U.S. dollar, which reduces the dollar value of securities denominated in that currency.
Foreign taxes. The fund may be subject to withholding tax on income and/or capital gains or repatriation taxes imposed by certain countries in which the fund invests. Taxes are accrued based upon investment income, realized gains or unrealized appreciation.
Line of credit. The fund may borrow from banks for temporary or emergency purposes, including meeting redemption requests that otherwise might require the untimely sale of securities. Pursuant to the fund’s custodian agreement, the custodian may loan money to the fund to make properly authorized payments. The fund is obligated to repay the custodian for any overdraft, including any related costs or expenses. The custodian may have a lien, security interest or security entitlement in any fund property that is not otherwise segregated or pledged, to the maximum extent permitted by law, to the extent of any overdraft.
In addition, the fund and other affiliated funds have entered into an agreement with Citibank N.A. that enables them to potentially participate in a $300 million unsecured committed line of credit. A commitment fee, payable at the end of each calendar quarter, based on the average daily unused portion of the line of credit, is charged to each participating fund on a pro rata basis and is reflected in other expenses on the Statement of operations. Commitment fees for the year ended July 31, 2014 were $901. For the year ended July 31, 2014, the fund had no borrowings under the line of credit.
Expenses. Within the John Hancock group of funds complex, expenses that are directly attributable to an individual fund are allocated to such fund. Expenses that are not readily attributable to a specific fund are allocated among all funds in an equitable manner, taking into consideration, among other things, the nature and type of expense and the fund’s relative net assets. Expense estimates are accrued in the period to which they relate and adjustments are made when actual amounts are known.
Class allocations. Income, common expenses and realized and unrealized gains (losses) are determined at the fund level and allocated daily to each class of shares based on the net assets of the class. Class-specific expenses, such as distribution and service fees, if any, transfer agent fees, state registration fees and printing and postage, for all classes, are calculated daily at the class level based on the appropriate net assets of each class and the specific expense rates applicable to each class.
Federal income taxes. The fund intends to continue to qualify as a regulated investment company by complying with the applicable provisions of the Internal Revenue Code and will not be subject to federal income tax on taxable income that is distributed to shareholders. Therefore, no federal income tax provision is required.
Under the Regulated Investment Company Modernization Act of 2010, the fund is permitted to carry forward capital losses for an unlimited period. Capital losses that are carried forward will retain their character as either short-term or long-term capital losses rather than being considered all short-term as under previous law. As of July 31, 2014, the fund has a short-term capital loss
| |
| Annual report | Short Duration Credit Opportunities Fund | 47 |
carryforward of $7,705,378 and a long-term capital loss carryforward of $3,718,894 available to offset future net realized capital gains.
As of July 31, 2014, the fund had no uncertain tax positions that would require financial statement recognition, derecognition or disclosure. The fund’s federal tax returns are subject to examination by the Internal Revenue Service for a period of three years.
Distribution of income and gains. Distributions to shareholders from net investment income and net realized gains, if any, are recorded on the ex-date. The fund generally declares dividends daily and pays them monthly. Capital gain distributions, if any, are paid annually. The tax character of distributions for the years ended July 31, 2014 and 2013 was as follows:
| | | | |
| | JULY 31, 2014 | JULY 31, 2013 | | |
| | |
| Ordinary Income | $45,301,141 | $40,612,501 | | |
| Long-term capital gains | 14,714,312 | — | | |
| Total | $60,015,453 | $40,612,501 | | |
Distributions paid by the fund with respect to each class of shares are calculated in the same manner, at the same time and in the same amount, except for the effect of class level expenses that may be applied differently to each class. As of July 31, 2014, the fund has no distributable earnings on a tax basis.
Such distributions and distributable earnings, on a tax basis, are determined in conformity with income tax regulations, which may differ from US GAAP. Distributions in excess of tax basis earnings and profits, if any, are reported in the fund’s financial statements as a return of capital.
Capital accounts within the financial statements are adjusted for permanent book-tax differences. These adjustments have no impact on net assets or the results of operations. Temporary book-tax differences, if any, will reverse in a subsequent period. Book-tax differences are primarily attributable to foreign currency transactions, derivative transactions, wash sale loss deferrals, characterization of distributions and amortization and accretion on debt securities.
Note 3 — Derivative instruments
The fund may invest in derivatives in order to meet its investment objective. Derivatives include a variety of different instruments that may be traded in the over-the-counter market, on a regulated exchange or through a clearing facility. The risks in using derivatives vary depending upon the structure of the instruments, including the use of leverage, optionality, the liquidity or lack of liquidity of the contract, the creditworthiness of the counterparty or clearing organization and the volatility of the position. Some derivatives involve risks that are potentially greater than the risks associated with investing directly in the referenced securities or other referenced underlying instrument. Specifically, the fund is exposed to the risk that the counterparty to an OTC derivatives contract will be unable or unwilling to make timely settlement payments or otherwise honor its obligations. OTC derivatives transactions typically can only be closed out with the other party to the transaction.
Forward foreign currency contracts and certain swaps are typically traded through the OTC market. Certain forwards and swaps are regulated by the Commodity Futures Trading Commission (the CFTC) as swaps. Derivative counterparty risk is managed through an ongoing evaluation of the creditworthiness of all potential counterparties and, if applicable, designated clearing organizations. The fund attempts to reduce its exposure to counterparty risk for derivatives traded in the OTC market, whenever possible, by entering into an International Swaps and Derivatives Association (ISDA) Master Agreement with each of its OTC counterparties. The ISDA gives each party to the agreement the right to terminate all transactions traded under the agreement if there is certain deterioration in the credit quality or contractual default of the other party, as defined in the ISDA.
| |
| 48 | Short Duration Credit Opportunities Fund | Annual report |
Upon an event of default or a termination of the ISDA, the non-defaulting party has the right to close out all transactions and to net amounts owed.
As defined by the ISDA, the fund may have collateral agreements with certain counterparties to mitigate counterparty risk on OTC derivatives. Subject to established minimum levels, collateral for OTC transactions is generally determined based on the net aggregate unrealized gain or loss on contracts with a particular counterparty. Collateral pledged to the fund is held in a segregated account by a third-party agent or held by the custodian bank for the benefit of the fund and can be in the form of cash or debt securities issued by the U.S. government or related agencies; collateral posted by the fund for OTC transactions is held in a segregated account at the fund’s custodian and is noted in the accompanying Fund’s investments, or if cash is posted, on the Statement of assets and liabilities as Cash collateral for swap contracts. The fund’s maximum risk of loss due to counterparty risk is equal to the asset value of outstanding contracts offset by collateral received.
For financial reporting purposes, the portfolio does not offset OTC derivative assets or liabilities that are subject to master netting arrangements, as defined by the ISDAs, in the Statement of assets and liabilities. In the event of default by the counterparty or a termination of the agreement, the ISDA allows an offset of amounts across the various transactions between the fund and the applicable counterparty.
Futures and cleared swaps are traded or cleared on an exchange or central clearinghouse. Exchange-traded or cleared transactions generally present less counterparty risk to a fund than OTC transactions. The exchange or clearinghouse stands between the fund and the broker to the contract and therefore, credit risk is generally limited to the failure of the exchange or clearinghouse and the clearing member.
Cleared swap contracts are subject to clearing house rules, including initial and variation margin requirements, daily settlement of obligations and the clearinghouse guarantee of payments to the broker. There is, however, still counterparty risk due to the potential insolvency of the broker with respect to any margin held in the brokers’ customer accounts. While clearing members are required to segregate customer assets from their own assets, in the event of insolvency, there may be a shortfall in the amount of margin held by the broker for its clients. Collateral or margin requirements for exchange-traded or cleared derivatives are set by the broker or applicable clearinghouse. Margin for exchange-traded and exchange-cleared transactions are detailed in the Statement of assets and liabilities as Cash held at broker for futures contracts and Receivable for exchange cleared swaps, respectively. Securities pledged by the fund for exchange-traded and cleared transactions, if any, are identified in the Fund’s investments.
Futures. A futures contract is a contractual agreement to buy or sell a particular currency or financial instrument at a pre-determined price in the future. Risks related to the use of futures contracts include possible illiquidity of the futures markets, contract prices that can be highly volatile and imperfectly correlated to movements in the underlying financial instrument and potential losses in excess of the amounts recognized on the Statement of assets and liabilities. Use of long futures contracts subjects the fund to the risk of loss up to the notional value of the futures contracts. Use of short futures contracts subjects the fund to unlimited risk of loss.
Upon entering into a futures contract, the fund is required to deposit initial margin with the broker in the form of cash or securities. The amount of required margin is generally based on a percentage of the contract value; this amount is the initial margin for the trade. The margin deposit must then be maintained at the established level over the life of the contract. Futures collateral receivable/payable is included on the Statement of assets and liabilities. Futures contracts are marked-to-market daily and an appropriate payable or receivable for the change in value (variation margin) and unrealized gain or loss is recorded by the fund. When the contract is closed, the fund records
| |
| Annual report | Short Duration Credit Opportunities Fund | 49 |
a realized gain or loss equal to the difference between the value of the contract at the time it was opened and the value at the time it was closed.
During the year ended July 31, 2014, the fund used futures contracts to manage duration of the fund. During the year ended July 31, 2014, the fund held futures contracts with notional values ranging from $356.3 million to $476.7 million as measured at each quarter end. The following table summarizes the contracts held at July 31, 2014.
| | | | | | |
| | | | | | | UNREALIZED |
| OPEN | NUMBER OF | | | | | APPRECIATION |
| CONTRACTS | CONTRACTS | POSITION | EXPIRATION DATE | NOTIONAL BASIS | NOTIONAL VALUE | (DEPRECIATION) |
|
| U.S. Treasury | 170 | Long | Sep 2014 | $37,350,174 | $37,301,719 | ($48,455) |
| 2-Year Note | | | | | | |
| Futures | | | | | | |
| U.S. Treasury Ultra | 34 | Long | Sep 2014 | 5,124,567 | 5,128,688 | 4,121 |
| Bond Futures | | | | | | |
| U.S. Treasury | 471 | Short | Sep 2014 | (56,319,517) | (55,971,727) | 347,790 |
| 5-Year Note | | | | | | |
| Futures | | | | | | |
| U.S. Treasury | 2,073 | Short | Sep 2014 | (259,019,353) | (258,315,234) | 704,119 |
| 10-Year Note | | | | | | |
| Futures | | | | | | |
| U.S. Treasury Long | 873 | Short | Sep 2014 | (120,116,044) | (119,955,656) | 160,388 |
| Bond Futures | | | | | | |
| | | | | | | $1,167,963 |
Notional basis refers to the contractual amount agreed upon at inception of open contracts; notional value represents the current value of the open contract.
Forward foreign currency contracts. A forward foreign currency contract is an agreement between two parties to buy and sell specific currencies at a price that is set on the date of the contract. The forward contract calls for delivery of the currencies on a future date that is specified in the contract. Risks related to the use of forwards include the possible failure of counterparties to meet the terms of the forward agreement, the failure of the counterparties to timely post collateral if applicable, the risk that currency movements will not favor the fund thereby reducing the fund’s total return, and the potential for losses in excess of the amounts recognized on the Statement of assets and liabilities.
The market value of a forward foreign currency contract fluctuates with changes in foreign currency exchange rates. Forward foreign currency contracts are marked-to-market daily and the change in value is recorded by the fund as an unrealized gain or loss. Realized gains or losses, equal to the difference between the value of the contract at the time it was opened and the value at the time it was closed, are recorded upon delivery or receipt of the currency or settlement with the counterparty.
During the year ended July 31, 2014, the fund used forward foreign currency contracts to manage against anticipated changes in currency exchange rates and to gain exposure to foreign currency. During the year ended July 31, 2014, the fund held forward foreign currency contracts with U.S. Dollar notional values ranging from $66.1 million to $101.0 million as measured at each quarter end. The following table summarizes the contracts held at July 31, 2014
| | | | | | | | | | |
| | | | | | | | CONTRACTUAL | | | NET UNREALIZED |
| CONTRACT | | CONTRACT | | | SETTLEMENT | UNREALIZED | UNREALIZED | APPRECIATION/ |
| TO BUY | | TO SELL | | COUNTERPARTY | DATE | APPRECIATION | DEPRECIATION | (DEPRECIATION) |
|
| COP | 1,335,192,650 | | USD | 695,000 | | Citibank N.A. | 8-29-14 | $14,535 | — | $14,535 |
| EUR | 517,519 | | USD | 704,179 | | Citibank N.A. | 8-29-14 | — | ($11,145) | (11,145) |
| NGN | 99,666,640 | | USD | 599,066 | | Citibank N.A. | 8-27-14 | 14,065 | — | 14,065 |
| PHP | 41,047,850 | | USD | 936,774 | | Citibank N.A. | 8-26-14 | 6,949 | — | 6,949 |
| |
| 50 | Short Duration Credit Opportunities Fund | Annual report |
| | | | | | | | | | |
| | | | | | | | CONTRACTUAL | | | NET UNREALIZED |
| CONTRACT | | CONTRACT | | | SETTLEMENT | UNREALIZED | UNREALIZED | APPRECIATION/ |
| TO BUY | | TO SELL | | COUNTERPARTY | DATE | APPRECIATION | DEPRECIATION | (DEPRECIATION) |
|
| USD | 703,103 | | COP | 1,335,192,650 | | Citibank N.A. | 8-29-14 | — | ($6,432) | ($6,432) |
| USD | 25,167,830 | | EUR | 18,450,000 | | Citibank N.A. | 8-20-14 | $461,211 | — | 461,211 |
| USD | 6,833,547 | | EUR | 4,995,045 | | Citibank N.A. | 8-29-14 | 144,448 | — | 144,448 |
| USD | 27,675,450 | | GBP | 16,500,000 | | Citibank N.A. | 8-15-14 | — | (179,031) | (179,031) |
| USD | 1,237,331 | | GBP | 724,400 | | Citibank N.A. | 8-29-14 | 14,572 | — | 14,572 |
| USD | 596,806 | | NGN | 99,666,640 | | Citibank N.A. | 8-27-14 | — | (16,325) | (16,325) |
| USD | 939,095 | | PHP | 41,047,850 | | Citibank N.A. | 8-26-14 | — | (4,628) | (4,628) |
| | | | | | | | | $655,780 | ($217,561) | $438,219 |
| |
| Currency Abbreviation |
| COP | Colombian Peso |
| EUR | Euro |
| GBP | Pound Sterling |
| NGN | Nirgerian Naira |
| PHP | Philippine Peso |
| USD | U.S. Dollar |
Swaps. Swap agreements are agreements between the fund and counterparty to exchange cash flows, assets, foreign currencies or market-linked returns at specified intervals. Swap agreements are privately negotiated in the OTC market (OTC swaps) or may be executed on a registered commodities exchange (centrally cleared swaps). Swaps are marked-to-market daily and the change in value is recorded as a component of unrealized appreciation/depreciation of swap contracts. The value of the swap will typically impose collateral posting obligations on the party that is considered out-of-the-money on the swap.
Upfront payments made/received by the fund are amortized/accreted for financial reporting purposes, with the unamortized/unaccreted portion included in the Statement of assets and liabilities. A termination payment by the counterparty or the fund is recorded as realized gain or loss, as well as the net periodic payments received or paid by the fund.
Entering into swap agreements involves, to varying degrees, elements of credit, market and documentation risk that may amount to values that are in excess of the amounts recognized on the Statement of assets and liabilities. Such risks involve the possibility that there will be no liquid market for the swap, or that a counterparty may default on its obligation or delay payment under the swap terms. The counterparty may disagree or contest the terms of the swap. Market risks may also accompany the swap, including interest rate risk. The fund may also suffer losses if it is unable to terminate or assign outstanding swaps or reduce its exposure through offsetting transactions.
Credit default swaps. Credit default swaps (CDS) involve the exchange of a fixed rate premium (paid by the Buyer), for protection against the loss in value of an underlying debt instrument, referenced entity or index, in the event of a defined credit event (such as payment default or bankruptcy). Under the terms of the swap, one party acts as a “guarantor” (the Seller), receiving the premium and agreeing to contingent payments that are specified within the credit default agreement. The fund may enter into CDS in which it may act as either Buyer or Seller. By acting as the Seller, the fund may incur economic leverage since it would be obligated to pay the Buyer the notional amount of the contract in the event of a default. The amount of loss in such case could be significant, but would typically be reduced by any recovery value on the underlying credit.
During the year ended July 31, 2014, the fund used CDS as a Buyer of protection to manage against potential credit events. During the year ended July 31, 2014, the fund held CDS contracts with total USD notional amounts ranging from $112.6 million to $223.5 million as measured at each quarter end. The following table summarizes the credit default swap contracts the fund held as of July 31, 2014 as a Buyer of protection.
| |
| Annual report | Short Duration Credit Opportunities Fund | 51 |
| | | | | | | | |
| | | | | | UNAMORTIZED | UNREALIZED | |
| REFERENCE | USD NOTIONAL | | (PAY)/RECEIVED | MATURITY | UPFRONT | APPRECIATION | MARKET |
| OBLIGATION | AMOUNT | | FIXED RATE | DATE | PAYMENT | (DEPRECIATION) | VALUE |
|
| Exchange Cleared Swaps | | | | | | | |
|
| CDX.NA.HY.22 | $74,002,500 | | (5.000)% | Jun 2019 | ($6,206,214) | $887,970 | ($5,318,244) |
| CDX. | 149,500,000 | | (1.000)% | Jun 2019 | (2,241,139) | (423,499) | (2,664,638) |
| NA.IG.22-V1 | | | | | | | |
| | $223,502,500 | | | | ($8,447,353) | $464,471 | ($7,982,882) |
Implied credit spreads are utilized in determining the market value of CDS agreements in which the fund is the Seller at period end. The implied credit spread generally represents the yield of the instrument above a credit-risk free rate, such as the U.S. Treasury Bond Yield, and may include upfront payments required to be made to enter into the agreement. It also serves as an indicator of the current status of the payment/performance risk and represents the likelihood or risk of default for the credit derivative. Wider credit spreads represent a deterioration of the referenced entity’s creditworthiness and an increased risk of default or other credit event occurring as defined under the terms of the agreement.
For CDS agreements where implied credit spreads are not reported or available, the average credit rating on the underlying index is shown. Increasing market values, in absolute terms when compared to the notional amount of the swap, represent a deterioration of the referenced entity’s creditworthiness and a greater likelihood of a credit event occurring. This is also represented by a decrease in the average credit rating of the underlying index. The maximum potential amount of future payments (undiscounted) that a fund as the Seller could be required to make under any CDS agreement equals the notional amount of the agreement.
The fund used CDS as a Seller of protection during the year ended July 31, 2014 to take a long exposure to the benchmark credit. During the year ended July 31, 2014, the fund acted as Seller on CDS contracts with total USD notional amounts ranging from $7.5 million to $13.8 million, as measured at each quarter end. The following table summarizes the credit default swap contracts the fund held as of July 31, 2014 where the fund acted as a Seller of protection.
| | | | | | | | | | |
| | | IMPLIED | | | | | | | | |
| | | CREDIT | | | | | | | | |
| | | SPREAD | | | | | | | | |
| | | AND/OR | | | | | | UNAMORTIZED | | |
| | | CREDIT | | USD | | (PAY)/ | | UPFRONT | UNREALIZED | |
| | REFERENCE | RATING AT | | NOTIONAL | | RECEIVED | MATURITY | PAYMENT PAID | APPRECIATION | MARKET |
| COUNTERPARTY | OBLIGATION | 7-31-14 | CURRENCY | AMOUNT | | FIXED RATE | DATE | (RECEIVED) | (DEPRECIATION) | VALUE |
|
| Citibank N.A. | CMBX NA AM 4 | 2.20% | USD | $3,000,000 | | 0.500% | Feb 2051 | ($497,135) | $349,300 | ($147,835) |
| Citibank N.A. | CMBX.NA.AAA.4 | 0.51% | USD | 4,000,000 | | 0.350% | Feb 2051 | (740,269) | 719,290 | (20,979) |
| Citibank N.A. | CMBX.NA.AM.4 | 2.20% | USD | 1,650,000 | | 0.500% | Feb 2051 | (324,447) | 243,138 | (81,309) |
| Citibank N.A. | CMBX.NA.AM.4 | 2.20% | USD | 4,000,000 | | 0.500% | Feb 2051 | (385,942) | 188,829 | (197,113) |
| Citigroup | CMBX.NA.AM.4 | 2.20% | USD | 1,150,000 | | 0.500% | Feb 2051 | (276,657) | 219,987 | (56,670) |
| | | | | $13,800,000 | | | | ($2,224,450) | $1,720,544 | ($503,906) |
| |
| 52 | Short Duration Credit Opportunities Fund | Annual report |
Fair value of derivative instruments by risk category
The table below summarizes the fair value of derivatives held by the fund at July 31, 2014 by risk category:
| | | | |
| | | FINANCIAL | ASSET | LIABILITY |
| | STATEMENT OF ASSETS AND | INSTRUMENTS | DERIVATIVES | DERIVATIVES |
| RISK | LIABILITIES LOCATION | LOCATION | FAIR VALUE | FAIR VALUE |
|
| Interest rate contracts | Receivable/Payable for | Futures† | $1,216,418 | ($48,455) |
| | futures | | | |
| |
| Foreign currency | Receivable/Payable for | Foreign forward | 655,780 | (217,561) |
| contracts | foreign currency | currency | | |
| | exchange contracts | contracts | | |
| Credit contracts | Swap contracts, at value | Credit default | — | (8,486,788) |
| | | swaps^ | | |
| Total | | | $1,872,198 | ($8,752,804) |
† Reflects cumulative appreciation/depreciation on futures as disclosed above. Only the year end variation margin is separately disclosed on the Statement of assets and liabilities.
^ Reflects cumulative appreciation/depreciation on swap contracts. Receivable for exchange cleared swaps, which represents margin, and swap appreciation/depreciation on OTC swaps, are shown separately on the Statement of assets and liabilities.
Effect of derivative instruments on the Statement of operations
The table below summarizes the net realized gain (loss) included in the net increase (decrease) in net assets from operations, classified by derivative instrument and risk category, for the year ended July 31, 2014:
| | | | |
| | INVESTMENTS | | |
| | IN UNAFFILIATED | | |
| | | ISSUERS AND | | |
| | FUTURES | FOREIGN CURRENCY | | |
| RISK | CONTRACTS | TRANSACTIONS* | SWAP CONTRACTS | TOTAL |
|
| Interest rate | ($4,012,729) | — | — | ($4,012,729) |
| contracts | | | | |
| Foreign currency | — | ($2,513,217) | — | (2,513,217) |
| contracts | | | | |
| Credit contracts | — | — | ($2,702,982) | (2,702,982) |
| |
| Total | ($4,012,729) | ($2,513,217) | ($2,702,982) | ($9,228,928) |
* Realized gain/loss associated with foreign currency contracts is included in this caption on the Statement of operations.
| |
| Annual report | Short Duration Credit Opportunities Fund | 53 |
The table below summarizes the net change in unrealized appreciation (depreciation) included in the net increase (decrease) in net assets from operations, classified by derivative instrument and risk category, for the year ended July 31, 2014:
| | | | |
| | INVESTMENTS | | |
| | IN UNAFFILIATED | | |
| | ISSUERS AND | | |
| | TRANSLATION OF | | |
| | | ASSETS AND | | |
| | | LIABILITIES: | | |
| | | FOREIGN | | |
| RISK | FUTURES CONTRACTS | CURRENCIES* | SWAP CONTRACTS | TOTAL |
|
| Interest rate | ($8,658,111) | — | — | ($8,658,111) |
| contracts | | | | |
| Foreign currency | — | ($429,411) | — | (429,411) |
| contracts | | | | |
| Credit contracts | — | — | $2,001,349 | 2,001,349 |
| Total | ($8,658,111) | ($429,411) | $2,001,349 | ($7,086,173) |
* Change unrealized appreciation/depreciation associated with foreign currency contracts is included in this caption on the Statement of operatons.
Note 4 — Guarantees and indemnifications
Under the Trust’s organizational documents, its Officers and Trustees are indemnified against certain liabilities arising out of the performance of their duties to the Trust, including the fund. Additionally, in the normal course of business, the fund enters into contracts with service providers that contain general indemnification clauses. The fund’s maximum exposure under these arrangements is unknown, as this would involve future claims that may be made against the fund that have not yet occurred. The risk of material loss from such claims is considered remote.
Note 5 — Fees and transactions with affiliates
John Hancock Advisers, LLC (the Advisor or JHA) serves as investment advisor for the fund. Prior to January 1, 2014, John Hancock Investment Management Services, LLC (JHIMS) served as investment advisor for the fund. JHIMS and JHA have identical officers, directors and other personnel, and share common facilities and resources. Terms of the investment management contract with JHA are substantially identical to the former contract with JHIMS. In this report, depending on the context, the term “Advisor” shall refer to either JHA in its current capacity as investment advisor, or to JHIMS in its capacity as investment advisor prior to January 1, 2014. John Hancock Funds, LLC (the Distributor), an affiliate of the Advisor, serves as principal underwriter of the fund. The Advisor and the Distributor are indirect, wholly owned subsidiaries of Manulife Financial Corporation (MFC).
Management fee. The fund has an investment management agreement with the Advisor under which the fund pays a daily management fee to the Advisor equivalent, on an annual basis, to the sum of: a) 0.740% of the first $250 million of the fund’s average daily net assets, b) 0.700% of the next $500 million of the fund’s average daily net assets and c) 0.675% of the fund’s average daily net assets in excess of $750 million. The Advisor has a subadvisory agreement with Stone Harbor Investment Partners LP. The fund is not responsible for payment of the subadvisory fees.
The Advisor has contractually agreed to waive a portion of its management fee and/or reimburse expenses for certain funds of the John Hancock complex, including the fund (the participating portfolios). The waiver equals, on an annualized basis, 0.01% of that portion of the aggregate net assets of all the participating portfolios that exceeds $75 billion but is less than or equal to $125 billion; 0.0125% of that portion of the aggregate net assets of all the participating portfolios
| |
| 54 | Short Duration Credit Opportunities Fund | Annual report |
that exceeds $125 billion but is less than or equal to $150 billion; and 0.015% of that portion of the aggregate net assets of all the participating portfolios that exceeds $150 billion. The amount of the reimbursement is calculated daily and allocated among all the participating portfolios in proportion to the daily net assets of each fund. This arrangement may be amended or terminated at any time by the Advisor upon notice to the fund and with the approval of the Board of Trustees.
The Advisor has contractually agreed to waive fees and/or reimburse operating expenses for Class A, Class C and Class I shares excluding certain expenses such as taxes, brokerage commissions, interest expense, short dividend expense, acquired fund fees, litigation and indemnification expenses and other extraordinary expenses not incurred in the ordinary course of the fund’s business. The fee waivers and/or expense reimbursements are such that these expenses will not exceed 1.21%, 2.00% and 0.90% for Class A, Class C and Class I shares, respectively. The fee waivers and/or reimbursements will continue in effect until November 30, 2014 for Class A and Class I shares, and until November 30, 2015 for Class C shares, unless renewed by mutual agreement of the fund and the Advisor based upon determination that this is appropriate under the circumstances at that time.
The expense reductions described above amounted to $25,433, $1,456, $25,372 and $77,978 for Class A, Class C, Class I and Class NAV shares for the year ended July 31, 2014.
The investment management fees incurred for the year ended July 31, 2014 were equivalent to a net annual effective rate of 0.69% of the fund’s average daily net assets.
Expense recapture. The Advisor may recapture operating expenses reimbursed or fees waived under previous expense limitation or waiver arrangements for a period of three years following the month in which the reimbursements or waivers occurred to the extent that the fund is below its expense limitation during this period. The table below outlines the amounts recovered during the year ended July 31, 2014, and the amount of waived or reimbursed expenses subject to potential recovery and the respective expiration dates.
| | | |
| | | | AMOUNT |
| AMOUNTS ELIGIBLE FOR | AMOUNTS ELIGIBLE FOR | AMOUNTS ELIGIBLE FOR | RECOVERED DURING |
| RECOVERY THROUGH | RECOVERY THROUGH | RECOVERY THROUGH | THE PERIOD ENDED |
| JULY 1, 2015 | JULY 1, 2016 | JANUARY 1, 2017 | JULY 31, 2014 |
|
| — | $14,081 | $51,344 | $1,040 |
Amounts recovered by class
| | | | |
| CLASS | AMOUNT | | | |
| | | |
| Class I | $1,040 | | | |
Accounting and legal services. Pursuant to a service agreement, the fund reimburses the Advisor for all expenses associated with providing the administrative, financial, legal, accounting and recordkeeping services to the fund, including the preparation of all tax returns, periodic reports to shareholders and regulatory reports, among other services. These expenses are allocated to each share class based on its relative net assets at the time the expense was incurred. These accounting and legal services fees incurred for the year ended July 31, 2014 amounted to an annual rate of 0.01% of the fund’s average daily net assets.
Distribution and service plans. The fund has a distribution agreement with the Distributor. The fund has adopted distribution and service plans with respect to Class A and Class C shares pursuant to Rule 12b-1 under the 1940 Act, to pay the Distributor for services provided as the distributor of shares of the fund. The fund may pay up to 0.30% and 1.00% for Class A and Class C shares, respectively, for distribution and service fees under these arrangements, expressed as an annual percentage of average daily net assets for the fund’s Class A and Class C shares, respectively.
| |
| Annual report | Short Duration Credit Opportunities Fund | 55 |
Sales charges. Class A shares are assessed up-front sales charges, which resulted in payments to the Distributor amounting to $100,957 for the year ended July 31, 2014. Of this amount, $18,384 was retained and used for printing prospectuses, advertising, sales literature and other purposes, $82,402 was paid as sales commissions to broker-dealers and $171 was paid as sales commissions to sales personnel of Signator Investors, Inc., a broker-dealer affiliate of the Advisor. The up-front sales charge for Class A shares is 2.50%.
Class A and Class C shares may be subject to contingent deferred sales charges (CDSCs). Certain Class A shares that were acquired through purchases of $1 million or more through February 2, 2014 and are redeemed within one year of purchase are subject to a 1% sales charge. Effective February 3, 2014, certain Class A shares that are acquired through purchase of $250,000 or more and are redeemed within one year of purchase are subject to a 0.50% sales charge. Class C shares that are redeemed within one year of purchase are subject to a 1.00% CDSC. CDSCs are applied to the lesser of the current market value at the time of redemption or the original purchase cost of the shares being redeemed. Proceeds from CDSCs are used to compensate the Distributor for providing distribution-related services in connection with the sale of these shares. During the year ended July 31, 2014, there were no CDSCs received by the Distributor for Class A or Class C shares.
Transfer agent fees. The fund has a transfer agent agreement with John Hancock Signature Services, Inc. (Signature Services), an affiliate of the Advisor. The transfer agent fees paid to Signature Services are determined based on the cost to Signature Services (Signature Services Cost) of providing recordkeeping services. The Signature Services Cost includes a component of allocated John Hancock corporate overhead for providing transfer agent services to the fund and to all other John Hancock affiliated funds. It also includes out-of-pocket expenses, including payments made to third-parties for recordkeeping services provided to their clients who invest in one or more John Hancock funds. In addition, Signature Services Cost may be reduced by certain fees that Signature Services receives in connection with retirement and small accounts. Signature Services Cost is calculated monthly and allocated, as applicable, to five categories of share classes: Retail Share and Institutional Classes of Non-Municipal Bond Funds, Class R6 Shares, Retirement Share Classes and Municipal Bond Share Classes. Within each of these categories, the applicable costs are allocated to the affected John Hancock affiliated funds and/or classes, based on the relative average daily net assets.
Prior to October 1, 2013, Signature Services Cost was calculated monthly and allocated, as applicable, to four categories of share classes: Institutional Share Classes, Retirement Share Classes, Municipal Bond Classes and all other Retail Share Classes. Within each of these categories, the applicable costs were allocated to the affected John Hancock affiliated funds and/or classes, based on the relative average daily net assets.
Class level expenses. Class level expenses for the year ended July 31, 2014 were:
| | | | |
| | DISTRIBUTION | TRANSFER | STATE | PRINTING AND |
| CLASS | AND SERVICE FEES | AGENT FEES | REGISTRATION FEES | POSTAGE |
|
| Class A | $28,845 | $12,885 | $24,050 | $4,646 |
| Class C | 245 | 33 | 1,467 | 7 |
| Class I | — | 5,180 | 23,171 | 2,450 |
| Total | $29,090 | $18,098 | $48,688 | $7,103 |
Trustee expenses. The fund compensates each Trustee who is not an employee of the Advisor or its affiliates. The costs of paying Trustee compensation and expenses are allocated to each fund based on its net assets relative to other funds within the John Hancock group of funds complex.
| |
| 56 | Short Duration Credit Opportunities Fund | Annual report |
Note 6 — Fund share transactions
Transactions in fund shares for the years ended July 31, 2014 and 2013 were as follows:
| | | | |
| | | Year ended 7-31-14 | | Year ended 7-31-13 |
| | Shares | Amount | Shares | Amount |
| Class A shares | | | | |
|
| Sold | 2,924,136 | $29,912,719 | 173,587 | $1,794,593 |
| Distributions reinvested | 35,534 | 362,781 | 578 | 5,950 |
| Repurchased | (1,346,429) | (13,802,271) | (5,638) | (57,963) |
| | | | | |
| Net increase | 1,613,241 | $16,473,229 | 168,527 | $1,742,580 |
| |
| Class C shares1 | | | | |
|
| Sold | 71,399 | $734,012 | — | — |
| Distributions reinvested | 38 | 390 | — | — |
| Repurchased | (15) | (152) | — | — |
| | | | | |
| Net increase | 71,422 | $734,250 | — | — |
| |
| Class I shares | | | | |
|
| Sold | 1,822,681 | $18,618,876 | 119,339 | $1,244,362 |
| Distributions reinvested | 14,610 | 149,471 | 654 | 6,741 |
| Repurchased | (281,852) | (2,890,625) | (2,948) | (30,230) |
| | | | | |
| Net increase | 1,555,439 | $15,877,722 | 117,045 | $1,220,873 |
| |
| Class NAV shares | | | | |
|
| Sold | 29,499,006 | $301,772,650 | 14,011,129 | $146,281,398 |
| Distributions reinvested | 5,829,733 | 59,495,053 | 3,895,386 | 40,597,558 |
| Repurchased | (4,020,768) | (41,280,747) | (9,840,661) | (103,327,653) |
| | | | | |
| Net increase | 31,307,971 | $319,986,956 | 8,065,854 | $83,551,303 |
| |
| Total net increase | 34,548,073 | $353,072,157 | 8,351,426 | $86,514,756 |
|
1 The inception date for Class C shares is 6-27-14.
Affiliates of the fund owned 14% and 100% of shares of beneficial interest of Class C and Class NAV, respectively, on July 31, 2014.
Note 7 — Purchase and sale of securities
Purchases and sales of securities, other than short-term securities and U.S. Treasury obligations, amounted to $1,086,104,084 and $797,000,386, respectively, for the year ended July 31, 2014. Purchases and sales of U.S. Treasury obligations aggregated $1,502,994 and $0, respectively, for the year ended July 31, 2014.
| |
| Annual report | Short Duration Credit Opportunities Fund | 57 |
Note 8 — Investment by affiliated funds
Certain investors in the fund are affiliated funds that are managed by the Advisor and its affiliates. The affiliated funds do not invest in the fund for the purpose of exercising management or control; however, this investment may represent a significant portion of the fund’s net assets. At July 31, 2014, funds within the John Hancock group of funds complex held 97.6% of the fund’s net assets. The following funds had an affiliate ownership of 5% or more of the fund’s net assets:
| | |
| | AFFILIATE | |
| FUND | CONCENTRATION | |
| |
| John Hancock Lifestyle Balanced Portfolio | 36.3% | |
| John Hancock Lifestyle Growth Portfolio | 15.2% | |
| John Hancock Lifestyle Moderate Portfolio | 13.4% | |
| John Hancock Alternative Asset Allocation Fund | 11.7% | |
| John Hancock Lifestyle Conservative Portfolio | 11.5% | |
| |
| 58 | Short Duration Credit Opportunities Fund | Annual report |
Auditor’s report
Report of Independent Registered Public Accounting Firm
To the Board of Trustees of John Hancock Funds II and Shareholders of
John Hancock Short Duration Credit Opportunities Fund:
In our opinion, the accompanying statement of assets and liabilities, including the schedule of investments, and the related statements of operations and of changes in net assets and the financial highlights present fairly, in all material respects, the financial position of the John Hancock Short Duration Credit Opportunities Fund (the “Fund”) at July 31, 2014, the results of its operations for the year then ended, the changes in its net assets for each of the two years in the period then ended and the financial highlights for each of the periods indicated, in conformity with accounting principles generally accepted in the United States of America. These financial statements and financial highlights (hereafter referred to as “financial statements”) are the responsibility of the Fund’s management. Our responsibility is to express an opinion on these financial statements based on our audits. We conducted our audits of these financial statements in accordance with the standards of the Public Company Accounting Oversight Board (United States). Those standards require that we plan and perform the audit to obtain reasonable assurance about whether the financial statements are free of material misstatement. An audit includes examining, on a test basis, evidence supporting the amounts and disclosures in the financial statements, assessing the accounting principles used and significant estimates made by management, and evaluating the overall financial statement presentation. We believe that our audits, which included confirmation of securities at July 31, 2014 by correspondence with the custodian, agent banks and brokers, and the application of alternative auditing procedures where securities purchased confirmations had not been received, provide a reasonable basis for our opinion.
PricewaterhouseCoopers LLP
Boston, Massachusetts
September 17, 2014
| |
| Annual report | Short Duration Credit Opportunities Fund | 59 |
Tax information
Unaudited
For federal income tax purposes, the following information is furnished with respect to the distributions of the fund, if any, paid during its taxable year ended July 31, 2014.
The fund reports the maximum amount allowable of its net taxable income as eligible for the corporate dividends-received deduction.
The fund reports the maximum amount allowable of its net taxable income as qualified dividend income as provided in the Jobs and Growth Tax Relief Reconciliation Act of 2003.
The fund paid $14,714,312 in capital gain dividends.
Eligible shareholders will be mailed a 2014 Form 1099-DIV in early 2015. This will reflect the tax character of all distributions paid in calendar year 2014.
Please consult a tax advisor regarding the tax consequences of your investment in the fund.
| |
| 60 | Short Duration Credit Opportunities Fund | Annual report |
Continuation of Investment Advisory and Subadvisory Agreements
Evaluation of Advisory and Subadvisory Agreements by the Board of Trustees
This section describes the evaluation by the Board of Trustees (the Board) of John Hancock Funds II (the Trust) of the Advisory Agreement (the Advisory Agreement) with John Hancock Advisers, LLC (the Advisor) and the Subadvisory Agreement (the Subadvisory Agreement) with Stone Harbor Investment Partners LP (the Subadvisor), for John Hancock Short Duration Credit Opportunities Fund (the fund). The Advisory Agreement and Subadvisory Agreement are collectively referred to as the Agreements. Prior to the June 23–25, 2014 meeting at which the Agreements were approved, the Board also discussed and considered information regarding the proposed continuation of the Agreements at an in-person meeting held on May 27–29, 2014.
Approval of Advisory and Subadvisory Agreements
At in-person meetings held on June 23–25, 2014, the Board, including the Trustees who are not considered to be interested persons of the Trust under the Investment Company Act of 1940, as amended (the 1940 Act) (the Independent Trustees), reapproved for an annual period the continuation of the Advisory Agreement between the Trust and the Advisor and the Subadvisory Agreement between the Advisor and the Subadvisor with respect to the fund.
In considering the Advisory Agreement and the Subadvisory Agreement, the Board received in advance of the meetings a variety of materials relating to the fund, the Advisor and the Subadvisor, including comparative performance, fee and expense information for a peer group of similar funds prepared by an independent third-party provider of fund data, performance information for an applicable benchmark index; and, with respect to the Subadvisor, comparative performance information for comparably managed accounts, as applicable, and other information provided by the Advisor and the Subadvisor regarding the nature, extent and quality of services provided by the Advisor and the Subadvisor under their respective Agreements, as well as information regarding the Advisor’s revenues and costs of providing services to the fund and any compensation paid to affiliates of the Advisor. At the meetings at which the renewal of the Advisory Agreement and Subadvisory Agreement are considered, particular focus is given to information concerning fund performance, comparability of fees and total expenses, and profitability. However, the Board notes that the evaluation process with respect to the Advisor and the Subadvisor is an ongoing one. In this regard, the Board also took into account discussions with management and information provided to the Board at prior meetings with respect to the services provided by the Advisor and the Subadvisor to the fund, including quarterly performance reports prepared by management containing reviews of investment results and prior presentations from the Subadvisor with respect to the fund. The Board also considered the nature, quality, and extent of non-advisory services, if any, to be provided to the fund by the Advisor’s affiliates, including distribution services.
Throughout the process, the Board asked questions of and requested additional information from management. The Board is assisted by counsel for the Trust and the Independent Trustees are also separately assisted by independent legal counsel throughout the process. The Independent Trustees also received a memorandum from their independent legal counsel discussing the legal standards for their consideration of the proposed continuation of the Agreements and discussed the proposed continuation of the Agreements in private sessions with their independent legal counsel at which no representatives of management were present.
Approval of Advisory Agreement
In approving the Advisory Agreement with respect to the fund, the Board, including the Independent Trustees, considered a variety of factors, including those discussed below. The Board also considered other factors (including conditions and trends prevailing generally in the economy, the securities markets, and the industry) and does not treat any single factor as determinative, and each Trustee
| |
| Annual report | Short Duration Credit Opportunities Fund | 61 |
may attribute different weights to different factors. The Board’s conclusions may be based in part on its consideration of the advisory and subadvisory arrangements in prior years and on the Board’s ongoing regular review of fund performance and operations throughout the year.
Nature, extent, and quality of services. Among the information received by the Board from the Advisor relating to the nature, extent, and quality of services provided to the fund, the Board reviewed information provided by the Advisor relating to its operations and personnel, descriptions of its organizational and management structure, and information regarding the Advisor’s compliance and regulatory history, including its Form ADV. The Board also noted that on a regular basis it receives and reviews information from the Trust’s Chief Compliance Officer (CCO) regarding the fund’s compliance policies and procedures established pursuant to Rule 38a-1 under the 1940 Act. The Board also considered the Advisor’s risk management processes. The Board considered that the Advisor is responsible for the management of the day-to-day operations of the fund, including, but not limited to, general supervision of and coordination of the services provided by the Subadvisor, and is also responsible for monitoring and reviewing the activities of the Subadvisor and other third-party service providers.
In considering the nature, extent, and quality of the services provided by the Advisor, the Trustees also took into account their knowledge of the Advisor’s management and the quality of the performance of the Advisor’s duties, through Board meetings, discussions and reports during the preceding year and through each Trustee’s experience as a Trustee of the Trust and of the other trusts in the complex.
In the course of their deliberations regarding the Advisory Agreement, the Board considered, among other things:
(a) the skills and competency with which the Advisor has in the past managed the Trust’s affairs and its subadvisory relationship, the Advisor’s oversight and monitoring of the Subadvisor’s investment performance and compliance programs, such as the Subadvisor’s compliance with fund policies and objectives, review of brokerage matters, including with respect to trade allocation and best execution and the Advisor’s timeliness in responding to performance issues;
(b) the background, qualifications and skills of the Advisor’s personnel;
(c) the Advisor’s compliance policies and procedures and its responsiveness to regulatory changes and mutual fund industry developments;
(d) the Advisor’s administrative capabilities, including its ability to supervise the other service providers for the fund;
(e) the financial condition of the Advisor and whether it has the financial wherewithal to provide a high level and quality of services to the fund; and
(f) the Advisor’s reputation and experience in serving as an investment advisor to the Trust and the benefit to shareholders of investing in funds that are part of a family of funds offering a variety of investments.
The Board concluded that the Advisor may reasonably be expected to continue to provide a high quality of services under the Advisory Agreement with respect to the fund.
Investment performance. In considering the fund’s performance, the Board noted that it reviews at its regularly scheduled meetings information about the fund’s performance results. In connection with the consideration of the Advisory Agreement, the Board:
| |
| 62 | Short Duration Credit Opportunities Fund | Annual report |
(a) reviewed information prepared by management regarding the fund’s performance;
(b) considered the comparative performance of an applicable benchmark index;
(c) considered the performance of comparable funds, if any, as included in the report prepared by an independent third-party provider of fund data; and
(d) took into account the Advisor’s analysis of the fund’s performance and its plans and recommendations regarding the Trust’s subadvisory arrangements generally.
The Board noted that the fund outperformed its benchmark index for the one- and three-year periods ended December 31, 2013. The Board also noted that the fund had outperformed its peer group average for the one- and three-year periods ended December 31, 2013.
The Board noted the fund’s favorable performance relative to the benchmark index and peer group for the one- and three-year periods.
The Board concluded that the fund’s performance has generally outperformed the historical performance of comparable funds and the fund’s benchmark.
Fees and expenses. The Board reviewed comparative information prepared by an independent third-party provider of mutual fund data, including, among other data, the fund’s contractual and net management fees (and subadvisory fees, to the extent available) and total expenses as compared to similarly situated investment companies deemed to be comparable to the fund. The Board considered the fund’s ranking within a smaller group of peer funds chosen by the independent third-party provider, as well as the fund’s ranking within a broader group of funds. In comparing the fund’s contractual and net management fees to those of comparable funds, the Board noted that such fees include both advisory and administrative costs.
The Board noted that net management fees for the fund are higher than the peer group median and total expenses for the fund are equal to the peer group median. The Board took into account management’s discussion of the fund’s expenses.
The Board also took into account management’s discussion with respect to the advisory/subadvisory fee structure, including the amount of the advisory fee retained by the Advisor after payment of the subadvisory fee. The Board also noted that the Advisor pays the subadvisory fee, and that such fees are negotiated at arm’s length with respect to the Subadvisor. In addition, the Board took into account that management had agreed, effective July 1, 2014, to implement an overall fee waiver across the complex, including the fund, which is discussed further below. The Board also noted management’s discussion of the fund’s expenses, as well as actions taken over the past several years to reduce the fund’s operating expenses. The Board also noted that, in addition, the Advisor is currently waiving fees and/or reimbursing expenses with respect to the fund and that the fund has breakpoints in its contractual management fee schedule that reduces management fees as assets increase. The Board reviewed information provided by the Advisor concerning the investment advisory fee charged by the Advisor or one of its advisory affiliates to other clients (including other funds in the complex) having similar investment mandates, if any. The Board considered any differences between the Advisor’s and Subadvisor’s services to the fund and the services they provide to other comparable clients or funds. The Board concluded that the advisory fee paid with respect to the fund is reasonable.
Profitability/indirect benefits. In considering the costs of the services to be provided and the profits to be realized by the Advisor and its affiliates from the Advisor’s relationship with the Trust, the Board:
| |
| Annual report | Short Duration Credit Opportunities Fund | 63 |
(a) reviewed financial information of the Advisor;
(b) reviewed and considered information presented by the Advisor regarding the net profitability to the Advisor and its affiliates with respect to the fund;
(c) received and reviewed profitability information with respect to the John Hancock fund complex as a whole;
(d) received information with respect to the Advisor’s allocation methodologies used in preparing the profitability data;
(e) considered that the John Hancock insurance companies that are affiliates of the Advisor, as shareholders of the Trust directly or through their separate accounts, receive certain tax credits or deductions relating to foreign taxes paid and dividends received by certain funds of the Trust and noted that these tax benefits, which are not available to participants in qualified retirement plans under applicable income tax law, are reflected in the profitability analysis reviewed by the Board;
(f) considered that the Advisor also provides administrative services to the fund on a cost basis pursuant to an administrative services agreement;
(g) noted that affiliates of the Advisor provide transfer agency services and distribution services to the fund, and that the fund’s distributor also receives Rule 12b-1 payments to support distribution of the fund;
(h) noted that the Advisor also derives reputational and other indirect benefits from providing advisory services to the fund;
(i) noted that the subadvisory fee for the fund is paid by the Advisor and is negotiated at arm’s length; and
(j) considered that the Advisor should be entitled to earn a reasonable level of profits in exchange for the level of services it provides to the fund and the entrepreneurial risk that it assumes as Advisor.
Based upon its review, the Board concluded that the level of profitability, if any, of the Advisor and its affiliates from their relationship with the fund was reasonable and not excessive.
Economies of scale. In considering the extent to which economies of scale would be realized as the fund grows and whether fee levels reflect these economies of scale for the benefit of fund shareholders, the Board:
(a) considered that the Advisor has agreed, effective July 1, 2014, to waive a portion of its management fee for the fund and each of the other John Hancock funds in the complex (except for those discussed below) (the Participating Portfolios) or otherwise reimburse the expenses of the Participating Portfolios as follows (the Reimbursement):
The Reimbursement shall equal, on an annualized basis, 0.01% of that portion of the aggregate net assets of all the Participating Portfolios that exceed $75 billion but is less than or equal to $125 billion, 0.0125% of that portion of the aggregate net assets of all the Participating Portfolios that exceed $125 billion but is less than or equal to $150 billion and 0.015% of that portion of the aggregate net assets of all the Participating Portfolios that exceeds $150 billion. (The funds that are not Participating Portfolios are the funds of funds in the complex, which benefit from such overall management fee waiver through their investment in underlying portfolios that include Participating Portfolios, which are subject to the Reimbursement.)
| |
| 64 | Short Duration Credit Opportunities Fund | Annual report |
(b) reviewed the fund’s advisory fee structure and concluded that: (i) the fund’s fee structure contains breakpoints at the subadvisory fee level and that such breakpoints are reflected as breakpoints in the advisory fees for the fund; and (ii) although economies of scale cannot be measured with precision, these arrangements permit shareholders of the fund to benefit from economies of scale if the fund grows. The Board also took into account management’s discussion of the fund’s advisory fee structure; and
(c) the Board also considered the effect of the fund’s growth in size on its performance and fees. The Board also noted that if the fund’s assets increase over time, the fund may realize other economies of scale.
Approval of Subadvisory Agreement
In making its determination with respect to approval of the Subadvisory Agreement, the Board reviewed:
(1) information relating to the Subadvisor’s business, including current subadvisory services to the Trust (and other funds in the John Hancock family of funds);
(2) the historical and current performance of the fund and comparative performance information relating to an applicable benchmark index and comparable funds;
(3) the subadvisory fee for the fund, including any breakpoints, and to the extent available, comparable fee information prepared by an independent third party provider of fund data; and
(4) information relating to the nature and scope of any material relationships and their significance to the Trust’s Advisor and Subadvisors.
Nature, extent, and quality of services. With respect to the services provided by the Subadvisor, the Board received information provided to the Board by the Subadvisor, including the Subadvisor’s Form ADV, as well as took into account information presented throughout the past year. The Board considered the Subadvisor’s current level of staffing and its overall resources, as well as received information relating to the Subadvisor’s compensation program. The Board reviewed the Subadvisor’s history and investment experience, as well as information regarding the qualifications, background, and responsibilities of the Subadvisor’s investment and compliance personnel who provide services to the fund. The Board also considered, among other things, the Subadvisor’s compliance program and any disciplinary history. The Board also considered the Subadvisor’s risk assessment and monitoring process. The Board reviewed the Subadvisor’s regulatory history, including whether it was involved in any regulatory actions or investigations as well as material litigation, and any settlements and amelioratory actions undertaken, as appropriate. The Board noted that the Advisor conducts regular, periodic reviews of the Subadvisor and its operations, including regarding investment processes and organizational and staffing matters. The Board also noted that the Trust’s CCO and his staff conduct regular, periodic compliance reviews with the Subadvisor and present reports to the Independent Trustees regarding the same, which includes evaluating the regulatory compliance systems of the Subadvisor and procedures reasonably designed to assure compliance with the federal securities laws. The Board also took into account the financial condition of the Subadvisor.
The Board considered the Subadvisor’s investment process and philosophy. The Board took into account that the Subadvisor’s responsibilities include the development and maintenance of an investment program for the fund that is consistent with the fund’s investment objective, the selection of investment securities and the placement of orders for the purchase and sale of such securities, as well as the implementation of compliance controls related to performance of these services. The Board also received information with respect to the Subadvisor’s brokerage policies and practices, including with respect to best execution and soft dollars.
| |
| Annual report | Short Duration Credit Opportunities Fund | 65 |
Subadvisor compensation. In considering the cost of services to be provided by the Subadvisor and the profitability to the Subadvisor of its relationship with the fund, the Board noted that the fees under the Subadvisory Agreement are paid by the Advisor and not the fund.
The Board also relied on the ability of the Advisor to negotiate the Subadvisory Agreement with the Subadvisor, which is not affiliated with the Advisor, and the fees thereunder at arm’s length. As a result, the costs of the services to be provided and the profits to be realized by the Subadvisor from its relationship with the Trust were not a material factor in the Board’s consideration of the Subadvisory Agreement.
The Board also received information regarding the nature and scope (including their significance to the Advisor and its affiliates and to the Subadvisor) of any material relationships, if any, with respect to the Subadvisor, which include arrangements in which the Subadvisor or its affiliates provide advisory, distribution, or management services in connection with financial products sponsored by the Advisor or its affiliates, and may include other registered investment companies, a 529 education savings plan, managed separate accounts and exempt group annuity contracts sold to qualified plans. The Board also received information and took into account any other potential conflicts of interest the Advisor might have in connection with the Subadvisory Agreement.
In addition, the Board considered other potential indirect benefits that the Subadvisor and its affiliates may receive from the Subadvisor’s relationship with the fund, such as the opportunity to provide advisory services to additional funds in the John Hancock fund complex and reputational benefits.
Subadvisory fee. The Board considered that the fund pays an advisory fee to the Advisor and that, in turn, the Advisor pays a subadvisory fee to the Subadvisor. As noted above, the Board also considered the fund’s subadvisory fee as compared to similarly situated investment companies deemed to be comparable to the fund as included in the report prepared by the independent third party provider of fund data, to the extent available. The Board noted that the limited size of the peer group was not sufficient for comparative purposes. The Board also took into account the subadvisory fee paid by the Advisor to the Subadvisor with respect to the fund to fees charged by the Subadvisor to manage other subadvised portfolios and portfolios not subject to regulation under the 1940 Act, as applicable.
Subadvisor performance. As noted above, the Board considered the fund’s performance as compared to the fund’s peer group and the benchmark index and noted that the Board reviews information about the fund’s performance results at its regularly scheduled meetings. The Board noted the Advisor’s expertise and resources in monitoring the performance, investment style and risk-adjusted performance of the Subadvisor. The Board was mindful of the Advisor’s focus on the Subadvisor’s performance. The Board also noted the Subadvisor’s long-term performance record for similar accounts, as applicable.
The Board’s decision to approve the Subadvisory Agreement was based on a number of determinations, including the following:
(1) the Subadvisor has extensive experience and demonstrated skills as a manager;
(2) the performance of the fund has generally been in line with or outperformed the historical performance of comparable funds and the fund’s benchmark index;
(3) the subadvisory fee is reasonable in relation to the level and quality of services being provided; and
| |
| 66 | Short Duration Credit Opportunities Fund | Annual report |
(4) subadvisory fee breakpoints are reflected as breakpoints in the advisory fees for the fund in order to permit shareholders to benefit from economies of scale if the fund grows.
Based on the Board’s evaluation of all factors that the Board deemed to be material, including those factors described above, the Board, including the Independent Trustees, concluded that renewal of the Advisory Agreement and the Subadvisory Agreement would be in the best interest of the fund and its shareholders. Accordingly, the Board, and the Independent Trustees voting separately, approved the Advisory Agreement and Subadvisory Agreement for an additional one-year period.
| |
| Annual report | Short Duration Credit Opportunities Fund | 67 |
Trustees and Officers
This chart provides information about the Trustees and Officers who oversee your John Hancock fund. Officers elected by the Trustees manage the day-to-day operations of the fund and execute policies formulated by the Trustees.
| | |
| Independent Trustees | | |
| | | |
| Name, year of birth | Trustee | Number of John |
| Position(s) held with fund | of the | Hancock funds |
| Principal occupation(s) and other | Trust | overseen by |
| directorships during past 5 years | since1 | Trustee |
| |
| James M. Oates, Born: 1946 | 2005 | 230 |
|
| Managing Director, Wydown Group (financial consulting firm) (since 1994); Chairman and Director, |
| Emerson Investment Management, Inc. (since 2000); Independent Chairman, Hudson Castle Group, Inc. |
| (formerly IBEX Capital Markets, Inc.) (financial services company) (1997–2011); Director, Stifel Financial |
| (since 1996); Director, Investor Financial Services Corporation (1995–2007); Director, Connecticut River |
| Bancorp (since 1998); Director, Virtus Funds (formerly Phoenix Mutual Funds) (since 1988). | |
| | |
| Trustee and Chairperson of the Board, John Hancock retail funds3 (since 2012); Trustee (2005–2006 and |
| since 2012) and Chairperson of the Board (since 2012), John Hancock Funds III; Trustee (since 2004) and |
| Chairperson of the Board (since 2005), John Hancock Variable Insurance Trust; Trustee and Chairperson |
| of the Board, John Hancock Funds II (since 2005). | | |
| |
| Charles L. Bardelis,2 Born: 1941 | 2005 | 230 |
|
| Director, Island Commuter Corp. (marine transport). | | |
| | | |
| Trustee, John Hancock retail funds3 (since 2012); Trustee, John Hancock Funds III (2005–2006 and |
| since 2012); Trustee, John Hancock Variable Insurance Trust (since 1988); Trustee, John Hancock |
| Funds II (since 2005). | | |
| |
| Peter S. Burgess,2 Born: 1942 | 2005 | 230 |
|
| Consultant (financial, accounting, and auditing matters) (since 1999); Certified Public Accountant; |
| Partner, Arthur Andersen (independent public accounting firm) (prior to 1999); Director, Lincoln |
| Educational Services Corporation (since 2004); Director, Symetra Financial Corporation (since 2010); |
| Director, PMA Capital Corporation (2004–2010). | | |
| | | |
| Trustee, John Hancock retail funds3 (since 2012); Trustee, John Hancock Funds III (2005–2006 and |
| since 2012); Trustee, John Hancock Variable Insurance Trust and John Hancock Funds II (since 2005). |
| |
| William H. Cunningham, Born: 1944 | 2012 | 230 |
|
| Professor, University of Texas, Austin, Texas (since 1971); former Chancellor, University of Texas System |
| and former President of the University of Texas, Austin, Texas; Director, LIN Television (since 2009); |
| Chairman (since 2009) and Director (since 2006), Lincoln National Corporation (insurance); Director, |
| Resolute Energy Corporation (since 2009); Director, Southwest Airlines (since 2000); former Director, |
| Introgen (manufacturer of biopharmaceuticals) (until 2008); former Director, Hicks Acquisition Company I, |
| Inc. (until 2007); former Director, Texas Exchange Bank, SSB (formerly Bank of Crowley) (until 2009); |
| former Advisory Director, JP Morgan Chase Bank (formerly Texas Commerce Bank–Austin) (until 2009). |
| |
| Trustee, John Hancock retail funds3 (since 1986); Trustee, John Hancock Variable Insurance Trust |
| (since 2012); Trustee, John Hancock Funds II (2005–2006 and since 2012). | | |
| |
| 68 | Short Duration Credit Opportunities Fund | Annual report |
| | |
| Independent Trustees (continued) | | |
| |
| Name, Year of Birth | Trustee | Number of John |
| Position(s) held with Fund | of the | Hancock funds |
| Principal occupation(s) and other | Trust | overseen by |
| directorships during past 5 years | since1 | Trustee |
| |
| Grace K. Fey, Born: 1946 | 2008 | 230 |
|
| Chief Executive Officer, Grace Fey Advisors (since 2007); Director and Executive Vice President, Frontier |
| Capital Management Company (1988–2007); Director, Fiduciary Trust (since 2009). | |
| | |
| Trustee, John Hancock retail funds3 (since 2012); Trustee, John Hancock Variable Insurance Trust and |
| John Hancock Funds II (since 2008). | | |
| |
| Theron S. Hoffman,2 Born: 1947 | 2008 | 230 |
|
| Chief Executive Officer, T. Hoffman Associates, LLC (consulting firm) (since 2003); Director, The Todd |
| Organization (consulting firm) (2003–2010); President, Westport Resources Management (investment |
| management consulting firm) (2006–2008); Senior Managing Director, Partner, and Operating Head, |
| Putnam Investments (2000–2003); Executive Vice President, The Thomson Corp. (financial and legal |
| information publishing) (1997–2000). | | |
| | | |
| Trustee, John Hancock retail funds3 (since 2012); Trustee, John Hancock Variable Insurance Trust and |
| John Hancock Funds II (since 2008). | | |
| |
| Deborah C. Jackson, Born: 1952 | 2012 | 230 |
|
| President, Cambridge College, Cambridge, Massachusetts (since 2011); Chief Executive Officer, |
| American Red Cross of Massachusetts Bay (2002–2011); Board of Directors of Eastern Bank Corporation |
| (since 2001); Board of Directors of Eastern Bank Charitable Foundation (since 2001); Board of Directors |
| of American Student Assistance Corporation (1996–2009); Board of Directors of Boston Stock Exchange |
| (2002–2008); Board of Directors of Harvard Pilgrim Healthcare (health benefits company) (2007–2011). |
| |
| Trustee, John Hancock retail funds3 (since 2008); Trustee of John Hancock Variable Insurance Trust and |
| John Hancock Funds II (since 2012). | | |
| |
| Hassell H. McClellan, Born: 1945 | 2005 | 230 |
|
| Trustee, Virtus Variable Insurance Trust (formerly Phoenix Edge Series Funds) (since 2008); Director, The |
| Barnes Group (since 2010); Associate Professor, The Wallace E. Carroll School of Management, Boston |
| College (retired 2013). | | |
| | | |
| Trustee, John Hancock retail funds3 (since 2012); Trustee, John Hancock Funds III (2005–2006 and |
| since 2012); Trustee, John Hancock Variable Insurance Trust and John Hancock Funds II (since 2005). |
| |
| Steven R. Pruchansky, Born: 1944 | 2012 | 230 |
|
| Chairman and Chief Executive Officer, Greenscapes of Southwest Florida, Inc. (since 2000); Director |
| and President, Greenscapes of Southwest Florida, Inc. (until 2000); Member, Board of Advisors, First |
| American Bank (until 2010); Managing Director, Jon James, LLC (real estate) (since 2000); Director, |
| First Signature Bank & Trust Company (until 1991); Director, Mast Realty Trust (until 1994); President, |
| Maxwell Building Corp. (until 1991). | | |
| | | |
| Trustee (since 1992) and Chairperson of the Board (2011–2012), John Hancock retail funds3; Trustee and |
| Vice Chairperson of the Board, John Hancock retail funds,3 John Hancock Variable Insurance Trust, and |
| John Hancock Funds II (since 2012). | | |
| |
| Annual report | Short Duration Credit Opportunities Fund | 69 |
| | |
| Independent Trustees (continued) | | |
| |
| Name, Year of Birth | Trustee | Number of John |
| Position(s) held with Fund | of the | Hancock funds |
| Principal occupation(s) and other | Trust | overseen by |
| directorships during past 5 years | since1 | Trustee |
| |
| Gregory A. Russo, Born: 1949 | 2012 | 230 |
|
| Director and Audit Committee Chairman (since 2012), and Member, Audit Committee and Finance |
| Committee (since 2011), NCH Healthcare System, Inc. (holding company for multi-entity healthcare |
| system); Director and Member of Finance Committee, The Moorings, Inc. (nonprofit continuing care |
| community) (since 2012); Vice Chairman, Risk & Regulatory Matters, KPMG LLP (KPMG) (2002–2006); |
| Vice Chairman, Industrial Markets, KPMG (1998–2002); Chairman and Treasurer, Westchester County, |
| New York, Chamber of Commerce (1986–1992); Director, Treasurer, and Chairman of Audit and |
| Finance Committees, Putnam Hospital Center (1989–1995); Director and Chairman of Fundraising |
| Campaign, United Way of Westchester and Putnam Counties, New York (1990–1995). | |
| | |
| Trustee, John Hancock retail funds3 (since 2008); Trustee, John Hancock Variable Insurance Trust and |
| John Hancock Funds II (since 2012). | | |
| |
| |
| Non-Independent Trustees4 | | |
| | | |
| Name, year of birth | Trustee | Number of John |
| Position(s) held with fund | of the | Hancock funds |
| Principal occupation(s) and other | Trust | overseen by |
| directorships during past 5 years | since1 | Trustee |
| |
| Craig Bromley, Born: 1966 | 2012 | 230 |
|
| President, John Hancock Financial Services (since 2012); Senior Executive Vice President and General |
| Manager, U.S. Division, Manulife Financial Corporation (since 2012); President and Chief Executive |
| Officer, Manulife Insurance Company (Manulife Japan) (2005–2012, including prior positions). |
| |
| Trustee, John Hancock retail funds,3 John Hancock Variable Insurance Trust, and John Hancock |
| Funds II (since 2012). | | |
| |
| Warren A. Thomson, Born: 1955 | 2012 | 230 |
|
| Senior Executive Vice President and Chief Investment Officer, Manulife Financial Corporation and The |
| Manufacturers Life Insurance Company (since 2009); Chairman and Chief Executive Officer, Manulife |
| Asset Management (since 2001, including prior positions); Director (since 2006), and President and |
| Chief Executive Officer (since 2013), Manulife Asset Management Limited; Director and Chairman, |
| Hancock Natural Resources Group, Inc. (since 2013). | | |
| | | |
| Trustee, John Hancock retail funds,3 John Hancock Variable Insurance Trust, and John Hancock |
| Funds II (since 2012). | | |
| |
| |
| Principal officers who are not Trustees | | |
| | | |
| Name, year of birth | | Officer |
| Position(s) held with fund | | of the |
| Principal occupation(s) and other | | Trust |
| directorships during past 5 years | | since |
| |
| Andrew G. Arnott, Born: 1971 | | 2009 |
|
| President | | |
| Senior Vice President, John Hancock Financial Services (since 2009); Director and Executive Vice |
| President, John Hancock Advisers, LLC (since 2005, including prior positions); Director and Executive |
| Vice President, John Hancock Investment Management Services, LLC (since 2006, including prior |
| positions); President, John Hancock Funds, LLC (since 2004, including prior positions); President |
| (effective 3-13-14) and Executive Vice President, John Hancock retail funds,3 John Hancock Variable |
| Insurance Trust, and John Hancock Funds II (since 2007, including prior positions). | |
| |
| 70 | Short Duration Credit Opportunities Fund | Annual report |
| |
| Principal officers who are not Trustees (continued) | |
| |
| Name, Year of Birth | Officer |
| Position(s) held with Fund | of the |
| Principal occupation(s) and other | Trust |
| directorships during past 5 years | since |
| |
| John J. Danello, Born: 1955 | 2006 |
|
| Senior Vice President, Secretary, and Chief Legal Officer | |
| Vice President and Chief Counsel, John Hancock Wealth Management (since 2005); Senior Vice | |
| President (since 2007) and Chief Legal Counsel (2007–2010), John Hancock Funds, LLC and The | |
| Berkeley Financial Group, LLC; Senior Vice President (since 2006, including prior positions) and Chief |
| Legal Officer and Secretary (since 2014), John Hancock retail funds3 and John Hancock Variable | |
| Insurance Trust; Vice President, John Hancock Life & Health Insurance Company (since 2009); | |
| Vice President, John Hancock Life Insurance Company (USA) and John Hancock Life Insurance | |
| Company of New York (since 2010); and Senior Vice President, Secretary, and Chief Legal Counsel | |
| (2007–2014, including prior positions) of John Hancock Advisers, LLC and John Hancock Investment |
| Management Services, LLC. | |
| |
| Francis V. Knox, Jr., Born: 1947 | 2005 |
|
| Chief Compliance Officer | |
| Vice President, John Hancock Financial Services (since 2005); Chief Compliance Officer, John Hancock |
| retail funds,3 John Hancock Variable Insurance Trust, John Hancock Funds II, John Hancock Advisers, |
| LLC, and John Hancock Investment Management Services, LLC (since 2005). | |
| |
| Charles A. Rizzo, Born: 1957 | 2007 |
|
| Chief Financial Officer | |
| Vice President, John Hancock Financial Services (since 2008); Senior Vice President, John Hancock | |
| Advisers, LLC and John Hancock Investment Management Services, LLC (since 2008); Chief Financial |
| Officer, John Hancock retail funds,3 John Hancock Variable Insurance Trust and John Hancock | |
| Funds II (since 2007). | |
| |
| Salvatore Schiavone, Born: 1965 | 2009 |
|
| Treasurer | |
| Assistant Vice President, John Hancock Financial Services (since 2007); Vice President, John Hancock |
| Advisers, LLC and John Hancock Investment Management Services, LLC (since 2007); Treasurer, | |
| John Hancock retail funds3 (since 2007, including prior positions); Treasurer, John Hancock Variable |
| Insurance Trust and John Hancock Funds II (since 2010 and 2007–2009, including prior positions). | |
The business address for all Trustees and Officers is 601 Congress Street, Boston, Massachusetts 02210-2805.
1 Each Trustee holds office until his or her successor is elected and qualified, or until the Trustee’s death, retirement, resignation, or removal.
2 Member of the Audit Committee.
3 “John Hancock retail funds” comprises John Hancock Funds III and 37 other John Hancock funds consisting of 27 series of other John Hancock trusts and 10 closed-end funds.
4 Because Messrs. Bromley and Thomson are senior executives or directors of the advisor and/or its affiliates, each of them is considered an “interested person of the fund,” as defined in the Investment Company Act of 1940.
| |
| Annual report | Short Duration Credit Opportunities Fund | 71 |
More information
| |
| Trustees | Investment advisor |
| James M. Oates, Chairperson | John Hancock Advisers, LLC |
| Steven R. Pruchansky, Vice Chairperson | |
| Charles L. Bardelis* | Subadvisor |
| Craig Bromley† | Stone Harbor Investment Partners LP |
| Peter S. Burgess* | |
| William H. Cunningham | Principal distributor |
| Grace K. Fey | John Hancock Funds, LLC |
| Theron S. Hoffman* | |
| Deborah C. Jackson | Custodian |
| Hassell H. McClellan | State Street Bank and Trust Company |
| Gregory A. Russo | |
| Warren A. Thomson† | Transfer agent |
| | John Hancock Signature Services, Inc. |
| Officers | |
| Andrew G. Arnott | Legal counsel |
| President | K&L Gates LLP |
| | |
| John J. Danello | Independent registered |
| Senior Vice President, Secretary, | public accounting firm |
| and Chief Legal Officer | PricewaterhouseCoopers LLP |
| | |
| Francis V. Knox, Jr. | |
| Chief Compliance Officer | |
| | |
| Charles A. Rizzo | |
| Chief Financial Officer | |
| | |
| Salvatore Schiavone | |
| Treasurer | |
| |
| *Member of the Audit Committee | |
| †Non-Independent Trustee | |
The fund’s proxy voting policies and procedures, as well as the fund’s proxy voting record for the most recent twelve-month period ended June 30, are available free of charge on the Securities and Exchange Commission (SEC) website at sec.gov or on our website.
The fund’s complete list of portfolio holdings, for the first and third fiscal quarters, is filed with the SEC on Form N-Q. The fund’s Form N-Q is available on our website and the SEC’s website, sec.gov, and can be reviewed and copied (for a fee) at the SEC’s Public Reference Room in Washington, DC. Call 800-SEC-0330 to receive information on the operation of the SEC’s Public Reference Room.
We make this information on your fund, as well as monthly portfolio holdings, and other fund details available on our website at jhinvestments.com or by calling 800-225-5291.
| | |
| You can also contact us: | | |
| 800-225-5291 | Regular mail: | Express mail: |
| jhinvestments.com | John Hancock Signature Services, Inc. | John Hancock Signature Services, Inc. |
| | P.O. Box 55913 | 30 Dan Road |
| | Boston, MA 02205-5913 | Canton, MA 02021 |
| |
| 72 | Short Duration Credit Opportunities Fund | Annual report |

800-225-5291
800-231-5469 TDD
800-338-8080 EASI-Line
jhinvestments.com
| |
| This report is for the information of the shareholders of John Hancock Short Duration Credit Opportunities Fund. | |
| It is not authorized for distribution to prospective investors unless preceded or accompanied by a prospectus. | 350A 7/14 |
| MF195347 | 9/14 |

A look at performance
Total returns for the period ended July 31, 2014
| | | | | | | | | | | | | |
| | | | | | | | | | | | SEC 30-day | | SEC 30-day |
| | Average annual total returns (%) | | Cumulative total returns (%) | | yield (%) | | yield (%) |
| | with maximum sales charge | | | with maximum sales charge | | subsidized | | unsubsidized1 |
|
| | 1-year | 5-year | 10-year | Since inception2 | | 1-year | 5-year | 10-year | Since inception2 | | as of 7-31-14 | | as of 7-31-14 |
| Class A | 2.67 | — | — | 6.81 | | 2.67 | — | — | 36.72 | | 3.90 | | 3.31 |
|
| Class I3 | 7.17 | — | — | 8.04 | | 7.17 | — | — | 44.36 | | 4.36 | | –26.33 |
|
| Class NAV3 | 7.43 | — | — | 8.17 | | 7.43 | — | — | 45.24 | | 4.46 | | 4.45 |
|
| Index 1† | 9.53 | — | — | 10.43 | | 9.53 | — | — | 60.14 | | — | | — |
|
| Index 2† | 9.53 | — | — | 9.71 | | 9.53 | — | — | 55.24 | | — | | — |
|
Performance figures assume all distributions are reinvested. Figures reflect maximum sales charge on Class A shares of 4%. The returns for Class A shares have been adjusted to reflect the reduction in the maximum sales charge from 4.5% to 4.0%, effective 2-3-14. Sales charges are not applicable to Class I and Class NAV shares.
The expense ratios of the fund, both net (including any fee waivers and/or expense limitations) and gross (excluding any fee waivers and/or expense limitations), are set forth according to the most recent publicly available prospectuses for the fund and may differ from those disclosed in the Financial highlights tables in this report. Had the fee waivers and expense limitations not been in place, gross expenses would apply. The expense ratios are as follows:
| | | | | | | | | |
| | Class A | Class I | Class NAV | | | | | | |
| Gross (%) | 7.87 | 16.19 | 0.87 | | | | | | |
| Net (%) | 1.35 | 1.04 | 0.87 | | | | | | |
Please refer to the most recent prospectus and annual report for more information on expenses and any expense limitation arrangements for each class.
The returns reflect past results and should not be considered indicative of future performance. The return and principal value of an investment will fluctuate so that shares, when redeemed, may be worth more or less than their original cost. Due to market volatility, the fund’s current performance may be higher or lower than the performance shown. For current to the most recent month-end performance data, please call 800-225-5291 or visit the fund’s website at jhinvestments.com.
The performance table above and the chart on the next page do not reflect the deduction of taxes that a shareholder may pay on fund distributions or on the redemption of fund shares. The fund’s performance results reflect any applicable fee waivers or expense reductions, without which the expenses would increase and results would have been less favorable.
† Index 1 is the Bank of America Merrill Lynch Global High Yield and Emerging Markets Plus Index; Index 2 is 50% Bank of America Merrill Lynch U.S. High Yield Master II Constrained Index and 50% JPMorgan EMBI Global Diversified Index.
See the following page for footnotes.
| |
| 6 | Global Income Fund | Annual report |
| | | | | |
| | | With maximum | Without | | |
| | Start date | sales charge | sales charge | Index 1 | Index 2 |
|
| Class I3 | 11-2-09 | $14,436 | $14,436 | $16,014 | $15,524 |
|
| Class NAV3 | 11-2-09 | 14,524 | 14,524 | 16,014 | 15,524 |
|
The values shown in the chart for “Class A with maximum sales charge” have been adjusted to reflect the reduction in the Class A maximum sales charge from 4.5% to 4.0%, which became effective on 2-3-14.
BofA Merrill Lynch Global High Yield and Emerging Markets Plus Index — Index 1 — tracks the performance of the below and border-line investment-grade global debt markets denominated in the major developed market currencies.
BofA Merrill Lynch U.S. High Yield Master II Constrained Index is an unmanaged index composed of U.S. currency high-yield bonds issued by U.S. and non-U.S. issuers.
JPMorgan EMBI Global Diversified Index is a uniquely weighted index that tracks total returns for U.S. dollar-denominated Brady bonds, Eurobonds, traded loans and local market debt instruments issued by sovereign and quasi-sovereign entities.
Blended Index — Index 2 — is 50% BofA Merrill Lynch U.S. High Yield Master II Constrained Index and 50% JPMorgan EMBI Global Diversified Index.
It is not possible to invest directly in an index. Index figures do not reflect expenses or sales charges, which would have resulted in lower values.
Footnotes related to performance pages
1 Unsubsidized yield reflects what the yield would have been without the effect of reimbursements and waivers.
2 From 11-2-09.
3 For certain types of investors as described in the fund’s prospectuses.
| |
| Annual report | Global Income Fund | 7 |
Management’s discussion of
Fund performance
From Stone Harbor Investment Partners LP
High-yield and emerging-market bonds performed very well during the past 12 months, providing a favorable backdrop for fund performance. For the twelve-month period ended July 31, 2014, John Hancock Global Income Fund’s Class A shares produced a total return of 6.95%, excluding sales charges. For the same twelve-month period, the fund’s benchmark – the Bank of America Merrill Lynch Global High Yield and Emerging Markets Plus Index – gained 9.53%.
While the fund finished the twelve-month period with a strong absolute return, its positioning in the emerging markets weighed on relative performance. Two factors stood out as being causes for this shortfall. First, we used the volatility of mid–2013 to boost the fund’s weighting in emerging-market debt denominated in local currencies. Local-currency debt remained under pressure through the end of January, so this above-average allocation was a headwind to performance in the first six months of the reporting period. The second factor weighing on performance in the emerging markets was the fund’s positioning within Argentina. Several elements of the fund’s positioning in the emerging markets aided returns, including its allocation to emerging market corporate bonds, its underweight positions in several underperforming Asian countries, and our decision to favor shorter-term bonds in Mexico and Venezuela. The fund held 4.2% in Russian securities as of July 31, 2014, compared with 2.1% one year ago. This shift reflected our view that the attractive yields in the Russian market, combined with the country’s conservative fiscal and monetary policies, made it a compelling contrarian opportunity.
The fund’s high-yield portfolio performed in line with the broader market. Individual security selection was the most important factor in the fund’s results within high yield, with holdings in the telecommunications services, gaming, and cable/media industries adding the most to relative performance. The positive impact of issue selection was offset to some extent by industry allocation, particularly the fund’s underweight in the banking industry.
This commentary reflects the views of the portfolio management team through the end of the period discussed in this report. As such, they are in no way guarantees of future events and are not intended to be used as investment advice or a recommendation regarding any specific security. They are also subject to change at any time as market and other conditions warrant.
Past performance does not guarantee future results.
| |
| 8 | Global Income Fund | Annual report |
Your expenses
These examples are intended to help you understand your ongoing operating expenses of investing in the fund so you can compare these costs with the ongoing costs of investing in other mutual funds.
Understanding fund expenses
As a shareholder of the fund, you incur two types of costs:
▪ Transaction costs, which include sales charges (loads) on purchases or redemptions (varies by share class), minimum account fee charge, etc.
▪ Ongoing operating expenses, including management fees, distribution and service fees (if applicable), and other fund expenses.
We are going to present only your ongoing operating expenses here.
Actual expenses/actual returns
This example is intended to provide information about the fund’s actual ongoing operating expenses and is based on the fund’s actual return. It assumes an account value of $1,000.00 on February 1, 2014, with the same investment held until July 31, 2014.
| | | | |
| | | | Expenses paid | |
| | Account value | Ending value | during period | Annualized |
| | on 2-1-2014 | on 7-31-2014 | ended 7-31-20141 | expense ratio |
|
| Class A | $1,000.00 | $1,066.00 | $6.92 | 1.35% |
|
| Class I | 1,000.00 | 1,067.70 | 5.33 | 1.04% |
|
| Class NAV | 1,000.00 | 1,068.30 | 4.72 | 0.92% |
|
Together with the value of your account, you may use this information to estimate the operating expenses that you paid over the period. Simply divide your account value at July 31, 2014, by $1,000.00, then multiply it by the “expenses paid” for your share class from the table above. For example, for an account value of $8,600.00, the operating expenses should be calculated as follows:
| |
| Annual report | Global Income Fund | 9 |
Your expenses
Hypothetical example for comparison purposes
This table allows you to compare the fund’s ongoing operating expenses with those of any other fund. It provides an example of the fund’s hypothetical account values and hypothetical expenses based on each class’s actual expense ratio and an assumed 5% annualized return before expenses (which is not the fund’s actual return). It assumes an account value of $1,000.00 on February 1, 2014, with the same investment held until July 31, 2014. Look in any other fund shareholder report to find its hypothetical example and you will be able to compare these expenses. Please remember that these hypothetical account values and expenses may not be used to estimate the actual ending account balance or expenses you paid for the period.
| | | | |
| | | | Expenses paid | |
| | Account value | Ending value | during period | Annualized |
| | on 2-1-2014 | on 7-31-2014 | ended 7-31-20141 | expense ratio |
|
| Class A | $1,000.00 | $1,018.10 | $6.76 | 1.35% |
|
| Class I | 1,000.00 | 1,019.60 | 5.21 | 1.04% |
|
| Class NAV | 1,000.00 | 1,020.20 | 4.61 | 0.92% |
|
Remember, these examples do not include any transaction costs, therefore, these examples will not help you to determine the relative total costs of owning different funds. If transaction costs were included, your expenses would have been higher. See the prospectus for details regarding transaction costs.
1 Expenses are equal to the fund’s annualized expense ratio, multiplied by the average account value over the period, multiplied by 181/365 (to reflect the one-half year period).
| |
| 10 | Global Income Fund | Annual report |
Portfolio summary
| | | | |
| Top 10 Issuers (28.3% of Net Assets on 7-31-14)1,2 | | | |
|
| Government of Russia | 4.2% | | Republic of Turkey | 2.5% |
| |
|
| Republic of Indonesia | 3.4% | | Republic of Argentina | 2.4% |
| |
|
| Government of Mexico | 3.2% | | Republic of Colombia | 2.3% |
| |
|
| Federative Republic of Brazil | 3.1% | | Republic of Venezuela | 2.3% |
| |
|
| Petroleos de Venezuela SA | 2.8% | | KazMunayGas National Company | 2.1% |
| |
|
| |
| Quality Composition1,3 | | | | |
|
| AA | 0.4% | | B | 30.1% |
| |
|
| A | 8.3% | | CCC & Below | 11.8% |
| |
|
| BBB | 27.1% | | Not Rated | 1.0% |
| |
|
| BB | 17.6% | | Short-Term Investments & Other | 3.7% |
| |
|
| | | | |
| Country Composition1,4 | | | |
| | | |
| United States | 37.4% | | | |
| | | |
| Venezuela | 5.1% | | | |
| | | |
| Russia | 4.2% | | | |
| | | |
| Indonesia | 4.0% | | | |
| | | |
| Mexico | 3.4% | | | |
| | | |
| Brazil | 3.1% | | | |
| | | |
| Luxembourg | 3.0% | | | |
| | | |
| Colombia | 2.8% | | | |
| | | |
| Turkey | 2.6% | | | |
| | | |
| Argentina | 2.4% | | | |
| | | |
| Other Countries | 32.0% | | | |
| | | |
1 As a percentage of net assets on 7-31-14.
2 Cash and cash equivalents are not included.
3 Ratings are from Moody’s Investors Service, Inc. If not available, we have used Standard & Poor’s Ratings Services. In the absence of ratings from these agencies, we have used Fitch Ratings, Inc. “Not Rated” securities are those with no ratings available from these agencies. All ratings are as of 7-31-14 and do not reflect subsequent downgrades or upgrades, if any.
4 Fixed-income investments are subject to interest-rate and credit risk; their value will normally decline as interest rates rise or if a creditor is unable or unwilling to make principal or interest payments. Investments in higher-yielding, lower-rated securities include a higher risk of default. Foreign investing, especially in emerging markets, has additional risks, such as currency and market volatility and political and social instability. Currency transactions are affected by fluctuations in exchange rates. The use of hedging and derivatives could produce disproportionate gains or losses and may increase costs. Mortgage- and asset-backed securities may be sensitive to changes in interest rates, and may be subject to early repayment and the market’s perception of issuer creditworthiness. Illiquid securities may be difficult to sell at a price approximating their value. Loan participations and assignments involve additional risks, including credit, interest-rate, counterparty, liquidity, and lending risk. Sector investing is subject to greater risks than the market as a whole. Because the fund may focus on particular sectors of the economy, its performance may depend on the performance of those sectors and investments focused in one sector may fluctuate more widely than investments diversified across sectors. Please see the fund’s prospectuses for additional risks.
| |
| Annual report | Global Income Fund | 11 |
Fund’s investments
As of 7-31-14
| | | | | |
| | | | Maturity | | |
| | Rate (%) | | date | Par value^ | Value |
| Corporate Bonds 49.1% | | | | $290,324,587 |
|
| (Cost $283,772,018) | | | | | |
| | | | | | |
| Argentina 0.0% | | | | | 201,760 |
|
| YPF SA (S) | 8.750 | | 04-04-24 | 194,000 | 201,760 |
| | | | | | |
| Austria 0.1% | | | | | 297,160 |
|
| ESAL GmbH (S) | 6.250 | | 02-05-23 | 304,000 | 297,160 |
| | | | | | |
| Azerbaijan 0.4% | | | | | 2,139,963 |
|
| State Oil Company of the Azerbaijan Republic | 4.750 | | 03-13-23 | 1,631,000 | 1,626,923 |
|
| State Oil Company of the Azerbaijan Republic | 5.450 | | 02-09-17 | 484,000 | 513,040 |
| | | | | | |
| Brazil 0.0% | | | | | 286,638 |
|
| Samarco Mineracao SA (S) | 4.125 | | 11-01-22 | 303,000 | 286,638 |
| | | | | | |
| Canada 1.5% | | | | | 9,111,813 |
|
| Bombardier, Inc. (S) | 6.000 | | 10-15-22 | 1,055,000 | 1,033,900 |
|
| Bombardier, Inc. (S) | 6.125 | | 01-15-23 | 500,000 | 492,500 |
|
| Cascades, Inc. (S) | 5.500 | | 07-15-22 | 845,000 | 834,438 |
|
| Cascades, Inc. | 7.875 | | 01-15-20 | 600,000 | 635,250 |
|
| MEG Energy Corp. (S) | 6.500 | | 03-15-21 | 750,000 | 770,625 |
|
| MEG Energy Corp. (S) | 7.000 | | 03-31-24 | 500,000 | 528,750 |
|
| Mercer International, Inc. | 9.500 | | 12-01-17 | 1,045,000 | 1,107,700 |
|
| Norbord, Inc. (S) | 5.375 | | 12-01-20 | 1,340,000 | 1,329,950 |
|
| Quebecor Media, Inc. | 5.750 | | 01-15-23 | 1,275,000 | 1,287,750 |
|
| Trinidad Drilling, Ltd. (S) | 7.875 | | 01-15-19 | 1,039,000 | 1,090,950 |
| | | | | | |
| Cayman Islands 0.6% | | | | | 3,634,196 |
|
| Grupo Aval, Ltd. (S) | 4.750 | | 09-26-22 | 200,000 | 199,500 |
|
| Gruposura Finance (S) | 5.700 | | 05-18-21 | 200,000 | 216,000 |
|
| Itau Unibanco Holding SA (S) | 5.650 | | 03-19-22 | 404,000 | 415,635 |
|
| MAF Global Securities, Ltd. (7.125% to | | | | | |
| 10-29-18, then 5 year U.S. Swap Rate + | | | | | |
| 5.702%) (Q) | 7.125 | | 10-29-18 | 200,000 | 215,500 |
|
| Odebrecht Drilling Norbe VIII/IX, Ltd. | 6.350 | | 06-30-21 | 175,000 | 185,010 |
|
| Odebrecht Drilling Norbe VIII/IX, Ltd. (S) | 6.350 | | 06-30-21 | 140,875 | 148,933 |
|
| Odebrecht Offshore Drilling Finance, Ltd. (S) | 6.750 | | 10-01-22 | 192,840 | 202,482 |
|
| Offshore Group Investment, Ltd. | 7.125 | | 04-01-23 | 1,995,000 | 1,970,063 |
|
| Schahin II Finance Company, SPV, Ltd. (S) | 5.875 | | 09-25-22 | 83,580 | 81,073 |
| | |
| 12 | Global Income Fund | Annual report | See notes to financial statements |
| | | | | |
| | | | Maturity | | |
| | Rate (%) | | date | Par value^ | Value |
| Chile 1.9% | | | | | $11,293,014 |
|
| Banco del Estado de Chile (S) | 3.875 | | 02-08-22 | 164,000 | 164,986 |
|
| Cencosud SA (S) | 4.875 | | 01-20-23 | 229,000 | 227,612 |
|
| Cencosud SA (S) | 5.500 | | 01-20-21 | 150,000 | 157,984 |
|
| Corporacion Nacional del Cobre de Chile (S) | 3.000 | | 07-17-22 | 2,844,000 | 2,731,992 |
|
| Corporacion Nacional del Cobre de Chile | 3.750 | | 11-04-20 | 860,000 | 889,936 |
|
| Corporacion Nacional del Cobre de Chile (S) | 4.250 | | 07-17-42 | 637,000 | 581,559 |
|
| Corporacion Nacional del Cobre de Chile (S) | 4.500 | | 08-13-23 | 2,857,000 | 3,021,215 |
|
| Corporacion Nacional del Cobre de Chile (S) | 6.150 | | 10-24-36 | 255,000 | 298,720 |
|
| Corporacion Nacional del Cobre de Chile | 6.150 | | 10-24-36 | 2,361,000 | 2,765,798 |
|
| Corporacion Nacional del Cobre de Chile | 7.500 | | 01-15-19 | 197,000 | 237,462 |
|
| GeoPark Latin America, Ltd. Agencia en | | | | | |
| Chile (S) | 7.500 | | 02-11-20 | 200,000 | 215,750 |
| | | | | | |
| China 0.1% | | | | | 400,000 |
|
| Country Garden Holdings Company, Ltd. | 11.125 | | 02-23-18 | 175,000 | 190,750 |
|
| Kaisa Group Holdings, Ltd. (S) | 8.875 | | 03-19-18 | 200,000 | 209,250 |
| | | | | | |
| Colombia 0.2% | | | | | 996,138 |
|
| Bancolombia SA | 5.125 | | 09-11-22 | 435,000 | 435,653 |
|
| Pacific Rubiales Energy Corp. (S) | 5.125 | | 03-28-23 | 351,000 | 345,735 |
|
| Transportadora de Gas Internacional SA ESP (S) | 5.700 | | 03-20-22 | 200,000 | 214,750 |
| | | | | | |
| France 0.5% | | | | | 2,860,375 |
|
| Numericable Group SA (S) | 6.000 | | 05-15-22 | 880,000 | 880,000 |
|
| Numericable Group SA (S) | 6.250 | | 05-15-24 | 630,000 | 633,150 |
|
| SPCM SA (S) | 6.000 | | 01-15-22 | 1,265,000 | 1,347,225 |
| | | | | | |
| Germany 0.3% | | | | | 1,873,750 |
|
| CeramTec Group GmbH | 8.250 | | 08-15-21 | EUR 1,275,000 | 1,873,750 |
| | | | | | |
| Hong Kong 0.1% | | | | | 536,825 |
|
| CITIC Pacific, Ltd. | 6.375 | | 04-10-20 | 290,000 | 324,075 |
|
| CITIC Pacific, Ltd. (7.875% to 4-15-16, then | | | | | |
| 5 year CMT + 5.545%) (Q) | 7.875 | | 04-15-16 | 200,000 | 212,750 |
| | | | | | |
| India 0.1% | | | | | 716,745 |
|
| Vedanta Resources PLC (S) | 6.000 | | 01-31-19 | 368,000 | 378,120 |
|
| Vedanta Resources PLC | 6.750 | | 06-07-16 | 150,000 | 157,425 |
|
| Vedanta Resources PLC (S) | 8.250 | | 06-07-21 | 160,000 | 181,200 |
| | | | | | |
| Indonesia 0.2% | | | | | 967,875 |
|
| Adaro Indonesia PT | 7.625 | | 10-22-19 | 300,000 | 312,000 |
|
| Perusahaan Gas Negara Persero Tbk PT (S) | 5.125 | | 05-16-24 | 70,000 | 70,875 |
|
| Perusahaan Listrik Negara PT | 5.250 | | 10-24-42 | 650,000 | 585,000 |
| | | | | | |
| Ireland 0.6% | | | | | 3,598,689 |
|
| Alfa Bank OJSC (S) | 7.500 | | 09-26-19 | 68,000 | 65,620 |
|
| Ardagh Packaging Finance PLC (S) | 4.250 | | 01-15-22 | EUR 425,000 | 557,145 |
|
| Ardagh Packaging Finance PLC (S) | 6.000 | | 06-30-21 | 675,000 | 644,625 |
|
| Grifols Worldwide Operations, Ltd. (S) | 5.250 | | 04-01-22 | 1,075,000 | 1,079,031 |
|
| Ono Finance II PLC (S) | 10.875 | | 07-15-19 | 895,000 | 971,075 |
|
| Vimpel Communications (S) | 7.748 | | 02-02-21 | 274,000 | 281,193 |
| | |
| See notes to financial statements | Annual report | Global Income Fund | 13 |
| | | | | |
| | | | Maturity | | |
| | Rate (%) | | date | Par value^ | Value |
| Kazakhstan 2.2% | | | | | $12,970,982 |
|
| KazMunayGas National Company (S) | 4.400 | | 04-30-23 | 652,000 | 650,370 |
|
| KazMunayGas National Company (S) | 5.750 | | 04-30-43 | 421,000 | 414,769 |
|
| KazMunayGas National Company | 6.375 | | 04-09-21 | 2,369,000 | 2,680,405 |
|
| KazMunayGas National Company (S) | 6.375 | | 04-09-21 | 433,000 | 489,918 |
|
| KazMunayGas National Company | 7.000 | | 05-05-20 | 2,053,000 | 2,371,215 |
|
| KazMunayGas National Company (S) | 7.000 | | 05-05-20 | 325,000 | 375,375 |
|
| KazMunayGas National Company (S) | 9.125 | | 07-02-18 | 1,856,000 | 2,245,760 |
|
| KazMunayGas National Company | 11.750 | | 01-23-15 | 3,079,000 | 3,226,607 |
|
| Zhaikmunai LLP (S) | 7.125 | | 11-13-19 | 475,000 | 516,563 |
| | | | | | |
| Luxembourg 3.0% | | | | | 17,830,360 |
|
| Altice SA (S) | 7.750 | | 05-15-22 | 1,265,000 | 1,293,463 |
|
| APERAM (S) | 7.375 | | 04-01-16 | 900,000 | 920,250 |
|
| APERAM (S) | 7.750 | | 04-01-18 | 550,000 | 578,875 |
|
| ArcelorMittal | 6.750 | | 02-25-22 | 1,585,000 | 1,715,763 |
|
| ArcelorMittal | 7.500 | | 10-15-39 | 1,045,000 | 1,089,413 |
|
| Ardagh Finance Holdings SA, PIK (S) | 8.625 | | 06-15-19 | 595,000 | 599,463 |
|
| Cosan Luxembourg SA (S) | 5.000 | | 03-14-23 | 375,000 | 354,375 |
|
| Far East Capital, Ltd. SA (S) | 8.000 | | 05-02-18 | 207,000 | 149,040 |
|
| INEOS Group Holdings SA (S) | 5.875 | | 02-15-19 | 1,610,000 | 1,626,100 |
|
| Mallinckrodt International Finance SA (S) | 5.750 | | 08-01-22 | 1,000,000 | 1,005,000 |
|
| Matterhorn Mobile Holdings SA | 8.250 | | 02-15-20 | EUR 800,000 | 1,162,296 |
|
| Mobile Challenger Intermediate Group SA, PIK | 8.750 | | 03-15-19 | EUR 850,000 | 1,160,957 |
|
| Pacific Drilling SA (S) | 5.375 | | 06-01-20 | 1,500,000 | 1,428,750 |
|
| Trinseo Materials Operating SCA | 8.750 | | 02-01-19 | 2,362,000 | 2,486,005 |
|
| Wind Acquisition Finance SA (S) | 4.000 | | 07-15-20 | EUR 340,000 | 455,846 |
|
| Wind Acquisition Finance SA (S) | 4.750 | | 07-15-20 | 65,000 | 63,538 |
|
| Wind Acquisition Finance SA (S) | 6.500 | | 04-30-20 | 1,055,000 | 1,120,938 |
|
| Wind Acquisition Finance SA (S) | 7.375 | | 04-23-21 | 595,000 | 620,288 |
| | | | | | |
| Mexico 0.2% | | | | | 1,418,131 |
|
| Cemex SAB de CV (S) | 7.250 | | 01-15-21 | 200,000 | 212,000 |
|
| Cemex SAB de CV (S) | 9.500 | | 06-15-18 | 400,000 | 446,000 |
|
| Comision Federal de Electricidad (S) | 4.875 | | 01-15-24 | 295,000 | 313,733 |
|
| Metalsa SA de CV (S) | 4.900 | | 04-24-23 | 249,000 | 243,398 |
|
| Mexico Generadora de Energia S de rl (S) | 5.500 | | 12-06-32 | 200,000 | 203,000 |
| | | | | | |
| Morocco 0.2% | | | | | 1,257,000 |
|
| OCP SA (S) | 5.625 | | 04-25-24 | 1,200,000 | 1,257,000 |
| | | | | | |
| Netherlands 0.7% | | | | | 4,215,268 |
|
| Bharti Airtel International Netherlands BV | 4.000 | | 12-10-18 | EUR 120,000 | 172,909 |
|
| Bharti Airtel International Netherlands BV (S) | 5.125 | | 03-11-23 | 296,000 | 306,020 |
|
| Constellium NV (S) | 5.750 | | 05-15-24 | 865,000 | 890,950 |
|
| Indosat Palapa Company BV | 7.375 | | 07-29-20 | 200,000 | 214,000 |
|
| Intergas Finance BV | 6.375 | | 05-14-17 | 158,000 | 172,220 |
|
| Listrindo Capital BV (S) | 6.950 | | 02-21-19 | 201,000 | 216,075 |
|
| UPC Holding BV | 6.375 | | 09-15-22 | EUR 1,200,000 | 1,735,409 |
|
| VimpelCom Holdings BV (S) | 5.200 | | 02-13-19 | 300,000 | 288,000 |
|
| VTR Finance BV (S) | 6.875 | | 01-15-24 | 212,000 | 219,685 |
| | |
| 14 | Global Income Fund | Annual report | See notes to financial statements |
| | | | | |
| | | | Maturity | | |
| | Rate (%) | | date | Par value^ | Value |
| Peru 0.2% | | | | | $1,014,250 |
|
| Cementos Pacasmayo SAA (S) | 4.500 | | 02-08-23 | 325,000 | 307,125 |
|
| Cia Minera Ares SAC (S) | 7.750 | | 01-23-21 | 450,000 | 487,125 |
|
| Inkia Energy, Ltd. (S) | 8.375 | | 04-04-21 | 200,000 | 220,000 |
| | | | | | |
| Russia 0.0% | | | | | 202,650 |
|
| EuroChem Mineral & Chemical Company | | | | | |
| OJSC (S) | 5.125 | | 12-12-17 | 210,000 | 202,650 |
| | | | | | |
| Singapore 0.1% | | | | | 287,141 |
|
| STATS ChipPAC, Ltd. (S) | 4.500 | | 03-20-18 | 83,000 | 84,141 |
|
| TBG Global Pte, Ltd. (S) | 4.625 | | 04-03-18 | 200,000 | 203,000 |
| | | | | | |
| South Africa 0.2% | | | | | 1,099,725 |
|
| Eskom Holdings SOC, Ltd. (S) | 6.750 | | 08-06-23 | 1,023,000 | 1,099,725 |
| | | | | | |
| South Korea 0.2% | | | | | 911,800 |
|
| Magnachip Semiconductor Corp. | 6.625 | | 07-15-21 | 940,000 | 911,800 |
| | | | | | |
| Thailand 0.1% | | | | | 504,489 |
|
| PTT Exploration & Production PCL (4.875% to | | | | | |
| 6-18-19, then 5 year CMT + 3.177%) (Q)(S) | 4.875 | | 06-18-19 | 499,000 | 504,489 |
| | | | | | |
| Turkey 0.1% | | | | | 611,320 |
|
| Turk Telekomunikasyon AS (S) | 4.875 | | 06-19-24 | 620,000 | 611,320 |
| | | | | | |
| United Kingdom 0.5% | | | | | 3,213,313 |
|
| Boparan Finance PLC (S) | 5.500 | | 07-15-21 | GBP 450,000 | 708,134 |
|
| Premier Foods PLC | 6.500 | | 03-15-21 | GBP 700,000 | 1,149,310 |
|
| R&R PLC, PIK | 9.250 | | 05-15-18 | EUR 900,000 | 1,234,069 |
|
| Tullow Oil PLC (S) | 6.000 | | 11-01-20 | 120,000 | 121,800 |
| | | | | | |
| United States 30.6% | | | | | 181,095,684 |
|
| Access Midstream Partners LP | 4.875 | | 05-15-23 | 1,215,000 | 1,251,414 |
|
| Access Midstream Partners LP | 4.875 | | 03-15-24 | 525,000 | 540,750 |
|
| ACCO Brands Corp. | 6.750 | | 04-30-20 | 1,962,000 | 2,040,480 |
|
| AES Corp. | 4.875 | | 05-15-23 | 1,300,000 | 1,225,250 |
|
| Aircastle, Ltd. | 6.750 | | 04-15-17 | 725,000 | 789,344 |
|
| Alcatel-Lucent USA, Inc. (S) | 6.750 | | 11-15-20 | 910,000 | 930,475 |
|
| Allegiant Travel Company | 5.500 | | 07-15-19 | 525,000 | 530,906 |
|
| AMC Entertainment, Inc. | 5.875 | | 02-15-22 | 1,385,000 | 1,405,775 |
|
| American Builders & Contractors Supply | | | | | |
| Company, Inc. (S) | 5.625 | | 04-15-21 | 950,000 | 952,375 |
|
| Amkor Technology, Inc. | 6.375 | | 10-01-22 | 1,486,000 | 1,545,440 |
|
| Arch Coal, Inc. | 7.250 | | 06-15-21 | 1,620,000 | 1,053,000 |
|
| Artesyn Escrow, Inc. (S) | 9.750 | | 10-15-20 | 1,030,000 | 1,014,550 |
|
| BBVA Bancomer SA/Texas (S) | 6.750 | | 09-30-22 | 205,000 | 232,675 |
|
| Biomet, Inc. | 6.500 | | 08-01-20 | 1,010,000 | 1,089,437 |
|
| BMC Software Finance, Inc. (S) | 8.125 | | 07-15-21 | 1,060,000 | 1,054,700 |
|
| Bonanza Creek Energy, Inc. | 5.750 | | 02-01-23 | 450,000 | 441,000 |
|
| Bonanza Creek Energy, Inc. | 6.750 | | 04-15-21 | 1,545,000 | 1,606,800 |
|
| Cablevision Systems Corp. | 5.875 | | 09-15-22 | 2,255,000 | 2,221,175 |
|
| Cablevision Systems Corp. | 8.000 | | 04-15-20 | 890,000 | 1,003,475 |
|
| Calpine Corp. | 5.375 | | 01-15-23 | 220,000 | 215,050 |
|
| Calpine Corp. | 5.750 | | 01-15-25 | 1,200,000 | 1,167,000 |
|
| Calpine Corp. (S) | 7.875 | | 01-15-23 | 1,694,000 | 1,842,225 |
| | |
| See notes to financial statements | Annual report | Global Income Fund | 15 |
| | | | | |
| | | | Maturity | | |
| | Rate (%) | | date | Par value^ | Value |
| United States (continued) | | | | | |
|
| Calumet Specialty Products Partners LP (S) | 6.500 | | 04-15-21 | 1,005,000 | $1,025,100 |
|
| Calumet Specialty Products Partners LP | 9.625 | | 08-01-20 | 1,015,000 | 1,157,100 |
|
| CBS Outdoor Americas Capital LLC (S) | 5.250 | | 02-15-22 | 1,190,000 | 1,187,025 |
|
| CCO Holdings LLC | 6.625 | | 01-31-22 | 1,630,000 | 1,711,500 |
|
| Cemex Finance LLC (S) | 9.375 | | 10-12-22 | 325,000 | 370,500 |
|
| CenturyLink, Inc. | 5.800 | | 03-15-22 | 530,000 | 543,250 |
|
| CenturyLink, Inc. | 6.750 | | 12-01-23 | 515,000 | 558,775 |
|
| CenturyLink, Inc. | 7.650 | | 03-15-42 | 735,000 | 735,000 |
|
| Cequel Communications Holdings I LLC (S) | 5.125 | | 12-15-21 | 1,470,000 | 1,414,875 |
|
| Chemtura Corp. | 5.750 | | 07-15-21 | 2,285,000 | 2,319,275 |
|
| Chiquita Brands International, Inc. | 7.875 | | 02-01-21 | 2,067,000 | 2,211,690 |
|
| Choice Hotels International, Inc. | 5.750 | | 07-01-22 | 630,000 | 680,400 |
|
| Chrysler Group LLC | 8.250 | | 06-15-21 | 1,475,000 | 1,618,813 |
|
| Cincinnati Bell, Inc. | 8.375 | | 10-15-20 | 850,000 | 922,250 |
|
| Cincinnati Bell, Inc. | 8.750 | | 03-15-18 | 1,120,000 | 1,172,640 |
|
| CIT Group, Inc. | 5.000 | | 08-15-22 | 830,000 | 856,975 |
|
| CIT Group, Inc. | 5.250 | | 03-15-18 | 790,000 | 833,450 |
|
| Clean Harbors, Inc. | 5.250 | | 08-01-20 | 1,115,000 | 1,123,363 |
|
| Cleaver-Brooks, Inc. (S) | 8.750 | | 12-15-19 | 1,171,000 | 1,299,810 |
|
| Cloud Peak Energy Resources LLC | 6.375 | | 03-15-24 | 860,000 | 887,950 |
|
| Cloud Peak Energy Resources LLC | 8.500 | | 12-15-19 | 1,060,000 | 1,122,275 |
|
| Community Health Systems, Inc. (S) | 6.875 | | 02-01-22 | 945,000 | 966,263 |
|
| Community Health Systems, Inc. | 8.000 | | 11-15-19 | 1,160,000 | 1,244,332 |
|
| CONSOL Energy, Inc. | 8.250 | | 04-01-20 | 1,850,000 | 1,970,250 |
|
| CyrusOne LP | 6.375 | | 11-15-22 | 1,675,000 | 1,767,125 |
|
| DaVita Healthcare Partners, Inc. | 5.125 | | 07-15-24 | 1,345,000 | 1,324,825 |
|
| Denbury Resources, Inc. | 5.500 | | 05-01-22 | 1,485,000 | 1,459,013 |
|
| DISH DBS Corp. | 5.000 | | 03-15-23 | 4,000,000 | 3,920,000 |
|
| EP Energy LLC | 9.375 | | 05-01-20 | 1,150,000 | 1,273,625 |
|
| Erickson, Inc. | 8.250 | | 05-01-20 | 1,264,000 | 1,270,320 |
|
| First Data Corp. (S) | 6.750 | | 11-01-20 | 484,000 | 511,830 |
|
| First Data Corp. | 12.625 | | 01-15-21 | 1,100,000 | 1,317,938 |
|
| Frontier Communications Corp. | 9.000 | | 08-15-31 | 1,454,000 | 1,548,510 |
|
| FTS International, Inc. (S) | 6.250 | | 05-01-22 | 1,225,000 | 1,246,438 |
|
| Gannett Company, Inc. (S) | 6.375 | | 10-15-23 | 1,435,000 | 1,513,925 |
|
| GenOn Energy, Inc. | 9.500 | | 10-15-18 | 3,395,000 | 3,547,775 |
|
| Gray Television, Inc. | 7.500 | | 10-01-20 | 1,760,000 | 1,841,400 |
|
| Griffon Corp. | 5.250 | | 03-01-22 | 2,155,000 | 2,109,206 |
|
| Guitar Center, Inc. (S) | 6.500 | | 04-15-19 | 375,000 | 356,250 |
|
| Guitar Center, Inc. (S) | 9.625 | | 04-15-20 | 695,000 | 641,138 |
|
| Halcon Resources Corp. | 9.750 | | 07-15-20 | 1,410,000 | 1,501,650 |
|
| HCA Holdings, Inc. | 7.750 | | 05-15-21 | 985,000 | 1,062,569 |
|
| HCA, Inc. | 5.875 | | 03-15-22 | 1,070,000 | 1,136,206 |
|
| HealthSouth Corp. | 5.750 | | 11-01-24 | 1,025,000 | 1,071,125 |
|
| Hilton Worldwide Finance LLC (S) | 5.625 | | 10-15-21 | 1,440,000 | 1,508,400 |
|
| HJ Heinz Company | 4.250 | | 10-15-20 | 1,055,000 | 1,048,406 |
|
| Hologic, Inc. | 6.250 | | 08-01-20 | 860,000 | 896,550 |
|
| Hornbeck Offshore Services, Inc. | 5.000 | | 03-01-21 | 765,000 | 749,700 |
| | |
| 16 | Global Income Fund | Annual report | See notes to financial statements |
| | | | | |
| | | | Maturity | | |
| | Rate (%) | | date | Par value^ | Value |
| United States (continued) | | | | | |
|
| Hot Topic, Inc. (S) | 9.250 | | 06-15-21 | 1,245,000 | $1,369,500 |
|
| IASIS Healthcare LLC | 8.375 | | 05-15-19 | 1,425,000 | 1,506,938 |
|
| International Lease Finance Corp. | 8.250 | | 12-15-20 | 1,120,000 | 1,346,800 |
|
| Isle of Capri Casinos, Inc. | 5.875 | | 03-15-21 | 1,910,000 | 1,957,750 |
|
| Kinetic Concepts, Inc. | 10.500 | | 11-01-18 | 1,105,000 | 1,223,788 |
|
| Kinetic Concepts, Inc. | 12.500 | | 11-01-19 | 1,140,000 | 1,275,432 |
|
| Kodiak Oil & Gas Corp. | 5.500 | | 01-15-21 | 845,000 | 887,250 |
|
| Landry’s, Inc. (S) | 9.375 | | 05-01-20 | 1,200,000 | 1,302,000 |
|
| Laredo Petroleum, Inc. | 5.625 | | 01-15-22 | 715,000 | 727,513 |
|
| Laredo Petroleum, Inc. | 7.375 | | 05-01-22 | 830,000 | 904,700 |
|
| Lennar Corp. | 4.750 | | 11-15-22 | 1,350,000 | 1,296,000 |
|
| Level 3 Escrow II, Inc. (S) | 5.375 | | 08-15-22 | 550,000 | 543,125 |
|
| Level 3 Financing, Inc. | 7.000 | | 06-01-20 | 1,545,000 | 1,637,700 |
|
| Levi Strauss & Company | 6.875 | | 05-01-22 | 1,355,000 | 1,456,625 |
|
| LifePoint Hospitals, Inc. (S) | 5.500 | | 12-01-21 | 1,785,000 | 1,825,163 |
|
| Linn Energy LLC | 7.750 | | 02-01-21 | 1,740,000 | 1,822,650 |
|
| Louisiana-Pacific Corp. | 7.500 | | 06-01-20 | 895,000 | 977,788 |
|
| MasTec, Inc. | 4.875 | | 03-15-23 | 2,345,000 | 2,301,031 |
|
| Mediacom Broadband LLC (S) | 5.500 | | 04-15-21 | 460,000 | 464,600 |
|
| Mediacom LLC | 7.250 | | 02-15-22 | 1,735,000 | 1,865,125 |
|
| MGM Resorts International | 6.625 | | 12-15-21 | 1,990,000 | 2,151,688 |
|
| Midstates Petroleum Company, Inc. | 10.750 | | 10-01-20 | 1,405,000 | 1,513,888 |
|
| NCR Corp. | 5.000 | | 07-15-22 | 1,135,000 | 1,120,813 |
|
| Nexstar Broadcasting, Inc. | 6.875 | | 11-15-20 | 1,305,000 | 1,383,300 |
|
| NRG Energy, Inc. (S) | 6.250 | | 07-15-22 | 1,665,000 | 1,714,950 |
|
| Nuance Communications, Inc. (S) | 5.375 | | 08-15-20 | 1,250,000 | 1,262,500 |
|
| Oasis Petroleum, Inc. (S) | 6.875 | | 03-15-22 | 1,250,000 | 1,353,125 |
|
| Oasis Petroleum, Inc. | 7.250 | | 02-01-19 | 720,000 | 752,400 |
|
| Ocwen Financial Corp. (S) | 6.625 | | 05-15-19 | 780,000 | 797,550 |
|
| Outerwall, Inc. | 6.000 | | 03-15-19 | 900,000 | 920,250 |
|
| Parker Drilling Company (S) | 6.750 | | 07-15-22 | 1,510,000 | 1,540,200 |
|
| Peabody Energy Corp. | 6.250 | | 11-15-21 | 2,590,000 | 2,454,025 |
|
| Petco Holdings Inc., PIK (S) | 8.500 | | 10-15-17 | 1,115,000 | 1,126,150 |
|
| Pinnacle Entertainment, Inc. | 6.375 | | 08-01-21 | 1,975,000 | 2,034,250 |
|
| Post Holdings, Inc. | 7.375 | | 02-15-22 | 1,740,000 | 1,835,700 |
|
| Prestige Brands, Inc. (S) | 5.375 | | 12-15-21 | 620,000 | 620,000 |
|
| Prospect Medical Holdings, Inc. (S) | 8.375 | | 05-01-19 | 950,000 | 1,028,375 |
|
| Provident Funding Associates LP (S) | 6.750 | | 06-15-21 | 500,000 | 496,250 |
|
| Provident Funding Associates LP (S) | 10.125 | | 02-15-19 | 975,000 | 1,048,125 |
|
| QEP Resources, Inc. | 5.375 | | 10-01-22 | 1,870,000 | 1,902,725 |
|
| Quiksilver, Inc. (S) | 7.875 | | 08-01-18 | 1,095,000 | 1,007,400 |
|
| Quiksilver, Inc. | 10.000 | | 08-01-20 | 665,000 | 568,575 |
|
| Rayonier AM Products, Inc. (S) | 5.500 | | 06-01-24 | 1,435,000 | 1,413,475 |
|
| Reynolds Group Issuer, Inc. | 8.250 | | 02-15-21 | 1,585,000 | 1,680,100 |
|
| RHP Hotel Properties LP | 5.000 | | 04-15-21 | 1,260,000 | 1,250,550 |
|
| RJS Power Holdings LLC (S) | 5.125 | | 07-15-19 | 1,345,000 | 1,324,825 |
|
| RSI Home Products, Inc. (S) | 6.875 | | 03-01-18 | 975,000 | 1,033,500 |
|
| Sabine Pass Liquefaction LLC | 5.625 | | 02-01-21 | 1,505,000 | 1,557,675 |
| | |
| See notes to financial statements | Annual report | Global Income Fund | 17 |
| | | | | |
| | | | Maturity | | |
| | Rate (%) | | date | Par value^ | Value |
| United States (continued) | | | | | |
|
| Samson Investment Company (S) | 10.750 | | 02-15-20 | 1,845,000 | $1,868,063 |
|
| SandRidge Energy, Inc. | 7.500 | | 03-15-21 | 2,185,000 | 2,272,400 |
|
| Sealed Air Corp. (S) | 8.375 | | 09-15-21 | 490,000 | 547,575 |
|
| Signode Industrial Group Lux SA (S) | 6.375 | | 05-01-22 | 660,000 | 650,100 |
|
| Sinclair Television Group, Inc. (S) | 5.625 | | 08-01-24 | 565,000 | 549,463 |
|
| Sinclair Television Group, Inc. | 6.125 | | 10-01-22 | 2,295,000 | 2,369,588 |
|
| SiTV LLC (S) | 10.375 | | 07-01-19 | 275,000 | 276,375 |
|
| Smithfield Foods, Inc. | 6.625 | | 08-15-22 | 1,025,000 | 1,109,563 |
|
| Spectrum Brands, Inc. | 6.375 | | 11-15-20 | 1,330,000 | 1,399,825 |
|
| Sprint Capital Corp. | 8.750 | | 03-15-32 | 3,050,000 | 3,385,500 |
|
| T-Mobile USA, Inc. | 6.500 | | 01-15-24 | 815,000 | 847,600 |
|
| T-Mobile USA, Inc. | 6.731 | | 04-28-22 | 1,305,000 | 1,366,988 |
|
| Tenet Healthcare Corp. | 6.000 | | 10-01-20 | 755,000 | 792,750 |
|
| Tenet Healthcare Corp. | 8.125 | | 04-01-22 | 1,050,000 | 1,173,375 |
|
| Tesoro Logistics LP | 5.875 | | 10-01-20 | 795,000 | 818,850 |
|
| Tesoro Logistics LP | 6.125 | | 10-15-21 | 1,160,000 | 1,206,400 |
|
| The Bon-Ton Department Stores, Inc. | 8.000 | | 06-15-21 | 590,000 | 536,900 |
|
| The Goodyear Tire & Rubber Company | 6.500 | | 03-01-21 | 1,085,000 | 1,147,388 |
|
| The Sun Products Corp. (S) | 7.750 | | 03-15-21 | 1,455,000 | 1,193,100 |
|
| The William Carter Company | 5.250 | | 08-15-21 | 1,125,000 | 1,170,000 |
|
| Ultra Petroleum Corp. (S) | 5.750 | | 12-15-18 | 860,000 | 894,400 |
|
| Venoco, Inc. | 8.875 | | 02-15-19 | 1,355,000 | 1,314,350 |
|
| WESCO Distribution, Inc. | 5.375 | | 12-15-21 | 655,000 | 669,738 |
|
| Windstream Corp. | 7.500 | | 04-01-23 | 2,118,000 | 2,255,670 |
|
| Xerium Technologies, Inc. | 8.875 | | 06-15-18 | 930,000 | 985,800 |
| | | | | | |
| Venezuela 2.8% | | | | | 16,735,486 |
|
| Petroleos de Venezuela SA | 5.000 | | 10-28-15 | 2,706,514 | 2,540,740 |
|
| Petroleos de Venezuela SA | 5.250 | | 04-12-17 | 2,595,500 | 2,186,709 |
|
| Petroleos de Venezuela SA | 5.375 | | 04-12-27 | 662,100 | 396,598 |
|
| Petroleos de Venezuela SA | 6.000 | | 05-16-24 | 326,162 | 212,821 |
|
| Petroleos de Venezuela SA | 6.000 | | 11-15-26 | 1,560,965 | 962,335 |
|
| Petroleos de Venezuela SA | 8.500 | | 11-02-17 | 8,946,200 | 8,346,805 |
|
| Petroleos de Venezuela SA | 9.750 | | 05-17-35 | 2,587,589 | 2,089,478 |
| | | | | | |
| Virgin Islands 1.4% | | | | | 8,042,047 |
|
| Sinochem Offshore Capital Company, Ltd. (S) | 3.250 | | 04-29-19 | 933,000 | 945,404 |
|
| Sinochem Overseas Capital Company, Ltd. (S) | 4.500 | | 11-12-20 | 4,695,000 | 5,000,137 |
|
| Sinopec Capital 2013, Ltd. (S) | 3.125 | | 04-24-23 | 658,000 | 617,642 |
|
| Sinopec Group Overseas Development | | | | | |
| 2012, Ltd. | 3.900 | | 05-17-22 | 525,000 | 529,780 |
|
| Sinopec Group Overseas Development | | | | | |
| 2012, Ltd. (S) | 4.875 | | 05-17-42 | 371,000 | 377,325 |
|
| Sinopec Group Overseas Development | | | | | |
| 2014, Ltd. (S) | 4.375 | | 04-10-24 | 551,000 | 571,759 |
| | |
| 18 | Global Income Fund | Annual report | See notes to financial statements |
| | | | | |
| | | | Maturity | | |
| | Rate (%) | | date | Par value^ | Value |
| Foreign Government Obligations 43.7% | | | $258,154,807 |
|
| (Cost $255,751,366) | | | | | |
| |
| Argentina 2.4% | | | | | 13,947,797 |
|
| Republic of Argentina | | | | | |
| Bond (H) | 6.000 | | 03-31-23 | 931,000 | 1,052,030 |
| Bond | 7.000 | | 10-03-15 | 4,080,068 | 3,937,266 |
| Bond | 7.000 | | 04-17-17 | 8,516,985 | 7,771,749 |
| Bond | 8.750 | | 06-02-17 | 1,342,480 | 1,186,752 |
| |
| Azerbaijan 0.4% | | | | | 2,650,428 |
|
| Republic of Azerbaijan | | | | | |
| Bond (S) | 4.750 | | 03-18-24 | 2,567,000 | 2,650,428 |
| |
| Brazil 3.1% | | | | | 18,241,163 |
|
| Brazil Minas SPE | 5.333 | | 02-15-28 | 200,000 | 198,500 |
|
| Federative Republic of Brazil | | | | | |
| Bond | 2.625 | | 01-05-23 | 8,109,000 | 7,411,626 |
| Bond | 4.250 | | 01-07-25 | 7,972,000 | 7,991,930 |
| Bond | 4.875 | | 01-22-21 | 402,000 | 432,954 |
| Bond | 7.125 | | 01-20-37 | 1,757,000 | 2,200,643 |
| Bond | 8.250 | | 01-20-34 | 4,000 | 5,510 |
| |
| Colombia 2.6% | | | | | 15,464,894 |
|
| Bogota Distrito Capital | | | | | |
| Bond | 9.750 | | 07-26-28 | COP 2,728,000,000 | 1,817,703 |
|
| Republic of Colombia | | | | | |
| Bond | 2.625 | | 03-15-23 | 515,000 | 481,525 |
| Bond | 4.000 | | 02-26-24 | 3,022,000 | 3,089,995 |
| Bond | 4.375 | | 07-12-21 | 1,421,000 | 1,513,365 |
| Bond | 7.375 | | 09-18-37 | 3,302,000 | 4,457,700 |
| Bond | 7.750 | | 04-14-21 | COP 633,000,000 | 378,671 |
| Bond | 8.125 | | 05-21-24 | 450,000 | 605,250 |
| Bond | 9.850 | | 06-28-27 | COP 510,000,000 | 350,581 |
| Bond | 10.375 | | 01-28-33 | 391,000 | 616,803 |
| Bond | 11.750 | | 02-25-20 | 1,109,000 | 1,599,733 |
| Bond | 12.000 | | 10-22-15 | COP 954,000,000 | 553,568 |
| |
| Costa Rica 0.7% | | | | | 4,380,898 |
|
| Republic of Costa Rica | | | | | |
| Bond | 4.250 | | 01-26-23 | 3,535,000 | 3,331,738 |
| Bond (S) | 4.375 | | 04-30-25 | 616,000 | 568,260 |
| Bond (S) | 7.000 | | 04-04-44 | 458,000 | 480,900 |
| |
| Croatia 1.5% | | | | | 8,602,289 |
|
| Republic of Croatia | | | | | |
| Bond | 5.500 | | 04-04-23 | 2,841,000 | 2,940,435 |
| Bond (S) | 6.000 | | 01-26-24 | 1,717,000 | 1,832,898 |
| Bond | 6.000 | | 01-26-24 | 941,000 | 1,004,518 |
| Bond | 6.250 | | 04-27-17 | 1,450,000 | 1,556,938 |
| Bond (S) | 6.375 | | 03-24-21 | 116,000 | 127,020 |
| Bond | 6.750 | | 11-05-19 | 1,024,000 | 1,140,480 |
| |
| Dominican Republic 1.7% | | | | | 10,116,884 |
|
| Government of Dominican Republic | | | | | |
| Bond (S) | 5.875 | | 04-18-24 | 972,000 | 1,006,020 |
| Bond | 6.600 | | 01-28-24 | 1,816,000 | 1,979,440 |
| Bond (S) | 7.450 | | 04-30-44 | 647,000 | 689,055 |
| Bond | 7.500 | | 05-06-21 | 5,029,000 | 5,745,633 |
| Bond | 9.040 | | 01-23-18 | 631,960 | 696,736 |
| | |
| See notes to financial statements | Annual report | Global Income Fund | 19 |
| | | | | |
| | | | Maturity | | |
| | Rate (%) | | date | Par value^ | Value |
| El Salvador 0.7% | | | | $4,405,133 |
|
| Republic of El Salvador | | | | |
| Bond | 5.875 | | 01-30-25 | 368,000 | 367,080 |
| Bond | 7.650 | | 06-15-35 | 1,995,000 | 2,174,550 |
| Bond | 7.750 | | 01-24-23 | 1,135,000 | 1,279,713 |
| Bond | 8.250 | | 04-10-32 | 500,000 | 583,790 |
| |
| Gabon 0.1% | | | | 662,679 |
|
| Republic of Gabon | | | | |
| Bond | 8.200 | | 12-12-17 | 580,000 | 662,679 |
| |
| Ghana 0.1% | | | | 468,363 |
|
| Republic of Ghana | | | | |
| Bond | 8.500 | | 10-04-17 | 445,000 | 468,363 |
| |
| Hungary 1.3% | | | | 7,571,693 |
|
| Republic of Hungary | | | | |
| Bond | 4.125 | | 02-19-18 | 390,000 | 404,625 |
| Bond | 4.375 | | 07-04-17 | EUR 442,000 | 637,729 |
| Bond | 5.000 | | 03-30-16 | GBP 104,000 | 183,300 |
| Bond | 5.375 | | 03-25-24 | 88,000 | 93,060 |
| Bond | 5.750 | | 11-22-23 | 1,758,000 | 1,911,825 |
| Bond | 6.000 | | 01-11-19 | EUR 331,000 | 513,034 |
| Bond | 6.375 | | 03-29-21 | 3,358,000 | 3,828,120 |
| |
| Indonesia 3.4% | | | | 20,319,329 |
|
| Republic of Indonesia | | | | |
| Bond (S) | 3.375 | | 04-15-23 | 2,922,000 | 2,768,595 |
| Bond | 3.750 | | 04-25-22 | 1,864,000 | 1,831,380 |
| Bond | 4.875 | | 05-05-21 | 1,631,000 | 1,730,899 |
| Bond | 6.625 | | 02-17-37 | 1,443,000 | 1,666,665 |
| Bond | 6.875 | | 03-09-17 | 874,000 | 978,880 |
| Bond | 6.875 | | 01-17-18 | 287,000 | 326,463 |
| Bond | 7.000 | | 05-15-22 | IDR 2,000,000,000 | 162,384 |
| Bond | 7.750 | | 01-17-38 | 2,912,000 | 3,771,040 |
| Bond | 8.500 | | 10-12-35 | 755,000 | 1,043,788 |
| Bond (S) | 11.625 | | 03-04-19 | 1,555,000 | 2,107,025 |
| Bond | 11.625 | | 03-04-19 | 2,902,000 | 3,932,210 |
| |
| Iraq 0.6% | | | | 3,268,080 |
|
| Republic of Iraq | | | | |
| Bond | 5.800 | | 01-15-28 | 3,672,000 | 3,268,080 |
| |
| Ivory Coast 0.6% | | | | 3,800,326 |
|
| Republic of Ivory Coast | | | | |
| Bond (S) | 5.375 | | 07-23-24 | 479,000 | 469,420 |
| Bond (P) | 5.750 | | 12-31-32 | 3,394,000 | 3,330,906 |
| |
| Jamaica 0.1% | | | | 693,000 |
|
| Government of Jamaica | | | | |
| Bond | 7.625 | | 07-09-25 | 660,000 | 693,000 |
| |
| Kenya 0.2% | | | | 1,084,802 |
|
| Republic of Kenya | | | | |
| Bond (S) | 6.875 | | 06-24-24 | 1,022,000 | 1,084,802 |
| |
| Lithuania 0.4% | | | | 2,266,478 |
|
| Republic of Lithuania | | | | |
| Bond | 6.625 | | 02-01-22 | 1,877,000 | 2,266,478 |
| | |
| 20 | Global Income Fund | Annual report | See notes to financial statements |
| | | | | |
| | | | Maturity | | |
| | Rate (%) | | date | Par value^ | Value |
| Mexico 3.2% | | | | $18,892,513 |
|
| Government of Mexico | | | | |
| Bond | 4.000 | | 10-02-23 | 1,920,000 | 1,998,720 |
| Bond | 4.750 | | 03-08-44 | 554,000 | 555,385 |
| Bond | 5.550 | | 01-21-45 | 1,430,000 | 1,611,610 |
| Bond | 6.050 | | 01-11-40 | 5,486,000 | 6,617,488 |
| Bond | 6.250 | | 06-16-16 | MXN 1,029,000 | 81,945 |
| Bond | 8.000 | | 12-07-23 | MXN 31,000,000 | 2,714,371 |
| Bond | 8.500 | | 12-13-18 | MXN 36,890,000 | 3,205,599 |
| Bond | 9.500 | | 12-18-14 | MXN 3,120,000 | 241,537 |
| Bond | 10.000 | | 12-05-24 | MXN 18,699,000 | 1,865,858 |
| |
| Morocco 0.2% | | | | 1,426,215 |
|
| Kingdom of Morocco | | | | |
| Bond (S) | 4.250 | | 12-11-22 | 1,428,000 | 1,426,215 |
| |
| Netherlands 0.2% | | | | 994,146 |
|
| Republic of Mozambique | | | | |
| Bond | 6.305 | | 09-11-20 | 987,000 | 994,146 |
| |
| Nigeria 0.5% | | | | 3,108,279 |
|
| Federal Republic of Nigeria | | | | |
| Bond (S) | 6.375 | | 07-12-23 | 526,000 | 570,473 |
| Bond | 6.375 | | 07-12-23 | 721,000 | 781,961 |
| Bond | 6.750 | | 01-28-21 | 1,589,000 | 1,755,845 |
| |
| Panama 1.2% | | | | 7,153,384 |
|
| Republic of Panama | | | | |
| Bond | 5.200 | | 01-30-20 | 1,431,000 | 1,581,255 |
| Bond | 6.700 | | 01-26-36 | 1,067,000 | 1,309,743 |
| Bond | 7.125 | | 01-29-26 | 101,000 | 128,018 |
| Bond | 8.125 | | 04-28-34 | 472,000 | 627,760 |
| Bond | 8.875 | | 09-30-27 | 1,155,000 | 1,654,538 |
| Bond | 9.375 | | 04-01-29 | 1,243,000 | 1,852,070 |
| |
| Paraguay 0.1% | | | | 681,725 |
|
| Republic of Paraguay | | | | |
| Bond | 4.625 | | 01-25-23 | 670,000 | 681,725 |
| |
| Peru 1.1% | | | | 6,209,711 |
|
| Republic of Peru | | | | |
| Bond | 7.125 | | 03-30-19 | 196,000 | 236,866 |
| Bond | 7.350 | | 07-21-25 | 2,136,000 | 2,819,520 |
| Bond | 8.375 | | 05-03-16 | 203,000 | 228,375 |
| Bond | 8.750 | | 11-21-33 | 1,918,000 | 2,924,950 |
| |
| Philippines 0.5% | | | | 3,173,570 |
|
| Republic of Philippines | | | | |
| Bond | 7.750 | | 01-14-31 | 2,090,000 | 2,905,100 |
| Bond | 9.500 | | 02-02-30 | 171,000 | 268,470 |
| |
| Poland 0.6% | | | | 3,656,139 |
|
| Republic of Poland | | | | |
| Bond | 5.000 | | 03-23-22 | 910,000 | 1,013,513 |
| Bond | 5.125 | | 04-21-21 | 2,126,000 | 2,384,841 |
| Bond | 6.375 | | 07-15-19 | 218,000 | 257,785 |
| |
| Romania 1.3% | | | | 7,595,621 |
|
| Government of Romania | | | | |
| Bond | 4.375 | | 08-22-23 | 658,000 | 676,983 |
| Bond (S) | 4.875 | | 01-22-24 | 1,206,000 | 1,282,883 |
| Bond | 6.750 | | 02-07-22 | 4,726,000 | 5,635,755 |
| | |
| See notes to financial statements | Annual report | Global Income Fund | 21 |
| | | | | |
| | | | Maturity | | |
| | Rate (%) | | date | Par value^ | Value |
| Russia 4.2% | | | | | $24,916,202 |
|
| Government of Russia | | | | | |
| Bond (S) | 4.875 | | 09-16-23 | 2,400,000 | 2,385,600 |
| Bond | 7.000 | | 08-16-23 | RUB 133,100,000 | 3,227,965 |
| Bond (P) | 7.500 | | 03-31-30 | 15,308,003 | 17,328,659 |
| Bond | 12.750 | | 06-24-28 | 1,189,000 | 1,973,978 |
| |
| Serbia 0.6% | | | | | 3,478,215 |
|
| Republic of Serbia | | | | | |
| Bond | 5.875 | | 12-03-18 | 1,121,000 | 1,195,266 |
| Bond | 7.250 | | 09-28-21 | 588,000 | 678,405 |
| Note | 4.875 | | 02-25-20 | 613,000 | 626,793 |
| Note (S) | 5.875 | | 12-03-18 | 917,000 | 977,751 |
| |
| Slovakia 0.2% | | | | | 918,477 |
|
| Government of Slovakia | | | | | |
| Bond (S) | 4.375 | | 05-21-22 | 859,000 | 918,477 |
| |
| Slovenia 0.6% | | | | | 3,734,188 |
|
| Republic of Slovenia | | | | | |
| Bond (S) | 5.250 | | 02-18-24 | 2,003,000 | 2,141,968 |
| Bond | 5.850 | | 05-10-23 | 1,428,000 | 1,592,220 |
| |
| South Africa 1.5% | | | | | 8,866,439 |
|
| Republic of South Africa | | | | | |
| Bond | 4.665 | | 01-17-24 | 2,007,000 | 2,047,140 |
| Bond | 5.500 | | 03-09-20 | 486,000 | 528,525 |
| Bond | 5.875 | | 05-30-22 | 486,000 | 541,647 |
| Bond | 5.875 | | 09-16-25 | 3,452,000 | 3,815,150 |
| Bond | 6.875 | | 05-27-19 | 1,686,000 | 1,933,977 |
| |
| Trinidad And Tobago 0.3% | | | | | 1,569,263 |
|
| Republic of Trinidad & Tobago | | | | | |
| Bond (S) | 4.375 | | 01-16-24 | 1,443,000 | 1,569,263 |
| |
| Turkey 2.5% | | | | | 15,062,721 |
|
| Republic of Turkey | | | | | |
| Bond | 3.250 | | 03-23-23 | 2,338,000 | 2,175,392 |
| Bond | 6.250 | | 09-26-22 | 1,205,000 | 1,372,134 |
| Bond | 6.750 | | 04-03-18 | 454,000 | 510,750 |
| Bond | 7.000 | | 09-26-16 | 416,000 | 458,120 |
| Bond | 7.000 | | 03-11-19 | 398,000 | 457,700 |
| Bond | 7.000 | | 06-05-20 | 1,225,000 | 1,429,871 |
| Bond | 7.250 | | 03-15-15 | 871,000 | 903,227 |
| Bond | 7.375 | | 02-05-25 | 3,817,000 | 4,660,557 |
| Bond | 7.500 | | 07-14-17 | 396,000 | 450,428 |
| Bond | 7.500 | | 11-07-19 | 2,233,000 | 2,644,542 |
| |
| Ukraine 1.6% | | | | | 9,172,320 |
|
| Republic of Ukraine | | | | | |
| Bond | 4.950 | | 10-13-15 | EUR 762,000 | 959,135 |
| Bond | 6.250 | | 06-17-16 | 202,000 | 194,425 |
| Bond | 6.580 | | 11-21-16 | 4,881,000 | 4,661,355 |
| Bond | 6.750 | | 11-14-17 | 193,000 | 183,447 |
| Bond (S) | 6.875 | | 09-23-15 | 657,000 | 636,633 |
| Bond | 9.250 | | 07-24-17 | 2,506,000 | 2,537,325 |
| |
| Uruguay 0.9% | | | | | 5,299,733 |
|
| Republic of Uruguay | | | | | |
| Bond | 4.500 | | 08-14-24 | 1,284,426 | 1,351,858 |
| Bond | 5.100 | | 06-18-50 | 4,018,193 | 3,947,875 |
| | |
| 22 | Global Income Fund | Annual report | See notes to financial statements |
| | | | | |
| | | | Maturity | | |
| | Rate (%) | | date | Par value^ | Value |
| Venezuela 2.3% | | | | | $13,353,729 |
|
| Republic of Venezuela | | | | | |
| Bond | 5.750 | | 02-26-16 | 1,126,000 | 1,058,440 |
| Bond | 6.000 | | 12-09-20 | 1,374,000 | 1,033,935 |
| Bond | 7.750 | | 10-13-19 | 3,223,800 | 2,716,052 |
| Bond | 8.250 | | 10-13-24 | 839,300 | 650,458 |
| Bond | 9.000 | | 05-07-23 | 3,311,500 | 2,756,824 |
| Bond | 11.750 | | 10-21-26 | 1,183,900 | 1,123,521 |
| Bond | 11.950 | | 08-05-31 | 818,000 | 768,920 |
| Bond | 12.750 | | 08-23-22 | 2,385,400 | 2,409,254 |
| Bond | 13.625 | | 08-15-18 | 810,000 | 836,325 |
| | | | | | |
| Vietnam 0.2% | | | | | 947,981 |
|
| Socialist Republic of Vietnam | | | | | |
| Bond | 6.875 | | 01-15-16 | 887,000 | 947,981 |
| |
| Convertible Bonds 0.5% | | | | | $2,666,162 |
|
| (Cost $2,539,610) | | | | | |
| | | | | | |
| China 0.0% | | | | | 22,684 |
|
| Home Inns & Hotels Management, Inc. | 2.000 | | 12-15-15 | 23,000 | 22,684 |
| | | | | | |
| United States 0.5% | | | | | 2,643,478 |
|
| Altra Industrial Motion Corp. | 2.750 | | 03-01-31 | 113,000 | 145,982 |
|
| Ciena Corp. | 0.875 | | 06-15-17 | 115,000 | 113,922 |
|
| Ciena Corp. (S) | 4.000 | | 03-15-15 | 219,000 | 244,048 |
|
| HomeAway, Inc. (S) | 0.125 | | 04-01-19 | 53,000 | 51,907 |
|
| Hornbeck Offshore Services, Inc. | 1.500 | | 09-01-19 | 190,000 | 220,756 |
|
| Intel Corp. | 2.950 | | 12-15-35 | 149,000 | 190,534 |
|
| Jarden Corp. (S) | 1.125 | | 03-15-34 | 110,000 | 108,625 |
|
| Netsuite, Inc. | 0.250 | | 06-01-18 | 104,000 | 105,495 |
|
| Nuance Communications, Inc. | 2.750 | | 11-01-31 | 170,000 | 169,150 |
|
| Palo Alto Networks, Inc. (S)(Z) | 0.000 | | 07-01-19 | 17,000 | 17,255 |
|
| RTI International Metals, Inc. | 1.625 | | 10-15-19 | 18,000 | 17,539 |
|
| RTI International Metals, Inc. | 3.000 | | 12-01-15 | 257,000 | 264,549 |
|
| SanDisk Corp. (S) | 0.500 | | 10-15-20 | 250,000 | 290,781 |
|
| ServiceNow, Inc. (S)(Z) | 0.349 | | 11-01-18 | 130,000 | 139,588 |
|
| Stone Energy Corp. | 1.750 | | 03-01-17 | 90,000 | 103,444 |
|
| The Greenbrier Companies, Inc. | 3.500 | | 04-01-18 | 44,000 | 80,520 |
|
| The Ryland Group, Inc. | 0.250 | | 06-01-19 | 348,000 | 320,595 |
|
| TRW Automotive, Inc. | 3.500 | | 12-01-15 | 17,000 | 58,788 |
| |
| Structured Notes (K) 0.4% | | | | | $2,458,351 |
|
| (Cost $2,746,697) | | | | | |
| | | | | | |
| Indonesia 0.4% | | | | | 2,458,351 |
|
| Republic of Indonesia (Deutsche Bank AG) | | | | | |
| Note (S) | 7.000 | | 05-17-22 | IDR 30,200,000,000 | 2,458,351 |
| | |
| See notes to financial statements | Annual report | Global Income Fund | 23 |
| | | | | |
| | | | Maturity | | |
| | Rate (%) | | date | Par value^ | Value |
| Term Loans (M) 2.0% | | | | | $11,694,726 |
|
| (Cost $11,947,128) | | | | | |
| | | | | | |
| United States 2.0% | | | | | 11,694,726 |
|
| Arch Coal, Inc. | 6.250 | | 05-16-18 | 623,848 | 611,804 |
|
| Del Monte Foods, Inc. | 8.250 | | 08-18-21 | 1,095,000 | 1,065,800 |
|
| Dell International LLC | 4.500 | | 04-29-20 | 2,322,450 | 2,323,651 |
|
| Gates Global LLC | 4.250 | | 07-05-21 | 770,000 | 764,363 |
|
| Hostess Brands, Inc. | 6.750 | | 04-09-20 | 1,252,463 | 1,290,036 |
|
| La Quinta Intermediate Holdings LLC | 4.000 | | 04-14-21 | 1,154,286 | 1,153,564 |
|
| Texas Competitive Electric Holdings | | | | | |
| Company LLC | 4.646 | | 10-10-17 | 3,548,940 | 2,697,194 |
|
| Tribune Company | 4.000 | | 12-27-20 | 1,791,000 | 1,788,314 |
| |
| Asset Backed Securities 0.5% | | | | | $3,069,499 |
|
| (Cost $3,075,838) | | | | | |
| | | | | | |
| United States 0.5% | | | | | 3,069,499 |
|
| Brazil Loan Trust 1 | | | | | |
| Senior Secured Pass-Through Notes | 5.477 | | 07-24-23 | 222,000 | 230,325 |
| Senior Secured Pass-Through Notes (S) | 5.477 | | 07-24-23 | 2,749,805 | 2,839,174 |
| | | | | | |
| | | | | Shares | Value |
| Common Stocks 0.1% | | | | | $841,335 |
|
| (Cost $1,980,390) | | | | | |
| | | | | | |
| United Kingdom 0.0% | | | | | 78,280 |
|
| Subsea 7 SA | | | | 4,768 | 78,280 |
| | | | | | |
| United States 0.1% | | | | | 763,055 |
|
| Comtech Telecommunications Corp. | | | | 9,974 | 337,121 |
|
| EME Reorganization Trust | | | | 1,794,196 | 243,293 |
|
| General Maritime Corp. (I) | | | | 816 | 8 |
|
| NRG Energy, Inc. | | | | 5,899 | 182,633 |
| |
| Preferred Securities 0.0% | | | | | $272,153 |
|
| (Cost $270,994) | | | | | |
| | | | | | |
| United States 0.0% | | | | | 272,153 |
|
| SandRidge Energy, Inc., 8.500% | | | | 2,620 | 272,153 |
| | | | | | |
| | | | Yield (%) | Shares | Value |
| Short-Term Investments 3.3% | | | | | $19,552,268 |
|
| (Cost $19,552,268) | | | | | |
| | | | | | |
| Money Market Funds 3.3% | | | | | 19,552,268 |
|
| State Street Institutional Liquid Reserves Fund | | | 0.0682(Y) | 19,552,268 | 19,552,268 |
| |
| Total investments (Cost $581,636,309)† 99.6% | $589,033,888 |
|
| |
| Other assets and liabilities, net 0.4% | | | | $2,262,112 |
|
| |
| Total net assets 100.0% | | | | $591,296,000 |
|
The percentage shown for each investment category is the total value of that category as a percentage of the net assets of the fund.
| | |
| 24 | Global Income Fund | Annual report | See notes to financial statements |
Notes to Fund’s investments
^ All par values are denominated in U.S. dollars unless otherwise indicated.
| |
| Currency Abbreviations |
| COP | Colombian Peso |
| EUR | Euro |
| GBP | Pound Sterling |
| IDR | Indonesian Rupiah |
| MXN | Mexican Peso |
| RUB | Russian Ruble |
PIK Paid-in-kind
(H) Non-income producing — Bond is in default.
(I) Non-income producing security.
(K) Underlying issuer is shown parenthetically in security description.
(M) Term loans are variable rate obligations. The coupon rate shown represents the rate at period end.
(P) Variable rate obligation. The coupon rate shown represents the rate at period end.
(Q) Perpetual bonds have no stated maturity date. Date shown as maturity date is next call date.
(S) These securities are exempt from registration under Rule 144A of the Securities Act of 1933. Such securities may be resold, normally to qualified institutional buyers, in transactions exempt from registration. Rule 144A securities amounted to $132,117,282 or 22.3% of the fund’s net assets as of 7-31-14.
(Y) The rate shown is the annualized seven-day yield as of 7-31-14.
(Z) Zero coupon bonds are issued at a discount from their principal amount in lieu of paying interest periodically. Rate shown is the annualized yield at period end.
† At 7-31-14, the aggregate cost of investment securities for federal income tax purposes was $586,244,379. Net unrealized appreciation aggregated $2,789,509, of which $12,382,506 related to appreciated investment securities and $9,592,997 related to depreciated investment securities.
The fund had the following sector composition as a percentage of net assets on 7-31-14:
| | |
| Foreign Government | 43.7% | |
| Energy | 14.4% | |
| Consumer Discretionary | 9.6% | |
| Materials | 6.7% | |
| Telecommunication Services | 4.3% | |
| Industrials | 4.1% | |
| Health Care | 3.3% | |
| Utilities | 2.8% | |
| Consumer Staples | 2.8% | |
| Financials | 2.5% | |
| Information Technology | 2.1% | |
| Short-Term Investments & Other | 3.7% | |
| |
| |
| Total | 100.0% | |
| | |
| See notes to financial statements | Annual report | Global Income Fund | 25 |
F I N A N C I A L S T A T E M E N T S
Financial statements
Statement of assets and liabilities 7-31-14
This Statement of assets and liabilities is the fund’s balance sheet. It shows the value of what the fund owns, is due and owes. You’ll also find the net asset value and the maximum public offering price per share.
| |
| Assets | |
|
| Investments, at value (Cost $581,636,309) | $589,033,888 |
| Receivable for investments sold | 3,431,805 |
| Receivable for fund shares sold | 19,208 |
| Receivable for forward foreign currency exchange contracts | 283,692 |
| Dividends and interest receivable | 8,921,301 |
| Other receivables and prepaid expenses | 23,868 |
| | |
| Total assets | 601,713,762 |
| |
| Liabilities | |
|
| Due to custodian | 3,352,533 |
| Payable for investments purchased | 3,538,323 |
| Payable for forward foreign currency exchange contracts | 17,980 |
| Payable for fund shares repurchased | 3,246,644 |
| Distributions payable | 1,111 |
| Payable to affiliates | |
| Accounting and legal services fees | 12,414 |
| Transfer agent fees | 288 |
| Investment management fees | 675 |
| Other liabilities and accrued expenses | 247,794 |
| | |
| Total liabilities | 10,417,762 |
| | |
| Net assets | $591,296,000 |
| |
| Net assets consist of | |
|
| Paid-in capital | $592,019,494 |
| Accumulated distributions in excess of net investment income | (272,363) |
| Accumulated net realized gain (loss) on investments and foreign | |
| currency transactions | (8,108,087) |
| Net unrealized appreciation (depreciation) on investments and translation | |
| of assets and liabilities in foreign currencies | 7,656,956 |
| | |
| Net assets | $591,296,000 |
| |
| Net asset value per share | |
|
| Based on net asset values and shares outstanding — the fund has an | |
| unlimited number of shares authorized with no par value | |
| Class A ($2,566,108 ÷ 252,015 shares)1 | $10.18 |
| Class I ($80,493 ÷ 7,914 shares) | $10.17 |
| Class NAV ($588,649,399 ÷ 57,803,698 shares) | $10.18 |
| |
| Maximum offering price per share | |
|
| Class A (net asset value per share ÷ 96%)2 | $10.60 |
1 Redemption price per share is equal to net asset value less any applicable contingent deferred sales charge.
2 On single retail sales of less than $100,000. On sales of $100,000 or more and on group sales the offering price is reduced.
| | |
| 26 | Global Income Fund | Annual report | See notes to financial statements |
F I N A N C I A L S T A T E M E N T S
Statement of operations For the year ended 7-31-14
This Statement of operations summarizes the fund’s investment income earned and expenses incurred in operating the fund. It also shows net gains (losses) for the period stated.
| |
| Investment income | |
|
| Interest | $34,359,987 |
| Dividends | 157,890 |
| Less foreign taxes withheld | (391) |
| | |
| Total investment income | 34,517,486 |
| |
| Expenses | |
|
| Investment management fees | 4,544,730 |
| Distribution and service fees | 4,150 |
| Accounting and legal services fees | 70,257 |
| Transfer agent fees | 2,506 |
| Trustees’ fees | 7,169 |
| State registration fees | 47,832 |
| Printing and postage | 2,992 |
| Professional fees | 133,830 |
| Custodian fees | 384,077 |
| Registration and filing fees | 56,028 |
| Other | 11,805 |
| | |
| Total expenses | 5,265,376 |
| Less expense reductions | (86,099) |
| | |
| Net expenses | 5,179,277 |
| | |
| Net investment income | 29,338,209 |
| |
| Realized and unrealized gain (loss) | |
|
| Net realized gain (loss) on | |
| Investments and foreign currency transactions | (3,312,062) |
| | |
| | (3,312,062) |
| Change in net unrealized appreciation (depreciation) of | |
| Investments and translation of assets and liabilities in foreign currencies | 15,138,027 |
| | |
| | 15,138,027 |
| | |
| Net realized and unrealized gain | 11,825,965 |
| | |
| Increase in net assets from operations | $41,164,174 |
| | |
| See notes to financial statements | Annual report | Global Income Fund | 27 |
F I N A N C I A L S T A T E M E N T S
Statements of changes in net assets
These Statements of changes in net assets show how the value of the fund’s net assets has changed during the last two periods. The difference reflects earnings less expenses, any investment gains and losses, distributions, if any, paid to shareholders and the net of fund share transactions.
| | |
| | Year | Year |
| | ended | ended |
| | 7-31-14 | 7-31-13 |
| |
| Increase (decrease) in net assets | | |
|
| From operations | | |
| Net investment income | $29,338,209 | $27,850,282 |
| Net realized gain (loss) | (3,312,062) | 8,225,593 |
| Change in net unrealized appreciation (depreciation) | 15,138,027 | (21,253,133) |
| | | |
| Increase in net assets resulting from operations | 41,164,174 | 14,822,742 |
| | | |
| Distributions to shareholders | | |
| From net investment income | | |
| Class A | (67,892) | (6,369) |
| Class I | (27,309) | (2,696) |
| Class NAV | (30,676,339) | (29,887,473) |
| From net realized gain | | |
| Class A | (7,716) | (289) |
| Class I | (373) | (289) |
| Class NAV | (3,727,098) | (5,394,311) |
| From tax return of capital | | |
| Class A | (1,944) | — |
| Class I | (782) | — |
| Class NAV | (878,433) | — |
| | | |
| Total distributions | (35,387,886) | (35,291,427) |
| | | |
| From fund share transactions | 43,081,855 | 94,095,424 |
| | | |
| Total increase | 48,858,143 | 73,626,739 |
| |
| Net assets | | |
|
| Beginning of year | 542,437,857 | 468,811,118 |
| | | |
| End of year | $591,296,000 | $542,437,857 |
| | | |
| Undistributed (accumulated distributions in excess of) net | | |
| investment income | ($272,363) | $290,995 |
| | |
| 28 | Global Income Fund | Annual report | See notes to financial statements |
Financial highlights
The Financial highlights show how the fund’s net asset value for a share has changed during the period.
| | | | | |
| CLASS A SHARES Period ended | 7-31-14 | 7-31-13 | 7-31-12 | 7-31-11 | 7-31-101 |
| |
| Per share operating performance | | | | | |
|
| Net asset value, beginning of period | $10.09 | $10.47 | $10.67 | $10.47 | $10.00 |
| Net investment income2 | 0.47 | 0.52 | 0.63 | 0.65 | 0.45 |
| Net realized and unrealized gain (loss) on investments | 0.21 | (0.21) | 0.02 | 0.42 | 0.49 |
| Total from investment operations | 0.68 | 0.31 | 0.65 | 1.07 | 0.94 |
| Less distributions | | | | | |
| From net investment income | (0.51) | (0.57) | (0.71) | (0.68) | (0.47) |
| From net realized gain | (0.07) | (0.12) | (0.14) | (0.19) | — |
| From tax return of capital | (0.01) | — | — | — | — |
| Total distributions | (0.59) | (0.69) | (0.85) | (0.87) | (0.47) |
| Net asset value, end of period | $10.18 | $10.09 | $10.47 | $10.67 | $10.47 |
| Total return (%)3,4 | 6.95 | 2.85 | 6.72 | 10.67 | 9.665 |
| |
| Ratios and supplemental data | | | | | |
|
| Net assets, end of period (in millions) | $3 | $1 | —6 | —6 | —6 |
| Ratios (as a percentage of average net assets): | | | | | |
| Expenses before reductions | 3.22 | 7.91 | 1.41 | 1.39 | 1.347 |
| Expenses including reductions | 1.35 | 1.34 | 1.30 | 1.30 | 1.307 |
| Net investment income | 4.65 | 5.18 | 6.17 | 6.11 | 5.977 |
| Portfolio turnover (%) | 70 | 71 | 48 | 68 | 49 |
1 Period from 11-2-09 (commencement of operations) to 7-31-10.
2 Based on average daily shares outstanding.
3 Total returns would have been lower had certain expenses not been reduced during the applicable periods.
4 Does not reflect the effect of sales charges, if any.
5 Not annualized.
6 Less than $500,000.
7 Annualized.
| | |
| See notes to financial statements | Annual report | Global Income Fund | 29 |
| | | | | |
| CLASS I SHARES Period ended | 7-31-14 | 7-31-13 | 7-31-12 | 7-31-11 | 7-31-101 |
| |
| Per share operating performance | | | | | |
|
| Net asset value, beginning of period | $10.09 | $10.47 | $10.67 | $10.47 | $10.00 |
| Net investment income2 | 0.50 | 0.55 | 0.66 | 0.68 | 0.47 |
| Net realized and unrealized gain (loss) on investments | 0.20 | (0.21) | 0.03 | 0.42 | 0.49 |
| Total from investment operations | 0.70 | 0.34 | 0.69 | 1.10 | 0.96 |
| Less distributions | | | | | |
| From net investment income | (0.53) | (0.60) | (0.75) | (0.71) | (0.49) |
| From net realized gain | (0.07) | (0.12) | (0.14) | (0.19) | — |
| From tax return of capital | (0.02) | — | — | — | — |
| Total distributions | (0.62) | (0.72) | (0.89) | (0.90) | (0.49) |
| Net asset value, end of period | $10.17 | $10.09 | $10.47 | $10.67 | $10.47 |
| Total return (%)3 | 7.17 | 3.17 | 7.05 | 11.00 | 9.894 |
| |
| Ratios and supplemental data | | | | | |
|
| Net assets, end of period (in millions) | —5 | —5 | —5 | —5 | —5 |
| Ratios (as a percentage of average net assets): | | | | | |
| Expenses before reductions | 5.82 | 16.19 | 1.01 | 0.97 | 1.356 |
| Expenses including reductions | 1.04 | 1.02 | 1.00 | 1.00 | 1.006 |
| Net investment income | 4.92 | 5.31 | 6.47 | 6.41 | 6.256 |
| Portfolio turnover (%) | 70 | 71 | 48 | 68 | 49 |
1 Period from 11-2-09 (commencement of operations) to 7-31-10.
2 Based on average daily shares outstanding.
3 Total returns would have been lower had certain expenses not been reduced during the applicable periods.
4 Not annualized.
5 Less than $500,000.
6 Annualized.
| | | | | |
| CLASS NAV SHARES Period ended | 7-31-14 | 7-31-13 | 7-31-12 | 7-31-11 | 7-31-101 |
| |
| Per share operating performance | | | | | |
|
| Net asset value, beginning of period | $10.09 | $10.47 | $10.67 | $10.47 | $10.00 |
| Net investment income2 | 0.52 | 0.57 | 0.67 | 0.69 | 0.49 |
| Net realized and unrealized gain (loss) on investments | 0.20 | (0.22) | 0.03 | 0.42 | 0.48 |
| Total from investment operations | 0.72 | 0.35 | 0.70 | 1.11 | 0.97 |
| Less distributions | | | | | |
| From net investment income | (0.54) | (0.61) | (0.76) | (0.72) | (0.50) |
| From net realized gain | (0.07) | (0.12) | (0.14) | (0.19) | — |
| From tax return of capital | (0.02) | — | — | — | — |
| Total distributions | (0.63) | (0.73) | (0.90) | (0.91) | (0.50) |
| Net asset value, end of period | $10.18 | $10.09 | $10.47 | $10.67 | $10.47 |
| Total return (%)3 | 7.43 | 3.30 | 7.15 | 11.09 | 9.964 |
| |
| Ratios and supplemental data | | | | | |
|
| Net assets, end of period (in millions) | $589 | $542 | $469 | $377 | $273 |
| Ratios (as a percentage of average net assets): | | | | | |
| Expenses before reductions | 0.92 | 0.90 | 0.90 | 0.93 | 0.945 |
| Expenses including reductions | 0.91 | 0.90 | 0.90 | 0.92 | 0.945 |
| Net investment income | 5.18 | 5.44 | 6.55 | 6.50 | 6.515 |
| Portfolio turnover (%) | 70 | 71 | 48 | 68 | 49 |
1 Period from 11-2-09 (commencement of operations) to 7-31-10.
2 Based on average daily shares outstanding.
3 Total returns would have been lower had certain expenses not been reduced during the applicable periods.
4 Not annualized.
5 Annualized.
| | |
| 30 | Global Income Fund | Annual report | See notes to financial statements |
Notes to financial statements
Note 1 — Organization
John Hancock Global Income Fund, formerly John Hancock Global High Yield Fund, (the fund) is a series of John Hancock Funds II (the Trust), an open-end management investment company organized as a Massachusetts business trust and registered under the Investment Company Act of 1940, as amended (the 1940 Act). Effective December 1, 2013, the investment objective of the fund is to seek a high level of current income with capital appreciation as a secondary objective. Prior to December 1, 2013, the investment objective of the fund was to seek maximum total return, which consisted of income on its investments and capital appreciation.
The fund may offer multiple classes of shares. The shares currently offered are detailed in the Statement of assets and liabilities. Class A shares are offered to all investors. Class I shares are offered to institutions and certain investors. Class NAV shares are offered to John Hancock affiliated funds of funds and certain 529 plans. Shareholders of each class have exclusive voting rights to matters that affect that class. The distribution and service fees, if any, transfer agent fees, state registration fees and printing and postage for each class may differ.
Effective December 1, 2013, John Hancock Global High Yield Fund changed its name to John Hancock Global Income Fund.
Note 2 — Significant accounting policies
The financial statements have been prepared in conformity with accounting principles generally accepted in the United States of America (US GAAP), which require management to make certain estimates and assumptions as of the date of the financial statements. Actual results could differ from those estimates and those differences could be significant. The fund intends to qualify as an investment company under Topic 946 of Accounting Standards Codification of US GAAP.
Events or transactions occurring after the end of the fiscal period through the date that the financial statements were issued have been evaluated in the preparation of the financial statements. The following summarizes the significant accounting policies of the fund:
Security valuation. Investments are stated at value as of the close of regular trading on the New York Stock Exchange (NYSE), normally at 4:00 P.M., Eastern Time. In order to value the securities, the fund uses the following valuation techniques: Equity securities held by the fund are valued at the last sale price or official closing price on the exchange where the security was acquired or most likely will be sold. In the event there were no sales during the day or closing prices are not available, the securities are valued using the last available bid price. Investments by the fund in open-end mutual funds are valued at their respective net asset values each business day. Debt obligations are valued based on the evaluated prices provided by an independent pricing vendor or from broker-dealers. Independent pricing vendors utilize matrix pricing which takes into account factors such as institutional-size trading in similar groups of securities, yield, quality, coupon rate, maturity, type of issue, trading characteristics and other market data, as well as broker supplied prices. Foreign securities and currencies, including forward foreign currency contracts, are valued in U.S. dollars, based on foreign currency exchange rates supplied by an independent pricing vendor. Securities that trade only in the over-the-counter (OTC) market are valued using bid prices. Certain short-term securities with maturities of 60 days or less at the time of purchase are valued at amortized cost.
| |
| Annual report | Global Income Fund | 31 |
Other fund securities and assets, for which reliable market quotations are not readily available, are valued at fair value as determined in good faith by the fund’s Pricing Committee following procedures established by the Board of Trustees. The frequency with which these fair valuation procedures are used cannot be predicted and fair value of securities may differ significantly from the value that would have been used had a ready market for such securities existed. Trading in foreign securities may be completed before the daily close of trading on the NYSE. Significant events at the issuer or market level may affect the values of securities between the time when the valuation of the securities is generally determined and the close of the NYSE. If a significant event occurs, these securities may be fair valued, as determined in good faith by the fund’s Pricing Committee, following procedures established by the Board of Trustees. The fund uses fair value adjustment factors provided by an independent pricing vendor to value certain foreign securities in order to adjust for events that may occur between the close of foreign exchanges or markets and the close of the NYSE.
The fund uses a three-tier hierarchy to prioritize the pricing assumptions, referred to as inputs, used in valuation techniques to measure fair value. Level 1 includes securities valued using quoted prices in active markets for identical securities. Level 2 includes securities valued using other significant observable inputs. Observable inputs may include quoted prices for similar securities, interest rates, prepayment speeds and credit risk. Prices for securities valued using these inputs are received from independent pricing vendors and brokers and are based on an evaluation of the inputs described. Level 3 includes securities valued using significant unobservable inputs when market prices are not readily available or reliable, including the fund’s own assumptions in determining the fair value of investments. Factors used in determining value may include market or issuer specific events or trends, changes in interest rates and credit quality. The inputs or methodology used for valuing securities are not necessarily an indication of the risks associated with investing in those securities. Changes in valuation techniques may result in transfers into or out of an assigned level within the disclosure hierarchy.
The following is a summary of the values by input classification of the fund’s investments as of July 31, 2014, by major security category or type:
| | | | |
| | | | | LEVEL 3 |
| | | | LEVEL 2 | SIGNIFICANT |
| | TOTAL MARKET | LEVEL 1 | SIGNIFICANT | UNOBSERVABLE |
| | VALUE AT 7-31-14 | QUOTED PRICE | OBSERVABLE INPUTS | INPUTS |
|
| Corporate Bonds | $290,324,587 | — | $290,324,587 | — |
| Foreign Government | | | | |
| Obligations | 258,154,807 | — | 258,154,807 | — |
| Convertible Bonds | 2,666,162 | — | 2,666,162 | — |
| Structured Notes | 2,458,351 | — | 2,458,351 | — |
| Term Loans | 11,694,726 | — | 11,694,726 | — |
| Asset Backed Securities | 3,069,499 | — | 3,069,499 | — |
| Common Stocks | 841,335 | $841,327 | — | $8 |
| Preferred Securities | 272,153 | — | 272,153 | — |
| Short-Term Investments | 19,552,268 | 19,552,268 | — | — |
| |
|
| Total Investments in | | | | |
| Securities | $589,033,888 | $20,393,595 | $568,640,285 | $8 |
| Other Financial | | | | |
| Instruments | | | | |
| Forward Foreign | | | | |
| Currency Contracts | $265,712 | — | $265,712 | — |
| |
| 32 | Global Income Fund | Annual report |
Security transactions and related investment income. Investment security transactions are accounted for on a trade date plus one basis for daily net asset value calculations. However, for financial reporting purposes, investment transactions are reported on trade date. Interest income is accrued as earned. Interest income includes coupon interest and amortization/accretion of premiums/discounts on debt securities. Debt obligations may be placed in a non-accrual status and related interest income may be reduced by stopping current accruals and writing off interest receivable when the collection of all or a portion of interest has become doubtful. Dividend income is recorded on the ex-date, except for dividends of foreign securities where the dividend may not be known until after the ex-date. In those cases, dividend income, net of withholding taxes, is recorded when the fund becomes aware of the dividends. Foreign taxes are provided for based on the fund’s understanding of the tax rules and rates that exist in the foreign markets in which it invests. Gains and losses on securities sold are determined on the basis of identified cost and may include proceeds from litigation.
Foreign currency translation. Assets, including investments and liabilities denominated in foreign currencies, are translated into U.S. dollar values each day at the prevailing exchange rate. Purchases and sales of securities, income and expenses are translated into U.S. dollars at the prevailing exchange rate on the date of the transaction. The effect of changes in foreign currency exchange rates on the value of securities is reflected as a component of the realized and unrealized gains (losses) on investments.
Funds that invest internationally generally carry more risk than funds that invest strictly in U.S. securities. These risks are heightened for investments in emerging markets. Risks can result from differences in economic and political conditions, regulations, market practices (including higher transaction costs), accounting standards and other factors. Foreign investments are also subject to a decline in the value of a foreign currency versus the U.S. dollar, which reduces the dollar value of securities denominated in that currency.
Foreign taxes. The fund may be subject to withholding tax on income and/or capital gains or repatriation taxes imposed by certain countries in which the fund invests. Taxes are accrued based upon investment income, realized gains or unrealized appreciation.
Line of credit. The fund may borrow from banks for temporary or emergency purposes, including meeting redemption requests that otherwise might require the untimely sale of securities. Pursuant to the fund’s custodian agreement, the custodian may loan money to the fund to make properly authorized payments. The fund is obligated to repay the custodian for any overdraft, including any related costs or expenses. The custodian may have a lien, security interest or security entitlement in any fund property that is not otherwise segregated or pledged, to the maximum extent permitted by law, to the extent of any overdraft.
In addition, the fund and other affiliated funds have entered into an agreement with Citibank N.A. that enables them to potentially participate in a $300 million unsecured committed line of credit. A commitment fee, payable at the end of each calendar quarter, based on the average daily unused portion of the line of credit, is charged to each participating fund on a pro rata basis and is reflected in other expenses on the Statement of operations. Commitment fees for the year ended July 31, 2014 were $657. For the year ended July 31, 2014, the fund had no borrowings under the line of credit.
Expenses. Within the John Hancock group of funds complex, expenses that are directly attributable to an individual fund are allocated to such fund. Expenses that are not readily attributable to a specific fund are allocated among all funds in an equitable manner, taking into consideration, among other things, the nature and type of expense and the fund’s relative net assets. Expense estimates are accrued in the period to which they relate and adjustments are made when actual amounts are known.
| |
| Annual report | Global Income Fund | 33 |
Class allocations. Income, common expenses and realized and unrealized gains (losses) are determined at the fund level and allocated daily to each class of shares based on the net assets of the class. Class-specific expenses, such as distribution and service fees, if any, transfer agent fees, state registration fees and printing and postage, for all classes, are calculated daily at the class level based on the appropriate net assets of each class and the specific expense rates applicable to each class.
Federal income taxes. The fund intends to continue to qualify as a regulated investment company by complying with the applicable provisions of the Internal Revenue Code and will not be subject to federal income tax on taxable income that is distributed to shareholders. Therefore, no federal income tax provision is required.
Under the Regulated Investment Company Modernization Act of 2010, the fund is permitted to carry forward capital losses for an unlimited period. Capital losses that are carried forward will retain their character as either short-term or long-term capital losses rather than being considered all short-term as under previous law.
For federal income tax purposes, as of July 31, 2014, the fund has a short-term capital loss carryfoward of $3,505,557 available to offset future net realized capital gains. These carryforwards as of July 31, 2014 do not expire.
As of July 31, 2014, the fund had no uncertain tax positions that would require financial statement recognition, derecognition or disclosure. The fund’s federal tax returns are subject to examination by the Internal Revenue Service for a period of three years.
Distribution of income and gains. Distributions to shareholders from net investment income and net realized gains, if any, are recorded on the ex-date. The fund generally declares dividends daily and pays them monthly. Capital gain distributions, if any, are typically distributed annually. The tax character of distributions for the years ended July 31, 2014 and 2013 was as follows:
| | | | | |
| | JULY 31, 2014 | JULY 31, 2013 | | | |
| | | |
| Ordinary Income | $30,771,819 | $31,068,258 | | | |
| Long-Term Capital Gain | $3,734,908 | $4,223,169 | | | |
| Tax Return of Capital | $881,159 | — | | | |
| Total | $35,387,886 | $35,291,427 | | | |
Distributions paid by the fund with respect to each class of shares are calculated in the same manner, at the same time and in the same amount, except for the effect of class level expenses that may be applied differently to each class. As of July 31, 2014, the fund has no distributable earnings on a tax basis.
Such distributions and distributable earnings, on a tax basis, are determined in conformity with income tax regulations, which may differ from US GAAP. Distributions in excess of tax basis earnings and profits, if any, are reported in the fund’s financial statements as a return of capital.
Capital accounts within the financial statements are adjusted for permanent book-tax differences. These adjustments have no impact on net assets or the results of operations. Temporary book-tax differences, if any, will reverse in a subsequent period. Book-tax differences are primarily attributable to foreign currency transactions, wash sale loss deferrals, and amortization and accretion on debt securities.
| |
| 34 | Global Income Fund | Annual report |
Note 3 — Derivative Instruments
The fund may invest in derivatives in order to meet its investment objectives. Derivatives include a variety of different instruments that may be traded in the OTC market, on a regulated exchange or through a clearing facility. The risks in using derivatives vary depending upon the structure of the instruments, including the use of leverage, optionality, the liquidity or lack of liquidity of the contract, the creditworthiness of the counterparty or clearing organization and the volatility of the position. Some derivatives involve risks that are potentially greater than the risks associated with investing directly in the referenced securities or other referenced underlying instrument. Specifically, the fund is exposed to the risk that the counterparty to an OTC derivatives contract will be unable or unwilling to make timely settlement payments or otherwise honor its obligations. OTC derivatives transactions typically can only be closed out with the other party to the transaction.
Forward foreign currency contracts are typically traded through the OTC market. Derivative counterparty risk is managed through an ongoing evaluation of the creditworthiness of all potential counterparties and, if applicable, designated clearing organizations. The fund attempts to reduce its exposure to counterparty risk for derivatives traded in the OTC market, whenever possible, by entering into an International Swaps and Derivatives Association (ISDA) Master Agreement with each of its OTC counterparties. The ISDA gives each party to the agreement the right to terminate all transactions traded under the agreement if there is certain deterioration in the credit quality or contractual default of the other party, as defined in the ISDA. Upon an event of default or a termination of the ISDA, the non-defaulting party has the right to close out all transactions and to net amounts owed.
As defined by the ISDA, the fund may have collateral agreements with certain counterparties to mitigate counterparty risk on OTC derivatives. Subject to established minimum levels, collateral for OTC transactions is generally determined based on the net aggregate unrealized gain or loss on contracts with a particular counterparty. Collateral pledged to the fund is held in a segregated account by a third-party agent or held by the custodian bank for the benefit of the fund and can be in the form of cash or debt securities issued by the U.S. government or related agencies; collateral posted by the fund for OTC transactions is held in a segregated account at the fund’s custodian and is noted in the accompanying Fund’s investments, or if cash is posted, on the Statement of assets and liabilities. The fund’s maximum risk of loss due to counterparty risk is equal to the asset value of outstanding contracts offset by collateral received.
Forward foreign currency contracts. A forward foreign currency contract is an agreement between two parties to buy and sell specific currencies at a price that is set on the date of the contract. The forward contract calls for delivery of the currencies on a future date that is specified in the contract. Risks related to the use of forwards include the possible failure of counterparties to meet the terms of the forward agreement, the failure of the counterparties to timely post collateral if applicable, the risk that currency movements will not favor the fund thereby reducing the fund’s total return, and the potential for losses in excess of the amounts recognized on the Statement of assets and liabilities.
The market value of a forward foreign currency contract fluctuates with changes in foreign currency exchange rates. Forward foreign currency contracts are marked-to-market daily and the change in value is recorded by the fund as an unrealized gain or loss. Realized gains or losses, equal to the difference between the value of the contract at the time it was opened and the value at the time it was closed, are recorded upon delivery or receipt of the currency or settlement with the counterparty.
The fund used forward foreign currency contracts to manage against anticipated changes in currency exchange rates and gain exposure to foreign currencies. During the year ended July 31, 2014 the fund held forward foreign currency contracts with USD notional values ranging from approximately $13.5 million to $59.7 million, as measured at each quarter end. The following table summarizes the contracts held at July 31, 2014.
| |
| Annual report | Global Income Fund | 35 |
| | | | | | | | | | |
| | | | | | | | CONTRACTUAL | | | NET UNREALIZED |
| CONTRACT | | CONTRACT | | | SETTLEMENT | UNREALIZED | UNREALIZED | APPRECIATION/ |
| TO BUY | | TO SELL | | COUNTERPARTY | DATE | APPRECIATION | DEPRECIATION | (DEPRECIATION) |
|
| |
| EUR | 781,873 | | USD | 1,065,023 | | Citibank N.A. | 8-29-14 | — | ($17,980) | ($17,980) |
|
| USD | 12,107,334 | | EUR | 8,848,514 | | Citibank N.A. | 8-29-14 | $257,873 | — | 257,873 |
|
| USD | 2,120,578 | | GBP | 1,241,000 | | Citibank N.A. | 8-29-14 | 25,819 | — | 25,819 |
|
| | | | | | | | | $283,692 | ($17,980) | $265,712 |
| |
| Currency Abbreviations |
| EUR | Euro |
| GBP | Pound Sterling |
| USD | United States Dollar |
Fair value of derivative instruments by risk category
The table below summarizes the fair value of derivatives held by the fund at July 31, 2014 by risk category:
| | | | |
| | | FINANCIAL | ASSET | LIABILITIES |
| | STATEMENT OF ASSETS AND | INSTRUMENT | DERIVATIVES | DERIVATIVES |
| RISK | LIABILITIES LOCATION | LOCATION | FAIR VALUE | FAIR VALUE |
|
| Foreign currency | Receivable-payable for | Forward foreign | $283,692 | ($17,980) |
| contracts | forward foreign currency | currency | | |
| | exchange contracts | exchange | | |
| | | contracts | | |
Effect of derivative instruments on the Statement of operations
The table below summarizes the net realized gain (loss) included in the net increase (decrease) in net assets from operations, classified by derivative instrument and risk category, for the year ended July 31, 2014:
| | |
| | | INVESTMENTS IN UNAFFILIATED |
| | | ISSUERS AND FOREIGN |
| RISK | STATEMENT OF OPERATIONS LOCATION | CURRENCY TRANSACTIONS* |
|
| Foreign currency | Net realized gain (loss) | ($1,035,418) |
* Realized gain/loss associated with forward foreign currency contracts is included in this caption on the Statement of operations.
The table below summarizes the net change in unrealized appreciation (depreciation) included in the net increase (decrease) in net assets from operations, classified by derivative instrument and risk category, for the year ended July 31, 2014:
| | |
| | | INVESTMENTS IN UNAFFILIATED ISSUERS |
| | | AND TRANSLATION OF ASSETS AND |
| RISK | STATEMENT OF OPERATIONS LOCATION | LIABILITIES IN FOREIGN CURRENCIES* |
|
| Foreign currency contracts | Change in unrealized appreciation | $543,622 |
| | (depreciation) | |
* Change in unrealized appreciation/depreciation associated with forward foreign currency contracts is included in this caption on the Statement of operations.
Note 4 — Guarantees and indemnifications
Under the Trust’s organizational documents, its Officers and Trustees are indemnified against certain liabilities arising out of the performance of their duties to the Trust, including the fund. Additionally, in the normal course of business, the fund enters into contracts with service providers that contain general indemnification clauses. The fund’s maximum exposure under these arrangements is unknown, as this would involve future claims that may be made against the fund that have not yet occurred. The risk of material loss from such claims is considered remote.
| |
| 36 | Global Income Fund | Annual report |
Note 5 — Fees and transactions with affiliates
John Hancock Advisers, LLC (the Advisor or JHA) serves as investment advisor for the fund. Prior to January 1, 2014, John Hancock Investment Management Services, LLC (JHIMS) served as investment advisor for the fund. JHIMS and JHA have identical officers, directors and other personnel, and share common facilities and resources. Terms of the investment management contract with JHA are substantially identical to the former contract with JHIMS. In this report, depending on the context, the term “Advisor” shall refer to either JHA in its current capacity as investment advisor, or to JHIMS in its capacity as investment advisor prior to January 1, 2014. John Hancock Funds, LLC (the Distributor), an affiliate of the Advisor, serves as principal underwriter of the fund. The Advisor and the Distributor are indirect, wholly owned subsidiaries of Manulife Financial Corporation.
Management fee. Effective July 1, 2014, the fund has an investment management agreement with the Advisor under which the fund pays a daily management fee to the Advisor equivalent, on an annual basis, to the sum of: a) 0.785% of the first $250 million of the fund’s average daily net assets, b) 0.770% of the next $500 million of the fund’s average daily net assets and c) 0.750% of the fund’s average daily net assets in excess of $750 million. Prior to July 1, 2014, the fund had an investment management agreement with the Advisor under which the fund paid a daily management fee to the Advisor equivalent, on an annual basis, to the sum of: a) 0.825% of the first $250 million of the fund’s average daily net assets, b) 0.790% of the next $500 million of the fund’s average daily net assets and c) 0.770% of the fund’s average daily net assets in excess of $750 million. The Advisor has a subadvisory agreement with Stone Harbor Investment Partners LP. The fund is not responsible for payment of the subadvisory fees.
The Advisor has contractually agreed to waive a portion of its management fee and/or reimburse expenses for certain funds of the John Hancock complex, including the fund (the participating portfolios). The waiver equals, on an annualized basis, 0.01% of that portion of the aggregate net assets of all the participating portfolios that exceeds $75 billion but is less than or equal to $125 billion; 0.0125% of that portion of the aggregate net assets of all the participating portfolios that exceeds $125 billion but is less than or equal to $150 billion; and 0.015% of that portion of the aggregate net assets of all the participating portfolios that exceeds $150 billion. The amount of the reimbursement is calculated daily and allocated among all the participating portfolios in proportion to the daily net assets of each fund. This arrangement may be amended or terminated at any time by the Advisor upon notice to the fund and with the approval of the Board of Trustees.
To the extent that expenses of Class A and Class I shares exceed 1.35% and 1.04%, respectively, of average annual net assets (on an annualized basis) attributable to Class A and Class I shares (Expense Limitation), the Advisor contractually agrees to reduce its management fee or, if necessary, make payments to the classes in an amount equal to the amount by which expenses of the each share class exceeds its the Expense Limitation. Expenses means all fund-level and class-specific operating expenses, excluding (a) taxes, (b) brokerage commissions, (c) interest expense, (d) underlying fund expenses (acquired fund fees), (e) litigation and indemnification expenses and other extraordinary expenses not incurred in the ordinary course of the fund’s business, and (f) short dividend expense. The Expense Limitation expires on November 30, 2015, unless renewed by mutual agreement of the fund and the Advisor based upon a determination that this is appropriate under the circumstances at that time.
The expense reductions described above amounted to $25,914, $24,989 and $35,196 for Class A, Class I and Class NAV shares, respectively, for the year ended July 31, 2014.
The investment management fees, including the impact of waivers and reimbursements as described above, incurred for the year ended July 31, 2014 were equivalent to a net annual effective rate of 0.788% of the fund’s average daily net assets.
| |
| Annual report | Global Income Fund | 37 |
Expense recapture. The Advisor may recapture operating expenses reimbursed or fees waived under previous expense limitation or waiver arrangements for a period of three years following the month in which the reimbursements or waivers occurred to the extent that the fund is below its expense limitation during this period. For the year ended July 31, 2014, no amounts were recaptured. The table below outlines the amount of waived or reimbursed expenses subject to potential recovery in future periods and the respective expiration dates.
| | |
| AMOUNTS ELIGIBLE | AMOUNTS ELIGIBLE | AMOUNTS ELIGIBLE |
| FOR RECOVERY THROUGH | FOR RECOVERY THROUGH | FOR RECOVERY THROUGH |
| JULY 1, 2015 | JULY 1, 2016 | JULY 1, 2017 |
|
| — | $15,223 | $50,782 |
Accounting and legal services. Pursuant to a service agreement, the fund reimburses the Advisor for all expenses associated with providing the administrative, financial, legal, accounting and recordkeeping services to the fund, including the preparation of all tax returns, periodic reports to shareholders and regulatory reports, among other services. These expenses are allocated to each share class based on its relative net assets at the time the expense was incurred. These accounting and legal services fees incurred for the year ended July 31, 2014 amounted to an annual rate of 0.01% of the fund’s average daily net assets.
Distribution and service plans. The fund has a distribution agreement with the Distributor. The fund has adopted a distribution and service plan with respect to Class A shares pursuant to Rule 12b-1 under the 1940 Act, to pay the Distributor for services provided as the distributor of shares of the fund. The fund pays 0.30% for Class A shares for distribution and service fees under this arrangement, expressed as an annual percentage of average daily net assets.
Sales charges. Class A shares are assessed up-front sales charges, which resulted in payments to the Distributor amounting to $35,958 for the year ended July 31, 2014. Of this amount, $4,920 was retained and used for printing prospectuses, advertising, sales literature and other purposes, $31,038 was paid as sales commissions to broker-dealers and $0 was paid as sales commissions to sales personnel of Signator Investors, Inc., a broker-dealer affiliate of the Advisor.
The up-front sales charge for Class A shares is 4.00%. Prior to February 3, 2014, the up-front sales charge for Class A shares was 4.50%.
Class A shares may be subject to contingent deferred sales charges (CDSCs). Certain Class A shares that are acquired through purchases of $1 million or more and are redeemed within one year of purchase are subject to a 1.00% sales charge. CDSCs are applied to the lesser of the current market value at the time of redemption or the original purchase cost of the shares being redeemed. Proceeds from CDSCs are used to compensate the Distributor for providing distribution-related services in connection with the sale of these shares. During the year ended July 31, 2014, there were no CDSCs received by the Distributor for Class A shares.
Transfer agent fees. The fund has a transfer agent agreement with John Hancock Signature Services, Inc. (Signature Services), an affiliate of the Advisor. The transfer agent fees paid to Signature Services are determined based on the cost to Signature Services (Signature Services Cost) of providing recordkeeping services. The Signature Services Cost includes a component of allocated John Hancock corporate overhead for providing transfer agent services to the fund and to all other John Hancock affiliated funds. It also includes out-of-pocket expenses, including payments made to third-parties for recordkeeping services provided to their clients who invest in one or more John Hancock funds. In addition, Signature Services Cost may be reduced by certain fees that Signature Services receives in connection with retirement and small accounts. Signature Services
| |
| 38 | Global Income Fund | Annual report |
Cost is calculated monthly and allocated, as applicable, to five categories of share classes: Retail Share and Institutional Share Classes of Non-Municipal Bond Funds, Class R6 Shares, Retirement Share Classes and Municipal Bond Share Classes. Within each of these categories, the applicable costs are allocated to the affected John Hancock affiliated funds and/or classes, based on the relative average daily net assets.
Prior to October 1, 2013, Signature Services Cost was calculated monthly and allocated, as applicable, to four categories of share classes: Institutional Share Classes, Retirement Share Classes, Municipal Bond Share Classes and all other Retail Share Classes. Within each of these categories, the applicable costs were allocated to the affected John Hancock affiliated funds and/or classes, based on the relative average daily net assets.
Class level expenses. Class level expenses for the year ended July 31, 2014 were:
| | | | |
| | DISTRIBUTION | TRANSFER | STATE | PRINTING AND |
| CLASS | AND SERVICE FEES | AGENT FEES | REGISTRATION FEES | POSTAGE |
|
| Class A | $4,150 | $1,876 | $23,916 | $1,878 |
| Class I | — | 630 | 23,916 | 1,114 |
| Total | $4,150 | $2,506 | $47,832 | $2,992 |
Trustee expenses. The fund compensates each Trustee who is not an employee of the Advisor or its affiliates. The costs of paying Trustee compensation and expenses are allocated to each fund based on its net assets relative to other funds within the John Hancock group of funds complex.
Note 6 — Fund share transactions
Transactions in fund shares for the years ended July 31, 2014 and 2013 were as follows:
| | | | |
| | Year ended 7-31-14 | Year ended 7-31-13 |
| | Shares | Amount | Shares | Amount |
| Class A shares | | | | |
|
| Sold | 257,992 | $2,605,280 | 50,296 | $527,317 |
| Distributions reinvested | 7,049 | 70,979 | 435 | 4,412 |
| Repurchased | (66,129) | (664,029) | (128) | (1,292) |
| | | | | |
| Net increase | 198,912 | $2,012,230 | 50,603 | $530,437 |
| |
| Class I shares | | | | |
|
| Sold | 121,960 | $1,207,785 | 10,238 | $110,000 |
| Distributions reinvested | 2,673 | 26,856 | 117 | 1,184 |
| Repurchased | (129,574) | (1,324,190) | — | — |
| | | | | |
| Net increase (decrease) | (4,941) | ($89,549) | 10,355 | $111,184 |
| |
| Class NAV shares | | | | |
|
| Sold | 6,911,611 | $69,234,172 | 8,620,566 | $90,658,666 |
| Distributions reinvested | 3,515,976 | 35,281,870 | 3,350,641 | 35,281,784 |
| Repurchased | (6,304,804) | (63,356,868) | (3,079,853) | (32,486,647) |
| | | | | |
| Net increase | 4,122,783 | $41,159,174 | 8,891,354 | $93,453,803 |
| |
| Total net increase | 4,316,754 | $43,081,855 | 8,952,312 | $94,095,424 |
|
Affiliates of the fund owned 5%, 20%, and 100% of shares of beneficial interest of Class A, Class I, and Class NAV, respectively, on July 31, 2014.
| |
| Annual report | Global Income Fund | 39 |
Note 7 — Purchase and sale of securities
Purchases and sales of securities, other than short-term investments, amounted to $413,958,570 and $375,993,157, respectively, for the year ended July 31, 2014.
Note 8 — Investment by affiliated funds
Certain investors in the fund are affiliated funds that are managed by the Advisor and its affiliates. The affiliated funds do not invest in the fund for the purpose of exercising management or control; however, this investment may represent a significant portion of the fund’s net assets. At July 31, 2014, funds within the John Hancock group of funds complex held 99.5% of the fund’s net assets. The following funds had an affiliate ownership of 5% or more of the fund’s net assets:
| | |
| | AFFILIATE | |
| FUND | CONCENTRATION | |
| |
| John Hancock Funds II Lifestyle Balanced | 32.1% | |
| John Hancock Funds II Lifestyle Growth | 18.2% | |
| John Hancock Funds II Alternative Asset Allocation | 14.0% | |
| John Hancock Funds II Lifestyle Moderate | 13.3% | |
| John Hancock Funds II Lifestyle Conservative | 7.8% | |
| |
| 40 | Global Income Fund | Annual report |
Auditor’s report
Report of Independent Registered Public Accounting Firm
To the Board of Trustees of John Hancock Funds II and Shareholders of
John Hancock Global Income Fund (formerly, John Hancock Global High Yield Fund):
In our opinion, the accompanying statement of assets and liabilities, including the schedule of investments, and the related statements of operations and of changes in net assets and the financial highlights present fairly, in all material respects, the financial position of the John Hancock Global Income Fund (formerly, John Hancock Global High Yield Fund) (the “Fund”) at July 31, 2014, the results of its operations for the year then ended, the changes in its net assets for each of the two years in the period then ended and the financial highlights for each of the periods indicated, in conformity with accounting principles generally accepted in the United States of America. These financial statements and financial highlights (hereafter referred to as “financial statements”) are the responsibility of the Fund’s management. Our responsibility is to express an opinion on these financial statements based on our audits. We conducted our audits of these financial statements in accordance with the standards of the Public Company Accounting Oversight Board (United States). Those standards require that we plan and perform the audit to obtain reasonable assurance about whether the financial statements are free of material misstatement. An audit includes examining, on a test basis, evidence supporting the amounts and disclosures in the financial statements, assessing the accounting principles used and significant estimates made by management, and evaluating the overall financial statement presentation. We believe that our audits, which included confirmation of securities at July 31, 2014 by correspondence with the custodian, agent banks and brokers, and the application of alternative auditing procedures where securities purchased confirmations had not been received, provide a reasonable basis for our opinion.
PricewaterhouseCoopers LLP
Boston, Massachusetts
September 17, 2014
| |
| Annual report | Global Income Fund | 41 |
Tax information
Unaudited
For federal income tax purposes, the following information is furnished with respect to the distributions of the fund, if any, paid during its taxable year ended July 31, 2014.
The fund reports the maximum amount allowable of its net taxable income as eligible for the corporate dividends-received deduction.
The fund reports the maximum amount allowable of its net taxable income as qualified dividend income as provided in the Jobs and Growth Tax Relief Reconciliation Act of 2003.
The fund paid $3,734,908 in capital gain dividends.
Eligible shareholders will be mailed a 2014 Form 1099-DIV in early 2015. This will reflect the tax character of all distributions paid in calendar year 2014.
Please consult a tax advisor regarding the tax consequences of your investment in the fund.
| |
| 42 | Global Income Fund | Annual report |
Continuation of Investment Advisory and Subadvisory Agreements
Evaluation of Advisory and Subadvisory Agreements by the Board of Trustees
This section describes the evaluation by the Board of Trustees (the Board) of John Hancock Funds II (the Trust) of the Advisory Agreement (the Advisory Agreement) with John Hancock Advisers, LLC (the Advisor) and the Subadvisory Agreement (the Subadvisory Agreement) with Stone Harbor Investment Partners LP (the Subadvisor), for John Hancock Global Income Fund (the fund). The Advisory Agreement and Subadvisory Agreement are collectively referred to as the Agreements. Prior to the June 23–25, 2014 meeting at which the Agreements were approved, the Board also discussed and considered information regarding the proposed continuation of the Agreements at an in-person meeting held on May 27–29, 2014.
Approval of Advisory and Subadvisory Agreements
At in-person meetings held on June 23–25, 2014, the Board, including the Trustees who are not considered to be interested persons of the Trust under the Investment Company Act of 1940, as amended (the 1940 Act) (the Independent Trustees), reapproved for an annual period the continuation of the Advisory Agreement between the Trust and the Advisor and the Subadvisory Agreement between the Advisor and the Subadvisor with respect to the fund.
In considering the Advisory Agreement and the Subadvisory Agreement, the Board received in advance of the meetings a variety of materials relating to the fund, the Advisor and the Subadvisor, including comparative performance, fee and expense information for a peer group of similar funds prepared by an independent third-party provider of fund data, performance information for an applicable benchmark index; and, with respect to the Subadvisor, comparative performance information for comparably managed accounts, as applicable, and other information provided by the Advisor and the Subadvisor regarding the nature, extent and quality of services provided by the Advisor and the Subadvisor under their respective Agreements, as well as information regarding the Advisor’s revenues and costs of providing services to the fund and any compensation paid to affiliates of the Advisor. At the meetings at which the renewal of the Advisory Agreement and Subadvisory Agreement are considered, particular focus is given to information concerning fund performance, comparability of fees and total expenses, and profitability. However, the Board notes that the evaluation process with respect to the Advisor and the Subadvisor is an ongoing one. In this regard, the Board also took into account discussions with management and information provided to the Board at prior meetings with respect to the services provided by the Advisor and the Subadvisor to the fund, including quarterly performance reports prepared by management containing reviews of investment results and prior presentations from the Subadvisor with respect to the fund. The Board also considered the nature, quality, and extent of non-advisory services, if any, to be provided to the fund by the Advisor’s affiliates, including distribution services.
Throughout the process, the Board asked questions of and requested additional information from management. The Board is assisted by counsel for the Trust and the Independent Trustees are also separately assisted by independent legal counsel throughout the process. The Independent Trustees also received a memorandum from their independent legal counsel discussing the legal standards for their consideration of the proposed continuation of the Agreements and discussed the proposed continuation of the Agreements in private sessions with their independent legal counsel at which no representatives of management were present.
Approval of Advisory Agreement
In approving the Advisory Agreement with respect to the fund, the Board, including the Independent Trustees, considered a variety of factors, including those discussed below. The Board also considered other factors (including conditions and trends prevailing generally in the economy, the securities markets, and the industry) and does not treat any single factor as determinative, and each Trustee
| |
| Annual report | Global Income Fund | 43 |
may attribute different weights to different factors. The Board’s conclusions may be based in part on its consideration of the advisory and subadvisory arrangements in prior years and on the Board’s ongoing regular review of fund performance and operations throughout the year.
Nature, extent, and quality of services. Among the information received by the Board from the Advisor relating to the nature, extent, and quality of services provided to the fund, the Board reviewed information provided by the Advisor relating to its operations and personnel, descriptions of its organizational and management structure, and information regarding the Advisor’s compliance and regulatory history, including its Form ADV. The Board also noted that on a regular basis it receives and reviews information from the Trust’s Chief Compliance Officer (CCO) regarding the fund’s compliance policies and procedures established pursuant to Rule 38a-1 under the 1940 Act. The Board also considered the Advisor’s risk management processes. The Board considered that the Advisor is responsible for the management of the day-to-day operations of the fund, including, but not limited to, general supervision of and coordination of the services provided by the Subadvisor, and is also responsible for monitoring and reviewing the activities of the Subadvisor and other third-party service providers.
In considering the nature, extent, and quality of the services provided by the Advisor, the Trustees also took into account their knowledge of the Advisor’s management and the quality of the performance of the Advisor’s duties, through Board meetings, discussions and reports during the preceding year and through each Trustee’s experience as a Trustee of the Trust and of the other trusts in the complex.
In the course of their deliberations regarding the Advisory Agreement, the Board considered, among other things:
(a) the skills and competency with which the Advisor has in the past managed the Trust’s affairs and its subadvisory relationship, the Advisor’s oversight and monitoring of the Subadvisor’s investment performance and compliance programs, such as the Subadvisor’s compliance with fund policies and objectives, review of brokerage matters, including with respect to trade allocation and best execution and the Advisor’s timeliness in responding to performance issues;
(b) the background, qualifications and skills of the Advisor’s personnel;
(c) the Advisor’s compliance policies and procedures and its responsiveness to regulatory changes and mutual fund industry developments;
(d) the Advisor’s administrative capabilities, including its ability to supervise the other service providers for the fund;
(e) the financial condition of the Advisor and whether it has the financial wherewithal to provide a high level and quality of services to the fund; and
(f) the Advisor’s reputation and experience in serving as an investment advisor to the Trust and the benefit to shareholders of investing in funds that are part of a family of funds offering a variety of investments.
The Board concluded that the Advisor may reasonably be expected to continue to provide a high quality of services under the Advisory Agreement with respect to the fund.
| |
| 44 | Global Income Fund | Annual report |
Investment performance. In considering the fund’s performance, the Board noted that it reviews at its regularly scheduled meetings information about the fund’s performance results. In connection with the consideration of the Advisory Agreement, the Board:
(a) reviewed information prepared by management regarding the fund’s performance;
(b) considered the comparative performance of an applicable benchmark index;
(c) considered the performance of comparable funds, if any, as included in the report prepared by an independent third-party provider of fund data; and
(d) took into account the Advisor’s analysis of the fund’s performance and its plans and recommendations regarding the Trust’s subadvisory arrangements generally.
The Board noted that the fund underperformed its benchmark index and its peer group average for the one-, and three-year periods ended December 31, 2013.
The Board took into account management’s discussion of the fund’s performance, including the factors that contributed to the fund’s relative performance, noting the differences between the investment strategy of the fund and those of its peer group. The Board also noted the fund’s more recent improvement in performance.
The Board also concluded that the fund’s performance is being monitored and reasonably addressed.
Fees and expenses. The Board reviewed comparative information prepared by an independent third-party provider of mutual fund data, including, among other data, the fund’s contractual and net management fees (and subadvisory fees, to the extent available) and total expenses as compared to similarly situated investment companies deemed to be comparable to the fund. The Board considered the fund’s ranking within a smaller group of peer funds chosen by the independent third-party provider, as well as the fund’s ranking within a broader group of funds. In comparing the fund’s contractual and net management fees to those of comparable funds, the Board noted that such fees include both advisory and administrative costs.
The Board noted that net management fees and total expenses for the fund are higher than the peer group median.
The Board took into account management’s discussion of the fund’s expenses, including action taken that will further reduce certain fund expenses. The Board also took into account management’s discussion with respect to the advisory/subadvisory fee structure, including the amount of the advisory fee retained by the Advisor after payment of the subadvisory fee. The Board also noted that the Advisor pays the subadvisory fee, and that such fees are negotiated at arm’s length with respect to the Subadvisor. In addition, the Board took into account that management had agreed, effective July 1, 2014, to implement an overall fee waiver across the complex, including the fund, which is discussed further below. The Board also noted actions taken over the past several years to reduce the fund’s operating expenses. The Board noted that, in addition, the Advisor is currently waiving fees and/or reimbursing expenses with respect to the fund and that the Advisor agreed to implement an advisory fee reduction for the fund effective July 1, 2014. The Board also noted that the fund has breakpoints in its contractual management fee schedule that reduces management fees as assets increase. The Board reviewed information provided by the Advisor concerning the investment advisory fee charged by the Advisor or one of its advisory affiliates to other clients (including other funds in the complex) having similar investment mandates, if any. The Board considered any differences between the Advisor’s and Subadvisor’s services to the fund and the services they provide to other comparable clients or funds. The Board concluded that the advisory fee paid with respect to the fund is reasonable.
| |
| Annual report | Global Income Fund | 45 |
Profitability/indirect benefits. In considering the costs of the services to be provided and the profits to be realized by the Advisor and its affiliates from the Advisor’s relationship with the Trust, the Board:
(a) reviewed financial information of the Advisor;
(b) reviewed and considered information presented by the Advisor regarding the net profitability to the Advisor and its affiliates with respect to the fund;
(c) received and reviewed profitability information with respect to the John Hancock fund complex as a whole;
(d) received information with respect to the Advisor’s allocation methodologies used in preparing the profitability data;
(e) considered that the John Hancock insurance companies that are affiliates of the Advisor, as shareholders of the Trust directly or through their separate accounts, receive certain tax credits or deductions relating to foreign taxes paid and dividends received by certain funds of the Trust and noted that these tax benefits, which are not available to participants in qualified retirement plans under applicable income tax law, are reflected in the profitability analysis reviewed by the Board;
(f) considered that the Advisor also provides administrative services to the fund on a cost basis pursuant to an administrative services agreement;
(g) noted that affiliates of the Advisor provide transfer agency services and distribution services to the fund, and that the fund’s distributor also receives Rule 12b-1 payments to support distribution of the fund;
(h) noted that the Advisor also derives reputational and other indirect benefits from providing advisory services to the fund;
(i) noted that the subadvisory fee for the fund is paid by the Advisor and is negotiated at arm’s length; and
(j) considered that the Advisor should be entitled to earn a reasonable level of profits in exchange for the level of services it provides to the fund and the entrepreneurial risk that it assumes as Advisor.
Based upon its review, the Board concluded that the level of profitability, if any, of the Advisor and its affiliates from their relationship with the fund was reasonable and not excessive.
Economies of scale. In considering the extent to which economies of scale would be realized as the fund grows and whether fee levels reflect these economies of scale for the benefit of fund shareholders, the Board:
(a) considered that the Advisor has agreed, effective July 1, 2014, to waive a portion of its management fee for the fund and each of the other John Hancock funds in the complex (except for those discussed below) (the Participating Portfolios) or otherwise reimburse the expenses of the Participating Portfolios as follows (the Reimbursement):
| |
| 46 | Global Income Fund | Annual report |
The Reimbursement shall equal, on an annualized basis, 0.01% of that portion of the aggregate net assets of all the Participating Portfolios that exceed $75 billion but is less than or equal to $125 billion, 0.0125% of that portion of the aggregate net assets of all the Participating Portfolios that exceed $125 billion but is less than or equal to $150 billion and 0.015% of that portion of the aggregate net assets of all the Participating Portfolios that exceeds $150 billion. (The funds that are not Participating Portfolios are the funds of funds in the complex, which benefit from such overall management fee waiver through their investment in underlying portfolios that include Participating Portfolios, which are subject to the Reimbursement.)
(b) reviewed the fund’s advisory fee structure and concluded that: (i) the fund’s fee structure contains breakpoints at the subadvisory fee level and that such breakpoints are reflected as breakpoints in the advisory fees for the fund; and (ii) although economies of scale cannot be measured with precision, these arrangements permit shareholders of the fund to benefit from economies of scale if the fund grows. The Board also took into account management’s discussion of the fund’s advisory fee structure; and
(c) the Board also considered the effect of the fund’s growth in size on its performance and fees. The Board also noted that if the fund’s assets increase over time, the fund may realize other economies of scale.
Approval of Subadvisory Agreement
In making its determination with respect to approval of the Subadvisory Agreement, the Board reviewed:
(1) information relating to the Subadvisor’s business, including current subadvisory services to the Trust (and other funds in the John Hancock family of funds);
(2) the historical and current performance of the fund and comparative performance information relating to an applicable benchmark index and comparable funds;
(3) the subadvisory fee for the fund, including any breakpoints, and to the extent available, comparable fee information prepared by an independent third party provider of fund data; and
(4) information relating to the nature and scope of any material relationships and their significance to the Trust’s Advisor and Subadvisors.
Nature, extent, and quality of services. With respect to the services provided by the Subadvisor, the Board received information provided to the Board by the Subadvisor, including the Subadvisor’s Form ADV, as well as took into account information presented throughout the past year. The Board considered the Subadvisor’s current level of staffing and its overall resources, as well as received information relating to the Subadvisor’s compensation program. The Board reviewed the Subadvisor’s history and investment experience, as well as information regarding the qualifications, background, and responsibilities of the Subadvisor’s investment and compliance personnel who provide services to the fund. The Board also considered, among other things, the Subadvisor’s compliance program and any disciplinary history. The Board also considered the Subadvisor’s risk assessment and monitoring process. The Board reviewed the Subadvisor’s regulatory history, including whether it was involved in any regulatory actions or investigations as well as material litigation, and any settlements and amelioratory actions undertaken, as appropriate. The Board noted that the Advisor conducts regular, periodic reviews of the Subadvisor and its operations, including regarding investment processes and organizational and staffing matters. The Board also noted that the Trust’s CCO and his staff conduct regular, periodic compliance reviews with the Subadvisor and present reports to the
| |
| Annual report | Global Income Fund | 47 |
Independent Trustees regarding the same, which includes evaluating the regulatory compliance systems of the Subadvisor and procedures reasonably designed to assure compliance with the federal securities laws. The Board also took into account the financial condition of the Subadvisor.
The Board considered the Subadvisor’s investment process and philosophy. The Board took into account that the Subadvisor’s responsibilities include the development and maintenance of an investment program for the fund that is consistent with the fund’s investment objective, the selection of investment securities and the placement of orders for the purchase and sale of such securities, as well as the implementation of compliance controls related to performance of these services. The Board also received information with respect to the Subadvisor’s brokerage policies and practices, including with respect to best execution and soft dollars.
Subadvisor compensation. In considering the cost of services to be provided by the Subadvisor and the profitability to the Subadvisor of its relationship with the fund, the Board noted that the fees under the Subadvisory Agreement are paid by the Advisor and not the fund.
The Board also relied on the ability of the Advisor to negotiate the Subadvisory Agreement with the Subadvisor, which is not affiliated with the Advisor, and the fees thereunder at arm’s length. As a result, the costs of the services to be provided and the profits to be realized by the Subadvisor from its relationship with the Trust were not a material factor in the Board’s consideration of the Subadvisory Agreement.
The Board also received information regarding the nature and scope (including their significance to the Advisor and its affiliates and to the Subadvisor) of any material relationships, if any, with respect to the Subadvisor, which include arrangements in which the Subadvisor or its affiliates provide advisory, distribution, or management services in connection with financial products sponsored by the Advisor or its affiliates, and may include other registered investment companies, a 529 education savings plan, managed separate accounts and exempt group annuity contracts sold to qualified plans. The Board also received information and took into account any other potential conflicts of interest the Advisor might have in connection with the Subadvisory Agreement.
In addition, the Board considered other potential indirect benefits that the Subadvisor and its affiliates may receive from the Subadvisor’s relationship with the fund, such as the opportunity to provide advisory services to additional funds in the John Hancock fund complex and reputational benefits.
Subadvisory fee. The Board considered that the fund pays an advisory fee to the Advisor and that, in turn, the Advisor pays a subadvisory fee to the Subadvisor. As noted above, the Board also considered the fund’s subadvisory fee as compared to similarly situated investment companies deemed to be comparable to the fund as included in the report prepared by the independent third party provider of fund data, to the extent available. The Board noted that the subadvisory fee for the fund is higher than the peer group median. The Board also took into account the subadvisory fee paid by the Advisor to the Subadvisor with respect to the fund to fees charged by the Subadvisor to manage other subadvised portfolios and portfolios not subject to regulation under the 1940 Act, as applicable.
Subadvisor performance. As noted above, the Board considered the fund’s performance as compared to the fund’s peer group and the benchmark index and noted that the Board reviews information about the fund’s performance results at its regularly scheduled meetings. The Board noted the Advisor’s expertise and resources in monitoring the performance, investment style and risk-adjusted performance of the Subadvisor. The Board was mindful of the Advisor’s focus on the Subadvisor’s performance. The Board also noted the Subadvisor’s long-term performance record for similar accounts, as applicable.
| |
| 48 | Global Income Fund | Annual report |
The Board’s decision to approve the Subadvisory Agreement was based on a number of determinations, including the following:
(1) the Subadvisor has extensive experience and demonstrated skills as a manager;
(2) the performance of the fund is eing monitored and reasonably addressed;
(3) the subadvisory fee is reasonable in relation to the level and quality of services being provided; and
(4) subadvisory fee breakpoints are reflected as breakpoints in the advisory fees for the fund in order to permit shareholders to benefit from economies of scale if the fund grows.
Based on the Board’s evaluation of all factors that the Board deemed to be material, including those factors described above, the Board, including the Independent Trustees, concluded that renewal of the Advisory Agreement and the Subadvisory Agreement would be in the best interest of the fund and its shareholders. Accordingly, the Board, and the Independent Trustees voting separately, approved the Advisory Agreement and Subadvisory Agreement for an additional one-year period.
| |
| Annual report | Global Income Fund | 49 |
Trustees and Officers
This chart provides information about the Trustees and Officers who oversee your John Hancock fund. Officers elected by the Trustees manage the day-to-day operations of the fund and execute policies formulated by the Trustees.
| | |
| Independent Trustees | | |
| | | |
| Name, year of birth | Trustee | Number of John |
| Position(s) held with fund | of the | Hancock funds |
| Principal occupation(s) and other | Trust | overseen by |
| directorships during past 5 years | since1 | Trustee |
| |
| James M. Oates, Born: 1946 | 2005 | 230 |
|
| Managing Director, Wydown Group (financial consulting firm) (since 1994); Chairman and Director, |
| Emerson Investment Management, Inc. (since 2000); Independent Chairman, Hudson Castle Group, Inc. |
| (formerly IBEX Capital Markets, Inc.) (financial services company) (1997–2011); Director, Stifel Financial |
| (since 1996); Director, Investor Financial Services Corporation (1995–2007); Director, Connecticut River |
| Bancorp (since 1998); Director, Virtus Funds (formerly Phoenix Mutual Funds) (since 1988). | |
| | |
| Trustee and Chairperson of the Board, John Hancock retail funds3 (since 2012); Trustee (2005–2006 and |
| since 2012) and Chairperson of the Board (since 2012), John Hancock Funds III; Trustee (since 2004) and |
| Chairperson of the Board (since 2005), John Hancock Variable Insurance Trust; Trustee and Chairperson |
| of the Board, John Hancock Funds II (since 2005). | | |
| |
| Charles L. Bardelis,2 Born: 1941 | 2005 | 230 |
|
| Director, Island Commuter Corp. (marine transport). | | |
| | | |
| Trustee, John Hancock retail funds3 (since 2012); Trustee, John Hancock Funds III (2005–2006 and |
| since 2012); Trustee, John Hancock Variable Insurance Trust (since 1988); Trustee, John Hancock |
| Funds II (since 2005). | | |
| |
| Peter S. Burgess,2 Born: 1942 | 2005 | 230 |
|
| Consultant (financial, accounting, and auditing matters) (since 1999); Certified Public Accountant; |
| Partner, Arthur Andersen (independent public accounting firm) (prior to 1999); Director, Lincoln |
| Educational Services Corporation (since 2004); Director, Symetra Financial Corporation (since 2010); |
| Director, PMA Capital Corporation (2004–2010). | | |
| | | |
| Trustee, John Hancock retail funds3 (since 2012); Trustee, John Hancock Funds III (2005–2006 and |
| since 2012); Trustee, John Hancock Variable Insurance Trust and John Hancock Funds II (since 2005). |
| |
| William H. Cunningham, Born: 1944 | 2012 | 230 |
|
| Professor, University of Texas, Austin, Texas (since 1971); former Chancellor, University of Texas System |
| and former President of the University of Texas, Austin, Texas; Director, LIN Television (since 2009); |
| Chairman (since 2009) and Director (since 2006), Lincoln National Corporation (insurance); Director, |
| Resolute Energy Corporation (since 2009); Director, Southwest Airlines (since 2000); former Director, |
| Introgen (manufacturer of biopharmaceuticals) (until 2008); former Director, Hicks Acquisition Company I, |
| Inc. (until 2007); former Director, Texas Exchange Bank, SSB (formerly Bank of Crowley) (until 2009); |
| former Advisory Director, JP Morgan Chase Bank (formerly Texas Commerce Bank–Austin) (until 2009). |
| |
| Trustee, John Hancock retail funds3 (since 1986); Trustee, John Hancock Variable Insurance Trust |
| (since 2012); Trustee, John Hancock Funds II (2005–2006 and since 2012). | | |
| |
| 50 | Global Income Fund | Annual report |
| | |
| Independent Trustees (continued) | | |
| |
| Name, Year of Birth | Trustee | Number of John |
| Position(s) held with Fund | of the | Hancock funds |
| Principal occupation(s) and other | Trust | overseen by |
| directorships during past 5 years | since1 | Trustee |
| |
| Grace K. Fey, Born: 1946 | 2008 | 230 |
|
| Chief Executive Officer, Grace Fey Advisors (since 2007); Director and Executive Vice President, Frontier |
| Capital Management Company (1988–2007); Director, Fiduciary Trust (since 2009). | |
| | |
| Trustee, John Hancock retail funds3 (since 2012); Trustee, John Hancock Variable Insurance Trust and |
| John Hancock Funds II (since 2008). | | |
| |
| Theron S. Hoffman,2 Born: 1947 | 2008 | 230 |
|
| Chief Executive Officer, T. Hoffman Associates, LLC (consulting firm) (since 2003); Director, The Todd |
| Organization (consulting firm) (2003–2010); President, Westport Resources Management (investment |
| management consulting firm) (2006–2008); Senior Managing Director, Partner, and Operating Head, |
| Putnam Investments (2000–2003); Executive Vice President, The Thomson Corp. (financial and legal |
| information publishing) (1997–2000). | | |
| | | |
| Trustee, John Hancock retail funds3 (since 2012); Trustee, John Hancock Variable Insurance Trust and |
| John Hancock Funds II (since 2008). | | |
| |
| Deborah C. Jackson, Born: 1952 | 2012 | 230 |
|
| President, Cambridge College, Cambridge, Massachusetts (since 2011); Chief Executive Officer, |
| American Red Cross of Massachusetts Bay (2002–2011); Board of Directors of Eastern Bank Corporation |
| (since 2001); Board of Directors of Eastern Bank Charitable Foundation (since 2001); Board of Directors |
| of American Student Assistance Corporation (1996–2009); Board of Directors of Boston Stock Exchange |
| (2002–2008); Board of Directors of Harvard Pilgrim Healthcare (health benefits company) (2007–2011). |
| |
| Trustee, John Hancock retail funds3 (since 2008); Trustee of John Hancock Variable Insurance Trust and |
| John Hancock Funds II (since 2012). | | |
| |
| Hassell H. McClellan, Born: 1945 | 2005 | 230 |
|
| Trustee, Virtus Variable Insurance Trust (formerly Phoenix Edge Series Funds) (since 2008); Director, The |
| Barnes Group (since 2010); Associate Professor, The Wallace E. Carroll School of Management, Boston |
| College (retired 2013). | | |
| | | |
| Trustee, John Hancock retail funds3 (since 2012); Trustee, John Hancock Funds III (2005–2006 and |
| since 2012); Trustee, John Hancock Variable Insurance Trust and John Hancock Funds II (since 2005). |
| |
| Steven R. Pruchansky, Born: 1944 | 2012 | 230 |
|
| Chairman and Chief Executive Officer, Greenscapes of Southwest Florida, Inc. (since 2000); Director |
| and President, Greenscapes of Southwest Florida, Inc. (until 2000); Member, Board of Advisors, First |
| American Bank (until 2010); Managing Director, Jon James, LLC (real estate) (since 2000); Director, |
| First Signature Bank & Trust Company (until 1991); Director, Mast Realty Trust (until 1994); President, |
| Maxwell Building Corp. (until 1991). | | |
| | | |
| Trustee (since 1992) and Chairperson of the Board (2011–2012), John Hancock retail funds3; Trustee and |
| Vice Chairperson of the Board, John Hancock retail funds,3 John Hancock Variable Insurance Trust, and |
| John Hancock Funds II (since 2012). | | |
| |
| Annual report | Global Income Fund | 51 |
| | |
| Independent Trustees (continued) | | |
| |
| Name, Year of Birth | Trustee | Number of John |
| Position(s) held with Fund | of the | Hancock funds |
| Principal occupation(s) and other | Trust | overseen by |
| directorships during past 5 years | since1 | Trustee |
| |
| Gregory A. Russo, Born: 1949 | 2012 | 230 |
|
| Director and Audit Committee Chairman (since 2012), and Member, Audit Committee and Finance |
| Committee (since 2011), NCH Healthcare System, Inc. (holding company for multi-entity healthcare |
| system); Director and Member of Finance Committee, The Moorings, Inc. (nonprofit continuing care |
| community) (since 2012); Vice Chairman, Risk & Regulatory Matters, KPMG LLP (KPMG) (2002–2006); |
| Vice Chairman, Industrial Markets, KPMG (1998–2002); Chairman and Treasurer, Westchester County, |
| New York, Chamber of Commerce (1986–1992); Director, Treasurer, and Chairman of Audit and |
| Finance Committees, Putnam Hospital Center (1989–1995); Director and Chairman of Fundraising |
| Campaign, United Way of Westchester and Putnam Counties, New York (1990–1995). | |
| | |
| Trustee, John Hancock retail funds3 (since 2008); Trustee, John Hancock Variable Insurance Trust and |
| John Hancock Funds II (since 2012). | | |
| |
| |
| Non-Independent Trustees4 | | |
| | | |
| Name, year of birth | Trustee | Number of John |
| Position(s) held with fund | of the | Hancock funds |
| Principal occupation(s) and other | Trust | overseen by |
| directorships during past 5 years | since1 | Trustee |
| |
| Craig Bromley, Born: 1966 | 2012 | 230 |
|
| President, John Hancock Financial Services (since 2012); Senior Executive Vice President and General |
| Manager, U.S. Division, Manulife Financial Corporation (since 2012); President and Chief Executive |
| Officer, Manulife Insurance Company (Manulife Japan) (2005–2012, including prior positions). |
| |
| Trustee, John Hancock retail funds,3 John Hancock Variable Insurance Trust, and John Hancock |
| Funds II (since 2012). | | |
| |
| Warren A. Thomson, Born: 1955 | 2012 | 230 |
|
| Senior Executive Vice President and Chief Investment Officer, Manulife Financial Corporation and The |
| Manufacturers Life Insurance Company (since 2009); Chairman and Chief Executive Officer, Manulife |
| Asset Management (since 2001, including prior positions); Director (since 2006), and President and |
| Chief Executive Officer (since 2013), Manulife Asset Management Limited; Director and Chairman, |
| Hancock Natural Resources Group, Inc. (since 2013). | | |
| | | |
| Trustee, John Hancock retail funds,3 John Hancock Variable Insurance Trust, and John Hancock |
| Funds II (since 2012). | | |
| |
| |
| Principal officers who are not Trustees | | |
| | | |
| Name, year of birth | | Officer |
| Position(s) held with fund | | of the |
| Principal occupation(s) and other | | Trust |
| directorships during past 5 years | | since |
| |
| Andrew G. Arnott, Born: 1971 | | 2009 |
|
| President | | |
| Senior Vice President, John Hancock Financial Services (since 2009); Director and Executive Vice |
| President, John Hancock Advisers, LLC (since 2005, including prior positions); Director and Executive |
| Vice President, John Hancock Investment Management Services, LLC (since 2006, including prior |
| positions); President, John Hancock Funds, LLC (since 2004, including prior positions); President |
| (effective 3-13-14) and Executive Vice President, John Hancock retail funds,3 John Hancock Variable |
| Insurance Trust, and John Hancock Funds II (since 2007, including prior positions). | |
| |
| 52 | Global Income Fund | Annual report |
| |
| Principal officers who are not Trustees (continued) | |
| |
| Name, Year of Birth | Officer |
| Position(s) held with Fund | of the |
| Principal occupation(s) and other | Trust |
| directorships during past 5 years | since |
| |
| John J. Danello, Born: 1955 | 2006 |
|
| Senior Vice President, Secretary, and Chief Legal Officer | |
| Vice President and Chief Counsel, John Hancock Wealth Management (since 2005); Senior Vice | |
| President (since 2007) and Chief Legal Counsel (2007–2010), John Hancock Funds, LLC and The | |
| Berkeley Financial Group, LLC; Senior Vice President (since 2006, including prior positions) and Chief |
| Legal Officer and Secretary (since 2014), John Hancock retail funds3 and John Hancock Variable | |
| Insurance Trust; Vice President, John Hancock Life & Health Insurance Company (since 2009); | |
| Vice President, John Hancock Life Insurance Company (USA) and John Hancock Life Insurance | |
| Company of New York (since 2010); and Senior Vice President, Secretary, and Chief Legal Counsel | |
| (2007–2014, including prior positions) of John Hancock Advisers, LLC and John Hancock Investment |
| Management Services, LLC. | |
| |
| Francis V. Knox, Jr., Born: 1947 | 2005 |
|
| Chief Compliance Officer | |
| Vice President, John Hancock Financial Services (since 2005); Chief Compliance Officer, John Hancock |
| retail funds,3 John Hancock Variable Insurance Trust, John Hancock Funds II, John Hancock Advisers, |
| LLC, and John Hancock Investment Management Services, LLC (since 2005). | |
| |
| Charles A. Rizzo, Born: 1957 | 2007 |
|
| Chief Financial Officer | |
| Vice President, John Hancock Financial Services (since 2008); Senior Vice President, John Hancock | |
| Advisers, LLC and John Hancock Investment Management Services, LLC (since 2008); Chief Financial |
| Officer, John Hancock retail funds,3 John Hancock Variable Insurance Trust and John Hancock | |
| Funds II (since 2007). | |
| |
| Salvatore Schiavone, Born: 1965 | 2009 |
|
| Treasurer | |
| Assistant Vice President, John Hancock Financial Services (since 2007); Vice President, John Hancock |
| Advisers, LLC and John Hancock Investment Management Services, LLC (since 2007); Treasurer, | |
| John Hancock retail funds3 (since 2007, including prior positions); Treasurer, John Hancock Variable |
| Insurance Trust and John Hancock Funds II (since 2010 and 2007–2009, including prior positions). | |
The business address for all Trustees and Officers is 601 Congress Street, Boston, Massachusetts 02210-2805.
1 Each Trustee holds office until his or her successor is elected and qualified, or until the Trustee’s death, retirement, resignation, or removal.
2 Member of the Audit Committee.
3 “John Hancock retail funds” comprises John Hancock Funds III and 37 other John Hancock funds consisting of 27 series of other John Hancock trusts and 10 closed-end funds.
4 Because Messrs. Bromley and Thomson are senior executives or directors of the advisor and/or its affiliates, each of them is considered an “interested person of the fund,” as defined in the Investment Company Act of 1940.
| |
| Annual report | Global Income Fund | 53 |
More information
| |
| Trustees | Investment advisor |
| James M. Oates, Chairperson | John Hancock Advisers, LLC |
| Steven R. Pruchansky, Vice Chairperson | |
| Charles L. Bardelis* | Subadvisor |
| Craig Bromley† | Stone Harbor Investment Partners LP |
| Peter S. Burgess* | |
| William H. Cunningham | Principal distributor |
| Grace K. Fey | John Hancock Funds, LLC |
| Theron S. Hoffman* | |
| Deborah C. Jackson | Custodian |
| Hassell H. McClellan | State Street Bank and Trust Company |
| Gregory A. Russo | |
| Warren A. Thomson† | Transfer agent |
| | John Hancock Signature Services, Inc. |
| Officers | |
| Andrew G. Arnott | Legal counsel |
| President | K&L Gates LLP |
| | |
| John J. Danello | Independent registered |
| Senior Vice President, Secretary, | public accounting firm |
| and Chief Legal Officer | PricewaterhouseCoopers LLP |
| | |
| Francis V. Knox, Jr. | |
| Chief Compliance Officer | |
| | |
| Charles A. Rizzo | |
| Chief Financial Officer | |
| | |
| Salvatore Schiavone | |
| Treasurer | |
| |
| *Member of the Audit Committee | |
| †Non-Independent Trustee | |
The fund’s proxy voting policies and procedures, as well as the fund’s proxy voting record for the most recent twelve-month period ended June 30, are available free of charge on the Securities and Exchange Commission (SEC) website at sec.gov or on our website.
The fund’s complete list of portfolio holdings, for the first and third fiscal quarters, is filed with the SEC on Form N-Q. The fund’s Form N-Q is available on our website and the SEC’s website, sec.gov, and can be reviewed and copied (for a fee) at the SEC’s Public Reference Room in Washington, DC. Call 800-SEC-0330 to receive information on the operation of the SEC’s Public Reference Room.
We make this information on your fund, as well as monthly portfolio holdings, and other fund details available on our website at jhinvestments.com or by calling 800-225-5291.
| | |
| You can also contact us: | | |
| 800-225-5291 | Regular mail: | Express mail: |
| jhinvestments.com | John Hancock Signature Services, Inc. | John Hancock Signature Services, Inc. |
| | P.O. Box 55913 | 30 Dan Road |
| | Boston, MA 02205-5913 | Canton, MA 02021 |
| |
| 54 | Global Income Fund | Annual report |

800-225-5291
800-231-5469 TDD
800-338-8080 EASI-Line
jhinvestments.com
| |
| This report is for the information of the shareholders of John Hancock Global Income Fund. | |
| It is not authorized for distribution to prospective investors unless preceded or accompanied by a prospectus. | 352A 7/14 |
| MF195341 | 9/14 |

A look at performance
Total returns for the period ended July 31, 2014
| | | | | | | | |
| | Average annual total returns (%) | Cumulative total returns (%) | |
| | with maximum sales charge | | with maximum sales charge | |
|
| | 1-year | 5-year | 10-year | Since inception1 | 1-year | 5-year | 10-year | Since inception1 |
|
| Class A | 0.97 | — | — | 0.37 | 0.97 | — | — | 1.48 |
|
| Class I2 | 4.49 | — | — | 1.58 | 4.49 | — | — | 6.46 |
|
| Class R62,3 | 4.58 | — | — | 1.68 | 4.58 | — | — | 6.92 |
|
| Class NAV2 | 4.66 | — | — | 1.77 | 4.66 | — | — | 7.26 |
|
| Index† | 0.03 | — | — | 0.05 | 0.03 | — | — | 0.21 |
|
Performance figures assume all distributions have been reinvested. Figures reflect maximum sales charges on Class A shares of 3.00%. Sales charges are not applicable to Class I, Class R6, and NAV shares.
The expense ratios of the fund, both net (including any fee waivers and/or expense limitations) and gross (excluding any fee waivers and/or expense limitations), are set forth according to the most recent publicly available prospectuses for the fund and may differ from those disclosed in the Financial highlights tables in this report. Had the fee waivers and expense limitations not been in place, gross expenses would apply. The expense ratios are as follows:
| | | | | |
| | Class A | Class I | Class R6 | Class NAV | |
| Gross (%) | 1.53 | 1.16 | 1.53 | 0.92 | |
| Net (%) | 1.53 | 1.16 | 0.92 | 0.92 | |
Please refer to the most recent prospectus and annual report for more information on expenses and any expense limitation arrangements for each class.
The returns reflect past results and should not be considered indicative of future performance. The return and principal value of an investment will fluctuate so that shares, when redeemed, may be worth more or less than their original cost. Due to market volatility, the fund’s current performance may be higher or lower than the performance shown. For current to the most recent month-end performance data, please call 800-225-5291 or visit the fund’s website at jhinvestments.com.
The performance table above and the chart on the next page do not reflect the deduction of taxes that a shareholder may pay on fund distributions or on the redemption of fund shares. The fund’s performance results reflect any applicable fee waivers or expense reductions, without which the expenses would increase and results would have been less favorable.
† Index is the Citigroup 1-Month U.S. Treasury Bill Index.
See the following page for footnotes.
| |
| 6 | Absolute Return Currency Fund | Annual report |
| | | | |
| | | With maximum | Without | |
| | Start date | sales charge | sales charge | Index |
|
| Class I2 | 8-2-10 | $10,646 | $10,646 | $10,021 |
|
| Class R62 | 8-2-10 | 10,692 | 10,692 | 10,021 |
|
| Class NAV2 | 8-2-10 | 10,726 | 10,726 | 10,021 |
|
Citigroup 1-Month U.S. Treasury Bill Index is a market value-weighted index of public obligators of the U.S. Treasury with maturities of one month.
It is not possible to invest directly in an index. Index figures do not reflect expenses or sales charges, which would have resulted in lower values.
Footnotes related to performance pages
1 From 8-2-10.
2 For certain types of investors as described in the fund’s prospectuses.
3 Class R6 shares were first offered on 11-1-11. The returns prior to this date are those of Class A shares that have been recalculated to apply the gross fees and expenses of Class R6 shares.
| | |
| | Annual report | Absolute Return Currency Fund | 7 |
Management’s discussion of
Fund performance
First Quadrant, L.P.
During the fiscal year ended July 31, 2014, we saw market volatility in currencies and other financial assets drop to multi-year lows. Global stock markets moved higher with many developed- and emerging-market equities registering double-digit percentage gains. Fixed-income markets in many parts of the world also delivered positive returns. Still, the period did not produce a uniformly smooth path for capital market participants.
For the 12 months ended July 31, 2014, John Hancock Absolute Return Currency Fund’s Class A shares were up, returning 4.13%, excluding sales charges. The Citigroup 1-Month U.S. Treasury Bill Index, the fund’s reference benchmark, was essentially flat, returning 0.03%, as short-term rates remain anchored near zero.
In terms of individual contributors for the period, a short position in the Canadian dollar had the greatest impact. The fund’s Swedish krona short was also among the top contributing positions. On the long side, the fund’s British pound sterling position was the greatest contributor to performance.
On a gloomy outlook for the local economy, the fund’s short exposure to the Canadian dollar was a key contributor to performance. Throughout the course of the period, two currency factor models that we use in our process, unhedged export flows (UEF) and prospective equity flows (PEF), successfully and consistently informed our Canadian dollar view.
The UEF and PEF models also influenced the fund’s short position in the Swedish krona, another contributor to the fiscal year’s favorable results.
The fund’s long position in the Norwegian krone resulted in a loss. The krone depreciated quite abruptly in June as Norges Bank released a report containing a weak assessment of the Norwegian economy; the findings essentially ruled out hopes of any monetary policy tightening for the rest of the calendar year. Positions in the Australian and New Zealand dollars also detracted during the period.
This commentary reflects the views of the portfolio managers through the end of the period discussed in this report. As such, they are in no way guarantees of future events and are not intended to be used as investment advice or a recommendation regarding any specific security. They are also subject to change at any time as market and other conditions warrant.
Past performance does not guarantee future results.
| |
| 8 | Absolute Return Currency Fund | Annual report |
Your expenses
These examples are intended to help you understand your ongoing operating expenses of investing in the fund so you can compare these costs with the ongoing costs of investing in other mutual funds.
Understanding fund expenses
As a shareholder of the fund, you incur two types of costs:
■ Transaction costs, which include sales charges (loads) on purchases or redemptions (varies by share class), minimum account fee charge, etc.
■ Ongoing operating expenses, including management fees, distribution and service fees (if applicable), and other fund expenses.
We are going to present only your ongoing operating expenses here.
Actual expenses/actual returns
This example is intended to provide information about the fund’s actual ongoing operating expenses and is based on the fund’s actual return. It assumes an account value of $1,000.00 on February 1, 2014, with the same investment held until July 31, 2014.
| | | | |
| | | | Expenses paid | |
| | Account value | Ending value | during period | Annualized |
| | on 2-1-2014 | on 7-31-2014 | ended 7-31-20141 | expense ratio |
|
| Class A | $1,000.00 | $1,019.00 | $7.11 | 1.42% |
|
| Class I | 1,000.00 | 1,020.80 | 5.21 | 1.04% |
|
| Class R6 | 1,000.00 | 1,021.80 | 4.91 | 0.98% |
|
| Class NAV | 1,000.00 | 1,021.70 | 4.56 | 0.91% |
|
Together with the value of your account, you may use this information to estimate the operating expenses that you paid over the period. Simply divide your account value at July 31, 2014, by $1,000.00, then multiply it by the “expenses paid” for your share class from the table above. For example, for an account value of $8,600.00, the operating expenses should be calculated as follows:
| |
| Annual report | Absolute Return Currency Fund | 9 |
Your expenses
Hypothetical example for comparison purposes
This table allows you to compare the fund’s ongoing operating expenses with those of any other fund. It provides an example of the fund’s hypothetical account values and hypothetical expenses based on each class’s actual expense ratio and an assumed 5% annualized return before expenses (which is not the fund’s actual return). It assumes an account value of $1,000.00 on February 1, 2014, with the same investment held until July 31, 2014. Look in any other fund shareholder report to find its hypothetical example and you will be able to compare these expenses. Please remember that these hypothetical account values and expenses may not be used to estimate the actual ending account balance or expenses you paid for the period.
| | | | |
| | | | Expenses paid | |
| | Account value | Ending value | during period | Annualized |
| | on 2-1-2014 | on 7-31-2014 | ended 7-31-20141 | expense ratio |
|
| Class A | $1,000.00 | $1,017.80 | $7.10 | 1.42% |
|
| Class I | 1,000.00 | 1,019.60 | 5.21 | 1.04% |
|
| Class R6 | 1,000.00 | 1,019.90 | 4.91 | 0.98% |
|
| Class NAV | 1,000.00 | 1,020.30 | 4.56 | 0.91% |
|
Remember, these examples do not include any transaction costs, therefore, these examples will not help you to determine the relative total costs of owning different funds. If transaction costs were included, your expenses would have been higher. See the prospectuses for details regarding transaction costs.
1 Expenses are equal to the fund’s annualized expense ratio, multiplied by the average account value over the period, multiplied by 181/365 (to reflect the one-half year period).
| |
| 10 | Absolute Return Currency Fund | Annual report |
Portfolio summary

1 As a percentage of net assets on 7-31-14. The fund’s assets are exposed to both short (unfavored) and long (favored) currency positions.
| |
| Annual report | Absolute Return Currency Fund | 11 |
Fund’s investments
As of 7-31-14
| | | | | |
| Short-Term Investments 98.7% | | | | $1,858,783,161 |
|
| (Cost $1,858,683,330) | | | | | |
| |
| | | | Maturity | | |
| | Yield* (%) | | date | Par value | Value |
|
| U.S. Government 96.0% | | | | 1,807,897,077 |
| U.S. Treasury Bill | 0.045 | | 10-02-14 | $30,000,000 | 29,999,340 |
|
| U.S. Treasury Bill | 0.046 | | 10-23-14 | 125,000,000 | 124,995,000 |
|
| U.S. Treasury Bill | 0.050 | | 11-20-14 | 50,000,000 | 49,995,000 |
|
| U.S. Treasury Bill | 0.050 | | 12-04-14 | 200,000,000 | 199,970,400 |
|
| U.S. Treasury Bill | 0.050 | | 01-15-15 | 100,000,000 | 99,975,600 |
|
| U.S. Treasury Bill | 0.054 | | 11-28-14 | 40,000,000 | 39,995,040 |
|
| U.S. Treasury Bill | 0.055 | | 01-08-15 | 75,000,000 | 74,982,525 |
|
| U.S. Treasury Bill | 0.065 | | 09-04-14 | 532,000,000 | 531,995,212 |
|
| U.S. Treasury Bill | 0.070 | | 09-18-14 | 150,000,000 | 149,996,550 |
|
| U.S. Treasury Bill | 0.079 | | 09-25-14 | 506,000,000 | 505,992,410 |
| |
| | | | Yield (%) | Shares | Value |
| Money Market Funds 2.7% | | | | | 50,886,084 |
| State Street Institutional Liquid Reserves Fund | | | 0.0682 (Y) | 50,886,084 | 50,886,084 |
|
| Total investments (Cost $1,858,683,330)† 98.7% | | | $1,858,783,161 |
|
| |
| Other assets and liabilities, net 1.3% | | | | $25,239,716 |
|
| |
| Total net assets 100.0% | | | | $1,884,022,877 |
The percentage shown for each investment category is the total value of that category as a percentage of the net assets of the fund.
* Yield represents the annualized yield at the date of purchase.
(Y) The rate shown is the annualized seven-day yield as of 7-31-14.
† At 7-31-14, the aggregate cost of investment securities for federal income tax purposes was $1,858,683,330. Net unrealized appreciation aggregated $99,831, of which $101,036 related to appreciated investment securities and $1,205 related to depreciated investment securities.
The following table summarizes the forward foreign currency contracts held by the fund at 7-31-14:
| | | | | | | | | |
| | | | | | | CONTRACTUAL | | | NET UNREALIZED |
| CONTRACT | CONTRACT | | | SETTLEMENT | UNREALIZED | UNREALIZED | APPRECIATION/ |
| TO BUY | | TO SELL | | | COUNTERPARTY | DATE | APPRECIATION | DEPRECIATION | (DEPRECIATION) |
|
| AUD | 9,214,357 | USD | 8,621,865 | | Barclays Bank PLC | 9-17-14 | — | ($84,429) | ($84,429) |
| | | | | | Wholesale | | | | |
| AUD | 80,611,675 | USD | 74,947,272 | | Deutsche Bank AG | 9-17-14 | — | (257,636) | (257,636) |
| | | | | | London | | | | |
| | |
| 12 | Absolute Return Currency Fund | Annual report | See notes to financial statements |
| | | | | | | | | |
| | | | | | | CONTRACTUAL | | | NET UNREALIZED |
| CONTRACT | CONTRACT | | | SETTLEMENT | UNREALIZED | UNREALIZED | APPRECIATION/ |
| TO BUY | TO SELL | | | COUNTERPARTY | DATE | APPRECIATION | DEPRECIATION | (DEPRECIATION) |
|
| AUD | 248,156,504 | USD | 231,798,589 | | J. Aron & Company | 9-17-14 | — | ($1,872,600) | ($1,872,600) |
| AUD | 51,042,046 | USD | 47,618,815 | | Morgan Stanley | 9-17-14 | — | (326,510) | (326,510) |
| | | | | | Capital Services, Inc. | | | | |
| CAD | 284,158,202 | USD | 261,276,750 | | Barclays Bank PLC | 9-17-14 | — | (949,612) | (949,612) |
| | | | | | Wholesale | | | | |
| CAD | 321,167,677 | USD | 296,086,457 | | Deutsche Bank AG | 9-17-14 | — | (1,853,660) | (1,853,660) |
| | | | | | London | | | | |
| CAD | 385,260,663 | USD | 359,489,082 | | J. Aron & Company | 9-17-14 | — | (6,538,487) | (6,538,487) |
| CAD | 306,916,350 | USD | 285,339,442 | | Morgan Stanley | 9-17-14 | — | (4,162,780) | (4,162,780) |
| | | | | | Capital Services, Inc. | | | | |
| CHF | 23,122,301 | USD | 25,935,683 | | Barclays Bank PLC | 9-17-14 | — | (484,014) | (484,014) |
| | | | | | Wholesale | | | | |
| CHF | 28,886,805 | USD | 32,301,506 | | Deutsche Bank AG | 9-17-14 | — | (504,608) | (504,608) |
| | | | | | London | | | | |
| CHF | 74,505,373 | USD | 83,431,938 | | J. Aron & Company | 9-17-14 | — | (1,420,800) | (1,420,800) |
| CHF | 41,379,471 | USD | 46,475,314 | | Morgan Stanley | 9-17-14 | — | (927,223) | (927,223) |
| | | | | | Capital Services, Inc. | | | | |
| EUR | 238,539,600 | USD | 325,340,859 | | Barclays Bank PLC | 9-17-14 | — | (5,882,173) | (5,882,173) |
| | | | | | Wholesale | | | | |
| EUR | 12,090,388 | USD | 16,513,536 | | J. Aron & Company | 9-17-14 | — | (321,761) | (321,761) |
| EUR | 102,580,059 | USD | 140,034,224 | | Morgan Stanley | 9-17-14 | — | (2,656,233) | (2,656,233) |
| | | | | | Capital Services, Inc. | | | | |
| GBP | 88,403,344 | USD | 148,484,643 | | Barclays Bank PLC | 9-17-14 | $713,018 | — | 713,018 |
| | | | | | Wholesale | | | | |
| GBP | 61,390,571 | USD | 103,117,865 | | Deutsche Bank AG | 9-17-14 | 490,542 | — | 490,542 |
| | | | | | London | | | | |
| GBP | 62,727,643 | USD | 105,549,446 | | J. Aron & Company | 9-17-14 | 315,527 | — | 315,527 |
| GBP | 114,429,892 | USD | 192,223,406 | | Morgan Stanley | 9-17-14 | 899,065 | — | 899,065 |
| | | | | | Capital Services, Inc. | | | | |
| JPY | 27,162,526,743 | USD | 265,635,166 | | Barclays Bank PLC | 9-17-14 | — | (1,503,359) | (1,503,359) |
| | | | | | Wholesale | | | | |
| JPY | 15,571,778,959 | USD | 152,265,177 | | Deutsche Bank AG | 9-17-14 | — | (843,251) | (843,251) |
| | | | | | London | | | | |
| JPY | 105,765,290,726 | USD | 1,034,779,268 | | J. Aron & Company | 9-17-14 | — | (6,304,358) | (6,304,358) |
| JPY | 4,420,554,794 | USD | 43,217,374 | | Morgan Stanley | 9-17-14 | — | (231,346) | (231,346) |
| | | | | | Capital Services, Inc. | | | | |
| NOK | 1,841,866,782 | USD | 305,016,236 | | Barclays Bank PLC | 9-17-14 | — | (12,474,536) | (12,474,536) |
| | | | | | Wholesale | | | | |
| NOK | 1,516,984,703 | USD | 250,024,341 | | Deutsche Bank AG | 9-17-14 | — | (9,083,308) | (9,083,308) |
| | | | | | London | | | | |
| NOK | 1,015,334,579 | USD | 167,293,033 | | J. Aron & Company | 9-17-14 | — | (6,028,546) | (6,028,546) |
| NOK | 2,286,304,846 | USD | 379,958,658 | | Morgan Stanley | 9-17-14 | — | (16,827,339) | (16,827,339) |
| | | | | | Capital Services, Inc. | | | | |
| NZD | 3,009,527 | USD | 2,607,635 | | Barclays Bank PLC | 9-17-14 | — | (62,015) | (62,015) |
| | | | | | Wholesale | | | | |
| NZD | 42,604,762 | USD | 37,044,917 | | Deutsche Bank AG | 9-17-14 | — | (1,007,521) | (1,007,521) |
| | | | | | London | | | | |
| NZD | 266,411,948 | USD | 227,767,355 | | J. Aron & Company | 9-17-14 | — | (2,421,828) | (2,421,828) |
| NZD | 331,103,743 | USD | 279,364,240 | | Morgan Stanley | 9-17-14 | 701,085 | — | 701,085 |
| | | | | | Capital Services, Inc. | | | | |
| SEK | 2,284,141,816 | USD | 338,718,129 | | Barclays Bank PLC | 9-17-14 | — | (7,656,578) | (7,656,578) |
| | | | | | Wholesale | | | | |
| SEK | 801,451,553 | USD | 119,171,939 | | Deutsche Bank AG | 9-17-14 | — | (3,010,237) | (3,010,237) |
| | | | | | London | | | | |
| SEK | 524,649,210 | USD | 77,538,885 | | J. Aron & Company | 9-17-14 | — | (1,496,679) | (1,496,679) |
| | |
| See notes to financial statements | Annual report | Absolute Return Currency Fund | 13 |
| | | | | | | | | |
| | | | | | | CONTRACTUAL | | | NET UNREALIZED |
| CONTRACT | CONTRACT | | | SETTLEMENT | UNREALIZED | UNREALIZED | APPRECIATION/ |
| TO BUY | | TO SELL | | | COUNTERPARTY | DATE | APPRECIATION | DEPRECIATION | (DEPRECIATION) |
|
| SEK | 111,717,780 | USD | 16,589,496 | | Morgan Stanley | 9-17-14 | — | ($397,216) | ($397,216) |
| | | | | | Capital Services, Inc. | | | | |
| SGD | 91,782,604 | USD | 73,510,064 | | Barclays Bank PLC | 9-17-14 | $64,585 | — | 64,585 |
| | | | | | Wholesale | | | | |
| SGD | 77,857,893 | USD | 62,468,858 | | Deutsche Bank AG | 9-17-14 | — | (56,516) | (56,516) |
| | | | | | London | | | | |
| SGD | 280,486,285 | USD | 224,639,498 | | J. Aron & Company | 9-17-14 | 203,542 | — | 203,542 |
| SGD | 15,953,919 | USD | 12,831,563 | | Morgan Stanley | 9-17-14 | — | (42,602) | (42,602) |
| | | | | | Capital Services, Inc. | | | | |
| USD | 29,363,723 | AUD | 31,557,368 | | Barclays Bank PLC | 9-17-14 | 124,678 | — | 124,678 |
| | | | | | Wholesale | | | | |
| USD | 30,349,432 | AUD | 32,531,639 | | Deutsche Bank AG | 9-17-14 | 207,689 | — | 207,689 |
| | | | | | London | | | | |
| USD | 99,241,103 | AUD | 106,320,580 | | J. Aron & Company | 9-17-14 | 731,234 | — | 731,234 |
| USD | 184,950,943 | AUD | 199,185,260 | | Morgan Stanley | 9-17-14 | 398,584 | — | 398,584 |
| | | | | | Capital Services, Inc. | | | | |
| USD | 26,799,404 | CAD | 29,343,579 | | Deutsche Bank AG | 9-17-14 | — | (83,261) | (83,261) |
| | | | | | London | | | | |
| USD | 416,467,014 | CAD | 455,970,585 | | J. Aron & Company | 9-17-14 | — | (1,263,379) | (1,263,379) |
| USD | 184,034,391 | CAD | 201,506,075 | | Morgan Stanley | 9-17-14 | — | (572,280) | (572,280) |
| | | | | | Capital Services, Inc. | | | | |
| USD | 406,911,075 | CHF | 362,901,721 | | Barclays Bank PLC | 9-17-14 | 7,450,176 | — | 7,450,176 |
| | | | | | Wholesale | | | | |
| USD | 128,813,470 | CHF | 114,760,919 | | Deutsche Bank AG | 9-17-14 | 2,491,392 | — | 2,491,392 |
| | | | | | London | | | | |
| USD | 731,312,376 | CHF | 652,771,144 | | J. Aron & Company | 9-17-14 | 12,780,244 | — | 12,780,244 |
| USD | 252,934,588 | CHF | 225,608,766 | | Morgan Stanley | 9-17-14 | 4,597,709 | — | 4,597,709 |
| | | | | | Capital Services, Inc. | | | | |
| USD | 293,604,199 | EUR | 216,140,542 | | Barclays Bank PLC | 9-17-14 | 4,142,936 | — | 4,142,936 |
| | | | | | Wholesale | | | | |
| USD | 462,836,855 | EUR | 340,302,484 | | Deutsche Bank AG | 9-17-14 | 7,094,560 | — | 7,094,560 |
| | | | | | London | | | | |
| USD | 620,545,496 | EUR | 455,943,849 | | J. Aron & Company | 9-17-14 | 9,933,154 | — | 9,933,154 |
| USD | 183,917,360 | EUR | 135,284,730 | | Morgan Stanley | 9-17-14 | 2,740,391 | — | 2,740,391 |
| | | | | | Capital Services, Inc. | | | | |
| USD | 78,406,752 | GBP | 45,916,710 | | Barclays Bank PLC | 9-17-14 | 913,466 | — | 913,466 |
| | | | | | Wholesale | | | | |
| USD | 10,400,386 | GBP | 6,093,168 | | Deutsche Bank AG | 9-17-14 | 116,992 | — | 116,992 |
| | | | | | London | | | | |
| USD | 67,690,735 | GBP | 39,803,028 | | J. Aron & Company | 9-17-14 | 515,465 | — | 515,465 |
| USD | 65,082,206 | GBP | 38,021,258 | | Morgan Stanley | 9-17-14 | 914,013 | — | 914,013 |
| | | | | | Capital Services, Inc. | | | | |
| USD | 207,286,516 | NOK | 1,266,519,747 | | Barclays Bank PLC | 9-17-14 | 6,126,557 | — | 6,126,557 |
| | | | | | Wholesale | | | | |
| USD | 164,252,904 | NOK | 990,975,940 | | Deutsche Bank AG | 9-17-14 | 6,857,270 | — | 6,857,270 |
| | | | | | London | | | | |
| USD | 84,030,131 | NOK | 520,514,579 | | J. Aron & Company | 9-17-14 | 1,357,368 | — | 1,357,368 |
| USD | 42,384,865 | NOK | 259,871,503 | | Morgan Stanley | 9-17-14 | 1,109,759 | — | 1,109,759 |
| | | | | | Capital Services, Inc. | | | | |
| USD | 40,223,133 | NZD | 47,443,430 | | Barclays Bank PLC | 9-17-14 | 92,933 | — | 92,933 |
| | | | | | Wholesale | | | | |
| USD | 146,505,659 | NZD | 172,547,829 | | Deutsche Bank AG | 9-17-14 | 555,440 | — | 555,440 |
| | | | | | London | | | | |
| USD | 272,596,815 | NZD | 316,822,091 | | J. Aron & Company | 9-17-14 | 4,611,679 | — | 4,611,679 |
| | |
| 14 | Absolute Return Currency Fund | Annual report | See notes to financial statements |
| | | | | | | | | |
| | | | | | | CONTRACTUAL | | | NET UNREALIZED |
| CONTRACT | CONTRACT | | | SETTLEMENT | UNREALIZED | UNREALIZED | APPRECIATION/ |
| TO BUY | | TO SELL | | COUNTERPARTY | DATE | APPRECIATION | DEPRECIATION | (DEPRECIATION) |
|
| USD | 190,220,390 | NZD | 220,764,359 | | Morgan Stanley | 9-17-14 | $3,486,042 | — | $3,486,042 |
| | | | | | Capital Services, Inc. | | | | |
| USD | 352,575,782 | SEK | 2,348,528,572 | | Barclays Bank PLC | 9-17-14 | 12,182,067 | — | 12,182,067 |
| | | | | | Wholesale | | | | |
| USD | 249,397,785 | SEK | 1,664,363,075 | | Deutsche Bank AG | 9-17-14 | 8,166,430 | — | 8,166,430 |
| | | | | | London | | | | |
| USD | 437,432,021 | SEK | 2,917,713,387 | | J. Aron & Company | 9-17-14 | 14,541,148 | — | 14,541,148 |
| USD | 364,465,043 | SEK | 2,429,561,960 | | Morgan Stanley | 9-17-14 | 12,326,419 | — | 12,326,419 |
| | | | | | Capital Services, Inc. | | | | |
| USD | 268,615,331 | SGD | 336,472,644 | | Barclays Bank PLC | 9-17-14 | — | ($1,107,421) | (1,107,421) |
| | | | | | Wholesale | | | | |
| USD | 40,614,706 | SGD | 50,874,753 | | Deutsche Bank AG | 9-17-14 | — | (167,445) | (167,445) |
| | | | | | London | | | | |
| USD | 359,314,831 | SGD | 449,985,142 | | J. Aron & Company | 9-17-14 | — | (1,401,660) | (1,401,660) |
| USD | 155,892,303 | SGD | 195,222,372 | | Morgan Stanley | 9-17-14 | — | (601,595) | (601,595) |
| | | | | | Capital Services, Inc. | | | | |
| | | | | | | | $129,953,159 | ($102,886,802) | $27,066,357 |
Currency Abbreviations
| | | | |
| AUD | Australian Dollar | NOK | Norwegian Krone | |
| CAD | Canadian Dollar | NZD | New Zealand Dollar | |
| CHF | Swiss Franc | SEK | Swedish Krona | |
| EUR | Euro | SGD | Singapore Dollar | |
| GBP | Pound Sterling | USD | United States Dollar | |
| JPY | Japanese Yen | | | |
| | |
| See notes to financial statements | Annual report | Absolute Return Currency Fund | 15 |
F I N A N C I A L S T A T E M E N T S
Financial statements
Statement of assets and liabilities 7-31-14
This Statement of assets and liabilities is the fund’s balance sheet. It shows the value of what the fund owns, is due and owes. You’ll also find the net asset value and the maximum offering price per share.
| |
| Assets | |
|
| Investments, at value (Cost $1,858,683,330) | $1,858,783,161 |
| Receivable for fund shares sold | 2,102,079 |
| Receivable for forward foreign currency exchange contracts | 129,953,159 |
| Interest receivable | 5,422 |
| Receivable due from advisor | 1,532 |
| Other receivables and prepaid expenses | 88,380 |
| | |
| Total assets | 1,990,933,733 |
| |
| Liabilities | |
|
| Payable for forward foreign currency exchange contracts | 102,886,802 |
| Payable for fund shares repurchased | 3,739,703 |
| Payable to affiliates | |
| Accounting and legal services fees | 40,985 |
| Transfer agent fees | 43,838 |
| Other liabilities and accrued expenses | 199,528 |
| | |
| Total liabilities | 106,910,856 |
| | |
| Net assets | $1,884,022,877 |
| |
| Net assets consist of | |
|
| Paid-in capital | $1,827,243,424 |
| Accumulated net realized gain (loss) on investments and foreign | |
| currency transactions | 29,613,265 |
| Net unrealized appreciation (depreciation) on investments and translation | |
| of assets and liabilities in foreign currencies | 27,166,188 |
| | |
| Net assets | $1,884,022,877 |
| |
| Net asset value per share | |
|
| Based on net asset values and shares outstanding — the fund has an | |
| unlimited number of shares authorized with no par value | |
| Class A ($47,992,669 ÷ 4,984,432 shares)1 | $9.63 |
| Class I ($392,389,687 ÷ 40,004,448 shares) | $9.81 |
| Class R6 ($81,010,501 ÷ 8,219,943 shares) | $9.86 |
| Class NAV ($1,362,630,020 ÷ 137,794,019 shares) | $9.89 |
| |
| Maximum offering price per share | |
|
| Class A (net asset value per share ÷ 97%)2 | $9.93 |
1 Redemption price per share is equal to net asset value less any applicable contingent deferred sales charge.
2 On single retail sales of less than $100,000. On sales of $100,000 or more and on group sales the offering price is reduced.
| | |
| 16 | Absolute Return Currency Fund | Annual report | See notes to financial statements |
F I N A N C I A L S T A T E M E N T S
Statement of operations For the year ended 7-31-14
This Statement of operations summarizes the fund’s investment income earned and expenses incurred in operating the fund. It also shows net gains (losses) for the period stated.
| |
| Investment income | |
|
| Interest | $784,351 |
| |
| Expenses | |
|
| Investment management fees | 12,515,144 |
| Distribution and service fees | 113,893 |
| Accounting and legal services fees | 177,041 |
| Transfer agent fees | 221,334 |
| Trustees’ fees | 17,663 |
| State registration fees | 61,856 |
| Printing and postage | 16,754 |
| Professional fees | 68,522 |
| Custodian fees | 156,699 |
| Registration and filing fees | 119,391 |
| Expense recapture | 28,350 |
| Other | 22,678 |
| | |
| Total expenses | 13,519,325 |
| Less expense reductions | (109,518) |
| | |
| Net expenses | 13,409,807 |
| | |
| Net investment loss | (12,625,456) |
| |
| Realized and unrealized gain (loss) | |
|
| |
| Net realized gain (loss) on | |
| Investments and foreign currency transactions | 32,789,905 |
| | |
| Change in net unrealized appreciation (depreciation) of | |
| Investments and translation of assets and liabilities in foreign currencies | 47,829,221 |
| | |
| Net realized and unrealized gain | 80,619,126 |
| | |
| Increase in net assets from operations | $67,993,670 |
| | |
| See notes to financial statements | Annual report | Absolute Return Currency Fund | 17 |
F I N A N C I A L S T A T E M E N T S
Statements of changes in net assets
These Statements of changes in net assets show how the value of the fund’s net assets has changed during the last two periods. The difference reflects earnings less expenses, any investment gains and losses, distributions, if any, paid to shareholders and the net of fund share transactions.
| | |
| | Year | Year |
| | ended | ended |
| | 7-31-14 | 7-31-13 |
| Increase (decrease) in net assets | | |
|
| |
| From operations | | |
| Net investment loss | ($12,625,456) | ($9,287,883) |
| Net realized gain | 32,789,905 | 98,362,116 |
| Change in net unrealized appreciation (depreciation) | 47,829,221 | 25,264,997 |
| | | |
| Increase in net assets resulting from operations | 67,993,670 | 114,339,230 |
| | | |
| Distributions to shareholders | | |
| From net realized gain | | |
| Class A | (2,367,167) | (242,826) |
| Class I | (5,443,267) | (841,400) |
| Class R6 | (2,910,158) | (52,774) |
| Class NAV | (75,237,482) | (13,441,057) |
| | | |
| Total distributions | (85,958,074) | (14,578,057) |
| | | |
| From fund share transactions | 707,116,637 | 137,167,224 |
| | | |
| Total increase | 689,152,233 | 236,928,397 |
| |
| Net assets | | |
|
| |
| Beginning of year | 1,194,870,644 | 957,942,247 |
| | | |
| End of year | $1,884,022,877 | $1,194,870,644 |
| | |
| 18 | Absolute Return Currency Fund | Annual report | See notes to financial statements |
Financial highlights
The Financial highlights show how the fund’s net asset value for a share has changed during the period.
| | | | |
| CLASS A SHARES Period ended | 7-31-14 | 7-31-13 | 7-31-12 | 7-31-111 |
| | | | | |
| Per share operating performance | | | | |
|
| Net asset value, beginning of period | $9.91 | $9.16 | $8.58 | $10.00 |
| Net investment loss2 | (0.13) | (0.14) | (0.14) | (0.14) |
| Net realized and unrealized gain (loss) on investments | 0.50 | 1.02 | 0.72 | (1.28) |
| Total from investment operations | 0.37 | 0.88 | 0.58 | (1.42) |
| Less distributions | | | | |
| From net realized gain | (0.65) | (0.13) | — | — |
| Net asset value, end of period | $9.63 | $9.91 | $9.16 | $8.58 |
| Total return (%)3,4 | 4.13 | 9.69 | 6.76 | (14.20)5 |
| |
| Ratios and supplemental data | | | | |
|
| Net assets, end of period (in millions) | $48 | $28 | $11 | $6 |
| Ratios (as a percentage of average net assets): | | | | |
| Expenses before reductions | 1.42 | 1.616 | 1.74 | 1.567 |
| Expenses including reductions | 1.42 | 1.60 | 1.60 | 1.567 |
| Net investment loss | (1.36) | (1.50) | (1.53) | (1.48)7 |
| Portfolio turnover (%) | — | — | — | — |
| |
1 Period from 8-2-10 (commencement of operations) to 7-31-11.
2 Based on average daily shares outstanding.
3 Total returns would have been lower had certain expenses not been reduced during the applicable periods.
4 Does not reflect the effect of sales charges, if any.
5 Not annualized.
6 Expense ratio has been revised to conform with current year presentation of expense recapture and net
expense reductions.
7 Annualized.
| | | | |
| CLASS I SHARES Period ended | 7-31-14 | 7-31-13 | 7-31-12 | 7-31-111 |
| |
| Per share operating performance | | | | |
|
| Net asset value, beginning of period | $10.05 | $9.24 | $8.61 | $10.00 |
| Net investment loss2 | (0.10) | (0.10) | (0.10) | (0.09) |
| Net realized and unrealized gain (loss) on investments | 0.51 | 1.04 | 0.73 | (1.30) |
| Total from investment operations | 0.41 | 0.94 | 0.63 | (1.39) |
| Less distributions | | | | |
| From net realized gain | (0.65) | (0.13) | — | — |
| Net asset value, end of period | $9.81 | $10.05 | $9.24 | $8.61 |
| Total return (%)3 | 4.49 | 10.26 | 7.32 | (13.90)4 |
| |
| Ratios and supplemental data | | | | |
|
| Net assets, end of period (in millions) | $392 | $65 | $43 | $26 |
| Ratios (as a percentage of average net assets): | | | | |
| Expenses before reductions | 1.05 | 1.11 | 1.17 | 1.055 |
| Expenses including reductions | 1.05 | 1.11 | 1.17 | 1.055 |
| Net investment loss | (1.00) | (1.01) | (1.10) | (0.98)5 |
| Portfolio turnover (%) | — | — | — | — |
| |
1 Period from 8-2-10 (commencement of operations) to 7-31-11.
2 Based on average daily shares outstanding.
3 Total returns would have been lower had certain expenses not been reduced during the applicable periods.
4 Not annualized.
5 Annualized.
| | |
| See notes to financial statements | Annual report | Absolute Return Currency Fund | 19 |
| | | | |
| CLASS R6 SHARES Period ended | | 7-31-14 | 7-31-13 | 7-31-121 |
| |
| Per share operating performance | | | | |
|
| Net asset value, beginning of period | | $10.09 | $9.27 | $9.29 |
| Net investment loss2 | | (0.09) | (0.09) | (0.07) |
| Net realized and unrealized gain on investments | | 0.51 | 1.04 | 0.05 |
| Total from investment operations | | 0.42 | 0.95 | (0.02) |
| Less distributions | | | | |
| From net realized gain | | (0.65) | (0.13) | — |
| Net asset value, end of period | | $9.86 | $10.09 | $9.27 |
| Total return (%)3 | | 4.58 | 10.34 | (0.22)4 |
|
| Ratios and supplemental data | | | | |
|
| Net assets, end of period (in millions) | | $81 | $4 | $3 |
| Ratios (as a percentage of average net assets): | | | | |
| Expenses before reductions | | 1.04 | 1.52 | 1.405 |
| Expenses including reductions | | 0.99 | 1.05 | 1.055 |
| Net investment loss | | (0.94) | (0.95) | (0.97)5 |
| Portfolio turnover (%) | | — | — | — |
| | |
1 The inception date for Class R6 shares is 11-1-11.
2 Based on average daily shares outstanding.
3 Total returns would have been lower had certain expenses not been reduced during the applicable periods.
4 Not annualized.
5 Annualized.
| | | | |
| CLASS NAV SHARES Period ended | 7-31-14 | 7-31-13 | 7-31-12 | 7-31-111 |
| |
| Per share operating performance | | | | |
|
| Net asset value, beginning of period | $10.11 | $9.28 | $8.63 | $10.00 |
| Net investment loss2 | (0.08) | (0.08) | (0.08) | (0.08) |
| Net realized and unrealized gain (loss) on investments | 0.51 | 1.04 | 0.73 | (1.29) |
| Total from investment operations | 0.43 | 0.96 | 0.65 | (1.37) |
| Less distributions | | | | |
| From net realized gain | (0.65) | (0.13) | — | — |
| Net asset value, end of period | $9.89 | $10.11 | $9.28 | $8.63 |
| Total return (%)3 | 4.66 | 10.43 | 7.53 | (13.70)4 |
| |
| Ratios and supplemental data | | | | |
|
| Net assets, end of period (in millions) | $1,363 | $1,098 | $901 | $878 |
| Ratios (as a percentage of average net assets): | | | | |
| Expenses before reductions | 0.91 | 0.92 | 0.94 | 0.955 |
| Expenses including reductions | 0.91 | 0.92 | 0.93 | 0.955 |
| Net investment loss | (0.85) | (0.82) | (0.86) | (0.86)5 |
| Portfolio turnover (%) | — | — | — | — |
| |
1 Period from 8-2-10 (commencement of operations) to 7-31-11.
2 Based on average daily shares outstanding.
3 Total returns would have been lower had certain expenses not been reduced during the applicable periods.
4 Not annualized.
5 Annualized.
| | |
| 20 | Absolute Return Currency Fund | Annual report | See notes to financial statements |
Notes to financial statements
Note 1 — Organization
John Hancock Absolute Return Currency Fund, formerly John Hancock Currency Strategies Fund (the fund) is a series of John Hancock Funds II (the Trust), an open-end management investment company organized as a Massachusetts business trust and registered under the Investment Company Act of 1940, as amended (the 1940 Act). Effective January 3, 2014, the investment objective of the fund is to achieve absolute return from investments in currency markets. Prior to January 3, 2014, the fund’s investment objective was to seek to achieve total return from investments in currency markets.
The fund may offer multiple classes of shares. The shares currently offered are detailed in the Statement of assets and liabilities. Class A shares are offered to all investors. Class I shares are offered to institutions and certain investors. Class R6 shares are available only to certain retirement plans, institutions and other investors. Class NAV shares are offered to John Hancock affiliated funds of funds and certain 529 plans. Shareholders of each class have exclusive voting rights to matters that affect that class. The distribution and service fees, if any, transfer agent fees, state registration fees and printing and postage for each class may differ.
Effective January 3, 2014, John Hancock Currency Strategies Fund changed its name to John Hancock Absolute Return Currency Fund.
Note 2 — Significant accounting policies
The financial statements have been prepared in conformity with accounting principles generally accepted in the United States of America (US GAAP), which require management to make certain estimates and assumptions as of the date of the financial statements. Actual results could differ from those estimates and those differences could be significant. The fund intends to qualify as an investment company under Topic 946 of Accounting Standards Codification of US GAAP.
Events or transactions occurring after the end of the fiscal period through the date that the financial statements were issued have been evaluated in the preparation of the financial statements. The following summarizes the significant accounting policies of the fund:
Security valuation. Investments are stated at value as of the close of regular trading on the New York Stock Exchange (NYSE), normally at 4:00 P.M., Eastern Time. In order to value the securities, the fund uses the following valuation techniques: Investments by the fund in open-end mutual funds are valued at their respective net asset values each business day. Debt obligations are valued based on the evaluated prices provided by an independent pricing vendor or from broker-dealers. Independent pricing vendors utilize matrix pricing which takes into account factors such as institutional-size trading in similar groups of securities, yield, quality, coupon rate, maturity, type of issue, trading characteristics and other market data, as well as broker supplied prices. Foreign securities and currencies, including forward foreign currency contracts, are valued in U.S. dollars, based on foreign currency exchange rates supplied by an independent pricing vendor. Securities that trade only in the over-the-counter (OTC) market are valued using bid prices. Certain short-term securities with maturities of 60 days or less at the time of purchase are valued at amortized cost. Other fund securities and assets, for which reliable market quotations are not readily available, are valued at fair value as determined in good faith by the fund’s Pricing Committee following procedures established by the Board of Trustees. The frequency with which these fair valuation procedures are used cannot be predicted and fair value of securities may differ significantly from the value that would have been used had a ready market for such securities existed.
| |
| Annual report | Absolute Return Currency Fund | 21 |
The fund uses a three-tier hierarchy to prioritize the pricing assumptions, referred to as inputs, used in valuation techniques to measure fair value. Level 1 includes securities valued using quoted prices in active markets for identical securities. Level 2 includes securities valued using other significant observable inputs. Observable inputs may include quoted prices for similar securities, interest rates, prepayment speeds and credit risk. Prices for securities valued using these inputs are received from independent pricing vendors and brokers and are based on an evaluation of the inputs described. Level 3 includes securities valued using significant unobservable inputs when market prices are not readily available or reliable, including the fund’s own assumptions in determining the fair value of investments. Factors used in determining value may include market or issuer specific events or trends, changes in interest rates and credit quality. The inputs or methodology used for valuing securities are not necessarily an indication of the risks associated with investing in those securities. Changes in valuation techniques may result in transfers into or out of an assigned level within the disclosure hierarchy.
As of July 31, 2014, all investments are categorized as Level 2 under the hierarchy described above, except for money market funds, which are categorized as Level 1.
Security transactions and related investment income. Investment security transactions are accounted for on a trade date plus one basis for daily net asset value calculations. However, for financial reporting purposes, investment transactions are reported on trade date. Interest income is accrued as earned. Interest income includes coupon interest and amortization/accretion of premiums/discounts on debt securities. Debt obligations may be placed in a non-accrual status and related interest income may be reduced by stopping current accruals and writing off interest receivable when the collection of all or a portion of interest has become doubtful. Gains and losses on securities sold are determined on the basis of identified cost and may include proceeds from litigation.
Foreign currency translation. Assets, including investments and liabilities denominated in foreign currencies, are translated into U.S. dollar values each day at the prevailing exchange rate. Purchases and sales of securities, income and expenses are translated into U.S. dollars at the prevailing exchange rate on the date of the transaction. The effect of changes in foreign currency exchange rates on the value of securities is reflected as a component of the realized and unrealized gains (losses) on investments.
Funds that invest internationally generally carry more risk than funds that invest strictly in U.S. securities. Risks can result from differences in economic and political conditions, regulations, market practices (including higher transaction costs), accounting standards and other factors. Foreign investments are also subject to a decline in the value of a foreign currency versus the U.S. dollar, which reduces the dollar value of securities denominated in that currency.
Line of credit. The fund may borrow from banks for temporary or emergency purposes, including meeting redemption requests that otherwise might require the untimely sale of securities. Pursuant to the fund’s custodian agreement, the custodian may loan money to the fund to make properly authorized payments. The fund is obligated to repay the custodian for any overdraft, including any related costs or expenses. The custodian may have a lien, security interest or security entitlement in any fund property that is not otherwise segregated or pledged, to the maximum extent permitted by law, to the extent of any overdraft.
In addition, the fund and other affiliated funds have entered into an agreement with Citibank N.A. that enables them to potentially participate in a $300 million unsecured committed line of credit. A commitment fee, payable at the end of each calendar quarter, based on the average daily unused portion of the line of credit, is charged to each participating fund on a pro rata basis and is
| |
| 22 | Absolute Return Currency Fund | Annual report |
reflected in other expenses on the Statement of operations. Commitment fees for the year ended July 31, 2014 were $947. For the year ended July 31, 2014, the fund had no borrowings under the line of credit.
Expenses. Within the John Hancock group of funds complex, expenses that are directly attributable to an individual fund are allocated to such fund. Expenses that are not readily attributable to a specific fund are allocated among all funds in an equitable manner, taking into consideration, among other things, the nature and type of expense and the fund’s relative net assets. Expense estimates are accrued in the period to which they relate and adjustments are made when actual amounts are known.
Class allocations. Income, common expenses and realized and unrealized gains (losses) are determined at the fund level and allocated daily to each class of shares based on the net assets of the class. Class-specific expenses, such as distribution and service fees, if any, transfer agent fees, state registration fees and printing and postage, for all classes, are calculated daily at the class level based on the appropriate net assets of each class and the specific expense rates applicable to each class.
Federal income taxes. The fund intends to continue to qualify as a regulated investment company by complying with the applicable provisions of the Internal Revenue Code and will not be subject to federal income tax on taxable income that is distributed to shareholders. Therefore, no federal income tax provision is required.
As of July 31, 2014, the fund had no uncertain tax positions that would require financial statement recognition, derecognition or disclosure. The fund’s federal tax returns are subject to examination by the Internal Revenue Service for a period of three years.
Distribution of income and gains. Distributions to shareholders from net investment income and net realized gains, if any, are recorded on the ex-date. The fund generally declares and pays dividends and capital gain distributions, if any, annually.
The tax character of distributions for the years ended July 31, 2014 and 2013 was as follows:
| | | |
| | JULY 31, 2014 | JULY 31, 2013 | |
| |
| Ordinary Income | $25,997,538 | — | |
| Long-Term Capital Gains | 59,960,536 | $14,578,057 | |
| Total | $85,958,074 | $14,578,057 | |
Distributions paid by the fund with respect to each class of shares are calculated in the same manner, at the same time and in the same amount, except for the effect of class level expenses that may be applied differently to each class. As of July 31, 2014, the components of distributable earnings on a tax basis consisted of $16,118,639 of undistributed ordinary income and $43,670,098 of undistributed long-term capital gains.
Such distributions and distributable earnings, on a tax basis, are determined in conformity with income tax regulations, which may differ from US GAAP. Distributions in excess of tax basis earnings and profits, if any, are reported in the fund’s financial statements as a return of capital.
Capital accounts within the financial statements are adjusted for permanent book-tax differences. These adjustments have no impact on net assets or the results of operations. Temporary book-tax differences, if any, will reverse in a subsequent period. Book-tax differences are primarily attributable to net operating losses and derivative transactions.
| |
| Annual report | Absolute Return Currency Fund | 23 |
Note 3 — Derivative instruments
The fund may invest in derivatives in order to meet its investment objective. Derivatives include a variety of different instruments that may be traded in the over-the-counter market, on a regulated exchange or through a clearing facility. The risks in using derivatives vary depending upon the structure of the instruments, including the use of leverage, optionality, the liquidity or lack of liquidity of the contract, the creditworthiness of the counterparty or clearing organization and the volatility of the position. Some derivatives involve risks that are potentially greater than the risks associated with investing directly in the referenced securities or other referenced underlying instrument. Specifically, the fund is exposed to the risk that the counterparty to an OTC derivatives contract will be unable or unwilling to make timely settlement payments or otherwise honor its obligations. OTC derivatives transactions typically can only be closed out with the other party to the transaction.
Forward foreign currency contracts are typically traded through the OTC market. Non-deliverable forwards are regulated by the Commodity Futures Trading Commission (the CFTC) as swaps. Derivative counterparty risk is managed through an ongoing evaluation of the creditworthiness of all potential counterparties and, if applicable, designated clearing organizations. The fund attempts to reduce its exposure to counterparty risk for derivatives traded in the OTC market, whenever possible, by entering into an International Swaps and Derivatives Association (ISDA) Master Agreement with each of its OTC counterparties. The ISDA gives each party to the agreement the right to terminate all transactions traded under the agreement if there is certain deterioration in the credit quality or contractual default of the other party, as defined in the ISDA. Upon an event of default or a termination of the ISDA, the non-defaulting party has the right to close out all transactions and to net amounts owed.
As defined by the ISDA, the fund may have collateral agreements with certain counterparties to mitigate counterparty risk on OTC derivatives. Subject to established minimum levels, collateral for OTC transactions is generally determined based on the net aggregate unrealized gain or loss on contracts with a particular counterparty. Collateral pledged to the fund is held in a segregated account by a third-party agent or held by the custodian bank for the benefit of the fund and can be in the form of cash or debt securities issued by the U.S. government or related agencies; collateral posted by the fund for OTC transactions is held in a segregated account at the fund’s custodian and is noted in the accompanying Fund’s investments, or if cash is posted, on the Statement of assets and liabilities. The fund’s maximum risk of loss due to counterparty risk is equal to the asset value of outstanding contracts offset by collateral received.
Forward foreign currency contracts. A forward foreign currency contract is an agreement between two parties to buy and sell specific currencies at a price that is set on the date of the contract. The forward contract calls for delivery of the currencies on a future date that is specified in the contract. Risks related to the use of forwards include the possible failure of counterparties to meet the terms of the forward agreement, the failure of the counterparties to timely post collateral if applicable, the risk that currency movements will not favor the fund thereby reducing the fund’s total return, and the potential for losses in excess of the amounts recognized on the Statement of assets and liabilities.
The market value of a forward foreign currency contract fluctuates with changes in foreign currency exchange rates. Forward foreign currency contracts are marked-to-market daily and the change in value is recorded by the fund as an unrealized gain or loss. Realized gains or losses, equal to the difference between the value of the contract at the time it was opened and the value at the time it was closed, are recorded upon delivery or receipt of the currency or settlement with the counterparty.
| |
| 24 | Absolute Return Currency Fund | Annual report |
During the year ended July 31, 2014, the fund used forward foreign currency contracts to manage exposure to foreign currency. During the year ended July 31, 2014, the fund held forward foreign currency contracts with U.S. dollar notional values ranging from $6.8 billion to $14.5 billion, as measured at each quarter end. Forward currency contracts are presented in a table at the end of the Fund’s investments.
Fair value of derivative instruments by risk category
The table below summarizes the fair value of derivatives held by the fund at July 31, 2014 by risk category:
| | | | |
| | | FINANCIAL | | LIABILITY |
| | STATEMENT OF ASSETS AND | INSTRUMENTS | ASSET DERIVATIVES | DERIVATIVES |
| RISK | LIABILITIES LOCATION | LOCATION | FAIR VALUE | FAIR VALUE |
|
| Foreign Currency | Receivable/Payable for | Forward foreign | $129,953,159 | ($102,886,802) |
| Contracts | forward foreign currency | currency | | |
| | exchange contracts | contracts | | |
For financial reporting purposes, the fund does not offset OTC derivative assets or liabilities that are subject to master netting arrangements, as defined by the ISDAs, in the Statement of assets and liabilities. In the event of default by the counterparty or a termination of the agreement, the ISDA allows an offset of amounts across the various transactions between the fund and the applicable counterparty. The table below reflects the fund’s exposure to counterparties subject to an ISDA for OTC derivative transactions:
| | | | |
| | TOTAL MARKET VALUE | COLLATERAL | COLLATERAL | |
| COUNTERPARTY | OF OTC DERIVATIVES | RECEIVED BY FUND | PLEDGED BY FUND | NET EXPOSURE |
|
| Barclays Bank PLC | $1,606,279 | $800,000 | — | $806,279 |
| Wholesale | | | | |
| Deutsche Bank | 9,112,872 | 10,280,000 | — | (1,167,128) |
| AG London | | | | |
| J. Aron & Company | 15,919,263 | 17,532,000 | — | (1,612,737) |
| Morgan Stanley | 427,943 | — | — | 427,943 |
| Capital Services, Inc. | | | | |
| Totals | $27,066,357 | $28,612,000 | — | ($1,545,643) |
Effect of derivative instruments on the Statement of operations
The table below summarizes the net realized gain (loss) included in the net increase (decrease) in net assets from operations, classified by derivative instrument and risk category, for the year ended July 31, 2014:
| | |
| | | INVESTMENTS AND FOREIGN |
| RISK | STATEMENT OF OPERATIONS LOCATION | CURRENCY TRANSACTIONS* |
|
| Foreign Currency Contracts | Net realized gain (loss) on | $32,789,863 |
* Realized gain/loss associated with forward currency contracts is included in this caption on the Statement of operations.
| |
| Annual report | Absolute Return Currency Fund | 25 |
The table below summarizes the net change in unrealized appreciation (depreciation) included in the net increase (decrease) in net assets from operations, classified by derivative instrument and risk category, for the year ended July 31, 2014:
| | |
| | | INVESTMENTS AND TRANSLATION OF |
| | | ASSETS AND LIABILITIES IN |
| RISK | STATEMENT OF OPERATIONS LOCATION | FOREIGN CURRENCIES* |
|
| Foreign Currency Contracts | Change in net unrealized | $47,776,156 |
| | appreciation (depreciation) of | |
*Change in unrealized appreciation/depreciation associated with forward currency contracts is included in this caption on the Statement of operations.
Note 4 — Guarantees and indemnifications
Under the Trust’s organizational documents, its Officers and Trustees are indemnified against certain liabilities arising out of the performance of their duties to the Trust, including the fund. Additionally, in the normal course of business, the fund enters into contracts with service providers that contain general indemnification clauses. The fund’s maximum exposure under these arrangements is unknown, as this would involve future claims that may be made against the fund that have not yet occurred. The risk of material loss from such claims is considered remote.
Note 5 — Fees and transactions with affiliates
John Hancock Advisers, LLC (the Advisor or JHA) serves as investment advisor for the fund. Prior to January 1, 2014, John Hancock Investment Management Services, LLC (JHIMS) served as investment advisor for the fund. JHIMS and JHA have identical officers, directors and other personnel, and share common facilities and resources. Terms of the investment management contract with JHA are substantially identical to the former contract with JHIMS. In this report, depending on the context, the term “Advisor” shall refer to either JHA in its current capacity as investment advisor, or to JHIMS in its capacity as investment advisor prior to January 1, 2014. John Hancock Funds, LLC (the Distributor), an affiliate of the Advisor, serves as principal underwriter of the fund. The Advisor and the Distributor are indirect, wholly owned subsidiaries of Manulife Financial Corporation.
Management fee. The fund has an investment management agreement with the Advisor under which the fund pays a daily management fee to the Advisor equivalent, on an annual basis, to the sum of: a) 0.95% of the first $250 million of the fund’s average daily net assets, b) 0.90% of the next $250 million of the fund’s average daily net assets and c) 0.85% of the fund’s average daily net assets in excess of $500 million. The Advisor has a subadvisory agreement with First Quadrant, L.P. The fund is not responsible for payment of the subadvisory fees.
The Advisor has contractually agreed to waive a portion of its management fee and/or reimburse expenses for certain funds of the John Hancock complex, including the fund (the participating funds). The waiver equals, on an annualized basis, 0.01% of that portion of the aggregate net assets of all the participating funds that exceeds $75 billion but is less than or equal to $125 billion; 0.0125% of that portion of the aggregate net assets of all the participating funds that exceeds $125 billion but is less than or equal to $150 billion; and 0.015% of that portion of the aggregate net assets of all the participating funds that exceeds $150 billion. The amount of the reimbursement is calculated daily and allocated among all the participating funds in proportion to the daily net assets of each fund. This arrangement may be amended or terminated at any time by the Advisor upon notice to the fund and with the approval of the Board of Trustees.
| |
| 26 | Absolute Return Currency Fund | Annual report |
The Advisor has contractually agreed to waive all or a portion of its management fee and reimburse operating expenses of the fund to the extent necessary to maintain the fund’s total operating expenses at 1.60% and 1.05% for Class A and Class R6 shares, respectively, excluding certain expenses such as taxes, brokerage commissions, interest expense, litigation, acquired fund fees, short dividend expense and indemnification expenses and other extraordinary expenses. The fee waivers and/or reimbursements will continue in effect until November 30, 2014, unless renewed by mutual agreement of the fund and the Advisor based upon a determination that this is appropriate under the circumstances at the time.
Effective Febrauary 1, 2014, for Class R6 shares, the Advisor has contractually agreed to waive and/ or reimburse all class specific expense of the fund, including transfer agency fees and service fees, blue sky fees, and printing and postage, as applicable, to the extent they exceed 0.00% of average annual net assets. The fee waiver and/or reimbursement will continue in effect until November 30, 2015, unless renewed by mutual agreement of the fund and Advisor based upon a determination of that this is appropriate under the circumstances at the time. This waiver was in effect on a voluntary basis from January 1, 2014 to January 31, 2014.
The fee waivers and/or expense reductions described above amounted to $2,384, $9,137, $22,613 and $75,384 for Class A, Class I, Class R6 and Class NAV shares, respectively, for the year ended July 31, 2014.
The investment management fees, including the impact of the waivers and reimbursements as described above, incurred for the year ended July 31, 2014 were equivalent to a net annual effective rate of 0.87% of the fund’s average daily net assets.
Expense recapture. The Advisor may recapture operating expenses reimbursed or fees waived under previous expense limitation or waiver arrangements for a period of three years following the month in which the reimbursements or waivers occurred to the extent that the fund is below its expense limitation during this period. For the year ended July 31, 2014, the fund recovered $194 and $28,156 for Class A and Class R6 shares, respectively. As of July 31, 2014, there are no waivers or reimbursements subject to potential recovery in future periods.
Accounting and legal services. Pursuant to a service agreement, the fund reimburses the Advisor for all expenses associated with providing the administrative, financial, legal, accounting and recordkeeping services to the fund, including the preparation of all tax returns, periodic reports to shareholders and regulatory reports, among other services. These expenses are allocated to each share class based on its relative net assets at the time the expense was incurred. These accounting and legal services fees incurred for the year ended July 31, 2014 amounted to an annual rate of 0.01% of the fund’s average daily net assets.
Distribution and service plans. The fund has a distribution agreement with the Distributor. The fund has adopted a distribution and service plan with respect to Class A shares pursuant to Rule 12b-1 under the 1940 Act, to pay the Distributor for services provided as the distributor of shares of the fund. The fund pays 0.30% for Class A shares for distribution and service fees under this arrangement, expressed as an annual percentage of average daily net assets.
Sales charges. Class A shares are assessed up-front sales charges, which resulted in payments to the Distributor amounting to $40,834 for the year ended July 31, 2014. Of this amount, $7,361 was retained and used for printing prospectuses, advertising, sales literature and other purposes, $33,473 was paid as sales commissions to broker-dealers.
| |
| Annual report | Absolute Return Currency Fund | 27 |
Class A shares may be subject to contingent deferred sales charges (CDSCs). Certain Class A shares that are acquired through purchases of $1 million or more and are redeemed within one year of purchase are subject to a 1.00% sales charge. CDSCs are applied to the lesser of the current market value at the time of redemption or the original purchase cost of the shares being redeemed. Proceeds from CDSCs are used to compensate the Distributor for providing distribution-related services in connection with the sale of these shares. During the year ended July 31, 2014, there were no CDSCs received by the Distributor for Class A shares.
Transfer agent fees. The fund has a transfer agent agreement with John Hancock Signature Services, Inc. (Signature Services), an affiliate of the Advisor. The transfer agent fees paid to Signature Services are determined based on the cost to Signature Services (Signature Services Cost) of providing recordkeeping services. The Signature Services Cost includes a component of allocated John Hancock corporate overhead for providing transfer agent services to the fund and to all other John Hancock affiliated funds. It also includes out-of-pocket expenses, including payments made to third-parties for recordkeeping services provided to their clients who invest in one or more John Hancock funds. In addition, Signature Services Cost may be reduced by certain fees that Signature Services receives in connection with retirement and small accounts. Signature Services Cost is calculated monthly and allocated, as applicable, to five categories of share classes: Retail Share and Institutional Share Classes of Non-Municipal Bond Funds, Class R6 Shares, Retirement Share Classes and Municipal Bond Share Classes. Within each of these categories, the applicable costs are allocated to the affected John Hancock affiliated funds and/or classes, based on the relative average daily net assets.
Prior to October 1, 2013, Signature Services Cost was calculated monthly and allocated, as applicable, to four categories of share classes: Institutional Share Classes, Retirement Share Classes, Municipal Bond Share Classes and all other Retail Share Classes. Within each of these categories, the applicable costs were allocated to the affected John Hancock affiliated funds and/or classes, based on the relative average daily net assets.
Class level expenses. Class level expenses for the year ended July 31, 2014 were:
| | | | |
| | DISTRIBUTION | TRANSFER | STATE | PRINTING AND |
| CLASS | AND SERVICE FEES | AGENT FEES | REGISTRATION FEES | POSTAGE |
|
| Class A | $113,893�� | $51,929 | $22,772 | $3,853 |
| Class I | — | 159,921 | 22,100 | 10,889 |
| Class R6 | — | 9,484 | 16,984 | 2,012 |
| Total | $113,893 | $221,334 | $61,856 | $16,754 |
Trustee expenses. The fund compensates each Trustee who is not an employee of the Advisor or its affiliates. The costs of paying Trustee compensation and expenses are allocated to each fund based on its net assets relative to other funds within the John Hancock group of funds complex.
Note 6 — Fund share transactions
Transactions in fund shares for the years ended July 31, 2014 and 2013 were as follows:
| | | | |
| | | Year ended 7-31-14 | | Year ended 7-31-13 |
| | Shares | Amount | Shares | Amount |
| Class A shares | | | | |
|
| Sold | 4,117,805 | $39,711,024 | 2,026,889 | $19,456,689 |
| Distributions reinvested | 258,866 | 2,363,445 | 25,805 | 242,826 |
| Repurchased | (2,263,473) | (21,542,273) | (377,414) | (3,571,049) |
| | | | | |
| Net increase | 2,113,198 | $20,532,196 | 1,675,280 | $16,128,466 |
| |
| 28 | Absolute Return Currency Fund | Annual report |
| | | | |
| | | Year ended 7-31-14 | | Year ended 7-31-13 |
| | Shares | Amount | Shares | Amount |
| Class I shares |
|
| Sold | 37,266,729 | $363,910,879 | 5,919,465 | $57,233,333 |
| Distributions reinvested | 532,117 | 4,938,050 | 88,141 | 838,218 |
| Repurchased | (4,223,811) | (41,396,987) | (4,218,643) | (41,908,084) |
| | | | | |
| Net increase | 33,575,035 | $327,451,942 | 1,788,963 | $16,163,467 |
| |
| Class R6 shares | | | | |
|
| Sold | 8,047,803 | $79,526,488 | 143,411 | $1,361,026 |
| Distributions reinvested | 18,478 | 172,217 | 5,526 | 52,774 |
| Repurchased | (231,845) | (2,314,444) | (88,174) | (848,024) |
| | | | | |
| Net increase | 7,834,436 | $77,384,261 | 60,763 | $565,776 |
| |
| Class NAV shares | | | | |
|
| Sold | 31,875,856 | $312,057,054 | 22,335,412 | $213,201,264 |
| Distributions reinvested | 8,046,790 | 75,237,482 | 1,405,968 | 13,441,057 |
| Repurchased | (10,669,662) | (105,546,298) | (12,299,583) | (122,332,806) |
| | | | | |
| Net increase | 29,252,984 | $281,748,238 | 11,441,797 | $104,309,515 |
| |
| Total net increase | 72,775,653 | $707,116,637 | 14,966,803 | $137,167,224 |
|
Affiliates of the fund owned 100% of shares of beneficial interest of Class NAV on July 31, 2014.
Note 7 — Purchase and sale of securities
All purchases and sales of the fund were of short-term investments for the year ended July 31, 2014.
Note 8 — Investment by affiliated funds
Certain investors in the fund are affiliated funds that are managed by the Advisor and its affiliates. The affiliated funds do not invest in the fund for the purpose of exercising management or control; however, this investment may represent a significant portion of the fund’s net assets. At July 31, 2014, funds within the John Hancock group of funds complex held 72.3% of the fund’s net assets. The following funds had an affiliate ownership of 5% or more of the fund’s net assets:
| | |
| | AFFILIATED | |
| FUND | CONCENTRATION | |
| |
| John Hancock Lifestyle Balanced Portfolio | 19.5% | |
| John Hancock Lifestyle Growth Portfolio | 17.7% | |
| John Hancock Alternative Asset Allocation Fund | 9.1% | |
| John Hancock Lifestyle Conservative Portfolio | 6.1% | |
| John Hancock Lifestyle Moderate Portfolio | 6.0% | |
| John Hancock Lifestyle Aggressive Portfolio | 5.0% | |
| |
| Annual report | Absolute Return Currency Fund | 29 |
Auditor’s report
Report of Independent Registered Public Accounting Firm
To the Board of Trustees of John Hancock Funds II and Shareholders of
John Hancock Absolute Return Currency Fund (formerly, John Hancock Currency Strategies Fund):
In our opinion, the accompanying statement of assets and liabilities, including the schedule of investments, and the related statements of operations and of changes in net assets and the financial highlights present fairly, in all material respects, the financial position of the John Hancock Absolute Return Currency Fund (formerly, John Hancock Currency Strategies Fund) (the “Fund”) at July 31, 2014, the results of its operations for the year then ended, the changes in its net assets for each of the two years in the period then ended and the financial highlights for each of the periods indicated, in conformity with accounting principles generally accepted in the United States of America. These financial statements and financial highlights (hereafter referred to as “financial statements”) are the responsibility of the Fund’s management. Our responsibility is to express an opinion on these financial statements based on our audits. We conducted our audits of these financial statements in accordance with the standards of the Public Company Accounting Oversight Board (United States). Those standards require that we plan and perform the audit to obtain reasonable assurance about whether the financial statements are free of material misstatement. An audit includes examining, on a test basis, evidence supporting the amounts and disclosures in the financial statements, assessing the accounting principles used and significant estimates made by management, and evaluating the overall financial statement presentation. We believe that our audits, which included confirmation of securities at July 31, 2014 by correspondence with the custodian and brokers, provide a reasonable basis for our opinion.
PricewaterhouseCoopers LLP
Boston, Massachusetts
September 17, 2014
| |
| 30 | Absolute Return Currency Fund | Annual report |
Tax information
Unaudited
For federal income tax purposes, the following information is furnished with respect to the distributions of the fund, if any, paid during its taxable year ended July 31, 2014.
The fund paid $59,960,536 in capital gain dividends.
Eligible shareholders will be mailed a 2014 Form 1099-DIV in early 2015. This will reflect the tax character of all distributions paid in calendar year 2014.
Please consult a tax advisor regarding the tax consequences of your investment in the fund.
| |
| Annual report | Absolute Return Currency Fund | 31 |
Continuation of Investment Advisory and Subadvisory Agreements
Evaluation of Advisory and Subadvisory Agreements by the Board of Trustees
This section describes the evaluation by the Board of Trustees (the Board) of John Hancock Funds II (the Trust) of the Advisory Agreement (the Advisory Agreement) with John Hancock Advisers, LLC (the Advisor) and the Subadvisory Agreement (the Subadvisory Agreement) with First Quadrant, LP (the Subadvisor), for John Hancock Absolute Return Currency Fund (the fund). The Advisory Agreement and Subadvisory Agreement are collectively referred to as the Agreements. Prior to the June 23–25, 2014 meeting at which the Agreements were approved, the Board also discussed and considered information regarding the proposed continuation of the Agreements at an in-person meeting held on May 27–29, 2014.
Approval of Advisory and Subadvisory Agreements
At in-person meetings held on June 23–25, 2014, the Board, including the Trustees who are not considered to be interested persons of the Trust under the Investment Company Act of 1940, as amended (the 1940 Act) (the Independent Trustees), reapproved for an annual period the continuation of the Advisory Agreement between the Trust and the Advisor and the Subadvisory Agreement between the Advisor and the Subadvisor with respect to the fund.
In considering the Advisory Agreement and the Subadvisory Agreement, the Board received in advance of the meetings a variety of materials relating to the fund, the Advisor and the Subadvisor, including comparative performance, fee and expense information for a peer group of similar funds prepared by an independent third-party provider of fund data, performance information for an applicable benchmark index; and, with respect to the Subadvisor, comparative performance information for comparably managed accounts, as applicable, and other information provided by the Advisor and the Subadvisor regarding the nature, extent and quality of services provided by the Advisor and the Subadvisor under their respective Agreements, as well as information regarding the Advisor’s revenues and costs of providing services to the fund and any compensation paid to affiliates of the Advisor. At the meetings at which the renewal of the Advisory Agreement and Subadvisory Agreement are considered, particular focus is given to information concerning fund performance, comparability of fees and total expenses, and profitability. However, the Board notes that the evaluation process with respect to the Advisor and the Subadvisor is an ongoing one. In this regard, the Board also took into account discussions with management and information provided to the Board at prior meetings with respect to the services provided by the Advisor and the Subadvisor to the fund, including quarterly performance reports prepared by management containing reviews of investment results and prior presentations from the Subadvisor with respect to the fund. The Board also considered the nature, quality, and extent of non-advisory services, if any, to be provided to the fund by the Advisor’s affiliates, including distribution services.
Throughout the process, the Board asked questions of and requested additional information from management. The Board is assisted by counsel for the Trust and the Independent Trustees are also separately assisted by independent legal counsel throughout the process. The Independent Trustees also received a memorandum from their independent legal counsel discussing the legal standards for their consideration of the proposed continuation of the Agreements and discussed the proposed continuation of the Agreements in private sessions with their independent legal counsel at which no representatives of management were present.
Approval of Advisory Agreement
In approving the Advisory Agreement with respect to the fund, the Board, including the Independent Trustees, considered a variety of factors, including those discussed below. The Board
| |
| 32 | Absolute Return Currency Fund | Annual report |
also considered other factors (including conditions and trends prevailing generally in the economy, the securities markets, and the industry) and does not treat any single factor as determinative, and each Trustee may attribute different weights to different factors. The Board’s conclusions may be based in part on its consideration of the advisory and subadvisory arrangements in prior years and on the Board’s ongoing regular review of fund performance and operations throughout the year.
Nature, extent, and quality of services. Among the information received by the Board from the Advisor relating to the nature, extent, and quality of services provided to the fund, the Board reviewed information provided by the Advisor relating to its operations and personnel, descriptions of its organizational and management structure, and information regarding the Advisor’s compliance and regulatory history, including its Form ADV. The Board also noted that on a regular basis it receives and reviews information from the Trust’s Chief Compliance Officer (CCO) regarding the fund’s compliance policies and procedures established pursuant to Rule 38a-1 under the 1940 Act. The Board also considered the Advisor’s risk management processes. The Board considered that the Advisor is responsible for the management of the day-to-day operations of the fund, including, but not limited to, general supervision of and coordination of the services provided by the Subadvisor, and is also responsible for monitoring and reviewing the activities of the Subadvisor and other third-party service providers.
In considering the nature, extent, and quality of the services provided by the Advisor, the Trustees also took into account their knowledge of the Advisor’s management and the quality of the performance of the Advisor’s duties, through Board meetings, discussions and reports during the preceding year and through each Trustee’s experience as a Trustee of the Trust and of the other trusts in the complex.
In the course of their deliberations regarding the Advisory Agreement, the Board considered, among other things:
(a) the skills and competency with which the Advisor has in the past managed the Trust’s affairs and its subadvisory relationship, the Advisor’s oversight and monitoring of the Subadvisor’s investment performance and compliance programs, such as the Subadvisor’s compliance with fund policies and objectives, review of brokerage matters, including with respect to trade allocation and best execution and the Advisor’s timeliness in responding to performance issues;
(b) the background, qualifications and skills of the Advisor’s personnel;
(c) the Advisor’s compliance policies and procedures and its responsiveness to regulatory changes and mutual fund industry developments;
(d) the Advisor’s administrative capabilities, including its ability to supervise the other service providers for the fund;
(e) the financial condition of the Advisor and whether it has the financial wherewithal to provide a high level and quality of services to the fund; and
(f) the Advisor’s reputation and experience in serving as an investment advisor to the Trust and the benefit to shareholders of investing in funds that are part of a family of funds offering a variety of investments.
The Board concluded that the Advisor may reasonably be expected to continue to provide a high quality of services under the Advisory Agreement with respect to the fund.
| |
| Annual report | Absolute Return Currency Fund | 33 |
Investment performance. In considering the fund’s performance, the Board noted that it reviews at its regularly scheduled meetings information about the fund’s performance results. In connection with the consideration of the Advisory Agreement, the Board:
(a) reviewed information prepared by management regarding the fund’s performance;
(b) considered the comparative performance of an applicable benchmark index;
(c) considered the performance of comparable funds, if any, as included in the report prepared by an independent third-party provider of fund data; and
(d) took into account the Advisor’s analysis of the fund’s performance and its plans and recommendations regarding the Trust’s subadvisory arrangements generally.
The Board noted that the fund outperformed its benchmark index for the one-, and three-year periods ended December 31, 2013. The Board also noted that the fund had underperformed its peer group average for the one-year period ended December 31, 2013 and outperformed its peer group average for the three-year period ended December 31, 2013.
The Board took into account management’s discussion of the fund’s performance. The Board also took into account management’s discussion of the differences between the investment strategy of the fund and those of its peer group. In addition, the Board noted the fund’s favorable performance relative to the benchmark index for the one-, and three-year periods and to the peer group for the three-year period.
The Board concluded that the fund’s performance has generally been in line with or outperformed the historical performance of comparable funds and has outperformed the fund’s benchmark.
Fees and expenses. The Board reviewed comparative information prepared by an independent third-party provider of mutual fund data, including, among other data, the fund’s contractual and net management fees (and subadvisory fees, to the extent available) and total expenses as compared to similarly situated investment companies deemed to be comparable to the fund. The Board considered the fund’s ranking within a smaller group of peer funds chosen by the independent third-party provider, as well as the fund’s ranking within a broader group of funds. In comparing the fund’s contractual and net management fees to those of comparable funds, the Board noted that such fees include both advisory and administrative costs.
The Board noted that net management fees are higher than the peer group median, and the total expenses for the fund are lower than the peer group median.
The Board took into account management’s discussion of the fund’s expenses. The Board also took into account management’s discussion with respect to the advisory/subadvisory fee structure, including the amount of the advisory fee retained by the Advisor after payment of the subadvisory fee. The Board also noted that the Advisor pays the subadvisory fee, and that such fees are negotiated at arm’s length with respect to the Subadvisor. In addition, the Board took into account that management had agreed, effective July 1, 2014, to implement an overall fee waiver across the complex, including the fund, which is discussed further below. The Board also noted actions taken over the past several years to reduce the fund’s operating expenses. The Board also noted that, in addition, the Advisor is currently waiving fees and/or reimbursing expenses with respect to the fund, and that the fund has breakpoints in its contractual management fee schedule that reduces management fees as assets increase. The Board reviewed information provided by the Advisor concerning the investment advisory fee charged by the Advisor or one of its advisory affiliates to other clients (including other funds in the complex) having similar investment mandates, if any. The Board considered any differences between the Advisor’s and Subadvisor’s services to the fund and the
| |
| 34 | Absolute Return Currency Fund | Annual report |
services they provide to other comparable clients or funds. The Board concluded that the advisory fee paid with respect to the fund is reasonable.
Profitability/indirect benefits. In considering the costs of the services to be provided and the profits to be realized by the Advisor and its affiliates from the Advisor’s relationship with the Trust, the Board:
(a) reviewed financial information of the Advisor;
(b) reviewed and considered information presented by the Advisor regarding the net profitability to the Advisor and its affiliates with respect to the fund;
(c) received and reviewed profitability information with respect to the John Hancock fund complex as a whole;
(d) received information with respect to the Advisor’s allocation methodologies used in preparing the profitability data;
(e) considered that the John Hancock insurance companies that are affiliates of the Advisor, as shareholders of the Trust directly or through their separate accounts, receive certain tax credits or deductions relating to foreign taxes paid and dividends received by certain funds of the Trust and noted that these tax benefits, which are not available to participants in qualified retirement plans under applicable income tax law, are reflected in the profitability analysis reviewed by the Board;
(f) considered that the Advisor also provides administrative services to the fund on a cost basis pursuant to an administrative services agreement;
(g) noted that affiliates of the Advisor provide transfer agency services and distribution services to the fund, and that the fund’s distributor also receives Rule 12b-1 payments to support distribution of the fund;
(h) noted that the Advisor also derives reputational and other indirect benefits from providing advisory services to the fund;
(i) noted that the subadvisory fee for the fund is paid by the Advisor and is negotiated at arm’s length; and
(j) considered that the Advisor should be entitled to earn a reasonable level of profits in exchange for the level of services it provides to the fund and the entrepreneurial risk that it assumes as Advisor.
Based upon its review, the Board concluded that the level of profitability, if any, of the Advisor and its affiliates from their relationship with the fund was reasonable and not excessive.
Economies of scale. In considering the extent to which economies of scale would be realized as the fund grows and whether fee levels reflect these economies of scale for the benefit of fund shareholders, the Board:
(a) considered that the Advisor has agreed, effective July 1, 2014, to waive a portion of its management fee for the fund and each of the other John Hancock funds in the complex (except for those discussed below) (the Participating Portfolios) or otherwise reimburse the expenses of the Participating Portfolios as follows (the Reimbursement):
The Reimbursement shall equal, on an annualized basis, 0.01% of that portion of the aggregate net assets of all the Participating Portfolios that exceed $75 billion but is less
| |
| Annual report | Absolute Return Currency Fund | 35 |
than or equal to $125 billion, 0.0125% of that portion of the aggregate net assets of all the Participating Portfolios that exceed $125 billion but is less than or equal to $150 billion and 0.015% of that portion of the aggregate net assets of all the Participating Portfolios that exceeds $150 billion. (The funds that are not Participating Portfolios are the funds of funds in the complex, which benefit from such overall management fee waiver through their investment in underlying portfolios that include Participating Portfolios, which are subject to the Reimbursement.)
(b) reviewed the fund’s advisory fee structure and concluded that: (i) the fund’s fee structure contains breakpoints at the subadvisory fee level and that such breakpoints are reflected as breakpoints in the advisory fees for the fund; and (ii) although economies of scale cannot be measured with precision, these arrangements permit shareholders of the fund to benefit from economies of scale if the fund grows. The Board also took into account management’s discussion of the fund’s advisory fee structure; and
(c) the Board also considered the effect of the fund’s growth in size on its performance and fees. The Board also noted that if the fund’s assets increase over time, the fund may realize other economies of scale.
Approval of Subadvisory Agreement
In making its determination with respect to approval of the Subadvisory Agreement, the Board reviewed:
(1) information relating to the Subadvisor’s business, including current subadvisory services to the Trust (and other funds in the John Hancock family of funds);
(2) the historical and current performance of the fund and comparative performance information relating to an applicable benchmark index and comparable funds;
(3) the subadvisory fee for the fund, including any breakpoints, and to the extent available, comparable fee information prepared by an independent third party provider of fund data; and
(4) information relating to the nature and scope of any material relationships and their significance to the Trust’s Advisor and Subadvisors.
Nature, extent, and quality of services. With respect to the services provided by the Subadvisor, the Board received information provided to the Board by the Subadvisor, including the Subadvisor’s Form ADV, as well as took into account information presented throughout the past year. The Board considered the Subadvisor’s current level of staffing and its overall resources, as well as received information relating to the Subadvisor’s compensation program. The Board reviewed the Subadvisor’s history and investment experience, as well as information regarding the qualifications, background, and responsibilities of the Subadvisor’s investment and compliance personnel who provide services to the fund. The Board also considered, among other things, the Subadvisor’s compliance program and any disciplinary history. The Board also considered the Subadvisor’s risk assessment and monitoring process. The Board reviewed the Subadvisor’s regulatory history, including whether it was involved in any regulatory actions or investigations as well as material litigation, and any settlements and amelioratory actions undertaken, as appropriate. The Board noted that the Advisor conducts regular, periodic reviews of the Subadvisor and its operations, including regarding investment processes and organizational and staffing matters. The Board also noted that the Trust’s CCO and his staff conduct regular, periodic compliance reviews with the Subadvisor and present reports to the Independent Trustees regarding the same, which includes evaluating the regulatory compliance systems of the Subadvisor and procedures reasonably designed to
| |
| 36 | Absolute Return Currency Fund | Annual report |
assure compliance with the federal securities laws. The Board also took into account the financial condition of the Subadvisor.
The Board considered the Subadvisor’s investment process and philosophy. The Board took into account that the Subadvisor’s responsibilities include the development and maintenance of an investment program for the fund that is consistent with the fund’s investment objective, the selection of investment securities and the placement of orders for the purchase and sale of such securities, as well as the implementation of compliance controls related to performance of these services. The Board also received information with respect to the Subadvisor’s brokerage policies and practices, including with respect to best execution and soft dollars.
Subadvisor compensation. In considering the cost of services to be provided by the Subadvisor and the profitability to the Subadvisor of its relationship with the fund, the Board noted that the fees under the Subadvisory Agreement are paid by the Advisor and not the fund.
The Board also relied on the ability of the Advisor to negotiate the Subadvisory Agreement with the Subadvisor, which is not affiliated with the Advisor, and the fees thereunder at arm’s length. As a result, the costs of the services to be provided and the profits to be realized by the Subadvisor from its relationship with the Trust were not a material factor in the Board’s consideration of the Subadvisory Agreement.
The Board also received information regarding the nature and scope (including their significance to the Advisor and its affiliates and to the Subadvisor) of any material relationships, if any, with respect to the Subadvisor, which include arrangements in which the Subadvisor or its affiliates provide advisory, distribution, or management services in connection with financial products sponsored by the Advisor or its affiliates, and may include other registered investment companies, a 529 education savings plan, managed separate accounts and exempt group annuity contracts sold to qualified plans. The Board also received information and took into account any other potential conflicts of interest the Advisor might have in connection with the Subadvisory Agreement.
In addition, the Board considered other potential indirect benefits that the Subadvisor and its affiliates may receive from the Subadvisor’s relationship with the fund, such as the opportunity to provide advisory services to additional funds in the John Hancock fund complex and reputational benefits.
Subadvisory fee. The Board considered that the fund pays an advisory fee to the Advisor and that, in turn, the Advisor pays a subadvisory fee to the Subadvisor. As noted above, the Board also considered the fund’s subadvisory fee as compared to similarly situated investment companies deemed to be comparable to the fund as included in the report prepared by the independent third party provider of fund data, to the extent available. The Board noted that the limited size of the peer group was not sufficient for comparative purposes. The Board also took into account the sub-advisory fee paid by the Advisor to the Subadvisor with respect to the fund to fees charged by the Subadvisor to manage other subadvised portfolios and portfolios not subject to regulation under the 1940 Act, as applicable.
Subadvisor performance. As noted above, the Board considered the fund’s performance as compared to the fund’s peer group and the benchmark index and noted that the Board reviews information about the fund’s performance results at its regularly scheduled meetings. The Board noted the Advisor’s expertise and resources in monitoring the performance, investment style and risk-adjusted performance of the Subadvisor. The Board was mindful of the Advisor’s focus on the Subadvisor’s performance. The Board also noted the Subadvisor’s long-term performance record for similar accounts, as applicable.
| |
| Annual report | Absolute Return Currency Fund | 37 |
The Board’s decision to approve the Subadvisory Agreement was based on a number of determinations, including the following:
(1) the Subadvisor has extensive experience and demonstrated skills as a manager;
(2) the performance of the fund has generally been in line with or outperformed the historical performance of comparable funds and has outperformed its benchmark index;
(3) the subadvisory fee is reasonable in relation to the level and quality of services being provided; and
(4) subadvisory fee breakpoints are reflected as breakpoints in the advisory fees for the fund in order to permit shareholders to benefit from economies of scale if the fund grows.
Based on the Board’s evaluation of all factors that the Board deemed to be material, including those factors described above, the Board, including the Independent Trustees, concluded that renewal of the Advisory Agreement and the Subadvisory Agreement would be in the best interest of the fund and its shareholders. Accordingly, the Board, and the Independent Trustees voting separately, approved the Advisory Agreement and Subadvisory Agreement for an additional one-year period.
| |
| 38 | Absolute Return Currency Fund | Annual report |
Trustees and Officers
This chart provides information about the Trustees and Officers who oversee your John Hancock fund. Officers elected by the Trustees manage the day-to-day operations of the fund and execute policies formulated by the Trustees.
Independent Trustees
| | |
| Name, year of birth | Trustee | Number of John |
| Position(s) held with fund | of the | Hancock funds |
| Principal occupation(s) and other | Trust | overseen by |
| directorships during past 5 years | since1 | Trustee |
| |
| James M. Oates, Born: 1946 | 2005 | 230 |
|
| Managing Director, Wydown Group (financial consulting firm) (since 1994); Chairman and Director, |
| Emerson Investment Management, Inc. (since 2000); Independent Chairman, Hudson Castle Group, Inc. |
| (formerly IBEX Capital Markets, Inc.) (financial services company) (1997–2011); Director, Stifel Financial |
| (since 1996); Director, Investor Financial Services Corporation (1995–2007); Director, Connecticut River |
| Bancorp (since 1998); Director, Virtus Funds (formerly Phoenix Mutual Funds) (since 1988). | |
| | |
| Trustee and Chairperson of the Board, John Hancock retail funds3 (since 2012); Trustee (2005–2006 and |
| since 2012) and Chairperson of the Board (since 2012), John Hancock Funds III; Trustee (since 2004) and |
| Chairperson of the Board (since 2005), John Hancock Variable Insurance Trust; Trustee and Chairperson |
| of the Board, John Hancock Funds II (since 2005). | | |
|
| |
| Charles L. Bardelis,2 Born: 1941 | 2005 | 230 |
|
| Director, Island Commuter Corp. (marine transport). | | |
| | | |
| Trustee, John Hancock retail funds3 (since 2012); Trustee, John Hancock Funds III (2005–2006 and |
| since 2012); Trustee, John Hancock Variable Insurance Trust (since 1988); Trustee, John Hancock |
| Funds II (since 2005). | | |
|
| |
| Peter S. Burgess,2 Born: 1942 | 2005 | 230 |
|
| Consultant (financial, accounting, and auditing matters) (since 1999); Certified Public Accountant; |
| Partner, Arthur Andersen (independent public accounting firm) (prior to 1999); Director, Lincoln |
| Educational Services Corporation (since 2004); Director, Symetra Financial Corporation (since 2010); |
| Director, PMA Capital Corporation (2004–2010). | | |
| | | |
| Trustee, John Hancock retail funds3 (since 2012); Trustee, John Hancock Funds III (2005–2006 and |
| since 2012); Trustee, John Hancock Variable Insurance Trust and John Hancock Funds II (since 2005). |
|
| |
| William H. Cunningham, Born: 1944 | 2012 | 230 |
|
| Professor, University of Texas, Austin, Texas (since 1971); former Chancellor, University of Texas System |
| and former President of the University of Texas, Austin, Texas; Director, LIN Television (since 2009); |
| Chairman (since 2009) and Director (since 2006), Lincoln National Corporation (insurance); Director, |
| Resolute Energy Corporation (since 2009); Director, Southwest Airlines (since 2000); former Director, |
| Introgen (manufacturer of biopharmaceuticals) (until 2008); former Director, Hicks Acquisition Company I, |
| Inc. (until 2007); former Director, Texas Exchange Bank, SSB (formerly Bank of Crowley) (until 2009); |
| former Advisory Director, JP Morgan Chase Bank (formerly Texas Commerce Bank–Austin) (until 2009). |
| |
| Trustee, John Hancock retail funds3 (since 1986); Trustee, John Hancock Variable Insurance Trust |
| (since 2012); Trustee, John Hancock Funds II (2005–2006 and since 2012). | | |
| |
| Annual report | Absolute Return Currency Fund | 39 |
Independent Trustees (continued)
| | |
| Name, Year of Birth | Trustee | Number of John |
| Position(s) held with Fund | of the | Hancock funds |
| Principal occupation(s) and other | Trust | overseen by |
| directorships during past 5 years | since1 | Trustee |
| |
| Grace K. Fey, Born: 1946 | 2008 | 230 |
|
| Chief Executive Officer, Grace Fey Advisors (since 2007); Director and Executive Vice President, Frontier |
| Capital Management Company (1988–2007); Director, Fiduciary Trust (since 2009). | |
| | |
| Trustee, John Hancock retail funds3 (since 2012); Trustee, John Hancock Variable Insurance Trust and |
| John Hancock Funds II (since 2008). | | |
|
| |
| Theron S. Hoffman,2 Born: 1947 | 2008 | 230 |
|
| Chief Executive Officer, T. Hoffman Associates, LLC (consulting firm) (since 2003); Director, The Todd |
| Organization (consulting firm) (2003–2010); President, Westport Resources Management (investment |
| management consulting firm) (2006–2008); Senior Managing Director, Partner, and Operating Head, |
| Putnam Investments (2000–2003); Executive Vice President, The Thomson Corp. (financial and legal |
| information publishing) (1997–2000). | | |
| | | |
| Trustee, John Hancock retail funds3 (since 2012); Trustee, John Hancock Variable Insurance Trust and |
| John Hancock Funds II (since 2008). | | |
|
| |
| Deborah C. Jackson, Born: 1952 | 2012 | 230 |
|
| President, Cambridge College, Cambridge, Massachusetts (since 2011); Chief Executive Officer, |
| American Red Cross of Massachusetts Bay (2002–2011); Board of Directors of Eastern Bank Corporation |
| (since 2001); Board of Directors of Eastern Bank Charitable Foundation (since 2001); Board of Directors |
| of American Student Assistance Corporation (1996–2009); Board of Directors of Boston Stock Exchange |
| (2002–2008); Board of Directors of Harvard Pilgrim Healthcare (health benefits company) (2007–2011). |
| |
| Trustee, John Hancock retail funds3 (since 2008); Trustee of John Hancock Variable Insurance Trust and |
| John Hancock Funds II (since 2012). | | |
|
| |
| Hassell H. McClellan, Born: 1945 | 2005 | 230 |
|
| Trustee, Virtus Variable Insurance Trust (formerly Phoenix Edge Series Funds) (since 2008); Director, The |
| Barnes Group (since 2010); Associate Professor, The Wallace E. Carroll School of Management, Boston |
| College (retired 2013). | | |
| | | |
| Trustee, John Hancock retail funds3 (since 2012); Trustee, John Hancock Funds III (2005–2006 and |
| since 2012); Trustee, John Hancock Variable Insurance Trust and John Hancock Funds II (since 2005). |
|
| |
| Steven R. Pruchansky, Born: 1944 | 2012 | 230 |
|
| Chairman and Chief Executive Officer, Greenscapes of Southwest Florida, Inc. (since 2000); Director |
| and President, Greenscapes of Southwest Florida, Inc. (until 2000); Member, Board of Advisors, First |
| American Bank (until 2010); Managing Director, Jon James, LLC (real estate) (since 2000); Director, |
| First Signature Bank & Trust Company (until 1991); Director, Mast Realty Trust (until 1994); President, |
| Maxwell Building Corp. (until 1991). | | |
| | | |
| Trustee (since 1992) and Chairperson of the Board (2011–2012), John Hancock retail funds3; Trustee and |
| Vice Chairperson of the Board, John Hancock retail funds,3 John Hancock Variable Insurance Trust, and |
| John Hancock Funds II (since 2012). | | |
| |
| 40 | Absolute Return Currency Fund | Annual report |
Independent Trustees (continued)
| | |
| Name, Year of Birth | Trustee | Number of John |
| Position(s) held with Fund | of the | Hancock funds |
| Principal occupation(s) and other | Trust | overseen by |
| directorships during past 5 years | since1 | Trustee |
|
| Gregory A. Russo, Born: 1949 | 2012 | 230 |
|
| Director and Audit Committee Chairman (since 2012), and Member, Audit Committee and Finance |
| Committee (since 2011), NCH Healthcare System, Inc. (holding company for multi-entity healthcare |
| system); Director and Member of Finance Committee, The Moorings, Inc. (nonprofit continuing care |
| community) (since 2012); Vice Chairman, Risk & Regulatory Matters, KPMG LLP (KPMG) (2002–2006); |
| Vice Chairman, Industrial Markets, KPMG (1998–2002); Chairman and Treasurer, Westchester County, |
| New York, Chamber of Commerce (1986–1992); Director, Treasurer, and Chairman of Audit and |
| Finance Committees, Putnam Hospital Center (1989–1995); Director and Chairman of Fundraising |
| Campaign, United Way of Westchester and Putnam Counties, New York (1990–1995). | |
| | |
| Trustee, John Hancock retail funds3 (since 2008); Trustee, John Hancock Variable Insurance Trust and |
| John Hancock Funds II (since 2012). | | |
Non-Independent Trustees4
| | |
| Name, year of birth | Trustee | Number of John |
| Position(s) held with fund | of the | Hancock funds |
| Principal occupation(s) and other | Trust | overseen by |
| directorships during past 5 years | since1 | Trustee |
| |
| Craig Bromley, Born: 1966 | 2012 | 230 |
|
| President, John Hancock Financial Services (since 2012); Senior Executive Vice President and General |
| Manager, U.S. Division, Manulife Financial Corporation (since 2012); President and Chief Executive |
| Officer, Manulife Insurance Company (Manulife Japan) (2005–2012, including prior positions). |
| |
| Trustee, John Hancock retail funds,3 John Hancock Variable Insurance Trust, and John Hancock |
| Funds II (since 2012). | | |
|
| |
| Warren A. Thomson, Born: 1955 | 2012 | 230 |
|
| Senior Executive Vice President and Chief Investment Officer, Manulife Financial Corporation and The |
| Manufacturers Life Insurance Company (since 2009); Chairman and Chief Executive Officer, Manulife |
| Asset Management (since 2001, including prior positions); Director (since 2006), and President and |
| Chief Executive Officer (since 2013), Manulife Asset Management Limited; Director and Chairman, |
| Hancock Natural Resources Group, Inc. (since 2013). | | |
| | | |
| Trustee, John Hancock retail funds,3 John Hancock Variable Insurance Trust, and John Hancock |
| Funds II (since 2012). | | |
Principal officers who are not Trustees
| |
| Name, year of birth | Officer |
| Position(s) held with fund | of the |
| Principal occupation(s) and other | Trust |
| directorships during past 5 years | since |
| |
| Andrew G. Arnott, Born: 1971 | 2009 |
|
| President | |
| Senior Vice President, John Hancock Financial Services (since 2009); Director and Executive Vice | |
| President, John Hancock Advisers, LLC (since 2005, including prior positions); Director and Executive |
| Vice President, John Hancock Investment Management Services, LLC (since 2006, including prior | |
| positions); President, John Hancock Funds, LLC (since 2004, including prior positions); President | |
| (effective 3-13-14) and Executive Vice President, John Hancock retail funds,3 John Hancock Variable |
| Insurance Trust, and John Hancock Funds II (since 2007, including prior positions). | |
| |
| Annual report | Absolute Return Currency Fund | 41 |
Principal officers who are not Trustees (continued)
| |
| Name, Year of Birth | Officer |
| Position(s) held with Fund | of the |
| Principal occupation(s) and other | Trust |
| directorships during past 5 years | since |
| |
| John J. Danello, Born: 1955 | 2006 |
|
| Senior Vice President, Secretary, and Chief Legal Officer | |
| Vice President and Chief Counsel, John Hancock Wealth Management (since 2005); Senior Vice | |
| President (since 2007) and Chief Legal Counsel (2007–2010), John Hancock Funds, LLC and The | |
| Berkeley Financial Group, LLC; Senior Vice President (since 2006, including prior positions) and Chief |
| Legal Officer and Secretary (since 2014), John Hancock retail funds3 and John Hancock Variable | |
| Insurance Trust; Vice President, John Hancock Life & Health Insurance Company (since 2009); | |
| Vice President, John Hancock Life Insurance Company (USA) and John Hancock Life Insurance | |
| Company of New York (since 2010); and Senior Vice President, Secretary, and Chief Legal Counsel | |
| (2007–2014, including prior positions) of John Hancock Advisers, LLC and John Hancock Investment |
| Management Services, LLC. | |
|
| |
| Francis V. Knox, Jr., Born: 1947 | 2005 |
|
| Chief Compliance Officer | |
| Vice President, John Hancock Financial Services (since 2005); Chief Compliance Officer, John Hancock |
| retail funds,3 John Hancock Variable Insurance Trust, John Hancock Funds II, John Hancock Advisers, |
| LLC, and John Hancock Investment Management Services, LLC (since 2005). | |
|
| |
| Charles A. Rizzo, Born: 1957 | 2007 |
|
| Chief Financial Officer | |
| Vice President, John Hancock Financial Services (since 2008); Senior Vice President, John Hancock | |
| Advisers, LLC and John Hancock Investment Management Services, LLC (since 2008); Chief Financial |
| Officer, John Hancock retail funds,3 John Hancock Variable Insurance Trust and John Hancock | |
| Funds II (since 2007). | |
|
| |
| Salvatore Schiavone, Born: 1965 | 2009 |
|
| Treasurer | |
| Assistant Vice President, John Hancock Financial Services (since 2007); Vice President, John Hancock |
| Advisers, LLC and John Hancock Investment Management Services, LLC (since 2007); Treasurer, | |
| John Hancock retail funds3 (since 2007, including prior positions); Treasurer, John Hancock Variable |
| Insurance Trust and John Hancock Funds II (since 2010 and 2007–2009, including prior positions). | |
The business address for all Trustees and Officers is 601 Congress Street, Boston, Massachusetts 02210-2805.
1 Each Trustee holds office until his or her successor is elected and qualified, or until the Trustee’s death, retirement, resignation, or removal.
2 Member of the Audit Committee.
3 “John Hancock retail funds” comprises John Hancock Funds III and 37 other John Hancock funds consisting of 27 series of other John Hancock trusts and 10 closed-end funds.
4 Because Messrs. Bromley and Thomson are senior executives or directors of the advisor and/or its affiliates, each of them is considered an “interested person of the fund,” as defined in the Investment Company Act of 1940.
| |
| 42 | Absolute Return Currency Fund | Annual report |
More information
| |
| Trustees | Investment advisor |
| James M. Oates, Chairperson | John Hancock Advisers, LLC |
| Steven R. Pruchansky, Vice Chairperson | |
| Charles L. Bardelis* | Subadvisor |
| Craig Bromley† | First Quadrant, L.P. |
| Peter S. Burgess* | |
| William H. Cunningham | Principal distributor |
| Grace K. Fey | John Hancock Funds, LLC |
| Theron S. Hoffman* | |
| Deborah C. Jackson | Custodian |
| Hassell H. McClellan | State Street Bank and Trust Company |
| Gregory A. Russo | |
| Warren A. Thomson† | Transfer agent |
| | John Hancock Signature Services, Inc. |
| Officers | |
| Andrew G. Arnott | Legal counsel |
| President | K&L Gates LLP |
| John J. Danello | |
| Senior Vice President, Secretary, | Independent registered |
| and Chief Legal Officer | public accounting firm |
| Francis V. Knox, Jr. | PricewaterhouseCoopers LLP |
| Chief Compliance Officer | |
| Charles A. Rizzo | |
| Chief Financial Officer | |
| Salvatore Schiavone | |
| Treasurer | |
*Member of the Audit Committee
†Non-Independent Trustee
The fund’s proxy voting policies and procedures, as well as the fund’s proxy voting record for the most recent twelve-month period ended June 30, are available free of charge on the Securities and Exchange Commission (SEC) website at sec.gov or on our website.
The fund’s complete list of portfolio holdings, for the first and third fiscal quarters, is filed with the SEC on Form N-Q. The fund’s Form N-Q is available on our website and the SEC’s website, sec.gov, and can be reviewed and copied (for a fee) at the SEC’s Public Reference Room in Washington, DC. Call 800-SEC-0330 to receive information on the operation of the SEC’s Public Reference Room.
We make this information on your fund, as well as monthly portfolio holdings, and other fund details available on our website at jhinvestments.com or by calling 800-225-5291.
| | |
| You can also contact us: | | |
| 800-225-5291 | Regular mail: | Express mail: |
| jhinvestments.com | John Hancock Signature Services, Inc. | John Hancock Signature Services, Inc. |
| | P.O. Box 55913 | 30 Dan Road |
| | Boston, MA 02205-5913 | Canton, MA 02021 |
| |
| Annual report | Absolute Return Currency Fund | 43 |

800-225-5291
800-231-5469 TDD
800-338-8080 EASI-Line
jhinvestments.com

| |
| This report is for the information of the shareholders of John Hancock Absolute Return Currency Fund. | |
| It is not authorized for distribution to prospective investors unless preceded or accompanied by a prospectus. | 364A 7/14 |
| MF195334 | 9/14 |

A look at performance
Total returns for the period ended July 31, 2014
| | | | | | | | |
| | Average annual total returns (%) | Cumulative total returns (%) | |
| | with maximum sales charge | | with maximum sales charge | |
|
| | 1-year | 5-year | 10-year | Since inception1 | 1-year | 5-year | 10-year | Since inception1 |
|
| Class A | 8.51 | — | — | 11.97 | 8.51 | — | — | 43.07 |
|
| Class I2 | 14.62 | — | — | 14.28 | 14.62 | — | — | 52.61 |
|
| Index† | 16.94 | — | — | 14.53 | 16.94 | — | — | 53.67 |
|
Performance figures assume all distributions have been reinvested. Figures reflect maximum sales charges on Class A shares of 5.00%. Sales charges are not applicable to Class I shares.
The expense ratios of the fund, both net (including any fee waivers and/or expense limitations) and gross (excluding any fee waivers and/or expense limitations), are set forth according to the most recent publicly available prospectuses for the fund and may differ from those disclosed in the Financial highlights tables in this report. Had the fee waivers and expense limitations not been in place, gross expenses would apply. The expense ratios are as follows:
| | | | |
| | Class A | Class I | | |
| Gross (%) | 2.44 | 1.83 | | |
| Net (%) | 1.30 | 0.94 | | |
Please refer to the most recent prospectuses and annual report for more information on expenses and any expense limitation arrangements for each class.
The returns reflect past results and should not be considered indicative of future performance. The return and principal value of an investment will fluctuate so that shares, when redeemed, may be worth more or less than their original cost. Due to market volatility, the fund’s current performance may be higher or lower than the performance shown. For current to the most recent month-end performance data, please call 800–225–5291 or visit the fund’s website at jhinvestments.com.
The performance table above and the chart on the next page do not reflect the deduction of taxes that a shareholder may pay on fund distributions or on the redemption of fund shares. The fund’s performance results reflect any applicable fee waivers or expense reductions, without which the expenses would increase and results would have been less favorable.
† Index is the S&P 500 Index.
See the following page for footnotes.
| |
| 6 | Fundamental Large Cap Core Fund | Annual report |
| | | | |
| | | With maximum | Without | |
| | Start date | sales charge | sales charge | Index |
|
| Class I2 | 6-1-11 | $15,261 | $15,261 | $15,367 |
|
S&P 500 Index is an unmanaged index that includes 500 widely traded common stocks.
It is not possible to invest directly in an index. Index figures do not reflect expenses or sales charges, which would have resulted in lower values.
Footnotes related to performance pages
1 From 6-1-11.
2 For certain types of investors as described in the fund’s prospectus.
| |
| Annual report | Fundamental Large Cap Core Fund | 7 |
Management’s discussion of
Fund performance
John Hancock Asset Management a division of Manulife Asset Management (US) LLC
U.S. stocks rallied for the year ended July 31, 2014, gaining momentum last fall as Congress reached a budget agreement to end the federal government shutdown. The rally gathered steam as economic growth improved in the fourth quarter and many corporations reported better-than-expected earnings. Severe winter weather that dampened economic growth and financial turmoil in emerging markets hampered returns in the first quarter. However, an improving job outlook, better economic data, and favorable corporate earnings helped revive the rally last spring, outweighing concerns over mounting geopolitical tensions and potentially higher interest rates.
Over the twelve-month reporting period, John Hancock Fundamental Large Cap Core Fund’s Class A shares returned 14.23%, excluding sales charges, which lagged the 16.94% gain of the S&P 500 Index. Security selection and a sizable overweight in the financials sector hindered performance versus the index. Individual disappointments included diversified financial Bank of America Corp. Its return was hampered by continued low interest rates and a miscalculation of its capital position that forced the company to submit revised plans to regulators for a dividend increase and also to suspend plans for a stock buyback. Elsewhere, shares of e-commerce leader Amazon.com, Inc. were held back by concern that the company’s investments for long-term growth were hindering short-term profits. Networking equipment company Cisco Systems, Inc. also detracted as sluggish end-market demand pressured the stock’s return. An overweight in the top-performing information technology sector gave the biggest boost to relative performance. Winners here included consumer technology leader Apple, Inc., which saw strong earnings results and shareholder-friendly initiatives drive its stock up over 50% for the year. An overweight in search engine company Google, Inc. also contributed, as growing click volumes and a two-for-one stock split helped fuel a sizable gain in its share price.
This commentary reflects the views of the portfolio managers through the end of the period discussed in this report. As such, they are in no way guarantees of future events and are not intended to be used as investment advice or a recommendation regarding any specific security. They are also subject to change at any time as market and other conditions warrant.
Past performance does not guarantee future results.
| |
| 8 | Fundamental Large Cap Core Fund | Annual report |
Your expenses
These examples are intended to help you understand your ongoing operating expenses of investing in the fund so you can compare these costs with the ongoing costs of investing in other mutual funds.
Understanding fund expenses
As a shareholder of the fund, you incur two types of costs:
■ Transaction costs, which include sales charges (loads) on purchases or redemptions (varies by share class), minimum account fee charge, etc.
■ Ongoing operating expenses, including management fees, distribution and service fees (if applicable), and other fund expenses.
We are going to present only your ongoing operating expenses here.
Actual expenses/actual returns
This example is intended to provide information about the fund’s actual ongoing operating expenses and is based on the fund’s actual return. It assumes an account value of $1,000.00 on February 1, 2014, with the same investment held until July 31, 2014.
| | | | |
| | | | Expenses paid | |
| | Account value | Ending value | during period | Annualized |
| | on 2-1-2014 | on 7-31-2014 | ended 7-31-20141 | expense ratio |
|
| |
| Class A | $1,000.00 | $1,058.70 | $6.64 | 1.30% |
|
| |
| Class I | 1,000.00 | 1,060.80 | 4.80 | 0.94% |
|
Together with the value of your account, you may use this information to estimate the operating expenses that you paid over the period. Simply divide your account value at July 31, 2014, by $1,000.00, then multiply it by the “expenses paid” for your share class from the table above. For example, for an account value of $8,600.00, the operating expenses should be calculated as follows:
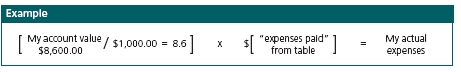
| |
| Annual report | Fundamental Large Cap Core Fund | 9 |
Your expenses
Hypothetical example for comparison purposes
This table allows you to compare the fund’s ongoing operating expenses with those of any other fund. It provides an example of the fund’s hypothetical account values and hypothetical expenses based on each class’s actual expense ratio and an assumed 5% annualized return before expenses (which is not the fund’s actual return). It assumes an account value of $1,000.00 on February 1, 2014, with the same investment held until July 31, 2014. Look in any other fund shareholder report to find its hypothetical example and you will be able to compare these expenses. Please remember that these hypothetical account values and expenses may not be used to estimate the actual ending account balance or expenses you paid for the period.
| | | | |
| | | | Expenses paid | |
| | Account value | Ending value | during period | Annualized |
| | on 2-1-2014 | on 7-31-2014 | ended 7-31-20141 | expense ratio |
|
| |
| Class A | $1,000.00 | $1,018.30 | $6.51 | 1.30% |
|
| |
| Class I | 1,000.00 | 1,020.10 | 4.71 | 0.94% |
|
Remember, these examples do not include any transaction costs, therefore, these examples will not help you to determine the relative total costs of owning different funds. If transaction costs were included, your expenses would have been higher. See the prospectuses for details regarding transaction costs.
1 Expenses are equal to the fund’s annualized expense ratio, multiplied by the average account value over the period, multiplied by 181/365 (to reflect the one-half year period).
| |
| 10 | Fundamental Large Cap Core Fund | Annual report |
Portfolio summary
| | | | |
| Top 10 Holdings (38.9% of Net Assets on 7-31-14)1,2 | | | |
|
| Apple, Inc. | 5.1% | | Facebook, Inc., Class A | 4.1% |
| |
|
| Amazon.com, Inc. | 4.9% | | Lennar Corp., Class A | 3.1% |
| |
|
| JPMorgan Chase & Company | 4.4% | | The Goldman Sachs Group, Inc. | 3.0% |
| |
|
| QUALCOMM, Inc. | 4.2% | | EMC Corp. | 3.0% |
| |
|
| Bank of America Corp. | 4.2% | | American International Group, Inc. | 2.9% |
| |
|
| |
| Sector Composition1,3 | | | | |
|
| Information Technology | 25.0% | | Health Care | 6.7% |
| |
|
| Financials | 24.2% | | Industrials | 5.9% |
| |
|
| Consumer Discretionary | 16.1% | | Consumer Staples | 5.7% |
| |
|
| Energy | 12.6% | | Short-Term Investments & Other | 3.8% |
| |
|

1 As a percentage of net assets on 7-31-14.
2 Cash and cash equivalents not included.
3 Large company stocks could fall out of favor. Foreign investing, especially in emerging markets, has additional risks, such as currency and market volatility, and political and social instability. Hedging and other strategic transactions may increase volatility and result in losses if not successful. Illiquid securities may be difficult to sell at a price approximating their value. Sector investing is subject to greater risks than the market as a whole. Because the fund may focus on particular sectors of the economy, its performance may depend on the performance of those sectors and investments focused in one sector may fluctuate more widely than investments diversified across sectors. Please see the fund’s prospectuses for additional risks.
| |
| Annual report | Fundamental Large Cap Core Fund | 11 |
Fund’s investments
As of 7-31-14
| | |
| | Shares | Value |
| Common Stocks 96.2% | | $39,196,629 |
|
| (Cost $33,681,983) | | |
| | | |
| Consumer Discretionary 16.1% | | 6,578,827 |
| | | |
| Hotels, Restaurants & Leisure 2.4% | | |
|
| McDonald’s Corp. | 5,860 | 554,122 |
|
| Starbucks Corp. | 5,648 | 438,737 |
| | | |
| Household Durables 6.1% | | |
|
| Lennar Corp., Class A | 35,021 | 1,268,811 |
|
| NVR, Inc. (I) | 653 | 735,578 |
|
| Tempur Sealy International, Inc. (I) | 9,054 | 495,344 |
| | | |
| Internet & Catalog Retail 4.9% | | |
|
| Amazon.com, Inc. (I) | 6,360 | 1,990,615 |
| | | |
| Specialty Retail 2.7% | | |
|
| CarMax, Inc. (I) | 9,418 | 459,693 |
|
| Lowe’s Companies, Inc. | 13,290 | 635,927 |
| | | |
| Consumer Staples 5.7% | | 2,304,621 |
| | | |
| Beverages 4.6% | | |
|
| Diageo PLC, ADR | 4,772 | 573,690 |
|
| PepsiCo, Inc. | 9,357 | 824,352 |
|
| SABMiller PLC | 8,938 | 486,688 |
| | | |
| Tobacco 1.1% | | |
|
| Philip Morris International, Inc. | 5,120 | 419,891 |
| | | |
| Energy 12.6% | | 5,126,581 |
| | | |
| Energy Equipment & Services 3.9% | | |
|
| National Oilwell Varco, Inc. | 6,365 | 515,820 |
|
| Schlumberger, Ltd. | 9,926 | 1,075,879 |
| | | |
| Oil, Gas & Consumable Fuels 8.7% | | |
|
| Apache Corp. | 9,576 | 983,072 |
|
| Cabot Oil & Gas Corp. | 12,327 | 406,175 |
|
| Chevron Corp. | 3,545 | 458,156 |
|
| Exxon Mobil Corp. | 4,361 | 431,477 |
|
| Occidental Petroleum Corp. | 8,965 | 875,970 |
|
| Southwestern Energy Company (I) | 9,365 | 380,032 |
| | |
| 12 | Fundamental Large Cap Core Fund | Annual report | See notes to financial statements |
| | |
| | Shares | Value |
| Financials 24.2% | | $9,839,686 |
| | | |
| Banks 12.1% | | |
|
| Bank of America Corp. | 113,230 | 1,726,758 |
|
| Citigroup, Inc. | 19,718 | 964,407 |
|
| JPMorgan Chase & Company | 31,041 | 1,790,134 |
|
| Wells Fargo & Company | 8,496 | 432,446 |
| | | |
| Capital Markets 7.3% | | |
|
| Morgan Stanley | 19,284 | 623,645 |
|
| State Street Corp. | 5,392 | 379,812 |
|
| T. Rowe Price Group, Inc. | 9,553 | 741,886 |
|
| The Goldman Sachs Group, Inc. | 7,171 | 1,239,651 |
| | | |
| Consumer Finance 1.0% | | |
|
| American Express Company | 4,325 | 380,600 |
| | | |
| Insurance 3.8% | | |
|
| American International Group, Inc. | 22,643 | 1,176,983 |
|
| Prudential Financial, Inc. | 4,408 | 383,364 |
| | | |
| Health Care 6.7% | | 2,734,384 |
| | | |
| Biotechnology 1.8% | | |
|
| Amgen, Inc. | 5,592 | 712,365 |
| | | |
| Health Care Equipment & Supplies 1.4% | | |
|
| Medtronic, Inc. | 9,340 | 576,652 |
| | | |
| Pharmaceuticals 3.5% | | |
|
| Merck & Company, Inc. | 13,453 | 763,323 |
|
| Novartis AG, ADR | 7,845 | 682,044 |
| | | |
| Industrials 5.9% | | 2,424,445 |
| | | |
| Aerospace & Defense 0.9% | | |
|
| L-3 Communications Holdings, Inc. | 3,528 | 370,299 |
| | | |
| Air Freight & Logistics 1.1% | | |
|
| United Parcel Service, Inc., Class B | 4,576 | 444,284 |
| | | |
| Industrial Conglomerates 1.6% | | |
|
| General Electric Company | 27,016 | 679,452 |
| | | |
| Machinery 1.0% | | |
|
| Caterpillar, Inc. | 4,100 | 413,075 |
| | | |
| Professional Services 1.3% | | |
|
| IHS, Inc., Class A (I) | 3,938 | 517,335 |
| | | |
| Information Technology 25.0% | | 10,188,085 |
| | | |
| Communications Equipment 4.2% | | |
|
| QUALCOMM, Inc. | 23,466 | 1,729,444 |
| | | |
| Internet Software & Services 10.1% | | |
|
| Facebook, Inc., Class A (I) | 22,845 | 1,659,689 |
|
| Google, Inc., Class A (I) | 1,521 | 881,496 |
|
| Google, Inc., Class C (I) | 1,521 | 869,404 |
|
| LinkedIn Corp., Class A (I) | 3,917 | 707,567 |
| | | |
| Software 2.6% | | |
|
| Oracle Corp. | 25,925 | 1,047,111 |
| | |
| See notes to financial statements | Annual report | Fundamental Large Cap Core Fund | 13 |
| | |
| | Shares | Value |
| Technology Hardware, Storage & Peripherals 8.1% | | |
|
| Apple, Inc. | 21,602 | $2,064,503 |
|
| EMC Corp. | 41,941 | 1,228,871 |
|
| |
| Short-Term Investments 3.6% | | $1,466,000 |
|
| (Cost $1,466,000) | | |
| | | |
| Repurchase Agreement 3.6% | | 1,466,000 |
| Barclays Tri-Party Repurchase Agreement dated 7-31-14 at 0.600% to | | |
| be repurchased at $1,466,002 on 8-1-14, collateralized by $1,419,500 | | |
| Treasury Inflation Index Notes, 0.125% due 4-15-18 (valued at | | |
| $1,495,336 including interest) | 1,466,000 | 1,466,000 |
| |
| Total investments (Cost $35,147,983)† 99.8% | | $40,662,629 |
|
| |
| Other assets and liabilities, net 0.2% | | $65,890 |
|
| |
| Total net assets 100.0% | | $40,728,519 |
|
The percentage shown for each investment category is the total value of the category as a percentage of the net assets of the fund.
ADR American Depositary Receipts
(I) Non-income producing security.
† At 7-31-14, the aggregate cost of investment securities for federal income tax purposes was $35,244,912. Net unrealized appreciation aggregated $5,417,717 of which $5,460,041 related to appreciated investment securities and $42,324 related to depreciated investment securities.
| | |
| 14 | Fundamental Large Cap Core Fund | Annual report | See notes to financial statements |
F I N A N C I A L S T A T E M E N T S
Financial statements
Statement of assets and liabilities 7-31-14
This Statement of assets and liabilities is the fund’s balance sheet. It shows the value of what the fund owns, is due and owes. You’ll also find the net asset value and the maximum offering price per share.
| |
| Assets | |
|
| Investments, at value (Cost $35,147,983) | $40,662,629 |
| Cash | 42,116 |
| Foreign currency, at value (Cost $7,845) | 7,801 |
| Receivable for fund shares sold | 101,789 |
| Dividends and interest receivable | 11,696 |
| Other receivables and prepaid expenses | 21,799 |
| | |
| Total assets | 40,847,830 |
| |
| Liabilities | |
|
| Payable for fund shares repurchased | 65,609 |
| Payable to affiliates | |
| Accounting and legal services fees | 956 |
| Transfer agent fees | 4,049 |
| Investment management fees | 790 |
| Other liabilities and accrued expenses | 47,907 |
| | |
| Total liabilities | 119,311 |
| | |
| Net assets | $40,728,519 |
| |
| Net assets consist of | |
|
| Paid-in capital | $34,374,526 |
| Undistributed net investment income | 70,580 |
| Accumulated net realized gain (loss) on investments and foreign | |
| currency transactions | 768,811 |
| Net unrealized appreciation (depreciation) on investments and translation | |
| of assets and liabilities in foreign currencies | 5,514,602 |
| | |
| Net assets | $40,728,519 |
| |
| Net asset value per share | |
|
| Based on net asset values and shares outstanding — the fund has an | |
| unlimited number of shares authorized with no par value | |
| Class A ($7,086,772 ÷ 491,223 shares)1 | $14.43 |
| Class I ($33,641,747 ÷ 2,322,419 shares) | $14.49 |
| |
| Maximum offering price per share | |
|
| Class A (net asset value per share ÷ 95%)2 | $15.19 |
1 Redemption price is equal to net asset value less any applicable contingent deferred sales charge.
2 On single retail sales of less than $50,000. On sales of $50,000 or more and on group sales the offering price is reduced.
| | |
| See notes to financial statements | Annual report | Fundamental Large Cap Core Fund | 15 |
F I N A N C I A L S T A T E M E N T S
Statement of operations For the year ended 7-31-14
This Statement of operations summarizes the fund’s investment income earned and expenses incurred in operating the fund. It also shows net gains (losses) for the period stated.
| |
| Investment income | |
|
| Dividends | $489,643 |
| Interest | 192 |
| Less foreign taxes withheld | (2,969) |
| | |
| Total investment income | 486,866 |
| |
| Expenses | |
|
| Investment management fees | 232,665 |
| Distribution and service fees | 18,543 |
| Accounting and legal services fees | 4,164 |
| Transfer agent fees | 38,897 |
| Trustees’ fees | 417 |
| State registration fees | 37,441 |
| Printing and postage | 11,949 |
| Professional fees | 38,108 |
| Custodian fees | 9,563 |
| Registration and filing fees | 21,466 |
| Expense recapture | 1,899 |
| Other | 6,745 |
| | |
| Total expenses | 421,857 |
| Less expense reductions | (97,943) |
| | |
| Net expenses | 323,914 |
| | |
| Net investment income | 162,952 |
| |
| Realized and unrealized gain (loss) | |
|
| Net realized gain (loss) on | |
| Investments in unaffiliated issuers and foreign currency transactions | 1,053,677 |
| | 1,053,677 |
| Change in net unrealized appreciation (depreciation) of | |
| Investments in unaffiliated issuers and translation of assets and liabilities in | |
| foreign currencies | 2,810,947 |
| | 2,810,947 |
| Net realized and unrealized gain | 3,864,624 |
| | |
| Increase in net assets from operations | $4,027,576 |
| | |
| 16 | Fundamental Large Cap Core Fund | Annual report | See notes to financial statements |
F I N A N C I A L S T A T E M E N T S
Statements of changes in net assets
These Statements of changes in net assets show how the value of the fund’s net assets has changed during the last two periods. The difference reflects earnings less expenses, any investment gains and losses, distributions, if any, paid to shareholders and the net of fund share transactions.
| | |
| | Year | Year |
| | ended | ended |
| | 7-31-14 | 7-31-13 |
| |
| Increase (decrease) in net assets | | |
|
|
| From operations | | |
| Net investment income | $162,952 | $101,324 |
| Net realized gain | 1,053,677 | 507,629 |
| Change in net unrealized appreciation (depreciation) | 2,810,947 | 2,533,372 |
| | | |
| Increase in net assets resulting from operations | 4,027,576 | 3,142,325 |
| | | |
| Distributions to shareholders | | |
| From net investment income | | |
| Class A | (17,255) | (4,589) |
| Class I | (145,853) | (34,650) |
| From net realized gain | | |
| Class A | (136,434) | (32,865) |
| Class I | (536,586) | (71,193) |
| | | |
| Total distributions | (836,128) | (143,297) |
| | | |
| From fund share transactions | 14,790,023 | 15,697,060 |
| | | |
| Total increase | 17,981,471 | 18,696,088 |
| |
| Net assets | | |
|
| Beginning of year | 22,747,048 | 4,050,960 |
| | | |
| End of year | $40,728,519 | $22,747,048 |
| | | |
| Undistributed net investment income | $70,580 | $70,156 |
| | |
| See notes to financial statements | Annual report | Fundamental Large Cap Core Fund | 17 |
Financial highlights
The Financial highlights show how the fund’s net asset value for a share has changed during the period.
| | | | |
| CLASS A SHARES Period ended | 7-31-14 | 7-31-13 | 7-31-12 | 7-31-111 |
| |
| Per share operating performance | | | | |
|
| Net asset value, beginning of period | $12.95 | $10.35 | $9.73 | $10.00 |
| Net investment income2 | 0.03 | 0.06 | 0.04 | —3 |
| Net realized and unrealized gain (loss) on investments | 1.80 | 2.67 | 0.64 | (0.27) |
| Total from investment operations | 1.83 | 2.73 | 0.68 | (0.27) |
| Less distributions | | | | |
| From net investment income | (0.04) | (0.02) | (0.03) | — |
| From net realized gain | (0.31) | (0.11) | (0.03) | — |
| Total distributions | (0.35) | (0.13) | (0.06) | — |
| Net asset value, end of period | $14.43 | $12.95 | $10.35 | $9.73 |
| Total return (%)4,5 | 14.23 | 26.53 | 7.09 | (2.70)6 |
|
| Ratios and supplemental data | | | | |
|
| Net assets, end of period (in millions) | $7 | $5 | $3 | $2 |
| Ratios (as a percentage of average net assets): | | | | |
| Expenses before reductions | 1.73 | 2.45 | 6.29 | 5.957 |
| Expenses including reductions | 1.30 | 1.30 | 1.30 | 1.307 |
| Net investment income (loss) | 0.22 | 0.56 | 0.46 | (0.12)7 |
| Portfolio turnover (%) | 23 | 31 | 40 | 4 |
| |
1 Period from 6-1-11 (commencement of operations) to 7-31-11.
2 Based on average daily shares outstanding.
3 Less than $0.005 per share.
4 Total returns would have been lower had certain expenses not been reduced during the applicable periods.
5 Does not reflect the effect of sales charges, if any.
6 Not annualized.
7 Annualized.
| | | | |
| CLASS I SHARES Period ended | 7-31-14 | 7-31-13 | 7-31-12 | 7-31-111 |
| |
| Per share operating performance | | | | |
|
| Net asset value, beginning of period | $13.00 | $10.38 | $9.74 | $10.00 |
| Net investment income2 | 0.08 | 0.11 | 0.09 | 0.01 |
| Net realized and unrealized gain (loss) on investments | 1.80 | 2.67 | 0.64 | (0.27) |
| Total from investment operations | 1.88 | 2.78 | 0.73 | (0.26) |
| Less distributions | | | | |
| From net investment income | (0.08) | (0.05) | (0.06) | — |
| From net realized gain | (0.31) | (0.11) | (0.03) | — |
| Total distributions | (0.39) | (0.16) | (0.09) | — |
| Net asset value, end of period | $14.49 | $13.00 | $10.38 | $9.74 |
| Total return (%)3 | 14.62 | 27.07 | 7.58 | (2.60)4 |
| |
| Ratios and supplemental data | | | | |
|
| Net assets, end of period (in millions) | $34 | $18 | $1 | $1 |
| Ratios (as a percentage of average net assets): | | | | |
| Expenses before reductions | 1.22 | 1.80 | 7.53 | 5.615 |
| Expenses including reductions | 0.94 | 0.92 | 0.84 | 0.845 |
| Net investment income | 0.58 | 0.89 | 0.93 | 0.365 |
| Portfolio turnover (%) | 23 | 31 | 40 | 4 |
| |
1 Period from 6-1-11 (commencement of operations) to 7-31-11.
2 Based on average daily shares outstanding.
3 Total returns would have been lower had certain expenses not been reduced during the applicable periods.
4 Not annualized.
5 Annualized.
| | |
| 18 | Fundamental Large Cap Core Fund | Annual report | See notes to financial statements |
Notes to financial statements
Note 1 — Organization
John Hancock Fundamental Large Cap Core Fund (the fund) is a series of John Hancock Funds II (the Trust), an open-end management investment company organized as a Massachusetts business trust and registered under the Investment Company Act of 1940, as amended (the 1940 Act). The investment objective of the fund is to seek long-term capital appreciation.
The fund may offer multiple classes of shares. The shares currently offered are detailed in the Statement of assets and liabilities. Class A shares are offered to all investors. Class I shares are offered to institutions and certain investors. Shareholders of each class have exclusive voting rights to matters that affect that class. The distribution and service fees, if any, transfer agent fees, printing and postage, and state registration fees for each class may differ.
Note 2 — Significant accounting policies
The financial statements have been prepared in conformity with accounting principles generally accepted in the United States of America (US GAAP), which require management to make certain estimates and assumptions as of the date of the financial statements. Actual results could differ from those estimates and those differences could be significant. The fund intends to qualify as an investment company under Topic 946 of Accounting Standards Codification of US GAAP.
Events or transactions occurring after the end of the fiscal period through the date that the financial statements were issued have been evaluated in the preparation of the financial statements. The following summarizes the significant accounting policies of the fund:
Security valuation. Investments are stated at value as of the close of regular trading on the New York Stock Exchange (NYSE), normally at 4:00 P.M., Eastern Time. In order to value the securities, the fund uses the following valuation techniques: Equity securities held by the fund are valued at the last sale price or official closing price on the exchange where the security was acquired or most likely will be sold. In the event there were no sales during the day or closing prices are not available, the securities are valued using the last available bid price. Foreign securities and currencies are valued in U.S. dollars, based on foreign currency exchange rates supplied by an independent pricing vendor. Securities that trade only in the over-the-counter (OTC) market are valued using bid prices. Other portfolio securities and assets, for which reliable market quotations are not readily available, are valued at fair value as determined in good faith by the fund’s Pricing Committee following procedures established by the Board of Trustees. The frequency with which these fair valuation procedures are used cannot be predicted and fair value of securities may differ significantly from the value that would have been used had a ready market for such securities existed. Certain short-term securities with maturities of 60 days or less at the time of purchase are valued at amortized cost.
The fund uses a three-tier hierarchy to prioritize the pricing assumptions, referred to as inputs, used in valuation techniques to measure fair value. Level 1 includes securities valued using quoted prices in active markets for identical securities. Level 2 includes securities valued using other significant observable inputs. Observable inputs may include quoted prices for similar securities, interest rates, prepayment speeds and credit risk. Prices for securities valued using these inputs are received from independent pricing vendors and brokers and are based on an evaluation of the inputs described. Level 3 includes securities valued using significant unobservable inputs when market prices are not readily available or reliable, including the fund’s own assumptions in determining the fair value
| |
| Annual report | Fundamental Large Cap Core Fund | 19 |
of investments. Factors used in determining value may include market or issuer specific events or trends, changes in interest rates and credit quality. The inputs or methodology used for valuing securities are not necessarily an indication of the risks associated with investing in those securities. Changes in valuation techniques may result in transfers into or out of an assigned level within the disclosure hierarchy.
The following is a summary of the values by input classification of the fund’s investments as of July 31, 2014, by major security category or type:
| | | | |
| | | | | LEVEL 3 |
| | | | LEVEL 2 | SIGNIFICANT |
| | TOTAL MARKET | LEVEL 1 | SIGNIFICANT | UNOBSERVABLE |
| | VALUE AT 7-31-14 | QUOTED PRICE | OBSERVABLE INPUTS | INPUTS |
|
| Common Stocks | | | | |
| Consumer Discretionary | $6,578,827 | $6,578,827 | — | — |
| Consumer Staples | 2,304,621 | 1,817,933 | $486,688 | — |
| Energy | 5,126,581 | 5,126,581 | — | — |
| Financials | 9,839,686 | 9,839,686 | — | — |
| Health Care | 2,734,384 | 2,734,384 | — | — |
| Industrials | 2,424,445 | 2,424,445 | — | — |
| Information Technology | 10,188,085 | 10,188,085 | — | — |
| Short-Term Investments | 1,466,000 | — | 1,466,000 | — |
| |
|
| Total Investments in | | | | |
| Securities | $40,662,629 | $38,709,941 | $1,952,688 | — |
Repurchase agreements. The fund may enter into repurchase agreements. When the fund enters into a repurchase agreement, it receives collateral that is held in a segregated account by the fund’s custodian or for tri-party repurchase agreements, collateral is held at a third party custodian bank in a segregated account for the benefit of the fund. The collateral amount is marked-to-market and monitored on a daily basis to ensure that the collateral held is in an amount not less than the principal amount of the repurchase agreement plus any accrued interest. Collateral received by the fund for repurchase agreements is disclosed in the Fund’s investments as part of the caption related to the repurchase agreement.
Repurchase agreements are typically governed by the terms and conditions of the Master Repurchase Agreement and/or Global Master Repurchase Agreement (collectively, MRA). Upon an event of default, the non-defaulting party may close out all transactions traded under the MRA and net amounts owed. Absent an event of default, the MRA does not result in an offset of the reported amounts of assets and liabilities in the Statement of assets and liabilities. In the event of a default by the counterparty, realization of the collateral proceeds could be delayed, during which time the collateral value may decline or the counterparty may have insufficient assets to pay back claims resulting from close-out of the transactions.
Security transactions and related investment income. Investment security transactions are accounted for on a trade date plus one basis for daily net asset value calculations. However, for financial reporting purposes, investment transactions are reported on trade date. Interest income is accrued as earned. Dividend income is recorded on the ex-date, except for dividends of foreign securities where the dividend may not be known until after the ex-date. In those cases, dividend income, net of withholding taxes, is recorded when the fund becomes aware of the dividends. Foreign taxes are provided for based on the fund’s understanding of the tax rules and rates that exist in the foreign markets in which it invests. Gains and losses on securities sold are determined on the basis of identified cost and may include proceeds from litigation.
| |
| 20 | Fundamental Large Cap Core Fund | Annual report |
Foreign currency translation. Assets, including investments and liabilities denominated in foreign currencies, are translated into U.S. dollar values each day at the prevailing exchange rate. Purchases and sales of securities, income and expenses are translated into U.S. dollars at the prevailing exchange rate on the date of the transaction. The effect of changes in foreign currency exchange rates on the value of securities is reflected as a component of the realized and unrealized gains (losses) on investments.
Funds that invest internationally generally carry more risk than funds that invest strictly in U.S. securities. Risks can result from differences in economic and political conditions, regulations, market practices (including higher transaction costs), accounting standards and other factors. Foreign investments are also subject to a decline in the value of a foreign currency versus the U.S. dollar, which reduces the dollar value of securities denominated in that currency.
Foreign taxes. The fund may be subject to withholding tax on income and/or capital gains or repatriation taxes imposed by certain countries in which the fund invests. Taxes are accrued based upon investment income, realized gains or unrealized appreciation.
Line of credit. The fund may borrow from banks for temporary or emergency purposes, including meeting redemption requests that otherwise might require the untimely sale of securities. Pursuant to the fund’s custodian agreement, the custodian may loan money to the fund to make properly authorized payments. The fund is obligated to repay the custodian for any overdraft, including any related costs or expenses. The custodian may have a lien, security interest or security entitlement in any fund property that is not otherwise segregated or pledged, to the maximum extent permitted by law, to the extent of any overdraft.
In addition, the fund and other affiliated funds have entered into an agreement with Citibank N.A. that enables them to potentially participate in a $300 million unsecured committed line of credit. A commitment fee, payable at the end of each calendar quarter, based on the average daily unused portion of the line of credit, is charged to each participating fund on a pro rata basis and is reflected in other expenses on the Statement of operations. Commitment fees for the year ended July 31, 2014 were $464. For the year ended July 31, 2014, the fund had no borrowings under the line of credit.
Expenses. Within the John Hancock group of funds complex, expenses that are directly attributable to an individual fund are allocated to such fund. Expenses that are not readily attributable to a specific fund are allocated among all funds in an equitable manner, taking into consideration, among other things, the nature and type of expense and the fund’s relative net assets. Expense estimates are accrued in the period to which they relate and adjustments are made when actual amounts are known.
Class allocations. Income, common expenses and realized and unrealized gains (losses) are determined at the fund level and allocated daily to each class of shares based on the net assets of the class. Class-specific expenses, such as distribution and service fees, if any, transfer agent fees, state registration fees and printing and postage expenses, for all classes, are calculated daily at the class level based on the appropriate net assets of each class and the specific expense rates applicable to each class.
Federal income taxes. The fund intends to continue to qualify as a regulated investment company by complying with the applicable provisions of the Internal Revenue Code and will not be subject to federal income tax on taxable income that is distributed to shareholders. Therefore, no federal income tax provision is required.
| |
| Annual report | Fundamental Large Cap Core Fund | 21 |
As of July 31, 2014, the fund had no uncertain tax positions that would require financial statement recognition, derecognition or disclosure. The fund’s federal tax returns are subject to examination by the Internal Revenue Service for a period of three years.
Distribution of income and gains. Distributions to shareholders from net investment income and net realized gains, if any, are recorded on the ex-date. The fund generally declares and pays dividends and capital gain distributions, if any, annually. The tax character of distributions for the years ended July 31, 2014 and 2013 was as follows:
| | | | |
| | JULY 31, 2014 | JULY 31, 2013 | | |
| | |
| Ordinary Income | $310,126 | $73,563 | | |
| Long-Term Capital Gain | 526,002 | 69,734 | | |
| Total | $836,128 | $143,297 | | |
Distributions paid by the fund with respect to each class of shares are calculated in the same manner, at the same time and in the same amount, except for the effect of class level expenses that may be applied differently to each class. As of July 31, 2014, the components of distributable earnings on a tax basis consisted of $255,304 of undistributed ordinary income and $681,016 of long-term capital gains.
Such distributions and distributable earnings, on a tax basis, are determined in conformity with income tax regulations, which may differ from US GAAP. Distributions in excess of tax basis earnings and profits, if any, are reported in the fund’s financial statements as a return of capital.
Capital accounts within the financial statements are adjusted for permanent book-tax differences. These adjustments have no impact on net assets or the results of operations. Temporary book-tax differences, if any, will reverse in a subsequent period. Book-tax differences are primarily attributable to wash sale loss deferrals.
Note 3 — Guarantees and indemnifications
Under the Trust’s organizational documents, its Officers and Trustees are indemnified against certain liabilities arising out of the performance of their duties to the Trust, including the fund. Additionally, in the normal course of business, the fund enters into contracts with service providers that contain general indemnification clauses. The fund’s maximum exposure under these arrangements is unknown, as this would involve future claims that may be made against the fund that have not yet occurred. The risk of material loss from such claims is considered remote.
Note 4 — Fees and transactions with affiliates
John Hancock Advisers, LLC (the Advisor or JHA) serves as investment advisor for the fund. Prior to January 1, 2014, John Hancock Investment Management Services, LLC (JHIMS) served as investment advisor for the fund. JHIMS and JHA have identical officers, directors and other personnel, and share common facilities and resources. Terms of the investment management contract with JHA are substantially identical to the former contract with JHIMS. In this report, depending on the context, the term “Advisor” shall refer to either JHA in its current capacity as investment advisor, or to JHIMS in its capacity as investment advisor prior to January 1, 2014. John Hancock Funds, LLC (the Distributor), an affiliate of the Advisor, serves as principal underwriter of the fund. The Advisor and the Distributor are indirect, wholly owned subsidiaries of Manulife Financial Corporation (MFC).
Management fee. The fund has an investment management agreement with the Advisor under which the fund pays a daily management fee to the Advisor equivalent, on an annual basis, to the sum of: a) 0.725% of the first $500 million of the fund’s average daily net assets; b) 0.700% of the next $500 million of the fund’s average daily net assets; c) 0.675% of the next $500 million of the
| |
| 22 | Fundamental Large Cap Core Fund | Annual report |
fund’s average daily net assets; and d) 0.650% of the fund’s average daily net assets in excess of $1.5 billion. The Advisor has a subadvisory agreement with John Hancock Asset Management a division of Manulife Asset Management (US) LLC, an indirectly owned subsidiary of MFC and an affiliate of the Advisor. The fund is not responsible for payment of the subadvisory fees.
The Advisor has contractually agreed to waive a portion of its management fee and/or reimburse expenses for certain funds of the John Hancock complex, including the fund (the participating portfolios). The waiver equals, on an annualized basis, 0.01% of that portion of the aggregate net assets of all the participating portfolios that exceeds $75 billion but is less than or equal to $125 billion; 0.0125% of that portion of the aggregate net assets of all the participating portfolios that exceeds $125 billion but is less than or equal to $150 billion; and 0.015% of that portion of the aggregate net assets of all the participating portfolios that exceeds $150 billion. The amount of the reimbursement is calculated daily and allocated among all the participating portfolios in proportion to the daily net assets of each fund. This arrangement may be amended or terminated at any time by the Advisor upon notice to the fund and with the approval of the Board of Trustees.
The Advisor has contractually agreed to waive all or a portion of its management fee and reimburse or pay operating expenses of the fund to the extent necessary to maintain the fund’s total operating expense at 1.30% and 0.94% for Class A and Class I shares respectively, excluding certain expenses such as taxes, brokerage commissions, interest expense, litigation and indemnification expenses and other extraordinary expenses not incurred in the ordinary course of the fund’s business, underlying fund expenses, and short dividend expense. The current expense limitation agreement expires on November 30, 2015, unless renewed by mutual agreement of the fund and the Advisor based upon determination that this is appropriate under the circumstances at the time.
Additionally, the Advisor has voluntarily agreed to waive other expenses excluding advisory fees, 12b-1 fees, service fees, transfer agent fees, blue sky fees, taxes, printing and postage, brokerage commissions, interest expense, acquired fund fees, short dividend expense, and litigation and indemnification expenses and other extraordinary expenses not incurred in the ordinary course of business. The waivers are such that these expenses will not exceed 0.20% of average net assets. This voluntary expense reimbursement may be terminated at any time by the Advisor on notice to the fund.
The expense reductions described above amounted to $26,406 and $71,537 for Class A and Class I shares, respectively, for the year ended July 31, 2014.
The investment management fees, including the impact of the waivers and reimbursement described above, incurred for the year ended July 31, 2014 were equivalent to a net effective rate of 0.42% of the fund’s average daily net assets.
Expense recapture. The Advisor may recapture operating expenses reimbursed or fees waived under previous expense limitation or waiver arrangements for a period of three years following the month in which the reimbursements or waivers occurred to the extent that the fund is below its expense limitation during this period. The table below outlines the amounts recovered during the year ended July 31, 2014, and the amount of waived or reimbursed expenses subject to potential recovery and the respective expiration dates.
| | | |
| AMOUNTS ELIGIBLE FOR | AMOUNTS ELIGIBLE FOR | AMOUNTS ELIGIBLE FOR | AMOUNT RECOVERED |
| RECOVERY THROUGH | RECOVERY THROUGH | RECOVERY THROUGH | DURING THE YEAR |
| JULY 1, 2015 | JULY 1, 2016 | JULY 1, 2017 | ENDED JULY 31, 2014 |
|
| $139,441 | $112,320 | $95,919 | $1,899 |
| |
| Annual report | Fundamental Large Cap Core Fund | 23 |
| | | | |
| Amounts recovered by class | | |
| CLASS A | CLASS I | TOTAL | | |
| | |
| $340 | $1,559 | $1,899 | | |
Accounting and legal services. Pursuant to a service agreement, the fund reimburses the Advisor for all expenses associated with providing the administrative, financial, legal, accounting and recordkeeping services to the fund, including the preparation of all tax returns, periodic reports to shareholders and regulatory reports, among other services. These expenses are allocated to each share class based on its relative net assets at the time the expense was incurred. These accounting and legal services fees incurred for the year ended July 31, 2014, amounted to an annual rate of 0.01% of the fund’s average daily net assets.
Distribution and service plans. The fund has a distribution agreement with the Distributor. The fund has adopted a distribution and service plan with respect to Class A shares pursuant to Rule 12b-1 under the 1940 Act, to pay the Distributor for services provided as the distributor of shares of the fund. The fund pays 0.30% for Class A shares for distribution and service fees under these arrangements, expressed as an annual percentage of average daily net assets for each class of the fund’s shares.
Sales charges. Class A shares are assessed up-front sales charges, which resulted in payments to the Distributor amounting to $25,427 for the year ended July 31, 2014. Of this amount, $4,225 was retained and used for printing prospectuses, advertising, sales literature and other purposes, $21,165 was paid as sales commissions to broker-dealers and $37 was paid as sales commissions to sales personnel of Signator Investors, Inc., a broker-dealer affiliate of the Advisor.
Class A shares may be subject to contingent deferred sales charges (CDSCs). Certain Class A shares that are acquired through purchases of $1 million or more and are redeemed within one year of purchase are subject to a 1.00% sales charge. CDSCs are applied to the lesser of the current market value at the time of redemption or the original purchase cost of the shares being redeemed. Proceeds from CDSCs are used to compensate the Distributor for providing distribution-related services in connection with the sale of these shares. During the year ended July 31, 2014, there were no CDSCs received by the Distributor for Class A shares.
Transfer agent fees. The fund has a transfer agent agreement with John Hancock Signature Services, Inc. (Signature Services), an affiliate of the Advisor. The transfer agent fees paid to Signature Services are determined based on the cost to Signature Services (Signature Services Cost) of providing recordkeeping services. The Signature Services Cost includes a component of allocated John Hancock corporate overhead for providing transfer agent services to the fund and to all other John Hancock affiliated funds. It also includes out-of-pocket expenses, including payments made to third-parties for recordkeeping services provided to their clients who invest in one or more John Hancock funds. In addition, Signature Services Cost may be reduced by certain fees that Signature Services receives in connection with retirement and small accounts. Signature Services Cost is calculated monthly and allocated, as applicable, to five categories of share classes: Retail Share and Institutional Classes of Non-Municipal Bond Funds, Class R6 Shares, Retirement Share Classes and Municipal Bond Share Classes. Within each of these categories, the applicable costs are allocated to the affected John Hancock affiliated funds and/or classes, based on the relative average daily net assets.
Prior to October 1, 2013, Signature Services Cost was calculated monthly and allocated, as applicable, to four categories of share classes: Institutional Share Classes, Retirement Share Classes, Municipal Bond Share Classes and all other Retail Share Classes. Within each of these categories, the applicable costs were allocated to the affected John Hancock affiliated funds and/or classes, based on the relative average daily net assets.
| |
| 24 | Fundamental Large Cap Core Fund | Annual report |
Class level expenses. Class level expenses for the year ended July 31, 2014 were:
| | | | |
| | DISTRIBUTION | TRANSFER | STATE REGISTRATION | PRINTING AND |
| CLASS | AND SERVICE FEES | AGENT FEES | FEES | POSTAGE |
|
| Class A | $18,543 | $8,448 | $16,689 | $2,355 |
| Class I | — | 30,449 | 20,752 | 9,594 |
| Total | $18,543 | $38,897 | $37,441 | $11,949 |
Trustee expenses. The fund compensates each Trustee who is not an employee of the Advisor or its affiliates. The costs of paying Trustee compensation and expenses are allocated to the fund based on its net assets relative to other funds within the John Hancock group of funds complex.
Note 5 — Fund share transactions
Transactions in fund shares for the years ended July 31, 2014 and 2013 were as follows:
| | | | |
| | Year ended 7-31-14 | Year ended 7-31-13 |
| | Shares | Amount | Shares | Amount |
| Class A shares | | | | |
|
| Sold | 191,257 | $2,651,645 | 136,512 | $1,590,142 |
| Distributions reinvested | 6,201 | 86,878 | 1,250 | 13,835 |
| Repurchased | (77,648) | (1,081,548) | (48,294) | (564,008) |
| | | | | |
| Net increase | 119,810 | $1,656,975 | 89,468 | $1,039,969 |
| |
| Class I shares | | | | |
|
| Sold | 1,351,001 | $18,686,613 | 1,365,519 | $15,807,369 |
| Distributions reinvested | 48,616 | 682,083 | 9,544 | 105,843 |
| Repurchased | (456,873) | (6,235,648) | (104,409) | (1,256,121) |
| | | | | |
| Net increase | 942,744 | $13,133,048 | 1,270,654 | $14,657,091 |
| |
| Total net increase | 1,062,554 | $14,790,023 | 1,360,122 | $15,697,060 |
|
Affiliates of the fund owned 39% of shares of beneficial interest of Class A, on July 31, 2014.
Note 6 — Purchase and sale of securities
Purchases and sales of securities other than short-term securities, amounted to $20,145,344 and $7,100,371 respectively, for the year ended July 31, 2014.
| |
| Annual report | Fundamental Large Cap Core Fund | 25 |
Auditor’s report
Report of Independent Registered Public Accounting Firm
To the Board of Trustees of John Hancock Funds II and Shareholders of
John Hancock Fundamental Large Cap Core Fund:
In our opinion, the accompanying statement of assets and liabilities, including the schedule of investments, and the related statements of operations and of changes in net assets and the financial highlights present fairly, in all material respects, the financial position of the John Hancock Fundamental Large Cap Core Fund (the “Fund”) at July 31, 2014, the results of its operations for the year then ended, the changes in its net assets for each of the two years in the period then ended and the financial highlights for each of the periods indicated, in conformity with accounting principles generally accepted in the United States of America. These financial statements and financial highlights (hereafter referred to as “financial statements”) are the responsibility of the Fund’s management. Our responsibility is to express an opinion on these financial statements based on our audits. We conducted our audits of these financial statements in accordance with the standards of the Public Company Accounting Oversight Board (United States). Those standards require that we plan and perform the audit to obtain reasonable assurance about whether the financial statements are free of material misstatement. An audit includes examining, on a test basis, evidence supporting the amounts and disclosures in the financial statements, assessing the accounting principles used and significant estimates made by management, and evaluating the overall financial statement presentation. We believe that our audits, which included confirmation of securities at July 31, 2014 by correspondence with the custodian and brokers, provide a reasonable basis for our opinion.
PricewaterhouseCoopers LLP
Boston, Massachusetts
September 17, 2014
| |
| 26 | Fundamental Large Cap Core Fund | Annual report |
Tax information
Unaudited
For federal income tax purposes, the following information is furnished with respect to the distributions of the fund, if any, paid during its taxable year ended July 31, 2014.
The fund reports the maximum amount allowable of its net taxable income as eligible for the corporate dividends-received deduction.
The fund reports the maximum amount allowable of its net taxable income as qualified divided income as provided in the Jobs and Growth Tax Relief Reconciliation Act of 2003.
The fund paid $526,002 in capital gain dividends.
Eligible shareholders will be mailed a 2014 Form 1099-DIV in early 2015. This will reflect the tax character of all distributions paid in calendar year 2014.
Please consult a tax advisor regarding the tax consequences of your investment in the fund.
| |
| Annual report | Fundamental Large Cap Core Fund | 27 |
Continuation of Investment Advisory and Subadvisory Agreements
Evaluation of Advisory and Subadvisory Agreements by the Board of Trustees
This section describes the evaluation by the Board of Trustees (the Board) of John Hancock Funds II (the Trust) of the Advisory Agreement (the Advisory Agreement) with John Hancock Advisers, LLC (the Advisor) and the Subadvisory Agreement (the Subadvisory Agreement) with John Hancock Asset Management a division of Manulife Asset Management (US) LLC (the Subadvisor) for John Hancock Fundamental Large Cap Core Fund (the fund). The Advisory Agreement and Subadvisory Agreement are collectively referred to as the Agreements. Prior to the June 23–25, 2014 meeting at which the Agreements were approved, the Board also discussed and considered information regarding the proposed continuation of the Agreements at an in-person meeting held on May 27–29, 2014.
Approval of Advisory and Subadvisory Agreements
At in-person meetings held on June 23–25, 2014, the Board, including the Trustees who are not considered to be interested persons of the Trust under the Investment Company Act of 1940, as amended (the 1940 Act) (the Independent Trustees), reapproved for an annual period the continuation of the Advisory Agreement between the Trust and the Advisor and the Subadvisory Agreement between the Advisor and the Subadvisor with respect to the fund.
In considering the Advisory Agreement and the Subadvisory Agreement, the Board received in advance of the meetings a variety of materials relating to the fund, the Advisor and the Subadvisor, including comparative performance, fee and expense information for a peer group of similar funds prepared by an independent third-party provider of fund data, performance information for an applicable benchmark index; and, with respect to the Subadvisor, comparative performance information for comparably managed accounts, as applicable, and other information provided by the Advisor and the Subadvisor regarding the nature, extent and quality of services provided by the Advisor and the Subadvisor under their respective Agreements, as well as information regarding the Advisor’s revenues and costs of providing services to the fund and any compensation paid to affiliates of the Advisor. At the meetings at which the renewal of the Advisory Agreement and Subadvisory Agreement are considered, particular focus is given to information concerning fund performance, comparability of fees and total expenses, and profitability. However, the Board notes that the evaluation process with respect to the Advisor and the Subadvisor is an ongoing one. In this regard, the Board also took into account discussions with management and information provided to the Board at prior meetings with respect to the services provided by the Advisor and the Subadvisor to the fund, including quarterly performance reports prepared by management containing reviews of investment results and prior presentations from the Subadvisor with respect to the fund. The Board noted the affiliation of the Subadvisor with the Advisor, noting any potential conflicts of interest. The Board also considered the nature, quality, and extent of non-advisory services, if any, to be provided to the fund by the Advisor’s affiliates, including distribution services.
Throughout the process, the Board asked questions of and requested additional information from management. The Board is assisted by counsel for the Trust and the Independent Trustees are also separately assisted by independent legal counsel throughout the process. The Independent Trustees also received a memorandum from their independent legal counsel discussing the legal standards for their consideration of the proposed continuation of the Agreements and discussed the proposed continuation of the Agreements in private sessions with their independent legal counsel at which no representatives of management were present.
Approval of Advisory Agreement
In approving the Advisory Agreement with respect to the fund, the Board, including the Independent Trustees, considered a variety of factors, including those discussed below. The Board also considered other factors (including conditions and trends prevailing generally in the economy, the securities
| |
| 28 | Fundamental Large Cap Core Fund | Annual report |
markets, and the industry) and does not treat any single factor as determinative, and each Trustee may attribute different weights to different factors. The Board’s conclusions may be based in part on its consideration of the advisory and subadvisory arrangements in prior years and on the Board’s ongoing regular review of fund performance and operations throughout the year.
Nature, extent, and quality of services. Among the information received by the Board from the Advisor relating to the nature, extent, and quality of services provided to the fund, the Board reviewed information provided by the Advisor relating to its operations and personnel, descriptions of its organizational and management structure, and information regarding the Advisor’s compliance and regulatory history, including its Form ADV. The Board also noted that on a regular basis it receives and reviews information from the Trust’s Chief Compliance Officer (CCO) regarding the fund’s compliance policies and procedures established pursuant to Rule 38a-1 under the 1940 Act. The Board also considered the Advisor’s risk management processes. The Board considered that the Advisor is responsible for the management of the day-to-day operations of the fund, including, but not limited to, general supervision of and coordination of the services provided by the Subadvisor, and is also responsible for monitoring and reviewing the activities of the Subadvisor and third-party service providers.
In considering the nature, extent, and quality of the services provided by the Advisor, the Trustees also took into account their knowledge of the Advisor’s management and the quality of the performance of the Advisor’s duties, through Board meetings, discussions and reports during the preceding year and through each Trustee’s experience as a Trustee of the Trust and of the other trusts in the complex.
In the course of their deliberations regarding the Advisory Agreement, the Board considered, among other things:
(a) the skills and competency with which the Advisor has in the past managed the Trust’s affairs and its subadvisory relationship, the Advisor’s oversight and monitoring of the Subadvisor’s investment performance and compliance programs, such as the Subadvisor’s compliance with fund policies and objectives, review of brokerage matters, including with respect to trade allocation and best execution and the Advisor’s timeliness in responding to performance issues;
(b) the background, qualifications and skills of the Advisor’s personnel;
(c) the Advisor’s compliance policies and procedures and its responsiveness to regulatory changes and mutual fund industry developments;
(d) the Advisor’s administrative capabilities, including its ability to supervise the other service providers for the fund;
(e) the financial condition of the Advisor and whether it has the financial wherewithal to provide a high level and quality of services to the fund; and
(f) the Advisor’s reputation and experience in serving as an investment advisor to the Trust and the benefit to shareholders of investing in funds that are part of a family of funds offering a variety of investments.
The Board concluded that the Advisor may reasonably be expected to continue to provide a high quality of services under the Advisory Agreement with respect to the fund.
Investment performance. In considering the fund’s performance, the Board noted that it reviews at its regularly scheduled meetings information about the fund’s performance results. In connection with the consideration of the Advisory Agreement, the Board:
| |
| Annual report | Fundamental Large Cap Core Fund | 29 |
(a) reviewed information prepared by management regarding the fund’s performance;
(b) considered the comparative performance of an applicable benchmark index;
(c) considered the performance of comparable funds, if any, as included in the report prepared by an independent third-party provider of fund data; and
(d) took into account the Advisor’s analysis of the fund’s performance and its plans and recommendations regarding the Trust’s subadvisory arrangements generally.
The Board noted that the fund underperformed its benchmark index for the one-year period ended December 31, 2013 and outperformed its benchmark index for the since inception period ended December 31, 2013. The Board also noted that the fund had outperformed its peer group average for the one-year and since inception periods ended December 31, 2013.
The Board took into account management’s discussion of the fund’s performance and noted that the fund had a relatively limited performance history since its inception on June 1, 2011. The Board also noted the fund’s favorable performance relative to the peer group for the one-year period.
The Board concluded that the fund’s performance has generally outperformed the historical performance of comparable funds and has been in line with or outperformed its benchmark index.
Fees and expenses. The Board reviewed comparative information prepared by an independent third-party provider of mutual fund data, including, among other data, the fund’s contractual and net management fees (and subadvisory fees, to the extent available) and total expenses as compared to similarly situated investment companies deemed to be comparable to the fund. The Board considered the fund’s ranking within a smaller group of peer funds chosen by the independent third-party provider, as well as the fund’s ranking within a broader group of funds. In comparing the fund’s contractual and net management fees to those of comparable funds, the Board noted that such fees include both advisory and administrative costs.
The Board noted that net management fees and total expenses for the fund are lower than the peer group median.
The Board also took into account management’s discussion with respect to the advisory/subadvisory fee structure, including the amount of the advisory fee retained by the Advisor after payment of the subadvisory fee. The Board also noted that the Advisor pays the subadvisory fee. In addition, the Board took into account that management had agreed, effective July 1, 2014, to implement an overall fee waiver across the complex, including the fund, which is discussed further below. The Board also noted management’s discussion of the fund’s expenses, as well as actions taken over the past several years to reduce the fund’s operating expenses. The Board also noted that, in addition, the Advisor is currently waiving fees and/or reimbursing expenses with respect to the fund and that the fund has an expense cap until November 2014, which reduces certain expenses for the fund. In addition, the Board noted that the fund has breakpoints in its contractual management fee schedule that reduces management fees as assets increase. The Board reviewed information provided by the Advisor concerning the investment advisory fee charged by the Advisor or one of its advisory affiliates to other clients (including other funds in the complex) having similar investment mandates, if any. The Board considered any differences between the Advisor’s and Subadvisor’s services to the fund and the services they provide to other comparable clients or funds. The Board concluded that the advisory fee paid with respect to the fund is reasonable.
Profitability/indirect benefits. In considering the costs of the services to be provided and the profits to be realized by the Advisor and its affiliates (including the Subadvisor) from the Advisor’s relationship with the Trust, the Board:
| |
| 30 | Fundamental Large Cap Core Fund | Annual report |
(a) reviewed financial information of the Advisor;
(b) reviewed and considered information presented by the Advisor regarding the net profitability to the Advisor and its affiliates with respect to the fund;
(c) received and reviewed profitability information with respect to the John Hancock fund complex as a whole;
(d) received information with respect to the Advisor’s allocation methodologies used in preparing the profitability data;
(e) considered that the John Hancock insurance companies that are affiliates of the Advisor, as shareholders of the Trust directly or through their separate accounts, receive certain tax credits or deductions relating to foreign taxes paid and dividends received by certain funds of the Trust and noted that these tax benefits, which are not available to participants in qualified retirement plans under applicable income tax law, are reflected in the profitability analysis reviewed by the Board;
(f) considered that the Advisor also provides administrative services to the fund on a cost basis pursuant to an administrative services agreement;
(g) noted that affiliates of the Advisor provide transfer agency services and distribution services to the fund, and that the fund’s distributor also receives Rule 12b-1 payments to support distribution of the fund;
(h) noted that the fund’s Subadvisor is an affiliate of the Advisor;
(i) noted that the Advisor also derives reputational and other indirect benefits from providing advisory services to the fund;
(j) noted that the subadvisory fee for the fund is paid by the Advisor; and
(k) considered that the Advisor should be entitled to earn a reasonable level of profits in exchange for the level of services it provides to the fund and the entrepreneurial risk that it assumes as Advisor.
Based upon its review, the Board concluded that the level of profitability, if any, of the Advisor and its affiliates (including the Subadvisor) from their relationship with the fund was reasonable and not excessive.
Economies of scale. In considering the extent to which economies of scale would be realized as the fund grows and whether fee levels reflect these economies of scale for the benefit of fund shareholders, the Board:
(a) considered that the Advisor has agreed, effective July 1, 2014, to waive a portion of its management fee for the fund and each of the other John Hancock funds in the complex (except for those discussed below) (the Participating Portfolios) or otherwise reimburse the expenses of the Participating Portfolios as follows (the Reimbursement):
The Reimbursement shall equal, on an annualized basis, 0.01% of that portion of the aggregate net assets of all the Participating Portfolios that exceed $75 billion but is less than or equal to $125 billion, 0.0125% of that portion of the aggregate net assets of all the Participating Portfolios that exceed $125 billion but is less than or equal to $150 billion and 0.015% of that portion of the aggregate net assets of all the Participating Portfolios that exceeds $150 billion. (The funds that are not Participating Portfolios are the funds of funds in the complex, which benefit from such overall management fee waiver through their investment in underlying portfolios that include Participating Portfolios, which are subject to the Reimbursement.)
| |
| Annual report | Fundamental Large Cap Core Fund | 31 |
(b) reviewed the fund’s advisory fee structure and concluded that: (i) the fund’s fee structure contains breakpoints at the subadvisory fee level and that such breakpoints are reflected as breakpoints in the advisory fees for the fund; and (ii) although economies of scale cannot be measured with precision, these arrangements permit shareholders of the fund to benefit from economies of scale if the fund grows. The Board also took into account management’s discussion of the fund’s advisory fee structure; and
(c) the Board also considered the effect of the fund’s growth in size on its performance and fees. The Board also noted that if the fund’s assets increase over time, the fund may realize other economies of scale.
Approval of Subadvisory Agreement
In making its determination with respect to approval of the Subadvisory Agreement, the Board reviewed:
(1) information relating to the Subadvisor’s business, including current subadvisory services to the Trust (and other funds in the John Hancock family of funds);
(2) the historical and current performance of the fund and comparative performance information relating to an applicable benchmark index and comparable funds; and
(3) the subadvisory fee for the fund, including any breakpoints, and to the extent available, comparable fee information prepared by an independent third party provider of fund data.
Nature, extent, and quality of services. With respect to the services provided by the Subadvisor, the Board received information provided to the Board by the Subadvisor, including the Subadvisor’s Form ADV, as well as took into account information presented throughout the past year. The Board considered the Subadvisor’s current level of staffing and its overall resources, as well as received information relating to the Subadvisor’s compensation program. The Board reviewed the Subadvisor’s history and investment experience, as well as information regarding the qualifications, background, and responsibilities of the Subadvisor’s investment and compliance personnel who provide services to the fund. The Board also considered, among other things, the Subadvisor’s compliance program and any disciplinary history. The Board also considered the Subadvisor’s risk assessment and monitoring process. The Board reviewed the Subadvisor’s regulatory history, including whether it was involved in any regulatory actions or investigations as well as material litigation, and any settlements and amelioratory actions undertaken, as appropriate. The Board noted that the Advisor conducts regular, periodic reviews of the Subadvisor and its operations, including regarding investment processes and organizational and staffing matters. The Board also noted that the Trust’s CCO and his staff conduct regular, periodic compliance reviews with the Subadvisor and present reports to the Independent Trustees regarding the same, which includes evaluating the regulatory compliance systems of the Subadvisor and procedures reasonably designed to assure compliance with the federal securities laws. The Board also took into account the financial condition of the Subadvisor.
The Board considered the Subadvisor’s investment process and philosophy. The Board took into account that the Subadvisor’s responsibilities include the development and maintenance of an investment program for the fund that is consistent with the fund’s investment objective, the selection of investment securities and the placement of orders for the purchase and sale of such securities, as well as the implementation of compliance controls related to performance of these services. The Board also received information with respect to the Subadvisor’s brokerage policies and practices, including with respect to best execution and soft dollars.
Subadvisor compensation. In considering the cost of services to be provided by the Subadvisor and the profitability to the Subadvisor of its relationship with the fund, the Board noted that
| |
| 32 | Fundamental Large Cap Core Fund | Annual report |
the fees under the Subadvisory Agreement are paid by the Advisor and not the fund. The Board also considered any potential conflicts of interest the Advisor might have in connection with the Subadvisory Agreement.
In addition, the Board considered other potential indirect benefits that the Subadvisor and its affiliates may receive from the Subadvisor’s relationship with the fund, such as the opportunity to provide advisory services to additional funds in the John Hancock fund complex and reputational benefits.
Subadvisory fee. The Board considered that the fund pays an advisory fee to the Advisor and that, in turn, the Advisor pays a subadvisory fee to the Subadvisor. As noted above, the Board also considered the fund’s subadvisory fee as compared to similarly situated investment companies deemed to be comparable to the fund as included in the report prepared by the independent third party provider of fund data, to the extent available. The Board noted that the limited size of the peer group was not sufficient for comparative purposes. The Board also took into account the sub-advisory fee paid by the Advisor to the Subadvisor with respect to the fund to fees charged by the Subadvisor to manage other subadvised portfolios and portfolios not subject to regulation under the 1940 Act, as applicable.
Subadvisor performance. As noted above, the Board considered the fund’s performance as compared to the fund’s peer group and the benchmark index and noted that the Board reviews information about the fund’s performance results at its regularly scheduled meetings. The Board noted the Advisor’s expertise and resources in monitoring the performance, investment style and risk-adjusted performance of the Subadvisor. The Board was mindful of the Advisor’s focus on the Subadvisor’s performance. The Board also noted the Subadvisor’s long-term performance record for similar accounts, as applicable.
The Board’s decision to approve the Subadvisory Agreement was based on a number of determinations, including the following:
(1) the Subadvisor has extensive experience and demonstrated skills as a manager;
(2) the performance of the fund has generally outperformed the historical performance of comparable funds and has been in line with or outperformed its benchmark index;
(3) the subadvisory fee is reasonable in relation to the level and quality of services being provided; and
(4) subadvisory fee breakpoints are reflected as breakpoints in the advisory fees for the fund in order to permit shareholders to benefit from economies of scale if the fund grows.
Based on the Board’s evaluation of all factors that the Board deemed to be material, including those factors described above, the Board, including the Independent Trustees, concluded that renewal of the Advisory Agreement and the Subadvisory Agreement would be in the best interest of the fund and its shareholders. Accordingly, the Board, and the Independent Trustees voting separately, approved the Advisory Agreement and Subadvisory Agreement for an additional one-year period.
| |
| Annual report | Fundamental Large Cap Core Fund | 33 |
Trustees and Officers
This chart provides information about the Trustees and Officers who oversee your John Hancock fund. Officers elected by the Trustees manage the day-to-day operations of the fund and execute policies formulated by the Trustees.
Independent Trustees
| | |
| Name, year of birth | Trustee | Number of John |
| Position(s) held with fund | of the | Hancock funds |
| Principal occupation(s) and other | Trust | overseen by |
| directorships during past 5 years | since1 | Trustee |
| |
| James M. Oates, Born: 1946 | 2005 | 230 |
|
| Managing Director, Wydown Group (financial consulting firm) (since 1994); Chairman and Director, |
| Emerson Investment Management, Inc. (since 2000); Independent Chairman, Hudson Castle Group, Inc. |
| (formerly IBEX Capital Markets, Inc.) (financial services company) (1997–2011); Director, Stifel Financial |
| (since 1996); Director, Investor Financial Services Corporation (1995–2007); Director, Connecticut River |
| Bancorp (since 1998); Director, Virtus Funds (formerly Phoenix Mutual Funds) (since 1988). | |
| | |
| Trustee and Chairperson of the Board, John Hancock retail funds3 (since 2012); Trustee (2005–2006 and |
| since 2012) and Chairperson of the Board (since 2012), John Hancock Funds III; Trustee (since 2004) and |
| Chairperson of the Board (since 2005), John Hancock Variable Insurance Trust; Trustee and Chairperson |
| of the Board, John Hancock Funds II (since 2005). | | |
|
| |
| Charles L. Bardelis,2 Born: 1941 | 2005 | 230 |
|
| Director, Island Commuter Corp. (marine transport). | | |
| | | |
| Trustee, John Hancock retail funds3 (since 2012); Trustee, John Hancock Funds III (2005–2006 and |
| since 2012); Trustee, John Hancock Variable Insurance Trust (since 1988); Trustee, John Hancock |
| Funds II (since 2005). | | |
|
| |
| Peter S. Burgess,2 Born: 1942 | 2005 | 230 |
|
| Consultant (financial, accounting, and auditing matters) (since 1999); Certified Public Accountant; |
| Partner, Arthur Andersen (independent public accounting firm) (prior to 1999); Director, Lincoln |
| Educational Services Corporation (since 2004); Director, Symetra Financial Corporation (since 2010); |
| Director, PMA Capital Corporation (2004–2010). | | |
| | | |
| Trustee, John Hancock retail funds3 (since 2012); Trustee, John Hancock Funds III (2005–2006 and |
| since 2012); Trustee, John Hancock Variable Insurance Trust and John Hancock Funds II (since 2005). |
|
| |
| William H. Cunningham, Born: 1944 | 2012 | 230 |
|
| Professor, University of Texas, Austin, Texas (since 1971); former Chancellor, University of Texas System |
| and former President of the University of Texas, Austin, Texas; Director, LIN Television (since 2009); |
| Chairman (since 2009) and Director (since 2006), Lincoln National Corporation (insurance); Director, |
| Resolute Energy Corporation (since 2009); Director, Southwest Airlines (since 2000); former Director, |
| Introgen (manufacturer of biopharmaceuticals) (until 2008); former Director, Hicks Acquisition Company I, |
| Inc. (until 2007); former Director, Texas Exchange Bank, SSB (formerly Bank of Crowley) (until 2009); |
| former Advisory Director, JP Morgan Chase Bank (formerly Texas Commerce Bank–Austin) (until 2009). |
| |
| Trustee, John Hancock retail funds3 (since 1986); Trustee, John Hancock Variable Insurance Trust |
| (since 2012); Trustee, John Hancock Funds II (2005–2006 and since 2012). | | |
| |
| 34 | Fundamental Large Cap Core Fund | Annual report |
Independent Trustees (continued)
| | |
| Name, Year of Birth | Trustee | Number of John |
| Position(s) held with Fund | of the | Hancock funds |
| Principal occupation(s) and other | Trust | overseen by |
| directorships during past 5 years | since1 | Trustee |
| |
| Grace K. Fey, Born: 1946 | 2008 | 230 |
|
| Chief Executive Officer, Grace Fey Advisors (since 2007); Director and Executive Vice President, Frontier |
| Capital Management Company (1988–2007); Director, Fiduciary Trust (since 2009). | |
| | |
| Trustee, John Hancock retail funds3 (since 2012); Trustee, John Hancock Variable Insurance Trust and |
| John Hancock Funds II (since 2008). | | |
|
| |
| Theron S. Hoffman,2 Born: 1947 | 2008 | 230 |
|
| Chief Executive Officer, T. Hoffman Associates, LLC (consulting firm) (since 2003); Director, The Todd |
| Organization (consulting firm) (2003–2010); President, Westport Resources Management (investment |
| management consulting firm) (2006–2008); Senior Managing Director, Partner, and Operating Head, |
| Putnam Investments (2000–2003); Executive Vice President, The Thomson Corp. (financial and legal |
| information publishing) (1997–2000). | | |
| | | |
| Trustee, John Hancock retail funds3 (since 2012); Trustee, John Hancock Variable Insurance Trust and |
| John Hancock Funds II (since 2008). | | |
|
| |
| Deborah C. Jackson, Born: 1952 | 2012 | 230 |
|
| President, Cambridge College, Cambridge, Massachusetts (since 2011); Chief Executive Officer, |
| American Red Cross of Massachusetts Bay (2002–2011); Board of Directors of Eastern Bank Corporation |
| (since 2001); Board of Directors of Eastern Bank Charitable Foundation (since 2001); Board of Directors |
| of American Student Assistance Corporation (1996–2009); Board of Directors of Boston Stock Exchange |
| (2002–2008); Board of Directors of Harvard Pilgrim Healthcare (health benefits company) (2007–2011). |
|
| Trustee, John Hancock retail funds3 (since 2008); Trustee of John Hancock Variable Insurance Trust and |
| John Hancock Funds II (since 2012). | | |
|
| |
| Hassell H. McClellan, Born: 1945 | 2005 | 230 |
|
| Trustee, Virtus Variable Insurance Trust (formerly Phoenix Edge Series Funds) (since 2008); Director, The |
| Barnes Group (since 2010); Associate Professor, The Wallace E. Carroll School of Management, Boston |
| College (retired 2013). | | |
| | | |
| Trustee, John Hancock retail funds3 (since 2012); Trustee, John Hancock Funds III (2005–2006 and |
| since 2012); Trustee, John Hancock Variable Insurance Trust and John Hancock Funds II (since 2005). |
| |
| |
| Steven R. Pruchansky, Born: 1944 | 2012 | 230 |
|
| Chairman and Chief Executive Officer, Greenscapes of Southwest Florida, Inc. (since 2000); Director |
| and President, Greenscapes of Southwest Florida, Inc. (until 2000); Member, Board of Advisors, First |
| American Bank (until 2010); Managing Director, Jon James, LLC (real estate) (since 2000); Director, |
| First Signature Bank & Trust Company (until 1991); Director, Mast Realty Trust (until 1994); President, |
| Maxwell Building Corp. (until 1991). | | |
| | | |
| Trustee (since 1992) and Chairperson of the Board (2011–2012), John Hancock retail funds3; Trustee and |
| Vice Chairperson of the Board, John Hancock retail funds,3 John Hancock Variable Insurance Trust, and |
| John Hancock Funds II (since 2012). | | |
| |
| Annual report | Fundamental Large Cap Core Fund | 35 |
Independent Trustees (continued)
| | |
| Name, Year of Birth | Trustee | Number of John |
| Position(s) held with Fund | of the | Hancock funds |
| Principal occupation(s) and other | Trust | overseen by |
| directorships during past 5 years | since1 | Trustee |
| |
| Gregory A. Russo, Born: 1949 | 2012 | 230 |
|
| Director and Audit Committee Chairman (since 2012), and Member, Audit Committee and Finance |
| Committee (since 2011), NCH Healthcare System, Inc. (holding company for multi-entity healthcare |
| system); Director and Member of Finance Committee, The Moorings, Inc. (nonprofit continuing care |
| community) (since 2012); Vice Chairman, Risk & Regulatory Matters, KPMG LLP (KPMG) (2002–2006); |
| Vice Chairman, Industrial Markets, KPMG (1998–2002); Chairman and Treasurer, Westchester County, |
| New York, Chamber of Commerce (1986–1992); Director, Treasurer, and Chairman of Audit and |
| Finance Committees, Putnam Hospital Center (1989–1995); Director and Chairman of Fundraising |
| Campaign, United Way of Westchester and Putnam Counties, New York (1990–1995). | |
| | |
| Trustee, John Hancock retail funds3 (since 2008); Trustee, John Hancock Variable Insurance Trust and |
| John Hancock Funds II (since 2012). | | |
Non-Independent Trustees4
| | |
| Name, year of birth | Trustee | Number of John |
| Position(s) held with fund | of the | Hancock funds |
| Principal occupation(s) and other | Trust | overseen by |
| directorships during past 5 years | since1 | Trustee |
| |
| Craig Bromley, Born: 1966 | 2012 | 230 |
|
| President, John Hancock Financial Services (since 2012); Senior Executive Vice President and General |
| Manager, U.S. Division, Manulife Financial Corporation (since 2012); President and Chief Executive |
| Officer, Manulife Insurance Company (Manulife Japan) (2005–2012, including prior positions). |
| |
| Trustee, John Hancock retail funds,3 John Hancock Variable Insurance Trust, and John Hancock |
| Funds II (since 2012). | | |
|
| |
| Warren A. Thomson, Born: 1955 | 2012 | 230 |
|
| Senior Executive Vice President and Chief Investment Officer, Manulife Financial Corporation and The |
| Manufacturers Life Insurance Company (since 2009); Chairman and Chief Executive Officer, Manulife |
| Asset Management (since 2001, including prior positions); Director (since 2006), and President and |
| Chief Executive Officer (since 2013), Manulife Asset Management Limited; Director and Chairman, |
| Hancock Natural Resources Group, Inc. (since 2013). | | |
| | | |
| Trustee, John Hancock retail funds,3 John Hancock Variable Insurance Trust, and John Hancock |
| Funds II (since 2012). | | |
Principal officers who are not Trustees
| |
| Name, year of birth | Officer |
| Position(s) held with fund | of the |
| Principal occupation(s) and other | Trust |
| directorships during past 5 years | since |
| |
| Andrew G. Arnott, Born: 1971 | 2009 |
|
| President | |
| Senior Vice President, John Hancock Financial Services (since 2009); Director and Executive Vice | |
| President, John Hancock Advisers, LLC (since 2005, including prior positions); Director and Executive |
| Vice President, John Hancock Investment Management Services, LLC (since 2006, including prior | |
| positions); President, John Hancock Funds, LLC (since 2004, including prior positions); President | |
| (effective 3-13-14) and Executive Vice President, John Hancock retail funds,3 John Hancock Variable |
| Insurance Trust, and John Hancock Funds II (since 2007, including prior positions). | |
| |
| 36 | Fundamental Large Cap Core Fund | Annual report |
Principal officers who are not Trustees (continued)
| |
| Name, Year of Birth | Officer |
| Position(s) held with Fund | of the |
| Principal occupation(s) and other | Trust |
| directorships during past 5 years | since |
| |
| John J. Danello, Born: 1955 | 2006 |
|
| Senior Vice President, Secretary, and Chief Legal Officer | |
| Vice President and Chief Counsel, John Hancock Wealth Management (since 2005); Senior Vice | |
| President (since 2007) and Chief Legal Counsel (2007–2010), John Hancock Funds, LLC and The | |
| Berkeley Financial Group, LLC; Senior Vice President (since 2006, including prior positions) and Chief |
| Legal Officer and Secretary (since 2014), John Hancock retail funds3 and John Hancock Variable | |
| Insurance Trust; Vice President, John Hancock Life & Health Insurance Company (since 2009); | |
| Vice President, John Hancock Life Insurance Company (USA) and John Hancock Life Insurance | |
| Company of New York (since 2010); and Senior Vice President, Secretary, and Chief Legal Counsel | |
| (2007–2014, including prior positions) of John Hancock Advisers, LLC and John Hancock Investment |
| Management Services, LLC. | |
| |
| |
| Francis V. Knox, Jr., Born: 1947 | 2005 |
|
| Chief Compliance Officer | |
| Vice President, John Hancock Financial Services (since 2005); Chief Compliance Officer, John Hancock |
| retail funds,3 John Hancock Variable Insurance Trust, John Hancock Funds II, John Hancock Advisers, |
| LLC, and John Hancock Investment Management Services, LLC (since 2005). | |
|
| |
| Charles A. Rizzo, Born: 1957 | 2007 |
|
| Chief Financial Officer | |
| Vice President, John Hancock Financial Services (since 2008); Senior Vice President, John Hancock | |
| Advisers, LLC and John Hancock Investment Management Services, LLC (since 2008); Chief Financial |
| Officer, John Hancock retail funds,3 John Hancock Variable Insurance Trust and John Hancock | |
| Funds II (since 2007). | |
| |
| |
| Salvatore Schiavone, Born: 1965 | 2009 |
|
| Treasurer | |
| Assistant Vice President, John Hancock Financial Services (since 2007); Vice President, John Hancock |
| Advisers, LLC and John Hancock Investment Management Services, LLC (since 2007); Treasurer, | |
| John Hancock retail funds3 (since 2007, including prior positions); Treasurer, John Hancock Variable |
| Insurance Trust and John Hancock Funds II (since 2010 and 2007–2009, including prior positions). | |
The business address for all Trustees and Officers is 601 Congress Street, Boston, Massachusetts 02210-2805.
1 Each Trustee holds office until his or her successor is elected and qualified, or until the Trustee’s death, retirement, resignation, or removal.
2 Member of the Audit Committee.
3 “John Hancock retail funds” comprises John Hancock Funds III and 37 other John Hancock funds consisting of 27 series of other John Hancock trusts and 10 closed-end funds.
4 Because Messrs. Bromley and Thomson are senior executives or directors of the advisor and/or its affiliates, each of them is considered an “interested person of the fund,” as defined in the Investment Company Act of 1940.
| |
| Annual report | Fundamental Large Cap Core Fund | 37 |
More information
| |
| Trustees | Investment advisor |
| James M. Oates, Chairperson | John Hancock Advisers, LLC |
| Steven R. Pruchansky, Vice Chairperson | |
| Charles L. Bardelis* | Subadvisor |
| Craig Bromley† | John Hancock Asset Management a division of |
| Peter S. Burgess* | Manulife Asset Management (US) LLC |
| William H. Cunningham | |
| Grace K. Fey | Principal distributor |
| Theron S. Hoffman* | John Hancock Funds, LLC |
| Deborah C. Jackson | |
| Hassell H. McClellan | Custodian |
| Gregory A. Russo | State Street Bank and Trust Company |
| Warren A. Thomson† | |
| | Transfer agent |
| Officers | John Hancock Signature Services, Inc. |
| Andrew G. Arnott | |
| President | Legal counsel |
| K&L Gates LLP |
| John J. Danello | |
| Senior Vice President, Secretary, | Independent registered |
| and Chief Legal Officer | public accounting firm |
| | PricewaterhouseCoopers LLP |
| Francis V. Knox, Jr. | |
| Chief Compliance Officer | |
| | |
| Charles A. Rizzo | |
| Chief Financial Officer | |
| | |
| Salvatore Schiavone | |
| Treasurer | |
| |
| *Member of the Audit Committee | |
| †Non-Independent Trustee | |
The fund’s proxy voting policies and procedures, as well as the fund’s proxy voting record for the most recent twelve-month period ended June 30, are available free of charge on the Securities and Exchange Commission (SEC) website at sec.gov or on our website.
The fund’s complete list of portfolio holdings, for the first and third fiscal quarters, is filed with the SEC on Form N-Q. The fund’s Form N-Q is available on our website and the SEC’s website, sec.gov, and can be reviewed and copied (for a fee) at the SEC’s Public Reference Room in Washington, DC. Call 800-SEC-0330 to receive information on the operation of the SEC’s Public Reference Room.
We make this information on your fund, as well as monthly portfolio holdings, and other fund details available on our website at jhinvestments.com or by calling 800-225-5291.
| | |
| You can also contact us: | | |
| 800-225-5291 | Regular mail: | Express mail: |
| jhinvestments.com | John Hancock Signature Services, Inc. | John Hancock Signature Services, Inc. |
| | P.O. Box 55913 | 30 Dan Road |
| | Boston, MA 02205-5913 | Canton, MA 02021 |
| |
| 38 | Fundamental Large Cap Core Fund | Annual report |

800-225-5291
800-231-5469 TDD
800-338-8080 EASI-Line
jhinvestments.com

| |
| This report is for the information of the shareholders of John Hancock Fundamental Large Cap Core Fund. | |
| It is not authorized for distribution to prospective investors unless preceded or accompanied by a prospectus. | 372A 7/14 |
| MF195338 | 9/14 |

A look at performance
Total returns for the period ended July 31, 2014
| | | | | | | | | |
| | Average annual total returns (%) | | Cumulative total returns (%) | |
| | with maximum sales charge | | | with maximum sales charge | |
|
| | 1-year | 5-year | 10-year | Since
inception | | 1-year | 5-year | 10-year | Since
inception |
|
| Class A | 9.32 | — | — | 14.121 | | 9.32 | — | — | 51.951 |
|
| Class I2 | 15.40 | — | — | 16.471 | | 15.40 | — | — | 62.061 |
|
| Class NAV2 | 15.69 | — | — | 26.603 | | 15.69 | — | — | 100.193 |
|
| Index† | 15.47 | — | — | 14.581 | | 15.47 | — | — | 53.881 |
|
Performance figures assume all distributions have been reinvested. Figures reflect maximum sales charges on Class A shares of 5.00%. Sales charges are not applicable to Class I and Class NAV shares.
The expense ratios of the fund, both net (including any fee waivers and/or expense limitations) and gross (excluding any fee waivers and/or expense limitations), are set forth according to the most recent publicly available prospectuses for the fund and may differ from those disclosed in the Financial highlights tables in this report. Had the fee waivers and expense limitations not been in place, gross expenses would apply. The expense ratios are as follows:
| | | | | |
| | Class A | Class I | Class NAV | | |
| Gross (%) | 1.51 | 1.12 | 0.70 | | |
| Net (%) | 1.30 | 0.94 | 0.70 | | |
Please refer to the most recent prospectuses and annual report for more information on expenses and any expense limitation arrangements for each class.
The returns reflect past results and should not be considered indicative of future performance. The return and principal value of an investment will fluctuate so that shares, when redeemed, may be worth more or less than their original cost. Due to market volatility, the fund’s current performance may be higher or lower than the performance shown. For current to the most recent month-end performance data, please call 800–225–5291 or visit the fund’s website at jhinvestments.com.
The performance table above and the chart on the next page do not reflect the deduction of taxes that a shareholder may pay on fund distributions or on the redemption of fund shares. The fund’s performance results reflect any applicable fee waivers or expense reductions, without which the expenses would increase and results would have been less favorable.
† Index is the Russell 1000 Value Index.
See the following page for footnotes.
| |
| 6 | Fundamental Large Cap Value Fund | Annual report |
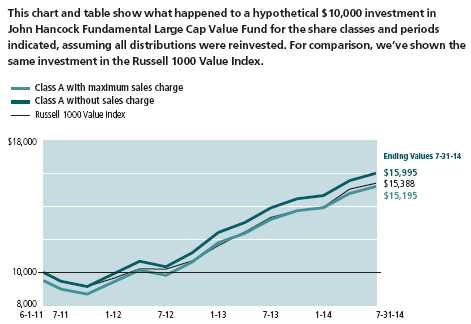
| | | | |
| | | With maximum | Without | |
| | Start date | sales charge | sales charge | Index |
|
| Class I2 | 6-1-11 | $16,206 | $16,206 | $15,388 |
|
| Class NAV2 | 8-23-11 | 20,119 | 20,119 | 18,780 |
|
Russell 1000 Value Index is an unmanaged index containing those securities in the Russell 1000 Index with a less-than-average growth orientation.
It is not possible to invest directly in an index. Index figures do not reflect expenses or sales charges, which would have resulted in lower values.
Footnotes related to performance pages
1 From 6-1-11.
2 For certain types of investors as described in the fund’s prospectuses.
3 From 8-23-11.
| |
| Annual report | Fundamental Large Cap Value Fund | 7 |
Management’s discussion of
Fund performance
John Hancock Asset Management a division of Manulife Asset Management (US) LLC
U.S. stocks rallied for the year ended July 31, 2014, gaining momentum last fall as Congress reached a budget agreement to end the federal government shutdown. The rally gathered steam as economic growth improved and many corporations reported better-than-expected earnings. However, severe winter weather that dampened economic growth hampered the market’s progress in the first quarter. An improving job and economic outlook and favorable corporate earnings helped revive the rally starting in mid-May, largely outweighing concerns over mounting geopolitical tensions and potentially higher interest rates.
Over the twelve-month reporting period, John Hancock Fundamental Large Cap Value Fund’s Class A shares advanced 15.08%, excluding sales charges, versus the 15.47% gain of its benchmark, the Russell 1000 Value Index. Consumer staples and financials hindered relative performance. One of the biggest individual detractors was Germany-based sports apparel company adidas AG, an out-of-index position in the consumer discretionary sector. Its stock suffered as slowing growth in emerging markets impeded revenues. An overweight in The Goldman Sachs Group, Inc. also hampered results, as lower industry-wide trading volumes and rising costs related to new regulatory requirements kept a lid on the investment bank’s stock return. A large overweight in information technology and security selection in energy helped the most versus the index. Top contributors included an outsized stake in consumer technology leader Apple, Inc., which saw strong earnings results, a deal to sell iPhones through wireless carrier China Mobile, new shareholder-friendly initiatives, and anticipation of new and refreshed products push its stock up over 50%. An out-of-index stake in energy services company Weatherford International PLC also helped, as a renewed focus on core businesses, divesture of less profitable operations, and cost cutting drove its stock sharply higher.
This commentary reflects the views of the portfolio managers through the end of the period discussed in this report. As such, they are in no way guarantees of future events and are not intended to be used as investment advice or a recommendation regarding any specific security. They are also subject to change at any time as market and other conditions warrant.
Past performance does not guarantee future results.
| |
| 8 | Fundamental Large Cap Value Fund | Annual report |
Your expenses
These examples are intended to help you understand your ongoing operating expenses of investing in the fund so you can compare these costs with the ongoing costs of investing in other mutual funds.
Understanding fund expenses
As a shareholder of the fund, you incur two types of costs:
■ Transaction costs, which include sales charges (loads) on purchases or redemptions (varies by share class), minimum account fee charge, etc.
■ Ongoing operating expenses, including management fees, distribution and service fees (if applicable), and other fund expenses.
We are going to present only your ongoing operating expenses here.
Actual expenses/actual returns
This example is intended to provide information about the fund’s actual ongoing operating expenses and is based on the fund’s actual return. It assumes an account value of $1,000.00 on February 1, 2014, with the same investment held until July 31, 2014.
| | | | |
| | | | Expenses paid | |
| | Account value | Ending value | during period | Annualized |
| | on 2-1-2014 | on 7-31-2014 | ended 7-31-20141,2 | expense ratio |
|
| Class A | $1,000.00 | $1,092.20 | $6.74 | 1.30% |
|
| Class C | 1,000.00 | 984.90 | 1.85 | 2.00% |
|
| Class I | 1,000.00 | 1,094.40 | 4.88 | 0.94% |
|
| Class NAV | 1,000.00 | 1,095.40 | 3.48 | 0.67% |
|
Together with the value of your account, you may use this information to estimate the operating expenses that you paid over the period. Simply divide your account value at July 31, 2014, by $1,000.00, then multiply it by the “expenses paid” for your share class from the table above. For example, for an account value of $8,600.00, the operating expenses should be calculated as follows:
| |
| Annual report | Fundamental Large Cap Value Fund | 9 |
Your expenses
Hypothetical example for comparison purposes
This table allows you to compare the fund’s ongoing operating expenses with those of any other fund. It provides an example of the fund’s hypothetical account values and hypothetical expenses based on each class’s actual expense ratio and an assumed 5% annualized return before expenses (which is not the fund’s actual return). It assumes an account value of $1,000.00 on February 1, 2014, with the same investment held until July 31, 2014. Look in any other fund shareholder report to find its hypothetical example and you will be able to compare these expenses. Please remember that these hypothetical account values and expenses may not be used to estimate the actual ending account balance or expenses you paid for the period.
| | | | |
| | | | Expenses paid | |
| | Account value | Ending value | during period | Annualized |
| | on 2-1-2014 | on 7-31-2014 | ended 7-31-20143 | expense ratio |
|
| Class A | $1,000.00 | $1,018.30 | $6.51 | 1.30% |
|
| Class C | 1,000.00 | 1,002.80 | 1.87 | 2.00% |
|
| Class I | 1,000.00 | 1,020.10 | 4.71 | 0.94% |
|
| Class NAV | 1,000.00 | 1,021.50 | 3.36 | 0.67% |
|
Remember, these examples do not include any transaction costs, therefore, these examples will not help you to determine the relative total costs of owning different funds. If transaction costs were included, your expenses would have been higher. See the prospectuses for details regarding transaction costs.
1 Expenses are equal to the fund’s annualized expense ratio for Class A, Class I and Class NAV shares, multiplied by the average account value over the period, multiplied by 181/365 (to reflect the one-half year period).
2 Expenses are equal to the fund’s annualized expense ratio for Class C shares, multiplied by the average account value over the period, multiplied by 34/365 (to reflect the period).
3 Expenses are equal to the fund’s annualized expense ratio, multiplied by the average account value over the period, multiplied by 181/365 (to reflect the one-half year period).
| |
| 10 | Fundamental Large Cap Value Fund | Annual report |
Portfolio summary
| | | | |
| Top 10 Holdings (37.0% of Net Assets on 7-31-14)1,2 | | | |
|
| JPMorgan Chase & Company | 4.7% | | Apache Corp. | 3.3% |
| |
|
| Bank of America Corp. | 4.5% | | Weatherford International PLC | 3.1% |
| |
|
| Apple, Inc. | 4.2% | | Morgan Stanley | 3.1% |
| |
|
| American International Group, Inc. | 4.1% | | Lennar Corp., Class A | 3.1% |
| |
|
| The Goldman Sachs Group, Inc. | 3.9% | | Citigroup, Inc. | 3.0% |
| |
|
|
| |
| Sector Composition1,3 | | | | |
|
| Financials | 32.1% | | Industrials | 7.1% |
| |
|
| Energy | 15.8% | | Health Care | 5.9% |
| |
|
| Information Technology | 13.3% | | Materials | 2.8% |
| |
|
| Consumer Discretionary | 10.7% | | Short-Term Investments & Other | 2.2% |
| |
|
| Consumer Staples | 10.1% | | | |
| | | |
| |
| Country Composition1,3 | | | | |
|
| United States | 86.6% | | Netherlands | 2.6% |
| |
|
| Switzerland | 4.7% | | France | 1.0% |
| |
|
| United Kingdom | 4.2% | | Germany | 0.9% |
| |
|
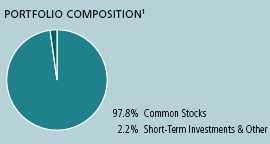
1 As a percentage of net assets on 7-31-14.
2 Cash and cash equivalents are not included.
3 Large company stocks could fall out of favor. Value stocks may decline in price. Foreign investing has additional risks, such as currency and market volatility and political and social instability. Hedging and other strategic transactions may increase volatility and result in losses if not successful. Illiquid securities may be difficult to sell at a price approximating their value. Sector investing is subject to greater risks than the market as a whole. Because the fund may focus on particular sectors of the economy, its performance may depend on the performance of those sectors and investments focused in one sector may fluctuate more widely than investments diversified across sectors. Please see the fund’s prospectuses for additional risks.
| |
| Annual report | Fundamental Large Cap Value Fund | 11 |
Fund’s investments
As of 7-31-14
| | |
| | Shares | Value |
|
| Common Stocks 97.8% | $1,188,378,141 |
|
| (Cost $917,467,225) | | |
| | | |
| Consumer Discretionary 10.7% | | 130,450,872 |
| | | |
| Household Durables 6.4% | | |
|
| Lennar Corp., Class A | 1,042,394 | 37,765,934 |
|
| NVR, Inc. (I) | 10,951 | 12,335,863 |
|
| Tempur Sealy International, Inc. (I) | 496,496 | 27,163,296 |
| | | |
| Specialty Retail 3.4% | | |
|
| Advance Auto Parts, Inc. | 139,245 | 16,863,962 |
|
| Lowe’s Companies, Inc. | 521,035 | 24,931,525 |
| | | |
| Textiles, Apparel & Luxury Goods 0.9% | | |
|
| adidas AG | 143,845 | 11,390,292 |
| | | |
| Consumer Staples 10.1% | | 122,508,876 |
| | | |
| Beverages 5.6% | | |
|
| Diageo PLC, ADR | 129,909 | 15,617,660 |
|
| Heineken Holding NV | 188,647 | 12,010,757 |
|
| PepsiCo, Inc. | 225,863 | 19,898,530 |
|
| SABMiller PLC | 385,362 | 20,983,570 |
| | | |
| Food Products 1.1% | | |
|
| Danone SA | 175,322 | 12,663,643 |
| | | |
| Household Products 1.2% | | |
|
| The Procter & Gamble Company | 187,180 | 14,472,758 |
| | | |
| Tobacco 2.2% | | |
|
| Imperial Tobacco Group PLC | 331,003 | 14,330,420 |
|
| Philip Morris International, Inc. | 152,805 | 12,531,538 |
| | | |
| Energy 15.8% | | 191,991,654 |
| | | |
| Energy Equipment & Services 4.3% | | |
|
| National Oilwell Varco, Inc. | 175,903 | 14,255,179 |
|
| Weatherford International PLC (I) | 1,696,998 | 37,961,845 |
| | | |
| Oil, Gas & Consumable Fuels 11.5% | | |
|
| Apache Corp. | 395,145 | 40,565,586 |
|
| Cabot Oil & Gas Corp. | 522,879 | 17,228,863 |
|
| Chevron Corp. | 174,025 | 22,490,991 |
|
| Exxon Mobil Corp. | 131,889 | 13,049,098 |
|
| Occidental Petroleum Corp. | 367,896 | 35,947,118 |
|
| Southwestern Energy Company (I) | 258,575 | 10,492,974 |
| | |
| 12 | Fundamental Large Cap Value Fund | Annual report | See notes to financial statements |
| | |
| | Shares | Value |
| Financials 32.1% | | $389,688,049 |
| | | |
| Banks 15.9% | | |
|
| Bank of America Corp. | 3,591,443 | 54,769,506 |
|
| CIT Group, Inc. | 541,208 | 26,578,725 |
|
| Citigroup, Inc. | 751,226 | 36,742,464 |
|
| JPMorgan Chase & Company | 988,448 | 57,003,796 |
|
| Wells Fargo & Company | 360,248 | 18,336,623 |
| | | |
| Capital Markets 12.1% | | |
|
| AllianceBernstein Holding LP | 1,122,342 | 29,338,020 |
|
| Morgan Stanley | 1,170,442 | 37,852,094 |
|
| Northern Trust Corp. | 212,611 | 14,221,550 |
|
| State Street Corp. | 252,394 | 17,778,633 |
|
| The Goldman Sachs Group, Inc. | 277,503 | 47,971,944 |
| | | |
| Insurance 4.1% | | |
|
| American International Group, Inc. | 944,492 | 49,094,694 |
| | | |
| Health Care 5.9% | | 70,961,374 |
| | | |
| Biotechnology 1.1% | | |
|
| Amgen, Inc. | 99,545 | 12,681,038 |
| | | |
| Health Care Equipment & Supplies 1.6% | | |
|
| Medtronic, Inc. | 320,697 | 19,799,833 |
| | | |
| Pharmaceuticals 3.2% | | |
|
| Merck & Company, Inc. | 345,132 | 19,582,790 |
|
| Novartis AG, ADR | 217,365 | 18,897,713 |
| | | |
| Industrials 7.1% | | 86,743,284 |
| | | |
| Air Freight & Logistics 1.7% | | |
|
| FedEx Corp. | 144,301 | 21,194,931 |
| | | |
| Electrical Equipment 1.6% | | |
|
| Sensata Technologies Holding NV (I) | 415,474 | 19,211,518 |
| | | |
| Industrial Conglomerates 2.2% | | |
|
| General Electric Company | 1,058,481 | 26,620,797 |
| | | |
| Trading Companies & Distributors 1.6% | | |
|
| United Rentals, Inc. (I) | 186,176 | 19,716,038 |
| | | |
| Information Technology 13.3% | | 162,023,935 |
| | | |
| Communications Equipment 4.4% | | |
|
| Cisco Systems, Inc. | 856,080 | 21,598,898 |
|
| QUALCOMM, Inc. | 432,937 | 31,907,457 |
| | | |
| Semiconductors & Semiconductor Equipment 1.3% | | |
|
| Intel Corp. | 475,004 | 16,097,886 |
| | | |
| Software 3.4% | | |
|
| Microsoft Corp. | 459,924 | 19,850,320 |
|
| Oracle Corp. | 533,652 | 21,554,204 |
| | | |
| Technology Hardware, Storage & Peripherals 4.2% | | |
|
| Apple, Inc. | 533,799 | 51,015,170 |
| | |
| See notes to financial statements | Annual report | Fundamental Large Cap Value Fund | 13 |
| | |
| | Shares | Value |
| Materials 2.8% | | $34,010,097 |
| | | |
| Containers & Packaging 1.3% | | |
|
| Avery Dennison Corp. | 342,897 | 16,188,167 |
| | | |
| Paper & Forest Products 1.5% | | |
|
| Louisiana-Pacific Corp. (I) | 1,316,243 | 17,821,930 |
| |
| | Par value | Value |
| Short-Term Investments 1.7% | | $20,239,000 |
|
| (Cost $20,239,000) | | |
| Barclays Tri-Party Repurchase Agreement dated 7-31-14 at 0.060% | | |
| to be repurchased at $19,683,033 on 8-1-14, collateralized by | | |
| $15,771,200 Treasury Inflation Index Notes, 2.625% due | | |
| 7-15-17 (valued at $20,076,734, including interest) | $19,683,000 | 19,683,000 |
|
| Repurchase Agreement with State Street Corp. dated 7-31-14 at | | |
| 0.000% to be repurchased at $556,000 on 8-1-14, collateralized | | |
| by $570,000 Federal National Mortgage Association, 1.100% due | | |
| 10-5-17 (valued at $567,863, including interest) | 556,000 | 556,000 |
|
| |
| Total investments (Cost $937,706,225)† 99.5% | $1,208,617,141 |
|
| |
| Other assets and liabilities, net 0.5% | | $6,285,681 |
|
| |
| Total net assets 100.0% | $1,214,902,822 |
|
The percentage shown for each investment is the total value of the category at a percentage of net assets of the fund.
ADR American Depositary Receipts
(I) Non-income producing security.
† At 7-31-14, the aggregate cost of investment securities for federal income tax purposes was $937,422,163. Net unrealized appreciation aggregated $271,194,978, of which $273,447,165 related to appreciated investment securities and $2,252,187 related to depreciated investment securities.
The fund had the following country concentration as a percentage of net assets on 7-31-14:
| | |
| United States | 86.6% | |
| Switzerland | 4.7% | |
| United Kingdom | 4.2% | |
| Netherlands | 2.6% | |
| France | 1.0% | |
| Germany | 0.9% | |
|
| |
| Total | 100.0% | |
| | |
| 14 | Fundamental Large Cap Value Fund | Annual report | See notes to financial statements |
F I N A N C I A L S T A T E M E N T S
Financial statements
Statement of assets and liabilities 7-31-14
This Statement of assets and liabilities is the fund’s balance sheet. It shows the value of what the fund owns, is due and owes. You’ll also find the net asset value and the maximum offering price per share.
| |
| Assets | |
|
| Investments, at value (Cost $937,706,225) | $1,208,617,141 |
| Cash | 774 |
| Foreign currency, at value (Cost $2,261,551) | 2,246,908 |
| Receivable for investments sold | 3,207,402 |
| Receivable for fund shares sold | 67,950 |
| Dividends and interest receivable | 884,421 |
| Receivable due from advisor | 384 |
| Other receivables and prepaid expenses | 45,403 |
| | |
| Total assets | 1,215,070,383 |
| |
| Liabilities | |
|
| Payable to affiliates | |
| Accounting and legal services fees | 24,152 |
| Transfer agent fees | 1,549 |
| Other liabilities and accrued expenses | 141,860 |
| | |
| Total liabilities | 167,561 |
| | |
| Net assets | $1,214,902,822 |
| |
| Net assets consist of | |
|
| Paid-in capital | $885,974,500 |
| Undistributed net investment income | 5,891,435 |
| Accumulated net realized gain (loss) on investments | 52,143,386 |
| Net unrealized appreciation (depreciation) on investments and translation | |
| of assets and liabilities in foreign currencies | 270,893,501 |
| | |
| Net assets | $1,214,902,822 |
| |
| Net asset value per share | |
|
| Based on net asset values and shares outstanding — the fund has an | |
| unlimited number of shares authorized with no par value | |
| Class A ($11,718,022 ÷ 860,357 shares)1 | $13.62 |
| Class C ($181,873 ÷ 13,316 shares) | $13.66 |
| Class I ($2,381,359 ÷ 174,104 shares) | $13.68 |
| Class NAV ($1,200,621,568 ÷ 87,800,446 shares) | $13.67 |
| |
| Maximum offering price per share | |
|
| Class A (net asset value per share ÷ 95%)2 | $14.34 |
1 Redemption price is equal to net asset value less any applicable contingent deferred sales charge.
2 On single retail sales of less than $50,000. On sales of $50,000 or more and on group sales the offering price is reduced.
| | |
| See notes to financial statements | Annual report | Fundamental Large Cap Value Fund | 15 |
F I N A N C I A L S T A T E M E N T S
Statement of operations For the year ended 7-31-14
This Statement of operations summarizes the fund’s investment income earned and expenses incurred in operating the fund. It also shows net gains (losses) for the period stated.
| |
| Investment income | |
|
| Dividends | $19,457,112 |
| Interest | 8,346 |
| Less foreign taxes withheld | (256,609) |
| | |
| Total investment income | 19,208,849 |
| |
| Expenses | |
|
| Investment management fees | 6,704,032 |
| Distribution and service fees | 29,538 |
| Accounting and legal services fees | 129,869 |
| Transfer agent fees | 16,100 |
| Trustees’ fees | 13,311 |
| State registration fees | 34,002 |
| Printing and postage | 5,507 |
| Professional fees | 48,061 |
| Custodian fees | 171,342 |
| Registration and filing fees | 53,828 |
| Expense recapture | 1,246 |
| Other | 18,236 |
| | |
| Total expenses | 7,225,072 |
| Less expense reductions | (84,443) |
| | |
| Net expenses | 7,140,629 |
| | |
| Net investment income | 12,068,220 |
| |
| Realized and unrealized gain (loss) | |
|
| Net realized gain (loss) on | |
| Investments in unaffiliated issuers and foreign currency transactions | 70,005,222 |
| | 70,005,222 |
| Change in net unrealized appreciation (depreciation) of | |
| Investments in unaffiliated issuers and translation of assets and liabilities in | |
| foreign currencies | 67,916,807 |
| | 67,916,807 |
| Net realized and unrealized gain | 137,922,029 |
| | |
| Increase in net assets from operations | $149,990,249 |
| | |
| 16 | Fundamental Large Cap Value Fund | Annual report | See notes to financial statements |
F I N A N C I A L S T A T E M E N T S
Statements of changes in net assets
These Statements of changes in net assets show how the value of the fund’s net assets has changed during the last two periods. The difference reflects earnings less expenses, any investment gains and losses, distributions, if any, paid to shareholders and the net of fund share transactions.
| | |
| | Year | Year |
| | ended | ended |
| | 7-31-14 | 7-31-13 |
|
| |
| Increase (decrease) in net assets | | |
|
| From operations | | |
| Net investment income | $12,068,220 | $14,507,060 |
| Net realized gain | 70,005,222 | 101,336,233 |
| Change in net unrealized appreciation (depreciation) | 67,916,807 | 142,319,463 |
| | | |
| Increase in net assets resulting from operations | 149,990,249 | 258,162,756 |
| | | |
| Distributions to shareholders | | |
| From net investment income | | |
| Class A | (61,614) | (35,015) |
| Class I | (22,556) | (110,922) |
| Class NAV | (12,244,873) | (11,378,017) |
| From net realized gain | | |
| Class A | (888,460) | (172,906) |
| Class I | (215,153) | (394,916) |
| Class NAV | (94,200,407) | (33,936,142) |
| | | |
| Total distributions | (107,633,063) | (46,027,918) |
| | | |
| From fund share transactions | 235,144,807 | (66,895,385) |
| | | |
| Total increase | 277,501,993 | 145,239,453 |
| | | |
| Net assets | | |
|
| Beginning of year | 937,400,829 | 792,161,376 |
| | | |
| End of year | $1,214,902,822 | $937,400,829 |
| | | |
| Undistributed net investment income | $5,891,435 | $6,672,700 |
| | |
| See notes to financial statements | Annual report | Fundamental Large Cap Value Fund | 17 |
Financial highlights
The Financial highlights show how the fund’s net asset value for a share has changed during the period.
| | | | |
| CLASS A SHARES Period ended | 7-31-14 | 7-31-13 | 7-31-12 | 7-31-111 |
| |
| Per share operating performance | | | | |
|
| Net asset value, beginning of period | $13.11 | $10.27 | $9.46 | $10.00 |
| Net investment income2 | 0.07 | 0.11 | 0.09 | —3 |
| Net realized and unrealized gain (loss) on investments | 1.82 | 3.32 | 0.78 | (0.54) |
| Total from investment operations | 1.89 | 3.43 | 0.87 | (0.54) |
| Less distributions | | | | |
| From net investment income | (0.09) | (0.10) | (0.03) | — |
| From net realized gain | (1.29) | (0.49) | (0.03) | — |
| Total distributions | (1.38) | (0.59) | (0.06) | — |
| Net asset value, end of period | $13.62 | $13.11 | $10.27 | $9.46 |
| Total return (%)4,5 | 15.08 | 34.46 | 9.28 | (5.40)6 |
| |
| Ratios and supplemental data | | | | |
|
| Net assets, end of period (in millions) | $12 | $9 | $3 | $2 |
| Ratios (as a percentage of average net assets): | | | | |
| Expenses before reductions | 1.34 | 1.53 | 2.807 | 5.958 |
| Expenses including reductions | 1.30 | 1.30 | 1.30 | 1.308 |
| Net investment income | 0.54 | 0.96 | 0.94 | 0.268 |
| Portfolio turnover (%) | 24 | 38 | 26 | 5 |
1 Period from 6-1-11 (commencement of operations) to 7-31-11.
2 Based on average daily shares outstanding.
3 Less than $0.005 per share.
4 Does not reflect the effect of sales charges, if any.
5 Total returns would have been lower had certain expenses not been reduced during the applicable periods.
6 Not annualized.
7 Expense ratio has been revised to conform with current year presentation of expense recapture and net
expense reductions.
8 Annualized.
| | | | |
| CLASS C SHARES Period ended | | | | 7-31-141 |
| |
| Per share operating performance | | | | |
|
| Net asset value, beginning of period | | | | $13.87 |
| Net investment loss2 | | | | (0.01) |
| Net realized and unrealized loss on investments | | | | (0.20) |
| Total from investment operations | | | | (0.21) |
| Net asset value, end of period | | | | $13.66 |
| Total return (%)3,4 | | | | (1.51)5 |
| |
| Ratios and supplemental data | | | | |
|
| Net assets, end of period (in millions) | | | | —6 |
| Ratios (as a percentage of average net assets): | | | | |
| Expenses before reductions | | | | 17.117 |
| Expenses including reductions | | | | 2.007 |
| Net investment loss | | | | (0.69)7 |
| Portfolio turnover (%) | | | | 248 |
1 The inception date for Class C shares is 6-27-14.
2 Based on average daily shares outstanding.
3 Does not reflect the effect of sales charges, if any.
4 Total returns would have been lower had certain expenses not been reduced during the applicable periods.
5 Not annualized.
6 Less than $500,000.
7 Annualized.
8 The portfolio turnover is shown for the period from 8-1-13 to 7-31-14.
| | |
| 18 | Fundamental Large Cap Value Fund | Annual report | See notes to financial statements |
| | | | |
| CLASS I SHARES Period ended | 7-31-14 | 7-31-13 | 7-31-12 | 7-31-111 |
| |
| Per share operating performance | | | | |
|
| Net asset value, beginning of period | $13.17 | $10.30 | $9.46 | $10.00 |
| Net investment income2 | 0.13 | 0.18 | 0.14 | 0.01 |
| Net realized and unrealized gain (loss) on investments | 1.81 | 3.32 | 0.79 | (0.55) |
| Total from investment operations | 1.94 | 3.50 | 0.93 | (0.54) |
| Less distributions | | | | |
| From net investment income | (0.14) | (0.14) | (0.06) | — |
| From net realized gain | (1.29) | (0.49) | (0.03) | — |
| Total distributions | (1.43) | (0.63) | (0.09) | — |
| Net asset value, end of period | $13.68 | $13.17 | $10.30 | $9.46 |
| Total return (%)3 | 15.40 | 35.11 | 9.87 | (5.40)4 |
| |
| Ratios and supplemental data | | | | |
|
| Net assets, end of period (in millions) | $2 | $4 | $1 | $1 |
| Ratios (as a percentage of average net assets): | | | | |
| Expenses before reductions | 1.53 | 1.09 | 4.035 | 5.616 |
| Expenses including reductions | 0.94 | 0.92 | 0.84 | 0.846 |
| Net investment income | 0.96 | 1.50 | 1.44 | 0.746 |
| Portfolio turnover (%) | 24 | 38 | 26 | 5 |
1 Period from 6-1-11 (commencement of operations) to 7-31-11.
2 Based on average daily shares outstanding.
3 Total returns would have been lower had certain expenses not been reduced during the applicable periods.
4 Not annualized.
5 Expense ratio has been revised to conform with current year presentation of expense recapture and net
expense reductions.
6 Annualized.
| | | | |
| CLASS NAV SHARES Period ended | | 7-31-14 | 7-31-13 | 7-31-121 |
| |
| Per share operating performance | | | | |
|
| Net asset value, beginning of period | | $13.16 | $10.30 | $8.13 |
| Net investment income2 | | 0.15 | 0.20 | 0.13 |
| Net realized and unrealized gain on investments | | 1.82 | 3.31 | 2.13 |
| Total from investment operations | | 1.97 | 3.51 | 2.26 |
| Less distributions | | | | |
| From net investment income | | (0.17) | (0.16) | (0.06) |
| From net realized gain | | (1.29) | (0.49) | (0.03) |
| Total distributions | | (1.46) | (0.65) | (0.09) |
| Net asset value, end of period | | $13.67 | $13.16 | $10.30 |
| Total return (%)3 | | 15.69 | 35.33 | 27.864 |
| |
| Ratios and supplemental data | | | | |
|
| Net assets, end of period (in millions) | | $1,201 | $924 | $789 |
| Ratios (as a percentage of average net assets): | | | | |
| Expenses before reductions | | 0.68 | 0.70 | 0.755,6 |
| Expenses including reductions | | 0.67 | 0.69 | 0.755 |
| Net investment income | | 1.16 | 1.69 | 1.405 |
| Portfolio turnover (%) | | 24 | 38 | 26 |
1 Period from 8-23-11 (commencement of operations) to 7-31-12.
2 Based on average daily shares outstanding.
3 Total returns would have been lower had certain expenses not been reduced during the applicable periods.
4 Not annualized.
5 Annualized.
6 Expense ratio has been revised to conform with current year presentation of expense recapture and net
expense reductions.
| | |
| See notes to financial statements | Annual report | Fundamental Large Cap Value Fund | 19 |
Notes to financial statements
Note 1 — Organization
John Hancock Fundamental Large Cap Value Fund (the fund) is a series of John Hancock Funds II (the Trust), an open-end management investment company organized as a Massachusetts business trust and registered under the Investment Company Act of 1940, as amended (the 1940 Act). The investment objective of the fund is to seek long-term capital appreciation.
The fund may offer multiple classes of shares. The shares currently offered are detailed in the Statement of assets and liabilities. Class A and Class C shares are offered to all investors. Class I shares are offered to institutions and certain investors. Class NAV shares are offered to John Hancock affiliated funds of funds and certain 529 plans. Shareholders of each class have exclusive voting rights to matters that affect that class. The distribution and service fees, if any, and transfer agent fees, printing and postage, and state registration fees for each class may differ.
Note 2 — Significant accounting policies
The financial statements have been prepared in conformity with accounting principles generally accepted in the United States of America (US GAAP), which require management to make certain estimates and assumptions as of the date of the financial statements. Actual results could differ from those estimates and those differences could be significant. The fund intends to qualify as an investment company under Topic 946 of Accounting Standards Codification of US GAAP.
Events or transactions occurring after the end of the fiscal period through the date that the financial statements were issued have been evaluated in the preparation of the financial statements. The following summarizes the significant accounting policies of the fund:
Security valuation. Investments are stated at value as of the close of regular trading on the New York Stock Exchange (NYSE), normally at 4:00 p.m., Eastern Time. In order to value the securities, the fund uses the following valuation techniques: Equity securities held by the fund are valued at the last sale price or official closing price on the exchange where the security was acquired or most likely will be sold. In the event there were no sales during the day or closing prices are not available, the securities are valued using the last available bid price. Foreign securities and currencies are valued in U.S. dollars, based on foreign currency exchange rates supplied by an independent pricing vendor. Securities that trade only in the over-the-counter (OTC) market are valued using bid prices. Other portfolio securities and assets, for which reliable market quotations are not readily available, are valued at fair value as determined in good faith by the fund’s Pricing Committee following procedures established by the Board of Trustees. The frequency with which these fair valuation procedures are used cannot be predicted and fair value of securities may differ significantly from the value that would have been used had a ready market for such securities existed. Certain short-term securities with maturities of 60 days or less at the time of purchase are valued at amortized cost.
The fund uses a three-tier hierarchy to prioritize the pricing assumptions, referred to as inputs, used in valuation techniques to measure fair value. Level 1 includes securities valued using quoted prices in active markets for identical securities. Level 2 includes securities valued using other significant observable inputs. Observable inputs may include quoted prices for similar securities, interest rates, prepayment speeds and credit risk. Prices for securities valued using these inputs are received from independent pricing vendors and brokers and are based on an evaluation of the inputs described. Level 3 includes securities valued using significant unobservable inputs when market prices are
| |
| 20 | Fundamental Large Cap Value Fund | Annual report |
not readily available or reliable, including the fund’s own assumptions in determining the fair value of investments. Factors used in determining value may include market or issuer specific events or trends, changes in interest rates and credit quality. The inputs or methodology used for valuing securities are not necessarily an indication of the risks associated with investing in those securities. Changes in valuation techniques may result in transfers into or out of an assigned level within the disclosure hierarchy.
The following is a summary of the values by input classification of the fund’s investments as of July 31, 2014, by major security category or type:
| | | | |
| | | | | LEVEL 3 |
| | | | LEVEL 2 | SIGNIFICANT |
| | TOTAL MARKET | LEVEL 1 | SIGNIFICANT | UNOBSERVABLE |
| | VALUE AT 7-31-14 | QUOTED PRICE | OBSERVABLE INPUTS | INPUTS |
|
| Common Stocks | | | | |
| Consumer Discretionary | $130,450,872 | $119,060,580 | $11,390,292 | — |
| Consumer Staples | 122,508,876 | 62,520,486 | 59,988,390 | — |
| Energy | 191,991,654 | 191,991,654 | — | — |
| Financials | 389,688,049 | 389,688,049 | — | — |
| Health Care | 70,961,374 | 70,961,374 | — | — |
| Industrials | 86,743,284 | 86,743,284 | — | — |
| Information Technology | 162,023,935 | 162,023,935 | — | — |
| Materials | 34,010,097 | 34,010,097 | — | — |
| Short-Term Investments | 20,239,000 | — | 20,239,000 | — |
| |
|
| Total Investments | | | | |
| in Securities | $1,208,617,141 | $1,116,999,459 | $91,617,682 | — |
Repurchase agreements. The fund may enter into repurchase agreements. When the fund enters into a repurchase agreement, it receives collateral that is held in a segregated account by the fund’s custodian or for tri-party repurchase agreements, collateral is held at a third party custodian bank in a segregated account for the benefit of the fund. The collateral amount is marked-to-market and monitored on a daily basis to ensure that the collateral held is in an amount not less than the principal amount of the repurchase agreement plus any accrued interest. Collateral received by the fund for repurchase agreements is disclosed in the Fund’s investments as part of the caption related to the repurchase agreement.
Repurchase agreements are typically governed by the terms and conditions of the Master Repurchase Agreement and/or Global Master Repurchase Agreement (collectively, MRA). Upon an event of default, the non-defaulting party may close out all transactions traded under the MRA and net amounts owed. Absent an event of default, the MRA does not result in an offset of the reported amounts of assets and liabilities in the Statement of assets and liabilities. In the event of a default by the counterparty, realization of the collateral proceeds could be delayed, during which time the collateral value may decline or the counterparty may have insufficient assets to pay back claims resulting from close-out of the transactions.
Security transactions and related investment income. Investment security transactions are accounted for on a trade date plus one basis for daily net asset value calculations. However, for financial reporting purposes, investment transactions are reported on trade date. Interest income is accrued as earned. Dividend income is recorded on the ex-date, except for dividends of foreign securities where the dividend may not be known until after the ex-date. In those cases, dividend income, net of withholding taxes, is recorded when the fund becomes aware of the dividends. Foreign taxes are provided for based on the fund’s understanding of the tax rules and rates that exist in the foreign markets in which it invests. Gains and losses on securities sold are determined on the basis of identified cost and may include proceeds from litigation.
| |
| Annual report | Fundamental Large Cap Value Fund | 21 |
Foreign currency translation. Assets, including investments and liabilities denominated in foreign currencies, are translated into U.S. dollar values each day at the prevailing exchange rate. Purchases and sales of securities, income and expenses are translated into U.S. dollars at the prevailing exchange rate on the date of the transaction. The effect of changes in foreign currency exchange rates on the value of securities is reflected as a component of the realized and unrealized gains (losses) on investments.
Funds that invest internationally generally carry more risk than funds that invest strictly in U.S. securities. Risks can result from differences in economic and political conditions, regulations, market practices (including higher transaction costs), accounting standards and other factors. Foreign investments are also subject to a decline in the value of a foreign currency versus the U.S. dollar, which reduces the dollar value of securities denominated in that currency.
Foreign taxes. The fund may be subject to withholding tax on income and/or capital gains or repatriation taxes imposed by certain countries in which the fund invests. Taxes are accrued based upon investment income, realized gains or unrealized appreciation.
Line of credit. The fund may borrow from banks for temporary or emergency purposes, including meeting redemption requests that otherwise might require the untimely sale of securities. Pursuant to the fund’s custodian agreement, the custodian may loan money to the fund to make properly authorized payments. The fund is obligated to repay the custodian for any overdraft, including any related costs or expenses. The custodian may have a lien, security interest or security entitlement in any fund property that is not otherwise segregated or pledged, to the maximum extent permitted by law, to the extent of any overdraft.
In addition, the fund and other affiliated funds have entered into an agreement with Citibank N.A. that enables them to potentially participate in a $300 million unsecured committed line of credit. A commitment fee, payable at the end of each calendar quarter, based on the average daily unused portion of the line of credit, is charged to each participating fund on a pro rata basis and is reflected in other expenses on the Statement of operations. Commitment fees for the year ended July 31, 2014 were $831. For the year ended July 31, 2014, the fund had no borrowings under the line of credit.
Expenses. Within the John Hancock group of funds complex, expenses that are directly attributable to an individual fund are allocated to such fund. Expenses that are not readily attributable to a specific fund are allocated among all funds in an equitable manner, taking into consideration, among other things, the nature and type of expense and the fund’s relative net assets. Expense estimates are accrued in the period to which they relate and adjustments are made when actual amounts are known.
Class allocations. Income, common expenses and realized and unrealized gains (losses) are determined at the fund level and allocated daily to each class of shares based on the net assets of the class. Class-specific expenses, such as distribution and service fees, if any, transfer agent fees, state registration fees and printing and postage expenses, for all classes, are calculated daily at the class level based on the appropriate net assets of each class and the specific expense rates applicable to each class.
Federal income taxes. The fund intends to continue to qualify as a regulated investment company by complying with the applicable provisions of the Internal Revenue Code and will not be subject to federal income tax on taxable income that is distributed to shareholders. Therefore, no federal income tax provision is required.
| |
| 22 | Fundamental Large Cap Value Fund | Annual report |
As of July 31, 2014, the fund had no uncertain tax positions that would require financial statement recognition, derecognition or disclosure. The fund’s federal tax returns are subject to examination by the Internal Revenue Service for a period of three years.
Distribution of income and gains. Distributions to shareholders from net investment income and net realized gains, if any, are recorded on the ex-date. The fund generally declares and pays dividends and capital gain distributions, if any, annually.
The tax character of distributions for the years ended July 31, 2014 and 2013 was as follows:
| | | | |
| | JULY 31, 2014 | JULY 31, 2013 | | |
| | |
| Ordinary Income | $27,721,452 | $28,283,550 | | |
| Long-Term Capital Gain | 79,911,611 | 17,744,368 | | |
| | | | | |
| Total | $107,633,063 | $46,027,918 | | |
Distributions paid by the fund with respect to each class of shares are calculated in the same manner, at the same time and in the same amount, except for the effect of class level expenses that may be applied differently to each class. As of July 31 2014, the components of distributable earnings on a tax basis consisted of $15,643,444 of undistributed ordinary income and $42,107,317 of long-term capital gains.
Such distributions and distributable earnings, on a tax basis, are determined in conformity with income tax regulations, which may differ from accounting principles generally accepted in the United States of America. Distributions in excess of tax basis earnings and profits, if any, are reported in the fund’s financial statements as a return of capital.
Capital accounts within the financial statements are adjusted for permanent book-tax differences. These adjustments have no impact on net assets or the results of operations. Temporary book-tax differences, if any, will reverse in a subsequent period. Book-tax differences are primarily attributable to partnerships.
Note 3 — Guarantees and indemnifications
Under the Trust’s organizational documents, its Officers and Trustees are indemnified against certain liabilities arising out of the performance of their duties to the Trust, including the fund. Additionally, in the normal course of business, the fund enters into contracts with service providers that contain general indemnification clauses. The fund’s maximum exposure under these arrangements is unknown, as this would involve future claims that may be made against the fund that have not yet occurred. The risk of material loss from such claims is considered remote.
Note 4 — Fees and transactions with affiliates
John Hancock Advisers, LLC (the Advisor or JHA) serves as investment advisor for the fund. Prior to January 1, 2014, John Hancock Investment Management Services, LLC (JHIMS) served as investment advisor for the fund. JHIMS and JHA have identical officers, directors and other personnel, and share common facilities and resources. Terms of the investment management contract with JHA are substantially identical to the former contract with JHIMS. In this report, depending on the context, the term “Advisor” shall refer to either JHA in its current capacity as investment advisor, or to JHIMS in its capacity as investment advisor prior to January 1, 2014. John Hancock Funds, LLC (the Distributor), an affiliate of the Advisor, serves as principal underwriter of the fund. The Advisor and the Distributor are indirect, wholly owned subsidiaries of Manulife Financial Corporation (MFC).
Management fee. Effective June 25, 2014, the fund has an investment management agreement with the Advisor under which the fund pays a daily management fee to the Advisor equivalent, on an annual basis, to the sum of: a) 0.70% of the first $500 million of the fund’s aggregate daily net
| |
| Annual report | Fundamental Large Cap Value Fund | 23 |
assets together with the net assets of Fundamental Value Trust and Fundamental Large Cap Value Trust, both series of John Hancock Variable Insurance Trust (combined aggregate average daily net assets); (b) 0.65% of the next $500 million of the combined aggregate average daily net assets; and (c) 0.60% of the combined aggregate average daily net assets in excess of $1 billion. Prior to June 25, 2014, the aggregate daily net assets were together with the net assets of Fundamental Large Cap Value Trust, a series of John Hancock Variable Insurance Trust. The Advisor has a subadvisory agreement with John Hancock Asset Management a division of Manulife Asset Management (US) LLC, an indirectly owned subsidiary of MFC and an affiliate of the Advisor. The fund is not responsible for payment of the subadvisory fees.
The Advisor has contractually agreed to waive a portion of its management fee and/or reimburse expenses for certain funds of the John Hancock complex, including the fund (the participating portfolios). The waiver equals, on an annualized basis, 0.01% of that portion of the aggregate net assets of all the participating portfolios that exceeds $75 billion but is less than or equal to $125 billion; 0.0125% of that portion of the aggregate net assets of all the participating portfolios that exceeds $125 billion but is less than or equal to $150 billion; and 0.015% of that portion of the aggregate net assets of all the participating portfolios that exceeds $150 billion. The amount of the reimbursement is calculated daily and allocated among all the participating portfolios in proportion to the daily net assets of each fund. This arrangement may be amended or terminated at any time by the Advisor upon notice to the fund and with the approval of the Board of Trustees.
The Advisor has contractually agreed to waive all or a portion of its management fee and reimburse or pay operating expenses of the fund to the extent necessary to maintain the total operating expenses at 1.30%, 2.00% and 0.94% for Class A, Class C and Class I shares, respectively, excluding certain expenses such as taxes, brokerage commissions, interest expense, litigation and indemnification expenses and other extraordinary expenses not incurred in the ordinary course of the fund’s business. The current expense limitation agreement expires on November 30, 2015, unless renewed by mutual agreement of the fund and the Advisor based upon a determination that this is appropriate under the circumstances at that time.
Accordingly, these expense reductions described above amounted to $4,204, $1,451, $13,649 and $65,139 for Class A, Class C, Class I and Class NAV shares, respectively, for the year ended July 31, 2014.
The investment management fees, including the impact of the waivers and reimbursement described above, incurred for the year ended July 31, 2014 were equivalent to a net effective rate of 0.63% of the fund’s average daily net assets.
Expense recapture. The Advisor may recapture operating expenses reimbursed or fees waived under previous expense limitation or waiver arrangements for a period of three years following the month in which the reimbursements or waivers occurred to the extent that the fund is below its expense limitation during this period. The table below outlines the amounts recovered during the year ended July 31, 2014, and the amount of waived or reimbursed expenses subject to potential recovery and the respective expiration dates.
| | | |
| AMOUNTS ELIGIBLE FOR | AMOUNTS ELIGIBLE FOR | AMOUNTS ELIGIBLE FOR | AMOUNT RECOVERED |
| RECOVERY THROUGH | RECOVERY THROUGH | RECOVERY THROUGH | DURING THE YEAR |
| JULY 1, 2015 | JULY 1, 2016 | JULY 1, 2017 | ENDED JULY 31, 2014 |
|
| $24,193 | $17,339 | $18,547 | $1,246 |
Amounts recovered by class
| |
| 24 | Fundamental Large Cap Value Fund | Annual report |
Accounting and legal services. Pursuant to a service agreement, the fund reimburses the Advisor for all expenses associated with providing the administrative, financial, legal, accounting and recordkeeping services to the fund, including the preparation of all tax returns, periodic reports to shareholders and regulatory reports, among other services. These expenses are allocated to each share class based on its relative net assets at the time the expense was incurred. These accounting and legal services fees incurred for the year ended July 31, 2014 amounted to an annual rate of 0.01% of the fund’s average daily net assets.
Distribution and service plans. The fund has a distribution agreement with the Distributor. The fund has adopted distribution and service plans with respect to Class A and Class C shares pursuant to Rule 12b-1 under the 1940 Act, to pay the Distributor for services provided as the distributor of shares of the fund. The fund pays 0.30% for Class A shares and 1.00% for Class C shares for distribution and service fees under these arrangements, expressed as an annual percentage of average daily net assets for each class of the fund’s shares.
Sales charges. Class A shares are assessed up-front sales charges, which resulted in payments to the Distributor amounting to $44,462 for the year ended July 31, 2014. Of this amount, $7,485 was retained and used for printing prospectuses, advertising, sales literature and other purposes, $36,884 was paid as sales commissions to broker-dealers and $93 was paid as sales commissions to sales personnel of Signator Investors, Inc., a broker-dealer affiliate of the Advisor.
Class A and Class C shares may be subject to contingent deferred sales charges (CDSCs). Certain Class A shares that are acquired through purchases of $1 million or more and are redeemed within one year of purchase are subject to a 1.00% sales charge. Class C shares that are redeemed within one year of purchase are subject to a 1.00% CDSC. CDSCs are applied to the lesser of the current market value at the time of redemption or the original purchase cost of the shares being redeemed. Proceeds from CDSCs are used to compensate the Distributor for providing distribution-related services in connection with the sale of these shares. During the year ended July 31, 2014, there were no CDSCs received by the Distributor for Class A or Class C shares.
Transfer agent fees. The fund has a transfer agent agreement with John Hancock Signature Services, Inc. (Signature Services), an affiliate of the Advisor. The transfer agent fees paid to Signature Services are determined based on the cost to Signature Services (Signature Services Cost) of providing recordkeeping services. The Signature Services Cost includes a component of allocated John Hancock corporate overhead for providing transfer agent services to the fund and to all other John Hancock affiliated funds. It also includes out-of-pocket expenses, including payments made to third-parties for recordkeeping services provided to their clients who invest in one or more John Hancock funds. In addition, Signature Services Cost may be reduced by certain fees that Signature Services receives in connection with retirement and small accounts. Signature Services Cost is calculated monthly and allocated, as applicable, to five categories of share classes: Retail Share and Institutional Classes of Non-Municipal Bond Funds, Class R6 Shares, Retirement Share Classes and Municipal Bond Share Classes. Within each of these categories, the applicable costs are allocated to the affected John Hancock affiliated funds and/or classes, based on the relative average daily net assets.
Prior to October 1, 2013, Signature Services Cost was calculated monthly and allocated, as applicable, to four categories of share classes: Institutional Share Classes, Retirement Share Classes, Municipal Bond Share Classes and all other Retail Share Classes. Within each of these categories, the applicable costs were allocated to the affected John Hancock affiliated funds and/or classes, based on the relative average daily net assets.
| |
| Annual report | Fundamental Large Cap Value Fund | 25 |
Class level expenses. Class level expenses for the year ended July 31, 2014 were:
| | | | |
| | DISTRIBUTION | TRANSFER | STATE REGISTRATION | PRINTING AND |
| CLASS | AND SERVICE FEES | AGENT FEES | FEES | POSTAGE |
|
| Class A | $29,442 | $13,446 | $16,350 | $4,651 |
| Class C | 96 | 13 | 1,467 | 3 |
| Class I | — | 2,641 | 16,185 | 853 |
| | | | | |
| Total | $29,538 | $16,100 | $34,002 | $5,507 |
Trustee expenses. The fund compensates each Trustee who is not an employee of the Advisor or its affiliates. The costs of paying Trustee compensation and expenses are allocated to each fund based on its net assets relative to other funds within the John Hancock group of funds complex.
Note 5 — Fund share transactions
Transactions in fund shares for the years ended July 31, 2014 and 2013 were as follows:
| | | | |
| | | Year ended 7-31-14 | Year ended 7-31-13 |
| | Shares | Amount | Shares | Amount |
| Class A shares | | | | |
|
| Sold | 352,741 | $4,727,994 | 598,682 | $7,132,228 |
| Distributions reinvested | 53,392 | 686,083 | 8,863 | 97,048 |
| Repurchased | (244,319) | (3,234,773) | (165,913) | (2,069,953) |
| | | | | |
| Net increase | 161,814 | $2,179,304 | 441,632 | $5,159,323 |
| |
| Class C shares1 | | | | |
|
| Sold | 13,316 | $185,047 | — | $— |
| | | | | |
| Net increase | 13,316 | $185,047 | — | $— |
| |
| Class I shares | | | | |
|
| Sold | 68,093 | $915,886 | 1,547,473 | $18,191,155 |
| Distributions reinvested | 18,456 | 237,709 | 46,111 | 505,838 |
| Repurchased | (226,487) | (2,906,213) | (1,377,727) | (16,666,845) |
| | | | | |
| Net increase (decrease) | (139,938) | ($1,752,618) | 215,857 | $2,030,148 |
| |
| Class NAV shares | | | | |
|
| Sold | 14,269,525 | $195,651,871 | 455,014 | $5,404,494 |
| Distributions reinvested | 8,283,679 | 106,445,280 | 4,138,279 | 45,314,159 |
| Repurchased | (4,993,920) | (67,564,077) | (10,936,314) | (124,803,509) |
| | | | | |
| Net increase (decrease) | 17,559,284 | $234,533,074 | (6,343,021) | ($74,084,856) |
| |
| Total net increase (decrease) | 17,594,476 | $235,144,807 | (5,685,532) | ($66,895,385) |
|
1 The inception date for Class C shares is 6-27-14.
Affiliates of the fund owned 22% of shares of beneficial interest of Class A shares, 54% of Class C shares and 100% of beneficial interest of Class NAV shares on July 31, 2014.
| |
| 26 | Fundamental Large Cap Value Fund | Annual report |
Note 6 — Purchase and sale of securities
Purchases and sales of securities amounted to $386,462,287 and $247,185,921, respectively, for the year ended July 31, 2014.
Note 7 — Investment by affiliated funds
Certain investors in the fund are affiliated funds that are managed by the Advisor and its affiliates. The affiliated funds do not invest in the fund for the purpose of exercising management or control; however, this investment may represent a significant portion of the fund’s net assets. At July 31, 2014, funds within the John Hancock group of funds complex held 98.8% of the fund’s net assets. The following funds had an affiliate ownership of 5% or more of the fund’s net assets:
| | | |
| | AFFILIATE | | |
| FUND | CONCENTRATION | | |
| | |
| John Hancock Lifestyle Aggressive Portfolio | 14.17% | | |
| John Hancock Lifestyle Growth Portfolio | 35.51% | | |
| John Hancock Lifestyle Balanced Portfolio | 26.60% | | |
| John Hancock Lifestyle Moderate Portfolio | 12.19% | | |
| |
| Annual report | Fundamental Large Cap Value Fund | 27 |
Auditor’s report
Report of Independent Registered Public Accounting Firm
To the Board of Trustees of John Hancock Funds II and Shareholders of
John Hancock Fundamental Large Cap Value Fund:
In our opinion, the accompanying statement of assets and liabilities, including the schedule of investments, and the related statements of operations and of changes in net assets and the financial highlights present fairly, in all material respects, the financial position of the John Hancock Fundamental Large Cap Value Fund (the “Fund”) at July 31, 2014, the results of its operations for the year then ended, the changes in its net assets for each of the two years in the period then ended and the financial highlights for each of the periods indicated, in conformity with accounting principles generally accepted in the United States of America. These financial statements and financial highlights (hereafter referred to as “financial statements”) are the responsibility of the Fund’s management. Our responsibility is to express an opinion on these financial statements based on our audits. We conducted our audits of these financial statements in accordance with the standards of the Public Company Accounting Oversight Board (United States). Those standards require that we plan and perform the audit to obtain reasonable assurance about whether the financial statements are free of material misstatement. An audit includes examining, on a test basis, evidence supporting the amounts and disclosures in the financial statements, assessing the accounting principles used and significant estimates made by management, and evaluating the overall financial statement presentation. We believe that our audits, which included confirmation of securities at July 31, 2014 by correspondence with the custodian and brokers, provide a reasonable basis for our opinion.
PricewaterhouseCoopers LLP
Boston, Massachusetts
September 17, 2014
| |
| 28 | Fundamental Large Cap Value Fund | Annual report |
Tax information
Unaudited
For federal income tax purposes, the following information is furnished with respect to the distributions of the fund, if any, paid during its taxable year ended July 31, 2014.
The fund reports the maximum amount allowable of its net taxable income as eligible for the corporate dividends-received deduction.
The fund reports the maximum amount allowable of its net taxable income as qualified divided income as provided in the Jobs and Growth Tax Relief Reconciliation Act of 2003.
The fund paid $79,911,611 in capital gain dividends.
Eligible shareholders will be mailed a 2014 Form 1099-DIV in early 2015. This will reflect the tax character of all distributions paid in calendar year 2014.
Please consult a tax advisor regarding the tax consequences of your investment in the fund.
| |
| Annual report | Fundamental Large Cap Value Fund | 29 |
Continuation of Investment Advisory and Subadvisory Agreements
Evaluation of Advisory and Subadvisory Agreements by the Board of Trustees
This section describes the evaluation by the Board of Trustees (the Board) of John Hancock Funds II (the Trust) of the Advisory Agreement (the Advisory Agreement) with John Hancock Advisers, LLC (the Advisor) and the Subadvisory Agreement (the Subadvisory Agreement) with John Hancock Asset Management a division of Manulife Asset Management (US) LLC (the Subadvisor) for John Hancock Fundamental Large Cap Value Fund (the fund). The Advisory Agreement and Subadvisory Agreement are collectively referred to as the Agreements. Prior to the June 23–25, 2014 meeting at which the Agreements were approved, the Board also discussed and considered information regarding the proposed continuation of the Agreements at an in-person meeting held on May 27–29, 2014.
Approval of Advisory and Subadvisory Agreements
At in-person meetings held on June 23–25, 2014, the Board, including the Trustees who are not considered to be interested persons of the Trust under the Investment Company Act of 1940, as amended (the 1940 Act) (the Independent Trustees), reapproved for an annual period the continuation of the Advisory Agreement between the Trust and the Advisor and the Subadvisory Agreement between the Advisor and the Subadvisor with respect to the fund.
In considering the Advisory Agreement and the Subadvisory Agreement, the Board received in advance of the meetings a variety of materials relating to the fund, the Advisor and the Subadvisor, including comparative performance, fee and expense information for a peer group of similar funds prepared by an independent third-party provider of fund data, performance information for an applicable benchmark index; and, with respect to the Subadvisor, comparative performance information for comparably managed accounts, as applicable, and other information provided by the Advisor and the Subadvisor regarding the nature, extent and quality of services provided by the Advisor and the Subadvisor under their respective Agreements, as well as information regarding the Advisor’s revenues and costs of providing services to the fund and any compensation paid to affiliates of the Advisor. At the meetings at which the renewal of the Advisory Agreement and Subadvisory Agreement are considered, particular focus is given to information concerning fund performance, comparability of fees and total expenses, and profitability. However, the Board notes that the evaluation process with respect to the Advisor and the Subadvisor is an ongoing one. In this regard, the Board also took into account discussions with management and information provided to the Board at prior meetings with respect to the services provided by the Advisor and the Subadvisor to the fund, including quarterly performance reports prepared by management containing reviews of investment results and prior presentations from the Subadvisor with respect to the fund. The Board noted the affiliation of the Subadvisor with the Advisor, noting any potential conflicts of interest. The Board also considered the nature, quality, and extent of non-advisory services, if any, to be provided to the fund by the Advisor’s affiliates, including distribution services.
Throughout the process, the Board asked questions of and requested additional information from management. The Board is assisted by counsel for the Trust and the Independent Trustees are also separately assisted by independent legal counsel throughout the process. The Independent Trustees also received a memorandum from their independent legal counsel discussing the legal standards for their consideration of the proposed continuation of the Agreements and discussed the proposed continuation of the Agreements in private sessions with their independent legal counsel at which no representatives of management were present.
| |
| 30 | Fundamental Large Cap Value Fund | Annual report |
Approval of Advisory Agreement
In approving the Advisory Agreement with respect to the fund, the Board, including the Independent Trustees, considered a variety of factors, including those discussed below. The Board also considered other factors (including conditions and trends prevailing generally in the economy, the securities markets, and the industry) and does not treat any single factor as determinative, and each Trustee may attribute different weights to different factors. The Board’s conclusions may be based in part on its consideration of the advisory and subadvisory arrangements in prior years and on the Board’s ongoing regular review of fund performance and operations throughout the year.
Nature, extent, and quality of services. Among the information received by the Board from the Advisor relating to the nature, extent, and quality of services provided to the fund, the Board reviewed information provided by the Advisor relating to its operations and personnel, descriptions of its organizational and management structure, and information regarding the Advisor’s compliance and regulatory history, including its Form ADV. The Board also noted that on a regular basis it receives and reviews information from the Trust’s Chief Compliance Officer (CCO) regarding the fund’s compliance policies and procedures established pursuant to Rule 38a-1 under the 1940 Act. The Board also considered the Advisor’s risk management processes. The Board considered that the Advisor is responsible for the management of the day-to-day operations of the fund, including, but not limited to, general supervision of and coordination of the services provided by the Subadvisor, and is also responsible for monitoring and reviewing the activities of the Subadvisor and third-party service providers.
In considering the nature, extent, and quality of the services provided by the Advisor, the Trustees also took into account their knowledge of the Advisor’s management and the quality of the performance of the Advisor’s duties, through Board meetings, discussions and reports during the preceding year and through each Trustee’s experience as a Trustee of the Trust and of the other trusts in the complex.
In the course of their deliberations regarding the Advisory Agreement, the Board considered, among other things:
(a) the skills and competency with which the Advisor has in the past managed the Trust’s affairs and its subadvisory relationship, the Advisor’s oversight and monitoring of the Subadvisor’s investment performance and compliance programs, such as the Subadvisor’s compliance with fund policies and objectives, review of brokerage matters, including with respect to trade allocation and best execution and the Advisor’s timeliness in responding to performance issues;
(b) the background, qualifications and skills of the Advisor’s personnel;
(c) the Advisor’s compliance policies and procedures and its responsiveness to regulatory changes and mutual fund industry developments;
(d) the Advisor’s administrative capabilities, including its ability to supervise the other service providers for the fund;
(e) the financial condition of the Advisor and whether it has the financial wherewithal to provide a high level and quality of services to the fund; and
(f) the Advisor’s reputation and experience in serving as an investment advisor to the Trust and the benefit to shareholders of investing in funds that are part of a family of funds offering a variety of investments.
The Board concluded that the Advisor may reasonably be expected to continue to provide a high quality of services under the Advisory Agreement with respect to the fund.
| |
| Annual report | Fundamental Large Cap Value Fund | 31 |
Investment performance. In considering the fund’s performance, the Board noted that it reviews at its regularly scheduled meetings information about the fund’s performance results. In connection with the consideration of the Advisory Agreement, the Board:
(a) reviewed information prepared by management regarding the fund’s performance;
(b) considered the comparative performance of an applicable benchmark index;
(c) considered the performance of comparable funds, if any, as included in the report prepared by an independent third-party provider of fund data; and
(d) took into account the Advisor’s analysis of the fund’s performance and its plans and recommendations regarding the Trust’s subadvisory arrangements generally.
The Board noted that the fund underperformed its benchmark index for the one-year period ended December 31, 2013, and outperformed its benchmark index for the since inception period ended December 31, 2013. The Board also noted that the fund had outperformed its peer group average for the one- year and since inception periods ended December 31, 2013.
The Board noted that the fund had a relatively limited performance history since its inception on June 1, 2011. The Board also noted the fund’s favorable relative performance relative to the peer group for the one-year period.
The Board concluded that the fund’s performance has generally outperformed the historical performance of comparable funds and has been in line with or outperformed the fund’s benchmark index.
Fees and expenses. The Board reviewed comparative information prepared by an independent third-party provider of mutual fund data, including, among other data, the fund’s contractual and net management fees (and subadvisory fees, to the extent available) and total expenses as compared to similarly situated investment companies deemed to be comparable to the fund. The Board considered the fund’s ranking within a smaller group of peer funds chosen by the independent third-party provider, as well as the fund’s ranking within a broader group of funds. In comparing the fund’s contractual and net management fees to those of comparable funds, the Board noted that such fees include both advisory and administrative costs.
The Board noted that net management fees and total expenses for the fund are lower than the peer group median.
The Board also took into account management’s discussion with respect to the advisory/subadvisory fee structure, including the amount of the advisory fee retained by the Advisor after payment of the subadvisory fee. The Board also noted that the Advisor pays the subadvisory fee. In addition, the Board took into account that management had agreed, effective July 1, 2014, to implement an overall fee waiver across the complex, including the fund, which is discussed further below. The Board also noted management’s discussion of the fund’s expenses, as well as actions taken over the past several years to reduce the fund’s operating expenses. The Board also noted that, in addition, the Advisor is currently waiving fees and/or reimbursing expenses with respect to the fund and that the fund has an expense cap until November 2014, which reduces certain expenses for the fund. In addition the Board noted that the fund has breakpoints in its contractual management fee schedule that reduces management fees as assets increase. The Board reviewed information provided by the Advisor concerning the investment advisory fee charged by the Advisor or one of its advisory affiliates to other clients (including other funds in the complex) having similar investment mandates, if any. The Board considered any differences between the Advisor’s and Subadvisor’s services to the fund and the services they provide to other comparable clients or funds. The Board concluded that the advisory fee paid with respect to the fund is reasonable.
| |
| 32 | Fundamental Large Cap Value Fund | Annual report |
Profitability/indirect benefits. In considering the costs of the services to be provided and the profits to be realized by the Advisor and its affiliates (including the Subadvisor) from the Advisor’s relationship with the Trust, the Board:
(a) reviewed financial information of the Advisor;
(b) reviewed and considered information presented by the Advisor regarding the net profitability to the Advisor and its affiliates with respect to the fund;
(c) received and reviewed profitability information with respect to the John Hancock fund complex as a whole;
(d) received information with respect to the Advisor’s allocation methodologies used in preparing the profitability data;
(e) considered that the John Hancock insurance companies that are affiliates of the Advisor, as shareholders of the Trust directly or through their separate accounts, receive certain tax credits or deductions relating to foreign taxes paid and dividends received by certain funds of the Trust and noted that these tax benefits, which are not available to participants in qualified retirement plans under applicable income tax law, are reflected in the profitability analysis reviewed by the Board;
(f) considered that the Advisor also provides administrative services to the fund on a cost basis pursuant to an administrative services agreement;
(g) noted that affiliates of the Advisor provide transfer agency services and distribution services to the fund, and that the fund’s distributor also receives Rule 12b-1 payments to support distribution of the fund;
(h) noted that the fund’s Subadvisor is an affiliate of the Advisor;
(i) noted that the Advisor also derives reputational and other indirect benefits from providing advisory services to the fund;
(j) noted that the subadvisory fee for the fund is paid by the Advisor; and
(k) considered that the Advisor should be entitled to earn a reasonable level of profits in exchange for the level of services it provides to the fund and the entrepreneurial risk that it assumes as Advisor.
Based upon its review, the Board concluded that the level of profitability, if any, of the Advisor and its affiliates (including the Subadvisor) from their relationship with the fund was reasonable and not excessive.
Economies of scale. In considering the extent to which economies of scale would be realized as the fund grows and whether fee levels reflect these economies of scale for the benefit of fund shareholders, the Board:
(a) considered that the Advisor has agreed, effective July 1, 2014, to waive a portion of its management fee for the fund and each of the other John Hancock funds in the complex (except for those discussed below) (the Participating Portfolios) or otherwise reimburse the expenses of the Participating Portfolios as follows (the Reimbursement):
The Reimbursement shall equal, on an annualized basis, 0.01% of that portion of the aggregate net assets of all the Participating Portfolios that exceed $75 billion but is less than or equal to $125 billion, 0.0125% of that portion of the aggregate net assets of all the Participating Portfolios that exceed $125 billion but is less than or equal to $150 billion
| |
| Annual report | Fundamental Large Cap Value Fund | 33 |
and 0.015% of that portion of the aggregate net assets of all the Participating Portfolios that exceeds $150 billion. (The funds that are not Participating Portfolios are the funds of funds in the complex, which benefit from such overall management fee waiver through their investment in underlying portfolios that include Participating Portfolios, which are subject to the Reimbursement.)
(b) reviewed the fund’s advisory fee structure and concluded that: (i) the fund’s fee structure contains breakpoints at the subadvisory fee level and that such breakpoints are reflected as breakpoints in the advisory fees for the fund; and (ii) although economies of scale cannot be measured with precision, these arrangements permit shareholders of the fund to benefit from economies of scale if the fund grows. The Board also took into account management’s discussion of the fund’s advisory fee structure; and
(c) the Board also considered the effect of the fund’s growth in size on its performance and fees. The Board also noted that if the fund’s assets increase over time, the fund may realize other economies of scale.
Approval of Subadvisory Agreement
In making its determination with respect to approval of the Subadvisory Agreement, the Board reviewed:
(1) information relating to the Subadvisor’s business, including current subadvisory services to the Trust (and other funds in the John Hancock family of funds);
(2) the historical and current performance of the fund and comparative performance information relating to an applicable benchmark index and comparable funds; and
(3) the subadvisory fee for the fund, including any breakpoints, and to the extent available, comparable fee information prepared by an independent third party provider of fund data.
Nature, extent, and quality of services. With respect to the services provided by the Subadvisor, the Board received information provided to the Board by the Subadvisor, including the Subadvisor’s Form ADV, as well as took into account information presented throughout the past year. The Board considered the Subadvisor’s current level of staffing and its overall resources, as well as received information relating to the Subadvisor’s compensation program. The Board reviewed the Subadvisor’s history and investment experience, as well as information regarding the qualifications, background, and responsibilities of the Subadvisor’s investment and compliance personnel who provide services to the fund. The Board also considered, among other things, the Subadvisor’s compliance program and any disciplinary history. The Board also considered the Subadvisor’s risk assessment and monitoring process. The Board reviewed the Subadvisor’s regulatory history, including whether it was involved in any regulatory actions or investigations as well as material litigation, and any settlements and amelioratory actions undertaken, as appropriate. The Board noted that the Advisor conducts regular, periodic reviews of the Subadvisor and its operations, including regarding investment processes and organizational and staffing matters. The Board also noted that the Trust’s CCO and his staff conduct regular, periodic compliance reviews with the Subadvisor and present reports to the Independent Trustees regarding the same, which includes evaluating the regulatory compliance systems of the Subadvisor and procedures reasonably designed to assure compliance with the federal securities laws. The Board also took into account the financial condition of the Subadvisor.
The Board considered the Subadvisor’s investment process and philosophy. The Board took into account that the Subadvisor’s responsibilities include the development and maintenance of an investment program for the fund that is consistent with the fund’s investment objective, the selection of investment securities and the placement of orders for the purchase and sale of such
| |
| 34 | Fundamental Large Cap Value Fund | Annual report |
securities, as well as the implementation of compliance controls related to performance of these services. The Board also received information with respect to the Subadvisor’s brokerage policies and practices, including with respect to best execution and soft dollars.
Subadvisor compensation. In considering the cost of services to be provided by the Subadvisor and the profitability to the Subadvisor of its relationship with the fund, the Board noted that the fees under the Subadvisory Agreement are paid by the Advisor and not the fund. The Board also considered any potential conflicts of interest the Advisor might have in connection with the Subadvisory Agreement.
In addition, the Board considered other potential indirect benefits that the Subadvisor and its affiliates may receive from the Subadvisor’s relationship with the fund, such as the opportunity to provide advisory services to additional funds in the John Hancock fund complex and reputational benefits.
Subadvisory fee. The Board considered that the fund pays an advisory fee to the Advisor and that, in turn, the Advisor pays a subadvisory fee to the Subadvisor. As noted above, the Board also considered the fund’s subadvisory fee as compared to similarly situated investment companies deemed to be comparable to the fund as included in the report prepared by the independent third party provider of fund data, to the extent available. The Board noted that the limited size of the peer group was not sufficient for comparative purposes. The Board also took into account the sub-advisory fee paid by the Advisor to the Subadvisor with respect to the fund to fees charged by the Subadvisor to manage other subadvised portfolios and portfolios not subject to regulation under the 1940 Act, as applicable.
Subadvisor performance. As noted above, the Board considered the fund’s performance as compared to the fund’s peer group and the benchmark index and noted that the Board reviews information about the fund’s performance results at its regularly scheduled meetings. The Board noted the Advisor’s expertise and resources in monitoring the performance, investment style and risk-adjusted performance of the Subadvisor. The Board was mindful of the Advisor’s focus on the Subadvisor’s performance. The Board also noted the Subadvisor’s long-term performance record for similar accounts, as applicable.
The Board’s decision to approve the Subadvisory Agreement was based on a number of determinations, including the following:
(1) the Subadvisor has extensive experience and demonstrated skills as a manager;
(2) the performance of the fund has generally outperformed the historical performance of comparable funds and has been in line with or outperformed the fund’s benchmark index;
(3) the subadvisory fee is reasonable in relation to the level and quality of services being provided; and
(4) subadvisory fee breakpoints are reflected as breakpoints in the advisory fees for the fund in order to permit shareholders to benefit from economies of scale if the fund grows.
Based on the Board’s evaluation of all factors that the Board deemed to be material, including those factors described above, the Board, including the Independent Trustees, concluded that renewal of the Advisory Agreement and the Subadvisory Agreement would be in the best interest of the fund and its shareholders. Accordingly, the Board, and the Independent Trustees voting separately, approved the Advisory Agreement and Subadvisory Agreement for an additional one-year period.
| |
| Annual report | Fundamental Large Cap Value Fund | 35 |
Trustees and Officers
This chart provides information about the Trustees and Officers who oversee your John Hancock fund. Officers elected by the Trustees manage the day-to-day operations of the fund and execute policies formulated by the Trustees.
Independent Trustees
| | |
| Name, year of birth | Trustee | Number of John |
| Position(s) held with fund | of the | Hancock funds |
| Principal occupation(s) and other | Trust | overseen by |
| directorships during past 5 years | since1 | Trustee |
| |
| James M. Oates, Born: 1946 | 2005 | 230 |
|
| Managing Director, Wydown Group (financial consulting firm) (since 1994); Chairman and Director, |
| Emerson Investment Management, Inc. (since 2000); Independent Chairman, Hudson Castle Group, Inc. |
| (formerly IBEX Capital Markets, Inc.) (financial services company) (1997–2011); Director, Stifel Financial |
| (since 1996); Director, Investor Financial Services Corporation (1995–2007); Director, Connecticut River |
| Bancorp (since 1998); Director, Virtus Funds (formerly Phoenix Mutual Funds) (since 1988). | |
| |
| Trustee and Chairperson of the Board, John Hancock retail funds3 (since 2012); Trustee (2005–2006 and |
| since 2012) and Chairperson of the Board (since 2012), John Hancock Funds III; Trustee (since 2004) and |
| Chairperson of the Board (since 2005), John Hancock Variable Insurance Trust; Trustee and Chairperson |
| of the Board, John Hancock Funds II (since 2005). | | |
|
| |
| Charles L. Bardelis,2 Born: 1941 | 2005 | 230 |
|
| Director, Island Commuter Corp. (marine transport). | | |
| |
| Trustee, John Hancock retail funds3 (since 2012); Trustee, John Hancock Funds III (2005–2006 and |
| since 2012); Trustee, John Hancock Variable Insurance Trust (since 1988); Trustee, John Hancock |
| Funds II (since 2005). | | |
|
| |
| Peter S. Burgess,2 Born: 1942 | 2005 | 230 |
|
| Consultant (financial, accounting, and auditing matters) (since 1999); Certified Public Accountant; |
| Partner, Arthur Andersen (independent public accounting firm) (prior to 1999); Director, Lincoln |
| Educational Services Corporation (since 2004); Director, Symetra Financial Corporation (since 2010); |
| Director, PMA Capital Corporation (2004–2010). | | |
| |
| Trustee, John Hancock retail funds3 (since 2012); Trustee, John Hancock Funds III (2005–2006 and |
| since 2012); Trustee, John Hancock Variable Insurance Trust and John Hancock Funds II (since 2005). |
|
| |
| William H. Cunningham, Born: 1944 | 2012 | 230 |
|
| Professor, University of Texas, Austin, Texas (since 1971); former Chancellor, University of Texas System |
| and former President of the University of Texas, Austin, Texas; Director, LIN Television (since 2009); |
| Chairman (since 2009) and Director (since 2006), Lincoln National Corporation (insurance); Director, |
| Resolute Energy Corporation (since 2009); Director, Southwest Airlines (since 2000); former Director, |
| Introgen (manufacturer of biopharmaceuticals) (until 2008); former Director, Hicks Acquisition Company I, |
| Inc. (until 2007); former Director, Texas Exchange Bank, SSB (formerly Bank of Crowley) (until 2009); |
| former Advisory Director, JP Morgan Chase Bank (formerly Texas Commerce Bank–Austin) (until 2009). |
| |
| Trustee, John Hancock retail funds3 (since 1986); Trustee, John Hancock Variable Insurance Trust |
| (since 2012); Trustee, John Hancock Funds II (2005–2006 and since 2012). | | |
| |
| 36 | Fundamental Large Cap Value Fund | Annual report |
Independent Trustees (continued)
| | |
| Name, Year of Birth | Trustee | Number of John |
| Position(s) held with Fund | of the | Hancock funds |
| Principal occupation(s) and other | Trust | overseen by |
| directorships during past 5 years | since1 | Trustee |
| |
| Grace K. Fey, Born: 1946 | 2008 | 230 |
|
| Chief Executive Officer, Grace Fey Advisors (since 2007); Director and Executive Vice President, Frontier |
| Capital Management Company (1988–2007); Director, Fiduciary Trust (since 2009). | |
| |
| Trustee, John Hancock retail funds3 (since 2012); Trustee, John Hancock Variable Insurance Trust and |
| John Hancock Funds II (since 2008). | | |
|
| |
| Theron S. Hoffman,2 Born: 1947 | 2008 | 230 |
|
| Chief Executive Officer, T. Hoffman Associates, LLC (consulting firm) (since 2003); Director, The Todd |
| Organization (consulting firm) (2003–2010); President, Westport Resources Management (investment |
| management consulting firm) (2006–2008); Senior Managing Director, Partner, and Operating Head, |
| Putnam Investments (2000–2003); Executive Vice President, The Thomson Corp. (financial and legal |
| information publishing) (1997–2000). | | |
| |
| Trustee, John Hancock retail funds3 (since 2012); Trustee, John Hancock Variable Insurance Trust and |
| John Hancock Funds II (since 2008). | | |
|
| |
| Deborah C. Jackson, Born: 1952 | 2012 | 230 |
|
| President, Cambridge College, Cambridge, Massachusetts (since 2011); Chief Executive Officer, |
| American Red Cross of Massachusetts Bay (2002–2011); Board of Directors of Eastern Bank Corporation |
| (since 2001); Board of Directors of Eastern Bank Charitable Foundation (since 2001); Board of Directors |
| of American Student Assistance Corporation (1996–2009); Board of Directors of Boston Stock Exchange |
| (2002–2008); Board of Directors of Harvard Pilgrim Healthcare (health benefits company) (2007–2011). |
| |
| Trustee, John Hancock retail funds3 (since 2008); Trustee of John Hancock Variable Insurance Trust and |
| John Hancock Funds II (since 2012). | | |
|
| |
| Hassell H. McClellan, Born: 1945 | 2005 | 230 |
|
| Trustee, Virtus Variable Insurance Trust (formerly Phoenix Edge Series Funds) (since 2008); Director, The |
| Barnes Group (since 2010); Associate Professor, The Wallace E. Carroll School of Management, Boston |
| College (retired 2013). | | |
| |
| Trustee, John Hancock retail funds3 (since 2012); Trustee, John Hancock Funds III (2005–2006 and |
| since 2012); Trustee, John Hancock Variable Insurance Trust and John Hancock Funds II (since 2005). |
|
| |
| Steven R. Pruchansky, Born: 1944 | 2012 | 230 |
|
| Chairman and Chief Executive Officer, Greenscapes of Southwest Florida, Inc. (since 2000); Director |
| and President, Greenscapes of Southwest Florida, Inc. (until 2000); Member, Board of Advisors, First |
| American Bank (until 2010); Managing Director, Jon James, LLC (real estate) (since 2000); Director, |
| First Signature Bank & Trust Company (until 1991); Director, Mast Realty Trust (until 1994); President, |
| Maxwell Building Corp. (until 1991). | | |
| |
| Trustee (since 1992) and Chairperson of the Board (2011–2012), John Hancock retail funds3; Trustee and |
| Vice Chairperson of the Board, John Hancock retail funds,3 John Hancock Variable Insurance Trust, and |
| John Hancock Funds II (since 2012). | | |
| |
| Annual report | Fundamental Large Cap Value Fund | 37 |
Independent Trustees (continued)
| | |
| Name, Year of Birth | Trustee | Number of John |
| Position(s) held with Fund | of the | Hancock funds |
| Principal occupation(s) and other | Trust | overseen by |
| directorships during past 5 years | since1 | Trustee |
| |
| Gregory A. Russo, Born: 1949 | 2012 | 230 |
|
| Director and Audit Committee Chairman (since 2012), and Member, Audit Committee and Finance |
| Committee (since 2011), NCH Healthcare System, Inc. (holding company for multi-entity healthcare |
| system); Director and Member of Finance Committee, The Moorings, Inc. (nonprofit continuing care |
| community) (since 2012); Vice Chairman, Risk & Regulatory Matters, KPMG LLP (KPMG) (2002–2006); |
| Vice Chairman, Industrial Markets, KPMG (1998–2002); Chairman and Treasurer, Westchester County, |
| New York, Chamber of Commerce (1986–1992); Director, Treasurer, and Chairman of Audit and |
| Finance Committees, Putnam Hospital Center (1989–1995); Director and Chairman of Fundraising |
| Campaign, United Way of Westchester and Putnam Counties, New York (1990–1995). | |
| |
| Trustee, John Hancock retail funds3 (since 2008); Trustee, John Hancock Variable Insurance Trust and |
| John Hancock Funds II (since 2012). | | |
| |
| |
| Non-Independent Trustees4 | | |
| | | |
| Name, year of birth | Trustee | Number of John |
| Position(s) held with fund | of the | Hancock funds |
| Principal occupation(s) and other | Trust | overseen by |
| directorships during past 5 years | since1 | Trustee |
| |
| Craig Bromley, Born: 1966 | 2012 | 230 |
|
| President, John Hancock Financial Services (since 2012); Senior Executive Vice President and General |
| Manager, U.S. Division, Manulife Financial Corporation (since 2012); President and Chief Executive |
| Officer, Manulife Insurance Company (Manulife Japan) (2005–2012, including prior positions). |
| |
| Trustee, John Hancock retail funds,3 John Hancock Variable Insurance Trust, and John Hancock |
| Funds II (since 2012). | | |
|
| |
| Warren A. Thomson, Born: 1955 | 2012 | 230 |
|
| Senior Executive Vice President and Chief Investment Officer, Manulife Financial Corporation and The |
| Manufacturers Life Insurance Company (since 2009); Chairman and Chief Executive Officer, Manulife |
| Asset Management (since 2001, including prior positions); Director (since 2006), and President and |
| Chief Executive Officer (since 2013), Manulife Asset Management Limited; Director and Chairman, |
| Hancock Natural Resources Group, Inc. (since 2013). | | |
| |
| Trustee, John Hancock retail funds,3 John Hancock Variable Insurance Trust, and John Hancock |
| Funds II (since 2012). | | |
| |
| |
| Principal officers who are not Trustees | | |
| | | |
| Name, year of birth | | Officer |
| Position(s) held with fund | | of the |
| Principal occupation(s) and other | | Trust |
| directorships during past 5 years | | since |
| |
| Andrew G. Arnott, Born: 1971 | | 2009 |
|
| President | | |
| Senior Vice President, John Hancock Financial Services (since 2009); Director and Executive Vice |
| President, John Hancock Advisers, LLC (since 2005, including prior positions); Director and Executive |
| Vice President, John Hancock Investment Management Services, LLC (since 2006, including prior |
| positions); President, John Hancock Funds, LLC (since 2004, including prior positions); President |
| (effective 3-13-14) and Executive Vice President, John Hancock retail funds,3 John Hancock Variable |
| Insurance Trust, and John Hancock Funds II (since 2007, including prior positions). | |
| |
| 38 | Fundamental Large Cap Value Fund | Annual report |
| |
| Principal officers who are not Trustees (continued) | |
| |
| Name, Year of Birth | Officer |
| Position(s) held with Fund | of the |
| Principal occupation(s) and other | Trust |
| directorships during past 5 years | since |
| |
| John J. Danello, Born: 1955 | 2006 |
|
| Senior Vice President, Secretary, and Chief Legal Officer | |
| Vice President and Chief Counsel, John Hancock Wealth Management (since 2005); Senior Vice | |
| President (since 2007) and Chief Legal Counsel (2007–2010), John Hancock Funds, LLC and The | |
| Berkeley Financial Group, LLC; Senior Vice President (since 2006, including prior positions) and Chief |
| Legal Officer and Secretary (since 2014), John Hancock retail funds3 and John Hancock Variable | |
| Insurance Trust; Vice President, John Hancock Life & Health Insurance Company (since 2009); | |
| Vice President, John Hancock Life Insurance Company (USA) and John Hancock Life Insurance | |
| Company of New York (since 2010); and Senior Vice President, Secretary, and Chief Legal Counsel | |
| (2007–2014, including prior positions) of John Hancock Advisers, LLC and John Hancock Investment |
| Management Services, LLC. | |
|
| |
| Francis V. Knox, Jr., Born: 1947 | 2005 |
|
| Chief Compliance Officer | |
| Vice President, John Hancock Financial Services (since 2005); Chief Compliance Officer, John Hancock |
| retail funds,3 John Hancock Variable Insurance Trust, John Hancock Funds II, John Hancock Advisers, |
| LLC, and John Hancock Investment Management Services, LLC (since 2005). | |
|
| |
| Charles A. Rizzo, Born: 1957 | 2007 |
|
| Chief Financial Officer | |
| Vice President, John Hancock Financial Services (since 2008); Senior Vice President, John Hancock | |
| Advisers, LLC and John Hancock Investment Management Services, LLC (since 2008); Chief Financial |
| Officer, John Hancock retail funds,3 John Hancock Variable Insurance Trust and John Hancock | |
| Funds II (since 2007). | |
|
| |
| Salvatore Schiavone, Born: 1965 | 2009 |
|
| Treasurer | |
| Assistant Vice President, John Hancock Financial Services (since 2007); Vice President, John Hancock |
| Advisers, LLC and John Hancock Investment Management Services, LLC (since 2007); Treasurer, | |
| John Hancock retail funds3 (since 2007, including prior positions); Treasurer, John Hancock Variable |
| Insurance Trust and John Hancock Funds II (since 2010 and 2007–2009, including prior positions). | |
The business address for all Trustees and Officers is 601 Congress Street, Boston, Massachusetts 02210-2805.
1 Each Trustee holds office until his or her successor is elected and qualified, or until the Trustee’s death, retirement, resignation, or removal.
2 Member of the Audit Committee.
3 “John Hancock retail funds” comprises John Hancock Funds III and 37 other John Hancock funds consisting of 27 series of other John Hancock trusts and 10 closed-end funds.
4 Because Messrs. Bromley and Thomson are senior executives or directors of the advisor and/or its affiliates, each of them is considered an “interested person of the fund,” as defined in the Investment Company Act of 1940.
| |
| Annual report | Fundamental Large Cap Value Fund | 39 |
More information
| |
| Trustees | Investment advisor |
| James M. Oates, Chairperson | John Hancock Advisers, LLC |
| Steven R. Pruchansky, Vice Chairperson | |
| Charles L. Bardelis* | Subadvisor |
| Craig Bromley† | John Hancock Asset Management a division of |
| Peter S. Burgess* | Manulife Asset Management (US) LLC |
| William H. Cunningham | |
| Grace K. Fey | Principal distributor |
| Theron S. Hoffman* | John Hancock Funds, LLC |
| Deborah C. Jackson | |
| Hassell H. McClellan | Custodian |
| Gregory A. Russo | State Street Bank and Trust Company |
| Warren A. Thomson† | |
| | Transfer agent |
| Officers | John Hancock Signature Services, Inc. |
| Andrew G. Arnott |
| President | Legal counsel |
| | K&L Gates LLP |
| John J. Danello | |
| Senior Vice President, Secretary, | Independent registered |
| and Chief Legal Officer | public accounting firm |
| | PricewaterhouseCoopers LLP |
| Francis V. Knox, Jr. | |
| Chief Compliance Officer | |
| | |
| Charles A. Rizzo | |
| Chief Financial Officer | |
| | |
| Salvatore Schiavone | |
| Treasurer | |
| |
| *Member of the Audit Committee | |
| †Non-Independent Trustee | |
The fund’s proxy voting policies and procedures, as well as the fund’s proxy voting record for the most recent twelve-month period ended June 30, are available free of charge on the Securities and Exchange Commission (SEC) website at sec.gov or on our website.
The fund’s complete list of portfolio holdings, for the first and third fiscal quarters, is filed with the SEC on Form N-Q. The fund’s Form N-Q is available on our website and the SEC’s website, sec.gov, and can be reviewed and copied (for a fee) at the SEC’s Public Reference Room in Washington, DC. Call 800-SEC-0330 to receive information on the operation of the SEC’s Public Reference Room.
We make this information on your fund, as well as monthly portfolio holdings, and other fund details available on our website at jhinvestments.com or by calling 800-225-5291.
| | |
| You can also contact us: | | |
| 800-225-5291 | Regular mail: | Express mail: |
| jhinvestments.com | John Hancock Signature Services, Inc. | John Hancock Signature Services, Inc. |
| | P.O. Box 55913 | 30 Dan Road |
| | Boston, MA 02205-5913 | Canton, MA 02021 |
| |
| 40 | Fundamental Large Cap Value Fund | Annual report |

800-225-5291
800-231-5469 TDD
800-338-8080 EASI-Line
jhinvestments.com
| |
| This report is for the information of the shareholders of John Hancock Fundamental Large Cap Value Fund. | |
| It is not authorized for distribution to prospective investors unless preceded or accompanied by a prospectus. | 374A 7/14 |
| MF195339 | 9/14 |

A look at performance
Total returns for the period ended July 31, 2014
| | | | | | | | | | |
| | | Average annual total returns (%) | | Cumulative total returns (%) | |
| | | with maximum sales charge | | | with maximum sales charge | |
|
| | | | | Since | | | | | Since |
| | | 1-year | 5-year | 10-year | inception1 | | 1-year | 5-year | 10-year | inception1 |
|
| Class A | | 10.79 | — | — | 13.13 | | 10.79 | — | — | 47.82 |
|
| Class I2 | | 17.01 | — | — | 15.46 | | 17.01 | — | — | 57.65 |
|
| Index† | | 16.37 | — | — | 14.14 | | 16.37 | — | — | 52.04 |
|
Performance figures assume all distributions have been reinvested. Figures reflect maximum sales charges on Class A shares of 5.00%. Sales charges are not applicable to Class I shares.
The expense ratios of the fund, both net (including any fee waivers and/or expense limitations) and gross (excluding any fee waivers and/or expense limitations), are set forth according to the most recent publicly available prospectuses for the fund and may differ from those disclosed in the Financial highlights tables in this report. Had the fee waivers and expense limitations not been in place, gross expenses would apply. The expense ratios are as follows:
| | | | | | | | | | |
| | Class A | Class I | | | | | | | | |
| Gross (%) | 2.77 | 3.22 | | | | | | | | |
| Net (%) | 1.30 | 0.94 | | | | | | | | |
Please refer to the most recent prospectuses and annual report for more information on expenses and any expense limitation arrangements for each class.
The returns reflect past results and should not be considered indicative of future performance. The return and principal value of an investment will fluctuate so that shares, when redeemed, may be worth more or less than their original cost. Due to market volatility, the fund’s current performance may be higher or lower than the performance shown. For current to the most recent month-end performance data, please call 800–225–5291 or visit the fund’s website at jhinvestments.com.
The performance table above and the chart on the next page do not reflect the deduction of taxes that a shareholder may pay on fund distributions or on the redemption of fund shares. The fund’s performance results reflect any applicable fee waivers or expense reductions, without which the expenses would increase and results would have been less favorable.
† Index is the Russell 3000 Index.
See the following page for footnotes.
| |
| 6 | Fundamental All Cap Core Fund | Annual report |

| | | | |
| | | With maximum | Without | |
| | Start date | sales charge | sales charge | Index |
|
| Class I2 | 6-1-11 | $15,765 | $15,765 | $15,204 |
|
Russell 3000 Index is an unmanaged index of the 3,000 largest U.S. companies based on total market capitalization, which represents approximately 98% of the investable U.S. equity market.
It is not possible to invest directly in an index. Index figures do not reflect expenses or sales charges, which would have resulted in lower values.
Footnotes related to performance pages
1 From 6-11-11.
2 For certain types of investors as described in the fund’s prospectus.
| |
| Annual report | Fundamental All Cap Core Fund | 7 |
Management’s discussion of
Fund performance
John Hancock Asset Management a Division of Manulife Asset Management (US) LLC
U.S. stocks across all market caps rallied for the year ended July 31, 2014, with large-and mid-cap stocks beating small-cap securities. Stocks gained momentum last fall as Congress reached a budget agreement to end the federal government shutdown, then gathered steam as economic growth improved and many corporations reported better-than-expected earnings. However, the market made little progress in the first quarter, held back as severe winter weather dampened economic growth and financial turmoil rocked emerging markets. Small-cap stocks fell behind as investors became more risk averse. An improving job outlook, better economic data, and favorable corporate earnings helped revive the rally in the second quarter, outweighing concerns over mounting geopolitical tensions and potentially higher interest rates.
Over the twelve-month reporting period, John Hancock Fundamental All Cap Core Fund’s Class A shares advanced 16.62% excluding sales charges, versus the 16.37% gain of its benchmark, the Russell 3000 Index. Security selection in information technology and consumer discretionary helped versus the index. Top contributors included payment-processing technology company VeriFone Systems, Inc. and energy services company Weatherford International PLC, which is not in the index. VeriFone’s shares benefited from improving expectations under new management and more people worldwide paying with plastic. We locked in profits for the fund and sold VeriFone before period end. Weatherford’s stock rose, as the company refocused on its core businesses, divested less profitable operations, and cut costs. By contrast, healthcare and financials detracted from relative performance. Two of the biggest individual disappointments, however, were consumer discretionary stocks Amazon.com and Blue Nile, Inc. Shares of e-commerce leader Amazon.com lagged as the company’s investments for long-term growth pressured near-term profits. Online jewelry retailer Blue Nile’s stock sank, hurt by rising diamond prices and the challenges of moving beyond the engagement ring category.
This commentary reflects the views of the portfolio managers through the end of the period discussed in this report. As such, they are in no way guarantees of future events and are not intended to be used as investment advice or a recommendation regarding any specific security. They are also subject to change at any time as market and other conditions warrant.
Past performance does not guarantee future results.
| |
| 8 | Fundamental All Cap Core Fund | Annual report |
Your expenses
These examples are intended to help you understand your ongoing operating expenses of investing in the fund so you can compare these costs with the ongoing costs of investing in other mutual funds.
Understanding fund expenses
As a shareholder of the fund, you incur two types of costs:
▪ Transaction costs, which include sales charges (loads) on purchases or redemptions (varies by share class), minimum account fee charge, etc.
▪ Ongoing operating expenses, including management fees, distribution and service fees (if applicable), and other fund expenses.
We are going to present only your ongoing operating expenses here.
Actual expenses/actual returns
This example is intended to provide information about the fund’s actual ongoing operating expenses and is based on the fund’s actual return. It assumes an account value of $1,000.00 on February 1, 2014, with the same investment held until July 31, 2014.
| | | | |
| | | | Expenses paid | |
| | Account value | Ending value | during period | Annualized |
| | on 2-1-2014 | on 7-31-2014 | ended 7-31-20141,2,3 | expense ratio |
|
| Class A | $1,000.00 | $1,051.40 | $6.61 | 1.30% |
|
| Class C | 1,000.00 | 988.30 | 1.85 | 2.00% |
|
| Class I | 1,000.00 | 1,053.40 | 4.79 | 0.94% |
|
| Class NAV | 1,000.00 | 989.70 | 0.83 | 0.87% |
|
Together with the value of your account, you may use this information to estimate the operating expenses that you paid over the period. Simply divide your account value at July 31, 2014, by $1,000.00, then multiply it by the “expenses paid” for your share class from the table above. For example, for an account value of $8,600.00, the operating expenses should be calculated as follows:
| |
| Annual report | Fundamental All Cap Core Fund | 9 |
Your expenses
Hypothetical example for comparison purposes
This table allows you to compare the fund’s ongoing operating expenses with those of any other fund. It provides an example of the fund’s hypothetical account values and hypothetical expenses based on each class’s actual expense ratio and an assumed 5% annualized return before expenses (which is not the fund’s actual return). It assumes an account value of $1,000.00 on February 1, 2014, with the same investment held until July 31, 2014. Look in any other fund shareholder report to find its hypothetical example and you will be able to compare these expenses. Please remember that these hypothetical account values and expenses may not be used to estimate the actual ending account balance or expenses you paid for the period.
| | | | |
| | | | Expenses paid | |
| | Account value | Ending value | during period | Annualized |
| | on 2-1-2014 | on 7-31-2014 | ended 7-31-20144 | expense ratio |
|
| Class A | $1,000.00 | $1,018.30 | $6.51 | 1.30% |
|
| Class C | 1,000.00 | 1,014.90 | 9.99 | 2.00% |
|
| Class I | 1,000.00 | 1,020.10 | 4.71 | 0.94% |
|
| Class NAV | 1,000.00 | 1,020.50 | 4.36 | 0.87% |
|
Remember, these examples do not include any transaction costs, therefore, these examples will not help you to determine the relative total costs of owning different funds. If transaction costs were included, your expenses would have been higher. See the prospectuses for details regarding transaction costs.
1 Expenses are equal to the fund’s annualized expense ratio for Class A and Class I shares, multiplied by the average account value over the period, multiplied by 181/365 (to reflect the one-half year period).
2 Expenses are equal to the fund’s annualized expense ratio for Class C shares, multiplied by the average account value over the period, multiplied by 34/365 (to reflect the period).
3 Expenses are equal to the fund’s annualized expense ratio for Class NAV shares, multiplied by the average account value over the period, multiplied by 35/365 (to reflect the period).
4 Expenses are equal to the fund’s annualized expense ratio, multiplied by the average account value over the period, multiplied by 181/365 (to reflect the one-half year period).
| |
| 10 | Fundamental All Cap Core Fund | Annual report |
Portfolio summary
| | | | |
| Top 10 Holdings (44.1% of Net Assets on 7-31-14)1,2 | | | |
|
| Amazon.com, Inc. | 7.9% | | Lennar Corp., Class A | 3.9% |
| |
|
| Facebook, Inc., Class A | 6.2% | | American International Group, Inc. | 3.4% |
| |
|
| Bank of America Corp. | 4.7% | | The Goldman Sachs Group, Inc. | 3.3% |
| |
|
| Apple, Inc. | 4.3% | | Bankrate, Inc. | 3.2% |
| |
|
| QUALCOMM, Inc. | 4.1% | | EMC Corp. | 3.1% |
| |
|
| |
| Sector Composition1,3 | | | | |
|
| Information Technology | 29.9% | | Materials | 3.5% |
| |
|
| Financials | 27.2% | | Consumer Staples | 2.5% |
| |
|
| Consumer Discretionary | 20.7% | | Health Care | 1.4% |
| |
|
| Energy | 6.2% | | Short-Term Investments & Other | 2.8% |
| |
|
| Industrials | 5.8% | | | |
| | |
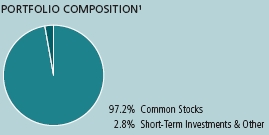
1 As a percentage of net assets on 7-31-14.
2 Cash and cash equivalents not included.
3 Large company stocks could fall out of favor. The stock prices of midsize and small companies can change more frequently and dramatically than those of large companies. Foreign investing has additional risks, such as currency and market volatility and political and social instability. Hedging and other strategic transactions may increase volatility and result in losses if not successful. Illiquid securities may be difficult to sell at a price approximating their value. Sector investing is subject to greater risks than the market as a whole. Because the fund may focus on particular sectors of the economy, its performance may depend on the performance of those sectors and investments focused in one sector may fluctuate more widely than investments diversified across sectors. Please see the fund’s prospectuses for additional risks.
| |
| Annual report | Fundamental All Cap Core Fund | 11 |
Fund’s investments
As of 7-31-14
| | |
| | Shares | Value |
| |
| Common Stocks 97.2% | | $144,475,356 |
|
| (Cost $144,436,087) | | |
| | | |
| Consumer Discretionary 20.7% | | 30,830,747 |
| | | |
| Hotels, Restaurants & Leisure 1.4% | | |
|
| Starbucks Corp. | 27,933 | 2,169,835 |
| | | |
| Household Durables 7.4% | | |
|
| Lennar Corp., Class A | 161,521 | 5,851,906 |
|
| NVR, Inc. (I) | 2,290 | 2,579,593 |
|
| Tempur Sealy International, Inc. (I) | 47,203 | 2,582,476 |
| | | |
| Internet & Catalog Retail 8.0% | | |
|
| Amazon.com, Inc. (I) | 37,652 | 11,784,698 |
|
| Blue Nile, Inc. (I) | 1,889 | 48,642 |
| | | |
| Specialty Retail 3.9% | | |
|
| Advance Auto Parts, Inc. | 16,405 | 1,986,810 |
|
| CarMax, Inc. (I) | 40,157 | 1,960,063 |
|
| Lowe’s Companies, Inc. | 39,012 | 1,866,724 |
| | | |
| Consumer Staples 2.5% | | 3,725,487 |
| | | |
| Beverages 2.5% | | |
|
| Diageo PLC, ADR | 11,891 | 1,429,536 |
|
| SABMiller PLC | 42,165 | 2,295,951 |
| | | |
| Energy 6.2% | | 9,202,152 |
| | | |
| Energy Equipment & Services 3.8% | | |
|
| National Oilwell Varco, Inc. | 19,395 | 1,571,771 |
|
| Schlumberger, Ltd. | 13,546 | 1,468,251 |
|
| Weatherford International PLC (I) | 114,422 | 2,559,620 |
| | | |
| Oil, Gas & Consumable Fuels 2.4% | | |
|
| Cabot Oil & Gas Corp. | 68,904 | 2,270,387 |
|
| Range Resources Corp. | 17,623 | 1,332,123 |
| | | |
| Financials 27.2% | | 40,399,406 |
| | | |
| Banks 11.3% | | |
|
| Bank of America Corp. | 455,072 | 6,939,848 |
|
| CIT Group, Inc. | 39,626 | 1,946,033 |
|
| Citigroup, Inc. | 74,362 | 3,637,045 |
|
| JPMorgan Chase & Company | 72,323 | 4,170,867 |
| | |
| 12 | Fundamental All Cap Core Fund | Annual report | See notes to financial statements |
| | |
| | Shares | Value |
| | | |
| Capital Markets 12.5% | | |
|
| AllianceBernstein Holding LP | 169,940 | $4,442,232 |
|
| Morgan Stanley | 126,061 | 4,076,813 |
|
| Northern Trust Corp. | 27,143 | 1,815,595 |
|
| T. Rowe Price Group, Inc. | 43,060 | 3,344,040 |
|
| The Goldman Sachs Group, Inc. | 28,590 | 4,942,353 |
| | | |
| Insurance 3.4% | | |
|
| American International Group, Inc. | 97,818 | 5,084,580 |
| | | |
| Health Care 1.4% | | 2,034,640 |
| | | |
| Health Care Providers & Services 1.4% | | |
|
| AMN Healthcare Services, Inc. (I) | 155,316 | 2,034,640 |
| | | |
| Industrials 5.8% | | 8,598,324 |
| | | |
| Aerospace & Defense 1.4% | | |
|
| TransDigm Group, Inc. | 12,431 | 2,087,414 |
| | | |
| Electrical Equipment 1.5% | | |
|
| Sensata Technologies Holding NV (I) | 47,912 | 2,215,451 |
| | | |
| Professional Services 1.2% | | |
|
| IHS, Inc., Class A (I) | 13,228 | 1,737,762 |
| | | |
| Trading Companies & Distributors 1.7% | | |
|
| United Rentals, Inc. (I) | 24,152 | 2,557,697 |
| | | |
| Information Technology 29.9% | | 44,393,796 |
| | | |
| Communications Equipment 4.1% | | |
|
| QUALCOMM, Inc. | 83,133 | 6,126,902 |
| | | |
| Internet Software & Services 14.4% | | |
|
| Bankrate, Inc. (I) | 286,215 | 4,825,585 |
|
| Facebook, Inc., Class A (I) | 126,014 | 9,154,917 |
|
| Google, Inc., Class A (I) | 4,327 | 2,507,713 |
|
| Google, Inc., Class C (I) | 4,327 | 2,473,313 |
|
| LinkedIn Corp., Class A (I) | 13,510 | 2,440,446 |
| | | |
| IT Services 1.1% | | |
|
| Blackhawk Network Holdings, Inc., Class B (I) | 58,850 | 1,641,327 |
| | | |
| Software 1.4% | | |
|
| Workday, Inc., Class A (I) | 25,119 | 2,105,977 |
| | | |
| Technology Hardware, Storage & Peripherals 8.9% | | |
|
| Apple, Inc. | 67,188 | 6,421,157 |
|
| EMC Corp. | 156,254 | 4,578,242 |
|
| NetApp, Inc. | 54,537 | 2,118,217 |
| | | |
| Materials 3.5% | | 5,290,804 |
| | | |
| Containers & Packaging 1.9% | | |
|
| Avery Dennison Corp. | 61,451 | 2,901,102 |
| | | |
| Paper & Forest Products 1.6% | | |
|
| Louisiana-Pacific Corp. (I) | 176,492 | 2,389,702 |
| | |
| See notes to financial statements | Annual report | Fundamental All Cap Core Fund | 13 |
| | |
| | Par value | Value |
| |
| Short-Term Investments 2.9% | | $4,268,000 |
|
| (Cost $4,268,000) | | |
| | | |
| Repurchase Agreement 2.9% | | 4,268,000 |
| Barclays Tri-Party Repurchase Agreement dated 7-31-14 at 0.060% to | | |
| be repurchased at $4,268,007 on 8-1-14, collateralized by $4,132,600 | | |
| Treasury Inflation Indexed Bonds, 0.1250% due 4-15-18 (valued at | | |
| $4,353,381, including interest) | $4,268,000 | 4,268,000 |
| |
| Total investments (Cost $148,704,087)† 100.1% | | $148,743,356 |
|
| |
| Other assets and liabilities, net (0.1%) | | ($110,729) |
|
| |
| Total net assets 100.0% | | $148,632,627 |
|
The percentage shown for each investment category is the total value of the category as a percentage of the net assets of the fund.
ADR American Depositary Receipts
(I) Non-income producing security.
† At 7-31-14, the aggregate cost of investment securities for federal income tax purposes was $148,781,569. Net unrealized depreciation aggregated $38,213, of which $3,287,546 related to appreciated investment securities and $3,325,759 related to depreciated investment securities.
| | |
| 14 | Fundamental All Cap Core Fund | Annual report | See notes to financial statements |
FINANCIAL STATEMENTS
Financial statements
Statement of assets and liabilities 7-31-14
This Statement of assets and liabilities is the fund’s balance sheet. It shows the value of what the fund owns, is due and owes. You’ll also find the net asset value and the maximum offering price per share.
| |
| Assets | |
|
| Investments, at value (Cost $148,704,087) | $148,743,356 |
| Cash | 121,432 |
| Foreign currency, at value (Cost $9,364) | 9,155 |
| Receivable for investments sold | 8,530 |
| Receivable for fund shares sold | 31,590 |
| Dividends and interest receivable | 22,872 |
| Receivable due from advisor | 14,026 |
| Other receivables and prepaid expenses | 41,603 |
| | |
| Total assets | 148,992,564 |
| |
| Liabilities | |
|
| Payable for investments purchased | 278,503 |
| Payable to affiliates | |
| Accounting and legal services fees | 1,954 |
| Transfer agent fees | 2,220 |
| Other liabilities and accrued expenses | 77,260 |
| | |
| Total liabilities | 359,937 |
| | |
| Net assets | $148,632,627 |
| |
| Net assets consist of | |
|
| Paid-in capital | $146,552,179 |
| Accumulated net realized gain (loss) on investments and foreign | |
| currency transactions | 2,041,388 |
| Net unrealized appreciation (depreciation) on investments and translation | |
| of assets and liabilities in foreign currencies | 39,060 |
| | |
| Net assets | $148,632,627 |
| |
| Net asset value per share | |
|
| Based on net asset values and shares outstanding — the fund has an | |
| unlimited number of shares authorized with no par value | |
| Class A ($14,375,359 ÷ 1,003,506 shares)1 | $14.33 |
| Class C ($120,542 ÷ 8,387 shares)1 | $14.37 |
| Class I ($5,726,107 ÷ 398,012 shares) | $14.39 |
| Class NAV ($128,410,619 ÷ 8,925,354 shares) | $14.39 |
| |
| Maximum offering price per share | |
|
| Class A (net asset value per share ÷ 95%)2 | $15.08 |
1 Redemption price per share is equal to net asset value less any applicable contingent deferred sales charge.
2 On single retail sales of less than $50,000. On sales of $50,000 or more and on group sales the offering price is reduced.
| | |
| See notes to financial statements | Annual report | Fundamental All Cap Core Fund | 15 |
FINANCIAL STATEMENTSStatement of operations For the year ended 7-31-14
This Statement of operations summarizes the fund’s investment income earned and expenses incurred in operating the fund. It also shows net gains (losses) for the period stated.
| |
| Investment income | |
|
| Dividends | $275,289 |
| Interest | 1,181 |
| Less foreign taxes withheld | (207) |
| | |
| Total investment income | 276,263 |
| |
| Expenses | |
|
| Investment management fees | 190,800 |
| Distribution and service fees | 35,064 |
| Accounting and legal services fees | 3,571 |
| Transfer agent fees | 20,229 |
| Trustees’ fees | 204 |
| State registration fees | 35,209 |
| Printing and postage | 4,551 |
| Professional fees | 36,246 |
| Custodian fees | 8,972 |
| Registration and filing fees | 41,020 |
| Expense recapture | 3,219 |
| Other | 6,592 |
| | |
| Total expenses | 385,677 |
| Less expense reductions | (86,897) |
| | |
| Net expenses | 298,780 |
| | |
| Net investment loss | (22,517) |
| |
| Realized and unrealized gain (loss) | |
|
| Net realized gain (loss) on | |
| Investments in unaffiliated issuers and foreign currency transactions | 2,342,303 |
| | |
| | 2,342,303 |
| Change in net unrealized appreciation (depreciation) of | |
| Investments in unaffiliated issuers and translation of assets and liabilities in | |
| foreign currencies | (1,423,246) |
| | |
| | (1,423,246) |
| | |
| Net realized and unrealized gain | 919,057 |
| | |
| Increase in net assets from operations | $896,540 |
| | |
| 16 | Fundamental All Cap Core Fund | Annual report | See notes to financial statements |
FINANCIAL STATEMENTS
Statements of changes in net assets
These Statements of changes in net assets show how the value of the fund’s net assets has changed during the last two periods. The difference reflects earnings less expenses, any investment gains and losses, distributions, if any, paid to shareholders and the net of fund share transactions.
| | |
| | Year | Year |
| | ended | ended |
| | 7-31-14 | 7-31-13 |
| |
| Increase (decrease) in net assets | | |
|
| From operations | | |
| Net investment income (loss) | ($22,517) | $40,724 |
| Net realized gain | 2,342,303 | 564,703 |
| Change in net unrealized appreciation (depreciation) | (1,423,246) | 1,403,057 |
| | | |
| Increase in net assets resulting from operations | 896,540 | 2,008,484 |
| | | |
| Distributions to shareholders | | |
| From net investment income | | |
| Class A | (7,360) | (26,317) |
| Class I | (11,647) | (10,376) |
| From net realized gain | | |
| Class A | (509,810) | (104,544) |
| Class I | (140,201) | (25,779) |
| | | |
| Total distributions | (669,018) | (167,016) |
| | | |
| From fund share transactions | 137,041,449 | 4,697,528 |
| | | |
| Total increase | 137,268,971 | 6,538,996 |
| |
| Net assets | | |
|
| Beginning of year | 11,363,656 | 4,824,660 |
| | | |
| End of year | $148,632,627 | $11,363,656 |
| | | |
| Undistributed net investment income | — | $2,944 |
| | |
| See notes to financial statements | Annual report | Fundamental All Cap Core Fund | 17 |
Financial highlights
The Financial highlights show how the fund’s net asset value for a share has changed during the period.
| | | | |
| CLASS A SHARES Period ended | 7-31-14 | 7-31-13 | 7-31-12 | 7-31-111 |
| |
| Per share operating performance | | | | |
|
| Net asset value, beginning of period | $12.88 | $9.96 | $9.73 | $10.00 |
| Net investment income (loss)2 | —3 | 0.06 | 0.02 | (0.01) |
| Net realized and unrealized gain (loss) on investments | 2.12 | 3.16 | 0.28 | (0.26) |
| Total from investment operations | 2.12 | 3.22 | 0.30 | (0.27) |
| Less distributions | | | | |
| From net investment income | (0.01) | (0.06) | (0.02) | — |
| From net realized gain | (0.66) | (0.24) | (0.05) | — |
| Total distributions | (0.67) | (0.30) | (0.07) | — |
| Net asset value, end of period | $14.33 | $12.88 | $9.96 | $9.73 |
| Total return (%)4,5 | 16.62 | 32.93 | 3.15 | (2.70)6 |
| |
| Ratios and supplemental data | | | | |
|
| Net assets, end of period (in millions) | $14 | $9 | $4 | $2 |
| Ratios (as a percentage of average net assets): | | | | |
| Expenses before reductions | 1.78 | 2.78 | 5.62 | 5.777 |
| Expenses including reductions | 1.30 | 1.30 | 1.30 | 1.307 |
| Net investment income (loss) | (0.02) | 0.51 | 0.24 | (0.33)7 |
| Portfolio turnover (%) | 44 | 59 | 47 | 8 |
1 Period from 6-1-11 (commencement of operations) to 7-31-11.
2 Based on average daily shares outstanding.
3 Less than $0.005 per share.
4 Does not reflect the effect of sales charges, if any.
5 Total returns would have been lower had certain expenses not been reduced during the applicable periods.
6 Not annualized.
7 Annualized.
| | | | |
| CLASS C SHARES Period ended | | | | 7-31-141 |
| |
| Per share operating performance | | | | |
|
| Net asset value, beginning of period | | | | $14.54 |
| Net investment loss2 | | | | (0.02) |
| Net realized and unrealized loss on investments | | | | (0.15) |
| Total from investment operations | | | | (0.17) |
| Net asset value, end of period | | | | $14.37 |
| Total return (%)3,4 | | | | (1.17)5 |
| |
| Ratios and supplemental data | | | | |
|
| Net assets, end of period (in millions) | | | | —6 |
| Ratios (as a percentage of average net assets): | | | | |
| Expenses before reductions | | | | 17.057 |
| Expenses including reductions | | | | 2.007 |
| Net investment loss | | | | (1.39)7 |
| Portfolio turnover (%) | | | | 448 |
1 The inception date for Class C shares is 6-27-14.
2 Based on average daily shares outstanding.
3 Does not reflect the effect of sales charges, if any.
4 Total returns would have been lower had certain expenses not been reduced during the applicable periods.
5 Not annualized.
6 Less than $500,000.
7 Annualized.
8 The portfolio turnover is shown for the period from 8-1-13 to 7-31-14.
| | |
| 18 | Fundamental All Cap Core Fund | Annual report | See notes to financial statements |
| | | | |
| CLASS I SHARES Period ended | 7-31-14 | 7-31-13 | 7-31-12 | 7-31-111 |
| |
| Per share operating performance | | | | |
|
| Net asset value, beginning of period | $12.93 | $9.99 | $9.74 | $10.00 |
| Net investment income2 | 0.05 | 0.09 | 0.07 | —3 |
| Net realized and unrealized gain (loss) on investments | 2.12 | 3.19 | 0.28 | (0.26) |
| Total from investment operations | 2.17 | 3.28 | 0.35 | (0.26) |
| Less distributions | | | | |
| From net investment income | (0.05) | (0.10) | (0.05) | — |
| From net realized gain | (0.66) | (0.24) | (0.05) | — |
| Total distributions | (0.71) | (0.34) | (0.10) | — |
| Net asset value, end of period | $14.39 | $12.93 | $9.99 | $9.74 |
| Total return (%)4 | 17.01 | 34.48 | 3.63 | (2.60)5 |
| |
| Ratios and supplemental data | | | | |
|
| Net assets, end of period (in millions) | $6 | $3 | $1 | $1 |
| Ratios (as a percentage of average net assets): | | | | |
| Expenses before reductions | 1.76 | 3.18 | 7.00 | 5.456 |
| Expenses including reductions | 0.94 | 0.91 | 0.84 | 0.846 |
| Net investment income | 0.37 | 0.80 | 0.75 | 0.146 |
| Portfolio turnover (%) | 44 | 59 | 47 | 8 |
1 Period from 6-1-11 (commencement of operations) to 7-31-11.
2 Based on average daily shares outstanding.
3 Less than $0.005 per share.
4 Total returns would have been lower had certain expenses not been reduced during the applicable periods.
5 Not annualized.
6 Annualized.
| | | | |
| CLASS NAV SHARES Period ended | | | | 7-31-141 |
| |
| Per share operating performance | | | | |
|
| Net asset value, beginning of period | | | | $14.54 |
| Net investment income2 | | | | —3 |
| Net realized and unrealized loss on investments | | | | (0.15) |
| Total from investment operations | | | | (0.15) |
| Net asset value, end of period | | | | $14.39 |
| Total return (%)4 | | | | (1.03)5 |
| |
| Ratios and supplemental data | | | | |
|
| Net assets, end of period (in millions) | | | | $128 |
| Ratios (as a percentage of average net assets): | | | | |
| Expenses before reductions | | | | 0.876 |
| Expenses including reductions | | | | 0.876 |
| Net investment loss | | | | (0.26)6 |
| Portfolio turnover (%) | | | | 447 |
1 The inception date for Class NAV shares is 6-26-14.
2 Based on average daily shares outstanding.
3 Less than $0.005 per share.
4 Total returns would have been lower had certain expenses not been reduced during the applicable periods.
5 Not annualized.
6 Annualized.
7 The portfolio turnover is shown for the period from 8-1-13 to 7-31-14.
| | |
| See notes to financial statements | Annual report | Fundamental All Cap Core Fund | 19 |
Notes to financial statements
Note 1 — Organization
John Hancock Fundamental All Cap Core Fund (the fund) is a series of John Hancock Funds II (the Trust), an open-end management investment company organized as a Massachusetts business trust and registered under the Investment Company Act of 1940, as amended (the 1940 Act). The investment objective of the fund is to seek long-term capital appreciation.
The fund may offer multiple classes of shares. The shares currently offered are detailed in the Statement of assets and liabilities. Class A and Class C shares are offered to all investors. Class I shares are offered to institutions and certain investors. Class NAV shares are offered to John Hancock affiliated funds of funds and certain 529 plans. Shareholders of each class have exclusive voting rights to matters that affect that class. The distribution and service fees if any, and transfer agent fees, state registration fees and printing and postage for each class may differ.
Note 2 — Significant accounting policies
The financial statements have been prepared in conformity with accounting principles generally accepted in the United States of America (US GAAP), which require management to make certain estimates and assumptions as of the date of the financial statements. Actual results could differ from those estimates and those differences could be significant. The fund intends to qualify as an investment company under Topic 946 of Accounting Standards Codification of US GAAP.
Events or transactions occurring after the end of the fiscal period through the date that the financial statements were issued have been evaluated in the preparation of the financial statements. The following summarizes the significant accounting policies of the fund:
Security valuation. Investments are stated at value as of the close of regular trading on the New York Stock Exchange (NYSE), normally at 4:00 P.M., Eastern Time. In order to value the securities, the fund uses the following valuation techniques: Equity securities held by the fund are valued at the last sale price or official closing price on the exchange where the security was acquired or most likely will be sold. In the event there were no sales during the day or closing prices are not available, the securities are valued using the last available bid price. Certain short-term securities with maturities of 60 days or less at the time of purchase are valued at amortized cost. Other portfolio securities and assets, for which reliable market quotations are not readily available, are valued at fair value as determined in good faith by the fund’s Pricing Committee following procedures established by the Board of Trustees. The frequency with which these fair valuation procedures are used cannot be predicted and fair value of securities may differ significantly from the value that would have been used had a ready market for such securities existed.
The fund uses a three-tier hierarchy to prioritize the pricing assumptions, referred to as inputs, used in valuation techniques to measure fair value. Level 1 includes securities valued using quoted prices in active markets for identical securities. Level 2 includes securities valued using other significant observable inputs. Observable inputs may include quoted prices for similar securities, interest rates, prepayment speeds and credit risk. Prices for securities valued using these inputs are received from independent pricing vendors and brokers and are based on an evaluation of the inputs described. Level 3 includes securities valued using significant unobservable inputs when market prices are not readily available or reliable, including the fund’s own assumptions in determining the fair value of investments. Factors used in determining value may include market or issuer specific events or trends, changes in interest rates and credit quality. The inputs or methodology used for valuing
| |
| 20 | Fundamental All Cap Core Fund | Annual report |
securities are not necessarily an indication of the risks associated with investing in those securities. Changes in valuation techniques may result in transfers into or out of an assigned level within the disclosure hierarchy.
The following is a summary of the values by input classification of the fund’s investments as of July 31, 2014, by major security category or type:
| | | | |
| | | | | LEVEL 3 |
| | | | LEVEL 2 | SIGNIFICANT |
| | TOTAL MARKET | LEVEL 1 | SIGNIFICANT | UNOBSERVABLE |
| | VALUE AT 7-31-14 | QUOTED PRICE | OBSERVABLE INPUTS | INPUTS |
|
| Common Stocks | | | | |
| Consumer Discretionary | $30,830,747 | $30,830,747 | — | — |
| Consumer Staples | 3,725,487 | 1,429,536 | $2,295,951 | — |
| Energy | 9,202,152 | 9,202,152 | — | — |
| Financials | 40,399,406 | 40,399,406 | — | — |
| Health Care | 2,034,640 | 2,034,640 | — | — |
| Industrials | 8,598,324 | 8,598,324 | — | — |
| Information Technology | 44,393,796 | 44,393,796 | — | — |
| Materials | 5,290,804 | 5,290,804 | — | — |
| Short-Term Investments | 4,268,000 | — | 4,268,000 | — |
| |
|
| Total Investments in | | | | |
| Securities | $148,743,356 | $142,179,405 | $6,563,951 | — |
Repurchase agreements. The fund may enter into repurchase agreements. When the fund enters into a repurchase agreement, it receives collateral that is held in a segregated account by the fund’s custodian, or for tri-party repurchase agreements, collateral is held at a third-party custodian bank in a segregated account for the benefit of the fund. The collateral amount is marked-to-market and monitored on a daily basis to ensure that the collateral held is in an amount not less than the principal amount of the repurchase agreement plus any accrued interest. Collateral received by the fund for repurchase agreements is disclosed in the Fund’s investments as part of the caption related to the repurchase agreement.
Repurchase agreements are typically governed by the terms and conditions of the Master Repurchase Agreement and/or Global Master Repurchase Agreement (collectively, MRA). Upon an event of default, the non-defaulting party may close out all transactions traded under the MRA and net amounts owed. Absent an event of default, the MRA does not result in an offset of the reported amounts of assets and liabilities in the Statement of assets and liabilities. In the event of a default by the counterparty, realization of the collateral proceeds could be delayed, during which time the collateral value may decline or the counterparty may have insufficient assets to pay back claims resulting from close-out of the transactions.
Security transactions and related investment income. Investment security transactions are accounted for on a trade date plus one basis for daily net asset value calculations. However, for financial reporting purposes, investment transactions are reported on trade date. Interest income is accrued as earned. Dividend income is recorded on the ex-date, except for dividends of foreign securities where the dividend may not be known until after the ex-date. In those cases, dividend income, net of withholding taxes, is recorded when the fund becomes aware of the dividends. Foreign taxes are provided for based on the fund’s understanding of the tax rules and rates that exist in the foreign markets in which it invests. Gains and losses on securities sold are determined on the basis of identified cost and may include proceeds from litigation.
Foreign taxes. The fund may be subject to withholding tax on income and/or capital gains or repatriation taxes imposed by certain countries in which the fund invests. Taxes are accrued based upon investment income, realized gains or unrealized appreciation.
| |
| Annual report | Fundamental All Cap Core Fund | 21 |
Line of credit. The fund may borrow from banks for temporary or emergency purposes, including meeting redemption requests that otherwise might require the untimely sale of securities. Pursuant to the fund’s custodian agreement, the custodian may loan money to the fund to make properly authorized payments. The fund is obligated to repay the custodian for any overdraft, including any related costs or expenses. The custodian may have a lien, security interest or security entitlement in any fund property that is not otherwise segregated or pledged, to the maximum extent permitted by law, to the extent of any overdraft.
In addition, the fund and other affiliated funds have entered into an agreement with Citibank N.A. that enables them to potentially participate in a $300 million unsecured committed line of credit. A commitment fee, payable at the end of each calendar quarter, based on the average daily unused portion of the line of credit, is charged to each participating fund on a pro rata basis and is reflected in other expenses on the Statement of operations. Commitment fees for the year ended July 31, 2014 were $458. For the year ended July 31, 2014, the fund had no borrowings under the line of credit.
Expenses. Within the John Hancock group of funds complex, expenses that are directly attributable to an individual fund are allocated to such fund. Expenses that are not readily attributable to a specific fund are allocated among all funds in an equitable manner, taking into consideration, among other things, the nature and type of expense and the fund’s relative net assets. Expense estimates are accrued in the period to which they relate and adjustments are made when actual amounts are known.
Class allocations. Income, common expenses and realized and unrealized gains (losses) are determined at the fund level and allocated daily to each class of shares based on the net assets of the class. Class-specific expenses, such as distribution and service fees, if any, transfer agent fees, state registration fees and printing and postage, for all classes, are calculated daily at the class level based on the appropriate net assets of each class and the specific expense rates applicable to each class.
Federal income taxes. The fund intends to continue to qualify as a regulated investment company by complying with the applicable provisions of the Internal Revenue Code and will not be subject to federal income tax on taxable income that is distributed to shareholders. Therefore, no federal income tax provision is required.
As of July 31, 2014, the fund had no uncertain tax positions that would require financial statement recognition, derecognition or disclosure. The fund’s federal tax returns are subject to examination by the Internal Revenue Service for a period of three years.
Distribution of income and gains. Distributions to shareholders from net investment income and net realized gains, if any, are recorded on the ex-date. The fund generally declares and pays dividends and capital gain distributions, if any, annually.
The tax character of distributions for the years ended July 31, 2014 and 2013 was as follows:
| | | | |
| | JULY 31, 2014 | JULY 31, 2013 | | |
| | |
| Ordinary Income | $146,012 | $78,547 | | |
| Long-Term Capital Gain | $523,006 | $88,469 | | |
| Total | $669,018 | $167,016 | | |
Distributions paid by the fund with respect to each class of shares are calculated in the same manner, at the same time and in the same amount, except for the effect of class level expenses that may be applied differently to each class. As of July 31, 2014, the components of distributable earnings on a tax basis consisted of $399,640 of undistributed ordinary income and $1,719,230 of undistributed long-term capital gains.
| |
| 22 | Fundamental All Cap Core Fund | Annual report |
Such distributions and distributable earnings, on a tax basis, are determined in conformity with income tax regulations, which may differ from US GAAP. Distributions in excess of tax basis earnings and profits, if any, are reported in the fund’s financial statements as a return of capital.
Capital accounts within the financial statements are adjusted for permanent book-tax differences. These adjustments have no impact on net assets or the results of operations. Temporary book-tax differences, if any, will reverse in a subsequent period. Book-tax differences are primarily attributable to wash sale loss deferrals.
Note 3 — Guarantees and indemnifications
Under the Trust’s organizational documents, its Officers and Trustees are indemnified against certain liabilities arising out of the performance of their duties to the Trust, including the fund. Additionally, in the normal course of business, the fund enters into contracts with service providers that contain general indemnification clauses. The fund’s maximum exposure under these arrangements is unknown, as this would involve future claims that may be made against the fund that have not yet occurred. The risk of material loss from such claims is considered remote.
Note 4 — Fees and transactions with affiliates
John Hancock Advisers, LLC (the Advisor or JHA) serves as investment advisor for the fund. Prior to January 1, 2014, John Hancock Investment Management Services, LLC (JHIMS) served as investment advisor for the fund. JHIMS and JHA have identical officers, directors and other personnel, and share common facilities and resources. Terms of the investment management contract with JHA are substantially identical to the former contract with JHIMS. In this report, depending on the context, the term “Advisor” shall refer to either JHA in its current capacity as investment advisor, or to JHIMS in its capacity as investment advisor prior to January 1, 2014. John Hancock Funds, LLC (the Distributor), an affiliate of the Advisor, serves as principal underwriter of the fund. The Advisor and the Distributor are indirect, wholly owned subsidiaries of Manulife Financial Corporation (MFC).
Management fee. The fund has an investment management agreement with the Advisor under which the fund pays a daily management fee to the Advisor equivalent, on an annual basis, to the sum of: a) 0.675% of the first $2.5 billion of the fund’s aggregate average daily net assets together with the net assets of Fundamental All Cap Core Trust, a series of John Hancock Variable Insurance Trust (combined aggregate average daily net assets); and b) 0.650% of the combined aggregate average daily net assets in excess of $2.5 billion. The Advisor has a subadvisory agreement with John Hancock Asset Management a division of Manulife Asset Management (US) LLC, an indirectly owned subsidiary of MFC and an affiliate of the Advisor. The fund is not responsible for payment of the subadvisory fees.
The Advisor has contractually agreed to waive a portion of its management fee and/or reimburse expenses for certain funds of the John Hancock complex, including the fund (the participating portfolios). The waiver equals, on an annualized basis, 0.01% of that portion of the aggregate net assets of all the participating portfolios that exceeds $75 billion but is less than or equal to $125 billion; 0.0125% of that portion of the aggregate net assets of all the participating portfolios that exceeds $125 billion but is less than or equal to $150 billion; and 0.015% of that portion of the aggregate net assets of all the participating portfolios that exceeds $150 billion. The amount of the reimbursement is calculated daily and allocated among all the participating portfolios in proportion to the daily net assets of each fund. This arrangement may be amended or terminated at any time by the Advisor upon notice to the fund and with the approval of the Board of Trustees.
The Advisor has contractually agreed to waive all or a portion of its management fee and reimburse or pay operating expenses of the fund to the extent necessary to maintain the fund’s total operating
| |
| Annual report | Fundamental All Cap Core Fund | 23 |
expense at 1.30%, 2.00% and 0.94% for Class A, Class C and Class I shares, respectively, excluding certain expenses such as taxes, brokerage commissions, interest expense, litigation and indemnification expenses and other extraordinary expenses. The current expense limitation agreement expires on November 30, 2015 for Class A, Class C and Class I shares, unless renewed by mutual agreement of the fund and the Advisor based upon determination that this is appropriate under the circumstances at the time.
Additionally, the Advisor has voluntarily agreed to waive other expenses excluding advisory fees, 12b-1 fees, service fees, transfer agent fees, blue sky fees, taxes, printing and postage, brokerage commission, interest expenses, acquired fund fees, litigation and indemnification expenses and other extraordinary expenses not incurred in the ordinary course of business. The waivers are such that these expenses will not exceed 0.20% of average net assets. This voluntary expense reimbursement may be terminated at any time by the Advisor on notice to the fund.
The expense reductions described above amounted to $55,433, $1,474 and $29,990 for Class A, Class C and Class I shares, respectively, for the year ended July 31, 2014. There were no expense reductions for Class NAV.
The investment management fees, including the impact of the waivers and reimbursement described above, incurred for the year ended July 31, 2014 were equivalent to a net annual effective rate of 0.37% of the fund’s average daily net assets.
Expense recapture. The Advisor may recapture operating expenses reimbursed or fees waived under previous expense limitation or waiver arrangements for a period of three years following the month in which the reimbursements or waivers occurred to the extent that the fund is below its expense limitation during this period. The table below outlines the amounts recovered during the year ended July 31, 2014, and the amount of waived or reimbursed expenses subject to potential recovery and the respective expiration dates.
| | | |
| AMOUNTS ELIGIBLE | AMOUNTS ELIGIBLE | AMOUNTS ELIGIBLE | AMOUNT RECOVERED |
| FOR RECOVERY THROUGH | FOR RECOVERY THROUGH | FOR RECOVERY THROUGH | DURING THE YEAR |
| JULY 1, 2015 | JULY 1, 2016 | JANUARY 1, 2017 | ENDED 7-31-14 |
|
| $126,520 | $108,512 | $84,977 | $3,219 |
Amounts recovered by class
| | | | | | | | | |
| CLASS A | CLASS C | CLASS I | CLASS NAV | TOTAL | | | | | |
| | | | | |
| $310 | $2 | $123 | $2,784 | $3,219 | | | | | |
Accounting and legal services. Pursuant to a service agreement, the fund reimburses the Advisor for all expenses associated with providing the administrative, financial, legal, accounting and recordkeeping services to the fund, including the preparation of all tax returns, periodic reports to shareholders and regulatory reports, among other services. These expenses are allocated to each share class based on its relative net assets at the time the expense was incurred. These accounting and legal services fees incurred for the year ended July 31, 2014 amounted to an annual rate of 0.01% of the fund’s average daily net assets.
Distribution and service plans. The fund has a distribution agreement with the Distributor. The fund has adopted distribution and service plans with respect to Class A and Class C pursuant to Rule 12b-1 under the 1940 Act, to pay the Distributor for services provided as the distributor of shares of the fund. The fund pays 0.30% and 1.00% for Class A shares and Class C shares, respectively, for distribution and service fees under these arrangements, expressed as an annual percentage of average daily net assets for each class of the fund’s shares.
| |
| 24 | Fundamental All Cap Core Fund | Annual report |
Sales charges. Class A shares are assessed up-front sales charges, which resulted in payments to the Distributor amounting to $56,808 for the year ended July 31, 2014. Of this amount, $9,551 was retained and used for printing prospectuses, advertising, sales literature and other purposes, $46,984 was paid as sales commissions to broker-dealers and $273 was paid as sales commissions to sales personnel of Signator Investors, Inc., a broker-dealer affiliate of the Advisor.
Class A and Class C shares may be subject to contingent deferred sales charges (CDSCs). Certain Class A shares that are acquired through purchases of $1 million or more and are redeemed within one year of purchase are subject to a 1.00% sales charge. Class C shares that are redeemed within one year of purchase are subject to a 1.00% CDSC. CDSCs are applied to the lesser of the current market value at the time of redemption or the original purchase cost of the shares being redeemed. Proceeds from CDSCs are used to compensate the Distributor for providing distribution-related services in connection with the sale of these shares. During the year ended July 31, 2014, there were no CDSCs received by the Distributor for Class A and Class C shares.
Transfer agent fees. The fund has a transfer agent agreement with John Hancock Signature Services, Inc. (Signature Services), an affiliate of the Advisor. The transfer agent fees paid to Signature Services are determined based on the cost to Signature Services (Signature Services Cost) of providing recordkeeping services. The Signature Services Cost includes a component of allocated John Hancock corporate overhead for providing transfer agent services to the fund and to all other John Hancock affiliated funds. It also includes out-of-pocket expenses, including payments made to third-parties for recordkeeping services provided to their clients who invest in one or more John Hancock funds. In addition, Signature Services Cost may be reduced by certain fees that Signature Services receives in connection with retirement and small accounts. Signature Services Cost is calculated monthly and allocated, as applicable, to five categories of share classes: Retail Share and Institutional Classes of Non-Municipal Bond Funds, Class R6 Shares, Retirement Share Classes and Municipal Bond Share Classes. Within each of these categories, the applicable costs are allocated to the affected John Hancock affiliated funds and/or classes, based on the relative average daily net assets.
Prior to October 1, 2013, Signature Services Cost was calculated monthly and allocated, as applicable, to four categories of share classes: Institutional Share Classes, Retirement Share Classes, Municipal Bond Share Classes and all other Retail Share Classes. Within each of these categories, the applicable costs were allocated to the affected John Hancock affiliated funds and/or classes, based on the relative average daily net assets.
Class level expenses. Class level expenses for the year ended July 31, 2014 were:
| | | | |
| | DISTRIBUTION | TRANSFER | STATE | PRINTING AND |
| CLASS | AND SERVICE FEES | AGENT FEES | REGISTRATION FEES | POSTAGE |
|
| A | $34,966 | $15,921 | $16,852 | $3,389 |
| C | $98 | $13 | $1,467 | $3 |
| I | — | $4,295 | $16,890 | $1,159 |
| Total | $35,064 | $20,229 | $35,209 | $4,551 |
Trustee expenses. The fund compensates each Trustee who is not an employee of the Advisor or its affiliates. The costs of paying Trustee compensation and expenses are allocated to each fund based on its net assets relative to other funds within the John Hancock group of funds complex.
| |
| Annual report | Fundamental All Cap Core Fund | 25 |
Note 5 — Fund share transactions
Transactions in fund shares for the years ended July 31, 2014 and 2013 were as follows:
| | | | |
| | | Year ended 7-31-14 | Year ended 7-31-13 |
| | Shares | Amount | Shares | Amount |
| Class A shares | | | | |
|
| Sold | 408,569 | $5,649,622 | 403,125 | $4,734,347 |
| Distributions reinvested | 28,203 | 390,311 | 6,647 | 72,454 |
| Repurchased | (119,234) | (1,652,524) | (102,729) | (1,172,965) |
| | | | | |
| Net increase | 317,538 | $4,387,409 | 307,043 | $3,633,836 |
| |
| Class C shares1 | | | | |
|
| Sold | 8,387 | $121,980 | — | — |
| | | | | |
| Net increase | 8,387 | $121,980 | — | — |
| |
| Class I shares | | | | |
|
| Sold | 240,996 | $3,382,612 | 115,760 | $1,363,712 |
| Distributions reinvested | 10,948 | 151,848 | 3,311 | 36,155 |
| Repurchased | (49,459) | (673,796) | (28,907) | (336,175) |
| | | | | |
| Net increase | 202,485 | $2,860,664 | 90,164 | $1,063,692 |
| |
| Class NAV shares2 | | | | |
|
| Sold | 9,284,732 | $135,000,000 | — | — |
| Repurchased | (359,378) | (5,328,604) | — | — |
| | | | | |
| Net increase | 8,925,354 | $129,671,396 | — | — |
| |
| Total net increase | 9,453,764 | $137,041,449 | 397,207 | $4,697,528 |
|
1 The inception date for Class C shares is 6-27-14.
2 The inception date for Class NAV shares is 6-26-14.
Affiliates of the fund owned 19%, 89% and 100% of shares of beneficial interest of Class A, Class C and Class NAV, respectively, on July 31, 2014.
Note 6 — Purchase and sale of securities
Purchases and sales of securities, other than short-term investments, amounted to $147,915,744 and $15,384,565, respectively, for the year ended July 31, 2014.
| |
| 26 | Fundamental All Cap Core Fund | Annual report |
Auditor’s report
Report of Independent Registered Public Accounting Firm
To the Board of Trustees of John Hancock Funds II and Shareholders of
John Hancock Fundamental All Cap Core Fund:
In our opinion, the accompanying statement of assets and liabilities, including the schedule of investments, and the related statements of operations and of changes in net assets and the financial highlights present fairly, in all material respects, the financial position of the John Hancock Fundamental All Cap Core Fund (the “Fund”) at July 31, 2014, the results of its operations for the year then ended, the changes in its net assets for each of the two years in the period then ended and the financial highlights for each of the periods indicated, in conformity with accounting principles generally accepted in the United States of America. These financial statements and financial highlights (hereafter referred to as “financial statements”) are the responsibility of the Fund’s management. Our responsibility is to express an opinion on these financial statements based on our audits. We conducted our audits of these financial statements in accordance with the standards of the Public Company Accounting Oversight Board (United States). Those standards require that we plan and perform the audit to obtain reasonable assurance about whether the financial statements are free of material misstatement. An audit includes examining, on a test basis, evidence supporting the amounts and disclosures in the financial statements, assessing the accounting principles used and significant estimates made by management, and evaluating the overall financial statement presentation. We believe that our audits, which included confirmation of securities at July 31, 2014 by correspondence with the custodian and brokers, and the application of alternative auditing procedures where securities purchased confirmations had not been received, provide a reasonable basis for our opinion.
PricewaterhouseCoopers LLP
Boston, Massachusetts
September 17, 2014
| |
| Annual report | Fundamental All Cap Core Fund | 27 |
Tax information
Unaudited
For federal income tax purposes, the following information is furnished with respect to the distributions of the fund, if any, paid during its taxable year ended July 31, 2014.
The fund reports the maximum amount allowable of its net taxable income as eligible for the corporate dividends-received deduction.
The fund reports the maximum amount allowable of its net taxable income as qualified dividend income as provided in the Jobs and Growth Tax Relief Reconciliation Act of 2003.
The fund paid $523,006 in capital gain dividends.
Eligible shareholders will be mailed a 2014 Form 1099-DIV in early 2015. This will reflect the tax character of all distributions paid in calendar year 2014.
Please consult a tax advisor regarding the tax consequences of your investment in the fund.
| |
| 28 | Fundamental All Cap Core Fund | Annual report |
Continuation of Investment Advisory and
Subadvisory Agreements
Evaluation of Advisory and Subadvisory Agreements by the Board Of Trustees
This section describes the evaluation by the Board of Trustees (the Board) of John Hancock Funds II (the Trust) of the Advisory Agreement (the Advisory Agreement) with John Hancock Advisers, LLC (the Advisor) and the Subadvisory Agreement (the Subadvisory Agreement) with John Hancock Asset Management a division of Manulife Asset Management (US) LLC (the Subadvisor) for John Hancock Fundamental All Cap Core Fund (the fund). The Advisory Agreement and Subadvisory Agreement are collectively referred to as the Agreements. Prior to the June 23–25, 2014 meeting at which the Agreements were approved, the Board also discussed and considered information regarding the proposed continuation of the Agreements at an in-person meeting held on May 27–29, 2014.
Approval of Advisory and Subadvisory Agreements
At in-person meetings held on June 23–25, 2014, the Board, including the Trustees who are not considered to be interested persons of the Trust under the Investment Company Act of 1940, as amended (the 1940 Act) (the Independent Trustees), reapproved for an annual period the continuation of the Advisory Agreement between the Trust and the Advisor and the Subadvisory Agreement between the Advisor and the Subadvisor with respect to the fund.
In considering the Advisory Agreement and the Subadvisory Agreement, the Board received in advance of the meetings a variety of materials relating to the fund, the Advisor and the Subadvisor, including comparative performance, fee and expense information for a peer group of similar funds prepared by an independent third-party provider of fund data, performance information for an applicable benchmark index; and, with respect to the Subadvisor, comparative performance information for comparably managed accounts, as applicable, and other information provided by the Advisor and the Subadvisor regarding the nature, extent and quality of services provided by the Advisor and the Subadvisor under their respective Agreements, as well as information regarding the Advisor’s revenues and costs of providing services to the fund and any compensation paid to affiliates of the Advisor. At the meetings at which the renewal of the Advisory Agreement and Subadvisory Agreement are considered, particular focus is given to information concerning fund performance, comparability of fees and total expenses, and profitability. However, the Board notes that the evaluation process with respect to the Advisor and the Subadvisor is an ongoing one. In this regard, the Board also took into account discussions with management and information provided to the Board at prior meetings with respect to the services provided by the Advisor and the Subadvisor to the fund, including quarterly performance reports prepared by management containing reviews of investment results and prior presentations from the Subadvisor with respect to the fund. The Board noted the affiliation of the Subadvisor with the Advisor, noting any potential conflicts of interest. The Board also considered the nature, quality, and extent of non-advisory services, if any, to be provided to the fund by the Advisor’s affiliates, including distribution services.
Throughout the process, the Board asked questions of and requested additional information from management. The Board is assisted by counsel for the Trust and the Independent Trustees are also separately assisted by independent legal counsel throughout the process. The Independent Trustees also received a memorandum from their independent legal counsel discussing the legal standards for their consideration of the proposed continuation of the Agreements and discussed the proposed continuation of the Agreements in private sessions with their independent legal counsel at which no representatives of management were present.
Approval of Advisory Agreement
In approving the Advisory Agreement with respect to the fund, the Board, including the Independent Trustees, considered a variety of factors, including those discussed below. The Board also considered other factors (including conditions and trends prevailing generally in the economy,
| |
| Annual report | Fundamental All Cap Core Fund | 29 |
the securities markets, and the industry) and does not treat any single factor as determinative, and each Trustee may attribute different weights to different factors. The Board’s conclusions may be based in part on its consideration of the advisory and subadvisory arrangements in prior years and on the Board’s ongoing regular review of fund performance and operations throughout the year.
Nature, extent, and quality of services. Among the information received by the Board from the Advisor relating to the nature, extent, and quality of services provided to the fund, the Board reviewed information provided by the Advisor relating to its operations and personnel, descriptions of its organizational and management structure, and information regarding the Advisor’s compliance and regulatory history, including its Form ADV. The Board also noted that on a regular basis it receives and reviews information from the Trust’s Chief Compliance Officer (CCO) regarding the fund’s compliance policies and procedures established pursuant to Rule 38a-1 under the 1940 Act. The Board also considered the Advisor’s risk management processes. The Board considered that the Advisor is responsible for the management of the day-to-day operations of the fund, including, but not limited to, general supervision of and coordination of the services provided by the Subadvisor, and is also responsible for monitoring and reviewing the activities of the Subadvisor and third-party service providers.
In considering the nature, extent, and quality of the services provided by the Advisor, the Trustees also took into account their knowledge of the Advisor’s management and the quality of the performance of the Advisor’s duties, through Board meetings, discussions and reports during the preceding year and through each Trustee’s experience as a Trustee of the Trust and of the other trusts in the complex.
In the course of their deliberations regarding the Advisory Agreement, the Board considered, among other things:
(a) the skills and competency with which the Advisor has in the past managed the Trust’s affairs and its subadvisory relationship, the Advisor’s oversight and monitoring of the Subadvisor’s investment performance and compliance programs, such as the Subadvisor’s compliance with fund policies and objectives, review of brokerage matters, including with respect to trade allocation and best execution and the Advisor’s timeliness in responding to performance issues;
(b) the background, qualifications and skills of the Advisor’s personnel;
(c) the Advisor’s compliance policies and procedures and its responsiveness to regulatory changes and mutual fund industry developments;
(d) the Advisor’s administrative capabilities, including its ability to supervise the other service providers for the fund;
(e) the financial condition of the Advisor and whether it has the financial wherewithal to provide a high level and quality of services to the fund; and
(f) the Advisor’s reputation and experience in serving as an investment advisor to the Trust and the benefit to shareholders of investing in funds that are part of a family of funds offering a variety of investments.
The Board concluded that the Advisor may reasonably be expected to continue to provide a high quality of services under the Advisory Agreement with respect to the fund.
Investment performance. In considering the fund’s performance, the Board noted that it reviews at its regularly scheduled meetings information about the fund’s performance results. In connection with the consideration of the Advisory Agreement, the Board:
| |
| 30 | Fundamental All Cap Core Fund | Annual report |
(a) reviewed information prepared by management regarding the fund’s performance;
(b) considered the comparative performance of an applicable benchmark index;
(c) considered the performance of comparable funds, if any, as included in the report prepared by an independent third-party provider of fund data; and
(d) took into account the Advisor’s analysis of the fund’s performance and its plans and recommendations regarding the Trust’s subadvisory arrangements generally.
The Board noted that the fund outperformed its benchmark index for the one-year and since inception periods ended December 31, 2013. The Board also noted that the fund had outperformed its peer group average for the one-year and since inception periods ended December 31, 2013.
The Board noted that the fund has a relatively limited performance history since its inception on June 1, 2011. The Board also noted the fund’s favorable performance relative to its benchmark index and peer group for the one-year and since inception periods.
The Board concluded that the fund’s performance has generally outperformed the historical performance of comparable funds and the fund’s benchmark index.
Fees and expenses. The Board reviewed comparative information prepared by an independent third-party provider of mutual fund data, including, among other data, the fund’s contractual and net management fees (and subadvisory fees, to the extent available) and total expenses as compared to similarly situated investment companies deemed to be comparable to the fund. The Board considered the fund’s ranking within a smaller group of peer funds chosen by the independent third-party provider, as well as the fund’s ranking within a broader group of funds. In comparing the fund’s contractual and net management fees to those of comparable funds, the Board noted that such fees include both advisory and administrative costs.
The Board noted that net management fees are lower than the peer group median and total expenses for the fund are equal to the peer group median.
The Board also took into account management’s discussion with respect to the advisory/subadvisory fee structure, including the amount of the advisory fee retained by the Advisor after payment of the subadvisory fee. The Board also noted that the Advisor pays the subadvisory fee. In addition, the Board took into account that management had agreed, effective July 1, 2014, to implement an overall fee waiver across the complex, including the fund, which is discussed further below. The Board also noted management’s discussion of the fund’s expenses, as well as actions taken over the past several years to reduce the fund’s operating expenses. The Board also noted that, in addition, the Advisor is currently waiving fees and/or reimbursing expenses with respect to the fund and that the fund has an expense cap until November 2014, which reduces certain expenses of the Fund. In addition, the Board noted that the fund has breakpoints in its contractual management fee schedule that reduces management fees as assets increase. The Board reviewed information provided by the Advisor concerning the investment advisory fee charged by the Advisor or one of its advisory affiliates to other clients (including other funds in the complex) having similar investment mandates, if any. The Board considered any differences between the Advisor’s and Subadvisor’s services to the fund and the services they provide to other comparable clients or funds. The Board concluded that the advisory fee paid with respect to the fund is reasonable.
Profitability/indirect benefits. In considering the costs of the services to be provided and the profits to be realized by the Advisor and its affiliates (including the Subadvisor) from the Advisor’s relationship with the Trust, the Board:
(a) reviewed financial information of the Advisor;
| |
| Annual report | Fundamental All Cap Core Fund | 31 |
(b) reviewed and considered information presented by the Advisor regarding the net profitability to the Advisor and its affiliates with respect to the fund;
(c) received and reviewed profitability information with respect to the John Hancock fund complex as a whole;
(d) received information with respect to the Advisor’s allocation methodologies used in preparing the profitability data;
(e) considered that the John Hancock insurance companies that are affiliates of the Advisor, as shareholders of the Trust directly or through their separate accounts, receive certain tax credits or deductions relating to foreign taxes paid and dividends received by certain funds of the Trust and noted that these tax benefits, which are not available to participants in qualified retirement plans under applicable income tax law, are reflected in the profitability analysis reviewed by the Board;
(f) considered that the Advisor also provides administrative services to the fund on a cost basis pursuant to an administrative services agreement;
(g) noted that affiliates of the Advisor provide transfer agency services and distribution services to the fund, and that the fund’s distributor also receives Rule 12b-1 payments to support distribution of the fund;
(h) noted that the fund’s Subadvisor is an affiliate of the Advisor;
(i) noted that the Advisor also derives reputational and other indirect benefits from providing advisory services to the fund;
(j) noted that the subadvisory fee for the fund is paid by the Advisor; and
(k) considered that the Advisor should be entitled to earn a reasonable level of profits in exchange for the level of services it provides to the fund and the entrepreneurial risk that it assumes as Advisor.
Based upon its review, the Board concluded that the level of profitability, if any, of the Advisor and its affiliates (including the Subadvisor) from their relationship with the fund was reasonable and not excessive.
Economies of scale. In considering the extent to which economies of scale would be realized as the fund grows and whether fee levels reflect these economies of scale for the benefit of fund shareholders, the Board:
(a) considered that the Advisor has agreed, effective July 1, 2014, to waive a portion of its management fee for the fund and each of the other John Hancock funds in the complex (except for those discussed below) (the Participating Portfolios) or otherwise reimburse the expenses of the Participating Portfolios as follows (the Reimbursement):
The Reimbursement shall equal, on an annualized basis, 0.01% of that portion of the aggregate net assets of all the Participating Portfolios that exceed $75 billion but is less than or equal to $125 billion, 0.0125% of that portion of the aggregate net assets of all the Participating Portfolios that exceed $125 billion but is less than or equal to $150 billion and 0.015% of that portion of the aggregate net assets of all the Participating Portfolios that exceeds $150 billion. (The funds that are not Participating Portfolios are the funds of funds in the complex, which benefit from such overall management fee waiver through their investment in underlying portfolios that include Participating Portfolios, which are subject to the Reimbursement.)
| |
| 32 | Fundamental All Cap Core Fund | Annual report |
(b) reviewed the fund’s advisory fee structure and concluded that: (i) the fund’s fee structure contains breakpoints at the subadvisory fee level and that such breakpoints are reflected as breakpoints in the advisory fees for the fund; and (ii) although economies of scale cannot be measured with precision, these arrangements permit shareholders of the fund to benefit from economies of scale if the fund grows. The Board also took into account management’s discussion of the fund’s advisory fee structure; and
(c) the Board also considered the effect of the fund’s growth in size on its performance and fees. The Board also noted that if the fund’s assets increase over time, the fund may realize other economies of scale.
Approval of Subadvisory Agreement
In making its determination with respect to approval of the Subadvisory Agreement, the Board reviewed:
(1) information relating to the Subadvisor’s business, including current subadvisory services to the Trust (and other funds in the John Hancock family of funds);
(2) the historical and current performance of the fund and comparative performance information relating to an applicable benchmark index and comparable funds; and
(3) the subadvisory fee for the fund, including any breakpoints, and to the extent available, comparable fee information prepared by an independent third party provider of fund data.
Nature, extent, and quality of services. With respect to the services provided by the Subadvisor, the Board received information provided to the Board by the Subadvisor, including the Subadvisor’s Form ADV, as well as took into account information presented throughout the past year. The Board considered the Subadvisor’s current level of staffing and its overall resources, as well as received information relating to the Subadvisor’s compensation program. The Board reviewed the Subadvisor’s history and investment experience, as well as information regarding the qualifications, background, and responsibilities of the Subadvisor’s investment and compliance personnel who provide services to the fund. The Board also considered, among other things, the Subadvisor’s compliance program and any disciplinary history. The Board also considered the Subadvisor’s risk assessment and monitoring process. The Board reviewed the Subadvisor’s regulatory history, including whether it was involved in any regulatory actions or investigations as well as material litigation, and any settlements and amelioratory actions undertaken, as appropriate. The Board noted that the Advisor conducts regular, periodic reviews of the Subadvisor and its operations, including regarding investment processes and organizational and staffing matters. The Board also noted that the Trust’s CCO and his staff conduct regular, periodic compliance reviews with the Subadvisor and present reports to the Independent Trustees regarding the same, which includes evaluating the regulatory compliance systems of the Subadvisor and procedures reasonably designed to assure compliance with the federal securities laws. The Board also took into account the financial condition of the Subadvisor.
The Board considered the Subadvisor’s investment process and philosophy. The Board took into account that the Subadvisor’s responsibilities include the development and maintenance of an investment program for the fund that is consistent with the fund’s investment objective, the selection of investment securities and the placement of orders for the purchase and sale of such securities, as well as the implementation of compliance controls related to performance of these services. The Board also received information with respect to the Subadvisor’s brokerage policies and practices, including with respect to best execution and soft dollars.
Subadvisor compensation. In considering the cost of services to be provided by the Subadvisor and the profitability to the Subadvisor of its relationship with the fund, the Board noted that
| |
| Annual report | Fundamental All Cap Core Fund | 33 |
the fees under the Subadvisory Agreement are paid by the Advisor and not the fund. The Board also considered any potential conflicts of interest the Advisor might have in connection with the Subadvisory Agreement.
In addition, the Board considered other potential indirect benefits that the Subadvisor and its affiliates may receive from the Subadvisor’s relationship with the fund, such as the opportunity to provide advisory services to additional funds in the John Hancock fund complex and reputational benefits.
Subadvisory fee. The Board considered that the fund pays an advisory fee to the Advisor and that, in turn, the Advisor pays a subadvisory fee to the Subadvisor. As noted above, the Board also considered the fund’s subadvisory fee as compared to similarly situated investment companies deemed to be comparable to the fund as included in the report prepared by the independent third party provider of fund data, to the extent available. The Board noted that the limited size of the peer group was not sufficient for comparative purposes. The Board also took into account the sub-advisory fee paid by the Advisor to the Subadvisor with respect to the fund to fees charged by the Subadvisor to manage other subadvised portfolios and portfolios not subject to regulation under the 1940 Act, as applicable.
Subadvisor performance. As noted above, the Board considered the fund’s performance as compared to the fund’s peer group and the benchmark index and noted that the Board reviews information about the fund’s performance results at its regularly scheduled meetings. The Board noted the Advisor’s expertise and resources in monitoring the performance, investment style and risk-adjusted performance of the Subadvisor. The Board was mindful of the Advisor’s focus on the Subadvisor’s performance. The Board also noted the Subadvisor’s long-term performance record for similar accounts, as applicable.
The Board’s decision to approve the Subadvisory Agreement was based on a number of determinations, including the following:
(1) the Subadvisor has extensive experience and demonstrated skills as a manager;
(2) the performance of the fund has generally outperformed the historical performance of comparable funds and the fund’s benchmark index;
(3) the subadvisory fee is reasonable in relation to the level and quality of services being provided; and
(4) subadvisory fee breakpoints are reflected as breakpoints in the advisory fees for the fund in order to permit shareholders to benefit from economies of scale if the fund grows.
Based on the Board’s evaluation of all factors that the Board deemed to be material, including those factors described above, the Board, including the Independent Trustees, concluded that renewal of the Advisory Agreement and the Subadvisory Agreement would be in the best interest of the fund and its shareholders. Accordingly, the Board, and the Independent Trustees voting separately, approved the Advisory Agreement and Subadvisory Agreement for an additional one-year period.
| |
| 34 | Fundamental All Cap Core Fund | Annual report |
Trustees and Officers
This chart provides information about the Trustees and Officers who oversee your John Hancock fund. Officers elected by the Trustees manage the day-to-day operations of the fund and execute policies formulated by the Trustees.
| | |
| Independent Trustees | | |
| | | |
| Name, year of birth | Trustee | Number of John |
| Position(s) held with fund | of the | Hancock funds |
| Principal occupation(s) and other | Trust | overseen by |
| directorships during past 5 years | since1 | Trustee |
| |
| James M. Oates, Born: 1946 | 2005 | 230 |
|
| Managing Director, Wydown Group (financial consulting firm) (since 1994); Chairman and Director, |
| Emerson Investment Management, Inc. (since 2000); Independent Chairman, Hudson Castle Group, Inc. |
| (formerly IBEX Capital Markets, Inc.) (financial services company) (1997–2011); Director, Stifel Financial |
| (since 1996); Director, Investor Financial Services Corporation (1995–2007); Director, Connecticut River |
| Bancorp (since 1998); Director, Virtus Funds (formerly Phoenix Mutual Funds) (since 1988). | |
| |
| Trustee and Chairperson of the Board, John Hancock retail funds3 (since 2012); Trustee (2005–2006 and |
| since 2012) and Chairperson of the Board (since 2012), John Hancock Funds III; Trustee (since 2004) and |
| Chairperson of the Board (since 2005), John Hancock Variable Insurance Trust; Trustee and Chairperson |
| of the Board, John Hancock Funds II (since 2005). | | |
|
| |
| Charles L. Bardelis,2 Born: 1941 | 2005 | 230 |
|
| Director, Island Commuter Corp. (marine transport). | | |
| |
| Trustee, John Hancock retail funds3 (since 2012); Trustee, John Hancock Funds III (2005–2006 and |
| since 2012); Trustee, John Hancock Variable Insurance Trust (since 1988); Trustee, John Hancock |
| Funds II (since 2005). | | |
|
| |
| Peter S. Burgess,2 Born: 1942 | 2005 | 230 |
|
| Consultant (financial, accounting, and auditing matters) (since 1999); Certified Public Accountant; |
| Partner, Arthur Andersen (independent public accounting firm) (prior to 1999); Director, Lincoln |
| Educational Services Corporation (since 2004); Director, Symetra Financial Corporation (since 2010); |
| Director, PMA Capital Corporation (2004–2010). | | |
| |
| Trustee, John Hancock retail funds3 (since 2012); Trustee, John Hancock Funds III (2005–2006 and |
| since 2012); Trustee, John Hancock Variable Insurance Trust and John Hancock Funds II (since 2005). |
|
| |
| William H. Cunningham, Born: 1944 | 2012 | 230 |
|
| Professor, University of Texas, Austin, Texas (since 1971); former Chancellor, University of Texas System |
| and former President of the University of Texas, Austin, Texas; Director, LIN Television (since 2009); |
| Chairman (since 2009) and Director (since 2006), Lincoln National Corporation (insurance); Director, |
| Resolute Energy Corporation (since 2009); Director, Southwest Airlines (since 2000); former Director, |
| Introgen (manufacturer of biopharmaceuticals) (until 2008); former Director, Hicks Acquisition Company I, |
| Inc. (until 2007); former Director, Texas Exchange Bank, SSB (formerly Bank of Crowley) (until 2009); |
| former Advisory Director, JP Morgan Chase Bank (formerly Texas Commerce Bank–Austin) (until 2009). |
| |
| Trustee, John Hancock retail funds3 (since 1986); Trustee, John Hancock Variable Insurance Trust |
| (since 2012); Trustee, John Hancock Funds II (2005–2006 and since 2012). | | |
| |
| Annual report | Fundamental All Cap Core Fund | 35 |
| | |
| Independent Trustees (continued) | | |
| |
| Name, Year of Birth | Trustee | Number of John |
| Position(s) held with Fund | of the | Hancock funds |
| Principal occupation(s) and other | Trust | overseen by |
| directorships during past 5 years | since1 | Trustee |
| |
| Grace K. Fey, Born: 1946 | 2008 | 230 |
|
| Chief Executive Officer, Grace Fey Advisors (since 2007); Director and Executive Vice President, Frontier |
| Capital Management Company (1988–2007); Director, Fiduciary Trust (since 2009). | |
| |
| Trustee, John Hancock retail funds3 (since 2012); Trustee, John Hancock Variable Insurance Trust and |
| John Hancock Funds II (since 2008). | | |
|
| |
| Theron S. Hoffman,2 Born: 1947 | 2008 | 230 |
|
| Chief Executive Officer, T. Hoffman Associates, LLC (consulting firm) (since 2003); Director, The Todd |
| Organization (consulting firm) (2003–2010); President, Westport Resources Management (investment |
| management consulting firm) (2006–2008); Senior Managing Director, Partner, and Operating Head, |
| Putnam Investments (2000–2003); Executive Vice President, The Thomson Corp. (financial and legal |
| information publishing) (1997–2000). | | |
| |
| Trustee, John Hancock retail funds3 (since 2012); Trustee, John Hancock Variable Insurance Trust and |
| John Hancock Funds II (since 2008). | | |
|
| |
| Deborah C. Jackson, Born: 1952 | 2012 | 230 |
|
| President, Cambridge College, Cambridge, Massachusetts (since 2011); Chief Executive Officer, |
| American Red Cross of Massachusetts Bay (2002–2011); Board of Directors of Eastern Bank Corporation |
| (since 2001); Board of Directors of Eastern Bank Charitable Foundation (since 2001); Board of Directors |
| of American Student Assistance Corporation (1996–2009); Board of Directors of Boston Stock Exchange |
| (2002–2008); Board of Directors of Harvard Pilgrim Healthcare (health benefits company) (2007–2011). |
| |
| Trustee, John Hancock retail funds3 (since 2008); Trustee of John Hancock Variable Insurance Trust and |
| John Hancock Funds II (since 2012). | | |
|
| |
| Hassell H. McClellan, Born: 1945 | 2005 | 230 |
|
| Trustee, Virtus Variable Insurance Trust (formerly Phoenix Edge Series Funds) (since 2008); Director, The |
| Barnes Group (since 2010); Associate Professor, The Wallace E. Carroll School of Management, Boston |
| College (retired 2013). | | |
| |
| Trustee, John Hancock retail funds3 (since 2012); Trustee, John Hancock Funds III (2005–2006 and |
| since 2012); Trustee, John Hancock Variable Insurance Trust and John Hancock Funds II (since 2005). |
|
| |
| Steven R. Pruchansky, Born: 1944 | 2012 | 230 |
|
| Chairman and Chief Executive Officer, Greenscapes of Southwest Florida, Inc. (since 2000); Director |
| and President, Greenscapes of Southwest Florida, Inc. (until 2000); Member, Board of Advisors, First |
| American Bank (until 2010); Managing Director, Jon James, LLC (real estate) (since 2000); Director, |
| First Signature Bank & Trust Company (until 1991); Director, Mast Realty Trust (until 1994); President, |
| Maxwell Building Corp. (until 1991). | | |
| |
| Trustee (since 1992) and Chairperson of the Board (2011–2012), John Hancock retail funds3; Trustee and |
| Vice Chairperson of the Board, John Hancock retail funds,3 John Hancock Variable Insurance Trust, and |
| John Hancock Funds II (since 2012). | | |
| |
| 36 | Fundamental All Cap Core Fund | Annual report |
| | |
| Independent Trustees (continued) | | |
| |
| Name, Year of Birth | Trustee | Number of John |
| Position(s) held with Fund | of the | Hancock funds |
| Principal occupation(s) and other | Trust | overseen by |
| directorships during past 5 years | since1 | Trustee |
| |
| Gregory A. Russo, Born: 1949 | 2012 | 230 |
|
| Director and Audit Committee Chairman (since 2012), and Member, Audit Committee and Finance |
| Committee (since 2011), NCH Healthcare System, Inc. (holding company for multi-entity healthcare |
| system); Director and Member of Finance Committee, The Moorings, Inc. (nonprofit continuing care |
| community) (since 2012); Vice Chairman, Risk & Regulatory Matters, KPMG LLP (KPMG) (2002–2006); |
| Vice Chairman, Industrial Markets, KPMG (1998–2002); Chairman and Treasurer, Westchester County, |
| New York, Chamber of Commerce (1986–1992); Director, Treasurer, and Chairman of Audit and |
| Finance Committees, Putnam Hospital Center (1989–1995); Director and Chairman of Fundraising |
| Campaign, United Way of Westchester and Putnam Counties, New York (1990–1995). | |
| |
| Trustee, John Hancock retail funds3 (since 2008); Trustee, John Hancock Variable Insurance Trust and |
| John Hancock Funds II (since 2012). | | |
| |
| |
| Non-Independent Trustees4 | | |
| | | |
| Name, year of birth | Trustee | Number of John |
| Position(s) held with fund | of the | Hancock funds |
| Principal occupation(s) and other | Trust | overseen by |
| directorships during past 5 years | since1 | Trustee |
| |
| Craig Bromley, Born: 1966 | 2012 | 230 |
|
| President, John Hancock Financial Services (since 2012); Senior Executive Vice President and General |
| Manager, U.S. Division, Manulife Financial Corporation (since 2012); President and Chief Executive |
| Officer, Manulife Insurance Company (Manulife Japan) (2005–2012, including prior positions). |
| |
| Trustee, John Hancock retail funds,3 John Hancock Variable Insurance Trust, and John Hancock |
| Funds II (since 2012). | | |
|
| |
| Warren A. Thomson, Born: 1955 | 2012 | 230 |
|
| Senior Executive Vice President and Chief Investment Officer, Manulife Financial Corporation and The |
| Manufacturers Life Insurance Company (since 2009); Chairman and Chief Executive Officer, Manulife |
| Asset Management (since 2001, including prior positions); Director (since 2006), and President and |
| Chief Executive Officer (since 2013), Manulife Asset Management Limited; Director and Chairman, |
| Hancock Natural Resources Group, Inc. (since 2013). | | |
| |
| Trustee, John Hancock retail funds,3 John Hancock Variable Insurance Trust, and John Hancock |
| Funds II (since 2012). | | |
| |
| |
| Principal officers who are not Trustees | | |
| | | |
| Name, year of birth | | Officer |
| Position(s) held with fund | | of the |
| Principal occupation(s) and other | | Trust |
| directorships during past 5 years | | since |
| |
| Andrew G. Arnott, Born: 1971 | | 2009 |
|
| President | | |
| Senior Vice President, John Hancock Financial Services (since 2009); Director and Executive Vice |
| President, John Hancock Advisers, LLC (since 2005, including prior positions); Director and Executive |
| Vice President, John Hancock Investment Management Services, LLC (since 2006, including prior |
| positions); President, John Hancock Funds, LLC (since 2004, including prior positions); President |
| (effective 3-13-14) and Executive Vice President, John Hancock retail funds,3 John Hancock Variable |
| Insurance Trust, and John Hancock Funds II (since 2007, including prior positions). | |
| |
| Annual report | Fundamental All Cap Core Fund | 37 |
| |
| Principal officers who are not Trustees (continued) | |
| |
| Name, Year of Birth | Officer |
| Position(s) held with Fund | of the |
| Principal occupation(s) and other | Trust |
| directorships during past 5 years | since |
| |
| John J. Danello, Born: 1955 | 2006 |
|
| Senior Vice President, Secretary, and Chief Legal Officer | |
| Vice President and Chief Counsel, John Hancock Wealth Management (since 2005); Senior Vice | |
| President (since 2007) and Chief Legal Counsel (2007–2010), John Hancock Funds, LLC and The | |
| Berkeley Financial Group, LLC; Senior Vice President (since 2006, including prior positions) and Chief |
| Legal Officer and Secretary (since 2014), John Hancock retail funds3 and John Hancock Variable | |
| Insurance Trust; Vice President, John Hancock Life & Health Insurance Company (since 2009); | |
| Vice President, John Hancock Life Insurance Company (USA) and John Hancock Life Insurance | |
| Company of New York (since 2010); and Senior Vice President, Secretary, and Chief Legal Counsel | |
| (2007–2014, including prior positions) of John Hancock Advisers, LLC and John Hancock Investment |
| Management Services, LLC. | |
|
| |
| Francis V. Knox, Jr., Born: 1947 | 2005 |
|
| Chief Compliance Officer | |
| Vice President, John Hancock Financial Services (since 2005); Chief Compliance Officer, John Hancock |
| retail funds,3 John Hancock Variable Insurance Trust, John Hancock Funds II, John Hancock Advisers, |
| LLC, and John Hancock Investment Management Services, LLC (since 2005). | |
|
| |
| Charles A. Rizzo, Born: 1957 | 2007 |
|
| Chief Financial Officer | |
| Vice President, John Hancock Financial Services (since 2008); Senior Vice President, John Hancock | |
| Advisers, LLC and John Hancock Investment Management Services, LLC (since 2008); Chief Financial |
| Officer, John Hancock retail funds,3 John Hancock Variable Insurance Trust and John Hancock | |
| Funds II (since 2007). | |
|
| |
| Salvatore Schiavone, Born: 1965 | 2009 |
|
| Treasurer | |
| Assistant Vice President, John Hancock Financial Services (since 2007); Vice President, John Hancock |
| Advisers, LLC and John Hancock Investment Management Services, LLC (since 2007); Treasurer, | |
| John Hancock retail funds3 (since 2007, including prior positions); Treasurer, John Hancock Variable |
| Insurance Trust and John Hancock Funds II (since 2010 and 2007–2009, including prior positions). | |
The business address for all Trustees and Officers is 601 Congress Street, Boston, Massachusetts 02210-2805.
1 Each Trustee holds office until his or her successor is elected and qualified, or until the Trustee’s death, retirement, resignation, or removal.
2 Member of the Audit Committee.
3 “John Hancock retail funds” comprises John Hancock Funds III and 37 other John Hancock funds consisting of 27 series of other John Hancock trusts and 10 closed-end funds.
4 Because Messrs. Bromley and Thomson are senior executives or directors of the advisor and/or its affiliates, each of them is considered an “interested person of the fund,” as defined in the Investment Company Act of 1940.
| |
| 38 | Fundamental All Cap Core Fund | Annual report |
More information
| |
| Trustees | Investment advisor |
| James M. Oates, Chairperson | John Hancock Advisers, LLC |
| Steven R. Pruchansky, Vice Chairperson | |
| Charles L. Bardelis* | Subadvisor |
| Craig Bromley† | John Hancock Asset Management a division of |
| Peter S. Burgess* | Manulife Asset Management (US) LLC |
| William H. Cunningham | |
| Grace K. Fey | Principal distributor |
| Theron S. Hoffman* | John Hancock Funds, LLC |
| Deborah C. Jackson | |
| Hassell H. McClellan | Custodian |
| Gregory A. Russo | State Street Bank and Trust Company |
| Warren A. Thomson† | |
| | Transfer agent |
| Officers | John Hancock Signature Services, Inc. |
| Andrew G. Arnott | |
| President | Legal counsel |
| | K&L Gates LLP |
| John J. Danello | |
| Senior Vice President, Secretary, | Independent registered |
| and Chief Legal Officer | public accounting firm |
| | PricewaterhouseCoopers LLP |
| Francis V. Knox, Jr. | |
| Chief Compliance Officer | |
| | |
| Charles A. Rizzo | |
| Chief Financial Officer | |
| | |
| Salvatore Schiavone | |
| Treasurer | |
| |
| *Member of the Audit Committee | |
| †Non-Independent Trustee | |
The fund’s proxy voting policies and procedures, as well as the fund’s proxy voting record for the most recent twelve-month period ended June 30, are available free of charge on the Securities and Exchange Commission (SEC) website at sec.gov or on our website.
The fund’s complete list of portfolio holdings, for the first and third fiscal quarters, is filed with the SEC on Form N-Q. The fund’s Form N-Q is available on our website and the SEC’s website, sec.gov, and can be reviewed and copied (for a fee) at the SEC’s Public Reference Room in Washington, DC. Call 800-SEC-0330 to receive information on the operation of the SEC’s Public Reference Room.
We make this information on your fund, as well as monthly portfolio holdings, and other fund details available on our website at jhinvestments.com or by calling 800-225-5291.
| | |
| You can also contact us: | | |
| 800-225-5291 | Regular mail: | Express mail: |
| jhinvestments.com | John Hancock Signature Services, Inc. | John Hancock Signature Services, Inc. |
| | P.O. Box 55913 | 30 Dan Road |
| | Boston, MA 02205-5913 | Canton, MA 02021 |
| |
| Annual report | Fundamental All Cap Core Fund | 39 |

800-225-5291
800-231-5469 TDD
800-338-8080 EASI-Line
jhinvestments.com
| |
| This report is for the information of the shareholders of John Hancock Fundamental All Cap Core Fund. | |
| It is not authorized for distribution to prospective investors unless preceded or accompanied by a prospectus. | 376A 7/14 |
| MF195336 | 9/14 |
John Hancock Diversified Strategies Fund
Table of contents
| |
| Management’s discussion of fund performance | Page 3 |
| A look at performance | Page 4 |
| Your expenses | Page 6 |
| Portfolio summary | Page 7 |
| Portfolio of Investments | Page 8 |
| Financial statements | Page 23 |
| Financial highlights | Page 26 |
| Notes to financial statements | Page 28 |
| Federal tax information | Page 39 |
| Board Consideration | Page 40 |
| Trustees and Officers | Page 46 |
| More information | Page 50 |
John Hancock Diversified Strategies Fund
Management’s Discussion of Fund Performance
By John Hancock Asset Management a division of Manulife Asset Management (US) LLC
During the year ended July 31, 2014, the fund’s Class A shares returned 6.89%, excluding sales charges, compared with the 7.81% return of the fund’s benchmark, a blend of 70% Barclays U.S. Aggregate Bond Index/30% S&P 500 Index. During the period, the S&P 500 Index returned 16.94%, and the average return of the fund’s peers in the U.S. conservative allocation category was 7.47%, as tracked by Morningstar, Inc.1 Contributions to return came from a variety of sources across the fund’s equity, fixed income, real asset, and long/short opportunistic exposures.
Of its equity holdings, the fund’s largest contributors to returns were within the information technology and energy sectors. Contributing information technology stocks included Microsoft Corp., Apple, Inc., Google, Inc., and Facebook, Inc. Within energy, Weatherford International PLC, Apache Corp., and Schlumberger, Ltd., shares contributed to performance. In the fund’s fixed-income allocation, exposure to certain high yield and emerging-market issues boosted performance. The fund’s government bond holdings also delivered positive, albeit more modest, returns. The fund’s real asset exposures – including Exchange-Traded Fund (ETF) positions linked to physical or tangible assets such as precious metals, commodities, real estate, and oil – delivered mixed results; infrastructure-related holdings generated strong performance, but positions linked to the prices of physical commodities lagged.
A number of the fund’s pairings of long versus short strategies performed well, including:
• the long information technology equity versus short S&P 500 Index strategy;
• the long British pound versus short Japanese yen strategy; and
• the long European equity versus short Australian equity strategy.
On the other hand, the fund’s long homebuilder shares versus short S&P 500 Index strategy lagged, as did the long South Korean equity versus short emerging-market equity strategy.
This commentary reflects the views of the portfolio managers through the end of the period discussed in this report. As such, they are in no way guarantees of future events and are not intended to be used as investment advice or a recommendation regarding any specific security. They are also subject to change at any time as market and other conditions warrant.
Past performance does not guarantee future results. The fund’s performance depends on the Advisor's skill in determining the strategic asset class allocations, the mix of underlying strategies and funds, and the performance of those underlying strategies and funds. The underlying strategies and funds' performance may be lower than the performance of the asset class that they were selected to represent. The fund is subject to the same risks as the underlying strategies and funds in which it invests, which include the following: stocks and bonds can decline due to adverse issuer, market, regulatory or economic developments; foreign investing, especially in emerging markets, has additional risks, such as currency and market volatility and political and social instability; the securities of small-capitalization companies are subject to higher volatility than larger, more established companies; and high-yield bonds are subject to additional risks, such as increased risk of default. Absolute return funds are not designed to outperform stocks and bonds in strong markets and there is no guarantee of positive returns. They employ certain techniques that are intended to reduce risk and volatility in the portfolio and provide protection against a decline in the fund’s assets. However, there is no guarantee that any investment strategy will be successful or that the fund’s objectives will be achieved. Commodity investments involve the risk of volatile market price fluctuation of commodities resulting from fluctuating demand, supply disruption, speculation and other factors. The use of hedging and derivatives transactions could produce disproportionate gains or losses and main increase volatility and costs. The issuer or grantor of a security, or counterparty to a transaction, may be unable or unwilling to make principal, interest, or settlement payments. If the fund invests in illiquid securities, it may be difficult to sell them at a price approximating their value. Please see the prospectus for additional risks.
1 Figures from Morningstar, Inc. include reinvested distributions and do not take into account sales charges. Actual load-adjusted performance is lower.
A look at performance
Total returns for the period ended July 31, 2014
| | | | | | | | | |
| | Average annual total returns (%) | | Cumulative total returns (%) | |
| | with maximum sales charge | | | with maximum sales charge | |
|
| | 1-year | 5-year | 10-year | Since inception1 | | 1-year | 5-year | 10-year | Since inception1 |
|
| Class A | 1.57 | — | — | 6.61 | | 1.57 | — | — | 19.92 |
|
| Class I2 | 7.19 | — | — | 8.96 | | 7.19 | — | — | 27.58 |
|
| Index 1† | 16.94 | — | — | 22.26 | | 16.94 | — | — | 76.91 |
|
| Index 2† | 3.97 | — | — | 2.47 | | 3.97 | — | — | 7.17 |
|
| Index 3† | 7.81 | — | — | 8.22 | | 7.81 | — | — | 25.12 |
|
Performance figures assume all distributions are reinvested. Figures reflect maximum sales charges on Class A shares of 5.00%. Sales charges are not applicable to Class I shares.
The expense ratios of the fund, both net (including any fee waivers or expense limitations) and gross (excluding any fee waivers or expense limitations), are set forth according to the most recent publicly available prospectuses for the fund and may differ from those disclosed in the Financial highlights tables in this report. The expense ratios are as follows:
| | | | | | | | | | |
| | Class A | Class I | | | | | | | | |
| Net/Gross (%) | 1.67 | 1.37 | | | | | | | | |
Please refer to the most recent prospectus and annual report for more information on expenses and any expense limitation arrangements for each class.
The returns reflect past results and should not be considered indicative of future performance. The return and principal value of an investment will fluctuate so that shares, when redeemed, may be worth more or less than their original cost. Due to market volatility, the fund’s current performance may be higher or lower than the performance shown. For current to the most recent month-end performance data, please call 800-225-5291 or visit the fund’s website at jhinvestments.com.
The performance table above and the chart on the next page do not reflect the deduction of taxes that a shareholder may pay on fund distributions or on the redemption of fund shares. The fund’s performance results reflect any applicable fee waivers or expense reductions, without which the expenses would increase and results would have been less favorable.
† Index 1 is the S&P 500 Index; Index 2 is the Barclays U.S. Aggregate Bond Index; Index 3 is 70% Barclays U.S. Aggregate Bond Index and 30% S&P 500 Index.
See the following page for footnotes.
| |
| Diversified Strategies Fund | Annual report | |
| | 4 |

| | | | | | |
| | | With maximum | Without | | | |
| | Start date | sales charge | sales charge | Index 1 | Index 2 | Index 3 |
|
| Class I2 | 9-30-11 | $12,758 | $12,758 | $17,691 | $10,717 | $12,512 |
|
S&P 500 Index — Index 1 — is an unmanaged index that includes 500 widely traded common stocks.
Barclays U.S. Aggregate Bond Index — Index 2 — is an unmanaged index of dollar-denominated and nonconvertible investment-grade debt issues.
Blended Index — Index 3 — is 70% Barclays U.S. Aggregate Bond Index and 30% S&P 500 Index.
It is not possible to invest directly in an index. Index figures do not reflect expenses or sales charges, which would have resulted in lower values.
Footnotes related to performance pages
1 From 9-30-11.
2 For certain types of investors as described in the fund’s prospectus.
| |
| | Annual report | Diversified Strategies Fund |
| 5 | |
Your expenses
These examples are intended to help you understand your ongoing operating expenses of investing in the fund so you can compare these costs with the ongoing costs of investing in other mutual funds.
Understanding fund expenses
As a shareholder of the fund, you incur two types of costs:
• Transaction costs which include sales charges (loads) on purchases or redemptions (varies by share class), minimum account fee charge, etc.
• Ongoing operating expenses including management fees, distribution and service fees (if applicable), and other fund expenses.
We are going to present only your ongoing operating expenses here.
Actual expenses/actual returns
This example is intended to provide information about your fund’s actual ongoing operating expenses, and is based on your fund’s actual return. It assumes an account value of $1,000.00 on February 1, 2014 with the same investment held until July 31, 2014.
| | | | |
| | Account value | Ending value | Expenses paid during | Annualized |
| | on 2-1-2014 | on 7-31-2014 | period ended 7-31-20141 | Expense ratio |
|
| Class A | $1,000.00 | $1,043.00 | $8.41 | 1.66% |
| Class I | 1,000.00 | 1,044.80 | 6.79 | 1.34% |
Together with the value of your account, you may use this information to estimate the operating expenses that you paid over the period. Simply divide your account value at July 31, 2014 by $1,000.00, then multiply it by the “expenses paid” for your share class from the table above. For example, for an account value of $8,600.00, the operating expenses should be calculated as follows:
Example
[ My account value $8,600.00 / $1,000.00 = 8.6 ] x $[ “expenses paid” from table ] = My actual expenses
Hypothetical example for comparison purposes
This table allows you to compare your fund’s ongoing operating expenses with those of any other fund. It provides an example of the fund’s hypothetical account values and hypothetical expenses based on each class’s actual expense ratio and an assumed 5% annualized return before expenses (which is not your fund’s actual return). It assumes an account value of $1,000.00 on February 1, 2014, with the same investment held until July 31, 2014. Look in any other fund shareholder report to find its hypothetical example and you will be able to compare these expenses.
| | | | |
| | Account value | Ending value | Expenses paid during | Annualized |
| | on 2-1-2014 | on 7-31-2014 | period ended 7-31-20141 | Expense ratio |
|
| Class A | $1,000.00 | $1,016.60 | $8.30 | 1.66% |
| Class I | 1,000.00 | 1,018.10 | 6.71 | 1.34% |
Remember, these examples do not include any transaction costs, therefore, these examples will not help you to determine the relative total costs of owning different funds. If transaction costs were included, your expenses would have been higher. See the prospectuses for details regarding transaction costs.
1 Expenses are equal to the fund's annualized expense ratio multiplied by the average account value over the period, multiplied by 181/365 (to reflect the one-half year period).
Diversified Strategies Fund
Portfolio summary
| | | |
| Portfolio Composition1 | | | |
| Equity | 32.2% | | |
| Common Stocks | 30.4% | | |
| Preferred Securities | 1.8% | | |
| Fixed Income | 52.2% | | |
| Corporate Bonds | 32.6% | | |
| U.S. Government | 6.7% | | |
| Collateralized Mortgage Obligations | 4.4% | | |
| Term Loans | 3.1% | | |
| U.S. Government Agency | 2.2% | | |
| Asset Backed Securities | 1.4% | | |
| Convertible Bonds | 0.7% | | |
| Foreign Government Obligations | 0.6% | | |
| Capital Preferred Securities | 0.5% | | |
| Investment Companies | 11.8% | | |
| Exchange-Traded Funds | 11.8% | | |
| Other | 3.8% | | |
Fixed Income Quality Composition2,3
| | |
| U.S. Government | 6.7% | |
| U.S. Government Agency | 2.2% | |
| U.S. Government Agency Collateralized Mortgage Obligations | 0.6% | |
| AAA | 0.4% | |
| AA | 0.2% | |
| A | 3.9% | |
| BBB | 17.3% | |
| BB | 7.4% | |
| B | 8.2% | |
| CCC & Below | 3.8% | |
| Not Rated | 1.5% | |
1 As a percentage of net assets on 7-31-14.
2 Ratings are from Moody’s Investors Service, Inc. If not available, we have used Standard & Poor’s Ratings Services. In the absence of ratings from these agencies, we have used Fitch Ratings, Inc. “Not Rated” securities are those with no ratings available from these agencies. All ratings are as of 7-31-14 and do not reflect subsequent downgrades or upgrades, if any.
3 Composition based on fixed income securities which represent $22,242,815 and 52.2% of the fund's net assets on 7-31-14. Percentages shown are based on net assets.
Diversified Strategies Fund
Fund’s investments
As of 7-31-14
| | | | |
| | | Maturity | | |
| | Rate (%) | date | Par value^ | Value |
| |
| Corporate Bonds 32.6% | | | | $13,882,708 |
|
| (Cost $12,915,353) | | | | |
| |
| Consumer Discretionary 3.0% | | | | 1,279,032 |
|
| |
| Auto Components 0.6% | | | | |
| Allison Transmission, Inc. (S) | 7.125 | 05/15/19 | 125,000 | 132,500 |
| Dana Holding Corp. | 6.000 | 09/15/23 | 50,000 | 52,125 |
| Delphi Corp. | 5.000 | 02/15/23 | 80,000 | 85,900 |
| | | | | |
| Automobiles 0.2% | | | | |
| Ford Motor Company | 4.750 | 01/15/43 | 10,000 | 10,034 |
| Ford Motor Credit Company LLC | 5.875 | 08/02/21 | 70,000 | 81,489 |
| | | | | |
| Hotels, Restaurants & Leisure 0.4% | | | | |
| CCM Merger, Inc. (S) | 9.125 | 05/01/19 | 150,000 | 158,250 |
| PF Chang's China Bistro, Inc. (S) | 10.250 | 06/30/20 | 25,000 | 25,375 |
| | | | | |
| Media 0.3% | | | | |
| AMC Entertainment, Inc. | 5.875 | 02/15/22 | 35,000 | 35,525 |
| Cinemark USA, Inc. | 4.875 | 06/01/23 | 30,000 | 29,325 |
| Sirius XM Radio, Inc. (S) | 5.250 | 08/15/22 | 70,000 | 73,150 |
| | | | | |
| Multiline Retail 0.5% | | | | |
| Macy's Retail Holdings, Inc. | 7.875 | 08/15/36 | 175,000 | 194,171 |
| | | | | |
| Specialty Retail 0.7% | | | | |
| Automotores Gildemeister SA (S) | 8.250 | 05/24/21 | 150,000 | 96,000 |
| AutoNation, Inc. | 5.500 | 02/01/20 | 50,000 | 54,813 |
| Conn's, Inc. (S) | 7.250 | 07/15/22 | 35,000 | 34,125 |
| Jo-Ann Stores Holdings, Inc., PIK (S) | 9.750 | 10/15/19 | 50,000 | 50,500 |
| L Brands, Inc. | 6.625 | 04/01/21 | 50,000 | 55,750 |
| | | | | |
| Textiles, Apparel & Luxury Goods 0.3% | | | | |
| Hot Topic, Inc. (S) | 9.250 | 06/15/21 | 100,000 | 110,000 |
| |
| Consumer Staples 1.0% | | | | 430,454 |
|
| |
| Beverages 0.3% | | | | |
| Ajecorp BV (S) | 6.500 | 05/14/22 | 40,000 | 37,220 |
| Crestview DS Merger Sub II, Inc. | 10.000 | 09/01/21 | 70,000 | 78,663 |
| | | | | |
| Food & Staples Retailing 0.1% | | | | |
| Safeway, Inc. | 5.000 | 08/15/19 | 60,000 | 61,821 |
| | | | | |
| Personal Products 0.1% | | | | |
| Revlon Consumer Products Corp. | 5.750 | 02/15/21 | 50,000 | 50,750 |
| | | | | |
| Tobacco 0.5% | | | | |
| Alliance One International, Inc. | 9.875 | 07/15/21 | 100,000 | 97,500 |
| Vector Group, Ltd. | 7.750 | 02/15/21 | 100,000 | 104,500 |
| |
| Energy 5.4% | | | | 2,282,230 |
|
| |
| Energy Equipment & Services 0.4% | | | | |
| Key Energy Services, Inc. | 6.750 | 03/01/21 | 35,000 | 35,700 |
| Trinidad Drilling, Ltd. (S) | 7.875 | 01/15/19 | 100,000 | 105,000 |
| | | | | |
| Oil, Gas & Consumable Fuels 5.0% | | | | |
| Access Midstream Partners LP | 4.875 | 03/15/24 | 25,000 | 25,750 |
| Afren PLC (S) | 10.250 | 04/08/19 | 200,000 | 219,000 |
| BreitBurn Energy Partners LP | 7.875 | 04/15/22 | 17,000 | 17,765 |
| Cimarex Energy Company | 4.375 | 06/01/24 | 35,000 | 35,744 |
Diversified Strategies Fund
Fund’s investments
As of 7-31-14
| | | | |
| | | Maturity | | |
| | Rate (%) | date | Par value^ | Value |
| |
| Energy (continued) | | | | |
|
| Compressco Partners LP (S) | 7.250 | 08/15/22 | 20,000 | $19,950 |
| Ecopetrol SA | 5.875 | 09/18/23 | 150,000 | 168,705 |
| Enterprise Products Operating LLC (8.375% to 08/01/2016, | | | |
| then 3 month LIBOR + 3.708%) | 8.375 | 08/01/66 | 20,000 | 22,475 |
| EP Energy LLC | 7.750 | 09/01/22 | 20,000 | 21,800 |
| EV Energy Partners LP | 8.000 | 04/15/19 | 100,000 | 104,500 |
| Halcon Resources Corp. | 8.875 | 05/15/21 | 30,000 | 31,125 |
| Kinder Morgan Energy Partners LP | 5.800 | 03/15/35 | 200,000 | 216,559 |
| Memorial Resource Development Corp. (S) | 5.875 | 07/01/22 | 15,000 | 14,588 |
| Midstates Petroleum Company, Inc. | 9.250 | 06/01/21 | 100,000 | 103,250 |
| Newfield Exploration Company | 5.750 | 01/30/22 | 100,000 | 109,000 |
| Pertamina Persero PT (S) | 5.250 | 05/23/21 | 200,000 | 208,250 |
| Pertamina Persero PT (S) | 6.450 | 05/30/44 | 200,000 | 209,500 |
| Petrobras International Finance Company | 5.375 | 01/27/21 | 25,000 | 25,752 |
| Petroleos de Venezuela SA | 5.375 | 04/12/27 | 50,000 | 29,950 |
| Petroleos de Venezuela SA (S) | 8.500 | 11/02/17 | 200,000 | 186,600 |
| Petroleos Mexicanos | 5.500 | 01/21/21 | 150,000 | 165,842 |
| Rex Energy Corp. | 8.875 | 12/01/20 | 15,000 | 16,350 |
| Summit Midstream Holdings LLC | 7.500 | 07/01/21 | 30,000 | 32,625 |
| TransCanada Pipelines, Ltd. (6.350% to 05/15/2017, then 3 | | | |
| month LIBOR + 2.210%) | 6.350 | 05/15/67 | 100,000 | 104,200 |
| WPX Energy, Inc. | 6.000 | 01/15/22 | 50,000 | 52,250 |
| |
| Financials 10.6% | | | | 4,501,475 |
|
| |
| Banks 3.5% | | | | |
| Banco do Brasil SA (6.250% to 04/15/2024, then 10 Year | | | |
| U.S. Treasury + 4.398%) (Q)(S) | 6.250 | 04/15/24 | 200,000 | 156,020 |
| Credit Agricole SA (7.875% to 01/23/2024, then 5 Year U.S. | | | |
| Swap Rate + 4.898%) (Q)(S) | 7.875 | 01/23/24 | 200,000 | 212,450 |
| Fifth Third Bancorp (5.100% to 06/30/2023, then 3 month | | | |
| LIBOR + 3.033%) (Q) | 5.100 | 06/30/23 | 60,000 | 57,090 |
| HBOS PLC (S) | 6.000 | 11/01/33 | 95,000 | 106,230 |
| ICICI Bank, Ltd. (S) | 5.750 | 11/16/20 | 200,000 | 217,271 |
| JPMorgan Chase & Company (5.150% to 05/01/2023, then 3 | | | |
| month LIBOR + 3.250%) (Q) | 5.150 | 05/01/23 | 50,000 | 47,188 |
| JPMorgan Chase & Company (6.750% to 02/01/2024, then 3 | | | |
| month LIBOR + 3.780%) (Q) | 6.750 | 02/01/24 | 65,000 | 69,388 |
| JPMorgan Chase & Company (7.900% to 04/30/2018, then 3 | | | |
| month LIBOR + 3.470%) (Q) | 7.900 | 04/30/18 | 200,000 | 220,250 |
| Russian Agricultural Bank OJSC (S) | 5.100 | 07/25/18 | 200,000 | 188,000 |
| Synovus Financial Corp. | 7.875 | 02/15/19 | 20,000 | 22,650 |
| The PNC Financial Services Group, Inc. (4.850% to | | | | |
| 06/01/2023, then 3 month LIBOR + 3.040%) (Q) | 4.850 | 06/01/23 | 30,000 | 28,500 |
| Wells Fargo & Company (5.900% to 06/15/2024, then 3 | | | |
| month LIBOR + 3.110%) (Q) | 5.900 | 06/15/24 | 55,000 | 57,448 |
| Wells Fargo & Company, Series K (7.980% to 03/15/2018, | | | |
| then 3 month LIBOR + 3.770%) (Q) | 7.980 | 03/15/18 | 100,000 | 113,400 |
| | | | | |
| Capital Markets 0.8% | | | | |
| Fifth Street Finance Corp. | 4.875 | 03/01/19 | 35,000 | 36,309 |
| Jefferies Group LLC | 6.875 | 04/15/21 | 200,000 | 236,440 |
| The Goldman Sachs Group, Inc. | 5.750 | 01/24/22 | 10,000 | 11,472 |
| Walter Investment Management Corp. (S) | 7.875 | 12/15/21 | 40,000 | 40,800 |
| | | | | |
| Consumer Finance 0.1% | | | | |
| Credit Acceptance Corp. (S) | 6.125 | 02/15/21 | 40,000 | 41,200 |
Diversified Strategies Fund
Fund’s investments
As of 7-31-14
| | | | |
| | | Maturity | | |
| | Rate (%) | date | Par value^ | Value |
| |
| Financials (continued) | | | | |
|
| |
| Diversified Financial Services 1.4% | | | | |
| FS Investment Corp. | 4.000 | 07/15/19 | 30,000 | $30,057 |
| General Electric Capital Corp. (7.125% until 06/15/2022, then | | | |
| 3 month LIBOR + 5.296%) (Q) | 7.125 | 06/15/22 | 100,000 | 117,000 |
| Nationstar Mortgage LLC | 7.875 | 10/01/20 | 30,000 | 30,600 |
| Rabobank Nederland NV | 3.875 | 02/08/22 | 85,000 | 89,889 |
| Rabobank Nederland NV (11.000% to 06/30/2019, then 3 | | | |
| month LIBOR + 10.868%) (Q)(S) | 11.000 | 06/30/19 | 200,000 | 268,200 |
| Voya Financial, Inc. (5.650% to 05/15/2023, then 3 month | | | |
| LIBOR + 3.580%) | 5.650 | 05/15/53 | 50,000 | 50,875 |
| | | | | |
| Insurance 3.3% | | | | |
| Assured Guaranty US Holdings, Inc. | 5.000 | 07/01/24 | 40,000 | 40,344 |
| AXA SA | 8.600 | 12/15/30 | 200,000 | 269,000 |
| CNA Financial Corp. | 7.250 | 11/15/23 | 200,000 | 247,963 |
| Liberty Mutual Group, Inc. (S) | 6.500 | 03/15/35 | 50,000 | 61,318 |
| Liberty Mutual Group, Inc. (S) | 7.800 | 03/15/37 | 200,000 | 237,000 |
| Lincoln National Corp. (6.050% to 04/20/2017, then 3 month | | | |
| LIBOR + 2.040%) | 6.050 | 04/20/67 | 150,000 | 151,500 |
| Nippon Life Insurance Company (5.000% to 10/18/2022, then | | | |
| 3 month LIBOR + 4.240%) (S) | 5.000 | 10/18/42 | 200,000 | 215,000 |
| Pacific LifeCorp. (S) | 6.000 | 02/10/20 | 25,000 | 28,578 |
| Prudential Financial, Inc. (5.200% to 03/15/2024, then 3 | | | |
| month LIBOR + 3.040%) | 5.200 | 03/15/44 | 10,000 | 10,150 |
| Prudential Financial, Inc. (5.875% to 09/01/2022, then 3 | | | |
| month LIBOR + 4.175%) | 5.875 | 09/15/42 | 45,000 | 48,713 |
| Sirius International Group, Ltd. (7.506% to 06/30/2017, then | | | |
| 3 month LIBOR + 3.200%) (Q)(S) | 7.506 | 06/30/17 | 50,000 | 52,750 |
| USI, Inc. (S) | 7.750 | 01/15/21 | 40,000 | 39,700 |
| | | | | |
| Real Estate Investment Trusts 1.4% | | | | |
| American Tower Corp. | 4.700 | 03/15/22 | 40,000 | 42,676 |
| ARC Properties Operating Partnership LP (S) | 4.600 | 02/06/24 | 50,000 | 50,971 |
| Host Hotels & Resorts LP | 5.250 | 03/15/22 | 25,000 | 27,505 |
| MPT Operating Partnership LP | 6.375 | 02/15/22 | 35,000 | 37,275 |
| MPT Operating Partnership LP | 6.875 | 05/01/21 | 100,000 | 107,500 |
| Prologis LP | 6.875 | 03/15/20 | 73,000 | 86,517 |
| Weyerhaeuser Company | 7.375 | 03/15/32 | 200,000 | 269,902 |
| | | | | |
| Real Estate Management & Development 0.1% | | | | |
| General Shopping Investments, Ltd. (12.000% to 03/20/2017, | | | |
| then 5 Year USGG + 11.052%) (Q)(S) | 12.000 | 03/20/17 | 30,000 | 28,386 |
| |
| Health Care 0.6% | | | | 249,015 |
|
| |
| Health Care Providers & Services 0.5% | | | | |
| HCA, Inc. | 7.500 | 02/15/22 | 100,000 | 113,250 |
| National Mentor Holdings, Inc. (S) | 12.500 | 02/15/18 | 84,000 | 89,040 |
| | | | | |
| Pharmaceuticals 0.1% | | | | |
| Mallinckrodt International Finance SA (C)(S) | 5.750 | 08/01/22 | 25,000 | 25,125 |
| Valeant Pharmaceuticals International, Inc. (S) | 7.500 | 07/15/21 | 20,000 | 21,600 |
| |
| Industrials 4.0% | | | | 1,697,267 |
|
| |
| Aerospace & Defense 0.7% | | | | |
| Huntington Ingalls Industries, Inc. | 7.125 | 03/15/21 | 150,000 | 160,500 |
Diversified Strategies Fund
Fund’s investments
As of 7-31-14
| | | | |
| | | Maturity | | |
| | Rate (%) | date | Par value^ | Value |
| |
| Industrials (continued) | | | | |
|
| Textron Financial Corp. (6.000% to 02/15/2017, then 3 month | | | |
| LIBOR + 1.735%) (S) | 6.000 | 02/15/67 | 150,000 | $135,000 |
| | | | | |
| Airlines 1.4% | | | | |
| American Airlines 2011-1 Class B Pass Through Trust (S) | 7.000 | 01/31/18 | 77,974 | 84,602 |
| British Airways PLC 2013-1 Class B Pass Through Trust (S) | 5.625 | 06/20/20 | 24,891 | 26,633 |
| Continental Airlines 1997-4 Class A Pass Through Trust | 6.900 | 01/02/18 | 22,482 | 24,125 |
| Delta Air Lines 2002-1 Class G-1 Pass Through Trust | 6.718 | 01/02/23 | 64,120 | 74,860 |
| Delta Air Lines 2007-1 Class A Pass Through Trust | 6.821 | 08/10/22 | 130,121 | 153,621 |
| Delta Air Lines 2010-1 Class A Pass Through Trust | 6.200 | 07/02/18 | 132,878 | 149,156 |
| United Airlines 2014-2 Class A Pass Through Trust (C) | 3.750 | 09/03/26 | 35,000 | 34,913 |
| United Airlines 2014-2 Class B Pass Through Trust (C) | 4.625 | 09/03/22 | 20,000 | 19,975 |
| US Airways 2012-1 Class A Pass Through Trust | 5.900 | 10/01/24 | 23,177 | 25,901 |
| | | | | |
| Commercial Services & Supplies 0.6% | | | | |
| Ahern Rentals, Inc. (S) | 9.500 | 06/15/18 | 20,000 | 21,700 |
| Casella Waste Systems, Inc. | 7.750 | 02/15/19 | 40,000 | 41,200 |
| Iron Mountain, Inc. | 5.750 | 08/15/24 | 45,000 | 45,000 |
| Iron Mountain, Inc. | 6.000 | 08/15/23 | 45,000 | 46,913 |
| Safway Group Holding LLC (S) | 7.000 | 05/15/18 | 100,000 | 104,750 |
| | | | | |
| Construction & Engineering 0.1% | | | | |
| Tutor Perini Corp. | 7.625 | 11/01/18 | 50,000 | 52,125 |
| | | | | |
| Industrial Conglomerates 0.5% | | | | |
| Odebrecht Finance, Ltd. (Q)(S) | 7.500 | 09/14/15 | 200,000 | 204,200 |
| Tenedora Nemak SA de CV (S) | 5.500 | 02/28/23 | 20,000 | 20,700 |
| Machinery 0.1% | | | | |
| SPL Logistics Escrow LLC (S) | 8.875 | 08/01/20 | 24,000 | 26,580 |
| | | | | |
| Trading Companies & Distributors 0.3% | | | | |
| Aircastle, Ltd. | 6.250 | 12/01/19 | 25,000 | 26,813 |
| International Lease Finance Corp. (S) | 7.125 | 09/01/18 | 100,000 | 114,500 |
| | | | | |
| Transportation Infrastructure 0.3% | | | | |
| Florida East Coast Holdings Corp. (S) | 6.750 | 05/01/19 | 100,000 | 103,500 |
| |
| Information Technology 0.1% | | | | 51,750 |
|
| |
| Internet Software & Services 0.1% | | | | |
| Ancestry.com, Inc. | 11.000 | 12/15/20 | 45,000 | 51,750 |
| |
| Materials 2.3% | | | | 993,943 |
|
| |
| Chemicals 0.2% | | | | |
| Braskem Finance, Ltd. (S) | 7.000 | 05/07/20 | 100,000 | 112,000 |
| | | | | |
| Construction Materials 0.2% | | | | |
| American Gilsonite Company (S) | 11.500 | 09/01/17 | 70,000 | 76,213 |
| | | | | |
| Containers & Packaging 0.1% | | | | |
| Tekni-Plex, Inc. (S) | 9.750 | 06/01/19 | 28,000 | 30,590 |
| | | | | |
| Metals & Mining 1.3% | | | | |
| AngloGold Ashanti Holdings PLC | 8.500 | 07/30/20 | 60,000 | 67,890 |
| Commercial Metals Company | 7.350 | 08/15/18 | 150,000 | 169,500 |
| Edgen Murray Corp. (S) | 8.750 | 11/01/20 | 19,000 | 21,280 |
| Rain CII Carbon LLC (S) | 8.000 | 12/01/18 | 40,000 | 41,400 |
| SunCoke Energy, Inc. | 7.625 | 08/01/19 | 37,000 | 39,220 |
| Vale Overseas, Ltd. | 4.625 | 09/15/20 | 200,000 | 213,406 |
Diversified Strategies Fund
Fund’s investments
As of 7-31-14
| | | | |
| | | Maturity | | |
| | Rate (%) | date | Par value^ | Value |
| |
| Materials (continued) | | | | |
|
| |
| Paper & Forest Products 0.5% | | | | |
| Georgia-Pacific LLC | 7.250 | 06/01/28 | 171,000 | $222,444 |
| |
| Telecommunication Services 3.1% | | | | 1,343,778 |
|
| |
| Diversified Telecommunication Services 1.8% | | | | |
| CenturyLink, Inc. | 5.800 | 03/15/22 | 50,000 | 51,250 |
| CenturyLink, Inc. | 7.600 | 09/15/39 | 200,000 | 200,000 |
| GTP Acquisition Partners I LLC (S) | 4.704 | 05/15/18 | 50,000 | 50,702 |
| T-Mobile USA, Inc. | 6.250 | 04/01/21 | 15,000 | 15,675 |
| Telecom Italia Capital SA | 6.999 | 06/04/18 | 35,000 | 39,550 |
| Telecom Italia Capital SA | 7.200 | 07/18/36 | 200,000 | 214,000 |
| Telefonica Emisiones SAU | 5.134 | 04/27/20 | 200,000 | 221,726 |
| | | | | |
| Wireless Telecommunication Services 1.3% | | | | |
| Digicel Group, Ltd. (S) | 8.250 | 09/30/20 | 200,000 | 213,500 |
| Millicom International Cellular SA (S) | 6.625 | 10/15/21 | 200,000 | 212,500 |
| Ooredoo International Finance, Ltd. (S) | 7.875 | 06/10/19 | 100,000 | 124,875 |
| |
| Utilities 2.5% | | | | 1,053,764 |
|
| |
| Electric Utilities 1.9% | | | | |
| DPL, Inc. | 7.250 | 10/15/21 | 200,000 | 211,000 |
| Electricite de France SA (5.250% to 01/29/2023, then 10 | | | |
| Year U.S. Swap Rate + 3.709%) (Q)(S) | 5.250 | 01/29/23 | 100,000 | 101,613 |
| Israel Electric Corp., Ltd. (S) | 5.625 | 06/21/18 | 200,000 | 213,200 |
| Majapahit Holding BV (S) | 7.750 | 01/20/20 | 150,000 | 177,188 |
| NextEra Energy Capital Holdings, Inc. (6.650% to | | | | |
| 06/15/2017, then 3 month LIBOR + 2.125%) | 6.650 | 06/15/67 | 30,000 | 30,638 |
| NRG Yield Operating LLC (S) | 5.375 | 08/15/24 | 20,000 | 20,000 |
| Southern California Edison Company (6.250% to 02/01/2022, | | | |
| then 3 month LIBOR + 4.199%) (Q) | 6.250 | 02/01/22 | 35,000 | 37,975 |
| | | | | |
| Independent Power and Renewable Electricity Producers 0.4% | | | |
| NRG Energy, Inc. | 8.250 | 09/01/20 | 150,000 | 161,250 |
| | | | | |
| Multi-Utilities 0.2% | | | | |
| Integrys Energy Group, Inc. (6.110% to 12/01/2016, then 3 | | | |
| month LIBOR + 2.120%) | 6.110 | 12/01/66 | 100,000 | 100,900 |
| |
| U.S. Government & Agency Obligations 8.9% | | | | $3,785,978 |
|
| (Cost $3,781,072) | | | | |
| |
| U.S. Government 6.7% | | | | 2,868,014 |
|
| Treasury Inflation Protected Securities | | | | |
| Inflation Indexed Bond | 0.125 | 04/15/17 | 227,264 | 233,141 |
| Inflation Indexed Bond | 1.250 | 07/15/20 | 169,063 | 183,711 |
| Inflation Indexed Bond | 1.875 | 07/15/15 | 218,906 | 226,004 |
| U.S. Treasury | | | | |
| Bond | 3.125 | 02/15/42 | 70,000 | 67,889 |
| Note | 1.000 | 06/30/19 | 500,000 | 481,992 |
| Note | 1.500 | 12/31/18 | 1,300,000 | 1,292,383 |
| Note | 2.500 | 05/15/24 | 385,000 | 382,894 |
Diversified Strategies Fund
Fund’s investments
As of 7-31-14
| | | | | |
| | | Maturity | | | |
| | Rate (%) | date | | Par value^ | Value |
| |
| U.S. Government Agency 2.2% | | | | | $917,964 |
|
| Federal Home Loan Bank | | | | | |
| Bond | 2.900 | 09/05/25 | | 19,048 | 18,278 |
| Bond | 3.170 | 10/04/27 | | 15,000 | 14,265 |
| Bond | 3.250 | 06/21/27 | | 21,212 | 20,529 |
| Federal Home Loan Mortgage Corp. | | | | | |
| Freddie Mac Pool | 4.000 | 12/01/40 | | 474,245 | 500,996 |
| Freddie Mac Pool | 4.500 | 12/01/40 | | 336,108 | 363,896 |
| |
| Foreign Government Obligations 0.6% | | | | | $253,661 |
|
| (Cost $255,019) | | | | | |
| |
| Argentina 0.1% | | | | | 31,195 |
|
| Republic of Argentina | | | | | |
| Bond (H) | 8.280 | 12/31/33 | | 35,051 | 31,195 |
| |
| Brazil 0.3% | | | | | 112,704 |
|
| Federative Republic of Brazil | | | | | |
| Bond | 10.000 | 01/01/21 | BRL | 275,000 | 112,704 |
| |
| Mexico 0.2% | | | | | 109,762 |
|
| Government of Mexico | | | | | |
| Bond | 10.000 | 12/05/24 | MXN | 1,100,000 | 109,762 |
| |
| Capital Preferred Securities 0.5% | | | | | $221,888 |
|
| (Cost $197,583) | | | | | |
| |
| Financials 0.5% | | | | | 221,888 |
|
| MetLife Capital Trust IV (7.875% to 12/15/2032, then 3 | | | | |
| month LIBOR + 3.960%) (S) | 7.875 | 12/15/37 | | 35,000 | 44,275 |
| MetLife Capital Trust X (9.250% to 04/08/2033, then 3 month | | | | |
| LIBOR + 5.540%) (S) | 9.250 | 04/08/38 | | 30,000 | 43,050 |
| ZFS Finance USA Trust II (6.450% to 06/15/2016 then 3 | | | | |
| month LIBOR + 2.000%) (S) | 6.450 | 12/15/65 | | 100,000 | 107,750 |
| ZFS Finance USA Trust V (6.500% to 05/09/2017, then 3 | | | | |
| month LIBOR + 2.285%) (S) | 6.500 | 05/09/37 | | 25,000 | 26,813 |
| |
| Convertible Bonds 0.7% | | | | | $299,094 |
|
| (Cost $302,225) | | | | | |
| |
| Consumer Discretionary 0.3% | | | | | 133,594 |
|
| |
| Hotels, Restaurants & Leisure 0.3% | | | | | |
| MGM Resorts International | 4.250 | 04/15/15 | | 90,000 | 133,594 |
| |
| Financials 0.2% | | | | | 92,250 |
|
| |
| Capital Markets 0.2% | | | | | |
| Walter Investment Management Corp. | 4.500 | 11/01/19 | | 100,000 | 92,250 |
| |
| Health Care 0.2% | | | | | 73,250 |
|
| |
| Pharmaceuticals 0.2% | | | | | |
| Vivus, Inc. (S) | 4.500 | 05/01/20 | | 100,000 | 73,250 |
Diversified Strategies Fund
Fund’s investments
As of 7-31-14
| | | | |
| | | Maturity | | |
| | Rate (%) | date | Par value^ | Value |
| |
| Term Loans (M) 3.1% | | | | $1,309,742 |
|
| (Cost $1,281,651) | | | | |
| |
| Consumer Discretionary 0.4% | | | | 170,503 |
|
| |
| Hotels, Restaurants & Leisure 0.1% | | | | |
| Marina District Finance Company, Inc. | 6.750 | 08/15/18 | 24,875 | 25,062 |
| | | | | |
| Media 0.3% | | | | |
| Clear Channel Communications, Inc. | 3.805 | 01/29/16 | 1,920 | 1,901 |
| Clear Channel Communications, Inc. | 6.905 | 01/30/19 | 110,259 | 108,168 |
| Clear Channel Communications, Inc. | 7.655 | 07/30/19 | 35,461 | 35,372 |
| |
| Consumer Staples 0.2% | | | | 94,582 |
|
| |
| Household Products 0.2% | | | | |
| The Sun Products Corp. | 5.500 | 03/23/20 | 98,013 | 94,582 |
| |
| Energy 0.5% | | | | 209,464 |
|
| |
| Energy Equipment & Services 0.2% | | | | |
| Paragon Offshore Finance Company (T) | TBD | 06/19/21 | 100,000 | 99,438 |
| | | | | |
| Oil, Gas & Consumable Fuels 0.3% | | | | |
| FTS International, Inc. | 5.750 | 04/16/21 | 109,091 | 110,026 |
| |
| Health Care 0.6% | | | | 259,726 |
|
| |
| Health Care Providers & Services 0.6% | | | | |
| Catalent Pharma Solutions, Inc. | 6.500 | 12/29/17 | 150,000 | 150,375 |
| CRC Health Corp. | 9.000 | 09/28/21 | 50,000 | 50,375 |
| National Mentor Holdings, Inc. | 4.750 | 01/31/21 | 58,854 | 58,976 |
| |
| Industrials 0.5% | | | | 196,938 |
|
| |
| Aerospace & Defense 0.3% | | | | |
| WP CPP Holdings LLC | 4.750 | 12/27/19 | 98,500 | 98,746 |
| | | | | |
| Airlines 0.2% | | | | |
| Delta Air Lines, Inc. | 3.250 | 10/18/18 | 98,500 | 98,192 |
| |
| Information Technology 0.2% | | | | 95,293 |
|
| |
| Software 0.2% | | | | |
| BMC Software Finance, Inc. | 5.000 | 09/10/20 | 96,028 | 95,293 |
| |
| Utilities 0.7% | | | | 283,236 |
|
| |
| Electric Utilities 0.7% | | | | |
| Texas Competitive Electric Holdings Company LLC | 3.750 | 05/05/16 | 282,178 | 283,236 |
| |
| Collateralized Mortgage Obligations 4.4% | | | | $1,885,017 |
|
| (Cost $1,852,266) | | | | |
| |
| Commercial & Residential 3.8% | | | | 1,645,408 |
|
| Adjustable Rate Mortgage Trust | | | | |
| Series 2005-4, Class 7A12 (P) | 0.735 | 08/25/35 | 21,902 | 20,728 |
| American Home Mortgage Assets Trust | | | | |
| Series 2006-6, Class XP IO | 2.456 | 12/25/46 | 1,124,764 | 82,220 |
| American Home Mortgage Investment Trust | | | | |
| Series 2005-1, Class 1A1 (P) | 0.375 | 06/25/45 | 48,843 | 46,285 |
Diversified Strategies Fund
Fund’s investments
As of 7-31-14
| | | | |
| | | Maturity | | |
| | Rate (%) | date | Par value^ | Value |
| |
| Commercial & Residential (continued) | | | | |
|
| Americold 2010 LLC Trust | | | | |
| Series 2010-ARTA, Class D (S) | 7.443 | 01/14/29 | 100,000 | $114,087 |
| Banc of America Commercial Mortgage Securities Trust | | | |
| Series 2013-DSNY, Class E (P) (S) | 2.752 | 09/15/26 | 100,000 | 100,474 |
| Commercial Mortgage Pass Through Certificates | | | | |
| Series 2014-CR16, Class C (P) | 4.906 | 04/10/47 | 45,000 | 47,491 |
| Countrywide Alternative Loan Trust | | | | |
| Series 2007-16CB, Class 4A7 | 6.000 | 08/25/37 | 93,752 | 85,730 |
| Hilton USA Trust | | | | |
| Series 2013-HLF, Class EFL (P) (S) | 3.906 | 11/05/30 | 100,000 | 100,358 |
| Series 2013-HLT, Class DFX (S) | 4.407 | 11/05/30 | 100,000 | 102,760 |
| Series 2014-ORL, Class D (P) (S) | 2.300 | 07/15/29 | 100,000 | 100,059 |
| IndyMac Index Mortgage Loan Trust | | | | |
| Series 2005-AR12, Class AX2 IO | 2.213 | 07/25/35 | 598,864 | 43,181 |
| JPMBB Commercial Mortgage Securities Trust | | | |
| Series 2014-C19, Class C (P) | 4.679 | 04/15/47 | 55,000 | 56,951 |
| JPMorgan Chase Commercial Mortgage Securities Trust | | | |
| Series 2014-FBLU, Class C (P) (S) | 2.152 | 12/15/28 | 100,000 | 100,537 |
| Series 2014-FBLU, Class D (P) (S) | 2.752 | 12/15/28 | 100,000 | 100,224 |
| Series 2014-INN, Class F (P) (S) | 4.152 | 06/15/29 | 100,000 | 100,008 |
| Morgan Stanley Mortgage Loan Trust | | | | |
| Series 2004-6AR, Class 2A2 (P) | 2.704 | 08/25/34 | 62,195 | 61,707 |
| Motel 6 Trust | | | | |
| Series 2012-MTL6, Class D (S) | 3.781 | 10/05/25 | 100,000 | 100,899 |
| UBS-Barclays Commercial Mortgage Trust | | | |
| Series 2012-C2, Class XA IO (S) | 1.775 | 05/10/63 | 534,110 | 45,123 |
| VNDO Mortgage Trust | | | | |
| Series 2013-PENN, Class D (P) (S) | 3.947 | 12/13/29 | 100,000 | 101,281 |
| WaMu Mortgage Pass Through Certificates | | | | |
| Series 2005-AR2, Class 2A1B (P) | 0.525 | 01/25/45 | 23,860 | 22,133 |
| Wells Fargo Commercial Mortgage Trust | | | | |
| Series 2013-120B, Class C (P) (S) | 2.710 | 03/18/28 | 80,000 | 77,202 |
| Series 2013-BTC, Class E (P) (S) | 3.550 | 04/16/35 | 40,000 | 35,970 |
| |
| U.S. Government Agency 0.6% | | | | 239,609 |
|
| Federal Home Loan Mortgage Corp. | | | | |
| Series 288, Class IO | 3.000 | 10/15/27 | 327,509 | 43,293 |
| Series 4077, Class IK IO | 5.000 | 07/15/42 | 90,688 | 21,282 |
| Series K018, Class X1 IO | 1.449 | 01/25/22 | 399,665 | 33,574 |
| Series K710, Class X1 IO | 1.780 | 05/25/19 | 276,520 | 19,977 |
| Federal National Mortgage Association | | | | |
| Series 2012-118, Class IB IO | 3.500 | 11/25/42 | 149,979 | 33,739 |
| Series 2012-137, Class WI IO | 3.500 | 12/25/32 | 218,214 | 42,411 |
| Series 407, Class C6 IO | 5.500 | 01/25/40 | 119,223 | 26,291 |
| Government National Mortgage Association | | | | |
| Series 2012-114, Class IO | 1.038 | 01/16/53 | 217,632 | 19,042 |
| |
| Asset Backed Securities 1.4% | | | | $604,727 |
|
| (Cost $586,762) | | | | |
| |
| Aegis Asset Backed Securities Trust | | | |
| Series 2005-4, Class M1 (P) | 0.605 | 10/25/35 | 75,000 | 65,197 |
| Ally Master Owner Trust | | | | |
| Series 2012-4, Class A | 1.720 | 07/15/19 | 20,000 | 20,082 |
| Chase Issuance Trust | | | | |
| Series 2014-A6, Class A | 1.260 | 07/15/19 | 46,000 | 45,844 |
Diversified Strategies Fund
Fund’s investments
As of 7-31-14
| | | | |
| | | Maturity | | |
| | Rate (%) | date | Par value^ | Value |
| | | | | |
| Citibank Credit Card Issuance Trust | | | | |
| Series 2007-A8, Class A8 | 5.650 | 09/20/19 | 30,000 | $33,811 |
| Citicorp Residential Mortgage Securities, Inc. | | | | |
| Series 2007-2, Class A6 (P) | 5.729 | 06/25/37 | 27,678 | 28,626 |
| Countrywide Asset-Backed Certificates | | | | |
| Series 2004-10, Class AF5B (P) | 5.417 | 02/25/35 | 55,367 | 56,616 |
| Credit Suisse Mortgage Trust | | | | |
| Series 2014-ICE, Class D (P) (S) | 2.400 | 04/15/27 | 35,000 | 35,098 |
| Ford Credit Floorplan Master Owner Trust | | | | |
| Series 2012-5, Class A | 1.490 | 09/15/19 | 40,000 | 39,836 |
| Sierra Timeshare Receivables Funding LLC | | | | |
| Series 2014-2A, Class A (S) | 2.050 | 06/20/31 | 55,000 | 54,823 |
| Soundview Home Loan Trust | | | | |
| Series 2005-CTX1, Class M2 (P) | 0.592 | 11/25/35 | 35,000 | 33,425 |
| Series 2006-OPT2, Class A3 (P) | 0.335 | 05/25/36 | 23,576 | 21,882 |
| Structured Asset Securities Corp. Mortgage Loan Trust | | | | |
| Series 2005-2XS, Class 2A2 (P) | 1.656 | 02/25/35 | 40,741 | 40,420 |
| TAL Advantage V LLC | | | | |
| Series 2014-1A, Class A (S) | 3.510 | 02/22/39 | 28,750 | 29,067 |
| Westgate Resorts LLC | | | | |
| Series 2014-AA, Class A (S) | 6.250 | 10/20/26 | 100,000 | 100,000 |
| | | | | |
| | | | Shares | Value |
| |
| Common Stocks 30.4% | | | | $12,968,152 |
|
| (Cost $12,425,070) | | | | |
| |
| Consumer Discretionary 3.8% | | | | 1,614,652 |
|
| |
| Auto Components 0.1% | | | | |
| Tenneco, Inc. (I) | | | 489 | 31,149 |
| | | | | |
| Automobiles 1.1% | | | | |
| Ford Motor Company | | | 3,808 | 64,812 |
| General Motors Company | | | 4,133 | 139,778 |
| Nissan Motor Company, Ltd. | | | 19,100 | 187,379 |
| Toyota Motor Corp. | | | 1,600 | 94,464 |
| | | | | |
| Hotels, Restaurants & Leisure 0.2% | | | | |
| Norwegian Cruise Line Holdings, Ltd. (I) | | | 2,111 | 69,199 |
| Starbucks Corp. | | | 484 | 37,597 |
| | | | | |
| Household Durables 0.1% | | | | |
| Lennar Corp., Class A | | | 1,513 | 54,816 |
| | | | | |
| Internet & Catalog Retail 0.6% | | | | |
| Amazon.com, Inc. (I) | | | 633 | 198,123 |
| The Priceline Group, Inc. (I) | | | 49 | 60,880 |
| | | | | |
| Media 0.8% | | | | |
| Comcast Corp., Class A | | | 1,614 | 86,720 |
| Lions Gate Entertainment Corp. | | | 1,694 | 52,175 |
| Pearson PLC | | | 3,853 | 74,112 |
| Viacom, Inc., Class B | | | 1,362 | 112,597 |
| | | | | |
| Multiline Retail 0.3% | | | | |
| Macy's, Inc. | | | 1,976 | 114,193 |
| | | | | |
| Specialty Retail 0.4% | | | | |
| Advance Auto Parts, Inc. | | | 219 | 26,523 |
| Lowe's Companies, Inc. | | | 2,732 | 130,726 |
Diversified Strategies Fund
Fund’s investments
As of 7-31-14
| | |
| | Shares | Value |
| |
| Consumer Discretionary (continued) | | |
|
| |
| Textiles, Apparel & Luxury Goods 0.2% | | |
| Movado Group, Inc. | 1,150 | $47,070 |
| Wolverine World Wide, Inc. | 1,333 | 32,339 |
| |
| Consumer Staples 2.1% | | 895,460 |
|
| |
| Beverages 0.2% | | |
| PepsiCo, Inc. | 1,027 | 90,479 |
| | | |
| Food & Staples Retailing 0.3% | | |
| CVS Caremark Corp. | 871 | 66,510 |
| Koninklijke Ahold NV | 3,651 | 63,660 |
| | | |
| Food Products 0.6% | | |
| Mondelez International, Inc., Class A | 2,642 | 95,112 |
| The Hain Celestial Group, Inc. (I) | 435 | 37,193 |
| Unilever NV | 2,460 | 101,244 |
| | | |
| Personal Products 0.3% | | |
| Pola Orbis Holdings, Inc. | 3,400 | 141,179 |
| | | |
| Tobacco 0.7% | | |
| British American Tobacco PLC | 2,100 | 123,023 |
| Philip Morris International, Inc. | 2,159 | 177,060 |
| |
| Energy 2.8% | | 1,181,675 |
|
| |
| Energy Equipment & Services 0.5% | | |
| Noble Corp. PLC | 1,594 | 50,004 |
| Schlumberger, Ltd. | 873 | 94,624 |
| Weatherford International PLC (I) | 2,936 | 65,678 |
| | | |
| Oil, Gas & Consumable Fuels 2.3% | | |
| Apache Corp. | 1,168 | 119,907 |
| Denbury Resources, Inc. | 7,306 | 123,837 |
| Devon Energy Corp. | 865 | 65,308 |
| Eni SpA | 5,202 | 132,370 |
| Inpex Corp. | 2,500 | 37,052 |
| Occidental Petroleum Corp. | 1,041 | 101,716 |
| Royal Dutch Shell PLC, Class A | 4,180 | 171,864 |
| Suncor Energy, Inc. | 1,400 | 57,498 |
| Total SA | 2,509 | 161,817 |
| |
| Financials 5.9% | | 2,525,714 |
|
| |
| Banks 4.2% | | |
| Barclays PLC | 56,584 | 214,492 |
| BB&T Corp. | 1,870 | 69,227 |
| BBCN Bancorp, Inc. | 3,110 | 46,712 |
| CIT Group, Inc. | 756 | 37,127 |
| Citigroup, Inc. | 2,325 | 113,716 |
| HSBC Holdings PLC | 17,615 | 188,849 |
| Intesa Sanpaolo SpA | 12,784 | 37,964 |
| JPMorgan Chase & Company | 5,918 | 341,291 |
| Royal Bank of Scotland Group PLC (I) | 6,222 | 37,086 |
| Standard Chartered PLC | 6,200 | 128,574 |
| Sumitomo Mitsui Financial Group, Inc. | 3,900 | 158,981 |
| SVB Financial Group (I) | 359 | 39,138 |
| U.S. Bancorp | 2,488 | 104,571 |
| UniCredit SpA | 14,823 | 115,636 |
| Wells Fargo & Company | 3,145 | 160,081 |
Diversified Strategies Fund
Fund’s investments
As of 7-31-14
| | |
| | Shares | Value |
| |
| Financials (continued) | | |
|
| |
| Capital Markets 1.0% | | |
| AllianceBernstein Holding LP | 1,788 | $46,738 |
| Credit Suisse Group AG (I) | 3,554 | 96,412 |
| Morgan Stanley | 1,785 | 57,727 |
| Northern Trust Corp. | 629 | 42,074 |
| The Carlyle Group LP | 2,825 | 94,299 |
| The Goldman Sachs Group, Inc. | 447 | 77,273 |
| | | |
| Consumer Finance 0.1% | | |
| Acom Company, Ltd. (I) | 9,900 | 38,981 |
| | | |
| Diversified Financial Services 0.2% | | |
| Berkshire Hathaway, Inc., Class B (I) | 682 | 85,543 |
| Insurance 0.4% | | |
| American International Group, Inc. | 1,624 | 84,416 |
| Arthur J. Gallagher & Company | 972 | 43,740 |
| MetLife, Inc. | 1,237 | 65,066 |
| |
| Health Care 4.4% | | 1,884,001 |
|
| |
| Biotechnology 0.9% | | |
| Alexion Pharmaceuticals, Inc. (I) | 310 | 49,287 |
| Amgen, Inc. | 998 | 127,135 |
| Biogen Idec, Inc. (I) | 436 | 145,794 |
| Celgene Corp. (I) | 893 | 77,825 |
| | | |
| Health Care Equipment & Supplies 0.5% | | |
| Align Technology, Inc. (I) | 674 | 36,538 |
| Baxter International, Inc. | 1,614 | 120,550 |
| Medtronic, Inc. | 816 | 50,380 |
| | | |
| Health Care Providers & Services 0.2% | | |
| Express Scripts Holding Company (I) | 649 | 45,203 |
| Fresenius Medical Care AG & Company KGaA | 739 | 51,226 |
| | | |
| Health Care Technology 0.1% | | |
| athenahealth, Inc. (I) | 400 | 49,760 |
| | | |
| Life Sciences Tools & Services 0.1% | | |
| Bio-Rad Laboratories, Inc., Class A (I) | 346 | 39,787 |
| | | |
| Pharmaceuticals 2.6% | | |
| AbbVie, Inc. | 987 | 51,660 |
| GlaxoSmithKline PLC | 3,798 | 91,527 |
| Johnson & Johnson | 1,968 | 196,977 |
| Novartis AG | 3,219 | 280,048 |
| Pfizer, Inc. | 3,815 | 109,491 |
| Roche Holding AG | 841 | 244,063 |
| Sanofi | 1,112 | 116,750 |
| |
| Industrials 4.0% | | 1,693,704 |
|
| |
| Aerospace & Defense 1.5% | | |
| Precision Castparts Corp. | 286 | 65,437 |
| Safran SA | 3,259 | 191,523 |
| The Boeing Company | 453 | 54,577 |
| TransDigm Group, Inc. | 408 | 68,511 |
| United Technologies Corp. | 2,249 | 236,482 |
| | | |
| Air Freight & Logistics 0.2% | | |
| FedEx Corp. | 708 | 103,991 |
Diversified Strategies Fund
Fund’s investments
As of 7-31-14
| | |
| | Shares | Value |
| |
| Industrials (continued) | | |
|
| |
| Building Products 0.2% | | |
| AO Smith Corp. | 933 | $43,571 |
| Fortune Brands Home & Security, Inc. | 1,439 | 54,380 |
| | | |
| Commercial Services & Supplies 0.1% | | |
| Clean Harbors, Inc. (I) | 538�� | 31,005 |
| | | |
| Electrical Equipment 0.6% | | |
| Eaton Corp. PLC | 2,772 | 188,274 |
| Prysmian SpA | 2,200 | 46,781 |
| | | |
| Industrial Conglomerates 0.7% | | |
| Danaher Corp. | 1,334 | 98,556 |
| General Electric Company | 7,271 | 182,866 |
| Rheinmetall AG | 509 | 30,851 |
| | | |
| Machinery 0.5% | | |
| CNH Industrial NV | 12,316 | 113,676 |
| Cummins, Inc. | 256 | 35,684 |
| Hoshizaki Electric Company, Ltd. | 1,600 | 81,463 |
| | | |
| Professional Services 0.1% | | |
| The Advisory Board Company (I) | 823 | 41,265 |
| | | |
| Trading Companies & Distributors 0.1% | | |
| Watsco, Inc. | 277 | 24,811 |
| |
| Information Technology 5.0% | | 2,120,428 |
|
| |
| Communications Equipment 0.7% | | |
| QUALCOMM, Inc. | 3,974 | 292,884 |
| | | |
| Electronic Equipment, Instruments & Components 0.1% | | |
| Optex Company, Ltd. | 2,200 | 47,603 |
| | | |
| Internet Software & Services 0.9% | | |
| eBay, Inc. (I) | 1,442 | 76,138 |
| Facebook, Inc., Class A (I) | 1,179 | 85,654 |
| Google, Inc., Class A (I) | 244 | 141,410 |
| Google, Inc., Class C (I) | 177 | 101,173 |
| | | |
| IT Services 0.3% | | |
| Visa, Inc., Class A | 520 | 109,725 |
| | | |
| Semiconductors & Semiconductor Equipment 0.3% | | |
| Infineon Technologies AG | 8,266 | 91,079 |
| Lasertec Corp. | 3,800 | 38,733 |
| | | |
| Software 1.3% | | |
| Bottomline Technologies, Inc. (I) | 911 | 25,790 |
| Microsoft Corp. | 6,083 | 262,542 |
| Oracle Corp. | 3,242 | 130,944 |
| SAP AG | 941 | 73,955 |
| Synchronoss Technologies, Inc. (I) | 995 | 40,208 |
| | | |
| Technology Hardware, Storage & Peripherals 1.4% | | |
| Apple, Inc. | 4,503 | 430,352 |
| EMC Corp. | 4,759 | 139,439 |
| Lenovo Group, Ltd. | 24,000 | 32,799 |
| |
| Materials 1.4% | | 609,561 |
|
| |
| Chemicals 0.4% | | |
| Akzo Nobel NV | 628 | 45,231 |
Diversified Strategies Fund
Fund’s investments
As of 7-31-14
| | |
| | Shares | Value |
| |
| Materials (continued) | | |
|
| E.I. du Pont de Nemours & Company | 1,633 | $105,018 |
| The Sherwin-Williams Company | 191 | 39,390 |
| | | |
| Containers & Packaging 0.6% | | |
| Amcor, Ltd. | 11,471 | 109,792 |
| Avery Dennison Corp. | 3,275 | 154,613 |
| | | |
| Metals & Mining 0.4% | | |
| Anglo American PLC | 1,773 | 47,616 |
| Freeport-McMoRan Copper & Gold, Inc. | 2,899 | 107,901 |
| |
| Telecommunication Services 1.0% | | 442,957 |
|
| |
| Diversified Telecommunication Services 0.8% | | |
| Koninklijke KPN NV (I) | 30,467 | 97,423 |
| Nippon Telegraph & Telephone Corp. | 1,400 | 92,966 |
| Telefonica SA | 5,391 | 87,887 |
| Verizon Communications, Inc. | 1,377 | 69,517 |
| | | |
| Wireless Telecommunication Services 0.2% | | |
| Vodafone Group PLC | 28,577 | 95,164 |
| |
| Preferred Securities 1.8% | | $759,692 |
|
| (Cost $728,287) | | |
| |
| Consumer Staples 0.2% | | 69,611 |
|
| |
| Household Products 0.2% | | |
| Henkel AG & Company KGaA | 626 | 69,611 |
| |
| Financials 0.8% | | 355,585 |
|
| |
| Banks 0.4% | | |
| Regions Financial Corp., 6.375% | 1,935 | 47,930 |
| The PNC Financial Services Group, Inc., 6.125% | 2,150 | 58,545 |
| U.S. Bancorp, 6.000% | 1,700 | 46,461 |
| Wells Fargo & Company, Series L, 7.500% | 18 | 21,780 |
| | | |
| Capital Markets 0.1% | | |
| The Goldman Sachs Group, Inc., 5.500% | 1,200 | 28,752 |
| | | |
| Consumer Finance 0.1% | | |
| Ally Financial, Inc., 7.000% (S) | 43 | 42,785 |
| Discover Financial Services, 6.500% | 1,100 | 27,962 |
| | | |
| Diversified Financial Services 0.1% | | |
| GMAC Capital Trust I (8.125% to 02/15/2016, then 3 month LIBOR | | |
| + 5.785%) | 2,000 | 54,360 |
| Real Estate Investment Trusts 0.1% | | |
| Weyerhaeuser Company, 6.375% | 500 | 27,010 |
| |
| Industrials 0.4% | | 177,919 |
|
| |
| Aerospace & Defense 0.1% | | |
| United Technologies Corp., 7.500% | 662 | 39,270 |
| | | |
| Airlines 0.3% | | |
| Continental Airlines Finance Trust II, 6.000% | 2,835 | 138,649 |
| |
| Telecommunication Services 0.2% | | 98,500 |
|
| |
| Diversified Telecommunication Services 0.2% | | |
| Intelsat SA, 5.750% | 2,000 | 98,500 |
Diversified Strategies Fund
Fund’s investments
As of 7-31-14
| | |
| | Shares | Value |
| |
| Utilities 0.2% | | $58,077 |
|
| |
| Electric Utilities 0.1% | | |
| Exelon Corp., 6.500% (I) | 364 | 17,872 |
| | | |
| Multi-Utilities 0.1% | | |
| Dominion Resources, Inc., 6.375% (I) | 793 | 40,205 |
| |
| Investment Companies 11.8% | | $5,014,996 |
|
| (Cost $4,695,953) | | |
| |
| Exchange-Traded Funds 11.8% | | 5,014,996 |
|
| Energy Select Sector SPDR Fund | 1,559 | 150,646 |
| Financial Select Sector SPDR Fund | 10,250 | 229,703 |
| iShares Global Infrastructure ETF | 5,592 | 241,463 |
| iShares MSCI Singapore ETF | 23,225 | 326,544 |
| iShares MSCI South Korea Capped ETF | 6,700 | 442,870 |
| iShares MSCI Taiwan Index | 11,740 | 184,553 |
| iShares Transportation Average ETF | 815 | 118,851 |
| iShares U.S. Oil & Gas Exploration & Production ETF | 1,372 | 127,459 |
| Market Vectors Coal ETF | 1,142 | 21,401 |
| Market Vectors Gold Miners ETF | 624 | 16,155 |
| Market Vectors Oil Service ETF | 3,342 | 181,070 |
| PowerShares DB Agriculture Fund (I) | 1,422 | 38,124 |
| PowerShares DB Commodity Index Tracking Fund (I) | 7,902 | 199,921 |
| PowerShares DB Energy Fund (I) | 1,993 | 57,837 |
| PowerShares DB Gold Fund (I) | 689 | 29,510 |
| SPDR S&P China ETF | 4,490 | 360,008 |
| SPDR S&P Global Natural Resources ETF | 4,053 | 211,486 |
| SPDR S&P Homebuilders ETF | 7,275 | 214,322 |
| Vanguard Energy ETF | 845 | 117,100 |
| Vanguard Global ex-U.S. Real Estate ETF | 1,077 | 63,166 |
| Vanguard Health Care ETF | 2,100 | 233,667 |
| Vanguard Industrials ETF | 3,350 | 333,325 |
| Vanguard Information Technology ETF | 6,075 | 591,037 |
| Vanguard Materials ETF | 303 | 33,012 |
| Vanguard REIT ETF | 1,453 | 108,830 |
| WisdomTree Europe SmallCap Dividend Fund | 2,130 | 121,027 |
| WisdomTree International SmallCap Dividend Fund | 2,050 | 130,688 |
| WisdomTree Japan Hedged Equity Fund | 2,626 | 131,221 |
| |
| Total investments (Cost $39,021,241)† 96.2% | | $40,985,655 |
|
| |
| Other assets and liabilities, net 3.8% | | $1,635,093 |
|
| |
| Total net assets 100.0% | | $42,620,748 |
|
The percentage shown for each investment category is the total value of the category as a percentage of the net assets of the fund.
^All par values are denominated in U.S. dollars unless otherwise indicated.
| |
| Currency Abbreviations |
| BRL | Brazilian Real |
| MXN | Mexican Peso |
| | |
| Notes to Fund’s investments |
| IO | Interest-Only Security - (Interest Tranche of Stripped Mortgage Pool). Rate shown is the annualized yield at |
| | the end of the period. |
| LIBOR | London Interbank Offered Rate |
Diversified Strategies Fund
Fund’s investments
As of 7-31-14
PIK Paid-in-kind
TBD To Be Determined
USGG U.S. Generic Government Yield Index
(C) Security purchased on a when-issued or delayed delivery basis.
(H) Non-income producing - Bond is in default.
(I) Non-income producing security.
(M) Term loans are variable rate obligations. The coupon rate shown represents the rate at period end.
(P) Variable rate obligation. The coupon rate shown represents the rate at period end.
(Q) Perpetual bonds have no stated maturity date. Date shown as maturity date is next call date.
(S) These securities are exempt from registration under Rule 144A of the Securities Act of 1933. Such securities may be resold, normally to qualified institutional buyers, in transactions exempt from registration. Rule 144A securities amounted to $7,732,766 or 18.1% of the fund's net assets as of 7-31-14.
(T) This position represents an unsettled loan commitment at period end. Certain details associated with this purchase are not known prior to the settlement date, including coupon rate.
† At 7-31-14, the aggregate cost of investment securities for federal income tax purposes was $39,060,773. Net unrealized appreciation aggregated $1,924,882, of which $2,517,818 related to appreciated investment securities and $592,936 related to depreciated investment securities.
The fund had the following country concentration as a percentage of net assets on 7-31-14:
| | |
| United States | 75.3% | |
| United Kingdom | 3.5% | |
| Japan | 2.7% | |
| France | 2.5% | |
| Netherlands | 2.5% | |
| Luxembourg | 1.8% | |
| Switzerland | 1.6% | |
| Cayman Islands | 1.2% | |
| Indonesia | 1.0% | |
| Brazil | 0.8% | |
| Other Countries | 7.1% | |
| |
| |
| Total | 100.0% | |
Diversified Strategies Fund
Statement of assets and liabilities — July 31, 2014
| | |
| Assets | | |
|
| Investments, at value (Cost $39,021,241) | $ | 40,985,655 |
| Cash | | 909,157 |
| Cash held at broker for futures contracts | | 175,977 |
| Receivable for investments sold | | 547,717 |
| Receivable for forward foreign currency | | |
| exchange contracts | | 17,362 |
| Dividends and interest receivable | | 283,841 |
| Receivable for futures variation margin | | 73,289 |
| Other receivables and prepaid expenses | | 227 |
| | | |
| Total assets | | 42,993,225 |
| |
| |
| Liabilities | | |
|
| Payable for investments purchased | | 236,197 |
| Payable for delayed delivery securities | | |
| purchased | | 80,000 |
| Payable for forward foreign currency exchange | | |
| contracts | | 5,436 |
| Payable to affiliates | | |
| Accounting and legal services fees | | 811 |
| Transfer agent fees | | 4,731 |
| Other liabilities and accrued expenses | | 45,302 |
| | | |
| Total liabilities | | 372,477 |
| |
| Net assets | $ | 42,620,748 |
| |
| |
| Net assets consist of | | |
|
| Paid-in capital | $ | 38,977,459 |
| Undistributed net investment income | | 754,423 |
| Accumulated net realized gain (loss) on | | |
| investments, foreign currency transactions and | | |
| futures contracts | | 897,191 |
| Net unrealized appreciation (depreciation) on | | |
| investments, futures contracts and translation of | | |
| assets and liabilities in foreign currencies | | 1,991,675 |
| | | |
| Net assets | $ | 42,620,748 |
| |
| |
| Net asset value per share | | |
|
| Based on net asset values and shares | | |
| outstanding-the fund has an unlimited number of | | |
| shares authorized with no par value | | |
| Class A ($32,765,099 ÷ 3,000,000 shares)1 | $ | 10.92 |
| Class I ($9,855,649 ÷ 900,000 shares) | $ | 10.95 |
| |
| Maximum offering price per share | | |
| Class A (net asset value per share ÷ 95%)2 | $ | 11.49 |
1 Redemption price per share is equal to the net asset value less any applicable contingent deferred sales charge.
2 On single retail sales of less than $50,000. On sales of $50,000 or more and on group sales the offering price is reduced.
| |
| See notes to financial statements, | |
| | 23 |
Diversified Strategies Fund
Statement of operations — For the year ended July 31, 2014
| | |
| Investment income | | |
|
| Interest | $ | 1,407,028 |
| Dividends | | 517,296 |
| Less foreign taxes withheld | | (13,767) |
| | | |
| Total investment income | | 1,910,557 |
| |
| Expenses | | |
|
| Investment management fees | | 405,582 |
| Distribution and service fees | | 98,611 |
| Accounting and legal services fees | | 5,224 |
| Transfer agent fees | | 56,690 |
| Trustees' fees | | 550 |
| Professional fees | | 47,763 |
| Custodian fees | | 24,042 |
| Registration and filing fees | | 16,355 |
| Other | | 7,030 |
| | | |
| Total expenses | | 661,847 |
| | | |
| Less expense reductions | | (8,498) |
| | | |
| Net expenses | | 653,349 |
| |
| Net investment income | | 1,257,208 |
| |
| |
| Realized and unrealized gain (loss) | | |
|
| Net realized gain (loss) on | | |
| Investments in unaffiliated issuers and foreign | | |
| currency transactions | | 1,631,731 |
| Investments in affiliated issuers | | 1,174,014 |
| Capital gain distributions received from | | |
| unaffiliated underlying funds | | 3,357 |
| Futures contracts | | (347,704) |
| | | |
| | | 2,461,398 |
| |
| Change in net unrealized appreciation | | |
| (depreciation) of | | |
| Investments in unaffiliated issuers and | | |
| translation of assets and liabilities in foreign | | |
| currencies | | 419,779 |
| Investments in affiliated issuers | | (1,265,480) |
| Futures contracts | | 15,283 |
| | | |
| | | (830,418) |
| |
| Net realized and unrealized gain | | 1,630,980 |
| |
| Increase in net assets from operations | $ | 2,888,188 |
| |
| See notes to financial statements | |
| | 24 |
Diversified Strategies Fund
Statements of changes in net assets
| | | | |
| | | Year ended | | Year ended |
| | | 7-31-14 | | 7-31-13 |
| |
| Increase (decrease) in net assets | | | | |
|
| From operations | | | | |
| Net investment income | $ | 1,257,208 | $ | 1,555,738 |
| Net realized gain | | 2,461,398 | | 869,315 |
| Change in net unrealized appreciation | | | | |
| (depreciation) | | (830,418) | | 101,702 |
| | | | | |
| Increase in net assets resulting from | | | | |
| operations | | 2,888,188 | | 2,526,755 |
| |
| Distributions to shareholders | | | | |
| From net investment income | | | | |
| Class A | | (1,050,720) | | (1,269,180) |
| Class I | | (345,285) | | (419,031) |
| From net realized gain | | | | |
| Class A | | (1,603,890) | | (528,330) |
| Class I | | (481,167) | | (158,490) |
| | | | | |
| Total distributions | | (3,481,062) | | (2,375,031) |
| | | | | |
| From fund share transactions | | — | | — |
| |
| Total increase (decrease) | | (592,874) | | 151,724 |
| |
| Net assets | | | | |
|
| Beginning of year | | 43,213,622 | | 43,061,898 |
| | | | | |
| End of year | $ | 42,620,748 | $ | 43,213,622 |
| |
| Undistributed net investment income | $ | 754,423 | $ | 842,399 |
| |
| See notes to financial statements | |
| | 25 |
Diversified Strategies Fund
Financial highlights
Class A Shares
| | | | | | |
| | | Year | | Year | | Period |
| | | ended | | ended | | ended |
| | | 7-31-14 | | 7-31-13 | | 7-31-121 |
| Per share operating performance | | | | | | |
| |
| |
| |
|
| Net asset value, beginning of period | | $11.07 | | $11.04 | | $10.00 |
| Net investment income2 | | 0.31 | | 0.39 | | 0.32 |
| Net realized and unrealized gain on | | | | | | |
| investments | | 0.42 | | 0.24�� | | 0.84 |
| Total from investment operations | | 0.73 | | 0.63 | | 1.16 |
| |
| Less distributions | | | | | | |
| From net investment income | | (0.35) | | (0.42) | | (0.10) |
| From net realized gain | | (0.53) | | (0.18) | | (0.02) |
| Total distributions | | (0.88) | | (0.60) | | (0.12) |
| |
| Net asset value, end of period | | $10.92 | | $11.07 | | $11.04 |
| |
| Total return (%)3,4 | | 6.89 | | 5.81 | | 11.655 |
| |
| Ratios and supplemental data | | | | | | |
| |
| |
| |
|
| Net assets, end of period (in millions) | | $33 | | $33 | | $33 |
| Ratios (as a percentage of average net | | | | | | |
| assets): | | | | | | |
| Expenses before reductions6 | | 1.62 | | 1.23 | | 1.357 |
| Expenses including reductions6 | | 1.60 | | 1.14 | | 1.177 |
| Net investment income | | 2.87 | | 3.50 | | 3.607 |
| Portfolio turnover (%) | | 119 | | 40 | | 21 |
1 Period from 9-30-11 (commencement of operations) to 7-31-12.
2 Based on average daily shares outstanding.
3 Total returns would have been lower had certain expenses not been reduced during the applicable periods.
4 Does not reflect the effect of sales charges, if any.
5 Not annualized.
6 Ratios do not include expenses indirectly incurred from underlying funds whose expense ratios can vary based on the mix of underlying funds held by the fund. The range of expense ratios of the underlying funds held by the fund was as follows: 0.10% - 1.01%, 0.74%–1.42%, and 0.75%–1.43% for the years ended 7-31-14, 7-31-13, and the period ended 7-31-12, respectively.
7 Annualized.
| |
| See notes to financial statements | |
| | 26 |
Diversified Strategies Fund
Financial highlights
Class I Shares
| | | | | | |
| | | Year | | Year | | Period |
| | | ended | | ended | | ended |
| | | 7-31-14 | | 7-31-13 | | 7-31-121 |
| Per share operating performance | | | | | | |
| |
| |
| |
|
| Net asset value, beginning of period | | $11.10 | | $11.06 | | $10.00 |
| Net investment income2 | | 0.35 | | 0.43 | | 0.35 |
| Net realized and unrealized gain (loss) on | | | | | | |
| investments | | 0.42 | | 0.25 | | 0.84 |
| Total from investment operations | | 0.77 | | 0.68 | | 1.19 |
| |
| Less distributions | | | | | | |
| From net investment income | | (0.39) | | (0.46) | | (0.11) |
| From net realized gain | | (0.53) | | (0.18) | | (0.02) |
| Total distributions | | (0.92) | | (0.64) | | (0.13) |
| |
| Net asset value, end of period | | $10.95 | | $11.10 | | $11.06 |
| |
| Total return (%)3 | | 7.19 | | 6.30 | | 11.964 |
| |
| Ratios and supplemental data | | | | | | |
| |
| |
| |
|
| Net assets, end of period (in millions) | | $10 | | $10 | | $10 |
| Ratios (as a percentage of average net | | | | | | |
| assets): | | | | | | |
| Expenses before reductions5 | | 1.30 | | 0.86 | | 0.956 |
| Expenses including reductions5 | | 1.28 | | 0.77 | | 0.786 |
| Net investment income | | 3.19 | | 3.87 | | 3.996 |
| Portfolio turnover (%) | | 119 | | 40 | | 21 |
1 Period from 9-30-11 (commencement of operations) to 7-31-12.
2 Based on average daily shares outstanding.
3 Total returns would have been lower had certain expenses not been reduced during the applicable periods.
4 Not annualized.
5 Ratios do not include expenses indirectly incurred from underlying funds whose expense ratios can vary based on the mix of underlying funds held by the portfolio. The range of expense ratios of the underlying funds held by the fund was as follows: 0.10% - 1.01%, 0.74%–1.42%, and 0.75%–1.43% for the years ended 7-31-14, 7-31-13, and the period ended 7-31-12, respectively.
6 Annualized.
| |
| See notes to financial statements | |
| | 27 |
Notes to Financial Statements
Note1 - Organization
John Hancock Diversified Strategies Fund (the fund) is a series of John Hancock Funds II (the Trust), an open-end management investment company organized as a Massachusetts business trust and registered under the Investment Company Act of 1940, as amended (the 1940 Act). The investment objective of the fund is to seek long term total return.
The fund may offer multiple classes of shares. The shares currently offered are detailed in the Statement of assets and liabilities. Class A shares are offered to all investors. Class I shares are offered to institutions and certain investors. Shareholders of each class have exclusive voting rights to matters that affect that class. The distribution and service fees, if any, and transfer agent fees for each class may differ.
Note 2 - Significant accounting policies
The financial statements have been prepared in conformity with accounting principles generally accepted in the United States of America (US GAAP), which require management to make certain estimates and assumptions as of the date of the financial statements. Actual results could differ from those estimates and those differences could be significant. The fund intends to qualify as an investment company under Topic 946 of Accounting Standards Codification of US GAAP.
Events or transactions occurring after the end of the fiscal period through the date that the financial statements were issued have been evaluated in the preparation of the financial statements. The following summarizes the significant accounting policies of the fund:
Security valuation. Investments are stated at value as of the close of regular trading on the New York Stock Exchange (NYSE), normally at 4:00 P.M., Eastern Time. In order to value the securities, the fund uses the following valuation techniques: Equity securities, including exchange-traded funds, held by the fund are valued at the last sale price or official closing price on the exchange where the security was acquired or most likely will be sold. In the event there were no sales during the day or closing prices are not available, the securities are valued using the last available bid price. Investments by the fund in other open-end management investment companies are valued at their respective net asset values each business day. Debt obligations are valued based on the evaluated prices provided by an independent pricing vendor or from broker-dealers. Independent pricing vendors utilize matrix pricing which takes into account factors such as institutional-size trading in similar groups of securities, yield, quality, coupon rate, maturity, type of issue, trading characteristics and other market data, as well as broker supplied prices. Futures contracts are valued at settlement prices, which are the official closing prices published by the exchange on which they trade. Foreign index futures that trade in the electronic trading market subsequent to the close of regular trading and have sufficient liquidity will be valued at the last traded price in the electronic trading market as of 4:00 P.M. Eastern Time. Foreign securities and currencies, including forward foreign currency contracts, are valued in U.S. dollars, based on foreign currency exchange rates supplied by an independent pricing vendor. Securities that trade only in the over-the-counter (OTC) market are valued using bid prices.
Other portfolio securities and assets, for which reliable market quotations are not readily available, are valued at fair value as determined in good faith by the fund’s Pricing Committee following procedures established by the Board of Trustees. The frequency with which these fair valuation procedures are used cannot be predicted and fair value of securities may differ significantly from the value that would have been used had a ready market for such securities existed. Trading in foreign securities may be completed before the daily close of trading on the NYSE. Significant events at the issuer or market level may affect the values of securities between the time when the valuation of the securities is generally determined and the close of the NYSE. If a significant event occurs, these securities may be fair valued, as determined in good faith by the fund’s Pricing Committee, following procedures established by the Board of Trustees. The fund uses fair value adjustment factors provided by an independent pricing vendor to value certain foreign securities in order to adjust for events that may occur between the close of foreign exchanges or markets and the close of the NYSE.
The fund uses a three-tier hierarchy to prioritize the pricing assumptions, referred to as inputs, used in valuation techniques to measure fair value. Level 1 includes securities valued using quoted prices in active markets for identical securities. Level 2 includes securities valued using other significant observable inputs. Observable inputs may include quoted prices for similar securities, interest rates, prepayment speeds and credit risk. Prices for securities valued using these inputs are received from independent pricing vendors and brokers and are based on an evaluation of the inputs described. Level 3 includes securities valued using significant unobservable inputs when market prices are not readily available or reliable, including the fund’s own assumptions in determining the fair value of investments. Factors used in determining value may include market or issuer specific events or trends, changes in interest rates and credit quality. The inputs or methodology used for valuing securities are not necessarily an indication of the risks associated with investing in those securities. Changes in valuation techniques may result in transfers into or out of an assigned level within the disclosure hierarchy.
The following is a summary of the values by input classification of the fund’s investments as of July 31, 2014, by major security category or type:
| | | | |
| | | | Level 2 | Level 3 |
| | Total Market | Level 1 | Significant | Significant |
| | Value at | Quoted | Observable | Unobservable |
| | 7-31-14 | Price | Inputs | Inputs |
| Corporate Bonds | $13,882,708 | — | $13,882,708 | — |
| U.S. Government & Agency Obligations | 3,785,978 | — | 3,785,978 | — |
| Foreign Government Obligations | 253,661 | — | 253,661 | — |
| Capital Preferred Securities | 221,888 | — | 221,888 | — |
| Convertible Bonds | 299,094 | — | 299,094 | — |
| Term Loans | 1,309,742 | — | 1,309,742 | — |
| Collateralized Mortgage Obligations | 1,885,017 | — | 1,784,958 | $100,059 |
| Asset Backed Securities | 604,727 | — | 604,727 | — |
| Common Stocks | 12,968,152 | $8,485,340 | 4,482,812 | — |
| Preferred Securities | 759,692 | 508,647 | 251,045 | — |
| Investment Companies | 5,014,996 | 5,014,996 | — | — |
| |
|
| Total Investments in Securities | $40,985,655 | $14,008,983 | $26,876,613 | $100,059 |
| Other Financial Instruments: | | | | |
| Futures | $15,283 | $15,283 | — | — |
| Forward Foreign Currency Contracts | $11,926 | — | $11,926 | — |
Term loans (Floating rate loans).The fund may invest in term loans, which often include debt securities that are rated below investment grade at the time of purchase. Term loans are generally subject to legal or contractual restrictions on resale. The liquidity of term loans, including the volume and frequency of secondary market trading in such loans, varies significantly over time and among individual loans. During periods of infrequent trading, valuing a term loan can be more difficult and buying and selling a term loan at an acceptable price can be more difficult and delayed, which could result in a loss.
The fund’s ability to receive payments of principal, interest and other amounts in connection with term loans will depend primarily on the financial condition of the borrower. The fund’s failure to receive scheduled payments on a term loan due to a default, bankruptcy or other reason, would adversely affect the fund’s income and would likely reduce the value of its assets. Because many term loans are not rated by independent credit rating agencies, a decision to invest in a particular loan could depend exclusively on the subadvisor’s credit analysis of the borrower and/or term loan agents. The fund may have limited rights to enforce the terms of an underlying loan.
At July 31, 2014 the fund had $100,000 in unfunded loan commitments outstanding.
Security transactions and related investment income. Investment security transactions are accounted for on a trade date plus one basis for daily net asset value calculations. However, for financial reporting purposes, investment transactions are reported on trade date. Interest income is accrued as earned. Interest income includes coupon interest and amortization/accretion of premiums/discounts on debt
securities. Debt obligations may be placed in a non-accrual status and related interest income may be reduced by stopping current accruals and writing off interest receivable when the collection of all or a portion of interest has become doubtful. Dividend income is recorded on the ex-date, except for dividends of foreign securities where the dividend may not be known until after the ex-date. In those cases, dividend income, net of withholding taxes, is recorded when the fund becomes aware of the dividends. Distributions received on securities that represent a return of capital or capital gain are recorded as a reduction of cost of investments and/or as a realized gain if amounts are estimable. Foreign taxes are provided for based on the fund’s understanding of the tax rules and rates that exist in the foreign markets in which it invests. Gains and losses on securities sold are determined on the basis of identified cost and may include proceeds from litigation.
Inflation-indexed bonds. Inflation-indexed bonds are securities that generally have a lower coupon interest rate fixed at issuance but whose principal value is periodically adjusted based on a rate of inflation, such as the Consumer Price Index. Over the life of an inflation-indexed bond, interest is paid on the inflation adjusted principal value as described above. Increases in the principal amount of these securities are recorded as interest income. Decreases in the principal amount of these securities may reduce interest income to the extent of income previously recorded. Excess amounts are recorded as an adjustment to cost.
Foreign currency translation. Assets, including investments and liabilities denominated in foreign currencies, are translated into U.S. dollar values each day at the prevailing exchange rate. Purchases and sales of securities, income and expenses are translated into U.S. dollars at the prevailing exchange rate on the date of the transaction. The effect of changes in foreign currency exchange rates on the value of securities is reflected as a component of the realized and unrealized gains (losses) on investments.
Funds that invest internationally generally carry more risk than funds that invest strictly in U.S. securities. These risks are heightened for investments in emerging markets. Risks can result from differences in economic and political conditions, regulations, market practices (including higher transaction costs), accounting standards and other factors. Foreign investments are also subject to a decline in the value of a foreign currency versus the U.S. dollar, which reduces the dollar value of securities denominated in that currency.
Foreign taxes. The fund may be subject to withholding tax on income and/or capital gains or repatriation taxes imposed by certain countries in which the fund invests. Taxes are accrued based upon investment income, realized gains or unrealized appreciation.
Line of credit. The fund may borrow from banks for temporary or emergency purposes, including meeting redemption requests that otherwise might require the untimely sale of securities. Pursuant to the fund’s custodian agreement, the custodian may loan money to the fund to make properly authorized payments. The fund is obligated to repay the custodian for any overdraft, including any related costs or expenses. The custodian may have a lien, security interest or security entitlement in any fund property that is not otherwise segregated or pledged, to the maximum extent permitted by law, to the extent of any overdraft.
In addition, the fund and other affiliated funds have entered into an agreement with Citibank N.A. that enables them to potentially participate in a $300 million unsecured committed line of credit. A commitment fee, payable at the end of each calendar quarter, based on the average daily unused portion of the line of credit, is charged to each participating fund on a pro rata basis and is reflected in other expenses on the Statement of operations. Commitment fees for the year ended July 31, 2014 were $468. For the year ended July 31, 2014, the fund had no borrowings under the line of credit.
Expenses. Within the John Hancock group of funds complex, expenses that are directly attributable to an individual fund are allocated to such fund. Expenses that are not readily attributable to a specific fund are allocated among all funds in an equitable manner, taking into consideration, among other things, the
nature and type of expense and the fund’s relative net assets. Expense estimates are accrued in the period to which they relate and adjustments are made when actual amounts are known.
Class allocations. Income, common expenses and realized and unrealized gains (losses) are determined at the fund level and allocated daily to each class of shares based on the net assets of the class. Class-specific expenses, such as distribution and service fees, if any, and transfer agent fees, are calculated daily for each class, based on the net asset value of the class and the applicable specific expense rates.
Federal income taxes. The fund intends to continue to qualify as a regulated investment company by complying with the applicable provisions of the Internal Revenue Code and will not be subject to federal income tax on taxable income that is distributed to shareholders. Therefore, no federal income tax provision is required.
As of July 31, 2014, the fund had no uncertain tax positions that would require financial statement recognition, derecognition or disclosure. The fund’s federal tax returns are subject to examination by the Internal Revenue Service for a period of three years.
Distribution of income and gains. Distributions to shareholders from net investment income and net realized gains, if any, are recorded on the ex-date. The fund generally declares and pays dividends and capital gain distributions, if any, annually.
The tax character of distributions for the years ended July 31, 2014 and 2013 was as follows:
| | |
| | July 31, 2014 | July 31, 2013 |
|
| Ordinary Income | $1,462,032 | $2,354,712 |
|
| Long-Term Capital Gain | 2,019,030 | 20,319 |
|
| Total | $3,481,062 | $2,375,031 |
|
Distributions paid by the fund with respect to each class of shares are calculated in the same manner, at the same time and in the same amount, except for the effect of class level expenses that may be applied differently to each class. As of July 31, 2014, the components of distributable earnings on a tax basis consisted of $1,288,482 of undistributed ordinary income and $418,549 of undistributed long-term capital gain.
Such distributions, on a tax basis, are determined in conformity with income tax regulations, which may differ from US GAAP. Distributions in excess of tax basis earnings and profits, if any, are reported in the fund’s financial statements as a return of capital. Short-term gains from underlying funds are treated as ordinary income for tax purposes.
Capital accounts within the financial statements are adjusted for permanent book-tax differences. These adjustments have no impact on net assets or the results of operations. Temporary book-tax differences, if any, will reverse in a subsequent period. Book-tax differences are primarily attributable to amortization and accretion on debt securities.
Note - 3 Derivative instruments The fund may invest in derivatives in order to meet its investment objective. Derivatives include a variety of different instruments that may be traded in the over-the-counter market, on a regulated exchange or through a clearing facility. The risks in using derivatives vary depending upon the structure of the instruments, including the use of leverage, optionality, the liquidity or lack of liquidity of the contract, the creditworthiness of the counterparty or clearing organization and the volatility of the position. Some derivatives involve risks that are potentially greater than the risks associated with investing directly in the referenced securities or other referenced underlying instrument. Specifically, the fund is exposed to the risk that the counterparty to an OTC derivatives contract will be unable or unwilling to make timely settlement payments or otherwise honor
its obligations. OTC derivatives transactions typically can only be closed out with the other party to the transaction.
Forward foreign currency contracts are typically traded through the OTC market. Certain forwards are regulated by the Commodity Futures Trading Commission (the CFTC) as swaps. Derivative counterparty risk is managed through an ongoing evaluation of the creditworthiness of all potential counterparties and, if applicable, designated clearing organizations. The fund attempts to reduce its exposure to counterparty risk for derivatives traded in the OTC market, whenever possible, by entering into an International Swaps and Derivatives Association (ISDA) Master Agreement with each of its OTC counterparties. The ISDA gives each party to the agreement the right to terminate all transactions traded under the agreement if there is certain deterioration in the credit quality or contractual default of the other party, as defined in the ISDA. Upon an event of default or a termination of the ISDA, the non-defaulting party has the right to close out all transactions and to net amounts owed.
As defined by the ISDA, the fund may have collateral agreements with certain counterparties to mitigate counterparty risk on OTC derivatives. Subject to established minimum levels, collateral for OTC transactions is generally determined based on the net aggregate unrealized gain or loss on contracts with a particular counterparty. Collateral pledged to the fund is held in a segregated account by a third-party agent or held by the custodian bank for the benefit of the fund and can be in the form of cash or debt securities issued by the U.S. government or related agencies; collateral posted by the fund for OTC transactions is held in a segregated account at the fund’s custodian and is noted in the accompanying portfolio of investments, or if cash is posted, on the Statement of assets and liabilities. The fund’s maximum risk of loss due to counterparty risk is equal to the asset value of outstanding contracts offset by collateral received.
For financial reporting purposes, the fund does not offset OTC derivative assets or liabilities that are subject to master netting arrangements, as defined by the ISDAs, in the Statement of assets and liabilities. In the event of default by the counterparty or a termination of the agreement, the ISDA allows an offset of amounts across the various transactions between the fund and the applicable counterparty.
Futures are traded on an exchange. Exchange-traded transactions generally present less counterparty risk to a fund than OTC transactions. The exchange stands between the fund and the broker to the contract and therefore, credit risk is generally limited to the failure of the exchange and the clearing member.
Futures. A futures contract is a contractual agreement to buy or sell a particular currency or financial instrument at a pre-determined price in the future. Risks related to the use of futures contracts include possible illiquidity of the futures markets, contract prices that can be highly volatile and imperfectly correlated to movements in the underlying financial instrument and potential losses in excess of the amounts recognized on the Statement of assets and liabilities. Use of long futures contracts subjects the fund to the risk of loss up to the notional value of the futures contracts. Use of short futures contracts subjects the fund to unlimited risk of loss.
Upon entering into a futures contract, the fund is required to deposit initial margin with the broker in the form of cash or securities. The amount of required margin is generally based on a percentage of the contract value; this amount is the initial margin for the trade. The margin deposit must then be maintained at the established level over the life of the contract. Futures collateral receivable/payable is included on the Statement of assets and liabilities. Futures contracts are marked-to-market daily and an appropriate payable or receivable for the change in value (variation margin) and unrealized gain or loss is recorded by the fund. When the contract is closed, the fund records a realized gain or loss equal to the difference between the value of the contract at the time it was opened and the value at the time it was closed.
During the year ended July 31, 2014, the fund used futures contracts to maintain diversity and liquidity of the fund, manage against anticipated changes in securities and substitute for securities purchased. During the year ended July 31, 2014, the fund held futures contracts with notional values ranging up to $4.5 million as measured at each quarter end. The following table summarizes the contracts held at July 31, 2014:
| | | | | | | |
| | | | | | | | Unrealized |
| | | Number of | | Expiration | Notional | Notional | appreciation |
| Fund | Open Contracts | contracts | Position | date | basis | value | (depreciation) |
|
| Diversified | | | | | | | |
| | U.S. Treasury Ultra Bond Futures | 1 | Long | Sep 2014 | $151,065 | $150,844 | ($221) |
| Strategies Fund | | | | | | | |
| | NIKKEI 225 OSE Futures | 2 | Long | Sep 2014 | 295,465 | 304,282 | 8,817 |
| | 10-Year U.S. Treasury Note Futures | 3 | Short | Sep 2014 | (375,040) | (373,828) | 1,212 |
| | CAC 40 Index Futures | 2 | Short | Sep 2014 | (119,654) | (113,699) | 5,955 |
| | Mini MSCI Emerging Markets Index | | | | | | |
| | | 20 | Short | Sep 2014 | (1,038,754) | (1,054,600) | (15,846) |
| | Futures | | | | | | |
| | Russell 2000 Mini Index Futures | 2 | Short | Sep 2014 | (231,404) | (223,340) | 8,064 |
| | Russell 2000 Mini Index Futures | 2 | Short | Sep 2014 | (231,405) | (223,340) | 8,065 |
| | S&P 500 Index E-Mini Futures | 2 | Short | Sep 2014 | (192,819) | (192,480) | 339 |
| | S&P 500 Index E-Mini Futures | 18 | Short | Sep 2014 | (1,735,387) | (1,732,320) | 3,067 |
| | SPI 200 Index Futures | 1 | Short | Sep 2014 | (125,239) | (129,408) | (4,169) |
|
| | | | | | | | $15,283 |
Notional basis refers to the contractual amount agreed upon at inception of open contracts; notional value represents the current value of the open contract.
Forward foreign currency contracts. A forward foreign currency contract is an agreement between two parties to buy and sell specific currencies at a price that is set on the date of the contract. The forward contract calls for delivery of the currencies on a future date that is specified in the contract. Risks related to the use of forwards include the possible failure of counterparties to meet the terms of the forward agreement, the failure of the counterparties to timely post collateral if applicable, the risk that currency movements will not favor the fund thereby reducing the fund’s total return, and the potential for losses in excess of the amounts recognized on the Statement of assets and liabilities.
The market value of a forward foreign currency contract fluctuates with changes in foreign currency exchange rates. Forward foreign currency contracts are marked-to-market daily and the change in value is recorded by the fund as an unrealized gain or loss. Realized gains or losses, equal to the difference between the value of the contract at the time it was opened and the value at the time it was closed, are recorded upon delivery or receipt of the currency or settlement with the counterparty.
During the year ended July 31, 2014, the fund used forward foreign currency contracts to manage against anticipated changes in currency exchange rates and to gain exposure to foreign currency. During the year ended July 31, 2014, the fund held forward foreign currency contracts with U.S. dollar notional values ranging up to $1.7 million as measured at each quarter end. The following table summarizes the contracts held at July 31, 2014:
| | | | | | | | | | | |
| | | | | | | | | Contractual | | | Net Unrealized |
| | | | | | | | | settlement | Unrealized | Unrealized | appreciation/ |
| Fund | Contract to buy | | Contract to sell | | Counterparty | date | appreciation | depreciation | (depreciation) |
| Diversified | | | | | | | State Street Bank and Trust | | | | |
| Strategies | GBP | 33,172 | | EUR | 42,000 | | Company | 10/1/2014 | - | ($273) | ($273) |
| | | | | | | | | | | |
| Fund | | | | | | | | | | | |
| | GBP | 124,179 | | USD | 212,371 | | JPMorgan Chase Bank N.A. | 10/1/2014 | - | (2,820) | (2,820) |
| | MXN | 1,827,615 | | USD | 140,015 | | Bank of Nova Scotia | 10/1/2014 | - | (2,343) | (2,343) |
| | | | | | | | Barclays Bank PLC | | | | |
| | USD | 188,982 | | AUD | 201,822 | | Wholesale | 10/1/2014 | $2,168 | - | 2,168 |
| | USD | 390,085 | | CAD | 416,404 | | Toronto Dominion Bank | 10/1/2014 | 8,728 | - | 8,728 |
| | | | | | | | State Street Bank and | | | | |
| | USD | 94,293 | | EUR | 70,000 | | Trust Company | 10/1/2014 | 543 | - | 543 |
| | | | | | | | State Street Bank and | | | | |
| | USD | 540,492 | | JPY | 54,968,000 | | Trust Company | 10/1/2014 | 5,923 | - | 5,923 |
|
| | | | | | | | | | $17,362 | ($5,436) | $11,926 |
Fair value of derivative instruments by risk category
The table below summarizes the fair value of derivatives held by the funds at July 31, 2014 by risk category:
| | | | |
| | | | Asset | Liability |
| | Statement of assets and liabilities | Financial | derivatives | derivatives fair |
| Risk | location | instruments location | fair value | value |
|
| Equity contracts | Receivable/payable for futures | Futures† | $34,307 | ($20,015) |
| |
| Interest rate contracts | Receivable/payable for futures | Futures† | $1,212 | (221) |
| Foreign currency | Receivable/payable for forward | Forward foreign | | |
| contracts | foreign currency exchange contracts | currency contracts | 17,362 | (5,436) |
|
| | | | $52,881 | ($25,672) |
† Reflects cumulative appreciation/depreciation on futures as disclosed above. Only the year end variation margin is separately disclosed in the Statement of assets and liabilities.
Effect of derivative instruments on the Statement of operations
The table below summarizes the net realized gain (loss) included in the net increase (decrease) in net assets from operations, classified by derivative instrument and risk category, for the year ended July 31, 2014:
Statement of operations location — Net Realized Gain (Loss) on:
| | | |
| | | Investments in unaffiliated | |
| | | issuers and foreign | |
| Risk | Futures contracts | currency transactions* | Total |
|
| Equity contracts | ($347,704) | - | ($347,704) |
| Foreign currency contracts | - | $23,907 | 23,907 |
|
| | ($347,704) | $23,907 | ($323,797) |
*Realized gain/loss associated with forward foreign currency contracts is included in this caption on the Statement of operations.
The table below summarizes the net change in unrealized appreciation (depreciation) included in the net increase (decrease) in net assets from operations, classified by derivative instrument and risk category, for the year ended July 31, 2014:
Statement of operations location — Change in Unrealized Appreciation (Depreciation) of:
| | | |
| | | Investments in | |
| Risk | Futures contracts | unaffiliated issuers | Total |
| | | |
| | | and translation of | |
| | | assets and liabilities | |
| | | in foreign currencies* | |
|
| Equity contracts | $14,292 | - | $14,292 |
| |
| Interest rate contracts | 991 | - | 991 |
| |
| Foreign currency contracts | - | $11,926 | 11,926 |
| | $15,283 | $11,926 | $27,209 |
* Change in unrealized appreciation/depreciation associated with forward foreign currency contracts is included in this caption on the Statement of operations.
Note 4 - Guarantees and indemnifications
Under the Trust’s organizational documents, its Officers and Trustees are indemnified against certain liabilities arising out of the performance of their duties to the Trust, including the fund. Additionally, in the normal course of business, the fund enters into contracts with service providers that contain general indemnification clauses. The fund’s maximum exposure under these arrangements is unknown, as this would involve future claims that may be made against the fund that have not yet occurred. The risk of material loss from such claims is considered remote.
Note 5 – Fees and transactions with affiliates
John Hancock Advisers, LLC (the Advisor or JHA) serves as investment advisor for the fund. Prior to January 1, 2014, John Hancock Investment Management Services, LLC (JHIMS) served as investment advisor for the fund. JHIMS and JHA have identical officers, directors and other personnel, and share common facilities and resources. Terms of the investment management contract with JHA are substantially identical to the former contract with JHIMS. In this report, depending on the context, the term “Advisor” shall refer to either JHA in its current capacity as investment advisor, or to JHIMS in its capacity as investment advisor prior to January 1, 2014. John Hancock Funds, LLC (the Distributor), an affiliate of the Advisor, serves as principal underwriter of the fund. The Advisor and the Distributor are indirect, wholly owned subsidiaries of Manulife Financial Corporation (MFC).
Management fee. The fund has an investment management agreement with the Advisor under which the fund pays a daily management fee to the Advisor equivalent, on an annual basis, to the sum of: (a) 1.000% of the first $500 million of the fund’s average daily net assets and (b) 0.950% of the fund’s average daily net assets in excess of $500 million. The Advisor has a subadvisory agreement with John Hancock Asset Management a division of Manulife Asset Management (US) LLC, an indirectly owned subsidiary of MFC and an affiliate of the Advisor. The fund is not responsible for payment of the subadvisory fees.
Prior to September 20, 2013, the fund had an investment management agreement with the Advisor under which the fund paid a daily management fee to the Advisor equivalent, on an annual basis, to the sum of: (a) a fee on assets invested in a fund of John Hancock Funds III (JHF III) or John Hancock Funds II (JHF II) and (b) a fee on assets invested in investments other than a fund of JHF III and JHF II (Other Assets). A fee on assets invested in the fund of JHF III or JHF II was stated as an annual percentage of the current value of the aggregate net assets of the fund, equivalent to the sum of: (a) 0.250% of the first $1 billion of the fund’s aggregate net assets and (b) 0.225% of the excess of $1 billion of the fund’s aggregate net assets. The fee on Other Assets was stated as an annual percentage of the current value of the aggregate net assets of the fund equivalent to the sum of: (a) 0.700% of the first $1 billion of the fund’s aggregate net assets and (b) 0.675% of the fund’s aggregate net assets in excess of $1 billion.
The Advisor has contractually agreed to waive a portion of its management fee and/or reimburse expenses for certain funds of the John Hancock complex, including the fund (the participating portfolios). The waiver equals, on an annualized basis, 0.01% of that portion of the aggregate net assets of all the participating portfolios that exceeds $75 billion but is less than or equal to $125 billion; 0.0125% of that
portion of the aggregate net assets of all the participating portfolios that exceeds $125 billion but is less than or equal to $150 billion; and 0.015% of that portion of the aggregate net assets of all the participating portfolios that exceeds $150 billion. The amount of the reimbursement is calculated daily and allocated among all the participating portfolios in proportion to the daily net assets of each fund. This arrangement may be amended or terminated at any time by the Advisor upon notice to the fund and with the approval of the Board of Trustees.
The Advisor has voluntarily agreed to waive fees and/or reimburse certain expenses for each share class of the fund excluding certain expenses such as taxes, brokerage commissions, interest expense, short dividend expense, litigation and indemnification expenses and other extraordinary expenses not incurred in the ordinary course of the fund’s business. The fee waivers and/or reimbursements are such that these expenses will not exceed 1.70% and 1.39% for Class A and Class I shares, respectively. This voluntary arrangement can be amended or terminated at any time by the Advisor upon notice to the fund. Prior to September 20, 2013, the fee waivers and/or reimbursements were such that these expenses did not exceed 1.22% and 0.80% for Class A and Class I shares, respectively.
Also, prior to September 20, 2013, the Advisor voluntarily agreed to reduce its management fee for the fund, or if necessary make payment to the fund, in an amount equal to the amount by which the expenses of the fund exceeded 0.10% of the average annual net assets (on an annualized basis) of the fund. “Expenses” means all the expenses of the fund, excluding (a) taxes, (b) brokerage commissions, (c) interest expense, (d) litigation and indemnification expenses and other extraordinary expenses not incurred in the ordinary course of the fund’s business, (e) advisory fees, (f) Rule 12b-1 fees, (g) transfer agent fees and service fees, (h) blue sky fees, (i) printing and postage, (j) underlying fund expenses (“acquired fund fees”) and (k) short dividend expense.
The expense reductions described above amounted to $6,432 and $2,066 for Class A and Class I shares, respectively, for the year ended July 31, 2014.
The investment management fees including the impact of waivers and reimbursements described above, incurred for the year ended July 31, 2014, were equivalent to the net effective rate of 0.93% of the fund’s average daily net assets.
Expense recapture. The Advisor may recapture operating expenses reimbursed or fees waived under previous expense limitation or waiver arrangements for a period of three years following the month in which the reimbursements or waivers occurred to the extent that the fund is below its expense limitation during this period. As of year ended July 31, 2014 there were no amounts eligible for recapture.
Accounting and legal services. Pursuant to a service agreement, the fund reimburses the Advisor for all expenses associated with providing the administrative, financial, legal, accounting and recordkeeping services to the fund, including the preparation of all tax returns, periodic reports to shareholders and regulatory reports, among other services. These expenses are allocated to each share class based on its relative net assets at the time the expense was incurred. These accounting and legal services fees incurred for the year ended July 31, 2014 amounted to an annual rate of 0.01% of the fund’s average daily net assets.
Distribution and service plans. The fund has a distribution agreement with the Distributor. The fund has adopted distribution and service plans with respect to Class A shares pursuant to Rule 12b-1 under the 1940 Act, to pay the Distributor for services provided as the distributor of shares of the fund. The fund pays 0.30% for Class A shares of distribution and service fees under these arrangements, expressed as an annual percentage of average daily net assets.
Sales charges. Class A shares may be subject to contingent deferred sales charges (CDSCs). Certain Class A shares that are acquired through purchases of $1 million or more and are redeemed within one year of purchase are subject to a 1.00% sales charge. Proceeds from CDSCs are used to compensate the Distributor for providing distribution-related services in connection with the sale of these shares. During the year ended July 31, 2014, there were no CDSCs received by the Distributor for Class A
shares.
Transfer agent fees. The fund has a transfer agent agreement with John Hancock Signature Services, Inc. (Signature Services), an affiliate of the Advisor. The transfer agent fees paid to Signature Services are determined based on the cost to Signature Services (Signature Services Cost) of providing recordkeeping services. The Signature Services Cost includes a component of allocated John Hancock corporate overhead for providing transfer agent services to the fund and to all other John Hancock affiliated funds. It also includes out-of-pocket expenses, including payments made to third-parties for recordkeeping services provided to their clients who invest in one or more John Hancock funds. In addition, Signature Services Cost may be reduced by certain fees that Signature Services receives in connection with retirement and small accounts. Signature Services Cost is calculated monthly and allocated, as applicable, to five categories of share classes: Retail Share and Institutional Classes of Non-Municipal Bond Funds, Class R6 Shares, Retirement Share Classes and Municipal Bond Share Classes. Within each of these categories, the applicable costs are allocated to the affected John Hancock affiliated funds and/or classes, based on the relative average daily net assets.
Prior to October 1, 2013, Signature Services Cost was calculated monthly and allocated, as applicable, to four categories of share classes: Institutional Share Classes, Retirement Share Classes, Municipal Bond Share Classes and all other Retail Share Classes. Within each of these categories, the applicable costs were allocated to the affected John Hancock affiliated funds and/or classes, based on the relative average daily net assets.
Class level expenses. Class level expenses for the year ended July 31, 2014 were:
| | | | |
| Class | Distribution and | Transfer agent fees | | |
| | service fees | | | |
| | |
| A | $ 98,611 | $ 45,112 | | |
| | |
| I | - | $ 11,578 | | |
| | |
| Total | $ 98,611 | $ 56,690 | | |
| | |
Trustee expenses. The fund compensates each Trustee who is not an employee of the Advisor or its affiliates. The costs of paying Trustee compensation and expenses are allocated to each fund based on its net assets relative to other funds within the John Hancock group of funds complex.
Note 6 - Fund share transactions
There were no transactions in fund shares for the years ended July 31, 2014 and 2013. Affiliates of the fund owned 100% of shares of beneficial interest of Class A and Class I on July 31, 2014.
Note 7 - Purchase and sale of securities
Purchases and sales of securities, other than short-term securities and U.S. Treasury obligations, amounted to $44,934,253 and $49,699,680, respectively, for the year ended July 31, 2014. Purchases and sales of U.S. Treasury obligations aggregated $3,275,532 and $1,797,937 respectively, for the year ended July 31, 2014.
|
| Report of Independent Registered Public Accounting Firm |
To the Board of Trustees of John Hancock Funds II and Shareholders of
John Hancock Diversified Strategies Fund:
In our opinion, the accompanying statement of assets and liabilities, including the schedule of investments, and the related statements of operations and of changes in net assets and the financial highlights present fairly, in all material respects, the financial position of the John Hancock Diversified Strategies Fund (the "Fund") at July 31, 2014, the results of its operations for the year then ended, the changes in its net assets for each of the two years in the period then ended and the financial highlights for each of the periods indicated, in conformity with accounting principles generally accepted in the United States of America. These financial statements and financial highlights (hereafter referred to as "financial statements") are the responsibility of the Fund's management. Our responsibility is to express an opinion on these financial statements based on our audits. We conducted our audits of these financial statements in accordance with the standards of the Public Company Accounting Oversight Board (United States). Those standards require that we plan and perform the audit to obtain reasonable assurance about whether the financial statements are free of material misstatement. An audit includes examining, on a test basis, evidence supporting the amounts and disclosures in the financial statements, assessing the accounting principles used and significant estimates made by management, and evaluating the overall financial statement presentation. We believe that our audits, which included confirmation of securities at July 31, 2014 by correspondence with the custodian, agent banks and brokers, and the application of alternative auditing procedures where securities purchased confirmations had not been received, provide a reasonable basis for our opinion.
PricewaterhouseCoopers LLP
Boston, Massachusetts
September 17, 2014
Federal Tax Information (Unaudited)
For federal income tax purposes, the following information is furnished with respect to the distributions of the fund, if any, paid during its taxable year ended July 31, 2014.
The fund reports the maximum amount allowable of its net taxable income as eligible for the corporate dividends-received deduction.
The fund reports the maximum amount allowable of its net taxable income as qualified dividend income as provided in the Jobs and Growth Tax Relief Reconciliation Act of 2003.
The fund paid $2,019,030 in capital gain dividends.
Eligible shareholders will be mailed a 2014 Form 1099-DIV in early 2015. This will reflect the tax character of all distributions paid in calendar year 2014.
Please consult a tax advisor regarding the tax consequences of your investment in the fund.
|
| EVALUATION OF ADVISORY AND SUBADVISORY |
| AGREEMENTS BY THE BOARD OF TRUSTEES |
| |
| John Hancock Diversified Strategies Fund |
This section describes the evaluation by the Board of Trustees (the Board) of John Hancock Funds II (the Trust) of the Advisory Agreement (the Advisory Agreement) with John Hancock Advisers, LLC (the Advisor) and the Subadvisory Agreement (the Subadvisory Agreement) with John Hancock Asset Management a division of Manulife Asset Management (US) LLC (the Subadvisor), for John Hancock Diversified Strategies Fund (the fund). The Advisory Agreement and Subadvisory Agreement are collectively referred to as the Agreements. Prior to the June 23 25, 2014 meeting at which the Agreements were approved, the Board also discussed and considered information regarding the proposed continuation of the Agreements at an in-person meeting held on May 27 29, 2014.
Approval of Advisory and Subadvisory Agreements
At in-person meetings held on June 23 25, 2014, the Board, including the Trustees who are not considered to be interested persons of the Trust under the Investment Company Act of 1940, as amended (the 1940 Act) (the Independent Trustees), reapproved for an annual period, the continuation of the Advisory Agreement between the Trust and the Advisor and the Subadvisory Agreement between the Advisor and the Subadvisor with respect to the fund.
In considering the Advisory Agreement and the Subadvisory Agreement, the Board received in advance of the meetings a variety of materials relating to the fund, the Advisor and the Subadvisor, including comparative performance, fee and expense information for a peer group of similar funds prepared by an independent third-party provider of fund data, performance information for an applicable benchmark index; and, with respect to the Subadvisor, comparative performance information for comparably managed accounts, as applicable, and other information provided by the Advisor and the Subadvisor regarding the nature, extent and quality of services provided by the Advisor and the Subadvisor under their respective Agreements, as well as information regarding the Advisor’s revenues and costs of providing services to the fund and any compensation paid to affiliates of the Advisor. At the meetings at which the renewal of the Advisory Agreement and Subadvisory Agreement are considered, particular focus is given to information concerning fund performance, comparability of fees and total expenses, and profitability. However, the Board notes that the evaluation process with respect to the Advisor and the Subadvisor is an ongoing one. In this regard, the Board also took into account discussions with management and information provided to the Board at prior meetings with respect to the services provided by the Advisor and the Subadvisor to the fund, including quarterly performance reports prepared by management containing reviews of investment results and prior presentations from the Subadvisor with respect to the fund. The Board noted the affiliation of the Subadvisor with the Advisor, noting any potential conflicts of interest. The Board also considered the nature, quality, and extent of non-advisory services, if any, to be provided to the fund by the Advisor’s affiliates, including distribution services.
Throughout the process, the Board asked questions of and requested additional information from management. The Board is assisted by counsel for the Trust and the Independent Trustees are also separately assisted by independent legal counsel throughout the process. The Independent Trustees also received a memorandum from their independent legal counsel discussing the legal standards for their consideration of the proposed continuation of the Agreements and discussed the proposed continuation of the Agreements in private sessions with their independent legal counsel at which no representatives of management were present.
Approval of Advisory Agreement
In approving the Advisory Agreement with respect to the fund, the Board, including the Independent Trustees, considered a variety of factors, including those discussed below. The Board also considered other factors (including conditions and trends prevailing generally in the economy, the securities markets, and the industry) and does not treat any single factor as determinative, and each Trustee may attribute different weights to different factors. The Board’s conclusions may be based in part on its conside ration of the advisory and subadvisory
arrangements in prior years and on the Board’s ongoing regular review of fund performance and operations throughout the year.
Nature, extent, and quality of services. Among the information received by the Board from the Advisor relating to the nature, extent, and quality of services provided to the fund, the Board reviewed information provided by the Advisor relating to its operations and personnel, descriptions of its organizational and management structure, and information regarding the Advisor’s compliance and regulatory history, including its Form ADV. The Board also noted that on a regular basis it receives and reviews information from the Trust’s Chief Compliance Officer (CCO) regarding the fund’s compliance policies and procedures established pursuant to Rule 38a-1 under the 1940 Act. The Board also considered the Advisor’s risk management processes. The Board considered that the Advisor is responsible for the management of the day-to-day operations of the fund, including, but not limited to, general supervision of and coordination of the services provided by the Subadvisor, and is also responsible for monitoring and reviewing the activities of the Subadvisor and third-party service providers.
In considering the nature, extent, and quality of the services provided by the Advisor, the Trustees also took into account their knowledge of the Advisor’s management and the quality of the performance of the Advisor’s duties, through Board meetings, discussions and repor ts during the preceding year and through each Trustee’s experience as a Trustee of the Trust and of the other trusts in the complex.
In the course of their deliberations regarding the Advisory Agreement, the Board considered, among other things:
(a) the skills and competency with which the Advisor has in the past managed the Trust’s affairs and its subadvisory relationship, the Advisor’s oversight and monitoring of the Subadvisor’s investment performance and compliance programs, such as the Subadvisor’s comp liance with fund policies and objectives, review of brokerage matters, including with respect to trade allocation and best execution and the Advisor’s timeliness in responding to performance issues;
(b) the background, qualifications and skills of the Advisor’s personnel;
(c) the Advisor’s compliance policies and procedures and its responsiveness to regulatory changes and mutual fund industry developments;
(d) the Advisor’s administrative capabilities, including its ability to supervise the other service providers for the fund;
(e) the financial condition of the Advisor and whether it has the financial wherewithal to provide a high level and quality of services to the fund; and
(f) the Advisor’s reputation and experience in serving as an investment advisor to the Trust and the benefit to shareholders of investing in funds that are part of a family of funds offering a variety of investments.
The Board concluded that the Advisor may reasonably be expected to continue to provide a high quality of services under the Advisory Agreement with respect to the fund.
Investment performance. In considering the fund’s performance, the Board noted that it reviews at its regularly scheduled meetings information about the fund’s performance results. In connection with the consideratio n of the Advisory Agreement, the Board:
(a) reviewed information prepared by management regarding the fund’s performance;
(b) considered the comparative performance of an applicable benchmark index;
(c) considered the performance of comparable funds, if any, as included in the report prepared by an independent third-party provider of fund data; and
(d) took into account the Advisor’s analysis of the fund’s performance and its plans and recommendations regarding the Trust’s subadvisory arrangements generally.
The Board noted that the fund underperformed its benchmark index for the one-year period ended December 31, 2013, and outperformed its benchmark index for the since inception period ended December 31, 2013. The Board also noted that the fund had underperformed its peer group average for the one-year and since inception periods ended December 31, 2013.
The Board took into account management’s discussion of the fund’s performance relative to its peer group.
The Board also noted the fund’s relatively short performance history.
The Board concluded that the fund’s performance is being monitored and reasonabl y addressed.
Fees and expenses. The Board reviewed comparative information prepared by an independent third-party provider of mutual fund data, including, among other data, the fund’s contractual and net management fees (and subadvisory fees, to the extent available) and total expenses as compared to similarly situated investment companies deemed to be comparable to the fund. The Board considered the fund’s ranking within a smaller group of peer funds chosen by the independent third-party provider, as well as the fund’s ranking within a broader group of funds. In comparing the fund’s contractual and net management fees to those of comparable funds, the Board noted that such fees include both advisory and administrative costs.
The Board noted that net management fees and total expenses for the fund are lower than the peer group median. The Board also noted fee and expense waivers applicable to the fund and certain of its classes.
The Board also took into account management’s discussion with respect to the advisory/subadvisory fee structure, including the amount of the advisory fee retained by the Advisor after payment of the subadvisory fee. The Board also noted that the Advisor pays the subadvisory fee. In addition, the Board took into account that management had agreed, effective July 1, 2014, to implement an overall fee waiver across the complex, including the fund, which is discussed further below. The Board also noted management’s discussion of the fund’s expenses, as well as actions taken over the past several years to reduce the fund’s operating expenses. The Board also noted that, in addition, the Advisor is currently waiving fees and/or reimbursing expenses with respect to the fund and that the fund has breakpoints in its contractual management fee schedule that reduces management fees as assets increase. The Board reviewed information provided by the Advisor concerning the investment advisory fee charged by the Advisor or one of its advisory affiliates to other clients (including other funds in the complex) having similar investment mandates, if any. The Board considered any differences between the Advisor’s and Subadvisor’s services to the fund and the services they provide to other comparable clients or funds. The Board concluded that the advisory fee paid with respect to the fund is reasonable.
In addition, the Trustees reviewed the advisory fee to be paid to the Advisor for the fund and concluded that the advisory fee is based on services provided that are in addition to, rather than duplicative of, the services provided pursuant to the advisory agreements for the underlying portfolios of the fund and that the additional services are necessary because of the differences between the investment policies, strategies, and techniques of a fund of funds and those of its underlying portfolios.
Profitability/indirect benefits. In considering the costs of the services to be provided and the profits to be realized by the Advisor and its affiliates (including the Subadvisor) from the Advisor’s relationship with the Trust, the Board:
(a) reviewed financial information of the Advisor;
(b) reviewed and considered information presented by the Advisor regarding the net profitability to the Advisor and its affiliates with respect to the fund;
(c) received and reviewed profitability information with respect to the John Hancock fund complex as a whole;
(d) received information with respect to the Advisor’s allocation methodologies used in preparing the profitability data;
(e) considered that the John Hancock insurance companies that are affiliates of the Advisor, as shareholders of the Trust directly or through their separate accounts, receive certain tax credits or deductions relating to foreign taxes paid and dividends received by certain funds of the Trust and noted that these tax benefits, which are not available to participants in qualified retirement plans under applicable income tax law, are reflected in the profitability analysis reviewed by the Board;
(f) considered that the Advisor also provides administrative services to the fund on a cost basis pursuant to an administrative services agreement;
(g) noted that affiliates of the Advisor provide transfer agency services and distribution services to the fund, and that the fund’s distributor also receives Rule 12b-1 payments to support distribution of the fund;
(h) noted that the fund’s Subadvisor is an affiliate of the Advisor;
(i) noted that the Advisor also derives reputational and other indirect benefits from providing advisory services to the fund;
(j) noted that the subadvisory fee for the fund is paid by the Advisor; and
(k) considered that the Advisor should be entitled to earn a reasonable level of profits in exchange for the level of services it provides to the fund and the entrepreneurial risk that it assumes as Advisor.
Based upon its review, the Board concluded that the level of profitability, if any, of the Advisor and its affiliates (including the Subadvisor) from their relationship with the fund was reasonable and not excessive.
Economies of scale. In considering the extent to which economies of scale would be realized as the fund grows and whether fee levels reflect these economies of scale for the benefit of fund shareholders, the Board:
(a) considered that the Advisor has agreed, effective July 1, 2014, to waive a portion of its management fee for the fund and each of the other John Hancock funds in the complex (except for those discussed below) (the Participating Portfolios) or otherwise reimburse the expenses of the Participating Portfolios as follows (the Reimbursement): The Reimbursement shall equal, on an annualized basis, 0.01% of that portion of the aggregate net assets of all the Participating Portfolios that exceed $75 billion but is less than or equal to $125 billion, 0.0125% of that portion of the aggregate net assets of all the Participating Portfolios that exceed $125 billion but is less than or equal to $150 billion and 0.015% of that portion of the aggregate net assets of all the Participating Portfolios that exceeds $150 billion. (The funds that are not Participating Portfolios are the funds of funds in the complex, which benefit from such overall management fee waiver through their investment in underlying portfolios that include Participating Portfolios, which are subject to the Reimbursement.)
(b) reviewed the fund’s advisory fee structure and concluded that: (i) the fund’s fee structure contains breakpoints at the subadvisory fee level and that such breakpoints are reflected as breakpoints in the advisory fees for the fund; and (ii) although economies of scale cannot be measured with precision, these arrangements permit shareholders of the fund to benefit from economies of scale if the fund grows. The Board also took into account management’s discussion of the fund’s advisory fee structure; and
(c) the Board also considered the effect of the fund’s growth in size on its performance and fees. The Board also noted that if the fund’s assets increase over time, the fund may realize other economies of scale.
Approval of Subadvisory Agreement
In making its determination with respect to approval of the Subadvisory Agreement, the Board reviewed:
(1) information relating to the Subadvisor’s business, including current subadvisory services to the Trust (and other funds in the John Hancock family of funds);
(2) the historical and current performance of the fund and comparative performance information relating to an applicable benchmark index and comparable funds; and
(3) the subadvisory fee for the fund, including any breakpoints, and to the extent available, comparable fee information prepared by an independent third party provider of fund data.
Nature, extent, and quality of services. With respect to the services provided by the Subadvisor, the Board received information provided to the Board by the Subadvisor, including the Subadvisor’s Form ADV, as well as took into account information presented throughout the past year. The Board considered the Subadvisor’s current level of staffing and its overall resources, as well as received information relating to the Subadvisor’s compensation program. The Board reviewed the Subadvisor’s history and investment experience, as well as information regarding the qualifications, background, and responsibilities of the Subadvisor’s investment and compliance personnel who provide services to the fund. The Board also considered, among other things, the Subadvisor’s compliance program and any disciplinary history. The Board also considered the Subadvisor’s risk assessment and monitoring process. The Board reviewed the Subadvisor’s regulatory history, including whether it was involved in any regulatory actions or investigations as well as material litigation, and any settlements and amelioratory actions undertaken, as appropriate. The Board noted that the Advisor conducts regular, periodic reviews of the Subadvisor and its operations, including regarding investment processes and organizational and staffing matters. The Board also noted that the Trust’s CCO and his staff conduct regular, periodic compliance reviews with the Subadvisor and present reports to the Independent Trustees regarding the same, which includes evaluating the regulatory compliance systems of the Subadvisor and procedures reasonably designed to assure compliance with the federal securities laws. The Board also took into account the financial condition of the Subadvisor.
The Board considered the Subadvisor’s investment process and philosophy. The Board took into account that the Subadvisor’s responsibilities include the development and maintenance of an investment program for the fund that is consistent with the fund’s investment objective, the selection of investment securities and the placement of orders for the purchase and sale of such securities, as well as the implementation of compliance controls related to performance of these services. The Board also received information with respect to the Subadvisor’s brokerage policies and practices, including with respect to best execution and soft dollars.
Subadvisor compensation. In considering the cost of services to be provided by the Subadvisor and the profitability to the Subadvisor of its relationship with the fund, the Board noted that the fees under the Subadvisory Agreement are paid by the Advisor and not the fund. The Board also considered any potential conflicts of interest the Advisor might have in connection with the Subadvisory Agreement.
In addition, the Board considered other potential indirect benefits that the Subadvisor and its affiliates may receive from the Subadvisor’s relationship with the fund, such as the opportunity to provide advisory services to additional funds in the John Hancock fund complex and reputational benefits.
Subadvisory fee. The Board considered that the fund pays an advisory fee to the Advisor and that, in turn, the Advisor pays a subadvisory fee to the Subadvisor. As noted above, the Board also considered the fund’s subadvisory fee as compared to similarly situated investment companies deemed to be comparable to the fund as included in the report prepared by the independent third party provider of fund data, to the extent available. The Board noted that the limited size of the peer group was not sufficient for comparative purposes. The Board also took into account the subadvisory fee paid by the Advisor to the Subadvisor with respect to the fund to fees charged by the Subadvisor to manage other subadvised portfolios and portfolios not subject to regulation under the 1940 Act, as applicable.
Subadvisor performance. As noted above, the Board considered the fund’s performance as compared to the fund’s peer group and the benchmark index and noted that the Board reviews information about the fund’s performance results at its regularly scheduled meetings. The Board noted the Advisor’s expertise and resou rces in monitoring the performance, investment style and risk-adjusted performance of the Subadvisor. The Board was mindful of the Advisor’s focus on the Subadvisor’s performance. The Board also noted the Subadvisor’s long-term performance record for similar accounts, as applicable.
The Board’s decision to approve the Subadvisory Agreement was based on a number of determinations, including the following:
(1) the Subadvisor has extensive experience and demonstrated skills as a manager;
(2) the performance of the fund being monitored and reasonably addressed;
(3) the subadvisory fee is reasonable in relation to the level and quality of services being provided; and
(4) subadvisory fee breakpoints are reflected as breakpoints in the advisory fees for the fund in order to permit shareholders to benefit from economies of scale if the fund grows.
In addition, the Trustees reviewed the subadvisory fee to be paid to the Subadvisor for the fund and concluded that the subadvisory fee is based on services provided that are in addition to, rather than duplicative of, the services provided pursuant to the subadvisory agreements for the underlying portfolios in which the fund invests and that the additional services are necessary because of the differences between the investment policies, strategies and techniques of a fund of funds and those of the underlying portfolios.
Based on the Board’s evaluation of all factors that the Board deemed to be material, including those factors described above, the Board, including the Independent Trustees, concluded that renewal of the Advisory Agreement and the Subadvisory Agreement would be in the best interest of the fund and its shareholders. Accordingly, the Board, and the Independent Trustees voting separately, approved the Advisory Agreement and Subadvisory Agreement for an additional one-year period.
Trustees and Officers
This chart provides information about the Trustees and Officers who oversee your John Hancock fund. Officers elected by the Trustees manage the day-to-day operations of the fund and execute policies formulated by the Trustees.
| | |
| Independent Trustees | | |
| | | |
| Name, year of birth | Trustee | Number of John |
| Position(s) held with fund | of the | Hancock funds |
| Principal occupation(s) and other | Trust | overseen by |
| directorships during past 5 years | since1 | Trustee |
| |
| James M. Oates, Born: 1946 | 2005 | 230 |
|
| Managing Director, Wydown Group (financial consulting firm) (since 1994); Chairman and Director, |
| Emerson Investment Management, Inc. (since 2000); Independent Chairman, Hudson Castle Group, Inc. |
| (formerly IBEX Capital Markets, Inc.) (financial services company) (1997–2011); Director, Stifel Financial |
| (since 1996); Director, Investor Financial Services Corporation (1995–2007); Director, Connecticut River |
| Bancorp (since 1998); Director, Virtus Funds (formerly Phoenix Mutual Funds) (since 1988). | |
| | |
| Trustee and Chairperson of the Board, John Hancock retail funds3 (since 2012); Trustee (2005–2006 and |
| since 2012) and Chairperson of the Board (since 2012), John Hancock Funds III; Trustee (since 2004) and |
| Chairperson of the Board (since 2005), John Hancock Variable Insurance Trust; Trustee and Chairperson |
| of the Board, John Hancock Funds II (since 2005). | | |
| |
| Charles L. Bardelis,2 Born: 1941 | 2005 | 230 |
|
| Director, Island Commuter Corp. (marine transport). | | |
| | | |
| Trustee, John Hancock retail funds3 (since 2012); Trustee, John Hancock Funds III (2005–2006 and |
| since 2012); Trustee, John Hancock Variable Insurance Trust (since 1988); Trustee, John Hancock |
| Funds II (since 2005). | | |
| |
| Peter S. Burgess,2 Born: 1942 | 2005 | 230 |
|
| Consultant (financial, accounting, and auditing matters) (since 1999); Certified Public Accountant; |
| Partner, Arthur Andersen (independent public accounting firm) (prior to 1999); Director, Lincoln |
| Educational Services Corporation (since 2004); Director, Symetra Financial Corporation (since 2010); |
| Director, PMA Capital Corporation (2004–2010). | | |
| | | |
| Trustee, John Hancock retail funds3 (since 2012); Trustee, John Hancock Funds III (2005–2006 and |
| since 2012); Trustee, John Hancock Variable Insurance Trust and John Hancock Funds II (since 2005). |
| |
| William H. Cunningham, Born: 1944 | 2012 | 230 |
|
| Professor, University of Texas, Austin, Texas (since 1971); former Chancellor, University of Texas System |
| and former President of the University of Texas, Austin, Texas; Director, LIN Television (since 2009); |
| Chairman (since 2009) and Director (since 2006), Lincoln National Corporation (insurance); Director, |
| Resolute Energy Corporation (since 2009); Director, Southwest Airlines (since 2000); former Director, |
| Introgen (manufacturer of biopharmaceuticals) (until 2008); former Director, Hicks Acquisition Company I, |
| Inc. (until 2007); former Director, Texas Exchange Bank, SSB (formerly Bank of Crowley) (until 2009); |
| former Advisory Director, JP Morgan Chase Bank (formerly Texas Commerce Bank–Austin) (until 2009). |
| |
| Trustee, John Hancock retail funds3 (since 1986); Trustee, John Hancock Variable Insurance Trust |
| (since 2012); Trustee, John Hancock Funds II (2005–2006 and since 2012). | | |
| |
| Diversified Strategies Fund | Annual report | |
| | 46 |
| | |
| Independent Trustees (continued) | | |
| |
| Name, Year of Birth | Trustee | Number of John |
| Position(s) held with Fund | of the | Hancock funds |
| Principal occupation(s) and other | Trust | overseen by |
| directorships during past 5 years | since1 | Trustee |
| |
| Grace K. Fey, Born: 1946 | 2008 | 230 |
|
| Chief Executive Officer, Grace Fey Advisors (since 2007); Director and Executive Vice President, Frontier |
| Capital Management Company (1988–2007); Director, Fiduciary Trust (since 2009). | |
| | |
| Trustee, John Hancock retail funds3 (since 2012); Trustee, John Hancock Variable Insurance Trust and |
| John Hancock Funds II (since 2008). | | |
| |
| Theron S. Hoffman,2 Born: 1947 | 2008 | 230 |
|
| Chief Executive Officer, T. Hoffman Associates, LLC (consulting firm) (since 2003); Director, The Todd |
| Organization (consulting firm) (2003–2010); President, Westport Resources Management (investment |
| management consulting firm) (2006–2008); Senior Managing Director, Partner, and Operating Head, |
| Putnam Investments (2000–2003); Executive Vice President, The Thomson Corp. (financial and legal |
| information publishing) (1997–2000). | | |
| | | |
| Trustee, John Hancock retail funds3 (since 2012); Trustee, John Hancock Variable Insurance Trust and |
| John Hancock Funds II (since 2008). | | |
| |
| Deborah C. Jackson, Born: 1952 | 2012 | 230 |
|
| President, Cambridge College, Cambridge, Massachusetts (since 2011); Chief Executive Officer, |
| American Red Cross of Massachusetts Bay (2002–2011); Board of Directors of Eastern Bank Corporation |
| (since 2001); Board of Directors of Eastern Bank Charitable Foundation (since 2001); Board of Directors |
| of American Student Assistance Corporation (1996–2009); Board of Directors of Boston Stock Exchange |
| (2002–2008); Board of Directors of Harvard Pilgrim Healthcare (health benefits company) (2007–2011). |
| |
| Trustee, John Hancock retail funds3 (since 2008); Trustee of John Hancock Variable Insurance Trust and |
| John Hancock Funds II (since 2012). | | |
| |
| Hassell H. McClellan, Born: 1945 | 2005 | 230 |
|
| Trustee, Virtus Variable Insurance Trust (formerly Phoenix Edge Series Funds) (since 2008); Director, The |
| Barnes Group (since 2010); Associate Professor, The Wallace E. Carroll School of Management, Boston |
| College (retired 2013). | | |
| | | |
| Trustee, John Hancock retail funds3 (since 2012); Trustee, John Hancock Funds III (2005–2006 and |
| since 2012); Trustee, John Hancock Variable Insurance Trust and John Hancock Funds II (since 2005). |
| |
| Steven R. Pruchansky, Born: 1944 | 2012 | 230 |
|
| Chairman and Chief Executive Officer, Greenscapes of Southwest Florida, Inc. (since 2000); Director |
| and President, Greenscapes of Southwest Florida, Inc. (until 2000); Member, Board of Advisors, First |
| American Bank (until 2010); Managing Director, Jon James, LLC (real estate) (since 2000); Director, |
| First Signature Bank & Trust Company (until 1991); Director, Mast Realty Trust (until 1994); President, |
| Maxwell Building Corp. (until 1991). | | |
| | | |
| Trustee (since 1992) and Chairperson of the Board (2011–2012), John Hancock retail funds3; Trustee and |
| Vice Chairperson of the Board, John Hancock retail funds,3 John Hancock Variable Insurance Trust, and |
| John Hancock Funds II (since 2012). | | |
| |
| | Annual report | Diversified Strategies Fund |
| 47 | |
| | |
| Independent Trustees (continued) | | |
| |
| Name, Year of Birth | Trustee | Number of John |
| Position(s) held with Fund | of the | Hancock funds |
| Principal occupation(s) and other | Trust | overseen by |
| directorships during past 5 years | since1 | Trustee |
| |
| Gregory A. Russo, Born: 1949 | 2012 | 230 |
|
| Director and Audit Committee Chairman (since 2012), and Member, Audit Committee and Finance |
| Committee (since 2011), NCH Healthcare System, Inc. (holding company for multi-entity healthcare |
| system); Director and Member of Finance Committee, The Moorings, Inc. (nonprofit continuing care |
| community) (since 2012); Vice Chairman, Risk & Regulatory Matters, KPMG LLP (KPMG) (2002–2006); |
| Vice Chairman, Industrial Markets, KPMG (1998–2002); Chairman and Treasurer, Westchester County, |
| New York, Chamber of Commerce (1986–1992); Director, Treasurer, and Chairman of Audit and |
| Finance Committees, Putnam Hospital Center (1989–1995); Director and Chairman of Fundraising |
| Campaign, United Way of Westchester and Putnam Counties, New York (1990–1995). | |
| | |
| Trustee, John Hancock retail funds3 (since 2008); Trustee, John Hancock Variable Insurance Trust and |
| John Hancock Funds II (since 2012). | | |
| |
| |
| Non-Independent Trustees4 | | |
| | | |
| Name, year of birth | Trustee | Number of John |
| Position(s) held with fund | of the | Hancock funds |
| Principal occupation(s) and other | Trust | overseen by |
| directorships during past 5 years | since1 | Trustee |
| |
| Craig Bromley, Born: 1966 | 2012 | 230 |
|
| President, John Hancock Financial Services (since 2012); Senior Executive Vice President and General |
| Manager, U.S. Division, Manulife Financial Corporation (since 2012); President and Chief Executive |
| Officer, Manulife Insurance Company (Manulife Japan) (2005–2012, including prior positions). |
| |
| Trustee, John Hancock retail funds,3 John Hancock Variable Insurance Trust, and John Hancock |
| Funds II (since 2012). | | |
| |
| Warren A. Thomson, Born: 1955 | 2012 | 230 |
|
| Senior Executive Vice President and Chief Investment Officer, Manulife Financial Corporation and The |
| Manufacturers Life Insurance Company (since 2009); Chairman and Chief Executive Officer, Manulife |
| Asset Management (since 2001, including prior positions); Director (since 2006), and President and |
| Chief Executive Officer (since 2013), Manulife Asset Management Limited; Director and Chairman, |
| Hancock Natural Resources Group, Inc. (since 2013). | | |
| | | |
| Trustee, John Hancock retail funds,3 John Hancock Variable Insurance Trust, and John Hancock |
| Funds II (since 2012). | | |
| |
| |
| Principal officers who are not Trustees | | |
| | | |
| Name, year of birth | | Officer |
| Position(s) held with fund | | of the |
| Principal occupation(s) and other | | Trust |
| directorships during past 5 years | | since |
| |
| Andrew G. Arnott, Born: 1971 | | 2009 |
|
| President | | |
| Senior Vice President, John Hancock Financial Services (since 2009); Director and Executive Vice |
| President, John Hancock Advisers, LLC (since 2005, including prior positions); Director and Executive |
| Vice President, John Hancock Investment Management Services, LLC (since 2006, including prior |
| positions); President, John Hancock Funds, LLC (since 2004, including prior positions); President |
| (effective 3-13-14) and Executive Vice President, John Hancock retail funds,3 John Hancock Variable |
| |
| Diversified Strategies Fund | Annual report | |
| | 48 |
| |
| Principal officers who are not Trustees (continued) | |
| |
| Name, Year of Birth | Officer |
| Position(s) held with Fund | of the |
| Principal occupation(s) and other | Trust |
| directorships during past 5 years | since |
| |
| John J. Danello, Born: 1955 | 2006 |
|
| Senior Vice President, Secretary, and Chief Legal Officer | |
| Vice President and Chief Counsel, John Hancock Wealth Management (since 2005); Senior Vice | |
| President (since 2007) and Chief Legal Counsel (2007–2010), John Hancock Funds, LLC and The | |
| Berkeley Financial Group, LLC; Senior Vice President (since 2006, including prior positions) and Chief |
| Legal Officer and Secretary (since 2014), John Hancock retail funds3 and John Hancock Variable | |
| Insurance Trust; Vice President, John Hancock Life & Health Insurance Company (since 2009); | |
| Vice President, John Hancock Life Insurance Company (USA) and John Hancock Life Insurance | |
| Company of New York (since 2010); and Senior Vice President, Secretary, and Chief Legal Counsel | |
| (2007–2014, including prior positions) of John Hancock Advisers, LLC and John Hancock Investment |
| Management Services, LLC. | |
| |
| Francis V. Knox, Jr., Born: 1947 | 2005 |
|
| Chief Compliance Officer | |
| Vice President, John Hancock Financial Services (since 2005); Chief Compliance Officer, John Hancock |
| retail funds,3 John Hancock Variable Insurance Trust, John Hancock Funds II, John Hancock Advisers, |
| LLC, and John Hancock Investment Management Services, LLC (since 2005). | |
| |
| Charles A. Rizzo, Born: 1957 | 2007 |
|
| Chief Financial Officer | |
| Vice President, John Hancock Financial Services (since 2008); Senior Vice President, John Hancock | |
| Advisers, LLC and John Hancock Investment Management Services, LLC (since 2008); Chief Financial |
| Officer, John Hancock retail funds,3 John Hancock Variable Insurance Trust and John Hancock | |
| Funds II (since 2007). | |
| |
| Salvatore Schiavone, Born: 1965 | 2009 |
|
| Treasurer | |
| Assistant Vice President, John Hancock Financial Services (since 2007); Vice President, John Hancock |
| Advisers, LLC and John Hancock Investment Management Services, LLC (since 2007); Treasurer, | |
| John Hancock retail funds3 (since 2007, including prior positions); Treasurer, John Hancock Variable |
| Insurance Trust and John Hancock Funds II (since 2010 and 2007–2009, including prior positions). | |
The business address for all Trustees and Officers is 601 Congress Street, Boston, Massachusetts 02210-2805.
1 Each Trustee holds office until his or her successor is elected and qualified, or until the Trustee’s death, retirement, resignation, or removal.
2 Member of the Audit Committee.
3 “John Hancock retail funds” comprises John Hancock Funds III and 37 other John Hancock funds consisting of 27 series of other John Hancock trusts and 10 closed-end funds.
4 Because Messrs. Bromley and Thomson are senior executives or directors of the advisor and/or its affiliates, each of them is considered an “interested person of the fund,” as defined in the Investment Company Act of 1940.
| |
| | Annual report | Diversified Strategies Fund |
| 49 | |
More information
| |
| Trustees | Investment advisor |
| James M. Oates, Chairperson | John Hancock Advisers, LLC |
| Steven R. Pruchansky, Vice Chairperson | |
| Charles L. Bardelis* | Subadvisor |
| Craig Bromley† | John Hancock Asset Management a division of |
| Peter S. Burgess* | Manulife Asset Management (US) LLC |
| William H. Cunningham | |
| Grace K. Fey | Principal distributor |
| Theron S. Hoffman* | John Hancock Funds, LLC |
| Deborah C. Jackson | |
| Hassell H. McClellan | Custodian |
| Gregory A. Russo | State Street Bank and Trust Company |
| Warren A. Thomson† | |
| | Transfer agent |
| | John Hancock Signature Services, Inc. |
| Officers | |
| Andrew G. Arnott | Legal counsel |
| President | K&L Gates LLP |
| John J. Danello | |
| Senior Vice President, Secretary, | Independent registered |
| and Chief Legal Officer | public accounting firm |
| Francis V. Knox, Jr. | PricewaterhouseCoopers LLP |
| Chief Compliance Officer | |
| Charles A. Rizzo | |
| Chief Financial Officer | |
| Salvatore Schiavone | |
| Treasurer | |
| |
| *Member of the Audit Committee | |
| †Non-Independent Trustee | |
The fund’s proxy voting policies and procedures, as well as the fund’s proxy voting record for the most recent twelve-month period ended June 30, are available free of charge on the Securities and Exchange Commission (SEC) website at sec.gov or on our website.
The fund’s complete list of portfolio holdings, for the first and third fiscal quarters, is filed with the SEC on Form N-Q. The fund’s Form N-Q is available on our Web site and the SEC’s website, sec.gov, and can be reviewed and copied (for a fee) at the SEC’s Public Reference Room in Washington, DC. Call 800-SEC-0330 to receive information on the operation of the SEC's Public Reference Room.
We make this information on your fund, as well as monthly portfolio holdings, and other fund details available on our Web site at jhinvestments.com or by calling 800-225-5291.
| | |
| You can also contact us: | | |
| 800-225-5291 | Regular mail: | Express mail: |
| jhinvestments.com | John Hancock Signature Services, Inc. | John Hancock Signature Services, Inc. |
| | P.O. Box 55913 | 30 Dan Road |
| | Boston, MA 02205-5913 | Canton, MA 02021 |
| |
| John Hancock China Emerging Leaders Fund | |
| |
| Table of Contents | |
| |
| Management’s discussion of Fund Performance | Page 3 |
| A look at performance | Page 4 |
| Your expenses | Page 6 |
| Portfolio summary | Page 7 |
| Fund’s investments | Page 8 |
| Financial statements | Page 12 |
| Financial highlights | Page 15 |
| Notes to financial statements | Page 18 |
| Auditors Report | Page 26 |
| Federal Tax Information | Page 27 |
| Board Consideration | Page 28 |
| Trustees and Officers | Page 37 |
| More information | Page 41 |
John Hancock China Emerging Leaders Fund
Management’s Discussion of Fund Performance
By Dimensional Fund Advisors LP
Effective December 19, 2013, Dimensional Fund Advisors LP replaced Atlantis Investment Management (Hong Kong) Ltd. as the subadvisor for this fund.
The Chinese equity market posted solid gains during the year ended July 31, 2014, as concerns about a slowdown in the growth rate of China’s economy eased during the latter months of the period. Economic indicators were mixed throughout most of the period, and a decline in property values in several major Chinese cities weakened some financials sector stocks. In November 2013, the Communist Party leadership pledged to adopt economic reforms in coming years. However, the absence of detailed plans to transition to a more domestically focused economy left markets unimpressed, and stocks fell modestly following this announcement. During the winter, concerns about the possibility of a hard landing for China’s economy mounted after key indicators remained weak, including data on industrial production and real estate. However, data in the spring suggested an improving outlook for China’s domestic consumption and the possibility that gross domestic product growth might reach the government’s 7.5% growth target for 2014. Equities gained further support in April from the announcement of a government stimulus initiative targeting small- and medium-sized businesses. Chinese equities posted strong gains in May, June, and July as exports increased, credit conditions improved, and an index of purchasing manager activity climbed to a six-month high.
For the year ended July 31, 2014, the fund’s Class A shares returned 18.61%, excluding sales charges, trailing the 20.50% return of its benchmark, the MSCI China Index, but outpacing the average 16.03% return of Morningstar, Inc.’s China region fund category.1 Our stock selection in industrials as well as the fund’s relative overweight in the sector contributed the most to performance, while underweights in financials and telecommunication services also added value. On the negative side, an underweight in information technology as well as stock selection in the sector detracted. Our stock selection in healthcare, materials, and utilities also weighed on performance.
At the individual security level, the largest contributor was the fund’s position in Haier Electronics Group Company, Ltd., a consumer discretionary sector stock. Other notable contributors included China Fiber Optic Network System Group, Ltd. (industrials), NQ Mobile, Inc. (information technology), and Viva China Holdings, Ltd. (consumer discretionary). Among the largest detractors were Tencent Holdings, Ltd. (information technology), Silver Base Group Holdings, Ltd. (consumer discretionary), and China Yurun Food Group, Ltd. (consumer staples). We sold the fund’s positions in Optic Network, NQ Mobile, and China Yurun prior to the period’s end.
1 Figures from Morningstar, Inc. include distributions reinvested and do not take into account sales charges. Actual load-adjusted performance is lower.
This commentary reflects the views of the portfolio manager through the end of the period discussed in this report. As such, they are in no way guarantees of future events, and are not intended to be used as investment advice or a recommendation regarding any specific security. They are also subject to change at any time as market and other conditions warrant. Past performance does not guarantee future results.
Sector investing is subject to greater risks than the market as a whole. Because the fund may focus on particular sectors of the economy, its performance may depend on the performance of those sectors. International investing involves special risks such as political, economic, and currency risks and differences in accounting standards and financial reporting. Although they are larger and/or more established than many emerging markets, the markets of China function in many ways as emerging markets, and carry the high levels of risk associated with emerging markets. These include higher inflation, interest rates, and unemployment as well as greater social, economic, regulatory, and political uncertainties than more developed countries. Please see the fund’s prospectuses for additional risks.
A look at performance
Total returns for the period ended July 31, 2014
| | | | | | | | |
| | Average annual total returns (%) | Cumulative total returns (%) | |
| | with maximum sales charge | | with maximum sales charge | |
|
| | 1-year | 5-year | 10-year | Since inception 1 | 1-year | 5-year | 10-year | Since inception 1 |
|
| Class A | 12.62 | — | — | 0.32 | 12.62 | — | — | 0.82 |
|
| Class I2 | 19.11 | — | — | 2.73 | 19.11 | — | — | 7.24 |
|
| Class NAV2 | 19.12 | — | — | 2.82 | 19.12 | — | — | 7.46 |
|
| Index† | 20.50 | — | — | 13.00 | 20.50 | — | — | 37.28 |
|
Performance figures assume all distributions are reinvested. Figures reflect maximum sales charges on Class A shares of 5.00%. Sales charges are not applicable to Class I and Class NAV shares.
The expense ratios of the fund, both net (including any fee waivers and/or expense limitations) and gross (excluding any fee waivers and/or expense limitations), are set forth according to the most recent publicly available prospectuses for the fund and may differ from those disclosed in the Financial highlights tables in this report. The expense ratios are as follows:
| | | |
| | Class A | Class I | Class NAV |
| Gross/Net (%) | 1.77 | 1.46 | 1.31 |
Please refer to the most recent prospectus and annual report for more information on expenses and any limitation arrangements for each class.
The returns reflect past results and should not be considered indicative of future performance. The return and principal value of an investment will fluctuate so that shares, when redeemed, may be worth more or less than their original cost. Due to market volatility, the fund’s current performance may be higher or lower than the performance shown. For current to the most recent month-end performance data, please call 800-225-5291 or visit the fund’s website at jhinvestments.com.
The performance table above and the chart on the next page do not reflect the deduction of taxes that a shareholder may pay on fund distributions or on the redemption of fund shares. The fund’s performance results reflect any applicable fee waivers or expense reductions, without which the expenses would increase and results would have been less favorable.
† Index is the MSCI China Index.
See the following page for footnotes.
| | |
| China Emerging Leaders Fund | Annual report | 4 | |
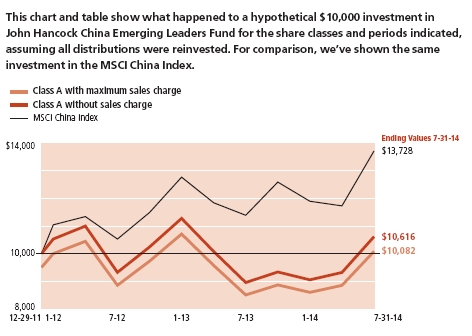
| | | | |
| | | With maximum | Without | |
| | Start date | sales charge | sales charge | Index |
|
| Class I2 | 12-29-11 | $10,724 | $10,724 | $13,728 |
|
| Class NAV2 | 12-29-11 | 10,746 | 10,746 | 13,728 |
|
MSCI China Index (gross of foreign withholding taxes on dividends) is an unmanaged free float-adjusted market capitalization weighted index that is designed to measure large and mid cap equity market performance in China.
It is not possible to invest directly in an index. Index figures do not reflect expenses or sales charges, which would have resulted in lower values.
Footnotes related to performance pages
1 From 12-29-11.
2 For certain types of investors as described in the fund’s prospectuses.
| | |
| | 5 | Annual report | China Emerging Leaders Fund |
Your expenses
These examples are intended to help you understand your ongoing operating expenses.
Understanding your fund expenses
As a shareholder of the Fund, you incur two types of costs:
• Transaction costs which include sales charges (loads) on purchases or redemptions (varies by share class), minimum account fee charge, etc.
• Ongoing operating expenses including management fees, distribution and service fees (if applicable), and other fund expenses.
We are going to present only your ongoing operating expenses here.
Actual expenses/actual returns
This example is intended to provide information about your fund’s actual ongoing operating expenses, and is based on your fund’s actual return. It assumes an account value of $1,000.00 on February 1, 2014, with the same investment held until July 31, 2014.
| | | | |
| | | | Expenses paid | |
| | Account value | Ending value | during period | Annualized |
| | on 2-1-2014 | on 7-31-2014 | ended 7-31-20141 | Expense Ratio |
|
| Class A | $1,000.00 | $1,173.10 | $9.16 | 1.70% |
|
| Class I | 1,000.00 | 1,176.50 | 7.39 | 1.37% |
|
| Class NAV | 1,000.00 | 1,176.50 | 6.80 | 1.26% |
|
Together with the value of your account, you may use this information to estimate the operating expenses that you paid over the period. Simply divide your account value at July 31, 2014, by $1,000.00, then multiply it by the “expenses paid” for your share class from the table above. For example, for an account value of $8,600.00, the operating expenses should be calculated as follows:
Example
[ My account value $8,600.00 / $1,000.00 = 8.6 ] x $[ “expenses paid” from table ] = My actual expenses
Hypothetical example for comparison purposes
This table allows you to compare the fund’s ongoing operating expenses with those of any other fund. It provides an example of the fund’s hypothetical account values and hypothetical expenses based on each class’s actual expense ratio and an assumed 5% annualized return before expenses (which is not the fund’s actual return). It assumes an account value of $1,000.00 on February 1, 2014, with the same investment held until July 31, 2014. Look in any other fund shareholder report to find it’s hypothetical Example and you will be able to compare these expenses.
| | | | |
| | | | Expenses paid | |
| | Account value | Ending value | during period | Annualized |
| | on 2-1-2014 | on 7-31-2014 | ended 7-31-20141 | Expense Ratio |
|
| Class A | $1,000.00 | $1,016.40 | $8.50 | 1.70% |
|
| Class I | 1,000.00 | 1,018.00 | 6.85 | 1.37% |
|
| Class NAV | 1,000.00 | 1,018.50 | 6.31 | 1.26% |
|
Remember, these examples do not include any transaction costs; therefore, these examples will not help you to determine the relative total costs of owning different funds. If transaction costs were included, your expenses would have been higher. See the prospectus for details regarding transaction costs.
1 Expenses are equal to the fund's annualized expense ratio, multiplied by the average account value over the period, multiplied by 181/365 (to reflect the one-half year period).
China Emerging Leaders Fund
As of 7-31-14
Portfolio Summary
| |
| Top 10 Holdings (42.9% of Net Assets on 7-31-14)1,2 | |
| Bank of China, Ltd., H Shares | 4.8% |
| China Construction Bank Corp., H Shares | 4.8% |
| Industrial & Commercial Bank of China, Ltd., H Shares | 4.8% |
| China Mobile, Ltd. | 4.7% |
| CNOOC, Ltd. | 4.6% |
| Tencent Holdings, Ltd. | 4.4% |
| PetroChina Company, Ltd., H Shares | 4.4% |
| China Petroleum & Chemical Corp., H Shares | 4.1% |
| China Life Insurance Company, Ltd., H Shares | 3.6% |
| Ping An Insurance Group Company, H Shares | 2.7% |
| |
| Country Concentration1 | |
| China | 76.5% |
| Hong Kong | 22.3% |
| United States | 1.2% |
| |
| Sector Composition1,3 | |
| Financials | 35.7% |
| Energy | 17.9% |
| Telecommunication Services | 7.4% |
| Consumer Discretionary | 7.3% |
| Information Technology | 7.0% |
| Industrials | 6.5% |
| Consumer Staples | 5.8% |
| Materials | 4.7% |
| Utilities | 4.5% |
| Health Care | 2.0% |
| Short-Term Investments & Other | 1.2% |
1As a percentage of net assets on 7-31-14.
2Cash and cash equivalents are not included.
3Sector investing is subject to greater risks than the market as a whole. Because the fund may focus on particular sectors of the economy, its performance may depend on the performance of those sectors. International investing involves special risks such as political, economic, and currency risks and differences in accounting standards and financial reporting. Although they are larger and/or more established than many emerging markets, the markets of China function in many ways as emerging markets and carry the high levels of risk associated with emerging markets.
China Emerging Leaders Fund
Fund’s investments
As of 7-31-14
| | |
| | Shares | Value |
| |
| Common Stocks 98.8% | | $277,470,738 |
|
| (Cost $285,608,231) | | |
| |
| China 76.5% | | 215,007,040 |
|
| Agricultural Bank of China, Ltd., H Shares | 10,051,000 | 4,869,207 |
| Air China, Ltd., H Shares | 774,000 | 473,298 |
| Aluminum Corp. of China, Ltd., H Shares (I) | 1,660,000 | 758,782 |
| Angang Steel Company, Ltd., H Shares | 292,000 | 215,495 |
| Anhui Conch Cement Company, Ltd., H Shares | 508,000 | 1,913,536 |
| ANTA Sports Products, Ltd. | 322,000 | 529,246 |
| Bank of China, Ltd., H Shares | 28,574,000 | 13,618,483 |
| Bank of Communications Company, Ltd., H Shares | 4,072,000 | 3,119,989 |
| BBMG Corp., H Shares | 304,500 | 235,992 |
| Biostime International Holdings, Ltd. | 76,000 | 346,131 |
| Byd Company, Ltd., H Shares | 244,500 | 1,617,019 |
| China CITIC Bank Corp., Ltd., H Shares | 3,775,000 | 2,499,502 |
| China Coal Energy Company, Ltd., H Shares | 1,682,000 | 1,013,056 |
| China Communications Construction Company, Ltd., H Shares | 1,884,000 | 1,428,221 |
| China Communications Services Corp., Ltd., H Shares | 332,000 | 162,228 |
| China Construction Bank Corp., H Shares | 17,589,000 | 13,502,695 |
| China COSCO Holdings Company, Ltd., H Shares (I) | 986,500 | 424,163 |
| China Eastern Airlines Corp., Ltd., H Shares (I) | 564,000 | 177,623 |
| China Galaxy Securities Company, Ltd., H Shares | 448,000 | 337,541 |
| China Hongqiao Group, Ltd. | 315,500 | 269,916 |
| China International Marine Containers Group Company, Ltd., H Shares | 214,700 | 471,488 |
| China Life Insurance Company, Ltd., H Shares | 3,403,000 | 10,128,125 |
| China Longyuan Power Group Corp., H Shares | 1,165,000 | 1,183,737 |
| China Mengniu Dairy Company, Ltd. | 581,000 | 2,808,913 |
| China Merchants Bank Company, Ltd., H Shares | 2,144,500 | 4,339,389 |
| China Minsheng Banking Corp., Ltd., H Shares | 2,884,500 | 2,979,644 |
| China Molybdenum Company, Ltd., H Shares | 399,000 | 263,725 |
| China National Building Material Company, Ltd., H Shares | 1,208,000 | 1,204,390 |
| China Oilfield Services, Ltd., H Shares | 752,000 | 1,870,054 |
| China Pacific Insurance Group Company, Ltd., H Shares | 1,202,400 | 4,722,635 |
| China Petroleum & Chemical Corp., H Shares | 11,742,000 | 11,495,470 |
| China Railway Construction Corp., H Shares | 813,500 | 777,641 |
| China Railway Group, Ltd., H Shares | 1,561,000 | 830,848 |
| China Shenhua Energy Company, Ltd., H Shares | 1,564,000 | 4,608,809 |
| China Shipping Container Lines Company, Ltd., H Shares (I) | 940,000 | 271,499 |
| China Southern Airlines Company, Ltd., H Shares | 652,000 | 220,470 |
| China Telecom Corp., Ltd., H Shares | 6,402,000 | 3,608,449 |
| Chongqing Rural Commercial Bank, H Shares | 753,000 | 372,441 |
| CITIC Securities Company, Ltd., H Shares | 474,600 | 1,189,557 |
| CNOOC, Ltd. | 7,388,000 | 13,049,568 |
| Country Garden Holdings Company, Ltd. | 1,933,000 | 985,843 |
| CSR Corp., Ltd., H Shares | 818,000 | 731,590 |
| Datang International Power Generation Company, Ltd., H Shares | 1,142,000 | 566,354 |
| Dongfeng Motor Group Company, Ltd., H Shares | 1,154,000 | 2,052,190 |
| ENN Energy Holdings, Ltd. | 318,000 | 2,241,099 |
| Evergrande Real Estate Group, Ltd. | 2,468,000 | 1,069,764 |
| Fosun International, Ltd. | 676,500 | 859,162 |
| Great Wall Motor Company, Ltd., H Shares | 431,000 | 1,773,129 |
| Guangzhou Automobile Group Company, Ltd., H Shares | 968,000 | 1,085,485 |
| Guangzhou Pharmaceutical Company, Ltd. | 80,000 | 253,843 |
| Guangzhou R&F Properties Company, Ltd., H Shares | 377,600 | 553,620 |
| Haitian International Holdings, Ltd. | 131,000 | 306,209 |
| Hengan International Group Company, Ltd. | 306,000 | 3,275,635 |
China Emerging Leaders Fund
Fund’s investments
As of 7-31-14
| | |
| | Shares | Value |
| |
| China (continued) | | |
|
| Hengshi Mining Investments, Ltd. (I) | 13,647,000 | $4,487,899 |
| Huadian Power International Corp., H Shares | 148,000 | 91,061 |
| Huaneng Power International, Inc., H Shares | 1,332,000 | 1,476,876 |
| Industrial & Commercial Bank of China, Ltd., H Shares | 19,626,000 | 13,410,390 |
| Inner Mongolia Yitai Coal Company, H Shares | 1,448,700 | 2,060,289 |
| Jiangsu Expressway Company, Ltd., H Shares | 500,000 | 609,680 |
| Jiangxi Copper Company, Ltd., H Shares | 588,000 | 1,119,539 |
| Kingsoft Corp., Ltd. | 230,600 | 680,534 |
| Lenovo Group, Ltd. | 2,594,000 | 3,545,078 |
| Longfor Properties Company, Ltd. | 572,500 | 827,336 |
| Metallurgical Corp. of China, Ltd., H Shares | 1,099,000 | 240,670 |
| New China Life Insurance Company, Ltd., H Shares | 317,200 | 1,148,830 |
| PetroChina Company, Ltd., H Shares | 9,590,000 | 12,429,310 |
| PICC Property & Casualty Company, Ltd., H Shares | 1,350,000 | 2,186,336 |
| Ping An Insurance Group Company, H Shares | 909,500 | 7,722,209 |
| Semiconductor Manufacturing International Corp. (I) | 3,688,000 | 334,463 |
| Shandong Weigao Group Medical Polymer Company, Ltd., H Shares | 700,000 | 718,019 |
| Shanghai Electric Group Company, Ltd., H Shares | 1,148,000 | 507,858 |
| Shanghai Fosun Pharmaceutical Group Company, Ltd., H Shares | 102,000 | 336,574 |
| Shanghai Pharmaceuticals Holding Company, Ltd., H Shares | 235,300 | 436,685 |
| Shenzhou International Group Holdings, Ltd. | 226,000 | 711,494 |
| Sihuan Pharmaceutical Holdings Group, Ltd. | 1,690,000 | 1,036,032 |
| Sino-Ocean Land Holdings, Ltd. | 995,429 | 581,356 |
| Sinopec Shanghai Petrochemical Company, Ltd., H Shares | 1,412,000 | 430,838 |
| Sinopharm Group Company, Ltd., H Shares | 409,200 | 1,201,720 |
| SOHO China, Ltd. | 670,500 | 562,813 |
| Sun Art Retail Group, Ltd. | 1,011,000 | 1,258,160 |
| Tencent Holdings, Ltd. | 770,000 | 12,494,865 |
| Tingyi Cayman Islands Holding Corp. | 814,000 | 2,315,313 |
| Tsingtao Brewery Company, Ltd., H Shares | 154,000 | 1,250,790 |
| Want Want China Holdings, Ltd. | 2,496,000 | 3,414,753 |
| Weichai Power Company, Ltd., H Shares | 194,000 | 842,857 |
| Xiao Nan Guo Restaurants Holdings, Ltd. | 14,724,000 | 1,789,977 |
| Xinjiang Goldwind Science & Technology Company, Ltd., H Shares | 191,400 | 217,273 |
| Yanzhou Coal Mining Company, Ltd., H Shares | 816,000 | 665,851 |
| Zhejiang Expressway Company, Ltd., H Shares | 146,000 | 158,289 |
| Zhuzhou CSR Times Electric Company, Ltd., H Shares | 146,500 | 501,975 |
| Zijin Mining Group Company, Ltd., H Shares | 2,464,000 | 643,133 |
| Zoomlion Heavy Industry Science and Technology Company, Ltd., H Shares | 559,200 | 351,485 |
| ZTE Corp., H Shares | 262,400 | 545,532 |
| |
| Hong Kong 22.3% | | 62,463,698 |
|
| Beijing Enterprises Holdings, Ltd. | 239,000 | 2,082,722 |
| Beijing Enterprises Water Group, Ltd. | 1,352,200 | 884,041 |
| Belle International Holdings, Ltd. | 1,918,000 | 2,380,606 |
| Brilliance China Automotive Holdings, Ltd. | 1,280,000 | 2,395,418 |
| China Everbright International, Ltd. | 1,090,000 | 1,455,196 |
| China Gas Holdings, Ltd. | 838,000 | 1,614,542 |
| China Merchants Holdings International Company, Ltd. | 483,336 | 1,625,916 |
| China Metal Recycling Holdings, Ltd. (I) | 14,221,734 | 0 |
| China Mobile, Ltd. | 1,217,000 | 13,297,724 |
| China Overseas Land & Investment, Ltd. | 1,820,000 | 5,545,895 |
| China Resources Cement Holdings, Ltd. | 796,000 | 575,824 |
| China Resources Enterprises, Ltd. | 510,000 | 1,548,674 |
| China Resources Gas Group, Ltd. | 366,000 | 1,155,899 |
| China Resources Land, Ltd. | 854,000 | 1,988,019 |
| China Resources Power Holdings Company, Ltd. | 800,000 | 2,245,085 |
China Emerging Leaders Fund
Fund’s investments
As of 7-31-14
| | | |
| | | Shares | Value |
| |
| Hong Kong (continued) | | | |
|
| China South City Holdings, Ltd. | | 636,000 | $318,705 |
| China State Construction International Holdings, Ltd. | | 740,000 | 1,303,082 |
| China Taiping Insurance Holdings Company, Ltd. (I) | | 279,400 | 609,234 |
| China Unicom Hong Kong, Ltd. | | 2,196,000 | 3,836,194 |
| CITIC Pacific, Ltd. | | 600,000 | 1,198,112 |
| COSCO Pacific, Ltd. | | 486,445 | 732,223 |
| CSPC Pharmaceutical Group, Ltd. | | 692,000 | 539,275 |
| GCL-Poly Energy Holdings, Ltd. (I) | | 3,837,000 | 1,238,713 |
| Geely Automobile Holdings, Ltd. | | 1,400,000 | 561,099 |
| Guangdong Investment, Ltd. | | 1,074,000 | 1,203,058 |
| Haier Electronics Group Company, Ltd. | | 349,000 | 998,840 |
| Hanergy Solar Group, Ltd. (I) | | 4,816,000 | 754,464 |
| Huili Resources Group, Ltd. (I) | | 900,000 | 144,019 |
| Kunlun Energy Company, Ltd. | | 1,352,000 | 2,296,273 |
| Ming Fung Jewellery Group, Ltd. (I) | | 7,540,000 | 76,431 |
| New World China Land, Ltd. | | 86,000 | 51,391 |
| Shanghai Industrial Holdings, Ltd. | | 115,000 | 382,743 |
| Shimao Property Holdings, Ltd. | | 476,500 | 1,095,588 |
| Silver Base Group Holdings, Ltd. (I) | | 34,010,000 | 4,294,013 |
| Sino Biopharmaceutical, Ltd. | | 1,232,000 | 1,059,108 |
| Viva China Holdings, Ltd. (I) | | 1,792,000 | 209,125 |
| Wison Engineering Services Company, Ltd. | | 12,000,000 | 766,447 |
| | Yield (%) | Shares | Value |
| |
| Short-Term Investments 0.0% | | | $55,540 |
|
| (Cost $55,540) | | | |
| |
| Money Market Funds 0.0% | | | 55,540 |
|
| State Street Institutional Liquid Reserves Fund | 0.0682(Y) | 55,540 | 55,540 |
|
| |
| Total investments (Cost $285,663,771)† 98.8% | | | $277,526,278 |
|
| |
| Other assets and liabilities, net 1.2% | | | $3,403,644 |
|
| |
| Total net assets 100.0% | | | $280,929,922 |
|
The percentage shown for each investment category is the total value of the category as a percentage of the net assets of the fund.
(I) Non-income producing security.
(Y) The rate shown is the annualized seven-day yield as of 7-31-14.
† At 7-31-14, the aggregate cost of investment securities for federal income tax purposes was $285,911,469. Net unrealized depreciation aggregated $8,385,191, of which $24,516,925 related to appreciated investment securities and $32,902,116 related to depreciated investment securities.
China Emerging Leaders Fund
Fund’s investments
As of 7-31-14
The fund had the following sector composition as a percentage of total net assets on 7-31-14:
| |
| Financials | 35.7% |
| Energy | 17.9% |
| Telecommunication Services | 7.4% |
| Consumer Discretionary | 7.3% |
| Information Technology | 7.0% |
| Industrials | 6.5% |
| Consumer Staples | 5.8% |
| Materials | 4.7% |
| Utilities | 4.5% |
| Health Care | 2.0% |
| Short-Term Investments & Other | 1.2% |
| |
|
| Total | 100.0% |
Statement of assets and liabilities — July 31, 2014
| | |
| | | China |
| | | Emerging |
| | | Leaders Fund |
| Assets | | |
|
| Investments, at value (Cost $285,663,771) | $ | 277,526,278 |
| Foreign currency, at value (Cost $1,252,245) | | 1,252,304 |
| Cash held at broker for futures contracts | | 331 |
| Receivable for investments sold | | 290,054 |
| Dividends and interest receivable | | 2,012,244 |
| Receivable due from advisor | | 6,232 |
| Other receivables and prepaid expenses | | 1,424 |
| Total assets | | 281,088,867 |
| |
| |
| Liabilities | | |
|
| Payable to affiliates | | |
| Accounting and legal services fees | | 3,888 |
| Transfer agent fees | | 20 |
| Other liabilities and accrued expenses | | 155,037 |
| Total liabilities | | 158,945 |
| |
| Net assets | $ | 280,929,922 |
| |
| |
| Net assets consist of | | |
|
| Paid-in capital | $ | 283,510,981 |
| Undistributed net investment income | | 4,138,031 |
| Accumulated net realized gain (loss) on | | |
| investments, foreign currency transactions and | | |
| futures contracts | | 1,416,720 |
| Net unrealized appreciation (depreciation) on | | |
| investments, translation of assets and liabilities | | |
| in foreign currencies and futures contracts | | (8,135,810) |
| Net assets | $ | 280,929,922 |
| |
| |
| Net asset value per share | | |
|
| Based on net asset values and shares | | |
| outstanding-the fund has an unlimited number of | | |
| shares authorized with no par value | | |
| Class A ($99,636 ÷ 10,000 shares)1 | $ | 9.96 |
| Class I ($99,960 ÷ 10,000 shares) | $ | 10.00 |
| Class NAV ($280,730,326 ÷ 28,071,076 shares) | $ | 10.00 |
| |
| Maximum offering price per share | | |
| Class A (net asset value per share ÷ 95%)2 | $ | 10.48 |
1 Redemption price per share is equal to net asset value less any applicable contingent deferred sales charge.
2 On single retail sales of less than $50,000. On sales of $50,000 or more and on group sales the offering price is reduced.
See notes to financial statements
China Emerging Leaders Fund
Statement of operations — For the year ended July 31, 2014
| | |
| | | China |
| | | Emerging |
| | | Leaders Fund |
| Investment income | | |
|
| Dividends | $ | 7,972,894 |
| Interest | | 5,417 |
| Less foreign taxes withheld | | (626,638) |
| Total investment income | | 7,351,673 |
| |
| Expenses | | |
|
| Investment management fees | | 3,403,385 |
| Distribution and service fees | | 269 |
| Accounting and legal services fees | | 36,994 |
| Transfer agent fees | | 229 |
| Trustees' fees | | 4,241 |
| Professional fees | | 122,089 |
| Custodian fees | | 329,882 |
| Registration and filing fees | | 17,148 |
| Other | | 10,095 |
| | | |
| Total expenses | | 3,924,332 |
| | | |
| Less expense reductions | | (43,679) |
| | | |
| Net expenses | | 3,880,653 |
| |
| Net investment income | | 3,471,020 |
| |
| |
| Realized and unrealized gain (loss) | | |
|
| Net realized gain (loss) on | | |
| Investments in unaffiliated issuers and foreign | | |
| currency transactions | | 16,951,454 |
| Investments in affiliated issuers | | (12,356,654) |
| Futures contracts | | (1,973,596) |
| | | 2,621,204 |
| |
| Change in net unrealized appreciation | | |
| (depreciation) of | | |
| Investments in unaffiliated issuers and | | |
| translation of assets and liabilities in foreign | | |
| currencies | | 28,868,848 |
| Investments in affiliated issuers | | 14,625,255 |
| | | 43,494,103 |
| |
| Net realized and unrealized gain | | 46,115,307 |
| |
| Increase in net assets from operations | $ | 49,586,327 |
See notes to financial statements
China Emerging Leaders Fund
Statements of changes in net assets
| | | | |
| | | Year ended | | Year ended |
| | | 7-31-14 | | 7-31-13 |
| |
| Increase (decrease) in net assets | | | | |
|
| From operations | | | | |
| Net investment income | $ | 3,471,020 | $ | 1,138,385 |
| Net realized gain | | 2,621,204 | | 14,535,900 |
| Change in net unrealized appreciation | | | | |
| (depreciation) | | 43,494,103 | | (27,297,822) |
| | | | | |
| Increase (decrease) in net assets resulting | | | | |
| from operations | | 49,586,327 | | (11,623,537) |
| |
| |
| Distributions to shareholders | | | | |
| From net investment income | | | | |
| Class A | | (4) | | — |
| Class I | | (333) | | (256) |
| Class NAV | | (1,687,747) | | (1,058,174) |
| From net realized gain | | | | |
| Class A | | (2,563) | | (3,558) |
| Class I | | (2,563) | | (3,558) |
| Class NAV | | (9,772,310) | | (10,873,251) |
| Total distributions | | (11,465,520) | | (11,938,797) |
| |
| From fund share transactions | | (88,730,896) | | 70,372,684 |
| |
| |
| Total increase (decrease) | | (50,610,089) | | 46,810,350 |
| |
| Net assets | | | | |
|
| Beginning of year | | 331,540,011 | | 284,729,661 |
| | | | | |
| End of year | $ | 280,929,922 | $ | 331,540,011 |
| |
| Undistributed net investment income | $ | 4,138,031 | $ | 1,152,273 |
See notes to financial statements
China Emerging Leaders Fund
Financial highlights
| | | | |
| Class A Shares | | | | |
| | |
| | 7-31-14 | 7-31-13 | 7-31-121 | |
| Per share operating performance | | | | |
| |
| Net asset value, beginning of period | $8.65 | $9.32 | $10.00 | |
| Net investment income (loss) 2 | 0.10 | (0.02) | 0.02 | |
| Net realized and unrealized gain (loss) on | | | | |
| investments | 1.47 | (0.29) | (0.70) | |
| Total from investment operations | 1.57 | (0.31) | (0.68) | |
| | | | | |
| Less distributions | | | | |
| From net investment income | — 3 | — | — | |
| From net realized gain | (0.26) | (0.36) | — | |
| Total distributions | (0.26) | (0.36) | — | |
| | | | | |
| Net asset value, end of period | $9.96 | $8.65 | $9.32 | |
| | | | | |
| Total return (%)4,5 | 18.61 | (3.96) | (6.80)6 | |
| | | | | |
| Ratios and supplemental data | | | | |
| |
| Net assets, end of period (in millions) | — 7 | — 7 | — 7 | |
| Ratios (as a percentage of average net | | | | |
| assets): | | | | |
| Expenses before reductions | 1.71 | 1.76 9 | 1.838 | |
| Expenses including reductions | 1.69 | 1.76 | 1.808 | |
| Net investment income (loss) | 1.07 | (0.20) | 0.358 | |
| Portfolio turnover (%) | 122 | 51 | 35 | |
1 Period from 12-29-11 (commencement of operations) to 7-31-12.
2 Based on average daily shares outstanding.
3 Less than $0.005 per share.
4 Total returns would have been lower had certain expenses not been reduced during the applicable periods.
5 Does not reflect the effect of sales charges, if any.
6 Not annualized.
7 Less than $500,000.
8 Annualized.
9 Expense ratio has been revised to conform with current year presentation of expense recapture and net expense reductions.
See notes to financial statements
China Emerging Leaders Fund
Financial highlights
| | | | |
| Class I Shares | | | | |
| | |
| | 7-31-14 | 7-31-13 | 7-31-121 | |
| Per share operating performance | | | | |
| |
| Net asset value, beginning of period | $8.68 | $9.34 | $10.00 | |
| Net investment income2 | 0.13 | 0.02 | 0.04 | |
| Net realized and unrealized gain (loss) on | | | | |
| investments | 1.48 | (0.29) | (0.70) | |
| Total from investment operations | 1.61 | (0.27) | (0.66) | |
| | | | | |
| Less distributions | | | | |
| From net investment income | (0.03) | (0.03) | — | |
| From net realized gain | (0.26) | (0.36) | — | |
| Total distributions | (0.29) | (0.39) | — | |
| | | | | |
| Net asset value, end of period | $10.00 | $8.68 | $9.34 | |
| | | | | |
| Total return (%)3 | 19.11 | (3.61) | (6.60)4 | |
| | | | |
| Ratios and supplemental data | | | | |
| |
| Net assets, end of period (in millions) | — 5 | — 5 | — 5 | |
| Ratios (as a percentage of average net | | | | |
| assets): | | | | |
| Expenses before reductions | 1.39 | 1.37 | 1.446 | |
| Expenses including reductions | 1.37 | 1.37 | 1.446 | |
| Net investment income | 1.40 | 0.19 | 0.726 | |
| Portfolio turnover (%) | 122 | 51 | 35 | |
1 Period from 12-29-11 (commencement of operations) to 7-31-12.
2 Based on average daily shares outstanding.
3 Total returns would have been lower had certain expenses not been reduced during the applicable periods.
4 Not annualized.
5 Less than $500,000.
6 Annualized.
See notes to financial statements
China Emerging Leaders Fund
Financial highlights
| | | | |
| Class NAV Shares | | | | |
| | |
| | 7-31-14 | 7-31-13 | 7-31-121 | |
| Per share operating performance | | | | |
| |
| Net asset value, beginning of period | $8.69 | $9.34 | $10.00 | |
| Net investment income2 | 0.10 | 0.04 | 0.05 | |
| Net realized and unrealized gain (loss) on | | | | |
| investments | 1.51 | (0.30) | (0.71) | |
| Total from investment operations | 1.61 | (0.26) | (0.66) | |
| | | | | |
| Less distributions | | | | |
| From net investment income | (0.04) | (0.03) | — | |
| From net realized gain | (0.26) | (0.36) | — | |
| Total distributions | (0.30) | (0.39) | — | |
| | | | | |
| Net asset value, end of period | $10.00 | $8.69 | $9.34 | |
| | | | | |
| Total return (%)3 | 19.12 | (3.41) | (6.60)4 | |
| | | | | |
| Ratios and supplemental data | | | | |
| |
| Net assets, end of period (in millions) | $281 | $331 | $285 | |
| Ratios (as a percentage of average net | | | | |
| assets): | | | | |
| Expenses before reductions | 1.27 | 1.27 | 1.345 | |
| Expenses including reductions | 1.25 | 1.27 | 1.345 | |
| Net investment income | 1.12 | 0.36 | 0.845 | |
| Portfolio turnover (%) | 122 | 51 | 35 | |
1 Period from 12-29-11 (commencement of operations) to 7-31-12.
2 Based on average daily shares outstanding.
3 Total returns would have been lower had certain expenses not been reduced during the applicable periods.
4 Not annualized.
5 Annualized.
See notes to financial statements
China Emerging Leaders Fund
Notes to financial statements
Note 1 — Organization
John Hancock China Emerging Leaders Fund (the fund) is a series of John Hancock Funds II (the Trust), an open-end management investment company organized as a Massachusetts business trust and registered under the Investment Company Act of 1940, as amended (the 1940 Act). The investment objective of the fund is to achieve long-term capital appreciation.
The fund may offer multiple classes of shares. The shares currently offered are detailed in the Statement of assets and liabilities. Class A shares are offered to all investors. Class I shares are offered to institutions and certain investors. Class NAV shares are offered to John Hancock affiliated funds of funds and certain 529 plans. Shareholders of each class have exclusive voting rights to matters that affect that class. The distribution and service fees, if any, and transfer agent fees for each class may differ.
Note 2 - Significant accounting policies
The financial statements have been prepared in conformity with accounting principles generally accepted in the United States of America (US GAAP), which require management to make certain estimates and assumptions as of the date of the financial statements. Actual results could differ from those estimates and those differences could be significant. The fund intends to qualify as an investment company under Topic 946 of Accounting Standards Codification of US GAAP.
Events or transactions occurring after the end of the fiscal period through the date that the financial statements were issued have been evaluated in the preparation of the financial statements. The following summarizes the significant accounting policies of the fund:
Security valuation. Investments are stated at value as of the close of regular trading on the New York Stock Exchange (NYSE), normally at 4:00 P.M., Eastern Time. In order to value the securities, the fund uses the following valuation techniques: Equity securities held by the fund are valued at the last sale price or official closing price on the exchange where the security was acquired or most likely will be sold. In the event there were no sales during the day or closing prices are not available, the securities are valued using the last available bid price. Futures contracts are valued at settlement prices, which are the official closing prices published by the exchange on which they trade. Foreign securities and currencies are valued in U.S. dollars, based on foreign currency exchange rates supplied by an independent pricing vendor. Securities that trade only in the over-the-counter (OTC) market are valued using bid prices. Certain short-term securities with maturities of 60 days or less at the time of purchase are valued at amortized cost. Other portfolio securities and assets, for which reliable market quotations are not readily available, are valued at fair value as determined in good faith by the fund’s Pricing Committee following procedures established by the Board of Trustees. The frequency with which these fair valuation procedures are used cannot be predicted and fair value of securities may differ significantly from the value that would have been used had a ready market for such securities existed. Trading in foreign securities may be completed before the daily close of trading on the NYSE. Significant events at the issuer or market level may affect the values of securities between the time when the valuation of the securities is generally determined and the close of the NYSE. If a significant event occurs, these securities may be fair valued, as determined in good faith by the fund’s Pricing Committee, following procedures established by the Board of Trustees. The fund uses fair value adjustment factors provided by an independent pricing vendor to value certain foreign securities in order to adjust for events that may occur between the close of foreign exchanges or markets and the close of the NYSE.
The fund uses a three-tier hierarchy to prioritize the pricing assumptions, referred to as inputs, used in valuation techniques to measure fair value. Level 1 includes securities valued using quoted prices in active markets for identical securities. Level 2 includes securities valued using other significant observable inputs. Observable inputs may include quoted prices for similar securities, interest rates, prepayment speeds and credit risk. Prices for securities valued using these inputs are received from independent pricing vendors and brokers and are based on an evaluation of the inputs described. Level 3 includes securities valued using significant unobservable inputs when market prices are not readily available or reliable, including the
fund’s own assumptions in determining the fair value of investments. Factors used in determining value may include market or issuer specific events or trends, changes in interest rates and credit quality. The inputs or methodology used for valuing securities are not necessarily an indication of the risks associated with investing in those securities. Changes in valuation techniques may result in transfers into or out of an assigned level within the disclosure hierarchy.
The following is a summary of the values by input classification of the fund’s investments as of July 31, 2014, by major security category or type:
| | | | |
| | Total Market | | | |
| | Value at | Level 1 Quoted | Level 2 Significant | Level 3 Significant |
| | 7-31-14 | Price | Observable Inputs | Unobservable Inputs |
| Common Stocks | | | | |
| China | $215,007,040 | — | $215,007,040 | — |
| Hong Kong | 62,463,698 | — | 61,697,251 | $766,447 |
| Short-Term Investments | 55,540 | $55,540 | — | — |
| |
|
| Total Investments in Securities | $277,526,278 | $55,540 | $276,704,291 | $766,447 |
Securities with a market value of approximately $3,559,171 at the beginning of the year were transferred from Level 2 to Level 3 during the year because significant observable inputs used in valuations were no longer readily available.
Security transactions and related investment income. Investment security transactions are accounted for on a trade date plus one basis for daily net asset value calculations. However, for financial reporting purposes, investment transactions are reported on trade date. Interest income is accrued as earned. Dividend income is recorded on the ex-date, except for dividends of foreign securities where the dividend may not be known until after the ex-date. In those cases, dividend income, net of withholding taxes, is recorded when the fund becomes aware of the dividends. Distributions received on securities that represent a return of capital or capital gain are recorded as a reduction of cost of investments and/or as a realized gain if amounts are estimable. Foreign taxes are provided for based on the fund’s understanding of the tax rules and rates that exist in the foreign markets in which it invests. Gains and losses on securities sold are determined on the basis of identified cost and may include proceeds from litigation.
Foreign currency translation. Assets, including investments and liabilities denominated in foreign currencies, are translated into U.S. dollar values each day at the prevailing exchange rate. Purchases and sales of securities, income and expenses are translated into U.S. dollars at the prevailing exchange rate on the date of the transaction. The effect of changes in foreign currency exchange rates on the value of securities is reflected as a component of the realized and unrealized gains (losses) on investments.
Funds that invest internationally generally carry more risk than funds that invest strictly in U.S. securities. Funds investing in a single country or in a limited geographic region tend to be riskier than funds that invest more broadly. Risks can result from differences in economic and political conditions, regulations, market practices (including higher transaction costs), accounting standards and other factors. Foreign investments are also subject to a decline in the value of a foreign currency versus the U.S. dollar, which reduces the dollar value of securities denominated in that currency.
Foreign taxes. The fund may be subject to withholding tax on income and/or capital gains or repatriation taxes imposed by certain countries in which the fund invests. Taxes are accrued based upon investment income, realized gains or unrealized appreciation.
Line of credit. The fund may borrow from banks for temporary or emergency purposes, including meeting redemption requests that otherwise might require the untimely sale of securities. Pursuant to the fund’s custodian agreement, the custodian may loan money to the fund to make properly authorized payments. The fund is obligated to repay the custodian for any overdraft, including any related costs or expenses. The
custodian may have a lien, security interest or security entitlement in any fund property that is not otherwise segregated or pledged, to the maximum extent permitted by law, to the extent of any overdraft.
In addition, the fund and other affiliated funds have entered into an agreement with Citibank N.A. that enables them to potentially participate in a $300 million unsecured committed line of credit. A commitment fee, payable at the end of each calendar quarter, based on the average daily unused portion of the line of credit, is charged to each participating fund on a pro rata basis and is reflected in other expenses on the Statement of operations. Commitment fees for the year ended July 31, 2014 were $565.
For the year ended July 31, 2014, the fund had no borrowings under the line of credit.
Expenses. Within the John Hancock group of funds complex, expenses that are directly attributable to an individual fund are allocated to such fund. Expenses that are not readily attributable to a specific fund are allocated among all funds in an equitable manner, taking into consideration, among other things, the nature and type of expense and the fund’s relative net assets. Expense estimates are accrued in the period to which they relate and adjustments are made when actual amounts are known.
Class allocations. Income, common expenses and realized and unrealized gains (losses) are determined at the fund level and allocated daily to each class of shares based on the net assets of the class. Class-specific expenses, such as distribution and service fees, if any, and transfer agent fees, for all classes, are calculated daily at the class level based on the appropriate net assets of each class and the specific expense rates applicable to each class.
Federal income taxes. The fund intends to continue to qualify as a regulated investment company by complying with the applicable provisions of the Internal Revenue Code and will not be subject to federal income tax on taxable income that is distributed to shareholders. Therefore, no federal income tax provision is required.
As of July 31, 2014, the fund had no uncertain tax positions that would require financial statement recognition, derecognition or disclosure. The fund’s federal tax returns are subject to examination by the Internal Revenue Service for a period of three years.
Distribution of income and gains. Distributions to shareholders from net investment income and net realized gains, if any, are recorded on the ex-date. The fund generally declares and pays dividends and capital gain distributions, if any, annually.
The tax character of distributions for the years ended July 31, 2014 and 2013 was as follows:
| | |
| | July 31, 2014 | July 31, 2013 |
|
| Ordinary Income | $8,853,494 | $11,938,797 |
|
| Long-Term Capital Gain | $2,612,026 | ---- |
|
| Total | $11,465,520 | $11,938,797 |
|
Distributions paid by the fund with respect to each class of shares are calculated in the same manner, at the same time and in the same amount, except for the effect of class level expenses that may be applied differently to each class. As of July 31, 2014, the components of distributable earnings on a tax basis consisted of $5,802,449 of undistributed ordinary income.
Such distributions and distributable earnings, on a tax basis, are determined in conformity with income tax regulations, which may differ from US GAAP. Distributions in excess of tax basis earnings and profits, if any, are reported in the fund’s financial statements as a return of capital.
Capital accounts within the financial statements are adjusted for permanent book-tax differences. These adjustments have no impact on net assets or the results of operations. Temporary book-tax differences, if any, will reverse in a subsequent period. Book-tax differences are primarily attributable to passive foreign investment companies and wash sale loss deferrals.
Note 3 – Derivative Instruments
The fund may invest in derivatives in order to meet its investment objective. Derivatives include a variety of different instruments that may be traded in the OTC market, on a regulated exchange or through a clearing facility. The risks in using derivatives vary depending upon the structure of the instruments, including the use of leverage, optionality, the liquidity or lack of liquidity of the contract, the creditworthiness of the counterparty or clearing organization and the volatility of the position. Some derivatives involve risks that are potentially greater than the risks associated with investing directly in the referenced securities or other referenced underlying instrument. Specifically, the fund is exposed to the risk that the counterparty to an OTC derivatives contract will be unable or unwilling to make timely settlement payments or otherwise honor its obligations. OTC derivatives transactions typically can only be closed out with the other party to the transaction.
Futures are traded on an exchange. Exchange-traded transactions generally present less counterparty risk to a fund than OTC transactions. The exchange stands between the fund and the broker to the contract and therefore, credit risk is generally limited to the failure of the exchange and the clearing member.
Futures. A futures contract is a contractual agreement to buy or sell a particular currency or financial instrument at a pre-determined price in the future. Risks related to the use of futures contracts include possible illiquidity of the futures markets, contract prices that can be highly volatile and imperfectly correlated to movements in the underlying financial instrument and potential losses in excess of the amounts recognized on the Statement of assets and liabilities. Use of long futures contracts subjects the fund to the risk of loss up to the notional value of the futures contracts. Use of short futures contracts subjects the fund to unlimited risk of loss.
Upon entering into a futures contract, the fund is required to deposit initial margin with the broker in the form of cash or securities. The amount of required margin is generally based on a percentage of the contract value; this amount is the initial margin for the trade. The margin deposit must then be maintained at the established level over the life of the contract. Futures collateral receivable / payable is included on the Statement of assets and liabilities. Futures contracts are marked-to-market daily and an appropriate payable or receivable for the change in value (variation margin) and unrealized gain or loss is recorded by the fund. When the contract is closed, the fund records a realized gain or loss equal to the difference between the value of the contract at the time it was opened and the value at the time it was closed.
During the year ended July 31, 2014, the fund used futures contracts to gain exposure to certain securities markets. During the year ended July 31, 2014, the fund held futures contracts with notional values up to $15.0 million, as measured at each quarter end. There were no open futures contracts as of July 31, 2014.
Effect of derivative instruments on the Statement of operations
The table below summarizes the net realized gain (loss) included in the net increase (decrease) in net assets from operations, classified by derivative instrument and risk category, for the year ended July 31, 2014:
| | | |
| | Statement of Operations | Futures | |
| Risk | Location | Contracts | |
| |
| | |
| Index Contracts | Net realized gain (loss) | ($1,973,596) | |
Note 4 - Guarantees and indemnifications
Under the Trust’s organizational documents, its Officers and Trustees are indemnified against certain liabilities arising out of the performance of their duties to the Trust, including the fund. Additionally, in the normal course of business, the fund enters into contracts with service providers that contain general indemnification clauses. The fund’s maximum exposure under these arrangements is unknown, as this would involve future claims that may be made against the fund that have not yet occurred. The risk of material loss from such claims is considered remote.
Note 5 – Fees and transactions with affiliates
John Hancock Advisers, LLC (the Advisor or JHA) serves as investment advisor for the fund. Prior to January 1, 2014, John Hancock Investment Management Services, LLC (JHIMS) served as investment advisor for the fund. JHIMS and JHA have identical officers, directors and other personnel, and share common facilities and resources. Terms of the investment management contract with JHA are substantially identical to the former contract with JHIMS. In this report, depending on the context, the term “Advisor” shall refer to either JHA in its current capacity as investment advisor, or to JHIMS in its capacity as investment advisor prior to January 1, 2014. John Hancock Funds, LLC (the Distributor), an affiliate of the Advisor, serves as principal underwriter of the fund. The Advisor and the Distributor are indirect, wholly owned subsidiaries of Manulife Financial Corporation (MFC).
Management fee. The fund has an investment management agreement with the Advisor under which the fund pays a daily management fee to the Advisor equivalent, on an annual basis, to the sum of: a) 1.10% of the first $500 million of the fund’s average daily net assets, b) 1.05% of the next $500 million of the fund’s average daily net assets and c) 1.00% of the fund’s average daily net assets in excess of $1 billion. Effective December 18, 2013, the Advisor has a subadvisory agreement with Dimensional Fund Advisors LP. Prior to December 18, 2013, the Advisor had a subadvisory agreement with Atlantis Investment Management (H.K.), Ltd. The fund is not responsible for payment of the subadvisory fees.
The Advisor has contractually agreed to waive a portion of its management fee and/or reimburse expenses for certain funds of the John Hancock complex, including the fund (the participating portfolios). The waiver equals, on an annualized basis, 0.01% of that portion of the aggregate net assets of all the participating portfolios that exceeds $75 billion but is less than or equal to $125 billion; 0.0125% of that portion of the aggregate net assets of all the participating portfolios that exceeds $125 billion but is less than or equal to $150 billion; and 0.015% of that portion of the aggregate net assets of all the participating portfolios that exceeds $150 billion. The amount of the reimbursement is calculated daily and allocated among all the participating portfolios in proportion to the daily net assets of each fund. This arrangement may be amended or terminated at any time by the Advisor upon notice to the fund and with the approval of the Board of Trustees.
The Advisor has voluntarily agreed to waive and/or reimburse operating expenses for Class A, Class I, and Class NAV shares, excluding certain expenses such as taxes, brokerage commissions, interest expense, litigation and indemnification expenses and other extraordinary expenses not incurred in the ordinary course of the fund’s business. Effective December 19, 2013, the fee waivers and/or reimbursements are such that the expenses will not exceed 1.70%, 1.37%, and 1.26% for Class A, Class I, and Class NAV shares, respectively. Prior to December 19, 2013, the fee waivers and/or reimbursements are such that the expenses will not exceed 1.80% and 1.44% for Class A and Class I shares, respectively This voluntary expense reimbursement may be terminated at any time by the Advisor on notice to the fund.
Additionally, the Advisor has voluntarily agreed to reduce its management fee for the fund, or if necessary make payment to the fund, in an amount equal to the amount by which the expenses of the fund exceed
0.25% of the average annual net assets (on an annualized basis) of the fund. “Expenses” means all the expenses of the fund, excluding (a) taxes, (b) brokerage commissions, (c) interest expense, (d) litigation and indemnification expenses and other extraordinary expenses not incurred in the ordinary course of the fund’s business, (e) advisory fees, (f) Rule 12b-1 fees, (g) transfer agent fees and service fees, (h) blue sky fees, (i) printing and postage, (j) underlying fund expenses (“acquired fund fees”) and (k) short dividend expense. This voluntary expense reimbursement will continue in effect until terminated at any time by the advisor on notice to the fund.
Accordingly, these expense reductions amounted to $12, $20, and $43,647 for Class A, Class I and Class NAV shares, respectively, for the year ended July 31, 2014.
The investment management fees incurred for the year ended July 31, 2014, were equivalent to a net annual effective rate of 1.09% of the fund’s average daily net assets.
Expense recapture. The Advisor may recapture operating expenses reimbursed or fees waived under previous expense limitation or waiver arrangements for a period of three years following the month in which the reimbursements or waivers occurred to the extent that the fund is below its expense limitation during this period. For the year ended July 31, 2014, no amounts were recaptured. The table below outlines the amount of waived or reimbursed expenses subject to potential recovery in future periods and the respective expiration dates.
| | | | |
| Amounts | Amounts | Amounts eligible | |
| eligible for | eligible for | eligible for | |
| recovery | recovery | recovery | |
| through July 1, | through July 1, | through January 1, | |
| 2015 | 2016 | 2017 | |
|
| |
| - | - | $24,548 | |
Accounting and legal services. Pursuant to a service agreement, the fund reimburses the Advisor for all expenses associated with providing the administrative, financial, legal, accounting and recordkeeping services to the fund, including the preparation of all tax returns, periodic reports to shareholders and regulatory reports, among other services. These expenses are allocated to each share class based on its relative net assets at the time the expense was incurred. These accounting and legal services fees incurred for the year ended July 31, 2014 amounted to an annual rate of 0.01% of the fund’s average daily net assets.
Distribution and service plans. The fund has a distribution agreement with the Distributor. The fund has adopted distribution and service plans with respect to Class A pursuant to Rule 12b-1 under the 1940 Act, to pay the Distributor for services provided as the distributor of shares of the fund. The fund may pay up to 0.30% for Class A shares for distribution and service fees, expressed as an annual percentage of average daily net assets for each class of the fund’s shares.
Sales charges. Class A shares may be subject to contingent deferred sales charges (CDSCs). Certain Class A shares that are acquired through purchases of $1 million or more and are redeemed within one year of purchase are subject to a 1.00% sales charge. CDSCs are applied to the lesser of the current market value at the time of redemption or the original purchase cost of the shares being redeemed. Proceeds from CDSCs are used to compensate the Distributor for providing distribution-related services in connection with the sale of these shares. During the year ended July 31, 2014 there were no CDSCs received by the Distributor for Class A shares.
Transfer agent fees. The fund has a transfer agent agreement with John Hancock Signature Services, Inc. (Signature Services), an affiliate of the Advisor. The transfer agent fees paid to Signature Services are determined based on the cost to Signature Services (Signature Services Cost) of providing recordkeeping services. The Signature Services Cost includes a component of allocated John Hancock corporate overhead for providing transfer agent services to the fund and to all other John Hancock
affiliated funds. It also includes out-of-pocket expenses, including payments made to third-parties for recordkeeping services provided to their clients who invest in one or more John Hancock funds. In addition, Signature Services Cost may be reduced by certain fees that Signature Services receives in connection with retirement and small accounts. Signature Services Cost is calculated monthly and allocated, as applicable, to five categories of share classes: Retail Share and Institutional Classes of Non-Municipal Bond Funds, Class R6 Shares, Retirement Share Classes and Municipal Bond Share Classes. Within each of these categories, the applicable costs are allocated to the affected John Hancock affiliated funds and/or classes, based on the relative average daily net assets.
Prior to October 1, 2013, Signature Services Cost were calculated monthly and allocated, as applicable, to four categories of share classes: Institutional Share Classes, Retirement Share Classes, Municipal Bond Share Classes and all other Retail Share Classes. Within each of these categories, the applicable costs were allocated to the affected John Hancock affiliated funds and/or classes, based on the relative average daily net assets.
Class level expenses. Class level expenses for the year ended July 31, 2014 were:
| | |
| | Distribution and | |
| Class | service fees | Transfer agent fees |
|
| Class A | $269 | $123 |
| Class I | — | 106 |
| |
|
| Total | $269 | $229 |
Trustee expenses. The fund compensates each Trustee who is not an employee of the Advisor or its affiliates. The costs of paying Trustee compensation and expenses are allocated to each fund based on its net assets relative to other funds within the John Hancock group of funds complex.
Note 6 - Fund share transactions
Transactions in fund shares for the years ended July 31, 2014 and 2013 were as follows:
| | | | |
| | Year ended | Year ended |
| | 7/31/14 | 7/31/13 |
| |
|
|
| | Shares | Amount | Shares | Amount |
| Class NAV shares | | | | |
| Sold | 7,433 | $ 67,041 | 6,903,780 | $ 62,149,839 |
| Distributions reinvested | 1,340,358 | 11,460,057 | 1,165,178 | 11,931,425 |
| Repurchased | (11,421,785) | (100,257,994) | (376,638) | (3,708,580) |
|
|
|
|
|
| | |
| Net increase (decrease) | (10,073,994) | $ (88,730,896) | 7,692,320 | $ 70,372,684 |
|
|
|
|
|
| Total net increase (decrease) | (10,073,994) | $ (88,730,896) | 7,692,320 | $ 70,372,684 |
|
|
|
|
|
There were no fund share transactions for Class A and Class I shares for the years ended July 31, 2014 and 2013.
Affiliates of the fund owned 100% of shares of beneficial interest of the fund on July 31, 2014.
Note 7 - Purchase and sale of securities
Purchases and sales of securities, other than short-term investments, amounted to $362,035,228 and $453,660,496, respectively, for the year ended July 31, 2014.
Note 8 - Investment by affiliated funds
Certain investors in the fund are affiliated funds that are managed by the Advisor and its affiliates. The affiliated funds do not invest in the fund for the purpose of exercising management or control; however, this investment may represent a significant portion of the fund’s net assets. At July 31, 2014, funds within the John Hancock group of funds complex held 100% of the fund’s net assets. The following funds had an affiliate ownership of 5% or more of the fund’s net assets:
| | |
| | Affiliated | |
| Fund | Concentration | |
| John Hancock Funds II Lifestyle Growth | 39.2% | |
| John Hancock Funds II Lifestyle Balanced | 28.9% | |
| John Hancock Funds II Lifestyle Aggressive | 13.7% | |
Note 9 – Transactions in securities of affiliated issuers
Affiliated issuers, as defined by the 1940 Act, are those in which the fund’s holdings of an issuer represent 5% or more of the outstanding voting securities of the issuer. A summary of the fund’s transactions in the securities of these issuers during the year ended July 31, 2014, is set forth below:
| | | | | |
| | Beginning | Ending | | | |
| | share | share | Realized | Dividend | Ending |
| Affiliate | amount | amount | gain (loss) | income | value |
|
| Silver Base Group | | | | | |
| Holdings, Ltd. | 75,000,000 | 34,010,000 | ($12,356,654) | - | $4,294,013* |
Bought: 2,000,000
Sold: 42,990,000
*At the year ended July 31, 2014, the issuer was held but was no longer an affiliate.
Report of Independent Registered Public Accounting Firm
To the Board of Trustees of John Hancock Funds II and Shareholders of
John Hancock China Emerging Leaders Fund:
In our opinion, the accompanying statement of assets and liabilities, including the schedule of investments, and the related statements of operations and of changes in net assets and the financial highlights present fairly, in all material respects, the financial position of the John Hancock China Emerging Leaders Fund (the "Fund") at July 31, 2014, the results of its operations for the year then ended, the changes in its net assets for each of the two years in the period then ended and the financial highlights for each of the periods indicated, in conformity with accounting principles generally accepted in the United States of America. These financial statements and financial highlights (hereafter referred to as "financial statements") are the responsibility of the Fund's management. Our responsibility is to express an opinion on these financial statements based on our audits. We conducted our audits of these financial statements in accordance with the standards of the Public Company Accounting Oversight Board (United States). Those standards require that we plan and perform the audit to obtain reasonable assurance about whether the financial statements are free of material misstatement. An audit includes examining, on a test basis, evidence supporting the amounts and disclosures in the financial statements, assessing the accounting principles used and significant estimates made by management, and evaluating the overall financial statement presentation. We believe that our audits, which included confirmation of securities at July 31, 2014 by correspondence with the custodian and brokers, provide a reasonable basis for our opinion.
PricewaterhouseCoopers LLP
Boston, Massachusetts
September 17, 2014
Federal Tax Information (Unaudited)
For federal income tax purposes, the following information is furnished with respect to the distributions of the fund, if any, paid during its taxable year ended July 31, 2014.
The fund reports the maximum amount allowable of its net taxable income as eligible for the corporate dividends-received deduction.
The fund reports the maximum amount allowable of its net taxable income as qualified dividend income as provided in the Jobs and Growth Tax Relief Reconciliation Act of 2003.
The fund paid $2,612,026 in capital gain dividends.
Income derived from foreign securities was $7,972,894. The fund intends to pass through foreign tax credit of $625,793.
Eligible shareholders will be mailed a 2014 Form 1099-DIV in early 2015. This will reflect the tax character of all distributions paid in calendar year 2014.
Please consult a tax advisor regarding the tax consequences of your investment in the fund.
|
| EVALUATION OF ADVISORY AND SUBADVISORY |
| AGREEMENTS BY THE BOARD OF TRUSTEES |
| |
| John Hancock China Emerging Leaders Fund |
This section describes the evaluation by the Board of Trustees (the Board) of John Hancock Funds II (the Trust) of the Advisory Agreement (the Advisory Agreement) with John Hancock Advisers, LLC (the Advisor) and the Subadvisory Agreement (the Subadvisory Agreement) with Dimensional Fund Advisors LP (the Subadvisor), for John Hancock China Emerging Leaders Fund (the fund). The Advisory Agreement and Subadvisory Agreement are collectively referred to as the Agreements. Prior to the June 23 25, 2014 meeting at which the Agreements were approved, the Board also discussed and considered information regarding the proposed continuation of the Agreements at an in-person meeting held on May 27 29, 2014.
Approval of Advisory and Subadvisory Agreements
At in-person meetings held on June 23 25, 2014, the Board, including the Trustees who are not considered to be interested persons of the Trust under the Investment Company Act of 1940, as amended (the 1940 Act) (the Independent Trustees), reapproved for an annual period the continuation of the Advisory Agreement between the Trust and the Advisor and the Subadvisory Agreement between the Advisor and the Subadvisor with respect to the fund.
In considering the Advisory Agreement and the Subadvisory Agreement, the Board received in advance of the meetings a variety of materials relating to the fund, the Advisor and the Subadvisor, including comparative performance, fee and expense information for a peer group of similar funds prepared by an independent third-party provider of fund data, performance information for an applicable benchmark index; and, with respect to the Subadvisor, comparative performance information for comparably managed accounts, as applicable, and other information provided by the Advisor and the Subadvisor regarding the nature, extent and quality of services provided by the Advisor and the Subadvisor under their respective Agreements, as well as information regarding the Advisor’s revenues and costs of providing services to the fund and any compensation paid to affiliates of the Advisor. At the meetings at which the renewal of the Advisory Agreement and Subadvisory Agreement are considered, particular focus is given to information concerning fund performance, comparability of fees and total expenses, and profitability. However, the Board notes that the evaluation process with respect to the Advisor and the Subadvisor is an ongoing one. In this regard, the Board also took into account discussions with management and information provided to the Board at prior meetings with respect to the services provided by the Advisor and the Subadvisor to the fund, including quarterly performance reports prepared by management containing reviews of investment results and prior presentations from the Subadvisor with respect to the fund. The Board also considered the nature, quality, and extent of non-advisory services, if any, to be provided to the fund by the Advisor’s affiliates, including distribution services.
Throughout the process, the Board asked questions of and requested additional information from management. The Board is assisted by counsel for the Trust and the Independent Trustees are also separately assisted by independent legal counsel throughout the process. The Independent Trustees also received a memorandum from their independent legal counsel discussing the legal standards for their consideration of the proposed continuation of the Agreements and discussed the proposed continuation of the Agreements in private sessions with their independent legal counsel at which no representatives of management were present.
Approval of Advisory Agreement
In approving the Advisory Agreement with respect to the fund, the Board, including the Independent Trustees, considered a variety of factors, including those discussed below. The Board also considered other factors (including conditions and trends prevailing generally in the economy, the securities markets, and the industry) and does not treat any single factor as determinative, and each Trustee may attribute different weights to different factors. The Board’s conclusions may be based in part on its consideration of the advisory and subadvisory arrangements in prior years and on the Board’s ongoing regular review of fund performance and operations throughout the year.
Nature, extent, and quality of services. Among the information received by the Board from the Advisor relating to the nature, extent, and quality of services provided to the fund, the Board reviewed information provided by the Advisor relating to its operations and personnel, descriptions of its organizational and management structure, and information regarding the Advisor’s compliance and regulatory history, including its Form ADV. The Board also noted that on a regular basis it receives and reviews information from the Trust’s Chief Compliance Officer (CCO) regarding the fund’s compliance policies and procedures established pursuant to Rule 38a-1 under the 1940 Act. The Board also considered the
Advisor’s risk management processes. The Board considered that the Advisor is responsible for the management of the day-to-day operations of the fund, including, but not limited to, general supervision of and coordination of the services provided by the Subadvisor, and is also responsible for monitoring and reviewing the activities of the Subadvisor and other third-party service providers.
In considering the nature, extent, and quality of the services provided by the Advisor, the Trustees also took into account their knowledge of the Advisor’s management and the quality of the performance of the Advisor’s duties, through Board meetings, discussions and reports during the preceding year and through each Trustee’s experience as a Trustee of the Trust and of the other trusts in the complex.
In the course of their deliberations regarding the Advisory Agreement, the Board considered, among other things:
(a) the skills and competency with which the Advisor has in the past managed the Trust’s affairs and its subadvisory relationship, the Advisor’s oversight and monitoring of the Subadvisor’s investment performance and compliance programs, such as the Subadvisor’s compliance with fund policies and objectives, review of brokerage matters, including with respect to trade allocation and best execution and the Advisor’s timeliness in responding to performance issues;
(b) the background, qualifications and skills of the Advisor’s personnel;
(c) the Advisor’s compliance policies and procedures and its responsiveness to regulatory changes and mutual fund industry developments;
(d) the Advisor’s administrative capabilities, including its ability to supervise the other service providers for the fund;
(e) the financial condition of the Advisor and whether it has the financial wherewithal to provide a high level and quality of services to the fund; and
(f) the Advisor’s reputation and experience in serving as an investment advisor to the Trust and the benefit to shareholders of investing in funds that are part of a family of funds offering a variety of investments.
The Board concluded that the Advisor may reasonably be expected to continue to provide a high quality of services under the Advisory Agreement with respect to the fund.
Investment performance. In considering the fund’s performance, the Board noted that it reviews at its regularly scheduled meetings information about the fund’s performance results. In connection with the consideration of the Advisory Agreement, the Board:
(a) reviewed information prepared by management regarding the fund’s performance;
(b) considered the comparative performance of an applicable benchmark index;
(c) considered the performance of comparable funds, if any, as included in the report prepared by an independent third-party provider of fund data; and
(d) took into account the Advisor’s analysis of the fund’s performance and its plans and recommendations regarding the Trust’s subadvisory arrangements generally.
The Board noted that the fund underperformed its benchmark index and peer group average for the one-year period ended December 31, 2013. The Board took into account management’s discussion of the fund’s performance, including relative to the benchmark index and peer group. The Board noted that the performance of the fund has improved since Dimensional Fund Advisors took over management of the fund in December 2013. The Board also noted that the fund has a relatively limited performance history.
The Board concluded that the fund’s performance is being monitored and reasonably addressed.
Fees and expenses. The Board reviewed comparative information prepared by an independent third-party provider of mutual fund data, including, among other data, the fund’s contractual and net management fees (and subadvisory fees, to the extent available) and total expenses as compared to similarly situated investment companies deemed to be comparable to the fund. The Board considered the fund’s ranking within a smaller group of peer funds chosen by the independent third-party provider, as well as the fund’s ranking within a broader group of funds. In comparing the fund’s contractual and net management fees to those of comparable funds, the Board noted that such fees include both advisory and administrative costs.
The Board noted that net management fees for the fund are equal to the peer group median and that total expenses for the fund are lower than the peer group median.
The Board took into account management’s discussion of the fund’s expenses, noting action taken that will further reduce certain fund expenses. The Board also took into account management’s discussion with respect to the advisory/subadvisory fee structure, including the amount of the advisory fee retained by the Advisor after payment of the subadvisory fee. The Board also noted that the Advisor pays the subadvisory fee, and that such fees are negotiated at arm’s length with respect to the Subadvisor. In addition, the Board took into account that management had agreed, effective July 1, 2014, to implement an overall fee waiver across the complex, including the fund, which is discussed further below. The Board also noted actions taken over the past several years to reduce the fund’s operating expenses. The Board also noted that, in addition, the Advisor is currently waiving fees and/or reimbursing expenses with respect to the fund and that the fund has breakpoints in its contractual management fee schedule that reduces management fees as assets increase. The Board reviewed information provided by the Advisor concerning the investment advisory fee charged by the Advisor or one of its advisory affiliates to other clients (including other funds in the complex) having similar investment mandates, if any. The Board considered any differences between the Advisor’s and Subadvisor’s services to the fund and the services they provide to other comparable clients or funds. The Board concluded that the advisory fee paid with respect to the fund is reasonable.
Profitability/indirect benefits. In considering the costs of the services to be provided and the profits to be realized by the Advisor and its affiliates from the Advisor’s relationship with the Trust, the Board:
(a) reviewed financial information of the Advisor;
(b) reviewed and considered information presented by the Advisor regarding the net profitability to the Advisor and its affiliates with respect to the fund;
(c) received and reviewed profitability information with respect to the John Hancock fund complex as a whole;
(d) received information with respect to the Advisor’s allocation methodologies used in preparing the profitability data;
(e) considered that the John Hancock insurance companies that are affiliates of the Advisor, as shareholders of the Trust directly or through their separate accounts, receive certain tax credits or deductions relating to foreign taxes paid and dividends received by certain funds of the Trust and noted that these tax benefits, which are not available to participants in qualified retirement plans under applicable income tax law, are reflected in the profitability analysis reviewed by the Board;
(f) considered that the Advisor also provides administrative services to the fund on a cost basis pursuant to an administrative services agreement;
(g) noted that affiliates of the Advisor provide transfer agency services and distribution services to the fund, and that the fund’s distributor also receives Rule 12b-1 payments to support distribution of the fund;
(h) noted that the Advisor also derives reputational and other indirect benefits from providing advisory services to the fund;
(i) noted that the subadvisory fee for the fund is paid by the Advisor and is negotiated at arm’s length; and
(j) considered that the Advisor should be entitled to earn a reasonable level of profits in exchange for the level of services it provides to the fund and the entrepreneurial risk that it assumes as Advisor.
Based upon its review, the Board concluded that the level of profitability, if any, of the Advisor and its affiliates from their relationship with the fund was reasonable and not excessive.
Economies of scale. In considering the extent to which economies of scale would be realized as the fund grows and whether fee levels reflect these economies of scale for the benefit of fund shareholders, the Board:
(a) considered that the Advisor has agreed, effective July 1, 2014, to waive a portion of its management fee for the fund and each of the other John Hancock funds in the complex (except for those discussed below) (the Participating Portfolios) or otherwise reimburse the expenses of the Participating Portfolios as follows (the Reimbursement):
The Reimbursement shall equal, on an annualized basis, 0.01% of that portion of the aggregate net assets of all the Participating Portfolios that exceed $75 billion but is less than or equal to $125 billion, 0.0125% of that portion of the aggregate net assets of all the Participating Portfolios that exceed $125 billion but is less than or equal to $150 billion and 0.015% of that portion of the aggregate net assets of all the Participating Portfolios that exceeds $150 billion. (The funds that are not Participating Portfolios are the funds of funds in the complex, which benefit from such overall management fee waiver through their investment in underlying portfolios that include Participating Portfolios, which are subject to the Reimbursement.)
(b) reviewed the fund’s advisory fee structure and concluded that: (i) the fund’s fee structure contains breakpoints at the subadvisory fee level and that such breakpoints are reflected as breakpoints in the advisory fees for the fund; and (ii) although economies of scale cannot be measured with precision, these arrangements permit shareholders of the fund to benefit from economies of scale if the fund grows. The Board also took into account management’s discussion of the fund’s advisory fee structure; and
(c) the Board also considered the effect of the fund’s growth in size on its performance and fees. The Board also noted that if the fund’s assets increase over time, the fund may realize other economies of scale.
Approval of Subadvisory Agreement
In making its determination with respect to approval of the Subadvisory Agreement, the Board reviewed:
(1) information relating to the Subadvisor’s business, including current subadvisory services to the Trust (and other funds in the John Hancock family of funds);
(2) the historical and current performance of the fund and comparative performance information relating to an applicable benchmark index and comparable funds;
(3) the subadvisory fee for the fund, including any breakpoints, and to the extent available, comparable fee information prepared by an independent third party provider of fund data; and
(4) information relating to the nature and scope of any material relationships and their significance to the Trust’s Advisor and Subadvisor.
Nature, extent, and quality of services. With respect to the services provided by the Subadvisor, the Board received information provided to the Board by the Subadvisor, including the Subadvisor’s Form ADV, as well as took into account information presented throughout the past year. The Board considered the Subadvisor’s current level of staffing and its overall resources, as well as received information relating to the Subadvisor’s compensation program. The Board reviewed the Subadvisor’s history and investment experience, as well as information regarding the qualifications, background, and responsibilities of the Subadvisor’s investment and compliance personnel who provide services to the fund. The Board also considered, among other things, the Subadvisor’s compliance program and any disciplinary history. The Board also considered the Subadvisor’s risk assessment and monitoring process. The Board reviewed the Subadvisor’s regulatory history, including whether it was involved in any regulatory actions or investigations as well as material litigation, and any settlements and amelioratory actions undertaken, as appropriate. The Board noted that the Advisor conducts regular, periodic reviews of the Subadvisor and its operations, including regarding investment processes and organizational and
staffing matters. The Board also noted that the Trust’s CCO and his staff conduct regular, periodic compliance reviews with the Subadvisor and present reports to the Independent Trustees regarding the same, which includes evaluating the regulatory compliance systems of the Subadvisor and procedures reasonably designed to assure compliance with the federal securities laws. The Board also took into account the financial condition of the Subadvisor.
The Board considered the Subadvisor’s investment process and philosophy. The Board took into account that the Subadvisor’s responsibilities include the development and maintenance of an investment program for the fund that is consistent with the fund’s investment objective, the selection of investment securities and the placement of orders for the purchase and sale of such securities, as well as the implementation of compliance controls related to performance of these services. The Board also received information with respect to the Subadvisor’s brokerage policies and practices, including with respect to best execution and soft dollars.
Subadvisor compensation. In considering the cost of services to be provided by the Subadvisor and the profitability to the Subadvisor of its relationship with the fund, the Board noted that the fees under the Subadvisory Agreement are paid by the Advisor and not the fund.
The Board also relied on the ability of the Advisor to negotiate the Subadvisory Agreement with the Subadvisor, which is not affiliated with the Advisor, and the fees thereunder at arm’s length. As a result, the costs of the services to be provided and the profits to be realized by the Subadvisor from its relationship with the Trust were not a material factor in the Board’s consideration of the Subadvisory Agreement.
The Board also received information regarding the nature and scope (including their significance to the Advisor and its affiliates and to the Subadvisor) of any material relationships, if any, with respect to the Subadvisor, which include arrangements in which the Subadvisor or its affiliates provide advisory, distribution, or management services in connection with financial products sponsored by the Advisor or its affiliates, and may include other registered investment companies, a 529 education savings plan, managed separate accounts and exempt group annuity contracts sold to qualified plans. The Board also received information and took into account any other potential conflicts of interest the Advisor might have in connection with the Subadvisory Agreement.
In addition, the Board considered other potential indirect benefits that the Subadvisor and its affiliates may receive from the Subadvisor’s relationship with the fund, such as the opportunity to provide advisory services to additional funds in the John Hancock fund complex and reputational benefits.
Subadvisory fee. The Board considered that the fund pays an advisory fee to the Advisor and that, in turn, the Advisor pays a subadvisory fee to the Subadvisor. As noted above, the Board also considered the fund’s subadvisory fee as compared to similarly situated investment companies deemed to be comparable to the fund as included in the report prepared by the independent third party provider of fund data, to the extent available. The Board noted that the limited size of the peer group was not sufficient for comparative purposes. The Board also took into account the subadvisory fee paid by the Advisor to the Subadvisor with respect to the fund to fees charged by the Subadvisor to manage other subadvised portfolios and portfolios not subject to regulation under the 1940 Act, as applicable.
Subadvisor performance. As noted above, the Board considered the fund’s performance as compared to the fund’s peer group and the benchmark index and noted that the Board reviews information about the fund’s performance results at its regularly scheduled meetings. The Board noted the Advisor’s expertise and resources in monitoring the performance, investment style and risk-adjusted performance of the
Subadvisor. The Board was mindful of the Advisor’s focus on the Subadvisor’s performance. The Board also noted the Subadvisor’s long-term performance record for similar accounts, as applicable.
The Board’s decision to approve the Subadvisory Agreement was based on a number of determinations, including the following:
(1) the Subadvisor has extensive experience and demonstrated skills as a manager;
(2) the performance of the fund is being monitored and reasonably addressed;
(3) the subadvisory fee is reasonable in relation to the level and quality of services being provided; and
(4) subadvisory fee breakpoints are reflected as breakpoints in the advisory fees for the fund in order to permit shareholders to benefit from economies of scale if the fund grows.
Based on the Board’s evaluation of all factors that the Board deemed to be material, including those factors described above, the Board, including the Independent Trustees, concluded that renewal of the Advisory Agreement and the Subadvisory Agreement would be in the best interest of the fund and its shareholders. Accordingly, the Board, and the Independent Trustees voting separately, approved the Advisory Agreement and Subadvisory Agreement for an additional one-year period.
|
| EVALUATION OF SUBADVISORY |
| AGREEMENT BY THE BOARD OF TRUSTEES |
| |
| China Emerging Leaders Fund |
This section describes the evaluation by the Board of Trustees (the Board) of John Hancock Funds II (the Trust or JHF II) of the Subadvisory Agreement (the Subadvisory Agreement) with Dimensional Fund Advisors LP (the Subadvisor or DFA) for China Emerging Leaders Fund (the fund). The Subadvisor replaced Atlantis Investment Management (Hong Kong) Ltd. as the fund’s subadvisor effective December 19, 2013. John Hancock Advisers, LLC continues to serve as the fund’s investment advisor (the Advisor).
Board Consideration of New Subadvisory Agreement
The Board, including the Independent Trustees, is responsible for approving the Advisor’s selection of fund subadvisors and approving the fund’s subadvisory agreements, their periodic continuation and any amendments. Consistent with SEC rules, the Board regularly evaluates JHF II’s subadvisory arrangements, including consideration of the factors listed below. The Board also may consider other factors (including conditions and trends prevailing generally in the economy, the securities markets and the industry) and does not treat any single factor as determinative, and each Trustee may attribute different weights to different factors. The Board is furnished with an analysis of its fiduciary obligations in connection with its evaluation and, throughout the evaluation process, the Board is assisted by counsel for JHF II and the Independent Trustees are also separately assisted by independent legal counsel. The factors considered by the Board with respect to the fund are:
• the nature, extent and quality of the services to be provided by the subadvisor to the Fund;
• the investment performance of the fund and its subadvisor;
• the extent to which economies of scale would be realized as the aggregate net assets on which the fund’s fee is based might grow and whether fee levels reflect these economies of scale for the benefit of fund shareholders;
• the costs of the services to be provided and the profits to be realized by the subadvisor from its relationship with JHF II; and
• comparative services rendered and comparative subadvisory fee rates.
With respect to its evaluation of subadvisory agreements with entities that are not affiliated with the Advisor, the Board believes that, in view of JHF II’s role as a “manager-of-managers” in accordance with the Order, the costs of the services to be provided and the profits to be realized by those subadvisors that are not affiliated with the Advisor from their relationship with JHF II, generally, are not a material factor in the Board’s consideration of these subadvisory agreements because such fees are paid to subadvisors by the Advisor and not by the funds and because the Board relies on the ability of the Advisor to negotiate such subadvisory fees at arm’s-length.
In evaluating subadvisory arrangements, the Board also considers other material business relationships that unaffiliated subadvisors and their affiliates have with the Advisor or its affiliates, including the involvement by certain affiliates of certain subadvisors in the distribution of financial products, including shares of JHF II, offered by the Advisor and other affiliates of the Advisor (“Material Relationships”).
In making its determination and with reference to the factors that it considered, the Board reviews:
• information relating to the subadvisor’s business, including current subadvisory services to JHF II
(and other funds in the John Hancock family of funds);
• the performance of the fund and the performance of other funds (including but not limited to other funds in the John Hancock family of funds) that are managed by the subadvisor;
• the subadvisory fee for the fund, including any breakpoints; and
• information relating to the nature and scope of Material Relationships and their significance to the Advisor and the subadvisor.
Particular considerations of the Board at the December 16-18, 2013 meeting in approving the new subadvisory agreement with DFA for the fund included the following:
• DFA has demonstrated skills as a manager, is currently the subadvisor to multiple funds of the Trust and John Hancock Variable Insurance Trust, and may be expected to provide a high quality of investment management services and personnel to the fund;
• DFA has demonstrated, as subadvisor to other John Hancock funds and portfolios, significant experience in trading international securities;
• the subadvisory fees for the fund are paid by the Advisor, not the fund, and approval of the new subadvisory agreement will not result in any change in the advisory fees for the fund;
• the subadvisory fee rates under the new subadvisory agreement with DFA are the same as the rates under the prior subadvisory agreement with Atlantis. In addition, the subadvisory fee rates with respect to the fund under the new subadvisory agreement are the product of arms-length negotiation between the Advisor and DFA and within industry norms, and the subadvisory fee is paid by the Advisor and not by the fund.
Based on the Board’s evaluation of all factors that the Board deemed to be material, including those factors described above, the Board, including the Independent Trustees, concluded that approval of the Subadvisory Agreement would be in the best interest of the fund and its shareholders. Accordingly, the Board, and the Independent Trustees voting separately, approved the Subadvisory Agreement.
Trustees and Officers
This chart provides information about the Trustees and Officers who oversee your John Hancock fund. Officers elected by the Trustees manage the day-to-day operations of the fund and execute policies formulated by the Trustees.
Independent Trustees
| | |
| Name, year of birth | Trustee | Number of John |
| Position(s) held with fund | of the | Hancock funds |
| Principal occupation(s) and other | Trust | overseen by |
| directorships during past 5 years | since1 | Trustee |
| |
| James M. Oates, Born: 1946 | 2005 | 230 |
|
| Managing Director, Wydown Group (financial consulting firm) (since 1994); Chairman and Director, |
| Emerson Investment Management, Inc. (since 2000); Independent Chairman, Hudson Castle Group, Inc. |
| (formerly IBEX Capital Markets, Inc.) (financial services company) (1997–2011); Director, Stifel Financial |
| (since 1996); Director, Investor Financial Services Corporation (1995–2007); Director, Connecticut River |
| Bancorp (since 1998); Director, Virtus Funds (formerly Phoenix Mutual Funds) (since 1988). | |
| | |
| Trustee and Chairperson of the Board, John Hancock retail funds3 (since 2012); Trustee (2005–2006 and |
| since 2012) and Chairperson of the Board (since 2012), John Hancock Funds III; Trustee (since 2004) and |
| Chairperson of the Board (since 2005), John Hancock Variable Insurance Trust; Trustee and Chairperson |
| of the Board, John Hancock Funds II (since 2005). | | |
|
| |
| Charles L. Bardelis,2 Born: 1941 | 2005 | 230 |
|
| Director, Island Commuter Corp. (marine transport). | | |
| | | |
| Trustee, John Hancock retail funds3 (since 2012); Trustee, John Hancock Funds III (2005–2006 and |
| since 2012); Trustee, John Hancock Variable Insurance Trust (since 1988); Trustee, John Hancock |
| Funds II (since 2005). | | |
|
| |
| Peter S. Burgess,2 Born: 1942 | 2005 | 230 |
|
| Consultant (financial, accounting, and auditing matters) (since 1999); Certified Public Accountant; |
| Partner, Arthur Andersen (independent public accounting firm) (prior to 1999); Director, Lincoln |
| Educational Services Corporation (since 2004); Director, Symetra Financial Corporation (since 2010); |
| Director, PMA Capital Corporation (2004–2010). | | |
| | | |
| Trustee, John Hancock retail funds3 (since 2012); Trustee, John Hancock Funds III (2005–2006 and |
| since 2012); Trustee, John Hancock Variable Insurance Trust and John Hancock Funds II (since 2005). |
|
| |
| William H. Cunningham, Born: 1944 | 2012 | 230 |
|
| Professor, University of Texas, Austin, Texas (since 1971); former Chancellor, University of Texas System |
| and former President of the University of Texas, Austin, Texas; Director, LIN Television (since 2009); |
| Chairman (since 2009) and Director (since 2006), Lincoln National Corporation (insurance); Director, |
| Resolute Energy Corporation (since 2009); Director, Southwest Airlines (since 2000); former Director, |
| Introgen (manufacturer of biopharmaceuticals) (until 2008); former Director, Hicks Acquisition Company I, |
| Inc. (until 2007); former Director, Texas Exchange Bank, SSB (formerly Bank of Crowley) (until 2009); |
| former Advisory Director, JP Morgan Chase Bank (formerly Texas Commerce Bank–Austin) (until 2009). |
| |
| Trustee, John Hancock retail funds3 (since 1986); Trustee, John Hancock Variable Insurance Trust |
| (since 2012); Trustee, John Hancock Funds II (2005–2006 and since 2012). | | |
| |
| China Emerging Leaders Fund | Annual report | 37 |
Independent Trustees (continued)
| | |
| Name, Year of Birth | Trustee | Number of John |
| Position(s) held with Fund | of the | Hancock funds |
| Principal occupation(s) and other | Trust | overseen by |
| directorships during past 5 years | since1 | Trustee |
| |
| Grace K. Fey, Born: 1946 | 2008 | 230 |
|
| Chief Executive Officer, Grace Fey Advisors (since 2007); Director and Executive Vice President, Frontier |
| Capital Management Company (1988–2007); Director, Fiduciary Trust (since 2009). | |
| | |
| Trustee, John Hancock retail funds3 (since 2012); Trustee, John Hancock Variable Insurance Trust and |
| John Hancock Funds II (since 2008). | | |
|
| |
| Theron S. Hoffman,2 Born: 1947 | 2008 | 230 |
|
| Chief Executive Officer, T. Hoffman Associates, LLC (consulting firm) (since 2003); Director, The Todd |
| Organization (consulting firm) (2003–2010); President, Westport Resources Management (investment |
| management consulting firm) (2006–2008); Senior Managing Director, Partner, and Operating Head, |
| Putnam Investments (2000–2003); Executive Vice President, The Thomson Corp. (financial and legal |
| information publishing) (1997–2000). | | |
| | | |
| Trustee, John Hancock retail funds3 (since 2012); Trustee, John Hancock Variable Insurance Trust and |
| John Hancock Funds II (since 2008). | | |
|
| |
| Deborah C. Jackson, Born: 1952 | 2012 | 230 |
|
| President, Cambridge College, Cambridge, Massachusetts (since 2011); Chief Executive Officer, |
| American Red Cross of Massachusetts Bay (2002–2011); Board of Directors of Eastern Bank Corporation |
| (since 2001); Board of Directors of Eastern Bank Charitable Foundation (since 2001); Board of Directors |
| of American Student Assistance Corporation (1996–2009); Board of Directors of Boston Stock Exchange |
| (2002–2008); Board of Directors of Harvard Pilgrim Healthcare (health benefits company) (2007–2011). |
| |
| Trustee, John Hancock retail funds3 (since 2008); Trustee of John Hancock Variable Insurance Trust and |
| John Hancock Funds II (since 2012). | | |
|
| |
| Hassell H. McClellan, Born: 1945 | 2005 | 230 |
|
| Trustee, Virtus Variable Insurance Trust (formerly Phoenix Edge Series Funds) (since 2008); Director, The |
| Barnes Group (since 2010); Associate Professor, The Wallace E. Carroll School of Management, Boston |
| College (retired 2013). | | |
| | | |
| Trustee, John Hancock retail funds3 (since 2012); Trustee, John Hancock Funds III (2005–2006 and |
| since 2012); Trustee, John Hancock Variable Insurance Trust and John Hancock Funds II (since 2005). |
|
| |
| Steven R. Pruchansky, Born: 1944 | 2012 | 230 |
|
| Chairman and Chief Executive Officer, Greenscapes of Southwest Florida, Inc. (since 2000); Director |
| and President, Greenscapes of Southwest Florida, Inc. (until 2000); Member, Board of Advisors, First |
| American Bank (until 2010); Managing Director, Jon James, LLC (real estate) (since 2000); Director, |
| First Signature Bank & Trust Company (until 1991); Director, Mast Realty Trust (until 1994); President, |
| Maxwell Building Corp. (until 1991). | | |
| | | |
| Trustee (since 1992) and Chairperson of the Board (2011–2012), John Hancock retail funds3; Trustee and |
| Vice Chairperson of the Board, John Hancock retail funds,3 John Hancock Variable Insurance Trust, and |
| John Hancock Funds II (since 2012). | | |
| |
| 38 | Annual report | China Emerging Leaders Fund |
Independent Trustees (continued)
| | |
| Name, Year of Birth | Trustee | Number of John |
| Position(s) held with Fund | of the | Hancock funds |
| Principal occupation(s) and other | Trust | overseen by |
| directorships during past 5 years | since1 | Trustee |
| |
| Gregory A. Russo, Born: 1949 | 2012 | 230 |
|
| Director and Audit Committee Chairman (since 2012), and Member, Audit Committee and Finance |
| Committee (since 2011), NCH Healthcare System, Inc. (holding company for multi-entity healthcare |
| system); Director and Member of Finance Committee, The Moorings, Inc. (nonprofit continuing care |
| community) (since 2012); Vice Chairman, Risk & Regulatory Matters, KPMG LLP (KPMG) (2002–2006); |
| Vice Chairman, Industrial Markets, KPMG (1998–2002); Chairman and Treasurer, Westchester County, |
| New York, Chamber of Commerce (1986–1992); Director, Treasurer, and Chairman of Audit and |
| Finance Committees, Putnam Hospital Center (1989–1995); Director and Chairman of Fundraising |
| Campaign, United Way of Westchester and Putnam Counties, New York (1990–1995). | |
| | |
| Trustee, John Hancock retail funds3 (since 2008); Trustee, John Hancock Variable Insurance Trust and |
| John Hancock Funds II (since 2012). | | |
| |
| |
| Non-Independent Trustees4 | | |
| | | |
| Name, year of birth | Trustee | Number of John |
| Position(s) held with fund | of the | Hancock funds |
| Principal occupation(s) and other | Trust | overseen by |
| directorships during past 5 years | since1 | Trustee |
| |
| Craig Bromley, Born: 1966 | 2012 | 230 |
|
| President, John Hancock Financial Services (since 2012); Senior Executive Vice President and General |
| Manager, U.S. Division, Manulife Financial Corporation (since 2012); President and Chief Executive |
| Officer, Manulife Insurance Company (Manulife Japan) (2005–2012, including prior positions). |
| |
| Trustee, John Hancock retail funds,3 John Hancock Variable Insurance Trust, and John Hancock |
| Funds II (since 2012). | | |
| |
| |
| Warren A. Thomson, Born: 1955 | 2012 | 230 |
|
| Senior Executive Vice President and Chief Investment Officer, Manulife Financial Corporation and The |
| Manufacturers Life Insurance Company (since 2009); Chairman and Chief Executive Officer, Manulife |
| Asset Management (since 2001, including prior positions); Director (since 2006), and President and |
| Chief Executive Officer (since 2013), Manulife Asset Management Limited; Director and Chairman, |
| Hancock Natural Resources Group, Inc. (since 2013). | | |
| | | |
| Trustee, John Hancock retail funds,3 John Hancock Variable Insurance Trust, and John Hancock |
| Funds II (since 2012). | | |
Principal officers who are not Trustees
| |
| Name, year of birth | Officer |
| Position(s) held with fund | of the |
| Principal occupation(s) and other | Trust |
| directorships during past 5 years | since |
| |
| Andrew G. Arnott, Born: 1971 | 2009 |
|
| President | |
| Senior Vice President, John Hancock Financial Services (since 2009); Director and Executive Vice | |
| President, John Hancock Advisers, LLC (since 2005, including prior positions); Director and Executive |
| Vice President, John Hancock Investment Management Services, LLC (since 2006, including prior | |
| positions); President, John Hancock Funds, LLC (since 2004, including prior positions); President | |
| (effective 3-13-14) and Executive Vice President, John Hancock retail funds,3 John Hancock Variable |
| Insurance Trust, and John Hancock Funds II (since 2007, including prior positions). | |
| |
| China Emerging Leaders Fund | Annual report | 39 |
Principal officers who are not Trustees (continued)
| |
| Name, Year of Birth | Officer |
| Position(s) held with Fund | of the |
| Principal occupation(s) and other | Trust |
| directorships during past 5 years | since |
| |
| John J. Danello, Born: 1955 | 2006 |
|
| Senior Vice President, Secretary, and Chief Legal Officer | |
| Vice President and Chief Counsel, John Hancock Wealth Management (since 2005); Senior Vice | |
| President (since 2007) and Chief Legal Counsel (2007–2010), John Hancock Funds, LLC and The | |
| Berkeley Financial Group, LLC; Senior Vice President (since 2006, including prior positions) and Chief |
| Legal Officer and Secretary (since 2014), John Hancock retail funds3 and John Hancock Variable | |
| Insurance Trust; Vice President, John Hancock Life & Health Insurance Company (since 2009); | |
| Vice President, John Hancock Life Insurance Company (USA) and John Hancock Life Insurance | |
| Company of New York (since 2010); and Senior Vice President, Secretary, and Chief Legal Counsel | |
| (2007–2014, including prior positions) of John Hancock Advisers, LLC and John Hancock Investment |
| Management Services, LLC. | |
|
| |
| Francis V. Knox, Jr., Born: 1947 | 2005 |
|
| Chief Compliance Officer | |
| Vice President, John Hancock Financial Services (since 2005); Chief Compliance Officer, John Hancock |
| retail funds,3 John Hancock Variable Insurance Trust, John Hancock Funds II, John Hancock Advisers, |
| LLC, and John Hancock Investment Management Services, LLC (since 2005). | |
|
| |
| Charles A. Rizzo, Born: 1957 | 2007 |
|
| Chief Financial Officer | |
| Vice President, John Hancock Financial Services (since 2008); Senior Vice President, John Hancock | |
| Advisers, LLC and John Hancock Investment Management Services, LLC (since 2008); Chief Financial |
| Officer, John Hancock retail funds,3 John Hancock Variable Insurance Trust and John Hancock | |
| Funds II (since 2007). | |
|
| |
| Salvatore Schiavone, Born: 1965 | 2009 |
|
| Treasurer | |
| Assistant Vice President, John Hancock Financial Services (since 2007); Vice President, John Hancock |
| Advisers, LLC and John Hancock Investment Management Services, LLC (since 2007); Treasurer, | |
| John Hancock retail funds3 (since 2007, including prior positions); Treasurer, John Hancock Variable |
| Insurance Trust and John Hancock Funds II (since 2010 and 2007–2009, including prior positions). | |
The business address for all Trustees and Officers is 601 Congress Street, Boston, Massachusetts 02210-2805.
1 Each Trustee holds office until his or her successor is elected and qualified, or until the Trustee’s death, retirement, resignation, or removal.
2 Member of the Audit Committee.
3 “John Hancock retail funds” comprises John Hancock Funds III and 37 other John Hancock funds consisting of 27 series of other John Hancock trusts and 10 closed-end funds.
4 Because Messrs. Bromley and Thomson are senior executives or directors of the advisor and/or its affiliates, each of them is considered an “interested person of the fund,” as defined in the Investment Company Act of 1940.
| | |
| | 40 | Annual report | China Emerging Leaders Fund |
More information
| |
| Trustees | Investment advisor |
| James M. Oates, Chairperson | John Hancock Advisers, LLC |
| Steven R. Pruchansky, Vice Chairperson | |
| Charles L. Bardelis* | Subadvisor |
| James R. Boyle† | Dimensional Fund Advisers LP |
| Craig Bromley† | |
| Peter S. Burgess* | Principal distributor |
| William H. Cunningham | John Hancock Funds, LLC |
| Grace K. Fey | |
| Theron S. Hoffman* | Custodian |
| Deborah C. Jackson | State Street Bank and Trust Company |
| Hassell H. McClellan | |
| Gregory A. Russo | Transfer agent |
| Warren A. Thomson† | John Hancock Signature Services, Inc. |
| | |
| | Legal counsel |
| Officers | K&L Gates LLP |
| Andrew G. Arnott | |
| President | Independent registered |
| | public accounting firm |
| John J. Danello | PricewaterhouseCoopers LLP |
| Senior Vice President, Secretary, and Chief Legal Officer | |
| | |
| Francis V. Knox, Jr. | |
| Chief Compliance Officer | |
| | |
| Charles A. Rizzo | |
| Chief Financial Officer | |
| | |
| Salvatore Schiavone | |
| Treasurer | |
| |
| |
| |
| *Member of the Audit Committee | |
| †Non-Independent Trustee | |
The fund’s proxy voting policies and procedures, as well as the fund’s proxy voting record, if any, for the most recent twelve-month period ended June 30, are available free of charge on the Securities and Exchange Commission (SEC) Web site at www.sec.gov or on our Web site.
The fund’s complete list of portfolio holdings, for the first and third fiscal quarters, is filed with the SEC on Form N-Q. The fund’s Form N-Q is available on our Web site and the SEC’s Web site, www.sec.gov, and can be reviewed and copied (for a fee) at the SEC’s Public Reference Room in Washington, DC. Call 800-SEC-0330 to receive information on the operation of the SEC's Public Reference Room.
We make this information on your fund, as well as monthly portfolio holdings, and other fund details available on our Web site at jhinvestments.com or by calling 800-225-5291.
| | |
| You can also contact us: | | |
| 800-225-5291 | Regular mail: | Express mail: |
| jhinvestments.com | John Hancock Signature Services, Inc. | John Hancock Signature Services, Inc. |
| | P.O. Box 55913 | Mutual Fund Investment Operations |
| | Boston, MA 02205-5913 | 30 Dan Road |
| | | Canton, MA 02021 |
A look at performance
Total returns for the period ended July 31, 2014
| | | | | | | | | | |
| | | Average annual total returns (%) | | Cumulative total returns (%) | |
| | | with maximum sales charge | | | with maximum sales charge | |
|
| | | | | Since | | | | | Since |
| | | 1-year | 5-year | 10-year | inception1 | | 1-year | 5-year | 10-year | inception1 |
|
| Class A | | –0.31 | — | — | 3.35 | | –0.31 | — | — | 9.04 |
|
| Class C2 | | 3.24 | — | — | 4.67 | | 3.24 | — | — | 12.74 |
|
| Class I3 | | 5.37 | — | — | 5.81 | | 5.37 | — | — | 15.99 |
|
| Class R22,3 | | 4.67 | — | — | 5.17 | | 4.67 | — | — | 14.14 |
|
| Class R62,3 | | 5.44 | — | — | 5.81 | | 5.44 | — | — | 15.96 |
|
| Class NAV3 | | 5.50 | — | — | 5.88 | | 5.50 | — | — | 16.17 |
|
| Index 1† | | 0.08 | — | — | 0.10 | | 0.08 | — | — | 0.27 |
|
| Index 2† | | 16.58 | — | — | 19.84 | | 16.58 | — | — | 60.65 |
|
Performance figures assume all distributions have been reinvested. Figures reflect maximum sales charges on Class A shares of 5.00% and the applicable contingent deferred sales charge (CDSC) on Class C shares. Class C shares sold within one year of purchase are subject to a 1% CDSC. Sales charges are not applicable to Class I, Class R2, Class R6, and Class NAV shares.
The expense ratios of the fund, both net (including any fee waivers and/or expense limitations) and gross (excluding any fee waivers and/or expense limitations), are set forth according to the most recent publicly available prospectuses for the fund and may differ from those disclosed in the Financial highlights tables in this report. Had the fee waivers and expense limitations not been in place, gross expenses would apply. The expense ratios are as follows:
| | | | | | | | | | | | |
| | Class A | Class C | Class I | Class R2 | Class R6 | Class NAV | | | | | | |
| Gross (%) | 1.78 | 2.51 | 1.46 | 9.14 | 1.52 | 1.29 | | | | | | |
| Net (%) | 1.78 | 2.51 | 1.46 | 2.00 | 1.31 | 1.29 | | | | | | |
Please refer to the most recent prospectus and annual report for more information on expenses and any expense limitation arrangements for each class.
The returns reflect past results and should not be considered indicative of future performance. The return and principal value of an investment will fluctuate so that shares, when redeemed, may be worth more or less than their original cost. Due to market volatility, the fund’s current performance may be higher or lower than the performance shown. For current to the most recent month-end performance data, please call 800–225–5291 or visit the fund’s website at jhinvestments.com.
The performance table above and the chart on the next page do not reflect the deduction of taxes that a shareholder may pay on fund distributions or on the redemption of fund shares. The fund’s performance results reflect any applicable fee waivers or expense reductions, without which the expenses would increase and results would have been less favorable.
† Index 1 is the Bank of America Merrill Lynch U.S. Dollar 1-Month LIBID Average Index; Index 2 is the MSCI World Index.
See the following page for footnotes.
| |
| 6 | Global Absolute Return Strategies Fund | Annual report |
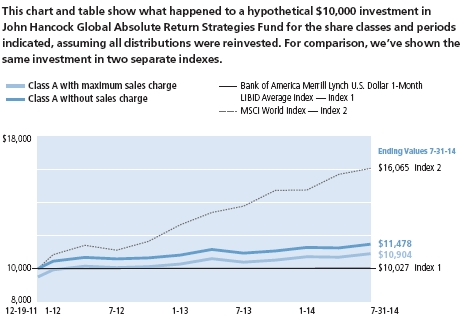
| | | | | |
| | | With maximum | Without | | |
| | Start date | sales charge | sales charge | Index 1 | Index 2 |
|
| Class C4 | 12-19-11 | $11,274 | $11,274 | $10,027 | $16,065 |
|
| Class I3 | 12-19-11 | 11,599 | 11,599 | 10,027 | 16,065 |
|
| Class R23 | 12-19-11 | 11,414 | 11,414 | 10,027 | 16,065 |
|
| Class R63 | 12-19-11 | 11,596 | 11,596 | 10,027 | 16,065 |
|
| Class NAV3 | 12-19-11 | 11,617 | 11,617 | 10,027 | 16,065 |
|
Bank of America Merrill Lynch U.S. Dollar 1-Month LIBID Average Index — Index 1 — tracks the performance of a synthetic asset paying LIBID (London Interbank Bid Rate) to a stated maturity.
MSCI World Index (gross of foreign withholding taxes on dividends) — Index 2 — is a free float-adjusted market-capitalization weighted index that is designed to measure equity market performance of developed markets.
It is not possible to invest directly in an index. Index figures do not reflect expenses or sales charges, which would have resulted in lower values.
Footnotes related to performance pages
1 From 12-19-11.
2 Class R2 and Class R6 shares were first offered on 3-1-12; Class C shares were first offered on 8-1-12. The returns prior to these dates are those of Class A shares that have been recalculated to apply the gross fees and expenses of Class R2, Class R6, and Class C shares.
3 For certain types of investors as described in the fund’s prospectuses.
4 The contingent deferred sales charge is not applicable.
| |
| Annual report | Global Absolute Return Strategies Fund | 7 |
Management’s discussion of
Fund performance
Standard Life Investments (Corporate Funds) Limited
Global stock markets moved higher during the fund’s fiscal year, with many developed- and emerging-market equities registering double-digit percentage gains. Continued support from global central banks and encouraging economic data helped sustain investor confidence. Low volatility persisted throughout much of the period, as investors seemed to shrug off geopolitical risk in the Middle East and Ukraine. Government bonds delivered positive returns, and global credit performed well, too.
For the 12 months ended July 31, 2014, John Hancock Global Absolute Return Strategies Fund’s Class A shares returned 4.94%, excluding sales charges. The fund outpaced its reference benchmark, the Bank of America Merrill Lynch U.S. Dollar 1-Month LIBID Average Index, which returned 0.08%.
While not limited to traditional broad-market returns as a potential source of performance, our decision to make meaningful allocations to these broad-market strategies proved beneficial during the fiscal year. The fund’s global equity, high-yield credit, European corporate bonds, and global real estate strategies were all contributors.
In a strong period for stocks, the fund’s global equity strategy boosted results. This fiscal year was also profitable for the fund’s high-yield credit strategy, which was supported by the market’s positive outlook for corporate earnings and low default rates.
The market experienced low levels of volatility during the period. The fund’s long equity variance strategy, which is designed to profit when stock prices move sharply, detracted from fund’s results during the period. Still, with an array of global macro uncertainties, we see value in this strategy, which acts as good diversifier alongside the other exposures in the fund.
This commentary reflects the views of the portfolio manager through the end of the period discussed in this report. As such, they are in no way guarantees of future events and are not intended to be used as investment advice or a recommendation regarding any specific security. They are also subject to change at any time as market and other conditions warrant.
Past performance does not guarantee future results.
| |
| 8 | Global Absolute Return Strategies Fund | Annual report |
Your expenses
These examples are intended to help you understand your ongoing operating expenses of investing in the fund so you can compare these costs with the ongoing costs of investing in other mutual funds.
Understanding fund expenses
As a shareholder of the fund, you incur two types of costs:
▪ Transaction costs, which include sales charges (loads) on purchases or redemptions (varies by share class), minimum account fee charge, etc.
▪ Ongoing operating expenses, including management fees, distribution and service fees (if applicable), and other fund expenses.
We are going to present only your ongoing operating expenses here.
Actual expenses/actual returns
This example is intended to provide information about the fund’s actual ongoing operating expenses and is based on the fund’s actual return. It assumes an account value of $1,000.00 on February 1, 2014, with the same investment held until July 31, 2014.
| | | | |
| | | | Expenses paid | |
| | Account value | Ending value | during period | Annualized |
| | on 2-1-2014 | on 7-31-2014 | ended 7-31-20141 | expense ratio |
|
| Class A | $1,000.00 | $1,017.20 | $8.50 | 1.70% |
|
| Class C | 1,000.00 | 1,013.60 | 12.03 | 2.41% |
|
| Class I | 1,000.00 | 1,019.00 | 6.96 | 1.39% |
|
| Class R2 | 1,000.00 | 1,015.40 | 9.99 | 2.00% |
|
| Class R6 | 1,000.00 | 1,019.90 | 6.31 | 1.26% |
|
| Class NAV | 1,000.00 | 1,019.90 | 6.26 | 1.25% |
|
Together with the value of your account, you may use this information to estimate the operating expenses that you paid over the period. Simply divide your account value at July 31, 2014, by $1,000.00, then multiply it by the “expenses paid” for your share class from the table above. For example, for an account value of $8,600.00, the operating expenses should be calculated as follows:
| |
| Annual report | Global Absolute Return Strategies Fund | 9 |
Your expenses
Hypothetical example for comparison purposes
This table allows you to compare the fund’s ongoing operating expenses with those of any other fund. It provides an example of the fund’s hypothetical account values and hypothetical expenses based on each class’s actual expense ratio and an assumed 5% annualized return before expenses (which is not the fund’s actual return). It assumes an account value of $1,000.00 on February 1, 2014, with the same investment held until July 31, 2014. Look in any other fund shareholder report to find its hypothetical example and you will be able to compare these expenses. Please remember that these hypothetical account values and expenses may not be used to estimate the actual ending account balance or expenses you paid for the period.
| | | | |
| | | | Expenses paid | |
| | Account value | Ending value | during period | Annualized |
| | on 2-1-2014 | on 7-31-2014 | ended 7-31-20141 | expense ratio |
|
| Class A | $1,000.00 | $1,016.40 | $8.50 | 1.70% |
|
| Class C | 1,000.00 | 1,012.80 | 12.03 | 2.41% |
|
| Class I | 1,000.00 | 1,017.90 | 6.95 | 1.39% |
|
| Class R2 | 1,000.00 | 1,014.90 | 9.99 | 2.00% |
|
| Class R6 | 1,000.00 | 1,018.50 | 6.31 | 1.26% |
|
| Class NAV | 1,000.00 | 1,018.60 | 6.26 | 1.25% |
|
Remember, these examples do not include any transaction costs, therefore, these examples will not help you to determine the relative total costs of owning different funds. If transaction costs were included, your expenses would have been higher. See the prospectus for details regarding transaction costs.
1 Expenses are equal to the fund’s annualized expense ratio, multiplied by the average account value over the period, multiplied by 181/365 (to reflect the one-half year period).
| |
| 10 | Global Absolute Return Strategies Fund | Annual report |
Portfolio summary
| | | | |
| Corporate Bonds | 10.1% | | Foreign Government Obligations | 7.5% |
| |
|
| United States | 3.6% | | Mexico | 4.4% |
| |
|
| France | 1.2% | | Brazil | 3.0% |
| |
|
| United Kingdom | 1.2% | | Spain | 0.1% |
| |
|
| Netherlands | 0.9% | | | |
| | | |
| Luxembourg | 0.5% | | Purchased Options | 2.0% |
| |
|
| Italy | 0.4% | | United States | 0.9% |
| |
|
| Ireland | 0.3% | | Germany | 0.7% |
| |
|
| Germany | 0.3% | | United Kingdom | 0.3% |
| |
|
| Spain | 0.3% | | South Korea | 0.1% |
| |
|
| Canada | 0.2% | | | |
| | |
| Other Countries | 1.2% | | Short-Term Investments & Other | 45.2% |
| |
|
| | | | Certificate of Deposit | 20.8% |
| | | |
|
| Common Stocks | 35.2% | | Commercial Paper | 10.5% |
| |
|
| United States | 11.2% | | Time Deposits | 7.1% |
| |
|
| United Kingdom | 3.7% | | U.S. Government | 3.6% |
| |
|
| Japan | 2.3% | | Repurchase Agreement | 0.1% |
| |
|
| France | 2.1% | | Other | 3.1% |
| |
|
| Switzerland | 2.1% | | | |
| | |
| China | 1.8% | | | |
| | |
| Sweden | 1.3% | | | |
| | |
| Spain | 1.2% | | | |
| | |
| Denmark | 1.0% | | | |
| | |
| Finland | 0.9% | | | |
| | |
| Other Countries | 7.6% | | | |
| | |
As a percentage of net assets on 7-31-14.
Absolute return funds are not designed to outperform stocks and bonds in strong markets. There is no guarantee of a positive return, of the fund achieving its objective, or that volatility-reducing strategies will be successful. Events in the financial markets have resulted, and may continue to result, in an unusually high degree of volatility in the financial markets, both domestic and foreign. In addition, reduced liquidity in credit and fixed-income markets may adversely affect issuers worldwide. The use of hedging and derivatives could produce disproportionate gains or losses and may increase costs. Illiquid securities may be difficult to sell at a price approximating their value. Currency transactions are affected by fluctuations in exchange rates. Foreign investing, especially in emerging markets, has additional risks, such as currency and market volatility and political and social instability. Investments in higher-yielding, lower-rated securities include a higher risk of default. The stock prices of midsize and small companies can change more frequently and dramatically than those of large companies. Please see the fund’s prospectuses for additional risks.
| |
| Annual report | Global Absolute Return Strategies Fund | 11 |
Fund’s investments
As of 7-31-14
| | | | | |
| | Rate | | Maturity | | |
| | (%) | | date | Par value^ | Value |
| |
| Corporate Bonds 10.1% | | | | $573,101,872 |
|
| (Cost $545,928,743) | | | | | |
| | | | | | |
| Australia 0.2% | | | | | 9,433,468 |
|
| CNOOC Curtis Funding No. 1 Pty, Ltd. | 2.750 | | 10-03-20 | EUR 390,000 | 554,302 |
|
| Emeco Pty, Ltd. (S) | 9.875 | | 03-15-19 | 1,410,000 | 1,402,950 |
|
| FMG Resources August 2006 Pty, Ltd. (S) | 8.250 | | 11-01-19 | 1,600,000 | 1,720,000 |
|
| Origin Energy Finance, Ltd. | 3.500 | | 10-04-21 | EUR 300,000 | 441,783 |
|
| Santos Finance, Ltd. (8.250% to 9-22-17, | | | | | |
| then 3 month EURIBOR + 6.851%) | 8.250 | | 09-22-70 | EUR 1,510,000 | 2,294,931 |
|
| Telstra Corp., Ltd. | 2.500 | | 09-15-23 | EUR 920,000 | 1,307,332 |
|
| Westfield Retail Trust 1 | 3.250 | | 09-11-23 | EUR 1,160,000 | 1,712,170 |
| | | | | | |
| Austria 0.1% | | | | | 5,421,748 |
|
| JBS Investments GmbH (S) | 7.250 | | 04-03-24 | 1,050,000 | 1,084,125 |
|
| JBS Investments GmbH (S) | 7.750 | | 10-28-20 | 600,000 | 643,500 |
|
| Raiffeisen Bank International AG | 6.000 | | 10-16-23 | EUR 700,000 | 973,610 |
|
| Raiffeisen Bank International AG (4.500% | | | | | |
| to 2-21-20, then 5 Year Euro Swap | | | | | |
| Rate + 3.300%) | 4.500 | | 02-21-25 | EUR 900,000 | 1,187,526 |
|
| UniCredit Bank Austria AG | 2.625 | | 01-30-18 | EUR 1,100,000 | 1,532,987 |
| | | | | | |
| Belgium 0.1% | | | | | 4,703,839 |
|
| Anheuser-Busch InBev NV | 4.000 | | 06-02-21 | EUR 330,000 | 520,211 |
|
| Belfius Bank SA | 1.125 | | 05-22-17 | EUR 100,000 | 135,083 |
|
| Belfius Bank SA/NV | 2.250 | | 09-26-18 | EUR 1,900,000 | 2,653,087 |
|
| KBC Groep NV (5.625% to 3-19-19, then | | | | | |
| 5 Year Euro Swap Rate + 4.759%) (Q) | 5.625 | | 03-19-19 | EUR 1,050,000 | 1,395,458 |
| | | | | | |
| Brazil 0.0% | | | | | 1,787,821 |
|
| Telemar Norte Leste SA | 5.125 | | 12-15-17 | EUR 375,000 | 528,552 |
|
| Vale SA | 3.750 | | 01-10-23 | EUR 380,000 | 548,274 |
|
| Vale SA | 4.375 | | 03-24-18 | EUR 480,000 | 710,995 |
| | | | | | |
| Canada 0.2% | | | | | 10,510,986 |
|
| Air Canada 2013-1 Class B Pass Through | | | | | |
| Trust (S) | 5.375 | | 05-15-21 | 696,189 | 715,334 |
|
| Bombardier, Inc. (S) | 7.750 | | 03-15-20 | 500,000 | 540,000 |
|
| Cascades, Inc. (S) | 5.500 | | 07-15-22 | 1,170,000 | 1,155,375 |
|
| Cascades, Inc. | 7.875 | | 01-15-20 | 512,000 | 542,080 |
|
| CHC Helicopter SA | 9.250 | | 10-15-20 | 900,000 | 965,430 |
|
| CHC Helicopter SA | 9.375 | | 06-01-21 | 1,310,000 | 1,375,500 |
|
| First Quantum Minerals, Ltd. (S) | 6.750 | | 02-15-20 | 618,000 | 630,360 |
| | |
| 12 | Global Absolute Return Strategies Fund | Annual report | See notes to financial statements |
| | | | | |
| | Rate | | Maturity | | |
| | (%) | | date | Par value^ | Value |
| | | | | | |
| Canada (continued) | | | | | |
|
| First Quantum Minerals, Ltd. (S) | 7.000 | | 02-15-21 | 618,000 | $636,540 |
|
| First Quantum Minerals, Ltd. (S) | 7.250 | | 05-15-22 | 800,000 | 816,000 |
|
| Garda World Security Corp. (S) | 7.250 | | 11-15-21 | 870,000 | 885,225 |
|
| Great-West Lifeco, Inc. | 2.500 | | 04-18-23 | EUR 1,620,000 | 2,249,142 |
| | | | | | |
| Cayman Islands 0.1% | | | | | 6,019,800 |
|
| Hutchison Whampoa Europe Finance 13, Ltd. | | | | | |
| (3.750% to 5-10-18, then 5 Year Euro Swap | | | | | |
| Rate + 2.941%) (Q) | 3.750 | | 05-10-18 | EUR 380,000 | 517,489 |
|
| Hutchison Whampoa Finance 09, Ltd. | 4.750 | | 11-14-16 | EUR 1,350,000 | 1,969,328 |
|
| IPIC GMTN, Ltd. | 5.875 | | 03-14-21 | EUR 1,930,000 | 3,243,380 |
|
| UPCB Finance, Ltd. | 7.625 | | 01-15-20 | EUR 205,000 | 289,603 |
| | | | | | |
| Czech Republic 0.1% | | | | | 2,355,471 |
|
| CEZ A/S | 4.500 | | 06-29-20 | EUR 860,000 | 1,361,379 |
|
| CEZ A/S | 4.875 | | 04-16-25 | EUR 100,000 | 166,204 |
|
| CEZ A/S | 5.000 | | 10-19-21 | EUR 500,000 | 827,888 |
| | | | | | |
| Denmark 0.2% | | | | | 8,471,813 |
|
| Danske Bank A/S | 3.875 | | 02-28-17 | EUR 1,282,000 | 1,858,555 |
|
| Danske Bank A/S (3.875% to 10-4-18, then | | | | | |
| 5 Year Euro Swap Rate + 2.625%) | 3.875 | | 10-04-23 | EUR 600,000 | 859,897 |
|
| Danske Bank A/S (4.100% to 3-16-15, then | | | | | |
| 3 month EURIBOR + 1.810%) | 4.100 | | 03-16-18 | EUR 1,220,000 | 1,654,715 |
|
| DONG Energy A/S | 4.875 | | 12-16-21 | EUR 660,000 | 1,083,017 |
|
| DONG Energy A/S (4.875% to 7-8-18, then | | | | | |
| 5 Year Euro Swap Rate + 3.800%) | 4.875 | | 07-08-18 | EUR 1,150,000 | 1,644,631 |
|
| DONG Energy A/S (6.250% to 6-26-23, then | | | | | |
| 5 Year Euro Swap Rate + 4.750%) | 6.250 | | 06-26-23 | EUR 236,000 | 364,461 |
|
| DONG Energy A/S | 6.500 | | 05-07-19 | EUR 600,000 | 1,006,537 |
| | | | | | |
| Finland 0.0% | | | | | 894,193 |
|
| Teollisuuden Voima OYJ | 2.500 | | 03-17-21 | EUR 400,000 | 558,081 |
|
| Teollisuuden Voima OYJ | 4.625 | | 02-04-19 | EUR 220,000 | 336,112 |
| | | | | | |
| France 1.2% | | | | | 66,682,960 |
|
| Alstom SA | 4.500 | | 03-18-20 | EUR 400,000 | 620,462 |
|
| Areva SA | 3.250 | | 09-04-20 | EUR 1,000,000 | 1,432,703 |
|
| Autoroutes du Sud de la France SA | 2.950 | | 01-17-24 | EUR 200,000 | 289,070 |
|
| Autoroutes du Sud de la France SA | 7.375 | | 03-20-19 | EUR 550,000 | 944,599 |
|
| Banque Federative du Credit Mutuel SA | 3.000 | | 11-28-23 | EUR 400,000 | 582,032 |
|
| BNP Paribas SA | 2.500 | | 08-23-19 | EUR 500,000 | 714,154 |
|
| BNP Paribas SA | 2.875 | | 11-27-17 | EUR 1,600,000 | 2,288,717 |
|
| BNP Paribas SA (2.875% to 3-20-21, then | | | | | |
| 5 Year Euro Swap Rate + 1.650%) | 2.875 | | 03-20-26 | EUR 700,000 | 961,935 |
|
| BNP Paribas SA (4.730% to 4-12-16, then | | | | | |
| 3 month EURIBOR + 1.690%) (Q) | 4.730 | | 04-12-16 | EUR 300,000 | 414,269 |
|
| BPCE SA | 1.375 | | 05-22-19 | EUR 600,000 | 811,074 |
|
| BPCE SA | 2.000 | | 04-24-18 | EUR 800,000 | 1,113,732 |
|
| BPCE SA | 4.500 | | 02-10-22 | EUR 900,000 | 1,446,577 |
|
| BPCE SA | 5.150 | | 07-21-24 | 1,100,000 | 1,152,073 |
|
| Casino Guichard Perrachon SA | 3.157 | | 08-06-19 | EUR 600,000 | 875,831 |
|
| Casino Guichard Perrachon SA | 3.311 | | 01-25-23 | EUR 200,000 | 291,862 |
| | |
| See notes to financial statements | Annual report | Global Absolute Return Strategies Fund | 13 |
| | | | | |
| | Rate | | Maturity | | |
| | (%) | | date | Par value^ | Value |
| | | | | | |
| France (continued) | | | | | |
|
| Casino Guichard Perrachon SA | 4.472 | | 04-04-16 | EUR 600,000 | $854,813 |
|
| Casino Guichard Perrachon SA | 4.726 | | 05-26-21 | EUR 300,000 | 477,970 |
|
| Christian Dior SA | 3.750 | | 09-23-14 | EUR 450,000 | 605,031 |
|
| Christian Dior SA | 4.000 | | 05-12-16 | EUR 700,000 | 988,973 |
|
| Cie Financiere et Industrielle des Autoroutes SA | 5.000 | | 05-24-21 | EUR 300,000 | 492,547 |
|
| CNP Assurances (6.875% to 9-30-21, then | | | | | |
| 12 month EURIBOR + 4.400%) | 6.875 | | 09-30-41 | EUR 400,000 | 644,083 |
|
| Credit Agricole SA (6.500% to 6-23-21, then | | | | | |
| 5 Year U.S. Swap Rate + 5.120%) (Q) | 6.500 | | 06-23-21 | EUR 600,000 | 838,580 |
|
| Credit Agricole SA (6.637% to 5-31-17, then | | | | | |
| 3 month EURIBOR + 1.232%) (Q) | 6.637 | | 05-31-17 | 400,000 | 424,200 |
|
| Credit Logement SA (P)(Q) | 1.392 | | 09-16-14 | EUR 1,350,000 | 1,586,272 |
|
| Electricite de France SA | 3.875 | | 01-18-22 | EUR 500,000 | 779,323 |
|
| Electricite de France SA (4.125% to 1-22-22, | | | | | |
| then 8 Year Euro Swap Rate + 2.441%) (Q) | 4.125 | | 01-22-22 | EUR 700,000 | 979,515 |
|
| Electricite de France SA | 4.625 | | 09-11-24 | EUR 450,000 | 744,406 |
|
| Electricite de France SA | 4.625 | | 04-26-30 | EUR 900,000 | 1,518,579 |
|
| Eutelsat SA | 2.625 | | 01-13-20 | EUR 1,900,000 | 2,689,067 |
|
| Eutelsat SA | 5.000 | | 01-14-19 | EUR 100,000 | 155,377 |
|
| GDF Suez | 1.375 | | 05-19-20 | EUR 400,000 | 543,612 |
|
| GDF Suez | 3.500 | | 10-18-22 | EUR 1,924,000 | 2,954,559 |
|
| GDF Suez (3.875% to 6-2-24, then 10 Year | | | | | |
| Euro Swap Rate + 2.650%) (Q) | 3.875 | | 06-02-24 | EUR 400,000 | 544,993 |
|
| Ingenico | 2.500 | | 05-20-21 | EUR 1,000,000 | 1,359,251 |
|
| Kering | 2.500 | | 07-15-20 | EUR 300,000 | 426,382 |
|
| Lafarge SA | 4.750 | | 09-30-20 | EUR 710,000 | 1,093,667 |
|
| Lafarge SA | 6.625 | | 11-29-18 | EUR 1,350,000 | 2,136,270 |
|
| Lagardere SCA | 4.125 | | 10-31-17 | EUR 800,000 | 1,151,099 |
|
| Legrand SA | 4.375 | | 03-21-18 | EUR 500,000 | 751,602 |
|
| Mercialys SA | 4.125 | | 03-26-19 | EUR 300,000 | 451,669 |
|
| Numericable Group SA (S) | 4.875 | | 05-15-19 | 200,000 | 201,000 |
|
| Numericable Group SA | 5.375 | | 05-15-22 | EUR 400,000 | 555,792 |
|
| Numericable Group SA | 5.625 | | 05-15-24 | EUR 250,000 | 349,887 |
|
| Numericable Group SA (S) | 6.000 | | 05-15-22 | 850,000 | 850,000 |
|
| Numericable Group SA (S) | 6.250 | | 05-15-24 | 1,175,000 | 1,180,875 |
|
| Orange SA | 3.875 | | 04-09-20 | EUR 620,000 | 944,104 |
|
| Orange SA | 3.875 | | 01-14-21 | EUR 1,200,000 | 1,842,908 |
|
| Orange SA | 8.125 | | 01-28-33 | EUR 340,000 | 746,768 |
|
| Pernod Ricard SA | 2.000 | | 06-22-20 | EUR 200,000 | 275,769 |
|
| Pernod Ricard SA | 5.000 | | 03-15-17 | EUR 900,000 | 1,336,224 |
|
| RCI Banque SA | 1.750 | | 07-06-16 | EUR 540,000 | 736,645 |
|
| RCI Banque SA | 2.250 | | 03-29-21 | EUR 600,000 | 834,680 |
|
| RCI Banque SA | 4.250 | | 04-27-17 | EUR 780,000 | 1,136,367 |
|
| RCI Banque SA | 5.625 | | 03-13-15 | EUR 856,000 | 1,179,869 |
|
| Renault SA | 3.125 | | 03-05-21 | EUR 550,000 | 778,965 |
|
| Sanofi | 2.500 | | 11-14-23 | EUR 600,000 | 861,478 |
|
| SGD Group SAS | 5.625 | | 05-15-19 | EUR 455,000 | 624,500 |
|
| Societe Des Autoroutes Paris-Rhin-Rhone | 4.875 | | 01-21-19 | EUR 400,000 | 623,799 |
|
| Societe Fonciere Lyonnaise SA | 3.500 | | 11-28-17 | EUR 200,000 | 288,625 |
| | |
| 14 | Global Absolute Return Strategies Fund | Annual report | See notes to financial statements |
| | | | | |
| | Rate | | Maturity | | |
| | (%) | | date | Par value^ | Value |
| | | | | | |
| France (continued) | | | | | |
|
| Societe Fonciere Lyonnaise SA | 4.625 | | 05-25-16 | EUR 700,000 | $1,000,905 |
|
| Societe Generale SA | 4.000 | | 06-07-23 | EUR 1,100,000 | 1,590,192 |
|
| Societe Generale SA | 4.750 | | 03-02-21 | EUR 200,000 | 324,157 |
|
| Societe Generale SA (6.750% to 4-7-21, then | | | | | |
| 5 Year U.S. Swap Rate + 5.538%) (Q) | 6.750 | | 04-07-21 | EUR 660,000 | 914,705 |
|
| Societe Generale SA (8.250% to 11-29-18, | | | | | |
| then 5 Year U.S. Swap Rate + 6.394%) (Q) | 8.250 | | 11-29-18 | 750,000 | 803,400 |
|
| Societe Generale SA (9.375% to 9-4-19, then | | | | | |
| 3 month EURIBOR + 8.901%) (Q) | 9.375 | | 09-04-19 | EUR 300,000 | 496,018 |
|
| SPCM SA | 5.500 | | 06-15-20 | EUR 605,000 | 870,885 |
|
| SPCM SA (S) | 6.000 | | 01-15-22 | 1,050,000 | 1,118,250 |
|
| Unibail-Rodamco SE | 3.875 | | 12-13-17 | EUR 710,000 | 1,046,464 |
|
| Unibail-Rodamco SE | 4.625 | | 09-23-16 | EUR 145,000 | 210,767 |
|
| Veolia Environnement SA | 4.625 | | 03-30-27 | EUR 400,000 | 649,343 |
|
| Veolia Environnement SA | 6.750 | | 04-24-19 | EUR 980,000 | 1,653,716 |
|
| Vinci SA (6.250% to 11-13-15, then 3 month | | | | | |
| EURIBOR + 3.750%) (Q) | 6.250 | | 11-13-15 | EUR 350,000 | 494,935 |
|
| Vivendi SA | 4.125 | | 07-18-17 | EUR 700,000 | 1,030,038 |
| | | | | | |
| Germany 0.3% | | | | | 16,773,489 |
|
| Allianz SE (4.750% to 10-24-23, then 3 month | | | | | |
| EURIBOR + 3.600%) (Q) | 4.750 | | 10-24-23 | EUR 2,600,000 | 3,789,646 |
|
| Commerzbank AG | 7.750 | | 03-16-21 | EUR 900,000 | 1,482,738 |
|
| Continental AG | 3.125 | | 09-09-20 | EUR 248,000 | 365,043 |
|
| Deutsche Bank AG (6.000% to 4-30-22, then | | | | | |
| 5 Year Euro Swap Rate + 4.698%) (Q) | 6.000 | | 04-30-22 | EUR 600,000 | 799,413 |
|
| Deutsche Bank AG (6.250% to 4-30-20, then | | | | | |
| 5 Year U.S. Swap Rate + 4.358%) (Q) | 6.250 | | 04-30-20 | 1,400,000 | 1,393,000 |
|
| FMC Finance VIII SA | 6.500 | | 09-15-18 | EUR 575,000 | 908,315 |
|
| Henkel AG & Company KGaA (5.375% to | | | | | |
| 11-25-15, then 3 month EURIBOR | | | | | |
| + 2.850%) | 5.375 | | 11-25-15 | EUR 530,000 | 745,766 |
|
| KraussMaffei Group GmbH | 8.750 | | 12-15-20 | EUR 515,000 | 768,916 |
|
| Muenchener Rueckversicherungs AG (6.250% | | | | | |
| to 5-26-22, then 3 month EURIBOR | | | | | |
| + 4.950%) | 6.250 | | 05-26-42 | EUR 400,000 | 653,939 |
|
| Trionista TopCo GmbH | 6.875 | | 04-30-21 | EUR 575,000 | 816,844 |
|
| Unitymedia Hessen GmbH & Company KG | 5.750 | | 01-15-23 | EUR 350,000 | 506,161 |
|
| Unitymedia Hessen GmbH & Company KG | 6.250 | | 01-15-29 | EUR 1,000,000 | 1,506,431 |
|
| Unitymedia Hessen GmbH & Company KG | 7.500 | | 03-15-19 | EUR 225,000 | 320,117 |
|
| Unitymedia KabelBW GmbH | 9.500 | | 03-15-21 | EUR 200,000 | 302,531 |
|
| Unitymedia KabelBW GmbH | 9.625 | | 12-01-19 | EUR 260,000 | 370,837 |
|
| Volkswagen Leasing GmbH | 3.250 | | 05-10-18 | EUR 1,400,000 | 2,043,792 |
| | | | | | |
| Greece 0.0% | | | | | 437,525 |
|
| Navios Maritime Holdings, Inc. (S) | 7.375 | | 01-15-22 | 430,000 | 437,525 |
| | | | | | |
| Ireland 0.3% | | | | | 17,744,346 |
|
| AG Spring Finance II, Ltd. | 9.500 | | 06-01-19 | EUR 450,000 | 544,123 |
|
| AIB Mortgage Bank | 2.625 | | 07-29-16 | EUR 380,000 | 527,732 |
|
| Aquarius + Investments PLC (4.250% to | | | | | |
| 10-2-23, then 3 month EURIBOR + 3.450%) | 4.250 | | 10-02-43 | EUR 137,000 | 198,947 |
| | |
| See notes to financial statements | Annual report | Global Absolute Return Strategies Fund | 15 |
| | | | | |
| | Rate | | Maturity | | |
| | (%) | | date | Par value^ | Value |
| | | | | | |
| Ireland (continued) | | | | | |
|
| Aquarius + Investments PLC (6.375% to | | | | | |
| 9-1-19, then 5 Year U.S. Swap Rate | | | | | |
| + 5.210%) | 6.375 | | 09-01-24 | 360,000 | $382,050 |
|
| Ardagh Glass Finance PLC | 8.750 | | 02-01-20 | EUR 100,000 | 141,270 |
|
| Ardagh Packaging Finance PLC | 4.250 | | 01-15-22 | EUR 500,000 | 655,465 |
|
| Ardagh Packaging Finance PLC (S) | 7.000 | | 11-15-20 | 70,588 | 69,529 |
|
| Ardagh Packaging Finance PLC (S) | 9.125 | | 10-15-20 | 505,000 | 545,400 |
|
| Bank of Ireland | 2.000 | | 05-08-17 | EUR 800,000 | 1,070,443 |
|
| Bank of Ireland Mortgage Bank | 3.125 | | 11-20-15 | EUR 540,000 | 746,105 |
|
| Bank of Ireland Mortgage Bank | 3.625 | | 10-02-20 | EUR 650,000 | 988,206 |
|
| Bord Gais Eireann | 3.625 | | 12-04-17 | EUR 350,000 | 509,222 |
|
| ESB Finance, Ltd. | 6.250 | | 09-11-17 | EUR 1,280,000 | 1,993,021 |
|
| FGA Capital Ireland PLC | 4.000 | | 10-17-18 | EUR 650,000 | 939,143 |
|
| FGA Capital Ireland PLC | 4.375 | | 09-18-14 | EUR 800,000 | 1,076,044 |
|
| Fly Leasing, Ltd. | 6.750 | | 12-15-20 | 1,125,000 | 1,189,688 |
|
| GE Capital European Funding | 3.625 | | 06-15-17 | EUR 536,000 | 775,510 |
|
| GE Capital European Funding | 4.625 | | 02-22-27 | EUR 550,000 | 927,839 |
|
| GE Capital European Funding | 5.375 | | 01-23-20 | EUR 200,000 | 329,347 |
|
| Rottapharm, Ltd. | 6.125 | | 11-15-19 | EUR 675,000 | 973,908 |
|
| Smurfit Kappa Acquisitions | 4.125 | | 01-30-20 | EUR 615,000 | 865,202 |
|
| Smurfit Kappa Acquisitions | 5.125 | | 09-15-18 | EUR 100,000 | 145,191 |
|
| Swisscom AG | 2.000 | | 09-30-20 | EUR 900,000 | 1,254,659 |
|
| Willow No. 2 Ireland PLC | 3.375 | | 06-27-22 | EUR 600,000 | 896,302 |
| | | | | | |
| Israel 0.0% | | | | | 1,010,635 |
|
| Teva Pharmaceutical Finance IV BV | 2.875 | | 04-15-19 | EUR 700,000 | 1,010,635 |
| | | | | | |
| Italy 0.4% | | | | | 21,971,720 |
|
| Assicurazioni Generali SpA | 2.875 | | 01-14-20 | EUR 1,200,000 | 1,710,316 |
|
| Assicurazioni Generali SpA | 5.125 | | 09-16-24 | EUR 900,000 | 1,458,515 |
|
| Assicurazioni Generali SpA (7.750% to | | | | | |
| 12-12-22, then 3 month EURIBOR | | | | | |
| + 7.113%) | 7.750 | | 12-12-42 | EUR 500,000 | 840,254 |
|
| Astaldi SpA | 7.125 | | 12-01-20 | EUR 425,000 | 611,779 |
|
| Edison SpA | 3.875 | | 11-10-17 | EUR 820,000 | 1,200,060 |
|
| Enel SpA (5.000% to 1-15-20, then 5 Year | | | | | |
| Euro Swap Rate + 3.648%) | 5.000 | | 01-15-75 | EUR 500,000 | 694,668 |
|
| Eni SpA | 3.250 | | 07-10-23 | EUR 426,000 | 634,410 |
|
| Eni SpA | 3.625 | | 01-29-29 | EUR 380,000 | 570,276 |
|
| Eni SpA | 3.750 | | 09-12-25 | EUR 1,000,000 | 1,538,263 |
|
| Eni SpA | 4.000 | | 06-29-20 | EUR 100,000 | 154,242 |
|
| GTECH SpA | 5.375 | | 12-05-16 | EUR 600,000 | 884,409 |
|
| GTECH SpA | 5.375 | | 02-02-18 | EUR 400,000 | 610,636 |
|
| Intesa Sanpaolo SpA | 3.000 | | 01-28-19 | EUR 400,000 | 570,476 |
|
| Intesa Sanpaolo SpA | 4.000 | | 11-09-17 | EUR 100,000 | 145,874 |
|
| Intesa Sanpaolo SpA | 4.125 | | 01-14-16 | EUR 100,000 | 140,038 |
|
| Intesa Sanpaolo SpA | 4.125 | | 09-19-16 | EUR 200,000 | 285,224 |
|
| Intesa Sanpaolo SpA | 4.375 | | 10-15-19 | EUR 200,000 | 304,051 |
|
| Intesa Sanpaolo SpA | 4.875 | | 07-10-15 | EUR 400,000 | 555,680 |
|
| Intesa Sanpaolo SpA | 5.000 | | 02-28-17 | EUR 1,900,000 | 2,794,748 |
|
| Intesa Sanpaolo SpA | 6.625 | | 09-13-23 | EUR 230,000 | 377,748 |
| | |
| 16 | Global Absolute Return Strategies Fund | Annual report | See notes to financial statements |
| | | | | |
| | Rate | | Maturity | | |
| | (%) | | date | Par value^ | Value |
| | | | | | |
| Italy (continued) | | | | | |
|
| Intesa Sanpaolo SpA (3.750% to 3-2-15, then | | | | | |
| 3 month EURIBOR + 0.890%) | 3.750 | | 03-02-20 | EUR 200,000 | $265,132 |
|
| Lottomatica Group SpA (8.250% to 3-31-16, | | | | | |
| then 6 month EURIBOR + 5.050%) | 8.250 | | 03-31-66 | EUR 165,000 | 237,083 |
|
| Snam SpA | 3.875 | | 03-19-18 | EUR 160,000 | 236,134 |
|
| Telecom Italia SpA | 5.250 | | 02-10-22 | EUR 450,000 | 662,053 |
|
| Telecom Italia SpA | 7.000 | | 01-20-17 | EUR 1,000,000 | 1,504,597 |
|
| UniCredit SpA | 4.875 | | 03-07-17 | EUR 850,000 | 1,245,192 |
|
| UniCredit SpA (5.750% to 10-28-20, then | | | | | |
| 5 Year Euro Swap Rate + 4.100%) | 5.750 | | 10-28-25 | EUR 900,000 | 1,329,343 |
|
| UniCredit SpA | 6.125 | | 04-19-21 | EUR 270,000 | 410,519 |
| | | | | | |
| Jamaica 0.0% | | | | | 1,585,238 |
|
| Digicel Group, Ltd. (S) | 8.250 | | 09-30-20 | 1,485,000 | 1,585,238 |
| | | | | | |
| Jersey, Channel Islands 0.1% | | | | | 7,794,053 |
|
| CPUK Finance, Ltd. | 11.625 | | 02-28-18 | GBP 475,000 | 888,151 |
|
| Heathrow Funding, Ltd. | 1.875 | | 05-23-22 | EUR 200,000 | 271,439 |
|
| Heathrow Funding, Ltd. | 4.125 | | 10-12-16 | EUR 1,000,000 | 1,439,142 |
|
| Heathrow Funding, Ltd. | 4.375 | | 01-25-17 | EUR 560,000 | 816,156 |
|
| Heathrow Funding, Ltd. | 4.600 | | 02-15-18 | EUR 1,060,000 | 1,601,110 |
|
| Prosecure Funding LP | 4.668 | | 06-30-16 | EUR 900,000 | 1,261,145 |
|
| UBS AG (4.500% to 9-16-14, then 3 month | | | | | |
| EURIBOR + 1.260%) | 4.500 | | 09-16-19 | EUR 1,130,000 | 1,516,910 |
| | | | | | |
| Luxembourg 0.5% | | | | | 29,167,495 |
|
| Altice SA | 7.250 | | 05-15-22 | EUR 730,000 | 1,014,163 |
|
| Altice SA (S) | 7.750 | | 05-15-22 | 1,105,000 | 1,129,863 |
|
| ArcelorMittal | 6.000 | | 03-01-21 | 1,015,000 | 1,053,063 |
|
| ArcelorMittal | 9.500 | | 02-15-15 | 380,000 | 393,870 |
|
| Bilbao Luxembourg SA, PIK | 10.500 | | 12-01-18 | EUR 450,000 | 644,873 |
|
| Cabot Financial Luxembourg SA | 8.375 | | 08-01-20 | GBP 100,000 | 182,103 |
|
| Cabot Financial Luxembourg SA | 10.375 | | 10-01-19 | GBP 625,000 | 1,200,275 |
|
| CNH Industrial Finance Europe SA | 2.750 | | 03-18-19 | EUR 1,270,000 | 1,713,671 |
|
| CNH Industrial Finance Europe SA | 5.250 | | 03-11-15 | EUR 770,000 | 1,055,299 |
|
| CNH Industrial Finance Europe SA | 6.250 | | 03-09-18 | EUR 1,050,000 | 1,590,414 |
|
| Expro Finance Luxembourg SCA (S) | 8.500 | | 12-15-16 | 445,000 | 458,906 |
|
| Fiat Finance & Trade SA | 4.750 | | 07-15-22 | EUR 330,000 | 462,876 |
|
| Fiat Finance & Trade SA | 6.750 | | 10-14-19 | EUR 600,000 | 927,274 |
|
| Gazprom OAO | 3.755 | | 03-15-17 | EUR 1,510,000 | 1,997,702 |
|
| Geo Debt Finance SCA | 7.500 | | 08-01-18 | EUR 100,000 | 139,596 |
|
| Geo Travel Finance SCA | 10.375 | | 05-01-19 | EUR 287,676 | 411,214 |
|
| Gestamp Funding Luxembourg SA | 5.875 | | 05-31-20 | EUR 200,000 | 281,201 |
|
| Glencore Finance Europe SA | 3.375 | | 09-30-20 | EUR 1,050,000 | 1,549,775 |
|
| Glencore Finance Europe SA | 5.250 | | 03-22-17 | EUR 1,350,000 | 2,009,340 |
|
| HeidelbergCement Finance Luxembourg SA | 6.750 | | 12-15-15 | EUR 730,000 | 1,050,820 |
|
| HeidelbergCement Finance Luxembourg SA | 7.500 | | 04-03-20 | EUR 150,000 | 253,603 |
|
| INEOS Group Holdings SA | 5.750 | | 02-15-19 | EUR 450,000 | 614,624 |
|
| INEOS Group Holdings SA (S) | 5.875 | | 02-15-19 | 520,000 | 525,200 |
|
| INEOS Group Holdings SA (S) | 6.125 | | 08-15-18 | 545,000 | 550,450 |
|
| Intelsat Jackson Holdings SA | 6.625 | | 12-15-22 | 520,000 | 522,600 |
| | |
| See notes to financial statements | Annual report | Global Absolute Return Strategies Fund | 17 |
| | | | | |
| | Rate | | Maturity | | |
| | (%) | | date | Par value^ | Value |
| | | | | | |
| Luxembourg (continued) | | | | | |
|
| Intelsat Luxembourg SA | 7.750 | | 06-01-21 | 1,722,000 | $1,760,745 |
|
| Matterhorn Mobile Holdings SA | 8.250 | | 02-15-20 | EUR 500,000 | 726,435 |
|
| Prologis International Funding II SA | 2.750 | | 10-23-18 | EUR 300,000 | 423,850 |
|
| Prologis International Funding II SA | 2.875 | | 04-04-22 | EUR 1,175,000 | 1,640,174 |
|
| Stackpole International Intermediate | | | | | |
| Company SA (S) | 7.750 | | 10-15-21 | 892,000 | 892,000 |
|
| Wind Acquisition Finance SA | 4.000 | | 07-15-20 | EUR 400,000 | 536,290 |
|
| Wind Acquisition Finance SA (S) | 6.500 | | 04-30-20 | 600,000 | 637,500 |
|
| Wind Acquisition Finance SA | 7.000 | | 04-23-21 | EUR 300,000 | 431,844 |
|
| Wind Acquisition Finance SA (S) | 7.375 | | 04-23-21 | 200,000 | 208,500 |
|
| Zinc Capital SA | 8.875 | | 05-15-18 | EUR 125,000 | 177,382 |
| | | | | | |
| Marshall Islands 0.0% | | | | | 2,291,900 |
|
| Millennium Offshore Services | | | | | |
| Superholdings LLC (S) | 9.500 | | 02-15-18 | 1,570,000 | 1,679,900 |
|
| Navios South American Logistics, Inc. (S) | 7.250 | | 05-01-22 | 600,000 | 612,000 |
| | | | | | |
| Mexico 0.1% | | | | | 5,107,203 |
|
| America Movil SAB de CV | 3.000 | | 07-12-21 | EUR 260,000 | 377,293 |
|
| America Movil SAB de CV | 4.125 | | 10-25-19 | EUR 400,000 | 612,524 |
|
| America Movil SAB de CV | 4.750 | | 06-28-22 | EUR 600,000 | 971,130 |
|
| America Movil SAB de CV (5.125% to 9-6-18, | | | | | |
| then 5 Year Euro Swap Rate + 3.850%) | 5.125 | | 09-06-73 | EUR 600,000 | 870,115 |
|
| Cemex SAB de CV (S) | 7.250 | | 01-15-21 | 375,000 | 397,500 |
|
| Petroleos Mexicanos | 3.125 | | 11-27-20 | EUR 960,000 | 1,388,134 |
|
| Petroleos Mexicanos | 5.500 | | 01-09-17 | EUR 330,000 | 490,507 |
| | | | | | |
| Netherlands 0.9% | | | | | 52,179,867 |
|
| ABN AMRO Bank NV (4.310% to 3-10-16, then | | | | | |
| 3 month EURIBOR + 1.660%) (Q) | 4.310 | | 03-10-16 | EUR 90,000 | 122,624 |
|
| ABN AMRO Bank NV | 6.375 | | 04-27-21 | EUR 510,000 | 835,307 |
|
| Achmea BV | 2.500 | | 11-19-20 | EUR 1,160,000 | 1,632,221 |
|
| Aegon NV | 3.000 | | 07-18-17 | EUR 350,000 | 498,829 |
|
| Alliander NV (3.250% to 11-27-18,then 5 Year | | | | | |
| Euro Swap Rate + 2.295%) (Q) | 3.250 | | 11-27-18 | EUR 1,000,000 | 1,396,362 |
|
| Bharti Airtel International Netherlands BV | 4.000 | | 12-10-18 | EUR 1,175,000 | 1,693,071 |
|
| British American Tobacco Holdings The | | | | | |
| Netherlands BV | 3.125 | | 03-06-29 | EUR 220,000 | 313,111 |
|
| Coca-Cola HBC Finance BV | 4.250 | | 11-16-16 | EUR 238,000 | 343,112 |
|
| Conti-Gummi Finance BV | 2.500 | | 03-20-17 | EUR 250,000 | 349,067 |
|
| Deutsche Annington Finance BV | 2.125 | | 07-25-16 | EUR 1,100,000 | 1,509,900 |
|
| Deutsche Annington Finance BV | 3.125 | | 07-25-19 | EUR 500,000 | 723,643 |
|
| Deutsche Annington Finance BV | 3.625 | | 10-08-21 | EUR 700,000 | 1,044,451 |
|
| Deutsche Telekom International Finance BV | 6.625 | | 03-29-18 | EUR 513,000 | 830,103 |
|
| E.ON International Finance BV | 5.750 | | 05-07-20 | EUR 410,000 | 687,841 |
|
| Enel Finance International NV | 4.625 | | 06-24-15 | EUR 775,000 | 1,075,331 |
|
| Enel Finance International NV | 4.875 | | 03-11-20 | EUR 940,000 | 1,486,747 |
|
| Enel Finance International NV | 5.750 | | 10-24-18 | EUR 1,750,000 | 2,782,011 |
|
| Fresenius Finance BV | 3.000 | | 02-01-21 | EUR 600,000 | 843,650 |
|
| Fresenius Finance BV | 4.250 | | 04-15-19 | EUR 270,000 | 401,313 |
|
| Gas Natural Fenosa Finance BV | 2.875 | | 03-11-24 | EUR 300,000 | 424,365 |
|
| Grupo Isolux Corsan Finance BV | 6.625 | | 04-15-21 | EUR 450,000 | 605,736 |
| | |
| 18 | Global Absolute Return Strategies Fund | Annual report | See notes to financial statements |
| | | | | |
| | Rate | | Maturity | | |
| | (%) | | date | Par value^ | Value |
| | | | | | |
| Netherlands (continued) | | | | | |
|
| HeidelbergCement Finance BV | 8.000 | | 01-31-17 | EUR 800,000 | $1,241,567 |
|
| HIT Finance BV | 5.750 | | 03-09-18 | EUR 600,000 | 934,670 |
|
| Iberdrola International BV | 3.000 | | 01-31-22 | EUR 800,000 | 1,162,923 |
|
| Iberdrola International BV (5.750% to 2-27-18, | | | | | |
| then 5 Year Euro Swap Rate + 4.810%) (Q) | 5.750 | | 02-27-18 | EUR 200,000 | 291,914 |
|
| ING Bank NV (3.500% to 11-21-18, then | | | | | |
| 5 Year Euro Swap Rate + 2.450%) | 3.500 | | 11-21-23 | EUR 685,000 | 957,126 |
|
| KBC IFIMA NV | 4.500 | | 03-27-17 | EUR 1,540,000 | 2,266,862 |
|
| Koninklijke KPN NV | 7.500 | | 02-04-19 | EUR 878,000 | 1,500,639 |
|
| LeasePlan Corp. NV | 2.375 | | 04-23-19 | EUR 400,000 | 565,154 |
|
| LeasePlan Corp. NV | 2.500 | | 09-19-16 | EUR 350,000 | 486,483 |
|
| Linde Finance BV (7.375% to 7-14-16, then | | | | | |
| 3 month EURIBOR + 4.125%) | 7.375 | | 07-14-66 | EUR 820,000 | 1,223,964 |
|
| Petrobras Global Finance BV | 2.750 | | 01-15-18 | EUR 1,500,000 | 2,058,930 |
|
| Playa Resorts Holding BV (S) | 8.000 | | 08-15-20 | 1,785,000 | 1,883,175 |
|
| Rabobank Nederland NV (2.500% to 5-26-21, | | | | | |
| then 5 Year Euro Swap Rate + 1.400%) | 2.500 | | 05-26-26 | EUR 1,750,000 | 2,334,691 |
|
| Rabobank Nederland NV | 3.500 | | 10-17-18 | EUR 920,000 | 1,365,393 |
|
| Rabobank Nederland NV | 4.125 | | 01-14-20 | EUR 890,000 | 1,383,241 |
|
| Rabobank Nederland NV (8.375% to 7-26-16, | | | | | |
| then 5 Year Constant Maturity Treasury + | | | | | |
| 6.425%) (Q) | 8.375 | | 07-26-16 | 450,000 | 491,850 |
|
| Repsol International Finance BV | 3.625 | | 10-07-21 | EUR 1,100,000 | 1,647,047 |
|
| Repsol International Finance BV | 4.250 | | 02-12-16 | EUR 100,000 | 141,082 |
|
| RWE Finance BV | 6.500 | | 08-10-21 | EUR 380,000 | 672,604 |
|
| SABIC Capital I BV | 2.750 | | 11-20-20 | EUR 720,000 | 1,022,914 |
|
| Schaeffler Finance BV | 4.250 | | 05-15-18 | EUR 100,000 | 137,962 |
|
| Schaeffler Finance BV | 7.750 | | 02-15-17 | EUR 300,000 | 454,991 |
|
| Swiss Reinsurance Company (5.252% to | | | | | |
| 5-25-16, then 6 month EURIBOR | | | | | |
| + 2.090%) (Q) | 5.252 | | 05-25-16 | EUR 1,550,000 | 2,174,115 |
|
| Telefonica Europe BV | 5.875 | | 02-14-33 | EUR 230,000 | 412,158 |
|
| TenneT Holding BV (6.655% to 6-1-17, then | | | | | |
| 5 Year Euro Swap Rate + 3.600%) (Q) | 6.655 | | 06-01-17 | EUR 450,000 | 674,881 |
|
| Unify Germany Holdings BV | 10.750 | | 11-15-15 | EUR 92,000 | 123,821 |
|
| UPC Holding BV | 6.375 | | 09-15-22 | EUR 100,000 | 144,617 |
|
| UPC Holding BV | 8.375 | | 08-15-20 | EUR 500,000 | 729,769 |
|
| Volkswagen International Finance NV | 2.000 | | 03-26-21 | EUR 780,000 | 1,090,346 |
|
| Volkswagen International Finance NV (3.750% | | | | | |
| to 3-24-21, then 7 Year U.S. Swap Rate | | | | | |
| + 2.534%) (Q) | 3.750 | | 03-24-21 | EUR 1,350,000 | 1,885,912 |
|
| Volkswagen International Finance NV (3.875% | | | | | |
| to 9-4-18, then 5 Year Euro Swap Rate + | | | | | |
| 2.700%) (Q) | 3.875 | | 09-04-18 | EUR 290,000 | 409,200 |
|
| Ziggo Bond Company BV | 8.000 | | 05-15-18 | EUR 485,000 | 711,071 |
| | | | | | |
| Norway 0.1% | | | | | 6,558,534 |
|
| DNB Bank ASA (3.000% to 9-26-18, then | | | | | |
| 5 Year Euro Swap Rate + 1.770%) | 3.000 | | 09-26-23 | EUR 880,000 | 1,236,329 |
|
| DNB Bank ASA | 4.375 | | 02-24-21 | EUR 1,210,000 | 1,935,859 |
|
| SpareBank 1 Sr. Bank ASA | 2.125 | | 02-03-20 | EUR 300,000 | 420,563 |
| | |
| See notes to financial statements | Annual report | Global Absolute Return Strategies Fund | 19 |
| | | | | |
| | Rate | | Maturity | | |
| | (%) | | date | Par value^ | Value |
| | | | | | |
| Norway (continued) | | | | | |
|
| Statkraft AS | 2.500 | | 11-28-22 | EUR 780,000 | $1,106,740 |
|
| Statkraft AS | 6.625 | | 04-02-19 | EUR 690,000 | 1,156,376 |
|
| Telenor ASA | 2.500 | | 05-22-25 | EUR 500,000 | 702,667 |
| | | | | | |
| South Africa 0.0% | | | | | 271,218 |
|
| Edcon Holdings Pty, Ltd. | 13.375 | | 06-30-19 | EUR 225,000 | 271,218 |
| | | | | | |
| Spain 0.3% | | | | | 15,368,828 |
|
| Amadeus Capital Markets SA | 4.875 | | 07-15-16 | EUR 930,000 | 1,341,729 |
|
| Banco Bilbao Vizcaya Argentaria SA | 3.500 | | 12-05-17 | EUR 800,000 | 1,167,821 |
|
| Banco Santander SA | 4.375 | | 03-16-15 | EUR 400,000 | 548,396 |
|
| Bankia SA | 3.500 | | 11-13-14 | EUR 450,000 | 607,296 |
|
| BBVA Senior Finance SAU | 2.375 | | 01-22-19 | EUR 100,000 | 140,416 |
|
| BBVA Senior Finance SAU | 3.250 | | 04-23-15 | EUR 400,000 | 545,995 |
|
| BBVA Senior Finance SAU | 4.375 | | 09-21-15 | EUR 500,000 | 697,965 |
|
| BBVA Subordinated Capital SAU (3.500% to | | | | | |
| 4-11-19, then 5 Year Euro Swap Rate | | | | | |
| + 2.550%) | 3.500 | | 04-11-24 | EUR 900,000 | 1,242,329 |
|
| CaixaBank | 3.000 | | 03-22-18 | EUR 300,000 | 432,049 |
|
| Catalunya Banc SA | 3.500 | | 03-07-16 | EUR 200,000 | 279,093 |
|
| Ferrovial Emisiones SA | 3.375 | | 01-30-18 | EUR 900,000 | 1,297,194 |
|
| Gas Natural Capital Markets SA | 6.000 | | 01-27-20 | EUR 400,000 | 662,850 |
|
| Iberdrola Finanzas SAU | 5.625 | | 05-09-18 | EUR 900,000 | 1,412,898 |
|
| Telefonica Emisiones SAU | 3.661 | | 09-18-17 | EUR 350,000 | 506,766 |
|
| Telefonica Emisiones SAU | 4.710 | | 01-20-20 | EUR 900,000 | 1,404,544 |
|
| Telefonica Emisiones SAU | 4.750 | | 02-07-17 | EUR 300,000 | 440,420 |
|
| Telefonica Emisiones SAU | 4.967 | | 02-03-16 | EUR 1,100,000 | 1,567,012 |
|
| Telefonica Emisiones SAU | 5.811 | | 09-05-17 | EUR 700,000 | 1,074,055 |
| | | | | | |
| Sweden 0.1% | | | | | 4,701,627 |
|
| Atlas Copco AB | 2.500 | | 02-28-23 | EUR 540,000 | 771,961 |
|
| Investor AB | 3.250 | | 09-17-18 | EUR 550,000 | 805,740 |
|
| Norcell Sweden Holding 2 AB | 10.750 | | 09-29-19 | EUR 208,000 | 314,034 |
|
| Nordea Bank AB | 4.000 | | 06-29-20 | EUR 410,000 | 638,856 |
|
| Nordea Bank AB | 4.000 | | 03-29-21 | EUR 429,000 | 646,731 |
|
| Nordea Bank AB (4.625% to 2-15-17, then | | | | | |
| 5 Year Euro Swap Rate + 3.150%) | 4.625 | | 02-15-22 | EUR 530,000 | 766,012 |
|
| Svenska Handelsbanken AB | 4.375 | | 10-20-21 | EUR 470,000 | 758,293 |
| | | | | | |
| Switzerland 0.0% | | | | | 1,497,393 |
|
| UBS AG (4.750% to 2-12-21, then 5 Year Euro | | | | | |
| Swap Rate + 3.400%) | 4.750 | | 02-12-26 | EUR 1,050,000 | 1,497,393 |
| | | | | | |
| United Arab Emirates 0.0% | | | | | 1,717,697 |
|
| Emirates Telecommunications Corp. | 2.750 | | 06-18-26 | EUR 1,000,000 | 1,363,421 |
|
| Glencore Finance Dubai, Ltd. | 1.750 | | 05-19-16 | EUR 260,000 | 354,276 |
| | | | | | |
| United Kingdom 1.2% | | | | | 65,402,569 |
|
| Abbey National Treasury Services PLC | 1.750 | | 01-15-18 | EUR 280,000 | 385,551 |
|
| Abbey National Treasury Services PLC | 2.000 | | 01-14-19 | EUR 200,000 | 277,971 |
|
| Abbey National Treasury Services PLC | 2.625 | | 07-16-20 | EUR 940,000 | 1,349,825 |
|
| Anglo American Capital PLC | 3.250 | | 04-03-23 | EUR 650,000 | 929,522 |
|
| Arqiva Broadcast Finance PLC | 9.500 | | 03-31-20 | GBP 1,280,000 | 2,409,541 |
| | |
| 20 | Global Absolute Return Strategies Fund | Annual report | See notes to financial statements |
| | | | | |
| | Rate | | Maturity | | |
| | (%) | | date | Par value^ | Value |
| | | | | | |
| United Kingdom (continued) | | | | | |
|
| Avis Budget Finance PLC | 6.000 | | 03-01-21 | EUR 475,000 | $675,929 |
|
| Aviva PLC (5.700% to 9-29-15, then 3 month | | | | | |
| EURIBOR + 2.350%) (Q) | 5.700 | | 09-29-15 | EUR 320,000 | 441,994 |
|
| Aviva PLC (6.125% to 7-5-23, then 5 Year Euro | | | | | |
| Swap Rate + 5.130%) | 6.125 | | 07-05-43 | EUR 1,110,000 | 1,746,456 |
|
| Barclays Bank PLC | 2.250 | | 06-10-24 | EUR 750,000 | 1,025,795 |
|
| Barclays Bank PLC | 7.625 | | 11-21-22 | 2,647,000 | 2,958,023 |
|
| Barclays Bank PLC | 10.000 | | 05-21-21 | GBP 210,000 | 464,968 |
|
| BAT International Finance PLC | 3.625 | | 11-09-21 | EUR 560,000 | 853,966 |
|
| Brambles Finance PLC | 4.625 | | 04-20-18 | EUR 430,000 | 650,184 |
|
| Care UK Health & Social Care PLC | 9.750 | | 08-01-17 | GBP 545,000 | 965,246 |
|
| CEVA Group PLC (S) | 7.000 | | 03-01-21 | 1,455,000 | 1,484,100 |
|
| CEVA Group PLC (S) | 9.000 | | 09-01-21 | 350,000 | 357,875 |
|
| Coventry Building Society | 2.250 | | 12-04-17 | EUR 1,280,000 | 1,789,077 |
|
| Coventry Building Society | 2.500 | | 11-18-20 | EUR 400,000 | 563,566 |
|
| Experian Finance PLC | 4.750 | | 02-04-20 | EUR 540,000 | 847,932 |
|
| FCE Bank PLC | 1.875 | | 04-18-19 | EUR 600,000 | 824,994 |
|
| FCE Bank PLC | 1.875 | | 06-24-21 | EUR 800,000 | 1,078,945 |
|
| FCE Bank PLC | 2.875 | | 10-03-17 | EUR 470,000 | 667,178 |
|
| G4S International Finance PLC | 2.625 | | 12-06-18 | EUR 400,000 | 562,941 |
|
| G4S International Finance PLC | 2.875 | | 05-02-17 | EUR 681,000 | 954,785 |
|
| Grainger PLC | 5.000 | | 12-16-20 | GBP 525,000 | 901,868 |
|
| Hammerson PLC | 2.000 | | 07-01-22 | EUR 600,000 | 810,925 |
|
| Hammerson PLC | 2.750 | | 09-26-19 | EUR 660,000 | 947,802 |
|
| Hammerson PLC | 4.875 | | 06-19-15 | EUR 515,000 | 715,191 |
|
| HBOS PLC (4.375% to 10-30-14, then 3 month | | | | | |
| EURIBOR + 1.36%) | 4.375 | | 10-30-19 | EUR 215,000 | 287,866 |
|
| HBOS PLC | 4.875 | | 03-20-15 | EUR 260,000 | 356,640 |
|
| Heathrow Finance PLC | 5.375 | | 09-01-19 | GBP 495,000 | 872,733 |
|
| HSBC Holdings PLC (3.375% to 1-10-19, then | | | | | |
| 5 Year Euro Swap Rate + 1.950%) | 3.375 | | 01-10-24 | EUR 380,000 | 537,435 |
|
| Imperial Tobacco Finance PLC | 2.250 | | 02-26-21 | EUR 800,000 | 1,101,428 |
|
| Imperial Tobacco Finance PLC | 3.375 | | 02-26-26 | EUR 800,000 | 1,140,699 |
|
| Imperial Tobacco Finance PLC | 5.000 | | 12-02-19 | EUR 1,420,000 | 2,239,442 |
|
| Imperial Tobacco Finance PLC | 8.375 | | 02-17-16 | EUR 625,000 | 934,878 |
|
| Jaguar Land Rover Automotive PLC | 5.000 | | 02-15-22 | GBP 375,000 | 634,379 |
|
| Jaguar Land Rover Automotive PLC (S) | 5.625 | | 02-01-23 | 150,000 | 156,750 |
|
| Jaguar Land Rover Automotive PLC | 8.250 | | 03-15-20 | GBP 225,000 | 418,804 |
|
| LBG Capital No.2 PLC | 15.000 | | 12-21-19 | EUR 560,000 | 1,147,230 |
|
| Legal & General Group PLC (4.000% to 6-8-15 | | | | | |
| then 3 month EURIBOR +1.700%) | 4.000 | | 06-08-25 | EUR 410,000 | 554,501 |
|
| Lloyds Bank PLC | 6.375 | | 06-17-16 | EUR 519,000 | 770,371 |
|
| Lloyds Bank PLC | 6.500 | | 03-24-20 | EUR 1,420,000 | 2,321,121 |
|
| Lloyds Banking Group PLC (7.000% to | | | | | |
| 6-27-19, then 5 Year British Pound Swap | | | | | |
| Rate + 5.060%) (Q) | 7.000 | | 06-27-19 | GBP 525,000 | 901,868 |
|
| Mondi Finance PLC | 3.375 | | 09-28-20 | EUR 650,000 | 943,048 |
|
| Mondi Finance PLC | 5.750 | | 04-03-17 | EUR 310,000 | 466,379 |
|
| Motability Operations Group PLC | 3.250 | | 11-30-18 | EUR 1,230,000 | 1,808,006 |
|
| National Grid PLC | 5.000 | | 07-02-18 | EUR 575,000 | 890,542 |
| | |
| See notes to financial statements | Annual report | Global Absolute Return Strategies Fund | 21 |
| | | | | |
| | Rate | | Maturity | | |
| | (%) | | date | Par value^ | Value |
| | | | | | |
| United Kingdom (continued) | | | | | |
|
| Nationwide Building Society | 6.750 | | 07-22-20 | EUR 1,000,000 | $1,641,799 |
|
| NGG Finance PLC (4.250% to 6-18-20, then | | | | | |
| 7 Year Euro Swap Rate + 2.880%) | 4.250 | | 06-18-76 | EUR 1,360,000 | 1,934,928 |
|
| Pennon Group PLC (6.750% to 3-8-18, then | | | | | |
| 3 month LIBOR + 10.745%) (Q) | 6.750 | | 03-08-18 | GBP 325,000 | 582,991 |
|
| Phones4u Finance PLC | 9.500 | | 04-01-18 | GBP 100,000 | 172,207 |
|
| Phosphorus Holdco PLC, PIK | 10.000 | | 04-01-19 | GBP 400,000 | 580,775 |
|
| Premier Foods PLC | 6.500 | | 03-15-21 | GBP 175,000 | 287,327 |
|
| Rentokil Initial PLC | 3.250 | | 10-07-21 | EUR 1,000,000 | 1,463,185 |
|
| Rolls-Royce PLC | 2.125 | | 06-18-21 | EUR 500,000 | 701,452 |
|
| SSE PLC (5.025% to 10-1-15, then 5 Year Euro | | | | | |
| Swap Rate + 3.150%) (Q) | 5.025 | | 10-01-15 | EUR 630,000 | 871,427 |
|
| SSE PLC (5.625% to 10-1-17, then 5 Year Euro | | | | | |
| Swap Rate + 4.620%) (Q) | 5.625 | | 10-01-17 | EUR 560,000 | 817,919 |
|
| Stagecoach Group PLC | 5.750 | | 12-16-16 | GBP 200,000 | 364,904 |
|
| The Royal Bank of Scotland PLC | 1.625 | | 06-25-19 | EUR 1,300,000 | 1,761,714 |
|
| The Royal Bank of Scotland PLC (3.625% to | | | | | |
| 3-25-19, then 5 Year Euro Swap Rate | | | | | |
| + 2.650%) | 3.625 | | 03-25-24 | EUR 210,000 | 285,660 |
|
| The Royal Bank of Scotland PLC (4.625% to | | | | | |
| 9-22-16, then 3 month EURIBOR + 1.300%) | 4.625 | | 09-22-21 | EUR 874,000 | 1,204,852 |
|
| The Royal Bank of Scotland PLC | 4.875 | | 01-20-17 | EUR 350,000 | 514,455 |
|
| The Royal Bank of Scotland PLC | 5.375 | | 09-30-19 | EUR 164,000 | 263,644 |
|
| The Royal Bank of Scotland PLC | 5.500 | | 03-23-20 | EUR 420,000 | 685,792 |
|
| The Royal Bank of Scotland PLC | 6.934 | | 04-09-18 | EUR 242,000 | 374,877 |
|
| Thomas Cook Group PLC | 7.750 | | 06-22-17 | GBP 475,000 | 860,083 |
|
| Tullow Oil PLC (S) | 6.000 | | 11-01-20 | 785,000 | 796,775 |
|
| UBS AG | 6.000 | | 04-18-18 | EUR 310,000 | 494,563 |
|
| Virgin Media Finance PLC | 8.875 | | 10-15-19 | GBP 100,000 | 177,930 |
|
| Virgin Media Secured Finance PLC | 6.000 | | 04-15-21 | GBP 650,000 | 1,130,042 |
|
| Yorkshire Building Society | 2.125 | | 03-18-19 | EUR 950,000 | 1,306,998 |
| | | | | |
| United States 3.6% | | | | 205,238,436 |
|
| 24 Hour Holdings III LLC (S) | 8.000 | | 06-01-22 | 850,000 | 822,375 |
|
| Advanced Micro Devices, Inc. (S) | 7.000 | | 07-01-24 | 250,000 | 243,750 |
|
| Advanced Micro Devices, Inc. | 7.500 | | 08-15-22 | 1,460,000 | 1,511,100 |
|
| Affinia Group, Inc. | 7.750 | | 05-01-21 | 635,000 | 654,050 |
|
| Aleris International, Inc. | 7.625 | | 02-15-18 | 250,000 | 255,000 |
|
| Aleris International, Inc. | 7.875 | | 11-01-20 | 793,000 | 814,808 |
|
| Allegiant Travel Company | 5.500 | | 07-15-19 | 975,000 | 985,969 |
|
| American Airlines 2013-1 Class B Pass | | | | | |
| Through Trust | 5.625 | | 01-15-21 | 800,916 | 831,951 |
|
| American Axle & Manufacturing, Inc. | 7.750 | | 11-15-19 | 289,000 | 328,015 |
|
| American Energy-Permian Basin LLC (S) | 7.125 | | 11-01-20 | 180,000 | 173,700 |
|
| American Energy-Permian Basin LLC (S) | 7.375 | | 11-01-21 | 755,000 | 728,575 |
|
| American International Group, Inc. (4.875% to | | | | | |
| 3-15-17, then 3 month EURIBOR + 1.730%) | 4.875 | | 03-15-67 | EUR 300,000 | 419,692 |
|
| American International Group, Inc. | 5.000 | | 06-26-17 | EUR 800,000 | 1,194,823 |
|
| Amgen, Inc. | 4.375 | | 12-05-18 | EUR 630,000 | 962,951 |
|
| Amsurg Corp. (S) | 5.625 | | 07-15-22 | 930,000 | 933,488 |
|
| Approach Resources, Inc. | 7.000 | | 06-15-21 | 1,430,000 | 1,483,625 |
| | |
| 22 | Global Absolute Return Strategies Fund | Annual report | See notes to financial statements |
| | | | | |
| | Rate | | Maturity | | |
| | (%) | | date | Par value^ | Value |
| | | | | | |
| United States (continued) | | | | | |
|
| APX Group, Inc. | 6.375 | | 12-01-19 | 695,000 | $695,000 |
|
| APX Group, Inc. | 8.750 | | 12-01-20 | 1,183,000 | 1,153,425 |
|
| AT&T, Inc. | 2.400 | | 03-15-24 | EUR 600,000 | 832,583 |
|
| AT&T, Inc. | 2.500 | | 03-15-23 | EUR 750,000 | 1,059,427 |
|
| AT&T, Inc. | 2.650 | | 12-17-21 | EUR 500,000 | 721,498 |
|
| AT&T, Inc. | 3.550 | | 12-17-32 | EUR 280,000 | 410,823 |
|
| Atlas Pipeline Partners LP | 6.625 | | 10-01-20 | 620,000 | 644,800 |
|
| Atwood Oceanics, Inc. | 6.500 | | 02-01-20 | 373,000 | 391,650 |
|
| Avis Budget Car Rental LLC | 5.500 | | 04-01-23 | 958,000 | 958,000 |
|
| Bank of America Corp. (P) | 1.049 | | 03-28-18 | EUR 750,000 | 992,136 |
|
| Bank of America Corp. | 2.500 | | 07-27-20 | EUR 540,000 | 766,531 |
|
| Bank of America Corp. | 4.750 | | 04-03-17 | EUR 1,200,000 | 1,773,226 |
|
| Bank of America Corp. | 7.000 | | 06-15-16 | EUR 1,000,000 | 1,498,062 |
|
| Basic Energy Services, Inc. | 7.750 | | 10-15-22 | 835,000 | 903,888 |
|
| BlueLine Rental Finance Corp. (S) | 7.000 | | 02-01-19 | 698,000 | 725,920 |
|
| BOE Intermediate Holding Corp., PIK (S) | 9.000 | | 11-01-17 | 937,479 | 979,666 |
|
| Cablevision Systems Corp. | 5.875 | | 09-15-22 | 635,000 | 625,475 |
|
| Cablevision Systems Corp. | 8.625 | | 09-15-17 | 700,000 | 798,000 |
|
| Casella Waste Systems, Inc. | 7.750 | | 02-15-19 | 1,400,000 | 1,442,000 |
|
| CCM Merger, Inc. (S) | 9.125 | | 05-01-19 | 2,361,000 | 2,490,855 |
|
| CCO Holdings LLC | 5.250 | | 09-30-22 | 500,000 | 490,000 |
|
| CCO Holdings LLC | 5.750 | | 01-15-24 | 760,000 | 754,300 |
|
| CDW LLC | 8.500 | | 04-01-19 | 1,065,000 | 1,134,225 |
|
| CenturyLink, Inc. | 5.625 | | 04-01-20 | 1,096,000 | 1,142,580 |
|
| CenturyLink, Inc. | 7.600 | | 09-15-39 | 1,300,000 | 1,300,000 |
|
| Cequel Communications Escrow I LLC (S) | 6.375 | | 09-15-20 | 1,710,000 | 1,761,300 |
|
| Cequel Communications Holdings I LLC (S) | 5.125 | | 12-15-21 | 540,000 | 519,750 |
|
| Chaparral Energy, Inc. | 8.250 | | 09-01-21 | 825,000 | 882,750 |
|
| Chassix Holdings, Inc., PIK (S) | 10.000 | | 12-15-18 | 406,000 | 407,015 |
|
| Chassix, Inc. (S) | 9.250 | | 08-01-18 | 1,337,000 | 1,420,563 |
|
| Chesapeake Energy Corp. | 6.875 | | 11-15-20 | 1,515,000 | 1,696,800 |
|
| Chesapeake Energy Corp. | 7.250 | | 12-15-18 | 740,000 | 838,050 |
|
| Chesapeake Oilfield Operating LLC | 6.625 | | 11-15-19 | 125,000 | 131,250 |
|
| Chrysler Group LLC | 8.250 | | 06-15-21 | 3,250,000 | 3,566,875 |
|
| Citigroup, Inc. (P) | 1.686 | | 02-10-19 | EUR 720,000 | 958,331 |
|
| Citigroup, Inc. (P) | 4.750 | | 02-10-19 | EUR 630,000 | 838,540 |
|
| Citigroup, Inc. | 5.000 | | 08-02-19 | EUR 120,000 | 189,808 |
|
| Citigroup, Inc. | 7.375 | | 09-04-19 | EUR 1,700,000 | 2,955,427 |
|
| Claire’s Stores, Inc. (S) | 9.000 | | 03-15-19 | 1,050,000 | 1,057,875 |
|
| Clear Channel Worldwide Holdings, Inc. | 7.625 | | 03-15-20 | 1,120,000 | 1,176,000 |
|
| Cloud Peak Energy Resources LLC | 6.375 | | 03-15-24 | 1,225,000 | 1,264,813 |
|
| Colt Defense LLC | 8.750 | | 11-15-17 | 592,000 | 467,680 |
|
| Community Health Systems, Inc. (S) | 5.125 | | 08-01-21 | 1,685,000 | 1,697,638 |
|
| Community Health Systems, Inc. (S) | 6.875 | | 02-01-22 | 1,263,000 | 1,291,418 |
|
| Continental Resources, Inc. | 4.500 | | 04-15-23 | 450,000 | 479,150 |
|
| Crown Americas LLC | 6.250 | | 02-01-21 | 100,000 | 105,000 |
|
| Diamondback Energy, Inc. (S) | 7.625 | | 10-01-21 | 1,222,000 | 1,325,870 |
|
| DIRECTV Holdings LLC | 2.750 | | 05-19-23 | EUR 730,000 | 1,026,768 |
| | |
| See notes to financial statements | Annual report | Global Absolute Return Strategies Fund | 23 |
| | | | | |
| | Rate | | Maturity | | |
| | (%) | | date | Par value^ | Value |
| | | | | | |
| United States (continued) | | | | | |
|
| DISH DBS Corp. | 5.125 | | 05-01-20 | 620,000 | $632,400 |
|
| DISH DBS Corp. | 6.750 | | 06-01-21 | 875,000 | 962,500 |
|
| DJO Finance LLC | 7.750 | | 04-15-18 | 500,000 | 515,000 |
|
| DJO Finance LLC | 9.875 | | 04-15-18 | 700,000 | 738,500 |
|
| DR Horton, Inc. | 4.375 | | 09-15-22 | 1,010,000 | 994,850 |
|
| Eagle Midco, Inc. (S) | 9.000 | | 06-15-18 | 690,000 | 703,800 |
|
| El Paso Corp. | 7.750 | | 01-15-32 | 850,000 | 939,250 |
|
| Endo Finance LLC (S) | 7.000 | | 12-15-20 | 1,500,000 | 1,582,500 |
|
| Energy XXI Gulf Coast, Inc. (S) | 6.875 | | 03-15-24 | 420,000 | 417,900 |
|
| Energy XXI Gulf Coast, Inc. | 7.500 | | 12-15-21 | 776,000 | 810,920 |
|
| Ferrellgas LP (S) | 6.750 | | 01-15-22 | 1,275,000 | 1,329,188 |
|
| Freescale Semiconductor, Inc. | 10.750 | | 08-01-20 | 1,137,000 | 1,259,228 |
|
| Fresenius Medical Care US Finance II, Inc. (S) | 5.625 | | 07-31-19 | 954,000 | 1,016,010 |
|
| Fresenius Medical Care US Finance II, Inc. (S) | 5.875 | | 01-31-22 | 425,000 | 464,313 |
|
| Frontier Communications Corp. | 7.625 | | 04-15-24 | 805,000 | 839,213 |
|
| Frontier Communications Corp. | 8.125 | | 10-01-18 | 560,000 | 641,200 |
|
| Frontier Communications Corp. | 9.000 | | 08-15-31 | 1,300,000 | 1,384,500 |
|
| FTS International, Inc. (S) | 6.250 | | 05-01-22 | 1,250,000 | 1,271,875 |
|
| General Motors Company | 6.250 | | 10-02-43 | 1,505,000 | 1,704,413 |
|
| GenOn Americas Generation LLC | 8.500 | | 10-01-21 | 525,000 | 511,875 |
|
| GenOn Energy, Inc. | 9.500 | | 10-15-18 | 1,920,000 | 2,006,400 |
|
| Golden Nugget Escrow, Inc. (S) | 8.500 | | 12-01-21 | 1,583,000 | 1,642,363 |
|
| Goodrich Petroleum Corp. | 8.875 | | 03-15-19 | 2,650,000 | 2,775,875 |
|
| Greektown Holdings LLC (S) | 8.875 | | 03-15-19 | 670,000 | 666,650 |
|
| Group 1 Automotive, Inc. (S) | 5.000 | | 06-01-22 | 600,000 | 591,000 |
|
| Halcon Resources Corp. | 8.875 | | 05-15-21 | 1,515,000 | 1,571,813 |
|
| Halcon Resources Corp. | 9.750 | | 07-15-20 | 645,000 | 686,925 |
|
| Harland Clarke Holdings Corp. (S) | 9.250 | | 03-01-21 | 1,540,000 | 1,543,850 |
|
| HCA Holdings, Inc. | 7.750 | | 05-15-21 | 380,000 | 409,925 |
|
| HCA, Inc. | 7.250 | | 09-15-20 | 825,000 | 872,438 |
|
| HCA, Inc. | 7.500 | | 11-15-95 | 1,960,000 | 1,822,800 |
|
| Hexion US Finance Corp. | 6.625 | | 04-15-20 | 1,181,000 | 1,222,335 |
|
| Hexion US Finance Corp. | 8.875 | | 02-01-18 | 425,000 | 436,688 |
|
| Hiland Partners LP (S) | 5.500 | | 05-15-22 | 420,000 | 414,750 |
|
| Hiland Partners LP (S) | 7.250 | | 10-01-20 | 2,010,000 | 2,145,675 |
|
| HSBC Finance Corp. | 3.750 | | 11-04-15 | EUR 720,000 | 1,002,370 |
|
| Infor Software Parent LLC, PIK (S) | 7.125 | | 05-01-21 | 680,000 | 673,200 |
|
| Infor US, Inc. | 10.000 | | 04-01-19 | EUR 1,420,000 | 2,120,118 |
|
| Innovation Ventures LLC (S) | 9.500 | | 08-15-19 | 460,000 | 443,900 |
|
| Interface Master Holdings, Inc., PIK (S) | 12.500 | | 08-01-18 | 600,000 | 594,000 |
|
| Interface Security Systems Holdings, Inc. (S) | 9.250 | | 01-15-18 | 585,000 | 599,625 |
|
| JPMorgan Chase & Company | 2.625 | | 04-23-21 | EUR 1,750,000 | 2,519,866 |
|
| JPMorgan Chase & Company (4.375% to | | | | | |
| 11-12-14, then 3 month EURIBOR | | | | | |
| + 1.500%) | 4.375 | | 11-12-19 | EUR 750,000 | 1,009,309 |
|
| Jurassic Holdings III, Inc. (S) | 6.875 | | 02-15-21 | 700,000 | 696,500 |
|
| Kinetic Concepts, Inc. | 10.500 | | 11-01-18 | 406,000 | 449,645 |
|
| Laredo Petroleum, Inc. | 7.375 | | 05-01-22 | 215,000 | 234,350 |
|
| Laureate Education, Inc. (S) | 9.250 | | 09-01-19 | 1,995,000 | 1,995,000 |
| | |
| 24 | Global Absolute Return Strategies Fund | Annual report | See notes to financial statements |
| | | | | |
| | Rate | | Maturity | | |
| | (%) | | date | Par value^ | Value |
| | | | | | |
| United States (continued) | | | | | |
|
| Level 3 Communications, Inc. | 8.875 | | 06-01-19 | 910,000 | $977,113 |
|
| Level 3 Financing, Inc. | 8.625 | | 07-15-20 | 2,095,000 | 2,278,313 |
|
| Light Tower Rentals Inc (S) | 8.125 | | 08-01-19 | 1,000,000 | 1,017,500 |
|
| Linn Energy LLC | 8.625 | | 04-15-20 | 264,000 | 278,850 |
|
| McGraw-Hill Global Education Holdings LLC | 9.750 | | 04-01-21 | 1,040,000 | 1,162,200 |
|
| Mcron Finance Sub LLC (S) | 8.375 | | 05-15-19 | 736,000 | 804,080 |
|
| MetroPCS Wireless, Inc. | 6.625 | | 11-15-20 | 850,000 | 892,500 |
|
| Metropolitan Life Global Funding I | 2.375 | | 09-30-19 | EUR 2,400,000 | 3,410,831 |
|
| MHGE Parent LLC (S) | 8.500 | | 08-01-19 | 1,000,000 | 970,000 |
|
| Midstates Petroleum Company, Inc. | 9.250 | | 06-01-21 | 312,000 | 322,140 |
|
| Midstates Petroleum Company, Inc. | 10.750 | | 10-01-20 | 962,000 | 1,036,555 |
|
| Milacron LLC (S) | 7.750 | | 02-15-21 | 995,000 | 1,072,113 |
|
| Morgan Stanley | 4.500 | | 02-23-16 | EUR 1,450,000 | 2,055,146 |
|
| Morgan Stanley | 5.375 | | 08-10-20 | EUR 200,000 | 326,324 |
|
| Morgan Stanley | 5.500 | | 10-02-17 | EUR 840,000 | 1,284,200 |
|
| New Academy Finance Company LLC, PIK (S) | 8.000 | | 06-15-18 | 425,000 | 427,125 |
|
| Novelis, Inc. | 8.750 | | 12-15-20 | 780,000 | 842,400 |
|
| NPC International, Inc. | 10.500 | | 01-15-20 | 880,000 | 976,800 |
|
| NRG Energy, Inc. | 8.250 | | 09-01-20 | 760,000 | 817,000 |
|
| Oasis Petroleum, Inc. (S) | 6.875 | | 03-15-22 | 700,000 | 757,750 |
|
| Paperworks Industries, Inc. (S) | 9.500 | | 08-15-19 | 600,000 | 600,000 |
|
| Parsley Energy LLC (S) | 7.500 | | 02-15-22 | 1,865,000 | 1,939,600 |
|
| Petroleos Mexicanos | 6.375 | | 08-05-16 | EUR 973,000 | 1,447,877 |
|
| Pfizer, Inc. | 5.750 | | 06-03-21 | EUR 800,000 | 1,377,020 |
|
| Philip Morris International, Inc. | 1.875 | | 03-03-21 | EUR 500,000 | 690,347 |
|
| Philip Morris International, Inc. | 2.750 | | 03-19-25 | EUR 450,000 | 637,170 |
|
| Philip Morris International, Inc. | 3.125 | | 06-03-33 | EUR 380,000 | 535,570 |
|
| Pinnacle Entertainment, Inc. | 6.375 | | 08-01-21 | 978,000 | 1,007,340 |
|
| Pittsburgh Glass Works LLC (S) | 8.000 | | 11-15-18 | 890,000 | 954,525 |
|
| ProLogis LP | 3.000 | | 01-18-22 | EUR 1,000,000 | 1,435,047 |
|
| Prologis LP | 3.375 | | 02-20-24 | EUR 800,000 | 1,154,111 |
|
| Prospect Medical Holdings, Inc. (S) | 8.375 | | 05-01-19 | 585,000 | 633,263 |
|
| Quad/Graphics, Inc. (S) | 7.000 | | 05-01-22 | 1,290,000 | 1,267,425 |
|
| Radio One, Inc. (S) | 9.250 | | 02-15-20 | 1,150,000 | 1,216,125 |
|
| Rain CII Carbon LLC (S) | 8.250 | | 01-15-21 | 425,000 | 440,938 |
|
| Rain CII Carbon LLC | 8.500 | | 01-15-21 | EUR 775,000 | 1,067,703 |
|
| Resolute Forest Products, Inc. | 5.875 | | 05-15-23 | 1,030,000 | 978,500 |
|
| Reynolds Group Issuer, Inc. | 7.875 | | 08-15-19 | 568,000 | 604,210 |
|
| Rite Aid Corp. | 8.000 | | 08-15-20 | 1,840,000 | 1,994,100 |
|
| RJS Power Holdings LLC (S) | 5.125 | | 07-15-19 | 667,000 | 656,995 |
|
| Sabine Pass Liquefaction LLC | 5.625 | | 02-01-21 | 1,595,000 | 1,650,825 |
|
| Sealed Air Corp. (S) | 6.500 | | 12-01-20 | 1,094,000 | 1,197,930 |
|
| Service Corp. International (S) | 5.375 | | 05-15-24 | 830,000 | 846,600 |
|
| Simmons Foods, Inc. (S) | 10.500 | | 11-01-17 | 2,061,000 | 2,192,389 |
|
| Sinclair Television Group, Inc. | 6.125 | | 10-01-22 | 860,000 | 887,950 |
|
| Sophia Holding Finance LP, PIK (S) | 9.625 | | 12-01-18 | 1,010,000 | 1,020,100 |
|
| Sprint Capital Corp. | 6.875 | | 11-15-28 | 1,177,000 | 1,147,575 |
|
| Sprint Communications, Inc. | 6.000 | | 11-15-22 | 2,361,000 | 2,325,585 |
| | |
| See notes to financial statements | Annual report | Global Absolute Return Strategies Fund | 25 |
| | | | | |
| | Rate | | Maturity | | |
| | (%) | | date | Par value^ | Value |
| | | | | | |
| United States (continued) | | | | | |
|
| Sprint Communications, Inc. | 7.000 | | 08-15-20 | 400,000 | $423,000 |
|
| Sprint Corp. (S) | 7.125 | | 06-15-24 | 275,000 | 280,500 |
|
| Sprint Corp. (S) | 7.250 | | 09-15-21 | 1,300,000 | 1,384,500 |
|
| Station Casinos LLC | 7.500 | | 03-01-21 | 741,000 | 783,608 |
|
| Summit Materials LLC | 10.500 | | 01-31-20 | 965,000 | 1,073,563 |
|
| T-Mobile USA, Inc. | 6.125 | | 01-15-22 | 860,000 | 884,725 |
|
| Tenet Healthcare Corp. | 4.500 | | 04-01-21 | 913,000 | 887,893 |
|
| Tenet Healthcare Corp. (S) | 5.000 | | 03-01-19 | 450,000 | 443,250 |
|
| Tenet Healthcare Corp. | 6.250 | | 11-01-18 | 520,000 | 562,900 |
|
| Tenet Healthcare Corp. | 8.000 | | 08-01-20 | 378,000 | 403,515 |
|
| The Men’s Wearhouse, Inc. (S) | 7.000 | | 07-01-22 | 1,280,000 | 1,331,200 |
|
| The Procter & Gamble Company | 2.000 | | 11-05-21 | EUR 100,000 | 140,424 |
|
| The Procter & Gamble Company | 4.875 | | 05-11-27 | EUR 100,000 | 175,388 |
|
| Toll Brothers Finance Corp. | 5.625 | | 01-15-24 | 167,000 | 174,933 |
|
| Toll Brothers Finance Corp. | 5.875 | | 02-15-22 | 817,000 | 876,233 |
|
| Tops Holding II Corp. | 8.750 | | 06-15-18 | 519,000 | 538,463 |
|
| Townsquare Radio LLC (S) | 9.000 | | 04-01-19 | 860,000 | 933,100 |
|
| TransUnion Holding Company, Inc. | 8.125 | | 06-15-18 | 1,170,000 | 1,210,950 |
|
| TransUnion Holding Company, Inc. | 9.625 | | 06-15-18 | 389,000 | 404,560 |
|
| Triangle USA Petroleum Corp. (S) | 6.750 | | 07-15-22 | 1,010,000 | 1,008,738 |
|
| UAL 2007-1 Pass Through Trust | 6.636 | | 07-02-22 | 1,568,219 | 1,728,962 |
|
| United Rentals North America, Inc. | 5.750 | | 07-15-18 | 840,000 | 873,600 |
|
| United Rentals North America, Inc. | 7.625 | | 04-15-22 | 469,000 | 512,383 |
|
| Univision Communications, Inc. (S) | 6.750 | | 09-15-22 | 434,000 | 467,635 |
|
| Univision Communications, Inc. (S) | 7.875 | | 11-01-20 | 520,000 | 559,000 |
|
| US Airways 2011-1 Class A Pass Through Trust | 7.125 | | 10-22-23 | 1,870,382 | 2,197,698 |
|
| Valeant Pharmaceuticals International, Inc. (S) | 6.750 | | 08-15-21 | 1,420,000 | 1,476,800 |
|
| Vander Intermediate Holding II Corp., PIK (S) | 9.750 | | 02-01-19 | 1,590,000 | 1,669,500 |
|
| Vector Group, Ltd. (S) | 7.750 | | 02-15-21 | 295,000 | 308,275 |
|
| Vector Group, Ltd. | 7.750 | | 02-15-21 | 1,335,000 | 1,395,075 |
|
| Verizon Communications, Inc. | 2.375 | | 02-17-22 | EUR 880,000 | 1,239,345 |
|
| Verizon Communications, Inc. | 3.250 | | 02-17-26 | EUR 880,000 | 1,291,374 |
|
| Visant Corp. | 10.000 | | 10-01-17 | 1,210,000 | 1,173,700 |
|
| Wachovia Corp. | 4.375 | | 11-27-18 | EUR 900,000 | 1,361,650 |
|
| Wal-Mart Stores, Inc. | 4.875 | | 09-21-29 | EUR 200,000 | 351,966 |
|
| Walter Energy, Inc. (S) | 9.500 | | 10-15-19 | 920,000 | 913,100 |
|
| Waterjet Holdings, Inc. (S) | 7.625 | | 02-01-20 | 1,057,000 | 1,112,493 |
|
| Wells Fargo & Company | 2.125 | | 06-04-24 | EUR 600,000 | 816,880 |
|
| Wells Fargo & Company | 2.250 | | 09-03-20 | EUR 1,350,000 | 1,921,839 |
|
| Wells Fargo & Company | 2.625 | | 08-16-22 | EUR 400,000 | 575,044 |
|
| Windstream Corp. | 6.375 | | 08-01-23 | 2,270,000 | 2,241,625 |
|
| Windstream Corp. | 7.750 | | 10-01-21 | 519,000 | 559,871 |
| |
| |
| Capital Preferred Securities 0.0% | | | | $1,111,041 |
|
| (Cost $965,376) | | | | | |
| | | | | | |
| United States 0.0% | | | | | 1,111,041 |
|
| GE Capital Trust IV (4.625% to 9-15-16, then | | | | | |
| month EURIBOR +1.600%) | 4.625 | | 09-15-66 | EUR 795,000 | 1,111,041 |
| | |
| 26 | Global Absolute Return Strategies Fund | Annual report | See notes to financial statements |
| | | | | |
| | Rate | | Maturity | | |
| | (%) | | date | Par value^ | Value |
| |
| Foreign Government Obligations 7.5% | | | $426,455,921 |
|
| (Cost $433,735,829) | | | | | |
| | | | | |
| Brazil 3.0% | | | | 172,480,649 |
|
| Federative Republic of Brazil | | | | |
| Inflation-Linked Note | 6.000 | | 08-15-22 | BRL 54,900,000 | 61,382,786 |
| Inflation-Linked Note | 6.000 | | 08-15-50 | BRL 24,500,000 | 26,908,705 |
| Note | 10.000 | | 01-01-17 | BRL 97,300,000 | 41,884,953 |
| Note | 10.000 | | 01-01-23 | BRL 105,000,000 | 42,304,205 |
| | | | | | |
| Germany 0.0% | | | | | 2,315,692 |
|
| Federal Republic of Germany | | | | |
| Bond | 1.500 | | 05-15-24 | EUR 1,410,000 | 1,943,777 |
| Bond | 4.750 | | 07-04-40 | EUR 180,000 | 371,915 |
| | | | | |
| Mexico 4.4% | | | | 248,804,036 |
|
| Government of Mexico | | | | | |
| Bond | 6.500 | | 06-10-21 | MXN 770,674,800 | 61,953,918 |
| Bond | 7.500 | | 06-03-27 | MXN 737,230,200 | 62,424,047 |
| Bond | 8.500 | | 05-31-29 | MXN 692,307,700 | 63,068,865 |
| Bond | 10.000 | | 12-05-24 | MXN 614,901,400 | 61,357,206 |
| | | | | | |
| Spain 0.1% | | | | | 2,855,544 |
|
| Kingdom of Spain | | | | | |
| Bond (S) | 5.400 | | 01-31-23 | EUR 600,000 | 996,366 |
| Bond | 5.500 | | 04-30-21 | EUR 1,120,000 | 1,859,178 |
| |
| | | | | | |
| | | | | Shares | Value |
| |
| Common Stocks 35.2% | | | $2,008,960,504 |
|
| (Cost $1,807,346,050) | | | | | |
| | | | | | |
| Australia 0.6% | | | | | 33,172,359 |
|
| Federation Centres, Ltd. | | | 1,192,291 | 2,834,465 |
|
| Fortescue Metals Group, Ltd. | | | 840,000 | 3,765,917 |
|
| Mirvac Group | | | | 3,324,890 | 5,561,935 |
|
| Oil Search, Ltd. | | | | 1,012,978 | 8,859,922 |
|
| Santos, Ltd. | | | | 645,319 | 8,645,385 |
|
| Scentre Group (I) | | | | 665,630 | 2,103,137 |
|
| The GPT Group | | | | 372,275 | 1,401,598 |
| | | | | | |
| Austria 0.1% | | | | | 4,844,987 |
|
| Oesterreichische Post AG | | | 103,339 | 4,844,987 |
| | | | | | |
| Belgium 0.4% | | | | | 19,967,793 |
|
| Anheuser-Busch InBev NV | | | 98,812 | 10,665,046 |
|
| UCB SA | | | | 101,421 | 9,302,747 |
| | | | | | |
| Bermuda 0.2% | | | | | 11,176,405 |
|
| Lazard, Ltd., Class A | | | | 213,698 | 11,176,405 |
| | | | | | |
| Brazil 0.3% | | | | | 19,803,000 |
|
| Vale SA, ADR | | | | 1,380,000 | 19,803,000 |
| | | | | | |
| Canada 0.6% | | | | | 32,947,580 |
|
| Africa Oil Corp. (I) | | | | 479,383 | 2,987,126 |
|
| Alimentation Couche Tard, Inc., Class B | | | 550,515 | 15,066,142 |
|
| Element Financial Corp. (I) | | | 570,546 | 7,409,484 |
|
| First Quantum Minerals, Ltd. | | | 159,000 | 3,771,028 |
|
| Teck Resources, Ltd., Class B | | | 155,000 | 3,713,800 |
| | |
| See notes to financial statements | Annual report | Global Absolute Return Strategies Fund | 27 |
| | |
| | Shares | Value |
| | | |
| China 1.8% | | $104,733,033 |
|
| 500.com, Ltd., Class A, ADR (I) | 10,669 | 393,579 |
|
| 51job, Inc., ADR (I) | 77,972 | 5,891,564 |
|
| AAC Technologies Holdings, Inc. | 106,000 | 630,507 |
|
| Agricultural Bank of China, Ltd., H Shares | 3,201,000 | 1,550,725 |
|
| Anhui Conch Cement Company, Ltd., H Shares | 530,500 | 1,998,289 |
|
| Baidu, Inc., ADR (I) | 12,583 | 2,718,557 |
|
| Bank of China, Ltd., H Shares | 7,348,000 | 3,502,086 |
|
| Bank of Communications Company, Ltd., H Shares | 651,000 | 498,800 |
|
| China Construction Bank Corp., H Shares | 10,178,000 | 7,813,431 |
|
| China Life Insurance Company, Ltd., H Shares | 944,000 | 2,809,565 |
|
| China Longyuan Power Group Corp., H Shares | 416,000 | 422,691 |
|
| China Mengniu Dairy Company, Ltd. | 2,628,000 | 12,705,375 |
|
| China Merchants Bank Company, Ltd., H Shares | 1,643,564 | 3,325,746 |
|
| China Oilfield Services, Ltd., H Shares | 438,000 | 1,089,207 |
|
| China Pacific Insurance Group Company, Ltd., H Shares | 287,600 | 1,129,599 |
|
| China Petroleum & Chemical Corp., H Shares | 7,408,400 | 7,252,856 |
|
| China Shenhua Energy Company, Ltd., H Shares | 301,000 | 886,989 |
|
| China Telecom Corp., Ltd., H Shares | 2,024,000 | 1,140,815 |
|
| CNOOC, Ltd. | 1,680,000 | 2,967,417 |
|
| Great Wall Motor Company, Ltd., H Shares | 160,500 | 660,295 |
|
| Hengan International Group Company, Ltd. | 319,500 | 3,420,149 |
|
| Huaneng Power International, Inc., H Shares | 1,080,000 | 1,197,467 |
|
| Industrial & Commercial Bank of China, Ltd., H Shares | 12,514,000 | 8,550,780 |
|
| Jiangxi Copper Company, Ltd., H Shares | 255,000 | 485,514 |
|
| Lenovo Group, Ltd. | 472,000 | 645,057 |
|
| Minth Group, Ltd. | 222,000 | 423,536 |
|
| New Oriental Education & Technology Group, ADR | 142,800 | 2,791,740 |
|
| Perfect World Company, Ltd., ADR | 59,900 | 1,163,857 |
|
| PetroChina Company, Ltd., H Shares | 2,602,000 | 3,372,374 |
|
| Ping An Insurance Group Company, H Shares | 341,000 | 2,895,298 |
|
| Shandong Weigao Group Medical Polymer Company, Ltd., H Shares | 1,058,033 | 1,085,269 |
|
| Sihuan Pharmaceutical Holdings Group, Ltd. | 1,782,000 | 1,092,432 |
|
| Tencent Holdings, Ltd. | 774,500 | 12,567,887 |
|
| Tianhe Chemicals Group, Ltd. (I)(S) | 2,396,000 | 754,349 |
|
| Tingyi Cayman Islands Holding Corp. | 238,000 | 676,959 |
|
| Vipshop Holdings, Ltd., ADR (I) | 13,224 | 2,718,061 |
|
| Zhuzhou CSR Times Electric Company, Ltd., H Shares | 439,000 | 1,504,211 |
| | | |
| Denmark 1.0% | | 59,142,820 |
|
| Coloplast A/S | 156,223 | 13,209,071 |
|
| Danske Bank A/S | 945,021 | 27,302,259 |
|
| ISS A/S (I) | 74,954 | 2,403,361 |
|
| Novo Nordisk A/S, Class B | 352,539 | 16,228,129 |
| | | |
| Finland 0.9% | | 51,877,865 |
|
| Kesko OYJ, B Shares | 104,225 | 3,964,024 |
|
| Nokia OYJ | 2,070,296 | 16,401,662 |
|
| Sampo OYJ, Class A | 251,336 | 12,485,262 |
|
| Wartsila OYJ Abp | 377,805 | 19,026,917 |
| | |
| 28 | Global Absolute Return Strategies Fund | Annual report | See notes to financial statements |
| | |
| | Shares | Value |
| | | |
| France 2.1% | | $122,380,562 |
|
| Airbus Group NV | 139,198 | 8,076,291 |
|
| AXA SA | 274,848 | 6,314,537 |
|
| BNP Paribas SA | 190,838 | 12,662,758 |
|
| Cie de Saint-Gobain | 94,702 | 4,607,898 |
|
| Edenred | 210,040 | 6,565,305 |
|
| GDF Suez | 205,445 | 5,297,297 |
|
| ICADE | 19,880 | 1,919,669 |
|
| Klepierre | 143,678 | 6,796,879 |
|
| L’Oreal SA | 21,770 | 3,676,080 |
|
| Renault SA | 42,630 | 3,558,755 |
|
| Rexel SA | 223,224 | 4,325,363 |
|
| Sanofi | 99,124 | 10,407,111 |
|
| SCOR SE | 18,028 | 579,939 |
|
| Societe BIC SA | 59,067 | 8,143,740 |
|
| Total SA | 469,579 | 30,285,343 |
|
| Unibail-Rodamco SE | 34,137 | 9,163,597 |
| | | |
| Germany 0.8% | | 45,564,364 |
|
| BASF SE | 80,436 | 8,324,639 |
|
| Bayer AG | 83,534 | 11,018,677 |
|
| Bilfinger SE | 22,066 | 1,795,465 |
|
| Daimler AG | 60,777 | 5,015,240 |
|
| Deutsche Post AG | 260,035 | 8,319,734 |
|
| Symrise AG | 211,804 | 11,090,609 |
| | | |
| Hong Kong 0.7% | | 40,049,054 |
|
| AIA Group, Ltd. | 450,600 | 2,416,927 |
|
| Belle International Holdings, Ltd. | 773,000 | 959,441 |
|
| Cheung Kong Holdings, Ltd. | 164,000 | 3,178,910 |
|
| China Merchants Holdings International Company, Ltd. | 336,000 | 1,130,284 |
|
| China Metal Recycling Holdings, Ltd. (I) | 1,799,400 | 0 |
|
| China Mobile, Ltd. | 794,500 | 8,681,217 |
|
| China Overseas Land & Investment, Ltd. | 1,004,000 | 3,059,384 |
|
| China Resources Land, Ltd. | 994,000 | 2,313,923 |
|
| China Resources Power Holdings Company, Ltd. | 284,000 | 797,005 |
|
| China State Construction International Holdings, Ltd. | 810,000 | 1,426,346 |
|
| China Unicom Hong Kong, Ltd. | 754,000 | 1,317,163 |
|
| Galaxy Entertainment Group, Ltd. | 394,000 | 3,308,382 |
|
| Henderson Land Development Company, Ltd. | 143,000 | 915,194 |
|
| Hong Kong Land Holdings, Ltd. | 796,000 | 5,440,729 |
|
| REXLot Holdings, Ltd. | 1,925,000 | 200,390 |
|
| Shanghai Industrial Holdings, Ltd. | 161,000 | 535,840 |
|
| Sun Hung Kai Properties, Ltd. | 288,000 | 4,367,919 |
| | | |
| Ireland 0.4% | | 22,473,059 |
|
| Ryanair Holdings PLC, ADR (I) | 424,100 | 22,473,059 |
| | | |
| Italy 0.6% | | 32,500,192 |
|
| Atlantia SpA | 289,104 | 7,651,498 |
|
| Eni SpA | 385,000 | 9,796,674 |
|
| Prada SpA | 107,400 | 763,076 |
| | |
| See notes to financial statements | Annual report | Global Absolute Return Strategies Fund | 29 |
| | |
| | Shares | Value |
| | | |
| Italy (continued) | | |
|
| Snam SpA | 1,211,173 | $7,139,722 |
|
| Telecom Italia RSP | 7,646,458 | 7,149,222 |
| | | |
| Japan 2.3% | | 132,237,077 |
|
| Advance Residence Investment Corp. | 580 | 1,381,094 |
|
| Cosmos Pharmaceutical Corp. | 30,500 | 3,737,665 |
|
| Mitsubishi Estate Company, Ltd. | 352,000 | 8,607,483 |
|
| Mitsui Fudosan Company, Ltd. | 858,000 | 28,334,423 |
|
| Nippon Prologis REIT, Inc. | 1,350 | 3,140,114 |
|
| Nippon Steel & Sumitomo Metal Corp. | 3,177,000 | 9,593,458 |
|
| Nishimatsu Construction Company, Ltd. | 461,000 | 2,170,794 |
|
| ORIX Corp. | 550,100 | 8,890,316 |
|
| Otsuka Corp. | 318,300 | 14,502,814 |
|
| Resorttrust, Inc. | 353,600 | 7,303,026 |
|
| Seven & I Holdings Company, Ltd. | 223,500 | 9,301,080 |
|
| Sumitomo Mitsui Financial Group, Inc. | 308,100 | 12,559,533 |
|
| Sumitomo Realty & Development Company, Ltd. | 341,000 | 14,079,273 |
|
| Yamada Denki Company, Ltd. | 2,433,200 | 8,636,004 |
| | | |
| Luxembourg 0.3% | | 18,652,976 |
|
| RTLGroup SA | 78,348 | 7,975,508 |
|
| SES SA | 290,297 | 10,677,468 |
| | | |
| Macau 0.2% | | 10,831,038 |
|
| Sands China, Ltd. | 1,474,000 | 10,831,038 |
| | | |
| Netherlands 0.8% | | 44,280,181 |
|
| Koninklijke Boskalis Westinster NV | 154,669 | 8,260,672 |
|
| Koninklijke Philips NV | 250,531 | 7,721,507 |
|
| Royal Dutch Shell PLC, A Shares | 688,145 | 28,298,002 |
| | | |
| Norway 0.7% | | 42,434,066 |
|
| DNB ASA | 742,911 | 13,165,556 |
|
| Gjensidige Forsikring ASA | 334,653 | 6,452,749 |
|
| Statoil ASA | 431,142 | 12,319,698 |
|
| Telenor ASA | 456,092 | 10,496,063 |
| | | |
| Portugal 0.3% | | 14,656,843 |
|
| CTT-Correios de Portugal SA | 309,652 | 3,295,349 |
|
| Galp Energia SGPS SA | 640,113 | 11,361,494 |
| | | |
| Russia 0.3% | | 14,870,352 |
|
| Magnit OJSC, GDR | 108,828 | 6,420,852 |
|
| MMC Norilsk Nickel OJSC, ADR | 430,000 | 8,449,500 |
| | | |
| Singapore 0.2% | | 13,255,122 |
|
| Avago Technologies, Ltd. | 169,100 | 11,732,158 |
|
| CapitaCommercial Trust | 1,142,000 | 1,522,964 |
| | | |
| South Korea 0.1% | | 8,270,459 |
|
| Samsung Engineering Company, Ltd. (I) | 123,428 | 8,270,459 |
| | | |
| Spain 1.2% | | 69,822,306 |
|
| Amadeus IT Holding SA, A Shares | 186,017 | 7,319,889 |
|
| Banco Bilbao Vizcaya Argentaria SA | 1,985,061 | 24,401,749 |
|
| Bankinter SA | 839,510 | 7,248,857 |
| | |
| 30 | Global Absolute Return Strategies Fund | Annual report | See notes to financial statements |
| | |
| | Shares | Value |
| | | |
| Spain (continued) | | |
|
| Fomento de Construcciones y Contratas SA (I) | 251,137 | $5,439,019 |
|
| Grifols SA | 155,848 | 7,034,639 |
|
| Inditex SA | 272,735 | 7,967,398 |
|
| Repsol SA | 417,473 | 10,410,755 |
| | | |
| Sweden 1.3% | | 72,539,914 |
|
| Atlas Copco AB, Series A | 256,946 | 7,665,949 |
|
| Castellum AB | 116,877 | 1,961,125 |
|
| Elekta AB, B Shares | 566,623 | 6,943,010 |
|
| Fabege AB | 147,676 | 2,020,200 |
|
| Investment AB Kinnevik, B Shares | 338,826 | 14,063,789 |
|
| Lundin Petroleum AB (I) | 273,120 | 4,895,312 |
|
| Svenska Handelsbanken AB, Class A | 251,563 | 12,115,374 |
|
| Swedbank AB, Class A | 492,456 | 12,615,549 |
|
| Swedish Match AB | 313,428 | 10,259,606 |
| | | |
| Switzerland 2.1% | | 121,916,382 |
|
| Glencore Xstrata PLC | 3,600,000 | 21,753,454 |
|
| Nestle SA | 132,963 | 9,844,581 |
|
| Novartis AG | 184,153 | 16,021,052 |
|
| Partners Group Holding AG | 20,127 | 5,045,340 |
|
| Roche Holding AG | 108,173 | 31,392,408 |
|
| Swiss Re AG (I) | 139,133 | 11,827,349 |
|
| Swisscom AG | 15,376 | 8,536,762 |
|
| Syngenta AG | 11,185 | 3,962,334 |
|
| Zurich Insurance Group AG (I) | 46,584 | 13,533,102 |
| | | |
| United Kingdom 3.7% | | 208,172,681 |
|
| Anglo American PLC | 376,000 | 10,097,841 |
|
| Antofagasta PLC | 269,000 | 3,660,429 |
|
| Aveva Group PLC | 24,835 | 837,982 |
|
| Barclays PLC | 2,208,264 | 8,370,840 |
|
| BHP Billiton PLC | 1,520,000 | 51,850,232 |
|
| BP PLC | 2,017,646 | 16,431,185 |
|
| British Land Company PLC | 1,036,056 | 12,257,359 |
|
| BT Group PLC | 2,026,994 | 13,270,515 |
|
| Capital & Counties Properties PLC | 565,414 | 3,053,198 |
|
| Derwent London PLC, ADR | 156,688 | 7,056,245 |
|
| DS Smith PLC | 559,110 | 2,465,559 |
|
| Great Portland Estates PLC | 403,245 | 4,335,458 |
|
| Hammerson PLC | 612,715 | 6,195,716 |
|
| International Consolidated Airlines Group SA (I) | 978,874 | 5,476,415 |
|
| Land Securities Group PLC | 552,911 | 9,700,418 |
|
| Petrofac, Ltd. | 403,856 | 7,442,387 |
|
| Rio Tinto PLC | 749,752 | 42,851,336 |
|
| Workspace Group PLC | 272,635 | 2,819,566 |
| | | |
| United States 11.2% | | 636,388,034 |
|
| Activision Blizzard, Inc. | 307,371 | 6,878,963 |
|
| Acuity Brands, Inc. | 90,833 | 9,743,656 |
|
| Alliance Data Systems Corp. (I) | 56,760 | 14,887,580 |
| | |
| See notes to financial statements | Annual report | Global Absolute Return Strategies Fund | 31 |
| | |
| | Shares | Value |
| | | |
| United States (continued) | | |
|
| American Tower Corp. | 157,261 | $14,843,866 |
|
| Amgen, Inc. | 86,874 | 11,066,879 |
|
| AvalonBay Communities, Inc. | 45,748 | 6,774,364 |
|
| Baxter International, Inc. | 133,036 | 9,936,459 |
|
| BorgWarner, Inc. | 193,384 | 12,038,154 |
|
| Boston Properties, Inc. | 92,862 | 11,092,366 |
|
| Brixmor Property Group, Inc. | 244,881 | 5,546,555 |
|
| Calpine Corp. (I) | 588,368 | 12,967,631 |
|
| Celgene Corp. (I) | 128,298 | 11,181,171 |
|
| Chevron Corp. | 201,000 | 25,977,240 |
|
| CVS Caremark Corp. | 114,605 | 8,751,238 |
|
| DDR Corp. | 164,949 | 2,893,205 |
|
| Delta Air Lines, Inc. | 210,924 | 7,901,213 |
|
| Electronic Arts, Inc. (I) | 293,402 | 9,858,307 |
|
| EOG Resources, Inc. | 101,884 | 11,150,185 |
|
| Equinix, Inc. (I) | 37,614 | 8,068,955 |
|
| Equity Residential | 101,732 | 6,576,974 |
|
| Essex Property Trust, Inc. | 32,416 | 6,145,101 |
|
| Exxon Mobil Corp. | 460,000 | 45,512,400 |
|
| Facebook, Inc., Class A (I) | 147,139 | 10,689,648 |
|
| Federal Realty Investment Trust | 41,508 | 5,068,127 |
|
| First Republic Bank | 232,585 | 10,866,371 |
|
| FLIR Systems, Inc. | 327,135 | 10,887,053 |
|
| Fortune Brands Home & Security, Inc. | 279,522 | 10,563,136 |
|
| Freeport-McMoRan Copper & Gold, Inc. | 280,000 | 10,421,600 |
|
| Generac Holdings, Inc. (I) | 176,151 | 7,644,953 |
|
| General Growth Properties, Inc. | 261,431 | 6,109,642 |
|
| Google, Inc., Class A (I) | 17,999 | 10,431,320 |
|
| Google, Inc., Class C (I) | 25,495 | 14,572,942 |
|
| Halliburton Company | 143,597 | 9,906,757 |
|
| Hanesbrands, Inc. | 127,196 | 12,428,321 |
|
| Hewlett-Packard Company | 278,173 | 9,905,741 |
|
| Hilton Worldwide Holdings, Inc. (I) | 122,380 | 2,962,820 |
|
| Host Hotels & Resorts, Inc. | 413,205 | 8,983,077 |
|
| Illumina, Inc. (I) | 62,960 | 10,067,934 |
|
| J.B. Hunt Transport Services, Inc. | 208,330 | 16,095,576 |
|
| Kansas City Southern | 99,024 | 10,799,557 |
|
| Kimco Realty Corp. | 205,617 | 4,601,708 |
|
| Las Vegas Sands Corp. | 68,416 | 5,052,522 |
|
| LyondellBasell Industries NV, Class A | 100,187 | 10,644,869 |
|
| Macy’s, Inc. | 149,962 | 8,666,304 |
|
| Marriott International, Inc., Class A | 43,681 | 2,826,598 |
|
| Pall Corp. | 189,257 | 14,661,740 |
|
| Pebblebrook Hotel Trust | 77,661 | 2,826,860 |
|
| Prologis, Inc. | 285,432 | 11,648,480 |
|
| Public Storage | 13,292 | 2,281,040 |
|
| Simon Property Group, Inc. | 66,152 | 11,126,105 |
|
| SL Green Realty Corp. | 96,329 | 10,384,266 |
| | |
| 32 | Global Absolute Return Strategies Fund | Annual report | See notes to financial statements |
| | |
| | Shares | Value |
| | | |
| United States (continued) | | |
|
| Starwood Hotels & Resorts Worldwide, Inc. | 45,592 | $3,503,289 |
|
| Stillwater Mining Company (I) | 735,478 | 13,165,056 |
|
| The Charles Schwab Corp. | 412,479 | 11,446,292 |
|
| The Estee Lauder Companies, Inc., Class A | 119,843 | 8,803,667 |
|
| The Macerich Company | 95,406 | 6,202,344 |
|
| The TJX Companies, Inc. | 244,325 | 13,020,079 |
|
| Time Warner, Inc. | 135,690 | 11,264,984 |
|
| Time, Inc. (I) | 16,961 | 408,760 |
|
| Ventas, Inc. | 30,239 | 1,920,177 |
|
| Visteon Corp. (I) | 129,607 | 12,377,469 |
|
| Vornado Realty Trust | 91,442 | 9,694,681 |
|
| Washington Prime Group, Inc. (I) | 103,640 | 1,957,760 |
|
| Waters Corp. (I) | 74,445 | 7,700,591 |
|
| Western Digital Corp. | 120,258 | 12,005,356 |
| |
| |
| Warrants 0.0% | | $17,920 |
|
| (Cost $0) | | |
| | | |
| Sun Hung Kai Properties, Ltd. (Expiration Date: 4-22-16; Strike Price: HKD | | |
| 98.60) (I) | 7,166 | 17,920 |
| |
| | | |
| | Notional | Value |
| |
| Purchased Options 2.0% | | $111,473,600 |
|
| (Cost $102,999,501) | | |
| | | |
| Call Options 0.8% | | 46,422,569 |
|
| Exchange Traded on S&P 500 Index (Expiration Date: 6-19-15; | | |
| Strike Price: $1,850.00) (I) | 292,000 | 42,821,800 |
|
| Over the Counter on the USD vs. JPY (Expiration Date: 12-18-14; | | |
| Strike Price: $83.00; Counterparty: Goldman Sachs Group, Inc.) (I) | 18,750,000 | 3,600,769 |
| | | |
| Put Options 1.2% | | 65,051,031 |
|
| Exchange Traded on Apple CBOE Flex Options (Expiration Date: 7-17-15; | | |
| Strike Price: $95.00) (I) | 239,300 | 2,440,484 |
|
| Exchange Traded on FTSE 100 Index (Expiration Date: 6-17-16; | | |
| Strike Price GBP 6,400.00) (I) | 19,860 | 17,938,350 |
|
| Exchange Traded on STOXX 50 Index (Expiration Date: 6-17-16; | | |
| Strike Price EUR 3,000) (I) | 49,930 | 22,337,517 |
|
| Over the Counter on 20 Year Interest Rate Swap (Expiration Date: 1-6-34; | | |
| Underlying Swap: Pay Fixed 4.000%, receive EURIBOR maturing 1-10-54; | | |
| Counterparty: Morgan Stanley & Company) (I) | 45,000,000 | 2,270,385 |
|
| Over the Counter on 20 Year Interest Rate Swap (Expiration Date: 12-11-33; | | |
| Underlying Swap: Pay Fixed 4.000%, receive EURIBOR maturing 12-14-53; | | |
| Counterparty: Morgan Stanley & Company) (I) | 30,000,000 | 1,518,499 |
|
| Over the Counter on 20 Year Interest Rate Swap (Expiration Date: 12-17-33; | | |
| Underlying Swap: Pay Fixed 4.000%, receive EURIBOR maturing 12-21-53; | | |
| Counterparty: Morgan Stanley & Company) (I) | 10,000,000 | 505,741 |
|
| Over the Counter on 20 Year Interest Rate Swap (Expiration Date: 12-4-33; | | |
| Underlying Swap: Pay Fixed 4.000%, receive EURIBOR maturing 12-7-53; | | |
| Counterparty: Morgan Stanley & Company) (I) | 25,000,000 | 1,266,477 |
|
| Over the Counter on 20 Year Interest Rate Swap (Expiration Date: 3-5-34; | | |
| Underlying Swap: Pay Fixed 4.000%, receive EURIBOR maturing 3-8-54; | | |
| Counterparty: Morgan Stanley & Company) (I) | 30,000,000 | 1,503,137 |
| | |
| See notes to financial statements | Annual report | Global Absolute Return Strategies Fund | 33 |
| | |
| | Notional | Value |
| | | |
| Put Options (continued) | | |
|
| Over the Counter on 20 Year Interest Rate Swap (Expiration Date: 3-6-34; | | |
| Underlying Swap: Pay Fixed 4.000%, receive EURIBOR maturing 3-8-54; | | |
| Counterparty: Citibank N.A.) (I) | 65,000,000 | $3,256,798 |
|
| Over the Counter on 20 Year Interest Rate Swap (Expiration Date: 4-1-34; | | |
| Underlying Swap: Pay Fixed 4.000%, receive EURIBOR maturing 4-5-54; | | |
| Counterparty: Morgan Stanley & Company) (I) | 25,000,000 | 1,248,306 |
|
| Over the Counter on 20 Year Interest Rate Swap (Expiration Date: 4-1-34; | | |
| Underlying Swap: Pay Fixed 4.000%, receive EURIBOR maturing 4-5-54; | | |
| Counterparty: Morgan Stanley & Company) (I) | 35,000,000 | 1,747,629 |
|
| Over the Counter on 20 Year Interest Rate Swap (Expiration Date: 4-11-34; | | |
| Underlying Swap: Pay Fixed 4.000%, receive EURIBOR maturing 4-13-54; | | |
| Counterparty: Morgan Stanley & Company) (I) | 45,000,000 | 2,244,709 |
|
| Over the Counter on 20 Year Interest Rate Swap (Expiration Date: 4-3-34; | | |
| Underlying Swap: Pay Fixed 4.000%, receive EURIBOR maturing 4-5-54; | | |
| Counterparty: Morgan Stanley & Company) (I) | 22,000,000 | 1,098,509 |
|
| Over the Counter on 20 Year Interest Rate Swap (Expiration Date: 4-3-34; | | |
| Underlying Swap: Pay Fixed 4.000%, receive EURIBOR maturing 4-5-54; | | |
| Counterparty: Morgan Stanley & Company) (I) | 12,000,000 | 599,187 |
|
| Over the Counter on 20 Year Interest Rate Swap (Expiration Date: 5-8-34; | | |
| Underlying Swap: Pay Fixed 4.000%, receive EURIBOR maturing 5-10-54; | | |
| Counterparty: Morgan Stanley & Company) (I) | 56,000,000 | 2,784,238 |
|
| Over the Counter on KOSPI 200 Index (Expiration Date: 9-11-14; | | |
| Strike Price: KRW 253.201; Counterparty: BNP Paribas SA) (I) | 146,000,000 | 69,810 |
|
| Over the Counter on KOSPI 200 Index (Expiration Date: 9-11-14; | | |
| Strike Price: KRW 270.372; Counterparty: Morgan Stanley | | |
| Company, Inc.) (I) | 287,195,000 | 1,204,309 |
|
| Over the Counter on KOSPI 200 Index (Expiration Date: 9-11-14; | | |
| Strike Price: KRW 271.216; Counterparty: BNP Paribas SA) (I) | 221,000,000 | 1,016,946 |
| | | | | |
| | | | Maturity | | |
| | Yield (%)* | | date | Par value | Value |
| |
| Short-Term Investments 42.1% | | | | $2,402,828,114 |
|
| (Cost $2,402,690,132) | | | | | |
| | | | | |
| Certificate of Deposit 20.8% | | | | 1,185,096,339 |
|
| ABN AMRO Bank NV | 0.300 | | 10-10-14 | 25,000,000 | 25,003,440 |
|
| ABN AMRO Bank NV | 0.310 | | 08-14-14 | 30,000,000 | 30,001,749 |
|
| ABN AMRO Bank NV | 0.340 | | 09-10-14 | 60,000,000 | 60,010,230 |
|
| Bank of China, Ltd. | 0.350 | | 08-11-14 | 75,000,000 | 75,000,000 |
|
| Barclays Bank PLC | 0.230 | | 10-09-14 | 50,000,000 | 49,999,995 |
|
| Credit Agricole SA | 0.260 | | 09-26-14 | 30,000,000 | 30,004,746 |
|
| Credit Agricole SA | 0.350 | | 10-16-14 | 95,000,000 | 95,022,287 |
|
| Credit Suisse AG | 0.250 | | 11-04-14 | 35,000,000 | 34,999,062 |
|
| Credit Suisse Group AG | 0.210 | | 08-27-14 | 90,000,000 | 90,002,790 |
|
| Deutsche Bank AG | 0.230 | | 08-29-14 | 100,000,000 | 99,986,310 |
|
| Goldman Sachs International | 0.480 | | 10-03-14 | 75,000,000 | 75,044,453 |
|
| ING Bank NV | 0.240 | | 09-02-14 | 50,000,000 | 50,003,205 |
|
| Mizuho Corporate Bank | 0.250 | | 08-12-14 | 100,000,000 | 100,001,800 |
|
| Nationwide Building Society | 0.210 | | 08-15-14 | 65,000,000 | 65,001,755 |
|
| Nationwide Building Society | 0.220 | | 11-17-14 | 50,000,000 | 49,993,945 |
|
| Natixis | 0.260 | | 09-02-14 | 100,000,000 | 99,989,000 |
|
| Natixis | 0.320 | | 11-03-14 | 25,000,000 | 25,004,600 |
| | |
| 34 | Global Absolute Return Strategies Fund | Annual report | See notes to financial statements |
| | | | | |
| | | | Maturity | | |
| | Yield (%)* | | date | Par value | Value |
| | | | | | |
| Certificate of Deposit (continued) | | | | | |
|
| SMFG Preferred Capital | 0.250 | | 08-22-14 | 85,000,000 | $85,004,080 |
|
| Societe Generale SA | 0.700 | | 09-05-14 | 45,000,000 | 45,022,892 |
| | | | | | |
| Commercial Paper 10.5% | | | | | 599,232,639 |
|
| Agence Centrale Organismes | 0.170 | | 08-04-14 | 20,000,000 | 19,999,717 |
|
| Agence Centrale Organismes | 0.212 | | 10-03-14 | 100,000,000 | 99,974,580 |
|
| Barclays Bank PLC | 0.230 | | 10-24-14 | 50,000,000 | 49,977,925 |
|
| Commerzbank AG | 0.280 | | 10-21-14 | 100,000,000 | 99,941,920 |
|
| Dekabank Deutsche Girozentrale | 0.220 | | 10-01-14 | 89,500,000 | 89,473,642 |
|
| Landwirtschaftliche Rentenbank | 0.100 | | 08-26-14 | 65,000,000 | 64,995,487 |
|
| Nomura International PLC | 0.470 | | 11-28-14 | 75,000,000 | 74,879,756 |
|
| NRW.Bank | 0.110 | | 09-04-14 | 100,000,000 | 99,989,612 |
| | | | | | |
| Time Deposits 7.1% | | | | | 405,281,781 |
|
| Abbey National | 0.080 | | 08-05-14 | 120,333,391 | 120,333,391 |
|
| DZ Bank AG | 0.060 | | 08-05-14 | 119,228,671 | 119,228,671 |
|
| KBC Bank NV | 0.100 | | 08-05-14 | 123,996,845 | 123,996,845 |
|
| Sumitomo Mitsui Banking Corp. | 0.060 | | 08-05-14 | 22,219,603 | 22,219,603 |
|
| UBS AG | 0.020 | | 08-05-14 | 19,503,271 | 19,503,271 |
| | | | | | |
| U.S. Government 3.6% | | | | | 204,984,355 |
|
| U.S. Treasury Bill (D) | 0.020 | | 10-23-14 | 20,000,000 | 19,999,200 |
|
| U.S. Treasury Bill (D) | 0.030 | | 10-16-14 | 65,000,000 | 64,997,595 |
|
| U.S. Treasury Bill (D) | 0.031 | | 11-13-14 | 55,000,000 | 54,994,060 |
|
| U.S. Treasury Bill | 0.032 | | 11-20-14 | 65,000,000 | 64,993,500 |
| |
| | | | | | |
| | | | | Par value | Value |
| | | | | | |
| Repurchase Agreement 0.1% | | | | | $8,233,000 |
|
| Repurchase Agreement with State Street Corp. dated 7-31-14 at | | | | |
| 0.000% to be repurchased at $8,233,000 on 8-1-14, collateralized | | |
| by $8,430,000 Federal Home Loan Mortgage Corp., 1.100% due | | |
| 10-5-17 (valued at $8,398,388, including interest) | | | $8,233,000 | 8,233,000 |
| |
| Total investments (Cost $5,293,665,631)† 96.9% | | | $5,523,948,972 |
|
| |
| Other assets and liabilities, net 3.1% | | | | $176,913,018 |
|
| |
| Total net assets 100.0% | | | | $5,700,861,990 |
|
The percentage shown for each investment category is the total value of that category as a percentage of the net assets of the fund.
^ All par values are denominated in U.S. dollars unless otherwise indicated.
| |
| Currency Abbreviations |
| BRL | Brazilian Real |
| EUR | Euro |
| GBP | Pound Sterling |
| HKD | Hong Kong Dollar |
| JPY | Japanese Yen |
| KRW | Korean Won |
| MXN | Mexican Peso |
| | |
| See notes to financial statements | Annual report | Global Absolute Return Strategies Fund | 35 |
Notes to Schedule of Investments
| |
| ADR | American Depositary Receipts |
| EURIBOR | Euro Interbank Offered Rate |
| GDR | Global Depositary Receipt |
| LIBOR | London Interbank Offered Rate |
| PIK | Paid-in-kind |
(D) A portion of this security is segregated at the custodian as collateral pursuant to certain derivative instrument contracts.
(I) Non-income producing security.
(P) Variable rate obligation. The coupon rate shown represents the rate at period end.
(Q) Perpetual bonds have no stated maturity date. Date shown as maturity date is next call date.
(S) These securities are exempt from registration under Rule 144A of the Securities Act of 1933. Such securities may be resold, normally to qualified institutional buyers, in transactions exempt from registration.
* Yield represents either the annualized yield at the date of purchase, the stated coupon rate or, for floating rate securities, the rate at period end.
† At 7-31-14, the aggregate cost of investment securities for federal income tax purposes was $5,306,405,818. Net unrealized appreciation aggregated $217,543,154, of which $271,039,130 related to appreciated investment securities and $53,495,976 related to depreciated investment securities.
The fund had the following portfolio allocation as a percentage of net assets on 7-31-14:
| | | | | | | |
| Financials | 13.2% | | | | | | |
| Foreign Government Obligations | 7.5% | | | | | | |
| Energy | 5.4% | | | | | | |
| Industrials | 5.1% | | | | | | |
| Materials | 5.0% | | | | | | |
| Consumer Discretionary | 4.3% | | | | | | |
| Health Care | 3.5% | | | | | | |
| Information Technology | 3.3% | | | | | | |
| Consumer Staples | 2.3% | | | | | | |
| Purchased Options | 2.0% | | | | | | |
| Telecommunication Services | 1.9% | | | | | | |
| Utilities | 1.3% | | | | | | |
| Short-Term Investments & Other | 45.2% | | | | | | |
| |
| | | | | | |
| Total | 100.0% | | | | | | |
| | |
| 36 | Global Absolute Return Strategies Fund | Annual report | See notes to financial statements |
FINANCIAL STATEMENTS
Financial statements
Statement of assets and liabilities 7-31-14
This Statement of assets and liabilities is the fund’s balance sheet. It shows the value of what the fund owns, is due and owes. You’ll also find the net asset value and the maximum offering price per share.
| |
| Assets | |
|
| Investments, at value (Cost $5,293,665,631) | $5,523,948,972 |
| Cash | 182,688 |
| Foreign currency, at value (Cost $17,486,867) | 17,429,747 |
| Cash held at broker for futures contracts | 100,276,150 |
| Receivable for investments sold | 36,756,022 |
| Receivable for fund shares sold | 19,045,488 |
| Receivable for forward foreign currency exchange contracts | 68,408,679 |
| Dividends and interest receivable | 16,727,982 |
| Swap contracts, at value | 24,376,310 |
| Receivable for futures variation margin | 15,044,423 |
| Receivable due from advisor | 1,803 |
| Other receivables and prepaid expenses | 139,989 |
| | |
| Total assets | 5,822,338,253 |
| |
| Liabilities | |
|
| Payable for investments purchased | 51,109,034 |
| Payable for forward foreign currency exchange contracts | 17,748,677 |
| Payable for fund shares repurchased | 12,739,457 |
| Written options, at value (premium received $11,801,368) | 6,847,737 |
| Swap contracts, at value (including net unamortized upfront | |
| payment of $1,032,324) | 30,838,128 |
| Payable for exchange cleared swaps | 67,761 |
| Payable to affiliates | |
| Accounting and legal services fees | 133,121 |
| Transfer agent fees | 474,004 |
| Distribution and service fees | 946 |
| Other liabilities and accrued expenses | 1,517,398 |
| | |
| Total liabilities | 121,476,263 |
| | |
| Net assets | $5,700,861,990 |
| |
| Net assets consist of | |
|
| Paid-in capital | $5,484,786,781 |
| Accumulated distribution in excess of net investment income | (15,346,716) |
| Accumulated net realized gain (loss) on investments, futures contracts, | |
| options written and swap agreements | (147,678,752) |
| Net unrealized appreciation (depreciation) on investments, futures | |
| contracts, options written, translation of assets and liabilities in foreign | |
| currencies and swap agreements | 379,100,677 |
| | |
| Net assets | $5,700,861,990 |
| | |
| See notes to financial statements | Annual report | Global Absolute Return Strategies Fund | 37 |
FINANCIAL STATEMENTSStatement of assets and liabilities (continued)
| |
| Net asset value per share | |
|
| Based on net asset values and shares outstanding — the fund has an | |
| unlimited number of shares authorized with no par value | |
| Class A ($971,173,458 ÷ 86,289,422 shares)1 | $11.25 |
| Class C ($202,737,626 ÷ 18,078,683 shares) | $11.21 |
| Class I ($3,495,238,568 ÷ 309,716,184 shares) | $11.29 |
| Class R2 ($1,107,831 ÷ 98,565 shares) | $11.24 |
| Class R6 ($196,043,579 ÷ 17,368,406 shares) | $11.29 |
| Class NAV ($834,560,928 ÷ 73,987,286 shares) | $11.28 |
| |
| Maximum offering price per share2 | |
|
| Class A (net asset value per share ÷ 95%) | $11.84 |
1 Redemption price per share is equal to net asset value less any applicable contingent deferred sales charge.
2 On single retail sales of less than $50,000. On sales of $50,000 or more and on group sales the offering price is reduced.
| | |
| 38 | Global Absolute Return Strategies Fund | Annual report | See notes to financial statements |
FINANCIAL STATEMENTS
Statement of operations For the year ended 7-31-14
This Statement of operations summarizes the fund’s investment income earned and expenses incurred in operating the fund. It also shows net gains (losses) for the period stated.
| |
| Investment income | |
|
| Interest | $51,308,329 |
| Dividends | 47,867,236 |
| Less foreign taxes withheld | (4,144,005) |
| | |
| Total investment income | 95,031,560 |
| |
| Expenses | |
|
| Investment management fees | 56,314,284 |
| Distribution and service fees | 5,736,860 |
| Accounting and legal services fees | 603,834 |
| Transfer agent fees | 4,935,204 |
| Trustees’ fees | 62,435 |
| State registration fees | 226,113 |
| Printing and postage | 300,485 |
| Professional fees | 219,677 |
| Custodian fees | 2,665,471 |
| Registration and filing fees | 252,463 |
| Expense recapture | 7,974 |
| Other | 56,006 |
| | |
| Total expenses | 71,380,806 |
| Less expense reductions | (347,103) |
| | |
| Net expenses | 71,033,703 |
| | |
| Net investment income | 23,997,857 |
| |
| Realized and unrealized gain (loss) | |
|
| Net realized gain (loss) on | |
| Investments in unaffiliated issuers and foreign currency transactions | 3,160,887 |
| Futures contracts | (108,627,485) |
| Written options | 19,822,606 |
| Swap contracts | (29,620,830) |
| | |
| | (115,264,822) |
| Change in net unrealized appreciation (depreciation) of | |
| Investments in unaffiliated issuers and translation of assets and liabilities in | |
| foreign currencies | 192,000,924 |
| Futures contracts | 71,819,289 |
| Written options | 14,337,677 |
| Swap contracts | 52,871,790 |
| | |
| | 331,029,680 |
| | |
| Net realized and unrealized gain | 215,764,858 |
| | |
| Increase in net assets from operations | $239,762,715 |
| | |
| See notes to financial statements | Annual report | Global Absolute Return Strategies Fund | 39 |
FINANCIAL STATEMENTSStatements of changes in net assets
These Statements of changes in net assets show how the value of the fund’s net assets has changed during the last two periods. The difference reflects earnings less expenses, any investment gains and losses, distributions, if any, paid to shareholders and the net of fund share transactions.
| | |
| | Year | Year |
| | ended | ended |
| | 7-31-14 | 7-31-13 |
|
| |
| Increase (decrease) in net assets | | |
|
| From operations | | |
| Net investment income | $23,997,857 | $10,086,633 |
| Net realized loss | (115,264,822) | (20,510,125) |
| Change in net unrealized appreciation (depreciation) | 331,029,680 | 47,543,622 |
| | | |
| Increase in net assets resulting from operations | 239,762,715 | 37,120,130 |
| | | |
| Distributions to shareholders | | |
| From net investment income | | |
| Class A | (14,497,640) | (950,792) |
| Class C | (777,764) | — |
| Class I | (32,086,254) | (3,500,080) |
| Class R2 | (13,169) | (4) |
| Class R6 | (778,533) | (19,029) |
| Class NAV | (10,990,010) | (3,794,422) |
| From net realized gain | | |
| Class A | — | (3,171,454) |
| Class C | — | (195,118) |
| Class I | — | (4,218,719) |
| Class R2 | — | (848) |
| Class R6 | — | (27,087) |
| Class NAV | — | (3,753,256) |
| | | |
| Total distributions | (59,143,370) | (19,630,809) |
| | | |
| From fund share transactions | 1,760,967,189 | 2,902,408,638 |
| | | |
| Total increase | 1,941,586,534 | 2,919,897,959 |
| |
| Net assets | | |
|
| Beginning of year | 3,759,275,456 | 839,377,497 |
| | | |
| End of year | $5,700,861,990 | $3,759,275,456 |
| | | |
| Undistributed (accumulated distribution in excess of) net | | |
| investment income | ($15,346,716) | $47,158,133 |
| | |
| 40 | Global Absolute Return Strategies Fund | Annual report | See notes to financial statements |
Financial highlights
The Financial highlights show how the fund’s net asset value for a share has changed during the period.
| | | | | | |
| CLASS A SHARES Period ended | | | | 7-31-14 | 7-31-13 | 7-31-121 |
| |
| Per share operating performance | | | | | | |
|
| Net asset value, beginning of period | | | | $10.84 | $10.59 | $10.00 |
| Net investment income2 | | | | 0.03 | 0.02 | —3 |
| Net realized and unrealized gain on investments | | | | 0.50 | 0.33 | 0.59 |
| Total from investment operations | | | | 0.53 | 0.35 | 0.59 |
| Less distributions | | | | | | |
| From net investment income | | | | (0.12) | (0.03) | — |
| From net realized gain | | | | — | (0.07) | — |
| Total distributions | | | | (0.12) | (0.10) | — |
| Net asset value, end of period | | | | $11.25 | $10.84 | $10.59 |
| Total return (%)4,5 | | | | 4.94 | 3.28 | 5.906 |
| |
| Ratios and supplemental data | | | | | | |
|
| Net assets, end of period (in millions) | | | | $971 | $1,161 | $175 |
| Ratios (as a percentage of average net assets): | | | | | | |
| Expenses before reductions | | | | 1.72 | 1.80 | 1.977 |
| Expenses including reductions | | | | 1.71 | 1.80 | 1.957 |
| Net investment income (loss) | | | | 0.27 | 0.18 | (0.01)7 |
| Portfolio turnover (%) | | | | 56 | 106 | 33 |
1 Period from 12-19-11 (commencement of operations) to 7-31-12.
2 Based on average daily shares outstanding.
3 Less than $0.005 per share.
4 Does not reflect the effect of sales charges, if any.
5 Total returns would have been lower had certain expenses not been reduced during the applicable periods.
6 Not annualized.
7 Annualized.
| | | | | | |
| CLASS C SHARES Period ended | | | | | 7-31-14 | 7-31-131 |
| |
| Per share operating performance | | | | | | |
|
| Net asset value, beginning of period | | | | | $10.80 | $10.61 |
| Net investment loss2 | | | | | (0.05) | (0.06) |
| Net realized and unrealized gain on investments | | | | | 0.51 | 0.32 |
| Total from investment operations | | | | | 0.46 | 0.26 |
| Less distributions | | | | | | |
| From net investment income | | | | | (0.05) | — |
| From net realized gain | | | | | — | (0.07) |
| Total distributions | | | | | (0.05) | (0.07) |
| Net asset value, end of period | | | | | $11.21 | $10.80 |
| Total return (%)3,4 | | | | | 4.24 | 2.50 |
| |
| Ratios and supplemental data | | | | | | |
|
| Net assets, end of period (in millions) | | | | | $203 | $146 |
| Ratios (as a percentage of average net assets): | | | | | | |
| Expenses before reductions | | | | | 2.42 | 2.53 |
| Expenses including reductions | | | | | 2.41 | 2.52 |
| Net investment loss | | | | | (0.43) | (0.55) |
| Portfolio turnover (%) | | | | | 56 | 106 |
1 The inception date for Class C shares is 8-1-12.
2 Based on average daily shares outstanding.
3 Does not reflect the effect of sales charges, if any.
4 Total returns would have been lower had certain expenses not been reduced during the applicable periods.
| | |
| See notes to financial statements | Annual report | Global Absolute Return Strategies Fund | 41 |
| | | | | | |
| CLASS I SHARES Period ended | | | | 7-31-14 | 7-31-13 | 7-31-121 |
| |
| Per share operating performance | | | | | | |
|
| Net asset value, beginning of period | | | | $10.87 | $10.62 | $10.00 |
| Net investment income2 | | | | 0.07 | 0.06 | 0.04 |
| Net realized and unrealized gain (loss) on investments | | | | 0.51 | 0.33 | 0.58 |
| Total from investment operations | | | | 0.58 | 0.39 | 0.62 |
| Less distributions | | | | | | |
| From net investment income | | | | (0.16) | (0.07) | — |
| From net realized gain | | | | — | (0.07) | — |
| Total distributions | | | | (0.16) | (0.14) | — |
| Net asset value, end of period | | | | $11.29 | $10.87 | $10.62 |
| Total return (%)3 | | | | 5.37 | 3.65 | 6.204 |
| |
| Ratios and supplemental data | | | | | | |
|
| Net assets, end of period (in millions) | | | | $3,495 | $1,740 | $167 |
| Ratios (as a percentage of average net assets): | | | | | | |
| Expenses before reductions | | | | 1.39 | 1.43 | 1.605 |
| Expenses including reductions | | | | 1.38 | 1.42 | 1.595 |
| Net investment income | | | | 0.63 | 0.58 | 0.585 |
| Portfolio turnover (%) | | | | 56 | 106 | 33 |
1 Period from 12-19-11 (commencement of operations) to 7-31-12.
2 Based on average daily shares outstanding.
3 Total returns would have been lower had certain expenses not been reduced during the applicable periods.
4 Not annualized.
5 Annualized.
| | | | | | |
| CLASS R2 SHARES Period ended | | | | 7-31-14 | 7-31-13 | 7-31-121 |
| |
| Per share operating performance | | | | | | |
|
| Net asset value, beginning of period | | | | $10.83 | $10.58 | $10.67 |
| Net investment income2 | | | | —3 | —3 | 0.01 |
| Net realized and unrealized gain (loss) on investments | | | | 0.50 | 0.32 | (0.10) |
| Total from investment operations | | | | 0.50 | 0.32 | (0.09) |
| Less distributions | | | | | | |
| From net investment income | | | | (0.09) | — | — |
| From net realized gain | | | | — | (0.07) | — |
| Total distributions | | | | (0.09) | (0.07) | — |
| Net asset value, end of period | | | | $11.24 | $10.83 | $10.58 |
| Total return (%)4 | | | | 4.67 | 3.08 | (0.84)5 |
| |
| Ratios and supplemental data | | | | | | |
|
| Net assets, end of period (in millions) | | | | $1 | $1 | —6 |
| Ratios (as a percentage of average net assets): | | | | | | |
| Expenses before reductions | | | | 2.85 | 8.88 | 18.317 |
| Expenses including reductions | | | | 2.00 | 2.00 | 2.007 |
| Net investment income (loss) | | | | 0.02 | (0.01) | 0.197 |
| Portfolio turnover (%) | | | | 56 | 106 | 33 |
1 The inception date for Class R2 shares is 3-1-12.
2 Based on average daily shares outstanding.
3 Less than $0.005 per share.
4 Total returns would have been lower had certain expenses not been reduced during the applicable periods.
5 Not annualized.
6 Less than $500,000.
7 Annualized.
| | |
| 42 | Global Absolute Return Strategies Fund | Annual report | See notes to financial statements |
| | | | | | |
| CLASS R6 SHARES Period ended | | | | 7-31-14 | 7-31-13 | 7-31-121 |
| |
| Per share operating performance | | | | | | |
|
| Net asset value, beginning of period | | | | $10.86 | $10.60 | $10.67 |
| Net investment income2 | | | | 0.09 | 0.05 | 0.03 |
| Net realized and unrealized gain (loss) on investments | | | | 0.50 | 0.34 | (0.10) |
| Total from investment operations | | | | 0.59 | 0.39 | (0.07) |
| Less distributions | | | | | | |
| From net investment income | | | | (0.16) | (0.06) | — |
| From net realized gain | | | | — | (0.07) | — |
| Total distributions | | | | (0.16) | (0.13) | — |
| Net asset value, end of period | | | | $11.29 | $10.86 | $10.60 |
| Total return (%)3 | | | | 5.44 | 3.66 | (0.66)4 |
| |
| Ratios and supplemental data | | | | | | |
|
| Net assets, end of period (in millions) | | | | $196 | $39 | —5 |
| Ratios (as a percentage of average net assets): | | | | | | |
| Expenses before reductions | | | | 1.33 | 1.51 | 18.046 |
| Expenses including reductions | | | | 1.28 | 1.50 | 1.506 |
| Net investment income | | | | 0.78 | 0.51 | 0.696 |
| Portfolio turnover (%) | | | | 56 | 106 | 33 |
1 The inception date for Class R6 shares is 3-1-12.
2 Based on average daily shares outstanding.
3 Total returns would have been lower had certain expenses not been reduced during the applicable periods.
4 Not annualized.
5 Less than $500,000.
6 Annualized.
| | | | | | |
| CLASS NAV SHARES Period ended | | | | 7-31-14 | 7-31-13 | 7-31-121 |
| |
| Per share operating performance | | | | | | |
|
| Net asset value, beginning of period | | | | $10.86 | $10.61 | $10.00 |
| Net investment income2 | | | | 0.08 | 0.08 | 0.04 |
| Net realized and unrealized gain on investments | | | | 0.51 | 0.32 | 0.57 |
| Total from investment operations | | | | 0.59 | 0.40 | 0.61 |
| Less distributions | | | | | | |
| From net investment income | | | | (0.17) | (0.08) | — |
| From net realized gain | | | | — | (0.07) | — |
| Total distributions | | | | (0.17) | (0.15) | — |
| Net asset value, end of period | | | | $11.28 | $10.86 | $10.61 |
| Total return (%)3 | | | | 5.50 | 3.78 | 6.104 |
| |
| Ratios and supplemental data | | | | | | |
|
| Net assets, end of period (in millions) | | | | $835 | $673 | $497 |
| Ratios (as a percentage of average net assets): | | | | | | |
| Expenses before reductions | | | | 1.26 | 1.29 | 1.435 |
| Expenses including reductions | | | | 1.26 | 1.29 | 1.435 |
| Net investment income | | | | 0.72 | 0.73 | 0.695 |
| Portfolio turnover (%) | | | | 56 | 106 | 33 |
1 Period from 12-19-11 (commencement of operations) to 7-31-12.
2 Based on average daily shares outstanding.
3 Total returns would have been lower had certain expenses not been reduced during the applicable periods.
4 Not annualized.
5 Annualized.
| | |
| See notes to financial statements | Annual report | Global Absolute Return Strategies Fund | 43 |
Notes to financial statements
Note 1 — Organization
John Hancock Global Absolute Return Strategies Fund (the fund) is a series of John Hancock Funds II (the Trust), an open-end management investment company organized as a Massachusetts business trust and registered under the Investment Company Act of 1940, as amended (the 1940 Act). The investment objective of the fund is to seek long term total return.
The fund may offer multiple classes of shares. The shares currently offered are detailed in the Statement of assets and liabilities. Class A and Class C shares are offered to all investors. Class I shares are offered to institutions and certain investors. Class R2 shares are available only to certain retirement plans. Class R6 shares are available only to certain retirement plans, institutions and other investors. Class NAV shares are offered to John Hancock affiliated funds of funds and certain 529 plans. Shareholders of each class have exclusive voting rights to matters that affect that class. The distribution and service fees, if any, and transfer agent fees, state registration fees and printing and postage for each class may differ.
Note 2 — Significant accounting policies
The financial statements have been prepared in conformity with accounting principles generally accepted in the United States of America (US GAAP), which require management to make certain estimates and assumptions as of the date of the financial statements. Actual results could differ from those estimates and those differences could be significant. The fund intends to qualify as an investment company under Topic 946 of Accounting Standards Codification of US GAAP.
Events or transactions occurring after the end of the fiscal period through the date that the financial statements were issued have been evaluated in the preparation of the financial statements. The following summarizes the significant accounting policies of the fund:
Security valuation. Investments are stated at value as of the close of regular trading on the New York Stock Exchange (NYSE), normally at 4:00 P.M., Eastern Time (ET). In order to value the securities, the fund uses the following valuation techniques: Equity securities held by the fund are valued at the last sale price or official closing price on the exchange where the security was acquired or most likely will be sold. In the event there were no sales during the day or closing prices are not available, the securities are valued using the last available bid price. Debt obligations are valued based on the evaluated prices provided by an independent pricing vendor or from broker-dealers. Independent pricing vendors utilize matrix pricing which takes into account factors such as institutional-size trading in similar groups of securities, yield, quality, coupon rate, maturity, type of issue, trading characteristics and other market data, as well as broker supplied prices. Options listed on an exchange are valued at the mean of the most recent bid and ask prices from the exchange where the option was acquired or most likely will be sold. Swaps and unlisted options are valued using evaluated prices obtained from an independent pricing vendor. Futures contracts are valued at settlement prices, which are the official closing prices published by the exchange on which they trade. Foreign index futures that trade in the electronic trading market subsequent to the close of regular trading and have sufficient liquidity will be valued at the last traded price in the electronic trading market as of 4:00 p.m. ET. Foreign securities and currencies, including forward foreign currency contracts, are valued in U.S. dollars, based on foreign currency exchange rates supplied by an independent pricing vendor. Securities that trade only in the over-the-counter (OTC) market are valued using bid prices. Certain short-term securities with maturities of 60 days or less at the time of purchase are valued at amortized cost.
| |
| 44 | Global Absolute Return Strategies Fund | Annual report |
Other portfolio securities and assets, for which reliable market quotations are not readily available, are valued at fair value as determined in good faith by the fund’s Pricing Committee following procedures established by the Board of Trustees. The frequency with which these fair valuation procedures are used cannot be predicted and fair value of securities may differ significantly from the value that would have been used had a ready market for such securities existed. Trading in foreign securities may be completed before the daily close of trading on the NYSE. Significant events at the issuer or market level may affect the values of securities between the time when the valuation of the securities is generally determined and the close of the NYSE. If a significant event occurs, these securities may be fair valued, as determined in good faith by the fund’s Pricing Committee, following procedures established by the Board of Trustees. The fund uses fair value adjustment factors provided by an independent pricing vendor to value certain foreign securities in order to adjust for events that may occur between the close of foreign exchanges or markets and the close of the NYSE.
The fund uses a three-tier hierarchy to prioritize the pricing assumptions, referred to as inputs, used in valuation techniques to measure fair value. Level 1 includes securities valued using quoted prices in active markets for identical securities. Level 2 includes securities valued using other significant observable inputs. Observable inputs may include quoted prices for similar securities, interest rates, prepayment speeds and credit risk. Prices for securities valued using these inputs are received from independent pricing vendors and brokers and are based on an evaluation of the inputs described. Level 3 includes securities valued using significant unobservable inputs when market prices are not readily available or reliable, including the fund’s own assumptions in determining the fair value of investments. Factors used in determining value may include market or issuer specific events or trends, changes in interest rates and credit quality. The inputs or methodology used for valuing securities are not necessarily an indication of the risks associated with investing in those securities. Changes in valuation techniques may result in transfers into or out of an assigned level within the disclosure hierarchy.
The following is a summary of the values by input classification of the Fund’s investments as of July 31, 2014, by major security category or type:
| | | | |
| | | | | LEVEL 3 |
| | | | LEVEL 2 | SIGNIFICANT |
| | TOTAL MARKET | LEVEL 1 | SIGNIFICANT | UNOBSERVABLE |
| | VALUE AT 7-31-14 | QUOTED PRICE | OBSERVABLE INPUTS | INPUTS |
|
| Corporate Bonds | $573,101,872 | — | $573,101,872 | — |
| Capital Preferred Securities | 1,111,041 | — | 1,111,041 | — |
| Foreign Government | | | | |
| Obligations | 426,455,921 | — | 426,455,921 | — |
| Common Stocks | 2,008,960,504 | $747,210,468 | 1,261,750,036 | — |
| Warrants | 17,920 | 17,920 | — | — |
| Purchased Options | 111,473,600 | 60,760,150 | 50,713,450 | — |
| Short-Term Investments | 2,402,828,114 | — | 2,402,828,114 | — |
| |
|
| Total Investments in | | | | |
| Securities | $5,523,948,972 | $807,988,538 | $4,715,960,434 | — |
| Other Financial | | | | |
| Instruments: | | | | |
| Futures | $40,976,655 | $42,881,310 | ($1,904,655) | — |
| Forward Foreign Currency | | | | |
| Contracts | $50,660,002 | — | $50,660,002 | — |
| Written Options | ($6,847,737) | — | ($6,847,737) | — |
| Interest Rate Swaps | $41,340,145 | — | $41,340,145 | — |
| Variance Swaps | ($10,779,281) | — | ($10,779,281) | — |
| Inflation Swaps | $5,636,330 | — | $5,636,330 | — |
| |
| Annual report | Global Absolute Return Strategies Fund | 45 |
Repurchase agreements. The fund may enter into repurchase agreements. When the fund enters into a repurchase agreement, it receives collateral that is held in a segregated account by the fund’s custodian. The collateral amount is marked-to-market and monitored on a daily basis to ensure that the collateral held is in an amount not less than the principal amount of the repurchase agreement plus any accrued interest. Collateral received by the fund for repurchase agreements is disclosed in the Fund’s investments as part of the caption related to the repurchase agreement.
Repurchase agreements are typically governed by the terms and conditions of the Master Repurchase Agreement and/or Global Master Repurchase Agreement (collectively, MRA). Upon an event of default, the non-defaulting party may close out all transactions traded under the MRA and net amounts owed. Absent an event of default, the MRA does not result in an offset of the reported amounts of assets and liabilities in the Statement of assets and liabilities. In the event of a default by the counterparty, realization of the collateral proceeds could be delayed, during which time the collateral value may decline or the counterparty may have insufficient assets to pay back claims resulting from close-out of the transactions.
Security transactions and related investment income. Investment security transactions are accounted for on a trade date plus one basis for daily net asset value calculations. However, for financial reporting purposes, investment transactions are reported on trade date. Interest income is accrued as earned. Interest income includes coupon interest and amortization/accretion of premiums/discounts on debt securities. Debt obligations may be placed in a non-accrual status and related interest income may be reduced by stopping current accruals and writing off interest receivable when the collection of all or a portion of interest has become doubtful. Dividend income is recorded on the ex-date, except for dividends of foreign securities where the dividend may not be known until after the ex-date. In those cases, dividend income, net of withholding taxes, is recorded when the fund becomes aware of the dividends. Foreign taxes are provided for based on the fund’s understanding of the tax rules and rates that exist in the foreign markets in which it invests. Gains and losses on securities sold are determined on the basis of identified cost and may include proceeds from litigation.
Foreign currency translation. Assets, including investments and liabilities denominated in foreign currencies, are translated into U.S. dollar values each day at the prevailing exchange rate. Purchases and sales of securities, income and expenses are translated into U.S. dollars at the prevailing exchange rate on the date of the transaction. The effect of changes in foreign currency exchange rates on the value of securities is reflected as a component of the realized and unrealized gains (losses) on investments.
Funds that invest internationally generally carry more risk than funds that invest strictly in U.S. securities. These risks are heightened for investments in emerging markets. Risks can result from differences in economic and political conditions, regulations, market practices (including higher transaction costs), accounting standards and other factors. Foreign investments are also subject to a decline in the value of a foreign currency versus the U.S. dollar, which reduces the dollar value of securities denominated in that currency.
Foreign taxes. The fund may be subject to withholding tax on income and/or capital gains or repatriation taxes imposed by certain countries in which the fund invests. Taxes are accrued based upon investment income, realized gains or unrealized appreciation.
Line of credit. The fund may borrow from banks for temporary or emergency purposes, including meeting redemption requests that otherwise might require the untimely sale of securities. Pursuant to the fund’s custodian agreement, the custodian may loan money to the fund to make properly authorized payments. The fund is obligated to repay the custodian for any overdraft, including any related costs or expenses. The custodian may have a lien, security interest or security entitlement in
| |
| 46 | Global Absolute Return Strategies Fund | Annual report |
any fund property that is not otherwise segregated or pledged, to the maximum extent permitted by law, to the extent of any overdraft.
In addition, the fund and other affiliated funds have entered into an agreement with Citibank N.A. that enables them to potentially participate in a $300 million unsecured committed line of credit. A commitment fee, payable at the end of each calendar quarter, based on the average daily unused portion of the line of credit, is charged to each participating fund on a pro rata basis and is reflected in other expenses on the Statement of operations. Commitment fees for the year ended July 31, 2014 were $2,250.
During the year ended July 31, 2014, the fund had average borrowings from the line of credit and overdrafts of $124,775 at an average interest rate of 0.97%. Interest expense incurred by the fund amounted to $1,210 and is included in other expenses on the Statement of operations. There were no outstanding borrowings by the fund at July 31, 2014.
Expenses. Within the John Hancock group of funds complex, expenses that are directly attributable to an individual fund are allocated to such fund. Expenses that are not readily attributable to a specific fund are allocated among all funds in an equitable manner, taking into consideration, among other things, the nature and type of expense and the fund’s relative net assets. Expense estimates are accrued in the period to which they relate and adjustments are made when actual amounts are known.
Class allocations. Income, common expenses and realized and unrealized gains (losses) are determined at the fund level and allocated daily to each class of shares based on the net assets of the class. Class-specific expenses, such as distribution and service fees, if any, transfer agent fees, state registration fees and printing and postage, for all classes, are calculated daily at the class level based on the appropriate net assets of each class and the specific expense rates applicable to each class.
Federal income taxes. The fund intends to continue to qualify as a regulated investment company by complying with the applicable provisions of the Internal Revenue Code and will not be subject to federal income tax on taxable income that is distributed to shareholders. Therefore, no federal income tax provision is required.
Under the Regulated Investment Company Modernization Act of 2010, the fund is permitted to carry forward capital losses for an unlimited period. Capital losses that are carried forward will retain their character as either short-term or long-term capital losses rather than being considered all short-term as under previous law.
For federal income tax purposes, as of July 31, 2014, the fund has a short-term loss carryforward of $95,323,896 available to offset future net realized capital gains, which do not expire.
As of July 31, 2014, the fund had no uncertain tax positions that would require financial statement recognition, derecognition or disclosure. The fund’s federal tax returns are subject to examination by the Internal Revenue Service for a period of three years.
Distribution of income and gains. Distributions to shareholders from net investment income and net realized gains, if any, are recorded on the ex-date. The fund generally declares and pays dividends and capital gain distributions, if any, annually.
The tax character of distributions for the years ended July 31, 2014 and 2013 was as follows:
| | | | | | |
| | JULY 31, 2014 | JULY 31, 2013 | | | | |
| | | | |
| Ordinary Income | $59,143,370 | $15,292,862 | | | | |
| Long-Term Capital Gain | — | 4,337,947 | | | | |
| |
| | | | |
| Total | $59,143,370 | $19,630,809 | | | | |
| |
| Annual report | Global Absolute Return Strategies Fund | 47 |
Distributions paid by the fund with respect to each class of shares are calculated in the same manner, at the same time and in the same amount, except for the effect of class level expenses that may be applied differently to each class.
As of July 31, 2014, the components of distributable earnings on a tax basis consisted of $40,272,962 of undistributed ordinary income.
Such distributions, on a tax basis, are determined in conformity with income tax regulations, which may differ from US GAAP. Distributions in excess of tax basis earnings and profits, if any, are reported in the fund’s financial statements as a return of capital.
Capital accounts within the financial statements are adjusted for permanent book-tax differences. These adjustments have no impact on net assets or the results of operations. Temporary book-tax differences, if any, will reverse in a subsequent period. Book-tax differences are primarily attributable to foreign currency transactions, derivative transactions, amortization and accretion on debt securities, wash sale loss deferrals and passive foreign investment companies.
Note 3 — Derivative Instruments
The fund may invest in derivatives in order to meet its investment objective. Derivatives include a variety of different instruments that may be traded in the OTC market, on a regulated exchange or through a clearing facility. The risks in using derivatives vary depending upon the structure of the instruments, including the use of leverage, optionality, the liquidity or lack of liquidity of the contract, the creditworthiness of the counterparty or clearing organization and the volatility of the position. Some derivatives involve risks that are potentially greater than the risks associated with investing directly in the referenced securities or other referenced underlying instrument. Specifically, the fund is exposed to the risk that the counterparty to an OTC derivatives contract will be unable or unwilling to make timely settlement payments or otherwise honor its obligations. OTC derivatives transactions typically can only be closed out with the other party to the transaction.
Forward foreign currency contracts, certain options and certain swaps are typically traded through the OTC market. Certain forwards, options and swaps are regulated by the Commodity Futures Trading Commission (the CFTC) as swaps. Derivative counterparty risk is managed through an ongoing evaluation of the creditworthiness of all potential counterparties and, if applicable, designated clearing organizations. The fund attempts to reduce its exposure to counterparty risk for derivatives traded in the OTC market, whenever possible, by entering into an International Swaps and Derivatives Association (ISDA) Master Agreement with each of its OTC counterparties. The ISDA gives each party to the agreement the right to terminate all transactions traded under the agreement if there is certain deterioration in the credit quality or contractual default of the other party, as defined in the ISDA. Upon an event of default or a termination of the ISDA, the non-defaulting party has the right to close out all transactions and to net amounts owed.
As defined by the ISDA, the fund may have collateral agreements with certain counterparties to mitigate counterparty risk on OTC derivatives. Subject to established minimum levels, collateral for OTC transactions is generally determined based on the net aggregate unrealized gain or loss on contracts with a particular counterparty. Collateral pledged to the fund is held in a segregated account by a third-party agent or held by the custodian bank for the benefit of the fund and can be in the form of cash or debt securities issued by the U.S. government or related agencies; collateral posted by the portfolio for OTC transactions is held in a segregated account at the fund’s custodian and is noted in the accompanying Fund’s investments, or if cash is posted, on the Statement of assets and liabilities. The fund’s maximum risk of loss due to counterparty risk is equal to the asset value of outstanding contracts offset by collateral received.
| |
| 48 | Global Absolute Return Strategies Fund | Annual report |
Futures, certain options and cleared swaps are traded or cleared on an exchange or central clearinghouse. Exchange-traded or cleared transactions generally present less counterparty risk to a fund than OTC transactions. The exchange or clearinghouse stands between the fund and the broker to the contract and therefore, credit risk is generally limited to the failure of the exchange or clearinghouse and the clearing member.
Cleared swap contracts are subject to clearing house rules, including initial and variation margin requirements, daily settlement of obligations and the clearinghouse guarantee of payments to the broker. There is, however, still counterparty risk due to the potential insolvency of the broker with respect to any margin held in the brokers’ customer accounts. While clearing members are required to segregate customer assets from their own assets, in the event of insolvency, there may be a shortfall in the amount of margin held by the broker for its clients. Collateral or margin requirements for exchange-traded or cleared derivatives are set by the broker or applicable clearinghouse. Margin for exchange-traded and exchange-cleared transactions are detailed in the Statement of assets and liabilities as Cash held at broker for futures contracts and Payable for exchange-cleared swaps, respectively. Securities pledged by the fund for exchange-traded and cleared transactions, if any, are identified in the Fund’s investments.
Futures. A futures contract is a contractual agreement to buy or sell a particular currency or financial instrument at a pre-determined price in the future. Risks related to the use of futures contracts include possible illiquidity of the futures markets, contract prices that can be highly volatile and imperfectly correlated to movements in the underlying financial instrument and potential losses in excess of the amounts recognized on the Statement of assets and liabilities. Use of long futures contracts subjects the fund to the risk of loss up to the notional value of the futures contracts. Use of short futures contracts subjects the fund to unlimited risk of loss.
Upon entering into a futures contract, the fund is required to deposit initial margin with the broker in the form of cash or securities. The amount of required margin is generally based on a percentage of the contract value; this amount is the initial margin for the trade. The margin deposit must then be maintained at the established level over the life of the contract. Futures collateral receivable/payable is included on the Statement of assets and liabilities. Futures contracts are marked-to-market daily and an appropriate payable or receivable for the change in value (variation margin) and unrealized gain or loss is recorded by the fund. When the contract is closed, the fund records a realized gain or loss equal to the difference between the value of the contract at the time it was opened and the value at the time it was closed.
The fund used futures contracts to manage duration of the fund, manage against anticipated interest rate changes and changes in securities markets, gain exposure to certain securities markets and treasuries market, and maintain diversity and liquidity of the fund. During the year ended July 31, 2014 the fund held futures contracts with total notional values ranging from approximately $2.0 billion to $3.0 billion, as measured at each quarter end. The following table summarizes the contracts held at July 31, 2014.
| | | | | | |
| | | | | | | UNREALIZED |
| OPEN | NUMBER OF | | EXPIRATION | NOTIONAL | NOTIONAL | APPRECIATION |
| CONTRACTS | CONTRACTS | POSITION | DATE | BASIS | VALUE | (DEPRECIATION) |
|
| DAX Index Futures | 816 | Long | Sep 2014 | $271,740,040 | $257,281,621 | ($14,458,419) |
| Euro STOXX Bank | 7,539 | Long | Sep 2014 | 75,299,652 | 72,634,240 | (2,665,412) |
| Futures | | | | | | |
| FTSE 100 Index | 781 | Long | Sep 2014 | 88,549,379 | 88,112,895 | (436,484) |
| Futures | | | | | | |
| NASDAQ 100 E-Mini | 7,443 | Long | Sep 2014 | 561,770,281 | 578,283,885 | 16,513,604 |
| Futures | | | | | | |
| Nikkei 225 Futures | 1,166 | Long | Sep 2014 | 170,772,414 | 177,396,588 | 6,624,174 |
| |
| Annual report | Global Absolute Return Strategies Fund | 49 |
| | | | | | |
| | | | | | | UNREALIZED |
| OPEN | NUMBER OF | | EXPIRATION | NOTIONAL | NOTIONAL | APPRECIATION |
| CONTRACTS | CONTRACTS | POSITION | DATE | BASIS | VALUE | (DEPRECIATION) |
|
| CAC 40 Index | 4,403 | Short | Aug 2014 | ($255,949,382) | ($250,278,322) | $5,671,060 |
| Futures | | | | | | |
| Euro STOXX 50 | 4,319 | Short | Sep 2014 | (187,455,099) | (180,382,928) | 7,072,171 |
| Index Futures | | | | | | |
| Hang Seng Index | 795 | Short | Aug 2014 | (124,268,684) | (127,024,793) | (2,756,109) |
| Futures | | | | | | |
| OMX Stockholm 30 | 2,227 | Short | Aug 2014 | (44,608,438) | (44,616,190) | (7,752) |
| Index Futures | | | | | | |
| Russell 2000 Mini | 4,554 | Short | Sep 2014 | (528,145,610) | (508,545,180) | 19,600,430 |
| Index Futures | | | | | | |
| S&P 500 Index | 4,900 | Short | Sep 2014 | (473,190,427) | (471,576,000) | 1,614,427 |
| E-Mini Futures | | | | | | |
| SPI 200 Index | 107 | Short | Sep 2014 | (13,358,715) | (13,846,335) | (487,620) |
| Futures | | | | | | |
| Swiss Market Index | 2,332 | Short | Sep 2014 | (222,514,137) | (215,916,897) | 6,597,240 |
| Futures | | | | | | |
| TOPIX Index Futures | 295 | Short | Sep 2014 | (35,162,133) | (37,066,788) | (1,904,655) |
| | | | | | | $40,976,655 |
Notional basis refers to the contractual amount agreed upon at inception of open contracts; notional value represents the current value of the open contract.
Forward foreign currency contracts. A forward foreign currency contract is an agreement between two parties to buy and sell specific currencies at a price that is set on the date of the contract. The forward contract calls for delivery of the currencies on a future date that is specified in the contract. Risks related to the use of forwards include the possible failure of counterparties to meet the terms of the forward agreement, the failure of the counterparties to timely post collateral if applicable, the risk that currency movements will not favor the fund thereby reducing the fund’s total return, and the potential for losses in excess of the amounts recognized on the Statement of assets and liabilities.
The market value of a forward foreign currency contract fluctuates with changes in foreign currency exchange rates. Forward foreign currency contracts are marked-to-market daily and the change in value is recorded by the fund as an unrealized gain or loss. Realized gains or losses, equal to the difference between the value of the contract at the time it was opened and the value at the time it was closed, are recorded upon delivery or receipt of the currency or settlement with the counterparty.
During the year ended July 31, 2014, the fund used forward foreign currency contracts to manage against anticipated changes in currency exchange rates, gain exposure to foreign currencies and maintain diversity and liquidity of the fund. During the year ended July 31, 2014, the fund held forward foreign currency contracts with USD notional values ranging from approximately $3.3 billion to $5.7 billion, as measured at each quarter end. The following table summarizes the contracts held at July 31, 2014.
| | | | | | | | | | |
| | | | | | | | CONTRACTUAL | | | NET UNREALIZED |
| | CONTRACT | | | CONTRACT | | | SETTLEMENT | UNREALIZED | UNREALIZED | APPRECIATION/ |
| | TO BUY | | | TO SELL | | COUNTERPARTY | DATE | APPRECIATION | DEPRECIATION | (DEPRECIATION) |
|
| EUR | 193,889 | | USD | 263,583 | | Barclays Bank | 9-5-14 | — | ($3,931) | ($3,931) |
| | | | | | | PLC Wholesale | | | | |
| EUR | 38,679,635 | | USD | 52,654,332 | | BNP Paribas SA | 9-5-14 | — | (855,549) | (855,549) |
| EUR | 72,667,940 | | USD | 98,116,603 | | Goldman Sachs | 9-5-14 | — | (801,549) | (801,549) |
| | | | | | | International | | | | |
| |
| 50 | Global Absolute Return Strategies Fund | Annual report |
| | | | | | | | | | |
| | | | | | | | CONTRACTUAL | | | NET UNREALIZED |
| | CONTRACT | | | CONTRACT | | | SETTLEMENT | UNREALIZED | UNREALIZED | APPRECIATION/ |
| | TO BUY | | | TO SELL | | COUNTERPARTY | DATE | APPRECIATION | DEPRECIATION | (DEPRECIATION) |
|
| EUR | 36,792,008 | | USD | 50,226,373 | | UBS AG London | 9-5-14 | — | ($955,450) | ($955,450) |
| EUR | 1,144,702 | | USD | 1,534,078 | | Barclays Bank | 9-11-14 | — | (1,092) | (1,092) |
| | | | | | | PLC Wholesale | | | | |
| EUR | 408,327 | | USD | 546,929 | | BNP Paribas SA | 9-11-14 | — | (98) | (98) |
| GBP | 883,147 | | USD | 1,487,163 | | BNP Paribas SA | 9-5-14 | $3,470 | — | 3,470 |
| GBP | 791,380 | | USD | 1,347,404 | | Goldman Sachs | 9-5-14 | — | (11,662) | (11,662) |
| | | | | | | International | | | | |
| GBP | 1,432,569 | | USD | 2,429,131 | | Goldman Sachs | 9-11-14 | — | (11,272) | (11,272) |
| | | | | | | International | | | | |
| INR | 17,100,000,000 | | USD | 281,430,523 | | BNP Paribas SA | 10-31-14 | — | (4,558,082) | (4,558,082) |
| JPY | 266,113,534 | | USD | 2,611,856 | | Royal Bank of | 9-11-14 | — | (24,243) | (24,243) |
| | | | | | | Scotland PLC | | | | |
| JPY | 79,353,991 | | USD | 778,758 | | UBS AG London | 9-11-14 | — | (7,142) | (7,142) |
| MXN | 325,600,000 | | USD | 24,963,582 | | Barclays Bank | 8-19-14 | — | (361,067) | (361,067) |
| | | | | | | PLC Wholesale | | | | |
| MXN | 1,522,000,000 | | USD | 116,838,752 | | BNP Paribas SA | 8-20-14 | — | (1,843,948) | (1,843,948) |
| MXN | 1,427,400,000 | | USD | 109,675,982 | | Royal Bank of | 8-21-14 | — | (1,836,519) | (1,836,519) |
| | | | | | | Scotland PLC | | | | |
| MXN | 1,000,000,000 | | USD | 76,857,452 | | Barclays Bank | 8-22-14 | — | (1,313,364) | (1,313,364) |
| | | | | | | PLC Wholesale | | | | |
| MXN | 890,000,000 | | USD | 68,385,263 | | BNP Paribas SA | 8-26-14 | — | (1,170,549) | (1,170,549) |
| SEK | 1,398,941 | | USD | 210,364 | | BNP Paribas SA | 9-11-14 | — | (7,598) | (7,598) |
| USD | 25,732,568 | | AUD | 27,890,265 | | BNP Paribas SA | 8-12-14 | — | (173,296) | (173,296) |
| USD | 4,636,158 | | AUD | 5,013,780 | | Barclays Bank | 8-13-14 | — | (20,569) | (20,569) |
| | | | | | | PLC Wholesale | | | | |
| USD | 9,833,250 | | AUD | 10,500,000 | | Barclays Bank | 9-9-14 | 99,206 | — | 99,206 |
| | | | | | | PLC Wholesale | | | | |
| USD | 13,318,243 | | AUD | 14,400,000 | | UBS AG London | 9-9-14 | — | (31,303) | (31,303) |
| USD | 11,683,528 | | AUD | 12,631,140 | | Barclays Bank | 9-11-14 | — | (24,565) | (24,565) |
| | | | | | | PLC Wholesale | | | | |
| USD | 53,272,358 | | AUD | 57,285,623 | | Barclays Bank | 10-15-14 | 298,283 | — | 298,283 |
| | | | | | | PLC Wholesale | | | | |
| USD | 69,851,400 | | AUD | 75,000,000 | | BNP Paribas SA | 10-27-14 | 553,932 | — | 553,932 |
| USD | 27,330,926 | | AUD | 29,319,994 | | BNP Paribas SA | 10-28-14 | 242,120 | — | 242,120 |
| USD | 58,114,479 | | AUD | 62,295,717 | | Royal Bank of | 10-29-14 | 563,323 | — | 563,323 |
| | | | | | | Scotland PLC | | | | |
| USD | 193,479,829 | | AUD | 206,116,853 | | UBS AG London | 10-30-14 | 3,074,436 | — | 3,074,436 |
| USD | 94,900,959 | | BRL | 215,730,000 | | Barclays Bank | 9-3-14 | 637,625 | — | 637,625 |
| | | | | | | PLC Wholesale | | | | |
| USD | 91,504,751 | | BRL | 212,850,000 | | Barclays Bank | 9-4-14 | — | (1,473,299) | (1,473,299) |
| | | | | | | PLC Wholesale | | | | |
| USD | 11,235,762 | | CAD | 12,357,653 | | BNP Paribas SA | 8-12-14 | — | (95,001) | (95,001) |
| USD | 3,094,699 | | CAD | 3,395,299 | | BNP Paribas SA | 8-13-14 | — | (18,388) | (18,388) |
| USD | 118,319,193 | | CAD | 128,570,960 | | Merrill Lynch | 9-2-14 | 489,581 | — | 489,581 |
| | | | | | | International | | | | |
| USD | 53,277,882 | | CAD | 57,877,628 | | UBS AG London | 9-3-14 | 236,830 | — | 236,830 |
| USD | 16,638,352 | | CAD | 18,050,000 | | UBS AG London | 9-9-14 | 99,031 | — | 99,031 |
| |
| Annual report | Global Absolute Return Strategies Fund | 51 |
| | | | | | | | | | |
| | | | | | | | CONTRACTUAL | | | NET UNREALIZED |
| | CONTRACT | | | CONTRACT | | | SETTLEMENT | UNREALIZED | UNREALIZED | APPRECIATION/ |
| | TO BUY | | | TO SELL | | COUNTERPARTY | DATE | APPRECIATION | DEPRECIATION | (DEPRECIATION) |
|
| USD | 252,703,914 | | CAD | 276,818,690 | | Royal Bank of | 9-12-14 | — | ($928,890) | ($928,890) |
| | | | | | | Scotland PLC | | | | |
| USD | 106,973,091 | | CAD | 117,000,000 | | BNP Paribas SA | 9-17-14 | — | (214,647) | (214,647) |
| USD | 269,695,968 | | CAD | 288,307,687 | | Royal Bank of | 10-14-14 | $5,735,660 | — | 5,735,660 |
| | | | | | | Scotland PLC | | | | |
| USD | 3,192,201 | | CHF | 2,900,051 | | Merrill Lynch | 8-5-14 | 948 | — | 948 |
| | | | | | | International | | | | |
| USD | 16,923,146 | | CHF | 15,000,000 | | BNP Paribas SA | 8-12-14 | 416,177 | — | 416,177 |
| USD | 41,569,778 | | CHF | 36,466,065 | | Royal Bank of | 8-12-14 | 1,440,164 | — | 1,440,164 |
| | | | | | | Scotland PLC | | | | |
| USD | 76,428,244 | | CHF | 68,470,000 | | Goldman Sachs | 9-9-14 | 1,064,985 | — | 1,064,985 |
| | | | | | | International | | | | |
| USD | 5,535,733 | | DKK | 30,000,000 | | BNP Paribas SA | 8-12-14 | 147,698 | — | 147,698 |
| USD | 1,473,224 | | DKK | 7,924,221 | | Goldman Sachs | 8-12-14 | 50,024 | — | 50,024 |
| | | | | | | International | | | | |
| USD | 13,272,502 | | DKK | 72,740,000 | | UBS AG London | 9-9-14 | 205,798 | — | 205,798 |
| USD | 46,796,360 | | EUR | 34,000,000 | | BNP Paribas SA | 8-12-14 | 1,267,601 | — | 1,267,601 |
| USD | 234,891,781 | | EUR | 169,374,333 | | Royal Bank of | 8-12-14 | 8,085,804 | — | 8,085,804 |
| | | | | | | Scotland PLC | | | | |
| USD | 1,965,587 | | EUR | 1,438,409 | | BNP Paribas SA | 9-5-14 | 39,307 | — | 39,307 |
| USD | 58,726,562 | | EUR | 42,731,593 | | Goldman Sachs | 9-5-14 | 1,501,496 | — | 1,501,496 |
| | | | | | | International | | | | |
| USD | 507,561,135 | | EUR | 368,102,008 | | Merrill Lynch | 9-5-14 | 14,608,290 | — | 14,608,290 |
| | | | | | | International | | | | |
| USD | 1,549,625 | | EUR | 1,138,707 | | Royal Bank of | 9-5-14 | 24,698 | — | 24,698 |
| | | | | | | Scotland PLC | | | | |
| USD | 14,112,117 | | EUR | 10,366,911 | | UBS AG London | 9-5-14 | 229,014 | — | 229,014 |
| USD | 282,609,988 | | EUR | 207,605,000 | | Goldman Sachs | 9-9-14 | 4,587,021 | — | 4,587,021 |
| | | | | | | International | | | | |
| USD | 14,879,711 | | EUR | 11,000,000 | | Merrill Lynch | 9-9-14 | 148,598 | — | 148,598 |
| | | | | | | International | | | | |
| USD | 17,819,758 | | EUR | 13,078,299 | | BNP Paribas SA | 9-11-14 | 305,289 | — | 305,289 |
| USD | 229,716 | | EUR | 169,302 | | Goldman Sachs | 9-11-14 | 2,987 | — | 2,987 |
| | | | | | | International | | | | |
| USD | 2,543,898 | | EUR | 1,872,328 | | UBS AG London | 9-11-14 | 36,474 | — | 36,474 |
| USD | 115,974,618 | | EUR | 85,134,919 | | BNP Paribas SA | 10-3-14 | 1,953,671 | — | 1,953,671 |
| USD | 76,306,330 | | EUR | 55,712,203 | | Merrill Lynch | 10-14-14 | 1,687,950 | — | 1,687,950 |
| | | | | | | International | | | | |
| USD | 211,230,385 | | EUR | 155,962,788 | | Merrill Lynch | 10-22-14 | 2,334,068 | — | 2,334,068 |
| | | | | | | International | | | | |
| USD | 194,795,178 | | EUR | 143,883,137 | | Goldman Sachs | 10-23-14 | 2,077,532 | — | 2,077,532 |
| | | | | | | International | | | | |
| USD | 282,819,600 | | EUR | 210,000,000 | | BNP Paribas SA | 10-31-14 | 1,535,496 | — | 1,535,496 |
| USD | 36,950,886 | | GBP | 21,920,252 | | Royal Bank of | 8-12-14 | — | (54,687) | (54,687) |
| | | | | | | Scotland PLC | | | | |
| |
| 52 | Global Absolute Return Strategies Fund | Annual report |
| | | | | | | | | | |
| | | | | | | | CONTRACTUAL | | | NET UNREALIZED |
| | CONTRACT | | | CONTRACT | | | SETTLEMENT | UNREALIZED | UNREALIZED | APPRECIATION/ |
| | TO BUY | | | TO SELL | | COUNTERPARTY | DATE | APPRECIATION | DEPRECIATION | (DEPRECIATION) |
|
| USD | 115,087,157 | | GBP | 67,936,144 | | Barclays Bank | 8-13-14 | $398,890 | — | $398,890 |
| | | | | | | PLC Wholesale | | | | |
| USD | 913,103 | | GBP | 543,643 | | BNP Paribas SA | 9-5-14 | — | ($4,493) | (4,493) |
| USD | 16,304,015 | | GBP | 9,679,066 | | Goldman Sachs | 9-5-14 | — | (32,943) | (32,943) |
| | | | | | | International | | | | |
| USD | 62,923,283 | | GBP | 37,490,000 | | UBS AG London | 9-9-14 | — | (352,621) | (352,621) |
| USD | 46,884,600 | | GBP | 27,997,756 | | Barclays Bank | 9-11-14 | — | (369,418) | (369,418) |
| | | | | | | PLC Wholesale | | | | |
| USD | 102,588,897 | | HKD | 795,148,790 | | Barclays Bank | 8-12-14 | — | (12,096) | (12,096) |
| | | | | | | PLC Wholesale | | | | |
| USD | 3,276,753 | | HKD | 25,400,000 | | BNP Paribas SA | 9-10-14 | — | (879) | (879) |
| USD | 14,193,849 | | HKD | 110,000,000 | | Royal Bank of | 9-10-14 | — | (620) | (620) |
| | | | | | | Scotland PLC | | | | |
| USD | 4,054,889 | | HKD | 31,433,788 | | Barclays Bank | 9-11-14 | — | (1,349) | (1,349) |
| | | | | | | PLC Wholesale | | | | |
| USD | 304,631 | | HKD | 2,360,747 | | Royal Bank of | 9-11-14 | — | (2) | (2) |
| | | | | | | Scotland PLC | | | | |
| USD | 22,231,028 | | JPY | 2,265,308,455 | | BNP Paribas SA | 8-12-14 | 207,851 | — | 207,851 |
| USD | 200,822,782 | | JPY | 20,339,893,645 | | Merrill Lynch | 8-27-14 | 3,062,390 | — | 3,062,390 |
| | | | | | | International | | | | |
| USD | 10,843,902 | | JPY | 1,100,000,000 | | BNP Paribas SA | 8-28-14 | 148,777 | — | 148,777 |
| USD | 51,032,710 | | JPY | 5,158,024,000 | | UBS AG London | 8-28-14 | 882,064 | — | 882,064 |
| USD | 39,617,818 | | JPY | 4,025,000,000 | | UBS AG London | 9-9-14 | 480,413 | — | 480,413 |
| USD | 40,932,843 | | JPY | 4,197,638,514 | | Barclays Bank | 9-11-14 | 116,199 | — | 116,199 |
| | | | | | | PLC Wholesale | | | | |
| USD | 1,613,048 | | JPY | 164,701,300 | | BNP Paribas SA | 9-11-14 | 11,539 | — | 11,539 |
| USD | 6,122,383 | | JPY | 624,856,220 | | Royal Bank of | 9-11-14 | 46,458 | — | 46,458 |
| | | | | | | Scotland PLC | | | | |
| USD | 349,577 | | JPY | 35,800,109 | | UBS AG London | 9-11-14 | 1,467 | — | 1,467 |
| USD | 89,309,621 | | MXN | 1,165,704,900 | | BNP Paribas SA | 10-8-14 | 1,541,167 | — | 1,541,167 |
| USD | 24,190,417 | | MXN | 316,000,000 | | Goldman Sachs | 10-8-14 | 398,091 | — | 398,091 |
| | | | | | | International | | | | |
| USD | 2,360,063 | | NOK | 14,000,000 | | BNP Paribas SA | 8-12-14 | 133,638 | — | 133,638 |
| USD | 1,046,567 | | NOK | 6,262,413 | | Goldman Sachs | 8-12-14 | 50,654 | — | 50,654 |
| | | | | | | International | | | | |
| USD | 8,715,208 | | NOK | 52,350,000 | | UBS AG London | 9-9-14 | 398,147 | — | 398,147 |
| USD | 68,822,392 | | NZD | 80,000,000 | | Merrill Lynch | 10-21-14 | 1,376,592 | — | 1,376,592 |
| | | | | | | International | | | | |
| USD | 71,321,768 | | NZD | 83,000,000 | | Merrill Lynch | 10-23-14 | 1,360,313 | — | 1,360,313 |
| | | | | | | International | | | | |
| USD | 6,824,082 | | RUB | 249,959,300 | | BNP Paribas SA | 8-13-14 | — | (155,979) | (155,979) |
| USD | 24,768,824 | | SEK | 162,460,917 | | BNP Paribas SA | 8-12-14 | 1,218,404 | — | 1,218,404 |
| USD | 21,406,349 | | SEK | 143,200,000 | | UBS AG London | 8-12-14 | 648,002 | — | 648,002 |
| USD | 4,232,572 | | SEK | 28,224,542 | | BNP Paribas SA | 9-11-14 | 141,633 | — | 141,633 |
| USD | 273,997 | | SEK | 1,880,704 | | Royal Bank of | 9-11-14 | 1,403 | — | 1,403 |
| | | | | | | Scotland PLC | | | | |
| USD | 1,759,968 | | SGD | 2,200,000 | | UBS AG London | 8-12-14 | — | (3,567) | (3,567) |
| |
| Annual report | Global Absolute Return Strategies Fund | 53 |
| | | | | | | | | | |
| | | | | | | | CONTRACTUAL | | | NET UNREALIZED |
| | CONTRACT | | | CONTRACT | | | SETTLEMENT | UNREALIZED | UNREALIZED | APPRECIATION/ |
| | TO BUY | | | TO SELL | | COUNTERPARTY | DATE | APPRECIATION | DEPRECIATION | (DEPRECIATION) |
|
| USD | 1,073,328 | | SGD | 1,345,000 | | UBS AG London | 9-9-14 | — | ($4,845) | ($4,845) |
| USD | 1,500,646 | | SGD | 1,887,129 | | Royal Bank of | 9-11-14 | — | (12,105) | (12,105) |
| | | | | | | Scotland PLC | | | | |
| | | | | | | | | $68,408,679 | ($17,748,677) | $50,660,002 |
Currency Abbreviations
| |
| AUD | Australian Dollar |
| BRL | Brazilian Real |
| CAD | Canadian Dollar |
| CHF | Swiss Franc |
| DKK | Danish Krone |
| EUR | Euro |
| GBP | Pound Sterling |
| HKD | Hong Kong Dollar |
| INR | Indian Rupee |
| JPY | Japanese Yen |
| MXN | Mexican Peso |
| NOK | Norwegian Krone |
| NZD | New Zealand Dollar |
| RUB | Russian Ruble |
| SEK | Swedish Krona |
| SGD | Singapore Dollar |
| USD | U.S. Dollar |
Options. There are two types of options, put options and call options. Options are traded either over-the-counter or on an exchange. A call option gives the purchaser of the option the right to buy (and the seller the obligation to sell) the underlying instrument at the exercise price. A put option gives the purchaser of the option the right to sell (and the writer the obligation to buy) the underlying instrument at the exercise price. Writing puts and buying calls may increase the fund’s exposure to changes in the value of the underlying instrument. Buying puts and writing calls may decrease the fund’s exposure to such changes. Risks related to the use of options include the loss of premiums, possible illiquidity of the options markets, trading restrictions imposed by an exchange and movements in underlying security values, and for written options, potential losses in excess of the amounts recognized on the Statement of assets and liabilities. In addition, over-the-counter options are subject to the risks of all over-the-counter derivatives contracts.
When the fund purchases an option, the premium paid by the fund is included in the fund’s investments and subsequently “marked-to-market” to reflect current market value. If the purchased option expires, the fund realizes a loss equal to the cost of the option. If the fund exercises a call option, the cost of the securities acquired by exercising the call is increased by the premium paid to buy the call. If the fund exercises a put option, it realizes a gain or loss from the sale of the underlying security and the proceeds from such sale are decreased by the premium paid. If the fund enters into a closing sale transaction, the fund realizes a gain or loss, depending on whether proceeds from the closing sale are greater or less than the original cost. When the fund writes an option, the premium received is included as a liability and subsequently “marked-to-market” to reflect the current market value of the option written. Premiums received from writing options that expire unexercised are recorded as realized gains. Premiums received from writing options which are exercised or are closed are added to or offset against the proceeds or amount paid on the transaction to determine the realized gain or loss. If a put option on a security is exercised, the premium received reduces the cost basis of the securities purchased by the fund.
During the year ended July 31, 2014, the fund used purchased options to manage duration of the fund, manage against anticipated changes in securities markets and interest rate changes, gain exposure to foreign currencies and to certain securities markets and maintain diversity and liquidity of the fund. During the year ended July 31, 2014, the fund held purchased options with market values ranging from $44.2 million to $111.5 million, as measured at each quarter end.
| |
| 54 | Global Absolute Return Strategies Fund | Annual report |
During the year ended July 31, 2014, the fund wrote option contracts to manage against anticipated changes in securities markets, gain exposure to foreign currencies and certain securities markets and maintain diversity and liquidity of the fund. The following tables summarize the fund’s written options activities during the year ended July 31, 2014 and the contracts held at July 31, 2014.
| | | |
| | NUMBER OF | NOTIONAL | PREMIUMS |
| | CONTRACTS* | AMOUNT* | RECEIVED |
|
| Outstanding, beginning of period | 59,290 | 1,588,037,116 | $35,588,073 |
| Options written | 5,123 | 1,228,195,600 | 27,259,524 |
| Option closed | (2,910) | (1,069,000,000) | (19,989,545) |
| Options exercised | — | (174,171,779) | (4,379,347) |
| Options expired | (59,110) | (900,115,937) | (26,677,337) |
| Outstanding, end of period | 2,393 | 672,945,000 | $11,801,368 |
*The amounts for options on securities represent number of contracts. The amounts for OTC index options and foreign currency options represent notional amount.
Options on securities
| | | | | | |
| | | | EXPIRATION | NUMBER OF | | |
| NAME OF ISSUER | EXERCISE PRICE | | DATE | CONTRACTS | PREMIUM | VALUE |
|
| Calls | | | | | | |
| Apple, Inc. | $95.00 | | Jul 2015 | 2,393 | $2,022,516 | ($2,254,212) |
Index options (OTC)
| | | | | | | |
| | | EXERCISE | | EXPIRATION | NOTIONAL | | |
| NAME OF ISSUER | COUNTERPARTY | PRICE | | DATE | AMOUNT | PREMIUM | VALUE |
|
| Calls | | | | | | | |
| Kospi 200 Index | BNP Paribas | 271.22 | | Sep 2014 | KRW 221,000,000 | $3,349,119 | ($853,128) |
| Kospi 200 Index | BNP Paribas | 253.20 | | Sep 2014 | KRW 146,000,000 | 1,140,698 | (2,513,751) |
| Kospi 200 Index | Morgan Stanley | 270.37 | | Sep 2014 | KRW 287,195,000 | 4,222,660 | (1,226,627) |
| | | | | | 654,195,000 | $8,712,477 | ($4,593,506) |
Foreign currency options (OTC)
| | | | | | | |
| | | EXERCISE | | EXPIRATION | NOTIONAL | | |
| DESCRIPTION | COUNTERPARTY | PRICE | | DATE | AMOUNT | PREMIUM | VALUE |
|
| Puts | | | | | | | |
| USD versus JPY | Goldman Sachs | $68.00 | | Dec 2014 | 18,750,000 | $1,066,375 | ($19) |
Swaps. Swap agreements are agreements between the fund and counterparty to exchange cash flows, assets, foreign currencies or market-linked returns at specified intervals. Swap agreements are privately negotiated in the OTC market (OTC swaps) or may be executed on a registered commodities exchange (centrally cleared swaps). Swaps are marked-to-market daily and the change in value is recorded as a component of unrealized appreciation/depreciation of swap contracts. The value of the swap will typically impose collateral posting obligations on the party that is considered out-of-the-money on the swap.
Upfront payments made/received by the fund are amortized/accreted for financial reporting purposes, with the unamortized/unaccreted portion included in the Statement of assets and liabilities. A termination payment by the counterparty or the fund is recorded as realized gain or loss, as well as the net periodic payments received or paid by the fund.
| |
| Annual report | Global Absolute Return Strategies Fund | 55 |
Entering into swap agreements involves, to varying degrees, elements of credit, market and documentation risk that may amount to values that are in excess of the amounts recognized on the Statement of assets and liabilities. Such risks involve the possibility that there will be no liquid market for the swap, or that a counterparty may default on its obligation or delay payment under the swap terms. The counterparty may disagree or contest the terms of the swap. Market risks may also accompany the swap, including interest rate risk. The fund may also suffer losses if it is unable to terminate or assign outstanding swaps or reduce its exposure through offsetting transactions.
Interest rate swaps. Interest rate swaps represent an agreement between the fund and a counterparty to exchange cash flows based on the difference between two interest rates applied to a notional amount. The payment flows are usually netted against each other, with the difference being paid by one party to the other. The fund settles accrued net interest receivable or payable under the swap contracts at specified, future intervals.
During the year ended July 31, 2014, the fund used interest rate swaps to manage duration of the fund, manage against anticipated interest rate changes and maintain diversity and liquidity in the fund. During the year ended July 31, 2014, the fund held interest rate swaps with total USD notional amounts ranging from $1.1 billion to $8.1 billion, as measured at each quarter end. The following table summarizes the interest rate swap contracts held as of July 31, 2014.
| | | | | | | | | | | |
| | | | | | | | | | UNAMORTIZED | | |
| | | | | USD | | PAYMENTS | PAYMENTS | | UPFRONT | UNREALIZED | |
| COUNTER- | NOTIONAL | | CUR- | NOTIONAL | | MADE | RECEIVED | MATURITY | PAYMENT PAID | APPRECIATION | MARKET |
| PARTY | AMOUNT | | RENCY | AMOUNT | | BY FUND | BY FUND | DATE | (RECEIVED) | (DEPRECIATION) | VALUE |
|
| Royal | 117,111,000 | | EUR | $163,153,143 | | Fixed 1.21% | EUR-EURIBOR- | Aug 2016 | ($1,032,324) | ($286,543) | ($1,318,867) |
| Bank of | | | | | | | Reuters | | | | |
| Scotland | | | | | | | | | | | |
| PLC | | | | | | | | | | | |
|
| Exchange Cleared Swaps | | | | | | | | |
|
| | 190,385,000 | | AUD | 173,973,871 | | AUD-BBR-BBSW | Fixed 4.215% | Dec 2017 | — | 3,173,499 | 3,173,499 |
| | 380,770,000 | | AUD | 344,006,693 | | AUD-BBR-BBSW | Fixed 4.200% | Dec 2017 | — | 6,228,813 | 6,228,813 |
| | 190,385,000 | | AUD | 174,345,078 | | AUD-BBR-BBSW | Fixed 4.200% | Dec 2017 | — | 3,098,359 | 3,098,359 |
| | 193,000,000 | | AUD | 174,423,701 | | AUD-BBR-BBSW | Fixed 4.015% | Mar 2018 | — | 2,195,017 | 2,195,017 |
| | 193,000,000 | | AUD | 175,398,418 | | AUD-BBR-BBSW | Fixed 4.0625% | Mar 2018 | — | 2,351,504 | 2,351,504 |
| | 193,000,000 | | AUD | 175,398,418 | | AUD-BBR-BBSW | Fixed 4.015% | Mar 2018 | — | 2,195,017 | 2,195,017 |
| | 200,000,000 | | AUD | 184,939,969 | | AUD-BBR-BBSW | Fixed 4.065% | Apr 2018 | — | 2,400,697 | 2,400,697 |
| | 200,000,000 | | AUD | 184,939,969 | | AUD-BBR-BBSW | Fixed 4.050% | Apr 2018 | — | 2,349,549 | 2,349,549 |
| | 27,000,000 | | AUD | 24,916,944 | | AUD-BBR-BBSW | Fixed 4.0525% | Apr 2018 | — | 317,483 | 317,483 |
| | 27,000,000 | | AUD | 24,916,944 | | AUD-BBR-BBSW | Fixed 4.055% | Apr 2018 | — | 318,632 | 318,632 |
| | 27,000,000 | | AUD | 24,916,944 | | AUD-BBR-BBSW | Fixed 4.055% | Apr 2018 | — | 318,632 | 318,632 |
| | 27,000,000 | | AUD | 24,916,944 | | AUD-BBR-BBSW | Fixed 4.055% | Apr 2018 | — | 318,632 | 318,632 |
| | 27,000,000 | | AUD | 24,916,944 | | AUD-BBR-BBSW | Fixed 4.0525% | Apr 2018 | — | 317,483 | 317,483 |
| | 54,000,000 | | AUD | 50,133,597 | | AUD-BBR-BBSW | Fixed 4.0025% | Apr 2018 | — | 588,818 | 588,818 |
| | 86,250,000 | | EUR | 113,190,165 | | EUR-EURIBOR- | Fixed 1.380% | Jun 2016 | — | 1,191,265 | 1,191,265 |
| | | | | | | Reuters | | | | | |
| | 86,250,000 | | EUR | 119,650,247 | | Fixed 1.380% | EUR-EURIBOR- | Jun 2016 | (1,019,628) | (171,637) | (1,191,265) |
| | | | | | | | Reuters | | | | |
| | 86,250,000 | | EUR | 112,974,592 | | EUR-EURIBOR- | Fixed 1.250% | Jun 2016 | — | 1,037,220 | 1,037,220 |
| | | | | | | Reuters | | | | | |
| | 86,250,000 | | EUR | 112,974,592 | | EUR-EURIBOR- | Fixed 1.250% | Jun 2016 | — | 1,037,220 | 1,037,220 |
| | | | | | | Reuters | | | | | |
| | 86,250,000 | | EUR | 120,159,153 | | Fixed 1.250% | EUR-EURIBOR- | Jun 2016 | (869,325) | (167,895) | (1,037,220) |
| | | | | | | | Reuters | | | | |
| |
| 56 | Global Absolute Return Strategies Fund | Annual report |
| | | | | | | | | | | |
| | | | | | | | | | UNAMORTIZED | | |
| | | | | USD | | PAYMENTS | PAYMENTS | | UPFRONT | UNREALIZED | |
| COUNTER- | NOTIONAL | | CUR- | NOTIONAL | | MADE | RECEIVED | MATURITY | PAYMENT PAID | APPRECIATION | MARKET |
| PARTY | AMOUNT | | RENCY | AMOUNT | | BY FUND | BY FUND | DATE | (RECEIVED) | (DEPRECIATION) | VALUE |
|
| | 86,250,000 | | EUR | $120,159,153 | | Fixed 1.250% | EUR-EURIBOR- | Jun 2016 | ($860,409) | ($176,811) | ($1,037,220) |
| | | | | | | | Reuters | | | | |
| | 76,891,000 | | EUR | 101,957,441 | | EUR-EURIBOR- | Fixed 1.204% | Aug 2016 | — | 859,754 | 859,754 |
| | | | | | | Reuters | | | | | |
| | 86,250,000 | | EUR | 114,419,208 | | EUR-EURIBOR- | Fixed 1.200% | Aug 2016 | — | 959,782 | 959,782 |
| | | | | | | Reuters | | | | | |
| | 117,111,000 | | EUR | 155,359,396 | | EUR-EURIBOR- | Fixed 1.210% | Aug 2016 | — | 1,318,867 | 1,318,867 |
| | | | | | | Reuters | | | | | |
| | 117,111,000 | | EUR | 155,359,396 | | EUR-EURIBOR- | Fixed 1.220% | Aug 2016 | — | 1,334,517 | 1,334,517 |
| | | | | | | Reuters | | | | | |
| | 117,111,000 | | EUR | 155,289,148 | | EUR-EURIBOR- | Fixed 1.2075% | Aug 2016 | — | 1,314,946 | 1,314,946 |
| | | | | | | Reuters | | | | | |
| | 86,250,000 | | EUR | 119,650,247 | | Fixed 1.200% | EUR-EURIBOR- | Aug 2016 | (752,999) | (206,783) | (959,782) |
| | | | | | | | Reuters | | | | |
| | 117,111,000 | | EUR | 163,153,143 | | Fixed 1.2075% | EUR-EURIBOR- | Aug 2016 | (1,015,885) | (299,061) | (1,314,946) |
| | | | | | | | Reuters | | | | |
| | 117,111,000 | | EUR | 163,153,143 | | Fixed 1.220% | EUR-EURIBOR- | Aug 2016 | (1,048,484) | (286,033) | (1,334,517) |
| | | | | | | | Reuters | | | | |
| | 76,891,000 | | EUR | 106,982,355 | | Fixed 1.204% | EUR-EURIBOR- | Aug 2016 | (676,614) | (183,141) | (859,755) |
| | | | | | | | Reuters | | | | |
| | 68,539,000 | | EUR | 91,537,285 | | EUR-EURIBOR- | Fixed 1.270% | Aug 2016 | — | 826,206 | 826,206 |
| | | | | | | Reuters | | | | | |
| | 76,891,000 | | EUR | 102,691,802 | | EUR-EURIBOR- | Fixed 1.202% | Aug 2016 | — | 856,975 | 856,975 |
| | | | | | | Reuters | | | | | |
| | 76,891,000 | | EUR | 102,691,802 | | EUR-EURIBOR- | Fixed 1.255% | Aug 2016 | — | 911,461 | 911,461 |
| | | | | | | Reuters | | | | | |
| | 76,891,000 | | EUR | 102,691,802 | | EUR-EURIBOR- | Fixed 1.252% | Aug 2016 | — | 908,383 | 908,383 |
| | | | | | | Reuters | | | | | |
| | 76,891,000 | | EUR | 102,691,802 | | EUR-EURIBOR- | Fixed 1.207% | Aug 2016 | — | 862,112 | 862,112 |
| | | | | | | Reuters | | | | | |
| | 76,891,000 | | EUR | 102,691,802 | | EUR-EURIBOR- | Fixed 1.239% | Aug 2016 | — | 895,019 | 895,019 |
| | | | | | | Reuters | | | | | |
| | 76,891,000 | | EUR | 102,691,802 | | EUR-EURIBOR- | Fixed 1.244% | Aug 2016 | — | 900,156 | 900,156 |
| | | | | | | Reuters | | | | | |
| | 76,891,000 | | EUR | 102,691,802 | | EUR-EURIBOR- | Fixed 1.212% | Aug 2016 | — | 867,260 | 867,260 |
| | | | | | | Reuters | | | | | |
| | 76,891,000 | | EUR | 106,478,648 | | Fixed 1.255% | EUR-EURIBOR- | Aug 2016 | (690,046) | (221,416) | (911,462) |
| | | | | | | | Reuters | | | | |
| | 68,539,000 | | EUR | 94,912,799 | | Fixed 1.270% | EUR-EURIBOR- | Aug 2016 | (630,361) | (195,845) | (826,206) |
| | | | | | | | Reuters | | | | |
| | 76,891,000 | | EUR | 106,478,648 | | Fixed 1.239% | EUR-EURIBOR- | Aug 2016 | (692,123) | (202,896) | (895,019) |
| | | | | | | | Reuters | | | | |
| | 76,891,000 | | EUR | 106,478,648 | | Fixed 1.250% | EUR-EURIBOR- | Aug 2016 | (686,722) | (221,661) | (908,383) |
| | | | | | | | Reuters | | | | |
| | 76,891,000 | | EUR | 106,478,648 | | Fixed 1.244% | EUR-EURIBOR- | Aug 2016 | (685,753) | (214,403) | (900,156) |
| | | | | | | | Reuters | | | | |
| | 76,891,000 | | EUR | 106,982,355 | | Fixed 1.207% | EUR-EURIBOR- | Aug 2016 | (671,327) | (190,785) | (862,112) |
| | | | | | | | Reuters | | | | |
| | 76,891,000 | | EUR | 106,982,355 | | Fixed 1.212% | EUR-EURIBOR- | Aug 2016 | (660,057) | (207,203) | (867,260) |
| | | | | | | | Reuters | | | | |
| | 76,891,000 | | EUR | 106,982,355 | | Fixed 1.202% | EUR-EURIBOR- | Aug 2016 | (670,214) | (186,761) | (856,975) |
| | | | | | | | Reuters | | | | |
| | 87,500,000 | | EUR | 118,895,077 | | EUR-EURIBOR- | Fixed 2.286% | Dec 2024 | — | 9,431,454 | 9,431,454 |
| | | | | | | Reuters | | | | | |
| | 87,500,000 | | EUR | 120,220,546 | | EUR-EURIBOR- | Fixed 2.399% | Dec 2024 | — | 10,643,218 | 10,643,218 |
| | | | | | | Reuters | | | | | |
| | 87,500,000 | | EUR | 120,623,104 | | EUR-EURIBOR- | Fixed 2.379% | Dec 2024 | — | 10,386,681 | 10,386,681 |
| | | | | | | Reuters | | | | | |
| |
| Annual report | Global Absolute Return Strategies Fund | 57 |
| | | | | | | | | | | |
| | | | | | | | | | UNAMORTIZED | | |
| | | | | USD | | PAYMENTS | PAYMENTS | | UPFRONT | UNREALIZED | |
| COUNTER- | NOTIONAL | | CUR- | NOTIONAL | | MADE | RECEIVED | MATURITY | PAYMENT PAID | APPRECIATION | MARKET |
| PARTY | AMOUNT | | RENCY | AMOUNT | | BY FUND | BY FUND | DATE | (RECEIVED) | (DEPRECIATION) | VALUE |
|
| | 87,500,000 | | EUR | $119,043,732 | | EUR-EURIBOR- | Fixed 2.495% | Jan 2025 | — | $11,473,544 | $11,473,544 |
| | | | | | | Reuters | | | | | |
| | 38,200,000 | | EUR | 52,259,541 | | EUR-EURIBOR- | Fixed 2.402% | Jan 2025 | — | 4,542,538 | 4,542,538 |
| | | | | | | Reuters | | | | | |
| | 12,000,000 | | EUR | 15,699,594 | | EUR-EURIBOR- | Fixed 2.780% | Jun 2027 | — | 1,098,344 | 1,098,344 |
| | | | | | | Reuters | | | | | |
| | 12,000,000 | | EUR | 16,119,001 | | Fixed 2.780% | EUR-EURIBOR- | Jun 2027 | $376,110 | (1,474,454) | (1,098,344) |
| | | | | | | | Reuters | | | | |
| | 90,000,000 | | EUR | 117,823,563 | | EUR-EURIBOR- | Fixed 2.765% | Jun 2027 | — | 8,063,289 | 8,063,289 |
| | | | | | | Reuters | | | | | |
| | 90,000,000 | | EUR | 120,892,509 | | Fixed 2.765% | EUR-EURIBOR- | Jun 2027 | 2,982,015 | (11,045,304) | (8,063,289) |
| | | | | | | | Reuters | | | | |
| | 24,710,000 | | EUR | 32,949,566 | | EUR-EURIBOR- | Fixed 3.227% | Aug 2027 | — | 3,476,258 | 3,476,258 |
| | | | | | | Reuters | | | | | |
| | 24,710,000 | | EUR | 32,949,566 | | EUR-EURIBOR- | Fixed 3.216% | Aug 2027 | — | 3,442,740 | 3,442,740 |
| | | | | | | Reuters | | | | | |
| | 24,710,000 | | EUR | 32,949,566 | | EUR-EURIBOR- | Fixed 3.219% | Aug 2027 | — | 3,451,882 | 3,451,882 |
| | | | | | | Reuters | | | | | |
| | 28,870,000 | | EUR | 38,496,721 | | EUR-EURIBOR- | Fixed 3.219% | Aug 2027 | — | 4,033,016 | 4,033,016 |
| | | | | | | Reuters | | | | | |
| | 24,710,000 | | EUR | 33,283,137 | | Fixed 3.227% | EUR-EURIBOR- | Aug 2027 | (265,349) | (3,210,909) | (3,476,258) |
| | | | | | | | Reuters | | | | |
| | 24,710,000 | | EUR | 33,283,137 | | Fixed 3.219% | EUR-EURIBOR- | Aug 2027 | (242,451) | (3,209,431) | (3,451,882) |
| | | | | | | | Reuters | | | | |
| | 24,710,000 | | EUR | 33,283,137 | | Fixed 3.216% | EUR-EURIBOR- | Aug 2027 | (234,369) | (3,208,371) | (3,442,740) |
| | | | | | | | Reuters | | | | |
| | 28,870,000 | | EUR | 38,886,449 | | Fixed 3.219% | EUR-EURIBOR- | Aug 2027 | (284,206) | (3,748,810) | (4,033,016) |
| | | | | | | | Reuters | | | | |
| | 6,793,000 | | EUR | 9,126,059 | | EUR-EURIBOR- | Fixed 3.020% | Nov 2035 | — | 1,364,612 | 1,364,612 |
| | | | | | | Reuters | | | | | |
| | 6,793,000 | | EUR | 9,126,059 | | EUR-EURIBOR- | Fixed 3.000% | Nov 2035 | — | 1,333,627 | 1,333,627 |
| | | | | | | Reuters | | | | | |
| | 8,463,667 | | EUR | 11,394,643 | | EUR-EURIBOR- | Fixed 2.960% | Nov 2035 | — | 1,584,408 | 1,584,408 |
| | | | | | | Reuters | | | | | |
| | 13,402,000 | | EUR | 18,043,125 | | EUR-EURIBOR- | Fixed 3.006% | Nov 2035 | — | 2,649,470 | 2,649,470 |
| | | | | | | Reuters | | | | | |
| | 13,585,000 | | EUR | 18,250,774 | | EUR-EURIBOR- | Fixed 3.010% | Nov 2035 | — | 2,698,041 | 2,698,041 |
| | | | | | | Reuters | | | | | |
| | 13,585,000 | | EUR | 18,250,774 | | EUR-EURIBOR- | Fixed 2.995% | Nov 2035 | — | 2,651,567 | 2,651,567 |
| | | | | | | Reuters | | | | | |
| | 8,463,667 | | EUR | 11,390,824 | | EUR-EURIBOR- | Fixed 2.950% | Nov 2035 | — | 1,563,738 | 1,563,738 |
| | | | | | | Reuters | | | | | |
| | 8,463,666 | | EUR | 11,417,914 | | EUR-EURIBOR- | Fixed 2.915% | Nov 2035 | — | 1,495,350 | 1,495,350 |
| | | | | | | Reuters | | | | | |
| | 36,906,749 | | EUR | 49,574,994 | | EUR-EURIBOR- | Fixed 2.940% | Nov 2035 | — | 6,718,811 | 6,718,811 |
| | | | | | | Reuters | | | | | |
| | 38,945,669 | | EUR | 52,313,774 | | EUR-EURIBOR- | Fixed 2.940% | Nov 2035 | — | 7,089,993 | 7,089,993 |
| | | | | | | Reuters | | | | | |
| | 44,598,582 | | EUR | 60,072,065 | | EUR-EURIBOR- | Fixed 2.960% | Nov 2035 | — | 8,315,263 | 8,315,263 |
| | | | | | | Reuters | | | | | |
| | 4,000,000 | | EUR | 5,233,198 | | Fixed 2.790% | EUR-EURIBOR- | Jun 2047 | — | (591,456) | (591,456) |
| | | | | | | | Reuters | | | | |
| | 4,000,000 | | EUR | 5,373,000 | | EUR-EURIBOR- | Fixed 2.790% | Jun 2047 | (244,472) | 835,928 | 591,456 |
| | | | | | | Reuters | | | | | |
| | 40,000,000 | | EUR | 52,366,028 | | Fixed 2.774% | EUR-EURIBOR- | Jun 2047 | — | (5,721,017) | (5,721,017) |
| | | | | | | | Reuters | | | | |
| | 40,000,000 | | EUR | 53,730,004 | | EUR-EURIBOR- | Fixed 2.774% | Jun 2047 | (2,619,338) | 8,340,355 | 5,721,017 |
| | | | | | | Reuters | | | | | |
| |
| 58 | Global Absolute Return Strategies Fund | Annual report |
| | | | | | | | | | | |
| | | | | | | | | | UNAMORTIZED | | |
| | | | | USD | | PAYMENTS | PAYMENTS | | UPFRONT | UNREALIZED | |
| COUNTER- | NOTIONAL | | CUR- | NOTIONAL | | MADE | RECEIVED | MATURITY | PAYMENT PAID | APPRECIATION | MARKET |
| PARTY | AMOUNT | | RENCY | AMOUNT | | BY FUND | BY FUND | DATE | (RECEIVED) | (DEPRECIATION) | VALUE |
|
| | 12,019,000 | | EUR | $16,026,744 | | Fixed 3.038% | EUR-EURIBOR- | Aug 2047 | — | ($2,599,821) | ($2,599,821) |
| | | | | | | | Reuters | | | | |
| | 12,019,000 | | EUR | 16,026,744 | | Fixed 3.030% | EUR-EURIBOR- | Aug 2047 | — | (2,571,291) | (2,571,291) |
| | | | | | | | Reuters | | | | |
| | 12,019,000 | | EUR | 16,026,744 | | Fixed 3.027% | EUR-EURIBOR- | Aug 2047 | — | (2,560,593) | (2,560,593) |
| | | | | | | | Reuters | | | | |
| | 14,043,000 | | EUR | 18,725,648 | | Fixed 3.030% | EUR-EURIBOR- | Aug 2047 | — | (3,004,296) | (3,004,296) |
| | | | | | | | Reuters | | | | |
| | 12,019,000 | | EUR | 16,188,993 | | EUR-EURIBOR- | Fixed 3.038% | Aug 2047 | ($56,572) | 2,656,393 | 2,599,821 |
| | | | | | | Reuters | | | | | |
| | 12,019,000 | | EUR | 16,188,993 | | EUR-EURIBOR- | Fixed 3.030% | Aug 2047 | (80,817) | 2,652,108 | 2,571,291 |
| | | | | | | Reuters | | | | | |
| | 12,019,000 | | EUR | 16,188,993 | | EUR-EURIBOR- | Fixed 3.027% | Aug 2047 | (90,246) | 2,650,839 | 2,560,593 |
| | | | | | | Reuters | | | | | |
| | 14,043,000 | | EUR | 18,915,220 | | EUR-EURIBOR- | Fixed 3.030% | Aug 2047 | (95,633) | 3,099,929 | 3,004,296 |
| | | | | | | Reuters | | | | | |
| | 4,252,000 | | EUR | 5,712,351 | | Fixed 3.000% | EUR-EURIBOR- | Nov 2055 | — | (1,279,450) | (1,279,450) |
| | | | | | | | Reuters | | | | |
| | 4,252,000 | | EUR | 5,712,351 | | Fixed 2.980% | EUR-EURIBOR- | Nov 2055 | — | (1,247,812) | (1,247,812) |
| | | | | | | | Reuters | | | | |
| | 5,305,333 | | EUR | 7,142,575 | | Fixed 2.938% | EUR-EURIBOR- | Nov 2055 | — | (1,474,031) | (1,474,031) |
| | | | | | | | Reuters | | | | |
| | 5,305,334 | | EUR | 7,157,164 | | Fixed 2.891% | EUR-EURIBOR- | Nov 2055 | — | (1,379,899) | (1,379,899) |
| | | | | | | | Reuters | | | | |
| | 8,403,000 | | EUR | 11,312,966 | | Fixed 2.986% | EUR-EURIBOR- | Nov 2055 | — | (2,484,742) | (2,484,742) |
| | | | | | | | Reuters | | | | |
| | 8,503,000 | | EUR | 11,423,359 | | Fixed 2.995% | EUR-EURIBOR- | Nov 2055 | — | (2,542,782) | (2,542,782) |
| | | | | | | | Reuters | | | | |
| | 8,503,000 | | EUR | 11,423,359 | | Fixed 2.9775% | EUR-EURIBOR- | Nov 2055 | — | (2,487,423) | (2,487,423) |
| | | | | | | | Reuters | | | | |
| | 5,305,333 | | EUR | 7,140,181 | | Fixed 2.928% | EUR-EURIBOR- | Nov 2055 | — | (1,453,379) | (1,453,379) |
| | | | | | | | Reuters | | | | |
| | 23,072,692 | | EUR | 30,992,396 | | Fixed 2.8942% | EUR-EURIBOR- | Nov 2055 | — | (6,021,114) | (6,021,114) |
| | | | | | | | Reuters | | | | |
| | 24,486,214 | | EUR | 32,891,109 | | Fixed 2.890% | EUR-EURIBOR- | Nov 2055 | — | (6,351,744) | (6,351,744) |
| | | | | | | | Reuters | | | | |
| | 31,612,094 | | EUR | 42,579,913 | | Fixed 2.900% | EUR-EURIBOR- | Nov 2055 | — | (8,312,373) | (8,312,373) |
| | | | | | | | Reuters | | | | |
| | 10,375,000 | | GBP | 17,200,190 | | Fixed 3.3625% | GBP-LIBOR-BBA | Jan 2044 | — | (962,661) | (962,661) |
| | 10,375,000 | | GBP | 17,200,190 | | Fixed 3.365% | GBP-LIBOR-BBA | Jan 2044 | — | (971,571) | (971,571) |
| | 22,800,000 | | GBP | 37,923,269 | | Fixed 3.3638% | GBP-LIBOR-BBA | Jan 2044 | — | (2,123,328) | (2,123,328) |
| | 22,800,000 | | GBP | 37,618,858 | | Fixed 3.3125% | GBP-LIBOR-BBA | Jan 2044 | — | (1,718,333) | (1,718,333) |
| | 5,187,500 | | GBP | 8,546,410 | | Fixed 3.3125% | GBP-LIBOR-BBA | Jan 2044 | — | (387,647) | (387,647) |
| | 22,800,000 | | GBP | 37,563,017 | | Fixed 3.310% | GBP-LIBOR-BBA | Jan 2044 | — | (1,684,213) | (1,684,213) |
| | 10,375,000 | | GBP | 17,055,449 | | Fixed 3.283% | GBP-LIBOR-BBA | Jan 2044 | — | (669,455) | (669,455) |
| | 21,643,750 | | GBP | 35,335,581 | | Fixed 3.291% | GBP-LIBOR-BBA | Feb 2044 | — | (1,924,236) | (1,924,236) |
| | 50,000 | | GBP | 83,380 | | Fixed 3.3252% | GBP-LIBOR-BBA | Feb 2044 | — | (4,974) | (4,974) |
| | 21,643,750 | | GBP | 36,112,580 | | Fixed 3.306% | GBP-LIBOR-BBA | Feb 2044 | — | (2,004,953) | (2,004,953) |
| | 5,125,000,000 | | JPY | 50,026,844 | | Fixed 0.944% | JPY-LIBOR-BBA | Dec 2024 | — | (1,146,931) | (1,146,931) |
| | 5,125,000,000 | | JPY | 49,615,180 | | Fixed 1.030% | JPY-LIBOR-BBA | Dec 2024 | — | (1,554,215) | (1,554,215) |
| | 5,125,000,000 | | JPY | 50,041,498 | | Fixed 1.010% | JPY-LIBOR-BBA | Dec 2024 | — | (1,447,007) | (1,447,007) |
| | 5,125,000,000 | | JPY | 48,900,339 | | Fixed 1.0788% | JPY-LIBOR-BBA | Jan 2025 | — | (1,725,491) | (1,725,491) |
| |
| Annual report | Global Absolute Return Strategies Fund | 59 |
| | | | | | | | | | | |
| | | | | | | | | | UNAMORTIZED | | |
| | | | | USD | | PAYMENTS | PAYMENTS | | UPFRONT | UNREALIZED | |
| COUNTER- | NOTIONAL | | CUR- | NOTIONAL | | MADE | RECEIVED | MATURITY | PAYMENT PAID | APPRECIATION | MARKET |
| PARTY | AMOUNT | | RENCY | AMOUNT | | BY FUND | BY FUND | DATE | (RECEIVED) | (DEPRECIATION) | VALUE |
|
| | 2,970,000,000 | | JPY | $28,500,144 | | Fixed 1.015% | JPY-LIBOR-BBA | Jan 2025 | — | ($815,732) | ($815,732) |
| | 66,250,000 | | USD | 66,250,000 | | Fixed 3.2875% | USD-LIBOR-BBA | Dec 2024 | — | (2,727,281) | (2,727,281) |
| | 66,250,000 | | USD | 66,250,000 | | Fixed 3.388% | USD-LIBOR-BBA | Dec 2024 | — | (3,273,625) | (3,273,625) |
| | 66,250,000 | | USD | 66,250,000 | | Fixed 3.335% | USD-LIBOR-BBA | Dec 2024 | — | (2,933,278) | (2,933,278) |
| | 66,250,000 | | USD | 66,250,000 | | Fixed 3.543% | USD-LIBOR-BBA | Jan 2025 | — | (3,981,400) | (3,981,400) |
| | 36,400,000 | | USD | 36,400,000 | | Fixed 3.3913% | USD-LIBOR-BBA | Jan 2025 | — | (1,683,223) | (1,683,223) |
| | | | | $8,056,103,224 | | | | | ($13,517,599) | $54,857,744 | $41,340,145 |
The following are abbreviations for the table above:
| |
| BBA | The British Bankers’ Association |
| BBR | Bank Bill Rate |
| BBSW | Bank Bill Swap Rate |
| EURIBOR | Euro Interbank Offered Rate |
| LIBOR | London Interbank Offered Rate |
Credit default swaps. Credit default swaps (CDS) involve the exchange of a fixed rate premium (paid by the Buyer), for protection against the loss in value of an underlying debt instrument, referenced entity or index, in the event of a defined credit event (such as payment default or bankruptcy). Under the terms of the swap, one party acts as a “guarantor” (the Seller), receiving the premium and agreeing to contingent payments that are specified within the credit default agreement. The fund may enter into CDS in which it may act as either Buyer or Seller. By acting as the Seller, the fund may incur economic leverage since it would be obligated to pay the Buyer the notional amount of the contract in the event of a default. The amount of loss in such case could be significant, but would typically be reduced by any recovery value on the underlying credit.
During the year ended July 31, 2014, the fund used CDS as a Buyer of protection to maintain diversity and liquidity of the fund. During the year ended July 31, 2014, the fund held credit default swap contracts with total USD notional amounts up to approximately $170.0 million, as measured at each quarter end. The following table summarizes the credit default swap contracts the fund held as of July 31, 2014 as a Buyer of protection.
| | | | | | | | | | | |
| | | | | | | | | | UNAMORTIZED | | |
| | | | | | | | (PAY)/ | | UPFRONT | | |
| | | | | | USD | | RECEIVED | | PAYMENT | UNREALIZED | |
| COUNTER- | | NOTIONAL | | CUR- | NOTIONAL | | FIXED | MATURITY | PAID | APPRECIATION | MARKET |
| PARTY | REFERENCE OBLIGATION | AMOUNT | | RENCY | AMOUNT | | RATE | DATE | (RECEIVED) | (DEPRECIATION) | VALUE |
|
| Exchange Cleared Swaps | | | | | | | | | | |
|
| | CDX North America High | 49,500,000 | | USD | $49,500,000 | | (5.000)% | Jun 2018 | ($2,487,957) | ($1,681,509) | ($4,169,466) |
| | Yield CDSI 20 5Y | | | | | | | | | | |
| | CDX North America High | 118,800,000 | | USD | 118,800,000 | | (5.000)% | Dec 2018 | (6,253,676) | (2,944,240) | (9,197,916) |
| | Yield 21 5Y | | | | | | | | | | |
| | | | | | $168,300,000 | | | | ($8,741,633) | ($4,625,749) | ($13,367,382) |
Implied credit spreads are utilized in determining the market value of CDS agreements in which the fund is the Seller at period end. The implied credit spread generally represents the yield of the instrument above a credit-risk free rate, such as the U.S. Treasury Bond Yield, and may include upfront payments required to be made to enter into the agreement. It also serves as an indicator of the current status of the payment/performance risk and represents the likelihood or risk of default for the credit derivative. Wider credit spreads represent a deterioration of the referenced entity’s creditworthiness and an increased risk of default or other credit event occurring as defined under the terms of the agreement.
| |
| 60 | Global Absolute Return Strategies Fund | Annual report |
For CDS agreements where implied credit spreads are not reported or available, the average credit rating on the underlying index is shown. Increasing market values, in absolute terms when compared to the notional amount of the swap, represent a deterioration of the referenced entity’s creditworthiness and a greater likelihood of a credit event occurring. This is also represented by a decrease in the average credit rating of the underlying index. The maximum potential amount of future payments (undiscounted) that a fund as the Seller could be required to make under any CDS agreement equals the notional amount of the agreement.
The fund used CDS as a Seller of protection during the year ended July 31, 2014 to take a long position in the exposure of the benchmark credit. During the year ended July 31, 2014, the fund acted as Seller on credit default swap contracts with total USD notional amounts ranging from $80.0 million to $170.0 million, as measured at each quarter end. The following table summarizes the credit default swap contracts the fund held as of July 31, 2014 where the fund acted as a Seller of protection.
| | | | | | | | | | | |
| | | IMPLIED | | | | | | | | | |
| | | CREDIT | | | | | | | | | |
| | | SPREAD | | | | | | | UNAMORTIZED | | |
| | | AND/OR | | | | | (PAY)/ | | UPFRONT | | |
| | | CREDIT | | | USD | | RECEIVED | | PAYMENT | UNREALIZED | |
| COUNTER- | REFERENCE | RATING AT | NOTIONAL | CUR- | NOTIONAL | | FIXED | MATURITY | PAID | APPRECIATION | MARKET |
| PARTY | OBLIGATION | 7-31-14 | AMOUNT | RENCY | AMOUNT | | RATE | DATE | (RECEIVED) | (DEPRECIATION) | VALUE |
|
| Exchange Cleared Swaps | | | | | | | | | |
|
| | CDX North | 2.78% | 49,500,000 | USD | $49,500,000 | | 5.000% | Jun 2018 | $1,901,506 | $2,267,960 | $4,169,466 |
| | America High | | | | | | | | | | |
| | Yield CDSI | | | | | | | | | | |
| | 20 5Y | | | | | | | | | | |
| | CDX North | 3.17% | 118,800,000 | USD | 118,800,000 | | 5.000% | Dec 2018 | 4,568,174 | 4,629,742 | 9,197,916 |
| | America High | | | | | | | | | | |
| | Yield 21 5Y | | | | | | | | | | |
| | | | | | $168,300,000 | | | | $6,469,680 | $6,897,702 | $13,367,382 |
Variance Swaps. Variance swap agreements involve two parties agreeing to exchange cash flows based on the measured variance (or square of volatility) of a specified underlying asset. One party agrees to exchange a “fixed rate” or strike price payment for the “floating rate” or realized price variance on the underlying asset with respect to the notional amount. At inception, the strike price is generally chosen such that the fair value of the swap is zero. At the maturity date, a net cash flow is exchanged, where the payoff amount is equivalent to the difference between the realized price variance of the underlying asset and the strike price multiplied by the notional amount. As a receiver of the realized price variance, the fund would receive the payoff amount when the realized price variance of the underlying asset is greater than the strike price and would owe the payoff amount when the price variance is less than the strike price. As a payer of the realized price variance the fund would owe the payoff amount when the realized price variance of the underlying asset is greater than the strike price and would receive the payoff amount when the variance is less than the strike price.
During the year ended July 31, 2014, the fund used variance swaps to maintain diversity and liquidity of the fund and manage against anticipated changes in securities markets. During the year ended July 31, 2014, the fund held variance swaps with total USD notional amounts ranging from $2.8 million to $16.6 million, as measured at each quarter end. The following table summarizes the interest rate swap contracts held as of July 31, 2014.
| |
| Annual report | Global Absolute Return Strategies Fund | 61 |
| | | | | | | | | | |
| | | | | | | | | | UNREALIZED | |
| | REFERENCE | CUR- | NOTIONAL | USD NOTIONAL | | PAY/RECEIVE | | VOLATILITY | APPRECIATION | |
| COUNTERPARTY | ENTITY | RENCY | AMOUNT | AMOUNT | | VARIANCE | MATURITY DATE | STRIKE PRICE | (DEPRECIATION) | MARKET VALUE |
|
| Barclays Bank | DJ | EUR | 60,000 | $82,828 | | Receive | Aug 2014 | 18.95% | ($369,943) | ($369,943) |
| | EuroStoxx | | | | | | | | | |
| | 50 | | | | | | | | | |
| BNP Paribas | Kospi 2 | KRW | 100,000,000 | 97,800 | | Receive | Aug 2014 | 14.10% | (298,796) | (298,796) |
| | Index | | | | | | | | | |
| BNP Paribas | DJ | EUR | 20,000 | 27,748 | | Receive | Aug 2014 | 18.90% | (123,013) | (123,013) |
| | EuroStoxx | | | | | | | | | |
| | 50 | | | | | | | | | |
| BNP Paribas | DJ | EUR | 27,000 | 37,456 | | Receive | Aug 2014 | 18.65% | (157,414) | (157,414) |
| | EuroStoxx | | | | | | | | | |
| | 50 | | | | | | | | | |
| BNP Paribas | DJ | EUR | 73,000 | 101,091 | | Receive | Aug 2014 | 18.45% | (411,107) | (411,107) |
| | EuroStoxx | | | | | | | | | |
| | 50 | | | | | | | | | |
| BNP Paribas | DJ | EUR | 110,000 | 151,349 | | Receive | Aug 2014 | 18.35% | (605,111) | (605,111) |
| | EuroStoxx | | | | | | | | | |
| | 50 | | | | | | | | | |
| BNP Paribas | FTSE 100 | GBP | 50,000 | 84,380 | | Receive | Aug 2014 | 14.15% | (361,732) | (361,732) |
| BNP Paribas | FTSE 100 | GBP | 30,000 | 50,628 | | Receive | Aug 2014 | 14.15% | (217,040) | (217,040) |
| BNP Paribas | FTSE 100 | GBP | 40,000 | 67,504 | | Receive | Aug 2014 | 14.15% | (289,387) | (289,387) |
| BNP Paribas | FTSE 100 | GBP | 26,000 | 44,080 | | Receive | Aug 2014 | 14.30% | (189,959) | (189,959) |
| BNP Paribas | FTSE 100 | GBP | 25,000 | 42,337 | | Receive | Aug 2014 | 14.25% | (181,574) | (181,574) |
| BNP Paribas | FTSE 100 | GBP | 30,000 | 50,554 | | Receive | Aug 2014 | 14.10% | (213,872) | (213,872) |
| BNP Paribas | S&P 500 | USD | 100,000 | 100,000 | | Receive | Aug 2014 | 14.40% | (324,163) | (324,163) |
| BNP Paribas | FTSE 100 | GBP | 30,000 | 50,460 | | Receive | Sep 2014 | 14.40% | (167,794) | (167,794) |
| BNP Paribas | FTSE 100 | GBP | 15,000 | 25,078 | | Receive | Sep 2014 | 14.10% | (71,493) | (71,493) |
| BNP Paribas | FTSE 100 | GBP | 133,000 | 227,151 | | Receive | Oct 2014 | 13.35% | 36,187 | 36,187 |
| BNP Paribas | Nikkei-225 | JPY | 15,000,000 | 147,870 | | Receive | Nov 2014 | 19.00% | (13,793) | (13,793) |
| BNP Paribas | DJ | EUR | 138,000 | 185,797 | | Receive | Nov 2014 | 17.50% | 387,035 | 387,035 |
| | EuroStoxx | | | | | | | | | |
| | 50 | | | | | | | | | |
| BNP Paribas | FTSE 100 | GBP | 15,000 | 25,414 | | Receive | Nov 2014 | 14.10% | 18,547 | 18,547 |
| BNP Paribas | Kospi 2 | KRW | 411,750,000 | 375,104 | | Receive | Dec 2014 | 22.70% | (3,042,151) | (3,042,151) |
| | Index | | | | | | | | | |
| BNP Paribas | Kospi 2 | KRW | 212,200,000 | 200,105 | | Receive | Dec 2014 | 21.10% | (1,311,475) | (1,311,475) |
| | Index | | | | | | | | | |
| BNP Paribas | FTSE 100 | GBP | 16,178 | 25,725 | | Pay | Dec 2014 | 28.50% | 318,880 | 318,880 |
| BNP Paribas | FTSE 100 | GBP | 34,377 | 54,788 | | Pay | Dec 2014 | 28.20% | 669,040 | 669,040 |
| BNP Paribas | FTSE 100 | GBP | 35,000 | 56,759 | | Pay | Dec 2014 | 25.20% | 573,421 | 573,421 |
| BNP Paribas | FTSE 100 | GBP | 44,000 | 70,436 | | Pay | Dec 2014 | 26.90% | 798,741 | 798,741 |
| BNP Paribas | FTSE 100 | GBP | 90,000 | 143,901 | | Pay | Dec 2014 | 25.00% | 1,455,468 | 1,455,468 |
| BNP Paribas | FTSE 100 | GBP | 120,000 | 192,145 | | Pay | Dec 2014 | 18.10% | 1,026,684 | 1,026,684 |
| BNP Paribas | S&P 500 | USD | 300,000 | 300,000 | | Pay | Dec 2014 | 21.60% | 2,112,871 | 2,112,871 |
| BNP Paribas | S&P 500 | USD | 300,000 | 300,000 | | Pay | Dec 2014 | 21.40% | 2,066,485 | 2,066,485 |
| BNP Paribas | S&P 500 | USD | 375,000 | 375,000 | | Pay | Dec 2014 | 20.80% | 2,401,768 | 2,401,768 |
| BNP Paribas | S&P 500 | USD | 200,000 | 200,000 | | Pay | Dec 2014 | 19.10% | 1,006,530 | 1,006,530 |
| BNP Paribas | China Ent. | HKD | 109,541 | 14,123 | | Receive | Dec 2014 | 34.25% | (158,051) | (158,051) |
| | Index | | | | | | | | | |
| BNP Paribas | China Ent. | HKD | 317,178 | 40,891 | | Receive | Dec 2014 | 34.00% | (450,427) | (450,427) |
| | Index | | | | | | | | | |
| BNP Paribas | China Ent. | HKD | 450,000 | 58,041 | | Receive | Dec 2014 | 33.30% | (618,430) | (618,430) |
| | Index | | | | | | | | | |
| BNP Paribas | China Ent. | HKD | 480,000 | 61,891 | | Receive | Dec 2014 | 33.65% | (672,465) | (672,465) |
| | Index | | | | | | | | | |
| BNP Paribas | China Ent. | HKD | 800,000 | 103,203 | | Receive | Dec 2014 | 33.50% | (1,109,499) | (1,109,499) |
| | Index | | | | | | | | | |
| |
| 62 | Global Absolute Return Strategies Fund | Annual report |
| | | | | | | | | | |
| | | | | | | | | | UNREALIZED | |
| | REFERENCE | CUR- | NOTIONAL | USD NOTIONAL | | PAY/RECEIVE | | VOLATILITY | APPRECIATION | |
| COUNTERPARTY | ENTITY | RENCY | AMOUNT | AMOUNT | | VARIANCE | MATURITY DATE | STRIKE PRICE | (DEPRECIATION) | MARKET VALUE |
|
| BNP Paribas | China Ent. | HKD | 2,328,300 | $299,922 | | Receive | Dec 2014 | 28.90% | ($2,197,201) | ($2,197,201) |
| | Index | | | | | | | | | |
| BNP Paribas | Hang Seng | HKD | 2,328,900 | 300,123 | | Receive | Dec 2014 | 23.00% | (1,805,996) | (1,805,996) |
| | Index | | | | | | | | | |
| BNP Paribas | Hang Seng | HKD | 1,495,200 | 192,884 | | Receive | Dec 2014 | 22.45% | (1,116,523) | (1,116,523) |
| | Index | | | | | | | | | |
| BNP Paribas | Kospi 2 | KRW | 330,000,000 | 321,750 | | Receive | Dec 2015 | 20.05% | (231,328) | (231,328) |
| | Index | | | | | | | | | |
| BNP Paribas | Kospi 2 | KRW | 300,000,000 | 293,100 | | Receive | Dec 2015 | 20.15% | (231,171) | (231,171) |
| | Index | | | | | | | | | |
| BNP Paribas | Kospi 2 | KRW | 60,000,000 | 58,800 | | Receive | Dec 2015 | 19.65% | (7,595) | (7,595) |
| | Index | | | | | | | | | |
| BNP Paribas | FTSE 100 | GBP | 377,000 | 635,302 | | Pay | Dec 2015 | 17.00% | 208,171 | 208,171 |
| BNP Paribas | S&P 500 | USD | 300,000 | 300,000 | | Pay | Dec 2015 | 20.60% | 817,652 | 817,652 |
| BNP Paribas | S&P 500 | USD | 318,000 | 318,000 | | Pay | Dec 2015 | 18.20% | (118,226) | (118,226) |
| BNP Paribas | S&P 500 | USD | 300,000 | 300,000 | | Pay | Dec 2015 | 18.30% | (87,475) | (87,475) |
| BNP Paribas | S&P 500 | USD | 64,000 | 64,000 | | Pay | Dec 2015 | 17.75% | (64,838) | (64,838) |
| BNP Paribas | Hang Seng | HKD | 4,966,000 | 640,649 | | Receive | Dec 2015 | 26.00% | (715,971) | (715,971) |
| | Index | | | | | | | | | |
| BNP Paribas | FTSE 100 | GBP | 124,000 | 211,234 | | Receive | Sep 2014 | 13.90% | (419,705) | (419,705) |
| BNP Paribas | S&P 500 | USD | 164,000 | 164,000 | | Receive | Sep 2014 | 12.80% | 223,995 | 223,995 |
| BNP Paribas | S&P 500 | USD | 154,000 | 154,000 | | Receive | Oct 2014 | 13.90% | 210,055 | 210,055 |
| BNP Paribas | Kospi 2 | KRW | 315,000,000 | 293,265 | | Receive | Dec 2015 | 22.50% | (1,146,360) | (1,146,360) |
| | Index | | | | | | | | | |
| BNP Paribas | S&P 500 | USD | 128,000 | 128,000 | | Pay | Dec 2016 | 19.20% | (208,869) | (208,869) |
| Citibank N.A. | FTSE 100 | GBP | 80,000 | 135,072 | | Receive | Aug 2014 | 14.60% | (627,081) | (627,081) |
| Citibank N.A. | S&P 500 | USD | 160,000 | 160,000 | | Receive | Sep 2014 | 13.50% | (4,684) | (4,684) |
| Citibank N.A. | S&P 500 | USD | 100,000 | 100,000 | | Pay | Dec 2015 | 18.00% | (116,941) | (116,941) |
| Citibank N.A. | Hang Seng | HKD | 120,000 | 15,481 | | Receive | Dec 2015 | 20.80% | 6,943 | 6,943 |
| | Index | | | | | | | | | |
| Credit Suisse | S&P 500 | USD | 130,000 | 130,000 | | Receive | Oct 2014 | 13.95% | 237,339 | 237,339 |
| International | | | | | | | | | | |
| Goldman Sachs | FTSE 100 | GBP | 38,000 | 63,732 | | Receive | Aug 2014 | 13.65% | (242,880) | (242,880) |
| Goldman Sachs | Kospi 2 | KRW | 500,000,000 | 463,000 | | Receive | Dec 2015 | 21.30% | (1,160,695) | (1,160,695) |
| | Index | | | | | | | | | |
| Goldman Sachs | Kospi 2 | KRW | 150,000,000 | 142,500 | | Receive | Dec 2015 | 20.85% | (268,144) | (268,144) |
| | Index | | | | | | | | | |
| Goldman Sachs | Kospi 2 | KRW | 55,000,000 | 54,065 | | Receive | Dec 2015 | 19.15% | 24,754 | 24,754 |
| | Index | | | | | | | | | |
| Goldman Sachs | Kospi 2 | KRW | 22,000,000 | 21,648 | | Receive | Dec 2015 | 19.15% | 10,466 | 10,466 |
| | Index | | | | | | | | | |
| Goldman Sachs | Kospi 2 | KRW | 75,000,000 | 73,350 | | Receive | Dec 2015 | 19.35% | 27,893 | 27,893 |
| | Index | | | | | | | | | |
| Goldman Sachs | Kospi 2 | KRW | 130,000,000 | 127,270 | | Receive | Dec 2015 | 19.00% | 101,578 | 101,578 |
| | Index | | | | | | | | | |
| Goldman Sachs | Kospi 2 | KRW | 150,000,000 | 147,600 | | Receive | Dec 2015 | 19.00% | 119,491 | 119,491 |
| | Index | | | | | | | | | |
| Goldman Sachs | Kospi 2 | KRW | 302,730,000 | 300,005 | | Receive | Dec 2015 | 19.00% | 266,012 | 266,012 |
| | Index | | | | | | | | | |
| Goldman Sachs | FTSE 100 | GBP | 30,000 | 50,940 | | Pay | Dec 2015 | 17.20% | 3,714 | 3,714 |
| Goldman Sachs | FTSE 100 | GBP | 50,000 | 84,805 | | Pay | Dec 2015 | 17.25% | 8,535 | 8,535 |
| Goldman Sachs | FTSE 100 | GBP | 57,000 | 96,988 | | Pay | Dec 2015 | 17.00% | (19,944) | (19,944) |
| Goldman Sachs | FTSE 100 | GBP | 52,000 | 88,551 | | Pay | Dec 2015 | 16.85% | (33,175) | (33,175) |
| Goldman Sachs | FTSE 100 | GBP | 112,500 | 191,020 | | Pay | Dec 2015 | 16.95% | (58,960) | (58,960) |
| Goldman Sachs | FTSE 100 | GBP | 22,800 | 38,826 | | Pay | Dec 2015 | 16.95% | (12,834) | (12,834) |
| Goldman Sachs | FTSE 100 | GBP | 126,700 | 217,341 | | Pay | Dec 2015 | 16.75% | (145,439) | (145,439) |
| Goldman Sachs | S&P 500 | USD | 500,000 | 500,000 | | Pay | Dec 2015 | 19.45% | 653,103 | 653,103 |
| |
| Annual report | Global Absolute Return Strategies Fund | 63 |
| | | | | | | | | | |
| | | | | | | | | | UNREALIZED | |
| | REFERENCE | CUR- | NOTIONAL | USD NOTIONAL | | PAY/RECEIVE | | VOLATILITY | APPRECIATION | |
| COUNTERPARTY | ENTITY | RENCY | AMOUNT | AMOUNT | | VARIANCE | MATURITY DATE | STRIKE PRICE | (DEPRECIATION) | MARKET VALUE |
|
| Goldman Sachs | S&P 500 | USD | 100,000 | $100,000 | | Pay | Dec 2015 | 19.05% | $80,820 | $80,820 |
| Goldman Sachs | S&P 500 | USD | 60,000 | 60,000 | | Pay | Dec 2015 | 17.40% | (96,163) | (96,163) |
| Goldman Sachs | S&P 500 | USD | 90,000 | 90,000 | | Pay | Dec 2015 | 17.80% | (115,484) | (115,484) |
| Goldman Sachs | S&P 500 | USD | 111,000 | 111,000 | | Pay | Dec 2015 | 17.65% | (173,896) | (173,896) |
| Goldman Sachs | S&P 500 | USD | 147,400 | 147,400 | | Pay | Dec 2015 | 17.70% | (226,991) | (226,991) |
| Goldman Sachs | S&P 500 | USD | 125,000 | 125,000 | | Pay | Dec 2015 | 17.00% | (314,381) | (314,381) |
| Goldman Sachs | Hang Seng | HKD | 700,000 | 90,311 | | Receive | Dec 2015 | 26.10% | (56,567) | (56,567) |
| | Index | | | | | | | | | |
| Goldman Sachs | Hang Seng | HKD | 750,000 | 96,755 | | Receive | Dec 2015 | 26.10% | (57,828) | (57,828) |
| | Index | | | | | | | | | |
| Goldman Sachs | Hang Seng | HKD | 750,000 | 96,756 | | Receive | Dec 2015 | 25.90% | (29,804) | (29,804) |
| | Index | | | | | | | | | |
| Goldman Sachs | Hang Seng | HKD | 1,413,000 | 182,284 | | Receive | Dec 2015 | 25.40% | 43,227 | 43,227 |
| | Index | | | | | | | | | |
| Goldman Sachs | Hang Seng | HKD | 300,000 | 38,700 | | Receive | Dec 2015 | 25.45% | 7,378 | 7,378 |
| | Index | | | | | | | | | |
| Goldman Sachs | Hang Seng | HKD | 1,600,000 | 206,450 | | Receive | Dec 2015 | 25.70% | 28,197 | 28,197 |
| | Index | | | | | | | | | |
| Goldman Sachs | Kospi 2 | KRW | 125,125,000 | 122,623 | | Receive | Dec 2016 | 20.45% | 117,018 | 117,018 |
| | Index | | | | | | | | | |
| Goldman Sachs | S&P 500 | USD | 120,000 | 120,000 | | Pay | Dec 2016 | 18.70% | (229,414) | (229,414) |
| Morgan Stanley | DJ | EUR | 15,000 | 20,811 | | Receive | Aug 2014 | 18.95% | (93,020) | (93,020) |
| | EuroStoxx | | | | | | | | | |
| | 50 | | | | | | | | | |
| Morgan Stanley | FTSE 100 | GBP | 22,000 | 36,958 | | Receive | Aug 2014 | 14.80% | (177,454) | (177,454) |
| Morgan Stanley | DJ | EUR | 61,000 | 83,305 | | Receive | Sep 2014 | 17.80% | (96,106) | (96,106) |
| | EuroStoxx | | | | | | | | | |
| | 50 | | | | | | | | | |
| Morgan Stanley | DJ | EUR | 41,000 | 55,945 | | Receive | Sep 2014 | 16.60% | 1,143 | 1,143 |
| | EuroStoxx | | | | | | | | | |
| | 50 | | | | | | | | | |
| Morgan Stanley | FTSE 100 | GBP | 78,000 | 131,840 | | Receive | Sep 2014 | 14.20% | (410,823) | (410,823) |
| Morgan Stanley | FTSE 100 | GBP | 30,000 | 50,708 | | Receive | Sep 2014 | 14.30% | (161,947) | (161,947) |
| Morgan Stanley | FTSE 100 | GBP | 15,000 | 25,211 | | Receive | Sep 2014 | 13.90% | (69,799) | (69,799) |
| Morgan Stanley | FTSE 100 | GBP | 9,600 | 16,046 | | Receive | Sep 2014 | 14.05% | (45,802) | (45,802) |
| Morgan Stanley | FTSE 100 | GBP | 13,500 | 22,613 | | Receive | Sep 2014 | 14.35% | (67,043) | (67,043) |
| Morgan Stanley | FTSE 100 | GBP | 28,000 | 47,065 | | Receive | Sep 2014 | 14.15% | (124,532) | (124,532) |
| Morgan Stanley | FTSE 100 | GBP | 40,000 | 67,014 | | Receive | Sep 2014 | 13.90% | (155,523) | (155,523) |
| Morgan Stanley | DJ | EUR | 87,000 | 118,350 | | Receive | Oct 2014 | 16.15% | 353,689 | 353,689 |
| | EuroStoxx | | | | | | | | | |
| | 50 | | | | | | | | | |
| Morgan Stanley | FTSE 100 | GBP | 53,000 | 90,304 | | Receive | Nov 2014 | 14.00% | 46,108 | 46,108 |
| Morgan Stanley | Kospi 2 | KRW | 290,250,000 | 249,905 | | Receive | Dec 2014 | 23.00% | (2,121,185) | (2,121,185) |
| | Index | | | | | | | | | |
| Morgan Stanley | S&P 500 | USD | 250,000 | 250,000 | | Pay | Dec 2014 | 21.30% | 1,746,080 | 1,746,080 |
| Morgan Stanley | FTSE 100 | GBP | 101,000 | 173,074 | | Pay | Dec 2015 | 16.60% | (153,755) | (153,755) |
| Morgan Stanley | S&P 500 | USD | 70,000 | 70,000 | | Pay | Dec 2015 | 18.00% | (60,743) | (60,743) |
| Morgan Stanley | Hang Seng | HKD | 650,000 | 83,844 | | Receive | Dec 2015 | 21.00% | (2,179) | (2,179) |
| | Index | | | | | | | | | |
| Morgan Stanley | Hang Seng | HKD | 1,337,500 | 172,566 | | Receive | Dec 2015 | 25.60% | 69,741 | 69,741 |
| | Index | | | | | | | | | |
| Morgan Stanley | Kospi 2 | KRW | 100,000,000 | 97,100 | | Receive | Dec 2016 | 21.70% | 12,903 | 12,903 |
| | Index | | | | | | | | | |
| Morgan Stanley | S&P 500 | USD | 97,000 | 97,000 | | Pay | Dec 2016 | 20.00% | (96,557) | (96,557) |
| UBS AG London | FTSE 100 | GBP | 42,000 | 70,556 | | Receive | Aug 2014 | 14.80% | (338,777) | (338,777) |
| UBS AG London | FTSE 100 | GBP | 70,000 | 117,593 | | Receive | Aug 2014 | 14.80% | (564,626) | (564,626) |
| UBS AG London | FTSE 100 | GBP | 90,000 | 151,425 | | Receive | Aug 2014 | 14.70% | (720,142) | (720,142) |
| |
| 64 | Global Absolute Return Strategies Fund | Annual report |
| | | | | | | | | | |
| | | | | | | | | | UNREALIZED | |
| | REFERENCE | CUR- | NOTIONAL | USD NOTIONAL | | PAY/RECEIVE | | VOLATILITY | APPRECIATION | |
| COUNTERPARTY | ENTITY | RENCY | AMOUNT | AMOUNT | | VARIANCE | MATURITY DATE | STRIKE PRICE | (DEPRECIATION) | MARKET VALUE |
|
| UBS AG London | S&P 500 | USD | 36,000 | $36,000 | | Receive | Aug 2014 | 14.85% | ($130,843) | ($130,843) |
| UBS AG London | S&P 500 | USD | 57,500 | 57,500 | | Receive | Sep 2014 | 14.35% | (82,752) | (82,752) |
| UBS AG London | S&P 500 | USD | 80,400 | 80,400 | | Receive | Sep 2014 | 14.50% | (112,039) | (112,039) |
| UBS AG London | S&P 500 | USD | 100,000 | 100,000 | | Receive | Sep 2014 | 14.15% | (17,979) | (17,979) |
| UBS AG London | S&P 500 | USD | 80,000 | 80,000 | | Receive | Sep 2014 | 14.15% | (14,383) | (14,383) |
| UBS AG London | S&P 500 | USD | 37,000 | 37,000 | | Receive | Sep 2014 | 13.80% | 7,232 | 7,232 |
| UBS AG London | DJ | EUR | 120,000 | 164,160 | | Receive | Oct 2014 | 16.85% | 335,790 | 335,790 |
| | EuroStoxx | | | | | | | | | |
| | 50 | | | | | | | | | |
| UBS AG London | DJ | EUR | 50,000 | 68,207 | | Receive | Oct 2014 | 17.65% | 99,296 | 99,296 |
| | EuroStoxx | | | | | | | | | |
| | 50 | | | | | | | | | |
| | | | | $16,558,639 | | | | | ($10,779,281) | ($10,779,281) |
Inflation swaps. In an inflation swap, one party pays a fixed rate on a notional principal amount while the other party pays a floating rate linked to an inflation index on that same notional amount. The party paying the floating rate pays the inflation adjusted rate multiplied by the notional principal amount. If the average inflation rate over the term of the swap is the same as the fixed rate of the swap, the two legs will have the same value and the swap will break even.
During the year ended July 31, 2014, the fund used inflation swaps to manage duration of the fund, maintain diversity and liquidity of the fund and manage against anticipated changes in inflation. During the year ended July 31, 2014, the fund held inflation swaps with total USD notional amounts up to approximately $160.3 million, as measured at period end. The following table summarizes the inflation swap contracts held as of July 31, 2014.
| | | | | | | | | | |
| | | | | USD | | PAYMENTS | PAYMENTS | | UNREALIZED | |
| | NOTIONAL | | CUR- | NOTIONAL | | MADE | RECEIVED | MATURITY | APPRECIATION | MARKET |
| COUNTERPARTY | AMOUNT | | RENCY | AMOUNT | | BY FUND | BY FUND | DATE | (DEPRECIATION) | VALUE |
|
| BNP Paribas | 15,000,000 | | GBP | $24,949,519 | | UK-RPI | Fixed 3.671% | Jan 2044 | $1,105,926 | $1,105,926 |
| BNP Paribas | 15,000,000 | | GBP | 24,749,249 | | UK-RPI | Fixed 3.641% | Jan 2044 | 832,018 | 832,018 |
| BNP Paribas | 6,800,000 | | GBP | 11,178,511 | | UK-RPI | Fixed 3.636% | Jan 2044 | 356,347 | 356,347 |
| BNP Paribas | 14,100,000 | | GBP | 23,019,657 | | UK-RPI | Fixed 3.631% | Feb 2044 | 735,100 | 735,100 |
| BNP Paribas | 14,100,000 | | GBP | 23,525,839 | | UK-RPI | Fixed 3.621% | Feb 2044 | 649,594 | 649,594 |
| Morgan Stanley | 6,800,000 | | GBP | 11,273,378 | | UK-RPI | Fixed 3.665% | Jan 2044 | 476,537 | 476,537 |
| Morgan Stanley | 6,800,000 | | GBP | 11,273,378 | | UK-RPI | Fixed 3.670% | Jan 2044 | 497,398 | 497,398 |
| Morgan Stanley | 15,000,000 | | GBP | 24,712,511 | | UK-RPI | Fixed 3.640% | Jan 2044 | 822,658 | 822,658 |
| Royal Bank of | 3,400,000 | | GBP | 5,601,503 | | UK-RPI | Fixed 3.6275% | Jan 2044 | 160,752 | 160,752 |
| Scotland | | | | | | | | | | |
| | | | | $160,283,545 | | | | | $5,636,330 | $5,636,330 |
| |
| Annual report | Global Absolute Return Strategies Fund | 65 |
Fair value of derivative instruments by risk category
The table below summarizes the fair value of derivatives held by the fund at July 31, 2014 by risk category:
| | | | |
| | | FINANCIAL | ASSET | LIABILITY |
| | STATEMENT OF ASSETS AND | INSTRUMENTS | DERIVATIVES | DERIVATIVES |
| RISK | LIABILITIES LOCATION | LOCATION | FAIR VALUE | FAIR VALUE |
|
| Interest rate | Investments, at value* | Purchased | $20,043,615 | — |
| contracts | | options | | |
| Interest rate | Swap contracts, at value | Interest rate | 166,809,596 | ($125,469,451) |
| contracts | | swaps^ | | |
| Interest rate | Swap contracts, at value | Inflation swaps^ | 5,636,330 | — |
| contracts | | | | |
| Foreign exchange | Investments, at value* | Purchased | 3,600,769 | — |
| contracts | | options | | |
| Foreign exchange | Written options, at value | Written options | — | (19) |
| contracts | | | | |
| Foreign exchange | Receivable/payable for | Forward foreign | 68,408,679 | (17,748,677) |
| contracts | forward foreign currency | currency contracts | | |
| | exchange contracts | | | |
| Equity contracts | Investments, at value* | Purchased options | 87,829,216 | — |
| Equity contracts | Written options, at value | Written options | — | (6,847,718) |
| Equity contracts | Receivable/payable | Futures† | 63,693,106 | (22,716,451) |
| | for futures | | | |
| Equity contracts | Swap contracts, at value | Variance swaps^ | 18,739,980 | (29,519,261) |
| Credit contracts | Swap contracts, at value | Credit default | 13,367,382 | (13,367,382) |
| | | swaps^ | | |
* Purchased options are included in the Fund’s investment.
† Reflects cumulative appreciation/depreciation on futures as disclosed in Note 3. Only the period end variation margin is separately disclosed on the Statement of assets and liabilities.
^ Reflects cumulative appreciation/depreciation on swap contracts. Variation margin for centrally cleared swaps and appreciation/depreciation for OTC swaps are shown separately in the Statement of assets and liabilities.
For financial reporting purposes, the fund does not offset OTC derivative assets or liabilities that are subject to master netting arrangements, as defined by the ISDAs, in the Statement of assets and liabilities. In the event of default by the counterparty or a termination of the agreement, the ISDA allows an offset of amounts across the various transactions between the fund and the applicable counterparty. The table below reflects certain fund’s exposure to counterparties subject to an ISDA for OTC derivative transactions:
| | |
| OTC FINANCIAL INSTRUMENTS | ASSET | LIABILITY |
|
| Foreign forward currency contracts | $68,408,679 | ($17,748,677) |
| Purchased options | 25,935,449 | — |
| Written Options | — | (4,593,525) |
| Interest rate swaps | — | (1,318,867) |
| Variance swaps | 18,739,980 | (29,519,261) |
| Inflation swaps | 5,636,330 | — |
| Totals | $118,720,438 | ($53,180,330) |
| |
| 66 | Global Absolute Return Strategies Fund | Annual report |
| | | | |
| | TOTAL MARKET VALUE | COLLATERAL POSTED | COLLATERAL POSTED | |
| COUNTERPARTY | OF OTC DERIVATIVES | BY COUNTERPARTY | BY FUND | NET EXPOSURE |
|
| Barclays Bank PLC | ($2,400,490) | — | $6,139,717 | $3,739,227 |
| BNP Paribas SA | (3,922,374) | $468,932 | — | (4,391,306) |
| Citibank N.A. | 2,515,035 | 1,943,596 | — | 571,439 |
| Credit Suisse | 237,339 | — | 158,993 | 396,332 |
| Goldman Sachs | 10,725,701 | 11,032,264 | — | (306,563) |
| Group Inc. | | | | |
| Merrill Lynch | 25,068,730 | 21,464,069 | — | 3,604,661 |
| Morgan Stanley & | 17,547,471 | 16,490,000 | — | 1,057,471 |
| Company, Inc. | | | | |
| The Royal Bank of | 12,371,171 | 7,036,274 | — | 5,334,897 |
| Scotland PLC | | | | |
| UBS AG | 3,397,525 | — | 2,939,077 | 6,336,602 |
| Totals | $65,540,108 | $58,435,135 | $9,237,787 | $16,342,760 |
Effect of derivative instruments on the Statement of operations
The table below summarizes the net realized gain (loss) included in the net increase (decrease) in net assets from operations, classified by derivative instrument and risk category, for the year ended July 31, 2014:
| | | | | | | |
| | | | | | | INVESTMENTS | |
| | | | | | | IN UNAFFILIATED | |
| | | | | | | ISSUERS AND | |
| | STATEMENT OF | INVESTMENTS | | | | FOREIGN | |
| | OPERATIONS | (PURCHASED | WRITTEN | FUTURES | SWAP | CURRENCY | |
| RISK | LOCATION | OPTIONS) | OPTIONS | CONTRACTS | CONTRACTS | TRANSACTIONS* | TOTAL |
|
| Interest rate | Net realized | — | — | $897,477 | ($3,456,327) | — | ($2,558,850) |
| contracts | gain (loss) | | | | | | |
| Foreign | Net realized | ($28,612,291) | $25,447,806 | — | — | ($37,560,062) | (40,724,547) |
| exchange | gain (loss) | | | | | | |
| contracts | | | | | | | |
| Equity contracts | Net realized | 21,756,605 | (5,625,200) | (109,524,962) | (30,527,855) | — | (123,921,412) |
| | gain (loss) | | | | | | |
| Credit contracts | Net realized | — | — | — | 4,363,352 | — | 4,363,352 |
| | gain (loss) | | | | | | |
| Total | | ($6,855,686) | $19,822,606 | ($108,627,485) | ($29,620,830) | ($37,560,062) | ($162,841,457) |
* Realized gain/loss associated with forward foreign currency contracts is included in this caption on the Statement of operations.
| |
| Annual report | Global Absolute Return Strategies Fund | 67 |
The table below summarizes the net change in unrealized appreciation (depreciation) included in the net increase (decrease) in net assets from operations, classified by derivative instrument and risk category, for the year ended July 31, 2014:
| | | | | | | |
| | | | | | | INVESTMENTS IN | |
| | | | | | | UNAFFILIATED | |
| | | | | | | ISSUERS AND | |
| | | | | | | TRANSLATION | |
| | | | | | | OF ASSETS | |
| | STATEMENT OF | INVESTMENTS | | | | AND LIABILITIES | |
| | OPERATIONS | (PURCHASED | FUTURES | WRITTEN | SWAP | IN FOREIGN | |
| RISK | LOCATION | OPTIONS) | CONTRACTS | OPTIONS | CONTRACTS | CURRENCIES* | TOTAL |
|
| Interest rate | Change in | ($1,770,806) | $1,165,160 | — | $65,811,152 | — | $65,205,506 |
| contracts | unrealized | | | | | | |
| | appreciation | | | | | | |
| | (depreciation) | | | | | | |
| Foreign | Change in | (233,616) | — | $14,508,893 | — | $41,384,996 | $55,660,273 |
| exchange | unrealized | | | | | | |
| contracts | appreciation | | | | | | |
| | (depreciation) | | | | | | |
| Equity | Change in | 2,687,226 | 70,654,129 | (171,216) | (12,602,075) | — | $60,568,064 |
| contracts | unrealized | | | | | | |
| | appreciation | | | | | | |
| | (depreciation) | | | | | | |
| Credit | Change in | — | — | — | (337,287) | — | ($337,287) |
| contracts | unrealized | | | | | | |
| | appreciation | | | | | | |
| | (depreciation) | | | | | | |
| Total | | $682,804 | $71,819,289 | $14,337,677 | $52,871,790 | $41,384,996 | $181,096,556 |
* Change in unrealized appreciation/depreciation associated with forward foreign currency contracts is included in the caption on this Statement of operations.
Note 4 — Guarantees and indemnifications
Under the Trust’s organizational documents, its Officers and Trustees are indemnified against certain liabilities arising out of the performance of their duties to the Trust, including the fund. Additionally, in the normal course of business, the fund enters into contracts with service providers that contain general indemnification clauses. The fund’s maximum exposure under these arrangements is unknown, as this would involve future claims that may be made against the fund that have not yet occurred. The risk of material loss from such claims is considered remote.
Note 5 — Fees and transactions with affiliates
John Hancock Advisers, LLC (the Advisor or JHA) serves as investment advisor for the fund. Prior to January 1, 2014, John Hancock Investment Management Services, LLC (JHIMS) served as investment advisor for the fund. JHIMS and JHA have identical officers, directors and other personnel, and share common facilities and resources. Terms of the investment management contract with JHA are substantially identical to the former contract with JHIMS. In this report, depending on the context, the term “Advisor” shall refer to either JHA in its current capacity as investment advisor, or to JHIMS in its capacity as investment advisor prior to January 1, 2014. John Hancock Funds, LLC (the Distributor), an affiliate of the Advisor, serves as principal underwriter of the fund. The Advisor and the Distributor are indirect, wholly owned subsidiaries of Manulife Financial Corporation (MFC).
| |
| 68 | Global Absolute Return Strategies Fund | Annual report |
Management fee. Effective July 1, 2014, the fund has an investment management contract with the Advisor under which the fund pays a daily management fee to the Advisor equivalent, on an annual basis, to the sum of: (a) 1.30% of the first $200 million of the fund’s average daily net assets; (b) 1.25% of the next $300 million of the fund’s average daily net assets provided that net assets are less than or equal to $500 million. If net assets exceed $500 million, the following rates apply; (a) 1.20% of the first $3 billion of the fund’s average daily net assets; (b) 1.15% of the next $2.5 billion of the fund’s average daily net assets; (c) 1.12% of the next $1.5 billion of the fund’s average daily net assets; (d) 1.10% of the next $3 billion of the fund’s average daily net assets; and (e) 1.07% of the fund’s average daily net assets in excess of $10.0 billion.
Prior to July 1, 2014, the fund had an investment management contract with the Advisor under which the fund paid a daily management fee to the Advisor equivalent, on an annual basis, to the sum of: (a) 1.30% of the first $200 million of the fund’s average daily net assets; (b) 1.25% of the next $300 million of the fund’s average daily net assets; (c) 1.20% of the next $2.5 billion of the fund’s average daily net assets provided that if net assets exceed $500 million, but were less than or equal to $3.0 billion, the 1.20% rate applied retroactively to all assets; and (d) 1.15% of the fund’s average daily net assets in excess of $3.0 billion. If the net assets of the fund exceeded $3.0 billion, the daily management fee paid to the Advisor was equivalent, on an annualized basis, to the sum of: (a) 1.20% of the first $3.0 billion of the fund’s average daily net assets; and (b) 1.15% of the fund’s average daily net assets in excess of $3.0 billion.
The Advisor has contractually agreed to waive a portion of its management fee and/or reimburse expenses for certain funds of the John Hancock complex, including the fund (the participating portfolios). The waiver equals, on an annualized basis, 0.01% of that portion of the aggregate net assets of all the participating portfolios that exceeds $75 billion but is less than or equal to $125 billion; 0.0125% of that portion of the aggregate net assets of all the participating portfolios that exceeds $125 billion but is less than or equal to $150 billion; and 0.015% of that portion of the aggregate net assets of all the participating portfolios that exceeds $150 billion. The amount of the reimbursement is calculated daily and allocated among all the participating portfolios in proportion to the daily net assets of each fund. This arrangement may be amended or terminated at any time by the Advisor upon notice to the fund and with the approval of the Board of Trustees.
The Advisor has contractually agreed to waive all or a portion of its management fee and reimburse operating expenses of the fund to the extent necessary to maintain the fund’s total operating expenses at 2.00% and 1.50% for Class R2 and Class R6 shares, respectively, excluding certain expenses such as taxes, brokerage commissions, interest expense, litigation and indemnification expenses and other extraordinary expenses. The fee waivers and/or reimbursements will continue in effect until November 30, 2014, unless renewed by mutual agreement of the fund and the Advisor based upon a determination that this is appropriate under the circumstances at the time.
Effective February 1, 2014, for Class R6 shares, the Advisor has contractually agreed to waive and/or reimburse all class specific expense of the fund, including transfer agency fees and service fees, blue sky fees, and printing and postage, as applicable, to the extent they exceed 0.00% of average annual net assets. The fee waiver and/or reimbursement will continue in effect until November 30, 2015, unless renewed by mutual agreement of the fund and Advisor based upon a determination of that this is appropriate under the circumstances at the time. This waiver was in effect on a voluntary basis from January 1, 2014 to January 31, 2014.
| |
| Annual report | Global Absolute Return Strategies Fund | 69 |
For the year ended July 31, 2014, the expense reductions described above amounted to the following:
| | | | | | | |
| | EXPENSE | | | | | | |
| CLASS | REDUCTIONS | | | | | | |
| | | | | | |
| Class A | $80,488 | | | | | | |
| Class C | 11,540 | | | | | | |
| Class I | 155,624 | | | | | | |
| Class R2 | 13,942 | | | | | | |
| Class R6 | 38,858 | | | | | | |
| Class NAV | 46,651 | | | | | | |
| Total | $347,103 | | | | | | |
The investment management fees including the impact of the waivers and reimbursements as described above incurred for the year ended July 31, 2014 were equivalent to a net annual effective rate of 1.17% of the fund’s average daily net assets.
Expense recapture. The Advisor may recapture operating expenses reimbursed or fees waived under previous expense limitation or waiver arrangements for a period of three years following the month in which the reimbursements or waivers occurred to the extent that the fund is below its expense limitation during this period. The table below outlines the amounts recovered during the year ended July 31, 2014, and the amount of waived or reimbursed expenses subject to potential recovery and the respective expiration dates.
| | | | |
| | | | AMOUNT RECOVERED | |
| AMOUNTS ELIGIBLE FOR | AMOUNTS ELIGIBLE FOR | AMOUNTS ELIGIBLE FOR | DURING THE | |
| RECOVERY THROUGH | RECOVERY THROUGH | RECOVERY THROUGH | YEAR ENDED | |
| JULY 1, 2015 | JULY 1, 2016 | JULY 1, 2017 | JULY 31, 2014* | |
| |
| | |
| $6,712 | $21,180 | $13,839 | $7,974 | |
*Amount recovered during the period ended July 31, 2014 is for Class R6.
Accounting and legal services. Pursuant to a service agreement, the fund reimburses the Advisor for all expenses associated with providing the administrative, financial, legal, accounting and recordkeeping services to the fund, including the preparation of all tax returns, periodic reports to shareholders and regulatory reports, among other services. These expenses are allocated to each share class based on its relative net assets at the time the expense was incurred. These accounting and legal services fees incurred for the year ended July 31, 2014 amounted to an annual rate of 0.01% of the fund’s average daily net assets.
Distribution and service plans. The fund has a distribution agreement with the Distributor. The fund has adopted distribution and service plans with respect to Class A, Class C and Class R2 shares pursuant to Rule 12b-1 under the 1940 Act, to pay the Distributor for services provided as the distributor of shares of the fund. In addition, under a service plan for Class R2 shares, the fund pays for certain other services. The fund may pay up to the following contractual rates of distribution and service fees under these arrangements, expressed as an annual percentage of average daily net assets for each class of the fund’s shares.
| | | | | | | | |
| CLASS | RULE 12b-1 FEE | SERVICE FEE | | | | | | |
| | | | | | |
| Class A | 0.30% | — | | | | | | |
| Class C | 1.00% | — | | | | | | |
| Class R2 | 0.25% | 0.25% | | | | | | |
| |
| 70 | Global Absolute Return Strategies Fund | Annual report |
Sales charges. Class A shares are assessed up-front sales charges, which resulted in payments to the Distributor amounting to $827,961 for the year ended July 31, 2014. Of this amount, $136,126 was retained and used for printing prospectuses, advertising, sales literature and other purposes, $689,286 was paid as sales commissions to broker-dealers and $2,549 was paid as sales commissions to sales personnel of Signator Investors, Inc., a broker-dealer affiliate of the Advisor.
Class A shares may be subject to contingent deferred sales charges (CDSCs). Certain Class A shares that are acquired through purchases of $1 million or more and are redeemed within one year of purchase are subject to a 1.00% sales charge. Class C shares that are redeemed within one year of purchase are subject to a 1.00% CDSC. CDSCs are applied to the lesser of the current market value at the time of redemption or the original purchase cost of the shares being redeemed. Proceeds from CDSCs are used to compensate the Distributor for providing distribution-related services in connection with the sale of these shares. During the year ended July 31, 2014, CDSCs received by the Distributor amounted to $4,453 and $77,811 for Class A and Class C shares, respectively.
Transfer agent fees. The fund has a transfer agent agreement with John Hancock Signature Services, Inc. (Signature Services), an affiliate of the Advisor. The transfer agent fees paid to Signature Services are determined based on the cost to Signature Services (Signature Services Cost) of providing recordkeeping services. The Signature Services Cost includes a component of allocated John Hancock corporate overhead for providing transfer agent services to the fund and to all other John Hancock affiliated funds. It also includes out-of-pocket expenses, including payments made to third-parties for recordkeeping services provided to their clients who invest in one or more John Hancock funds. In addition, Signature Services Cost may be reduced by certain fees that Signature Services receives in connection with retirement and small accounts. Signature Services Cost is calculated monthly and allocated, as applicable, to five categories of share classes: Retail Share and Institutional Classes of Non-Municipal Bond Funds, Class R6 Shares, Retirement Share Classes and Municipal Bond Share Classes. Within each of these categories, the applicable costs are allocated to the affected John Hancock affiliated funds and/or classes, based on the relative average daily net assets.
Prior to October 1, 2013, Signature Services Cost were calculated monthly and allocated, as applicable, to four categories of share classes: Institutional Share Classes, Retirement Share Classes, Municipal Bond Share Classes and all other Retail Share Classes. Within each of these categories, the applicable costs were allocated to the affected John Hancock affiliated funds and/or classes, based on the relative average daily net assets.
Class level expenses. Class level expenses for the year ended July 31, 2014 were:
| | | | |
| | DISTRIBUTION | TRANSFER | STATE | PRINTING AND |
| CLASS | AND SERVICE FEES | AGENT FEES | REGISTRATION FEES | POSTAGE |
|
| Class A | $3,886,276 | $1,776,046 | $72,729 | $122,153 |
| Class C | 1,842,440 | 252,199 | 21,258 | 12,239 |
| Class I | — | 2,889,674 | 90,137 | 161,233 |
| Class R2 | 8,144 | 344 | 16,396 | 1,145 |
| Class R6 | — | 16,941 | 25,593 | 3,715 |
| Total | $5,736,860 | $4,935,204 | $226,113 | $300,485 |
Trustee expenses. The fund compensates each Trustee who is not an employee of the Advisor or its affiliates. The costs of paying Trustee compensation and expenses are allocated to each fund based on its net assets relative to other funds within the John Hancock group of funds complex.
| |
| Annual report | Global Absolute Return Strategies Fund | 71 |
Note 6 — Fund share transactions
Transactions in fund shares for the year ended July 31, 2014 and 2013 were as follows:
| | | | |
| | | Year ended 7-31-14 | | Year ended 7-31-13 |
| | Shares | Amount | Shares | Amount |
| Class A shares | | | | |
|
| Sold | 56,648,539 | $623,966,801 | 101,961,758 | $1,107,245,332 |
| Distributions reinvested | 1,305,500 | 14,386,611 | 384,649 | 4,096,508 |
| Repurchased | (78,728,641) | (876,234,160) | (11,802,459) | (128,308,378) |
| | | | | |
| Net increase (decrease) | (20,774,602) | ($237,880,748) | 90,543,948 | $983,033,462 |
| |
| Class C shares1 | | | | |
|
| Sold | 7,878,744 | $86,416,862 | 14,028,318 | $152,472,412 |
| Distributions reinvested | 64,825 | 715,016 | 18,002 | 191,898 |
| Repurchased | (3,351,778) | (36,940,662) | (559,428) | (6,111,479) |
| | | | | |
| Net increase | 4,591,791 | $50,191,216 | 13,486,892 | $146,552,831 |
| |
| Class I shares | | | | |
|
| Sold | 222,055,210 | $2,464,261,419 | 164,457,240 | $1,788,855,952 |
| Distributions reinvested | 2,658,482 | 29,323,051 | 716,332 | 7,636,093 |
| Repurchased | (75,057,959) | (830,458,267) | (20,868,596) | (226,995,052) |
| | | | | |
| Net increase | 149,655,733 | $1,663,126,203 | 144,304,976 | $1,569,496,993 |
| |
| Class R2 shares | | | | |
|
| Sold | 109,492 | $1,205,873 | 98,096 | $1,080,410 |
| Distributions reinvested | 960 | 10,592 | 15 | 157 |
| Repurchased | (118,578) | (1,327,571) | (792) | (8,621) |
| | | | | |
| Net increase (decrease) | (8,126) | ($111,106) | 97,319 | $1,071,946 |
| |
| Class R6 shares | | | | |
|
| Sold | 14,175,688 | $157,581,970 | 3,674,241 | $39,896,756 |
| Distributions reinvested | 70,514 | 777,061 | 4,219 | 44,937 |
| Repurchased | (489,022) | (5,387,011) | (76,606) | (828,222) |
| | | | | |
| Net increase | 13,757,180 | $152,972,020 | 3,601,854 | $39,113,471 |
| |
| Class NAV shares | | | | |
|
| Sold | 11,975,959 | $131,714,718 | 15,941,681 | $172,518,005 |
| Distributions reinvested | 997,279 | 10,990,010 | 708,702 | 7,547,678 |
| Repurchased | (913,248) | (10,035,124) | (1,550,325) | (16,925,748) |
| | | | | |
| Net increase | 12,059,990 | $132,669,604 | 15,100,058 | $163,139,935 |
| |
| Total net increase | 159,281,966 | $1,760,967,189 | 267,135,047 | $2,902,408,638 |
|
1 The inception date for Class C shares is 8-1-12.
Affiliates of the fund owned 100% of shares of beneficial interest of Class NAV, on July 31, 2014.
Note 7 — Purchase and sale of securities
Purchases and sales of securities, other than short-term investments, amounted to $2,591,717,224 and $1,409,414,672, respectively, for the year ended July 31, 2014.
| |
| 72 | Global Absolute Return Strategies Fund | Annual report |
Note 8 — Investment by affiliated funds
Certain investors in the fund are affiliated funds that are managed by the Advisor and its affiliates. The affiliated funds do not invest in the fund for the purpose of exercising management or control; however, this investment may represent a significant portion of the fund’s net assets. At July 31, 2014, funds within the John Hancock group of funds complex held 14.6% of the fund’s net assets.
| |
| Annual report | Global Absolute Return Strategies Fund | 73 |
Auditor’s report
Report of Independent Registered Public Accounting Firm
To the Board of Trustees of John Hancock Funds II and Shareholders of
John Hancock Global Absolute Return Strategies Fund:
In our opinion, the accompanying statement of assets and liabilities, including the schedule of investments, and the related statements of operations and of changes in net assets and the financial highlights present fairly, in all material respects, the financial position of the John Hancock Global Absolute Return Strategies Fund (the “Fund”) at July 31, 2014, the results of its operations for the year then ended, the changes in its net assets for each of the two years in the period then ended and the financial highlights for each of the periods indicated, in conformity with accounting principles generally accepted in the United States of America. These financial statements and financial highlights (hereafter referred to as “financial statements”) are the responsibility of the Fund’s management. Our responsibility is to express an opinion on these financial statements based on our audits. We conducted our audits of these financial statements in accordance with the standards of the Public Company Accounting Oversight Board (United States). Those standards require that we plan and perform the audit to obtain reasonable assurance about whether the financial statements are free of material misstatement. An audit includes examining, on a test basis, evidence supporting the amounts and disclosures in the financial statements, assessing the accounting principles used and significant estimates made by management, and evaluating the overall financial statement presentation. We believe that our audits, which included confirmation of securities at July 31, 2014 by correspondence with the custodian and brokers, and the application of alternative auditing procedures where securities purchased confirmations had not been received, provide a reasonable basis for our opinion.
PricewaterhouseCoopers LLP
Boston, Massachusetts
September 17, 2014
| |
| 74 | Global Absolute Return Strategies Fund | Annual report |
Tax information
Unaudited
For federal income tax purposes, the following information is furnished with respect to the distributions of the fund, if any, paid during its taxable year ended July 31, 2014.
The fund reports the maximum amount allowable of its net taxable income as eligible for the corporate dividends-received deduction.
The fund reports the maximum amount allowable of its net taxable income as qualified dividend income as provided in the Jobs and Growth Tax Relief Reconciliation Act of 2003.
Eligible shareholders will be mailed a 2014 Form 1099-DIV in early 2015. This will reflect the tax character of all distributions paid in calendar year 2014.
Please consult a tax advisor regarding the tax consequences of your investment in the fund.
| |
| Annual report | Global Absolute Return Strategies Fund | 75 |
Continuation of Investment Advisory and
Subadvisory Agreements
Evaluation of Advisory and Subadvisory Agreements by the Board of Trustees
This section describes the evaluation by the Board of Trustees (the Board) of John Hancock Funds II (the Trust) of the Advisory Agreement (the Advisory Agreement) with John Hancock Advisers, LLC (the Advisor) and the Subadvisory Agreement (the Subadvisory Agreement) with Standard Life Investments (Corporate Funds) Limited (the Subadvisor), for John Hancock Global Absolute Return Strategies Fund (the fund). The Advisory Agreement and Subadvisory Agreement are collectively referred to as the Agreements. Prior to the June 23–25, 2014 meeting at which the Agreements were approved, the Board also discussed and considered information regarding the proposed continuation of the Agreements at an in-person meeting held on May 27–29, 2014.
Approval of Advisory and Subadvisory Agreements
At in-person meetings held on June 23–25, 2014, the Board, including the Trustees who are not considered to be interested persons of the Trust under the Investment Company Act of 1940, as amended (the 1940 Act) (the Independent Trustees), reapproved for an annual period the continuation of the Advisory Agreement between the Trust and the Advisor and the Subadvisory Agreement between the Advisor and the Subadvisor with respect to the fund.
In considering the Advisory Agreement and the Subadvisory Agreement, the Board received in advance of the meetings a variety of materials relating to the fund, the Advisor and the Subadvisor, including comparative performance, fee and expense information for a peer group of similar funds prepared by an independent third-party provider of fund data, performance information for an applicable benchmark index; and, with respect to the Subadvisor, comparative performance information for comparably managed accounts, as applicable, and other information provided by the Advisor and the Subadvisor regarding the nature, extent and quality of services provided by the Advisor and the Subadvisor under their respective Agreements, as well as information regarding the Advisor’s revenues and costs of providing services to the fund and any compensation paid to affiliates of the Advisor. At the meetings at which the renewal of the Advisory Agreement and Subadvisory Agreement are considered, particular focus is given to information concerning fund performance, comparability of fees and total expenses, and profitability. However, the Board notes that the evaluation process with respect to the Advisor and the Subadvisor is an ongoing one. In this regard, the Board also took into account discussions with management and information provided to the Board at prior meetings with respect to the services provided by the Advisor and the Subadvisor to the fund, including quarterly performance reports prepared by management containing reviews of investment results and prior presentations from the Subadvisor with respect to the fund. The Board also considered the nature, quality, and extent of non-advisory services, if any, to be provided to the fund by the Advisor’s affiliates, including distribution services.
Throughout the process, the Board asked questions of and requested additional information from management. The Board is assisted by counsel for the Trust and the Independent Trustees are also separately assisted by independent legal counsel throughout the process. The Independent Trustees also received a memorandum from their independent legal counsel discussing the legal standards for their consideration of the proposed continuation of the Agreements and discussed the proposed continuation of the Agreements in private sessions with their independent legal counsel at which no representatives of management were present.
Approval of Advisory Agreement
In approving the Advisory Agreement with respect to the fund, the Board, including the Independent Trustees, considered a variety of factors, including those discussed below. The Board also considered other factors (including conditions and trends prevailing generally in the economy, the securities markets, and the industry) and does not treat any single factor as determinative, and
| |
| 76 | Global Absolute Return Strategies Fund | Annual report |
each Trustee may attribute different weights to different factors. The Board’s conclusions may be based in part on its consideration of the advisory and subadvisory arrangements in prior years and on the Board’s ongoing regular review of fund performance and operations throughout the year.
Nature, extent, and quality of services. Among the information received by the Board from the Advisor relating to the nature, extent, and quality of services provided to the fund, the Board reviewed information provided by the Advisor relating to its operations and personnel, descriptions of its organizational and management structure, and information regarding the Advisor’s compliance and regulatory history, including its Form ADV. The Board also noted that on a regular basis it receives and reviews information from the Trust’s Chief Compliance Officer (CCO) regarding the fund’s compliance policies and procedures established pursuant to Rule 38a-1 under the 1940 Act. The Board also considered the Advisor’s risk management processes. The Board considered that the Advisor is responsible for the management of the day-to-day operations of the fund, including, but not limited to, general supervision of and coordination of the services provided by the Subadvisor, and is also responsible for monitoring and reviewing the activities of the Subadvisor and other third-party service providers.
In considering the nature, extent, and quality of the services provided by the Advisor, the Trustees also took into account their knowledge of the Advisor’s management and the quality of the performance of the Advisor’s duties, through Board meetings, discussions and reports during the preceding year and through each Trustee’s experience as a Trustee of the Trust and of the other trusts in the complex.
In the course of their deliberations regarding the Advisory Agreement, the Board considered, among other things:
(a) the skills and competency with which the Advisor has in the past managed the Trust’s affairs and its subadvisory relationship, the Advisor’s oversight and monitoring of the Subadvisor’s investment performance and compliance programs, such as the Subadvisor’s compliance with fund policies and objectives, review of brokerage matters, including with respect to trade allocation and best execution and the Advisor’s timeliness in responding to performance issues;
(b) the background, qualifications and skills of the Advisor’s personnel;
(c) the Advisor’s compliance policies and procedures and its responsiveness to regulatory changes and mutual fund industry developments;
(d) the Advisor’s administrative capabilities, including its ability to supervise the other service providers for the fund;
(e) the financial condition of the Advisor and whether it has the financial wherewithal to provide a high level and quality of services to the fund; and
(f) the Advisor’s reputation and experience in serving as an investment advisor to the Trust and the benefit to shareholders of investing in funds that are part of a family of funds offering a variety of investments.
The Board concluded that the Advisor may reasonably be expected to continue to provide a high quality of services under the Advisory Agreement with respect to the fund.
Investment performance. In considering the fund’s performance, the Board noted that it reviews at its regularly scheduled meetings information about the fund’s performance results. In connection with the consideration of the Advisory Agreement, the Board:
| |
| Annual report | Global Absolute Return Strategies Fund | 77 |
(a) reviewed information prepared by management regarding the fund’s performance;
(b) considered the comparative performance of an applicable benchmark index;
(c) considered the performance of comparable funds, if any, as included in the report prepared by an independent third-party provider of fund data; and
(d) took into account the Advisor’s analysis of the fund’s performance and its plans and recommendations regarding the Trust’s subadvisory arrangements generally.
The Board noted that the fund outperformed its benchmark index and peer group average for the one-year and since inception periods ended December 31, 2013.
The Board noted the fund’s favorable performance relative to the benchmark index and peer group average for the one-year period.
The Board concluded that the fund’s performance has generally outperformed the historical performance of comparable funds and the fund’s benchmark.
Fees and expenses. The Board reviewed comparative information prepared by an independent third-party provider of mutual fund data, including, among other data, the fund’s contractual and net management fees (and subadvisory fees, to the extent available) and total expenses as compared to similarly situated investment companies deemed to be comparable to the fund. The Board considered the fund’s ranking within a smaller group of peer funds chosen by the independent third-party provider, as well as the fund’s ranking within a broader group of funds. In comparing the fund’s contractual and net management fees to those of comparable funds, the Board noted that such fees include both advisory and administrative costs.
The Board noted that net management fees and total expenses for the fund are higher than the peer group median.
The Board took into account management’s discussion of the fund’s expenses, including the reduction in the advisory fee rate effective June 26, 2013, and action taken that will further reduce certain fund expenses. The Board also took into account management’s discussion with respect to the advisory/subadvisory fee structure, including the amount of the advisory fee retained by the Advisor after payment of the subadvisory fee. The Board also noted that the Advisor pays the subadvisory fee, and that such fees are negotiated at arm’s length with respect to the Subadvisor. In addition, the Board took into account that management had agreed, effective July 1, 2014, to implement an overall fee waiver across the complex, including the fund, which is discussed further below. The Board also noted actions taken over the past several years to reduce the fund’s operating expenses. In addition, the Advisor is currently waiving fees and/or reimbursing expenses with respect to the fund, and that the fund has breakpoints in its contractual management fee schedule that reduces management fees as assets increase. The Board reviewed information provided by the Advisor concerning the investment advisory fee charged by the Advisor or one of its advisory affiliates to other clients (including other funds in the complex) having similar investment mandates, if any. The Board considered any differences between the Advisor’s and Subadvisor’s services to the fund and the services they provide to other comparable clients or funds. The Board concluded that the advisory fee paid with respect to the fund is reasonable.
Profitability/indirect benefits. In considering the costs of the services to be provided and the profits to be realized by the Advisor and its affiliates from the Advisor’s relationship with the Trust, the Board:
(a) reviewed financial information of the Advisor;
| |
| 78 | Global Absolute Return Strategies Fund | Annual report |
(b) reviewed and considered information presented by the Advisor regarding the net profitability to the Advisor and its affiliates with respect to the fund;
(c) received and reviewed profitability information with respect to the John Hancock fund complex as a whole;
(d) received information with respect to the Advisor’s allocation methodologies used in preparing the profitability data;
(e) considered that the John Hancock insurance companies that are affiliates of the Advisor, as shareholders of the Trust directly or through their separate accounts, receive certain tax credits or deductions relating to foreign taxes paid and dividends received by certain funds of the Trust and noted that these tax benefits, which are not available to participants in qualified retirement plans under applicable income tax law, are reflected in the profitability analysis reviewed by the Board;
(f) considered that the Advisor also provides administrative services to the fund on a cost basis confirm services at cost under services agreement pursuant to an administrative services agreement;
(g) noted that affiliates of the Advisor provide transfer agency services and distribution services to the fund, and that the fund’s distributor also receives Rule 12b-1 payments to support distribution of the fund;
(h) noted that the Advisor also derives reputational and other indirect benefits from providing advisory services to the fund;
(i) noted that the subadvisory fee for the fund is paid by the Advisor and is negotiated at arm’s length; and
(j) considered that the Advisor should be entitled to earn a reasonable level of profits in exchange for the level of services it provides to the fund and the entrepreneurial risk that it assumes as Advisor.
Based upon its review, the Board concluded that the level of profitability, if any, of the Advisor and its affiliates from their relationship with the fund was reasonable and not excessive.
Economies of scale. In considering the extent to which economies of scale would be realized as the fund grows and whether fee levels reflect these economies of scale for the benefit of fund shareholders, the Board:
(a) considered that the Advisor has agreed, effective July 1, 2014, to waive a portion of its management fee for the fund and each of the other John Hancock funds in the complex (except for those discussed below) (the Participating Portfolios) or otherwise reimburse the expenses of the Participating Portfolios as follows (the Reimbursement):
The Reimbursement shall equal, on an annualized basis, 0.01% of that portion of the aggregate net assets of all the Participating Portfolios that exceed $75 billion but is less than or equal to $125 billion, 0.0125% of that portion of the aggregate net assets of all the Participating Portfolios that exceed $125 billion but is less than or equal to $150 billion and 0.015% of that portion of the aggregate net assets of all the Participating Portfolios that exceeds $150 billion. (The funds that are not Participating Portfolios are the funds of funds in the complex, which benefit from such overall management fee waiver through their investment in underlying portfolios that include Participating Portfolios, which are subject to the Reimbursement.)
| |
| Annual report | Global Absolute Return Strategies Fund | 79 |
(b) reviewed the fund’s advisory fee structure and concluded that: (i) the fund’s fee structure contains breakpoints at the subadvisory fee level and that such breakpoints are reflected as breakpoints in the advisory fees for the fund; and (ii) although economies of scale cannot be measured with precision, these arrangements permit shareholders of the fund to benefit from economies of scale if the fund grows. The Board also took into account management’s discussion of the fund’s advisory fee structure; and
(c) the Board also considered the effect of the fund’s growth in size on its performance and fees. The Board also noted that if the fund’s assets increase over time, the fund may realize other economies of scale.
Approval of Subadvisory Agreement
In making its determination with respect to approval of the Subadvisory Agreement, the Board reviewed:
(1) information relating to the Subadvisor’s business, including current subadvisory services to the Trust (and other funds in the John Hancock family of funds);
(2) the historical and current performance of the fund and comparative performance information relating to an applicable benchmark index and comparable funds;
(3) the subadvisory fee for the fund, including any breakpoints, and to the extent available, comparable fee information prepared by an independent third party provider of fund data; and
(4) information relating to the nature and scope of any material relationships and their significance to the Trust’s Advisor and Subadvisors.
Nature, extent, and quality of services. With respect to the services provided by the Subadvisor, the Board received information provided to the Board by the Subadvisor, including the Subadvisor’s Form ADV, as well as took into account information presented throughout the past year. The Board considered the Subadvisor’s current level of staffing and its overall resources, as well as received information relating to the Subadvisor’s compensation program. The Board reviewed the Subadvisor’s history and investment experience, as well as information regarding the qualifications, background, and responsibilities of the Subadvisor’s investment and compliance personnel who provide services to the fund. The Board also considered, among other things, the Subadvisor’s compliance program and any disciplinary history. The Board also considered the Subadvisor’s risk assessment and monitoring process. The Board reviewed the Subadvisor’s regulatory history, including whether it was involved in any regulatory actions or investigations as well as material litigation, and any settlements and amelioratory actions undertaken, as appropriate. The Board noted that the Advisor conducts regular, periodic reviews of the Subadvisor and its operations, including regarding investment processes and organizational and staffing matters. The Board also noted that the Trust’s CCO and his staff conduct regular, periodic compliance reviews with the Subadvisor and present reports to the Independent Trustees regarding the same, which includes evaluating the regulatory compliance systems of the Subadvisor and procedures reasonably designed to assure compliance with the federal securities laws. The Board also took into account the financial condition of the Subadvisor.
The Board considered the Subadvisor’s investment process and philosophy. The Board took into account that the Subadvisor’s responsibilities include the development and maintenance of an investment program for the fund that is consistent with the fund’s investment objective, the selection of investment securities and the placement of orders for the purchase and sale of such securities, as well as the implementation of compliance controls related to performance of these
| |
| 80 | Global Absolute Return Strategies Fund | Annual report |
services. The Board also received information with respect to the Subadvisor’s brokerage policies and practices, including with respect to best execution and soft dollars.
Subadvisor compensation. In considering the cost of services to be provided by the Subadvisor and the profitability to the Subadvisor of its relationship with the fund, the Board noted that the fees under the Subadvisory Agreement are paid by the Advisor and not the fund.
The Board also relied on the ability of the Advisor to negotiate the Subadvisory Agreement with the Subadvisor, which is not affiliated with the Advisor, and the fees thereunder at arm’s length. As a result, the costs of the services to be provided and the profits to be realized by the Subadvisor from its relationship with the Trust were not a material factor in the Board’s consideration of the Subadvisory Agreement.
The Board also received information regarding the nature and scope (including their significance to the Advisor and its affiliates and to the Subadvisor) of any material relationships, if any, with respect to the Subadvisor, which include arrangements in which the Subadvisor or its affiliates provide advisory, distribution, or management services in connection with financial products sponsored by the Advisor or its affiliates, and may include other registered investment companies, a 529 education savings plan, managed separate accounts and exempt group annuity contracts sold to qualified plans. The Board also received information and took into account any other potential conflicts of interest the Advisor might have in connection with the Subadvisory Agreement.
In addition, the Board considered other potential indirect benefits that the Subadvisor and its affiliates may receive from the Subadvisor’s relationship with the fund, such as the opportunity to provide advisory services to additional funds in the John Hancock fund complex and reputational benefits.
Subadvisory fee. The Board considered that the fund pays an advisory fee to the Advisor and that, in turn, the Advisor pays a subadvisory fee to the Subadvisor. As noted above, the Board also considered the fund’s subadvisory fee as compared to similarly situated investment companies deemed to be comparable to the fund as included in the report prepared by the independent third party provider of fund data, to the extent available. The Board noted that the limited size of the peer group was not sufficient for comparative purposes. The Board also took into account the sub-advisory fee paid by the Advisor to the Subadvisor with respect to the fund to fees charged by the Subadvisor to manage other subadvised portfolios and portfolios not subject to regulation under the 1940 Act, as applicable.
Subadvisor performance. As noted above, the Board considered the fund’s performance as compared to the fund’s peer group and the benchmark index and noted that the Board reviews information about the fund’s performance results at its regularly scheduled meetings. The Board noted the Advisor’s expertise and resources in monitoring the performance, investment style and risk-adjusted performance of the Subadvisor. The Board was mindful of the Advisor’s focus on the Subadvisor’s performance. The Board also noted the Subadvisor’s long-term performance record for similar accounts, as applicable.
The Board’s decision to approve the Subadvisory Agreement was based on a number of determinations, including the following:
(1) the Subadvisor has extensive experience and demonstrated skills as a manager;
(2) the performance of the fund has generally outperformed the historical performance of comparable funds and the fund’s benchmark;
(3) the subadvisory fee is reasonable in relation to the level and quality of services being provided; and
| |
| Annual report | Global Absolute Return Strategies Fund | 81 |
(4) subadvisory fee breakpoints are reflected as breakpoints in the advisory fees for the fund in order to permit shareholders to benefit from economies of scale if the fund grows.
Based on the Board’s evaluation of all factors that the Board deemed to be material, including those factors described above, the Board, including the Independent Trustees, concluded that renewal of the Advisory Agreement and the Subadvisory Agreement would be in the best interest of the fund and its shareholders. Accordingly, the Board, and the Independent Trustees voting separately, approved the Advisory Agreement and Subadvisory Agreement for an additional one-year period.
| |
| 82 | Global Absolute Return Strategies Fund | Annual report |
Trustees and Officers
This chart provides information about the Trustees and Officers who oversee your John Hancock fund. Officers elected by the Trustees manage the day-to-day operations of the fund and execute policies formulated by the Trustees.
| | |
| Independent Trustees | | |
| | | |
| Name, year of birth | Trustee | Number of John |
| Position(s) held with fund | of the | Hancock funds |
| Principal occupation(s) and other | Trust | overseen by |
| directorships during past 5 years | since1 | Trustee |
| |
| James M. Oates, Born: 1946 | 2005 | 230 |
|
| Managing Director, Wydown Group (financial consulting firm) (since 1994); Chairman and Director, |
| Emerson Investment Management, Inc. (since 2000); Independent Chairman, Hudson Castle Group, Inc. |
| (formerly IBEX Capital Markets, Inc.) (financial services company) (1997–2011); Director, Stifel Financial |
| (since 1996); Director, Investor Financial Services Corporation (1995–2007); Director, Connecticut River |
| Bancorp (since 1998); Director, Virtus Funds (formerly Phoenix Mutual Funds) (since 1988). | |
| |
| Trustee and Chairperson of the Board, John Hancock retail funds3 (since 2012); Trustee (2005–2006 and |
| since 2012) and Chairperson of the Board (since 2012), John Hancock Funds III; Trustee (since 2004) and |
| Chairperson of the Board (since 2005), John Hancock Variable Insurance Trust; Trustee and Chairperson |
| of the Board, John Hancock Funds II (since 2005). | | |
|
| |
| Charles L. Bardelis,2 Born: 1941 | 2005 | 230 |
|
| Director, Island Commuter Corp. (marine transport). | | |
| |
| Trustee, John Hancock retail funds3 (since 2012); Trustee, John Hancock Funds III (2005–2006 and |
| since 2012); Trustee, John Hancock Variable Insurance Trust (since 1988); Trustee, John Hancock |
| Funds II (since 2005). | | |
|
| |
| Peter S. Burgess,2 Born: 1942 | 2005 | 230 |
|
| Consultant (financial, accounting, and auditing matters) (since 1999); Certified Public Accountant; |
| Partner, Arthur Andersen (independent public accounting firm) (prior to 1999); Director, Lincoln |
| Educational Services Corporation (since 2004); Director, Symetra Financial Corporation (since 2010); |
| Director, PMA Capital Corporation (2004–2010). | | |
| |
| Trustee, John Hancock retail funds3 (since 2012); Trustee, John Hancock Funds III (2005–2006 and |
| since 2012); Trustee, John Hancock Variable Insurance Trust and John Hancock Funds II (since 2005). |
|
| |
| William H. Cunningham, Born: 1944 | 2012 | 230 |
|
| Professor, University of Texas, Austin, Texas (since 1971); former Chancellor, University of Texas System |
| and former President of the University of Texas, Austin, Texas; Director, LIN Television (since 2009); |
| Chairman (since 2009) and Director (since 2006), Lincoln National Corporation (insurance); Director, |
| Resolute Energy Corporation (since 2009); Director, Southwest Airlines (since 2000); former Director, |
| Introgen (manufacturer of biopharmaceuticals) (until 2008); former Director, Hicks Acquisition Company I, |
| Inc. (until 2007); former Director, Texas Exchange Bank, SSB (formerly Bank of Crowley) (until 2009); |
| former Advisory Director, JP Morgan Chase Bank (formerly Texas Commerce Bank–Austin) (until 2009). |
| |
| Trustee, John Hancock retail funds3 (since 1986); Trustee, John Hancock Variable Insurance Trust |
| (since 2012); Trustee, John Hancock Funds II (2005–2006 and since 2012). | | |
| |
| Annual report | Global Absolute Return Strategies Fund | 83 |
| | |
| Independent Trustees (continued) | | |
| |
| Name, Year of Birth | Trustee | Number of John |
| Position(s) held with Fund | of the | Hancock funds |
| Principal occupation(s) and other | Trust | overseen by |
| directorships during past 5 years | since1 | Trustee |
| |
| Grace K. Fey, Born: 1946 | 2008 | 230 |
|
| Chief Executive Officer, Grace Fey Advisors (since 2007); Director and Executive Vice President, Frontier |
| Capital Management Company (1988–2007); Director, Fiduciary Trust (since 2009). | |
| |
| Trustee, John Hancock retail funds3 (since 2012); Trustee, John Hancock Variable Insurance Trust and |
| John Hancock Funds II (since 2008). | | |
|
| |
| Theron S. Hoffman,2 Born: 1947 | 2008 | 230 |
|
| Chief Executive Officer, T. Hoffman Associates, LLC (consulting firm) (since 2003); Director, The Todd |
| Organization (consulting firm) (2003–2010); President, Westport Resources Management (investment |
| management consulting firm) (2006–2008); Senior Managing Director, Partner, and Operating Head, |
| Putnam Investments (2000–2003); Executive Vice President, The Thomson Corp. (financial and legal |
| information publishing) (1997–2000). | | |
| |
| Trustee, John Hancock retail funds3 (since 2012); Trustee, John Hancock Variable Insurance Trust and |
| John Hancock Funds II (since 2008). | | |
|
| |
| Deborah C. Jackson, Born: 1952 | 2012 | 230 |
|
| President, Cambridge College, Cambridge, Massachusetts (since 2011); Chief Executive Officer, |
| American Red Cross of Massachusetts Bay (2002–2011); Board of Directors of Eastern Bank Corporation |
| (since 2001); Board of Directors of Eastern Bank Charitable Foundation (since 2001); Board of Directors |
| of American Student Assistance Corporation (1996–2009); Board of Directors of Boston Stock Exchange |
| (2002–2008); Board of Directors of Harvard Pilgrim Healthcare (health benefits company) (2007–2011). |
| |
| Trustee, John Hancock retail funds3 (since 2008); Trustee of John Hancock Variable Insurance Trust and |
| John Hancock Funds II (since 2012). | | |
|
| |
| Hassell H. McClellan, Born: 1945 | 2005 | 230 |
|
| Trustee, Virtus Variable Insurance Trust (formerly Phoenix Edge Series Funds) (since 2008); Director, The |
| Barnes Group (since 2010); Associate Professor, The Wallace E. Carroll School of Management, Boston |
| College (retired 2013). | | |
| |
| Trustee, John Hancock retail funds3 (since 2012); Trustee, John Hancock Funds III (2005–2006 and |
| since 2012); Trustee, John Hancock Variable Insurance Trust and John Hancock Funds II (since 2005). |
|
| |
| Steven R. Pruchansky, Born: 1944 | 2012 | 230 |
|
| Chairman and Chief Executive Officer, Greenscapes of Southwest Florida, Inc. (since 2000); Director |
| and President, Greenscapes of Southwest Florida, Inc. (until 2000); Member, Board of Advisors, First |
| American Bank (until 2010); Managing Director, Jon James, LLC (real estate) (since 2000); Director, |
| First Signature Bank & Trust Company (until 1991); Director, Mast Realty Trust (until 1994); President, |
| Maxwell Building Corp. (until 1991). | | |
| |
| Trustee (since 1992) and Chairperson of the Board (2011–2012), John Hancock retail funds3; Trustee and |
| Vice Chairperson of the Board, John Hancock retail funds,3 John Hancock Variable Insurance Trust, and |
| John Hancock Funds II (since 2012). | | |
| |
| 84 | Global Absolute Return Strategies Fund | Annual report |
| | |
| Independent Trustees (continued) | | |
| |
| Name, Year of Birth | Trustee | Number of John |
| Position(s) held with Fund | of the | Hancock funds |
| Principal occupation(s) and other | Trust | overseen by |
| directorships during past 5 years | since1 | Trustee |
| |
| Gregory A. Russo, Born: 1949 | 2012 | 230 |
|
| Director and Audit Committee Chairman (since 2012), and Member, Audit Committee and Finance |
| Committee (since 2011), NCH Healthcare System, Inc. (holding company for multi-entity healthcare |
| system); Director and Member of Finance Committee, The Moorings, Inc. (nonprofit continuing care |
| community) (since 2012); Vice Chairman, Risk & Regulatory Matters, KPMG LLP (KPMG) (2002–2006); |
| Vice Chairman, Industrial Markets, KPMG (1998–2002); Chairman and Treasurer, Westchester County, |
| New York, Chamber of Commerce (1986–1992); Director, Treasurer, and Chairman of Audit and |
| Finance Committees, Putnam Hospital Center (1989–1995); Director and Chairman of Fundraising |
| Campaign, United Way of Westchester and Putnam Counties, New York (1990–1995). | |
| |
| Trustee, John Hancock retail funds3 (since 2008); Trustee, John Hancock Variable Insurance Trust and |
| John Hancock Funds II (since 2012). | | |
| |
| |
| Non-Independent Trustees4 | | |
| | | |
| Name, year of birth | Trustee | Number of John |
| Position(s) held with fund | of the | Hancock funds |
| Principal occupation(s) and other | Trust | overseen by |
| directorships during past 5 years | since1 | Trustee |
| |
| Craig Bromley, Born: 1966 | 2012 | 230 |
|
| President, John Hancock Financial Services (since 2012); Senior Executive Vice President and General |
| Manager, U.S. Division, Manulife Financial Corporation (since 2012); President and Chief Executive |
| Officer, Manulife Insurance Company (Manulife Japan) (2005–2012, including prior positions). |
| |
| Trustee, John Hancock retail funds,3 John Hancock Variable Insurance Trust, and John Hancock |
| Funds II (since 2012). | | |
|
| |
| Warren A. Thomson, Born: 1955 | 2012 | 230 |
|
| Senior Executive Vice President and Chief Investment Officer, Manulife Financial Corporation and The |
| Manufacturers Life Insurance Company (since 2009); Chairman and Chief Executive Officer, Manulife |
| Asset Management (since 2001, including prior positions); Director (since 2006), and President and |
| Chief Executive Officer (since 2013), Manulife Asset Management Limited; Director and Chairman, |
| Hancock Natural Resources Group, Inc. (since 2013). | | |
| |
| Trustee, John Hancock retail funds,3 John Hancock Variable Insurance Trust, and John Hancock |
| Funds II (since 2012). | | |
| |
| |
| Principal officers who are not Trustees | | |
| | | |
| Name, year of birth | | Officer |
| Position(s) held with fund | | of the |
| Principal occupation(s) and other | | Trust |
| directorships during past 5 years | | since |
| |
| Andrew G. Arnott, Born: 1971 | | 2009 |
|
| President | | |
| Senior Vice President, John Hancock Financial Services (since 2009); Director and Executive Vice |
| President, John Hancock Advisers, LLC (since 2005, including prior positions); Director and Executive |
| Vice President, John Hancock Investment Management Services, LLC (since 2006, including prior |
| positions); President, John Hancock Funds, LLC (since 2004, including prior positions); President |
| (effective 3-13-14) and Executive Vice President, John Hancock retail funds,3 John Hancock Variable |
| Insurance Trust, and John Hancock Funds II (since 2007, including prior positions). | |
| |
| Annual report | Global Absolute Return Strategies Fund | 85 |
| |
| Principal officers who are not Trustees (continued) | |
| |
| Name, Year of Birth | Officer |
| Position(s) held with Fund | of the |
| Principal occupation(s) and other | Trust |
| directorships during past 5 years | since |
| |
| John J. Danello, Born: 1955 | 2006 |
|
| Senior Vice President, Secretary, and Chief Legal Officer | |
| Vice President and Chief Counsel, John Hancock Wealth Management (since 2005); Senior Vice | |
| President (since 2007) and Chief Legal Counsel (2007–2010), John Hancock Funds, LLC and The | |
| Berkeley Financial Group, LLC; Senior Vice President (since 2006, including prior positions) and Chief |
| Legal Officer and Secretary (since 2014), John Hancock retail funds3 and John Hancock Variable | |
| Insurance Trust; Vice President, John Hancock Life & Health Insurance Company (since 2009); | |
| Vice President, John Hancock Life Insurance Company (USA) and John Hancock Life Insurance | |
| Company of New York (since 2010); and Senior Vice President, Secretary, and Chief Legal Counsel | |
| (2007–2014, including prior positions) of John Hancock Advisers, LLC and John Hancock Investment |
| Management Services, LLC. | |
|
| |
| Francis V. Knox, Jr., Born: 1947 | 2005 |
|
| Chief Compliance Officer | |
| Vice President, John Hancock Financial Services (since 2005); Chief Compliance Officer, John Hancock |
| retail funds,3 John Hancock Variable Insurance Trust, John Hancock Funds II, John Hancock Advisers, |
| LLC, and John Hancock Investment Management Services, LLC (since 2005). | |
|
| |
| Charles A. Rizzo, Born: 1957 | 2007 |
|
| Chief Financial Officer | |
| Vice President, John Hancock Financial Services (since 2008); Senior Vice President, John Hancock | |
| Advisers, LLC and John Hancock Investment Management Services, LLC (since 2008); Chief Financial |
| Officer, John Hancock retail funds,3 John Hancock Variable Insurance Trust and John Hancock | |
| Funds II (since 2007). | |
|
| |
| Salvatore Schiavone, Born: 1965 | 2009 |
|
| Treasurer | |
| Assistant Vice President, John Hancock Financial Services (since 2007); Vice President, John Hancock |
| Advisers, LLC and John Hancock Investment Management Services, LLC (since 2007); Treasurer, | |
| John Hancock retail funds3 (since 2007, including prior positions); Treasurer, John Hancock Variable |
| Insurance Trust and John Hancock Funds II (since 2010 and 2007–2009, including prior positions). | |
The business address for all Trustees and Officers is 601 Congress Street, Boston, Massachusetts 02210-2805.
1 Each Trustee holds office until his or her successor is elected and qualified, or until the Trustee’s death, retirement, resignation, or removal.
2 Member of the Audit Committee.
3 “John Hancock retail funds” comprises John Hancock Funds III and 37 other John Hancock funds consisting of 27 series of other John Hancock trusts and 10 closed-end funds.
4 Because Messrs. Bromley and Thomson are senior executives or directors of the advisor and/or its affiliates, each of them is considered an “interested person of the fund,” as defined in the Investment Company Act of 1940.
| |
| 86 | Global Absolute Return Strategies Fund | Annual report |
More information
| |
| Trustees | Investment advisor |
| James M. Oates, Chairperson | John Hancock Advisers, LLC |
| Steven R. Pruchansky, Vice Chairperson | |
| Charles L. Bardelis* | Subadvisor |
| Craig Bromley† | Standard Life Investments (Corporate Funds) |
| Peter S. Burgess* | Limited |
| William H. Cunningham | |
| Grace K. Fey | Principal distributor |
| Theron S. Hoffman* | John Hancock Funds, LLC |
| Deborah C. Jackson | |
| Hassell H. McClellan | Custodian |
| Gregory A. Russo | State Street Bank and Trust Company |
| Warren A. Thomson† | |
| | Transfer agent |
| Officers | John Hancock Signature Services, Inc. |
| Andrew G. Arnott | |
| President | Legal counsel |
| | K&L Gates LLP |
| John J. Danello | |
| Senior Vice President, Secretary, | Independent registered |
| and Chief Legal Officer | public accounting firm |
| | PricewaterhouseCoopers LLP |
| Francis V. Knox, Jr. | |
| Chief Compliance Officer | |
| | |
| Charles A. Rizzo | |
| Chief Financial Officer | |
| | |
| Salvatore Schiavone | |
| Treasurer | |
| |
| *Member of the Audit Committee | |
| †Non-Independent Trustee | |
The fund’s proxy voting policies and procedures, as well as the fund’s proxy voting record for the most recent twelve-month period ended June 30, are available free of charge on the Securities and Exchange Commission (SEC) website at sec.gov or on our website.
The fund’s complete list of portfolio holdings, for the first and third fiscal quarters, is filed with the SEC on Form N-Q. The fund’s Form N-Q is available on our website and the SEC’s website, sec.gov, and can be reviewed and copied (for a fee) at the SEC’s Public Reference Room in Washington, DC. Call 800-SEC-0330 to receive information on the operation of the SEC’s Public Reference Room.
We make this information on your fund, as well as monthly portfolio holdings, and other fund details available on our website at jhinvestments.com or by calling 800-225-5291.
| | |
| You can also contact us: | | |
| 800-225-5291 | Regular mail: | Express mail: |
| jhinvestments.com | John Hancock Signature Services, Inc. | John Hancock Signature Services, Inc. |
| | P.O. Box 55913 | 30 Dan Road |
| | Boston, MA 02205-5913 | Canton, MA 02021 |
| |
| Annual report | Global Absolute Return Strategies Fund | 87 |

800-225-5291
800-231-5469 TDD
800-338-8080 EASI-Line
jhinvestments.com
| |
| This report is for the information of the shareholders of John Hancock Global Absolute Return Strategies Fund. | |
| It is not authorized for distribution to prospective investors unless preceded or accompanied by a prospectus. | 395A 7/14 |
| MF195340 | 9/14 |

A look at performance
Total returns for the period ended July 31, 2014
| | | | | | | | |
| | Average annual total returns (%) | Cumulative total returns (%) | |
| | with maximum sales charge | | with maximum sales charge | |
|
| | 1-year | 5-year | 10-year | Since inception 1 | 1-year | 5-year | 10-year | Since inception 1 |
|
| Class A2 | 6.44 | 10.71 | — | 3.02 | 6.44 | 66.28 | — | 25.03 |
|
| Class I2,3 | 12.32 | 13.00 | — | 4.92 | 12.32 | 84.23 | — | 43.34 |
|
| Index† | 13.33 | 9.83 | — | 3.13 | 13.33 | 59.84 | — | 25.98 |
|
Performance figures assume all dividends have been reinvested. Figures reflect maximum sales charge on Class A shares of 5%. Sales charges are not applicable to Class I shares.
The expense ratios of the fund, both net (including any fee waivers and/or expense limitations) and gross (excluding any fee waivers and/or expense limitations), are set forth according to the most recent publicly available prospectuses for the fund and may differ from those disclosed in the Financial highlights tables in this report. Had the fee waivers and expense limitations not been in place, gross expenses would apply. The expense ratios are as follows:
| | | | |
| | Class A | Class I | | |
| Gross (%) | 1.91 | 1.53 | | |
| Net (%) | 1.35 | 1.10 | | |
Please refer to the most recent prospectuses and annual report for more information on expenses and any expense limitation arrangements for each class.
The returns reflect past results and should not be considered indicative of future performance. The return and principal value of an investment will fluctuate so that shares, when redeemed, may be worth more or less than their original cost. Due to market volatility, the fund’s current performance may be higher or lower than the performance shown. For performance data current to the most recent month end, please call 800-225-5291 or visit the fund’s website at jhinvestments.com.
The performance table above and the chart on the next page do not reflect the deduction of taxes that a shareholder would pay on fund distributions or the redemption of fund shares. The fund’s performance results reflect any applicable fee waivers or expense reductions, without which the expenses would increase and results would have been less favorable.
† Index is the MSCI World ex-USA Growth Index.
See the following page for footnotes.
| |
| 6 | International Growth Equity Fund | Annual report |
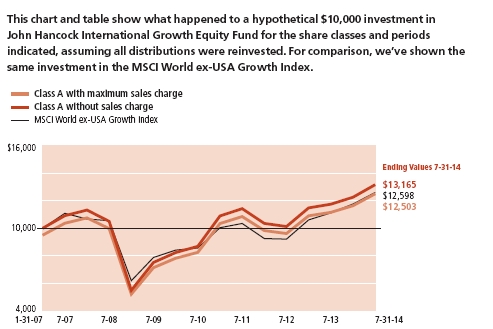
| | | | |
| | | With maximum | Without | |
| | Start date | sales charge | sales charge | Index |
|
| Class I3 | 1-31-07 | $14,334 | $14,334 | $12,598 |
|
MSCI World ex-USA Growth Index (gross of foreign withholding taxes on dividends) is a free float-adjusted market capitalization weighted index that is designed to measure the equity market performance of developed markets, excluding the United States of America, that have higher than average growth characteristics.
It is not possible to invest directly in an index. Index figures do not reflect expenses or sales charges, which would have resulted in lower values.
Footnotes related to performance pages
1 From 1-31-07.
2 The fund is the successor to the Turner International Growth Fund (the predecessor fund). The predecessor fund’s Investor class shares commenced operations on 10-31-08. Periods prior to 10-31-08 represent the performance of the predecessor fund’s Institutional class shares, which commenced operations on 1-31-07. Class A shares were first offered on 1-14-13. Performance prior to this date is that of the predecessor fund’s Institutional class shares, recalculated to reflect the gross fees and expenses of Class A shares. The performance history of the Institutional class shares of the predecessor fund was designated as that of John Hancock International Growth Equity Fund Class I shares, which were first offered on 1-14-13.
3 For certain types of investors as described in the fund’s prospectuses.
| |
| Annual report | International Growth Equity Fund | 7 |
Management’s discussion of
Fund performance
Turner Investments, L.P.
Stocks in developed markets outside the United States generated strong results during the 12 months ended July 31, 2014, driven higher by improved economic conditions in the eurozone, the United Kingdom, and Japan. Low interest rates and accommodative monetary policies also contributed to the generally strong global equity performance.
The eurozone posted modest growth following a recession, but this improvement came against a backdrop of persistently low inflation that remained below the level that monetary policymakers considered necessary to sustain the region’s nascent recovery. The United Kingdom’s equity market outperformed while Japanese equities underperformed.
For the 12 months ended July 31, 2014, John Hancock International Growth Equity Fund’s Class A shares posted a total return of 12.05%, excluding sales charges. This result trailed the 13.33% return of the fund’s benchmark, the MSCI World ex-USA Growth Index. The fund’s performance relative to its benchmark was hampered by our stock selection in Japan, Italy, and Mexico, while relative performance was aided by stock picking in the Pacific ex-Japan region and overweights in some emerging markets and Canada.
At the individual security level, the fund’s out-of-benchmark position in Lululemon Athletica, Inc. (Canada) had the largest negative impact on relative results. Other stocks that significantly detracted included Petroleum Geo-Services ASA (Norway), Novo Nordisk A/S (Denmark), Nomura Holdings, Inc. (Japan), Honda Motor Company, Ltd. (Japan), Unicharm Corp. (Japan), and Concentradora Fibra Hotelera Mexicana SA de CV (Mexico). We sold the fund’s positions in each of these companies during the period.
On the positive side, the most significant contributor to relative performance was the fund’s position in Shire PLC (Ireland). Relative performance also was aided by positions in Avago Technologies, Ltd. (Singapore), Canadian Pacific Railway, Ltd. (Canada), Wynn Macau, Ltd. (Macau), InterContinental Hotels Group PLC (United Kingdom), and Baidu, Inc. (China).
This commentary reflects the views of the portfolio manager through the end of the period discussed in this report. As such, they are in no way guarantees of future events and are not intended to be used as investment advice or a recommendation regarding any specific security. They are also subject to change at any time as market and other conditions warrant.
Past performance does not guarantee future results.
| |
| 8 | International Growth Equity Fund | Annual report |
Your expenses
These examples are intended to help you understand your ongoing operating expenses of investing in the fund so you can compare these costs with the ongoing costs of investing in other mutual funds.
Understanding fund expenses
As a shareholder of the fund, you incur two types of costs:
■ Transaction costs, which include sales charges (loads) on purchases or redemptions (varies by share class), minimum account fee charge, etc.
■ Ongoing operating expenses, including management fees, distribution and service fees (if applicable), and other fund expenses.
We are going to present only your ongoing operating expenses here.
Actual expenses/actual returns
This example is intended to provide information about the fund’s actual ongoing operating expenses and is based on the fund’s actual return. It assumes an account value of $1,000.00 on February 1, 2014, with the same investment held until July 31, 2014.
| | | | |
| | | | Expenses paid | |
| | Account value | Ending value | during period | Annualized |
| | on 2-1-2014 | on 7-31-2014 | ended 7-31-20141 | expense ratio |
|
| |
| Class A | $1,000.00 | $1,074.20 | $6.94 | 1.35% |
|
| |
| Class I | 1,000.00 | 1,074.60 | 5.66 | 1.10% |
|
Together with the value of your account, you may use this information to estimate the operating expenses that you paid over the period. Simply divide your account value at July 31, 2014, by $1,000.00, then multiply it by the “expenses paid” for your share class from the table above. For example, for an account value of $8,600.00, the operating expenses should be calculated as follows:
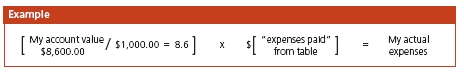
| |
| Annual report | International Growth Equity Fund | 9 |
Your expenses
Hypothetical example for comparison purposes
This table allows you to compare the fund’s ongoing operating expenses with those of any other fund. It provides an example of the fund’s hypothetical account values and hypothetical expenses based on each class’s actual expense ratio and an assumed 5% annualized return before expenses (which is not the fund’s actual return). It assumes an account value of $1,000.00 on February 1, 2014, with the same investment held until July 31, 2014. Look in any other fund shareholder report to find its hypothetical example and you will be able to compare these expenses. Please remember that these hypothetical account values and expenses may not be used to estimate the actual ending account balance or expenses you paid for the period.
| | | | |
| | | | Expenses paid | |
| | Account value | Ending value | during period | Annualized |
| | on 2-1-2014 | on 7-31-2014 | ended 7-31-20141 | expense ratio |
|
| |
| Class A | $1,000.00 | $1,018.20 | $6.76 | 1.35% |
|
| |
| Class I | 1,000.00 | 1,019.40 | 5.51 | 1.10% |
|
Remember, these examples do not include any transaction costs, therefore, these examples will not help you to determine the relative total costs of owning different funds. If transaction costs were included, your expenses would have been higher. See the prospectus for details regarding transaction costs.
1 Expenses are equal to the fund’s annualized expense ratio, multiplied by the average account value over the period, multiplied by 181/365 (to reflect the one-half year period).
| |
| 10 | International Growth Equity Fund | Annual report |
Portfolio summary
| | | | |
| Top 10 Holdings (25.8 of Net Assets on 7-31-14)1,2 | | | |
|
| Roche Holding AG | 3.7% | | BHP Billiton, Ltd. | 2.5% |
| |
|
| Toyota Motor Corp. | 3.2% | | Mitsui Fudosan Company, Ltd. | 2.3% |
| |
|
| Nestle SA | 2.8% | | IHI Corp. | 2.1% |
| |
|
| Canadian Pacific Railway, Ltd. | 2.7% | | iShares MSCI India ETF | 2.0% |
| |
|
| WisdomTree Japan Hedged Equity Fund | 2.6% | | British American Tobacco PLC | 1.9% |
| |
|
|
| |
| Sector Composition1,3 | | | | |
|
| Industrials | 17.1% | | Materials | 6.7% |
| |
|
| Consumer Staples | 14.9% | | Energy | 5.3% |
| |
|
| Financials | 14.2% | | Exchange-Traded Funds | 4.6% |
| |
|
| Health Care | 12.3% | | Telecommunication Services | 3.2% |
| |
|
| Consumer Discretionary | 11.9% | | Short-Term Investments & Other | 2.1% |
| |
|
| Information Technology | 7.7% | | | |
| | |
| |
| Top 10 Countries1,2,3 | | | | |
|
| Japan | 14.7% | | Australia | 5.5% |
| |
|
| United Kingdom | 13.2% | | United States | 5.2% |
| |
|
| Switzerland | 12.2% | | France | 4.1% |
| |
|
| Canada | 10.9% | | Hong Kong | 2.5% |
| |
|
| Germany | 6.6% | | Spain | 2.5% |
| |
|
1 As a percentage of net assets on 7-31-14.
2 Cash and cash equivalents are not included.
3 Foreign investing, especially in emerging markets, has additional risks, such as currency and market volatility and political and social instability. Growth stocks may be more susceptible to earnings disappointments. Currency transactions are affected by fluctuations in exchange rates, and frequent trading may increase fund transaction costs. Sector investing is subject to greater risks than the market as a whole. Because the fund may focus on particular sectors of the economy, its performance may depend on the performance of those sectors and investments focused in one sector may fluctuate more widely than investments diversified across sectors. Please see the fund’s prospectuses for additional risks.
| |
| Annual report | International Growth Equity Fund | 11 |
Fund’s investments
As of 7-31-14
| | |
| | Shares | Value |
| Common Stocks 91.7% | | $29,515,733 |
|
| (Cost $25,346,071) | | |
| | | |
| Australia 5.5% | | 1,768,779 |
| BHP Billiton, Ltd. | 22,930 | 814,162 |
|
| Commonwealth Bank of Australia | 6,480 | 499,801 |
|
| CSL, Ltd. | 7,300 | 454,816 |
| | | |
| Belgium 1.3% | | 429,572 |
| Anheuser-Busch InBev NV | 3,980 | 429,572 |
| | | |
| Canada 10.9% | | 3,502,809 |
| Canadian Pacific Railway, Ltd. | 4,500 | 855,675 |
|
| Enbridge, Inc. | 11,320 | 554,917 |
|
| IMAX Corp. (I)(L) | 16,450 | 432,471 |
|
| Intact Financial Corp. | 7,390 | 492,870 |
|
| Methanex Corp. | 8,750 | 569,450 |
|
| Suncor Energy, Inc. | 14,550 | 597,426 |
| | | |
| China 1.4% | | 438,582 |
| Baidu, Inc., ADR (I) | 2,030 | 438,582 |
| | | |
| France 4.1% | | 1,327,029 |
| Dassault Systemes SA | 7,800 | 523,424 |
|
| L’Oreal SA | 2,942 | 496,786 |
|
| Schneider Electric SE | 3,620 | 306,819 |
| | | |
| Germany 5.0% | | 1,601,512 |
| Bayer AG | 4,566 | 602,285 |
|
| GEA Group AG | 11,860 | 532,162 |
|
| Linde AG | 2,290 | 467,065 |
| | | |
| Hong Kong 2.5% | | 815,385 |
| AIA Group, Ltd. | 101,457 | 544,195 |
|
| CIMC Enric Holdings, Ltd. | 227,758 | 271,190 |
| | | |
| India 2.4% | | 777,014 |
| HDFC Bank, Ltd., ADR | 6,840 | 324,216 |
|
| ICICI Bank, Ltd., ADR | 6,670 | 333,633 |
|
| Larsen & Toubro, Ltd., GDR | 4,850 | 119,165 |
| | | |
| Ireland 1.2% | | 394,257 |
| Shire PLC | 4,790 | 394,257 |
| | | |
| Israel 1.8% | | 574,590 |
| Teva Pharmaceutical Industries, Ltd., ADR | 10,740 | 574,590 |
| | |
| 12 | International Growth Equity Fund | Annual report | See notes to financial statements |
| | |
| | Shares | Value |
| Italy 0.9% | | $285,776 |
| Luxottica Group SpA | 5,180 | 285,776 |
| | | |
| Japan 14.7% | | 4,721,894 |
| FANUC Corp. | 3,490 | 603,178 |
|
| IHI Corp. | 144,130 | 666,528 |
|
| Mitsui Fudosan Company, Ltd. | 22,250 | 734,780 |
|
| Murata Manufacturing Company, Ltd. | 6,210 | 591,970 |
|
| Seven & I Holdings Company, Ltd. | 14,120 | 587,612 |
|
| SoftBank Corp. | 7,110 | 511,125 |
|
| Toyota Motor Corp. | 17,390 | 1,026,701 |
| | | |
| Macau 1.3% | | 410,425 |
| Wynn Macau, Ltd. | 96,312 | 410,425 |
| | | |
| Mexico 1.0% | | 311,609 |
| Cemex SAB de CV (I) | 247,713 | 311,609 |
| | | |
| Netherlands 1.4% | | 459,520 |
| NXP Semiconductor NV (I) | 7,370 | 459,520 |
| | | |
| Panama 1.3% | | 410,049 |
| Copa Holdings SA, Class A | 2,700 | 410,049 |
| | | |
| Philippines 2.4% | | 761,720 |
| Metropolitan Bank & Trust Company | 168,116 | 330,593 |
|
| Universal Robina Corp. | 116,380 | 431,127 |
| | | |
| Singapore 1.4% | | 455,827 |
| Avago Technologies, Ltd. | 6,570 | 455,827 |
| | | |
| South Africa 1.1% | | 356,633 |
| Naspers, Ltd. | 2,900 | 356,633 |
| | | |
| Spain 2.5% | | 798,669 |
| Banco Santander SA | 33,072 | 332,284 |
|
| Inditex SA | 15,965 | 466,385 |
| | | |
| Sweden 1.6% | | 511,990 |
| Assa Abloy AB, Series B | 10,420 | 511,990 |
| | | |
| Switzerland 12.2% | | 3,934,962 |
| Cie Financiere Richemont SA | 3,950 | 374,824 |
|
| Nestle SA | 12,165 | 900,697 |
|
| Novartis AG | 6,210 | 540,261 |
|
| Roche Holding AG | 4,150 | 1,204,353 |
|
| UBS AG (I) | 27,710 | 476,100 |
|
| Wolseley PLC | 8,427 | 438,727 |
| | | |
| United Kingdom 13.2% | | 4,268,061 |
| | |
| Ashtead Group PLC | 38,490 | 577,375 |
|
| BG Group PLC | 27,300 | 538,335 |
|
| British American Tobacco PLC | 10,370 | 607,499 |
|
| Britvic PLC | 33,040 | 390,433 |
|
| BT Group PLC | 80,030 | 523,948 |
|
| InterContinental Hotels Group PLC | 11,560 | 468,998 |
|
| Lloyds Banking Group PLC (I) | 425,240 | 530,136 |
|
| Polypipe Group PLC (I) | 48,630 | 200,843 |
|
| SABMiller PLC | 7,906 | 430,494 |
| | |
| See notes to financial statements | Annual report | International Growth Equity Fund | 13 |
| | | |
| | | Shares | Value |
| United States 0.6% | | | $199,069 |
| Valeant Pharmaceuticals International, Inc. (I) | | 1,698 | 199,069 |
| |
| Preferred Securities 1.6% | | | $505,961 |
|
| (Cost $509,130) | | | |
| | | | |
| Germany 1.6% | | | 505,961 |
| Henkel AG & Company KGaA | | 4,550 | 505,961 |
| |
| Exchange-Traded Funds 4.6% | | | $1,476,330 |
|
| (Cost $1,366,985) | | | |
| | | | |
| iShares MSCI India ETF | | 21,610 | 643,330 |
|
| WisdomTree Japan Hedged Equity Fund | | 16,670 | 833,000 |
| |
| Rights 0.0% | | | $10,235 |
|
| (Cost $10,042) | | | |
| | | |
| Banco Santander SA (I)(N) | | 48,685 | 10,235 |
| | Yield (%) | Shares | Value |
| Securities Lending Collateral 0.8% | | | $267,112 |
|
| (Cost $267,093) | | | |
| | | |
| John Hancock Collateral Investment Trust (W) | 0.0965 (Y) | 26,692 | 267,112 |
| |
| Short-Term Investments 2.1% | | | $675,115 |
|
| (Cost $675,115) | | | |
| | | | |
| Money Market Funds 2.1% | | | 675,115 |
| State Street Institutional Treasury Plus Money | | | |
| Market Fund | 0.0000 (Y) | 675,115 | 675,115 |
| |
| Total investments (Cost $28,174,436)† 100.8% | | | $32,450,486 |
|
| Other assets and liabilities, net (0.8%) | | | ($265,772) |
|
| Total net assets 100.0% | | | $32,184,714 |
|
The percentage shown for each investment category is the total value of the category as a percentage of the net assets of the fund.
ADR American Depositary Receipts
GDR Global Depositary Receipt
(I) Non-income producing security.
(L) A portion of this security is on loan as of 7-31-14.
(N) Strike price and/or expiration date not available.
(W) Investment is an affiliate of the fund, the advisor and/or subadvisor. This investment represents collateral received for securities lending.
(Y) The rate shown is the annualized seven-day yield as of 7-31-14.
† At 7-31-14, the aggregate cost of investment securities for federal income tax purposes was $28,497,217. Net unrealized appreciation aggregated $3,953,269, of which $4,182,036 related to appreciated investment securities and $228,767 related to depreciated investment securities.
| | |
| 14 | International Growth Equity Fund | Annual report | See notes to financial statements |
Notes to Fund’s investments
The fund had the following sector composition as a percentage of net assets on 7-31-14:
| | |
| Industrials | 17.1% | |
| Consumer Staples | 14.9% | |
| Financials | 14.2% | |
| Health Care | 12.3% | |
| Consumer Discretionary | 11.9% | |
| Information Technology | 7.7% | |
| Materials | 6.7% | |
| Energy | 5.3% | |
| Exchange-Traded Funds | 4.6% | |
| Telecommunication Services | 3.2% | |
| Short-Term Investments & Other | 2.1% | |
| |
| |
| Total | 100.0% | |
| | |
| See notes to financial statements | Annual report | International Growth Equity Fund | 15 |
F I N A N C I A L S T A T E M E N T S
Financial statements
Statement of assets and liabilities 7-31-14
This Statement of assets and liabilities is the fund’s balance sheet. It shows the value of what the fund owns, is due and owes. You’ll also find the net asset value and the maximum offering price per share.
| |
| Assets | |
|
| Investments in unaffiliated issuers, at value (Cost $27,907,343) including | |
| ($257,642) of securities loaned | $32,183,374 |
| Investments in affiliated issuers, at value (Cost $267,093) | 267,112 |
| | |
| Total investments, at value (Cost $28,174,436) | 32,450,486 |
| Foreign currency, at value (Cost $122) | 120 |
| Receivable for investments sold | 281,198 |
| Receivable for fund shares sold | 6,802 |
| Dividends and interest receivable | 51,475 |
| Receivable for securities lending income | 48 |
| Receivable due from advisor | 2,105 |
| Other receivables and prepaid expenses | 15,048 |
| | |
| Total assets | 32,807,282 |
| |
| Liabilities | |
|
| Payable for investments purchased | 296,402 |
| Payable upon return of securities loaned | 267,050 |
| Payable to affiliates | |
| Accounting and legal services fees | 589 |
| Transfer agent fees | 3,251 |
| Other liabilities and accrued expenses | 55,276 |
| | |
| Total liabilities | 622,568 |
| | |
| Net assets | $32,184,714 |
| |
| Net assets consist of | |
|
| Paid-in capital | $25,884,534 |
| Undistributed net investment income | 191,449 |
| Accumulated net realized gain (loss) on investments and investments | 1,831,993 |
| Net unrealized appreciation (depreciation) on investments and translation | |
| of assets and liabilities in foreign currencies | 4,276,738 |
| | |
| Net assets | $32,184,714 |
| |
| Net asset value per share | |
|
| Based on net asset values and shares outstanding — the fund has an | |
| unlimited number of shares authorized with no par value | |
| Class A ($5,477,925 ÷ 425,462 shares)1 | $12.88 |
| Class I ($26,706,789 ÷ 2,060,887 shares) | $12.96 |
| |
| Maximum offering price per share | |
|
| Class A (net asset value per share ÷ 95%)2 | $13.56 |
1 Redemption price is equal to net asset value less any applicable contingent deferred sales charge.
2 On single retail sales of less than $50,000. On sales of $50,000 or more and on group sales the offering price is reduced.
| | |
| 16 | International Growth Equity Fund | Annual report | See notes to financial statements |
F I N A N C I A L S T A T E M E N T S
Statement of operations For the year ended 7-31-14
This Statement of operations summarizes the fund’s investment income earned and expenses incurred in operating the fund. It also shows net gains (losses) for the period stated.
| |
| Investment income | |
|
| Dividends | $752,774 |
| Securities lending | 12,144 |
| Less foreign taxes withheld | (48,652) |
| |
| Total investment income | 716,266 |
| |
| Expenses | |
|
| Investment management fees | 277,593 |
| Distribution and service fees | 14,219 |
| Accounting and legal services fees | 4,034 |
| Transfer agent fees | 39,188 |
| Trustees’ fees | 478 |
| State registration fees | 27,403 |
| Printing and postage | 3,489 |
| Professional fees | 42,042 |
| Custodian fees | 35,835 |
| Registration and filing fees | 16,692 |
| Other | 5,626 |
| | |
| Total expenses | 466,599 |
| Less expense reductions | (95,215) |
| | |
| Net expenses | 371,384 |
| | |
| Net investment income | 344,882 |
|
| Realized and unrealized gain (loss) | |
| |
| Net realized gain (loss) on | |
| Investments in unaffiliated issuers and foreign currency transactions | 2,999,851 |
| Capital gain distributions received from unaffiliated underlying funds | 8,566 |
| | 3,008,417 |
| Change in net unrealized appreciation (depreciation) of | |
| Investments in unaffiliated issuers and translation of assets and liabilities in | |
| foreign currencies | 538,783 |
| Investments in affiliated issuers | 6 |
| | 538,789 |
| Net realized and unrealized gain | 3,547,206 |
| | |
| Increase in net assets from operations | $3,892,088 |
| | |
| See notes to financial statements | Annual report | International Growth Equity Fund | 17 |
F I N A N C I A L S T A T E M E N T S
Statements of changes in net assets
These Statements of changes in net assets show how the value of the fund’s net assets has changed during the last three periods. The difference reflects earnings less expenses, any investment gains and losses, distributions, if any, paid to shareholders and the net of fund share transactions.
| | | |
| | 7-31-14 | 7-31-131 | 9-30-122 |
| Increase (decrease) in net assets | | | |
|
| From operations | | | |
| Net investment income | $344,882 | $400,229 | $162,480 |
| Net realized gain (loss) | 3,008,417 | 1,975,398 | (1,452,847) |
| Change in net unrealized appreciation (depreciation) | 538,789 | 1,182,563 | 3,859,223 |
| | | | |
| Increase in net assets resulting from operations | 3,892,088 | 3,558,190 | 2,568,856 |
| | | | |
| Distributions to shareholders | | | |
| From net investment income | | | |
| Class A | (48,523) | (38,207) | — |
| Class I | (386,495) | (231,228) | — |
| From net realized gain | | | |
| Class A | (125,641) | — | — |
| Class I | (822,384) | — | — |
| | | | |
| Total distributions | (1,383,043) | (269,435) | — |
| | | | |
| From fund share transactions | (2,422,857) | (766,765) | 16,083,620 |
| | | | |
| Total increase | 86,188 | 2,521,990 | 18,652,476 |
| |
| Net assets | | | |
|
| Beginning of period | 32,098,526 | 29,576,536 | 10,924,060 |
| | | | |
| End of period | $32,184,714 | $32,098,526 | $29,576,536 |
| | | | |
| Undistributed net investment income | $191,449 | $261,319 | $123,142 |
1 For the ten-month period ended 7-31-13. The fund changed its fiscal year end from September 30 to July 31.
2 Audited by previous independent registered public accounting firm.
| | |
| 18 | International Growth Equity Fund | Annual report | See notes to financial statements |
Financial highlights
The Financial highlights show how the fund’s net asset value for a share has changed during the period.
| | | | | | |
| CLASS A SHARES Period ended | 7-31-14 | 7-31-131,2 | 9-30-123 | 9-30-113 | 9-30-103 | 9-30-093,4 |
| |
| Per share operating performance | | | | | | |
|
| Net asset value, beginning of period | $11.94 | $10.79 | $9.17 | $9.39 | $8.24 | $6.27 |
| Net investment income5 | 0.11 | 0.12 | 0.08 | 0.05 | 0.05 | 0.07 |
| Net realized and unrealized gain (loss) | | | | | | |
| on investments | 1.31 | 1.10 | 1.54 | (0.20) | 1.23 | 2.01 |
| Total from investment operations | 1.42 | 1.22 | 1.62 | (0.15) | 1.28 | 2.08 |
| Less distributions | | | | | | |
| From net investment income | (0.13) | (0.07) | — | (0.07) | (0.13) | (0.11) |
| From net realized gain | (0.35) | — | — | — | — | — |
| Total distributions | (0.48) | (0.07) | — | (0.07) | (0.13) | (0.11) |
| Net asset value, end of period | $12.88 | $11.94 | $10.79 | $9.17 | $9.39 | $8.24 |
| Total return (%)6,7 | 12.05 | 11.378 | 17.67 | (1.67) | 15.61 | 33.95 |
| |
| Ratios and supplemental data | | | | | | |
|
| Net assets, end of period (in millions) | $5 | $4 | $6 | $5 | —9 | —9 |
| Ratios (as a percentage of average net | | | | | | |
| assets): | | | | | | |
| Expenses before reductions | 1.93 | 1.9110 | 2.15 | 2.46 | 4.15 | 5.5910 |
| Expenses including reductions | 1.35 | 1.3510 | 1.35 | 1.35 | 1.35 | 1.2910 |
| Net investment income | 0.90 | 1.2710 | 0.78 | 0.44 | 0.61 | 1.1410 |
| Portfolio turnover (%) | 114 | 132 | 138 | 210 | 120 | 139 |
| |
1 For the ten-month period ended 7-31-13. The fund changed its fiscal year end from September 30 to July 31.
2 After the close of business on 1-11-13, holders of Investor Class shares of the former Turner International Growth
Fund (the Predecessor Fund) became owners of an equal number of full and fractional Class A shares of the John
Hancock International Growth Equity Fund. These shares were first offered on 1-14-13. Additionally, the accounting
and performance history of the Investor Class shares of the Predecessor Fund was redesigned as that of John
Hancock International Growth Equity Fund Class A.
3 Audited by previous independent registered public accounting firm.
4 Commenced operations on 10-31-08. All ratios for the period have been annualized.
5 Based on average daily shares outstanding.
6 Total returns would have been lower had certain expenses not been reduced during the applicable periods.
7 Does not reflect the effect of sales charges, if any.
8 Not annualized.
9 Less than $500,000.
10 Annualized.
| | |
| See notes to financial statements | Annual report | International Growth Equity Fund | 19 |
| | | | | | |
| CLASS I SHARES Period ended | 7-31-14 | 7-31-131,2 | 9-30-123 | 9-30-113 | 9-30-103 | 9-30-093 |
| |
| Per share operating performance | | | | | | |
|
| Net asset value, beginning of period | $12.01 | $10.86 | $9.21 | $9.41 | $8.24 | $8.34 |
| Net investment income4 | 0.14 | 0.15 | 0.11 | 0.08 | 0.04 | 0.08 |
| Net realized and unrealized gain (loss) | | | | | | |
| on investments | 1.32 | 1.10 | 1.54 | (0.19) | 1.26 | (0.07) |
| Total from investment operations | 1.46 | 1.25 | 1.65 | (0.11) | 1.30 | 0.01 |
| Less distributions | | | | | | |
| From net investment income | (0.16) | (0.10) | — | (0.09) | (0.13) | (0.11) |
| From net realized gain | (0.35) | — | — | — | — | — |
| Total distributions | (0.51) | (0.10) | — | (0.09) | (0.13) | (0.11) |
| Net asset value, end of period | $12.96 | $12.01 | $10.86 | $9.21 | $9.41 | $8.24 |
| Total return (%)5 | 12.32 | 11.606 | 17.92 | (1.32) | 15.88 | 0.71 |
| |
| Ratios and supplemental data | | | | | | |
|
| Net assets, end of period (in millions) | $27 | $28 | $23 | $6 | $5 | $4 |
| Ratios (as a percentage of average net assets): | | | | | | |
| Expenses before reductions | 1.34 | 1.537 | 1.90 | 2.41 | 3.93 | 5.24 |
| Expenses including reductions | 1.10 | 1.107 | 1.10 | 1.10 | 1.10 | 1.10 |
| Net investment income | 1.08 | 1.547 | 1.03 | 0.70 | 0.51 | 1.31 |
| Portfolio turnover (%) | 114 | 132 | 138 | 210 | 120 | 139 |
| |
1 For the ten-month period ended 7-31-13. The fund changed its fiscal year end from September 30 to July 31.
2 After the close of business on 1-11-13, holders of Institutional Class shares of the former Turner International
Growth Fund (the Predecessor Fund) became owners of an equal number of full and fractional Class I shares of
the John Hancock International Growth Equity Fund. These shares were first offered on 1-14-13. Additionally, the
accounting and performance history of the Investor Class shares of the Predecessor Fund was redesigned as that of
John Hancock International Growth Equity Fund Class I.
3 Audited by previous independent registered public accounting firm.
4 Based on average daily shares outstanding.
5 Total returns would have been lower had certain expenses not been reduced during the applicable periods.
6 Not annualized.
7 Annualized.
| | |
| 20 | International Growth Equity Fund | Annual report | See notes to financial statements |
Notes to financial statements
Note 1 — Organization
John Hancock International Growth Equity Fund (the fund) is a series of John Hancock Funds II (the Trust), an open-end management investment company organized as a Massachusetts business trust and registered under the Investment Company Act of 1940, as amended (the 1940 Act). The investment objective of the fund is to seek long-term capital appreciation.
The fund may offer multiple classes of shares. The shares currently offered are detailed in the Statement of assets and liabilities. Class A shares are offered to all investors. Class I shares are offered to institutions and certain investors. Shareholders of each class have exclusive voting rights to matters that affect that class. The distribution and service fees, if any, transfer agent fees, printing and postage and state registration fees for each class may differ.
The fund is the accounting and performance successor of the Turner International Growth Fund (the Predecessor Fund). At the close of business on January 11, 2013, the fund acquired substantially all the assets and assumed the liabilities of the Predecessor Fund pursuant to an agreement and plan of reorganization, in exchange for Class A and Class I shares of the fund.
Note 2 — Significant accounting policies
The financial statements have been prepared in conformity with accounting principles generally accepted in the United States of America (US GAAP), which require management to make certain estimates and assumptions as of the date of the financial statements. Actual results could differ from those estimates and those differences could be significant. The fund intends to qualify as an investment company under Topic 946 of Accounting Standards Codification of US GAAP.
Events or transactions occurring after the end of the fiscal period through the date that the financial statements were issued have been evaluated in the preparation of the financial statements. The following summarizes the significant accounting policies of the fund:
Security valuation. Investments are stated at value as of the close of regular trading on the New York Stock Exchange (NYSE), normally at 4:00 P.M., Eastern Time (ET). In order to value the securities, the fund uses the following valuation techniques: Equity securities, including exchange-traded funds, held by the fund are valued at the last sale price or official closing price on the exchange where the security was acquired or most likely will be sold. In the event there were no sales during the day or closing prices are not available, the securities are valued using the last available bid price. Investments by the funds in open-end mutual funds, including John Hancock Collateral Investment Trust (JHCIT), are valued at their respective net asset values each business day. Foreign securities and currencies are valued in U.S. dollars, based on foreign currency exchange rates supplied by an independent pricing vendor. Securities that trade only in the over-the-counter (OTC) market are valued using bid prices.
Other portfolio securities and assets, for which reliable market quotations are not readily available, are valued at fair value as determined in good faith by the fund’s Pricing Committee following procedures established by the Board of Trustees. The frequency with which these fair valuation procedures are used cannot be predicted and fair value of securities may differ significantly from the value that would have been used had a ready market for such securities existed. Trading in foreign securities may be completed before the daily close of trading on the NYSE. Significant events at the issuer or market level may affect the values of securities between the time when the valuation
| |
| Annual report | International Growth Equity Fund | 21 |
of the securities is generally determined and the close of the NYSE. If a significant event occurs, these securities may be fair valued, as determined in good faith by the fund’s Pricing Committee, following procedures established by the Board of Trustees. The fund uses fair value adjustment factors provided by an independent pricing vendor to value certain foreign securities in order to adjust for events that may occur between the close of foreign exchanges or markets and the close of the NYSE.
The fund uses a three-tier hierarchy to prioritize the pricing assumptions, referred to as inputs, used in valuation techniques to measure fair value. Level 1 includes securities valued using quoted prices in active markets for identical securities. Level 2 includes securities valued using other significant observable inputs. Observable inputs may include quoted prices for similar securities, interest rates, prepayment speeds and credit risk. Prices for securities valued using these inputs are received from independent pricing vendors and brokers and are based on an evaluation of the inputs described. Level 3 includes securities valued using significant unobservable inputs when market prices are not readily available or reliable, including the fund’s own assumptions in determining the fair value of investments. Factors used in determining value may include market or issuer specific events or trends, changes in interest rates and credit quality. The inputs or methodology used for valuing securities are not necessarily an indication of the risks associated with investing in those securities. Changes in valuation techniques may result in transfers into or out of an assigned level within the disclosure hierarchy.
The following is a summary of the values by input classification of the fund’s investments as of July 31, 2014, by major security category or type:
| | | | |
| | | | | LEVEL 3 |
| | | | LEVEL 2 | SIGNIFICANT |
| | TOTAL MARKET | LEVEL 1 | SIGNIFICANT | UNOBSERVABLE |
| | VALUE AT 7-31-14 | QUOTED PRICE | OBSERVABLE INPUTS | INPUTS |
|
| Common Stocks | | | | |
| Australia | $1,768,779 | — | $1,768,779 | — |
| Belgium | 429,572 | — | 429,572 | — |
| Canada | 3,502,809 | $3,502,809 | — | — |
| China | 438,582 | 438,582 | — | — |
| France | 1,327,029 | — | 1,327,029 | — |
| Germany | 1,601,512 | — | 1,601,512 | — |
| Hong Kong | 815,385 | — | 815,385 | — |
| India | 777,014 | 657,849 | 119,165 | — |
| Ireland | 394,257 | — | 394,257 | — |
| Israel | 574,590 | 574,590 | — | — |
| Italy | 285,776 | — | 285,776 | — |
| Japan | 4,721,894 | — | 4,721,894 | — |
| Macau | 410,425 | — | 410,425 | — |
| Mexico | 311,609 | 311,609 | — | — |
| Netherlands | 459,520 | 459,520 | — | — |
| Panama | 410,049 | 410,049 | — | — |
| Philippines | 761,720 | — | 761,720 | — |
| Singapore | 455,827 | 455,827 | — | — |
| South Africa | 356,633 | — | 356,633 | — |
| Spain | 798,669 | — | 798,669 | — |
| Sweden | 511,990 | — | 511,990 | — |
| Switzerland | 3,934,962 | — | 3,934,962 | — |
| United Kingdom | 4,268,061 | — | 4,268,061 | — |
| United States | 199,069 | 199,069 | — | — |
| |
| 22 | International Growth Equity Fund | Annual report |
| | | | |
| | | | | LEVEL 3 |
| | | | LEVEL 2 | SIGNIFICANT |
| | TOTAL MARKET | LEVEL 1 | SIGNIFICANT | UNOBSERVABLE |
| | VALUE AT 7-31-14 | QUOTED PRICE | OBSERVABLE INPUTS | INPUTS |
|
| Preferred Securities | $505,961 | — | $505,961 | — |
| Exchange-Traded Funds | 1,476,330 | $1,476,330 | — | — |
| Rights | 10,235 | 10,235 | — | — |
| Securities Lending | | | | |
| Collateral | 267,112 | 267,112 | — | — |
| Short-Term Investments | 675,115 | 675,115 | — | — |
| |
|
| Total Investments in | | | | |
| Securities | $32,450,486 | $9,438,696 | $23,011,790 | — |
Security transactions and related investment income. Investment security transactions are accounted for on a trade date plus one basis for daily net asset value calculations. However, for financial reporting purposes, investment transactions are reported on trade date. Interest income is accrued as earned. Interest income includes coupon interest and amortization/accretion of premiums/discounts on debt securities. Dividend income is recorded on the ex-date, except for dividends of foreign securities where the dividend may not be known until after the ex-date. In those cases, dividend income, net of withholding taxes, is recorded when the fund becomes aware of the dividends. Foreign taxes are provided for based on the fund’s understanding of the tax rules and rates that exist in the foreign markets in which it invests. Gains and losses on securities sold are determined on the basis of identified cost and may include proceeds from litigation.
Securities lending. The fund may lend its securities to earn additional income. The fund receives cash collateral from the borrower in an amount not less than the market value of the loaned securities. The fund will invest its collateral in JHCIT, an affiliate of the fund, which has a floating net asset value (NAV) and is registered with the Securities and Exchange Commission as an investment company. JHCIT invests cash received as collateral as part of the securities lending program in short-term money market investments. The fund will receive the benefit of any gains and bear any losses generated by JHCIT with respect to the cash collateral.
If a borrower fails to return loaned securities when due, then the lending agent is responsible and indemnifies the fund for the lent securities. The lending agent uses the collateral received from the borrower to purchase replacement securities of the same issue, type, class and series of the loaned securities. If the value of the collateral is less than the purchase cost of replacement securities, the lending agent is responsible for satisfying the shortfall but only to the extent that the shortfall is not due to any decrease in the value of JHCIT.
Although the risk of the loss of the securities lent is mitigated by receiving collateral from the borrower and through lending agent indemnification, the fund could experience a delay in recovering its securities or could experience a lower than expected return if the borrower fails to return the securities on a timely basis. The fund may receive compensation for lending its securities by retaining a portion of the return on the investment of the collateral and compensation from fees earned from borrowers of the securities. Net income received from JHCIT is a component of securities lending income as recorded on the Statement of Operations.
Collateral received by the fund is shown on the Statements of assets and liabilities as Payable upon return of securities loaned.
Foreign currency translation. Assets, including investments and liabilities denominated in foreign currencies, are translated into U.S. dollar values each day at the prevailing exchange rate. Purchases and sales of securities, income and expenses are translated into U.S. dollars at the prevailing exchange rate on the date of the transaction. The effect of changes in foreign currency exchange
| |
| Annual report | International Growth Equity Fund | 23 |
rates on the value of securities is reflected as a component of the realized and unrealized gains (losses) on investments.
Funds that invest internationally generally carry more risk than funds that invest strictly in U.S. securities. Risks can result from differences in economic and political conditions, regulations, market practices (including higher transaction costs), accounting standards and other factors. Foreign investments are also subject to a decline in the value of a foreign currency versus the U.S. dollar, which reduces the dollar value of securities denominated in that currency.
Foreign taxes. The fund may be subject to withholding tax on income and/or capital gains or repatriation taxes imposed by certain countries in which the fund invests. Taxes are accrued based upon investment income, realized gains or unrealized appreciation.
Line of credit. The fund may borrow from banks for temporary or emergency purposes, including meeting redemption requests that otherwise might require the untimely sale of securities. Pursuant to the fund’s custodian agreement, the custodian may loan money to the fund to make properly authorized payments. The fund is obligated to repay the custodian for any overdraft, including any related costs or expenses. The custodian may have a lien, security interest or security entitlement in any fund property that is not otherwise segregated or pledged, to the maximum extent permitted by law, to the extent of any overdraft.
In addition, the fund and other affiliated funds have entered into an agreement with Citibank N.A. that enables them to potentially participate in a $300 million unsecured committed line of credit. A commitment fee, payable at the end of each calendar quarter, based on the average daily unused portion of the line of credit, is charged to each participating fund on a pro rata basis and is reflected in other expenses on the Statement of operations. Commitment fees for the year ended July 31, 2014 were $464. For the year ended July 31, 2014, the fund had no borrowings under the line of credit.
Expenses. Within the John Hancock group of funds complex, expenses that are directly attributable to an individual fund are allocated to such fund. Expenses that are not readily attributable to a specific fund are allocated among all funds in an equitable manner, taking into consideration, among other things, the nature and type of expense and the fund’s relative net assets. Expense estimates are accrued in the period to which they relate and adjustments are made when actual amounts are known.
Class allocations. Income, common expenses and realized and unrealized gains (losses) are determined at the fund level and allocated daily to each class of shares based on the net assets of the class. Class-specific expenses, such as distribution and service fees, if any, transfer agent fees, state registration fees and printing and postage expenses, for all classes, are calculated daily at the class level based on the appropriate net assets of each class and the specific expense rates applicable to each class.
Federal income taxes. The fund intends to continue to qualify as a regulated investment company by complying with the applicable provisions of the Internal Revenue Code and will not be subject to federal income tax on taxable income that is distributed to shareholders. Therefore, no federal income tax provision is required.
As of July 31, 2014, the fund had no uncertain tax positions that would require financial statement recognition, derecognition or disclosure. The fund’s federal tax returns are subject to examination by the Internal Revenue Service for a period of three years.
| |
| 24 | International Growth Equity Fund | Annual report |
Distribution of income and gains. Distributions to shareholders from net investment income and net realized gains, if any, are recorded on the ex-date. The fund generally declares and pays dividends and capital gain distributions, if any, annually. The tax character of distributions for the year ended July 31, 2014 the period ended July 31, 2013 and the period ended September 30, 2012 was as follows:
| | | | |
| | JULY 31, 2014 | JULY 31, 2013 | SEPTEMBER 30, 2012 | |
| |
| Ordinary Income | $640,039 | $269,435 | — | |
| Long-Term Capital Gain | $743,004 | — | — | |
| Total | $1,383,043 | $269,435 | — | |
Distributions paid by the fund with respect to each class of shares are calculated in the same manner, at the same time and in the same amount, except for the effect of class level expenses that may be applied differently to each class. As of July 31, 2014, the components of distributable earnings on a tax basis consisted of $677,422 of undistributed ordinary income and $1,668,834 of long-term capital gains.
Such distributions and distributable earnings, on a tax basis, are determined in conformity with income tax regulations, which may differ from US GAAP. Distributions in excess of tax basis earnings and profits, if any, are reported in the fund’s financial statements as a return of capital.
Capital accounts within the financial statements are adjusted for permanent book-tax differences. These adjustments have no impact on net assets or the results of operations. Temporary book-tax differences, if any, will reverse in a subsequent period. Book-tax differences are primarily attributable to foreign currency transactions, passive foreign investment companies and wash sale loss deferrals.
Note 3 — Guarantees and indemnifications
Under the Trust’s organizational documents, its Officers and Trustees are indemnified against certain liabilities arising out of the performance of their duties to the Trust, including the fund. Additionally, in the normal course of business, the fund enters into contracts with service providers that contain general indemnification clauses. The fund’s maximum exposure under these arrangements is unknown, as this would involve future claims that may be made against the fund that have not yet occurred. The risk of material loss from such claims is considered remote.
Note 4 — Fees and transactions with affiliates
John Hancock Advisers, LLC (the Advisor or JHA) serves as investment advisor for the fund. Prior to January 1, 2014, John Hancock Investment Management Services, LLC (JHIMS) served as investment advisor for the fund. JHIMS and JHA have identical officers, directors and other personnel, and share common facilities and resources. Terms of the investment management contract with JHA are substantially identical to the former contract with JHIMS. In this report, depending on the context, the term “Advisor” shall refer to either JHA in its current capacity as investment advisor, or to JHIMS in its capacity as investment advisor prior to January 1, 2014. John Hancock Funds, LLC (the Distributor), an affiliate of the Advisor, serves as principal underwriter of the fund. The Advisor and the Distributor are indirect, wholly owned subsidiaries of Manulife Financial Corporation (MFC).
Management fee. The fund has an investment management agreement with the Advisor under which the fund pays a daily management fee to the Advisor equivalent, on an annual basis, to the sum of: (a) 0.850% of the first $750,000,000 of the fund’s average daily net assets; (b) 0.800% of the next $500,000,000 of the fund’s average daily net assets; and (c) 0.750% of the fund’s average
| |
| Annual report | International Growth Equity Fund | 25 |
daily net assets in excess over $1,250,000,000. The Advisor has a subadvisory agreement with Turner Investments, L.P. (Turner). The fund is not responsible for payment of the subadvisory fees.
The Advisor has contractually agreed to waive a portion of its management fee and/or reimburse expenses for certain funds of the John Hancock complex, including the fund (the participating portfolios). The waiver equals, on an annualized basis, 0.01% of that portion of the aggregate net assets of all the participating portfolios that exceeds $75 billion but is less than or equal to $125 billion; 0.0125% of that portion of the aggregate net assets of all the participating portfolios that exceeds $125 billion but is less than or equal to $150 billion; and 0.015% of that portion of the aggregate net assets of all the participating portfolios that exceeds $150 billion. The amount of the reimbursement is calculated daily and allocated among all the participating portfolios in proportion to the daily net assets of each fund. This arrangement may be amended or terminated at any time by the Advisor upon notice to the fund and with the approval of the Board of Trustees.
The Advisor has contractually agreed to waive all or a portion of its management fee and/or reimburse or pay operating expenses of the fund to the extent necessary to maintain the fund’s total operating expenses at 1.35% and 1.10%, for Class A and Class I shares, respectively, excluding certain expenses such as taxes, brokerage commissions, interest expense and acquired fund fees and expenses, short dividend expense, litigation and indemnification expenses, and other extraordinary expenses not incurred in the ordinary course of the fund’s business. The current expense limitation agreement expires on November 30, 2015, unless renewed by mutual agreement of the fund and the Advisor based upon a determination that this is appropriate under the circumstances at that time.
Additionally, the Advisor has voluntarily agreed to waive and/or reimburse a portion of its management fee or other expenses of the fund if certain expenses of the fund exceed 0.25% of average net assets. Expenses excluded from this waiver include taxes, brokerage commissions, interest expense, litigation and indemnification expenses and other extraordinary expenses not incurred in the ordinary course of the fund’s business, advisory fees, Rule 12b-1 fees, transfer agent and service fees, blue sky fees, printing and postage expenses, acquired fund fees and short dividend expense. This voluntary expense reimbursement may be terminated at any time by the Advisor on notice to the fund.
The expense reductions described above amounted to amounted to $27,520 and $67,695 for Class A and Class I shares, respectively, for the year July 31, 2014.
The investment management fees, including the impact of the waivers and reimbursements described above, incurred for the year ended July 31, 2014 were equivalent to a net annual effective rate of 0.56% of the fund’s average daily net assets.
Expense recapture. The Advisor may recapture operating expenses reimbursed or fees waived under previous expense limitation or waiver arrangements for a period of three years following the month in which the reimbursements or waivers occurred to the extent that the fund is below its expense limitation during this period. For the year ended July 31, 2014, no amounts were recaptured. The table below outlines the amount of waived or reimbursed expenses subject to potential recovery in future periods and the respective expiration dates.
| | | |
| AMOUNTS ELIGIBLE FOR | AMOUNTS ELIGIBLE FOR | AMOUNTS ELIGIBLE FOR | |
| RECOVERY THROUGH | RECOVERY THROUGH | RECOVERY THROUGH | |
| JULY 1, 2015 | JULY 1, 2016 | JULY 1, 2017 | |
| |
| | |
| — | $65,806 | $93,184 | |
| |
| 26 | International Growth Equity Fund | Annual report |
Accounting and legal services. Pursuant to a service agreement, the fund reimburses the Advisor for all expenses associated with providing the administrative, financial, legal, accounting and recordkeeping services to the fund, including the preparation of all tax returns, periodic reports to shareholders and regulatory reports, among other services. These expenses are allocated to each share class based on its relative net assets at the time the expense was incurred. These accounting and legal services fees incurred for the year ended July 31, 2014 amounted to an annual rate of 0.01% of the fund’s average daily net assets.
Distribution and service plans. The fund has a distribution agreement with the Distributor. The fund has adopted distribution and service plans with respect to Class A shares pursuant to Rule 12b-1 under the 1940 Act, to pay the Distributor for services provided as the distributor of shares of the fund. The fund may pay up to the following contractual rates of distribution and service fees under these arrangements, expressed as an annual percentage of average daily net assets for class A shares.
| | | |
| CLASS | RULE 12b-1 FEE | | |
| | |
| Class A | 0.30% | | |
Sales charges. Class A shares are assessed up-front sales charges, which resulted in payments to the Distributor amounting to $38,521 for the year ended July 31, 2014. Of this amount, $6,293 was retained and used for printing prospectuses, advertising, sales literature and other purposes, $31,933 was paid as sales commissions to broker-dealers and $295 was paid as sales commissions to sales personnel of Signator Investors, Inc., a broker-dealer affiliate of the Advisor.
Class A shares may be subject to contingent deferred sales charges (CDSCs). Certain Class A shares that are acquired through purchases of $1 million or more and are redeemed within one year of purchase are subject to a 1.00% sales charge. CDSCs are applied to the lesser of the current market value at the time of redemption or the original purchase cost of the shares being redeemed. Proceeds from CDSCs are used to compensate the Distributor for providing distribution-related services in connection with the sale of these shares. During the year ended July 31, 2014, there were no CDSCs received by the Distributor.
Transfer agent fees. The fund has a transfer agent agreement with John Hancock Signature Services, Inc. (Signature Services), an affiliate of the Advisor. The transfer agent fees paid to Signature Services are determined based on the cost to Signature Services (Signature Services Cost) of providing recordkeeping services. The Signature Services Cost includes a component of allocated John Hancock corporate overhead for providing transfer agent services to the fund and to all other John Hancock affiliated funds. It also includes out-of-pocket expenses, including payments made to third-parties for recordkeeping services provided to their clients who invest in one or more John Hancock funds. In addition, Signature Services Cost may be reduced by certain fees that Signature Services receives in connection with retirement and small accounts. Signature Services Cost is calculated monthly and allocated, as applicable, to five categories of share classes: Retail Share and Institutional Classes of Non-Municipal Bond Funds, Class R6 Shares, Retirement Share Classes and Municipal Bond Share Classes. Within each of these categories, the applicable costs are allocated to the affected John Hancock affiliated funds and/or classes, based on the relative average daily net assets.
Prior to October 1, 2013, Signature Services Cost were calculated monthly and allocated, as applicable, to four categories of share classes: Institutional Share Classes, Retirement Share Classes, Municipal Bond Share Classes and all other Retail Share Classes. Within each of these categories, the applicable costs were allocated to the affected John Hancock affiliated funds and/or classes, based on the relative average daily net assets.
| |
| Annual report | International Growth Equity Fund | 27 |
Class level expenses. Class level expenses for the year ended July 31, 2014 were:
| | | | |
| | DISTRIBUTION | TRANSFER | STATE | PRINTING AND |
| CLASS | AND SERVICE FEES | AGENT FEES | REGISTRATION FEES | POSTAGE |
|
| Class A | 14,219 | 6,473 | 13,702 | 1,481 |
| Class I | — | 32,715 | 13,701 | 2,008 |
| Total | 14,219 | 39,188 | 27,403 | 3,489 |
Trustee expenses. The fund compensates each Trustee who is not an employee of the Advisor or its affiliates. The costs of paying Trustee compensation and expenses are allocated to each fund based on its net assets relative to other funds within the John Hancock funds complex.
Note 5 — Fund share transactions
Transactions in fund shares for the year ended July 31, 2014, the period ended July 31, 2013 and the year ended September 30, 2012 were as follows:
| | | | | | |
| | Year ended 7-31-14 | Period ended 7-31-131 | Year ended 9-30-12 |
| | Shares | Amount | Shares | Amount | Shares | Amount |
| Class A shares | | | | | | |
|
| Sold | 243,618 | $3,054,987 | 87,066 | $976,815 | 648,843 | $6,899,468 |
| Distributions | | | | | | |
| reinvested | 13,944 | 174,164 | 3,427 | 38,005 | — | — |
| | | | | | | |
| Repurchased | (157,229) | (1,976,311) | (337,170) | (3,871,397) | (612,673) | (6,345,955) |
| Net increase | | | | | | |
| (decrease) | 100,333 | $1,252,840 | (246,677) | ($2,856,577) | 36,170 | $553,513 |
| | | | | | | |
| Class I shares | | | | | | |
|
| Sold | 45,842 | $582,767 | 233,362 | $2,557,858 | 1,509,128 | $15,611,150 |
| Distributions | | | | | | |
| reinvested | 94,097 | 1,181,847 | 20,275 | 225,863 | — | — |
| | | | | | | |
| Repurchased | (428,843) | (5,440,311) | (58,226) | (693,909) | (7,869) | (81,043) |
| Net increase | | | | | | |
| (decrease) | (288,904) | ($3,675,697) | 195,411 | $2,089,812 | 1,501,259 | $15,530,107 |
| | | | | | | |
| Total net | | | | | | |
| decrease | (188,571) | ($2,422,857) | (51,266) | ($766,765) | 1,537,429 | $16,083,620 |
|
1 For the ten-month period ended 7-31-13. The fund changed its fiscal year end from September 30 to July 31.
Note 6 — Purchase and sale of securities
Purchases and sales of securities, other than short-term securities, amounted to $36,614,347 and $40,243,157, respectively, for the year ended July 31, 2014.
Note 7 — Reorganization
At the close of business on January 11, 2013, the fund acquired all assets and liabilities of the Predecessor Fund in exchange for the Class A and Class I shares of the fund. The fund had no assets liabilities or operations prior to the reorganization.
The Agreement provided for (a) the acquisition of all the assets, subject to all of the liabilities, of the Predecessor Fund in for a representative amount of shares of the fund; (b) the liquidation of the Predecessor Fund; and (c) the distribution to Predecessor Fund’s shareholders of the fund’s shares. The reorganization was intended to allow the fund to be better positioned to increase asset size and achieve additional economies of scale by increasing sales and spreading fixed expenses over a larger asset base. As a result of the reorganization, the fund is the legal survivor, and accounting and performance successor to the Predecessor Fund have been redesignated as that of Class A and Class I shares, respectively, of the fund.
| |
| 28 | International Growth Equity Fund | Annual report |
Based on the opinion of tax counsel, the reorganization qualified as a tax-free reorganization for federal income tax purposes with no gain or loss recognized by the Predecessor Fund or their shareholders. Thus, the investments were transferred to the fund at the Predecessor Fund’s identified cost. In addition, the expenses of the reorganization were borne by the Advisors of both the Predecessor Fund and the fund. The effective time of the reorganization occurred immediately after the close of regularly scheduled trading on the New York Stock Exchange (NYSE) on January 11, 2013. The following outlines the reorganization:
| | | | |
| | ACQUIRED NET | APPRECIATION OF | | |
| | ASSET VALUE OF THE | PREDECESSOR FUND’S | SHARES ISSUED | TOTAL NET ASSETS |
| PREDECESSOR FUND | PREDECESSOR FUND | INVESTMENTS | BY THE FUND | AFTER COMBINATION |
|
| |
| Turner International | $33,298,902 | $4,223,198 | 2,903,133 | $33,298,902 |
| Growth Fund | | | | |
| |
| Annual report | International Growth Equity Fund | 29 |
Auditor’s report
Report of Independent Registered Public Accounting Firm
To the Board of Trustees of John Hancock Funds II and Shareholders of
John Hancock International Growth Equity Fund:
In our opinion, the accompanying statement of assets and liabilities, including the schedule of investments, and the related statements of operations and of changes in net assets and the financial highlights present fairly, in all material respects, the financial position of the John Hancock International Growth Equity Fund (the “Fund”) at July 31, 2014, the results of its operations for the year then ended and the changes in its net assets and the financial highlights for each the periods indicated, in conformity with accounting principles generally accepted in the United States of America. These financial statements and financial highlights (hereafter referred to as “financial statements”) are the responsibility of the Fund’s management. Our responsibility is to express an opinion on these financial statements based on our audits. We conducted our audits of these financial statements in accordance with the standards of the Public Company Accounting Oversight Board (United States). Those standards require that we plan and perform the audit to obtain reasonable assurance about whether the financial statements are free of material misstatement. An audit includes examining, on a test basis, evidence supporting the amounts and disclosures in the financial statements, assessing the accounting principles used and significant estimates made by management, and evaluating the overall financial statement presentation. We believe that our audits, which included confirmation of securities at July 31, 2014 by correspondence with the custodian, transfer agent, and brokers, and the application of alternative auditing procedures where securities purchased confirmations had not been received, provide a reasonable basis for our opinion.
PricewaterhouseCoopers LLP
Boston, Massachusetts
September 17, 2014
| |
| 30 | International Growth Equity Fund | Annual report |
Tax information
Unaudited
For federal income tax purposes, the following information is furnished with respect to the distributions of the fund, if any, paid during its taxable year ended July 31, 2014.
The fund reports the maximum amount allowable of its net taxable income as eligible for the corporate dividends-received deduction.
The fund reports the maximum amount allowable of its net taxable income as qualified divided income as provided in the Jobs and Growth Tax Relief Reconciliation Act of 2003.
The fund paid $743,004 in capital gain dividends.
Income derived from foreign sources was $603,306. The fund intends to pass through foreign tax credits of $30,411.
Eligible shareholders will be mailed a 2014 Form 1099-DIV in early 2015. This will reflect the tax character of all distributions paid in calendar year 2014.
Please consult a tax advisor regarding the tax consequences of your investment in the fund.
| |
| Annual report | International Growth Equity Fund | 31 |
Continuation of Investment Advisory and Subadvisory Agreements
Evaluation of Advisory and Subadvisory Agreements by the Board of Trustees
This section describes the evaluation by the Board of Trustees (the Board) of John Hancock Funds II (the Trust) of the Advisory Agreement (the Advisory Agreement) with John Hancock Advisers, LLC (the Advisor) and the Subadvisory Agreement (the Subadvisory Agreement) with Turner Investments, L.P. (the Subadvisor), for John Hancock International Growth Equity Fund (the fund). The Advisory Agreement and Subadvisory Agreement are collectively referred to as the Agreements. Prior to the June 23–25, 2014 meeting at which the Agreements were approved, the Board also discussed and considered information regarding the proposed continuation of the Agreements at an in-person meeting held on May 27–29, 2014.
Approval of Advisory and Subadvisory Agreements
At in-person meetings held on June 23–25, 2014, the Board, including the Trustees who are not considered to be interested persons of the Trust under the Investment Company Act of 1940, as amended (the 1940 Act) (the Independent Trustees), reapproved for an annual period the continuation of the Advisory Agreement between the Trust and the Advisor and the Subadvisory Agreement between the Advisor and the Subadvisor with respect to the fund.
In considering the Advisory Agreement and the Subadvisory Agreement, the Board received in advance of the meetings a variety of materials relating to the fund, the Advisor and the Subadvisor, including comparative performance, fee and expense information for a peer group of similar funds prepared by an independent third-party provider of fund data, performance information for an applicable benchmark index; and, with respect to the Subadvisor, comparative performance information for comparably managed accounts, as applicable, and other information provided by the Advisor and the Subadvisor regarding the nature, extent and quality of services provided by the Advisor and the Subadvisor under their respective Agreements, as well as information regarding the Advisor’s revenues and costs of providing services to the fund and any compensation paid to affiliates of the Advisor. At the meetings at which the renewal of the Advisory Agreement and Subadvisory Agreement are considered, particular focus is given to information concerning fund performance, comparability of fees and total expenses, and profitability. However, the Board notes that the evaluation process with respect to the Advisor and the Subadvisor is an ongoing one. In this regard, the Board also took into account discussions with management and information provided to the Board at prior meetings with respect to the services provided by the Advisor and the Subadvisor to the fund, including quarterly performance reports prepared by management containing reviews of investment results and prior presentations from the Subadvisor with respect to the fund. The Board also considered the nature, quality, and extent of non-advisory services, if any, to be provided to the fund by the Advisor’s affiliates, including distribution services.
Throughout the process, the Board asked questions of and requested additional information from management. The Board is assisted by counsel for the Trust and the Independent Trustees are also separately assisted by independent legal counsel throughout the process. The Independent Trustees also received a memorandum from their independent legal counsel discussing the legal standards for their consideration of the proposed continuation of the Agreements and discussed the proposed continuation of the Agreements in private sessions with their independent legal counsel at which no representatives of management were present.
Approval of Advisory Agreement
In approving the Advisory Agreement with respect to the fund, the Board, including the Independent Trustees, considered a variety of factors, including those discussed below. The Board also considered other factors (including conditions and trends prevailing generally in the economy, the securities
| |
| 32 | International Growth Equity Fund | Annual report |
markets, and the industry) and does not treat any single factor as determinative, and each Trustee may attribute different weights to different factors. The Board’s conclusions may be based in part on its consideration of the advisory and subadvisory arrangements in prior years and on the Board’s ongoing regular review of fund performance and operations throughout the year.
Nature, extent, and quality of services. Among the information received by the Board from the Advisor relating to the nature, extent, and quality of services provided to the fund, the Board reviewed information provided by the Advisor relating to its operations and personnel, descriptions of its organizational and management structure, and information regarding the Advisor’s compliance and regulatory history, including its Form ADV. The Board also noted that on a regular basis it receives and reviews information from the Trust’s Chief Compliance Officer (CCO) regarding the fund’s compliance policies and procedures established pursuant to Rule 38a-1 under the 1940 Act. The Board also considered the Advisor’s risk management processes. The Board considered that the Advisor is responsible for the management of the day-to-day operations of the fund, including, but not limited to, general supervision of and coordination of the services provided by the Subadvisor, and is also responsible for monitoring and reviewing the activities of the Subadvisor and other third-party service providers.
In considering the nature, extent, and quality of the services provided by the Advisor, the Trustees also took into account their knowledge of the Advisor’s management and the quality of the performance of the Advisor’s duties, through Board meetings, discussions and reports during the preceding year and through each Trustee’s experience as a Trustee of the Trust and of the other trusts in the complex.
In the course of their deliberations regarding the Advisory Agreement, the Board considered, among other things:
(a) the skills and competency with which the Advisor has in the past managed the Trust’s affairs and its subadvisory relationship, the Advisor’s oversight and monitoring of the Subadvisor’s investment performance and compliance programs, such as the Subadvisor’s compliance with fund policies and objectives, review of brokerage matters, including with respect to trade allocation and best execution and the Advisor’s timeliness in responding to performance issues;
(b) the background, qualifications and skills of the Advisor’s personnel;
(c) the Advisor’s compliance policies and procedures and its responsiveness to regulatory changes and mutual fund industry developments;
(d) the Advisor’s administrative capabilities, including its ability to supervise the other service providers for the fund;
(e) the financial condition of the Advisor and whether it has the financial wherewithal to provide a high level and quality of services to the fund; and
(f) the Advisor’s reputation and experience in serving as an investment advisor to the Trust and the benefit to shareholders of investing in funds that are part of a family of funds offering a variety of investments.
The Board concluded that the Advisor may reasonably be expected to continue to provide a high quality of services under the Advisory Agreement with respect to the fund.
Investment performance. In considering the fund’s performance, the Board noted that it reviews at its regularly scheduled meetings information about the fund’s performance results. In connection with the consideration of the Advisory Agreement, the Board:
| |
| Annual report | International Growth Equity Fund | 33 |
(a) reviewed information prepared by management regarding the fund’s performance;
(b) considered the comparative performance of an applicable benchmark index;
(c) considered the performance of comparable funds, if any, as included in the report prepared by an independent third-party provider of fund data; and
(d) took into account the Advisor’s analysis of the fund’s performance and its plans and recommendations regarding the Trust’s subadvisory arrangements generally.
The Board noted that the fund underperformed its benchmark index for the one-year period ended December 31, 2013, and outperformed its benchmark for the three-, and five-year periods ended December 31, 2013. The Board also noted that the fund had outperformed its peer group average for the one-, three, and five-year periods ended December 31, 2013.
The Board noted the fund’s favorable performance relative to the benchmark index for the three- and five-year periods and to the peer group average for the one-, three-, and five-year periods.
The Board concluded that the fund’s performance has generally been in line with or outperformed the historical performance of comparable funds and the fund’s benchmark.
Fees and expenses. The Board reviewed comparative information prepared by an independent third-party provider of mutual fund data, including, among other data, the fund’s contractual and net management fees (and subadvisory fees, to the extent available) and total expenses as compared to similarly situated investment companies deemed to be comparable to the fund. The Board considered the fund’s ranking within a smaller group of peer funds chosen by the independent third-party provider, as well as the fund’s ranking within a broader group of funds. In comparing the fund’s contractual and net management fees to those of comparable funds, the Board noted that such fees include both advisory and administrative costs.
The Board noted that net management fees and total expenses for the fund are lower than the peer group median.
The Board noted action taken that will further reduce certain fund expenses. The Board also took into account management’s discussion with respect to the advisory/subadvisory fee structure, including the amount of the advisory fee retained by the Advisor after payment of the subadvisory fee. The Board also noted that the Advisor pays the subadvisory fee, and that such fees are negotiated at arm’s length with respect to the Subadvisor. In addition, the Board took into account that management had agreed, effective July 1, 2014, to implement an overall fee waiver across the complex, including the fund, which is discussed further below. The Board also noted management’s discussion of the fund’s expenses, as well as actions taken over the past several years to reduce the fund’s operating expenses. The Board also noted that, in addition, the Advisor is currently waiving fees and/or reimbursing expenses with respect to the fund and that the fund has breakpoints in its contractual management fee schedule that reduces management fees as assets increase. The Board reviewed information provided by the Advisor concerning the investment advisory fee charged by the Advisor or one of its advisory affiliates to other clients (including other funds in the complex) having similar investment mandates, if any. The Board considered any differences between the Advisor’s and Subadvisor’s services to the fund and the services they provide to other comparable clients or funds. The Board concluded that the advisory fee paid with respect to the fund is reasonable.
Profitability/indirect benefits. In considering the costs of the services to be provided and the profits to be realized by the Advisor and its affiliates from the Advisor’s relationship with the Trust, the Board:
| |
| 34 | International Growth Equity Fund | Annual report |
(a) reviewed financial information of the Advisor;
(b) reviewed and considered information presented by the Advisor regarding the net profitability to the Advisor and its affiliates with respect to the fund;
(c) received and reviewed profitability information with respect to the John Hancock fund complex as a whole;
(d) received information with respect to the Advisor’s allocation methodologies used in preparing the profitability data;
(e) considered that the John Hancock insurance companies that are affiliates of the Advisor, as shareholders of the Trust directly or through their separate accounts, receive certain tax credits or deductions relating to foreign taxes paid and dividends received by certain funds of the Trust and noted that these tax benefits, which are not available to participants in qualified retirement plans under applicable income tax law, are reflected in the profitability analysis reviewed by the Board;
(f) considered that the Advisor also provides administrative services to the fund on a cost basis pursuant to an administrative services agreement;
(g) noted that affiliates of the Advisor provide transfer agency services and distribution services to the fund, and that the fund’s distributor also receives Rule 12b-1 payments to support distribution of the fund;
(h) noted that the Advisor also derives reputational and other indirect benefits from providing advisory services to the fund;
(i) noted that the subadvisory fee for the fund is paid by the Advisor and is negotiated at arm’s length; and
(j) considered that the Advisor should be entitled to earn a reasonable level of profits in exchange for the level of services it provides to the fund and the entrepreneurial risk that it assumes as Advisor.
Based upon its review, the Board concluded that the level of profitability, if any, of the Advisor and its affiliates from their relationship with the fund was reasonable and not excessive.
Economies of scale. In considering the extent to which economies of scale would be realized as the fund grows and whether fee levels reflect these economies of scale for the benefit of fund shareholders, the Board:
(a) considered that the Advisor has agreed, effective July 1, 2014, to waive a portion of its management fee for the fund and each of the other John Hancock funds in the complex (except for those discussed below) (the Participating Portfolios) or otherwise reimburse the expenses of the Participating Portfolios as follows (the Reimbursement):
The Reimbursement shall equal, on an annualized basis, 0.01% of that portion of the aggregate net assets of all the Participating Portfolios that exceed $75 billion but is less than or equal to $125 billion, 0.0125% of that portion of the aggregate net assets of all the Participating Portfolios that exceed $125 billion but is less than or equal to $150 billion and 0.015% of that portion of the aggregate net assets of all the Participating Portfolios that exceeds $150 billion. (The funds that are not Participating Portfolios are the funds of funds in the complex, which benefit from such overall management fee waiver through their investment in underlying portfolios that include Participating Portfolios, which are subject to the Reimbursement.)
| |
| Annual report | International Growth Equity Fund | 35 |
(b) reviewed the fund’s advisory fee structure and concluded that: (i) the fund’s fee structure contains breakpoints at the subadvisory fee level and that such breakpoints are reflected as breakpoints in the advisory fees for the fund; and (ii) although economies of scale cannot be measured with precision, these arrangements permit shareholders of the fund to benefit from economies of scale if the fund grows. The Board also took into account management’s discussion of the fund’s advisory fee structure; and
(c) the Board also considered the effect of the fund’s growth in size on its performance and fees. The Board also noted that if the fund’s assets increase over time, the fund may realize other economies of scale.
Approval of Subadvisory Agreement
In making its determination with respect to approval of the Subadvisory Agreement, the Board reviewed:
(1) information relating to the Subadvisor’s business, including current subadvisory services to the Trust (and other funds in the John Hancock family of funds);
(2) the historical and current performance of the fund and comparative performance information relating to an applicable benchmark index and comparable funds;
(3) the subadvisory fee for the fund, including any breakpoints, and to the extent available, comparable fee information prepared by an independent third party provider of fund data; and
4) information relating to the nature and scope of any material relationships and their significance to the Trust’s Advisor and Subadvisors.
Nature, extent, and quality of services. With respect to the services provided by the Subadvisor, the Board received information provided to the Board by the Subadvisor, including the Subadvisor’s Form ADV, as well as took into account information presented throughout the past year. The Board considered the Subadvisor’s current level of staffing and its overall resources, as well as received information relating to the Subadvisor’s compensation program. The Board reviewed the Subadvisor’s history and investment experience, as well as information regarding the qualifications, background, and responsibilities of the Subadvisor’s investment and compliance personnel who provide services to the fund. The Board also considered, among other things, the Subadvisor’s compliance program and any disciplinary history. The Board also considered the Subadvisor’s risk assessment and monitoring process. The Board reviewed the Subadvisor’s regulatory history, including whether it was involved in any regulatory actions or investigations as well as material litigation, and any settlements and amelioratory actions undertaken, as appropriate. The Board noted that the Advisor conducts regular, periodic reviews of the Subadvisor and its operations, including regarding investment processes and organizational and staffing matters. The Board also noted that the Trust’s CCO and his staff conduct regular, periodic compliance reviews with the Subadvisor and present reports to the Independent Trustees regarding the same, which includes evaluating the regulatory compliance systems of the Subadvisor and procedures reasonably designed to assure compliance with the federal securities laws. The Board also took into account the financial condition of the Subadvisor.
The Board considered the Subadvisor’s investment process and philosophy. The Board took into account that the Subadvisor’s responsibilities include the development and maintenance of an investment program for the fund that is consistent with the fund’s investment objective, the selection of investment securities and the placement of orders for the purchase and sale of such securities, as well as the implementation of compliance controls related to performance of these services. The Board also received information with respect to the Subadvisor’s brokerage policies and practices, including with respect to best execution and soft dollars.
| |
| 36 | International Growth Equity Fund | Annual report |
Subadvisor compensation. In considering the cost of services to be provided by the Subadvisor and the profitability to the Subadvisor of its relationship with the fund, the Board noted that the fees under the Subadvisory Agreement are paid by the Advisor and not the fund.
The Board also relied on the ability of the Advisor to negotiate the Subadvisory Agreement with the Subadvisor, which is not affiliated with the Advisor, and the fees thereunder at arm’s length. As a result, the costs of the services to be provided and the profits to be realized by the Subadvisor from its relationship with the Trust were not a material factor in the Board’s consideration of the Subadvisory Agreement.
The Board also received information regarding the nature and scope (including their significance to the Advisor and its affiliates and to the Subadvisor) of any material relationships, if any, with respect to the Subadvisor, which include arrangements in which the Subadvisor or its affiliates provide advisory, distribution, or management services in connection with financial products sponsored by the Advisor or its affiliates, and may include other registered investment companies, a 529 education savings plan, managed separate accounts and exempt group annuity contracts sold to qualified plans. The Board also received information and took into account any other potential conflicts of interest the Advisor might have in connection with the Subadvisory Agreement.
In addition, the Board considered other potential indirect benefits that the Subadvisor and its affiliates may receive from the Subadvisor’s relationship with the fund, such as the opportunity to provide advisory services to additional funds in the John Hancock fund complex and reputational benefits.
Subadvisory fee. The Board considered that the fund pays an advisory fee to the Advisor and that, in turn, the Advisor pays a subadvisory fee to the Subadvisor. As noted above, the Board also considered the fund’s subadvisory fee as compared to similarly situated investment companies deemed to be comparable to the fund as included in the report prepared by the independent third party provider of fund data, to the extent available. The Board noted that the limited size of the peer group was not sufficient for comparative purposes. The Board also took into account the subadvisory fee paid by the Advisor to the Subadvisor with respect to the fund to fees charged by the Subadvisor to manage other subadvised portfolios and portfolios not subject to regulation under the 1940 Act, as applicable.
Subadvisor performance. As noted above, the Board considered the fund’s performance as compared to the fund’s peer group and the benchmark index and noted that the Board reviews information about the fund’s performance results at its regularly scheduled meetings. The Board noted the Advisor’s expertise and resources in monitoring the performance, investment style and risk-adjusted performance of the Subadvisor. The Board was mindful of the Advisor’s focus on the Subadvisor’s performance. The Board also noted the Subadvisor’s long-term performance record for similar accounts, as applicable.
The Board’s decision to approve the Subadvisory Agreement was based on a number of determinations, including the following:
(1) the Subadvisor has extensive experience and demonstrated skills as a manager;
(2) the performance of the fund has generally been in line with or outperformed the historical performance of comparable funds and the fund’s benchmark;
(3) the subadvisory fee is reasonable in relation to the level and quality of services being provided; and
| |
| Annual report | International Growth Equity Fund | 37 |
(4) subadvisory fee breakpoints are reflected as breakpoints in the advisory fees for the fund in order to permit shareholders to benefit from economies of scale if the fund grows.
Based on the Board’s evaluation of all factors that the Board deemed to be material, including those factors described above, the Board, including the Independent Trustees, concluded that renewal of the Advisory Agreement and the Subadvisory Agreement would be in the best interest of the fund and its shareholders. Accordingly, the Board, and the Independent Trustees voting separately, approved the Advisory Agreement and Subadvisory Agreement for an additional one-year period.
| |
| 38 | International Growth Equity Fund | Annual report |
Trustees and Officers
This chart provides information about the Trustees and Officers who oversee your John Hancock fund. Officers elected by the Trustees manage the day-to-day operations of the fund and execute policies formulated by the Trustees.
| | |
| Independent Trustees | | |
| Name, year of birth | Trustee | Number of John |
| Position(s) held with fund | of the | Hancock funds |
| Principal occupation(s) and other | Trust | overseen by |
| directorships during past 5 years | since1 | Trustee |
| |
| James M. Oates, Born: 1946 | 2005 | 230 |
|
| Managing Director, Wydown Group (financial consulting firm) (since 1994); Chairman and Director, |
| Emerson Investment Management, Inc. (since 2000); Independent Chairman, Hudson Castle Group, Inc. |
| (formerly IBEX Capital Markets, Inc.) (financial services company) (1997–2011); Director, Stifel Financial |
| (since 1996); Director, Investor Financial Services Corporation (1995–2007); Director, Connecticut River |
| Bancorp (since 1998); Director, Virtus Funds (formerly Phoenix Mutual Funds) (since 1988). | |
| | |
| Trustee and Chairperson of the Board, John Hancock retail funds3 (since 2012); Trustee (2005–2006 and |
| since 2012) and Chairperson of the Board (since 2012), John Hancock Funds III; Trustee (since 2004) and |
| Chairperson of the Board (since 2005), John Hancock Variable Insurance Trust; Trustee and Chairperson |
| of the Board, John Hancock Funds II (since 2005). | | |
|
| |
| Charles L. Bardelis,2 Born: 1941 | 2005 | 230 |
|
| Director, Island Commuter Corp. (marine transport). | | |
| | | |
| Trustee, John Hancock retail funds3 (since 2012); Trustee, John Hancock Funds III (2005–2006 and |
| since 2012); Trustee, John Hancock Variable Insurance Trust (since 1988); Trustee, John Hancock |
| Funds II (since 2005). | | |
|
| |
| Peter S. Burgess,2 Born: 1942 | 2005 | 230 |
|
| Consultant (financial, accounting, and auditing matters) (since 1999); Certified Public Accountant; |
| Partner, Arthur Andersen (independent public accounting firm) (prior to 1999); Director, Lincoln |
| Educational Services Corporation (since 2004); Director, Symetra Financial Corporation (since 2010); |
| Director, PMA Capital Corporation (2004–2010). | | |
| | | |
| Trustee, John Hancock retail funds3 (since 2012); Trustee, John Hancock Funds III (2005–2006 and |
| since 2012); Trustee, John Hancock Variable Insurance Trust and John Hancock Funds II (since 2005). |
|
| |
| William H. Cunningham, Born: 1944 | 2012 | 230 |
|
| Professor, University of Texas, Austin, Texas (since 1971); former Chancellor, University of Texas System |
| and former President of the University of Texas, Austin, Texas; Director, LIN Television (since 2009); |
| Chairman (since 2009) and Director (since 2006), Lincoln National Corporation (insurance); Director, |
| Resolute Energy Corporation (since 2009); Director, Southwest Airlines (since 2000); former Director, |
| Introgen (manufacturer of biopharmaceuticals) (until 2008); former Director, Hicks Acquisition Company I, |
| Inc. (until 2007); former Director, Texas Exchange Bank, SSB (formerly Bank of Crowley) (until 2009); |
| former Advisory Director, JP Morgan Chase Bank (formerly Texas Commerce Bank–Austin) (until 2009). |
| |
| Trustee, John Hancock retail funds3 (since 1986); Trustee, John Hancock Variable Insurance Trust |
| (since 2012); Trustee, John Hancock Funds II (2005–2006 and since 2012). | | |
| |
| Annual report | International Growth Equity Fund | 39 |
Independent Trustees (continued)
| | |
| Name, Year of Birth | Trustee | Number of John |
| Position(s) held with Fund | of the | Hancock funds |
| Principal occupation(s) and other | Trust | overseen by |
| directorships during past 5 years | since1 | Trustee |
| |
| Grace K. Fey, Born: 1946 | 2008 | 230 |
|
| Chief Executive Officer, Grace Fey Advisors (since 2007); Director and Executive Vice President, Frontier |
| Capital Management Company (1988–2007); Director, Fiduciary Trust (since 2009). | |
| | |
| Trustee, John Hancock retail funds3 (since 2012); Trustee, John Hancock Variable Insurance Trust and |
| John Hancock Funds II (since 2008). | | |
|
| |
| Theron S. Hoffman,2 Born: 1947 | 2008 | 230 |
|
| Chief Executive Officer, T. Hoffman Associates, LLC (consulting firm) (since 2003); Director, The Todd |
| Organization (consulting firm) (2003–2010); President, Westport Resources Management (investment |
| management consulting firm) (2006–2008); Senior Managing Director, Partner, and Operating Head, |
| Putnam Investments (2000–2003); Executive Vice President, The Thomson Corp. (financial and legal |
| information publishing) (1997–2000). | | |
| | | |
| Trustee, John Hancock retail funds3 (since 2012); Trustee, John Hancock Variable Insurance Trust and |
| John Hancock Funds II (since 2008). | | |
|
| |
| Deborah C. Jackson, Born: 1952 | 2012 | 230 |
|
| President, Cambridge College, Cambridge, Massachusetts (since 2011); Chief Executive Officer, |
| American Red Cross of Massachusetts Bay (2002–2011); Board of Directors of Eastern Bank Corporation |
| (since 2001); Board of Directors of Eastern Bank Charitable Foundation (since 2001); Board of Directors |
| of American Student Assistance Corporation (1996–2009); Board of Directors of Boston Stock Exchange |
| (2002–2008); Board of Directors of Harvard Pilgrim Healthcare (health benefits company) (2007–2011). |
| |
| Trustee, John Hancock retail funds3 (since 2008); Trustee of John Hancock Variable Insurance Trust and |
| John Hancock Funds II (since 2012). | | |
|
| |
| Hassell H. McClellan, Born: 1945 | 2005 | 230 |
|
| Trustee, Virtus Variable Insurance Trust (formerly Phoenix Edge Series Funds) (since 2008); Director, The |
| Barnes Group (since 2010); Associate Professor, The Wallace E. Carroll School of Management, Boston |
| College (retired 2013). | | |
| | | |
| Trustee, John Hancock retail funds3 (since 2012); Trustee, John Hancock Funds III (2005–2006 and |
| since 2012); Trustee, John Hancock Variable Insurance Trust and John Hancock Funds II (since 2005). |
|
| |
| Steven R. Pruchansky, Born: 1944 | 2012 | 230 |
|
| Chairman and Chief Executive Officer, Greenscapes of Southwest Florida, Inc. (since 2000); Director |
| and President, Greenscapes of Southwest Florida, Inc. (until 2000); Member, Board of Advisors, First |
| American Bank (until 2010); Managing Director, Jon James, LLC (real estate) (since 2000); Director, |
| First Signature Bank & Trust Company (until 1991); Director, Mast Realty Trust (until 1994); President, |
| Maxwell Building Corp. (until 1991). | | |
| | | |
| Trustee (since 1992) and Chairperson of the Board (2011–2012), John Hancock retail funds3; Trustee and |
| Vice Chairperson of the Board, John Hancock retail funds,3 John Hancock Variable Insurance Trust, and |
| John Hancock Funds II (since 2012). | | |
| |
| 40 | International Growth Equity Fund | Annual report |
Independent Trustees (continued)
| | |
| Name, Year of Birth | Trustee | Number of John |
| Position(s) held with Fund | of the | Hancock funds |
| Principal occupation(s) and other | Trust | overseen by |
| directorships during past 5 years | since1 | Trustee |
| |
| Gregory A. Russo, Born: 1949 | 2012 | 230 |
|
| Director and Audit Committee Chairman (since 2012), and Member, Audit Committee and Finance |
| Committee (since 2011), NCH Healthcare System, Inc. (holding company for multi-entity healthcare |
| system); Director and Member of Finance Committee, The Moorings, Inc. (nonprofit continuing care |
| community) (since 2012); Vice Chairman, Risk & Regulatory Matters, KPMG LLP (KPMG) (2002–2006); |
| Vice Chairman, Industrial Markets, KPMG (1998–2002); Chairman and Treasurer, Westchester County, |
| New York, Chamber of Commerce (1986–1992); Director, Treasurer, and Chairman of Audit and |
| Finance Committees, Putnam Hospital Center (1989–1995); Director and Chairman of Fundraising |
| Campaign, United Way of Westchester and Putnam Counties, New York (1990–1995). | |
| | |
| Trustee, John Hancock retail funds3 (since 2008); Trustee, John Hancock Variable Insurance Trust and |
| John Hancock Funds II (since 2012). | | |
Non-Independent Trustees4
| | |
| Name, year of birth | Trustee | Number of John |
| Position(s) held with fund | of the | Hancock funds |
| Principal occupation(s) and other | Trust | overseen by |
| directorships during past 5 years | since1 | Trustee |
| |
| Craig Bromley, Born: 1966 | 2012 | 230 |
|
| President, John Hancock Financial Services (since 2012); Senior Executive Vice President and General |
| Manager, U.S. Division, Manulife Financial Corporation (since 2012); President and Chief Executive |
| Officer, Manulife Insurance Company (Manulife Japan) (2005–2012, including prior positions). |
| |
| Trustee, John Hancock retail funds,3 John Hancock Variable Insurance Trust, and John Hancock |
| Funds II (since 2012). | | |
|
| |
| Warren A. Thomson, Born: 1955 | 2012 | 230 |
|
| Senior Executive Vice President and Chief Investment Officer, Manulife Financial Corporation and The |
| Manufacturers Life Insurance Company (since 2009); Chairman and Chief Executive Officer, Manulife |
| Asset Management (since 2001, including prior positions); Director (since 2006), and President and |
| Chief Executive Officer (since 2013), Manulife Asset Management Limited; Director and Chairman, |
| Hancock Natural Resources Group, Inc. (since 2013). | | |
| | | |
| Trustee, John Hancock retail funds,3 John Hancock Variable Insurance Trust, and John Hancock |
| Funds II (since 2012). | | |
Principal officers who are not Trustees
| |
| Name, year of birth | Officer |
| Position(s) held with fund | of the |
| Principal occupation(s) and other | Trust |
| directorships during past 5 years | since |
| |
| Andrew G. Arnott, Born: 1971 | 2009 |
|
| President | |
| Senior Vice President, John Hancock Financial Services (since 2009); Director and Executive Vice | |
| President, John Hancock Advisers, LLC (since 2005, including prior positions); Director and Executive |
| Vice President, John Hancock Investment Management Services, LLC (since 2006, including prior | |
| positions); President, John Hancock Funds, LLC (since 2004, including prior positions); President | |
| (effective 3-13-14) and Executive Vice President, John Hancock retail funds,3 John Hancock Variable |
| Insurance Trust, and John Hancock Funds II (since 2007, including prior positions). | |
| |
| Annual report | International Growth Equity Fund | 41 |
Principal officers who are not Trustees (continued)
| |
| Name, Year of Birth | Officer |
| Position(s) held with Fund | of the |
| Principal occupation(s) and other | Trust |
| directorships during past 5 years | since |
| |
| John J. Danello, Born: 1955 | 2006 |
|
| Senior Vice President, Secretary, and Chief Legal Officer | |
| Vice President and Chief Counsel, John Hancock Wealth Management (since 2005); Senior Vice | |
| President (since 2007) and Chief Legal Counsel (2007–2010), John Hancock Funds, LLC and The | |
| Berkeley Financial Group, LLC; Senior Vice President (since 2006, including prior positions) and Chief |
| Legal Officer and Secretary (since 2014), John Hancock retail funds3 and John Hancock Variable | |
| Insurance Trust; Vice President, John Hancock Life & Health Insurance Company (since 2009); | |
| Vice President, John Hancock Life Insurance Company (USA) and John Hancock Life Insurance | |
| Company of New York (since 2010); and Senior Vice President, Secretary, and Chief Legal Counsel | |
| (2007–2014, including prior positions) of John Hancock Advisers, LLC and John Hancock Investment |
| Management Services, LLC. | |
|
| |
| Francis V. Knox, Jr., Born: 1947 | 2005 |
|
| Chief Compliance Officer | |
| Vice President, John Hancock Financial Services (since 2005); Chief Compliance Officer, John Hancock |
| retail funds,3 John Hancock Variable Insurance Trust, John Hancock Funds II, John Hancock Advisers, |
| LLC, and John Hancock Investment Management Services, LLC (since 2005). | |
|
| |
| Charles A. Rizzo, Born: 1957 | 2007 |
|
| Chief Financial Officer | |
| Vice President, John Hancock Financial Services (since 2008); Senior Vice President, John Hancock | |
| Advisers, LLC and John Hancock Investment Management Services, LLC (since 2008); Chief Financial |
| Officer, John Hancock retail funds,3 John Hancock Variable Insurance Trust and John Hancock | |
| Funds II (since 2007). | |
|
| |
| Salvatore Schiavone, Born: 1965 | 2009 |
|
| Treasurer | |
| Assistant Vice President, John Hancock Financial Services (since 2007); Vice President, John Hancock |
| Advisers, LLC and John Hancock Investment Management Services, LLC (since 2007); Treasurer, | |
| John Hancock retail funds3 (since 2007, including prior positions); Treasurer, John Hancock Variable |
| Insurance Trust and John Hancock Funds II (since 2010 and 2007–2009, including prior positions). | |
The business address for all Trustees and Officers is 601 Congress Street, Boston, Massachusetts 02210-2805.
1 Each Trustee holds office until his or her successor is elected and qualified, or until the Trustee’s death, retirement, resignation, or removal.
2 Member of the Audit Committee.
3 “John Hancock retail funds” comprises John Hancock Funds III and 37 other John Hancock funds consisting of 27 series of other John Hancock trusts and 10 closed-end funds.
4 Because Messrs. Bromley and Thomson are senior executives or directors of the advisor and/or its affiliates, each of them is considered an “interested person of the fund,” as defined in the Investment Company Act of 1940.
| |
| 42 | International Growth Equity Fund | Annual report |
More information
| |
| Trustees | Investment advisor |
| James M. Oates, Chairperson | John Hancock Advisers, LLC |
| Steven R. Pruchansky, Vice Chairperson | |
| Charles L. Bardelis* | Subadvisor |
| Craig Bromley† | Turner Investments, L.P. |
| Peter S. Burgess* | |
| William H. Cunningham | Principal distributor |
| Grace K. Fey | John Hancock Funds, LLC |
| Theron S. Hoffman* | |
| Deborah C. Jackson | Custodian |
| Hassell H. McClellan | State Street Bank and Trust Company |
| Gregory A. Russo | |
| Warren A. Thomson† | Transfer agent |
| | John Hancock Signature Services, Inc. |
| Officers | |
| Andrew G. Arnott | Legal counsel |
| President | K&L Gates LLP |
| | |
| John J. Danello | Independent registered |
| Senior Vice President, Secretary, | public accounting firm |
| and Chief Legal Officer | PricewaterhouseCoopers LLP |
| | |
| Francis V. Knox, Jr. | |
| Chief Compliance Officer | |
| | |
| Charles A. Rizzo | |
| Chief Financial Officer | |
| | |
| Salvatore Schiavone | |
| Treasurer | |
| |
| *Member of the Audit Committee | |
| †Non-Independent Trustee | |
The fund’s proxy voting policies and procedures, as well as the fund’s proxy voting record for the most recent twelve-month period ended June 30, are available free of charge on the Securities and Exchange Commission (SEC) website at sec.gov or on our website.
The fund’s complete list of portfolio holdings, for the first and third fiscal quarters, is filed with the SEC on Form N-Q. The fund’s Form N-Q is available on our website and the SEC’s website, sec.gov, and can be reviewed and copied (for a fee) at the SEC’s Public Reference Room in Washington, DC. Call 800-SEC-0330 to receive information on the operation of the SEC’s Public Reference Room.
We make this information on your fund, as well as monthly portfolio holdings, and other fund details available on our website at jhinvestments.com or by calling 800-225-5291.
| | |
| You can also contact us: | | |
| 800-225-5291 | Regular mail: | Express mail: |
| jhinvestments.com | John Hancock Signature Services, Inc. | John Hancock Signature Services, Inc. |
| | P.O. Box 55913 | 30 Dan Road |
| | Boston, MA 02205-5913 | Canton, MA 02021 |
| |
| Annual report | International Growth Equity Fund | 43 |

800-225-5291
800-231-5469 TDD
800-338-8080 EASI-Line
jhinvestments.com

| |
| This report is for the information of the shareholders of John Hancock International Growth Equity Fund. | |
| It is not authorized for distribution to prospective investors unless preceded or accompanied by a prospectus. | 420A 7/14 |
| MF195343 | 9/14 |
ITEM 2. CODE OF ETHICS.
(a) As of the end of the fiscal year July 31, 2014 the registrant has adopted a code of ethics, as defined in Item 2 of Form N-CSR, that applies to its Principal Executive Officer and Principal Chief Financial Officer. A copy of the code of ethics is filed as an exhibit to this Form N-CSR.
(b)Not applicable
(c)Not applicable
(d)Not applicable
(e)Not applicable
(f)(1) A copy of the Code of Ethics is attached hereto.
|
| JOHN HANCOCK VARIABLE INSURANCE TRUST |
| JOHN HANCOCK FUNDS |
| JOHN HANCOCK FUNDS II |
| |
| SARBANES-OXLEY CODE OF ETHICS |
| FOR |
| PRINCIPAL EXECUTIVE, PRINCIPAL FINANCIAL OFFICERS & TREASURER |
I. Covered Officers/Purpose of the Code
This code of ethics (this “Code”) for John Hancock Variable Insurance Trust, John Hancock Funds1, and John Hancock Funds II and, each a registered management investment company under the Investment Company Act of 1940, as amended (“1940 Act”), which may issue shares in separate and distinct series (each investment company and series thereunder to be hereinafter referred to as a “Fund”), applies to each Fund’s Principal Executive Officer (“President”), Principal Financial Officer (“Chief Financial Officer”) and Treasurer (“Treasurer”) (the “Covered Officers” as set forth in Exhibit A) for the purpose of promoting:
► honest and ethical conduct, including the ethical handling of actual or apparent conflicts of interest between personal and professional relationships;
► full, fair, accurate, timely and understandable disclosure in reports and documents that the Fund files with, or submits to, the Securities and Exchange Commission (“SEC”) and in other public communications made by the Fund;
► compliance with applicable laws and governmental rules and regulations;
► the prompt internal reporting of violations of the Code to an appropriate person or persons identified in the Code; and
► accountability for adherence to the Code.
____________________________
1 John Hancock Funds includes the following trusts: John Hancock Financial Opportunities Fund; John Hancock Bond Trust; John Hancock California Tax-Free Income Fund; John Hancock Capital Series; John Hancock Current Interest; john Hancock Funds III; John Hancock Income Securities Trust; John Hancock Investment Trust; John Hancock Investment Trust II; John Hancock Investment Trust III; John Hancock Investors Trust; John Hancock Municipal Securities Trust; John Hancock Premium Dividend Fund ; John Hancock Preferred Income Fund; John Hancock Preferred Income Fund II; John Hancock Preferred Income Fund III; John Hancock Sovereign Bond Fund; John Hancock Strategic Series; John Hancock Tax-Exempt Series Fund; John Hancock Tax-Advantaged Dividend Income Fund; John Hancock Tax-Advantaged Global Shareholder Yield Fund and John Hancock Hedged Equity and Income Fund.
Each of the Covered Officers should adhere to a high standard of business ethics and should be sensitive to situations that may give rise to actual as well as apparent conflicts of interest.
II. Covered Officers Should Handle Ethically Actual and Apparent Conflicts of Interest
Overview
A “conflict of interest” occurs when a Covered Officer’s private interest interferes with the interests of, or his service to, the Fund. For example, a conflict of interest would arise if a Covered Officer, or a member of his family, receives improper personal benefits as a result of his position with the Fund. Certain conflicts of interest arise out of the relationships between the Covered Officers and the Fund and already are subject to conflict of interest provisions in the Investment Company Act of 1940, as amended (the “Investment Company Act”) and the Investment Advisers Act of 1940, as amended (the “Investment Advisers Act”). For example, Covered Officers may not individually engage in certain transactions (such as the purchase or sale of securities or other property) with the Fund because of their status as “affiliated persons” of the Fund. Each of the Covered Officers is an officer or employee of the investment adviser or a service provider (“Service Provider”) to the Fund. The Fund’s, the investment adviser’s and the Service Provider’s compliance programs and procedures are designed to prevent, or identify and correct, violations of these provisions. This Code does not, and is not intended to, repeat or replace these programs and procedures, and such conflicts fall outside of the parameters of this Code.
Although typically not presenting an opportunity for improper personal benefit, conflicts arise from, or as a result of, the contractual relationship between the Fund and the investment adviser and the Service Provider of which the Covered Officers are also officers or employees. As a result, this Code recognizes that the Covered Officers will, in the normal course of their duties (whether formally for the Fund, for the investment adviser or for the Service Provider), be involved in establishing policies and implementing decisions which will have different effects on the investment adviser, the Service Provider and the Fund. The participation of the Covered Officers in such activities is inherent in the contractual relationship between the Fund and the investment adviser and the Service Provider and is consistent with the performance by the Covered Officers of their duties as officers of the Fund. Thus, if such participation is performed in conformity with the provisions of the Investment Company Act and the Investment Advisers Act, it will be deemed to have been handled ethically. In addition, it is recognized by the Fund’s Board of Trustees/Directors (the “Board”) that the Covered Officers may also be officers or employees of one or more other investment companies covered by other Codes.
Other conflicts of interest are covered by the Code, even if such conflicts of interest are not subject to provisions in the Investment Company Act and the Investment Advisers Act. The following list provides examples of conflicts of interest under the Code, but the Covered Officers should keep in mind that these examples are not exhaustive. The overarching principle is that the personal interest of a Covered Officer should not be placed improperly before the interest of the Fund.
Each Covered Officer must:
► not use his/her personal influence or personal relationships improperly to influence investment decisions or financial reporting by the Fund whereby the Covered Officer would benefit personally to the detriment of the Fund;
► not cause the Fund to take action, or fail to take action, for the individual personal benefit of the Covered Officer rather than for the benefit of the Fund; and
► not use material non-public knowledge of portfolio transactions made or contemplated for the Fund to trade personally or cause others to trade personally in contemplation of the market effect of such transactions.
Additionally, conflicts of interest may arise in other situations, the propriety of which may be discussed, if material, with the Fund’s Chief Compliance Officer (“CCO”). Examples of these include:
► service as a director/trustee on the board of any public or private company;
► the receipt of any non-nominal gifts;
► the receipt of any entertainment from any company with which the Fund has current or prospective business dealings unless such entertainment is business-related, reasonable in cost, appropriate as to time and place, and not so frequent as to raise any question of impropriety (or other formulation as the Fund already uses in another code of conduct);
► any ownership interest in, or any consulting or employment relationship with, any of the Fund’s service providers, other than its investment adviser, any sub-adviser, principal underwriter, administrator or any affiliated person thereof; and
► a direct or indirect financial interest in commissions, transaction charges or spreads paid by the Fund for effecting portfolio transactions or for selling or redeeming shares other than an interest arising from the Covered Officer’s employment, such as compensation or equity ownership.
III. Disclosure & Compliance
► Each Covered Officer should familiarize himself or herself with the disclosure requirements generally applicable to the Fund;
► Each Covered Officer should not knowingly misrepresent, or cause others to misrepresent, facts about the Fund to others, whether within or outside the Fund, including to the Fund’s directors and auditors, and to governmental regulators and self-regulatory organizations;
► Each Covered Officer should, to the extent appropriate within his/her area of responsibility, consult with other officers and employees of the Fund and the Fund’s adviser or any sub-adviser with the goal of promoting full, fair, accurate, timely and understandable disclosure in the reports and documents the Fund files with, or submits to, the SEC and in other public communications made by the Fund; and
► It is the responsibility of each Covered Officer to promote compliance with the standards and restrictions imposed by applicable laws, rules and regulations.
IV. Reporting & Accountability
Each Covered Officer must:
► upon adoption of the Code (or thereafter as applicable, upon becoming an Covered Officer), affirm in writing to the Fund’s CCO that he/she has received, read, and understands the Code;
► annually thereafter affirm to the Fund’s CCO that he/she has complied with the requirements of the Code;
► not retaliate against any employee or Covered Officer or their affiliated persons for reports of potential violations that are made in good faith;
► notify the Fund’s CCO promptly if he/she knows of any violation of this Code (Note: failure to do so is itself a violation of this Code); and
► report at least annually any change in his/her affiliations from the prior year.
The Fund’s CCO is responsible for applying this Code to specific situations in which questions are presented under it and has the authority to interpret this Code in any particular situation. However, any approvals or waivers sought by the Principal Executive Officer will be considered by the Fund’s Board or the Compliance Committee thereof (the “Committee”).
The Fund will follow these procedures in investigating and enforcing this Code:
► the Fund’s CCO will take all appropriate action to investigate any potential violations reported to him/her;
► if, after such investigation, the CCO believes that no violation has occurred, the CCO is not required to take any further action;
► any matter that the CCO believes is a violation will be reported to the Board or, if applicable, Compliance Committee;
► if the Board or, if applicable, Compliance Committee concurs that a violation has occurred, the Board, either upon its determination of a violation or upon recommendation of the Compliance Committee, if applicable, will consider appropriate action, which may include review of, and appropriate modifications to, applicable policies and procedures; notification to appropriate personnel of the Service Provider or the investment adviser or its board; or a recommendation to dismiss the Registrant’s Executive Officer;
► the Board, or if applicable the Compliance Committee, will be responsible for granting waivers, as appropriate; and
► any changes to or waivers of this Code will, to the extent required, be disclosed as provided by SEC rules.
V. Other Policies & Procedures
This Code shall be the sole code of ethics adopted by the Fund for purposes of Section 406 of the Sarbanes-Oxley Act of 2002 and the rules and forms applicable to registered investment companies thereunder. Insofar as other policies or procedures of the Fund, the Fund’s adviser, any sub-adviser, principal underwriter or other service providers govern or purport to govern the behavior or activities of the Covered Officers who are subject to this Code, they are superseded by this Code to the extent that they overlap or conflict with the provisions of this Code. The Fund’s and its investment adviser’s codes of ethics under Rule 204A-1 under the Investment Advisers Act and Rule 17j-1 under the Investment Company Act, respectively, are separate requirements applying to the Covered Officers and others, and are not part of this Code.
VI. Amendments
Any amendments to this Code, other than amendments to Exhibit A, must be approved or ratified by a majority vote of the Fund’s Board, including a majority of independent directors.
VII. Confidentiality
All reports and records prepared or maintained pursuant to this Code will be considered confidential and shall be maintained and protected accordingly. Except as otherwise required by law or this Code, such matters shall not be disclosed to anyone other than the Fund’s Board and its counsel, the investment adviser and the relevant Service Providers.
VIII. Internal Use
The Code is intended solely for the internal use by the Fund and does not constitute an admission, by or on behalf of the Fund, as to any fact, circumstance, or legal conclusion.
|
| Exhibit A |
| Persons Covered by this Code of Ethics |
| (As of March 13, 2014) |
John Hancock Variable Insurance Trust
► Principal Executive Officer and President – Andrew Arnott
► Principal Financial Officer and Chief Financial Officer – Charles Rizzo
► Treasurer – Salvatore Schiavone
John Hancock Funds
► Principal Executive Officer and President – Andrew Arnott
► Principal Financial Officer and Chief Financial Officer – Charles Rizzo
► Treasurer – Salvatore Schiavone
John Hancock Funds II
► Principal Executive Officer and President – Andrew Arnott
► Principal Financial Officer and Chief Financial Officer – Charles Rizzo
► Treasurer – Salvatore Schiavone
(f)(2) Not applicable.
(f)(3) The Registrant will provide a copy of the Code of Ethics to any person without charge, upon request by calling the following toll free number (800) 344-1029.
ITEM 3. AUDIT COMMITTEE FINANCIAL EXPERT.
The Board of Trustees has determined that at least one member of its audit committee is an “audit committee financial expert”. Peter S. Burgess is the audit committee financial expert and is “independent”, pursuant to general instructions on Form N-CSR Item 3.
ITEM 4. PRINCIPAL ACCOUNTANT FEES AND SERVICES.
(a) AUDIT FEES:
2014: $518,111
2013: $482,312
These fees represent aggregate fees billed for the last two fiscal years (the “Reporting Periods”) for professional services rendered by the principal accountant for the audits of the Registrant’s annual financial statements or services that are normally provided by the accountant in connection with statutory and regulatory filing or engagements for such Reporting Periods.
(b) AUDIT RELATED FEES:
2014: $6,138
2013: $22,233
These fees represent the aggregate fees billed for the Reporting Periods for assurance and related services by the principal accountant that are reasonably related to the performance of the audit of the Registrant’s financial statements and are not reported under paragraph (a) of this Item. Such fees relate to professional services rendered by the principal accountant for separate reports in connection with service provider internal controls reviews. In addition, amounts billed to control affiliates were $98,642 and $99,637 for the fiscal years ended July 31, 2014 and 2013, respectively.
(c) TAX FEES:
2014: $38,850
2013: $38,502
These fees represent aggregate fees billed for the Reporting Periods for professional services
rendered by the principal accountant for tax compliance, tax advice and tax planning. The tax services provided by the principal accountant related to the review of the Registrant’s federal and state tax returns and tax distribution requirements.
(d) ALL OTHER FEES:
2014: $5,308
2013: $4,514
These fees represent all other fees billed to the Registrant for products and services provided by the principal accountant. These fees were billed to the Registrant and were approved by the Registrant’s audit committee.
(e) (1) Audit Committee Pre-Approval Policies and Procedures:
The Trust’s Audit Committee must pre-approve all audit and non-audit services provided by the independent registered public accounting firm (the “Auditor”) relating to the operations or financial reporting of the funds. Prior to the commencement of any audit or non-audit services to a fund, the Audit Committee reviews the services to determine whether they are appropriate and permissible under applicable law.
The Trust’s Audit Committee has adopted policies and procedures to, among other purposes, provide a framework for the Committee’s consideration of audit-related and non-audit services by the Auditor. The policies and procedures require that any audit-related and non-audit service provided by the Auditor and any non-audit service provided by the Auditor to a fund service provider that relates directly to the operations and financial reporting of a fund are subject to approval by the Audit Committee before such service is provided. Audit-related services provided by the Auditor that are expected to exceed $25,000 per instance/per fund are subject to specific pre-approval by the Audit Committee. Tax services provided by the Auditor that are expected to exceed $30,000 per instance/per fund are subject to specific pre-approval by the Audit Committee.
All audit services, as well as the audit-related and non-audit services that are expected to exceed the amounts stated above, must be approved in advance of provision of the service by formal resolution of the Audit Committee. At the regularly scheduled Audit Committee meetings, the Committee reviews a report summarizing the services, including fees, provided by the Auditor.
(2) Amount approved by the Audit Committee pursuant paragraph (c) (7) (i) (C) of Rule 2-01 of Regulation S-X: None.
(f) Not applicable.
(g) The aggregate non-audit fees billed by the registrant’s principal accountant for services rendered to the registrant and rendered to the registrant’s control affiliates for each of the last two fiscal years of the registrant were $6,231,775 for the fiscal year ended July 31, 2014 and $3,114,794 for the fiscal year ended July 31, 2013.
(h) The audit committee of the registrant has considered the non-audit services provided by the registrant’s principal accountant to the control affiliates and has determined that the services that were non pre-approved are compatible with maintaining the principal accountant’s independence.
ITEM 5. AUDIT COMMITTEE OF LISTED REGISTRANTS
Peter S. Burgess – Chairman
Charles L. Bardelis
Theron S. Hoffman
ITEM 6. SCHEDULE OF INVESTMENTS.
(a) This schedule is included as part of the Report to shareholders filed under Item 1 of this form.
(b) Not applicable.
ITEM 7. DISCLOSURE OF PROXY VOTING POLICIES AND PROCEDURES FOR CLOSED-END MANAGEMENT INVESTMENT COMPANIES.
Not applicable.
ITEM 8. PORTFOLIO MANAGERS OF CLOSED-END MANAGEMENT INVESTMENT COMPANIES.
Not applicable.
ITEM 9. PURCHASE OF EQUITY SECURITIES BY CLOSED-END MANAGEMENT INVESTMENT COMPANIES AND AFFILIATED PURCHASERS.
Not applicable.
ITEM 10. SUBMISSION OF MATTERS TO VOTE OF SECURITY HOLDERS.
(a) The registrant has adopted procedures by which shareholders may recommend nominees to the registrant's Board of Trustees. A copy of the procedures is filed as an exhibit to this Form N-CSR. See attached "John Hancock Funds - Nominating and Governance Committee Charter".
ITEM 11. CONTROLS AND PROCEDURES.
(a) EVALUATION OF DISCLOSURE CONTROLS AND PROCEDURES. The Registrant maintains disclosure controls and procedures that are designed to ensure that information required to be disclosed in this Form N-CSR is recorded, processed, summarized and reported within the periods specified in the rules and forms of the Securities and Exchange Commission. Such disclosure controls and procedures include controls and procedures designed to ensure that such information is accumulated and communicated to the Registrant's management, including its principal executive officer and principal financial officer, as appropriate, to allow timely decisions regarding required disclosure.
Within 90 days prior to the filing date of this Form N-CSR, the Registrant had carried out an evaluation, under the supervision and with the participation of the Registrant's management, including the Registrant's principal executive officer and the Registrant's principal financial officer, of the effectiveness of the design and operation of the Registrant's disclosure controls and procedures relating to information required to be disclosed on Form N-CSR. Based on such evaluation, the Registrant's principal executive officer and principal financial officer concluded that the Registrant's disclosure controls and procedures are operating effectively to ensure that:
(i) information required to be disclosed in this Form N-CSR is recorded, processed, summarized and reported within the periods specified in the rules and forms of the Securities and Exchange Commission, and (ii) information is accumulated and communicated to the Registrant’s management, including its principal executive officer and principal financial officer, as appropriate, to allow timely decisions regarding required disclosure.
(b) CHANGE IN REGISTRANT’S INTERNAL CONTROL: Not applicable.
ITEM 12. EXHIBITS.
(a)(1) Code of Ethics for Principal Executive Officer and Principal Financial Officer.
(a)(2) The certifications required by Rule 30a-2(a) under the 1940 Act.
(b) The certifications required by Rule 30a-2(b) under the 1940 Act.
(c)(1) Submission of Matters to a Vote of Security Holders is attached. See attached "John Hancock Funds - Nominating and Governance Committee Charter"
(c)(2) Contact person at the registrant.
Pursuant to the requirements of the Securities Exchange Act of 1934 and the Investment Company Act of 1940, the registrant has duly caused this report to be signed on its behalf by the undersigned, thereunto duly authorized.
| |
| JOHN HANCOCK FUNDS II | |
| | |
| | |
| /s/ Andrew Arnott | |
| Andrew Arnott | |
| President | |
| Date: September 23, 2014 | |
Pursuant to the requirements of the Securities Exchange Act of 1934 and the Investment Company Act of 1940, this report has been signed below by the following persons on behalf of the registrant and in the capacities and on the dates indicated.
|
| /s/ Andrew Arnott |
| Andrew Arnott |
| President |
| Date: September 23, 2014 |
| |
| |
| |
| /s/ Charles A. Rizzo |
| Charles A. Rizzo |
| Chief Financial Officer |
| Date: September 23, 2014 |