|
| UNITED STATES |
| SECURITIES AND EXCHANGE COMMISSION |
| Washington, D.C. 20549 |
| |
| FORM N-CSR |
| |
| CERTIFIED SHAREHOLDER REPORT OF REGISTERED MANAGEMENT INVESTMENT |
| COMPANIES |
| Investment Company Act file number 811-21779 |
| |
| JOHN HANCOCK FUNDS II |
| --------------------------------------------------------- |
| (Exact name of registrant as specified in charter) |
| |
| 601 CONGRESS STREET, BOSTON, MA 02210-2805 |
| ------------------------------------------------------------- |
| (Address of principal executive offices) (Zip code) |
| |
| SALVATORE SCHIAVONE, 601 CONGRESS STREET, BOSTON, MA 02210-2805 |
| ------------------------------------------------------------------------------------------ |
| (Name and address of agent for service) |
| |
| Registrant's telephone number, including area code: (617) 663-4497 |
| -------------- |
| Date of fiscal year end: 12/31 |
| ------ |
| |
| Date of reporting period: 12/31/12 |
| ------- |
ITEM 1. REPORTS TO STOCKHOLDERS.

Management’s discussion of
Fund performance
By the Portfolio Management Team at John Hancock Asset Management
John Hancock
Lifestyle Portfolios
Market Review
During 2012, investors were faced with a myriad of challenges, including recessions throughout Europe and in Japan, fears of the U.S. economy diving over the “fiscal cliff,” slowing earnings growth and critical leadership transitions in a number of the world’s largest economic powers. Although the majority of the headline news seemed to have a negative underlying tone during the year, most major global equity and fixed-income market indexes posted strong gains during 2012.
In the U.S., the equity market, as represented by the S&P 500 Index, rose 16%. But this was only part of the good news. Equity markets overseas in both developed and emerging markets also generated significant gains during the year as the MSCI EAFE Index rose over 17%, while the MSCI Emerging Markets Index rose over 18%. Within fixed income, the U.S. bond market as represented by the Barclays U.S. Aggregate Bond Index also recorded positive returns of over 4%, but non-investment-grade bonds generated returns similar to U.S. equities in the 15% range and emerging-market bonds returned over 18%.
If headline news around the world was less than stellar, why did the capital markets deliver such impressive returns? A number of worst-case scenarios never materialized, which caused depressed valuations of riskier assets to rise. This was in turn supported by improvement in a few key economic indicators. To shed a bit more light on this, consider the following example. During the year, one of the biggest fears was a disorderly breakup of the eurozone, coupled with debt defaults from a few major eurozone countries. These fears compressed European equity valuations to levels not seen in nearly 30 years, and bond yields in countries like Italy and Spain skyrocketed to well over 6%. However, in late July, the head of the European Central Bank committed to doing “whatever it takes to preserve the euro,” easing the markets’ fear of the worst-case scenario and allowing valuations to rise while also leading to lower borrowing costs for Italy and Spain.
| | | |
| | For the | | |
| Market Index | year ended | | |
| Total Returns | December 31, 2012 | | |
| | |
| | | |
| U.S. Stocks | | | |
| | |
| S&P 500 Index | 16.00% | | |
| Russell Midcap Index | 17.28% | | |
| Russell 2000 Index | 16.35% | | |
| FTSE NAREIT All Equity REIT Index | 19.70% | | |
| | | |
| International Stocks | | | |
| | |
| MSCI EAFE Index | 17.90% | | |
| MSCI Emerging Markets Index | 18.63% | | |
| MSCI EAFE Small Cap Index | 20.42% | | |
| | | |
| Fixed Income | | | |
| | |
| Barclays U.S. Aggregate Bond Index | 4.22% | | |
| Bank of America Merrill Lynch US High | | | |
| Yield Master II Index | 15.59% | | |
| JPM Global Government Bonds | | | |
| Unhedged Index | 1.30% | | |
But the strong year for the markets wasn’t just about avoiding the worst cases. There were also improvements in a few key economic data points that gave hope for more positive economic momentum in the future. Chief among these was the improvement seen in the epicenter of the last crisis, the housing market. Housing starts rose, overall housing supply fell and existing home prices climbed during the year in the U.S. Additionally, the stubbornly high unemployment rate in the U.S., while still above historical averages, did fall during the year.
| |
| 2 | Lifestyle Portfolios | Annual report |
Outlook
After such a strong year for the capital markets, what lies ahead? We believe global economic growth will likely remain challenged in Europe but be stronger in the U.S. With the recent rally across global equities, the question to ask is how much of this view is priced in current valuations? Our opinion is that there still exist attractive values in a number of regions and countries around the globe, while other regions and countries are more fairly valued. For example, we continue to believe that good value exists in Europe and in many emerging markets, particularly in Asia. In the U.S., valuations are a bit more mixed, given the market appreciation coupled with the higher overall starting point. However, there is a case to be made that valuations could increase a bit further in the short term from current levels.
Within fixed income, challenges to generating the strong returns of the last few years exist, namely the low absolute level of yield available. Although we are not expecting interest rates to spike materially higher in the short term, even a small increase can lead to price decreases that can diminish the return earned from interest payments in the high-quality sector. We continue to believe non-investment-grade and emerging-market bonds offer superior return potential; however, not without risk.

In 2013, we believe special care should be taken to build a portfolio that can also reasonably withstand unexpected shocks that may occur in the economic or geopolitical landscape, commensurate with the level of risk investors are comfortable taking on. While we never know in advance what these shocks may ultimately be, a wide range of candidates can be found by reading the news each day. To that end, we want to stress the importance of maintaining a well-diversified global portfolio that includes not only traditional equities and fixed income, but also exposure to more non-traditional strategies, like absolute return funds.

| |
| Annual report | Lifestyle Portfolios | 3 |
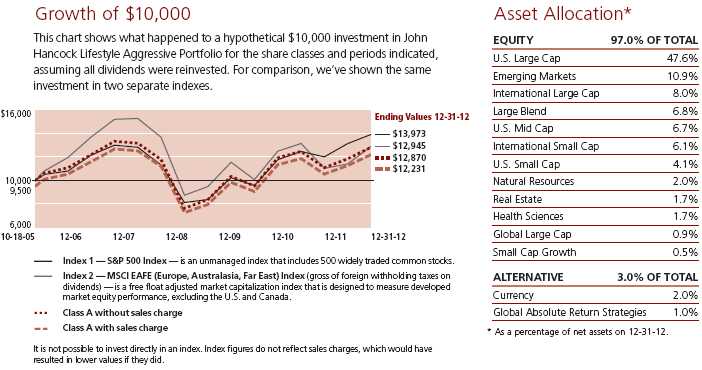
Lifestyle Aggressive Portfolio
For the 12-month period ended December 31, 2012, the Portfolio’s Class A shares returned 15.83%, excluding sales charges. In comparison, the benchmark S&P 500 Index returned 16.00% over the same period and the Morningstar, Inc. large blend fund category returned an average 14.96%.
The Portfolio’s performance was just shy of the benchmark index over the period. Performance was primarily driven by our asset class positioning and to a small degree by the performance of our underlying fund managers. International developed and emerging-market equities were among the largest contributors to relative results for the year, a dramatic reversal from 2011 and recent quarters, when these asset classes lagged. We continued to maintain our defensive equity theme, which incorporates a small group of underlying funds whose strategies, when combined, tend to exhibit less volatility than the broader equity market, but are expected to generate equity market returns over a full market cycle. This strategy generally stabilizes Portfolio results through strong risk-adjusted performance and reduced volatility. We continued to rely on the diversification benefits from our absolute return strategies, which may be uncorrelated to the broader equity and fixed-income markets and help improve downside protection.
The performance of our underlying fund managers in aggregate was slightly positive to relative results over the year. Several underlying funds turned in strong relative performance, including Alpha Opportunities Fund (Wellington), which benefited from its stock picking within the consumer discretionary and health care sectors. Blue Chip Growth Fund (T. Rowe Price) contributed positively to relative results through its stock selection within information technology, as well as its underweight in consumer staples. Fundamental Large Cap Value Fund (John Hancock) posted strong relative results through its positioning within financials and consumer discretionary stocks. Partially offsetting these positive contributors were underperforming strategies such as All Cap Value Fund (Lord Abbett), where negative contributors included stock selection in consumer discretionary and its positioning in financials, and Fundamental Value Fund (Davis), which detracted primarily due to stock selections in financials and energy.
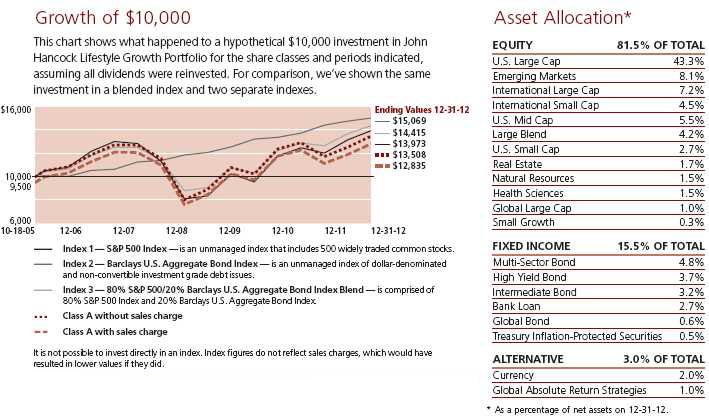
Lifestyle Growth Portfolio
For the 12-month period ended December 31, 2012, the Portfolio’s Class A shares returned 15.01%, excluding sales charges. In comparison, the S&P 500 Index returned 16.00% over the same period and the Barclays U.S. Aggregate Bond Index returned 4.22%. A blended benchmark comprised of 80% S&P 500 Index and 20% Barclays U.S. Aggregate Bond Index returned 13.66%. The Morningstar, Inc. aggressive allocation fund category returned an average 13.42%.
The Portfolio outperformed its blended benchmark and was in the top quartile of its peer group for the year. The Portfolio’s outperformance over the period was primarily driven by our asset class positioning and to a small degree by the performance of our underlying fund managers. International developed and emerging-market equities were among the largest contributors to relative results for the year, a dramatic reversal from 2011 and in recent quarters, when these asset classes lagged. We continued to maintain our defensive equity theme, which incorporates a small group of underlying funds whose strategies, when combined, tend to exhibit less volatility than the broader equity market, but are expected to generate equity market returns over a full market cycle. This strategy generally stabilizes results through strong risk-adjusted performance and reduced volatility. Our bond allocations strongly favor credit-sensitive sectors such as high-yield bonds and bank loans, both of which continued to outpace traditional fixed income, given their yield advantage and strong fundamentals. We continued to rely on the diversification benefits from our absolute return strategies, which may be uncorrelated to the broader equity and fixed-income markets and help improve downside protection.
The performance of our underlying fund managers in aggregate was positive to relative results over the year. Several underlying funds turned in strong relative performance, including Alpha Opportunities Fund (Wellington), which benefited from its stock picking within the consumer discretionary and health care sectors. Blue Chip Growth Fund (T. Rowe Price) contributed positively to relative results through its stock selection within information technology, as well as its underweight in consumer staples. Fundamental Large Cap Value Fund (John Hancock) posted strong relative results through its positioning within financials and consumer discretionary stocks. Partially offsetting these positive contributors were
| |
| 4 | Lifestyle Portfolios | Annual report |
underperforming strategies such as All Cap Value Fund (Lord Abbett), where negative contributors included stock selection in consumer discretionary and its positioning in financials, and Fundamental Value Fund (Davis), which detracted primarily due to stock selections in financials and energy.
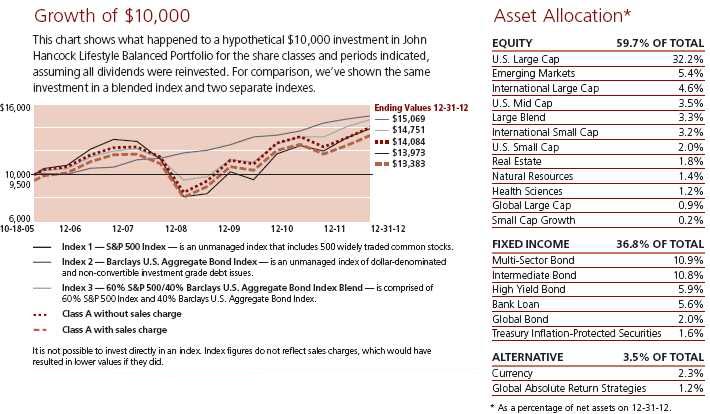
Lifestyle Balanced Portfolio
For the 12-month period ended December 31, 2012, the Portfolio’s Class A shares returned 13.59%, excluding sales charges. In comparison, the S&P 500 Index returned 16.00% over the same period and the Barclays U.S. Aggregate Bond Index returned 4.22%. A blended benchmark comprised of 60% S&P 500 Index and 40% Barclays U.S. Aggregate Bond Index returned 11.31%. The Morningstar, Inc. moderate allocation fund category returned an average 11.72%.
The Portfolio outperformed its blended benchmark and was in the top quartile of its peer group for the year. The Portfolio’s outperformance over the period was primarily driven by our asset class positioning and to a lesser degree by the performance of our underlying fund managers. The largest positive contributors to relative results were the Portfolio’s credit-sensitive fixed-income allocations, such as high-yield bonds and bank loans, both of which continued to outpace traditional fixed income, given their yield advantage and strong fundamentals. Also adding value was the allocation to multi-sector bonds, which represent a multitude of fixed-income sectors. Within equities, the Portfolio’s performance was boosted by exposures to international developed and emerging-market equities. We continued to maintain our defensive equity theme, which incorporates a small group of underlying funds whose strategies, when combined, tend to exhibit less volatility than the broader equity market, but are expected to generate equity market returns over a full market cycle. This strategy generally stabilizes results through strong risk-adjusted performance and reduced volatility. We also continued to rely on the diversification benefits from our absolute return strategies, which may be uncorrelated to the broader equity and fixed-income markets and help improve downside protection.
The performance of our underlying fund managers in aggregate was positive to relative results over the year. Several underlying funds turned in strong relative performance, including Alpha Opportunities Fund (Wellington), which benefited from its stock picking within the consumer discretionary and health care sectors. Fundamental Large Cap Value Fund (John Hancock) posted strong relative results through its positioning within financials and consumer discretionary stocks. Also positively contributing to relative results were fixed-income strategies such as Total Return Fund (PIMCO) and Active Bond Fund (John Hancock/Declaration). Partially offsetting these positive contributors were underperforming strategies such as All Cap Value Fund (Lord Abbett), where negative contributors included stock selection in consumer discretionary and its positioning in financials, and Fundamental Value Fund (Davis), which detracted primarily due to stock selections in financials and energy.
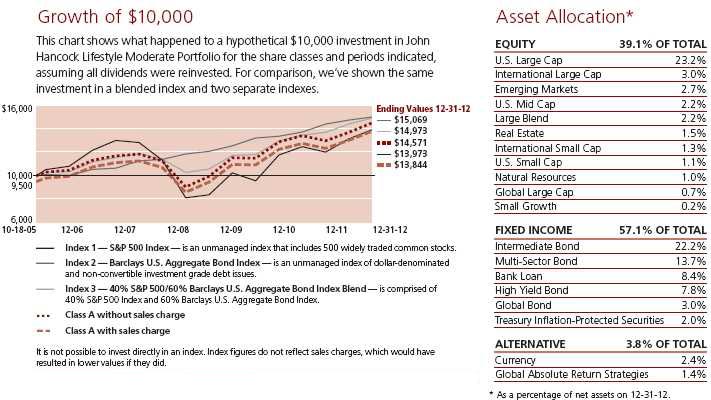
Lifestyle Moderate Portfolio
For the 12-month period ended December 31, 2012, the Portfolio’s Class A shares returned 11.94%, excluding sales charges. In comparison, the S&P 500 Index returned 16.00% over the same period and the Barclays U.S. Aggregate Bond Index returned 4.22%. A blended benchmark comprised of 40% S&P 500 Index and 60% Barclays U.S. Aggregate Bond Index returned 8.95%. The Morningstar, Inc. conservative allocation fund category returned an average 9.40%.
The Portfolio outperformed its blended benchmark and was in the top quartile of its peer group for the year. The Portfolio’s outperformance over the period was primarily driven by our asset class positioning and to a lesser degree by the performance of our underlying fund managers. The largest positive contributors to relative results were the Portfolio’s credit-sensitive fixed-income allocations, such as high-yield bonds and bank loans, both of which continued to outpace traditional fixed income, given their yield advantage and strong fundamentals. Also adding value was the allocation to multi-sector bonds, which represent a multitude of fixed-income sectors. Within equities, the Portfolio’s performance was boosted by exposures to international developed and emerging-market equities. We continued to maintain our defensive equity theme, which incorporates a small group of underlying funds whose strategies, when combined, tend to exhibit less volatility than the broader equity market, but are expected to generate equity market returns over a full market cycle. This strategy generally
| |
| Annual report | Lifestyle Portfolios | 5 |
stabilizes results through strong risk-adjusted performance and reduced volatility. We also continued to rely on the diversification benefits from our absolute return strategies, which may be uncorrelated to the broader equity and fixed-income markets and help improve downside protection.
The performance of our underlying fund managers in aggregate was positive to relative results over the year. Several underlying funds turned in strong relative performance, including Total Return Fund (PIMCO), which benefited primarily from its allocation to mortgage-related securities and to a lesser extent its corporate bond exposure. Also positively contributing to relative results were Active Bond Fund (John Hancock/Declaration), Global Bond Fund (PIMCO) and High Income Fund (John Hancock). Partially offsetting these positive contributors were underperforming strategies such as All Cap Value Fund (Lord Abbett), where negative contributors included stock selection in consumer discretionary and its positioning in financials, and Fundamental Value Fund (Davis), which detracted primarily due to stock selections in financials and energy.
Lifestyle Conservative Portfolio
For the 12-month period ended December 31, 2012, the Portfolio’s Class A shares returned 10.03%, excluding sales charges. In comparison, the S&P 500 Index returned 16.00% over the same period and the Barclays U.S. Aggregate Bond Index returned 4.22%. A blended benchmark comprised of 20% S&P 500 Index and 80% Barclays U.S. Aggregate Bond Index returned 6.59%. The Morningstar, Inc. conservative allocation fund category returned an average 9.40%.
The Portfolio’s outperformance of its blended benchmark over the period was primarily driven by our asset class positioning and to a lesser degree by the performance of our underlying fund managers. The largest positive contributors to relative results were the Portfolio’s credit-sensitive fixed-income allocations, such as high-yield bonds and bank loans, both of which continued to outpace traditional fixed income, given their yield advantage and strong fundamentals. Also adding value was the Portfolio’s allocation to multi-sector bonds, which represent a multitude of fixed-income sectors. Within equities, the Portfolio’s performance was boosted by exposures to international developed and emerging-market equities. We continued to maintain our defensive equity theme, which incorporates a small group of underlying funds whose strategies, when combined, tend to exhibit less volatility than the broader equity market, but are expected to generate equity market returns over a full market cycle. This strategy generally stabilizes results through strong risk-adjusted performance and reduced volatility. We also continued to rely on the diversification benefits from our absolute return strategies, which may be uncorrelated to the broader equity and fixed-income markets and help improve downside protection.
The performance of our underlying fund managers in aggregate was positive to relative results over the year. Several underlying funds turned in strong relative performance, including Total Return Fund (PIMCO), which benefited primarily from its allocation to mortgage-related securities and to a lesser extent its corporate bond exposure. Also positively contributing to relative results were Active Bond Fund (John Hancock/Declaration), Global Bond Fund (PIMCO) and High Income Fund (John Hancock). Partially offsetting these positive contributors were underperforming strategies such as Spectrum Income Fund (T. Rowe Price), where its holdings in lower-risk fixed-income and developed international bond segments were a drag on relative results, and U.S. High Yield Bond Fund (Wells Capital), which detracted due to its conservative positioning.
This commentary reflects the views of the portfolio managers through the end of the period discussed in this report. The managers’ statements reflect their own opinions. As such, they are in no way a guarantee of future events and are not intended to be used as investment advice or a recommendation regarding any specific security. They are also subject to change at any time as market and other conditions warrant.
The Portfolios’ performance depends on the Adviser’s and Subadvisers’ skill in determining the strategic asset class allocations, the mix of underlying funds and the performance of those underlying funds. The underlying funds’ performance may be lower than the performance of the asset class which they were selected to represent. The Portfolios are subject to the same risks as the underlying funds in which they invest, which include the following: stocks and bonds can decline due to adverse issuer, market, regulatory or economic developments; foreign investing, especially in emerging markets, has additional risks, such as currency and market volatility and political and social instability; and the securities of small-capitalization companies are subject to higher volatility than larger, more established companies; high-yield bonds are subject to additional risks, such as increased risk of default. Absolute return funds are not designed to outperform stocks and bonds in strong markets and there is no guarantee of positive returns. They employ certain techniques which are intended to reduce risk and volatility in the portfolio and provide protection against a decline in the fund’s assets. However, there is no guarantee that any investment strategy will be successful or that the fund’s objectives will be achieved. For additional information on these and other risk considerations, please see the Portfolios’ prospectus.
| |
| 6 | Lifestyle Portfolios | Annual report |
John Hancock Lifestyle Aggressive Portfolio
Performance chart
Total returns with maximum sales charge for the period ended 12-31-12
| | | | | | | | | | |
|
| | Class A | Class B | Class C | Class R11 | Class R21,2 | Class R31 | Class R41 | Class R51 | Class R61,2 | Class 11 |
|
| Start date | 10-18-05 | 10-18-05 | 10-18-05 | 9-18-06 | 10-18-05 | 10-18-05 | 10-18-05 | 10-18-05 | 10-15-05 | 10-15-05 |
|
| Average annual total returns — 1 year | 10.08% | 9.94% | 14.00% | 15.42% | 15.58% | 15.53% | 15.86% | 16.22% | 16.43% | 16.43% |
|
| Average annual total returns — 5 year | –1.54% | –1.65% | –1.24% | –0.88% | –1.50% | –0.81% | –0.51% | –0.19% | –1.57% | –0.04% |
|
| Average annual total returns — Since inception | 2.83% | 2.80% | 2.84% | 1.93% | 2.50% | 3.33% | 3.62% | 3.93% | 2.30% | 4.06% |
|
| Cumulative returns — 1 year | 10.08% | 9.94% | 14.00% | 15.42% | 15.58% | 15.53% | 15.86% | 16.22% | 16.43% | 16.43% |
|
| Cumulative returns — 5 year | –7.48% | –7.96% | –6.05% | –4.33% | –7.30% | –3.98% | –2.50% | –0.93% | –7.61% | –0.19% |
|
| Cumulative returns — Since inception | 22.31% | 22.03% | 22.36% | 12.80% | 19.45% | 26.62% | 29.18% | 31.99% | 17.79% | 33.30% |
|
Performance figures assume all distributions are reinvested. Returns with maximum sales charge reflect a sales charge on Class A shares of 5%, and the applicable contingent deferred sales charge (CDSC) on Class B shares and Class C shares. The Class B shares’ CDSC declines annually between years 1–6 according to the following schedule: 5, 4, 3, 3, 2, 1%. No sales charges will be assessed after the sixth year. Class C shares held for less than one year are subject to a 1% CDSC. Sales charges are not applicable to Class R1, Class R2, Class R3, Class R4, Class R5, Class R6 and Class 1 shares.
Performance of the classes will vary based on the difference in sales charges paid by shareholders investing in the different classes and the fee structure of those classes.
The expense ratios of the Portfolio, both net (including any fee waivers, expense limitations or recoupments) and gross (excluding any fee waivers, expense limitations or recoupments), are set forth according to the most recent publicly available prospectuses for the Portfolio and may differ from those disclosed in the Financial highlights tables in this report. The fee waivers and expense limitations are contractual at least until 4-30-14 for Class B, Class R2 and Class R6 shares. Had the fee waivers, expense limitations and recoupments not been in place gross expenses would apply. For all other classes the net expenses equal the gross expenses. The following expense ratios include expenses of the underlying affiliated funds in which the Portfolio invests. The expense ratios are as follows:
| | | | | | | | | | | | | |
| | Class A | Class B | Class C | Class R1 | Class R2* | Class R3 | Class R4 | Class R5 | Class R6 | Class 1 | | | |
| Net (%) | 1.47 | 2.24 | 2.18 | 1.88 | 1.51 | 1.76 | 1.40 | 1.15 | 1.00 | 1.00 | | | |
| Gross (%) | 1.47 | 2.22 | 2.18 | 1.88 | 1.75 | 1.76 | 1.40 | 1.15 | 17.45 | 1.00 | | | |
* Expenses have been estimated for the class’s first full year of operations.
The returns reflect past results and should not be considered indicative of future performance. The return and principal value of an investment will fluctu-ate so that shares, when redeemed, may be worth more or less than their original cost. Due to market volatility, the Portfolio’s current performance may be higher or lower than the performance shown. For performance data current to the most recent month end, please call 1-800-225-5291 or visit the Portfolio’s Web site at www.jhfunds.com.
This performance information does not reflect the deduction of taxes that a shareholder may pay on Portfolio distributions or the redemption of Portfolio shares. The Portfolio’s performance results reflect any applicable fee waivers and expense reductions, without which the expenses would increase and results would have been less favorable.
1 For certain types of investors, as described in the Portfolio’s prospectuses.
2 Class R2 shares were first offered on 3-1-12; returns prior to that date are those of Class A shares that have been recalculated to apply the estimated gross fees and expenses of Class R2 shares. Class R6 shares were first offered on 9-1-11; returns prior to that date are those of Class 1 shares that have been recalculated to apply the gross fees and expenses of Class R6 shares.
| |
| Annual report | Lifestyle Portfolios | 7 |
John Hancock Lifestyle Growth Portfolio
Performance chart
Total returns with maximum sales charge for the period ended 12-31-12
| | | | | | | | | | | |
|
| | Class A | Class B | Class C | Class R11 | Class R21,2 | Class R31 | Class R41 | Class R51 | Class R61,2 | Class 11 | Class 51 |
|
| Start date | 10-18-05 | 10-18-05 | 10-18-05 | 9-18-06 | 10-18-05 | 10-18-05 | 10-18-05 | 10-18-05 | 10-15-05 | 10-15-05 | 7-3-06 |
|
| Average annual total returns — 1 year | 9.25% | 9.18% | 13.21% | 14.67% | 14.79% | 14.77% | 15.11% | 15.43% | 15.60% | 15.50% | 15.57% |
|
| Average annual total returns — 5 year | 0.17% | 0.10% | 0.50% | 0.88% | 0.33% | 0.96% | 1.28% | 1.57% | 0.76% | 1.67% | 1.74% |
|
| Average annual total returns — Since inception | 3.52% | 3.51% | 3.55% | 2.96% | 3.33% | 4.03% | 4.34% | 4.63% | 3.68% | 4.73% | 3.95% |
|
| Cumulative returns — 1 year | 9.25% | 9.18% | 13.21% | 14.67% | 14.79% | 14.77% | 15.11% | 15.43% | 15.60% | 15.50% | 15.57% |
|
| Cumulative returns — 5 year | 0.84% | 0.48% | 2.54% | 4.48% | 1.66% | 4.90% | 6.57% | 8.09% | 3.83% | 8.63% | 9.00% |
|
| Cumulative returns — Since inception | 28.35% | 28.19% | 28.54% | 20.18% | 26.64% | 32.95% | 35.78% | 38.58% | 29.80% | 39.62% | 28.67% |
|
Performance figures assume all distributions are reinvested. Returns with maximum sales charge reflect a sales charge on Class A shares of 5%, and the applicable contingent deferred sales charge (CDSC) on Class B shares and Class C shares. The Class B shares’ CDSC declines annually between years 1–6 according to the following schedule: 5, 4, 3, 3, 2, 1%. No sales charges will be assessed after the sixth year. Class C shares held for less than one year are subject to a 1% CDSC. Sales charges are not applicable to Class R1, Class R2, Class R3, Class R4, Class R5, Class R6, Class 1 and Class 5 shares.
Performance of the classes will vary based on the difference in sales charges paid by shareholders investing in the different classes and the fee structure of those classes.
The expense ratios of the Portfolio, both net (including any fee waivers or expense limitations) and gross (excluding any fee waivers or expense limitations), are set forth according to the most recent publicly available prospectuses for the Portfolio and may differ from those disclosed in the Financial highlights tables in this report. The fee waivers and expense limitations are contractual at least until 4-30-14 for Class R2 and Class R6 shares. Had the fee waivers and expense limitations not been in place gross expenses would apply. For all other classes the net expenses equal the gross expenses. The following expense ratios include expenses of the underlying affiliated funds in which the Portfolio invests. The expense ratios are as follows:
| | | | | | | | | | | | | |
| | Class A | Class B | Class C | Class R1 | Class R2* | Class R3 | Class R4 | Class R5 | Class R6 | Class 1 | Class 5 | | |
| Net (%) | 1.44 | 2.15 | 2.14 | 1.78 | 1.48 | 1.67 | 1.28 | 1.07 | 0.97 | 0.97 | 0.92 | | |
| Gross (%) | 1.44 | 2.15 | 2.14 | 1.78 | 1.64 | 1.67 | 1.28 | 1.07 | 16.81 | 0.97 | 0.92 | | |
* Expenses have been estimated for the class’s first full year of operations.
The returns reflect past results and should not be considered indicative of future performance. The return and principal value of an investment will fluctuate so that shares, when redeemed, may be worth more or less than their original cost. Due to market volatility, the Portfolio’s current performance may be higher or lower than the performance shown. For performance data current to the most recent month end, please call 1-800-225-5291 or visit the Portfolio’s Web site at www.jhfunds.com.
This performance information does not reflect the deduction of taxes that a shareholder may pay on Portfolio distributions or the redemption of Portfolio shares. The Portfolio’s performance results reflect any applicable fee waivers and expense reductions, without which the expenses would increase and results would have been less favorable.
1 For certain types of investors, as described in the Portfolio’s prospectuses.
2 Class R2 shares were first offered on 3-1-12; returns prior to that date are those of Class A shares that have been recalculated to apply the estimated gross fees and expenses of Class R2 shares. Class R6 shares were first offered on 9-1-11; returns prior to that date are those of Class 1 shares that have been recalculated to apply the gross fees and expenses of Class R6 shares.
| |
| 8 | Lifestyle Portfolios | Annual report |
John Hancock Lifestyle Balanced Portfolio
Performance chart
Total returns with maximum sales charge for the period ended 12-31-12
| | | | | | | | | | | |
|
| | Class A | Class B | Class C | Class R11 | Class R21,2 | Class R31 | Class R41 | Class R51 | Class R61,2 | Class 11 | Class 51 |
|
| Start date | 10-18-05 | 10-18-05 | 10-18-05 | 9-18-06 | 10-18-05 | 10-18-05 | 10-18-05 | 10-18-05 | 10-15-05 | 10-15-05 | 7-3-06 |
|
| Average annual total returns — 1 year | 7.88% | 7.80% | 11.81% | 13.29% | 13.37% | 13.38% | 13.77% | 13.96% | 14.09% | 14.09% | 14.14% |
|
| Average annual total returns — 5 year | 1.54% | 1.48% | 1.88% | 2.19% | 1.69% | 2.36% | 2.68% | 2.97% | 2.13% | 3.07% | 3.10% |
|
| Average annual total returns — Since inception | 4.13% | 4.08% | 4.15% | 3.70% | 3.91% | 4.64% | 4.95% | 5.24% | 4.26% | 5.32% | 4.85% |
|
| Cumulative returns — 1 year | 7.88% | 7.80% | 11.81% | 13.29% | 13.37% | 13.38% | 13.77% | 13.96% | 14.09% | 14.09% | 14.14% |
|
| Cumulative returns — 5 year | 7.96% | 7.63% | 9.77% | 11.45% | 8.73% | 12.36% | 14.15% | 15.78% | 11.13% | 16.31% | 16.51% |
|
| Cumulative returns — Since inception | 33.83% | 33.43% | 34.04% | 25.72% | 31.84% | 38.64% | 41.61% | 44.44% | 35.11% | 45.37% | 36.07% |
|
Performance figures assume all distributions are reinvested. Returns with maximum sales charge reflect a sales charge on Class A shares of 5% and the applicable contingent deferred sales charge (CDSC) on Class B shares and Class C shares. The Class B shares’ CDSC declines annually between years 1–6 according to the following schedule: 5, 4, 3, 3, 2, 1%. No sales charges will be assessed after the sixth year. Class C shares held for less than one year are subject to a 1% CDSC. Sales charges are not applicable to Class R1, Class R2, Class R3, Class R4, Class R5, Class R6, Class 1 and Class 5 shares.
Performance of the classes will vary based on the difference in sales charges paid by shareholders investing in the different classes and the fee structure of those classes.
The expense ratios of the Portfolio, both net (including any fee waivers or expense limitations) and gross (excluding any fee waivers or expense limitations), are set forth according to the most recent publicly available prospectuses for the Portfolio and may differ from those disclosed in the Financial highlights tables in this report. The fee waivers and expense limitations are contractual at least until 4-30-14 for Class R2 and Class R6 shares. Had the fee waivers and expense limitations not been in place, gross expenses would apply. For all other classes the net expenses equal the gross expenses. The following expense ratios include expenses of the underlying affiliated funds in which the Portfolio invests. The expense ratios are as follows:
| | | | | | | | | | | | | |
| | Class A | Class B | Class C | Class R1 | Class R2* | Class R3 | Class R4 | Class R5 | Class R6 | Class 1 | Class 5 | | |
| Net (%) | 1.36 | 2.08 | 2.06 | 1.73 | 1.41 | 1.58 | 1.19 | 0.97 | 0.90 | 0.90 | 0.85 | | |
| Gross (%) | 1.36 | 2.08 | 2.06 | 1.73 | 1.57 | 1.58 | 1.19 | 0.97 | 17.16 | 0.90 | 0.85 | | |
* Expenses have been estimated for the class’s first full year of operations.
The returns reflect past results and should not be considered indicative of future performance. The return and principal value of an investment will fluctuate so that shares, when redeemed, may be worth more or less than their original cost. Due to market volatility, the Portfolio’s current performance may be higher or lower than the performance shown. For performance data current to the most recent month end, please call 1-800-225-5291 or visit the Portfolio’s Web site at www.jhfunds.com.
This performance information does not reflect the deduction of taxes that a shareholder may pay on Portfolio distributions or the redemption of Portfolio shares. The Portfolio’s performance results reflect any applicable fee waivers and expense reductions, without which the expenses would increase and results would have been less favorable.
1 For certain types of investors, as described in the Portfolio’s prospectuses.
2 Class R2 shares were first offered on 3-1-12; returns prior to that date are those of Class A shares that have been recalculated to apply the estimated gross fees and expenses of Class R2 shares. Class R6 shares were first offered on 9-1-11; returns prior to that date are those of Class 1 shares that have been recalculated to apply the gross fees and expenses of Class R6 shares.
| |
| Annual report | Lifestyle Portfolios | 9 |
John Hancock Lifestyle Moderate Portfolio
Performance chart
Total returns with maximum sales charge for the period ended 12-31-12
| | | | | | | | | | | |
|
| | Class A | Class B | Class C | Class R11 | Class R21,2 | Class R31 | Class R41 | Class R51 | Class R61,2 | Class 11 | Class 51 |
|
| Start date | 10-18-05 | 10-18-05 | 10-18-05 | 9-18-06 | 10-18-05 | 10-18-05 | 10-18-05 | 10-18-05 | 10-15-05 | 10-15-05 | 7-3-06 |
|
| Average annual total returns — 1 year | 6.31% | 6.14% | 10.17% | 11.58% | 11.72% | 11.64% | 12.02% | 12.26% | 12.50% | 12.49% | 12.56% |
|
| Average annual total returns — 5 year | 3.13% | 3.03% | 3.45% | 3.76% | 3.27% | 3.84% | 4.14% | 4.49% | 3.00% | 4.65% | 4.69% |
|
| Average annual total returns — Since inception | 4.62% | 4.55% | 4.63% | 4.60% | 4.41% | 5.08% | 5.35% | 5.69% | 3.97% | 5.81% | 5.72% |
|
| Cumulative returns — 1 year | 6.31% | 6.14% | 10.17% | 11.58% | 11.72% | 11.64% | 12.02% | 12.26% | 12.50% | 12.49% | 12.56% |
|
| Cumulative returns — 5 year | 16.66% | 16.10% | 18.51% | 20.29% | 17.44% | 20.72% | 22.49% | 24.55% | 15.96% | 25.50% | 25.74% |
|
| Cumulative returns — Since inception | 38.44% | 37.81% | 38.53% | 32.70% | 36.44% | 42.92% | 45.60% | 48.99% | 32.40% | 50.33% | 43.56% |
|
Performance figures assume all distributions are reinvested. Returns with maximum sales charge reflect a sales charge on Class A shares of 5%, and the applicable contingent deferred sales charge (CDSC) on Class B shares and Class C shares. The Class B shares’ CDSC declines annually between years 1–6 according to the following schedule: 5, 4, 3, 3, 2, 1%. No sales charges will be assessed after the sixth year. Class C shares held for less than one year are subject to a 1% CDSC. Sales charges are not applicable to Class R1, Class R2, Class R3, Class R4, Class R5, Class R6, Class 1 and Class 5 shares.
Performance of the classes will vary based on the difference in sales charges paid by shareholders investing in the different classes and the fee structure of those classes.
The expense ratios of the Portfolio, both net (including any fee waivers or expense limitations) and gross (excluding any fee waivers or expense limitations), are set forth according to the most recent publicly available prospectuses for the Portfolio and may differ from those disclosed in the Financial highlights tables in this report. The fee waivers and expense limitations are contractual at least until 4-30-14 for Class R2 and Class R6 shares. Had the fee waivers and expense limitations not been in place gross expenses would apply. For all other classes the net expenses equal the gross expenses. The following expense ratios include expenses of the underlying affiliated funds in which the Portfolio invests. The expense ratios are as follows:
| | | | | | | | | | | | | |
| | Class A | Class B | Class C | Class R1 | Class R2* | Class R3 | Class R4 | Class R5 | Class R6 | Class 1 | Class 5 | | |
| Net (%) | 1.36 | 2.10 | 2.06 | 1.81 | 1.40 | 1.66 | 1.31 | 1.02 | 0.89 | 0.89 | 0.84 | | |
| Gross (%) | 1.36 | 2.10 | 2.06 | 1.81 | 1.64 | 1.66 | 1.31 | 1.02 | 17.03 | 0.89 | 0.84 | | |
* Expenses have been estimated for the class’s first full year of operations.
The returns reflect past results and should not be considered indicative of future performance. The return and principal value of an investment will fluctuate so that shares, when redeemed, may be worth more or less than their original cost. Due to market volatility, the Portfolio’s current performance may be higher or lower than the performance shown. For performance data current to the most recent month end, please call 1-800-225-5291 or visit the Portfolio’s Web site at www.jhfunds.com.
This performance information does not reflect the deduction of taxes that a shareholder may pay on Portfolio distributions or the redemption of Portfolio shares. The Portfolio’s performance results reflect any applicable fee waivers and expense reductions, without which the expenses would increase and results would have been less favorable.
1 For certain types of investors, as described in the Portfolio’s prospectuses.
2 Class R2 shares were first offered on 3-1-12; returns prior to that date are those of Class A shares that have been recalculated to apply the estimated gross fees and expenses of Class R2 shares. Class R6 shares were first offered on 9-1-11; returns prior to that date are those of Class 1 shares that have been recalculated to apply the gross fees and expenses of Class R6 shares.
| |
| 10 | Lifestyle Portfolios | Annual report |
John Hancock Lifestyle Conservative Portfolio

Performance chart
Total returns with maximum sales charge for the period ended 12-31-12
| | | | | | | | | | |
|
| | Class A | Class B | Class C | Class R11 | Class R21,2 | Class R31 | Class R41 | Class R51 | Class R61,2 | Class 11 |
|
| Start date | 10-18-05 | 10-18-05 | 10-18-05 | 9-18-06 | 10-18-05 | 10-18-05 | 10-18-05 | 10-18-05 | 10-15-05 | 10-15-05 |
|
| Average annual total returns — 1 year | 4.56% | 4.24% | 8.28% | 9.52% | 9.72% | 9.71% | 10.06% | 10.37% | 10.56% | 10.56% |
|
| Average annual total returns — 5 year | 4.13% | 4.06% | 4.45% | 4.73% | 4.25% | 4.84% | 5.13% | 5.49% | 3.74% | 5.66% |
|
| Average annual total returns — Since inception | 4.89% | 4.85% | 4.89% | 5.15% | 4.67% | 5.35% | 5.61% | 5.96% | 3.95% | 6.10% |
|
| Cumulative returns — 1 year | 4.56% | 4.24% | 8.28% | 9.52% | 9.72% | 9.71% | 10.06% | 10.37% | 10.56% | 10.56% |
|
| Cumulative returns — 5 year | 22.42% | 22.04% | 24.31% | 25.97% | 23.15% | 26.65% | 28.42% | 30.64% | 20.17% | 31.70% |
|
| Cumulative returns — Since inception | 41.09% | 40.67% | 41.03% | 37.14% | 38.90% | 45.62% | 48.21% | 51.79% | 32.28% | 53.23% |
|
Performance figures assume all distributions are reinvested. Returns with maximum sales charge reflect a sales charge on Class A shares of 5%, and the applicable contingent deferred sales charge (CDSC) on Class B shares and Class C shares. The Class B shares’ CDSC declines annually between years 1–6 according to the following schedule: 5, 4, 3, 3, 2, 1%. No sales charges will be assessed after the sixth year. Class C shares held for less than one year are subject to a 1% CDSC. Sales charges are not applicable to Class R1, Class R2, Class R3, Class R4, Class R5, Class R6 and Class 1 shares.
Performance of the classes will vary based on the difference in sales charges paid by shareholders investing in the different classes and the fee structure of those classes.
The expense ratios of the Portfolio, both net (including any fee waivers or expense limitations) and gross (excluding any fee waivers or expense limitations), are set forth according to the most recent publicly available prospectuses for the Portfolio and may differ from those disclosed in the Financial highlights tables in this report. The fee waivers and expense limitations are contractual at least until 4-30-14 for Class R2 and Class R6 shares. Had the fee waivers and expense limitations not been in place, gross expenses would apply. For all other classes the net expenses equal the gross expenses. The following expense ratios include expenses of the underlying affiliated funds in which the Portfolio invests. The expense ratios are as follows:
| | | | | | | | | | | | | |
| | Class A | Class B | Class C | Class R1 | Class R2* | Class R3 | Class R4 | Class R5 | Class R6 | Class 1 | | | |
| Net (%) | 1.29 | 2.02 | 1.99 | 1.77 | 1.33 | 1.59 | 1.24 | 0.95 | 0.82 | 0.82 | | | |
| Gross (%) | 1.29 | 2.02 | 1.99 | 1.77 | 1.57 | 1.59 | 1.24 | 0.95 | 16.87 | 0.82 | | | |
* Expenses have been estimated for the class’s first full year of operations.
The returns reflect past results and should not be considered indicative of future performance. The return and principal value of an investment will fluctuate so that shares, when redeemed, may be worth more or less than their original cost. Due to market volatility, the Portfolio’s current performance may be higher or lower than the performance shown. For performance data current to the most recent month end, please call 1-800-225-5291 or visit the Portfolio’s Web site at www.jhfunds.com.
This performance information does not reflect the deduction of taxes that a shareholder may pay on Portfolio distributions or the redemption of Portfolio shares. The Portfolio’s performance results reflect any applicable fee waivers and expense reductions, without which the expenses would increase and results would have been less favorable.
1 For certain types of investors, as described in the Portfolio’s prospectuses.
2 Class R2 shares were first offered on 3-1-12; returns prior to that date are those of Class A shares that have been recalculated to apply the estimated gross fees and expenses of Class R2 shares. Class R6 shares were first offered on 9-1-11; returns prior to that date are those of Class 1 shares that have been recalculated to apply the gross fees and expenses of Class R6 shares.
| |
| Annual report | Lifestyle Portfolios | 11 |
Your expenses
As a shareholder of a John Hancock Funds II Lifestyle Portfolio, you incur two types of costs: (1) transaction costs, including sales charges (loads) on certain purchase and redemption fees on certain exchanges and redemptions; and (2) ongoing costs, including management fees, distribution and service (12b-1) fees and other Portfolio expenses. In addition to the operating expenses that each Portfolio bears directly, the Portfolio indirectly bears a pro rata share of the operating expenses of the underlying funds in which the Portfolio invests. Because the underlying funds have varied operating expenses and transaction costs, and each Portfolio may own different proportions of the underlying funds at different times, the amount of expenses incurred indirectly by the Portfolio will vary. Had these indirect expenses been reflected in the following analysis, total expenses would have been higher than the amounts shown.
These examples are intended to help you understand your ongoing costs (in dollars) of investing in a Portfolio so you can compare these costs with the ongoing costs of investing in other mutual funds. The examples are based on an investment of $1,000 at the beginning of the period and held for the entire period (July 1, 2012 through December 31, 2012).
Actual expenses:
The first line of each share class in the tables on the following pages provides information about actual account values and actual expenses. You may use the information in this line, together with the amount you invested, to estimate the expenses that you paid over the period. Simply divide your account value by $1,000 (for example, an $8,600 account value divided by $1,000 = 8.6), then multiply the result by the number in the first line under the heading entitled “Expenses paid during period” to estimate the expenses you paid on your account during this period.
Hypothetical example for comparison purposes:
The second line of each share class in the tables on the following pages provides information about hypothetical account values and hypothetical expenses based on the actual expense ratio for the share class and an assumed annualized rate of return of 5% per year before expenses, which is not the actual return of the share class. The hypothetical account values and expenses may not be used to estimate the actual ending account balance or expenses you paid for the period. You may use this information to compare the ongoing costs of investing in the Portfolios and other funds. To do so, compare this 5% hypothetical example with the 5% hypothetical examples that appear in the shareholder reports of the other funds.
Please note that the expenses shown in the tables are meant to highlight your ongoing costs only and do not reflect any transactional costs. Therefore, the second line of each share class in the table is useful in comparing ongoing costs only, and will not help you determine the relative total costs of owning different funds. In addition, if these transactional costs were included, your costs would have been higher.
| |
| 12 | Lifestyle Portfolios | Annual report |
Shareholder expense example chart
| | | | | |
| | | Beginning | Ending | Expenses Paid | |
| | | Account Value | Account Value | During Period1 | Annualized |
| | | 7-1-12 | 12-31-12 | 7-1-12–12-31-12 | Expense Ratio2 |
|
| Lifestyle Aggressive Portfolio | | | | |
|
| Class A | Actual | $1,000.00 | $1,083.50 | $2.99 | 0.57% |
| | Hypothetical (5% annualized return before expenses) | 1,000.00 | 1,022.30 | 2.90 | 0.57% |
|
| Class B | Actual | 1,000.00 | 1,078.90 | 7.05 | 1.35% |
| | Hypothetical (5% annualized return before expenses) | 1,000.00 | 1,018.30 | 6.85 | 1.35% |
|
| Class C | Actual | 1,000.00 | 1,079.50 | 6.64 | 1.27% |
| | Hypothetical (5% annualized return before expenses) | 1,000.00 | 1,018.80 | 6.44 | 1.27% |
|
| Class R1 | Actual | 1,000.00 | 1,080.70 | 5.28 | 1.01% |
| | Hypothetical (5% annualized return before expenses) | 1,000.00 | 1,020.10 | 5.13 | 1.01% |
|
| Class R2 | Actual | 1,000.00 | 1,083.50 | 3.25 | 0.62% |
| | Hypothetical (5% annualized return before expenses) | 1,000.00 | 1,022.00 | 3.15 | 0.62% |
|
| Class R3 | Actual | 1,000.00 | 1,081.50 | 4.76 | 0.91% |
| | Hypothetical (5% annualized return before expenses) | 1,000.00 | 1,020.60 | 4.62 | 0.91% |
|
| Class R4 | Actual | 1,000.00 | 1,083.60 | 2.67 | 0.51% |
| | Hypothetical (5% annualized return before expenses) | 1,000.00 | 1,022.60 | 2.59 | 0.51% |
|
| Class R5 | Actual | 1,000.00 | 1,085.20 | 1.47 | 0.28% |
| | Hypothetical (5% annualized return before expenses) | 1,000.00 | 1,023.70 | 1.42 | 0.28% |
|
| Class R6 | Actual | 1,000.00 | 1,086.00 | 0.58 | 0.11% |
| | Hypothetical (5% annualized return before expenses) | 1,000.00 | 1,024.60 | 0.56 | 0.11% |
|
| Class 1 | Actual | 1,000.00 | 1,086.00 | 0.58 | 0.11% |
| | Hypothetical (5% annualized return before expenses) | 1,000.00 | 1,024.60 | 0.56 | 0.11% |
|
| Lifestyle Growth Portfolio | | | | |
|
| Class A | Actual | $1,000.00 | $1,076.30 | $2.92 | 0.56% |
| | Hypothetical (5% annualized return before expenses) | 1,000.00 | 1,022.30 | 2.85 | 0.56% |
|
| Class B | Actual | 1,000.00 | 1,073.00 | 6.67 | 1.28% |
| | Hypothetical (5% annualized return before expenses) | 1,000.00 | 1,018.70 | 6.50 | 1.28% |
|
| Class C | Actual | 1,000.00 | 1,073.20 | 6.57 | 1.26% |
| | Hypothetical (5% annualized return before expenses) | 1,000.00 | 1,018.80 | 6.39 | 1.26% |
|
| Class R1 | Actual | 1,000.00 | 1,075.10 | 4.64 | 0.89% |
| | Hypothetical (5% annualized return before expenses) | 1,000.00 | 1,020.70 | 4.52 | 0.89% |
|
| Class R2 | Actual | 1,000.00 | 1,077.10 | 3.24 | 0.62% |
| | Hypothetical (5% annualized return before expenses) | 1,000.00 | 1,022.00 | 3.15 | 0.62% |
|
| Class R3 | Actual | 1,000.00 | 1,075.70 | 4.33 | 0.83% |
| | Hypothetical (5% annualized return before expenses) | 1,000.00 | 1,021.00 | 4.22 | 0.83% |
|
| Class R4 | Actual | 1,000.00 | 1,077.20 | 2.14 | 0.41% |
| | Hypothetical (5% annualized return before expenses) | 1,000.00 | 1,023.10 | 2.09 | 0.41% |
|
| Class R5 | Actual | 1,000.00 | 1,078.40 | 0.94 | 0.18% |
| | Hypothetical (5% annualized return before expenses) | 1,000.00 | 1,024.20 | 0.92 | 0.18% |
|
| Class R6 | Actual | 1,000.00 | 1,079.80 | 0.58 | 0.11% |
| | Hypothetical (5% annualized return before expenses) | 1,000.00 | 1,024.60 | 0.56 | 0.11% |
|
| Class 1 | Actual | 1,000.00 | 1,078.90 | 0.57 | 0.11% |
| | Hypothetical (5% annualized return before expenses) | 1,000.00 | 1,024.60 | 0.56 | 0.11% |
|
| Class 5 | Actual | 1,000.00 | 1,079.50 | 0.31 | 0.06% |
| | Hypothetical (5% annualized return before expenses) | 1,000.00 | 1,024.80 | 0.31 | 0.06% |
|
| |
| Annual report | Lifestyle Portfolios | 13 |
Shareholder expense example chart, continued
| | | | | |
| | | Beginning | Ending | Expenses Paid | |
| | | Account Value | Account Value | During Period1 | Annualized |
| | | 7-1-12 | 12-31-12 | 7-1-12–12-31-12 | Expense Ratio2 |
|
| Lifestyle Balanced Portfolio | | | | |
|
| Class A | Actual | $1,000.00 | $1,068.30 | $2.91 | 0.56% |
| | Hypothetical (5% annualized return before expenses) | 1,000.00 | 1,022.30 | 2.85 | 0.56% |
|
| Class B | Actual | 1,000.00 | 1,064.60 | 6.69 | 1.29% |
| | Hypothetical (5% annualized return before expenses) | 1,000.00 | 1,018.70 | 6.55 | 1.29% |
|
| Class C | Actual | 1,000.00 | 1,064.60 | 6.54 | 1.26% |
| | Hypothetical (5% annualized return before expenses) | 1,000.00 | 1,018.80 | 6.39 | 1.26% |
|
| Class R1 | Actual | 1,000.00 | 1,067.10 | 4.57 | 0.88% |
| | Hypothetical (5% annualized return before expenses) | 1,000.00 | 1,020.70 | 4.47 | 0.88% |
|
| Class R2 | Actual | 1,000.00 | 1,068.30 | 3.17 | 0.61% |
| | Hypothetical (5% annualized return before expenses) | 1,000.00 | 1,022.10 | 3.10 | 0.61% |
|
| Class R3 | Actual | 1,000.00 | 1,068.10 | 4.05 | 0.78% |
| | Hypothetical (5% annualized return before expenses) | 1,000.00 | 1,021.20 | 3.96 | 0.78% |
|
| Class R4 | Actual | 1,000.00 | 1,070.10 | 1.98 | 0.38% |
| | Hypothetical (5% annualized return before expenses) | 1,000.00 | 1,023.20 | 1.93 | 0.38% |
|
| Class R5 | Actual | 1,000.00 | 1,070.40 | 0.99 | 0.19% |
| | Hypothetical (5% annualized return before expenses) | 1,000.00 | 1,024.20 | 0.97 | 0.19% |
|
| Class R6 | Actual | 1,000.00 | 1,071.10 | 0.57 | 0.11% |
| | Hypothetical (5% annualized return before expenses) | 1,000.00 | 1,024.60 | 0.56 | 0.11% |
|
| Class 1 | Actual | 1,000.00 | 1,071.10 | 0.57 | 0.11% |
| | Hypothetical (5% annualized return before expenses) | 1,000.00 | 1,024.60 | 0.56 | 0.11% |
|
| Class 5 | Actual | 1,000.00 | 1,071.30 | 0.31 | 0.06% |
| | Hypothetical (5% annualized return before expenses) | 1,000.00 | 1,024.80 | 0.31 | 0.06% |
|
| Lifestyle Moderate Portfolio | | | | |
|
| Class A | Actual | $1,000.00 | $1,060.00 | $2.95 | 0.57% |
| | Hypothetical (5% annualized return before expenses) | 1,000.00 | 1,022.30 | 2.90 | 0.57% |
|
| Class B | Actual | 1,000.00 | 1,056.20 | 6.72 | 1.30% |
| | Hypothetical (5% annualized return before expenses) | 1,000.00 | 1,018.60 | 6.60 | 1.30% |
|
| Class C | Actual | 1,000.00 | 1,056.40 | 6.56 | 1.27% |
| | Hypothetical (5% annualized return before expenses) | 1,000.00 | 1,018.80 | 6.44 | 1.27% |
|
| Class R1 | Actual | 1,000.00 | 1,058.10 | 4.97 | 0.96% |
| | Hypothetical (5% annualized return before expenses) | 1,000.00 | 1,020.30 | 4.88 | 0.96% |
|
| Class R2 | Actual | 1,000.00 | 1,059.60 | 3.21 | 0.62% |
| | Hypothetical (5% annualized return before expenses) | 1,000.00 | 1,022.00 | 3.15 | 0.62% |
|
| Class R3 | Actual | 1,000.00 | 1,058.50 | 4.76 | 0.92% |
| | Hypothetical (5% annualized return before expenses) | 1,000.00 | 1,020.50 | 4.67 | 0.92% |
|
| Class R4 | Actual | 1,000.00 | 1,060.50 | 2.49 | 0.48% |
| | Hypothetical (5% annualized return before expenses) | 1,000.00 | 1,022.70 | 2.44 | 0.48% |
|
| Class R5 | Actual | 1,000.00 | 1,061.10 | 1.66 | 0.32% |
| | Hypothetical (5% annualized return before expenses) | 1,000.00 | 1,023.50 | 1.63 | 0.32% |
|
| Class R6 | Actual | 1,000.00 | 1,062.60 | 0.57 | 0.11% |
| | Hypothetical (5% annualized return before expenses) | 1,000.00 | 1,024.60 | 0.56 | 0.11% |
|
| Class 1 | Actual | 1,000.00 | 1,062.60 | 0.57 | 0.11% |
| | Hypothetical (5% annualized return before expenses) | 1,000.00 | 1,024.60 | 0.56 | 0.11% |
|
| Class 5 | Actual | 1,000.00 | 1,062.90 | 0.31 | 0.06% |
| | Hypothetical (5% annualized return before expenses) | 1,000.00 | 1,024.80 | 0.31 | 0.06% |
|
| |
| 14 | Lifestyle Portfolios | Annual report |
Shareholder expense example chart, continued
| | | | | |
| | | Beginning | Ending | Expenses Paid | |
| | | Account Value | Account Value | During Period1 | Annualized |
| | | 7-1-12 | 12-31-12 | 7-1-12–12-31-12 | Expense Ratio2 |
|
| Lifestyle Conservative Portfolio | | | | |
|
| Class A | Actual | $1,000.00 | $1,050.00 | $2.89 | 0.56% |
| | Hypothetical (5% annualized return before expenses) | 1,000.00 | 1,022.30 | 2.85 | 0.56% |
|
| Class B | Actual | 1,000.00 | 1,046.20 | 6.64 | 1.29% |
| | Hypothetical (5% annualized return before expenses) | 1,000.00 | 1,018.70 | 6.55 | 1.29% |
|
| Class C | Actual | 1,000.00 | 1,046.40 | 6.48 | 1.26% |
| | Hypothetical (5% annualized return before expenses) | 1,000.00 | 1,018.80 | 6.39 | 1.26% |
|
| Class R1 | Actual | 1,000.00 | 1,046.80 | 5.66 | 1.10% |
| | Hypothetical (5% annualized return before expenses) | 1,000.00 | 1,019.60 | 5.58 | 1.10% |
|
| Class R2 | Actual | 1,000.00 | 1,049.90 | 3.19 | 0.62% |
| | Hypothetical (5% annualized return before expenses) | 1,000.00 | 1,022.00 | 3.15 | 0.62% |
|
| Class R3 | Actual | 1,000.00 | 1,047.60 | 5.35 | 1.04% |
| | Hypothetical (5% annualized return before expenses) | 1,000.00 | 1,019.90 | 5.28 | 1.04% |
|
| Class R4 | Actual | 1,000.00 | 1,050.40 | 2.58 | 0.50% |
| | Hypothetical (5% annualized return before expenses) | 1,000.00 | 1,022.60 | 2.54 | 0.50% |
|
| Class R5 | Actual | 1,000.00 | 1,051.50 | 1.65 | 0.32% |
| | Hypothetical (5% annualized return before expenses) | 1,000.00 | 1,023.50 | 1.63 | 0.32% |
|
| Class R6 | Actual | 1,000.00 | 1,053.40 | 0.57 | 0.11% |
| | Hypothetical (5% annualized return before expenses) | 1,000.00 | 1,024.60 | 0.56 | 0.11% |
|
| Class 1 | Actual | 1,000.00 | 1,052.50 | 0.57 | 0.11% |
| | Hypothetical (5% annualized return before expenses) | 1,000.00 | 1,024.60 | 0.56 | 0.11% |
|
1 Expenses are equal to the annualized expense ratio, multiplied by the average account value over the period, multiplied by the number of days in the period (184) and divided by 366 (to reflect the one-half year period).
2 The Portfolios’ expense ratios do not include fees and expenses indirectly incurred by the underlying funds whose expense ratios can vary based on the mix of underlying funds held by Portfolios. The range of expense ratios of the underlying funds held by the Portfolios was as follows:
| | | | | |
| | Lifestyle | Lifestyle | Lifestyle | Lifestyle | Lifestyle |
| Period ended | Aggressive | Growth | Balanced | Moderate | Conservative |
| 12-31-12 | 0.73%–1.48% | 0.63%–1.48% | 0.63%–1.48% | 0.63%–1.48% | 0.63%–1.48% |
| |
| Annual report | Lifestyle Portfolios | 15 |
Portfolios’ investments
| | | |
| Investment companies | | | |
| | | | |
| Underlying Funds’ Subadvisers | | | |
| | | | |
| American Century Investment | | | |
| Management, Inc. | (American Century) | | |
| | | | |
| Atlantis Investment Management | | | |
| (Hong Kong) Ltd. | (Atlantis) | | |
| | | | |
| Baillie Gifford Overseas Ltd. | (Baillie) | | |
| | | | |
| Columbia Management Investment | | | |
| Advisers, LLC | (Columbia) | | |
| | | | |
| Davis Selected Advisers, L.P. | (Davis) | | |
| | | | |
| Declaration Management & Research, LLC | (Declaration) | | |
| | | | |
| Deutsche Asset Management | (Deutsche) | | |
| | | | |
| Dimensional Fund Advisors LP | (DFA) | | |
| | | | |
| Epoch Investment Partners, Inc. | (Epoch) | | |
| | | | |
| First Quadrant, L.P. | (First Quadrant) | | |
| | | | |
| Franklin Mutual Advisers | | | |
| Franklin Templeton Investments Corp. | (Franklin) | | |
| | | | |
| Templeton Investment Counsel, LLC | | | |
| Frontier Capital Management Company, LLC | (Frontier) | | |
| | | | |
| Grantham, Mayo, Van Otterloo & Co. LLC | (GMO) | | |
| | | | |
| Invesco Advisers, Inc. | (Invesco) | | |
| | | | |
| Jennison Associates LLC | (Jennison) | | |
| | | | |
| John Hancock Asset Management* | (John Hancock) | | |
| | | | |
| Lord, Abbett & Co. LLC | (Lord Abbett) | | |
| | | | |
| Pacific Investment Management | | | |
| Company LLC | (PIMCO) | | |
| | | | |
| Perimeter Capital Management | (Perimeter) | | |
| | | | |
| QS Investors Inc. | (QS Investors) | | |
| | | | |
| Rainier Investment Management, Inc. | (Rainier) | | |
| | | | |
| RCM Capital Management LLC | (RCM) | | |
| | | | |
| Robeco Investment Management, Inc. | (Robeco) | | |
| | | | |
| RS Investment Management Co. LLC | (RS Investments) | | |
| | | | |
| Standard Life Investments | | | |
| (Corporate Funds) Limited | (Standard Life) | | |
| | | | |
| Stone Harbor Investment Partners LP | (Stone Harbor) | | |
| | | | |
| T. Rowe Price Associates, Inc. | (T. Rowe Price) | | |
| | | | |
| Wellington Management Company, LLP | (Wellington) | | |
| | | | |
| Wells Capital Management, Incorporated | (Wells Capital) | | |
| | | | |
| Western Asset Management Company | (WAMCO) | | |
* Manulife Asset Management (US) LLC and Manulife Asset Management (North America) Limited are doing business as John Hancock Asset Management.
Lifestyle Aggressive Portfolio
Securities owned by the Portfolio on 12-31-12
| | |
| | Shares | Value |
|
| AFFILIATED INVESTMENT COMPANIES — 100.00% | |
|
| EQUITY 97.0% | | |
| | | |
| John Hancock Funds II (G) 82.8% | | |
|
| All Cap Core, Class NAV (QS Investors) | 11,150,015 | $110,162,145 |
|
| All Cap Value, Class NAV (Lord Abbett) | 8,411,073 | 94,372,238 |
|
| Alpha Opportunities, Class NAV (Wellington) | 18,963,750 | 201,963,933 |
|
| Blue Chip Growth, Class NAV (T. Rowe Price) | 8,337,408 | 203,432,761 |
|
| Capital Appreciation, Class NAV (Jennison) | 13,301,748 | 173,321,775 |
|
| Capital Appreciation Value, Class NAV | | |
| (T. Rowe Price) | 16,845,586 | 185,806,818 |
|
| China Emerging Leaders, Class NAV (Atlantis) | 5,296,110 | 56,297,645 |
|
| Emerging Markets, Class NAV (DFA) | 33,173,820 | 356,286,831 |
|
| Equity-Income, Class NAV (T. Rowe Price) | 10,169,521 | 162,305,560 |
|
| Fundamental Global Franchise, Class NAV | | |
| (John Hancock1) (A) | 3,295,866 | 36,056,778 |
|
| Fundamental Large Cap Value, Class NAV | | |
| (John Hancock1) (A) | 10,136,797 | 110,896,559 |
|
| Fundamental Value, Class NAV (Davis) | 9,735,686 | 156,063,039 |
|
| Global Real Estate, Class NAV (Deutsche) | 5,693,554 | 47,142,624 |
|
| Health Sciences, Class NAV (T. Rowe Price) | 4,753,051 | 64,261,251 |
|
| Heritage, Class NAV (American Century) | 3,257,608 | 23,194,171 |
|
| International Growth Opportunities Fund (Baillie) | 4,804,712 | 54,677,626 |
|
| International Growth Stock, Class NAV (Invesco) | 7,121,693 | 81,757,033 |
|
| International Small Cap, Class NAV (Franklin) | 2,926,660 | 45,568,094 |
|
| International Small Company, Class NAV (DFA) | 5,573,191 | 46,146,020 |
|
| International Value, Class NAV (Franklin) | 11,429,998 | 163,220,377 |
|
| Mid Cap Stock, Class NAV (Wellington) | 5,874,205 | 104,090,914 |
|
| Mid Cap Value Equity, Class NAV (Columbia) | 1,790,226 | 14,142,787 |
|
| Mid Value, Class NAV (T. Rowe Price) | 6,954,992 | 90,136,697 |
|
| Mutual Shares, Class NAV (Franklin) | 4,978,543 | 57,651,523 |
|
| Natural Resources, Class NAV | | |
| (RS Investments/Wellington) | 4,522,074 | 75,428,198 |
|
| Real Estate Equity, Class NAV (T. Rowe Price) | 1,991,241 | 18,857,050 |
|
| Redwood, Class NAV (RCM) | 3,403,217 | 36,720,715 |
|
| Small Cap Growth, Class NAV (Wellington) | 2,578,742 | 21,119,896 |
|
| Small Cap Opportunities, Class NAV (Invesco/DFA) | 893,397 | 21,119,896 |
|
| Small Cap Value, Class NAV (Wellington) | 1,420,493 | 22,628,460 |
|
| Small Company Growth, Class NAV (Invesco) | 1,225,458 | 18,479,909 |
|
| Small Company Value, Class NAV (T. Rowe Price) | 1,180,615 | 33,942,689 |
|
| Smaller Company Growth, Class NAV | | |
| (Frontier/John Hancock2(A)/Perimeter) | 2,037,198 | 17,805,109 |
|
| Technical Opportunities, Class NAV (Wellington) (I) | 7,816,614 | 82,621,609 |
|
| U.S. Equity, Class NAV (GMO) | 11,776,511 | 133,663,403 |
|
| Value, Class NAV (Invesco) | 2,489,784 | 23,005,600 |
| | | |
| John Hancock Funds III (G) 13.2% | | |
|
| Disciplined Value, Class NAV (Robeco) | 5,421,675 | 76,011,880 |
|
| Global Shareholder Yield, Class NAV (Epoch) | 8,200,838 | 82,254,402 |
|
| International Core, Class NAV (GMO) | 3,300,090 | 93,722,563 |
|
| International Value Equity, Class NAV | | |
| (John Hancock1) (A) | 5,735,726 | 48,352,172 |
|
| Rainier Growth, Class NAV (Rainier) | 2,991,115 | 69,034,944 |
|
| Strategic Growth, Class NAV (John Hancock1) (A) | 11,362,924 | 133,287,101 |
| | |
| John Hancock Investment Trust (G) 1.0% | |
|
| Small Cap Intrinsic Value, Class NAV | | |
| (John Hancock1) (A) | 3,064,577 | 37,142,676 |
| | |
| 16 | Lifestyle Portfolios | Annual report | |
| | | See notes to financial statements |
Lifestyle Aggressive Portfolio (continued)
| | |
| | Shares | Value |
| | | |
| ALTERNATIVE 3.0% | | |
| | | |
| John Hancock Funds II (G) 3.0% | | |
|
| Currency Strategies, Class NAV (First Quadrant) | 7,845,499 | $75,552,152 |
|
| Global Absolute Return Strategies, Class NAV | | |
| (Standard Life) | 3,540,759 | 37,921,526 |
| |
| Total Investments (Lifestyle Aggressive Portfolio) |
| (Cost $3,160,564,171) 100.0% | | $3,797,627,149 |
| Other assets and liabilities, net 0.0% | | 131,728 |
|
| TOTAL NET ASSETS 100.0% | | $3,797,758,877 |
Percentages are based upon net assets.
Lifestyle Growth Portfolio
Securities owned by the Portfolio on 12-31-12
| | |
| | Shares | Value |
|
| AFFILIATED INVESTMENT COMPANIES — 100.00% | |
|
| EQUITY 81.5% | | |
| | | |
| John Hancock Funds II (G) 69.3% | | |
|
| All Cap Core, Class NAV (QS Investors) | 26,604,478 | $262,852,239 |
|
| All Cap Value, Class NAV (Lord Abbett) | 22,399,611 | 251,323,632 |
|
| Alpha Opportunities, Class NAV (Wellington) | 46,763,927 | 498,035,822 |
|
| Blue Chip Growth, Class NAV (T. Rowe Price) | 22,395,737 | 546,455,971 |
|
| Capital Appreciation Value, Class NAV | | |
| (T. Rowe Price) | 59,158,582 | 652,519,155 |
|
| Capital Appreciation, Class NAV (Jennison) | 35,656,398 | 464,602,861 |
|
| China Emerging Leaders, Class NAV (Atlantis) | 12,385,789 | 131,660,940 |
|
| Emerging Markets, Class NAV (DFA) | 77,217,408 | 829,314,967 |
|
| Equity-Income, Class NAV (T. Rowe Price) | 27,160,127 | 433,475,623 |
|
| Fundamental Global Franchise, Class NAV | | |
| (John Hancock1) (A) | 11,259,584 | 123,179,845 |
|
| Fundamental Large Cap Value, Class NAV | | |
| (John Hancock1) (A) | 27,082,742 | 296,285,199 |
|
| Fundamental Value, Class NAV (Davis) | 23,373,657 | 374,679,727 |
|
| Global Real Estate, Class NAV (Deutsche) | 17,777,367 | 147,196,597 |
|
| Health Sciences, Class NAV (T. Rowe Price) | 12,790,614 | 172,929,105 |
|
| Heritage, Class NAV (American Century) | 8,269,472 | 58,878,639 |
|
| International Growth Opportunities (Baillie) | 11,385,024 | 129,561,573 |
|
| International Growth Stock, Class NAV (Invesco) | 16,738,534 | 192,158,371 |
|
| International Small Cap, Class NAV (Franklin) | 6,057,878 | 94,321,161 |
|
| International Small Company, Class NAV (DFA) | 11,533,629 | 95,498,451 |
|
| International Value, Class NAV (Franklin) | 26,977,265 | 385,235,351 |
|
| Mid Cap Stock, Class NAV (Wellington) | 14,952,250 | 264,953,874 |
|
| Mid Cap Value Equity, Class NAV (Columbia) | 4,471,795 | 35,327,183 |
|
| Mid Value, Class NAV (T. Rowe Price) | 17,718,109 | 229,626,691 |
|
| Mutual Shares, Class NAV (Franklin) | 13,240,973 | 153,330,473 |
|
| Natural Resources, Class NAV | | |
| (RS Investments/Wellington) | 10,581,387 | 176,497,529 |
|
| Real Estate Equity, Class NAV (T. Rowe Price) | 6,217,385 | 58,878,639 |
|
| Redwood, Class NAV (RCM) | 10,684,529 | 115,286,070 |
|
| Small Cap Growth, Class NAV (Wellington) | 5,391,817 | 44,158,979 |
|
| Small Cap Opportunities, Class NAV (Invesco/DFA) | 1,867,977 | 44,158,979 |
|
| Small Cap Value, Class NAV (Wellington) | 2,956,868 | 47,102,911 |
|
| Small Company Growth, Class NAV (Invesco) | 2,537,872 | 38,271,115 |
|
| Small Company Value, Class NAV (T. Rowe Price) | 2,457,543 | 70,654,366 |
|
| Smaller Company Growth, Class NAV | | |
| (Frontier/John Hancock2 (A)/Perimeter) | 4,223,730 | 36,915,401 |
|
| Technical Opportunities, Class NAV | | |
| (Wellington) (I) | 20,941,273 | 221,349,254 |
|
| U.S. Equity, Class NAV (GMO) | 40,731,026 | 462,297,140 |
|
| Value, Class NAV (Invesco) | 6,372,147 | 58,878,639 |
| | | |
| John Hancock Funds III (G) 11.6% | | |
|
| Disciplined Value, Class NAV (Robeco) | 14,390,201 | 201,750,622 |
|
| Global Shareholder Yield, Class NAV (Epoch) | 28,390,488 | 284,756,592 |
|
| International Core, Class NAV (GMO) | 7,769,257 | 220,646,896 |
|
| International Value Equity, Class NAV | | |
| (John Hancock1) (A) | 13,465,959 | 113,518,037 |
Lifestyle Growth Portfolio (continued)
| | |
| | Shares | Value |
| John Hancock Funds III (G) (continued) | | |
|
| Rainier Growth, Class NAV (Rainier) | 7,992,102 | $184,457,712 |
|
| Strategic Growth, Class NAV (John Hancock1) (A) | 30,759,336 | 360,807,007 |
| | |
| John Hancock Investment Trust (G) 0.6% | |
|
| Small Cap Intrinsic Value, Class NAV | | |
| (John Hancock1) (A) | 6,334,368 | 76,772,537 |
| | | |
| FIXED INCOME 15.5% | | |
| | | |
| John Hancock Funds II (G) 15.5% | | |
|
| Active Bond, Class NAV | | |
| (John Hancock1 (A)/Declaration) | 18,067,384 | 189,165,512 |
|
| Floating Rate Income, Class NAV (WAMCO) | 34,092,995 | 320,133,224 |
|
| Global Bond, Class NAV (PIMCO) | 5,990,011 | 75,354,335 |
|
| Global High Yield, Class NAV (Stone Harbor) | 8,840,204 | 94,236,570 |
|
| High Income, Class NAV (John Hancock1) (A) | 13,404,791 | 106,434,043 |
|
| High Yield, Class NAV (WAMCO) | 12,866,134 | 118,239,767 |
|
| Multi-Sector Bond, Class NAV (Stone Harbor) | 15,546,416 | 162,926,445 |
|
| Real Return Bond, Class NAV (PIMCO) | 4,589,517 | 58,057,391 |
|
| Spectrum Income, Class NAV (T. Rowe Price) | 14,685,432 | 163,155,151 |
|
| Strategic Income Opportunities, Class NAV | | |
| (John Hancock1) (A) | 21,118,114 | 234,833,424 |
|
| Total Return, Class NAV (PIMCO) | 13,280,734 | 189,250,452 |
|
| U.S. High Yield Bond, Class NAV (Wells Capital) | 9,258,304 | 117,210,125 |
| | | |
| ALTERNATIVE 3.0% | | |
| | | |
| John Hancock Funds II (G) 3.0% | | |
|
| Currency Strategies, Class NAV (First Quadrant) | 24,504,379 | 235,977,165 |
|
| Global Absolute Return Strategies, Class NAV | | |
| (Standard Life) | 10,930,297 | 117,063,483 |
| | |
| Total Investments (Lifestyle Growth Portfolio) | |
| (Cost $10,015,987,737) 100.0% | $11,822,598,962 |
| Other assets and liabilities, net 0.0% | | 886,756 |
|
| TOTAL NET ASSETS 100.0% | | $11,823,485,718 |
Percentages are based upon net assets.
Lifestyle Balanced Portfolio
Securities owned by the Portfolio on 12-31-12
| | |
| | Shares | Value |
|
| AFFILIATED INVESTMENT COMPANIES — 100.00% | |
|
| EQUITY 59.7% | | |
| | | |
| John Hancock Funds II (G) 50.3% | | |
|
| All Cap Core, Class NAV (QS Investors) | 14,951,580 | $147,721,606 |
|
| All Cap Value, Class NAV (Lord Abbett) | 18,046,388 | 202,480,477 |
|
| Alpha Opportunities, Class NAV (Wellington) | 29,773,903 | 317,092,068 |
|
| Blue Chip Growth, Class NAV (T. Rowe Price) | 18,005,919 | 439,344,432 |
|
| Capital Appreciation Value, Class NAV | | |
| (T. Rowe Price) | 51,954,484 | 573,057,955 |
|
| Capital Appreciation, Class NAV (Jennison) | 28,733,528 | 374,397,864 |
|
| China Emerging Leaders, Class NAV (Atlantis) | 9,109,814 | 96,837,321 |
|
| Emerging Markets, Class NAV (DFA) | 55,734,007 | 598,583,231 |
|
| Equity-Income, Class NAV (T. Rowe Price) | 21,862,696 | 348,928,621 |
|
| Fundamental Global Franchise, Class NAV | | |
| (John Hancock1) (A) | 11,131,987 | 121,783,937 |
|
| Fundamental Large Cap Value, Class NAV | | |
| (John Hancock1) (A) | 21,767,588 | 238,137,417 |
|
| Fundamental Value, Class NAV (Davis) | 15,411,831 | 247,051,652 |
|
| Global Real Estate, Class NAV (Deutsche) | 19,577,922 | 162,105,197 |
|
| Health Sciences, Class NAV (T. Rowe Price) | 11,768,434 | 159,109,230 |
|
| Heritage, Class NAV (American Century) | 5,812,382 | 41,384,163 |
|
| International Growth Opportunities (Baillie) | 9,394,721 | 106,911,922 |
|
| International Growth Stock, Class NAV (Invesco) | 13,634,650 | 156,525,784 |
|
| International Small Cap, Class NAV (Franklin) | 4,375,823 | 68,131,568 |
|
| International Small Company, Class NAV (DFA) | 8,331,155 | 68,981,967 |
|
| International Value, Class NAV (Franklin) | 22,136,156 | 316,104,306 |
|
| Mid Cap Stock, Class NAV (Wellington) | 10,465,482 | 185,448,345 |
|
| Mid Cap Value Equity, Class NAV (Columbia) | 3,118,986 | 24,639,990 |
| | |
| | Annual report | Lifestyle Portfolios | 17 |
| See notes to financial statements | | |
Lifestyle Balanced Portfolio (continued)
| | |
| | Shares | Value |
| | | |
| John Hancock Funds II (G) (continued) | | |
|
| Mid Value, Class NAV (T. Rowe Price) | 12,408,052 | $160,808,355 |
|
| Mutual Shares, Class NAV (Franklin) | 10,667,170 | 123,525,826 |
|
| Natural Resources, Class NAV | | |
| (RS Investments/Wellington) | 11,040,258 | 184,151,503 |
|
| Real Estate Equity, Class NAV (T. Rowe Price) | 6,847,104 | 64,842,079 |
|
| Redwood, Class NAV (RCM) | 11,802,244 | 127,346,212 |
|
| Small Cap Growth, Class NAV (Wellington) | 4,433,646 | 36,311,564 |
|
| Small Cap Opportunities, Class NAV (Invesco/DFA) | 1,536,022 | 36,311,564 |
|
| Small Cap Value, Class NAV (Wellington) | 2,442,263 | 38,905,247 |
|
| Small Company Growth, Class NAV (Invesco) | 2,063,939 | 31,124,198 |
|
| Small Company Value, Class NAV (T. Rowe Price) | 2,029,839 | 58,357,871 |
|
| Smaller Company Growth, Class NAV | | |
| (Frontier/John Hancock2(A)/Perimeter) | 3,423,755 | 29,923,616 |
|
| Technical Opportunities, Class NAV (Wellington) (I) | 11,686,455 | 123,525,826 |
|
| U.S. Equity, Class NAV (GMO) | 40,965,891 | 464,962,858 |
|
| Value, Class NAV (Invesco) | 4,489,148 | 41,479,729 |
| | | |
| John Hancock Funds III (G) 8.9% | | |
|
| Disciplined Value, Class NAV (Robeco) | 11,626,473 | 163,003,152 |
|
| Global Shareholder Yield, Class NAV (Epoch) | 28,694,161 | 287,802,439 |
|
| International Core, Class NAV (GMO) | 6,354,992 | 180,481,787 |
|
| International Value Equity, Class NAV | | |
| (John Hancock1) (A) | 11,023,873 | 92,931,250 |
|
| Rainier Growth, Class NAV (Rainier) | 6,455,592 | 148,995,068 |
|
| Strategic Growth, Class NAV (John Hancock1) (A) | 24,372,418 | 285,888,468 |
| | |
| John Hancock Investment Trust (G) 0.5% | |
|
| Small Cap Intrinsic Value, Class NAV | | |
| (John Hancock1) (A) | 5,077,995 | 61,545,295 |
| | | |
| FIXED INCOME 36.8% | | |
| | | |
| John Hancock Funds II (G) 36.8% | | |
|
| Active Bond, Class NAV | | |
| (John Hancock1(A)/Declaration) | 51,498,893 | 539,193,407 |
|
| Core Bond, Class NAV (Wells Capital) | 17,094,390 | 224,620,285 |
|
| Floating Rate Income, Class NAV (WAMCO) | 77,931,674 | 731,778,423 |
|
| Global Bond, Class NAV (PIMCO) | 20,362,205 | 256,156,534 |
|
| Global High Yield, Class NAV (Stone Harbor) | 15,816,090 | 168,599,522 |
|
| High Income, Class NAV (John Hancock1) (A) | 21,327,055 | 169,336,813 |
|
| High Yield, Class NAV (WAMCO) | 23,387,105 | 214,927,493 |
|
| Investment Quality Bond, Class NAV (Wellington) | 7,497,473 | 96,267,549 |
|
| Multi-Sector Bond, Class NAV (Stone Harbor) | 42,862,702 | 449,201,120 |
|
| Real Return Bond, Class NAV (PIMCO) | 15,189,135 | 192,142,562 |
|
| Spectrum Income, Class NAV (T. Rowe Price) | 40,449,244 | 449,391,104 |
|
| Strategic Income Opportunities, Class NAV | | |
| (John Hancock1) (A) | 46,506,512 | 517,152,416 |
|
| Total Return, Class NAV (PIMCO) | 37,855,124 | 539,435,521 |
|
| U.S. High Yield Bond, Class NAV (Wells Capital) | 16,820,696 | 212,950,006 |
| | | |
| ALTERNATIVE 3.5% | | |
| | | |
| John Hancock Funds II (G) 3.5% | | |
|
| Currency Strategies, Class NAV (First Quadrant) | 30,370,888 | 292,471,654 |
|
| Global Absolute Return Strategies, Class NAV | | |
| (Standard Life) | 15,067,759 | 161,375,701 |
| | |
| Total Investments (Lifestyle Balanced Portfolio) | |
| (Cost $11,147,622,390) 100.0% | $12,951,983,070 |
| Other assets and liabilities, net 0.0% | | 223,164 |
|
| TOTAL NET ASSETS 100.0% | | $12,952,206,234 |
Percentages are based upon net assets.
Lifestyle Moderate Portfolio
Securities owned by the Portfolio on 12-31-12
| | |
| | Shares | Value |
|
| AFFILIATED INVESTMENT COMPANIES — 100.00% | |
|
| EQUITY 39.1% | | |
| | | |
| John Hancock Funds II (G) 33.6% | | |
|
| All Cap Value, Class NAV (Lord Abbett) | 5,603,175 | $62,867,623 |
|
| Alpha Opportunities, Class NAV (Wellington) | 6,645,833 | 70,778,118 |
|
| Blue Chip Growth, Class NAV (T. Rowe Price) | 4,129,292 | 100,754,733 |
|
| Capital Appreciation Value, Class NAV | | |
| (T. Rowe Price) | 13,739,659 | 151,548,441 |
|
| Capital Appreciation, Class NAV (Jennison) | 6,582,228 | 85,766,425 |
|
| Emerging Markets, Class NAV (DFA) | 10,497,669 | 112,744,960 |
|
| Equity-Income, Class NAV (T. Rowe Price) | 6,860,771 | 109,497,912 |
|
| Fundamental Global Franchise, Class NAV | | |
| (John Hancock1) (A) | 2,870,952 | 31,408,216 |
|
| Fundamental Large Cap Value, Class NAV | | |
| (John Hancock1) (A) | 6,774,118 | 74,108,853 |
|
| Fundamental Value, Class NAV (Davis) | 3,817,982 | 61,202,255 |
|
| Global Real Estate, Class NAV (Deutsche) | 5,098,103 | 42,212,291 |
|
| International Growth Opportunities (Baillie) | 1,983,116 | 22,567,866 |
|
| International Growth Stock, Class NAV (Invesco) | 2,888,238 | 33,156,968 |
|
| International Small Cap, Class NAV (Franklin) | 713,757 | 11,113,193 |
|
| International Small Company, Class NAV (DFA) | 1,358,926 | 11,251,905 |
|
| International Value, Class NAV (Franklin) | 4,664,896 | 66,614,718 |
|
| Mid Cap Stock, Class NAV (Wellington) | 2,679,956 | 47,488,827 |
|
| Mid Value, Class NAV (T. Rowe Price) | 3,664,261 | 47,488,827 |
|
| Natural Resources, Class NAV | | |
| (RS Investments/Wellington) | 2,530,713 | 42,212,291 |
|
| Real Estate Equity, Class NAV (T. Rowe Price) | 2,228,738 | 21,106,145 |
|
| Redwood, Class NAV (RCM) | 3,858,590 | 41,634,187 |
|
| Small Cap Growth, Class NAV (Wellington) | 1,236,990 | 10,130,950 |
|
| Small Cap Value, Class NAV (Wellington) | 662,465 | 10,553,073 |
|
| Small Company Growth, Class NAV (Invesco) | 559,845 | 8,442,458 |
|
| Small Company Value, Class NAV (T. Rowe Price) | 543,254 | 15,618,548 |
|
| Smaller Company Growth, Class NAV | | |
| (Frontier/John Hancock2(A)/Perimeter) | 935,857 | 8,179,393 |
|
| U.S. Equity, Class NAV (GMO) | 10,621,776 | 120,557,160 |
| | | |
| John Hancock Funds III (G) 5.5% | | |
|
| Global Shareholder Yield, Class NAV (Epoch) | 7,388,719 | 74,108,853 |
|
| International Core, Class NAV (GMO) | 1,348,886 | 38,308,372 |
|
| International Value Equity, Class NAV | | |
| (John Hancock1)(A) | 2,327,011 | 19,616,703 |
|
| Rainier Growth, Class NAV (Rainier) | 1,479,204 | 34,140,033 |
|
| Strategic Growth, Class NAV | | |
| (John Hancock1) (A) | 5,572,521 | 65,365,674 |
| | | |
| FIXED INCOME 57.1% | | |
| | | |
| John Hancock Funds II (G) 57.1% | | |
|
| Active Bond, Class NAV | | |
| (John Hancock1(A)/Declaration) | 33,358,416 | 349,262,615 |
|
| Core Bond, Class NAV (Wells Capital) | 11,444,217 | 150,377,006 |
|
| Floating Rate Income, Class NAV (WAMCO) | 38,120,268 | 357,949,315 |
|
| Global Bond, Class NAV (PIMCO) | 10,005,631 | 125,870,836 |
|
| Global High Yield, Class NAV (Stone Harbor) | 6,802,459 | 72,514,215 |
|
| High Income, Class NAV (John Hancock1) (A) | 9,132,773 | 72,514,215 |
|
| High Yield, Class NAV (WAMCO) | 9,999,319 | 91,893,745 |
|
| Investment Quality Bond, Class NAV (Wellington) | 6,922,108 | 88,879,868 |
|
| Multi-Sector Bond, Class NAV (Stone Harbor) | 17,595,722 | 184,403,166 |
|
| Real Return Bond, Class NAV (PIMCO) | 6,648,094 | 84,098,391 |
|
| Spectrum Income, Class NAV (T. Rowe Price) | 16,562,097 | 184,004,894 |
|
| Strategic Income Opportunities, Class NAV | | |
| (John Hancock1) (A) | 19,067,434 | 212,029,868 |
|
| Total Return, Class NAV (PIMCO) | 24,520,663 | 349,419,447 |
|
| U.S. High Yield Bond, Class NAV (Wells Capital) | 7,258,590 | 91,893,745 |
| | |
| 18 | Lifestyle Portfolios | Annual report | |
| | | See notes to financial statements |
Lifestyle Moderate Portfolio (continued)
| | |
| | Shares | Value |
| | | |
| ALTERNATIVE 3.8% | | |
| | | |
| John Hancock Funds II (G) 3.8% | | |
|
| Currency Strategies, Class NAV (First Quadrant) | 10,568,467 | $101,774,337 |
|
| Global Absolute Return Strategies, Class NAV | | |
| (Standard Life) | 5,340,411 | 57,195,807 |
| | |
| Total Investments (Lifestyle Moderate Portfolio) | |
| (Cost $3,811,776,463) 100.0% | | $4,226,627,441 |
| Other assets and liabilities, net 0.0% | | 314,684 |
|
| TOTAL NET ASSETS 100.0% | | $4,226,942,125 |
Percentages are based upon net assets.
Lifestyle Conservative Portfolio
Securities owned by the Portfolio on 12-31-12
| | |
| | Shares | Value |
|
| AFFILIATED INVESTMENT COMPANIES — 100.0% | |
|
| EQUITY 20.0% | | |
| | | |
| John Hancock Funds II (G) 18.3% | | |
|
| All Cap Value, Class NAV (Lord Abbett) | 631,498 | $7,085,406 |
|
| Blue Chip Growth, Class NAV (T. Rowe Price) | 4,742,963 | 115,728,294 |
|
| Capital Appreciation Value, Class NAV | | |
| (T. Rowe Price) | 8,208,136 | 90,535,740 |
|
| Emerging Markets, Class NAV (DFA) | 3,940,463 | 42,320,577 |
|
| Equity-Income, Class NAV (T. Rowe Price) | 5,524,683 | 88,173,938 |
|
| Fundamental Global Franchise, Class NAV | | |
| (John Hancock1) (A) | 1,833,649 | 20,060,124 |
|
| Fundamental Large Cap Value, Class NAV | | |
| (John Hancock1) (A) | 683,642 | 7,479,039 |
|
| Fundamental Value, Class NAV (Davis) | 3,560,629 | 57,076,880 |
|
| Global Real Estate, Class NAV (Deutsche) | 3,600,566 | 29,812,685 |
|
| International Growth Stock, Class NAV (Invesco) | 1,805,846 | 20,731,111 |
|
| International Value, Class NAV (Franklin) | 3,014,699 | 43,049,900 |
|
| Mid Cap Stock, Class NAV (Wellington) | 841,216 | 14,906,343 |
|
| Mid Value, Class NAV (T. Rowe Price) | 1,150,181 | 14,906,343 |
|
| Natural Resources, Class NAV | | |
| (RS Investments/Wellington) | 1,191,554 | 19,875,124 |
|
| Real Estate Equity, Class NAV (T. Rowe Price) | 2,098,746 | 19,875,123 |
|
| Redwood, Class NAV (RCM) | 3,648,134 | 39,363,365 |
|
| Small Cap Growth, Class NAV (Wellington) | 1,213,378 | 9,937,562 |
|
| Small Company Value, Class NAV (T. Rowe Price) | 345,654 | 9,937,562 |
|
| U.S. Equity, Class NAV (GMO) | 6,901,594 | 78,333,097 |
| | | |
| John Hancock Funds III (G) 1.7% | | |
|
| Global Shareholder Yield, Class NAV (Epoch) | 4,787,967 | 48,023,306 |
|
| International Core, Class NAV (GMO) | 743,470 | 21,114,536 |
| | | |
| FIXED INCOME 76.0% | | |
| | | |
| John Hancock Funds II (G) 76.0% | | |
|
| Active Bond, Class NAV | | |
| (John Hancock1/Declaration) (A) | 39,008,210 | 408,415,956 |
|
| Core Bond, Class NAV (Wells Capital) | 15,894,814 | 208,857,850 |
|
| Floating Rate Income, Class NAV (WAMCO) | 42,514,012 | 399,206,570 |
|
| Global Bond, Class NAV (PIMCO) | 12,662,660 | 159,296,262 |
|
| Global High Yield, Class NAV (Stone Harbor) | 6,591,028 | 70,260,356 |
|
| High Income, Class NAV (John Hancock1) (A) | 8,848,911 | 70,260,356 |
|
| High Yield, Class NAV (WAMCO) | 9,730,389 | 89,422,272 |
|
| Investment Quality Bond, Class NAV (Wellington) | 16,255,722 | 208,723,470 |
|
| Multi-Sector Bond, Class NAV (Stone Harbor) | 18,807,670 | 197,104,384 |
|
| Real Return Bond, Class NAV (PIMCO) | 11,009,978 | 139,276,225 |
|
| Short Term Government Income, Class NAV | | |
| (John Hancock1) (A) | 15,983,598 | 159,676,142 |
|
| Spectrum Income, Class NAV (T. Rowe Price) | 17,750,499 | 197,208,046 |
|
| Strategic Income Opportunities, Class NAV | | |
| (John Hancock1) (A) | 20,319,327 | 225,950,919 |
|
| Total Return, Class NAV (PIMCO) | 28,665,563 | 408,484,268 |
|
| U.S. High Yield Bond, Class NAV (Wells Capital) | 7,063,084 | 89,418,640 |
Lifestyle Conservative Portfolio (continued)
| | |
| | Shares | Value |
| | | |
| ALTERNATIVE 4.0% | | |
| | | |
| John Hancock Funds II (G) 4.0% | | |
|
| Global Absolute Return Strategies, Class NAV | | |
| (Standard Life) | 5,404,757 | $57,884,953 |
|
| Currency Strategies, Class NAV (First Quadrant) | 10,570,890 | 101,797,675 |
| |
| Total Investments (Lifestyle Conservative Portfolio) |
| (Cost $3,684,201,141) 100.0% | | $3,989,570,399 |
| Other assets and liabilities, net 0.0% | | 600,595 |
|
| TOTAL NET ASSETS 100.0% | | $3,990,170,994 |
Percentages are based upon net assets.
Footnote Legend:
1 Manulife Asset Management (US) LLC is doing business as John Hancock Asset Management.
2 Manulife Asset Management (North America) Limited is doing business as John Hancock Asset Management.
(A) The subadviser is an affiliate of the adviser.
(G) The Portfolio’s subadviser is shown parenthetically.
(I) Non-income producing.
| | |
| | Annual report | Lifestyle Portfolios | 19 |
| See notes to financial statements | | |
FINANCIAL STATEMENTSFinancial statements
Statements of assets and liabilities 12-31-12
These Statements of assets and liabilities are the Portfolios’ balance sheets. They show the value of what each Portfolio owns, is due and owes. You’ll also find the net asset value and the maximum offering price per share for each Portfolio. Net asset value is calculated by dividing the net assets of each class of shares by the number of outstanding shares in the class.
| | | |
| | Lifestyle | Lifestyle | Lifestyle |
| | Aggressive | Growth | Balanced |
|
| Assets | | | |
|
| Investments in affiliated underlying funds, at value | $3,797,627,149 | $11,822,598,962 | $12,951,983,070 |
| Cash | 431 | 1,546 | 1,525 |
| Receivable for investments sold | 28,505,855 | 70,859,873 | 50,533,640 |
| Receivable for fund shares sold | 1,686,226 | 6,130,597 | 8,340,929 |
| Dividends and interest receivable | 46,462 | 4,141,031 | 9,109,569 |
| Receivable due from adviser | 1,295 | 966 | 1,014 |
| Other assets | 49,953 | 70,265 | 87,744 |
| Total assets | 3,827,917,371 | 11,903,803,240 | 13,020,057,491 |
|
| Liabilities | | | |
|
| Payable for investments purchased | — | 4,358,760 | 9,788,066 |
| Payable for fund shares repurchased | 29,957,471 | 75,326,581 | 57,365,439 |
| Payable to affiliates: | Accounting and legal services fees | 79,631 | 245,902 | 265,702 |
| Transfer agent fees | 57,831 | 221,288 | 258,666 |
| Trustees’ fees | 1,052 | 3,226 | 3,371 |
| Distribution and service fees | 8,967 | 17,482 | 30,800 |
| Other liabilities and accrued expenses | 53,542 | 144,283 | 139,213 |
| Total liabilities | 30,158,494 | 80,317,522 | 67,851,257 |
| | | | |
| Net assets | 3,797,758,877 | 11,823,485,718 | 12,952,206,234 |
|
| Net assets consist of | | | |
|
| Paid-in capital | $3,700,932,374 | $11,401,675,560 | $12,518,187,670 |
| Accumulated undistributed net realized gain (loss) on investments | (540,236,475) | (1,384,801,067) | (1,370,342,116) |
| Net unrealized appreciation (depreciation) on investments | 637,062,978 | 1,806,611,225 | 1,804,360,680 |
| Net assets | $3,797,758,877 | $11,823,485,718 | $12,952,206,234 |
| Investments in affiliated underlying funds, at cost | $3,160,564,171 | $10,015,987,737 | $11,147,622,390 |
|
| Net asset value per share | | | |
|
| The Portfolios have an unlimited number of shares authorized with par value of $0.01 | | | |
| per share. Net asset value is calculated by dividing the net assets of each class of | | | |
| shares by the number of outstanding shares in the class. | | | |
| Class A:1 Net assets | $238,959,130 | $889,595,489 | $1,043,262,635 |
| Shares outstanding | 18,454,701 | 65,726,243 | 76,640,588 |
| Net asset value and redemption price per share | $12.95 | $13.53 | $13.61 |
| Class B:1 Net assets | $24,459,439 | $108,027,521 | $107,463,997 |
| Shares outstanding | 1,884,327 | 7,961,506 | 7,896,672 |
| Net asset value, offering price and redemption price per share | $12.98 | $13.57 | $13.61 |
| Class C:1 Net assets | $121,220,765 | $485,488,680 | $578,580,174 |
| Shares outstanding | 9,336,998 | 35,812,884 | 42,478,439 |
| Net asset value, offering price and redemption price per share | $12.98 | $13.56 | $13.62 |
| Class R1: Net assets | $8,868,467 | $19,199,446 | $17,284,213 |
| Shares outstanding | 683,223 | 1,413,477 | 1,274,134 |
| Net asset value, offering price and redemption price per share | $12.98 | $13.58 | $13.57 |
| Class R2: Net assets | $103,202 | $103,192 | $103,119 |
| Shares outstanding | 8,006 | 7,663 | 7,605 |
| Net asset value, offering price and redemption price per share | $12.89 | $13.47 | $13.56 |
| Class R3: Net assets | $9,814,066 | $18,737,898 | $32,980,355 |
| Shares outstanding | 759,140 | 1,386,221 | 2,427,523 |
| Net asset value, offering price and redemption price per share | $12.93 | $13.52 | $13.59 |
| Class R4: Net assets | $8,484,561 | $19,383,549 | $70,452,465 |
| Shares outstanding | 657,327 | 1,434,533 | 5,185,633 |
| Net asset value, offering price and redemption price per share | $12.91 | $13.51 | $13.59 |
| Class R5: Net assets | $8,740,803 | $31,681,080 | $39,171,063 |
| Shares outstanding | 676,727 | 2,342,647 | 2,879,449 |
| Net asset value, offering price and redemption price per share | $12.92 | $13.52 | $13.60 |
| Class R6: Net assets | $2,161,321 | $3,495,829 | $4,675,461 |
| Shares outstanding | 167,646 | 259,546 | 345,052 |
| Net asset value, offering price and redemption price per share | $12.89 | $13.47 | $13.55 |
| Class 1: Net assets | $3,374,947,123 | $10,105,998,329 | $10,973,567,991 |
| Shares outstanding | 261,904,663 | 750,112,795 | 810,091,254 |
| Net asset value, offering price and redemption price per share | $12.89 | $13.47 | $13.55 |
| Class 5: Net assets | — | $141,774,705 | $84,664,761 |
| Shares outstanding | — | 10,535,297 | 6,247,836 |
| Net asset value, offering price and redemption price per share | — | $13.46 | $13.55 |
|
| Maximum public offering price per share | | | |
|
| Class A (net asset value per share ÷ 95%)2 | $13.63 | $14.24 | $14.33 |
1 Redemption price per share is equal to net asset value less any applicable contingent deferred sales charge.
2 On single retail sales of less than $50,000. On sales of $50,000 or more and on group sales the offering price is reduced.
| | |
| 20 | Lifestyle Portfolios | Annual report | |
| | | See notes to financial statements |
FINANCIAL STATEMENTS
Statements of assets and liabilities 12-31-12
Continued
| | | |
| | Lifestyle | Lifestyle | |
| | Moderate | Conservative | |
| |
| Assets | | | |
| |
| Investments in affiliated underlying funds, at value | $4,226,627,441 | $3,989,570,399 | |
| Cash | 1,929 | 317 | |
| Receivable for investments sold | 17,029,507 | 14,879,616 | |
| Receivable for fund shares sold | 2,645,342 | 4,471,270 | |
| Dividends and interest receivable | 3,973,543 | 4,257,753 | |
| Receivable due from adviser | 945 | 950 | |
| Other assets | 64,878 | 73,342 | |
| Total assets | 4,250,343,585 | 4,013,253,647 | |
| |
| Liabilities | | | |
| |
| Payable for investments purchased | 4,287,253 | 4,596,129 | |
| Payable for fund shares repurchased | 18,849,853 | 18,209,571 | |
| Distributions payable | 405 | 515 | |
| Payable to affiliates: | Accounting and legal services fees | 85,906 | 78,909 | |
| Transfer agent fees | 109,571 | 127,389 | |
| Trustees’ fees | 1,097 | 967 | |
| Distribution and service fees | 8,499 | 8,580 | |
| Other liabilities and accrued expenses | 58,876 | 60,593 | |
| Total liabilities | 23,401,460 | 23,082,653 | |
| | | | |
| Net assets | 4,226,942,125 | 3,990,170,994 | |
| |
| Net assets consist of | | | |
| |
| Paid-in capital | $3,987,880,655 | $3,775,263,880 | |
| Accumulated undistributed net realized gain (loss) on investments | (175,789,508) | (90,462,144) | |
| Net unrealized appreciation (depreciation) on investments | 414,850,978 | 305,369,258 | |
| Net assets | $4,226,942,125 | $3,990,170,994 | |
| Investments in affiliated underlying funds, at cost | $3,811,776,463 | $3,684,201,141 | |
| |
| Net asset value per share | | | |
| |
| The Portfolios have an unlimited number of shares authorized with par value of $0.01 | | | |
| per share. Net asset value is calculated by dividing the net assets of each class of | | | |
| shares by the number of outstanding shares in the class. | | | |
| Class A:1 Net assets | $399,228,410 | $471,857,837 | |
| Shares outstanding | 29,902,281 | 35,114,539 | |
| Net asset value and redemption price per share | $13.35 | $13.44 | |
| Class B:1 Net assets | $44,754,910 | $48,463,358 | |
| Shares outstanding | 3,355,119 | 3,606,197 | |
| Net asset value, offering price and redemption price per share | $13.34 | $13.44 | |
| Class C:1 Net assets | $288,105,367 | $335,093,188 | |
| Shares outstanding | 21,579,251 | 24,943,761 | |
| Net asset value, offering price and redemption price per share | $13.35 | $13.43 | |
| Class R1: Net assets | $9,532,834 | $9,189,446 | |
| Shares outstanding | 714,267 | 684,127 | |
| Net asset value, offering price and redemption price per share | $13.35 | $13.43 | |
| Class R2: Net assets | $102,747 | $102,306 | |
| Shares outstanding | 7,716 | 7,622 | |
| Net asset value, offering price and redemption price per share | $13.32 | $13.42 | |
| Class R3: Net assets | $9,862,116 | $10,986,723 | |
| Shares outstanding | 740,044 | 819,497 | |
| Net asset value, offering price and redemption price per share | $13.33 | $13.41 | |
| Class R4: Net assets | $10,991,899 | $8,110,923 | |
| Shares outstanding | 825,899 | 604,399 | |
| Net asset value, offering price and redemption price per share | $13.31 | $13.42 | |
| Class R5: Net assets | $9,479,575 | $15,022,493 | |
| Shares outstanding | 711,681 | 1,118,450 | |
| Net asset value, offering price and redemption price per share | $13.32 | $13.43 | |
| Class R6: Net assets | $1,704,024 | $1,616,353 | |
| Shares outstanding | 128,048 | 120,484 | |
| Net asset value, offering price and redemption price per share | $13.31 | $13.42 | |
| Class 1: Net assets | $3,414,060,516 | $3,089,728,367 | |
| Shares outstanding | 256,291,967 | 230,274,297 | |
| Net asset value, offering price and redemption price per share | $13.32 | $13.42 | |
| Class 5: Net assets | $39,119,727 | — | |
| Shares outstanding | 2,939,332 | — | |
| Net asset value, offering price and redemption price per share | $13.31 | — | |
| |
| Maximum public offering price per share | | | |
| |
| Class A (net asset value per share ÷ 95%)2 | $14.05 | $14.15 | |
1 Redemption price per share is equal to net asset value less any applicable contingent deferred sales charge.
2 On single retail sales of less than $50,000. On sales of $50,000 or more and on group sales the offering price is reduced.
| | |
| | Annual report | Lifestyle Portfolios | 21 |
| See notes to financial statements | | |
FINANCIAL STATEMENTS
Statements of operations For the year ended 12-31-12
These Statements of operations summarize the Portfolios’ investment income earned and expenses directly incurred in operating each Portfolio. They also show net gains (losses) for the period stated.
| | | | | |
| | Lifestyle | Lifestyle | Lifestyle | Lifestyle | Lifestyle |
| | Aggressive | Growth | Balanced | Moderate | Conservative |
|
| Investment income | | | | | |
|
| Income distributions received from affiliated | | | | | |
| underlying funds | $43,904,545 | $204,565,254 | $301,680,309 | $120,462,206 | $123,726,600 |
| Interest | 9,315 | 5,471 | — | — | — |
| Total investment income | 43,913,860 | 204,570,725 | 301,680,309 | 120,462,206 | 123,726,600 |
|
| Expenses | | | | | |
|
| Investment management fees | 1,762,695 | 5,151,431 | 5,375,838 | 1,655,990 | 1,495,266 |
| Distribution and service fees | 3,946,535 | 13,425,649 | 15,035,011 | 5,886,057 | 6,187,404 |
| Transfer agent fees | 689,643 | 2,579,246 | 2,926,836 | 1,225,242 | 1,393,994 |
| Accounting and legal services fees | 496,847 | 1,520,393 | 1,616,183 | 523,642 | 473,521 |
| State registration fees | 148,176 | 212,477 | 242,329 | 180,177 | 187,489 |
| Professional fees | 124,172 | 261,320 | 272,686 | 128,258 | 120,229 |
| Printing and postage | 43,259 | 156,777 | 139,453 | 56,454 | 61,122 |
| Custodian fees | 11,999 | 11,999 | 11,999 | 11,999 | 11,999 |
| Trustees’ fees | 36,356 | 114,115 | 122,079 | 40,196 | 36,346 |
| Registration and filing fees | 28,228 | 36,934 | 58,477 | 38,015 | 40,973 |
| Other | 25,810 | 61,618 | 63,269 | 26,192 | 23,476 |
| Total expenses before reductions and | | | | | |
| amounts recaptured | 7,313,720 | 23,531,959 | 25,864,160 | 9,772,222 | 10,031,819 |
| | | | | | |
| Net expense reductions and amounts recaptured | (236,555) | (410,858) | (346,236) | (36,845) | (32,608) |
| Total expenses | 7,077,165 | 23,121,101 | 25,517,924 | 9,735,377 | 9,999,211 |
| | | | | | |
| Net investment income (loss) | 36,836,695 | 181,449,624 | 276,162,385 | 110,726,829 | 113,727,389 |
|
| Realized and unrealized gain (loss) | | | | | |
|
| Net realized gain (loss) on | | | | | |
| Investments in affiliated issuers | 64,325,959 | 202,854,148 | 140,828,067 | 43,833,282 | 15,205,976 |
| Capital gain distributions received from affiliated | | | | | |
| underlying funds | 52,038,610 | 148,639,732 | 146,371,829 | 45,070,391 | 39,522,482 |
| | 116,364,569 | 351,493,880 | 287,199,896 | 88,903,673 | 54,728,458 |
| Change in net unrealized appreciation | | | | | |
| (depreciation) of | | | | | |
| Investments in affiliated issuers | 407,908,728 | 1,108,277,322 | 1,030,528,139 | 261,491,409 | 185,828,952 |
| Net realized and unrealized gain (loss) | 524,273,297 | 1,459,771,202 | 1,317,728,035 | 350,395,082 | 240,557,410 |
| | | | | | |
| Increase (decrease) in net assets | | | | | |
| from operations | $561,109,992 | $1,641,220,826 | $1,593,890,420 | $461,121,911 | $354,284,799 |
| | |
| 22 | Lifestyle Portfolios | Annual report | |
| | | See notes to financial statements |
FINANCIAL STATEMENTS
Statements of changes in net assets
These Statements of changes in net assets show how the value of the Portfolios’ net assets have changed during the last two periods. They reflect earnings less expenses, any investment gains and losses, distributions, if any, paid to shareholders and the net of Portfolio share transactions.
| | | | |
| Lifestyle Aggressive | | Lifestyle Growth | |
| | Year Ended 12-31-12 | Year Ended 12-31-11 | Year Ended 12-31-12 | Year Ended 12-31-11 |
|
| Increase (decrease) in net assets | | | | |
|
| From operations | | | | |
| Net investment income (loss) | $36,836,695 | $27,348,459 | $181,449,624 | $165,175,357 |
| Net realized gain (loss) | 116,364,569 | 103,114,366 | 351,493,880 | 113,769,220 |
| Change in net unrealized appreciation (depreciation) | 407,908,728 | (391,725,607) | 1,108,277,322 | (850,845,129) |
| Increase (decrease) in net assets resulting | 561,109,992 | (261,262,782) | 1,641,220,826 | (571,900,552) |
| from operations | | | | |
| |
| Distributions to shareholders | | | | |
| | | | | |
| From net investment income | | | | |
| Class A | (1,426,449) | (700,042) | (10,466,105) | (7,782,581) |
| Class B | — | — | (544,450) | (348,822) |
| Class C | — | — | (2,485,677) | (1,670,295) |
| Class R1 | (25,162) | — | (179,049) | (135,095) |
| Class R2 | (584) | — | (1,195) | — |
| Class R3 | (32,965) | (10,424) | (179,360) | (196,334) |
| Class R4 | (56,166) | (34,438) | (263,146) | (208,698) |
| Class R5 | (78,266) | (88,708) | (480,706) | (398,709) |
| Class R6 | (22,535) | (834) | (56,542) | (2,280) |
| Class 1 | (35,346,570) | (27,078,977) | (164,805,425) | (153,172,473) |
| Class 5 | — | — | (2,351,186) | (1,853,683) |
| From net realized gain | | | | |
| Class A | (1,090,597) | (2,172,881) | (4,053,265) | (6,345,616) |
| Class B | (79,362) | (141,550) | (493,776) | (853,249) |
| Class C | (462,271) | (782,476) | (2,212,540) | (3,867,923) |
| Class R1 | (40,909) | (92,263) | (87,024) | (142,195) |
| Class R2 | (476) | — | (479) | — |
| Class R3 | (46,474) | (106,667) | (85,296) | (197,097) |
| Class R4 | (38,683) | (90,454) | (90,259) | (152,932) |
| Class R5 | (39,818) | (133,667) | (143,388) | (237,967) |
| Class R6 | (9,914) | (1,069) | (15,876) | (1,281) |
| Class 1 | (15,550,928) | (34,682,871) | (46,274,429) | (86,094,161) |
| Class 5 | — | — | (641,401) | (1,009,242) |
| | | | | |
| Total distributions | (54,348,129) | (66,117,321) | (235,910,574) | (264,670,633) |
| | | | | |
| From Portfolio share transactions | (246,993,721) | 6,758,871 | (399,018,075) | 84,959,314 |
| |
| Total increase (decrease) | 259,768,142 | (320,621,232) | 1,006,292,177 | (751,611,871) |
|
| Net assets | | | | |
|
| Beginning of year | 3,537,990,735 | 3,858,611,967 | 10,817,193,541 | 11,568,805,412 |
| | | | | |
| End of year | $3,797,758,877 | $3,537,990,735 | $11,823,485,718 | $10,817,193,541 |
| | | | | |
| Undistributed net investment income (loss) | — | — | — | — |
| | |
| | Annual report | Lifestyle Portfolios | 23 |
| See notes to financial statements | | |
FINANCIAL STATEMENTSStatements of changes in net assets
Continued
| | | | |
| | Lifestyle Balanced | | Lifestyle Moderate | |
| | Year Ended 12-31-12 | Year Ended 12-31-11 | Year Ended 12-31-12 | Year Ended 12-31-11 |
|
| Increase (decrease) in net assets | | | | |
|
| From operations | | | | |
| Net investment income (loss) | $276,162,385 | $279,875,969 | $110,726,829 | $116,480,410 |
| Net realized gain (loss) | 287,199,896 | 141,745,600 | 88,903,673 | 84,040,508 |
| Change in net unrealized appreciation | 1,030,528,139 | (690,607,982) | 261,491,409 | (166,047,489) |
| (depreciation) | | | | |
| Increase (decrease) in net assets resulting | 1,593,890,420 | (268,986,413) | 461,121,911 | 34,473,429 |
| from operations | | | | |
| |
| Distributions to shareholders | | | | |
| | | | | |
| From net investment income | | | | |
| Class A | (17,759,117) | (14,982,752) | (8,731,847) | (7,858,277) |
| Class B | (1,169,470) | (1,144,146) | (700,988) | (684,280) |
| Class C | (6,391,268) | (6,690,686) | (4,597,803) | (4,640,099) |
| Class R1 | (266,292) | (284,743) | (177,204) | (167,694) |
| Class R2 | (1,816) | — | (2,375) | — |
| Class R3 | (592,809) | (680,259) | (211,712) | (263,588) |
| Class R4 | (1,356,479) | (611,120) | (254,303) | (221,862) |
| Class R5 | (889,211) | (1,042,148) | (312,381) | (478,476) |
| Class R6 | (65,425) | (1,739) | (18,232) | (2,038) |
| Class 1 | (246,402,108) | (254,081,557) | (94,937,676) | (101,831,050) |
| Class 5 | (1,790,407) | (1,513,486) | (1,015,929) | (864,488) |
| From net realized gain | | | | |
| Class A | (5,017,754) | (6,004,534) | (2,228,251) | (2,045,833) |
| Class B | (519,957) | (679,849) | (250,939) | (237,300) |
| Class C | (2,801,537) | (3,884,359) | (1,611,104) | (1,564,925) |
| Class R1 | (85,281) | (130,078) | (53,353) | (48,165) |
| Class R2 | (507) | — | (584) | — |
| Class R3 | (179,741) | (287,062) | (57,754) | (70,316) |
| Class R4 | (341,854) | (208,972) | (61,612) | (54,582) |
| Class R5 | (189,156) | (334,545) | (53,383) | (105,512) |
| Class R6 | (21,516) | (798) | (8,247) | (687) |
| Class 1 | (53,477,967) | (79,114,700) | (19,188,839) | (21,102,136) |
| Class 5 | (404,478) | (481,682) | (216,562) | (188,078) |
| | | | | |
| Total distributions | (339,724,150) | (372,159,215) | (134,691,078) | (142,429,386) |
| | | | | |
| From Portfolio share transactions | 375,745,437 | 680,583,437 | 215,103,733 | 281,719,327 |
| |
| Total increase (decrease) | 1,629,911,707 | 39,437,809 | 541,534,566 | 173,763,370 |
|
| Net assets | | | | |
|
| Beginning of year | 11,322,294,527 | 11,282,856,718 | 3,685,407,559 | 3,511,644,189 |
| | | | | |
| End of year | $12,952,206,234 | $11,322,294,527 | $4,226,942,125 | $3,685,407,559 |
| | | | | |
| Undistributed net investment income (loss) | — | — | — | — |
| | |
| 24 | Lifestyle Portfolios | Annual report | |
| | | See notes to financial statements |
FINANCIAL STATEMENTS
Statements of changes in net assets
Continued
| | | | |
| Lifestyle Conservative | | | |
| | Year Ended 12-31-12 | Year Ended 12-31-11 | | |
| | |
| Increase (decrease) in net assets | | | | |
| | |
| From operations | | | | |
| Net investment income (loss) | $113,727,389 | $114,879,484 | | |
| Net realized gain (loss) | 54,728,458 | 47,951,885 | | |
| Change in net unrealized appreciation | 185,828,952 | (73,606,634) | | |
| (depreciation) | | | | |
| Increase in net assets resulting from | 354,284,799 | 89,224,735 | | |
| operations | | | | |
| | | | | |
| Distributions to shareholders | | | | |
| | | | | |
| From net investment income | | | | |
| Class A | (11,673,446) | (9,887,524) | | |
| Class B | (916,465) | (899,180) | | |
| Class C | (6,368,376) | (6,188,636) | | |
| Class R1 | (189,440) | (191,049) | | |
| Class R2 | (2,752) | — | | |
| Class R3 | (268,491) | (323,031) | | |
| Class R4 | (252,422) | (282,946) | | |
| Class R5 | (456,826) | (501,696) | | |
| Class R6 | (31,303) | (2,242) | | |
| Class 1 | (93,810,074) | (97,126,511) | | |
| From net realized gain | | | | |
| Class A | (2,813,285) | (1,523,292) | | |
| Class B | (290,353) | (166,421) | | |
| Class C | (2,009,193) | (1,147,749) | | |
| Class R1 | (54,987) | (29,044) | | |
| Class R2 | (622) | — | | |
| Class R3 | (66,658) | (46,156) | | |
| Class R4 | (48,823) | (39,364) | | |
| Class R5 | (89,119) | (70,861) | | |
| Class R6 | (9,255) | (451) | | |
| Class 1 | (18,514,941) | (11,835,463) | | |
| | | | | |
| Total distributions | (137,866,831) | (130,261,616) | | |
| | | | | |
| From Portfolio share transactions | 474,723,107 | 478,738,175 | | |
| | | |
| Total increase | 691,141,075 | 437,701,294 | | |
| | |
| Net assets | | | | |
| | |
| Beginning of year | 3,299,029,919 | 2,861,328,625 | | |
| | | | | |
| End of year | $3,990,170,994 | $3,299,029,919 | | |
| | | | | |
| Undistributed net investment income (loss) | — | — | | |
| | |
| | Annual report | Lifestyle Portfolios | 25 |
| See notes to financial statements | | |
Financial highlights
These Financial highlights show how each Portfolio’s net asset value for a share has changed since the end of the previous period.
Lifestyle Aggressive
| | | | | | | | | | | | | | | |
|
|
| Per share operating performance for a share outstanding throughout the period | | | Ratios and supplemental data | |
|
|
| | | Income (loss) from | | | | | | | | | | | | |
| | | investment operations | | Less distributions | | | | | Ratios to average net assets | | | |
| | |
| |
| |
| |
| | | | Net | | | | | | | | | Expenses | | | |
| | | | realized | Total | | | | | | | Expenses | including | | Net | |
| | Net asset | Net | and | from | From net | | | | | | before re- | reduc- | | assets, | |
| | value, | invest- | unrealized | invest- | invest- | | | | Net asset | | ductions and | tions and | Net | end of | |
| | beginning | ment in- | gain (loss) | ment | ment | From net | From | Total | value, end | Total | amounts | amounts | investment | period (in | Portfolio |
| | of period | come (loss) | on invest- | operations | income | realized | paid-in | distribu- | of period | return | recaptured | recaptured | income | millions) | turnover |
| Period ended | ($) | ($)1,2 | ments ($) | ($) | ($) | gain ($) | capital ($) | tions ($) | ($) | (%)3,4 | (%) | (%) | (loss) (%)1 | ($) | (%) |
|
| CLASS A | | | | | | | | | | | | | | | |
|
| 12-31-2012 | 11.30 | 0.08 | 1.71 | 1.79 | (0.08) | (0.06) | — | (0.14) | 12.95 | 15.83 | 0.585 | 0.575 | 0.66 | 239 | 21 |
| 12-31-2011 | 12.34 | 0.05 | (0.92) | (0.87) | (0.05) | (0.12) | — | (0.17) | 11.30 | (7.09) | 0.585 | 0.585 | 0.39 | 200 | 25 |
| 12-31-2010 | 10.82 | 0.04 | 1.64 | 1.68 | (0.04) | (0.12) | — | (0.16) | 12.34 | 15.50 | 0.595 | 0.615,6 | 0.34 | 185 | 19 |
| 12-31-2009 | 8.02 | 0.06 | 2.83 | 2.89 | (0.05) | (0.04) | — | (0.09) | 10.82 | 36.04 | 0.725 | 0.655 | 0.70 | 138 | 23 |
| 12-31-2008 | 15.22 | 0.10 | (6.58) | (6.48) | (0.09) | (0.63) | — | (0.72) | 8.02 | (42.40) | 0.665 | 0.615 | 0.77 | 78 | 36 |
|
| CLASS B | | | | | | | | | | | | | | | |
|
| 12-31-2012 | 11.33 | (0.02) | 1.71 | 1.69 | — | (0.04) | — | (0.04) | 12.98 | 14.94 | 1.335 | 1.355 | (0.18) | 24 | 21 |
| 12-31-2011 | 12.37 | (0.05) | (0.92) | (0.97) | — | (0.07) | — | (0.07) | 11.33 | (7.83) | 1.335 | 1.355,6 | (0.45) | 23 | 25 |
| 12-31-2010 | 10.86 | (0.05) | 1.64 | 1.59 | — | (0.08) | — | (0.08) | 12.37 | 14.61 | 1.375 | 1.355,6 | (0.46) | 24 | 19 |
| 12-31-2009 | 8.06 | (0.01) | 2.84 | 2.83 | — | (0.03) | — | (0.03) | 10.86 | 35.09 | 1.605 | 1.355 | (0.15) | 22 | 23 |
| 12-31-2008 | 15.23 | —7 | (6.54) | (6.54) | — | (0.63) | — | (0.63) | 8.06 | (42.84) | 1.515 | 1.355 | 0.01 | 16 | 36 |
|
| CLASS C | | | | | | | | | | | | | | | |
|
| 12-31-2012 | 11.33 | (0.01) | 1.71 | 1.70 | — | (0.05) | — | (0.05) | 12.98 | 15.00 | 1.285 | 1.275 | (0.11) | 121 | 21 |
| 12-31-2011 | 12.37 | (0.04) | (0.92) | (0.96) | — | (0.08) | — | (0.08) | 11.33 | (7.76) | 1.295 | 1.285 | (0.36) | 112 | 25 |
| 12-31-2010 | 10.86 | (0.04) | 1.63 | 1.59 | — | (0.08) | — | (0.08) | 12.37 | 14.61 | 1.295 | 1.335,6 | (0.39) | 111 | 19 |
| 12-31-2009 | 8.06 | (0.01) | 2.84 | 2.83 | — | (0.03) | — | (0.03) | 10.86 | 35.09 | 1.435 | 1.355 | (0.14) | 89 | 23 |
| 12-31-2008 | 15.23 | 0.01 | (6.55) | (6.54) | — | (0.63) | — | (0.63) | 8.06 | (42.79) | 1.365 | 1.315 | 0.05 | 62 | 36 |
|
| CLASS R1 | | | | | | | | | | | | | | | |
|
| 12-31-2012 | 11.33 | 0.02 | 1.73 | 1.75 | (0.04) | (0.06) | — | (0.10) | 12.98 | 15.42 | 0.975 | 0.965 | 0.19 | 9 | 21 |
| 12-31-2011 | 12.38 | (0.02) | (0.91) | (0.93) | — | (0.12) | — | (0.12) | 11.33 | (7.49) | 0.995 | 0.985 | (0.14) | 8 | 25 |
| 12-31-2010 | 10.87 | —7 | 1.63 | 1.63 | — | (0.12) | — | (0.12) | 12.38 | 14.99 | 0.915 | 0.965,6 | (0.03) | 8 | 19 |
| 12-31-2009 | 8.05 | 0.08 | 2.79 | 2.87 | (0.01) | (0.04) | — | (0.05) | 10.87 | 35.66 | 1.165 | 1.055 | 0.81 | 6 | 23 |
| 12-31-2008 | 15.27 | 0.10 | (6.63) | (6.53) | (0.06) | (0.63) | — | (0.69) | 8.05 | (42.56) | 1.495 | 0.855 | 0.83 | 2 | 36 |
|
| CLASS R2 | | | | | | | | | | | | | | | |
|
| 12-31-20128 | 12.49 | 0.09 | 0.44 | 0.53 | (0.07) | (0.06) | — | (0.13) | 12.89 | 4.279 | 16.295,10 | 0.625,10 | 0.699 | —11 | 2112 |
|
| CLASS R3 | | | | | | | | | | | | | | | |
|
| 12-31-2012 | 11.28 | 0.03 | 1.72 | 1.75 | (0.04) | (0.06) | — | (0.10) | 12.93 | 15.53 | 0.885 | 0.885 | 0.27 | 10 | 21 |
| 12-31-2011 | 12.33 | (0.01) | (0.90) | (0.91) | (0.02) | (0.12) | — | (0.14) | 11.28 | (7.41) | 0.875 | 0.875 | (0.06) | 10 | 25 |
| 12-31-2010 | 10.82 | 0.01 | 1.63 | 1.64 | (0.01) | (0.12) | — | (0.13) | 12.33 | 15.21 | 0.855 | 0.845 | 0.06 | 12 | 19 |
| 12-31-2009 | 8.03 | 0.03 | 2.83 | 2.86 | (0.03) | (0.04) | — | (0.07) | 10.82 | 35.59 | 0.955 | 0.955 | 0.31 | 10 | 23 |
| 12-31-2008 | 15.22 | 0.07 | (6.57) | (6.50) | (0.06) | (0.63) | — | (0.69) | 8.03 | (42.54) | 0.915 | 0.865 | 0.59 | 6 | 36 |
|
| CLASS R4 | | | | | | | | | | | | | | | |
|
| 12-31-2012 | 11.27 | 0.06 | 1.73 | 1.79 | (0.09) | (0.06) | — | (0.15) | 12.91 | 15.86 | 0.595 | 0.535 | 0.52 | 8 | 21 |
| 12-31-2011 | 12.32 | 0.04 | (0.92) | (0.88) | (0.05) | (0.12) | — | (0.17) | 11.27 | (7.13) | 0.615 | 0.615 | 0.33 | 8 | 25 |
| 12-31-2010 | 10.81 | 0.04 | 1.64 | 1.68 | (0.05) | (0.12) | — | (0.17) | 12.32 | 15.56 | 0.555 | 0.555 | 0.34 | 8 | 19 |
| 12-31-2009 | 8.01 | 0.06 | 2.83 | 2.89 | (0.05) | (0.04) | — | (0.09) | 10.81 | 36.09 | 0.625 | 0.625 | 0.68 | 9 | 23 |
| 12-31-2008 | 15.21 | 0.18 | (6.66) | (6.48) | (0.09) | (0.63) | — | (0.72) | 8.01 | (42.38) | 0.665 | 0.565 | 1.56 | 6 | 36 |
|
| CLASS R5 | | | | | | | | | | | | | | | |
|
| 12-31-2012 | 11.27 | 0.08 | 1.75 | 1.83 | (0.12) | (0.06) | — | (0.18) | 12.92 | 16.22 | 0.275 | 0.265 | 0.62 | 9 | 21 |
| 12-31-2011 | 12.31 | 0.08 | (0.91) | (0.83) | (0.09) | (0.12) | — | (0.21) | 11.27 | (6.76) | 0.265 | 0.255 | 0.67 | 12 | 25 |
| 12-31-2010 | 10.80 | 0.08 | 1.63 | 1.71 | (0.08) | (0.12) | — | (0.20) | 12.31 | 15.84 | 0.265 | 0.255 | 0.68 | 11 | 19 |
| 12-31-2009 | 8.00 | 0.09 | 2.83 | 2.92 | (0.08) | (0.04) | — | (0.12) | 10.80 | 36.51 | 0.325 | 0.325 | 0.97 | 10 | 23 |
| 12-31-2008 | 15.21 | 0.17 | (6.62) | (6.45) | (0.13) | (0.63) | — | (0.76) | 8.00 | (42.18) | 0.325 | 0.245 | 1.42 | 6 | 36 |
|
| | |
| 26 | Lifestyle Portfolios | Annual report | |
| | | See notes to financial statements |
Financial highlights
Continued
Lifestyle Aggressive continued
| | | | | | | | | | | | | | | |
|
|
| Per share operating performance for a share outstanding throughout the period | | | Ratios and supplemental data | |
|
|
| | | Income (loss) from | | | | | | | | | | | | |
| | | investment operations | | Less distributions | | | | | Ratios to average net assets | | | |
| | |
| |
| |
| |
| | | | Net | | | | | | | | | | | | |
| | | | realized | Total | | | | | | | Expenses | Expenses | | Net | |
| | Net asset | Net | and | from | From net | | | | | | before re- | including | | assets, | |
| | value, | invest- | unrealized | invest- | invest- | | | | Net asset | | ductions and | reductions | Net | end of | |
| | beginning | ment in- | gain (loss) | ment | ment | From net | From | Total | value, end | Total | amounts | and amounts | investment | period (in | Portfolio |
| | of period | come (loss) | on invest- | operations | income | realized | paid-in | distribu- | of period | return | recaptured | recaptured | income | millions) | turnover |
| Period ended | ($) | ($)1,2 | ments ($) | ($) | ($) | gain ($) | capital ($) | tions ($) | ($) | (%)3,4 | (%) | (%) | (loss) (%)1 | ($) | (%) |
|
| CLASS R6 | | | | | | | | | | | | | | | |
|
| 12-31-2012 | 11.24 | 0.36 | 1.49 | 1.85 | (0.14) | (0.06) | — | (0.20) | 12.89 | 16.43 | 2.575 | 0.115 | 2.88 | 2 | 21 |
| 12-31-201113 | 11.68 | 0.11 | (0.33) | (0.22) | (0.10) | (0.12) | — | (0.22) | 11.24 | (1.87)9 | 16.565,10 | 0.115,10 | 0.959 | —11 | 2514 |
|
| CLASS 1 | | | | | | | | | | | | | | | |
|
| 12-31-2012 | 11.24 | 0.13 | 1.72 | 1.85 | (0.14) | (0.06) | — | (0.20) | 12.89 | 16.43 | 0.125 | 0.115 | 1.05 | 3,375 | 21 |
| 12-31-2011 | 12.28 | 0.10 | (0.92) | (0.82) | (0.10) | (0.12) | — | (0.22) | 11.24 | (6.66) | 0.115 | 0.115 | 0.78 | 3,164 | 25 |
| 12-31-2010 | 10.77 | 0.09 | 1.63 | 1.72 | (0.09) | (0.12) | — | (0.21) | 12.28 | 16.01 | 0.125 | 0.115 | 0.79 | 3,499 | 19 |
| 12-31-2009 | 7.98 | 0.10 | 2.83 | 2.93 | (0.10) | (0.04) | — | (0.14) | 10.77 | 36.70 | 0.115 | 0.115 | 1.11 | 3,052 | 23 |
| 12-31-2008 | 15.18 | 0.15 | (6.57) | (6.42) | (0.15) | (0.63) | — | (0.78) | 7.98 | (42.08) | 0.125 | 0.125 | 1.24 | 2,120 | 36 |
|
1 Recognition of net investment income by the Portfolio is affected by the timing and frequency of the declaration of dividends by the underlying funds in which the Portfolio invests.
2 Based on the average daily shares outstanding.
3 Total returns would have been lower had certain expenses not been reduced during the applicable periods shown.
4 Does not reflect the effect of sales charges, if any.
5 Ratios do not include expenses indirectly incurred from underlying funds whose expense ratios can vary based on the mix of underlying funds held by the Portfolio. The range of expense ratios of the underlying funds held by the Portfolio was as follows: 0.73%–1.48%, 0.48%–1.40%, 0.48%–1.39%, 0.49%–1.40% and 0.49%–2.84% for the years ended 12-31-12, 12-31-11, 12-31-10, 12-31-09 and 12-31-08, respectively.
6 Includes the impact of expense recapture for the following periods ended: 12-31-11: 0.05% of average net assets for Class B shares. 12-31-10: 0.03%, 0.03%, 0.05% and 0.05% of average net assets for Class A, Class B, Class C and Class R1 shares, respectively. See Note 4.
7 Less than $0.005 per share.
8 The inception date for Class R2 shares is 3-1-12.
9 Not annualized.
10 Annualized.
11 Less than $500,000.
12 Portfolio turnover is shown for the period from 1-1-12 to 12-31-12.
13 The inception date for Class R6 shares is 9-1-11.
14 Portfolio turnover is shown for the period from 1-1-11 to 12-31-11.
Lifestyle Growth
| | | | | | | | | | | | | | | |
|
|
| Per share operating performance for a share outstanding throughout the period | | | Ratios and supplemental data | |
|
|
| | | Income (loss) from | | | | | | | | | | | | |
| | | investment operations | | Less distributions | | | | | Ratios to average net assets | | | |
| | |
| |
| |
| |
| | | | Net | | | | | | | | | | | | |
| | | | realized | Total | | | | | | | Expenses | Expenses | | Net | |
| | Net asset | Net | and | from | From net | | | | | | before re- | including | | assets, | |
| | value, | invest- | unrealized | invest- | invest- | | | | Net asset | | ductions and | reductions | Net | end of | |
| | beginning | ment in- | gain (loss) | ment | ment | From net | From | Total | value, end | Total | amounts | and amounts | investment | period (in | Portfolio |
| | of period | come (loss) | on invest- | operations | income | realized | paid-in | distribu- | of period | return | recaptured | recaptured | income | millions) | turnover |
| Period ended | ($) | ($)1,2 | ments ($) | ($) | ($) | gain ($) | capital ($) | tions ($) | ($) | (%)3,4 | (%) | (%) | (loss) (%)1 | ($) | (%) |
|
| CLASS A | | | | | | | | | | | | | | | |
|
| 12-31-2012 | 11.96 | 0.17 | 1.62 | 1.79 | (0.16) | (0.06) | — | (0.22) | 13.53 | 15.01 | 0.575 | 0.565 | 1.28 | 890 | 23 |
| 12-31-2011 | 12.89 | 0.15 | (0.83) | (0.68) | (0.14) | (0.11) | — | (0.25) | 11.96 | (5.30) | 0.585 | 0.575 | 1.14 | 699 | 24 |
| 12-31-2010 | 11.50 | 0.19 | 1.51 | 1.70 | (0.18) | (0.13) | — | (0.31) | 12.89 | 14.77 | 0.565 | 0.555 | 1.58 | 593 | 19 |
| 12-31-2009 | 8.73 | 0.21 | 2.81 | 3.02 | (0.21) | (0.04) | — | (0.25) | 11.50 | 34.54 | 0.645 | 0.625 | 2.17 | 417 | 26 |
| 12-31-2008 | 15.05 | 0.27 | (5.85) | (5.58) | (0.26) | (0.48) | — | (0.74) | 8.73 | (36.89) | 0.595 | 0.575 | 2.14 | 251 | 37 |
|
| CLASS B | | | | | | | | | | | | | | | |
|
| 12-31-2012 | 12.00 | 0.06 | 1.64 | 1.70 | (0.07) | (0.06) | — | (0.13) | 13.57 | 14.18 | 1.285 | 1.285 | 0.50 | 108 | 23 |
| 12-31-2011 | 12.92 | 0.05 | (0.81) | (0.76) | (0.05) | (0.11) | — | (0.16) | 12.00 | (5.91) | 1.295 | 1.305,6 | 0.37 | 93 | 24 |
| 12-31-2010 | 11.54 | 0.08 | 1.51 | 1.59 | (0.08) | (0.13) | — | (0.21) | 12.92 | 13.81 | 1.295 | 1.355,6 | 0.69 | 89 | 19 |
| 12-31-2009 | 8.77 | 0.13 | 2.81 | 2.94 | (0.13) | (0.04) | — | (0.17) | 11.54 | 33.53 | 1.485 | 1.355 | 1.32 | 75 | 26 |
| 12-31-2008 | 15.06 | 0.16 | (5.81) | (5.65) | (0.16) | (0.48) | — | (0.64) | 8.77 | (37.35) | 1.415 | 1.325 | 1.30 | 54 | 37 |
|
| CLASS C | | | | | | | | | | | | | | | |
|
| 12-31-2012 | 11.99 | 0.07 | 1.63 | 1.70 | (0.07) | (0.06) | — | (0.13) | 13.56 | 14.21 | 1.275 | 1.265 | 0.52 | 485 | 23 |
| 12-31-2011 | 12.91 | 0.05 | (0.81) | (0.76) | (0.05) | (0.11) | — | (0.16) | 11.99 | (5.90) | 1.285 | 1.275 | 0.38 | 422 | 24 |
| 12-31-2010 | 11.53 | 0.10 | 1.51 | 1.61 | (0.10) | (0.13) | — | (0.23) | 12.91 | 13.93 | 1.255 | 1.255 | 0.84 | 404 | 19 |
| 12-31-2009 | 8.76 | 0.14 | 2.81 | 2.95 | (0.14) | (0.04) | — | (0.18) | 11.53 | 33.63 | 1.355 | 1.345 | 1.37 | 305 | 26 |
| 12-31-2008 | 15.05 | 0.17 | (5.81) | (5.64) | (0.17) | (0.48) | — | (0.65) | 8.76 | (37.33) | 1.305 | 1.295 | 1.36 | 206 | 37 |
|
| | |
| | Annual report | Lifestyle Portfolios | 27 |
| See notes to financial statements | | |
Financial highlights
Continued
Lifestyle Growth continued
| | | | | | | | | | | | | | | |
|
|
| Per share operating performance for a share outstanding throughout the period | | | Ratios and supplemental data | |
|
|
| | | Income (loss) from | | | | | | | | | | | | |
| | | investment operations | | Less distributions | | | | | Ratios to average net assets | | | |
| | |
| |
| |
| |
| | | | Net | | | | | | | | | | | | |
| | | | realized | Total | | | | | | | Expenses | Expenses | | Net | |
| | Net asset | Net | and | from | From net | | | | | | before re- | including | | assets, | |
| | value, | invest- | unrealized | invest- | invest- | | | | Net asset | | ductions and | reductions | Net | end of | |
| | beginning | ment in- | gain (loss) | ment | ment | From net | From | Total | value, end | Total | amounts | and amounts | investment | period (in | Portfolio |
| | of period | come (loss) | on invest- | operations | income | realized | paid-in | distribu- | of period | return | recaptured | recaptured | income | millions) | turnover |
| Period ended | ($) | ($)1,2 | ments ($) | ($) | ($) | gain ($) | capital ($) | tions ($) | ($) | (%)3,4 | (%) | (%) | (loss) (%)1 | ($) | (%) |
|
| CLASS R1 | | | | | | | | | | | | | | | |
|
| 12-31-2012 | 12.01 | 0.13 | 1.63 | 1.76 | (0.13) | (0.06) | — | (0.19) | 13.58 | 14.67 | 0.875 | 0.865 | 0.97 | 19 | 23 |
| 12-31-2011 | 12.95 | 0.09 | (0.81) | (0.72) | (0.11) | (0.11) | — | (0.22) | 12.01 | (5.59) | 0.925 | 0.925 | 0.70 | 16 | 24 |
| 12-31-2010 | 11.57 | 0.15 | 1.50 | 1.65 | (0.14) | (0.13) | — | (0.27) | 12.95 | 14.28 | 0.875 | 0.865 | 1.24 | 15 | 19 |
| 12-31-2009 | 8.77 | 0.25 | 2.75 | 3.00 | (0.16) | (0.04) | — | (0.20) | 11.57 | 34.15 | 1.025 | 1.025 | 2.45 | 11 | 26 |
| 12-31-2008 | 15.10 | 0.34 | (5.96) | (5.62) | (0.23) | (0.48) | — | (0.71) | 8.77 | (37.05) | 1.345 | 0.835 | 2.81 | 3 | 37 |
|
| CLASS R2 | | | | | | | | | | | | | | | |
|
| 12-31-20127 | 13.05 | 0.16 | 0.48 | 0.64 | (0.16) | (0.06) | — | (0.22) | 13.47 | 4.908 | 16.205,9 | 0.625,9 | 1.218 | —10 | 2311 |
|
| CLASS R3 | | | | | | | | | | | | | | | |
|
| 12-31-2012 | 11.95 | 0.11 | 1.65 | 1.76 | (0.13) | (0.06) | — | (0.19) | 13.52 | 14.77 | 0.815 | 0.815 | 0.83 | 19 | 23 |
| 12-31-2011 | 12.88 | 0.10 | (0.81) | (0.71) | (0.11) | (0.11) | — | (0.22) | 11.95 | (5.50) | 0.815 | 0.815 | 0.80 | 22 | 24 |
| 12-31-2010 | 11.50 | 0.15 | 1.51 | 1.66 | (0.15) | (0.13) | — | (0.28) | 12.88 | 14.46 | 0.815 | 0.815 | 1.24 | 23 | 19 |
| 12-31-2009 | 8.73 | 0.18 | 2.81 | 2.99 | (0.18) | (0.04) | — | (0.22) | 11.50 | 34.26 | 0.885 | 0.885 | 1.77 | 19 | 26 |
| 12-31-2008 | 15.03 | 0.24 | (5.84) | (5.60) | (0.22) | (0.48) | — | (0.70) | 8.73 | (37.06) | 0.845 | 0.835 | 1.93 | 12 | 37 |
|
| CLASS R4 | | | | | | | | | | | | | | | |
|
| 12-31-2012 | 11.95 | 0.16 | 1.65 | 1.81 | (0.19) | (0.06) | — | (0.25) | 13.51 | 15.11 | 0.505 | 0.445 | 1.21 | 19 | 23 |
| 12-31-2011 | 12.88 | 0.14 | (0.81) | (0.67) | (0.15) | (0.11) | — | (0.26) | 11.95 | (5.18) | 0.525 | 0.525 | 1.08 | 17 | 24 |
| 12-31-2010 | 11.50 | 0.19 | 1.51 | 1.70 | (0.19) | (0.13) | — | (0.32) | 12.88 | 14.80 | 0.485 | 0.485 | 1.57 | 19 | 19 |
| 12-31-2009 | 8.72 | 0.21 | 2.82 | 3.03 | (0.21) | (0.04) | — | (0.25) | 11.50 | 34.73 | 0.545 | 0.545 | 2.11 | 16 | 26 |
| 12-31-2008 | 15.03 | 0.29 | (5.86) | (5.57) | (0.26) | (0.48) | — | (0.74) | 8.72 | (36.87) | 0.565 | 0.565 | 2.34 | 13 | 37 |
|
| CLASS R5 | | | | | | | | | | | | | | | |
|
| 12-31-2012 | 11.95 | 0.21 | 1.63 | 1.84 | (0.21) | (0.06) | — | (0.27) | 13.52 | 15.43 | 0.185 | 0.185 | 1.58 | 32 | 23 |
| 12-31-2011 | 12.88 | 0.19 | (0.82) | (0.63) | (0.19) | (0.11) | — | (0.30) | 11.95 | (4.92) | 0.215 | 0.205 | 1.49 | 26 | 24 |
| 12-31-2010 | 11.50 | 0.21 | 1.52 | 1.73 | (0.22) | (0.13) | — | (0.35) | 12.88 | 15.06 | 0.215 | 0.215 | 1.80 | 22 | 19 |
| 12-31-2009 | 8.72 | 0.25 | 2.81 | 3.06 | (0.24) | (0.04) | — | (0.28) | 11.50 | 35.09 | 0.265 | 0.265 | 2.48 | 18 | 26 |
| 12-31-2008 | 15.04 | 0.33 | (5.87) | (5.54) | (0.30) | (0.48) | — | (0.78) | 8.72 | (36.64) | 0.245 | 0.245 | 2.67 | 10 | 37 |
|
| CLASS R6 | | | | | | | | | | | | | | | |
|
| 12-31-2012 | 11.90 | 0.58 | 1.27 | 1.85 | (0.22) | (0.06) | — | (0.28) | 13.47 | 15.60 | 2.235 | 0.115 | 4.39 | 3 | 23 |
| 12-31-201112 | 12.34 | 0.19 | (0.32) | (0.13) | (0.20) | (0.11) | — | (0.31) | 11.90 | (1.07)8 | 15.945,9 | 0.105,9 | 1.588 | —10 | 2413 |
|
| CLASS 1 | | | | | | | | | | | | | | | |
|
| 12-31-2012 | 11.91 | 0.21 | 1.63 | 1.84 | (0.22) | (0.06) | — | (0.28) | 13.47 | 15.50 | 0.115 | 0.115 | 1.64 | 10,106 | 23 |
| 12-31-2011 | 12.84 | 0.19 | (0.81) | (0.62) | (0.20) | (0.11) | — | (0.31) | 11.91 | (4.84) | 0.115 | 0.115 | 1.50 | 9,411 | 24 |
| 12-31-2010 | 11.45 | 0.23 | 1.52 | 1.75 | (0.23) | (0.13) | — | (0.36) | 12.84 | 15.30 | 0.115 | 0.115 | 1.92 | 10,305 | 19 |
| 12-31-2009 | 8.68 | 0.25 | 2.81 | 3.06 | (0.25) | (0.04) | — | (0.29) | 11.45 | 35.27 | 0.115 | 0.115 | 2.55 | 8,903 | 26 |
| 12-31-2008 | 15.00 | 0.32 | (5.85) | (5.53) | (0.31) | (0.48) | — | (0.79) | 8.68 | (36.63) | 0.125 | 0.125 | 2.49 | 6,345 | 37 |
|
| CLASS 5 | | | | | | | | | | | | | | | |
|
| 12-31-2012 | 11.90 | 0.23 | 1.62 | 1.85 | (0.23) | (0.06) | — | (0.29) | 13.46 | 15.57 | 0.065 | 0.065 | 1.78 | 142 | 23 |
| 12-31-2011 | 12.82 | 0.21 | (0.81) | (0.60) | (0.21) | (0.11) | — | (0.32) | 11.90 | (4.72) | 0.065 | 0.065 | 1.63 | 111 | 24 |
| 12-31-2010 | 11.44 | 0.25 | 1.50 | 1.75 | (0.24) | (0.13) | — | (0.37) | 12.82 | 15.28 | 0.065 | 0.065 | 2.07 | 98 | 19 |
| 12-31-2009 | 8.67 | 0.27 | 2.80 | 3.07 | (0.26) | (0.04) | — | (0.30) | 11.44 | 35.37 | 0.075 | 0.075 | 2.70 | 68 | 26 |
| 12-31-2008 | 14.98 | 0.35 | (5.86) | (5.51) | (0.32) | (0.48) | — | (0.80) | 8.67 | (36.57) | 0.075 | 0.075 | 2.78 | 41 | 37 |
|
1 Recognition of net investment income by the Portfolio is affected by the timing and frequency of the declaration of dividends by the underlying funds in which the Portfolio invests.
2 Based on the average daily shares outstanding.
3 Total returns would have been lower had certain expenses not been reduced during the applicable periods shown.
4 Does not reflect the effect of sales charges, if any.
5 Ratios do not include expenses indirectly incurred from underlying funds whose expense ratios can vary based on the mix of the underlying funds held by the Portfolio. The range of expense ratios of the underlying funds held by the Portfolio was as follows: 0.63%–1.48%, 0.48%–1.40%, 0.48%–1.39%, 0.49%–1.40% and 0.49%–2.84% for the years ended 12-31-12, 12-31-11, 12-31-10, 12-31-09 and 12-31-08, respectively.
6 Includes the impact of expense recapture for the following periods ended: 12-31-11: 0.02% of average net assets for Class B shares. 12-31-10: 0.07% of average net assets for Class B shares. See Note 4.
7 The inception date for Class R2 shares is 3-1-12.
8 Not annualized.
9 Annualized.
10 Less than $500,000.
11 Portfolio turnover is shown for the period from 1-1-12 to 12-31-12.
12 The inception date for Class R6 shares is 9-1-11.
13 Portfolio turnover is shown for the period from 1-1-11 to 12-31-11.
| | |
| 28 | Lifestyle Portfolios | Annual report | |
| | | See notes to financial statements |
Financial highlights
Continued
Lifestyle Balanced
| | | | | | | | | | | | | | | |
|
|
| Per share operating performance for a share outstanding throughout the period | | | Ratios and supplemental data | |
|
|
| | | Income (loss) from | | | | | | | | | | | | |
| | | investment operations | | Less distributions | | | | | Ratios to average net assets | | | |
| | |
| |
| |
| |
| | | | Net | | | | | | | | | | | | |
| | | | realized | Total | | | | | | | Expenses | Expenses | | Net | |
| | Net asset | Net | and | from | From net | | | | | | before re- | including | | assets, | |
| | value, | invest- | unrealized | invest- | invest- | | | | Net asset | | ductions and | reductions | Net | end of | |
| | beginning | ment in- | gain (loss) | ment | ment | From net | From | Total | value, end | Total | amounts | and amounts | investment | period (in | Portfolio |
| | of period | come (loss) | on invest- | operations | income | realized | paid-in | distribu- | of period | return | recaptured | recaptured | income | millions) | turnover |
| Period ended | ($) | ($)1,2 | ments ($) | ($) | ($) | gain ($) | capital ($) | tions ($) | ($) | (%)3,4 | (%) | (%) | (loss) (%)1 | ($) | (%) |
|
| CLASS A | | | | | | | | | | | | | | | |
|
| 12-31-2012 | 12.26 | 0.26 | 1.40 | 1.66 | (0.24) | (0.07) | — | (0.31) | 13.61 | 13.59 | 0.565 | 0.565 | 1.96 | 1,043 | 20 |
| 12-31-2011 | 12.96 | 0.28 | (0.62) | (0.34) | (0.26) | (0.10) | — | (0.36) | 12.26 | (2.62) | 0.575 | 0.575 | 2.17 | 751 | 23 |
| 12-31-2010 | 11.85 | 0.31 | 1.23 | 1.54 | (0.30) | (0.13) | — | (0.43) | 12.96 | 13.13 | 0.545 | 0.545 | 2.55 | 588 | 19 |
| 12-31-2009 | 9.22 | 0.35 | 2.65 | 3.00 | (0.33) | (0.04) | — | (0.37) | 11.85 | 32.87 | 0.575 | 0.565 | 3.35 | 408 | 316 |
| 12-31-2008 | 14.54 | 0.45 | (4.96) | (4.51) | (0.42) | (0.39) | — | (0.81) | 9.22 | (31.63) | 0.545 | 0.545 | 3.60 | 249 | 36 |
|
| CLASS B | | | | | | | | | | | | | | | |
|
| 12-31-2012 | 12.26 | 0.16 | 1.41 | 1.57 | (0.15) | (0.07) | — | (0.22) | 13.61 | 12.80 | 1.295 | 1.285 | 1.18 | 107 | 20 |
| 12-31-2011 | 12.96 | 0.18 | (0.61) | (0.43) | (0.17) | (0.10) | — | (0.27) | 12.26 | (3.30) | 1.295 | 1.295 | 1.41 | 85 | 23 |
| 12-31-2010 | 11.85 | 0.20 | 1.24 | 1.44 | (0.20) | (0.13) | — | (0.33) | 12.96 | 12.23 | 1.285 | 1.315,7 | 1.67 | 74 | 19 |
| 12-31-2009 | 9.21 | 0.25 | 2.68 | 2.93 | (0.25) | (0.04) | — | (0.29) | 11.85 | 31.99 | 1.405 | 1.355 | 2.44 | 64 | 316 |
| 12-31-2008 | 14.53 | 0.33 | (4.94) | (4.61) | (0.32) | (0.39) | — | (0.71) | 9.21 | (32.22) | 1.365 | 1.325 | 2.66 | 46 | 36 |
|
| CLASS C | | | | | | | | | | | | | | | |
|
| 12-31-2012 | 12.27 | 0.16 | 1.41 | 1.57 | (0.15) | (0.07) | — | (0.22) | 13.62 | 12.81 | 1.265 | 1.265 | 1.19 | 579 | 20 |
| 12-31-2011 | 12.97 | 0.18 | (0.61) | (0.43) | (0.17) | (0.10) | — | (0.27) | 12.27 | (3.29) | 1.275 | 1.275 | 1.37 | 484 | 23 |
| 12-31-2010 | 11.86 | 0.22 | 1.23 | 1.45 | (0.21) | (0.13) | — | (0.34) | 12.97 | 12.34 | 1.245 | 1.245 | 1.82 | 448 | 19 |
| 12-31-2009 | 9.22 | 0.27 | 2.67 | 2.94 | (0.26) | (0.04) | — | (0.30) | 11.86 | 32.08 | 1.275 | 1.265 | 2.63 | 327 | 316 |
| 12-31-2008 | 14.55 | 0.34 | (4.95) | (4.61) | (0.33) | (0.39) | — | (0.72) | 9.22 | (32.19) | 1.245 | 1.245 | 2.76 | 209 | 36 |
|
| CLASS R1 | | | | | | | | | | | | | | | |
|
| 12-31-2012 | 12.22 | 0.20 | 1.42 | 1.62 | (0.20) | (0.07) | — | (0.27) | 13.57 | 13.29 | 0.865 | 0.865 | 1.52 | 17 | 20 |
| 12-31-2011 | 12.92 | 0.22 | (0.60) | (0.38) | (0.22) | (0.10) | — | (0.32) | 12.22 | (2.94) | 0.945 | 0.945 | 1.68 | 16 | 23 |
| 12-31-2010 | 11.82 | 0.26 | 1.23 | 1.49 | (0.26) | (0.13) | — | (0.39) | 12.92 | 12.75 | 0.885 | 0.885 | 2.17 | 15 | 19 |
| 12-31-2009 | 9.20 | 0.43 | 2.51 | 2.94 | (0.28) | (0.04) | — | (0.32) | 11.82 | 32.21 | 1.075 | 1.075 | 3.96 | 10 | 316 |
| 12-31-2008 | 14.53 | 0.44 | (5.01) | (4.57) | (0.37) | (0.39) | — | (0.76) | 9.20 | (32.01) | 2.585 | 1.065 | 3.69 | 1 | 36 |
|
| CLASS R2 | | | | | | | | | | | | | | | |
|
| 12-31-20128 | 13.15 | 0.24 | 0.48 | 0.72 | (0.24) | (0.07) | — | (0.31) | 13.56 | 5.489 | 16.335,10 | 0.615,10 | 1.789 | —12 | 2011 |
|
| CLASS R3 | | | | | | | | | | | | | | | |
|
| 12-31-2012 | 12.24 | 0.21 | 1.42 | 1.63 | (0.21) | (0.07) | — | (0.28) | 13.59 | 13.38 | 0.785 | 0.775 | 1.62 | 33 | 20 |
| 12-31-2011 | 12.94 | 0.23 | (0.59) | (0.36) | (0.24) | (0.10) | — | (0.34) | 12.24 | (2.82) | 0.795 | 0.785 | 1.79 | 36 | 23 |
| 12-31-2010 | 11.83 | 0.28 | 1.23 | 1.51 | (0.27) | (0.13) | — | (0.40) | 12.94 | 12.89 | 0.795 | 0.795 | 2.28 | 39 | 19 |
| 12-31-2009 | 9.20 | 0.30 | 2.67 | 2.97 | (0.30) | (0.04) | — | (0.34) | 11.83 | 32.62 | 0.845 | 0.845 | 2.94 | 30 | 316 |
| 12-31-2008 | 14.52 | 0.40 | (4.95) | (4.55) | (0.38) | (0.39) | — | (0.77) | 9.20 | (31.89) | 0.815 | 0.805 | 3.21 | 20 | 36 |
|
| CLASS R4 | | | | | | | | | | | | | | | |
|
| 12-31-2012 | 12.24 | 0.28 | 1.40 | 1.68 | (0.26) | (0.07) | — | (0.33) | 13.59 | 13.77 | 0.465 | 0.395 | 2.10 | 70 | 20 |
| 12-31-2011 | 12.94 | 0.28 | (0.60) | (0.32) | (0.28) | (0.10) | — | (0.38) | 12.24 | (2.52) | 0.505 | 0.505 | 2.13 | 26 | 23 |
| 12-31-2010 | 11.84 | 0.31 | 1.23 | 1.54 | (0.31) | (0.13) | — | (0.44) | 12.94 | 13.19 | 0.455 | 0.455 | 2.53 | 29 | 19 |
| 12-31-2009 | 9.20 | 0.35 | 2.66 | 3.01 | (0.33) | (0.04) | — | (0.37) | 11.84 | 33.10 | 0.535 | 0.535 | 3.37 | 24 | 316 |
| 12-31-2008 | 14.52 | 0.43 | (4.94) | (4.51) | (0.42) | (0.39) | — | (0.81) | 9.20 | (31.68) | 0.525 | 0.525 | 3.51 | 14 | 36 |
|
| CLASS R5 | | | | | | | | | | | | | | | |
|
| 12-31-2012 | 12.26 | 0.28 | 1.42 | 1.70 | (0.29) | (0.07) | — | (0.36) | 13.60 | 13.96 | 0.175 | 0.175 | 2.13 | 39 | 20 |
| 12-31-2011 | 12.96 | 0.31 | (0.60) | (0.29) | (0.31) | (0.10) | — | (0.41) | 12.26 | (2.23) | 0.185 | 0.185 | 2.42 | 42 | 23 |
| 12-31-2010 | 11.85 | 0.35 | 1.23 | 1.58 | (0.34) | (0.13) | — | (0.47) | 12.96 | 13.52 | 0.185 | 0.185 | 2.89 | 38 | 19 |
| 12-31-2009 | 9.21 | 0.39 | 2.65 | 3.04 | (0.36) | (0.04) | — | (0.40) | 11.85 | 33.45 | 0.225 | 0.225 | 3.74 | 27 | 316 |
| 12-31-2008 | 14.52 | 0.54 | (5.01) | (4.47) | (0.45) | (0.39) | — | (0.84) | 9.21 | (31.40) | 0.215 | 0.215 | 4.46 | 15 | 36 |
|
| CLASS R6 | | | | | | | | | | | | | | | |
|
| 12-31-2012 | 12.21 | 0.46 | 1.25 | 1.71 | (0.30) | (0.07) | — | (0.37) | 13.55 | 14.09 | 1.155 | 0.115 | 3.50 | 5 | 20 |
| 12-31-201113 | 12.56 | 0.21 | (0.24) | (0.03) | (0.22) | (0.10) | — | (0.32) | 12.21 | (0.22)9 | 16.365,10 | 0.105,10 | 1.699 | —12 | 2314 |
|
| CLASS 1 | | | | | | | | | | | | | | | |
|
| 12-31-2012 | 12.21 | 0.30 | 1.41 | 1.71 | (0.30) | (0.07) | — | (0.37) | 13.55 | 14.09 | 0.115 | 0.115 | 2.31 | 10,974 | 20 |
| 12-31-2011 | 12.90 | 0.32 | (0.59) | (0.27) | (0.32) | (0.10) | — | (0.42) | 12.21 | (2.10) | 0.115 | 0.115 | 2.49 | 9,822 | 23 |
| 12-31-2010 | 11.80 | 0.35 | 1.23 | 1.58 | (0.35) | (0.13) | — | (0.48) | 12.90 | 13.57 | 0.115 | 0.115 | 2.88 | 10,003 | 19 |
| 12-31-2009 | 9.17 | 0.38 | 2.66 | 3.04 | (0.37) | (0.04) | — | (0.41) | 11.80 | 33.59 | 0.115 | 0.115 | 3.65 | 8,557 | 316 |
| 12-31-2008 | 14.47 | 0.47 | (4.91) | (4.44) | (0.47) | (0.39) | — | (0.86) | 9.17 | (31.37) | 0.125 | 0.125 | 3.79 | 6,241 | 36 |
|
| | |
| | Annual report | Lifestyle Portfolios | 29 |
| See notes to financial statements | | |
Financial highlights
Continued
Lifestyle Balanced continued
| | | | | | | | | | | | | | | |
|
|
| Per share operating performance for a share outstanding throughout the period | | | Ratios and supplemental data | |
|
|
| | | Income (loss) from | | | | | | | | | | | | |
| | | investment operations | | Less distributions | | | | | Ratios to average net assets | | | |
| | |
| |
| |
| |
| | | | Net | | | | | | | | | | | | |
| | | | realized | Total | | | | | | | Expenses | Expenses | | Net | |
| | Net asset | Net | and | from | From net | | | | | | before re- | including | | assets, | |
| | value, | invest- | unrealized | invest- | invest- | | | | Net asset | | ductions and | reductions | Net | end of | |
| | beginning | ment in- | gain (loss) | ment | ment | From net | From | Total | value, end | Total | amounts | and amounts | investment | period (in | Portfolio |
| | of period | come (loss) | on invest- | operations | income | realized | paid-in | distribu- | of period | return | recaptured | recaptured | income | millions) | turnover |
| Period ended | ($) | ($)1,2 | ments ($) | ($) | ($) | gain ($) | capital ($) | tions ($) | ($) | (%)3,4 | (%) | (%) | (loss) (%)1 | ($) | (%) |
|
| CLASS 5 | | | | | | | | | | | | | | | |
|
| 12-31-2012 | 12.21 | 0.33 | 1.39 | 1.72 | (0.31) | (0.07) | — | (0.38) | 13.55 | 14.14 | 0.065 | 0.065 | 2.49 | 85 | 20 |
| 12-31-2011 | 12.91 | 0.34 | (0.61) | (0.27) | (0.33) | (0.10) | — | (0.43) | 12.21 | (2.13) | 0.065 | 0.065 | 2.65 | 60 | 23 |
| 12-31-2010 | 11.80 | 0.37 | 1.23 | 1.60 | (0.36) | (0.13) | — | (0.49) | 12.91 | 13.71 | 0.065 | 0.065 | 3.07 | 49 | 19 |
| 12-31-2009 | 9.17 | 0.40 | 2.65 | 3.05 | (0.38) | (0.04) | — | (0.42) | 11.80 | 33.66 | 0.075 | 0.075 | 3.89 | 32 | 316 |
| 12-31-2008 | 14.48 | 0.50 | (4.95) | (4.45) | (0.47) | (0.39) | — | (0.86) | 9.17 | (31.38) | 0.075 | 0.075 | 4.07 | 18 | 36 |
|
1 Recognition of net investment income by the Portfolio is affected by the timing and frequency of the declaration of dividends by the underlying funds in which the Portfolio invests.
2 Based on the average daily shares outstanding.
3 Total returns would have been lower had certain expenses not been reduced during the applicable periods shown.
4 Does not reflect the effect of sales charges, if any.
5 Ratios do not include expenses indirectly incurred from underlying funds whose expense ratios can vary based on the mix of underlying funds held by the Portfolio. The range of expense ratios of the underlying funds held by the Portfolio was as follows: 0.63%–1.48%, 0.48%–1.40%, 0.48%–1.39%, 0.49%–1.40% and 0.49%–2.84% for the years ended 12-31-12, 12-31-11, 12-31-10, 12-31-09 and 12-31-08, respectively.
6 Excludes merger activity.
7 Includes the impact of expense recapture which amounted to 0.03% of average net assets. See Note 4.
8 The inception date for Class R2 shares is 3-1-12.
9 Not annualized.
10 Annualized.
11 Portfolio turnover is shown for the period from 1-1-12 to 12-31-12.
12 Less than $500,000.
13 The inception date for Class R6 shares is 9-1-11.
14 Portfolio turnover is shown for the period from 1-1-11 to 12-31-11.
Lifestyle Moderate
| | | | | | | | | | | | | | | |
|
|
| Per share operating performance for a share outstanding throughout the period | | | Ratios and supplemental data | |
|
|
| | | Income (loss) from | | | | | | | | | | | | |
| | | investment operations | | Less distributions | | | | | Ratios to average net assets | | | |
| | |
| |
| |
| |
| | | | Net | | | | | | | | | | | | |
| | | | realized | Total | | | | | | | Expenses | Expenses | | Net | |
| | Net asset | Net | and | from | From net | | | | | | before re- | including | | assets, | |
| | value, | invest- | unrealized | invest- | invest- | | | | Net asset | | ductions and | reductions | Net | end of | |
| | beginning | ment in- | gain (loss) | ment | ment | From net | From | Total | value, end | Total | amounts | and amounts | investment | period (in | Portfolio |
| | of period | come (loss) | on invest- | operations | income | realized | paid-in | distribu- | of period | return | recaptured | recaptured | income | millions) | turnover |
| Period ended | ($) | ($)1,2 | ments ($) | ($) | ($) | gain ($) | capital ($) | tions ($) | ($) | (%)3,4 | (%) | (%) | (loss) (%)1 | ($) | (%) |
|
| CLASS A | | | | | | | | | | | | | | | |
|
| 12-31-2012 | 12.28 | 0.33 | 1.13 | 1.46 | (0.31) | (0.08) | — | (0.39) | 13.35 | 11.94 | 0.575 | 0.575 | 2.50 | 399 | 18 |
| 12-31-2011 | 12.63 | 0.38 | (0.29) | 0.09 | (0.35) | (0.09) | — | (0.44) | 12.28 | 0.73 | 0.585 | 0.585 | 2.96 | 299 | 19 |
| 12-31-2010 | 11.77 | 0.41 | 0.97 | 1.38 | (0.39) | (0.13) | — | (0.52) | 12.63 | 11.85 | 0.555 | 0.555 | 3.37 | 220 | 20 |
| 12-31-2009 | 9.59 | 0.45 | 2.19 | 2.64 | (0.42) | (0.04) | — | (0.46) | 11.77 | 27.88 | 0.545 | 0.545 | 4.27 | 146 | 29 |
| 12-31-2008 | 13.57 | 0.58 | (3.76) | (3.18) | (0.54) | (0.26) | — | (0.80) | 9.59 | (23.88) | 0.535 | 0.535 | 4.81 | 86 | 32 |
|
| CLASS B | | | | | | | | | | | | | | | |
|
| 12-31-2012 | 12.27 | 0.23 | 1.14 | 1.37 | (0.22) | (0.08) | — | (0.30) | 13.34 | 11.14 | 1.305 | 1.305 | 1.74 | 45 | 18 |
| 12-31-2011 | 12.63 | 0.28 | (0.29) | (0.01) | (0.26) | (0.09) | — | (0.35) | 12.27 | (0.08) | 1.325 | 1.325 | 2.22 | 35 | 19 |
| 12-31-2010 | 11.76 | 0.30 | 0.99 | 1.29 | (0.29) | (0.13) | — | (0.42) | 12.63 | 11.05 | 1.305 | 1.345,6 | 2.50 | 26 | 20 |
| 12-31-2009 | 9.58 | 0.35 | 2.20 | 2.55 | (0.33) | (0.04) | — | (0.37) | 11.76 | 26.91 | 1.415 | 1.355 | 3.33 | 20 | 29 |
| 12-31-2008 | 13.56 | 0.45 | (3.74) | (3.29) | (0.43) | (0.26) | — | (0.69) | 9.58 | (24.56) | 1.395 | 1.365 | 3.70 | 14 | 32 |
|
| CLASS C | | | | | | | | | | | | | | | |
|
| 12-31-2012 | 12.28 | 0.23 | 1.14 | 1.37 | (0.22) | (0.08) | — | (0.30) | 13.35 | 11.17 | 1.275 | 1.275 | 1.77 | 288 | 18 |
| 12-31-2011 | 12.64 | 0.28 | (0.29) | (0.01) | (0.26) | (0.09) | — | (0.35) | 12.28 | (0.05) | 1.285 | 1.285 | 2.21 | 227 | 19 |
| 12-31-2010 | 11.77 | 0.32 | 0.98 | 1.30 | (0.30) | (0.13) | — | (0.43) | 12.64 | 11.15 | 1.255 | 1.255 | 2.67 | 183 | 20 |
| 12-31-2009 | 9.59 | 0.38 | 2.18 | 2.56 | (0.34) | (0.04) | — | (0.38) | 11.77 | 27.00 | 1.255 | 1.255 | 3.58 | 116 | 29 |
| 12-31-2008 | 13.57 | 0.48 | (3.75) | (3.27) | (0.45) | (0.26) | — | (0.71) | 9.59 | (24.44) | 1.255 | 1.255 | 4.02 | 69 | 32 |
|
| | |
| 30 | Lifestyle Portfolios | Annual report | |
| | | See notes to financial statements |
Financial highlights
Continued
Lifestyle Moderate continued
| | | | | | | | | | | | | | | |
|
|
| Per share operating performance for a share outstanding throughout the period | | | Ratios and supplemental data | |
|
|
| | | Income (loss) from | | | | | | | | | | | | |
| | | investment operations | | Less distributions | | | | | Ratios to average net assets | | | |
| | |
| |
| |
| |
| | | | Net | | | | | | | | | | | | |
| | | | realized | Total | | | | | | | Expenses | Expenses | | Net | |
| | Net asset | Net | and | from | From net | | | | | | before re- | including | | assets, | |
| | value, | invest- | unrealized | invest- | invest- | | | | Net asset | | ductions and | reductions | Net | end of | |
| | beginning | ment in- | gain (loss) | ment | ment | From net | From | Total | value, end | Total | amounts | and amounts | investment | period (in | Portfolio |
| | of period | come (loss) | on invest- | operations | income | realized | paid-in | distribu- | of period | return | recaptured | recaptured | income | millions) | turnover |
| Period ended | ($) | ($)1,2 | ments ($) | ($) | ($) | gain ($) | capital ($) | tions ($) | ($) | (%)3,4 | (%) | (%) | (loss) (%)1 | ($) | (%) |
|
| CLASS R1 | | | | | | | | | | | | | | | |
|
| 12-31-2012 | 12.27 | 0.27 | 1.15 | 1.42 | (0.26) | (0.08) | — | (0.34) | 13.35 | 11.58 | 0.965 | 0.965 | 2.10 | 10 | 18 |
| 12-31-2011 | 12.63 | 0.30 | (0.27) | 0.03 | (0.30) | (0.09) | — | (0.39) | 12.27 | 0.21 | 1.035 | 1.035 | 2.32 | 7 | 19 |
| 12-31-2010 | 11.76 | 0.33 | 1.00 | 1.33 | (0.33) | (0.13) | — | (0.46) | 12.63 | 11.45 | 0.935 | 0.985,6 | 2.72 | 7 | 20 |
| 12-31-2009 | 9.58 | 0.50 | 2.09 | 2.59 | (0.37) | (0.04) | — | (0.41) | 11.76 | 27.35 | 1.145 | 1.065 | 4.57 | 6 | 29 |
| 12-31-2008 | 13.58 | 0.64 | (3.87) | (3.23) | (0.51) | (0.26) | — | (0.77) | 9.58 | (24.21) | 1.975 | 0.855 | 5.39 | 2 | 32 |
|
| CLASS R2 | | | | | | | | | | | | | | | |
|
| 12-31-20127 | 12.96 | 0.30 | 0.45 | 0.75 | (0.31) | (0.08) | — | (0.39) | 13.32 | 5.808 | 16.035,9 | 0.625,9 | 2.298 | —10 | 1811 |
|
| CLASS R3 | | | | | | | | | | | | | | | |
|
| 12-31-2012 | 12.26 | 0.27 | 1.16 | 1.43 | (0.28) | (0.08) | — | (0.36) | 13.33 | 11.64 | 0.885 | 0.885 | 2.08 | 10 | 18 |
| 12-31-2011 | 12.62 | 0.32 | (0.27) | 0.05 | (0.32) | (0.09) | — | (0.41) | 12.26 | 0.38 | 0.885 | 0.885 | 2.54 | 10 | 19 |
| 12-31-2010 | 11.76 | 0.35 | 0.99 | 1.34 | (0.35) | (0.13) | — | (0.48) | 12.62 | 11.56 | 0.875 | 0.875 | 2.87 | 10 | 20 |
| 12-31-2009 | 9.58 | 0.39 | 2.21 | 2.60 | (0.38) | (0.04) | — | (0.42) | 11.76 | 27.43 | 0.955 | 0.955 | 3.72 | 8 | 29 |
| 12-31-2008 | 13.57 | 0.55 | (3.78) | (3.23) | (0.50) | (0.26) | — | (0.76) | 9.58 | (24.22) | 1.005 | 0.865 | 4.55 | 5 | 32 |
|
| CLASS R4 | | | | | | | | | | | | | | | |
|
| 12-31-2012 | 12.24 | 0.33 | 1.14 | 1.47 | (0.32) | (0.08) | — | (0.40) | 13.31 | 12.02 | 0.575 | 0.515 | 2.51 | 11 | 18 |
| 12-31-2011 | 12.60 | 0.36 | (0.28) | 0.08 | (0.35) | (0.09) | — | (0.44) | 12.24 | 0.65 | 0.635 | 0.635 | 2.81 | 8 | 19 |
| 12-31-2010 | 11.74 | 0.40 | 0.97 | 1.37 | (0.38) | (0.13) | — | (0.51) | 12.60 | 11.84 | 0.585 | 0.605,6 | 3.30 | 7 | 20 |
| 12-31-2009 | 9.57 | 0.40 | 2.22 | 2.62 | (0.41) | (0.04) | — | (0.45) | 11.74 | 27.71 | 0.705 | 0.665 | 3.83 | 5 | 29 |
| 12-31-2008 | 13.55 | 0.56 | (3.75) | (3.19) | (0.53) | (0.26) | — | (0.79) | 9.57 | (23.94) | 0.795 | 0.575 | 4.66 | 4 | 32 |
|
| CLASS R5 | | | | | | | | | | | | | | | |
|
| 12-31-2012 | 12.26 | 0.31 | 1.19 | 1.50 | (0.36) | (0.08) | — | (0.44) | 13.32 | 12.26 | 0.275 | 0.275 | 2.41 | 9 | 18 |
| 12-31-2011 | 12.62 | 0.41 | (0.28) | 0.13 | (0.40) | (0.09) | — | (0.49) | 12.26 | 1.00 | 0.245 | 0.245 | 3.21 | 15 | 19 |
| 12-31-2010 | 11.75 | 0.46 | 0.97 | 1.43 | (0.43) | (0.13) | — | (0.56) | 12.62 | 12.35 | 0.245 | 0.245 | 3.75 | 11 | 20 |
| 12-31-2009 | 9.58 | 0.46 | 2.19 | 2.65 | (0.44) | (0.04) | — | (0.48) | 11.75 | 28.10 | 0.325 | 0.325 | 4.39 | 8 | 29 |
| 12-31-2008 | 13.56 | 0.63 | (3.78) | (3.15) | (0.57) | (0.26) | — | (0.83) | 9.58 | (23.67) | 0.365 | 0.235 | 5.27 | 5 | 32 |
|
| CLASS R6 | | | | | | | | | | | | | | | |
|
| 12-31-2012 | 12.24 | 0.62 | 0.90 | 1.52 | (0.37) | (0.08) | — | (0.45) | 13.31 | 12.50 | 4.795 | 0.115 | 4.66 | 2 | 18 |
| 12-31-201112 | 12.51 | 0.24 | (0.17) | 0.07 | (0.25) | (0.09) | — | (0.34) | 12.24 | 0.608 | 16.245,9 | 0.115,9 | 1.948 | —10 | 1913 |
|
| CLASS 1 | | | | | | | | | | | | | | | |
|
| 12-31-2012 | 12.25 | 0.37 | 1.15 | 1.52 | (0.37) | (0.08) | — | (0.45) | 13.32 | 12.49 | 0.115 | 0.115 | 2.87 | 3,414 | 18 |
| 12-31-2011 | 12.61 | 0.41 | (0.27) | 0.14 | (0.41) | (0.09) | — | (0.50) | 12.25 | 1.12 | 0.115 | 0.115 | 3.26 | 3,057 | 19 |
| 12-31-2010 | 11.74 | 0.44 | 1.00 | 1.44 | (0.44) | (0.13) | — | (0.57) | 12.61 | 12.43 | 0.115 | 0.115 | 3.66 | 3,026 | 20 |
| 12-31-2009 | 9.56 | 0.47 | 2.21 | 2.68 | (0.46) | (0.04) | — | (0.50) | 11.74 | 28.49 | 0.115 | 0.115 | 4.49 | 2,503 | 29 |
| 12-31-2008 | 13.54 | 0.59 | (3.73) | (3.14) | (0.58) | (0.26) | — | (0.84) | 9.56 | (23.63) | 0.125 | 0.125 | 4.90 | 1,857 | 32 |
|
| CLASS 5 | | | | | | | | | | | | | | | |
|
| 12-31-2012 | 12.24 | 0.39 | 1.14 | 1.53 | (0.38) | (0.08) | — | (0.46) | 13.31 | 12.56 | 0.065 | 0.065 | 3.03 | 39 | 18 |
| 12-31-2011 | 12.60 | 0.44 | (0.29) | 0.15 | (0.42) | (0.09) | — | (0.51) | 12.24 | 1.17 | 0.065 | 0.065 | 3.43 | 27 | 19 |
| 12-31-2010 | 11.73 | 0.47 | 0.97 | 1.44 | (0.44) | (0.13) | — | (0.57) | 12.60 | 12.50 | 0.065 | 0.065 | 3.87 | 22 | 20 |
| 12-31-2009 | 9.56 | 0.51 | 2.17 | 2.68 | (0.47) | (0.04) | — | (0.51) | 11.73 | 28.45 | 0.075 | 0.075 | 4.78 | 14 | 29 |
| 12-31-2008 | 13.54 | 0.67 | (3.80) | (3.13) | (0.59) | (0.26) | — | (0.85) | 9.56 | (23.59) | 0.075 | 0.075 | 5.70 | 8 | 32 |
|
1 Recognition of net investment income by the Portfolio is affected by the timing and frequency of the declaration of dividends by the underlying funds in which the Portfolio invests.
2 Based on the average daily shares outstanding.
3 Total returns would have been lower had certain expenses not been reduced during the applicable periods shown.
4 Does not reflect the effect of sales charges, if any.
5 Ratios do not include expenses indirectly incurred from underlying funds whose expense ratios can vary based on the mix of underlying funds held by the Portfolio. The range of expense ratios of the underlying funds held by the Portfolios was as follows: 0.63%–1.48%, 0.48%–1.40%, 0.48%–1.14%, 0.49%–1.17% and 0.49%–2.40% for the years ended 12-31-12, 12-31-11, 12-31-10, 12-31-09 and 12-31-08, respectively.
6 Includes the impact of expense recapture which amounted to 0.04%, 0.05% and 0.02% for Class B, Class R1 and Class R4, respectively, of average net assets. See Note 4.
7 The inception date for Class R2 shares is 3-1-12.
8 Not annualized.
9 Annualized.
10 Less than $500,000.
11 Portfolio turnover is shown for the period from 1-1-12 to 12-31-12.
12 The inception date for Class R6 shares is 9-1-11.
13 Portfolio turnover is shown for the period from 1-1-11 to 12-31-11.
| | |
| Annual report | Lifestyle Portfolios | 31 |
| See notes to financial statements | | |
Financial highlights
Continued
Lifestyle Conservative
| | | | | | | | | | | | | | | |
|
|
| Per share operating performance for a share outstanding throughout the period | | | Ratios and supplemental data | |
|
|
| | | Income (loss) from | | | | | | | | | | | | |
| | | investment operations | | Less distributions | | | | | Ratios to average net assets | | | |
| | |
| |
| |
| |
| | | | Net | | | | | | | | Expenses | | | | |
| | | | realized | Total | | | | | | | before | Expenses | | Net | |
| | Net asset | Net | and | from | From net | | | | | | reduc- | including | | assets, | |
| | value, | invest- | unrealized | invest- | invest- | | | | Net asset | | tions and | reductions | Net | end of | |
| | beginning | ment in- | gain (loss) | ment | ment | From net | From | Total | value, end | Total | amounts | and amounts | investment | period (in | Portfolio |
| | of period | come (loss) | on invest- | operations | income | realized | paid-in | distribu- | of period | return | recaptured | recaptured | income | millions) | turnover |
| Period ended | ($) | ($)1,2 | ments ($) | ($) | ($) | gain ($) | capital ($) | tions ($) | ($) | (%)3,4 | (%) | (%) | (loss) (%)1 | ($) | (%) |
|
| CLASS A | | | | | | | | | | | | | | | |
|
| 12-31-2012 | 12.63 | 0.38 | 0.88 | 1.26 | (0.37) | (0.08) | — | (0.45) | 13.44 | 10.03 | 0.565 | 0.565 | 2.89 | 472 | 14 |
| 12-31-2011 | 12.77 | 0.46 | (0.11) | 0.35 | (0.43) | (0.06) | — | (0.49) | 12.63 | 2.75 | 0.585 | 0.585 | 3.61 | 340 | 15 |
| 12-31-2010 | 12.15 | 0.48 | 0.71 | 1.19 | (0.45) | (0.12) | — | (0.57) | 12.77 | 9.96 | 0.555 | 0.555 | 3.78 | 218 | 24 |
| 12-31-2009 | 10.39 | 0.54 | 1.77 | 2.31 | (0.50) | (0.05) | — | (0.55) | 12.15 | 22.53 | 0.525 | 0.525 | 4.80 | 141 | 24 |
| 12-31-2008 | 13.32 | 0.73 | (2.75) | (2.02) | (0.63) | (0.28) | — | (0.91) | 10.39 | (15.41) | 0.535 | 0.535 | 6.01 | 87 | 33 |
|
| CLASS B | | | | | | | | | | | | | | | |
|
| 12-31-2012 | 12.63 | 0.28 | 0.88 | 1.16 | (0.27) | (0.08) | — | (0.35) | 13.44 | 9.24 | 1.305 | 1.305 | 2.13 | 48 | 14 |
| 12-31-2011 | 12.77 | 0.35 | (0.10) | 0.25 | (0.33) | (0.06) | — | (0.39) | 12.63 | 2.01 | 1.315 | 1.315 | 2.75 | 37 | 15 |
| 12-31-2010 | 12.15 | 0.37 | 0.73 | 1.10 | (0.36) | (0.12) | — | (0.48) | 12.77 | 9.16 | 1.295 | 1.295,6 | 2.96 | 28 | 24 |
| 12-31-2009 | 10.40 | 0.44 | 1.77 | 2.21 | (0.41) | (0.05) | — | (0.46) | 12.15 | 21.46 | 1.355 | 1.355 | 3.88 | 21 | 24 |
| 12-31-2008 | 13.32 | 0.59 | (2.70) | (2.11) | (0.53) | (0.28) | — | (0.81) | 10.40 | (16.04) | 1.365 | 1.345 | 4.81 | 13 | 33 |
|
| CLASS C | | | | | | | | | | | | | | | |
|
| 12-31-2012 | 12.62 | 0.29 | 0.88 | 1.17 | (0.28) | (0.08) | — | (0.36) | 13.43 | 9.28 | 1.265 | 1.265 | 2.17 | 335 | 14 |
| 12-31-2011 | 12.77 | 0.36 | (0.11) | 0.25 | (0.34) | (0.06) | — | (0.40) | 12.62 | 1.95 | 1.285 | 1.285 | 2.81 | 254 | 15 |
| 12-31-2010 | 12.14 | 0.39 | 0.72 | 1.11 | (0.36) | (0.12) | — | (0.48) | 12.77 | 9.28 | 1.245 | 1.245 | 3.10 | 189 | 24 |
| 12-31-2009 | 10.39 | 0.46 | 1.76 | 2.22 | (0.42) | (0.05) | — | (0.47) | 12.14 | 21.58 | 1.245 | 1.245 | 4.08 | 119 | 24 |
| 12-31-2008 | 13.32 | 0.62 | (2.73) | (2.11) | (0.54) | (0.28) | — | (0.82) | 10.39 | (16.03) | 1.245 | 1.245 | 5.05 | 73 | 33 |
|
| CLASS R1 | | | | | | | | | | | | | | | |
|
| 12-31-2012 | 12.62 | 0.31 | 0.88 | 1.19 | (0.30) | (0.08) | — | (0.38) | 13.43 | 9.52 | 1.075 | 1.075 | 2.36 | 9 | 14 |
| 12-31-2011 | 12.78 | 0.33 | (0.05) | 0.28 | (0.38) | (0.06) | — | (0.44) | 12.62 | 2.19 | 1.065 | 1.065 | 2.57 | 7 | 15 |
| 12-31-2010 | 12.15 | 0.41 | 0.74 | 1.15 | (0.40) | (0.12) | — | (0.52) | 12.78 | 9.56 | 0.885 | 0.935,6 | 3.24 | 8 | 24 |
| 12-31-2009 | 10.41 | 0.57 | 1.66 | 2.23 | (0.44) | (0.05) | — | (0.49) | 12.15 | 21.74 | 1.165 | 1.065 | 5.00 | 7 | 24 |
| 12-31-2008 | 13.34 | 1.02 | (3.07) | (2.05) | (0.60) | (0.28) | — | (0.88) | 10.41 | (15.62) | 2.315 | 0.885 | 8.75 | 2 | 33 |
|
| CLASS R2 | | | | | | | | | | | | | | | |
|
| 12-31-20127 | 13.12 | 0.35 | 0.39 | 0.74 | (0.36) | (0.08) | — | (0.44) | 13.42 | 5.738 | 10.395,9 | 0.625,9 | 2.648 | —10 | 1411 |
|
| CLASS R3 | | | | | | | | | | | | | | | |
|
| 12-31-2012 | 12.60 | 0.31 | 0.91 | 1.22 | (0.33) | (0.08) | — | (0.41) | 13.41 | 9.71 | 0.975 | 0.975 | 2.38 | 11 | 14 |
| 12-31-2011 | 12.76 | 0.40 | (0.11) | 0.29 | (0.39) | (0.06) | — | (0.45) | 12.60 | 2.30 | 0.885 | 0.885 | 3.08 | 10 | 15 |
| 12-31-2010 | 12.14 | 0.42 | 0.74 | 1.16 | (0.42) | (0.12) | — | (0.54) | 12.76 | 9.68 | 0.865 | 0.865 | 3.36 | 11 | 24 |
| 12-31-2009 | 10.40 | 0.46 | 1.79 | 2.25 | (0.46) | (0.05) | — | (0.51) | 12.14 | 21.94 | 0.925 | 0.925 | 4.14 | 8 | 24 |
| 12-31-2008 | 13.33 | 0.54 | (2.59) | (2.05) | (0.60) | (0.28) | — | (0.88) | 10.40 | (15.62) | 0.905 | 0.835 | 4.27 | 6 | 33 |
|
| CLASS R4 | | | | | | | | | | | | | | | |
|
| 12-31-2012 | 12.61 | 0.36 | 0.90 | 1.26 | (0.37) | (0.08) | — | (0.45) | 13.42 | 10.06 | 0.605 | 0.545 | 2.72 | 8 | 14 |
| 12-31-2011 | 12.76 | 0.45 | (0.11) | 0.34 | (0.43) | (0.06) | — | (0.49) | 12.61 | 2.65 | 0.635 | 0.635 | 3.50 | 9 | 15 |
| 12-31-2010 | 12.13 | 0.47 | 0.72 | 1.19 | (0.44) | (0.12) | — | (0.56) | 12.76 | 9.90 | 0.615 | 0.675,6 | 3.77 | 7 | 24 |
| 12-31-2009 | 10.39 | 0.52 | 1.75 | 2.27 | (0.48) | (0.05) | — | (0.53) | 12.13 | 22.22 | 0.775 | 0.665 | 4.60 | 4 | 24 |
| 12-31-2008 | 13.31 | 0.64 | (2.65) | (2.01) | (0.63) | (0.28) | — | (0.91) | 10.39 | (15.38) | 0.875 | 0.575 | 5.21 | 3 | 33 |
|
| CLASS R5 | | | | | | | | | | | | | | | |
|
| 12-31-2012 | 12.62 | 0.41 | 0.89 | 1.30 | (0.41) | (0.08) | — | (0.49) | 13.43 | 10.37 | 0.315 | 0.315 | 3.11 | 15 | 14 |
| 12-31-2011 | 12.77 | 0.50 | (0.12) | 0.38 | (0.47) | (0.06) | — | (0.53) | 12.62 | 3.00 | 0.245 | 0.245 | 3.91 | 16 | 15 |
| 12-31-2010 | 12.15 | 0.50 | 0.74 | 1.24 | (0.50) | (0.12) | — | (0.62) | 12.77 | 10.34 | 0.235 | 0.235 | 3.96 | 9 | 24 |
| 12-31-2009 | 10.40 | 0.57 | 1.75 | 2.32 | (0.52) | (0.05) | — | (0.57) | 12.15 | 22.67 | 0.335 | 0.335 | 5.08 | 9 | 24 |
| 12-31-2008 | 13.32 | 0.86 | (2.83) | (1.97) | (0.67) | (0.28) | — | (0.95) | 10.40 | (15.10) | 0.525 | 0.255 | 7.19 | 4 | 33 |
|
| CLASS R6 | | | | | | | | | | | | | | | |
|
| 12-31-2012 | 12.61 | 0.51 | 0.81 | 1.32 | (0.43) | (0.08) | — | (0.51) | 13.42 | 10.56 | 2.505 | 0.115 | 3.83 | 2 | 14 |
| 12-31-201112 | 12.81 | 0.27 | (0.12) | 0.15 | (0.29) | (0.06) | — | (0.35) | 12.61 | 1.168 | 16.165,9 | 0.115,9 | 2.138 | —10 | 1513 |
|
| | |
| 32 | Lifestyle Portfolios | Annual report | |
| | | See notes to financial statements |
Financial highlights
Continued
Lifestyle Conservative continued
| | | | | | | | | | | | | | | |
|
|
| Per share operating performance for a share outstanding throughout the period | | | Ratios and supplemental data | |
|
|
| | | Income (loss) from | | | | | | | | | | | | |
| | | investment operations | | Less distributions | | | | | Ratios to average net assets | | | |
| | |
| |
| |
| |
| | | | Net | | | | | | | | | | | | |
| | | | realized | Total | | | | | | | Expenses | Expenses | | Net | |
| | Net asset | Net | and | from | From net | | | | | | before re- | including | | assets, | |
| | value, | invest- | unrealized | invest- | invest- | | | | Net asset | | ductions and | reductions | Net | end of | |
| | beginning | ment in- | gain (loss) | ment | ment | From net | From | Total | value, end | Total | amounts | and amounts | investment | period (in | Portfolio |
| | of period | come (loss) | on invest- | operations | income | realized | paid-in | distribu- | of period | return | recaptured | recaptured | income | millions) | turnover |
| Period ended | ($) | ($)1,2 | ments ($) | ($) | ($) | gain ($) | capital ($) | tions ($) | ($) | (%)3,4 | (%) | (%) | (loss) (%)1 | ($) | (%) |
|
| CLASS 1 | | | | | | | | | | | | | | | |
|
| 12-31-2012 | 12.61 | 0.43 | 0.89 | 1.32 | (0.43) | (0.08) | — | (0.51) | 13.42 | 10.56 | 0.115 | 0.115 | 3.28 | 3,090 | 14 |
| 12-31-2011 | 12.76 | 0.50 | (0.10) | 0.40 | (0.49) | (0.06) | — | (0.55) | 12.61 | 3.16 | 0.115 | 0.115 | 3.85 | 2,626 | 15 |
| 12-31-2010 | 12.13 | 0.51 | 0.75 | 1.26 | (0.51) | (0.12) | — | (0.63) | 12.76 | 10.51 | 0.115 | 0.115 | 4.08 | 2,391 | 24 |
| 12-31-2009 | 10.38 | 0.56 | 1.78 | 2.34 | (0.54) | (0.05) | — | (0.59) | 12.13 | 22.96 | 0.125 | 0.125 | 4.99 | 1,931 | 24 |
| 12-31-2008 | 13.30 | 0.71 | (2.67) | (1.96) | (0.68) | (0.28) | — | (0.96) | 10.38 | (15.02) | 0.125 | 0.125 | 5.71 | 1,393 | 33 |
|
1 Recognition of net investment income by the Portfolio is affected by the timing and frequency of the declaration of dividends by the underlying funds in which the Portfolio invests.
2 Based on the average daily shares outstanding.
3 Does not reflect the effect of sales charges, if any.
4 Total returns would have been lower had certain expenses not been reduced during the applicable periods shown.
5 Ratios do not include expenses indirectly incurred from underlying funds whose expense ratios can vary based on the mix of underlying funds held by the Portfolio. The range of expense ratios of the underlying funds held by the Portfolio was as follows: 0.63%–1.48%, 0.48%–1.40%, 0.48%–1.13%, 0.49%–1.09% and 0.49%–2.40% for the years ended 12-31-12, 12-31-11, 12-31-10, 12-31-09 and 12-31-08, respectively.
6 Includes the impact of expense recapture, which amounted to less than 0.005%, 0.05% and 0.06% of average net assets for Class B, Class R1 and Class R4 shares, respectively. See Note 4.
7 The inception date for Class R2 shares is 3-1-12.
8 Not annualized.
9 Annualized.
10 Less than $500,000.
11 Portfolio turnover is shown for period from 1-1-12 to 12-31-12.
12 The inception date for Class R6 shares is 9-1-11.
13 Portfolio turnover is shown for the period from 1-1-11 to 12-31-11.
| | |
| | Annual report | Lifestyle Portfolios | 33 |
| See notes to financial statements | | |
Notes to financial statements
Note 1 — Organization
John Hancock Funds II (the Trust) is an open-end management investment company organized as a Massachusetts business trust and registered under the Investment Company Act of 1940, as amended (the 1940 Act). The Trust is a series company, which means it has several funds, each with a stated investment objective that it pursues through separate investment policies. The Trust currently offers multiple investment funds, five of which (collectively, Lifestyle Portfolios or the Portfolios and, individually, the Portfolio) are presented in this report. The Lifestyle Portfolios are series of the Trust and operate as “funds of funds” that primarily invest in Class NAV shares of underlying funds of the Trust, John Hancock Funds III (JHF III) and other affiliated funds of the John Hancock funds complex.
The Portfolios may offer multiple classes of shares. The shares currently offered by the Trust are detailed in the Statements of Assets and Liabilities. Class A, Class B and Class C shares are open to all investors. Class R1, Class R2, Class R3, Class R4 and Class R5 shares are available only to certain retirement plans. Class R6 shares are only available to certain retirement plans, institutions and other investors. Class 1 shares are offered only to certain affiliates of Manulife Financial Corporation (MFC). Class 5 shares are available only to the John Hancock Freedom 529 Plan. Class B shares convert to Class A shares eight years after purchase. Shareholders of each class have exclusive voting rights to matters that affect that class. The distribution and service fees, if any, transfer agent fees, printing and postage and state registration fees for each class may differ.
The accounting policies of the underlying funds of the Portfolios are outlined in the underlying funds’ shareholder reports, available without charge by calling 1-800-344-1029, at www.jhfunds.com, on the Securities and Exchange Commission (SEC) Web site at www.sec.gov or at the SEC’s public reference room in Washington, D.C. The underlying funds are not covered by this report.
Note 2 — Significant accounting policies
The financial statements have been prepared in conformity with accounting principles generally accepted in the United States of America, which require management to make certain estimates and assumptions at the date of the financial statements. Actual results could differ from those estimates and those differences could be significant. Events or transactions occurring after the end of the fiscal period through the date that the financial statements were issued have been evaluated in the preparation of the financial statements. The following summarizes the significant accounting policies of the Portfolios:
Security valuation. Investments are stated at value as of the close of regular trading on the New York Stock Exchange (NYSE), normally at 4:00 P.M., Eastern Time. In order to value the securities, the Portfolios use the following valuation techniques: Investments by the Portfolios in underlying affiliated funds and/or other open-end management investment companies are valued at their respective net asset values each business day.
The Portfolios use a three-tier hierarchy to prioritize the pricing assumptions, referred to as inputs, used in valuation techniques to measure fair value. Level 1 includes securities valued using quoted prices in active markets for identical securities, including registered investment companies. Level 2 includes securities valued using significant observable inputs. Observable inputs may include quoted prices for similar securities, interest rates, prepayment speeds and credit risk. Prices for securities valued using these inputs are received from independent pricing vendors and brokers and are based on an evaluation of the inputs described. Level 3 includes securities valued using significant unobservable inputs when market prices are not readily available or reliable, including the Portfolios’ own assumptions in determining the fair value of investments. Factors used in determining value may include market or issuer specific events or trends, changes in interest rates and credit quality. The inputs or methodology used for valuing securities are not necessarily an indication of the risks associated with investing in those securities. Changes in valuation techniques may result in transfers into or out of an assigned level within the disclosure hierarchy. As of December 31, 2012, all investments are categorized as Level 1 under the hierarchy described above.
Security transactions and related investment income. Investment security transactions are accounted for on a trade date plus one basis for daily net asset value calculations. However, for financial reporting purposes, investment transactions are reported on trade date. Income and capital gain distributions from underlying funds are recorded on ex-date. Gains and losses on securities sold are determined on the basis of identified cost and may include proceeds from litigation.
Line of credit. The Portfolios may borrow from banks for temporary or emergency purposes, including meeting redemption requests that otherwise might require the untimely sale of securities. Pursuant to the custodian agreement, the custodian may loan money to the Portfolios to make properly authorized payments. The Portfolios are obligated to repay the custodian for any overdraft, including any related costs or expenses. The custodian may have a lien, security interest or security entitlement in any Portfolio property that is not otherwise segregated or pledged, to the maximum extent permitted by law, to the extent of any overdraft.
| |
| 34 | Lifestyle Portfolios | Annual report |
In addition, the Portfolios and other affiliated funds have entered into an agreement with Citibank N.A. which enables them to participate in a $200 million unsecured committed line of credit. A commitment fee, payable at the end of each calendar quarter, based on the average daily unused portion of the line of credit, is charged to each participating Portfolio on a pro rata basis and is reflected in other expenses on the Statement of operations. For the year ended December 31, 2012, the Portfolios had no borrowings under the line of credit.
The commitment fees for the year ended December 31, 2012 were as follows:
| | | |
| Portfolio | Commitment fees | | |
| | |
| Lifestyle Aggressive | $1,681 | | |
| Lifestyle Growth | 4,063 | | |
| Lifestyle Balanced | 4,276 | | |
| Lifestyle Moderate | 1,728 | | |
| Lifestyle Conservative | 1,610 | | |
Expenses. Within the John Hancock Funds complex, expenses that are directly attributable to an individual fund are allocated to such portfolio. Expenses that are not readily attributable to a specific portfolio are allocated among all portfolios in an equitable manner, taking into consideration, among other things, the nature and type of expense and the portfolios’ relative net assets. Expense estimates are accrued in the period to which they relate and adjustments are made when actual amounts are known.
Class allocations. Income, common expenses and realized and unrealized gains (losses) are determined at the fund level and allocated daily to each class of shares based on the net assets of the class. Class-specific expenses, such as distribution and service fees, if any, transfer agent fees, state registration fees and printing and postage, for all classes, are calculated daily at the class level based on the appropriate net assets of each class and the specific expense rates applicable to each class.
Federal income taxes. Each Portfolio intends to continue to qualify as a regulated investment company by complying with the applicable provisions of the Internal Revenue Code and will not be subject to federal income tax on taxable income that is distributed to shareholders. Therefore, no federal income tax provision is required.
Under the Regulated Investment Company Modernization Act of 2010, the Portfolios are permitted to carry forward capital losses incurred in taxable years beginning after December 22, 2010 for an unlimited period. Any losses incurred during those taxable years will be required to be utilized prior to the losses incurred in pre-enactment taxable years. As a result of this ordering rule, pre-enactment capital loss carryforwards may be more likely to expire unused. Additionally, post-enactment capital losses that are carried forward will retain their character as either short-term or long-term capital losses rather than being considered all short-term as under previous law.
For federal income tax purposes, the Portfolios have a capital loss carryforward available to offset future net realized capital gains. The following table details the capital loss carryforward available as of December 31, 2012:
| | | | | | | |
| | Capital Loss Carryforward | | | | | |
| | Expiring at December 31, | | No Expiration Date | | |
| | |
| Portfolio | 2016 | 2017 | 2018 | Short-term | Long-term | | |
| | |
| Lifestyle Aggressive | — | $354,683,144 | $69,388,579 | — | — | | |
| Lifestyle Growth | $73,093,672 | 966,013,756 | — | — | — | | |
| Lifestyle Balanced | — | 949,636,213 | 57,148,343 | — | — | | |
| Lifestyle Moderate | — | 89,726,256 | 17,269,113 | — | — | | |
| Lifestyle Conservative | — | 24,617,601 | 4,934,051 | — | — | | |
As of December 31, 2012, the Portfolios had no uncertain tax positions that would require financial statement recognition, derecognition or disclosure. The Portfolios’ federal tax returns are subject to examination by the Internal Revenue Service for a period of three years.
The costs of investments owned on December 31, 2012, including short-term investments, for federal income tax purposes, were as follows:
| | | | |
| | | | | Net Unrealized |
| | | Unrealized | Unrealized | Appreciation/ |
| Portfolio | Aggregate Cost | Appreciation | Depreciation | (Depreciation) |
|
| Lifestyle Aggressive | $3,276,728,923 | $520,898,226 | — | $520,898,226 |
| Lifestyle Growth | 10,361,681,376 | 1,460,917,586 | — | 1,460,917,586 |
| Lifestyle Balanced | 11,511,179,950 | 1,440,992,627 | ($189,507) | 1,440,803,120 |
| Lifestyle Moderate | 3,880,570,602 | 352,503,982 | (6,447,143) | 346,056,839 |
| Lifestyle Conservative | 3,745,111,632 | 246,191,791 | (1,733,024) | 244,458,767 |
| |
| Annual report | Lifestyle Portfolios | 35 |
Distribution of income and gains. Distributions to shareholders from net investment income and net realized gains, if any, are recorded on the ex-date. The Lifestyle Aggressive and Lifestyle Growth Portfolios generally declare and pay income dividends and capital gain distributions, if any, annually. The Lifestyle Balanced, Lifestyle Moderate and Lifestyle Conservative Portfolios generally declare and pay income dividends quarterly and capital gain distributions, if any, annually.
During the year ended December 31, 2012, the tax character of distributions paid was as follows:
| | | | | | | |
| | 2012 Distributions | | | |
| |
| | | |
| | | Long-Term | Return of | | | | |
| Portfolio | Ordinary Income | Capital Gains | Capital | Total | | | |
| | | |
| Lifestyle Aggressive | $54,348,129 | — | — | $54,348,129 | | | |
| Lifestyle Growth | 235,910,574 | — | — | 235,910,574 | | | |
| Lifestyle Balanced | 339,724,150 | — | — | 339,724,150 | | | |
| Lifestyle Moderate | 134,691,078 | — | — | 134,691,078 | | | |
| Lifestyle Conservative | 137,866,831 | — | — | 137,866,831 | | | |
During the year ended December 31, 2011, the tax character of distributions paid was as follows:
| | | | | | | |
| | 2011 Distributions | | | |
| |
| | | |
| | | Long Term | Return of | | | | |
| Portfolio | Ordinary Income | Capital Gains | Capital | Total | | | |
| | | |
| Lifestyle Aggressive | $66,117,321 | — | — | $66,117,321 | | | |
| Lifestyle Growth | 264,670,633 | — | — | 264,670,633 | | | |
| Lifestyle Balanced | 372,159,215 | — | — | 372,159,215 | | | |
| Lifestyle Moderate | 142,429,386 | — | — | 142,429,386 | | | |
| Lifestyle Conservative | 130,261,616 | — | — | 130,261,616 | | | |
Distributions paid by the Portfolios with respect to each class of shares are calculated in the same manner, at the same time and in the same amount, except for the effect of class level expenses that may be applied differently to each class. Net capital losses that are a result of security transactions occurring after October 31, 2012 are treated as occurring on January 1, 2013, the first day of the Portfolio’s next taxable year. As of December 31, 2012, the components of distributable earnings on a tax basis were as follows:
| | | | | | | |
| | | Undistributed | | | | | |
| | Undistributed | Long-Term | Capital Loss | Post-October | | | |
| Portfolio | Ordinary Income | Capital Gains | Carryforward | Deferral | | | |
| | | |
| Lifestyle Aggressive | — | — | $424,071,723 | — | | | |
| Lifestyle Growth | — | — | 1,039,107,428 | — | | | |
| Lifestyle Balanced | — | — | 1,006,784,556 | — | | | |
| Lifestyle Moderate | — | — | 106,995,369 | — | | | |
| Lifestyle Conservative | — | — | 29,551,652 | — | | | |
Such distributions and distributable earnings, on a tax basis, are determined in conformity with income tax regulations, which may differ from accounting principles generally accepted in the United States of America. Material distributions in excess of tax basis earnings and profits, if any, are reported in the Portfolios’ financial statements as a return of capital. Short term gains from underlying funds are treated as ordinary income for tax purposes.
Capital accounts within the financial statements are adjusted for permanent book-tax differences. These adjustments have no impact on net assets or the results of operations. Temporary book-tax differences, if any, will reverse in a subsequent period. Book-tax differences are primarily attributable to wash sale loss deferrals for all Portfolios.
Note 3 — Guarantees and indemnifications
Under the Trust’s organizational documents, its Officers and Trustees are indemnified against certain liabilities arising out of the performance of their duties to the Trust, including the Portfolios. Additionally, in the normal course of business, the Trust enters into contracts with service providers that contain general indemnification clauses. The Trust’s maximum exposure under these arrangements is unknown, as this would involve future claims that may be made against the Portfolios that have not yet occurred. The risk of material loss from such claims is considered remote.
Note 4 — Fees and transactions with affiliates
John Hancock Investment Management Services, LLC (the Adviser), serves as investment adviser for the Portfolios. John Hancock Funds, LLC (the Distributor), an affiliate of the Adviser, serves as principal underwriter of the Portfolios. The Adviser and the Distributor are indirect wholly owned subsidiaries of Manulife Financial Corporation (MFC).
| |
| 36 | Lifestyle Portfolios | Annual report |
Management fee. The Portfolios pay the Adviser a management fee for its services to the Portfolios. The management fee has two components: (a) a fee on assets invested in a fund of the Trust or JHF III and (b) a fee on assets not invested in a fund of the Trust or JHF II (other assets). The fee on assets invested in a fund of the Trust or JHF III is stated as an annual percentage of the current value of the aggregate net assets of the Portfolios and the corresponding John Hancock Variable Insurance Trust (JHVIT) Lifestyle Trusts and is equivalent to the sum of: (a) 0.05% of the first $7.5 billion of aggregate net assets and (b) 0.04% of the excess over $7.5 billion of aggregate net assets. The fee on other assets is stated as an annual percentage of the current value of the aggregate net assets of the Portfolios and the corresponding JHVIT Lifestyle Trusts and is equivalent to the sum of: (a) 0.50% of the first $7.5 billion of aggregate net assets and (b) 0.49% of the excess over $7.5 billion of aggregate net assets.
John Hancock Asset Management a division of Manulife Asset Management (North America) Limited and John Hancock Asset Management a division of Manulife Asset Management (US) LLC, both indirectly owned subsidiaries of MFC and affiliates of the Adviser, act as subadvisers to the Portfolios. QS Investors, LLC also acts as subadviser consultant. The Portfolios are not responsible for payment of the subadvisory fees.
Expense reimbursements. The Adviser voluntarily agreed to waive its advisory fee or reimburse each Portfolio so that the aggregate advisory fee retained by the Adviser with respect to both the Portfolio and the underlying investments (after payment of any subadvisory fees) does not exceed 0.50% of the Lifestyle Portfolio’s first $7.5 billion of average daily net assets and 0.49% of the Portfolio’s average daily net assets in excess of $7.5 billion. This voluntary waiver may terminate at any time by the Adviser upon notice to the Trust.
The Adviser had contractually agreed (except as noted below) to waive fees and/or reimburse certain class specific expenses, excluding Portfolio level expenses such as advisory fees, taxes, brokerage commissions, interest expense, litigation and indemnification expenses and other extraordinary expenses and acquired fund fees and expenses for Class A, Class B, Class C, Class R1, Class R2, Class R3, Class R4, Class R5 and Class R6 shares, to the extent that the above expenses for each class exceeded 0.59%, 1.29%, 1.29%, 1.04%, 0.56% (effective 3-1-12), 0.94%, 0.64%, 0.34% and 0.05%, respectively, of the average daily net assets attributable to the classes. This expense fee waiver and/or reimbursement expired on April 30, 2012 for Class A, Class B, Class C, Class R1, Class R3, Class R4 and Class R5 shares, with the exception of Lifestyle Aggressive Portfolio Class B shares, which will continue in effect until at least April 30, 2014. This expense fee waiver and/or reimbursement will also continue in effect until at least April 30, 2014 for Class R2 and Class R6 shares, unless renewed by mutual agreement of the Portfolios and the Adviser based upon a determination that this is appropriate under the circumstances at that time.
For the year ended December 31, 2012, the expense reductions related to these plans amounted to the following and are reflected as a reduction of total expenses in the Statements of operations:
| | | | | | | | | | | | |
| | Expense Reimbursement by Class |
| |
|
| Portfolio | Class A | Class B | Class C | Class R1 | Class R2 | Class R3 | Class R4 | Class R5 | Class R6 | Class 1 | Class 5 | Total |
|
| Lifestyle Aggressive | $11,997 | $3,063 | $6,512 | $490 | $12,955 | $556 | $517 | $665 | $18,729 | $184,297 | — | $239,781 |
| Lifestyle Growth | 25,276 | 3,278 | 14,488 | 547 | 12,991 | 654 | 688 | 975 | 19,132 | 315,810 | $4,025 | 397,864 |
| Lifestyle Balanced | 19,765 | 2,166 | 11,780 | 383 | 13,170 | 801 | 1,436 | 924 | 18,969 | 231,485 | 1,551 | 302,430 |
| Lifestyle Moderate | — | — | — | — | 12,965 | — | — | — | 17,486 | — | — | 30,451 |
| Lifestyle | — | — | — | — | 8,247 | — | — | — | 19,131 | — | — | 27,378 |
| Conservative | | | | | | | | | | | | |
Expense recapture. The Adviser may recapture operating expenses reimbursed or fees waived under previous expense limitation or waiver arrangements for a period of three years following the beginning of the month in which such reimbursements or waivers originally occurred to the extent that the Portfolios are below their expense limitations during this period. The table below outlines the amounts of waived or reimbursed expenses subject to potential recovery and the amounts recovered during the year ended December 31, 2012. Certain reimbursements or waivers are not subject to recapture.
| | | | | | |
| | Amounts eligible for | Amounts eligible for | Amounts eligible for | Amount recovered | | |
| | recovery through | recovery through | recovery through | during the period ended | | |
| Porfolio | December 1, 2013 | December 1, 2014 | December 1, 2015 | December 31, 2012 | | |
| | |
| Lifestyle Aggressive | $6,440 | $11,680 | $33,406 | $8,421 | | |
| Lifestyle Growth | — | 5,277 | 32,094 | — | | |
| Lifestyle Balanced | — | 5,276 | 32,096 | — | | |
| Lifestyle Moderate | — | 5,276 | 30,451 | — | | |
| Lifestyle Conservative | — | 5,276 | 27,378 | — | | |
| | | | | | |
| Amounts recovered by class | | | | | | |
| | | | | |
| Portfolio | Class B | | | | | |
| | | | | |
| Lifestyle Aggressive | $8,421 | | | | | |
| |
| Annual report | Lifestyle Portfolios | 37 |
The investment management fees, including the impact of the expense reductions and recapture described above, incurred for the year ended December 31, 2012 were equivalent to a net annual effective rate of 0.04% of each Portfolio’s average daily net assets.
Accounting and legal services. Pursuant to a service agreement, the Portfolios reimburse the Adviser for all expenses associated with providing the administrative, financial, legal, accounting and recordkeeping services to the Portfolios, including the preparation of all tax returns, periodic reports to shareholders and regulatory reports, among other services. These expenses are allocated to each share class based on its relative net assets at the time the expense was incurred. These accounting and legal services fees incurred for the year ended December 31, 2012 amounted to an annual rate of 0.01% of the Portfolios’ average daily net assets.
Distribution and service plans. The Portfolios have a distribution agreement with the Distributor. The Portfolios have adopted distribution and service plans with respect to Class A, Class B, Class C, Class R1, Class R2, Class R3, Class R4 and Class 1 shares pursuant to Rule 12b-1 under the 1940 Act, to pay the Distributor for services provided as the distributor of shares of the Portfolio. In addition, under a service plan for Class R1, Class R2, Class R3, Class R4 and Class R5 shares, the Portfolios pay for certain other services. The Portfolios may pay up to the following contractual rates of Rule 12b-1 distribution and service fees and other service fees under these arrangements, expressed as an annual percentage of average daily net assets for each class of the Portfolios’ shares.
| | | | | | |
| Class | Rule 12b-1 Fee | Service Fee | | | | |
| | | | |
| Class A | 0.30% | — | | | | |
| Class B | 1.00% | — | | | | |
| Class C | 1.00% | — | | | | |
| Class R1 | 0.50% | 0.25% | | | | |
| Class R2 | 0.25% | 0.25% | | | | |
| Class R3 | 0.50% | 0.15% | | | | |
| Class R4 | 0.25% | 0.10% | | | | |
| Class R5 | — | 0.05% | | | | |
| Class 1 | 0.05% | — | | | | |
Effective June 1, 2012, the Distributor has contractually agreed to waive 0.10% of Rule 12b-1 fees for Class R4 shares to limit the Rule 12b-1 fees on Class R4 shares to 0.15% of the average daily net assets of Class R4 shares, until at least April 30, 2014, unless renewed by mutual agreement of the Portfolios and the Distributor based upon a determination that this is appropriate under the circumstances at the time.
Accordingly, these fee waivers and/or reimbursements amounted to the following for Class R4 shares, for the year ended December 31, 2012:
| | | | | | |
| | | Class R4 | | | | |
| Portfolio | | Rule 12b-1 Reimbursement | | | | |
| | | | |
| Lifestyle Aggressive | | $5,195 | | | | |
| Lifestyle Growth | | 12,994 | | | | |
| Lifestyle Balanced | | 43,806 | | | | |
| Lifestyle Moderate | | 6,394 | | | | |
| Lifestyle Conservative | | 5,230 | | | | |
Sales charges. Class A shares are assessed up-front sales charges of up to 5% of the net asset value of such shares. The following summarizes the net up-front sales charges received by the Distributor during the year ended December 31, 2012:
| | | | | | |
| Lifestyle Aggressive | Lifestyle Growth | Lifestyle Balanced | Lifestyle Moderate | Lifestyle Conservative |
|
| |
| Net sales charges | | $592,545 | $4,519,469 | $6,539,167 | $2,670,615 | $2,957,414 |
| Retained for printing prospectuses, | | | | | |
| advertising and sales literature | | 92,570 | 723,992 | 1,049,038 | 435,305 | 494,729 |
| Sales commission to unrelated broker-dealers | 477,557 | 3,697,440 | 5,408,708 | 2,168,612 | 2,401,769 |
| Sales commission to affiliated sales personnel | 22,418 | 98,037 | 81,421 | 66,698 | 60,916 |
| |
| 38 | Lifestyle Portfolios | Annual report |
Class A, Class B and Class C shares may be subject to contingent deferred sales charges (CDSCs). Certain Class A shares that are redeemed within one year of purchase are subject to a 1.00% sales charge. Class B shares that are redeemed within six years of purchase are subject to CDSCs, at declining rates, beginning at 5.00%. Class C shares that are redeemed within one year of purchase are subject to a 1.00% CDSC. CDSCs are applied to the lesser of the current market value at the time of redemption or the original purchase cost of the shares being redeemed. Proceeds from CDSCs are used to compensate the Distributor for service providing distribution-related services in connection with the sale of these shares. During the year ended December 31 2012, CDSCs received by the Distributor for Class A, Class B and Class C shares were as follows:
| | | | | | |
| Portfolio | Class A | Class B | Class C | | | |
| | | |
| Lifestyle Aggressive | $467 | $49,441 | $13,886 | | | |
| Lifestyle Growth | 5,755 | 196,001 | 56,649 | | | |
| Lifestyle Balanced | 3,418 | 176,035 | 61,338 | | | |
| Lifestyle Moderate | 1,400 | 88,698 | 42,523 | | | |
| Lifestyle Conservative | 1,226 | 91,856 | 68,895 | | | |
Transfer agent fees. The Portfolios have a transfer agent agreement with John Hancock Signature Services, Inc. (Signature Services), an affiliate of the Adviser. The transfer agent fees paid to Signature Services are determined based on the cost to Signature Services (Signature Services Cost) of providing recordkeeping services. The Signature Services Cost includes a component of allocated John Hancock corporate overhead for providing transfer agent services to the Portfolios and to all other John Hancock affiliated funds. It also includes out-of-pocket expenses that are comprised of payments made to third-parties for recordkeeping services provided to their clients who invest in one or more John Hancock funds. In addition, Signature Services Cost may be reduced by certain fees that Signature Services receives in connection with retirement and small accounts. Signature Services Cost is calculated monthly and allocated, as applicable, to four categories of share classes: Institutional Share Classes, Retirement Share Classes, Municipal Bond Classes and all other Retail Share Classes. Within each of these categories, the applicable costs are allocated to the affected John Hancock affiliated funds and/or classes, based on the relative average daily net assets.
Class level expenses. Class level expenses for the year ended December 31, 2012 were:
| | | | | |
| | | Distribution and | Transfer | State | Printing and |
| Portfolio | Share class | service fees | agent fees | registration fees | postage |
|
| Lifestyle Aggressive | Class A | $663,892 | $412,879 | $29,165 | $22,355 |
| | Class B | 238,413 | 44,421 | 14,291 | 3,768 |
| | Class C | 1,191,028 | 222,049 | 17,353 | 13,630 |
| | Class R1 | 63,886 | 2,216 | 13,633 | 826 |
| | Class R2 | 207 | 23 | 12,970 | 213 |
| | Class R3 | 65,566 | 2,518 | 14,034 | 739 |
| | Class R4 | 31,767 | 2,363 | 14,144 | 679 |
| | Class R5 | 6,492 | 2,979 | 13,983 | 769 |
| | Class R6 | — | 195 | 18,603 | 280 |
| | Class 1 | 1,685,284 | — | — | — |
| | Total | $3,946,535 | $689,643 | $148,176 | $43,259 |
|
| Lifestyle Growth | Class A | $2,415,765 | $1,502,879 | $66,546 | $81,407 |
| | Class B | 1,042,839 | 194,553 | 19,806 | 15,185 |
| | Class C | 4,606,543 | 858,739 | 35,740 | 54,411 |
| | Class R1 | 120,292 | 4,367 | 14,154 | 1,387 |
| | Class R2 | 208 | 23 | 12,983 | 240 |
| | Class R3 | 134,348 | 5,124 | 14,204 | 1,259 |
| | Class R4 | 74,896 | 5,548 | 15,170 | 1,126 |
| | Class R5 | 13,676 | 7,787 | 14,872 | 1,433 |
| | Class R6 | — | 226 | 19,002 | 329 |
| | Class 1 | 5,017,082 | — | — | — |
| | Total | $13,425,649 | $2,579,246 | $212,477 | $156,777 |
|
| Lifestyle Balanced | Class A | $2,718,021 | $1,691,397 | $79,757 | $72,033 |
| | Class B | 993,725 | 185,545 | 26,207 | 13,227 |
| | Class C | 5,405,731 | 1,008,002 | 43,040 | 46,559 |
| | Class R1 | 121,185 | 4,408 | 14,304 | 1,084 |
| | Class R2 | 209 | 23 | 12,962 | 443 |
| | Class R3 | 238,689 | 9,160 | 14,110 | 1,576 |
| | Class R4 | 224,071 | 17,334 | 16,773 | 2,547 |
| | Class R5 | 19,960 | 10,506 | 16,131 | 1,654 |
| | Class R6 | — | 461 | 19,045 | 330 |
| | Class 1 | 5,313,420 | — | — | — |
| | Total | $15,035,011 | $2,926,836 | $242,329 | $139,453 |
|
| |
| Annual report | Lifestyle Portfolios | 39 |
| | | | | |
| | | Distribution and | Transfer | State | Printing and |
| Portfolio | Share class | service fees | agent fees | registration fees | postage |
|
| Lifestyle Moderate | Class A | $1,046,443 | $651,128 | $44,224 | $26,453 |
| | Class B | 406,120 | 75,849 | 16,534 | 5,132 |
| | Class C | 2,614,424 | 487,744 | 30,960 | 21,332 |
| | Class R1 | 60,033 | 2,145 | 13,697 | 756 |
| | Class R2 | 210 | 23 | 12,962 | 240 |
| | Class R3 | 66,030 | 2,498 | 14,025 | 769 |
| | Class R4 | 34,471 | 2,594 | 14,657 | 650 |
| | Class R5 | 7,025 | 3,169 | 15,805 | 855 |
| | Class R6 | — | 92 | 17,313 | 267 |
| | Class 1 | 1,651,301 | — | — | — |
| | Total | $5,886,057 | $1,225,242 | $180,177 | $56,454 |
|
| Lifestyle Conservative | Class A | $1,206,937 | $751,629 | $38,197 | $29,031 |
| | Class B | 432,093 | 80,650 | 15,796 | 5,119 |
| | Class C | 2,951,713 | 550,890 | 24,139 | 23,387 |
| | Class R1 | 58,215 | 1,995 | 18,805 | 740 |
| | Class R2 | 211 | 23 | 8,245 | 240 |
| | Class R3 | 71,473 | 2,727 | 24,311 | 777 |
| | Class R4 | 32,828 | 2,367 | 14,851 | 686 |
| | Class R5 | 7,101 | 3,508 | 24,099 | 862 |
| | Class R6 | — | 205 | 19,046 | 280 |
| | Class 1 | 1,426,833 | — | — | — |
| | Total | $6,187,404 | $1,393,994 | $187,489 | $61,122 |
|
Trustee expenses. The Portfolios compensate each Trustee who is not an employee of the Adviser or its affiliates. The costs of paying Trustee compensation and expenses are allocated to each Portfolio based on its average daily net assets.
Note 5 — Fund share transactions
Transactions in Portfolios’ shares for the years ended December 31, 2012 and December 31, 2011 were as follows:
Lifestyle Aggressive
| | | | |
| | | Year ended 12-31-12 | | Year ended 12-31-11 |
| | Shares | Amount | Shares | Amount |
|
| Class A shares | | | | |
|
| Sold | 6,546,618 | $81,230,963 | 7,464,183 | $91,404,027 |
| Distributions reinvested | 189,811 | 2,441,000 | 243,063 | 2,751,452 |
| Repurchased | (6,006,478) | (74,601,304) | (4,951,189) | (60,481,347) |
| Net increase | 729,951 | $9,070,659 | 2,756,057 | $33,674,132 |
|
| Class B shares | | | | |
|
| Sold | 238,596 | $2,949,711 | 383,237 | $4,721,859 |
| Distributions reinvested | 5,888 | 75,895 | 11,799 | 133,917 |
| Repurchased | (359,517) | (4,419,877) | (342,031) | (4,148,048) |
| Net increase (decrease) | (115,033) | ($1,394,271) | 53,005 | $707,728 |
|
| Class C shares | | | | |
|
| Sold | 1,477,006 | $18,287,544 | 2,588,465 | $31,926,500 |
| Distributions reinvested | 34,428 | 444,120 | 65,280 | 740,942 |
| Repurchased | (2,028,905) | (25,079,212) | (1,764,063) | (21,317,749) |
| Net increase (decrease) | (517,471) | ($6,347,548) | 889,682 | $11,349,693 |
|
| Class R1 shares | | | | |
|
| Sold | 198,848 | $2,431,323 | 432,325 | $5,441,786 |
| Distributions reinvested | 4,049 | 52,186 | 6,396 | 72,657 |
| Repurchased | (267,568) | (3,279,369) | (366,618) | (4,506,805) |
| Net increase (decrease) | (64,671) | ($795,860) | 72,103 | $1,007,638 |
|
| Class R2 shares1 | | | | |
|
| Sold | 8,006 | $100,000 | — | — |
| Net increase | 8,006 | $100,000 | — | — |
|
| Class R3 shares | | | | |
|
| Sold | 202,975 | $2,501,105 | 290,766 | $3,553,417 |
| Distributions reinvested | 5,910 | 75,890 | 10,353 | 117,091 |
| Repurchased | (316,823) | (3,900,193) | (418,553) | (5,043,806) |
| Net decrease | (107,938) | ($1,323,198) | (117,434) | ($1,373,298) |
| |
| 40 | Lifestyle Portfolios | Annual report |
| | | | |
| | | Year ended 12-31-12 | | Year ended 12-31-11 |
| | Shares | Amount | Shares | Amount |
|
| Class R4 shares | | | | |
|
| Sold | 470,635 | $5,762,193 | 489,290 | $6,081,935 |
| Distributions reinvested | 7,398 | 94,846 | 11,062 | 124,889 |
| Repurchased | (558,684) | (6,943,072) | (428,018) | (5,286,717) |
| Net increase (decrease) | (80,651) | ($1,086,033) | 72,334 | $920,107 |
|
| Class R5 shares | | | | |
|
| Sold | 417,659 | $5,182,054 | 520,513 | $6,451,285 |
| Distributions reinvested | 9,200 | 118,042 | 19,696 | 222,375 |
| Repurchased | (842,458) | (10,587,042) | (375,287) | (4,504,410) |
| Net increase (decrease) | (415,599) | ($5,286,946) | 164,922 | $2,169,250 |
|
| Class R6 shares2 | | | | |
|
| Sold | 179,670 | $2,262,958 | 8,562 | $100,000 |
| Distributions reinvested | 2,404 | 30,777 | — | — |
| Repurchased | (22,990) | (285,963) | — | — |
| Net increase | 159,084 | $2,007,772 | 8,562 | $100,000 |
|
| Class 1 shares | | | | |
|
| Sold | 4,755,717 | $58,815,078 | 10,943,704 | $133,645,731 |
| Distributions reinvested | 3,976,367 | 50,897,498 | 5,480,200 | 61,761,848 |
| Repurchased | (28,314,394) | (351,650,872) | (19,800,854) | (237,203,958) |
| Net decrease | (19,582,310) | ($241,938,296) | (3,376,950) | ($41,796,379) |
|
| Net increase (decrease) | (19,986,632) | ($246,993,721) | 522,281 | $6,758,871 |
|
Lifestyle Growth
| | | | |
| | | Year ended 12-31-12 | | Year ended 12-31-11 |
| | Shares | Amount | Shares | Amount |
|
| Class A shares | | | | |
|
| Sold | 21,617,347 | $282,729,682 | 25,255,690 | $325,712,890 |
| Distributions reinvested | 1,047,720 | 14,102,737 | 1,135,940 | 13,619,901 |
| Repurchased | (15,385,999) | (201,129,161) | (13,974,478) | (179,071,981) |
| Net increase | 7,279,068 | $95,703,258 | 12,417,152 | $160,260,810 |
|
| Class B shares | | | | |
|
| Sold | 1,428,655 | $18,526,780 | 1,968,564 | $25,335,379 |
| Distributions reinvested | 72,488 | 978,594 | 92,910 | 1,116,780 |
| Repurchased | (1,315,668) | (17,132,556) | (1,198,774) | (15,315,522) |
| Net increase | 185,475 | $2,372,818 | 862,700 | $11,136,637 |
|
| Class C shares | | | | |
|
| Sold | 6,989,144 | $91,188,127 | 10,273,161 | $132,871,906 |
| Distributions reinvested | 331,572 | 4,469,588 | 430,104 | 5,165,542 |
| Repurchased | (6,714,814) | (87,411,788) | (6,786,907) | (86,332,541) |
| Net increase | 605,902 | $8,245,927 | 3,916,358 | $51,704,907 |
|
| Class R1 shares | | | | |
|
| Sold | 527,633 | $6,872,767 | 676,819 | $8,740,362 |
| Distributions reinvested | 15,702 | 212,144 | 17,883 | 215,130 |
| Repurchased | (439,681) | (5,699,950) | (559,464) | (7,376,787) |
| Net increase | 103,654 | $1,384,961 | 135,238 | $1,578,705 |
|
| Class R2 shares1 | | | | |
|
| Sold | 7,663 | $100,000 | — | — |
| Net increase | 7,663 | $100,000 | — | — |
|
| Class R3 shares | | | | |
|
| Sold | 348,629 | $4,518,692 | 731,870 | $9,416,869 |
| Distributions reinvested | 19,624 | 263,747 | 32,737 | 391,859 |
| Repurchased | (785,497) | (10,143,064) | (772,447) | (9,941,308) |
| Net decrease | (417,244) | ($5,360,625) | (7,840) | ($132,580) |
| |
| Annual report | Lifestyle Portfolios | 41 |
| | | | |
| | | Year ended 12-31-12 | | Year ended 12-31-11 |
| | Shares | Amount | Shares | Amount |
|
| Class R4 shares | | | | |
|
| Sold | 1,207,245 | $15,441,879 | 713,217 | $8,872,464 |
| Distributions reinvested | 25,659 | 344,864 | 30,211 | 361,630 |
| Repurchased | (1,209,750) | (15,997,180) | (839,042) | (10,488,230) |
| Net increase (decrease) | 23,154 | ($210,437) | (95,614) | ($1,254,136) |
|
| Class R5 shares | | | | |
|
| Sold | 1,317,356 | $17,284,507 | 938,722 | $12,212,673 |
| Distributions reinvested | 46,280 | 622,462 | 52,770 | 631,654 |
| Repurchased | (1,219,079) | (16,168,117) | (487,392) | (6,260,806) |
| Net increase | 144,557 | $1,738,852 | 504,100 | $6,583,521 |
|
| Class R6 shares2 | | | | |
|
| Sold | 253,307 | $3,395,751 | 11,535 | $141,552 |
| Distributions reinvested | 5,232 | 70,109 | 89 | 1,057 |
| Repurchased | (10,608) | (141,624) | (9) | (105) |
| Net increase | 247,931 | $3,324,236 | 11,615 | $142,504 |
|
| Class 1 shares | | | | |
|
| Sold | 11,077,067 | $144,086,192 | 18,053,853 | $233,685,010 |
| Distributions reinvested | 15,752,228 | 211,079,854 | 20,055,879 | 239,266,634 |
| Repurchased | (66,902,791) | (877,159,860) | (50,656,774) | (639,910,781) |
| Net decrease | (40,073,496) | ($521,993,814) | (12,547,042) | ($166,959,137) |
|
| Class 5 shares | | | | |
|
| Sold | 1,378,974 | $17,921,927 | 1,704,430 | $22,055,655 |
| Distributions reinvested | 223,661 | 2,992,587 | 240,178 | 2,862,925 |
| Repurchased | (400,947) | (5,237,765) | (240,535) | (3,020,497) |
| Net increase | 1,201,688 | $15,676,749 | 1,704,073 | $21,898,083 |
|
| Net increase (decrease) | (30,691,648) | ($399,018,075) | 6,900,740 | $84,959,314 |
|
Lifestyle Balanced
| | | | |
| | | Year ended 12-31-12 | | Year ended 12-31-11 |
| | Shares | Amount | Shares | Amount |
|
| Class A shares | | | | |
|
| Sold | 29,799,585 | $393,896,550 | 27,583,068 | $357,729,036 |
| Distributions reinvested | 1,648,142 | 22,203,029 | 1,623,599 | 20,142,210 |
| Repurchased | (16,076,799) | (212,815,312) | (13,281,688) | (171,487,865) |
| Net increase | 15,370,928 | $203,284,267 | 15,924,979 | $206,383,381 |
|
| Class B shares | | | | |
|
| Sold | 1,870,452 | $24,518,316 | 2,068,163 | $26,625,612 |
| Distributions reinvested | 117,766 | 1,591,417 | 136,001 | 1,676,290 |
| Repurchased | (1,002,770) | (13,220,061) | (1,032,699) | (13,314,679) |
| Net increase | 985,448 | $12,889,672 | 1,171,465 | $14,987,223 |
|
| Class C shares | | | | |
|
| Sold | 10,170,971 | $134,241,530 | 11,338,347 | $147,444,834 |
| Distributions reinvested | 648,794 | 8,772,999 | 793,316 | 9,792,429 |
| Repurchased | (7,790,575) | (102,765,426) | (7,232,333) | (93,268,932) |
| Net increase | 3,029,190 | $40,249,103 | 4,899,330 | $63,968,331 |
|
| Class R1 shares | | | | |
|
| Sold | 510,563 | $6,683,784 | 553,248 | $7,178,427 |
| Distributions reinvested | 19,161 | 257,539 | 24,934 | 307,691 |
| Repurchased | (581,101) | (7,660,314) | (376,903) | (4,861,927) |
| Net increase (decrease) | (51,377) | ($718,991) | 201,279 | $2,624,191 |
|
| Class R2 shares1 | | | | |
|
| Sold | 7,605 | $100,000 | — | — |
| Net increase | 7,605 | $100,000 | — | — |
| |
| 42 | Lifestyle Portfolios | Annual report |
| | | | |
| | | Year ended 12-31-12 | | Year ended 12-31-11 |
| | Shares | Amount | Shares | Amount |
|
| Class R3 shares | | | | |
|
| Sold | 788,988 | $10,363,332 | 865,516 | $11,151,510 |
| Distributions reinvested | 57,078 | 767,299 | 77,750 | 963,283 |
| Repurchased | (1,350,324) | (17,819,887) | (1,041,990) | (13,534,250) |
| Net decrease | (504,258) | ($6,689,256) | (98,724) | ($1,419,457) |
|
| Class R4 shares | | | | |
|
| Sold | 6,336,522 | $83,595,716 | 871,720 | $11,476,386 |
| Distributions reinvested | 126,337 | 1,697,241 | 65,932 | 819,277 |
| Repurchased | (3,411,704) | (45,323,645) | (1,037,906) | (13,443,059) |
| Net increase (decrease) | 3,051,155 | $39,969,312 | (100,254) | ($1,147,396) |
|
| Class R5 shares | | | | |
|
| Sold | 1,450,309 | $19,171,138 | 1,642,807 | $21,488,098 |
| Distributions reinvested | 80,278 | 1,077,660 | 110,529 | 1,376,693 |
| Repurchased | (2,067,688) | (27,326,993) | (1,290,830) | (16,820,167) |
| Net increase (decrease) | (537,101) | ($7,078,195) | 462,506 | $6,044,624 |
|
| Class R6 shares2 | | | | |
|
| Sold | 353,784 | $4,657,544 | 8,248 | $103,500 |
| Distributions reinvested | 6,223 | 83,976 | — | — |
| Repurchased | (23,203) | (310,274) | — | — |
| Net increase | 336,804 | $4,431,246 | 8,248 | $103,500 |
|
| Class 1 shares | | | | |
|
| Sold | 34,176,951 | $448,550,959 | 39,551,115 | $511,123,439 |
| Distributions reinvested | 22,417,405 | 299,880,075 | 26,838,854 | 333,196,257 |
| Repurchased | (51,222,941) | (676,975,779) | (36,844,586) | (470,092,098) |
| Net increase | 5,371,415 | $71,455,255 | 29,545,383 | $374,227,598 |
|
| Class 5 shares | | | | |
|
| Sold | 1,434,898 | $18,976,047 | 1,240,322 | $16,132,683 |
| Distributions reinvested | 163,876 | 2,194,885 | 160,865 | 1,995,168 |
| Repurchased | (256,469) | (3,317,908) | (259,546) | (3,316,409) |
| Net increase | 1,342,305 | $17,853,024 | 1,141,641 | $14,811,442 |
|
| Net increase | 28,402,114 | $375,745,437 | 53,155,853 | $680,583,437 |
|
Lifestyle Moderate
| | | | |
| | | Year ended 12-31-12 | | Year ended 12-31-11 |
| | Shares | Amount | Shares | Amount |
|
| Class A shares | | | | |
|
| Sold | 12,585,088 | $164,396,073 | 11,478,695 | $145,921,776 |
| Distributions reinvested | 788,832 | 10,431,025 | 754,289 | 9,356,716 |
| Repurchased | (7,794,657) | (101,628,949) | (5,332,351) | (67,791,561) |
| Net increase | 5,579,263 | $73,198,149 | 6,900,633 | $87,486,931 |
|
| Class B shares | | | | |
|
| Sold | 877,166 | $11,392,653 | 1,075,807 | $13,660,530 |
| Distributions reinvested | 63,761 | 843,884 | 63,595 | 786,336 |
| Repurchased | (408,443) | (5,320,085) | (367,327) | (4,657,413) |
| Net increase | 532,484 | $6,916,452 | 772,075 | $9,789,453 |
|
| Class C shares | | | | |
|
| Sold | 6,493,158 | $84,645,234 | 6,906,563 | $87,818,079 |
| Distributions reinvested | 438,826 | 5,811,808 | 457,098 | 5,659,846 |
| Repurchased | (3,837,488) | (50,036,708) | (3,348,037) | (42,388,595) |
| Net increase | 3,094,496 | $40,420,334 | 4,015,624 | $51,089,330 |
|
| Class R1 shares | | | | |
|
| Sold | 334,547 | $4,340,072 | 290,222 | $3,703,097 |
| Distributions reinvested | 12,333 | 163,215 | 13,573 | 168,255 |
| Repurchased | (204,333) | (2,654,134) | (265,849) | (3,385,518) |
| Net increase | 142,547 | $1,849,153 | 37,946 | $485,834 |
| |
| Annual report | Lifestyle Portfolios | 43 |
| | | | |
| | | Year ended 12-31-12 | | Year ended 12-31-11 |
| | Shares | Amount | Shares | Amount |
|
| Class R2 shares1 | | | | |
|
| Sold | 7,716 | $100,000 | — | — |
| Net increase | 7,716 | $100,000 | — | — |
|
| Class R3 shares | | | | |
|
| Sold | 260,175 | $3,374,916 | 403,702 | $5,139,065 |
| Distributions reinvested | 20,123 | 265,626 | 26,932 | 333,836 |
| Repurchased | (376,016) | (4,863,415) | (350,836) | (4,432,751) |
| Net increase (decrease) | (95,718) | ($1,222,873) | 79,798 | $1,040,150 |
|
| Class R4 shares | | | | |
|
| Sold | 570,862 | $7,382,594 | 246,227 | $3,128,495 |
| Distributions reinvested | 23,965 | 315,915 | 22,330 | 276,444 |
| Repurchased | (418,916) | (5,497,168) | (202,592) | (2,572,826) |
| Net increase | 175,911 | $2,201,341 | 65,965 | $832,113 |
|
| Class R5 shares | | | | |
|
| Sold | 416,723 | $5,420,537 | 790,524 | $10,089,122 |
| Distributions reinvested | 27,676 | 363,887 | 47,006 | 582,669 |
| Repurchased | (989,460) | (12,870,594) | (474,551) | (6,013,998) |
| Net increase (decrease) | (545,061) | ($7,086,170) | 362,979 | $4,657,793 |
|
| Class R6 shares2 | | | | |
|
| Sold | 132,468 | $1,768,610 | 7,994 | $100,000 |
| Distributions reinvested | 1,723 | 22,882 | — | — |
| Repurchased | (14,137) | (189,742) | — | — |
| Net increase | 120,054 | $1,601,750 | 7,994 | $100,000 |
|
| Class 1 shares | | | | |
|
| Sold | 13,540,901 | $175,499,000 | 13,082,359 | $166,615,780 |
| Distributions reinvested | 8,662,040 | 114,126,515 | 9,904,635 | 122,933,186 |
| Repurchased | (15,429,208) | (201,695,879) | (13,422,853) | (169,449,859) |
| Net increase | 6,773,733 | $87,929,636 | 9,564,141 | $120,099,107 |
|
| Class 5 shares | | | | |
|
| Sold | 887,000 | $11,536,611 | 612,369 | $7,775,812 |
| Distributions reinvested | 93,554 | 1,232,491 | 84,958 | 1,052,566 |
| Repurchased | (276,740) | (3,573,141) | (213,134) | (2,689,762) |
| Net increase | 703,814 | $9,195,961 | 484,193 | $6,138,616 |
|
| Net increase | 16,489,239 | $215,103,733 | 22,291,348 | $281,719,327 |
|
Lifestyle Conservative
| | | | |
| | | Year ended 12-31-12 | | Year ended 12-31-11 |
| | Shares | Amount | Shares | Amount |
|
| Class A shares | | | | |
|
| Sold | 16,485,132 | $218,406,695 | 16,626,365 | $214,371,407 |
| Distributions reinvested | 1,019,305 | 13,597,012 | 819,424 | 10,398,314 |
| Repurchased | (9,311,796) | (122,976,803) | (7,591,792) | (97,926,459) |
| Net increase | 8,192,641 | $109,026,904 | 9,853,997 | $126,843,262 |
|
| Class B shares | | | | |
|
| Sold | 1,085,716 | $14,340,232 | 1,213,609 | $15,617,448 |
| Distributions reinvested | 75,238 | 1,004,631 | 66,498 | 843,963 |
| Repurchased | (475,249) | (6,288,066) | (562,385) | (7,241,252) |
| Net increase | 685,705 | $9,056,797 | 717,722 | $9,220,159 |
|
| Class C shares | | | | |
|
| Sold | 8,677,376 | $114,808,866 | 9,052,182 | $116,563,348 |
| Distributions reinvested | 533,856 | 7,123,334 | 469,469 | 5,958,102 |
| Repurchased | (4,407,940) | (58,316,268) | (4,214,339) | (54,239,302) |
| Net increase | 4,803,292 | $63,615,932 | 5,307,312 | $68,282,148 |
| |
| 44 | Lifestyle Portfolios | Annual report |
| | | | |
| | | Year ended 12-31-12 | | Year ended 12-31-11 |
| | Shares | Amount | Shares | Amount |
|
| Class R1 shares | | | | |
|
| Sold | 355,693 | $4,723,573 | 306,782 | $3,975,039 |
| Distributions reinvested | 15,971 | 213,057 | 14,449 | 183,680 |
| Repurchased | (207,657) | (2,757,838) | (459,770) | (5,953,530) |
| Net increase (decrease) | 164,007 | $2,178,792 | (138,539) | ($1,794,811) |
|
| Class R2 shares1 | | | | |
|
| Sold | 7,622 | $100,000 | — | — |
| Net increase | 7,622 | $100,000 | — | — |
|
| Class R3 shares | | | | |
|
| Sold | 332,721 | $4,381,713 | 442,216 | $5,732,778 |
| Distributions reinvested | 24,838 | 330,471 | 29,066 | 369,187 |
| Repurchased | (355,405) | (4,671,166) | (490,152) | (6,346,100) |
| Net increase (decrease) | 2,154 | $41,018 | (18,870) | ($244,135) |
|
| Class R4 shares | | | | |
|
| Sold | 498,780 | $6,562,898 | 460,870 | $5,954,607 |
| Distributions reinvested | 22,529 | 299,530 | 25,387 | 322,310 |
| Repurchased | (611,503) | (8,087,876) | (302,677) | (3,897,650) |
| Net increase (decrease) | (90,194) | ($1,225,448) | 183,580 | $2,379,267 |
|
| Class R5 shares | | | | |
|
| Sold | 943,275 | $12,427,797 | 737,253 | $9,510,571 |
| Distributions reinvested | 40,401 | 537,917 | 44,615 | 566,159 |
| Repurchased | (1,115,453) | (14,626,308) | (266,887) | (3,452,543) |
| Net increase (decrease) | (131,777) | ($1,660,594) | 514,981 | $6,624,187 |
|
| Class R6 shares2 | | | | |
|
| Sold | 125,404 | $1,659,520 | 7,806 | $100,000 |
| Distributions reinvested | 2,732 | 36,576 | — | — |
| Repurchased | (15,458) | (207,702) | — | — |
| Net increase | 112,678 | $1,488,394 | 7,806 | $100,000 |
|
| Class 1 shares | | | | |
|
| Sold | 25,753,594 | $341,811,558 | 24,495,781 | $316,021,626 |
| Distributions reinvested | 8,441,260 | 112,325,015 | 8,583,834 | 108,961,974 |
| Repurchased | (12,200,592) | (162,035,261) | (12,240,403) | (157,655,502) |
| Net increase | 21,994,262 | $292,101,312 | 20,839,212 | $267,328,098 |
|
| Net increase | 35,740,390 | $474,723,107 | 37,267,201 | $478,738,175 |
|
1 The inception date for Class R2 shares is 3-1-12.
2 The inception date for Class R6 shares is 9-1-11.
As of December 31, 2012, affiliates of the Portfolios owned 100% of shares of beneficial interest of Class R2 of each of the Lifestyle Portfolios. As of December 31, 2012, affiliates of the Portfolios owned 5%, 3%, 2%, 7% and 7% of shares of beneficial interest of Class R6 of the Lifestyle Aggressive, Lifestyle Growth, Lifestyle Balanced, Lifestyle Moderate and Lifestyle Conservative Portfolios, respectively.
Note 6 — Purchase and sale of securities
The following summarizes the purchases and sales of the affiliated underlying funds for the year ended December 31, 2012:
| | | |
| Portfolio | Purchases | Sales | |
| |
| Lifestyle Aggressive | $807,398,705 | $1,019,844,863 | |
| Lifestyle Growth | 2,680,690,975 | 2,986,406,650 | |
| Lifestyle Balanced | 2,881,992,799 | 2,423,215,120 | |
| Lifestyle Moderate | 971,094,091 | 735,063,364 | |
| Lifestyle Conservative | 1,005,603,260 | 515,787,907 | |
| |
| Annual report | Lifestyle Portfolios | 45 |
Note 7 — Investment in affiliated underlying funds
The Portfolios invest primarily in affiliated underlying funds that are managed by the Adviser and affiliates. The Portfolios do not invest in the affiliated underlying funds for the purpose of exercising management or control; however, the Portfolios’ investment may represent a significant portion of each underlying fund’s net assets. As of December 31, 2012, the following Portfolios held 5% or more of an affiliated underlying fund’s net assets:
| | | | |
| | Percent of Underlying | | | Percent of Underlying |
| Portfolio Affiliate Class NAV | Funds’ Net Assets | | Portfolio Affiliate Class NAV | Funds’ Net Assets |
| |
|
| Lifestyle Aggressive | | | Lifestyle Growth | |
| John Hancock Funds II | | | John Hancock Funds II | |
| All Cap Core | 21.2% | | Active Bond | 11.0% |
| All Cap Value | 12.2% | | All Cap Core | 50.5% |
| Alpha Opportunities | 17.0% | | All Cap Value | 32.5% |
| Blue Chip Growth | 9.5% | | Alpha Opportunities | 41.8% |
| Capital Appreciation | 9.5% | | Blue Chip Growth | 25.4% |
| Capital Appreciation Value | 9.6% | | Capital Appreciation Value | 33.6% |
| China Emerging Leaders | 16.7% | | Capital Appreciation | 25.6% |
| Currency Strategies | 7.0% | | China Emerging Leaders | 39.0% |
| Emerging Markets | 14.5% | | Currency Strategies | 21.9% |
| Equity-Income | 10.6% | | Emerging Market | 33.8% |
| Fundamental Global Franchise | 9.4% | | Equity-Income | 28.3% |
| Fundamental Large Cap Value | 13.7% | | Floating Rate Income | 11.4% |
| Fundamental Value | 15.0% | | Fundamental Global Franchise | 32.1% |
| Global Real Estate | 9.2% | | Fundamental Large Cap Value | 36.6% |
| Health Science | 13.5% | | Fundamental Value | 35.9% |
| Heritage | 17.4% | | Global Absolute Return Strategies | 6.8% |
| International Growth Opportunities | 10.0% | | Global Bond | 9.8% |
| International Growth Stock | 15.5% | | Global High Yield | 18.6% |
| International Small Cap | 12.2% | | Global Real Estate | 28.7% |
| International Small Company | 17.0% | | Health Science | 36.3% |
| International Value | 11.0% | | Heritage | 44.3% |
| Mid Cap Stock | 10.5% | | High Income | 25.1% |
| Mid Cap Value Equity | 19.1% | | High Yield | 12.0% |
| Mid Value | 14.9% | | International Growth Opportunities | 23.7% |
| Mutual Shares | 15.6% | | International Growth Stock | 36.5% |
| Natural Resources | 9.7% | | International Small Cap | 25.3% |
| Real Estate Equity | 8.8% | | International Small Company | 35.1% |
| Redwood | 8.0% | | International Value | 26.0% |
| Small Cap Growth | 15.0% | | Mid Cap Stock | 26.8% |
| Small Cap Opportunities | 13.7% | | Mid Cap Value | 47.6% |
| Small Cap Value | 17.5% | | Mid Value | 38.0% |
| Small Company Growth | 17.3% | | Multi-Sector Bond | 14.2% |
| Small Company Value | 10.3% | | Mutual Shares | 41.4% |
| Smaller Company Growth | 17.4% | | Natural Resources | 22.6% |
| Technical Opportunities | 16.4% | | Real Estate Equity | 27.6% |
| U.S. Equity | 8.4% | | Real Return Bond | 8.2% |
| Value | 15.6% | | Redwood | 25.1% |
| John Hancock Funds III | | | Small Cap Growth | 31.3% |
| International Core | 7.4% | | Small Cap Opportunities | 28.6% |
| International Value Equity | 15.6% | | Small Cap Value | 36.3% |
| Rainier Growth | 6.6% | | Small Company Value | 21.5% |
| Strategic Growth | 14.2% | | Small Company Growth | 35.9% |
| John Hancock Investment Trust | | | Smaller Company Growth | 36.1% |
| Small Cap Intrinsic Value | 13.0% | | Spectrum Income | 14.8% |
| | | | Strategic Income Opportunities | 6.5% |
| | | | Technical Opportunities | 44.0% |
| | | | Total Return | 7.4% |
| | | | U.S. Equity | 28.9% |
| | | | U.S. High Yield Bond | 17.0% |
| | | | Value | 39.9% |
| | | | John Hancock Funds III | |
| | | | Disciplined Value | 6.1% |
| | | | Global Shareholder Yield | 16.0% |
| | | | International Core | 17.5% |
| | | | International Value Equity | 36.7% |
| | | | Rainer Growth | 17.6% |
| | | | Strategic Growth | 38.3% |
| | | | John Hancock Investment Trust | |
| | | | Small Cap Intrinsic Value | 26.9% |
| |
| 46 | Lifestyle Portfolios | Annual report |
| | | | |
| | Percent of Underlying | | | Percent of Underlying |
| Portfolio Affiliate Class NAV | Funds’ Net Assets | | Portfolio Affiliate Class NAV | Funds’ Net Assets |
|
| Lifestyle Balanced | | | Lifestyle Moderate | |
| John Hancock Funds II | | | John Hancock Funds II | |
| Active Bond | 31.3% | | Active Bond | 20.3% |
| All Cap Core | 28.4% | | All Cap Value | 8.1% |
| All Cap Value | 26.2% | | Alpha Opportunities | 5.9% |
| Alpha Opportunities | 26.6% | | Capital Appreciation Value | 7.8% |
| Blue Chip Growth | 20.5% | | Core Bond | 22.5% |
| Capital Appreciation Value | 29.5% | | Currency Strategies | 9.5% |
| Capital Appreciation | 20.6% | | Equity-Income | 7.1% |
| China Emerging Leaders | 28.7% | | Floating Rate Income | 12.7% |
| Core Bond | 33.6% | | Fundamental Global Franchise | 8.2% |
| Currency Strategies | 27.2% | | Fundamental Large Cap Value | 9.2% |
| Emerging Market | 24.4% | | Fundamental Value | 5.9% |
| Equity-Income | 22.7% | | Global Bond | 16.4% |
| Floating Rate Income | 25.9% | | Global High Yield | 14.3% |
| Fundamental Global Franchise | 31.7% | | Global Real Estate | 8.2% |
| Fundamental Large Cap Value | 29.4% | | High Income | 17.1% |
| Fundamental Value | 23.7% | | High Yield | 9.3% |
| Global Absolute Return Strategies | 9.3% | | International Growth Stock | 6.3% |
| Global Bond | 33.3% | | Investment Quality Bond | 18.5% |
| Global High Yield | 33.3% | | Mid Value | 7.9% |
| Global Real Estate | 31.6% | | Multi-Sector Bond | 16.0% |
| Health Science | 33.4% | | Natural Resources | 5.4% |
| Heritage | 31.1% | | Real Estate Equity | 9.9% |
| High Income | 39.9% | | Real Return Bond | 11.9% |
| High Yield | 21.7% | | Redwood | 9.1% |
| International Growth Opportunities | 19.5% | | Small Cap Growth | 7.2% |
| International Growth Stock | 29.8% | | Small Cap Value | 8.1% |
| International Small Cap | 18.3% | | Small Company Growth | 7.9% |
| International Small Company | 25.3% | | Smaller Company Growth | 8.0% |
| International Value | 21.3% | | Spectrum Income | 16.7% |
| Investment Quality Bond | 20.1% | | Strategic Income Opportunities | 5.9% |
| Mid Cap Stock | 18.8% | | Total Return | 13.7% |
| Mid Cap Value | 33.2% | | U.S. Equity | 7.5% |
| Mid Value | 26.6% | | U.S. High Yield Bond | 13.3% |
| Multi-Sector Bond | 39.1% | | John Hancock Funds III | |
| Mutual Shares | 33.4% | | International Value Equity | 6.3% |
| Natural Resources | 23.6% | | Strategic Growth | 6.9% |
| Real Estate Equity | 30.4% | | | |
| Real Return Bond | 27.1% | | Portfolio Affiliate Class NAV | Percent Funds’ of Underlying Net Assets |
| Redwood | 27.7% | |
|
| Small Cap Growth | 25.8% | | Lifestyle Conservative | |
| Small Cap Opportunities | 23.5% | | John Hancock Funds II | |
| Small Cap Value | 30.0% | | Active Bond | 23.7% |
| Small Company Value | 17.8% | | Blue Chip Growth | 5.4% |
| Small Company Growth | 29.2% | | Core Bond | 31.2% |
| Smaller Company Growth | 29.2% | | Currency Strategies | 9.5% |
| Spectrum Income | 40.7% | | Equity-Income | 5.7% |
| Strategic Income Opportunities | 14.4% | | Floating Rate Income | 14.2% |
| Technical Opportunities | 24.5% | | Fundamental Global Franchise | 5.2% |
| Total Return | 21.1% | | Fundamental Value | 5.5% |
| U.S. Equity | 29.1% | | Global Bond | 20.7% |
| U.S. High Yield Bond | 30.9% | | Global High Yield | 13.9% |
| Value | 28.1% | | Global Real Estate | 5.8% |
| John Hancock Funds III | | | High Income | 16.6% |
| Global Shareholder Yield | 16.1% | | High Yield | 9.0% |
| International Core | 14.3% | | Investment Quality Bond | 43.5% |
| International Value Equity | 30.1% | | Multi-Sector Bond | 17.2% |
| Rainer Growth | 14.2% | | Real Estate Equity | 9.3% |
| Strategic Growth | 30.4% | | Real Return Bond | 19.6% |
| John Hancock Investment Trust | | | Redwood | 8.6% |
| Small Cap Intrinsic Value | 21.6% | | Short Term Government Income | 72.5% |
| | | | Small Cap Growth | 7.1% |
| | | | Spectrum Income | 17.8% |
| | | | Strategic Income Opportunities | 6.3% |
| | | | Total Return | 16.0% |
| | | | U.S. High Yield Bond | 13.4% |
| |
| Annual report | Lifestyle Portfolios | 47 |
Auditors’ report
Report of Independent Registered Public Accounting Firm
To the Board of Trustees and Shareholders of John Hancock Funds II:
In our opinion, the accompanying statements of assets and liabilities, including the portfolios of investments, and the related statements of operations and of changes in net assets and the financial highlights present fairly, in all material respects, the financial position of each of the portfolios Lifestyle Aggressive Portfolio, Lifestyle Growth Portfolio, Lifestyle Balanced Portfolio, Lifestyle Moderate Portfolio, and Lifestyle Conservative Portfolio, which are part of John Hancock Funds II (the “Trust”) at December 31, 2012, the results of each of their operations for the year then ended, the changes in each of their net assets for each of the two years in the period then ended and the financial highlights for each of the periods indicated, in conformity with accounting principles generally accepted in the United States of America. These financial statements and financial highlights (hereafter referred to as “financial statements”) are the responsibility of the Trust’s management; our responsibility is to express an opinion on these financial statements based on our audits. We conducted our audits of these financial statements in accordance with the standards of the Public Company Accounting Oversight Board (United States). Those standards require that we plan and perform the audit to obtain reasonable assurance about whether the financial statements are free of material misstatement. An audit includes examining, on a test basis, evidence supporting the amounts and disclosures in the financial statements, assessing the accounting principles used and significant estimates made by management, and evaluating the overall financial statement presentation. We believe that our audits, which included confirmation of securities at December 31, 2012 by correspondence with the transfer agents, provide a reasonable basis for our opinion.
PricewaterhouseCoopers LLP
Boston, Massachusetts
February 25, 2013
| |
| 48 | Lifestyle Portfolios | Annual report |
Tax information
Unaudited
For federal income tax purposes, the following information is furnished with respect to the distributions of the Portfolios, if any, paid during their taxable year ended December 31, 2012.
Dividend Received Deduction. The Portfolios reports the maximum amount allowable of its net taxable income as eligible for the corporate dividends-received deduction.
Qualified Dividend Income. The Portfolios reports the maximum amount allowable of its net taxable income as qualified dividend income as provided in the Jobs and Growth Tax Relief Reconciliation Act of 2003.
Foreign Tax Credit. The following table details the income derived from foreign sources and the amounts the Portfolios intend to pass through as foreign tax credits for the fiscal year ended December 31, 2012:
| | | | |
| Fund | Foreign Source Income | Foreign Tax Credit | | |
| | |
| Lifestyle Aggressive | $19,827,491 | $1,773,863 | | |
| Lifestyle Growth | 45,930,125 | 4,114,601 | | |
| Lifestyle Balanced | 35,265,433 | 3,139,113 | | |
| Lifestyle Moderate | 6,854,170 | 609,888 | | |
| Lifestyle Conservative | 3,273,701 | 288,448 | | |
Eligible shareholders will be mailed a 2012 Form 1099-DIV in early 2013. This will reflect the tax character of all distributions paid in calendar year 2012.
Please consult a tax adviser regarding the tax consequences of your investment in the Fund.
| |
| Annual report | Lifestyle Portfolios | 49 |
Special Shareholder Meeting
Unaudited
On November 14, 2012, a Special Meeting of the Shareholders of John Hancock Funds II and each of its series, including John Hancock Lifestyle Portfolios, was held at 601 Congress Street, Boston, Massachusetts, for the purpose of considering and voting on the following proposal:
Proposal: Election of thirteen (13) Trustees as members of the Board of Trustees of John Hancock Funds II.
| | | | |
| | TOTAL VOTES | TOTAL VOTES WITHHELD | | |
| | FOR THE NOMINEE | FROM THE NOMINEE | | |
| | |
| Independent Trustees | | | | |
| Charles L. Bardelis | 7,616,504,618.81 | 68,337,736.33 | | |
| Peter S. Burgess | 7,615,970,679.45 | 68,871,675.70 | | |
| William H. Cunningham | 7,617,896,790.36 | 66,945,564.78 | | |
| Grace K. Fey | 7,615,778,673.96 | 69,063,681.18 | | |
| Theron S. Hoffman | 7,615,274,624.90 | 69,567,730.24 | | |
| Deborah C. Jackson | 7,613,243,797.95 | 71,598,557.20 | | |
| Hassell H. McClellan | 7,613,775,261.17 | 71,067,093.97 | | |
| James M. Oates | 7,609,760,388.78 | 75,081,966.36 | | |
| Steven R. Pruchansky | 7,616,850,614.43 | 67,991,740.71 | | |
| Gregory A. Russo | 7,622,347,084.59 | 62,495,270.55 | | |
| Non-Independent Trustees | | | | |
| James R. Boyle | 7,622,433,052.00 | 62,409,303.15 | | |
| Craig Bromley | 7,617,300,092.72 | 67,542,262.42 | | |
| Warren A. Thomson | 7,620,483,794.58 | 64,358,560.56 | | |
| |
| 50 | Lifestyle Portfolios | Annual report |
Trustees and Officers
This chart provides information about the Trustees and Officers who oversee your John Hancock fund as of December 1, 2012. Officers elected by the Trustees manage the day-to-day operations of each Portfolio and execute policies formulated by the Trustees.
Independent Trustees
| | |
| | | Number of |
| Name, Year of Birth | Trustee of | John Hancock |
| Position(s) held with Fund | the Fund | funds overseen |
| Principal occupation(s) and other directorships during past 5 years | since1 | by Trustee |
|
| James M. Oates, Born: 1946 | 2012 | 240 |
|
| Managing Director, Wydown Group (financial consulting firm) (since 1994); Chairman and | | |
| Director, Emerson Investment Management, Inc. (since 2000); Independent Chairman, | | |
| Hudson Castle Group, Inc. (formerly IBEX Capital Markets, Inc.) (financial services company) | | |
| (1997–2011); Director, Stifel Financial (since 1996); Director, Investor Financial Services | | |
| Corporation (1995–2007); Director, Connecticut River Bancorp (since 1998); Director, Virtus | | |
| Funds (formerly Phoenix Mutual Funds) (since 1988). Trustee and Chairman of the Board, | | |
| John Hancock retail funds (since 2012); Trustee, John Hancock Funds III (2005–2006 and since | | |
| 2012); Trustee (since 2004) and Chairman of the Board (since 2005), John Hancock Variable | | |
| Insurance Trust; Trustee and Chairman of the Board (since 2005), John Hancock Funds II. | | |
| |
|
| Charles L. Bardelis,3 Born: 1941 | 2012 | 240 |
|
| Director, Island Commuter Corp. (marine transport). Trustee, John Hancock retail funds (since | | |
| 2012); Trustee, John Hancock Funds III (2005–2006 and since 2012); Trustee, John Hancock | | |
| Variable Insurance Trust (since 1988); Trustee, John Hancock Funds II (since 2005). | | |
| |
|
| Peter S. Burgess,3 Born: 1942 | 2012 | 240 |
|
| Consultant (financial, accounting and auditing matters) (since 1999); Certified Public | | |
| Accountant; Partner, Arthur Andersen (independent public accounting firm) (prior to | | |
| 1999); Director, Lincoln Educational Services Corporation (since 2004); Director, | | |
| Symetra Financial Corporation (since 2010); former Director, PMA Capital Corporation | | |
| (2004–2010). Trustee, John Hancock retail funds (since 2012); Trustee, John Hancock | | |
| Funds III (2005–2006 and since 2012); Trustee, John Hancock Variable Insurance Trust | | |
| and John Hancock Funds II (since 2005). | | |
| |
|
| William H. Cunningham,2 Born: 1944 | 1994 | 240 |
|
| Professor, University of Texas, Austin, Texas (since 1971); former Chancellor, University | | |
| of Texas System and former President of the University of Texas, Austin, Texas; Director, | | |
| LIN Television (since 2009); Chairman (since 2009) and Director (since 2006), Lincoln | | |
| National Corporation (insurance); Director, Resolute Energy Corporation (since 2009); | | |
| Director, Southwest Airlines (since 2000); former Director, Introgen (manufacturer of | | |
| biopharmaceuticals) (until 2008); former Director, Hicks Acquisition Company I, Inc. (until | | |
| 2007); former Director, Texas Exchange Bank, SSB (formerly Bank of Crowley) (until 2009); | | |
| former Advisory Director, JP Morgan Chase Bank (formerly Texas Commerce Bank–Austin) | | |
| (until 2009). Trustee, John Hancock retail funds (since 1986); Trustee, John Hancock Variable | | |
| Insurance Trust (since 2012); Trustee, John Hancock Funds II (since 2012 and 2005–2006). | | |
| |
|
| Grace K. Fey, Born: 1946 | 2012 | 240 |
|
| Chief Executive Officer, Grace Fey Advisors (since 2007); Director and Executive Vice | | |
| President, Frontier Capital Management Company (1988–2007); Director, Fiduciary Trust | | |
| (since 2009). Trustee, John Hancock retail funds (since 2012); Trustee, John Hancock | | |
| Variable Insurance Trust and John Hancock Funds II (since 2008). | | |
| |
|
| Theron S. Hoffman,3 Born: 1947 | 2012 | 240 |
|
| Chief Executive Officer, T. Hoffman Associates, LLC (consulting firm) (since 2003); Director, | | |
| The Todd Organization (consulting firm) (2003–2010); President, Westport Resources | | |
| Management (investment management consulting firm) (2006–2008); Senior Managing | | |
| Director, Partner and Operating Head, Putnam Investments (2000–2003); Executive Vice | | |
| President, The Thomson Corp. (financial and legal information publishing) (1997–2000). | | |
| Trustee, John Hancock retail funds (since 2012); Trustee, John Hancock Variable Insurance | | |
| Trust and John Hancock Funds II (since 2008). | | |
| |
| Annual report | Lifestyle Portfolios | 51 |
Independent Trustees (continued)
| | |
| | | Number of |
| Name, Year of Birth | Trustee of | John Hancock |
| Position(s) held with Fund | the Fund | funds overseen |
| Principal occupation(s) and other directorships during past 5 years | since | by Trustee |
|
| Deborah C. Jackson,2 Born: 1952 | 2008 | 240 |
|
| President, Cambridge College, Cambridge, Massachusetts (since 2011); Chief Executive | | |
| Officer, American Red Cross of Massachusetts Bay (2002–2011); Board of Directors of | | |
| Eastern Bank Corporation (since 2001); Board of Directors of Eastern Bank Charitable | | |
| Foundation (since 2001); Board of Directors of American Student Assistance Corporation | | |
| (1996–2009); Board of Directors of Boston Stock Exchange (2002–2008); Board of | | |
| Directors of Harvard Pilgrim Healthcare (health benefits company) (2007–2011). Trustee, | | |
| John Hancock retail funds (since 2008); Trustee of John Hancock Variable Insurance Trust | | |
| and John Hancock Funds II (since 2012). | | |
| |
|
| Hassell H. McClellan, Born: 1945 | 2012 | 240 |
|
| Associate Professor, The Wallace E. Carroll School of Management, Boston College | | |
| (since 1984); Trustee, Virtus Variable Insurance Trust (formerly Phoenix Edge Series Funds) | | |
| (since 2008); Director, The Barnes Group (since 2010). Trustee, John Hancock retail funds | | |
| (since 2012); Trustee, John Hancock Funds III (2005–2006 and since 2012); Trustee, | | |
| John Hancock Variable Insurance Trust and John Hancock Funds II (since 2005). | | |
| |
|
| Steven R. Pruchansky,2 Born: 1944 | 1991 | 240 |
|
| Chairman and Chief Executive Officer, Greenscapes of Southwest Florida, Inc. (since 2000); | | |
| Director and President, Greenscapes of Southwest Florida, Inc. (until 2000); Member, Board | | |
| of Advisors, First American Bank (until 2010); Managing Director, Jon James, LLC (real estate) | | |
| (since 2000); Director, First Signature Bank & Trust Company (until 1991); Director, Mast | | |
| Realty Trust (until 1994); President, Maxwell Building Corp. (until 1991). Trustee (since 1992) | | |
| and Chairman of the Board (2011–2012), John Hancock retail funds; Trustee, John Hancock | | |
| Variable Insurance Trust and John Hancock Funds II (since 2012). | | |
| |
|
| Gregory A. Russo,2 Born: 1949 | 2009 | 240 |
|
| Director and Audit Committee Chairman (since 2012) and Member, Audit Committee and | | |
| Finance Committee (since 2011), NCH Healthcare System, Inc. (holding company for multi- | | |
| entity healthcare system); Director and Member of Finance Committee, The Moorings, Inc. | | |
| (nonprofit continuing care community) (since 2012); Vice Chairman, Risk & Regulatory Matters, | | |
| KPMG LLP (KPMG) (2002–2006); Vice Chairman, Industrial Markets, KPMG (1998–2002); | | |
| Chairman and Treasurer, Westchester County, New York, Chamber of Commerce (1986–1992); | | |
| Director, Treasurer and Chairman of Audit and Finance Committees, Putnam Hospital Center | | |
| (1989–1995); Director and Chairman of Fundraising Campaign, United Way of Westchester | | |
| and Putnam Counties, New York (1990–1995). Trustee, John Hancock retail funds (since 2008); | | |
| Trustee, John Hancock Variable Insurance Trust and John Hancock Funds II (since 2012). | | |
Non-Independent Trustees4
| | |
| | | Number of |
| Name, Year of Birth | Trustee of | John Hancock |
| Position(s) held with Fund | the Fund | funds overseen |
| Principal occupation(s) and other directorships during past 5 years | since | by Trustee |
|
| James R. Boyle, Born: 1959 | 2012 | 240 |
|
| Senior Executive Vice President, John Hancock Financial Services (since 1999, including | | |
| prior positions); Chairman and Director, John Hancock Advisers, LLC, John Hancock Funds, | | |
| LLC and John Hancock Investment Management Services, LLC (2005–2010). Trustee, | | |
| John Hancock retail funds (since 2012 and 2005–2010), Trustee, John Hancock Variable | | |
| Insurance Trust and John Hancock Funds II (since 2005). | | |
| |
|
| Craig Bromley,2 Born: 1966 | 2012 | 240 |
|
| President, John Hancock Financial Services (since 2012); Senior Executive Vice President and | | |
| General Manager, U.S. Division, John Hancock Financial Services (since 2012); President | | |
| and Chief Executive Officer, Manulife Insurance Company (Manulife (Japan) (2005–2012), | | |
| including prior positions). Trustee, John Hancock retail funds (since 2012); Trustee, | | |
| John Hancock Variable Insurance Trust and John Hancock Funds II (since 2012). | | |
| |
|
| Warren A. Thomson,2 Born: 1955 | 2012 | 240 |
|
| Senior Executive Vice President and Chief Investment Officer, Manulife Financial | | |
| Corporation (since 2001, including prior positions); Director, Manulife Trust Company and | | |
| Manulife Bank of Canada (2001–2013, including prior positions); Director and Chairman, | | |
| Manulife Asset Management (since 2001, including prior positions). Trustee, John Hancock | | |
| retail funds, John Hancock Variable Insurance Trust and John Hancock Funds II (since 2012). | | |
| |
| 52 | Lifestyle Portfolios | Annual report |
Principal officers who are not Trustees
| |
| | Officer |
| Name, Year of Birth | of the |
| Position(s) held with Fund | Trust |
| Principal occupation(s) and other directorships during past 5 years | since |
|
| Hugh McHaffie, Born: 1959 | 2009 |
|
| President | |
| Executive Vice President, John Hancock Financial Services (since 2006, including prior positions); Chairman | |
| and Director, John Hancock Advisers, LLC, John Hancock Investment Management Services, LLC and | |
| John Hancock Funds, LLC (since 2010); President, John Hancock Advisers, LLC (since 2012); President, | |
| John Hancock Investment Management Services, LLC (since 2010). President (since 2012) and former | |
| Trustee (2010–2012), John Hancock retail funds; President, John Hancock Variable Insurance Trust and | |
| John Hancock Funds II (since 2009). | |
| |
|
| Andrew G. Arnott, Born: 1971 | 2009 |
|
| Executive Vice President | |
| Senior Vice President, John Hancock Financial Services (since 2009); Executive Vice President, John Hancock | |
| Advisers, LLC (since 2005); Executive Vice President, John Hancock Investment Management Services, | |
| LLC (since 2006); President, John Hancock Funds, LLC (since 2004, including prior positions); Executive | |
| Vice President, John Hancock retail funds (since 2007, including prior positions); Executive Vice President, | |
| John Hancock Variable Insurance Trust and John Hancock Funds II (since 2007, including prior positions). | |
| |
|
| Thomas M. Kinzler, Born: 1955 | 2006 |
|
| Secretary and Chief Legal Officer | |
| Vice President, John Hancock Financial Services (since 2006); Secretary and Chief Legal Counsel, | |
| John Hancock Funds, LLC (since 2007); Secretary and Chief Legal Officer, John Hancock retail funds, | |
| John Hancock Variable Insurance Trust and John Hancock Funds II (since 2006). | |
| |
|
| Francis V. Knox, Jr., Born: 1947 | 2005 |
|
| Chief Compliance Officer | |
| Vice President, John Hancock Financial Services (since 2005); Chief Compliance Officer, John Hancock | |
| retail funds, John Hancock Variable Insurance Trust, John Hancock Funds II, John Hancock Advisers, | |
| LLC and John Hancock Investment Management Services, LLC (since 2005); Vice President and Chief | |
| Compliance Officer, John Hancock Asset Management a division of Manulife Asset Management (US) | |
| LLC (2005–2008). | |
| |
|
| Charles A. Rizzo, Born: 1957 | 2007 |
|
| Chief Financial Officer | |
| Vice President, John Hancock Financial Services (since 2008); Senior Vice President, John Hancock Advisers, | |
| LLC and John Hancock Investment Management Services, LLC (since 2008); Chief Financial Officer, | |
| John Hancock retail funds, John Hancock Variable Insurance Trust and John Hancock Funds II (since 2007). | |
| |
|
| Salvatore Schiavone, Born: 1965 | 2009 |
|
| Treasurer | |
| Assistant Vice President, John Hancock Financial Services (since 2007); Vice President, John Hancock | |
| Advisers, LLC and John Hancock Investment Management Services, LLC (since 2007); Treasurer, | |
| John Hancock retail funds (since 2007, including prior positions); Assistant Treasurer, John Hancock Variable | |
| Insurance Trust (2010–2012 and 2007–2009, including prior positions); Treasurer, John Hancock Fund II | |
| (since 2010, including prior positions). | |
John Hancock retail funds is comprised of John Hancock Funds III and 33 other John Hancock funds consisting of 23 series of other John Hancock trusts and 10 closed-end funds.
The business address for all Trustees and Officers is 601 Congress Street, Boston, Massachusetts 02210–2805.
The Statement of Additional Information of the Fund includes additional information about members of the Board of Trustees of the Fund and is available without charge, upon request, by calling 1-800–225-5291.
1 Each Trustee holds office until his or her successor is elected and qualified, or until the Trustee’s death, retirement, resignation or removal.
2 Became a Trustee of the Fund, effective December 1, 2012.
3 Member of Audit Committee.
4 Because Messrs. Bromley and Thomson are senior executives or directors and Mr. Boyle held prior positions as a senior executive or director with the Adviser and/or its affiliates, each of them is considered an “interested person,” as defined in the Investment Company Act of 1940, of the Fund.
| |
| Annual report | Lifestyle Portfolios | 53 |
More information
| |
| Trustees | Investment adviser |
| James M. Oates, Chairperson | John Hancock Advisers, LLC |
| Steven R. Pruchansky, Vice Chairperson | |
| Charles L. Bardelis* | Subadvisers |
| James R. Boyle† | John Hancock Asset Management a division of |
| Craig Bromley† | Manulife Asset Management (US) LLC |
| Peter S. Burgess* | |
| William H. Cunningham | Principal distributor |
| Grace K. Fey | John Hancock Funds, LLC |
| Theron S. Hoffman* | |
| Deborah C. Jackson | Custodian |
| Hassell H. McClellan | State Street Bank and Trust Company |
| Gregory A. Russo | |
| Warren A. Thomson† | Transfer agent |
| | John Hancock Signature Services, Inc. |
| Officers | |
| Hugh McHaffie | Legal counsel |
| President | K&L Gates LLP |
| | |
| Andrew G. Arnott | Independent registered public accounting firm |
| Executive Vice President | PricewaterhouseCoopers LLP |
| | |
| Thomas M. Kinzler | |
| Secretary and Chief Legal Officer | |
| | |
| Francis V. Knox, Jr. | |
| Chief Compliance Officer | |
| | |
| Charles A. Rizzo | |
| Chief Financial Officer | |
| | |
| Salvatore Schiavone | |
| Treasurer | |
| | |
| *Member of the Audit Committee | |
| †Non-Independent Trustee | |
The Portfolios’ proxy voting policies and procedures, as well as the Portfolios’ proxy voting record for the most recent twelve-month period ended June 30, are available free of charge on the Securities and Exchange Commission (SEC) Web site at www.sec.gov or on our Web site.
The Portfolios’ complete list of portfolio holdings, for the first and third fiscal quarters, is filed with the SEC on Form N-Q. The Portfolios’ Form N-Q is available on our Web site and the SEC’s Web site, www.sec.gov, and can be reviewed and copied (for a fee) at the SEC’s Public Reference Room in Washington, DC. Call 1-202-551-8090 to receive information on the operation of the SEC’s Public Reference Room.
We make this information on your portfolio, as well as monthly portfolio holdings, and other fund details available on our Web site at www.jhfunds.com or by calling 1-800-225-5291.
| | |
| You can also contact us: | | |
| 1-800-225-5291 | Regular mail: | Express mail: |
| jhfunds.com | John Hancock Signature Services, Inc. | John Hancock Signature Services, Inc. |
| | P.O. Box 55913 | Mutual Fund Image Operations |
| | Boston, MA 02205-5913 | 30 Dan Road |
| | | Canton, MA 02021 |
| |
| 54 | Lifestyle Portfolios | Annual report |

ITEM 2. CODE OF ETHICS.
(a) As of the end of the fiscal year, December 31, 2012, the registrant has adopted a code of ethics, as defined in Item 2 of Form N-CSR), that applies to its Chief Executive Officer and Chief Financial Officer (respectively, the principal executive officer, the principal financial officer, the “Covered Officers”). A copy of the code of ethics is filed as an exhibit to this Form N-CSR.
(b) Not applicable
(c) Not applicable
(d) Not applicable
(e) Not applicable
(f)(1) A copy of the Code of Ethics is attached hereto.
(f)(2) Not applicable
(f)(3) The Registrant will provide a copy of the Code of Ethics to any person without charge, upon request by calling the following toll free number (800) 344-1029.
ITEM 3. AUDIT COMMITTEE FINANCIAL EXPERT.
The Board of Trustees of the Registrant has determined that it has one “audit committee financial expert” as that term is defined in Item 3(b) of Form N-CSR: Peter S. Burgess, who is “independent” as that term is defined in Item 3(a) (2) of Form N-CSR.
ITEM 4. PRINCIPAL ACCOUNTANT FEES AND SERVICES.
(a) AUDIT FEES:
2012: $131,796
2011: $120,540
These fees represent aggregate fees billed for the last two fiscal years (the “Reporting Periods”) for professional services rendered by the principal accountant for the audits of the Registrant’s annual financial statements or services that are normally provided by the accountant in connection with statutory and regulatory filing or engagements for such Reporting Periods.
(b) AUDIT RELATED FEES:
2012: $41,776
2011: $40,948
These fees represent the aggregate fees billed for the Reporting Periods for assurance and related services by the principal accountant that are reasonably related to the performance of the audit of the Registrant’s financial statements and are not reported under paragraph (a) of this Item. Such fees relate to professional services rendered by PwC for separate audit reports in connection with security counts pursuant to Rule 17f-2 under the Investment Company Act of 1940 and affiliated service provider internal controls reviews.
(c) TAX FEES:
2012: $0
2011: $8,458
These fees represent aggregate fees billed for the Reporting Periods for professional services rendered by the principal accountant for tax compliance, tax advice and tax planning. The tax fees for the year ended December 31, 2012 were $0 as the tax services were provided by a service provider other than the principal accountant. The tax services provided by the principal accountant for the year ended December 31, 2011 related to the review of the Registrant’s tax returns and tax distribution requirements.
(d) ALL OTHER FEES:
2012: $36,842
2011: $370
These fees represent other fees for John Hancock Funds II billed to the registrant or to control affiliates.
(e) (1) Audit Committee Pre-Approval Policies and Procedures:
The Trust’s Audit Committee must pre-approve all audit and non-audit services provided by the independent registered public accounting firm (the “Auditor”) relating to the operations or financial reporting of the funds. Prior to the commencement of any audit or non-audit services to a fund, the Audit Committee reviews the services to determine whether they are appropriate and permissible under applicable law.
The Trust’s Audit Committee has adopted policies and procedures to, among other purposes, provide a framework for the Committee’s consideration of audit-related and non-audit services by the Auditor. The policies and procedures require that any audit-related and non-audit service provided by the Auditor and any non-audit service provided by the Auditor to a fund service provider that relates directly to the operations and financial reporting of a fund are subject to approval by the Audit Committee before such service is provided. Audit-related services provided by the Auditor that are expected to exceed $25,000 per instance/per fund are subject to specific pre-approval by the Audit Committee. Tax services provided by the Auditor that are expected to exceed $30,000 per instance/per fund are subject to specific pre-approval by the Audit Committee.
All audit services, as well as the audit-related and non-audit services that are expected to exceed the amounts stated above, must be approved in advance of provision of the service by formal resolution of the Audit Committee. At the regularly scheduled Audit Committee meetings, the Committee reviews a report summarizing the services, including fees, provided by the Auditor.
(2) Amount approved by the Audit Committee pursuant paragraph (c) (7) (i) (C) of Rule 2-01 of Regulation S-X: None.
(f) Not Applicable.
(g) The aggregate non-audit fees billed by PwC for services rendered to the registrant and rendered to the registrant's control affiliates for each of the last two fiscal years of the registrant were $2,909,584 for the fiscal year ended December 31, 2012 and $2,529,075 for the fiscal year ended December 31, 2011.
(h) The Registrant’s audit committee of the Board of Trustees has considered the provision of non-audit services that were rendered to the Registrant’s investment adviser and service affiliates that
were not pre-approved pursuant to paragraph (c) (7ii) of Rule 2-01 of Regulation S-X, to be compatible with maintaining PwC’s independence.
ITEM 5. AUDIT COMMITTEE OF LISTED REGISTRANTS
Peter S. Burgess - Chairman
Charles L. Bardelis
Theron S. Hoffman
ITEM 6. SCHEDULE OF INVESTMENTS.
(a) Included with Item 1.
(b) Not Applicable.
ITEM 7. DISCLOSURE OF PROXY VOTING POLICIES AND PROCEDURES FOR CLOSED-END MANAGEMENT INVESTMENT COMPANIES. Not Applicable.
ITEM 8. PORTFOLIO MANAGERS OF CLOSED-END MANAGEMENT INVESTMENT COMPANIES. Not Applicable.
ITEM 9. PURCHASE OF EQUITY SECURITIES BY CLOSED-END MANAGEMENT INVESTMENT COMPANIES AND AFFILIATED PURCHASERS. Not Applicable.
ITEM 10. SUBMISSION OF MATTERS TO VOTE OF SECURITY HOLDERS. Not Applicable.
ITEM 11. CONTROLS AND PROCEDURES.
(a) EVALUATION OF DISCLOSURE CONTROLS AND PROCEDURES. The Registrant maintains disclosure controls and procedures that are designed to ensure that information required to be disclosed in this Form N-CSR is recorded, processed, summarized and reported within the periods specified in the rules and forms of the Securities and Exchange Commission. Such disclosure controls and procedures include controls and procedures designed to ensure that such information is accumulated and communicated to the Registrant's management, including its principal executive officer and principal financial officer, as appropriate, to allow timely decisions regarding required disclosure.
Within 90 days prior to the filing date of this Form N-CSR, the Registrant had carried out an evaluation, under the supervision and with the participation of the Registrant's management, including the Registrant's principal executive officer and the Registrant's principal financial officer, of the effectiveness of the design and operation of the Registrant's disclosure controls and procedures relating to information required to be disclosed on Form N-CSR. Based on such evaluation, the Registrant's principal executive officer and principal financial officer concluded that the Registrant's disclosure controls and procedures are operating effectively to ensure that:
(i) information required to be disclosed in this Form N-CSR is recorded, processed, summarized and reported within the periods specified in the rules and forms of the Securities and Exchange Commission, and
(ii) information is accumulated and communicated to the Registrant’s management, including its principal executive officer and principal financial officer, as appropriate, to allow timely decisions regarding required disclosure.
(b) CHANGE IN REGISTRANT’S INTERNAL CONTROL: Not Applicable.
ITEM 12. EXHIBITS.
(a)(1) SEE ATTACHED CODE OF ETHICS.
(a)(2)(i) CERTIFICATION OF PRINCIPAL EXECUTIVE OFFICER.
(a)(2)(ii) CERTIFICATION OF PRINCIPAL FINANCIAL OFFICER.
(b) CERTIFICATION PURSUANT TO Rule 30a-2(b) OF THE INVESTMENT COMPANY ACT OF 1940
SIGNATURES
Pursuant to the requirements of the Securities Exchange Act of 1934 and the Investment Company Act of 1940, the registrant has duly caused this report to be signed on its behalf by the undersigned, thereunto duly authorized.
|
| JOHN HANCOCK FUNDS II |
| |
| |
| |
| |
| /s/ Hugh McHaffie |
| Hugh McHaffie |
| President |
| Date: February 20, 2013 |
Pursuant to the requirements of the Securities Exchange Act of 1934 and the Investment Company Act of 1940, this report has been signed below by the following persons on behalf of the registrant and in the capacities and on the dates indicated.
|
| /s/ Hugh McHaffie |
| Hugh McHaffie |
| President |
| Date: February 20, 2013 |
| |
| |
| |
| |
| /s/ Charles A. Rizzo |
| Charles A. Rizzo |
| Chief Financial Officer |
| Date: February 20, 2013 |