As a shareholder of a John Hancock Funds II Multimanager Lifestyle Portfolio, you incur two types of costs: (1) transaction costs, including sales charges (loads) on certain purchases or redemptions, and (2) ongoing costs, including management fees, distribution and service (Rule 12b-1) fees, and other portfolio expenses. In addition to the operating expenses which each portfolio bears directly, the portfolio indirectly bears a pro rata share of the operating expenses of the underlying funds in which each portfolio invests. Because underlying funds have varied operating expenses and transaction costs and the portfolio may own different proportions of the underlying funds at different times, the amount of expenses incurred indirectly by the portfolio will vary. Had these indirect expenses been reflected in the following analysis, total expenses would have been higher than the amounts shown.
These examples are intended to help you understand your ongoing costs (in dollars) of investing in a portfolio so you can compare these costs with the ongoing costs of investing in other mutual funds. The examples are based on an investment of $1,000 at the beginning of the period and held for the entire period (January 1, 2018 through June 30, 2018).
Actual expenses:
The first line of each share class in the following table provides information about actual account values and actual expenses. You may use the information in this line, together with the amount you invested, to estimate the expenses that you paid over the period. Simply divide your account value by $1,000 (for example, an $8,600 account value divided by $1,000 = 8.6), then multiply the result by the number in the first line under the heading entitled “Expenses paid during period ended” to estimate the expenses you paid on your account during this period.
Hypothetical example for comparison purposes:
The second line of each share class in the following table provides information about hypothetical account values and hypothetical expenses based on the actual expense ratio for the share class and an assumed annualized rate of return of 5% per year before expenses, which is not the actual return of the share class. The hypothetical account values and expenses may not be used to estimate the actual ending account balance or expenses you paid for the period. You may use this information to compare the ongoing costs of investing in a portfolio and other funds. To do so, compare this 5% hypothetical example with the 5% hypothetical examples that appear in the shareholder reports of the other funds. Please remember that these hypothetical account values and expenses may not be used to estimate the actual ending account balance or expenses you paid for the period.
Please note that the expenses shown in the table are meant to highlight your ongoing costs only and do not reflect any transactional costs. Therefore, the second line of each share class in the table is useful in comparing ongoing costs only, and will not help you determine the relative total costs of owning different funds. In addition, if these transactional costs were included, your costs would have been higher. See the portfolios’ prospectuses for details regarding transaction costs.
| SEMIANNUAL REPORT | JOHN HANCOCK MULTIMANAGER LIFESTYLE PORTFOLIOS 14 |
| |
| SHAREHOLDER EXPENSE EXAMPLE CHART |
|
| | | | | | | | | | |
| | | | | | | | Expenses | | |
| | | | Account | | Ending | | paid during | | Annualized |
| | | | value on | | value on | | period ended | | expense |
| | | | 1-1-2018 | | 6-30-2018 | | 6-30-20181 | | ratio2 |
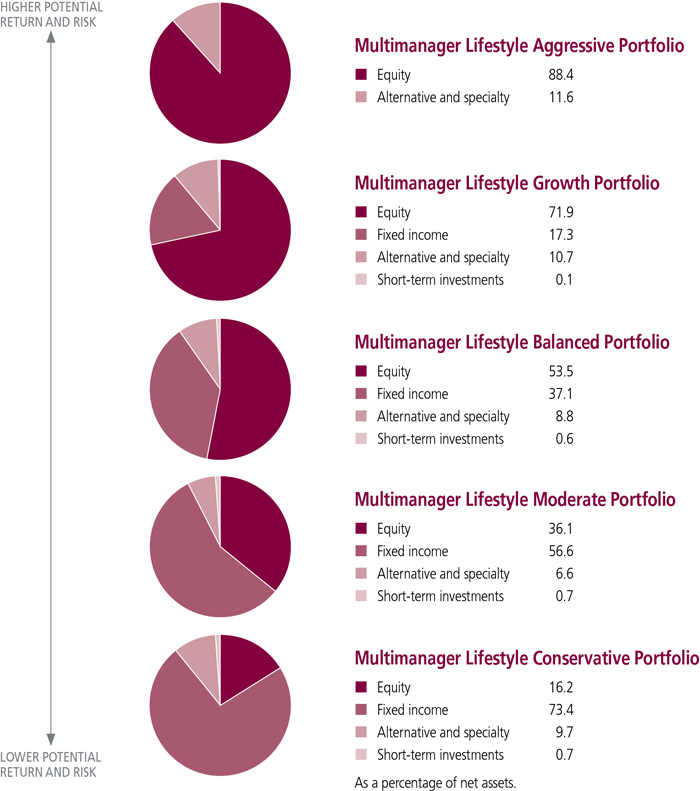
| Multimanager Lifestyle Aggressive Portfolio |
| Class A | | Actual expenses/actual returns | | $1,000.00 | | $1,010.30 | | $2.34 | | 0.47% |
| | Hypothetical example | | 1,000.00 | | 1,022.50 | | 2.36 | | 0.47% |
| Class B | | Actual expenses/actual returns | | 1,000.00 | | 1,006.60 | | 5.82 | | 1.17% |
| | Hypothetical example | | 1,000.00 | | 1,019.00 | | 5.86 | | 1.17% |
| Class C | | Actual expenses/actual returns | | 1,000.00 | | 1,006.60 | | 5.82 | | 1.17% |
| | Hypothetical example | | 1,000.00 | | 1,019.00 | | 5.86 | | 1.17% |
| Class I | | Actual expenses/actual returns | | 1,000.00 | | 1,011.50 | | 0.85 | | 0.17% |
| | Hypothetical example | | 1,000.00 | | 1,024.00 | | 0.85 | | 0.17% |
| Class R1 | | Actual expenses/actual returns | | 1,000.00 | | 1,008.50 | | 4.08 | | 0.82% |
| | Hypothetical example | | 1,000.00 | | 1,020.70 | | 4.11 | | 0.82% |
| Class R2 | | Actual expenses/actual returns | | 1,000.00 | | 1,009.70 | | 2.99 | | 0.60% |
| | Hypothetical example | | 1,000.00 | | 1,021.80 | | 3.01 | | 0.60% |
| Class R3 | | Actual expenses/actual returns | | 1,000.00 | | 1,008.50 | | 3.59 | | 0.72% |
| | Hypothetical example | | 1,000.00 | | 1,021.20 | | 3.61 | | 0.72% |
| Class R4 | | Actual expenses/actual returns | | 1,000.00 | | 1,010.90 | | 1.65 | | 0.33% |
| | Hypothetical example | | 1,000.00 | | 1,023.20 | | 1.66 | | 0.33% |
| Class R5 | | Actual expenses/actual returns | | 1,000.00 | | 1,011.50 | | 0.65 | | 0.13% |
| | Hypothetical example | | 1,000.00 | | 1,024.10 | | 0.65 | | 0.13% |
| Class R6 | | Actual expenses/actual returns | | 1,000.00 | | 1,012.10 | | 0.40 | | 0.08% |
| | Hypothetical example | | 1,000.00 | | 1,024.40 | | 0.40 | | 0.08% |
| Class 1 | | Actual expenses/actual returns | | 1,000.00 | | 1,011.60 | | 0.55 | | 0.11% |
| | Hypothetical example | | 1,000.00 | | 1,024.20 | | 0.55 | | 0.11% |
| Multimanager Lifestyle Growth Portfolio |
| Class A | | Actual expenses/actual returns | | $1,000.00 | | $1,003.70 | | $2.33 | | 0.47% |
| | Hypothetical example | | 1,000.00 | | 1,022.50 | | 2.36 | | 0.47% |
| Class B | | Actual expenses/actual returns | | 1,000.00 | | 1,000.60 | | 5.80 | | 1.17% |
| | Hypothetical example | | 1,000.00 | | 1,019.00 | | 5.86 | | 1.17% |
| Class C | | Actual expenses/actual returns | | 1,000.00 | | 1,000.60 | | 5.80 | | 1.17% |
| | Hypothetical example | | 1,000.00 | | 1,019.00 | | 5.86 | | 1.17% |
| Class I | | Actual expenses/actual returns | | 1,000.00 | | 1,005.00 | | 0.89 | | 0.18% |
| | Hypothetical example | | 1,000.00 | | 1,023.90 | | 0.90 | | 0.18% |
| Class R1 | | Actual expenses/actual returns | | 1,000.00 | | 1,001.80 | | 4.07 | | 0.82% |
| | Hypothetical example | | 1,000.00 | | 1,020.70 | | 4.11 | | 0.82% |
| Class R2 | | Actual expenses/actual returns | | 1,000.00 | | 1,003.10 | | 2.73 | | 0.55% |
| | Hypothetical example | | 1,000.00 | | 1,022.10 | | 2.76 | | 0.55% |
| Class R3 | | Actual expenses/actual returns | | 1,000.00 | | 1,002.50 | | 3.28 | | 0.66% |
| | Hypothetical example | | 1,000.00 | | 1,021.50 | | 3.31 | | 0.66% |
| Class R4 | | Actual expenses/actual returns | | 1,000.00 | | 1,004.30 | | 1.64 | | 0.33% |
| | Hypothetical example | | 1,000.00 | | 1,023.20 | | 1.66 | | 0.33% |
| Class R5 | | Actual expenses/actual returns | | 1,000.00 | | 1,005.60 | | 0.65 | | 0.13% |
| | Hypothetical example | | 1,000.00 | | 1,024.10 | | 0.65 | | 0.13% |
| Class R6 | | Actual expenses/actual returns | | 1,000.00 | | 1,005.60 | | 0.40 | | 0.08% |
| | Hypothetical example | | 1,000.00 | | 1,024.40 | | 0.40 | | 0.08% |
| Class 1 | | Actual expenses/actual returns | | 1,000.00 | | 1,005.60 | | 0.60 | | 0.12% |
| | Hypothetical example | | 1,000.00 | | 1,024.20 | | 0.60 | | 0.12% |
| Class 5 | | Actual expenses/actual returns | | 1,000.00 | | 1,005.60 | | 0.35 | | 0.07% |
| | Hypothetical example | | 1,000.00 | | 1,024.40 | | 0.35 | | 0.07% |
| SEMIANNUAL REPORT | JOHN HANCOCK MULTIMANAGER LIFESTYLE PORTFOLIOS 15 |
| |
| SHAREHOLDER EXPENSE EXAMPLE CHART (continued) |
|
| | | | | | | | | | |
| | | | | | | | Expenses | | |
| | | | Account | | Ending | | paid during | | Annualized |
| | | | value on | | value on | | period ended | | expense |
| | | | 1-1-2018 | | 6-30-2018 | | 6-30-20181 | | ratio2 |
| Multimanager Lifestyle Balanced Portfolio |
| Class A | | Actual expenses/actual returns | | $1,000.00 | | $ 998.70 | | $2.38 | | 0.48% |
| | Hypothetical example | | 1,000.00 | | 1,022.40 | | 2.41 | | 0.48% |
| Class B | | Actual expenses/actual returns | | 1,000.00 | | 995.50 | | 5.84 | | 1.18% |
| | Hypothetical example | | 1,000.00 | | 1,018.90 | | 5.91 | | 1.18% |
| Class C | | Actual expenses/actual returns | | 1,000.00 | | 994.80 | | 5.84 | | 1.18% |
| | Hypothetical example | | 1,000.00 | | 1,018.90 | | 5.91 | | 1.18% |
| Class I | | Actual expenses/actual returns | | 1,000.00 | | 1,000.10 | | 0.94 | | 0.19% |
| | Hypothetical example | | 1,000.00 | | 1,023.90 | | 0.95 | | 0.19% |
| Class R1 | | Actual expenses/actual returns | | 1,000.00 | | 996.90 | | 4.06 | | 0.82% |
| | Hypothetical example | | 1,000.00 | | 1,020.70 | | 4.11 | | 0.82% |
| Class R2 | | Actual expenses/actual returns | | 1,000.00 | | 998.20 | | 2.87 | | 0.58% |
| | Hypothetical example | | 1,000.00 | | 1,021.90 | | 2.91 | | 0.58% |
| Class R3 | | Actual expenses/actual returns | | 1,000.00 | | 997.50 | | 3.52 | | 0.71% |
| | Hypothetical example | | 1,000.00 | | 1,021.30 | | 3.56 | | 0.71% |
| Class R4 | | Actual expenses/actual returns | | 1,000.00 | | 999.40 | | 1.69 | | 0.34% |
| | Hypothetical example | | 1,000.00 | | 1,023.10 | | 1.71 | | 0.34% |
| Class R5 | | Actual expenses/actual returns | | 1,000.00 | | 1,000.40 | | 0.69 | | 0.14% |
| | Hypothetical example | | 1,000.00 | | 1,024.10 | | 0.70 | | 0.14% |
| Class R6 | | Actual expenses/actual returns | | 1,000.00 | | 1,000.00 | | 0.45 | | 0.09% |
| | Hypothetical example | | 1,000.00 | | 1,024.30 | | 0.45 | | 0.09% |
| Class 1 | | Actual expenses/actual returns | | 1,000.00 | | 1,000.50 | | 0.64 | | 0.13% |
| | Hypothetical example | | 1,000.00 | | 1,024.10 | | 0.65 | | 0.13% |
| Class 5 | | Actual expenses/actual returns | | 1,000.00 | | 1,000.70 | | 0.40 | | 0.08% |
| | Hypothetical example | | 1,000.00 | | 1,024.40 | | 0.40 | | 0.08% |
| Multimanager Lifestyle Moderate Portfolio |
| Class A | | Actual expenses/actual returns | | $1,000.00 | | $ 990.30 | | $2.42 | | 0.49% |
| | Hypothetical example | | 1,000.00 | | 1,022.40 | | 2.46 | | 0.49% |
| Class B | | Actual expenses/actual returns | | 1,000.00 | | 986.70 | | 5.86 | | 1.19% |
| | Hypothetical example | | 1,000.00 | | 1,018.90 | | 5.96 | | 1.19% |
| Class C | | Actual expenses/actual returns | | 1,000.00 | | 987.50 | | 5.86 | | 1.19% |
| | Hypothetical example | | 1,000.00 | | 1,018.90 | | 5.96 | | 1.19% |
| Class I | | Actual expenses/actual returns | | 1,000.00 | | 991.70 | | 0.99 | | 0.20% |
| | Hypothetical example | | 1,000.00 | | 1,023.80 | | 1.00 | | 0.20% |
| Class R1 | | Actual expenses/actual returns | | 1,000.00 | | 988.50 | | 4.04 | | 0.82% |
| | Hypothetical example | | 1,000.00 | | 1,020.70 | | 4.11 | | 0.82% |
| Class R2 | | Actual expenses/actual returns | | 1,000.00 | | 989.70 | | 3.01 | | 0.61% |
| | Hypothetical example | | 1,000.00 | | 1,021.80 | | 3.06 | | 0.61% |
| Class R3 | | Actual expenses/actual returns | | 1,000.00 | | 989.00 | | 3.50 | | 0.71% |
| | Hypothetical example | | 1,000.00 | | 1,021.30 | | 3.56 | | 0.71% |
| Class R4 | | Actual expenses/actual returns | | 1,000.00 | | 990.90 | | 1.78 | | 0.36% |
| | Hypothetical example | | 1,000.00 | | 1,023.00 | | 1.81 | | 0.36% |
| Class R5 | | Actual expenses/actual returns | | 1,000.00 | | 991.90 | | 0.74 | | 0.15% |
| | Hypothetical example | | 1,000.00 | | 1,024.10 | | 0.75 | | 0.15% |
| Class R6 | | Actual expenses/actual returns | | 1,000.00 | | 992.20 | | 0.49 | | 0.10% |
| | Hypothetical example | | 1,000.00 | | 1,024.30 | | 0.50 | | 0.10% |
| Class 1 | | Actual expenses/actual returns | | 1,000.00 | | 992.00 | | 0.69 | | 0.14% |
| | Hypothetical example | | 1,000.00 | | 1,024.10 | | 0.70 | | 0.14% |
| Class 5 | | Actual expenses/actual returns | | 1,000.00 | | 992.20 | | 0.44 | | 0.09% |
| | Hypothetical example | | 1,000.00 | | 1,024.30 | | 0.45 | | 0.09% |
| SEMIANNUAL REPORT | JOHN HANCOCK MULTIMANAGER LIFESTYLE PORTFOLIOS 16 |
| |
| SHAREHOLDER EXPENSE EXAMPLE CHART (continued) |
|
| | | | | | | | | | |
| | | | | | | | Expenses | | |
| | | | Account | | Ending | | paid during | | Annualized |
| | | | value on | | value on | | period ended | | expense |
| | | | 1-1-2018 | | 6-30-2018 | | 6-30-20181 | | ratio2 |
| Multimanager Lifestyle Conservative Portfolio |
| Class A | | Actual expenses/actual returns | | $1,000.00 | | $ 984.10 | | $2.46 | | 0.50% |
| | Hypothetical example | | 1,000.00 | | 1,022.30 | | 2.51 | | 0.50% |
| Class B | | Actual expenses/actual returns | | 1,000.00 | | 980.60 | | 5.89 | | 1.20% |
| | Hypothetical example | | 1,000.00 | | 1,018.80 | | 6.01 | | 1.20% |
| Class C | | Actual expenses/actual returns | | 1,000.00 | | 980.60 | | 5.89 | | 1.20% |
| | Hypothetical example | | 1,000.00 | | 1,018.80 | | 6.01 | | 1.20% |
| Class I | | Actual expenses/actual returns | | 1,000.00 | | 985.50 | | 1.03 | | 0.21% |
| | Hypothetical example | | 1,000.00 | | 1,023.80 | | 1.05 | | 0.21% |
| Class R1 | | Actual expenses/actual returns | | 1,000.00 | | 982.30 | | 4.13 | | 0.84% |
| | Hypothetical example | | 1,000.00 | | 1,020.60 | | 4.21 | | 0.84% |
| Class R2 | | Actual expenses/actual returns | | 1,000.00 | | 984.30 | | 3.20 | | 0.65% |
| | Hypothetical example | | 1,000.00 | | 1,021.60 | | 3.26 | | 0.65% |
| Class R3 | | Actual expenses/actual returns | | 1,000.00 | | 983.10 | | 3.29 | | 0.67% |
| | Hypothetical example | | 1,000.00 | | 1,021.50 | | 3.36 | | 0.67% |
| Class R4 | | Actual expenses/actual returns | | 1,000.00 | | 984.70 | | 1.77 | | 0.36% |
| | Hypothetical example | | 1,000.00 | | 1,023.00 | | 1.81 | | 0.36% |
| Class R5 | | Actual expenses/actual returns | | 1,000.00 | | 985.70 | | 0.79 | | 0.16% |
| | Hypothetical example | | 1,000.00 | | 1,024.00 | | 0.80 | | 0.16% |
| Class R6 | | Actual expenses/actual returns | | 1,000.00 | | 986.00 | | 0.54 | | 0.11% |
| | Hypothetical example | | 1,000.00 | | 1,024.20 | | 0.55 | | 0.11% |
| Class 1 | | Actual expenses/actual returns | | 1,000.00 | | 985.80 | | 0.74 | | 0.15% |
| | Hypothetical example | | 1,000.00 | | 1,024.10 | | 0.75 | | 0.15% |
| 1 | Expenses are equal to the annualized expense ratio, multiplied by the average account value over the period, multiplied by 181/365 (to reflect the one-half year period). |
| 2 | Ratios do not include expenses indirectly incurred by the underlying funds and can vary based on the mix of underlying funds held by the portfolios. The range of expense ratios of the underlying funds held by the portfolios for the period ended 6-30-2018 was as follows: |
| Portfolio | | Range | | Portfolio | | Range |
| Multimanager Lifestyle Aggressive Portfolio | | 0.53% - 1.62% | | Multimanager Lifestyle Moderate Portfolio | | 0.38% - 1.56% |
| Multimanager Lifestyle Growth Portfolio | | 0.38% - 1.56% | | Multimanager Lifestyle Conservative Portfolio | | 0.38% - 1.56% |
| Multimanager Lifestyle Balanced Portfolio | | 0.38% - 1.56% | | | | |
| SEMIANNUAL REPORT | JOHN HANCOCK MULTIMANAGER LIFESTYLE PORTFOLIOS 17 |
| | INVESTMENT COMPANIES | | | |
| Underlying Funds’ Investment Managers | | | |
| Allianz Global Investors U.S. LLC | | (Allianz) | |
| Barrow, Hanley, Mewhinney & Strauss, LLC | | (Barrow Hanley) | |
| Boston Partners Global Investors, Inc. | | (Boston Partners) | |
| Brandywine Asset Management, Inc. | | (Brandywine) | |
| Deutsche Investment Management Americas, Inc. | | (Deutsche) | |
| Dimensional Fund Advisors LP | | (DFA) | |
| Epoch Investment Partners, Inc. | | (Epoch) | |
| First Quadrant, L.P. | | (First Quadrant) | |
| Franklin Templeton Investments Corp. | | (Franklin Templeton) | |
| GW&K Investment Management, LLC | | (GW&K) | |
| Invesco Advisers, Inc. | | (Invesco) | |
| Jennison Associates LLC | | (Jennison) | |
| John Hancock Asset Management | | (JHAM) | |
| Pacific Investment Management Company LLC | | (PIMCO) | |
| Redwood Investments, LLC | | (Redwood) | |
| Standard Life Investments (Corporate Funds) Limited | | (Standard Life) | |
| Stone Harbor Investment Partners LP | | (Stone Harbor) | |
| T. Rowe Price Associates, Inc. | | (T. Rowe Price) | |
| Templeton Investment Counsel, LLC | | (Templeton) | |
| Wellington Management Company, LLP | | (Wellington) | |
| Wells Capital Management, Incorporated | | (Wells Capital) | |
| Western Asset Management Company | | (WAMCO) | |
| | | | | |
| MULTIMANAGER LIFESTYLE AGGRESSIVE PORTFOLIO |
| |
| As of 6-30-18 (unaudited) | | | | |
| | | Shares or | | |
| | Principal | | |
| | Amount | | Value |
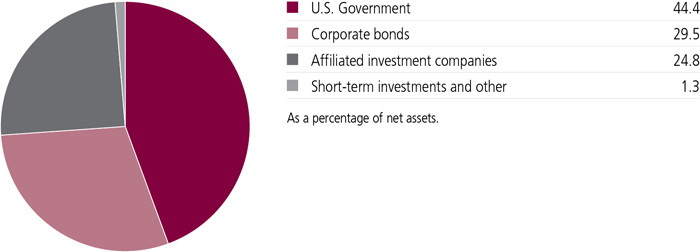
| AFFILIATED INVESTMENT COMPANIES (A) - 100.0% | | |
| Equity - 88.4% | | | | |
| Blue Chip Growth, Class NAV, JHF II | | | | |
| (T. Rowe Price) | | 3,493,236 | | $141,476,047 |
| Capital Appreciation, Class NAV, JHF II | | | | |
| (Jennison) | | 7,739,832 | | 137,691,614 |
| Capital Appreciation Value, Class NAV, JHF II | | | | |
| (T. Rowe Price) | | 14,888,512 | | 174,344,477 |
| Disciplined Value, Class NAV, JHF III | | | | |
| (Boston Partners) | | 7,811,403 | | 167,164,024 |
| Disciplined Value International, Class NAV, | | | | |
| JHIT (Boston Partners) | | 2,340,381 | | 31,805,771 |
| Emerging Markets, Class NAV, JHF II (DFA) | | 14,283,394 | | 158,545,673 |
| Emerging Markets Equity, Class NAV, JHIT | | | | |
| (JHAM) (B)(C) | | 13,941,347 | | 159,628,428 |
| Equity Income, Class NAV, JHF II | | | | |
| (T. Rowe Price) | | 10,727,816 | | 216,165,500 |
| Fundamental Global Franchise, Class NAV, JHF | | | | |
| II (JHAM) (B)(C) | | 2,606,424 | | 32,997,329 |
| Fundamental Large Cap Core, Class NAV, JHIT | | | | |
| (JHAM) (B)(C) | | 3,589,245 | | 184,702,547 |
| Global Equity, Class NAV, JHF II (JHAM) (B)(C) | | 6,227,293 | | 70,119,323 |
| Global Shareholder Yield, Class NAV, JHF III | | | | |
| (Epoch) | | 4,015,473 | | 44,290,660 |
| Greater China Opportunities, Class NAV, JHIT | | | | |
| III (JHAM) (B)(C) | | 389,425 | | 9,871,930 |
| International Growth, Class NAV, JHF III | | | | |
| (Wellington) | | 4,798,451 | | 135,124,382 |
| International Growth Stock, Class NAV, JHF II | | | | |
| (Invesco) | | 8,265,203 | | 110,257,805 |
| International Small Cap, Class NAV, JHF II | | | | |
| (Franklin Templeton) | | 3,618,197 | | 80,360,161 |
| International Small Company, Class NAV, JHF II | | | | |
| (DFA) | | 6,384,892 | | 80,577,335 |
| International Strategic Equity Allocation, | | | | |
| Class NAV, JHF II (JHAM) (B)(C) | | 28,816,116 | | 323,028,665 |
| International Value, Class NAV, JHF II | | | | |
| (Templeton) | | 8,411,470 | | 139,125,722 |
| International Value Equity, Class NAV, JHF III | | | | |
| (JHAM) (B)(C) | | 8,996,068 | | 75,207,130 |
| Mid Cap Stock, Class NAV, JHF II (Wellington) | | 7,735,697 | | 188,054,788 |
| Mid Value, Class NAV, JHF II (T. Rowe Price) | | 13,494,626 | | 226,844,662 |
| New Opportunities, Class NAV, JHF II | | | | |
| (Brandywine/DFA/GW&K) | | 1,259,027 | | 38,198,879 |
| Small Cap Core, Class NAV, JHIT (JHAM) (B)(C) | | 2,984,253 | | 37,601,589 |
| Small Cap Growth, Class NAV, JHF II | | | | |
| (Redwood) (D) | | 2,217,843 | | 39,566,311 |
| Small Cap Stock, Class NAV, JHF II | | | | |
| (Wellington) (E) | | 3,509,093 | | 39,056,207 |
| Small Cap Value, Class NAV, JHF II | | | | |
| (Wellington) | | 2,450,244 | | 53,464,324 |
| Small Company Value, Class NAV, JHF II | | | | |
| (T. Rowe Price) | | 1,218,648 | | 35,803,877 |
| Strategic Growth, Class NAV, JHF III (JHAM) | | | | |
| (B)(C) | | 7,397,146 | | 141,063,580 |
| SEE NOTES TO FINANCIAL STATEMENTS | SEMIANNUAL REPORT | JOHN HANCOCK MULTIMANAGER LIFESTYLE PORTFOLIOS 18 |
| |
MULTIMANAGER LIFESTYLE AGGRESSIVE PORTFOLIO
(continued) |
| | | | | | |
| | Shares or | | | |
| | Principal | | | |
| | Amount | | Value | |
| Equity - (continued) | | | | | |
| U.S. Strategic Equity Allocation, Class NAV, JHF | | | | | |
| II (JHAM) (B)(C) | | 21,079,391 | | $259,276,510 | |
| Value Equity, Class NAV, JHIT (Barrow Hanley) | | 7,883,483 | | 96,257,332 | |
| Alternative and specialty - 11.6% | | | | | |
| Absolute Return Currency, Class NAV, JHF II | | | | | |
| (First Quadrant) (F) | | 3,282,600 | | 29,576,229 | |
| Diversified Real Assets, Class NAV, JHIT | | | | | |
| (Deutsche/JHAM/Wellington) (B)(F)(G) | | 12,500,568 | | 132,881,033 | |
| Financial Industries, Class NAV, JHIT II (JHAM) | | | | | |
| (B)(C) | | 3,606,114 | | 71,328,937 | |
| Global Focused Strategies, Class NAV, JHIT | | | | | |
| (Standard Life) | | 4,133,814 | | 39,188,552 | |
| Health Sciences, Class NAV, JHF II | | | | | |
| (T. Rowe Price) | | 11,848,393 | | 54,858,059 | |
| Science & Technology, Class NAV, JHF II | | | | | |
| (T. Rowe Price/Allianz) | | 7,168,951 | | 40,934,711 | |
| Seaport Long/Short, Class NAV, JHIT | | | | | |
| (Wellington) | | 1,472,116 | | 16,841,012 | |
| Technical Opportunities, Class NAV, JHF II | | | | | |
| (Wellington) | | 7,015,145 | | 91,407,334 | |
| TOTAL AFFILIATED INVESTMENT COMPANIES (Cost | | | | | |
| $3,083,856,245) | | | | $4,104,688,449 | |
| SHORT-TERM INVESTMENTS - 0.0% | | | | | |
| Money market funds - 0.0% | | | | | |
| State Street Institutional U.S. Government | | | | | |
| Money Market Fund, Premier Class, | | | | | |
| 1.8098% (H) | | 1,156 | | 1,156 | |
| TOTAL SHORT-TERM INVESTMENTS (Cost $1,156) | | | | $1,156 | |
| |
| Total Investments (Multimanager Lifestyle | | | |
| Aggressive Portfolio) | | | | | |
| (Cost $3,083,857,401) - 100.0% | | | | $4,104,689,605 | |
| Other assets and liabilities, net - 0.0% | | | | (80,461 | ) |
| TOTAL NET ASSETS - 100.0% | | | | $4,104,609,144 | |
| |
| MULTIMANAGER LIFESTYLE GROWTH PORTFOLIO |
| |
| As of 6-30-18 (unaudited) |
| | | Shares or | | | |
| | | Principal | | | |
| | Amount | | Value | |
| AFFILIATED INVESTMENT COMPANIES (A) - 99.9% |
| Equity - 71.9% | | | | | |
| Blue Chip Growth, Class NAV, JHF II | | | | | |
| (T. Rowe Price) | | 8,325,008 | | $337,162,832 | |
| Capital Appreciation, Class NAV, JHF II | | | | | |
| (Jennison) | | 18,383,076 | | 327,034,915 | |
| Capital Appreciation Value, Class NAV, JHF II | | | | | |
| (T. Rowe Price) | | 45,339,727 | | 530,928,205 | |
| Disciplined Value, Class NAV, JHF III | | | | | |
| (Boston Partners) | | 18,896,132 | | 404,377,217 | |
| Disciplined Value International, Class NAV, | | | | | |
| JHIT (Boston Partners) | | 5,385,894 | | 73,194,298 | |
MULTIMANAGER LIFESTYLE GROWTH PORTFOLIO
(continued) |
| |
| | Shares or | | |
| | Principal | | |
| | Amount | | Value |
| Equity - (continued) | | | | |
| Emerging Markets, Class NAV, JHF II (DFA) | | 27,597,685 | | $306,334,300 |
| Emerging Markets Equity, Class NAV, JHIT | | | | |
| (JHAM) (B)(C) | | 26,995,724 | | 309,101,036 |
| Equity Income, Class NAV, JHF II | | | | |
| (T. Rowe Price) | | 25,990,863 | | 523,715,898 |
| Fundamental Global Franchise, Class NAV, JHF | | | | |
| II (JHAM) (B)(C) | | 9,195,524 | | 116,415,340 |
| Fundamental Large Cap Core, Class NAV, JHIT | | | | |
| (JHAM) (B)(C) | | 7,802,058 | | 401,493,880 |
| Global Equity, Class NAV, JHF II (JHAM) (B)(C) | | 18,943,479 | | 213,303,577 |
| Global Shareholder Yield, Class NAV, JHF III | | | | |
| (Epoch) | | 14,529,414 | | 160,259,442 |
| International Growth, Class NAV, JHF III | | | | |
| (Wellington) | | 10,825,395 | | 304,843,121 |
| International Growth Stock, Class NAV, JHF II | | | | |
| (Invesco) | | 21,798,802 | | 290,796,015 |
| International Small Cap, Class NAV, JHF II | | | | |
| (Franklin Templeton) | | 8,210,423 | | 182,353,489 |
| International Small Company, Class NAV, JHF II | | | | |
| (DFA) | | 14,547,411 | | 183,588,322 |
| International Strategic Equity Allocation, | | | | |
| Class NAV, JHF II (JHAM) (B)(C) | | 72,928,816 | | 817,532,026 |
| International Value, Class NAV, JHF II | | | | |
| (Templeton) | | 19,092,061 | | 315,782,690 |
| International Value Equity, Class NAV, JHF III | | | | |
| (JHAM) (B)(C) | | 25,126,577 | | 210,058,180 |
| Mid Cap Stock, Class NAV, JHF II (Wellington) | | 17,992,942 | | 437,408,410 |
| Mid Value, Class NAV, JHF II (T. Rowe Price) | | 31,899,011 | | 536,222,379 |
| New Opportunities, Class NAV, JHF II | | | | |
| (Brandywine/DFA/GW&K) | | 2,828,428 | | 85,814,512 |
| Small Cap Core, Class NAV, JHIT (JHAM) (B)(C) | | 6,743,007 | | 84,961,888 |
| Small Cap Growth, Class NAV, JHF II | | | | |
| (Redwood) (D) | | 4,279,265 | | 76,342,088 |
| Small Cap Stock, Class NAV, JHF II | | | | |
| (Wellington) (E) | | 6,751,308 | | 75,142,062 |
| Small Cap Value, Class NAV, JHF II | | | | |
| (Wellington) | | 4,836,453 | | 105,531,396 |
| Small Company Value, Class NAV, JHF II | | | | |
| (T. Rowe Price) | | 2,415,598 | | 70,970,276 |
| Strategic Growth, Class NAV, JHF III (JHAM) | | | | |
| (B)(C) | | 17,573,890 | | 335,134,075 |
| U.S. Strategic Equity Allocation, Class NAV, JHF | | | | |
| II (JHAM) (B)(C) | | 56,617,660 | | 696,397,223 |
| Value Equity, Class NAV, JHIT (Barrow Hanley) | | 19,062,832 | | 232,757,177 |
| Fixed income - 17.3% | | | | |
| Asia Pacific Total Return Bond, Class NAV, JHF | | | | |
| II (JHAM) (B)(C) | | 7,471,585 | | 70,531,764 |
| Bond, Class NAV, JHSB (JHAM) (B)(C) | | 21,006,914 | | 323,086,337 |
| Core Bond, Class NAV, JHF II (Wells Capital) | | 8,867,386 | | 111,463,039 |
| Emerging Markets Debt, Class NAV, JHF II | | | | |
| (JHAM) (B)(C) | | 21,536,144 | | 192,748,490 |
| Floating Rate Income, Class NAV, JHF II | | | | |
| (WAMCO) | | 18,289,091 | | 153,994,150 |
| Global Bond, Class NAV, JHF II (PIMCO) | | 2,772,000 | | 35,259,834 |
| SEE NOTES TO FINANCIAL STATEMENTS | SEMIANNUAL REPORT | JOHN HANCOCK MULTIMANAGER LIFESTYLE PORTFOLIOS 19 |
| |
MULTIMANAGER LIFESTYLE GROWTH PORTFOLIO
(continued) |
| | | | | |
| | Shares or | | |
| | Principal | | |
| | Amount | | Value |
| Fixed income - (continued) | | | | |
| Global Short Duration Credit, Class NAV, JHBT | | | | |
| (JHAM) (B)(C) | | 6,684,413 | | $58,822,838 |
| High Yield, Class NAV, JHBT (JHAM) (B)(C) | | 16,023,640 | | 54,480,375 |
| High Yield, Class NAV, JHF II (WAMCO) | | 3,488,290 | | 27,627,259 |
| Real Return Bond, Class NAV, JHF II (PIMCO) | | 19,375,166 | | 211,383,059 |
| Short Duration Credit Opportunities, | | | | |
| Class NAV, JHF II (Stone Harbor) | | 13,322,273 | | 125,629,035 |
| Short Term Government Income, Class NAV, | | | | |
| JHF II (JHAM) (B)(C) | | 3,297,366 | | 30,566,587 |
| Spectrum Income, Class NAV, JHF II | | | | |
| (T. Rowe Price) | | 14,387,627 | | 150,062,951 |
| Strategic Income Opportunities, Class NAV, JHF | | | | |
| II (JHAM) (B)(C) | | 26,074,115 | | 270,127,827 |
| Total Return, Class NAV, JHF II (PIMCO) | | 18,724,354 | | 247,348,715 |
| U.S. High Yield Bond, Class NAV, JHF II (Wells | | | | |
| Capital) | | 3,607,982 | | 39,832,121 |
| Alternative and specialty - 10.7% | | | | |
| Absolute Return Currency, Class NAV, JHF II | | | | |
| (First Quadrant) (F) | | 18,118,702 | | 163,249,504 |
| Diversified Real Assets, Class NAV, JHIT | | | | |
| (Deutsche/JHAM/Wellington) (B)(F)(G) | | 31,500,978 | | 334,855,395 |
| Financial Industries, Class NAV, JHIT II (JHAM) | | | | |
| (B)(C) | | 9,204,825 | | 182,071,447 |
| Global Absolute Return Strategies, Class NAV, | | | | |
| JHF II (Standard Life) (F) | | 16,452,402 | | 166,827,351 |
| Health Sciences, Class NAV, JHF II | | | | |
| (T. Rowe Price) | | 23,873,604 | | 110,534,787 |
| Science & Technology, Class NAV, JHF II | | | | |
| (T. Rowe Price/Allianz) | | 15,935,346 | | 90,990,823 |
| Seaport Long/Short, Class NAV, JHIT | | | | |
| (Wellington) | | 2,523,963 | | 28,874,140 |
| Technical Opportunities, Class NAV, JHF II | | | | |
| (Wellington) | | 16,817,003 | | 219,125,548 |
| TOTAL AFFILIATED INVESTMENT COMPANIES (Cost | | | | |
| $9,708,944,820) | | | | $12,144,449,645 |
| COMMON STOCKS - 0.0% | | | | |
| Consumer discretionary - 0.0% | | | | |
| Boardriders, Inc. (I)(J) | | 1,984 | | 68,807 |
| TOTAL COMMON STOCKS (Cost $62,580) | | | | $68,807 |
| ESCROW CERTIFICATES - 0.0% | | | | |
| Midstates Petroleum Company, Inc., 10.750%, | | | | |
| 10/01/2020 (I)(J) | | 186,995 | | 167 |
| TOTAL ESCROW CERTIFICATES (Cost $167) | | | | $167 |
| SHORT-TERM INVESTMENTS - 0.1% | | | | |
| U.S. Government - 0.1% | | | | |
| U.S. Treasury Bill, 1.875%, 09/13/2018 * | | 8,484,500 | | 8,452,284 |
| Money market funds - 0.0% | | | | |
| State Street Institutional U.S. Government | | | | |
| Money Market Fund, Premier Class, | | | | |
| 1.8098% (H) | | 1,474 | | 1,474 |
| TOTAL SHORT-TERM INVESTMENTS (Cost $8,453,273) | | $8,453,758 |
MULTIMANAGER LIFESTYLE GROWTH PORTFOLIO
(continued) |
| | | | | |
| Total Investments (Multimanager Lifestyle Growth | | | |
| Portfolio) | | | | |
| (Cost $9,717,460,840) - 100.0% | $12,152,972,377 | |
| Other assets and liabilities, net - 0.0% | | | (1,196,609 | ) |
| TOTAL NET ASSETS - 100.0% | $12,151,775,768 | |
| |
| MULTIMANAGER LIFESTYLE BALANCED PORTFOLIO |
| |
| As of 6-30-18 (unaudited) | | | | |
| Shares or | | | |
| Principal | | | |
| Amount | | Value | |
| AFFILIATED INVESTMENT COMPANIES (A) - 99.4% | | | |
| Equity - 53.5% | | | | |
| Blue Chip Growth, Class NAV, JHF II | | | | |
| (T. Rowe Price) | 5,924,765 | | $239,952,985 | |
| Capital Appreciation, Class NAV, JHF II | | | | |
| (Jennison) | 13,112,345 | | 233,268,615 | |
| Capital Appreciation Value, Class NAV, JHF II | | | | |
| (T. Rowe Price) | 45,518,618 | | 533,023,018 | |
| Disciplined Value, Class NAV, JHF III | | | | |
| (Boston Partners) | 13,332,756 | | 285,320,969 | |
| Disciplined Value International, Class NAV, | | | | |
| JHIT (Boston Partners) | 3,668,794 | | 49,858,908 | |
| Emerging Markets, Class NAV, JHF II (DFA) | 16,923,592 | | 187,851,874 | |
| Emerging Markets Equity, Class NAV, JHIT | | | | |
| (JHAM) (B)(C) | 16,835,117 | | 192,762,087 | |
| Equity Income, Class NAV, JHF II | | | | |
| (T. Rowe Price) | 18,353,935 | | 369,831,793 | |
| Fundamental Global Franchise, Class NAV, JHF | | | | |
| II (JHAM) (B)(C) | 10,584,794 | | 134,003,487 | |
| Fundamental Large Cap Core, Class NAV, JHIT | | | | |
| (JHAM) (B)(C) | 5,603,012 | | 288,330,976 | |
| Global Equity, Class NAV, JHF II (JHAM) (B)(C) | 17,905,295 | | 201,613,625 | |
| Global Shareholder Yield, Class NAV, JHF III | | | | |
| (Epoch) | 13,960,726 | | 153,986,804 | |
| International Growth, Class NAV, JHF III | | | | |
| (Wellington) | 7,686,870 | | 216,462,265 | |
| International Growth Stock, Class NAV, JHF II | | | | |
| (Invesco) | 14,033,500 | | 187,206,890 | |
| International Small Cap, Class NAV, JHF II | | | | |
| (Franklin Templeton) | 5,036,661 | | 111,864,249 | |
| International Small Company, Class NAV, JHF II | | | | |
| (DFA) | 8,924,069 | | 112,621,754 | |
| International Strategic Equity Allocation, | | | | |
| Class NAV, JHF II (JHAM) (B)(C) | 47,252,159 | | 529,696,698 | |
| International Value, Class NAV, JHF II | | | | |
| (Templeton) | 13,487,460 | | 223,082,585 | |
| International Value Equity, Class NAV, JHF III | | | | |
| (JHAM) (B)(C) | 15,887,853 | | 132,822,452 | |
| Mid Cap Stock, Class NAV, JHF II (Wellington) | 11,560,315 | | 281,031,253 | |
| Mid Value, Class NAV, JHF II (T. Rowe Price) | 20,497,455 | | 344,562,217 | |
| New Opportunities, Class NAV, JHF II | | | | |
| (Brandywine/DFA/GW&K) | 1,591,038 | | 48,272,107 | |
| Small Cap Core, Class NAV, JHIT (JHAM) (B)(C) | 3,794,760 | | 47,813,975 | |
| Small Cap Growth, Class NAV, JHF II | | | | |
| (Redwood) (D) | 3,139,303 | | 56,005,167 | |
| SEE NOTES TO FINANCIAL STATEMENTS | SEMIANNUAL REPORT | JOHN HANCOCK MULTIMANAGER LIFESTYLE PORTFOLIOS 20 |
| |
MULTIMANAGER LIFESTYLE BALANCED PORTFOLIO
(continued) |
| | | | | |
| | Shares or | | |
| | Principal | | |
| | Amount | | Value |
| Equity - (continued) | | | | |
| Small Cap Stock, Class NAV, JHF II | | | | |
| (Wellington) (E) | | 5,044,924 | | $56,150,001 |
| Small Cap Value, Class NAV, JHF II | | | | |
| (Wellington) | | 3,635,364 | | 79,323,639 |
| Small Company Value, Class NAV, JHF II | | | | |
| (T. Rowe Price) | | 1,795,932 | | 52,764,495 |
| Strategic Growth, Class NAV, JHF III (JHAM) | | | | |
| (B)(C) | | 12,512,048 | | 238,604,751 |
| U.S. Strategic Equity Allocation, Class NAV, JHF | | | | |
| II (JHAM) (B)(C) | | 51,293,618 | | 630,911,498 |
| Value Equity, Class NAV, JHIT (Barrow Hanley) | | 13,419,544 | | 163,852,629 |
| Fixed income - 37.1% | | | | |
| Asia Pacific Total Return Bond, Class NAV, JHF | | | | |
| II (JHAM) (B)(C) | | 12,430,732 | | 117,346,111 |
| Bond, Class NAV, JHSB (JHAM) (B)(C) | | 48,846,082 | | 751,252,741 |
| Core Bond, Class NAV, JHF II (Wells Capital) | | 20,077,049 | | 252,368,503 |
| Emerging Markets Debt, Class NAV, JHF II | | | | |
| (JHAM) (B)(C) | | 34,525,205 | | 309,000,588 |
| Floating Rate Income, Class NAV, JHF II | | | | |
| (WAMCO) | | 38,323,865 | | 322,686,941 |
| Global Bond, Class NAV, JHF II (PIMCO) | | 4,612,194 | | 58,667,109 |
| Global Short Duration Credit, Class NAV, JHBT | | | | |
| (JHAM) (B)(C) | | 12,883,400 | | 113,373,921 |
| High Yield, Class NAV, JHBT (JHAM) (B)(C) | | 30,875,769 | | 104,977,615 |
| High Yield, Class NAV, JHF II (WAMCO) | | 6,719,724 | | 53,220,214 |
| Real Return Bond, Class NAV, JHF II (PIMCO) | | 39,443,300 | | 430,326,399 |
| Short Duration Credit Opportunities, | | | | |
| Class NAV, JHF II (Stone Harbor) | | 32,781,460 | | 309,129,165 |
| Short Term Government Income, Class NAV, | | | | |
| JHF II (JHAM) (B)(C) | | 4,429,966 | | 41,065,787 |
| Spectrum Income, Class NAV, JHF II | | | | |
| (T. Rowe Price) | | 31,476,542 | | 328,300,335 |
| Strategic Income Opportunities, Class NAV, JHF | | | | |
| II (JHAM) (B)(C) | | 57,040,599 | | 590,940,603 |
| Total Return, Class NAV, JHF II (PIMCO) | | 43,104,780 | | 569,414,137 |
| U.S. High Yield Bond, Class NAV, JHF II (Wells | | | | |
| Capital) | | 6,950,385 | | 76,732,250 |
| Alternative and specialty - 8.8% | | | | |
| Absolute Return Currency, Class NAV, JHF II | | | | |
| (First Quadrant) (F) | | 19,476,359 | | 175,481,998 |
| Diversified Real Assets, Class NAV, JHIT | | | | |
| (Deutsche/JHAM/Wellington) (B)(F)(G) | | 25,586,111 | | 271,980,361 |
| Financial Industries, Class NAV, JHIT II (JHAM) | | | | |
| (B)(C) | | 7,391,227 | | 146,198,467 |
| Global Absolute Return Strategies, Class NAV, | | | | |
| JHF II (Standard Life) (F) | | 17,657,076 | | 179,042,750 |
| Health Sciences, Class NAV, JHF II | | | | |
| (T. Rowe Price) | | 16,874,496 | | 78,128,917 |
| Science & Technology, Class NAV, JHF II | | | | |
| (T. Rowe Price/Allianz) | | 10,397,646 | | 59,370,560 |
| Seaport Long/Short, Class NAV, JHIT | | | | |
| (Wellington) | | 2,562,184 | | 29,311,380 |
| Technical Opportunities, Class NAV, JHF II | | | | |
| (Wellington) | | 8,395,880 | | 109,398,317 |
MULTIMANAGER LIFESTYLE BALANCED PORTFOLIO
(continued) |
| |
| Shares or | | | |
| Principal | | | |
| | Amount | | Value | |
| TOTAL AFFILIATED INVESTMENT COMPANIES (Cost | | | | |
| $10,078,718,691) | | | $11,860,568,935 | |
| COMMON STOCKS - 0.0% |
| Consumer discretionary - 0.0% | | | | |
| Boardriders, Inc. (I)(J) | 3,882 | | $134,629 | |
| TOTAL COMMON STOCKS (Cost $122,433) | | | $134,629 | |
| ESCROW CERTIFICATES - 0.0% |
| Midstates Petroleum Company, Inc., 10.750%, | | | | |
| 10/01/2020 (I)(J) | 365,847 | | 328 | |
| TOTAL ESCROW CERTIFICATES (Cost $328) | | | $328 | |
| SHORT-TERM INVESTMENTS - 0.6% |
| U.S. Government - 0.6% | | | | |
| U.S. Treasury Bill, 1.871%, 08/30/2018 * | 30,418,000 | | 30,325,400 | |
| U.S. Treasury Bill, 1.875%, 09/13/2018 * | 16,818,300 | | 16,754,441 | |
| U.S. Treasury Bill, 1.880%, 08/30/2018 * | 30,418,000 | | 30,325,400 | |
| Money market funds - 0.0% | | | | |
| State Street Institutional U.S. Government | | | | |
| Money Market Fund, Premier Class, | | | | |
| 1.8098% (H) | 1,565 | | 1,565 | |
| TOTAL SHORT-TERM INVESTMENTS (Cost $77,400,881) | | $77,406,806 | |
| |
| Total Investments (Multimanager Lifestyle | | | |
| Balanced Portfolio) | | | | |
| (Cost $10,156,242,333) - 100.0% | $11,938,110,698 | |
| Other assets and liabilities, net - 0.0% | | | (1,638,804 | ) |
| TOTAL NET ASSETS - 100.0% | $11,936,471,894 | |
| |
| MULTIMANAGER LIFESTYLE MODERATE PORTFOLIO |
| |
| As of 6-30-18 (unaudited) |
| |
| Shares or | | | |
| Principal | | | |
| Amount | | Value | |
| AFFILIATED INVESTMENT COMPANIES (A) - 99.3% | |
| Equity - 36.1% | | | | |
| Blue Chip Growth, Class NAV, JHF II | | | | |
| (T. Rowe Price) | 862,190 | | $34,918,692 | |
| Capital Appreciation, Class NAV, JHF II | | | | |
| (Jennison) | 1,920,017 | | 34,157,101 | |
| Capital Appreciation Value, Class NAV, JHF II | | | | |
| (T. Rowe Price) | 13,226,850 | | 154,886,417 | |
| Disciplined Value, Class NAV, JHF III | | | | |
| (Boston Partners) | 1,957,998 | | 41,901,162 | |
| Disciplined Value International, Class NAV, | | | | |
| JHIT (Boston Partners) | 919,386 | | 12,494,458 | |
| Emerging Markets, Class NAV, JHF II (DFA) | 2,255,956 | | 25,041,108 | |
| Emerging Markets Equity, Class NAV, JHIT | | | | |
| (JHAM) (B)(C) | 2,223,836 | | 25,462,919 | |
| Equity Income, Class NAV, JHF II | | | | |
| (T. Rowe Price) | 2,705,913 | | 54,524,156 | |
| Fundamental Global Franchise, Class NAV, JHF | | | | |
| II (JHAM) (B)(C) | 3,423,955 | | 43,347,265 | |
| Fundamental Large Cap Core, Class NAV, JHIT | | | | |
| (JHAM) (B)(C) | 2,042,535 | | 105,108,854 | |
| SEE NOTES TO FINANCIAL STATEMENTS | SEMIANNUAL REPORT | JOHN HANCOCK MULTIMANAGER LIFESTYLE PORTFOLIOS 21 |
| |
| MULTIMANAGER LIFESTYLE MODERATE PORTFOLIO |
| (continued) |
| | | Shares or | | |
| | Principal | | |
| | Amount | | Value |
| Equity - (continued) | | | | |
| Global Equity, Class NAV, JHF II (JHAM) (B)(C) | | 5,518,964 | | $62,143,533 |
| Global Shareholder Yield, Class NAV, JHF III | | | | |
| (Epoch) | | 4,261,694 | | 47,006,488 |
| International Growth, Class NAV, JHF III | | | | |
| (Wellington) | | 1,078,535 | | 30,371,538 |
| International Growth Stock, Class NAV, JHF II | | | | |
| (Invesco) | | 3,191,160 | | 42,570,078 |
| International Small Cap, Class NAV, JHF II | | | | |
| (Franklin Templeton) | | 848,001 | | 18,834,093 |
| International Small Company, Class NAV, JHF II | | | | |
| (DFA) | | 1,506,121 | | 19,007,251 |
| International Strategic Equity Allocation, | | | | |
| Class NAV, JHF II (JHAM) (B)(C) | | 10,751,632 | | 120,525,797 |
| International Value, Class NAV, JHF II | | | | |
| (Templeton) | | 2,103,875 | | 34,798,093 |
| International Value Equity, Class NAV, JHF III | | | | |
| (JHAM) (B)(C) | | 3,149,865 | | 26,332,869 |
| Mid Cap Stock, Class NAV, JHF II (Wellington) | | 2,087,969 | | 50,758,538 |
| Mid Value, Class NAV, JHF II (T. Rowe Price) | | 3,498,901 | | 58,816,531 |
| Small Cap Growth, Class NAV, JHF II | | | | |
| (Redwood) (D) | | 633,704 | | 11,305,282 |
| Small Cap Stock, Class NAV, JHF II | | | | |
| (Wellington) (E) | | 1,018,162 | | 11,332,146 |
| Small Cap Value, Class NAV, JHF II | | | | |
| (Wellington) | | 1,344,768 | | 29,342,844 |
| Strategic Growth, Class NAV, JHF III (JHAM) | | | | |
| (B)(C) | | 1,795,303 | | 34,236,425 |
| U.S. Strategic Equity Allocation, Class NAV, JHF | | | | |
| II (JHAM) (B)(C) | | 9,755,837 | | 119,996,796 |
| Value Equity, Class NAV, JHIT (Barrow Hanley) | | 1,965,188 | | 23,994,951 |
| Fixed income - 56.6% | | | | |
| Asia Pacific Total Return Bond, Class NAV, JHF | | | | |
| II (JHAM) (B)(C) | | 6,712,384 | | 63,364,906 |
| Bond, Class NAV, JHSB (JHAM) (B)(C) | | 19,455,591 | | 299,226,990 |
| Core Bond, Class NAV, JHF II (Wells Capital) | | 22,643,034 | | 284,622,933 |
| Emerging Markets Debt, Class NAV, JHF II | | | | |
| (JHAM) (B)(C) | | 13,466,170 | | 120,522,219 |
| Floating Rate Income, Class NAV, JHF II | | | | |
| (WAMCO) | | 16,096,258 | | 135,530,493 |
| Global Bond, Class NAV, JHF II (PIMCO) | | 3,874,514 | | 49,283,816 |
| Global Short Duration Credit, Class NAV, JHBT | | | | |
| (JHAM) (B)(C) | | 4,917,581 | | 43,274,711 |
| High Yield, Class NAV, JHBT (JHAM) (B)(C) | | 12,016,554 | | 40,856,283 |
| High Yield, Class NAV, JHF II (WAMCO) | | 2,615,314 | | 20,713,284 |
| Real Return Bond, Class NAV, JHF II (PIMCO) | | 16,125,373 | | 175,927,817 |
| Short Duration Credit Opportunities, | | | | |
| Class NAV, JHF II (Stone Harbor) | | 11,869,254 | | 111,927,066 |
| Short Term Government Income, Class NAV, | | | | |
| JHF II (JHAM) (B)(C) | | 1,455,578 | | 13,493,205 |
| Spectrum Income, Class NAV, JHF II | | | | |
| (T. Rowe Price) | | 11,184,544 | | 116,654,792 |
| Strategic Income Opportunities, Class NAV, JHF | | | | |
| II (JHAM) (B)(C) | | 20,267,731 | | 209,973,697 |
| Total Return, Class NAV, JHF II (PIMCO) | | 21,461,778 | | 283,510,088 |
| MULTIMANAGER LIFESTYLE MODERATE PORTFOLIO |
| (continued) |
| | Shares or | | | |
| | Principal | | | |
| | Amount | | Value | |
| Fixed income - (continued) | | | | | |
| U.S. High Yield Bond, Class NAV, JHF II (Wells | | | | | |
| Capital) | | 2,705,253 | | $29,865,992 | |
| Alternative and specialty - 6.6% | | | | | |
| Absolute Return Currency, Class NAV, JHF II | | | | | |
| (First Quadrant) (F) | | 7,700,360 | | 69,380,243 | |
| Diversified Real Assets, Class NAV, JHIT | | | | | |
| (Deutsche/JHAM/Wellington) (B)(F)(G) | | 6,068,327 | | 64,506,320 | |
| Enduring Assets, Class NAV, JHIT (Wellington) | | 1,478,843 | | 17,568,659 | |
| Global Absolute Return Strategies, Class NAV, | | | | | |
| JHF II (Standard Life) (F) | | 6,975,601 | | 70,732,592 | |
| Seaport Long/Short, Class NAV, JHIT | | | | | |
| (Wellington) | | 832,769 | | 9,526,881 | |
| TOTAL AFFILIATED INVESTMENT COMPANIES (Cost | | | | | |
| $3,213,247,736) | | | | $3,503,678,372 | |
| COMMON STOCKS - 0.0% | | | | | |
| Consumer discretionary - 0.0% | | | | | |
| Boardriders, Inc. (I)(J) | | 1,476 | | 51,189 | |
| TOTAL COMMON STOCKS (Cost $46,561) | | | | $51,189 | |
| ESCROW CERTIFICATES - 0.0% | | | | | |
| Midstates Petroleum Company, Inc., 10.750%, | | | | | |
| 10/01/2020 (I)(J) | | 139,130 | | 125 | |
| TOTAL ESCROW CERTIFICATES (Cost $125) | | | | $125 | |
| SHORT-TERM INVESTMENTS - 0.7% | | | | | |
| U.S. Government - 0.7% | | | | | |
| U.S. Treasury Bill, 1.871%, 08/30/2018 * | | 8,963,000 | | 8,935,714 | |
| U.S. Treasury Bill, 1.875%, 09/13/2018 * | | 6,229,600 | | 6,205,946 | |
| U.S. Treasury Bill, 1.880%, 08/30/2018 * | | 8,963,000 | | 8,935,714 | |
| Money market funds - 0.0% | | | | | |
| State Street Institutional U.S. Government | | | | | |
| Money Market Fund, Premier Class, | | | | | |
| 1.8098% (H) | | 1,151 | | 1,151 | |
| TOTAL SHORT-TERM INVESTMENTS (Cost $24,076,707) | | $24,078,525 | |
| | | | | | |
| Total Investments (Multimanager Lifestyle | | | | | |
| Moderate Portfolio) | | | | | |
| (Cost $3,237,371,129) - 100.0% | | | | $3,527,808,211 | |
| Other assets and liabilities, net - 0.0% | | | | (782,366 | ) |
| TOTAL NET ASSETS - 100.0% | | | | $3,527,025,845 | |
| MULTIMANAGER LIFESTYLE CONSERVATIVE PORTFOLIO |
As of 6-30-18 (unaudited)
| | Shares or | | |
| | Principal | | |
| | Amount | | Value |
| AFFILIATED INVESTMENT COMPANIES (A) - 99.3% | | |
| Equity - 16.2% | | | | |
| Blue Chip Growth, Class NAV, JHF II | | | | |
| (T. Rowe Price) | | 116,012 | | $4,698,472 |
| Capital Appreciation, Class NAV, JHF II | | | | |
| (Jennison) | | 252,323 | | 4,488,828 |
| SEE NOTES TO FINANCIAL STATEMENTS | SEMIANNUAL REPORT | JOHN HANCOCK MULTIMANAGER LIFESTYLE PORTFOLIOS 22 |
| |
| MULTIMANAGER LIFESTYLE CONSERVATIVE PORTFOLIO |
| (continued) |
| | Shares or | | |
| | Principal | | |
| | Amount | | Value |
| Equity - (continued) | | | | |
| Capital Appreciation Value, Class NAV, JHF II | | | | |
| (T. Rowe Price) | | 6,455,118 | | $75,589,426 |
| Disciplined Value, Class NAV, JHF III | | | | |
| (Boston Partners) | | 354,607 | | 7,588,598 |
| Disciplined Value International, Class NAV, | | | | |
| JHIT (Boston Partners) | | 440,405 | | 5,985,109 |
| Emerging Markets, Class NAV, JHF II (DFA) | | 775,111 | | 8,603,727 |
| Emerging Markets Equity, Class NAV, JHIT | | | | |
| (JHAM) (B)(C) | | 770,100 | | 8,817,647 |
| Equity Income, Class NAV, JHF II | | | | |
| (T. Rowe Price) | | 492,532 | | 9,924,511 |
| Fundamental Global Franchise, Class NAV, JHF | | | | |
| II (JHAM) (B)(C) | | 1,656,725 | | 20,974,136 |
| Fundamental Large Cap Core, Class NAV, JHIT | | | | |
| (JHAM) (B)(C) | | 530,269 | | 27,287,630 |
| Global Equity, Class NAV, JHF II (JHAM) (B)(C) | | 2,532,501 | | 28,515,964 |
| Global Shareholder Yield, Class NAV, JHF III | | | | |
| (Epoch) | | 1,863,366 | | 20,552,924 |
| International Growth, Class NAV, JHF III | | | | |
| �� (Wellington) | | 419,832 | | 11,822,479 |
| International Growth Stock, Class NAV, JHF II | | | | |
| (Invesco) | | 939,017 | | 12,526,492 |
| International Strategic Equity Allocation, | | | | |
| Class NAV, JHF II (JHAM) (B)(C) | | 5,243,283 | | 58,777,201 |
| International Value, Class NAV, JHF II | | | | |
| (Templeton) | | 766,765 | | 12,682,288 |
| International Value Equity, Class NAV, JHF III | | | | |
| (JHAM) (B)(C) | | 698,488 | | 5,839,356 |
| Mid Cap Stock, Class NAV, JHF II (Wellington) | | 627,298 | | 15,249,611 |
| Mid Value, Class NAV, JHF II (T. Rowe Price) | | 1,133,934 | | 19,061,427 |
| Small Cap Stock, Class NAV, JHF II | | | | |
| (Wellington) (E) | | 640,882 | | 7,133,017 |
| Small Cap Value, Class NAV, JHF II | | | | |
| (Wellington) | | 481,630 | | 10,509,166 |
| Strategic Growth, Class NAV, JHF III (JHAM) | | | | |
| (B)(C) | | 236,066 | | 4,501,776 |
| U.S. Strategic Equity Allocation, Class NAV, JHF | | | | |
| II (JHAM) (B)(C) | | 2,799,998 | | 34,439,979 |
| Value Equity, Class NAV, JHIT (Barrow Hanley) | | 357,225 | | 4,361,722 |
| Fixed income - 73.4% | | | | |
| Asia Pacific Total Return Bond, Class NAV, JHF | | | | |
| II (JHAM) (B)(C) | | 5,193,671 | | 49,028,259 |
| Bond, Class NAV, JHSB (JHAM) (B)(C) | | 18,250,455 | | 280,691,999 |
| Core Bond, Class NAV, JHF II (Wells Capital) | | 20,773,605 | | 261,124,216 |
| Emerging Markets Debt, Class NAV, JHF II | | | | |
| (JHAM) (B)(C) | | 10,548,662 | | 94,410,522 |
| Floating Rate Income, Class NAV, JHF II | | | | |
| (WAMCO) | | 15,323,246 | | 129,021,733 |
| Global Bond, Class NAV, JHF II (PIMCO) | | 4,361,584 | | 55,479,345 |
| Global Short Duration Credit, Class NAV, JHBT | | | | |
| (JHAM) (B)(C) | | 3,604,985 | | 31,723,864 |
| High Yield, Class NAV, JHBT (JHAM) (B)(C) | | 7,660,096 | | 26,044,327 |
| High Yield, Class NAV, JHF II (WAMCO) | | 1,667,182 | | 13,204,084 |
| Real Return Bond, Class NAV, JHF II (PIMCO) | | 17,035,154 | | 185,853,535 |
| MULTIMANAGER LIFESTYLE CONSERVATIVE PORTFOLIO |
| (continued) |
| | | Shares or | | | |
| | Principal | | | |
| | Amount | | Value | |
| Fixed income - (continued) | | | | | |
| Short Duration Credit Opportunities, | | | | | |
| Class NAV, JHF II (Stone Harbor) | | 11,536,705 | | $108,791,125 | |
| Short Term Government Income, Class NAV, | | | | | |
| JHF II (JHAM) (B)(C) | | 12,519,423 | | 116,055,049 | |
| Spectrum Income, Class NAV, JHF II | | | | | |
| (T. Rowe Price) | | 9,330,139 | | 97,313,352 | |
| Strategic Income Opportunities, Class NAV, JHF | | | | | |
| II (JHAM) (B)(C) | | 16,907,825 | | 175,165,066 | |
| Total Return, Class NAV, JHF II (PIMCO) | | 19,813,272 | | 261,733,321 | |
| U.S. High Yield Bond, Class NAV, JHF II (Wells | | | | | |
| Capital) | | 1,724,263 | | 19,035,866 | |
| Alternative and specialty - 9.7% | | | | | |
| Absolute Return Currency, Class NAV, JHF II | | | | | |
| (First Quadrant) (F) | | 8,714,969 | | 78,521,869 | |
| Diversified Real Assets, Class NAV, JHIT | | | | | |
| (Deutsche/JHAM/Wellington) (B)(F)(G) | | 4,333,890 | | 46,069,256 | |
| Enduring Assets, Class NAV, JHIT (Wellington) | | 3,784,009 | | 44,954,023 | |
| Global Absolute Return Strategies, Class NAV, | | | | | |
| JHF II (Standard Life) (F) | | 7,876,017 | | 79,862,815 | |
| Seaport Long/Short, Class NAV, JHIT | | | | | |
| (Wellington) | | 361,088 | | 4,130,847 | |
| TOTAL AFFILIATED INVESTMENT COMPANIES (Cost | | | | | |
| $2,510,366,764) | | | | $2,578,145,959 | |
| COMMON STOCKS - 0.0% | | | | | |
| Consumer discretionary - 0.0% | | | | | |
| Boardriders, Inc. (I)(J) | | 1,226 | | 42,517 | |
| TOTAL COMMON STOCKS (Cost $38,672) | | | | $42,517 | |
| ESCROW CERTIFICATES - 0.0% | | | | | |
| Midstates Petroleum Company, Inc., 10.750%, | | | | | |
| 10/01/2020 (I)(J) | | 115,555 | | 103 | |
| TOTAL ESCROW CERTIFICATES (Cost $103) | | | | $103 | |
| SHORT-TERM INVESTMENTS - 0.7% | | | | | |
| U.S. Government - 0.7% | | | | | |
| U.S. Treasury Bill, 1.871%, 08/30/2018 * | | 6,611,000 | | 6,590,875 | |
| U.S. Treasury Bill, 1.875%, 09/13/2018 * | | 5,057,000 | | 5,037,799 | |
| U.S. Treasury Bill, 1.880%, 08/30/2018 * | | 6,611,000 | | 6,590,875 | |
| Money market funds - 0.0% | | | | | |
| State Street Institutional U.S. Government | | | | | |
| Money Market Fund, Premier Class, | | | | | |
| 1.8098% (H) | | 1,175 | | 1,175 | |
| TOTAL SHORT-TERM INVESTMENTS (Cost $18,219,355) | | $18,220,724 | |
| | | | |
| Total Investments (Multimanager Lifestyle | | | |
| Conservative Portfolio) | | | | | |
| (Cost $2,528,624,894) - 100.0% | | | | $2,596,409,303 | |
| Other assets and liabilities, net - 0.0% | | | | (569,320 | ) |
| TOTAL NET ASSETS - 100.0% | | | | $2,595,839,983 | |
| |
Percentages are based upon net assets. |
| |
| Security Abbreviations and Legend |
|
| JHF II | John Hancock Funds II |
| JHF III | John Hancock Funds III |
| SEE NOTES TO FINANCIAL STATEMENTS | SEMIANNUAL REPORT | JOHN HANCOCK MULTIMANAGER LIFESTYLE PORTFOLIOS 23 |
| |
| MULTIMANAGER LIFESTYLE CONSERVATIVE PORTFOLIO |
| (continued) |
| JHIT | John Hancock Investment Trust |
| JHIT III | John Hancock Investment Trust III |
| JHIT II | John Hancock Investment Trust II |
| JHSB | John Hancock Sovereign Bond Fund |
| JHBT | John Hancock Bond Trust |
| (A) | The underlying funds’ subadvisor is shown parenthetically. |
| (B) | The subadvisor is an affiliate of the advisor. |
| (C) | Manulife Asset Management (US) LLC is doing business as John Hancock Asset Management. |
| (D) | Formerly known as Small Company Growth Fund. |
| (E) | Formerly known as Small Cap Growth Fund. |
| (F) | Non-income producing. |
| (G) | Manulife Asset Management (North America) Limited is doing business as John Hancock Asset Management. |
| (H) | The rate shown is the annualized seven-day yield as of 6-30-18. |
| (I) | Security is valued using significant unobservable inputs and is classified as Level 3 in the fair value hierarchy. |
| (J) | Non-income producing security. |
| * | Yield represents either the annualized yield at the date of purchase, the stated coupon rate or, for floating rate securities, the rate at period end. |
| SEE NOTES TO FINANCIAL STATEMENTS | SEMIANNUAL REPORT | JOHN HANCOCK MULTIMANAGER LIFESTYLE PORTFOLIOS 24 |
| | | | | | | | | |
| STATEMENTS OF ASSETS AND LIABILITIES 6-30-18 (unaudited) | | | | | | | | |
| | Multimanager | | Multimanager | | Multimanager | | Multimanager | | Multimanager |
| | Lifestyle | | Lifestyle | | Lifestyle | | Lifestyle | | Lifestyle |
| | Aggressive | | Growth | | Balanced | | Moderate | | Conservative |
| | Portfolio | | Portfolio | | Portfolio | | Portfolio | | Portfolio |
| Assets | | | | | | | | | | |
| Unaffiliated investments, at value | | — | | $8,521,258 | | $77,540,198 | | $24,128,688 | | $18,262,169 |
| Unaffiliated funds, at value | | $1,156 | | 1,474 | | 1,565 | | 1,151 | | 1,175 |
| Affiliated funds, at value | | 4,104,688,449 | | 12,144,449,645 | | 11,860,568,935 | | 3,503,678,372 | | 2,578,145,959 |
| Total investments, at value | | 4,104,689,605 | | 12,152,972,377 | | 11,938,110,698 | | 3,527,808,211 | | 2,596,409,303 |
| Dividends and interest receivable | | 64,818 | | 199,021 | | 218,523 | | 68,409 | | 43,619 |
| Receivable for fund shares sold | | 763,802 | | 1,193,810 | | 979,660 | | 574,773 | | 521,941 |
| Receivable for investments sold | | 10,310,203 | | 35,404,388 | | 28,986,525 | | 7,904,127 | | 10,249,707 |
| Other assets | | 79,876 | | 108,501 | | 103,645 | | 79,431 | | 76,531 |
| Total assets | | 4,115,908,304 | | 12,189,878,097 | | 11,968,399,051 | | 3,536,434,951 | | 2,607,301,101 |
| Liabilities | | | | | | | | | | |
| Distributions payable | | — | | — | | 85,989 | | 119,168 | | 216,394 |
| Payable for fund shares repurchased | | 10,956,780 | | 37,138,384 | | 30,868,078 | | 8,955,464 | | 10,976,798 |
| Payable to affiliates | | | | | | | | | | |
| Accounting and legal services fees | | 228,451 | | 671,132 | | 656,174 | | 193,052 | | 141,865 |
| Transfer agent fees | | 58,662 | | 206,714 | | 223,203 | | 84,513 | | 72,759 |
| Distribution and service fees | | 9,533 | | 18,437 | | 20,097 | | 7,035 | | 5,309 |
| Trustees’ fees | | 1,260 | | 3,599 | | 4,134 | | 1,633 | | 1,427 |
| Other liabilities and accrued expenses | | 44,474 | | 64,063 | | 69,482 | | 48,241 | | 46,566 |
| Total liabilities | | 11,299,160 | | 38,102,329 | | 31,927,157 | | 9,409,106 | | 11,461,118 |
| Net assets | | $4,104,609,144 | | $12,151,775,768 | | $11,936,471,894 | | $3,527,025,845 | | $2,595,839,983 |
| Net assets consist of | | | | | | | | | | |
| Paid-in capital | | $2,894,385,249 | | $9,256,876,752 | | $9,903,576,531 | | $3,179,777,996 | | $2,534,969,572 |
| Undistributed net investment income (loss) | | (1,386,582) | | 28,780,318 | | 1,524,562 | | 589,329 | | 518,361 |
| Accumulated net realized gain (loss) on investments | | 190,778,273 | | 430,607,161 | | 249,502,436 | | 56,221,438 | | (7,432,359) |
| Net unrealized appreciation (depreciation) on investments | | 1,020,832,204 | | 2,435,511,537 | | 1,781,868,365 | | 290,437,082 | | 67,784,409 |
| Net assets | | $4,104,609,144 | | $12,151,775,768 | | $11,936,471,894 | | $3,527,025,845 | | $2,595,839,983 |
| Unaffiliated investments, including repurchase agreements, at cost | | — | | 8,514,546 | | 77,522,077 | | 24,122,242 | | 18,256,955 |
| Unaffiliated funds, at cost | | 1,156 | | 1,474 | | 1,565 | | 1,151 | | 1,175 |
| Affiliated funds, at cost | | 3,083,856,245 | | 9,708,944,820 | | 10,078,718,691 | | 3,213,247,736 | | $2,510,366,764 |
| Net asset value per share | | | | | | | | | | |
| The portfolios have an unlimited number of shares authorized with par value of $0.01 per share. Net asset value is calculated by dividing the net assets of each class of shares by the number of outstanding shares in the class. | | | | | | | | | |
| Class A1 | | | | | | | | | | |
| Net assets | | $511,712,130 | | $1,713,977,290 | | $1,814,600,415 | | $669,626,362 | | $576,432,477 |
| Shares outstanding | | 30,661,673 | | 105,685,744 | | 119,305,494 | | 49,190,299 | | 45,205,032 |
| Net asset value and redemption price per share | | $16.69 | | $16.22 | | $15.21 | | $13.61 | | $12.75 |
| Class B1 | | | | | | | | | | |
| Net assets | | $7,958,984 | | $36,232,721 | | $36,727,304 | | $15,797,819 | | $13,055,267 |
| Shares outstanding | | 477,697 | | 2,235,770 | | 2,416,871 | | 1,161,499 | | 1,023,196 |
| Net asset value, offering price and redemption price per share | | $16.66 | | $16.21 | | $15.20 | | $13.60 | | $12.76 |
| Class C1 | | | | | | | | | | |
| Net assets | | $115,546,137 | | $510,473,307 | | $591,231,891 | | $246,727,093 | | $214,389,891 |
| Shares outstanding | | 6,929,009 | | 31,538,411 | | 38,867,163 | | 18,120,582 | | 16,808,561 |
| Net asset value, offering price and redemption price per share | | $16.68 | | $16.19 | | $15.21 | | $13.62 | | $12.75 |
| Class I | | | | | | | | | | |
| Net assets | | $11,466,217 | | $36,723,318 | | $45,823,330 | | $12,386,558 | | $14,388,527 |
| Shares outstanding | | 688,118 | | 2,273,367 | | 3,030,675 | | 913,556 | | 1,130,238 |
| Net asset value, offering price and redemption price per share | | $16.66 | | $16.15 | | $15.12 | | $13.56 | | $12.73 |
| Class R1 | | | | | | | | | | |
| Net assets | | $6,603,561 | | $17,179,077 | | $16,184,522 | | $5,878,891 | | $6,878,097 |
| Shares outstanding | | 395,764 | | 1,056,261 | | 1,069,154 | | 432,572 | | 539,796 |
| Net asset value, offering price and redemption price per share | | $16.69 | | $16.26 | | $15.14 | | $13.59 | | $12.74 |
| SEE NOTES TO FINANCIAL STATEMENTS | SEMIANNUAL REPORT | JOHN HANCOCK MULTIMANAGER LIFESTYLE PORTFOLIOS 25 |
STATEMENTS OF ASSETS AND LIABILITIES 6-30-18 (unaudited) |
Continued |
| | Multimanager | | Multimanager | | Multimanager | | Multimanager | | Multimanager |
| | Lifestyle | | Lifestyle | | Lifestyle | | Lifestyle | | Lifestyle |
| | Aggressive | | Growth | | Balanced | | Moderate | | Conservative |
| | Portfolio | | Portfolio | | Portfolio | | Portfolio | | Portfolio |
| Class R2 | | | | | | | | | | |
| Net assets | | $7,145,802 | | $15,109,370 | | $15,398,519 | | $4,769,962 | | $3,284,971 |
| Shares outstanding | | 431,013 | | 938,324 | | 1,018,200 | | 351,760 | | 257,920 |
| Net asset value, offering price and redemption price per share | | $16.58 | | $16.10 | | $15.12 | | $13.56 | | $12.74 |
| Class R3 | | | | | | | | | | |
| Net assets | | $8,759,379 | | $13,211,551 | | $17,572,854 | | $5,690,676 | | $3,938,079 |
| Shares outstanding | | 526,952 | | 816,867 | | 1,158,375 | | 418,899 | | 309,564 |
| Net asset value, offering price and redemption price per share | | $16.62 | | $16.17 | | $15.17 | | $13.58 | | $12.72 |
| Class R4 | | | | | | | | | | |
| Net assets | | $6,579,252 | | $8,908,739 | | $11,709,565 | | $4,803,794 | | $2,785,826 |
| Shares outstanding | | 395,650 | | 549,643 | | 771,517 | | 354,349 | | 218,938 |
| Net asset value, offering price and redemption price per share | | $16.63 | | $16.21 | | $15.18 | | $13.56 | | $12.72 |
| Class R5 | | | | | | | | | | |
| Net assets | | $6,015,547 | | $16,340,107 | | $16,988,986 | | $8,420,191 | | $4,698,392 |
| Shares outstanding | | 360,774 | | 1,005,485 | | 1,117,669 | | 620,442 | | 369,049 |
| Net asset value, offering price and redemption price per share | | $16.67 | | $16.25 | | $15.20 | | $13.57 | | $12.73 |
| Class R6 | | | | | | | | | | |
| Net assets | | $30,576,047 | | $86,962,545 | | $78,197,709 | | $26,376,368 | | $15,035,633 |
| Shares outstanding | | 1,834,455 | | 5,377,996 | | 5,173,767 | | 1,946,708 | | 1,181,962 |
| Net asset value, offering price and redemption price per share | | $16.67 | | $16.17 | | $15.11 | | $13.55 | | $12.72 |
| Class 1 | | | | | | | | | | |
| Net assets | | $3,392,246,088 | | $9,376,634,345 | | $9,128,655,120 | | $2,467,500,974 | | $1,740,952,823 |
| Shares outstanding | | 203,855,124 | | 579,873,409 | | 604,139,510 | | 181,838,445 | | 136,824,577 |
| Net asset value, offering price and redemption price per share | | $16.64 | | $16.17 | | $15.11 | | $13.57 | | $12.72 |
| Class 5 | | | | | | | | | | |
| Net assets | | — | | $320,023,398 | | $163,381,679 | | $59,047,157 | | — |
| Shares outstanding | | — | | 19,814,422 | | 10,807,472 | | 4,356,497 | | — |
| | — | | $16.15 | | $15.12 | | $13.55 | | — |
| Maximum offering price per share | | | | | | | | | | |
| Class A (net asset value per share ÷ 95%)2 | | $17.57 | | $17.07 | | $16.01 | | $14.33 | | $13.42 |
| 1 | Redemption price per share is equal to net asset value less any applicable contingent deferred sales charge. |
| 2 | On single retail sales of less than $50,000. On sales of $50,000 or more and on group sales the offering price is reduced. |
| SEE NOTES TO FINANCIAL STATEMENTS | SEMIANNUAL REPORT | JOHN HANCOCK MULTIMANAGER LIFESTYLE PORTFOLIOS 26 |
STATEMENTS OF OPERATIONS For the six months ended 6-30-18 (unaudited) |
| |
| | Multimanager | | Multimanager | | Multimanager | | Multimanager | | Multimanager |
| | Lifestyle | | Lifestyle | | Lifestyle | | Lifestyle | | Lifestyle |
| | Aggressive | | Growth | | Balanced | | Moderate | | Conservative |
| | Portfolio | | Portfolio | | Portfolio | | Portfolio | | Portfolio |
| Investment income | | | | | | | | | | |
| Interest | | $10 | | $58,603 | | $195,664 | | $67,337 | | $53,605 |
| Income distributions received from affiliated funds | | 2,781,174 | | 42,524,683 | | 78,980,213 | | 31,805,685 | | 28,388,764 |
| Total investment income | | 2,781,184 | | 42,583,286 | | 79,175,877 | | 31,873,022 | | 28,442,369 |
| Expenses | | | | | | | | | | |
| Investment management fees | | 2,575,881 | | 7,098,832 | | 7,272,232 | | 2,169,176 | | 1,634,406 |
| Distribution and service fees | | 2,450,479 | | 8,294,420 | | 8,810,233 | | 3,182,260 | | 2,649,027 |
| Accounting and legal services fees | | 323,703 | | 955,336 | | 936,113 | | 276,232 | | 203,770 |
| Transfer agent fees | | 359,486 | | 1,280,251 | | 1,386,850 | | 528,182 | | 459,077 |
| Trustees’ fees | | 35,335 | | 105,395 | | 104,111 | | 31,236 | | 23,503 |
| Custodian fees | | 20,309 | | 20,320 | | 20,309 | | 20,301 | | 20,301 |
| State registration fees | | 78,649 | | 94,495 | | 95,153 | | 82,188 | | 78,812 |
| Printing and postage | | 31,217 | | 81,660 | | 74,808 | | 33,858 | | 29,308 |
| Professional fees | | 53,175 | | 112,384 | | 113,392 | | 52,176 | | 45,584 |
| Other | | 18,846 | | 45,653 | | 45,789 | | 18,218 | | 15,179 |
| Total expenses | | 5,947,080 | | 18,088,746 | | 18,858,990 | | 6,393,827 | | 5,158,967 |
| Less expense reductions | | (1,779,314) | | (4,285,778) | | (4,016,916) | | (1,100,044) | | (752,053) |
| Net expenses | | 4,167,766 | | 13,802,968 | | 14,842,074 | | 5,293,783 | | 4,406,914 |
| Net investment income (loss) | | (1,386,582) | | 28,780,318 | | 64,333,803 | | 26,579,239 | | 24,035,455 |
| Realized and unrealized gain (loss) | | | | | | | | | | |
| Net realized gain (loss) on | | | | | | | | | | |
| Affiliated funds | | 16,062,567 | | 79,917,229 | | 72,470,135 | | 28,912,991 | | 13,686,993 |
| Capital gain distributions received from affiliated funds | | 7,037,639 | | 13,578,861 | | 10,727,079 | | 2,192,945 | | — |
| | 23,100,206 | | 93,496,090 | | 83,197,214 | | 31,105,936 | | 13,686,993 |
| Change in net unrealized appreciation (depreciation) of | | | | | | | | | | |
| Unaffiliated investments and translation assets and liabilities in | | | | | | | | | | |
| foreign currencies | | — | | 6,712 | | 18,121 | | 6,446 | | 5,214 |
| Affiliated funds | | 29,088,042 | | (51,570,650) | | (143,094,944) | | (88,953,917) | | (78,259,402) |
| | 29,088,042 | | (51,563,938) | | (143,076,823) | | (88,947,471) | | (78,254,188) |
| Net realized and unrealized gain (loss) | | 52,188,248 | | 41,932,152 | | (59,879,609) | | (57,841,535) | | (64,567,195) |
| Increase (decrease) in net assets from operations | | $50,801,666 | | $70,712,470 | | $4,454,194 | | $(31,262,296) | | $(40,531,740) |
| SEE NOTES TO FINANCIAL STATEMENTS | SEMIANNUAL REPORT | JOHN HANCOCK MULTIMANAGER LIFESTYLE PORTFOLIOS 27 |
STATEMENTS OF CHANGES IN NET ASSETS |
| |
| | Multimanager Lifestyle | | Multimanager Lifestyle | | Multimanager Lifestyle |
| | Aggressive Portfolio | | Growth Portfolio | | Balanced Portfolio |
| | Six months | | | | Six months | | | | Six months | | |
| | ended | | | | ended | | | | ended | | |
| | 6-30-18 | | Year ended | | 6-30-18 | | Year ended | | 6-30-18 | | Year ended |
| | (unaudited) | | 12-31-17 | | (unaudited) | | 12-31-17 | | (unaudited) | | 12-31-17 |
| Increase (decrease) in net assets | | | | | | | | | | | | |
| From operations | | | | | | | | | | | | |
| Net investment income (loss) | | $(1,386,582) | | $42,319,602 | | $28,780,318 | | $180,472,305 | | $64,333,803 | | $232,927,423 |
| Net realized gain (loss) | | 23,100,206 | | 433,174,281 | | 93,496,090 | | 1,105,943,599 | | 83,197,214 | | 890,230,751 |
| Change in net unrealized appreciation (depreciation) | | 29,088,042 | | 396,816,221 | | (51,563,938) | | 969,575,201 | | (143,076,823) | | 700,180,954 |
| Increase (decrease) in net assets resulting from | | | | | | | | | | | | |
| operations | | 50,801,666 | | 872,310,104 | | 70,712,470 | | 2,255,991,105 | | 4,454,194 | | 1,823,339,128 |
| Distributions to shareholders | | | | | | | | | | | | |
| From net investment income | | | | | | | | | | | | |
| Class A | | — | | (3,646,118) | | — | | (19,802,476) | | (7,132,489) | | (28,483,192) |
| Class B | | — | | (9,936) | | — | | (234,447) | | (25,759) | | (410,994) |
| Class C | | — | | (146,045) | | — | | (3,242,022) | | (414,217) | | (6,299,154) |
| Class I | | — | | (98,275) | | — | | (550,048) | | (247,612) | | (747,213) |
| Class R1 | | — | | (26,086) | | — | | (154,438) | | (35,020) | | (204,760) |
| Class R2 | | — | | (37,134) | | — | | (143,411) | | (53,400) | | (214,087) |
| Class R3 | | — | | (50,744) | | — | | (132,784) | | (47,532) | | (226,587) |
| Class R4 | | — | | (70,310) | | — | | (148,281) | | (54,735) | | (253,066) |
| Class R5 | | — | | (68,461) | | — | | (317,544) | | (95,336) | | (361,493) |
| Class R6 | | — | | (314,535) | | — | | (1,179,126) | | (455,440) | | (1,212,237) |
| Class 1 | | — | | (37,942,285) | | — | | (150,224,009) | | (53,267,095) | | (192,067,901) |
| Class 5 | | — | | — | | — | | (4,800,561) | | (980,606) | | (3,191,062) |
| From net realized gain | | | | | | | | | | | | |
| Class A | | — | | (39,385,250) | | — | | (116,759,804) | | — | | (100,770,250) |
| Class B | | — | | (800,649) | | — | | (3,118,726) | | — | | (2,562,018) |
| Class C | | — | | (11,769,057) | | — | | (43,127,064) | | — | | (39,489,874) |
| Class I | | — | | (774,499) | | — | | (2,616,580) | | — | | (2,531,067) |
| Class R1 | | — | | (500,804) | | — | | (1,251,950) | | — | | (924,611) |
| Class R2 | | — | | (454,536) | | — | | (916,237) | | — | | (792,379) |
| Class R3 | | — | | (793,934) | | — | | (964,788) | | — | | (970,223) |
| Class R4 | | — | | (639,842) | | — | | (777,551) | | — | | (729,505) |
| Class R5 | | — | | (515,988) | | — | | (1,461,106) | | — | | (1,037,691) |
| Class R6 | | — | | (2,275,330) | | — | | (5,273,023) | | — | | (3,980,157) |
| Class 1 | | — | | (283,356,257) | | — | | (687,474,222) | | — | | (544,063,698) |
| Class 5 | | — | | — | | — | | (21,309,492) | | — | | (9,039,027) |
| Total distributions | | — | | (383,676,075) | | — | | (1,065,979,690) | | (62,809,241) | | (940,562,246) |
| From portfolio share transactions | | | | | | | | | | | | |
| Portfolio share transactions | | (226,796,800) | | (208,805,463) | | (818,616,614) | | (856,881,292) | | (771,153,009) | | (1,093,819,887) |
| Total from portfolio share transactions | | (226,796,800) | | (208,805,463) | | (818,616,614) | | (856,881,292) | | (771,153,009) | | (1,093,819,887) |
| Total increase (decrease) | | (175,995,134) | | 279,828,566 | | (747,904,144) | | 333,130,123 | | (829,508,056) | | (211,043,005) |
| Net assets | | | | | | | | | | | | |
| Beginning of period | | 4,280,604,278 | | 4,000,775,712 | | 12,899,679,912 | | 12,566,549,789 | | 12,765,979,950 | | 12,977,022,955 |
| End of period | | $4,104,609,144 | | $4,280,604,278 | | $12,151,775,768 | | $12,899,679,912 | | $11,936,471,894 | | $12,765,979,950 |
| Undistributed net investment income (loss) | | $(1,386,582) | | — | | $28,780,318 | | — | | $1,524,562 | | — |
| SEE NOTES TO FINANCIAL STATEMENTS | SEMIANNUAL REPORT | JOHN HANCOCK MULTIMANAGER LIFESTYLE PORTFOLIOS 28 |
STATEMENTS OF CHANGES IN NET ASSETS |
Continued |
| | Multimanager Lifestyle | | Multimanager Lifestyle |
| | Moderate Portfolio | | Conservative Portfolio |
| | Six months | | | | Six months | | |
| | ended | | | | ended | | |
| | 6-30-18 | | Year ended | | 6-30-18 | | Year ended |
| | (unaudited) | | 12-31-17 | | (unaudited) | | 12-31-17 |
| Increase (decrease) in net assets | | | | | | | | |
| From operations | | | | | | | | |
| Net investment income (loss) | | $26,579,239 | | $81,787,949 | | $24,035,455 | | $66,559,789 |
| Net realized gain (loss) | | 31,105,936 | | 160,963,712 | | 13,686,993 | | 57,944,633 |
| Change in net unrealized appreciation (depreciation) | | (88,947,471) | | 167,895,212 | | (78,254,188) | | 89,546,885 |
| Increase (decrease) in net assets resulting from operations | | (31,262,296) | | 410,646,873 | | (40,531,740) | | 214,051,307 |
| Distributions to shareholders | | | | | | | | |
| From net investment income | | | | | | | | |
| Class A | | (4,176,345) | | (13,122,758) | | (4,630,936) | | (12,586,671) |
| Class B | | (43,640) | | (247,892) | | (59,952) | | (247,626) |
| Class C | | (687,904) | | (3,715,222) | | (983,275) | | (3,713,003) |
| Class I | | (95,770) | | (256,162) | | (134,694) | | (329,156) |
| Class R1 | | (26,477) | | (97,985) | | (42,890) | | (114,893) |
| Class R2 | | (27,270) | | (100,716) | | (24,343) | | (52,539) |
| Class R3 | | (29,322) | | (102,218) | | (28,766) | | (87,356) |
| Class R4 | | (33,492) | | (128,939) | | (24,271) | | (95,853) |
| Class R5 | | (71,257) | | (213,977) | | (44,671) | | (142,590) |
| Class R6 | | (210,058) | | (613,121) | | (150,263) | | (357,695) |
| Class 1 | | (20,097,132) | | (62,035,952) | | (17,393,033) | | (49,052,835) |
| Class 5 | | (491,243) | | (1,408,409) | | — | | — |
| From net realized gain | | | | | | | | |
| Class A | | — | | (28,906,924) | | — | | (7,289,747) |
| Class B | | — | | (825,491) | | — | | (201,255) |
| Class C | | — | | (12,558,582) | | — | | (3,130,221) |
| Class I | | — | | (586,806) | | — | | (176,714) |
| Class R1 | | — | | (258,345) | | — | | (76,649) |
| Class R2 | | — | | (186,763) | | — | | (24,432) |
| Class R3 | | — | | (273,150) | | — | | (53,976) |
| Class R4 | | — | | (209,322) | | — | | (50,582) |
| Class R5 | | — | | (397,368) | | — | | (56,772) |
| Class R6 | | — | | (1,036,595) | | — | | (188,692) |
| Class 1 | | — | | (112,572,656) | | — | | (23,369,847) |
| Class 5 | | — | | (2,594,852) | | — | | — |
| Total distributions | | (25,989,910) | | (242,450,205) | | (23,517,094) | | (101,399,104) |
| From portfolio share transactions | | | | | | | | |
| Portfolio share transactions | | (217,317,842) | | (376,449,368) | | (212,756,900) | | (386,543,256) |
| Total from portfolio share transactions | | (217,317,842) | | (376,449,368) | | (212,756,900) | | (386,543,256) |
| Total increase (decrease) | | (274,570,048) | | (208,252,700) | | (276,805,734) | | (273,891,053) |
| Net assets | | | | | | | | |
| Beginning of period | | 3,801,595,893 | | 4,009,848,593 | | 2,872,645,717 | | 3,146,536,770 |
| End of period | | $3,527,025,845 | | $3,801,595,893 | | $2,595,839,983 | | $2,872,645,717 |
| Undistributed net investment income (loss) | | $589,329 | | — | | $518,361 | | — |
| SEE NOTES TO FINANCIAL STATEMENTS | SEMIANNUAL REPORT | JOHN HANCOCK MULTIMANAGER LIFESTYLE PORTFOLIOS 29 |
| Multimanager Lifestyle Aggressive Portfolio | | | | | | | | | | |
| | | | | | | | | | | |
| Per share operating performance for a share outstanding throughout each period | | | Ratios and supplemental data |
| | Income (loss) from | | | | | | | | | | | |
| | investment operations | | Less distributions | | | Ratios to average net assets | | |
| | | Net real- | | | | | | | | | | | |
| Net asset | | ized and | | | | | | | | | | Net | |
| value, | Net | unrealized | Total from | | | | Net asset | | Expenses | Expenses | Net | assets, | |
| beginning | investment | gain (loss) | investment | From net | From net | Total | value, | Total | before | including | investment | end of | Portfolio |
| of period | income | on invest- | operations | investment | realized | distribu- | end of | return | reductions | reductions | income | period | turnover |
| Period ended | ($) | (loss) ($)1, 2 | ments ($) | ($) | income ($) | gain ($)3 | tions ($) | period ($) | (%)4, 5 | (%)6 | (%)6 | (loss) (%)2 | (in millions) | (%) |
| Multimanager Lifestyle Aggressive Portfolio | | | | | | | | | | | | |
| Class A | | | | | | | | | | | | | | |
| 6-30-20187 | 16.52 | (0.03) | 0.20 | 0.17 | — | — | — | 16.69 | 1.038 | 0.569 | 0.479 | (0.34)9 | 512 | 5 |
| 12-31-2017 | 14.72 | 0.13 | 3.23 | 3.36 | (0.13) | (1.43) | (1.56) | 16.52 | 22.79 | 0.55 | 0.48 | 0.79 | 499 | 23 |
| 12-31-2016 | 14.87 | 0.12 | 0.91 | 1.03 | (0.12) | (1.06) | (1.18) | 14.72 | 6.92 | 0.53 | 0.47 | 0.78 | 419 | 31 |
| 12-31-2015 | 16.29 | 0.11 | (0.34) | (0.23) | (0.10) | (1.09) | (1.19) | 14.87 | (1.54) | 0.52 | 0.47 | 0.64 | 411 | 15 |
| 12-31-2014 | 15.94 | 0.10 | 0.60 | 0.70 | (0.09) | (0.26) | (0.35) | 16.29 | 4.39 | 0.53 | 0.47 | 0.59 | 393 | 18 |
| 12-31-2013 | 12.95 | 0.09 | 3.24 | 3.33 | (0.09) | (0.25) | (0.34) | 15.94 | 25.70 | 0.54 | 0.52 | 0.58 | 337 | 21 |
| Class B | | | | | | | | | | | | | | |
| 6-30-20187 | 16.55 | (0.09) | 0.20 | 0.11 | — | — | — | 16.66 | 0.668 | 1.269 | 1.179 | (1.05)9 | 8 | 5 |
| 12-31-2017 | 14.75 | (0.02) | 3.26 | 3.24 | (0.01) | (1.43) | (1.44) | 16.55 | 21.97 | 1.25 | 1.18 | (0.10) | 10 | 23 |
| 12-31-2016 | 14.90 | (0.01) | 0.93 | 0.92 | (0.01) | (1.06) | (1.07) | 14.75 | 6.15 | 1.23 | 1.19 | (0.08) | 12 | 31 |
| 12-31-2015 | 16.33 | (0.04) | (0.32) | (0.36) | — | (1.07) | (1.07) | 14.90 | (2.31) | 1.24 | 1.21 | (0.26) | 16 | 15 |
| 12-31-2014 | 15.98 | (0.06) | 0.63 | 0.57 | — | (0.22) | (0.22) | 16.33 | 3.58 | 1.28 | 1.26 | (0.36) | 22 | 18 |
| 12-31-2013 | 12.98 | (0.05) | 3.26 | 3.21 | — | (0.21) | (0.21) | 15.98 | 24.73 | 1.3210 | 1.32 | (0.33) | 27 | 21 |
| Class C | | | | | | | | | | | | | | |
| 6-30-20187 | 16.57 | (0.09) | 0.20 | 0.11 | — | — | — | 16.68 | 0.668 | 1.269 | 1.179 | (1.05)9 | 116 | 5 |
| 12-31-2017 | 14.76 | —11 | 3.25 | 3.25 | (0.01) | (1.43) | (1.44) | 16.57 | 22.03 | 1.25 | 1.18 | (0.03) | 148 | 23 |
| 12-31-2016 | 14.92 | —11 | 0.91 | 0.91 | (0.01) | (1.06) | (1.07) | 14.76 | 6.07 | 1.23 | 1.19 | 0.01 | 155 | 31 |
| 12-31-2015 | 16.33 | (0.02) | (0.32) | (0.34) | — | (1.07) | (1.07) | 14.92 | (2.19) | 1.22 | 1.19 | (0.11) | 167 | 15 |
| 12-31-2014 | 15.99 | (0.03) | 0.60 | 0.57 | — | (0.23) | (0.23) | 16.33 | 3.56 | 1.23 | 1.21 | (0.19) | 169 | 18 |
| 12-31-2013 | 12.98 | (0.02) | 3.25 | 3.23 | — | (0.22) | (0.22) | 15.99 | 24.90 | 1.24 | 1.23 | (0.17) | 159 | 21 |
| Class I | | | | | | | | | | | | | | |
| 6-30-20187 | 16.47 | —11 | 0.19 | 0.19 | — | — | — | 16.66 | 1.158 | 0.269 | 0.179 | (0.04)9 | 11 | 5 |
| 12-31-2017 | 14.67 | 0.22 | 3.19 | 3.41 | (0.18) | (1.43) | (1.61) | 16.47 | 23.20 | 0.24 | 0.17 | 1.33 | 10 | 23 |
| 12-31-2016 | 14.83 | 0.19 | 0.87 | 1.06 | (0.16) | (1.06) | (1.22) | 14.67 | 7.18 | 0.22 | 0.17 | 1.25 | 4 | 31 |
| 12-31-201512 | 17.07 | 0.28 | (1.28) | (1.00) | (0.15) | (1.09) | (1.24) | 14.83 | (5.98)8 | 0.209 | 0.179 | 2.569 | 3 | 1513 |
| Class R1 | | | | | | | | | | | | | | |
| 6-30-20187 | 16.55 | (0.06) | 0.20 | 0.14 | — | — | — | 16.69 | 0.858 | 0.909 | 0.829 | (0.68)9 | 7 | 5 |
| 12-31-2017 | 14.74 | 0.05 | 3.26 | 3.31 | (0.07) | (1.43) | (1.50) | 16.55 | 22.44 | 0.89 | 0.82 | 0.33 | 6 | 23 |
| 12-31-2016 | 14.90 | 0.05 | 0.91 | 0.96 | (0.06) | (1.06) | (1.12) | 14.74 | 6.48 | 0.88 | 0.84 | 0.35 | 6 | 31 |
| 12-31-2015 | 16.32 | 0.02 | (0.31) | (0.29) | (0.04) | (1.09) | (1.13) | 14.90 | (1.89) | 0.89 | 0.86 | 0.12 | 7 | 15 |
| 12-31-2014 | 15.98 | (0.03) | 0.64 | 0.61 | (0.01) | (0.26) | (0.27) | 16.32 | 3.82 | 1.02 | 1.00 | (0.18)9 | 8 | 18 |
| 12-31-2013 | 12.98 | 0.01 | 3.26 | 3.27 | (0.02) | (0.25) | (0.27) | 15.98 | 25.18 | 0.95 | 0.94 | 0.10 | 10 | 21 |
| Class R2 | | | | | | | | | | | | | | |
| 6-30-20187 | 16.42 | (0.04) | 0.20 | 0.16 | — | — | — | 16.58 | 0.978 | 0.689 | 0.609 | (0.46)9 | 7 | 5 |
| 12-31-2017 | 14.64 | 0.07 | 3.25 | 3.32 | (0.11) | (1.43) | (1.54) | 16.42 | 22.67 | 0.64 | 0.57 | 0.41 | 6 | 23 |
| 12-31-2016 | 14.80 | 0.10 | 0.90 | 1.00 | (0.10) | (1.06) | (1.16) | 14.64 | 6.78 | 0.62 | 0.58 | 0.67 | 7 | 31 |
| 12-31-2015 | 16.22 | 0.07 | (0.32) | (0.25) | (0.08) | (1.09) | (1.17) | 14.80 | (1.65) | 0.65 | 0.60 | 0.44 | 5 | 15 |
| 12-31-2014 | 15.88 | 0.14 | 0.53 | 0.67 | (0.07) | (0.26) | (0.33) | 16.22 | 4.19 | 1.01 | 0.62 | 0.85 | 5 | 18 |
| 12-31-2013 | 12.89 | 0.13 | 3.18 | 3.31 | (0.07) | (0.25) | (0.32) | 15.88 | 25.66 | 1.59 | 0.62 | 0.89 | 2 | 21 |
| Class R3 | | | | | | | | | | | | | | |
| 6-30-20187 | 16.48 | (0.05) | 0.19 | 0.14 | — | — | — | 16.62 | 0.858 | 0.809 | 0.729 | (0.59)9 | 9 | 5 |
| 12-31-2017 | 14.68 | 0.23 | 3.09 | 3.32 | (0.09) | (1.43) | (1.52) | 16.48 | 22.58 | 0.80 | 0.73 | 1.38 | 10 | 23 |
| 12-31-2016 | 14.84 | 0.07 | 0.91 | 0.98 | (0.08) | (1.06) | (1.14) | 14.68 | 6.59 | 0.77 | 0.73 | 0.45 | 5 | 31 |
| 12-31-2015 | 16.27 | 0.06 | (0.35) | (0.29) | (0.05) | (1.09) | (1.14) | 14.84 | (1.86) | 0.81 | 0.78 | 0.34 | 6 | 15 |
| 12-31-2014 | 15.92 | (0.01) | 0.64 | 0.63 | (0.02) | (0.26) | (0.28) | 16.27 | 3.94 | 0.94 | 0.92 | (0.06) | 7 | 18 |
| 12-31-2013 | 12.93 | —11 | 3.27 | 3.27 | (0.03) | (0.25) | (0.28) | 15.92 | 25.29 | 0.85 | 0.85 | 0.02 | 9 | 21 |
| Class R4 | | | | | | | | | | | | | | |
| 6-30-20187 | 16.45 | (0.02) | 0.20 | 0.18 | — | — | — | 16.63 | 1.098 | 0.519 | 0.339 | (0.20)9 | 7 | 5 |
| 12-31-2017 | 14.66 | 0.16 | 3.21 | 3.37 | (0.15) | (1.43) | (1.58) | 16.45 | 22.98 | 0.50 | 0.33 | 1.00 | 8 | 23 |
| 12-31-2016 | 14.81 | 0.11 | 0.94 | 1.05 | (0.14) | (1.06) | (1.20) | 14.66 | 7.10 | 0.47 | 0.33 | 0.76 | 7 | 31 |
| 12-31-2015 | 16.24 | 0.10 | (0.32) | (0.22) | (0.12) | (1.09) | (1.21) | 14.81 | (1.46) | 0.51 | 0.38 | 0.60 | 6 | 15 |
| 12-31-2014 | 15.90 | 0.09 | 0.59 | 0.68 | (0.08) | (0.26) | (0.34) | 16.24 | 4.25 | 0.68 | 0.56 | 0.53 | 7 | 18 |
| 12-31-2013 | 12.91 | 0.07 | 3.25 | 3.32 | (0.08) | (0.25) | (0.33) | 15.90 | 25.76 | 0.59 | 0.48 | 0.45 | 8 | 21 |
| SEE NOTES TO FINANCIAL STATEMENTS | SEMIANNUAL REPORT | JOHN HANCOCK MULTIMANAGER LIFESTYLE AGGRESSIVE PORTFOLIO 30 |
| Multimanager Lifestyle Aggressive Portfolio (continued) | | | | | | | | | |
| | | | | | | | | | |
| Per share operating performance for a share outstanding throughout each period | | | Ratios and supplemental data | | |
| | Income (loss) from | | | | | | | | | | | |
| | investment operations | | Less distributions | | | Ratios to average net assets | | |
| | | Net real- | | | | | | | | | | | |
| Net asset | | ized and | | | | | | | | | | Net | |
| value, | Net | unrealized | Total from | | | | Net asset | | Expenses | Expenses | Net | assets, | |
| beginning | investment | gain (loss) | investment | From net | From net | Total | value, | Total | before | including | investment | end of | Portfolio |
| of period | income | on invest- | operations | investment | realized | distribu- | end of | return | reductions | reductions | income | period | turnover |
| Period ended | ($) | (loss) ($)1, 2 | ments ($) | ($) | income ($) | gain ($)3 | tions ($) | period ($) | (%)4, 5 | (%)6 | (%)6 | (loss) (%)2 | (in millions) | (%) |
| Class R5 | | | | | | | | | | | | | | |
| 6-30-20187 | 16.48 | —11 | 0.19 | 0.19 | — | — | — | 16.67 | 1.158 | 0.219 | 0.139 | —9,14 | 6 | 5 |
| 12-31-2017 | 14.68 | 0.17 | 3.24 | 3.41 | (0.18) | (1.43) | (1.61) | 16.48 | 23.25 | 0.20 | 0.13 | 1.04 | 7 | 23 |
| 12-31-2016 | 14.83 | 0.15 | 0.93 | 1.08 | (0.17) | (1.06) | (1.23) | 14.68 | 7.30 | 0.17 | 0.13 | 1.01 | 7 | 31 |
| 12-31-2015 | 16.26 | 0.13 | (0.31) | (0.18) | (0.16) | (1.09) | (1.25) | 14.83 | (1.25) | 0.19 | 0.16 | 0.81 | 8 | 15 |
| 12-31-2014 | 15.92 | 0.12 | 0.61 | 0.73 | (0.13) | (0.26) | (0.39) | 16.26 | 4.56 | 0.28 | 0.26 | 0.75 | 12 | 18 |
| 12-31-2013 | 12.92 | 0.12 | 3.25 | 3.37 | (0.12) | (0.25) | (0.37) | 15.92 | 26.08 | 0.25 | 0.25 | 0.81 | 11 | 21 |
| Class R6 | | | | | | | | | | | | | | |
| 6-30-20187 | 16.47 | —11 | 0.20 | 0.20 | — | — | — | 16.67 | 1.218 | 0.169 | 0.089 | 0.069 | 31 | 5 |
| 12-31-2017 | 14.67 | 0.25 | 3.17 | 3.42 | (0.19) | (1.43) | (1.62) | 16.47 | 23.32 | 0.15 | 0.08 | 1.51 | 29 | 23 |
| 12-31-2016 | 14.82 | 0.16 | 0.93 | 1.09 | (0.18) | (1.06) | (1.24) | 14.67 | 7.38 | 0.12 | 0.06 | 1.10 | 18 | 31 |
| 12-31-2015 | 16.23 | 0.18 | (0.33) | (0.15) | (0.17) | (1.09) | (1.26) | 14.82 | (1.07) | 0.13 | 0.06 | 1.12 | 21 | 15 |
| 12-31-2014 | 15.89 | 0.20 | 0.56 | 0.76 | (0.16) | (0.26) | (0.42) | 16.23 | 4.76 | 0.26 | 0.06 | 1.24 | 15 | 18 |
| 12-31-2013 | 12.89 | 0.18 | 3.21 | 3.39 | (0.14) | (0.25) | (0.39) | 15.89 | 26.30 | 0.38 | 0.11 | 1.26 | 5 | 21 |
| Class 1 | | | | | | | | | | | | | | |
| 6-30-20187 | 16.45 | —11 | 0.19 | 0.19 | — | — | — | 16.64 | 1.168 | 0.209 | 0.119 | 0.029 | 3,392 | 5 |
| 12-31-2017 | 14.65 | 0.18 | 3.24 | 3.42 | (0.19) | (1.43) | (1.62) | 16.45 | 23.31 | 0.19 | 0.12 | 1.08 | 3,548 | 23 |
| 12-31-2016 | 14.81 | 0.16 | 0.91 | 1.07 | (0.17) | (1.06) | (1.23) | 14.65 | 7.26 | 0.16 | 0.11 | 1.10 | 3,360 | 31 |
| 12-31-2015 | 16.22 | 0.16 | (0.32) | (0.16) | (0.16) | (1.09) | (1.25) | 14.81 | (1.12) | 0.14 | 0.11 | 0.94 | 3,560 | 15 |
| 12-31-2014 | 15.88 | 0.14 | 0.61 | 0.75 | (0.15) | (0.26) | (0.41) | 16.22 | 4.71 | 0.13 | 0.11 | 0.88 | 3,937 | 18 |
| 12-31-2013 | 12.89 | 0.13 | 3.25 | 3.38 | (0.14) | (0.25) | (0.39) | 15.88 | 26.23 | 0.11 | 0.11 | 0.91 | 4,048 | 21 |
1. Based on average daily shares outstanding.
2. Net investment income is affected by the timing and frequency of the declaration of dividends by the underlying funds in which the portfolio invests.
3. Capital gain distributions may vary between classes due to expense differences applied to ordinary income distributions from underlying funds.
4. Does not reflect the effect of sales charges, if any.
5. Total returns would have been lower had certain expenses not been reduced during the applicable periods.
6. Ratios do not include expenses indirectly incurred from underlying funds and can vary based on the mix of underlying funds held by the portfolio. The range of expense ratios of the underlying funds held by the portfolio was as follows: 0.53%-1.62%, 0.53%-3.43%, 0.66%-3.77%, 0.66%-2.99%, 0.67%-2.85%, and 0.69%-3.11% for the periods ended 6-30-18, 12-31-17, 12-31-16, 12-31-15, 12-31-14, and 12-31-13, respectively.
7. Six months ended 6-30-18. Unaudited.
8. Not annualized.
9. Annualized.
10. Includes the impact of expense recapture which amounted to 0.04% of average net assets for Class B shares.
11. Less than $0.005 per share.
12. The inception date for Class I shares is 5-1-15.
13. Portfolio turnover is shown for the period from 1-1-15 to 12-31-15.
14. Less than 0.005%.
| SEE NOTES TO FINANCIAL STATEMENTS | SEMIANNUAL REPORT | JOHN HANCOCK MULTIMANAGER LIFESTYLE AGGRESSIVE PORTFOLIO 31 |
| Financial highlights continued |
| Multimanager Lifestyle Growth Portfolio | | | | | | | | | | |
| | | | | | | | | | | |
| Per share operating performance for a share outstanding throughout each period | | | Ratios and supplemental data |
| | Income (loss) from | | | | | | | | | | | |
| | investment operations | | Less distributions | | | Ratios to average net assets | | |
| | | Net real- | | | | | | | | | | | |
| Net asset | | ized and | | | | | | | | | | Net | |
| value, | Net | unrealized | Total from | | | | Net asset | | Expenses | Expenses | Net | assets, | |
| beginning | investment | gain (loss) | investment | From net | From net | Total | value, | Total | before | including | investment | end of | Portfolio |
| of period | income | on invest- | operations | investment | realized | distribu- | end of | return | reductions | reductions | income | period | turnover |
| Period ended | ($) | (loss) ($)1, 2 | ments ($) | ($) | income ($) | gain ($) | tions ($) | period ($) | (%)3, 4 | (%)5 | (%)5 | (loss) (%)2 | (in millions) | (%) |
| Multimanager Lifestyle Growth Portfolio | | | | | | | | | | | | |
| Class A | | | | | | | | | | | | | | |
| 6-30-20186 | 16.16 | 0.02 | 0.04 | 0.06 | — | — | — | 16.22 | 0.377 | 0.548 | 0.478 | 0.218 | 1,714 | 4 |
| 12-31-2017 | 14.77 | 0.19 | 2.59 | 2.78 | (0.20) | (1.19) | (1.39) | 16.16 | 18.84 | 0.54 | 0.48 | 1.17 | 1,719 | 24 |
| 12-31-2016 | 14.89 | 0.18 | 0.82 | 1.00 | (0.20) | (0.92) | (1.12) | 14.77 | 6.69 | 0.52 | 0.47 | 1.19 | 1,587 | 28 |
| 12-31-2015 | 16.35 | 0.19 | (0.41) | (0.22) | (0.19) | (1.05) | (1.24) | 14.89 | (1.45) | 0.51 | 0.47 | 1.17 | 1,611 | 15 |
| 12-31-2014 | 16.09 | 0.19 | 0.54 | 0.73 | (0.18) | (0.29) | (0.47) | 16.35 | 4.48 | 0.52 | 0.47 | 1.14 | 1,535 | 16 |
| 12-31-2013 | 13.53 | 0.17 | 2.78 | 2.95 | (0.17) | (0.22) | (0.39) | 16.09 | 21.81 | 0.53 | 0.52 | 1.13 | 1,274 | 20 |
| Class B | | | | | | | | | | | | | | |
| 6-30-20186 | 16.20 | (0.04) | 0.05 | 0.01 | — | — | — | 16.21 | 0.067 | 1.248 | 1.178 | (0.51)8 | 36 | 4 |
| 12-31-2017 | 14.82 | 0.05 | 2.61 | 2.66 | (0.09) | (1.19) | (1.28) | 16.20 | 17.94 | 1.24 | 1.18 | 0.31 | 46 | 24 |
| 12-31-2016 | 14.94 | 0.06 | 0.82 | 0.88 | (0.08) | (0.92) | (1.00) | 14.82 | 5.92 | 1.22 | 1.19 | 0.37 | 57 | 28 |
| 12-31-2015 | 16.39 | 0.05 | (0.38) | (0.33) | (0.07) | (1.05) | (1.12) | 14.94 | (2.09) | 1.22 | 1.19 | 0.30 | 76 | 15 |
| 12-31-2014 | 16.14 | 0.04 | 0.56 | 0.60 | (0.06) | (0.29) | (0.35) | 16.39 | 3.65 | 1.23 | 1.21 | 0.23 | 100 | 16 |
| 12-31-2013 | 13.57 | 0.04 | 2.80 | 2.84 | (0.05) | (0.22) | (0.27) | 16.14 | 20.93 | 1.24 | 1.24 | 0.29 | 119 | 20 |
| Class C | | | | | | | | | | | | | | |
| 6-30-20186 | 16.18 | (0.04) | 0.05 | 0.01 | — | — | — | 16.19 | 0.067 | 1.248 | 1.178 | (0.51)8 | 510 | 4 |
| 12-31-2017 | 14.80 | 0.06 | 2.60 | 2.66 | (0.09) | (1.19) | (1.28) | 16.18 | 17.97 | 1.24 | 1.18 | 0.40 | 629 | 24 |
| 12-31-2016 | 14.92 | 0.07 | 0.81 | 0.88 | (0.08) | (0.92) | (1.00) | 14.80 | 5.93 | 1.22 | 1.19 | 0.45 | 670 | 28 |
| 12-31-2015 | 16.37 | 0.07 | (0.40) | (0.33) | (0.07) | (1.05) | (1.12) | 14.92 | (2.09) | 1.21 | 1.19 | 0.42 | 730 | 15 |
| 12-31-2014 | 16.12 | 0.06 | 0.54 | 0.60 | (0.06) | (0.29) | (0.35) | 16.37 | 3.66 | 1.22 | 1.20 | 0.38 | 739 | 16 |
| 12-31-2013 | 13.56 | 0.06 | 2.77 | 2.83 | (0.05) | (0.22) | (0.27) | 16.12 | 20.88 | 1.23 | 1.23 | 0.39 | 646 | 20 |
| Class I | | | | | | | | | | | | | | |
| 6-30-20186 | 16.07 | 0.04 | 0.04 | 0.08 | — | — | — | 16.15 | 0.507 | 0.258 | 0.188 | 0.508 | 37 | 4 |
| 12-31-2017 | 14.69 | 0.29 | 2.53 | 2.82 | (0.25) | (1.19) | (1.44) | 16.07 | 19.20 | 0.23 | 0.17 | 1.78 | 38 | 24 |
| 12-31-2016 | 14.82 | 0.34 | 0.69 | 1.03 | (0.24) | (0.92) | (1.16) | 14.69 | 6.97 | 0.21 | 0.17 | 2.27 | 16 | 28 |
| 12-31-20159 | 16.97 | 0.23 | (1.09) | (0.86) | (0.24) | (1.05) | (1.29) | 14.82 | (5.17)7 | 0.208 | 0.178 | 2.118 | 6 | 1510 |
| Class R1 | | | | | | | | | | | | | | |
| 6-30-20186 | 16.23 | (0.01) | 0.04 | 0.03 | — | — | — | 16.26 | 0.187 | 0.898 | 0.828 | (0.14)8 | 17 | 4 |
| 12-31-2017 | 14.83 | 0.13 | 2.61 | 2.74 | (0.15) | (1.19) | (1.34) | 16.23 | 18.45 | 0.87 | 0.82 | 0.79 | 18 | 24 |
| 12-31-2016 | 14.96 | 0.13 | 0.80 | 0.93 | (0.14) | (0.92) | (1.06) | 14.83 | 6.24 | 0.85 | 0.81 | 0.83 | 18 | 28 |
| 12-31-2015 | 16.41 | 0.13 | (0.40) | (0.27) | (0.13) | (1.05) | (1.18) | 14.96 | (1.73) | 0.86 | 0.83 | 0.76 | 20 | 15 |
| 12-31-2014 | 16.15 | 0.10 | 0.56 | 0.66 | (0.11) | (0.29) | (0.40) | 16.41 | 4.04 | 0.89 | 0.87 | 0.62 | 22 | 16 |
| 12-31-2013 | 13.58 | 0.10 | 2.80 | 2.90 | (0.11) | (0.22) | (0.33) | 16.15 | 21.36 | 0.88 | 0.88 | 0.69 | 23 | 20 |
| Class R2 | | | | | | | | | | | | | | |
| 6-30-20186 | 16.05 | 0.01 | 0.04 | 0.05 | — | — | — | 16.10 | 0.317 | 0.628 | 0.558 | 0.148 | 15 | 4 |
| 12-31-2017 | 14.68 | 0.14 | 2.61 | 2.75 | (0.19) | (1.19) | (1.38) | 16.05 | 18.71 | 0.64 | 0.58 | 0.86 | 13 | 24 |
| 12-31-2016 | 14.81 | 0.17 | 0.80 | 0.97 | (0.18) | (0.92) | (1.10) | 14.68 | 6.56 | 0.61 | 0.58 | 1.14 | 18 | 28 |
| 12-31-2015 | 16.27 | 0.18 | (0.42) | (0.24) | (0.17) | (1.05) | (1.22) | 14.81 | (1.55) | 0.62 | 0.59 | 1.09 | 15 | 15 |
| 12-31-2014 | 16.02 | 0.18 | 0.51 | 0.69 | (0.15) | (0.29) | (0.44) | 16.27 | 4.29 | 0.73 | 0.62 | 1.07 | 12 | 16 |
| 12-31-2013 | 13.47 | 0.26 | 2.66 | 2.92 | (0.15) | (0.22) | (0.37) | 16.02 | 21.67 | 0.9011 | 0.62 | 1.72 | 9 | 20 |
| Class R3 | | | | | | | | | | | | | | |
| 6-30-20186 | 16.13 | —12 | 0.04 | 0.04 | — | — | — | 16.17 | 0.257 | 0.738 | 0.668 | 0.018 | 13 | 4 |
| 12-31-2017 | 14.75 | 0.17 | 2.57 | 2.74 | (0.17) | (1.19) | (1.36) | 16.13 | 18.54 | 0.78 | 0.73 | 1.05 | 14 | 24 |
| 12-31-2016 | 14.87 | 0.14 | 0.82 | 0.96 | (0.16) | (0.92) | (1.08) | 14.75 | 6.44 | 0.74 | 0.71 | 0.91 | 14 | 28 |
| 12-31-2015 | 16.33 | 0.12 | (0.38) | (0.26) | (0.15) | (1.05) | (1.20) | 14.87 | (1.70) | 0.77 | 0.74 | 0.71 | 18 | 15 |
| 12-31-2014 | 16.08 | 0.11 | 0.55 | 0.66 | (0.12) | (0.29) | (0.41) | 16.33 | 4.09 | 0.82 | 0.80 | 0.69 | 23 | 16 |
| 12-31-2013 | 13.52 | 0.12 | 2.78 | 2.90 | (0.12) | (0.22) | (0.34) | 16.08 | 21.45 | 0.79 | 0.79 | 0.79 | 24 | 20 |
| Class R4 | | | | | | | | | | | | | | |
| 6-30-20186 | 16.14 | 0.03 | 0.04 | 0.07 | — | — | — | 16.21 | 0.437 | 0.508 | 0.338 | 0.348 | 9 | 4 |
| 12-31-2017 | 14.75 | 0.19 | 2.62 | 2.81 | (0.23) | (1.19) | (1.42) | 16.14 | 19.03 | 0.48 | 0.32 | 1.19 | 11 | 24 |
| 12-31-2016 | 14.87 | 0.18 | 0.84 | 1.02 | (0.22) | (0.92) | (1.14) | 14.75 | 6.85 | 0.46 | 0.33 | 1.18 | 15 | 28 |
| 12-31-2015 | 16.33 | 0.18 | (0.38) | (0.20) | (0.21) | (1.05) | (1.26) | 14.87 | (1.30) | 0.47 | 0.34 | 1.10 | 19 | 15 |
| 12-31-2014 | 16.08 | 0.21 | 0.52 | 0.73 | (0.19) | (0.29) | (0.48) | 16.33 | 4.49 | 0.51 | 0.39 | 1.26 | 29 | 16 |
| 12-31-2013 | 13.51 | 0.18 | 2.79 | 2.97 | (0.18) | (0.22) | (0.40) | 16.08 | 21.99 | 0.50 | 0.40 | 1.20 | 24 | 20 |
| SEE NOTES TO FINANCIAL STATEMENTS | SEMIANNUAL REPORT | JOHN HANCOCK MULTIMANAGER LIFESTYLE GROWTH PORTFOLIOS 32 |
Multimanager Lifestyle Growth Portfolio (continued) |
| |
| Per share operating performance for a share outstanding throughout each period | Ratios and supplemental data |
| | Income (loss) from in- | | | | | | | | | | | |
| | vestment operations | | Less distributions | | | Ratios to average net assets | | |
| | | Net real- | | | | | | | | | | | |
| Net asset | | ized and | | | | | | | | | | Net | |
| value, | Net | unrealized | Total from | | | | Net asset | | Expenses | Expenses | Net | assets, | |
| beginning | investment | gain (loss) | investment | From net | From net | Total | value, | Total | before | including | investment | end of | Portfolio |
| of period | income | on invest- | operations | investment | realized | distribu- | end of | return | reductions | reductions | income | period | turnover |
| Period ended | ($) | (loss) ($)1,2 | ments ($) | ($) | income ($) | gain ($) | tions ($) | period ($) | (%)3,4 | (%)5 | (%)5 | (loss) (%)2 | (in millions) | (%) |
| Class R5 |
| 6-30-20186 | 16.16 | 0.04 | 0.05 | 0.09 | — | — | — | 16.25 | 0.567 | 0.208 | 0.138 | 0.558 | 16 | 4 |
| 12-31-2017 | 14.77 | 0.24 | 2.60 | 2.84 | (0.26) | (1.19) | (1.45) | 16.16 | 19.22 | 0.18 | 0.13 | 1.46 | 22 | 24 |
| 12-31-2016 | 14.89 | 0.21 | 0.84 | 1.05 | (0.25) | (0.92) | (1.17) | 14.77 | 7.05 | 0.16 | 0.13 | 1.40 | 21 | 28 |
| 12-31-2015 | 16.35 | 0.22 | (0.38) | (0.16) | (0.25) | (1.05) | (1.30) | 14.89 | (1.10) | 0.16 | 0.14 | 1.34 | 28 | 15 |
| 12-31-2014 | 16.10 | 0.22 | 0.55 | 0.77 | (0.23) | (0.29) | (0.52) | 16.35 | 4.71 | 0.19 | 0.17 | 1.34 | 38 | 16 |
| 12-31-2013 | 13.52 | 0.21 | 2.80 | 3.01 | (0.21) | (0.22) | (0.43) | 16.10 | 22.29 | 0.18 | 0.18 | 1.40 | 37 | 20 |
| Class R6 |
| 6-30-20186 | 16.08 | 0.05 | 0.04 | 0.09 | — | — | — | 16.17 | 0.567 | 0.158 | 0.088 | 0.618 | 87 | 4 |
| 12-31-2017 | 14.70 | 0.33 | 2.51 | 2.84 | (0.27) | (1.19) | (1.46) | 16.08 | 19.30 | 0.14 | 0.08 | 2.00 | 78 | 24 |
| 12-31-2016 | 14.82 | 0.23 | 0.83 | 1.06 | (0.26) | (0.92) | (1.18) | 14.70 | 7.16 | 0.11 | 0.06 | 1.56 | 41 | 28 |
| 12-31-2015 | 16.28 | 0.27 | (0.42) | (0.15) | (0.26) | (1.05) | (1.31) | 14.82 | (1.04) | 0.11 | 0.06 | 1.63 | 47 | 15 |
| 12-31-2014 | 16.03 | 0.30 | 0.49 | 0.79 | (0.25) | (0.29) | (0.54) | 16.28 | 4.86 | 0.17 | 0.06 | 1.81 | 37 | 16 |
| 12-31-2013 | 13.47 | 0.29 | 2.71 | 3.00 | (0.22) | (0.22) | (0.44) | 16.03 | 22.31 | 0.19 | 0.11 | 1.95 | 19 | 20 |
| Class 1 |
| 6-30-20186 | 16.08 | 0.05 | 0.04 | 0.09 | — | — | — | 16.17 | 0.567 | 0.198 | 0.128 | 0.568 | 9,377 | 4 |
| 12-31-2017 | 14.70 | 0.24 | 2.59 | 2.83 | (0.26) | (1.19) | (1.45) | 16.08 | 19.26 | 0.17 | 0.12 | 1.50 | 9,997 | 24 |
| 12-31-2016 | 14.83 | 0.23 | 0.81 | 1.04 | (0.25) | (0.92) | (1.17) | 14.70 | 7.03 | 0.15 | 0.11 | 1.55 | 9,850 | 28 |
| 12-31-2015 | 16.28 | 0.24 | (0.39) | (0.15) | (0.25) | (1.05) | (1.30) | 14.83 | (1.02) | 0.13 | 0.11 | 1.46 | 10,420 | 15 |
| 12-31-2014 | 16.03 | 0.23 | 0.55 | 0.78 | (0.24) | (0.29) | (0.53) | 16.28 | 4.80 | 0.13 | 0.11 | 1.41 | 11,576 | 16 |
| 12-31-2013 | 13.47 | 0.22 | 2.78 | 3.00 | (0.22) | (0.22) | (0.44) | 16.03 | 22.31 | 0.11 | 0.11 | 1.45 | 11,766 | 20 |
| Class 5 |
| 6-30-20186 | 16.06 | 0.05 | 0.04 | 0.09 | — | — | — | 16.15 | 0.567 | 0.148 | 0.078 | 0.628 | 320 | 4 |
| 12-31-2017 | 14.68 | 0.26 | 2.58 | 2.84 | (0.27) | (1.19) | (1.46) | 16.06 | 19.34 | 0.12 | 0.07 | 1.63 | 314 | 24 |
| 12-31-2016 | 14.81 | 0.25 | 0.80 | 1.05 | (0.26) | (0.92) | (1.18) | 14.68 | 7.09 | 0.10 | 0.06 | 1.65 | 259 | 28 |
| 12-31-2015 | 16.26 | 0.26 | (0.40) | (0.14) | (0.26) | (1.05) | (1.31) | 14.81 | (0.98) | 0.08 | 0.06 | 1.57 | 243 | 15 |
| 12-31-2014 | 16.01 | 0.25 | 0.54 | 0.79 | (0.25) | (0.29) | (0.54) | 16.26 | 4.86 | 0.08 | 0.06 | 1.53 | 233 | 16 |
| 12-31-2013 | 13.46 | 0.24 | 2.76 | 3.00 | (0.23) | (0.22) | (0.45) | 16.01 | 22.31 | 0.06 | 0.06 | 1.60 | 201 | 20 |
1. Based on average daily shares outstanding.
2. Net investment income is affected by the timing and frequency of the declaration of dividends by the underlying funds in which the portfolio invests.
3. Does not reflect the effect of sales charges, if any.
4. Total returns would have been lower had certain expenses not been reduced during the applicable periods.
5. Ratios do not include expenses indirectly incurred from underlying funds and can vary based on the mix of underlying funds held by the portfolio. The range of expense ratios of the underlying funds held by the portfolio was as follows: 0.38%-1.56%, 0.38%-3.43%, 0.60%-3.77%, 0.57%-2.99%, 0.55%-2.85%, and 0.63%-3.11% for the periods ended 6-30-18, 12-31-17, 12-31-16, 12-31-15, 12-31-14 and 12-31-13, respectively.
6. Six months ended 6-30-18. Unaudited.
7. Not annualized.
8. Annualized.
9. The inception date for Class I shares is 5-1-15.
10. Portfolio turnover is shown for the period from 1-1-15 to 12-31-15.
11. Includes the impact of expense recapture which amounted to 0.01% of average net assets for Class R2 shares.
12. Less than $0.005 per share.
| SEE NOTES TO FINANCIAL STATEMENTS | SEMIANNUAL REPORT | JOHN HANCOCK MULTIMANAGER LIFESTYLE GROWTH PORTFOLIO 33 |
| Financial highlights continued |
Multimanager Lifestyle Balanced Portfolio |
| |
| Per share operating performance for a share outstanding throughout each period | Ratios and supplemental data |
| | Income (loss) from in- | | | | | | | | | | | |
| | vestment operations | | Less distributions | | | Ratios to average net assets | | |
| | | Net real- | | | | | | | | | | | |
| Net asset | | ized and | | | | | | | | | | Net | |
| value, | Net | unrealized | Total from | | | | Net asset | | Expenses | Expenses | Net | assets, | |
| beginning | investment | gain (loss) | investment | From net | From net | Total | value, | Total | before | including | investment | end of | Portfolio |
| of period | income | on invest- | operations | investment | realized | distribu- | end of | return | reductions | reductions | income | period | turnover |
| Period ended | ($) | (loss) ($)1,2 | ments ($) | ($) | income ($) | gain ($) | tions ($) | period ($) | (%)3,4 | (%)5 | (%)5 | (loss) (%)2 | (in millions) | (%) |
| Multimanager Lifestyle Balanced Portfolio | | | | | | | | | | | | |
| Class A | | | | | | | | | | | | | | |
| 6-30-20186 | 15.29 | 0.06 | (0.08) | (0.02) | (0.06) | — | (0.06) | 15.21 | (0.13)7 | 0.558 | 0.488 | 0.818 | 1,815 | 4 |
| 12-31-2017 | 14.32 | 0.24 | 1.88 | 2.12 | (0.25) | (0.90) | (1.15) | 15.29 | 14.79 | 0.54 | 0.48 | 1.57 | 1,841 | 27 |
| 12-31-2016 | 14.31 | 0.24 | 0.72 | 0.96 | (0.25) | (0.70) | (0.95) | 14.32 | 6.73 | 0.52 | 0.47 | 1.64 | 1,782 | 23 |
| 12-31-2015 | 15.55 | 0.27 | (0.50) | (0.23) | (0.26) | (0.75) | (1.01) | 14.31 | (1.54) | 0.51 | 0.47 | 1.69 | 1,843 | 13 |
| 12-31-2014 | 15.36 | 0.28 | 0.34 | 0.62 | (0.27) | (0.16) | (0.43) | 15.55 | 4.00 | 0.52 | 0.47 | 1.77 | 1,786 | 15 |
| 12-31-2013 | 13.61 | 0.25 | 1.89 | 2.14 | (0.24) | (0.15) | (0.39) | 15.36 | 15.76 | 0.53 | 0.51 | 1.69 | 1,461 | 19 |
| Class B | | | | | | | | | | | | | | |
| 6-30-20186 | 15.28 | 0.01 | (0.08) | (0.07) | (0.01) | — | (0.01) | 15.20 | (0.45)7 | 1.258 | 1.188 | 0.088 | 37 | 4 |
| 12-31-2017 | 14.32 | 0.12 | 1.88 | 2.00 | (0.14) | (0.90) | (1.04) | 15.28 | 13.93 | 1.24 | 1.19 | 0.75 | 47 | 27 |
| 12-31-2016 | 14.31 | 0.12 | 0.74 | 0.86 | (0.15) | (0.70) | (0.85) | 14.32 | 5.99 | 1.22 | 1.19 | 0.83 | 59 | 23 |
| 12-31-2015 | 15.54 | 0.13 | (0.46) | (0.33) | (0.15) | (0.75) | (0.90) | 14.31 | (2.20) | 1.22 | 1.19 | 0.85 | 78 | 13 |
| 12-31-2014 | 15.35 | 0.13 | 0.37 | 0.50 | (0.15) | (0.16) | (0.31) | 15.54 | 3.21 | 1.24 | 1.22 | 0.85 | 98 | 15 |
| 12-31-2013 | 13.61 | 0.12 | 1.90 | 2.02 | (0.13) | (0.15) | (0.28) | 15.35 | 14.84 | 1.28 | 1.28 | 0.81 | 116 | 19 |
| Class C | | | | | | | | | | | | | | |
| 6-30-20186 | 15.30 | 0.01 | (0.09) | (0.08) | (0.01) | — | (0.01) | 15.21 | (0.52)7 | 1.258 | 1.188 | 0.088 | 591 | 4 |
| 12-31-2017 | 14.33 | 0.13 | 1.88 | 2.01 | (0.14) | (0.90) | (1.04) | 15.30 | 13.99 | 1.24 | 1.19 | 0.81 | 718 | 27 |
| 12-31-2016 | 14.32 | 0.13 | 0.73 | 0.86 | (0.15) | (0.70) | (0.85) | 14.33 | 5.99 | 1.22 | 1.19 | 0.90 | 792 | 23 |
| 12-31-2015 | 15.55 | 0.15 | (0.48) | (0.33) | (0.15) | (0.75) | (0.90) | 14.32 | (2.19) | 1.21 | 1.19 | 0.95 | 876 | 13 |
| 12-31-2014 | 15.37 | 0.16 | 0.33 | 0.49 | (0.15) | (0.16) | (0.31) | 15.55 | 3.18 | 1.22 | 1.20 | 1.00 | 892 | 15 |
| 12-31-2013 | 13.62 | 0.14 | 1.89 | 2.03 | (0.13) | (0.15) | (0.28) | 15.37 | 14.93 | 1.23 | 1.23 | 0.96 | 767 | 19 |
| Class I | | | | | | | | | | | | | | |
| 6-30-20186 | 15.20 | 0.08 | (0.08) | — | (0.08) | — | (0.08) | 15.12 | 0.017 | 0.258 | 0.198 | 1.118 | 46 | 4 |
| 12-31-2017 | 14.24 | 0.35 | 1.80 | 2.15 | (0.29) | (0.90) | (1.19) | 15.20 | 15.15 | 0.23 | 0.18 | 2.25 | 45 | 27 |
| 12-31-2016 | 14.24 | 0.35 | 0.65 | 1.00 | (0.30) | (0.70) | (1.00) | 14.24 | 7.01 | 0.21 | 0.17 | 2.42 | 17 | 23 |
| 12-31-20159 | 16.00 | 0.34 | (1.08) | (0.74) | (0.27) | (0.75) | (1.02) | 14.24 | (4.70)7 | 0.208 | 0.178 | 3.268 | 6 | 1310 |
| Class R1 | | | | | | | | | | | | | | |
| 6-30-20186 | 15.22 | 0.04 | (0.09) | (0.05) | (0.03) | — | (0.03) | 15.14 | (0.31)7 | 0.898 | 0.828 | 0.478 | 16 | 4 |
| 12-31-2017 | 14.26 | 0.19 | 1.86 | 2.05 | (0.19) | (0.90) | (1.09) | 15.22 | 14.39 | 0.88 | 0.83 | 1.21 | 17 | 27 |
| 12-31-2016 | 14.25 | 0.19 | 0.72 | 0.91 | (0.20) | (0.70) | (0.90) | 14.26 | 6.39 | 0.86 | 0.83 | 1.28 | 16 | 23 |
| 12-31-2015 | 15.48 | 0.20 | (0.48) | (0.28) | (0.20) | (0.75) | (0.95) | 14.25 | (1.86) | 0.86 | 0.84 | 1.27 | 17 | 13 |
| 12-31-2014 | 15.30 | 0.19 | 0.35 | 0.54 | (0.20) | (0.16) | (0.36) | 15.48 | 3.52 | 0.92 | 0.91 | 1.22 | 20 | 15 |
| 12-31-2013 | 13.57 | 0.18 | 1.88 | 2.06 | (0.18) | (0.15) | (0.33) | 15.30 | 15.23 | 0.90 | 0.90 | 1.21 | 19 | 19 |
| Class R2 | | | | | | | | | | | | | | |
| 6-30-20186 | 15.20 | 0.05 | (0.08) | (0.03) | (0.05) | — | (0.05) | 15.12 | (0.18)7 | 0.658 | 0.588 | 0.728 | 15 | 4 |
| 12-31-2017 | 14.25 | 0.22 | 1.86 | 2.08 | (0.23) | (0.90) | (1.13) | 15.20 | 14.61 | 0.64 | 0.58 | 1.45 | 14 | 27 |
| 12-31-2016 | 14.24 | 0.23 | 0.72 | 0.95 | (0.24) | (0.70) | (0.94) | 14.25 | 6.66 | 0.61 | 0.58 | 1.57 | 16 | 23 |
| 12-31-2015 | 15.48 | 0.25 | (0.50) | (0.25) | (0.24) | (0.75) | (0.99) | 14.24 | (1.66) | 0.63 | 0.59 | 1.58 | 14 | 13 |
| 12-31-2014 | 15.29 | 0.29 | 0.30 | 0.59 | (0.24) | (0.16) | (0.40) | 15.48 | 3.87 | 0.79 | 0.62 | 1.86 | 10 | 15 |
| 12-31-2013 | 13.56 | 0.34 | 1.76 | 2.10 | (0.22) | (0.15) | (0.37) | 15.29 | 15.59 | 1.0911 | 0.62 | 2.30 | 5 | 19 |
| Class R3 | | | | | | | | | | | | | | |
| 6-30-20186 | 15.25 | 0.04 | (0.08) | (0.04) | (0.04) | — | (0.04) | 15.17 | (0.25)7 | 0.778 | 0.718 | 0.598 | 18 | 4 |
| 12-31-2017 | 14.29 | 0.20 | 1.87 | 2.07 | (0.21) | (0.90) | (1.11) | 15.25 | 14.47 | 0.78 | 0.73 | 1.31 | 18 | 27 |
| 12-31-2016 | 14.28 | 0.20 | 0.72 | 0.92 | (0.21) | (0.70) | (0.91) | 14.29 | 6.48 | 0.75 | 0.72 | 1.38 | 22 | 23 |
| 12-31-2015 | 15.51 | 0.20 | (0.46) | (0.26) | (0.22) | (0.75) | (0.97) | 14.28 | (1.75) | 0.76 | 0.74 | 1.30 | 24 | 13 |
| 12-31-2014 | 15.33 | 0.20 | 0.36 | 0.56 | (0.22) | (0.16) | (0.38) | 15.51 | 3.64 | 0.80 | 0.78 | 1.27 | 30 | 15 |
| 12-31-2013 | 13.59 | 0.19 | 1.90 | 2.09 | (0.20) | (0.15) | (0.35) | 15.33 | 15.43 | 0.77 | 0.77 | 1.31 | 35 | 19 |
| Class R4 | | | | | | | | | | | | | | |
| 6-30-20186 | 15.26 | 0.07 | (0.08) | (0.01) | (0.07) | — | (0.07) | 15.18 | (0.06)7 | 0.518 | 0.348 | 0.948 | 12 | 4 |
| 12-31-2017 | 14.29 | 0.23 | 1.91 | 2.14 | (0.27) | (0.90) | (1.17) | 15.26 | 14.99 | 0.48 | 0.33 | 1.49 | 13 | 27 |
| 12-31-2016 | 14.28 | 0.24 | 0.74 | 0.98 | (0.27) | (0.70) | (0.97) | 14.29 | 6.90 | 0.46 | 0.33 | 1.68 | 21 | 23 |
| 12-31-2015 | 15.52 | 0.25 | (0.46) | (0.21) | (0.28) | (0.75) | (1.03) | 14.28 | (1.42) | 0.47 | 0.34 | 1.57 | 24 | 13 |
| 12-31-2014 | 15.33 | 0.28 | 0.35 | 0.63 | (0.28) | (0.16) | (0.44) | 15.52 | 4.12 | 0.49 | 0.37 | 1.78 | 40 | 15 |
| 12-31-2013 | 13.59 | 0.26 | 1.89 | 2.15 | (0.26) | (0.15) | (0.41) | 15.33 | 15.90 | 0.46 | 0.35 | 1.76 | 77 | 19 |
| SEE NOTES TO FINANCIAL STATEMENTS | SEMIANNUAL REPORT | JOHN HANCOCK MULTIMANAGER LIFESTYLE BALANCED PORTFOLIO 34 |
Multimanager Lifestyle Balanced Portfolio (continued) |
| |
| Per share operating performance for a share outstanding throughout each period | Ratios and supplemental data |
| | Income (loss) from in- | | | | | | | | | | | |
| | vestment operations | | Less distributions | | | Ratios to average net assets | | |
| | | Net real- | | | | | | | | | | | |
| Net asset | | ized and | | | | | | | | | | Net | |
| value, | Net | unrealized | Total from | | | | Net asset | | Expenses | Expenses | Net | assets, | |
| beginning | investment | gain (loss) | investment | From net | From net | Total | value, | Total | before | including | investment | end of | Portfolio |
| of period | income | on invest- | operations | investment | realized | distribu- | end of | return | reductions | reductions | income | period | turnover |
| Period ended | ($) | (loss) ($)1,2 | ments ($) | ($) | income ($) | gain ($) | tions ($) | period ($) | (%)3,4 | (%)5 | (%)5 | (loss) (%)2 | (in millions) | (%) |
| Class R5 | | | | | | | | | | | | | | |
| 6-30-20186 | 15.28 | 0.09 | (0.08) | 0.01 | (0.09) | — | (0.09) | 15.20 | 0.047 | 0.208 | 0.148 | 1.158 | 17 | 4 |
| 12-31-2017 | 14.31 | 0.30 | 1.87 | 2.17 | (0.30) | (0.90) | (1.20) | 15.28 | 15.19 | 0.19 | 0.14 | 1.95 | 19 | 27 |
| 12-31-2016 | 14.30 | 0.27 | 0.74 | 1.01 | (0.30) | (0.70) | (1.00) | 14.31 | 7.10 | 0.16 | 0.13 | 1.86 | 17 | 23 |
| 12-31-2015 | 15.53 | 0.30 | (0.47) | (0.17) | (0.31) | (0.75) | (1.06) | 14.30 | (1.16) | 0.16 | 0.14 | 1.88 | 29 | 13 |
| 12-31-2014 | 15.35 | 0.31 | 0.34 | 0.65 | (0.31) | (0.16) | (0.47) | 15.53 | 4.25 | 0.19 | 0.17 | 1.96 | 41 | 15 |
| 12-31-2013 | 13.60 | 0.28 | 1.91 | 2.19 | (0.29) | (0.15) | (0.44) | 15.35 | 16.20 | 0.17 | 0.17 | 1.93 | 41 | 19 |
| Class R6 | | | | | | | | | | | | | | |
| 6-30-20186 | 15.20 | 0.09 | (0.09) | — | (0.09) | — | (0.09) | 15.11 | 0.007 | 0.158 | 0.098 | 1.218 | 78 | 4 |
| 12-31-2017 | 14.24 | 0.35 | 1.82 | 2.17 | (0.31) | (0.90) | (1.21) | 15.20 | 15.27 | 0.14 | 0.08 | 2.29 | 73 | 27 |
| 12-31-2016 | 14.24 | 0.28 | 0.73 | 1.01 | (0.31) | (0.70) | (1.01) | 14.24 | 7.13 | 0.11 | 0.06 | 1.92 | 44 | 23 |
| 12-31-2015 | 15.47 | 0.35 | (0.51) | (0.16) | (0.32) | (0.75) | (1.07) | 14.24 | (1.08) | 0.11 | 0.06 | 2.27 | 66 | 13 |
| 12-31-2014 | 15.29 | 0.36 | 0.31 | 0.67 | (0.33) | (0.16) | (0.49) | 15.47 | 4.38 | 0.16 | 0.06 | 2.29 | 39 | 15 |
| 12-31-2013 | 13.55 | 0.36 | 1.83 | 2.19 | (0.30) | (0.15) | (0.45) | 15.29 | 16.26 | 0.17 | 0.11 | 2.49 | 21 | 19 |
| Class 1 | | | | | | | | | | | | | | |
| 6-30-20186 | 15.19 | 0.09 | (0.08) | 0.01 | (0.09) | — | (0.09) | 15.11 | 0.057 | 0.198 | 0.138 | 1.168 | 9,129 | 4 |
| 12-31-2017 | 14.24 | 0.29 | 1.86 | 2.15 | (0.30) | (0.90) | (1.20) | 15.19 | 15.14 | 0.17 | 0.12 | 1.90 | 9,797 | 27 |
| 12-31-2016 | 14.23 | 0.29 | 0.72 | 1.01 | (0.30) | (0.70) | (1.00) | 14.24 | 7.16 | 0.14 | 0.11 | 2.00 | 10,041 | 23 |
| 12-31-2015 | 15.46 | 0.31 | (0.47) | (0.16) | (0.32) | (0.75) | (1.07) | 14.23 | (1.13) | 0.13 | 0.11 | 1.99 | 10,678 | 13 |
| 12-31-2014 | 15.28 | 0.32 | 0.34 | 0.66 | (0.32) | (0.16) | (0.48) | 15.46 | 4.33 | 0.13 | 0.11 | 2.02 | 12,041 | 15 |
| 12-31-2013 | 13.55 | 0.29 | 1.89 | 2.18 | (0.30) | (0.15) | (0.45) | 15.28 | 16.18 | 0.11 | 0.11 | 2.00 | 12,284 | 19 |
| Class 5 | | | | | | | | | | | | | | |
| 6-30-20186 | 15.20 | 0.09 | (0.08) | 0.01 | (0.09) | — | (0.09) | 15.12 | 0.077 | 0.148 | 0.088 | 1.228 | 163 | 4 |
| 12-31-2017 | 14.24 | 0.31 | 1.86 | 2.17 | (0.31) | (0.90) | (1.21) | 15.20 | 15.27 | 0.12 | 0.07 | 2.00 | 165 | 27 |
| 12-31-2016 | 14.24 | 0.30 | 0.71 | 1.01 | (0.31) | (0.70) | (1.01) | 14.24 | 7.13 | 0.09 | 0.06 | 2.10 | 150 | 23 |
| 12-31-2015 | 15.47 | 0.33 | (0.49) | (0.16) | (0.32) | (0.75) | (1.07) | 14.24 | (1.07) | 0.08 | 0.06 | 2.09 | 141 | 13 |
| 12-31-2014 | 15.29 | 0.34 | 0.33 | 0.67 | (0.33) | (0.16) | (0.49) | 15.47 | 4.38 | 0.08 | 0.06 | 2.14 | 139 | 15 |
| 12-31-2013 | 13.55 | 0.31 | 1.89 | 2.20 | (0.31) | (0.15) | (0.46) | 15.29 | 16.31 | 0.06 | 0.06 | 2.15 | 118 | 19 |
1. Based on average daily shares outstanding.
2. Net investment income is affected by the timing and frequency of the declaration of dividends by the underlying funds in which the portfolio invests.
3. Does not reflect the effect of sales charges, if any.
4. Total returns would have been lower had certain expenses not been reduced during the applicable periods.
5. Ratios do not include expenses indirectly incurred from underlying funds and can vary based on the mix of underlying funds held by the portfolio. The range of expense ratios of the underlying funds held by the portfolio was as follows: 0.38%-1.56%, 0.38%-3.43%, 0.60%-3.77%, 0.57%-2.99%, 0.55%- 2.85%, and 0.62%-3.11% for the periods ended 6-30-18, 12-31-17, 12-31-16, 12-31-15, 12-31-14 and 12-31-13, respectively.
6. Six months ended 6-30-18. Unaudited.
7. Not annualized.
8. Annualized.
9. The inception date for Class I shares is 5-1-15.
10. Portfolio turnover is shown for the period from 1-1-15 to 12-31-15.
11. Includes the impact of expense recapture which amounted to 0.005% of average net assets for Class R2 shares.
| SEE NOTES TO FINANCIAL STATEMENTS | SEMIANNUAL REPORT | JOHN HANCOCK MULTIMANAGER LIFESTYLE BALANCED PORTFOLIO 35 |
| Financial highlights continued |
| Multimanager Lifestyle Moderate Portfolio |
| |
| Per share operating performance for a share outstanding throughout each period | Ratios and supplemental data |
| | Income (loss) from in- | | | | | | | | | | | |
| | vestment operations | | Less distributions | | | Ratios to average net assets | | |
| | | Net real- | | | | | | | | | | | |
| Net asset | | ized and | | | | | | | | | | Net | |
| value, | Net | unrealized | Total from | | | | Net asset | | Expenses | Expenses | Net | assets, | |
| beginning | investment | gain (loss) | investment | From net | From net | Total | value, | Total | before | including | investment | end of | Portfolio |
| of period | income | on invest- | operations | investment | realized | distribu- | end of | return | reductions | reductions | income | period | turnover |
| Period ended | ($) | (loss) ($)1, 2 | ments ($) | ($) | income ($) | gain ($) | tions ($) | period ($) | (%)3, 4 | (%)5 | (%)5 | (loss) (%)2 | (in millions) | (%) |
| Multimanager Lifestyle Moderate Portfolio |
| Class A |
| 6-30-20186 | 13.83 | 0.09 | (0.22) | (0.13) | (0.09) | — | (0.09) | 13.61 | (0.97)7 | 0.558 | 0.498 | 1.278 | 670 | 4 |
| 12-31-2017 | 13.30 | 0.27 | 1.14 | 1.41 | (0.27) | (0.61) | (0.88) | 13.83 | 10.64 | 0.55 | 0.49 | 1.90 | 693 | 28 |
| 12-31-2016 | 13.13 | 0.28 | 0.57 | 0.85 | (0.29) | (0.39) | (0.68) | 13.30 | 6.52 | 0.51 | 0.48 | 2.06 | 680 | 25 |
| 12-31-2015 | 14.11 | 0.31 | (0.54) | (0.23) | (0.31) | (0.44) | (0.75) | 13.13 | (1.67) | 0.51 | 0.47 | 2.21 | 680 | 11 |
| 12-31-2014 | 14.29 | 0.35 | 0.17 | 0.52 | (0.33) | (0.37) | (0.70) | 14.11 | 3.63 | 0.52 | 0.47 | 2.36 | 662 | 14 |
| 12-31-2013 | 13.35 | 0.31 | 1.02 | 1.33 | (0.30) | (0.09) | (0.39) | 14.29 | 10.05 | 0.53 | 0.52 | 2.22 | 551 | 17 |
| Class B |
| 6-30-20186 | 13.82 | 0.04 | (0.22) | (0.18) | (0.04) | — | (0.04) | 13.60 | (1.33)7 | 1.258 | 1.198 | 0.538 | 16 | 4 |
| 12-31-2017 | 13.28 | 0.15 | 1.17 | 1.32 | (0.17) | (0.61) | (0.78) | 13.82 | 9.96 | 1.25 | 1.20 | 1.08 | 20 | 28 |
| 12-31-2016 | 13.13 | 0.17 | 0.56 | 0.73 | (0.19) | (0.39) | (0.58) | 13.28 | 5.61 | 1.21 | 1.19 | 1.27 | 25 | 25 |
| 12-31-2015 | 14.10 | 0.19 | (0.51) | (0.32) | (0.21) | (0.44) | (0.65) | 13.13 | (2.33) | 1.22 | 1.20 | 1.36 | 30 | 11 |
| 12-31-2014 | 14.28 | 0.21 | 0.20 | 0.41 | (0.22) | (0.37) | (0.59) | 14.10 | 2.84 | 1.25 | 1.24 | 1.43 | 39 | 14 |
| 12-31-2013 | 13.34 | 0.19 | 1.04 | 1.23 | (0.20) | (0.09) | (0.29) | 14.28 | 9.23 | 1.26 | 1.25 | 1.36 | 45 | 17 |
| Class C |
| 6-30-20186 | 13.83 | 0.04 | (0.21) | (0.17) | (0.04) | — | (0.04) | 13.62 | (1.25)7 | 1.258 | 1.198 | 0.538 | 247 | 4 |
| 12-31-2017 | 13.30 | 0.16 | 1.15 | 1.31 | (0.17) | (0.61) | (0.78) | 13.83 | 9.87 | 1.25 | 1.20 | 1.12 | 299 | 28 |
| 12-31-2016 | 13.14 | 0.17 | 0.57 | 0.74 | (0.19) | (0.39) | (0.58) | 13.30 | 5.69 | 1.21 | 1.19 | 1.30 | 354 | 25 |
| 12-31-2015 | 14.11 | 0.21 | (0.53) | (0.32) | (0.21) | (0.44) | (0.65) | 13.14 | (2.32) | 1.21 | 1.19 | 1.46 | 392 | 11 |
| 12-31-2014 | 14.30 | 0.23 | 0.17 | 0.40 | (0.22) | (0.37) | (0.59) | 14.11 | 2.79 | 1.22 | 1.21 | 1.59 | 411 | 14 |
| 12-31-2013 | 13.35 | 0.20 | 1.04 | 1.24 | (0.20) | (0.09) | (0.29) | 14.30 | 9.34 | 1.23 | 1.23 | 1.47 | 366 | 17 |
| Class I |
| 6-30-20186 | 13.78 | 0.11 | (0.22) | (0.11) | (0.11) | — | (0.11) | 13.56 | (0.83)7 | 0.268 | 0.208 | 1.578 | 12 | 4 |
| 12-31-2017 | 13.25 | 0.35 | 1.10 | 1.45 | (0.31) | (0.61) | (0.92) | 13.78 | 11.01 | 0.24 | 0.19 | 2.54 | 14 | 28 |
| 12-31-2016 | 13.09 | 0.37 | 0.51 | 0.88 | (0.33) | (0.39) | (0.72) | 13.25 | 6.78 | 0.20 | 0.18 | 2.77 | 5 | 25 |
| 12-31-20159 | 14.42 | 0.33 | (0.92) | (0.59) | (0.30) | (0.44) | (0.74) | 13.09 | (4.13)7 | 0.198 | 0.178 | 3.558 | 2 | 1110 |
| Class R1 |
| 6-30-20186 | 13.81 | 0.06 | (0.22) | (0.16) | (0.06) | — | (0.06) | 13.59 | (1.15)7 | 0.888 | 0.828 | 0.948 | 6 | 4 |
| 12-31-2017 | 13.27 | 0.21 | 1.16 | 1.37 | (0.22) | (0.61) | (0.83) | 13.81 | 10.38 | 0.87 | 0.83 | 1.52 | 6 | 28 |
| 12-31-2016 | 13.12 | 0.22 | 0.57 | 0.79 | (0.25) | (0.39) | (0.64) | 13.27 | 6.03 | 0.84 | 0.82 | 1.67 | 7 | 25 |
| 12-31-2015 | 14.09 | 0.25 | (0.53) | (0.28) | (0.25) | (0.44) | (0.69) | 13.12 | (1.99) | 0.87 | 0.85 | 1.77 | 8 | 11 |
| 12-31-2014 | 14.28 | 0.24 | 0.20 | 0.44 | (0.26) | (0.37) | (0.63) | 14.09 | 3.07 | 1.01 | 1.00 | 1.65 | 8 | 14 |
| 12-31-2013 | 13.35 | 0.23 | 1.04 | 1.27 | (0.25) | (0.09) | (0.34) | 14.28 | 9.55 | 0.94 | 0.94 | 1.68 | 10 | 17 |
| Class R2 |
| 6-30-20186 | 13.78 | 0.08 | (0.22) | (0.14) | (0.08) | — | (0.08) | 13.56 | (1.03)7 | 0.678 | 0.618 | 1.168 | 5 | 4 |
| 12-31-2017 | 13.25 | 0.22 | 1.18 | 1.40 | (0.26) | (0.61) | (0.87) | 13.78 | 10.57 | 0.64 | 0.59 | 1.60 | 4 | 28 |
| 12-31-2016 | 13.09 | 0.26 | 0.57 | 0.83 | (0.28) | (0.39) | (0.67) | 13.25 | 6.35 | 0.60 | 0.58 | 1.98 | 7 | 25 |
| 12-31-2015 | 14.06 | 0.30 | (0.54) | (0.24) | (0.29) | (0.44) | (0.73) | 13.09 | (1.72) | 0.64 | 0.60 | 2.12 | 6 | 11 |
| 12-31-2014 | 14.25 | 0.36 | 0.13 | 0.49 | (0.31) | (0.37) | (0.68) | 14.06 | 3.41 | 1.02 | 0.62 | 2.50 | 4 | 14 |
| 12-31-2013 | 13.32 | 0.39 | 0.92 | 1.31 | (0.29) | (0.09) | (0.38) | 14.25 | 9.92 | 1.6811 | 0.62 | 2.82 | 2 | 17 |
| Class R3 |
| 6-30-20186 | 13.80 | 0.07 | (0.22) | (0.15) | (0.07) | — | (0.07) | 13.58 | (1.10)7 | 0.778 | 0.718 | 1.028 | 6 | 4 |
| 12-31-2017 | 13.27 | 0.24 | 1.14 | 1.38 | (0.24) | (0.61) | (0.85) | 13.80 | 10.39 | 0.78 | 0.74 | 1.70 | 7 | 28 |
| 12-31-2016 | 13.11 | 0.24 | 0.57 | 0.81 | (0.26) | (0.39) | (0.65) | 13.27 | 6.18 | 0.74 | 0.72 | 1.78 | 8 | 25 |
| 12-31-2015 | 14.08 | 0.26 | (0.52) | (0.26) | (0.27) | (0.44) | (0.71) | 13.11 | (1.89) | 0.78 | 0.76 | 1.82 | 8 | 11 |
| 12-31-2014 | 14.27 | 0.27 | 0.19 | 0.46 | (0.28) | (0.37) | (0.65) | 14.08 | 3.16 | 0.89 | 0.87 | 1.82 | 10 | 14 |
| 12-31-2013 | 13.33 | 0.25 | 1.04 | 1.29 | (0.26) | (0.09) | (0.35) | 14.27 | 9.70 | 0.84 | 0.84 | 1.82 | 11 | 17 |
| Class R4 |
| 6-30-20186 | 13.78 | 0.10 | (0.22) | (0.12) | (0.10) | — | (0.10) | 13.56 | (0.91)7 | 0.528 | 0.368 | 1.418 | 5 | 4 |
| 12-31-2017 | 13.24 | 0.25 | 1.19 | 1.44 | (0.29) | (0.61) | (0.90) | 13.78 | 10.93 | 0.49 | 0.34 | 1.78 | 5 | 28 |
| 12-31-2016 | 13.09 | 0.28 | 0.57 | 0.85 | (0.31) | (0.39) | (0.70) | 13.24 | 6.53 | 0.45 | 0.34 | 2.07 | 8 | 25 |
| 12-31-2015 | 14.06 | 0.30 | (0.51) | (0.21) | (0.32) | (0.44) | (0.76) | 13.09 | (1.50) | 0.48 | 0.36 | 2.15 | 10 | 11 |
| 12-31-2014 | 14.25 | 0.34 | 0.18 | 0.52 | (0.34) | (0.37) | (0.71) | 14.06 | 3.60 | 0.57 | 0.45 | 2.36 | 14 | 14 |
| 12-31-2013 | 13.31 | 0.31 | 1.03 | 1.34 | (0.31) | (0.09) | (0.40) | 14.25 | 10.17 | 0.55 | 0.44 | 2.19 | 13 | 17 |
| SEE NOTES TO FINANCIAL STATEMENTS | SEMIANNUAL REPORT | JOHN HANCOCK MULTIMANAGER LIFESTYLE MODERATE PORTFOLIO 36 |
| Multimanager Lifestyle Moderate Portfolio (continued) |
| |
| Per share operating performance for a share outstanding throughout each period | Ratios and supplemental data |
| | Income (loss) from in- | | | | | | | | | | | |
| | vestment operations | | Less distributions | | | Ratios to average net assets | | |
| | | Net real- | | | | | | | | | | | |
| Net asset | | ized and | | | | | | | | | | Net | |
| value, | Net | unrealized | Total from | | | | Net asset | | Expenses | Expenses | Net | assets, | |
| beginning | investment | gain (loss) | investment | From net | From net | Total | value, | Total | before | including | investment | end of | Portfolio |
| of period | income | on invest- | operations | investment | realized | distribu- | end of | return | reductions | reductions | income | period | turnover |
| Period ended | ($) | (loss) ($)1, 2 | ments ($) | ($) | income ($) | gain ($) | tions ($) | period ($) | (%)3, 4 | (%)5 | (%)5 | (loss) (%)2 | (in millions) | (%) |
| Class R5 |
| 6-30-20186 | 13.79 | 0.11 | (0.22) | (0.11) | (0.11) | — | (0.11) | 13.57 | (0.81)7 | 0.218 | 0.158 | 1.608 | 8 | 4 |
| 12-31-2017 | 13.26 | 0.32 | 1.14 | 1.46 | (0.32) | (0.61) | (0.93) | 13.79 | 11.05 | 0.19 | 0.14 | 2.26 | 10 | 28 |
| 12-31-2016 | 13.10 | 0.31 | 0.58 | 0.89 | (0.34) | (0.39) | (0.73) | 13.26 | 6.82 | 0.15 | 0.13 | 2.31 | 9 | 25 |
| 12-31-2015 | 14.07 | 0.35 | (0.53) | (0.18) | (0.35) | (0.44) | (0.79) | 13.10 | (1.29) | 0.18 | 0.16 | 2.47 | 11 | 11 |
| 12-31-2014 | 14.26 | 0.36 | 0.18 | 0.54 | (0.36) | (0.37) | (0.73) | 14.07 | 3.78 | 0.27 | 0.26 | 2.45 | 12 | 14 |
| 12-31-2013 | 13.32 | 0.35 | 1.02 | 1.37 | (0.34) | (0.09) | (0.43) | 14.26 | 10.39 | 0.25 | 0.25 | 2.53 | 13 | 17 |
| Class R6 |
| 6-30-20186 | 13.77 | 0.11 | (0.22) | (0.11) | (0.11) | — | (0.11) | 13.55 | (0.78)7 | 0.168 | 0.108 | 1.688 | 26 | 4 |
| 12-31-2017 | 13.24 | 0.31 | 1.16 | 1.47 | (0.33) | (0.61) | (0.94) | 13.77 | 11.14 | 0.15 | 0.09 | 2.20 | 25 | 28 |
| 12-31-2016 | 13.08 | 0.32 | 0.57 | 0.89 | (0.34) | (0.39) | (0.73) | 13.24 | 6.90 | 0.10 | 0.07 | 2.41 | 29 | 25 |
| 12-31-2015 | 14.05 | 0.38 | (0.54) | (0.16) | (0.37) | (0.44) | (0.81) | 13.08 | (1.20) | 0.11 | 0.06 | 2.74 | 30 | 11 |
| 12-31-2014 | 14.24 | 0.42 | 0.15 | 0.57 | (0.39) | (0.37) | (0.76) | 14.05 | 3.99 | 0.21 | 0.06 | 2.90 | 20 | 14 |
| 12-31-2013 | 13.31 | 0.45 | 0.93 | 1.38 | (0.36) | (0.09) | (0.45) | 14.24 | 10.49 | 0.32 | 0.11 | 3.22 | 11 | 17 |
| Class 1 |
| 6-30-20186 | 13.79 | 0.11 | (0.22) | (0.11) | (0.11) | — | (0.11) | 13.57 | (0.80)7 | 0.208 | 0.148 | 1.618 | 2,468 | 4 |
| 12-31-2017 | 13.26 | 0.31 | 1.15 | 1.46 | (0.32) | (0.61) | (0.93) | 13.79 | 11.07 | 0.18 | 0.13 | 2.23 | 2,657 | 28 |
| 12-31-2016 | 13.10 | 0.32 | 0.57 | 0.89 | (0.34) | (0.39) | (0.73) | 13.26 | 6.84 | 0.14 | 0.12 | 2.40 | 2,821 | 25 |
| 12-31-2015 | 14.07 | 0.35 | (0.52) | (0.17) | (0.36) | (0.44) | (0.80) | 13.10 | (1.25) | 0.13 | 0.11 | 2.50 | 3,005 | 11 |
| 12-31-2014 | 14.26 | 0.38 | 0.18 | 0.56 | (0.38) | (0.37) | (0.75) | 14.07 | 3.93 | 0.12 | 0.11 | 2.62 | 3,455 | 14 |
| 12-31-2013 | 13.32 | 0.35 | 1.04 | 1.39 | (0.36) | (0.09) | (0.45) | 14.26 | 10.55 | 0.11 | 0.11 | 2.51 | 3,562 | 17 |
| Class 5 |
| 6-30-20186 | 13.77 | 0.11 | (0.22) | (0.11) | (0.11) | — | (0.11) | 13.55 | (0.78)7 | 0.158 | 0.098 | 1.678 | 59 | 4 |
| 12-31-2017 | 13.24 | 0.33 | 1.14 | 1.47 | (0.33) | (0.61) | (0.94) | 13.77 | 11.14 | 0.13 | 0.08 | 2.33 | 62 | 28 |
| 12-31-2016 | 13.08 | 0.34 | 0.55 | 0.89 | (0.34) | (0.39) | (0.73) | 13.24 | 6.90 | 0.09 | 0.07 | 2.50 | 57 | 25 |
| 12-31-2015 | 14.06 | 0.37 | (0.54) | (0.17) | (0.37) | (0.44) | (0.81) | 13.08 | (1.27) | 0.08 | 0.06 | 2.61 | 52 | 11 |
| 12-31-2014 | 14.24 | 0.40 | 0.18 | 0.58 | (0.39) | (0.37) | (0.76) | 14.06 | 4.06 | 0.07 | 0.06 | 2.72 | 52 | 14 |
| 12-31-2013 | 13.31 | 0.36 | 1.03 | 1.39 | (0.37) | (0.09) | (0.46) | 14.24 | 10.54 | 0.06 | 0.06 | 2.62 | 48 | 17 |
1. Based on average daily shares outstanding.
2. Net investment income is affected by the timing and frequency of the declaration of dividends by the underlying funds in which the portfolio invests.
3. Does not reflect the effect of sales charges, if any.
4. Total returns would have been lower had certain expenses not been reduced during the applicable periods.
5. Ratios do not include expenses indirectly incurred from underlying funds and can vary based on the mix of underlying funds held by the portfolio. The range of expense ratios of the underlying funds held by the portfolio was as follows: 0.38%-1.56%, 0.38%-3.43%, 0.60%-3.77%, 0.57%-2.99%, 0.55%-2.85%, and 0.62%-3.11% for the periods ended 6-30-18, 12-31-17,12-31-16, 12-31-15, 12-31-14 and 12-31-13, respectively.
6. Six months ended 6-30-18. Unaudited.
7. Not annualized.
8. Annualized.
9. The inception date for Class I shares is 5-1-15.
10. Portfolio turnover is shown for the period from 1-1-15 to 12-31-15.
11. Includes the impact of expense recapture which amounted to 0.01% of average net assets for Class R2 shares.
| SEE NOTES TO FINANCIAL STATEMENTS | SEMIANNUAL REPORT | JOHN HANCOCK MULTIMANAGER LIFESTYLE MODERATE PORTFOLIO 37 |
| Financial highlights continued |
| Multimanager Lifestyle Conservative Portfolio |
| |
| Per share operating performance for a share outstanding throughout each period | Ratios and supplemental data |
| | Income (loss) from in- | | | | | | | | | | | |
| | vestment operations | | Less distributions | | | Ratios to average net assets | | |
| | | Net real- | | | | | | | | | | | |
| Net asset | | ized and | | | | | | | | | | Net | |
| value, | Net | unrealized | Total from | | | | Net asset | | Expenses | Expenses | Net | assets, | |
| beginning | investment | gain (loss) | investment | From net | From net | Total | value, | Total | before | including | investment | end of | Portfolio |
| of period | income | on invest- | operations | investment | realized | distribu- | end of | return | reductions | reductions | income | period | turnover |
| Period ended | ($) | (loss) ($)1, 2 | ments ($) | ($) | income ($) | gain ($) | tions ($) | period ($) | (%)3, 4 | (%)5 | (%)5 | (loss) (%)2 | (in millions) | (%) |
| Multimanager Lifestyle Conservative Portfolio |
| Class A |
| 6-30-20186 | 13.06 | 0.10 | (0.31) | (0.21) | (0.10) | — | (0.10) | 12.75 | (1.59)7 | 0.568 | 0.508 | 1.618 | 576 | 4 |
| 12-31-2017 | 12.60 | 0.27 | 0.62 | 0.89 | (0.27) | (0.16) | (0.43) | 13.06 | 7.11 | 0.55 | 0.50 | 2.05 | 611 | 26 |
| 12-31-2016 | 12.42 | 0.29 | 0.38 | 0.67 | (0.28) | (0.21) | (0.49) | 12.60 | 5.40 | 0.51 | 0.48 | 2.26 | 607 | 23 |
| 12-31-2015 | 13.30 | 0.33 | (0.56) | (0.23) | (0.33) | (0.32) | (0.65) | 12.42 | (1.74) | 0.51 | 0.47 | 2.47 | 576 | 10 |
| 12-31-2014 | 13.68 | 0.37 | 0.10 | 0.47 | (0.37) | (0.48) | (0.85) | 13.30 | 3.44 | 0.53 | 0.47 | 2.67 | 600 | 22 |
| 12-31-2013 | 13.44 | 0.33 | 0.29 | 0.62 | (0.33) | (0.05) | (0.38) | 13.68 | 4.66 | 0.54 | 0.52 | 2.44 | 530 | 17 |
| Class B |
| 6-30-20186 | 13.07 | 0.06 | (0.31) | (0.25) | (0.06) | — | (0.06) | 12.76 | (1.94)7 | 1.268 | 1.208 | 0.868 | 13 | 4 |
| 12-31-2017 | 12.61 | 0.16 | 0.64 | 0.80 | (0.18) | (0.16) | (0.34) | 13.07 | 6.35 | 1.25 | 1.21 | 1.24 | 17 | 26 |
| 12-31-2016 | 12.43 | 0.18 | 0.40 | 0.58 | (0.19) | (0.21) | (0.40) | 12.61 | 4.66 | 1.21 | 1.19 | 1.42 | 23 | 23 |
| 12-31-2015 | 13.30 | 0.22 | (0.54) | (0.32) | (0.23) | (0.32) | (0.55) | 12.43 | (2.39) | 1.22 | 1.20 | 1.64 | 30 | 10 |
| 12-31-2014 | 13.68 | 0.24 | 0.12 | 0.36 | (0.26) | (0.48) | (0.74) | 13.30 | 2.65 | 1.25 | 1.24 | 1.75 | 39 | 22 |
| 12-31-2013 | 13.44 | 0.22 | 0.30 | 0.52 | (0.23) | (0.05) | (0.28) | 13.68 | 3.87 | 1.26 | 1.26 | 1.65 | 47 | 17 |
| Class C |
| 6-30-20186 | 13.06 | 0.06 | (0.31) | (0.25) | (0.06) | — | (0.06) | 12.75 | (1.94)7 | 1.268 | 1.208 | 0.878 | 214 | 4 |
| 12-31-2017 | 12.61 | 0.17 | 0.62 | 0.79 | (0.18) | (0.16) | (0.34) | 13.06 | 6.27 | 1.25 | 1.21 | 1.28 | 261 | 26 |
| 12-31-2016 | 12.42 | 0.19 | 0.40 | 0.59 | (0.19) | (0.21) | (0.40) | 12.61 | 4.74 | 1.21 | 1.19 | 1.48 | 310 | 23 |
| 12-31-2015 | 13.30 | 0.23 | (0.56) | (0.33) | (0.23) | (0.32) | (0.55) | 12.42 | (2.47) | 1.21 | 1.19 | 1.73 | 349 | 10 |
| 12-31-2014 | 13.68 | 0.27 | 0.09 | 0.36 | (0.26) | (0.48) | (0.74) | 13.30 | 2.66 | 1.23 | 1.21 | 1.91 | 378 | 22 |
| 12-31-2013 | 13.43 | 0.23 | 0.30 | 0.53 | (0.23) | (0.05) | (0.28) | 13.68 | 3.98 | 1.24 | 1.24 | 1.71 | 355 | 17 |
| Class I |
| 6-30-20186 | 13.04 | 0.12 | (0.31) | (0.19) | (0.12) | — | (0.12) | 12.73 | (1.45)7 | 0.268 | 0.218 | 1.948 | 14 | 4 |
| 12-31-2017 | 12.58 | 0.32 | 0.61 | 0.93 | (0.31) | (0.16) | (0.47) | 13.04 | 7.44 | 0.24 | 0.20 | 2.42 | 15 | 26 |
| 12-31-2016 | 12.40 | 0.39 | 0.32 | 0.71 | (0.32) | (0.21) | (0.53) | 12.58 | 5.73 | 0.20 | 0.18 | 3.04 | 11 | 23 |
| 12-31-20159 | 13.49 | 0.34 | (0.80) | (0.46) | (0.31) | (0.32) | (0.63) | 12.40 | (3.40)7 | 0.198 | 0.178 | 3.848 | 4 | 1010 |
| Class R1 |
| 6-30-20186 | 13.05 | 0.08 | (0.31) | (0.23) | (0.08) | — | (0.08) | 12.74 | (1.77)7 | 0.908 | 0.848 | 1.308 | 7 | 4 |
| 12-31-2017 | 12.59 | 0.21 | 0.64 | 0.85 | (0.23) | (0.16) | (0.39) | 13.05 | 6.74 | 0.89 | 0.85 | 1.62 | 6 | 26 |
| 12-31-2016 | 12.41 | 0.24 | 0.39 | 0.63 | (0.24) | (0.21) | (0.45) | 12.59 | 5.04 | 0.86 | 0.84 | 1.90 | 9 | 23 |
| 12-31-2015 | 13.29 | 0.26 | (0.54) | (0.28) | (0.28) | (0.32) | (0.60) | 12.41 | (2.11) | 0.87 | 0.86 | 1.95 | 8 | 10 |
| 12-31-2014 | 13.68 | 0.30 | 0.09 | 0.39 | (0.30) | (0.48) | (0.78) | 13.29 | 2.86 | 1.00 | 0.99 | 2.14 | 10 | 22 |
| 12-31-2013 | 13.43 | 0.27 | 0.30 | 0.57 | (0.27) | (0.05) | (0.32) | 13.68 | 4.31 | 0.91 | 0.91 | 1.97 | 9 | 17 |
| Class R2 |
| 6-30-20186 | 13.04 | 0.10 | (0.30) | (0.20) | (0.10) | — | (0.10) | 12.74 | (1.57)7 | 0.718 | 0.658 | 1.538 | 3 | 4 |
| 12-31-2017 | 12.59 | 0.23 | 0.64 | 0.87 | (0.26) | (0.16) | (0.42) | 13.04 | 6.91 | 0.63 | 0.58 | 1.73 | 2 | 26 |
| 12-31-2016 | 12.40 | 0.25 | 0.42 | 0.67 | (0.27) | (0.21) | (0.48) | 12.59 | 5.39 | 0.60 | 0.58 | 1.95 | 4 | 23 |
| 12-31-2015 | 13.28 | 0.31 | (0.55) | (0.24) | (0.32) | (0.32) | (0.64) | 12.40 | (1.86) | 0.65 | 0.61 | 2.31 | 5 | 10 |
| 12-31-2014 | 13.67 | 0.46 | (0.02) | 0.44 | (0.35) | (0.48) | (0.83) | 13.28 | 3.21 | 1.13 | 0.62 | 3.30 | 5 | 22 |
| 12-31-2013 | 13.42 | 0.39 | 0.23 | 0.62 | (0.32) | (0.05) | (0.37) | 13.67 | 4.67 | 2.55 | 0.62 | 2.86 | 2 | 17 |
| Class R3 |
| 6-30-20186 | 13.03 | 0.09 | (0.31) | (0.22) | (0.09) | — | (0.09) | 12.72 | (1.69)7 | 0.728 | 0.678 | 1.438 | 4 | 4 |
| 12-31-2017 | 12.57 | 0.23 | 0.64 | 0.87 | (0.25) | (0.16) | (0.41) | 13.03 | 6.91 | 0.73 | 0.69 | 1.79 | 5 | 26 |
| 12-31-2016 | 12.39 | 0.25 | 0.40 | 0.65 | (0.26) | (0.21) | (0.47) | 12.57 | 5.19 | 0.69 | 0.68 | 1.94 | 6 | 23 |
| 12-31-2015 | 13.26 | 0.27 | (0.52) | (0.25) | (0.30) | (0.32) | (0.62) | 12.39 | (1.94) | 0.76 | 0.75 | 2.04 | 8 | 10 |
| 12-31-2014 | 13.65 | 0.31 | 0.10 | 0.41 | (0.32) | (0.48) | (0.80) | 13.26 | 3.01 | 0.88 | 0.86 | 2.21 | 11 | 22 |
| 12-31-2013 | 13.41 | 0.30 | 0.28 | 0.58 | (0.29) | (0.05) | (0.34) | 13.65 | 4.39 | 0.75 | 0.75 | 2.18 | 11 | 17 |
| Class R4 |
| 6-30-20186 | 13.03 | 0.11 | (0.31) | (0.20) | (0.11) | — | (0.11) | 12.72 | (1.53)7 | 0.518 | 0.368 | 1.708 | 3 | 4 |
| 12-31-2017 | 12.58 | 0.27 | 0.63 | 0.90 | (0.29) | (0.16) | (0.45) | 13.03 | 7.20 | 0.49 | 0.35 | 2.09 | 4 | 26 |
| 12-31-2016 | 12.40 | 0.30 | 0.39 | 0.69 | (0.30) | (0.21) | (0.51) | 12.58 | 5.56 | 0.45 | 0.34 | 2.35 | 6 | 23 |
| 12-31-2015 | 13.27 | 0.31 | (0.51) | (0.20) | (0.35) | (0.32) | (0.67) | 12.40 | (1.56) | 0.50 | 0.38 | 2.37 | 6 | 10 |
| 12-31-2014 | 13.66 | 0.36 | 0.10 | 0.46 | (0.37) | (0.48) | (0.85) | 13.27 | 3.36 | 0.63 | 0.51 | 2.62 | 9 | 22 |
| 12-31-2013 | 13.42 | 0.34 | 0.29 | 0.63 | (0.34) | (0.05) | (0.39) | 13.66 | 4.72 | 0.58 | 0.48 | 2.51 | 9 | 17 |
| SEE NOTES TO FINANCIAL STATEMENTS | SEMIANNUAL REPORT | JOHN HANCOCK MULTIMANAGER LIFESTYLE CONSERVATIVE PORTFOLIO 38 |
| Multimanager Lifestyle Conservative Portfolio (continued) |
| |
| Per share operating performance for a share outstanding throughout each period | Ratios and supplemental data |
| | Income (loss) from in- | | | | | | | | | | | |
| | vestment operations | | Less distributions | | | Ratios to average net assets | | |
| | | Net real- | | | | | | | | | | | |
| Net asset | | ized and | | | | | | | | | | Net | |
| value, | Net | unrealized | Total from | | | | Net asset | | Expenses | Expenses | Net | assets, | |
| beginning | investment | gain (loss) | investment | From net | From net | Total | value, | Total | before | including | investment | end of | Portfolio |
| of period | income | on invest- | operations | investment | realized | distribu- | end of | return | reductions | reductions | income | period | turnover |
| Period ended | ($) | (loss) ($)1, 2 | ments ($) | ($) | income ($) | gain ($) | tions ($) | period ($) | (%)3, 4 | (%)5 | (%)5 | (loss) (%)2 | (in millions) | (%) |
| Class R5 |
| 6-30-20186 | 13.04 | 0.13 | (0.32) | (0.19) | (0.12) | — | (0.12) | 12.73 | (1.43)7 | 0.218 | 0.168 | 1.968 | 5 | 4 |
| 12-31-2017 | 12.58 | 0.30 | 0.64 | 0.94 | (0.32) | (0.16) | (0.48) | 13.04 | 7.49 | 0.20 | 0.16 | 2.33 | 5 | 26 |
| 12-31-2016 | 12.40 | 0.32 | 0.40 | 0.72 | (0.33) | (0.21) | (0.54) | 12.58 | 5.77 | 0.15 | 0.13 | 2.53 | 7 | 23 |
| 12-31-2015 | 13.28 | 0.36 | (0.54) | (0.18) | (0.38) | (0.32) | (0.70) | 12.40 | (1.41) | 0.18 | 0.16 | 2.70 | 8 | 10 |
| 12-31-2014 | 13.67 | 0.38 | 0.12 | 0.50 | (0.41) | (0.48) | (0.89) | 13.28 | 3.64 | 0.26 | 0.24 | 2.75 | 13 | 22 |
| 12-31-2013 | 13.43 | 0.37 | 0.30 | 0.67 | (0.38) | (0.05) | (0.43) | 13.67 | 5.03 | 0.17 | 0.17 | 2.70 | 15 | 17 |
| Class R6 |
| 6-30-20186 | 13.03 | 0.13 | (0.31) | (0.18) | (0.13) | — | (0.13) | 12.72 | (1.40)7 | 0.168 | 0.118 | 1.998 | 15 | 4 |
| 12-31-2017 | 12.57 | 0.33 | 0.62 | 0.95 | (0.33) | (0.16) | (0.49) | 13.03 | 7.56 | 0.15 | 0.10 | 2.53 | 16 | 26 |
| 12-31-2016 | 12.39 | 0.34 | 0.39 | 0.73 | (0.34) | (0.21) | (0.55) | 12.57 | 5.85 | 0.10 | 0.07 | 2.68 | 14 | 23 |
| 12-31-2015 | 13.27 | 0.39 | (0.56) | (0.17) | (0.39) | (0.32) | (0.71) | 12.39 | (1.34) | 0.13 | 0.06 | 2.95 | 13 | 10 |
| 12-31-2014 | 13.65 | 0.47 | 0.06 | 0.53 | (0.43) | (0.48) | (0.91) | 13.27 | 3.87 | 0.42 | 0.06 | 3.41 | 8 | 22 |
| 12-31-2013 | 13.42 | 0.43 | 0.24 | 0.67 | (0.39) | (0.05) | (0.44) | 13.65 | 5.05 | 0.43 | 0.11 | 3.19 | 5 | 17 |
| Class 1 |
| 6-30-20186 | 13.03 | 0.13 | (0.31) | (0.18) | (0.13) | — | (0.13) | 12.72 | (1.42)7 | 0.208 | 0.158 | 1.968 | 1,741 | 4 |
| 12-31-2017 | 12.58 | 0.31 | 0.62 | 0.93 | (0.32) | (0.16) | (0.48) | 13.03 | 7.43 | 0.18 | 0.14 | 2.37 | 1,931 | 26 |
| 12-31-2016 | 12.39 | 0.33 | 0.40 | 0.73 | (0.33) | (0.21) | (0.54) | 12.58 | 5.88 | 0.13 | 0.12 | 2.59 | 2,149 | 23 |
| 12-31-2015 | 13.27 | 0.37 | (0.55) | (0.18) | (0.38) | (0.32) | (0.70) | 12.39 | (1.39) | 0.13 | 0.11 | 2.79 | 2,241 | 10 |
| 12-31-2014 | 13.66 | 0.41 | 0.10 | 0.51 | (0.42) | (0.48) | (0.90) | 13.27 | 3.74 | 0.13 | 0.11 | 2.94 | 2,584 | 22 |
| 12-31-2013 | 13.42 | 0.38 | 0.30 | 0.68 | (0.39) | (0.05) | (0.44) | 13.66 | 5.12 | 0.11 | 0.11 | 2.77 | 2,758 | 17 |
1. Based on average daily shares outstanding.
2. Net investment income is affected by the timing and frequency of the declaration of dividends by the underlying funds in which the portfolio invests.
3. Does not reflect the effect of sales charges, if any.
4. Total returns would have been lower had certain expenses not been reduced during the applicable periods.
5. Ratios do not include expenses indirectly incurred from underlying funds and can vary based on the mix of underlying funds held by the portfolio. The range of expense ratios of the underlying funds held by the portfolio was as follows: 0.38%-1.56%, 0.38%-3.43%, 0.60%-3.77%, 0.62%-2.99%, 0.62%-2.85%, and 0.62%-3.11% for the periods ended 6-30-18, 12-31-17, 12-31-16, 12-31-15, 12-31-14 and 12-31-13, respectively.
6. Six months ended 6-30-18. Unaudited.
7. Not annualized.
8. Annualized.
9. The inception date for Class I shares is 5-1-15.
10. Portfolio turnover is shown for the period from 1-1-15 to 12-31-15.
| SEE NOTES TO FINANCIAL STATEMENTS | SEMIANNUAL REPORT | JOHN HANCOCK MULTIMANAGER LIFESTYLE CONSERVATIVE PORTFOLIO 39 |
These examples are intended to help you understand your ongoing operating expenses of investing in the fund so you can compare these costs with the ongoing costs of investing in other mutual funds.
Understanding fund expenses
As a shareholder of the fund, you incur two types of costs:
| ● | Transaction costs, which include sales charges (loads) on purchases or redemptions (if applicable), minimum account fee charge, etc. |
| | |
| ● | Ongoing operating expenses, including management fees, distribution and service fees (if applicable), and other fund expenses. |
We are presenting only your ongoing operating expenses here.
Actual expenses/actual returns
The first line of the table on the following page is intended to provide information about the fund’s actual ongoing operating expenses, and is based on the fund’s actual return. It assumes an account value of $1,000.00 on January 1, 2018, with the same investment held until June 30, 2018.
Together with the value of your account, you may use this information to estimate the operating expenses that you paid over the period. Simply divide your account value at June 30, 2018, by $1,000.00, then multiply it by the “expenses paid” for your share class from the table. For example, for an account value of $8,600.00, the operating expenses should be calculated as follows:
Hypothetical example for comparison purposes
The second line of the table on the following page allows you to compare the fund’s ongoing operating expenses with those of any other fund. It provides an example of the fund’s hypothetical account values and hypothetical expenses based on the fund’s actual expense ratio and an assumed 5% annualized return before expenses (which is not the fund’s actual return). It assumes an account value of $1,000.00 on January 1, 2018, with the same investment held until June 30, 2018. Look in any other fund shareholder report to find its hypothetical example and you will be able to compare these expenses. Please remember that these hypothetical account values and expenses may not be used to estimate the actual ending account balance or expenses you paid for the period.
Remember, these examples do not include any transaction costs, therefore, these examples will not help you to determine the relative total costs of owning different funds. If transaction costs were included, your expenses would have been higher. See the prospectus for details regarding transaction costs.
| SEMIANNUAL REPORT | JOHN HANCOCK RETIREMENT INCOME 2040 FUND 9 |
| SHAREHOLDER EXPENSE EXAMPLE CHART |
| | | | | | | Expenses | | | |
| | | Account | | Ending | | paid during | | Annualized | |
| | | value on | | value on | | period ended | | expense | |
| | | 1-1-2018 | | 6-30-2018 | | 6-30-20181 | | ratio2 | |
| Class R6 | Actual expenses/actual returns | | $1,000.00 | | $973.80 | | $1.66 | | 0.34% | |
| Hypothetical example | | 1,000.00 | | 1,023.10 | | 1.71 | | 0.34% | |
| 1 | Expenses are equal to the annualized expense ratio, multiplied by the average account value over the period, multiplied by 181/365 (to reflect the one-half year period). |
| 2 | Ratios do not include fees and expenses indirectly incurred by the underlying funds and can vary based on mixed of underlying funds held by the fund. The expense ratio of the underlying fund held by the fund was 0.53%. |
| | SEMIANNUAL REPORT | JOHN HANCOCK RETIREMENT INCOME 2040 FUND 10 |
AS OF 6-30-18 (unaudited)
| | | Rate (%) | | Maturity date | | Par value^ | | Value |
| U.S. Government and Agency obligations 44.4% | | | | | | | | $10,428,370 |
| (Cost $10,652,773) | | | | | | | | |
| U.S. Government 44.4% | | | | | | | | 10,428,370 |
| U.S. Treasury | | | | | | | | |
| Bond | | 3.500 | | 02-15-39 | | 345,000 | | 375,363 |
| Bond | | 3.875 | | 08-15-40 | | 205,000 | | 235,606 |
| Bond | | 4.250 | | 05-15-39 | | 225,000 | | 271,143 |
| Bond | | 4.250 | | 11-15-40 | | 280,000 | | 339,095 |
| Bond | | 4.375 | | 02-15-38 | | 385,000 | | 468,828 |
| Bond | | 4.375 | | 11-15-39 | | 205,000 | | 251,453 |
| Bond | | 4.500 | | 02-15-36 | | 725,000 | | 885,859 |
| Bond | | 4.500 | | 05-15-38 | | 245,000 | | 303,427 |
| Bond | | 4.625 | | 02-15-40 | | 510,000 | | 646,505 |
| Bond | | 4.750 | | 02-15-37 | | 290,000 | | 367,246 |
| Bond | | 5.000 | | 05-15-37 | | 420,000 | | 547,920 |
| Bond | | 5.250 | | 02-15-29 | | 410,000 | | 498,967 |
| Bond | | 5.375 | | 02-15-31 | | 610,000 | | 770,292 |
| Bond | | 5.500 | | 08-15-28 | | 375,000 | | 461,382 |
| Bond | | 6.000 | | 02-15-26 | | 40,000 | | 48,700 |
| Bond | | 6.125 | | 08-15-29 | | 175,000 | | 228,895 |
| Bond | | 6.250 | | 05-15-30 | | 590,000 | | 789,102 |
| Bond | | 6.500 | | 11-15-26 | | 115,000 | | 146,400 |
| Bond | | 6.625 | | 02-15-27 | | 350,000 | | 451,377 |
| Bond | | 6.750 | | 08-15-26 | | 70,000 | | 89,947 |
| Bond | | 7.625 | | 11-15-22 | | 5,000 | | 6,007 |
| Bond | | 8.125 | | 08-15-21 | | 345,000 | | 401,426 |
| Note | | 1.375 | | 12-31-18 | | 195,000 | | 194,238 |
| Note | | 1.500 | | 11-30-19 | | 460,000 | | 453,783 |
| Note | | 1.750 | | 12-31-20 | | 440,000 | | 431,045 |
| Note | | 2.000 | | 02-15-25 | | 170,000 | | 161,639 |
| Note | | 2.250 | | 12-31-23 | | 370,000 | | 360,172 |
| Note | | 2.250 | | 11-15-27 | | 40,000 | | 38,009 |
| Note | | 2.500 | | 05-15-24 | | 10,000 | | 9,841 |
| Note | | 2.750 | | 02-15-24 | | 195,000 | | 194,703 |
| Corporate bonds 29.5% | | | | | | | | $6,927,347 |
| (Cost $7,380,242) | | | | | | | | |
| |
| Consumer discretionary 3.5% | | | | | | | | 809,510 |
| Automobiles 0.6% | | | | | | | | |
| Ford Motor Company | | 7.450 | | 07-16-31 | | 60,000 | | 70,502 |
| General Motors Company | | 6.600 | | 04-01-36 | | 55,000 | | 59,496 |
| Hotels, restaurants and leisure 0.3% | | | | | | | | |
| McDonald’s Corp. | | 6.300 | | 03-01-38 | | 60,000 | | 71,688 |
| Internet and direct marketing retail 0.5% | | | | | | | | |
| Amazon.com, Inc. | | 4.800 | | 12-05-34 | | 50,000 | | 54,786 |
| SEE NOTES TO FINANCIAL STATEMENTS | SEMIANNUAL REPORT | JOHN HANCOCK RETIREMENT INCOME 2040 FUND 11 |
| | Rate (%) | | Maturity date | | Par value^ | | Value |
| Consumer discretionary (continued) | | | | | | | | |
| Internet and direct marketing retail (continued) | | | | | | | | |
| eBay, Inc. | | 3.450 | | 08-01-24 | | 70,000 | | $67,890 |
| Media 1.9% | | | | | | | | |
| Charter Communications Operating LLC | | 5.375 | | 04-01-38 | | 75,000 | | 70,805 |
| Comcast Corp. | | 3.999 | | 11-01-49 | | 17,000 | | 15,014 |
| Comcast Corp. | | 4.049 | | 11-01-52 | | 43,000 | | 37,473 |
| Comcast Corp. | | 4.250 | | 01-15-33 | | 75,000 | | 73,202 |
| Comcast Corp. | | 6.500 | | 11-15-35 | | 55,000 | | 65,354 |
| Comcast Corp. | | 7.050 | | 03-15-33 | | 75,000 | | 93,153 |
| Warner Media LLC | | 3.875 | | 01-15-26 | | 85,000 | | 81,602 |
| Specialty retail 0.2% | | | | | | | | |
| The Home Depot, Inc. | | 5.875 | | 12-16-36 | | 40,000 | | 48,545 |
| |
| Consumer staples 1.2% | | | | | | | | 291,854 |
| Beverages 0.6% | | | | | | | | |
| Anheuser-Busch InBev Finance, Inc. | | 4.700 | | 02-01-36 | | 85,000 | | 86,094 |
| Anheuser-Busch InBev Worldwide, Inc. | | 8.200 | | 01-15-39 | | 35,000 | | 50,007 |
| Food products 0.2% | | | | | | | | |
| Kraft Heinz Foods Company | | 6.875 | | 01-26-39 | | 55,000 | | 64,522 |
| Personal products 0.4% | | | | | | | | |
| Johnson & Johnson | | 4.375 | | 12-05-33 | | 85,000 | | 91,231 |
| |
| Energy 4.4% | | | | | | | | 1,025,882 |
| Energy equipment and services 0.3% | | | | | | | | |
| Halliburton Company | | 4.850 | | 11-15-35 | | 60,000 | | 62,007 |
| Oil, gas and consumable fuels 4.1% | | | | | | | | |
| Anadarko Petroleum Corp. | | 6.200 | | 03-15-40 | | 45,000 | | 50,667 |
| Anadarko Petroleum Corp. | | 6.450 | | 09-15-36 | | 45,000 | | 51,974 |
| Canadian Natural Resources, Ltd. | | 6.250 | | 03-15-38 | | 45,000 | | 53,051 |
| Canadian Natural Resources, Ltd. | | 6.450 | | 06-30-33 | | 55,000 | | 64,385 |
| ConocoPhillips | | 5.900 | | 10-15-32 | | 80,000 | | 93,195 |
| Energy Transfer LP | | 6.050 | | 06-01-41 | | 50,000 | | 49,871 |
| Energy Transfer LP | | 7.500 | | 07-01-38 | | 45,000 | | 51,331 |
| Exxon Mobil Corp. | | 3.043 | | 03-01-26 | | 55,000 | | 53,564 |
| Kinder Morgan Energy Partners LP | | 5.800 | | 03-15-35 | | 75,000 | | 76,640 |
| Kinder Morgan Energy Partners LP | | 6.500 | | 09-01-39 | | 45,000 | | 48,563 |
| Marathon Oil Corp. | | 2.800 | | 11-01-22 | | 60,000 | | 57,512 |
| Shell International Finance BV | | 4.125 | | 05-11-35 | | 60,000 | | 60,823 |
| Sunoco Logistics Partners Operations LP | | 3.900 | | 07-15-26 | | 60,000 | | 56,113 |
| TransCanada PipeLines, Ltd. | | 4.625 | | 03-01-34 | | 85,000 | | 84,878 |
| Valero Energy Corp. | | 6.625 | | 06-15-37 | | 45,000 | | 53,776 |
| Valero Energy Corp. | | 7.500 | | 04-15-32 | | 45,000 | | 57,532 |
| SEE NOTES TO FINANCIAL STATEMENTS | SEMIANNUAL REPORT | JOHN HANCOCK RETIREMENT INCOME 2040 FUND 12 |
| | Rate (%) | | Maturity date | | Par value^ | | Value |
| Financials 5.5% | | | | | | | | $1,298,120 |
| Banks 2.5% | | | | | | | | |
| Citigroup, Inc. | | 6.000 | | 10-31-33 | | 85,000 | | 94,924 |
| Citigroup, Inc. | | 6.625 | | 06-15-32 | | 80,000 | | 94,213 |
| Fifth Third Bancorp | | 8.250 | | 03-01-38 | | 55,000 | | 75,022 |
| HSBC Holdings PLC | | 7.625 | | 05-17-32 | | 75,000 | | 95,336 |
| JPMorgan Chase & Co. | | 6.400 | | 05-15-38 | | 60,000 | | 73,535 |
| U.S. Bancorp | | 2.950 | | 07-15-22 | | 70,000 | | 68,378 |
| Wells Fargo & Company | | 3.500 | | 03-08-22 | | 80,000 | | 79,718 |
| Capital markets 1.1% | | | | | | | | |
| Morgan Stanley | | 3.125 | | 07-27-26 | | 100,000 | | 92,990 |
| Morgan Stanley | | 7.250 | | 04-01-32 | | 70,000 | | 88,271 |
| The Goldman Sachs Group, Inc. | | 6.125 | | 02-15-33 | | 80,000 | | 91,434 |
| Diversified financial services 0.3% | | | | | | | | |
| AerCap Ireland Capital DAC | | 3.950 | | 02-01-22 | | 65,000 | | 64,600 |
| Insurance 1.6% | | | | | | | | |
| American International Group, Inc. | | 3.875 | | 01-15-35 | | 95,000 | | 84,355 |
| MetLife, Inc. | | 6.500 | | 12-15-32 | | 50,000 | | 61,499 |
| Prudential Financial, Inc. | | 3.905 | | 12-07-47 | | 63,000 | | 56,621 |
| The Progressive Corp. | | 2.450 | | 01-15-27 | | 110,000 | | 99,279 |
| The Travelers Companies, Inc. | | 6.750 | | 06-20-36 | | 60,000 | | 77,945 |
| |
| Health care 3.4% | | | | | | | | 800,404 |
| Biotechnology 0.6% | | | | | | | | |
| AbbVie, Inc. | | 4.500 | | 05-14-35 | | 85,000 | | 83,298 |
| GlaxoSmithKline Capital, Inc. | | 5.375 | | 04-15-34 | | 45,000 | | 51,808 |
| Health care equipment and supplies 0.5% | | | | | | | | |
| Covidien International Finance SA | | 6.550 | | 10-15-37 | | 60,000 | | 76,102 |
| Medtronic, Inc. | | 6.500 | | 03-15-39 | | 40,000 | | 50,850 |
| Health care providers and services 1.4% | | | | | | | | |
| CVS Health Corp. | | 4.750 | | 12-01-22 | | 100,000 | | 103,704 |
| CVS Health Corp. | | 4.780 | | 03-25-38 | | 100,000 | | 98,846 |
| CVS Health Corp. | | 4.875 | | 07-20-35 | | 65,000 | | 65,271 |
| UnitedHealth Group, Inc. | | 4.625 | | 07-15-35 | | 60,000 | | 63,065 |
| Pharmaceuticals 0.9% | | | | | | | | |
| Allergan Funding SCS | | 4.550 | | 03-15-35 | | 90,000 | | 85,339 |
| Pfizer, Inc. | | 3.400 | | 05-15-24 | | 55,000 | | 55,117 |
| Wyeth LLC | | 5.950 | | 04-01-37 | | 55,000 | | 67,004 |
| |
| Industrials 2.9% | | | | | | | | 678,188 |
| Aerospace and defense 0.3% | | | | | | | | |
| Lockheed Martin Corp. | | 4.500 | | 05-15-36 | | 60,000 | | 62,232 |
| Air freight and logistics 0.2% | | | | | | | | |
| FedEx Corp. | | 4.900 | | 01-15-34 | | 50,000 | | 52,630 |
| SEE NOTES TO FINANCIAL STATEMENTS | SEMIANNUAL REPORT | JOHN HANCOCK RETIREMENT INCOME 2040 FUND 13 |
| | Rate (%) | | Maturity date | | Par value^ | | Value |
| Industrials (continued) | | | | | | | | |
| Industrial conglomerates 1.5% | | | | | | | | |
| General Electric Company | | 5.875 | | 01-14-38 | | 75,000 | | $85,101 |
| General Electric Company | | 6.750 | | 03-15-32 | | 70,000 | | 85,400 |
| General Electric Company | | 6.875 | | 01-10-39 | | 50,000 | | 63,278 |
| Georgia-Pacific LLC | | 8.875 | | 05-15-31 | | 50,000 | | 73,092 |
| Honeywell International, Inc. | | 3.812 | | 11-21-47 | | 40,000 | | 39,128 |
| Road and rail 0.2% | | | | | | | | |
| CSX Corp. | | 6.000 | | 10-01-36 | | 45,000 | | 53,445 |
| Trading companies and distributors 0.7% | | | | | | | | |
| AerCap Ireland Capital DAC | | 5.000 | | 10-01-21 | | 70,000 | | 72,123 |
| International Lease Finance Corp. | | 8.625 | | 01-15-22 | | 80,000 | | 91,759 |
| |
| Information technology 1.6% | | | | | | | | 380,564 |
| Software 1.2% | | | | | | | | |
| Microsoft Corp. | | 3.500 | | 02-12-35 | | 65,000 | | 62,944 |
| Microsoft Corp. | | 4.100 | | 02-06-37 | | 60,000 | | 62,471 |
| Microsoft Corp. | | 4.200 | | 11-03-35 | | 55,000 | | 57,797 |
| Oracle Corp. | | 3.900 | | 05-15-35 | | 50,000 | | 48,446 |
| Oracle Corp. | | 6.125 | | 07-08-39 | | 40,000 | | 49,035 |
| Technology hardware, storage and peripherals 0.4% | | | | | | | | |
| Dell International LLC (A) | | 6.020 | | 06-15-26 | | 95,000 | | 99,871 |
| |
| Materials 1.5% | | | | | | | | 355,044 |
| Chemicals 0.8% | | | | | | | | |
| LyondellBasell Industries NV | | 5.750 | | 04-15-24 | | 95,000 | | 102,926 |
| Praxair, Inc. | | 3.200 | | 01-30-26 | | 95,000 | | 92,674 |
| Containers and packaging 0.3% | | | | | | | | |
| International Paper Company | | 7.300 | | 11-15-39 | | 50,000 | | 63,919 |
| Metals and mining 0.4% | | | | | | | | |
| Rio Tinto Finance USA, Ltd. | | 3.750 | | 06-15-25 | | 95,000 | | 95,525 |
| |
| Telecommunication services 2.6% | | | | | | | | 614,691 |
| Diversified telecommunication services 2.4% | | | | | | | | |
| AT&T, Inc. | | 4.500 | | 05-15-35 | | 90,000 | | 83,196 |
| AT&T, Inc. (A) | | 5.150 | | 11-15-46 | | 110,000 | | 103,552 |
| AT&T, Inc. | | 5.350 | | 09-01-40 | | 50,000 | | 48,766 |
| Deutsche Telekom International Finance BV | | 9.250 | | 06-01-32 | | 50,000 | | 71,516 |
| Verizon Communications, Inc. (A) | | 4.329 | | 09-21-28 | | 102,000 | | 101,171 |
| Verizon Communications, Inc. | | 4.400 | | 11-01-34 | | 80,000 | | 74,567 |
| Verizon Communications, Inc. | | 5.250 | | 03-16-37 | | 75,000 | | 76,977 |
| Wireless telecommunication services 0.2% | | | | | | | | |
| Vodafone Group PLC | | 6.150 | | 02-27-37 | | 50,000 | | 54,946 |
| SEE NOTES TO FINANCIAL STATEMENTS | SEMIANNUAL REPORT | JOHN HANCOCK RETIREMENT INCOME 2040 FUND 14 |
| | | | Rate (%) | | Maturity date | | Par value^ | | Value |
| | Utilities 2.9% | | | | | | | | $673,090 |
| | Electric utilities 2.5% | | | | | | | | |
| | Duke Energy Carolinas LLC | | 6.050 | | 04-15-38 | | 60,000 | | 74,460 |
| | Duke Energy Carolinas LLC | | 6.450 | | 10-15-32 | | 75,000 | | 92,923 |
| | Florida Power & Light Company | | 5.950 | | 02-01-38 | | 60,000 | | 74,941 |
| | MidAmerican Energy Company | | 5.750 | | 11-01-35 | | 70,000 | | 84,774 |
| | Oncor Electric Delivery Company LLC | | 5.250 | | 09-30-40 | | 45,000 | | 52,097 |
| | Pacific Gas & Electric Company | | 6.050 | | 03-01-34 | | 80,000 | | 86,390 |
| | Pacific Gas & Electric Company | | 6.250 | | 03-01-39 | | 45,000 | | 49,325 |
| | PacifiCorp | | 5.250 | | 06-15-35 | | 55,000 | | 62,470 |
| | Multi-utilities 0.4% | | | | | | | | |
| | DTE Energy Company | | 6.375 | | 04-15-33 | | 80,000 | | 95,710 |
| | |
| | | | | | | | Shares | | Value |
| | Affiliated investment companies 24.8% | | | | | | | | $5,820,635 |
| | (Cost $5,997,146) | | | | | | | | |
| | | | | | | | | | |
| | Equity 24.8% | | | | | | | | 5,820,635 |
| | Strategic Equity Allocation, Class NAV, JHF II | | | | | | | | |
| | (JHAM) (B)(C) | | | | | | 449,817 | | 5,820,635 |
| | |
| | | | | | Yield (%) | | Shares | | Value |
| | Short-term investments 0.3% | | | | | | | | $81,042 |
| | (Cost $81,042) | | | | | | | | |
| | | | | | | | | | |
| | Money market funds 0.3% | | | | | | | | 81,042 |
| | State Street Institutional U.S. Government Money Market Fund, Premier | | | | | | |
| | Class | | | | 1.8098(D) | | 81,042 | | 81,042 |
| | |
| | Total investments (Cost $24,111,203) 99.0% | | | | | | | | $23,257,394 |
| | Other assets and liabilities, net 1.0% | | | | | | | | 224,315 |
| | Total net assets 100.0% | | | | | | | | $23,481,709 |
| |
The percentage shown for each investment category is the total value of the category as a percentage of the net assets of the fund. |
^All par values are denominated in U.S. dollars unless otherwise indicated. |
| Security Abbreviations and Legend |
| JHAM | John Hancock Asset Management |
| JHF II | John Hancock Funds II |
| (A) | These securities are exempt from registration under Rule 144A of the Securities Act of 1933. Such securities may be resold, normally to qualified institutional buyers, in transactions exempt from registration. |
| (B) | The subadvisor is an affiliate of the advisor. |
| (C) | Manulife Asset Management (US) LLC is doing business as John Hancock Asset Management. |
| (D) | The rate shown is the annualized seven-day yield as of 6-30-18. |
At 6-30-18, the aggregate cost of investments for federal income tax purposes was $24,273,177. Net unrealized depreciation aggregated to $1,015,783, of which $2,161 related to gross unrealized appreciation and $1,017,944 related to gross unrealized depreciation.
| SEE NOTES TO FINANCIAL STATEMENTS | SEMIANNUAL REPORT | JOHN HANCOCK RETIREMENT INCOME 2040 FUND 15 |
| STATEMENT OF ASSETS AND LIABILITIES 6-30-18 (unaudited) |
| Assets | | | |
| Unaffiliated investments, at value (Cost $18,114,057) | | $17,436,759 | |
| Affiliated funds, at value (Cost $5,997,146) | | 5,820,635 | |
| Total investments, at value (Cost $24,111,203) | | 23,257,394 | |
| Interest receivable | | 209,066 | |
| Receivable for investments sold | | 277,612 | |
| Receivable from affiliates | | 4,318 | |
| Other assets | | 12,920 | |
| Total assets | | 23,761,310 | |
| Liabilities | | | |
| Distributions payable | | 243,401 | |
| Payable to affiliates | | | |
| Accounting and legal services fees | | 1,383 | |
| Transfer agent fees | | 236 | |
| Trustees’ fees | | 289 | |
| Other liabilities and accrued expenses | | 34,292 | |
| Total liabilities | | 279,601 | |
| Net assets | | $23,481,709 | |
| Net assets consist of | | | |
| Paid-in capital | | $24,038,503 | |
| Distributions in excess of net investment income | | (248,557 | ) |
| Accumulated net realized gain (loss) on investments | | 545,572 | |
| Net unrealized appreciation (depreciation) on investments | | (853,809 | ) |
| Net assets | | $23,481,709 | |
| |
| Net asset value per share | | | |
| Based on net asset value and shares outstanding - the fund has an unlimited number of shares | | | |
| authorized with no par value | | | |
| Class R6 ($23,481,709 ÷ 480,831 shares) | | $48.84 | |
| SEE NOTES TO FINANCIAL STATEMENTS | SEMIANNUAL REPORT | JOHN HANCOCK RETIREMENT INCOME 2040 FUND 16 |
| STATEMENT OF OPERATIONS For the six months ended 6-30-18 (unaudited) |
| Investment income | | | |
| Interest | $ | 278,021 | |
| Expenses | | | |
| Investment management fees | | 47,322 | |
| Accounting and legal services fees | | 1,843 | |
| Transfer agent fees | | 1,422 | |
| Trustees’ fees | | 547 | |
| Custodian fees | | 17,990 | |
| State registration fees | | 20,695 | |
| Printing and postage | | 24,437 | |
| Professional fees | | 145,881 | |
| Other | | 5,240 | |
| Total expenses | | 265,377 | |
| Less expense reductions | | (225,153 | ) |
| Net expenses | | 40,224 | |
| Net investment income | | 237,797 | |
| Realized and unrealized gain (loss) | | | |
| Net realized gain (loss) on | | | |
| Unaffiliated investments | | (56,883 | ) |
| Affiliated funds | | (41,877 | ) |
| | (98,760 | ) |
| Change in net unrealized appreciation (depreciation) of | | | |
| Unaffiliated investments | | (862,769 | ) |
| Affiliated funds | | 78,798 | |
| | (783,971 | ) |
| Net realized and unrealized loss | | (882,731 | ) |
| Decrease in net assets from operations | $ | (644,934 | ) |
| SEE NOTES TO FINANCIAL STATEMENTS | SEMIANNUAL REPORT | JOHN HANCOCK RETIREMENT INCOME 2040 FUND 17 |
| STATEMENTS OF CHANGES IN NET ASSETS |
| | Six months ended 6-30-18 | | | | | |
| | (unaudited) | | Period ended 12-31-171 |
| Increase (decrease) in net assets | | | | | | | | | | |
| From operations | | | | | | | | | | |
| Net investment income | | | $237,797 | | | | | $324,823 | | |
| Net realized gain (loss) | | | (98,760 | ) | | | | 827,232 | | |
| Change in net unrealized appreciation (depreciation) | | | (783,971 | ) | | | | (69,838 | ) | |
| Increase (decrease) in net assets resulting from | | | | | | | | | | |
| operations | | | (644,934 | ) | | | | 1,082,217 | | |
| Distributions to shareholders | | | | | | | | | | |
| From net investment income | | | | | | | | | | |
| Class R6 | | | (486,841 | ) | | | | (470,785 | ) | |
| From net realized gain | | | | | | | | | | |
| Class R6 | | | — | | | | | (40,501 | ) | |
| Total distributions | | | (486,841 | ) | | | | (511,286 | ) | |
| From fund share transactions | | | 40 | | | | | 24,042,513 | | |
| Total increase (decrease) | | | (1,131,735 | ) | | | | 24,613,444 | | |
| Net assets | | | | | | | | | | |
| Beginning of period | | | 24,613,444 | | | | | — | | |
| End of period | | | $23,481,709 | | | | | $24,613,444 | | |
| Undistributed (Distributions in excess of) net | | | | | | | | | | |
| investment income | | | $(248,557 | ) | | | | $487 | | |
| 1 | Period from 7-6-17 (commencement of operations) to 12-31-17. |
| SEE NOTES TO FINANCIAL STATEMENTS | SEMIANNUAL REPORT | JOHN HANCOCK RETIREMENT INCOME 2040 FUND 18 |
| CLASS R6 SHARES Period ended | 6-30-181 | | 12-31-172 |
| Per share operating performance | | | | | | | | | | | |
| Net asset value, beginning of period | | $ | 51.19 | | | | | $ | 50.00 | | |
| Net investment income3,4 | | | 0.49 | | | | | | 0.69 | | |
| Net realized and unrealized gain (loss) on investments | | | (1.83 | ) | | | | | 1.56 | | |
| Total from investment operations | | | (1.34 | ) | | | | | 2.25 | | |
| Less distributions | | | | | | | | | | | |
| From net investment income | | | (1.01 | ) | | | | | (0.98 | ) | |
| From net realized gain | | | — | | | | | | (0.08 | ) | |
| Total distributions | | | (1.01 | ) | | | | | (1.06 | ) | |
| Net asset value, end of period | | $ | 48.84 | | | | | $ | 51.19 | | |
| Total return (%)5 | | | (2.62 | )6 | | | | | 4.53 | 6 | |
| Ratios and supplemental data | | | | | | | | | | | |
| Net assets, end of period (in millions) | | $ | 23 | | | | | $ | 25 | | |
| Ratios (as a percentage of average net assets): | | | | | | | | | | | |
| Expenses before reductions7 | | | 1.69 | 8 | | | | | 0.88 | 9 | |
| Expenses including reductions7 | | | 0.34 | 8 | | | | | 0.34 | 9 | |
| Net investment income4 | | | 2.01 | 8 | | | | | 2.29 | 9 | |
| Portfolio turnover (%) | | | 13 | | | | | | 17 | | |
| 1 | Six months ended 6-30-18. Unaudited. |
| 2 | Period from 7-6-17 (commencement of operations) to 12-31-17. |
| 3 | Based on average daily shares outstanding. |
| 4 | Net investment income is affected by the timing and frequency of the declaration of dividends by the underlying funds in which the fund invests. |
| 5 | Total returns would have been lower had certain expenses not been reduced during the applicable periods. |
| 6 | Not annualized. |
| 7 | Ratios do not include expense indirectly incurred from underlying funds and can vary based on the mix of underlying funds held by the fund. The expense ratios of the underlying fund held by the fund was 0.53% for the periods ended 6-30-18 and 12-31-17. |
| 8 | Annualized. |
| 9 | Annualized. Certain income and expenses are presented unannualized. |
| SEE NOTES TO FINANCIAL STATEMENTS | SEMIANNUAL REPORT | JOHN HANCOCK RETIREMENT INCOME 2040 FUND 19 |
ITEM 2. CODE OF ETHICS.
ITEM 3. AUDIT COMMITTEE FINANCIAL EXPERT.
ITEM 4. PRINCIPAL ACCOUNTANT FEES AND SERVICES.
ITEM 5. AUDIT COMMITTEE OF LISTED REGISTRANTS
Not Applicable.
ITEM 6. SCHEDULE OF INVESTMENTS.
(a) Included with Item 1.
(b) Not Applicable
ITEM 7. DISCLOSURE OF PROXY VOTING POLICIES AND PROCEDURES FOR CLOSED-END MANAGEMENT INVESTMENT COMPANIES.
Not Applicable.
ITEM 8. PORTFOLIO MANAGERS OF CLOSED-END MANAGEMENT INVESTMENT COMPANIES.
Not Applicable.
ITEM 9. PURCHASE OF EQUITY SECURITIES BY CLOSED-END MANAGEMENT INVESTMENT COMPANIES AND AFFILIATED PURCHASERS.
Not Applicable.
ITEM 10. SUBMISSION OF MATTERS TO VOTE OF SECURITY HOLDERS.
Not Applicable.
ITEM 11. CONTROLS AND PROCEDURES.
(a) Based upon their evaluation of the registrant's disclosure controls and procedures as conducted within 90 days of the filing date of this Form N-CSR, the registrant's principal executive officer and principal financial officer have concluded that those disclosure controls and procedures provide reasonable assurance that the material information required to be disclosed by the registrant on this report is recorded, processed, summarized and reported within the time periods specified in the Securities and Exchange Commission's rules and forms.
(b) There were no changes in the registrant's internal control over financial reporting that occurred during the second fiscal quarter of the period covered by this report that have materially affected, or are reasonably likely to materially affect, the registrant's internal control over financial reporting.
ITEM 12. DISCLOSURE OF SECURITIES LENDING ACTIVITIES FOR CLOSED-END MANAGEMENT INVESTMENT COMPANIES.: Not applicable.
ITEM 13. EXHIBITS.
(a)(1) Not applicable
(a)(2)(i) CERTIFICATION OF PRINCIPAL EXECUTIVE OFFICER.
(a)(2)(ii) CERTIFICATION OF PRINCIPAL FINANCIAL OFFICER.
(b) CERTIFICATION PURSUANT TO Rule 30a-2(b) OF THE INVESTMENT COMPANY ACT OF 1940
(c)(1) Submission of Matters to a Vote of Security Holders is attached. See attached “John Hancock Funds – Nominating and Governance Committee Charter”.
SIGNATURES
Pursuant to the requirements of the Securities Exchange Act of 1934 and the Investment Company Act of 1940, the registrant has duly caused this report to be signed on its behalf by the undersigned, thereunto duly authorized.
| JOHN HANCOCK FUNDS II |
| |
| |
| /s/ Andrew Arnott |
| Andrew Arnott |
| President |
| Date: August 22, 2018 |
Pursuant to the requirements of the Securities Exchange Act of 1934 and the Investment Company Act of 1940, this report has been signed below by the following persons on behalf of the registrant and in the capacities and on the dates indicated.
| |
| /s/ Andrew Arnott |
| Andrew Arnott |
| President |
| Date: August 22, 2018 |
| |
| |
| |
| /s/ Charles A. Rizzo |
| Charles A. Rizzo |
| Chief Financial Officer |
| Date: August 22, 2018 |