UNITED STATES
SECURITIES AND EXCHANGE COMMISSION
Washington, D.C. 20549
FORM N-CSR
CERTIFIED SHAREHOLDER REPORT OF REGISTERED MANAGEMENT INVESTMENT COMPANIES
Investment Company Act file number 811-21779
JOHN HANCOCK FUNDS II
---------------------------------------------------------
(Exact name of registrant as specified in charter)
200 BERKELEY STREET, BOSTON, MA 02216
-------------------------------------------------------------
(Address of principal executive offices) (Zip code)
SALVATORE SCHIAVONE, 200 BERKELEY STREET, BOSTON, MA 02216
------------------------------------------------------------------------------------------
(Name and address of agent for service)
Registrant's telephone number, including area code:(617) 663-4497
--------------
Date of fiscal year end: 7/31
Date of reporting period: 1/31/19
ITEM 1. REPORTS TO STOCKHOLDERS.
The Registrant prepared nine semiannual reports to shareholders for the period ended January 31, 2019. The first report applies to the Technical Opportunities Fund, the second report applies to the Global Income Fund, the third report applies to the Short Duration Credit Opportunities Fund, the fourth report applies to the Absolute Return Currency Fund, the fifth report applies to the Fundamental All Cap Core Fund, the sixth report applies to the Fundamental Large Cap Value Fund, the seventh report applies to the Diversified Strategies Fund, and the eight report applies to the Global Absolute Return Strategies Fund.
John Hancock
Technical Opportunities Fund
Semiannual report 1/31/19
Beginning on January 1, 2021, as permitted by regulations adopted by the Securities and Exchange Commission, paper copies of the Fund's shareholder reports like this one will no longer be sent by mail, unless you specifically request paper copies of the reports from the Fund or from your financial intermediary. Instead, the reports will be made available on a website, and you will be notified by mail each time a report is posted and provided with a website link to access the report.
If you already elected to receive shareholder reports electronically, you will not be affected by this change, and you do not need to take any action. You may elect to receive shareholder reports and other communications electronically by calling John Hancock Investments at 800-225-5291 (Class A and Class C shares) or 888-972-8696 (Class I, Class R6, and Class NAV shares) or by contacting your financial intermediary.
You may elect to receive all reports in paper, free of charge, at any time. You can inform John Hancock Investments or your financial intermediary that you wish to continue receiving paper copies of your shareholder reports by following the instructions listed above. Your election to receive reports in paper will apply to all funds held with John Hancock Investments or your financial intermediary.


A message to shareholders
Dear shareholder,
It's been a challenging time for equity investors as stock markets across many major economies worldwide posted losses for the period. In the United States, heightened fears of a full-blown trade war with China weighed on investor sentiment—despite relatively supportive U.S. economic fundamentals. Global economic growth slowed, and many international markets found themselves confronted by challenging issues that may not abate in the near future.
Concerns about the potential for a more widespread global economic slowdown led to a significant increase in volatility as well as a flight to quality, particularly in the final months of the year. At John Hancock Investments, we believe that we're in the late innings of the bull market, but the economic underpinnings in the United States suggest that there's still room for stocks to run.
Your best resource in unpredictable and volatile markets is your financial advisor, who can help position your portfolio so that it's sufficiently diversified to meet your long-term objectives and to withstand the inevitable turbulence along the way.
On behalf of everyone at John Hancock Investments, I'd like to take this opportunity to welcome new shareholders and to thank existing shareholders for the continued trust you've placed in us.
Sincerely,

Andrew G. Arnott
President and CEO,
John Hancock Investments
Head of Wealth and Asset Management,
United States and Europe
This commentary reflects the CEO's views, which are subject to change at any time. All investments entail risks, including the possible loss of principal. Diversification does not guarantee a profit or eliminate the risk of a loss. For more up-to-date information, you can visit our website at jhinvestments.com.
John Hancock
Technical Opportunities Fund
INVESTMENT OBJECTIVE
The fund seeks long-term capital appreciation.
AVERAGE ANNUAL TOTAL RETURNS AS OF 1/31/19 (%)
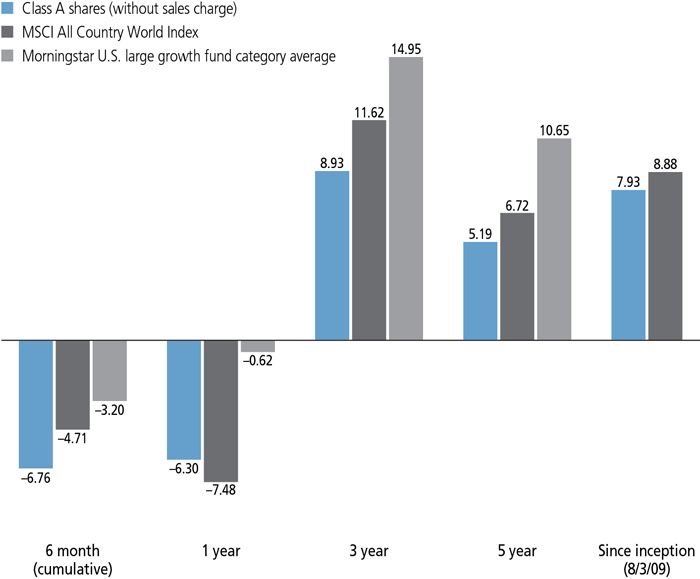
The MSCI All Country World Index is a free float-adjusted market capitalization weighted index that is designed to measure the equity market performance of developed and emerging markets.
It is not possible to invest directly in an index. Index figures do not reflect expenses or sales charges, which would result in lower returns.
Figures from Morningstar, Inc. include reinvested distributions and do not take into account sales charges. Actual load-adjusted performance is lower. Since-inception returns for the Morningstar fund category average are not available.
The past performance shown here reflects reinvested distributions and the beneficial effect of any expense reductions, and does not guarantee future results. Returns for periods shorter than one year are cumulative. Performance of the other share classes will vary based on the difference in the fees and expenses of those classes. Shares will fluctuate in value and, when redeemed, may be worth more or less than their original cost. Current month-end performance may be lower or higher than the performance cited, and can be found at jhinvestments.com or by calling 800-225-5291. For further information on the fund's objectives, risks, and strategy, see the fund's prospectus.
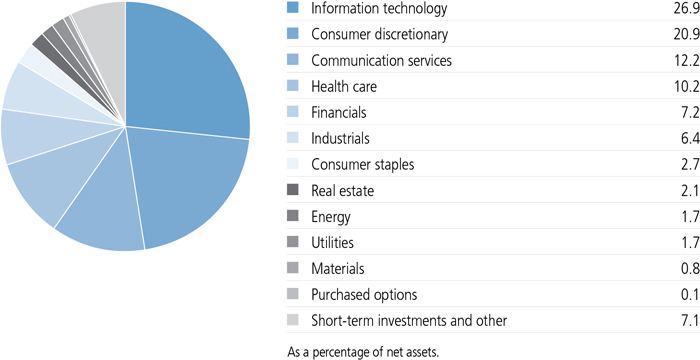
SECTOR COMPOSITION AS OF 1/31/19 (%)
COUNTRY COMPOSITION AS OF 1/31/19 (%)
| United States | 69.7 |
| Japan | 6.4 |
| Brazil | 3.7 |
| United Kingdom | 3.0 |
| China | 2.8 |
| France | 2.2 |
| Hong Kong | 1.8 |
| Germany | 1.0 |
| Other countries | 9.4 |
| TOTAL | 100.0 |
| As a percentage of net assets. |
A note about risks
The fund is subject to various risks as described in the fund's prospectus. For more information, please refer to the "Principal risks" section of the prospectus.
TOP 10 HOLDINGS AS OF 1/31/19 (%)
| Apple, Inc. | 2.0 |
| Amazon.com, Inc. | 1.7 |
| Microsoft Corp. | 1.7 |
| Alphabet, Inc., Class A | 1.6 |
| McDonald's Corp. | 1.4 |
| American Tower Corp. | 1.3 |
| NIKE, Inc., Class B | 1.3 |
| Wayfair, Inc., Class A | 1.2 |
| Edenred | 1.2 |
| Advanced Micro Devices, Inc. | 1.2 |
| TOTAL | 14.6 |
| As a percentage of net assets. | |
| Cash and cash equivalents are not included. | |
TOTAL RETURNS FOR THE PERIOD ENDED JANUARY 31, 2019
| Average annual total returns (%) with maximum sales charge | Cumulative total returns (%) with maximum sales charge | ||||||
| 1-year | 5-year | Since inception1 | 6-month | 5-year | Since inception1 | ||
| Class A | -11.01 | 4.11 | 7.35 | -11.42 | 22.28 | 96.10 | |
| Class C2 | -7.64 | 4.51 | 7.56 | -7.79 | 24.65 | 99.90 | |
| Class I3 | -6.14 | 5.49 | 8.27 | -6.72 | 30.62 | 112.78 | |
| Class R62,3 | -5.89 | 5.36 | 8.02 | -6.53 | 29.80 | 108.16 | |
| Class NAV3 | -5.98 | 5.62 | 8.44 | -6.62 | 31.46 | 115.94 | |
| Index† | -7.48 | 6.72 | 8.88 | -4.71 | 38.46 | 124.27 | |
Performance figures assume all distributions have been reinvested. Figures reflect maximum sales charges on Class A shares of 5.00% and the applicable contingent deferred sales charge (CDSC) on Class C shares. Class C shares sold within one year of purchase are subject to a 1% CDSC. Sales charges are not applicable to Class I, Class R6, and Class NAV shares.
The expense ratios of the fund, both net (including any fee waivers and/or expense limitations) and gross (excluding any fee waivers and/or expense limitations), are set forth according to the most recent publicly available prospectuses for the fund and may differ from those disclosed in the Financial highlights tables in this report. Net expenses reflect contractual expense limitation in effect until June 30, 2020 and are subject to change. Had the contractual fee waivers and expense limitations not been in place, gross expenses would apply. The expense ratios are as follows:
| Class A | Class C | Class I | Class R6 | Class NAV | |
| Gross (%) | 1.29 | 1.99 | 0.99 | 0.89 | 0.88 |
| Net (%) | 1.28 | 1.98 | 0.98 | 0.88 | 0.87 |
Please refer to the most recent prospectus and annual or semiannual report for more information on expenses and any expense limitation arrangements for each class.
The returns reflect past results and should not be considered indicative of future performance. The return and principal value of an investment will fluctuate so that shares, when redeemed, may be worth more or less than their original cost. Due to market volatility and other factors, the fund's current performance may be higher or lower than the performance shown. For current to the most recent month-end performance data, please call 800-225-5291 or visit the fund's website at jhinvestments.com.
The performance table above and the chart on the next page do not reflect the deduction of taxes that a shareholder would pay on fund distributions or the redemption of fund shares. The fund's performance results reflect any applicable fee waivers or expense reductions, without which the expenses would increase and results would have been less favorable.
| † | Index is the MSCI All Country World Index. |
See the following page for footnotes.
This chart and table show what happened to a hypothetical $10,000 investment in John Hancock Technical Opportunities Fund for the share classes and periods indicated, assuming all distributions were reinvested. For comparison, we've shown the same investment in the MSCI All Country World Index.
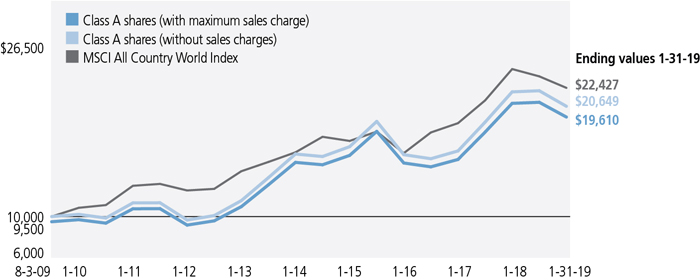
| Start date | With maximum sales charge ($) | Without sales charge ($) | Index ($) | |
| Class C2,4 | 8-3-09 | 19,990 | 19,990 | 22,427 |
| Class I3 | 8-3-09 | 21,278 | 21,278 | 22,427 |
| Class R62,3 | 8-3-09 | 20,816 | 20,816 | 22,427 |
| Class NAV3 | 8-3-09 | 21,594 | 21,594 | 22,427 |
The MSCI All Country World Index is a free float-adjusted market capitalization weighted index that is designed to measure the equity market performance of developed and emerging markets.
It is not possible to invest directly in an index. Index figures do not reflect expenses or sales charges, which would result in lower returns.
Footnotes related to performance pages
| 1 | From 8-3-09. |
| 2 | Class C shares were first offered on 8-28-14; Class R6 shares were first offered on 2-13-17. Returns prior to these dates are those of Class A shares (first offered on 8-3-09) that have not been adjusted for class-specific expenses; otherwise, returns would vary. |
| 3 | For certain types of investors as described in the fund's prospectuses. |
| 4 | The contingent deferred sales charge is not applicable. |
| Your expenses |

| SEMIANNUAL REPORT | JOHN HANCOCK TECHNICAL OPPORTUNITIES FUND | 7 |
| Account value on 8-1-2018 | Ending value on 1-31-2019 | Expenses paid during period ended 1-31-20191 | Annualized expense ratio | ||
| Class A | Actual expenses/actual returns | $1,000.00 | $932.40 | $6.19 | 1.27% |
| Hypothetical example | 1,000.00 | 1,018.80 | 6.46 | 1.27% | |
| Class C | Actual expenses/actual returns | 1,000.00 | 928.60 | 9.58 | 1.97% |
| Hypothetical example | 1,000.00 | 1,015.30 | 10.01 | 1.97% | |
| Class I | Actual expenses/actual returns | 1,000.00 | 932.80 | 4.82 | 0.99% |
| Hypothetical example | 1,000.00 | 1,020.20 | 5.04 | 0.99% | |
| Class R6 | Actual expenses/actual returns | 1,000.00 | 934.70 | 4.24 | 0.87% |
| Hypothetical example | 1,000.00 | 1,020.80 | 4.43 | 0.87% | |
| Class NAV | Actual expenses/actual returns | 1,000.00 | 933.80 | 4.19 | 0.86% |
| Hypothetical example | 1,000.00 | 1,020.90 | 4.38 | 0.86% |
| 1 | Expenses are equal to the annualized expense ratio, multiplied by the average account value over the period, multiplied by 184/365 (to reflect the one-half year period). |
| 8 | JOHN HANCOCK TECHNICAL OPPORTUNITIES FUND | SEMIANNUAL REPORT |
| Fund’s investments |
| Shares | Value | ||||
| Common stocks 92.8% | $90,379,244 | ||||
| (Cost $83,909,506) | |||||
| Communication services 12.2% | 11,888,320 | ||||
| Diversified telecommunication services 2.0% | |||||
| Cellnex Telecom SA (A)(B) | 23,596 | 664,926 | |||
| China Tower Corp., Ltd., H Shares (A)(B) | 3,641,762 | 782,067 | |||
| Ooma, Inc. (B) | 32,361 | 488,975 | |||
| Entertainment 4.4% | |||||
| Akatsuki, Inc. | 11,122 | 637,567 | |||
| Electronic Arts, Inc. (B) | 6,770 | 624,465 | |||
| Netflix, Inc. (B) | 2,875 | 976,063 | |||
| Nexon Company, Ltd. (B) | 41,503 | 631,405 | |||
| The Walt Disney Company | 5,767 | 643,136 | |||
| Toho Company, Ltd. | 21,284 | 776,423 | |||
| Interactive media and services 5.5% | |||||
| Alphabet, Inc., Class A (B) | 1,394 | 1,569,491 | |||
| Autohome, Inc., ADR (B)(C) | 4,014 | 290,533 | |||
| Facebook, Inc., Class A (B) | 6,281 | 1,046,980 | |||
| InterActiveCorp (B) | 3,727 | 787,441 | |||
| Match Group, Inc. (C) | 12,066 | 645,410 | |||
| Tencent Holdings, Ltd. | 22,411 | 997,616 | |||
| Wireless telecommunication services 0.3% | |||||
| T-Mobile US, Inc. (B) | 4,680 | 325,822 | |||
| Consumer discretionary 20.9% | 20,372,548 | ||||
| Auto components 0.6% | |||||
| Fox Factory Holding Corp. (B) | 9,553 | 566,779 | |||
| Diversified consumer services 1.5% | |||||
| Bright Horizons Family Solutions, Inc. (B) | 4,203 | 486,665 | |||
| Kroton Educacional SA | 296,235 | 929,000 | |||
| Hotels, restaurants and leisure 5.3% | |||||
| McDonald's Corp. | 7,657 | 1,368,918 | |||
| MGM China Holdings, Ltd. (C) | 365,563 | 709,801 | |||
| Planet Fitness, Inc., Class A (B) | 12,128 | 702,454 | |||
| Starbucks Corp. | 13,098 | 892,498 | |||
| Whitbread PLC | 14,769 | 946,326 | |||
| Wingstop, Inc. | 8,775 | 576,079 | |||
| Household durables 0.7% | |||||
| Sony Corp. | 12,701 | 636,408 | |||
| Internet and direct marketing retail 5.1% | |||||
| Amazon.com, Inc. (B) | 986 | 1,694,668 | |||
| Etsy, Inc. (B) | 11,637 | 635,962 | |||
| JD.com, Inc., ADR (B) | 26,021 | 646,622 | |||
| SEE NOTES TO FINANCIAL STATEMENTS | SEMIANNUAL REPORT | JOHN HANCOCK TECHNICAL OPPORTUNITIES FUND | 9 |
| Shares | Value | ||||
| Consumer discretionary (continued) | |||||
| Internet and direct marketing retail (continued) | |||||
| Ocado Group PLC (B) | 60,910 | $792,471 | |||
| Wayfair, Inc., Class A (B)(C) | 10,960 | 1,199,682 | |||
| Leisure products 0.7% | |||||
| Bandai Namco Holdings, Inc. | 15,588 | 688,626 | |||
| Multiline retail 1.4% | |||||
| Lojas Renner SA | 55,505 | 693,554 | |||
| Magazine Luiza SA | 14,176 | 696,902 | |||
| Specialty retail 3.1% | |||||
| Burlington Stores, Inc. (B) | 4,009 | 688,385 | |||
| Nextage Company, Ltd. | 67,368 | 749,062 | |||
| O'Reilly Automotive, Inc. (B) | 1,851 | 637,966 | |||
| The Home Depot, Inc. | 5,189 | 952,337 | |||
| Textiles, apparel and luxury goods 2.5% | |||||
| Deckers Outdoor Corp. (B) | 2,490 | 319,841 | |||
| NIKE, Inc., Class B | 15,045 | 1,231,885 | |||
| Puma SE | 1,668 | 929,657 | |||
| Consumer staples 2.7% | 2,670,929 | ||||
| Food and staples retailing 0.6% | |||||
| Kobe Bussan Company, Ltd. | 20,307 | 630,698 | |||
| Food products 2.1% | |||||
| a2 Milk Company, Ltd. (B) | 75,382 | 664,848 | |||
| Lamb Weston Holdings, Inc. | 10,993 | 794,794 | |||
| Post Holdings, Inc. (B) | 6,255 | 580,589 | |||
| Energy 1.7% | 1,713,910 | ||||
| Energy equipment and services 0.3% | |||||
| McDermott International, Inc. (B) | 34,504 | 304,325 | |||
| Oil, gas and consumable fuels 1.4% | |||||
| Neste OYJ | 8,362 | 766,128 | |||
| Valero Energy Corp. | 7,327 | 643,457 | |||
| Financials 7.2% | 6,978,266 | ||||
| Banks 1.9% | |||||
| Bank of America Corp. | 36,421 | 1,036,906 | |||
| JPMorgan Chase & Co. | 8,118 | 840,213 | |||
| Capital markets 1.9% | |||||
| CME Group, Inc. | 4,395 | 801,121 | |||
| S&P Global, Inc. | 5,207 | 997,922 | |||
| Diversified financial services 1.3% | |||||
| Berkshire Hathaway, Inc., Class B (B) | 3,231 | 664,100 | |||
| Sofina SA | 3,168 | 628,352 | |||
| Insurance 2.1% | |||||
| AIA Group, Ltd. | 111,538 | 1,007,133 | |||
| 10 | JOHN HANCOCK TECHNICAL OPPORTUNITIES FUND | SEMIANNUAL REPORT | SEE NOTES TO FINANCIAL STATEMENTS |
| Shares | Value | ||||
| Financials (continued) | |||||
| Insurance (continued) | |||||
| Aon PLC | 4,396 | $686,787 | |||
| IRB Brasil Resseguros SA | 13,503 | 315,732 | |||
| Health care 10.2% | 9,898,796 | ||||
| Biotechnology 0.9% | |||||
| Vanda Pharmaceuticals, Inc. (B) | 10,206 | 276,889 | |||
| Vitrolife AB | 35,660 | 629,906 | |||
| Health care equipment and supplies 3.0% | |||||
| Atrion Corp. | 1,302 | 971,084 | |||
| Masimo Corp. (B) | 4,042 | 502,784 | |||
| Medtronic PLC | 7,283 | 643,738 | |||
| Tandem Diabetes Care, Inc. (B) | 18,166 | 789,858 | |||
| Health care providers and services 1.8% | |||||
| CorVel Corp. (B) | 14,797 | 924,369 | |||
| WellCare Health Plans, Inc. (B) | 2,981 | 824,187 | |||
| Health care technology 1.1% | |||||
| Veeva Systems, Inc., Class A (B) | 9,366 | 1,021,456 | |||
| Life sciences tools and services 1.0% | |||||
| Illumina, Inc. (B) | 1,144 | 320,080 | |||
| Thermo Fisher Scientific, Inc. | 2,648 | 650,534 | |||
| Pharmaceuticals 2.4% | |||||
| Cronos Group, Inc. (B)(C) | 23,027 | 453,171 | |||
| Eli Lilly & Company | 2,704 | 324,101 | |||
| Merck & Company, Inc. | 8,565 | 637,493 | |||
| Pfizer, Inc. | 21,888 | 929,146 | |||
| Industrials 6.4% | 6,231,059 | ||||
| Aerospace and defense 1.7% | |||||
| Aerojet Rocketdyne Holdings, Inc. (B) | 16,282 | 642,649 | |||
| Safran SA | 7,446 | 978,324 | |||
| Air freight and logistics 0.8% | |||||
| SG Holdings Company, Ltd. | 29,765 | 798,989 | |||
| Airlines 1.0% | |||||
| Spirit Airlines, Inc. (B) | 16,213 | 953,649 | |||
| Commercial services and supplies 1.2% | |||||
| Edenred | 29,168 | 1,181,211 | |||
| Professional services 0.7% | |||||
| CoStar Group, Inc. (B) | 1,745 | 681,841 | |||
| Road and rail 1.0% | |||||
| Localiza Rent a Car SA | 108,767 | 994,396 | |||
| SEE NOTES TO FINANCIAL STATEMENTS | SEMIANNUAL REPORT | JOHN HANCOCK TECHNICAL OPPORTUNITIES FUND | 11 |
| Shares | Value | ||||
| Information technology 26.9% | $26,217,561 | ||||
| Communications equipment 1.8% | |||||
| Cisco Systems, Inc. | 18,160 | 858,786 | |||
| Ubiquiti Networks, Inc. (C) | 8,539 | 924,005 | |||
| Electronic equipment, instruments and components 1.0% | |||||
| CDW Corp. | 3,936 | 327,751 | |||
| Fabrinet (B) | 11,132 | 632,743 | |||
| IT services 4.2% | |||||
| EVERTEC, Inc. | 22,843 | 632,066 | |||
| Okta, Inc. (B) | 11,080 | 913,324 | |||
| PayPal Holdings, Inc. (B) | 10,417 | 924,613 | |||
| Twilio, Inc., Class A (B)(C) | 8,762 | 975,386 | |||
| Visa, Inc., Class A | 5,203 | 702,457 | |||
| Semiconductors and semiconductor equipment 7.6% | |||||
| Advanced Micro Devices, Inc. (B) | 47,963 | 1,170,777 | |||
| Applied Materials, Inc. | 24,331 | 950,855 | |||
| Broadcom, Inc. | 2,713 | 727,762 | |||
| Intel Corp. | 18,413 | 867,621 | |||
| SK Hynix, Inc. | 9,626 | 643,688 | |||
| Skyworks Solutions, Inc. | 12,997 | 949,301 | |||
| Taiwan Semiconductor Manufacturing Company, Ltd. | 98,649 | 731,775 | |||
| Tokyo Electron, Ltd. | 4,731 | 690,824 | |||
| Xilinx, Inc. | 5,681 | 635,931 | |||
| Software 9.6% | |||||
| Alarm.com Holdings, Inc. (B) | 10,853 | 682,979 | |||
| Atlassian Corp. PLC, Class A (B) | 6,405 | 630,252 | |||
| Avast PLC (A)(B) | 122,098 | 459,648 | |||
| Coupa Software, Inc. (B) | 7,971 | 693,158 | |||
| HubSpot, Inc. (B) | 2,100 | 332,451 | |||
| Microsoft Corp. | 15,888 | 1,659,184 | |||
| Paycom Software, Inc. (B) | 4,757 | 705,178 | |||
| salesforce.com, Inc. (B) | 6,301 | 957,563 | |||
| SPS Commerce, Inc. (B) | 10,601 | 939,885 | |||
| The Trade Desk, Inc., Class A (B)(C) | 6,023 | 859,362 | |||
| Workday, Inc., Class A (B) | 3,724 | 676,018 | |||
| Zscaler, Inc. (B)(C) | 15,968 | 772,372 | |||
| Technology hardware, storage and peripherals 2.7% | |||||
| Apple, Inc. | 11,687 | 1,945,184 | |||
| Western Digital Corp. | 14,329 | 644,662 | |||
| Materials 0.8% | 744,910 | ||||
| Metals and mining 0.8% | |||||
| MMC Norilsk Nickel PJSC, ADR | 35,455 | 744,910 | |||
| 12 | JOHN HANCOCK TECHNICAL OPPORTUNITIES FUND | SEMIANNUAL REPORT | SEE NOTES TO FINANCIAL STATEMENTS |
| Shares | Value | ||||
| Real estate 2.1% | $2,045,228 | ||||
| Equity real estate investment trusts 2.1% | |||||
| American Tower Corp. | 7,268 | 1,256,201 | |||
| Link REIT | 71,781 | 789,027 | |||
| Utilities 1.7% | 1,617,717 | ||||
| Electric utilities 0.7% | |||||
| Exelon Corp. | 13,596 | 649,345 | |||
| Water utilities 1.0% | |||||
| American Water Works Company, Inc. | 10,122 | 968,372 | |||
| Contracts/Notional amount | Value | ||||
| Purchased options 0.1% | $94,540 | ||||
| (Cost $209,276) | |||||
| Puts 0.1% | 94,540 | ||||
| Exchange Traded Option on S&P 500 Index (Expiration Date: 3-15-19; Strike Price: $2,400.00; Notional Amount: 16,300) (B) | 163 | 94,540 |
| Yield (%) | Shares | Value | |||
| Securities lending collateral 5.7% | $5,577,610 | ||||
| (Cost $5,575,904) | |||||
| John Hancock Collateral Trust (D) | 2.5450(E) | 557,387 | 5,577,610 | ||
| Par value^ | Value | ||||
| Short-term investments 3.2% | $3,100,000 | ||||
| (Cost $3,100,000) | |||||
| Repurchase agreement 3.2% | 3,100,000 | ||||
| Bank of America Tri-Party Repurchase Agreement dated 1-31-19 at 2.570% to be repurchased at $3,100,221 on 2-1-19, collateralized by $3,088,371 Government National Mortgage Association, 3.800% due 11-20-68 (valued at $3,162,000, including interest) | 3,100,000 | 3,100,000 |
| Total investments (Cost $92,794,686) 101.8% | $99,151,394 | ||||
| Other assets and liabilities, net (1.8%) | (1,718,890) | ||||
| Total net assets 100.0% | $97,432,504 | ||||
| The percentage shown for each investment category is the total value of the category as a percentage of the net assets of the fund. | |
| ^All par values are denominated in U.S. dollars unless otherwise indicated. | |
| Security Abbreviations and Legend | |
| ADR | American Depositary Receipt |
| (A) | These securities are exempt from registration under Rule 144A of the Securities Act of 1933. Such securities may be resold, normally to qualified institutional buyers, in transactions exempt from registration. |
| (B) | Non-income producing security. |
| (C) | All or a portion of this security is on loan as of 1-31-19. |
| (D) | Investment is an affiliate of the fund, the advisor and/or subadvisor. This security represents the investment of cash collateral received for securities lending. |
| SEE NOTES TO FINANCIAL STATEMENTS | SEMIANNUAL REPORT | JOHN HANCOCK TECHNICAL OPPORTUNITIES FUND | 13 |
| (E) | The rate shown is the annualized seven-day yield as of 1-31-19. |
| 14 | JOHN HANCOCK TECHNICAL OPPORTUNITIES FUND | SEMIANNUAL REPORT | SEE NOTES TO FINANCIAL STATEMENTS |
| Financial statements |
| Assets | |
| Unaffiliated investments, at value (Cost $87,218,782) including $5,488,099 of securities loaned | $93,573,784 |
| Affiliated investments, at value (Cost $5,575,904) | 5,577,610 |
| Total investments, at value (Cost $92,794,686) | 99,151,394 |
| Cash | 292,269 |
| Dividends and interest receivable | 121,669 |
| Receivable for investments sold | 8,566,023 |
| Receivable for securities lending income | 8,828 |
| Other assets | 50,464 |
| Total assets | 108,190,647 |
| Liabilities | |
| Payable for investments purchased | 4,866,860 |
| Payable for fund shares repurchased | 151,767 |
| Payable upon return of securities loaned | 5,644,357 |
| Payable to affiliates | |
| Accounting and legal services fees | 12,103 |
| Transfer agent fees | 2,851 |
| Trustees' fees | 1,626 |
| Other liabilities and accrued expenses | 78,579 |
| Total liabilities | 10,758,143 |
| Net assets | $97,432,504 |
| Net assets consist of | |
| Paid-in capital | $116,185,647 |
| Total distributable earnings (loss) | (18,753,143) |
| Net assets | $97,432,504 |
| Net asset value per share | |
| Based on net asset value and shares outstanding - the fund has an unlimited number of shares authorized with no par value | |
| Class A ($20,899,455 ÷ 2,630,734 shares)1 | $7.94 |
| Class C ($1,511,950 ÷ 188,004 shares)1 | $8.04 |
| Class I ($5,150,980 ÷ 610,881 shares) | $8.43 |
| Class R6 ($37,776 ÷ 4,354 shares) | $8.68 |
| Class NAV ($69,832,343 ÷ 8,054,950 shares) | $8.67 |
| Maximum offering price per share | |
| Class A (net asset value per share ÷ 95%)2 | $8.36 |
| 1 | Redemption price per share is equal to net asset value less any applicable contingent deferred sales charge. |
| 2 | On single retail sales of less than $50,000. On sales of $50,000 or more and on group sales the offering price is reduced. |
| SEE NOTES TO FINANCIAL STATEMENTS | SEMIANNUAL REPORT | JOHN HANCOCK TECHNICAL OPPORTUNITIES FUND | 15 |
| Investment income | |
| Dividends | $2,483,641 |
| Interest | 320,071 |
| Securities lending | 91,299 |
| Less foreign taxes withheld | (100,625) |
| Total investment income | 2,794,386 |
| Expenses | |
| Investment management fees | 1,758,781 |
| Distribution and service fees | 51,944 |
| Accounting and legal services fees | 36,054 |
| Transfer agent fees | 22,980 |
| Trustees' fees | 4,322 |
| Custodian fees | 32,210 |
| State registration fees | 34,051 |
| Printing and postage | 7,865 |
| Professional fees | 12,227 |
| Other | 15,671 |
| Total expenses | 1,976,105 |
| Less expense reductions | (17,327) |
| Net expenses | 1,958,778 |
| Net investment income | 835,608 |
| Realized and unrealized gain (loss) | |
| Net realized gain (loss) on | |
| Unaffiliated investments and foreign currency transactions | 1,325,317 |
| 1,325,317 | |
| Change in net unrealized appreciation (depreciation) of | |
| Unaffiliated investments and translation of assets and liabilities in foreign currencies | (39,655,229) |
| Affiliated investments | (4,719) |
| (39,659,948) | |
| Net realized and unrealized loss | (38,334,631) |
| Decrease in net assets from operations | $(37,499,023) |
| 16 | JOHN HANCOCK TECHNICAL OPPORTUNITIES FUND | SEMIANNUAL REPORT | SEE NOTES TO FINANCIAL STATEMENTS |
| Six months ended 1-31-19 (unaudited) | Year ended 7-31-18 | |
| Increase (decrease) in net assets | ||
| From operations | ||
| Net investment income | $835,608 | $439,563 |
| Net realized gain | 1,325,317 | 117,105,656 |
| Change in net unrealized appreciation (depreciation) | (39,659,948) | (32,305,526) |
| Increase (decrease) in net assets resulting from operations | (37,499,023) | 85,239,693 |
| Distributions to shareholders | ||
| From net investment income and net realized gain | ||
| Class A | (7,833,443) | — |
| Class C | (490,593) | — |
| Class I | (2,483,761) | — |
| Class R6 | (14,671) | — |
| Class NAV | (97,994,297) | — |
| From net investment income | ||
| Class I | — | (18,713) |
| Class R6 | — | (167) |
| Class NAV | — | (1,480,157) |
| From net realized gain | ||
| Class A | — | (4,799,849) |
| Class C | — | (313,705) |
| Class I | — | (1,516,762) |
| Class R6 | — | (9,657) |
| Class NAV | — | (80,632,476) |
| Total distributions | (108,816,765) | (88,771,486) |
| From fund share transactions | (255,369,539) | (76,993,688) |
| Total decrease | (401,685,327) | (80,525,481) |
| Net assets | ||
| Beginning of period | 499,117,831 | 579,643,312 |
| End of period1 | $97,432,504 | $499,117,831 |
| 1 | Net assets - End of year includes undistributed net investment income of $0 at July 31, 2018. The SEC eliminated the requirement to disclose undistributed net investment income in the current reporting period. |
| SEE NOTES TO FINANCIAL STATEMENTS | SEMIANNUAL REPORT | JOHN HANCOCK TECHNICAL OPPORTUNITIES FUND | 17 |
| Financial highlights |
| CLASS A SHARES Period ended | 1-31-191 | 7-31-18 | 7-31-17 | 7-31-16 | 7-31-15 | 7-31-14 |
| Per share operating performance | ||||||
| Net asset value, beginning of period | $12.34 | $12.72 | $10.38 | $14.47 | $13.76 | $13.15 |
| Net investment loss2 | —3 | (0.04) | (0.06) | (0.10) | (0.14) | (0.14) |
| Net realized and unrealized gain (loss) on investments | (1.06) | 1.91 | 2.41 | (2.42) | 2.81 | 2.09 |
| Total from investment operations | (1.06) | 1.87 | 2.35 | (2.52) | 2.67 | 1.95 |
| Less distributions | ||||||
| From net realized gain | (3.34) | (2.25) | (0.01) | (1.57) | (1.96) | (1.34) |
| Net asset value, end of period | $7.94 | $12.34 | $12.72 | $10.38 | $14.47 | $13.76 |
| Total return (%)4,5 | (6.76)6 | 15.86 | 22.65 | (18.77) | 21.46 | 14.86 |
| Ratios and supplemental data | ||||||
| Net assets, end of period (in millions) | $21 | $30 | $29 | $40 | $66 | $59 |
| Ratios (as a percentage of average net assets): | ||||||
| Expenses before reductions | 1.277 | 1.298 | 1.55 | 1.66 | 1.67 | 1.72 |
| Expenses including reductions | 1.277 | 1.288 | 1.54 | 1.65 | 1.65 | 1.71 |
| Net investment loss | —7,9 | (0.30) | (0.58) | (0.84) | (1.05) | (1.03) |
| Portfolio turnover (%) | 270 | 432 | 375 | 349 | 228 | 306 |
| 1 | Six months ended 1-31-19. Unaudited. |
| 2 | Based on average daily shares outstanding. |
| 3 | Less than $0.005 per share. |
| 4 | Total returns would have been lower had certain expenses not been reduced during the applicable periods. |
| 5 | Does not reflect the effect of sales charges, if any. |
| 6 | Not annualized. |
| 7 | Annualized. |
| 8 | Expense ratios have decreased due to a change in the fund's management fee during 2017. |
| 9 | Less than 0.005%. |
| 18 | JOHN HANCOCK TECHNICAL OPPORTUNITIES FUND | SEMIANNUAL REPORT | SEE NOTES TO FINANCIAL STATEMENTS |
| CLASS C SHARES Period ended | 1-31-191 | 7-31-18 | 7-31-17 | 7-31-16 | 7-31-152 |
| Per share operating performance | |||||
| Net asset value, beginning of period | $12.48 | $12.93 | $10.62 | $14.86 | $14.94 |
| Net investment loss3 | (0.04) | (0.13) | (0.14) | (0.18) | (0.27) |
| Net realized and unrealized gain (loss) on investments | (1.06) | 1.93 | 2.46 | (2.49) | 2.15 |
| Total from investment operations | (1.10) | 1.80 | 2.32 | (2.67) | 1.88 |
| Less distributions | |||||
| From net realized gain | (3.34) | (2.25) | (0.01) | (1.57) | (1.96) |
| Net asset value, end of period | $8.04 | $12.48 | $12.93 | $10.62 | $14.86 |
| Total return (%)4,5 | (7.14)6 | 14.99 | 21.86 | (19.32) | 14.416 |
| Ratios and supplemental data | |||||
| Net assets, end of period (in millions) | $2 | $2 | $2 | $3 | $2 |
| Ratios (as a percentage of average net assets): | |||||
| Expenses before reductions | 1.977 | 1.998 | 2.25 | 2.36 | 3.397 |
| Expenses including reductions | 1.977 | 1.988 | 2.24 | 2.35 | 2.507 |
| Net investment loss | (0.71)7 | (0.99) | (1.27) | (1.51) | (2.06)7 |
| Portfolio turnover (%) | 270 | 432 | 375 | 349 | 2289 |
| 1 | Six months ended 1-31-19. Unaudited. |
| 2 | The inception date for Class C shares is 8-28-14. |
| 3 | Based on average daily shares outstanding. |
| 4 | Total returns would have been lower had certain expenses not been reduced during the applicable periods. |
| 5 | Does not reflect the effect of sales charges, if any. |
| 6 | Not annualized. |
| 7 | Annualized. |
| 8 | Expense ratios have decreased due to a change in the fund's management fee during 2017. |
| 9 | Portfolio turnover is shown for the period from 8-1-14 to 7-31-15. |
| SEE NOTES TO FINANCIAL STATEMENTS | SEMIANNUAL REPORT | JOHN HANCOCK TECHNICAL OPPORTUNITIES FUND | 19 |
| CLASS I SHARES Period ended | 1-31-191 | 7-31-18 | 7-31-17 | 7-31-16 | 7-31-15 | 7-31-14 |
| Per share operating performance | ||||||
| Net asset value, beginning of period | $12.88 | $13.18 | $10.72 | $14.84 | $14.03 | $13.35 |
| Net investment income (loss)2 | 0.02 | —3 | (0.02) | (0.07) | (0.10) | (0.11) |
| Net realized and unrealized gain (loss) on investments | (1.10) | 1.97 | 2.49 | (2.48) | 2.87 | 2.13 |
| Total from investment operations | (1.08) | 1.97 | 2.47 | (2.55) | 2.77 | 2.02 |
| Less distributions | ||||||
| From net investment income | (0.03) | (0.02) | — | — | — | — |
| From net realized gain | (3.34) | (2.25) | (0.01) | (1.57) | (1.96) | (1.34) |
| Total distributions | (3.37) | (2.27) | (0.01) | (1.57) | (1.96) | (1.34) |
| Net asset value, end of period | $8.43 | $12.88 | $13.18 | $10.72 | $14.84 | $14.03 |
| Total return (%)4 | (6.72)5 | 16.18 | 23.05 | (18.49) | 21.79 | 15.17 |
| Ratios and supplemental data | ||||||
| Net assets, end of period (in millions) | $5 | $11 | $11 | $12 | $44 | $30 |
| Ratios (as a percentage of average net assets): | ||||||
| Expenses before reductions | 1.006 | 0.997 | 1.22 | 1.34 | 1.35 | 1.44 |
| Expenses including reductions | 0.996 | 0.987 | 1.22 | 1.34 | 1.34 | 1.43 |
| Net investment income (loss) | 0.276 | —8 | (0.19) | (0.54) | (0.74) | (0.75) |
| Portfolio turnover (%) | 270 | 432 | 375 | 349 | 228 | 306 |
| 1 | Six months ended 1-31-19. Unaudited. |
| 2 | Based on average daily shares outstanding. |
| 3 | Less than $0.005 per share. |
| 4 | Total returns would have been lower had certain expenses not been reduced during the applicable periods. |
| 5 | Not annualized. |
| 6 | Annualized. |
| 7 | Expense ratios have decreased due to a change in the fund's management fee during 2017. |
| 8 | Less than 0.005%. |
| 20 | JOHN HANCOCK TECHNICAL OPPORTUNITIES FUND | SEMIANNUAL REPORT | SEE NOTES TO FINANCIAL STATEMENTS |
| CLASS R6 SHARES Period ended | 1-31-191 | 7-31-18 | 7-31-172 |
| Per share operating performance | |||
| Net asset value, beginning of period | $13.14 | $13.40 | $11.63 |
| Net investment income3 | 0.02 | 0.01 | 0.02 |
| Net realized and unrealized gain (loss) on investments | (1.10) | 2.02 | 1.75 |
| Total from investment operations | (1.08) | 2.03 | 1.77 |
| Less distributions | |||
| From net investment income | (0.04) | (0.04) | — |
| From net realized gain | (3.34) | (2.25) | — |
| Total distributions | (3.38) | (2.29) | — |
| Net asset value, end of period | $8.68 | $13.14 | $13.40 |
| Total return (%)4 | (6.53)5 | 16.30 | 15.225 |
| Ratios and supplemental data | |||
| Net assets, end of period (in millions) | $—6 | $—6 | $—6 |
| Ratios (as a percentage of average net assets): | |||
| Expenses before reductions | 0.887 | 0.898 | 1.047 |
| Expenses including reductions | 0.877 | 0.888 | 1.037 |
| Net investment income | 0.397 | 0.08 | 0.377 |
| Portfolio turnover (%) | 270 | 432 | 3759 |
| 1 | Six months ended 1-31-19. Unaudited. |
| 2 | The inception date for Class R6 shares is 2-13-17. |
| 3 | Based on average daily shares outstanding. |
| 4 | Total returns would have been lower had certain expenses not been reduced during the applicable periods. |
| 5 | Not annualized. |
| 6 | Less than $500,000. |
| 7 | Annualized. |
| 8 | Expense ratios have decreased due to a change in the fund's management fee during 2017. |
| 9 | Portfolio turnover is shown for the period from 8-1-16 to 7-31-17. |
| SEE NOTES TO FINANCIAL STATEMENTS | SEMIANNUAL REPORT | JOHN HANCOCK TECHNICAL OPPORTUNITIES FUND | 21 |
| CLASS NAV SHARES Period ended | 1-31-191 | 7-31-18 | 7-31-17 | 7-31-16 | 7-31-15 | 7-31-14 |
| Per share operating performance | ||||||
| Net asset value, beginning of period | $13.14 | $13.40 | $10.89 | $15.03 | $14.16 | $13.44 |
| Net investment income (loss)2 | 0.03 | 0.01 | (0.01) | (0.05) | (0.08) | (0.08) |
| Net realized and unrealized gain (loss) on investments | (1.12) | 2.02 | 2.53 | (2.52) | 2.91 | 2.14 |
| Total from investment operations | (1.09) | 2.03 | 2.52 | (2.57) | 2.83 | 2.06 |
| Less distributions | ||||||
| From net investment income | (0.04) | (0.04) | — | — | — | — |
| From net realized gain | (3.34) | (2.25) | (0.01) | (1.57) | (1.96) | (1.34) |
| Total distributions | (3.38) | (2.29) | (0.01) | (1.57) | (1.96) | (1.34) |
| Net asset value, end of period | $8.67 | $13.14 | $13.40 | $10.89 | $15.03 | $14.16 |
| Total return (%)3 | (6.62)4 | 16.32 | 23.15 | (18.38) | 22.02 | 15.38 |
| Ratios and supplemental data | ||||||
| Net assets, end of period (in millions) | $70 | $456 | $538 | $594 | $758 | $783 |
| Ratios (as a percentage of average net assets): | ||||||
| Expenses before reductions | 0.865 | 0.886 | 1.12 | 1.23 | 1.21 | 1.22 |
| Expenses including reductions | 0.865 | 0.876 | 1.11 | 1.22 | 1.20 | 1.21 |
| Net investment income (loss) | 0.425 | 0.11 | (0.10) | (0.41) | (0.59) | (0.54) |
| Portfolio turnover (%) | 270 | 432 | 375 | 349 | 228 | 306 |
| 1 | Six months ended 1-31-19. Unaudited. |
| 2 | Based on average daily shares outstanding. |
| 3 | Total returns would have been lower had certain expenses not been reduced during the applicable periods. |
| 4 | Not annualized. |
| 5 | Annualized. |
| 6 | Expense ratios have decreased due to a change in the fund's management fee during 2017. |
| 22 | JOHN HANCOCK TECHNICAL OPPORTUNITIES FUND | SEMIANNUAL REPORT | SEE NOTES TO FINANCIAL STATEMENTS |
Note 1 — Organization
John Hancock Technical Opportunities Fund (the fund) is a series of John Hancock Funds II (the Trust), an open-end management investment company organized as a Massachusetts business trust and registered under the Investment Company Act of 1940, as amended (the 1940 Act). The investment objective of the fund is to seek long-term capital appreciation.
The fund may offer multiple classes of shares. The shares currently offered are detailed in the Statement of assets and liabilities. Class A and Class C are offered to allinvestors. Class I shares are offeredto institutions and certaininvestors. Class R6 shares are only available to certain retirement plans, institutions and other investors. Class NAV shares areoffered toJohn Hancock affiliated funds of funds, retirement plans for employees of John Hancock and/or Manulife Financial Corporation (MFC), and certain 529 plans. Class C shares convert to Class A shares ten years after purchase (certain exclusions may apply). Shareholders of each class have exclusive voting rights to matters that affect that class.The distribution and service fees if any, and transfer agent feesfor each class may differ.
At its meeting on December 11-13, 2018, the Board of Trustees of John Hancock Funds II (the "Board") approved the closing and liquidation of the fund pursuant to a Plan of Liquidation approved by the Board. The Board determined that continuation of the fund is not in the best interests of the fund or its shareholders as a result of factors or events adversely affecting the fund's ability to conduct its business and operations in an economically viable manner. Effective January 14, 2019, the fund no longer accepted orders from shareholders to purchase shares of the fund. On or about April 12, 2019, the fund will distribute pro rata all of its assets in cash to its shareholders, and all outstanding shares will be redeemed and cancelled.
Note 2 — Significant accounting policies
The financial statements have been prepared in conformity with accounting principles generally accepted in the United States of America (US GAAP), which require management to make certain estimates and assumptions as of the date of the financial statements. Actual results could differ from those estimates and those differences could be significant. The fund qualifies as an investment company under Topic 946 of Accounting Standards Codification of US GAAP.
Events or transactions occurring after the end of the fiscal period through the date that the financial statements were issued have been evaluated in the preparation of the financial statements. The following summarizes the significant accounting policies of the fund:
Security valuation.Investments are stated at value as of the scheduled close of regular trading on the New York Stock Exchange (NYSE), normally at 4:00 p.m., Eastern Time. In case of emergency or other disruption resulting in the NYSE not opening for trading or the NYSE closing at a time other than the regularly scheduled close, the net asset value (NAV) may be determined as of the regularly scheduled close of the NYSE pursuant to the fund's Valuation Policies and Procedures.
In order to value the securities, the fund uses the following valuation techniques: Equity securities held by the fund are typically valued at the last sale price or official closing price on the exchange or principal market where the security trades. In the event there were no sales during the day or closing prices are not available, the securities are valued using the last available bid price. Investments by the fund in open-end mutual funds, including John Hancock Collateral Trust (JHCT), are valued at their respective NAVs each business day. Foreign securities and currencies are valued in U.S. dollars based on foreign currency exchange rates supplied by an independent pricing vendor.
In certain instances, the Pricing Committee may determine to value equity securities using prices obtained from another exchange or market if trading on the exchange or market on which prices are typically obtained did not open for trading as scheduled, or if trading closed earlier than scheduled, and trading occurred as normal on another exchange or market.
Other portfolio securities and assets, for which reliable market quotations are not readily available, are valued at fair value as determined in good faith by the fund's Pricing Committee following procedures established by the Board of Trustees. The frequency with which these fair valuation procedures are used cannot be predicted and fair value of securities may differ significantly from the value that would have been used had a ready market for such securities existed. Trading in foreign securities may be completed before the scheduled daily close of trading on the NYSE. Significant events at the issuer or
market level may affect the values of securities between the time when the valuation of the securities is generally determined and the close of the NYSE. If a significant event occurs, these securities may be fair valued, as determined in good faith by the fund's Pricing Committee, following procedures established by the Board of Trustees. The fund uses fair value adjustment factors provided by an independent pricing vendor to value certain foreign securities in order to adjust for events that may occur between the close of foreign exchanges or markets and the close of the NYSE.
The fund uses a three-tier hierarchy to prioritize the pricing assumptions, referred to as inputs, used in valuation techniques to measure fair value. Level 1 includes securities valued using quoted prices in active markets for identical securities Level 2 includes securities valued using other significant observable inputs. Observable inputs may include quoted prices for similar securities, interest rates, prepayment speeds and credit risk. Prices for securities valued using these inputs are received from independent pricing vendors and brokers and are based on an evaluation of the inputs described. Level 3 includes securities valued using significant unobservable inputs when market prices are not readily available or reliable, including the fund's own assumptions in determining the fair value of investments. Factors used in determining value may include market or issuer specific events or trends, changes in interest rates and credit quality. The inputs or methodology used for valuing securities are not necessarily an indication of the risks associated with investing in those securities. Changes in valuation techniques and related inputs may result in transfers into or out of an assigned level within the disclosure hierarchy.
The following is a summary of the values by input classification of the fund's investments as of January 31, 2019, by major security category or type:
| Total value at 1-31-19 | Level 1 quoted price | Level 2 significant observable inputs | Level 3 significant unobservable inputs | ||
| Investments in securities: | |||||
| Assets | |||||
| Common stocks | |||||
| Communication services | $11,888,320 | $7,398,316 | $4,490,004 | — | |
| Consumer discretionary | 20,372,548 | 12,600,741 | 7,771,807 | — | |
| Consumer staples | 2,670,929 | 1,375,383 | 1,295,546 | — | |
| Energy | 1,713,910 | 947,782 | 766,128 | — | |
| Financials | 6,978,266 | 5,027,049 | 1,951,217 | — | |
| Health care | 9,898,796 | 9,268,890 | 629,906 | — | |
| Industrials | 6,231,059 | 2,278,139 | 3,952,920 | — | |
| Information technology | 26,217,561 | 23,691,626 | 2,525,935 | — | |
| Materials | 744,910 | 744,910 | — | — | |
| Real estate | 2,045,228 | 1,256,201 | 789,027 | — | |
| Utilities | 1,617,717 | 1,617,717 | — | — | |
| Purchased options | 94,540 | 94,540 | — | — | |
| Securities lending collateral | 5,577,610 | 5,577,610 | — | — | |
| Short-term investments | 3,100,000 | — | 3,100,000 | — | |
| Total investments in securities | $99,151,394 | $71,878,904 | $27,272,490 | — | |
Repurchase agreements.The fund may enter into repurchase agreements. When the fund enters into a repurchase agreement, it receives collateral that is held in a segregated account by the fund's custodian, or for tri-party repurchase agreements, collateral is held at a third-party custodian bank in a segregated account for the benefit of the fund. The collateral amount is marked-to-market and monitored on a daily basis to ensure that the collateral held is in an amount not less than the principal amount of the repurchase agreement plus any accrued interest. Collateral received by the fund for repurchase agreements is disclosed in the Fund's investments as part of the caption related to the repurchase agreement.
Repurchase agreements are typically governed by the terms and conditions of the Master Repurchase Agreement and/or Global Master Repurchase Agreement (collectively, MRA). Upon an event of default, the non-defaulting party may close out all transactions traded under the MRA and net amounts owed. Absent an event of default, assets and liabilities resulting from repurchase agreements are not offset in the Statement of assets and liabilities. In the event of a default by the counterparty, realization of the collateral proceeds could be delayed, during which time the collateral value may decline or the counterparty may have insufficient assets to pay back claims resulting from close-out of the transactions.
Security transactions and related investment income. Investment security transactions are accounted for on a trade date plus one basis for daily NAV calculations. However, for financial reporting purposes, investment transactions are reported on trade date. Interest income is accrued as earned. Dividend income is recorded on the ex-date, except for dividends of foreign securities where the dividend may not be known until after the ex-date. In those cases, dividend income, net of withholding taxes, is recorded when the fund becomes aware of the dividends. Non-cash dividends, if any, are recorded at the fair market value of the securities received. Gains and losses on securities sold are determined on the basis of identified cost and may include proceeds from litigation.
Securities lending. The fund may lend its securities to earn additional income. The fund receives cash collateral from the borrower in an amount not less than the market value of the loaned securities. The fund will invest its collateral in JHCT, an affiliate of the fund, which has a floating NAV and is registered with the Securities and Exchange Commission as an investment company. JHCT invests in short-term money market investments. The fund will receive the benefit of any gains and bear any losses generated by JHCT with respect to the cash collateral.
The fund has the right to recall loaned securities on demand. If a borrower fails to return loaned securities when due, then the lending agent is responsible and indemnifies the fund for the lent securities. The lending agent uses the collateral received from the borrower to purchase replacement securities of the same issue, type, class and series of the loaned securities. If the value of the collateral is less than the purchase cost of replacement securities, the lending agent is responsible for satisfying the shortfall but only to the extent that the shortfall is not due to any decrease in the value of JHCT.
Although the risk of the loss of the securities lent is mitigated by receiving collateral from the borrower and through lending agent indemnification, the fund could experience a delay in recovering securities or could experience a lower than expected return if the borrower fails to return the securities on a timely basis. The fund receives compensation for lending its securities by retaining a portion of the return on the investment of the collateral and compensation from fees earned from borrowers of the securities. Securities lending income received by the fund is net of fees retained by the securities lending agent. Net income received from JHCT is a component of securities lending income as recorded on the Statement of operations.
Obligations to repay collateral received by the fund are shown on the Statement of assets and liabilities as Payable upon return of securities loaned and are secured by the loaned securities. As of January 31, 2019, the fund loaned securities valued at $5,488,099 and received $5,644,357 of cash collateral.
Foreign investing. Assets, including investments, and liabilities denominated in foreign currencies are translated into U.S. dollar values each day at the prevailing exchange rate. Purchases and sales of securities, income and expenses are translated into U.S. dollars at the prevailing exchange rate on the date of the transaction. The effect of changes in foreign currency exchange rates on the value of securities is reflected as a component of the realized and unrealized gains (losses) on investments. Foreign investments are subject to a decline in the value of a foreign currency versus the U.S. dollar, which reduces the dollar value of securities denominated in that currency.
Funds that invest internationally generally carry more risk than funds that invest strictly in U.S. securities. These risks are heightened for investments in emerging markets. Risks can result from differences in economic and political conditions, regulations, market practices (including higher transaction costs), accounting standards and other factors.
Foreign taxes. The fund may be subject to withholding tax on income, capital gains or repatriation taxes imposed by certain countries, a portion of which may be recoverable. Foreign taxes are accrued based upon the fund's understanding of the tax rules and rates that exist in the foreign markets in which it invests. Taxes are accrued based on gains realized by the fund as a
result of certain foreign security sales. In certain circumstances, estimated taxes are accrued based on unrealized appreciation of such securities. Investment income is recorded net of foreign withholding taxes.
Line of credit.The fund may have the ability to borrow from banks for temporary or emergency purposes, including meeting redemption requests that otherwise might require the untimely sale of securities. Pursuant to the fund's custodian agreement, the custodian may loan money to the fund to make properly authorized payments. The fund is obligated to repay the custodian for any overdraft, including any related costs or expenses. The custodian may have a lien, security interest or security entitlement in any fund property that is not otherwise segregated or pledged, to the extent of any overdraft, and to the maximum extent permitted by law.
The fund and other affiliated funds have entered into a syndicated line of credit agreement with Citibank, N.A. as the administrative agent that enables them to participate in a $750 million unsecured committed line of credit. Excluding commitments designated for a certain fund and subject to the needs of all other affiliated funds, the fund can borrow up to an aggregate commitment amount of $500 million, subject to asset coverage and other limitations as specified in the agreement. A commitment fee payable at the end of each calendar quarter, based on the average daily unused portion of the line of credit, is charged to each participating fund based on a combination of fixed and asset based allocations and is reflected in Other expenses on the Statement of operations. For the six months ended January 31, 2019, the fund had no borrowings under the line of credit. Commitment fees for the six months ended January 31, 2019 were $1,346.
Expenses. Within the John Hancock group of funds complex, expenses that are directly attributable to an individual fund are allocated to such fund. Expenses that are not readily attributable to a specific fund are allocated among all funds in an equitable manner, taking into consideration, among other things, the nature and type of expense and the fund's relative net assets. Expense estimates are accrued in the period to which they relate and adjustments are made when actual amounts are known.
Class allocations. Income, common expenses and realized and unrealized gains (losses) are determined at the fund level and allocated daily to each class of shares based on the net assets of the class. Class-specific expenses, such as distribution and service fees, if any, and transfer agent fees, for all classes, are charged daily at the class level based on the net assets of each class and the specific expense rates applicable to each class.
Federal income taxes. The fund intends to continue to qualify as a regulated investment company by complying with the applicable provisions of the Internal Revenue Code and will not be subject to federal income tax on taxable income that is distributed to shareholders. Therefore, no federal income tax provision is required.
As of July 31, 2018, the fund had no uncertain tax positions that would require financial statement recognition, derecognition or disclosure. The fund's federal tax returns are subject to examination by the Internal Revenue Service for a period of three years.
Distribution of income and gains. Distributions to shareholders from net investment income and net realized gains, if any, are recorded on the ex-date. The fund typically declares and pays dividends and capital gain distributions, if any, annually.
Distributions paid by the fund with respect to each class of shares are calculated in the same manner, at the same time and in the same amount, except for the effect of class level expenses that may be applied differently to each class.
Such distributions, on a tax basis, are determined in conformity with income tax regulations, which may differ from US GAAP. Distributions in excess of tax basis earnings and profits, if any, are reported in the fund's financial statements as a return of capital. The final determination of tax characteristics of the fund's distribution will occur at the end of the year and will subsequently be reported to shareholders.
Capital accounts within the financial statements are adjusted for permanent book-tax differences. These adjustments have no impact on net assets or the results of operations. Temporary book-tax differences, if any, will reverse in a subsequent period. Book-tax differences are primarily attributable to investments in passive foreign investment companies, characterization of distribution and wash sale loss deferrals.
Note 3 — Derivative Instruments
The fund may invest in derivatives in order to meet its investment objective. Derivatives include a variety of different instruments that may be traded in the over-the-counter (OTC) market, on a regulated exchange or through a clearing facility. The risks in using derivatives vary depending upon the structure of the instruments, including the use of leverage, optionality, the liquidity or lack of liquidity of the contract, the creditworthiness of the counterparty or clearing organization and the volatility of the position. Some derivatives involve risks that are potentially greater than the risks associated with investing directly in the referenced securities or other referenced underlying instrument. Specifically, the fund is exposed to the risk that the counterparty to an OTC derivatives contract will be unable or unwilling to make timely settlement payments or otherwise honor its obligations. OTC derivatives transactions typically can only be closed out with the other party to the transaction.
Futures, certain options and centrally-cleared swaps are traded or cleared on an exchange or central clearinghouse. Exchange-traded or centrally-cleared transactions generally present less counterparty risk to a fund than OTC transactions. The exchange or clearinghouse stands between the fund and the broker to the contract and therefore, credit risk is generally limited to the failure of the exchange or clearinghouse and the clearing member. Securities pledged by the fund for exchange-traded and centrally-cleared transactions, if any, are identified in the Fund of investments.
Options. There are two types of options, put options and call options. Options are traded either OTC or on an exchange. A call option gives the purchaser of the option the right to buy (and the seller the obligation to sell) the underlying instrument at the exercise price. A put option gives the purchaser of the option the right to sell (and the writer the obligation to buy) the underlying instrument at the exercise price. Writing puts and buying calls may increase the fund's exposure to changes in the value of the underlying instrument. Buying puts and writing calls may decrease the fund's exposure to such changes. Risks related to the use of options include the loss of premiums, possible illiquidity of the options markets, trading restrictions imposed by an exchange and movements in underlying security values, and for written options, potential losses in excess of the amounts recognized on the Statement of assets and liabilities. In addition, OTC options are subject to the risks of all OTC derivatives contracts.
When the fund purchases an option, the premium paid by the fund is included in the portfolio of investments and subsequently "marked-to-market" to reflect current market value. If the purchased option expires, the fund realizes a loss equal to the cost of the option. If the fund enters into a closing sale transaction, the fund realizes a gain or loss, depending on whether proceeds from the closing sale are greater or less than the original cost.
During the six months ended January 31, 2019, the fund used purchased options contracts to manage against anticipated changes in securities markets.The fund held purchased options contracts with market values ranging up to $95,000 as measured at each quarter end.
Fair value of derivative instruments by risk category
The table below summarizes the fair value of derivatives held by the fund at January 31, 2019 by risk category:
| Risk | Statement of assets and liabilities location | Financial instruments location | Assets derivatives fair value | Liabilities derivatives fair value | |
| Foreign currency | Unaffiliated investment, at value* | Purchased Options | $94,540 | — | |
| * Purchased options are included in the Portfolio of investments | |||||
Effect of derivative instruments on the Statement of operations
The table below summarizes the net realized gain (loss) included in the net increase (decrease) in net assets from operations, classified by derivative instrument and risk category, for the six months ended January 31, 2019:
| Statement of operations location - net realized gain (loss) on: | |
| Risk | Unaffiliated investments and foreign currency transactions1 |
| Equity | $18,504 |
| 1 Change in unrealized appreciation/depreciation associated with purchased options is included in this caption on the Statement of operations. | |
The table below summarizes the net change in unrealized appreciation (depreciation) included in the net increase (decrease) in net assets from operations, classified by derivative instrument and risk category, for the six months ended January 31, 2019:
| Statement of operations location - change in net unrealized appreciation (depreciation) of: | |||||
| Risk | Unaffiliated investments and foreign currency transactions1 | ||||
| Equity | ($114,736 | ) | |||
| 1 Change in unrealized appreciation/depreciation associated with purchased options is included in this caption on the Statement of operations. | |||||
Note 4 — Guarantees and indemnifications
Under the Trust's organizational documents, its Officers and Trustees are indemnified against certain liabilities arising out of the performance of their duties to the Trust, including the fund. Additionally, in the normal course of business, the fund enters into contracts with service providers that contain general indemnification clauses. The fund's maximum exposure under these arrangements is unknown, as this would involve future claims that may be made against the fund that have not yet occurred. The risk of material loss from such claims is considered remote.
Note 5 — Fees and transactions with affiliates
John Hancock Advisers, LLC (the Advisor) serves as investment advisor for the fund. John Hancock Funds, LLC (the Distributor), an affiliate of the Advisor, serves as principal underwriter of the fund. The Advisor and the Distributor are indirect, wholly owned subsidiaries of MFC.
Management fee. The fund has an investment management agreement with the Advisor under which the fund pays a daily management fee to the Advisor equivalent on an annual basis to the sum of 0.800% of the fund's average daily net assets. The Advisor has a subadvisory agreement with Wellington Management Company LLP. The fund is not responsible for payment of the subadvisory fees.
The Advisor has contractually agreed to waive a portion of its management fee and/or reimburse expenses for certain funds of the John Hancock group of funds complex, including the fund (the participating portfolios). This waiver is based upon aggregate net assets of all the participating portfolios. The amount of the reimbursement is calculated daily and allocated among all the participating portfolios in proportion to the daily net assets of each fund. During the six months ended January 31, 2019, this waiver amounted to 0.01% of the fund's average net assets (on an annualized basis). This agreement expires on June 30, 2020, unless renewed by mutual agreement of the Fund and the Advisor based upon a determination that this is appropriate under the circumstances at that time.
The expense reductions described above amounted to the following for the six months ended January 31, 2019:
| Class | Expense reduction | Class | Expense reduction | |
| Class A | $1,125 | Class R6 | $3 | |
| Class C | 73 | Class NAV | 15,739 | |
| Class I | 387 | Total | $17,327 |
Expenses waived or reimbursed in the current fiscal period are not subject to recapture in future fiscal periods.
The investment management fees, including the impact of the waivers and reimbursements as described above, incurred for the six months ended January 31, 2019 were equivalent to a net annual effective rate of 0.79% of the fund's average daily net assets.
Accounting and legal services. Pursuant to a service agreement, the fund reimburses the Advisor for all expenses associated with providing the administrative, financial, legal, accounting and recordkeeping services to the fund, including the preparation of all tax returns, periodic reports to shareholders and regulatory reports, among other services. These expenses are allocated to each share class based on its relative net assets at the time the expense was incurred. These accounting and legal services fees incurred for the six months ended January 31, 2019 amounted to an annual rate of 0.02% of the fund's average daily net assets.
Distribution and service plans. The fund has a distribution agreement with the Distributor. The fund has adopted distribution and service plans with respect to Class A and Class C pursuant to Rule 12b-1 under the 1940 Act, to pay the Distributor for services provided as the distributor of shares of the fund. The fund may pay up to the following contractual rates of distribution and service fees under these arrangements, expressed as an annual percentage of average daily net assets for each class of the fund's shares:
| Class | Rule 12b-1 fee |
| Class A | 0.30% |
| Class C | 1.00% |
Sales charges. Class A shares are assessed up-front sales charges, which resulted in payments to the Distributor amounting to $12,035 for the six months ended January 31, 2019. Of this amount, $2,051 was retained and used for printing prospectuses, advertising, sales literature and other purposes, $7,696 was paid as sales commissions to broker-dealers and $2,288 was paid as sales commissions to sales personnel of Signator Investors, Inc., which had been a broker-dealer affiliate of the Advisor through December 31, 2018.
Class A and Class C shares may be subject to contingent deferred sales charges (CDSCs). Certain Class A shares that are acquired through purchases of $1 million or more and are redeemed within one year of purchase are subject to a 1.00% sales charge. Class C shares that are redeemed within one year of purchase are subject to a 1.00% CDSC. CDSCs are applied to the lesser of the current market value at the time of redemption or the original purchase cost of the shares being redeemed. Proceeds from CDSCs are used to compensate the Distributor for providing distribution-related services in connection with the sale of these shares. During the six months ended January 31, 2019, CDSCs received by the Distributor amounted to $127 Class C shares, and there were no CDSCs for Class A shares.
Transfer agent fees. The John Hancock Group of Funds has a complex-wide transfer agent agreement with John Hancock Signature Services, Inc. (Signature Services), an affiliate of the Advisor. The transfer agent fees paid to Signature Services are determined based on the cost to Signature Services (Signature Services Cost) of providing recordkeeping services. It also includes out-of-pocket expenses, including payments made to third-parties for recordkeeping services provided to their clients who invest in one or more John Hancock funds. In addition, Signature Services Cost may be reduced by certain fees that Signature Services receives in connection with retirement and small accounts. Signature Services Cost is calculated monthly and allocated, as applicable, to five categories of share classes: Retail Share and Institutional Share Classes of Non-Municipal Bond Funds, Class R6 Shares, Retirement Share Classes and Municipal Bond Share Classes. Within each of these
categories, the applicable costs are allocated to the affected John Hancock affiliated funds and/or classes, based on the relative average daily net assets.
Class level expenses. Class level expenses for the six months ended January 31, 2019 were:
| Class | Distribution and service fees | Transfer agent fees |
| Class A | $42,753 | $15,553 |
| Class C | 9,191 | 1,003 |
| Class I | — | 6,419 |
| Class R6 | — | 5 |
| Total | $51,944 | $22,980 |
Trustee expenses.The fund compensates each Trustee who is not an employee of the Advisor or its affiliates. The costs of paying Trustee compensation and expenses are allocated to the fund based on its net assets relative to other funds within the John Hancock group of funds complex.
Note 6 — Fund share transactions
Transactions in fund shares for the six months ended January 31, 2019 and for the year ended July 31, 2018 were as follows:
| Six months ended 1-31-19 | Year ended 7-31-18 | |||||||||||||||||||||||||
| Shares | Amount | Shares | Amount | |||||||||||||||||||||||
| Class A shares | ||||||||||||||||||||||||||
| Sold | 224,755 | $2,558,906 | 417,603 | $5,259,786 | ||||||||||||||||||||||
| Distributions reinvested | 1,037,158 | 7,747,569 | 410,150 | 4,741,334 | ||||||||||||||||||||||
| Repurchased | (1,084,458 | ) | (9,627,072 | ) | (670,841 | ) | (8,497,533 | ) | ||||||||||||||||||
| Net increase | 177,455 | $679,403 | 156,912 | $1,503,587 | ||||||||||||||||||||||
| Class C shares | ||||||||||||||||||||||||||
| Sold | 18,104 | $176,389 | 32,108 | $407,240 | ||||||||||||||||||||||
| Distributions reinvested | 54,601 | 413,331 | 22,791 | 267,567 | ||||||||||||||||||||||
| Repurchased | (42,317 | ) | (414,229 | ) | (56,488 | ) | (725,471 | ) | ||||||||||||||||||
| Net increase (decrease) | 30,388 | $175,491 | (1,589 | ) | $(50,664 | ) | ||||||||||||||||||||
| Class I shares | ||||||||||||||||||||||||||
| Sold | 94,302 | $1,234,843 | 283,546 | $3,768,629 | ||||||||||||||||||||||
| Distributions reinvested | 311,287 | 2,468,508 | 122,533 | 1,475,300 | ||||||||||||||||||||||
| Repurchased | (647,596 | ) | (6,132,426 | ) | (367,702 | ) | (4,852,265 | ) | ||||||||||||||||||
| Net increase (decrease) | (242,007 | ) | $(2,429,075 | ) | 38,377 | $391,664 | ||||||||||||||||||||
| Class R6 shares | ||||||||||||||||||||||||||
| Sold | 8 | $100 | 2,797 | $36,008 | ||||||||||||||||||||||
| Distributions reinvested | 16 | 133 | — | — | ||||||||||||||||||||||
| Repurchased | (2,766 | ) | (34,964 | ) | — | — | ||||||||||||||||||||
| Net increase (decrease) | (2,742 | ) | $(34,731 | ) | 2,797 | $36,008 | ||||||||||||||||||||
| Class NAV shares | ||||||||||||||||||||||||||
| Sold | 946,343 | $11,932,512 | 867,143 | $11,356,310 | ||||||||||||||||||||||
| Distributions reinvested | 12,023,840 | 97,994,296 | 6,686,696 | 82,112,633 | ||||||||||||||||||||||
| Repurchased | (39,607,063 | ) | (363,687,435 | ) | (12,968,575 | ) | (172,343,226 | ) | ||||||||||||||||||
| Net decrease | (26,636,880 | ) | $(253,760,627 | ) | (5,414,736 | ) | $(78,874,283 | ) | ||||||||||||||||||
| Total net decrease | (26,673,786 | ) | $(255,369,539 | ) | (5,218,239 | ) | $(76,993,688 | ) | ||||||||||||||||||
Affiliates of the fund owned 100% and 100% shares of Class R6 and Class NAV, respectively, on January 31, 2019. Such concentration of shareholders' capital could have a material effect on the fund if such shareholders redeem from the fund.
Note 7 — Purchase and sale of securities
Purchases and sales of securities, other than short-term investments, amounted to $1,059,462,380 and $1,397,262,753, respectively, for the six months ended January 31, 2019.
Note 8 — Industry or sector risk
The fund generally invests a large percentage of its assets in one or more particular industries or sectors of the economy. If a large percentage of the fund's assets are economically tied to a single or small number of industries or sectors of the economy, the fund will be less diversified than a more broadly diversified fund, and it may cause the fund to underperform if that industry or sector underperforms. In addition, focusing on a particular industry or sector may make the fund's NAV more volatile. Further, a fund that invests in particular industries or sectors is particularly susceptible to the impact of market, economic, regulatory and other factors affecting those industries or sectors. Financial services companies can be hurt by economic declines, changes in interest rates regulatory and market impacts.
Note 9 — Investment by affiliated funds
Certain investors in the fund are affiliated funds that are managed by the Advisor and its affiliates. The affiliated funds do not invest in the fund for the purpose of exercising management or control; however, this investment may represent a significant portion of the fund's net assets. At January 31, 2019, funds within the John Hancock group of funds complex held 65.2% of the fund's net assets. The following funds had an affiliate ownership of 5% or more of the fund's net assets:
| Fund | Affiliated concentration |
| John Hancock Funds II Multimanager Lifestyle Growth Portfolio | 34.0% |
| John Hancock Funds II Multimanager Lifestyle Balanced Portfolio | 17.3% |
| John Hancock Funds II Multimanager Lifestyle Aggressive Portfolio | 13.9% |
Note 10 — Investment in affiliated underlying funds
The fund may invest in affiliated underlying funds that are managed by the Advisor and its affiliates. Information regarding the fund's purchases and sales of the affiliated underlying funds as well as income and capital gains earned, if any, during the period is as follows:
| Dividends and distributions | ||||||||||||||||||||||||||||||||||||||
| Fund | Beginning share amount | Shares purchased | Shares sold | Ending share amount | Income distributions received | Capital gain distributions received | Realized gain (loss) | Change in unrealized appreciation (depreciation) | Ending value | |||||||||||||||||||||||||||||
| John Hancock Collateral Trust* | 2,927,627 | 17,673,510 | (20,043,750 | ) | 557,387 | — | — | $4,179 | ($4,719 | ) | $5,577,610 | |||||||||||||||||||||||||||
| *Refer to the Securities lending note within Note 2 for details regarding this investment. | ||||||||||||||||||||||||||||||||||||||
Trustees Hassell H. McClellan,Chairperson Officers Andrew G. Arnott Francis V. Knox, Jr. Charles A. Rizzo Salvatore Schiavone Christopher (Kit) Sechler** | Investment advisor John Hancock Advisers, LLC Subadvisor Wellington Management Company LLP Portfolio Manager David Lundgren, CMT, CFA Principal distributor John Hancock Funds, LLC Custodian State Street Bank and Trust Company Transfer agent John Hancock Signature Services, Inc. Legal counsel K&L Gates LLP |
* Member of the Audit Committee
† Non-Independent Trustee
#Effective 6-19-18
**Effective 9-13-18
The fund's proxy voting policies and procedures, as well as the fund proxy voting record for the most recent twelve-month period ended June 30, are available free of charge on the Securities and Exchange Commission (SEC) website at sec.gov or on our website.
The fund's complete list of portfolio holdings, for the first and third fiscal quarters, is filed with the SEC on Form N-Q. Effective April 30, 2019, all of the fund's holdings as of the end of the third month of every fiscal quarter will be filed with the SEC on Form N-PORT within 60 days of the end of the fiscal quarter. The fund's Form N-Q is available on our website and the SEC's website, sec.gov.
We make this information on your fund, as well asmonthly portfolio holdings, and other fund details available on our website at jhinvestments.com or by calling 800-225-5291.
| You can also contact us: | |||
| 800-225-5291 jhinvestments.com | Regular mail: John Hancock Signature Services, Inc. | Express mail: John Hancock Signature Services, Inc. | |
John Hancock family of funds
DOMESTIC EQUITY FUNDS Blue Chip Growth Classic Value Disciplined Value Disciplined Value Mid Cap Equity Income Financial Industries Fundamental All Cap Core Fundamental Large Cap Core Fundamental Large Cap Value New Opportunities Regional Bank Small Cap Core Small Cap Growth Small Cap Value U.S. Global Leaders Growth U.S. Growth U.S. Quality Growth Value Equity GLOBAL AND INTERNATIONAL EQUITY FUNDS Disciplined Value International Emerging Markets Emerging Markets Equity Fundamental Global Franchise Global Equity Global Shareholder Yield Global Thematic Opportunities Greater China Opportunities International Growth International Small Company | INCOME FUNDS Bond California Tax-Free Income Emerging Markets Debt Floating Rate Income Government Income High Yield High Yield Municipal Bond Income Investment Grade Bond Money Market Short Duration Credit Opportunities Spectrum Income Strategic Income Opportunities Tax-Free Bond ALTERNATIVE AND SPECIALTY FUNDS Absolute Return Currency Alternative Asset Allocation Disciplined Alternative Yield Global Absolute Return Strategies Global Conservative Absolute Return Global Focused Strategies Infrastructure Seaport Long/Short Technical Opportunities |
A fund's investment objectives, risks, charges, and expenses should be considered carefully before investing. The prospectus contains this and other important information about the fund. To obtain a prospectus, contact your financial professional, call John Hancock Investments at 800-225-5291, or visit our website at jhinvestments.com. Please read the prospectus carefully before investing or sending money.
ASSET ALLOCATION Balanced Income Allocation Multi-Index Lifetime Portfolios Multi-Index Preservation Portfolios Multimanager Lifestyle Portfolios Multimanager Lifetime Portfolios Retirement Income 2040 EXCHANGE-TRADED FUNDS John Hancock Multifactor Consumer Discretionary ETF John Hancock Multifactor Consumer Staples ETF John Hancock Multifactor Developed International ETF John Hancock Multifactor Emerging Markets ETF John Hancock Multifactor Energy ETF John Hancock Multifactor Financials ETF John Hancock Multifactor Healthcare ETF John Hancock Multifactor Industrials ETF John Hancock Multifactor Large Cap ETF John Hancock Multifactor Materials ETF John Hancock Multifactor Media and John Hancock Multifactor Mid Cap ETF John Hancock Multifactor Small Cap ETF John Hancock Multifactor Technology ETF John Hancock Multifactor Utilities ETF | ENVIRONMENTAL, SOCIAL, AND ESG All Cap Core ESG Core Bond ESG International Equity ESG Large Cap Core CLOSED-END FUNDS Financial Opportunities Hedged Equity & Income Income Securities Trust Investors Trust Preferred Income Preferred Income II Preferred Income III Premium Dividend Tax-Advantaged Dividend Income Tax-Advantaged Global Shareholder Yield |
John Hancock Multifactor ETF shares are bought and sold at market price (not NAV), and are not individually redeemed
from the fund. Brokerage commissions will reduce returns.
John Hancock ETFs are distributed by Foreside Fund Services, LLC, and are subadvised by Dimensional Fund Advisors LP.
Foreside is not affiliated with John Hancock Funds, LLC or Dimensional Fund Advisors LP.
Dimensional Fund Advisors LP receives compensation from John Hancock in connection with licensing rights to the
John Hancock Dimensional indexes. Dimensional Fund Advisors LP does not sponsor, endorse, or sell, and makes no
representation as to the advisability of investing in, John Hancock Multifactor ETFs.
John Hancock Investments
A trusted brand
John Hancock Investments is a premier asset manager representing one of
America's most trusted brands, with a heritage of financial stewardship dating
back to 1862. Helping our shareholders pursue their financial goals is at the
core of everything we do. It's why we support the role of professional financial
advice and operate with the highest standards of conduct and integrity.
A better way to invest
We serve investors globally through a unique multimanager approach:
We search the world to find proven portfolio teams with specialized
expertise for every strategy we offer, then we apply robust investment
oversight to ensure they continue to meet our uncompromising standards
and serve the best interests of our shareholders.
Results for investors
Our unique approach to asset management enables us to provide a diverse set
of investments backed by some of the world's best managers, along with strong
risk-adjusted returns across asset classes.

 | John Hancock Funds, LLC n Member FINRA, SIPC 200 Berkeley Street n Boston, MA 02116-5010 800-225-5291 n jhinvestments.com | |
| This report is for the information of the shareholders of John Hancock Technical Opportunities Fund. It is not authorized for distribution to prospective investors unless preceded or accompanied by a prospectus. | ||
| MF733329 | 347SA 1/19 3/19 | |
John Hancock
Short Duration Credit Opportunities Fund
Semiannual report 1/31/19
Beginning on January 1, 2021, as permitted by regulations adopted by the Securities and Exchange Commission, paper copies of the Fund's shareholder reports like this one will no longer be sent by mail, unless you specifically request paper copies of the reports from the Fund or from your financial intermediary. Instead, the reports will be made available on a website, and you will be notified by mail each time a report is posted and provided with a website link to access the report.
If you already elected to receive shareholder reports electronically, you will not be affected by this change, and you do not need to take any action. You may elect to receive shareholder reports and other communications electronically by calling John Hancock Investments at 800-225-5291 (Class A and Class C shares) or 888-972-8696 (Class I, Class R2, Class R4, Class R6, and Class NAV shares) or by contacting your financial intermediary.
You may elect to receive all reports in paper, free of charge, at any time. You can inform John Hancock Investments or your financial intermediary that you wish to continue receiving paper copies of your shareholder reports by following the instructions listed above. Your election to receive reports in paper will apply to all funds held with John Hancock Investments or your financial intermediary.

A message to shareholders
Dear shareholder,
It's been a challenging period for fixed-income investors, as short-term yields rose higher. A solid and stable economy led the U.S. Federal Reserve to continue normalizing monetary policy; however, concerns about the strength of the broader global economy and the durability of the now decade-old bull market convinced investors to dial back risk exposures. Against this backdrop, both interest-rate-sensitive and credit-sensitive securities posted declines.
Diversification in a fixed-income portfolio remains a time-tested strategy, but periods such as the last half of 2018—when a number of typically uncorrelated markets moved in the same direction—do sometimes occur. They also tend to be relatively short-lived, and eventually fundamentals—including credit risk, the direction of interest rates, and foreign exchange rates—reassert themselves to drive performance.
Your best resource in unpredictable and volatile markets is your financial advisor, who can help position your portfolio so that it's sufficiently diversified to meet your long-term objectives and to withstand the inevitable turbulence along the way.
On behalf of everyone at John Hancock Investments, I'd like to take this opportunity to welcome new shareholders and to thank existing shareholders for the continued trust you've placed in us.
Sincerely,
Andrew G. Arnott
President and CEO,
John Hancock Investments
Head of Wealth and Asset Management,
United States and Europe
This commentary reflects the CEO's views, which are subject to change at any time. All investments entail risks, including the possible loss of principal. Diversification does not guarantee a profit or eliminate the risk of a loss. For more up-to-date information, you can visit our website at jhinvestments.com.
John Hancock
Short Duration Credit Opportunities Fund
INVESTMENT OBJECTIVE
The fund seeks to maximize total return, which consists of income on its investments and capital appreciation.
AVERAGE ANNUAL TOTAL RETURNS AS OF 1/31/19 (%)
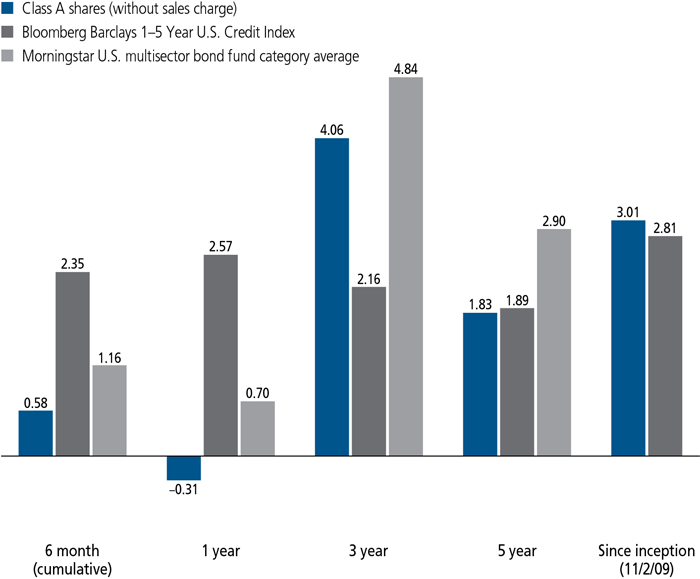
The Bloomberg Barclays 1 - 5 Year U.S. Credit Index includes investment-grade corporate and international U.S. dollar-denominated bonds with maturities of 1 to 5 years.
It is not possible to invest directly in an index. Index figures do not reflect expenses or sales charges, which would result in lower returns.
Figures from Morningstar, Inc. include reinvested distributions and do not take into account sales charges. Actual load-adjusted performance is lower. Since-inception returns for the Morningstar fund category average are not available.
The past performance shown here reflects reinvested distributions and the beneficial effect of any expense reductions, and does not guarantee future results. Returns for periods shorter than one year are cumulative. Performance of the other share classes will vary based on the difference in the fees and expenses of those classes. Shares will fluctuate in value and, when redeemed, may be worth more or less than their original cost. Current month-end performance may be lower or higher than the performance cited, and can be found at jhinvestments.com or by calling 800-225-5291. For further information on the fund's objectives, risks, and strategy, see the fund's prospectus.

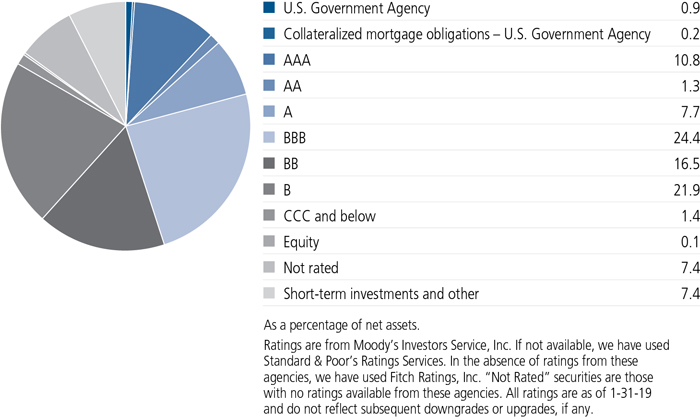
COUNTRY COMPOSITION AS OF 1/31/19 (%)
| United States | 70.7 |
| United Kingdom | 2.4 |
| Mexico | 1.6 |
| Indonesia | 1.4 |
| Netherlands | 1.2 |
| Ireland | 1.2 |
| South Africa | 1.2 |
| Russia | 1.2 |
| Argentina | 1.1 |
| Brazil | 1.1 |
| Other countries | 16.9 |
| TOTAL | 100.0 |
| As a percentage of net assets. |
TOTAL RETURNS FOR THE PERIOD ENDED JANUARY 31, 2019
| Average annual total returns (%) with maximum sales charge | Cumulative total returns (%) with maximum sales charge | SEC 30-day yield (%) subsidized | SEC 30-day yield (%) unsubsidized1 | ||||||||
| 1-year | 5-year | Since inception2 | 6-month | 5-year | Since inception2 | as of 1-31-19 | as of 1-31-19 | ||||
| Class A | -2.80 | 1.31 | 2.73 | -1.90 | 6.74 | 28.26 | 4.07 | 4.07 | |||
| Class C3 | -1.96 | 1.17 | 2.65 | -0.76 | 5.99 | 27.39 | 3.50 | 3.49 | |||
| Class I4 | -0.02 | 2.16 | 3.32 | 0.83 | 11.27 | 35.26 | 4.46 | 4.45 | |||
| Class R23,4 | -0.15 | 1.97 | 3.09 | 0.76 | 10.23 | 32.50 | 4.34 | 4.33 | |||
| Class R43,4 | -0.05 | 2.05 | 3.13 | 0.81 | 10.66 | 33.01 | 4.44 | 4.33 | |||
| Class R63,4 | 0.09 | 2.17 | 3.20 | 0.89 | 11.35 | 33.83 | 4.58 | 4.57 | |||
| Class NAV4 | 0.11 | 2.31 | 3.49 | 0.90 | 12.10 | 37.39 | 4.59 | 4.59 | |||
| Index† | 2.57 | 1.89 | 2.81 | 2.35 | 9.82 | 29.18 | — | — | |||
Performance figures assume all distributions are reinvested. Figures reflect maximum sales charges on Class A shares of 2.5% and the applicable contingent deferred sales charge (CDSC) on Class C shares. The returns for Class A shares have been adjusted to reflect the reduction in the maximum sales charge from 4.5% to 2.5%, effective 2-3-14. Class C shares sold within one year of purchase are subject to a 1% CDSC. Sales charges are not applicable to Class I, Class R2, Class R4, Class R6, and Class NAV shares.
The expense ratios of the fund, both net (including any fee waivers and/or expense limitations) and gross (excluding any fee waivers and/or expense limitations), are set forth according to the most recent publicly available prospectuses for the fund and may differ from those disclosed in the Financial highlights tables in this report. Net expenses reflect contractual expense limitations in effect until November 30, 2019 and are subject to change. Had the contractual fee waivers and expense limitations not been in place, gross expenses would apply. The expense ratios are as follows:
| Class A | Class C | Class I | Class R2 | Class R4 | Class R6 | Class NAV | |
| Gross (%) | 1.19 | 1.89 | 0.89 | 1.29 | 1.14 | 0.79 | 0.78 |
| Net (%) | 1.18 | 1.88 | 0.88 | 1.28 | 1.03 | 0.78 | 0.77 |
Please refer to the most recent prospectus and annual or semiannual report for more information on expenses and any expense limitation arrangements for each class.
The returns reflect past results and should not be considered indicative of future performance. The return and principal value of an investment will fluctuate so that shares, when redeemed, may be worth more or less than their original cost. Due to market volatility and other factors, the fund's current performance may be higher or lower than the performance shown. For current to the most recent month-end performance data, please call 800-225-5291 or visit the fund's website at jhinvestments.com.
The performance table above and the chart on the next page do not reflect the deduction of taxes that a shareholder would pay on fund distributions or the redemption of fund shares. The fund's performance results reflect any applicable fee waivers or expense reductions, without which the expenses would increase and results would have been less favorable.
| † | Index is the Bloomberg Barclays 1-5 Year U.S. Credit Index. |
See the following page for footnotes.
This chart and table show what happened to a hypothetical $10,000 investment in John Hancock Short Duration Credit Opportunities Fund for the share classes and periods indicated, assuming all distributions were reinvested. For comparison, we've shown the same investment in the Bloomberg Barclays 1-5 Year U.S. Credit Index.
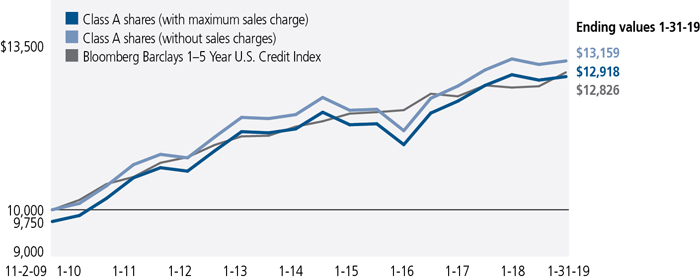
| Start date | With maximum sales charge ($) | Without sales charge ($) | Index ($) | |
| Class C3,5 | 11-2-09 | 12,739 | 12,739 | 12,918 |
| Class I4 | 11-2-09 | 13,526 | 13,526 | 12,918 |
| Class R23,4 | 11-2-09 | 13,250 | 13,250 | 12,918 |
| Class R43,4 | 11-2-09 | 13,301 | 13,301 | 12,918 |
| Class R63,4 | 11-2-09 | 13,383 | 13,383 | 12,918 |
| Class NAV4 | 11-2-09 | 13,739 | 13,739 | 12,918 |
The values shown in the chart for "Class A with maximum sales charge" have been adjusted to reflect the reduction in the Class A maximum sales charge from 4.5% to 2.5%, which became effective on 2-3-14.
The Bloomberg Barclays 1-5 Year U.S. Credit Index includes investment-grade corporate and international U.S. dollar-denominated bonds with maturities of 1 to 5 years.
It is not possible to invest directly in an index. Index figures do not reflect expenses or sales charges, which would result in lower returns.
Footnotes related to performance pages
| 1 | Unsubsidized yield reflects what the yield would have been without the effects of waivers and reimbursements. |
| 2 | From 11-2-09. |
| 3 | Class C shares were first offered on 6-27-14; Class R2, Class R4, and Class R6 shares were first offered on 3-27-15. Returns prior to these dates are those of Class A shares (first offered on 11-2-09) that have not been adjusted for class-specific expenses; otherwise, returns would vary. |
| 4 | For certain types of investors as described in the fund's prospectuses. |
| 5 | The contingent deferred sales charge is not applicable. |
| Your expenses |

| SEMIANNUAL REPORT | JOHN HANCOCK SHORT DURATION CREDIT OPPORTUNITIES FUND | 7 |
| Account value on 8-1-2018 | Ending value on 1-31-2019 | Expenses paid during period ended 1-31-20191 | Annualized expense ratio | ||
| Class A | Actual expenses/actual returns | $1,000.00 | $1,005.80 | $5.97 | 1.18% |
| Hypothetical example | 1,000.00 | 1,019.30 | 6.01 | 1.18% | |
| Class C | Actual expenses/actual returns | 1,000.00 | 1,002.30 | 9.49 | 1.88% |
| Hypothetical example | 1,000.00 | 1,015.70 | 9.55 | 1.88% | |
| Class I | Actual expenses/actual returns | 1,000.00 | 1,008.30 | 4.56 | 0.90% |
| Hypothetical example | 1,000.00 | 1,020.70 | 4.58 | 0.90% | |
| Class R2 | Actual expenses/actual returns | 1,000.00 | 1,007.60 | 5.21 | 1.03% |
| Hypothetical example | 1,000.00 | 1,020.00 | 5.24 | 1.03% | |
| Class R4 | Actual expenses/actual returns | 1,000.00 | 1,008.10 | 4.71 | 0.93% |
| Hypothetical example | 1,000.00 | 1,020.50 | 4.74 | 0.93% | |
| Class R6 | Actual expenses/actual returns | 1,000.00 | 1,008.90 | 3.95 | 0.78% |
| Hypothetical example | 1,000.00 | 1,021.30 | 3.97 | 0.78% | |
| Class NAV | Actual expenses/actual returns | 1,000.00 | 1,009.00 | 3.90 | 0.77% |
| Hypothetical example | 1,000.00 | 1,021.30 | 3.92 | 0.77% |
| 1 | Expenses are equal to the annualized expense ratio, multiplied by the average account value over the period, multiplied by 184/365 (to reflect the one-half year period). |
| 8 | JOHN HANCOCK SHORT DURATION CREDIT OPPORTUNITIES FUND | SEMIANNUAL REPORT |
| Fund’s investments |
| Rate (%) | Maturity date | Par value^ | Value | ||
| U.S. Government and Agency obligations 0.9% | $7,405,019 | ||||
| (Cost $7,468,696) | |||||
| U.S. Government Agency 0.9% | 7,405,019 | ||||
| Federal Home Loan Mortgage Corp. | |||||
| 30 Yr Pass Thru (12 month LIBOR + 1.650%) (A) | 2.198 | 12-01-42 | 868,093 | 887,836 | |
| 30 Yr Pass Thru (12 month LIBOR + 1.624%) (A) | 2.533 | 04-01-46 | 925,409 | 939,134 | |
| 30 Yr Pass Thru (12 month LIBOR + 1.853%) (A) | 2.798 | 03-01-42 | 112,208 | 117,394 | |
| 30 Yr Pass Thru (12 month LIBOR + 1.612%) (A) | 3.953 | 05-01-43 | 354,260 | 363,723 | |
| 30 Yr Pass Thru (12 month LIBOR + 1.743%) (A) | 4.454 | 01-01-37 | 49,974 | 52,326 | |
| Federal National Mortgage Association | |||||
| 30 Yr Pass Thru (12 month LIBOR + 1.620%) (A) | 2.399 | 11-01-46 | 1,435,052 | 1,427,080 | |
| 30 Yr Pass Thru (12 month LIBOR + 1.582%) (A) | 2.838 | 12-01-44 | 960,417 | 961,126 | |
| 30 Yr Pass Thru (12 month LIBOR + 1.571%) (A) | 3.911 | 04-01-37 | 574,948 | 598,710 | |
| 30 Yr Pass Thru (12 month LIBOR + 1.713%) (A) | 4.247 | 10-01-38 | 156,850 | 162,260 | |
| 30 Yr Pass Thru (12 month LIBOR + 1.661%) (A) | 4.297 | 08-01-35 | 206,885 | 216,213 | |
| 30 Yr Pass Thru (1 Year CMT + 2.221%) (A) | 4.419 | 01-01-37 | 270,735 | 282,920 | |
| 30 Yr Pass Thru (12 month LIBOR + 1.768%) (A) | 4.436 | 04-01-44 | 502,885 | 529,590 | |
| 30 Yr Pass Thru (12 month LIBOR + 1.907%) (A) | 4.782 | 01-01-37 | 33,098 | 34,832 | |
| Government National Mortgage Association | |||||
| 30 Yr Pass Thru (1 Year CMT + 1.500%) (A) | 3.375 | 01-20-41 | 608,942 | 623,753 | |
| 30 Yr Pass Thru | 4.500 | 01-15-40 | 111,550 | 117,614 | |
| 30 Yr Pass Thru | 6.000 | 08-15-35 | 81,321 | 90,508 | |
| Foreign government obligations 15.4% | $135,594,356 | ||||
| (Cost $139,888,541) | |||||
| Angola 0.4% | 3,470,193 | ||||
| Republic of Angola | |||||
| Bond (B) | 8.250 | 05-09-28 | 831,000 | 855,731 | |
| Bond | 8.250 | 05-09-28 | 527,000 | 542,985 | |
| Bond (B) | 9.375 | 05-08-48 | 531,000 | 559,791 | |
| Bond | 9.500 | 11-12-25 | 200,000 | 222,971 | |
| Bond (6 month LIBOR + 7.500%) (A) | 10.373 | 07-01-23 | 1,182,308 | 1,288,715 | |
| Argentina 1.1% | 9,383,597 | ||||
| Provincia del Chaco | |||||
| Bond | 9.375 | 08-18-24 | 301,000 | 231,770 | |
| SEE NOTES TO FINANCIAL STATEMENTS | SEMIANNUAL REPORT | JOHN HANCOCK SHORT DURATION CREDIT OPPORTUNITIES FUND | 9 |
| Rate (%) | Maturity date | Par value^ | Value | ||
| Argentina (continued) | |||||
| Republic of Argentina | |||||
| Bond (2.260% to 3-31-19, then 3.380% to 3-31-29, then 4.740% thereafter) | 2.260 | 12-31-38 | EUR | 4,358,000 | $2,965,464 |
| Bond | 4.500 | 02-13-20 | 336,000 | 323,568 | |
| Bond | 6.875 | 04-22-21 | 197,000 | 188,037 | |
| Bond | 6.875 | 01-11-48 | 129,000 | 98,880 | |
| Bond | 7.820 | 12-31-33 | EUR | 5,408,452 | 5,575,878 |
| Bahrain 0.1% | 647,871 | ||||
| Kingdom of Bahrain | |||||
| Bond | 6.750 | 09-20-29 | 640,000 | 647,871 | |
| Brazil 1.1% | 9,576,845 | ||||
| Brazil Minas SPE | |||||
| Bond | 5.333 | 02-15-28 | 1,315,000 | 1,334,396 | |
| Bond (B) | 5.333 | 02-15-28 | 119,000 | 120,755 | |
| Federative Republic of Brazil | |||||
| Bill (C) | 6.504 | 07-01-20 | BRL | 2,570,000 | 643,680 |
| Bond | 4.625 | 01-13-28 | 574,000 | 571,423 | |
| Bond | 5.000 | 01-27-45 | 1,126,000 | 1,037,057 | |
| Bond | 5.625 | 01-07-41 | 315,000 | 317,681 | |
| Bond | 5.625 | 02-21-47 | 255,000 | 253,473 | |
| Bond | 8.250 | 01-20-34 | 152,000 | 193,800 | |
| Note | 10.000 | 01-01-21 | BRL | 11,504,000 | 3,342,222 |
| Note | 10.000 | 01-01-23 | BRL | 1,150,000 | 337,021 |
| Note | 10.000 | 01-01-25 | BRL | 2,330,000 | 684,904 |
| Note | 10.000 | 01-01-27 | BRL | 2,516,000 | 740,433 |
| Cameroon 0.1% | 908,249 | ||||
| Republic of Cameroon | |||||
| Bond (B) | 9.500 | 11-19-25 | 259,000 | 277,185 | |
| Bond | 9.500 | 11-19-25 | 590,000 | 631,064 | |
| Chile 0.3% | 2,613,897 | ||||
| Republic of Chile | |||||
| Bond | 4.500 | 02-28-21 | CLP | 1,115,000,000 | 1,765,162 |
| Bond | 4.500 | 03-01-21 | CLP | 165,000,000 | 261,237 |
| Bond | 4.500 | 03-01-26 | CLP | 370,000,000 | 587,498 |
| Colombia 0.8% | 6,923,617 | ||||
| Bogota Distrito Capital | |||||
| Bond | 9.750 | 07-26-28 | COP | 427,000,000 | 146,968 |
| Republic of Colombia | |||||
| Bond | 2.625 | 03-15-23 | 263,000 | 252,875 | |
| Bond | 3.875 | 04-25-27 | 352,000 | 347,600 | |
| Bond | 4.375 | 03-21-23 | COP | 2,700,000,000 | 825,129 |
| Bond | 4.500 | 03-15-29 | 313,000 | 320,359 | |
| Bond | 5.000 | 06-15-45 | 143,000 | 144,574 | |
| Bond | 5.200 | 05-15-49 | 849,000 | 877,025 | |
| 10 | JOHN HANCOCK SHORT DURATION CREDIT OPPORTUNITIES FUND | SEMIANNUAL REPORT | SEE NOTES TO FINANCIAL STATEMENTS |
| Rate (%) | Maturity date | Par value^ | Value | ||
| Colombia (continued) | |||||
| Bond | 7.750 | 04-14-21 | COP | 2,830,000,000 | $949,531 |
| Bond | 8.125 | 05-21-24 | 312,000 | 370,500 | |
| Bond | 9.850 | 06-28-27 | COP | 5,740,000,000 | 2,266,496 |
| Bond | 10.375 | 01-28-33 | 278,000 | 422,560 | |
| Costa Rica 0.1% | 855,944 | ||||
| Republic of Costa Rica | |||||
| Bond (B) | 4.375 | 04-30-25 | 968,000 | 855,944 | |
| Czech Republic 0.1% | 1,290,645 | ||||
| Czech Republic | |||||
| Bond | 0.250 | 02-10-27 | CZK | 18,400,000 | 724,926 |
| Bond | 0.950 | 05-15-30 | CZK | 1,300,000 | 51,825 |
| Bond | 1.000 | 06-26-26 | CZK | 7,600,000 | 319,806 |
| Bond | 2.750 | 07-23-29 | CZK | 1,810,000 | 87,436 |
| Bond | 3.850 | 09-29-21 | CZK | 1,200,000 | 56,298 |
| Bond | 4.200 | 12-04-36 | CZK | 900,000 | 50,354 |
| Dominican Republic 0.3% | 2,371,301 | ||||
| Government of Dominican Republic | |||||
| Bond | 5.500 | 01-27-25 | 202,000 | 205,030 | |
| Bond (B) | 5.875 | 04-18-24 | 93,000 | 96,363 | |
| Bond | 5.950 | 01-25-27 | 290,000 | 297,975 | |
| Bond | 6.000 | 07-19-28 | 735,000 | 757,050 | |
| Bond | 6.600 | 01-28-24 | 347,000 | 367,820 | |
| Bond (B) | 7.450 | 04-30-44 | 595,000 | 647,063 | |
| Ecuador 0.2% | 2,146,832 | ||||
| Republic of Ecuador | |||||
| Bond | 7.875 | 01-23-28 | 1,930,000 | 1,711,331 | |
| Bond (B) | 8.875 | 10-23-27 | 257,000 | 239,961 | |
| Bond (B) | 9.650 | 12-13-26 | 200,000 | 195,540 | |
| Egypt 0.5% | 4,745,747 | ||||
| Arab Republic of Egypt | |||||
| Bond (B) | 4.750 | 04-16-26 | EUR | 125,000 | 133,602 |
| Bond (B) | 5.577 | 02-21-23 | 192,000 | 186,262 | |
| Bond (B) | 5.625 | 04-16-30 | EUR | 2,120,000 | 2,197,409 |
| Bond (B) | 6.125 | 01-31-22 | 609,000 | 607,390 | |
| Bond (B) | 6.588 | 02-21-28 | 426,000 | 395,564 | |
| Bond (B) | 6.875 | 04-30-40 | 58,000 | 49,880 | |
| Bond (B) | 8.500 | 01-31-47 | 1,222,000 | 1,175,640 | |
| El Salvador 0.1% | 820,200 | ||||
| Republic of El Salvador | |||||
| Bond (B) | 6.375 | 01-18-27 | 345,000 | 329,044 | |
| Bond (B) | 7.375 | 12-01-19 | 180,000 | 181,800 | |
| Bond | 7.650 | 06-15-35 | 111,000 | 110,963 | |
| Bond | 8.250 | 04-10-32 | 189,000 | 198,393 | |
| SEE NOTES TO FINANCIAL STATEMENTS | SEMIANNUAL REPORT | JOHN HANCOCK SHORT DURATION CREDIT OPPORTUNITIES FUND | 11 |
| Rate (%) | Maturity date | Par value^ | Value | ||
| Gabon 0.0% | $306,214 | ||||
| Republic of Gabon | |||||
| Bond | 6.950 | 06-16-25 | 319,000 | 306,214 | |
| Ghana 0.3% | 2,460,016 | ||||
| Republic of Ghana | |||||
| Bond (B) | 10.750 | 10-14-30 | 1,514,000 | 1,781,188 | |
| Bond | 10.750 | 10-14-30 | 577,000 | 678,828 | |
| Hungary 0.1% | 672,400 | ||||
| Republic of Hungary | |||||
| Bond | 5.375 | 03-25-24 | 424,000 | 458,071 | |
| Bond | 7.625 | 03-29-41 | 149,000 | 214,329 | |
| Indonesia 1.2% | 10,669,425 | ||||
| Republic of Indonesia | |||||
| Bond (B) | 3.850 | 07-18-27 | 1,339,000 | 1,308,409 | |
| Bond (B) | 4.350 | 01-08-27 | 1,417,000 | 1,432,668 | |
| Bond | 5.250 | 01-17-42 | 673,000 | 702,273 | |
| Bond | 5.350 | 02-11-49 | 50,000 | 53,705 | |
| Bond | 5.375 | 10-17-23 | 280,000 | 299,453 | |
| Bond | 7.500 | 08-15-32 | IDR | 4,020,000,000 | 263,734 |
| Bond | 7.500 | 05-15-38 | IDR | 2,889,000,000 | 188,051 |
| Bond | 8.250 | 06-15-32 | IDR | 11,670,000,000 | 816,710 |
| Bond | 8.250 | 05-15-36 | IDR | 16,760,000,000 | 1,171,311 |
| Bond | 8.375 | 03-15-24 | IDR | 15,839,000,000 | 1,150,871 |
| Bond | 8.375 | 09-15-26 | IDR | 38,254,000,000 | 2,743,405 |
| Bond | 8.375 | 03-15-34 | IDR | 7,600,000,000 | 538,835 |
| Iraq 0.1% | 662,373 | ||||
| Republic of Iraq | |||||
| Bond | 5.800 | 01-15-28 | 417,000 | 395,067 | |
| Bond (B) | 6.752 | 03-09-23 | 268,000 | 267,306 | |
| Ivory Coast 0.3% | 2,919,466 | ||||
| Republic of Ivory Coast | |||||
| Bond (B) | 5.125 | 06-15-25 | EUR | 440,000 | 497,502 |
| Bond (B) | 5.250 | 03-22-30 | EUR | 192,000 | 203,681 |
| Bond | 5.250 | 03-22-30 | EUR | 175,000 | 185,646 |
| Bond (B) | 6.125 | 06-15-33 | 1,876,000 | 1,675,407 | |
| Bond | 6.125 | 06-15-33 | 400,000 | 357,230 | |
| Jordan 0.1% | 513,124 | ||||
| Kingdom of Jordan | |||||
| Bond (B) | 5.750 | 01-31-27 | 531,000 | 513,124 | |
| Kenya 0.0% | 388,149 | ||||
| Republic of Kenya | |||||
| Bond (B) | 6.875 | 06-24-24 | 3,000 | 3,000 | |
| Bond | 6.875 | 06-24-24 | 339,000 | 338,288 | |
| Bond (B) | 7.250 | 02-28-28 | 48,000 | 46,861 | |
| 12 | JOHN HANCOCK SHORT DURATION CREDIT OPPORTUNITIES FUND | SEMIANNUAL REPORT | SEE NOTES TO FINANCIAL STATEMENTS |
| Rate (%) | Maturity date | Par value^ | Value | ||
| Lebanon 0.4% | $3,550,641 | ||||
| Republic of Lebanon | |||||
| Bond | 5.450 | 11-28-19 | 72,000 | 70,413 | |
| Bond | 6.100 | 10-04-22 | 339,000 | 296,456 | |
| Bond | 6.150 | 06-19-20 | 151,000 | 140,610 | |
| Bond | 6.250 | 05-27-22 | 66,000 | 57,515 | |
| Bond | 6.250 | 11-04-24 | 221,000 | 183,934 | |
| Bond | 6.375 | 03-09-20 | 182,000 | 174,338 | |
| Bond | 6.400 | 05-26-23 | 452,000 | 390,708 | |
| Bond | 6.600 | 11-27-26 | 24,000 | 19,969 | |
| Bond | 6.650 | 04-22-24 | 858,000 | 739,446 | |
| Bond | 6.650 | 11-03-28 | 82,000 | 66,451 | |
| Bond | 8.250 | 04-12-21 | 1,477,000 | 1,410,801 | |
| Malaysia 0.0% | 195,231 | ||||
| Government of Malaysia | |||||
| Bond | 3.620 | 11-30-21 | MYR | 390,000 | 95,259 |
| Bond | 3.955 | 09-15-25 | MYR | 410,000 | 99,972 |
| Mexico 1.0% | 8,369,467 | ||||
| Government of Mexico | |||||
| Bond | 3.750 | 01-11-28 | 670,000 | 639,515 | |
| Bond | 4.350 | 01-15-47 | 203,000 | 180,670 | |
| Bond | 4.750 | 03-08-44 | 128,000 | 120,640 | |
| Bond | 5.750 | 03-05-26 | MXN | 31,430,000 | 1,414,019 |
| Bond | 6.500 | 06-10-21 | MXN | 16,420,000 | 827,129 |
| Bond | 8.000 | 06-11-20 | MXN | 5,610,000 | 292,278 |
| Bond | 8.500 | 11-18-38 | MXN | 5,950,000 | 303,402 |
| Bond | 10.000 | 12-05-24 | MXN | 81,372,500 | 4,591,814 |
| Nigeria 0.4% | 3,666,519 | ||||
| Federal Republic of Nigeria | |||||
| Bond (B) | 6.500 | 11-28-27 | 1,559,000 | 1,490,374 | |
| Bond (B) | 7.143 | 02-23-30 | 265,000 | 254,449 | |
| Bond (B) | 7.625 | 11-28-47 | 794,000 | 745,290 | |
| Bond | 7.625 | 11-28-47 | 1,104,000 | 1,036,272 | |
| Bond (B) | 7.875 | 02-16-32 | 141,000 | 140,134 | |
| Oman 0.4% | 3,923,822 | ||||
| Sultanate of Oman | |||||
| Bond | 3.625 | 06-15-21 | 521,000 | 502,053 | |
| Bond (B) | 4.125 | 01-17-23 | 199,000 | 187,570 | |
| Bond (B) | 5.375 | 03-08-27 | 1,362,000 | 1,231,933 | |
| Bond (B) | 5.625 | 01-17-28 | 875,000 | 796,352 | |
| Bond (B) | 6.500 | 03-08-47 | 1,066,000 | 893,926 | |
| Bond (B) | 6.750 | 01-17-48 | 119,000 | 101,439 | |
| Bond | 6.750 | 01-17-48 | 247,000 | 210,549 | |
| Pakistan 0.1% | 1,296,397 | ||||
| Republic of Pakistan | |||||
| SEE NOTES TO FINANCIAL STATEMENTS | SEMIANNUAL REPORT | JOHN HANCOCK SHORT DURATION CREDIT OPPORTUNITIES FUND | 13 |
| Rate (%) | Maturity date | Par value^ | Value | ||
| Pakistan (continued) | |||||
| Bond (B) | 6.875 | 12-05-27 | 318,000 | $310,352 | |
| Bond | 6.875 | 12-05-27 | 716,000 | 698,778 | |
| Bond (B) | 8.250 | 09-30-25 | 270,000 | 287,267 | |
| Papua New Guinea 0.1% | 497,550 | ||||
| Independent State of Papua New Guinea | |||||
| Bond | 8.375 | 10-04-28 | 465,000 | 497,550 | |
| Paraguay 0.0% | 422,920 | ||||
| Republic of Paraguay | |||||
| Bond (B) | 6.100 | 08-11-44 | 388,000 | 422,920 | |
| Peru 0.1% | 887,234 | ||||
| Republic of Peru | |||||
| Bond (B) | 5.940 | 02-12-29 | PEN | 150,000 | 46,070 |
| Bond | 5.940 | 02-12-29 | PEN | 400,000 | 122,853 |
| Bond (B) | 6.150 | 08-12-32 | PEN | 1,100,000 | 335,041 |
| Bond (B) | 6.350 | 08-12-28 | PEN | 1,210,000 | 383,270 |
| Poland 0.8% | 6,634,882 | ||||
| Republic of Poland | |||||
| Bond | 1.750 | 07-25-21 | PLN | 850,000 | 229,475 |
| Bond | 2.000 | 04-25-21 | PLN | 7,390,000 | 2,007,744 |
| Bond | 2.250 | 04-25-22 | PLN | 320,000 | 87,035 |
| Bond | 2.500 | 01-25-23 | PLN | 2,230,000 | 611,925 |
| Bond | 2.500 | 07-25-27 | PLN | 3,500,000 | 930,355 |
| Bond | 2.750 | 04-25-28 | PLN | 7,107,000 | 1,913,319 |
| Bond | 3.250 | 07-25-25 | PLN | 89,000 | 25,132 |
| Bond | 4.000 | 10-25-23 | PLN | 2,840,000 | 829,897 |
| Qatar 0.1% | 669,265 | ||||
| Government of Qatar | |||||
| Bond (B) | 5.103 | 04-23-48 | 424,000 | 454,757 | |
| Bond | 5.103 | 04-23-48 | 200,000 | 214,508 | |
| Romania 0.1% | 484,245 | ||||
| Government of Romania | |||||
| Bond | 4.125 | 03-11-39 | EUR | 239,000 | 267,426 |
| Bond | 5.125 | 06-15-48 | 220,000 | 216,819 | |
| Russia 1.2% | 10,173,664 | ||||
| Government of Russia | |||||
| Bond | 4.750 | 05-27-26 | 1,600,000 | 1,630,470 | |
| Bond | 5.250 | 06-23-47 | 1,200,000 | 1,185,398 | |
| Bond | 5.625 | 04-04-42 | 200,000 | 213,877 | |
| Bond | 6.400 | 05-27-20 | RUB | 64,600,000 | 973,042 |
| Bond | 6.800 | 12-11-19 | RUB | 23,460,000 | 356,928 |
| Bond | 7.050 | 01-19-28 | RUB | 68,210,000 | 982,132 |
| Bond | 7.400 | 12-07-22 | RUB | 68,100,000 | 1,028,240 |
| Bond | 7.700 | 03-23-33 | RUB | 18,977,000 | 281,592 |
| Bond | 7.750 | 09-16-26 | RUB | 176,270,000 | 2,669,586 |
| 14 | JOHN HANCOCK SHORT DURATION CREDIT OPPORTUNITIES FUND | SEMIANNUAL REPORT | SEE NOTES TO FINANCIAL STATEMENTS |
| Rate (%) | Maturity date | Par value^ | Value | ||
| Russia (continued) | |||||
| Bond | 8.150 | 02-03-27 | RUB | 22,520,000 | $348,807 |
| Bond | 8.500 | 09-17-31 | RUB | 31,837,000 | 503,592 |
| Saudi Arabia 0.1% | 731,460 | ||||
| Kingdom of Saudi Arabia | |||||
| Bond (B) | 4.500 | 04-17-30 | 106,000 | 108,079 | |
| Bond | 4.500 | 10-26-46 | 240,000 | 223,922 | |
| Bond | 5.000 | 04-17-49 | 403,000 | 399,459 | |
| Senegal 0.1% | 519,461 | ||||
| Republic of Senegal | |||||
| Bond (B) | 6.250 | 05-23-33 | 560,000 | 519,461 | |
| South Africa 1.1% | 9,392,385 | ||||
| Republic of South Africa | |||||
| Bond | 4.300 | 10-12-28 | 822,000 | 765,912 | |
| Bond | 4.665 | 01-17-24 | 56,000 | 56,237 | |
| Bond | 4.850 | 09-27-27 | 240,000 | 233,548 | |
| Bond | 4.875 | 04-14-26 | 381,000 | 377,075 | |
| Bond | 5.875 | 06-22-30 | 740,000 | 759,708 | |
| Bond | 6.250 | 03-31-36 | ZAR | 25,740,000 | 1,421,836 |
| Bond | 6.300 | 06-22-48 | 351,000 | 355,903 | |
| Bond | 7.000 | 02-28-31 | ZAR | 56,900,000 | 3,608,225 |
| Bond | 8.750 | 02-28-48 | ZAR | 3,682,000 | 254,420 |
| Bond | 10.500 | 12-21-26 | ZAR | 18,706,000 | 1,559,521 |
| Sri Lanka 0.2% | 2,203,549 | ||||
| Republic of Sri Lanka | |||||
| Bond (B) | 5.750 | 04-18-23 | 288,000 | 278,897 | |
| Bond (B) | 6.125 | 06-03-25 | 393,000 | 374,890 | |
| Bond | 6.200 | 05-11-27 | 504,000 | 470,438 | |
| Bond | 6.250 | 07-27-21 | 477,000 | 479,555 | |
| Bond (B) | 6.750 | 04-18-28 | 624,000 | 599,769 | |
| Suriname 0.0% | 103,332 | ||||
| Republic of Suriname | |||||
| Bond (B) | 9.250 | 10-26-26 | 109,000 | 103,332 | |
| Thailand 0.3% | 2,963,313 | ||||
| Kingdom of Thailand | |||||
| Bond | 2.550 | 06-26-20 | THB | 3,470,000 | 112,202 |
| Bond | 2.875 | 12-17-28 | THB | 38,863,000 | 1,295,455 |
| Bond | 3.775 | 06-25-32 | THB | 10,170,000 | 361,148 |
| Bond | 3.850 | 12-12-25 | THB | 26,980,000 | 949,380 |
| Bond | 4.875 | 06-22-29 | THB | 6,325,000 | 245,128 |
| Tunisia 0.0% | 312,033 | ||||
| Banque Centrale de Tunisia | |||||
| Bond | 5.625 | 02-17-24 | EUR | 294,000 | 312,033 |
| SEE NOTES TO FINANCIAL STATEMENTS | SEMIANNUAL REPORT | JOHN HANCOCK SHORT DURATION CREDIT OPPORTUNITIES FUND | 15 |
| Rate (%) | Maturity date | Par value^ | Value | ||
| Turkey 0.6% | $5,094,926 | ||||
| Republic of Turkey | |||||
| Bond | 6.000 | 03-25-27 | 127,000 | 122,387 | |
| Bond | 6.250 | 09-26-22 | 946,000 | 960,093 | |
| Bond | 7.375 | 02-05-25 | 521,000 | 544,722 | |
| Bond | 7.400 | 02-05-20 | TRY | 3,480,000 | 607,543 |
| Bond | 8.000 | 03-12-25 | TRY | 6,660,000 | 969,355 |
| Bond | 9.400 | 07-08-20 | TRY | 3,000,000 | 522,582 |
| Bond | 10.500 | 08-11-27 | TRY | 510,000 | 82,670 |
| Bond | 10.700 | 02-17-21 | TRY | 3,210,000 | 554,503 |
| Bond | 10.700 | 08-17-22 | TRY | 1,300,000 | 218,904 |
| Bond | 11.000 | 03-02-22 | TRY | 140,000 | 24,008 |
| Bond | 11.000 | 02-24-27 | TRY | 1,320,000 | 219,717 |
| Bond | 12.200 | 01-18-23 | TRY | 1,530,000 | 268,442 |
| Ukraine 0.6% | 4,970,105 | ||||
| Republic of Ukraine | |||||
| Bond (B) | 7.375 | 09-25-32 | 796,000 | 677,897 | |
| Bond | 7.375 | 09-25-32 | 289,000 | 246,116 | |
| Bond (B) | 7.750 | 09-01-22 | 136,000 | 131,188 | |
| Bond (B) | 7.750 | 09-01-23 | 273,000 | 260,114 | |
| Bond | 7.750 | 09-01-23 | 233,000 | 222,002 | |
| Bond (B) | 7.750 | 09-01-25 | 530,000 | 486,503 | |
| Bond (B) | 7.750 | 09-01-26 | 463,000 | 420,404 | |
| Bond | 7.750 | 09-01-26 | 209,000 | 189,772 | |
| Bond (B) | 7.750 | 09-01-27 | 399,000 | 358,996 | |
| Bond | 7.750 | 09-01-27 | 200,000 | 179,948 | |
| Bond | 8.994 | 02-01-24 | 625,000 | 614,063 | |
| Bond | 9.750 | 11-01-28 | 256,000 | 253,937 | |
| GDP-Linked Bond (D) | 2.346* | 05-31-40 | 1,524,000 | 929,165 | |
| Uruguay 0.2% | 2,182,272 | ||||
| Republic of Uruguay | |||||
| Bond | 4.125 | 11-20-45 | 197,000 | 184,688 | |
| Bond | 4.375 | 10-27-27 | 723,000 | 743,967 | |
| Bond | 5.100 | 06-18-50 | 781,865 | 806,111 | |
| Bond (B) | 8.500 | 03-15-28 | UYU | 4,160,000 | 112,123 |
| Bond | 9.875 | 06-20-22 | UYU | 10,880,000 | 335,383 |
| Venezuela 0.0% | 415,635 | ||||
| Republic of Venezuela | |||||
| Bond (E) | 7.750 | 10-13-19 | 1,374,000 | 415,635 | |
| Zambia 0.2% | 1,587,943 | ||||
| Republic of Zambia | |||||
| Bond | 5.375 | 09-20-22 | 374,000 | 292,453 | |
| Bond (B) | 5.375 | 09-20-22 | 56,000 | 43,790 | |
| Bond (B) | 8.500 | 04-14-24 | 1,218,000 | 1,004,950 | |
| Bond | 8.970 | 07-30-27 | 300,000 | 246,750 | |
| 16 | JOHN HANCOCK SHORT DURATION CREDIT OPPORTUNITIES FUND | SEMIANNUAL REPORT | SEE NOTES TO FINANCIAL STATEMENTS |
| Rate (%) | Maturity date | Par value^ | Value | ||
| Corporate bonds 35.4% | $311,759,259 | ||||
| (Cost $317,395,295) | |||||
| Communication services 5.1% | 44,609,842 | ||||
| Diversified telecommunication services 1.0% | |||||
| British Telecommunications PLC | 4.500 | 12-04-23 | 1,975,000 | 2,034,621 | |
| Frontier Communications Corp. (F) | 9.000 | 08-15-31 | 849,000 | 464,828 | |
| Intelsat Jackson Holdings SA | 5.500 | 08-01-23 | 395,000 | 358,956 | |
| TELUS Corp. | 4.600 | 11-16-48 | 1,125,000 | 1,134,092 | |
| UPCB Finance IV, Ltd. (B) | 5.375 | 01-15-25 | 485,000 | 466,813 | |
| Verizon Communications, Inc. | 3.376 | 02-15-25 | 2,250,000 | 2,247,300 | |
| West Corp. (B) | 8.500 | 10-15-25 | 590,000 | 491,913 | |
| Zayo Group LLC (B) | 5.750 | 01-15-27 | 725,000 | 700,488 | |
| Ziggo BV (B) | 5.500 | 01-15-27 | 510,000 | 481,792 | |
| Entertainment 0.1% | |||||
| Lions Gate Capital Holdings LLC (B) | 6.375 | 02-01-24 | 505,000 | 510,050 | |
| Netflix, Inc. | 4.875 | 04-15-28 | 690,000 | 655,500 | |
| Interactive media and services 0.5% | |||||
| Baidu, Inc. | 3.875 | 09-29-23 | 2,200,000 | 2,198,988 | |
| Tencent Holdings, Ltd. (B) | 3.595 | 01-19-28 | 2,075,000 | 2,018,680 | |
| Media 2.8% | |||||
| Altice France SA (B) | 7.375 | 05-01-26 | 715,000 | 689,975 | |
| AMC Networks, Inc. | 4.750 | 08-01-25 | 900,000 | 869,625 | |
| Block Communications, Inc. (B) | 6.875 | 02-15-25 | 485,000 | 497,125 | |
| Cablevision Systems Corp. | 5.875 | 09-15-22 | 985,000 | 989,925 | |
| CCO Holdings LLC (B) | 5.125 | 05-01-27 | 520,000 | 503,100 | |
| CCO Holdings LLC (B) | 5.500 | 05-01-26 | 610,000 | 608,475 | |
| Charter Communications Operating LLC | 6.384 | 10-23-35 | 1,600,000 | 1,711,245 | |
| Charter Communications Operating LLC | 6.484 | 10-23-45 | 1,500,000 | 1,614,523 | |
| Cinemark USA, Inc. | 4.875 | 06-01-23 | 550,000 | 544,500 | |
| Comcast Corp. | 4.700 | 10-15-48 | 2,175,000 | 2,272,860 | |
| Cox Communications, Inc. (B) | 3.500 | 08-15-27 | 2,275,000 | 2,163,608 | |
| CSC Holdings LLC (B) | 7.750 | 07-15-25 | 635,000 | 665,163 | |
| Discovery Communications LLC | 4.900 | 03-11-26 | 2,075,000 | 2,123,491 | |
| DISH DBS Corp. | 7.750 | 07-01-26 | 1,885,000 | 1,623,456 | |
| Live Nation Entertainment, Inc. (B) | 5.625 | 03-15-26 | 700,000 | 707,000 | |
| Nexstar Broadcasting, Inc. (B) | 5.625 | 08-01-24 | 515,000 | 498,263 | |
| Omnicom Group, Inc. | 3.650 | 11-01-24 | 2,250,000 | 2,217,883 | |
| Quebecor Media, Inc. | 5.750 | 01-15-23 | 470,000 | 484,100 | |
| Sinclair Television Group, Inc. (B) | 5.625 | 08-01-24 | 550,000 | 532,675 | |
| Sirius XM Radio, Inc. (B) | 5.000 | 08-01-27 | 785,000 | 758,506 | |
| The Interpublic Group of Companies, Inc. | 4.650 | 10-01-28 | 2,150,000 | 2,169,169 | |
| Unitymedia GmbH (B) | 6.125 | 01-15-25 | 305,000 | 314,913 | |
| Virgin Media Finance PLC (B) | 6.000 | 10-15-24 | 450,000 | 455,760 | |
| SEE NOTES TO FINANCIAL STATEMENTS | SEMIANNUAL REPORT | JOHN HANCOCK SHORT DURATION CREDIT OPPORTUNITIES FUND | 17 |
| Rate (%) | Maturity date | Par value^ | Value | ||
| Communication services (continued) | |||||
| Wireless telecommunication services 0.7% | |||||
| Digicel Group Two, Ltd. (7.125% Cash or 2.000% PIK) (B) | 7.125 | 04-01-24 | 70,000 | $30,100 | |
| Sprint Capital Corp. | 8.750 | 03-15-32 | 1,475,000 | 1,618,813 | |
| T-Mobile USA, Inc. | 5.375 | 04-15-27 | 470,000 | 473,525 | |
| T-Mobile USA, Inc. | 6.500 | 01-15-26 | 530,000 | 560,475 | |
| Vodafone Group PLC | 5.000 | 05-30-38 | 3,250,000 | 3,147,568 | |
| Consumer discretionary 3.0% | 26,468,533 | ||||
| Auto components 0.1% | |||||
| Dana Financing Luxembourg Sarl (B) | 6.500 | 06-01-26 | 675,000 | 678,375 | |
| Automobiles 0.8% | |||||
| Ford Motor Credit Company LLC | 4.389 | 01-08-26 | 2,125,000 | 1,915,812 | |
| General Motors Financial Company, Inc. | 4.350 | 04-09-25 | 2,200,000 | 2,133,692 | |
| Hyundai Capital America (B) | 3.000 | 10-30-20 | 1,850,000 | 1,831,093 | |
| Hyundai Capital America (B) | 3.250 | 09-20-22 | 1,175,000 | 1,148,986 | |
| Diversified consumer services 0.1% | |||||
| Weight Watchers International, Inc. (B) | 8.625 | 12-01-25 | 800,000 | 788,000 | |
| Hotels, restaurants and leisure 1.0% | |||||
| Boyd Gaming Corp. | 6.000 | 08-15-26 | 215,000 | 215,538 | |
| Boyd Gaming Corp. | 6.375 | 04-01-26 | 450,000 | 459,563 | |
| Golden Nugget, Inc. (B) | 6.750 | 10-15-24 | 545,000 | 545,000 | |
| International Game Technology PLC (B) | 6.250 | 01-15-27 | 645,000 | 653,869 | |
| Jacobs Entertainment, Inc. (B) | 7.875 | 02-01-24 | 320,000 | 336,096 | |
| McDonald's Corp. | 4.450 | 03-01-47 | 1,100,000 | 1,086,049 | |
| Merlin Entertainments PLC (B) | 5.750 | 06-15-26 | 370,000 | 377,400 | |
| MGM Growth Properties Operating Partnership LP (B) | 5.750 | 02-01-27 | 745,000 | 752,450 | |
| Royal Caribbean Cruises, Ltd. | 2.650 | 11-28-20 | 2,275,000 | 2,242,765 | |
| Sands China, Ltd. | 4.600 | 08-08-23 | 2,100,000 | 2,108,400 | |
| Household durables 0.0% | |||||
| TopBuild Corp. (B) | 5.625 | 05-01-26 | 470,000 | 439,450 | |
| Internet and direct marketing retail 0.5% | |||||
| Alibaba Group Holding, Ltd. | 4.000 | 12-06-37 | 2,400,000 | 2,253,305 | |
| Amazon.com, Inc. | 3.875 | 08-22-37 | 2,000,000 | 2,003,736 | |
| Multiline retail 0.3% | |||||
| Dollar Tree, Inc. | 3.700 | 05-15-23 | 2,250,000 | 2,225,516 | |
| JC Penney Corp., Inc. | 7.400 | 04-01-37 | 500,000 | 182,500 | |
| JC Penney Corp., Inc. (B) | 8.625 | 03-15-25 | 210,000 | 118,125 | |
| Specialty retail 0.1% | |||||
| Party City Holdings, Inc. (B)(F) | 6.625 | 08-01-26 | 585,000 | 576,225 | |
| Textiles, apparel and luxury goods 0.1% | |||||
| Hanesbrands, Inc. (B) | 4.625 | 05-15-24 | 650,000 | 637,813 | |
| Levi Strauss & Company | 5.000 | 05-01-25 | 755,000 | 758,775 | |
| 18 | JOHN HANCOCK SHORT DURATION CREDIT OPPORTUNITIES FUND | SEMIANNUAL REPORT | SEE NOTES TO FINANCIAL STATEMENTS |
| Rate (%) | Maturity date | Par value^ | Value | ||
| Consumer staples 1.5% | $13,538,753 | ||||
| Beverages 0.3% | |||||
| Cott Holdings, Inc. (B) | 5.500 | 04-01-25 | 530,000 | 524,700 | |
| Keurig Dr. Pepper, Inc. | 3.430 | 06-15-27 | 2,200,000 | 2,057,204 | |
| Food and staples retailing 0.3% | |||||
| Albertsons Companies LLC | 6.625 | 06-15-24 | 860,000 | 847,100 | |
| Ingles Markets, Inc. | 5.750 | 06-15-23 | 654,000 | 660,540 | |
| The Kroger Company (F) | 4.450 | 02-01-47 | 1,075,000 | 951,049 | |
| Food products 0.7% | |||||
| Adecoagro SA (B) | 6.000 | 09-21-27 | 204,000 | 178,500 | |
| B&G Foods, Inc. | 5.250 | 04-01-25 | 825,000 | 808,913 | |
| Chobani LLC (B) | 7.500 | 04-15-25 | 675,000 | 577,125 | |
| Dean Foods Company (B) | 6.500 | 03-15-23 | 470,000 | 365,792 | |
| JBS Investments GmbH (B) | 6.250 | 02-05-23 | 171,000 | 171,855 | |
| KazAgro National Management Holding JSC (B) | 4.625 | 05-24-23 | 254,000 | 257,226 | |
| Kraft Heinz Foods Company (B) | 4.875 | 02-15-25 | 2,150,000 | 2,193,208 | |
| Marfrig Holdings Europe BV (B) | 8.000 | 06-08-23 | 44,000 | 45,461 | |
| Minerva Luxembourg SA (B) | 6.500 | 09-20-26 | 259,000 | 247,746 | |
| Pilgrim's Pride Corp. (B) | 5.750 | 03-15-25 | 375,000 | 367,500 | |
| Pilgrim's Pride Corp. (B) | 5.875 | 09-30-27 | 410,000 | 395,650 | |
| Post Holdings, Inc. (B) | 5.500 | 03-01-25 | 530,000 | 527,350 | |
| Sigma Holdco BV (B) | 7.875 | 05-15-26 | 375,000 | 333,094 | |
| Household products 0.1% | |||||
| Energizer Holdings, Inc. (B) | 5.500 | 06-15-25 | 790,000 | 748,525 | |
| Spectrum Brands, Inc. | 5.750 | 07-15-25 | 590,000 | 581,327 | |
| Personal products 0.1% | |||||
| Prestige Brands, Inc. (B) | 6.375 | 03-01-24 | 375,000 | 373,125 | |
| Revlon Consumer Products Corp. (F) | 6.250 | 08-01-24 | 595,000 | 325,763 | |
| Energy 5.2% | 46,237,585 | ||||
| Energy equipment and services 0.4% | |||||
| Apergy Corp. | 6.375 | 05-01-26 | 555,000 | 545,981 | |
| Ensco PLC | 7.750 | 02-01-26 | 150,000 | 120,469 | |
| Inkia Energy, Ltd. (B) | 5.875 | 11-09-27 | 223,000 | 213,163 | |
| Nabors Industries, Inc. (F) | 5.500 | 01-15-23 | 950,000 | 855,000 | |
| Rowan Companies, Inc. | 7.375 | 06-15-25 | 695,000 | 597,700 | |
| SESI LLC | 7.125 | 12-15-21 | 870,000 | 772,125 | |
| SESI LLC | 7.750 | 09-15-24 | 425,000 | 332,563 | |
| Unit Corp. | 6.625 | 05-15-21 | 515,000 | 486,675 | |
| Oil, gas and consumable fuels 4.8% | |||||
| Abu Dhabi Crude Oil Pipeline LLC (B) | 4.600 | 11-02-47 | 565,000 | 571,678 | |
| AI Candelaria Spain SLU (B) | 7.500 | 12-15-28 | 326,000 | 319,969 | |
| Alta Mesa Holdings LP | 7.875 | 12-15-24 | 460,000 | 317,538 | |
| Anadarko Petroleum Corp. | 6.450 | 09-15-36 | 1,800,000 | 2,047,844 | |
| Antero Resources Corp. | 5.000 | 03-01-25 | 485,000 | 468,025 | |
| SEE NOTES TO FINANCIAL STATEMENTS | SEMIANNUAL REPORT | JOHN HANCOCK SHORT DURATION CREDIT OPPORTUNITIES FUND | 19 |
| Rate (%) | Maturity date | Par value^ | Value | ||
| Energy (continued) | |||||
| Oil, gas and consumable fuels (continued) | |||||
| Apache Corp. | 5.100 | 09-01-40 | 2,150,000 | $2,004,094 | |
| Boardwalk Pipelines LP | 4.950 | 12-15-24 | 2,125,000 | 2,151,946 | |
| Concho Resources, Inc. | 4.300 | 08-15-28 | 2,275,000 | 2,307,673 | |
| Diamondback Energy, Inc. | 4.750 | 11-01-24 | 445,000 | 443,888 | |
| Eni SpA (B) | 4.000 | 09-12-23 | 1,575,000 | 1,588,798 | |
| Enterprise Products Operating LLC (4.875% to 8-16-22, then 3 month LIBOR + 2.986%) | 4.875 | 08-16-77 | 2,325,000 | 2,073,589 | |
| Eterna Capital Pte, Ltd. (6.500% Cash or 1.000% PIK) | 6.500 | 12-11-22 | 175,336 | 171,829 | |
| Eterna Capital Pte, Ltd. (8.000% Cash or PIK) | 8.000 | 12-11-22 | 104,791 | 90,341 | |
| Geopark, Ltd. (B) | 6.500 | 09-21-24 | 245,000 | 237,038 | |
| Hilcorp Energy I LP (B) | 5.750 | 10-01-25 | 830,000 | 807,175 | |
| Indo Energy Finance II BV | 6.375 | 01-24-23 | 289,000 | 280,697 | |
| KazMunayGas National Company JSC (B) | 4.750 | 04-19-27 | 210,000 | 212,365 | |
| KazMunayGas National Company JSC | 5.375 | 04-24-30 | 412,000 | 426,117 | |
| KazTransGas JSC (B) | 4.375 | 09-26-27 | 547,000 | 526,380 | |
| Kinder Morgan Energy Partners LP | 5.500 | 03-01-44 | 1,050,000 | 1,089,331 | |
| Laredo Petroleum, Inc. | 5.625 | 01-15-22 | 945,000 | 911,925 | |
| Marathon Petroleum Corp. (B) | 3.800 | 04-01-28 | 800,000 | 767,374 | |
| Marathon Petroleum Corp. (B) | 5.125 | 12-15-26 | 1,325,000 | 1,373,919 | |
| Murphy Oil Corp. | 5.750 | 08-15-25 | 475,000 | 476,758 | |
| Nostrum Oil & Gas Finance BV (B) | 7.000 | 02-16-25 | 160,000 | 104,332 | |
| Oasis Petroleum, Inc. (B)(F) | 6.250 | 05-01-26 | 225,000 | 212,906 | |
| Oasis Petroleum, Inc. | 6.875 | 03-15-22 | 475,000 | 473,813 | |
| Pertamina Persero PT | 5.250 | 05-23-21 | 242,000 | 249,368 | |
| Pertamina Persero PT (B) | 5.625 | 05-20-43 | 513,000 | 512,256 | |
| Pertamina Persero PT | 6.450 | 05-30-44 | 458,000 | 509,995 | |
| Petroamazonas EP (B) | 4.625 | 02-16-20 | 1,100,000 | 1,075,250 | |
| Petroamazonas EP (B) | 4.625 | 11-06-20 | 200,000 | 191,243 | |
| Petroleos de Venezuela SA (E) | 5.375 | 04-12-27 | 64,000 | 16,064 | |
| Petroleos de Venezuela SA (E) | 6.000 | 05-16-24 | 3,771,996 | 927,911 | |
| Petroleos de Venezuela SA (E) | 6.000 | 11-15-26 | 1,826,000 | 401,720 | |
| Petroleos de Venezuela SA (E) | 9.750 | 05-17-35 | 3,459,000 | 985,815 | |
| Petroleos Mexicanos | 4.250 | 01-15-25 | 336,000 | 298,838 | |
| Petroleos Mexicanos | 4.500 | 01-23-26 | 1,515,000 | 1,331,912 | |
| Petroleos Mexicanos | 4.625 | 09-21-23 | 89,000 | 84,183 | |
| Petroleos Mexicanos | 4.875 | 01-24-22 | 660,000 | 643,830 | |
| Petroleos Mexicanos | 5.350 | 02-12-28 | 1,394,000 | 1,219,750 | |
| Petroleos Mexicanos | 6.500 | 03-13-27 | 296,000 | 283,834 | |
| Petroleos Mexicanos | 6.875 | 08-04-26 | 223,000 | 220,213 | |
| Petroleos Mexicanos | 7.190 | 09-12-24 | MXN | 4,586,400 | 188,279 |
| Petroleos Mexicanos | 7.470 | 11-12-26 | MXN | 2,300,000 | 89,608 |
| Petroleos Mexicanos | 9.500 | 09-15-27 | 97,000 | 110,774 | |
| 20 | JOHN HANCOCK SHORT DURATION CREDIT OPPORTUNITIES FUND | SEMIANNUAL REPORT | SEE NOTES TO FINANCIAL STATEMENTS |
| Rate (%) | Maturity date | Par value^ | Value | ||
| Energy (continued) | |||||
| Oil, gas and consumable fuels (continued) | |||||
| PTTEP Treasury Center Company, Ltd. (4.875% to 6-18-19, then 5 Year CMT + 3.177%) (B)(G) | 4.875 | 06-18-19 | 244,000 | $242,952 | |
| QEP Resources, Inc. | 5.250 | 05-01-23 | 585,000 | 563,063 | |
| Range Resources Corp. | 5.000 | 03-15-23 | 460,000 | 437,000 | |
| Sabine Pass Liquefaction LLC | 5.875 | 06-30-26 | 2,000,000 | 2,172,805 | |
| Schlumberger Holdings Corp. (B) | 3.750 | 05-01-24 | 1,650,000 | 1,661,648 | |
| Sinopec Group Overseas Development 2017, Ltd. | 3.250 | 09-13-27 | 223,000 | 211,303 | |
| SM Energy Company | 5.625 | 06-01-25 | 145,000 | 138,838 | |
| SM Energy Company | 6.125 | 11-15-22 | 275,000 | 275,688 | |
| Southwestern Energy Company | 6.700 | 01-23-25 | 685,000 | 666,163 | |
| Targa Resources Partners LP (B) | 6.500 | 07-15-27 | 1,390,000 | 1,432,569 | |
| Western Gas Partners LP | 5.300 | 03-01-48 | 975,000 | 869,523 | |
| Western Gas Partners LP | 5.450 | 04-01-44 | 1,375,000 | 1,256,172 | |
| Whiting Petroleum Corp. | 6.625 | 01-15-26 | 600,000 | 588,000 | |
| Financials 7.2% | 63,398,087 | ||||
| Banks 4.7% | |||||
| Banco Nacional de Comercio Exterior SNC (3.800% to 8-11-21, then 5 Year CMT + 3.000%) (B) | 3.800 | 08-11-26 | 443,000 | 429,156 | |
| Banco Nacional de Comercio Exterior SNC (3.800% to 8-11-21, then 5 Year CMT + 3.000%) | 3.800 | 08-11-26 | 322,000 | 311,938 | |
| Bank of America Corp. | 3.950 | 04-21-25 | 2,750,000 | 2,761,580 | |
| Bank of America Corp. (2.738% to 1-23-21, then 3 month LIBOR + 0.370%) | 2.738 | 01-23-22 | 2,875,000 | 2,852,380 | |
| Barclays PLC | 4.836 | 05-09-28 | 1,225,000 | 1,176,893 | |
| Barclays PLC | 5.250 | 08-17-45 | 1,100,000 | 1,083,306 | |
| Brazil Loan Trust 1 (B) | 5.477 | 07-24-23 | 172,778 | 177,529 | |
| Citigroup, Inc. | 4.400 | 06-10-25 | 4,025,000 | 4,108,213 | |
| Citigroup, Inc. (2.876% to 7-24-22, then 3 month LIBOR + 0.950%) | 2.876 | 07-24-23 | 100,000 | 98,226 | |
| Credit Suisse Group AG (B) | 3.574 | 01-09-23 | 2,250,000 | 2,226,374 | |
| Deutsche Bank AG | 3.700 | 05-30-24 | 2,325,000 | 2,160,496 | |
| Development Bank of Kazakhstan JSC (B) | 8.950 | 05-04-23 | KZT | 50,000,000 | 113,060 |
| Fifth Third Bancorp | 3.650 | 01-25-24 | 2,750,000 | 2,764,293 | |
| HSBC Holdings PLC (3.950% to 5-18-23, then 3 month LIBOR + 0.987%) | 3.950 | 05-18-24 | 2,225,000 | 2,255,342 | |
| Intesa Sanpaolo SpA (B) | 3.875 | 07-14-27 | 5,125,000 | 4,441,841 | |
| JPMorgan Chase & Co. | 3.625 | 12-01-27 | 2,100,000 | 2,029,263 | |
| Mizuho Financial Group, Inc. (B) | 2.632 | 04-12-21 | 3,050,000 | 3,008,125 | |
| Santander Holdings USA, Inc. | 3.700 | 03-28-22 | 2,100,000 | 2,097,416 | |
| Sberbank of Russia (5.500% to 2-26-19, then 5 Year CMT + 4.023%) (B) | 5.500 | 02-26-24 | 432,000 | 432,000 | |
| SEE NOTES TO FINANCIAL STATEMENTS | SEMIANNUAL REPORT | JOHN HANCOCK SHORT DURATION CREDIT OPPORTUNITIES FUND | 21 |
| Rate (%) | Maturity date | Par value^ | Value | ||
| Financials (continued) | |||||
| Banks (continued) | |||||
| Standard Chartered PLC (4.247% to 1-20-22, then 3 month LIBOR + 1.150%) (B) | 4.247 | 01-20-23 | 4,400,000 | $4,403,634 | |
| Synovus Financial Corp. | 3.125 | 11-01-22 | 2,325,000 | 2,229,536 | |
| Ukreximbank | 9.625 | 04-27-22 | 363,000 | 361,730 | |
| Capital markets 0.7% | |||||
| 1MDB Global Investments, Ltd. | 4.400 | 03-09-23 | 2,000,000 | 1,862,180 | |
| The Goldman Sachs Group, Inc. (2.905% to 7-24-22, then 3 month LIBOR + 0.990%) | 2.905 | 07-24-23 | 2,275,000 | 2,226,501 | |
| UBS Group Funding Switzerland AG (B) | 2.650 | 02-01-22 | 2,200,000 | 2,152,277 | |
| Consumer finance 0.7% | |||||
| Capital One Financial Corp. | 3.750 | 03-09-27 | 3,525,000 | 3,404,912 | |
| Synchrony Financial | 3.700 | 08-04-26 | 2,400,000 | 2,191,809 | |
| Diversified financial services 0.6% | |||||
| Berkshire Hathaway Energy Company | 4.450 | 01-15-49 | 2,175,000 | 2,198,264 | |
| GE Capital International Funding Company Unlimited Company | 3.373 | 11-15-25 | 3,400,000 | 3,246,839 | |
| Refinitiv US Holdings, Inc. (B) | 8.250 | 11-15-26 | 150,000 | 140,625 | |
| Insurance 0.5% | |||||
| American International Group, Inc. | 3.875 | 01-15-35 | 2,400,000 | 2,164,724 | |
| Nippon Life Insurance Company (5.100% to 10-16-24, then 5 Year U.S. ISDAFIX + 3.650%) (B) | 5.100 | 10-16-44 | 2,150,000 | 2,187,625 | |
| Thrifts and mortgage finance 0.0% | |||||
| CFX Escrow Corp. (B) | 6.000 | 02-15-24 | 100,000 | 100,000 | |
| Health care 1.5% | 13,126,198 | ||||
| Health care equipment and supplies 0.1% | |||||
| Hologic, Inc. (B) | 4.375 | 10-15-25 | 370,000 | 363,384 | |
| Kinetic Concepts, Inc. (B) | 7.875 | 02-15-21 | 395,000 | 402,900 | |
| Health care providers and services 0.9% | |||||
| Cardinal Health, Inc. | 3.410 | 06-15-27 | 1,200,000 | 1,118,147 | |
| Community Health Systems, Inc. | 6.250 | 03-31-23 | 475,000 | 453,625 | |
| CVS Health Corp. | 4.100 | 03-25-25 | 1,950,000 | 1,985,611 | |
| CVS Health Corp. | 4.780 | 03-25-38 | 125,000 | 125,594 | |
| DaVita, Inc. | 5.000 | 05-01-25 | 580,000 | 558,250 | |
| Encompass Health Corp. | 5.750 | 11-01-24 | 580,000 | 586,525 | |
| HCA, Inc. | 5.375 | 09-01-26 | 595,000 | 610,619 | |
| HCA, Inc. | 5.625 | 09-01-28 | 1,075,000 | 1,110,948 | |
| Team Health Holdings, Inc. (B)(F) | 6.375 | 02-01-25 | 620,000 | 502,597 | |
| Tenet Healthcare Corp. | 4.625 | 07-15-24 | 525,000 | 514,227 | |
| Tenet Healthcare Corp. (B) | 6.250 | 02-01-27 | 365,000 | 370,475 | |
| 22 | JOHN HANCOCK SHORT DURATION CREDIT OPPORTUNITIES FUND | SEMIANNUAL REPORT | SEE NOTES TO FINANCIAL STATEMENTS |
| Rate (%) | Maturity date | Par value^ | Value | ||
| Health care (continued) | |||||
| Life sciences tools and services 0.1% | |||||
| Charles River Laboratories International, Inc. (B) | 5.500 | 04-01-26 | 720,000 | $736,200 | |
| Pharmaceuticals 0.4% | |||||
| Bausch Health Companies, Inc. (B) | 5.875 | 05-15-23 | 785,000 | 769,002 | |
| Bausch Health Companies, Inc. (B) | 6.125 | 04-15-25 | 690,000 | 652,050 | |
| Bausch Health Companies, Inc. (B) | 6.500 | 03-15-22 | 300,000 | 310,125 | |
| Endo Finance LLC (B) | 6.000 | 02-01-25 | 630,000 | 486,675 | |
| Mallinckrodt International Finance SA (B) | 5.625 | 10-15-23 | 425,000 | 358,594 | |
| Teva Pharmaceutical Finance Netherlands III BV | 2.200 | 07-21-21 | 1,175,000 | 1,110,650 | |
| Industrials 2.5% | 22,380,794 | ||||
| Aerospace and defense 0.3% | |||||
| Northrop Grumman Corp. | 2.930 | 01-15-25 | 325,000 | 315,834 | |
| Northrop Grumman Corp. | 4.030 | 10-15-47 | 1,775,000 | 1,697,909 | |
| TransDigm, Inc. (B) | 6.250 | 03-15-26 | 765,000 | 776,475 | |
| Air freight and logistics 0.3% | |||||
| FedEx Corp. | 4.400 | 01-15-47 | 2,300,000 | 2,102,537 | |
| Gol Finance, Inc. (B) | 7.000 | 01-31-25 | 223,000 | 206,554 | |
| Park-Ohio Industries, Inc. | 6.625 | 04-15-27 | 670,000 | 651,575 | |
| Building products 0.2% | |||||
| American Woodmark Corp. (B) | 4.875 | 03-15-26 | 620,000 | 575,050 | |
| Griffon Corp. | 5.250 | 03-01-22 | 870,000 | 852,600 | |
| Commercial services and supplies 0.3% | |||||
| ACCO Brands Corp. (B) | 5.250 | 12-15-24 | 725,000 | 708,688 | |
| Covanta Holding Corp. | 5.875 | 07-01-25 | 730,000 | 715,400 | |
| Waste Pro USA, Inc. (B) | 5.500 | 02-15-26 | 730,000 | 709,378 | |
| Construction and engineering 0.1% | |||||
| AECOM | 5.125 | 03-15-27 | 450,000 | 423,000 | |
| MasTec, Inc. | 4.875 | 03-15-23 | 655,000 | 656,638 | |
| Electrical equipment 0.1% | |||||
| Resideo Funding, Inc. (B) | 6.125 | 11-01-26 | 610,000 | 628,300 | |
| Industrial conglomerates 0.0% | |||||
| Axtel SAB de CV (B) | 6.375 | 11-14-24 | 214,000 | 205,975 | |
| Machinery 0.2% | |||||
| Allison Transmission, Inc. (B) | 4.750 | 10-01-27 | 680,000 | 632,400 | |
| Mueller Water Products, Inc. (B) | 5.500 | 06-15-26 | 475,000 | 477,375 | |
| SPX FLOW, Inc. (B) | 5.625 | 08-15-24 | 800,000 | 784,000 | |
| Road and rail 0.2% | |||||
| Ryder System, Inc. | 3.875 | 12-01-23 | 2,000,000 | 2,007,015 | |
| Trading companies and distributors 0.8% | |||||
| Air Lease Corp. | 3.625 | 12-01-27 | 3,400,000 | 3,098,371 | |
| GATX Corp. | 4.550 | 11-07-28 | 3,275,000 | 3,271,505 | |
| SEE NOTES TO FINANCIAL STATEMENTS | SEMIANNUAL REPORT | JOHN HANCOCK SHORT DURATION CREDIT OPPORTUNITIES FUND | 23 |
| Rate (%) | Maturity date | Par value^ | Value | ||
| Industrials (continued) | |||||
| Trading companies and distributors (continued) | |||||
| United Rentals North America, Inc. | 6.500 | 12-15-26 | 740,000 | $768,675 | |
| Transportation infrastructure 0.0% | |||||
| Rumo Luxembourg Sarl (B) | 7.375 | 02-09-24 | 109,000 | 115,540 | |
| Information technology 1.5% | 12,943,979 | ||||
| Communications equipment 0.1% | |||||
| Hughes Satellite Systems Corp. | 6.625 | 08-01-26 | 755,000 | 726,688 | |
| IT services 0.3% | |||||
| Fiserv, Inc. | 4.200 | 10-01-28 | 2,100,000 | 2,095,162 | |
| Travelport Corporate Finance PLC (B) | 6.000 | 03-15-26 | 635,000 | 652,463 | |
| Semiconductors and semiconductor equipment 0.7% | |||||
| Broadcom Corp. | 3.125 | 01-15-25 | 2,200,000 | 2,036,484 | |
| Entegris, Inc. (B) | 4.625 | 02-10-26 | 645,000 | 625,650 | |
| Qorvo, Inc. (B) | 5.500 | 07-15-26 | 575,000 | 570,688 | |
| Versum Materials, Inc. (B) | 5.500 | 09-30-24 | 540,000 | 548,100 | |
| Xilinx, Inc. | 2.950 | 06-01-24 | 2,250,000 | 2,211,470 | |
| Software 0.3% | |||||
| Nuance Communications, Inc. | 5.625 | 12-15-26 | 585,000 | 573,300 | |
| Oracle Corp. | 3.850 | 07-15-36 | 2,125,000 | 2,054,221 | |
| Technology hardware, storage and peripherals 0.1% | |||||
| Seagate HDD Cayman | 4.875 | 06-01-27 | 936,000 | 849,753 | |
| Materials 2.6% | 22,565,566 | ||||
| Chemicals 0.8% | |||||
| Axalta Coating Systems LLC (B) | 4.875 | 08-15-24 | 575,000 | 561,344 | |
| CF Industries, Inc. | 5.150 | 03-15-34 | 970,000 | 902,100 | |
| CNAC HK Finbridge Company, Ltd. | 3.500 | 07-19-22 | 328,000 | 322,600 | |
| DowDuPont, Inc. | 3.766 | 11-15-20 | 1,925,000 | 1,951,129 | |
| GCP Applied Technologies, Inc. (B) | 5.500 | 04-15-26 | 540,000 | 536,625 | |
| INEOS Group Holdings SA (B) | 5.625 | 08-01-24 | 600,000 | 575,682 | |
| OCI NV (B) | 6.625 | 04-15-23 | 825,000 | 846,716 | |
| OCP SA (B) | 6.875 | 04-25-44 | 196,000 | 207,398 | |
| Platform Specialty Products Corp. (B) | 5.875 | 12-01-25 | 800,000 | 798,000 | |
| Trinseo Materials Operating SCA (B) | 5.375 | 09-01-25 | 610,000 | 552,233 | |
| Construction materials 0.4% | |||||
| Summit Materials LLC | 6.125 | 07-15-23 | 500,000 | 503,600 | |
| U.S. Concrete, Inc. | 6.375 | 06-01-24 | 515,000 | 500,065 | |
| Vulcan Materials Company | 4.500 | 06-15-47 | 2,475,000 | 2,107,062 | |
| Containers and packaging 0.3% | |||||
| Ardagh Packaging Finance PLC (B) | 6.000 | 02-15-25 | 950,000 | 923,875 | |
| Berry Global, Inc. (B) | 4.500 | 02-15-26 | 250,000 | 235,625 | |
| Berry Global, Inc. | 5.125 | 07-15-23 | 245,000 | 245,693 | |
| Cascades, Inc. (B) | 5.500 | 07-15-22 | 650,000 | 646,750 | |
| Crown Americas LLC | 4.750 | 02-01-26 | 575,000 | 562,063 | |
| 24 | JOHN HANCOCK SHORT DURATION CREDIT OPPORTUNITIES FUND | SEMIANNUAL REPORT | SEE NOTES TO FINANCIAL STATEMENTS |
| Rate (%) | Maturity date | Par value^ | Value | ||
| Materials (continued) | |||||
| Containers and packaging (continued) | |||||
| Plastipak Holdings, Inc. (B) | 6.250 | 10-15-25 | 420,000 | $379,050 | |
| Metals and mining 0.7% | |||||
| Anglo American Capital PLC (B) | 4.000 | 09-11-27 | 2,200,000 | 2,078,604 | |
| Commercial Metals Company | 5.375 | 07-15-27 | 535,000 | 493,538 | |
| Commercial Metals Company | 5.750 | 04-15-26 | 425,000 | 402,688 | |
| Corp. Nacional Del Cobre De Chile (B) | 4.375 | 02-05-49 | 576,000 | 551,923 | |
| Freeport-McMoRan, Inc. | 4.550 | 11-14-24 | 460,000 | 441,025 | |
| Indonesia Asahan Aluminium Persero PT (B) | 5.710 | 11-15-23 | 195,000 | 205,275 | |
| Indonesia Asahan Aluminium Persero PT (B) | 6.757 | 11-15-48 | 75,000 | 82,786 | |
| Kaiser Aluminum Corp. | 5.875 | 05-15-24 | 550,000 | 558,250 | |
| Metinvest BV (B) | 0.000 | 04-23-23 | 0 | 0 | |
| Newmont Mining Corp. | 6.250 | 10-01-39 | 975,000 | 1,107,362 | |
| Vedanta Resources PLC (B) | 6.125 | 08-09-24 | 156,000 | 141,893 | |
| Vedanta Resources PLC (B) | 6.375 | 07-30-22 | 112,000 | 108,136 | |
| Paper and forest products 0.4% | |||||
| Boise Cascade Company (B) | 5.625 | 09-01-24 | 935,000 | 906,950 | |
| Flex Acquisition Company, Inc. (B) | 6.875 | 01-15-25 | 300,000 | 280,500 | |
| Louisiana-Pacific Corp. | 4.875 | 09-15-24 | 580,000 | 569,125 | |
| Mercer International, Inc. | 5.500 | 01-15-26 | 785,000 | 728,088 | |
| Norbord, Inc. (B) | 6.250 | 04-15-23 | 545,000 | 551,813 | |
| Real estate 1.5% | 13,109,467 | ||||
| Equity real estate investment trusts 1.5% | |||||
| American Homes 4 Rent LP | 4.250 | 02-15-28 | 2,250,000 | 2,167,678 | |
| Crown Castle International Corp. | 3.200 | 09-01-24 | 2,375,000 | 2,275,993 | |
| Digital Realty Trust LP | 2.750 | 02-01-23 | 100,000 | 95,986 | |
| Digital Realty Trust LP | 4.750 | 10-01-25 | 1,975,000 | 2,044,382 | |
| Office Properties Income Trust | 4.250 | 05-15-24 | 2,475,000 | 2,343,362 | |
| SITE Centers Corp. | 4.250 | 02-01-26 | 2,125,000 | 2,090,763 | |
| Welltower, Inc. | 3.950 | 09-01-23 | 2,075,000 | 2,091,303 | |
| Utilities 3.8% | 33,380,455 | ||||
| Electric utilities 2.2% | |||||
| American Electric Power Company, Inc. | 3.650 | 12-01-21 | 1,725,000 | 1,748,329 | |
| Electricite de France SA (B) | 5.000 | 09-21-48 | 4,550,000 | 4,296,168 | |
| Enel Finance International NV (B) | 2.875 | 05-25-22 | 300,000 | 288,473 | |
| Enel Finance International NV (B) | 4.625 | 09-14-25 | 2,950,000 | 2,913,509 | |
| Eskom Holdings SOC, Ltd. (B) | 5.750 | 01-26-21 | 307,000 | 300,800 | |
| Eskom Holdings SOC, Ltd. (B) | 7.125 | 02-11-25 | 449,000 | 442,265 | |
| Eskom Holdings SOC, Ltd. (B) | 8.450 | 08-10-28 | 497,000 | 513,570 | |
| FirstEnergy Corp. | 4.850 | 07-15-47 | 2,075,000 | 2,104,545 | |
| Georgia Power Company | 4.300 | 03-15-42 | 2,200,000 | 2,053,487 | |
| NextEra Energy Capital Holdings, Inc. | 3.342 | 09-01-20 | 2,200,000 | 2,208,485 | |
| SEE NOTES TO FINANCIAL STATEMENTS | SEMIANNUAL REPORT | JOHN HANCOCK SHORT DURATION CREDIT OPPORTUNITIES FUND | 25 |
| Rate (%) | Maturity date | Par value^ | Value | ||
| Utilities (continued) | |||||
| Electric utilities (continued) | |||||
| NSTAR Electric Company | 3.200 | 05-15-27 | 1,125,000 | $1,101,943 | |
| Pampa Energia SA (B) | 7.375 | 07-21-23 | 153,000 | 144,969 | |
| Pampa Energia SA (B) | 7.500 | 01-24-27 | 183,000 | 162,413 | |
| Vistra Operations Company LLC (B) | 5.625 | 02-15-27 | 745,000 | 751,053 | |
| Gas utilities 0.1% | |||||
| Southern Gas Corridor CJSC | 6.875 | 03-24-26 | 400,000 | 444,012 | |
| Independent power and renewable electricity producers 0.5% | |||||
| Calpine Corp. | 5.750 | 01-15-25 | 971,000 | 915,168 | |
| Exelon Generation Company LLC | 5.600 | 06-15-42 | 2,050,000 | 2,005,495 | |
| Minejesa Capital BV (B) | 4.625 | 08-10-30 | 217,000 | 203,866 | |
| Minejesa Capital BV (B) | 5.625 | 08-10-37 | 33,000 | 30,967 | |
| NRG Energy, Inc. | 5.750 | 01-15-28 | 785,000 | 793,871 | |
| Vistra Energy Corp. (B) | 8.000 | 01-15-25 | 630,000 | 672,525 | |
| Vistra Energy Corp. (B) | 8.125 | 01-30-26 | 130,000 | 140,400 | |
| Multi-utilities 1.0% | |||||
| ACWA Power Management and Investments One, Ltd. (B) | 5.950 | 12-15-39 | 637,000 | 622,743 | |
| CenterPoint Energy, Inc. | 4.250 | 11-01-28 | 2,100,000 | 2,132,263 | |
| Cometa Energia SA de CV (B) | 6.375 | 04-24-35 | 203,322 | 195,209 | |
| Dominion Energy, Inc. | 2.579 | 07-01-20 | 3,150,000 | 3,129,967 | |
| DTE Energy Company | 3.500 | 06-01-24 | 2,150,000 | 2,109,709 | |
| Sempra Energy | 4.000 | 02-01-48 | 1,100,000 | 954,251 | |
| Term loans (H) 20.3% | $179,004,925 | ||||
| (Cost $186,296,556) | |||||
| Communication services 4.1% | 36,358,010 | ||||
| Diversified telecommunication services 1.0% | |||||
| Consolidated Communications, Inc., 2016 Term Loan B (1 month LIBOR + 3.000%) | 5.500 | 10-04-23 | 1,627,601 | 1,565,753 | |
| Frontier Communications Corp., 2017 Term Loan B1 (1 month LIBOR + 3.750%) | 6.250 | 06-15-24 | 1,896,125 | 1,809,624 | |
| Intelsat Jackson Holdings SA, 2017 Term Loan B3 (1 month LIBOR + 3.750%) | 6.252 | 11-27-23 | 835,000 | 826,800 | |
| Level 3 Parent LLC, 2017 Term Loan B (1 month LIBOR + 2.250%) | 4.756 | 02-22-24 | 964,000 | 945,925 | |
| Telesat Canada, Term Loan B4 (3 month LIBOR + 2.500%) | 5.310 | 11-17-23 | 1,692,777 | 1,658,211 | |
| West Corp., 2017 Term Loan (1 month LIBOR + 4.000%) | 6.499 | 10-10-24 | 1,580,089 | 1,446,856 | |
| Windstream Services LLC, Repriced Term Loan B6 (1 month LIBOR + 4.000%) | 6.510 | 03-29-21 | 1,045,128 | 970,663 | |
| Interactive media and services 0.3% | |||||
| MH Sub I LLC, 2017 1st Lien Term Loan (1 month LIBOR + 3.750%) | 6.269 | 09-13-24 | 1,351,122 | 1,325,369 | |
| TierPoint LLC, 2017 1st Lien Term Loan (1 month LIBOR + 3.750%) | 6.249 | 05-06-24 | 1,416,181 | 1,341,831 | |
| 26 | JOHN HANCOCK SHORT DURATION CREDIT OPPORTUNITIES FUND | SEMIANNUAL REPORT | SEE NOTES TO FINANCIAL STATEMENTS |
| Rate (%) | Maturity date | Par value^ | Value | ||
| Communication services (continued) | |||||
| Media 2.4% | |||||
| Altice France SA, USD Term Loan B11 (1 month LIBOR + 2.750%) | 5.249 | 07-31-25 | 1,688,849 | $1,553,741 | |
| AMC Entertainment Holdings, Inc., Initial Term Loan (1 month LIBOR + 2.250%) | 4.759 | 12-15-22 | 2,048,669 | 2,013,248 | |
| Charter Communications Operating LLC, 2017 Term Loan B (1 month LIBOR + 2.000%) | 4.500 | 04-30-25 | 1,668,150 | 1,643,878 | |
| Cogeco Communications USA II LP, 2017 1st Lien Term Loan (1 month LIBOR + 2.375%) | 4.874 | 01-03-25 | 1,014,900 | 993,333 | |
| Creative Artists Agency LLC, 2018 Term Loan B (1 month LIBOR + 3.000%) | 5.503 | 02-15-24 | 1,685,018 | 1,657,637 | |
| CSC Holdings LLC, 2017 1st Lien Term Loan (1 month LIBOR + 2.250%) | 4.759 | 07-17-25 | 1,714,102 | 1,657,862 | |
| Cumulus Media New Holdings, Inc., Exit Term Loan (1 month LIBOR + 4.500%) | 7.000 | 05-15-22 | 2,076,035 | 2,000,778 | |
| Formula One Management, Ltd., 2018 USD Term Loan (1 month LIBOR + 2.500%) | 4.999 | 02-01-24 | 1,279,902 | 1,229,243 | |
| Hubbard Radio LLC, 2015 Term Loan B (1 month LIBOR + 3.000%) | 6.020 | 03-28-25 | 1,154,936 | 1,134,725 | |
| Mission Broadcasting, Inc., 2018 Term Loan B3 (3 month LIBOR + 2.250%) | 4.756 | 01-17-24 | 137,563 | 132,920 | |
| Nexstar Broadcasting, Inc., 2018 Term Loan B3 (1 month LIBOR + 2.250%) | 4.752 | 01-17-24 | 795,712 | 768,857 | |
| Quebecor Media, Inc., Term Loan B1 (3 month LIBOR + 2.250%) | 4.866 | 08-17-20 | 1,059,711 | 1,051,763 | |
| Tribune Media Company, Term Loan (1 month LIBOR + 3.000%) | 5.499 | 12-27-20 | 183,524 | 183,371 | |
| Tribune Media Company, Term Loan C (1 month LIBOR + 3.000%) | 5.499 | 01-27-24 | 2,287,387 | 2,273,091 | |
| Unitymedia Finance LLC, Term Loan B (1 month LIBOR + 2.250%) | 4.759 | 09-30-25 | 1,475,000 | 1,450,795 | |
| Virgin Media Bristol LLC, USD Term Loan K (1 month LIBOR + 2.500%) | 5.009 | 01-15-26 | 1,325,000 | 1,299,520 | |
| Wireless telecommunication services 0.4% | |||||
| SBA Senior Finance II LLC, 2018 Term Loan B (1 month LIBOR + 2.000%) | 4.500 | 04-11-25 | 1,442,150 | 1,414,504 | |
| Sprint Communications, Inc., 1st Lien Term Loan B (1 month LIBOR + 2.500%) | 5.000 | 02-02-24 | 1,425,733 | 1,391,872 | |
| Syniverse Holdings, Inc., 2018 1st Lien Term Loan (1 month LIBOR + 5.000%) | 7.509 | 03-09-23 | 679,863 | 615,840 | |
| Consumer discretionary 2.3% | 19,944,896 | ||||
| Diversified consumer services 0.2% | |||||
| Weight Watchers International, Inc., 2017 Term Loan B (3 month LIBOR + 4.750%) | 7.560 | 11-29-24 | 1,665,584 | 1,655,175 | |
| Hotels, restaurants and leisure 1.1% | |||||
| Alterra Mountain Company, Term Loan B1 (1 month LIBOR + 3.000%) | 5.499 | 07-31-24 | 1,764,990 | 1,740,722 | |
| SEE NOTES TO FINANCIAL STATEMENTS | SEMIANNUAL REPORT | JOHN HANCOCK SHORT DURATION CREDIT OPPORTUNITIES FUND | 27 |
| Rate (%) | Maturity date | Par value^ | Value | ||
| Consumer discretionary (continued) | |||||
| Hotels, restaurants and leisure (continued) | |||||
| Boyd Gaming Corp., Term Loan B3 (1 week LIBOR + 2.250%) | 4.664 | 09-15-23 | 1,413,594 | $1,393,280 | |
| Caesars Resort Collection LLC, 2017 1st Lien Term Loan B (1 month LIBOR + 2.750%) | 5.249 | 12-22-24 | 1,422,159 | 1,401,011 | |
| CityCenter Holdings LLC, 2017 Term Loan B (1 month LIBOR + 2.250%) | 4.749 | 04-18-24 | 1,086,505 | 1,065,546 | |
| Golden Nugget, Inc., 2017 Incremental Term Loan B (1 month LIBOR + 2.750%) | 5.253 | 10-04-23 | 2,005,596 | 1,971,621 | |
| New Red Finance, Inc., Term Loan B3 (1 month LIBOR + 2.250%) | 4.749 | 02-16-24 | 950,113 | 933,486 | |
| Scientific Games International, Inc., 2018 Term Loan B5 (1 month LIBOR + 2.750%) | 5.249 | 08-14-24 | 760,222 | 736,146 | |
| Leisure products 0.2% | |||||
| Hayward Industries, Inc., 1st Lien Term Loan (1 month LIBOR + 3.500%) | 5.999 | 08-05-24 | 2,059,885 | 2,009,933 | |
| Multiline retail 0.3% | |||||
| JC Penney Corp., Inc., 2016 Term Loan B (3 month LIBOR + 4.250%) | 6.956 | 06-23-23 | 2,589,841 | 2,236,976 | |
| Specialty retail 0.5% | |||||
| Bass Pro Group LLC, Term Loan B (1 month LIBOR + 5.000%) | 7.499 | 09-25-24 | 1,627,196 | 1,606,856 | |
| Petco Animal Supplies, Inc., 2017 Term Loan B (3 month LIBOR + 3.250%) | 5.994 | 01-26-23 | 1,951,640 | 1,491,912 | |
| PetSmart, Inc., Term Loan B2 (1 month LIBOR + 3.000%) | 5.520 | 03-11-22 | 2,036,650 | 1,702,232 | |
| Consumer staples 2.0% | 17,434,532 | ||||
| Beverages 0.2% | |||||
| Sunshine Investments BV, USD Term Loan B3 (3 month LIBOR + 3.250%) | 5.866 | 03-28-25 | 1,595,000 | 1,567,088 | |
| Food and staples retailing 0.2% | |||||
| Albertson's LLC, Term Loan B7 (1 month LIBOR + 3.000%) | 5.499 | 11-17-25 | 2,175,685 | 2,126,732 | |
| Food products 1.0% | |||||
| Chobani LLC, 2017 Term Loan B (1 month LIBOR + 3.500%) | 5.999 | 10-10-23 | 1,102,629 | 1,054,665 | |
| Dole Food Company, Inc., 2017 Term Loan B (Prime rate + 1.750% and 1 and 3 month LIBOR + 2.750%) | 5.259 | 04-06-24 | 1,661,714 | 1,604,933 | |
| Hostess Brands LLC, 2017 Repriced Term Loan (1 and 3 month LIBOR + 2.250%) | 4.895 | 08-03-22 | 1,737,076 | 1,674,836 | |
| Nomad Foods Lux Sarl, 2017 USD Term Loan B4 (1 month LIBOR + 2.250%) | 4.759 | 05-15-24 | 2,598,850 | 2,523,483 | |
| Post Holdings, Inc., 2017 Series A Incremental Term Loan (1 month LIBOR + 2.000%) | 4.520 | 05-24-24 | 1,139,133 | 1,123,470 | |
| 28 | JOHN HANCOCK SHORT DURATION CREDIT OPPORTUNITIES FUND | SEMIANNUAL REPORT | SEE NOTES TO FINANCIAL STATEMENTS |
| Rate (%) | Maturity date | Par value^ | Value | ||
| Consumer staples (continued) | |||||
| Food products (continued) | |||||
| Sigma US Corp., 2018 USD Term Loan B2 (3 month LIBOR + 3.000%) | 5.797 | 07-02-25 | 1,190,020 | $1,136,469 | |
| Household products 0.2% | |||||
| Energizer Holdings, Inc., 2018 Term Loan B (1 month LIBOR + 2.250%) | 4.758 | 06-20-25 | 1,500,000 | 1,488,750 | |
| Personal products 0.4% | |||||
| Prestige Brands, Inc., Term Loan B4 (1 month LIBOR + 2.000%) | 4.499 | 01-26-24 | 1,133,287 | 1,116,287 | |
| Revlon Consumer Products Corp., 2016 Term Loan B (3 month LIBOR + 3.500%) | 6.207 | 09-07-23 | 2,854,300 | 2,017,819 | |
| Energy 0.6% | 5,057,558 | ||||
| Energy equipment and services 0.3% | |||||
| Apergy Corp., 2018 1st Lien Term Loan (Prime rate + 1.500% and 1 month LIBOR + 2.500%) | 5.162 | 05-09-25 | 838,354 | 820,539 | |
| HFOTCO LLC, 2018 Term Loan B (1 month LIBOR + 2.750%) | 5.250 | 06-26-25 | 1,338,275 | 1,319,874 | |
| Oil, gas and consumable fuels 0.3% | |||||
| FTS International, Inc., New Term Loan B (1 month LIBOR + 4.750%) | 7.249 | 04-16-21 | 297,897 | 292,684 | |
| Granite Acquisition, Inc., Term Loan B (3 month LIBOR + 3.500%) | 6.303 | 12-19-21 | 2,518,607 | 2,509,943 | |
| Granite Acquisition, Inc., Term Loan C (3 month LIBOR + 3.500%) | 6.303 | 12-19-21 | 114,913 | 114,518 | |
| Financials 0.8% | 7,468,336 | ||||
| Capital markets 0.1% | |||||
| Sequa Mezzanine Holdings LLC, 1st Lien Term Loan (1 and 3 month LIBOR + 5.000%) | 7.516 | 11-28-21 | 1,221,400 | 1,198,499 | |
| Diversified financial services 0.6% | |||||
| AlixPartners LLP, 2017 Term Loan B (1 month LIBOR + 2.750%) | 5.249 | 04-04-24 | 1,439,363 | 1,420,017 | |
| Crown Finance US, Inc., 2018 USD Term Loan (1 month LIBOR + 2.500%) | 4.999 | 02-28-25 | 1,513,038 | 1,474,833 | |
| Dakota Holding Corp., 2017 Term Loan B (1 month LIBOR + 3.250%) | 5.749 | 02-13-25 | 1,203,618 | 1,158,735 | |
| Refinitiv US Holdings, Inc., 2018 USD Term Loan (1 month LIBOR + 3.750%) | 6.249 | 10-01-25 | 1,280,000 | 1,228,006 | |
| Insurance 0.1% | |||||
| USI, Inc., 2017 Repriced Term Loan (3 month LIBOR + 3.000%) | 5.803 | 05-16-24 | 1,032,111 | 988,246 | |
| SEE NOTES TO FINANCIAL STATEMENTS | SEMIANNUAL REPORT | JOHN HANCOCK SHORT DURATION CREDIT OPPORTUNITIES FUND | 29 |
| Rate (%) | Maturity date | Par value^ | Value | ||
| Health care 2.3% | $20,176,701 | ||||
| Health care equipment and supplies 0.4% | |||||
| Air Medical Group Holdings, Inc., 2018 Term Loan B1 (1 month LIBOR + 3.250%) | 5.764 | 04-28-22 | 2,208,634 | 2,072,427 | |
| Kinetic Concepts, Inc., 2017 USD Term Loan B (3 month LIBOR + 3.250%) | 6.053 | 02-02-24 | 1,664,504 | 1,652,021 | |
| Health care providers and services 1.1% | |||||
| Air Methods Corp., 2017 Term Loan B (3 month LIBOR + 3.500%) | 6.303 | 04-21-24 | 2,056,162 | 1,670,632 | |
| Community Health Systems, Inc., Term Loan H (3 month LIBOR + 3.250%) | 5.957 | 01-27-21 | 657,555 | 645,910 | |
| Envision Healthcare Corp., 2018 1st Lien Term Loan (1 month LIBOR + 3.750%) | 6.249 | 10-10-25 | 3,110,000 | 2,924,955 | |
| RegionalCare Hospital Partners Holdings, Inc., 2018 Term Loan B (3 month LIBOR + 4.500%) | 7.129 | 11-16-25 | 1,705,000 | 1,661,949 | |
| Surgery Center Holdings, Inc., 2017 Term Loan B (1 month LIBOR + 3.250%) | 5.750 | 09-02-24 | 1,217,588 | 1,183,799 | |
| Team Health Holdings, Inc., 1st Lien Term Loan (1 month LIBOR + 2.750%) | 5.249 | 02-06-24 | 1,897,099 | 1,702,646 | |
| Health care technology 0.2% | |||||
| Change Healthcare Holdings LLC, 2017 Term Loan B (1 month LIBOR + 2.750%) | 5.249 | 03-01-24 | 1,453,487 | 1,421,511 | |
| Life sciences tools and services 0.2% | |||||
| Jaguar Holding Company II, 2018 Term Loan (1 month LIBOR + 2.500%) | 4.999 | 08-18-22 | 1,463,214 | 1,432,121 | |
| Pharmaceuticals 0.4% | |||||
| Endo International PLC, 2017 Term Loan B (1 month LIBOR + 4.250%) | 6.749 | 04-29-24 | 1,254,225 | 1,240,642 | |
| IQVIA, Inc., 2017 USD Term Loan B2 (1 month LIBOR + 2.000%) | 4.803 | 01-17-25 | 1,084,508 | 1,070,952 | |
| Valeant Pharmaceuticals International, 2018 Term Loan B (1 month LIBOR + 3.000%) | 5.513 | 06-02-25 | 1,514,691 | 1,497,136 | |
| Industrials 3.2% | 28,600,572 | ||||
| Air freight and logistics 0.1% | |||||
| XPO Logistics, Inc., 2018 Term Loan B (1 month LIBOR + 2.000%) | 4.500 | 02-24-25 | 1,000,000 | 983,610 | |
| Building products 0.1% | |||||
| HNC Holdings, Inc., Term Loan B (1 month LIBOR + 4.000%) | 6.499 | 10-05-23 | 1,360,036 | 1,331,135 | |
| Commercial services and supplies 0.8% | |||||
| Advanced Disposal Services, Inc., Term Loan B3 (1 week LIBOR + 2.250%) | 4.664 | 11-10-23 | 2,183,200 | 2,156,937 | |
| Clean Harbors, Inc., 2017 Term Loan B (1 month LIBOR + 1.750%) | 4.249 | 06-28-24 | 1,202,178 | 1,188,653 | |
| GFL Environmental, Inc., 2018 USD Term Loan B (1 month LIBOR + 2.750%) | 5.499 | 05-30-25 | 1,293,858 | 1,246,412 | |
| 30 | JOHN HANCOCK SHORT DURATION CREDIT OPPORTUNITIES FUND | SEMIANNUAL REPORT | SEE NOTES TO FINANCIAL STATEMENTS |
| Rate (%) | Maturity date | Par value^ | Value | ||
| Industrials (continued) | |||||
| Commercial services and supplies (continued) | |||||
| Prime Security Services Borrower LLC, 2016 1st Lien Term Loan (1 month LIBOR + 2.750%) | 5.249 | 05-02-22 | 1,256,874 | $1,238,021 | |
| TMS International Corp., 2018 Term Loan B2 (1 and 3 month LIBOR + 2.750%) | 5.400 | 08-14-24 | 925,322 | 895,018 | |
| Construction and engineering 0.1% | |||||
| Zodiac Pool Solutions LLC, 2018 Term Loan B (1 month LIBOR + 2.250%) | 4.749 | 07-02-25 | 935,300 | 920,803 | |
| Machinery 1.8% | |||||
| Accuride Corp., 2017 Term Loan B (3 month LIBOR + 5.250%) | 8.053 | 11-17-23 | 961,943 | 875,369 | |
| Blount International, Inc., 2018 Term Loan B (1 month LIBOR + 3.750%) | 6.249 | 04-12-23 | 2,092,406 | 2,084,559 | |
| Douglas Dynamics LLC, 2017 Incremental Term Loan (1 month LIBOR + 3.000%) | 5.499 | 12-31-21 | 1,333,969 | 1,308,957 | |
| Filtration Group Corp., 2018 1st Lien Term Loan (1 month LIBOR + 3.000%) | 5.499 | 03-29-25 | 2,388,129 | 2,365,251 | |
| Gardner Denver, Inc., 2017 USD Term Loan B (1 month LIBOR + 2.750%) | 5.249 | 07-30-24 | 1,131,198 | 1,123,427 | |
| Gates Global LLC, 2017 USD Repriced Term Loan B (1 month LIBOR + 2.750%) | 5.249 | 04-01-24 | 3,001,547 | 2,935,033 | |
| Navistar, Inc., 2017 1st Lien Term Loan B (1 month LIBOR + 3.500%) | 6.020 | 11-06-24 | 2,610,134 | 2,566,101 | |
| RBS Global, Inc., 2017 Term Loan B (1 month LIBOR + 2.000%) | 4.499 | 08-21-24 | 982,154 | 973,029 | |
| Titan Acquisition, Ltd., 2018 Term Loan B (1 month LIBOR + 3.000%) | 5.499 | 03-28-25 | 1,297,100 | 1,219,819 | |
| Welbilt, Inc., 2018 Term Loan B (1 month LIBOR + 2.500%) | 4.999 | 10-23-25 | 786,162 | 767,490 | |
| Professional services 0.1% | |||||
| Trans Union LLC, 2018 Term Loan B4 (1 month LIBOR + 2.000%) | 4.499 | 06-19-25 | 995,000 | 981,140 | |
| Trading companies and distributors 0.2% | |||||
| Beacon Roofing Supply, Inc., 2017 Term Loan B (1 month LIBOR + 2.250%) | 4.769 | 01-02-25 | 1,483,788 | 1,439,808 | |
| Information technology 2.6% | 22,801,065 | ||||
| Communications equipment 0.2% | |||||
| Ciena Corp., 2018 Term Loan B (1 month LIBOR + 2.000%) | 4.508 | 09-26-25 | 1,012,463 | 1,004,869 | |
| Plantronics, Inc., 2018 Term Loan B (1 month LIBOR + 2.500%) | 4.999 | 07-02-25 | 1,015,781 | 986,151 | |
| Electronic equipment, instruments and components 0.9% | |||||
| CPI International, Inc., 2017 1st Lien Term Loan (1 month LIBOR + 3.500%) | 6.002 | 07-26-24 | 1,752,813 | 1,713,374 | |
| Dell International LLC, 2017 Term Loan A2 (1 month LIBOR + 1.750%) | 4.250 | 09-07-21 | 2,053,645 | 2,026,948 | |
| Dell International LLC, 2017 Term Loan B (1 month LIBOR + 2.000%) | 4.500 | 09-07-23 | 2,051,458 | 2,021,445 | |
| SEE NOTES TO FINANCIAL STATEMENTS | SEMIANNUAL REPORT | JOHN HANCOCK SHORT DURATION CREDIT OPPORTUNITIES FUND | 31 |
| Rate (%) | Maturity date | Par value^ | Value | ||
| Information technology (continued) | |||||
| Electronic equipment, instruments and components (continued) | |||||
| Robertshaw US Holding Corp., 2018 1st Lien Term Loan (1 month LIBOR + 3.500%) | 6.000 | 02-28-25 | 1,171,150 | $1,081,850 | |
| Robertshaw US Holding Corp., 2018 2nd Lien Term Loan (1 month LIBOR + 8.000%) | 10.500 | 02-28-26 | 700,000 | 609,000 | |
| IT services 0.3% | |||||
| First Data Corp., 2017 USD Term Loan (1 month LIBOR + 2.000%) | 4.519 | 07-08-22 | 1,971,896 | 1,963,358 | |
| Optiv Security, Inc., 1st Lien Term Loan (1 month LIBOR + 3.250%) | 5.749 | 02-01-24 | 909,299 | 841,101 | |
| Software 0.9% | |||||
| Avaya, Inc., 2018 Term Loan B (1 month LIBOR + 4.250%) | 6.759 | 12-15-24 | 2,933,191 | 2,881,860 | |
| Infor US, Inc., Term Loan B6 (1 month LIBOR + 2.750%) | 5.249 | 02-01-22 | 1,553,824 | 1,543,336 | |
| SS&C European Holdings Sarl, 2018 Term Loan B4 (1 month LIBOR + 2.250%) | 4.749 | 04-16-25 | 665,788 | 651,826 | |
| SS&C Technologies, Inc., 2018 Term Loan B3 (1 month LIBOR + 2.250%) | 4.749 | 04-16-25 | 1,730,970 | 1,694,671 | |
| TIBCO Software, Inc., Repriced Term Loan B (1 month LIBOR + 3.500%) | 6.010 | 12-04-20 | 1,334,048 | 1,320,040 | |
| Technology hardware, storage and peripherals 0.3% | |||||
| HCP Acquisition LLC, 2017 Term Loan B (1 month LIBOR + 3.000%) | 5.499 | 05-16-24 | 1,115,990 | 1,084,463 | |
| Western Digital Corp., 2018 Term Loan B4 (1 month LIBOR + 1.750%) | 4.260 | 04-29-23 | 1,412,075 | 1,376,773 | |
| Materials 1.4% | 11,900,219 | ||||
| Chemicals 0.9% | |||||
| Alpha 3 BV, 2017 Term Loan B1 (3 month LIBOR + 3.000%) | 5.803 | 01-31-24 | 1,384,885 | 1,341,607 | |
| Axalta Coating Systems US Holdings, Inc., USD Term Loan B3 (3 month LIBOR + 1.750%) | 4.553 | 06-01-24 | 602,750 | 590,695 | |
| Encapsys LLC, 1st Lien Term Loan (1 month LIBOR + 3.250%) | 5.749 | 11-07-24 | 1,165,195 | 1,125,870 | |
| Encapsys LLC, 2nd Lien Term Loan (1 month LIBOR + 7.500%) | 9.999 | 11-07-25 | 800,000 | 760,000 | |
| Ferro Corp., 2018 USD Term Loan B1 (3 month LIBOR + 2.250%) | 5.053 | 02-14-24 | 1,631,898 | 1,609,459 | |
| MacDermid, Inc., Term Loan (I) | TBD | 11-14-25 | 725,000 | 716,242 | |
| OXEA Corp., 2017 USD Term Loan B2 (1 month LIBOR + 3.500%) | 6.063 | 10-14-24 | 1,371,155 | 1,352,301 | |
| Construction materials 0.1% | |||||
| Summit Materials LLC, 2017 Term Loan B (1 month LIBOR + 2.000%) | 4.499 | 11-21-24 | 1,064,250 | 1,035,866 | |
| 32 | JOHN HANCOCK SHORT DURATION CREDIT OPPORTUNITIES FUND | SEMIANNUAL REPORT | SEE NOTES TO FINANCIAL STATEMENTS |
| Rate (%) | Maturity date | Par value^ | Value | ||
| Materials (continued) | |||||
| Metals and mining 0.1% | |||||
| Covia Holdings Corp., Term Loan (3 month LIBOR + 3.750%) | 6.553 | 06-01-25 | 1,049,725 | $831,582 | |
| Paper and forest products 0.3% | |||||
| Flex Acquisition Company, Inc., 1st Lien Term Loan (1 month LIBOR + 3.000%) | 5.520 | 12-29-23 | 2,619,558 | 2,536,597 | |
| Real estate 0.4% | 3,830,531 | ||||
| Equity real estate investment trusts 0.4% | |||||
| Lightstone Holdco LLC, 2018 Term Loan B (1 month LIBOR + 3.750%) | 6.249 | 01-30-24 | 2,323,443 | 2,231,481 | |
| Lightstone Holdco LLC, 2018 Term Loan C (1 month LIBOR + 3.750%) | 6.249 | 01-30-24 | 158,433 | 152,163 | |
| VICI Properties 1 LLC, Replacement Term Loan B (1 month LIBOR + 2.000%) | 4.503 | 12-20-24 | 1,475,000 | 1,446,887 | |
| Utilities 0.6% | 5,432,505 | ||||
| Electric utilities 0.5% | |||||
| Vistra Operations Company LLC, 1st Lien Term Loan B3 (1 month LIBOR + 2.000%) | 4.505 | 12-31-25 | 1,939,228 | 1,900,986 | |
| Vistra Operations Company LLC, 2016 Term Loan B2 (1 month LIBOR + 2.250%) | 4.749 | 12-14-23 | 2,513,700 | 2,485,949 | |
| Independent power and renewable electricity producers 0.1% | |||||
| Calpine Corp., Term Loan B5 (3 month LIBOR + 2.500%) | 5.310 | 01-15-24 | 1,065,669 | 1,045,570 | |
| Collateralized mortgage obligations 10.9% | $96,198,224 | ||||
| (Cost $94,041,552) | |||||
| Commercial and residential 10.7% | 94,538,749 | ||||
| 280 Park Avenue Mortgage Trust Series 2015-280P, Class A (1 month LIBOR + 0.880%) (A)(B) | 3.389 | 09-15-34 | 2,500,000 | 2,484,317 | |
| Arroyo Mortgage Trust Series 2018-1, Class A1 (B)(J) | 3.763 | 04-25-48 | 2,207,718 | 2,206,152 | |
| BBCMS Mortgage Trust | |||||
| Series 2018, Class TALL A (1 month LIBOR + 0.722%) (A)(B) | 3.231 | 03-15-37 | 3,700,000 | 3,635,076 | |
| Series 2018-TALL, Class B (1 month LIBOR + 0.971%) (A)(B) | 3.480 | 03-15-37 | 2,225,000 | 2,198,713 | |
| BBCMS Trust | |||||
| Series 2018, Class RRI (1 month LIBOR + 0.700%) (A)(B) | 3.209 | 02-15-33 | 2,356,976 | 2,327,412 | |
| Series 2018-BXH, Class A (1 month LIBOR + 1.000%) (A)(B) | 3.509 | 10-15-37 | 2,400,000 | 2,355,420 | |
| BX Trust Series 2017-SLCT, Class A (1 month LIBOR + 0.920%) (A)(B) | 3.429 | 07-15-34 | 876,341 | 870,844 | |
| CG-CCRE Commercial Mortgage Trust Series 2014-FL2, Class A (1 month LIBOR + 1.854%) (A)(B) | 4.363 | 11-15-31 | 1,216,964 | 1,217,088 | |
| SEE NOTES TO FINANCIAL STATEMENTS | SEMIANNUAL REPORT | JOHN HANCOCK SHORT DURATION CREDIT OPPORTUNITIES FUND | 33 |
| Rate (%) | Maturity date | Par value^ | Value | ||
| Commercial and residential (continued) | |||||
| CGMS Commercial Mortgage Trust Series 2017-MDRB, Class A (1 month LIBOR + 1.100%) (A)(B) | 3.609 | 07-15-30 | 2,849,396 | $2,847,798 | |
| CHT Mortgage Trust Series 2017-CSMO, Class A (1 month LIBOR + 0.930%) (A)(B) | 3.439 | 11-15-36 | 4,900,000 | 4,878,484 | |
| Citigroup Commercial Mortgage Trust (Citigroup/Drexel Hamilton) Series 2018-TBR, Class A (1 month LIBOR + 0.830%) (A)(B) | 3.339 | 12-15-36 | 3,575,000 | 3,539,134 | |
| Citigroup Mortgage Loan Trust Series 2013-2, Class 5A1 (1 month LIBOR + 0.140%) (A)(B) | 2.455 | 07-25-36 | 1,636,093 | 1,589,469 | |
| COLT Mortgage Loan Trust Series 2018-1, Class A1 (B)(J) | 2.930 | 02-25-48 | 1,095,511 | 1,084,449 | |
| Countrywide Home Loan Mortgage Pass Through Trust | |||||
| Series 2006-3, Class 3A1 (1 month LIBOR + 0.250%) (A) | 2.815 | 02-25-36 | 913,022 | 856,249 | |
| Series 2004-25, Class 2A1 (1 month LIBOR + 0.680%) (A) | 2.995 | 02-25-35 | 2,286,075 | 2,240,519 | |
| DBGS Mortgage Trust Series 2018-5BP, Class A (1 month LIBOR + 0.645%) (A)(B) | 3.154 | 06-15-33 | 4,000,000 | 3,923,185 | |
| Deephaven Residential Mortgage Trust Series 2018-1A, Class A1 (B)(J) | 2.976 | 12-25-57 | 1,991,748 | 1,973,911 | |
| Financial Asset Securities Corp. AAA Trust Series 2005-2, Class A3 (1 month LIBOR + 0.300%) (A)(B) | 2.802 | 11-26-35 | 2,411,146 | 2,327,842 | |
| GS Mortgage Securities Corp. Trust Series 2018-FBLU, Class A (1 month LIBOR + 0.950%) (A)(B) | 3.410 | 11-15-35 | 2,600,000 | 2,595,157 | |
| HarborView Mortgage Loan Trust Series 2007-3, Class 2A1A (1 month LIBOR + 0.200%) (A) | 2.706 | 05-19-47 | 2,057,437 | 1,952,945 | |
| Hilton Orlando Trust Series 2018-ORL, Class A (1 month LIBOR + 0.770%) (A)(B) | 3.279 | 12-15-34 | 2,675,000 | 2,648,142 | |
| Hudsons Bay Simon JV Trust Series 2015-HBFL, Class AFL (1 month LIBOR + 1.580%) (A)(B) | 4.343 | 08-05-34 | 6,250,000 | 6,259,131 | |
| IndyMac INDA Mortgage Loan Trust Series 2005-AR2, Class 1A1 (J) | 3.382 | 01-25-36 | 529,522 | 479,754 | |
| JPMBB Commercial Mortgage Securities Trust Series 2015-C29, Class A2 | 2.921 | 05-15-48 | 1,945,915 | 1,940,284 | |
| JPMorgan Chase Commercial Mortgage Securities Trust | |||||
| Series 2006-LDP9, Class AMS | 5.337 | 05-15-47 | 4,635,000 | 4,275,788 | |
| Series 2007-LDPX, Class AM (J) | 5.464 | 01-15-49 | 783,733 | 784,135 | |
| Series 2017-MAUI, Class A (1 month LIBOR + 0.830%) (A)(B) | 3.341 | 07-15-34 | 1,150,000 | 1,139,394 | |
| LSTAR Securities Investment, Ltd. | |||||
| Series 2017-5R, Class A (1 month LIBOR + 2.500%) (A)(B) | 4.879 | 05-06-22 | 1,957,611 | 1,947,822 | |
| 34 | JOHN HANCOCK SHORT DURATION CREDIT OPPORTUNITIES FUND | SEMIANNUAL REPORT | SEE NOTES TO FINANCIAL STATEMENTS |
| Rate (%) | Maturity date | Par value^ | Value | ||
| Commercial and residential (continued) | |||||
| Series 2017-6, Class A (1 month LIBOR + 1.750%) (A)(B) | 4.270 | 09-01-22 | 2,621,688 | $2,620,869 | |
| Series 2017-9, Class A (1 month LIBOR + 1.550%) (A)(B) | 4.070 | 12-01-22 | 2,264,951 | 2,264,243 | |
| MSCG Trust Series 2018-SELF, Class A (1 month LIBOR + 0.900%) (A)(B) | 3.409 | 10-15-37 | 1,775,000 | 1,761,652 | |
| RBS Commercial Funding, Inc. Trust Series 2013-GSP, Class A (B)(J) | 3.834 | 01-15-32 | 4,250,000 | 4,317,444 | |
| RBSSP Resecuritization Trust | |||||
| Series 2012-6, Class 10A1 (1 month LIBOR + 0.150%) (A)(B) | 2.656 | 08-26-36 | 592,346 | 592,350 | |
| Series 2012-6, Class 4A1 (1 month LIBOR + 0.330%) (A)(B) | 2.836 | 01-26-36 | 1,234,783 | 1,216,404 | |
| Series 2012-6, Class 6A1 (1 month LIBOR + 0.340%) (A)(B) | 2.846 | 11-26-35 | 3,180,837 | 3,174,252 | |
| Series 2012-6, Class 8A1 (1 month LIBOR + 0.500%) (A)(B) | 3.006 | 04-26-35 | 864,488 | 858,526 | |
| Waldorf Astoria Boca Raton Trust Series 2016-BOCA, Class A (1 month LIBOR + 1.350%) (A)(B) | 3.859 | 06-15-29 | 2,700,000 | 2,702,505 | |
| WaMu Mortgage Pass Through Certificates Series 2005-AR6, Class 2A1A (1 month LIBOR + 0.460%) (A) | 2.970 | 04-25-45 | 1,757,198 | 1,759,340 | |
| WaMu Mortgage Pass-Through Certificates | |||||
| Series 2005-AR1, Class A1A (1 month LIBOR + 0.640%) (A) | 3.150 | 01-25-45 | 750,269 | 767,696 | |
| Series 2005-AR11, Class A1 (1 month LIBOR + 0.320%) (A) | 2.830 | 08-25-45 | 1,929,551 | 1,917,623 | |
| Series 2005-AR19, Class A1A1 (1 month LIBOR + 0.270%) (A) | 3.046 | 12-25-45 | 1,887,086 | 1,867,305 | |
| Series 2005-AR8, Class 1A (1 month LIBOR + 0.540%) (A) | 3.050 | 07-25-45 | 1,502,046 | 1,504,101 | |
| Wells Fargo Mortgage Backed Securities Trust Series 2005-AR4, Class 2A2 (J) | 4.424 | 04-25-35 | 631,482 | 635,825 | |
| U.S. Government Agency 0.2% | 1,659,475 | ||||
| Federal Home Loan Mortgage Corp. | |||||
| Series 2015-SC02, Class 1A | 3.000 | 09-25-45 | 275,764 | 269,785 | |
| Series 4013, Class DK | 3.000 | 02-15-31 | 1,082,875 | 1,106,989 | |
| Government National Mortgage Association Series 2014-80, Class XA | 3.000 | 06-20-40 | 281,791 | 282,701 | |
| Asset backed securities 9.6% | $84,496,394 | ||||
| (Cost $84,765,809) | |||||
| Asset backed securities 9.6% | 84,496,394 | ||||
| AmeriCredit Automobile Receivables Trust Series 2017-3, Class C | 2.690 | 06-19-23 | 2,150,000 | 2,122,289 | |
| Chesapeake Funding II LLC Series 2016-1A, Class A2 (1 month LIBOR + 1.150%) (A)(B) | 3.659 | 03-15-28 | 567,749 | 568,831 | |
| SEE NOTES TO FINANCIAL STATEMENTS | SEMIANNUAL REPORT | JOHN HANCOCK SHORT DURATION CREDIT OPPORTUNITIES FUND | 35 |
| Rate (%) | Maturity date | Par value^ | Value | ||
| Asset backed securities (continued) | |||||
| Ford Credit Auto Owner Trust Series 2018-1, Class A (B) | 3.190 | 07-15-31 | 2,400,000 | $2,368,784 | |
| Hertz Fleet Lease Funding LP Series 2017-1, Class A1 (1 month LIBOR + 0.650%) (A)(B) | 3.037 | 04-10-31 | 1,680,459 | 1,683,080 | |
| Hyundai Auto Lease Securitization Trust Series 2017-C, Class A3 (B) | 2.120 | 02-16-21 | 2,615,000 | 2,599,760 | |
| Invitation Homes Trust | |||||
| Series 2018-SFR1, Class A (1 month LIBOR + 0.700%) (A)(B) | 3.208 | 03-17-37 | 2,968,035 | 2,914,207 | |
| Series 2018-SFR2, Class A (1 month LIBOR + 0.900%) (A)(B) | 3.409 | 06-17-37 | 1,906,065 | 1,890,677 | |
| Series 2018-SFR3, Class A (1 month LIBOR + 1.000%) (A)(B) | 3.508 | 07-17-37 | 3,229,442 | 3,218,144 | |
| Mill City Mortgage Loan Trust | |||||
| Series 2016-1, Class A1 (B)(J) | 2.500 | 04-25-57 | 1,286,155 | 1,261,510 | |
| Series 2017-1, Class A1 (B)(J) | 2.750 | 11-25-58 | 37,172 | 36,565 | |
| New Residential Advance Receivables Trust Series 2017-T1, Class AT1 (B) | 3.214 | 02-15-51 | 4,625,000 | 4,613,788 | |
| Oak Hill Advisors Residential Loan Trust Series 2017-NPL2, Class A1 (B) | 3.000 | 07-25-57 | 1,082,219 | 1,059,738 | |
| Pretium Mortgage Credit Partners I LLC | |||||
| Series 2017-NPL5, Class A1 (B)(J) | 3.327 | 12-30-32 | 4,149,268 | 4,091,139 | |
| Series 2018-NPL2, Class A1 (B) | 3.700 | 03-27-33 | 2,004,080 | 1,977,667 | |
| RCO V Mortgage LLC Series 2018-1, Class A1 (B) | 4.000 | 05-25-23 | 2,151,083 | 2,144,457 | |
| Santander Drive Auto Receivables Trust Series 2018-1, Class E (B) | 4.370 | 05-15-25 | 1,775,000 | 1,761,563 | |
| SLC Student Loan Trust Series 2004-1, Class A6 (3 month LIBOR + 0.160%) (A) | 2.776 | 05-15-23 | 2,001,307 | 2,000,463 | |
| SoFi Professional Loan Program LLC | |||||
| Series 2015-C, Class A1 (1 month LIBOR + 1.050%) (A)(B) | 3.560 | 08-27-35 | 856,275 | 861,810 | |
| Series 2016-C, Class A1 (1 month LIBOR + 1.100%) (A)(B) | 3.610 | 10-27-36 | 1,061,695 | 1,075,639 | |
| Series 2016-D, Class A1 (1 month LIBOR + 0.950%) (A)(B) | 3.460 | 01-25-39 | 643,397 | 647,434 | |
| Springleaf Funding Trust Series 2016-AA, Class A (B) | 2.900 | 11-15-29 | 3,492,739 | 3,477,234 | |
| TAL Advantage V LLC Series 2013-2A, Class A (B) | 3.550 | 11-20-38 | 1,812,500 | 1,803,118 | |
| Towd Point Mortgage Trust | |||||
| Series 2016-2, Class A1A (B)(J) | 2.750 | 08-25-55 | 1,253,650 | 1,231,471 | |
| Series 2018-4, Class A1 (B)(J) | 3.000 | 06-25-58 | 4,014,842 | 3,915,292 | |
| Trafigura Securitisation Finance PLC | |||||
| Series 2017-1A, Class A1 (1 month LIBOR + 0.850%) (A)(B) | 3.359 | 12-15-20 | 3,550,000 | 3,567,044 | |
| Series 2018-1A, Class A1 (1 month LIBOR + 0.730%) (A)(B) | 3.239 | 03-15-22 | 2,725,000 | 2,725,687 | |
| VOLT LXII LLC Series 2017-NPL9, Class A1 (B) | 3.125 | 09-25-47 | 1,438,570 | 1,425,084 | |
| 36 | JOHN HANCOCK SHORT DURATION CREDIT OPPORTUNITIES FUND | SEMIANNUAL REPORT | SEE NOTES TO FINANCIAL STATEMENTS |
| Rate (%) | Maturity date | Par value^ | Value | ||
| Asset backed securities (continued) | |||||
| VOLT LXIV LLC Series 2017-NP11, Class A1 (B) | 3.375 | 10-25-47 | 3,390,737 | $3,379,307 | |
| VOLT LXIX LLC Series 2018-NPL5, Class A1A (B) | 4.213 | 08-25-48 | 2,117,107 | 2,118,427 | |
| VOLT LXV LLC Series 2018-NPL1, Class A1 (B) | 3.750 | 04-25-48 | 4,065,588 | 4,028,075 | |
| VOLT LXX LLC Series 2018-NPL6, Class A1A (B) | 4.115 | 09-25-48 | 2,111,513 | 2,109,714 | |
| VOLT LXXII LLC Series 2018-NPL8, Class A1A (B) | 4.213 | 10-26-48 | 3,853,569 | 3,837,525 | |
| VOLT LXXIII LLC Series 2018-NPL9, Class A1A (B) | 4.458 | 10-25-48 | 1,200,000 | 1,197,785 | |
| VOLT LXXIV LLC Series 2018-NP10, Class A1A (B) | 4.581 | 11-25-48 | 2,438,482 | 2,443,801 | |
| Westlake Automobile Receivables Trust Series 2018-1A, Class A2B (1 month LIBOR + 0.250%) (A)(B) | 2.759 | 12-15-20 | 862,722 | 862,559 | |
| World Financial Network Credit Card Master Trust | |||||
| Series 2017-C Class M | 2.660 | 08-15-24 | 3,375,000 | 3,337,671 | |
| Series 2018-B Class M | 3.810 | 07-15-25 | 4,100,000 | 4,139,055 | |
| Shares | Value | ||||
| Common stocks 0.1% | $634,074 | ||||
| (Cost $615,301) | |||||
| Consumer discretionary 0.1% | 322,988 | ||||
| Media 0.1% | |||||
| Cumulus Media, Inc., Class A (D) | 26,806 | 322,988 | |||
| Energy 0.0% | 172,255 | ||||
| Energy equipment and services 0.0% | |||||
| Paragon Offshore PLC, Litigation Trust A (D) | 2,695 | 2,358 | |||
| Paragon Offshore PLC, Litigation Trust B (D) | 1,348 | 46,843 | |||
| Southcross Holdings Borrower LP (D) | 246 | 123,000 | |||
| Oil, gas and consumable fuels 0.0% | |||||
| Euronav NV | 7 | 54 | |||
| Information technology 0.0% | 138,831 | ||||
| Software 0.0% | |||||
| Avaya Holdings Corp. (D) | 8,210 | 138,831 | |||
| Rate (%) | Maturity date | Par value^ | Value | ||
| Escrow certificates 0.0% | $16,813 | ||||
| (Cost $4,430) | |||||
| Midstates Petroleum Company, Inc. (D)(K) | 10.750 | 10-01-20 | 650,000 | 582 | |
| Texas Competitive Electric Holdings Company LLC (D)(K) | 11.500 | 10-01-20 | 10,820,544 | 16,231 | |
| SEE NOTES TO FINANCIAL STATEMENTS | SEMIANNUAL REPORT | JOHN HANCOCK SHORT DURATION CREDIT OPPORTUNITIES FUND | 37 |
| Shares | Value | ||||
| Warrants 0.0% | $100 | ||||
| (Cost $0) | |||||
| Halcon Resources Corp. (Expiration Date: 9-9-20; Strike Price: $14.04) (D) | 4,896 | 98 | |||
| Midstates Petroleum Company, Inc. (Expiration Date: 4-21-20; Strike Price $24.00) (D) | 2,196 | 2 |
| Yield (%) | Shares | Value | |||
| Securities lending collateral 0.4% | $3,443,133 | ||||
| (Cost $3,441,742) | |||||
| John Hancock Collateral Trust (L) | 2.5450(M) | 344,083 | 3,443,133 | ||
| Yield*(%) | Maturity date | Par value^ | Value | ||
| Short-term investments 5.7% | $50,472,266 | ||||
| (Cost $50,466,091) | |||||
| Foreign government 0.0% | 465,187 | ||||
| Argentina Treasury Bill | (7.821) | 06-28-19 | ARS | 5,400,000 | 154,286 |
| Egypt Treasury Bill | 16.540 | 08-06-19 | EGP | 6,000,000 | 310,901 |
| Yield (%) | Shares | Value | |||
| Money market funds 5.7% | 50,007,079 | ||||
| State Street Institutional Treasury Plus Money Market Fund, Premier Class | 2.3189(M) | 50,007,079 | 50,007,079 | ||
| Total investments (Cost $884,384,013) 98.7% | $869,024,563 | ||||
| Other assets and liabilities, net 1.3% | 11,145,367 | ||||
| Total net assets 100.0% | $880,169,930 | ||||
| The percentage shown for each investment category is the total value of the category as a percentage of the net assets of the fund. | |
| ^All par values are denominated in U.S. dollars unless otherwise indicated. | |
| Currency Abbreviations | |
| ARS | Argentine Peso |
| BRL | Brazilian Real |
| CLP | Chilean Peso |
| COP | Colombian Peso |
| CZK | Czech Republic Koruna |
| EGP | Egyptian Pound |
| EUR | Euro |
| IDR | Indonesian Rupiah |
| KZT | Kazakhstan Tenge |
| MXN | Mexican Peso |
| MYR | Malaysian Ringgit |
| PEN | Peruvian Nuevo Sol |
| PLN | Polish Zloty |
| RUB | Russian Ruble |
| THB | Thai Bhat |
| TRY | Turkish Lira |
| UYU | Uruguayan Peso |
| 38 | JOHN HANCOCK SHORT DURATION CREDIT OPPORTUNITIES FUND | SEMIANNUAL REPORT | SEE NOTES TO FINANCIAL STATEMENTS |
| ZAR | South African Rand |
| Security Abbreviations and Legend | |
| CMT | Constant Maturity Treasury |
| ISDAFIX | International Swaps and Derivatives Association Fixed Interest Rate Swap Rate |
| LIBOR | London Interbank Offered Rate |
| PIK | Pay-in-Kind Security - Represents a payment-in-kind which may pay interest in additional par and/or cash. Rates shown are the current rate and most recent payment rate. |
| (A) | Variable rate obligation. The coupon rate shown represents the rate at period end. |
| (B) | These securities are exempt from registration under Rule 144A of the Securities Act of 1933. Such securities may be resold, normally to qualified institutional buyers, in transactions exempt from registration. Rule 144A securities amounted to $274,015,853 or 31.1% of the fund's net assets as of 1-31-19. |
| (C) | Zero coupon bonds are issued at a discount from their principal amount in lieu of paying interest periodically. Rate shown is the effective yield at period end. |
| (D) | Non-income producing security. |
| (E) | Non-income producing - Issuer is in default. |
| (F) | All or a portion of this security is on loan as of 1-31-19. |
| (G) | Perpetual bonds have no stated maturity date. Date shown as maturity date is next call date. |
| (H) | Term loans are variable rate obligations. The coupon rate shown represents the rate at period end. |
| (I) | This position represents an unsettled loan commitment at period end. Certain details associated with this purchase are not known prior to the settlement date, including coupon rate, which is disclosed as TBD (To Be Determined). |
| (J) | Variable or floating rate security, the interest rate of which adjusts periodically based on a weighted average of interest rates and prepayments on the underlying pool of assets. The interest rate shown is the current rate as of period end. |
| (K) | Security is valued using significant unobservable inputs and is classified as Level 3 in the fair value hierarchy. |
| (L) | Investment is an affiliate of the fund, the advisor and/or subadvisor. This security represents the investment of cash collateral received for securities lending. |
| (M) | The rate shown is the annualized seven-day yield as of 1-31-19. |
| * | Yield represents either the annualized yield at the date of purchase, the stated coupon rate or, for floating rate securities, the rate at period end. |
| SEE NOTES TO FINANCIAL STATEMENTS | SEMIANNUAL REPORT | JOHN HANCOCK SHORT DURATION CREDIT OPPORTUNITIES FUND | 39 |
| Open contracts | Number of contracts | Position | Expiration date | Notional basis* | Notional value* | Unrealized appreciation (depreciation) |
| 2-Year U.S. Treasury Note Futures | 170 | Long | Mar 2019 | $35,852,050 | $36,095,781 | $243,731 |
| 5-Year U.S. Treasury Note Futures | 481 | Long | Mar 2019 | 54,249,604 | 55,247,359 | 997,755 |
| 10-Year U.S. Treasury Note Futures | 376 | Short | Mar 2019 | (44,763,138) | (46,048,250) | (1,285,112) |
| Ultra U.S. Treasury Bond Futures | 372 | Short | Mar 2019 | (56,560,028) | (59,938,501) | (3,378,473) |
| $(3,422,099) |
| Contract to buy | Contract to sell | Counterparty (OTC) | Contractual settlement date | Unrealized appreciation | Unrealized depreciation | ||
| ARS | 13,909,466 | USD | 337,690 | JPMorgan Chase Bank N.A. | 2/13/2019 | $31,618 | — |
| ARS | 6,797,697 | USD | 162,678 | Citibank N.A. | 2/22/2019 | 16,128 | — |
| ARS | 30,271,211 | USD | 722,808 | JPMorgan Chase Bank N.A. | 2/22/2019 | 73,443 | — |
| ARS | 1,090,000 | USD | 26,898 | Citibank N.A. | 3/27/2019 | 790 | — |
| ARS | 10,971,078 | USD | 272,536 | JPMorgan Chase Bank N.A. | 3/27/2019 | 6,150 | — |
| BRL | 4,331,000 | USD | 1,128,873 | Goldman Sachs International | 2/4/2019 | 58,613 | — |
| BRL | 2,810,000 | USD | 743,697 | JPMorgan Chase Bank N.A. | 2/4/2019 | 26,757 | — |
| BRL | 2,941,000 | USD | 789,276 | Goldman Sachs International | 3/6/2019 | 15,805 | — |
| BRL | 2,810,000 | USD | 754,484 | JPMorgan Chase Bank N.A. | 3/6/2019 | 14,736 | — |
| CAD | 5,860,000 | USD | 4,304,542 | Citibank N.A. | 2/4/2019 | 155,599 | — |
| CLP | 462,262,169 | USD | 676,752 | Citibank N.A. | 2/22/2019 | 28,183 | — |
| CLP | 387,877,675 | USD | 568,152 | Goldman Sachs International | 2/22/2019 | 23,348 | — |
| CZK | 4,619,452 | USD | 205,413 | Citibank N.A. | 3/8/2019 | 40 | — |
| CZK | 17,483,720 | USD | 777,296 | Goldman Sachs International | 3/8/2019 | 304 | — |
| CZK | 11,836,828 | USD | 526,233 | JPMorgan Chase Bank N.A. | 3/8/2019 | 218 | — |
| EUR | 7,420,000 | JPY | 926,878,723 | Citibank N.A. | 2/12/2019 | — | $(15,966) |
| EUR | 1,900,000 | JPY | 237,624,830 | JPMorgan Chase Bank N.A. | 2/28/2019 | — | (6,470) |
| EUR | 1,890,000 | USD | 2,154,196 | JPMorgan Chase Bank N.A. | 2/4/2019 | 9,098 | — |
| EUR | 3,930,000 | USD | 4,499,025 | Goldman Sachs International | 2/19/2019 | 4,921 | — |
| EUR | 1,900,000 | USD | 2,173,210 | Citibank N.A. | 2/28/2019 | 5,923 | — |
| EUR | 1,910,000 | USD | 2,172,088 | JPMorgan Chase Bank N.A. | 2/28/2019 | 18,514 | — |
| EUR | 1,890,000 | USD | 2,177,268 | Citibank N.A. | 3/4/2019 | — | (8,872) |
| EUR | 546,905 | USD | 628,325 | JPMorgan Chase Bank N.A. | 3/11/2019 | — | (468) |
| HUF | 353,656,150 | USD | 1,266,087 | Goldman Sachs International | 2/22/2019 | 16,884 | — |
| HUF | 96,729,850 | USD | 346,181 | JPMorgan Chase Bank N.A. | 2/22/2019 | 4,730 | — |
| IDR | 4,233,780,000 | USD | 298,700 | JPMorgan Chase Bank N.A. | 3/29/2019 | 3,554 | — |
| PLN | 1,403,716 | USD | 372,347 | Citibank N.A. | 2/22/2019 | 4,959 | — |
| PLN | 1,177,284 | USD | 311,973 | Goldman Sachs International | 2/22/2019 | 4,469 | — |
| SGD | 12,290,000 | USD | 9,003,973 | JPMorgan Chase Bank N.A. | 2/7/2019 | 125,777 | — |
| TRY | 455,000 | USD | 84,777 | JPMorgan Chase Bank N.A. | 2/28/2019 | 1,959 | — |
| USD | 368,329 | ARS | 13,909,466 | JPMorgan Chase Bank N.A. | 2/13/2019 | — | (980) |
| USD | 143,603 | ARS | 5,500,000 | JPMorgan Chase Bank N.A. | 2/22/2019 | — | (1,068) |
| 40 | JOHN HANCOCK SHORT DURATION CREDIT OPPORTUNITIES FUND | SEMIANNUAL REPORT | SEE NOTES TO FINANCIAL STATEMENTS |
| Contract to buy | Contract to sell | Counterparty (OTC) | Contractual settlement date | Unrealized appreciation | Unrealized depreciation | ||
| USD | 1,152,312 | BRL | 4,331,000 | Goldman Sachs International | 2/4/2019 | — | $(35,174) |
| USD | 755,884 | BRL | 2,810,000 | JPMorgan Chase Bank N.A. | 2/4/2019 | — | (14,570) |
| USD | 2,134,403 | CAD | 2,850,000 | Citibank N.A. | 2/4/2019 | — | (34,777) |
| USD | 2,267,686 | CAD | 3,010,000 | JPMorgan Chase Bank N.A. | 2/4/2019 | — | (23,273) |
| USD | 201,528 | CLP | 135,708,239 | Citibank N.A. | 2/22/2019 | — | (5,423) |
| USD | 456,912 | CLP | 306,654,675 | Goldman Sachs International | 2/22/2019 | — | (10,727) |
| USD | 2,172,139 | EUR | 1,890,000 | Citibank N.A. | 2/4/2019 | $8,846 | — |
| USD | 12,355,515 | EUR | 10,834,764 | JPMorgan Chase Bank N.A. | 3/11/2019 | — | (82,993) |
| USD | 330,073 | MXN | 6,323,481 | Citibank N.A. | 3/22/2019 | 1,646 | — |
| USD | 1,429,181 | MXN | 27,382,825 | Goldman Sachs International | 3/22/2019 | 6,983 | — |
| USD | 785,667 | MXN | 15,035,694 | JPMorgan Chase Bank N.A. | 3/22/2019 | 4,749 | — |
| USD | 210,737 | PEN | 704,367 | Citibank N.A. | 3/29/2019 | — | (574) |
| USD | 291,892 | PEN | 975,533 | JPMorgan Chase Bank N.A. | 3/29/2019 | — | (769) |
| USD | 316,316 | PLN | 1,188,700 | Citibank N.A. | 2/22/2019 | — | (3,195) |
| USD | 1,432,860 | RUB | 96,613,900 | Goldman Sachs International | 3/15/2019 | — | (35,417) |
| USD | 4,260,733 | SGD | 5,780,000 | Citibank N.A. | 2/7/2019 | — | (32,998) |
| USD | 2,392,443 | SGD | 3,255,000 | Goldman Sachs International | 2/7/2019 | — | (25,567) |
| USD | 2,403,640 | SGD | 3,255,000 | JPMorgan Chase Bank N.A. | 2/7/2019 | — | (14,369) |
| USD | 564,587 | THB | 18,481,741 | JPMorgan Chase Bank N.A. | 2/14/2019 | — | (27,100) |
| USD | 575,131 | TRY | 3,160,000 | JPMorgan Chase Bank N.A. | 2/28/2019 | — | (27,260) |
| USD | 353,317 | ZAR | 4,846,000 | JPMorgan Chase Bank N.A. | 2/7/2019 | — | (11,917) |
| ZAR | 3,162,777 | USD | 228,439 | Goldman Sachs International | 2/7/2019 | 9,934 | — |
| ZAR | 5,523,223 | USD | 398,875 | JPMorgan Chase Bank N.A. | 2/7/2019 | 17,400 | — |
| $702,078 | $(419,927) | ||||||
| Interest rate swaps | ||||||||||
| Counterparty (OTC)/ Centrally cleared | Notional amount | Currency | Payments made | Payments received | Fixed payment frequency | Floating payment frequency | Maturity date | Unamortized upfront payment paid (received) | Unrealized appreciation (depreciation) | Value |
| Centrally cleared | 3,515,000 | ZAR | ZAR JIBAR SAFEX | Fixed 7.315% | Quarterly | Quarterly | Apr 2023 | $(6) | $2 | $(4) |
| $(6) | $2 | $(4) | ||||||||
| Credit default swaps - Buyer | ||||||||||
| Counterparty (OTC)/ Centrally cleared | Reference obligation | Notional amount | Currency | USD notional amount | Pay fixed rate | Fixed payment frequency | Maturity date | Unamortized upfront payment paid (received) | Unrealized appreciation (depreciation) | Value |
| Centrally cleared | CDX.EM.30 | 27,050,000 | USD | $27,050,000 | 1.000% | Quarterly | Dec 2023 | $987,325 | $(177,628) | $809,697 |
| Centrally cleared | CDX.NA.HY.31 | 30,037,000 | USD | 30,037,000 | 5.000% | Quarterly | Dec 2023 | (2,027,677) | 31,051 | (1,996,626) |
| Centrally cleared | iTraxx Europe Crossover Series 30 | 11,025,926 | EUR | 12,952,371 | 5.000% | Quarterly | Dec 2023 | (1,337,808) | 195,021 | (1,142,787) |
| $70,039,371 | $(2,378,160) | $48,444 | $(2,329,716) | |||||||
| SEE NOTES TO FINANCIAL STATEMENTS | SEMIANNUAL REPORT | JOHN HANCOCK SHORT DURATION CREDIT OPPORTUNITIES FUND | 41 |
| Currency swaps | |||||||||||
| Counterparty (OTC) | Receive | Pay | Payment frequency | Maturity date | Notional amount of currency received | Notional amount of currency delivered | Unamortized upfront payment paid | Unrealized appreciation (depreciation) | Value | ||
| Goldman Sachs | Fixed rate equal to 8.670% based on the notional amount of currency received | Fixed rate equal to 3.750% based on the notional amount of currency delivered | Semi-Annual | Jan 2028 | MXN | 13,205,700 | USD | 670,000 | $(11,368) | $(13,044) | $(24,412) |
| $(11,368) | $(13,044) | $(24,412) | |||||||||
| Derivatives Currency Abbreviations | |
| ARS | Argentine Peso |
| BRL | Brazilian Real |
| CAD | Canadian Dollar |
| CLP | Chilean Peso |
| CZK | Czech Republic Koruna |
| EUR | Euro |
| HUF | Hungarian Forint |
| IDR | Indonesian Rupiah |
| JPY | Japanese Yen |
| MXN | Mexican Peso |
| PEN | Peruvian Nuevo Sol |
| PLN | Polish Zloty |
| RUB | Russian Ruble |
| SGD | Singapore Dollar |
| THB | Thai Bhat |
| TRY | Turkish Lira |
| USD | U.S. Dollar |
| ZAR | South African Rand |
| Derivatives Abbreviations | |
| JIBAR | Johannesburg Interbank Agreed Rate |
| 42 | JOHN HANCOCK SHORT DURATION CREDIT OPPORTUNITIES FUND | SEMIANNUAL REPORT | SEE NOTES TO FINANCIAL STATEMENTS |
| Financial statements |
| Assets | |
| Unaffiliated investments, at value (Cost $880,942,271) including $3,274,993 of securities loaned | $865,581,430 |
| Affiliated investments, at value (Cost $3,441,742) | 3,443,133 |
| Total investments, at value (Cost $884,384,013) | 869,024,563 |
| Receivable for centrally cleared swaps | 2,525,941 |
| Unrealized appreciation on forward foreign currency contracts | 702,078 |
| Foreign currency, at value (Cost $707,502) | 722,833 |
| Collateral held at broker for futures contracts | 1,535,115 |
| Interest receivable | 7,379,012 |
| Receivable for fund shares sold | 2,282,296 |
| Receivable for investments sold | 11,305,404 |
| Receivable for securities lending income | 3,707 |
| Other assets | 92,285 |
| Total assets | 895,573,234 |
| Liabilities | |
| Unrealized depreciation on forward foreign currency contracts | 419,927 |
| Swap contracts, at value | 24,412 |
| Payable for futures variation margin | 491,805 |
| Due to custodian | 768,208 |
| Distributions payable | 378 |
| Payable for collateral on OTC derivatives | 320,000 |
| Payable for investments purchased | 8,805,515 |
| Payable for fund shares repurchased | 882,178 |
| Payable upon return of securities loaned | 3,444,111 |
| Payable to affiliates | |
| Accounting and legal services fees | 32,838 |
| Transfer agent fees | 10,874 |
| Trustees' fees | 2,610 |
| Other liabilities and accrued expenses | 200,448 |
| Total liabilities | 15,403,304 |
| Net assets | $880,169,930 |
| Net assets consist of | |
| Paid-in capital | $983,176,105 |
| Total distributable earnings (loss) | (103,006,175) |
| Net assets | $880,169,930 |
| SEE NOTES TO FINANCIAL STATEMENTS | SEMIANNUAL REPORT | JOHN HANCOCK SHORT DURATION CREDIT OPPORTUNITIES FUND | 43 |
| Net asset value per share | |
| Based on net asset value and shares outstanding - the fund has an unlimited number of shares authorized with no par value | |
| Class A ($77,628,883 ÷ 8,273,859 shares)1 | $9.38 |
| Class C ($3,707,038 ÷ 395,147 shares)1 | $9.38 |
| Class I ($31,334,055 ÷ 3,344,381 shares) | $9.37 |
| Class R2 ($48,344 ÷ 5,155 shares) | $9.38 |
| Class R4 ($48,344 ÷ 5,155 shares) | $9.38 |
| Class R6 ($7,347,591 ÷ 783,270 shares) | $9.38 |
| Class NAV ($760,055,675 ÷ 80,974,355 shares) | $9.39 |
| Maximum offering price per share | |
| Class A (net asset value per share ÷ 97.5%)2 | $9.62 |
| 1 | Redemption price per share is equal to net asset value less any applicable contingent deferred sales charge. |
| 2 | On single retail sales of less than $100,000. On sales of $100,000 or more and on group sales the offering price is reduced. |
| 44 | JOHN HANCOCK SHORT DURATION CREDIT OPPORTUNITIES FUND | SEMIANNUAL REPORT | SEE NOTES TO FINANCIAL STATEMENTS |
| Investment income | |
| Interest | $23,512,736 |
| Dividends | 130,233 |
| Securities lending | 29,432 |
| Less foreign taxes withheld | (43,680) |
| Total investment income | 23,628,721 |
| Expenses | |
| Investment management fees | 3,243,228 |
| Distribution and service fees | 120,063 |
| Accounting and legal services fees | 78,463 |
| Transfer agent fees | 62,209 |
| Trustees' fees | 8,089 |
| Custodian fees | 78,333 |
| State registration fees | 66,668 |
| Printing and postage | 14,552 |
| Professional fees | 59,933 |
| Other | 19,239 |
| Total expenses | 3,750,777 |
| Less expense reductions | (35,887) |
| Net expenses | 3,714,890 |
| Net investment income | 19,913,831 |
| Realized and unrealized gain (loss) | |
| Net realized gain (loss) on | |
| Unaffiliated investments and foreign currency transactions | (12,685,939) |
| Affiliated investments | (12) |
| Futures contracts | 3,172,643 |
| Forward foreign currency contracts | 1,162,874 |
| Swap contracts | (2,082,098) |
| (10,432,532) | |
| Change in net unrealized appreciation (depreciation) of | |
| Unaffiliated investments and translation of assets and liabilities in foreign currencies | 265,081 |
| Affiliated investments | 604 |
| Futures contracts | (4,102,366) |
| Forward foreign currency contracts | (836,519) |
| Swap contracts | 1,427,815 |
| (3,245,385) | |
| Net realized and unrealized loss | (13,677,917) |
| Increase in net assets from operations | $6,235,914 |
| SEE NOTES TO FINANCIAL STATEMENTS | SEMIANNUAL REPORT | JOHN HANCOCK SHORT DURATION CREDIT OPPORTUNITIES FUND | 45 |
| Six months ended 1-31-19 (unaudited) | Year ended 7-31-18 | |
| Increase (decrease) in net assets | ||
| From operations | ||
| Net investment income | $19,913,831 | $37,275,344 |
| Net realized loss | (10,432,532) | (1,739,694) |
| Change in net unrealized appreciation (depreciation) | (3,245,385) | (22,554,803) |
| Increase in net assets resulting from operations | 6,235,914 | 12,980,847 |
| Distributions to shareholders | ||
| From net investment income and net realized gain | ||
| Class A | (1,324,469) | — |
| Class C | (47,401) | — |
| Class I | (686,486) | — |
| Class R2 | (978) | — |
| Class R4 | (1,002) | — |
| Class R6 | (144,932) | — |
| Class NAV | (17,265,106) | — |
| From net investment income | ||
| Class A | — | (1,516,158) |
| Class C | — | (83,341) |
| Class I | — | (1,219,123) |
| Class R2 | — | (2,331) |
| Class R4 | — | (2,399) |
| Class R6 | — | (178,627) |
| Class NAV | — | (33,452,222) |
| Total distributions | (19,470,374) | (36,454,201) |
| From fund share transactions | (64,777,078) | (249,541,491) |
| Total decrease | (78,011,538) | (273,014,845) |
| Net assets | ||
| Beginning of period | 958,181,468 | 1,231,196,313 |
| End of period1 | $880,169,930 | $958,181,468 |
| 1 | Net assets - End of year includes undistributed net investment income of $2,841,026 at July 31, 2018. The SEC eliminated the requirement to disclose undistributed net investment income in the current reporting period. |
| 46 | JOHN HANCOCK SHORT DURATION CREDIT OPPORTUNITIES FUND | SEMIANNUAL REPORT | SEE NOTES TO FINANCIAL STATEMENTS |
| Financial highlights |
| CLASS A SHARES Period ended | 1-31-191 | 7-31-18 | 7-31-17 | 7-31-16 | 7-31-15 | 7-31-14 |
| Per share operating performance | ||||||
| Net asset value, beginning of period | $9.51 | $9.74 | $9.57 | $9.73 | $10.25 | $10.32 |
| Net investment income2 | 0.18 | 0.32 | 0.29 | 0.29 | 0.31 | 0.30 |
| Net realized and unrealized gain (loss) on investments | (0.13) | (0.23) | 0.17 | (0.11) | (0.52) | 0.08 |
| Total from investment operations | 0.05 | 0.09 | 0.46 | 0.18 | (0.21) | 0.38 |
| Less distributions | ||||||
| From net investment income | (0.18) | (0.32) | (0.29) | (0.34) | (0.31) | (0.32) |
| From net realized gain | — | — | — | — | — | (0.13) |
| Total distributions | (0.18) | (0.32) | (0.29) | (0.34) | (0.31) | (0.45) |
| Net asset value, end of period | $9.38 | $9.51 | $9.74 | $9.57 | $9.73 | $10.25 |
| Total return (%)3,4 | 0.585 | 0.91 | 4.85 | 1.93 | (2.03) | 3.76 |
| Ratios and supplemental data | ||||||
| Net assets, end of period (in millions) | $78 | $60 | $37 | $27 | $27 | $18 |
| Ratios (as a percentage of average net assets): | ||||||
| Expenses before reductions | 1.196 | 1.18 | 1.17 | 1.17 | 1.21 | 1.47 |
| Expenses including reductions | 1.186 | 1.17 | 1.16 | 1.17 | 1.20 | 1.21 |
| Net investment income | 3.856 | 3.30 | 2.99 | 3.10 | 3.10 | 2.93 |
| Portfolio turnover (%) | 26 | 68 | 77 | 52 | 61 | 65 |
| 1 | Six months ended 1-31-19. Unaudited. |
| 2 | Based on average daily shares outstanding. |
| 3 | Total returns would have been lower had certain expenses not been reduced during the applicable periods. |
| 4 | Does not reflect the effect of sales charges, if any. |
| 5 | Not annualized. |
| 6 | Annualized. |
| SEE NOTES TO FINANCIAL STATEMENTS | SEMIANNUAL REPORT | JOHN HANCOCK SHORT DURATION CREDIT OPPORTUNITIES FUND | 47 |
| CLASS C SHARES Period ended | 1-31-191 | 7-31-18 | 7-31-17 | 7-31-16 | 7-31-15 | 7-31-142 |
| Per share operating performance | ||||||
| Net asset value, beginning of period | $9.51 | $9.74 | $9.57 | $9.73 | $10.25 | $10.29 |
| Net investment income (loss)3 | 0.16 | 0.26 | 0.24 | 0.23 | 0.23 | —4 |
| Net realized and unrealized gain (loss) on investments | (0.14) | (0.24) | 0.15 | (0.12) | (0.52) | (0.02) |
| Total from investment operations | 0.02 | 0.02 | 0.39 | 0.11 | (0.29) | (0.02) |
| Less distributions | ||||||
| From net investment income | (0.15) | (0.25) | (0.22) | (0.27) | (0.23) | (0.02) |
| Net asset value, end of period | $9.38 | $9.51 | $9.74 | $9.57 | $9.73 | $10.25 |
| Total return (%)5,6 | 0.237 | 0.24 | 4.15 | 1.23 | (2.82) | (0.18)7 |
| Ratios and supplemental data | ||||||
| Net assets, end of period (in millions) | $4 | $3 | $3 | $3 | $2 | $1 |
| Ratios (as a percentage of average net assets): | ||||||
| Expenses before reductions | 1.898 | 1.88 | 1.87 | 1.88 | 2.27 | 7.958 |
| Expenses including reductions | 1.888 | 1.87 | 1.86 | 1.87 | 2.00 | 2.008 |
| Net investment income (loss) | 3.308 | 2.72 | 2.44 | 2.47 | 2.36 | (0.52)8 |
| Portfolio turnover (%) | 26 | 68 | 77 | 52 | 61 | 659 |
| 1 | Six months ended 1-31-19. Unaudited. |
| 2 | The inception date for Class C shares is 6-27-14. |
| 3 | Based on average daily shares outstanding. |
| 4 | Less than $0.005 per share. |
| 5 | Total returns would have been lower had certain expenses not been reduced during the applicable periods. |
| 6 | Does not reflect the effect of sales charges, if any. |
| 7 | Not annualized. |
| 8 | Annualized. |
| 9 | Portfolio turnover is shown for the period from 8-1-13 to 7-31-14. |
| 48 | JOHN HANCOCK SHORT DURATION CREDIT OPPORTUNITIES FUND | SEMIANNUAL REPORT | SEE NOTES TO FINANCIAL STATEMENTS |
| CLASS I SHARES Period ended | 1-31-191 | 7-31-18 | 7-31-17 | 7-31-16 | 7-31-15 | 7-31-14 |
| Per share operating performance | ||||||
| Net asset value, beginning of period | $9.49 | $9.73 | $9.56 | $9.72 | $10.24 | $10.32 |
| Net investment income2 | 0.20 | 0.36 | 0.33 | 0.33 | 0.34 | 0.32 |
| Net realized and unrealized gain (loss) on investments | (0.12) | (0.25) | 0.16 | (0.12) | (0.51) | 0.08 |
| Total from investment operations | 0.08 | 0.11 | 0.49 | 0.21 | (0.17) | 0.40 |
| Less distributions | ||||||
| From net investment income | (0.20) | (0.35) | (0.32) | (0.37) | (0.35) | (0.35) |
| From net realized gain | — | — | — | — | — | (0.13) |
| Total distributions | (0.20) | (0.35) | (0.32) | (0.37) | (0.35) | (0.48) |
| Net asset value, end of period | $9.37 | $9.49 | $9.73 | $9.56 | $9.72 | $10.24 |
| Total return (%)3 | 0.834 | 1.13 | 5.21 | 2.25 | (1.71) | 3.98 |
| Ratios and supplemental data | ||||||
| Net assets, end of period (in millions) | $31 | $37 | $33 | $23 | $26 | $17 |
| Ratios (as a percentage of average net assets): | ||||||
| Expenses before reductions | 0.915 | 0.88 | 0.86 | 0.86 | 0.88 | 1.46 |
| Expenses including reductions | 0.905 | 0.87 | 0.85 | 0.85 | 0.87 | 0.90 |
| Net investment income | 4.235 | 3.70 | 3.44 | 3.49 | 3.46 | 3.23 |
| Portfolio turnover (%) | 26 | 68 | 77 | 52 | 61 | 65 |
| 1 | Six months ended 1-31-19. Unaudited. |
| 2 | Based on average daily shares outstanding. |
| 3 | Total returns would have been lower had certain expenses not been reduced during the applicable periods. |
| 4 | Not annualized. |
| 5 | Annualized. |
| SEE NOTES TO FINANCIAL STATEMENTS | SEMIANNUAL REPORT | JOHN HANCOCK SHORT DURATION CREDIT OPPORTUNITIES FUND | 49 |
| CLASS R2 SHARES Period ended | 1-31-191 | 7-31-18 | 7-31-17 | 7-31-16 | 7-31-152 |
| Per share operating performance | |||||
| Net asset value, beginning of period | $9.50 | $9.74 | $9.57 | $9.73 | $9.93 |
| Net investment income3 | 0.19 | 0.34 | 0.31 | 0.32 | 0.11 |
| Net realized and unrealized gain (loss) on investments | (0.12) | (0.24) | 0.17 | (0.13) | (0.20) |
| Total from investment operations | 0.07 | 0.10 | 0.48 | 0.19 | (0.09) |
| Less distributions | |||||
| From net investment income | (0.19) | (0.34) | (0.31) | (0.35) | (0.11) |
| Net asset value, end of period | $9.38 | $9.50 | $9.74 | $9.57 | $9.73 |
| Total return (%)4 | 0.765 | 0.99 | 5.05 | 2.12 | (0.87)5 |
| Ratios and supplemental data | |||||
| Net assets, end of period (in millions) | $—6 | $—6 | $—6 | $—6 | $—6 |
| Ratios (as a percentage of average net assets): | |||||
| Expenses before reductions | 1.047 | 1.03 | 1.02 | 1.02 | 1.017 |
| Expenses including reductions | 1.037 | 1.02 | 1.01 | 1.01 | 1.007 |
| Net investment income | 4.127 | 3.53 | 3.23 | 3.34 | 3.097 |
| Portfolio turnover (%) | 26 | 68 | 77 | 52 | 618 |
| 1 | Six months ended 1-31-19. Unaudited. |
| 2 | The inception date for Class R2 shares is 3-27-15. |
| 3 | Based on average daily shares outstanding. |
| 4 | Total returns would have been lower had certain expenses not been reduced during the applicable periods. |
| 5 | Not annualized. |
| 6 | Less than $500,000. |
| 7 | Annualized. |
| 8 | Portfolio turnover is shown for the period from 8-1-14 to 7-31-15. |
| 50 | JOHN HANCOCK SHORT DURATION CREDIT OPPORTUNITIES FUND | SEMIANNUAL REPORT | SEE NOTES TO FINANCIAL STATEMENTS |
| CLASS R4 SHARES Period ended | 1-31-191 | 7-31-18 | 7-31-17 | 7-31-16 | 7-31-152 |
| Per share operating performance | |||||
| Net asset value, beginning of period | $9.50 | $9.74 | $9.57 | $9.73 | $9.93 |
| Net investment income3 | 0.20 | 0.35 | 0.32 | 0.33 | 0.11 |
| Net realized and unrealized gain (loss) on investments | (0.13) | (0.24) | 0.17 | (0.13) | (0.19) |
| Total from investment operations | 0.07 | 0.11 | 0.49 | 0.20 | (0.08) |
| Less distributions | |||||
| From net investment income | (0.19) | (0.35) | (0.32) | (0.36) | (0.12) |
| Net asset value, end of period | $9.38 | $9.50 | $9.74 | $9.57 | $9.73 |
| Total return (%)4 | 0.815 | 1.09 | 5.15 | 2.22 | (0.84)5 |
| Ratios and supplemental data | |||||
| Net assets, end of period (in millions) | $—6 | $—6 | $—6 | $—6 | $—6 |
| Ratios (as a percentage of average net assets): | |||||
| Expenses before reductions | 1.047 | 1.03 | 1.02 | 1.02 | 1.017 |
| Expenses including reductions | 0.937 | 0.92 | 0.91 | 0.91 | 0.907 |
| Net investment income | 4.227 | 3.63 | 3.33 | 3.44 | 3.197 |
| Portfolio turnover (%) | 26 | 68 | 77 | 52 | 618 |
| 1 | Six months ended 1-31-19. Unaudited. |
| 2 | The inception date for Class R4 shares is 3-27-15. |
| 3 | Based on average daily shares outstanding. |
| 4 | Total returns would have been lower had certain expenses not been reduced during the applicable periods. |
| 5 | Not annualized. |
| 6 | Less than $500,000. |
| 7 | Annualized. |
| 8 | Portfolio turnover is shown for the period from 8-1-14 to 7-31-15. |
| SEE NOTES TO FINANCIAL STATEMENTS | SEMIANNUAL REPORT | JOHN HANCOCK SHORT DURATION CREDIT OPPORTUNITIES FUND | 51 |
| CLASS R6 SHARES Period ended | 1-31-191 | 7-31-18 | 7-31-17 | 7-31-16 | 7-31-152 |
| Per share operating performance | |||||
| Net asset value, beginning of period | $9.50 | $9.74 | $9.57 | $9.73 | $9.93 |
| Net investment income3 | 0.21 | 0.37 | 0.34 | 0.34 | 0.11 |
| Net realized and unrealized gain (loss) on investments | (0.13) | (0.25) | 0.16 | (0.12) | (0.19) |
| Total from investment operations | 0.08 | 0.12 | 0.50 | 0.22 | (0.08) |
| Less distributions | |||||
| From net investment income | (0.20) | (0.36) | (0.33) | (0.38) | (0.12) |
| Net asset value, end of period | $9.38 | $9.50 | $9.74 | $9.57 | $9.73 |
| Total return (%)4 | 0.895 | 1.24 | 5.33 | 2.40 | (0.78)5 |
| Ratios and supplemental data | |||||
| Net assets, end of period (in millions) | $7 | $6 | $2 | $1 | $—6 |
| Ratios (as a percentage of average net assets): | |||||
| Expenses before reductions | 0.797 | 0.78 | 0.77 | 0.77 | 0.747 |
| Expenses including reductions | 0.787 | 0.77 | 0.74 | 0.74 | 0.737 |
| Net investment income | 4.387 | 3.85 | 3.56 | 3.61 | 3.317 |
| Portfolio turnover (%) | 26 | 68 | 77 | 52 | 618 |
| 1 | Six months ended 1-31-19. Unaudited. |
| 2 | The inception date for Class R6 shares is 3-27-15. |
| 3 | Based on average daily shares outstanding. |
| 4 | Total returns would have been lower had certain expenses not been reduced during the applicable periods. |
| 5 | Not annualized. |
| 6 | Less than $500,000. |
| 7 | Annualized. |
| 8 | Portfolio turnover is shown for the period from 8-1-14 to 7-31-15. |
| 52 | JOHN HANCOCK SHORT DURATION CREDIT OPPORTUNITIES FUND | SEMIANNUAL REPORT | SEE NOTES TO FINANCIAL STATEMENTS |
| CLASS NAV SHARES Period ended | 1-31-191 | 7-31-18 | 7-31-17 | 7-31-16 | 7-31-15 | 7-31-14 |
| Per share operating performance | ||||||
| Net asset value, beginning of period | $9.51 | $9.75 | $9.57 | $9.74 | $10.25 | $10.32 |
| Net investment income2 | 0.21 | 0.37 | 0.34 | 0.34 | 0.36 | 0.37 |
| Net realized and unrealized gain (loss) on investments | (0.13) | (0.25) | 0.17 | (0.13) | (0.51) | 0.06 |
| Total from investment operations | 0.08 | 0.12 | 0.51 | 0.21 | (0.15) | 0.43 |
| Less distributions | ||||||
| From net investment income | (0.20) | (0.36) | (0.33) | (0.38) | (0.36) | (0.37) |
| From net realized gain | — | — | — | — | — | (0.13) |
| Total distributions | (0.20) | (0.36) | (0.33) | (0.38) | (0.36) | (0.50) |
| Net asset value, end of period | $9.39 | $9.51 | $9.75 | $9.57 | $9.74 | $10.25 |
| Total return (%)3 | 0.904 | 1.25 | 5.43 | 2.27 | (1.46) | 4.26 |
| Ratios and supplemental data | ||||||
| Net assets, end of period (in millions) | $760 | $853 | $1,156 | $1,326 | $1,402 | $1,469 |
| Ratios (as a percentage of average net assets): | ||||||
| Expenses before reductions | 0.785 | 0.77 | 0.75 | 0.75 | 0.74 | 0.75 |
| Expenses including reductions | 0.775 | 0.76 | 0.74 | 0.74 | 0.73 | 0.75 |
| Net investment income | 4.385 | 3.81 | 3.55 | 3.61 | 3.63 | 3.59 |
| Portfolio turnover (%) | 26 | 68 | 77 | 52 | 61 | 65 |
| 1 | Six months ended 1-31-19. Unaudited. |
| 2 | Based on average daily shares outstanding. |
| 3 | Total returns would have been lower had certain expenses not been reduced during the applicable periods. |
| 4 | Not annualized. |
| 5 | Annualized. |
| SEE NOTES TO FINANCIAL STATEMENTS | SEMIANNUAL REPORT | JOHN HANCOCK SHORT DURATION CREDIT OPPORTUNITIES FUND | 53 |
Note 1 — Organization
John Hancock Short Duration Credit Opportunities Fund (the fund) is a series of John Hancock Funds II (the Trust), an open-end management investment company organized as a Massachusetts business trust and registered under the Investment Company Act of 1940, as amended (the 1940 Act). The investment objective of the fund is to seek to maximize total return, which consists of income on its investments and capital appreciation.
The fund may offer multiple classes of shares. The shares currently offered are detailed in the Statement of assets and liabilities. Class A and Class C shares are offered to all investors. Class I shares are offered to institutions and certain investors. Class R2 and Class R4 shares are available only to certain retirement and 529 plans. Class R6 shares are only available to certain retirement plans, institutions and other investors. Class NAV shares are offered to John Hancock affiliated funds of funds, retirement plans for employees of John Hancock and/or Manulife Financial Corporation (MFC), and certain 529 plans. Class C shares convert to Class A shares ten years after purchase (certain exclusions may apply). Shareholders of each class have exclusive voting rights to matters that affect that class. The distribution and service fees, if any, and transfer agent fees for each class may differ.
Note 2 — Significant accounting policies
The financial statements have been prepared in conformity with accounting principles generally accepted in the United States of America (US GAAP), which require management to make certain estimates and assumptions as of the date of the financial statements. Actual results could differ from those estimates and those differences could be significant. The fund qualifies as an investment company under Topic 946 of Accounting Standards Codification of US GAAP.
Events or transactions occurring after the end of the fiscal period through the date that the financial statements were issued have been evaluated in the preparation of the financial statements. The following summarizes the significant accounting policies of the fund:
Security valuation.Investments are stated at value as of the scheduled close of regular trading on the New York Stock Exchange (NYSE), normally at 4:00 p.m., Eastern Time. In case of emergency or other disruption resulting in the NYSE not opening for trading or the NYSE closing at a time other than the regularly scheduled close, the net asset value (NAV) may be determined as of the regularly scheduled close of the NYSE pursuant to the fund's Valuation Policies and Procedures.
In order to value the securities, the fund uses the following valuation techniques: Debt obligations are typically valued based on the evaluated prices provided by an independent pricing vendor. Independent pricing vendors utilize matrix pricing which takes into account factors such as institutional-size trading in similar groups of securities, yield, quality, coupon rate, maturity, type of issue, trading characteristics and other market data, as well as broker supplied prices. Equity securities held by the fund are typically valued at the last sale price or official closing price on the exchange or principal market where the security trades. In the event there were no sales during the day or closing prices are not available, the securities are valued using the last available bid price. Investments by the fund in open-end mutual funds, including John Hancock Collateral Trust (JHCT), are valued at their respective NAVs each business day. Swaps are generally valued using evaluated prices obtained from an independent pricing vendor. Futures contracts are typically valued at the last traded price on the exchange on which they trade. Forward foreign currency contracts are valued at the prevailing forward rates which are based on foreign currency exchange spot rates and forward points supplied by an independent pricing vendor. Foreign securities and currencies are valued in U.S. dollars based on foreign currency exchange rates supplied by an independent pricing vendor.
In certain instances, the Pricing Committee may determine to value equity securities using prices obtained from another exchange or market if trading on the exchange or market on which prices are typically obtained did not open for trading as scheduled, or if trading closed earlier than scheduled, and trading occurred as normal on another exchange or market.
Other portfolio securities and assets, for which reliable market quotations are not readily available, are valued at fair value as determined in good faith by the fund's Pricing Committee following procedures established by the Board of Trustees. The frequency with which these fair valuation procedures are used cannot be predicted and fair value of securities may differ significantly from the value that would have been used had a ready market for such securities existed. Trading in foreign securities may be completed before the scheduled daily close of trading on the NYSE. Significant events at the issuer or market level may affect the values of securities between the time when the valuation of the securities is generally determined and the close of the NYSE. If a significant event occurs, these securities may be fair valued, as determined in good faith by the
fund's Pricing Committee, following procedures established by the Board of Trustees. The fund uses fair value adjustment factors provided by an independent pricing vendor to value certain foreign securities in order to adjust for events that may occur between the close of foreign exchanges or markets and the close of the NYSE.
The fund uses a three-tier hierarchy to prioritize the pricing assumptions, referred to as inputs, used in valuation techniques to measure fair value. Level 1 includes securities valued using quoted prices in active markets for identical securities. Level 2 includes securities valued using other significant observable inputs. Observable inputs may include quoted prices for similar securities, interest rates, prepayment speeds and credit risk. Prices for securities valued using these inputs are received from independent pricing vendors and brokers and are based on an evaluation of the inputs described. Level 3 includes securities valued using significant unobservable inputs when market prices are not readily available or reliable, including the fund's own assumptions in determining the fair value of investments. Factors used in determining value may include market or issuer specific events or trends, changes in interest rates and credit quality. The inputs or methodology used for valuing securities are not necessarily an indication of the risks associated with investing in those securities. Changes in valuation techniques and related inputs may result in transfers into or out of an assigned level within the disclosure hierarchy.
The following is a summary of the values by input classification of the fund's investments as of January 31, 2019, by major security category or type:
| Total value at 1-31-19 | Level 1 quoted price | Level 2 significant observable inputs | Level 3 significant unobservable inputs | |||||||||||
| Investments in securities: | ||||||||||||||
| Assets | ||||||||||||||
| U.S. Government and Agency obligations | $7,405,019 | — | $7,405,019 | — | ||||||||||
| Foreign government obligations | 135,594,356 | — | 135,594,356 | — | ||||||||||
| Corporate bonds | 311,759,259 | — | 311,759,259 | — | ||||||||||
| Term loans | 179,004,925 | — | 179,004,925 | — | ||||||||||
| Collateralized mortgage obligations | 96,198,224 | — | 96,198,224 | — | ||||||||||
| Asset backed securities | 84,496,394 | — | 84,496,394 | — | ||||||||||
| Common stocks | 634,074 | $461,873 | 172,201 | — | ||||||||||
| Escrow certificates | 16,813 | — | — | $16,813 | ||||||||||
| Warrants | 100 | 98 | 2 | — | ||||||||||
| Securities lending collateral | 3,443,133 | 3,443,133 | — | — | ||||||||||
| Short-term investments | 50,472,266 | 50,007,079 | 465,187 | — | ||||||||||
| Total investments in securities | $869,024,563 | $53,912,183 | $815,095,567 | $16,813 | ||||||||||
| Derivatives: | ||||||||||||||
| Assets | ||||||||||||||
| Futures | $1,241,486 | $1,241,486 | — | — | ||||||||||
| Forward foreign currency contracts | 702,078 | — | $702,078 | — | ||||||||||
| Swap contracts | 809,697 | — | 809,697 | — | ||||||||||
| Liabilities | ||||||||||||||
| Futures | (4,663,585 | ) | (4,663,585 | ) | — | — | ||||||||
| Forward foreign currency contracts | (419,927 | ) | — | (419,927 | ) | — | ||||||||
| Swap contracts | (3,163,829 | ) | — | (3,163,829 | ) | — |
Term loans (Floating rate loans). The fund may invest in term loans, which are debt securities and are often rated below investment grade at the time of purchase. Term loans are generally subject to legal or contractual restrictions on resale and generally have longer settlement periods than conventional debt securities. Term loans involve special types of risk, including credit risk, interest-rate risk, counterparty risk and risk associated with extended settlement. The liquidity of term loans, including the volume and frequency of secondary market trading in such loans, varies significantly over time and among
individual loans. During periods of infrequent trading, valuing a term loan can be more difficult and buying and selling a term loan at an acceptable price can be more difficult and delayed, which could result in a loss.
The fund's ability to receive payments of principal, interest and other amounts in connection with term loans will depend primarily on the financial condition of the borrower. Failure to receive scheduled payments on a term loan due to a default, bankruptcy or other reason would adversely affect the fund's income and would likely reduce the value of its assets. Transactions in loan investments typically take a significant amount of time (i.e., seven days or longer) to settle. This could pose a liquidity risk to the fund and, if the fund's exposure to such investments is substantial, could impair the fund's ability to meet redemptions. Because term loans may not be rated by independent credit rating agencies, a decision to invest in a particular loan could depend exclusively on the subadvisor's credit analysis of the borrower and/or term loan agents. There is greater risk that the fund may have limited rights to enforce the terms of an underlying loan than for other types of debt instruments.
Security transactions and related investment income. Investment security transactions are accounted for on a trade date plus one basis for daily NAV calculations. However, for financial reporting purposes, investment transactions are reported on trade date. Interest income is accrued as earned. Interest income includes coupon interest and amortization/accretion of premiums/discounts on debt securities. Debt obligations may be placed in a non-accrual status and related interest income may be reduced by stopping current accruals and writing off interest receivable when the collection of all or a portion of interest has become doubtful. Dividend income is recorded on the ex-date, except for dividends of foreign securities where the dividend may not be known until after the ex-date. In those cases, dividend income, net of withholding taxes, is recorded when the fund becomes aware of the dividends. Non-cash dividends, if any, are recorded at the fair market value of the securities received. Gains and losses on securities sold are determined on the basis of identified cost and may include proceeds from litigation.
Securities lending. The fund may lend its securities to earn additional income. The fund receives cash collateral from the borrower in an amount not less than the market value of the loaned securities. The fund will invest its collateral in JHCT, an affiliate of the fund, which has a floating NAV and is registered with the Securities and Exchange Commission as an investment company. JHCT invests in short-term money market investments. The fund will receive the benefit of any gains and bear any losses generated by JHCT with respect to the cash collateral.
The fund has the right to recall loaned securities on demand. If a borrower fails to return loaned securities when due, then the lending agent is responsible and indemnifies the fund for the lent securities. The lending agent uses the collateral received from the borrower to purchase replacement securities of the same issue, type, class and series of the loaned securities. If the value of the collateral is less than the purchase cost of replacement securities, the lending agent is responsible for satisfying the shortfall but only to the extent that the shortfall is not due to any decrease in the value of JHCT.
Although the risk of the loss of the securities lent is mitigated by receiving collateral from the borrower and through lending agent indemnification, the fund could experience a delay in recovering securities or could experience a lower than expected return if the borrower fails to return the securities on a timely basis. The fund receives compensation for lending its securities by retaining a portion of the return on the investment of the collateral and compensation from fees earned from borrowers of the securities. Securities lending income received by the fund is net of fees retained by the securities lending agent. Net income received from JHCT is a component of securities lending income as recorded on the Statement of operations.
Obligations to repay collateral received by the fund are shown on the Statement of assets and liabilities as Payable upon return of securities loaned and are secured by the loaned securities. As of January 31, 2019, the fund loaned securities valued at $3,274,993 and received $3,444,111 of cash collateral.
Foreign investing. Assets, including investments, and liabilities denominated in foreign currencies are translated into U.S. dollar values each day at the prevailing exchange rate. Purchases and sales of securities, income and expenses are translated into U.S. dollars at the prevailing exchange rate on the date of the transaction. The effect of changes in foreign currency exchange rates on the value of securities is reflected as a component of the realized and unrealized gains (losses) on investments. Foreign investments are subject to a decline in the value of a foreign currency versus the U.S. dollar, which reduces the dollar value of securities denominated in that currency.
Funds that invest internationally generally carry more risk than funds that invest strictly in U.S. securities. These risks are heightened for investments in emerging markets. Risks can result from differences in economic and political conditions, regulations, market practices (including higher transaction costs), accounting standards and other factors.
Foreign taxes. The fund may be subject to withholding tax on income, capital gains or repatriation taxes imposed by certain countries, a portion of which may be recoverable. Foreign taxes are accrued based upon the fund's understanding of the tax rules and rates that exist in the foreign markets in which it invests. Taxes are accrued based on gains realized by the fund as a result of certain foreign security sales. In certain circumstances, estimated taxes are accrued based on unrealized appreciation of such securities. Investment income is recorded net of foreign withholding taxes.
Line of credit. The fund may have the ability to borrow from banks for temporary or emergency purposes, including meeting redemption requests that otherwise might require the untimely sale of securities. Pursuant to the fund's custodian agreement, the custodian may loan money to the fund to make properly authorized payments. The fund is obligated to repay the custodian for any overdraft, including any related costs or expenses. The custodian may have a lien, security interest or security entitlement in any fund property that is not otherwise segregated or pledged, to the extent of any overdraft, and to the maximum extent permitted by law. Overdrafts at period end are presented under the caption Due to custodian in the Statement of assets and liabilities.
The fund and other affiliated funds have entered into a syndicated line of credit agreement with Citibank, N.A. as the administrative agent that enables them to participate in a $750 million unsecured committed line of credit. Excluding commitments designated for a certain fund and subject to the needs of all other affiliated funds, the fund can borrow up to an aggregate commitment amount of $500 million, subject to asset coverage and other limitations as specified in the agreement. A commitment fee payable at the end of each calendar quarter, based on the average daily unused portion of the line of credit, is charged to each participating fund based on a combination of fixed and asset based allocations and is reflected in Other expenses on the Statement of operations. For the six months ended January 31, 2019, the fund had no borrowings under the line of credit. Commitment fees for the six months ended January 31, 2019 were $1,614.
Expenses. Within the John Hancock group of funds complex, expenses that are directly attributable to an individual fund are allocated to such fund. Expenses that are not readily attributable to a specific fund are allocated among all funds in an equitable manner, taking into consideration, among other things, the nature and type of expense and the fund's relative net assets. Expense estimates are accrued in the period to which they relate and adjustments are made when actual amounts are known.
Class allocations. Income, common expenses and realized and unrealized gains (losses) are determined at the fund level and allocated daily to each class of shares based on the net assets of the class. Class-specific expenses, such as distribution and service fees, if any, and transfer agent fees, for all classes, are charged daily at the class level based on the net assets of each class and the specific expense rates applicable to each class.
Federal income taxes. The fund intends to continue to qualify as a regulated investment company by complying with the applicable provisions of the Internal Revenue Code and will not be subject to federal income tax on taxable income that is distributed to shareholders. Therefore, no federal income tax provision is required.
For federal income tax purposes, as of July 31, 2018, the fund has a short-term capital loss carryforward of $25,262,909 and a long-term capital loss carryforward of $50,127,625 available to offset future net realized capital gains. These carryforwards do not expire.
As of July 31, 2018, the fund had no uncertain tax positions that would require financial statement recognition, derecognition or disclosure. The fund's federal tax returns are subject to examination by the Internal Revenue Service for a period of three years.
Distribution of income and gains. Distributions to shareholders from net investment income and net realized gains, if any, are recorded on the ex-date. The fund generally declares dividends daily and pays them monthly. Capital gain distributions, if any, are paid annually.
Distributions paid by the fund with respect to each class of shares are calculated in the same manner, at the same time and in the same amount, except for the effect of class level expenses that may be applied differently to each class.
Such distributions, on a tax basis, are determined in conformity with income tax regulations, which may differ from US GAAP. Distributions in excess of tax basis earnings and profits, if any, are reported in the fund's financial statements as a return of capital. The final determination of tax characteristics of the fund's distribution will occur at the end of the year and will subsequently be reported to shareholders.
Capital accounts within the financial statements are adjusted for permanent book-tax differences. These adjustments have no impact on net assets or the results of operations. Temporary book-tax differences, if any, will reverse in a subsequent period. Book-tax differences are primarily attributable to foreign currency transactions, derivative transactions, wash sale loss deferrals and amortization and accretion on debt securities.
Note 3 — Derivative Instruments
The fund may invest in derivatives in order to meet its investment objective. Derivatives include a variety of different instruments that may be traded in the over-the-counter (OTC) market, on a regulated exchange or through a clearing facility. The risks in using derivatives vary depending upon the structure of the instruments, including the use of leverage, optionality, the liquidity or lack of liquidity of the contract, the creditworthiness of the counterparty or clearing organization and the volatility of the position. Some derivatives involve risks that are potentially greater than the risks associated with investing directly in the referenced securities or other referenced underlying instrument. Specifically, the fund is exposed to the risk that the counterparty to an OTC derivatives contract will be unable or unwilling to make timely settlement payments or otherwise honor its obligations. OTC derivatives transactions typically can only be closed out with the other party to the transaction.
Forward foreign currency contracts and certain swaps are typically traded through the OTC market. Certain forwards and swaps are regulated by the Commodity Futures Trading Commission. Derivative counterparty risk is managed through an ongoing evaluation of the creditworthiness of all potential counterparties and, if applicable, designated clearing organizations. The fund attempts to reduce its exposure to counterparty risk for derivatives traded in the OTC market, whenever possible, by entering into an International Swaps and Derivatives Association (ISDA) Master Agreement with each of its OTC counterparties. The ISDA gives each party to the agreement the right to terminate all transactions traded under the agreement if there is certain deterioration in the credit quality or contractual default of the other party, as defined in the ISDA. Upon an event of default or a termination of the ISDA, the non-defaulting party has the right to close out all transactions and to net amounts owed.
As defined by the ISDA, the fund may have collateral agreements with certain counterparties to mitigate counterparty risk on OTC derivatives. Subject to established minimum levels, collateral for OTC transactions is generally determined based on the net aggregate unrealized gain or loss on contracts with a particular counterparty. Collateral pledged to the fund is held in a segregated account by a third-party agent or held by the custodian bank for the benefit of the fund and can be in the form of cash or debt securities issued by the U.S. government or related agencies; collateral posted by the fund for OTC transactions is held in a segregated account at the fund's custodian and is noted in the accompanying fund's investments, or if cash is posted, on the Statement of assets and liabilities as Collateral segregated at custodian for OTC derivative contracts. The fund's risk of loss due to counterparty risk is equal to the asset value of outstanding contracts offset by collateral received.
Futures and certain centrally-cleared swaps are traded or cleared on an exchange or central clearinghouse. Exchange-traded or centrally-cleared transactions generally present less counterparty risk to a fund than OTC transactions. The exchange or clearinghouse stands between the fund and the broker to the contract and therefore, credit risk is generally limited to the failure of the exchange or clearinghouse and the clearing member.
Centrally-cleared swap contracts are subject to clearinghouse rules, including initial and variation margin requirements, daily settlement of obligations and the clearinghouse guarantee of payments to the broker. There is, however, still counterparty risk due to the potential insolvency of the broker with respect to any margin held in the brokers' customer accounts. While clearing members are required to segregate customer assets from their own assets, in the event of insolvency, there may be a shortfall in the amount of margin held by the broker for its clients. Collateral or margin requirements for exchange-traded or centrally-cleared derivatives are set by the broker or applicable clearinghouse. Margin for exchange-traded and centrally-cleared transactions is detailed in the Statements of assets and liabilities as Collateral held at broker for futures contracts and Receivable for centrally-cleared swaps, respectively. Securities pledged by the fund for exchange-traded and centrally-cleared transactions, if any, are identified in the Fund's investments.
Futures.A futures contract is a contractual agreement to buy or sell a particular currency or financial instrument at a pre-determined price in the future. Risks related to the use of futures contracts include possible illiquidity of the futures markets, contract prices that can be highly volatile and imperfectly correlated to movements in the underlying financial instrument and potential losses in excess of the amounts recognized on the Statementof assets and liabilities. Use of long futures contracts subjects the fund to the risk of loss up to the notional value of the futures contracts. Use of short futures contracts subjects the fund to unlimited risk of loss.
Upon entering into a futures contract, the fund is required to deposit initial margin with the broker in the form of cash or securities. The amount of required margin is generally based on a percentage of the contract value; this amount is the initial margin for the trade. The margin deposit must then be maintained at the established level over the life of the contract. Futures margin receivable / payable is included on the Statement of assets and liabilities. Futures contracts are marked-to-market daily and an appropriate payable or receivable for the change in value (variation margin) and unrealized gain or loss is recorded by the fund. When the contract is closed, the fund records a realized gain or loss equal to the difference between the value of the contract at the time it was opened and the value at the time it was closed.
During the six months ended January 31, 2019, the fund used futures contracts to manage duration of the fund. The fund held futures contracts with notional values ranging from $127.5 million to $197.3 million, as measured at each quarter end.
Forward foreign currency contracts. A forward foreign currency contract is an agreement between two parties to buy and sell specific currencies at a price that is set on the date of the contract. The forward contract calls for delivery of the currencies on a future date that is specified in the contract. Risks related to the use of forwards include the possible failure of counterparties to meet the terms of the forward agreement, the failure of the counterparties to timely post collateral if applicable, the risk that currency movements will not favor the fund thereby reducing the fund's total return, and the potential for losses in excess of the amounts recognized on the Statement of assets and liabilities.
The market value of a forward foreign currency contract fluctuates with changes in foreign currency exchange rates. Forward foreign currency contracts are marked-to-market daily and the change in value is recorded by the fund as an unrealized gain or loss. Realized gains or losses, equal to the difference between the value of the contract at the time it was opened and the value at the time it was closed, are recorded upon delivery or receipt of the currency or settlement with the counterparty.
During the six months ended January 31, 2019, the fund used forward foreign currency contracts to manage against anticipated changes in currency exchange rates and gain exposure to foreign currencies. The fund held forward foreign currency contracts with U.S. Dollar notional values ranging from $86.2 million to $147.7 million, as measured at each quarter end.
Swaps. Swap agreements are agreements between the fund and counterparty to exchange cash flows, assets, foreign currencies or market-linked returns at specified intervals. Swap agreements are privately negotiated in the OTC market (OTC swaps) or may be executed on a registered commodities exchange (centrally cleared swaps). Swaps are marked-to-market daily and the change in value is recorded as a component of unrealized appreciation/depreciation of swap contracts. The value of the swap will typically impose collateral posting obligations on the party that is considered out-of-the-money on the swap.
Upfront payments made/received by the fund are amortized/accreted for financial reporting purposes, with the unamortized/unaccreted portion included in the Statement of assets and liabilities. A termination payment by the counterparty or the fund is recorded as realized gain or loss, as well as the net periodic payments received or paid by the fund.
Entering into swap agreements involves, to varying degrees, elements of credit, market and documentation risk that may provide outcomes that are in excess of the amounts recognized on the Statement of assets and liabilities. Such risks involve the possibility that there will be no liquid market for the swap, or that a counterparty may default on its obligation or delay payment under the swap terms. The counterparty may disagree or contest the terms of the swap. In addition to interest rate risk, market risks may also impact the swap. The fund may also suffer losses if it is unable to terminate or assign outstanding swaps or reduce its exposure through offsetting transactions.
Interest rate swaps. Interest rate swaps represent an agreement between the fund and a counterparty to exchange cash flows based on the difference between two interest rates applied to a notional amount. The payment flows are usually netted
against each other, with the difference being paid by one party to the other. The fund settles accrued net interest receivable or payable under the swap contracts at specified, future intervals.
During the six months ended January 31, 2019, the fund used interest rate swap contracts to manage against anticipated interest rate changes. The fund held interest rate swaps with total USD notional amounts ranging from $238,000 to $267,000, as measured at each quarter end.
Credit default swaps. Credit default swaps (CDS) involve the exchange of a fixed rate premium (paid by the Buyer), for protection against the loss in value of an underlying debt instrument, referenced entity or index, in the event of a defined credit event (such as payment default or bankruptcy). Under the terms of the swap, one party acts as a "guarantor" (the Seller), receiving the premium and agreeing to contingent payments that are specified within the credit default agreement. The fund may enter into CDS in which it may act as either Buyer or Seller. By acting as the Seller, the fund may incur economic leverage since it would be obligated to pay the Buyer the notional amount of the contract in the event of a default. The amount of loss in such case could be significant, but would typically be reduced by any recovery value on the underlying credit.
During the six months ended January 31, 2019, the fund used CDS as a Buyer of protection to manage against potential credit events. The fund held credit default swap contracts with total USD notional amounts ranging from $58.3 milllion to $87.0 milllion, as measured at each quarter end.
Currency Swaps.A currency swap is an agreement between a fund and a counterparty to exchange cash flows based on the notional difference among two or more currencies.
During the six months ended January 31, 2019, the fund used currency swaps to manage against anticipated currency exchange rates. The fund held currency swaps with total USD notional amounts ranging up to $670,000, as measured at each quarter end.
Fair value of derivative instruments by risk category
The table below summarizes the fair value of derivatives held by the fund at January 31, 2019 by risk category:
| Risk | Statement of assets and liabilities location | Financial instruments location | Assets derivatives fair value | Liabilities derivatives fair value | |||||||||||||
| Interest rate | Receivable/payable for futures | Futures† | $1,241,486 | ($4,663,585 | ) | ||||||||||||
| Foreign currency | Unrealized appreciation / depreciation on forward foreign currency contracts | Forward foreign currency contracts | 702,078 | (419,927 | ) | ||||||||||||
| Credit | Swap contracts, at value | Credit default swaps^ | 809,697 | (3,139,413 | ) | ||||||||||||
| Foreign currency | Swap contracts, at value | Currency swaps^ | — | (24,412 | ) | ||||||||||||
| Interest rate | Swap contracts, at value | Interest rate swaps^ | — | (4 | ) | ||||||||||||
| $2,753,261 | ($8,247,341 | ) | |||||||||||||||
| † Reflects cumulative appreciation/depreciation on futures as disclosed in Fund's investments. Only the period end variation margin is separately disclosed on the Statement of assets and liabilities. | |||||||||||||||||
| ^ Reflects cumulative value of swap contracts. Receivable for centrally cleared swaps, which includes value and margin, and swap contracts at value, which represents OTC swaps, are shown separately on the Statement of assets and liabilities. | |||||||||||||||||
For financial reporting purposes, the fund does not offset OTC derivative assets or liabilities that are subject to master netting arrangements, as defined by the ISDAs, in the Statement of assets and liabilities. In the event of default by the counterparty or a termination of the agreement, the ISDA allows an offset of amounts across the various transactions between the fund and the applicable counterparty.
Effect of derivative instruments on the Statement of operations
The table below summarizes the net realized gain (loss) included in the net increase (decrease) in net assets from operations, classified by derivative instrument and risk category, for the six months ended January 31, 2019:
| Statement of operations location - net realized gain (loss) on: | ||||||||||||||
| Risk | Futures contracts | Forward foreign currency contracts | Swap contracts | Total | ||||||||||
| Credit | — | — | ($2,083,195 | ) | ($2,083,195 | ) | ||||||||
| Foreign currency | — | $1,162,874 | 693 | 1,163,567 | ||||||||||
| Interest rate | $3,172,643 | — | 404 | 3,173,047 | ||||||||||
| Total | $3,172,643 | $1,162,874 | ($2,082,098 | ) | $2,253,419 | |||||||||
The table below summarizes the net change in unrealized appreciation (depreciation) included in the net increase (decrease) in net assets from operations, classified by derivative instrument and risk category, for the six months ended January 31, 2019:
| Statement of operations location - change in net unrealized appreciation (depreciation) of: | ||||||||||||||
| Risk | Futures contracts | Forward foreign currency contracts | Swap contracts | Total | ||||||||||
| Credit | — | — | $1,483,965 | $1,483,965 | ||||||||||
| Foreign currency | — | ($836,519 | ) | (58,818 | ) | (895,337 | ) | |||||||
| Interest rate | ($4,102,366 | ) | — | 2,668 | (4,099,698 | ) | ||||||||
| Total | ($4,102,366 | ) | ($836,519 | ) | $1,427,815 | ($3,511,070 | ) | |||||||
Note 4 — Guarantees and indemnifications
Under the Trust's organizational documents, its Officers and Trustees are indemnified against certain liabilities arising out of the performance of their duties to the Trust, including the fund. Additionally, in the normal course of business, the fund enters into contracts with service providers that contain general indemnification clauses. The fund's maximum exposure under these arrangements is unknown, as this would involve future claims that may be made against the fund that have not yet occurred. The risk of material loss from such claims is considered remote.
Note 5 — Fees and transactions with affiliates
John Hancock Advisers, LLC (the Advisor) serves as investment advisor for the fund. John Hancock Funds, LLC (the Distributor), an affiliate of the Advisor, serves as principal underwriter of the fund. The Advisor and the Distributor are indirect, wholly owned subsidiaries of MFC.
Management fee. The fund has an investment management agreement with the Advisor under which the fund pays a daily management fee to the Advisor equivalent on an annual basis to the sum of: a) 0.740% of the first $250 million of the fund's aggregate daily net assets, b) 0.700% of the next $500 million of the fund's aggregate daily net assets and c) 0.675% of the fund's aggregate daily net assets in excess of $750 million. Aggregate net assets include the net assets of the fund and Short Duration Opportunities Fund, a sub-fund of John HancockWorldwide Investors, PLC. The fund has a subadvisory agreement with Stone Harbor Investment Partners LP. The fund is not responsible for payment of the subadvisory fees.
The Advisor has contractually agreed to waive a portion of its management fee and/or reimburse expenses for certain funds of the John Hancock group of funds complex, including the fund (the participating portfolios). This waiver is based upon aggregate net assets of all the participating portfolios. The amount of the reimbursement is calculated daily and allocated among all the participating portfolios in proportion to the daily net assets of each fund. During the six months ended January 31, 2019 this waiver amounted to 0.01% of the fund's average net assets (on an annualized basis). This agreement expires
on June 30, 2020, unless renewed by mutual agreement of the Fund and the Advisor based upon a determination that this is appropriate under the circumstances at that time.
The expense reductions described above amounted to the following for the six months ended January 31, 2019:
| Class | Expense reduction | Class | Expense reduction | |
| Class A | $2,644 | Class R4 | $2 | |
| Class C | 115 | Class R6 | 263 | |
| Class I | 1,294 | Class NAV | 31,543 | |
| Class R2 | 2 | Total | $35,863 |
Expenses waived or reimbursed in the current fiscal period are not subject to recapture in future fiscal periods.
The investment management fees, including the impact of the waivers and reimbursements as described above, incurred for the six months ended January 31, 2019 were equivalent to a net annual effective rate of 0.70% of the fund's average daily net assets.
Accounting and legal services. Pursuant to a service agreement, the fund reimburses the Advisor for all expenses associated with providing the administrative, financial, legal, compliance, accounting and recordkeeping services to the fund, including the preparation of all tax returns, periodic reports to shareholders and regulatory reports, among other services. These expenses are allocated to each share class based on its relative net assets at the time the expense was incurred. These accounting and legal services fees incurred for the six months ended January 31, 2019 amounted to an annual rate of 0.02% of the fund's average daily net assets.
Distribution and service plans. The fund has a distribution agreement with the Distributor. The fund has adopted distribution and service plans with respect to Class A, Class C, Class R2 and Class R4 shares pursuant to Rule 12b-1 under the 1940 Act, to pay the Distributor for services provided as the distributor of shares of the fund. In addition, under a service plan for Class R2 and Class R4 shares, the fund pays for certain other services. The fund may pay up to the following contractual rates of distribution and service fees under these arrangements, expressed as an annual percentage of average daily net assets for each class of the fund's shares:
| Class | Rule 12b-1 fee | Service fee | Class | Rule 12b-1 fee | Service fee | |
| Class A | 0.30% | — | Class R2 | 0.25% | 0.25% | |
| Class C | 1.00% | — | Class R4 | 0.25% | 0.10% |
The fund's Distributor has contractually agreed to waive 0.10% of Rule12b-1 fees for Class R4 shares. The current waiver agreement expires on November 30, 2019, unless renewed by mutual agreement of the fund and the Distributor based upon a determination that this is appropriate under the circumstances at the time. This contractual waiver amounted to $24 for Class R4 shares for the six months ended January 31, 2019.
Sales charges. Class A shares are assessed up-front sales charges, which resulted in payments to the Distributor amounting to $33,276 for the six months ended January 31, 2019. Of this amount, $6,147 was retained and used for printing prospectuses, advertising, sales literature and other purposes, $27,089 was paid as sales commissions to broker-dealers and $40 was paid as sales commissions to sales personnel of Signator Investors, Inc., which had been a broker-dealer affiliate of the Advisor through December 31, 2018.
Class A and Class C shares may be subject to contingent deferred sales charges (CDSCs). Certain Class A shares that are acquired through purchases of $1 million or more and are redeemed within one year of purchase are subject to a 1.00% sales charge. Class C shares that are redeemed within one year of purchase are subject to a 1.00% CDSC. CDSCs are applied to the lesser of the current market value at the time of redemption or the original purchase cost of the shares being redeemed. Proceeds from CDSCs are used to compensate the Distributor for providing distribution-related services in connection with the sale of these shares. During the six months ended January 31, 2019, CDSCs received by the Distributor amounted to $17,434 and $5 for Class A and Class C shares, respectively.
Transfer agent fees. The John Hancock group of funds has a complex-wide transfer agent agreement with John Hancock Signature Services, Inc. (Signature Services), an affiliate of the Advisor. The transfer agent fees paid to Signature Services are determined based on the cost to Signature Services (Signature Services Cost) of providing recordkeeping services. It also includes out-of-pocket expenses, including payments made to third-parties for recordkeeping services provided to their clients who invest in one or more John Hancock funds. In addition, Signature Services Cost may be reduced by certain fees that Signature Services receives in connection with retirement and small accounts. Signature Services Cost is calculated monthly and allocated, as applicable, to five categories of share classes: Retail Share and Institutional Share Classes of Non-Municipal Bond Funds, Class R6 Shares, Retirement Share Classes and Municipal Bond Share Classes. Within each of these categories, the applicable costs are allocated to the affected John Hancock affiliated funds and/or classes, based on the relative average daily net assets.
Class level expenses. Class level expenses for the six months ended January 31, 2019 were:
| Class | Distribution and service fees | Transfer agent fees |
| Class A | $105,123 | $38,351 |
| Class C | 14,819 | 1,623 |
| Class I | — | 21,789 |
| Class R2 | 60 | 3 |
| Class R4 | 61 | 3 |
| Class R6 | — | 440 |
| Total | $120,063 | $62,209 |
Trustee expenses.The fund compensates each Trustee who is not an employee of the Advisor or its affiliates. The costs of paying Trustee compensation and expenses are allocated to the funds based on its net assets relative to other funds within the John Hancock group of funds complex.
Note 6 — Fund share transactions
Transactions in fund shares for the six months ended January 31, 2019 and for the year ended July 31, 2018 were as follows:
| Six months ended 1-31-19 | Year ended 7-31-18 | |||||||||||||||||||||||||
| Shares | Amount | Shares | Amount | |||||||||||||||||||||||
| Class A shares | ||||||||||||||||||||||||||
| Sold | 14,908,273 | $139,236,388 | 19,831,798 | $191,178,440 | ||||||||||||||||||||||
| Distributions reinvested | 142,125 | 1,323,416 | 157,070 | 1,512,531 | ||||||||||||||||||||||
| Repurchased | (13,078,506 | ) | (122,152,295 | ) | (17,515,859 | ) | (168,888,558 | ) | ||||||||||||||||||
| Net increase | 1,971,892 | $18,407,509 | 2,473,009 | $23,802,413 | ||||||||||||||||||||||
| Class C shares | ||||||||||||||||||||||||||
| Sold | 208,691 | $1,930,441 | 120,685 | $1,165,086 | ||||||||||||||||||||||
| Distributions reinvested | 5,066 | 47,199 | 8,610 | 83,028 | ||||||||||||||||||||||
| Repurchased | (121,185 | ) | (1,129,784 | ) | (157,948 | ) | (1,519,087 | ) | ||||||||||||||||||
| Net increase (decrease) | 92,572 | $847,856 | (28,653 | ) | $(270,973 | ) | ||||||||||||||||||||
| Class I shares | ||||||||||||||||||||||||||
| Sold | 1,162,852 | $10,831,794 | 2,831,553 | $27,316,995 | ||||||||||||||||||||||
| Distributions reinvested | 73,743 | 686,416 | 126,145 | 1,214,012 | ||||||||||||||||||||||
| Repurchased | (1,740,503 | ) | (16,191,271 | ) | (2,457,164 | ) | (23,718,030 | ) | ||||||||||||||||||
| Net increase (decrease) | (503,908 | ) | $(4,673,061 | ) | 500,534 | $4,812,977 | ||||||||||||||||||||
| Class R2 shares | ||||||||||||||||||||||||||
| Repurchased | — | — | (4,915 | ) | (47,676 | ) | ||||||||||||||||||||
| Net decrease | — | — | (4,915 | ) | $(47,676 | ) | ||||||||||||||||||||
| Six months ended 1-31-19 | Year ended 7-31-18 | |||||||||||||||||||||||||
| Shares | Amount | Shares | Amount | |||||||||||||||||||||||
| Class R4 shares | ||||||||||||||||||||||||||
| Repurchased | — | — | (4,915 | ) | (47,676 | ) | ||||||||||||||||||||
| Net decrease | — | — | (4,915 | ) | $(47,676 | ) | ||||||||||||||||||||
| Class R6 shares | ||||||||||||||||||||||||||
| Sold | 224,058 | $2,091,457 | 642,720 | $6,232,112 | ||||||||||||||||||||||
| Distributions reinvested | 15,562 | 144,928 | 18,522 | 178,188 | ||||||||||||||||||||||
| Repurchased | (112,016 | ) | (1,044,516 | ) | (182,873 | ) | (1,769,214 | ) | ||||||||||||||||||
| Net increase | 127,604 | $1,191,869 | 478,369 | $4,641,086 | ||||||||||||||||||||||
| Class NAV shares | ||||||||||||||||||||||||||
| Sold | 2,050,893 | $19,132,868 | 8,003,156 | $76,241,555 | ||||||||||||||||||||||
| Distributions reinvested | 1,851,292 | 17,265,106 | 3,465,576 | 33,452,222 | ||||||||||||||||||||||
| Repurchased | (12,569,636 | ) | (116,949,225 | ) | (40,437,426 | ) | (392,125,419 | ) | ||||||||||||||||||
| Net decrease | (8,667,451 | ) | $(80,551,251 | ) | (28,968,694 | ) | $(282,431,642 | ) | ||||||||||||||||||
| Total net decrease | (6,979,291 | ) | $(64,777,078 | ) | (25,555,265 | ) | $(249,541,491 | ) | ||||||||||||||||||
Affiliates of the fund owned 100% of shares of Class R2, Class R4 and Class NAV, respectively, on January 31, 2019. Such concentration of shareholders' capital could have a material effect on the fund if such shareholders redeem from the fund.
Note 7 — Purchase and sale of securities
Purchases and sales of securities, other than short-term investments, amounted to $228,106,021 and $308,609,291, respectively, for the six months ended January 31, 2019.
Note 8 — Investment by affiliated funds
Certain investors in the fund are affiliated funds that are managed by the Advisor and its affiliates. The affiliated funds do not invest in the fund for the purpose of exercising management or control; however, this investment may represent a significant portion of the fund's net assets. At January 31, 2019, funds within the John Hancock group of funds complex held 86.4% of the fund's net assets. The following funds had an affiliate ownership of 5% or more of the fund's net assets:
| Fund | Affiliate concentration |
| John Hancock Funds II Multimanager Lifestyle Balanced Portfolio | 31.6% |
| John Hancock Funds II Multimanager Lifestyle Growth Portfolio | 12.5% |
| John Hancock Funds II Multimanager Lifestyle Moderate Portfolio | 11.4% |
| John Hancock Funds II Multimanager Lifestyle Conservative Portfolio | 11.3% |
| John Hancock Funds II Alternative Asset Allocation Fund | 8.9% |
Note 9 — Investment in affiliated underlying funds
The fund may invest in affiliated underlying funds that are managed by the Advisor and its affiliates. Information regarding the fund's purchases and sales of the affiliated underlying funds as well as income and capital gains earned, if any, during the period is as follows:
| Dividends and distributions | ||||||||||||||||||||||||||||||||||||||
| Fund | Beginning share amount | Shares purchased | Shares sold | Ending share amount | Income distributions received | Capital gain distributions received | Realized gain (loss) | Change in unrealized appreciation (depreciation) | Ending value | |||||||||||||||||||||||||||||
| John Hancock Collateral Trust* | 756,689 | 1,291,911 | (1,704,517 | ) | 344,083 | — | — | ($12 | ) | $604 | $3,443,133 | |||||||||||||||||||||||||||
| *Refer to the Securities lending note within Note 2 for details regarding this investment. | ||||||||||||||||||||||||||||||||||||||
Note 10 — New accounting pronouncement
In March 2017, the Financial Accounting Standards Board issued Accounting Standards Update (ASU) 2017-08, Premium Amortization on Purchased Callable Debt Securities, which shortens the premium amortization period for purchased non-contingently callable debt securities. The standard is effective for annual periods beginning after December 15, 2018 and interim periods within those fiscal years. Management does not expect the ASU to have an impact on the fund's net assets or total return. Depending upon holdings of the fund, the shortening of the premium amortization period could decrease interest income with a corresponding offset to unrealized gain (loss).
Trustees Hassell H. McClellan,Chairperson Officers Andrew G. Arnott Francis V. Knox, Jr. Charles A. Rizzo Salvatore Schiavone Christopher (Kit) Sechler** | Investment advisor John Hancock Advisers, LLC Subadvisor Stone Harbor Investment Partners LP Portfolio Manager The Investment Management Team at Stone Harbor Investment Partners LP Principal distributor John Hancock Funds, LLC Custodian State Street Bank and Trust Company Transfer agent John Hancock Signature Services, Inc. Legal counsel K&L Gates LLP |
* Member of the Audit Committee
† Non-Independent Trustee
#Effective 6-19-18
**Effective 9-13-18
The fund's proxy voting policies and procedures, as well as the fund proxy voting record for the most recent twelve-month period ended June 30, are available free of charge on the Securities and Exchange Commission (SEC) website at sec.gov or on our website.
The fund's complete list of portfolio holdings, for the first and third fiscal quarters, is filed with the SEC on Form N-Q. Effective April 30, 2019, all of the fund's holdings as of the end of the third month of every fiscal quarter will be filed with the SEC on Form N-PORT within 60 days of the end of the fiscal quarter. The fund's Form N-Q is available on our website and the SEC's website, sec.gov.
We make this information on your fund, as well asmonthly portfolio holdings, and other fund details available on our website at jhinvestments.com or by calling 800-225-5291.
| You can also contact us: | |||
| 800-225-5291 jhinvestments.com | Regular mail: John Hancock Signature Services, Inc. | Express mail: John Hancock Signature Services, Inc. | |
John Hancock family of funds
DOMESTIC EQUITY FUNDS Blue Chip Growth Classic Value Disciplined Value Disciplined Value Mid Cap Equity Income Financial Industries Fundamental All Cap Core Fundamental Large Cap Core Fundamental Large Cap Value New Opportunities Regional Bank Small Cap Core Small Cap Growth Small Cap Value U.S. Global Leaders Growth U.S. Growth U.S. Quality Growth Value Equity GLOBAL AND INTERNATIONAL EQUITY FUNDS Disciplined Value International Emerging Markets Emerging Markets Equity Fundamental Global Franchise Global Equity Global Shareholder Yield Global Thematic Opportunities Greater China Opportunities International Growth International Small Company | INCOME FUNDS Bond California Tax-Free Income Emerging Markets Debt Floating Rate Income Government Income High Yield High Yield Municipal Bond Income Investment Grade Bond Money Market Short Duration Credit Opportunities Spectrum Income Strategic Income Opportunities Tax-Free Bond ALTERNATIVE AND SPECIALTY FUNDS Absolute Return Currency Alternative Asset Allocation Disciplined Alternative Yield Global Absolute Return Strategies Global Conservative Absolute Return Global Focused Strategies Infrastructure Seaport Long/Short Technical Opportunities |
A fund's investment objectives, risks, charges, and expenses should be considered carefully before investing. The prospectus contains this and other important information about the fund. To obtain a prospectus, contact your financial professional, call John Hancock Investments at 800-225-5291, or visit our website at jhinvestments.com. Please read the prospectus carefully before investing or sending money.
ASSET ALLOCATION Balanced Income Allocation Multi-Index Lifetime Portfolios Multi-Index Preservation Portfolios Multimanager Lifestyle Portfolios Multimanager Lifetime Portfolios Retirement Income 2040 EXCHANGE-TRADED FUNDS John Hancock Multifactor Consumer Discretionary ETF John Hancock Multifactor Consumer Staples ETF John Hancock Multifactor Developed International ETF John Hancock Multifactor Emerging Markets ETF John Hancock Multifactor Energy ETF John Hancock Multifactor Financials ETF John Hancock Multifactor Healthcare ETF John Hancock Multifactor Industrials ETF John Hancock Multifactor Large Cap ETF John Hancock Multifactor Materials ETF John Hancock Multifactor Media and John Hancock Multifactor Mid Cap ETF John Hancock Multifactor Small Cap ETF John Hancock Multifactor Technology ETF John Hancock Multifactor Utilities ETF | ENVIRONMENTAL, SOCIAL, AND ESG All Cap Core ESG Core Bond ESG International Equity ESG Large Cap Core CLOSED-END FUNDS Financial Opportunities Hedged Equity & Income Income Securities Trust Investors Trust Preferred Income Preferred Income II Preferred Income III Premium Dividend Tax-Advantaged Dividend Income Tax-Advantaged Global Shareholder Yield |
John Hancock Multifactor ETF shares are bought and sold at market price (not NAV), and are not individually redeemed
from the fund. Brokerage commissions will reduce returns.
John Hancock ETFs are distributed by Foreside Fund Services, LLC, and are subadvised by Dimensional Fund Advisors LP.
Foreside is not affiliated with John Hancock Funds, LLC or Dimensional Fund Advisors LP.
Dimensional Fund Advisors LP receives compensation from John Hancock in connection with licensing rights to the
John Hancock Dimensional indexes. Dimensional Fund Advisors LP does not sponsor, endorse, or sell, and makes no
representation as to the advisability of investing in, John Hancock Multifactor ETFs.
John Hancock Investments
A trusted brand
John Hancock Investments is a premier asset manager representing one of
America's most trusted brands, with a heritage of financial stewardship dating
back to 1862. Helping our shareholders pursue their financial goals is at the
core of everything we do. It's why we support the role of professional financial
advice and operate with the highest standards of conduct and integrity.
A better way to invest
We serve investors globally through a unique multimanager approach:
We search the world to find proven portfolio teams with specialized
expertise for every strategy we offer, then we apply robust investment
oversight to ensure they continue to meet our uncompromising standards
and serve the best interests of our shareholders.
Results for investors
Our unique approach to asset management enables us to provide a diverse set
of investments backed by some of the world's best managers, along with strong
risk-adjusted returns across asset classes.
| | John Hancock Funds, LLC n Member FINRA, SIPC 200 Berkeley Street n Boston, MA 02116-5010 800-225-5291 n jhinvestments.com | |
| This report is for the information of the shareholders of John Hancock Short Duration Credit Opportunities Fund. It is not authorized for distribution to prospective investors unless preceded or accompanied by a prospectus. | ||
| MF733327 | 350SA 1/19 3/19 | |
John Hancock
Absolute Return Currency Fund
Semiannual report 1/31/19
Beginning on January 1, 2021, as permitted by regulations adopted by the Securities and Exchange Commission, paper copies of the Fund's shareholder reports like this one will no longer be sent by mail, unless you specifically request paper copies of the reports from the Fund or from your financial intermediary. Instead, the reports will be made available on a website, and you will be notified by mail each time a report is posted and provided with a website link to access the report.
If you already elected to receive shareholder reports electronically, you will not be affected by this change, and you do not need to take any action. You may elect to receive shareholder reports and other communications electronically by calling John Hancock Investments at 800-225-5291 (Class A and Class C shares) or 888-972-8696 (Class I, Class R2, Class R4, Class R6, and Class NAV shares) or by contacting your financial intermediary.
You may elect to receive all reports in paper, free of charge, at any time. You can inform John Hancock Investments or your financial intermediary that you wish to continue receiving paper copies of your shareholder reports by following the instructions listed above. Your election to receive reports in paper will apply to all funds held with John Hancock Investments or your financial intermediary.
A message to shareholders
Dear shareholder,
It's been a challenging period for fixed-income investors, as short-term yields rose higher. A solid and stable economy led the U.S. Federal Reserve to continue normalizing monetary policy; however, concerns about the strength of the broader global economy and the durability of the now decade-old bull market convinced investors to dial back risk exposures. Against this backdrop, both interest-rate-sensitive and credit-sensitive securities posted declines.
Diversification in a fixed-income portfolio remains a time-tested strategy, but periods such as the last half of 2018—when a number of typically uncorrelated markets moved in the same direction—do sometimes occur. They also tend to be relatively short-lived, and eventually fundamentals—including credit risk, the direction of interest rates, and foreign exchange rates—reassert themselves to drive performance.
Your best resource in unpredictable and volatile markets is your financial advisor, who can help position your portfolio so that it's sufficiently diversified to meet your long-term objectives and to withstand the inevitable turbulence along the way.
On behalf of everyone at John Hancock Investments, I'd like to take this opportunity to welcome new shareholders and to thank existing shareholders for the continued trust you've placed in us.
Sincerely,
Andrew G. Arnott
President and CEO,
John Hancock Investments
Head of Wealth and Asset Management,
United States and Europe
This commentary reflects the CEO's views, which are subject to change at any time. All investments entail risks, including the possible loss of principal. Diversification does not guarantee a profit or eliminate the risk of a loss. For more up-to-date information, you can visit our website at jhinvestments.com.
John Hancock
Absolute Return Currency Fund
INVESTMENT OBJECTIVE
The fund seeks to achieve absolute return from investments in currency markets.
AVERAGE ANNUAL TOTAL RETURNS AS OF 1/31/19 (%)
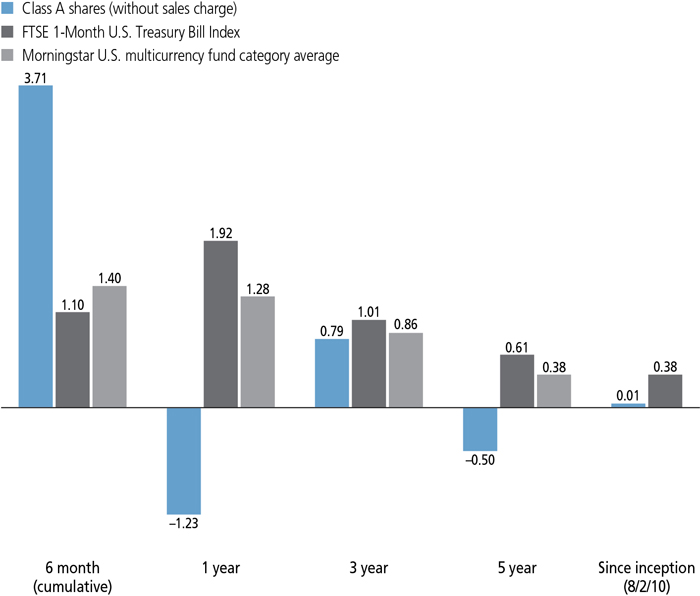
The FTSE 1-Month U.S. Treasury Bill Index is a market value-weighted index of public obligations of the U.S. Treasury with maturities of one month.
It is not possible to invest directly in an index. Index figures do not reflect expenses or sales charges, which would result in lower returns.
Figures from Morningstar, Inc. include reinvested distributions and do not take into account sales charges. Actual load-adjusted performance is lower. Since-inception returns for the Morningstar fund category average are not available.
The past performance shown here reflects reinvested distributions and the beneficial effect of any expense reductions, and does not guarantee future results. Returns for periods shorter than one year are cumulative. Performance of the other share classes will vary based on the difference in the fees and expenses of those classes. Shares will fluctuate in value and, when redeemed, may be worth more or less than their original cost. Current month-end performance may be lower or higher than the performance cited, and can be found at jhinvestments.com or by calling 800-225-5291. For further information on the fund's objectives, risks, and strategy, see the fund's prospectus.
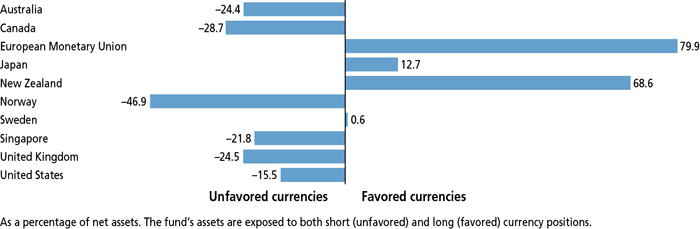
TOTAL RETURNS FOR THE PERIOD ENDED JANUARY 31, 2019
| Average annual total returns (%) with maximum sales charge | Cumulative total returns (%) with maximum sales charge | ||||||
| 1-year | 5-year | Since inception1 | 6-month | 5-year | Since inception1 | ||
| Class A | -4.20 | -1.10 | -0.35 | 0.55 | -5.40 | -2.90 | |
| Class C2 | -2.97 | -1.17 | -0.38 | 2.26 | -5.73 | -3.21 | |
| Class I3 | -1.00 | -0.20 | 0.38 | 3.80 | -0.98 | 3.27 | |
| Class R22,3 | -1.24 | -0.43 | 0.06 | 3.67 | -2.14 | 0.48 | |
| Class R42,3 | -1.03 | -0.33 | 0.12 | 3.75 | -1.62 | 1.02 | |
| Class R62,3 | -0.98 | -0.09 | 0.40 | 3.77 | -0.44 | 3.44 | |
| Class NAV3 | -0.99 | -0.09 | 0.52 | 3.75 | -0.45 | 4.52 | |
| Index† | 1.92 | 0.61 | 0.38 | 1.10 | 3.11 | 3.32 | |
Performance figures assume all distributions have been reinvested. Figures reflect maximum sales charges on Class A shares of 3.00% and the applicable contingent deferred sales charge (CDSC) on Class C shares. Class C shares sold within one year of purchase are subject to a 1% CDSC. Sales charges are not applicable to Class I, Class R2, Class R4, Class R6, and NAV shares.
The expense ratios of the fund, both net (including any fee waivers and/or expense limitations) and gross (excluding any fee waivers and/or expense limitations), are set forth according to the most recent publicly available prospectuses for the fund and may differ from those disclosed in the Financial highlights tables in this report. Net expenses reflect contractual expense limitations in effect until November 30, 2019 and are subject to change. Had the contractual fee waivers and expense limitations not been in place, gross expenses would apply. The expense ratios are as follows:
| Class A | Class C | Class I | Class R2 | Class R4 | Class R6 | Class NAV | |
| Gross (%) | 1.34 | 2.04 | 1.05 | 1.45 | 1.30 | 0.95 | 0.93 |
| Net (%) | 1.33 | 2.03 | 1.04 | 1.44 | 1.19 | 0.94 | 0.92 |
Please refer to the most recent prospectus and annual or semiannual report for more information on expenses and any expense limitation arrangements for each class.
The returns reflect past results and should not be considered indicative of future performance. The return and principal value of an investment will fluctuate so that shares, when redeemed, may be worth more or less than their original cost. Due to market volatility and other factors, the fund's current performance may be higher or lower than the performance shown. For current to the most recent month-end performance data, please call 800-225-5291 or visit the fund's website at jhinvestments.com.
The performance table above and the chart on the next page do not reflect the deduction of taxes that a shareholder would pay on fund distributions or the redemption of fund shares. The fund's performance results reflect any applicable fee waivers or expense reductions, without which the expenses would increase and results would have been less favorable.
| † | Index is the FTSE 1-Month U.S. Treasury Bill Index. |
See the following page for footnotes.
This chart and table show what happened to a hypothetical $10,000 investment in John Hancock Absolute Return Currency Fund for the share classes and periods indicated, assuming all distributions were reinvested. For comparison, we've shown the same investment in the Citigroup 1-Month U.S. Treasury Bill Index.
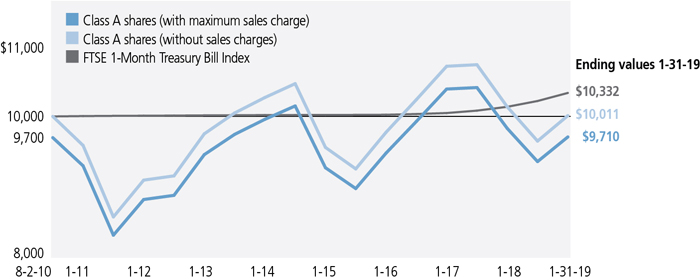
| Start date | With maximum sales charge ($) | Without sales charge ($) | Index ($) | |
| Class C2,4 | 8-2-10 | 9,679 | 9,679 | 10,332 |
| Class I3 | 8-2-10 | 10,327 | 10,327 | 10,332 |
| Class R22,3 | 8-2-10 | 10,048 | 10,048 | 10,332 |
| Class R42,3 | 8-2-10 | 10,102 | 10,102 | 10,332 |
| Class R62,3 | 8-2-10 | 10,344 | 10,344 | 10,332 |
| Class NAV3 | 8-2-10 | 10,452 | 10,452 | 10,332 |
The FTSE 1-Month U.S. Treasury Bill Index is a market value-weighted index of public obligators of the U.S. Treasury with maturities of one month.
It is not possible to invest directly in an index. Index figures do not reflect expenses or sales charges, which would result in lower returns.
Footnotes related to performance pages
| 1 | From 8-2-10. |
| 2 | Class C shares were first offered on 8-28-14; Class R2 and Class R4 shares were first offered on 3-27-15; Class R6 shares were first offered on 11-1-11. Returns prior to these dates are those of Class A shares (first offered on 8-2-10) that have not been adjusted for class-specific expenses; otherwise, returns would vary. |
| 3 | For certain types of investors as described in the fund's prospectuses. |
| 4 | The contingent deferred sales charge is not applicable. |
| Your expenses |

| 6 | JOHN HANCOCK ABSOLUTE RETURN CURRENCY FUND | SEMIANNUAL REPORT |
| Account value on 8-1-2018 | Ending value on 1-31-2019 | Expenses paid during period ended 1-31-20191 | Annualized expense ratio | ||
| Class A | Actual expenses/actual returns | $1,000.00 | $1,037.10 | $6.88 | 1.34% |
| Hypothetical example | 1,000.00 | 1,018.50 | 6.82 | 1.34% | |
| Class C | Actual expenses/actual returns | 1,000.00 | 1,032.60 | 10.45 | 2.04% |
| Hypothetical example | 1,000.00 | 1,014.90 | 10.36 | 2.04% | |
| Class I | Actual expenses/actual returns | 1,000.00 | 1,038.00 | 5.45 | 1.06% |
| Hypothetical example | 1,000.00 | 1,019.90 | 5.40 | 1.06% | |
| Class R2 | Actual expenses/actual returns | 1,000.00 | 1,036.70 | 6.67 | 1.30% |
| Hypothetical example | 1,000.00 | 1,018.70 | 6.61 | 1.30% | |
| Class R4 | Actual expenses/actual returns | 1,000.00 | 1,037.50 | 5.60 | 1.09% |
| Hypothetical example | 1,000.00 | 1,019.70 | 5.55 | 1.09% | |
| Class R6 | Actual expenses/actual returns | 1,000.00 | 1,037.70 | 4.83 | 0.94% |
| Hypothetical example | 1,000.00 | 1,020.50 | 4.79 | 0.94% | |
| Class NAV | Actual expenses/actual returns | 1,000.00 | 1,037.50 | 4.78 | 0.93% |
| Hypothetical example | 1,000.00 | 1,020.50 | 4.74 | 0.93% |
| 1 | Expenses are equal to the annualized expense ratio, multiplied by the average account value over the period, multiplied by 184/365 (to reflect the one-half year period). |
| SEMIANNUAL REPORT | JOHN HANCOCK ABSOLUTE RETURN CURRENCY FUND | 7 |
| Fund’s investments |
| Yield* (%) | Maturity date | Par value^ | Value | ||
| Short-term investments 101.0% | $1,268,168,872 | ||||
| (Cost $1,268,191,360) | |||||
| U.S. Government 94.8% | 1,190,976,620 | ||||
| U.S. Treasury Bill | 2.236 | 02-28-19 | 507,500,000 | 506,600,771 | |
| U.S. Treasury Bill | 2.345 | 03-28-19 | 300,000,000 | 298,912,032 | |
| U.S. Treasury Bill | 2.365 | 05-23-19 | 233,000,000 | 231,299,149 | |
| U.S. Treasury Bill (A) | 2.406 | 04-25-19 | 155,000,000 | 154,164,668 |
| Yield (%) | Shares | Value | |||
| Money market funds 6.2% | 77,192,252 | ||||
| State Street Institutional Treasury Plus Money Market Fund, Premier Class | 2.3189(B) | 77,192,252 | 77,192,252 | ||
| Total investments (Cost $1,268,191,360) 101.0% | $1,268,168,872 | ||||
| Other assets and liabilities, net (1.0%) | (12,227,742) | ||||
| Total net assets 100.0% | $1,255,941,130 | ||||
| The percentage shown for each investment category is the total value of the category as a percentage of the net assets of the fund. | |
| ^All par values are denominated in U.S. dollars unless otherwise indicated. | |
| Security Abbreviations and Legend | |
| (A) | All or a portion of this security is segregated at the custodian as collateral for certain derivatives. |
| (B) | The rate shown is the annualized seven-day yield as of 1-31-19. |
| * | Yield represents either the annualized yield at the date of purchase, the stated coupon rate or, for floating rate securities, the rate at period end. |
| 8 | JOHN HANCOCK ABSOLUTE RETURN CURRENCY FUND | SEMIANNUAL REPORT | SEE NOTES TO FINANCIAL STATEMENTS |
| Contract to buy | Contract to sell | Counterparty (OTC) | Contractual settlement date | Unrealized appreciation | Unrealized depreciation | ||
| AUD | 61,177,359 | USD | 44,228,111 | Barclays Bank PLC Wholesale | 3/20/2019 | $270,148 | — |
| AUD | 126,004,140 | USD | 91,008,394 | Citibank N.A. | 3/20/2019 | 642,585 | — |
| AUD | 242,571,283 | USD | 173,785,318 | J. Aron & Company | 3/20/2019 | 2,652,504 | — |
| AUD | 144,724,379 | USD | 103,683,257 | Morgan Stanley Capital Services, Inc. | 3/20/2019 | 1,584,166 | — |
| AUD | 661,003,650 | USD | 479,688,991 | State Street Bank and Trust Company | 3/20/2019 | 1,101,819 | — |
| CAD | 64,471,280 | USD | 48,322,190 | Barclays Bank PLC Wholesale | 3/20/2019 | 799,353 | — |
| CAD | 437,009,879 | USD | 327,017,798 | Citibank N.A. | 3/20/2019 | 5,945,955 | — |
| CAD | 9,429,516 | USD | 6,972,629 | Deutsche Bank AG London | 3/20/2019 | 211,847 | — |
| CAD | 215,063,398 | USD | 162,096,227 | J. Aron & Company | 3/20/2019 | 1,763,493 | — |
| CAD | 71,931,730 | USD | 53,746,781 | Morgan Stanley Capital Services, Inc. | 3/20/2019 | 1,058,980 | — |
| CAD | 409,265,147 | USD | 308,610,043 | State Street Bank and Trust Company | 3/20/2019 | 3,214,625 | — |
| EUR | 40,475,844 | USD | 46,219,846 | Barclays Bank PLC Wholesale | 3/20/2019 | 284,623 | — |
| EUR | 12,463,024 | USD | 14,294,209 | Citibank N.A. | 3/20/2019 | 25,106 | — |
| EUR | 1,108,220,649 | USD | 1,273,775,240 | Deutsche Bank AG London | 3/20/2019 | — | $(492,009) |
| EUR | 403,981,681 | USD | 463,664,156 | J. Aron & Company | 3/20/2019 | 488,089 | — |
| EUR | 158,952,312 | USD | 182,445,741 | Morgan Stanley Capital Services, Inc. | 3/20/2019 | 181,530 | — |
| GBP | 38,289,835 | USD | 48,956,785 | Barclays Bank PLC Wholesale | 3/20/2019 | 1,378,377 | — |
| GBP | 7,442,065 | USD | 9,758,162 | Citibank N.A. | 3/20/2019 | 25,049 | — |
| GBP | 297,629,829 | USD | 380,594,424 | Deutsche Bank AG London | 3/20/2019 | 10,664,662 | — |
| GBP | 142,741,021 | USD | 181,847,070 | J. Aron & Company | 3/20/2019 | 5,797,838 | — |
| GBP | 37,537,173 | USD | 47,843,852 | Morgan Stanley Capital Services, Inc. | 3/20/2019 | 1,501,875 | — |
| GBP | 216,720,609 | USD | 277,302,987 | State Street Bank and Trust Company | 3/20/2019 | 7,594,220 | — |
| JPY | 16,329,743,681 | USD | 146,802,808 | Barclays Bank PLC Wholesale | 3/20/2019 | 3,653,690 | — |
| JPY | 14,052,033,266 | USD | 126,673,724 | Citibank N.A. | 3/20/2019 | 2,796,754 | — |
| JPY | 35,397,046,848 | USD | 316,233,018 | Deutsche Bank AG London | 3/20/2019 | 9,902,887 | — |
| JPY | 9,684,347,642 | USD | 87,492,346 | J. Aron & Company | 3/20/2019 | 1,735,817 | — |
| JPY | 10,486,344,860 | USD | 93,859,603 | Morgan Stanley Capital Services, Inc. | 3/20/2019 | 2,757,881 | — |
| JPY | 1,616,177,425 | USD | 14,442,074 | State Street Bank and Trust Company | 3/20/2019 | 448,815 | — |
| NOK | 318,166,523 | USD | 37,410,097 | Barclays Bank PLC Wholesale | 3/20/2019 | 390,706 | — |
| NOK | 211,925,985 | USD | 24,753,428 | Citibank N.A. | 3/20/2019 | 425,124 | — |
| NOK | 2,249,841,292 | USD | 263,630,597 | Deutsche Bank AG London | 3/20/2019 | 3,669,081 | — |
| NOK | 803,590,429 | USD | 94,858,104 | J. Aron & Company | 3/20/2019 | 615,058 | — |
| NOK | 1,360,336,111 | USD | 157,352,095 | Morgan Stanley Capital Services, Inc. | 3/20/2019 | 4,267,042 | — |
| NOK | 109,537,052 | USD | 12,880,282 | State Street Bank and Trust Company | 3/20/2019 | 133,622 | — |
| SEE NOTES TO FINANCIAL STATEMENTS | SEMIANNUAL REPORT | JOHN HANCOCK ABSOLUTE RETURN CURRENCY FUND | 9 |
| Contract to buy | Contract to sell | Counterparty (OTC) | Contractual settlement date | Unrealized appreciation | Unrealized depreciation | ||
| NZD | 188,837,114 | USD | 129,959,590 | Barclays Bank PLC Wholesale | 3/20/2019 | $689,572 | — |
| NZD | 180,704,326 | USD | 124,327,837 | Citibank N.A. | 3/20/2019 | 694,562 | — |
| NZD | 428,801,340 | USD | 295,731,249 | Deutsche Bank AG London | 3/20/2019 | 939,964 | — |
| NZD | 136,382,497 | USD | 93,688,383 | J. Aron & Company | 3/20/2019 | 669,439 | — |
| NZD | 454,006,362 | USD | 313,632,665 | Morgan Stanley Capital Services, Inc. | 3/20/2019 | 476,937 | — |
| NZD | 468,840,145 | USD | 321,610,691 | State Street Bank and Trust Company | 3/20/2019 | 2,761,837 | — |
| SEK | 532,745,602 | USD | 59,258,521 | Barclays Bank PLC Wholesale | 3/20/2019 | — | $(172,871) |
| SEK | 1,152,384,107 | USD | 128,913,242 | Citibank N.A. | 3/20/2019 | — | (1,104,843) |
| SEK | 2,183,623,970 | USD | 244,331,887 | Deutsche Bank AG London | 3/20/2019 | — | (2,150,930) |
| SEK | 832,427,201 | USD | 92,835,468 | J. Aron & Company | 3/20/2019 | — | (512,789) |
| SEK | 598,398,411 | USD | 66,185,102 | Morgan Stanley Capital Services, Inc. | 3/20/2019 | 181,957 | — |
| SEK | 2,003,546,980 | USD | 223,700,706 | State Street Bank and Trust Company | 3/20/2019 | — | (1,491,694) |
| SGD | 736,616,901 | USD | 539,935,651 | Citibank N.A. | 3/20/2019 | 7,783,774 | — |
| SGD | 33,712,317 | USD | 24,723,998 | J. Aron & Company | 3/20/2019 | 343,158 | — |
| SGD | 119,429,534 | USD | 87,506,791 | Morgan Stanley Capital Services, Inc. | 3/20/2019 | 1,296,325 | — |
| SGD | 128,856,752 | USD | 94,782,970 | State Street Bank and Trust Company | 3/20/2019 | 1,029,854 | — |
| USD | 170,115,278 | AUD | 235,307,439 | Barclays Bank PLC Wholesale | 3/20/2019 | — | (1,039,079) |
| USD | 270,180,219 | AUD | 373,621,911 | Citibank N.A. | 3/20/2019 | — | (1,579,220) |
| USD | 368,037,122 | AUD | 508,725,769 | Deutsche Bank AG London | 3/20/2019 | — | (1,992,113) |
| USD | 94,692,848 | AUD | 132,072,210 | J. Aron & Company | 3/20/2019 | — | (1,371,835) |
| USD | 269,277,815 | AUD | 372,588,730 | Morgan Stanley Capital Services, Inc. | 3/20/2019 | — | (1,730,124) |
| USD | 25,828,750 | AUD | 35,968,421 | State Street Bank and Trust Company | 3/20/2019 | — | (333,414) |
| USD | 37,542,403 | CAD | 49,763,096 | Barclays Bank PLC Wholesale | 3/20/2019 | — | (372,776) |
| USD | 178,104,461 | CAD | 236,913,824 | Citibank N.A. | 3/20/2019 | — | (2,403,396) |
| USD | 421,885,927 | CAD | 563,662,860 | Deutsche Bank AG London | 3/20/2019 | — | (7,576,450) |
| USD | 149,033,298 | CAD | 198,281,926 | J. Aron & Company | 3/20/2019 | — | (2,040,391) |
| USD | 318,172,243 | CAD | 425,634,373 | Morgan Stanley Capital Services, Inc. | 3/20/2019 | — | (6,124,360) |
| USD | 154,863,973 | CAD | 206,267,202 | State Street Bank and Trust Company | 3/20/2019 | — | (2,293,805) |
| USD | 69,605,715 | EUR | 60,655,283 | Barclays Bank PLC Wholesale | 3/20/2019 | — | (83,796) |
| USD | 399,097,787 | EUR | 348,242,925 | Citibank N.A. | 3/20/2019 | — | (1,013,760) |
| USD | 92,543,857 | EUR | 80,476,414 | Deutsche Bank AG London | 3/20/2019 | 80,979 | — |
| USD | 127,141,671 | EUR | 110,288,832 | J. Aron & Company | 3/20/2019 | 426,005 | — |
| USD | 287,636,203 | EUR | 250,556,232 | State Street Bank and Trust Company | 3/20/2019 | — | (238,825) |
| USD | 212,943,369 | GBP | 166,605,407 | Barclays Bank PLC Wholesale | 3/20/2019 | — | (6,073,251) |
| USD | 449,793,129 | GBP | 350,100,232 | Citibank N.A. | 3/20/2019 | — | (10,442,651) |
| USD | 74,130,310 | GBP | 56,828,385 | Deutsche Bank AG London | 3/20/2019 | — | (575,314) |
| 10 | JOHN HANCOCK ABSOLUTE RETURN CURRENCY FUND | SEMIANNUAL REPORT | SEE NOTES TO FINANCIAL STATEMENTS |
| Contract to buy | Contract to sell | Counterparty (OTC) | Contractual settlement date | Unrealized appreciation | Unrealized depreciation | ||
| USD | 397,911,099 | GBP | 308,117,604 | J. Aron & Company | 3/20/2019 | — | $(7,135,032) |
| USD | 49,491,759 | GBP | 38,571,457 | Morgan Stanley Capital Services, Inc. | 3/20/2019 | — | (1,213,619) |
| USD | 69,682,633 | GBP | 54,440,734 | State Street Bank and Trust Company | 3/20/2019 | — | (1,884,224) |
| USD | 87,156,930 | JPY | 9,707,653,150 | Citibank N.A. | 3/20/2019 | — | (2,285,962) |
| USD | 7,124,288 | JPY | 775,888,420 | Deutsche Bank AG London | 3/20/2019 | — | (24,474) |
| USD | 168,507,629 | JPY | 18,518,604,748 | J. Aron & Company | 3/20/2019 | — | (2,116,262) |
| USD | 170,631,850 | JPY | 19,007,626,568 | Morgan Stanley Capital Services, Inc. | 3/20/2019 | — | (4,497,718) |
| USD | 198,516,314 | JPY | 22,166,179,749 | State Street Bank and Trust Company | 3/20/2019 | — | (5,715,047) |
| USD | 58,675,826 | NOK | 499,363,374 | Barclays Bank PLC Wholesale | 3/20/2019 | — | (652,656) |
| USD | 61,436,326 | NOK | 530,460,636 | Citibank N.A. | 3/20/2019 | — | (1,586,768) |
| USD | 214,952,887 | NOK | 1,831,057,592 | Deutsche Bank AG London | 3/20/2019 | — | (2,591,838) |
| USD | 106,748,516 | NOK | 915,688,018 | J. Aron & Company | 3/20/2019 | — | (2,042,764) |
| USD | 586,987,754 | NOK | 4,959,813,804 | Morgan Stanley Capital Services, Inc. | 3/20/2019 | — | (2,278,980) |
| USD | 150,712,256 | NOK | 1,281,822,811 | State Street Bank and Trust Company | 3/20/2019 | — | (1,578,852) |
| USD | 27,000,986 | NZD | 39,912,678 | Citibank N.A. | 3/20/2019 | — | (613,067) |
| USD | 7,749,336 | NZD | 11,415,690 | Deutsche Bank AG London | 3/20/2019 | — | (148,743) |
| USD | 76,854,017 | NZD | 112,208,761 | J. Aron & Company | 3/20/2019 | — | (778,924) |
| USD | 40,176,906 | NZD | 58,787,100 | Morgan Stanley Capital Services, Inc. | 3/20/2019 | — | (495,635) |
| USD | 264,287,333 | NZD | 389,676,465 | State Street Bank and Trust Company | 3/20/2019 | — | (5,314,879) |
| USD | 66,807,987 | SEK | 599,447,292 | Barclays Bank PLC Wholesale | 3/20/2019 | $324,600 | — |
| USD | 12,346,125 | SEK | 110,475,362 | Citibank N.A. | 3/20/2019 | 93,544 | — |
| USD | 17,746,612 | SEK | 157,901,034 | Deutsche Bank AG London | 3/20/2019 | 234,154 | — |
| USD | 75,391,611 | SEK | 680,334,543 | J. Aron & Company | 3/20/2019 | — | (62,805) |
| USD | 129,346,080 | SEK | 1,154,116,270 | Morgan Stanley Capital Services, Inc. | 3/20/2019 | 1,345,570 | — |
| USD | 504,908,631 | SEK | 4,526,000,969 | State Street Bank and Trust Company | 3/20/2019 | 2,939,767 | — |
| USD | 60,481,118 | SGD | 82,614,183 | Barclays Bank PLC Wholesale | 3/20/2019 | — | (947,547) |
| USD | 72,692,891 | SGD | 99,482,150 | Citibank N.A. | 3/20/2019 | — | (1,278,133) |
| USD | 59,923,897 | SGD | 81,811,100 | Deutsche Bank AG London | 3/20/2019 | — | (907,627) |
| USD | 114,434,531 | SGD | 156,290,883 | J. Aron & Company | 3/20/2019 | — | (1,777,238) |
| USD | 420,128,626 | SGD | 573,749,044 | Morgan Stanley Capital Services, Inc. | 3/20/2019 | — | (6,488,651) |
| USD | 287,835,913 | SGD | 393,685,601 | State Street Bank and Trust Company | 3/20/2019 | — | (4,893,245) |
| $100,295,319 | $(112,520,386) | ||||||
| Derivatives Currency Abbreviations | |
| AUD | Australian Dollar |
| CAD | Canadian Dollar |
| SEE NOTES TO FINANCIAL STATEMENTS | SEMIANNUAL REPORT | JOHN HANCOCK ABSOLUTE RETURN CURRENCY FUND | 11 |
| EUR | Euro |
| GBP | Pound Sterling |
| JPY | Japanese Yen |
| NOK | Norwegian Krone |
| NZD | New Zealand Dollar |
| SEK | Swedish Krona |
| SGD | Singapore Dollar |
| USD | U.S. Dollar |
| 12 | JOHN HANCOCK ABSOLUTE RETURN CURRENCY FUND | SEMIANNUAL REPORT | SEE NOTES TO FINANCIAL STATEMENTS |
| Financial statements |
| Assets | |
| Unaffiliated investments, at value (Cost $1,268,191,360) | $1,268,168,872 |
| Unrealized appreciation on forward foreign currency contracts | 100,295,319 |
| Interest receivable | 158,413 |
| Receivable for fund shares sold | 959,188 |
| Other assets | 90,750 |
| Total assets | 1,369,672,542 |
| Liabilities | |
| Unrealized depreciation on forward foreign currency contracts | 112,520,386 |
| Payable for fund shares repurchased | 850,095 |
| Payable to affiliates | |
| Accounting and legal services fees | 45,592 |
| Transfer agent fees | 81,989 |
| Distribution and service fees | 16 |
| Trustees' fees | 4,191 |
| Other liabilities and accrued expenses | 229,143 |
| Total liabilities | 113,731,412 |
| Net assets | $1,255,941,130 |
| Net assets consist of | |
| Paid-in capital | $1,407,359,634 |
| Total distributable earnings (loss) | (151,418,504) |
| Net assets | $1,255,941,130 |
| Net asset value per share | |
| Based on net asset value and shares outstanding - the fund has an unlimited number of shares authorized with no par value | |
| Class A ($15,612,339 ÷ 1,759,261 shares)1 | $8.87 |
| Class C ($635,596 ÷ 71,727 shares)1 | $8.86 |
| Class I ($688,206,396 ÷ 75,238,316 shares) | $9.15 |
| Class R2 ($86,920 ÷ 9,500 shares) | $9.15 |
| Class R4 ($46,555 ÷ 5,071 shares) | $9.18 |
| Class R6 ($4,020,680 ÷ 435,504 shares) | $9.23 |
| Class NAV ($547,332,644 ÷ 59,083,936 shares) | $9.26 |
| Maximum offering price per share | |
| Class A (net asset value per share ÷ 97%)2 | $9.14 |
| 1 | Redemption price per share is equal to net asset value less any applicable contingent deferred sales charge. |
| 2 | On single retail sales of less than $100,000. On sales of $100,000 or more and on group sales the offering price is reduced. |
| SEE NOTES TO FINANCIAL STATEMENTS | SEMIANNUAL REPORT | JOHN HANCOCK ABSOLUTE RETURN CURRENCY FUND | 13 |
| Investment income | |
| Interest | $14,888,789 |
| Expenses | |
| Investment management fees | 6,121,533 |
| Distribution and service fees | 28,618 |
| Accounting and legal services fees | 117,473 |
| Transfer agent fees | 486,926 |
| Trustees' fees | 12,563 |
| Custodian fees | 96,252 |
| State registration fees | 56,560 |
| Printing and postage | 35,991 |
| Professional fees | 58,565 |
| Other | 22,597 |
| Total expenses | 7,037,078 |
| Less expense reductions | (54,596) |
| Net expenses | 6,982,482 |
| Net investment income | 7,906,307 |
| Realized and unrealized gain (loss) | |
| Net realized gain (loss) on | |
| Unaffiliated investments | 316,506 |
| Forward foreign currency contracts | 40,010,870 |
| 40,327,376 | |
| Change in net unrealized appreciation (depreciation) of | |
| Unaffiliated investments | 9,188 |
| Forward foreign currency contracts | 4,602,236 |
| 4,611,424 | |
| Net realized and unrealized gain | 44,938,800 |
| Increase in net assets from operations | $52,845,107 |
| 14 | JOHN HANCOCK ABSOLUTE RETURN CURRENCY FUND | SEMIANNUAL REPORT | SEE NOTES TO FINANCIAL STATEMENTS |
| Six months ended 1-31-19 (unaudited) | Year ended 7-31-18 | |
| Increase (decrease) in net assets | ||
| From operations | ||
| Net investment income | $7,906,307 | $7,435,861 |
| Net realized gain (loss) | 40,327,376 | (183,777,455) |
| Change in net unrealized appreciation (depreciation) | 4,611,424 | 6,194,269 |
| Increase (decrease) in net assets resulting from operations | 52,845,107 | (170,147,325) |
| Distributions to shareholders | ||
| From net investment income and net realized gain | ||
| Class A | (51,210) | — |
| Class I | (4,347,079) | — |
| Class R2 | (333) | — |
| Class R4 | (275) | — |
| Class R6 | (36,867) | — |
| Class NAV | (4,065,435) | — |
| Total distributions | (8,501,199) | — |
| From fund share transactions | (264,889,902) | 229,182,945 |
| Total increase (decrease) | (220,545,994) | 59,035,620 |
| Net assets | ||
| Beginning of period | 1,476,487,124 | 1,417,451,504 |
| End of period1 | $1,255,941,130 | $1,476,487,124 |
| 1 | Net assets - End of year includes undistributed net investment income of $5,028,481 at July 31, 2018. The SEC eliminated the requirement to disclose undistributed net investment income in the current reporting period. |
| SEE NOTES TO FINANCIAL STATEMENTS | SEMIANNUAL REPORT | JOHN HANCOCK ABSOLUTE RETURN CURRENCY FUND | 15 |
| Financial highlights |
| CLASS A SHARES Period ended | 1-31-191 | 7-31-18 | 7-31-17 | 7-31-16 | 7-31-15 | 7-31-14 |
| Per share operating performance | ||||||
| Net asset value, beginning of period | $8.59 | $9.54 | $9.11 | $8.23 | $9.63 | $9.91 |
| Net investment income (loss)2 | 0.04 | 0.01 | (0.08) | (0.10) | (0.12) | (0.13) |
| Net realized and unrealized gain (loss) on investments | 0.27 | (0.96) | 0.51 | 0.98 | (0.98) | 0.50 |
| Total from investment operations | 0.31 | (0.95) | 0.43 | 0.88 | (1.10) | 0.37 |
| Less distributions | ||||||
| From net investment income | (0.03) | — | — | — | — | — |
| From net realized gain | — | — | — | — | (0.30) | (0.65) |
| Total distributions | (0.03) | — | — | — | (0.30) | (0.65) |
| Net asset value, end of period | $8.87 | $8.59 | $9.54 | $9.11 | $8.23 | $9.63 |
| Total return (%)3,4 | 3.715 | (10.05) | 4.83 | 10.56 | (11.51) | 4.13 |
| Ratios and supplemental data | ||||||
| Net assets, end of period (in millions) | $16 | $17 | $22 | $21 | $22 | $48 |
| Ratios (as a percentage of average net assets): | ||||||
| Expenses before reductions | 1.346 | 1.33 | 1.35 | 1.37 | 1.37 | 1.42 |
| Expenses including reductions | 1.346 | 1.32 | 1.34 | 1.36 | 1.35 | 1.42 |
| Net investment income (loss) | 0.806 | 0.06 | (0.83) | (1.13) | (1.29) | (1.36) |
| Portfolio turnover (%)7 | 0 | 0 | 0 | 0 | 0 | 0 |
| 1 | Six months ended 1-31-19. Unaudited. |
| 2 | Based on average daily shares outstanding. |
| 3 | Total returns would have been lower had certain expenses not been reduced during the applicable periods. |
| 4 | Does not reflect the effect of sales charges, if any. |
| 5 | Not annualized. |
| 6 | Annualized. |
| 7 | The calculation of portfolio turnover excludes amounts from securities whose maturities or expiration dates at the time of acquisition were one year or less, which represents a significant amount of the investments held by the fund. As a result, the portfolio turnover is 0%. |
| 16 | JOHN HANCOCK ABSOLUTE RETURN CURRENCY FUND | SEMIANNUAL REPORT | SEE NOTES TO FINANCIAL STATEMENTS |
| CLASS C SHARES Period ended | 1-31-191 | 7-31-18 | 7-31-17 | 7-31-16 | 7-31-152 |
| Per share operating performance | |||||
| Net asset value, beginning of period | $8.58 | $9.60 | $9.23 | $8.40 | $10.01 |
| Net investment loss3 | — | (0.06) | (0.15) | (0.16) | (0.18) |
| Net realized and unrealized gain (loss) on investments | 0.28 | (0.96) | 0.52 | 0.99 | (1.13) |
| Total from investment operations | 0.28 | (1.02) | 0.37 | 0.83 | (1.31) |
| Less distributions | |||||
| From net realized gain | — | — | — | — | (0.30) |
| Net asset value, end of period | $8.86 | $8.58 | $9.60 | $9.23 | $8.40 |
| Total return (%)4,5 | 3.266 | (10.62) | 4.01 | 9.88 | (13.29)6 |
| Ratios and supplemental data | |||||
| Net assets, end of period (in millions) | $1 | $1 | $1 | $1 | $—7 |
| Ratios (as a percentage of average net assets): | |||||
| Expenses before reductions | 2.048 | 2.03 | 2.05 | 2.07 | 3.048 |
| Expenses including reductions | 2.048 | 2.02 | 2.04 | 2.06 | 2.258 |
| Net investment income (loss) | 0.118 | (0.67) | (1.52) | (1.81) | (2.19)8 |
| Portfolio turnover (%)9 | 0 | 0 | 0 | 0 | 0 |
| 1 | Six months ended 1-31-19. Unaudited. |
| 2 | The inception date for Class C shares is 8-28-14. |
| 3 | Based on average daily shares outstanding. |
| 4 | Total returns would have been lower had certain expenses not been reduced during the applicable periods. |
| 5 | Does not reflect the effect of sales charges, if any. |
| 6 | Not annualized. |
| 7 | Less than $500,000. |
| 8 | Annualized. |
| 9 | The calculation of portfolio turnover excludes amounts from securities whose maturities or expiration dates at the time of acquisition were one year or less, which represents a significant amount of the investments held by the fund. As a result, the portfolio turnover is 0%. |
| SEE NOTES TO FINANCIAL STATEMENTS | SEMIANNUAL REPORT | JOHN HANCOCK ABSOLUTE RETURN CURRENCY FUND | 17 |
| CLASS I SHARES Period ended | 1-31-191 | 7-31-18 | 7-31-17 | 7-31-16 | 7-31-15 | 7-31-14 |
| Per share operating performance | ||||||
| Net asset value, beginning of period | $8.87 | $9.82 | $9.35 | $8.42 | $9.81 | $10.05 |
| Net investment income (loss)2 | 0.05 | 0.04 | (0.05) | (0.07) | (0.09) | (0.10) |
| Net realized and unrealized gain (loss) on investments | 0.29 | (0.99) | 0.52 | 1.00 | (1.00) | 0.51 |
| Total from investment operations | 0.34 | (0.95) | 0.47 | 0.93 | (1.09) | 0.41 |
| Less distributions | ||||||
| From net investment income | (0.06) | — | — | — | — | — |
| From net realized gain | — | — | — | — | (0.30) | (0.65) |
| Total distributions | (0.06) | — | — | — | (0.30) | (0.65) |
| Net asset value, end of period | $9.15 | $8.87 | $9.82 | $9.35 | $8.42 | $9.81 |
| Total return (%)3 | 3.804 | (9.77) | 5.13 | 11.05 | (11.29) | 4.49 |
| Ratios and supplemental data | ||||||
| Net assets, end of period (in millions) | $688 | $720 | $397 | $210 | $371 | $392 |
| Ratios (as a percentage of average net assets): | ||||||
| Expenses before reductions | 1.075 | 1.04 | 1.04 | 1.05 | 1.03 | 1.05 |
| Expenses including reductions | 1.065 | 1.03 | 1.03 | 1.04 | 1.02 | 1.05 |
| Net investment income (loss) | 1.085 | 0.42 | (0.49) | (0.82) | (0.96) | (1.00) |
| Portfolio turnover (%)6 | 0 | 0 | 0 | 0 | 0 | 0 |
| 1 | Six months ended 1-31-19. Unaudited. |
| 2 | Based on average daily shares outstanding. |
| 3 | Total returns would have been lower had certain expenses not been reduced during the applicable periods. |
| 4 | Not annualized. |
| 5 | Annualized. |
| 6 | The calculation of portfolio turnover excludes amounts from securities whose maturities or expiration dates at the time of acquisition were one year or less, which represents a significant amount of the investments held by the fund. As a result, the portfolio turnover is 0%. |
| 18 | JOHN HANCOCK ABSOLUTE RETURN CURRENCY FUND | SEMIANNUAL REPORT | SEE NOTES TO FINANCIAL STATEMENTS |
| CLASS R2 SHARES Period ended | 1-31-191 | 7-31-18 | 7-31-17 | 7-31-16 | 7-31-152 |
| Per share operating performance | |||||
| Net asset value, beginning of period | $8.86 | $9.83 | $9.38 | $8.46 | $8.70 |
| Net investment income (loss)3 | 0.04 | 0.01 | (0.07) | (0.09) | (0.03) |
| Net realized and unrealized gain (loss) on investments | 0.29 | (0.98) | 0.52 | 1.01 | (0.21) |
| Total from investment operations | 0.33 | (0.97) | 0.45 | 0.92 | (0.24) |
| Less distributions | |||||
| From net investment income | (0.04) | — | — | — | — |
| Net asset value, end of period | $9.15 | $8.86 | $9.83 | $9.38 | $8.46 |
| Total return (%)4 | 3.675 | (9.96) | 4.90 | 10.87 | (2.76)5 |
| Ratios and supplemental data | |||||
| Net assets, end of period (in millions) | $—6 | $—6 | $—6 | $—6 | $—6 |
| Ratios (as a percentage of average net assets): | |||||
| Expenses before reductions | 1.317 | 1.27 | 1.20 | 1.23 | 1.187 |
| Expenses including reductions | 1.307 | 1.26 | 1.20 | 1.22 | 1.167 |
| Net investment income (loss) | 0.857 | 0.07 | (0.68) | (0.98) | (1.08)7 |
| Portfolio turnover (%)8 | 0 | 0 | 0 | 0 | 0 |
| 1 | Six months ended 1-31-19. Unaudited. |
| 2 | The inception date for Class R2 shares is 3-27-15. |
| 3 | Based on average daily shares outstanding. |
| 4 | Total returns would have been lower had certain expenses not been reduced during the applicable periods. |
| 5 | Not annualized. |
| 6 | Less than $500,000. |
| 7 | Annualized. |
| 8 | The calculation of portfolio turnover excludes amounts from securities whose maturities or expiration dates at the time of acquisition were one year or less, which represents a significant amount of the investments held by the fund. As a result, the portfolio turnover is 0%. |
| SEE NOTES TO FINANCIAL STATEMENTS | SEMIANNUAL REPORT | JOHN HANCOCK ABSOLUTE RETURN CURRENCY FUND | 19 |
| CLASS R4 SHARES Period ended | 1-31-191 | 7-31-18 | 7-31-17 | 7-31-16 | 7-31-152 |
| Per share operating performance | |||||
| Net asset value, beginning of period | $8.90 | $9.86 | $9.39 | $8.47 | $8.70 |
| Net investment income (loss)3 | 0.05 | 0.02 | (0.06) | (0.08) | (0.03) |
| Net realized and unrealized gain (loss) on investments | 0.28 | (0.98) | 0.53 | 1.00 | (0.20) |
| Total from investment operations | 0.33 | (0.96) | 0.47 | 0.92 | (0.23) |
| Less distributions | |||||
| From net investment income | (0.05) | — | — | — | — |
| Net asset value, end of period | $9.18 | $8.90 | $9.86 | $9.39 | $8.47 |
| Total return (%)4 | 3.755 | (9.83) | 5.11 | 10.86 | (2.64)5 |
| Ratios and supplemental data | |||||
| Net assets, end of period (in millions) | $—6 | $—6 | $—6 | $—6 | $—6 |
| Ratios (as a percentage of average net assets): | |||||
| Expenses before reductions | 1.207 | 1.19 | 1.19 | 1.21 | 1.187 |
| Expenses including reductions | 1.097 | 1.08 | 1.09 | 1.10 | 1.067 |
| Net investment income (loss) | 1.067 | 0.21 | (0.57) | (0.87) | (0.98)7 |
| Portfolio turnover (%)8 | 0 | 0 | 0 | 0 | 0 |
| 1 | Six months ended 1-31-19. Unaudited. |
| 2 | The inception date for Class R4 shares is 3-27-15. |
| 3 | Based on average daily shares outstanding. |
| 4 | Total returns would have been lower had certain expenses not been reduced during the applicable periods. |
| 5 | Not annualized. |
| 6 | Less than $500,000. |
| 7 | Annualized. |
| 8 | The calculation of portfolio turnover excludes amounts from securities whose maturities or expiration dates at the time of acquisition were one year or less, which represents a significant amount of the investments held by the fund. As a result, the portfolio turnover is 0%. |
| 20 | JOHN HANCOCK ABSOLUTE RETURN CURRENCY FUND | SEMIANNUAL REPORT | SEE NOTES TO FINANCIAL STATEMENTS |
| CLASS R6 SHARES Period ended | 1-31-191 | 7-31-18 | 7-31-17 | 7-31-16 | 7-31-15 | 7-31-14 |
| Per share operating performance | ||||||
| Net asset value, beginning of period | $8.96 | $9.91 | $9.42 | $8.48 | $9.86 | $10.09 |
| Net investment income (loss)2 | 0.05 | 0.05 | (0.03) | (0.06) | (0.08) | (0.09) |
| Net realized and unrealized gain (loss) on investments | 0.29 | (1.00) | 0.52 | 1.00 | (1.00) | 0.51 |
| Total from investment operations | 0.34 | (0.95) | 0.49 | 0.94 | (1.08) | 0.42 |
| Less distributions | ||||||
| From net investment income | (0.07) | — | — | — | — | — |
| From net realized gain | — | — | — | — | (0.30) | (0.65) |
| Total distributions | (0.07) | — | — | — | (0.30) | (0.65) |
| Net asset value, end of period | $9.23 | $8.96 | $9.91 | $9.42 | $8.48 | $9.86 |
| Total return (%)3 | 3.774 | (9.59) | 5.20 | 11.08 | (11.13) | 4.58 |
| Ratios and supplemental data | ||||||
| Net assets, end of period (in millions) | $4 | $119 | $137 | $38 | $37 | $81 |
| Ratios (as a percentage of average net assets): | ||||||
| Expenses before reductions | 0.955 | 0.94 | 0.95 | 0.96 | 0.94 | 1.04 |
| Expenses including reductions | 0.945 | 0.92 | 0.92 | 0.93 | 0.90 | 0.99 |
| Net investment income (loss) | 1.055 | 0.48 | (0.32) | (0.71) | (0.84) | (0.94) |
| Portfolio turnover (%)6 | 0 | 0 | 0 | 0 | 0 | 0 |
| 1 | Six months ended 1-31-19. Unaudited. |
| 2 | Based on average daily shares outstanding. |
| 3 | Total returns would have been lower had certain expenses not been reduced during the applicable periods. |
| 4 | Not annualized. |
| 5 | Annualized. |
| 6 | The calculation of portfolio turnover excludes amounts from securities whose maturities or expiration dates at the time of acquisition were one year or less, which represents a significant amount of the investments held by the fund. As a result, the portfolio turnover is 0%. |
| SEE NOTES TO FINANCIAL STATEMENTS | SEMIANNUAL REPORT | JOHN HANCOCK ABSOLUTE RETURN CURRENCY FUND | 21 |
| CLASS NAV SHARES Period ended | 1-31-191 | 7-31-18 | 7-31-17 | 7-31-16 | 7-31-15 | 7-31-14 |
| Per share operating performance | ||||||
| Net asset value, beginning of period | $8.99 | $9.94 | $9.45 | $8.50 | $9.89 | $10.11 |
| Net investment income (loss)2 | 0.06 | 0.04 | (0.04) | (0.06) | (0.08) | (0.08) |
| Net realized and unrealized gain (loss) on investments | 0.28 | (0.99) | 0.53 | 1.01 | (1.01) | 0.51 |
| Total from investment operations | 0.34 | (0.95) | 0.49 | 0.95 | (1.09) | 0.43 |
| Less distributions | ||||||
| From net investment income | (0.07) | — | — | — | — | — |
| From net realized gain | — | — | — | — | (0.30) | (0.65) |
| Total distributions | (0.07) | — | — | — | (0.30) | (0.65) |
| Net asset value, end of period | $9.26 | $8.99 | $9.94 | $9.45 | $8.50 | $9.89 |
| Total return (%)3 | 3.754 | (9.56) | 5.19 | 11.05 | (11.10) | 4.66 |
| Ratios and supplemental data | ||||||
| Net assets, end of period (in millions) | $547 | $620 | $860 | $779 | $886 | $1,363 |
| Ratios (as a percentage of average net assets): | ||||||
| Expenses before reductions | 0.935 | 0.92 | 0.93 | 0.94 | 0.91 | 0.91 |
| Expenses including reductions | 0.935 | 0.92 | 0.92 | 0.93 | 0.90 | 0.91 |
| Net investment income (loss) | 1.215 | 0.47 | (0.41) | (0.71) | (0.84) | (0.85) |
| Portfolio turnover (%)6 | 0 | 0 | 0 | 0 | 0 | 0 |
| 1 | Six months ended 1-31-19. Unaudited. |
| 2 | Based on average daily shares outstanding. |
| 3 | Total returns would have been lower had certain expenses not been reduced during the applicable periods. |
| 4 | Not annualized. |
| 5 | Annualized. |
| 6 | The calculation of portfolio turnover excludes amounts from securities whose maturities or expiration dates at the time of acquisition were one year or less, which represents a significant amount of the investments held by the fund. As a result, the portfolio turnover is 0%. |
| 22 | JOHN HANCOCK ABSOLUTE RETURN CURRENCY FUND | SEMIANNUAL REPORT | SEE NOTES TO FINANCIAL STATEMENTS |
Note 1 — Organization
John Hancock Absolute Return Currency Fund (the fund) is a series of John Hancock Funds II (the Trust), an open-end management investment company organized as a Massachusetts business trust and registered under the Investment Company Act of 1940, as amended (the 1940 Act). The investment objective of the fund is to seek to achieve absolute return from investments in currency markets.
The fund may offer multiple classes of shares. The shares currently offered by the fund are detailed in the Statement of assets and liabilities. Class A and Class C shares are offered to allinvestors. Class I shares are offeredto institutions and certaininvestors. Class R2 and Class R4 shares are available only to certain retirement and 529 plans. Class R6 shares are only available to certain retirement plans, institutions and other investors. Class NAV shares areoffered toJohn Hancock affiliated funds of funds, retirement plans for employees of John Hancock and/or Manulife Financial Corporation (MFC), and certain 529 plans. Class C shares convert to Class A shares ten years after purchase (certain exclusions may apply). Shareholders of each class have exclusive voting rights to matters that affect that class.The distribution and service fees, if any, and transfer agent feesfor each class may differ.
Note 2 — Significant accounting policies
The financial statements have been prepared in conformity with accounting principles generally accepted in the United States of America (US GAAP), which require management to make certain estimates and assumptions as of the date of the financial statements. Actual results could differ from those estimates and those differences could be significant. The fund qualifies as an investment company under Topic 946 of Accounting Standards Codification of US GAAP.
Events or transactions occurring after the end of the fiscal period through the date that the financial statements were issued have been evaluated in the preparation of the financial statements. The following summarizes the significant accounting policies of the fund:
Security valuation.Investments are stated at value as of the scheduled close of regular trading on the New York Stock Exchange (NYSE), normally at 4:00 p.m., Eastern Time. In case of emergency or other disruption resulting in the NYSE not opening for trading or the NYSE closing at a time other than the regularly scheduled close, the net asset value (NAV) may be determined as of the regularly scheduled close of the NYSE pursuant to the fund's Valuation Policies and Procedures.
In order to value the securities, the fund uses the following valuation techniques: Investments by the fund in open-end mutual funds are valued at their respective NAVs each business day. Debt obligations are typically valued based on the evaluated prices provided by an independent pricing vendor. Independent pricing vendors utilize matrix pricing which takes into account factors such as institutional-size trading in similar groups of securities, yield, quality, coupon rate, maturity, type of issue, trading characteristics and other market data, as well as broker supplied prices. Forward foreign currency contracts are valued at the prevailing forward rates which are based on foreign currency exchange spot rates and forward points supplied by an independent pricing vendor. Foreign securities and currencies are valued in U.S. dollars based on foreign currency exchange rates supplied by an independent pricing vendor.
Other portfolio securities and assets, for which reliable market quotations are not readily available, are valued at fair value as determined in good faith by the fund's Pricing Committee following procedures established by the Board of Trustees. The frequency with which these fair valuation procedures are used cannot be predicted and fair value of securities may differ significantly from the value that would have been used had a ready market for such securities existed.
The fund uses a three-tier hierarchy to prioritize the pricing assumptions, referred to as inputs, used in valuation techniques to measure fair value. Level 1 includes securities valued using quoted prices in active markets for identical securities. Level 2 includes securities valued using other significant observable inputs. Observable inputs may include quoted prices for similar securities, interest rates, prepayment speeds and credit risk. Prices for securities valued using these inputs are received from independent pricing vendors and brokers and are based on an evaluation of the inputs described. Level 3 includes securities valued using significant unobservable inputs when market prices are not readily available or reliable, including the fund's own assumptions in determining the fair value of investments. Factors used in determining value may include market or issuer specific events or trends, changes in interest rates and credit quality. The inputs or methodology used for valuing
securities are not necessarily an indication of the risks associated with investing in those securities. Changes in valuation techniques and related inputs may result in transfers into or out of an assigned level within the disclosure hierarchy.
As of January 31, 2019, all investments are categorized as Level 2 under the hierarchy described above, except for money market funds, which is categorized as Level 1.
Security transactions and related investment income. Investment security transactions are accounted for on a trade date plus one basis for daily NAV calculations. However, for financial reporting purposes, investment transactions are reported on trade date. Interest income is accrued as earned. Interest income includes coupon interest and amortization/accretion of premiums/discounts on debt securities. Debt obligations may be placed in a non-accrual status and related interest income may be reduced by stopping current accruals and writing off interest receivable when the collection of all or a portion of interest has become doubtful. Gains and losses on securities sold are determined on the basis of identified cost and may include proceeds from litigation.
Foreign investing. Assets, including investments, and liabilities denominated in foreign currencies are translated into U.S. dollar values each day at the prevailing exchange rate. Purchases and sales of securities, income and expenses are translated into U.S. dollars at the prevailing exchange rate on the date of the transaction. The effect of changes in foreign currency exchange rates on the value of securities is reflected as a component of the realized and unrealized gains (losses) on investments. Foreign investments are subject to a decline in the value of a foreign currency versus the U.S. dollar, which reduces the dollar value of securities denominated in that currency.
Funds that invest internationally generally carry more risk than funds that invest strictly in U.S. securities. Risks can result from differences in economic and political conditions, regulations, market practices (including higher transaction costs), accounting standards and other factors.
Line of credit.The fund may have the ability to borrow from banks for temporary or emergency purposes, including meeting redemption requests that otherwise might require the untimely sale of securities. Pursuant to the fund's custodian agreement, the custodian may loan money to the fund to make properly authorized payments. The fund is obligated to repay the custodian for any overdraft, including any related costs or expenses. The custodian may have a lien, security interest or security entitlement in any fund property that is not otherwise segregated or pledged, to the extent of any overdraft, and to the maximum extent permitted by law.
The fund and other affiliated funds have entered into a syndicated line of credit agreement with Citibank, N.A. as the administrative agent that enables them to participate in a $750 million unsecured committed line of credit. Excluding commitments designated for a certain fund and subject to the needs of all other affiliated funds, the fund can borrow up to an aggregate commitment amount of $500 million, subject to asset coverage and other limitations as specified in the agreement. A commitment fee payable at the end of each calendar quarter, based on the average daily unused portion of the line of credit, is charged to each participating fund based on a combination of fixed and asset based allocations and is reflected in Other expenses on the Statement of operations. For the six months ended January 31, 2019, the fund had no borrowings under the line of credit. Commitment fees for the six months ended January 31, 2019 were $2,150.
Expenses.Within the John Hancock group of funds complex, expenses that are directly attributable to an individual fund are allocated to such fund. Expenses that are not readily attributable to a specific fund are allocated among all funds in an equitable manner, taking into consideration, among other things, the nature and type of expense and the fund's relative net assets. Expense estimates are accrued in the period to which they relate and adjustments are made when actual amounts are known.
Class allocations. Income, common expenses and realized and unrealized gains (losses) are determined at the fund level and allocated daily to each class of shares based on the net assets of the class. Class-specific expenses, such as distribution and service fees, if any, and transfer agent fees, for all classes, are charged daily at the class level based on the net assets of each class and the specific expense rates applicable to each class.
Federal income taxes. The fund intends to continue to qualify as a regulated investment company by complying with the applicable provisions of the Internal Revenue Code and will not be subject to federal income tax on taxable income that is distributed to shareholders. Therefore, no federal income tax provision is required.
For federal income tax purposes, as of July 31, 2018, the fund has short-term capital loss carryforward of $103,382,443 and a long-term capital loss carryforward of $111,407,463 available to offset future net realized capital gains. These carryforwards do not expire.
As of July 31, 2018, the fund had no uncertain tax positions that would require financial statement recognition, derecognition or disclosure. The fund's federal tax returns are subject to examination by the Internal Revenue Service for a period of three years.
Distribution of income and gains. Distributions to shareholders from net investment income and net realized gains, if any, are recorded on the ex-date. The fund generally declares and pays dividends and capital gain distributions, if any, annually.
Distributions paid by the fund with respect to each class of shares are calculated in the same manner, at the same time and in the same amount, except for the effect of class level expenses that may be applied differently to each class.
Such distributions, on a tax basis, are determined in conformity with income tax regulations, which may differ from US GAAP. Distributions in excess of tax basis earnings and profits, if any, are reported in the fund's financial statements as a return of capital. The final determination of tax characteristics of the fund's distribution will occur at the end of the year and will be subsequently be reported to shareholders.
Capital accounts within the financial statements are adjusted for permanent book-tax differences. These adjustments have no impact on net assets or the results of operations. Temporary book-tax differences, if any, will reverse in a subsequent period. Book-tax differences are primarily attributable to derivative transactions.
Note 3 — Derivative Instruments
The fund may invest in derivatives in order to meet its investment objective. Derivatives include a variety of different instruments that may be traded in the over-the-counter (OTC) market, on a regulated exchange or through a clearing facility. The risks in using derivatives vary depending upon the structure of the instruments, including the use of leverage, optionality, the liquidity or lack of liquidity of the contract, the creditworthiness of the counterparty or clearing organization and the volatility of the position. Some derivatives involve risks that are potentially greater than the risks associated with investing directly in the referenced securities or other referenced underlying instrument. Specifically, the fund is exposed to the risk that the counterparty to an OTC derivatives contract will be unable or unwilling to make timely settlement payments or otherwise honor its obligations. OTC derivatives transactions typically can only be closed out with the other party to the transaction.
Forward foreign currency contracts are typically traded through the OTC market. Certain forwards are regulated by the Commodity Futures Trading Commission. Derivative counterparty risk is managed through an ongoing evaluation of the creditworthiness of all potential counterparties and, if applicable, designated clearing organizations. The fund attempts to reduce its exposure to counterparty risk for derivatives traded in the OTC market, whenever possible, by entering into an International Swaps and Derivatives Association (ISDA) Master Agreement with each of its OTC counterparties. The ISDA gives each party to the agreement the right to terminate all transactions traded under the agreement if there is certain deterioration in the credit quality or contractual default of the other party, as defined in the ISDA. Upon an event of default or a termination of the ISDA, the non-defaulting party has the right to close out all transactions and to net amounts owed.
As defined by the ISDA, the fund may have collateral agreements with certain counterparties to mitigate counterparty risk on OTC derivatives. Subject to established minimum levels, collateral for OTC transactions is generally determined based on the net aggregate unrealized gain or loss on contracts with a particular counterparty. Collateral pledged to the fund is held in a segregated account by a third-party agent or held by the custodian bank for the benefit of the fund and can be in the form of cash or debt securities issued by the U.S. government or related agencies; collateral posted by the fund for OTC transactions is held in a segregated account at the fund's custodian and is noted in the accompanying fund's investments, or if cash is
posted, on the Statement of assets and liabilities. The fund's maximum risk of loss due to counterparty risk is equal to the asset value of outstanding contracts offset by collateral received.
Forward foreign currency contracts. A forward foreign currency contract is an agreement between two parties to buy and sell specific currencies at a price that is set on the date of the contract. The forward contract calls for delivery of the currencies on a future date that is specified in the contract. Risks related to the use of forwards include the possible failure of counterparties to meet the terms of the forward agreement, the failure of the counterparties to timely post collateral if applicable, the risk that currency movements will not favor the fund thereby reducing the fund's total return, and the potential for losses in excess of the amounts recognized on the Statement of assets and liabilities.
The market value of a forward foreign currency contract fluctuates with changes in foreign currency exchange rates. Forward foreign currency contracts are marked-to-market daily and the change in value is recorded by the fund as an unrealized gain or loss. Realized gains or losses, equal to the difference between the value of the contract at the time it was opened and the value at the time it was closed, are recorded upon delivery or receipt of the currency or settlement with the counterparty.
During the six months ended January 31, 2019, the fund used forward foreign currency contracts to manage and gain exposure to foreign currencies. The fund held forward foreign currency contracts with U.S. Dollar notional values ranging from $17.7 billion to $24.3 billion, as measured at each quarter end.
Fair value of derivative instruments by risk category
The table below summarizes the fair value of derivatives held by the fund at January 31, 2019 by risk category:
| Risk | Statement of assets and liabilities location | Financial instruments location | Assets derivatives fair value | Liabilities derivatives fair value | |||||||||||||
| Foreign currency | Unrealized appreciation / depreciation on forward foreign currency contracts | Forward foreign currency contracts | $100,295,319 | ($112,520,386 | ) |
For financial reporting purposes, the fund does not offset OTC derivative assets or liabilities that are subject to master netting arrangements, as defined by the ISDAs, in the Statement of assets and liabilities. In the event of default by the counterparty or a termination of the agreement, the ISDA allows an offset of amounts across the various transactions between the fund and the applicable counterparty. The fund's exposure to counterparties subject to an ISDA is comprised of forward foreign currency assets and liabilities amounting to $100,295,319 and ($112,520,386) respectively. The table below reflects the fund's exposure to counterparties subject to an ISDA for OTC derivative transactions:
| OTC Financial Instruments | Asset | Liability | ||||||
| Forward foreign currency contracts | $100,295,319 | ($112,520,386 | ) | |||||
| Totals | $100,295,319 | ($112,520,386 | ) |
| Counterparty | Total market value of OTC derivatives | Collateral posted by counterparty | Collateral posted by fund | Net exposure | ||||||||||
| Barclays Bank PLC Wholesale | ($1,550,907 | ) | — | $1,550,907 | — | |||||||||
| Citibank N.A. | (3,875,347 | ) | — | 3,875,347 | — | |||||||||
| Deutsche Bank AG London | 9,244,076 | $5,413,627 | — | $3,830,449 | ||||||||||
| J. Aron & Company | (3,346,639 | ) | — | 3,272,269 | (74,370 | ) | ||||||||
| Morgan Stanley Capital Services, Inc. | (8,176,824 | ) | — | 4,740,315 | (3,436,509 | ) | ||||||||
| State Street Bank and Trust Company | (4,519,426 | ) | — | 4,519,426 | — | |||||||||
| Totals | ($12,225,067 | ) | $5,413,627 | $17,958,264 | $319,570 |
Effect of derivative instruments on the Statement of operations
The table below summarizes the net realized gain (loss) included in the net increase (decrease) in net assets from operations, classified by derivative instrument and risk category, for the six months ended January 31, 2019:
| Statement of operations location - net realized gain (loss) on: | |
| Risk | Forward foreign currency contracts |
| Foreign currency | $40,010,870 |
The table below summarizes the net change in unrealized appreciation (depreciation) included in the net increase (decrease) in net assets from operations, classified by derivative instrument and risk category, for the six months ended January 31, 2019:
| Statement of operations location - change in net unrealized appreciation (depreciation) of: | |
| Risk | Forward foreign currency contracts |
| Foreign currency | $4,602,236 |
Note 4 — Guarantees and indemnifications
Under the Trust's organizational documents, its Officers and Trustees are indemnified against certain liabilities arising out of the performance of their duties to the Trust, including the fund. Additionally, in the normal course of business, the fund enters into contracts with service providers that contain general indemnification clauses. The fund's maximum exposure under these arrangements is unknown, as this would involve future claims that may be made against the fund that have not yet occurred. The risk of material loss from such claims is considered remote.
Note 5 — Fees and transactions with affiliates
John Hancock Advisers, LLC (the Advisor) serves as investment advisor for the fund. John Hancock Funds, LLC (the Distributor), an affiliate of the Advisor, serves as principal underwriter of the fund. The Advisor and the Distributor are indirect, wholly owned subsidiaries of MFC.
Management fee. The fund has an investment management agreement with the Advisor under which the fund pays a daily management fee to the Advisor, on an annual basis, equal to the sum of: a) 0.95% of the first $250 million of the fund's average daily net assets; b) 0.90% of the next $250 million of the fund's average daily net assets; c) 0.85% of the next $2 billion of the fund's average daily net assets; d) 0.83% of the next $1.5 billion of the fund's average daily net assets; and d) 0.81% of the fund's average daily net assets in excess of $4 billion. The Advisor has a subadvisory agreement with First Quadrant, L.P. The fund is not responsible for payment of the subadvisory fees.
The Advisor has contractually agreed to waive a portion of its management fee and/or reimburse expenses for certain funds of the John Hancock funds complex, including the fund (the participating portfolios). This waiver is based upon aggregate net assets of all the participating portfolios. The amount of the reimbursement is calculated daily and allocated among all the participating portfolios in proportion to the daily net assets of each fund. During the six months ended January 31, 2019, this waiver amounted to 0.01% of the fund's average net assets (on an annualized basis). This agreement expires on June 30, 2020, unless renewed by mutual agreement of the Fund and the Advisor based upon a determination that this is appropriate under the circumstances at that time.
The expense reductions described above amounted to for the following for the six months ended January 31, 2019:
| Class | Expense reduction | Class | Expense reduction | |
| Class A | $649 | Class R4 | $1 | |
| Class C | 27 | Class R6 | 2,471 | |
| Class I | 28,042 | Class NAV | 23,378 | |
| Class R2 | 4 | Total | $54,572 |
Expenses waived or reimbursed in the current fiscal period are not subject to recapture in future fiscal periods.
The investment management fees, including the impact of the waivers and reimbursements as described above, incurred for the six months ended January 31, 2019 were equivalent to a net annual effective rate of 0.87% of the fund's average daily net assets.
Accounting and legal services. Pursuant to a service agreement, the fund reimburses the Advisor for all expenses associated with providing the administrative, financial, legal, accounting and recordkeeping services to the fund, including the preparation of all tax returns, periodic reports to shareholders and regulatory reports, among other services. These expenses are allocated to each share class based on its relative net assets at the time the expense was incurred. These accounting and legal services fees incurred for the six months ended January 31, 2019 amounted to an annual rate of 0.02% of the fund's average daily net assets.
Distribution and service plans. The fund has a distribution agreement with the Distributor. The fund has adopted distribution and service plans with respect to Class A, Class C, Class R2 and Class R4 pursuant to Rule 12b-1 under the 1940 Act, to pay the Distributor for services provided as the distributor of shares of the fund. In addition, under a service plan for Class R2 and Class R4 shares, the fund pays for certain other services. The fund may pay up to the following contractual rates of distribution and service fees under these arrangements, expressed as an annual percentage of average daily net assets for each class of the fund's shares:
| Class | Rule 12b-1 fee | Service fee | Class | Rule 12b-1 fee | Service fee | |
| Class A | 0.30% | — | Class R2 | 0.25% | 0.25% | |
| Class C | 1.00% | — | Class R4 | 0.25% | 0.10% |
The fund's Distributor has contractually agreed to waive 0.10% of Rule12b-1 fees for Class R4 shares. The current waiver agreement expires on November 30, 2019, unless renewed by mutual agreement of the fund and the Distributor based upon a determination that this is appropriate under the circumstances at the time. This contractual waiver amounted to $24 for Class R4 shares for the six months ended January 31, 2019.
Sales charges. Class A shares are assessed up-front sales charges, which resulted in payments to the Distributor amounting to $457 for the six months ended January 31, 2019. Of this amount, $79 was retained and used for printing prospectuses, advertising, sales literature and other purposes, $378 was paid as sales commissions to broker-dealers and $0 was paid as sales commissions to sales personnel of Signator Investors, Inc., which had been a broker-dealer affiliate of the Advisor through December 31, 2018.
Class A and Class C shares may be subject to contingent deferred sales charges (CDSCs). Certain Class A shares that are acquired through purchases of $1 million or more and are redeemed within one year of purchase are subject to a 1.00% sales charge. Class C shares that are redeemed within one year of purchase are subject to a 1.00% CDSC. CDSCs are applied to the lesser of the current market value at the time of redemption or the original purchase cost of the shares being redeemed. Proceeds from CDSCs are used to compensate the Distributor for providing distribution-related services in connection with the sale of these shares. During the six months ended January 31, 2019, there were no CDSCs received by the Distributor for Class A and Class C.
Transfer agent fees. The John Hancock group of funds has a complex-wide transfer agent agreement with John Hancock Signature Services, Inc. (Signature Services), an affiliate of the Advisor. The transfer agent fees paid to Signature Services are determined based on the cost to Signature Services (Signature Services Cost) of providing recordkeeping services. It also includes out-of-pocket expenses, including payments made to third-parties for recordkeeping services provided to their clients who invest in one or more John Hancock funds. In addition, Signature Services Cost may be reduced by certain fees that Signature Services receives in connection with retirement and small accounts. Signature Services Cost is calculated monthly and allocated, as applicable, to five categories of share classes: Retail Share and Institutional Share Classes of Non-Municipal Bond Funds, Class R6 Shares, Retirement Share Classes and Municipal Bond Share Classes. Within each of these
categories, the applicable costs are allocated to the affected John Hancock affiliated funds and/or classes, based on the relative average daily net assets.
Class level expenses. Class level expenses for the six months ended January 31, 2019 were:
| Class | Distribution and service fees | Transfer agent fees |
| Class A | $24,921 | $9,071 |
| Class C | 3,485 | 381 |
| Class I | — | 473,510 |
| Class R2 | 154 | 5 |
| Class R4 | 58 | 3 |
| Class R6 | — | 3,956 |
| Total | $28,618 | $486,926 |
Trustee expenses.The fund compensates each Trustee who is not an employee of the Advisor or its affiliates. The costs of paying Trustee compensation and expenses are allocated to the fund based on its net assets relative to other funds within the John Hancock group of funds complex.
Note 6 — Fund share transactions
Transactions in fund shares for the six months ended January 31, 2019 and for the year ended July 31, 2018 were as follows:
| Six months ended 1-31-19 | Year ended 7-31-18 | |||||||||||||||||||||||||
| Shares | Amount | Shares | Amount | |||||||||||||||||||||||
| Class A shares | ||||||||||||||||||||||||||
| Sold | 157,912 | $1,393,999 | 353,042 | $3,180,337 | ||||||||||||||||||||||
| Distributions reinvested | 5,725 | 51,184 | — | — | ||||||||||||||||||||||
| Repurchased | (402,197 | ) | (3,542,790 | ) | (627,972 | ) | (5,731,787 | ) | ||||||||||||||||||
| Net decrease | (238,560 | ) | $(2,097,607 | ) | (274,930 | ) | $(2,551,450 | ) | ||||||||||||||||||
| Class C shares | ||||||||||||||||||||||||||
| Sold | 14,966 | $130,098 | 11,461 | $104,875 | ||||||||||||||||||||||
| Repurchased | (25,017 | ) | (219,234 | ) | (50,821 | ) | (464,317 | ) | ||||||||||||||||||
| Net decrease | (10,051 | ) | $(89,136 | ) | (39,360 | ) | $(359,442 | ) | ||||||||||||||||||
| Class I shares | ||||||||||||||||||||||||||
| Sold | 9,176,310 | $83,274,846 | 66,849,909 | $637,832,091 | ||||||||||||||||||||||
| Distributions reinvested | 156,112 | 1,437,790 | — | — | ||||||||||||||||||||||
| Repurchased | (15,215,371 | ) | (138,349,796 | ) | (26,203,856 | ) | (242,564,415 | ) | ||||||||||||||||||
| Net increase (decrease) | (5,882,949 | ) | $(53,637,160 | ) | 40,646,053 | $395,267,676 | ||||||||||||||||||||
| Class R2 shares | ||||||||||||||||||||||||||
| Sold | 487 | $4,385 | 1,409 | $13,132 | ||||||||||||||||||||||
| Distributions reinvested | 17 | 154 | — | — | ||||||||||||||||||||||
| Repurchased | — | — | (6,407 | ) | (62,324 | ) | ||||||||||||||||||||
| Net increase (decrease) | 504 | $4,539 | (4,998 | ) | $(49,192 | ) | ||||||||||||||||||||
| Class R4 shares | ||||||||||||||||||||||||||
| Repurchased | — | — | (6,423 | ) | (62,560 | ) | ||||||||||||||||||||
| Net decrease | — | — | (6,423 | ) | $(62,560 | ) | ||||||||||||||||||||
| Six months ended 1-31-19 | Year ended 7-31-18 | |||||||||||||||||||||||||
| Shares | Amount | Shares | Amount | |||||||||||||||||||||||
| Class R6 shares | ||||||||||||||||||||||||||
| Sold | 382,173 | $3,471,050 | 13,232,160 | $126,016,207 | ||||||||||||||||||||||
| Distributions reinvested | 3,907 | 36,296 | — | — | ||||||||||||||||||||||
| Repurchased | (13,260,347 | ) | (121,342,572 | ) | (13,771,177 | ) | (128,115,729 | ) | ||||||||||||||||||
| Net decrease | (12,874,267 | ) | $(117,835,226 | ) | (539,017 | ) | $(2,099,522 | ) | ||||||||||||||||||
| Class NAV shares | ||||||||||||||||||||||||||
| Sold | 216,516 | $2,001,001 | 9,780,973 | $93,045,197 | ||||||||||||||||||||||
| Distributions reinvested | 435,738 | 4,065,435 | — | — | ||||||||||||||||||||||
| Repurchased | (10,516,745 | ) | (97,301,748 | ) | (27,342,806 | ) | (254,007,762 | ) | ||||||||||||||||||
| Net decrease | (9,864,491 | ) | $(91,235,312 | ) | (17,561,833 | ) | $(160,962,565 | ) | ||||||||||||||||||
| Total net increase (decrease) | (28,869,814 | ) | $(264,889,902 | ) | 22,219,492 | $229,182,945 | ||||||||||||||||||||
Affiliates of the fund owned 54%, 100% and 100% of shares of Class R2, Class R4 and Class NAV, respectively, on January 31, 2019. Such concentration of shareholders' capital could have a material effect on the fund if such shareholders redeem from the fund.
Note 7 — Purchase and sale of securities
For the six months ended January 31, 2019, all purchases and sales of investments were short-term.
Note 8 — Investment by affiliated funds
Certain investors in the fund are affiliated funds that are managed by the Advisor and its affiliates. The affiliated funds do not invest in the fund for the purpose of exercising management or control; however, this investment may represent a significant portion of the fund's net assets. At January 31, 2019, funds within the John Hancock group of funds complex held 43.6% of the fund's net assets. The following funds had an affiliate ownership of 5% or more of the fund's net assets:
| Fund | Affiliated concentration |
| John Hancock Funds II Multimanager Lifestyle Balanced Portfolio | 11.3% |
| John Hancock Funds II Multimanager Lifestyle Growth Portfolio | 10.2% |
| John Hancock Funds II Multimanager Lifestyle Conservative Portfolio | 5.4% |
Trustees Hassell H. McClellan,Chairperson Officers Andrew G. Arnott Francis V. Knox, Jr. Charles A. Rizzo Salvatore Schiavone Christopher (Kit) Sechler** | Investment advisor John Hancock Advisers, LLC Subadvisor First Quadrant, L.P. Portfolio Managers Dori S. Levanoni Principal distributor John Hancock Funds, LLC Custodian State Street Bank and Trust Company Transfer agent John Hancock Signature Services, Inc. Legal counsel K&L Gates LLP |
* Member of the Audit Committee
† Non-Independent Trustee
#Effective 6-19-18
**Effective 9-13-18
The fund's proxy voting policies and procedures, as well as the fund proxy voting record for the most recent twelve-month period ended June 30, are available free of charge on the Securities and Exchange Commission (SEC) website at sec.gov or on our website.
The fund's complete list of portfolio holdings, for the first and third fiscal quarters, is filed with the SEC on Form N-Q. Effective April 30, 2019, all of the fund's holdings as of the end of the third month of every fiscal quarter will be filed with the SEC on Form N-PORT within 60 days of the end of the fiscal quarter. The fund's Form N-Q is available on our website and the SEC's website, sec.gov.
We make this information on your fund, as well asmonthly portfolio holdings, and other fund details available on our website at jhinvestments.com or by calling 800-225-5291.
| You can also contact us: | |||
| 800-225-5291 jhinvestments.com | Regular mail: John Hancock Signature Services, Inc. | Express mail: John Hancock Signature Services, Inc. | |
John Hancock family of funds
DOMESTIC EQUITY FUNDS Blue Chip Growth Classic Value Disciplined Value Disciplined Value Mid Cap Equity Income Financial Industries Fundamental All Cap Core Fundamental Large Cap Core Fundamental Large Cap Value New Opportunities Regional Bank Small Cap Core Small Cap Growth Small Cap Value U.S. Global Leaders Growth U.S. Growth U.S. Quality Growth Value Equity GLOBAL AND INTERNATIONAL EQUITY FUNDS Disciplined Value International Emerging Markets Emerging Markets Equity Fundamental Global Franchise Global Equity Global Shareholder Yield Global Thematic Opportunities Greater China Opportunities International Growth International Small Company | INCOME FUNDS Bond California Tax-Free Income Emerging Markets Debt Floating Rate Income Government Income High Yield High Yield Municipal Bond Income Investment Grade Bond Money Market Short Duration Credit Opportunities Spectrum Income Strategic Income Opportunities Tax-Free Bond ALTERNATIVE AND SPECIALTY FUNDS Absolute Return Currency Alternative Asset Allocation Disciplined Alternative Yield Global Absolute Return Strategies Global Conservative Absolute Return Global Focused Strategies Infrastructure Seaport Long/Short Technical Opportunities |
A fund's investment objectives, risks, charges, and expenses should be considered carefully before investing. The prospectus contains this and other important information about the fund. To obtain a prospectus, contact your financial professional, call John Hancock Investments at 800-225-5291, or visit our website at jhinvestments.com. Please read the prospectus carefully before investing or sending money.
ASSET ALLOCATION Balanced Income Allocation Multi-Index Lifetime Portfolios Multi-Index Preservation Portfolios Multimanager Lifestyle Portfolios Multimanager Lifetime Portfolios Retirement Income 2040 EXCHANGE-TRADED FUNDS John Hancock Multifactor Consumer Discretionary ETF John Hancock Multifactor Consumer Staples ETF John Hancock Multifactor Developed International ETF John Hancock Multifactor Emerging Markets ETF John Hancock Multifactor Energy ETF John Hancock Multifactor Financials ETF John Hancock Multifactor Healthcare ETF John Hancock Multifactor Industrials ETF John Hancock Multifactor Large Cap ETF John Hancock Multifactor Materials ETF John Hancock Multifactor Media and John Hancock Multifactor Mid Cap ETF John Hancock Multifactor Small Cap ETF John Hancock Multifactor Technology ETF John Hancock Multifactor Utilities ETF | ENVIRONMENTAL, SOCIAL, AND ESG All Cap Core ESG Core Bond ESG International Equity ESG Large Cap Core CLOSED-END FUNDS Financial Opportunities Hedged Equity & Income Income Securities Trust Investors Trust Preferred Income Preferred Income II Preferred Income III Premium Dividend Tax-Advantaged Dividend Income Tax-Advantaged Global Shareholder Yield |
John Hancock Multifactor ETF shares are bought and sold at market price (not NAV), and are not individually redeemed
from the fund. Brokerage commissions will reduce returns.
John Hancock ETFs are distributed by Foreside Fund Services, LLC, and are subadvised by Dimensional Fund Advisors LP.
Foreside is not affiliated with John Hancock Funds, LLC or Dimensional Fund Advisors LP.
Dimensional Fund Advisors LP receives compensation from John Hancock in connection with licensing rights to the
John Hancock Dimensional indexes. Dimensional Fund Advisors LP does not sponsor, endorse, or sell, and makes no
representation as to the advisability of investing in, John Hancock Multifactor ETFs.
John Hancock Investments
A trusted brand
John Hancock Investments is a premier asset manager representing one of
America's most trusted brands, with a heritage of financial stewardship dating
back to 1862. Helping our shareholders pursue their financial goals is at the
core of everything we do. It's why we support the role of professional financial
advice and operate with the highest standards of conduct and integrity.
A better way to invest
We serve investors globally through a unique multimanager approach:
We search the world to find proven portfolio teams with specialized
expertise for every strategy we offer, then we apply robust investment
oversight to ensure they continue to meet our uncompromising standards
and serve the best interests of our shareholders.
Results for investors
Our unique approach to asset management enables us to provide a diverse set
of investments backed by some of the world's best managers, along with strong
risk-adjusted returns across asset classes.
| | John Hancock Funds, LLC n Member FINRA, SIPC 200 Berkeley Street n Boston, MA 02116-5010 800-225-5291 n jhinvestments.com | |
| This report is for the information of the shareholders of John Hancock Absolute Return Currency Fund. It is not authorized for distribution to prospective investors unless preceded or accompanied by a prospectus. | ||
| MF733301 | 364SA 1/19 3/19 | |
John Hancock
Fundamental All Cap Core Fund
Semiannual report 1/31/19
Beginning on January 1, 2021, as permitted by regulations adopted by the Securities and Exchange Commission, paper copies of the Fund's shareholder reports like this one will no longer be sent by mail, unless you specifically request paper copies of the reports from the Fund or from your financial intermediary. Instead, the reports will be made available on a website, and you will be notified by mail each time a report is posted and provided with a website link to access the report.
If you already elected to receive shareholder reports electronically, you will not be affected by this change, and you do not need to take any action. You may elect to receive shareholder reports and other communications electronically by calling John Hancock Investments at 800-225-5291 (Class A and Class C shares) or 888-972-8696 (Class I, Class R2, Class R4, and Class R6 shares) or by contacting your financial intermediary.
You may elect to receive all reports in paper, free of charge, at any time. You can inform John Hancock Investments or your financial intermediary that you wish to continue receiving paper copies of your shareholder reports by following the instructions listed above. Your election to receive reports in paper will apply to all funds held with John Hancock Investments or your financial intermediary.

A message to shareholders
Dear shareholder,
It's been a challenging time for equity investors as stock markets across many major economies worldwide posted losses for the period. In the United States, heightened fears of a full-blown trade war with China weighed on investor sentiment—despite relatively supportive U.S. economic fundamentals. Global economic growth slowed, and many international markets found themselves confronted by challenging issues that may not abate in the near future.
Concerns about the potential for a more widespread global economic slowdown led to a significant increase in volatility as well as a flight to quality, particularly in the final months of the year. At John Hancock Investments, we believe that we're in the late innings of the bull market, but the economic underpinnings in the United States suggest that there's still room for stocks to run.
Your best resource in unpredictable and volatile markets is your financial advisor, who can help position your portfolio so that it's sufficiently diversified to meet your long-term objectives and to withstand the inevitable turbulence along the way.
On behalf of everyone at John Hancock Investments, I'd like to take this opportunity to welcome new shareholders and to thank existing shareholders for the continued trust you've placed in us.
Sincerely,
Andrew G. Arnott
President and CEO,
John Hancock Investments
Head of Wealth and Asset Management,
United States and Europe
This commentary reflects the CEO's views, which are subject to change at any time. All investments entail risks, including the possible loss of principal. Diversification does not guarantee a profit or eliminate the risk of a loss. For more up-to-date information, you can visit our website at jhinvestments.com.
John Hancock
Fundamental All Cap Core Fund
INVESTMENT OBJECTIVE
The fund seeks long-term capital appreciation.
AVERAGE ANNUAL TOTAL RETURNS AS OF 1/31/19 (%)
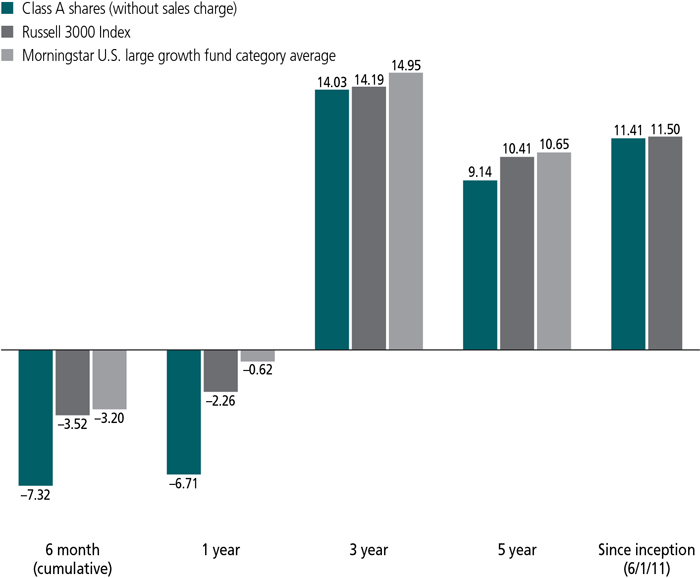
The Russell 3000 Index is an unmanaged index of the 3,000 largest U.S. companies based on total market capitalization, which represents approximately 98% of the investable U.S. equity market.
It is not possible to invest directly in an index. Index figures do not reflect expenses or sales charges, which would result in lower returns.
Figures from Morningstar, Inc. include reinvested distributions and do not take into account sales charges. Actual load-adjusted performance is lower. Since-inception returns for the Morningstar fund category average are not available.
The past performance shown here reflects reinvested distributions and the beneficial effect of any expense reductions, and does not guarantee future results. Returns for periods shorter than one year are cumulative. Performance of the other share classes will vary based on the difference in the fees and expenses of those classes. Shares will fluctuate in value and, when redeemed, may be worth more or less than their original cost. Current month-end performance may be lower or higher than the performance cited, and can be found at jhinvestments.com or by calling 800-225-5291. For further information on the fund's objectives, risks, and strategy, see the fund's prospectus.
SECTOR COMPOSITION AS OF 1/31/19 (%)
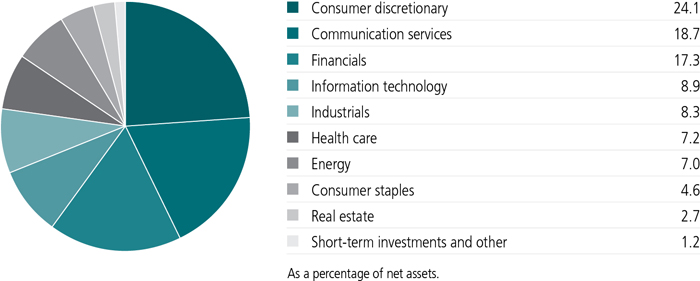
TOP 10 HOLDINGS AS OF 1/31/19 (%)
| Amazon.com, Inc. | 8.6 |
| Facebook, Inc., Class A | 5.5 |
| Lennar Corp., A Shares | 5.3 |
| Citigroup, Inc. | 4.6 |
| Bank of America Corp. | 4.6 |
| Alphabet, Inc., Class A | 4.4 |
| Polaris Industries, Inc. | 4.4 |
| Apple, Inc. | 4.0 |
| Morgan Stanley | 3.1 |
| Cargurus, Inc. | 3.1 |
| TOTAL | 47.6 |
| As a percentage of net assets. | |
| Cash and cash equivalents are not included. | |
A note about risks
The fund is subject to various risks as described in the fund's prospectus. For more information, please refer to the "Principal risks" section of the prospectus.
TOTAL RETURNS FOR THE PERIOD ENDED JANUARY 31, 2019
| Average annual total returns (%) with maximum sales charge | Cumulative total returns (%) with maximum sales charge | ||||||
| 1-year | 5-year | Since inception1 | 6-month | 5-year | Since inception1 | ||
| Class A | -11.37 | 8.02 | 10.67 | -11.96 | 47.08 | 117.68 | |
| Class C3 | -8.22 | 8.43 | 10.95 | -8.50 | 49.90 | 121.86 | |
| Class I2 | -6.44 | 9.48 | 11.81 | -7.23 | 57.31 | 135.42 | |
| Class R22,3 | -6.81 | 9.20 | 11.45 | -7.37 | 55.25 | 129.78 | |
| Class R42,3 | -6.55 | 9.32 | 11.54 | -7.25 | 56.12 | 131.07 | |
| Class R62,3 | -6.34 | 9.47 | 11.64 | -7.17 | 57.22 | 132.69 | |
| Index† | -2.26 | 10.41 | 11.50 | -3.52 | 64.09 | 130.47 | |
Performance figures assume all distributions have been reinvested. Figures reflect maximum sales charges on Class A shares of 5.00% and the applicable contingent deferred sales charge (CDSC) on Class C shares. Class C shares sold within one year of purchase are subject to a 1% CDSC. Sales charges are not applicable to Class I, Class R2, Class R4, and Class R6 shares.
The expense ratios of the fund, both net (including any fee waivers and/or expense limitations) and gross (excluding any fee waivers and/or expense limitations), are set forth according to the most recent publicly available prospectus for the fund and may differ from those disclosed in the Financial highlights tables in this report. Net expenses reflect contractual expense limitations in effect until November 30, 2019 and are subject to change. Had the contractual fee waivers and expense limitations not been in place, gross expenses would apply. The expense ratios are as follows:
| Class A | Class C | Class I | Class R2 | Class R4 | Class R6 | ||
| Gross (%) | 1.34 | 2.04 | 1.04 | 1.44 | 1.29 | 0.94 | |
| Net (%) | 1.33 | 2.03 | 1.03 | 1.43 | 1.18 | 0.93 |
Please refer to the most recent prospectus and annual or semiannual report for more information on expenses and any expense limitation arrangements for each class.
The returns reflect past results and should not be considered indicative of future performance. The return and principal value of an investment will fluctuate so that shares, when redeemed, may be worth more or less than their original cost. Due to market volatility and other factors, the fund's current performance may be higher or lower than the performance shown. For current to the most recent month-end performance data, please call 800-225-5291 or visit the fund's website at jhinvestments.com.
The performance table above and the chart on the next page do not reflect the deduction of taxes that a shareholder would pay on fund distributions or the redemption of fund shares. The fund's performance results reflect any applicable fee waivers or expense reductions, without which the expenses would increase and results would have been less favorable.
| † | Index is the Russell 3000 Index. |
See the following page for footnotes.
This chart and table show what happened to a hypothetical $10,000 investment in John Hancock Fundamental All Cap Core Fund for the share classes and periods indicated, assuming all distributions were reinvested. For comparison, we've shown the same investment in the Russell 3000 Index.
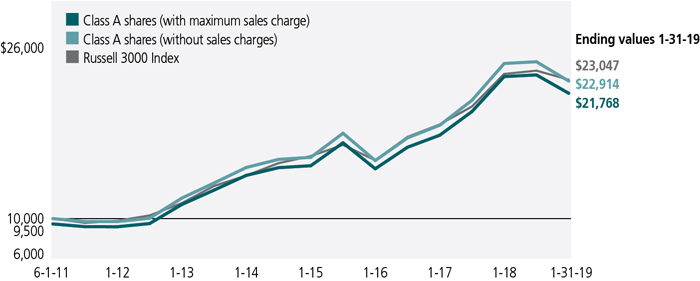
| Start date | With maximum sales charge ($) | Without sales charge ($) | Index ($) | |
| Class C4 | 6-1-11 | 22,186 | 22,186 | 23,047 |
| Class I2 | 6-1-11 | 23,542 | 23,542 | 23,047 |
| Class R22,3 | 6-1-11 | 22,978 | 22,978 | 23,047 |
| Class R42,3 | 6-1-11 | 23,107 | 23,107 | 23,047 |
| Class R62,3 | 6-1-11 | 23,269 | 23,269 | 23,047 |
The Russell 3000 Index is an unmanaged index of the 3,000 largest U.S. companies based on total market capitalization, which represents approximately 98% of the investable U.S. equity market.
It is not possible to invest directly in an index. Index figures do not reflect expenses or sales charges, which would result in lower returns.
Footnotes related to performance pages
| 1 | From 6-1-11. |
| 2 | For certain types of investors as described in the fund's prospectus. |
| 3 | Class C shares were first offered on 6-27-14; Class R2, Class R4 and Class R6 shares were first offered on 3-27-15. Returns prior to these dates are those of Class A shares (first offered on 6-1-11) that have not been adjusted for class-specific expenses; otherwise, returns would vary. |
| 4 | The contingent deferred sales charge is not applicable. |
| Your expenses |
| 6 | JOHN HANCOCK FUNDAMENTAL ALL CAP CORE FUND | SEMIANNUAL REPORT |
| Account value on 8-1-2018 | Ending value on 1-31-2019 | Expenses paid during period ended 1-31-20191 | Annualized expense ratio | ||
| Class A | Actual expenses/actual returns | $1,000.00 | $926.80 | $6.22 | 1.28% |
| Hypothetical example | 1,000.00 | 1,018.80 | 6.51 | 1.28% | |
| Class C | Actual expenses/actual returns | 1,000.00 | 923.30 | 9.60 | 1.98% |
| Hypothetical example | 1,000.00 | 1,015.20 | 10.06 | 1.98% | |
| Class I | Actual expenses/actual returns | 1,000.00 | 927.70 | 4.86 | 1.00% |
| Hypothetical example | 1,000.00 | 1,020.20 | 5.09 | 1.00% | |
| Class R2 | Actual expenses/actual returns | 1,000.00 | 926.30 | 6.70 | 1.38% |
| Hypothetical example | 1,000.00 | 1,018.20 | 7.02 | 1.38% | |
| Class R4 | Actual expenses/actual returns | 1,000.00 | 927.50 | 5.49 | 1.13% |
| Hypothetical example | 1,000.00 | 1,019.50 | 5.75 | 1.13% | |
| Class R6 | Actual expenses/actual returns | 1,000.00 | 928.30 | 4.28 | 0.88% |
| Hypothetical example | 1,000.00 | 1,020.80 | 4.48 | 0.88% |
| 1 | Expenses are equal to the annualized expense ratio, multiplied by the average account value over the period, multiplied by 184/365 (to reflect the one-half year period). |
| SEMIANNUAL REPORT | JOHN HANCOCK FUNDAMENTAL ALL CAP CORE FUND | 7 |
| Fund’s investments |
| Shares | Value | ||||
| Common stocks 98.8% | $81,180,134 | ||||
| (Cost $70,340,452) | |||||
| Communication services 18.7% | 15,398,411 | ||||
| Entertainment 2.5% | |||||
| Liberty Media Corp.-Liberty Formula One, Series C (A) | 65,968 | 2,069,416 | |||
| Interactive media and services 16.2% | |||||
| Alphabet, Inc., Class A (A) | 3,191 | 3,592,715 | |||
| CarGurus, Inc. (A) | 59,011 | 2,523,900 | |||
| Facebook, Inc., Class A (A) | 27,090 | 4,515,633 | |||
| Twitter, Inc. (A) | 80,356 | 2,696,747 | |||
| Consumer discretionary 24.1% | 19,839,667 | ||||
| Household durables 9.2% | |||||
| Lennar Corp., A Shares | 91,019 | 4,316,121 | |||
| NVR, Inc. (A) | 409 | 1,087,940 | |||
| Tempur Sealy International, Inc. (A) | 41,065 | 2,177,266 | |||
| Internet and direct marketing retail 8.6% | |||||
| Amazon.com, Inc. (A) | 4,111 | 7,065,700 | |||
| Leisure products 4.3% | |||||
| Polaris Industries, Inc. | 42,726 | 3,583,857 | |||
| Specialty retail 1.2% | |||||
| Group 1 Automotive, Inc. | 15,707 | 958,598 | |||
| Textiles, apparel and luxury goods 0.8% | |||||
| Salvatore Ferragamo SpA | 32,419 | 650,185 | |||
| Consumer staples 4.6% | 3,740,094 | ||||
| Beverages 4.1% | |||||
| Anheuser-Busch InBev SA, ADR | 32,506 | 2,484,759 | |||
| Diageo PLC, ADR | 5,698 | 869,800 | |||
| Food products 0.5% | |||||
| The Hain Celestial Group, Inc. (A) | 21,033 | 385,535 | |||
| Energy 7.0% | 5,711,925 | ||||
| Energy equipment and services 3.2% | |||||
| Baker Hughes, a GE Company LLC | 52,882 | 1,246,429 | |||
| National Oilwell Varco, Inc. | 23,857 | 703,304 | |||
| Schlumberger, Ltd. | 14,595 | 645,245 | |||
| Oil, gas and consumable fuels 3.8% | |||||
| Cheniere Energy, Inc. (A) | 27,658 | 1,815,748 | |||
| Kinder Morgan, Inc. | 26,104 | 472,482 | |||
| Suncor Energy, Inc. | 25,641 | 828,717 | |||
| 8 | JOHN HANCOCK FUNDAMENTAL ALL CAP CORE FUND | SEMIANNUAL REPORT | SEE NOTES TO FINANCIAL STATEMENTS |
| Shares | Value | ||||
| Financials 17.3% | $14,180,255 | ||||
| Banks 9.8% | |||||
| Bank of America Corp. | 131,607 | 3,746,851 | |||
| Citigroup, Inc. | 59,203 | 3,816,225 | |||
| First Hawaiian, Inc. | 16,948 | 436,072 | |||
| Capital markets 5.9% | |||||
| Morgan Stanley | 60,089 | 2,541,765 | |||
| The Goldman Sachs Group, Inc. | 11,621 | 2,301,074 | |||
| Consumer finance 1.6% | |||||
| American Express Company | 6,432 | 660,566 | |||
| Synchrony Financial | 22,560 | 677,702 | |||
| Health care 7.2% | 5,897,749 | ||||
| Biotechnology 3.8% | |||||
| Alnylam Pharmaceuticals, Inc. (A) | 5,137 | 429,094 | |||
| Amgen, Inc. | 13,228 | 2,475,091 | |||
| Moderna, Inc. (A) | 12,611 | 209,343 | |||
| Health care equipment and supplies 1.3% | |||||
| Hologic, Inc. (A) | 23,941 | 1,062,980 | |||
| Health care providers and services 1.0% | |||||
| Anthem, Inc. | 2,697 | 817,191 | |||
| Pharmaceuticals 1.1% | |||||
| Allergan PLC | 6,279 | 904,050 | |||
| Industrials 8.3% | 6,847,410 | ||||
| Electrical equipment 1.9% | |||||
| Regal Beloit Corp. | 9,143 | 701,817 | |||
| Sensata Technologies Holding PLC (A) | 17,720 | 841,700 | |||
| Industrial conglomerates 2.6% | |||||
| General Electric Company | 214,564 | 2,179,970 | |||
| Machinery 0.5% | |||||
| The Manitowoc Company, Inc. (A) | 25,338 | 385,644 | |||
| Professional services 2.3% | |||||
| IHS Markit, Ltd. (A) | 36,113 | 1,874,987 | |||
| Trading companies and distributors 1.0% | |||||
| United Rentals, Inc. (A) | 6,892 | 863,292 | |||
| Information technology 8.9% | 7,305,887 | ||||
| Semiconductors and semiconductor equipment 1.4% | |||||
| Analog Devices, Inc. | 4,820 | 476,505 | |||
| NVIDIA Corp. | 4,377 | 629,194 | |||
| Software 3.5% | |||||
| Workday, Inc., Class A (A) | 16,035 | 2,910,834 | |||
| Technology hardware, storage and peripherals 4.0% | |||||
| Apple, Inc. | 19,763 | 3,289,354 | |||
| SEE NOTES TO FINANCIAL STATEMENTS | SEMIANNUAL REPORT | JOHN HANCOCK FUNDAMENTAL ALL CAP CORE FUND | 9 |
| Shares | Value | ||||
| Real estate 2.7% | $2,258,736 | ||||
| Equity real estate investment trusts 2.2% | |||||
| American Tower Corp. | 10,614 | 1,834,524 | |||
| Real estate management and development 0.5% | |||||
| Five Point Holdings LLC, Class A (A) | 55,308 | 424,212 | |||
| Yield (%) | Shares | Value | |||
| Short-term investments 0.8% | $634,733 | ||||
| (Cost $634,733) | |||||
| Money market funds 0.1% | 86,733 | ||||
| State Street Institutional U.S. Government Money Market Fund, Premier Class | 2.3198(B) | 86,733 | 86,733 | ||
| Par value^ | Value | ||||
| Repurchase agreement 0.7% | 548,000 | ||||
| Barclays Tri-Party Repurchase Agreement dated 1-31-19 at 2.520% to be repurchased at $548,038 on 2-1-19, collateralized by $555,200 U.S. Treasury Notes, 2.625% due 12-15-21 (valued at $559,036, including interest) | 548,000 | 548,000 |
| Total investments (Cost $70,975,185) 99.6% | $81,814,867 | ||||
| Other assets and liabilities, net 0.4% | 347,362 | ||||
| Total net assets 100.0% | $82,162,229 | ||||
| The percentage shown for each investment category is the total value of the category as a percentage of the net assets of the fund. | |
| ^All par values are denominated in U.S. dollars unless otherwise indicated. | |
| Security Abbreviations and Legend | |
| ADR | American Depositary Receipt |
| (A) | Non-income producing security. |
| (B) | The rate shown is the annualized seven-day yield as of 1-31-19. |
| 10 | JOHN HANCOCK FUNDAMENTAL ALL CAP CORE FUND | SEMIANNUAL REPORT | SEE NOTES TO FINANCIAL STATEMENTS |
| Financial statements |
| Assets | |
| Unaffiliated investments, at value (Cost $70,975,185) | $81,814,867 |
| Foreign currency, at value (Cost $1,631) | 1,688 |
| Dividends and interest receivable | 29,619 |
| Receivable for fund shares sold | 131,457 |
| Receivable for investments sold | 933,188 |
| Receivable from affiliates | 211 |
| Other assets | 35,566 |
| Total assets | 82,946,596 |
| Liabilities | |
| Payable for investments purchased | 628,130 |
| Payable for fund shares repurchased | 90,870 |
| Payable to affiliates | |
| Accounting and legal services fees | 2,612 |
| Transfer agent fees | 6,869 |
| Distribution and service fees | 6 |
| Trustees' fees | 453 |
| Other liabilities and accrued expenses | 55,427 |
| Total liabilities | 784,367 |
| Net assets | $82,162,229 |
| Net assets consist of | |
| Paid-in capital | $74,493,585 |
| Total distributable earnings (loss) | 7,668,644 |
| Net assets | $82,162,229 |
| Net asset value per share | |
| Based on net asset value and shares outstanding - the fund has an unlimited number of shares authorized with no par value | |
| Class A ($44,949,023 ÷ 2,689,032 shares)1 | $16.72 |
| Class C ($5,563,736 ÷ 343,143 shares)1 | $16.21 |
| Class I ($21,741,888 ÷ 1,281,674 shares) | $16.96 |
| Class R2 ($47,287 ÷ 2,809 shares) | $16.83 |
| Class R4 ($5,414 ÷ 320 shares) | $16.92 |
| Class R6 ($9,854,881 ÷ 579,965 shares) | $16.99 |
| Maximum offering price per share | |
| Class A (net asset value per share ÷ 95%)2 | $17.60 |
| 1 | Redemption price per share is equal to net asset value less any applicable contingent deferred sales charge. |
| 2 | On single retail sales of less than $50,000. On sales of $50,000 or more and on group sales the offering price is reduced. |
| SEE NOTES TO FINANCIAL STATEMENTS | SEMIANNUAL REPORT | JOHN HANCOCK FUNDAMENTAL ALL CAP CORE FUND | 11 |
| Investment income | |
| Dividends | $526,148 |
| Interest | 23,779 |
| Less foreign taxes withheld | (6,121) |
| Total investment income | 543,806 |
| Expenses | |
| Investment management fees | 301,881 |
| Distribution and service fees | 100,304 |
| Accounting and legal services fees | 7,296 |
| Transfer agent fees | 45,461 |
| Trustees' fees | 920 |
| Custodian fees | 13,037 |
| State registration fees | 49,172 |
| Printing and postage | 16,821 |
| Professional fees | 24,475 |
| Other | 8,295 |
| Total expenses | 567,662 |
| Less expense reductions | (33,909) |
| Net expenses | 533,753 |
| Net investment income | 10,053 |
| Realized and unrealized gain (loss) | |
| Net realized gain (loss) on | |
| Unaffiliated investments and foreign currency transactions | 62,376 |
| 62,376 | |
| Change in net unrealized appreciation (depreciation) of | |
| Unaffiliated investments and translation of assets and liabilities in foreign currencies | (7,534,837) |
| (7,534,837) | |
| Net realized and unrealized loss | (7,472,461) |
| Decrease in net assets from operations | $(7,462,408) |
| 12 | JOHN HANCOCK FUNDAMENTAL ALL CAP CORE FUND | SEMIANNUAL REPORT | SEE NOTES TO FINANCIAL STATEMENTS |
| Six months ended 1-31-19 (unaudited) | Year ended 7-31-18 | |
| Increase (decrease) in net assets | ||
| From operations | ||
| Net investment income (loss) | $10,053 | $(147,332) |
| Net realized gain | 62,376 | 4,797,395 |
| Change in net unrealized appreciation (depreciation) | (7,534,837) | 8,809,351 |
| Increase (decrease) in net assets resulting from operations | (7,462,408) | 13,459,414 |
| Distributions to shareholders | ||
| From net investment income and net realized gain | ||
| Class A | (3,534,019) | — |
| Class C | (472,320) | — |
| Class I | (1,809,069) | — |
| Class R2 | (3,456) | — |
| Class R4 | (386) | — |
| Class R6 | (959,836) | — |
| From net investment income | ||
| Class I | — | (49,116) |
| Class R2 | — | (52) |
| Class R4 | — | (1,224) |
| Class R6 | — | (19,235) |
| From net realized gain | ||
| Class A | — | (2,573,481) |
| Class C | — | (320,001) |
| Class I | — | (1,684,737) |
| Class R2 | — | (4,196) |
| Class R4 | — | (55,469) |
| Class R6 | — | (498,178) |
| Total distributions | (6,779,086) | (5,205,689) |
| From fund share transactions | (1,753,535) | 20,036,890 |
| Total increase (decrease) | (15,995,029) | 28,290,615 |
| Net assets | ||
| Beginning of period | 98,157,258 | 69,866,643 |
| End of period1 | $82,162,229 | $98,157,258 |
| 1 | Net assets - End of year includes undistributed net investment income of $0 at July 31, 2018. The SEC eliminated the requirement to disclose undistributed net investment income in the current reporting period. |
| SEE NOTES TO FINANCIAL STATEMENTS | SEMIANNUAL REPORT | JOHN HANCOCK FUNDAMENTAL ALL CAP CORE FUND | 13 |
| Financial highlights |
| CLASS A SHARES Period ended | 1-31-191 | 7-31-18 | 7-31-17 | 7-31-16 | 7-31-15 | 7-31-14 |
| Per share operating performance | ||||||
| Net asset value, beginning of period | $19.84 | $17.95 | $14.97 | $16.16 | $14.33 | $12.88 |
| Net investment income (loss)2 | (0.01) | (0.05) | 0.03 | —3 | (0.04) | —3 |
| Net realized and unrealized gain (loss) on investments | (1.66) | 3.08 | 2.97 | (0.40) | 2.27 | 2.12 |
| Total from investment operations | (1.67) | 3.03 | 3.00 | (0.40) | 2.23 | 2.12 |
| Less distributions | ||||||
| From net investment income | — | — | (0.02) | — | — | (0.01) |
| From net realized gain | (1.45) | (1.14) | — | (0.79) | (0.40) | (0.66) |
| Total distributions | (1.45) | (1.14) | (0.02) | (0.79) | (0.40) | (0.67) |
| Net asset value, end of period | $16.72 | $19.84 | $17.95 | $14.97 | $16.16 | $14.33 |
| Total return (%)4,5 | (7.32)6 | 17.14 | 20.07 | (2.43) | 15.77 | 16.62 |
| Ratios and supplemental data | ||||||
| Net assets, end of period (in millions) | $45 | $49 | $38 | $30 | $23 | $14 |
| Ratios (as a percentage of average net assets): | ||||||
| Expenses before reductions | 1.357 | 1.33 | 1.35 | 1.28 | 1.30 | 1.78 |
| Expenses including reductions | 1.287 | 1.28 | 1.26 | 1.27 | 1.29 | 1.30 |
| Net investment income (loss) | (0.07)7 | (0.25) | 0.18 | (0.03) | (0.29) | (0.02) |
| Portfolio turnover (%) | 16 | 23 | 52 | 40 | 42 | 44 |
| 1 | Six months ended 1-31-19. Unaudited. |
| 2 | Based on average daily shares outstanding. |
| 3 | Less than $0.005 per share. |
| 4 | Total returns would have been lower had certain expenses not been reduced during the applicable periods. |
| 5 | Does not reflect the effect of sales charges, if any. |
| 6 | Not annualized. |
| 7 | Annualized. |
| 14 | JOHN HANCOCK FUNDAMENTAL ALL CAP CORE FUND | SEMIANNUAL REPORT | SEE NOTES TO FINANCIAL STATEMENTS |
| CLASS C SHARES Period ended | 1-31-191 | 7-31-18 | 7-31-17 | 7-31-16 | 7-31-15 | 7-31-142 |
| Per share operating performance | ||||||
| Net asset value, beginning of period | $19.36 | $17.67 | $14.81 | $16.11 | $14.37 | $14.54 |
| Net investment loss3 | (0.07) | (0.18) | (0.09) | (0.11) | (0.16) | (0.02) |
| Net realized and unrealized gain (loss) on investments | (1.63) | 3.01 | 2.95 | (0.40) | 2.30 | (0.15) |
| Total from investment operations | (1.70) | 2.83 | 2.86 | (0.51) | 2.14 | (0.17) |
| Less distributions | ||||||
| From net realized gain | (1.45) | (1.14) | — | (0.79) | (0.40) | — |
| Net asset value, end of period | $16.21 | $19.36 | $17.67 | $14.81 | $16.11 | $14.37 |
| Total return (%)4,5 | (7.67)6 | 16.25 | 19.31 | (3.14) | 15.09 | (1.17)6 |
| Ratios and supplemental data | ||||||
| Net assets, end of period (in millions) | $6 | $6 | $5 | $3 | $2 | $—7 |
| Ratios (as a percentage of average net assets): | ||||||
| Expenses before reductions | 2.058 | 2.03 | 2.05 | 1.98 | 2.69 | 17.058 |
| Expenses including reductions | 1.988 | 1.98 | 1.96 | 1.97 | 2.00 | 2.008 |
| Net investment loss | (0.77)8 | (0.95) | (0.54) | (0.74) | (1.06) | (1.39)8 |
| Portfolio turnover (%) | 16 | 23 | 52 | 40 | 42 | 449 |
| 1 | Six months ended 1-31-19. Unaudited. |
| 2 | The inception date for Class C shares is 6-27-14. |
| 3 | Based on average daily shares outstanding. |
| 4 | Total returns would have been lower had certain expenses not been reduced during the applicable periods. |
| 5 | Does not reflect the effect of sales charges, if any. |
| 6 | Not annualized. |
| 7 | Less than $500,000. |
| 8 | Annualized. |
| 9 | Portfolio turnover is shown for the period from 8-1-13 to 7-31-14. |
| SEE NOTES TO FINANCIAL STATEMENTS | SEMIANNUAL REPORT | JOHN HANCOCK FUNDAMENTAL ALL CAP CORE FUND | 15 |
| CLASS I SHARES Period ended | 1-31-191 | 7-31-18 | 7-31-17 | 7-31-16 | 7-31-15 | 7-31-14 |
| Per share operating performance | ||||||
| Net asset value, beginning of period | $20.08 | $18.13 | $15.12 | $16.27 | $14.39 | $12.93 |
| Net investment income2 | 0.02 | 0.01 | 0.07 | 0.04 | 0.01 | 0.05 |
| Net realized and unrealized gain (loss) on investments | (1.69) | 3.11 | 3.01 | (0.39) | 2.29 | 2.12 |
| Total from investment operations | (1.67) | 3.12 | 3.08 | (0.35) | 2.30 | 2.17 |
| Less distributions | ||||||
| From net investment income | — | (0.03) | (0.07) | (0.01) | (0.02) | (0.05) |
| From net realized gain | (1.45) | (1.14) | — | (0.79) | (0.40) | (0.66) |
| Total distributions | (1.45) | (1.17) | (0.07) | (0.80) | (0.42) | (0.71) |
| Net asset value, end of period | $16.96 | $20.08 | $18.13 | $15.12 | $16.27 | $14.39 |
| Total return (%)3 | (7.23)4 | 17.50 | 20.40 | (2.08) | 16.20 | 17.01 |
| Ratios and supplemental data | ||||||
| Net assets, end of period (in millions) | $22 | $29 | $21 | $8 | $11 | $6 |
| Ratios (as a percentage of average net assets): | ||||||
| Expenses before reductions | 1.085 | 1.03 | 1.04 | 0.97 | 1.05 | 1.76 |
| Expenses including reductions | 1.005 | 0.98 | 0.95 | 0.95 | 0.94 | 0.94 |
| Net investment income | 0.225 | 0.03 | 0.42 | 0.27 | 0.07 | 0.37 |
| Portfolio turnover (%) | 16 | 23 | 52 | 40 | 42 | 44 |
| 1 | Six months ended 1-31-19. Unaudited. |
| 2 | Based on average daily shares outstanding. |
| 3 | Total returns would have been lower had certain expenses not been reduced during the applicable periods. |
| 4 | Not annualized. |
| 5 | Annualized. |
| 16 | JOHN HANCOCK FUNDAMENTAL ALL CAP CORE FUND | SEMIANNUAL REPORT | SEE NOTES TO FINANCIAL STATEMENTS |
| CLASS R2 SHARES Period ended | 1-31-191 | 7-31-18 | 7-31-17 | 7-31-16 | 7-31-152 |
| Per share operating performance | |||||
| Net asset value, beginning of period | $19.98 | $18.09 | $15.09 | $16.26 | $15.12 |
| Net investment income (loss)3 | —4 | (0.05) | 0.06 | 0.02 | (0.01) |
| Net realized and unrealized gain (loss) on investments | (1.70) | 3.09 | 2.99 | (0.40) | 1.15 |
| Total from investment operations | (1.70) | 3.04 | 3.05 | (0.38) | 1.14 |
| Less distributions | |||||
| From net investment income | — | (0.01) | (0.05) | — | — |
| From net realized gain | (1.45) | (1.14) | — | (0.79) | — |
| Total distributions | (1.45) | (1.15) | (0.05) | (0.79) | — |
| Net asset value, end of period | $16.83 | $19.98 | $18.09 | $15.09 | $16.26 |
| Total return (%)5 | (7.37)6 | 17.09 | 20.25 | (2.28) | 7.546 |
| Ratios and supplemental data | |||||
| Net assets, end of period (in millions) | $—7 | $—7 | $—7 | $—7 | $—7 |
| Ratios (as a percentage of average net assets): | |||||
| Expenses before reductions | 1.468 | 1.35 | 1.20 | 1.12 | 1.108 |
| Expenses including reductions | 1.388 | 1.30 | 1.11 | 1.11 | 1.108 |
| Net investment income (loss) | 0.028 | (0.28) | 0.35 | 0.13 | (0.19)8 |
| Portfolio turnover (%) | 16 | 23 | 52 | 40 | 429 |
| 1 | Six months ended 1-31-19. Unaudited. |
| 2 | The inception date for Class R2 shares is 3-27-15. |
| 3 | Based on average daily shares outstanding. |
| 4 | Less than $0.005 per share. |
| 5 | Total returns would have been lower had certain expenses not been reduced during the applicable periods. |
| 6 | Not annualized. |
| 7 | Less than $500,000. |
| 8 | Annualized. |
| 9 | Portfolio turnover is shown for the period from 8-1-14 to 7-31-15. |
| SEE NOTES TO FINANCIAL STATEMENTS | SEMIANNUAL REPORT | JOHN HANCOCK FUNDAMENTAL ALL CAP CORE FUND | 17 |
| CLASS R4 SHARES Period ended | 1-31-191 | 7-31-18 | 7-31-17 | 7-31-16 | 7-31-152 |
| Per share operating performance | |||||
| Net asset value, beginning of period | $20.03 | $18.11 | $15.10 | $16.27 | $15.12 |
| Net investment income (loss)3 | 0.02 | (0.02) | 0.07 | 0.03 | (0.01) |
| Net realized and unrealized gain (loss) on investments | (1.68) | 3.11 | 3.00 | (0.40) | 1.16 |
| Total from investment operations | (1.66) | 3.09 | 3.07 | (0.37) | 1.15 |
| Less distributions | |||||
| From net investment income | — | (0.03) | (0.06) | (0.01) | — |
| From net realized gain | (1.45) | (1.14) | — | (0.79) | — |
| Total distributions | (1.45) | (1.17) | (0.06) | (0.80) | — |
| Net asset value, end of period | $16.92 | $20.03 | $18.11 | $15.10 | $16.27 |
| Total return (%)4 | (7.25)5 | 17.31 | 20.42 | (2.24) | 7.615 |
| Ratios and supplemental data | |||||
| Net assets, end of period (in millions) | $—6 | $1 | $—6 | $—6 | $—6 |
| Ratios (as a percentage of average net assets): | |||||
| Expenses before reductions | 1.307 | 1.27 | 1.19 | 1.12 | 1.107 |
| Expenses including reductions | 1.137 | 1.12 | 1.01 | 1.01 | 1.007 |
| Net investment income (loss) | 0.157 | (0.12) | 0.45 | 0.23 | (0.09)7 |
| Portfolio turnover (%) | 16 | 23 | 52 | 40 | 428 |
| 1 | Six months ended 1-31-19. Unaudited. |
| 2 | The inception date for Class R4 shares is 3-27-15. |
| 3 | Based on average daily shares outstanding. |
| 4 | Total returns would have been lower had certain expenses not been reduced during the applicable periods. |
| 5 | Not annualized. |
| 6 | Less than $500,000. |
| 7 | Annualized. |
| 8 | Portfolio turnover is shown for the period from 8-1-14 to 7-31-15. |
| 18 | JOHN HANCOCK FUNDAMENTAL ALL CAP CORE FUND | SEMIANNUAL REPORT | SEE NOTES TO FINANCIAL STATEMENTS |
| CLASS R6 SHARES Period ended | 1-31-191 | 7-31-18 | 7-31-17 | 7-31-16 | 7-31-152 |
| Per share operating performance | |||||
| Net asset value, beginning of period | $20.10 | $18.14 | $15.12 | $16.28 | $15.12 |
| Net investment income3 | 0.03 | 0.02 | 0.09 | 0.07 | —4 |
| Net realized and unrealized gain (loss) on investments | (1.69) | 3.12 | 3.01 | (0.42) | 1.16 |
| Total from investment operations | (1.66) | 3.14 | 3.10 | (0.35) | 1.16 |
| Less distributions | |||||
| From net investment income | — | (0.04) | (0.08) | (0.02) | — |
| From net realized gain | (1.45) | (1.14) | — | (0.79) | — |
| Total distributions | (1.45) | (1.18) | (0.08) | (0.81) | — |
| Net asset value, end of period | $16.99 | $20.10 | $18.14 | $15.12 | $16.28 |
| Total return (%)5 | (7.17)6 | 17.62 | 20.59 | (2.10) | 7.676 |
| Ratios and supplemental data | |||||
| Net assets, end of period (in millions) | $10 | $13 | $6 | $3 | $—7 |
| Ratios (as a percentage of average net assets): | |||||
| Expenses before reductions | 0.968 | 0.93 | 0.95 | 0.86 | 0.858 |
| Expenses including reductions | 0.888 | 0.88 | 0.85 | 0.84 | 0.838 |
| Net investment income | 0.358 | 0.13 | 0.52 | 0.49 | 0.018 |
| Portfolio turnover (%) | 16 | 23 | 52 | 40 | 429 |
| 1 | Six months ended 1-31-19. Unaudited. |
| 2 | The inception date for Class R6 shares is 3-27-15. |
| 3 | Based on average daily shares outstanding. |
| 4 | Less than $0.005 per share. |
| 5 | Total returns would have been lower had certain expenses not been reduced during the applicable periods. |
| 6 | Not annualized. |
| 7 | Less than $500,000. |
| 8 | Annualized. |
| 9 | Portfolio turnover is shown for the period from 8-1-14 to 7-31-15. |
| SEE NOTES TO FINANCIAL STATEMENTS | SEMIANNUAL REPORT | JOHN HANCOCK FUNDAMENTAL ALL CAP CORE FUND | 19 |
Note 1 — Organization
John Hancock Fundamental All Cap Core Fund (the fund) is a series of John Hancock Funds II (the Trust), an open-end management investment company organized as a Massachusetts business trust and registered under the Investment Company Act of 1940, as amended (the 1940 Act). The investment objective of the fund is to seek long-term capital appreciation.
The fund may offer multiple classes of shares. The shares currently offered by the fund are detailed in the Statement of assets and liabilities. Class A and Class C shares are offered to all investors. Class I shares are offered to institutions and certain investors. Class R2 and Class R4 shares are available only to certain retirement and 529 plans. Class R6 shares are only available to certain retirement plans, institutions and other investors. Class C shares convert to Class A shares ten years after purchase (certain exclusions may apply). Shareholders of each class have exclusive voting rights to matters that affect that class. The distribution and service fees, if any, and transfer agent fees for each class may differ.
Note 2 — Significant accounting policies
The financial statements have been prepared in conformity with accounting principles generally accepted in the United States of America (US GAAP), which require management to make certain estimates and assumptions as of the date of the financial statements. Actual results could differ from those estimates and those differences could be significant. The fund qualifies as an investment company under Topic 946 of Accounting Standards Codification of US GAAP.
Events or transactions occurring after the end of the fiscal period through the date that the financial statements were issued have been evaluated in the preparation of the financial statements. The following summarizes the significant accounting policies of the fund:
Security valuation.Investments are stated at value as of the scheduled close of regular trading on the New York Stock Exchange (NYSE), normally at 4:00 p.m., Eastern Time. In case of emergency or other disruption resulting in the NYSE not opening for trading or the NYSE closing at a time other than the regularly scheduled close, the net asset value (NAV) may be determined as of the regularly scheduled close of the NYSE pursuant to the fund's Valuation Policies and Procedures.
In order to value the securities, the fund uses the following valuation techniques: Equity securities held by the fund are typically valued at the last sale price or official closing price on the exchange or principal market where the security trades. In the event there were no sales during the day or closing prices are not available, the securities are valued using the last available bid price. Investments by the fund in open-end mutual funds are valued at their respective NAVs each business day. Foreign securities and currencies are valued in U.S. dollars based on foreign currency exchange rates supplied by an independent pricing vendor. Debt obligations are typically valued based on the evaluated prices provided by an independent pricing vendor. Independent pricing vendors utilize matrix pricing which takes into account factors such as institutional-size trading in similar groups of securities, yield, quality, coupon rate, maturity, type of issue, trading characteristics and other market data, as well as broker supplied prices.
In certain instances, the Pricing Committee may determine to value equity securities using prices obtained from another exchange or market if trading on the exchange or market on which prices are typically obtained did not open for trading as scheduled, or if trading closed earlier than scheduled, and trading occurred as normal on another exchange or market.
Other portfolio securities and assets, for which reliable market quotations are not readily available, are valued at fair value as determined in good faith by the fund's Pricing Committee following procedures established by the Board of Trustees. The frequency with which these fair valuation procedures are used cannot be predicted and fair value of securities may differ significantly from the value that would have been used had a ready market for such securities existed.
The fund uses a three-tier hierarchy to prioritize the pricing assumptions, referred to as inputs, used in valuation techniques to measure fair value. Level 1 includes securities valued using quoted prices in active markets for identical securities. Level 2 includes securities valued using other significant observable inputs. Observable inputs may include quoted prices for similar securities, interest rates, prepayment speeds and credit risk. Prices for securities valued using these inputs are received from independent pricing vendors and brokers and are based on an evaluation of the inputs described. Level 3 includes securities valued using significant unobservable inputs when market prices are not readily available or reliable, including the fund's own assumptions in determining the fair value of investments. Factors used in determining value may include market or issuer specific events or trends,
changes in interest rates and credit quality. The inputs or methodology used for valuing securities are not necessarily an indication of the risks associated with investing in those securities. Changes in valuation techniques and related inputs may result in transfers into or out of an assigned level within the disclosure hierarchy.
The following is a summary of the values by input classification of the fund's investments as of January 31, 2019, by major security category or type:
| Total value at 1-31-19 | Level 1 quoted price | Level 2 significant observable inputs | Level 3 significant unobservable inputs | ||
| Investments in securities: | |||||
| Assets | |||||
| Common stocks | |||||
| Communication services | $15,398,411 | $15,398,411 | — | — | |
| Consumer discretionary | 19,839,667 | 19,189,482 | $650,185 | — | |
| Consumer staples | 3,740,094 | 3,740,094 | — | — | |
| Energy | 5,711,925 | 5,711,925 | — | — | |
| Financials | 14,180,255 | 14,180,255 | — | — | |
| Health care | 5,897,749 | 5,897,749 | — | — | |
| Industrials | 6,847,410 | 6,847,410 | — | — | |
| Information technology | 7,305,887 | 7,305,887 | — | — | |
| Real estate | 2,258,736 | 2,258,736 | — | — | |
| Short-term investments | 634,733 | 86,733 | 548,000 | — | |
| Total investments in securities | $81,814,867 | $80,616,682 | $1,198,185 | — | |
Repurchase agreements. The fund may enter into repurchase agreements. When the fund enters into a repurchase agreement, it receives collateral that is held in a segregated account by the fund's custodian, or for tri-party repurchase agreements, collateral is held at a third-party custodian bank in a segregated account for the benefit of the fund. The collateral amount is marked-to-market and monitored on a daily basis to ensure that the collateral held is in an amount not less than the principal amount of the repurchase agreement plus any accrued interest. Collateral received by the fund for repurchase agreements is disclosed in the Fund's investments as part of the caption related to the repurchase agreement.
Repurchase agreements are typically governed by the terms and conditions of the Master Repurchase Agreement and/or Global Master Repurchase Agreement (collectively, MRA). Upon an event of default, the non-defaulting party may close out all transactions traded under the MRA and net amounts owed. Absent an event of default, assets and liabilities resulting from repurchase agreements are not offset in the Statement of assets and liabilities. In the event of a default by the counterparty, realization of the collateral proceeds could be delayed, during which time the collateral value may decline or the counterparty may have insufficient assets to pay back claims resulting from close-out of the transactions.
Security transactions and related investment income. Investment security transactions are accounted for on a trade date plus one basis for daily NAV calculations. However, for financial reporting purposes, investment transactions are reported on trade date. Interest income is accrued as earned. Interest income includes coupon interest and amortization/accretion of premiums/discounts on debt securities. Debt obligations may be placed in a non-accrual status and related interest income may be reduced by stopping current accruals and writing off interest receivable when the collection of all or a portion of interest has become doubtful. Dividend income is recorded on the ex-date, except for dividends of foreign securities where the dividend may not be known until after the ex-date. In those cases, dividend income, net of withholding taxes, is recorded when the fund becomes aware of the dividends. Non-cash dividends, if any, are recorded at the fair market value of the securities received. Gains and losses on securities sold are determined on the basis of identified cost and may include proceeds from litigation.
Foreign investing. Assets, including investments, and liabilities denominated in foreign currencies are translated into U.S. dollar values each day at the prevailing exchange rate. Purchases and sales of securities, income and expenses are translated into U.S.
dollars at the prevailing exchange rate on the date of the transaction. The effect of changes in foreign currency exchange rates on the value of securities is reflected as a component of the realized and unrealized gains (losses) on investments. Foreign investments are subject to a decline in the value of a foreign currency versus the U.S. dollar, which reduces the dollar value of securities denominated in that currency.
Funds that invest internationally generally carry more risk than funds that invest strictly in U.S. securities. Risks can result from differences in economic and political conditions, regulations, market practices (including higher transaction costs), accounting standards and other factors.
Foreign taxes. The fund may be subject to withholding tax on income, capital gains or repatriation taxes imposed by certain countries, a portion of which may be recoverable. Foreign taxes are accrued based upon the fund's understanding of the tax rules and rates that exist in the foreign markets in which it invests. Taxes are accrued based on gains realized by the fund as a result of certain foreign security sales. In certain circumstances, estimated taxes are accrued based on unrealized appreciation of such securities. Investment income is recorded net of foreign withholding taxes, less any amounts reclaimable.
Line of credit.The fund may have the ability to borrow from banks for temporary or emergency purposes, including meeting redemption requests that otherwise might require the untimely sale of securities. Pursuant to the fund's custodian agreement, the custodian may loan money to the fund to make properly authorized payments. The fund is obligated to repay the custodian for any overdraft, including any related costs or expenses. The custodian may have a lien, security interest or security entitlement in any fundproperty that is not otherwise segregated or pledged, to the extent of any overdraft, and to the maximum extent permitted by law.
The fund and other affiliated funds have entered into a syndicated line of credit agreement with Citibank, N.A. as the administrative agent that enables them to participate in a $750 million unsecured committed line of credit. Excluding commitments designated for a certain fund and subject to the needs of all other affiliated funds, the fund can borrow up to an aggregate commitment amount of $500 million, subject to asset coverage and other limitations as specified in the agreement. A commitment fee payable at the end of each calendar quarter, based on the average daily unused portion of the line of credit, is charged to each participating fund based on a combination of fixed and asset based allocations and is reflected in Other expenses on the Statement of operations. For the six months ended January 31, 2019, the fund had no borrowings under the line of credit. Commitment fees for the six months ended January 31, 2019were $1,061.
Expenses. Within the John Hancock group of funds complex, expenses that are directly attributable to an individual fund are allocated to such fund. Expenses that are not readily attributable to a specific fund are allocated among all funds in an equitable manner, taking into consideration, among other things, the nature and type of expense and the fund's relative net assets. Expense estimates are accrued in the period to which they relate and adjustments are made when actual amounts are known.
Class allocations. Income, common expenses and realized and unrealized gains (losses) are determined at the fund level and allocated daily to each class of shares based on the net assets of the class. Class-specific expenses, such as distribution and service fees, if any, and transfer agent fees, for all classes, are charged daily at the class level based on the net assets of each class and the specific expense rates applicable to each class.
Federal income taxes. The fund intends to continue to qualify as a regulated investment company by complying with the applicable provisions of the Internal Revenue Code and will not be subject to federal income tax on taxable income that is distributed to shareholders. Therefore, no federal income tax provision is required.
As of July 31, 2018, the fund had no uncertain tax positions that would require financial statement recognition, derecognition or disclosure. The fund's federal tax returns are subject to examination by the Internal Revenue Service for a period of three years.
Distribution of income and gains. Distributions to shareholders from net investment income and net realized gains, if any, are recorded on the ex-date. The fund generally declares and pays dividends and capital gain distributions, if any, annually.
Distributions paid by the fund with respect to each class of shares are calculated in the same manner, at the same time and in the same amount, except for the effect of class level expenses that may be applied differently to each class.
Such distributions, on a tax basis, are determined in conformity with income tax regulations, which may differ from US GAAP. Distributions in excess of tax basis earnings and profits, if any, are reported in the fund's financial statements as a return of capital. The final determination of tax characteristics of the fund's distribution will occur at the end of the year and will subsequently be reported to shareholders.
Capital accounts within the financial statements are adjusted for permanent book-tax differences. These adjustments have no impact on net assets or the results of operations. Temporary book-tax differences, if any, will reverse in a subsequent period. Book-tax differences are primarily attributable to net operating losses.
Note 3 — Guarantees and indemnifications
Under the Trust's organizational documents, its Officers and Trustees are indemnified against certain liabilities arising out of the performance of their duties to the Trust, including the fund. Additionally, in the normal course of business, the fund enters into contracts with service providers that contain general indemnification clauses. The fund's maximum exposure under these arrangements is unknown, as this would involve future claims that may be made against the fund that have not yet occurred. The risk of material loss from such claims is considered remote.
Note 4 — Fees and transactions with affiliates
John Hancock Advisers, LLC (the Advisor) serves as investment advisor for the fund. John Hancock Funds, LLC (the Distributor), an affiliate of the Advisor, serves as principal underwriter of the fund. The Advisor and the Distributor are indirect, wholly owned subsidiaries of Manulife Financial Corporation (MFC).
Management fee. The fund has an investment management agreement with the Advisor under which the fund pays a daily management fee to the Advisor equivalent on an annual basis to the sum of: a) 0.675% of the first $2.5 billion of the fund's aggregate average daily net assets together with the net assets of Fundamental All Cap Core Trust, a series of John Hancock Variable Insurance Trust (combined aggregate average daily net assets); and b) 0.650% of the combined aggregate average daily net assets in excess of $2.5 billion. The Advisor has a subadvisory agreement with John Hancock Asset Management a division of Manulife Asset Management (US) LLC, an indirectly owned subsidiary of MFC and an affiliate of the Advisor. The fund is not responsible for payment of the subadvisory fees.
The Advisor has contractually agreed to waive a portion of its management fee and/or reimburse expenses for certain funds of the John Hancock group of funds complex, including the fund (the participating portfolios). This waiver is based upon aggregate net assets of all the participating portfolios. The amount of the reimbursement is calculated daily and allocated among all the participating portfolios in proportion to the daily net assets of each fund. During the six months ended January 31, 2019, this waiver amounted to 0.01% of the fund's average net assets (on an annualized basis). This agreement expires on June 30, 2020, unless renewed by mutual agreement of the Fund and the Advisor based upon a determination that this is appropriate under the circumstances at that time.
The Advisor has voluntarily agreed to reduce its management fee, or if necessary make payment to the fund, in an amount equal to the amount by which the expenses of the fund exceed 0.20% of the average net assets of the fund. For purposes of this agreement, "expenses of the fund" means all the expenses of the fund, excluding taxes; brokerage commissions; interest expense; litigation and indemnification expenses and other extraordinary expenses not incurred in the ordinary course of the fund's business; management fees; class-specific expenses; underlying fund expenses (acquired fund fees); and short dividend expense. This voluntary expense reimbursement will continue in effect until terminated at any time by the Advisor on notice to the fund.
The expense reductions described above amounted to the following for the six months ended January 31, 2019:
| Class | Expense reduction | Class | Expense reduction | |
| Class A | $17,470 | Class R4 | $141 | |
| Class C | 2,264 | Class R6 | 4,530 | |
| Class I | 9,164 | Total | $33,624 | |
| Class R2 | 55 |
Expenses waived or reimbursed in the current fiscal period are not subject to recapture in future fiscal periods.
The investment management fees incurred for the six months ended January 31, 2019 were equivalent to a net annual effective rate of 0.60% of the fund's average daily net assets.
Accounting and legal services. Pursuant to a service agreement, the fund reimburses the Advisor for all expenses associated with providing the administrative, financial, legal, accounting and recordkeeping services to the fund, including the preparation of all tax returns, periodic reports to shareholders and regulatory reports, among other services. These expenses are allocated to each share class based on its relative net assets at the time the expense was incurred. These accounting and legal services fees incurred for the six months ended January 31, 2019 amounted to an annual rate of 0.02% of the fund's average daily net assets.
Distribution and service plans. The fund has a distribution agreement with the Distributor. The fund has adopted distribution and service plans with respect to Class A, Class C, Class R2 and Class R4 shares pursuant to Rule 12b-1 under the 1940 Act, to pay the Distributor for services provided as the distributor of shares of the fund. In addition, under a service plan for Class R2 and Class R4 shares, the fund pays for certain other services. The fund may pay up to the following contractual rates of distribution and service fees under these arrangements, expressed as an annual percentage of average daily net assets for each class of the fund's shares.
| Class | Rule 12b-1 fee | Service fee | Class | Rule 12b-1 fee | Service fee | |
| Class A | 0.30% | — | Class R2 | 0.25% | 0.25% | |
| Class C | 1.00% | — | Class R4 | 0.25% | 0.10% |
The fund's Distributor has contractually agreed to waive 0.10% of Rule12b-1 fees for Class R4 shares. The current waiver agreement expires on November 30, 2019, unless renewed by mutual agreement of the fund and the Distributor based upon a determination that this is appropriate under the circumstances at the time. This contractual waiver amounted to $285 for Class R4 shares for the six months ended January 31, 2019.
Sales charges. Class A shares are assessed up-front sales charges, which resulted in payments to the Distributor amounting to $31,301 for the six months ended January 31, 2019. Of this amount, $5,072 was retained and used for printing prospectuses, advertising, sales literature and other purposes, $25,009 was paid as sales commissions to broker-dealers and $1,220 was paid as sales commissions to sales personnel of Signator Investors, Inc., which had been a broker-dealer affiliate of the Advisor through December 31, 2018.
Class A and Class C shares may be subject to contingent deferred sales charges (CDSCs). Certain Class A shares that are acquired through purchases of $1 million or more and are redeemed within one year of purchase are subject to a 1.00% sales charge. Class C shares that are redeemed within one year of purchase are subject to a 1.00% CDSC. CDSCs are applied to the lesser of the current market value at the time of redemption or the original purchase cost of the shares being redeemed. Proceeds from CDSCs are used to compensate the Distributor for providing distribution-related services in connection with the sale of these shares. During the six months ended January 31, 2019, CDSCs received by the Distributor amounted to $159 and $472 for Class A and Class C shares, respectively.
Transfer agent fees. The John Hancock group of funds has a complex-wide transfer agent agreement with John Hancock Signature Services, Inc. (Signature Services), an affiliate of the Advisor. The transfer agent fees paid to Signature Services are determined based on the cost to Signature Services (Signature Services Cost) of providing recordkeeping services. It also includes out-of-pocket expenses, including payments made to third-parties for recordkeeping services provided to their clients who invest in one or more John Hancock funds. In addition, Signature Services Cost may be reduced by certain fees that Signature Services receives in connection with retirement and small accounts. Signature Services Cost is calculated monthly and allocated, as applicable, to five categories of share classes: Retail Share and Institutional Share Classes of Non-Municipal Bond Funds, Class R6 Shares, Retirement Share Classes and Municipal Bond Share Classes. Within each of these categories, the applicable costs are allocated to the affected John Hancock affiliated funds and/or classes, based on the relative average daily net assets.
Class level expenses. Class level expenses for the six months ended January 31, 2019 were:
| Class | Distribution and service fees | Transfer agent fees |
| Class A | $68,815 | $25,054 |
| Class C | 30,040 | 3,280 |
| Class I | — | 16,295 |
| Class R2 | 452 | 12 |
| Class R4 | 997 | 37 |
| Class R6 | — | 783 |
| Total | $100,304 | $45,461 |
Trustee expenses.The fund compensates each Trustee who is not an employee of the Advisor or its affiliates. The costs of paying Trustee compensation and expenses are allocated to the fund based on its net assets relative to other funds within the John Hancock group of funds complex.
Note 5 — Fund share transactions
Transactions in fund shares for the six months ended January 31,2019 and for the year ended July 31, 2018 were as follows:
| Six months ended 1-31-19 | Year ended 7-31-18 | |||||||||||||||||||||||||
| Shares | Amount | Shares | Amount | |||||||||||||||||||||||
| Class A shares | ||||||||||||||||||||||||||
| Sold | 268,112 | $4,720,799 | 759,938 | $14,646,498 | ||||||||||||||||||||||
| Distributions reinvested | 242,629 | 3,532,684 | 135,097 | 2,572,241 | ||||||||||||||||||||||
| Repurchased | (286,294 | ) | (5,125,627 | ) | (548,351 | ) | (10,544,267 | ) | ||||||||||||||||||
| Net increase | 224,447 | $3,127,856 | 346,684 | $6,674,472 | ||||||||||||||||||||||
| Class C shares | ||||||||||||||||||||||||||
| Sold | 46,104 | $804,077 | 118,563 | $2,234,524 | ||||||||||||||||||||||
| Distributions reinvested | 33,427 | 472,321 | 17,149 | 320,001 | ||||||||||||||||||||||
| Repurchased | (69,042 | ) | (1,154,535 | ) | (67,111 | ) | (1,262,712 | ) | ||||||||||||||||||
| Net increase | 10,489 | $121,863 | 68,601 | $1,291,813 | ||||||||||||||||||||||
| Class I shares | ||||||||||||||||||||||||||
| Sold | 217,002 | $3,928,776 | 999,600 | $19,254,792 | ||||||||||||||||||||||
| Distributions reinvested | 122,463 | 1,808,778 | 90,027 | 1,731,228 | ||||||||||||||||||||||
| Repurchased | (482,142 | ) | (8,710,579 | ) | (797,401 | ) | (15,526,258 | ) | ||||||||||||||||||
| Net increase (decrease) | (142,677 | ) | $(2,973,025 | ) | 292,226 | $5,459,762 | ||||||||||||||||||||
| Class R2 shares | ||||||||||||||||||||||||||
| Sold | 853 | $16,047 | 12,703 | $245,305 | ||||||||||||||||||||||
| Distributions reinvested | 208 | 3,057 | 65 | 1,246 | ||||||||||||||||||||||
| Repurchased | (11,086 | ) | (202,675 | ) | (6,672 | ) | (130,678 | ) | ||||||||||||||||||
| Net increase (decrease) | (10,025 | ) | $(183,571 | ) | 6,096 | $115,873 | ||||||||||||||||||||
| Class R4 shares | ||||||||||||||||||||||||||
| Sold | 1,011 | $20,104 | 48,432 | $918,794 | ||||||||||||||||||||||
| Distributions reinvested | 26 | 385 | 2,801 | 53,800 | ||||||||||||||||||||||
| Repurchased | (50,283 | ) | (906,304 | ) | (8,281 | ) | (162,318 | ) | ||||||||||||||||||
| Net increase (decrease) | (49,246 | ) | $(885,815 | ) | 42,952 | $810,276 | ||||||||||||||||||||
| Six months ended 1-31-19 | Year ended 7-31-18 | |||||||||||||||||||||||||
| Shares | Amount | Shares | Amount | |||||||||||||||||||||||
| Class R6 shares | ||||||||||||||||||||||||||
| Sold | 44,989 | $821,188 | 315,298 | $6,150,653 | ||||||||||||||||||||||
| Distributions reinvested | 64,898 | 959,837 | 26,893 | 517,413 | ||||||||||||||||||||||
| Repurchased | (175,745 | ) | (2,741,868 | ) | (49,479 | ) | (983,372 | ) | ||||||||||||||||||
| Net increase | (65,858 | ) | $(960,843 | ) | 292,712 | $5,684,694 | ||||||||||||||||||||
| Total net increase (decrease) | (32,870 | ) | $(1,753,535 | ) | 1,049,271 | $20,036,890 | ||||||||||||||||||||
Affiliates of the fund owned 49% of shares of Class R6 on January 31, 2019. Such concentration of shareholders' capital could have a material effect on the fund if such shareholders redeem from the fund.
Note 6 — Purchase and sale of securities
Purchases and sales of securities, other than short-term investments, amounted to $14,310,709 and $21,754,933, respectively, for the six months ended January 31, 2019.
Note 7 — Industry or sector risk
The fund may invest a large percentage of its assets in one or more particular industries or sectors of the economy. If a large percentage of the fund's assets are economically tied to a single or small number of industries or sectors of the economy, the fund will be less diversified than a more broadly diversified fund, and it may cause the fund to underperform if that industry or sector underperforms. In addition, focusing on a particular industry or sector may make the fund's NAV more volatile. Further, a fund that invests in particular industries or sectors is particularly susceptible to the impact of market, economic, regulatory and other factors affecting those industries or sectors.
Trustees Hassell H. McClellan,Chairperson Officers Andrew G. Arnott Francis V. Knox, Jr. Charles A. Rizzo Salvatore Schiavone Christopher (Kit) Sechler** | Investment advisor John Hancock Advisers, LLC Subadvisor John Hancock Asset Management a division of Manulife Asset Management (US) LLC Portfolio Managers Emory W. (Sandy) Sanders, Jr., CFA Principal distributor John Hancock Funds, LLC Custodian State Street Bank and Trust Company Transfer agent John Hancock Signature Services, Inc. Legal counsel K&L Gates LLP |
* Member of the Audit Committee
† Non-Independent Trustee
#Effective 6-19-18
**Effective 9-13-18
The fund's proxy voting policies and procedures, as well as the fund proxy voting record for the most recent twelve-month period ended June 30, are available free of charge on the Securities and Exchange Commission (SEC) website at sec.gov or on our website.
The fund's complete list of portfolio holdings, for the first and third fiscal quarters, is filed with the SEC on Form N-Q. Effective April 30, 2019, all of the fund's holdings as of the end of the third month of every fiscal quarter will be filed with the SEC on Form N-PORT within 60 days of the end of the fiscal quarter. The fund's Form N-Q is available on our website and the SEC's website, sec.gov.
We make this information on your fund, as well asmonthly portfolio holdings, and other fund details available on our website at jhinvestments.com or by calling 800-225-5291.
| You can also contact us: | |||
| 800-225-5291 jhinvestments.com | Regular mail: John Hancock Signature Services, Inc. | Express mail: John Hancock Signature Services, Inc. | |
John Hancock family of funds
DOMESTIC EQUITY FUNDS Blue Chip Growth Classic Value Disciplined Value Disciplined Value Mid Cap Equity Income Financial Industries Fundamental All Cap Core Fundamental Large Cap Core Fundamental Large Cap Value New Opportunities Regional Bank Small Cap Core Small Cap Growth Small Cap Value U.S. Global Leaders Growth U.S. Growth U.S. Quality Growth Value Equity GLOBAL AND INTERNATIONAL EQUITY FUNDS Disciplined Value International Emerging Markets Emerging Markets Equity Fundamental Global Franchise Global Equity Global Shareholder Yield Global Thematic Opportunities Greater China Opportunities International Growth International Small Company | INCOME FUNDS Bond California Tax-Free Income Emerging Markets Debt Floating Rate Income Government Income High Yield High Yield Municipal Bond Income Investment Grade Bond Money Market Short Duration Credit Opportunities Spectrum Income Strategic Income Opportunities Tax-Free Bond ALTERNATIVE AND SPECIALTY FUNDS Absolute Return Currency Alternative Asset Allocation Disciplined Alternative Yield Global Absolute Return Strategies Global Conservative Absolute Return Global Focused Strategies Infrastructure Seaport Long/Short Technical Opportunities |
A fund's investment objectives, risks, charges, and expenses should be considered carefully before investing. The prospectus contains this and other important information about the fund. To obtain a prospectus, contact your financial professional, call John Hancock Investments at 800-225-5291, or visit our website at jhinvestments.com. Please read the prospectus carefully before investing or sending money.
ASSET ALLOCATION Balanced Income Allocation Multi-Index Lifetime Portfolios Multi-Index Preservation Portfolios Multimanager Lifestyle Portfolios Multimanager Lifetime Portfolios Retirement Income 2040 EXCHANGE-TRADED FUNDS John Hancock Multifactor Consumer Discretionary ETF John Hancock Multifactor Consumer Staples ETF John Hancock Multifactor Developed International ETF John Hancock Multifactor Emerging Markets ETF John Hancock Multifactor Energy ETF John Hancock Multifactor Financials ETF John Hancock Multifactor Healthcare ETF John Hancock Multifactor Industrials ETF John Hancock Multifactor Large Cap ETF John Hancock Multifactor Materials ETF John Hancock Multifactor Media and John Hancock Multifactor Mid Cap ETF John Hancock Multifactor Small Cap ETF John Hancock Multifactor Technology ETF John Hancock Multifactor Utilities ETF | ENVIRONMENTAL, SOCIAL, AND ESG All Cap Core ESG Core Bond ESG International Equity ESG Large Cap Core CLOSED-END FUNDS Financial Opportunities Hedged Equity & Income Income Securities Trust Investors Trust Preferred Income Preferred Income II Preferred Income III Premium Dividend Tax-Advantaged Dividend Income Tax-Advantaged Global Shareholder Yield |
John Hancock Multifactor ETF shares are bought and sold at market price (not NAV), and are not individually redeemed
from the fund. Brokerage commissions will reduce returns.
John Hancock ETFs are distributed by Foreside Fund Services, LLC, and are subadvised by Dimensional Fund Advisors LP.
Foreside is not affiliated with John Hancock Funds, LLC or Dimensional Fund Advisors LP.
Dimensional Fund Advisors LP receives compensation from John Hancock in connection with licensing rights to the
John Hancock Dimensional indexes. Dimensional Fund Advisors LP does not sponsor, endorse, or sell, and makes no
representation as to the advisability of investing in, John Hancock Multifactor ETFs.
John Hancock Investments
A trusted brand
John Hancock Investments is a premier asset manager representing one of
America's most trusted brands, with a heritage of financial stewardship dating
back to 1862. Helping our shareholders pursue their financial goals is at the
core of everything we do. It's why we support the role of professional financial
advice and operate with the highest standards of conduct and integrity.
A better way to invest
We serve investors globally through a unique multimanager approach:
We search the world to find proven portfolio teams with specialized
expertise for every strategy we offer, then we apply robust investment
oversight to ensure they continue to meet our uncompromising standards
and serve the best interests of our shareholders.
Results for investors
Our unique approach to asset management enables us to provide a diverse set
of investments backed by some of the world's best managers, along with strong
risk-adjusted returns across asset classes.
| | John Hancock Funds, LLC n Member FINRA, SIPC 200 Berkeley Street n Boston, MA 02116-5010 800-225-5291 n jhinvestments.com | |
| This report is for the information of the shareholders of John Hancock Fundamental All Cap Core Fund. It is not authorized for distribution to prospective investors unless preceded or accompanied by a prospectus. | ||
| MF733307 | 376SA 1/19 3/19 | |
John Hancock
Fundamental Large Cap Value Fund
Semiannual report 1/31/19
Beginning on January 1, 2021, as permitted by regulations adopted by the Securities and Exchange Commission, paper copies of the Fund's shareholder reports like this one will no longer be sent by mail, unless you specifically request paper copies of the reports from the Fund or from your financial intermediary. Instead, the reports will be made available on a website, and you will be notified by mail each time a report is posted and provided with a website link to access the report.
If you already elected to receive shareholder reports electronically, you will not be affected by this change, and you do not need to take any action. You may elect to receive shareholder reports and other communications electronically by calling John Hancock Investments at 800-225-5291 (Class A and Class C shares) or 888-972-8696 (Class I, Class R2, Class R4, Class R6, and Class NAV shares) or by contacting your financial intermediary.
You may elect to receive all reports in paper, free of charge, at any time. You can inform John Hancock Investments or your financial intermediary that you wish to continue receiving paper copies of your shareholder reports by following the instructions listed above. Your election to receive reports in paper will apply to all funds held with John Hancock Investments or your financial intermediary.
A message to shareholders
Dear shareholder,
It's been a challenging time for equity investors as stock markets across many major economies worldwide posted losses for the period. In the United States, heightened fears of a full-blown trade war with China weighed on investor sentiment—despite relatively supportive U.S. economic fundamentals. Global economic growth slowed, and many international markets found themselves confronted by challenging issues that may not abate in the near future.
Concerns about the potential for a more widespread global economic slowdown led to a significant increase in volatility as well as a flight to quality, particularly in the final months of the year. At John Hancock Investments, we believe that we're in the late innings of the bull market, but the economic underpinnings in the United States suggest that there's still room for stocks to run.
Your best resource in unpredictable and volatile markets is your financial advisor, who can help position your portfolio so that it's sufficiently diversified to meet your long-term objectives and to withstand the inevitable turbulence along the way.
On behalf of everyone at John Hancock Investments, I'd like to take this opportunity to welcome new shareholders and to thank existing shareholders for the continued trust you've placed in us.
Sincerely,
Andrew G. Arnott
President and CEO,
John Hancock Investments
Head of Wealth and Asset Management,
United States and Europe
This commentary reflects the CEO's views, which are subject to change at any time. All investments entail risks, including the possible loss of principal. Diversification does not guarantee a profit or eliminate the risk of a loss. For more up-to-date information, you can visit our website at jhinvestments.com.
John Hancock
Fundamental Large Cap Value Fund
INVESTMENT OBJECTIVE
The fund seeks long-term capital appreciation.
AVERAGE ANNUAL TOTAL RETURNS AS OF 1/31/19 (%)
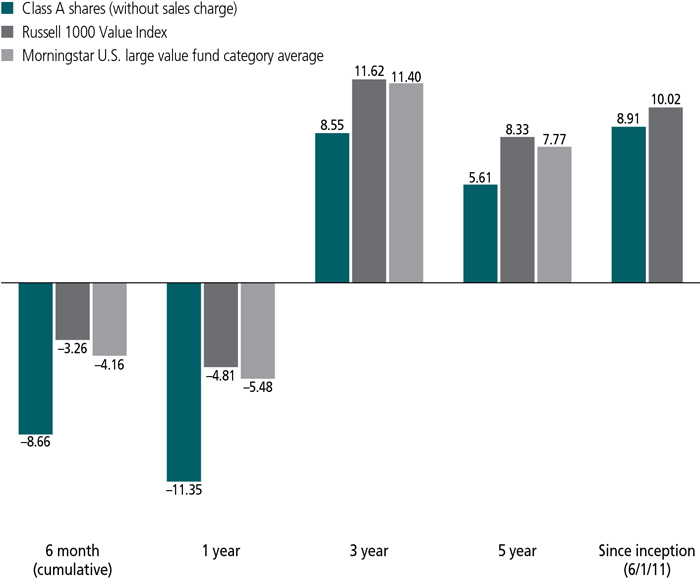
The Russell 1000 Value Index is an unmanaged index containing those securities in the Russell 1000 Index with a less-than-average growth orientation.
It is not possible to invest directly in an index. Index figures do not reflect expenses or sales charges, which would result in lower returns.
Figures from Morningstar, Inc. include reinvested distributions and do not take into account sales charges. Actual load-adjusted performance is lower. Since-inception returns for the Morningstar fund category average are not available.
The past performance shown here reflects reinvested distributions and the beneficial effect of any expense reductions, and does not guarantee future results. Returns for periods shorter than one year are cumulative. Performance of the other share classes will vary based on the difference in the fees and expenses of those classes. Shares will fluctuate in value and, when redeemed, may be worth more or less than their original cost. Current month-end performance may be lower or higher than the performance cited, and can be found at jhinvestments.com or by calling 800-225-5291. For further information on the fund's objectives, risks, and strategy, see the fund's prospectus.
SECTOR COMPOSITION AS OF 1/31/19 (%)
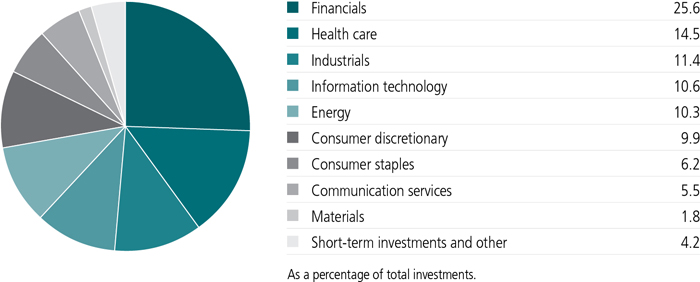
TOP 10 HOLDINGS AS OF 1/31/19 (%)
| Citigroup, Inc. | 4.6 |
| Bank of America Corp. | 4.5 |
| Danaher Corp. | 3.8 |
| Lennar Corp., A Shares | 3.7 |
| Microsoft Corp. | 3.6 |
| Kinder Morgan, Inc. | 3.4 |
| JPMorgan Chase & Co. | 3.3 |
| American Express Company | 3.2 |
| Apple, Inc. | 3.1 |
| Morgan Stanley | 2.9 |
| TOTAL | 36.1 |
| As a percentage of net assets. | |
| Cash and cash equivalents are not included. | |
A note about risks
The fund is subject to various risks as described in the fund's prospectus. For more information, please refer to the "Principal risks" section of the prospectus.
TOTAL RETURNS FOR THE PERIOD ENDED JANUARY 31, 2019
| Average annual total returns (%) with maximum sales charge | Cumulative total returns (%) with maximum sales charge | ||||||
| 1-year | 5-year | Since inception1 | 6-month | 5-year | Since inception1 | ||
| Class A | -15.78 | 4.53 | 8.18 | -13.22 | 24.82 | 82.80 | |
| Class C2 | -12.65 | 4.92 | 8.44 | -9.69 | 27.17 | 86.23 | |
| Class I3 | -11.00 | 5.95 | 9.29 | -8.44 | 33.50 | 97.69 | |
| Class R22,3 | -11.38 | 5.64 | 8.93 | -8.63 | 31.58 | 92.69 | |
| Class R42,3 | -11.12 | 5.84 | 9.06 | -8.50 | 32.80 | 94.48 | |
| Class R62,3 | -10.94 | 5.98 | 9.15 | -8.37 | 33.69 | 95.78 | |
| Class NAV3,4 | -10.94 | 6.10 | 12.83 | -8.44 | 34.43 | 145.69 | |
| Index† | -4.81 | 8.33 | 10.02 | -3.26 | 49.18 | 108.02 | |
Performance figures assume all distributions have been reinvested. Figures reflect maximum sales charges on Class A shares of 5.00% and the applicable contingent deferred sales charge (CDSC) on Class C shares. Class C shares sold within one year of purchase are subject to a 1% CDSC. Sales charges are not applicable to Class I, Class R2, Class R4, Class R6, and Class NAV shares.
The expense ratios of the fund, both net (including any fee waivers and/or expense limitations) and gross (excluding any fee waivers and/or expense limitations), are set forth according to the most recent publicly available prospectuses for the fund and may differ from those disclosed in the Financial highlights tables in this report. Net expenses reflect contractual expense limitations in effect until November 30, 2019 and are subject to change. Had the fee waivers and expense limitations not been in place, gross expenses would apply. The expense ratios are as follows:
| Class A | Class C | Class I | Class R2 | Class R4 | Class R6 | Class NAV | |
| Gross (%) | 1.11 | 1.81 | 0.81 | 1.22 | 1.07 | 0.72 | 0.70 |
| Net (%) | 1.10 | 1.80 | 0.80 | 1.21 | 0.96 | 0.71 | 0.69 |
Please refer to the most recent prospectus and annual or semiannual report for more information on expenses and any expense limitation arrangements for each class.
The returns reflect past results and should not be considered indicative of future performance. The return and principal value of an investment will fluctuate so that shares, when redeemed, may be worth more or less than their original cost. Due to market volatility and other factors, the fund's current performance may be higher or lower than the performance shown. For current to the most recent month-end performance data, please call 800-225-5291 or visit the fund's website at jhinvestments.com.
The performance table above and the chart on the next page do not reflect the deduction of taxes that a shareholder would pay on fund distributions or the redemption of fund shares. The fund's performance results reflect any applicable fee waivers or expense reductions, without which the expenses would increase and results would have been less favorable.
| † | Index is the Russell 1000 Value Index. |
See the following page for footnotes.
This chart and table show what happened to a hypothetical $10,000 investment in John Hancock Fundamental Large Cap Value Fund for the share classes and periods indicated, assuming all distributions were reinvested. For comparison, we've shown the same investment in the Russell 1000 Value Index.
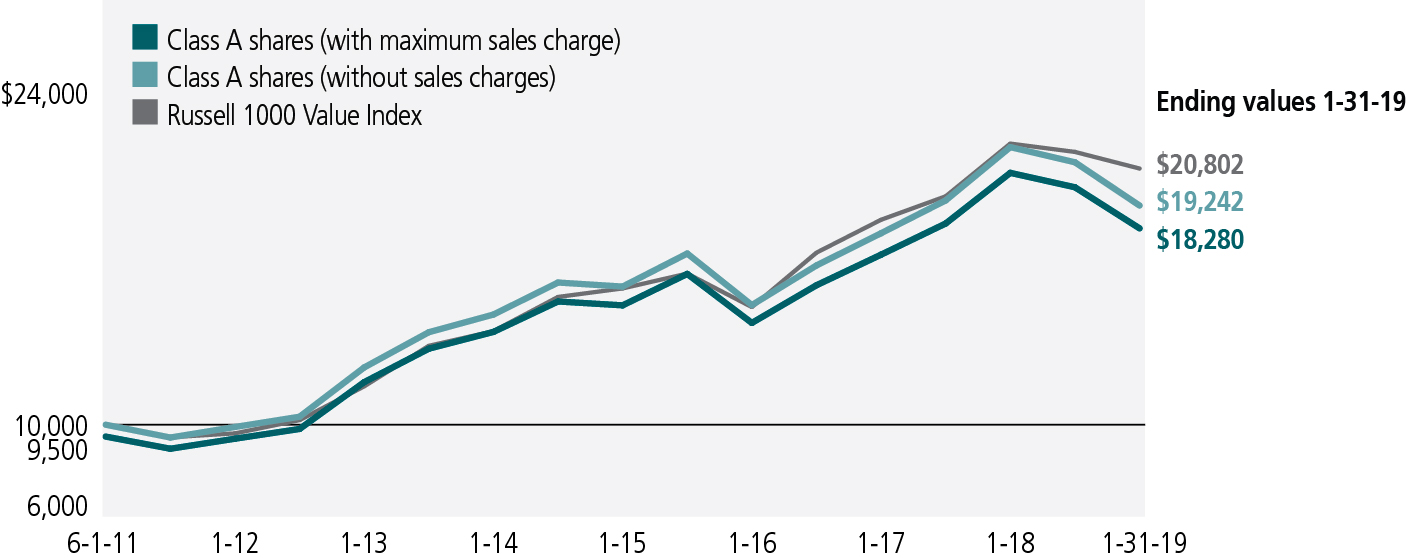
| Start date | With maximum sales charge ($) | Without sales charge ($) | Index ($) | |
| Class C2,5 | 6-1-11 | 18,623 | 18,623 | 20,802 |
| Class I3 | 6-1-11 | 19,769 | 19,769 | 20,802 |
| Class R22,3 | 6-1-11 | 19,269 | 19,269 | 20,802 |
| Class R42,3 | 6-1-11 | 19,448 | 19,448 | 20,802 |
| Class R62,3 | 6-1-11 | 19,578 | 19,578 | 20,802 |
| Class NAV3,4 | 8-23-11 | 24,569 | 24,569 | 20,802 |
The Russell 1000 Value Index is an unmanaged index containing those securities in the Russell 1000 Index with a less-than-average growth orientation.
It is not possible to invest directly in an index. Index figures do not reflect expenses or sales charges, which would result in lower returns.
Footnotes related to performance pages
| 1 | From 6-1-11. |
| 2 | Class C shares were first offered on 6-27-14; Class R2, Class R4, and Class R6 shares were first offered on 3-27-15. Returns prior to these dates are those of Class A shares (first offered on 6-1-11) that have not been adjusted for class-specific expenses; otherwise, returns would vary. |
| 3 | For certain types of investors as described in the fund's prospectuses. |
| 4 | From 8-23-11. |
| 5 | The contingent deferred sales charge is not applicable. |
| Your expenses |

| 6 | JOHN HANCOCK FUNDAMENTAL LARGE CAP VALUE FUND | SEMIANNUAL REPORT |
| Account value on 8-1-2018 | Ending value on 1-31-2019 | Expenses paid during period ended 1-31-20191 | Annualized expense ratio | ||
| Class A | Actual expenses/actual returns | $1,000.00 | $913.40 | $5.55 | 1.15% |
| Hypothetical example | 1,000.00 | 1,019.40 | 5.85 | 1.15% | |
| Class C | Actual expenses/actual returns | 1,000.00 | 911.00 | 8.91 | 1.85% |
| Hypothetical example | 1,000.00 | 1,015.90 | 9.40 | 1.85% | |
| Class I | Actual expenses/actual returns | 1,000.00 | 915.60 | 4.25 | 0.88% |
| Hypothetical example | 1,000.00 | 1,020.80 | 4.48 | 0.88% | |
| Class R2 | Actual expenses/actual returns | 1,000.00 | 913.70 | 6.08 | 1.26% |
| Hypothetical example | 1,000.00 | 1,018.90 | 6.41 | 1.26% | |
| Class R4 | Actual expenses/actual returns | 1,000.00 | 915.00 | 4.39 | 0.91% |
| Hypothetical example | 1,000.00 | 1,020.60 | 4.63 | 0.91% | |
| Class R6 | Actual expenses/actual returns | 1,000.00 | 916.30 | 3.67 | 0.76% |
| Hypothetical example | 1,000.00 | 1,021.40 | 3.87 | 0.76% | |
| Class NAV | Actual expenses/actual returns | 1,000.00 | 915.60 | 3.62 | 0.75% |
| Hypothetical example | 1,000.00 | 1,021.40 | 3.82 | 0.75% |
| 1 | Expenses are equal to the annualized expense ratio, multiplied by the average account value over the period, multiplied by 184/365 (to reflect the one-half year period). |
| SEMIANNUAL REPORT | JOHN HANCOCK FUNDAMENTAL LARGE CAP VALUE FUND | 7 |
| Fund’s investments |
| Shares | Value | ||||
| Common stocks 95.8% | $112,363,242 | ||||
| (Cost $98,926,499) | |||||
| Communication services 5.5% | 6,425,549 | ||||
| Entertainment 1.9% | |||||
| Twenty-First Century Fox, Inc., Class A | 45,619 | 2,249,473 | |||
| Interactive media and services 2.1% | |||||
| Alphabet, Inc., Class A (A) | 2,162 | 2,434,174 | |||
| Media 1.5% | |||||
| Comcast Corp., Class A | 47,632 | 1,741,902 | |||
| Consumer discretionary 9.9% | 11,593,813 | ||||
| Household durables 5.2% | |||||
| Lennar Corp., A Shares | 91,743 | 4,350,453 | |||
| Tempur Sealy International, Inc. (A) | 32,796 | 1,738,844 | |||
| Internet and direct marketing retail 2.3% | |||||
| eBay, Inc. (A) | 79,670 | 2,680,896 | |||
| Specialty retail 2.4% | |||||
| AutoZone, Inc. (A) | 1,930 | 1,635,366 | |||
| Group 1 Automotive, Inc. | 19,470 | 1,188,254 | |||
| Consumer staples 6.2% | 7,293,267 | ||||
| Beverages 5.2% | |||||
| Anheuser-Busch InBev SA, ADR | 16,389 | 1,252,775 | |||
| Heineken Holding NV | 33,602 | 2,917,078 | |||
| PepsiCo, Inc. | 16,962 | 1,911,109 | |||
| Food products 1.0% | |||||
| Danone SA | 16,659 | 1,212,305 | |||
| Energy 10.3% | 12,125,636 | ||||
| Energy equipment and services 2.3% | |||||
| Baker Hughes, a GE Company LLC | 70,594 | 1,663,901 | |||
| National Oilwell Varco, Inc. | 35,946 | 1,059,688 | |||
| Oil, gas and consumable fuels 8.0% | |||||
| Chevron Corp. | 23,076 | 2,645,663 | |||
| Exxon Mobil Corp. | 17,669 | 1,294,784 | |||
| Kinder Morgan, Inc. | 218,837 | 3,960,950 | |||
| Suncor Energy, Inc. | 46,431 | 1,500,650 | |||
| Financials 25.6% | 30,017,004 | ||||
| Banks 14.4% | |||||
| Bank of America Corp. | 184,004 | 5,238,594 | |||
| CIT Group, Inc. | 25,341 | 1,170,501 | |||
| Citigroup, Inc. | 84,533 | 5,448,993 | |||
| JPMorgan Chase & Co. | 37,264 | 3,856,824 | |||
| 8 | JOHN HANCOCK FUNDAMENTAL LARGE CAP VALUE FUND | SEMIANNUAL REPORT | SEE NOTES TO FINANCIAL STATEMENTS |
| Shares | Value | ||||
| Financials (continued) | |||||
| Banks (continued) | |||||
| Wells Fargo & Company | 23,477 | $1,148,260 | |||
| Capital markets 5.5% | |||||
| Morgan Stanley | 79,625 | 3,368,138 | |||
| The Goldman Sachs Group, Inc. | 15,561 | 3,081,234 | |||
| Consumer finance 4.3% | |||||
| American Express Company | 36,721 | 3,771,247 | |||
| Synchrony Financial | 44,341 | 1,332,004 | |||
| Insurance 1.4% | |||||
| Prudential Financial, Inc. | 17,378 | 1,601,209 | |||
| Health care 14.5% | 17,036,272 | ||||
| Biotechnology 3.9% | |||||
| Amgen, Inc. | 3,598 | 673,222 | |||
| Biogen, Inc. (A) | 7,190 | 2,399,878 | |||
| Gilead Sciences, Inc. | 21,688 | 1,518,377 | |||
| Health care equipment and supplies 6.3% | |||||
| Danaher Corp. | 40,555 | 4,498,361 | |||
| Hologic, Inc. (A) | 28,588 | 1,269,307 | |||
| Zimmer Biomet Holdings, Inc. | 15,212 | 1,666,627 | |||
| Pharmaceuticals 4.3% | |||||
| Allergan PLC | 18,710 | 2,693,866 | |||
| Merck & Company, Inc. | 31,125 | 2,316,634 | |||
| Industrials 11.4% | 13,320,658 | ||||
| Aerospace and defense 3.9% | |||||
| L3 Technologies, Inc. | 7,361 | 1,449,234 | |||
| United Technologies Corp. | 26,638 | 3,145,149 | |||
| Industrial conglomerates 2.1% | |||||
| General Electric Company | 236,478 | 2,402,616 | |||
| Machinery 2.0% | |||||
| Parker-Hannifin Corp. | 11,530 | 1,900,259 | |||
| The Manitowoc Company, Inc. (A) | 24,924 | 379,343 | |||
| Road and rail 2.4% | |||||
| Union Pacific Corp. | 17,825 | 2,835,423 | |||
| Trading companies and distributors 1.0% | |||||
| United Rentals, Inc. (A) | 9,649 | 1,208,634 | |||
| Information technology 10.6% | 12,382,794 | ||||
| Communications equipment 1.5% | |||||
| Cisco Systems, Inc. | 37,266 | 1,762,309 | |||
| Semiconductors and semiconductor equipment 0.6% | |||||
| Analog Devices, Inc. | 6,631 | 655,541 | |||
| SEE NOTES TO FINANCIAL STATEMENTS | SEMIANNUAL REPORT | JOHN HANCOCK FUNDAMENTAL LARGE CAP VALUE FUND | 9 |
| Shares | Value | ||||
| Information technology (continued) | |||||
| Software 5.4% | |||||
| Microsoft Corp. | 40,282 | $4,206,649 | |||
| Oracle Corp. | 42,403 | 2,129,903 | |||
| Technology hardware, storage and peripherals 3.1% | |||||
| Apple, Inc. | 21,800 | 3,628,392 | |||
| Materials 1.8% | 2,168,249 | ||||
| Chemicals 1.8% | |||||
| LyondellBasell Industries NV, Class A | 24,931 | 2,168,249 | |||
| Yield* (%) | Maturity date | Par value^ | Value | ||
| Short-term investments 3.6% | $4,250,000 | ||||
| (Cost $4,250,000) | |||||
| U.S. Government Agency 0.4% | 517,000 | ||||
| Federal Home Loan Bank Discount Note | 2.259 | 02-01-19 | 517,000 | 517,000 |
| Par value^ | Value | ||||
| Repurchase agreement 3.2% | 3,733,000 | ||||
| Barclays Tri-Party Repurchase Agreement dated 1-31-19 at 2.520% to be repurchased at $3,733,261 on 2-1-19, collateralized by $3,781,800 U.S. Treasury Notes, 2.625% due 12-15-21 (valued at $3,807,930, including interest) | 3,733,000 | 3,733,000 |
| Total investments (Cost $103,176,499) 99.4% | $116,613,242 | ||||
| Other assets and liabilities, net 0.6% | 654,239 | ||||
| Total net assets 100.0% | $117,267,481 | ||||
| The percentage shown for each investment category is the total value of the category as a percentage of the net assets of the fund. | |
| ^All par values are denominated in U.S. dollars unless otherwise indicated. | |
| Security Abbreviations and Legend | |
| ADR | American Depositary Receipt |
| (A) | Non-income producing security. |
| * | Yield represents either the annualized yield at the date of purchase, the stated coupon rate or, for floating rate securities, the rate at period end. |
| 10 | JOHN HANCOCK FUNDAMENTAL LARGE CAP VALUE FUND | SEMIANNUAL REPORT | SEE NOTES TO FINANCIAL STATEMENTS |
| Financial statements |
| Assets | |
| Unaffiliated investments, at value (Cost $103,176,499) | $116,613,242 |
| Cash | 74,782 |
| Foreign currency, at value (Cost $56) | 54 |
| Dividends and interest receivable | 267,336 |
| Receivable for fund shares sold | 56,192 |
| Receivable for investments sold | 334,801 |
| Other assets | 52,162 |
| Total assets | 117,398,569 |
| Liabilities | |
| Payable for fund shares repurchased | 13,315 |
| Payable to affiliates | |
| Accounting and legal services fees | 4,254 |
| Transfer agent fees | 2,076 |
| Distribution and service fees | 94 |
| Trustees' fees | 2,773 |
| Other liabilities and accrued expenses | 108,576 |
| Total liabilities | 131,088 |
| Net assets | $117,267,481 |
| Net assets consist of | |
| Paid-in capital | $33,256,645 |
| Total distributable earnings (loss) | 84,010,836 |
| Net assets | $117,267,481 |
| Net asset value per share | |
| Based on net asset value and shares outstanding - the fund has an unlimited number of shares authorized with no par value | |
| Class A ($18,666,470 ÷ 1,635,496 shares)1 | $11.41 |
| Class C ($1,561,493 ÷ 136,782 shares)1 | $11.42 |
| Class I ($2,442,480 ÷ 212,647 shares) | $11.49 |
| Class R2 ($235,355 ÷ 20,556 shares) | $11.45 |
| Class R4 ($36,997 ÷ 3,224 shares) | $11.48 |
| Class R6 ($4,026,950 ÷ 350,916 shares) | $11.48 |
| Class NAV ($90,297,736 ÷ 7,869,518 shares) | $11.47 |
| Maximum offering price per share | |
| Class A (net asset value per share ÷ 95%)2 | $12.01 |
| 1 | Redemption price per share is equal to net asset value less any applicable contingent deferred sales charge. |
| 2 | On single retail sales of less than $50,000. On sales of $50,000 or more and on group sales the offering price is reduced. |
| SEE NOTES TO FINANCIAL STATEMENTS | SEMIANNUAL REPORT | JOHN HANCOCK FUNDAMENTAL LARGE CAP VALUE FUND | 11 |
| Investment income | |
| Dividends | $3,873,748 |
| Interest | 54,311 |
| Less foreign taxes withheld | (37,910) |
| Total investment income | 3,890,149 |
| Expenses | |
| Investment management fees | 1,197,428 |
| Distribution and service fees | 37,554 |
| Accounting and legal services fees | 33,709 |
| Transfer agent fees | 12,974 |
| Trustees' fees | 6,096 |
| Custodian fees | 26,496 |
| State registration fees | 47,133 |
| Printing and postage | 15,449 |
| Professional fees | 33,668 |
| Other | 14,509 |
| Total expenses | 1,425,016 |
| Less expense reductions | (15,061) |
| Net expenses | 1,409,955 |
| Net investment income | 2,480,194 |
| Realized and unrealized gain (loss) | |
| Net realized gain (loss) on | |
| Unaffiliated investments and foreign currency transactions | 34,205,625 |
| Redemptions in kind | 67,152,776 |
| 101,358,401 | |
| Change in net unrealized appreciation (depreciation) of | |
| Unaffiliated investments and translation of assets and liabilities in foreign currencies | (121,886,142) |
| (121,886,142) | |
| Net realized and unrealized loss | (20,527,741) |
| Decrease in net assets from operations | $(18,047,547) |
| 12 | JOHN HANCOCK FUNDAMENTAL LARGE CAP VALUE FUND | SEMIANNUAL REPORT | SEE NOTES TO FINANCIAL STATEMENTS |
| Six months ended 1-31-19 (unaudited) | Year ended 7-31-18 | |
| Increase (decrease) in net assets | ||
| From operations | ||
| Net investment income | $2,480,194 | $9,016,607 |
| Net realized gain | 101,358,401 | 34,938,567 |
| Change in net unrealized appreciation (depreciation) | (121,886,142) | 23,033,941 |
| Increase (decrease) in net assets resulting from operations | (18,047,547) | 66,989,115 |
| Distributions to shareholders | ||
| From net investment income and net realized gain | ||
| Class A | (2,795,429) | — |
| Class C | (245,290) | — |
| Class I | (251,649) | — |
| Class R2 | (32,249) | — |
| Class R4 | (6,578) | — |
| Class R6 | (814,699) | — |
| Class NAV | (52,668,237) | — |
| From net investment income | ||
| Class A | — | (160,375) |
| Class C | — | (3,320) |
| Class I | — | (29,521) |
| Class R2 | — | (2,091) |
| Class R4 | — | (521) |
| Class R6 | — | (58,959) |
| Class NAV | — | (9,177,347) |
| From net realized gain | ||
| Class A | — | (1,383,884) |
| Class C | — | (148,129) |
| Class I | — | (184,653) |
| Class R2 | — | (17,899) |
| Class R4 | — | (3,429) |
| Class R6 | — | (338,402) |
| Class NAV | — | (52,532,794) |
| Total distributions | (56,814,131) | (64,041,324) |
| From fund share transactions | (582,027,177) | (29,452,605) |
| Total decrease | (656,888,855) | (26,504,814) |
| Net assets | ||
| Beginning of period | 774,156,336 | 800,661,150 |
| End of period1 | $117,267,481 | $774,156,336 |
| 1 | Net assets - End of year includes undistributed net investment income of $4,667,330 at July 31, 2018. The SEC eliminated the requirement to disclose undistributed net investment income in the current reporting period. |
| SEE NOTES TO FINANCIAL STATEMENTS | SEMIANNUAL REPORT | JOHN HANCOCK FUNDAMENTAL LARGE CAP VALUE FUND | 13 |
| Financial highlights |
| CLASS A SHARES Period ended | 1-31-191 | 7-31-18 | 7-31-17 | 7-31-16 | 7-31-15 | 7-31-14 |
| Per share operating performance | ||||||
| Net asset value, beginning of period | $14.50 | $14.49 | $12.80 | $13.84 | $13.62 | $13.11 |
| Net investment income2 | 0.05 | 0.11 | 0.12 | 0.12 | 0.09 | 0.07 |
| Net realized and unrealized gain (loss) on investments | (1.12) | 1.09 | 1.96 | (0.52) | 0.94 | 1.82 |
| Total from investment operations | (1.07) | 1.20 | 2.08 | (0.40) | 1.03 | 1.89 |
| Less distributions | ||||||
| From net investment income | (0.21) | (0.13) | (0.29) | (0.09) | (0.07) | (0.09) |
| From net realized gain | (1.81) | (1.06) | (0.10) | (0.55) | (0.74) | (1.29) |
| Total distributions | (2.02) | (1.19) | (0.39) | (0.64) | (0.81) | (1.38) |
| Net asset value, end of period | $11.41 | $14.50 | $14.49 | $12.80 | $13.84 | $13.62 |
| Total return (%)3,4 | (8.66)5 | 8.27 | 16.40 | (2.92) | 7.64 | 15.08 |
| Ratios and supplemental data | ||||||
| Net assets, end of period (in millions) | $19 | $20 | $21 | $17 | $16 | $12 |
| Ratios (as a percentage of average net assets): | ||||||
| Expenses before reductions | 1.166 | 1.11 | 1.11 | 1.11 | 1.14 | 1.34 |
| Expenses including reductions | 1.156 | 1.10 | 1.10 | 1.10 | 1.13 | 1.30 |
| Net investment income | 0.836 | 0.76 | 0.88 | 0.93 | 0.62 | 0.54 |
| Portfolio turnover (%) | 187 | 26 | 49 | 21 | 20 | 24 |
| 1 | Six months ended 1-31-19. Unaudited. |
| 2 | Based on average daily shares outstanding. |
| 3 | Total returns would have been lower had certain expenses not been reduced during the applicable periods. |
| 4 | Does not reflect the effect of sales charges, if any. |
| 5 | Not annualized. |
| 6 | Annualized. |
| 7 | Excludes in-kind transactions. |
| 14 | JOHN HANCOCK FUNDAMENTAL LARGE CAP VALUE FUND | SEMIANNUAL REPORT | SEE NOTES TO FINANCIAL STATEMENTS |
| CLASS C SHARES Period ended | 1-31-191 | 7-31-18 | 7-31-17 | 7-31-16 | 7-31-15 | 7-31-142 |
| Per share operating performance | ||||||
| Net asset value, beginning of period | $14.47 | $14.47 | $12.79 | $13.83 | $13.66 | $13.87 |
| Net investment income (loss)3 | — | 0.01 | 0.02 | 0.03 | (0.04) | (0.01) |
| Net realized and unrealized gain (loss) on investments | (1.11) | 1.08 | 1.96 | (0.52) | 0.95 | (0.20) |
| Total from investment operations | (1.11) | 1.09 | 1.98 | (0.49) | 0.91 | (0.21) |
| Less distributions | ||||||
| From net investment income | (0.13) | (0.03) | (0.20) | — | — | — |
| From net realized gain | (1.81) | (1.06) | (0.10) | (0.55) | (0.74) | — |
| Total distributions | (1.94) | (1.09) | (0.30) | (0.55) | (0.74) | — |
| Net asset value, end of period | $11.42 | $14.47 | $14.47 | $12.79 | $13.83 | $13.66 |
| Total return (%)4,5 | (8.90)6 | 7.49 | 15.63 | (3.59) | 6.73 | (1.51)6 |
| Ratios and supplemental data | ||||||
| Net assets, end of period (in millions) | $2 | $2 | $2 | $1 | $1 | $—7 |
| Ratios (as a percentage of average net assets): | ||||||
| Expenses before reductions | 1.868 | 1.81 | 1.81 | 1.81 | 2.60 | 17.118 |
| Expenses including reductions | 1.858 | 1.80 | 1.80 | 1.80 | 2.00 | 2.008 |
| Net investment income (loss) | 0.148 | 0.06 | 0.17 | 0.22 | (0.26) | (0.69)8 |
| Portfolio turnover (%) | 189 | 26 | 49 | 21 | 20 | 2410 |
| 1 | Six months ended 1-31-19. Unaudited. |
| 2 | The inception date for Class C shares is 6-27-14. |
| 3 | Based on average daily shares outstanding. |
| 4 | Total returns would have been lower had certain expenses not been reduced during the applicable periods. |
| 5 | Does not reflect the effect of sales charges, if any. |
| 6 | Not annualized. |
| 7 | Less than $500,000. |
| 8 | Annualized. |
| 9 | Excludes in-kind transactions. |
| 10 | Portfolio turnover is shown for the period from 8-1-13 to 7-31-14. |
| SEE NOTES TO FINANCIAL STATEMENTS | SEMIANNUAL REPORT | JOHN HANCOCK FUNDAMENTAL LARGE CAP VALUE FUND | 15 |
| CLASS I SHARES Period ended | 1-31-191 | 7-31-18 | 7-31-17 | 7-31-16 | 7-31-15 | 7-31-14 |
| Per share operating performance | ||||||
| Net asset value, beginning of period | $14.59 | $14.58 | $12.87 | $13.92 | $13.68 | $13.17 |
| Net investment income2 | 0.07 | 0.15 | 0.16 | 0.16 | 0.11 | 0.13 |
| Net realized and unrealized gain (loss) on investments | (1.12) | 1.09 | 1.98 | (0.53) | 0.96 | 1.81 |
| Total from investment operations | (1.05) | 1.24 | 2.14 | (0.37) | 1.07 | 1.94 |
| Less distributions | ||||||
| From net investment income | (0.24) | (0.17) | (0.33) | (0.13) | (0.09) | (0.14) |
| From net realized gain | (1.81) | (1.06) | (0.10) | (0.55) | (0.74) | (1.29) |
| Total distributions | (2.05) | (1.23) | (0.43) | (0.68) | (0.83) | (1.43) |
| Net asset value, end of period | $11.49 | $14.59 | $14.58 | $12.87 | $13.92 | $13.68 |
| Total return (%)3 | (8.44)4 | 8.55 | 16.81 | (2.64) | 7.93 | 15.40 |
| Ratios and supplemental data | ||||||
| Net assets, end of period (in millions) | $2 | $2 | $5 | $3 | $3 | $2 |
| Ratios (as a percentage of average net assets): | ||||||
| Expenses before reductions | 0.895 | 0.81 | 0.80 | 0.79 | 0.94 | 1.53 |
| Expenses including reductions | 0.885 | 0.81 | 0.79 | 0.78 | 0.93 | 0.94 |
| Net investment income | 1.195 | 1.04 | 1.18 | 1.24 | 0.76 | 0.96 |
| Portfolio turnover (%) | 186 | 26 | 49 | 21 | 20 | 24 |
| 1 | Six months ended 1-31-19. Unaudited. |
| 2 | Based on average daily shares outstanding. |
| 3 | Total returns would have been lower had certain expenses not been reduced during the applicable periods. |
| 4 | Not annualized. |
| 5 | Annualized. |
| 6 | Excludes in-kind transactions. |
| 16 | JOHN HANCOCK FUNDAMENTAL LARGE CAP VALUE FUND | SEMIANNUAL REPORT | SEE NOTES TO FINANCIAL STATEMENTS |
| CLASS R2 SHARES Period ended | 1-31-191 | 7-31-18 | 7-31-17 | 7-31-16 | 7-31-152 |
| Per share operating performance | |||||
| Net asset value, beginning of period | $14.53 | $14.53 | $12.84 | $13.90 | $13.41 |
| Net investment income3 | 0.04 | 0.10 | 0.12 | 0.13 | 0.03 |
| Net realized and unrealized gain (loss) on investments | (1.12) | 1.09 | 1.97 | (0.53) | 0.46 |
| Total from investment operations | (1.08) | 1.19 | 2.09 | (0.40) | 0.49 |
| Less distributions | |||||
| From net investment income | (0.19) | (0.13) | (0.30) | (0.11) | — |
| From net realized gain | (1.81) | (1.06) | (0.10) | (0.55) | — |
| Total distributions | (2.00) | (1.19) | (0.40) | (0.66) | — |
| Net asset value, end of period | $11.45 | $14.53 | $14.53 | $12.84 | $13.90 |
| Total return (%)4 | (8.63)5 | 8.18 | 16.43 | (2.88) | 3.655 |
| Ratios and supplemental data | |||||
| Net assets, end of period (in millions) | $—6 | $—6 | $—6 | $—6 | $—6 |
| Ratios (as a percentage of average net assets): | |||||
| Expenses before reductions | 1.277 | 1.16 | 1.11 | 1.05 | 0.937 |
| Expenses including reductions | 1.267 | 1.16 | 1.10 | 1.04 | 0.927 |
| Net investment income | 0.727 | 0.71 | 0.90 | 1.07 | 0.677 |
| Portfolio turnover (%) | 188 | 26 | 49 | 21 | 209 |
| 1 | Six months ended 1-31-19. Unaudited. |
| 2 | The inception date for Class R2 shares is 3-27-15. |
| 3 | Based on average daily shares outstanding. |
| 4 | Total returns would have been lower had certain expenses not been reduced during the applicable periods. |
| 5 | Not annualized. |
| 6 | Less than $500,000. |
| 7 | Annualized. |
| 8 | Excludes in-kind transactions. |
| 9 | Portfolio turnover is shown for the period from 8-1-14 to 7-31-15. |
| SEE NOTES TO FINANCIAL STATEMENTS | SEMIANNUAL REPORT | JOHN HANCOCK FUNDAMENTAL LARGE CAP VALUE FUND | 17 |
| CLASS R4 SHARES Period ended | 1-31-191 | 7-31-18 | 7-31-17 | 7-31-16 | 7-31-152 |
| Per share operating performance | |||||
| Net asset value, beginning of period | $14.57 | $14.55 | $12.85 | $13.90 | $13.41 |
| Net investment income3 | 0.06 | 0.15 | 0.16 | 0.15 | 0.04 |
| Net realized and unrealized gain (loss) on investments | (1.11) | 1.10 | 1.96 | (0.52) | 0.45 |
| Total from investment operations | (1.05) | 1.25 | 2.12 | (0.37) | 0.49 |
| Less distributions | |||||
| From net investment income | (0.23) | (0.17) | (0.32) | (0.13) | — |
| From net realized gain | (1.81) | (1.06) | (0.10) | (0.55) | — |
| Total distributions | (2.04) | (1.23) | (0.42) | (0.68) | — |
| Net asset value, end of period | $11.48 | $14.57 | $14.55 | $12.85 | $13.90 |
| Total return (%)4 | (8.50)5 | 8.57 | 16.70 | (2.70) | 3.655 |
| Ratios and supplemental data | |||||
| Net assets, end of period (in millions) | $—6 | $—6 | $—6 | $—6 | $—6 |
| Ratios (as a percentage of average net assets): | |||||
| Expenses before reductions | 1.017 | 0.97 | 0.96 | 0.95 | 0.937 |
| Expenses including reductions | 0.917 | 0.86 | 0.85 | 0.84 | 0.827 |
| Net investment income | 1.107 | 1.03 | 1.15 | 1.19 | 0.777 |
| Portfolio turnover (%) | 188 | 26 | 49 | 21 | 209 |
| 1 | Six months ended 1-31-19. Unaudited. |
| 2 | The inception date for Class R4 shares is 3-27-15. |
| 3 | Based on average daily shares outstanding. |
| 4 | Total returns would have been lower had certain expenses not been reduced during the applicable periods. |
| 5 | Not annualized. |
| 6 | Less than $500,000. |
| 7 | Annualized. |
| 8 | Excludes in-kind transactions. |
| 9 | Portfolio turnover is shown for the period from 8-1-14 to 7-31-15. |
| 18 | JOHN HANCOCK FUNDAMENTAL LARGE CAP VALUE FUND | SEMIANNUAL REPORT | SEE NOTES TO FINANCIAL STATEMENTS |
| CLASS R6 SHARES Period ended | 1-31-191 | 7-31-18 | 7-31-17 | 7-31-16 | 7-31-152 |
| Per share operating performance | |||||
| Net asset value, beginning of period | $14.58 | $14.57 | $12.86 | $13.91 | $13.41 |
| Net investment income3 | 0.07 | 0.16 | 0.18 | 0.15 | 0.05 |
| Net realized and unrealized gain (loss) on investments | (1.11) | 1.10 | 1.97 | (0.50) | 0.45 |
| Total from investment operations | (1.04) | 1.26 | 2.15 | (0.35) | 0.50 |
| Less distributions | |||||
| From net investment income | (0.25) | (0.19) | (0.34) | (0.15) | — |
| From net realized gain | (1.81) | (1.06) | (0.10) | (0.55) | — |
| Total distributions | (2.06) | (1.25) | (0.44) | (0.70) | — |
| Net asset value, end of period | $11.48 | $14.58 | $14.57 | $12.86 | $13.91 |
| Total return (%)4 | (8.37)5 | 8.66 | 16.93 | (2.53) | 3.735 |
| Ratios and supplemental data | |||||
| Net assets, end of period (in millions) | $4 | $6 | $1 | $1 | $—6 |
| Ratios (as a percentage of average net assets): | |||||
| Expenses before reductions | 0.777 | 0.72 | 0.71 | 0.70 | 0.687 |
| Expenses including reductions | 0.767 | 0.71 | 0.68 | 0.68 | 0.667 |
| Net investment income | 1.247 | 1.14 | 1.30 | 1.19 | 0.947 |
| Portfolio turnover (%) | 188 | 26 | 49 | 21 | 209 |
| 1 | Six months ended 1-31-19. Unaudited. |
| 2 | The inception date for Class R6 shares is 3-27-15. |
| 3 | Based on average daily shares outstanding. |
| 4 | Total returns would have been lower had certain expenses not been reduced during the applicable periods. |
| 5 | Not annualized. |
| 6 | Less than $500,000. |
| 7 | Annualized. |
| 8 | Excludes in-kind transactions. |
| 9 | Portfolio turnover is shown for the period from 8-1-14 to 7-31-15. |
| SEE NOTES TO FINANCIAL STATEMENTS | SEMIANNUAL REPORT | JOHN HANCOCK FUNDAMENTAL LARGE CAP VALUE FUND | 19 |
| CLASS NAV SHARES Period ended | 1-31-191 | 7-31-18 | 7-31-17 | 7-31-16 | 7-31-15 | 7-31-14 |
| Per share operating performance | ||||||
| Net asset value, beginning of period | $14.58 | $14.57 | $12.86 | $13.91 | $13.67 | $13.16 |
| Net investment income2 | 0.10 | 0.17 | 0.20 | 0.17 | 0.15 | 0.15 |
| Net realized and unrealized gain (loss) on investments | (1.15) | 1.09 | 1.95 | (0.52) | 0.96 | 1.82 |
| Total from investment operations | (1.05) | 1.26 | 2.15 | (0.35) | 1.11 | 1.97 |
| Less distributions | ||||||
| From net investment income | (0.25) | (0.19) | (0.34) | (0.15) | (0.13) | (0.17) |
| From net realized gain | (1.81) | (1.06) | (0.10) | (0.55) | (0.74) | (1.29) |
| Total distributions | (2.06) | (1.25) | (0.44) | (0.70) | (0.87) | (1.46) |
| Net asset value, end of period | $11.47 | $14.58 | $14.57 | $12.86 | $13.91 | $13.67 |
| Total return (%)3 | (8.44)4 | 8.67 | 16.93 | (2.54) | 8.23 | 15.69 |
| Ratios and supplemental data | ||||||
| Net assets, end of period (in millions) | $90 | $744 | $771 | $1,206 | $1,289 | $1,201 |
| Ratios (as a percentage of average net assets): | ||||||
| Expenses before reductions | 0.755 | 0.70 | 0.69 | 0.68 | 0.67 | 0.68 |
| Expenses including reductions | 0.755 | 0.70 | 0.68 | 0.67 | 0.66 | 0.67 |
| Net investment income | 1.405 | 1.16 | 1.49 | 1.36 | 1.10 | 1.16 |
| Portfolio turnover (%) | 186 | 26 | 49 | 21 | 20 | 24 |
| 1 | Six months ended 1-31-19. Unaudited. |
| 2 | Based on average daily shares outstanding. |
| 3 | Total returns would have been lower had certain expenses not been reduced during the applicable periods. |
| 4 | Not annualized. |
| 5 | Annualized. |
| 6 | Excludes in-kind transactions. |
| 20 | JOHN HANCOCK FUNDAMENTAL LARGE CAP VALUE FUND | SEMIANNUAL REPORT | SEE NOTES TO FINANCIAL STATEMENTS |
Note 1 — Organization
John Hancock Fundamental Large Cap Value Fund (the fund) is a series of John Hancock Funds II (the Trust), an open-end management investment company organized as a Massachusetts business trust and registered under the Investment Company Act of 1940, as amended (the 1940 Act). The investment objective of the fund is to seek long-term capital appreciation.
The fund may offer multiple classes of shares. The shares currently offered by the fund are detailed in the Statement of assets and liabilities. Class A and Class C shares are offered to all investors. Class I shares are offered to institutions and certain investors. Class R2 and Class R4 shares are available only to certain retirement and 529 plans. Class R6 shares are only available to certain retirement plans, institutions and other investors.Class NAV shares are offered to John Hancock affiliated funds of funds, retirement plans for employees of John Hancock and/or Manulife Financial Corporation (MFC), and certain 529 plans. Class C shares convert to Class A shares ten years after purchase (certain exclusions may apply). Shareholders of each class have exclusive voting rights to matters that affect that class. The distribution and service fees, if any, and transfer agent fees for each class may differ.
Note 2 — Significant accounting policies
The financial statements have been prepared in conformity with accounting principles generally accepted in the United States of America (US GAAP), which require management to make certain estimates and assumptions as of the date of the financial statements. Actual results could differ from those estimates and those differences could be significant. The fund qualifies as an investment company under Topic 946 of Accounting Standards Codification of US GAAP.
Events or transactions occurring after the end of the fiscal period through the date that the financial statements were issued have been evaluated in the preparation of the financial statements. The following summarizes the significant accounting policies of the fund:
Security valuation.Investments are stated at value as of the scheduled close of regular trading on the New York Stock Exchange (NYSE), normally at 4:00 p.m., Eastern Time. In case of emergency or other disruption resulting in the NYSE not opening for trading or the NYSE closing at a time other than the regularly scheduled close, the net asset value (NAV) may be determined as of the regularly scheduled close of the NYSE pursuant to the fund's Valuation Policies and Procedures.
In order to value the securities, the fund uses the following valuation techniques: Equity securities held by the fund are typically valued at the last sale price or official closing price on the exchange or principal market where the security trades. In the event there were no sales during the day or closing prices are not available, the securities are valued using the last available bid price. Debt obligations are typically valued based on the evaluated prices provided by an independent pricing vendor. Independent pricing vendors utilize matrix pricing which takes into account factors such as institutional-size trading in similar groups of securities, yield, quality, coupon rate, maturity, type of issue, trading characteristics and other market data, as well as broker supplied prices. Foreign securities and currencies are valued in U.S. dollars based on foreign currency exchange rates supplied by an independent pricing vendor.
In certain instances, the Pricing Committee may determine to value equity securities using prices obtained from another exchange or market if trading on the exchange or market on which prices are typically obtained did not open for trading as scheduled, or if trading closed earlier than scheduled, and trading occurred as normal on another exchange or market.
Other portfolio securities and assets, for which reliable market quotations are not readily available, are valued at fair value as determined in good faith by the fund's Pricing Committee following procedures established by the Board of Trustees. The frequency with which these fair valuation procedures are used cannot be predicted and fair value of securities may differ significantly from the value that would have been used had a ready market for such securities existed. Trading in foreign securities may be completed before the scheduled daily close of trading on the NYSE. Significant events at the issuer or market level may affect the values of securities between the time when the valuation of the securities is generally determined and the close of the NYSE. If a significant event occurs, these securities may be fair valued, as determined in good faith by the fund's Pricing Committee, following procedures established by the Board of Trustees. The fund uses fair value adjustment
factors provided by an independent pricing vendor to value certain foreign securities in order to adjust for events that may occur between the close of foreign exchanges or markets and the close of the NYSE.
The fund uses a three-tier hierarchy to prioritize the pricing assumptions, referred to as inputs, used in valuation techniques to measure fair value. Level 1 includes securities valued using quoted prices in active markets for identical securities. Level 2 includes securities valued using other significant observable inputs. Observable inputs may include quoted prices for similar securities, interest rates, prepayment speeds and credit risk. Prices for securities valued using these inputs are received from independent pricing vendors and brokers and are based on an evaluation of the inputs described. Level 3 includes securities valued using significant unobservable inputs when market prices are not readily available or reliable, including the fund's own assumptions in determining the fair value of investments. Factors used in determining value may include market or issuer specific events or trends, changes in interest rates and credit quality. The inputs or methodology used for valuing securities are not necessarily an indication of the risks associated with investing in those securities. Changes in valuation techniques and related inputs may result in transfers into or out of an assigned level within the disclosure hierarchy.
The following is a summary of the values by input classification of the fund's investments as of January 31, 2019, by major security category or type:
| Total value at 1-31-19 | Level 1 quoted price | Level 2 significant observable inputs | Level 3 significant unobservable inputs | ||
| Investments in securities: | |||||
| Assets | |||||
| Common stocks | |||||
| Communication services | $6,425,549 | $6,425,549 | — | — | |
| Consumer discretionary | 11,593,813 | 11,593,813 | — | — | |
| Consumer staples | 7,293,267 | 3,163,884 | $4,129,383 | — | |
| Energy | 12,125,636 | 12,125,636 | — | — | |
| Financials | 30,017,004 | 30,017,004 | — | — | |
| Health care | 17,036,272 | 17,036,272 | — | — | |
| Industrials | 13,320,658 | 13,320,658 | — | — | |
| Information technology | 12,382,794 | 12,382,794 | — | — | |
| Materials | 2,168,249 | 2,168,249 | — | — | |
| Short-term investments | 4,250,000 | — | 4,250,000 | — | |
| Total investments in securities | $116,613,242 | $108,233,859 | $8,379,383 | — | |
Repurchase agreements.The fund may enter into repurchase agreements. When the fund enters into a repurchase agreement, it receives collateral that is held in a segregated account by the fund's custodian, or for tri-party repurchase agreements, collateral is held at a third-party custodian bank in a segregated account for the benefit of the fund. The collateral amount is marked-to-market and monitored on a daily basis to ensure that the collateral held is in an amount not less than the principal amount of the repurchase agreement plus any accrued interest. Collateral received by the fund for repurchase agreements is disclosed in the Fund's investments as part of the caption related to the repurchase agreement.
Repurchase agreements are typically governed by the terms and conditions of the Master Repurchase Agreement and/or Global Master Repurchase Agreement (collectively, MRA). Upon an event of default, the non-defaulting party may close out all transactions traded under the MRA and net amounts owed. Absent an event of default, assets and liabilities resulting from repurchase agreements are not offset in the Statement of assets and liabilities. In the event of a default by the counterparty, realization of the collateral proceeds could be delayed, during which time the collateral value may decline or the counterparty may have insufficient assets to pay back claims resulting from close-out of the transactions.
Security transactions and related investment income. Investment security transactions are accounted for on a trade date plus one basis for daily NAV calculations. However, for financial reporting purposes, investment transactions are
reported on trade date. Interest income is accrued as earned. Dividend income is recorded on the ex-date, except for dividends of foreign securities where the dividend may not be known until after the ex-date. In those cases, dividend income, net of withholding taxes, is recorded when the fund becomes aware of the dividends. Gains and losses on securities sold are determined on the basis of identified cost and may include proceeds from litigation.
Foreign investing. Assets, including investments and liabilities denominated in foreign currencies, are translated into U.S. dollar values each day at the prevailing exchange rate. Purchases and sales of securities, income and expenses are translated into U.S. dollars at the prevailing exchange rate on the date of the transaction. The effect of changes in foreign currency exchange rates on the value of securities is reflected as a component of the realized and unrealized gains (losses) on investments. Foreign investments are subject to a decline in the value of a foreign currency versus the U.S. dollar, which reduces the dollar value of securities denominated in that currency.
Funds that invest internationally generally carry more risk than funds that invest strictly in U.S. securities. Risks can result from differences in economic and political conditions, regulations, market practices (including higher transaction costs), accounting standards and other factors.
Foreign taxes. The fund may be subject to withholding tax on income, capital gains or repatriation taxes imposed by certain countries, a portion of which may be recoverable. Foreign taxes are accrued based upon the fund's understanding of the tax rules and rates that exist in the foreign markets in which it invests. Taxes are accrued based on gains realized by the fund as a result of certain foreign security sales. In certain circumstances, estimated taxes are accrued based on unrealized appreciation of such securities. Investment income is recorded net of foreign withholding taxes, less any amounts reclaimable.
Line of credit.The fund may have the ability to borrow from banks for temporary or emergency purposes, including meeting redemption requests that otherwise might require the untimely sale of securities. Pursuant to the fund's custodian agreement, the custodian may loan money to the fund to make properly authorized payments. The fund is obligated to repay the custodian for any overdraft, including any related costs or expenses. The custodian may have a lien, security interest or security entitlement in any fund property that is not otherwise segregated or pledged, to the extent of any overdraft, and to the maximum extent permitted by law.
The fund and other affiliated funds have entered into a syndicated line of credit agreement with Citibank, N.A. as the administrative agent that enables them to participate in a $750 million unsecured committed line of credit. Excluding commitments designated for a certain fund and subject to the needs of all other affiliated funds, the fund can borrow up to an aggregate commitment amount of $500 million, subject to asset coverage and other limitations as specified in the agreement. A commitment fee payable at the end of each calendar quarter, based on the average daily unused portion of the line of credit, is charged to each participating fund based on a combination of fixed and asset based allocations and is reflected in Other expenses on the Statement of operations. For the six months ended January 31, 2019, the fund had no borrowings under the line of credit. Commitment fees for the six months ended January 31, 2019 were $1,518.
Expenses. Within the John Hancock group of funds complex, expenses that are directly attributable to an individual fund are allocated to such fund. Expenses that are not readily attributable to a specific fund are allocated among all funds in an equitable manner, taking into consideration, among other things, the nature and type of expense and the fund's relative net assets. Expense estimates are accrued in the period to which they relate and adjustments are made when actual amounts are known.
Class allocations. Income, common expenses and realized and unrealized gains (losses) are determined at the fund level and allocated daily to each class of shares based on the net assets of the class. Class-specific expenses, such as distribution and service fees, if any, and transfer agent fees, for all classes, are charged daily at the class level based on the net assets of each class and the specific expense rates applicable to each class.
Federal income taxes. The fund intends to continue to qualify as a regulated investment company by complying with the applicable provisions of the Internal Revenue Code and will not be subject to federal income tax on taxable income that is distributed to shareholders. Therefore, no federal income tax provision is required.
As of July 31, 2018, the fund had no uncertain tax positions that would require financial statement recognition, derecognition or disclosure. The fund's federal tax returns are subject to examination by the Internal Revenue Service for a period of three years.
Distribution of income and gains. Distributions to shareholders from net investment income and net realized gains, if any, are recorded on the ex-date. The fund generally declares and pays dividends and capital gain distributions, if any, annually.
Distributions paid by the fund with respect to each class of shares are calculated in the same manner, at the same time and in the same amount, except for the effect of class level expenses that may be applied differently to each class.
Such distributions, on a tax basis, are determined in conformity with income tax regulations, which may differ from US GAAP. Distributions in excess of tax basis earnings and profits, if any, are reported in the fund's financial statements as a return of capital. The final determination of tax characteristics of the fund's distribution will occur at the end of the year and will subsequently be reported to shareholders.
Capital accounts within the financial statements are adjusted for permanent book-tax differences. These adjustments have no impact on net assets or the results of operations. Temporary book-tax differences, if any, will reverse in a subsequent period. Book-tax differences are primarily attributable to litigation proceeds.
Note 3 — Guarantees and indemnifications
Under the Trust's organizational documents, its Officers and Trustees are indemnified against certain liabilities arising out of the performance of their duties to the Trust, including the fund. Additionally, in the normal course of business, the fund enters into contracts with service providers that contain general indemnification clauses. The fund's maximum exposure under these arrangements is unknown, as this would involve future claims that may be made against the fund that have not yet occurred. The risk of material loss from such claims is considered remote.
Note 4 — Fees and transactions with affiliates
John Hancock Advisers, LLC (the Advisor) serves as investment advisor for the fund. John Hancock Funds, LLC (the Distributor), an affiliate of the Advisor, serves as principal underwriter of the fund. The Advisor and the Distributor are indirect, wholly owned subsidiaries of MFC.
Management fee. The fund has an investment management agreement with the Advisor under which the fund pays a daily management fee to the Advisor equivalent on an annual basis to the sum of: a) 0.70% of the first $500 million of the fund's aggregate daily net assets together with the net assets of Fundamental Large Cap Value Trust, a series of the John Hancock Variable Insurance Trust (combined aggregate average daily net assets); b) 0.65% of the next $500 million of the combined aggregate average daily net assets; and c) 0.60% of the combined aggregate average daily net assets in excess of $1 billion. The Advisor has a subadvisory agreement with John Hancock Asset Management a division of Manulife Asset Management (US) LLC, an indirectly owned subsidiary of MFC and an affiliate of the Advisor. The fund is not responsible for payment of the subadvisory fees.
The Advisor has contractually agreed to waive a portion of its management fee and/or reimburse expenses for certain funds of the John Hancock group of funds complex, including the fund (the participating portfolios). This waiver is based upon aggregate net assets of all the participating portfolios. The amount of the reimbursement is calculated daily and allocated among all the participating portfolios in proportion to the daily net assets of each fund. During the six months ended January 31, 2019, this waiver amounted to 0.01% of the fund's average net assets (on an annualized basis). This agreement expires on June 30, 2020, unless renewed by mutual agreement of the Fund and the Advisor based upon a determination that this is appropriate under the circumstances at that time.
The expense reductions described above amounted to the following for the six months ended January 31, 2019:
| Class | Expense reduction | Class | Expense reduction | |
| Class A | $747 | Class R4 | $2 | |
| Class C | 68 | Class R6 | 207 | |
| Class I | 82 | Class NAV | 13,927 | |
| Class R2 | 9 | Total | $15,041 |
Expenses waived or reimbursed in the current fiscal period are not subject to recapture in future fiscal periods.
The investment management fees, including the impact of the waivers and reimbursements as described above, incurred for the six months ended January 31, 2019 were equivalent to a net annual effective rate of 0.65% of the fund's average daily net assets.
Accounting and legal services. Pursuant to a service agreement, the fund reimburses the Advisor for all expenses associated with providing the administrative, financial, legal, accounting and recordkeeping services to the fund, including the preparation of all tax returns, periodic reports to shareholders and regulatory reports, among other services. These expenses are allocated to each share class based on its relative net assets at the time the expense was incurred. These accounting and legal services fees incurred for the six months ended January 31, 2019 amounted to an annual rate of 0.02% of the fund's average daily net assets.
Distribution and service plans. The fund has a distribution agreement with the Distributor. The fund has adopted distribution and service plans with respect to Class A, Class C, Class R2 and Class R4 shares pursuant to Rule 12b-1 under the 1940 Act, to pay the Distributor for services provided as the distributor of shares of the fund. In addition, under a service plan for Class R2 and Class R4 shares, the fund pays for certain other services. The fund may pay up to the following contractual rates of distribution and service fees under these arrangements, expressed as an annual percentage of average daily net assets for each class of the fund's shares:
| Class | Rule 12b-1 fee | Service fee | Class | Rule 12b-1 fee | Service fee | |
| Class A | 0.30% | — | Class R2 | 0.25% | 0.25% | |
| Class C | 1.00% | — | Class R4 | 0.25% | 0.10% |
The fund's Distributor has contractually agreed to waive 0.10% of Rule12b-1 fees for Class R4 shares. The current waiver agreement expires on November 30, 2019, unless renewed by mutual agreement of the fund and the Distributor based upon a determination that this is appropriate under the circumstances at the time. This contractual waiver amounted to $20 for Class R4 shares for the six months ended January 31, 2019.
Sales charges. Class A shares are assessed up-front sales charges, which resulted in payments to the Distributor amounting to $15,518 for the six months ended January 31, 2019. Of this amount, $2,646 was retained and used for printing prospectuses, advertising, sales literature and other purposes, $12,822 was paid as sales commissions to broker-dealers and $50 was paid as sales commissions to sales personnel of Signator Investors, Inc., which had been a broker-dealer affiliate of the Advisor through December 31, 2018.
Class A and Class C shares may be subject to contingent deferred sales charges (CDSCs). Certain Class A shares that are acquired through purchases of $1 million or more and are redeemed within one year of purchase are subject to a 1.00% sales charge. Class C shares that are redeemed within one year of purchase are subject to a 1.00% CDSC. CDSCs are applied to the lesser of the current market value at the time of redemption or the original purchase cost of the shares being redeemed. Proceeds from CDSCs are used to compensate the Distributor for providing distribution-related services in connection with the sale of these shares. During the six months ended January 31, 2019, CDSCs received by the Distributor amounted to $9 for Class C shares. There were no CDSCs for Class A shares during the six months ended January 31, 2019.
Transfer agent fees. The John Hancock Group of Funds has a complex-wide transfer agent agreement with John Hancock Signature Services, Inc. (Signature Services), an affiliate of the Advisor. The transfer agent fees paid to Signature Services are
determined based on the cost to Signature Services (Signature Services Cost) of providing recordkeeping services. It also includes out-of-pocket expenses, including payments made to third-parties for recordkeeping services provided to their clients who invest in one or more John Hancock funds. In addition, Signature Services Cost may be reduced by certain fees that Signature Services receives in connection with retirement and small accounts. Signature Services Cost is calculated monthly and allocated, as applicable, to five categories of share classes: Retail Share and Institutional Share Classes of Non-Municipal Bond Funds, Class R6 Shares, Retirement Share Classes and Municipal Bond Share Classes. Within each of these categories, the applicable costs are allocated to the affected John Hancock affiliated funds and/or classes, based on the relative average daily net assets.
Class level expenses. Class level expenses for the six months ended January 31, 2019 were:
| Class | Distribution and service fees | Transfer agent fees |
| Class A | $28,292 | $10,303 |
| Class C | 8,649 | 994 |
| Class I | — | 1,371 |
| Class R2 | 562 | 15 |
| Class R4 | 51 | 2 |
| Class R6 | — | 339 |
| Total | $37,554 | $12,974 |
Trustee expenses.The fund compensates each Trustee who is not an employee of the Advisor or its affiliates. The costs of paying Trustee compensation and expenses are allocated to the fund based on its net assets relative to other funds within the John Hancock group of funds complex.
Note 5 — Fund share transactions
Transactions in fund shares for the six months ended January 31,2019 and for the year ended July 31, 2018 were as follows:
| Six months ended 1-31-19 | Year ended 7-31-18 | |||||||||||||||||||||||||
| Shares | Amount | Shares | Amount | |||||||||||||||||||||||
| Class A shares | ||||||||||||||||||||||||||
| Sold | 238,885 | $2,846,968 | 342,469 | $4,976,612 | ||||||||||||||||||||||
| Distributions reinvested | 223,280 | 2,793,237 | 106,389 | 1,542,648 | ||||||||||||||||||||||
| Repurchased | (228,223 | ) | (2,826,943 | ) | (466,470 | ) | (6,745,735 | ) | ||||||||||||||||||
| Net increase (decrease) | 233,942 | $2,813,262 | (17,612 | ) | $(226,475 | ) | ||||||||||||||||||||
| Class C shares | ||||||||||||||||||||||||||
| Sold | 37,040 | $431,380 | 24,232 | $353,922 | ||||||||||||||||||||||
| Distributions reinvested | 19,561 | 245,290 | 10,430 | 151,449 | ||||||||||||||||||||||
| Repurchased | (58,544 | ) | (698,899 | ) | (38,144 | ) | (549,029 | ) | ||||||||||||||||||
| Net decrease | (1,943 | ) | $(22,229 | ) | (3,482 | ) | $(43,658 | ) | ||||||||||||||||||
| Class I shares | ||||||||||||||||||||||||||
| Sold | 123,803 | $1,466,560 | 96,820 | $1,403,130 | ||||||||||||||||||||||
| Distributions reinvested | 20,004 | 251,649 | 14,710 | 214,174 | ||||||||||||||||||||||
| Repurchased | (54,684 | ) | (693,392 | ) | (326,057 | ) | (4,839,474 | ) | ||||||||||||||||||
| Net increase (decrease) | 89,123 | $1,024,817 | (214,527 | ) | $(3,222,170 | ) | ||||||||||||||||||||
| Class R2 shares | ||||||||||||||||||||||||||
| Sold | 2,284 | $25,986 | 2,186 | $31,331 | ||||||||||||||||||||||
| Distributions reinvested | 2,570 | 32,249 | 1,112 | 16,151 | ||||||||||||||||||||||
| Repurchased | (7 | ) | (90 | ) | (8,643 | ) | (127,104 | ) | ||||||||||||||||||
| Net increase (decrease) | 4,847 | $58,145 | (5,345 | ) | $(79,622 | ) | ||||||||||||||||||||
| Six months ended 1-31-19 | Year ended 7-31-18 | |||||||||||||||||||||||||
| Shares | Amount | Shares | Amount | |||||||||||||||||||||||
| Class R4 shares | ||||||||||||||||||||||||||
| Repurchased | — | — | (4,233 | ) | $(65,400 | ) | ||||||||||||||||||||
| Net decrease | — | — | (4,233 | ) | $(65,400 | ) | ||||||||||||||||||||
| Class R6 shares | ||||||||||||||||||||||||||
| Sold | 47,695 | $561,984 | 324,774 | $4,832,417 | ||||||||||||||||||||||
| Distributions reinvested | 64,865 | 814,699 | 27,329 | 397,361 | ||||||||||||||||||||||
| Repurchased | (159,688 | ) | (1,760,910 | ) | (38,175 | ) | (553,551 | ) | ||||||||||||||||||
| Net increase (decrease) | (47,128 | ) | $(384,227 | ) | 313,928 | $4,676,227 | ||||||||||||||||||||
| Class NAV shares | ||||||||||||||||||||||||||
| Sold | 7,308 | $102,886 | 314,522 | $4,672,187 | ||||||||||||||||||||||
| Distributions reinvested | 4,193,331 | 52,668,238 | 4,244,164 | 61,710,142 | ||||||||||||||||||||||
| Repurchased | (47,352,015 | ) | (638,288,069 | ) | (6,493,498 | ) | (96,873,836 | ) | ||||||||||||||||||
| Net decrease | (43,151,376 | ) | $(585,516,945 | ) | (1,934,812 | ) | $(30,491,507 | ) | ||||||||||||||||||
| Total net decrease | (42,872,535 | ) | $(582,027,177 | ) | (1,866,083 | ) | $(29,452,605 | ) | ||||||||||||||||||
Affiliates of the fund owned 100%, 14%, and 100% of shares of Class R4, Class R6, and Class NAV, respectively, on January 31, 2019. Such concentration of shareholders' capital could have a material effect on the fund if such shareholders redeem from the fund.
On October 4, 2018, there was a redemption in kind from Class NAV of $347,912,806, which represented approximately 46% of the fund on that date. For purposes of US GAAP, this transaction was treated as a sale of securities and the resulting gains and losses were recognized based on the market value of the securities on the date of the transfer. For tax purposes, no gains or losses were recognized. Net realized gain resulting from such redemption in kind is shown on the Statement of operations.
Note 6 — Purchase and sale of securities
Purchases and sales of securities, other than short-term investments and redemption in-kind, amounted to $68,063,785 and $354,436,828, respectively, for the six months ended January 31, 2019.
Note 7 — Industry or sector risk
The fund may invest a large percentage of its assets in one or more particular industries or sectors of the economy. If a large percentage of the fund's assets are economically tied to a single or small number of industries or sectors of the economy, the fund will be less diversified than a more broadly diversified fund, and it may cause the fund to underperform if that industry or sector underperforms. In addition, focusing on a particular industry or sector may make the fund's NAV more volatile. Further, a fund that invests in particular industries or sectors is particularly susceptible to the impact of market, economic, regulatory and other factors affecting those industries or sectors.
Note 8 — Investment by affiliated funds
Certain investors in the fund are affiliated funds that are managed by the Advisor and its affiliates. The affiliated funds do not invest in the fund for the purpose of exercising management or control; however, this investment may represent a significant portion of the fund's net assets. At January 31, 2019, funds within the John Hancock group of funds complex held 77.0% of the fund's net assets. The following funds had an affiliate ownership of 5% or more of the fund's net assets:
| Fund | Affiliate concentration |
| John Hancock Variable Insurance Trust Managed Volatility Balanced Portfolio | 35.0% |
| John Hancock Variable Insurance Trust Managed Volatility Growth Portfolio | 25.0% |
| John Hancock Variable Insurance Trust Managed Volatility Moderate Porfolio | 11.5% |
Trustees Hassell H. McClellan,Chairperson Officers Andrew G. Arnott Francis V. Knox, Jr. Charles A. Rizzo Salvatore Schiavone Christopher (Kit) Sechler** | Investment advisor John Hancock Advisers, LLC Subadvisor John Hancock Asset Management a division of Manulife Asset Management (US) LLC Portfolio Managers Emory W. (Sandy) Sanders, Jr., CFA Principal distributor John Hancock Funds, LLC Custodian State Street Bank and Trust Company Transfer agent John Hancock Signature Services, Inc. Legal counsel K&L Gates LLP |
* Member of the Audit Committee
† Non-Independent Trustee
#Effective 6-19-18
**Effective 9-13-18
The fund's proxy voting policies and procedures, as well as the fund proxy voting record for the most recent twelve-month period ended June 30, are available free of charge on the Securities and Exchange Commission (SEC) website at sec.gov or on our website.
The fund's complete list of portfolio holdings, for the first and third fiscal quarters, is filed with the SEC on Form N-Q. Effective April 30, 2019, all of the fund's holdings as of the end of the third month of every fiscal quarter will be filed with the SEC on Form N-PORT within 60 days of the end of the fiscal quarter. The fund's Form N-Q is available on our website and the SEC's website, sec.gov.
We make this information on your fund, as well asmonthly portfolio holdings, and other fund details available on our website at jhinvestments.com or by calling 800-225-5291.
| You can also contact us: | |||
| 800-225-5291 jhinvestments.com | Regular mail: John Hancock Signature Services, Inc. | Express mail: John Hancock Signature Services, Inc. | |
John Hancock family of funds
DOMESTIC EQUITY FUNDS Blue Chip Growth Classic Value Disciplined Value Disciplined Value Mid Cap Equity Income Financial Industries Fundamental All Cap Core Fundamental Large Cap Core Fundamental Large Cap Value New Opportunities Regional Bank Small Cap Core Small Cap Growth Small Cap Value U.S. Global Leaders Growth U.S. Growth U.S. Quality Growth Value Equity GLOBAL AND INTERNATIONAL EQUITY FUNDS Disciplined Value International Emerging Markets Emerging Markets Equity Fundamental Global Franchise Global Equity Global Shareholder Yield Global Thematic Opportunities Greater China Opportunities International Growth International Small Company | INCOME FUNDS Bond California Tax-Free Income Emerging Markets Debt Floating Rate Income Government Income High Yield High Yield Municipal Bond Income Investment Grade Bond Money Market Short Duration Credit Opportunities Spectrum Income Strategic Income Opportunities Tax-Free Bond ALTERNATIVE AND SPECIALTY FUNDS Absolute Return Currency Alternative Asset Allocation Disciplined Alternative Yield Global Absolute Return Strategies Global Conservative Absolute Return Global Focused Strategies Infrastructure Seaport Long/Short Technical Opportunities |
A fund's investment objectives, risks, charges, and expenses should be considered carefully before investing. The prospectus contains this and other important information about the fund. To obtain a prospectus, contact your financial professional, call John Hancock Investments at 800-225-5291, or visit our website at jhinvestments.com. Please read the prospectus carefully before investing or sending money.
ASSET ALLOCATION Balanced Income Allocation Multi-Index Lifetime Portfolios Multi-Index Preservation Portfolios Multimanager Lifestyle Portfolios Multimanager Lifetime Portfolios Retirement Income 2040 EXCHANGE-TRADED FUNDS John Hancock Multifactor Consumer Discretionary ETF John Hancock Multifactor Consumer Staples ETF John Hancock Multifactor Developed International ETF John Hancock Multifactor Emerging Markets ETF John Hancock Multifactor Energy ETF John Hancock Multifactor Financials ETF John Hancock Multifactor Healthcare ETF John Hancock Multifactor Industrials ETF John Hancock Multifactor Large Cap ETF John Hancock Multifactor Materials ETF John Hancock Multifactor Media and John Hancock Multifactor Mid Cap ETF John Hancock Multifactor Small Cap ETF John Hancock Multifactor Technology ETF John Hancock Multifactor Utilities ETF | ENVIRONMENTAL, SOCIAL, AND ESG All Cap Core ESG Core Bond ESG International Equity ESG Large Cap Core CLOSED-END FUNDS Financial Opportunities Hedged Equity & Income Income Securities Trust Investors Trust Preferred Income Preferred Income II Preferred Income III Premium Dividend Tax-Advantaged Dividend Income Tax-Advantaged Global Shareholder Yield |
John Hancock Multifactor ETF shares are bought and sold at market price (not NAV), and are not individually redeemed
from the fund. Brokerage commissions will reduce returns.
John Hancock ETFs are distributed by Foreside Fund Services, LLC, and are subadvised by Dimensional Fund Advisors LP.
Foreside is not affiliated with John Hancock Funds, LLC or Dimensional Fund Advisors LP.
Dimensional Fund Advisors LP receives compensation from John Hancock in connection with licensing rights to the
John Hancock Dimensional indexes. Dimensional Fund Advisors LP does not sponsor, endorse, or sell, and makes no
representation as to the advisability of investing in, John Hancock Multifactor ETFs.
John Hancock Investments
A trusted brand
John Hancock Investments is a premier asset manager representing one of
America's most trusted brands, with a heritage of financial stewardship dating
back to 1862. Helping our shareholders pursue their financial goals is at the
core of everything we do. It's why we support the role of professional financial
advice and operate with the highest standards of conduct and integrity.
A better way to invest
We serve investors globally through a unique multimanager approach:
We search the world to find proven portfolio teams with specialized
expertise for every strategy we offer, then we apply robust investment
oversight to ensure they continue to meet our uncompromising standards
and serve the best interests of our shareholders.
Results for investors
Our unique approach to asset management enables us to provide a diverse set
of investments backed by some of the world's best managers, along with strong
risk-adjusted returns across asset classes.
| | John Hancock Funds, LLC n Member FINRA, SIPC 200 Berkeley Street n Boston, MA 02116-5010 800-225-5291 n jhinvestments.com | |
| This report is for the information of the shareholders of John Hancock Fundamental Large Cap Value Fund. It is not authorized for distribution to prospective investors unless preceded or accompanied by a prospectus. | ||
| MF733310 | 374SA 1/19 3/19 | |
John Hancock
Diversified Strategies Fund
Semiannual report 1/31/19
Beginning on January 1, 2021, as permitted by regulations adopted by the Securities and Exchange Commission, paper copies of the Fund's shareholder reports like this one will no longer be sent by mail, unless you specifically request paper copies of the reports from the Fund or from your financial intermediary. Instead, the reports will be made available on a website, and you will be notified by mail each time a report is posted and provided with a website link to access the report.
If you already elected to receive shareholder reports electronically, you will not be affected by this change, and you do not need to take any action. You may elect to receive shareholder reports and other communications electronically by calling John Hancock Investments at 800-225-5291 (Class A shares) or 888-972-8696 (Class I shares) or by contacting your financial intermediary.
You may elect to receive all reports in paper, free of charge, at any time. You can inform John Hancock Investments or your financial intermediary that you wish to continue receiving paper copies of your shareholder reports by following the instructions listed above. Your election to receive reports in paper will apply to all funds held with John Hancock Investments or your financial intermediary.
A message to shareholders
Dear shareholder,
It's been a challenging time for equity investors as stock markets across many major economies worldwide posted losses for the period. In the United States, heightened fears of a full-blown trade war with China weighed on investor sentiment—despite relatively supportive U.S. economic fundamentals. Looking overseas, global economic growth slowed somewhat in the latter half of 2018, and many international markets found themselves confronted by challenging issues that may not abate in the near future.
Concerns about the potential for a more widespread global economic slowdown led to a significant increase in volatility as well as a flight to quality, particularly in the final months of the period.
Your best resource in unpredictable and volatile markets is your financial advisor, who can help position your portfolio so that it's sufficiently diversified to meet your long-term objectives and to withstand the inevitable turbulence along the way.
On behalf of everyone at John Hancock Investments, I'd like to take this opportunity to welcome new shareholders and to thank existing shareholders for the continued trust you've placed in us.
Sincerely,
Andrew G. Arnott
President and CEO,
John Hancock Investments
Head of Wealth and Asset Management,
United States and Europe
This commentary reflects the CEO's views, which are subject to change at any time. Investing involves risks, including the potential loss of principal. Diversification does not guarantee a profit or eliminate the risk of a loss. It is not possible to invest directly in an index. For more up-to-date information, please visit our website at jhinvestments.com.
John Hancock
Diversified Strategies Fund
PORTFOLIO ALLOCATION AS OF 1/31/19 (%)
| Purchased options | 1.4 | |
| Short-term investments and other | 98.6 | |
| Commercial paper | 65.0 | |
| U.S. Government | 25.1 | |
| Money market funds | 4.2 | |
| Other assets and liabilities, net | 4.3 | |
| TOTAL | 100.0 | |
| As a percentage of net assets. | ||
A note about risks
The fund is subject to various risks as described in the fund's prospectus. For more information, please refer to the "Principal risks" section of the prospectus.
| Your expenses |

| SEMIANNUAL REPORT | JOHN HANCOCK DIVERSIFIED STRATEGIES FUND | 3 |
| Account value on 8-1-2018 | Ending value on 1-31-2019 | Expenses paid during period ended 1-31-20191 | Annualized expense ratio | ||
| Class A | Actual expenses/actual returns | $1,000.00 | $990.70 | $8.53 | 1.70% |
| Hypothetical example | 1,000.00 | 1,016.60 | 8.64 | 1.70% | |
| Class I | Actual expenses/actual returns | 1,000.00 | 993.00 | 6.98 | 1.39% |
| Hypothetical example | 1,000.00 | 1,018.20 | 7.07 | 1.39% |
| 1 | Expenses are equal to the annualized expense ratio, multiplied by the average account value over the period, multiplied by 184/365 (to reflect the one-half year period). |
| 4 | JOHN HANCOCK DIVERSIFIED STRATEGIES FUND | SEMIANNUAL REPORT |
| Fund’s investments |
| Contracts/Notional amount | Value | ||||
| Purchased options 1.4% | $138,270 | ||||
| (Cost $184,288) | |||||
| Calls 0.6% | 54,794 | ||||
| Over the Counter Option on the EUR vs. GBP (Expiration Date: 10-11-19; Strike Price: EUR 0.91; Counterparty: Goldman Sachs Bank USA) (A)(B) | 1,000,000 | 21,783 | |||
| Over the Counter Option on the EUR vs. SEK (Expiration Date: 2-12-19; Strike Price: EUR 10.35; Counterparty: UBS AG) (A)(B) | 1,500,000 | 6,648 | |||
| Over the Counter Option on the EUR vs. SEK (Expiration Date: 2-12-19; Strike Price: EUR 10.65; Counterparty: UBS AG) (A)(B) | 1,500,000 | 24 | |||
| Over the Counter Option on the NOK vs. SEK (Expiration Date: 7-9-19; Strike Price: NOK 1.06; Counterparty: Goldman Sachs Bank Paris) (A)(B) | 12,500,000 | 26,301 | |||
| Over the Counter Option on the USD vs. CNY (Expiration Date: 2-15-19; Strike Price: $6.95; Counterparty: UBS Securities LLC) (A)(B) | 1,500,000 | 35 | |||
| Over the Counter Option on the USD vs. CNY (Expiration Date: 2-15-19; Strike Price: $7.05; Counterparty: UBS Securities LLC) (A)(B) | 2,500,000 | 3 | |||
| Puts 0.8% | 83,476 | ||||
| Over the Counter Option on the AUD vs. JPY (Expiration Date: 6-6-19; Strike Price: AUD 76.00; Counterparty: HSBC Bank USA) (A)(B) | 1,000,000 | 10,302 | |||
| Over the Counter Option on the AUD vs. JPY (Expiration Date: 6-6-19; Strike Price: AUD 79.00; Counterparty: Pacific International Securities) (A)(B) | 1,000,000 | 20,323 | |||
| Over the Counter Option on the AUD vs. NOK (Expiration Date: 3-26-19; Strike Price: AUD 6.10; Counterparty: HSBC Bank USA) (A)(B) | 1,250,000 | 8,934 | |||
| Over the Counter Option on the EUR vs. NOK (Expiration Date: 3-18-19; Strike Price: EUR 9.70; Counterparty: Goldman Sachs Bank Paris) (A)(B) | 2,500,000 | 26,824 | |||
| Over the Counter Option on the EUR vs. USD (Expiration Date: 10-23-19; Strike Price: EUR 1.14; Counterparty: HSBC Bank USA) (A)(B) | 1,200,000 | 16,556 | |||
| Over the Counter Option on the EUR vs. USD (Expiration Date: 2-7-19; Strike Price: EUR 1.14; Counterparty: Morgan Stanley & Company, Inc.) (A)(B) | 750,000 | 537 | |||
| Yield* (%) | Maturity date | Par value^ | Value | ||
| Short-term investments 94.3% | $9,401,931 | ||||
| (Cost $9,402,297) | |||||
| Commercial paper 65.0% | 6,484,336 | ||||
| Apple, Inc. | 2.510 | 02-26-19 | 500,000 | 499,108 | |
| Chevron Corp. | 2.450 | 02-19-19 | 500,000 | 499,358 | |
| CPPIB Capital, Inc. | 2.470 | 02-12-19 | 500,000 | 499,597 |
| SEE NOTES TO FINANCIAL STATEMENTS | SEMIANNUAL REPORT | JOHN HANCOCK DIVERSIFIED STRATEGIES FUND | 5 |
| Yield* (%) | Maturity date | Par value^ | Value | ||
| Commercial paper (continued) | |||||
| Henkel of America, Inc. | 2.500 | 02-12-19 | 500,000 | $499,594 | |
| John Deere, Ltd. | 2.530 | 03-14-19 | 500,000 | 498,564 | |
| Manhattan Asset Funding Company LLC | 2.530 | 03-12-19 | 500,000 | 498,587 | |
| National Rural Utilities Cooperative Finance Corp. | 2.480 | 02-26-19 | 500,000 | 499,101 | |
| Novartis Financial Corp. | 2.400 | 02-21-19 | 500,000 | 499,287 | |
| Old Line Funding LLC | 2.570 | 03-12-19 | 500,000 | 498,587 | |
| ONE Gas, Inc. | 2.450 | 02-20-19 | 495,000 | 494,320 | |
| Philip Morris International, Inc. | 2.500 | 02-01-19 | 500,000 | 499,967 | |
| Province of Ontario | 2.505 | 02-19-19 | 500,000 | 499,356 | |
| University of California | 2.450 | 03-04-19 | 500,000 | 498,910 | |
| U.S. Government 25.1% | 2,498,228 | ||||
| U.S. Treasury Bill | 2.323 | 02-12-19 | 2,500,000 | 2,498,228 |
| Yield (%) | Shares | Value | |||
| Money market funds 4.2% | 419,367 | ||||
| State Street Institutional U.S. Government Money Market Fund, Premier Class | 2.3198(C) | 419,367 | 419,367 | ||
| Total investments (Cost $9,586,585) 95.7% | $9,540,201 | ||||
| Other assets and liabilities, net 4.3% | 425,349 | ||||
| Total net assets 100.0% | $9,965,550 | ||||
| The percentage shown for each investment category is the total value of the category as a percentage of the net assets of the fund. | |
| ^All par values are denominated in U.S. dollars unless otherwise indicated. | |
| Currency Abbreviations | |
| AUD | Australian Dollar |
| CNY | Chinese Yuan Renminbi |
| EUR | Euro |
| GBP | Pound Sterling |
| JPY | Japanese Yen |
| NOK | Norwegian Krone |
| SEK | Swedish Krona |
| Security Abbreviations and Legend | |
| (A) | Non-income producing security. |
| (B) | For this type of option, notional amounts are equivalent to number of contracts. |
| (C) | The rate shown is the annualized seven-day yield as of 1-31-19. |
| * | Yield represents either the annualized yield at the date of purchase, the stated coupon rate or, for floating rate securities, the rate at period end. |
| 6 | JOHN HANCOCK DIVERSIFIED STRATEGIES FUND | SEMIANNUAL REPORT | SEE NOTES TO FINANCIAL STATEMENTS |
| Open contracts | Number of contracts | Position | Expiration date | Notional basis* | Notional value* | Unrealized appreciation (depreciation) |
| 2-Year U.S. Treasury Note Futures | 28 | Long | Mar 2019 | $5,907,181 | $5,945,188 | $38,007 |
| 5-Year U.S. Treasury Note Futures | 21 | Long | Mar 2019 | 2,409,629 | 2,412,047 | 2,418 |
| CME E-Mini Financial Sector Futures | 1 | Long | Mar 2019 | 75,262 | 79,750 | 4,488 |
| S&P 500 Index E-Mini Communication Services Sector Futures | 2 | Long | Mar 2019 | 113,835 | 120,825 | 6,990 |
| S&P 500 Index E-Mini Real Estate Sector Futures | 2 | Long | Mar 2019 | 79,992 | 83,150 | 3,158 |
| SGX Nifty 50 Futures | 10 | Long | Feb 2019 | 213,630 | 217,111 | 3,481 |
| 10-Year U.S. Treasury Note Futures | 14 | Short | Mar 2019 | (1,721,472) | (1,714,563) | 6,909 |
| CME E-Mini Consumer Discretionary Sector Futures | 1 | Short | Mar 2019 | (104,564) | (109,900) | (5,336) |
| CME E-Mini Energy Sector Futures | 1 | Short | Mar 2019 | (63,347) | (64,170) | (823) |
| CME E-Mini Technology Sector Futures | 1 | Short | Mar 2019 | (62,615) | (66,620) | (4,005) |
| Ultra U.S. Treasury Bond Futures | 4 | Short | Mar 2019 | (643,616) | (644,500) | (884) |
| $54,403 |
| Contract to buy | Contract to sell | Counterparty (OTC) | Contractual settlement date | Unrealized appreciation | Unrealized depreciation | ||
| EUR | 500,000 | GBP | 436,398 | Citibank N.A. | 2/27/2019 | $354 | — |
| EUR | 500,000 | GBP | 436,379 | Royal Bank of Canada | 2/27/2019 | 380 | — |
| EUR | 450,000 | NOK | 4,384,259 | Bank of America, N.A. | 2/27/2019 | — | $(4,331) |
| EUR | 500,000 | USD | 572,755 | Bank of America, N.A. | 2/27/2019 | 653 | — |
| EUR | 500,000 | USD | 573,097 | Morgan Stanley Capital Services, Inc. | 2/27/2019 | 311 | — |
| SEK | 5,185,094 | EUR | 500,000 | Royal Bank of Canada | 2/7/2019 | 735 | — |
| USD | 570,416 | EUR | 500,000 | State Street Bank and Trust Company | 2/27/2019 | — | (2,991) |
| $2,433 | $(7,322) | ||||||
| Foreign currency options | |||||||
| Description | Counterparty (OTC) | Exercise price | Expiration date | Notional amount* | Premium | Value | |
| Calls | |||||||
| Euro versus Pound Sterling | Goldman Sachs Bank USA | EUR | 0.89 | Mar 2019 | 1,000,000 | $9,930 | $(9,375) |
| Euro versus Pound Sterling | Goldman Sachs Bank USA | EUR | 0.95 | Oct 2019 | 1,000,000 | 16,199 | (11,240) |
| Euro versus Swedish Krona | UBS AG | EUR | 10.50 | Feb 2019 | 3,000,000 | 10,653 | (1,212) |
| Euro versus U.S. Dollar | Morgan Stanley and Company, Inc. | EUR | 1.17 | Feb 2019 | 750,000 | 2,119 | (94) |
| Norwegian Krone versus Swedish Krona | Goldman Sachs Bank Paris | NOK | 1.10 | Jul 2019 | 12,500,000 | 4,111 | (6,818) |
| SEE NOTES TO FINANCIAL STATEMENTS | SEMIANNUAL REPORT | JOHN HANCOCK DIVERSIFIED STRATEGIES FUND | 7 |
| Foreign currency options (continued) | |||||||
| Description | Counterparty (OTC) | Exercise price | Expiration date | Notional amount* | Premium | Value | |
| U.S. Dollar versus Chinese Yuan | UBS Securities LLC | USD | 7.25 | Feb 2019 | 5,000,000 | 20,800 | (5) |
| U.S. Dollar versus Chinese Yuan | UBS Securities LLC | USD | 7.05 | Feb 2019 | 2,500,000 | 9,275 | (3) |
| $73,087 | $(28,747) | ||||||
| Puts | |||||||
| Australian Dollar versus Japanese Yen | HSBC Bank USA | AUD | 79.00 | Jun 2019 | 1,000,000 | 37,854 | (20,322) |
| Australian Dollar versus Japanese Yen | UBS AG | AUD | 76.00 | Jun 2019 | 1,000,000 | 15,715 | (10,302) |
| Australian Dollar versus Norwegian Krone | HSBC Bank USA | AUD | 5.90 | Mar 2019 | 1,250,000 | 4,218 | (1,620) |
| Euro versus Norwegian Krone | Goldman Sachs Bank Paris | EUR | 9.40 | Mar 2019 | 2,500,000 | 1,866 | (1,597) |
| Euro versus U.S. Dollar | HSBC Bank USA | EUR | 1.09 | Oct 2019 | 1,200,000 | 11,989 | (6,567) |
| $71,642 | $(40,408) | ||||||
| $144,729 | $(69,155) | ||||||
| * For this type of option, notional amounts are equivalent to number of contracts. | |||||||
| Interest rate swaps | ||||||||||
| Counterparty (OTC)/ Centrally cleared | Notional amount | Currency | Payments made | Payments received | Fixed payment frequency | Floating payment frequency | Maturity date | Unamortized upfront payment paid (received) | Unrealized appreciation (depreciation) | Value |
| Centrally cleared | 250,000 | USD | USD LIBOR BBA | Fixed 2.679% | Semi-Annual | Quarterly | Jan 2021 | — | $393 | $393 |
| — | $393 | $393 | ||||||||
| Derivatives Currency Abbreviations | |
| AUD | Australian Dollar |
| EUR | Euro |
| GBP | Pound Sterling |
| NOK | Norwegian Krone |
| SEK | Swedish Krona |
| USD | U.S. Dollar |
| Derivatives Abbreviations | |
| BBA | The British Banker's Association |
| LIBOR | London Interbank Offered Rate |
| 8 | JOHN HANCOCK DIVERSIFIED STRATEGIES FUND | SEMIANNUAL REPORT | SEE NOTES TO FINANCIAL STATEMENTS |
| Financial statements |
| Assets | |
| Unaffiliated investments, at value (Cost $9,586,585) | $9,540,201 |
| Receivable for centrally cleared swaps | 393 |
| Unrealized appreciation on forward foreign currency contracts | 2,433 |
| Receivable for futures variation margin | 7,460 |
| Foreign currency, at value (Cost $175,629) | 177,829 |
| Collateral held at broker for futures contracts | 330,936 |
| Dividends and interest receivable | 3,344 |
| Receivable for investments sold | 15,098 |
| Receivable from affiliates | 110 |
| Other assets | 3,511 |
| Total assets | 10,081,315 |
| Liabilities | |
| Unrealized depreciation on forward foreign currency contracts | 7,322 |
| Written options, at value (Premiums received $144,729) | 69,155 |
| Payable to affiliates | |
| Accounting and legal services fees | 392 |
| Transfer agent fees | 1,039 |
| Trustees' fees | 352 |
| Other liabilities and accrued expenses | 37,505 |
| Total liabilities | 115,765 |
| Net assets | $9,965,550 |
| Net assets consist of | |
| Paid-in capital | $10,093,703 |
| Total distributable earnings (loss) | (128,153) |
| Net assets | $9,965,550 |
| Net asset value per share | |
| Based on net asset value and shares outstanding - the fund has an unlimited number of shares authorized with no par value | |
| Class A ($4,864,608 ÷ 623,959 shares)1 | $7.80 |
| Class I ($5,100,942 ÷ 649,577 shares) | $7.85 |
| Maximum offering price per share | |
| Class A (net asset value per share ÷ 95%)2 | $8.21 |
| 1 | Redemption price per share is equal to net asset value less any applicable contingent deferred sales charge. |
| 2 | On single retail sales of less than $50,000. On sales of $50,000 or more and on group sales the offering price is reduced. |
| SEE NOTES TO FINANCIAL STATEMENTS | SEMIANNUAL REPORT | JOHN HANCOCK DIVERSIFIED STRATEGIES FUND | 9 |
| Investment income | |
| Interest | $114,799 |
| Less foreign taxes withheld | (145) |
| Total investment income | 114,654 |
| Expenses | |
| Investment management fees | 52,317 |
| Distribution and service fees | 7,375 |
| Accounting and legal services fees | 890 |
| Transfer agent fees | 6,336 |
| Trustees' fees | 261 |
| Custodian fees | 5,111 |
| Printing and postage | 8,334 |
| Professional fees | 22,324 |
| Other | 5,802 |
| Total expenses | 108,750 |
| Less expense reductions | (28,408) |
| Net expenses | 80,342 |
| Net investment income | 34,312 |
| Realized and unrealized gain (loss) | |
| Net realized gain (loss) on | |
| Unaffiliated investments and foreign currency transactions | 2,217 |
| Futures contracts | (136,906) |
| Forward foreign currency contracts | (61,199) |
| Written options | 50,511 |
| (145,377) | |
| Change in net unrealized appreciation (depreciation) of | |
| Unaffiliated investments and translation of assets and liabilities in foreign currencies | (22,941) |
| Futures contracts | 56,037 |
| Forward foreign currency contracts | (6,521) |
| Written options | (2,593) |
| Swap contracts | 393 |
| 24,375 | |
| Net realized and unrealized loss | (121,002) |
| Decrease in net assets from operations | $(86,690) |
| 10 | JOHN HANCOCK DIVERSIFIED STRATEGIES FUND | SEMIANNUAL REPORT | SEE NOTES TO FINANCIAL STATEMENTS |
| Six months ended 1-31-19 (unaudited) | Year ended 7-31-18 | |
| Increase (decrease) in net assets | ||
| From operations | ||
| Net investment income | $34,312 | $137,175 |
| Net realized gain (loss) | (145,377) | 2,950,225 |
| Change in net unrealized appreciation (depreciation) | 24,375 | (2,503,267) |
| Increase (decrease) in net assets resulting from operations | (86,690) | 584,133 |
| Distributions to shareholders | ||
| From net investment income and net realized gain | ||
| Class A | (1,082,050) | — |
| Class I | (1,230,106) | — |
| From net investment income | ||
| Class A | — | (168,105) |
| Class I | — | (205,847) |
| Total distributions | (2,312,156) | (373,952) |
| From fund share transactions | 1,850,839 | (31,994,575) |
| Total decrease | (548,007) | (31,784,394) |
| Net assets | ||
| Beginning of period | 10,513,557 | 42,297,951 |
| End of period1 | $9,965,550 | $10,513,557 |
| 1 | Net assets - End of year includes undistributed net investment income of $(85,379) at July 31, 2018. The SEC eliminated the requirement to disclose undistributed net investment income in the current reporting period. |
| SEE NOTES TO FINANCIAL STATEMENTS | SEMIANNUAL REPORT | JOHN HANCOCK DIVERSIFIED STRATEGIES FUND | 11 |
| Financial highlights |
| CLASS A SHARES Period ended | 1-31-191 | 7-31-18 | 7-31-17 | 7-31-16 | 7-31-15 | 7-31-14 |
| Per share operating performance | ||||||
| Net asset value, beginning of period | $10.13 | $10.50 | $10.09 | $10.43 | $10.92 | $11.07 |
| Net investment income2 | 0.02 | 0.07 | 0.12 | 0.17 | 0.21 | 0.31 |
| Net realized and unrealized gain (loss) on investments | (0.12) | (0.08) | 0.45 | (0.27) | (0.10) | 0.42 |
| Total from investment operations | (0.10) | (0.01) | 0.57 | (0.10) | 0.11 | 0.73 |
| Less distributions | ||||||
| From net investment income | — | (0.36) | (0.16) | (0.23) | (0.32) | (0.35) |
| From net realized gain | (2.23) | — | — | (0.01) | (0.28) | (0.53) |
| Total distributions | (2.23) | (0.36) | (0.16) | (0.24) | (0.60) | (0.88) |
| Net asset value, end of period | $7.80 | $10.13 | $10.50 | $10.09 | $10.43 | $10.92 |
| Total return (%)3,4 | (0.93)5 | (0.17) | 5.74 | (0.96) | 1.07 | 6.89 |
| Ratios and supplemental data | ||||||
| Net assets, end of period (in millions) | $5 | $5 | $32 | $30 | $31 | $33 |
| Ratios (as a percentage of average net assets): | ||||||
| Expenses before reductions6 | 2.237 | 1.89 | 1.71 | 1.77 | 1.66 | 1.62 |
| Expenses including reductions6 | 1.707 | 1.70 | 1.70 | 1.70 | 1.66 | 1.60 |
| Net investment income | 0.497 | 0.62 | 1.22 | 1.67 | 1.93 | 2.87 |
| Portfolio turnover (%) | 0 | 171 | 73 | 55 | 62 | 119 |
| 1 | Six months ended 1-31-19. Unaudited. |
| 2 | Based on average daily shares outstanding. |
| 3 | Total returns would have been lower had certain expenses not been reduced during the applicable periods. |
| 4 | Does not reflect the effect of sales charges, if any. |
| 5 | Not annualized. |
| 6 | Ratios do not include expense indirectly incurred from underlying funds and can vary based on the mix of underlying funds held by the fund. |
| 7 | Annualized. |
| 12 | JOHN HANCOCK DIVERSIFIED STRATEGIES FUND | SEMIANNUAL REPORT | SEE NOTES TO FINANCIAL STATEMENTS |
| CLASS I SHARES Period ended | 1-31-191 | 7-31-18 | 7-31-17 | 7-31-16 | 7-31-15 | 7-31-14 |
| Per share operating performance | ||||||
| Net asset value, beginning of period | $10.18 | $10.52 | $10.12 | $10.46 | $10.95 | $11.10 |
| Net investment income2 | 0.04 | 0.05 | 0.16 | 0.20 | 0.24 | 0.35 |
| Net realized and unrealized gain (loss) on investments | (0.14) | —3 | 0.43 | (0.27) | (0.10) | 0.42 |
| Total from investment operations | (0.10) | 0.05 | 0.59 | (0.07) | 0.14 | 0.77 |
| Less distributions | ||||||
| From net investment income | — | (0.39) | (0.19) | (0.26) | (0.35) | (0.39) |
| From net realized gain | (2.23) | — | — | (0.01) | (0.28) | (0.53) |
| Total distributions | (2.23) | (0.39) | (0.19) | (0.27) | (0.63) | (0.92) |
| Net asset value, end of period | $7.85 | $10.18 | $10.52 | $10.12 | $10.46 | $10.95 |
| Total return (%)4 | (0.70)5 | 0.32 | 5.94 | (0.63) | 1.40 | 7.19 |
| Ratios and supplemental data | ||||||
| Net assets, end of period (in millions) | $5 | $6 | $10 | $10 | $9 | $10 |
| Ratios (as a percentage of average net assets): | ||||||
| Expenses before reductions6 | 1.957 | 1.59 | 1.40 | 1.45 | 1.35 | 1.30 |
| Expenses including reductions6 | 1.397 | 1.39 | 1.39 | 1.39 | 1.35 | 1.28 |
| Net investment income | 0.807 | 0.66 | 1.53 | 1.98 | 2.24 | 3.19 |
| Portfolio turnover (%) | 0 | 171 | 73 | 55 | 62 | 119 |
| 1 | Six months ended 1-31-19. Unaudited. |
| 2 | Based on average daily shares outstanding. |
| 3 | Less than $0.005 per share. |
| 4 | Total returns would have been lower had certain expenses not been reduced during the applicable periods. |
| 5 | Not annualized. |
| 6 | Ratios do not include expense indirectly incurred from underlying funds and can vary based on the mix of underlying funds held by the fund. |
| 7 | Annualized. |
| SEE NOTES TO FINANCIAL STATEMENTS | SEMIANNUAL REPORT | JOHN HANCOCK DIVERSIFIED STRATEGIES FUND | 13 |
Note 1 — Organization
John Hancock Diversified Strategies Fund (the fund) is a series of John Hancock Funds II (the Trust), an open-end management investment company organized as a Massachusetts business trust and registered under the Investment Company Act of 1940, as amended (the 1940 Act). The investment objective of the fund is to seek long-term total return.
The fund may offer multiple classes of shares. The shares currently offered are detailed in the Statement of assets and liabilities. Class A shares are offered to all investors. Class I shares are offered to institutions and certain investors. Shareholders of each class have exclusive voting rights to matters that affect that class. The distribution and service fees, if any, and transfer agent fees for each class may differ.
Note 2 — Significant accounting policies
The financial statements have been prepared in conformity with accounting principles generally accepted in the United States of America (US GAAP), which require management to make certain estimates and assumptions as of the date of the financial statements. Actual results could differ from those estimates and those differences could be significant. The fund qualifies as an investment company under Topic 946 of Accounting Standards Codification of US GAAP.
Events or transactions occurring after the end of the fiscal period through the date that the financial statements were issued have been evaluated in the preparation of the financial statements. The following summarizes the significant accounting policies of the fund:
Security valuation.Investments are stated at value as of the scheduled close of regular trading on the New York Stock Exchange (NYSE), normally at 4:00 p.m., Eastern Time. In case of emergency or other disruption resulting in the NYSE not opening for trading or the NYSE closing at a time other than the regularly scheduled close, the net asset value (NAV) may be determined as of the regularly scheduled close of the NYSE pursuant to the fund's Valuation Policies and Procedures.
In order to value the securities, the fund uses the following valuation techniques: Debt obligations are typically valued based on the evaluated prices provided by an independent pricing vendor. Independent pricing vendors utilize matrix pricing which takes into account factors such as institutional-size trading in similar groups of securities, yield, quality, coupon rate, maturity, type of issue, trading characteristics and other market data, as well as broker supplied prices. Investments by the fund in open-end mutual funds are valued at their respective NAVs each business day. Options listed on an exchange are valued at the mid-price of the last quoted bid and ask prices from the primary exchange where the option trades. Swaps and unlisted options are generally valued using evaluated prices obtained from an independent pricing vendor. Futures contracts are typically valued at the last traded price on the exchange on which they trade. Foreign equity index futures that trade in the electronic trading market subsequent to the close of regular trading may be valued at the last traded price in the electronic trading market as of 4:00 p.m. ET, or may be fair valued based on fair value adjustment factors provided by an independent pricing vendor in order to adjust for events that may occur between the close of foreign exchanges or markets and the close of the NYSE. Forward foreign currency contracts are valued at the prevailing forward rates which are based on foreign currency exchange spot rates and forward points supplied by an independent pricing vendor. Foreign securities and currencies are valued in U.S. dollars based on foreign currency exchange rates supplied by an independent pricing vendor.
Other portfolio securities and assets, for which reliable market quotations are not readily available, are valued at fair value as determined in good faith by the fund's Pricing Committee following procedures established by the Board of Trustees. The frequency with which these fair valuation procedures are used cannot be predicted and fair value of securities may differ significantly from the value that would have been used had a ready market for such securities existed. Trading in foreign securities may be completed before the scheduled daily close of trading on the NYSE. Significant events at the issuer or market level may affect the values of securities between the time when the valuation of the securities is generally determined and the close of the NYSE. If a significant event occurs, these securities may be fair valued, as determined in good faith by the fund's Pricing Committee, following procedures established by the Board of Trustees. The fund uses fair value adjustment
factors provided by an independent pricing vendor to value certain foreign securities in order to adjust for events that may occur between the close of foreign exchanges or markets and the close of the NYSE.
The fund uses a three-tier hierarchy to prioritize the pricing assumptions, referred to as inputs, used in valuation techniques to measure fair value. Level 1 includes securities valued using quoted prices in active markets for identical securities, including registered investment companies. Level 2 includes securities valued using other significant observable inputs. Observable inputs may include quoted prices for similar securities, interest rates, prepayment speeds and credit risk. Prices for securities valued using these inputs are received from independent pricing vendors and brokers and are based on an evaluation of the inputs described. Level 3 includes securities valued using significant unobservable inputs when market prices are not readily available or reliable, including the fund's own assumptions in determining the fair value of investments. Factors used in determining value may include market or issuer specific events or trends, changes in interest rates and credit quality. The inputs or methodology used for valuing securities are not necessarily an indication of the risks associated with investing in those securities. Changes in valuation techniques and related inputs may result in transfers into or out of an assigned level within the disclosure hierarchy.
The following is a summary of the values by input classification of the fund's investments as of January 31, 2019, by major security category or type:
| Total value at 1-31-19 | Level 1 quoted price | Level 2 significant observable inputs | Level 3 significant unobservable inputs | |||||||||||
| Investments in securities: | ||||||||||||||
| Assets | ||||||||||||||
| Purchased options | $138,270 | — | $138,270 | — | ||||||||||
| Short-term investments | 9,401,931 | $419,367 | 8,982,564 | — | ||||||||||
| Total investments in securities | $9,540,201 | $419,367 | $9,120,834 | — | ||||||||||
| Derivatives: | ||||||||||||||
| Assets | ||||||||||||||
| Futures | $65,451 | $65,451 | — | — | ||||||||||
| Forward foreign currency contracts | 2,433 | — | $2,433 | — | ||||||||||
| Swap contracts | 393 | — | 393 | — | ||||||||||
| Liabilities | ||||||||||||||
| Futures | (11,048 | ) | (11,048 | ) | — | — | ||||||||
| Forward foreign currency contracts | (7,322 | ) | — | (7,322 | ) | — | ||||||||
| Written options | (69,155 | ) | — | (69,155 | ) | — |
Security transactions and related investment income. Investment security transactions are accounted for on a trade date plus one basis for daily NAV calculations. However, for financial reporting purposes, investment transactions are reported on trade date. Interest income is accrued as earned. Interest income includes coupon interest and amortization/accretion of premiums/discounts on debt securities. Debt obligations may be placed in a non-accrual status and related interest income may be reduced by stopping current accruals and writing off interest receivable when the collection of all or a portion of interest has become doubtful. Gains and losses on securities sold are determined on the basis of identified cost and may include proceeds from litigation.
Foreign investing. Assets, including investments, and liabilities denominated in foreign currencies are translated into U.S. dollar values each day at the prevailing exchange rate. Purchases and sales of securities, income and expenses are translated into U.S. dollars at the prevailing exchange rate on the date of the transaction. The effect of changes in foreign currency exchange rates on the value of securities is reflected as a component of the realized and unrealized gains (losses) on
investments. Foreign investments are subject to a decline in the value of a foreign currency versus the U.S. dollar, which reduces the dollar value of securities denominated in that currency.
Funds that invest internationally generally carry more risk than funds that invest strictly in U.S. securities. These risks are heightened for investments in emerging markets. Risks can result from differences in economic and political conditions, regulations, market practices (including higher transaction costs), accounting standards and other factors.
Foreign taxes. The fund may be subject to withholding tax on income, capital gains or repatriation taxes imposed by certain countries, a portion of which may be recoverable. Foreign taxes are accrued based upon the fund's understanding of the tax rules and rates that exist in the foreign markets in which it invests. Taxes are accrued based on gains realized by the fund as a result of certain foreign security sales. In certain circumstances, estimated taxes are accrued based on unrealized appreciation of such securities. Investment income is recorded net of foreign withholding taxes.
Line of credit. The fund may have the ability to borrow from banks for temporary or emergency purposes, including meeting redemption requests that otherwise might require the untimely sale of securities. Pursuant to the fund's custodian agreement, the custodian may loan money to the fund to make properly authorized payments. The fund is obligated to repay the custodian for any overdraft, including any related costs or expenses. The custodian may have a lien, security interest or security entitlement in any fund property that is not otherwise segregated or pledged, to the extent of any overdraft, and to the maximum extent permitted by law.
The fund and other affiliated funds have entered into a syndicated line of credit agreement with Citibank, N.A. as the administrative agent that enables them to participate in a $750 million unsecured committed line of credit. Excluding commitments designated for a certain fund and subject to the needs of all other affiliated funds, the fund can borrow up to an aggregate commitment amount of $500 million, subject to asset coverage and other limitations as specified in the agreement. A commitment fee payable at the end of each calendar quarter, based on the average daily unused portion of the line of credit, is charged to each participating fund based on a combination of fixed and asset based allocations and is reflected in Other expenses on the Statement of operations. For the six months ended January 31, 2019, the fund had no borrowings under the line of credit. Commitment fees for the six months ended January 31, 2019 were $1,003.
Expenses. Within the John Hancock group of funds complex, expenses that are directly attributable to an individual fund are allocated to such fund. Expenses that are not readily attributable to a specific fund are allocated among all funds in an equitable manner, taking into consideration, among other things, the nature and type of expense and the fund's relative net assets. Expense estimates are accrued in the period to which they relate and adjustments are made when actual amounts are known.
Class allocations. Income, common expenses and realized and unrealized gains (losses) are determined at the fund level and allocated daily to each class of shares based on the net assets of the class. Class-specific expenses, such as distribution and service fees, if any, and transfer agent fees, for all classes, are charged daily at the class level based on the net assets of each class and the specific expense rates applicable to each class.
Federal income taxes. The fund intends to continue to qualify as a regulated investment company by complying with the applicable provisions of the Internal Revenue Code and will not be subject to federal income tax on taxable income that is distributed to shareholders. Therefore, no federal income tax provision is required.
As of July 31, 2018, the fund had no uncertain tax positions that would require financial statement recognition, derecognition or disclosure. The fund's federal tax returns are subject to examination by the Internal Revenue Service for a period of three years.
Distribution of income and gains. Distributions to shareholders from net investment income and net realized gains, if any, are recorded on the ex-date. The fund generally declares and pays dividends and capital gain distributions, if any, annually.
Distributions paid by the fund with respect to each class of shares are calculated in the same manner, at the same time and in the same amount, except for the effect of class level expenses that may be applied differently to each class.
Such distributions, on a tax basis, are determined in conformity with income tax regulations, which may differ from US GAAP. Distributions in excess of tax basis earnings and profits, if any, are reported in the fund's financial statements as a return of capital. The final determination of tax characteristics of the fund's distribution will occur at the end of the year and will subsequently be reported to shareholders.
Capital accounts within the financial statements are adjusted for permanent book-tax differences. These adjustments have no impact on net assets or the results of operations. Temporary book-tax differences, if any, will reverse in a subsequent period. Book-tax differences are primarily attributable to foreign currency transactions, derivative transactions and amortization and accretion on debt securities.
Note 3 — Derivative Instruments
The fund may invest in derivatives in order to meet its investment objective. Derivatives include a variety of different instruments that may be traded in the over-the-counter (OTC) market, on a regulated exchange or through a clearing facility. The risks in using derivatives vary depending upon the structure of the instruments, including the use of leverage, optionality, the liquidity or lack of liquidity of the contract, the creditworthiness of the counterparty or clearing organization and the volatility of the position. Some derivatives involve risks that are potentially greater than the risks associated with investing directly in the referenced securities or other referenced underlying instruments. Specifically, the fund is exposed to the risk that the counterparty to an OTC derivatives contract will be unable or unwilling to make timely settlement payments or otherwise honor its obligations. OTC derivatives transactions typically can only be closed out with the other party to the transaction.
Forward foreign currency contracts, certain options and swaps are typically traded through the OTC market. Certain forwards and swaps are regulated by the Commodity Futures Trading Commission. Derivative counterparty risk is managed through an ongoing evaluation of the creditworthiness of all potential counterparties and, if applicable, designated clearing organizations. The fund attempts to reduce its exposure to counterparty risk for derivatives traded in the OTC market, whenever possible, by entering into an International Swaps and Derivatives Association (ISDA) Master Agreement with each of its OTC counterparties. The ISDA gives each party to the agreement the right to terminate all transactions traded under the agreement if there is certain deterioration in the credit quality or contractual default of the other party, as defined in the ISDA. Upon an event of default or a termination of the ISDA, the non-defaulting party has the right to close out all transactions and to net amounts owed.
Futures and certain options are traded or cleared on an exchange or central clearinghouse. Exchange-traded or centrally-cleared transactions generally present less counterparty risk to a fund than OTC transactions. The exchange or clearinghouse stands between the fund and the broker to the contract and therefore, credit risk is generally limited to the failure of the exchange or clearinghouse and the clearing member.
Centrally-cleared swap contracts are subject to clearinghouse rules, including initial and variation margin requirements, daily settlement of obligations and the clearinghouse guarantee of payments to the broker. There is, however, still counterparty risk due to the potential insolvency of the broker with respect to any margin held in the brokers' customer accounts. While clearing members are required to segregate customer assets from their own assets, in the event of insolvency, there may be a shortfall in the amount of margin held by the broker for its clients. Collateral or margin requirements for exchange-traded or centrally-cleared derivatives are set by the broker or applicable clearinghouse. Margin for exchange-traded and centrally-cleared transactions is detailed in the Statement of assets and liabilities as Collateral held at broker for futures contracts and receivable for centrally-cleared swaps, respectively. Securities pledged by the fund for exchange-traded and centrally-cleared transactions, if any, are identified in the Fund's investments.
Futures.A futures contract is a contractual agreement to buy or sell a particular currency or financial instrument at a pre-determined price in the future. Risks related to the use of futures contracts include possible illiquidity of the futures markets, contract prices that can be highly volatile and imperfectly correlated to movements in the underlying financial instrument and potential losses in excess of the amounts recognized on the Statementof assets and liabilities. Use of long futures contracts subjects the fund to the risk of loss up to the notional value of the futures contracts. Use of short futures contracts subjects the fund to unlimited risk of loss.
Upon entering into a futures contract, the fund is required to deposit initial margin with the broker in the form of cash or securities. The amount of required margin is generally based on a percentage of the contract value; this amount is the initial margin for the trade. The margin deposit must then be maintained at the established level over the life of the contract. Futures margin receivable / payable is included on the Statement of assets and liabilities. Futures contracts are marked-to-market daily and an appropriate payable or receivable for the change in value (variation margin) and unrealized gain or loss is recorded by the fund. When the contract is closed, the fund records a realized gain or loss equal to the difference between the value of the contract at the time it was opened and the value at the time it was closed.
During the six months ended January 31, 2019, the fund used futures contracts to maintain diversity of the fund, manage against anticipated changes in securities market, gain exposure to certain securities markets and as a substitute for securities purchased. The fund held futures contracts with notional values ranging from $5.0 million to $11.4 million, as measured at each quarter end.
Forward foreign currency contracts. A forward foreign currency contract is an agreement between two parties to buy and sell specific currencies at a price that is set on the date of the contract. The forward contract calls for delivery of the currencies on a future date that is specified in the contract. Risks related to the use of forwards include the possible failure of counterparties to meet the terms of the forward agreement, the failure of the counterparties to timely post collateral if applicable, the risk that currency movements will not favor the fund thereby reducing the fund's total return, and the potential for losses in excess of the amounts recognized on the Statement of assets and liabilities.
The market value of a forward foreign currency contract fluctuates with changes in foreign currency exchange rates. Forward foreign currency contracts are marked-to-market daily and the change in value is recorded by the fund as an unrealized gain or loss. Realized gains or losses, equal to the difference between the value of the contract at the time it was opened and the value at the time it was closed, are recorded upon delivery or receipt of the currency or settlement with the counterparty.
During the six months ended January 31, 2019, the fund used forward foreign currency contracts to manage against anticipated changes in currency exchange rates, gain exposure to foreign currencies and as a substitute for securities purchased. The fund held forward foreign currency contracts with U.S. Dollar notional values ranging from $4.0 million to $9.2 million, as measured at each quarter end.
Options. There are two types of options, put options and call options. Options are traded either OTC or on an exchange. A call option gives the purchaser of the option the right to buy (and the seller the obligation to sell) the underlying instrument at the exercise price. A put option gives the purchaser of the option the right to sell (and the writer the obligation to buy) the underlying instrument at the exercise price. Writing puts and buying calls may increase the fund's exposure to changes in the value of the underlying instrument. Buying puts and writing calls may decrease the fund's exposure to such changes. Risks related to the use of options include the loss of premiums, possible illiquidity of the options markets, trading restrictions imposed by an exchange and movements in underlying security values, and for written options, potential losses in excess of the amounts recognized on the Statement of assets and liabilities. In addition, OTC options are subject to the risks of all OTC derivatives contracts.
When the fund purchases an option, the premium paid by the fund is included in the Fund's investments and subsequently "marked-to-market" to reflect current market value. If the purchased option expires, the fund realizes a loss equal to the cost of the option. If the fund exercises a call option, the cost of the securities acquired by exercising the call is increased by the
premium paid to buy the call. If the fund exercises a put option, it realizes a gain or loss from the sale of the underlying security and the proceeds from such sale are decreased by the premium paid. If the fund enters into a closing sale transaction, the fund realizes a gain or loss, depending on whether proceeds from the closing sale are greater or less than the original cost. When the fund writes an option, the premium received is included as a liability and subsequently "marked-to-market" to reflect the current market value of the option written. Premiums received from writing options that expire unexercised are recorded as realized gains. Premiums received from writing options which are exercised or are closed are added to or offset against the proceeds or amount paid on the transaction to determine the realized gain or loss. If a put option on a security is exercised, the premium received reduces the cost basis of the securities purchased by the fund.
During the six months ended January 31, 2019, the fund used purchased options contracts to manage against anticipated currency exchange rates, and to gain exposure to foreign currency. The fund held purchased options contracts with market values ranging from $87,238 to $138,270, as measured at each quarter end.
During the six months ended January 31, 2019, the fund wrote option contracts to manage against anticipated currency exchange rates, and to gain exposure to foreign currency. The fund held written options contracts with market values ranging from $14,058 to $69,156, as measured at each quarter end.
Interest rate swaps. Interest rate swaps represent an agreement between the fund and a counterparty to exchange cash flows based on the difference between two interest rates applied to a notional amount. The payment flows are usually netted against each other, with the difference being paid by one party to the other. The fund settles accrued net interest receivable or payable under the swap contracts at specified, future intervals. Swap agreements are privately negotiated in the OTC market or may be executed on a registered commodities exchange (centrally cleared swaps). Swaps are marked-to-market daily and the change in value is recorded as unrealized appreciation/depreciation of swap contracts. A termination payment by the counterparty or the fund is recorded as realized gain or loss, as well as the net periodic payments received or paid by the fund. The value of the swap will typically impose collateral posting obligations on the party that is considered out-of-the-money on the swap.
Entering into swap agreements involves, to varying degrees, elements of credit, market and documentation risk that may provide outcomes that are in excess of the amounts recognized on the Statement of assets and liabilities. Such risks involve the possibility that there will be no liquid market for the swap, or that a counterparty may default on its obligation or delay payment under the swap terms. The counterparty may disagree or contest the terms of the swap. In addition to interest rate risk, market risks may also impact the swap. The fund may also suffer losses if it is unable to terminate or assign outstanding swaps or reduce its exposure through offsetting transactions.
During the six months ended January 31, 2019, the fund used interest rate swaps to manage against anticipated interest rate changes. The fund held interest rate swaps with total USD notional amounts ranging up to $250,000, as measured at each quarter end.
Fair value of derivative instruments by risk category
The table below summarizes the fair value of derivatives held by the fund at six months ended January 31, 2019 by risk category:
| Risk | Statement of assets and liabilities location | Financial instruments location | Asset derivatives fair value | Liabilities derivative fair value | |||||||||||||
| Equity | Receivable/payable for futures variation margin | Futures† | $18,117 | ($10,164 | ) | ||||||||||||
| Interest rate | Receivable/payable for futures variation margin | Futures† | 47,334 | (884 | ) |
| Risk | Statement of assets and liabilities location | Financial instruments location | Asset derivatives fair value | Liabilities derivative fair value | |||||||||||||
| Foreign currency | Unrealized appreciation/depreciation on forward foreign currency exchange contracts | Forward foreign currency contracts | $2,433 | ($7,322 | ) | ||||||||||||
| Foreign currency | Unaffiliated Investments, at value* | Purchased options | 138,270 | — | |||||||||||||
| Foreign currency | Written options, at value | Written options | — | (69,155 | ) | ||||||||||||
| Interest rate | Receivable for centrally cleared swap contracts, at value | Interest rate swaps^ | 393 | — | |||||||||||||
| $206,547 | ($87,525 | ) | |||||||||||||||
| † Reflects cumulative appreciation/depreciation on futures as disclosed in the Fund's Investments. Only the period end variation margin is separately disclosed on the Statement of assets and liabilities. | |||||||||||||||||
| * Purchased options are included in the Fund's investments | |||||||||||||||||
| ^ Reflects cumulative value of swap contracts. Receivable for centrally cleared swaps, which includes value and margin, and swap contracts at value, which represents OTC swaps, are shown separately on the Statement of assets and liabilities. | |||||||||||||||||
| OTC Financial Instruments | Asset | Liability | ||||||
| Forward foreign currency contracts | $2,433 | ($7,322 | ) | |||||
| Purchased options | 138,270 | |||||||
| Written options | (69,155 | ) | ||||||
| Totals | $140,703 | ($76,477 | ) |
| Counterparty | Total market value of OTC derivatives | Collateral posted by counterparty | Collateral posted by fund | Net exposure | ||||||||||
| Bank of America, N.A. | ($3,678 | ) | — | — | ($3,678 | ) | ||||||||
| Citibank N.A. | 354 | — | — | 354 | ||||||||||
| Goldman Sachs Bank Paris | 44,710 | — | — | 44,710 | ||||||||||
| Goldman Sachs Bank USA | 1,168 | — | — | 1,168 | ||||||||||
| HSBC Bank USA | 7,283 | — | — | 7,283 | ||||||||||
| Morgan Stanley & Company, Inc. | 443 | — | — | 443 | ||||||||||
| Morgan Stanley Capital Services, Inc. | 311 | — | — | 311 | ||||||||||
| Pacific International Securities | 20,323 | — | — | 20,323 | ||||||||||
| Royal Bank of Canada | 1,115 | — | — | 1,115 | ||||||||||
| State Street Bank and Trust Company | (2,991 | ) | — | — | (2,991 | ) | ||||||||
| UBS AG | (4,842 | ) | — | — | (4,842 | ) | ||||||||
| UBS Securities LLC | 30 | — | — | 30 | ||||||||||
| Totals | $64,226 | — | — | $64,226 |
Effect of derivative instruments on the Statement of operations
The table below summarizes the net realized gain (loss) included in the net increase (decrease) in net assets from operations, classified by derivative instrument and risk category, for the six months ended January 31, 2019:
| Statement of operations location - net realized gain (loss) on: | |||||||||||||||||
| Risk | Unaffiliated investments and foreign currency transactions1 | Futures contracts | Forward foreign currency contracts | Written options | Total | ||||||||||||
| Equity | — | ($134,401 | ) | — | $1,596 | ($132,805 | ) | ||||||||||
| Foreign currency | ($58,990 | ) | — | ($61,199 | ) | 30,502 | (89,687 | ) | |||||||||
| Interest rate | (10,669 | ) | (2,505 | ) | — | 18,413 | 5,239 | ||||||||||
| Total | ($69,659 | ) | ($136,906 | ) | ($61,199 | ) | $50,511 | ($217,253 | ) | ||||||||
| 1 Realized gain/loss associated with purchased options is included in this caption on the Statement of operations. | |||||||||||||||||
The table below summarizes the net change in unrealized appreciation (depreciation) included in the net increase (decrease) in net assets from operations, classified by derivative instrument and risk category, for the six months ended January 31, 2019:
| Statement of operations location - change in net unrealized appreciation (depreciation) of: | ||||||||||||||||||||
| Risk | Unaffiliated investments and translation of assets and liabilities in foreign currencies1 | Futures contracts | Forward foreign currency contracts | Written options | Swap contracts | Total | ||||||||||||||
| Equity | ($9,373 | ) | $6,261 | — | — | — | ($3,112 | ) | ||||||||||||
| Foreign currency | (8,683 | ) | — | ($6,521 | ) | ($2,593 | ) | — | (17,797 | ) | ||||||||||
| Interest rate | — | 49,776 | — | — | $393 | 50,169 | ||||||||||||||
| Total | ($18,056 | ) | $56,037 | ($6,521 | ) | ($2,593 | ) | $393 | $29,260 | |||||||||||
| 1 Change in unrealized appreciation/depreciation associated with purchased options is included in this caption on the Statement of operations. | ||||||||||||||||||||
Note 4 — Guarantees and indemnifications
Under the Trust's organizational documents, its Officers and Trustees are indemnified against certain liabilities arising out of the performance of their duties to the Trust, including the fund. Additionally, in the normal course of business, the fund enters into contracts with service providers that contain general indemnification clauses. The fund's maximum exposure under these arrangements is unknown, as this would involve future claims that may be made against the fund that have not yet occurred. The risk of material loss from such claims is considered remote.
Note 5 — Fees and transactions with affiliates
John Hancock Advisers, LLC (the Advisor) serves as investment advisor for the fund. John Hancock Funds, LLC (the Distributor), an affiliate of the Advisor, serves as principal underwriter of the fund. The Advisor and the Distributor are indirect, wholly owned subsidiaries of Manulife Financial Corporation (MFC).
Management fee.The fund has an investment management agreement with the Advisor under which the fund pays a daily management fee to the Advisor equivalent on an annual basis to the sum of: (a) 1.00% of the first $500 million of the fund's average daily net assets and (b) 0.95% of the fund's average daily net assets in excess of $500 million. The Advisor has a subadvisory agreement with John Hancock Asset Management a division of Manulife Asset Management (US) LLC, an
indirectly owned subsidiary of MFC and an affiliate of the Advisor. The fund is not responsible for payment of the subadvisory fees.
The Advisor has contractually agreed to waive a portion of its management fee and/or reimburse expenses for certain funds of the John Hancock group of funds complex, including the fund (the participating portfolios). This waiver is based upon aggregate net assets of all the participating portfolios. The amount of the reimbursement is calculated daily and allocated among all the participating portfolios in proportion to the daily net assets of each fund. During the six months ended January 31, 2019, this waiver amounted to 0.01% of the fund's average net assets (on an annualized basis). This agreement expires on June 30, 2020, unless renewed by mutual agreement of the fund and the Advisor based upon a determination that this is appropriate under the circumstances at that time.
The Advisor voluntarily agrees to reduce its management fee or, if necessary, make payments to Class A and Class I shares, in an amount equal to the amount by which the expenses of Class A and Class I shares exceed 1.70% and 1.39%, respectively, of average annual net assets. For purposes of this agreement, expenses mean all fund level and class specific operating expenses, excluding: (a) taxes, (b) brokerage commissions, (c) interest expense, (d) litigation and indemnification expenses and other extraordinary expenses not incurred in the ordinary course of the fund's business, (e) underlying fund expenses (acquired fund fees), and (f) short dividend expense. This agreement will remain in effect until terminated at any time by the Advisor upon notice to the fund.
The expense reductions described above amounted to $12,939 and $15,469 for Class A and Class I shares, respectively, for the six months ended January 31, 2019.
Expenses waived or reimbursed in the current fiscal period are not subject to recapture in future fiscal periods.
The investment management fees, including the impact of the waivers and reimbursements as described above, incurred for the six months ended January 31, 2019 were equivalent to a net annual effective rate of 0.46% of the fund's average daily net assets.
Accounting and legal services. Pursuant to a service agreement, the fund reimburses the Advisor for all expenses associated with providing the administrative, financial, legal, accounting and recordkeeping services to the fund, including the preparation of all tax returns, periodic reports to shareholders and regulatory reports, among other services. These expenses are allocated to each share class based on its relative net assets at the time the expense was incurred. These accounting and legal services fees incurred for the six months ended January 31, 2019 amounted to an annual rate of 0.02% of the fund's average daily net assets.
Distribution and service plans. The fund has a distribution agreement with the Distributor. The fund has adopted distribution and service plans with respect to Class A shares pursuant to Rule 12b-1 under the 1940 Act, to pay the Distributor for services provided as the distributor of shares of the fund. The fund pays 0.30% for Class A distribution and service fees under these arrangements, expressed as an annual percentage of average daily net assets.
Sales charges. Class A shares may be subject to up-front sales charges. For the six months ended January 31, 2019, there were no sales charges assessed for Class A shares.
Class A shares may be subject to contingent deferred sales charges (CDSCs). Certain Class A shares that are acquired through purchases of $1 million or more and are redeemed within one year of purchase are subject to a 1.00% sales charge. CDSCs are applied to the lesser of the current market value at the time of redemption or the original purchase cost of the shares being redeemed. Proceeds from CDSCs are used to compensate the Distributor for providing distribution-related services in connection with the sale of these shares. During the six months ended January 31, 2019, there were no CDSCs received by the Distributor for Class A.
Transfer agent fees. The John Hancock group of funds has a complex-wide transfer agent agreement with John Hancock Signature Services, Inc. (Signature Services), an affiliate of the Advisor. The transfer agent fees paid to Signature Services are
determined based on the cost to Signature Services (Signature Services Cost) of providing recordkeeping services. It also includes out-of-pocket expenses, including payments made to third-parties for recordkeeping services provided to their clients who invest in one or more John Hancock funds. In addition, Signature Services Cost may be reduced by certain fees that Signature Services receives in connection with retirement and small accounts. Signature Services Cost is calculated monthly and allocated, as applicable, to five categories of share classes: Retail Share and Institutional Share Classes of Non-Municipal Bond Funds, Class R6 Shares, Retirement Share Classes and Municipal Bond Share Classes. Within each of these categories, the applicable costs are allocated to the affected John Hancock affiliated funds and/or classes, based on the relative average daily net assets.
Class level expenses. Class level expenses for the six months ended January 31, 2019 were:
| Class | Distribution and service fees | Transfer agent fees |
| Class A | $7,375 | $2,686 |
| Class I | — | 3,650 |
| Total | $7,375 | $6,336 |
Trustee expenses.The fund compensates each Trustee who is not an employee of the Advisor or its affiliates. The costs of paying Trustee compensation and expenses are allocated to the fund based on its net assets relative to other funds within the John Hancock group of funds complex.
Interfund lending program. Pursuant to an Exemptive Order issued by the SEC, the fund, along with certain other funds advised by the Advisor or its affiliates, may participate in an interfund lending program. This program provides an alternative credit facility allowing the funds to borrow from, or lend money to, other participating affiliated funds. At period end, no interfund loans were outstanding. The fund's activity in this program during the period for which loans were outstanding was as follows:
| Borrower or lender | Weighted average loan balance | Days outstanding | Weighted average interest rate | Interest income |
| Lender | $500,000 | 1 | 1.910% | $27 |
Note 6 — Fund share transactions
Transactions in fund shares for the six months ended January 31, 2019 and for the year ended July 31, 2018 were as follows:
| Six months ended 1-31-19 | Year ended 7-31-18 | |||||||||||||||||||||||||
| Shares | Amount | Shares | Amount | |||||||||||||||||||||||
| Class A shares | ||||||||||||||||||||||||||
| Sold | — | — | 468,051 | $5,000,000 | ||||||||||||||||||||||
| Distributions reinvested | 139,619 | $1,082,050 | 16,289 | 168,105 | ||||||||||||||||||||||
| Repurchased | — | — | (3,048,222 | ) | (32,562,941 | ) | ||||||||||||||||||||
| Net increase | 139,619 | $1,082,050 | (2,563,882 | ) | $(27,394,836 | ) | ||||||||||||||||||||
| Class I shares | ||||||||||||||||||||||||||
| Sold | — | — | 476,551 | $5,103,441 | ||||||||||||||||||||||
| Distributions reinvested | 157,706 | $1,230,106 | 19,927 | 205,847 | ||||||||||||||||||||||
| Repurchased | (58,934 | ) | (461,317 | ) | (924,521 | ) | (9,909,027 | ) | ||||||||||||||||||
| Net increase | 98,772 | $768,789 | (428,043 | ) | $(4,599,739 | ) | ||||||||||||||||||||
| Total net increase (decrease) | 238,391 | $1,850,839 | (2,991,925 | ) | $(31,994,575 | ) | ||||||||||||||||||||
Affiliates of the fund owned 100% of shares of Class A and Class I on January 31, 2019. Such concentration of shareholders' capital could have a material effect on the fund if such shareholders redeem from the fund.
Note 7 — Purchase and sale of securities
Purchases and sales of securities, other than short-term securities, amounted to $0 and $140,938, respectively, for the six months ended January 31, 2019.
Trustees Hassell H. McClellan,Chairperson Officers Andrew G. Arnott Francis V. Knox, Jr. Charles A. Rizzo Salvatore Schiavone Christopher (Kit) Sechler** | Investment advisor John Hancock Advisers, LLC Subadvisor John Hancock Asset Management a division of Manulife Asset Management (US) LLC Portfolio Managers Christopher Fellingham Principal distributor John Hancock Funds, LLC Custodian State Street Bank and Trust Company Transfer agent John Hancock Signature Services, Inc. Legal counsel K&L Gates LLP |
* Member of the Audit Committee
† Non-Independent Trustee
#Effective 6-19-18
**Effective 9-13-18
The fund's proxy voting policies and procedures, as well as the fund proxy voting record for the most recent twelve-month period ended June 30, are available free of charge on the Securities and Exchange Commission (SEC) website at sec.gov or on our website.
The fund's complete list of portfolio holdings, for the first and third fiscal quarters, is filed with the SEC on Form N-Q. Effective April 30, 2019, all of the fund's holdings as of the end of the third month of every fiscal quarter will be filed with the SEC on Form N-PORT within 60 days of the end of the fiscal quarter. The fund's Form N-Q is available on our website and the SEC's website, sec.gov.
We make this information on your fund, as well asmonthly portfolio holdings, and other fund details available on our website at jhinvestments.com or by calling 800-225-5291.
| You can also contact us: | |||
| 800-225-5291 jhinvestments.com | Regular mail: John Hancock Signature Services, Inc. | Express mail: John Hancock Signature Services, Inc. | |
John Hancock family of funds
DOMESTIC EQUITY FUNDS Blue Chip Growth Classic Value Disciplined Value Disciplined Value Mid Cap Equity Income Financial Industries Fundamental All Cap Core Fundamental Large Cap Core Fundamental Large Cap Value New Opportunities Regional Bank Small Cap Core Small Cap Growth Small Cap Value U.S. Global Leaders Growth U.S. Growth U.S. Quality Growth Value Equity GLOBAL AND INTERNATIONAL EQUITY FUNDS Disciplined Value International Emerging Markets Emerging Markets Equity Fundamental Global Franchise Global Equity Global Shareholder Yield Global Thematic Opportunities Greater China Opportunities International Growth International Small Company | INCOME FUNDS Bond California Tax-Free Income Emerging Markets Debt Floating Rate Income Government Income High Yield High Yield Municipal Bond Income Investment Grade Bond Money Market Short Duration Credit Opportunities Spectrum Income Strategic Income Opportunities Tax-Free Bond ALTERNATIVE AND SPECIALTY FUNDS Absolute Return Currency Alternative Asset Allocation Disciplined Alternative Yield Global Absolute Return Strategies Global Conservative Absolute Return Global Focused Strategies Infrastructure Seaport Long/Short Technical Opportunities |
A fund's investment objectives, risks, charges, and expenses should be considered carefully before investing. The prospectus contains this and other important information about the fund. To obtain a prospectus, contact your financial professional, call John Hancock Investments at 800-225-5291, or visit our website at jhinvestments.com. Please read the prospectus carefully before investing or sending money.
ASSET ALLOCATION Balanced Income Allocation Multi-Index Lifetime Portfolios Multi-Index Preservation Portfolios Multimanager Lifestyle Portfolios Multimanager Lifetime Portfolios Retirement Income 2040 EXCHANGE-TRADED FUNDS John Hancock Multifactor Consumer Discretionary ETF John Hancock Multifactor Consumer Staples ETF John Hancock Multifactor Developed International ETF John Hancock Multifactor Emerging Markets ETF John Hancock Multifactor Energy ETF John Hancock Multifactor Financials ETF John Hancock Multifactor Healthcare ETF John Hancock Multifactor Industrials ETF John Hancock Multifactor Large Cap ETF John Hancock Multifactor Materials ETF John Hancock Multifactor Media and John Hancock Multifactor Mid Cap ETF John Hancock Multifactor Small Cap ETF John Hancock Multifactor Technology ETF John Hancock Multifactor Utilities ETF | ENVIRONMENTAL, SOCIAL, AND ESG All Cap Core ESG Core Bond ESG International Equity ESG Large Cap Core CLOSED-END FUNDS Financial Opportunities Hedged Equity & Income Income Securities Trust Investors Trust Preferred Income Preferred Income II Preferred Income III Premium Dividend Tax-Advantaged Dividend Income Tax-Advantaged Global Shareholder Yield |
John Hancock Multifactor ETF shares are bought and sold at market price (not NAV), and are not individually redeemed
from the fund. Brokerage commissions will reduce returns.
John Hancock ETFs are distributed by Foreside Fund Services, LLC, and are subadvised by Dimensional Fund Advisors LP.
Foreside is not affiliated with John Hancock Funds, LLC or Dimensional Fund Advisors LP.
Dimensional Fund Advisors LP receives compensation from John Hancock in connection with licensing rights to the
John Hancock Dimensional indexes. Dimensional Fund Advisors LP does not sponsor, endorse, or sell, and makes no
representation as to the advisability of investing in, John Hancock Multifactor ETFs.
John Hancock Investments
A trusted brand
John Hancock Investments is a premier asset manager representing one of
America's most trusted brands, with a heritage of financial stewardship dating
back to 1862. Helping our shareholders pursue their financial goals is at the
core of everything we do. It's why we support the role of professional financial
advice and operate with the highest standards of conduct and integrity.
A better way to invest
We serve investors globally through a unique multimanager approach:
We search the world to find proven portfolio teams with specialized
expertise for every strategy we offer, then we apply robust investment
oversight to ensure they continue to meet our uncompromising standards
and serve the best interests of our shareholders.
Results for investors
Our unique approach to asset management enables us to provide a diverse set
of investments backed by some of the world's best managers, along with strong
risk-adjusted returns across asset classes.
| | John Hancock Funds, LLC n Member FINRA, SIPC 200 Berkeley Street n Boston, MA 02116-5010 800-225-5291 n jhinvestments.com | |
| This report is for the information of the shareholders of John Hancock Diversified Strategies Fund. It is not authorized for distribution to prospective investors unless preceded or accompanied by a prospectus. | ||
| 392SA 1/19 3/19 | ||
John Hancock
Global Absolute Return Strategies Fund
Semiannual report 1/31/19
Beginning on January 1, 2021, as permitted by regulations adopted by the Securities and Exchange Commission, paper copies of the Fund's shareholder reports like this one will no longer be sent by mail, unless you specifically request paper copies of the reports from the Fund or from your financial intermediary. Instead, the reports will be made available on a website, and you will be notified by mail each time a report is posted and provided with a website link to access the report.
If you already elected to receive shareholder reports electronically, you will not be affected by this change, and you do not need to take any action. You may elect to receive shareholder reports and other communications electronically by calling John Hancock Investments at 800-225-5291 (Class A and Class C shares) or 888-972-8696 (Class I, Class R2, Class R6, and Class NAV shares) or by contacting your financial intermediary.
You may elect to receive all reports in paper, free of charge, at any time. You can inform John Hancock Investments or your financial intermediary that you wish to continue receiving paper copies of your shareholder reports by following the instructions listed above. Your election to receive reports in paper will apply to all funds held with John Hancock Investments or your financial intermediary.
A message to shareholders
Dear shareholder,
It's been a challenging time for equity investors as stock markets across many major economies worldwide posted losses for the period. In the United States, heightened fears of a full-blown trade war with China weighed on investor sentiment—despite relatively supportive U.S. economic fundamentals. Looking overseas, global economic growth slowed somewhat in the latter half of 2018, and many international markets found themselves confronted by challenging issues that may not abate in the near future.
Concerns about the potential for a more widespread global economic slowdown led to a significant increase in volatility as well as a flight to quality, particularly in the final months of the period.
Your best resource in unpredictable and volatile markets is your financial advisor, who can help position your portfolio so that it's sufficiently diversified to meet your long-term objectives and to withstand the inevitable turbulence along the way.
On behalf of everyone at John Hancock Investments, I'd like to take this opportunity to welcome new shareholders and to thank existing shareholders for the continued trust you've placed in us.
Sincerely,
Andrew G. Arnott
President and CEO,
John Hancock Investments
Head of Wealth and Asset Management,
United States and Europe
This commentary reflects the CEO's views, which are subject to change at any time. All investments entail risks, including the possible loss of principal. Diversification does not guarantee a profit or eliminate the risk of a loss. For more up-to-date information, you can visit our website at jhinvestments.com.
John Hancock
Global Absolute Return Strategies Fund
INVESTMENT OBJECTIVE
The fund seeks long-term total return.
AVERAGE ANNUAL TOTAL RETURNS AS OF 1/31/19 (%)
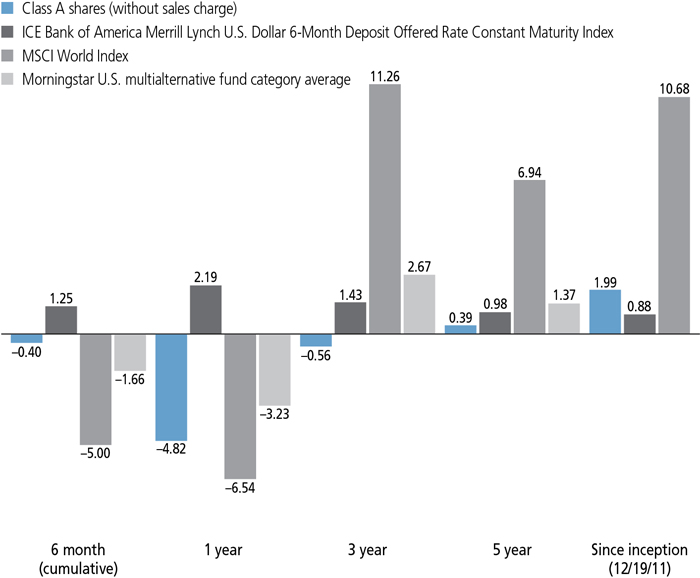
The ICE Bank of America Merrill Lynch U.S. Dollar 6-Month Deposit Offered Rate Constant Maturity Index tracks the average interest rate at which a selection of banks in London are prepared to lend to one another in U.S. dollars with a constant maturity of 6 months.
The MSCI World Index is a free float-adjusted market-capitalization-weighted index that is designed to measure equity market performance of global developed markets, and is included here as a broad measure of market performance.
It is not possible to invest directly in an index. Index figures do not reflect expenses or sales charges, which would result in lower returns.
Figures from Morningstar, Inc. include reinvested distributions and do not take into account sales charges. Actual load-adjusted performance is lower. Since-inception returns for the Morningstar fund category average are not available.
The past performance shown here reflects reinvested distributions and the beneficial effect of any expense reductions, and does not guarantee future results. Returns for periods shorter than one year are cumulative. Performance of the other share classes will vary based on the difference in the fees and expenses of those classes. Shares will fluctuate in value and, when redeemed, may be worth more or less than their original cost. Current month-end performance may be lower or higher than the performance cited, and can be found at jhinvestments.com or by calling 800-225-5291. For further information on the fund's objectives, risks, and strategy, see the fund's prospectus.
PORTFOLIO ALLOCATION AS OF 1/31/19 (%)
| Foreign government obligations | 24.0 | |
| Common stocks | 17.8 | |
| Energy | 5.3 | |
| Financials | 2.9 | |
| Health care | 2.0 | |
| Industrials | 1.5 | |
| Consumer staples | 1.3 | |
| Information technology | 1.1 | |
| Materials | 1.1 | |
| Consumer discretionary | 1.1 | |
| Communication services | 0.9 | |
| Utilities | 0.4 | |
| Real estate | 0.2 | |
| U.S. Government | 10.9 | |
| Corporate bonds | 3.8 | |
| Purchased options | 2.3 | |
| Short-term investments and other | 41.2 | |
| Time deposits | 23.3 | |
| Money market funds | 7.9 | |
| U.S. Government | 5.0 | |
| Certificate of deposit | 1.1 | |
| Other assets and liabilities, net | 3.9 | |
| TOTAL | 100.0 | |
| As a percentage of net assets. | ||
PORTFOLIO COMPOSITION AS OF 1/31/19 (%)
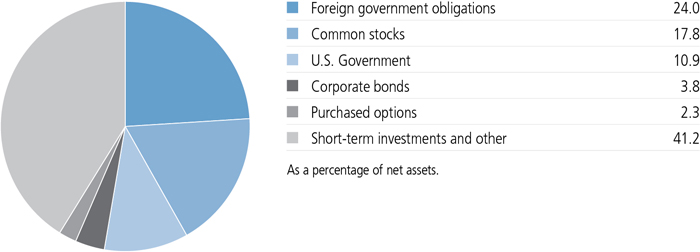
COUNTRY COMPOSITION AS OF 1/31/19 (%)
| United States | 36.2 |
| Brazil | 11.1 |
| France | 9.5 |
| Mexico | 5.5 |
| Germany | 4.7 |
| United Kingdom | 4.2 |
| Belgium | 4.1 |
| Canada | 3.9 |
| Japan | 3.9 |
| Switzerland | 2.5 |
| Other Countries | 14.4 |
| TOTAL | 100.0 |
| As a percentage of net assets. |
A note about risks
The fund is subject to various risks as described in the fund's prospectus. For more information, please refer to the "Principal risks" section of the prospectus.
TOTAL RETURNS FOR THE PERIOD ENDED JANUARY 31, 2019
| Average annual total returns (%) with maximum sales charge | Cumulative total returns (%) with maximum sales charge | ||||||
| 1-year | 5-year | Since inception1 | 6-month | 5-year | Since inception1 | ||
| Class A | -9.58 | -0.64 | 1.26 | -5.38 | -3.14 | 9.30 | |
| Class C2 | -6.41 | -0.31 | 1.33 | -1.80 | -1.55 | 9.90 | |
| Class I3 | -4.50 | 0.69 | 2.33 | -0.29 | 3.52 | 17.84 | |
| Class R22,3 | -4.83 | 0.22 | 1.82 | -0.40 | 1.11 | 13.66 | |
| Class R62,3 | -4.40 | 0.82 | 2.40 | -0.20 | 4.18 | 18.35 | |
| Class NAV3 | -4.40 | 0.82 | 2.43 | -0.20 | 4.17 | 18.65 | |
| Index 1† | 2.19 | 0.98 | 0.88 | 1.25 | 4.99 | 6.46 | |
| Index 2† | -6.54 | 6.94 | 10.68 | -5.00 | 39.86 | 105.96 | |
Performance figures assume all distributions have been reinvested. Figures reflect maximum sales charges on Class A shares of 5.00% and the applicable contingent deferred sales charge (CDSC) on Class C shares. Class C shares sold within one year of purchase are subject to a 1% CDSC. Sales charges are not applicable to Class I, Class R2, Class R6, and Class NAV shares.
The expense ratios of the fund, both net (including any fee waivers and/or expense limitations) and gross (excluding any fee waivers and/or expense limitations), are set forth according to the most recent publicly available prospectuses for the fund and may differ from those disclosed in the Financial highlights tables in this report. Net expenses reflect contractual expense limitations in effect until June 30, 2020 and are subject to change.Had the contractual fee waivers and expense limitations not been in place, gross expenses would apply. The expense ratios are as follows:
| Class A | Class C | Class I | Class R2 | Class R6 | Class NAV | |
| Gross (%) | 1.65 | 2.35 | 1.35 | 1.76 | 1.26 | 1.24 |
| Net (%) | 1.64 | 2.34 | 1.34 | 1.75 | 1.25 | 1.23 |
Please refer to the most recent prospectuses and annual or semiannual report for more information on expenses and any expense limitation arrangements for each class.
The returns reflect past results and should not be considered indicative of future performance. The return and principal value of an investment will fluctuate so that shares, when redeemed, may be worth more or less than their original cost. Due to market volatility and other factors, the fund's current performance may be higher or lower than the performance shown. For current to the most recent month-end performance data, please call 800-225-5291 or visit the fund's website at jhinvestments.com.
The performance table above and the chart on the next page do not reflect the deduction of taxes that a shareholder would pay on fund distributions or the redemption of fund shares. The fund's performance results reflect any applicable fee waivers or expense reductions, without which the expenses would increase and results would have been less favorable.
| † | Index 1 is The ICE Bank of America Merrill Lynch U.S. Dollar 6-Month Deposit Offered Rate Constant Maturity Index; Index 2 is the MSCI World Index. |
See the following page for footnotes.
This chart and table show what happened to a hypothetical $10,000 investment in John Hancock Global Absolute Return Strategies Fund for the share classes and periods indicated, assuming all distributions were reinvested. For comparison, we've shown the same investment in two separate indexes.
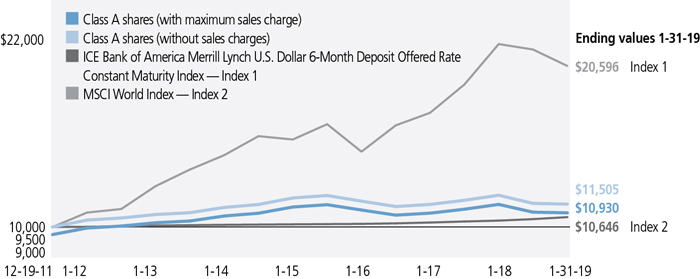
| Start date | With maximum sales charge ($) | Without sales charge ($) | Index 1 ($) | Index 2 ($) | |
| Class C2,4 | 12-19-11 | 10,990 | 10,990 | 10,646 | 20,596 |
| Class I3 | 12-19-11 | 11,784 | 11,784 | 10,646 | 20,596 |
| Class R22,3 | 12-19-11 | 11,366 | 11,366 | 10,646 | 20,596 |
| Class R62,3 | 12-19-11 | 11,835 | 11,835 | 10,646 | 20,596 |
| Class NAV3 | 12-19-11 | 11,865 | 11,865 | 10,646 | 20,596 |
The ICE Bank of America Merrill Lynch U.S. Dollar 6-Month Deposit Offered Rate Constant Maturity Index tracks the average interest rate at which a selection of banks in London are prepared to lend to one another in U.S. dollars with a constant maturity of 6 months.
The MSCI World Index is a free float-adjusted market-capitalization-weighted index that is designed to measure equity market performance of global developed markets and is included here as a broad measure of market performance.
It is not possible to invest directly in an index. Index figures do not reflect expenses or sales charges, which would result in lower returns.
Footnotes related to performance pages
| 1 | From 12-19-11. |
| 2 | Class C shares were first offered on 8-1-12; Class R2 and Class R6 shares were first offered on 3-1-12. Returns prior to these dates are those of Class A shares (first offered on 12-19-11) that have not been adjusted for class-specific expenses; otherwise, returns would vary. |
| 3 | For certain types of investors as described in the fund's prospectuses. |
| 4 | The contingent deferred sales charge is not applicable. |
| Your expenses |

| SEMIANNUAL REPORT | JOHN HANCOCK GLOBAL ABSOLUTE RETURN STRATEGIES FUND | 7 |
| Account value on 8-1-2018 | Ending value on 1-31-2019 | Expenses paid during period ended 1-31-20191 | Annualized expense ratio | ||
| Class A | Actual expenses/actual returns | $1,000.00 | $996.00 | $8.40 | 1.67% |
| Hypothetical example | 1,000.00 | 1,016.80 | 8.49 | 1.67% | |
| Class C | Actual expenses/actual returns | 1,000.00 | 992.00 | 11.90 | 2.37% |
| Hypothetical example | 1,000.00 | 1,013.30 | 12.03 | 2.37% | |
| Class I | Actual expenses/actual returns | 1,000.00 | 997.10 | 7.05 | 1.40% |
| Hypothetical example | 1,000.00 | 1,018.10 | 7.12 | 1.40% | |
| Class R2 | Actual expenses/actual returns | 1,000.00 | 996.00 | 8.70 | 1.73% |
| Hypothetical example | 1,000.00 | 1,016.50 | 8.79 | 1.73% | |
| Class R6 | Actual expenses/actual returns | 1,000.00 | 998.00 | 6.45 | 1.28% |
| Hypothetical example | 1,000.00 | 1,018.80 | 6.51 | 1.28% | |
| Class NAV | Actual expenses/actual returns | 1,000.00 | 998.00 | 6.40 | 1.27% |
| Hypothetical example | 1,000.00 | 1,018.80 | 6.46 | 1.27% |
| 1 | Expenses are equal to the annualized expense ratio, multiplied by the average account value over the period, multiplied by 184/365 (to reflect the one-half year period). |
| 8 | JOHN HANCOCK GLOBAL ABSOLUTE RETURN STRATEGIES FUND | SEMIANNUAL REPORT |
| Fund’s investments |
| Rate (%) | Maturity date | Par value^ | Value | ||
| U.S. Government and Agency obligations 10.9% | $196,851,739 | ||||
| (Cost $198,920,215) | |||||
| United States 10.9% | 196,851,739 | ||||
| U.S. Treasury | |||||
| Treasury Inflation Protected Security | 0.625 | 02-15-43 | 17,766,300 | 17,594,704 | |
| Treasury Inflation Protected Security | 0.750 | 02-15-42 | 17,858,600 | 18,613,989 | |
| Treasury Inflation Protected Security | 0.750 | 02-15-45 | 17,700,100 | 17,488,475 | |
| Treasury Inflation Protected Security | 0.875 | 02-15-47 | 15,988,100 | 15,835,476 | |
| Treasury Inflation Protected Security | 1.000 | 02-15-46 | 15,674,000 | 16,321,618 | |
| Treasury Inflation Protected Security | 1.000 | 02-15-48 | 13,668,600 | 13,682,129 | |
| Treasury Inflation Protected Security | 1.375 | 02-15-44 | 17,727,400 | 20,391,592 | |
| Treasury Inflation Protected Security | 2.125 | 02-15-40 | 11,597,500 | 16,308,596 | |
| Treasury Inflation Protected Security | 2.125 | 02-15-41 | 18,449,400 | 25,733,021 | |
| Treasury Inflation Protected Security (A) | 3.375 | 04-15-32 | 8,221,200 | 15,353,426 | |
| Treasury Inflation Protected Security (A) | 3.875 | 04-15-29 | 9,819,000 | 19,528,713 | |
| Foreign government obligations 24.0% | $432,761,377 | ||||
| (Cost $417,573,971) | |||||
| Argentina 0.3% | 5,013,285 | ||||
| Provincia de Buenos Aires Bond (Argentina Deposit Rate Badlar Private Banks + 3.830%) (B) | 50.913 | 05-31-22 | ARS | 35,219,000 | 903,511 |
| Republic of Argentina Bond (7 day Argentina Central Bank Repo Reference Rate) (B) | 55.908 | 06-21-20 | ARS | 139,210,006 | 4,109,774 |
| Brazil 11.0% | 197,986,640 | ||||
| Federative Republic of Brazil | |||||
| Bill (C) | 6.504 | 07-01-20 | BRL | 185,323,000 | 46,415,861 |
| Bill (C) | 7.200 | 07-01-21 | BRL | 222,861,000 | 51,534,773 |
| Note | 10.000 | 01-01-21 | BRL | 54,616,000 | 15,738,473 |
| Note | 10.000 | 01-01-23 | BRL | 163,398,000 | 47,499,881 |
| Note | 10.000 | 01-01-25 | BRL | 45,417,000 | 13,243,104 |
| Note | 10.000 | 01-01-27 | BRL | 80,686,000 | 23,554,548 |
| Colombia 1.1% | 20,173,611 | ||||
| Republic of Colombia | |||||
| Bond | 7.500 | 08-26-26 | COP | 6,421,400,000 | 2,198,350 |
| Bond | 7.750 | 09-18-30 | COP | 25,884,200,000 | 8,890,518 |
| Bond | 10.000 | 07-24-24 | COP | 24,003,300,000 | 9,084,743 |
| Czech Republic 0.2% | 4,387,678 | ||||
| Czech Republic | |||||
| Bond | 0.450 | 10-25-23 | CZK | 52,460,000 | 2,204,433 |
| Bond | 2.400 | 09-17-25 | CZK | 47,070,000 | 2,183,245 |
| SEE NOTES TO FINANCIAL STATEMENTS | SEMIANNUAL REPORT | JOHN HANCOCK GLOBAL ABSOLUTE RETURN STRATEGIES FUND | 9 |
| Rate (%) | Maturity date | Par value^ | Value | ||
| Dominican Republic 0.1% | $2,537,872 | ||||
| Government of Dominican Republic Bond (D) | 11.250 | 02-05-27 | DOP | 124,900,000 | 2,537,872 |
| Hungary 0.4% | 6,357,749 | ||||
| Republic of Hungary Bond | 1.000 | 09-23-20 | HUF | 1,739,960,000 | 6,357,749 |
| Indonesia 1.3% | 23,096,865 | ||||
| Republic of Indonesia | |||||
| Bond | 5.625 | 05-15-23 | IDR | 13,342,000,000 | 878,724 |
| Bond | 7.000 | 05-15-22 | IDR | 45,244,000,000 | 3,174,586 |
| Bond | 7.000 | 05-15-27 | IDR | 113,412,000,000 | 7,487,749 |
| Bond | 7.500 | 08-15-32 | IDR | 29,805,000,000 | 1,955,370 |
| Bond | 7.500 | 05-15-38 | IDR | 17,204,000,000 | 1,119,845 |
| Bond | 8.250 | 05-15-36 | IDR | 28,706,000,000 | 2,006,184 |
| Bond | 8.375 | 09-15-26 | IDR | 53,536,000,000 | 3,839,362 |
| Bond | 8.375 | 03-15-34 | IDR | 37,166,000,000 | 2,635,045 |
| Malaysia 0.7% | 11,778,719 | ||||
| Government of Malaysia | |||||
| Bond | 3.492 | 03-31-20 | MYR | 7,684,000 | 1,875,950 |
| Bond | 3.844 | 04-15-33 | MYR | 4,758,000 | 1,089,380 |
| Bond | 4.059 | 09-30-24 | MYR | 19,490,000 | 4,796,091 |
| Bond | 4.160 | 07-15-21 | MYR | 7,426,000 | 1,836,389 |
| Bond | 4.378 | 11-29-19 | MYR | 8,865,000 | 2,180,909 |
| Mexico 4.8% | 85,921,250 | ||||
| Government of Mexico | |||||
| Bond | 6.500 | 06-09-22 | MXN | 162,369,800 | 8,063,446 |
| Bond | 7.500 | 06-03-27 | MXN | 64,658,300 | 3,190,505 |
| Bond | 8.000 | 12-07-23 | MXN | 563,087,700 | 29,190,247 |
| Bond | 8.000 | 11-07-47 | MXN | 73,396,500 | 3,521,082 |
| Bond | 8.500 | 11-18-38 | MXN | 93,721,000 | 4,779,013 |
| Bond | 10.000 | 12-05-24 | MXN | 658,820,700 | 37,176,957 |
| Peru 0.5% | 9,941,308 | ||||
| Republic of Peru | |||||
| Bond (D) | 5.940 | 02-12-29 | PEN | 14,330,000 | 4,401,190 |
| Bond | 6.900 | 08-12-37 | PEN | 6,444,000 | 2,078,862 |
| Bond | 8.200 | 08-12-26 | PEN | 9,792,000 | 3,461,256 |
| Philippines 0.5% | 9,068,363 | ||||
| Republic of Philippines | |||||
| Bond | 5.750 | 04-12-25 | PHP | 183,670,000 | 3,430,562 |
| Bond | 6.250 | 03-22-28 | PHP | 62,030,000 | 1,177,839 |
| Bond | 6.250 | 01-14-36 | PHP | 25,000,000 | 494,253 |
| Bond | 6.875 | 01-10-29 | PHP | 199,580,000 | 3,965,709 |
| Poland 0.8% | 14,774,122 | ||||
| Republic of Poland | |||||
| Bond | 1.500 | 04-25-20 | PLN | 24,997,000 | 6,722,920 |
| 10 | JOHN HANCOCK GLOBAL ABSOLUTE RETURN STRATEGIES FUND | SEMIANNUAL REPORT | SEE NOTES TO FINANCIAL STATEMENTS |
| Rate (%) | Maturity date | Par value^ | Value | ||
| Poland (continued) | |||||
| Bond | 5.250 | 10-25-20 | PLN | 24,867,000 | $7,114,678 |
| Bond | 5.500 | 10-25-19 | PLN | 3,382,000 | 936,524 |
| South Africa 1.1% | 19,238,531 | ||||
| Republic of South Africa | |||||
| Bond | 6.250 | 03-31-36 | ZAR | 35,369,000 | 1,953,726 |
| Bond | 8.000 | 01-31-30 | ZAR | 45,074,000 | 3,142,751 |
| Bond | 8.250 | 03-31-32 | ZAR | 29,615,000 | 2,046,586 |
| Bond | 8.750 | 02-28-48 | ZAR | 64,655,000 | 4,467,558 |
| Bond | 9.000 | 01-31-40 | ZAR | 29,067,000 | 2,072,060 |
| Bond | 10.500 | 12-21-26 | ZAR | 66,634,000 | 5,555,850 |
| Thailand 0.6% | 11,623,662 | ||||
| Kingdom of Thailand | |||||
| Bond | 1.250 | 03-12-28 | THB | 302,113,000 | 9,342,857 |
| Bond | 3.650 | 12-17-21 | THB | 67,861,000 | 2,280,805 |
| Turkey 0.5% | 8,818,940 | ||||
| Republic of Turkey | |||||
| Bond | 3.000 | 08-02-23 | TRY | 6,718,104 | 2,338,552 |
| Bond | 7.100 | 03-08-23 | TRY | 13,741,000 | 2,034,561 |
| Bond | 9.200 | 09-22-21 | TRY | 10,856,000 | 1,788,094 |
| Bond | 9.500 | 01-12-22 | TRY | 4,526,000 | 744,602 |
| Bond | 12.200 | 01-18-23 | TRY | 10,904,000 | 1,913,131 |
| Uruguay 0.1% | 2,042,782 | ||||
| Republic of Uruguay Bond | 4.375 | 12-15-28 | UYU | 35,261,393 | 2,042,782 |
| Corporate bonds 3.8% | $67,900,760 | ||||
| (Cost $68,694,089) | |||||
| Australia 0.0% | 329,061 | ||||
| BHP Billiton Finance, Ltd. (6.500% to 10-22-22, then 5 Year British Pound Swap Rate + 4.817%) | 6.500 | 10-22-77 | GBP | 225,000 | 329,061 |
| Austria 0.0% | 280,986 | ||||
| Sappi Papier Holding GmbH | 4.000 | 04-01-23 | EUR | 240,000 | 280,986 |
| Canada 0.1% | 1,048,338 | ||||
| Clearwater Seafoods, Inc. (D) | 6.875 | 05-01-25 | 400,000 | 385,000 | |
| First Quantum Minerals, Ltd. (D) | 7.000 | 02-15-21 | 665,000 | 663,338 | |
| Cayman Islands 0.0% | 417,354 | ||||
| Tecnoglass, Inc. (D) | 8.200 | 01-31-22 | 399,000 | 417,354 | |
| Denmark 0.1% | 2,386,623 | ||||
| Danske Bank A/S (5.875% to 4-6-22, then 7 Year Euro Swap Rate + 5.471%) (E) | 5.875 | 04-06-22 | EUR | 225,000 | 259,090 |
| DKT Finance ApS (D) | 9.375 | 06-17-23 | 1,213,000 | 1,276,683 | |
| SEE NOTES TO FINANCIAL STATEMENTS | SEMIANNUAL REPORT | JOHN HANCOCK GLOBAL ABSOLUTE RETURN STRATEGIES FUND | 11 |
| Rate (%) | Maturity date | Par value^ | Value | ||
| Denmark (continued) | |||||
| Welltec A/S (D) | 9.500 | 12-01-22 | 884,000 | $850,850 | |
| France 0.1% | 1,666,127 | ||||
| Credit Agricole SA (7.875% to 1-23-24, then 5 Year U.S. Swap Rate + 4.898%) (D)(E) | 7.875 | 01-23-24 | 680,000 | 712,739 | |
| Crown European Holdings SA | 2.250 | 02-01-23 | EUR | 295,000 | 345,367 |
| La Financiere Atalian SASU | 4.000 | 05-15-24 | EUR | 115,000 | 101,788 |
| Paprec Holding SA | 4.000 | 03-31-25 | EUR | 160,000 | 155,613 |
| SPCM SA (D) | 4.875 | 09-15-25 | 373,000 | 350,620 | |
| Germany 0.1% | 2,300,557 | ||||
| Aareal Bank AG (7.625% to 4-30-20, then 1 Year Euro Swap Rate + 7.180%) (E) | 7.625 | 04-30-20 | EUR | 200,000 | 235,104 |
| IHO Verwaltungs GmbH (2.750% Cash or 3.500% PIK) | 2.750 | 09-15-21 | EUR | 210,000 | 240,329 |
| IHO Verwaltungs GmbH (3.250% Cash or 4.000% PIK) | 3.250 | 09-15-23 | EUR | 110,000 | 123,434 |
| Nidda Healthcare Holding GmbH | 3.500 | 09-30-24 | EUR | 220,000 | 245,431 |
| Platin 1426 GmbH | 5.375 | 06-15-23 | EUR | 237,000 | 252,313 |
| RWE AG (7.000% to 3-20-19, then 5 Year British Pound Swap Rate + 5.100%) (E) | 7.000 | 03-20-19 | GBP | 300,000 | 395,446 |
| Tele Columbus AG (D) | 3.875 | 05-02-25 | EUR | 290,000 | 302,784 |
| Unitymedia Hessen GmbH & Company KG | 4.000 | 01-15-25 | EUR | 425,000 | 505,716 |
| India 0.1% | 602,472 | ||||
| Vedanta Resources PLC (D) | 6.375 | 07-30-22 | 624,000 | 602,472 | |
| Ireland 0.1% | 996,120 | ||||
| Ardagh Packaging Finance PLC (D) | 4.250 | 09-15-22 | 200,000 | 197,960 | |
| Ardagh Packaging Finance PLC (D) | 4.625 | 05-15-23 | 200,000 | 200,000 | |
| Ardagh Packaging Finance PLC | 6.750 | 05-15-24 | EUR | 235,000 | 284,110 |
| Smurfit Kappa Acquisitions ULC | 4.125 | 01-30-20 | EUR | 265,000 | 314,050 |
| Italy 0.1% | 901,313 | ||||
| Telecom Italia SpA (D) | 5.303 | 05-30-24 | 372,000 | 353,400 | |
| UniCredit SpA | 6.950 | 10-31-22 | EUR | 255,000 | 331,456 |
| Wind Tre SpA | 2.625 | 01-20-23 | EUR | 210,000 | 216,457 |
| Luxembourg 0.1% | 2,395,041 | ||||
| Altice Luxembourg SA (D) | 7.750 | 05-15-22 | 300,000 | 291,000 | |
| Cirsa Finance International Sarl (D) | 6.250 | 12-20-23 | EUR | 328,000 | 390,430 |
| Cirsa Finance International Sarl (D) | 7.875 | 12-20-23 | 352,000 | 357,192 | |
| Dufry Finance SCA | 4.500 | 08-01-23 | EUR | 175,000 | 207,024 |
| Garfunkelux Holdco 3 SA | 8.500 | 11-01-22 | GBP | 200,000 | 220,348 |
| Intralot Capital Luxembourg SA | 5.250 | 09-15-24 | EUR | 319,000 | 250,306 |
| Matterhorn Telecom SA | 3.875 | 05-01-22 | EUR | 330,000 | 374,603 |
| Telecom Italia Finance SA | 7.750 | 01-24-33 | EUR | 221,000 | 304,138 |
| 12 | JOHN HANCOCK GLOBAL ABSOLUTE RETURN STRATEGIES FUND | SEMIANNUAL REPORT | SEE NOTES TO FINANCIAL STATEMENTS |
| Rate (%) | Maturity date | Par value^ | Value | ||
| Mexico 0.7% | $13,077,272 | ||||
| Cemex SAB de CV (D) | 5.700 | 01-11-25 | 270,000 | 273,645 | |
| Mexican Bonos | 7.250 | 12-09-21 | MXN | 227,068,500 | 11,580,912 |
| Petroleos Mexicanos | 7.190 | 09-12-24 | MXN | 29,784,800 | 1,222,715 |
| Netherlands 0.3% | 4,233,658 | ||||
| Cimpress NV (D) | 7.000 | 06-15-26 | 429,000 | 416,130 | |
| Energizer Gamma Acquisition BV (D) | 4.625 | 07-15-26 | EUR | 310,000 | 348,112 |
| InterXion Holding NV (D) | 4.750 | 06-15-25 | EUR | 385,000 | 461,111 |
| OCI NV | 5.000 | 04-15-23 | EUR | 335,000 | 402,133 |
| OI European Group BV (D) | 4.000 | 03-15-23 | 502,000 | 485,685 | |
| Teva Pharmaceutical Finance Netherlands II BV | 1.250 | 03-31-23 | EUR | 160,000 | 172,323 |
| Teva Pharmaceutical Finance Netherlands II BV | 3.250 | 04-15-22 | EUR | 145,000 | 171,485 |
| Teva Pharmaceutical Finance Netherlands III BV | 6.750 | 03-01-28 | 611,000 | 635,103 | |
| UPCB Finance IV, Ltd. (D) | 5.375 | 01-15-25 | 630,000 | 606,375 | |
| Ziggo Bond Company BV | 7.125 | 05-15-24 | EUR | 325,000 | 390,594 |
| Ziggo BV | 4.250 | 01-15-27 | EUR | 125,000 | 144,607 |
| Norway 0.0% | 424,428 | ||||
| Nassa Topco AS | 2.875 | 04-06-24 | EUR | 360,000 | 424,428 |
| Sweden 0.0% | 274,786 | ||||
| Verisure Holding AB (D) | 3.500 | 05-15-23 | EUR | 238,000 | 274,786 |
| United Kingdom 0.2% | 4,154,964 | ||||
| Arqiva Broadcast Finance PLC | 6.750 | 09-30-23 | GBP | 370,000 | 505,156 |
| International Game Technology PLC (D) | 3.500 | 07-15-24 | EUR | 258,000 | 291,174 |
| KCA Deutag UK Finance PLC (D) | 9.625 | 04-01-23 | 434,000 | 327,670 | |
| Pinnacle Bidco PLC | 6.375 | 02-15-25 | GBP | 250,000 | 329,678 |
| TalkTalk Telecom Group PLC | 5.375 | 01-15-22 | GBP | 250,000 | 326,709 |
| Tesco Property Finance 2 PLC | 6.052 | 10-13-39 | GBP | 222,498 | 348,694 |
| The Royal Bank of Scotland Group PLC (8.625% to 8-15-21, then 5 Year U.S. Swap Rate + 7.598%) (E) | 8.625 | 08-15-21 | 700,000 | 745,290 | |
| Thomas Cook Finance 2 PLC | 3.875 | 07-15-23 | EUR | 175,000 | 137,830 |
| Thomas Cook Group PLC | 6.250 | 06-15-22 | EUR | 150,000 | 135,583 |
| Virgin Media Finance PLC (D) | 6.000 | 10-15-24 | 520,000 | 526,656 | |
| Virgin Media Secured Finance PLC | 5.500 | 01-15-25 | GBP | 234,900 | 311,945 |
| Virgin Media Secured Finance PLC (6.000% to 1-15-21, then 11.000% thereafter) (D) | 6.000 | 01-15-25 | GBP | 115,000 | 168,579 |
| United States 1.8% | 32,411,660 | ||||
| ACI Worldwide, Inc. (D) | 5.750 | 08-15-26 | 418,000 | 428,963 | |
| Alliance Data Systems Corp. (D) | 5.375 | 08-01-22 | 681,000 | 681,000 | |
| Ally Financial, Inc. | 5.750 | 11-20-25 | 478,000 | 497,120 | |
| Apergy Corp. | 6.375 | 05-01-26 | 478,000 | 470,233 |
| SEE NOTES TO FINANCIAL STATEMENTS | SEMIANNUAL REPORT | JOHN HANCOCK GLOBAL ABSOLUTE RETURN STRATEGIES FUND | 13 |
| Rate (%) | Maturity date | Par value^ | Value | ||
| United States (continued) | |||||
| Avantor, Inc. | 4.750 | 10-01-24 | EUR | 467,000 | $550,042 |
| Bausch Health Companies, Inc. (D) | 5.500 | 11-01-25 | 236,000 | 235,377 | |
| Bausch Health Companies, Inc. (D) | 7.000 | 03-15-24 | 736,000 | 772,340 | |
| Bruin E&P Partners LLC (D) | 8.875 | 08-01-23 | 509,000 | 484,507 | |
| Builders FirstSource, Inc. (D) | 5.625 | 09-01-24 | 451,000 | 430,141 | |
| Calpine Corp. (D) | 5.250 | 06-01-26 | 275,000 | 261,250 | |
| CCO Holdings LLC (D) | 5.875 | 04-01-24 | 244,000 | 250,159 | |
| CEMEX Finance LLC (D) | 6.000 | 04-01-24 | 490,000 | 499,315 | |
| Centene Corp. | 4.750 | 01-15-25 | 382,000 | 387,253 | |
| Century Communities, Inc. | 5.875 | 07-15-25 | 597,000 | 549,240 | |
| CenturyLink, Inc. | 5.625 | 04-01-20 | 307,000 | 309,778 | |
| CFX Escrow Corp. (D) | 6.000 | 02-15-24 | 106,000 | 106,000 | |
| CFX Escrow Corp. (D) | 6.375 | 02-15-26 | 63,000 | 63,000 | |
| Change Healthcare Holdings LLC (D) | 5.750 | 03-01-25 | 378,000 | 361,935 | |
| Charter Communications Operating LLC | 6.384 | 10-23-35 | 581,000 | 621,396 | |
| Cheniere Corpus Christi Holdings LLC | 7.000 | 06-30-24 | 692,000 | 762,792 | |
| Cheniere Energy Partners LP | 5.250 | 10-01-25 | 302,000 | 303,507 | |
| Commercial Metals Company | 5.750 | 04-15-26 | 489,000 | 463,328 | |
| Consolidated Communications, Inc. | 6.500 | 10-01-22 | 506,000 | 462,990 | |
| CSC Holdings LLC (D) | 6.500 | 02-01-29 | 389,000 | 394,349 | |
| CSC Holdings LLC (D) | 10.875 | 10-15-25 | 497,000 | 572,793 | |
| DaVita, Inc. | 5.125 | 07-15-24 | 424,000 | 417,767 | |
| Dell International LLC (D) | 5.875 | 06-15-21 | 437,000 | 444,089 | |
| EMI Music Publishing Group North America Holdings, Inc. (D) | 7.625 | 06-15-24 | 338,000 | 358,510 | |
| Encompass Health Corp. | 5.750 | 11-01-24 | 424,000 | 428,770 | |
| Energy Transfer LP | 5.875 | 01-15-24 | 218,000 | 232,715 | |
| Energy Transfer LP | 7.500 | 10-15-20 | 199,000 | 211,189 | |
| ESH Hospitality, Inc. (D) | 5.250 | 05-01-25 | 353,000 | 348,976 | |
| Exela Intermediate LLC (D) | 10.000 | 07-15-23 | 377,000 | 377,943 | |
| GLP Capital LP | 5.375 | 04-15-26 | 248,000 | 253,290 | |
| Graham Holdings Company (D) | 5.750 | 06-01-26 | 88,000 | 91,080 | |
| Gray Television, Inc. (D) | 7.000 | 05-15-27 | 349,000 | 362,820 | |
| Harland Clarke Holdings Corp. (D) | 6.875 | 03-01-20 | 378,000 | 374,220 | |
| Harland Clarke Holdings Corp. (D) | 8.375 | 08-15-22 | 330,000 | 309,375 | |
| HCA, Inc. | 7.500 | 11-15-95 | 1,685,000 | 1,680,788 | |
| IQVIA, Inc. | 3.250 | 03-15-25 | EUR | 215,000 | 248,803 |
| Iron Mountain, Inc. (D) | 5.250 | 03-15-28 | 466,000 | 433,380 | |
| j2 Cloud Services LLC (D) | 6.000 | 07-15-25 | 583,000 | 584,458 | |
| Lennar Corp. | 4.750 | 11-29-27 | 659,000 | 624,403 | |
| MDC Holdings, Inc. | 6.000 | 01-15-43 | 521,000 | 431,128 | |
| Meredith Corp. (D) | 6.875 | 02-01-26 | 516,000 | 530,190 | |
| Moss Creek Resources Holdings, Inc. (D) | 7.500 | 01-15-26 | 622,000 | 556,690 | |
| MPT Operating Partnership LP | 4.000 | 08-19-22 | EUR | 215,000 | 265,579 |
| 14 | JOHN HANCOCK GLOBAL ABSOLUTE RETURN STRATEGIES FUND | SEMIANNUAL REPORT | SEE NOTES TO FINANCIAL STATEMENTS |
| Rate (%) | Maturity date | Par value^ | Value | ||
| United States (continued) | |||||
| Navient Corp. | 4.875 | 06-17-19 | 325,000 | $325,406 | |
| Netflix, Inc. (D) | 5.875 | 11-15-28 | 561,000 | 568,714 | |
| New Enterprise Stone & Lime Company, Inc. (D) | 6.250 | 03-15-26 | 459,000 | 438,345 | |
| Nine Energy Service, Inc. (D) | 8.750 | 11-01-23 | 170,000 | 170,425 | |
| Novelis Corp. (D) | 6.250 | 08-15-24 | 495,000 | 499,950 | |
| NRG Energy, Inc. | 6.250 | 05-01-24 | 181,000 | 187,335 | |
| NRG Energy, Inc. | 7.250 | 05-15-26 | 407,000 | 439,764 | |
| Oasis Petroleum, Inc. | 6.875 | 03-15-22 | 387,000 | 386,033 | |
| Oasis Petroleum, Inc. | 6.875 | 01-15-23 | 81,000 | 80,291 | |
| Parsley Energy LLC (D) | 5.375 | 01-15-25 | 302,000 | 299,735 | |
| Pitney Bowes, Inc. | 3.875 | 10-01-21 | 252,000 | 246,330 | |
| Pitney Bowes, Inc. | 4.375 | 05-15-22 | 206,000 | 194,052 | |
| Post Holdings, Inc. (D) | 5.000 | 08-15-26 | 424,000 | 400,765 | |
| Sirius XM Radio, Inc. (D) | 6.000 | 07-15-24 | 368,000 | 382,260 | |
| SM Energy Company | 6.750 | 09-15-26 | 429,000 | 422,629 | |
| Sprint Corp. | 7.625 | 02-15-25 | 490,000 | 512,197 | |
| Sprint Corp. | 7.625 | 03-01-26 | 293,000 | 304,354 | |
| Standard Industries, Inc. (D) | 6.000 | 10-15-25 | 252,000 | 253,575 | |
| Steel Dynamics, Inc. | 4.125 | 09-15-25 | 255,000 | 242,250 | |
| Steel Dynamics, Inc. | 5.000 | 12-15-26 | 248,000 | 246,760 | |
| Tenet Healthcare Corp. | 4.500 | 04-01-21 | 131,000 | 131,262 | |
| Tenet Healthcare Corp. | 4.625 | 07-15-24 | 451,000 | 441,745 | |
| Tennant Company | 5.625 | 05-01-25 | 317,000 | 313,038 | |
| The Goodyear Tire & Rubber Company | 5.125 | 11-15-23 | 294,000 | 293,265 | |
| T-Mobile USA, Inc. | 6.500 | 01-15-26 | 446,000 | 471,645 | |
| Versum Materials, Inc. (D) | 5.500 | 09-30-24 | 255,000 | 258,825 | |
| Viking Cruises, Ltd. (D) | 6.250 | 05-15-25 | 433,000 | 433,000 | |
| Vistra Energy Corp. | 7.375 | 11-01-22 | 248,000 | 257,920 | |
| WMG Acquisition Corp. (D) | 3.625 | 10-15-26 | EUR | 183,000 | 209,219 |
| WMG Acquisition Corp. (D) | 5.500 | 04-15-26 | 364,000 | 359,450 | |
| WPX Energy, Inc. | 8.250 | 08-01-23 | 711,000 | 790,988 | |
| Wyndham Destinations, Inc. | 4.150 | 04-01-24 | 228,000 | 221,301 | |
| Wyndham Destinations, Inc. | 4.500 | 04-01-27 | 344,000 | 328,520 | |
| Wyndham Destinations, Inc. | 5.100 | 10-01-25 | 239,000 | 238,403 | |
| Zayo Group LLC (D) | 5.750 | 01-15-27 | 223,000 | 215,460 | |
| ZF North America Capital, Inc. (D) | 4.750 | 04-29-25 | 375,000 | 361,478 | |
| Convertible bonds 0.0% | $106,233 | ||||
| (Cost $113,712) | |||||
| Italy 0.0% | 106,233 | ||||
| Telecom Italia SpA | 1.125 | 03-26-22 | EUR | 100,000 | 106,233 |
| SEE NOTES TO FINANCIAL STATEMENTS | SEMIANNUAL REPORT | JOHN HANCOCK GLOBAL ABSOLUTE RETURN STRATEGIES FUND | 15 |
| Shares | Value | ||||
| Common stocks 17.8% | $321,513,282 | ||||
| (Cost $298,337,741) | |||||
| Belgium 0.1% | 2,099,315 | ||||
| Umicore SA | 49,656 | 2,099,315 | |||
| Canada 0.1% | 1,580,271 | ||||
| Alimentation Couche-Tard, Inc., Class B | 12,027 | 653,364 | |||
| Restaurant Brands International, Inc. | 14,795 | 926,907 | |||
| China 0.0% | 722,892 | ||||
| Tianhe Chemicals Group, Ltd. (D)(F)(G) | 4,848,409 | 722,892 | |||
| Denmark 0.3% | 5,118,496 | ||||
| Coloplast A/S, B Shares | 19,916 | 1,819,311 | |||
| Novo Nordisk A/S, B Shares | 70,396 | 3,299,185 | |||
| Finland 0.6% | 11,235,383 | ||||
| Kesko OYJ, B Shares | 17,601 | 1,012,806 | |||
| Kone OYJ, B Shares | 43,941 | 2,136,542 | |||
| Nokia OYJ | 357,569 | 2,258,995 | |||
| Nordea Bank ABP | 292,287 | 2,660,188 | |||
| Sampo OYJ, A Shares | 40,253 | 1,844,201 | |||
| Wartsila OYJ ABP | 81,002 | 1,322,651 | |||
| France 1.6% | 27,950,022 | ||||
| Airbus SE | 21,989 | 2,534,448 | |||
| AXA SA | 157,900 | 3,661,721 | |||
| Cie Generale des Etablissements Michelin SCA | 18,102 | 1,966,269 | |||
| Orange SA | 162,978 | 2,527,848 | |||
| Thales SA | 5,881 | 650,375 | |||
| TOTAL SA | 267,178 | 14,646,965 | |||
| Vivendi SA | 76,960 | 1,962,396 | |||
| Germany 0.7% | 12,423,128 | ||||
| Allianz SE | 8,772 | 1,861,174 | |||
| Bayer AG | 38,152 | 2,891,756 | |||
| Covestro AG (D) | 21,232 | 1,173,270 | |||
| Deutsche Post AG | 72,291 | 2,135,191 | |||
| Siemens AG | 30,050 | 3,299,417 | |||
| TUI AG | 70,160 | 1,062,320 | |||
| Hong Kong 0.0% | 0 | ||||
| China Metal Recycling Holdings, Ltd. (F)(G) | 1,799,400 | 0 | |||
| Ireland 0.3% | 6,154,210 | ||||
| Allegion PLC | 9,035 | 775,745 | |||
| CRH PLC | 63,442 | 1,826,148 | |||
| Medtronic PLC | 9,120 | 806,117 |
| 16 | JOHN HANCOCK GLOBAL ABSOLUTE RETURN STRATEGIES FUND | SEMIANNUAL REPORT | SEE NOTES TO FINANCIAL STATEMENTS |
| Shares | Value | ||||
| Ireland (continued) | |||||
| Paddy Power Betfair PLC | 18,045 | $1,473,951 | |||
| Ryanair Holdings PLC, ADR (G) | 17,919 | 1,272,249 | |||
| Italy 0.8% | 15,112,263 | ||||
| Enel SpA | 612,184 | 3,699,984 | |||
| Eni SpA | 567,557 | 9,623,380 | |||
| Mediobanca Banca di Credito Finanziario SpA | 205,273 | 1,788,899 | |||
| Netherlands 1.3% | 22,722,030 | ||||
| Akzo Nobel NV | 33,532 | 2,886,004 | |||
| ASML Holding NV | 20,511 | 3,586,699 | |||
| Koninklijke KPN NV | 692,807 | 2,129,837 | |||
| Royal Dutch Shell PLC, A Shares | 151,093 | 4,683,934 | |||
| Royal Dutch Shell PLC, A Shares | 305,115 | 9,435,556 | |||
| Portugal 0.1% | 973,968 | ||||
| Galp Energia SGPS SA | 62,336 | 973,968 | |||
| Spain 1.0% | 18,392,771 | ||||
| Amadeus IT Group SA | 14,249 | 1,036,162 | |||
| Banco Santander SA | 530,780 | 2,517,289 | |||
| Bankinter SA | 369,187 | 2,882,699 | |||
| Industria de Diseno Textil SA | 60,074 | 1,680,459 | |||
| Repsol SA | 585,436 | 10,276,162 | |||
| Sweden 0.7% | 12,418,424 | ||||
| Assa Abloy AB, B Shares | 75,005 | 1,397,652 | |||
| Atlas Copco AB, A Shares | 52,905 | 1,380,257 | |||
| Essity AB, B Shares | 79,396 | 2,196,772 | |||
| Swedbank AB, A Shares | 160,352 | 3,642,628 | |||
| Swedish Match AB | 36,751 | 1,646,521 | |||
| Volvo AB, B Shares | 149,522 | 2,154,594 | |||
| Switzerland 1.4% | 25,096,468 | ||||
| Nestle SA | 55,369 | 4,827,285 | |||
| Novartis AG | 56,923 | 4,969,422 | |||
| Partners Group Holding AG | 3,400 | 2,338,535 | |||
| Roche Holding AG | 21,879 | 5,820,596 | |||
| Swiss Re AG | 21,666 | 2,077,870 | |||
| Zurich Insurance Group AG | 16,131 | 5,062,760 | |||
| United Kingdom 3.6% | 64,840,180 | ||||
| Anglo American PLC | 64,853 | 1,657,365 | |||
| AstraZeneca PLC | 12,512 | 906,391 | |||
| Aviva PLC | 185,367 | 1,008,136 | |||
| BAE Systems PLC | 210,919 | 1,418,928 | |||
| Barratt Developments PLC | 149,328 | 1,056,214 | |||
| Bellway PLC | 23,064 | 857,801 |
| SEE NOTES TO FINANCIAL STATEMENTS | SEMIANNUAL REPORT | JOHN HANCOCK GLOBAL ABSOLUTE RETURN STRATEGIES FUND | 17 |
| Shares | Value | ||||
| United Kingdom (continued) | |||||
| BP PLC | 2,192,904 | $14,980,008 | |||
| British American Tobacco PLC | 100,659 | 3,548,225 | |||
| Dixons Carphone PLC | 286,142 | 518,186 | |||
| DS Smith PLC | 231,717 | 1,027,635 | |||
| GlaxoSmithKline PLC | 194,733 | 3,782,594 | |||
| HSBC Holdings PLC | 708,460 | 5,965,394 | |||
| Imperial Brands PLC | 56,578 | 1,878,049 | |||
| Inchcape PLC | 149,250 | 1,123,022 | |||
| Johnson Matthey PLC | 28,627 | 1,143,633 | |||
| National Grid PLC | 254,303 | 2,769,198 | |||
| Phoenix Group Holdings PLC | 370,415 | 3,088,333 | |||
| Prudential PLC | 102,813 | 2,010,621 | |||
| Reckitt Benckiser Group PLC | 24,524 | 1,886,986 | |||
| RELX PLC | 98,810 | 2,188,589 | |||
| Rio Tinto PLC | 75,902 | 4,199,050 | |||
| Standard Chartered PLC | 288,561 | 2,327,273 | |||
| Unilever NV | 54,832 | 2,936,257 | |||
| Vodafone Group PLC | 1,404,935 | 2,562,292 | |||
| United States 5.2% | 94,673,461 | ||||
| Adobe, Inc. (G) | 3,126 | 774,683 | |||
| Allergan PLC | 4,453 | 641,143 | |||
| Alphabet, Inc., Class A (G) | 805 | 906,341 | |||
| Alphabet, Inc., Class C (G) | 2,023 | 2,258,417 | |||
| Altria Group, Inc. | 6,799 | 335,531 | |||
| Amazon.com, Inc. (G) | 1,106 | 1,900,915 | |||
| American Tower Corp. | 11,945 | 2,064,574 | |||
| AmerisourceBergen Corp. | 6,328 | 527,565 | |||
| Anadarko Petroleum Corp. | 10,491 | 496,539 | |||
| Anthem, Inc. | 2,632 | 797,496 | |||
| Apple, Inc. | 12,001 | 1,997,446 | |||
| Bank of America Corp. | 56,921 | 1,620,541 | |||
| Baxter International, Inc. | 17,197 | 1,246,611 | |||
| Booking Holdings, Inc. (G) | 590 | 1,081,358 | |||
| Boston Scientific Corp. (G) | 36,670 | 1,398,961 | |||
| Broadcom, Inc. | 4,008 | 1,075,146 | |||
| Burlington Stores, Inc. (G) | 5,011 | 860,439 | |||
| CDW Corp. | 4,635 | 385,956 | |||
| Celanese Corp. | 9,777 | 936,246 | |||
| Chevron Corp. | 94,393 | 10,822,157 | |||
| Cisco Systems, Inc. | 25,339 | 1,198,281 | |||
| Citigroup, Inc. | 13,982 | 901,280 | |||
| CMS Energy Corp. | 36,201 | 1,887,520 | |||
| Comcast Corp., Class A | 32,346 | 1,182,893 | |||
| Constellation Brands, Inc., Class A | 3,824 | 664,076 | |||
| CSX Corp. | 10,527 | 691,624 |
| 18 | JOHN HANCOCK GLOBAL ABSOLUTE RETURN STRATEGIES FUND | SEMIANNUAL REPORT | SEE NOTES TO FINANCIAL STATEMENTS |
| Shares | Value | ||||
| United States (continued) | |||||
| Deere & Company | 7,272 | $1,192,608 | |||
| DowDuPont, Inc. | 22,759 | 1,224,662 | |||
| Electronic Arts, Inc. (G) | 6,817 | 628,800 | |||
| Eli Lilly & Company | 6,303 | 755,478 | |||
| Equinix, Inc. | 2,264 | 892,016 | |||
| Exxon Mobil Corp. | 129,063 | 9,457,737 | |||
| First Data Corp., Class A (G) | 20,751 | 511,512 | |||
| First Republic Bank | 11,513 | 1,112,501 | |||
| Huntington Bancshares, Inc. | 38,350 | 507,754 | |||
| Hyatt Hotels Corp., Class A | 5,110 | 357,240 | |||
| Intercontinental Exchange, Inc. | 13,765 | 1,056,601 | |||
| Johnson & Johnson | 15,166 | 2,018,291 | |||
| Lear Corp. | 2,574 | 396,216 | |||
| Marathon Oil Corp. | 42,471 | 670,617 | |||
| Martin Marietta Materials, Inc. | 1,941 | 342,936 | |||
| Marvell Technology Group, Ltd. | 43,797 | 811,558 | |||
| Mastercard, Inc., Class A | 9,855 | 2,080,686 | |||
| McDonald's Corp. | 6,715 | 1,200,508 | |||
| Microsoft Corp. | 33,675 | 3,516,680 | |||
| Mondelez International, Inc., Class A | 22,525 | 1,042,007 | |||
| Netflix, Inc. (G) | 3,042 | 1,032,759 | |||
| NextEra Energy, Inc. | 8,142 | 1,457,255 | |||
| NVIDIA Corp. | 2,976 | 427,800 | |||
| Occidental Petroleum Corp. | 151,093 | 10,089,991 | |||
| Pfizer, Inc. | 19,677 | 835,289 | |||
| Raytheon Company | 6,706 | 1,104,881 | |||
| Service Corp. International | 8,743 | 375,250 | |||
| Steel Dynamics, Inc. | 10,564 | 386,537 | |||
| The Boeing Company | 1,997 | 770,083 | |||
| The Charles Schwab Corp. | 24,401 | 1,141,235 | |||
| The Coca-Cola Company | 12,216 | 587,956 | |||
| The Home Depot, Inc. | 6,079 | 1,115,679 | |||
| The TJX Companies, Inc. | 12,811 | 637,091 | |||
| UnitedHealth Group, Inc. | 8,567 | 2,314,803 | |||
| Verizon Communications, Inc. | 28,091 | 1,546,690 | |||
| Vertex Pharmaceuticals, Inc. (G) | 4,022 | 767,840 | |||
| Wells Fargo & Company | 21,271 | 1,040,365 | |||
| Yum! Brands, Inc. | 6,510 | 611,810 | |||
| Contracts/Notional amount | Value | ||||
| Purchased options 2.3% | $42,509,053 | ||||
| (Cost $44,691,771) | |||||
| Calls 0.8% | 15,030,741 | ||||
| Exchange Traded Option on FTSE 100 Index (Expiration Date: 12-20-19; Strike Price: GBP 7,050.00; Notional Amount: 200,500) (G) | 2,005 | 5,916,937 | |||
| SEE NOTES TO FINANCIAL STATEMENTS | SEMIANNUAL REPORT | JOHN HANCOCK GLOBAL ABSOLUTE RETURN STRATEGIES FUND | 19 |
| Contracts/Notional amount | Value | ||||
| Calls (continued) | |||||
| Exchange Traded Option on S&P 500 Index (Expiration Date: 3-15-19; Strike Price: $2,580.00; Notional Amount: 26,500) (G) | 265 | $3,786,850 | |||
| Exchange Traded Option on S&P 500 Index (Expiration Date: 3-15-19; Strike Price: $2,620.00; Notional Amount: 14,300) (G) | 143 | 1,590,160 | |||
| Over the Counter Option on Hang Seng China Enterprises Index (Expiration Date: 2-28-19; Strike Price: HKD 10,892.40; Counterparty: Goldman Sachs) (G)(H) | 19,342 | 719,629 | |||
| Over the Counter Option on Ibovespa Brasil Index (Expiration Date: 2-14-19; Strike Price: BRL 93,855.29; Counterparty: Merril Lynch International) (G)(H) | 525 | 598,739 | |||
| Over the Counter Option on Ibovespa Brasil Index (Expiration Date: 2-14-19; Strike Price: BRL 94,110.99; Counterparty: Merril Lynch International) (G)(H) | 609 | 658,770 | |||
| Over the Counter Option on Ibovespa Brasil Index (Expiration Date: 2-14-19; Strike Price: BRL 94,137.16; Counterparty: Merril Lynch International) (G)(H) | 596 | 641,157 | |||
| Over the Counter Option on Ibovespa Brasil Index (Expiration Date: 2-14-19; Strike Price: BRL 94,467.30; Counterparty: Goldman Sachs) (G)(H) | 225 | 225,349 | |||
| Over the Counter Option on Ibovespa Brasil Index (Expiration Date: 2-14-19; Strike Price: BRL 94,672.34; Counterparty: Merril Lynch International) (G)(H) | 444 | 424,627 | |||
| Over the Counter Option on Ibovespa Brasil Index (Expiration Date: 2-14-19; Strike Price: BRL 94,878.27; Counterparty: Morgan Stanley & Company, Inc.) (G)(H) | 226 | 206,051 | |||
| Over the Counter Option on Swiss Market Index (Expiration Date: 3-18-19; Strike Price: CHF 8,851.79; Counterparty: UBS AG) (G)(H) | 532 | 92,562 | |||
| Over the Counter Option on Swiss Market Index (Expiration Date: 3-18-19; Strike Price: CHF 8,862.97; Counterparty: UBS AG) (G)(H) | 252 | 42,160 | |||
| Over the Counter Option on Swiss Market Index (Expiration Date: 3-18-19; Strike Price: CHF 8,870.38; Counterparty: UBS AG) (G)(H) | 784 | 127,750 | |||
| Puts 1.5% | 27,478,312 | ||||
| Exchange Traded Option on NASDAQ 100 Stock Index (Expiration Date: 12-20-19; Strike Price: $6,650.00; Notional Amount: 13,400) (G) | 134 | 5,070,560 | |||
| Exchange Traded Option on NASDAQ 100 Stock Index (Expiration Date: 12-20-19; Strike Price: $6,700.00; Notional Amount: 6,700) (G) | 67 | 2,648,845 | |||
| Exchange Traded Option on NASDAQ 100 Stock Index (Expiration Date: 12-20-19; Strike Price: $6,900.00; Notional Amount: 4,600) (G) | 46 | 2,155,330 | |||
| Exchange Traded Option on NASDAQ 100 Stock Index (Expiration Date: 12-20-19; Strike Price: $7,075.00; Notional Amount: 6,900) (G) | 69 | 3,715,650 | |||
| Exchange Traded Option on NASDAQ 100 Stock Index (Expiration Date: 12-20-19; Strike Price: $7,550.00; Notional Amount: 3,800) (G) | 38 | 2,973,500 | |||
| Exchange Traded Option on NASDAQ 100 Stock Index (Expiration Date: 12-20-19; Strike Price: $7,600.00; Notional Amount: 4,400) (G) | 44 | 3,577,200 | |||
| Exchange Traded Option on NASDAQ 100 Stock Index (Expiration Date: 12-20-19; Strike Price: $7,675.00; Notional Amount: 3,000) (G) | 30 | 2,581,500 | |||
| Over the Counter Option on Ibovespa Brasil Index (Expiration Date: 2-14-19; Strike Price: BRL 86,796.41; Counterparty: Goldman Sachs) (G)(H) | 1,231 | 12,343 | |||
| Over the Counter Option on Ibovespa Brasil Index (Expiration Date: 2-14-19; Strike Price: BRL 87,429.51; Counterparty: Morgan Stanley & Company, Inc.) (G)(H) | 645 | 7,980 | |||
| 20 | JOHN HANCOCK GLOBAL ABSOLUTE RETURN STRATEGIES FUND | SEMIANNUAL REPORT | SEE NOTES TO FINANCIAL STATEMENTS |
| Contracts/Notional amount | Value | ||||
| Puts (continued) | |||||
| Over the Counter Option on Ibovespa Brasil Index (Expiration Date: 2-14-19; Strike Price: BRL 87,556.78; Counterparty: Goldman Sachs) (G)(H) | 749 | $9,670 | |||
| Over the Counter Option on Swiss Market Index (Expiration Date: 3-18-19; Strike Price: CHF 8,450.71; Counterparty: Merrill Lynch International) (G)(H) | 2,194 | 97,374 | |||
| Over the Counter Option on Swiss Market Index (Expiration Date: 3-18-19; Strike Price: CHF 8,560.68; Counterparty: Merrill Lynch International) (G)(H) | 2,194 | 133,132 | |||
| Over the Counter Option on the EUR vs. USD (Expiration Date: 8-23-19; Strike Price EUR 1.14; Counterparty: Deutsche Bank AG) (G)(H) | 34,000,000 | 505,739 | |||
| Over the Counter Option on the EUR vs. USD (Expiration Date: 8-23-19; Strike Price EUR 1.14; Counterparty: Deutsche Bank AG) (G)(H) | 36,200,000 | 538,464 | |||
| Over the Counter Option on the EUR vs. USD (Expiration Date: 8-23-19; Strike Price EUR 1.14; Counterparty: Deutsche Bank AG) (G)(H) | 36,200,000 | 538,464 | |||
| Over the Counter Option on the EUR vs. USD (Expiration Date: 8-30-19; Strike Price EUR 1.14; Counterparty: Deutsche Bank AG) (G)(H) | 41,400,000 | 620,377 | |||
| Over the Counter Option on the EUR vs. USD (Expiration Date: 8-30-19; Strike Price EUR 1.14; Counterparty: Deutsche Bank AG) (G)(H) | 40,800,000 | 611,386 | |||
| Over the Counter Option on the EUR vs. USD (Expiration Date: 9-9-19; Strike Price EUR 1.14; Counterparty: Deutsche Bank AG) (G)(H) | 42,200,000 | 642,480 | |||
| Over the Counter Option on the EUR vs. USD (Expiration Date: 9-9-19; Strike Price EUR 1.14; Counterparty: Deutsche Bank AG) (G)(H) | 34,000,000 | 517,637 | |||
| Over the Counter Option on the EUR vs. USD (Expiration Date: 9-9-19; Strike Price EUR 1.14; Counterparty: Deutsche Bank AG) (G)(H) | 34,200,000 | 520,681 | |||
| Yield* (%) | Maturity date | Par value^ | Value | ||
| Short-term investments 37.3% | $672,023,605 | ||||
| (Cost $672,015,517) | |||||
| Certificate of deposit 1.1% | 20,004,660 | ||||
| Credit Suisse Group AG | 2.660 | 04-15-19 | 20,000,000 | 20,004,660 | |
| Time deposits 23.3% | 420,580,809 | ||||
| Bank of Montreal | 2.470 | 02-05-19 | 68,000,000 | 68,000,000 | |
| BNP Paribas SA | 2.320 | 02-01-19 | 70,188,251 | 70,188,251 | |
| DZ Bank AG | 2.410 | 02-01-19 | 70,557,935 | 70,557,935 | |
| KBC Bank NV | 2.370 | 02-01-19 | 71,033,563 | 71,033,563 | |
| Natixis SA | 2.390 | 02-01-19 | 70,783,696 | 70,783,696 | |
| Sumitomo Mitsui Banking Corp. | 2.410 | 02-07-19 | 38,017,364 | 38,017,364 | |
| Sumitomo Mitsui Financial Group, Inc. | 2.430 | 02-04-19 | 32,000,000 | 32,000,000 | |
| U.S. Government 5.0% | 90,116,293 | ||||
| U.S. Treasury Bill | 2.330 | 02-07-19 | 60,000,000 | 59,977,357 | |
| U.S. Treasury Bill | 2.370 | 04-25-19 | 15,000,000 | 14,919,161 | |
| U.S. Treasury Bill | 2.420 | 09-12-19 | 15,449,700 | 15,219,775 |
| SEE NOTES TO FINANCIAL STATEMENTS | SEMIANNUAL REPORT | JOHN HANCOCK GLOBAL ABSOLUTE RETURN STRATEGIES FUND | 21 |
| Yield (%) | Shares | Value | |||
| Money market funds 7.9% | 141,321,843 | ||||
| Federated Government Obligations Fund, Institutional Class | 2.2514(I) | 141,321,843 | 141,321,843 | ||
| Total investments (Cost $1,700,347,016) 96.1% | $1,733,666,049 | ||||
| Other assets and liabilities, net 3.9% | 69,926,849 | ||||
| Total net assets 100.0% | $1,803,592,898 | ||||
| The percentage shown for each investment category is the total value of the category as a percentage of the net assets of the fund. | |
| ^All par values are denominated in U.S. dollars unless otherwise indicated. | |
| Currency Abbreviations | |
| ARS | Argentine Peso |
| BRL | Brazilian Real |
| CHF | Swiss Franc |
| COP | Colombian Peso |
| CZK | Czech Republic Koruna |
| DOP | Dominican Republic Peso |
| EUR | Euro |
| GBP | Pound Sterling |
| HKD | Hong Kong Dollar |
| HUF | Hungarian Forint |
| IDR | Indonesian Rupiah |
| MXN | Mexican Peso |
| MYR | Malaysian Ringgit |
| PEN | Peruvian Nuevo Sol |
| PHP | Philippine Peso |
| PLN | Polish Zloty |
| THB | Thai Bhat |
| TRY | Turkish Lira |
| UYU | Uruguayan Peso |
| ZAR | South African Rand |
| Security Abbreviations and Legend | |
| ADR | American Depositary Receipt |
| PIK | Pay-in-Kind Security - Represents a payment-in-kind which may pay interest in additional par and/or cash. Rates shown are the current rate and most recent payment rate. |
| (A) | All or a portion of this security is segregated at the custodian as collateral for certain derivatives. |
| (B) | Variable rate obligation. The coupon rate shown represents the rate at period end. |
| (C) | Zero coupon bonds are issued at a discount from their principal amount in lieu of paying interest periodically. Rate shown is the effective yield at period end. |
| (D) | These securities are exempt from registration under Rule 144A of the Securities Act of 1933. Such securities may be resold, normally to qualified institutional buyers, in transactions exempt from registration. |
| (E) | Perpetual bonds have no stated maturity date. Date shown as maturity date is next call date. |
| (F) | Security is valued using significant unobservable inputs and is classified as Level 3 in the fair value hierarchy. |
| (G) | Non-income producing security. |
| (H) | For this type of option, notional amounts are equivalent to number of contracts. |
| (I) | The rate shown is the annualized seven-day yield as of 1-31-19. |
| * | Yield represents either the annualized yield at the date of purchase, the stated coupon rate or, for floating rate securities, the rate at period end. |
| 22 | JOHN HANCOCK GLOBAL ABSOLUTE RETURN STRATEGIES FUND | SEMIANNUAL REPORT | SEE NOTES TO FINANCIAL STATEMENTS |
| Open contracts | Number of contracts | Position | Expiration date | Notional basis* | Notional value* | Unrealized appreciation (depreciation) |
| 2-Year U.S. Treasury Note Futures | 1,072 | Long | Apr 2019 | $227,381,367 | $227,624,125 | $242,758 |
| Hang Seng China Enterprises Index Futures | 748 | Long | Feb 2019 | 51,829,964 | 53,149,035 | 1,319,071 |
| Mini MSCI Emerging Markets Index Futures | 2,514 | Long | Mar 2019 | 122,248,051 | 133,732,230 | 11,484,179 |
| S&P 500 Index E-Mini Futures | 342 | Long | Mar 2019 | 43,691,318 | 46,217,025 | 2,525,707 |
| Euro STOXX 50 Index Futures | 2,522 | Short | Mar 2019 | (88,130,456) | (91,334,348) | (3,203,892) |
| FTSE 100 Index Futures | 560 | Short | Mar 2019 | (49,163,040) | (50,793,909) | (1,630,869) |
| OMX Stockholm 30 Index Futures | 796 | Short | Feb 2019 | (12,814,370) | (13,369,593) | (555,223) |
| Russell 2000 Mini Index Futures | 1,306 | Short | Mar 2019 | (92,473,472) | (97,897,760) | (5,424,288) |
| $4,757,443 |
| Contract to buy | Contract to sell | Counterparty (OTC) | Contractual settlement date | Unrealized appreciation | Unrealized depreciation | ||
| AUD | 56,600,000 | USD | 39,903,679 | Barclays Capital | 2/1/2019 | $1,238,713 | — |
| AUD | 18,300,000 | USD | 12,904,703 | Barclays Capital | 2/15/2019 | 399,612 | — |
| AUD | 53,700,000 | USD | 38,363,549 | Barclays Capital | 2/21/2019 | 680,331 | — |
| AUD | 3,221,819 | USD | 2,329,309 | Goldman Sachs | 3/20/2019 | 14,081 | — |
| AUD | 7,992,832 | USD | 5,736,320 | Natwest Markets PLC | 3/20/2019 | 77,267 | — |
| AUD | 2,460,704 | USD | 1,781,617 | Nomura Securities | 3/20/2019 | 8,177 | — |
| BRL | 215,000,000 | USD | 57,384,477 | Citigroup | 2/6/2019 | 1,558,561 | — |
| BRL | 79,000,000 | USD | 20,462,080 | Deutsche Bank | 3/15/2019 | 1,147,121 | — |
| BRL | 22,000,000 | USD | 5,934,078 | HSBC | 3/15/2019 | 83,675 | — |
| CAD | 25,800,000 | JPY | 2,079,234,900 | RBC Dominion Securities | 2/8/2019 | 542,914 | — |
| CAD | 2,200,000 | USD | 1,674,394 | JPMorgan Chase | 3/15/2019 | 1,409 | — |
| CAD | 6,200,000 | USD | 4,677,187 | Nomura Securities | 3/15/2019 | 45,529 | — |
| CAD | 335,165 | USD | 252,387 | HSBC | 3/20/2019 | 2,951 | — |
| CAD | 249,805 | USD | 189,519 | Morgan Stanley | 3/20/2019 | 789 | — |
| CHF | 7,124,383 | USD | 7,176,656 | Bank National Paris | 3/14/2019 | 12,471 | — |
| CHF | 1,112,199 | USD | 1,126,413 | Citigroup | 3/14/2019 | — | $(4,107) |
| CHF | 4,682,607 | USD | 4,718,790 | JPMorgan Chase | 3/14/2019 | 6,372 | — |
| CHF | 434,059 | USD | 438,856 | Merrill Lynch | 3/14/2019 | — | (853) |
| CHF | 4,250,000 | USD | 4,317,242 | JPMorgan Chase | 3/15/2019 | — | (28,173) |
| CHF | 1,148,654 | USD | 1,168,709 | Merrill Lynch | 3/20/2019 | — | (8,892) |
| CHF | 23,143,812 | USD | 23,448,313 | UBS AG | 3/20/2019 | — | (79,592) |
| CNY | 62,000,000 | USD | 9,194,720 | HSBC | 2/13/2019 | 52,828 | — |
| CZK | 306,560,000 | USD | 13,709,430 | Barclays Capital | 4/25/2019 | — | (54,338) |
| DKK | 7,896,246 | USD | 1,202,369 | Bank National Paris | 3/14/2019 | 12,279 | — |
| DKK | 5,827,938 | USD | 895,714 | Citigroup | 3/14/2019 | 775 | — |
| DKK | 4,024,934 | USD | 621,874 | JPMorgan Chase | 3/14/2019 | — | (2,735) |
| DKK | 33,574,662 | USD | 5,159,997 | Merrill Lynch | 3/20/2019 | 7,671 | — |
| EUR | 9,063,082 | USD | 10,385,490 | Barclays Capital | 3/14/2019 | 20,323 | — |
| SEE NOTES TO FINANCIAL STATEMENTS | SEMIANNUAL REPORT | JOHN HANCOCK GLOBAL ABSOLUTE RETURN STRATEGIES FUND | 23 |
| Contract to buy | Contract to sell | Counterparty (OTC) | Contractual settlement date | Unrealized appreciation | Unrealized depreciation | ||
| EUR | 763,032 | USD | 873,902 | HSBC | 3/14/2019 | $2,176 | — |
| EUR | 29,726,599 | USD | 33,971,321 | JPMorgan Chase | 3/14/2019 | 159,391 | — |
| EUR | 811,539 | USD | 928,925 | Merrill Lynch | 3/14/2019 | 2,847 | — |
| EUR | 6,116,637 | USD | 7,046,830 | Natwest Markets PLC | 3/14/2019 | — | $(23,990) |
| EUR | 208,511 | USD | 240,043 | Nomura Securities | 3/14/2019 | — | (640) |
| EUR | 4,500,000 | USD | 5,166,859 | HSBC | 3/15/2019 | 313 | — |
| EUR | 34,000,000 | USD | 39,292,729 | Natwest Markets PLC | 3/15/2019 | — | (251,875) |
| EUR | 13,304,198 | USD | 15,247,691 | Citigroup | 3/20/2019 | 36,076 | — |
| EUR | 67,466,173 | USD | 77,323,906 | JPMorgan Chase | 3/20/2019 | 180,748 | — |
| EUR | 3,381,505 | USD | 3,883,511 | Merrill Lynch | 3/20/2019 | 1,138 | — |
| EUR | 8,753,551 | USD | 10,278,212 | Morgan Stanley | 3/20/2019 | — | (222,196) |
| EUR | 5,261,366 | USD | 6,036,584 | Natwest Markets PLC | 3/20/2019 | 7,635 | — |
| EUR | 311,614 | USD | 355,190 | Nomura Securities | 3/20/2019 | 2,790 | — |
| EUR | 3,309,454 | USD | 3,791,192 | Societe Generale | 3/20/2019 | 10,685 | — |
| EUR | 7,781,494 | USD | 8,942,142 | UBS AG | 3/20/2019 | — | (2,818) |
| EUR | 23,200,000 | USD | 26,731,736 | Citigroup | 4/4/2019 | — | (42,689) |
| EUR | 34,000,000 | USD | 39,078,070 | Morgan Stanley | 4/4/2019 | 35,189 | — |
| EUR | 50,300,000 | USD | 57,858,330 | Bank National Paris | 4/23/2019 | 105,371 | — |
| GBP | 509,871 | USD | 658,203 | Citigroup | 3/14/2019 | 11,791 | — |
| GBP | 916,046 | USD | 1,153,663 | JPMorgan Chase | 3/14/2019 | 50,062 | — |
| GBP | 81,189 | USD | 106,756 | Nomura Securities | 3/14/2019 | — | (70) |
| GBP | 14,239,638 | USD | 18,507,296 | RBC Dominion Securities | 3/14/2019 | 204,230 | — |
| GBP | 11,999,973 | USD | 15,753,600 | UBS AG | 3/14/2019 | 14,904 | — |
| GBP | 6,400,000 | USD | 8,187,810 | Goldman Sachs | 3/15/2019 | 222,535 | — |
| GBP | 10,592,572 | USD | 13,600,457 | Citigroup | 3/20/2019 | 323,199 | — |
| GBP | 403,462 | USD | 520,504 | Natwest Markets PLC | 3/20/2019 | 9,837 | — |
| GBP | 36,816,838 | USD | 47,295,536 | RBC Dominion Securities | 3/20/2019 | 1,099,224 | — |
| GBP | 1,903,285 | USD | 2,445,325 | Societe Generale | 3/20/2019 | 56,494 | — |
| GBP | 302,101 | USD | 386,676 | UBS AG | 3/20/2019 | 10,428 | — |
| HKD | 26,000,000 | USD | 3,333,972 | Natwest Markets PLC | 3/15/2019 | — | (15,359) |
| HKD | 70,746,190 | USD | 9,054,785 | Natwest Markets PLC | 3/20/2019 | — | (23,181) |
| IDR | 47,000,000,000 | USD | 3,333,735 | Deutsche Bank | 2/4/2019 | 30,015 | — |
| INR | 1,100,000,000 | USD | 15,463,555 | Natwest Markets PLC | 2/4/2019 | 3,261 | — |
| INR | 305,000,000 | USD | 4,235,271 | Societe Generale | 4/25/2019 | 19,668 | — |
| JPY | 4,259,325,000 | CAD | 50,000,000 | RBC Dominion Securities | 2/8/2019 | 1,058,160 | — |
| JPY | 4,261,575,000 | CAD | 50,000,000 | RBC Dominion Securities | 2/14/2019 | 1,090,945 | — |
| JPY | 4,258,450,000 | CAD | 50,000,000 | RBC Dominion Securities | 2/22/2019 | 1,078,377 | — |
| JPY | 3,953,000,000 | USD | 35,343,619 | Deutsche Bank | 3/12/2019 | 1,046,276 | — |
| JPY | 2,947,000,000 | USD | 26,172,431 | Natwest Markets PLC | 3/12/2019 | 956,590 | — |
| JPY | 155,477,513 | USD | 1,386,396 | Citigroup | 3/20/2019 | 45,927 | — |
| JPY | 52,519,265 | USD | 469,434 | Deutsche Bank | 3/20/2019 | 14,395 | — |
| JPY | 1,552,190,820 | USD | 13,877,010 | Natwest Markets PLC | 3/20/2019 | 422,407 | — |
| JPY | 9,559,096 | USD | 84,677 | RBC Dominion Securities | 3/20/2019 | 3,386 | — |
| JPY | 370,000,000 | USD | 3,433,299 | Bank National Paris | 4/23/2019 | — | (14,290) |
| 24 | JOHN HANCOCK GLOBAL ABSOLUTE RETURN STRATEGIES FUND | SEMIANNUAL REPORT | SEE NOTES TO FINANCIAL STATEMENTS |
| Contract to buy | Contract to sell | Counterparty (OTC) | Contractual settlement date | Unrealized appreciation | Unrealized depreciation | ||
| JPY | 2,700,000,000 | USD | 24,820,260 | Merrill Lynch | 4/24/2019 | $131,458 | — |
| KRW | 33,000,000,000 | USD | 29,516,995 | HSBC | 2/12/2019 | 150,104 | — |
| KRW | 32,800,000,000 | USD | 29,364,369 | Merrill Lynch | 2/15/2019 | 125,980 | — |
| KRW | 4,000,000,000 | USD | 3,579,098 | Bank National Paris | 3/12/2019 | 20,354 | — |
| KRW | 1,200,000,000 | USD | 1,072,530 | Natwest Markets PLC | 4/25/2019 | 8,875 | — |
| MXN | 99,000,000 | USD | 5,205,543 | JPMorgan Chase | 2/5/2019 | — | $(29,060) |
| MYR | 15,000,000 | USD | 3,634,601 | Goldman Sachs | 2/4/2019 | 27,508 | — |
| NOK | 105,750,000 | EUR | 10,874,148 | Citigroup | 4/1/2019 | 63,932 | — |
| NOK | 111,037,500 | EUR | 11,403,942 | Citigroup | 4/3/2019 | 81,901 | — |
| NOK | 92,795,625 | EUR | 9,579,991 | Citigroup | 4/5/2019 | 10,407 | — |
| NOK | 236,500,000 | EUR | 24,121,577 | Citigroup | 4/8/2019 | 360,929 | — |
| NOK | 113,416,875 | EUR | 11,706,219 | Citigroup | 4/10/2019 | 12,547 | — |
| NOK | 302,000,000 | EUR | 30,923,549 | Bank National Paris | 4/15/2019 | 309,352 | — |
| NOK | 236,500,000 | EUR | 24,126,744 | Citigroup | 4/15/2019 | 345,753 | — |
| RUB | 290,000,000 | USD | 4,391,873 | JPMorgan Chase | 2/4/2019 | 44,413 | — |
| RUB | 1,023,952,777 | USD | 15,218,008 | HSBC | 4/25/2019 | 222,031 | — |
| SEK | 30,891,265 | USD | 3,411,711 | HSBC | 3/14/2019 | 12,180 | — |
| SEK | 38,869,392 | USD | 4,291,177 | Natwest Markets PLC | 3/14/2019 | 16,985 | — |
| SEK | 2,493,066 | USD | 277,784 | Citigroup | 3/20/2019 | — | (1,319) |
| SEK | 90,585,531 | USD | 10,176,848 | Merrill Lynch | 3/20/2019 | — | (131,484) |
| SEK | 19,196,637 | USD | 2,143,900 | Nomura Securities | 3/20/2019 | — | (15,114) |
| SEK | 17,332,432 | USD | 1,942,382 | Societe Generale | 3/20/2019 | — | (20,324) |
| SEK | 17,031,740 | USD | 1,906,119 | UBS AG | 3/20/2019 | — | (17,407) |
| SGD | 3,903,639 | USD | 2,844,514 | Natwest Markets PLC | 3/20/2019 | 57,970 | — |
| SGD | 185,828 | USD | 135,718 | UBS AG | 3/20/2019 | 2,451 | — |
| TRY | 8,300,000 | USD | 1,527,982 | Barclays Capital | 4/25/2019 | 10,222 | — |
| TRY | 42,590,000 | USD | 7,547,310 | Societe Generale | 4/25/2019 | 345,716 | — |
| USD | 18,057,237 | AUD | 25,470,000 | Citigroup | 2/1/2019 | — | (456,840) |
| USD | 22,071,170 | AUD | 31,130,000 | UBS AG | 2/1/2019 | — | (557,146) |
| USD | 26,630,174 | AUD | 36,500,000 | JPMorgan Chase | 2/15/2019 | 94,245 | — |
| USD | 20,181,056 | AUD | 28,000,000 | Barclays Capital | 2/21/2019 | — | (177,019) |
| USD | 10,087,322 | AUD | 14,000,000 | Deutsche Bank | 2/21/2019 | — | (91,716) |
| USD | 10,522,744 | AUD | 14,600,000 | Morgan Stanley | 2/21/2019 | — | (92,538) |
| USD | 10,588,650 | AUD | 14,600,000 | Bank National Paris | 2/26/2019 | — | (27,391) |
| USD | 20,408,021 | AUD | 28,000,000 | JPMorgan Chase | 2/26/2019 | 48,490 | — |
| USD | 10,153,574 | AUD | 14,000,000 | Societe Generale | 2/26/2019 | — | (26,191) |
| USD | 1,923,784 | AUD | 2,600,000 | HSBC | 3/15/2019 | 32,805 | — |
| USD | 9,817,593 | AUD | 13,675,356 | HSBC | 3/20/2019 | — | (129,177) |
| USD | 44,362,917 | AUD | 61,700,000 | Bank National Paris | 4/15/2019 | — | (530,817) |
| USD | 14,395,010 | BRL | 54,000,000 | Citigroup | 2/6/2019 | — | (409,288) |
| USD | 17,302,420 | BRL | 65,000,000 | Goldman Sachs | 2/6/2019 | — | (517,568) |
| USD | 12,506,652 | BRL | 47,000,000 | HSBC | 2/6/2019 | — | (378,570) |
| USD | 12,972,572 | BRL | 49,000,000 | Merrill Lynch | 2/6/2019 | — | (460,957) |
| USD | 24,324,343 | BRL | 92,000,000 | Goldman Sachs | 3/15/2019 | — | (840,804) |
| SEE NOTES TO FINANCIAL STATEMENTS | SEMIANNUAL REPORT | JOHN HANCOCK GLOBAL ABSOLUTE RETURN STRATEGIES FUND | 25 |
| Contract to buy | Contract to sell | Counterparty (OTC) | Contractual settlement date | Unrealized appreciation | Unrealized depreciation | ||
| USD | 7,609,751 | BRL | 29,000,000 | Morgan Stanley | 3/15/2019 | — | $(322,741) |
| USD | 18,836,491 | BRL | 70,100,000 | Bank National Paris | 3/18/2019 | — | (333,358) |
| USD | 5,339,318 | BRL | 20,700,000 | Citigroup | 3/18/2019 | — | (321,394) |
| USD | 47,925,773 | BRL | 187,500,000 | Barclays Capital | 3/26/2019 | — | (3,313,843) |
| USD | 8,714,597 | BRL | 33,200,000 | JPMorgan Chase | 3/26/2019 | — | (358,231) |
| USD | 63,752,277 | BRL | 238,000,000 | Bank National Paris | 4/9/2019 | — | (1,216,139) |
| USD | 4,262,771 | BRL | 16,000,000 | Bank National Paris | 4/25/2019 | — | (100,472) |
| USD | 4,243,098 | BRL | 16,030,000 | JPMorgan Chase | 4/25/2019 | — | (128,326) |
| USD | 13,739,062 | BRL | 52,600,000 | Deutsche Bank | 5/9/2019 | — | (591,537) |
| USD | 1,646,079 | CAD | 2,200,000 | JPMorgan Chase | 3/15/2019 | — | (29,724) |
| USD | 5,579,863 | CAD | 7,500,000 | RBC Dominion Securities | 3/15/2019 | — | (133,100) |
| USD | 25,219 | CAD | 32,739 | Deutsche Bank | 3/20/2019 | $277 | — |
| USD | 1,004,162 | CAD | 1,339,480 | Goldman Sachs | 3/20/2019 | — | (16,290) |
| USD | 13,643 | CAD | 18,237 | JPMorgan Chase | 3/20/2019 | — | (251) |
| USD | 32,949,440 | CHF | 32,446,306 | JPMorgan Chase | 3/14/2019 | 208,271 | — |
| USD | 4,319,983 | CHF | 4,250,000 | JPMorgan Chase | 3/15/2019 | 30,914 | — |
| USD | 965,305 | CHF | 953,981 | Deutsche Bank | 3/20/2019 | 2,053 | — |
| USD | 2,303,824 | CHF | 2,268,238 | JPMorgan Chase | 3/20/2019 | 13,544 | — |
| USD | 1,036,038 | CHF | 1,020,056 | Morgan Stanley | 3/20/2019 | 6,069 | — |
| USD | 19,036,512 | CHF | 19,000,000 | Natwest Markets PLC | 3/20/2019 | — | (148,129) |
| USD | 724,024 | CHF | 715,001 | Nomura Securities | 3/20/2019 | 2,075 | — |
| USD | 6,100,168 | CHF | 6,018,258 | Societe Generale | 3/20/2019 | 23,425 | — |
| USD | 8,866,009 | CNY | 62,000,000 | HSBC | 2/13/2019 | — | (381,540) |
| USD | 9,167,529 | CNY | 62,000,000 | HSBC | 5/23/2019 | — | (65,959) |
| USD | 5,658,439 | DKK | 36,835,006 | JPMorgan Chase | 3/14/2019 | — | (7,743) |
| USD | 8,383,123 | DKK | 55,000,000 | HSBC | 3/20/2019 | — | (82,241) |
| USD | 4,241,569 | EUR | 3,700,000 | Goldman Sachs | 3/7/2019 | — | (3,843) |
| USD | 38,899,287 | EUR | 33,900,000 | JPMorgan Chase | 3/7/2019 | 2,136 | — |
| USD | 118,330,049 | EUR | 103,258,311 | JPMorgan Chase | 3/14/2019 | — | (226,387) |
| USD | 80,550,617 | EUR | 70,000,000 | JPMorgan Chase | 3/15/2019 | 172,388 | — |
| USD | 85,231,050 | EUR | 75,000,000 | Bank National Paris | 3/20/2019 | — | (928,410) |
| USD | 337,103 | EUR | 296,096 | HSBC | 3/20/2019 | — | (3,050) |
| USD | 25,955,853 | EUR | 22,225,198 | Natwest Markets PLC | 3/20/2019 | 423,706 | — |
| USD | 27,849,900 | EUR | 24,197,664 | Societe Generale | 3/20/2019 | 51,798 | — |
| USD | 1,611,137 | EUR | 1,400,000 | Bank National Paris | 4/23/2019 | — | (2,167) |
| USD | 58,123,592 | EUR | 50,300,000 | JPMorgan Chase | 4/23/2019 | 159,891 | — |
| USD | 412,830 | GBP | 322,323 | Citigroup | 3/14/2019 | — | (10,716) |
| USD | 81,350,832 | GBP | 63,460,444 | JPMorgan Chase | 3/14/2019 | — | (2,039,048) |
| USD | 5,406,309 | GBP | 4,200,000 | Bank National Paris | 3/15/2019 | — | (112,980) |
| USD | 20,237,834 | GBP | 15,700,000 | Morgan Stanley | 3/15/2019 | — | (393,794) |
| USD | 8,266,453 | GBP | 6,322,988 | Natwest Markets PLC | 3/20/2019 | — | (44,947) |
| USD | 9,677,048 | GBP | 7,480,772 | RBC Dominion Securities | 3/20/2019 | — | (156,228) |
| USD | 57,375,600 | GBP | 44,190,767 | Societe Generale | 3/20/2019 | — | (711,996) |
| USD | 1,772,978 | GBP | 1,365,781 | UBS AG | 3/20/2019 | — | (22,305) |
| 26 | JOHN HANCOCK GLOBAL ABSOLUTE RETURN STRATEGIES FUND | SEMIANNUAL REPORT | SEE NOTES TO FINANCIAL STATEMENTS |
| Contract to buy | Contract to sell | Counterparty (OTC) | Contractual settlement date | Unrealized appreciation | Unrealized depreciation | ||
| USD | 36,722,787 | HKD | 286,000,000 | Citigroup | 3/15/2019 | $218,042 | — |
| USD | 9,048,448 | HKD | 70,746,190 | JPMorgan Chase | 3/20/2019 | 16,844 | — |
| USD | 3,038,138 | IDR | 47,000,000,000 | Deutsche Bank | 2/4/2019 | — | $(325,612) |
| USD | 3,284,072 | IDR | 47,000,000,000 | Deutsche Bank | 5/15/2019 | — | (47,946) |
| USD | 14,898,476 | INR | 1,100,000,000 | Natwest Markets PLC | 2/4/2019 | — | (568,340) |
| USD | 15,271,415 | INR | 1,100,000,000 | Natwest Markets PLC | 5/15/2019 | — | (33,956) |
| USD | 36,409,842 | JPY | 3,940,000,000 | Barclays Capital | 3/12/2019 | 139,620 | — |
| USD | 738,000 | JPY | 82,513,837 | Goldman Sachs | 3/15/2019 | — | (21,802) |
| USD | 15,782,827 | JPY | 1,769,746,694 | Societe Generale | 3/20/2019 | — | (520,803) |
| USD | 29,696,288 | KRW | 33,000,000,000 | HSBC | 2/12/2019 | 29,189 | — |
| USD | 29,509,672 | KRW | 32,800,000,000 | HSBC | 2/15/2019 | 19,323 | — |
| USD | 29,042,483 | KRW | 32,800,000,000 | HSBC | 2/26/2019 | — | (459,050) |
| USD | 29,240,809 | KRW | 32,800,000,000 | HSBC | 3/11/2019 | — | (273,746) |
| USD | 23,934,249 | KRW | 26,500,000,000 | Bank National Paris | 3/12/2019 | 87,879 | — |
| USD | 29,314,051 | KRW | 33,000,000,000 | HSBC | 3/14/2019 | — | (383,408) |
| USD | 28,977,778 | KRW | 32,600,000,000 | HSBC | 3/20/2019 | — | (365,515) |
| USD | 29,566,448 | KRW | 33,000,000,000 | HSBC | 4/11/2019 | — | (158,467) |
| USD | 44,596,974 | KRW | 49,900,000,000 | Bank National Paris | 4/16/2019 | — | (358,086) |
| USD | 3,146,088 | KRW | 3,520,000,000 | Natwest Markets PLC | 4/25/2019 | — | (26,034) |
| USD | 29,443,447 | KRW | 32,800,000,000 | Merrill Lynch | 5/9/2019 | — | (128,836) |
| USD | 5,003,673 | MXN | 99,000,000 | Citigroup | 2/5/2019 | — | (172,810) |
| USD | 5,128,914 | MXN | 99,000,000 | JPMorgan Chase | 5/15/2019 | 30,014 | — |
| USD | 3,598,676 | MYR | 15,000,000 | Barclays Capital | 2/4/2019 | — | (63,434) |
| USD | 3,634,601 | MYR | 15,000,000 | Goldman Sachs | 5/15/2019 | — | (41,520) |
| USD | 44,596,105 | NOK | 379,000,000 | Bank National Paris | 4/15/2019 | — | (480,797) |
| USD | 6,621,063 | PEN | 22,000,000 | Bank National Paris | 4/25/2019 | 26,996 | — |
| USD | 8,595,713 | PHP | 455,100,000 | Natwest Markets PLC | 4/25/2019 | — | (88,304) |
| USD | 4,363,166 | RUB | 290,000,000 | Merrill Lynch | 2/4/2019 | — | (73,120) |
| USD | 4,333,233 | RUB | 290,000,000 | JPMorgan Chase | 5/15/2019 | — | (27,541) |
| USD | 1,008,533 | SEK | 9,047,343 | Citigroup | 3/12/2019 | 5,925 | — |
| USD | 25,896,465 | SEK | 231,671,099 | JPMorgan Chase | 3/14/2019 | 218,765 | — |
| USD | 7,086,429 | SEK | 62,932,484 | Nomura Securities | 3/15/2019 | 110,593 | — |
| USD | 3,902,649 | SEK | 34,687,685 | Merrill Lynch | 3/20/2019 | 56,003 | — |
| USD | 11,093,606 | SEK | 100,000,000 | Societe Generale | 3/20/2019 | 4,237 | — |
| USD | 2,982,466 | SGD | 4,089,466 | Societe Generale | 3/20/2019 | — | (58,186) |
| USD | 17,136,266 | TWD | 520,000,000 | Bank National Paris | 3/15/2019 | 158,380 | — |
| USD | 44,565,019 | TWD | 1,370,000,000 | Bank National Paris | 4/12/2019 | — | (247,461) |
| USD | 9,513,276 | ZAR | 140,000,000 | Citigroup | 2/6/2019 | — | (1,039,555) |
| USD | 4,204,087 | ZAR | 58,780,000 | Bank National Paris | 4/25/2019 | — | (186,019) |
| USD | 10,166,304 | ZAR | 140,000,000 | Merrill Lynch | 5/15/2019 | — | (263,490) |
| ZAR | 140,000,000 | USD | 10,286,136 | Merrill Lynch | 2/6/2019 | 266,695 | — |
| $19,251,979 | $(24,307,255) | ||||||
| SEE NOTES TO FINANCIAL STATEMENTS | SEMIANNUAL REPORT | JOHN HANCOCK GLOBAL ABSOLUTE RETURN STRATEGIES FUND | 27 |
| Options on index | ||||||||
| Counterparty (OTC)/ Exchange- traded | Name of issuer | Exercise price | Expiration date | Number of contracts | Notional amount | Premium | Value | |
| Calls | ||||||||
| Barclays Bank PLC | Euro STOXX 50 Index | EUR | 3,140.00 | Mar 2019 | 1,108 | 1,108 | $58,972 | $(58,972) |
| Barclays Bank PLC | S&P 500 Index | USD | 2,660.00 | Feb 2019 | 2,500 | 2,500 | 116,250 | (159,309) |
| Barclays Bank PLC | S&P 500 Index | USD | 2,635.00 | Feb 2019 | 2,500 | 2,500 | 117,500 | (210,224) |
| Citibank N.A. | KOSPI 200 Index | KRW | 286.00 | Mar 2019 | 10,820,000 | 10,820,000 | 48,614 | (48,614) |
| Citibank N.A. | S&P/ASX 200 Index | AUD | 5,865.00 | Mar 2019 | 316 | 316 | 13,428 | (13,428) |
| Deutsche Bank AG | Nikkei 225 Index | JPY | 20,625.00 | Feb 2019 | 14,040 | 14,040 | 48,409 | (54,419) |
| Deutsche Bank AG | Swiss Market Index | CHF | 8,950.00 | Mar 2019 | 146 | 146 | 17,765 | (17,765) |
| Goldman Sachs | Ibovespa Brasil Index | BRL | 87,556.78 | Feb 2019 | 749 | 749 | 660,528 | (2,065,169) |
| Goldman Sachs | Ibovespa Brasil Index | BRL | 86,796.41 | Feb 2019 | 1,231 | 1,231 | 1,098,847 | (3,646,572) |
| Merrill Lynch | Nikkei 225 Index | JPY | 20,760.00 | Mar 2019 | 14,040 | 14,040 | 47,434 | (47,434) |
| Merrill Lynch | S&P 500 Index | USD | 2,680.00 | Mar 2019 | 2,500 | 2,500 | 108,600 | (108,600) |
| Merrill Lynch | Swiss Market Index | CHF | 8,450.71 | Mar 2019 | 2,194 | 2,194 | 629,920 | (1,055,131) |
| Merrill Lynch | Swiss Market Index | CHF | 8,560.68 | Mar 2019 | 2,194 | 2,194 | 640,907 | (848,014) |
| Morgan Stanley & Company, Inc. | Euro STOXX 50 Index | EUR | 3,135.00 | Feb 2019 | 1,108 | 1,108 | 58,350 | (68,078) |
| Morgan Stanley & Company, Inc. | Ibovespa Brasil Index | BRL | 87,429.51 | Feb 2019 | 645 | 645 | 573,117 | (1,800,517) |
| Morgan Stanley & Company, Inc. | Swiss Market Index | CHF | 8,950.00 | Feb 2019 | 146 | 146 | 17,111 | (16,721) |
| Morgan Stanley & Company, Inc. | Swiss Market Index | CHF | 8,870.00 | Feb 2019 | 146 | 146 | 17,667 | (24,748) |
| Societe Generale Paris | Euro STOXX 50 Index | EUR | 3,155.00 | Feb 2019 | 1,108 | 1,108 | 52,387 | (49,030) |
| Societe Generale Paris | KOSPI 200 Index | KRW | 283.00 | Feb 2019 | 10,820,000 | 10,820,000 | 38,768 | (59,255) |
| Societe Generale Paris | KOSPI 200 Index | KRW | 286.50 | Feb 2019 | 10,820,000 | 10,820,000 | 46,764 | (40,776) |
| Societe Generale Paris | Nikkei 225 Index | JPY | 20,800.00 | Feb 2019 | 14,040 | 14,040 | 49,999 | (38,981) |
| Societe Generale Paris | Nikkei 225 Index | JPY | 20,660.00 | Feb 2019 | 14,040 | 14,040 | 47,878 | (51,123) |
| Societe Generale Paris | Nikkei 225 Index | JPY | 20,600.00 | Feb 2019 | 14,040 | 14,040 | 47,678 | (57,685) |
| Societe Generale Paris | S&P/ASX 200 Index | AUD | 5,910.00 | Feb 2019 | 316 | 316 | 12,485 | (8,178) |
| 28 | JOHN HANCOCK GLOBAL ABSOLUTE RETURN STRATEGIES FUND | SEMIANNUAL REPORT | SEE NOTES TO FINANCIAL STATEMENTS |
| Options on index (continued) | ||||||||
| Counterparty (OTC)/ Exchange- traded | Name of issuer | Exercise price | Expiration date | Number of contracts | Notional amount | Premium | Value | |
| Societe Generale Paris | S&P/ASX 200 Index | AUD | 5,880.00 | Feb 2019 | 316 | 316 | $13,144 | $(11,403) |
| Societe Generale Paris | Swiss Market Index | CHF | 8,915.00 | Feb 2019 | 146 | 146 | 17,801 | (20,845) |
| Societe Generale Paris | Swiss Market Index | CHF | 8,925.00 | Feb 2019 | 146 | 146 | 18,456 | (20,386) |
| UBS AG | Euro STOXX 50 Index | EUR | 3,150.00 | Feb 2019 | 1,108 | 1,108 | 53,538 | (54,659) |
| UBS AG | Euro STOXX 50 Index | EUR | 3,150.00 | Feb 2019 | 1,108 | 1,108 | 62,273 | (58,051) |
| UBS AG | KOSPI 200 Index | KRW | 281.65 | Feb 2019 | 10,820,000 | 10,820,000 | 41,829 | (65,482) |
| UBS AG | KOSPI 200 Index | KRW | 281.65 | Feb 2019 | 10,820,000 | 10,820,000 | 38,948 | (66,899) |
| UBS AG | S&P 500 Index | USD | 2,635.00 | Feb 2019 | 2,500 | 2,500 | 117,500 | (213,054) |
| UBS AG | S&P 500 Index | USD | 2,655.00 | Feb 2019 | 2,500 | 2,500 | 113,455 | (176,780) |
| UBS AG | S&P/ASX 200 Index | AUD | 5,865.00 | Feb 2019 | 316 | 316 | 13,787 | (13,231) |
| UBS AG | S&P/ASX 200 Index | AUD | 5,880.00 | Feb 2019 | 316 | 316 | 12,883 | (11,269) |
| $5,072,992 | $(11,260,802) | |||||||
| Puts | ||||||||
| Barclays Bank PLC | Euro STOXX 50 Index | EUR | 3,140.00 | Mar 2019 | 1,108 | 1,108 | $56,981 | $(56,981) |
| Barclays Bank PLC | S&P 500 Index | USD | 2,660.00 | Feb 2019 | 2,500 | 2,500 | 101,750 | (51,004) |
| Barclays Bank PLC | S&P 500 Index | USD | 2,635.00 | Feb 2019 | 2,500 | 2,500 | 118,500 | (39,867) |
| Citibank N.A. | KOSPI 200 Index | KRW | 286.00 | Mar 2019 | 10,820,000 | 10,820,000 | 38,898 | (38,898) |
| Citibank N.A. | S&P/ASX 200 Index | AUD | 5,865.00 | Mar 2019 | 316 | 316 | 19,754 | (19,754) |
| Deutsche Bank AG | Nikkei 225 Index | JPY | 20,625.00 | Feb 2019 | 14,040 | 14,040 | 50,079 | (37,314) |
| Deutsche Bank AG | Swiss Market Index | CHF | 8,950.00 | Mar 2019 | 146 | 146 | 18,058 | (18,058) |
| Goldman Sachs | Hang Seng China Enterprises Index | HKD | 10,892.40 | Feb 2019 | 19,342 | 19,342 | 569,452 | (359,962) |
| Goldman Sachs | Ibovespa Brasil Index | BRL | 94,467.30 | Feb 2019 | 225 | 225 | 131,158 | (33,076) |
| Merrill Lynch | Ibovespa Brasil Index | BRL | 93,855.29 | Feb 2019 | 525 | 525 | 357,000 | (62,235) |
| Merrill Lynch | Ibovespa Brasil Index | BRL | 94,137.16 | Feb 2019 | 596 | 596 | 405,280 | (78,038) |
| Merrill Lynch | Ibovespa Brasil Index | BRL | 94,110.99 | Feb 2019 | 609 | 609 | 414,120 | (79,009) |
| Merrill Lynch | Ibovespa Brasil Index | BRL | 94,672.34 | Feb 2019 | 444 | 444 | 301,920 | (70,102) |
| Merrill Lynch | Nikkei 225 Index | JPY | 20,760.00 | Mar 2019 | 14,040 | 14,040 | 46,660 | (46,660) |
| Merrill Lynch | S&P 500 Index | USD | 2,680.00 | Mar 2019 | 2,500 | 2,500 | 109,900 | (109,900) |
| SEE NOTES TO FINANCIAL STATEMENTS | SEMIANNUAL REPORT | JOHN HANCOCK GLOBAL ABSOLUTE RETURN STRATEGIES FUND | 29 |
| Options on index (continued) | ||||||||
| Counterparty (OTC)/ Exchange- traded | Name of issuer | Exercise price | Expiration date | Number of contracts | Notional amount | Premium | Value | |
| Morgan Stanley & Company, Inc. | Euro STOXX 50 Index | EUR | 3,135.00 | Feb 2019 | 1,108 | 1,108 | $58,270 | $(39,209) |
| Morgan Stanley & Company, Inc. | Ibovespa Brasil Index | BRL | 94,878.27 | Feb 2019 | 226 | 226 | 133,944 | (38,322) |
| Morgan Stanley & Company, Inc. | Swiss Market Index | CHF | 8,950.00 | Feb 2019 | 146 | 146 | 18,165 | (14,456) |
| Morgan Stanley & Company, Inc. | Swiss Market Index | CHF | 8,870.00 | Feb 2019 | 146 | 146 | 18,634 | (10,757) |
| Societe Generale Paris | Euro STOXX 50 Index | EUR | 3,155.00 | Feb 2019 | 1,108 | 1,108 | 63,239 | (45,430) |
| Societe Generale Paris | KOSPI 200 Index | KRW | 283.00 | Feb 2019 | 10,820,000 | 10,820,000 | 42,155 | (28,072) |
| Societe Generale Paris | KOSPI 200 Index | KRW | 286.50 | Feb 2019 | 10,820,000 | 10,820,000 | 43,615 | (43,033) |
| Societe Generale Paris | Nikkei 225 Index | JPY | 20,800.00 | Feb 2019 | 14,040 | 14,040 | 46,794 | (42,847) |
| Societe Generale Paris | Nikkei 225 Index | JPY | 20,660.00 | Feb 2019 | 14,040 | 14,040 | 49,419 | (36,961) |
| Societe Generale Paris | Nikkei 225 Index | JPY | 20,600.00 | Feb 2019 | 14,040 | 14,040 | 51,544 | (37,523) |
| Societe Generale Paris | S&P/ASX 200 Index | AUD | 5,910.00 | Feb 2019 | 316 | 316 | 17,785 | (25,144) |
| Societe Generale Paris | S&P/ASX 200 Index | AUD | 5,880.00 | Feb 2019 | 316 | 316 | 18,777 | (22,197) |
| Societe Generale Paris | Swiss Market Index | CHF | 8,915.00 | Feb 2019 | 146 | 146 | 18,441 | (13,490) |
| Societe Generale Paris | Swiss Market Index | CHF | 8,925.00 | Feb 2019 | 146 | 146 | 18,515 | (14,535) |
| UBS AG | Euro STOXX 50 Index | EUR | 3,150.00 | Feb 2019 | 1,108 | 1,108 | 62,402 | (44,767) |
| UBS AG | Euro STOXX 50 Index | EUR | 3,150.00 | Feb 2019 | 1,108 | 1,108 | 57,707 | (48,307) |
| UBS AG | KOSPI 200 Index | KRW | 281.65 | Feb 2019 | 10,820,000 | 10,820,000 | 35,748 | (21,447) |
| UBS AG | KOSPI 200 Index | KRW | 281.65 | Feb 2019 | 10,820,000 | 10,820,000 | 39,625 | (22,733) |
| UBS AG | S&P 500 Index | USD | 2,635.00 | Feb 2019 | 2,500 | 2,500 | 116,875 | (42,354) |
| UBS AG | S&P 500 Index | USD | 2,655.00 | Feb 2019 | 2,500 | 2,500 | 117,205 | (56,197) |
| UBS AG | S&P/ASX 200 Index | AUD | 5,865.00 | Feb 2019 | 316 | 316 | 16,792 | (17,013) |
| UBS AG | S&P/ASX 200 Index | AUD | 5,880.00 | Feb 2019 | 316 | 316 | 18,821 | (21,382) |
| UBS AG | Swiss Market Index | CHF | 8,870.38 | Mar 2019 | 784 | 784 | 94,586 | (116,714) |
| UBS AG | Swiss Market Index | CHF | 8,851.79 | Mar 2019 | 532 | 532 | 65,221 | (75,121) |
| UBS AG | Swiss Market Index | CHF | 8,862.97 | Mar 2019 | 252 | 252 | 30,976 | (36,734) |
| $3,994,765 | $(2,015,603) | |||||||
| Exchange-traded | S&P 500 Index | USD | 2,580.00 | Mar 2019 | 265 | 26,500 | 2,013,487 | (568,425) |
| 30 | JOHN HANCOCK GLOBAL ABSOLUTE RETURN STRATEGIES FUND | SEMIANNUAL REPORT | SEE NOTES TO FINANCIAL STATEMENTS |
| Options on index (continued) | ||||||||
| Counterparty (OTC)/ Exchange- traded | Name of issuer | Exercise price | Expiration date | Number of contracts | Notional amount | Premium | Value | |
| Exchange-traded | S&P 500 Index | USD | 2,620.00 | Mar 2019 | 143 | 14,300 | $914,923 | $(381,810) |
| Exchange-traded | S&P 500 Index | USD | 2,900.00 | Dec 2019 | 111 | 11,100 | 1,786,885 | (2,743,365) |
| Exchange-traded | S&P 500 Index | USD | 2,925.00 | Dec 2019 | 182 | 18,200 | 2,930,727 | (4,760,210) |
| Exchange-traded | S&P 500 Index | USD | 2,675.00 | Dec 2019 | 515 | 51,500 | 9,423,104 | (7,397,975) |
| Exchange-traded | S&P 500 Index | USD | 2,725.00 | Dec 2019 | 130 | 13,000 | 2,313,749 | (2,107,300) |
| Exchange-traded | S&P 500 Index | USD | 2,800.00 | Dec 2019 | 180 | 18,000 | 3,225,252 | (3,510,000) |
| $22,608,127 | $(21,469,085) | |||||||
| $31,675,884 | $(34,745,490) | |||||||
| Interest rate swaps | ||||||||||
| Counterparty (OTC)/ Centrally cleared | Notional amount | Currency | Payments made | Payments received | Fixed payment frequency | Floating payment frequency | Maturity date | Unamortized upfront payment paid (received) | Unrealized appreciation (depreciation) | Value |
| Deutsche Bank AG | 2,535,000,000 | CLP | CLICP | Fixed 4.020% | Semi-Annual | Semi-Annual | Sep 2027 | — | $45,144 | $45,144 |
| Goldman Sachs | 2,614,000,000 | CLP | CLICP | Fixed 4.030% | Semi-Annual | Semi-Annual | Sep 2027 | — | 49,764 | 49,764 |
| Goldman Sachs | 3,601,000,000 | CLP | CLICP | Fixed 4.038% | Semi-Annual | Semi-Annual | Sep 2027 | — | 71,463 | 71,463 |
| — | $166,371 | $166,371 | ||||||||
| Centrally cleared | 217,200,000 | CAD | 3 month CDOR | Fixed 1.879% | Semi-Annual | Semi-Annual | Oct 2019 | — | (511,565) | (511,565) |
| Centrally cleared | 144,800,000 | CAD | 3 month CDOR | Fixed 1.840% | Semi-Annual | Semi-Annual | Oct 2019 | — | (386,944) | (386,944) |
| Centrally cleared | 1,356,000,000 | SEK | Fixed -0.213% | 3 month STIBOR | Annual | Quarterly | Oct 2019 | — | 244,249 | 244,249 |
| Centrally cleared | 904,000,000 | SEK | Fixed -0.220% | 3 month STIBOR | Annual | Quarterly | Oct 2019 | — | 170,042 | 170,042 |
| Centrally cleared | 72,400,000 | CAD | 3 month CDOR | Fixed 1.830% | Semi-Annual | Semi-Annual | Oct 2019 | — | (193,129) | (193,129) |
| Centrally cleared | 452,000,000 | SEK | Fixed -0.222% | 3 month STIBOR | Annual | Quarterly | Oct 2019 | — | 86,888 | 86,888 |
| Centrally cleared | 217,200,000 | CAD | 3 month CDOR | Fixed 1.775% | Semi-Annual | Semi-Annual | Nov 2019 | — | (671,704) | (671,704) |
| Centrally cleared | 144,800,000 | CAD | 3 month CDOR | Fixed 1.800% | Semi-Annual | Semi-Annual | Nov 2019 | — | (406,079) | (406,079) |
| Centrally cleared | 144,800,000 | CAD | 3 month CDOR | Fixed 1.795% | Semi-Annual | Semi-Annual | Nov 2019 | — | (423,581) | (423,581) |
| Centrally cleared | 1,356,000,000 | SEK | Fixed -0.247% | 3 month STIBOR | Annual | Quarterly | Nov 2019 | — | 118,832 | 118,832 |
| Centrally cleared | 217,200,000 | CAD | 3 month CDOR | Fixed 1.775% | Semi-Annual | Semi-Annual | Nov 2019 | — | (668,044) | (668,044) |
| Centrally cleared | 904,000,000 | SEK | Fixed -0.245% | 3 month STIBOR | Annual | Quarterly | Nov 2019 | — | 78,970 | 78,970 |
| Centrally cleared | 904,000,000 | SEK | Fixed -0.257% | 3 month STIBOR | Annual | Quarterly | Nov 2019 | — | 91,157 | 91,157 |
| Centrally cleared | 72,400,000 | CAD | 3 month CDOR | Fixed 1.780% | Semi-Annual | Semi-Annual | Nov 2019 | — | (221,555) | (221,555) |
| Centrally cleared | 1,356,000,000 | SEK | Fixed -0.249% | 3 month STIBOR | Annual | Quarterly | Nov 2019 | — | 123,432 | 123,432 |
| Centrally cleared | 72,400,000 | CAD | 3 month CDOR | Fixed 1.800% | Semi-Annual | Semi-Annual | Nov 2019 | — | (200,202) | (200,202) |
| Centrally cleared | 452,000,000 | SEK | Fixed -0.234% | 3 month STIBOR | Annual | Quarterly | Nov 2019 | — | 33,926 | 33,926 |
| Centrally cleared | 217,200,000 | CAD | 3 month CDOR | Fixed 1.810% | Semi-Annual | Semi-Annual | Nov 2019 | — | (611,501) | (611,501) |
| Centrally cleared | 452,000,000 | SEK | Fixed -0.222% | 3 month STIBOR | Annual | Quarterly | Nov 2019 | — | 28,026 | 28,026 |
| Centrally cleared | 1,356,000,000 | SEK | Fixed -0.255% | 3 month STIBOR | Annual | Quarterly | Nov 2019 | — | 136,102 | 136,102 |
| Centrally cleared | 72,400,000 | CAD | 3 month CDOR | Fixed 1.760% | Semi-Annual | Semi-Annual | Nov 2019 | — | (233,915) | (233,915) |
| Centrally cleared | 72,400,000 | CAD | 3 month CDOR | Fixed 1.763% | Semi-Annual | Semi-Annual | Nov 2019 | — | (232,458) | (232,458) |
| Centrally cleared | 452,000,000 | SEK | Fixed -0.245% | 3 month STIBOR | Annual | Quarterly | Nov 2019 | — | 51,779 | 51,779 |
| SEE NOTES TO FINANCIAL STATEMENTS | SEMIANNUAL REPORT | JOHN HANCOCK GLOBAL ABSOLUTE RETURN STRATEGIES FUND | 31 |
| Interest rate swaps (continued) | ||||||||||
| Counterparty (OTC)/ Centrally cleared | Notional amount | Currency | Payments made | Payments received | Fixed payment frequency | Floating payment frequency | Maturity date | Unamortized upfront payment paid (received) | Unrealized appreciation (depreciation) | Value |
| Centrally cleared | 72,400,000 | CAD | 3 month CDOR | Fixed 1.835% | Semi-Annual | Semi-Annual | Dec 2019 | — | $(188,010) | $(188,010) |
| Centrally cleared | 452,000,000 | SEK | Fixed -0.236% | 3 month STIBOR | Annual | Quarterly | Dec 2019 | — | 50,144 | 50,144 |
| Centrally cleared | 72,400,000 | CAD | 3 month CDOR | Fixed 1.871% | Semi-Annual | Semi-Annual | Dec 2019 | — | (174,509) | (174,509) |
| Centrally cleared | 452,000,000 | SEK | Fixed -0.212% | 3 month STIBOR | Annual | Quarterly | Dec 2019 | — | 38,450 | 38,450 |
| Centrally cleared | 452,000,000 | SEK | Fixed -0.223% | 3 month STIBOR | Annual | Quarterly | Dec 2019 | — | 44,800 | 44,800 |
| Centrally cleared | 111,400,000 | CAD | 3 month CDOR | Fixed 2.403% | Semi-Annual | Semi-Annual | Aug 2020 | — | 407,377 | 407,377 |
| Centrally cleared | 111,400,000 | CAD | 3 month CDOR | Fixed 2.430% | Semi-Annual | Semi-Annual | Aug 2020 | — | 449,562 | 449,562 |
| Centrally cleared | 111,400,000 | CAD | 3 month CDOR | Fixed 2.420% | Semi-Annual | Semi-Annual | Aug 2020 | — | 483,468 | 483,468 |
| Centrally cleared | 807,000,000 | SEK | Fixed -0.128% | 3 month STIBOR | Annual | Quarterly | Aug 2020 | — | 135,831 | 135,831 |
| Centrally cleared | 111,400,000 | CAD | 3 month CDOR | Fixed 2.422% | Semi-Annual | Semi-Annual | Aug 2020 | — | 484,236 | 484,236 |
| Centrally cleared | 807,000,000 | SEK | Fixed -0.123% | 3 month STIBOR | Annual | Quarterly | Aug 2020 | — | 127,596 | 127,596 |
| Centrally cleared | 111,400,000 | CAD | 3 month CDOR | Fixed 2.407% | Semi-Annual | Semi-Annual | Aug 2020 | — | 458,504 | 458,504 |
| Centrally cleared | 807,000,000 | SEK | Fixed -0.116% | 3 month STIBOR | Annual | Quarterly | Aug 2020 | — | 119,986 | 119,986 |
| Centrally cleared | 807,000,000 | SEK | Fixed -0.105% | 3 month STIBOR | Annual | Quarterly | Aug 2020 | — | 98,826 | 98,826 |
| Centrally cleared | 807,000,000 | SEK | Fixed -0.108% | 3 month STIBOR | Annual | Quarterly | Aug 2020 | — | 109,559 | 109,559 |
| Centrally cleared | 270,000,000 | SEK | Fixed 0.040% | 3 month STIBOR | Annual | Quarterly | Jan 2021 | $7,634 | (6,786) | 848 |
| Centrally cleared | 270,000,000 | SEK | Fixed 0.050% | 3 month STIBOR | Annual | Quarterly | Jan 2021 | 4,004 | (8,104) | (4,100) |
| Centrally cleared | 270,000,000 | SEK | Fixed 0.065% | 3 month STIBOR | Annual | Quarterly | Jan 2021 | 8,113 | (20,534) | (12,421) |
| Centrally cleared | 270,000,000 | SEK | Fixed 0.085% | 3 month STIBOR | Annual | Quarterly | Jan 2021 | 2,341 | (25,882) | (23,541) |
| Centrally cleared | 119,919,800 | CAD | 3 month CDOR | Fixed 2.503% | Semi-Annual | Semi-Annual | Jul 2021 | — | 567,697 | 567,697 |
| Centrally cleared | 6,460,000 | CAD | Fixed 2.503% | 3 month CDOR | Semi-Annual | Semi-Annual | Jul 2021 | 27,615 | (58,196) | (30,581) |
| Centrally cleared | 19,380,000 | CAD | Fixed 2.503% | 3 month CDOR | Semi-Annual | Semi-Annual | Jul 2021 | 100,378 | (192,122) | (91,744) |
| Centrally cleared | 19,380,000 | CAD | Fixed 2.503% | 3 month CDOR | Semi-Annual | Semi-Annual | Jul 2021 | 82,846 | (174,590) | (91,744) |
| Centrally cleared | 19,380,000 | CAD | Fixed 2.503% | 3 month CDOR | Semi-Annual | Semi-Annual | Jul 2021 | 101,721 | (193,465) | (91,744) |
| Centrally cleared | 239,839,350 | CAD | 3 month CDOR | Fixed 2.510% | Semi-Annual | Semi-Annual | Jul 2021 | — | 1,161,513 | 1,161,513 |
| Centrally cleared | 36,089,200 | CAD | Fixed 2.510% | 3 month CDOR | Semi-Annual | Semi-Annual | Jul 2021 | (102,066) | (72,710) | (174,776) |
| Centrally cleared | 59,393,354 | CAD | Fixed 2.510% | 3 month CDOR | Semi-Annual | Semi-Annual | Jul 2021 | (207,481) | (80,154) | (287,635) |
| Centrally cleared | 72,178,398 | CAD | Fixed 2.510% | 3 month CDOR | Semi-Annual | Semi-Annual | Jul 2021 | (318,421) | (31,130) | (349,551) |
| Centrally cleared | 72,178,398 | CAD | Fixed 2.510% | 3 month CDOR | Semi-Annual | Semi-Annual | Jul 2021 | (265,040) | (84,510) | (349,550) |
| Centrally cleared | 119,919,800 | CAD | 3 month CDOR | Fixed 2.503% | Semi-Annual | Semi-Annual | Jul 2021 | — | 568,774 | 568,774 |
| Centrally cleared | 71,800,195 | CAD | Fixed 2.503% | 3 month CDOR | Semi-Annual | Semi-Annual | Jul 2021 | (186,009) | (154,536) | (340,545) |
| Centrally cleared | 24,059,803 | CAD | Fixed 2.503% | 3 month CDOR | Semi-Annual | Semi-Annual | Jul 2021 | (56,317) | (57,797) | (114,114) |
| Centrally cleared | 24,059,802 | CAD | Fixed 2.503% | 3 month CDOR | Semi-Annual | Semi-Annual | Jul 2021 | (63,083) | (51,031) | (114,114) |
| Centrally cleared | 59,959,900 | CAD | 3 month CDOR | Fixed 2.520% | Semi-Annual | Semi-Annual | Jul 2021 | — | 299,514 | 299,514 |
| Centrally cleared | 70,924,000 | CAD | 3 month CDOR | Fixed 2.500% | Semi-Annual | Semi-Annual | Jul 2021 | — | 332,762 | 332,762 |
| Centrally cleared | 20,030,494 | CAD | Fixed 2.500% | 3 month CDOR | Semi-Annual | Semi-Annual | Jul 2021 | (62,300) | (31,679) | (93,979) |
| Centrally cleared | 30,863,013 | CAD | Fixed 2.500% | 3 month CDOR | Semi-Annual | Semi-Annual | Jul 2021 | (103,227) | (41,576) | (144,803) |
| Centrally cleared | 20,030,493 | CAD | Fixed 2.500% | 3 month CDOR | Semi-Annual | Semi-Annual | Jul 2021 | (47,468) | (46,511) | (93,979) |
| Centrally cleared | 119,919,800 | CAD | 3 month CDOR | Fixed 2.500% | Semi-Annual | Semi-Annual | Jul 2021 | — | 561,445 | 561,445 |
| Centrally cleared | 44,957,077 | CAD | Fixed 2.500% | 3 month CDOR | Semi-Annual | Semi-Annual | Jul 2021 | (102,252) | (108,230) | (210,482) |
| Centrally cleared | 15,002,823 | CAD | Fixed 2.500% | 3 month CDOR | Semi-Annual | Semi-Annual | Jul 2021 | (46,492) | (23,749) | (70,241) |
| 32 | JOHN HANCOCK GLOBAL ABSOLUTE RETURN STRATEGIES FUND | SEMIANNUAL REPORT | SEE NOTES TO FINANCIAL STATEMENTS |
| Interest rate swaps (continued) | ||||||||||
| Counterparty (OTC)/ Centrally cleared | Notional amount | Currency | Payments made | Payments received | Fixed payment frequency | Floating payment frequency | Maturity date | Unamortized upfront payment paid (received) | Unrealized appreciation (depreciation) | Value |
| Centrally cleared | 15,002,823 | CAD | Fixed 2.500% | 3 month CDOR | Semi-Annual | Semi-Annual | Jul 2021 | $(35,348) | $(34,893) | $(70,241) |
| Centrally cleared | 44,957,077 | CAD | Fixed 2.500% | 3 month CDOR | Semi-Annual | Semi-Annual | Jul 2021 | (115,163) | (95,319) | (210,482) |
| Centrally cleared | 53,200,000 | CAD | 3 month CDOR | Fixed 2.500% | Semi-Annual | Semi-Annual | Jul 2021 | — | 248,964 | 248,964 |
| Centrally cleared | 193,500,000 | CAD | 3 month CDOR | Fixed 2.620% | Semi-Annual | Semi-Annual | Jul 2021 | — | 1,247,548 | 1,247,548 |
| Centrally cleared | 193,500,000 | CAD | Fixed 2.620% | 3 month CDOR | Semi-Annual | Semi-Annual | Jul 2021 | (822,363) | (425,185) | (1,247,548) |
| Centrally cleared | 193,500,000 | CAD | 3 month CDOR | Fixed 2.639% | Semi-Annual | Semi-Annual | Jul 2021 | — | 1,302,567 | 1,302,567 |
| Centrally cleared | 46,043,829 | CAD | Fixed 2.639% | 3 month CDOR | Semi-Annual | Semi-Annual | Jul 2021 | (246,656) | (63,293) | (309,949) |
| Centrally cleared | 147,456,171 | CAD | Fixed 2.639% | 3 month CDOR | Semi-Annual | Semi-Annual | Jul 2021 | (758,545) | (234,073) | (992,618) |
| Centrally cleared | 129,000,000 | CAD | 3 month CDOR | Fixed 2.615% | Semi-Annual | Semi-Annual | Jul 2021 | — | 820,889 | 820,889 |
| Centrally cleared | 64,500,000 | CAD | Fixed 2.615% | 3 month CDOR | Semi-Annual | Semi-Annual | Jul 2021 | (307,118) | (103,327) | (410,445) |
| Centrally cleared | 64,500,000 | CAD | Fixed 2.615% | 3 month CDOR | Semi-Annual | Semi-Annual | Jul 2021 | (259,158) | (151,287) | (410,445) |
| Centrally cleared | 193,500,000 | CAD | 3 month CDOR | Fixed 2.662% | Semi-Annual | Semi-Annual | Aug 2021 | — | 1,369,293 | 1,369,293 |
| Centrally cleared | 33,116,781 | CAD | Fixed 2.662% | 3 month CDOR | Semi-Annual | Semi-Annual | Aug 2021 | (180,794) | (53,555) | (234,349) |
| Centrally cleared | 63,633,218 | CAD | Fixed 2.662% | 3 month CDOR | Semi-Annual | Semi-Annual | Aug 2021 | (294,178) | (156,119) | (450,297) |
| Centrally cleared | 33,116,782 | CAD | Fixed 2.662% | 3 month CDOR | Semi-Annual | Semi-Annual | Aug 2021 | (156,132) | (78,217) | (234,349) |
| Centrally cleared | 63,633,219 | CAD | Fixed 2.662% | 3 month CDOR | Semi-Annual | Semi-Annual | Aug 2021 | (312,878) | (137,419) | (450,297) |
| Centrally cleared | 129,000,000 | CAD | 3 month CDOR | Fixed 2.653% | Semi-Annual | Semi-Annual | Aug 2021 | — | 895,494 | 895,494 |
| Centrally cleared | 129,000,000 | CAD | Fixed 2.653% | 3 month CDOR | Semi-Annual | Semi-Annual | Aug 2021 | (717,546) | (177,948) | (895,494) |
| Centrally cleared | 549,400,000 | USD | 3 month LIBOR | Fixed 2.881% | Semi-Annual | Quarterly | Dec 2021 | — | 4,159,178 | 4,159,178 |
| Centrally cleared | 541,200,000 | USD | 3 month LIBOR | Fixed 2.880% | Semi-Annual | Quarterly | Dec 2021 | — | 4,088,117 | 4,088,117 |
| Centrally cleared | 541,200,000 | USD | Fixed 2.880% | 3 month LIBOR | Semi-Annual | Quarterly | Dec 2021 | (3,381,880) | (706,237) | (4,088,117) |
| Centrally cleared | 549,400,000 | USD | Fixed 2.881% | 3 month LIBOR | Semi-Annual | Quarterly | Dec 2021 | (2,973,331) | (1,185,847) | (4,159,178) |
| Centrally cleared | 549,400,000 | USD | 3 month LIBOR | Fixed 2.825% | Semi-Annual | Quarterly | Dec 2021 | — | 3,589,780 | 3,589,780 |
| Centrally cleared | 549,400,000 | USD | Fixed 2.825% | 3 month LIBOR | Semi-Annual | Quarterly | Dec 2021 | (2,666,162) | (923,618) | (3,589,780) |
| Centrally cleared | 650,000,000 | INR | 1 day MIBOR | Fixed 7.253% | Semi-Annual | Semi-Annual | Oct 2023 | — | 328,735 | 328,735 |
| Centrally cleared | 164,000,000 | CZK | Fixed 1.020% | 6 month PRIBOR | Annual | Semi-Annual | Jun 2024 | — | 258,853 | 258,853 |
| Centrally cleared | 42,000,000 | CAD | Fixed 2.357% | 3 month CDOR | Semi-Annual | Semi-Annual | Oct 2027 | — | (29,473) | (29,473) |
| Centrally cleared | 10,500,000 | CAD | 3 month CDOR | Fixed 2.357% | Semi-Annual | Semi-Annual | Oct 2027 | 17,322 | (9,954) | 7,368 |
| Centrally cleared | 10,500,000 | CAD | 3 month CDOR | Fixed 2.357% | Semi-Annual | Semi-Annual | Oct 2027 | (52,957) | 60,325 | 7,368 |
| Centrally cleared | 10,500,000 | CAD | 3 month CDOR | Fixed 2.357% | Semi-Annual | Semi-Annual | Oct 2027 | (4,604) | 11,972 | 7,368 |
| Centrally cleared | 10,500,000 | CAD | 3 month CDOR | Fixed 2.357% | Semi-Annual | Semi-Annual | Oct 2027 | (53,866) | 61,234 | 7,368 |
| Centrally cleared | 28,000,000 | CAD | Fixed 2.325% | 3 month CDOR | Semi-Annual | Semi-Annual | Oct 2027 | — | 38,308 | 38,308 |
| Centrally cleared | 256,800,000 | SEK | 3 month STIBOR | Fixed 1.190% | Annual | Quarterly | Oct 2027 | — | 860,076 | 860,076 |
| Centrally cleared | 55,100,000 | SEK | Fixed 1.190% | 3 month STIBOR | Annual | Quarterly | Oct 2027 | (137,063) | (47,478) | (184,541) |
| Centrally cleared | 55,100,000 | SEK | Fixed 1.190% | 3 month STIBOR | Annual | Quarterly | Oct 2027 | (128,410) | (56,131) | (184,541) |
| Centrally cleared | 55,100,000 | SEK | Fixed 1.190% | 3 month STIBOR | Annual | Quarterly | Oct 2027 | (136,812) | (47,729) | (184,541) |
| Centrally cleared | 55,100,000 | SEK | Fixed 1.190% | 3 month STIBOR | Annual | Quarterly | Oct 2027 | (131,724) | (52,817) | (184,541) |
| Centrally cleared | 171,200,000 | SEK | 3 month STIBOR | Fixed 1.158% | Annual | Quarterly | Oct 2027 | — | 516,937 | 516,937 |
| Centrally cleared | 14,000,000 | CAD | Fixed 2.356% | 3 month CDOR | Semi-Annual | Semi-Annual | Oct 2027 | — | (8,845) | (8,845) |
| Centrally cleared | 85,600,000 | SEK | 3 month STIBOR | Fixed 1.212% | Annual | Quarterly | Oct 2027 | — | 301,107 | 301,107 |
| Centrally cleared | 42,000,000 | CAD | Fixed 2.288% | 3 month CDOR | Semi-Annual | Semi-Annual | Nov 2027 | — | 156,463 | 156,463 |
| SEE NOTES TO FINANCIAL STATEMENTS | SEMIANNUAL REPORT | JOHN HANCOCK GLOBAL ABSOLUTE RETURN STRATEGIES FUND | 33 |
| Interest rate swaps (continued) | ||||||||||
| Counterparty (OTC)/ Centrally cleared | Notional amount | Currency | Payments made | Payments received | Fixed payment frequency | Floating payment frequency | Maturity date | Unamortized upfront payment paid (received) | Unrealized appreciation (depreciation) | Value |
| Centrally cleared | 28,000,000 | CAD | Fixed 2.301% | 3 month CDOR | Semi-Annual | Semi-Annual | Nov 2027 | — | $79,539 | $79,539 |
| Centrally cleared | 256,800,000 | SEK | 3 month STIBOR | Fixed 1.166% | Annual | Quarterly | Nov 2027 | — | 809,408 | 809,408 |
| Centrally cleared | 28,000,000 | CAD | Fixed 2.280% | 3 month CDOR | Semi-Annual | Semi-Annual | Nov 2027 | — | 121,422 | 121,422 |
| Centrally cleared | 171,200,000 | SEK | 3 month STIBOR | Fixed 1.156% | Annual | Quarterly | Nov 2027 | — | 522,135 | 522,135 |
| Centrally cleared | 42,000,000 | CAD | Fixed 2.257% | 3 month CDOR | Semi-Annual | Semi-Annual | Nov 2027 | — | 241,086 | 241,086 |
| Centrally cleared | 171,200,000 | SEK | 3 month STIBOR | Fixed 1.130% | Annual | Quarterly | Nov 2027 | — | 477,602 | 477,602 |
| Centrally cleared | 256,800,000 | SEK | 3 month STIBOR | Fixed 1.133% | Annual | Quarterly | Nov 2027 | — | 725,217 | 725,217 |
| Centrally cleared | 14,000,000 | CAD | Fixed 2.266% | 3 month CDOR | Semi-Annual | Semi-Annual | Nov 2027 | — | 72,777 | 72,777 |
| Centrally cleared | 14,000,000 | CAD | Fixed 2.297% | 3 month CDOR | Semi-Annual | Semi-Annual | Nov 2027 | — | 43,629 | 43,629 |
| Centrally cleared | 85,600,000 | SEK | 3 month STIBOR | Fixed 1.154% | Annual | Quarterly | Nov 2027 | — | 256,514 | 256,514 |
| Centrally cleared | 85,600,000 | SEK | 3 month STIBOR | Fixed 1.175% | Annual | Quarterly | Nov 2027 | — | 273,616 | 273,616 |
| Centrally cleared | 42,000,000 | CAD | Fixed 2.312% | 3 month CDOR | Semi-Annual | Semi-Annual | Nov 2027 | — | 98,371 | 98,371 |
| Centrally cleared | 256,800,000 | SEK | 3 month STIBOR | Fixed 1.152% | Annual | Quarterly | Nov 2027 | — | 761,582 | 761,582 |
| Centrally cleared | 14,000,000 | CAD | Fixed 2.195% | 3 month CDOR | Semi-Annual | Semi-Annual | Nov 2027 | — | 138,796 | 138,796 |
| Centrally cleared | 14,000,000 | CAD | Fixed 2.209% | 3 month CDOR | Semi-Annual | Semi-Annual | Nov 2027 | — | 126,823 | 126,823 |
| Centrally cleared | 85,600,000 | SEK | 3 month STIBOR | Fixed 1.090% | Annual | Quarterly | Nov 2027 | — | 194,389 | 194,389 |
| Centrally cleared | 85,600,000 | SEK | 3 month STIBOR | Fixed 1.110% | Annual | Quarterly | Dec 2027 | — | 209,538 | 209,538 |
| Centrally cleared | 14,000,000 | CAD | Fixed 2.268% | 3 month CDOR | Semi-Annual | Semi-Annual | Dec 2027 | — | 74,008 | 74,008 |
| Centrally cleared | 85,600,000 | SEK | 3 month STIBOR | Fixed 1.110% | Annual | Quarterly | Dec 2027 | — | 207,688 | 207,688 |
| Centrally cleared | 14,000,000 | CAD | Fixed 2.285% | 3 month CDOR | Semi-Annual | Semi-Annual | Dec 2027 | — | 60,573 | 60,573 |
| Centrally cleared | 85,600,000 | SEK | 3 month STIBOR | Fixed 1.110% | Annual | Quarterly | Dec 2027 | — | 207,253 | 207,253 |
| Centrally cleared | 63,400,000 | EUR | 6 month EURIBOR | Fixed 1.383% | Annual | Semi-Annual | Jan 2029 | — | 631,975 | 631,975 |
| Centrally cleared | 95,100,000 | EUR | 6 month EURIBOR | Fixed 1.401% | Annual | Semi-Annual | Jan 2029 | — | 1,041,738 | 1,041,738 |
| Centrally cleared | 63,400,000 | EUR | 6 month EURIBOR | Fixed 1.383% | Annual | Semi-Annual | Jan 2029 | — | 628,224 | 628,224 |
| Centrally cleared | 47,550,000 | EUR | 6 month EURIBOR | Fixed 1.345% | Annual | Semi-Annual | Jan 2029 | — | 368,151 | 368,151 |
| Centrally cleared | 47,550,000 | EUR | 6 month EURIBOR | Fixed 1.301% | Annual | Semi-Annual | Jan 2029 | — | 251,337 | 251,337 |
| Centrally cleared | 150,000,000 | EUR | 6 month EURIBOR | Fixed 1.310% | Annual | Semi-Annual | Jan 2029 | — | 860,851 | 860,851 |
| Centrally cleared | 56,367,934 | EUR | 6 month EURIBOR | Fixed 1.308% | Annual | Semi-Annual | Jan 2029 | — | 316,889 | 316,889 |
| Centrally cleared | 93,632,066 | EUR | 6 month EURIBOR | Fixed 1.284% | Annual | Semi-Annual | Feb 2029 | — | 395,825 | 395,825 |
| Centrally cleared | 120,600,000 | USD | Fixed 2.973% | 3 month LIBOR | Semi-Annual | Quarterly | Dec 2029 | — | (3,100,385) | (3,100,385) |
| Centrally cleared | 118,800,000 | USD | Fixed 2.960% | 3 month LIBOR | Semi-Annual | Quarterly | Dec 2029 | — | (2,919,712) | (2,919,712) |
| Centrally cleared | 120,600,000 | USD | Fixed 2.940% | 3 month LIBOR | Semi-Annual | Quarterly | Dec 2029 | — | (2,752,900) | (2,752,900) |
| $(15,080,870) | $18,037,994 | $2,957,124 | ||||||||
| $(15,080,870) | $18,204,365 | $3,123,495 | ||||||||
| Credit default swaps - Buyer | ||||||||||
| Counterparty (OTC)/ Centrally cleared | Reference obligation | Notional amount | Currency | USD notional amount | Pay fixed rate | Fixed payment frequency | Maturity date | Unamortized upfront payment paid (received) | Unrealized appreciation (depreciation) | Value |
| Centrally cleared | CDX.NA.HY.31 | 84,280,000 | USD | $84,280,000 | 5.000% | Quarterly | Dec 2023 | $(5,510,208) | $(92,071) | $(5,602,279) |
| 34 | JOHN HANCOCK GLOBAL ABSOLUTE RETURN STRATEGIES FUND | SEMIANNUAL REPORT | SEE NOTES TO FINANCIAL STATEMENTS |
| Credit default swaps - Buyer (continued) | ||||||||||
| Counterparty (OTC)/ Centrally cleared | Reference obligation | Notional amount | Currency | USD notional amount | Pay fixed rate | Fixed payment frequency | Maturity date | Unamortized upfront payment paid (received) | Unrealized appreciation (depreciation) | Value |
| Centrally cleared | CDX.NA.HY.31 | 11,956,000 | USD | $11,956,000 | 5.000% | Quarterly | Dec 2023 | $(532,939) | $(261,803) | $(794,742) |
| $96,236,000 | $(6,043,147) | $(353,874) | $(6,397,021) | |||||||
| Credit default swaps - Seller | |||||||||||
| Counterparty (OTC)/ Centrally cleared | Reference obligation | Implied credit spread | Notional amount | Currency | USD notional amount | Received fixed rate | Fixed payment frequency | Maturity date | Unamortized upfront payment paid (received) | Unrealized appreciation (depreciation) | Value |
| Centrally cleared | CDX.NA.HY.31 | 3.543% | 5,556,600 | USD | $5,556,600 | 5.000% | Quarterly | Dec 2023 | $266,161 | $103,199 | $369,360 |
| Centrally cleared | CDX.NA.HY.31 | 3.543% | 3,763,200 | USD | 3,763,200 | 5.000% | Quarterly | Dec 2023 | 133,612 | 116,536 | 250,148 |
| Centrally cleared | CDX.NA.HY.31 | 3.543% | 8,820,000 | USD | 8,820,000 | 5.000% | Quarterly | Dec 2023 | 393,792 | 192,493 | 586,285 |
| Centrally cleared | CDX.NA.HY.31 | 3.543% | 2,518,600 | USD | 2,518,600 | 5.000% | Quarterly | Dec 2023 | 82,839 | 84,578 | 167,417 |
| Centrally cleared | CDX.NA.HY.31 | 3.543% | 6,252,400 | USD | 6,252,400 | 5.000% | Quarterly | Dec 2023 | 222,292 | 193,319 | 415,611 |
| Centrally cleared | CDX.NA.HY.31 | 3.543% | 6,232,800 | USD | 6,232,800 | 5.000% | Quarterly | Dec 2023 | 228,085 | 186,223 | 414,308 |
| Centrally cleared | CDX.NA.HY.31 | 3.543% | 2,861,600 | USD | 2,861,600 | 5.000% | Quarterly | Dec 2023 | 87,411 | 102,806 | 190,217 |
| Centrally cleared | CDX.NA.HY.31 | 3.543% | 2,714,600 | USD | 2,714,600 | 5.000% | Quarterly | Dec 2023 | 96,588 | 83,857 | 180,445 |
| Centrally cleared | CDX.NA.HY.31 | 3.543% | 5,145,000 | USD | 5,145,000 | 5.000% | Quarterly | Dec 2023 | 182,810 | 159,190 | 342,000 |
| Centrally cleared | CDX.NA.HY.31 | 3.543% | 4,655,000 | USD | 4,655,000 | 5.000% | Quarterly | Dec 2023 | 160,092 | 149,336 | 309,428 |
| Centrally cleared | CDX.NA.HY.31 | 3.543% | 8,428,000 | USD | 8,428,000 | 5.000% | Quarterly | Dec 2023 | 322,703 | 237,525 | 560,228 |
| Centrally cleared | CDX.NA.HY.31 | 3.543% | 6,301,400 | USD | 6,301,400 | 5.000% | Quarterly | Dec 2023 | 219,714 | 199,154 | 418,868 |
| Centrally cleared | CDX.NA.HY.31 | 3.543% | 20,354,600 | USD | 20,354,600 | 5.000% | Quarterly | Dec 2023 | 983,508 | 369,507 | 1,353,015 |
| Centrally cleared | ITRAXX EUR Crossover S30 | 3.100% | 10,043,212 | EUR | 11,495,430 | 5.000% | Quarterly | Dec 2023 | 955,304 | — | 955,304 |
| Centrally cleared | ITRAXX EUR Crossover S30 | 3.100% | 7,725,548 | EUR | 8,834,549 | 5.000% | Quarterly | Dec 2023 | 673,986 | 126,730 | 800,716 |
| Centrally cleared | ITRAXX EUR Crossover S30 | 3.100% | 21,152,159 | EUR | 24,281,568 | 5.000% | Quarterly | Dec 2023 | 1,870,732 | 321,588 | 2,192,320 |
| Centrally cleared | ITRAXX EUR Main S30 | 0.706% | 80,500,000 | EUR | 92,099,994 | 1.000% | Quarterly | Dec 2023 | 647,442 | 794,978 | 1,442,420 |
| Centrally cleared | ITRAXX EUR Main S30 | 0.706% | 80,500,000 | EUR | 93,001,225 | 1.000% | Quarterly | Dec 2023 | 764,022 | 678,398 | 1,442,420 |
| $313,316,566 | $8,291,093 | $4,099,417 | $12,390,510 | ||||||||
| Total return swaps | ||||||||||
| Pay/receive total return* | Reference entity | Floating rate | Payment frequency | Currency | Notional amount/ contract amount | Maturity date | Counterparty (OTC) | Unamortized upfront payment paid (received) | Unrealized appreciation (depreciation) | Value |
| Pay | Australia and New Zealand Banking Group, Ltd. | 1 Month AUD Bank Bill Swap Rate + 0.25% | Monthly | AUD | 819,562 | Jan 2020 | Citibank N.A. | — | $9,737 | $9,737 |
| SEE NOTES TO FINANCIAL STATEMENTS | SEMIANNUAL REPORT | JOHN HANCOCK GLOBAL ABSOLUTE RETURN STRATEGIES FUND | 35 |
| Total return swaps (continued) | ||||||||||
| Pay/receive total return* | Reference entity | Floating rate | Payment frequency | Currency | Notional amount/ contract amount | Maturity date | Counterparty (OTC) | Unamortized upfront payment paid (received) | Unrealized appreciation (depreciation) | Value |
| Pay | Commonwealth Bank of Australia | 1 Month AUD Bank Bill Swap Rate + 0.25% | Monthly | AUD | 1,399,162 | Jan 2020 | Citibank N.A. | — | $16,808 | $16,808 |
| Pay | Westpac Banking Corp. | 1 Month AUD Bank Bill Swap Rate + 0.25% | Monthly | AUD | 900,748 | Jan 2020 | Citibank N.A. | — | 16,121 | 16,121 |
| Pay | Australia and New Zealand Banking Group, Ltd. | 1 Month AUD Bank Bill Swap Rate + 0.25% | Monthly | AUD | 991,459 | Jan 2020 | Citibank N.A. | — | — | — |
| Pay | Commonwealth Bank of Australia | 1 Month AUD Bank Bill Swap Rate + 0.25% | Monthly | AUD | 1,661,833 | Jan 2020 | Citibank N.A. | — | — | — |
| Pay | National Australia Bank | 1 Month AUD Bank Bill Swap Rate + 0.25% | Monthly | AUD | 946,567 | Jan 2020 | Citibank N.A. | — | — | — |
| Pay | Westpac Banking Corp. | 1 Month AUD Bank Bill Swap Rate + 0.25% | Monthly | AUD | 1,062,237 | Jan 2020 | Citibank N.A. | — | — | — |
| Pay | National Australia Bank | 1 Month AUD Bank Bill Swap Rate + 0.25% | Monthly | AUD | 778,471 | Jan 2020 | Citigroup Global Markets, Ltd. | — | 7,260 | 7,260 |
| — | $49,926 | $49,926 | ||||||||
| Inflation swaps | |||||||||||
| Counterparty (OTC)/ Centrally cleared | Notional amount | Currency | USD notional amount | Payments made | Payments received | Fixed payment frequency | Floating payment frequency | Maturity date | Unamortized upfront payment paid (received) | Unrealized appreciation (depreciation) | Value |
| Centrally cleared | 16,550,000 | GBP | $20,917,593 | GBP - Non-Revised RPI | Fixed 3.665% | At maturity | At maturity | Dec 2028 | — | $543,438 | $543,438 |
| Centrally cleared | 3,972,000 | GBP | 5,020,222 | GBP - Non-Revised RPI | Fixed 3.683% | At maturity | At maturity | Dec 2028 | — | 141,700 | 141,700 |
| Centrally cleared | 7,944,000 | GBP | 10,040,445 | GBP - Non-Revised RPI | Fixed 3.683% | At maturity | At maturity | Dec 2028 | — | 283,400 | 283,400 |
| Centrally cleared | 16,550,000 | GBP | 20,872,746 | GBP - Non-Revised RPI | Fixed 3.685% | At maturity | At maturity | Dec 2028 | — | 597,134 | 597,134 |
| Centrally cleared | 12,774,000 | GBP | 16,269,503 | GBP - Non-Revised RPI | Fixed 3.594% | At maturity | At maturity | Jan 2029 | — | 253,479 | 253,479 |
| Centrally cleared | 1,730,000 | GBP | 2,208,943 | GBP - Non-Revised RPI | Fixed 3.595% | At maturity | At maturity | Jan 2029 | — | 34,607 | 34,607 |
| Centrally cleared | 5,540,000 | GBP | 7,136,049 | GBP - Non-Revised RPI | Fixed 3.593% | At maturity | At maturity | Jan 2029 | — | 109,041 | 109,041 |
| Centrally cleared | 5,540,000 | GBP | 7,136,049 | GBP - Non-Revised RPI | Fixed 3.585% | At maturity | At maturity | Jan 2029 | — | 101,913 | 101,913 |
| Centrally cleared | 5,540,000 | GBP | 7,259,100 | GBP - Non-Revised RPI | Fixed 3.490% | At maturity | At maturity | Jan 2029 | — | 17,651 | 17,651 |
| Centrally cleared | 5,540,000 | GBP | 7,259,100 | GBP - Non-Revised RPI | Fixed 3.490% | At maturity | At maturity | Jan 2029 | — | 17,651 | 17,651 |
| $104,119,750 | — | $2,100,014 | $2,100,014 | ||||||||
| 36 | JOHN HANCOCK GLOBAL ABSOLUTE RETURN STRATEGIES FUND | SEMIANNUAL REPORT | SEE NOTES TO FINANCIAL STATEMENTS |
| Variance swaps | |||||||||||
| Counterparty (OTC) | Reference entity | Currency | Notional amount | USD notional amount | Pay/ receive volatility | Volatility strike rate | Payment frequency | Maturity date | Unamortized upfront payment paid (received) | Unrealized appreciation (depreciation) | Value |
| BNP Paribas Securities Corp. | Euro STOXX 50 Index | EUR | 41,500 | $50,815 | Receive | 21.700% | At maturity | Dec 2019 | — | $(234,585) | $(234,585) |
| BNP Paribas Securities Corp. | S&P 500 Index | USD | 50,700 | 50,700 | Pay | 20.200% | At maturity | Dec 2019 | — | 107,683 | 107,683 |
| BNP Paribas Securities Corp. | Euro STOXX 50 Index | EUR | 54,500 | 66,733 | Receive | 22.500% | At maturity | Dec 2019 | — | (346,324) | (346,324) |
| BNP Paribas Securities Corp. | S&P 500 Index | USD | 68,400 | 68,400 | Pay | 20.750% | At maturity | Dec 2019 | — | 177,665 | 177,665 |
| BNP Paribas Securities Corp. | Euro STOXX 50 Index | EUR | 83,100 | 102,517 | Receive | 21.650% | At maturity | Dec 2019 | — | (465,627) | (465,627) |
| BNP Paribas Securities Corp. | S&P 500 Index | USD | 103,000 | 103,000 | Pay | 19.700% | At maturity | Dec 2019 | — | 171,790 | 171,790 |
| BNP Paribas Securities Corp. | Euro STOXX 50 Index | EUR | 83,500 | 102,926 | Receive | 21.700% | At maturity | Dec 2019 | — | (469,170) | (469,170) |
| BNP Paribas Securities Corp. | S&P 500 Index | USD | 103,000 | 103,000 | Pay | 19.800% | At maturity | Dec 2019 | — | 177,853 | 177,853 |
| BNP Paribas Securities Corp. | Euro STOXX 50 Index | EUR | 84,800 | 104,579 | Receive | 22.700% | At maturity | Dec 2019 | — | (551,827) | (551,827) |
| BNP Paribas Securities Corp. | S&P 500 Index | USD | 105,000 | 105,000 | Pay | 21.000% | At maturity | Dec 2019 | — | 292,012 | 292,012 |
| BNP Paribas Securities Corp. | Euro STOXX 50 Index | EUR | 127,000 | 156,298 | Receive | 21.400% | At maturity | Dec 2019 | — | (675,938) | (675,938) |
| BNP Paribas Securities Corp. | S&P 500 Index | USD | 156,000 | 156,000 | Pay | 19.300% | At maturity | Dec 2019 | — | 197,486 | 197,486 |
| BNP Paribas Securities Corp. | Euro STOXX 50 Index | EUR | 79,900 | 98,836 | Receive | 21.600% | At maturity | Dec 2019 | — | (437,110) | (437,110) |
| BNP Paribas Securities Corp. | S&P 500 Index | USD | 99,600 | 99,600 | Pay | 19.500% | At maturity | Dec 2019 | — | 139,805 | 139,805 |
| JPMorgan Chase Bank | Euro STOXX 50 Index | EUR | 82,400 | 100,825 | Receive | 22.900% | At maturity | Dec 2019 | — | (553,460) | (553,460) |
| JPMorgan Chase Bank | S&P 500 Index | USD | 101,000 | 101,000 | Pay | 21.500% | At maturity | Dec 2019 | — | 326,995 | 326,995 |
| JPMorgan Chase Bank | Euro STOXX 50 Index | EUR | 83,300 | 101,926 | Receive | 23.200% | At maturity | Dec 2019 | — | (580,799) | (580,799) |
| SEE NOTES TO FINANCIAL STATEMENTS | SEMIANNUAL REPORT | JOHN HANCOCK GLOBAL ABSOLUTE RETURN STRATEGIES FUND | 37 |
| Variance swaps (continued) | |||||||||||
| Counterparty (OTC) | Reference entity | Currency | Notional amount | USD notional amount | Pay/ receive volatility | Volatility strike rate | Payment frequency | Maturity date | Unamortized upfront payment paid (received) | Unrealized appreciation (depreciation) | Value |
| JPMorgan Chase Bank | S&P 500 Index | USD | 102,000 | $102,000 | Pay | 21.700% | At maturity | Dec 2019 | — | $347,012 | $347,012 |
| JPMorgan Chase Bank | Euro STOXX 50 Index | EUR | 83,400 | 102,503 | Receive | 23.150% | At maturity | Dec 2019 | — | (578,588) | (578,588) |
| JPMorgan Chase Bank | S&P 500 Index | USD | 102,000 | 102,000 | Pay | 21.500% | At maturity | Dec 2019 | — | 331,031 | 331,031 |
| JPMorgan Chase Bank | Euro STOXX 50 Index | EUR | 41,700 | 51,251 | Receive | 23.050% | At maturity | Dec 2019 | — | (285,748) | (285,748) |
| JPMorgan Chase Bank | S&P 500 Index | USD | 51,400 | 51,400 | Pay | 21.500% | At maturity | Dec 2019 | — | 166,814 | 166,814 |
| JPMorgan Chase Bank | Euro STOXX 50 Index | EUR | 168,000 | 207,261 | Receive | 22.900% | At maturity | Dec 2019 | — | (1,121,703) | (1,121,703) |
| JPMorgan Chase Bank | S&P 500 Index | USD | 207,000 | 207,000 | Pay | 20.900% | At maturity | Dec 2019 | — | 557,986 | 557,986 |
| Morgan Stanley & Company International PLC | Euro STOXX 50 Index | EUR | 65,900 | 81,067 | Receive | 21.500% | At maturity | Dec 2019 | — | (354,045) | (354,045) |
| Morgan Stanley & Company International PLC | S&P 500 Index | USD | 81,500 | 81,500 | Pay | 19.400% | At maturity | Dec 2019 | — | 105,528 | 105,528 |
| UBS AG | KOSPI 200 Index | KRW | 179,000,000 | 167,697 | Receive | 19.450% | At maturity | Dec 2019 | — | (382,629) | (382,629) |
| UBS AG | S&P 500 Index | USD | 168,000 | 168,000 | Pay | 19.250% | At maturity | Dec 2019 | — | 199,905 | 199,905 |
| $2,993,834 | — | $(3,737,988) | $(3,737,988) | ||||||||
| Derivatives Currency Abbreviations | |
| AUD | Australian Dollar |
| BRL | Brazilian Real |
| CAD | Canadian Dollar |
| CHF | Swiss Franc |
| CLP | Chilean Peso |
| CNY | Chinese Yuan Renminbi |
| CZK | Czech Republic Koruna |
| DKK | Danish Krone |
| EUR | Euro |
| GBP | Pound Sterling |
| HKD | Hong Kong Dollar |
| IDR | Indonesian Rupiah |
| INR | Indian Rupee |
| JPY | Japanese Yen |
| KRW | Korean Won |
| 38 | JOHN HANCOCK GLOBAL ABSOLUTE RETURN STRATEGIES FUND | SEMIANNUAL REPORT | SEE NOTES TO FINANCIAL STATEMENTS |
| MXN | Mexican Peso |
| MYR | Malaysian Ringgit |
| NOK | Norwegian Krone |
| PEN | Peruvian Nuevo Sol |
| PHP | Philippine Peso |
| RUB | Russian Ruble |
| SEK | Swedish Krona |
| SGD | Singapore Dollar |
| TRY | Turkish Lira |
| TWD | New Taiwan Dollar |
| USD | U.S. Dollar |
| ZAR | South African Rand |
| Derivatives Abbreviations | |
| CDOR | Canadian Dollar Offered Rate |
| CLICP | Sinacofi Chile Interbank Rate Average |
| EURIBOR | Euro Interbank Offered Rate |
| LIBOR | London Interbank Offered Rate |
| MIBOR | Mumbai Interbank Offered Rate |
| PRIBOR | Prague Interbank Offered Rate |
| RPI | Retail Price Index |
| STIBOR | Stockholm Interbank Offered Rate |
| SEE NOTES TO FINANCIAL STATEMENTS | SEMIANNUAL REPORT | JOHN HANCOCK GLOBAL ABSOLUTE RETURN STRATEGIES FUND | 39 |
| Financial statements |
| Assets | |
| Unaffiliated investments, at value (Cost $1,700,347,016) | $1,733,666,049 |
| Swap contracts, at value | 3,349,491 |
| Receivable for centrally cleared swaps | 18,290,506 |
| Unrealized appreciation on forward foreign currency contracts | 19,251,979 |
| Receivable for futures variation margin | 1,385,352 |
| Foreign currency, at value (Cost $5,873,234) | 5,873,418 |
| Collateral held at broker for futures contracts | 25,616,472 |
| Collateral segregated at custodian for OTC derivative contracts | 101,439,062 |
| Dividends and interest receivable | 10,654,886 |
| Receivable for fund shares sold | 702,454 |
| Receivable for investments sold | 23,976,827 |
| Other assets | 217,287 |
| Total assets | 1,944,423,783 |
| Liabilities | |
| Unrealized depreciation on forward foreign currency contracts | 24,307,255 |
| Written options, at value (Premiums received $31,675,884) | 34,745,490 |
| Swap contracts, at value | 7,037,553 |
| Due to custodian | 23,159,616 |
| Payable for collateral on OTC derivatives | 20,884,019 |
| Payable for investments purchased | 19,926,419 |
| Payable for fund shares repurchased | 10,055,704 |
| Payable to affiliates | |
| Accounting and legal services fees | 48,485 |
| Transfer agent fees | 167,134 |
| Distribution and service fees | 408 |
| Trustees' fees | 12,988 |
| Other liabilities and accrued expenses | 485,814 |
| Total liabilities | 140,830,885 |
| Net assets | $1,803,592,898 |
| Net assets consist of | |
| Paid-in capital | $2,298,824,098 |
| Total distributable earnings (loss) | (495,231,200) |
| Net assets | $1,803,592,898 |
| 40 | JOHN HANCOCK Global Absolute Return Strategies Fund | SEMIANNUAL REPORT | SEE NOTES TO FINANCIAL STATEMENTS |
| Net asset value per share | |
| Based on net asset value and shares outstanding - the fund has an unlimited number of shares authorized with no par value | |
| Class A ($82,291,495 ÷ 8,165,744 shares)1 | $10.08 |
| Class C ($64,576,976 ÷ 6,542,392 shares)1 | $9.87 |
| Class I ($1,264,028,519 ÷ 124,068,834 shares) | $10.19 |
| Class R2 ($1,123,080 ÷ 111,905 shares) | $10.04 |
| Class R6 ($227,115,190 ÷ 22,220,523 shares) | $10.22 |
| Class NAV ($164,457,638 ÷ 16,105,948 shares) | $10.21 |
| Maximum offering price per share | |
| Class A (net asset value per share ÷ 95%)2 | $10.61 |
| 1 | Redemption price per share is equal to net asset value less any applicable contingent deferred sales charge. |
| 2 | On single retail sales of less than $50,000. On sales of $50,000 or more and on group sales the offering price is reduced. |
| SEE NOTES TO FINANCIAL STATEMENTS | SEMIANNUAL REPORT | JOHN HANCOCK Global Absolute Return Strategies Fund | 41 |
| Investment income | |
| Interest | $37,983,721 |
| Dividends | 14,265,380 |
| Less foreign taxes withheld | (963,312) |
| Total investment income | 51,285,789 |
| Expenses | |
| Investment management fees | 17,134,098 |
| Distribution and service fees | 537,141 |
| Accounting and legal services fees | 218,549 |
| Transfer agent fees | 1,348,888 |
| Trustees' fees | 31,800 |
| Custodian fees | 507,640 |
| State registration fees | 53,241 |
| Printing and postage | 84,638 |
| Professional fees | 141,642 |
| Other | 75,200 |
| Total expenses | 20,132,837 |
| Less expense reductions | (113,587) |
| Net expenses | 20,019,250 |
| Net investment income | 31,266,539 |
| Realized and unrealized gain (loss) | |
| Net realized gain (loss) on | |
| Unaffiliated investments and foreign currency transactions | (47,285,988) |
| Futures contracts | 58,653,719 |
| Forward foreign currency contracts | 68,829,058 |
| Written options | (64,159,074) |
| Swap contracts | (15,081,004) |
| 956,711 | |
| Change in net unrealized appreciation (depreciation) of | |
| Unaffiliated investments and translation of assets and liabilities in foreign currencies | (80,055,997) |
| Futures contracts | 12,400,481 |
| Forward foreign currency contracts | (35,338,226) |
| Written options | 1,601,892 |
| Swap contracts | 23,176,583 |
| (78,215,267) | |
| Net realized and unrealized loss | (77,258,556) |
| Decrease in net assets from operations | $(45,992,017) |
| 42 | JOHN HANCOCK Global Absolute Return Strategies Fund | SEMIANNUAL REPORT | SEE NOTES TO FINANCIAL STATEMENTS |
| Six months ended 1-31-19 (unaudited) | Year ended 7-31-18 | |
| Increase (decrease) in net assets | ||
| From operations | ||
| Net investment income | $31,266,539 | $78,343,833 |
| Net realized gain | 956,711 | 17,460,419 |
| Change in net unrealized appreciation (depreciation) | (78,215,267) | (156,110,529) |
| Decrease in net assets resulting from operations | (45,992,017) | (60,306,277) |
| From fund share transactions | (1,959,074,257) | (1,598,894,831) |
| Total decrease | (2,005,066,274) | (1,659,201,108) |
| Net assets | ||
| Beginning of period | 3,808,659,172 | 5,467,860,280 |
| End of period1 | $1,803,592,898 | $3,808,659,172 |
| 1 | Net assets - End of year includes undistributed net investment income of $(53,811,874) at July 31, 2018. The SEC eliminated the requirement to disclose undistributed net investment income in the current reporting period. |
| SEE NOTES TO FINANCIAL STATEMENTS | SEMIANNUAL REPORT | JOHN HANCOCK Global Absolute Return Strategies Fund | 43 |
| Financial highlights |
| CLASS A SHARES Period ended | 1-31-191 | 7-31-18 | 7-31-17 | 7-31-16 | 7-31-15 | 7-31-14 |
| Per share operating performance | ||||||
| Net asset value, beginning of period | $10.12 | $10.30 | $9.94 | $11.27 | $11.25 | $10.84 |
| Net investment income2 | 0.10 | 0.14 | 0.06 | 0.04 | 0.03 | 0.03 |
| Net realized and unrealized gain (loss) on investments | (0.14) | (0.32) | 0.30 | (0.69) | 0.53 | 0.50 |
| Total from investment operations | (0.04) | (0.18) | 0.36 | (0.65) | 0.56 | 0.53 |
| Less distributions | ||||||
| From net investment income | — | — | — | (0.68) | (0.54) | (0.12) |
| Net asset value, end of period | $10.08 | $10.12 | $10.30 | $9.94 | $11.27 | $11.25 |
| Total return (%)3,4 | (0.40)5 | (1.75) | 3.62 | (6.00) | 5.15 | 4.94 |
| Ratios and supplemental data | ||||||
| Net assets, end of period (in millions) | $82 | $114 | $194 | $1,047 | $1,080 | $971 |
| Ratios (as a percentage of average net assets): | ||||||
| Expenses before reductions | 1.686 | 1.65 | 1.65 | 1.64 | 1.67 | 1.72 |
| Expenses including reductions | 1.676 | 1.64 | 1.64 | 1.63 | 1.66 | 1.71 |
| Net investment income | 2.006 | 1.35 | 0.57 | 0.34 | 0.23 | 0.27 |
| Portfolio turnover (%) | 23 | 59 | 59 | 80 | 80 | 56 |
| 1 | Six months ended 1-31-19. Unaudited. |
| 2 | Based on average daily shares outstanding. |
| 3 | Total returns would have been lower had certain expenses not been reduced during the applicable periods. |
| 4 | Does not reflect the effect of sales charges, if any. |
| 5 | Not annualized. |
| 6 | Annualized. |
| 44 | JOHN HANCOCK Global Absolute Return Strategies Fund | SEMIANNUAL REPORT | SEE NOTES TO FINANCIAL STATEMENTS |
| CLASS C SHARES Period ended | 1-31-191 | 7-31-18 | 7-31-17 | 7-31-16 | 7-31-15 | 7-31-14 |
| Per share operating performance | ||||||
| Net asset value, beginning of period | $9.95 | $10.19 | $9.91 | $11.23 | $11.21 | $10.80 |
| Net investment income (loss)2 | 0.06 | 0.06 | —3 | (0.04) | (0.05) | (0.05) |
| Net realized and unrealized gain (loss) on investments | (0.14) | (0.30) | 0.28 | (0.67) | 0.53 | 0.51 |
| Total from investment operations | (0.08) | (0.24) | 0.28 | (0.71) | 0.48 | 0.46 |
| Less distributions | ||||||
| From net investment income | — | — | — | (0.61) | (0.46) | (0.05) |
| Net asset value, end of period | $9.87 | $9.95 | $10.19 | $9.91 | $11.23 | $11.21 |
| Total return (%)4,5 | (0.80)6 | (2.36) | 2.83 | (6.61) | 4.43 | 4.24 |
| Ratios and supplemental data | ||||||
| Net assets, end of period (in millions) | $65 | $91 | $162 | $309 | $293 | $203 |
| Ratios (as a percentage of average net assets): | ||||||
| Expenses before reductions | 2.387 | 2.35 | 2.35 | 2.34 | 2.37 | 2.42 |
| Expenses including reductions | 2.377 | 2.34 | 2.34 | 2.33 | 2.36 | 2.41 |
| Net investment income (loss) | 1.307 | 0.61 | (0.05) | (0.35) | (0.45) | (0.43) |
| Portfolio turnover (%) | 23 | 59 | 59 | 80 | 80 | 56 |
| 1 | Six months ended 1-31-19. Unaudited. |
| 2 | Based on average daily shares outstanding. |
| 3 | Less than $0.005 per share. |
| 4 | Total returns would have been lower had certain expenses not been reduced during the applicable periods. |
| 5 | Does not reflect the effect of sales charges, if any. |
| 6 | Not annualized. |
| 7 | Annualized. |
| SEE NOTES TO FINANCIAL STATEMENTS | SEMIANNUAL REPORT | JOHN HANCOCK Global Absolute Return Strategies Fund | 45 |
| CLASS I SHARES Period ended | 1-31-191 | 7-31-18 | 7-31-17 | 7-31-16 | 7-31-15 | 7-31-14 |
| Per share operating performance | ||||||
| Net asset value, beginning of period | $10.22 | $10.36 | $9.97 | $11.30 | $11.29 | $10.87 |
| Net investment income2 | 0.11 | 0.17 | 0.10 | 0.07 | 0.06 | 0.07 |
| Net realized and unrealized gain (loss) on investments | (0.14) | (0.31) | 0.29 | (0.68) | 0.53 | 0.51 |
| Total from investment operations | (0.03) | (0.14) | 0.39 | (0.61) | 0.59 | 0.58 |
| Less distributions | ||||||
| From net investment income | — | — | — | (0.72) | (0.58) | (0.16) |
| Net asset value, end of period | $10.19 | $10.22 | $10.36 | $9.97 | $11.30 | $11.29 |
| Total return (%)3 | (0.29)4 | (1.35) | 3.91 | (5.67) | 5.38 | 5.37 |
| Ratios and supplemental data | ||||||
| Net assets, end of period (in millions) | $1,264 | $2,413 | $3,481 | $5,316 | $5,093 | $3,495 |
| Ratios (as a percentage of average net assets): | ||||||
| Expenses before reductions | 1.415 | 1.35 | 1.33 | 1.32 | 1.36 | 1.39 |
| Expenses including reductions | 1.405 | 1.35 | 1.33 | 1.31 | 1.34 | 1.38 |
| Net investment income | 2.225 | 1.66 | 1.01 | 0.67 | 0.56 | 0.63 |
| Portfolio turnover (%) | 23 | 59 | 59 | 80 | 80 | 56 |
| 1 | Six months ended 1-31-19. Unaudited. |
| 2 | Based on average daily shares outstanding. |
| 3 | Total returns would have been lower had certain expenses not been reduced during the applicable periods. |
| 4 | Not annualized. |
| 5 | Annualized. |
| 46 | JOHN HANCOCK Global Absolute Return Strategies Fund | SEMIANNUAL REPORT | SEE NOTES TO FINANCIAL STATEMENTS |
| CLASS R2 SHARES Period ended | 1-31-191 | 7-31-18 | 7-31-17 | 7-31-16 | 7-31-15 | 7-31-14 |
| Per share operating performance | ||||||
| Net asset value, beginning of period | $10.08 | $10.27 | $9.92 | $11.25 | $11.24 | $10.83 |
| Net investment income (loss)2 | 0.10 | 0.12 | 0.08 | 0.01 | (0.01) | —3 |
| Net realized and unrealized gain (loss) on investments | (0.14) | (0.31) | 0.27 | (0.66) | 0.53 | 0.50 |
| Total from investment operations | (0.04) | (0.19) | 0.35 | (0.65) | 0.52 | 0.50 |
| Less distributions | ||||||
| From net investment income | — | — | — | (0.68) | (0.51) | (0.09) |
| Net asset value, end of period | $10.04 | $10.08 | $10.27 | $9.92 | $11.25 | $11.24 |
| Total return (%)4 | (0.40)5 | (1.85) | 3.53 | (6.08) | 4.75 | 4.67 |
| Ratios and supplemental data | ||||||
| Net assets, end of period (in millions) | $1 | $1 | $2 | $3 | $5 | $1 |
| Ratios (as a percentage of average net assets): | ||||||
| Expenses before reductions | 1.746 | 1.75 | 1.72 | 1.75 | 1.99 | 2.85 |
| Expenses including reductions | 1.736 | 1.74 | 1.71 | 1.74 | 1.97 | 2.00 |
| Net investment income (loss) | 1.986 | 1.17 | 0.78 | 0.09 | (0.06) | 0.02 |
| Portfolio turnover (%) | 23 | 59 | 59 | 80 | 80 | 56 |
| 1 | Six months ended 1-31-19. Unaudited. |
| 2 | Based on average daily shares outstanding. |
| 3 | Less than $0.005 per share. |
| 4 | Total returns would have been lower had certain expenses not been reduced during the applicable periods. |
| 5 | Not annualized. |
| 6 | Annualized. |
| SEE NOTES TO FINANCIAL STATEMENTS | SEMIANNUAL REPORT | JOHN HANCOCK Global Absolute Return Strategies Fund | 47 |
| CLASS R6 SHARES Period ended | 1-31-191 | 7-31-18 | 7-31-17 | 7-31-16 | 7-31-15 | 7-31-14 |
| Per share operating performance | ||||||
| Net asset value, beginning of period | $10.24 | $10.38 | $9.97 | $11.30 | $11.29 | $10.86 |
| Net investment income2 | 0.12 | 0.19 | 0.11 | 0.09 | 0.09 | 0.09 |
| Net realized and unrealized gain (loss) on investments | (0.14) | (0.33) | 0.30 | (0.69) | 0.51 | 0.50 |
| Total from investment operations | (0.02) | (0.14) | 0.41 | (0.60) | 0.60 | 0.59 |
| Less distributions | ||||||
| From net investment income | — | — | — | (0.73) | (0.59) | (0.16) |
| Net asset value, end of period | $10.22 | $10.24 | $10.38 | $9.97 | $11.30 | $11.29 |
| Total return (%)3 | (0.20)4 | (1.35) | 4.11 | (5.55) | 5.51 | 5.44 |
| Ratios and supplemental data | ||||||
| Net assets, end of period (in millions) | $227 | $546 | $693 | $639 | $557 | $196 |
| Ratios (as a percentage of average net assets): | ||||||
| Expenses before reductions | 1.295 | 1.26 | 1.24 | 1.23 | 1.26 | 1.33 |
| Expenses including reductions | 1.285 | 1.24 | 1.22 | 1.20 | 1.23 | 1.28 |
| Net investment income | 2.325 | 1.79 | 1.08 | 0.81 | 0.77 | 0.78 |
| Portfolio turnover (%) | 23 | 59 | 59 | 80 | 80 | 56 |
| 1 | Six months ended 1-31-19. Unaudited. |
| 2 | Based on average daily shares outstanding. |
| 3 | Total returns would have been lower had certain expenses not been reduced during the applicable periods. |
| 4 | Not annualized. |
| 5 | Annualized. |
| 48 | JOHN HANCOCK Global Absolute Return Strategies Fund | SEMIANNUAL REPORT | SEE NOTES TO FINANCIAL STATEMENTS |
| CLASS NAV SHARES Period ended | 1-31-191 | 7-31-18 | 7-31-17 | 7-31-16 | 7-31-15 | 7-31-14 |
| Per share operating performance | ||||||
| Net asset value, beginning of period | $10.23 | $10.37 | $9.96 | $11.29 | $11.28 | $10.86 |
| Net investment income2 | 0.11 | 0.19 | 0.11 | 0.08 | 0.08 | 0.08 |
| Net realized and unrealized gain (loss) on investments | (0.13) | (0.33) | 0.30 | (0.68) | 0.52 | 0.51 |
| Total from investment operations | (0.02) | (0.14) | 0.41 | (0.60) | 0.60 | 0.59 |
| Less distributions | ||||||
| From net investment income | — | — | — | (0.73) | (0.59) | (0.17) |
| Net asset value, end of period | $10.21 | $10.23 | $10.37 | $9.96 | $11.29 | $11.28 |
| Total return (%)3 | (0.20)4 | (1.35) | 4.12 | (5.56) | 5.51 | 5.50 |
| Ratios and supplemental data | ||||||
| Net assets, end of period (in millions) | $164 | $643 | $936 | $1,119 | $1,260 | $835 |
| Ratios (as a percentage of average net assets): | ||||||
| Expenses before reductions | 1.275 | 1.24 | 1.22 | 1.21 | 1.24 | 1.26 |
| Expenses including reductions | 1.275 | 1.23 | 1.22 | 1.20 | 1.23 | 1.26 |
| Net investment income | 2.105 | 1.81 | 1.12 | 0.75 | 0.68 | 0.72 |
| Portfolio turnover (%) | 23 | 59 | 59 | 80 | 80 | 56 |
| 1 | Six months ended 1-31-19. Unaudited. |
| 2 | Based on average daily shares outstanding. |
| 3 | Total returns would have been lower had certain expenses not been reduced during the applicable periods. |
| 4 | Not annualized. |
| 5 | Annualized. |
| SEE NOTES TO FINANCIAL STATEMENTS | SEMIANNUAL REPORT | JOHN HANCOCK Global Absolute Return Strategies Fund | 49 |
Note 1 — Organization
John Hancock Global Absolute Return Strategies Fund (the fund) is a series of John Hancock Funds II (the Trust), an open-end management investment company organized as a Massachusetts business trust and registered under the Investment Company Act of 1940, as amended (the 1940 Act). The investment objective of the fund is to seek long-term total return.
The fund may offer multiple classes of shares. The shares currently offered by the fund are detailed in the Statement of assets and liabilities. Class A and Class C shares are offered to all investors. Class I shares are offered to institutions and certain investors. Class R2 shares are available only to certain retirement and 529 plans. Class R6 shares are only available to certain retirement plans, institutions and other investors.Class NAV shares are offered to John Hancock affiliated funds of funds, retirement plans for employees of John Hancock and/or Manulife Financial Corporation, and certain 529 plans. Class C shares convert to Class A shares ten years after purchase (certain exclusions may apply). Shareholders of each class have exclusive voting rights to matters that affect that class. The distribution and service fees, if any, and transfer agent fees for each class may differ.
Note 2 — Significant accounting policies
The financial statements have been prepared in conformity with accounting principles generally accepted in the United States of America (US GAAP), which require management to make certain estimates and assumptions as of the date of the financial statements. Actual results could differ from those estimates and those differences could be significant. The fund qualifies as an investment company under Topic 946 of Accounting Standards Codification of US GAAP.
Events or transactions occurring after the end of the fiscal period through the date that the financial statements were issued have been evaluated in the preparation of the financial statements. The following summarizes the significant accounting policies of the fund:
Security valuation.Investments are stated at value as of the scheduled close of regular trading on the New York Stock Exchange (NYSE), normally at 4:00 p.m., Eastern Time. In case of emergency or other disruption resulting in the NYSE not opening for trading or the NYSE closing at a time other than the regularly scheduled close, the net asset value (NAV) may be determined as of the regularly scheduled close of the NYSE pursuant to the fund's Valuation Policies and Procedures.
In order to value the securities, the fund uses the following valuation techniques: Equity securities held by the fund are typically valued at the last sale price or official closing price on the exchange or principal market where the security trades. In the event there were no sales during the day or closing prices are not available, the securities are valued using the last available bid price. Investments by the fund in open-end management investment companies are valued at their respective NAVs each business day. Debt obligations are typically valued based on the evaluated prices provided by an independent pricing vendor. Independent pricing vendors utilize matrix pricing which takes into account factors such as institutional-size trading in similar groups of securities, yield, quality, coupon rate, maturity, type of issue, trading characteristics and other market data, as well as broker supplied prices. Options listed on an exchange are valued at the mid-price of the last quoted bid and ask prices from the primary exchange where the option trades. Swaps and unlisted options are generally valued using evaluated prices obtained from an independent pricing vendor. Futures contracts are typically valued at the last traded price on the exchange on which they trade. Foreign equity index futures that trade in the electronic trading market subsequent to the close of regular trading may be valued at the last traded price in the electronic trading market as of 4:00 p.m. ET, or may be fair valued based on fair value adjustment factors provided by an independent pricing vendor in order to adjust for events that may occur between the close of foreign exchanges or markets and the close of the NYSE. Forward foreign currency contracts are valued at the prevailing forward rates which are based on foreign currency exchange spot rates and forward points supplied by an independent pricing vendor. Foreign securities and currencies are valued in U.S. dollars based on foreign currency exchange rates supplied by an independent pricing vendor.
In certain instances, the Pricing Committee may determine to value equity securities using prices obtained from another exchange or market if trading on the exchange or market on which prices are typically obtained did not open for trading as scheduled, or if trading closed earlier than scheduled, and trading occurred as normal on another exchange or market.
Other portfolio securities and assets, for which reliable market quotations are not readily available, are valued at fair value as determined in good faith by the fund's Pricing Committee following procedures established by the Board of Trustees. The frequency with which these fair valuation procedures are used cannot be predicted and fair value of securities may differ significantly from the value that would have been used had a ready market for such securities existed. Trading in foreign
securities may be completed before the scheduled daily close of trading on the NYSE. Significant events at the issuer or market level may affect the values of securities between the time when the valuation of the securities is generally determined and the close of the NYSE. If a significant event occurs, these securities may be fair valued, as determined in good faith by the fund's Pricing Committee, following procedures established by the Board of Trustees. The fund uses fair value adjustment factors provided by an independent pricing vendor to value certain foreign securities in order to adjust for events that may occur between the close of foreign exchanges or markets and the close of the NYSE.
The fund uses a three-tier hierarchy to prioritize the pricing assumptions, referred to as inputs, used in valuation techniques to measure fair value. Level 1 includes securities valued using quoted prices in active markets for identical securities. Level 2 includes securities valued using other significant observable inputs. Observable inputs may include quoted prices for similar securities, interest rates, prepayment speeds and credit risk. Prices for securities valued using these inputs are received from independent pricing vendors and brokers and are based on an evaluation of the inputs described. Level 3 includes securities valued using significant unobservable inputs when market prices are not readily available or reliable, including the fund's own assumptions in determining the fair value of investments. Factors used in determining value may include market or issuer specific events or trends, changes in interest rates and credit quality. The inputs or methodology used for valuing securities are not necessarily an indication of the risks associated with investing in those securities. Changes in valuation techniques and related inputs may result in transfers into or out of an assigned level within the disclosure hierarchy.
The following is a summary of the values by input classification of the fund's investments as of January 31, 2019, by major security category or type:
| Total value at 1-31-19 | Level 1 quoted price | Level 2 significant observable inputs | Level 3 significant unobservable inputs | |||||||||||
| Investments in securities: | ||||||||||||||
| Assets | ||||||||||||||
| U.S. Government and Agency obligations | $196,851,739 | — | $196,851,739 | — | ||||||||||
| Foreign government obligations | 432,761,377 | — | 432,761,377 | — | ||||||||||
| Corporate bonds | 67,900,760 | — | 67,900,760 | — | ||||||||||
| Convertible bonds | 106,233 | — | 106,233 | — | ||||||||||
| Common stocks | 321,513,282 | $99,107,843 | 221,682,547 | $722,892 | ||||||||||
| Purchased options | 42,509,053 | 34,016,532 | 8,492,521 | — | ||||||||||
| Short-term investments | 672,023,605 | 141,321,843 | 530,701,762 | — | ||||||||||
| Total investments in securities | $1,733,666,049 | $274,446,218 | $1,458,496,939 | $722,892 | ||||||||||
| Derivatives: | ||||||||||||||
| Assets | ||||||||||||||
| Futures | $15,571,715 | $14,252,644 | $1,319,071 | — | ||||||||||
| Forward foreign currency contracts | 19,251,979 | — | 19,251,979 | — | ||||||||||
| Swap contracts | 56,079,418 | — | 56,079,418 | — | ||||||||||
| Liabilities | ||||||||||||||
| Futures | (10,814,272 | ) | (10,259,049 | ) | (555,223 | ) | — | |||||||
| Forward foreign currency contracts | (24,307,255 | ) | — | (24,307,255 | ) | — | ||||||||
| Written options | (34,745,490 | ) | (21,469,085 | ) | (13,276,405 | ) | — | |||||||
| Swap contracts | (48,550,482 | ) | — | (48,550,482 | ) | — |
Security transactions and related investment income. Investment security transactions are accounted for on a trade date plus one basis for daily NAV calculations. However, for financial reporting purposes, investment transactions are reported on trade date. Interest income is accrued as earned. Interest income includes coupon interest and amortization/accretion of premiums/discounts on debt securities. Debt obligations may be placed in a non-accrual status and related interest income may be reduced by stopping current accruals and writing off interest receivable when the collection of all or a portion of interest has become doubtful. Dividend income is recorded on the ex-date, except for dividends of foreign securities where the dividend may not be known until after the ex-date. In those cases, dividend income, net of withholding
taxes, is recorded when the fund becomes aware of the dividends. Non-cash dividends, if any, are recorded at the fair market value of the securities received. Gains and losses on securities sold are determined on the basis of identified cost and may include proceeds from litigation.
Inflation-indexed bonds. Inflation-indexed bonds are securities that generally have a lower coupon interest rate fixed at issuance but whose principal value is periodically adjusted based on a rate of inflation, such as the Consumer Price Index. Over the life of an inflation-indexed bond, interest is paid on the inflation adjusted principal value as described above. Increases in the principal amount of these securities are recorded as interest income. Decreases in the principal amount of these securities may reduce interest income to the extent of income previously recorded. If these decreases are in excess of income previously recorded, an adjustment to the cost of the security is made.
Real estate investment trusts. The fund may invest in real estate investment trusts (REITs). Distributions from REITs may be recorded as income and subsequently characterized by the REIT at the end of the fiscal year as a reduction of cost of investments and/or as a realized gain. As a result, the fund will estimate the components of distributions from these securities. Such estimates are revised when the actual components of the distributions are known.
Foreign investing. Assets, including investments, and liabilities denominated in foreign currencies are translated into U.S. dollar values each day at the prevailing exchange rate. Purchases and sales of securities, income and expenses are translated into U.S. dollars at the prevailing exchange rate on the date of the transaction. The effect of changes in foreign currency exchange rates on the value of securities is reflected as a component of the realized and unrealized gains (losses) on investments. Foreign investments are subject to a decline in the value of a foreign currency versus the U.S. dollar, which reduces the dollar value of securities denominated in that currency.
Funds that invest internationally generally carry more risk than funds that invest strictly in U.S. securities. These risks are heightened for investments in emerging markets. Risks can result from differences in economic and political conditions, regulations, market practices (including higher transaction costs), accounting standards and other factors.
Foreign taxes. The fund may be subject to withholding tax on income, capital gains or repatriation taxes imposed by certain countries, a portion of which may be recoverable. Foreign taxes are accrued based upon the fund's understanding of the tax rules and rates that exist in the foreign markets in which it invests. Taxes are accrued based on gains realized by the fund as a result of certain foreign security sales. In certain circumstances, estimated taxes are accrued based on unrealized appreciation of such securities. Investment income is recorded net of foreign withholding taxes.
Line of credit.The fund may have the ability to borrow from banks for temporary or emergency purposes, including meeting redemption requests that otherwise might require the untimely sale of securities. Pursuant to the fund's custodian agreement, the custodian may loan money to the fund to make properly authorized payments. The fund is obligated to repay the custodian for any overdraft, including any related costs or expenses. The custodian may have a lien, security interest or security entitlement in any fund property that is not otherwise segregated or pledged, to the extent of any overdraft, and to the maximum extent permitted by law. Overdrafts at period end are presented under the caption Due to custodian in the Statement of assets and liabilities.
The fund and other affiliated funds have entered into a syndicated line of credit agreement with Citibank, N.A. as the administrative agent that enables them to participate in a $750 million unsecured committed line of credit. Excluding commitments designated for a certain fund and subject to the needs of all other affiliated funds, the fund can borrow up to an aggregate commitment amount of $500 million, subject to asset coverage and other limitations as specified in the agreement. A commitment fee payable at the end of each calendar quarter, based on the average daily unused portion of the line of credit, is charged to each participating fund based on a combination of fixed and asset based allocations and is reflected in Other expenses on the Statement of operations. For the six months ended January 31, 2019, the fund had no borrowings under the line of credit. Commitment fees for the six months ended January 31, 2019 were $3,897.
Expenses. Within the John Hancock group of funds complex, expenses that are directly attributable to an individual fund are allocated to such fund. Expenses that are not readily attributable to a specific fund are allocated among all funds in an equitable manner, taking into consideration, among other things, the nature and type of expense and the fund's relative net assets. Expense estimates are accrued in the period to which they relate and adjustments are made when actual amounts are known.
Class allocations. Income, common expenses and realized and unrealized gains (losses) are determined at the fund level and allocated daily to each class of shares based on the net assets of the class. Class-specific expenses, such as distribution and service fees, if any, and transfer agent fees, for all classes, are charged daily at the class level based on the net assets of each class and the specific expense rates applicable to each class.
Federal income taxes. The fund intends to continue to qualify as a regulated investment company by complying with the applicable provisions of the Internal Revenue Code and will not be subject to federal income tax on taxable income that is distributed to shareholders. Therefore, no federal income tax provision is required.
For federal income tax purposes, as of July 31, 2018, the fund has a short-term capital loss carryforward of $524,351,892 available to offset future net realized capital gains. This carryforward does not expire.
As of July 31, 2018, the fund had no uncertain tax positions that would require financial statement recognition, derecognition or disclosure. The fund's federal tax returns are subject to examination by the Internal Revenue Service for a period of three years.
Distribution of income and gains. Distributions to shareholders from net investment income and net realized gains, if any, are recorded on the ex-date. The fund generally declares and pays dividends and capital gain distributions, if any, annually.
Distributions paid by the fund with respect to each class of shares are calculated in the same manner, at the same time and in the same amount, except for the effect of class level expenses that may be applied differently to each class.
Such distributions, on a tax basis, are determined in conformity with income tax regulations, which may differ from US GAAP. Distributions in excess of tax basis earnings and profits, if any, are reported in the fund's financial statements as a return of capital. The final determination of tax characteristics of the fund's distribution will occur at the end of the year and will subsequently be reported to shareholders.
Capital accounts within the financial statements are adjusted for permanent book-tax differences. These adjustments have no impact on net assets or the results of operations. Temporary book-tax differences, if any, will reverse in a subsequent period. Book-tax differences are primarily attributable to foreign currency transactions, net operating losses, derivative transactions, amortization and accretion on debt securities, investments in passive foreign investment companies, wash sale loss deferrals and treasury inflation protected securities.
Note 3 — Derivative Instruments
The fund may invest in derivatives in order to meet its investment objective. Derivatives include a variety of different instruments that may be traded in the over-the-counter (OTC) market, on a regulated exchange or through a clearing facility. The risks in using derivatives vary depending upon the structure of the instruments, including the use of leverage, optionality, the liquidity or lack of liquidity of the contract, the creditworthiness of the counterparty or clearing organization and the volatility of the position. Some derivatives involve risks that are potentially greater than the risks associated with investing directly in the referenced securities or other referenced underlying instrument. Specifically, the fund is exposed to the risk that the counterparty to an OTC derivatives contract will be unable or unwilling to make timely settlement payments or otherwise honor its obligations. OTC derivatives transactions typically can only be closed out with the other party to the transaction.
Forward foreign currency contracts, certain options and certain swaps are typically traded through the OTC market. Certain forwards, options and swaps are regulated by the Commodity Futures Trading Commission. Derivative counterparty risk is managed through an ongoing evaluation of the creditworthiness of all potential counterparties and, if applicable, designated clearing organizations. The fund attempts to reduce its exposure to counterparty risk for derivatives traded in the OTC market, whenever possible, by entering into an International Swaps and Derivatives Association (ISDA) Master Agreement with each of its OTC counterparties. The ISDA gives each party to the agreement the right to terminate all transactions traded under the agreement if there is certain deterioration in the credit quality or contractual default of the other party, as defined in the ISDA. Upon an event of default or a termination of the ISDA, the non-defaulting party has the right to close out all transactions and to net amounts owed.
As defined by the ISDA, the fund may have collateral agreements with certain counterparties to mitigate counterparty risk on OTC derivatives. Subject to established minimum levels, collateral for OTC transactions is generally determined based on the net aggregate unrealized gain or loss on contracts with a particular counterparty. Collateral pledged to the fund is held in a
segregated account by a third-party agent or held by the custodian bank for the benefit of the fund and can be in the form of cash or debt securities issued by the U.S. government or related agencies; collateral posted by the fund for OTC transactions is held in a segregated account at the fund's custodian and is noted in the accompanying fund's investments, or if cash is posted, on the Statement of assets and liabilities. The fund's risk of loss due to counterparty risk is equal to the asset value of outstanding contracts offset by collateral received.
Futures, certain options and centrally-cleared swaps are traded or cleared on an exchange or central clearinghouse. Exchange-traded or centrally-cleared transactions generally present less counterparty risk to a fund than OTC transactions. The exchange or clearinghouse stands between the fund and the broker to the contract and therefore, credit risk is generally limited to the failure of the exchange or clearinghouse and the clearing member.
Centrally-cleared swap contracts are subject to clearinghouse rules, including initial and variation margin requirements, daily settlement of obligations and the clearinghouse guarantee of payments to the broker. There is, however, still counterparty risk due to the potential insolvency of the broker with respect to any margin held in the brokers' customer accounts. While clearing members are required to segregate customer assets from their own assets, in the event of insolvency, there may be a shortfall in the amount of margin held by the broker for its clients. Collateral or margin requirements for exchange-traded or centrally-cleared derivatives are set by the broker or applicable clearinghouse. Margin for exchange-traded and centrally-cleared transactions is detailed in the Statement of assets and liabilities as Collateral held at broker for futures contracts and receivable for centrally-cleared swaps, respectively. Securities pledged by the fund for exchange-traded and centrally-cleared transactions, if any, are identified in the Fund's investments.
Futures.A futures contract is a contractual agreement to buy or sell a particular currency or financial instrument at a pre-determined price in the future. Risks related to the use of futures contracts include possible illiquidity of the futures markets, contract prices that can be highly volatile and imperfectly correlated to movements in the underlying financial instrument and potential losses in excess of the amounts recognized on the Statementof assets and liabilities. Use of long futures contracts subjects the fund to the risk of loss up to the notional value of the futures contracts. Use of short futures contracts subjects the fund to unlimited risk of loss.
Upon entering into a futures contract, the fund is required to deposit initial margin with the broker in the form of cash or securities. The amount of required margin is generally based on a percentage of the contract value; this amount is the initial margin for the trade. The margin deposit must then be maintained at the established level over the life of the contract. Futures margin receivable / payable is included on the Statement of assets and liabilities. Futures contracts are marked-to-market daily and an appropriate payable or receivable for the change in value (variation margin) and unrealized gain or loss is recorded by the fund. When the contract is closed, the fund records a realized gain or loss equal to the difference between the value of the contract at the time it was opened and the value at the time it was closed.
During the six months ended January 31, 2019, the fund used futures contracts to manage against anticipated changes in securities markets and interest rates, gain exposure to certain securities markets and foreign bond markets, and maintain diversity of the fund. The fund held futures contracts with notional values ranging from $714.1 million to $3.6 billion, as measured at each quarter end.
Forward foreign currency contracts. A forward foreign currency contract is an agreement between two parties to buy and sell specific currencies at a price that is set on the date of the contract. The forward contract calls for delivery of the currencies on a future date that is specified in the contract. Risks related to the use of forwards include the possible failure of counterparties to meet the terms of the forward agreement, the failure of the counterparties to timely post collateral if applicable, the risk that currency movements will not favor the fund thereby reducing the fund's total return, and the potential for losses in excess of the amounts recognized on the Statement of assets and liabilities.
The market value of a forward foreign currency contract fluctuates with changes in foreign currency exchange rates. Forward foreign currency contracts are marked-to-market daily and the change in value is recorded by the fund as an unrealized gain or loss. Realized gains or losses, equal to the difference between the value of the contract at the time it was opened and the value at the time it was closed, are recorded upon delivery or receipt of the currency or settlement with the counterparty.
During the six months ended January 31, 2019, the fund used forward foreign currency contracts to manage against anticipated changes in current exchange rates, gain exposure to foreign currencies and maintain diversity of the fund. The
fund held forward foreign currency contracts with U.S. Dollar notional values ranging from $3.0 billion to $5.0 billion, as measured at each quarter end.
Options. There are two types of options, put options and call options. Options are traded either OTC or on an exchange. A call option gives the purchaser of the option the right to buy (and the seller the obligation to sell) the underlying instrument at the exercise price. A put option gives the purchaser of the option the right to sell (and the writer the obligation to buy) the underlying instrument at the exercise price. Writing puts and buying calls may increase the fund's exposure to changes in the value of the underlying instrument. Buying puts and writing calls may decrease the fund's exposure to such changes. Risks related to the use of options include the loss of premiums, possible illiquidity of the options markets, trading restrictions imposed by an exchange and movements in underlying security values, and for written options, potential losses in excess of the amounts recognized on the Statement of assets and liabilities. In addition, OTC options are subject to the risks of all OTC derivatives contracts.
When the fund purchases an option, the premium paid by the fund is included in the Fund's investments and subsequently "marked-to-market" to reflect current market value. If the purchased option expires, the fund realizes a loss equal to the cost of the option. If the fund exercises a call option, the cost of the securities acquired by exercising the call is increased by the premium paid to buy the call. If the fund exercises a put option, it realizes a gain or loss from the sale of the underlying security and the proceeds from such sale are decreased by the premium paid. Use the following disclosure only when fund has written/purchased options: If the fund enters into a closing sale transaction, the fund realizes a gain or loss, depending on whether proceeds from the closing sale are greater or less than the original cost. When the fund writes an option, the premium received is included as a liability and subsequently "marked-to-market" to reflect the current market value of the option written. Premiums received from writing options that expire unexercised are recorded as realized gains. Premiums received from writing options which are exercised or are closed are added to or offset against the proceeds or amount paid on the transaction to determine the realized gain or loss. If a put option on a security is exercised, the premium received reduces the cost basis of the securities purchased by the fund.
During the six months ended January 31, 2019, the fund used purchased options contracts to maintain diversity of the fund.The fund held purchased options contracts with market values ranging from $42.5 million to $93.7 million, as measured at each quarter end.
During the six months ended January 31, 2019, the fund wrote option contracts to manage against anticipated changes in securities markets and gain exposure to certain securities markets. The fund held written options contracts with market values ranging from $19.0 million to $68.2 million, as measured at each quarter end.
Swaps. Swap agreements are agreements between the fund and counterparty to exchange cash flows, assets, foreign currencies or market-linked returns at specified intervals. Swap agreements are privately negotiated in the OTC market (OTC swaps) or may be executed on a registered commodities exchange (centrally cleared swaps). Swaps are marked-to-market daily and the change in value is recorded as a component of unrealized appreciation/depreciation of swap contracts. The value of the swap will typically impose collateral posting obligations on the party that is considered out-of-the-money on the swap.
Upfront payments made/received by the fund are amortized/accreted for financial reporting purposes, with the unamortized/unaccreted portion included in the Statement of assets and liabilities. A termination payment by the counterparty or the fund is recorded as realized gain or loss, as well as the net periodic payments received or paid by the fund.
Entering into swap agreements involves, to varying degrees, elements of credit, market and documentation risk that may provide outcomes that are in excess of the amounts recognized on the Statement of assets and liabilities. Such risks involve the possibility that there will be no liquid market for the swap, or that a counterparty may default on its obligation or delay payment under the swap terms. The counterparty may disagree or contest the terms of the swap. In addition to interest rate risk, market risks may also impact the swap. The fund may also suffer losses if it is unable to terminate or assign outstanding swaps or reduce its exposure through offsetting transactions.
Interest rate swaps. Interest rate swaps represent an agreement between the fund and a counterparty to exchange cash flows based on the difference between two interest rates applied to a notional amount. The payment flows are usually netted against each other, with the difference being paid by one party to the other. The fund settles accrued net interest receivable or payable under the swap contracts at specified, future intervals.
During the six monthsended January 31, 2019, the fund used interest rate swap contracts to manage against anticipated changes in securities markets and gain exposure to certain securities markets. The fund held interest rate swaps with total USD notional amounts ranging from $7.3 billion to $11.1 billion, as measured at each quarter end.
Credit default swaps. Credit default swaps (CDS) involve the exchange of a fixed rate premium (paid by the Buyer), for protection against the loss in value of an underlying debt instrument, referenced entity or index, in the event of a defined credit event (such as payment default or bankruptcy). Under the terms of the swap, one party acts as a "guarantor" (the Seller), receiving the premium and agreeing to contingent payments that are specified within the credit default agreement. The fund may enter into CDS in which it may act as either Buyer or Seller. By acting as the Seller, the fund may incur economic leverage since it would be obligated to pay the Buyer the notional amount of the contract in the event of a default. The amount of loss in such case could be significant, but would typically be reduced by any recovery value on the underlying credit.
Credit default swaps—Buyer
During the six months ended January 31, 2019, the fund used CDS as a Buyer of protection to manage against potential credit events. The fund held credit default swap contracts with total USD notional amounts ranging from $86.0 million to $118.0 million, as measured at each quarter end.
Credit default swaps—Seller
Implied credit spreads are utilized in determining the market value of CDS agreements in which the fund is the Seller at period end. The implied credit spread generally represents the yield of the instrument above a credit-risk free rate, such as the U.S. Treasury Bond Yield, and may include upfront payments required to be made to enter into the agreement. It also serves as an indicator of the current status of the payment/performance risk and represents the likelihood or risk of default for the credit derivative. Wider credit spreads represent a deterioration of the referenced entity's creditworthiness and an increased risk of default or other credit event occurring as defined under the terms of the agreement.
For CDS agreements where implied credit spreads are not reported or available, the average credit rating on the underlying index is shown. Increasing market values, in absolute terms when compared to the notional amount of the swap, represent a deterioration of the referenced entity's creditworthiness and a greater likelihood of a credit event occurring. This is also represented by a decrease in the average credit rating of the underlying index. The maximum potential amount of future payments (undiscounted) that a fund as the Seller could be required to make under any CDS agreement equals the notional amount of the agreement.
During the six monthsended January 31, 2019, the fund used CDS as a Seller of protection to take a long position in the exposure of the benchmark credit. The fund acted as Seller on credit default swap contracts with total USD notional amounts ranging up to $313.3 million, as measured at each quarter end.
Inflation Swaps.In an inflation swap, one party pays a fixed rate on a notional principal amount while the other party pays a floating rate linked to an inflation index on that same notional amount. The party paying the floating rate pays the inflation adjusted rate multiplied by the notional principal amount. If the average inflation rate over the term of the swap is the same as the fixed rate of the swap, the two legs will have the same value and the swap will break even.
During the six months ended January 31, 2019, the fund used inflation swaps to manage inflation duration of the fund, maintain diversity and liquidity of the fund, and manage against anticipated changes in inflation. The fund held inflation swaps with total USD notional amounts ranging up to $104.1 million, as measured at each quarter end.
Total Return Swaps.The fund may enter into total return swap contracts to obtain synthetic exposure to a specific reference asset or index without owning, taking physical custody of, or short selling the underlying assets. Total return swaps are commitments where one party pays a fixed or variable rate premium (the Buyer) in exchange for a market-linked return (the Seller). The Seller pays the total return of a specific reference asset or index and in return receives interest payments from the Buyer To the extent the total return of the underlying asset or index exceeds or falls short of the offsetting interest rate obligation, the Buyer will receive or make a payment to the Seller. The fund may enter into total return swaps in which it may act as either the Buyer or the Seller. Total return swap contracts are subject to the risk associated with the investment in the underlying reference asset or index. The risk in the case of short total return swap contracts is unlimited based on the potential for unlimited increases in the market value of the underlying reference asset or index.
During the six months ended January 31, 2019, the fund used total return swaps to manage against anticipated changes in securities, gain exposure to certain securities markets, and to maintain diversity of the fund. The fund held total return swaps with total USD notional amounts ranging from $6.2 million to $116.9 million, as measured at each quarter end.
Variance Swaps. Variance swap agreements involve two parties agreeing to exchange cash flows based on the measured variance (or square of volatility) of a specified underlying asset. One party agrees to exchange a "fixed rate" or strike price payment for the "floating rate" or realized price variance on the underlying asset with respect to the notional amount. At inception, the strike price is generally chosen such that the fair value of the swap is zero. At the maturity date, a net cash flow is exchanged, where the payoff amount is equivalent to the difference between the realized price variance of the underlying asset and the strike price multiplied by the notional amount. As a receiver of the realized price variance, the fund would receive the payoff amount when the realized price variance of the underlying asset is greater than the strike price and would owe the payoff amount when the price variance is less than the strike price. As a payer of the realized price variance the fund would owe the payoff amount when the realized price variance of the underlying asset is greater than the strike price and would receive the payoff amount when the variance is less than the strike price
During the six months ended January 31, 2019, the fund used variance swaps to maintain diversity of the fund and manage against volatility and anticipated changes in securities markets. The fund held variance swaps with total USD notional amounts ranging from $3.0 million to $13.2 million, as measured at each quarter end.
Fair value of derivative instruments by risk category
The table below summarizes the fair value of derivatives held by the fund at January 31, 2019 by risk category:
| Risk | Statement of assets and liabilities location | Financial instruments location | Assets derivatives fair value | Liabilities derivatives fair value | |||||||||||||
| Equity | Receivable/payable for futures variation margin | Futures† | $15,328,957 | ($10,814,272 | ) | ||||||||||||
| Interest rate | Receivable/payable for futures variation margin | Futures† | 242,758 | — | |||||||||||||
| Foreign currency | Unrealized appreciation / depreciation on forward foreign currency contracts | Forward foreign currency contracts | 19,251,979 | (24,307,255 | ) | ||||||||||||
| Equity | Unaffiliated nvestments, at value* | Purchased options | 38,013,825 | — | |||||||||||||
| Foreign currency | Unaffiliated nvestments, at value* | Purchased options | 4,495,228 | — | |||||||||||||
| Equity | Written options, at value | Written options | — | (34,745,490 | ) | ||||||||||||
| Credit | Swap contracts, at value | Credit default swaps^ | 12,390,510 | (6,397,021 | ) | ||||||||||||
| Equity | Swap contracts, at value | Total return swaps^ | 49,926 | — | |||||||||||||
| Equity | Swap contracts, at value | Variance swaps^ | 3,299,565 | (7,037,553 | ) | ||||||||||||
| Interest rate | Swap contracts, at value | Inflation swaps^ | 2,100,014 | — | |||||||||||||
| Interest rate | Swap contracts, at value | Interest rate swaps^ | 38,239,403 | (35,115,908 | ) | ||||||||||||
| $133,412,165 | ($118,417,499 | ) | |||||||||||||||
| † Reflects cumulative appreciation/depreciation on futures as disclosed in the Fund's investments. Only the period end variation margin is separately disclosed on the Statement of assets and liabilities. | |||||||||||||||||
| * Purchased options are included in the Fund's investments. | |||||||||||||||||
| ^ Reflects cumulative value of swap contracts. Receivable/payable for centrally cleared swaps, which includes value and margin, and swap contracts at value, which represents OTC swaps, are shown separately on the Statement of assets and liabilities. | |||||||||||||||||
For financial reporting purposes, the fund does not offset OTC derivative assets or liabilities that are subject to master netting arrangements, as defined by the ISDAs, in the Statement of assets and liabilities. In the event of default by the counterparty or
a termination of the agreement, the ISDA allows an offset of amounts across the various transactions between the fund and the applicable counterparty.
| OTC Financial Instruments | Asset | Liability | ||||||
| Forward foreign currency contracts | $19,251,979 | ($24,307,255 | ) | |||||
| Purchase options | 8,492,521 | — | ||||||
| Written options | — | (13,276,405 | ) | |||||
| Interest rate swaps | 166,371 | — | ||||||
| Total return swaps | 49,926 | — | ||||||
| Variance swaps | 3,299,565 | (7,037,553 | ) | |||||
| $31,260,362 | ($44,621,213 | ) |
| Counterparty | Total market value of OTC derivatives | Collateral posted by counterparty | Collateral posted by fund | Net exposure | ||||||||||
| Barclays | ($1,696,170 | ) | — | $1,577,506 | ($118,664 | ) | ||||||||
| BNP Paribas | (5,721,592 | ) | — | 3,011,795 | (2,709,797 | ) | ||||||||
| Citibank N.A. | 546,279 | — | 191,466 | 737,745 | ||||||||||
| Deutsche Bank | 5,596,142 | $5,596,142 | — | — | ||||||||||
| Goldman Sachs | (6,194,264 | ) | — | 4,267,480 | (1,926,784 | ) | ||||||||
| HSBC | (2,073,148 | ) | — | 867,794 | (1,205,354 | ) | ||||||||
| JPMorgan Chase | (2,829,782 | ) | — | 1,579,924 | (1,249,858 | ) | ||||||||
| Merrill Lynch | (427,164 | ) | — | 427,164 | — | |||||||||
| Morgan Stanley | (3,036,516 | ) | — | 2,972,323 | (64,193 | ) | ||||||||
| Natwest Markets PLC | 760,418 | 537,373 | — | 223,045 | ||||||||||
| Nomura Securities | 153,340 | — | — | 153,340 | ||||||||||
| Royal Bank of Canada | 4,787,908 | 4,500,000 | — | 287,908 | ||||||||||
| Societe General | (1,492,371 | ) | — | 1,389,760 | (102,611 | ) | ||||||||
| UBS AG | (1,733,931 | ) | — | 1,062,071 | (671,860 | ) | ||||||||
| Totals | ($13,360,851 | ) | $10,633,515 | $17,347,283 | ($6,647,083 | ) |
Effect of derivative instruments on the Statement of operations
The table below summarizes the net realized gain (loss) included in the net increase (decrease) in net assets from operations, classified by derivative instrument and risk category, for the six months ended January 31, 2019:
| Statement of operations location - net realized gain (loss) on: | ||||||||||||||||||||
| Risk | Unaffiliated investments and foreign currency transactions1 | Futures contracts | Written options | Swap contracts | Forward foreign currency contracts | Total | ||||||||||||||
| Credit | — | — | — | ($3,294,145 | ) | — | ($3,294,145 | ) | ||||||||||||
| Equity | ($8,602,647 | ) | $54,908,953 | ($66,492,505 | ) | (21,620,136 | ) | — | (41,806,335 | ) | ||||||||||
| Foreign currency | 5,557,245 | — | 2,333,431 | — | $68,829,058 | 76,719,734 | ||||||||||||||
| Interest rate | — | 3,744,766 | — | 9,833,277 | — | 13,578,043 | ||||||||||||||
| Total | ($3,045,402 | ) | $58,653,719 | ($64,159,074 | ) | ($15,081,004 | ) | $68,829,058 | $45,197,297 | |||||||||||
| 1 Realized gain/loss associated with purchased options is included in this caption on the Statement of operations. | ||||||||||||||||||||
The table below summarizes the net change in unrealized appreciation (depreciation) included in the net increase (decrease) in net assets from operations, classified by derivative instrument and risk category, for the six months ended January 31, 2019:
| Statement of operations location - change in net unrealized appreciation (depreciation) of: | ||||||||||||||||||||
| Risk | Unaffiliated investments and foreign currency transactions1 | Futures contracts | Written options | Swap contracts | Forward foreign currency contracts | Total | ||||||||||||||
| Credit | — | — | — | $5,604,766 | — | $5,604,766 | ||||||||||||||
| Equity | $14,183,553 | $19,770,029 | $3,852,204 | 1,843,014 | — | 39,648,800 | ||||||||||||||
| Foreign currency | (5,522,987 | ) | — | (2,250,312 | ) | — | ($35,338,226 | ) | (43,111,525 | ) | ||||||||||
| Interest rate | — | (7,369,548 | ) | — | 15,728,803 | — | 8,359,255 | |||||||||||||
| Total | $8,660,566 | $12,400,481 | $1,601,892 | $23,176,583 | ($35,338,226 | ) | $10,501,296 | |||||||||||||
| 1 Change in unrealized appreciation/depreciation associated with purchased options is included in this caption on the Statement of operations. | ||||||||||||||||||||
Note 4 — Guarantees and indemnifications
Under the Trust's organizational documents, its Officers and Trustees are indemnified against certain liabilities arising out of the performance of their duties to the Trust, including the fund. Additionally, in the normal course of business, the fund enters into contracts with service providers that contain general indemnification clauses. The fund's maximum exposure under these arrangements is unknown, as this would involve future claims that may be made against the fund that have not yet occurred. The risk of material loss from such claims is considered remote.
Note 5 — Fees and transactions with affiliates
John Hancock Advisers, LLC (the Advisor) serves as investment advisor for the fund. John Hancock Funds, LLC (the Distributor), an affiliate of the Advisor, serves as principal underwriter of the fund. The Advisor and the Distributor are indirect, wholly owned subsidiaries of Manulife Financial Corporation (MFC).
Management fee. The fund has an investment management agreement with the Advisor under which the fund pays a daily management fee to the Advisor equivalent on an annual basis to the sum of: (a) 1.300% of the first 200 million of the fund's average daily net assets; and (b) 1.250% of the next $300 million of the fund's average daily net assets provided that net assets are less than or equal to $500 million. If net assets exceed $500 million, the following rates apply; (a) 1.200% of the first $3.0 billion of the fund's average daily net assets; (b) 1.1500% of the next $2.5 billion of the fund's average daily net assets; (c) 1.120% of the next $1.5 billion of the fund's average daily net assets; (d) 1.100% of the next $3.0 billion of the fund's average daily net assets; and (e) 1.070% of the fund's average daily net assets in excess of $10.0 billion. The Advisor has a subadvisory agreement with Standard Life Investments (Corporate Funds) Limited. Effective January 1, 2019, Standard Life Investments (USA) Limited was replaced by Aberdeen Standard Investments, Inc. as the fund's sub-subadvisor. The fund is not responsible for payment of the subadvisory fees.
The Advisor has contractually agreed to waive a portion of its management fee and/or reimburse expenses for certain funds of the John Hancock group of funds complex, including the fund (the participating portfolios). This waiver is based upon aggregate net assets of all the participating portfolios. The amount of the reimbursement is calculated daily and allocated among all the participating portfolios in proportion to the daily net assets of each fund. During the six months ended January 31, 2019, this waiver amounted to 0.01% of the fund's average net assets (on an annualized basis). This agreement expires on June 30, 2020, unless renewed by mutual agreement of the Fund and the Advisor based upon a determination that this is appropriate under the circumstances at that time.
For the six months ended January 31, 2019, the expense reductions described above amounted to the following:
| Class | Expense reduction | Class | Expense reduction | |||||||||||
| Class A | $3,900 | Class R6 | $14,452 | |||||||||||
| Class C | 3,034 | Class NAV | 18,197 |
| Class | Expense reduction | Class | Expense reduction | |||||||||||
| Class I | $73,956 | Total | $113,587 | |||||||||||
| Class R2 | 48 |
Expenses waived or reimbursed in the current fiscal period are not subject to recapture in future fiscal periods.
The investment management fees incurred, including the impact of the waivers and reimbursements as described above, for the six months ended January 31, 2019 were equivalent to a net annual effective rate of 1.19% of the fund's average daily net assets.
Accounting and legal services. Pursuant to a service agreement, the fund reimburses the Advisor for all expenses associated with providing the administrative, financial, legal, accounting and recordkeeping services to the fund, including the preparation of all tax returns, periodic reports to shareholders and regulatory reports, among other services. These expenses are allocated to each share class based on its relative net assets at the time the expense was incurred. These accounting and legal services fees incurred for the six months ended January 31, 2019 amounted to an annual rate of 0.02% of the fund's average daily net assets.
Distribution and service plans. The fund has a distribution agreement with the Distributor. The fund has adopted distribution and service plans with respect to Class A, Class C, and Class R2 shares pursuant to Rule 12b-1 under the 1940 Act, to pay the Distributor for services provided as the distributor of shares of the fund. In addition, under a service plan for Class R2 shares, the fund pays for certain other services. The fund may pay up to the following contractual rates of distribution and service fees under these arrangements, expressed as an annual percentage of average daily net assets for each class of the fund's shares.
| Class | Rule 12b-1 fee | Service fee |
| Class A | 0.30% | — |
| Class C | 1.00% | — |
| Class R2 | 0.25% | 0.25% |
Sales charges. Class A shares are assessed up-front sales charges, which resulted in payments to the Distributor amounting to $7,932 for the six months ended January 31, 2019. Of this amount, $1,291 was retained and used for printing prospectuses, advertising, sales literature and other purposes, $6,616 was paid as sales commissions to broker-dealers and $25 was paid as sales commissions to sales personnel of Signator Investors, Inc., which had been a broker-dealer affiliate of the Advisor through December 31, 2018.
Class A and Class C shares may be subject to contingent deferred sales charges (CDSCs). Certain Class A shares that are acquired through purchases of $1 million or more and are redeemed within one year of purchase are subject to a 1.00% sales charge. Class C shares that are redeemed within one year of purchase are subject to a 1.00% CDSC. CDSCs are applied to the lesser of the current market value at the time of redemption or the original purchase cost of the shares being redeemed. Proceeds from CDSCs are used to compensate the Distributor for providing distribution-related services in connection with the sale of these shares. During the six months ended January 31, 2019, CDSCs received by the Distributor amounted to $608 for Class C shares. During the six months ended January 31, 2019, there were no CDSCs received by the Distributor for Class A shares.
Transfer agent fees. The John Hancock group of funds has a complex-wide transfer agent agreement with John Hancock Signature Services, Inc. (Signature Services), an affiliate of the Advisor. The transfer agent fees paid to Signature Services are determined based on the cost to Signature Services (Signature Services Cost) of providing recordkeeping services. It also includes out-of-pocket expenses, including payments made to third-parties for recordkeeping services provided to their clients who invest in one or more John Hancock funds. In addition, Signature Services Cost may be reduced by certain fees that Signature Services receives in connection with retirement and small accounts. Signature Services Cost is calculated monthly and allocated, as applicable, to five categories of share classes: Retail Share and Institutional Share Classes of Non-Municipal Bond Funds, Class R6 Shares, Retirement Share Classes and Municipal Bond Share Classes. Within each of these categories, the applicable costs are allocated to the affected John Hancock affiliated funds and/or classes, based on the relative average daily net assets.
Class level expenses. Class level expenses for the six months ended January 31, 2019 were:
| Class | Distribution and service fees | Transfer agent fees |
| Class A | $148,807 | $54,091 |
| Class C | 385,599 | 42,047 |
| Class I | — | 1,228,962 |
| Class R2 | 2,735 | 78 |
| Class R6 | — | 23,710 |
| Total | $537,141 | $1,348,888 |
Trustee expenses.The fund compensates each Trustee who is not an employee of the Advisor or its affiliates. The costs of paying Trustee compensation and expenses are allocated to the fund based on its net assets relative to other funds within the John Hancock group of funds complex.
Note 6 — Fund share transactions
Transactions in fund shares for the six months ended January 31, 2019 and for the year ended July 31, 2018 were as follows:
| Six months ended 1-31-19 | Year ended 7-31-18 | |||||||||||||||||||||||||
| Shares | Amount | Shares | Amount | |||||||||||||||||||||||
| Class A shares | ||||||||||||||||||||||||||
| Sold | 480,410 | $4,785,017 | 3,221,196 | $33,164,797 | ||||||||||||||||||||||
| Repurchased | (3,547,695 | ) | (35,223,706 | ) | (10,782,153 | ) | (110,919,648 | ) | ||||||||||||||||||
| Net decrease | (3,067,285 | ) | $(30,438,689 | ) | (7,560,957 | ) | $(77,754,851 | ) | ||||||||||||||||||
| Class C shares | ||||||||||||||||||||||||||
| Sold | 27,470 | $267,350 | 294,718 | $3,003,179 | ||||||||||||||||||||||
| Repurchased | (2,634,303 | ) | (25,683,006 | ) | (7,028,211 | ) | (71,340,546 | ) | ||||||||||||||||||
| Net decrease | (2,606,833 | ) | $(25,415,656 | ) | (6,733,493 | ) | $(68,337,367 | ) | ||||||||||||||||||
| Class I shares | ||||||||||||||||||||||||||
| Sold | 16,869,782 | $169,618,615 | 52,684,709 | $547,836,699 | ||||||||||||||||||||||
| Repurchased | (128,975,247 | ) | (1,293,154,024 | ) | (152,436,892 | ) | (1,578,042,859 | ) | ||||||||||||||||||
| Net decrease | (112,105,465 | ) | $(1,123,535,409 | ) | (99,752,183 | ) | $(1,030,206,160 | ) | ||||||||||||||||||
| Class R2 shares | ||||||||||||||||||||||||||
| Sold | 7,048 | $70,268 | 19,791 | $203,145 | ||||||||||||||||||||||
| Repurchased | (25,497 | ) | (251,736 | ) | (112,283 | ) | (1,154,045 | ) | ||||||||||||||||||
| Net decrease | (18,449 | ) | $(181,468 | ) | (92,492 | ) | $(950,900 | ) | ||||||||||||||||||
| Class R6 shares | ||||||||||||||||||||||||||
| Sold | 877,043 | $8,880,795 | 13,103,168 | $134,902,273 | ||||||||||||||||||||||
| Repurchased | (31,999,110 | ) | (322,223,154 | ) | (26,517,261 | ) | (274,041,157 | ) | ||||||||||||||||||
| Net decrease | (31,122,067 | ) | $(313,342,359 | ) | (13,414,093 | ) | $(139,138,884 | ) | ||||||||||||||||||
| Class NAV shares | ||||||||||||||||||||||||||
| Sold | 10,411 | $104,587 | 704,761 | $7,340,189 | ||||||||||||||||||||||
| Repurchased | (46,739,294 | ) | (466,265,263 | ) | (28,183,844 | ) | (289,846,858 | ) | ||||||||||||||||||
| Net decrease | (46,728,883 | ) | $(466,160,676 | ) | (27,479,083 | ) | $(282,506,669 | ) | ||||||||||||||||||
| Total net decrease | (195,648,982 | ) | $(1,959,074,257 | ) | (155,032,301 | ) | $(1,598,894,831 | ) | ||||||||||||||||||
Affiliates of the Fund owned 100% of shares of Class NAV on January 31, 2019. Such concentration of shareholders' capital could have a material effect on the fund if such shareholders redeem from the fund.
Note 7 — Purchase and sale of securities
Purchases and sales of securities, other than short-term securities and U.S. Treasury obligations, amounted to $301,098,064 and $1,756,392,796, respectively, for the six months ended January 31, 2019. Purchases and sales of U.S. Treasury obligations aggregated $125,557,645 and $168,013,250, respectively, for the six months ended January 31, 2019.
Note 8 — Investment by affiliated funds
Certain investors in the fund are affiliated funds that are managed by the Advisor and its affiliates. The affiliated funds do not invest in the fund for the purpose of exercising management or control; however, this investment may represent a significant portion of the fund's net assets. At January 31, 2019, funds within the John Hancock group of funds complex held 8.9% of the fund's net assets. As of January 31, 2019, no affiliated funds owned 5% or more of the fund's net assets.
Note 9 — New accounting pronouncement
In March 2017, the Financial Accounting Standards Board issued Accounting Standards Update (ASU) 2017-08, Premium Amortization on Purchased Callable Debt Securities, which shortens the premium amortization period for purchased non-contingently callable debt securities. The standard is effective for annual periods beginning after December 15, 2018 and interim periods within those fiscal years. Management does not expect the ASU to have an impact on the fund's net assets or total return. Depending upon holdings of the fund, the shortening of the premium amortization period could decrease interest income with a corresponding offset to unrealized gain (loss).
Trustees Hassell H. McClellan,Chairperson Officers Andrew G. Arnott Francis V. Knox, Jr. Charles A. Rizzo Salvatore Schiavone Christopher (Kit) Sechler** | Investment advisor John Hancock Advisers, LLC Subadvisor Standard Life Investments (Corporate Funds) Limited Portfolio Manager Guy B. Stern, CFA Principal distributor John Hancock Funds, LLC Custodian Citibank, N.A. Transfer agent John Hancock Signature Services, Inc. Legal counsel K&L Gates LLP |
* Member of the Audit Committee
† Non-Independent Trustee
#Effective 6-19-18
**Effective 9-13-18
The fund's proxy voting policies and procedures, as well as the fund proxy voting record for the most recent twelve-month period ended June 30, are available free of charge on the Securities and Exchange Commission (SEC) website at sec.gov or on our website.
The fund's complete list of portfolio holdings, for the first and third fiscal quarters, is filed with the SEC on Form N-Q. Effective April 30, 2019, all of the fund's holdings as of the end of the third month of every fiscal quarter will be filed with the SEC on Form N-PORT within 60 days of the end of the fiscal quarter. The fund's Form N-Q is available on our website and the SEC's website, sec.gov.
We make this information on your fund, as well asmonthly portfolio holdings, and other fund details available on our website at jhinvestments.com or by calling 800-225-5291.
| You can also contact us: | |||
| 800-225-5291 jhinvestments.com | Regular mail: John Hancock Signature Services, Inc. | Express mail: John Hancock Signature Services, Inc. | |
John Hancock family of funds
DOMESTIC EQUITY FUNDS Blue Chip Growth Classic Value Disciplined Value Disciplined Value Mid Cap Equity Income Financial Industries Fundamental All Cap Core Fundamental Large Cap Core Fundamental Large Cap Value New Opportunities Regional Bank Small Cap Core Small Cap Growth Small Cap Value U.S. Global Leaders Growth U.S. Growth U.S. Quality Growth Value Equity GLOBAL AND INTERNATIONAL EQUITY FUNDS Disciplined Value International Emerging Markets Emerging Markets Equity Fundamental Global Franchise Global Equity Global Shareholder Yield Global Thematic Opportunities Greater China Opportunities International Growth International Small Company | INCOME FUNDS Bond California Tax-Free Income Emerging Markets Debt Floating Rate Income Government Income High Yield High Yield Municipal Bond Income Investment Grade Bond Money Market Short Duration Credit Opportunities Spectrum Income Strategic Income Opportunities Tax-Free Bond ALTERNATIVE AND SPECIALTY FUNDS Absolute Return Currency Alternative Asset Allocation Disciplined Alternative Yield Global Absolute Return Strategies Global Conservative Absolute Return Global Focused Strategies Infrastructure Seaport Long/Short Technical Opportunities |
A fund's investment objectives, risks, charges, and expenses should be considered carefully before investing. The prospectus contains this and other important information about the fund. To obtain a prospectus, contact your financial professional, call John Hancock Investments at 800-225-5291, or visit our website at jhinvestments.com. Please read the prospectus carefully before investing or sending money.
ASSET ALLOCATION Balanced Income Allocation Multi-Index Lifetime Portfolios Multi-Index Preservation Portfolios Multimanager Lifestyle Portfolios Multimanager Lifetime Portfolios Retirement Income 2040 EXCHANGE-TRADED FUNDS John Hancock Multifactor Consumer Discretionary ETF John Hancock Multifactor Consumer Staples ETF John Hancock Multifactor Developed International ETF John Hancock Multifactor Emerging Markets ETF John Hancock Multifactor Energy ETF John Hancock Multifactor Financials ETF John Hancock Multifactor Healthcare ETF John Hancock Multifactor Industrials ETF John Hancock Multifactor Large Cap ETF John Hancock Multifactor Materials ETF John Hancock Multifactor Media and John Hancock Multifactor Mid Cap ETF John Hancock Multifactor Small Cap ETF John Hancock Multifactor Technology ETF John Hancock Multifactor Utilities ETF | ENVIRONMENTAL, SOCIAL, AND ESG All Cap Core ESG Core Bond ESG International Equity ESG Large Cap Core CLOSED-END FUNDS Financial Opportunities Hedged Equity & Income Income Securities Trust Investors Trust Preferred Income Preferred Income II Preferred Income III Premium Dividend Tax-Advantaged Dividend Income Tax-Advantaged Global Shareholder Yield |
John Hancock Multifactor ETF shares are bought and sold at market price (not NAV), and are not individually redeemed
from the fund. Brokerage commissions will reduce returns.
John Hancock ETFs are distributed by Foreside Fund Services, LLC, and are subadvised by Dimensional Fund Advisors LP.
Foreside is not affiliated with John Hancock Funds, LLC or Dimensional Fund Advisors LP.
Dimensional Fund Advisors LP receives compensation from John Hancock in connection with licensing rights to the
John Hancock Dimensional indexes. Dimensional Fund Advisors LP does not sponsor, endorse, or sell, and makes no
representation as to the advisability of investing in, John Hancock Multifactor ETFs.
John Hancock Investments
A trusted brand
John Hancock Investments is a premier asset manager representing one of
America's most trusted brands, with a heritage of financial stewardship dating
back to 1862. Helping our shareholders pursue their financial goals is at the
core of everything we do. It's why we support the role of professional financial
advice and operate with the highest standards of conduct and integrity.
A better way to invest
We serve investors globally through a unique multimanager approach:
We search the world to find proven portfolio teams with specialized
expertise for every strategy we offer, then we apply robust investment
oversight to ensure they continue to meet our uncompromising standards
and serve the best interests of our shareholders.
Results for investors
Our unique approach to asset management enables us to provide a diverse set
of investments backed by some of the world's best managers, along with strong
risk-adjusted returns across asset classes.
| | John Hancock Funds, LLC n Member FINRA, SIPC 200 Berkeley Street n Boston, MA 02116-5010 800-225-5291 n jhinvestments.com | |
| This report is for the information of the shareholders of John Hancock Global Absolute Return Strategies Fund. It is not authorized for distribution to prospective investors unless preceded or accompanied by a prospectus. | ||
| MF733312 | 395SA 1/19 3/19 | |
ITEM 2. CODE OF ETHICS.
(a) Not Applicable
(b) Not Applicable
(c) Not Applicable
(d) Not Applicable
(e) Not Applicable
(f) Not Applicable
ITEM 3. AUDIT COMMITTEE FINANCIAL EXPERT.
Not Applicable
ITEM 4. PRINCIPAL ACCOUNTANT FEES AND SERVICES.
(a) Not Applicable
(b) Not Applicable
(c) Not Applicable
(d) Not Applicable
(e) Not Applicable
(f) Not Applicable.
(g) Not Applicable
(h) Not Applicable
ITEM 5. AUDIT COMMITTEE OF LISTED REGISTRANTS
Not Applicable.
ITEM 6. SCHEDULE OF INVESTMENTS.
(a) Included with Item 1.
(b) Not Applicable.
ITEM 7. DISCLOSURE OF PROXY VOTING POLICIES AND PROCEDURES FOR CLOSED-END MANAGEMENT INVESTMENT COMPANIES.
Not Applicable.
ITEM 8. PORTFOLIO MANAGERS OF CLOSED-END MANAGEMENT INVESTMENT COMPANIES.
Not Applicable.
ITEM 9. PURCHASE OF EQUITY SECURITIES BY CLOSED-END MANAGEMENT INVESTMENT COMPANIES AND AFFILIATED PURCHASERS.
Not Applicable.
ITEM 10. SUBMISSION OF MATTERS TO VOTE OF SECURITY HOLDERS.
Not Applicable.
ITEM 11. CONTROLS AND PROCEDURES.
| (a) | EVALUATION OF DISCLOSURE CONTROLS AND PROCEDURES. The Registrant maintains disclosure controls and procedures that are designed to ensure that information required to be disclosed in this Form N-CSR is recorded, processed, summarized and reported within the periods specified in the rules and forms of the Securities and Exchange Commission. Such disclosure controls and procedures include controls and procedures designed to ensure that such information is accumulated and communicated to the Registrant's management, including its principal executive officer and principal financial officer, as appropriate, to allow timely decisions regarding required disclosure. | |
| Within 90 days prior to the filing date of this Form N-CSR, the Registrant had carried out an evaluation, under the supervision and with the participation of the Registrant's management, including the Registrant's principal executive officer and the Registrant's principal financial officer, of the effectiveness of the design and operation of the Registrant's disclosure controls and procedures relating to information required to be disclosed on Form N-CSR. Based on such evaluation, the Registrant's principal executive officer and principal financial officer concluded that the Registrant's disclosure controls and procedures are operating effectively to ensure that: | ||
| (i) information required to be disclosed in this Form N-CSR is recorded, processed, summarized and reported within the periods specified in the rules and forms of the Securities and Exchange Commission, and (ii) information is accumulated and communicated to the Registrant’s management, including its principal executive officer and principal financial officer, as appropriate, to allow timely decisions regarding required disclosure. | ||
| (b) | CHANGE IN REGISTRANT’S INTERNAL CONTROL: Not Applicable. | |
ITEM 12. DISCLOSURE OF SECURITIES LENDING ACTIVITIES FOR CLOSED-END MANAGEMENT INVESTMENT COMPANIES.
Not applicable.
ITEM 12. EXHIBITS.
(a)(1) Separate certifications for the registrant's principal executive officer and principal financial officer, as required by Section 302 of the Sarbanes-Oxley Act of 2002 and Rule 30a-2(a) under the Investment Company Act of 1940, are attached.
(b)(1) Separate certifications for the registrant's principal executive officer and principal financial officer, as required by 18 U.S.C. Section 1350, as adopted pursuant to Section 906 of the Sarbanes-Oxley Act of 2002, and Rule 30a-2(b) under the Investment Company Act of 1940, are attached. The certifications furnished pursuant to this paragraph are not deemed to be "filed" for purposes of Section 18 of the Securities Exchange Act of 1934, or otherwise subject to the liability of that section. Such certifications are not deemed to be incorporated by reference into any filing under the Securities Act of 1933 or the Securities Exchange Act of 1934, except to the extent that the Registrant specifically incorporates them by reference.
(c)(1) Submission of Matters to a Vote of Security Holders is attached. See attached “John Hancock Funds – Nominating and Governance Committee Charter”.
SIGNATURES
Pursuant to the requirements of the Securities Exchange Act of 1934 and the Investment Company Act of 1940, the registrant has duly caused this report to be signed on its behalf by the undersigned, thereunto duly authorized.
| JOHN HANCOCK FUNDS II |
| /s/ Andrew G. Arnott |
| Andrew G. Arnott |
| President |
| Date: March 20, 2019 |
Pursuant to the requirements of the Securities Exchange Act of 1934 and the Investment Company Act of 1940, this report has been signed below by the following persons on behalf of the registrant and in the capacities and on the dates indicated.
| /s/ Andrew G. Arnott |
| Andrew G. Arnott |
| President |
| Date: March 20, 2019 |
| /s/ Charles A. Rizzo |
| Charles A. Rizzo |
| Chief Financial Officer |
| Date: March 20, 2019 |