UNITED STATES
SECURITIES AND EXCHANGE COMMISSION
Washington, D.C. 20549
FORM N-CSR
CERTIFIED SHAREHOLDER REPORT OF REGISTERED MANAGEMENT INVESTMENT COMPANIES
Investment Company Act file number 811-21779
| JOHN HANCOCK FUNDS II |
| (Exact name of registrant as specified in charter) |
| 200 BERKELEY STREET, BOSTON, MA 02216 |
| (Address of principal executive offices) (Zip code) |
| SALVATORE SCHIAVONE, 200 BERKELEY STREET, BOSTON, MA 02216 |
| (Name and address of agent for service) |
| Registrant's telephone number, including area code: | (617) 663-4497 |
Date of fiscal year end: 7/31
Date of reporting period: 1/31/20
ITEM 1. REPORTS TO STOCKHOLDERS.
The Registrant prepared five semiannual reports to shareholders for the period ended January 31, 2020. The first report applies to Short Duration Credit Opportunities Fund, the second report applies to Absolute Return Currency Fund, the third report applies to Fundamental All Cap Core Fund, the fourth report applies to Diversified Strategies Fund, and the fifth report applies to Multi-Asset Absolute Return Fund.
John Hancock
Short Duration Credit Opportunities Fund
Semiannual report 1/31/2020
Beginning on January 1, 2021, as permitted by regulations adopted by the Securities and Exchange Commission, paper copies of the fund's shareholder reports like this one will no longer be sent by mail, unless you specifically request paper copies of the reports from the fund or from your financial intermediary. Instead, the reports will be made available on a website, and you will be notified by mail each time a report is posted and provided with a website link to access the report.
If you already elected to receive shareholder reports electronically, you will not be affected by this change, and you do not need to take any action. You may elect to receive shareholder reports and other communications electronically by calling John Hancock Investment Management at 800-225-5291 (Class A and Class C shares) or 888-972-8696 (Class I, Class R2, Class R4, Class R6, and Class NAV shares) or by contacting your financial intermediary.
You may elect to receive all reports in paper, free of charge, at any time. You can inform John Hancock Investment Management or your financial intermediary that you wish to continue receiving paper copies of your shareholder reports by following the instructions listed above. Your election to receive reports in paper will apply to all funds held with John Hancock Investment Management or your financial intermediary.

A message to shareholders
Dear shareholder,
The bond markets posted positive performance during the 6 months ended January 31, 2020, with strong gains coming in the investment-grade corporate and high-yield segments of the market. U.S. Treasuries and tax-exempt municipal bonds also registered gains. Fixed-income investors have benefited from a combination of declining interest rates, low inflation, and accommodative central bank policy.
After a strong period of positive returns, investors are prudent to consider the risks to future gains. Growth has slowed in the United States, with some negative data in manufacturing reflecting concerns over international trade and wavering business confidence. Additionally, the spread of the coronavirus, trade disputes, and other geopolitical tensions may continue to create uncertainty among businesses and skepticism among investors. Your financial advisor can helpposition your portfolio so that it's sufficiently diversified to meet your long-term objectives and to withstand the inevitable bouts of market volatility along the way.
On behalf of everyone at John Hancock Investment Management, I'd like to take this opportunity to welcome new shareholders and thank existing shareholders for the continued trust you've placed in us.
Sincerely,
Andrew G. Arnott
President and CEO,
John Hancock Investment Management
Head of Wealth and Asset Management,
United States and Europe
This commentary reflects the CEO's views as of this report's period end and are subject to change at any time. Diversification does not guarantee investment returns and does not eliminate risk of loss. All investments entail risks, including the possible loss of principal. For more up-to-date information, you can visit our website at jhinvestments.com.
John Hancock
Short Duration Credit Opportunities Fund
Table of contents
| | | |
| 2 | | Your fund at a glance |
| 3 | | Portfolio summary |
| 5 | | A look at performance |
| 7 | | Your expenses |
| 9 | | Fund's investments |
| 46 | | Financial statements |
| 50 | | Financial highlights |
| 55 | | Notes to financial statements |
| 70 | | More information |
SEMIANNUAL REPORT | JOHN HANCOCK SHORT DURATION CREDIT OPPORTUNITIES FUND 1
INVESTMENT OBJECTIVE
The fund seeks to maximize total return, which consists of income on its investments and capital appreciation.
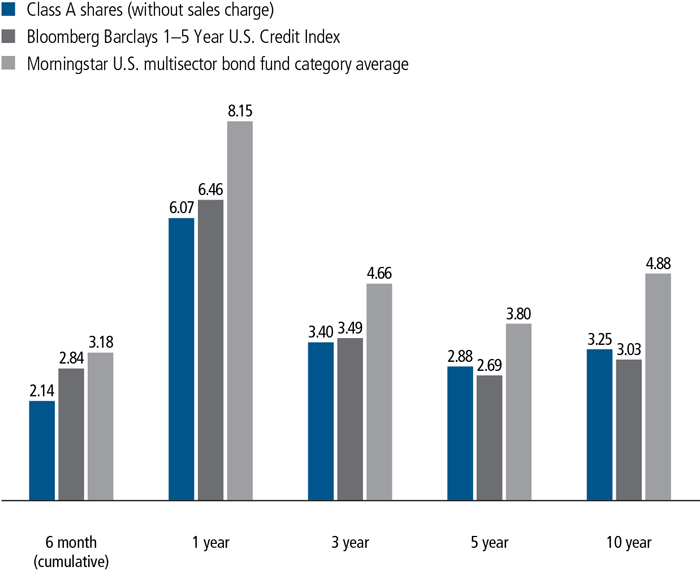
AVERAGE ANNUAL TOTAL RETURNS AS OF 1/31/2020 (%)
The Bloomberg Barclays 1 - 5 Year U.S. Credit Index includes investment-grade corporate and international U.S. dollar-denominated bonds with maturities of 1 to 5 years.
It is not possible to invest directly in an index. Index figures do not reflect expenses or sales charges, which would result in lower returns.
Figures from Morningstar, Inc. include reinvested distributions and do not take into account sales charges. Actual load-adjusted performance is lower. Since-inception returns for the Morningstar fund category average are not available.
The past performance shown here reflects reinvested distributions and the beneficial effect of any expense reductions, and does not guarantee future results. Returns for periods shorter than one year are cumulative. Performance of the other share classes will vary based on the difference in the fees and expenses of those classes. Shares will fluctuate in value and, when redeemed, may be worth more or less than their original cost. Current month-end performance may be lower or higher than the performance cited, and can be found at jhinvestments.com or by calling 800-225-5291. For further information on the fund's objectives, risks, and strategy, see the fund's prospectus.
SEMIANNUAL REPORT | JOHN HANCOCK SHORT DURATION CREDIT OPPORTUNITIES FUND 2
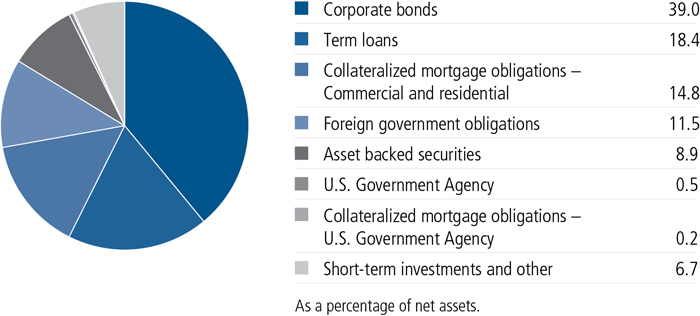
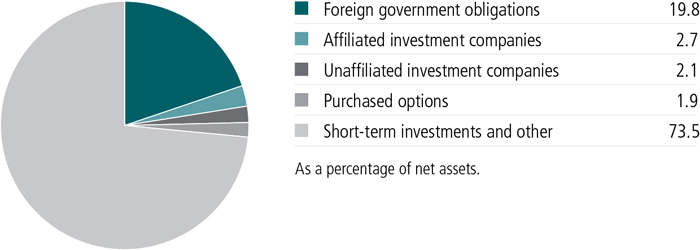
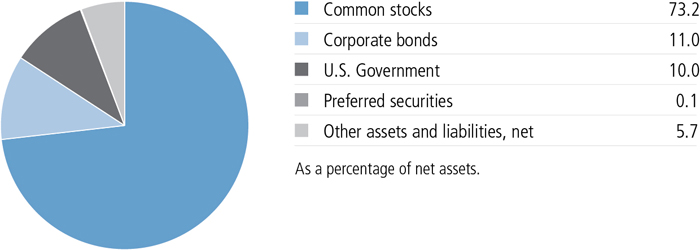
PORTFOLIO COMPOSITION AS OF 1/31/2020 (%)
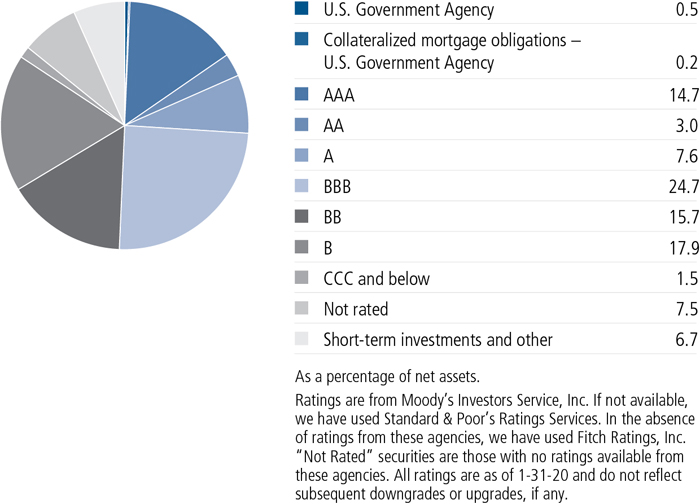
QUALITY COMPOSITION AS OF 1/31/2020 (%)
SEMIANNUAL REPORT | JOHN HANCOCK SHORT DURATION CREDIT OPPORTUNITIES FUND 3
COUNTRY COMPOSITION AS OF 1/31/2020 (%)
| | |
| United States | 74.3 |
| United Kingdom | 2.4 |
| Ireland | 1.5 |
| Netherlands | 1.3 |
| Mexico | 1.3 |
| France | 1.2 |
| Indonesia | 1.0 |
| Canada | 1.0 |
| Other countries | 16.0 |
| TOTAL | 100.0 |
| As a percentage of net assets. | |
A note about risks
The fund is subject to various risks as described in the fund's prospectus. For more information, please refer to the "Principal risks" section of the prospectus.
SEMIANNUAL REPORT | JOHN HANCOCK SHORT DURATION CREDIT OPPORTUNITIES FUND 4
TOTAL RETURNS FOR THE PERIOD ENDED JANUARY 31, 2020
| | | | | | | | | | | | |
Average annual
total returns (%)
with maximum sales charge | | Cumulative total
returns (%)
with maximum sales charge | | SEC 30-day
yield (%)
subsidized | | SEC 30-day
yield (%)
unsubsidized1 |
| | 1-year | 5-year | 10-year | | 6-month | 5-year | 10-year | | as of
1-31-20 | | as of
1-31-20 |
| Class A | 3.43 | 2.37 | 2.99 | | -0.46 | 12.40 | 34.28 | | 2.62 | | 2.62 |
| Class C2 | 4.34 | 2.17 | 2.85 | | 0.78 | 11.32 | 32.43 | | 2.00 | | 2.00 |
| Class I3 | 6.29 | 3.19 | 3.55 | | 2.18 | 17.00 | 41.77 | | 3.00 | | 2.99 |
| Class R62,3 | 6.51 | 3.31 | 3.47 | | 2.35 | 17.69 | 40.66 | | 3.11 | | 3.10 |
| Class NAV3 | 6.41 | 3.31 | 3.72 | | 2.25 | 17.68 | 44.10 | | 3.13 | | 3.12 |
| Index† | 6.46 | 2.69 | 3.03 | | 2.84 | 14.22 | 34.73 | | — | | — |
Performance figures assume all distributions are reinvested. Figures reflect maximum sales charges on Class A shares of 2.5% and the applicable contingent deferred sales charge (CDSC) on Class C shares. The returns for Class A shares have been adjusted to reflect the reduction in the maximum sales charge from 4.5% to 2.5%, effective 2-3-14. Class C shares sold within one year of purchase are subject to a 1% CDSC. Sales charges are not applicable to Class I, Class R6, and Class NAV shares.
The expense ratios of the fund, both net (including any fee waivers and/or expense limitations) and gross (excluding any fee waivers and/or expense limitations), are set forth according to the most recent publicly available prospectuses for the fund and may differ from those disclosed in the Financial highlights tables in this report. Net expenses reflect contractual expense limitations in effect until July 31, 2021 and are subject to change. Had the contractual fee waivers and expense limitations not been in place, gross expenses would apply. The expense ratios are as follows:
| | | | | | |
| | Class A | Class C | Class I | Class R6 | Class NAV |
| Gross (%) | 1.21 | 1.91 | 0.91 | 0.80 | 0.79 |
| Net (%) | 1.20 | 1.90 | 0.90 | 0.79 | 0.78 |
Please refer to the most recent prospectus and annual or semiannual report for more information on expenses and any expense limitation arrangements for each class.
The returns reflect past results and should not be considered indicative of future performance. The return and principal value of an investment will fluctuate so that shares, when redeemed, may be worth more or less than their original cost. Due to market volatility and other factors, the fund's current performance may be higher or lower than the performance shown. For current to the most recent month-end performance data, please call 800-225-5291 or visit the fund's website at jhinvestments.com.
The performance table above and the chart on the next page do not reflect the deduction of taxes that a shareholder would pay on fund distributions or the redemption of fund shares. The fund's performance results reflect any applicable fee waivers or expense reductions, without which the expenses would increase and results would have been less favorable.
| † | Index is the Bloomberg Barclays 1-5 Year U.S. Credit Index. |
See the following page for footnotes.
SEMIANNUAL REPORT | JOHN HANCOCK SHORT DURATION CREDIT OPPORTUNITIES FUND 5
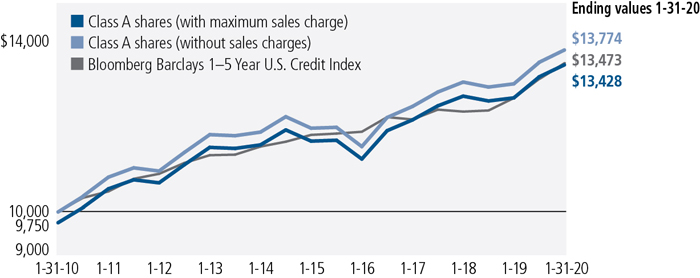
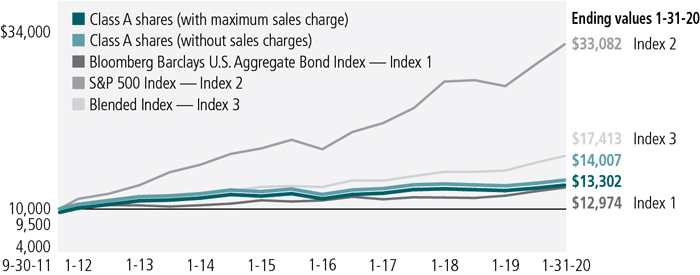
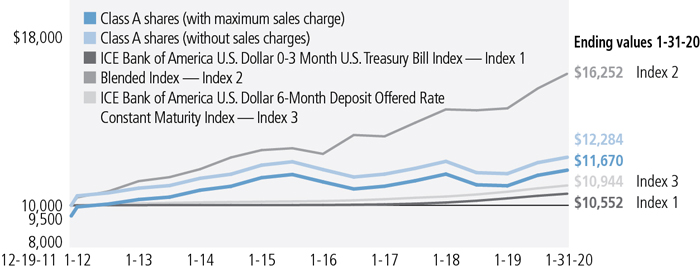
This chart and table show what happened to a hypothetical $10,000 investment in John Hancock Short Duration Credit Opportunities Fund for the share classes and periods indicated, assuming all distributions were reinvested. For comparison, we've shown the same investment in the Bloomberg Barclays 1-5 Year U.S. Credit Index.
| | | | | |
| | Start date | With maximum
sales charge ($) | Without
sales charge ($) | Index ($) |
| Class C2,4 | 1-31-10 | 13,243 | 13,243 | 13,473 |
| Class I3 | 1-31-10 | 14,177 | 14,177 | 13,473 |
| Class R62,3 | 1-31-10 | 14,066 | 14,066 | 13,473 |
| Class NAV3 | 1-31-10 | 14,410 | 14,410 | 13,473 |
The values shown in the chart for "Class A with maximum sales charge" have been adjusted to reflect the reduction in the Class A maximum sales charge from 4.5% to 2.5%, which became effective on 2-3-14.
The Bloomberg Barclays 1-5 Year U.S. Credit Index includes investment-grade corporate and international U.S. dollar-denominated bonds with maturities of 1 to 5 years.
It is not possible to invest directly in an index. Index figures do not reflect expenses or sales charges, which would result in lower returns.
Footnotes related to performance pages
| 1 | Unsubsidized yield reflects what the yield would have been without the effects of waivers and reimbursements. |
| 2 | Class C shares were first offered on 6-27-14; Class R6 shares were first offered on 3-27-15. Returns prior to these dates are those of Class A shares (first offered on 11-2-09) that have not been adjusted for class-specific expenses; otherwise, returns would vary. |
| 3 | For certain types of investors as described in the fund's prospectuses. |
| 4 | The contingent deferred sales charge is not applicable. |
SEMIANNUAL REPORT | JOHN HANCOCK SHORT DURATION CREDIT OPPORTUNITIES FUND 6
These examples are intended to help you understand your ongoing operating expenses of investing in the fund so you can compare these costs with the ongoing costs of investing in other mutual funds.
Understanding fund expenses
As a shareholder of the fund, you incur two types of costs:
■Transaction costs,which include sales charges (loads) on purchases or redemptions (varies by share class), minimum account fee charge, etc.
■Ongoing operating expenses, including management fees, distribution and service fees (if applicable), and other fund expenses.
We are presenting only your ongoing operating expenses here.
Actual expenses/actual returns
The first line of each share class in the table on the following page is intended to provide information about the fund’s actual ongoing operating expenses, and is based on the fund’s actual return. It assumes an account value of $1,000.00 on August 1, 2019, with the same investment held until January 31, 2020.
Together with the value of your account, you may use this information to estimate the operating expenses that you paid over the period. Simply divide your account value at January 31, 2020, by $1,000.00, then multiply it by the “expenses paid” for your share class from the table. For example, for an account value of $8,600.00, the operating expenses should be calculated as follows:
Hypothetical example for comparison purposes
The second line of each share class in the table on the following page allows you to compare the fund’s ongoing operating expenses with those of any other fund. It provides an example of the fund’s hypothetical account values and hypothetical expenses based on each class’s actual expense ratio and an assumed 5% annualized return before expenses (which is not the class’s actual return). It assumes an account value of $1,000.00 on August 1, 2019, with the same investment held until January 31, 2020. Look in any other fund shareholder report to find its hypothetical example and you will be able to compare these expenses. Please remember that these hypothetical account values and expenses may not be used to estimate the actual ending account balance or expenses you paid for the period.
| | SEMIANNUAL REPORT | JOHN HANCOCK SHORT DURATION CREDIT OPPORTUNITIES FUND | 7 |
Remember, these examples do not include any transaction costs, therefore, these examples will not help you to determine the relative total costs of owning different funds. If transaction costs were included, your expenses would have been higher. See the prospectuses for details regarding transaction costs.
SHAREHOLDER EXPENSE EXAMPLE CHART
| | | Account
value on
8-1-2019 | Ending
value on
1-31-2020 | Expenses
paid during
period ended
1-31-20201 | Annualized
expense
ratio |
| Class A | Actual expenses/actual returns | $1,000.00 | $1,021.40 | $6.10 | 1.20% |
| | Hypothetical example | 1,000.00 | 1,019.10 | 6.09 | 1.20% |
| Class C | Actual expenses/actual returns | 1,000.00 | 1,017.80 | 9.64 | 1.90% |
| | Hypothetical example | 1,000.00 | 1,015.60 | 9.63 | 1.90% |
| Class I | Actual expenses/actual returns | 1,000.00 | 1,021.80 | 4.57 | 0.90% |
| | Hypothetical example | 1,000.00 | 1,020.60 | 4.57 | 0.90% |
| Class R6 | Actual expenses/actual returns | 1,000.00 | 1,023.50 | 4.02 | 0.79% |
| | Hypothetical example | 1,000.00 | 1,021.20 | 4.01 | 0.79% |
| Class NAV | Actual expenses/actual returns | 1,000.00 | 1,022.50 | 3.97 | 0.78% |
| | Hypothetical example | 1,000.00 | 1,021.20 | 3.96 | 0.78% |
| 1 | Expenses are equal to the annualized expense ratio, multiplied by the average account value over the period, multiplied by 184/366 (to reflect the one-half year period). |
| 8 | JOHN HANCOCK SHORT DURATION CREDIT OPPORTUNITIES FUND | SEMIANNUAL REPORT | |
AS OF 1-31-20 (unaudited)
| | Rate (%) | Maturity date | | Par value^ | Value |
| U.S. Government and Agency obligations 0.5% | | | | $3,605,671 |
| (Cost $3,599,388) | | | | | |
| U.S. Government Agency 0.5% | | | 3,605,671 |
| Federal Home Loan Mortgage Corp. | | | |
| 30 Yr Pass Thru (12 month LIBOR + 1.625%) (A) | 2.721 | 04-01-46 | | 996,525 | 1,017,352 |
| 30 Yr Pass Thru (12 month LIBOR + 1.650%) (A) | 3.639 | 12-01-42 | | 414,349 | 428,379 |
| 30 Yr Pass Thru (12 month LIBOR + 1.743%) (A) | 4.031 | 01-01-37 | | 47,997 | 50,373 |
| 30 Yr Pass Thru (12 month LIBOR + 1.619%) (A) | 4.390 | 05-01-43 | | 220,926 | 228,106 |
| Federal National Mortgage Association | | | |
| 30 Yr Pass Thru (12 month LIBOR + 1.600%) (A) | 2.287 | 08-01-45 | | 185,778 | 189,248 |
| 30 Yr Pass Thru (12 month LIBOR + 1.582%) (A) | 2.841 | 12-01-44 | | 769,648 | 786,528 |
| 30 Yr Pass Thru (12 month LIBOR + 1.778%) (A) | 4.039 | 04-01-44 | | 350,428 | 364,764 |
| 30 Yr Pass Thru (1 Year CMT + 2.227%) (A) | 4.399 | 01-01-37 | | 215,343 | 227,240 |
| 30 Yr Pass Thru (12 month LIBOR + 1.765%) (A) | 4.740 | 10-01-38 | | 115,433 | 121,568 |
| Government National Mortgage Association | | | |
| 30 Yr Pass Thru | 4.500 | 01-15-40 | | 93,973 | 103,153 |
|
| 30 Yr Pass Thru | 6.000 | 08-15-35 | | 77,908 | 88,960 |
| Foreign government obligations 11.5% | | | $94,416,805 |
| (Cost $91,615,036) | | | | | |
| Angola 0.3% | | | 2,814,789 |
| Republic of Angola | | | | | |
| Bond (6 month LIBOR + 4.500%) (A) | 6.388 | 12-07-23 | | 168,000 | 163,800 |
| Bond (B) | 9.125 | 11-26-49 | | 928,000 | 978,233 |
| Bond (B) | 9.375 | 05-08-48 | | 187,000 | 202,552 |
| Bond (6 month LIBOR + 7.500%) (A) | 9.412 | 07-01-23 | | 1,048,462 | 1,136,921 |
| Bond | 9.500 | 11-12-25 | | 285,000 | 333,283 |
| Argentina 0.4% | | | 3,268,630 |
| Republic of Argentina | | | | | |
| Bond | 3.375 | 01-15-23 | EUR | 423,000 | 207,459 |
| Bond | 5.000 | 01-15-27 | EUR | 107,000 | 49,591 |
| Bond | 6.625 | 07-06-28 | | 451,000 | 200,249 |
| Bond | 6.875 | 01-26-27 | | 450,000 | 201,600 |
| Bond | 7.820 | 12-31-33 | EUR | 4,439,675 | 2,609,731 |
| SEE NOTES TO FINANCIAL STATEMENTS | SEMIANNUAL REPORT | JOHN HANCOCK SHORT DURATION CREDIT OPPORTUNITIES FUND | 9 |
| | Rate (%) | Maturity date | | Par value^ | Value |
| Azerbaijan 0.0% | | | $307,680 |
| Republic of Azerbaijan | | | | | |
| Bond (B) | 3.500 | 09-01-32 | | 306,000 | 307,680 |
| Bahrain 0.1% | | | 627,025 |
| Kingdom of Bahrain | | | | | |
| Bond (B) | 6.000 | 09-19-44 | | 140,000 | 145,342 |
| Bond (B) | 7.000 | 10-12-28 | | 408,000 | 481,683 |
| Belarus 0.1% | | | 512,922 |
| Republic of Belarus | | | | | |
| Bond | 6.200 | 02-28-30 | | 200,000 | 218,246 |
| Bond | 7.625 | 06-29-27 | | 255,000 | 294,676 |
| Benin 0.1% | | | 490,242 |
| Republic of Benin | | | | | |
| Bond (B) | 5.750 | 03-26-26 | EUR | 428,000 | 490,242 |
| Bolivia 0.0% | | | 212,007 |
| Plurinational State of Bolivia | | | | | |
| Bond | 4.500 | 03-20-28 | | 218,000 | 212,007 |
| Brazil 0.8% | | | 6,444,878 |
| Brazil Minas SPE | | | | | |
| Bond | 5.333 | 02-15-28 | | 1,183,500 | 1,275,233 |
| Bond (B) | 5.333 | 02-15-28 | | 107,100 | 115,401 |
| Federative Republic of Brazil | | | | | |
| Bill (C) | 3.987 | 07-01-20 | BRL | 480,000 | 110,246 |
| Bond | 4.500 | 05-30-29 | | 208,000 | 225,890 |
| Bond | 4.625 | 01-13-28 | | 8,000 | 8,820 |
| Bond | 4.750 | 01-14-50 | | 774,000 | 797,994 |
| Bond | 5.000 | 01-27-45 | | 753,000 | 812,306 |
| Note | 10.000 | 01-01-21 | BRL | 5,350,000 | 1,320,148 |
| Note | 10.000 | 01-01-23 | BRL | 1,490,000 | 391,331 |
| Note | 10.000 | 01-01-25 | BRL | 1,410,000 | 383,519 |
| Note | 10.000 | 01-01-27 | BRL | 2,740,000 | 765,388 |
| Note | 10.000 | 01-01-29 | BRL | 695,000 | 198,261 |
| Note | 10.000 | 01-01-31 | BRL | 140,000 | 40,341 |
| Cameroon 0.0% | | | 107,091 |
| Republic of Cameroon | | | | | |
| Bond (B) | 9.500 | 11-19-25 | | 94,000 | 107,091 |
| Chile 0.1% | | | 636,955 |
| Republic of Chile | | | | | |
| Bond | 4.500 | 03-01-26 | CLP | 225,000,000 | 311,340 |
| Bond (B) | 4.700 | 09-01-30 | CLP | 230,000,000 | 325,615 |
| Colombia 0.6% | | | 4,907,054 |
| Bogota Distrito Capital | | | | | |
| Bond | 9.750 | 07-26-28 | COP | 427,000,000 | 141,896 |
| 10 | JOHN HANCOCK SHORT DURATION CREDIT OPPORTUNITIES FUND | SEMIANNUAL REPORT | SEE NOTES TO FINANCIAL STATEMENTS |
| | Rate (%) | Maturity date | | Par value^ | Value |
| Colombia (continued) | | | |
| Republic of Colombia | | | | | |
| Bond | 3.875 | 04-25-27 | | 95,000 | $102,078 |
| Bond | 4.375 | 03-21-23 | COP | 2,800,000,000 | 801,050 |
| Bond | 4.500 | 01-28-26 | | 325,000 | 358,277 |
| Bond | 4.500 | 03-15-29 | | 628,000 | 708,742 |
| Bond | 5.000 | 06-15-45 | | 143,000 | 173,602 |
| Bond | 5.200 | 05-15-49 | | 568,000 | 713,408 |
| Bond | 8.125 | 05-21-24 | | 312,000 | 385,713 |
| Bond | 9.850 | 06-28-27 | COP | 2,888,000,000 | 1,068,450 |
| Bond | 10.375 | 01-28-33 | | 278,000 | 453,838 |
| Costa Rica 0.0% | | | 201,600 |
| Republic of Costa Rica | | | | | |
| Bond | 4.375 | 04-30-25 | | 200,000 | 201,600 |
| Czech Republic 0.1% | | | 1,105,235 |
| Czech Republic | | | | | |
| Bond | 0.250 | 02-10-27 | CZK | 9,020,000 | 362,744 |
| Bond | 0.950 | 05-15-30 | CZK | 8,470,000 | 352,582 |
| Bond | 1.000 | 06-26-26 | CZK | 2,620,000 | 111,450 |
| Bond | 2.750 | 07-23-29 | CZK | 930,000 | 45,361 |
| Bond | 4.200 | 12-04-36 | CZK | 3,800,000 | 233,098 |
| Dominican Republic 0.3% | | | 2,722,184 |
| Government of Dominican Republic | | | | | |
| Bond (B) | 4.500 | 01-30-30 | | 200,000 | 199,752 |
| Bond | 5.500 | 01-27-25 | | 202,000 | 216,142 |
| Bond (B) | 5.875 | 04-18-24 | | 93,000 | 99,627 |
| Bond (B) | 5.875 | 01-30-60 | | 396,000 | 395,802 |
| Bond | 5.950 | 01-25-27 | | 290,000 | 318,640 |
| Bond | 6.600 | 01-28-24 | | 347,000 | 385,607 |
| Bond | 6.875 | 01-29-26 | | 347,000 | 395,583 |
| Bond (B) | 7.450 | 04-30-44 | | 595,000 | 711,031 |
| Ecuador 0.3% | | | 2,720,119 |
| Republic of Ecuador | | | | | |
| Bond | 7.875 | 03-27-25 | | 446,000 | 381,330 |
| Bond (B) | 7.875 | 01-23-28 | | 237,000 | 197,599 |
| Bond | 7.875 | 01-23-28 | | 272,000 | 221,003 |
| Bond | 8.875 | 10-23-27 | | 305,000 | 258,106 |
| Bond (B) | 10.750 | 01-31-29 | | 1,834,000 | 1,662,081 |
| Egypt 0.5% | | | 3,981,839 |
| Arab Republic of Egypt | | | | | |
| Bond (B) | 4.750 | 04-16-26 | EUR | 125,000 | 148,404 |
| Bond (B) | 5.577 | 02-21-23 | | 192,000 | 201,730 |
| Bond (B) | 5.625 | 04-16-30 | EUR | 1,251,000 | 1,455,098 |
| Bond (B) | 6.125 | 01-31-22 | | 609,000 | 639,108 |
| SEE NOTES TO FINANCIAL STATEMENTS | SEMIANNUAL REPORT | JOHN HANCOCK SHORT DURATION CREDIT OPPORTUNITIES FUND | 11 |
| | Rate (%) | Maturity date | | Par value^ | Value |
| Egypt (continued) | | | |
| Bond (B) | 6.375 | 04-11-31 | EUR | 226,000 | $272,583 |
| Bond (B) | 8.150 | 11-20-59 | | 181,000 | 197,950 |
| Bond (B) | 8.500 | 01-31-47 | | 693,000 | 792,835 |
| Bond | 14.400 | 09-10-29 | EGP | 1,840,000 | 119,892 |
| Bond | 15.600 | 08-06-26 | EGP | 2,270,000 | 154,239 |
| El Salvador 0.1% | | | 959,986 |
| Republic of El Salvador | | | | | |
| Bond | 7.650 | 06-15-35 | | 456,000 | 530,105 |
| Bond | 8.250 | 04-10-32 | | 189,000 | 230,864 |
| Bond | 8.625 | 02-28-29 | | 162,000 | 199,017 |
| Ghana 0.2% | | | 1,272,416 |
| Republic of Ghana | | | | | |
| Bond (B) | 7.875 | 03-26-27 | | 167,000 | 178,490 |
| Bond (B) | 8.125 | 01-18-26 | | 48,000 | 53,340 |
| Bond (B) | 8.627 | 06-16-49 | | 177,000 | 177,404 |
| Bond (B) | 8.950 | 03-26-51 | | 223,000 | 227,781 |
| Bond (B) | 10.750 | 10-14-30 | | 494,000 | 635,401 |
| Hungary 0.0% | | | 317,883 |
| Republic of Hungary | | | | | |
| Bond | 5.375 | 03-25-24 | | 59,000 | 67,196 |
| Bond | 7.625 | 03-29-41 | | 149,000 | 250,687 |
| Indonesia 0.8% | | | 6,714,373 |
| Republic of Indonesia | | | | | |
| Bond | 2.850 | 02-14-30 | | 402,000 | 406,964 |
| Bond | 3.700 | 10-30-49 | | 295,000 | 307,090 |
| Bond (B) | 3.850 | 07-18-27 | | 1,339,000 | 1,443,675 |
| Bond (B) | 4.350 | 01-08-27 | | 20,000 | 22,131 |
| Bond | 5.250 | 01-17-42 | | 673,000 | 832,110 |
| Bond (B) | 5.250 | 01-08-47 | | 52,000 | 65,154 |
| Bond | 7.500 | 08-15-32 | IDR | 1,000,000,000 | 74,634 |
| Bond | 7.500 | 05-15-38 | IDR | 2,889,000,000 | 211,075 |
| Bond | 8.250 | 05-15-36 | IDR | 8,904,000,000 | 700,337 |
| Bond | 8.375 | 03-15-24 | IDR | 13,640,000,000 | 1,085,511 |
| Bond | 8.375 | 09-15-26 | IDR | 8,028,000,000 | 649,265 |
| Bond | 8.375 | 03-15-34 | IDR | 9,130,000,000 | 734,746 |
| Bond | 8.375 | 04-15-39 | IDR | 1,902,000,000 | 151,976 |
| Bond | 9.000 | 03-15-29 | IDR | 356,000,000 | 29,705 |
| Ivory Coast 0.1% | | | 1,113,030 |
| Republic of Ivory Coast | | | | | |
| Bond (B) | 5.875 | 10-17-31 | EUR | 598,000 | 702,570 |
| Bond | 6.125 | 06-15-33 | | 400,000 | 410,460 |
| 12 | JOHN HANCOCK SHORT DURATION CREDIT OPPORTUNITIES FUND | SEMIANNUAL REPORT | SEE NOTES TO FINANCIAL STATEMENTS |
| | Rate (%) | Maturity date | | Par value^ | Value |
| Jamaica 0.1% | | | $529,044 |
| Government of Jamaica | | | | | |
| Bond | 7.875 | 07-28-45 | | 389,000 | 529,044 |
| Jordan 0.1% | | | 567,848 |
| Kingdom of Jordan | | | | | |
| Bond (B) | 5.750 | 01-31-27 | | 531,000 | 567,848 |
| Kenya 0.1% | | | 1,020,333 |
| Republic of Kenya | | | | | |
| Bond | 6.875 | 06-24-24 | | 339,000 | 367,687 |
| Bond (B) | 7.000 | 05-22-27 | | 211,000 | 224,109 |
| Bond (B) | 8.000 | 05-22-32 | | 185,000 | 201,272 |
| Bond | 8.250 | 02-28-48 | | 211,000 | 227,265 |
| Lebanon 0.0% | | | 362,572 |
| Republic of Lebanon | | | | | |
| Bond | 6.650 | 04-22-24 | | 475,000 | 178,360 |
| Bond | 6.750 | 11-29-27 | | 500,000 | 184,212 |
| Malaysia 0.1% | | | 1,094,540 |
| Government of Malaysia | | | | | |
| Bond | 3.502 | 05-31-27 | MYR | 416,000 | 104,079 |
| Bond | 3.620 | 11-30-21 | MYR | 180,000 | 44,533 |
| Bond | 3.733 | 06-15-28 | MYR | 450,000 | 114,496 |
| Bond | 3.885 | 08-15-29 | MYR | 979,000 | 253,607 |
| Bond | 3.899 | 11-16-27 | MYR | 347,000 | 89,143 |
| Bond | 3.906 | 07-15-26 | MYR | 1,410,000 | 361,388 |
| Bond | 4.498 | 04-15-30 | MYR | 470,000 | 127,294 |
| Mexico 0.7% | | | 5,525,124 |
| Government of Mexico | | | | | |
| Bond | 3.250 | 04-16-30 | | 295,000 | 300,163 |
| Bond | 4.350 | 01-15-47 | | 67,000 | 73,399 |
| Bond | 4.500 | 04-22-29 | | 1,422,000 | 1,591,943 |
| Bond | 4.750 | 03-08-44 | | 128,000 | 147,008 |
| Bond | 5.750 | 03-05-26 | MXN | 9,530,000 | 482,983 |
| Bond | 6.500 | 06-10-21 | MXN | 1,660,000 | 87,601 |
| Bond | 7.500 | 06-03-27 | MXN | 14,140,000 | 786,281 |
| Bond | 7.750 | 11-13-42 | MXN | 12,180,000 | 702,580 |
| Bond | 10.000 | 12-05-24 | MXN | 22,396,500 | 1,353,166 |
| Mozambique 0.1% | | | 618,031 |
| Republic of Mozambique | | | | | |
| Bond (B) | 5.000 | 09-15-31 | | 646,000 | 618,031 |
| Nigeria 0.3% | | | 2,028,819 |
| Federal Republic of Nigeria | | | | | |
| Bond (B) | 6.500 | 11-28-27 | | 1,078,000 | 1,110,163 |
| Bond (B) | 7.143 | 02-23-30 | | 495,000 | 510,045 |
| SEE NOTES TO FINANCIAL STATEMENTS | SEMIANNUAL REPORT | JOHN HANCOCK SHORT DURATION CREDIT OPPORTUNITIES FUND | 13 |
| | Rate (%) | Maturity date | | Par value^ | Value |
| Nigeria (continued) | | | |
| Bond (B) | 7.625 | 11-28-47 | | 268,000 | $260,957 |
| Bond (B) | 7.875 | 02-16-32 | | 141,000 | 147,654 |
| Oman 0.3% | | | 2,047,761 |
| Sultanate of Oman | | | | | |
| Bond | 3.625 | 06-15-21 | | 521,000 | 523,472 |
| Bond (B) | 3.875 | 03-08-22 | | 296,000 | 298,960 |
| Bond (B) | 4.875 | 02-01-25 | | 10,000 | 10,313 |
| Bond (B) | 5.375 | 03-08-27 | | 831,000 | 859,655 |
| Bond (B) | 6.000 | 08-01-29 | | 340,000 | 355,361 |
| Pakistan 0.1% | | | 756,664 |
| Republic of Pakistan | | | | | |
| Bond | 6.875 | 12-05-27 | | 716,000 | 756,664 |
| Panama 0.2% | | | 1,662,661 |
| Republic of Panama | | | | | |
| Bond | 3.160 | 01-23-30 | | 1,573,000 | 1,662,661 |
| Papua New Guinea 0.1% | | | 1,183,173 |
| Independent State of Papua New Guinea | | | | | |
| Bond (B) | 8.375 | 10-04-28 | | 1,093,000 | 1,183,173 |
| Paraguay 0.1% | | | 857,465 |
| Republic of Paraguay | | | | | |
| Bond (B) | 5.400 | 03-30-50 | | 318,000 | 372,461 |
| Bond (B) | 6.100 | 08-11-44 | | 388,000 | 485,004 |
| Peru 0.2% | | | 1,702,938 |
| Republic of Peru | | | | | |
| Bond (B) | 5.400 | 08-12-34 | PEN | 540,000 | 171,655 |
| Bond | 5.625 | 11-18-50 | | 170,000 | 260,525 |
| Bond (B) | 5.940 | 02-12-29 | PEN | 510,000 | 173,182 |
| Bond (B) | 6.150 | 08-12-32 | PEN | 2,491,000 | 853,976 |
| Bond | 6.550 | 03-14-37 | | 160,000 | 243,600 |
| Poland 0.3% | | | 2,558,867 |
| Republic of Poland | | | | | |
| Bond | 2.000 | 04-25-21 | PLN | 420,000 | 109,184 |
| Bond | 2.500 | 04-25-24 | PLN | 930,000 | 247,079 |
| Bond | 2.500 | 07-25-26 | PLN | 3,316,000 | 879,933 |
| Bond | 2.750 | 04-25-28 | PLN | 1,480,000 | 398,862 |
| Bond | 4.000 | 10-25-23 | PLN | 1,290,000 | 359,939 |
| Bond | 5.750 | 09-23-22 | PLN | 1,976,000 | 563,870 |
| Qatar 0.4% | | | 3,048,725 |
| State of Qatar | | | | | |
| Bond (B) | 4.000 | 03-14-29 | | 1,258,000 | 1,418,463 |
| Bond | 4.000 | 03-14-29 | | 235,000 | 265,378 |
| 14 | JOHN HANCOCK SHORT DURATION CREDIT OPPORTUNITIES FUND | SEMIANNUAL REPORT | SEE NOTES TO FINANCIAL STATEMENTS |
| | Rate (%) | Maturity date | | Par value^ | Value |
| Qatar (continued) | | | |
| Bond (B) | 4.500 | 04-23-28 | | 199,000 | $230,664 |
| Bond (B) | 5.103 | 04-23-48 | | 658,000 | 869,833 |
| Bond | 5.103 | 04-23-48 | | 200,000 | 264,387 |
| Romania 0.2% | | | 1,316,378 |
| Government of Romania | | | | | |
| Bond | 3.875 | 10-29-35 | EUR | 526,000 | 695,245 |
| Bond | 4.125 | 03-11-39 | EUR | 70,000 | 93,706 |
| Bond (B) | 4.625 | 04-03-49 | EUR | 136,000 | 193,063 |
| Bond | 5.000 | 02-12-29 | RON | 1,365,000 | 334,364 |
| Russia 0.8% | | | 6,880,796 |
| Government of Russia | | | | | |
| Bond | 4.250 | 06-23-27 | | 200,000 | 221,163 |
| Bond | 4.750 | 05-27-26 | | 800,000 | 904,760 |
| Bond | 4.875 | 09-16-23 | | 200,000 | 219,023 |
| Bond | 5.100 | 03-28-35 | | 800,000 | 977,680 |
| Bond | 5.250 | 06-23-47 | | 1,000,000 | 1,310,028 |
| Bond | 7.050 | 01-19-28 | RUB | 51,960,000 | 862,892 |
| Bond | 7.400 | 12-07-22 | RUB | 39,800,000 | 653,202 |
| Bond | 7.700 | 03-23-33 | RUB | 29,600,000 | 521,099 |
| Bond | 7.750 | 09-16-26 | RUB | 25,710,000 | 440,513 |
| Bond | 7.950 | 10-07-26 | RUB | 21,710,000 | 375,475 |
| Bond | 8.150 | 02-03-27 | RUB | 22,520,000 | 394,961 |
| Saudi Arabia 0.3% | | | 2,081,540 |
| Kingdom of Saudi Arabia | | | | | |
| Bond (B) | 3.625 | 03-04-28 | | 263,000 | 282,844 |
| Bond (B) | 4.375 | 04-16-29 | | 117,000 | 133,492 |
| Bond (B) | 4.500 | 04-17-30 | | 106,000 | 123,437 |
| Bond | 4.500 | 10-26-46 | | 866,000 | 991,032 |
| Bond (B) | 4.625 | 10-04-47 | | 212,000 | 246,880 |
| KSA Sukuk, Ltd. | | | | | |
| Bond (B) | 3.628 | 04-20-27 | | 282,000 | 303,855 |
| Senegal 0.1% | | | 598,018 |
| Republic of Senegal | | | | | |
| Bond (B) | 6.250 | 05-23-33 | | 560,000 | 598,018 |
| South Africa 0.5% | | | 3,958,899 |
| Republic of South Africa | | | | | |
| Bond | 4.665 | 01-17-24 | | 56,000 | 58,660 |
| Bond | 4.875 | 04-14-26 | | 207,000 | 217,182 |
| Bond | 5.000 | 10-12-46 | | 55,000 | 51,461 |
| Bond | 5.750 | 09-30-49 | | 400,000 | 393,484 |
| Bond | 5.875 | 06-22-30 | | 164,000 | 178,632 |
| Bond | 6.250 | 03-31-36 | ZAR | 22,600,000 | 1,077,403 |
| Bond | 6.300 | 06-22-48 | | 78,000 | 83,070 |
| SEE NOTES TO FINANCIAL STATEMENTS | SEMIANNUAL REPORT | JOHN HANCOCK SHORT DURATION CREDIT OPPORTUNITIES FUND | 15 |
| | Rate (%) | Maturity date | | Par value^ | Value |
| South Africa (continued) | | | |
| Bond | 7.000 | 02-28-31 | ZAR | 10,650,000 | $602,732 |
| Bond | 8.875 | 02-28-35 | ZAR | 2,340,000 | 145,395 |
| Bond | 10.500 | 12-21-26 | ZAR | 15,320,000 | 1,150,880 |
| Sri Lanka 0.2% | | | 1,512,899 |
| Republic of Sri Lanka | | | | | |
| Bond (B) | 5.750 | 04-18-23 | | 139,000 | 139,133 |
| Bond | 6.200 | 05-11-27 | | 196,000 | 186,489 |
| Bond | 6.250 | 07-27-21 | | 477,000 | 486,621 |
| Bond (B) | 6.750 | 04-18-28 | | 624,000 | 602,205 |
| Bond (B) | 7.850 | 03-14-29 | | 97,000 | 98,451 |
| Thailand 0.2% | | | 1,444,921 |
| Kingdom of Thailand | | | | | |
| Bond | 2.875 | 12-17-28 | THB | 16,330,000 | 592,705 |
| Bond | 3.775 | 06-25-32 | THB | 21,160,000 | 852,216 |
| Tunisia 0.0% | | | 323,277 |
| Banque Centrale de Tunisia | | | | | |
| Bond | 5.625 | 02-17-24 | EUR | 294,000 | 323,277 |
| Turkey 0.6% | | | 4,601,559 |
| Hazine Mustesarligi Varlik Kiralama AS | | | | | |
| Bond (B) | 5.800 | 02-21-22 | | 119,000 | 124,374 |
| Republic of Turkey | | | | | |
| Bond | 5.125 | 02-17-28 | | 75,000 | 75,204 |
| Bond | 5.750 | 03-22-24 | | 100,000 | 106,000 |
| Bond | 5.750 | 05-11-47 | | 305,000 | 294,478 |
| Bond | 6.000 | 03-25-27 | | 165,000 | 174,697 |
| Bond | 6.125 | 10-24-28 | | 389,000 | 412,904 |
| Bond | 6.250 | 09-26-22 | | 946,000 | 1,010,756 |
| Bond | 6.875 | 03-17-36 | | 469,000 | 521,497 |
| Bond | 7.375 | 02-05-25 | | 521,000 | 589,342 |
| Bond | 7.625 | 04-26-29 | | 197,000 | 229,211 |
| Bond | 8.000 | 03-12-25 | TRY | 3,510,000 | 544,850 |
| Bond | 10.700 | 02-17-21 | TRY | 1,080,000 | 182,083 |
| Bond | 10.700 | 08-17-22 | TRY | 490,000 | 83,594 |
| Bond | 11.000 | 02-24-27 | TRY | 1,426,000 | 252,569 |
| Ukraine 0.3% | | | 2,310,123 |
| Republic of Ukraine | | | | | |
| Bond (B) | 4.375 | 01-27-30 | EUR | 273,000 | 300,558 |
| Bond (B) | 6.750 | 06-20-26 | EUR | 301,000 | 386,856 |
| Bond (B) | 7.375 | 09-25-32 | | 189,000 | 208,845 |
| Bond (B) | 7.750 | 09-01-26 | | 248,000 | 280,860 |
| Bond (B) | 7.750 | 09-01-27 | | 157,000 | 177,759 |
| Bond (B) | 8.994 | 02-01-24 | | 564,000 | 646,485 |
| Bond (B) | 9.750 | 11-01-28 | | 248,000 | 308,760 |
| 16 | JOHN HANCOCK SHORT DURATION CREDIT OPPORTUNITIES FUND | SEMIANNUAL REPORT | SEE NOTES TO FINANCIAL STATEMENTS |
| | Rate (%) | Maturity date | | Par value^ | Value |
| United Arab Emirates 0.0% | | | $294,664 |
| Abu Dhabi Government | | | | | |
| Bond (B) | 4.125 | 10-11-47 | | 248,000 | 294,664 |
| Uruguay 0.2% | | | 1,553,172 |
| Republic of Uruguay | | | | | |
| Bond | 4.125 | 11-20-45 | | 197,000 | 223,103 |
| Bond | 4.975 | 04-20-55 | | 171,000 | 211,828 |
| Bond | 5.100 | 06-18-50 | | 848,865 | 1,067,456 |
| Bond (B) | 8.500 | 03-15-28 | UYU | 2,160,000 | 50,785 |
| Venezuela 0.0% | | | 168,315 |
| Republic of Venezuela | | | | | |
| Bond (D) | 7.750 | 10-13-19 | | 1,374,000 | 168,315 |
| Zambia 0.0% | | | 369,741 |
| Republic of Zambia | | | | | |
| Bond (B) | 5.375 | 09-20-22 | | 126,000 | 86,965 |
|
| Bond (B) | 8.500 | 04-14-24 | | 414,000 | 282,776 |
| Corporate bonds 39.0% | | | $320,197,872 |
| (Cost $304,006,235) | | | | | |
| Communication services 4.7% | | 38,353,740 |
| Diversified telecommunication services 1.0% | | |
| Altice France SA (B) | 7.375 | 05-01-26 | | 845,000 | 898,911 |
| AT&T, Inc. | 4.350 | 03-01-29 | | 1,950,000 | 2,201,707 |
| Axtel SAB de CV (B) | 6.375 | 11-14-24 | | 214,000 | 226,040 |
| CenturyLink, Inc. (B) | 4.000 | 02-15-27 | | 411,000 | 412,878 |
| Level 3 Financing, Inc. (B) | 4.625 | 09-15-27 | | 632,000 | 649,393 |
| Midcontinent Communications (B) | 5.375 | 08-15-27 | | 230,000 | 243,225 |
| UPCB Finance IV, Ltd. (B) | 5.375 | 01-15-25 | | 485,000 | 496,650 |
| Verizon Communications, Inc. | 4.329 | 09-21-28 | | 1,900,000 | 2,198,708 |
| Zayo Group LLC (B) | 5.750 | 01-15-27 | | 639,000 | 652,515 |
| Ziggo BV (B) | 5.500 | 01-15-27 | | 510,000 | 540,600 |
| Entertainment 0.3% | | |
| Lions Gate Capital Holdings LLC (B) | 6.375 | 02-01-24 | | 590,000 | 592,950 |
| Live Nation Entertainment, Inc. (B) | 4.750 | 10-15-27 | | 480,000 | 493,824 |
| Netflix, Inc. | 4.875 | 04-15-28 | | 690,000 | 738,300 |
| Netflix, Inc. (B) | 4.875 | 06-15-30 | | 424,000 | 442,285 |
| Interactive media and services 0.3% | | |
| Tencent Holdings, Ltd. (B) | 3.595 | 01-19-28 | | 2,075,000 | 2,214,254 |
| Twitter, Inc. (B) | 3.875 | 12-15-27 | | 236,000 | 236,295 |
| Media 2.5% | | |
| AMC Networks, Inc. | 4.750 | 08-01-25 | | 424,000 | 428,062 |
| Cablevision Systems Corp. | 5.875 | 09-15-22 | | 515,000 | 553,625 |
| CCO Holdings LLC (B) | 5.125 | 05-01-27 | | 520,000 | 543,400 |
| CCO Holdings LLC (B) | 5.375 | 06-01-29 | | 495,000 | 529,056 |
| SEE NOTES TO FINANCIAL STATEMENTS | SEMIANNUAL REPORT | JOHN HANCOCK SHORT DURATION CREDIT OPPORTUNITIES FUND | 17 |
| | Rate (%) | Maturity date | | Par value^ | Value |
| Communication services (continued) | | |
| Media (continued) | | |
| CCO Holdings LLC (B) | 5.500 | 05-01-26 | | 410,000 | $428,450 |
| Charter Communications Operating LLC | 6.484 | 10-23-45 | | 2,675,000 | 3,470,293 |
| Comcast Corp. | 3.969 | 11-01-47 | | 2,000,000 | 2,295,543 |
| Cox Communications, Inc. (B) | 3.350 | 09-15-26 | | 2,050,000 | 2,174,964 |
| CSC Holdings LLC (B) | 7.500 | 04-01-28 | | 1,185,000 | 1,348,175 |
| Discovery Communications LLC | 5.000 | 09-20-37 | | 2,200,000 | 2,556,554 |
| DISH DBS Corp. | 7.750 | 07-01-26 | | 614,000 | 644,700 |
| Lamar Media Corp. (B) | 4.000 | 02-15-30 | | 463,000 | 466,473 |
| Sirius XM Radio, Inc. (B) | 4.625 | 07-15-24 | | 260,000 | 269,588 |
| Sirius XM Radio, Inc. (B) | 5.000 | 08-01-27 | | 855,000 | 897,750 |
| TEGNA, Inc. (B) | 4.625 | 03-15-28 | | 478,000 | 480,390 |
| Telenet Finance Luxembourg Notes Sarl (B) | 5.500 | 03-01-28 | | 600,000 | 636,327 |
| Terrier Media Buyer, Inc. (B) | 8.875 | 12-15-27 | | 333,000 | 342,990 |
| The Interpublic Group of Companies, Inc. | 4.650 | 10-01-28 | | 2,150,000 | 2,486,881 |
| Wireless telecommunication services 0.6% | | |
| Millicom International Cellular SA (B) | 6.250 | 03-25-29 | | 139,000 | 153,220 |
| Sprint Corp. | 7.625 | 02-15-25 | | 1,192,000 | 1,240,860 |
| T-Mobile USA, Inc. | 5.375 | 04-15-27 | | 555,000 | 592,463 |
| T-Mobile USA, Inc. | 6.500 | 01-15-26 | | 325,000 | 346,596 |
| Vodafone Group PLC | 5.000 | 05-30-38 | | 1,850,000 | 2,228,845 |
| Consumer discretionary 4.1% | | 33,517,930 |
| Auto components 0.3% | | |
| Dana Financing Luxembourg Sarl (B) | 6.500 | 06-01-26 | | 335,000 | 355,100 |
| Lear Corp. | 5.250 | 05-15-49 | | 1,175,000 | 1,288,525 |
| Panther BF Aggregator 2 LP (B) | 6.250 | 05-15-26 | | 495,000 | 530,938 |
| Panther BF Aggregator 2 LP (B) | 8.500 | 05-15-27 | | 287,000 | 308,525 |
| Automobiles 0.8% | | |
| Ford Motor Credit Company LLC | 4.271 | 01-09-27 | | 2,100,000 | 2,132,868 |
| General Motors Financial Company, Inc. | 4.350 | 01-17-27 | | 2,000,000 | 2,147,338 |
| Hyundai Capital America (B) | 3.000 | 10-30-20 | | 925,000 | 932,245 |
| Hyundai Capital America (B) | 3.250 | 09-20-22 | | 1,175,000 | 1,208,378 |
| Diversified consumer services 0.1% | | |
| Prime Security Services Borrower LLC (B) | 6.250 | 01-15-28 | | 313,000 | 310,066 |
| WW International, Inc. (B) | 8.625 | 12-01-25 | | 605,000 | 632,225 |
| Hotels, restaurants and leisure 0.9% | | |
| Boyd Gaming Corp. | 6.000 | 08-15-26 | | 220,000 | 233,750 |
| Churchill Downs, Inc. (B) | 5.500 | 04-01-27 | | 425,000 | 448,375 |
| International Game Technology PLC (B) | 6.250 | 01-15-27 | | 502,000 | 563,495 |
| NCL Corp., Ltd. (B) | 3.625 | 12-15-24 | | 472,000 | 468,460 |
| 18 | JOHN HANCOCK SHORT DURATION CREDIT OPPORTUNITIES FUND | SEMIANNUAL REPORT | SEE NOTES TO FINANCIAL STATEMENTS |
| | Rate (%) | Maturity date | | Par value^ | Value |
| Consumer discretionary (continued) | | |
| Hotels, restaurants and leisure (continued) | | |
| New Red Finance, Inc. (B) | 3.875 | 01-15-28 | | 180,000 | $181,143 |
| New Red Finance, Inc. (B) | 4.375 | 01-15-28 | | 435,000 | 436,044 |
| Royal Caribbean Cruises, Ltd. | 2.650 | 11-28-20 | | 2,150,000 | 2,161,036 |
| Sands China, Ltd. | 4.600 | 08-08-23 | | 2,100,000 | 2,222,619 |
| Station Casinos LLC (B) | 5.000 | 10-01-25 | | 480,000 | 491,256 |
| Household durables 0.2% | | |
| KB Home | 4.800 | 11-15-29 | | 275,000 | 285,313 |
| PulteGroup, Inc. | 5.000 | 01-15-27 | | 464,000 | 512,720 |
| TopBuild Corp. (B) | 5.625 | 05-01-26 | | 535,000 | 557,738 |
| Internet and direct marketing retail 0.9% | | |
| Alibaba Group Holding, Ltd. | 4.000 | 12-06-37 | | 2,000,000 | 2,272,223 |
| Amazon.com, Inc. | 3.875 | 08-22-37 | | 1,900,000 | 2,230,784 |
| Expedia Group, Inc. (B) | 3.250 | 02-15-30 | | 3,300,000 | 3,252,987 |
| Leisure products 0.1% | | |
| Diamond Sports Group LLC (B) | 5.375 | 08-15-26 | | 482,000 | 480,121 |
| Diamond Sports Group LLC (B)(E) | 6.625 | 08-15-27 | | 317,000 | 296,395 |
| Multiline retail 0.3% | | |
| Dollar Tree, Inc. | 4.000 | 05-15-25 | | 2,050,000 | 2,220,301 |
| Specialty retail 0.3% | | |
| AutoZone, Inc. | 3.750 | 04-18-29 | | 2,000,000 | 2,181,734 |
| Party City Holdings, Inc. (B) | 6.625 | 08-01-26 | | 493,000 | 350,030 |
| Textiles, apparel and luxury goods 0.2% | | |
| Hanesbrands, Inc. (B) | 4.625 | 05-15-24 | | 575,000 | 602,313 |
| Hanesbrands, Inc. (B) | 4.875 | 05-15-26 | | 206,000 | 217,073 |
| Levi Strauss & Company | 5.000 | 05-01-25 | | 555,000 | 572,416 |
| The William Carter Company (B) | 5.625 | 03-15-27 | | 407,000 | 433,396 |
| Consumer staples 1.1% | | 9,159,145 |
| Beverages 0.1% | | |
| Cott Holdings, Inc. (B) | 5.500 | 04-01-25 | | 610,000 | 632,875 |
| Food and staples retailing 0.3% | | |
| Albertsons Companies, Inc. (B) | 4.875 | 02-15-30 | | 463,000 | 475,733 |
| Albertsons Companies, Inc. (B) | 5.875 | 02-15-28 | | 225,000 | 240,188 |
| Albertsons Companies, Inc. | 6.625 | 06-15-24 | | 575,000 | 598,000 |
| Ingles Markets, Inc. | 5.750 | 06-15-23 | | 509,000 | 517,694 |
| The Kroger Company | 4.450 | 02-01-47 | | 1,075,000 | 1,173,560 |
| Food products 0.4% | | |
| Adecoagro SA (B) | 6.000 | 09-21-27 | | 295,000 | 295,738 |
| Chobani LLC (B)(E) | 7.500 | 04-15-25 | | 460,000 | 457,525 |
| JBS USA LUX SA (B) | 6.500 | 04-15-29 | | 860,000 | 963,209 |
| Pilgrim's Pride Corp. (B) | 5.750 | 03-15-25 | | 375,000 | 385,313 |
| Pilgrim's Pride Corp. (B) | 5.875 | 09-30-27 | | 330,000 | 350,031 |
| SEE NOTES TO FINANCIAL STATEMENTS | SEMIANNUAL REPORT | JOHN HANCOCK SHORT DURATION CREDIT OPPORTUNITIES FUND | 19 |
| | Rate (%) | Maturity date | | Par value^ | Value |
| Consumer staples (continued) | | |
| Food products (continued) | | |
| Post Holdings, Inc. (B) | 5.000 | 08-15-26 | | 445,000 | $459,463 |
| Post Holdings, Inc. (B) | 5.500 | 03-01-25 | | 345,000 | 357,361 |
| Food, beverage and tobacco 0.3% | | |
| Imperial Brands Finance PLC (B) | 3.500 | 07-26-26 | | 2,175,000 | 2,252,455 |
| Energy 5.9% | | 48,261,786 |
| Energy equipment and services 0.2% | | |
| Apergy Corp. | 6.375 | 05-01-26 | | 405,000 | 429,300 |
| Archrock Partners LP (B) | 6.250 | 04-01-28 | | 380,000 | 390,925 |
| Inkia Energy, Ltd. (B) | 5.875 | 11-09-27 | | 223,000 | 235,267 |
| SESI LLC | 7.750 | 09-15-24 | | 425,000 | 264,609 |
| Transocean, Inc. (B) | 8.000 | 02-01-27 | | 407,000 | 378,836 |
| Oil, gas and consumable fuels 5.7% | | |
| Abu Dhabi Crude Oil Pipeline LLC (B) | 3.650 | 11-02-29 | | 518,000 | 563,973 |
| Abu Dhabi Crude Oil Pipeline LLC (B) | 4.600 | 11-02-47 | | 665,000 | 781,375 |
| AI Candelaria Spain SLU (B) | 7.500 | 12-15-28 | | 326,000 | 371,902 |
| Alta Mesa Holdings LP (D) | 7.875 | 12-15-24 | | 460,000 | 5,750 |
| Antero Midstream Partners LP (B) | 5.750 | 03-01-27 | | 996,000 | 776,830 |
| Antero Midstream Partners LP (B) | 5.750 | 01-15-28 | | 344,000 | 267,529 |
| Antero Resources Corp. | 5.000 | 03-01-25 | | 600,000 | 395,880 |
| Apache Corp. | 5.100 | 09-01-40 | | 2,150,000 | 2,173,307 |
| Boardwalk Pipelines LP | 5.950 | 06-01-26 | | 2,125,000 | 2,441,268 |
| Cheniere Corpus Christi Holdings LLC | 5.125 | 06-30-27 | | 1,825,000 | 2,033,485 |
| Concho Resources, Inc. | 3.750 | 10-01-27 | | 2,100,000 | 2,217,079 |
| DCP Midstream Operating LP | 5.125 | 05-15-29 | | 545,000 | 574,975 |
| Diamondback Energy, Inc. | 2.875 | 12-01-24 | | 2,175,000 | 2,211,668 |
| Empresa Nacional del Petroleo | 3.750 | 08-05-26 | | 210,000 | 219,066 |
| Enterprise Products Operating LLC (4.875% to 8-16-22, then 3 month LIBOR + 2.986%) | 4.875 | 08-16-77 | | 2,125,000 | 2,126,084 |
| Genesis Energy LP | 6.000 | 05-15-23 | | 435,000 | 437,045 |
| Genesis Energy LP | 7.750 | 02-01-28 | | 276,000 | 278,285 |
| Geopark, Ltd. (B)(E) | 6.500 | 09-21-24 | | 245,000 | 258,230 |
| Hilcorp Energy I LP (B) | 5.750 | 10-01-25 | | 832,000 | 752,269 |
| Holly Energy Partners LP (B) | 5.000 | 02-01-28 | | 439,000 | 445,998 |
| KazMunayGas National Company JSC (B) | 4.750 | 04-24-25 | | 407,000 | 449,125 |
| KazMunayGas National Company JSC | 5.375 | 04-24-30 | | 514,000 | 611,111 |
| KazMunayGas National Company JSC (B) | 5.750 | 04-19-47 | | 306,000 | 379,391 |
| KazMunayGas National Company JSC (B) | 6.375 | 10-24-48 | | 545,000 | 727,435 |
| KazTransGas JSC (B) | 4.375 | 09-26-27 | | 547,000 | 586,482 |
| Kinder Morgan Energy Partners LP | 5.500 | 03-01-44 | | 975,000 | 1,165,663 |
| 20 | JOHN HANCOCK SHORT DURATION CREDIT OPPORTUNITIES FUND | SEMIANNUAL REPORT | SEE NOTES TO FINANCIAL STATEMENTS |
| | Rate (%) | Maturity date | | Par value^ | Value |
| Energy (continued) | | |
| Oil, gas and consumable fuels (continued) | | |
| Kosmos Energy, Ltd. (B) | 7.125 | 04-04-26 | | 58,000 | $58,653 |
| Marathon Petroleum Corp. | 3.800 | 04-01-28 | | 1,025,000 | 1,096,092 |
| Marathon Petroleum Corp. | 5.125 | 12-15-26 | | 1,000,000 | 1,151,978 |
| Murphy Oil Corp. | 5.750 | 08-15-25 | | 375,000 | 386,018 |
| Murphy Oil Corp. | 5.875 | 12-01-27 | | 411,000 | 421,275 |
| Murphy Oil USA, Inc. | 4.750 | 09-15-29 | | 420,000 | 438,900 |
| NAK Naftogaz Ukraine (B) | 7.625 | 11-08-26 | | 299,000 | 318,307 |
| Oasis Petroleum, Inc. (B)(E) | 6.250 | 05-01-26 | | 150,000 | 114,375 |
| Oasis Petroleum, Inc. | 6.875 | 03-15-22 | | 475,000 | 456,000 |
| Pertamina Persero PT (B) | 3.650 | 07-30-29 | | 320,000 | 333,600 |
| Pertamina Persero PT | 5.250 | 05-23-21 | | 242,000 | 251,081 |
| Pertamina Persero PT (B) | 5.625 | 05-20-43 | | 513,000 | 601,984 |
| Pertamina Persero PT | 6.450 | 05-30-44 | | 363,000 | 470,677 |
| Petroamazonas EP (B) | 4.625 | 02-16-20 | | 91,667 | 91,593 |
| Petroamazonas EP (B) | 4.625 | 11-06-20 | | 166,667 | 165,837 |
| Petrobras Global Finance BV | 6.900 | 03-19-49 | | 456,000 | 556,480 |
| Petroleos de Venezuela SA (D) | 5.375 | 04-12-27 | | 64,000 | 5,120 |
| Petroleos de Venezuela SA (D) | 6.000 | 05-16-24 | | 3,771,996 | 301,760 |
| Petroleos de Venezuela SA (D) | 6.000 | 11-15-26 | | 1,826,000 | 146,080 |
| Petroleos de Venezuela SA (D) | 9.750 | 05-17-35 | | 3,459,000 | 276,720 |
| Petroleos del Peru SA | 4.750 | 06-19-32 | | 640,000 | 716,800 |
| Petroleos del Peru SA (B) | 4.750 | 06-19-32 | | 177,000 | 198,240 |
| Petroleos del Peru SA | 5.625 | 06-19-47 | | 628,000 | 756,941 |
| Petroleos Mexicanos | 5.350 | 02-12-28 | | 254,000 | 257,658 |
| Petroleos Mexicanos (B) | 5.950 | 01-28-31 | | 194,000 | 195,310 |
| Petroleos Mexicanos (B) | 6.490 | 01-23-27 | | 600,000 | 651,000 |
| Petroleos Mexicanos | 6.500 | 03-13-27 | | 367,000 | 397,890 |
| Petroleos Mexicanos | 6.500 | 01-23-29 | | 279,000 | 297,944 |
| Petroleos Mexicanos (B) | 6.840 | 01-23-30 | | 339,000 | 367,307 |
| Petroleos Mexicanos | 7.190 | 09-12-24 | MXN | 4,586,400 | 223,617 |
| Petroleos Mexicanos | 7.470 | 11-12-26 | MXN | 2,300,000 | 108,074 |
| Petroleos Mexicanos | 7.470 | 11-12-26 | MXN | 11,000 | 517 |
| Petroleos Mexicanos (B) | 7.690 | 01-23-50 | | 1,162,000 | 1,278,769 |
| Petroleos Mexicanos | 9.500 | 09-15-27 | | 97,000 | 116,255 |
| Petronas Capital, Ltd. (B) | 4.500 | 03-18-45 | | 452,000 | 567,749 |
| QEP Resources, Inc. | 5.250 | 05-01-23 | | 455,000 | 436,800 |
| Sabine Pass Liquefaction LLC | 5.000 | 03-15-27 | | 1,975,000 | 2,203,805 |
| Saudi Arabian Oil Company | 2.875 | 04-16-24 | | 484,000 | 497,292 |
| Saudi Arabian Oil Company (B) | 4.250 | 04-16-39 | | 150,000 | 166,220 |
| Sinopec Group Overseas Development 2016, Ltd. | 2.750 | 09-29-26 | | 223,000 | 227,511 |
| Sinopec Group Overseas Development 2017, Ltd. | 3.625 | 04-12-27 | | 753,000 | 803,669 |
| SEE NOTES TO FINANCIAL STATEMENTS | SEMIANNUAL REPORT | JOHN HANCOCK SHORT DURATION CREDIT OPPORTUNITIES FUND | 21 |
| | Rate (%) | Maturity date | | Par value^ | Value |
| Energy (continued) | | |
| Oil, gas and consumable fuels (continued) | | |
| SM Energy Company | 6.125 | 11-15-22 | | 275,000 | $272,250 |
| Targa Resources Partners LP | 6.500 | 07-15-27 | | 1,021,000 | 1,112,890 |
| The Oil and Gas Holding Company BSCC (B) | 7.625 | 11-07-24 | | 324,000 | 379,120 |
| Tullow Oil PLC (B) | 7.000 | 03-01-25 | | 245,000 | 198,149 |
| Unit Corp. | 6.625 | 05-15-21 | | 515,000 | 225,570 |
| Western Midstream Operating LP | 5.300 | 03-01-48 | | 975,000 | 865,395 |
| Western Midstream Operating LP | 5.450 | 04-01-44 | | 1,375,000 | 1,251,738 |
| Whiting Petroleum Corp. | 6.625 | 01-15-26 | | 825,000 | 461,959 |
| WPX Energy, Inc. | 4.500 | 01-15-30 | | 430,000 | 432,675 |
| Financials 8.0% | | 65,938,976 |
| Banks 5.5% | | |
| Banco Mercantil del Norte SA (6.750% to 9-27-24, then 5 Year CMT + 4.967%) (B)(F) | 6.750 | 09-27-24 | | 187,000 | 203,400 |
| Banco Mercantil del Norte SA (7.500% to 6-27-29, then 10 Year CMT + 5.470%) (B)(F) | 7.500 | 06-27-29 | | 124,000 | 140,431 |
| Banco Nacional de Comercio Exterior SNC (3.800% to 8-11-21, then 5 Year CMT + 3.000%) (B) | 3.800 | 08-11-26 | | 233,000 | 235,915 |
| Banco Nacional de Comercio Exterior SNC (3.800% to 8-11-21, then 5 Year CMT + 3.000%) | 3.800 | 08-11-26 | | 115,000 | 116,439 |
| Bank of America Corp. | 3.950 | 04-21-25 | | 3,550,000 | 3,846,876 |
| Bank of America Corp. (4.078% to 4-23-39, then 3 month LIBOR + 1.320%) | 4.078 | 04-23-40 | | 2,400,000 | 2,814,560 |
| Barclays PLC | 4.836 | 05-09-28 | | 1,000,000 | 1,114,182 |
| Barclays PLC | 5.250 | 08-17-45 | | 875,000 | 1,109,483 |
| Brazil Loan Trust 1 (B) | 5.477 | 07-24-23 | | 140,814 | 147,151 |
| CIT Group, Inc. | 6.125 | 03-09-28 | | 180,000 | 214,300 |
| Citigroup, Inc. | 4.400 | 06-10-25 | | 4,025,000 | 4,438,916 |
| Citigroup, Inc. (2.876% to 7-24-22, then 3 month LIBOR + 0.950%) | 2.876 | 07-24-23 | | 75,000 | 76,574 |
| Deutsche Bank AG | 3.700 | 05-30-24 | | 2,325,000 | 2,407,525 |
| Fifth Third Bancorp | 3.650 | 01-25-24 | | 2,150,000 | 2,287,974 |
| HSBC Holdings PLC (3.950% to 5-18-23, then 3 month LIBOR + 0.987%) | 3.950 | 05-18-24 | | 2,000,000 | 2,117,998 |
| Intesa Sanpaolo SpA (B) | 4.000 | 09-23-29 | | 3,150,000 | 3,334,959 |
| JPMorgan Chase & Co. | 3.625 | 12-01-27 | | 2,100,000 | 2,261,691 |
| KeyBank NA | 3.900 | 04-13-29 | | 2,150,000 | 2,379,016 |
| Mizuho Financial Group, Inc. (2.721% to 7-16-22, then 3 month LIBOR + 0.840%) | 2.721 | 07-16-23 | | 2,125,000 | 2,162,899 |
| 22 | JOHN HANCOCK SHORT DURATION CREDIT OPPORTUNITIES FUND | SEMIANNUAL REPORT | SEE NOTES TO FINANCIAL STATEMENTS |
| | Rate (%) | Maturity date | | Par value^ | Value |
| Financials (continued) | | |
| Banks (continued) | | |
| Santander Holdings USA, Inc. (B) | 3.244 | 10-05-26 | | 2,175,000 | $2,229,238 |
| Societe Generale SA (B) | 2.625 | 10-16-24 | | 5,550,000 | 5,633,726 |
| Standard Chartered PLC (2.819% to 1-30-25, then 3 month LIBOR + 1.209%) (B) | 2.819 | 01-30-26 | | 2,150,000 | 2,177,061 |
| Sumitomo Mitsui Financial Group, Inc. | 3.202 | 09-17-29 | | 1,375,000 | 1,444,313 |
| The Royal Bank of Scotland Group PLC | 6.100 | 06-10-23 | | 1,975,000 | 2,193,451 |
| Ukreximbank | 9.625 | 04-27-22 | | 151,250 | 160,567 |
| Capital markets 1.3% | | |
| 1MDB Global Investments, Ltd. | 4.400 | 03-09-23 | | 1,000,000 | 991,549 |
| Credit Suisse Group AG (4.207% to 6-12-23, then 3 month LIBOR + 1.240%) (B) | 4.207 | 06-12-24 | | 2,000,000 | 2,135,483 |
| MDGH - GMTN BV (B) | 2.875 | 11-07-29 | | 160,000 | 162,600 |
| MDGH - GMTN BV (B) | 4.500 | 11-07-28 | | 601,000 | 688,265 |
| MSCI, Inc. (B) | 4.000 | 11-15-29 | | 395,000 | 403,394 |
| MV24 Capital BV (B) | 6.748 | 06-01-34 | | 268,208 | 289,209 |
| State Street Corp. (3.031% to 11-1-29, then SOFR + 1.490%) | 3.031 | 11-01-34 | | 1,625,000 | 1,683,851 |
| The Goldman Sachs Group, Inc. (2.905% to 7-24-22, then 3 month LIBOR + 0.990%) | 2.905 | 07-24-23 | | 2,100,000 | 2,147,216 |
| UBS Group AG (B) | 3.491 | 05-23-23 | | 2,075,000 | 2,146,769 |
| Consumer finance 0.8% | | |
| Ally Financial, Inc. | 8.000 | 11-01-31 | | 153,000 | 215,816 |
| Capital One Financial Corp. | 3.750 | 03-09-27 | | 3,075,000 | 3,329,307 |
| Springleaf Finance Corp. | 7.125 | 03-15-26 | | 475,000 | 544,991 |
| Synchrony Financial | 3.700 | 08-04-26 | | 2,125,000 | 2,235,436 |
| Diversified financial services 0.3% | | |
| GE Capital International Funding Company Unlimited Company | 3.373 | 11-15-25 | | 2,325,000 | 2,464,531 |
| Insurance 0.1% | | |
| Acrisure LLC (B) | 7.000 | 11-15-25 | | 304,000 | 297,920 |
| Acrisure LLC (B) | 8.125 | 02-15-24 | | 415,000 | 443,531 |
| Alliant Holdings Intermediate LLC (B) | 6.750 | 10-15-27 | | 485,000 | 510,463 |
| Health care 2.3% | | 18,496,828 |
| Biotechnology 0.4% | | |
| AbbVie, Inc. (B) | 2.950 | 11-21-26 | | 3,150,000 | 3,253,851 |
| Health care equipment and supplies 0.1% | | |
| Hologic, Inc. (B) | 4.375 | 10-15-25 | | 370,000 | 376,782 |
| Health care providers and services 1.3% | | |
| Centene Corp. (B) | 4.250 | 12-15-27 | | 471,000 | 492,195 |
| CVS Health Corp. | 4.300 | 03-25-28 | | 2,125,000 | 2,357,578 |
| SEE NOTES TO FINANCIAL STATEMENTS | SEMIANNUAL REPORT | JOHN HANCOCK SHORT DURATION CREDIT OPPORTUNITIES FUND | 23 |
| | Rate (%) | Maturity date | | Par value^ | Value |
| Health care (continued) | | |
| Health care providers and services (continued) | | |
| CVS Health Corp. | 4.780 | 03-25-38 | | 125,000 | $146,038 |
| Encompass Health Corp. | 4.500 | 02-01-28 | | 180,000 | 185,407 |
| HCA, Inc. | 5.250 | 06-15-49 | | 1,925,000 | 2,233,990 |
| HCA, Inc. | 5.375 | 09-01-26 | | 595,000 | 669,405 |
| HCA, Inc. | 5.625 | 09-01-28 | | 700,000 | 809,410 |
| Tenet Healthcare Corp. | 4.625 | 07-15-24 | | 675,000 | 691,875 |
| Tenet Healthcare Corp. (B) | 4.875 | 01-01-26 | | 225,000 | 234,000 |
| Tenet Healthcare Corp. (B) | 6.250 | 02-01-27 | | 515,000 | 544,664 |
| UnitedHealth Group, Inc. | 3.875 | 08-15-59 | | 2,075,000 | 2,305,504 |
| Life sciences tools and services 0.1% | | |
| Charles River Laboratories International, Inc. (B) | 4.250 | 05-01-28 | | 90,000 | 91,312 |
| Charles River Laboratories International, Inc. (B) | 5.500 | 04-01-26 | | 720,000 | 765,900 |
| Pharmaceuticals 0.4% | | |
| Bausch Health Companies, Inc. (B) | 6.125 | 04-15-25 | | 975,000 | 1,002,905 |
| Bausch Health Companies, Inc. (B) | 7.000 | 01-15-28 | | 615,000 | 666,131 |
| Catalent Pharma Solutions, Inc. (B) | 5.000 | 07-15-27 | | 465,000 | 489,482 |
| Endo DAC (B) | 6.000 | 02-01-25 | | 505,000 | 349,713 |
| IQVIA, Inc. (B) | 5.000 | 05-15-27 | | 580,000 | 611,923 |
| Par Pharmaceutical, Inc. (B) | 7.500 | 04-01-27 | | 215,000 | 218,763 |
| Industrials 2.4% | | 19,860,092 |
| Aerospace and defense 0.3% | | |
| Bombardier, Inc. (B) | 6.000 | 10-15-22 | | 833,000 | 816,340 |
| Moog, Inc. (B) | 4.250 | 12-15-27 | | 124,000 | 127,119 |
| Signature Aviation US Holdings, Inc. (B) | 4.000 | 03-01-28 | | 274,000 | 271,005 |
| TransDigm, Inc. (B) | 6.250 | 03-15-26 | | 875,000 | 943,688 |
| Air freight and logistics 0.5% | | |
| FedEx Corp. | 4.400 | 01-15-47 | | 2,300,000 | 2,422,256 |
| Gol Finance SA (B)(E) | 7.000 | 01-31-25 | | 310,000 | 314,805 |
| Park-Ohio Industries, Inc. | 6.625 | 04-15-27 | | 535,000 | 543,095 |
| XPO Logistics, Inc. (B) | 6.125 | 09-01-23 | | 200,000 | 206,750 |
| XPO Logistics, Inc. (B) | 6.750 | 08-15-24 | | 225,000 | 243,844 |
| Building products 0.2% | | |
| Advanced Drainage Systems, Inc. (B) | 5.000 | 09-30-27 | | 550,000 | 567,875 |
| American Woodmark Corp. (B) | 4.875 | 03-15-26 | | 640,000 | 658,400 |
| Griffon Corp. | 5.250 | 03-01-22 | | 690,000 | 689,227 |
| Commercial services and supplies 0.3% | | |
| ACCO Brands Corp. (B) | 5.250 | 12-15-24 | | 605,000 | 626,175 |
| Covanta Holding Corp. | 5.875 | 07-01-25 | | 655,000 | 679,358 |
| GFL Environmental, Inc. (B) | 5.125 | 12-15-26 | | 148,000 | 152,418 |
| GFL Environmental, Inc. (B) | 8.500 | 05-01-27 | | 540,000 | 588,600 |
| 24 | JOHN HANCOCK SHORT DURATION CREDIT OPPORTUNITIES FUND | SEMIANNUAL REPORT | SEE NOTES TO FINANCIAL STATEMENTS |
| | Rate (%) | Maturity date | | Par value^ | Value |
| Industrials (continued) | | |
| Commercial services and supplies (continued) | | |
| Waste Pro USA, Inc. (B) | 5.500 | 02-15-26 | | 425,000 | $436,626 |
| Construction and engineering 0.0% | | |
| IHS Netherlands Holdco BV (B) | 8.000 | 09-18-27 | | 92,000 | 99,360 |
| Machinery 0.1% | | |
| Mueller Water Products, Inc. (B) | 5.500 | 06-15-26 | | 475,000 | 497,563 |
| SPX FLOW, Inc. (B) | 5.625 | 08-15-24 | | 700,000 | 728,000 |
| Road and rail 0.3% | | |
| Ryder System, Inc. | 3.650 | 03-18-24 | | 2,000,000 | 2,128,776 |
| Trading companies and distributors 0.6% | | |
| Air Lease Corp. | 3.625 | 12-01-27 | | 2,150,000 | 2,264,749 |
| Beacon Roofing Supply, Inc. (B) | 4.500 | 11-15-26 | | 285,000 | 292,838 |
| GATX Corp. | 4.550 | 11-07-28 | | 1,775,000 | 2,005,637 |
| United Rentals North America, Inc. | 6.500 | 12-15-26 | | 625,000 | 678,906 |
| Transportation infrastructure 0.1% | | |
| Aeropuerto Internacional de Tocumen SA | 5.625 | 05-18-36 | | 411,000 | 494,232 |
| Aeropuerto Internacional de Tocumen SA (B) | 6.000 | 11-18-48 | | 262,000 | 330,940 |
| Rumo Luxembourg Sarl (B) | 7.375 | 02-09-24 | | 48,000 | 51,510 |
| Information technology 1.8% | | 14,759,980 |
| Communications equipment 0.2% | | |
| Hughes Satellite Systems Corp. | 6.625 | 08-01-26 | | 600,000 | 661,500 |
| ViaSat, Inc. (B) | 5.625 | 04-15-27 | | 545,000 | 570,833 |
| IT services 0.6% | | |
| Broadridge Financial Solutions, Inc. | 2.900 | 12-01-29 | | 1,700,000 | 1,743,877 |
| Fiserv, Inc. | 3.200 | 07-01-26 | | 2,125,000 | 2,244,021 |
| The Western Union Company | 2.850 | 01-10-25 | | 1,300,000 | 1,331,315 |
| Semiconductors and semiconductor equipment 0.7% | | |
| Broadcom, Inc. (B) | 4.250 | 04-15-26 | | 2,075,000 | 2,243,870 |
| Entegris, Inc. (B) | 4.625 | 02-10-26 | | 560,000 | 578,200 |
| Qorvo, Inc. | 5.500 | 07-15-26 | | 520,000 | 549,900 |
| Xilinx, Inc. | 2.950 | 06-01-24 | | 2,100,000 | 2,181,406 |
| Software 0.2% | | |
| Fair Isaac Corp. (B) | 4.000 | 06-15-28 | | 533,000 | 542,328 |
| Nuance Communications, Inc. | 5.625 | 12-15-26 | | 600,000 | 638,250 |
| SS&C Technologies, Inc. (B) | 5.500 | 09-30-27 | | 560,000 | 592,368 |
| Technology hardware, storage and peripherals 0.1% | | |
| Seagate HDD Cayman | 4.875 | 06-01-27 | | 816,000 | 882,112 |
| SEE NOTES TO FINANCIAL STATEMENTS | SEMIANNUAL REPORT | JOHN HANCOCK SHORT DURATION CREDIT OPPORTUNITIES FUND | 25 |
| | Rate (%) | Maturity date | | Par value^ | Value |
| Materials 3.4% | | $28,328,167 |
| Chemicals 1.1% | | |
| Axalta Coating Systems LLC (B) | 4.875 | 08-15-24 | | 450,000 | 463,500 |
| CF Industries, Inc. | 5.150 | 03-15-34 | | 595,000 | 687,225 |
| CNAC HK Finbridge Company, Ltd. | 5.125 | 03-14-28 | | 863,000 | 989,634 |
| Element Solutions, Inc. (B) | 5.875 | 12-01-25 | | 675,000 | 697,694 |
| ENN Clean Energy International Investment, Ltd. | 7.500 | 02-27-21 | | 200,000 | 205,893 |
| GCP Applied Technologies, Inc. (B) | 5.500 | 04-15-26 | | 450,000 | 468,000 |
| Huntsman International LLC | 4.500 | 05-01-29 | | 2,075,000 | 2,262,431 |
| Nutrien, Ltd. | 5.000 | 04-01-49 | | 1,850,000 | 2,294,673 |
| OCI NV (B) | 6.625 | 04-15-23 | | 810,000 | 840,814 |
| The Chemours Company (E) | 7.000 | 05-15-25 | | 392,000 | 375,144 |
| Construction materials 0.4% | | |
| American Builders & Contractors Supply Company, Inc. (B) | 4.000 | 01-15-28 | | 280,000 | 282,307 |
| U.S. Concrete, Inc. | 6.375 | 06-01-24 | | 555,000 | 574,425 |
| Vulcan Materials Company | 4.500 | 06-15-47 | | 1,975,000 | 2,287,737 |
| Containers and packaging 0.3% | | |
| Ardagh Packaging Finance PLC (B) | 4.125 | 08-15-26 | | 170,000 | 174,888 |
| Berry Global, Inc. | 5.125 | 07-15-23 | | 170,000 | 172,978 |
| Crown Americas LLC | 4.750 | 02-01-26 | | 500,000 | 519,375 |
| WRKCo, Inc. | 3.900 | 06-01-28 | | 1,600,000 | 1,737,797 |
| Metals and mining 1.3% | | |
| Anglo American Capital PLC (B) | 4.000 | 09-11-27 | | 2,025,000 | 2,167,056 |
| ArcelorMittal SA | 4.550 | 03-11-26 | | 2,150,000 | 2,318,285 |
| Corp. Nacional del Cobre de Chile (B) | 3.000 | 09-30-29 | | 55,000 | 55,744 |
| Corp. Nacional del Cobre de Chile (B) | 3.625 | 08-01-27 | | 114,000 | 121,313 |
| Corp. Nacional del Cobre de Chile (B) | 4.375 | 02-05-49 | | 1,143,000 | 1,281,080 |
| Corp. Nacional del Cobre de Chile (B) | 4.500 | 09-16-25 | | 709,000 | 783,289 |
| Corp. Nacional del Cobre de Chile | 5.625 | 10-18-43 | | 136,000 | 177,611 |
| First Quantum Minerals, Ltd. (B) | 6.875 | 03-01-26 | | 120,000 | 115,200 |
| First Quantum Minerals, Ltd. (B) | 7.500 | 04-01-25 | | 120,000 | 118,200 |
| FMG Resources August 2006 Pty, Ltd. (B) | 4.500 | 09-15-27 | | 455,000 | 461,256 |
| Freeport-McMoRan, Inc. | 4.550 | 11-14-24 | | 460,000 | 485,300 |
| Freeport-McMoRan, Inc. | 5.000 | 09-01-27 | | 450,000 | 466,313 |
| Indonesia Asahan Aluminium Persero PT (B) | 5.710 | 11-15-23 | | 195,000 | 215,272 |
| Kaiser Aluminum Corp. (B) | 4.625 | 03-01-28 | | 475,000 | 484,500 |
| Metinvest BV (B) | 7.750 | 10-17-29 | | 252,000 | 265,265 |
| Metinvest BV | 8.500 | 04-23-26 | | 200,000 | 218,739 |
| Newmont Corp. | 6.250 | 10-01-39 | | 975,000 | 1,360,678 |
| Paper and forest products 0.3% | | |
| Boise Cascade Company (B) | 5.625 | 09-01-24 | | 645,000 | 669,188 |
| 26 | JOHN HANCOCK SHORT DURATION CREDIT OPPORTUNITIES FUND | SEMIANNUAL REPORT | SEE NOTES TO FINANCIAL STATEMENTS |
| | Rate (%) | Maturity date | | Par value^ | Value |
| Materials (continued) | | |
| Paper and forest products (continued) | | |
| Flex Acquisition Company, Inc. (B) | 6.875 | 01-15-25 | | 340,000 | $341,275 |
| Louisiana-Pacific Corp. | 4.875 | 09-15-24 | | 580,000 | 598,125 |
| Norbord, Inc. (B) | 6.250 | 04-15-23 | | 545,000 | 589,963 |
| Real estate 1.9% | | 15,781,822 |
| Equity real estate investment trusts 1.9% | | |
| American Homes 4 Rent LP | 4.250 | 02-15-28 | | 2,000,000 | 2,190,271 |
| Boston Properties LP | 2.900 | 03-15-30 | | 1,100,000 | 1,134,987 |
| Crown Castle International Corp. | 3.800 | 02-15-28 | | 2,000,000 | 2,178,288 |
| Equinix, Inc. | 2.625 | 11-18-24 | | 2,150,000 | 2,172,984 |
| MGM Growth Properties Operating Partnership LP | 5.750 | 02-01-27 | | 430,000 | 478,375 |
| Office Properties Income Trust | 4.250 | 05-15-24 | | 2,050,000 | 2,160,658 |
| SBA Communications Corp. (B) | 3.875 | 02-15-27 | | 288,000 | 291,960 |
| SITE Centers Corp. | 4.250 | 02-01-26 | | 2,125,000 | 2,298,483 |
| VICI Properties LP (B) | 4.125 | 08-15-30 | | 445,000 | 451,675 |
| WEA Finance LLC (B) | 2.875 | 01-15-27 | | 2,125,000 | 2,175,806 |
| Real estate management and development 0.0% | | |
| Wanda Properties International Company, Ltd. | 7.250 | 01-29-24 | | 247,000 | 248,335 |
| Utilities 3.4% | | 27,739,406 |
| Electric utilities 1.8% | | |
| Electricite de France SA (B) | 4.500 | 09-21-28 | | 1,950,000 | 2,227,612 |
| Enel Finance International NV (B) | 4.625 | 09-14-25 | | 2,975,000 | 3,308,515 |
| Entergy Texas, Inc. | 3.550 | 09-30-49 | | 1,375,000 | 1,507,106 |
| Eskom Holdings SOC, Ltd. (B) | 6.750 | 08-06-23 | | 470,000 | 475,570 |
| Eskom Holdings SOC, Ltd. (B) | 7.125 | 02-11-25 | | 178,000 | 180,451 |
| Eskom Holdings SOC, Ltd. (B) | 8.450 | 08-10-28 | | 270,000 | 290,304 |
| FirstEnergy Corp. | 4.850 | 07-15-47 | | 1,800,000 | 2,223,211 |
| Georgia Power Company | 4.300 | 03-15-42 | | 1,100,000 | 1,272,975 |
| Vistra Operations Company LLC (B) | 5.000 | 07-31-27 | | 220,000 | 225,786 |
| Vistra Operations Company LLC (B) | 5.625 | 02-15-27 | | 645,000 | 670,800 |
| Xcel Energy, Inc. | 3.500 | 12-01-49 | | 2,000,000 | 2,117,749 |
| Gas utilities 0.6% | | |
| Dominion Energy Gas Holdings LLC | 3.000 | 11-15-29 | | 1,425,000 | 1,464,199 |
| Dominion Energy, Inc. | 2.715 | 08-15-21 | | 2,150,000 | 2,172,740 |
| Southern Gas Corridor CJSC (B) | 6.875 | 03-24-26 | | 167,000 | 199,998 |
| Southern Gas Corridor CJSC | 6.875 | 03-24-26 | | 860,000 | 1,029,896 |
| Independent power and renewable electricity producers 0.5% | | |
| Calpine Corp. (B) | 4.500 | 02-15-28 | | 525,000 | 522,375 |
| Exelon Generation Company LLC | 5.600 | 06-15-42 | | 2,050,000 | 2,419,216 |
| Minejesa Capital BV (B) | 5.625 | 08-10-37 | | 33,000 | 35,892 |
| SEE NOTES TO FINANCIAL STATEMENTS | SEMIANNUAL REPORT | JOHN HANCOCK SHORT DURATION CREDIT OPPORTUNITIES FUND | 27 |
| | Rate (%) | Maturity date | | Par value^ | Value |
| Utilities (continued) | | |
| Independent power and renewable electricity producers (continued) | | |
| Mong Duong Finance Holdings BV (B) | 5.125 | 05-07-29 | | 214,000 | $220,834 |
| NRG Energy, Inc. | 5.750 | 01-15-28 | | 645,000 | 694,214 |
| Multi-utilities 0.5% | | |
| ACWA Power Management and Investments One, Ltd. (B) | 5.950 | 12-15-39 | | 773,000 | 840,207 |
| CenterPoint Energy, Inc. | 4.250 | 11-01-28 | | 1,950,000 | 2,193,113 |
| Cometa Energia SA de CV (B) | 6.375 | 04-24-35 | | 199,614 | 228,598 |
|
| Sempra Energy | 4.000 | 02-01-48 | | 1,100,000 | 1,218,045 |
| Term loans (G) 18.4% | | | $151,374,737 |
| (Cost $154,127,812) | | | | | |
| Communication services 2.6% | 21,632,442 |
| Diversified telecommunication services 1.2% | | |
| Altice France SA, USD Term Loan B11 (1 month LIBOR + 2.750%) | 4.395 | 07-31-25 | | 1,502,095 | 1,486,143 |
| Consolidated Communications, Inc., 2016 Term Loan B (1 month LIBOR + 3.000%) | 4.650 | 10-04-23 | | 1,760,653 | 1,697,111 |
| Conterra Ultra Broadband Holdings, Inc., 1st Lien Term Loan (1 month LIBOR + 4.500%) | 6.150 | 04-30-26 | | 895,500 | 894,381 |
| Frontier Communications Corp., 2017 Term Loan B1 (1 month LIBOR + 3.750%) | 5.400 | 06-15-24 | | 1,579,921 | 1,593,081 |
| Intelsat Jackson Holdings SA, 2017 Term Loan B3 (6 month LIBOR + 3.750%) | 5.682 | 11-27-23 | | 835,000 | 831,351 |
| Iridium Satellite LLC, Term Loan B (1 month LIBOR + 3.750%) | 5.395 | 11-04-26 | | 1,180,000 | 1,186,879 |
| Level 3 Financing, Inc., 2019 Term Loan B (1 month LIBOR + 1.750%) | 3.395 | 03-01-27 | | 650,368 | 648,905 |
| Telesat LLC, Term Loan B5 (3 month LIBOR + 2.750%) | 4.630 | 12-07-26 | | 1,455,000 | 1,460,093 |
| Entertainment 0.1% | | |
| UFC Holdings LLC, 2019 Term Loan (1 month LIBOR + 3.250%) | 4.900 | 04-29-26 | | 1,112,201 | 1,114,803 |
| Interactive media and services 0.2% | | |
| MH Sub I LLC, 2017 1st Lien Term Loan (1 month LIBOR + 3.750%) | 5.395 | 09-13-24 | | 1,337,440 | 1,335,768 |
| Media 0.7% | | |
| Charter Communications Operating LLC, 2019 Term Loan B1 (1 month LIBOR + 1.750%) | 3.400 | 04-30-25 | | 1,106,856 | 1,111,870 |
| Cogeco Communications USA II LP, 2017 1st Lien Term Loan (1 month LIBOR + 2.250%) | 3.895 | 01-03-25 | | 1,024,599 | 1,024,947 |
| 28 | JOHN HANCOCK SHORT DURATION CREDIT OPPORTUNITIES FUND | SEMIANNUAL REPORT | SEE NOTES TO FINANCIAL STATEMENTS |
| | Rate (%) | Maturity date | | Par value^ | Value |
| Communication services (continued) | |
| Media (continued) | | |
| CSC Holdings LLC, 2017 1st Lien Term Loan (1 month LIBOR + 2.250%) | 3.926 | 07-17-25 | | 1,507,627 | $1,508,698 |
| Cumulus Media New Holdings, Inc., Term Loan B (1 month LIBOR + 3.750%) | 5.395 | 03-31-26 | | 314,213 | 316,164 |
| Hubbard Radio LLC, 2015 Term Loan B (1 month LIBOR + 3.500%) | 5.150 | 03-28-25 | | 714,095 | 713,502 |
| Terrier Media Buyer, Inc., Term Loan B (3 month LIBOR + 4.250%) | 6.148 | 12-17-26 | | 1,120,000 | 1,128,120 |
| Wireless telecommunication services 0.4% | | |
| SBA Senior Finance II LLC, 2018 Term Loan B (1 month LIBOR + 1.750%) | 3.400 | 04-11-25 | | 1,427,656 | 1,428,555 |
| Sprint Communications, Inc., 1st Lien Term Loan B (1 month LIBOR + 2.500%) | 4.188 | 02-02-24 | | 1,411,222 | 1,379,469 |
| Syniverse Holdings, Inc., 2018 1st Lien Term Loan (6 month LIBOR + 5.000%) | 6.873 | 03-09-23 | | 846,687 | 772,602 |
| Consumer discretionary 2.5% | 20,814,475 |
| Auto components 0.1% | | |
| Panther BF Aggregator 2 LP, USD Term Loan B (1 month LIBOR + 3.500%) | 5.160 | 04-30-26 | | 798,000 | 802,589 |
| Diversified consumer services 0.5% | | |
| PCI Gaming Authority, Term Loan (1 month LIBOR + 2.500%) | 4.145 | 05-29-26 | | 610,397 | 612,918 |
| Prime Security Services Borrower LLC, 2019 Term Loan B1 (1 month LIBOR + 3.250%) | 5.013 | 09-23-26 | | 1,090,810 | 1,090,810 |
| Whatabrands LLC, Term Loan B (1 month LIBOR + 3.250%) | 4.984 | 08-02-26 | | 738,150 | 739,493 |
| WW International, Inc., 2017 Term Loan B (3 month LIBOR + 4.750%) | 6.720 | 11-29-24 | | 1,464,075 | 1,463,167 |
| Hotels, restaurants and leisure 0.9% | | |
| Alterra Mountain Company, Term Loan B1 (1 month LIBOR + 2.750%) | 4.395 | 07-31-24 | | 1,492,162 | 1,497,131 |
| Aramark Services, Inc., 2019 Term Loan B4 (3 month LIBOR + 1.750%) | 3.470 | 01-15-27 | | 500,000 | 500,625 |
| Boyd Gaming Corp., Term Loan B3 (1 week LIBOR + 2.250%) | 3.811 | 09-15-23 | | 949,193 | 951,272 |
| Caesars Resort Collection LLC, 2017 1st Lien Term Loan B (1 month LIBOR + 2.750%) | 4.395 | 12-23-24 | | 1,407,793 | 1,406,343 |
| Golden Nugget LLC, 2017 Incremental Term Loan B (1 month LIBOR + 2.750%) | 4.401 | 10-04-23 | | 1,523,285 | 1,525,341 |
| Motion Finco LLC, USD Term Loan B1 (3 month LIBOR + 3.250%) | 5.151 | 11-13-26 | | 816,667 | 824,017 |
| SEE NOTES TO FINANCIAL STATEMENTS | SEMIANNUAL REPORT | JOHN HANCOCK SHORT DURATION CREDIT OPPORTUNITIES FUND | 29 |
| | Rate (%) | Maturity date | | Par value^ | Value |
| Consumer discretionary (continued) | |
| Hotels, restaurants and leisure (continued) | | |
| New Red Finance, Term Loan B4 (1 month LIBOR + 1.750%) | 3.395 | 11-19-26 | | 864,545 | $863,033 |
| Leisure products 0.3% | | |
| Diamond Sports Group LLC, Term Loan (1 month LIBOR + 3.250%) | 4.910 | 08-24-26 | | 951,615 | 950,130 |
| Hayward Industries, Inc., 1st Lien Term Loan (1 month LIBOR + 3.500%) | 5.145 | 08-05-24 | | 1,578,612 | 1,560,189 |
| Multiline retail 0.1% | | |
| JC Penney Corp., Inc., 2016 Term Loan B (3 month LIBOR + 4.250%) | 6.159 | 06-23-23 | | 1,105,500 | 981,131 |
| Specialty retail 0.6% | | |
| Bass Pro Group LLC, Term Loan B (1 month LIBOR + 5.000%) | 6.645 | 09-25-24 | | 1,483,853 | 1,477,057 |
| Nascar Holdings LLC, Term Loan B (1 month LIBOR + 2.750%) | 4.408 | 10-19-26 | | 938,899 | 944,767 |
| Party City Holdings, Inc., 2018 Term Loan B (1 month LIBOR + 2.500%) | 4.150 | 08-19-22 | | 686,732 | 641,669 |
| Petco Animal Supplies, Inc., 2017 Term Loan B (3 month LIBOR + 3.250%) | 5.027 | 01-26-23 | | 1,115,732 | 941,198 |
| PetSmart, Inc., Consenting Term Loan (1 month LIBOR + 4.000%) | 5.670 | 03-11-22 | | 1,044,855 | 1,041,595 |
| Consumer staples 2.3% | 18,994,819 |
| Beverages 0.2% | | |
| Refresco Group BV, USD Term Loan B (H) | TBD | 01-29-25 | | 140,000 | 139,825 |
| Refresco Holding BV, USD Term Loan B3 (3 month LIBOR + 3.250%) | 5.160 | 03-28-25 | | 1,530,950 | 1,529,036 |
| Food and staples retailing 0.1% | | |
| Albertson's LLC, 2019 Term Loan B7 (1 month LIBOR + 2.750%) | 4.395 | 11-17-25 | | 751,954 | 751,954 |
| Food products 1.2% | | |
| Atkins Nutritionals Holdings, Inc., 2017 Term Loan B (1 month LIBOR + 3.750%) | 5.434 | 07-07-24 | | 600,927 | 606,936 |
| Chobani LLC, 2017 Term Loan B (1 month LIBOR + 3.500%) | 5.145 | 10-10-23 | | 1,091,386 | 1,090,022 |
| Dole Food Company, Inc., 2017 Term Loan B (1 month LIBOR + 2.750%) | 4.404 | 04-06-24 | | 1,399,396 | 1,396,430 |
| Froneri US, Inc., 2020 USD Term Loan (H) | TBD | 01-31-27 | | 1,495,000 | 1,498,738 |
| Hostess Brands LLC, 2019 Term Loan (1, 2, and 3 month LIBOR + 2.500%) | 3.986 | 08-03-25 | | 1,959,606 | 1,960,214 |
| JBS USA LUX SA, 2019 Term Loan B (1 month LIBOR + 2.000%) | 3.645 | 05-01-26 | | 858,513 | 862,118 |
| 30 | JOHN HANCOCK SHORT DURATION CREDIT OPPORTUNITIES FUND | SEMIANNUAL REPORT | SEE NOTES TO FINANCIAL STATEMENTS |
| | Rate (%) | Maturity date | | Par value^ | Value |
| Consumer staples (continued) | |
| Food products (continued) | | |
| Nomad Foods Lux Sarl, 2017 USD Term Loan B4 (3 month LIBOR + 2.250%) | 3.926 | 05-15-24 | | 1,719,423 | $1,719,423 |
| Upfield USA Corp., 2018 USD Term Loan B2 (3 month LIBOR + 3.000%) | 4.909 | 07-02-25 | | 651,085 | 647,556 |
| Household products 0.1% | | |
| Diamond BC BV, USD Term Loan (1 and 3 month LIBOR + 3.000%) | 4.777 | 09-06-24 | | 648,346 | 628,896 |
| Energizer Holdings, Inc., 2018 Term Loan B (1 month LIBOR + 2.250%) | 4.063 | 12-17-25 | | 477,000 | 477,797 |
| Personal products 0.7% | | |
| Edgewell Personal Care Company, Term Loan B (H) | TBD | 09-18-26 | | 930,000 | 930,000 |
| Prestige Brands, Inc., Term Loan B4 (1 month LIBOR + 2.000%) | 3.645 | 01-26-24 | | 1,042,683 | 1,048,387 |
| Revlon Consumer Products Corp., 2016 Term Loan B (3 month LIBOR + 3.500%) | 5.409 | 09-07-23 | | 3,401,327 | 2,658,715 |
| Sunshine Luxembourg VII Sarl, USD Term Loan B1 (3 month LIBOR + 4.250%) | 6.195 | 10-01-26 | | 1,045,000 | 1,048,772 |
| Energy 0.7% | 5,926,794 |
| Energy equipment and services 0.2% | | |
| Apergy Corp., 2018 1st Lien Term Loan (1 month LIBOR + 2.500%) | 4.188 | 05-09-25 | | 807,053 | 808,570 |
| Covia Holdings Corp., Term Loan (3 month LIBOR + 4.000%) | 5.874 | 06-01-25 | | 1,426,282 | 1,138,886 |
| Oil, gas and consumable fuels 0.5% | | |
| Buckeye Partners LP, 2019 Term Loan B (1 month LIBOR + 2.750%) | 4.531 | 11-01-26 | | 1,230,000 | 1,239,742 |
| Granite Acquisition, Inc., Term Loan B (3 month LIBOR + 3.500%) | 5.445 | 12-19-21 | | 2,004,293 | 2,008,462 |
| Prairie ECI Acquiror LP, Term Loan B (3 month LIBOR + 4.750%) | 6.695 | 03-11-26 | | 739,767 | 731,134 |
| Financials 1.1% | 9,203,276 |
| Capital markets 0.2% | | |
| Blackstone CQP Holdco LP, Term Loan B (3 month LIBOR + 3.500%) | 5.408 | 09-30-24 | | 776,100 | 775,456 |
| Sequa Mezzanine Holdings LLC, 1st Lien Term Loan (3 month LIBOR + 5.000%) | 6.904 | 11-28-21 | | 971,644 | 973,830 |
| Diversified financial services 0.5% | | |
| AlixPartners LLP, 2017 Term Loan B (1 month LIBOR + 2.500%) | 4.145 | 04-04-24 | | 1,260,975 | 1,260,193 |
| Crown Finance US, Inc., 2018 USD Term Loan (1 month LIBOR + 2.250%) | 3.895 | 02-28-25 | | 954,075 | 944,534 |
| SEE NOTES TO FINANCIAL STATEMENTS | SEMIANNUAL REPORT | JOHN HANCOCK SHORT DURATION CREDIT OPPORTUNITIES FUND | 31 |
| | Rate (%) | Maturity date | | Par value^ | Value |
| Financials (continued) | |
| Diversified financial services (continued) | | |
| Deerfield Dakota Holding LLC, 2018 Term Loan B (1 month LIBOR + 3.250%) | 4.895 | 02-13-25 | | 598,385 | $599,133 |
| Refinitiv US Holdings, Inc., 2018 USD Term Loan (1 month LIBOR + 3.250%) | 4.895 | 10-01-25 | | 1,504,800 | 1,518,780 |
| Insurance 0.4% | | |
| Alliant Holdings Intermediate LLC, Term Loan B (1 month LIBOR + 3.250%) | 4.920 | 05-09-25 | | 876,149 | 875,492 |
| Asurion LLC, 2017 Term Loan B4 (1 month LIBOR + 3.000%) | 4.645 | 08-04-22 | | 917,715 | 919,092 |
| HUB International, Ltd., 2019 Incremental Term Loan B (3 month LIBOR + 4.000%) | 5.903 | 04-25-25 | | 520,000 | 523,578 |
| USI, Inc., 2017 Repriced Term Loan (3 month LIBOR + 3.000%) | 4.945 | 05-16-24 | | 816,659 | 813,188 |
| Health care 2.2% | 18,000,672 |
| Biotechnology 0.1% | | |
| Aldevron LLC, 2019 Term Loan B (3 month LIBOR + 4.250%) | 6.195 | 10-12-26 | | 230,000 | 232,013 |
| Grifols Worldwide Operations USA, Inc., USD 2019 Term Loan B (1 week LIBOR + 2.000%) | 3.561 | 11-15-27 | | 816,327 | 820,155 |
| Health care equipment and supplies 0.1% | | |
| Air Medical Group Holdings, Inc., 2018 Term Loan B1 (1 month LIBOR + 3.250%) | 4.910 | 04-28-22 | | 1,105,004 | 1,078,417 |
| Health care providers and services 1.0% | | |
| Air Methods Corp., 2017 Term Loan B (3 month LIBOR + 3.500%) | 5.445 | 04-22-24 | | 2,038,516 | 1,748,028 |
| Envision Healthcare Corp., 2018 1st Lien Term Loan (1 month LIBOR + 3.750%) | 5.395 | 10-10-25 | | 2,507,298 | 2,102,821 |
| RegionalCare Hospital Partners Holdings, Inc., 2018 Term Loan B (1 month LIBOR + 3.750%) | 5.395 | 11-17-25 | | 1,777,087 | 1,783,555 |
| Surgery Center Holdings, Inc., 2017 Term Loan B (1 month LIBOR + 3.250%) | 4.900 | 09-02-24 | | 1,205,258 | 1,200,485 |
| Team Health Holdings, Inc., 1st Lien Term Loan (1 month LIBOR + 2.750%) | 4.395 | 02-06-24 | | 1,877,790 | 1,497,537 |
| Health care technology 0.2% | | |
| Change Healthcare Holdings LLC, 2017 Term Loan B (1 month LIBOR + 2.500%) | 4.145 | 03-01-24 | | 1,130,589 | 1,130,408 |
| 32 | JOHN HANCOCK SHORT DURATION CREDIT OPPORTUNITIES FUND | SEMIANNUAL REPORT | SEE NOTES TO FINANCIAL STATEMENTS |
| | Rate (%) | Maturity date | | Par value^ | Value |
| Health care (continued) | |
| Life sciences tools and services 0.2% | | |
| Jaguar Holding Company II, 2018 Term Loan (1 month LIBOR + 2.500%) | 4.145 | 08-18-22 | | 1,448,051 | $1,446,647 |
| Pharmaceuticals 0.6% | | |
| Bausch Health Americas, Inc., 2018 Term Loan B (1 month LIBOR + 3.000%) | 4.670 | 06-02-25 | | 1,471,241 | 1,476,390 |
| Catalent Pharma Solutions, Inc., Term Loan B2 (1 month LIBOR + 2.250%) | 3.895 | 05-18-26 | | 664,975 | 667,469 |
| Endo International PLC, 2017 Term Loan B (1 month LIBOR + 4.250%) | 5.938 | 04-29-24 | | 1,241,492 | 1,194,936 |
| IQVIA, Inc., 2017 USD Term Loan B2 (3 month LIBOR + 1.750%) | 3.695 | 01-17-25 | | 1,615,752 | 1,621,811 |
| Industrials 3.2% | 25,965,468 |
| Aerospace and defense 0.1% | | |
| AI Convoy Luxembourg Sarl, USD Term Loan B (H) | TBD | 01-20-27 | | 550,000 | 547,250 |
| Air freight and logistics 0.1% | | |
| XPO Logistics, Inc., 2018 Term Loan B (1 month LIBOR + 2.000%) | 3.645 | 02-24-25 | | 720,000 | 721,505 |
| Building products 0.4% | | |
| APi Group DE, Inc., Term Loan B (1 month LIBOR + 2.500%) | 4.145 | 10-01-26 | | 930,000 | 933,488 |
| Cornerstone Building Brands, Inc., 2018 Term Loan (1 month LIBOR + 3.750%) | 5.434 | 04-12-25 | | 1,043,076 | 1,038,518 |
| HNC Holdings, Inc., Term Loan B (1 month LIBOR + 4.000%) | 5.645 | 10-05-23 | | 836,413 | 838,504 |
| Commercial services and supplies 0.7% | | |
| Advanced Disposal Services, Inc., Term Loan B3 (1 week LIBOR + 2.250%) | 3.816 | 11-10-23 | | 1,241,910 | 1,241,774 |
| Clean Harbors, Inc., 2017 Term Loan B (1 month LIBOR + 1.750%) | 3.395 | 06-28-24 | | 1,189,973 | 1,197,708 |
| GFL Environmental, Inc., 2018 USD Term Loan B (1 month LIBOR + 3.000%) | 4.645 | 05-30-25 | | 1,280,855 | 1,276,692 |
| Intrado Corp., 2017 Term Loan (1 month LIBOR + 4.000%) | 5.645 | 10-10-24 | | 1,564,128 | 1,328,539 |
| MHI Holdings LLC, Term Loan B (1 month LIBOR + 5.000%) | 6.645 | 09-21-26 | | 500,000 | 501,250 |
| TMS International Holding Corp., 2018 Term Loan B2 (1 and 3 month LIBOR + 2.750%) | 4.475 | 08-14-24 | | 371,176 | 367,464 |
| Machinery 1.3% | | |
| Blount International, Inc., 2018 Term Loan B (1 month LIBOR + 3.750%) | 5.395 | 04-12-23 | | 837,258 | 842,223 |
| SEE NOTES TO FINANCIAL STATEMENTS | SEMIANNUAL REPORT | JOHN HANCOCK SHORT DURATION CREDIT OPPORTUNITIES FUND | 33 |
| | Rate (%) | Maturity date | | Par value^ | Value |
| Industrials (continued) | |
| Machinery (continued) | | |
| Douglas Dynamics LLC, 2017 Incremental Term Loan (1 month LIBOR + 3.000%) | 4.650 | 12-31-21 | | 1,082,297 | $1,081,626 |
| Filtration Group Corp., 2018 1st Lien Term Loan (1 month LIBOR + 3.000%) | 4.645 | 03-29-25 | | 2,274,552 | 2,282,718 |
| Gardner Denver, Inc., 2017 USD Term Loan B (1 month LIBOR + 2.750%) | 4.395 | 07-30-24 | | 810,178 | 811,296 |
| Gates Global LLC, 2017 USD Repriced Term Loan B (1 month LIBOR + 2.750%) | 4.395 | 04-01-24 | | 2,578,805 | 2,572,615 |
| Navistar, Inc., 2017 1st Lien Term Loan B (1 month LIBOR + 3.500%) | 5.170 | 11-06-24 | | 1,744,666 | 1,745,975 |
| Titan Acquisition, Ltd., 2018 Term Loan B (1 month LIBOR + 3.000%) | 4.645 | 03-28-25 | | 733,122 | 717,235 |
| Welbilt, Inc., 2018 Term Loan B (1 month LIBOR + 2.500%) | 4.145 | 10-23-25 | | 786,162 | 783,709 |
| Professional services 0.4% | | |
| Creative Artists Agency LLC, 2019 Term Loan B (1 month LIBOR + 3.750%) | 5.395 | 11-27-26 | | 1,410,000 | 1,416,458 |
| Trans Union LLC, 2019 Term Loan B5 (1 month LIBOR + 1.750%) | 3.395 | 11-16-26 | | 1,526,109 | 1,530,749 |
| Road and rail 0.1% | | |
| Genesee & Wyoming, Inc., Term Loan (3 month LIBOR + 2.000%) | 3.906 | 12-30-26 | | 1,125,000 | 1,130,153 |
| Trading companies and distributors 0.1% | | |
| Beacon Roofing Supply, Inc., 2017 Term Loan B (1 month LIBOR + 2.250%) | 3.895 | 01-02-25 | | 1,058,019 | 1,058,019 |
| Information technology 2.1% | 17,131,048 |
| Communications equipment 0.3% | | |
| Ciena Corp., 2018 Term Loan B (1 month LIBOR + 1.750%) | 3.410 | 09-26-25 | | 1,004,850 | 1,009,040 |
| Plantronics, Inc., 2018 Term Loan B (1 month LIBOR + 2.500%) | 4.145 | 07-02-25 | | 1,359,575 | 1,304,172 |
| Electronic equipment, instruments and components 0.3% | | |
| CPI International, Inc., 2017 1st Lien Term Loan (1 month LIBOR + 3.500%) | 5.145 | 07-26-24 | | 1,230,227 | 1,222,538 |
| Robertshaw US Holding Corp., 2018 1st Lien Term Loan (1 month LIBOR + 3.250%) | 4.938 | 02-28-25 | | 1,159,350 | 1,069,500 |
| Robertshaw US Holding Corp., 2018 2nd Lien Term Loan (1 month LIBOR + 8.000%) | 9.688 | 02-28-26 | | 700,000 | 560,000 |
| IT services 0.1% | | |
| Optiv Security, Inc., 1st Lien Term Loan (1 month LIBOR + 3.250%) | 4.895 | 02-01-24 | | 676,521 | 584,345 |
| 34 | JOHN HANCOCK SHORT DURATION CREDIT OPPORTUNITIES FUND | SEMIANNUAL REPORT | SEE NOTES TO FINANCIAL STATEMENTS |
| | Rate (%) | Maturity date | | Par value^ | Value |
| Information technology (continued) | |
| Software 0.8% | | |
| Avaya, Inc., 2018 Term Loan B (1 month LIBOR + 4.250%) | 5.926 | 12-15-24 | | 2,058,635 | $2,012,748 |
| Infor US, Inc., Term Loan B6 (3 month LIBOR + 2.750%) | 4.695 | 02-01-22 | | 1,544,524 | 1,545,497 |
| Informatica LLC, 2018 USD Term Loan (1 month LIBOR + 3.250%) | 4.895 | 08-05-22 | | 635,126 | 636,485 |
| SS&C European Holdings Sarl, 2018 Term Loan B4 (1 month LIBOR + 1.750%) | 3.895 | 04-16-25 | | 545,532 | 545,417 |
| SS&C Technologies, Inc., 2018 Term Loan B3 (1 month LIBOR + 1.750%) | 3.895 | 04-16-25 | | 756,447 | 756,289 |
| The Ultimate Software Group, Inc., Term Loan B (1 month LIBOR + 3.750%) | 5.395 | 05-04-26 | | 653,363 | 655,708 |
| Technology hardware, storage and peripherals 0.6% | | |
| Dell International LLC, 2019 Term Loan B (1 month LIBOR + 2.000%) | 3.650 | 09-19-25 | | 2,180,273 | 2,187,860 |
| HCP Acquisition LLC, 2017 Term Loan B (1 month LIBOR + 3.000%) | 4.645 | 05-16-24 | | 921,073 | 923,090 |
| TierPoint LLC, 2017 1st Lien Term Loan (1 month LIBOR + 3.750%) | 5.395 | 05-06-24 | | 931,422 | 907,102 |
| Western Digital Corp., 2018 Term Loan B4 (1 month LIBOR + 1.750%) | 3.395 | 04-29-23 | | 1,211,766 | 1,211,257 |
| Materials 1.0% | 8,288,839 |
| Chemicals 0.6% | | |
| Atotech Alpha 3 BV, 2017 Term Loan B1 (3 month LIBOR + 3.000%) | 4.945 | 01-31-24 | | 1,461,997 | 1,461,997 |
| Element Solutions, Inc., 2019 Term Loan B1 (1 month LIBOR + 2.000%) | 3.645 | 01-31-26 | | 717,764 | 720,233 |
| Encapsys LLC, 1st Lien Term Loan (1 month LIBOR + 3.500%) | 5.145 | 11-07-24 | | 1,278,587 | 1,282,845 |
| Ferro Corp., 2018 USD Term Loan B1 (3 month LIBOR + 2.250%) | 4.195 | 02-14-24 | | 1,615,456 | 1,614,454 |
| Construction materials 0.1% | | |
| Summit Materials LLC, 2017 Term Loan B (1 month LIBOR + 2.000%) | 3.645 | 11-21-24 | | 696,234 | 698,671 |
| Containers and packaging 0.1% | | |
| Berry Global, Inc., Term Loan W (1 month LIBOR + 2.000%) | 3.677 | 10-01-22 | | 710,000 | 712,592 |
| Paper and forest products 0.2% | | |
| Flex Acquisition Company, Inc., 1st Lien Term Loan (1 and 3 month LIBOR + 3.000%) | 4.905 | 12-29-23 | | 1,822,339 | 1,798,047 |
| SEE NOTES TO FINANCIAL STATEMENTS | SEMIANNUAL REPORT | JOHN HANCOCK SHORT DURATION CREDIT OPPORTUNITIES FUND | 35 |
| | Rate (%) | Maturity date | | Par value^ | Value |
| Real estate 0.3% | $2,093,081 |
| Equity real estate investment trusts 0.2% | | |
| VICI Properties 1 LLC, Replacement Term Loan B (1 month LIBOR + 1.750%) | 3.409 | 12-20-24 | | 1,070,000 | 1,070,139 |
| Real estate management and development 0.1% | | |
| Realogy Group LLC, 2018 Term Loan B (1 month LIBOR + 2.250%) | 3.895 | 02-08-25 | | 1,035,366 | 1,022,942 |
| Utilities 0.4% | 3,323,823 |
| Electric utilities 0.2% | | |
| Vistra Operations Company LLC, 1st Lien Term Loan B3 (1 month LIBOR + 1.750%) | 3.400 | 12-31-25 | | 1,957,672 | 1,963,682 |
| Independent power and renewable electricity producers 0.2% | | |
|
| Calpine Corp., Term Loan B5 (3 month LIBOR + 2.250%) | 4.200 | 01-15-24 | | 1,356,465 | 1,360,141 |
| Collateralized mortgage obligations 15.0% | | | | $123,007,094 |
| (Cost $120,769,072) | | | | | |
| Commercial and residential 14.8% | | | | 121,250,139 |
280 Park Avenue Mortgage Trust
Series 2017-280P, Class A (1 month LIBOR + 0.880%) (A)(B) | 2.556 | 09-15-34 | | 2,500,000 | 2,502,020 |
Arroyo Mortgage Trust
Series 2018-1, Class A1 (B)(I) | 3.763 | 04-25-48 | | 1,641,105 | 1,661,820 |
| BBCMS Mortgage Trust | | | | |
| Series 2018-TALL, Class A (1 month LIBOR + 0.722%) (A)(B) | 2.398 | 03-15-37 | | 3,700,000 | 3,690,707 |
| Series 2018-TALL, Class B (1 month LIBOR + 0.971%) (A)(B) | 2.647 | 03-15-37 | | 2,225,000 | 2,218,741 |
| BBCMS Trust | | | | |
| Series 2018-BXH, Class A (1 month LIBOR + 1.000%) (A)(B) | 2.676 | 10-15-37 | | 2,003,002 | 1,999,224 |
| Series 2018-RRI, Class A (1 month LIBOR + 0.700%) (A)(B) | 2.376 | 02-15-33 | | 1,802,742 | 1,791,424 |
| BX Commercial Mortgage Trust | | | | |
| Series 2019-IMC, Class B (1 month LIBOR + 1.300%) (A)(B) | 2.976 | 04-15-34 | | 3,000,000 | 3,001,877 |
| Series 2019-XL, Class B (1 month LIBOR + 1.080%) (A)(B) | 2.756 | 10-15-36 | | 1,500,000 | 1,506,075 |
| Series 2020-BXLP, Class B (1 month LIBOR + 1.000%) (A)(B) | 2.780 | 12-15-29 | | 1,500,000 | 1,501,928 |
BX Trust
Series 2019-ATL, Class A (1 month LIBOR + 1.087%) (A)(B) | 2.763 | 10-15-36 | | 4,000,000 | 3,999,994 |
CG-CCRE Commercial Mortgage Trust
Series 2014-FL2, Class A (1 month LIBOR + 1.854%) (A)(B) | 3.530 | 11-15-31 | | 1,216,964 | 1,214,724 |
| 36 | JOHN HANCOCK SHORT DURATION CREDIT OPPORTUNITIES FUND | SEMIANNUAL REPORT | SEE NOTES TO FINANCIAL STATEMENTS |
| | Rate (%) | Maturity date | | Par value^ | Value |
| Commercial and residential (continued) | | | | |
CGDB Commercial Mortgage Trust
Series 2019-MOB, Class A (1 month LIBOR + 0.950%) (A)(B) | 2.626 | 11-15-36 | | 2,000,000 | $1,997,589 |
CGMS Commercial Mortgage Trust
Series 2017-MDRB, Class A (1 month LIBOR + 1.100%) (A)(B) | 2.776 | 07-15-30 | | 2,849,396 | 2,828,315 |
CHT Mortgage Trust
Series 2017-CSMO, Class A (1 month LIBOR + 0.930%) (A)(B) | 2.606 | 11-15-36 | | 4,900,000 | 4,901,495 |
| Citigroup Commercial Mortgage Trust (Citigroup/Drexel Hamilton) | | | | |
| Series 2018-TBR, Class A (1 month LIBOR + 0.830%) (A)(B) | 2.506 | 12-15-36 | | 3,575,000 | 3,568,244 |
| Series 2019-SST2, Class A (1 month LIBOR + 0.920%) (A)(B) | 2.596 | 12-15-36 | | 3,040,000 | 3,038,171 |
Citigroup Mortgage Loan Trust
Series 2013-2, Class 5A1 (1 month LIBOR + 0.140%) (A)(B) | 1.932 | 07-25-36 | | 742,374 | 737,492 |
CLNY Trust
Series 2019-IKPR, Class A (1 month LIBOR + 1.129%) (A)(B) | 2.805 | 11-15-38 | | 3,500,000 | 3,476,962 |
COLT Mortgage Loan Trust
Series 2018-1, Class A1 (B)(I) | 2.930 | 02-25-48 | | 457,904 | 458,628 |
Countrywide Home Loan Mortgage Pass Through Trust
Series 2004-25, Class 2A1 (1 month LIBOR + 0.680%) (A) | 2.341 | 02-25-35 | | 1,951,959 | 1,901,880 |
Credit Suisse Mortgage Capital Certificates
Series 2019-ICE4, Class A (1 month LIBOR + 0.980%) (A)(B) | 2.656 | 05-15-36 | | 3,000,000 | 3,004,947 |
DBGS Mortgage Trust
Series 2018-5BP, Class A (1 month LIBOR + 0.645%) (A)(B) | 2.321 | 06-15-33 | | 4,000,000 | 3,988,653 |
| Deephaven Residential Mortgage Trust | | | | |
| Series 2018-1A, Class A1 (B)(I) | 2.976 | 12-25-57 | | 1,041,878 | 1,042,485 |
| Series 2019-2A, Class A1 (B)(I) | 3.558 | 04-25-59 | | 1,720,119 | 1,737,652 |
Financial Asset Securities Corp. AAA Trust
Series 2005-2, Class A3 (1 month LIBOR + 0.300%) (A)(B) | 1.960 | 11-26-35 | | 1,678,666 | 1,624,040 |
HarborView Mortgage Loan Trust
Series 2007-3, Class 2A1A (1 month LIBOR + 0.200%) (A) | 1.854 | 05-19-47 | | 1,784,303 | 1,768,263 |
Hilton Orlando Trust
Series 2018-ORL, Class A (1 month LIBOR + 0.770%) (A)(B) | 2.446 | 12-15-34 | | 2,675,000 | 2,674,936 |
Hudsons Bay Simon JV Trust
Series 2015-HBFL, Class AFL (1 month LIBOR + 1.830%) (A)(B) | 3.534 | 08-05-34 | | 6,250,000 | 6,257,208 |
IndyMac INDA Mortgage Loan Trust
Series 2005-AR2, Class 1A1 (I) | 3.247 | 01-25-36 | | 473,960 | 440,993 |
| SEE NOTES TO FINANCIAL STATEMENTS | SEMIANNUAL REPORT | JOHN HANCOCK SHORT DURATION CREDIT OPPORTUNITIES FUND | 37 |
| | Rate (%) | Maturity date | | Par value^ | Value |
| Commercial and residential (continued) | | | | |
JPMBB Commercial Mortgage Securities Trust
Series 2015-C29, Class A2 | 2.921 | 05-15-48 | | 983,375 | $983,926 |
JPMorgan Chase Commercial Mortgage Securities Corp.
Series 2019-MARG, Class A (1 month LIBOR + 1.100%) (A)(B) | 2.776 | 05-15-34 | | 2,250,000 | 2,252,288 |
JPMorgan Chase Commercial Mortgage Securities Trust
Series 2006-LDP9, Class AMS | 5.337 | 05-15-47 | | 4,260,857 | 4,151,800 |
Key Commercial Mortgage Securities Trust
Series 2019-S2, Class A1 (B) | 2.656 | 06-15-52 | | 2,984,917 | 3,025,495 |
| LSTAR Securities Investment Trust | | | | |
| Series 2019-1, Class A1 (1 month LIBOR + 1.700%) (A)(B) | 3.355 | 03-01-24 | | 1,133,644 | 1,129,264 |
| Series 2019-3, Class A1 (1 month LIBOR + 1.500%) (A)(B) | 3.155 | 04-01-24 | | 2,940,830 | 2,941,123 |
| Series 2019-4, Class A1 (1 month LIBOR + 1.500%) (A)(B) | 3.155 | 05-01-24 | | 4,443,862 | 4,446,397 |
MBRT
Series 2019-MBR, Class A (1 month LIBOR + 0.850%) (A)(B) | 2.590 | 11-15-36 | | 4,300,000 | 4,294,720 |
| Morgan Stanley Capital I Trust | | | | |
| Series 2017-ASHF, Class A (1 month LIBOR + 0.850%) (A)(B) | 2.526 | 11-15-34 | | 2,673,393 | 2,667,490 |
| Series 2019-NUGS, Class A (1 month LIBOR + 0.950%) (A)(B) | 2.626 | 12-15-36 | | 2,200,000 | 2,196,706 |
Motel 6 Trust
Series 2017-MTL6, Class B (1 month LIBOR + 1.190%) (A)(B) | 2.866 | 08-15-34 | | 1,604,896 | 1,604,875 |
MSCG Trust
Series 2018-SELF, Class A (1 month LIBOR + 0.900%) (A)(B) | 2.576 | 10-15-37 | | 1,775,000 | 1,774,996 |
MTRO Commercial Mortgage Trust
Series 2019-TECH, Class A (1 month LIBOR + 0.900%) (A)(B) | 2.576 | 12-15-33 | | 2,650,000 | 2,649,997 |
RBS Commercial Funding, Inc. Trust
Series 2013-GSP, Class A (B)(I) | 3.961 | 01-15-32 | | 4,250,000 | 4,506,397 |
| RBSSP Resecuritization Trust | | | | |
| Series 2012-6, Class 4A1 (1 month LIBOR + 0.330%) (A)(B) | 2.122 | 01-26-36 | | 478,076 | 476,902 |
| Series 2012-6, Class 6A1 (1 month LIBOR + 0.340%) (A)(B) | 2.472 | 11-26-35 | | 1,570,790 | 1,572,378 |
| Series 2012-6, Class 8A1 (1 month LIBOR + 0.500%) (A)(B) | 2.292 | 04-26-35 | | 306,929 | 306,655 |
| Verus Securitization Trust | | | | |
| Series 2019-2, Class A1 (B)(I) | 3.211 | 05-25-59 | | 1,343,162 | 1,355,434 |
| Series 2019-3, Class A1 (B) | 2.784 | 07-25-59 | | 2,121,516 | 2,129,074 |
| WaMu Mortgage Pass-Through Certificates | | | | |
| Series 2005-AR1, Class A1A (1 month LIBOR + 0.640%) (A) | 2.301 | 01-25-45 | | 613,745 | 613,295 |
| 38 | JOHN HANCOCK SHORT DURATION CREDIT OPPORTUNITIES FUND | SEMIANNUAL REPORT | SEE NOTES TO FINANCIAL STATEMENTS |
| | Rate (%) | Maturity date | | Par value^ | Value |
| Commercial and residential (continued) | | | | |
| Series 2005-AR11, Class A1A (1 month LIBOR + 0.320%) (A) | 1.981 | 08-25-45 | | 1,509,665 | $1,510,990 |
| Series 2005-AR19, Class A1A1 (1 month LIBOR + 0.270%) (A) | 1.931 | 12-25-45 | | 1,493,593 | 1,491,365 |
| Series 2005-AR6, Class 2A1A (1 month LIBOR + 0.460%) (A) | 2.121 | 04-25-45 | | 1,395,302 | 1,393,741 |
| Series 2005-AR8, Class 1A1A (1 month LIBOR + 0.540%) (A) | 2.201 | 07-25-45 | | 1,257,112 | 1,238,344 |
| U.S. Government Agency 0.2% | | | | 1,756,955 |
| Federal Home Loan Mortgage Corp. | | | | |
| Series 2015-SC02, Class 1A | 3.000 | 09-25-45 | | 247,153 | 251,287 |
| Series 4013, Class DK | 3.000 | 02-15-31 | | 822,443 | 842,197 |
|
Government National Mortgage Association
Series 2014-80, Class XA | 3.000 | 06-20-40 | | 646,118 | 663,471 |
| Asset backed securities 8.9% | | | | $73,363,276 |
| (Cost $72,629,104) | | | | | |
| Asset backed securities 8.9% | | | | 73,363,276 |
AmeriCredit Automobile Receivables Trust
Series 2017-3, Class C | 2.690 | 06-19-23 | | 2,150,000 | 2,172,220 |
Aqua Finance Trust
Series 2019-A, Class A (B) | 3.140 | 07-16-40 | | 1,806,770 | 1,823,974 |
Drive Auto Receivables Trust
Series 2019-1, Class C | 3.780 | 04-15-25 | | 2,415,000 | 2,463,084 |
Ford Credit Auto Owner Trust
Series 2018-1, Class A (B) | 3.190 | 07-15-31 | | 2,575,000 | 2,736,289 |
Hyundai Auto Lease Securitization Trust
Series 2017-C, Class A3 (B) | 2.120 | 02-16-21 | | 456,385 | 456,410 |
| Invitation Homes Trust | | | | | |
| Series 2017-SFR2, Class A (1 month LIBOR + 0.850%) (A)(B) | 2.519 | 12-17-36 | | 1,949,370 | 1,948,760 |
| Series 2018-SFR1, Class A (1 month LIBOR + 0.700%) (A)(B) | 2.369 | 03-17-37 | | 2,756,213 | 2,735,662 |
| Series 2018-SFR2, Class A (1 month LIBOR + 0.900%) (A)(B) | 2.576 | 06-17-37 | | 2,595,837 | 2,595,834 |
| Series 2018-SFR3, Class A (1 month LIBOR + 1.000%) (A)(B) | 2.669 | 07-17-37 | | 3,056,424 | 3,056,420 |
New Residential Advance Receivables Trust
Series 2019-T2, Class AT2 (B) | 2.520 | 08-15-53 | | 3,000,000 | 3,013,078 |
Ocwen Master Advance Receivables Trust
Series 2019-T2, Class BT2 (B) | 2.646 | 08-15-51 | | 1,600,000 | 1,616,948 |
| Pretium Mortgage Credit Partners I LLC | | | | | |
| Series 2019-NPL2, Class A1 (B) | 3.844 | 12-25-58 | | 1,865,615 | 1,872,729 |
| Series 2019-NPL3, Class A1 (B) | 3.105 | 07-27-59 | | 1,233,813 | 1,234,731 |
Santander Drive Auto Receivables Trust
Series 2018-1, Class E (B) | 4.370 | 05-15-25 | | 1,775,000 | 1,816,476 |
| SEE NOTES TO FINANCIAL STATEMENTS | SEMIANNUAL REPORT | JOHN HANCOCK SHORT DURATION CREDIT OPPORTUNITIES FUND | 39 |
| | Rate (%) | Maturity date | | Par value^ | Value |
| Asset backed securities (continued) | | | | |
| SMB Private Education Loan Trust | | | | | |
| Series 2015-B, Class A3 (1 month LIBOR + 1.750%) (A)(B) | 3.426 | 05-17-32 | | 900,000 | $920,747 |
| Series 2017-B, Class A2B (1 month LIBOR + 0.750%) (A)(B) | 2.426 | 10-15-35 | | 2,357,043 | 2,357,985 |
| SoFi Professional Loan Program LLC | | | | | |
| Series 2015-C, Class A1 (1 month LIBOR + 1.050%) (A)(B) | 2.711 | 08-27-35 | | 516,312 | 519,297 |
| Series 2016-C, Class A1 (1 month LIBOR + 1.100%) (A)(B) | 2.761 | 10-27-36 | | 592,754 | 596,032 |
| Series 2016-D, Class A1 (1 month LIBOR + 0.950%) (A)(B) | 2.611 | 01-25-39 | | 361,668 | 363,492 |
Springleaf Funding Trust
Series 2016-AA, Class A (B) | 2.900 | 11-15-29 | | 660,595 | 660,999 |
TAL Advantage V LLC
Series 2013-2A, Class A (B) | 3.550 | 11-20-38 | | 1,437,500 | 1,447,328 |
Towd Point Mortgage Trust
Series 2018-4, Class A1 (B)(I) | 3.000 | 06-25-58 | | 3,570,336 | 3,683,147 |
| Trafigura Securitisation Finance PLC | | | | | |
| Series 2017-1A, Class A1 (1 month LIBOR + 0.850%) (A)(B) | 2.526 | 12-15-20 | | 4,150,000 | 4,151,598 |
| Series 2018-1A, Class A1 (1 month LIBOR + 0.730%) (A)(B) | 2.406 | 03-15-22 | | 3,780,000 | 3,778,129 |
| Vericrest Opportunity Loan Trust | | | | | |
| Series 2019-NPL2, Class A1 (B) | 3.967 | 02-25-49 | | 1,683,428 | 1,691,125 |
| Series 2019-NPL3, Class A1 (B) | 3.967 | 03-25-49 | | 1,400,089 | 1,409,506 |
| Series 2019-NPL4, Class A1A (B) | 3.352 | 08-25-49 | | 1,909,209 | 1,913,476 |
VOLT LXIV LLC
Series 2017-NP11, Class A1 (B) | 3.375 | 10-25-47 | | 1,114,487 | 1,114,909 |
VOLT LXXII LLC
Series 2018-NPL8, Class A1A (B) | 4.213 | 10-26-48 | | 2,697,296 | 2,704,184 |
VOLT LXXX LLC
Series 2019-NPL6, Class A1A (B) | 3.228 | 10-25-49 | | 2,929,531 | 2,937,493 |
VOLT LXXXIII LLC
Series 2019-NPL9, Class A1A (B) | 3.327 | 11-26-49 | | 1,932,209 | 1,938,252 |
VOLT LXXXIV LLC
Series 2019-NP10, Class A1A (B) | 3.426 | 12-27-49 | | 4,050,000 | 4,051,987 |
| World Financial Network Credit Card Master Trust | | | | | |
| Series 2017-C, Class M | 2.660 | 08-15-24 | | 3,375,000 | 3,374,949 |
| Series 2018-B, Class M | 3.810 | 07-15-25 | | 4,100,000 | 4,206,026 |
|
| | | | | Shares | Value |
| Common stocks 0.0% | | | $37,556 |
| (Cost $98,232) | | | | | |
| Energy 0.0% | | | 37,556 |
| Energy equipment and services 0.0% | | | |
| Paragon Offshore PLC, Litigation Trust A (J) | | | | 2,695 | 539 |
| 40 | JOHN HANCOCK SHORT DURATION CREDIT OPPORTUNITIES FUND | SEMIANNUAL REPORT | SEE NOTES TO FINANCIAL STATEMENTS |
| | | | | Shares | Value |
| Energy (continued) | | | |
| Energy equipment and services (continued) | | | |
| Paragon Offshore PLC, Litigation Trust B (J) | | | | 1,348 | $20,220 |
| Southcross Holdings LP (J) | | | | 246 | 16,728 |
| Oil, gas and consumable fuels 0.0% | | | |
| Euronav NV | | | | 7 | 69 |
| | Rate (%) | Maturity date | | Par value^ | Value |
| Escrow certificates 0.0% | | | $16,231 |
| (Cost $4,430) | | | | | |
| Texas Competitive Electric Holdings Company LLC (J)(K) | 11.500 | 10-01-20 | | 10,820,544 | 16,231 |
|
| | | | | Shares/Notional amount | Value |
| Purchased options 0.0% | | | | | $12,662 |
| (Cost $78,096) | | | | | |
| Calls 0.0% | | | | | 12,662 |
| Over the Counter Option on the USD vs. HKD (Expiration Date: 9-1-20; Strike Price: $7.86; Counterparty: Goldman Sachs International) (J)(L) | | | 2,373,690 | 3,672 |
| Over the Counter Option on the USD vs. HKD (Expiration Date: 9-1-20; Strike Price: $7.86; Counterparty: Goldman Sachs International) (J)(L) | | | 5,696,857 | 8,990 |
|
| | | Yield (%) | | Shares | Value |
| Short-term investments 6.0% | | | $49,436,561 |
| (Cost $49,436,443) | | | | | |
| Short-term funds 6.0% | | | | | 49,436,561 |
| John Hancock Collateral Trust (M) | | 1.6984(N) | | 92,202 | 922,737 |
| State Street Institutional Treasury Plus Money Market Fund, Premier Class | | 1.5156(N) | | 48,513,824 | 48,513,824 |
|
| Total investments (Cost $796,363,848) 99.3% | | | $815,468,465 |
| Other assets and liabilities, net 0.7% | | | 5,548,762 |
| Total net assets 100.0% | | | $821,017,227 |
| The percentage shown for each investment category is the total value of the category as a percentage of the net assets of the fund. |
| ^All par values are denominated in U.S. dollars unless otherwise indicated. |
| Currency Abbreviations |
| BRL | Brazilian Real |
| CLP | Chilean Peso |
| COP | Colombian Peso |
| CZK | Czech Republic Koruna |
| EGP | Egyptian Pound |
| EUR | Euro |
| HKD | Hong Kong Dollar |
| SEE NOTES TO FINANCIAL STATEMENTS | SEMIANNUAL REPORT | JOHN HANCOCK SHORT DURATION CREDIT OPPORTUNITIES FUND | 41 |
| IDR | Indonesian Rupiah |
| MXN | Mexican Peso |
| MYR | Malaysian Ringgit |
| PEN | Peruvian Nuevo Sol |
| PLN | Polish Zloty |
| RON | Romanian New Leu |
| RUB | Russian Ruble |
| THB | Thai Bhat |
| TRY | Turkish Lira |
| UYU | Uruguayan Peso |
| ZAR | South African Rand |
| Security Abbreviations and Legend |
| CMT | Constant Maturity Treasury |
| LIBOR | London Interbank Offered Rate |
| SOFR | Secured Overnight Financing Rate |
| (A) | Variable rate obligation. The coupon rate shown represents the rate at period end. |
| (B) | These securities are exempt from registration under Rule 144A of the Securities Act of 1933. Such securities may be resold, normally to qualified institutional buyers, in transactions exempt from registration. Rule 144A securities amounted to $312,379,123 or 38.0% of the fund's net assets as of 1-31-20. |
| (C) | Zero coupon bonds are issued at a discount from their principal amount in lieu of paying interest periodically. Rate shown is the effective yield at period end. |
| (D) | Non-income producing - Issuer is in default. |
| (E) | All or a portion of this security is on loan as of 1-31-20. |
| (F) | Perpetual bonds have no stated maturity date. Date shown as maturity date is next call date. |
| (G) | Term loans are variable rate obligations. The coupon rate shown represents the rate at period end. |
| (H) | This position represents an unsettled loan commitment at period end. Certain details associated with this purchase are not known prior to the settlement date, including coupon rate, which is disclosed as TBD (To Be Determined). |
| (I) | Variable or floating rate security, the interest rate of which adjusts periodically based on a weighted average of interest rates and prepayments on the underlying pool of assets. The interest rate shown is the current rate as of period end. |
| (J) | Non-income producing security. |
| (K) | Security is valued using significant unobservable inputs and is classified as Level 3 in the fair value hierarchy. Refer to Note 2 to the financial statements. |
| (L) | For this type of option, notional amounts are equivalent to number of contracts. |
| (M) | Investment is an affiliate of the fund, the advisor and/or subadvisor. This security represents the investment of cash collateral received for securities lending. |
| (N) | The rate shown is the annualized seven-day yield as of 1-31-20. |
| 42 | JOHN HANCOCK SHORT DURATION CREDIT OPPORTUNITIES FUND | SEMIANNUAL REPORT | SEE NOTES TO FINANCIAL STATEMENTS |
DERIVATIVES
FUTURES
| Open contracts | Number of
contracts | Position | Expiration
date | Notional
basis^ | Notional
value^ | Unrealized
appreciation
(depreciation) |
| 2-Year U.S. Treasury Note Futures | 170 | Long | Mar 2020 | $36,668,847 | $36,781,094 | $112,247 |
| 5-Year U.S. Treasury Note Futures | 1,026 | Long | Mar 2020 | 122,082,318 | 123,448,641 | 1,366,323 |
| 10-Year U.S. Treasury Note Futures | 155 | Short | Mar 2020 | (20,108,241) | (20,406,719) | (298,478) |
| Ultra U.S. Treasury Bond Futures | 396 | Short | Mar 2020 | (74,814,655) | (76,700,250) | (1,885,595) |
| | | | | | | $(705,503) |
^ Notional basis refers to the contractual amount agreed upon at inception of open contracts; notional value represents the current value of the open contract.
FORWARD FOREIGN CURRENCY CONTRACTS
| Contract to buy | Contract to sell | Counterparty (OTC) | Contractual
settlement
date | Unrealized
appreciation | Unrealized
depreciation |
| BRL | 547,000 | USD | 134,534 | CITI | 2/4/2020 | — | $(6,807) |
| BRL | 693,000 | USD | 170,484 | GSI | 2/4/2020 | — | (8,666) |
| BRL | 1,120,000 | USD | 275,475 | JPM | 2/4/2020 | — | (13,952) |
| BRL | 948,000 | USD | 223,718 | CITI | 3/3/2020 | — | (2,691) |
| BRL | 693,000 | USD | 164,659 | GSI | 3/3/2020 | — | (3,086) |
| BRL | 870,000 | USD | 206,796 | JPM | 3/3/2020 | — | (3,955) |
| CLP | 309,489,818 | USD | 412,433 | CITI | 2/28/2020 | — | (25,851) |
| CLP | 24,741,360 | USD | 32,956 | JPM | 2/28/2020 | — | (2,051) |
| CZK | 10,100,452 | USD | 438,968 | CITI | 2/6/2020 | $5,169 | — |
| CZK | 3,768,000 | USD | 163,826 | GSI | 2/6/2020 | 1,860 | — |
| CZK | 8,049,828 | USD | 349,764 | JPM | 2/6/2020 | 4,203 | — |
| EUR | 7,550,000 | GBP | 6,406,724 | CITI | 2/13/2020 | — | (84,168) |
| EUR | 5,460,000 | USD | 6,128,855 | JPM | 2/10/2020 | — | (71,246) |
| EUR | 5,670,000 | USD | 6,320,921 | CITI | 2/13/2020 | — | (29,173) |
| EUR | 61,200 | USD | 68,294 | CITI | 2/28/2020 | — | (320) |
| EUR | 1,383,520 | USD | 1,540,902 | JPM | 3/25/2020 | — | (1,796) |
| HUF | 57,222,150 | USD | 188,116 | GSI | 2/28/2020 | 161 | — |
| HUF | 57,388,850 | USD | 188,627 | JPM | 2/28/2020 | 199 | — |
| JPY | 449,975,000 | USD | 4,094,247 | GSI | 2/6/2020 | 58,976 | — |
| MXN | 117,630,000 | USD | 6,286,394 | JPM | 2/6/2020 | — | (62,024) |
| MXN | 38,865,000 | USD | 2,072,685 | CITI | 2/20/2020 | — | (20,411) |
| MXN | 38,865,000 | USD | 2,072,725 | JPM | 2/20/2020 | — | (20,455) |
| SGD | 11,200,000 | USD | 8,312,108 | CITI | 2/6/2020 | — | (104,660) |
| THB | 5,636,000 | USD | 185,670 | CITI | 2/20/2020 | — | (4,802) |
| THB | 7,451,664 | USD | 246,556 | GSI | 2/20/2020 | — | (7,421) |
| THB | 1,638,000 | USD | 54,197 | JPM | 2/20/2020 | — | (1,631) |
| USD | 130,145 | BRL | 547,000 | CITI | 2/4/2020 | 2,419 | — |
| USD | 164,863 | BRL | 693,000 | GSI | 2/4/2020 | 3,045 | — |
| USD | 269,350 | BRL | 1,120,000 | JPM | 2/4/2020 | 7,826 | — |
| USD | 314,916 | COP | 1,040,671,380 | CITI | 3/20/2020 | 11,448 | — |
| USD | 9,605,596 | EUR | 8,550,561 | JPM | 3/25/2020 | 93,468 | — |
| SEE NOTES TO FINANCIAL STATEMENTS | SEMIANNUAL REPORT | JOHN HANCOCK SHORT DURATION CREDIT OPPORTUNITIES FUND | 43 |
FORWARD FOREIGN CURRENCY CONTRACTS (continued)
| Contract to buy | Contract to sell | Counterparty (OTC) | Contractual
settlement
date | Unrealized
appreciation | Unrealized
depreciation |
| USD | 4,162,311 | GBP | 3,160,000 | JPM | 2/6/2020 | — | $(10,685) |
| USD | 487,627 | IDR | 6,847,747,000 | JPM | 2/7/2020 | — | (11,459) |
| USD | 16,639,427 | JPY | 1,799,900,000 | GSI | 2/6/2020 | $26,536 | — |
| USD | 4,154,434 | JPY | 452,360,000 | GSI | 2/26/2020 | — | (25,213) |
| USD | 2,066,603 | MXN | 39,070,000 | CITI | 2/6/2020 | — | (779) |
| USD | 4,117,981 | MXN | 78,560,000 | GSI | 2/6/2020 | — | (39,006) |
| USD | 338,338 | MXN | 6,373,981 | CITI | 2/28/2020 | 2,157 | — |
| USD | 433,452 | MXN | 8,167,456 | GSI | 2/28/2020 | 2,679 | — |
| USD | 154,603 | MXN | 2,912,694 | JPM | 2/28/2020 | 980 | — |
| USD | 216,475 | PEN | 729,000 | CITI | 2/21/2020 | 1,323 | — |
| USD | 79,866 | PEN | 268,821 | GSI | 2/21/2020 | 528 | — |
| USD | 460,350 | RUB | 29,105,500 | GSI | 3/30/2020 | 7,774 | — |
| USD | 8,312,786 | SGD | 11,200,000 | JPM | 2/6/2020 | 105,339 | — |
| USD | 446,598 | ZAR | 6,689,551 | GSI | 2/13/2020 | 1,415 | — |
| ZAR | 850,000 | USD | 59,335 | GSI | 2/13/2020 | — | (2,768) |
| | | | | | | $337,505 | $(565,076) |
SWAPS
| Credit default swaps - Buyer |
Counterparty
(OTC)/
Centrally
cleared | Reference
obligation | Notional
amount | Currency | USD
notional
amount | Pay
fixed
rate | Fixed
payment
frequency | Maturity
date | Unamortized
upfront
payment
paid
(received) | Unrealized
appreciation
(depreciation) | Value |
| Centrally cleared | CDX.NA.HY.33 | 56,801,250 | USD | $56,801,250 | 5.000% | Quarterly | Dec 2024 | $(4,268,882) | $(811,766) | $(5,080,648) |
| Centrally cleared | CDX.NA.IG.33 | 80,975,000 | USD | 80,975,000 | 1.000% | Quarterly | Dec 2024 | (1,577,528) | (406,274) | (1,983,802) |
| Centrally cleared | iTraxx Europe Crossover Series 32 Version 1 | 9,800,000 | EUR | 10,789,803 | 5.000% | Quarterly | Dec 2024 | (1,310,827) | (87,801) | (1,398,628) |
| | | | | $148,566,053 | | | | $(7,157,237) | $(1,305,841) | $(8,463,078) |
| Derivatives Currency Abbreviations |
| BRL | Brazilian Real |
| CLP | Chilean Peso |
| COP | Colombian Peso |
| CZK | Czech Republic Koruna |
| EUR | Euro |
| GBP | Pound Sterling |
| HUF | Hungarian Forint |
| IDR | Indonesian Rupiah |
| JPY | Japanese Yen |
| MXN | Mexican Peso |
| PEN | Peruvian Nuevo Sol |
| RUB | Russian Ruble |
| 44 | JOHN HANCOCK SHORT DURATION CREDIT OPPORTUNITIES FUND | SEMIANNUAL REPORT | SEE NOTES TO FINANCIAL STATEMENTS |
| SGD | Singapore Dollar |
| THB | Thai Bhat |
| USD | U.S. Dollar |
| ZAR | South African Rand |
| Derivatives Abbreviations |
| CITI | Citibank, N.A. |
| GSI | Goldman Sachs International |
| JPM | JPMorgan Chase Bank, N.A. |
| OTC | Over-the-counter |
At 1-31-20, the aggregate cost of investments for federal income tax purposes was $790,752,865. Net unrealized appreciation aggregated to $15,319,448, of which $28,676,238 related to gross unrealized appreciation and $13,356,790 related to gross unrealized depreciation.
See Notes to financial statements regarding investment transactions and other derivatives information.
| SEE NOTES TO FINANCIAL STATEMENTS | SEMIANNUAL REPORT | JOHN HANCOCK SHORT DURATION CREDIT OPPORTUNITIES FUND | 45 |
STATEMENT OF ASSETS AND LIABILITIES 1-31-20 (unaudited)
| Assets | |
| Unaffiliated investments, at value (Cost $795,441,229) including $901,553 of securities loaned | $814,545,728 |
| Affiliated investments, at value (Cost $922,619) | 922,737 |
| Total investments, at value (Cost $796,363,848) | 815,468,465 |
| Receivable for centrally cleared swaps | 3,386,272 |
| Unrealized appreciation on forward foreign currency contracts | 337,505 |
| Receivable for futures variation margin | 65,454 |
| Cash | 751,221 |
| Foreign currency, at value (Cost $677,205) | 686,221 |
| Collateral held at broker for futures contracts | 1,440,477 |
| Collateral segregated at custodian for OTC derivative contracts | 260,000 |
| Interest receivable | 5,988,728 |
| Receivable for fund shares sold | 1,374,167 |
| Receivable for investments sold | 5,467,603 |
| Receivable for securities lending income | 409 |
| Other assets | 62,183 |
| Total assets | 835,288,705 |
| Liabilities | |
| Unrealized depreciation on forward foreign currency contracts | 565,076 |
| Distributions payable | 236 |
| Payable for collateral on OTC derivatives | 200,000 |
| Payable for investments purchased | 10,485,688 |
| Payable for fund shares repurchased | 1,942,384 |
| Payable upon return of securities loaned | 923,403 |
| Payable to affiliates | |
| Accounting and legal services fees | 12,963 |
| Transfer agent fees | 13,923 |
| Trustees' fees | 1,983 |
| Other liabilities and accrued expenses | 125,822 |
| Total liabilities | 14,271,478 |
| Net assets | $821,017,227 |
| Net assets consist of | |
| Paid-in capital | $901,470,899 |
| Total distributable earnings (loss) | (80,453,672) |
| Net assets | $821,017,227 |
| |
| 46 | JOHN HANCOCK SHORT DURATION CREDIT OPPORTUNITIES FUND | SEMIANNUAL REPORT | SEE NOTES TO FINANCIAL STATEMENTS |
STATEMENT OF ASSETS AND LIABILITIES (continued)
| Net asset value per share | |
| Based on net asset value and shares outstanding - the fund has an unlimited number of shares authorized with no par value | |
| Class A ($87,655,861 ÷ 9,112,940 shares)1 | $9.62 |
| Class C ($4,104,022 ÷ 426,703 shares)1 | $9.62 |
| Class I ($46,089,598 ÷ 4,798,224 shares) | $9.61 |
| Class R6 ($7,791,401 ÷ 810,107 shares) | $9.62 |
| Class NAV ($675,376,345 ÷ 70,180,222 shares) | $9.62 |
| Maximum offering price per share | |
| Class A (net asset value per share ÷ 97.5%)2 | $9.87 |
| 1 | Redemption price per share is equal to net asset value less any applicable contingent deferred sales charge. |
| 2 | On single retail sales of less than $100,000. On sales of $100,000 or more and on group sales the offering price is reduced. |
| SEE NOTES TO FINANCIAL STATEMENTS | SEMIANNUAL REPORT | JOHN HANCOCK SHORT DURATION CREDIT OPPORTUNITIES FUND | 47 |
STATEMENT OF OPERATIONSFor the six months ended 1-31-20 (unaudited)
Investment income
| |
| Interest | $18,623,956 |
| Dividends | 74,761 |
| Securities lending | 7,944 |
| Less foreign taxes withheld | (34,939) |
| Total investment income | 18,671,722 |
| Expenses | |
| Investment management fees | 2,975,584 |
| Distribution and service fees | 149,774 |
| Accounting and legal services fees | 78,182 |
| Transfer agent fees | 81,184 |
| Trustees' fees | 7,918 |
| Custodian fees | 78,750 |
| State registration fees | 66,781 |
| Printing and postage | 19,830 |
| Professional fees | 63,229 |
| Other | 22,445 |
| Total expenses | 3,543,677 |
| Less expense reductions | (31,527) |
| Net expenses | 3,512,150 |
| Net investment income | 15,159,572 |
| Realized and unrealized gain (loss) | |
| Net realized gain (loss) on | |
| Unaffiliated investments and foreign currency transactions | 3,529,688 |
| Affiliated investments | 750 |
| Futures contracts | (6,816,396) |
| Forward foreign currency contracts | (587,585) |
| Swap contracts | (2,324,127) |
| | (6,197,670) |
| Change in net unrealized appreciation (depreciation) of | |
| Unaffiliated investments and translation of assets and liabilities in foreign currencies | 6,534,725 |
| Affiliated investments | (549) |
| Futures contracts | 2,402,545 |
| Forward foreign currency contracts | 250,978 |
| Swap contracts | 836,112 |
| | 10,023,811 |
| Net realized and unrealized gain | 3,826,141 |
| Increase in net assets from operations | $18,985,713 |
| 48 | JOHN HANCOCK SHORT DURATION CREDIT OPPORTUNITIES FUND | SEMIANNUAL REPORT | SEE NOTES TO FINANCIAL STATEMENTS |
STATEMENTS OF CHANGES IN NET ASSETS
| | Six months ended
1-31-20
(unaudited) | Year ended
7-31-19 |
| Increase (decrease) in net assets | | |
| From operations | | |
| Net investment income | $15,159,572 | $37,640,939 |
| Net realized loss | (6,197,670) | (18,372,740) |
| Change in net unrealized appreciation (depreciation) | 10,023,811 | 22,021,633 |
| Increase in net assets resulting from operations | 18,985,713 | 41,289,832 |
| Distributions to shareholders | | |
| From earnings | | |
| Class A | (1,375,662) | (2,767,811) |
| Class C | (45,516) | (99,418) |
| Class I | (710,460) | (1,336,913) |
| Class R21 | (417) | (1,890) |
| Class R41 | (428) | (1,938) |
| Class R6 | (134,255) | (294,792) |
| Class NAV | (12,583,603) | (32,429,565) |
| Total distributions | (14,850,341) | (36,932,327) |
| From fund share transactions | (60,477,340) | (85,179,778) |
| Total decrease | (56,341,968) | (80,822,273) |
| Net assets | | |
| Beginning of period | 877,359,195 | 958,181,468 |
| End of period | $821,017,227 | $877,359,195 |
| 1 | Class R2 and Class R4 shares were fully redeemed on 10-29-19. |
| SEE NOTES TO FINANCIAL STATEMENTS | SEMIANNUAL REPORT | JOHN HANCOCK SHORT DURATION CREDIT OPPORTUNITIES FUND | 49 |
| CLASS A SHARES Period ended | 1-31-201 | 7-31-19 | 7-31-18 | 7-31-17 | 7-31-16 | 7-31-15 |
| Per share operating performance | | | | | | |
| Net asset value, beginning of period | $9.57 | $9.51 | $9.74 | $9.57 | $9.73 | $10.25 |
| Net investment income2 | 0.15 | 0.35 | 0.32 | 0.29 | 0.29 | 0.31 |
| Net realized and unrealized gain (loss) on investments | 0.05 | 0.06 | (0.23) | 0.17 | (0.11) | (0.52) |
| Total from investment operations | 0.20 | 0.41 | 0.09 | 0.46 | 0.18 | (0.21) |
| Less distributions | | | | | | |
| From net investment income | (0.15) | (0.35) | (0.32) | (0.29) | (0.34) | (0.31) |
| Net asset value, end of period | $9.62 | $9.57 | $9.51 | $9.74 | $9.57 | $9.73 |
| Total return (%)3,4 | 2.145 | 4.45 | 0.91 | 4.85 | 1.93 | (2.03) |
| Ratios and supplemental data | | | | | | |
| Net assets, end of period (in millions) | $88 | $92 | $60 | $37 | $27 | $27 |
| Ratios (as a percentage of average net assets): | | | | | | |
| Expenses before reductions | 1.216 | 1.20 | 1.18 | 1.17 | 1.17 | 1.21 |
| Expenses including reductions | 1.206 | 1.19 | 1.17 | 1.16 | 1.17 | 1.20 |
| Net investment income | 3.206 | 3.69 | 3.30 | 2.99 | 3.10 | 3.10 |
| Portfolio turnover (%) | 32 | 59 | 68 | 77 | 52 | 61 |
| 1 | Six months ended 1-31-20. Unaudited. |
| 2 | Based on average daily shares outstanding. |
| 3 | Total returns would have been lower had certain expenses not been reduced during the applicable periods. |
| 4 | Does not reflect the effect of sales charges, if any. |
| 5 | Not annualized. |
| 6 | Annualized. |
| 50 | JOHN HANCOCK SHORT DURATION CREDIT OPPORTUNITIES FUND | SEMIANNUAL REPORT | SEE NOTES TO FINANCIAL STATEMENTS |
| CLASS C SHARES Period ended | 1-31-201 | 7-31-19 | 7-31-18 | 7-31-17 | 7-31-16 | 7-31-15 |
| Per share operating performance | | | | | | |
| Net asset value, beginning of period | $9.57 | $9.51 | $9.74 | $9.57 | $9.73 | $10.25 |
| Net investment income2 | 0.12 | 0.29 | 0.26 | 0.24 | 0.23 | 0.23 |
| Net realized and unrealized gain (loss) on investments | 0.05 | 0.06 | (0.24) | 0.15 | (0.12) | (0.52) |
| Total from investment operations | 0.17 | 0.35 | 0.02 | 0.39 | 0.11 | (0.29) |
| Less distributions | | | | | | |
| From net investment income | (0.12) | (0.29) | (0.25) | (0.22) | (0.27) | (0.23) |
| Net asset value, end of period | $9.62 | $9.57 | $9.51 | $9.74 | $9.57 | $9.73 |
| Total return (%)3,4 | 1.785 | 3.74 | 0.24 | 4.15 | 1.23 | (2.82) |
| Ratios and supplemental data | | | | | | |
| Net assets, end of period (in millions) | $4 | $3 | $3 | $3 | $3 | $2 |
| Ratios (as a percentage of average net assets): | | | | | | |
| Expenses before reductions | 1.916 | 1.90 | 1.88 | 1.87 | 1.88 | 2.27 |
| Expenses including reductions | 1.906 | 1.89 | 1.87 | 1.86 | 1.87 | 2.00 |
| Net investment income | 2.546 | 3.12 | 2.72 | 2.44 | 2.47 | 2.36 |
| Portfolio turnover (%) | 32 | 59 | 68 | 77 | 52 | 61 |
| 1 | Six months ended 1-31-20. Unaudited. |
| 2 | Based on average daily shares outstanding. |
| 3 | Total returns would have been lower had certain expenses not been reduced during the applicable periods. |
| 4 | Does not reflect the effect of sales charges, if any. |
| 5 | Not annualized. |
| 6 | Annualized. |
| SEE NOTES TO FINANCIAL STATEMENTS | SEMIANNUAL REPORT | JOHN HANCOCK SHORT DURATION CREDIT OPPORTUNITIES FUND | 51 |
| CLASS I SHARES Period ended | 1-31-201 | 7-31-19 | 7-31-18 | 7-31-17 | 7-31-16 | 7-31-15 |
| Per share operating performance | | | | | | |
| Net asset value, beginning of period | $9.56 | $9.49 | $9.73 | $9.56 | $9.72 | $10.24 |
| Net investment income2 | 0.17 | 0.38 | 0.36 | 0.33 | 0.33 | 0.34 |
| Net realized and unrealized gain (loss) on investments | 0.05 | 0.07 | (0.25) | 0.16 | (0.12) | (0.51) |
| Total from investment operations | 0.22 | 0.45 | 0.11 | 0.49 | 0.21 | (0.17) |
| Less distributions | | | | | | |
| From net investment income | (0.17) | (0.38) | (0.35) | (0.32) | (0.37) | (0.35) |
| Net asset value, end of period | $9.61 | $9.56 | $9.49 | $9.73 | $9.56 | $9.72 |
| Total return (%)3 | 2.184 | 4.87 | 1.13 | 5.21 | 2.25 | (1.71) |
| Ratios and supplemental data | | | | | | |
| Net assets, end of period (in millions) | $46 | $37 | $37 | $33 | $23 | $26 |
| Ratios (as a percentage of average net assets): | | | | | | |
| Expenses before reductions | 0.915 | 0.91 | 0.88 | 0.86 | 0.86 | 0.88 |
| Expenses including reductions | 0.905 | 0.90 | 0.87 | 0.85 | 0.85 | 0.87 |
| Net investment income | 3.525 | 4.09 | 3.70 | 3.44 | 3.49 | 3.46 |
| Portfolio turnover (%) | 32 | 59 | 68 | 77 | 52 | 61 |
| 1 | Six months ended 1-31-20. Unaudited. |
| 2 | Based on average daily shares outstanding. |
| 3 | Total returns would have been lower had certain expenses not been reduced during the applicable periods. |
| 4 | Not annualized. |
| 5 | Annualized. |
| 52 | JOHN HANCOCK SHORT DURATION CREDIT OPPORTUNITIES FUND | SEMIANNUAL REPORT | SEE NOTES TO FINANCIAL STATEMENTS |
| CLASS R6 SHARES Period ended | 1-31-201 | 7-31-19 | 7-31-18 | 7-31-17 | 7-31-16 | 7-31-152 |
| Per share operating performance | | | | | | |
| Net asset value, beginning of period | $9.57 | $9.50 | $9.74 | $9.57 | $9.73 | $9.93 |
| Net investment income3 | 0.18 | 0.40 | 0.37 | 0.34 | 0.34 | 0.11 |
| Net realized and unrealized gain (loss) on investments | 0.04 | 0.06 | (0.25) | 0.16 | (0.12) | (0.19) |
| Total from investment operations | 0.22 | 0.46 | 0.12 | 0.50 | 0.22 | (0.08) |
| Less distributions | | | | | | |
| From net investment income | (0.17) | (0.39) | (0.36) | (0.33) | (0.38) | (0.12) |
| Net asset value, end of period | $9.62 | $9.57 | $9.50 | $9.74 | $9.57 | $9.73 |
| Total return (%)4 | 2.355 | 4.99 | 1.24 | 5.33 | 2.40 | (0.78)5 |
| Ratios and supplemental data | | | | | | |
| Net assets, end of period (in millions) | $8 | $7 | $6 | $2 | $1 | $—6 |
| Ratios (as a percentage of average net assets): | | | | | | |
| Expenses before reductions | 0.807 | 0.79 | 0.78 | 0.77 | 0.77 | 0.747 |
| Expenses including reductions | 0.797 | 0.79 | 0.77 | 0.74 | 0.74 | 0.737 |
| Net investment income | 3.657 | 4.22 | 3.85 | 3.56 | 3.61 | 3.317 |
| Portfolio turnover (%) | 32 | 59 | 68 | 77 | 52 | 618 |
| 1 | Six months ended 1-31-20. Unaudited. |
| 2 | The inception date for Class R6 shares is 3-27-15. |
| 3 | Based on average daily shares outstanding. |
| 4 | Total returns would have been lower had certain expenses not been reduced during the applicable periods. |
| 5 | Not annualized. |
| 6 | Less than $500,000. |
| 7 | Annualized. |
| 8 | Portfolio turnover is shown for the period from 8-1-14 to 7-31-15. |
| SEE NOTES TO FINANCIAL STATEMENTS | SEMIANNUAL REPORT | JOHN HANCOCK SHORT DURATION CREDIT OPPORTUNITIES FUND | 53 |
| CLASS NAV SHARES Period ended | 1-31-201 | 7-31-19 | 7-31-18 | 7-31-17 | 7-31-16 | 7-31-15 |
| Per share operating performance | | | | | | |
| Net asset value, beginning of period | $9.57 | $9.51 | $9.75 | $9.57 | $9.74 | $10.25 |
| Net investment income2 | 0.18 | 0.40 | 0.37 | 0.34 | 0.34 | 0.36 |
| Net realized and unrealized gain (loss) on investments | 0.04 | 0.05 | (0.25) | 0.17 | (0.13) | (0.51) |
| Total from investment operations | 0.22 | 0.45 | 0.12 | 0.51 | 0.21 | (0.15) |
| Less distributions | | | | | | |
| From net investment income | (0.17) | (0.39) | (0.36) | (0.33) | (0.38) | (0.36) |
| Net asset value, end of period | $9.62 | $9.57 | $9.51 | $9.75 | $9.57 | $9.74 |
| Total return (%)3 | 2.254 | 5.00 | 1.25 | 5.43 | 2.27 | (1.46) |
| Ratios and supplemental data | | | | | | |
| Net assets, end of period (in millions) | $675 | $738 | $853 | $1,156 | $1,326 | $1,402 |
| Ratios (as a percentage of average net assets): | | | | | | |
| Expenses before reductions | 0.795 | 0.78 | 0.77 | 0.75 | 0.75 | 0.74 |
| Expenses including reductions | 0.785 | 0.77 | 0.76 | 0.74 | 0.74 | 0.73 |
| Net investment income | 3.675 | 4.24 | 3.81 | 3.55 | 3.61 | 3.63 |
| Portfolio turnover (%) | 32 | 59 | 68 | 77 | 52 | 61 |
| 1 | Six months ended 1-31-20. Unaudited. |
| 2 | Based on average daily shares outstanding. |
| 3 | Total returns would have been lower had certain expenses not been reduced during the applicable periods. |
| 4 | Not annualized. |
| 5 | Annualized. |
| 54 | JOHN HANCOCK SHORT DURATION CREDIT OPPORTUNITIES FUND | SEMIANNUAL REPORT | SEE NOTES TO FINANCIAL STATEMENTS |
| Notes to financial statements (unaudited) | |
Note 1—Organization
John Hancock Short Duration Credit Opportunities Fund (the fund) is a series of John Hancock Funds II (the Trust), an open-end management investment company organized as a Massachusetts business trust and registered under the Investment Company Act of 1940, as amended (the 1940 Act). The investment objective of the fund is to seek to maximize total return, which consists of income on its investments and capital appreciation.
The fund may offer multiple classes of shares. The shares currently outstanding are detailed in the Statement of assets and liabilities. Class A and Class C shares are offered to all investors. Class I shares are offered to institutions and certain investors. Class R6 shares are only available to certain retirement plans, institutions and other investors. Class NAV shares are offered to John Hancock affiliated funds of funds, retirement plans for employees of John Hancock and/or Manulife Financial Corporation, and certain 529 plans. Class C shares convert to Class A shares ten years after purchase (certain exclusions may apply). Shareholders of each class have exclusive voting rights to matters that affect that class. The distribution and service fees, if any, and transfer agent fees for each class may differ.
All Class R2 and Class R4 shares were redeemed on October 29, 2019.
Note 2—Significant accounting policies
The financial statements have been prepared in conformity with accounting principles generally accepted in the United States of America (US GAAP), which require management to make certain estimates and assumptions as of the date of the financial statements. Actual results could differ from those estimates and those differences could be significant. The fund qualifies as an investment company under Topic 946 of Accounting Standards Codification of US GAAP.
Events or transactions occurring after the end of the fiscal period through the date that the financial statements were issued have been evaluated in the preparation of the financial statements. The following summarizes the significant accounting policies of the fund:
Security valuation. Investments are stated at value as of the scheduled close of regular trading on the New York Stock Exchange (NYSE), normally at 4:00 P.M., Eastern Time. In case of emergency or other disruption resulting in the NYSE not opening for trading or the NYSE closing at a time other than the regularly scheduled close, the net asset value (NAV) may be determined as of the regularly scheduled close of the NYSE pursuant to the fund's Valuation Policies and Procedures.
In order to value the securities, the fund uses the following valuation techniques: Debt obligations are typically valued based on the evaluated prices provided by an independent pricing vendor. Independent pricing vendors utilize matrix pricing, which takes into account factors such as institutional-size trading in similar groups of securities, yield, quality, coupon rate, maturity, type of issue, trading characteristics and other market data, as well as broker supplied prices. Equity securities, including exchange-traded or closed-end funds, are typically valued at the last sale price or official closing price on the exchange or principal market where the security trades. In the event there were no sales during the day or closing prices are not available, the securities are valued using the last available bid price. Investments by the fund in open-end mutual funds, including John Hancock Collateral Trust (JHCT), are valued at their respective NAVs each business day. Options listed on an exchange are valued at the mid-price of the last quoted bid and ask prices from the primary exchange where the option trades. Unlisted options are valued using evaluated prices obtained from an independent pricing vendor. Futures contracts are typically valued at last traded price on the exchange on which they trade. Swaps are generally valued using evaluated prices obtained from an independent pricing vendor. Forward foreign currency contracts are valued at
| | SEMIANNUAL REPORT | JOHN HANCOCK Short Duration Credit Opportunities Fund | 55 |
the prevailing forward rates which are based on foreign currency exchange spot rates and forward points supplied by an independent pricing vendor. Foreign securities and currencies are valued in U.S. dollars based on foreign currency exchange rates supplied by an independent pricing vendor.
In certain instances, the Pricing Committee may determine to value equity securities using prices obtained from another exchange or market if trading on the exchange or market on which prices are typically obtained did not open for trading as scheduled, or if trading closed earlier than scheduled, and trading occurred as normal on another exchange or market.
Other portfolio securities and assets, for which reliable market quotations are not readily available, are valued at fair value as determined in good faith by the fund's Pricing Committee following procedures established by the Board of Trustees. The frequency with which these fair valuation procedures are used cannot be predicted and fair value of securities may differ significantly from the value that would have been used had a ready market for such securities existed.
The fund uses a three-tier hierarchy to prioritize the pricing assumptions, referred to as inputs, used in valuation techniques to measure fair value. Level 1 includes securities valued using quoted prices in active markets for identical securities, including registered investment companies. Level 2 includes securities valued using other significant observable inputs. Observable inputs may include quoted prices for similar securities, interest rates, prepayment speeds and credit risk. Prices for securities valued using these inputs are received from independent pricing vendors and brokers and are based on an evaluation of the inputs described. Level 3 includes securities valued using significant unobservable inputs when market prices are not readily available or reliable, including the fund's own assumptions in determining the fair value of investments. Factors used in determining value may include market or issuer specific events or trends, changes in interest rates and credit quality. The inputs or methodology used for valuing securities are not necessarily an indication of the risks associated with investing in those securities. Changes in valuation techniques and related inputs may result in transfers into or out of an assigned level within the disclosure hierarchy.
The following is a summary of the values by input classification of the fund's investments as of January 31, 2020, by major security category or type:
| | Total
value at
1-31-20 | Level 1
quoted
price | Level 2
significant
observable
inputs | Level 3
significant
unobservable
inputs |
| Investments in securities: | | | | |
| Assets | | | | |
| U.S. Government and Agency obligations | $3,605,671 | — | $3,605,671 | — |
| Foreign government obligations | 94,416,805 | — | 94,416,805 | — |
| Corporate bonds | 320,197,872 | — | 320,197,872 | — |
| Term loans | 151,374,737 | — | 151,374,737 | — |
| Collateralized mortgage obligations | 123,007,094 | — | 123,007,094 | — |
| Asset backed securities | 73,363,276 | — | 73,363,276 | — |
| Common stocks | 37,556 | $69 | 37,487 | — |
| Escrow certificates | 16,231 | — | — | $16,231 |
| Purchased options | 12,662 | — | 12,662 | — |
| Short-term investments | 49,436,561 | 49,436,561 | — | — |
| Total investments in securities | $815,468,465 | $49,436,630 | $766,015,604 | $16,231 |
| 56 | JOHN HANCOCK Short Duration Credit Opportunities Fund | SEMIANNUAL REPORT | |
| | Total
value at
1-31-20 | Level 1
quoted
price | Level 2
significant
observable
inputs | Level 3
significant
unobservable
inputs |
| Derivatives: | | | | |
| Assets | | | | |
| Futures | $1,478,570 | $1,478,570 | — | — |
| Forward foreign currency contracts | 337,505 | — | $337,505 | — |
| Liabilities | | | | |
| Futures | (2,184,073) | (2,184,073) | — | — |
| Forward foreign currency contracts | (565,076) | — | (565,076) | — |
| Swap contracts | (8,463,078) | — | (8,463,078) | — |
Term loans (Floating rate loans). The fund may invest in term loans, which are debt securities and are often rated below investment grade at the time of purchase. Term loans are generally subject to legal or contractual restrictions on resale and generally have longer settlement periods than conventional debt securities. Term loans involve special types of risk, including credit risk, interest-rate risk, counterparty risk, and risk associated with extended settlement. The liquidity of term loans, including the volume and frequency of secondary market trading in such loans, varies significantly over time and among individual loans. During periods of infrequent trading, valuing a term loan can be more difficult and buying and selling a term loan at an acceptable price can be more difficult and delayed, which could result in a loss.
The fund's ability to receive payments of principal, interest and other amounts in connection with term loans will depend primarily on the financial condition of the borrower. The fund's failure to receive scheduled payments on a term loan due to a default, bankruptcy or other reason would adversely affect the fund's income and would likely reduce the value of its assets. Transactions in loan investments typically take a significant amount of time (i.e., seven days or longer) to settle. This could pose a liquidity risk to the fund and, if the fund's exposure to such investments is substantial, it could impair the fund's ability to meet redemptions. Because term loans may not be rated by independent credit rating agencies, a decision to invest in a particular loan could depend exclusively on the subadvisor’s credit analysis of the borrower and/or term loan agents. There is greater risk that the fund may have limited rights to enforce the terms of an underlying loan than for other types of debt instruments.
At January 31, 2020, the fund had $108,299 in unfunded loan commitments outstanding.
Security transactions and related investment income. Investment security transactions are accounted for on a trade date plus one basis for daily NAV calculations. However, for financial reporting purposes, investment transactions are reported on trade date. Interest income is accrued as earned. Interest income includes coupon interest and amortization/accretion of premiums/discounts on debt securities. Debt obligations may be placed in a non-accrual status and related interest income may be reduced by stopping current accruals and writing off interest receivable when the collection of all or a portion of interest has become doubtful. Dividend income is recorded on the ex-date, except for dividends of certain foreign securities where the dividend may not be known until after the ex-date. In those cases, dividend income, net of withholding taxes, is recorded when the fund becomes aware of the dividends. Non-cash dividends, if any, are recorded at the fair market value of the securities received. Gains and losses on securities sold are determined on the basis of identified cost and may include proceeds from litigation.
Securities lending. The fund may lend its securities to earn additional income. The fund receives collateral from the borrower in an amount not less than the market value of the loaned securities. The fund will invest its cash collateral in JHCT, an affiliate of the fund, which has a floating NAV and is registered with the Securities and
| | SEMIANNUAL REPORT | JOHN HANCOCK Short Duration Credit Opportunities Fund | 57 |
Exchange Commission (SEC) as an investment company. JHCT invests in short-term money market investments. The fund will receive the benefit of any gains and bear any losses generated by JHCT with respect to the cash collateral.
The fund has the right to recall loaned securities on demand. If a borrower fails to return loaned securities when due, then the lending agent is responsible and indemnifies the fund for the lent securities. The lending agent uses the collateral received from the borrower to purchase replacement securities of the same issue, type, class and series of the loaned securities. If the value of the collateral is less than the purchase cost of replacement securities, the lending agent is responsible for satisfying the shortfall but only to the extent that the shortfall is not due to any decrease in the value of JHCT.
Although the risk of loss on securities lent is mitigated by receiving collateral from the borrower and through lending agent indemnification, the fund could experience a delay in recovering securities or could experience a lower than expected return if the borrower fails to return the securities on a timely basis. The fund receives compensation for lending its securities by retaining a portion of the return on the investment of the collateral and compensation from fees earned from borrowers of the securities. Securities lending income received by the fund is net of fees retained by the securities lending agent. Net income received from JHCT is a component of securities lending income as recorded on the Statement of operations.
Obligations to repay collateral received by the fund are shown on the Statement of assets and liabilities as Payable upon return of securities loaned and are secured by the loaned securities. As of January 31, 2020, the fund loaned securities valued at $901,553 and received $923,403 of cash collateral.
Foreign investing. Assets, including investments, and liabilities denominated in foreign currencies are translated into U.S. dollar values each day at the prevailing exchange rate. Purchases and sales of securities, income and expenses are translated into U.S. dollars at the prevailing exchange rate on the date of the transaction. The effect of changes in foreign currency exchange rates on the value of securities is reflected as a component of the realized and unrealized gains (losses) on investments. Foreign investments are subject to a decline in the value of a foreign currency versus the U.S. dollar, which reduces the dollar value of securities denominated in that currency.
Funds that invest internationally generally carry more risk than funds that invest strictly in U.S. securities. Risks can result from differences in economic and political conditions, regulations, market practices (including higher transaction costs), accounting standards and other factors.
Foreign taxes. The fund may be subject to withholding tax on income, capital gains or repatriation taxes imposed by certain countries, a portion of which may be recoverable. Foreign taxes are accrued based upon the fund's understanding of the tax rules and rates that exist in the foreign markets in which it invests. Taxes are accrued based on gains realized by the fund as a result of certain foreign security sales. In certain circumstances, estimated taxes are accrued based on unrealized appreciation of such securities. Investment income is recorded net of foreign withholding taxes.
Overdraft. The fund may have the ability to borrow from banks for temporary or emergency purposes, including meeting redemption requests that otherwise might require the untimely sale of securities. Pursuant to the fund's custodian agreement, the custodian may loan money to the fund to make properly authorized payments. The fund is obligated to repay the custodian for any overdraft, including any related costs or expenses. The custodian may have a lien, security interest or security entitlement in any fund property that is not otherwise segregated or pledged, to the extent of any overdraft, and to the maximum extent permitted by law.
| 58 | JOHN HANCOCK Short Duration Credit Opportunities Fund | SEMIANNUAL REPORT | |
Line of credit. The fund and other affiliated funds have entered into a syndicated line of credit agreement with Citibank, N.A. as the administrative agent that enables them to participate in a $750 million unsecured committed line of credit. Excluding commitments designated for a certain fund and subject to the needs of all other affiliated funds, the fund can borrow up to an aggregate commitment amount of $500 million, subject to asset coverage and other limitations as specified in the agreement. A commitment fee payable at the end of each calendar quarter, based on the average daily unused portion of the line of credit, is charged to each participating fund based on a combination of fixed and asset based allocations and is reflected in Other expenses on the Statement of operations. For the six months ended January 31, 2020, the fund had no borrowings under the line of credit. Commitment fees for the six months ended January 31, 2020 were $1,746.
Expenses. Within the John Hancock group of funds complex, expenses that are directly attributable to an individual fund are allocated to such fund. Expenses that are not readily attributable to a specific fund are allocated among all funds in an equitable manner, taking into consideration, among other things, the nature and type of expense and the fund’s relative net assets. Expense estimates are accrued in the period to which they relate and adjustments are made when actual amounts are known.
Class allocations. Income, common expenses and realized and unrealized gains (losses) are determined at the fund level and allocated daily to each class of shares based on the net assets of the class. Class-specific expenses, such as distribution and service fees, if any, and transfer agent fees, for all classes, are charged daily at the class level based on the net assets of each class and the specific expense rates applicable to each class.
Change in accounting principle. Accounting Standards Update (ASU) 2017-08,Premium Amortization on Purchased Callable Debt Securities, shortens the premium amortization period for purchased non contingently callable debt securities and is effective for public companies with fiscal years beginning after December 15, 2018. Adoption of the ASU did not have a material impact to the fund.
Federal income taxes. The fund intends to continue to qualify as a regulated investment company by complying with the applicable provisions of the Internal Revenue Code and will not be subject to federal income tax on taxable income that is distributed to shareholders. Therefore, no federal income tax provision is required.
For federal income tax purposes, as of July 31, 2019, the fund has a short-term capital loss carryforward of $28,774,619 and a long-term capital loss carryforward of $63,079,106 available to offset future net realized capital gains. These carryforwards do not expire.
As of July 31, 2019, the fund had no uncertain tax positions that would require financial statement recognition, derecognition or disclosure. The fund's federal tax returns are subject to examination by the Internal Revenue Service for a period of three years.
Distribution of income and gains. Distributions to shareholders from net investment income and net realized gains, if any, are recorded on the ex-date. The fund generally declares dividends daily and pays them monthly. Capital gain distributions, if any, are typically distributed annually.
Distributions paid by the fund with respect to each class of shares are calculated in the same manner, at the same time and in the same amount, except for the effect of class level expenses that may be applied differently to each class.
Such distributions, on a tax basis, are determined in conformity with income tax regulations, which may differ from US GAAP. Distributions in excess of tax basis earnings and profits, if any, are reported in the fund's financial statements as a return of capital. The final determination of tax characteristics of the fund's distribution will occur at the end of the year and will subsequently be reported to shareholders.
| | SEMIANNUAL REPORT | JOHN HANCOCK Short Duration Credit Opportunities Fund | 59 |
Capital accounts within the financial statements are adjusted for permanent book-tax differences. These adjustments have no impact on net assets or the results of operations. Temporary book-tax differences, if any, will reverse in a subsequent period. Book-tax differences are primarily attributable to foreign currency transactions, derivative transactions, wash sale loss deferrals and amortization and accretion on debt securities.
Note 3—Derivative instruments
The fund may invest in derivatives in order to meet its investment objective. Derivatives include a variety of different instruments that may be traded in the over-the-counter (OTC) market, on a regulated exchange or through a clearing facility. The risks in using derivatives vary depending upon the structure of the instruments, including the use of leverage, optionality, the liquidity or lack of liquidity of the contract, the creditworthiness of the counterparty or clearing organization and the volatility of the position. Some derivatives involve risks that are potentially greater than the risks associated with investing directly in the referenced securities or other referenced underlying instrument. Specifically, the fund is exposed to the risk that the counterparty to an OTC derivatives contract will be unable or unwilling to make timely settlement payments or otherwise honor its obligations. OTC derivatives transactions typically can only be closed out with the other party to the transaction.
Derivatives which are typically traded through the OTC market are regulated by the Commodity Futures Trading Commission (the CFTC). Derivative counterparty risk is managed through an ongoing evaluation of the creditworthiness of all potential counterparties and, if applicable, designated clearing organizations. The fund attempts to reduce its exposure to counterparty risk for derivatives traded in the OTC market, whenever possible, by entering into an International Swaps and Derivatives Association (ISDA) Master Agreement with each of its OTC counterparties. The ISDA gives each party to the agreement the right to terminate all transactions traded under the agreement if there is certain deterioration in the credit quality or contractual default of the other party, as defined in the ISDA. Upon an event of default or a termination of the ISDA, the non-defaulting party has the right to close out all transactions and to net amounts owed.
As defined by the ISDA, the fund may have collateral agreements with certain counterparties to mitigate counterparty risk on OTC derivatives. Subject to established minimum levels, collateral for OTC transactions is generally determined based on the net aggregate unrealized gain or loss on contracts with a particular counterparty. Collateral pledged to the fund, if any, is held in a segregated account by a third-party agent or held by the custodian bank for the benefit of the fund and can be in the form of cash or debt securities issued by the U.S. government or related agencies; collateral posted by the fund, if any, for OTC transactions is held in a segregated account at the fund's custodian and is noted in the accompanying Fund's investments, or if cash is posted, on the Statement of assets and liabilities. The fund's risk of loss due to counterparty risk is equal to the asset value of outstanding contracts offset by collateral received.
Certain derivatives are traded or cleared on an exchange or central clearinghouse. Exchange-traded or centrally-cleared transactions generally present less counterparty risk to a fund than OTC transactions. The exchange or clearinghouse stands between the fund and the broker to the contract and therefore, credit risk is generally limited to the failure of the exchange or clearinghouse and the clearing member.
Centrally-cleared swap contracts are subject to clearinghouse rules, including initial and variation margin requirements, daily settlement of obligations and the clearinghouse guarantee of payments to the broker. There is, however, still counterparty risk due to the potential insolvency of the broker with respect to any margin held in the brokers’ customer accounts. While clearing members are required to segregate customer assets from their own assets, in the event of insolvency, there may be a shortfall in the amount of margin held by the broker for its clients. Collateral or margin requirements for centrally-cleared derivatives are set by the broker or applicable
| 60 | JOHN HANCOCK Short Duration Credit Opportunities Fund | SEMIANNUAL REPORT | |
clearinghouse. Margin for centrally-cleared transactions is detailed in the Statement of assets and liabilities as Receivable/Payable for centrally-cleared swaps. Securities pledged by the fund for centrally-cleared transactions, if any, are identified in the Fund's investments.
Futures. A futures contract is a contractual agreement to buy or sell a particular currency or financial instrument at a pre-determined price in the future. Risks related to the use of futures contracts include possible illiquidity of the futures markets and contract prices that can be highly volatile and imperfectly correlated to movements in the underlying financial instrument and potential losses in excess of the amounts recognized on the Statement of assets and liabilities. Use of long futures contracts subjects the fund to the risk of loss up to the notional value of the futures contracts. Use of short futures contracts subjects the fund to unlimited risk of loss.
Upon entering into a futures contract, the fund is required to deposit initial margin with the broker in the form of cash or securities. The amount of required margin is set by the broker and is generally based on a percentage of the contract value. The margin deposit must then be maintained at the established level over the life of the contract. Cash that has been pledged by the fund is detailed in the Statement of assets and liabilities as Collateral held at broker for futures contracts. Securities pledged by the fund, if any, are identified in the Fund's investments. Subsequent payments, referred to as variation margin, are made or received by the fund periodically and are based on changes in the market value of open futures contracts. Futures contracts are marked-to-market daily and unrealized gain or loss is recorded by the fund. Receivable for futures variation margin is included on the Statement of assets and liabilities. When the contract is closed, the fund records a realized gain or loss equal to the difference between the value of the contract at the time it was opened and the value at the time it was closed.
During the six months ended January 31, 2020, the fund used futures contracts to manage duration of the fund. The fund held futures contracts with USD notional values ranging from $217.1 million to $257.3 million, as measured at each quarter end.
Forward foreign currency contracts. A forward foreign currency contract is an agreement between two parties to buy and sell specific currencies at a price that is set on the date of the contract. The forward contract calls for delivery of the currencies on a future date that is specified in the contract. Risks related to the use of forwards include the possible failure of counterparties to meet the terms of the forward agreement, the failure of the counterparties to timely post collateral if applicable, and the risk that currency movements will not favor the fund thereby reducing the fund's total return, and the potential for losses in excess of the amounts recognized on the Statement of assets and liabilities.
The market value of a forward foreign currency contract fluctuates with changes in foreign currency exchange rates. Forward foreign currency contracts are marked-to-market daily and the change in value is recorded by the fund as an unrealized gain or loss. Realized gains or losses, equal to the difference between the value of the contract at the time it was opened and the value at the time it was closed, are recorded upon delivery or receipt of the currency or settlement with the counterparty.
During the six months ended January 31, 2020, the fund used forward foreign currency contracts to manage against anticipated changes in currency exchange rates and gain exposure to foreign currencies. The fund held forward foreign currency contracts with USD notional values ranging from $97.9 million to $104.5 million, as measured at each quarter end.
Options. There are two types of options, put options and call options. Options are traded either OTC or on an exchange. A call option gives the purchaser of the option the right to buy (and the seller the obligation to sell) the underlying instrument at the exercise price. A put option gives the purchaser of the option the right to sell (and the writer the obligation to buy) the underlying instrument at the exercise price. Writing puts and buying calls may
| | SEMIANNUAL REPORT | JOHN HANCOCK Short Duration Credit Opportunities Fund | 61 |
increase the fund's exposure to changes in the value of the underlying instrument. Buying puts and writing calls may decrease the fund's exposure to such changes. Risks related to the use of options include the loss of premiums, possible illiquidity of the options markets, trading restrictions imposed by an exchange and movements in underlying security values, and for written options, potential losses in excess of the amounts recognized on the Statement of assets and liabilities. In addition, OTC options are subject to the risks of all OTC derivatives contracts.
When the fund purchases an option, the premium paid is included in the Fund's investments and subsequently “marked-to-market” to reflect current market value. If the purchased option expires, the fund realizes a loss equal to the cost of the option. If the fund exercises a call option, the cost of the securities acquired by exercising the call is increased by the premium paid to buy the call. If the fund exercises a put option, it realizes a gain or loss from the sale of the underlying security and the proceeds from such sale are decreased by the premium paid. If the fund enters into a closing sale transaction, it realizes a gain or loss, depending on whether proceeds from the closing sale are greater or less than the original cost.
During the six months ended January 31, 2020, the fund used purchased options contracts to . The fund held purchased options contracts with market values ranging up to $31,000, as measured at each quarter end.
Swaps. Swap agreements are agreements between the fund and a counterparty to exchange cash flows, assets, foreign currencies or market-linked returns at specified intervals. Swap agreements are privately negotiated in the OTC market (OTC swaps) or may be executed on a registered commodities exchange (centrally cleared swaps). Swaps are marked-to-market daily and the change in value is recorded as a component of unrealized appreciation/depreciation of swap contracts. The value of the swap will typically impose collateral posting obligations on the party that is considered out-of-the-money on the swap.
Upfront payments made/received by the fund, if any, are amortized/accreted for financial reporting purposes, with the unamortized/unaccreted portion included in the Statement of assets and liabilities. A termination payment by the counterparty or the fund is recorded as realized gain or loss, as well as the net periodic payments received or paid by the fund.
Entering into swap agreements involves, to varying degrees, elements of credit, market and documentation risk that may provide outcomes that are in excess of the amounts recognized on the Statement of assets and liabilities. Such risks involve the possibility that there will be no liquid market for the swap, or that a counterparty may default on its obligation or delay payment under the swap terms. The counterparty may disagree or contest the terms of the swap. In addition to interest rate risk, market risks may also impact the swap. The fund may also suffer losses if it is unable to terminate or assign outstanding swaps or reduce its exposure through offsetting transactions.
Interest rate swaps. Interest rate swaps represent an agreement between the fund and a counterparty to exchange cash flows based on the difference between two interest rates applied to a notional amount. The payment flows are usually netted against each other, with the difference being paid by one party to the other. The fund settles accrued net interest receivable or payable under the swap contracts at specified, future intervals.
During the six months ended January 31, 2020, the fund used interest rate swap contracts to gain exposure to treasuries markets. The fund held interest rate swaps with total USD notional amounts ranging up to $283,000, as measured at each quarter end. There were no open interest rate swap contracts as of January 31, 2020.
Credit default swaps. Credit default swaps (CDS) involve the exchange of a fixed rate premium (paid by the Buyer), for protection against the loss in value of an underlying debt instrument, referenced entity or index, in the event of a defined credit event (such as payment default or bankruptcy). Under the terms of the swap, one party acts as a “guarantor” (the Seller), receiving the premium and agreeing to contingent payments that are specified
| 62 | JOHN HANCOCK Short Duration Credit Opportunities Fund | SEMIANNUAL REPORT | |
within the credit default agreement. The fund may enter into CDS in which it may act as either Buyer or Seller. By acting as the Seller, the fund may incur economic leverage since it would be obligated to pay the Buyer the notional amount of the contract in the event of a default. The amount of loss in such case could be significant, but would typically be reduced by any recovery value on the underlying credit.
Credit default swaps — Buyer
During the six months ended January 31, 2020, the fund used credit default swap contracts as a buyer to manage against potential credit events. The fund held credit default swaps with total USD notional amounts ranging from $145.3 million to $207.7 million, as measured at each quarter end.
Fair value of derivative instruments by risk category
The table below summarizes the fair value of derivatives held by the fund at January 31, 2020 by risk category:
| Risk | Statement of
assets and
liabilities location | Financial
instruments
location | Assets
derivatives
fair value | Liabilities
derivatives
fair value |
| Interest rate | Receivable/payable for futures variation margin | Futures1 | $1,478,570 | $(2,184,073) |
| Currency | Unrealized appreciation / depreciation on forward foreign currency contracts | Forward foreign currency contracts | 337,505 | (565,076) |
| Currency | Unaffiliated investments, at value2 | Purchased options | 12,662 | — |
| Credit | Swap contracts, at value | Credit default swaps3 | — | (8,463,078) |
| | | | $1,828,737 | $(11,212,227) |
| 1 | Reflects cumulative appreciation/depreciation on futures as disclosed in Fund's investments. Only the period end variation margin is separately disclosed on the Statement of assets and liabilities. |
| 2 | Purchased options are included in Fund's investments. |
| 3 | Reflects cumulative value of swap contracts. Receivable/payable for centrally cleared swaps, which includes value and margin, are shown separately on the Statement of assets and liabilities. |
For financial reporting purposes, the fund does not offset OTC derivative assets or liabilities that are subject to master netting arrangements, as defined by the ISDAs, in the Statement of assets and liabilities. In the event of default by the counterparty or a termination of the agreement, the ISDA allows an offset of amounts across the various transactions between the fund and the applicable counterparty.
Effect of derivative instruments on the Statement of operations
The table below summarizes the net realized gain (loss) included in the net increase (decrease) in net assets from operations, classified by derivative instrument and risk category, for the six months ended January 31, 2020:
| | Statement of operations location - Net realized gain (loss) on: |
| Risk | Futures contracts | Forward foreign
currency contracts | Swap contracts | Total |
| Interest rate | $(6,816,396) | — | $4,797 | $(6,811,599) |
| Currency | — | $(587,585) | — | (587,585) |
| Credit | — | — | (2,328,924) | (2,328,924) |
| Total | $(6,816,396) | $(587,585) | $(2,324,127) | $(9,728,108) |
| | SEMIANNUAL REPORT | JOHN HANCOCK Short Duration Credit Opportunities Fund | 63 |
The table below summarizes the net change in unrealized appreciation (depreciation) included in the net increase (decrease) in net assets from operations, classified by derivative instrument and risk category, for the six months ended January 31, 2020:
| | Statement of operations location - Change in net unrealized appreciation (depreciation) of: |
| Risk | Unaffiliated
investments and
translation of assets
and liabilities in
foreign currencies1 | Futures contracts | Forward foreign
currency contracts | Swap contracts | Total |
| Interest rate | — | $2,402,545 | — | $(3,184) | $2,399,361 |
| Currency | $(65,434) | — | $250,978 | — | 185,544 |
| Credit | — | — | — | 839,296 | 839,296 |
| Total | $(65,434) | $2,402,545 | $250,978 | $836,112 | $3,424,201 |
| 1 | Change in unrealized appreciation/depreciation associated with purchased options is included in this caption on the Statement of operations. |
Note 4—Guarantees and indemnifications
Under the Trust's organizational documents, its Officers and Trustees are indemnified against certain liabilities arising out of the performance of their duties to the Trust, including the fund. Additionally, in the normal course of business, the fund enters into contracts with service providers that contain general indemnification clauses. The fund's maximum exposure under these arrangements is unknown, as this would involve future claims that may be made against the fund that have not yet occurred. The risk of material loss from such claims is considered remote.
Note 5—Fees and transactions with affiliates
John Hancock Investment Management LLC (the Advisor) serves as investment advisor for the fund. John Hancock Investment Management Distributors LLC (the Distributor), an affiliate of the Advisor, serves as principal underwriter of the fund. The Advisor and the Distributor are indirect, wholly owned subsidiaries of Manulife Financial Corporation (MFC).
Management fee. The fund has an investment management agreement with the Advisor under which the fund pays a daily management fee to the Advisor equivalent on an annual basis to the sum of: a) 0.740% of the first $250 million of the fund’s aggregate daily net assets, b) 0.700% of the next $500 million of the fund’s aggregate daily net assets and c) 0.675% of the fund’s aggregate daily net assets in excess of $750 million. Aggregate net assets include the net assets of the fund and Manulife Global Multi-Strategy Credit Fund, a sub-fund of Manulife Investment Management I PLC. Prior to August 30, 2019, Manulife Global Multi-Strategy Credit Fund was named John Hancock Short Duration Credit Opportunities Fund and Manulife Investment Management I PLC was named John Hancock Worldwide Investors, PLC. The fund has a subadvisory agreement with Stone Harbor Investment Partners LP. The fund is not responsible for payment of the subadvisory fees.
The Advisor has contractually agreed to waive a portion of its management fee and/or reimburse expenses for certain funds of the John Hancock group of funds complex, including the fund (the participating portfolios). This waiver is based upon aggregate net assets of all the participating portfolios. The amount of the reimbursement is calculated daily and allocated among all the participating portfolios in proportion to the daily net assets of each fund. During the six months ended January 31, 2020, this waiver amounted to 0.01% of the fund’s average daily net assets on an annualized basis. This arrangement expires on July 31, 2021, unless renewed by mutual agreement of the fund and the Advisor based upon a determination that this is appropriate under the circumstances at that time.
| 64 | JOHN HANCOCK Short Duration Credit Opportunities Fund | SEMIANNUAL REPORT | |
For the six months ended January 31, 2020, the expense reductions described above amounted to the following:
| Class | Expense reduction |
| Class A | $3,258 |
| Class C | 139 |
| Class I | 1,544 |
| Class R2 | 1 |
| Class | Expense reduction |
| Class R4 | $1 |
| Class R6 | 282 |
| Class NAV | 26,290 |
| Total | $31,515 |
Expenses waived or reimbursed in the current fiscal period are not subject to recapture in future fiscal periods.
The investment management fees, including the impact of the waivers and reimbursements as described above, incurred for the six months ended January 31, 2020, were equivalent to a net annual effective rate of 0.70% of the fund's average daily net assets.
Accounting and legal services. Pursuant to a service agreement, the fund reimburses the Advisor for all expenses associated with providing the administrative, financial, legal, compliance, accounting and recordkeeping services to the fund, including the preparation of all tax returns, periodic reports to shareholders and regulatory reports, among other services. These expenses are allocated to each share class based on its relative net assets at the time the expense was incurred. These accounting and legal services fees incurred for the six months ended January 31, 2020 amounted to an annual rate of 0.02% of the fund's average daily net assets.
Distribution and service plans. The fund has a distribution agreement with the Distributor. The fund has adopted distribution and service plans for certain classes as detailed below pursuant to Rule 12b-1 under the 1940 Act, to pay the Distributor for services provided as the distributor of shares of the fund. In addition, under a service plan for certain classes as detailed below, the fund pays for certain other services. The fund may pay up to the following contractual rates of distribution and service fees under these arrangements, expressed as an annual percentage of average daily net assets for each class of the fund's shares:
| Class | Rule 12b-1 Fee | Service fee |
| Class A | 0.30% | — |
| Class C | 1.00% | — |
| Class R2 | 0.25% | 0.25% |
| Class R4 | 0.25% | 0.10% |
The fund's Distributor has contractually agreed to waive 0.10% of Rule12b-1 fees for Class R4 shares. The current waiver agreement would have expired on November 30, 2019, however, Class R4 shares were fully redeemed on October 29, 2019. This contractual waiver amounted to $12 for Class R4 shares for the six months ended January 31, 2020.
Sales charges. Class A shares are assessed up-front sales charges, which resulted in payments to the Distributor amounting to $66,659 for the six months ended January 31, 2020. Of this amount, $13,739 was retained and used for printing prospectuses, advertising, sales literature and other purposes and $52,920 was paid as sales commissions to broker-dealers.
Class A and Class C shares may be subject to contingent deferred sales charges (CDSCs). Certain Class A shares that are acquired through purchases of $1 million or more and are redeemed within one year of purchase are subject to a 1.00% sales charge. Class C shares that are redeemed within one year of purchase are subject to a 1.00% CDSC. CDSCs are applied to the lesser of the current market value at the time of redemption or the original purchase cost of the shares being redeemed. Proceeds from CDSCs are used to compensate the Distributor for
| | SEMIANNUAL REPORT | JOHN HANCOCK Short Duration Credit Opportunities Fund | 65 |
providing distribution-related services in connection with the sale of these shares. During the six months ended January 31, 2020, CDSCs received by the Distributor amounted to $14,646 and $256 for Class A and Class C shares, respectively.
Transfer agent fees. The John Hancock group of funds has a complex-wide transfer agent agreement with John Hancock Signature Services, Inc. (Signature Services), an affiliate of the Advisor. The transfer agent fees paid to Signature Services are determined based on the cost to Signature Services (Signature Services Cost) of providing recordkeeping services. It also includes out-of-pocket expenses, including payments made to third-parties for recordkeeping services provided to their clients who invest in one or more John Hancock funds. In addition, Signature Services Cost may be reduced by certain fees that Signature Services receives in connection with retirement and small accounts. Signature Services Cost is calculated monthly and allocated, as applicable, to five categories of share classes: Retail Share and Institutional Share Classes of Non-Municipal Bond Funds, Class R6 Shares, Retirement Share Classes and Municipal Bond Share Classes. Within each of these categories, the applicable costs are allocated to the affected John Hancock affiliated funds and/or classes, based on the relative average daily net assets.
Class level expenses. Class level expenses for the six months ended January 31, 2020 were as follows:
| Class | Distribution and service fees | Transfer agent fees |
| Class A | $131,306 | $53,342 |
| Class C | 18,407 | 2,244 |
| Class I | — | 25,111 |
| Class R2 | 31 | 1 |
| Class R4 | 30 | 2 |
| Class R6 | — | 484 |
| Total | $149,774 | $81,184 |
Trustee expenses. The fund compensates each Trustee who is not an employee of the Advisor or its affiliates. The costs of paying Trustee compensation and expenses are allocated to the fund based on its net assets relative to other funds within the John Hancock group of funds complex.
Interfund lending program. Pursuant to an Exemptive Order issued by the SEC, the fund, along with certain other funds advised by the Advisor or its affiliates, may participate in an interfund lending program. This program provides an alternative credit facility allowing the fund to borrow from, or lend money to, other participating affiliated funds. At period end, no interfund loans were outstanding. The fund's activity in this program during the period for which loans were outstanding was as follows:
Borrower
or Lender | Weighted Average
Loan Balance | Days
Outstanding | Weighted Average
Interest Rate | Interest Income
(Expense) |
| Lender | $4,434,880 | 4 | 1.550% | $764 |
| 66 | JOHN HANCOCK Short Duration Credit Opportunities Fund | SEMIANNUAL REPORT | |
Note 6—Fund share transactions
Transactions in fund shares for the six months ended January 31, 2020 and for the year ended July 31, 2019 were as follows:
| | Six Months Ended 1-31-20 | Year Ended 7-31-19 |
| | Shares | Amount | Shares | Amount |
| Class A shares | | | | |
| Sold | 5,694,441 | $54,349,115 | 29,124,465 | $274,068,707 |
| Distributions reinvested | 143,912 | 1,373,720 | 293,922 | 2,764,553 |
| Repurchased | (6,294,762) | (60,067,275) | (26,151,005) | (246,142,687) |
| Net increase (decrease) | (456,409) | $(4,344,440) | 3,267,382 | $30,690,573 |
| Class C shares | | | | |
| Sold | 102,675 | $981,717 | 282,031 | $2,625,288 |
| Distributions reinvested | 4,760 | 45,446 | 10,495 | 98,720 |
| Repurchased | (45,084) | (430,736) | (230,749) | (2,167,776) |
| Net increase | 62,351 | $596,427 | 61,777 | $556,232 |
| Class I shares | | | | |
| Sold | 1,937,043 | $18,446,831 | 2,432,520 | $22,874,522 |
| Distributions reinvested | 74,509 | 710,298 | 142,342 | 1,336,777 |
| Repurchased | (1,039,269) | (9,902,498) | (2,597,210) | (24,310,601) |
| Net increase (decrease) | 972,283 | $9,254,631 | (22,348) | $(99,302) |
| Class R2 shares1 | | | | |
| Repurchased | (5,155) | $(49,106) | — | — |
| Net decrease | (5,155) | $(49,106) | — | — |
| Class R4 shares1 | | | | |
| Repurchased | (5,155) | $(49,105) | — | — |
| Net decrease | (5,155) | $(49,105) | — | — |
| Class R6 shares | | | | |
| Sold | 144,358 | $1,379,211 | 334,168 | $3,131,878 |
| Distributions reinvested | 14,064 | 134,255 | 31,347 | 294,714 |
| Repurchased | (116,098) | (1,107,887) | (253,398) | (2,385,308) |
| Net increase | 42,324 | $405,579 | 112,117 | $1,041,284 |
| Class NAV shares | | | | |
| Sold | 1,168,878 | $11,139,501 | 4,655,528 | $43,672,987 |
| Distributions reinvested | 1,318,067 | 12,583,603 | 3,448,225 | 32,429,565 |
| Repurchased | (9,412,007) | (90,014,430) | (20,640,275) | (193,471,117) |
| Net decrease | (6,925,062) | $(66,291,326) | (12,536,522) | $(117,368,565) |
| Total net decrease | (6,314,823) | $(60,477,340) | (9,117,594) | $(85,179,778) |
| | SEMIANNUAL REPORT | JOHN HANCOCK Short Duration Credit Opportunities Fund | 67 |
| 1 | Class R2 and Class R4 shares were fully redeemed on 10-29-19. |
Affiliates of the fund owned 100% of shares of Class NAV on January 31, 2020. Such concentration of shareholders’ capital could have a material effect on the fund if such shareholders redeem from the fund.
Note 7—Purchase and sale of securities
Purchases and sales of securities, other than short-term investments, amounted to $246,973,266 and $277,446,520, respectively, for the six months ended January 31, 2020.
Note 8—Investment by affiliated funds
Certain investors in the fund are affiliated funds that are managed by the Advisor and its affiliates. The affiliated funds do not invest in the fund for the purpose of exercising management or control; however, this investment may represent a significant portion of the fund's net assets. At January 31, 2020, funds within the John Hancock group of funds complex held 82.2% of the fund's net assets. The following fund(s) had an affiliate ownership of 5% or more of the fund's net assets:
| Fund | Affiliated Concentration |
| John Hancock Funds II Multimanager Lifestyle Balanced Portfolio | 32.0% |
| John Hancock Funds II Multimanager Lifestyle Growth Portfolio | 14.1% |
| John Hancock Funds II Multimanager Lifestyle Moderate Portfolio | 11.3% |
| John Hancock Funds II Multimanager Lifestyle Conservative Portfolio | 10.4% |
| John Hancock Funds II Alternative Asset Allocation Fund | 5.1% |
Note 9—Investment in affiliated underlying funds
The fund may invest in affiliated underlying funds that are managed by the Advisor and its affiliates. Information regarding the fund's fiscal year to date purchases and sales of the affiliated underlying funds as well as income and capital gains earned by the fund, if any, is as follows:
| | | | | | | | Dividends and distributions |
| Affiliate | Ending
share
amount | Beginning
value | Cost of
purchases | Proceeds
from shares
sold | Realized
gain
(loss) | Change in
unrealized
appreciation
(depreciation) | Income
distributions
received | Capital gain
distributions
received | Ending
value |
| John Hancock Collateral Trust* | 92,202 | $1,851,041 | $7,165,302 | $(8,093,807) | $750 | $(549) | $7,944 | — | $922,737 |
| * | Refer to the Securities lending note within Note 2 for details regarding this investment. |
Note 10—LIBOR discontinuation risk
LIBOR (London Interbank Offered Rate) is a measure of the average interest rate at which major global banks can borrow from one another. Following allegations of rate manipulation and concerns regarding its thin liquidity, in July 2017, the U.K. Financial Conduct Authority, which regulates LIBOR, announced that it will stop encouraging banks to provide the quotations needed to sustain LIBOR after 2021. This event will likely cause LIBOR to cease to be published. Before then, it is expected that market participants will transition to the use of different reference or benchmark rates. However, although regulators have suggested alternative rates, there is currently no definitive information regarding the future utilization of LIBOR or of any replacement rate.
| 68 | JOHN HANCOCK Short Duration Credit Opportunities Fund | SEMIANNUAL REPORT | |
It is uncertain what impact the discontinuation of LIBOR will have on the use of LIBOR as a reference rate for securities in which the fund invests. It is expected that market participants will amend financial instruments referencing LIBOR to include fallback provisions and other measures that contemplate the discontinuation of LIBOR or other similar market disruption events, but neither the effect of the transition process nor the viability of such measures is known. In addition, there are obstacles to converting certain longer term securities and transactions to a new benchmark or benchmarks and the effectiveness of one alternative reference rate versus multiple alternative reference rates in new or existing financial instruments and products has not been determined. As market participants transition away from LIBOR, LIBOR's usefulness may deteriorate, which could occur prior to the end of 2021. The transition process may lead to increased volatility and illiquidity in markets that currently rely on LIBOR to determine interest rates. LIBOR's deterioration may adversely affect the liquidity and/or market value of securities that use LIBOR as a benchmark interest rate.
| | SEMIANNUAL REPORT | JOHN HANCOCK Short Duration Credit Opportunities Fund | 69 |
| | |
Trustees
Hassell H. McClellan,Chairperson
Steven R. Pruchansky,Vice Chairperson
Andrew G. Arnott†
Charles L. Bardelis*
James R. Boyle
Peter S. Burgess*
William H. Cunningham
Grace K. Fey
Marianne Harrison†
Deborah C. Jackson
James M. Oates*
Gregory A. Russo
Officers
Andrew G. Arnott
President
Francis V. Knox, Jr.
Chief Compliance Officer
Charles A. Rizzo
Chief Financial Officer
Salvatore Schiavone
Treasurer
Christopher (Kit) Sechler
Secretary and Chief Legal Officer
| Investment advisor
John Hancock Investment Management LLC
Subadvisor
Stone Harbor Investment Partners LP
Portfolio Managers
James E. Craige
Roger M. Lavan
Catherine M. Nolan
Peter J. Wilby
David A. Oliver
Matthew Kearns
Hunter C. Schwarz
David A. Torchia
William W. Perry
Stuart W. Sclater-Booth
Kumaran K. Damodaran
Principal distributor
John Hancock Investment Management Distributors LLC
Custodian
State Street Bank and Trust Company
Transfer agent
John Hancock Signature Services, Inc.
Legal counsel
K&L Gates LLP
|
* Member of the Audit Committee
† Non-Independent Trustee
The fund's proxy voting policies and procedures, as well as the fund proxy voting record for the most recent twelve-month period ended June 30, are available free of charge on the Securities and Exchange Commission (SEC) website at sec.gov or on our website.
All of the fund's holdings as of the end of the third month of every fiscal quarter are filed with the SEC on Form N-PORT within 60 days of the end of the fiscal quarter. The fund's Form N-PORT filings are available on our website and the SEC's website, sec.gov.
We make this information on your fund, as well asmonthly portfolio holdings, and other fund details available on our website at jhinvestments.com or by calling 800-225-5291.
| | | | |
| | You can also contact us: |
| | 800-225-5291
jhinvestments.com | Regular mail:
John Hancock Signature Services, Inc.
P.O. Box 55913
Boston, MA 02205-5913
| Express mail:
John Hancock Signature Services, Inc.
2000 Crown Colony Drive
Suite 55913
Quincy, MA 02169-0953
|
SEMIANNUAL REPORT | JOHN HANCOCK SHORT DURATION CREDIT OPPORTUNITIES FUND 70
John Hancock family of funds
| | | |
DOMESTIC EQUITY FUNDS
Blue Chip Growth
Classic Value
Disciplined Value
Disciplined Value Mid Cap
Equity Income
Financial Industries
Fundamental All Cap Core
Fundamental Large Cap Core
New Opportunities
Regional Bank
Small Cap Core
Small Cap Growth
Small Cap Value
U.S. Global Leaders Growth
U.S. Quality Growth
GLOBAL AND INTERNATIONAL EQUITY FUNDS
Disciplined Value International
Emerging Markets
Emerging Markets Equity
Fundamental Global Franchise
Global Equity
Global Shareholder Yield
Global Thematic Opportunities
International Dynamic Growth
International Growth
International Small Company
| | INCOME FUNDS
Bond
California Tax-Free Income
Emerging Markets Debt
Floating Rate Income
Government Income
High Yield
High Yield Municipal Bond
Income
Investment Grade Bond
Money Market
Short Duration Bond
Short Duration Credit Opportunities
Strategic Income Opportunities
Tax-Free Bond
ALTERNATIVE AND SPECIALTY FUNDS
Absolute Return Currency
Alternative Asset Allocation
Alternative Risk Premia
Diversified Macro
Infrastructure
Multi-Asset Absolute Return
Seaport Long/Short
|
A fund's investment objectives, risks, charges, and expenses should be considered carefully before investing. The prospectus contains this and other important information about the fund. To obtain a prospectus, contact your financial professional, call John Hancock Investment Management at 800-225-5291, or visit our website at jhinvestments.com. Please read the prospectus carefully before investing or sending money.
| | | |
ASSET ALLOCATION
Balanced
Income Allocation
Multi-Index Lifetime Portfolios
Multi-Index Preservation Portfolios
Multimanager Lifestyle Portfolios
Multimanager Lifetime Portfolios
Retirement Income 2040
EXCHANGE-TRADED FUNDS
John Hancock Multifactor Consumer Discretionary ETF
John Hancock Multifactor Consumer Staples ETF
John Hancock Multifactor Developed International ETF
John Hancock Multifactor Emerging Markets ETF
John Hancock Multifactor Energy ETF
John Hancock Multifactor Financials ETF
John Hancock Multifactor Healthcare ETF
John Hancock Multifactor Industrials ETF
John Hancock Multifactor Large Cap ETF
John Hancock Multifactor Materials ETF
John Hancock Multifactor Media and
Communications ETF
John Hancock Multifactor Mid Cap ETF
John Hancock Multifactor Small Cap ETF
John Hancock Multifactor Technology ETF
John Hancock Multifactor Utilities ETF
| | ENVIRONMENTAL, SOCIAL, AND
GOVERNANCE FUNDS
ESG All Cap Core
ESG Core Bond
ESG International Equity
ESG Large Cap Core
CLOSED-END FUNDS
Financial Opportunities
Hedged Equity & Income
Income Securities Trust
Investors Trust
Preferred Income
Preferred Income II
Preferred Income III
Premium Dividend
Tax-Advantaged Dividend Income
Tax-Advantaged Global Shareholder Yield
|
John Hancock Multifactor ETF shares are bought and sold at market price (not NAV), and are not individually redeemed
from the fund. Brokerage commissions will reduce returns.
John Hancock ETFs are distributed by Foreside Fund Services, LLC, and are subadvised by Dimensional Fund Advisors LP.
Foreside is not affiliated with John Hancock Investment Management Distributors LLC or Dimensional Fund Advisors LP.
Dimensional Fund Advisors LP receives compensation from John Hancock in connection with licensing rights to the
John Hancock Dimensional indexes. Dimensional Fund Advisors LP does not sponsor, endorse, or sell, and makes no
representation as to the advisability of investing in, John Hancock Multifactor ETFs.
John Hancock Investment Management
A trusted brand
John Hancock Investment Management is a premier asset manager
representing one of America's most trusted brands, with a heritage of
financial stewardship dating back to 1862. Helping our shareholders
pursue their financial goals is at the core of everything we do. It's why
we support the role of professional financial advice and operate with
the highest standards of conduct and integrity.
A better way to invest
We serve investors globally through a unique multimanager approach:
We search the world to find proven portfolio teams with specialized
expertise for every strategy we offer, then we apply robust investment
oversight to ensure they continue to meet our uncompromising
standards and serve the best interests of our shareholders.
Results for investors
Our unique approach to asset management enables us to provide
a diverse set of investments backed by some of the world's best
managers, along with strong risk-adjusted returns across asset classes.
John Hancock Investment Management Distributors LLC n Member FINRA, SIPC
200 Berkeley Street n Boston, MA 02116-5010 n 800-225-5291 n jhinvestments.com
This report is for the information of the shareholders of John Hancock Short Duration Credit Opportunities Fund. It is not authorized for distribution to prospective investors unless preceded or accompanied by a prospectus.
| | |
| MF1078052 | 350SA 1/20
3/2020 |
John Hancock
Absolute Return Currency Fund
Semiannual report 1/31/2020
Beginning on January 1, 2021, as permitted by regulations adopted by the Securities and Exchange Commission, paper copies of the fund's shareholder reports like this one will no longer be sent by mail, unless you specifically request paper copies of the reports from the fund or from your financial intermediary. Instead, the reports will be made available on a website, and you will be notified by mail each time a report is posted and provided with a website link to access the report.
If you already elected to receive shareholder reports electronically, you will not be affected by this change, and you do not need to take any action. You may elect to receive shareholder reports and other communications electronically by calling John Hancock Investment Management at 800-225-5291 (Class A and Class C shares) or 888-972-8696 (Class I, Class R2, Class R4, Class R6, and Class NAV shares) or by contacting your financial intermediary.
You may elect to receive all reports in paper, free of charge, at any time. You can inform John Hancock Investment Management or your financial intermediary that you wish to continue receiving paper copies of your shareholder reports by following the instructions listed above. Your election to receive reports in paper will apply to all funds held with John Hancock Investment Management or your financial intermediary.

A message to shareholders
Dear shareholder,
Global financial markets delivered positive returns during the 6 months ended January 31, 2020. Stocks were particularly strong in the United States, where they delivered positive returns across most economic sectors. Investors benefited from a combination of low inflation, accommodative central bank policy, healthy fundamentals, and corporate buybacks of stock. Investors in non-U.S. equities also saw strong gains, fueled in part by similarly supportive monetary policy and some signs of strength in developing markets. In today's environment of low inflation and declining interest rates, bonds have also fared well, with U.S. corporate bonds delivering positive returns.
After a strong period of positive returns—in a historically long bull market—investors are prudent to consider the risks to future gains. Growth has slowed in the United States, with some negative data in manufacturing reflecting concerns over international trade and wavering business confidence. Additionally, the spread of the coronavirus, trade disputes, and other geopolitical tensions may continue to create uncertainty among businesses and skepticism among investors. Your financial advisor can helpposition your portfolio so that it's sufficiently diversified to meet your long-term objectives and to withstand the inevitable bouts of market volatility along the way.
On behalf of everyone at John Hancock Investment Management, I'd like to take this opportunity to welcome new shareholders and thank existing shareholders for the continued trust you've placed in us.
Sincerely,
Andrew G. Arnott
President and CEO,
John Hancock Investment Management
Head of Wealth and Asset Management,
United States and Europe
This commentary reflects the CEO's views as of this report's period end and are subject to change at any time. Diversification does not guarantee investment returns and does not eliminate risk of loss. All investments entail risks, including the possible loss of principal. For more up-to-date information, you can visit our website at jhinvestments.com.
.
John Hancock
Absolute Return Currency Fund
Table of contents
| | | |
| 2 | | Your fund at a glance |
| 3 | | Portfolio summary |
| 4 | | A look at performance |
| 6 | | Your expenses |
| 8 | | Fund's investments |
| 11 | | Financial statements |
| 14 | | Financial highlights |
| 20 | | Notes to financial statements |
| 30 | | More information |
SEMIANNUAL REPORT | JOHN HANCOCK ABSOLUTE RETURN CURRENCY FUND 1
INVESTMENT OBJECTIVE
The fund seeks to achieve absolute return from investments in currency markets.
AVERAGE ANNUAL TOTAL RETURNS AS OF 1/31/2020 (%)
* Formerly known as Citigroup 1-Month U.S. Treasury Bill Index
The FTSE 1-Month U.S. Treasury Bill Index is an unmanaged index representing monthly return equivalents of yield averages of the last one-month Treasury Bill issue.
It is not possible to invest directly in an index. Index figures do not reflect expenses or sales charges, which would result in lower returns.
Figures from Morningstar, Inc. include reinvested distributions and do not take into account sales charges. Actual load-adjusted performance is lower. Since-inception returns for the Morningstar fund category average are not available.
The past performance shown here reflects reinvested distributions and the beneficial effect of any expense reductions, and does not guarantee future results. Returns for periods shorter than one year are cumulative. Performance of the other share classes will vary based on the difference in the fees and expenses of those classes. Shares will fluctuate in value and, when redeemed, may be worth more or less than their original cost. Current month-end performance may be lower or higher than the performance cited, and can be found at jhinvestments.com or by calling 800-225-5291. For further information on the fund's objectives, risks, and strategy, see the fund's prospectus.
SEMIANNUAL REPORT | JOHN HANCOCK ABSOLUTE RETURN CURRENCY FUND 2
CURRENCY ALLOCATION AS OF 1/31/2020 (%)
A note about risks
The fund is subject to various risks as described in the fund's prospectus. For more information, please refer to the "Principal risks" section of the prospectus.
SEMIANNUAL REPORT | JOHN HANCOCK ABSOLUTE RETURN CURRENCY FUND 3
TOTAL RETURNS FOR THE PERIOD ENDED JANUARY 31, 2020
| | | | | | | | |
Average annual total returns (%)
with maximum sales charge | | Cumulative total returns (%)
with maximum sales charge |
| | 1-year | 5-year | Since
inception1 | | 6-month | 5-year | Since
inception1 |
| Class A | -4.39 | 0.02 | -0.47 | | -3.23 | 0.08 | -4.34 |
| Class C2 | -3.05 | -0.08 | -0.56 | | -1.61 | -0.41 | -5.23 |
| Class I3 | -1.14 | 0.93 | 0.22 | | -0.05 | 4.74 | 2.09 |
| Class R22,3 | -1.30 | 0.73 | -0.09 | | -0.21 | 3.72 | -0.82 |
| Class R62,3 | -0.91 | 1.08 | 0.26 | | -0.05 | 5.53 | 2.49 |
| Class NAV3 | -0.90 | 1.08 | 0.37 | | -0.04 | 5.52 | 3.58 |
| Index† | 2.12 | 1.03 | 0.57 | | 0.91 | 5.27 | 5.50 |
Performance figures assume all distributions have been reinvested. Figures reflect maximum sales charges on Class A shares of 3.00% and the applicable contingent deferred sales charge (CDSC) on Class C shares. Class C shares sold within one year of purchase are subject to a 1% CDSC. Sales charges are not applicable to Class I, Class R2, Class R6, and Class NAV shares.
The expense ratios of the fund, both net (including any fee waivers and/or expense limitations) and gross (excluding any fee waivers and/or expense limitations), are set forth according to the most recent publicly available prospectuses for the fund and may differ from those disclosed in the Financial highlights tables in this report. Net expenses reflect contractual expense limitations in effect until July 31, 2021 and are subject to change. Had the contractual fee waivers and expense limitations not been in place, gross expenses would apply. The expense ratios are as follows:
| | | | | | | |
| | Class A | Class C | Class I | Class R2 | Class R6 | Class NAV |
| Gross (%) | 1.37 | 2.07 | 1.07 | 1.46 | 0.96 | 0.95 |
| Net (%) | 1.36 | 2.06 | 1.06 | 1.45 | 0.95 | 0.94 |
Please refer to the most recent prospectus and annual or semiannual report for more information on expenses and any expense limitation arrangements for each class.
The returns reflect past results and should not be considered indicative of future performance. The return and principal value of an investment will fluctuate so that shares, when redeemed, may be worth more or less than their original cost. Due to market volatility and other factors, the fund's current performance may be higher or lower than the performance shown. For current to the most recent month-end performance data, please call 800-225-5291 or visit the fund's website at jhinvestments.com.
The performance table above and the chart on the next page do not reflect the deduction of taxes that a shareholder would pay on fund distributions or the redemption of fund shares. The fund's performance results reflect any applicable fee waivers or expense reductions, without which the expenses would increase and results would have been less favorable.
| † | Index is the FTSE 1-Month U.S. Treasury Bill Index. |
See the following page for footnotes.
SEMIANNUAL REPORT | JOHN HANCOCK ABSOLUTE RETURN CURRENCY FUND 4
This chart and table show what happened to a hypothetical $10,000 investment in John Hancock Absolute Return Currency Fund for the share classes and periods indicated, assuming all distributions were reinvested. For comparison, we've shown the same investment in the FTSE 1-Month U.S. Treasury Bill Index.
| | | | | |
| | Start date | With maximum
sales charge ($) | Without
sales charge ($) | Index ($) |
| Class C2,4 | 8-2-10 | 9,477 | 9,477 | 10,550 |
| Class I3 | 8-2-10 | 10,209 | 10,209 | 10,550 |
| Class R22,3 | 8-2-10 | 9,918 | 9,918 | 10,550 |
| Class R62,3 | 8-2-10 | 10,249 | 10,249 | 10,550 |
| Class NAV3 | 8-2-10 | 10,358 | 10,358 | 10,550 |
The FTSE 1-Month U.S. Treasury Bill Index is an unmanaged index representing monthly return equivalents of yield averages of the last one-month Treasury Bill issue.
It is not possible to invest directly in an index. Index figures do not reflect expenses or sales charges, which would result in lower returns.
Footnotes related to performance pages
| 1 | From 8-2-10. |
| 2 | Class C shares were first offered on 8-28-14; Class R2 shares were first offered on 3-27-15; Class R6 shares were first offered on 11-1-11. Returns prior to these dates are those of Class A shares (first offered on 8-2-10) that have not been adjusted for class-specific expenses; otherwise, returns would vary. |
| 3 | For certain types of investors as described in the fund's prospectuses. |
| 4 | The contingent deferred sales charge is not applicable. |
SEMIANNUAL REPORT | JOHN HANCOCK ABSOLUTE RETURN CURRENCY FUND 5
These examples are intended to help you understand your ongoing operating expenses of investing in the fund so you can compare these costs with the ongoing costs of investing in other mutual funds.
Understanding fund expenses
As a shareholder of the fund, you incur two types of costs:
■Transaction costs,which include sales charges (loads) on purchases or redemptions (varies by share class), minimum account fee charge, etc.
■Ongoing operating expenses, including management fees, distribution and service fees (if applicable), and other fund expenses.
We are presenting only your ongoing operating expenses here.
Actual expenses/actual returns
The first line of each share class in the table on the following page is intended to provide information about the fund’s actual ongoing operating expenses, and is based on the fund’s actual return. It assumes an account value of $1,000.00 on August 1, 2019, with the same investment held until January 31, 2020.
Together with the value of your account, you may use this information to estimate the operating expenses that you paid over the period. Simply divide your account value at January 31, 2020, by $1,000.00, then multiply it by the “expenses paid” for your share class from the table. For example, for an account value of $8,600.00, the operating expenses should be calculated as follows:
Hypothetical example for comparison purposes
The second line of each share class in the table on the following page allows you to compare the fund’s ongoing operating expenses with those of any other fund. It provides an example of the fund’s hypothetical account values and hypothetical expenses based on each class’s actual expense ratio and an assumed 5% annualized return before expenses (which is not the class’s actual return). It assumes an account value of $1,000.00 on August 1, 2019, with the same investment held until January 31, 2020. Look in any other fund shareholder report to find its hypothetical example and you will be able to compare these expenses. Please remember that these hypothetical account values and expenses may not be used to estimate the actual ending account balance or expenses you paid for the period.
| 6 | JOHN HANCOCK ABSOLUTE RETURN CURRENCY FUND | SEMIANNUAL REPORT | |
Remember, these examples do not include any transaction costs, therefore, these examples will not help you to determine the relative total costs of owning different funds. If transaction costs were included, your expenses would have been higher. See the prospectuses for details regarding transaction costs.
SHAREHOLDER EXPENSE EXAMPLE CHART
| | | Account
value on
8-1-2019 | Ending
value on
1-31-2020 | Expenses
paid during
period ended
1-31-20201 | Annualized
expense
ratio |
| Class A | Actual expenses/actual returns | $1,000.00 | $997.50 | $7.03 | 1.40% |
| | Hypothetical example | 1,000.00 | 1,018.10 | 7.10 | 1.40% |
| Class C | Actual expenses/actual returns | 1,000.00 | 993.70 | 10.52 | 2.10% |
| | Hypothetical example | 1,000.00 | 1,014.60 | 10.63 | 2.10% |
| Class I | Actual expenses/actual returns | 1,000.00 | 999.50 | 5.53 | 1.10% |
| | Hypothetical example | 1,000.00 | 1,019.60 | 5.58 | 1.10% |
| Class R2 | Actual expenses/actual returns | 1,000.00 | 997.90 | 6.63 | 1.32% |
| | Hypothetical example | 1,000.00 | 1,018.50 | 6.70 | 1.32% |
| Class R6 | Actual expenses/actual returns | 1,000.00 | 999.50 | 4.98 | 0.99% |
| | Hypothetical example | 1,000.00 | 1,020.20 | 5.03 | 0.99% |
| Class NAV | Actual expenses/actual returns | 1,000.00 | 999.60 | 4.93 | 0.98% |
| | Hypothetical example | 1,000.00 | 1,020.20 | 4.98 | 0.98% |
| 1 | Expenses are equal to the annualized expense ratio, multiplied by the average account value over the period, multiplied by 184/366 (to reflect the one-half year period). |
| | SEMIANNUAL REPORT | JOHN HANCOCK ABSOLUTE RETURN CURRENCY FUND | 7 |
AS OF 1-31-20 (unaudited)
| | Yield* (%) | Maturity date | | Par value^ | Value |
| Short-term investments 101.6% | | | | | $514,342,627 |
| (Cost $514,312,257) | | | | | |
| U.S. Government 91.1% | | | | | 461,125,484 |
| U.S. Treasury Bill (A) | 1.450 | 02-27-20 | | 245,000,000 | 244,759,762 |
| U.S. Treasury Bill | 1.520 | 04-23-20 | | 167,000,000 | 166,431,582 |
| U.S. Treasury Bill (A) | 1.530 | 03-05-20 | | 50,000,000 | 49,934,140 |
| | | Yield (%) | | Shares | Value |
| Short-term funds 10.5% | | | | | 53,217,143 |
|
| State Street Institutional Treasury Plus Money Market Fund, Premier Class | 1.5156(B) | | 53,217,143 | 53,217,143 |
|
| Total investments (Cost $514,312,257) 101.6% | | | $514,342,627 |
| Other assets and liabilities, net (1.6%) | | | | (8,011,958) |
| Total net assets 100.0% | | | | | $506,330,669 |
| The percentage shown for each investment category is the total value of the category as a percentage of the net assets of the fund. |
| ^All par values are denominated in U.S. dollars unless otherwise indicated. |
| Security Abbreviations and Legend |
| (A) | All or a portion of this security is segregated at the custodian as collateral for certain derivatives. |
| (B) | The rate shown is the annualized seven-day yield as of 1-31-20. |
| * | Yield represents either the annualized yield at the date of purchase, the stated coupon rate or, for floating rate securities, the rate at period end. |
| 8 | JOHN HANCOCK ABSOLUTE RETURN CURRENCY FUND | SEMIANNUAL REPORT | SEE NOTES TO FINANCIAL STATEMENTS |
DERIVATIVES
FORWARD FOREIGN CURRENCY CONTRACTS
| Contract to buy | Contract to sell | Counterparty (OTC) | Contractual
settlement
date | Unrealized
appreciation | Unrealized
depreciation |
| AUD | 395,389,274 | USD | 270,333,315 | CITI | 3/18/2020 | — | $(5,452,579) |
| AUD | 395,389,274 | USD | 270,342,105 | DB | 3/18/2020 | — | (5,461,370) |
| AUD | 395,389,274 | USD | 270,560,517 | MSCS | 3/18/2020 | — | (5,679,781) |
| CAD | 169,530,473 | USD | 129,136,203 | CITI | 3/18/2020 | — | (1,038,858) |
| CAD | 169,530,473 | USD | 129,151,328 | DB | 3/18/2020 | — | (1,053,963) |
| CAD | 169,530,473 | USD | 129,135,642 | MSCS | 3/18/2020 | — | (1,038,297) |
| EUR | 218,379,864 | USD | 243,002,821 | CITI | 3/18/2020 | — | (169,397) |
| EUR | 218,379,864 | USD | 245,483,800 | DB | 3/18/2020 | — | (2,650,375) |
| EUR | 218,379,864 | USD | 243,855,526 | MSCS | 3/18/2020 | — | (1,022,102) |
| GBP | 131,976,536 | USD | 173,160,433 | CITI | 3/18/2020 | $1,314,652 | — |
| GBP | 131,976,536 | USD | 173,289,635 | DB | 3/18/2020 | 1,185,450 | — |
| GBP | 131,976,536 | USD | 173,217,407 | MSCS | 3/18/2020 | 1,257,678 | — |
| JPY | 9,329,957,386 | USD | 86,065,387 | CITI | 3/18/2020 | 239,329 | — |
| JPY | 9,329,957,386 | USD | 86,065,440 | DB | 3/18/2020 | 239,275 | — |
| JPY | 9,329,957,386 | USD | 86,059,708 | MSCS | 3/18/2020 | 245,007 | — |
| NOK | 1,820,228,065 | USD | 201,813,750 | CITI | 3/18/2020 | — | (3,885,273) |
| NOK | 1,820,228,065 | USD | 201,813,761 | DB | 3/18/2020 | — | (3,885,284) |
| NOK | 1,820,287,372 | USD | 201,804,865 | MSCS | 3/18/2020 | — | (3,869,939) |
| NZD | 219,256,777 | USD | 143,724,396 | CITI | 3/18/2020 | — | (1,919,445) |
| NZD | 219,256,777 | USD | 144,915,844 | DB | 3/18/2020 | — | (3,110,893) |
| NZD | 219,256,777 | USD | 143,724,178 | MSCS | 3/18/2020 | — | (1,919,227) |
| SEK | 2,541,022,094 | USD | 271,719,239 | CITI | 3/18/2020 | — | (7,232,528) |
| SEK | 2,541,022,094 | USD | 270,340,351 | DB | 3/18/2020 | — | (5,853,640) |
| SEK | 2,541,022,094 | USD | 270,339,324 | MSCS | 3/18/2020 | — | (5,852,613) |
| SGD | 191,093,755 | USD | 140,756,438 | CITI | 3/18/2020 | — | (705,546) |
| SGD | 191,093,755 | USD | 140,756,260 | DB | 3/18/2020 | — | (705,368) |
| SGD | 191,093,755 | USD | 140,755,742 | MSCS | 3/18/2020 | — | (704,850) |
| USD | 236,178,109 | AUD | 342,586,924 | CITI | 3/18/2020 | 6,670,930 | — |
| USD | 236,268,652 | AUD | 342,586,924 | DB | 3/18/2020 | 6,761,475 | — |
| USD | 236,102,663 | AUD | 342,586,924 | MSCS | 3/18/2020 | 6,595,485 | — |
| USD | 131,665,031 | CAD | 173,394,110 | CITI | 3/18/2020 | 648,319 | — |
| USD | 131,665,132 | CAD | 173,394,110 | DB | 3/18/2020 | 648,420 | — |
| USD | 131,665,631 | CAD | 173,394,110 | MSCS | 3/18/2020 | 648,919 | — |
| USD | 107,683,874 | EUR | 96,420,913 | CITI | 3/18/2020 | 466,020 | — |
| USD | 107,684,042 | EUR | 96,420,913 | DB | 3/18/2020 | 466,188 | — |
| USD | 107,684,434 | EUR | 96,420,913 | MSCS | 3/18/2020 | 466,579 | — |
| USD | 212,778,995 | GBP | 161,979,431 | CITI | 3/18/2020 | — | (1,360,395) |
| USD | 212,464,119 | GBP | 161,979,431 | DB | 3/18/2020 | — | (1,675,272) |
| USD | 212,503,295 | GBP | 161,979,431 | MSCS | 3/18/2020 | — | (1,636,096) |
| USD | 74,781,549 | JPY | 8,135,126,957 | CITI | 3/18/2020 | — | (470,650) |
| USD | 74,781,552 | JPY | 8,135,126,957 | DB | 3/18/2020 | — | (470,648) |
| SEE NOTES TO FINANCIAL STATEMENTS | SEMIANNUAL REPORT | JOHN HANCOCK ABSOLUTE RETURN CURRENCY FUND | 9 |
FORWARD FOREIGN CURRENCY CONTRACTS (continued)
| Contract to buy | Contract to sell | Counterparty (OTC) | Contractual
settlement
date | Unrealized
appreciation | Unrealized
depreciation |
| USD | 74,781,843 | JPY | 8,135,126,957 | MSCS | 3/18/2020 | — | $(470,357) |
| USD | 336,990,023 | NOK | 3,064,469,049 | CITI | 3/18/2020 | $3,764,917 | — |
| USD | 336,968,642 | NOK | 3,064,469,049 | DB | 3/18/2020 | 3,743,516 | — |
| USD | 337,659,723 | NOK | 3,064,528,356 | MSCS | 3/18/2020 | 4,428,167 | — |
| USD | 139,187,556 | NZD | 210,258,017 | CITI | 3/18/2020 | 3,202,580 | — |
| USD | 139,251,211 | NZD | 210,258,017 | DB | 3/18/2020 | 3,266,234 | — |
| USD | 139,130,306 | NZD | 210,258,017 | MSCS | 3/18/2020 | 3,145,329 | — |
| USD | 131,605,277 | SEK | 1,241,196,807 | CITI | 3/18/2020 | 2,413,145 | — |
| USD | 131,605,474 | SEK | 1,241,196,807 | DB | 3/18/2020 | 2,413,342 | — |
| USD | 131,640,135 | SEK | 1,241,196,807 | MSCS | 3/18/2020 | 2,448,003 | — |
| USD | 227,726,629 | SGD | 308,603,780 | CITI | 3/18/2020 | 1,553,698 | — |
| USD | 228,077,213 | SGD | 308,603,780 | DB | 3/18/2020 | 1,904,282 | — |
| USD | 227,672,323 | SGD | 308,603,780 | MSCS | 3/18/2020 | 1,499,392 | — |
| | | | | | | $61,636,331 | $(69,294,746) |
| Derivatives Currency Abbreviations |
| AUD | Australian Dollar |
| CAD | Canadian Dollar |
| EUR | Euro |
| GBP | Pound Sterling |
| JPY | Japanese Yen |
| NOK | Norwegian Krone |
| NZD | New Zealand Dollar |
| SEK | Swedish Krona |
| SGD | Singapore Dollar |
| USD | U.S. Dollar |
| Derivatives Abbreviations |
| CITI | Citibank, N.A. |
| DB | Deutsche Bank AG |
| MSCS | Morgan Stanley Capital Services LLC |
| OTC | Over-the-counter |
At 1-31-20, the aggregate cost of investments for federal income tax purposes was $514,312,257. Net unrealized depreciation aggregated to $7,628,045, of which $30,370 related to gross unrealized appreciation and $7,658,415 related to gross unrealized depreciation.
See Notes to financial statements regarding investment transactions and other derivatives information.
| 10 | JOHN HANCOCK ABSOLUTE RETURN CURRENCY FUND | SEMIANNUAL REPORT | SEE NOTES TO FINANCIAL STATEMENTS |
STATEMENT OF ASSETS AND LIABILITIES 1-31-20 (unaudited)
| Assets | |
| Unaffiliated investments, at value (Cost $514,312,257) | $514,342,627 |
| Unrealized appreciation on forward foreign currency contracts | 61,636,331 |
| Interest receivable | 48,170 |
| Receivable for fund shares sold | 228,850 |
| Other assets | 66,512 |
| Total assets | 576,322,490 |
| Liabilities | |
| Unrealized depreciation on forward foreign currency contracts | 69,294,746 |
| Payable for fund shares repurchased | 534,595 |
| Payable to affiliates | |
| Transfer agent fees | 16,225 |
| Distribution and service fees | 7 |
| Trustees' fees | 3,295 |
| Other liabilities and accrued expenses | 142,953 |
| Total liabilities | 69,991,821 |
| Net assets | $506,330,669 |
| Net assets consist of | |
| Paid-in capital | $684,430,893 |
| Total distributable earnings (loss) | (178,100,224) |
| Net assets | $506,330,669 |
| |
| Net asset value per share | |
| Based on net asset value and shares outstanding - the fund has an unlimited number of shares authorized with no par value | |
| Class A ($11,905,762 ÷ 1,399,333 shares)1 | $8.51 |
| Class C ($304,620 ÷ 35,847 shares)1 | $8.50 |
| Class I ($143,927,908 ÷ 16,399,968 shares) | $8.78 |
| Class R2 ($44,677 ÷ 5,087 shares) | $8.78 |
| Class R6 ($749,543 ÷ 84,554 shares) | $8.86 |
| Class NAV ($349,398,159 ÷ 39,288,781 shares) | $8.89 |
| Maximum offering price per share | |
| Class A (net asset value per share ÷ 97%)2 | $8.77 |
| 1 | Redemption price per share is equal to net asset value less any applicable contingent deferred sales charge. |
| 2 | On single retail sales of less than $100,000. On sales of $100,000 or more and on group sales the offering price is reduced. |
| SEE NOTES TO FINANCIAL STATEMENTS | SEMIANNUAL REPORT | JOHN HANCOCK ABSOLUTE RETURN CURRENCY FUND | 11 |
STATEMENT OF OPERATIONSFor the six months ended 1-31-20 (unaudited)
| Investment income | |
| Interest | $7,600,978 |
| Expenses | |
| Investment management fees | 3,580,882 |
| Distribution and service fees | 20,776 |
| Accounting and legal services fees | 63,442 |
| Transfer agent fees | 252,608 |
| Trustees' fees | 9,729 |
| Custodian fees | 116,366 |
| State registration fees | 47,105 |
| Printing and postage | 34,794 |
| Professional fees | 60,387 |
| Other | 22,740 |
| Total expenses | 4,208,829 |
| Less expense reductions | (29,818) |
| Net expenses | 4,179,011 |
| Net investment income | 3,421,967 |
| Realized and unrealized gain (loss) | |
| Net realized gain (loss) on | |
| Unaffiliated investments | 30,962 |
| Forward foreign currency contracts | 7,186,482 |
| | 7,217,444 |
| Change in net unrealized appreciation (depreciation) of | |
| Unaffiliated investments | (113,272) |
| Forward foreign currency contracts | (9,096,473) |
| | (9,209,745) |
| Net realized and unrealized loss | (1,992,301) |
| Increase in net assets from operations | $1,429,666 |
| 12 | JOHN HANCOCK ABSOLUTE RETURN CURRENCY FUND | SEMIANNUAL REPORT | SEE NOTES TO FINANCIAL STATEMENTS |
STATEMENTS OF CHANGES IN NET ASSETS
| | Six months ended
1-31-20
(unaudited) | Year ended
7-31-19 |
| Increase (decrease) in net assets | | |
| From operations | | |
| Net investment income | $3,421,967 | $16,014,294 |
| Net realized gain | 7,217,444 | 6,357,567 |
| Change in net unrealized appreciation (depreciation) | (9,209,745) | 18,440,680 |
| Increase in net assets resulting from operations | 1,429,666 | 40,812,541 |
| Distributions to shareholders | | |
| From earnings | | |
| Class A | (333,453) | (51,210) |
| Class C | (6,228) | — |
| Class I | (5,217,249) | (4,347,079) |
| Class R2 | (1,228) | (333) |
| Class R41 | — | (275) |
| Class R6 | (23,976) | (36,867) |
| Class NAV | (10,496,686) | (4,065,435) |
| Total distributions | (16,078,820) | (8,501,199) |
| From fund share transactions | (519,018,105) | (468,800,538) |
| Total decrease | (533,667,259) | (436,489,196) |
| Net assets | | |
| Beginning of period | 1,039,997,928 | 1,476,487,124 |
| End of period | $506,330,669 | $1,039,997,928 |
| 1 | Class R4 shares were fully redeemed on 10-29-19. |
| SEE NOTES TO FINANCIAL STATEMENTS | SEMIANNUAL REPORT | JOHN HANCOCK ABSOLUTE RETURN CURRENCY FUND | 13 |
| CLASS A SHARES Period ended | 1-31-201 | 7-31-19 | 7-31-18 | 7-31-17 | 7-31-16 | 7-31-15 |
| Per share operating performance | | | | | | |
| Net asset value, beginning of period | $8.77 | $8.59 | $9.54 | $9.11 | $8.23 | $9.63 |
| Net investment income (loss)2 | 0.02 | 0.08 | 0.01 | (0.08) | (0.10) | (0.12) |
| Net realized and unrealized gain (loss) on investments | (0.04) | 0.13 | (0.96) | 0.51 | 0.98 | (0.98) |
| Total from investment operations | (0.02) | 0.21 | (0.95) | 0.43 | 0.88 | (1.10) |
| Less distributions | | | | | | |
| From net investment income | (0.24) | (0.03) | — | — | — | — |
| From net realized gain | — | — | — | — | — | (0.30) |
| Total distributions | (0.24) | (0.03) | — | — | — | (0.30) |
| Net asset value, end of period | $8.51 | $8.77 | $8.59 | $9.54 | $9.11 | $8.23 |
| Total return (%)3,4 | (0.25)5 | 2.43 | (10.05) | 4.83 | 10.56 | (11.51) |
| Ratios and supplemental data | | | | | | |
| Net assets, end of period (in millions) | $12 | $13 | $17 | $22 | $21 | $22 |
| Ratios (as a percentage of average net assets): | | | | | | |
| Expenses before reductions | 1.416 | 1.35 | 1.33 | 1.35 | 1.37 | 1.37 |
| Expenses including reductions | 1.406 | 1.35 | 1.32 | 1.34 | 1.36 | 1.35 |
| Net investment income (loss) | 0.476 | 0.92 | 0.06 | (0.83) | (1.13) | (1.29) |
| Portfolio turnover (%)7 | 0 | 0 | 0 | 0 | 0 | 0 |
| 1 | Six months ended 1-31-20. Unaudited. |
| 2 | Based on average daily shares outstanding. |
| 3 | Total returns would have been lower had certain expenses not been reduced during the applicable periods. |
| 4 | Does not reflect the effect of sales charges, if any. |
| 5 | Not annualized. |
| 6 | Annualized. |
| 7 | The calculation of portfolio turnover excludes amounts from securities whose maturities or expiration dates at the time of acquisition were one year or less, which represents a significant amount of the investments held by the fund. As a result, the portfolio turnover is 0%. |
| 14 | JOHN HANCOCK ABSOLUTE RETURN CURRENCY FUND | SEMIANNUAL REPORT | SEE NOTES TO FINANCIAL STATEMENTS |
| CLASS C SHARES Period ended | 1-31-201 | 7-31-19 | 7-31-18 | 7-31-17 | 7-31-16 | 7-31-152 |
| Per share operating performance | | | | | | |
| Net asset value, beginning of period | $8.73 | $8.58 | $9.60 | $9.23 | $8.40 | $10.01 |
| Net investment income (loss)3 | (0.01) | 0.02 | (0.06) | (0.15) | (0.16) | (0.18) |
| Net realized and unrealized gain (loss) on investments | (0.04) | 0.13 | (0.96) | 0.52 | 0.99 | (1.13) |
| Total from investment operations | (0.05) | 0.15 | (1.02) | 0.37 | 0.83 | (1.31) |
| Less distributions | | | | | | |
| From net investment income | (0.18) | — | — | — | — | — |
| From net realized gain | — | — | — | — | — | (0.30) |
| Total distributions | (0.18) | — | — | — | — | (0.30) |
| Net asset value, end of period | $8.50 | $8.73 | $8.58 | $9.60 | $9.23 | $8.40 |
| Total return (%)4,5 | (0.63)6 | 1.75 | (10.62) | 4.01 | 9.88 | (13.29)6 |
| Ratios and supplemental data | | | | | | |
| Net assets, end of period (in millions) | $—7 | $—7 | $1 | $1 | $1 | $—7 |
| Ratios (as a percentage of average net assets): | | | | | | |
| Expenses before reductions | 2.118 | 2.05 | 2.03 | 2.05 | 2.07 | 3.048 |
| Expenses including reductions | 2.108 | 2.05 | 2.02 | 2.04 | 2.06 | 2.258 |
| Net investment income (loss) | (0.21)8 | 0.21 | (0.67) | (1.52) | (1.81) | (2.19)8 |
| Portfolio turnover (%)9 | 0 | 0 | 0 | 0 | 0 | 0 |
| 1 | Six months ended 1-31-20. Unaudited. |
| 2 | The inception date for Class C shares is 8-28-14. |
| 3 | Based on average daily shares outstanding. |
| 4 | Total returns would have been lower had certain expenses not been reduced during the applicable periods. |
| 5 | Does not reflect the effect of sales charges, if any. |
| 6 | Not annualized. |
| 7 | Less than $500,000. |
| 8 | Annualized. |
| 9 | The calculation of portfolio turnover excludes amounts from securities whose maturities or expiration dates at the time of acquisition were one year or less, which represents a significant amount of the investments held by the fund. As a result, the portfolio turnover is 0%. |
| SEE NOTES TO FINANCIAL STATEMENTS | SEMIANNUAL REPORT | JOHN HANCOCK ABSOLUTE RETURN CURRENCY FUND | 15 |
| CLASS I SHARES Period ended | 1-31-201 | 7-31-19 | 7-31-18 | 7-31-17 | 7-31-16 | 7-31-15 |
| Per share operating performance | | | | | | |
| Net asset value, beginning of period | $9.05 | $8.87 | $9.82 | $9.35 | $8.42 | $9.81 |
| Net investment income (loss)2 | 0.04 | 0.11 | 0.04 | (0.05) | (0.07) | (0.09) |
| Net realized and unrealized gain (loss) on investments | (0.04) | 0.13 | (0.99) | 0.52 | 1.00 | (1.00) |
| Total from investment operations | — | 0.24 | (0.95) | 0.47 | 0.93 | (1.09) |
| Less distributions | | | | | | |
| From net investment income | (0.27) | (0.06) | — | — | — | — |
| From net realized gain | — | — | — | — | — | (0.30) |
| Total distributions | (0.27) | (0.06) | — | — | — | (0.30) |
| Net asset value, end of period | $8.78 | $9.05 | $8.87 | $9.82 | $9.35 | $8.42 |
| Total return (%)3 | (0.05)4 | 2.67 | (9.77) | 5.13 | 11.05 | (11.29) |
| Ratios and supplemental data | | | | | | |
| Net assets, end of period (in millions) | $144 | $624 | $720 | $397 | $210 | $371 |
| Ratios (as a percentage of average net assets): | | | | | | |
| Expenses before reductions | 1.115 | 1.07 | 1.04 | 1.04 | 1.05 | 1.03 |
| Expenses including reductions | 1.105 | 1.06 | 1.03 | 1.03 | 1.04 | 1.02 |
| Net investment income (loss) | 0.835 | 1.21 | 0.42 | (0.49) | (0.82) | (0.96) |
| Portfolio turnover (%)6 | 0 | 0 | 0 | 0 | 0 | 0 |
| 1 | Six months ended 1-31-20. Unaudited. |
| 2 | Based on average daily shares outstanding. |
| 3 | Total returns would have been lower had certain expenses not been reduced during the applicable periods. |
| 4 | Not annualized. |
| 5 | Annualized. |
| 6 | The calculation of portfolio turnover excludes amounts from securities whose maturities or expiration dates at the time of acquisition were one year or less, which represents a significant amount of the investments held by the fund. As a result, the portfolio turnover is 0%. |
| 16 | JOHN HANCOCK ABSOLUTE RETURN CURRENCY FUND | SEMIANNUAL REPORT | SEE NOTES TO FINANCIAL STATEMENTS |
| CLASS R2 SHARES Period ended | 1-31-201 | 7-31-19 | 7-31-18 | 7-31-17 | 7-31-16 | 7-31-152 |
| Per share operating performance | | | | | | |
| Net asset value, beginning of period | $9.05 | $8.86 | $9.83 | $9.38 | $8.46 | $8.70 |
| Net investment income (loss)3 | 0.03 | 0.09 | 0.01 | (0.07) | (0.09) | (0.03) |
| Net realized and unrealized gain (loss) on investments | (0.06) | 0.14 | (0.98) | 0.52 | 1.01 | (0.21) |
| Total from investment operations | (0.03) | 0.23 | (0.97) | 0.45 | 0.92 | (0.24) |
| Less distributions | | | | | | |
| From net investment income | (0.24) | (0.04) | — | — | — | — |
| Net asset value, end of period | $8.78 | $9.05 | $8.86 | $9.83 | $9.38 | $8.46 |
| Total return (%)4 | (0.21)5 | 2.53 | (9.96) | 4.90 | 10.87 | (2.76)5 |
| Ratios and supplemental data | | | | | | |
| Net assets, end of period (in millions) | $—6 | $—6 | $—6 | $—6 | $—6 | $—6 |
| Ratios (as a percentage of average net assets): | | | | | | |
| Expenses before reductions | 1.337 | 1.32 | 1.27 | 1.20 | 1.23 | 1.187 |
| Expenses including reductions | 1.327 | 1.31 | 1.26 | 1.20 | 1.22 | 1.167 |
| Net investment income (loss) | 0.617 | 0.98 | 0.07 | (0.68) | (0.98) | (1.08)7 |
| Portfolio turnover (%)8 | 0 | 0 | 0 | 0 | 0 | 0 |
| 1 | Six months ended 1-31-20. Unaudited. |
| 2 | The inception date for Class R2 shares is 3-27-15. |
| 3 | Based on average daily shares outstanding. |
| 4 | Total returns would have been lower had certain expenses not been reduced during the applicable periods. |
| 5 | Not annualized. |
| 6 | Less than $500,000. |
| 7 | Annualized. |
| 8 | The calculation of portfolio turnover excludes amounts from securities whose maturities or expiration dates at the time of acquisition were one year or less, which represents a significant amount of the investments held by the fund. As a result, the portfolio turnover is 0%. |
| SEE NOTES TO FINANCIAL STATEMENTS | SEMIANNUAL REPORT | JOHN HANCOCK ABSOLUTE RETURN CURRENCY FUND | 17 |
| CLASS R6 SHARES Period ended | 1-31-201 | 7-31-19 | 7-31-18 | 7-31-17 | 7-31-16 | 7-31-15 |
| Per share operating performance | | | | | | |
| Net asset value, beginning of period | $9.15 | $8.96 | $9.91 | $9.42 | $8.48 | $9.86 |
| Net investment income (loss)2 | 0.04 | 0.10 | 0.05 | (0.03) | (0.06) | (0.08) |
| Net realized and unrealized gain (loss) on investments | (0.05) | 0.16 | (1.00) | 0.52 | 1.00 | (1.00) |
| Total from investment operations | (0.01) | 0.26 | (0.95) | 0.49 | 0.94 | (1.08) |
| Less distributions | | | | | | |
| From net investment income | (0.28) | (0.07) | — | — | — | — |
| From net realized gain | — | — | — | — | — | (0.30) |
| Total distributions | (0.28) | (0.07) | — | — | — | (0.30) |
| Net asset value, end of period | $8.86 | $9.15 | $8.96 | $9.91 | $9.42 | $8.48 |
| Total return (%)3 | (0.05)4 | 2.87 | (9.59) | 5.20 | 11.08 | (11.13) |
| Ratios and supplemental data | | | | | | |
| Net assets, end of period (in millions) | $1 | $1 | $119 | $137 | $38 | $37 |
| Ratios (as a percentage of average net assets): | | | | | | |
| Expenses before reductions | 1.005 | 0.95 | 0.94 | 0.95 | 0.96 | 0.94 |
| Expenses including reductions | 0.995 | 0.95 | 0.92 | 0.92 | 0.93 | 0.90 |
| Net investment income (loss) | 0.905 | 1.06 | 0.48 | (0.32) | (0.71) | (0.84) |
| Portfolio turnover (%)6 | 0 | 0 | 0 | 0 | 0 | 0 |
| 1 | Six months ended 1-31-20. Unaudited. |
| 2 | Based on average daily shares outstanding. |
| 3 | Total returns would have been lower had certain expenses not been reduced during the applicable periods. |
| 4 | Not annualized. |
| 5 | Annualized. |
| 6 | The calculation of portfolio turnover excludes amounts from securities whose maturities or expiration dates at the time of acquisition were one year or less, which represents a significant amount of the investments held by the fund. As a result, the portfolio turnover is 0%. |
| 18 | JOHN HANCOCK ABSOLUTE RETURN CURRENCY FUND | SEMIANNUAL REPORT | SEE NOTES TO FINANCIAL STATEMENTS |
| CLASS NAV SHARES Period ended | 1-31-201 | 7-31-19 | 7-31-18 | 7-31-17 | 7-31-16 | 7-31-15 |
| Per share operating performance | | | | | | |
| Net asset value, beginning of period | $9.18 | $8.99 | $9.94 | $9.45 | $8.50 | $9.89 |
| Net investment income (loss)2 | 0.04 | 0.12 | 0.04 | (0.04) | (0.06) | (0.08) |
| Net realized and unrealized gain (loss) on investments | (0.05) | 0.14 | (0.99) | 0.53 | 1.01 | (1.01) |
| Total from investment operations | (0.01) | 0.26 | (0.95) | 0.49 | 0.95 | (1.09) |
| Less distributions | | | | | | |
| From net investment income | (0.28) | (0.07) | — | — | — | — |
| From net realized gain | — | — | — | — | — | (0.30) |
| Total distributions | (0.28) | (0.07) | — | — | — | (0.30) |
| Net asset value, end of period | $8.89 | $9.18 | $8.99 | $9.94 | $9.45 | $8.50 |
| Total return (%)3 | (0.04)4 | 2.85 | (9.56) | 5.19 | 11.05 | (11.10) |
| Ratios and supplemental data | | | | | | |
| Net assets, end of period (in millions) | $349 | $401 | $620 | $860 | $779 | $886 |
| Ratios (as a percentage of average net assets): | | | | | | |
| Expenses before reductions | 0.995 | 0.94 | 0.92 | 0.93 | 0.94 | 0.91 |
| Expenses including reductions | 0.985 | 0.93 | 0.92 | 0.92 | 0.93 | 0.90 |
| Net investment income (loss) | 0.905 | 1.33 | 0.47 | (0.41) | (0.71) | (0.84) |
| Portfolio turnover (%)6 | 0 | 0 | 0 | 0 | 0 | 0 |
| 1 | Six months ended 1-31-20. Unaudited. |
| 2 | Based on average daily shares outstanding. |
| 3 | Total returns would have been lower had certain expenses not been reduced during the applicable periods. |
| 4 | Not annualized. |
| 5 | Annualized. |
| 6 | The calculation of portfolio turnover excludes amounts from securities whose maturities or expiration dates at the time of acquisition were one year or less, which represents a significant amount of the investments held by the fund. As a result, the portfolio turnover is 0%. |
| SEE NOTES TO FINANCIAL STATEMENTS | SEMIANNUAL REPORT | JOHN HANCOCK ABSOLUTE RETURN CURRENCY FUND | 19 |
| Notes to financial statements (unaudited) | |
Note 1—Organization
John Hancock Absolute Return Currency Fund (the fund) is a series of John Hancock Funds II (the Trust), an open-end management investment company organized as a Massachusetts business trust and registered under the Investment Company Act of 1940, as amended (the 1940 Act). The investment objective of the fund is to seek to achieve absolute return from investments in currency markets.
The fund may offer multiple classes of shares. The shares currently outstanding are detailed in the Statement of assets and liabilities. Class A and Class C shares are offered to all investors. Class I shares are offered to institutions and certain investors. Class R2 shares are available only to certain retirement and 529 plans. Class R6 shares are only available to certain retirement plans, institutions and other investors. Class NAV shares are offered to John Hancock affiliated funds of funds, retirement plans for employees of John Hancock and/or Manulife Financial Corporation, and certain 529 plans. Class C shares convert to Class A shares ten years after purchase (certain exclusions may apply). Shareholders of each class have exclusive voting rights to matters that affect that class. The distribution and service fees, if any, and transfer agent fees for each class may differ.
All Class R4 shares were redeemed on October 29, 2019.
Note 2—Significant accounting policies
The financial statements have been prepared in conformity with accounting principles generally accepted in the United States of America (US GAAP), which require management to make certain estimates and assumptions as of the date of the financial statements. Actual results could differ from those estimates and those differences could be significant. The fund qualifies as an investment company under Topic 946 of Accounting Standards Codification of US GAAP.
Events or transactions occurring after the end of the fiscal period through the date that the financial statements were issued have been evaluated in the preparation of the financial statements. The following summarizes the significant accounting policies of the fund:
Security valuation. Investments are stated at value as of the scheduled close of regular trading on the New York Stock Exchange (NYSE), normally at 4:00 P.M., Eastern Time. In case of emergency or other disruption resulting in the NYSE not opening for trading or the NYSE closing at a time other than the regularly scheduled close, the net asset value (NAV) may be determined as of the regularly scheduled close of the NYSE pursuant to the fund's Valuation Policies and Procedures.
In order to value the securities, the fund uses the following valuation techniques: Investments by the fund in open-end mutual funds are valued at their respective NAVs each business day. Debt obligations are typically valued based on the evaluated prices provided by an independent pricing vendor. Independent pricing vendors utilize matrix pricing, which takes into account factors such as institutional-size trading in similar groups of securities, yield, quality, coupon rate, maturity, type of issue, trading characteristics and other market data, as well as broker supplied prices. Forward foreign currency contracts are valued at the prevailing forward rates which are based on foreign currency exchange spot rates and forward points supplied by an independent pricing vendor.
Other portfolio securities and assets, for which reliable market quotations are not readily available, are valued at fair value as determined in good faith by the fund's Pricing Committee following procedures established by the Board of Trustees. The frequency with which these fair valuation procedures are used cannot be predicted and fair value of securities may differ significantly from the value that would have been used had a ready market for such securities existed.
| 20 | JOHN HANCOCK Absolute Return Currency Fund | SEMIANNUAL REPORT | |
The fund uses a three-tier hierarchy to prioritize the pricing assumptions, referred to as inputs, used in valuation techniques to measure fair value. Level 1 includes securities valued using quoted prices in active markets for identical securities, including registered investment companies. Level 2 includes securities valued using other significant observable inputs. Observable inputs may include quoted prices for similar securities, interest rates, prepayment speeds and credit risk. Prices for securities valued using these inputs are received from independent pricing vendors and brokers and are based on an evaluation of the inputs described. Level 3 includes securities valued using significant unobservable inputs when market prices are not readily available or reliable, including the fund's own assumptions in determining the fair value of investments. Factors used in determining value may include market or issuer specific events or trends, changes in interest rates and credit quality. The inputs or methodology used for valuing securities are not necessarily an indication of the risks associated with investing in those securities. Changes in valuation techniques and related inputs may result in transfers into or out of an assigned level within the disclosure hierarchy.
The following is a summary of the values by input classification of the fund's investments as of January 31, 2020, by major security category or type:
| | Total
value at
1-31-20 | Level 1
quoted
price | Level 2
significant
observable
inputs | Level 3
significant
unobservable
inputs |
| Investments in securities: | | | | |
| Assets | | | | |
| Short-term investments | $514,342,627 | $53,217,143 | $461,125,484 | — |
| Total investments in securities | $514,342,627 | $53,217,143 | $461,125,484 | — |
| Derivatives: | | | | |
| Assets | | | | |
| Forward foreign currency contracts | $61,636,331 | — | $61,636,331 | — |
| Liabilities | | | | |
| Forward foreign currency contracts | (69,294,746) | — | (69,294,746) | — |
Security transactions and related investment income. Investment security transactions are accounted for on a trade date plus one basis for daily NAV calculations. However, for financial reporting purposes, investment transactions are reported on trade date. Interest income is accrued as earned. Interest income includes coupon interest and amortization/accretion of premiums/discounts on debt securities. Debt obligations may be placed in a non-accrual status and related interest income may be reduced by stopping current accruals and writing off interest receivable when the collection of all or a portion of interest has become doubtful. Gains and losses on securities sold are determined on the basis of identified cost and may include proceeds from litigation.
Overdraft. The fund may have the ability to borrow from banks for temporary or emergency purposes, including meeting redemption requests that otherwise might require the untimely sale of securities. Pursuant to the fund's custodian agreement, the custodian may loan money to the fund to make properly authorized payments. The fund is obligated to repay the custodian for any overdraft, including any related costs or expenses. The custodian may have a lien, security interest or security entitlement in any fund property that is not otherwise segregated or pledged, to the extent of any overdraft, and to the maximum extent permitted by law.
| | SEMIANNUAL REPORT | JOHN HANCOCK Absolute Return Currency Fund | 21 |
Line of credit. The fund and other affiliated funds have entered into a syndicated line of credit agreement with Citibank, N.A. as the administrative agent that enables them to participate in a $750 million unsecured committed line of credit. Excluding commitments designated for a certain fund and subject to the needs of all other affiliated funds, the fund can borrow up to an aggregate commitment amount of $500 million, subject to asset coverage and other limitations as specified in the agreement. A commitment fee payable at the end of each calendar quarter, based on the average daily unused portion of the line of credit, is charged to each participating fund based on a combination of fixed and asset based allocations and is reflected in Other expenses on the Statement of operations. For the six months ended January 31, 2020, the fund had no borrowings under the line of credit. Commitment fees for the six months ended January 31, 2020 were $1,898.
Expenses. Within the John Hancock group of funds complex, expenses that are directly attributable to an individual fund are allocated to such fund. Expenses that are not readily attributable to a specific fund are allocated among all funds in an equitable manner, taking into consideration, among other things, the nature and type of expense and the fund’s relative net assets. Expense estimates are accrued in the period to which they relate and adjustments are made when actual amounts are known.
Class allocations. Income, common expenses and realized and unrealized gains (losses) are determined at the fund level and allocated daily to each class of shares based on the net assets of the class. Class-specific expenses, such as distribution and service fees, if any, and transfer agent fees, for all classes, are charged daily at the class level based on the net assets of each class and the specific expense rates applicable to each class.
Federal income taxes. The fund intends to continue to qualify as a regulated investment company by complying with the applicable provisions of the Internal Revenue Code and will not be subject to federal income tax on taxable income that is distributed to shareholders. Therefore, no federal income tax provision is required.
For federal income tax purposes, as of July 31, 2019, the fund has a short-term capital loss carryforward of $78,472,279 and a long-term capital loss carryforward of $99,829,736 available to offset future net realized capital gains. These carryforwards do not expire.
As of July 31, 2019, the fund had no uncertain tax positions that would require financial statement recognition, derecognition or disclosure. The fund's federal tax returns are subject to examination by the Internal Revenue Service for a period of three years.
Distribution of income and gains. Distributions to shareholders from net investment income and net realized gains, if any, are recorded on the ex-date. The fund generally declares and pays dividends annually. Capital gain distributions, if any, are typically distributed annually.
Distributions paid by the fund with respect to each class of shares are calculated in the same manner, at the same time and in the same amount, except for the effect of class level expenses that may be applied differently to each class.
Such distributions, on a tax basis, are determined in conformity with income tax regulations, which may differ from US GAAP. Distributions in excess of tax basis earnings and profits, if any, are reported in the fund's financial statements as a return of capital. The final determination of tax characteristics of the fund's distribution will occur at the end of the year and will subsequently be reported to shareholders.
Capital accounts within the financial statements are adjusted for permanent book-tax differences. These adjustments have no impact on net assets or the results of operations. Temporary book-tax differences, if any, will reverse in a subsequent period. Book-tax differences are primarily attributable to derivative transactions.
| 22 | JOHN HANCOCK Absolute Return Currency Fund | SEMIANNUAL REPORT | |
Note 3—Derivative instruments
The fund may invest in derivatives in order to meet its investment objective. Derivatives include a variety of different instruments that may be traded in the over-the-counter (OTC) market, on a regulated exchange or through a clearing facility. The risks in using derivatives vary depending upon the structure of the instruments, including the use of leverage, optionality, the liquidity or lack of liquidity of the contract, the creditworthiness of the counterparty or clearing organization and the volatility of the position. Some derivatives involve risks that are potentially greater than the risks associated with investing directly in the referenced securities or other referenced underlying instrument. Specifically, the fund is exposed to the risk that the counterparty to an OTC derivatives contract will be unable or unwilling to make timely settlement payments or otherwise honor its obligations. OTC derivatives transactions typically can only be closed out with the other party to the transaction.
Derivatives which are typically traded through the OTC market are regulated by the Commodity Futures Trading Commission (the CFTC). Derivative counterparty risk is managed through an ongoing evaluation of the creditworthiness of all potential counterparties and, if applicable, designated clearing organizations. The fund attempts to reduce its exposure to counterparty risk for derivatives traded in the OTC market, whenever possible, by entering into an International Swaps and Derivatives Association (ISDA) Master Agreement with each of its OTC counterparties. The ISDA gives each party to the agreement the right to terminate all transactions traded under the agreement if there is certain deterioration in the credit quality or contractual default of the other party, as defined in the ISDA. Upon an event of default or a termination of the ISDA, the non-defaulting party has the right to close out all transactions and to net amounts owed.
As defined by the ISDA, the fund may have collateral agreements with certain counterparties to mitigate counterparty risk on OTC derivatives. Subject to established minimum levels, collateral for OTC transactions is generally determined based on the net aggregate unrealized gain or loss on contracts with a particular counterparty. Collateral pledged to the fund, if any, is held in a segregated account by a third-party agent or held by the custodian bank for the benefit of the fund and can be in the form of cash or debt securities issued by the U.S. government or related agencies; collateral posted by the fund, if any, for OTC transactions is held in a segregated account at the fund's custodian and is noted in the accompanying Fund's investments, or if cash is posted, on the Statement of assets and liabilities. The fund's risk of loss due to counterparty risk is equal to the asset value of outstanding contracts offset by collateral received.
Forward foreign currency contracts. A forward foreign currency contract is an agreement between two parties to buy and sell specific currencies at a price that is set on the date of the contract. The forward contract calls for delivery of the currencies on a future date that is specified in the contract. Risks related to the use of forwards include the possible failure of counterparties to meet the terms of the forward agreement, the failure of the counterparties to timely post collateral if applicable, and the risk that currency movements will not favor the fund thereby reducing the fund's total return, and the potential for losses in excess of the amounts recognized on the Statement of assets and liabilities.
The market value of a forward foreign currency contract fluctuates with changes in foreign currency exchange rates. Forward foreign currency contracts are marked-to-market daily and the change in value is recorded by the fund as an unrealized gain or loss. Realized gains or losses, equal to the difference between the value of the contract at the time it was opened and the value at the time it was closed, are recorded upon delivery or receipt of the currency or settlement with the counterparty.
During the six months ended January 31, 2020, the fund used forward foreign currency contracts to gain exposure to foreign currencies. The fund held forward foreign currency contracts with USD notional values ranging from $9.8 billion to $12.5 billion, as measured at each quarter end.
| | SEMIANNUAL REPORT | JOHN HANCOCK Absolute Return Currency Fund | 23 |
Fair value of derivative instruments by risk category
The table below summarizes the fair value of derivatives held by the fund at January 31, 2020 by risk category:
| Risk | Statement of
assets and
liabilities location | Financial
instruments
location | Assets
derivatives
fair value | Liabilities
derivatives
fair value |
| Currency | Unrealized appreciation / depreciation on forward foreign currency contracts | Forward foreign currency contracts | $61,636,331 | $(69,294,746) |
For financial reporting purposes, the fund does not offset OTC derivative assets or liabilities that are subject to master netting arrangements, as defined by the ISDAs, in the Statement of assets and liabilities. In the event of default by the counterparty or a termination of the agreement, the ISDA allows an offset of amounts across the various transactions between the fund and the applicable counterparty. The tables below reflect the fund's exposure to OTC derivative transactions and exposure to counterparties subject to an ISDA:
| OTC Financial Instruments | Asset | Liability |
| Forward foreign currency contracts | $61,636,331 | $(69,294,746) |
| Totals | $61,636,331 | $(69,294,746) |
| Counterparty | Total Market
Value of OTC
Derivatives | Collateral
Posted by
Counterparty | Collateral
Posted by
Fund | Net
Exposure |
| Citibank, N.A. | $(1,961,081) | — | $1,961,081 | — |
| Deutsche Bank AG | (4,238,631) | — | 4,238,631 | — |
| Morgan Stanley Capital Services LLC | (1,458,703) | — | 1,458,703 | — |
| Totals | $(7,658,415) | — | $7,658,415 | — |
Effect of derivative instruments on the Statement of operations
The table below summarizes the net realized gain (loss) included in the net increase (decrease) in net assets from operations, classified by derivative instrument and risk category, for the six months ended January 31, 2020:
| | Statement of operations location - Net realized gain (loss) on: |
| Risk | Forward foreign
currency contracts |
| Currency | $7,186,482 |
The table below summarizes the net change in unrealized appreciation (depreciation) included in the net increase (decrease) in net assets from operations, classified by derivative instrument and risk category, for the six months ended January 31, 2020:
| | Statement of operations location - Change in net unrealized appreciation (depreciation) of: |
| Risk | Forward foreign
currency contracts |
| Currency | $(9,096,473) |
| 24 | JOHN HANCOCK Absolute Return Currency Fund | SEMIANNUAL REPORT | |
Note 4—Guarantees and indemnifications
Under the Trust's organizational documents, its Officers and Trustees are indemnified against certain liabilities arising out of the performance of their duties to the Trust, including the fund. Additionally, in the normal course of business, the fund enters into contracts with service providers that contain general indemnification clauses. The fund's maximum exposure under these arrangements is unknown, as this would involve future claims that may be made against the fund that have not yet occurred. The risk of material loss from such claims is considered remote.
Note 5—Fees and transactions with affiliates
John Hancock Investment Management LLC (the Advisor) serves as investment advisor for the fund. John Hancock Investment Management Distributors LLC (the Distributor), an affiliate of the Advisor, serves as principal underwriter of the fund. The Advisor and the Distributor are indirect, wholly owned subsidiaries of Manulife Financial Corporation (MFC).
Management fee. The fund has an investment management agreement with the Advisor under which the fund pays a daily management fee to the Advisor, on an annual basis, equal to the sum of: a) 0.95% of the first $250 million of the fund’s average daily net assets; b) 0.90% of the next $250 million of the fund’s average daily net assets; c) 0.85% of the next $2 billion of the fund's average daily net assets; d) 0.83% of the next $1.5 billion of the fund's average daily net assets; and e) 0.81% of the fund’s average daily net assets in excess of $4 billion. The Advisor has a subadvisory agreement with First Quadrant, L.P. The fund is not responsible for payment of the subadvisory fees.
The Advisor has contractually agreed to waive a portion of its management fee and/or reimburse expenses for certain funds of the John Hancock group of funds complex, including the fund (the participating portfolios). This waiver is based upon aggregate net assets of all the participating portfolios. The amount of the reimbursement is calculated daily and allocated among all the participating portfolios in proportion to the daily net assets of each fund. During the six months ended January 31, 2020, this waiver amounted to 0.01% of the fund’s average daily net assets on an annualized basis. This arrangement expires on July 31, 2021, unless renewed by mutual agreement of the fund and the Advisor based upon a determination that this is appropriate under the circumstances at that time.
For the six months ended January 31, 2020, the expense reductions described above amounted to the following:
| Class | Expense reduction |
| Class A | $474 |
| Class C | 13 |
| Class I | 14,947 |
| Class R2 | 2 |
| Class | Expense reduction |
| Class R4 | $1 |
| Class R6 | 35 |
| Class NAV | 14,335 |
| Total | $29,807 |
Expenses waived or reimbursed in the current fiscal period are not subject to recapture in future fiscal periods.
The investment management fees, including the impact of the waivers and reimbursements as described above, incurred for the six months ended January 31, 2020, were equivalent to a net annual effective rate of 0.89% of the fund's average daily net assets.
Accounting and legal services. Pursuant to a service agreement, the fund reimburses the Advisor for all expenses associated with providing the administrative, financial, legal, compliance, accounting and recordkeeping services to the fund, including the preparation of all tax returns, periodic reports to shareholders and regulatory
| | SEMIANNUAL REPORT | JOHN HANCOCK Absolute Return Currency Fund | 25 |
reports, among other services. These expenses are allocated to each share class based on its relative net assets at the time the expense was incurred. These accounting and legal services fees incurred for the six months ended January 31, 2020 amounted to an annual rate of 0.02% of the fund's average daily net assets.
Distribution and service plans. The fund has a distribution agreement with the Distributor. The fund has adopted distribution and service plans for certain classes as detailed below pursuant to Rule 12b-1 under the 1940 Act, to pay the Distributor for services provided as the distributor of shares of the fund. In addition, under a service plan for certain classes as detailed below, the fund pays for certain other services. The fund may pay up to the following contractual rates of distribution and service fees under these arrangements, expressed as an annual percentage of average daily net assets for each class of the fund's shares:
| Class | Rule 12b-1 Fee | Service fee |
| Class A | 0.30% | — |
| Class C | 1.00% | — |
| Class R2 | 0.25% | 0.25% |
| Class R4 | 0.25% | 0.10% |
The fund's Distributor has contractually agreed to waive 0.10% of Rule12b-1 fees for Class R4 shares. The current waiver agreement would have expired on November 30, 2019, however, Class R4 shares were fully redeemed on October 29, 2019. This contractual waiver amounted to $11 for Class R4 shares for the six months ended January 31, 2020.
Sales charges. Class A shares are assessed up-front sales charges, which resulted in payments to the Distributor amounting to $4,456 for the six months ended January 31, 2020. Of this amount, $741 was retained and used for printing prospectuses, advertising, sales literature and other purposes and $3,715 was paid as sales commissions to broker-dealers.
Class A and Class C shares may be subject to contingent deferred sales charges (CDSCs). Certain Class A shares that are acquired through purchases of $1 million or more and are redeemed within one year of purchase are subject to a 1.00% sales charge. Class C shares that are redeemed within one year of purchase are subject to a 1.00% CDSC. CDSCs are applied to the lesser of the current market value at the time of redemption or the original purchase cost of the shares being redeemed. Proceeds from CDSCs are used to compensate the Distributor for providing distribution-related services in connection with the sale of these shares. During the six months ended January 31, 2020, CDSCs received by the Distributor amounted to $15 for Class C shares. There were no CDSCs received by the Distributor for Class A shares.
Transfer agent fees. The John Hancock group of funds has a complex-wide transfer agent agreement with John Hancock Signature Services, Inc. (Signature Services), an affiliate of the Advisor. The transfer agent fees paid to Signature Services are determined based on the cost to Signature Services (Signature Services Cost) of providing recordkeeping services. It also includes out-of-pocket expenses, including payments made to third-parties for recordkeeping services provided to their clients who invest in one or more John Hancock funds. In addition, Signature Services Cost may be reduced by certain fees that Signature Services receives in connection with retirement and small accounts. Signature Services Cost is calculated monthly and allocated, as applicable, to five categories of share classes: Retail Share and Institutional Share Classes of Non-Municipal Bond Funds, Class R6 Shares, Retirement Share Classes and Municipal Bond Share Classes. Within each of these categories, the applicable costs are allocated to the affected John Hancock affiliated funds and/or classes, based on the relative average daily net assets.
| 26 | JOHN HANCOCK Absolute Return Currency Fund | SEMIANNUAL REPORT | |
Class level expenses. Class level expenses for the six months ended January 31, 2020 were as follows:
| Class | Distribution and service fees | Transfer agent fees |
| Class A | $18,861 | $7,663 |
| Class C | 1,788 | 218 |
| Class I | — | 244,661 |
| Class R2 | 99 | 4 |
| Class R4 | 28 | 1 |
| Class R6 | — | 61 |
| Total | $20,776 | $252,608 |
Trustee expenses. The fund compensates each Trustee who is not an employee of the Advisor or its affiliates. The costs of paying Trustee compensation and expenses are allocated to the fund based on its net assets relative to other funds within the John Hancock group of funds complex.
Interfund lending program. Pursuant to an Exemptive Order issued by the SEC, the fund, along with certain other funds advised by the Advisor or its affiliates, may participate in an interfund lending program. This program provides an alternative credit facility allowing the fund to borrow from, or lend money to, other participating affiliated funds. At period end, no interfund loans were outstanding. The fund's activity in this program during the period for which loans were outstanding was as follows:
Borrower
or Lender | Weighted Average
Loan Balance | Days
Outstanding | Weighted Average
Interest Rate | Interest Income
(Expense) |
| Lender | $5,400,000 | 3 | 1.550% | $698 |
Note 6—Fund share transactions
Transactions in fund shares for the six months ended January 31, 2020 and for the year ended July 31, 2019 were as follows:
| | Six Months Ended 1-31-20 | Year Ended 7-31-19 |
| | Shares | Amount | Shares | Amount |
| Class A shares | | | | |
| Sold | 101,323 | $874,381 | 287,180 | $2,526,884 |
| Distributions reinvested | 39,054 | 332,737 | 5,725 | 51,184 |
| Repurchased | (216,857) | (1,874,462) | (814,913) | (7,157,233) |
| Net decrease | (76,480) | $(667,344) | (522,008) | $(4,579,165) |
| Class C shares | | | | |
| Sold | 2,954 | $25,637 | 17,082 | $148,445 |
| Distributions reinvested | 731 | 6,228 | — | — |
| Repurchased | (17,147) | (148,048) | (49,551) | (434,067) |
| Net decrease | (13,462) | $(116,183) | (32,469) | $(285,622) |
| | SEMIANNUAL REPORT | JOHN HANCOCK Absolute Return Currency Fund | 27 |
| | Six Months Ended 1-31-20 | Year Ended 7-31-19 |
| | Shares | Amount | Shares | Amount |
| Class I shares | | | | |
| Sold | 3,992,406 | $35,949,960 | 14,812,383 | $134,090,580 |
| Distributions reinvested | 223,777 | 1,966,999 | 156,112 | 1,437,790 |
| Repurchased | (56,771,280) | (514,474,211) | (27,134,695) | (246,234,464) |
| Net decrease | (52,555,097) | $(476,557,252) | (12,166,200) | $(110,706,094) |
| Class R2 shares | | | | |
| Sold | 66 | $600 | 1,080 | $9,798 |
| Distributions reinvested | — | — | 17 | 154 |
| Repurchased | (5,072) | (45,088) | — | — |
| Net increase (decrease) | (5,006) | $(44,488) | 1,097 | $9,952 |
| Class R4 shares1 | | | | |
| Repurchased | (5,071) | $(45,808) | — | — |
| Net decrease | (5,071) | $(45,808) | — | — |
| Class R6 shares | | | | |
| Sold | 1,632 | $14,413 | 382,242 | $3,471,676 |
| Distributions reinvested | 2,703 | 23,976 | 3,907 | 36,296 |
| Repurchased | (38,975) | (352,441) | (13,576,726) | (124,240,236) |
| Net decrease | (34,640) | $(314,052) | (13,190,577) | $(120,732,264) |
| Class NAV shares | | | | |
| Sold | 378,941 | $3,374,305 | 383,886 | $3,534,200 |
| Distributions reinvested | 1,179,403 | 10,496,686 | 435,738 | 4,065,435 |
| Repurchased | (5,979,682) | (55,143,969) | (26,057,932) | (240,106,980) |
| Net decrease | (4,421,338) | $(41,272,978) | (25,238,308) | $(232,507,345) |
| Total net decrease | (57,111,094) | $(519,018,105) | (51,148,465) | $(468,800,538) |
| 1 | Class R4 shares were fully redeemed on 10-29-19. |
Affiliates of the fund owned 100% of shares of Class R2 and Class NAV on January 31, 2020. Such concentration of shareholders’ capital could have a material effect on the fund if such shareholders redeem from the fund.
Note 7—Purchase and sale of securities
For the six months ended January 31, 2020, all purchases and sales of investments were short-term.
Note 8—Investment by affiliated funds
Certain investors in the fund are affiliated funds that are managed by the Advisor and its affiliates. The affiliated funds do not invest in the fund for the purpose of exercising management or control; however, this investment may represent a significant portion of the fund's net assets. At January 31, 2020, funds within the John Hancock group of funds complex held 69.1% of the fund's net assets. The following fund(s) had an affiliate ownership of 5% or more of the fund's net assets:
| 28 | JOHN HANCOCK Absolute Return Currency Fund | SEMIANNUAL REPORT | |
| Fund | Affiliated Concentration |
| John Hancock Funds II Multimanager Lifestyle Balanced Portfolio | 18.0% |
| John Hancock Funds II Multimanager Lifestyle Growth Portfolio | 17.2% |
| John Hancock Funds II Multimanager Lifestyle Conservative Portfolio | 7.7% |
| John Hancock Funds II Multimanager Lifestyle Moderate Portfolio | 6.8% |
| | SEMIANNUAL REPORT | JOHN HANCOCK Absolute Return Currency Fund | 29 |
| | |
Trustees
Hassell H. McClellan,Chairperson
Steven R. Pruchansky,Vice Chairperson
Andrew G. Arnott†
Charles L. Bardelis*
James R. Boyle
Peter S. Burgess*
William H. Cunningham
Grace K. Fey
Marianne Harrison†
Deborah C. Jackson
James M. Oates*
Gregory A. Russo
Officers
Andrew G. Arnott
President
Francis V. Knox, Jr.
Chief Compliance Officer
Charles A. Rizzo
Chief Financial Officer
Salvatore Schiavone
Treasurer
Christopher (Kit) Sechler
Secretary and Chief Legal Officer
| Investment advisor
John Hancock Investment Management LLC
Subadvisor
First Quadrant, L.P.
Portfolio Managers
Dori S. Levanoni
Jeppe F. Ladekarl
Principal distributor
John Hancock Investment Management Distributors LLC
Custodian
State Street Bank and Trust Company
Transfer agent
John Hancock Signature Services, Inc.
Legal counsel
K&L Gates LLP
|
* Member of the Audit Committee
† Non-Independent Trustee
The fund's proxy voting policies and procedures, as well as the fund proxy voting record for the most recent twelve-month period ended June 30, are available free of charge on the Securities and Exchange Commission (SEC) website at sec.gov or on our website.
All of the fund's holdings as of the end of the third month of every fiscal quarter are filed with the SEC on Form N-PORT within 60 days of the end of the fiscal quarter. The fund's Form N-PORT filings are available on our website and the SEC's website, sec.gov.
We make this information on your fund, as well asmonthly portfolio holdings, and other fund details available on our website at jhinvestments.com or by calling 800-225-5291.
| | | | |
| | You can also contact us: |
| | 800-225-5291
jhinvestments.com | Regular mail:
John Hancock Signature Services, Inc.
P.O. Box 55913
Boston, MA 02205-5913
| Express mail:
John Hancock Signature Services, Inc.
2000 Crown Colony Drive
Suite 55913
Quincy, MA 02169-0953
|
SEMIANNUAL REPORT | JOHN HANCOCK ABSOLUTE RETURN CURRENCY FUND 30
John Hancock family of funds
| | | |
DOMESTIC EQUITY FUNDS
Blue Chip Growth
Classic Value
Disciplined Value
Disciplined Value Mid Cap
Equity Income
Financial Industries
Fundamental All Cap Core
Fundamental Large Cap Core
New Opportunities
Regional Bank
Small Cap Core
Small Cap Growth
Small Cap Value
U.S. Global Leaders Growth
U.S. Quality Growth
GLOBAL AND INTERNATIONAL EQUITY FUNDS
Disciplined Value International
Emerging Markets
Emerging Markets Equity
Fundamental Global Franchise
Global Equity
Global Shareholder Yield
Global Thematic Opportunities
International Dynamic Growth
International Growth
International Small Company
| | INCOME FUNDS
Bond
California Tax-Free Income
Emerging Markets Debt
Floating Rate Income
Government Income
High Yield
High Yield Municipal Bond
Income
Investment Grade Bond
Money Market
Short Duration Bond
Short Duration Credit Opportunities
Strategic Income Opportunities
Tax-Free Bond
ALTERNATIVE AND SPECIALTY FUNDS
Absolute Return Currency
Alternative Asset Allocation
Alternative Risk Premia
Diversified Macro
Infrastructure
Multi-Asset Absolute Return
Seaport Long/Short
|
A fund's investment objectives, risks, charges, and expenses should be considered carefully before investing. The prospectus contains this and other important information about the fund. To obtain a prospectus, contact your financial professional, call John Hancock Investment Management at 800-225-5291, or visit our website at jhinvestments.com. Please read the prospectus carefully before investing or sending money.
| | | |
ASSET ALLOCATION
Balanced
Income Allocation
Multi-Index Lifetime Portfolios
Multi-Index Preservation Portfolios
Multimanager Lifestyle Portfolios
Multimanager Lifetime Portfolios
Retirement Income 2040
EXCHANGE-TRADED FUNDS
John Hancock Multifactor Consumer Discretionary ETF
John Hancock Multifactor Consumer Staples ETF
John Hancock Multifactor Developed International ETF
John Hancock Multifactor Emerging Markets ETF
John Hancock Multifactor Energy ETF
John Hancock Multifactor Financials ETF
John Hancock Multifactor Healthcare ETF
John Hancock Multifactor Industrials ETF
John Hancock Multifactor Large Cap ETF
John Hancock Multifactor Materials ETF
John Hancock Multifactor Media and
Communications ETF
John Hancock Multifactor Mid Cap ETF
John Hancock Multifactor Small Cap ETF
John Hancock Multifactor Technology ETF
John Hancock Multifactor Utilities ETF
| | ENVIRONMENTAL, SOCIAL, AND
GOVERNANCE FUNDS
ESG All Cap Core
ESG Core Bond
ESG International Equity
ESG Large Cap Core
CLOSED-END FUNDS
Financial Opportunities
Hedged Equity & Income
Income Securities Trust
Investors Trust
Preferred Income
Preferred Income II
Preferred Income III
Premium Dividend
Tax-Advantaged Dividend Income
Tax-Advantaged Global Shareholder Yield
|
John Hancock Multifactor ETF shares are bought and sold at market price (not NAV), and are not individually redeemed
from the fund. Brokerage commissions will reduce returns.
John Hancock ETFs are distributed by Foreside Fund Services, LLC, and are subadvised by Dimensional Fund Advisors LP.
Foreside is not affiliated with John Hancock Investment Management Distributors LLC or Dimensional Fund Advisors LP.
Dimensional Fund Advisors LP receives compensation from John Hancock in connection with licensing rights to the
John Hancock Dimensional indexes. Dimensional Fund Advisors LP does not sponsor, endorse, or sell, and makes no
representation as to the advisability of investing in, John Hancock Multifactor ETFs.
John Hancock Investment Management
A trusted brand
John Hancock Investment Management is a premier asset manager
representing one of America's most trusted brands, with a heritage of
financial stewardship dating back to 1862. Helping our shareholders
pursue their financial goals is at the core of everything we do. It's why
we support the role of professional financial advice and operate with
the highest standards of conduct and integrity.
A better way to invest
We serve investors globally through a unique multimanager approach:
We search the world to find proven portfolio teams with specialized
expertise for every strategy we offer, then we apply robust investment
oversight to ensure they continue to meet our uncompromising
standards and serve the best interests of our shareholders.
Results for investors
Our unique approach to asset management enables us to provide
a diverse set of investments backed by some of the world's best
managers, along with strong risk-adjusted returns across asset classes.
John Hancock Investment Management Distributors LLC n Member FINRA, SIPC
200 Berkeley Street n Boston, MA 02116-5010 n 800-225-5291 n jhinvestments.com
This report is for the information of the shareholders of John Hancock Absolute Return Currency Fund. It is not authorized for distribution to prospective investors unless preceded or accompanied by a prospectus.
| | |
| MF1078033 | 364SA 1/20
3/2020 |
John Hancock
Fundamental All Cap Core Fund
Semiannual report 1/31/2020
Beginning on January 1, 2021, as permitted by regulations adopted by the Securities and Exchange Commission, paper copies of the fund's shareholder reports like this one will no longer be sent by mail, unless you specifically request paper copies of the reports from the fund or from your financial intermediary. Instead, the reports will be made available on a website, and you will be notified by mail each time a report is posted and provided with a website link to access the report.
If you already elected to receive shareholder reports electronically, you will not be affected by this change, and you do not need to take any action. You may elect to receive shareholder reports and other communications electronically by calling John Hancock Investment Management at 800-225-5291 (Class A and Class C shares) or 888-972-8696 (Class I, Class R2, Class R4, and Class R6 shares) or by contacting your financial intermediary.
You may elect to receive all reports in paper, free of charge, at any time. You can inform John Hancock Investment Management or your financial intermediary that you wish to continue receiving paper copies of your shareholder reports by following the instructions listed above. Your election to receive reports in paper will apply to all funds held with John Hancock Investment Management or your financial intermediary.

A message to shareholders
Dear shareholder,
Global financial markets delivered positive returns during the 6 months ended January 31, 2020. Stocks were particularly strong in the United States, where they delivered positive returns across most economic sectors. Investors benefited from a combination of low inflation, accommodative central bank policy, healthy fundamentals, and corporate buybacks of stock. Investors in non-U.S. equities also saw strong gains, fueled in part by similarly supportive monetary policy and some signs of strength in developing markets.
After a strong period of positive returns—in a historically long bull market—investors are prudent to consider the risks to future gains. Growth has slowed in the United States, with some negative data in manufacturing reflecting concerns over international trade and wavering business confidence. Additionally, the spread of the coronavirus, trade disputes, and other geopolitical tensions may continue to create uncertainty among businesses and skepticism among investors. Your financial advisor can helpposition your portfolio so that it's sufficiently diversified to meet your long-term objectives and to withstand the inevitable bouts of market volatility along the way.
On behalf of everyone at John Hancock Investment Management, I'd like to take this opportunity to welcome new shareholders and thank existing shareholders for the continued trust you've placed in us.
Sincerely,
Andrew G. Arnott
President and CEO,
John Hancock Investment Management
Head of Wealth and Asset Management,
United States and Europe
This commentary reflects the CEO's views as of this report's period end and are subject to change at any time. Diversification does not guarantee investment returns and does not eliminate risk of loss. All investments entail risks, including the possible loss of principal. For more up-to-date information, you can visit our website at jhinvestments.com.
John Hancock
Fundamental All Cap Core Fund
Table of contents
| | | |
| 2 | | Your fund at a glance |
| 3 | | Portfolio summary |
| 4 | | A look at performance |
| 6 | | Your expenses |
| 8 | | Fund's investments |
| 12 | | Financial statements |
| 15 | | Financial highlights |
| 21 | | Notes to financial statements |
| 30 | | More information |
SEMIANNUAL REPORT | JOHN HANCOCK FUNDAMENTAL ALL CAP CORE FUND 1
INVESTMENT OBJECTIVE
The fund seeks long-term capital appreciation.
AVERAGE ANNUAL TOTAL RETURNS AS OF 1/31/2020 (%)
The Russell 3000 Index is an unmanaged index of the 3,000 largest U.S. companies based on total market capitalization, which represents approximately 98% of the investable U.S. equity market.
It is not possible to invest directly in an index. Index figures do not reflect expenses or sales charges, which would result in lower returns.
Figures from Morningstar, Inc. include reinvested distributions and do not take into account sales charges. Actual load-adjusted performance is lower. Since-inception returns for the Morningstar fund category average are not available.
The past performance shown here reflects reinvested distributions and the beneficial effect of any expense reductions, and does not guarantee future results. Returns for periods shorter than one year are cumulative. Performance of the other share classes will vary based on the difference in the fees and expenses of those classes. Shares will fluctuate in value and, when redeemed, may be worth more or less than their original cost. Current month-end performance may be lower or higher than the performance cited, and can be found at jhinvestments.com or by calling 800-225-5291. For further information on the fund's objectives, risks, and strategy, see the fund's prospectus.
SEMIANNUAL REPORT | JOHN HANCOCK FUNDAMENTAL ALL CAP CORE FUND 2
SECTOR COMPOSITION AS OF 1/31/2020 (%)
TOP 10 HOLDINGS AS OF 1/31/2020 (%)
| | |
| Amazon.com, Inc. | 8.6 |
| Apple, Inc. | 6.7 |
| Facebook, Inc., Class A | 5.6 |
| Alphabet, Inc., Class A | 4.9 |
| Citigroup, Inc. | 4.7 |
| Lennar Corp., A Shares | 4.1 |
| Bank of America Corp. | 3.9 |
| Morgan Stanley | 3.5 |
| Liberty Media Corp.-Liberty Formula One, Series C | 3.1 |
| Cheniere Energy, Inc. | 2.7 |
| TOTAL | 47.8 |
| As a percentage of net assets. |
| Cash and cash equivalents are not included. |
A note about risks
The fund is subject to various risks as described in the fund's prospectus. For more information, please refer to the "Principal risks" section of the prospectus.
SEMIANNUAL REPORT | JOHN HANCOCK FUNDAMENTAL ALL CAP CORE FUND 3
TOTAL RETURNS FOR THE PERIOD ENDED JANUARY 31, 2020
| | | | | | | | |
Average annual total returns (%)
with maximum sales charge | | Cumulative total returns (%)
with maximum sales charge |
| | 1-year | 5-year | Since
inception1 | | 6-month | 5-year | Since
inception1 |
| Class A | 14.09 | 10.66 | 11.72 | | 3.06 | 65.97 | 161.43 |
| Class C3 | 18.31 | 11.03 | 11.88 | | 7.11 | 68.75 | 164.70 |
| Class I2 | 20.48 | 12.15 | 12.78 | | 8.57 | 77.40 | 183.64 |
| Class R22,3 | 19.95 | 11.84 | 12.40 | | 8.37 | 74.98 | 175.62 |
| Class R42,3 | 20.39 | 12.05 | 12.52 | | 8.58 | 76.61 | 178.18 |
| Class R62,3 | 20.64 | 12.25 | 12.64 | | 8.67 | 78.21 | 180.71 |
| Index† | 20.53 | 11.85 | 12.50 | | 8.63 | 75.03 | 177.78 |
Performance figures assume all distributions have been reinvested. Figures reflect maximum sales charges on Class A shares of 5.00% and the applicable contingent deferred sales charge (CDSC) on Class C shares. Class C shares sold within one year of purchase are subject to a 1% CDSC. Sales charges are not applicable to Class I, Class R2, Class R4, and Class R6 shares.
The expense ratios of the fund, both net (including any fee waivers and/or expense limitations) and gross (excluding any fee waivers and/or expense limitations), are set forth according to the most recent publicly available prospectus for the fund and may differ from those disclosed in the Financial highlights tables in this report. Net expenses reflect contractual expense limitations in effect until November 30, 2020 and are subject to change. Had the contractual fee waivers and expense limitations not been in place, gross expenses would apply. The expense ratios are as follows:
| | | | | | | |
| | Class A | Class C | Class I | Class R2 | Class R4 | Class R6 | |
| Gross (%) | 1.37 | 2.07 | 1.07 | 1.46 | 1.31 | 0.96 | |
| Net (%) | 1.26 | 1.96 | 0.96 | 1.35 | 1.10 | 0.85 | |
Please refer to the most recent prospectus and annual or semiannual report for more information on expenses and any expense limitation arrangements for each class.
The returns reflect past results and should not be considered indicative of future performance. The return and principal value of an investment will fluctuate so that shares, when redeemed, may be worth more or less than their original cost. Due to market volatility and other factors, the fund's current performance may be higher or lower than the performance shown. For current to the most recent month-end performance data, please call 800-225-5291 or visit the fund's website at jhinvestments.com.
The performance table above and the chart on the next page do not reflect the deduction of taxes that a shareholder would pay on fund distributions or the redemption of fund shares. The fund's performance results reflect any applicable fee waivers or expense reductions, without which the expenses would increase and results would have been less favorable.
| † | Index is the Russell 3000 Index. |
See the following page for footnotes.
SEMIANNUAL REPORT | JOHN HANCOCK FUNDAMENTAL ALL CAP CORE FUND 4
This chart and table show what happened to a hypothetical $10,000 investment in John Hancock Fundamental All Cap Core Fund for the share classes and periods indicated, assuming all distributions were reinvested. For comparison, we've shown the same investment in the Russell 3000 Index.
| | | | | |
| | Start date | With maximum
sales charge ($) | Without
sales charge ($) | Index ($) |
| Class C4 | 6-1-11 | 26,470 | 26,470 | 27,778 |
| Class I2 | 6-1-11 | 28,364 | 28,364 | 27,778 |
| Class R22,3 | 6-1-11 | 27,562 | 27,562 | 27,778 |
| Class R42,3 | 6-1-11 | 27,818 | 27,818 | 27,778 |
| Class R62,3 | 6-1-11 | 28,071 | 28,071 | 27,778 |
The Russell 3000 Index is an unmanaged index of the 3,000 largest U.S. companies based on total market capitalization, which represents approximately 98% of the investable U.S. equity market.
It is not possible to invest directly in an index. Index figures do not reflect expenses or sales charges, which would result in lower returns.
Footnotes related to performance pages
| 1 | From 6-1-11. |
| 2 | For certain types of investors as described in the fund's prospectus. |
| 3 | Class C shares were first offered on 6-27-14; Class R2, Class R4 and Class R6 shares were first offered on 3-27-15. Returns prior to these dates are those of Class A shares (first offered on 6-1-11) that have not been adjusted for class-specific expenses; otherwise, returns would vary. |
| 4 | The contingent deferred sales charge is not applicable. |
SEMIANNUAL REPORT | JOHN HANCOCK FUNDAMENTAL ALL CAP CORE FUND 5
These examples are intended to help you understand your ongoing operating expenses of investing in the fund so you can compare these costs with the ongoing costs of investing in other mutual funds.
Understanding fund expenses
As a shareholder of the fund, you incur two types of costs:
■Transaction costs,which include sales charges (loads) on purchases or redemptions (varies by share class), minimum account fee charge, etc.
■Ongoing operating expenses, including management fees, distribution and service fees (if applicable), and other fund expenses.
We are presenting only your ongoing operating expenses here.
Actual expenses/actual returns
The first line of each share class in the table on the following page is intended to provide information about the fund’s actual ongoing operating expenses, and is based on the fund’s actual return. It assumes an account value of $1,000.00 on August 1, 2019, with the same investment held until January 31, 2020.
Together with the value of your account, you may use this information to estimate the operating expenses that you paid over the period. Simply divide your account value at January 31, 2020, by $1,000.00, then multiply it by the “expenses paid” for your share class from the table. For example, for an account value of $8,600.00, the operating expenses should be calculated as follows:
Hypothetical example for comparison purposes
The second line of each share class in the table on the following page allows you to compare the fund’s ongoing operating expenses with those of any other fund. It provides an example of the fund’s hypothetical account values and hypothetical expenses based on each class’s actual expense ratio and an assumed 5% annualized return before expenses (which is not the class’s actual return). It assumes an account value of $1,000.00 on August 1, 2019, with the same investment held until January 31, 2020. Look in any other fund shareholder report to find its hypothetical example and you will be able to compare these expenses. Please remember that these hypothetical account values and expenses may not be used to estimate the actual ending account balance or expenses you paid for the period.
| 6 | JOHN HANCOCK FUNDAMENTAL ALL CAP CORE FUND | SEMIANNUAL REPORT | |
Remember, these examples do not include any transaction costs, therefore, these examples will not help you to determine the relative total costs of owning different funds. If transaction costs were included, your expenses would have been higher. See the prospectus for details regarding transaction costs.
SHAREHOLDER EXPENSE EXAMPLE CHART
| | | Account
value on
8-1-2019 | Ending
value on
1-31-2020 | Expenses
paid during
period ended
1-31-20201 | Annualized
expense
ratio |
| Class A | Actual expenses/actual returns | $1,000.00 | $1,084.80 | $6.60 | 1.26% |
| | Hypothetical example | 1,000.00 | 1,018.80 | 6.39 | 1.26% |
| Class C | Actual expenses/actual returns | 1,000.00 | 1,081.10 | 10.25 | 1.96% |
| | Hypothetical example | 1,000.00 | 1,015.30 | 9.93 | 1.96% |
| Class I | Actual expenses/actual returns | 1,000.00 | 1,085.70 | 5.03 | 0.96% |
| | Hypothetical example | 1,000.00 | 1,020.30 | 4.88 | 0.96% |
| Class R2 | Actual expenses/actual returns | 1,000.00 | 1,083.70 | 7.12 | 1.36% |
| | Hypothetical example | 1,000.00 | 1,018.30 | 6.90 | 1.36% |
| Class R4 | Actual expenses/actual returns | 1,000.00 | 1,085.80 | 5.30 | 1.01% |
| | Hypothetical example | 1,000.00 | 1,020.10 | 5.13 | 1.01% |
| Class R6 | Actual expenses/actual returns | 1,000.00 | 1,086.70 | 4.46 | 0.85% |
| | Hypothetical example | 1,000.00 | 1,020.90 | 4.32 | 0.85% |
| 1 | Expenses are equal to the annualized expense ratio, multiplied by the average account value over the period, multiplied by 184/366 (to reflect the one-half year period). |
| | SEMIANNUAL REPORT | JOHN HANCOCK FUNDAMENTAL ALL CAP CORE FUND | 7 |
AS OF 1-31-20 (unaudited)
| | | | | Shares | Value |
| Common stocks 98.1% | | | | | $88,608,915 |
| (Cost $62,666,030) | | | | | |
| Communication services 17.0% | | | 15,371,708 |
| Entertainment 3.1% | | | |
| Liberty Media Corp.-Liberty Formula One, Series C (A) | | | 59,096 | 2,765,102 |
| Interactive media and services 13.9% | | | |
| Alphabet, Inc., Class A (A) | | | 3,094 | 4,433,021 |
| CarGurus, Inc. (A) | | | 56,396 | 2,010,517 |
| Facebook, Inc., Class A (A) | | | 24,989 | 5,045,529 |
| Twitter, Inc. (A) | | | 34,407 | 1,117,539 |
| Consumer discretionary 21.6% | | | 19,550,423 |
| Household durables 7.5% | | | |
| Lennar Corp., A Shares | | | 56,400 | 3,742,704 |
| NVR, Inc. (A) | | | 239 | 912,256 |
| Tempur Sealy International, Inc. (A) | | | 23,348 | 2,139,144 |
| Internet and direct marketing retail 8.6% | | | |
| Amazon.com, Inc. (A) | | | 3,872 | 7,777,764 |
| Leisure products 1.9% | | | |
| Polaris, Inc. | | | 19,036 | 1,748,266 |
| Multiline retail 0.9% | | | |
| Dollar Tree, Inc. (A) | | | 9,759 | 849,716 |
| Specialty retail 1.2% | | | |
| Group 1 Automotive, Inc. | | | 10,609 | 1,069,069 |
| Textiles, apparel and luxury goods 1.5% | | | |
| Ralph Lauren Corp. | | | 6,447 | 731,735 |
| Salvatore Ferragamo SpA | | | 31,424 | 579,769 |
| Consumer staples 4.4% | | | 4,012,033 |
| Beverages 3.3% | | | |
| Anheuser-Busch InBev SA, ADR | | | 28,634 | 2,156,140 |
| Diageo PLC, ADR | | | 5,447 | 860,354 |
| Food products 1.1% | | | |
| The Hain Celestial Group, Inc. (A) | | | 41,121 | 995,539 |
| Energy 5.8% | | | 5,257,832 |
| Energy equipment and services 1.7% | | | |
| Baker Hughes Company | | | 50,538 | 1,094,653 |
| National Oilwell Varco, Inc. | | | 22,801 | 469,929 |
| Oil, gas and consumable fuels 4.1% | | | |
| Cheniere Energy, Inc. (A) | | | 40,900 | 2,422,916 |
| Kinder Morgan, Inc. | | | 24,948 | 520,665 |
| 8 | JOHN HANCOCK FUNDAMENTAL ALL CAP CORE FUND | SEMIANNUAL REPORT | SEE NOTES TO FINANCIAL STATEMENTS |
| | | | | Shares | Value |
| Energy (continued) | | | |
| Oil, gas and consumable fuels (continued) | | | |
| Suncor Energy, Inc. | | | 24,507 | $749,669 |
| Financials 17.8% | | | 16,090,495 |
| Banks 10.6% | | | |
| Bank of America Corp. | | | 108,188 | 3,551,812 |
| Citigroup, Inc. | | | 56,579 | 4,210,043 |
| First Hawaiian, Inc. | | | 61,213 | 1,778,850 |
| Capital markets 5.6% | | | |
| Morgan Stanley | | | 60,816 | 3,178,244 |
| The Goldman Sachs Group, Inc. | | | 7,883 | 1,874,183 |
| Consumer finance 1.6% | | | |
| American Express Company | | | 6,149 | 798,571 |
| Synchrony Financial | | | 21,561 | 698,792 |
| Health care 4.5% | | | 4,012,206 |
| Biotechnology 2.3% | | | |
| Alnylam Pharmaceuticals, Inc. (A) | | | 5,797 | 665,438 |
| Amgen, Inc. | | | 3,797 | 820,342 |
| Moderna, Inc. (A) | | | 30,103 | 617,413 |
| Health care equipment and supplies 1.4% | | | |
| Hologic, Inc. (A) | | | 22,881 | 1,224,591 |
| Health care providers and services 0.8% | | | |
| Anthem, Inc. | | | 2,580 | 684,422 |
| Industrials 6.8% | | | 6,123,623 |
| Electrical equipment 1.6% | | | |
| Regal Beloit Corp. | | | 8,740 | 685,740 |
| Sensata Technologies Holding PLC (A) | | | 16,936 | 800,563 |
| Industrial conglomerates 1.5% | | | |
| Roper Technologies, Inc. | | | 3,460 | 1,320,544 |
| Machinery 0.4% | | | |
| The Manitowoc Company, Inc. (A) | | | 24,217 | 349,936 |
| Professional services 2.3% | | | |
| IHS Markit, Ltd. (A) | | | 26,286 | 2,072,914 |
| Trading companies and distributors 1.0% | | | |
| United Rentals, Inc. (A) | | | 6,588 | 893,926 |
| Information technology 15.6% | | | 14,062,558 |
| Semiconductors and semiconductor equipment 1.7% | | | |
| Analog Devices, Inc. | | | 4,609 | 505,838 |
| NVIDIA Corp. | | | 4,245 | 1,003,645 |
| SEE NOTES TO FINANCIAL STATEMENTS | SEMIANNUAL REPORT | JOHN HANCOCK FUNDAMENTAL ALL CAP CORE FUND | 9 |
| | | | | Shares | Value |
| Information technology (continued) | | | |
| Software 6.2% | | | |
| Microsoft Corp. | | | 12,007 | $2,043,952 |
| salesforce.com, Inc. (A) | | | 10,843 | 1,976,787 |
| Workday, Inc., Class A (A) | | | 8,381 | 1,547,384 |
| Technology hardware, storage and peripherals 7.7% | | | |
| Apple, Inc. | | | 19,459 | 6,022,755 |
| Samsung Electronics Company, Ltd. | | | 20,767 | 962,197 |
| Real estate 4.6% | | | 4,128,037 |
| Equity real estate investment trusts 3.7% | | | |
| American Tower Corp. | | | 10,290 | 2,384,605 |
| Crown Castle International Corp. | | | 6,507 | 975,009 |
| Real estate management and development 0.9% | | | |
| Five Point Holdings LLC, Class A (A) | | | 94,750 | 768,423 |
|
| | Yield* (%) | Maturity date | | Par value^ | Value |
| Short-term investments 1.2% | | | | | $1,136,187 |
| (Cost $1,136,138) | | | | | |
| U.S. Government Agency 0.6% | | | | | 582,000 |
| Federal Agricultural Mortgage Corp. Discount Note | 1.500 | 02-03-20 | | 126,000 | 126,000 |
| Federal Home Loan Bank Discount Note | 1.500 | 02-03-20 | | 456,000 | 456,000 |
| | | Yield (%) | | Shares | Value |
| Short-term funds 0.0% | | | | | 19,187 |
| State Street Institutional U.S. Government Money Market Fund, Premier Class | 1.5121(B) | | 19,187 | 19,187 |
| | | | | Par value^ | Value |
| Repurchase agreement 0.6% | | | | | 535,000 |
| Barclays Tri-Party Repurchase Agreement dated 1-31-20 at 1.570% to be repurchased at $535,070 on 2-3-20, collateralized by $519,900 U.S. Treasury Notes, 2.625% due 12-31-23 (valued at $545,799) | | | | 535,000 | 535,000 |
|
| Total investments (Cost $63,802,168) 99.3% | | | $89,745,102 |
| Other assets and liabilities, net 0.7% | | | | 612,720 |
| Total net assets 100.0% | | | | | $90,357,822 |
| The percentage shown for each investment category is the total value of the category as a percentage of the net assets of the fund. |
| ^All par values are denominated in U.S. dollars unless otherwise indicated. |
| Security Abbreviations and Legend |
| ADR | American Depositary Receipt |
| (A) | Non-income producing security. |
| (B) | The rate shown is the annualized seven-day yield as of 1-31-20. |
| 10 | JOHN HANCOCK FUNDAMENTAL ALL CAP CORE FUND | SEMIANNUAL REPORT | SEE NOTES TO FINANCIAL STATEMENTS |
| * | Yield represents either the annualized yield at the date of purchase, the stated coupon rate or, for floating rate securities, the rate at period end. |
At 1-31-20, the aggregate cost of investments for federal income tax purposes was $63,944,121. Net unrealized appreciation aggregated to $25,800,981, of which $26,883,299 related to gross unrealized appreciation and $1,082,318 related to gross unrealized depreciation.
| SEE NOTES TO FINANCIAL STATEMENTS | SEMIANNUAL REPORT | JOHN HANCOCK FUNDAMENTAL ALL CAP CORE FUND | 11 |
STATEMENT OF ASSETS AND LIABILITIES 1-31-20 (unaudited)
| Assets | |
| Unaffiliated investments, at value (Cost $63,802,168) | $89,745,102 |
| Foreign currency, at value (Cost $1,686) | 1,676 |
| Dividends and interest receivable | 80,161 |
| Receivable for fund shares sold | 569,254 |
| Receivable from affiliates | 364 |
| Other assets | 33,412 |
| Total assets | 90,429,969 |
| Liabilities | |
| Payable for fund shares repurchased | 19,083 |
| Payable to affiliates | |
| Accounting and legal services fees | 1,596 |
| Transfer agent fees | 8,121 |
| Distribution and service fees | 35 |
| Trustees' fees | 115 |
| Other liabilities and accrued expenses | 43,197 |
| Total liabilities | 72,147 |
| Net assets | $90,357,822 |
| Net assets consist of | |
| Paid-in capital | $66,761,247 |
| Total distributable earnings (loss) | 23,596,575 |
| Net assets | $90,357,822 |
| |
| Net asset value per share | |
| Based on net asset value and shares outstanding - the fund has an unlimited number of shares authorized with no par value | |
| Class A ($52,183,351 ÷ 2,599,197 shares)1 | $20.08 |
| Class C ($6,299,807 ÷ 325,767 shares)1 | $19.34 |
| Class I ($19,251,056 ÷ 943,596 shares) | $20.40 |
| Class R2 ($76,939 ÷ 3,809 shares) | $20.20 |
| Class R4 ($65,821 ÷ 3,236 shares) | $20.34 |
| Class R6 ($12,480,848 ÷ 610,457 shares) | $20.45 |
| Maximum offering price per share | |
| Class A (net asset value per share ÷ 95%)2 | $21.14 |
| 1 | Redemption price per share is equal to net asset value less any applicable contingent deferred sales charge. |
| 2 | On single retail sales of less than $50,000. On sales of $50,000 or more and on group sales the offering price is reduced. |
| 12 | JOHN HANCOCK FUNDAMENTAL ALL CAP CORE FUND | SEMIANNUAL REPORT | SEE NOTES TO FINANCIAL STATEMENTS |
STATEMENT OF OPERATIONS For the six months ended 1-31-20 (unaudited)
| Investment income | |
| Dividends | $523,069 |
| Interest | 16,910 |
| Less foreign taxes withheld | (9,004) |
| Total investment income | 530,975 |
| Expenses | |
| Investment management fees | 297,603 |
| Distribution and service fees | 104,202 |
| Accounting and legal services fees | 8,386 |
| Transfer agent fees | 46,246 |
| Trustees' fees | 892 |
| Custodian fees | 11,384 |
| State registration fees | 48,338 |
| Printing and postage | 13,698 |
| Professional fees | 32,157 |
| Other | 8,715 |
| Total expenses | 571,621 |
| Less expense reductions | (50,835) |
| Net expenses | 520,786 |
| Net investment income | 10,189 |
| Realized and unrealized gain (loss) | |
| Net realized gain (loss) on | |
| Unaffiliated investments and foreign currency transactions | (1,163,005) |
| | (1,163,005) |
| Change in net unrealized appreciation (depreciation) of | |
| Unaffiliated investments and translation of assets and liabilities in foreign currencies | 8,369,177 |
| | 8,369,177 |
| Net realized and unrealized gain | 7,206,172 |
| Increase in net assets from operations | $7,216,361 |
| SEE NOTES TO FINANCIAL STATEMENTS | SEMIANNUAL REPORT | JOHN HANCOCK FUNDAMENTAL ALL CAP CORE FUND | 13 |
STATEMENTS OF CHANGES IN NET ASSETS
| | Six months ended
1-31-20
(unaudited) | Year ended
7-31-19 |
| Increase (decrease) in net assets | | |
| From operations | | |
| Net investment income | $10,189 | $83,584 |
| Net realized gain (loss) | (1,163,005) | 2,022,390 |
| Change in net unrealized appreciation (depreciation) | 8,369,177 | (800,956) |
| Increase in net assets resulting from operations | 7,216,361 | 1,305,018 |
| Distributions to shareholders | | |
| From earnings | | |
| Class A | (362) | (3,534,019) |
| Class C | — | (472,321) |
| Class I | (31,930) | (1,809,069) |
| Class R2 | — | (3,456) |
| Class R4 | (57) | (386) |
| Class R6 | (33,272) | (959,836) |
| Total distributions | (65,621) | (6,779,087) |
| From fund share transactions | (5,709,127) | (3,766,980) |
| Total increase (decrease) | 1,441,613 | (9,241,049) |
| Net assets | | |
| Beginning of period | 88,916,209 | 98,157,258 |
| End of period | $90,357,822 | $88,916,209 |
| 14 | JOHN HANCOCK FUNDAMENTAL ALL CAP CORE FUND | SEMIANNUAL REPORT | SEE NOTES TO FINANCIAL STATEMENTS |
| CLASS A SHARES Period ended | 1-31-201 | 7-31-19 | 7-31-18 | 7-31-17 | 7-31-16 | 7-31-15 |
| Per share operating performance | | | | | | |
| Net asset value, beginning of period | $18.51 | $19.84 | $17.95 | $14.97 | $16.16 | $14.33 |
| Net investment income (loss)2 | (0.01) | —3 | (0.05) | 0.03 | —3 | (0.04) |
| Net realized and unrealized gain (loss) on investments | 1.58 | 0.12 | 3.08 | 2.97 | (0.40) | 2.27 |
| Total from investment operations | 1.57 | 0.12 | 3.03 | 3.00 | (0.40) | 2.23 |
| Less distributions | | | | | | |
| From net investment income | —3 | — | — | (0.02) | — | — |
| From net realized gain | — | (1.45) | (1.14) | — | (0.79) | (0.40) |
| Total distributions | —3 | (1.45) | (1.14) | (0.02) | (0.79) | (0.40) |
| Net asset value, end of period | $20.08 | $18.51 | $19.84 | $17.95 | $14.97 | $16.16 |
| Total return (%)4,5 | 8.486 | 2.60 | 17.14 | 20.07 | (2.43) | 15.77 |
| Ratios and supplemental data | | | | | | |
| Net assets, end of period (in millions) | $52 | $49 | $49 | $38 | $30 | $23 |
| Ratios (as a percentage of average net assets): | | | | | | |
| Expenses before reductions | 1.387 | 1.36 | 1.33 | 1.35 | 1.28 | 1.30 |
| Expenses including reductions | 1.267 | 1.28 | 1.28 | 1.26 | 1.27 | 1.29 |
| Net investment income (loss) | (0.06)7 | 0.01 | (0.25) | 0.18 | (0.03) | (0.29) |
| Portfolio turnover (%) | 11 | 21 | 23 | 52 | 40 | 42 |
| 1 | Six months ended 1-31-20. Unaudited. |
| 2 | Based on average daily shares outstanding. |
| 3 | Less than $0.005 per share. |
| 4 | Total returns would have been lower had certain expenses not been reduced during the applicable periods. |
| 5 | Does not reflect the effect of sales charges, if any. |
| 6 | Not annualized. |
| 7 | Annualized. |
| SEE NOTES TO FINANCIAL STATEMENTS | SEMIANNUAL REPORT | JOHN HANCOCK FUNDAMENTAL ALL CAP CORE FUND | 15 |
| CLASS C SHARES Period ended | 1-31-201 | 7-31-19 | 7-31-18 | 7-31-17 | 7-31-16 | 7-31-15 |
| Per share operating performance | | | | | | |
| Net asset value, beginning of period | $17.89 | $19.36 | $17.67 | $14.81 | $16.11 | $14.37 |
| Net investment income (loss)2 | (0.07) | (0.12) | (0.18) | (0.09) | (0.11) | (0.16) |
| Net realized and unrealized gain (loss) on investments | 1.52 | 0.10 | 3.01 | 2.95 | (0.40) | 2.30 |
| Total from investment operations | 1.45 | (0.02) | 2.83 | 2.86 | (0.51) | 2.14 |
| Less distributions | | | | | | |
| From net realized gain | — | (1.45) | (1.14) | — | (0.79) | (0.40) |
| Net asset value, end of period | $19.34 | $17.89 | $19.36 | $17.67 | $14.81 | $16.11 |
| Total return (%)3,4 | 8.115 | 1.90 | 16.25 | 19.31 | (3.14) | 15.09 |
| Ratios and supplemental data | | | | | | |
| Net assets, end of period (in millions) | $6 | $6 | $6 | $5 | $3 | $2 |
| Ratios (as a percentage of average net assets): | | | | | | |
| Expenses before reductions | 2.086 | 2.06 | 2.03 | 2.05 | 1.98 | 2.69 |
| Expenses including reductions | 1.966 | 1.98 | 1.98 | 1.96 | 1.97 | 2.00 |
| Net investment income (loss) | (0.76)6 | (0.69) | (0.95) | (0.54) | (0.74) | (1.06) |
| Portfolio turnover (%) | 11 | 21 | 23 | 52 | 40 | 42 |
| 1 | Six months ended 1-31-20. Unaudited. |
| 2 | Based on average daily shares outstanding. |
| 3 | Total returns would have been lower had certain expenses not been reduced during the applicable periods. |
| 4 | Does not reflect the effect of sales charges, if any. |
| 5 | Not annualized. |
| 6 | Annualized. |
| 16 | JOHN HANCOCK FUNDAMENTAL ALL CAP CORE FUND | SEMIANNUAL REPORT | SEE NOTES TO FINANCIAL STATEMENTS |
| CLASS I SHARES Period ended | 1-31-201 | 7-31-19 | 7-31-18 | 7-31-17 | 7-31-16 | 7-31-15 |
| Per share operating performance | | | | | | |
| Net asset value, beginning of period | $18.82 | $20.08 | $18.13 | $15.12 | $16.27 | $14.39 |
| Net investment income (loss)2 | 0.02 | 0.06 | 0.01 | 0.07 | 0.04 | 0.01 |
| Net realized and unrealized gain (loss) on investments | 1.59 | 0.13 | 3.11 | 3.01 | (0.39) | 2.29 |
| Total from investment operations | 1.61 | 0.19 | 3.12 | 3.08 | (0.35) | 2.30 |
| Less distributions | | | | | | |
| From net investment income | (0.03) | — | (0.03) | (0.07) | (0.01) | (0.02) |
| From net realized gain | — | (1.45) | (1.14) | — | (0.79) | (0.40) |
| Total distributions | (0.03) | (1.45) | (1.17) | (0.07) | (0.80) | (0.42) |
| Net asset value, end of period | $20.40 | $18.82 | $20.08 | $18.13 | $15.12 | $16.27 |
| Total return (%)3 | 8.574 | 2.94 | 17.50 | 20.40 | (2.08) | 16.20 |
| Ratios and supplemental data | | | | | | |
| Net assets, end of period (in millions) | $19 | $20 | $29 | $21 | $8 | $11 |
| Ratios (as a percentage of average net assets): | | | | | | |
| Expenses before reductions | 1.085 | 1.08 | 1.03 | 1.04 | 0.97 | 1.05 |
| Expenses including reductions | 0.965 | 0.99 | 0.98 | 0.95 | 0.95 | 0.94 |
| Net investment income (loss) | 0.255 | 0.31 | 0.03 | 0.42 | 0.27 | 0.07 |
| Portfolio turnover (%) | 11 | 21 | 23 | 52 | 40 | 42 |
| 1 | Six months ended 1-31-20. Unaudited. |
| 2 | Based on average daily shares outstanding. |
| 3 | Total returns would have been lower had certain expenses not been reduced during the applicable periods. |
| 4 | Not annualized. |
| 5 | Annualized. |
| SEE NOTES TO FINANCIAL STATEMENTS | SEMIANNUAL REPORT | JOHN HANCOCK FUNDAMENTAL ALL CAP CORE FUND | 17 |
| CLASS R2 SHARES Period ended | 1-31-201 | 7-31-19 | 7-31-18 | 7-31-17 | 7-31-16 | 7-31-152 |
| Per share operating performance | | | | | | |
| Net asset value, beginning of period | $18.64 | $19.98 | $18.09 | $15.09 | $16.26 | $15.12 |
| Net investment income (loss)3 | (0.02) | — | (0.05) | 0.06 | 0.02 | (0.01) |
| Net realized and unrealized gain (loss) on investments | 1.58 | 0.11 | 3.09 | 2.99 | (0.40) | 1.15 |
| Total from investment operations | 1.56 | 0.11 | 3.04 | 3.05 | (0.38) | 1.14 |
| Less distributions | | | | | | |
| From net investment income | — | — | (0.01) | (0.05) | — | — |
| From net realized gain | — | (1.45) | (1.14) | — | (0.79) | — |
| Total distributions | — | (1.45) | (1.15) | (0.05) | (0.79) | — |
| Net asset value, end of period | $20.20 | $18.64 | $19.98 | $18.09 | $15.09 | $16.26 |
| Total return (%)4 | 8.375 | 2.53 | 17.09 | 20.25 | (2.28) | 7.545 |
| Ratios and supplemental data | | | | | | |
| Net assets, end of period (in millions) | $—6 | $—6 | $—6 | $—6 | $—6 | $—6 |
| Ratios (as a percentage of average net assets): | | | | | | |
| Expenses before reductions | 1.487 | 1.46 | 1.35 | 1.20 | 1.12 | 1.107 |
| Expenses including reductions | 1.367 | 1.38 | 1.30 | 1.11 | 1.11 | 1.107 |
| Net investment income (loss) | (0.18)7 | — | (0.28) | 0.35 | 0.13 | (0.19)7 |
| Portfolio turnover (%) | 11 | 21 | 23 | 52 | 40 | 428 |
| 1 | Six months ended 1-31-20. Unaudited. |
| 2 | The inception date for Class R2 shares is 3-27-15. |
| 3 | Based on average daily shares outstanding. |
| 4 | Total returns would have been lower had certain expenses not been reduced during the applicable periods. |
| 5 | Not annualized. |
| 6 | Less than $500,000. |
| 7 | Annualized. |
| 8 | Portfolio turnover is shown for the period from 8-1-14 to 7-31-15. |
| 18 | JOHN HANCOCK FUNDAMENTAL ALL CAP CORE FUND | SEMIANNUAL REPORT | SEE NOTES TO FINANCIAL STATEMENTS |
| CLASS R4 SHARES Period ended | 1-31-201 | 7-31-19 | 7-31-18 | 7-31-17 | 7-31-16 | 7-31-152 |
| Per share operating performance | | | | | | |
| Net asset value, beginning of period | $18.75 | $20.03 | $18.11 | $15.10 | $16.27 | $15.12 |
| Net investment income (loss)3 | (0.01) | 0.03 | (0.02) | 0.07 | 0.03 | (0.01) |
| Net realized and unrealized gain (loss) on investments | 1.62 | 0.14 | 3.11 | 3.00 | (0.40) | 1.16 |
| Total from investment operations | 1.61 | 0.17 | 3.09 | 3.07 | (0.37) | 1.15 |
| Less distributions | | | | | | |
| From net investment income | (0.02) | — | (0.03) | (0.06) | (0.01) | — |
| From net realized gain | — | (1.45) | (1.14) | — | (0.79) | — |
| Total distributions | (0.02) | (1.45) | (1.17) | (0.06) | (0.80) | — |
| Net asset value, end of period | $20.34 | $18.75 | $20.03 | $18.11 | $15.10 | $16.27 |
| Total return (%)4 | 8.585 | 2.84 | 17.31 | 20.42 | (2.24) | 7.615 |
| Ratios and supplemental data | | | | | | |
| Net assets, end of period (in millions) | $—6 | $—6 | $1 | $—6 | $—6 | $—6 |
| Ratios (as a percentage of average net assets): | | | | | | |
| Expenses before reductions | 1.237 | 1.31 | 1.27 | 1.19 | 1.12 | 1.107 |
| Expenses including reductions | 1.017 | 1.13 | 1.12 | 1.01 | 1.01 | 1.007 |
| Net investment income (loss) | (0.06)7 | 0.15 | (0.12) | 0.45 | 0.23 | (0.09)7 |
| Portfolio turnover (%) | 11 | 21 | 23 | 52 | 40 | 428 |
| 1 | Six months ended 1-31-20. Unaudited. |
| 2 | The inception date for Class R4 shares is 3-27-15. |
| 3 | Based on average daily shares outstanding. |
| 4 | Total returns would have been lower had certain expenses not been reduced during the applicable periods. |
| 5 | Not annualized. |
| 6 | Less than $500,000. |
| 7 | Annualized. |
| 8 | Portfolio turnover is shown for the period from 8-1-14 to 7-31-15. |
| SEE NOTES TO FINANCIAL STATEMENTS | SEMIANNUAL REPORT | JOHN HANCOCK FUNDAMENTAL ALL CAP CORE FUND | 19 |
| CLASS R6 SHARES Period ended | 1-31-201 | 7-31-19 | 7-31-18 | 7-31-17 | 7-31-16 | 7-31-152 |
| Per share operating performance | | | | | | |
| Net asset value, beginning of period | $18.86 | $20.10 | $18.14 | $15.12 | $16.28 | $15.12 |
| Net investment income (loss)3 | 0.03 | 0.07 | 0.02 | 0.09 | 0.07 | —4 |
| Net realized and unrealized gain (loss) on investments | 1.61 | 0.14 | 3.12 | 3.01 | (0.42) | 1.16 |
| Total from investment operations | 1.64 | 0.21 | 3.14 | 3.10 | (0.35) | 1.16 |
| Less distributions | | | | | | |
| From net investment income | (0.05) | — | (0.04) | (0.08) | (0.02) | — |
| From net realized gain | — | (1.45) | (1.14) | — | (0.79) | — |
| Total distributions | (0.05) | (1.45) | (1.18) | (0.08) | (0.81) | — |
| Net asset value, end of period | $20.45 | $18.86 | $20.10 | $18.14 | $15.12 | $16.28 |
| Total return (%)5 | 8.676 | 3.04 | 17.62 | 20.59 | (2.10) | 7.676 |
| Ratios and supplemental data | | | | | | |
| Net assets, end of period (in millions) | $12 | $14 | $13 | $6 | $3 | $—7 |
| Ratios (as a percentage of average net assets): | | | | | | |
| Expenses before reductions | 0.978 | 0.96 | 0.93 | 0.95 | 0.86 | 0.858 |
| Expenses including reductions | 0.858 | 0.88 | 0.88 | 0.85 | 0.84 | 0.838 |
| Net investment income (loss) | 0.358 | 0.39 | 0.13 | 0.52 | 0.49 | 0.018 |
| Portfolio turnover (%) | 11 | 21 | 23 | 52 | 40 | 429 |
| 1 | Six months ended 1-31-20. Unaudited. |
| 2 | The inception date for Class R6 shares is 3-27-15. |
| 3 | Based on average daily shares outstanding. |
| 4 | Less than $0.005 per share. |
| 5 | Total returns would have been lower had certain expenses not been reduced during the applicable periods. |
| 6 | Not annualized. |
| 7 | Less than $500,000. |
| 8 | Annualized. |
| 9 | Portfolio turnover is shown for the period from 8-1-14 to 7-31-15. |
| 20 | JOHN HANCOCK FUNDAMENTAL ALL CAP CORE FUND | SEMIANNUAL REPORT | SEE NOTES TO FINANCIAL STATEMENTS |
| Notes to financial statements (unaudited) | |
Note 1—Organization
John Hancock Fundamental All Cap Core Fund (the fund) is a series of John Hancock Funds II (the Trust), an open-end management investment company organized as a Massachusetts business trust and registered under the Investment Company Act of 1940, as amended (the 1940 Act). The investment objective of the fund is to seek long-term capital appreciation.
The fund may offer multiple classes of shares. The shares currently outstanding are detailed in the Statement of assets and liabilities. Class A and Class C shares are offered to all investors. Class I shares are offered to institutions and certain investors. Class R2 and Class R4 shares are available only to certain retirement and 529 plans. Class R6 shares are only available to certain retirement plans, institutions and other investors. Class C shares convert to Class A shares ten years after purchase (certain exclusions may apply). Shareholders of each class have exclusive voting rights to matters that affect that class. The distribution and service fees, if any, and transfer agent fees for each class may differ.
Note 2—Significant accounting policies
The financial statements have been prepared in conformity with accounting principles generally accepted in the United States of America (US GAAP), which require management to make certain estimates and assumptions as of the date of the financial statements. Actual results could differ from those estimates and those differences could be significant. The fund qualifies as an investment company under Topic 946 of Accounting Standards Codification of US GAAP.
Events or transactions occurring after the end of the fiscal period through the date that the financial statements were issued have been evaluated in the preparation of the financial statements. The following summarizes the significant accounting policies of the fund:
Security valuation. Investments are stated at value as of the scheduled close of regular trading on the New York Stock Exchange (NYSE), normally at 4:00 P.M., Eastern Time. In case of emergency or other disruption resulting in the NYSE not opening for trading or the NYSE closing at a time other than the regularly scheduled close, the net asset value (NAV) may be determined as of the regularly scheduled close of the NYSE pursuant to the fund's Valuation Policies and Procedures.
In order to value the securities, the fund uses the following valuation techniques: Equity securities, including exchange-traded or closed-end funds, are typically valued at the last sale price or official closing price on the exchange or principal market where the security trades. In the event there were no sales during the day or closing prices are not available, the securities are valued using the last available bid price. Investments by the fund in open-end mutual funds are valued at their respective NAVs each business day. Debt obligations are typically valued based on the evaluated prices provided by an independent pricing vendor. Independent pricing vendors utilize matrix pricing, which takes into account factors such as institutional-size trading in similar groups of securities, yield, quality, coupon rate, maturity, type of issue, trading characteristics and other market data, as well as broker supplied prices. Foreign securities and currencies are valued in U.S. dollars based on foreign currency exchange rates supplied by an independent pricing vendor.
In certain instances, the Pricing Committee may determine to value equity securities using prices obtained from another exchange or market if trading on the exchange or market on which prices are typically obtained did not open for trading as scheduled, or if trading closed earlier than scheduled, and trading occurred as normal on another exchange or market.
| | SEMIANNUAL REPORT | JOHN HANCOCK Fundamental All Cap Core Fund | 21 |
Other portfolio securities and assets, for which reliable market quotations are not readily available, are valued at fair value as determined in good faith by the fund's Pricing Committee following procedures established by the Board of Trustees. The frequency with which these fair valuation procedures are used cannot be predicted and fair value of securities may differ significantly from the value that would have been used had a ready market for such securities existed. Trading in foreign securities may be completed before the scheduled daily close of trading on the NYSE. Significant events at the issuer or market level may affect the values of securities between the time when the valuation of the securities is generally determined and the close of the NYSE. If a significant event occurs, these securities may be fair valued, as determined in good faith by the fund's Pricing Committee, following procedures established by the Board of Trustees. The fund uses fair value adjustment factors provided by an independent pricing vendor to value certain foreign securities in order to adjust for events that may occur between the close of foreign exchanges or markets and the close of the NYSE.
The fund uses a three-tier hierarchy to prioritize the pricing assumptions, referred to as inputs, used in valuation techniques to measure fair value. Level 1 includes securities valued using quoted prices in active markets for identical securities, including registered investment companies. Level 2 includes securities valued using other significant observable inputs. Observable inputs may include quoted prices for similar securities, interest rates, prepayment speeds and credit risk. Prices for securities valued using these inputs are received from independent pricing vendors and brokers and are based on an evaluation of the inputs described. Level 3 includes securities valued using significant unobservable inputs when market prices are not readily available or reliable, including the fund's own assumptions in determining the fair value of investments. Factors used in determining value may include market or issuer specific events or trends, changes in interest rates and credit quality. The inputs or methodology used for valuing securities are not necessarily an indication of the risks associated with investing in those securities. Changes in valuation techniques and related inputs may result in transfers into or out of an assigned level within the disclosure hierarchy.
The following is a summary of the values by input classification of the fund's investments as of January 31, 2020, by major security category or type:
| | Total
value at
1-31-20 | Level 1
quoted
price | Level 2
significant
observable
inputs | Level 3
significant
unobservable
inputs |
| Investments in securities: | | | | |
| Assets | | | | |
| Common stocks | | | | |
| Communication services | $15,371,708 | $15,371,708 | — | — |
| Consumer discretionary | 19,550,423 | 18,970,654 | $579,769 | — |
| Consumer staples | 4,012,033 | 4,012,033 | — | — |
| Energy | 5,257,832 | 5,257,832 | — | — |
| Financials | 16,090,495 | 16,090,495 | — | — |
| Health care | 4,012,206 | 4,012,206 | — | — |
| Industrials | 6,123,623 | 6,123,623 | — | — |
| Information technology | 14,062,558 | 13,100,361 | 962,197 | — |
| Real estate | 4,128,037 | 4,128,037 | — | — |
| Short-term investments | 1,136,187 | 19,187 | 1,117,000 | — |
| Total investments in securities | $89,745,102 | $87,086,136 | $2,658,966 | — |
| 22 | JOHN HANCOCK Fundamental All Cap Core Fund | SEMIANNUAL REPORT | |
Repurchase agreements. The fund may enter into repurchase agreements. When the fund enters into a repurchase agreement, it receives collateral that is held in a segregated account by the fund's custodian, or for tri-party repurchase agreements, collateral is held at a third-party custodian bank in a segregated account for the benefit of the fund. The collateral amount is marked-to-market and monitored on a daily basis to ensure that the collateral held is in an amount not less than the principal amount of the repurchase agreement plus any accrued interest. Collateral received by the fund for repurchase agreements is disclosed in the Fund's investments as part of the caption related to the repurchase agreement.
Repurchase agreements are typically governed by the terms and conditions of the Master Repurchase Agreement and/or Global Master Repurchase Agreement (collectively, MRA). Upon an event of default, the non-defaulting party may close out all transactions traded under the MRA and net amounts owed. Absent an event of default, assets and liabilities resulting from repurchase agreements are not offset in the Statement of assets and liabilities. In the event of a default by the counterparty, realization of the collateral proceeds could be delayed, during which time the collateral value may decline or the counterparty may have insufficient assets to pay claims resulting from close-out of the transactions.
Security transactions and related investment income. Investment security transactions are accounted for on a trade date plus one basis for daily NAV calculations. However, for financial reporting purposes, investment transactions are reported on trade date. Interest income is accrued as earned. Interest income includes coupon interest and amortization/accretion of premiums/discounts on debt securities. Debt obligations may be placed in a non-accrual status and related interest income may be reduced by stopping current accruals and writing off interest receivable when the collection of all or a portion of interest has become doubtful. Dividend income is recorded on the ex-date, except for dividends of certain foreign securities where the dividend may not be known until after the ex-date. In those cases, dividend income, net of withholding taxes, is recorded when the fund becomes aware of the dividends. Non-cash dividends, if any, are recorded at the fair market value of the securities received. Gains and losses on securities sold are determined on the basis of identified cost and may include proceeds from litigation.
Real estate investment trusts. The fund may invest in real estate investment trusts (REITs). Distributions from REITs may be recorded as income and subsequently characterized by the REIT at the end of the fiscal year as a reduction of cost of investments and/or as a realized gain. As a result, the fund will estimate the components of distributions from these securities. Such estimates are revised when the actual components of the distributions are known.
Foreign investing. Assets, including investments, and liabilities denominated in foreign currencies are translated into U.S. dollar values each day at the prevailing exchange rate. Purchases and sales of securities, income and expenses are translated into U.S. dollars at the prevailing exchange rate on the date of the transaction. The effect of changes in foreign currency exchange rates on the value of securities is reflected as a component of the realized and unrealized gains (losses) on investments. Foreign investments are subject to a decline in the value of a foreign currency versus the U.S. dollar, which reduces the dollar value of securities denominated in that currency.
Funds that invest internationally generally carry more risk than funds that invest strictly in U.S. securities. Risks can result from differences in economic and political conditions, regulations, market practices (including higher transaction costs), accounting standards and other factors.
Foreign taxes. The fund may be subject to withholding tax on income, capital gains or repatriation taxes imposed by certain countries, a portion of which may be recoverable. Foreign taxes are accrued based upon the fund's understanding of the tax rules and rates that exist in the foreign markets in which it invests. Taxes are
| | SEMIANNUAL REPORT | JOHN HANCOCK Fundamental All Cap Core Fund | 23 |
accrued based on gains realized by the fund as a result of certain foreign security sales. In certain circumstances, estimated taxes are accrued based on unrealized appreciation of such securities. Investment income is recorded net of foreign withholding taxes.
Overdraft. The fund may have the ability to borrow from banks for temporary or emergency purposes, including meeting redemption requests that otherwise might require the untimely sale of securities. Pursuant to the fund's custodian agreement, the custodian may loan money to the fund to make properly authorized payments. The fund is obligated to repay the custodian for any overdraft, including any related costs or expenses. The custodian may have a lien, security interest or security entitlement in any fund property that is not otherwise segregated or pledged, to the extent of any overdraft, and to the maximum extent permitted by law.
Line of credit. The fund and other affiliated funds have entered into a syndicated line of credit agreement with Citibank, N.A. as the administrative agent that enables them to participate in a $750 million unsecured committed line of credit. Excluding commitments designated for a certain fund and subject to the needs of all other affiliated funds, the fund can borrow up to an aggregate commitment amount of $500 million, subject to asset coverage and other limitations as specified in the agreement. A commitment fee payable at the end of each calendar quarter, based on the average daily unused portion of the line of credit, is charged to each participating fund based on a combination of fixed and asset based allocations and is reflected in Other expenses on the Statement of operations. For the six months ended January 31, 2020, the fund had no borrowings under the line of credit. Commitment fees for the six months ended January 31, 2020 were $1,173.
Expenses. Within the John Hancock group of funds complex, expenses that are directly attributable to an individual fund are allocated to such fund. Expenses that are not readily attributable to a specific fund are allocated among all funds in an equitable manner, taking into consideration, among other things, the nature and type of expense and the fund’s relative net assets. Expense estimates are accrued in the period to which they relate and adjustments are made when actual amounts are known.
Class allocations. Income, common expenses and realized and unrealized gains (losses) are determined at the fund level and allocated daily to each class of shares based on the net assets of the class. Class-specific expenses, such as distribution and service fees, if any, and transfer agent fees, for all classes, are charged daily at the class level based on the net assets of each class and the specific expense rates applicable to each class.
Federal income taxes. The fund intends to continue to qualify as a regulated investment company by complying with the applicable provisions of the Internal Revenue Code and will not be subject to federal income tax on taxable income that is distributed to shareholders. Therefore, no federal income tax provision is required.
As of July 31, 2019, the fund had no uncertain tax positions that would require financial statement recognition, derecognition or disclosure. The fund's federal tax returns are subject to examination by the Internal Revenue Service for a period of three years.
Distribution of income and gains. Distributions to shareholders from net investment income and net realized gains, if any, are recorded on the ex-date. The fund generally declares and pays dividends annually. Capital gain distributions, if any, are typically distributed annually.
Distributions paid by the fund with respect to each class of shares are calculated in the same manner, at the same time and in the same amount, except for the effect of class level expenses that may be applied differently to each class.
| 24 | JOHN HANCOCK Fundamental All Cap Core Fund | SEMIANNUAL REPORT | |
Such distributions, on a tax basis, are determined in conformity with income tax regulations, which may differ from US GAAP. Distributions in excess of tax basis earnings and profits, if any, are reported in the fund's financial statements as a return of capital. The final determination of tax characteristics of the fund's distribution will occur at the end of the year and will subsequently be reported to shareholders.
Capital accounts within the financial statements are adjusted for permanent book-tax differences. These adjustments have no impact on net assets or the results of operations. Temporary book-tax differences, if any, will reverse in a subsequent period. Book-tax differences are primarily attributable to wash sale loss deferrals.
Note 3—Guarantees and indemnifications
Under the Trust's organizational documents, its Officers and Trustees are indemnified against certain liabilities arising out of the performance of their duties to the Trust, including the fund. Additionally, in the normal course of business, the fund enters into contracts with service providers that contain general indemnification clauses. The fund's maximum exposure under these arrangements is unknown, as this would involve future claims that may be made against the fund that have not yet occurred. The risk of material loss from such claims is considered remote.
Note 4—Fees and transactions with affiliates
John Hancock Investment Management LLC (the Advisor) serves as investment advisor for the fund. John Hancock Investment Management Distributors LLC (the Distributor), an affiliate of the Advisor, serves as principal underwriter of the fund. The Advisor and the Distributor are indirect, wholly owned subsidiaries of Manulife Financial Corporation (MFC).
Management fee. The fund has an investment management agreement with the Advisor under which the fund pays a daily management fee to the Advisor equivalent, on an annual basis, to the sum of: a) 0.675% of the first $2.5 billion of the fund’s aggregate average daily net assets together with the net assets of Fundamental All Cap Core Trust, a series of John Hancock Variable Insurance Trust (combined aggregate average daily net assets); and b) 0.650% of the combined aggregate average daily net assets in excess of $2.5 billion. The Advisor has a subadvisory agreement with Manulife Investment Management (US) LLC an indirectly owned subsidiary of MFC and an affiliate of the Advisor. The fund is not responsible for payment of the subadvisory fees.
The Advisor has contractually agreed to waive a portion of its management fee and/or reimburse expenses for certain funds of the John Hancock group of funds complex, including the fund (the participating portfolios). This waiver is based upon aggregate net assets of all the participating portfolios. The amount of the reimbursement is calculated daily and allocated among all the participating portfolios in proportion to the daily net assets of each fund. During the six months ended January 31, 2020, this waiver amounted to 0.01% of the fund’s average daily net assets on an annualized basis. This arrangement expires on July 31, 2021, unless renewed by mutual agreement of the fund and the Advisor based upon a determination that this is appropriate under the circumstances at that time.
The Advisor has contractually agreed to reduce its management fee or, if necessary, make payment to the fund in an amount equal to the amount by which expenses of the fund exceed 0.84% of average daily net assets of the fund. For purposes of this agreement, “expenses of the fund” means all fund expenses, excluding taxes, brokerage commissions, interest expense, litigation and indemnification expenses and other extraordinary expenses not incurred in the ordinary course of the fund’s business, class-specific expenses, borrowing costs, prime brokerage fees, acquired fund fees and expenses paid indirectly, and short dividend expense. This agreement expires on November 30, 2020, unless renewed by mutual agreement of the fund and the advisor based upon a determination that this is appropriate under the circumstances at that time.
| | SEMIANNUAL REPORT | JOHN HANCOCK Fundamental All Cap Core Fund | 25 |
For the six months ended January 31, 2020, the expense reductions described above amounted to the following:
| Class | Expense reduction |
| Class A | $28,538 |
| Class C | 3,463 |
| Class I | 10,969 |
| Class R2 | 46 |
| Class | Expense reduction |
| Class R4 | $17 |
| Class R6 | 7,789 |
| Total | $50,822 |
Expenses waived or reimbursed in the current fiscal period are not subject to recapture in future fiscal periods.
The investment management fees, including the impact of the waivers and reimbursements as described above, incurred for the six months ended January 31, 2020, were equivalent to a net annual effective rate of 0.56% of the fund's average daily net assets.
Accounting and legal services. Pursuant to a service agreement, the fund reimburses the Advisor for all expenses associated with providing the administrative, financial, legal, compliance, accounting and recordkeeping services to the fund, including the preparation of all tax returns, periodic reports to shareholders and regulatory reports, among other services. These expenses are allocated to each share class based on its relative net assets at the time the expense was incurred. These accounting and legal services fees incurred for the six months ended January 31, 2020 amounted to an annual rate of 0.02% of the fund's average daily net assets.
Distribution and service plans. The fund has a distribution agreement with the Distributor. The fund has adopted distribution and service plans for certain classes as detailed below pursuant to Rule 12b-1 under the 1940 Act, to pay the Distributor for services provided as the distributor of shares of the fund. In addition, under a service plan for certain classes as detailed below, the fund pays for certain other services. The fund may pay up to the following contractual rates of distribution and service fees under these arrangements, expressed as an annual percentage of average daily net assets for each class of the fund's shares:
| Class | Rule 12b-1 Fee | Service fee |
| Class A | 0.30% | — |
| Class C | 1.00% | — |
| Class R2 | 0.25% | 0.25% |
| Class R4 | 0.25% | 0.10% |
The fund's Distributor has contractually agreed to waive 0.10% of Rule12b-1 fees for Class R4 shares. The current waiver agreement expires on November 30, 2020, unless renewed by mutual agreement of the fund and the Distributor based upon a determination that this is appropriate under the circumstances at the time. This contractual waiver amounted to $13 for Class R4 shares for the six months ended January 31, 2020.
Sales charges. Class A shares are assessed up-front sales charges, which resulted in payments to the Distributor amounting to $22,362 for the six months ended January 31, 2020. Of this amount, $3,768 was retained and used for printing prospectuses, advertising, sales literature and other purposes and $18,594 was paid as sales commissions to broker-dealers.
Class A and Class C shares may be subject to contingent deferred sales charges (CDSCs). Certain Class A shares that are acquired through purchases of $1 million or more and are redeemed within one year of purchase are subject to a 1.00% sales charge. Class C shares that are redeemed within one year of purchase are subject to a 1.00% CDSC. CDSCs are applied to the lesser of the current market value at the time of redemption or the original purchase cost of the shares being redeemed. Proceeds from CDSCs are used to compensate the Distributor for
| 26 | JOHN HANCOCK Fundamental All Cap Core Fund | SEMIANNUAL REPORT | |
providing distribution-related services in connection with the sale of these shares. During the six months ended January 31, 2020, CDSCs received by the Distributor amounted to $171 for Class C shares. There were no CDSCs received by the Distributor for Class A shares.
Transfer agent fees. The John Hancock group of funds has a complex-wide transfer agent agreement with John Hancock Signature Services, Inc. (Signature Services), an affiliate of the Advisor. The transfer agent fees paid to Signature Services are determined based on the cost to Signature Services (Signature Services Cost) of providing recordkeeping services. It also includes out-of-pocket expenses, including payments made to third-parties for recordkeeping services provided to their clients who invest in one or more John Hancock funds. In addition, Signature Services Cost may be reduced by certain fees that Signature Services receives in connection with retirement and small accounts. Signature Services Cost is calculated monthly and allocated, as applicable, to five categories of share classes: Retail Share and Institutional Share Classes of Non-Municipal Bond Funds, Class R6 Shares, Retirement Share Classes and Municipal Bond Share Classes. Within each of these categories, the applicable costs are allocated to the affected John Hancock affiliated funds and/or classes, based on the relative average daily net assets.
Class level expenses. Class level expenses for the six months ended January 31, 2020 were as follows:
| Class | Distribution and service fees | Transfer agent fees |
| Class A | $74,000 | $30,078 |
| Class C | 29,965 | 3,653 |
| Class I | — | 11,625 |
| Class R2 | 204 | 5 |
| Class R4 | 33 | 2 |
| Class R6 | — | 883 |
| Total | $104,202 | $46,246 |
Trustee expenses. The fund compensates each Trustee who is not an employee of the Advisor or its affiliates. The costs of paying Trustee compensation and expenses are allocated to the fund based on its net assets relative to other funds within the John Hancock group of funds complex.
Note 5—Fund share transactions
Transactions in fund shares for the six months ended January 31, 2020 and for the year ended July 31, 2019 were as follows:
| | Six Months Ended 1-31-20 | Year Ended 7-31-19 |
| | Shares | Amount | Shares | Amount |
| Class A shares | | | | |
| Sold | 219,765 | $4,229,343 | 485,174 | $8,551,348 |
| Distributions reinvested | 18 | 362 | 242,630 | 3,532,684 |
| Repurchased | (271,006) | (5,118,664) | (541,969) | (9,643,487) |
| Net increase (decrease) | (51,223) | $(888,959) | 185,835 | $2,440,545 |
| | SEMIANNUAL REPORT | JOHN HANCOCK Fundamental All Cap Core Fund | 27 |
| | Six Months Ended 1-31-20 | Year Ended 7-31-19 |
| | Shares | Amount | Shares | Amount |
| Class C shares | | | | |
| Sold | 38,734 | $710,007 | 80,406 | $1,391,400 |
| Distributions reinvested | — | — | 33,427 | 472,321 |
| Repurchased | (47,022) | (851,394) | (112,432) | (1,891,904) |
| Net increase (decrease) | (8,288) | $(141,387) | 1,401 | $(28,183) |
| Class I shares | | | | |
| Sold | 58,635 | $1,115,161 | 310,492 | $5,604,929 |
| Distributions reinvested | 1,587 | 31,924 | 122,463 | 1,808,778 |
| Repurchased | (180,459) | (3,414,615) | (793,473) | (14,234,036) |
| Net decrease | (120,237) | $(2,267,530) | (360,518) | $(6,820,329) |
| Class R2 shares | | | | |
| Sold | 1,356 | $24,521 | 2,017 | $36,622 |
| Distributions reinvested | — | — | 208 | 3,057 |
| Repurchased | (1,400) | (25,943) | (11,206) | (204,732) |
| Net decrease | (44) | $(1,422) | (8,981) | $(165,053) |
| Class R4 shares | | | | |
| Sold | 2,764 | $53,946 | 1,162 | $22,771 |
| Distributions reinvested | 1 | 12 | 26 | 385 |
| Repurchased | — | — | (50,283) | (906,304) |
| Net increase (decrease) | 2,765 | $53,958 | (49,095) | $(883,148) |
| Class R6 shares | | | | |
| Sold | 46,612 | $912,172 | 253,064 | $4,496,549 |
| Distributions reinvested | 1,651 | 33,272 | 64,898 | 959,837 |
| Repurchased | (168,367) | (3,409,231) | (233,224) | (3,767,198) |
| Net increase (decrease) | (120,104) | $(2,463,787) | 84,738 | $1,689,188 |
| Total net decrease | (297,131) | $(5,709,127) | (146,620) | $(3,766,980) |
Affiliates of the fund owned 78.9% and 48.3% of shares of Class R4 and Class R6, respectively, on January 31, 2020. Such concentration of shareholders’ capital could have a material effect on the fund if such shareholders redeem from the fund.
Note 6—Purchase and sale of securities
Purchases and sales of securities, other than short-term investments, amounted to $9,144,775 and $12,664,213, respectively, for the six months ended January 31, 2020.
Note 7—Industry or sector risk
The fund may invest a large percentage of its assets in one or more particular industries or sectors of the economy. If a large percentage of the fund’s assets are economically tied to a single or small number of industries or sectors of the economy, the fund will be less diversified than a more broadly diversified fund, and it may cause the fund to
| 28 | JOHN HANCOCK Fundamental All Cap Core Fund | SEMIANNUAL REPORT | |
underperform if that industry or sector underperforms. In addition, focusing on a particular industry or sector may make the fund’s NAV more volatile. Further, a fund that invests in particular industries or sectors is particularly susceptible to the impact of market, economic, regulatory and other factors affecting those industries or sectors.
| | SEMIANNUAL REPORT | JOHN HANCOCK Fundamental All Cap Core Fund | 29 |
| | |
Trustees
Hassell H. McClellan,Chairperson
Steven R. Pruchansky,Vice Chairperson
Andrew G. Arnott†
Charles L. Bardelis*
James R. Boyle
Peter S. Burgess*
William H. Cunningham
Grace K. Fey
Marianne Harrison†
Deborah C. Jackson
James M. Oates*
Gregory A. Russo
Officers
Andrew G. Arnott
President
Francis V. Knox, Jr.
Chief Compliance Officer
Charles A. Rizzo
Chief Financial Officer
Salvatore Schiavone
Treasurer
Christopher (Kit) Sechler
Secretary and Chief Legal Officer
| Investment advisor
John Hancock Investment Management LLC
Subadvisor
Manulife Investment Management (US) LLC
Portfolio Managers
Emory W. (Sandy) Sanders, Jr., CFA
Jonathan T. White, CFA
Principal distributor
John Hancock Investment Management Distributors LLC
Custodian
State Street Bank and Trust Company
Transfer agent
John Hancock Signature Services, Inc.
Legal counsel
K&L Gates LLP
|
* Member of the Audit Committee
† Non-Independent Trustee
The fund's proxy voting policies and procedures, as well as the fund proxy voting record for the most recent twelve-month period ended June 30, are available free of charge on the Securities and Exchange Commission (SEC) website at sec.gov or on our website.
All of the fund's holdings as of the end of the third month of every fiscal quarter are filed with the SEC on Form N-PORT within 60 days of the end of the fiscal quarter. The fund's Form N-PORT filings are available on our website and the SEC's website, sec.gov.
We make this information on your fund, as well asmonthly portfolio holdings, and other fund details available on our website at jhinvestments.com or by calling 800-225-5291.
| | | | |
| | You can also contact us: |
| | 800-225-5291
jhinvestments.com | Regular mail:
John Hancock Signature Services, Inc.
P.O. Box 55913
Boston, MA 02205-5913
| Express mail:
John Hancock Signature Services, Inc.
2000 Crown Colony Drive
Suite 55913
Quincy, MA 02169-0953
|
SEMIANNUAL REPORT | JOHN HANCOCK FUNDAMENTAL ALL CAP CORE FUND 30
John Hancock family of funds
| | | |
DOMESTIC EQUITY FUNDS
Blue Chip Growth
Classic Value
Disciplined Value
Disciplined Value Mid Cap
Equity Income
Financial Industries
Fundamental All Cap Core
Fundamental Large Cap Core
New Opportunities
Regional Bank
Small Cap Core
Small Cap Growth
Small Cap Value
U.S. Global Leaders Growth
U.S. Quality Growth
GLOBAL AND INTERNATIONAL EQUITY FUNDS
Disciplined Value International
Emerging Markets
Emerging Markets Equity
Fundamental Global Franchise
Global Equity
Global Shareholder Yield
Global Thematic Opportunities
International Dynamic Growth
International Growth
International Small Company
| | INCOME FUNDS
Bond
California Tax-Free Income
Emerging Markets Debt
Floating Rate Income
Government Income
High Yield
High Yield Municipal Bond
Income
Investment Grade Bond
Money Market
Short Duration Bond
Short Duration Credit Opportunities
Strategic Income Opportunities
Tax-Free Bond
ALTERNATIVE AND SPECIALTY FUNDS
Absolute Return Currency
Alternative Asset Allocation
Alternative Risk Premia
Diversified Macro
Infrastructure
Multi-Asset Absolute Return
Seaport Long/Short
|
A fund's investment objectives, risks, charges, and expenses should be considered carefully before investing. The prospectus contains this and other important information about the fund. To obtain a prospectus, contact your financial professional, call John Hancock Investment Management at 800-225-5291, or visit our website at jhinvestments.com. Please read the prospectus carefully before investing or sending money.
| | | |
ASSET ALLOCATION
Balanced
Income Allocation
Multi-Index Lifetime Portfolios
Multi-Index Preservation Portfolios
Multimanager Lifestyle Portfolios
Multimanager Lifetime Portfolios
Retirement Income 2040
EXCHANGE-TRADED FUNDS
John Hancock Multifactor Consumer Discretionary ETF
John Hancock Multifactor Consumer Staples ETF
John Hancock Multifactor Developed International ETF
John Hancock Multifactor Emerging Markets ETF
John Hancock Multifactor Energy ETF
John Hancock Multifactor Financials ETF
John Hancock Multifactor Healthcare ETF
John Hancock Multifactor Industrials ETF
John Hancock Multifactor Large Cap ETF
John Hancock Multifactor Materials ETF
John Hancock Multifactor Media and
Communications ETF
John Hancock Multifactor Mid Cap ETF
John Hancock Multifactor Small Cap ETF
John Hancock Multifactor Technology ETF
John Hancock Multifactor Utilities ETF
| | ENVIRONMENTAL, SOCIAL, AND
GOVERNANCE FUNDS
ESG All Cap Core
ESG Core Bond
ESG International Equity
ESG Large Cap Core
CLOSED-END FUNDS
Financial Opportunities
Hedged Equity & Income
Income Securities Trust
Investors Trust
Preferred Income
Preferred Income II
Preferred Income III
Premium Dividend
Tax-Advantaged Dividend Income
Tax-Advantaged Global Shareholder Yield
|
John Hancock Multifactor ETF shares are bought and sold at market price (not NAV), and are not individually redeemed
from the fund. Brokerage commissions will reduce returns.
John Hancock ETFs are distributed by Foreside Fund Services, LLC, and are subadvised by Dimensional Fund Advisors LP.
Foreside is not affiliated with John Hancock Investment Management Distributors LLC or Dimensional Fund Advisors LP.
Dimensional Fund Advisors LP receives compensation from John Hancock in connection with licensing rights to the
John Hancock Dimensional indexes. Dimensional Fund Advisors LP does not sponsor, endorse, or sell, and makes no
representation as to the advisability of investing in, John Hancock Multifactor ETFs.
John Hancock Investment Management
A trusted brand
John Hancock Investment Management is a premier asset manager
representing one of America's most trusted brands, with a heritage of
financial stewardship dating back to 1862. Helping our shareholders
pursue their financial goals is at the core of everything we do. It's why
we support the role of professional financial advice and operate with
the highest standards of conduct and integrity.
A better way to invest
We serve investors globally through a unique multimanager approach:
We search the world to find proven portfolio teams with specialized
expertise for every strategy we offer, then we apply robust investment
oversight to ensure they continue to meet our uncompromising
standards and serve the best interests of our shareholders.
Results for investors
Our unique approach to asset management enables us to provide
a diverse set of investments backed by some of the world's best
managers, along with strong risk-adjusted returns across asset classes.
John Hancock Investment Management Distributors LLC n Member FINRA, SIPC
200 Berkeley Street n Boston, MA 02116-5010 n 800-225-5291 n jhinvestments.com
This report is for the information of the shareholders of John Hancock Fundamental All Cap Core Fund. It is not authorized for distribution to prospective investors unless preceded or accompanied by a prospectus.
| | |
| MF1078038 | 376SA 1/20
3/2020 |
John Hancock
Diversified Strategies Fund
Semiannual report 1/31/2020
Beginning on January 1, 2021, as permitted by regulations adopted by the Securities and Exchange Commission, paper copies of the fund's shareholder reports like this one will no longer be sent by mail, unless you specifically request paper copies of the reports from the fund or from your financial intermediary. Instead, the reports will be made available on a website, and you will be notified by mail each time a report is posted and provided with a website link to access the report.
If you already elected to receive shareholder reports electronically, you will not be affected by this change, and you do not need to take any action. You may elect to receive shareholder reports and other communications electronically by calling John Hancock Investment Management at 800-225-5291 (Class A shares) or 888-972-8696 (Class I shares) or by contacting your financial intermediary.
You may elect to receive all reports in paper, free of charge, at any time. You can inform John Hancock Investment Management or your financial intermediary that you wish to continue receiving paper copies of your shareholder reports by following the instructions listed above. Your election to receive reports in paper will apply to all funds held with John Hancock Investment Management or your financial intermediary.
A message to shareholders
Dear shareholder,
Global financial markets delivered positive returns during the 6 months ended January 31, 2020. Stocks were particularly strong in the United States, where they delivered positive returns across most economic sectors. Investors benefited from a combination of low inflation, accommodative central bank policy, healthy fundamentals, and corporate buybacks of stock. Investors in non-U.S. equities also saw strong gains, fueled in part by similarly supportive monetary policy and some signs of strength in developing markets. In today's environment of low inflation and declining interest rates, bonds have also fared well, with U.S. corporate bonds delivering positive returns.
After a strong period of positive returns—in a historically long bull market—investors are prudent to consider the risks to future gains. Growth has slowed in the United States, with some negative data in manufacturing reflecting concerns over international trade and wavering business confidence. Additionally, the spread of the coronavirus, trade disputes, and other geopolitical tensions may continue to create uncertainty among businesses and skepticism among investors. Your financial advisor can helpposition your portfolio so that it's sufficiently diversified to meet your long-term objectives and to withstand the inevitable bouts of market volatility along the way.
On behalf of everyone at John Hancock Investment Management, I'd like to take this opportunity to welcome new shareholders and thank existing shareholders for the continued trust you've placed in us.
Sincerely,
Andrew G. Arnott
President and CEO,
John Hancock Investment Management
Head of Wealth and Asset Management,
United States and Europe
This commentary reflects the CEO's views as of this report's period end and are subject to change at any time. Diversification does not guarantee investment returns and does not eliminate risk of loss. All investments entail risks, including the possible loss of principal. For more up-to-date information, you can visit our website at jhinvestments.com.
John Hancock
Diversified Strategies Fund
Table of contents
| | | |
| 2 | | Your fund at a glance |
| 3 | | Portfolio summary |
| 4 | | A look at performance |
| 6 | | Your expenses |
| 8 | | Fund's investments |
| 16 | | Financial statements |
| 19 | | Financial highlights |
| 21 | | Notes to financial statements |
| 33 | | More information |
SEMIANNUAL REPORT | JOHN HANCOCK DIVERSIFIED STRATEGIES FUND 1
INVESTMENT OBJECTIVE
The fund seeks long-term total return.
AVERAGE ANNUAL TOTAL RETURNS AS OF 1/31/2020 (%)
The Blended Index is 70% Bloomberg Barclays U.S. Aggregate Bond Index and 30% S&P 500 Index.
The Bloomberg Barclays U.S. Aggregate Bond Index is an unmanaged index of dollar-denominated and non-convertible investment-grade debt issues.
The S&P 500 Index is an unmanaged index that includes 500 widely traded common stocks.
It is not possible to invest directly in an index. Index figures do not reflect expenses or sales charges, which would result in lower returns.
Figures from Morningstar, Inc. include reinvested distributions and do not take into account sales charges. Actual load-adjusted performance is lower. Since-inception returns for the Morningstar fund category average are not available.
The past performance shown here reflects reinvested distributions and the beneficial effect of any expense reductions, and does not guarantee future results. Returns for periods shorter than one year are cumulative. Performance of the other share classes will vary based on the difference in the fees and expenses of those classes. Shares will fluctuate in value and, when redeemed, may be worth more or less than their original cost. Current month-end performance may be lower or higher than the performance cited, and can be found at jhinvestments.com or by calling 800-225-5291. For further information on the fund's objectives, risks, and strategy, see the fund's prospectus.
SEMIANNUAL REPORT | JOHN HANCOCK DIVERSIFIED STRATEGIES FUND 2
PORTFOLIO COMPOSITION AS OF 1/31/2020 (%)
PORTFOLIO ALLOCATION AS OF 1/31/2020 (%)
| | | |
| Foreign government obligations | 19.8 |
| Affiliated investment companies | 2.7 |
| Unaffiliated investment companies | 2.1 |
| Purchased options | 1.9 |
| Short-term investments and other | 73.5 |
| | Commercial paper | 48.9 |
| | U.S. Government | 18.6 |
| | Short-term funds | 1.8 |
| | Other assets and liabilities, net | 4.2 |
| TOTAL | 100.0 |
| As a percentage of net assets. | |
A note about risks
The fund is subject to various risks as described in the fund's prospectus. For more information, please refer to the "Principal risks" section of the prospectus.
SEMIANNUAL REPORT | JOHN HANCOCK DIVERSIFIED STRATEGIES FUND 3
TOTAL RETURNS FOR THE PERIOD ENDED JANUARY 31, 2020
| | | | | | | | |
Average annual total returns (%)
with maximum sales charge | | Cumulative total returns (%)
with maximum sales charge |
| | 1-year | 5-year | Since
inception1 | | 6-month | 5-year | Since
inception1 |
| Class A | 0.67 | 1.42 | 3.48 | | -1.96 | 7.29 | 33.02 |
| Class I2 | 6.24 | 2.80 | 4.48 | | 3.35 | 14.82 | 44.13 |
| Index1† | 9.64 | 3.01 | 3.17 | | 4.20 | 16.00 | 29.74 |
| Index2† | 21.68 | 12.37 | 15.43 | | 9.31 | 79.17 | 230.82 |
| Index3† | 13.34 | 5.92 | 6.88 | | 5.76 | 33.30 | 74.13 |
Performance figures assume all distributions have been reinvested. Figures reflect maximum sales charges on Class A shares of 5.00%. Sales charges are not applicable to Class I shares.
The expense ratios of the fund, both net (including any fee waivers and/or expense limitations) and gross (excluding any fee waivers and/or expense limitations), are set forth according to the most recent publicly available prospectuses for the fund and may differ from those disclosed in the Financial highlights tables in this report. Net expenses reflect contractual expense limitations in effect until July 31, 2021 and are subject to change. Had the contractual fee waivers and expense limitations not been in place, gross expenses would apply. The expense ratios are as follows:
| | | |
| | Class A | Class I |
| Gross (%) | 2.58 | 2.28 |
| Net (%) | 2.57 | 2.27 |
Please refer to the most recent prospectus and annual or semiannual report for more information on expenses and any expense limitation arrangements for each class.
The returns reflect past results and should not be considered indicative of future performance. The return and principal value of an investment will fluctuate so that shares, when redeemed, may be worth more or less than their original cost. Due to market volatility and other factors, the fund's current performance may be higher or lower than the performance shown. For current to the most recent month-end performance data, please call 800-225-5291 or visit the fund's website at jhinvestments.com.
The performance table above and the chart on the next page do not reflect the deduction of taxes that a shareholder would pay on fund distributions or the redemption of fund shares. The fund's performance results reflect any applicable fee waivers or expense reductions, without which the expenses would increase and results would have been less favorable.
| † | Index 1 is the Bloomberg Barclays U.S. Aggregate Bond Index; Index 2 is the S&P 500 Index; Index 3 is 70% Bloomberg Barclays U.S. Aggregate Bond Index and 30% S&P 500 Index. |
See the following page for footnotes.
SEMIANNUAL REPORT | JOHN HANCOCK DIVERSIFIED STRATEGIES FUND 4
This chart and table show what happened to a hypothetical $10,000 investment in John Hancock Diversified Strategies Fund for the share classes and periods indicated, assuming all distributions were reinvested. For comparison, we've shown the same investment in two separate indexes and a blended index.
| | | | | | | |
| | Start date | With maximum
sales charge ($) | Without sales
charge ($) | Index 1 ($) | Index 2 ($) | Index 3 ($) |
| Class I2 | 9-30-11 | 14,413 | 14,413 | 12,974 | 33,082 | 17,413 |
The Bloomberg Barclays U.S. Aggregate Bond Index is an unmanaged index of dollar-denominated and non-convertible investment-grade debt issues.
The S&P 500 Index is an unmanaged index that includes 500 widely traded common stocks.
The Blended Index is 70% Bloomberg Barclays U.S. Aggregate Bond Index and 30% S&P 500 Index.
It is not possible to invest directly in an index. Index figures do not reflect expenses or sales charges, which would result in lower returns.
Footnotes related to performance pages
| 1 | From 9-30-11. |
| 2 | For certain types of investors as described in the fund's prospectuses. |
SEMIANNUAL REPORT | JOHN HANCOCK DIVERSIFIED STRATEGIES FUND 5
These examples are intended to help you understand your ongoing operating expenses of investing in the fund so you can compare these costs with the ongoing costs of investing in other mutual funds.
Understanding fund expenses
As a shareholder of the fund, you incur two types of costs:
■Transaction costs,which include sales charges (loads) on purchases or redemptions (varies by share class), minimum account fee charge, etc.
■Ongoing operating expenses, including management fees, distribution and service fees (if applicable), and other fund expenses.
We are presenting only your ongoing operating expenses here.
Actual expenses/actual returns
The first line of each share class in the table on the following page is intended to provide information about the fund’s actual ongoing operating expenses, and is based on the fund’s actual return. It assumes an account value of $1,000.00 on August 1, 2019, with the same investment held until January 31, 2020.
Together with the value of your account, you may use this information to estimate the operating expenses that you paid over the period. Simply divide your account value at January 31, 2020, by $1,000.00, then multiply it by the “expenses paid” for your share class from the table. For example, for an account value of $8,600.00, the operating expenses should be calculated as follows:
Hypothetical example for comparison purposes
The second line of each share class in the table on the following page allows you to compare the fund’s ongoing operating expenses with those of any other fund. It provides an example of the fund’s hypothetical account values and hypothetical expenses based on each class’s actual expense ratio and an assumed 5% annualized return before expenses (which is not the class’s actual return). It assumes an account value of $1,000.00 on August 1, 2019, with the same investment held until January 31, 2020. Look in any other fund shareholder report to find its hypothetical example and you will be able to compare these expenses. Please remember that these hypothetical account values and expenses may not be used to estimate the actual ending account balance or expenses you paid for the period.
| 6 | JOHN HANCOCK DIVERSIFIED STRATEGIES FUND | SEMIANNUAL REPORT | |
Remember, these examples do not include any transaction costs, therefore, these examples will not help you to determine the relative total costs of owning different funds. If transaction costs were included, your expenses would have been higher. See the prospectus for details regarding transaction costs.
SHAREHOLDER EXPENSE EXAMPLE CHART
| | | Account
value on
8-1-2019 | Ending
value on
1-31-2020 | Expenses
paid during
period ended
1-31-20201 | Annualized
expense
ratio |
| Class A | Actual expenses/actual returns | $1,000.00 | $1,031.90 | $8.73 | 1.71% |
| | Hypothetical example | 1,000.00 | 1,016.50 | 8.67 | 1.71% |
| Class I | Actual expenses/actual returns | 1,000.00 | 1,033.50 | 7.16 | 1.40% |
| | Hypothetical example | 1,000.00 | 1,018.10 | 7.10 | 1.40% |
| 1 | Expenses are equal to the annualized expense ratio, multiplied by the average account value over the period, multiplied by 184/366 (to reflect the one-half year period). |
| | SEMIANNUAL REPORT | JOHN HANCOCK DIVERSIFIED STRATEGIES FUND | 7 |
AS OF 1-31-20 (unaudited)
| | Rate (%) | Maturity date | | Par value^ | Value |
| Foreign government obligations 19.8% | | | | $2,081,381 |
| (Cost $1,953,676) | | | | | |
| Indonesia 7.7% | | | | | 812,543 |
| Republic of Indonesia | | | | | |
| Bond | 8.250 | 05-15-29 | IDR | 3,375,000,000 | 273,196 |
| Bond | 8.375 | 04-15-39 | IDR | 6,750,000,000 | 539,347 |
| Italy 12.1% | | | | | 1,268,838 |
Republic of Italy
Bond (A) | 3.850 | 09-01-49 | EUR | 800,000 | 1,268,838 |
|
| | | | | Shares | Value |
| Affiliated investment companies (B) 2.7% | | | $287,873 |
| (Cost $280,655) | | | | | |
| Fixed income 2.7% | | | 287,873 |
|
| Asia Pacific Total Return Bond, Class NAV, JHF II (MIM US) (C) | | | | 29,137 | 287,873 |
| Unaffiliated investment companies 2.1% | | | $214,562 |
| (Cost $202,402) | | | | | |
| Exchange-traded funds 2.1% | | | 214,562 |
| iShares JP Morgan USD Emerging Markets Bond ETF | | | | 1,850 | 214,562 |
| | | | | Contracts/Notional amount | Value |
| Purchased options 1.9% | | | | | $199,616 |
| (Cost $235,111) | | | | | |
| Calls 0.7% | | | | | 69,636 |
| Exchange Traded Option on DAX Index Futures (Expiration Date: 12-18-20; Strike Price: EUR 13,400.00; Notional Amount: 20) (D) | | | | 4 | 14,063 |
| Exchange Traded Option on Nikkei 225 Futures (Expiration Date: 12-11-20; Strike Price: JPY 23,500.00; Notional Amount: 1,000) (D) | | | | 1 | 7,522 |
| Exchange Traded Option on Nikkei 225 Futures (Expiration Date: 12-11-20; Strike Price: JPY 24,000.00; Notional Amount: 1,000) (D) | | | | 1 | 5,773 |
| Over the Counter Option on the AUD vs. NZD (Expiration Date: 3-19-20; Strike Price: AUD 1.05; Counterparty: Bank of America N.A.) (D)(E) | | | | 2,000,000 | 3,232 |
| Over the Counter Option on the NOK vs. SEK (Expiration Date: 3-20-20; Strike Price: NOK 1.05; Counterparty: Citibank N.A.) (D)(E) | | | | 20,000,000 | 16,908 |
| 8 | JOHN HANCOCK DIVERSIFIED STRATEGIES FUND | SEMIANNUAL REPORT | SEE NOTES TO FINANCIAL STATEMENTS |
| | | | | Contracts/Notional amount | Value |
| Calls (continued) | | | | | |
| Over the Counter Option on the USD vs. SEK (Expiration Date: 2-28-20; Strike Price: $9.55; Counterparty: Goldman Sachs USA) (D)(E) | | | | 2,000,000 | $22,138 |
| Puts 1.2% | | | | | 129,980 |
| Exchange Traded Option on DAX Index Futures (Expiration Date: 12-18-20; Strike Price: EUR 13,000.00; Notional Amount: 20) (D) | | | | 4 | 17,179 |
| Exchange Traded Option on Nikkei 225 Futures (Expiration Date: 12-11-20; Strike Price: JPY 22,500.00; Notional Amount: 1,000) (D) | | | | 1 | 13,936 |
| Exchange Traded Option on Nikkei 225 Futures (Expiration Date: 12-11-20; Strike Price: JPY 23,500.00; Notional Amount: 1,000) (D) | | | | 1 | 15,966 |
| Over the Counter Option on the EUR vs. AUD (Expiration Date: 5-8-20; Strike Price: EUR 1.60; Counterparty: Bank of America N.A.) (D)(E) | | | | 2,000,000 | 3,238 |
| Over the Counter Option on the EUR vs. NOK (Expiration Date: 11-18-20; Strike Price: EUR 10.00; Counterparty: Goldman Sachs International) (D)(E) | | | | 2,000,000 | 17,625 |
| Over the Counter Option on the EUR vs. USD (Expiration Date: 12-18-20; Strike Price: EUR 1.10; Counterparty: JPMorgan Chase Bank N.A.) (D)(E) | | | | 2,000,000 | 16,432 |
| Over the Counter Option on the EUR vs. USD (Expiration Date: 4-16-20; Strike Price: EUR 1.13; Counterparty: Goldman Sachs Bank USA) (D)(E) | | | | 1,200,000 | 23,731 |
| Over the Counter Option on the NOK vs. SEK (Expiration Date: 5-8-20; Strike Price: NOK 10.10; Counterparty: UBS Securities LLC) (D)(E) | | | | 2,000,000 | 14,269 |
| Over the Counter Option on the USD vs. JPY (Expiration Date: 3-13-20; Strike Price: $108.00; Counterparty: HSBC Bank USA) (D)(E) | | | | 1,000,000 | 7,604 |
|
| SEE NOTES TO FINANCIAL STATEMENTS | SEMIANNUAL REPORT | JOHN HANCOCK DIVERSIFIED STRATEGIES FUND | 9 |
| | Yield* (%) | Maturity date | | Par value^ | Value |
| Short-term investments 69.3% | | | | | $7,280,696 |
| (Cost $7,280,966) | | | | | |
| Commercial paper 48.9% | | | | | 5,142,176 |
| American Honda Finance Corp. | 1.700 | 02-06-20 | | 400,000 | 399,893 |
| Barclays Bank PLC | 1.950 | 02-21-20 | | 475,000 | 474,543 |
| CPPIB Capital, Inc. | 1.640 | 04-21-20 | | 475,000 | 473,274 |
| Cummins, Inc. | 1.680 | 02-13-20 | | 475,000 | 474,729 |
| Gotham Funding Corp. | 1.700 | 03-06-20 | | 475,000 | 474,226 |
| Henkel of America, Inc. | 1.620 | 04-07-20 | | 275,000 | 274,201 |
| John Deere Capital Corp. | 1.680 | 02-11-20 | | 475,000 | 474,780 |
| Koch Indusrties, Inc. | 1.570 | 02-12-20 | | 475,000 | 474,754 |
| ONE Gas, Inc. | 1.620 | 02-13-20 | | 475,000 | 474,729 |
| Province of British Columbia | 1.740 | 02-05-20 | | 200,000 | 199,957 |
| The Boeing Company | 2.150 | 03-09-20 | | 475,000 | 474,099 |
| University of California | 1.750 | 04-02-20 | | 475,000 | 472,991 |
| U.S. Government 18.6% | | | | | 1,949,925 |
| U.S. Treasury Bill | 1.477 | 02-04-20 | | 1,950,000 | 1,949,925 |
| | | Yield (%) | | Shares | Value |
| Short-term funds 1.8% | | | | | 188,595 |
|
| State Street Institutional U.S. Government Money Market Fund, Premier Class | 1.5121(F) | | 188,595 | 188,595 |
|
| Total investments (Cost $9,952,810) 95.8% | | | $10,064,128 |
| Other assets and liabilities, net 4.2% | | | | 436,910 |
| Total net assets 100.0% | | | | | $10,501,038 |
| The percentage shown for each investment category is the total value of the category as a percentage of the net assets of the fund. |
| ^All par values are denominated in U.S. dollars unless otherwise indicated. |
| Currency Abbreviations |
| AUD | Australian Dollar |
| EUR | Euro |
| IDR | Indonesian Rupiah |
| JPY | Japanese Yen |
| NOK | Norwegian Krone |
| NZD | New Zealand Dollar |
| SEK | Swedish Krona |
| Security Abbreviations and Legend |
| JHF II | John Hancock Funds II |
| MIM US | Manulife Investment Management (US) LLC |
| (A) | These securities are exempt from registration under Rule 144A of the Securities Act of 1933. Such securities may be resold, normally to qualified institutional buyers, in transactions exempt from registration. Rule 144A securities amounted to $1,268,838 or 12.1% of the fund's net assets as of 1-31-20. |
| (B) | The underlying funds' subadvisor is shown parenthetically. |
| (C) | The subadvisor is an affiliate of the advisor. |
| 10 | JOHN HANCOCK DIVERSIFIED STRATEGIES FUND | SEMIANNUAL REPORT | SEE NOTES TO FINANCIAL STATEMENTS |
| (D) | Non-income producing security. |
| (E) | For this type of option, notional amounts are equivalent to number of contracts. |
| (F) | The rate shown is the annualized seven-day yield as of 1-31-20. |
| * | Yield represents either the annualized yield at the date of purchase, the stated coupon rate or, for floating rate securities, the rate at period end. |
| SEE NOTES TO FINANCIAL STATEMENTS | SEMIANNUAL REPORT | JOHN HANCOCK DIVERSIFIED STRATEGIES FUND | 11 |
DERIVATIVES
FUTURES
| Open contracts | Number of
contracts | Position | Expiration
date | Notional
basis^ | Notional
value^ | Unrealized
appreciation
(depreciation) |
| 10-Year U.S. Treasury Note Futures | 52 | Long | Mar 2020 | $6,794,443 | $6,846,125 | $51,682 |
| CME E-mini Financial Sector Futures | 1 | Long | Mar 2020 | 95,048 | 92,138 | (2,910) |
| CME E-mini Health Care Sector Futures | 1 | Long | Mar 2020 | 105,193 | 100,080 | (5,113) |
| FTSE 250 Index Futures | 8 | Long | Mar 2020 | 460,982 | 445,695 | (15,287) |
| German Euro BUND Futures | 12 | Long | Mar 2020 | 2,321,369 | 2,329,536 | 8,167 |
| NASDAQ 100 Index E-Mini Futures | 1 | Long | Mar 2020 | 180,877 | 179,955 | (922) |
| S&P 500 Index E-Mini Futures | 3 | Long | Mar 2020 | 489,907 | 483,600 | (6,307) |
| Euro STOXX 50 Index Futures | 4 | Short | Mar 2020 | (167,172) | (161,433) | 5,739 |
| Euro-BTP Italian Government Bond Futures | 8 | Short | Mar 2020 | (1,308,363) | (1,313,381) | (5,018) |
| FTSE 100 Index Futures | 2 | Short | Mar 2020 | (190,916) | (190,614) | 302 |
| U.K. Long Gilt Bond Futures | 14 | Short | Mar 2020 | (2,494,974) | (2,494,635) | 339 |
| Ultra U.S. Treasury Bond Futures | 12 | Short | Mar 2020 | (2,302,342) | (2,324,250) | (21,908) |
| | | | | | | $8,764 |
^ Notional basis refers to the contractual amount agreed upon at inception of open contracts; notional value represents the current value of the open contract.
FORWARD FOREIGN CURRENCY CONTRACTS
| Contract to buy | Contract to sell | Counterparty (OTC) | Contractual
settlement
date | Unrealized
appreciation | Unrealized
depreciation |
| EUR | 1,000,000 | AUD | 1,618,685 | ANZ | 2/14/2020 | $26,001 | — |
| EUR | 500,000 | AUD | 821,904 | TD | 2/14/2020 | 4,590 | — |
| EUR | 500,000 | CAD | 729,034 | JPM | 2/14/2020 | 3,997 | — |
| EUR | 500,000 | JPY | 60,188,600 | CITI | 2/14/2020 | — | $(907) |
| EUR | 1,500,000 | JPY | 181,438,050 | TD | 2/14/2020 | — | (10,776) |
| EUR | 500,000 | MXN | 10,395,670 | GSI | 2/14/2020 | 5,428 | — |
| EUR | 500,000 | NOK | 4,980,371 | GSI | 2/14/2020 | 13,373 | — |
| EUR | 1,000,000 | NOK | 9,899,092 | JPM | 2/14/2020 | 33,449 | — |
| EUR | 375,000 | NOK | 3,712,427 | SSB | 2/14/2020 | 12,515 | — |
| EUR | 1,500,000 | SEK | 15,831,224 | BOA | 2/14/2020 | 19,328 | — |
| EUR | 1,500,000 | SEK | 15,837,318 | TD | 2/14/2020 | 18,694 | — |
| EUR | 1,000,000 | SEK | 10,544,340 | UBS | 2/14/2020 | 13,905 | — |
| EUR | 1,000,000 | USD | 1,114,826 | BOA | 2/14/2020 | — | (5,102) |
| EUR | 500,000 | USD | 557,364 | BMO | 2/14/2020 | — | (2,502) |
| EUR | 1,200,000 | USD | 1,334,349 | SCB | 2/14/2020 | — | (2,680) |
| EUR | 500,000 | USD | 557,353 | TD | 2/14/2020 | — | (2,491) |
| EUR | 2,910,000 | USD | 3,295,363 | SSB | 11/17/2020 | — | (14,408) |
| GBP | 250,000 | USD | 324,686 | BARC | 2/14/2020 | 5,525 | — |
| JPY | 60,168,600 | EUR | 500,000 | CITI | 2/14/2020 | 722 | — |
| JPY | 61,100,150 | EUR | 500,000 | JPM | 2/14/2020 | 9,324 | — |
| JPY | 120,079,900 | EUR | 1,000,000 | TD | 2/14/2020 | — | (931) |
| JPY | 54,690,400 | USD | 500,000 | TD | 2/14/2020 | 5,000 | — |
| MXN | 9,387,690 | USD | 500,000 | SSB | 2/14/2020 | — | (3,840) |
| 12 | JOHN HANCOCK DIVERSIFIED STRATEGIES FUND | SEMIANNUAL REPORT | SEE NOTES TO FINANCIAL STATEMENTS |
FORWARD FOREIGN CURRENCY CONTRACTS (continued)
| Contract to buy | Contract to sell | Counterparty (OTC) | Contractual
settlement
date | Unrealized
appreciation | Unrealized
depreciation |
| NOK | 3,739,638 | EUR | 375,000 | MSCS | 2/14/2020 | — | $(9,556) |
| NOK | 5,043,565 | EUR | 500,000 | SSB | 2/14/2020 | — | (6,502) |
| NOK | 5,000,000 | SEK | 5,231,750 | HUS | 2/14/2020 | — | (86) |
| NOK | 4,443,467 | USD | 500,000 | MSCS | 2/14/2020 | — | (16,886) |
| NOK | 4,434,176 | USD | 500,000 | TD | 2/14/2020 | — | (17,896) |
| NZD | 1,000,000 | USD | 664,278 | BARC | 2/14/2020 | — | (17,803) |
| NZD | 500,000 | USD | 330,586 | MSCS | 2/14/2020 | — | (7,348) |
| SEK | 15,840,306 | EUR | 1,500,000 | BARC | 2/14/2020 | — | (18,384) |
| SEK | 5,278,711 | EUR | 500,000 | JPM | 2/14/2020 | — | (6,273) |
| SEK | 21,110,584 | EUR | 2,000,000 | SSB | 2/14/2020 | — | (25,532) |
| SEK | 15,849,335 | NOK | 15,000,000 | BARC | 2/14/2020 | $16,271 | — |
| SEK | 7,205,533 | USD | 750,000 | BARC | 2/14/2020 | — | (1,166) |
| SEK | 9,489,632 | USD | 1,000,000 | SSB | 2/14/2020 | — | (13,791) |
| SEK | 4,729,468 | USD | 500,000 | UBS | 2/14/2020 | — | (8,491) |
| USD | 500,000 | CAD | 657,811 | TD | 2/14/2020 | 2,952 | — |
| USD | 2,780,152 | EUR | 2,500,000 | BOA | 2/14/2020 | 5,840 | — |
| USD | 1,170,629 | EUR | 1,045,000 | MSCS | 2/27/2020 | 10,042 | — |
| USD | 3,307,486 | EUR | 2,910,000 | SSB | 11/17/2020 | 26,531 | — |
| USD | 324,863 | GBP | 250,000 | BOA | 2/14/2020 | — | (5,348) |
| USD | 1,000,000 | HKD | 7,769,706 | RBC | 2/14/2020 | — | (208) |
| USD | 3,000,000 | HKD | 23,320,102 | SSB | 2/14/2020 | — | (2,037) |
| USD | 500,000 | ILS | 1,727,102 | MSCS | 2/14/2020 | — | (689) |
| USD | 500,000 | JPY | 54,748,355 | MSCS | 2/14/2020 | — | (5,535) |
| USD | 500,000 | MXN | 9,380,061 | BOA | 2/14/2020 | 4,244 | — |
| USD | 500,000 | NOK | 4,434,680 | SCB | 2/14/2020 | 17,841 | — |
| USD | 500,000 | NOK | 4,442,826 | TD | 2/14/2020 | 16,955 | — |
| USD | 660,774 | NZD | 1,000,000 | BARC | 2/14/2020 | 14,300 | — |
| USD | 331,006 | NZD | 500,000 | TD | 2/14/2020 | 7,769 | — |
| USD | 1,000,000 | SEK | 9,502,722 | SSB | 2/14/2020 | 12,431 | — |
| USD | 500,000 | SEK | 4,732,650 | TD | 2/14/2020 | 8,160 | — |
| | | | | | | $315,187 | $(207,168) |
WRITTEN OPTIONS
| Options on index |
Counterparty (OTC)/
Exchange-
traded | Name of
issuer | | Exercise
price | Expiration
date | Number of
contracts | Notional
amount | Premium | Value |
| Calls | | | | | | | | |
| Exchange-traded | Euro STOXX 50 Index | EUR | 3,800.00 | Dec 2020 | 5 | 50 | $6,719 | $(4,084) |
| Exchange-traded | S&P 500 Index | USD | 3,300.00 | Dec 2020 | 1 | 100 | 15,716 | (14,280) |
| SEE NOTES TO FINANCIAL STATEMENTS | SEMIANNUAL REPORT | JOHN HANCOCK DIVERSIFIED STRATEGIES FUND | 13 |
| Options on index (continued) |
Counterparty (OTC)/
Exchange-
traded | Name of
issuer | | Exercise
price | Expiration
date | Number of
contracts | Notional
amount | Premium | Value |
| Puts | | | | | | | | |
| Exchange-traded | Euro STOXX 50 Index | EUR | 3,700.00 | Dec 2020 | 5 | 50 | $12,014 | $(16,004) |
| Exchange-traded | S&P 500 Index | USD | 3,200.00 | Dec 2020 | 1 | 100 | 17,216 | (18,370) |
| | | | | | | | $51,665 | $(52,738) |
| Foreign currency options |
| Description | Counterparty (OTC) | | Exercise
price | Expiration
date | Notional
amount* | Premium | Value |
| Calls | | | | | | | |
| Australian Dollar versus New Zealand Dollar | BOA | AUD | 1.07 | Mar 2020 | 2,000,000 | $2,806 | $(485) |
| Euro versus Australian Dollar | BOA | EUR | 1.67 | May 2020 | 2,000,000 | 16,492 | (26,313) |
| Euro versus Norwegian Krone | UBS | EUR | 11.00 | May 2020 | 2,000,000 | 6,321 | (1,743) |
| Euro versus Norwegian Krone | GSI | EUR | 11.00 | Nov 2020 | 2,000,000 | 18,918 | (14,200) |
| Euro versus U.S. Dollar | GSI | EUR | 1.20 | Apr 2020 | 1,200,000 | 17,792 | (75) |
| Euro versus U.S. Dollar | JPM | EUR | 1.19 | Dec 2020 | 2,000,000 | 17,535 | (11,929) |
| Norwegian Krone versus Swedish Krona | CITI | NOK | 1.08 | Mar 2020 | 20,000,000 | 4,524 | (1,890) |
| U.S. Dollar versus Swedish Krona | GSI | USD | 9.75 | Feb 2020 | 2,000,000 | 2,556 | (4,924) |
| | | | | | | $86,944 | $(61,559) |
| Puts | | | | | | | |
| Euro versus Norwegian Krone | UBS | EUR | 9.85 | May 2020 | 2,000,000 | $9,148 | $(3,505) |
| Euro versus Norwegian Krone | GSI | EUR | 9.70 | Nov 2020 | 2,000,000 | 15,084 | (6,381) |
| Euro versus U.S. Dollar | JPM | EUR | 1.13 | Apr 2020 | 1,200,000 | 17,842 | (23,730) |
| | | | | | | $42,074 | $(33,616) |
| | | | | | | $129,018 | $(95,175) |
| * For this type of option, notional amounts are equivalent to number of contracts. |
| Derivatives Currency Abbreviations |
| AUD | Australian Dollar |
| CAD | Canadian Dollar |
| EUR | Euro |
| GBP | Pound Sterling |
| HKD | Hong Kong Dollar |
| ILS | Israeli New Shekel |
| JPY | Japanese Yen |
| 14 | JOHN HANCOCK DIVERSIFIED STRATEGIES FUND | SEMIANNUAL REPORT | SEE NOTES TO FINANCIAL STATEMENTS |
| MXN | Mexican Peso |
| NOK | Norwegian Krone |
| NZD | New Zealand Dollar |
| SEK | Swedish Krona |
| USD | U.S. Dollar |
| Derivatives Abbreviations |
| ANZ | Australia and New Zealand Banking Group Limited |
| BARC | Barclays Bank PLC |
| BMO | Bank of Montreal |
| BOA | Bank of America, N.A. |
| CITI | Citibank, N.A. |
| GSI | Goldman Sachs International |
| HUS | HSBC Bank USA, N.A. |
| JPM | JPMorgan Chase Bank, N.A. |
| MSCS | Morgan Stanley Capital Services LLC |
| OTC | Over-the-counter |
| RBC | Royal Bank of Canada |
| SCB | Standard Chartered Bank |
| SSB | State Street Bank and Trust Company |
| TD | The Toronto-Dominion Bank |
| UBS | UBS AG |
At 1-31-20, the aggregate cost of investments for federal income tax purposes was $9,772,720. Net unrealized appreciation aggregated to $260,278, of which $324,944 related to gross unrealized appreciation and $64,666 related to gross unrealized depreciation.
See Notes to financial statements regarding investment transactions and other derivatives information.
| SEE NOTES TO FINANCIAL STATEMENTS | SEMIANNUAL REPORT | JOHN HANCOCK DIVERSIFIED STRATEGIES FUND | 15 |
STATEMENT OF ASSETS AND LIABILITIES 1-31-20 (unaudited)
| Assets | |
| Unaffiliated investments, at value (Cost $9,672,155) | $9,776,255 |
| Affiliated investments, at value (Cost $280,655) | 287,873 |
| Total investments, at value (Cost $9,952,810) | 10,064,128 |
| Unrealized appreciation on forward foreign currency contracts | 315,187 |
| Receivable for futures variation margin | 5,572 |
| Foreign currency, at value (Cost $100,309) | 100,657 |
| Collateral held at broker for futures contracts | 250,000 |
| Collateral held at broker for exchange-traded derivatives | 175,000 |
| Dividends and interest receivable | 29,242 |
| Receivable for investments sold | 45,004 |
| Receivable from affiliates | 269 |
| Other assets | 2,017 |
| Total assets | 10,987,076 |
| Liabilities | |
| Unrealized depreciation on forward foreign currency contracts | 207,168 |
| Written options, at value (Premiums received $180,683) | 147,913 |
| Due to custodian | 32,933 |
| Payable for investments purchased | 43,806 |
| Payable to affiliates | |
| Accounting and legal services fees | 161 |
| Transfer agent fees | 1,053 |
| Trustees' fees | 25 |
| Other liabilities and accrued expenses | 52,979 |
| Total liabilities | 486,038 |
| Net assets | $10,501,038 |
| Net assets consist of | |
| Paid-in capital | $10,154,043 |
| Total distributable earnings (loss) | 346,995 |
| Net assets | $10,501,038 |
| |
| Net asset value per share | |
| Based on net asset value and shares outstanding - the fund has an unlimited number of shares authorized with no par value | |
| Class A ($5,147,618 ÷ 630,459 shares)1 | $8.16 |
| Class I ($5,353,420 ÷ 650,846 shares) | $8.23 |
| Maximum offering price per share | |
| Class A (net asset value per share ÷ 95%)2 | $8.59 |
| 1 | Redemption price per share is equal to net asset value less any applicable contingent deferred sales charge. |
| 2 | On single retail sales of less than $50,000. On sales of $50,000 or more and on group sales the offering price is reduced. |
| 16 | JOHN HANCOCK DIVERSIFIED STRATEGIES FUND | SEMIANNUAL REPORT | SEE NOTES TO FINANCIAL STATEMENTS |
STATEMENT OF OPERATIONSFor the six months ended 1-31-20 (unaudited)
| Investment income | |
| Interest | $107,891 |
| Income distributions received from affiliated investments | 10,821 |
| Dividends | 5,665 |
| Less foreign taxes withheld | (10,271) |
| Total investment income | 114,106 |
| Expenses | |
| Investment management fees | 52,018 |
| Distribution and service fees | 7,582 |
| Accounting and legal services fees | 951 |
| Transfer agent fees | 6,341 |
| Trustees' fees | 164 |
| Custodian fees | 29,084 |
| Printing and postage | 9,706 |
| Professional fees | 22,996 |
| Other | 9,861 |
| Total expenses | 138,703 |
| Less expense reductions | (58,052) |
| Net expenses | 80,651 |
| Net investment income | 33,455 |
| Realized and unrealized gain (loss) | |
| Net realized gain (loss) on | |
| Unaffiliated investments and foreign currency transactions | (287,236) |
| Affiliated investments | 98 |
| Futures contracts | 130,029 |
| Forward foreign currency contracts | 227,333 |
| Written options | 111,985 |
| Swap contracts | (28,862) |
| | 153,347 |
| Change in net unrealized appreciation (depreciation) of | |
| Unaffiliated investments and translation of assets and liabilities in foreign currencies | 105,429 |
| Affiliated investments | (2,470) |
| Futures contracts | 1,308 |
| Forward foreign currency contracts | 108,010 |
| Written options | (24,667) |
| | 187,610 |
| Net realized and unrealized gain | 340,957 |
| Increase in net assets from operations | $374,412 |
| SEE NOTES TO FINANCIAL STATEMENTS | SEMIANNUAL REPORT | JOHN HANCOCK DIVERSIFIED STRATEGIES FUND | 17 |
STATEMENTS OF CHANGES IN NET ASSETS
| | Six months ended
1-31-20
(unaudited) | Year ended
7-31-19 |
| Increase (decrease) in net assets | | |
| From operations | | |
| Net investment income | $33,455 | $80,472 |
| Net realized gain | 153,347 | 40,598 |
| Change in net unrealized appreciation (depreciation) | 187,610 | 16,178 |
| Increase in net assets resulting from operations | 374,412 | 137,248 |
| Distributions to shareholders | | |
| From earnings | | |
| Class A | (52,194) | (1,082,050) |
| Class I | (71,008) | (1,230,106) |
| Total distributions | (123,202) | (2,312,156) |
| From fund share transactions | 8,764 | 1,902,415 |
| Total increase (decrease) | 259,974 | (272,493) |
| Net assets | | |
| Beginning of period | 10,241,064 | 10,513,557 |
| End of period | $10,501,038 | $10,241,064 |
| 18 | JOHN HANCOCK DIVERSIFIED STRATEGIES FUND | SEMIANNUAL REPORT | SEE NOTES TO FINANCIAL STATEMENTS |
| CLASS A SHARES Period ended | 1-31-201 | 7-31-19 | 7-31-18 | 7-31-17 | 7-31-16 | 7-31-15 |
| Per share operating performance | | | | | | |
| Net asset value, beginning of period | $7.96 | $10.13 | $10.50 | $10.09 | $10.43 | $10.92 |
| Net investment income2 | 0.02 | 0.05 | 0.07 | 0.12 | 0.17 | 0.21 |
| Net realized and unrealized gain (loss) on investments | 0.26 | 0.01 | (0.08) | 0.45 | (0.27) | (0.10) |
| Total from investment operations | 0.28 | 0.06 | (0.01) | 0.57 | (0.10) | 0.11 |
| Less distributions | | | | | | |
| From net investment income | (0.08) | — | (0.36) | (0.16) | (0.23) | (0.32) |
| From net realized gain | — | (2.23) | — | — | (0.01) | (0.28) |
| Total distributions | (0.08) | (2.23) | (0.36) | (0.16) | (0.24) | (0.60) |
| Net asset value, end of period | $8.16 | $7.96 | $10.13 | $10.50 | $10.09 | $10.43 |
| Total return (%)3,4 | 3.195 | 1.23 | (0.17) | 5.74 | (0.96) | 1.07 |
| Ratios and supplemental data | | | | | | |
| Net assets, end of period (in millions) | $5 | $5 | $5 | $32 | $30 | $31 |
| Ratios (as a percentage of average net assets): | | | | | | |
| Expenses before reductions6 | 2.827 | 2.57 | 1.89 | 1.71 | 1.77 | 1.66 |
| Expenses including reductions6 | 1.717 | 1.70 | 1.70 | 1.70 | 1.70 | 1.66 |
| Net investment income | 0.487 | 0.63 | 0.62 | 1.22 | 1.67 | 1.93 |
| Portfolio turnover (%) | 197 | 173 | 171 | 73 | 55 | 62 |
| 1 | Six months ended 1-31-20. Unaudited. |
| 2 | Based on average daily shares outstanding. |
| 3 | Total returns would have been lower had certain expenses not been reduced during the applicable periods. |
| 4 | Does not reflect the effect of sales charges, if any. |
| 5 | Not annualized. |
| 6 | Ratios do not include expense indirectly incurred from underlying funds and can vary based on the mix of underlying funds held by the fund. |
| 7 | Annualized. |
| SEE NOTES TO FINANCIAL STATEMENTS | SEMIANNUAL REPORT | JOHN HANCOCK DIVERSIFIED STRATEGIES FUND | 19 |
| CLASS I SHARES Period ended | 1-31-201 | 7-31-19 | 7-31-18 | 7-31-17 | 7-31-16 | 7-31-15 |
| Per share operating performance | | | | | | |
| Net asset value, beginning of period | $8.03 | $10.18 | $10.52 | $10.12 | $10.46 | $10.95 |
| Net investment income2 | 0.03 | 0.08 | 0.05 | 0.16 | 0.20 | 0.24 |
| Net realized and unrealized gain (loss) on investments | 0.28 | —3 | —3 | 0.43 | (0.27) | (0.10) |
| Total from investment operations | 0.31 | 0.08 | 0.05 | 0.59 | (0.07) | 0.14 |
| Less distributions | | | | | | |
| From net investment income | (0.11) | — | (0.39) | (0.19) | (0.26) | (0.35) |
| From net realized gain | — | (2.23) | — | — | (0.01) | (0.28) |
| Total distributions | (0.11) | (2.23) | (0.39) | (0.19) | (0.27) | (0.63) |
| Net asset value, end of period | $8.23 | $8.03 | $10.18 | $10.52 | $10.12 | $10.46 |
| Total return (%)4 | 3.355 | 1.47 | 0.32 | 5.94 | (0.63) | 1.40 |
| Ratios and supplemental data | | | | | | |
| Net assets, end of period (in millions) | $5 | $5 | $6 | $10 | $10 | $9 |
| Ratios (as a percentage of average net assets): | | | | | | |
| Expenses before reductions6 | 2.527 | 2.28 | 1.59 | 1.40 | 1.45 | 1.35 |
| Expenses including reductions6 | 1.407 | 1.39 | 1.39 | 1.39 | 1.39 | 1.35 |
| Net investment income | 0.797 | 0.93 | 0.66 | 1.53 | 1.98 | 2.24 |
| Portfolio turnover (%) | 197 | 173 | 171 | 73 | 55 | 62 |
| 1 | Six months ended 1-31-20. Unaudited. |
| 2 | Based on average daily shares outstanding. |
| 3 | Less than $0.005 per share. |
| 4 | Total returns would have been lower had certain expenses not been reduced during the applicable periods. |
| 5 | Not annualized. |
| 6 | Ratios do not include expense indirectly incurred from underlying funds and can vary based on the mix of underlying funds held by the fund. |
| 7 | Annualized. |
| 20 | JOHN HANCOCK DIVERSIFIED STRATEGIES FUND | SEMIANNUAL REPORT | SEE NOTES TO FINANCIAL STATEMENTS |
| Notes to financial statements (unaudited) | |
Note 1—Organization
John Hancock Diversified Strategies Fund (the fund) is a series of John Hancock Funds II (the Trust), an open-end management investment company organized as a Massachusetts business trust and registered under the Investment Company Act of 1940, as amended (the 1940 Act). The investment objective of the fund is to seek long-term total return.
The fund may offer multiple classes of shares. The shares currently outstanding are detailed in the Statement of assets and liabilities. Class A shares are offered to all investors. Class I shares are offered to institutions and certain investors. Shareholders of each class have exclusive voting rights to matters that affect that class. The distribution and service fees, if any, and transfer agent fees for each class may differ.
Note 2—Significant accounting policies
The financial statements have been prepared in conformity with accounting principles generally accepted in the United States of America (US GAAP), which require management to make certain estimates and assumptions as of the date of the financial statements. Actual results could differ from those estimates and those differences could be significant. The fund qualifies as an investment company under Topic 946 of Accounting Standards Codification of US GAAP.
Events or transactions occurring after the end of the fiscal period through the date that the financial statements were issued have been evaluated in the preparation of the financial statements. The following summarizes the significant accounting policies of the fund:
Security valuation. Investments are stated at value as of the scheduled close of regular trading on the New York Stock Exchange (NYSE), normally at 4:00 P.M., Eastern Time. In case of emergency or other disruption resulting in the NYSE not opening for trading or the NYSE closing at a time other than the regularly scheduled close, the net asset value (NAV) may be determined as of the regularly scheduled close of the NYSE pursuant to the fund's Valuation Policies and Procedures.
In order to value the securities, the fund uses the following valuation techniques: Debt obligations are typically valued based on the evaluated prices provided by an independent pricing vendor. Independent pricing vendors utilize matrix pricing, which takes into account factors such as institutional-size trading in similar groups of securities, yield, quality, coupon rate, maturity, type of issue, trading characteristics and other market data, as well as broker supplied prices. Equity securities, including exchange-traded or closed-end funds, are typically valued at the last sale price or official closing price on the exchange or principal market where the security trades. In the event there were no sales during the day or closing prices are not available, the securities are valued using the last available bid price. Investments by the fund in open-end mutual funds are valued at their respective NAVs each business day. Options listed on an exchange are valued at the mid-price of the last quoted bid and ask prices from the primary exchange where the option trades. Unlisted options are valued using evaluated prices obtained from an independent pricing vendor. Futures contracts are typically valued at last traded price on the exchange on which they trade. Forward foreign currency contracts are valued at the prevailing forward rates which are based on foreign currency exchange spot rates and forward points supplied by an independent pricing vendor. Foreign securities and currencies are valued in U.S. dollars based on foreign currency exchange rates supplied by an independent pricing vendor.
| | SEMIANNUAL REPORT | JOHN HANCOCK Diversified Strategies Fund | 21 |
Other portfolio securities and assets, for which reliable market quotations are not readily available, are valued at fair value as determined in good faith by the fund's Pricing Committee following procedures established by the Board of Trustees. The frequency with which these fair valuation procedures are used cannot be predicted and fair value of securities may differ significantly from the value that would have been used had a ready market for such securities existed.
The fund uses a three-tier hierarchy to prioritize the pricing assumptions, referred to as inputs, used in valuation techniques to measure fair value. Level 1 includes securities valued using quoted prices in active markets for identical securities, including registered investment companies. Level 2 includes securities valued using other significant observable inputs. Observable inputs may include quoted prices for similar securities, interest rates, prepayment speeds and credit risk. Prices for securities valued using these inputs are received from independent pricing vendors and brokers and are based on an evaluation of the inputs described. Level 3 includes securities valued using significant unobservable inputs when market prices are not readily available or reliable, including the fund's own assumptions in determining the fair value of investments. Factors used in determining value may include market or issuer specific events or trends, changes in interest rates and credit quality. The inputs or methodology used for valuing securities are not necessarily an indication of the risks associated with investing in those securities. Changes in valuation techniques and related inputs may result in transfers into or out of an assigned level within the disclosure hierarchy.
The following is a summary of the values by input classification of the fund's investments as of January 31, 2020, by major security category or type:
| | Total
value at
1-31-20 | Level 1
quoted
price | Level 2
significant
observable
inputs | Level 3
significant
unobservable
inputs |
| Investments in securities: | | | | |
| Assets | | | | |
| Foreign government obligations | $2,081,381 | — | $2,081,381 | — |
| Affiliated investment companies | 287,873 | $287,873 | — | — |
| Unaffiliated investment companies | 214,562 | 214,562 | — | — |
| Purchased options | 199,616 | 58,473 | 141,143 | — |
| Short-term investments | 7,280,696 | 188,595 | 7,092,101 | — |
| Total investments in securities | $10,064,128 | $749,503 | $9,314,625 | — |
| Derivatives: | | | | |
| Assets | | | | |
| Futures | $66,229 | $66,229 | — | — |
| Forward foreign currency contracts | 315,187 | — | $315,187 | — |
| Liabilities | | | | |
| Futures | (57,465) | (57,465) | — | — |
| Forward foreign currency contracts | (207,168) | — | (207,168) | — |
| Written options | (147,913) | (52,738) | (95,175) | — |
Security transactions and related investment income. Investment security transactions are accounted for on a trade date plus one basis for daily NAV calculations. However, for financial reporting purposes, investment transactions are reported on trade date. Interest income is accrued as earned. Interest income includes coupon interest and amortization/accretion of premiums/discounts on debt securities. Debt obligations may be placed in a non-accrual status and related interest income may be reduced by stopping current accruals and writing off
| 22 | JOHN HANCOCK Diversified Strategies Fund | SEMIANNUAL REPORT | |
interest receivable when the collection of all or a portion of interest has become doubtful. Dividend income is recorded on the ex-date, except for dividends of certain foreign securities where the dividend may not be known until after the ex-date. In those cases, dividend income, net of withholding taxes, is recorded when the fund becomes aware of the dividends. Non-cash dividends, if any, are recorded at the fair market value of the securities received. Gains and losses on securities sold are determined on the basis of identified cost and may include proceeds from litigation.
Foreign investing. Assets, including investments, and liabilities denominated in foreign currencies are translated into U.S. dollar values each day at the prevailing exchange rate. Purchases and sales of securities, income and expenses are translated into U.S. dollars at the prevailing exchange rate on the date of the transaction. The effect of changes in foreign currency exchange rates on the value of securities is reflected as a component of the realized and unrealized gains (losses) on investments. Foreign investments are subject to a decline in the value of a foreign currency versus the U.S. dollar, which reduces the dollar value of securities denominated in that currency.
Funds that invest internationally generally carry more risk than funds that invest strictly in U.S. securities. Risks can result from differences in economic and political conditions, regulations, market practices (including higher transaction costs), accounting standards and other factors.
Foreign taxes. The fund may be subject to withholding tax on income, capital gains or repatriation taxes imposed by certain countries, a portion of which may be recoverable. Foreign taxes are accrued based upon the fund's understanding of the tax rules and rates that exist in the foreign markets in which it invests. Taxes are accrued based on gains realized by the fund as a result of certain foreign security sales. In certain circumstances, estimated taxes are accrued based on unrealized appreciation of such securities. Investment income is recorded net of foreign withholding taxes.
Overdraft. The fund may have the ability to borrow from banks for temporary or emergency purposes, including meeting redemption requests that otherwise might require the untimely sale of securities. Pursuant to the fund's custodian agreement, the custodian may loan money to the fund to make properly authorized payments. The fund is obligated to repay the custodian for any overdraft, including any related costs or expenses. The custodian may have a lien, security interest or security entitlement in any fund property that is not otherwise segregated or pledged, to the extent of any overdraft, and to the maximum extent permitted by law. Overdrafts at period end are presented under the caption Due to custodian in the Statement of assets and liabilities.
Line of credit. The fund and other affiliated funds have entered into a syndicated line of credit agreement with Citibank, N.A. as the administrative agent that enables them to participate in a $750 million unsecured committed line of credit. Excluding commitments designated for a certain fund and subject to the needs of all other affiliated funds, the fund can borrow up to an aggregate commitment amount of $500 million, subject to asset coverage and other limitations as specified in the agreement. A commitment fee payable at the end of each calendar quarter, based on the average daily unused portion of the line of credit, is charged to each participating fund based on a combination of fixed and asset based allocations and is reflected in Other expenses on the Statement of operations. For the six months ended January 31, 2020, the fund had no borrowings under the line of credit. Commitment fees for the six months ended January 31, 2020 were $1,113.
Expenses. Within the John Hancock group of funds complex, expenses that are directly attributable to an individual fund are allocated to such fund. Expenses that are not readily attributable to a specific fund are allocated among all funds in an equitable manner, taking into consideration, among other things, the nature and type of expense and the fund’s relative net assets. Expense estimates are accrued in the period to which they relate and adjustments are made when actual amounts are known.
| | SEMIANNUAL REPORT | JOHN HANCOCK Diversified Strategies Fund | 23 |
Class allocations. Income, common expenses and realized and unrealized gains (losses) are determined at the fund level and allocated daily to each class of shares based on the net assets of the class. Class-specific expenses, such as distribution and service fees, if any, and transfer agent fees, for all classes, are charged daily at the class level based on the net assets of each class and the specific expense rates applicable to each class.
Federal income taxes. The fund intends to continue to qualify as a regulated investment company by complying with the applicable provisions of the Internal Revenue Code and will not be subject to federal income tax on taxable income that is distributed to shareholders. Therefore, no federal income tax provision is required.
For federal income tax purposes, as of July 31, 2019, the fund has a short-term capital loss carryforward of $39,601 and a long-term capital loss carryforward of $4,612 available to offset future net realized capital gains. These carryforwards do not expire.
As of July 31, 2019, the fund had no uncertain tax positions that would require financial statement recognition, derecognition or disclosure. The fund's federal tax returns are subject to examination by the Internal Revenue Service for a period of three years.
Distribution of income and gains. Distributions to shareholders from net investment income and net realized gains, if any, are recorded on the ex-date. The fund generally declares and pays dividends annually. Capital gain distributions, if any, are typically distributed annually.
Distributions paid by the fund with respect to each class of shares are calculated in the same manner, at the same time and in the same amount, except for the effect of class level expenses that may be applied differently to each class.
Such distributions, on a tax basis, are determined in conformity with income tax regulations, which may differ from US GAAP. Distributions in excess of tax basis earnings and profits, if any, are reported in the fund's financial statements as a return of capital. The final determination of tax characteristics of the fund's distribution will occur at the end of the year and will subsequently be reported to shareholders.
Capital accounts within the financial statements are adjusted for permanent book-tax differences. These adjustments have no impact on net assets or the results of operations. Temporary book-tax differences, if any, will reverse in a subsequent period. Book-tax differences are primarily attributable to foreign currency transactions.
Note 3—Derivative instruments
The fund may invest in derivatives in order to meet its investment objective. Derivatives include a variety of different instruments that may be traded in the over-the-counter (OTC) market, on a regulated exchange or through a clearing facility. The risks in using derivatives vary depending upon the structure of the instruments, including the use of leverage, optionality, the liquidity or lack of liquidity of the contract, the creditworthiness of the counterparty or clearing organization and the volatility of the position. Some derivatives involve risks that are potentially greater than the risks associated with investing directly in the referenced securities or other referenced underlying instrument. Specifically, the fund is exposed to the risk that the counterparty to an OTC derivatives contract will be unable or unwilling to make timely settlement payments or otherwise honor its obligations. OTC derivatives transactions typically can only be closed out with the other party to the transaction.
Derivatives which are typically traded through the OTC market are regulated by the Commodity Futures Trading Commission (the CFTC). Derivative counterparty risk is managed through an ongoing evaluation of the creditworthiness of all potential counterparties and, if applicable, designated clearing organizations. The fund attempts to reduce its exposure to counterparty risk for derivatives traded in the OTC market, whenever possible, by entering into an International Swaps and Derivatives Association (ISDA) Master Agreement with each of its OTC
| 24 | JOHN HANCOCK Diversified Strategies Fund | SEMIANNUAL REPORT | |
counterparties. The ISDA gives each party to the agreement the right to terminate all transactions traded under the agreement if there is certain deterioration in the credit quality or contractual default of the other party, as defined in the ISDA. Upon an event of default or a termination of the ISDA, the non-defaulting party has the right to close out all transactions and to net amounts owed.
As defined by the ISDA, the fund may have collateral agreements with certain counterparties to mitigate counterparty risk on OTC derivatives. Subject to established minimum levels, collateral for OTC transactions is generally determined based on the net aggregate unrealized gain or loss on contracts with a particular counterparty. Collateral pledged to the fund, if any, is held in a segregated account by a third-party agent or held by the custodian bank for the benefit of the fund and can be in the form of cash or debt securities issued by the U.S. government or related agencies; collateral posted by the fund, if any, for OTC transactions is held in a segregated account at the fund's custodian and is noted in the accompanying Fund's investments, or if cash is posted, on the Statement of assets and liabilities. The fund's risk of loss due to counterparty risk is equal to the asset value of outstanding contracts offset by collateral received.
Certain derivatives are traded or cleared on an exchange or central clearinghouse. Exchange-traded or centrally-cleared transactions generally present less counterparty risk to a fund than OTC transactions. The exchange or clearinghouse stands between the fund and the broker to the contract and therefore, credit risk is generally limited to the failure of the exchange or clearinghouse and the clearing member.
Futures. A futures contract is a contractual agreement to buy or sell a particular currency or financial instrument at a pre-determined price in the future. Risks related to the use of futures contracts include possible illiquidity of the futures markets and contract prices that can be highly volatile and imperfectly correlated to movements in the underlying financial instrument and potential losses in excess of the amounts recognized on the Statement of assets and liabilities. Use of long futures contracts subjects the fund to the risk of loss up to the notional value of the futures contracts. Use of short futures contracts subjects the fund to unlimited risk of loss.
Upon entering into a futures contract, the fund is required to deposit initial margin with the broker in the form of cash or securities. The amount of required margin is set by the broker and is generally based on a percentage of the contract value. The margin deposit must then be maintained at the established level over the life of the contract. Cash that has been pledged by the fund is detailed in the Statement of assets and liabilities as Collateral held at broker for futures contracts. Securities pledged by the fund, if any, are identified in the Fund's investments. Subsequent payments, referred to as variation margin, are made or received by the fund periodically and are based on changes in the market value of open futures contracts. Futures contracts are marked-to-market daily and unrealized gain or loss is recorded by the fund. Receivable for futures variation margin is included on the Statement of assets and liabilities. When the contract is closed, the fund records a realized gain or loss equal to the difference between the value of the contract at the time it was opened and the value at the time it was closed.
During the six months ended January 31, 2020, the fund used futures contracts to manage against anticipated changes in securities markets, gain exposure to certain securities markets, as a substitute for securities purchased and to maintain diversity of the portfolio. The fund held futures contracts with USD notional values ranging from $4.5 million to $17.0 million, as measured at each quarter end.
Forward foreign currency contracts. A forward foreign currency contract is an agreement between two parties to buy and sell specific currencies at a price that is set on the date of the contract. The forward contract calls for delivery of the currencies on a future date that is specified in the contract. Risks related to the use of forwards include the possible failure of counterparties to meet the terms of the forward agreement, the failure of the counterparties to timely post collateral if applicable, and the risk that currency movements will not favor the fund thereby reducing the fund's total return, and the potential for losses in excess of the amounts recognized on
| | SEMIANNUAL REPORT | JOHN HANCOCK Diversified Strategies Fund | 25 |
the Statement of assets and liabilities.
The market value of a forward foreign currency contract fluctuates with changes in foreign currency exchange rates. Forward foreign currency contracts are marked-to-market daily and the change in value is recorded by the fund as an unrealized gain or loss. Realized gains or losses, equal to the difference between the value of the contract at the time it was opened and the value at the time it was closed, are recorded upon delivery or receipt of the currency or settlement with the counterparty.
During the six months ended January 31, 2020, the fund used forward foreign currency contracts to manage against anticipated changes in currency exchange rates and to gain exposure to foreign currencies. The fund held forward foreign currency contracts with USD notional values ranging from $9.0 million to $50.8 million, as measured at each quarter end.
Options. There are two types of options, put options and call options. Options are traded either OTC or on an exchange. A call option gives the purchaser of the option the right to buy (and the seller the obligation to sell) the underlying instrument at the exercise price. A put option gives the purchaser of the option the right to sell (and the writer the obligation to buy) the underlying instrument at the exercise price. Writing puts and buying calls may increase the fund's exposure to changes in the value of the underlying instrument. Buying puts and writing calls may decrease the fund's exposure to such changes. Risks related to the use of options include the loss of premiums, possible illiquidity of the options markets, trading restrictions imposed by an exchange and movements in underlying security values, and for written options, potential losses in excess of the amounts recognized on the Statement of assets and liabilities. In addition, OTC options are subject to the risks of all OTC derivatives contracts.
When the fund purchases an option, the premium paid is included in the Fund's investments and subsequently “marked-to-market” to reflect current market value. If the purchased option expires, the fund realizes a loss equal to the cost of the option. If the fund exercises a call option, the cost of the securities acquired by exercising the call is increased by the premium paid to buy the call. If the fund exercises a put option, it realizes a gain or loss from the sale of the underlying security and the proceeds from such sale are decreased by the premium paid. If the fund enters into a closing sale transaction, it realizes a gain or loss, depending on whether proceeds from the closing sale are greater or less than the original cost. When the fund writes an option, the premium received is included as a liability and subsequently “marked-to-market” to reflect the current market value of the option written. Premiums received from writing options that expire unexercised are recorded as realized gains. Premiums received from writing options which are exercised or are closed are added to or offset against the proceeds or amount paid on the transaction to determine the realized gain or loss. If a put option on a security is exercised, the premium received reduces the cost basis of the securities purchased by the fund.
During the six months ended January 31, 2020, the fund used purchased options contracts to manage against anticipated currency exchange rates, to gain exposure to foreign currency and as a substitute for securities purchased. The fund held purchased options contracts with market values ranging from $122,000 to $200,000, as measured at each quarter end.
During the six months ended January 31, 2020, the fund wrote option contracts to manage against anticipated currency exchange rates, to gain exposure to foreign currency and as a substitute for securities purchased. The fund held written option contracts with market values ranging from $28,000 to $148,000, as measured at each quarter end.
Swaps. Swap agreements are agreements between the fund and a counterparty to exchange cash flows, assets, foreign currencies or market-linked returns at specified intervals. Swap agreements are privately negotiated in the OTC market (OTC swaps) or may be executed on a registered commodities exchange (centrally cleared swaps).
| 26 | JOHN HANCOCK Diversified Strategies Fund | SEMIANNUAL REPORT | |
Swaps are marked-to-market daily and the change in value is recorded as a component of unrealized appreciation/depreciation of swap contracts. The value of the swap will typically impose collateral posting obligations on the party that is considered out-of-the-money on the swap.
Upfront payments made/received by the fund, if any, are amortized/accreted for financial reporting purposes, with the unamortized/unaccreted portion included in the Statement of assets and liabilities. A termination payment by the counterparty or the fund is recorded as realized gain or loss, as well as the net periodic payments received or paid by the fund.
Entering into swap agreements involves, to varying degrees, elements of credit, market and documentation risk that may provide outcomes that are in excess of the amounts recognized on the Statement of assets and liabilities. Such risks involve the possibility that there will be no liquid market for the swap, or that a counterparty may default on its obligation or delay payment under the swap terms. The counterparty may disagree or contest the terms of the swap. In addition to interest rate risk, market risks may also impact the swap. The fund may also suffer losses if it is unable to terminate or assign outstanding swaps or reduce its exposure through offsetting transactions.
Interest rate swaps. Interest rate swaps represent an agreement between the fund and a counterparty to exchange cash flows based on the difference between two interest rates applied to a notional amount. The payment flows are usually netted against each other, with the difference being paid by one party to the other. The fund settles accrued net interest receivable or payable under the swap contracts at specified, future intervals.
During the six months ended January 31, 2020, the fund used interest rate swap contracts to manage against anticipated interest rate changes and to gain exposure to certain securities markets.The fund held interest rate swaps with total USD notional amounts ranging up to $8.4 million, as measured at each quarter end. There were no open interest rate swap contracts as of January 31, 2020.
Fair value of derivative instruments by risk category
The table below summarizes the fair value of derivatives held by the fund at January 31, 2020 by risk category:
| Risk | Statement of
assets and
liabilities location | Financial
instruments
location | Assets
derivatives
fair value | Liabilities
derivatives
fair value |
| Interest rate | Receivable/payable for futures variation margin | Futures1 | $60,188 | $(26,926) |
| Equity | Receivable/payable for futures variation margin | Futures1 | 6,041 | (30,539) |
| Currency | Unrealized appreciation / depreciation on forward foreign currency contracts | Forward foreign currency contracts | 315,187 | (207,168) |
| Currency | Unaffiliated investments, at value2 | Purchased options | 125,177 | — |
| Equity | Unaffiliated investments, at value2 | Purchased options | 74,439 | — |
| Currency | Written options, at value | Written options | — | (95,175) |
| Equity | Written options, at value | Written options | — | (52,738) |
| | | | $581,032 | $(412,546) |
| 1 | Reflects cumulative appreciation/depreciation on futures as disclosed in Fund's investments. Only the period end variation margin is separately disclosed on the Statement of assets and liabilities. |
| 2 | Purchased options are included in Fund's investments. |
| | SEMIANNUAL REPORT | JOHN HANCOCK Diversified Strategies Fund | 27 |
For financial reporting purposes, the fund does not offset OTC derivative assets or liabilities that are subject to master netting arrangements, as defined by the ISDAs, in the Statement of assets and liabilities. In the event of default by the counterparty or a termination of the agreement, the ISDA allows an offset of amounts across the various transactions between the fund and the applicable counterparty. The tables below reflect the fund's exposure to OTC derivative transactions and exposure to counterparties subject to an ISDA:
| OTC Financial Instruments | Asset | Liability |
| Forward foreign currency contracts | $315,187 | $(207,168) |
| Purchased options | 125,177 | — |
| Written options | — | (95,175) |
| Totals | $440,364 | $(302,343) |
| Counterparty | Total Market
Value of OTC
Derivatives | Collateral
Posted by
Counterparty | Collateral
Posted by
Portfolio | Net
Exposure |
| Australia and New Zealand Banking Group Limited | $26,001 | — | — | $26,001 |
| Bank of America, N.A. | (1,366) | — | — | (1,366) |
| Bank of Montreal | (2,502) | — | — | (2,502) |
| Barclays Bank PLC | (1,257) | — | — | (1,257) |
| Citibank, N.A. | 14,833 | — | — | 14,833 |
| Goldman Sachs International | (6,779) | — | — | (6,779) |
| Goldman Sachs USA | 63,494 | — | — | 63,494 |
| HSBC Bank USA, N.A. | 7,518 | — | — | 7,518 |
| JPMorgan Chase Bank, N.A. | 21,270 | — | — | 21,270 |
| Morgan Stanley Capital Services LLC | (29,972) | — | — | (29,972) |
| Royal Bank of Canada | (208) | — | — | (208) |
| Standard Chartered Bank | 15,161 | — | — | 15,161 |
| State Street Bank and Trust Company | (14,633) | — | — | (14,633) |
| The Toronto-Dominion Bank | 32,026 | — | — | 32,026 |
| UBS AG | 166 | — | — | 166 |
| UBS Securities LLC | 14,269 | — | — | 14,269 |
| Totals | $138,021 | — | — | $138,021 |
Effect of derivative instruments on the Statement of operations
The table below summarizes the net realized gain (loss) included in the net increase (decrease) in net assets from operations, classified by derivative instrument and risk category, for the six months ended January 31, 2020:
| | Statement of operations location - Net realized gain (loss) on: |
| Risk | Unaffiliated
investments and
foreign currency
transactions1 | Futures contracts | Forward foreign
currency contracts | Written options | Swap contracts | Total |
| Interest rate | $740 | $104,542 | — | $7,704 | $(28,862) | $84,124 |
| Currency | (127,565) | — | $227,333 | 52,278 | — | 152,046 |
| Equity | (179,429) | 25,487 | — | 52,003 | — | (101,939) |
| Total | $(306,254) | $130,029 | $227,333 | $111,985 | $(28,862) | $134,231 |
| 28 | JOHN HANCOCK Diversified Strategies Fund | SEMIANNUAL REPORT | |
| 1 | Realized gain/loss associated with purchased options is included in this caption on the Statement of operations. |
The table below summarizes the net change in unrealized appreciation (depreciation) included in the net increase (decrease) in net assets from operations, classified by derivative instrument and risk category, for the six months ended January 31, 2020:
| | Statement of operations location - Change in net unrealized appreciation (depreciation) of: |
| Risk | Unaffiliated
investments and
translation of assets
and liabilities in
foreign currencies1 | Futures contracts | Forward foreign
currency contracts | Written options | Total |
| Interest rate | $7,866 | $35,821 | — | — | $43,687 |
| Currency | (8,780) | — | $108,010 | $(23,594) | 75,636 |
| Equity | (794) | (34,513) | — | (1,073) | (36,380) |
| Total | $(1,708) | $1,308 | $108,010 | $(24,667) | $82,943 |
| 1 | Change in unrealized appreciation/depreciation associated with purchased options is included in this caption on the Statement of operations. |
Note 4—Guarantees and indemnifications
Under the Trust's organizational documents, its Officers and Trustees are indemnified against certain liabilities arising out of the performance of their duties to the Trust, including the fund. Additionally, in the normal course of business, the fund enters into contracts with service providers that contain general indemnification clauses. The fund's maximum exposure under these arrangements is unknown, as this would involve future claims that may be made against the fund that have not yet occurred. The risk of material loss from such claims is considered remote.
Note 5—Fees and transactions with affiliates
John Hancock Investment Management LLC (the Advisor) serves as investment advisor for the fund. John Hancock Investment Management Distributors LLC (the Distributor), an affiliate of the Advisor, serves as principal underwriter of the fund. The Advisor and the Distributor are indirect, wholly owned subsidiaries of Manulife Financial Corporation (MFC).
Management fee. The fund has an investment management agreement with the Advisor under which the fund pays a daily management fee to the Advisor equivalent on an annual basis to the sum of: (a) 1.00% of the first $500 million of the fund’s average daily net assets and (b) 0.95% of the fund’s average daily net assets in excess of $500 million. The Advisor has a subadvisory agreement with Manulife Investment Management (US) LLC, an indirectly owned subsidiary of MFC and an affiliate of the Advisor. The fund is not responsible for payment of the subadvisory fees.
The Advisor has contractually agreed to waive a portion of its management fee and/or reimburse expenses for certain funds of the John Hancock group of funds complex, including the fund (the participating portfolios). This waiver is based upon aggregate net assets of all the participating portfolios. The amount of the reimbursement is calculated daily and allocated among all the participating portfolios in proportion to the daily net assets of each fund. During the six months ended January 31, 2020, this waiver amounted to 0.01% of the fund’s average daily net assets on an annualized basis. This arrangement expires on July 31, 2021, unless renewed by mutual agreement of the fund and the Advisor based upon a determination that this is appropriate under the circumstances at that time.
| | SEMIANNUAL REPORT | JOHN HANCOCK Diversified Strategies Fund | 29 |
The Advisor voluntarily agreed to reduce its management fee or, if necessary, make payments to Class A and Class I shares, in an amount equal to the amount by which the expenses of Class A and Class I shares exceed 1.70% and 1.39%, respectively, of average annual net assets (on an annualized basis). For purposes of this agreement, expenses mean all fund level and class specific operating expenses, excluding: (a) taxes, (b) brokerage commissions, (c) interest expense, (d) litigation and indemnification expenses and other extraordinary expenses not incurred in the ordinary course of the fund’s business, (e) underlying fund expenses (acquired fund fees), (f) short dividend expense and (g) overdraft expense. This agreement may be terminated at anytime by the Advisor upon notice to the fund.
For the six months ended January 31, 2020, the expense reductions described above amounted to the following:
| Class | Expense reduction |
| Class A | $28,090 |
| Class I | 29,962 |
| Total | $58,052 |
Expenses waived or reimbursed in the current fiscal period are not subject to recapture in future fiscal periods.
The investment management fees, including the impact of the waivers and reimbursements as described above, incurred for the six months ended January 31, 2020, were equivalent to a net annual effective rate of 0.00% of the fund's average daily net assets.
Accounting and legal services. Pursuant to a service agreement, the fund reimburses the Advisor for all expenses associated with providing the administrative, financial, legal, compliance, accounting and recordkeeping services to the fund, including the preparation of all tax returns, periodic reports to shareholders and regulatory reports, among other services. These expenses are allocated to each share class based on its relative net assets at the time the expense was incurred. These accounting and legal services fees incurred for the six months ended January 31, 2020 amounted to an annual rate of 0.02% of the fund's average daily net assets.
Distribution and service plans. The fund has a distribution agreement with the Distributor. The fund has adopted distribution and service plans for certain classes as detailed below pursuant to Rule 12b-1 under the 1940 Act, to pay the Distributor for services provided as the distributor of shares of the fund. The fund may pay up to the following contractual rates of distribution and service fees under these arrangements, expressed as an annual percentage of average daily net assets for each class of the fund's shares:
| Class | Rule 12b-1 Fee |
| Class A | 0.30% |
Sales charges. Class A shares may be subject to up-front sales charges. For the six months ended January 31, 2020, no sales charges were assessed.
Class A shares may be subject to contingent deferred sales charges (CDSCs). Certain Class A shares that are acquired through purchases of $1 million or more and are redeemed within one year of purchase are subject to a 1.00% sales charge. CDSCs are applied to the lesser of the current market value at the time of redemption or the original purchase cost of the shares being redeemed. Proceeds from CDSCs are used to compensate the Distributor for providing distribution-related services in connection with the sale of these shares. During the six months ended January 31, 2020, there were no CDSCs received by the Distributor for Class A shares.
| 30 | JOHN HANCOCK Diversified Strategies Fund | SEMIANNUAL REPORT | |
Transfer agent fees. The John Hancock group of funds has a complex-wide transfer agent agreement with John Hancock Signature Services, Inc. (Signature Services), an affiliate of the Advisor. The transfer agent fees paid to Signature Services are determined based on the cost to Signature Services (Signature Services Cost) of providing recordkeeping services. It also includes out-of-pocket expenses, including payments made to third-parties for recordkeeping services provided to their clients who invest in one or more John Hancock funds. In addition, Signature Services Cost may be reduced by certain fees that Signature Services receives in connection with retirement and small accounts. Signature Services Cost is calculated monthly and allocated, as applicable, to five categories of share classes: Retail Share and Institutional Share Classes of Non-Municipal Bond Funds, Class R6 Shares, Retirement Share Classes and Municipal Bond Share Classes. Within each of these categories, the applicable costs are allocated to the affected John Hancock affiliated funds and/or classes, based on the relative average daily net assets.
Class level expenses. Class level expenses for the six months ended January 31, 2020 were as follows:
| Class | Distribution and service fees | Transfer agent fees |
| Class A | $7,582 | $3,081 |
| Class I | — | 3,260 |
| Total | $7,582 | $6,341 |
Trustee expenses. The fund compensates each Trustee who is not an employee of the Advisor or its affiliates. The costs of paying Trustee compensation and expenses are allocated to the fund based on its net assets relative to other funds within the John Hancock group of funds complex.
Note 6—Fund share transactions
Transactions in fund shares for the six months ended January 31, 2020 and for the year ended July 31, 2019 were as follows:
| | Six Months Ended 1-31-20 | Year Ended 7-31-19 |
| | Shares | Amount | Shares | Amount |
| Class A shares | | | | |
| Distributions reinvested | 6,500 | $52,194 | 139,619 | $1,082,050 |
| Net increase | 6,500 | $52,194 | 139,619 | $1,082,050 |
| Class I shares | | | | |
| Sold | — | — | 6,568 | $51,574 |
| Distributions reinvested | 8,777 | $71,008 | 157,706 | 1,230,106 |
| Repurchased | (14,076) | (114,438) | (58,934) | (461,315) |
| Net increase (decrease) | (5,299) | $(43,430) | 105,340 | $820,365 |
| Total net increase | 1,201 | $8,764 | 244,959 | $1,902,415 |
Affiliates of the fund owned 100% of shares of Class A and Class I on January 31, 2020. Such concentration of shareholders’ capital could have a material effect on the fund if such shareholders redeem from the fund.
Note 7—Purchase and sale of securities
Purchases and sales of securities, other than short-term investments, amounted to $4,530,304 and $3,130,215, respectively, for the six months ended January 31, 2020.
| | SEMIANNUAL REPORT | JOHN HANCOCK Diversified Strategies Fund | 31 |
Note 8—Investment in affiliated underlying funds
The fund may invest in affiliated underlying funds that are managed by the Advisor and its affiliates. The fund does not invest in the affiliated underlying fund for the purpose of exercising management or control; however, the fund’s investment may represent a significant portion of the underlying fund’s net assets. At January 31, 2020, the fund did not hold 5% or more of the net assets of the underlying fund.
Information regarding the fund's fiscal year to date purchases and sales of the affiliated underlying funds as well as income and capital gains earned by the fund, if any, is as follows:
| | | | | | | | Dividends and distributions |
| Affiliate | Ending
share
amount | Beginning
value | Cost of
purchases | Proceeds
from shares
sold | Realized
gain
(loss) | Change in
unrealized
appreciation
(depreciation) | Income
distributions
received | Capital gain
distributions
received | Ending
value |
| Asia Pacific Total Return Bond | 29,137 | $284,081 | $10,858 | $(4,694) | $98 | $(2,470) | $10,821 | — | $287,873 |
| 32 | JOHN HANCOCK Diversified Strategies Fund | SEMIANNUAL REPORT | |
| | |
Trustees
Hassell H. McClellan,Chairperson
Steven R. Pruchansky,Vice Chairperson
Andrew G. Arnott†
Charles L. Bardelis*
James R. Boyle
Peter S. Burgess*
William H. Cunningham
Grace K. Fey
Marianne Harrison†
Deborah C. Jackson
James M. Oates*
Gregory A. Russo
Officers
Andrew G. Arnott
President
Francis V. Knox, Jr.
Chief Compliance Officer
Charles A. Rizzo
Chief Financial Officer
Salvatore Schiavone
Treasurer
Christopher (Kit) Sechler
Secretary and Chief Legal Officer
| Investment advisor
John Hancock Investment Management LLC
Subadvisor
Manulife Investment Management (US) LLC
Portfolio Managers
Christopher Fellingham
Andrew Graham
Mark Holden, CFA
Nathan Thooft, CFA
Christopher Walsh, CFA
Principal distributor
John Hancock Investment Management Distributors LLC
Custodian
State Street Bank and Trust Company
Transfer agent
John Hancock Signature Services, Inc.
Legal counsel
K&L Gates LLP
|
* Member of the Audit Committee
† Non-Independent Trustee
The fund's proxy voting policies and procedures, as well as the fund proxy voting record for the most recent twelve-month period ended June 30, are available free of charge on the Securities and Exchange Commission (SEC) website at sec.gov or on our website.
All of the fund's holdings as of the end of the third month of every fiscal quarter are filed with the SEC on Form N-PORT within 60 days of the end of the fiscal quarter. The fund's Form N-PORT filings are available on our website and the SEC's website, sec.gov.
We make this information on your fund, as well asmonthly portfolio holdings, and other fund details available on our website at jhinvestments.com or by calling 800-225-5291.
| | | | |
| | You can also contact us: |
| | 800-225-5291
jhinvestments.com | Regular mail:
John Hancock Signature Services, Inc.
P.O. Box 55913
Boston, MA 02205-5913
| Express mail:
John Hancock Signature Services, Inc.
2000 Crown Colony Drive
Suite 55913
Quincy, MA 02169-0953
|
SEMIANNUAL REPORT | JOHN HANCOCK DIVERSIFIED STRATEGIES FUND 33
John Hancock family of funds
| | | |
DOMESTIC EQUITY FUNDS
Blue Chip Growth
Classic Value
Disciplined Value
Disciplined Value Mid Cap
Equity Income
Financial Industries
Fundamental All Cap Core
Fundamental Large Cap Core
New Opportunities
Regional Bank
Small Cap Core
Small Cap Growth
Small Cap Value
U.S. Global Leaders Growth
U.S. Quality Growth
GLOBAL AND INTERNATIONAL EQUITY FUNDS
Disciplined Value International
Emerging Markets
Emerging Markets Equity
Fundamental Global Franchise
Global Equity
Global Shareholder Yield
Global Thematic Opportunities
International Dynamic Growth
International Growth
International Small Company
| | INCOME FUNDS
Bond
California Tax-Free Income
Emerging Markets Debt
Floating Rate Income
Government Income
High Yield
High Yield Municipal Bond
Income
Investment Grade Bond
Money Market
Short Duration Bond
Short Duration Credit Opportunities
Strategic Income Opportunities
Tax-Free Bond
ALTERNATIVE AND SPECIALTY FUNDS
Absolute Return Currency
Alternative Asset Allocation
Alternative Risk Premia
Diversified Macro
Infrastructure
Multi-Asset Absolute Return
Seaport Long/Short
|
A fund's investment objectives, risks, charges, and expenses should be considered carefully before investing. The prospectus contains this and other important information about the fund. To obtain a prospectus, contact your financial professional, call John Hancock Investment Management at 800-225-5291, or visit our website at jhinvestments.com. Please read the prospectus carefully before investing or sending money.
| | | |
ASSET ALLOCATION
Balanced
Income Allocation
Multi-Index Lifetime Portfolios
Multi-Index Preservation Portfolios
Multimanager Lifestyle Portfolios
Multimanager Lifetime Portfolios
Retirement Income 2040
EXCHANGE-TRADED FUNDS
John Hancock Multifactor Consumer Discretionary ETF
John Hancock Multifactor Consumer Staples ETF
John Hancock Multifactor Developed International ETF
John Hancock Multifactor Emerging Markets ETF
John Hancock Multifactor Energy ETF
John Hancock Multifactor Financials ETF
John Hancock Multifactor Healthcare ETF
John Hancock Multifactor Industrials ETF
John Hancock Multifactor Large Cap ETF
John Hancock Multifactor Materials ETF
John Hancock Multifactor Media and
Communications ETF
John Hancock Multifactor Mid Cap ETF
John Hancock Multifactor Small Cap ETF
John Hancock Multifactor Technology ETF
John Hancock Multifactor Utilities ETF
| | ENVIRONMENTAL, SOCIAL, AND
GOVERNANCE FUNDS
ESG All Cap Core
ESG Core Bond
ESG International Equity
ESG Large Cap Core
CLOSED-END FUNDS
Financial Opportunities
Hedged Equity & Income
Income Securities Trust
Investors Trust
Preferred Income
Preferred Income II
Preferred Income III
Premium Dividend
Tax-Advantaged Dividend Income
Tax-Advantaged Global Shareholder Yield
|
John Hancock Multifactor ETF shares are bought and sold at market price (not NAV), and are not individually redeemed
from the fund. Brokerage commissions will reduce returns.
John Hancock ETFs are distributed by Foreside Fund Services, LLC, and are subadvised by Dimensional Fund Advisors LP.
Foreside is not affiliated with John Hancock Investment Management Distributors LLC or Dimensional Fund Advisors LP.
Dimensional Fund Advisors LP receives compensation from John Hancock in connection with licensing rights to the
John Hancock Dimensional indexes. Dimensional Fund Advisors LP does not sponsor, endorse, or sell, and makes no
representation as to the advisability of investing in, John Hancock Multifactor ETFs.
John Hancock Investment Management
A trusted brand
John Hancock Investment Management is a premier asset manager
representing one of America's most trusted brands, with a heritage of
financial stewardship dating back to 1862. Helping our shareholders
pursue their financial goals is at the core of everything we do. It's why
we support the role of professional financial advice and operate with
the highest standards of conduct and integrity.
A better way to invest
We serve investors globally through a unique multimanager approach:
We search the world to find proven portfolio teams with specialized
expertise for every strategy we offer, then we apply robust investment
oversight to ensure they continue to meet our uncompromising
standards and serve the best interests of our shareholders.
Results for investors
Our unique approach to asset management enables us to provide
a diverse set of investments backed by some of the world's best
managers, along with strong risk-adjusted returns across asset classes.
John Hancock Investment Management Distributors LLC n Member FINRA, SIPC
200 Berkeley Street n Boston, MA 02116-5010 n 800-225-5291 n jhinvestments.com
This report is for the information of the shareholders of John Hancock Diversified Strategies Fund. It is not authorized for distribution to prospective investors unless preceded or accompanied by a prospectus.
John Hancock
Multi-Asset Absolute Return Fund
(formerly John Hancock Global Absolute Return Strategies Fund)
Semiannual report 1/31/2020
Beginning on January 1, 2021, as permitted by regulations adopted by the Securities and Exchange Commission, paper copies of the fund's shareholder reports like this one will no longer be sent by mail, unless you specifically request paper copies of the reports from the fund or from your financial intermediary. Instead, the reports will be made available on a website, and you will be notified by mail each time a report is posted and provided with a website link to access the report.
If you already elected to receive shareholder reports electronically, you will not be affected by this change, and you do not need to take any action. You may elect to receive shareholder reports and other communications electronically by calling John Hancock Investment Management at 800-225-5291 (Class A and Class C shares) or 888-972-8696 (Class I, Class R2, Class R6, and Class NAV shares) or by contacting your financial intermediary.
You may elect to receive all reports in paper, free of charge, at any time. You can inform John Hancock Investment Management or your financial intermediary that you wish to continue receiving paper copies of your shareholder reports by following the instructions listed above. Your election to receive reports in paper will apply to all funds held with John Hancock Investment Management or your financial intermediary.
A message to shareholders
Dear shareholder,
Global financial markets delivered positive returns during the 6 months ended January 31, 2020. Stocks were particularly strong in the United States, where they delivered positive returns across most economic sectors. Investors benefited from a combination of low inflation, accommodative central bank policy, healthy fundamentals, and corporate buybacks of stock. Investors in non-U.S. equities also saw strong gains, fueled in part by similarly supportive monetary policy and some signs of strength in developing markets. In today's environment of low inflation and declining interest rates, bonds have also fared well, with U.S. corporate bonds delivering positive returns.
After a strong period of positive returns—in a historically long bull market—investors are prudent to consider the risks to future gains. Growth has slowed in the United States, with some negative data in manufacturing reflecting concerns over international trade and wavering business confidence. Additionally, the spread of the coronavirus, trade disputes, and other geopolitical tensions may continue to create uncertainty among businesses and skepticism among investors. Your financial advisor can helpposition your portfolio so that it's sufficiently diversified to meet your long-term objectives and to withstand the inevitable bouts of market volatility along the way.
On behalf of everyone at John Hancock Investment Management, I'd like to take this opportunity to welcome new shareholders and thank existing shareholders for the continued trust you've placed in us.
Sincerely,
Andrew G. Arnott
President and CEO,
John Hancock Investment Management
Head of Wealth and Asset Management,
United States and Europe
This commentary reflects the CEO's views as of this report's period end and are subject to change at any time. Diversification does not guarantee investment returns and does not eliminate risk of loss. All investments entail risks, including the possible loss of principal. For more up-to-date information, you can visit our website at jhinvestments.com.
.
John Hancock
Multi-Asset Absolute Return Fund
Table of contents
| | | |
| 2 | | Your fund at a glance |
| 3 | | Portfolio summary |
| 5 | | A look at performance |
| 7 | | Your expenses |
| 9 | | Fund's investments |
| 24 | | Financial statements |
| 28 | | Financial highlights |
| 34 | | Notes to financial statements |
| 49 | | More information |
SEMIANNUAL REPORT | JOHN HANCOCK MULTI-ASSET ABSOLUTE RETURN FUND 1
INVESTMENT OBJECTIVE
The fund seeks long-term total return.
AVERAGE ANNUAL TOTAL RETURNS AS OF 1/31/2020 (%)
The blended index is 30% MSCI All Country World Index and 70% Bloomberg Barclays Global Aggregate Bond USD Hedged Index.
The MSCI All Country World Index tracks the performance of publicly traded large- and mid-cap stocks of companies in 23 developed markets and 23 emerging markets.
The Bloomberg Barclays Global Aggregate Bond Index UDF Hedged measures global investment grade debt from twenty-four local currency markets.
It is not possible to invest directly in an index. Index figures do not reflect expenses or sales charges, which would result in lower returns.
Figures from Morningstar, Inc. include reinvested distributions and do not take into account sales charges. Actual load-adjusted performance is lower. Since-inception returns for the Morningstar fund category average are not available.
The past performance shown here reflects reinvested distributions and the beneficial effect of any expense reductions, and does not guarantee future results. Returns for periods shorter than one year are cumulative. Performance of the other share classes will vary based on the difference in the fees and expenses of those classes. Shares will fluctuate in value and, when redeemed, may be worth more or less than their original cost. Current month-end performance may be lower or higher than the performance cited, and can be found at jhinvestments.com or by calling 800-225-5291. For further information on the fund's objectives, risks, and strategy, see the fund's prospectus.
SEMIANNUAL REPORT | JOHN HANCOCK MULTI-ASSET ABSOLUTE RETURN FUND 2
PORTFOLIO COMPOSITION AS OF 1/31/2020 (%)
COUNTRY COMPOSITION AS OF 1/31/2020 (%)
| | |
| United States | 53.9 |
| France | 7.5 |
| Japan | 4.8 |
| Denmark | 4.7 |
| Germany | 3.7 |
| Canada | 3.5 |
| United Kingdom | 3.2 |
| China | 3.0 |
| Ireland | 2.1 |
| South Korea | 2.0 |
| Other countries | 11.6 |
| TOTAL | 100.0 |
| As a percentage of net assets. | |
SEMIANNUAL REPORT | JOHN HANCOCK MULTI-ASSET ABSOLUTE RETURN FUND 3
PORTFOLIO ALLOCATION AS OF 1/31/2020 (%)
| | | |
| Common stocks | 73.2 |
| | Health care | 15.5 |
| | Information technology | 14.8 |
| | Consumer staples | 9.1 |
| | Communication services | 8.9 |
| | Financials | 6.6 |
| | Consumer discretionary | 6.3 |
| | Industrials | 6.0 |
| | Utilities | 2.8 |
| | Real estate | 1.5 |
| | Energy | 0.9 |
| | Materials | 0.8 |
| Corporate bonds | 11.0 |
| U.S. Government | 10.0 |
| Preferred securities | 0.1 |
| Other assets and liabilities, net | 5.7 |
| TOTAL | 100.0 |
| As a percentage of net assets. | |
A note about risks
The fund is subject to various risks as described in the fund's prospectus. For more information, please refer to the "Principal risks" section of the prospectus.
SEMIANNUAL REPORT | JOHN HANCOCK MULTI-ASSET ABSOLUTE RETURN FUND 4
TOTAL RETURNS FOR THE PERIOD ENDED JANUARY 31, 2020
| | | | | | | | |
Average annual total returns (%)
with maximum sales charge | | Cumulative total returns (%)
with maximum sales charge |
| | 1-year | 5-year | Since
inception1 | | 6-month | 5-year | Since
inception1 |
| Class A | 1.43 | -0.40 | 1.92 | | -3.00 | -2.00 | 16.70 |
| Class C2 | 5.13 | -0.06 | 1.90 | | 0.83 | -0.31 | 16.53 |
| Class I3 | 7.14 | 0.96 | 2.91 | | 2.32 | 4.87 | 26.25 |
| Class R22,3 | 6.74 | 0.53 | 2.41 | | 2.16 | 2.66 | 21.33 |
| Class R62,3 | 7.24 | 1.06 | 2.98 | | 2.33 | 5.41 | 26.92 |
| Class NAV3 | 7.24 | 1.06 | 3.01 | | 2.33 | 5.41 | 27.24 |
| Index 1† | 2.15 | 1.05 | 0.66 | | 0.93 | 5.36 | 5.52 |
| Index 2† | 11.27 | 5.18 | 6.17 | | 4.46 | 28.75 | 62.52 |
| Index 3† | 2.80 | 1.47 | 1.12 | | 1.22 | 7.58 | 9.44 |
Performance figures assume all distributions have been reinvested. Figures reflect maximum sales charges on Class A shares of 5.00% and the applicable contingent deferred sales charge (CDSC) on Class C shares. Class C shares sold within one year of purchase are subject to a 1% CDSC. Sales charges are not applicable to Class I, Class R2, Class R6, and Class NAV shares.
The expense ratios of the fund, both net (including any fee waivers and/or expense limitations) and gross (excluding any fee waivers and/or expense limitations), are set forth according to the most recent publicly available prospectuses for the fund and may differ from those disclosed in the Financial highlights tables in this report. Net expenses reflect contractual expense limitations in effect until July 31, 2021 and are subject to change.Had the contractual fee waivers and expense limitations not been in place, gross expenses would apply. The expense ratios are as follows:
| | | | | | | |
| | Class A | Class C | Class I | Class R2 | Class R6 | Class NAV |
| Gross (%) | 1.46 | 2.16 | 1.16 | 1.55 | 1.05 | 1.04 |
| Net (%) | 1.45 | 2.15 | 1.15 | 1.54 | 1.04 | 1.03 |
Please refer to the most recent prospectuses and annual or semiannual report for more information on expenses and any expense limitation arrangements for each class.
The returns reflect past results and should not be considered indicative of future performance. The return and principal value of an investment will fluctuate so that shares, when redeemed, may be worth more or less than their original cost. Due to market volatility and other factors, the fund's current performance may be higher or lower than the performance shown. For current to the most recent month-end performance data, please call 800-225-5291 or visit the fund's website at jhinvestments.com.
The performance table above and the chart on the next page do not reflect the deduction of taxes that a shareholder would pay on fund distributions or the redemption of fund shares. The fund's performance results reflect any applicable fee waivers or expense reductions, without which the expenses would increase and results would have been less favorable.
| † | Index 1 is The ICE Bank of America 0-3 Month U.S. Treasury Bill Index; Index 2 is 30% MSCI All Country World Index and 70% Bloomberg Barclays Global Aggregate Bond USD Hedged Index; Index 3 is The ICE Bank of America U.S. Dollar 6-Month Deposit Offered Rate Constant Maturity Index. |
See the following page for footnotes.
SEMIANNUAL REPORT | JOHN HANCOCK MULTI-ASSET ABSOLUTE RETURN FUND 5
This chart and table show what happened to a hypothetical $10,000 investment in John Hancock Multi-Asset Absolute Return Fund for the share classes and periods indicated, assuming all distributions were reinvested. For comparison, we've shown the same investment in two separate indexes and a blended index.
| | | | | | | |
| | Start date | With maximum
sales charge ($) | Without
sales charge ($) | Index 1 ($) | Index 2 ($) | Index 3 ($) |
| Class C2,4 | 12-19-11 | 11,653 | 11,653 | 10,552 | 16,252 | 10,944 |
| Class I3 | 12-19-11 | 12,625 | 12,625 | 10,552 | 16,252 | 10,944 |
| Class R22,3 | 12-19-11 | 12,133 | 12,133 | 10,552 | 16,252 | 10,944 |
| Class R62,3 | 12-19-11 | 12,692 | 12,692 | 10,552 | 16,252 | 10,944 |
| Class NAV3 | 12-19-11 | 12,724 | 12,724 | 10,552 | 16,252 | 10,944 |
Prior to August 28, 2019, the fund's primary benchmark was the ICE Bank of America Merrill Lynch U.S. Dollar 6-Month Deposit Offered Rate Constant Maturity Index. Effective August 28, 2019, the fund's primary benchmark index is the ICE Bank of America Merrill Lynch 0-3 Month U.S. Treasury Bill Index.
The ICE Bank of America 0-3 Month U.S. Treasury Bill Index tracks the performance of U.S. dollar-denominated U.S. Treasury bills publicly issued in the U.S. domestic market with a remaining term to final maturity of less than three months.
The Blended Index is 30% MSCI All Country World Index and 70% Bloomberg Barclays Global Aggregate Bond USD Hedged Index.
The MSCI All Country World Index tracks the performance of publicly traded large- and mid-cap stocks of companies in 23 developed markets and 23 emerging markets.
The Bloomberg Barclays Global Aggregate Bond USD Hedged Index measures global investment grade debt from twenty-four local currency markets.
The ICE Bank of America U.S. Dollar 6-Month Deposit Offered Rate Constant Maturity Index tracks the average interest rate at which a selection of banks in London are prepared to lend to one another in U.S. dollars with a constant maturity of 6 months.
It is not possible to invest directly in an index. Index figures do not reflect expenses or sales charges, which would result in lower returns.
Footnotes related to performance pages
| 1 | From 12-19-11. |
| 2 | Class C shares were first offered on 8-1-12; Class R2 and Class R6 shares were first offered on 3-1-12. Returns prior to these dates are those of Class A shares (first offered on 12-19-11) that have not been adjusted for class-specific expenses; otherwise, returns would vary. |
| 3 | For certain types of investors as described in the fund's prospectuses. |
| 4 | The contingent deferred sales charge is not applicable. |
SEMIANNUAL REPORT | JOHN HANCOCK MULTI-ASSET ABSOLUTE RETURN FUND 6
These examples are intended to help you understand your ongoing operating expenses of investing in the fund so you can compare these costs with the ongoing costs of investing in other mutual funds.
Understanding fund expenses
As a shareholder of the fund, you incur two types of costs:
■Transaction costs,which include sales charges (loads) on purchases or redemptions (varies by share class), minimum account fee charge, etc.
■Ongoing operating expenses, including management fees, distribution and service fees (if applicable), and other fund expenses.
We are presenting only your ongoing operating expenses here.
Actual expenses/actual returns
The first line of each share class in the table on the following page is intended to provide information about the fund’s actual ongoing operating expenses, and is based on the fund’s actual return. It assumes an account value of $1,000.00 on August 1, 2019, with the same investment held until January 31, 2020.
Together with the value of your account, you may use this information to estimate the operating expenses that you paid over the period. Simply divide your account value at January 31, 2020, by $1,000.00, then multiply it by the “expenses paid” for your share class from the table. For example, for an account value of $8,600.00, the operating expenses should be calculated as follows:
Hypothetical example for comparison purposes
The second line of each share class in the table on the following page allows you to compare the fund’s ongoing operating expenses with those of any other fund. It provides an example of the fund’s hypothetical account values and hypothetical expenses based on each class’s actual expense ratio and an assumed 5% annualized return before expenses (which is not the class’s actual return). It assumes an account value of $1,000.00 on August 1, 2019, with the same investment held until January 31, 2020. Look in any other fund shareholder report to find its hypothetical example and you will be able to compare these expenses. Please remember that these hypothetical account values and expenses may not be used to estimate the actual ending account balance or expenses you paid for the period.
| | SEMIANNUAL REPORT | JOHN HANCOCK MULTI-ASSET ABSOLUTE RETURN FUND | 7 |
Remember, these examples do not include any transaction costs, therefore, these examples will not help you to determine the relative total costs of owning different funds. If transaction costs were included, your expenses would have been higher. See the prospectuses for details regarding transaction costs.
SHAREHOLDER EXPENSE EXAMPLE CHART
| | | Account
value on
8-1-2019 | Ending
value on
1-31-2020 | Expenses
paid during
period ended
1-31-20201 | Annualized
expense
ratio |
| Class A | Actual expenses/actual returns | $1,000.00 | $1,021.10 | $7.87 | 1.55% |
| | Hypothetical example | 1,000.00 | 1,017.30 | 7.86 | 1.55% |
| Class C | Actual expenses/actual returns | 1,000.00 | 1,017.00 | 11.41 | 2.25% |
| | Hypothetical example | 1,000.00 | 1,013.80 | 11.39 | 2.25% |
| Class I | Actual expenses/actual returns | 1,000.00 | 1,023.20 | 6.36 | 1.25% |
| | Hypothetical example | 1,000.00 | 1,018.90 | 6.34 | 1.25% |
| Class R2 | Actual expenses/actual returns | 1,000.00 | 1,021.60 | 8.13 | 1.60% |
| | Hypothetical example | 1,000.00 | 1,017.10 | 8.11 | 1.60% |
| Class R6 | Actual expenses/actual returns | 1,000.00 | 1,023.30 | 5.85 | 1.15% |
| | Hypothetical example | 1,000.00 | 1,019.40 | 5.84 | 1.15% |
| Class NAV | Actual expenses/actual returns | 1,000.00 | 1,023.30 | 5.75 | 1.13% |
| | Hypothetical example | 1,000.00 | 1,019.50 | 5.74 | 1.13% |
| 1 | Expenses are equal to the annualized expense ratio, multiplied by the average account value over the period, multiplied by 184/366 (to reflect the one-half year period). |
| 8 | JOHN HANCOCK MULTI-ASSET ABSOLUTE RETURN FUND | SEMIANNUAL REPORT | |
AS OF 1-31-20 (unaudited)
| | | | | Shares | Value |
| Common stocks 73.2% | | | | | $402,311,918 |
| (Cost $380,909,783) | | | | | |
| Australia 0.2% | | | | | 1,268,601 |
| Ansell, Ltd. | | | 9,606 | 203,044 |
| Flight Centre Travel Group, Ltd. | | | 20,206 | 526,276 |
| JB Hi-Fi, Ltd. | | | 16,558 | 435,442 |
| Sonic Healthcare, Ltd. | | | 4,954 | 103,839 |
| Brazil 0.1% | | | | | 651,176 |
| Cia de Saneamento Basico do Estado de Sao Paulo, ADR | | | 45,987 | 651,176 |
| Canada 3.5% | | | | | 19,266,599 |
| Allied Properties Real Estate Investment Trust | | | 9,700 | 404,741 |
| Atco, Ltd., Class I | | | 8,900 | 347,150 |
| Badger Daylighting, Ltd. | | | 2,200 | 57,402 |
| CAE, Inc. | | | 4,800 | 142,361 |
| Canadian Utilities, Ltd., Class A | | | 13,400 | 410,080 |
| Canadian Western Bank | | | 22,200 | 548,877 |
| Cominar Real Estate Investment Trust | | | 16,100 | 177,253 |
| Empire Company, Ltd., Class A | | | 5,300 | 122,948 |
| IGM Financial, Inc. | | | 12,900 | 373,041 |
| Laurentian Bank of Canada | | | 10,000 | 324,543 |
| Metro, Inc. | | | 17,500 | 713,409 |
| National Bank of Canada | | | 48,800 | 2,707,710 |
| Open Text Corp. | | | 13,900 | 625,574 |
| Power Corp. of Canada | | | 31,800 | 793,438 |
| Power Financial Corp. | | | 23,500 | 609,963 |
| Royal Bank of Canada | | | 34,700 | 2,742,123 |
| TC Energy Corp. | | | 44,200 | 2,423,752 |
| TELUS Corp. | | | 46,000 | 1,843,963 |
| The Bank of Nova Scotia | | | 67,600 | 3,692,102 |
| The North West Company, Inc. | | | 9,900 | 206,169 |
| China 3.0% | | | | | 16,466,446 |
| China Communications Construction Company, Ltd., H Shares | | | 1,553,000 | 1,097,493 |
| China Construction Bank Corp., H Shares | | | 2,857,000 | 2,164,282 |
| China Longyuan Power Group Corp., Ltd., H Shares | | | 268,000 | 158,459 |
| China Petroleum & Chemical Corp., H Shares | | | 1,904,000 | 1,002,687 |
| China Railway Construction Corp., Ltd., H Shares | | | 1,040,500 | 1,015,257 |
| China Resources Double Crane Pharmaceutical Company, Ltd., Class A | | | 188,180 | 368,530 |
| China Resources Sanjiu Medical & Pharmaceutical Company, Ltd., Class A | | | 124,579 | 640,813 |
| China Telecom Corp., Ltd., H Shares | | | 4,100,000 | 1,595,254 |
| SEE NOTES TO FINANCIAL STATEMENTS | SEMIANNUAL REPORT | JOHN HANCOCK MULTI-ASSET ABSOLUTE RETURN FUND | 9 |
| | | | | Shares | Value |
| China (continued) | | | | | |
| ENN Energy Holdings, Ltd. | | | 55,700 | $647,507 |
| Henan Shuanghui Investment & Development Company, Ltd., Class A | | | 69,500 | 285,029 |
| Hengan International Group Company, Ltd. | | | 172,000 | 1,252,873 |
| Huadong Medicine Company, Ltd., Class A | | | 202,141 | 595,617 |
| Industrial & Commercial Bank of China, Ltd., H Shares | | | 4,549,000 | 3,019,505 |
| Ping An Insurance Group Company of China, Ltd., H Shares | | | 56,500 | 638,894 |
| Shanghai International Port Group Company, Ltd., Class A | | | 483,899 | 355,213 |
| Sinopharm Group Company, Ltd., H Shares | | | 460,400 | 1,498,109 |
| Tianhe Chemicals Group, Ltd. (A)(B)(C) | | | 4,848,409 | 36,519 |
| Tong Ren Tang Technologies Company, Ltd., H Shares | | | 102,000 | 94,405 |
| Denmark 0.8% | | | | | 4,212,930 |
| Novo Nordisk A/S, B Shares | | | 69,210 | 4,212,930 |
| France 3.5% | | | | | 19,101,355 |
| Air Liquide SA | | | 13,041 | 1,885,598 |
| CNP Assurances | | | 20,534 | 369,619 |
| Danone SA | | | 63,423 | 5,075,407 |
| IPSOS | | | 7,543 | 244,395 |
| Rubis SCA | | | 12,793 | 790,195 |
| Sanofi | | | 45,516 | 4,389,504 |
| Sopra Steria Group | | | 1,278 | 204,025 |
| Vinci SA | | | 55,444 | 6,142,612 |
| Germany 2.1% | | | | | 11,555,234 |
| Bayer AG | | | 63,305 | 5,080,594 |
| Bertrandt AG | | | 1,851 | 107,153 |
| Fraport AG Frankfurt Airport Services Worldwide | | | 4,063 | 302,195 |
| Fresenius Medical Care AG & Company KGaA | | | 8,217 | 631,766 |
| Fresenius SE & Company KGaA | | | 20,053 | 1,023,917 |
| Henkel AG & Company KGaA | | | 6,511 | 599,897 |
| Muenchener Rueckversicherungs-Gesellschaft AG | | | 3,346 | 986,539 |
| Siemens AG | | | 19,222 | 2,370,814 |
| Software AG | | | 13,569 | 452,359 |
| Hong Kong 1.5% | | | | | 8,148,250 |
| China Everbright International, Ltd. | | | 317,000 | 224,840 |
| China Metal Recycling Holdings, Ltd. (B)(C) | | | 1,799,400 | 0 |
| China Mobile, Ltd. | | | 303,000 | 2,490,556 |
| China Overseas Land & Investment, Ltd. | | | 502,000 | 1,613,643 |
| China Resources Land, Ltd. | | | 208,000 | 865,264 |
| CK Infrastructure Holdings, Ltd. | | | 119,500 | 833,729 |
| Power Assets Holdings, Ltd. | | | 75,000 | 541,456 |
| Techtronic Industries Company, Ltd. | | | 155,000 | 1,236,760 |
| 10 | JOHN HANCOCK MULTI-ASSET ABSOLUTE RETURN FUND | SEMIANNUAL REPORT | SEE NOTES TO FINANCIAL STATEMENTS |
| | | | | Shares | Value |
| Hong Kong (continued) | | | | | |
| Yue Yuen Industrial Holdings, Ltd. | | | 123,000 | $342,002 |
| India 0.8% | | | | | 4,531,797 |
| Axis Bank, Ltd., GDR | | | 19,456 | 994,392 |
| Infosys, Ltd., ADR | | | 319,217 | 3,498,618 |
| Wipro, Ltd., ADR | | | 10,685 | 38,787 |
| Indonesia 0.5% | | | | | 2,610,316 |
| Astra International Tbk PT | | | 299,600 | 138,307 |
| Bank Rakyat Indonesia Persero Tbk PT | | | 2,830,200 | 920,112 |
| Telekomunikasi Indonesia Persero Tbk PT | | | 5,594,900 | 1,551,897 |
| Ireland 2.1% | | | | | 11,599,369 |
| Accenture PLC, Class A | | | 21,034 | 4,316,387 |
| Glanbia PLC | | | 24,296 | 283,047 |
| Medtronic PLC | | | 60,637 | 6,999,935 |
| Israel 1.3% | | | | | 7,189,299 |
| Check Point Software Technologies, Ltd. (C) | | | 62,893 | 7,189,299 |
| Italy 0.4% | | | | | 2,044,456 |
| Hera SpA | | | 104,991 | 477,543 |
| Snam SpA | | | 292,352 | 1,566,913 |
| Japan 4.8% | | | | | 26,164,373 |
| ABC-Mart, Inc. | | | 6,700 | 429,844 |
| Aeon Delight Company, Ltd. | | | 4,200 | 144,110 |
| Aica Kogyo Company, Ltd. | | | 9,700 | 302,797 |
| Air Water, Inc. | | | 33,000 | 453,259 |
| BML, Inc. | | | 7,500 | 212,395 |
| Cosmos Pharmaceutical Corp. | | | 900 | 197,659 |
| Daicel Corp. | | | 25,400 | 240,444 |
| Daiichikosho Company, Ltd. | | | 3,200 | 155,448 |
| Denka Company, Ltd. | | | 14,300 | 386,308 |
| East Japan Railway Company | | | 12,200 | 1,074,230 |
| Electric Power Development Company, Ltd. | | | 27,200 | 613,395 |
| Fuyo General Lease Company, Ltd. | | | 2,300 | 143,460 |
| Hankyu Hanshin Holdings, Inc. | | | 13,400 | 543,667 |
| Hitachi Transport System, Ltd. | | | 8,300 | 238,275 |
| Hoya Corp. | | | 18,100 | 1,732,268 |
| Itochu Techno-Solutions Corp. | | | 15,000 | 441,732 |
| Izumi Company, Ltd. | | | 10,500 | 330,954 |
| Kamigumi Company, Ltd. | | | 13,400 | 286,326 |
| KDDI Corp. | | | 169,100 | 5,110,046 |
| Keisei Electric Railway Company, Ltd. | | | 19,900 | 719,923 |
| Kuraray Company, Ltd. | | | 32,600 | 391,868 |
| Kureha Corp. | | | 3,600 | 201,929 |
| SEE NOTES TO FINANCIAL STATEMENTS | SEMIANNUAL REPORT | JOHN HANCOCK MULTI-ASSET ABSOLUTE RETURN FUND | 11 |
| | | | | Shares | Value |
| Japan (continued) | | | | | |
| Maeda Road Construction Company, Ltd. | | | 9,700 | $327,860 |
| NEC Networks & System Integration Corp. | | | 2,300 | 85,966 |
| Nippon Express Company, Ltd. | | | 7,700 | 401,240 |
| Nippon Telegraph & Telephone Corp. | | | 180,800 | 4,609,865 |
| Nippon Television Holdings, Inc. | | | 22,500 | 303,987 |
| Otsuka Corp. | | | 1,900 | 74,090 |
| Sawai Pharmaceutical Company, Ltd. | | | 6,500 | 422,406 |
| Sekisui Chemical Company, Ltd. | | | 18,300 | 304,794 |
| Seven & i Holdings Company, Ltd. | | | 59,000 | 2,262,257 |
| Stanley Electric Company, Ltd. | | | 14,400 | 370,873 |
| Taikisha, Ltd. | | | 3,200 | 109,423 |
| Takeda Pharmaceutical Company, Ltd. | | | 35,600 | 1,367,161 |
| The Chugoku Electric Power Company, Inc. | | | 10,500 | 138,581 |
| Tokyo Century Corp. | | | 8,600 | 437,478 |
| USS Company, Ltd. | | | 6,600 | 119,788 |
| Valor Holdings Company, Ltd. | | | 13,900 | 242,914 |
| Yaoko Company, Ltd. | | | 4,600 | 235,353 |
| Malaysia 0.2% | | | | | 1,255,400 |
| Tenaga Nasional BHD | | | 414,700 | 1,255,400 |
| Mexico 0.2% | | | | | 881,287 |
| Grupo Financiero Banorte SAB de CV, Series O | | | 143,000 | 881,287 |
| Netherlands 0.0% | | | | | 197,108 |
| Eurocommercial Properties NV | | | 7,882 | 197,108 |
| Peru 0.5% | | | | | 2,700,827 |
| Credicorp, Ltd. | | | 13,074 | 2,700,827 |
| Philippines 0.0% | | | | | 154,954 |
| PLDT, Inc. | | | 7,965 | 154,954 |
| Singapore 0.3% | | | | | 1,414,180 |
| Ascendas Real Estate Investment Trust | | | 322,101 | 741,648 |
| CapitaLand Mall Trust | | | 108,200 | 198,930 |
| ComfortDelGro Corp., Ltd. | | | 299,400 | 473,602 |
| South Africa 0.6% | | | | | 3,431,352 |
| Absa Group, Ltd. | | | 64,389 | 585,953 |
| Aspen Pharmacare Holdings, Ltd. (C) | | | 45,207 | 347,980 |
| Netcare, Ltd. | | | 200,150 | 266,638 |
| Remgro, Ltd. | | | 24,892 | 300,769 |
| Sanlam, Ltd. | | | 70,884 | 347,089 |
| Shoprite Holdings, Ltd. | | | 22,524 | 174,822 |
| Standard Bank Group, Ltd. | | | 76,452 | 797,453 |
| The Foschini Group, Ltd. | | | 60,391 | 553,118 |
| 12 | JOHN HANCOCK MULTI-ASSET ABSOLUTE RETURN FUND | SEMIANNUAL REPORT | SEE NOTES TO FINANCIAL STATEMENTS |
| | | | | Shares | Value |
| South Africa (continued) | | | | | |
| Vodacom Group, Ltd. | | | 7,401 | $57,530 |
| South Korea 2.0% | | | | | 10,977,268 |
| Hyundai Glovis Company, Ltd. | | | 5,312 | 651,565 |
| Hyundai Mobis Company, Ltd. | | | 8,027 | 1,534,952 |
| KT&G Corp. | | | 20,654 | 1,641,243 |
| Samsung Electronics Company, Ltd. | | | 88,247 | 4,088,750 |
| Samsung Fire & Marine Insurance Company, Ltd. | | | 1,189 | 209,342 |
| SK Telecom Company, Ltd. | | | 12,392 | 2,373,873 |
| SK Telecom Company, Ltd., ADR | | | 22,515 | 477,543 |
| Spain 0.3% | | | | | 1,883,522 |
| Industria de Diseno Textil SA | | | 54,364 | 1,828,108 |
| Prosegur Cia de Seguridad SA | | | 14,052 | 55,414 |
| Sweden 0.1% | | | | | 595,881 |
| Castellum AB | | | 6,827 | 167,715 |
| Intrum AB | | | 15,454 | 428,166 |
| Switzerland 1.7% | | | | | 9,145,932 |
| Chubb, Ltd. | | | 19,856 | 3,017,913 |
| Helvetia Holding AG | | | 2,404 | 345,590 |
| Nestle SA | | | 15,521 | 1,711,853 |
| Roche Holding AG | | | 12,134 | 4,070,576 |
| Taiwan 0.7% | | | | | 3,972,298 |
| Delta Electronics, Inc. | | | 93,000 | 434,523 |
| Taiwan Semiconductor Manufacturing Company, Ltd. | | | 343,000 | 3,537,775 |
| Thailand 0.2% | | | | | 883,171 |
| Bangkok Bank PCL | | | 192,500 | 883,171 |
| Turkey 0.4% | | | | | 2,241,213 |
| Akbank T.A.S. (C) | | | 396,098 | 546,623 |
| Haci Omer Sabanci Holding AS | | | 502,579 | 817,097 |
| KOC Holding AS | | | 36,940 | 120,226 |
| Turkcell Iletisim Hizmetleri AS | | | 321,883 | 757,267 |
| United Arab Emirates 0.0% | | | | | 207,189 |
| First Abu Dhabi Bank PJSC | | | 49,382 | 207,189 |
| United Kingdom 3.2% | | | | | 17,772,742 |
| British American Tobacco PLC | | | 104,664 | 4,615,145 |
| Britvic PLC | | | 46,748 | 570,391 |
| Euromoney Institutional Investor PLC | | | 7,447 | 120,426 |
| Greggs PLC | | | 7,379 | 219,279 |
| Halfords Group PLC | | | 39,883 | 86,125 |
| IG Group Holdings PLC | | | 20,902 | 183,019 |
| SEE NOTES TO FINANCIAL STATEMENTS | SEMIANNUAL REPORT | JOHN HANCOCK MULTI-ASSET ABSOLUTE RETURN FUND | 13 |
| | | | | Shares | Value |
| United Kingdom (continued) | | | | | |
| Imperial Brands PLC | | | 88,408 | $2,266,975 |
| Informa PLC | | | 51,968 | 530,852 |
| Meggitt PLC | | | 71,933 | 639,921 |
| Moneysupermarket.com Group PLC | | | 135,255 | 580,588 |
| Reckitt Benckiser Group PLC | | | 21,876 | 1,810,748 |
| Rightmove PLC | | | 147,574 | 1,278,955 |
| Spectris PLC | | | 5,193 | 180,820 |
| Unilever PLC | | | 44,369 | 2,646,668 |
| WH Smith PLC | | | 11,919 | 375,480 |
| WPP PLC | | | 134,101 | 1,667,350 |
| United States 38.2% | | | | | 209,787,393 |
| 3M Company | | | 10,342 | 1,640,862 |
| Alphabet, Inc., Class A (C) | | | 3,673 | 5,262,601 |
| American Financial Group, Inc. | | | 4,996 | 543,515 |
| Amgen, Inc. | | | 29,105 | 6,288,135 |
| Anthem, Inc. | | | 14,331 | 3,801,728 |
| Archer-Daniels-Midland Company | | | 47,225 | 2,113,791 |
| AT&T, Inc. | | | 214,383 | 8,065,082 |
| Automatic Data Processing, Inc. | | | 25,514 | 4,372,844 |
| AutoZone, Inc. (C) | | | 3,478 | 3,679,585 |
| Bristol-Myers Squibb Company | | | 75,113 | 4,728,363 |
| Cadence Design Systems, Inc. (C) | | | 31,807 | 2,293,603 |
| Cerner Corp. | | | 11,114 | 798,319 |
| Cigna Corp. | | | 38,257 | 7,359,882 |
| Cinemark Holdings, Inc. | | | 4,643 | 146,301 |
| Cisco Systems, Inc. | | | 178,188 | 8,191,302 |
| Citrix Systems, Inc. | | | 15,807 | 1,916,125 |
| Cognizant Technology Solutions Corp., Class A | | | 105,187 | 6,456,378 |
| Colgate-Palmolive Company | | | 22,970 | 1,694,727 |
| Comcast Corp., Class A | | | 181,504 | 7,839,158 |
| Crane Company | | | 2,670 | 228,178 |
| CVS Health Corp. | | | 74,649 | 5,062,695 |
| Deluxe Corp. | | | 9,690 | 467,058 |
| eBay, Inc. | | | 130,399 | 4,376,190 |
| EnerSys | | | 6,043 | 434,854 |
| Eversource Energy | | | 19,303 | 1,784,369 |
| Expeditors International of Washington, Inc. | | | 35,289 | 2,577,509 |
| Exxon Mobil Corp. | | | 27,728 | 1,722,463 |
| F5 Networks, Inc. (C) | | | 15,851 | 1,935,724 |
| Fastenal Company | | | 45,351 | 1,581,843 |
| FedEx Corp. | | | 7,483 | 1,082,341 |
| Forward Air Corp. | | | 2,163 | 141,568 |
| Henry Schein, Inc. (C) | | | 26,133 | 1,801,609 |
| 14 | JOHN HANCOCK MULTI-ASSET ABSOLUTE RETURN FUND | SEMIANNUAL REPORT | SEE NOTES TO FINANCIAL STATEMENTS |
| | | | | Shares | Value |
| United States (continued) | | | | | |
| Hibbett Sports, Inc. (C) | | | 12,813 | $317,506 |
| HNI Corp. | | | 2,762 | 99,349 |
| Hubbell, Inc. | | | 3,320 | 475,524 |
| IBM Corp. | | | 38,847 | 5,583,479 |
| ICF International, Inc. | | | 1,218 | 106,685 |
| Insperity, Inc. | | | 17,843 | 1,558,943 |
| Intuit, Inc. | | | 4,998 | 1,401,339 |
| John Wiley & Sons, Inc., Class A | | | 3,926 | 171,252 |
| Johnson & Johnson | | | 62,108 | 9,246,018 |
| Kellogg Company | | | 22,609 | 1,542,160 |
| Laboratory Corp. of America Holdings (C) | | | 1,545 | 270,993 |
| Mastercard, Inc., Class A | | | 8,694 | 2,746,782 |
| Matthews International Corp., Class A | | | 8,141 | 303,822 |
| McKesson Corp. | | | 17,465 | 2,490,684 |
| Merck & Company, Inc. | | | 30,274 | 2,586,611 |
| Meredith Corp. | | | 1,878 | 56,434 |
| Microsoft Corp. | | | 17,072 | 2,906,167 |
| Monmouth Real Estate Investment Corp. | | | 9,326 | 136,439 |
| Monster Beverage Corp. (C) | | | 55,011 | 3,663,733 |
| National Fuel Gas Company | | | 7,007 | 302,632 |
| NIKE, Inc., Class B | | | 26,651 | 2,566,491 |
| Oracle Corp. | | | 129,089 | 6,770,718 |
| Paychex, Inc. | | | 25,728 | 2,206,691 |
| PepsiCo, Inc. | | | 11,994 | 1,703,388 |
| Pfizer, Inc. | | | 92,558 | 3,446,860 |
| Philip Morris International, Inc. | | | 21,170 | 1,750,759 |
| Prosperity Bancshares, Inc. | | | 5,795 | 406,809 |
| Public Service Enterprise Group, Inc. | | | 24,744 | 1,464,845 |
| Regal Beloit Corp. | | | 1,761 | 138,168 |
| Reinsurance Group of America, Inc. | | | 2,733 | 393,689 |
| Ross Stores, Inc. | | | 18,940 | 2,124,879 |
| ScanSource, Inc. (C) | | | 6,331 | 220,889 |
| Signature Bank | | | 5,666 | 803,949 |
| Silgan Holdings, Inc. | | | 22,957 | 708,453 |
| Simon Property Group, Inc. | | | 26,492 | 3,527,410 |
| Sonoco Products Company | | | 3,009 | 171,934 |
| Starbucks Corp. | | | 55,774 | 4,731,308 |
| Target Corp. | | | 35,892 | 3,974,680 |
| Texas Roadhouse, Inc. | | | 31,613 | 1,975,813 |
| The Coca-Cola Company | | | 30,150 | 1,760,760 |
| The Estee Lauder Companies, Inc., Class A | | | 10,942 | 2,135,441 |
| The Hanover Insurance Group, Inc. | | | 4,325 | 599,359 |
| The Hershey Company | | | 10,638 | 1,650,698 |
| The Procter & Gamble Company | | | 13,304 | 1,657,944 |
| SEE NOTES TO FINANCIAL STATEMENTS | SEMIANNUAL REPORT | JOHN HANCOCK MULTI-ASSET ABSOLUTE RETURN FUND | 15 |
| | | | | Shares | Value |
| United States (continued) | | | | | |
| The TJX Companies, Inc. | | | 35,493 | $2,095,507 |
| The Toro Company | | | 31,766 | 2,541,915 |
| USANA Health Sciences, Inc. (C) | | | 2,867 | 176,894 |
| Verizon Communications, Inc. | | | 37,410 | 2,223,650 |
| Visa, Inc., Class A | | | 14,616 | 2,908,146 |
| VMware, Inc., Class A (C) | | | 16,226 | 2,402,422 |
| Walgreens Boots Alliance, Inc. | | | 28,081 | 1,427,919 |
| Walmart, Inc. | | | 13,981 | 1,600,685 |
| WEC Energy Group, Inc. | | | 17,309 | 1,728,996 |
| Wolverine World Wide, Inc. | | | 13,652 | 430,994 |
| Woodward, Inc. | | | 1,181 | 137,362 |
| Xcel Energy, Inc. | | | 25,368 | 1,755,212 |
| Xilinx, Inc. | | | 43,196 | 3,649,198 |
|
| Zimmer Biomet Holdings, Inc. | | | 23,403 | 3,461,304 |
| Preferred securities 0.1% | | | | | $367,100 |
| (Cost $377,062) | | | | | |
| Brazil 0.1% | | | | | 367,100 |
| Banco Bradesco SA | | | 47,800 | 367,100 |
|
| | Rate (%) | Maturity date | | Par value^ | Value |
| U.S. Government and Agency obligations 10.0% | $54,869,633 |
| (Cost $53,863,427) | | | | | |
| United States 10.0% | | | | | 54,869,633 |
| U.S. Treasury | | | | | |
| Note | 1.750 | 11-15-29 | | 2,739,900 | 2,799,621 |
| Note | 2.000 | 02-15-25 | | 2,081,400 | 2,148,476 |
| Note | 2.000 | 11-15-26 | | 6,820,200 | 7,075,158 |
| Note | 2.250 | 11-15-25 | | 5,106,900 | 5,353,667 |
| Note | 2.250 | 02-15-27 | | 6,256,400 | 6,601,724 |
| Note | 2.250 | 08-15-27 | | 3,891,800 | 4,117,403 |
| Note | 2.375 | 05-15-29 | | 6,786,700 | 7,300,740 |
| Note | 2.625 | 02-15-29 | | 1,009,300 | 1,105,854 |
| Note | 2.750 | 02-15-28 | | 9,954,500 | 10,930,508 |
| Note | 2.875 | 05-15-28 | | 1,994,800 | 2,213,449 |
|
| Note | 3.125 | 11-15-28 | | 4,602,900 | 5,223,033 |
| Corporate bonds 11.0% | | | | $60,611,718 |
| (Cost $60,908,442) | | | | | |
| Australia 0.3% | | | | | 1,815,775 |
| Westpac Banking Corp. | 0.500 | 05-17-24 | EUR | 800,000 | 914,519 |
| Westpac Banking Corp. | 0.750 | 07-22-21 | EUR | 800,000 | 901,256 |
| Austria 0.1% | | | | | 595,418 |
| Erste Group Bank AG | 0.750 | 01-17-28 | EUR | 500,000 | 595,418 |
| 16 | JOHN HANCOCK MULTI-ASSET ABSOLUTE RETURN FUND | SEMIANNUAL REPORT | SEE NOTES TO FINANCIAL STATEMENTS |
| | Rate (%) | Maturity date | | Par value^ | Value |
| Belgium 0.1% | | | | | $363,905 |
| Belfius Bank SA | 1.000 | 06-12-28 | EUR | 300,000 | 363,905 |
| Denmark 3.9% | | | | | 21,644,964 |
| Nykredit Realkredit A/S | 1.000 | 04-01-21 | DKK | 18,000,000 | 2,717,876 |
| Nykredit Realkredit A/S | 1.000 | 10-01-50 | DKK | 4,500,000 | 667,864 |
| Nykredit Realkredit A/S | 2.000 | 10-01-50 | DKK | 19,643,551 | 3,030,539 |
| Nykredit Realkredit A/S | 2.500 | 10-01-47 | DKK | 6,878,686 | 1,070,663 |
| Nykredit Realkredit A/S | 3.000 | 10-01-47 | DKK | 5,472,698 | 871,316 |
| Realkredit Danmark A/S | 1.000 | 04-01-21 | DKK | 42,000,000 | 6,341,694 |
| Realkredit Danmark A/S | 1.000 | 04-01-22 | DKK | 24,500,000 | 3,750,624 |
| Realkredit Danmark A/S | 1.000 | 04-01-24 | DKK | 7,000,000 | 1,097,505 |
| Realkredit Danmark A/S | 1.000 | 10-01-50 | DKK | 7,925,245 | 1,175,043 |
| Realkredit Danmark A/S | 2.000 | 10-01-50 | DKK | 5,980,994 | 921,840 |
| France 4.0% | | | | | 22,140,436 |
| AXA Bank Europe SCF | 0.375 | 03-23-23 | EUR | 700,000 | 793,880 |
| AXA Bank Europe SCF | 0.500 | 04-18-25 | EUR | 500,000 | 576,723 |
| AXA Bank Europe SCF | 1.375 | 04-18-33 | EUR | 1,100,000 | 1,412,278 |
| AXA Home Loan SFH SA | 0.050 | 07-05-27 | EUR | 600,000 | 674,965 |
| BPCE SFH SA | 0.375 | 02-10-23 | EUR | 2,100,000 | 2,382,713 |
| BPCE SFH SA | 0.625 | 05-29-31 | EUR | 1,100,000 | 1,300,032 |
| BPCE SFH SA | 1.000 | 06-08-29 | EUR | 1,000,000 | 1,221,704 |
| BPCE SFH SA | 3.750 | 09-13-21 | EUR | 1,600,000 | 1,893,489 |
| Cie de Financement Foncier SA | 0.625 | 02-10-23 | EUR | 800,000 | 913,784 |
| Cie de Financement Foncier SA | 0.875 | 09-11-28 | EUR | 1,000,000 | 1,204,406 |
| Cie de Financement Foncier SA | 2.000 | 05-07-24 | EUR | 2,700,000 | 3,292,937 |
| Cie de Financement Foncier SA | 3.500 | 11-05-20 | EUR | 1,500,000 | 1,712,095 |
| Cie de Financement Foncier SA | 4.375 | 04-15-21 | EUR | 300,000 | 351,734 |
| HSBC SFH France SA | 0.500 | 04-17-25 | EUR | 600,000 | 692,680 |
| La Banque Postale Home Loan SFH SA | 1.000 | 10-04-28 | EUR | 1,100,000 | 1,337,208 |
| Societe Generale SFH SA | 0.250 | 09-11-23 | EUR | 2,100,000 | 2,379,808 |
| Germany 1.6% | | | | | 8,571,881 |
| Berlin Hyp AG | 0.000 | 10-10-22 | EUR | 900,000 | 1,008,614 |
| DZ HYP AG | 0.500 | 06-16-26 | EUR | 2,200,000 | 2,561,265 |
| DZ HYP AG | 0.875 | 04-17-34 | EUR | 500,000 | 612,651 |
| Landesbank Hessen-Thueringen Girozentrale | 0.000 | 11-23-20 | EUR | 700,000 | 778,828 |
| Landesbank Hessen-Thueringen Girozentrale | 0.000 | 07-03-24 | EUR | 1,900,000 | 2,137,987 |
| Muenchener Hypothekenbank eG | 1.375 | 04-16-21 | EUR | 1,300,000 | 1,472,536 |
| Netherlands 0.3% | | | | | 1,768,135 |
| Cooperatieve Rabobank UA | 0.875 | 02-08-28 | EUR | 500,000 | 601,575 |
| de Volksbank NV | 0.500 | 01-30-26 | EUR | 800,000 | 926,267 |
| de Volksbank NV | 0.750 | 10-24-31 | EUR | 100,000 | 119,839 |
| SEE NOTES TO FINANCIAL STATEMENTS | SEMIANNUAL REPORT | JOHN HANCOCK MULTI-ASSET ABSOLUTE RETURN FUND | 17 |
| | Rate (%) | Maturity date | | Par value^ | Value |
| Netherlands (continued) | | | | | |
| The Netherlands Nationale-Nederlanden Bank NV | 1.000 | 09-25-28 | EUR | 100,000 | $120,454 |
| New Zealand 0.2% | | | | | 798,696 |
| Westpac Securities NZ, Ltd. | 0.500 | 01-17-24 | EUR | 700,000 | 798,696 |
| Norway 0.5% | | | | | 2,912,508 |
| DNB Boligkreditt AS | 0.375 | 11-14-23 | EUR | 1,000,000 | 1,138,548 |
| Eika Boligkreditt AS | 0.875 | 02-01-29 | EUR | 800,000 | 958,683 |
| Sparebanken Vest Boligkreditt AS | 0.750 | 02-27-25 | EUR | 700,000 | 815,277 |
|
| Total investments (Cost $496,058,714) 94.3% | | | $518,160,369 |
| Other assets and liabilities, net 5.7% | | | 31,391,050 |
| Total net assets 100.0% | | | | | $549,551,419 |
| The percentage shown for each investment category is the total value of the category as a percentage of the net assets of the fund. |
| ^All par values are denominated in U.S. dollars unless otherwise indicated. |
| Currency Abbreviations |
| DKK | Danish Krone |
| EUR | Euro |
| Security Abbreviations and Legend |
| ADR | American Depositary Receipt |
| GDR | Global Depositary Receipt |
| (A) | These securities are exempt from registration under Rule 144A of the Securities Act of 1933. Such securities may be resold, normally to qualified institutional buyers, in transactions exempt from registration. |
| (B) | Security is valued using significant unobservable inputs and is classified as Level 3 in the fair value hierarchy. Refer to Note 2 to the financial statements. |
| (C) | Non-income producing security. |
| 18 | JOHN HANCOCK MULTI-ASSET ABSOLUTE RETURN FUND | SEMIANNUAL REPORT | SEE NOTES TO FINANCIAL STATEMENTS |
DERIVATIVES
FUTURES
| Open contracts | Number of
contracts | Position | Expiration
date | Notional
basis^ | Notional
value^ | Unrealized
appreciation
(depreciation) |
| 10-Year U.S. Treasury Note Futures | 99 | Long | Mar 2020 | $12,737,088 | $13,041,703 | $304,615 |
| Euro-Bund Futures | 3 | Long | Mar 2020 | 569,576 | 582,918 | 13,342 |
| ASX SPI 200 Index Futures | 58 | Short | Mar 2020 | (6,610,567) | (6,634,234) | (23,667) |
| Canadian 10-Year Bond Futures | 139 | Short | Mar 2020 | (14,628,293) | (14,926,167) | (297,874) |
| Euro STOXX 50 Index Futures | 521 | Short | Mar 2020 | (21,670,022) | (20,899,631) | 770,391 |
| Euro-BOBL Futures | 338 | Short | Mar 2020 | (50,248,724) | (50,598,600) | (349,876) |
| FTSE 100 Index Futures | 117 | Short | Mar 2020 | (11,371,041) | (11,114,606) | 256,435 |
| Mini MSCI Emerging Markets Index Futures | 402 | Short | Mar 2020 | (21,987,045) | (21,105,000) | 882,045 |
| Nikkei 225 Mini Index Futures | 622 | Short | Mar 2020 | (13,440,918) | (13,013,465) | 427,453 |
| S&P 500 E-Mini Index Futures | 624 | Short | Mar 2020 | (99,921,396) | (100,542,000) | (620,604) |
| | | | | | | $1,362,260 |
^ Notional basis refers to the contractual amount agreed upon at inception of open contracts; notional value represents the current value of the open contract.
FORWARD FOREIGN CURRENCY CONTRACTS
| Contract to buy | Contract to sell | Counterparty (OTC) | Contractual
settlement
date | Unrealized
appreciation | Unrealized
depreciation |
| AUD | 3,561,000 | JPY | 261,898,018 | GSI | 3/4/2020 | — | $(35,673) |
| AUD | 2,164,000 | SEK | 14,021,582 | JPM | 3/4/2020 | — | (9,113) |
| AUD | 1,073,030 | USD | 735,627 | BOA | 3/3/2020 | — | (16,989) |
| AUD | 132,669 | USD | 91,472 | BNP | 3/3/2020 | — | (2,620) |
| AUD | 999,459 | USD | 691,974 | JPM | 3/3/2020 | — | (22,609) |
| AUD | 704,000 | USD | 481,550 | BOA | 3/4/2020 | — | (10,053) |
| CAD | 239,000 | CHF | 177,224 | GSI | 3/4/2020 | — | (3,763) |
| CAD | 875,361 | GBP | 497,000 | BNP | 3/4/2020 | $4,638 | — |
| CAD | 453,000 | JPY | 37,715,154 | BNP | 3/4/2020 | — | (6,301) |
| CAD | 1,419,000 | JPY | 117,860,196 | JPM | 3/4/2020 | — | (17,143) |
| CAD | 957,000 | NOK | 6,557,998 | JPM | 3/4/2020 | 10,048 | — |
| CAD | 284,000 | USD | 216,818 | BOA | 3/3/2020 | — | (2,228) |
| CAD | 1,436,000 | USD | 1,102,145 | JPM | 3/3/2020 | — | (17,107) |
| CAD | 1,003,135 | USD | 768,000 | JPM | 3/4/2020 | — | (10,035) |
| CHF | 157,000 | USD | 161,099 | BOA | 3/3/2020 | 2,203 | — |
| CHF | 359,000 | USD | 369,524 | GSI | 3/3/2020 | 3,887 | — |
| CHF | 408,000 | USD | 421,727 | JPM | 3/3/2020 | 2,651 | — |
| CHF | 3,186,594 | USD | 3,256,970 | BNP | 3/4/2020 | 57,759 | — |
| CHF | 3,842,899 | USD | 3,912,339 | GSI | 3/4/2020 | 85,085 | — |
| CHF | 7,426,434 | USD | 7,580,710 | JPM | 3/4/2020 | 144,345 | — |
| DKK | 2,390,000 | USD | 356,640 | BOA | 3/3/2020 | — | (1,275) |
| DKK | 29,250,000 | USD | 4,368,808 | GSI | 3/3/2020 | — | (19,673) |
| EUR | 413,000 | CAD | 600,145 | BOA | 3/4/2020 | 5,359 | — |
| EUR | 6,273,000 | GBP | 5,334,354 | GSI | 3/4/2020 | — | (80,268) |
| SEE NOTES TO FINANCIAL STATEMENTS | SEMIANNUAL REPORT | JOHN HANCOCK MULTI-ASSET ABSOLUTE RETURN FUND | 19 |
FORWARD FOREIGN CURRENCY CONTRACTS (continued)
| Contract to buy | Contract to sell | Counterparty (OTC) | Contractual
settlement
date | Unrealized
appreciation | Unrealized
depreciation |
| EUR | 283,000 | JPY | 34,546,973 | BNP | 3/4/2020 | — | $(4,902) |
| EUR | 470,000 | JPY | 57,129,797 | GSI | 3/4/2020 | — | (5,877) |
| EUR | 562,000 | JPY | 68,151,554 | JPM | 3/4/2020 | — | (5,538) |
| EUR | 23,197,620 | USD | 26,068,716 | BOA | 2/4/2020 | — | (341,321) |
| EUR | 349,000 | USD | 388,736 | JPM | 2/4/2020 | — | (1,676) |
| EUR | 4,444,715 | USD | 4,958,872 | BOA | 3/3/2020 | — | (21,269) |
| EUR | 426,626 | USD | 475,216 | BNP | 3/3/2020 | — | (1,280) |
| EUR | 738,550 | USD | 826,699 | GSI | 3/3/2020 | — | (6,249) |
| EUR | 4,484,704 | USD | 4,981,184 | JPM | 3/3/2020 | $844 | — |
| EUR | 14,368,000 | USD | 15,953,701 | BOA | 3/4/2020 | 8,558 | — |
| EUR | 3,622,000 | USD | 4,035,153 | BNP | 3/4/2020 | — | (11,260) |
| EUR | 6,589,000 | USD | 7,337,077 | GSI | 3/4/2020 | — | (16,968) |
| EUR | 1,621,000 | USD | 1,822,834 | JPM | 3/4/2020 | — | (21,969) |
| EUR | 2,678,000 | USD | 2,969,283 | BOA | 4/17/2020 | 14,260 | — |
| EUR | 757,000 | USD | 844,842 | BNP | 4/17/2020 | — | (1,473) |
| EUR | 19,870,620 | USD | 22,033,376 | GSI | 5/4/2020 | 125,602 | — |
| GBP | 1,085,000 | AUD | 2,050,597 | JPM | 3/4/2020 | 60,453 | — |
| GBP | 1,194,340 | EUR | 1,399,000 | BNP | 3/4/2020 | 24,081 | — |
| GBP | 598,430 | USD | 784,327 | BOA | 3/3/2020 | 6,474 | — |
| GBP | 345,000 | USD | 451,148 | BNP | 3/3/2020 | 4,755 | — |
| GBP | 4,056,177 | USD | 5,314,141 | GSI | 3/3/2020 | 45,930 | — |
| GBP | 172,715 | USD | 226,354 | JPM | 3/3/2020 | 1,882 | — |
| GBP | 43,681 | USD | 57,702 | BOA | 3/4/2020 | 22 | — |
| GBP | 5,845,683 | USD | 7,701,644 | BNP | 3/4/2020 | 23,387 | — |
| HKD | 276,000 | USD | 35,486 | BOA | 3/3/2020 | 34 | — |
| HKD | 1,368,000 | USD | 175,676 | BNP | 3/3/2020 | 376 | — |
| HKD | 626,000 | USD | 79,928 | GSI | 3/3/2020 | 634 | — |
| HKD | 1,400,000 | USD | 180,103 | JPM | 3/3/2020 | 67 | — |
| JPY | 549,862,290 | AUD | 7,296,000 | JPM | 3/4/2020 | 195,731 | — |
| JPY | 5,758,356,192 | EUR | 47,699,433 | BNP | 3/4/2020 | 230,046 | — |
| JPY | 44,194,106 | EUR | 362,000 | JPM | 3/4/2020 | 6,301 | — |
| JPY | 81,855,655 | GBP | 575,000 | JPM | 3/4/2020 | — | (3,300) |
| JPY | 89,202,922 | NZD | 1,260,000 | BNP | 3/4/2020 | 9,723 | — |
| JPY | 38,941,939 | NZD | 534,000 | JPM | 3/4/2020 | 14,628 | — |
| JPY | 8,665,000 | USD | 79,420 | BOA | 3/3/2020 | 663 | — |
| JPY | 47,880,785 | USD | 441,361 | BNP | 3/3/2020 | 1,159 | — |
| JPY | 38,768,000 | USD | 355,678 | GSI | 3/3/2020 | 2,621 | — |
| JPY | 604,125,000 | USD | 5,552,668 | JPM | 3/3/2020 | 30,731 | — |
| JPY | 3,020,966,449 | USD | 27,949,914 | BOA | 3/4/2020 | — | (28,342) |
| JPY | 3,020,966,450 | USD | 27,926,082 | BNP | 3/4/2020 | — | (4,509) |
| JPY | 901,331,912 | USD | 8,258,000 | GSI | 3/4/2020 | 72,647 | — |
| JPY | 740,166,536 | USD | 6,800,000 | JPM | 3/4/2020 | 41,060 | — |
| NOK | 13,499,762 | GBP | 1,160,000 | JPM | 3/4/2020 | — | (65,090) |
| 20 | JOHN HANCOCK MULTI-ASSET ABSOLUTE RETURN FUND | SEMIANNUAL REPORT | SEE NOTES TO FINANCIAL STATEMENTS |
FORWARD FOREIGN CURRENCY CONTRACTS (continued)
| Contract to buy | Contract to sell | Counterparty (OTC) | Contractual
settlement
date | Unrealized
appreciation | Unrealized
depreciation |
| NOK | 17,018,569 | JPY | 202,518,000 | GSI | 3/4/2020 | — | $(21,347) |
| NOK | 14,688,322 | NZD | 2,491,000 | GSI | 3/4/2020 | — | (13,660) |
| NZD | 1,388,308 | CAD | 1,194,000 | BOA | 3/4/2020 | — | (4,471) |
| SEK | 2,885,402 | CHF | 302,000 | GSI | 3/4/2020 | — | (14,024) |
| SEK | 3,687,167 | CHF | 383,000 | JPM | 3/4/2020 | — | (14,886) |
| SEK | 5,561,860 | EUR | 533,000 | BOA | 3/4/2020 | — | (13,634) |
| SEK | 13,788,483 | GBP | 1,105,000 | GSI | 3/4/2020 | — | (26,065) |
| SEK | 5,021,825 | JPY | 58,418,000 | GSI | 3/4/2020 | — | (17,598) |
| SEK | 20,382,331 | NOK | 19,187,000 | BOA | 3/4/2020 | $33,812 | — |
| SEK | 31,828,314 | NZD | 5,081,000 | BNP | 3/4/2020 | 25,080 | — |
| SEK | 123,000 | USD | 12,966 | BNP | 3/3/2020 | — | (173) |
| SEK | 939,000 | USD | 100,584 | GSI | 3/3/2020 | — | (2,920) |
| SEK | 120,000 | USD | 12,774 | JPM | 3/3/2020 | — | (293) |
| SEK | 214,246,335 | USD | 22,757,154 | BOA | 3/4/2020 | — | (472,694) |
| SGD | 46,000 | USD | 34,043 | BOA | 3/3/2020 | — | (332) |
| USD | 868,869 | AUD | 1,263,843 | BOA | 3/3/2020 | 22,437 | — |
| USD | 2,097,185 | AUD | 3,086,831 | BNP | 3/3/2020 | 29,847 | — |
| USD | 243,350 | AUD | 355,259 | GSI | 3/3/2020 | 5,423 | — |
| USD | 219,448 | AUD | 319,735 | JPM | 3/3/2020 | 5,313 | — |
| USD | 24,800,670 | AUD | 36,230,415 | BNP | 3/4/2020 | 535,705 | — |
| USD | 599,306 | CAD | 789,000 | BOA | 3/3/2020 | 3,140 | — |
| USD | 20,825,959 | CAD | 27,650,028 | BNP | 3/3/2020 | — | (66,332) |
| USD | 277,669 | CAD | 364,000 | JPM | 3/3/2020 | 2,631 | — |
| USD | 917,000 | CAD | 1,193,043 | BOA | 3/4/2020 | 15,541 | — |
| USD | 32,214,766 | CAD | 42,536,227 | BNP | 3/4/2020 | 74,549 | — |
| USD | 357,233 | CHF | 347,000 | BOA | 3/3/2020 | — | (3,696) |
| USD | 6,712,422 | CHF | 6,658,854 | GSI | 3/3/2020 | — | (213,727) |
| USD | 161,698 | CHF | 156,000 | JPM | 3/3/2020 | — | (564) |
| USD | 2,647,058 | DKK | 17,733,000 | BOA | 3/3/2020 | 10,367 | — |
| USD | 26,020,862 | DKK | 175,355,000 | BNP | 3/3/2020 | — | (52,387) |
| USD | 90,379 | DKK | 604,000 | GSI | 3/3/2020 | 571 | — |
| USD | 2,068,323 | DKK | 14,000,000 | JPM | 3/3/2020 | — | (13,314) |
| USD | 1,437,158 | EUR | 1,302,000 | BOA | 2/4/2020 | — | (6,829) |
| USD | 2,646,549 | EUR | 2,374,000 | BNP | 2/4/2020 | 13,657 | — |
| USD | 2,823,330 | EUR | 2,520,224 | BOA | 3/3/2020 | 23,630 | — |
| USD | 84,809,632 | EUR | 76,554,562 | BNP | 3/3/2020 | — | (234,316) |
| USD | 1,073,224 | EUR | 970,713 | JPM | 3/3/2020 | — | (5,134) |
| USD | 7,667,541 | EUR | 6,871,104 | BOA | 3/4/2020 | 34,026 | — |
| USD | 41,843,461 | EUR | 37,509,571 | BNP | 3/4/2020 | 171,867 | — |
| USD | 57,126,399 | EUR | 51,029,567 | BOA | 4/17/2020 | 274,688 | — |
| USD | 600,275 | EUR | 539,000 | GSI | 4/17/2020 | — | (221) |
| USD | 25,116,561 | GBP | 19,366,992 | BOA | 3/3/2020 | — | (476,127) |
| USD | 18,288 | GBP | 13,969 | BNP | 3/3/2020 | — | (172) |
| SEE NOTES TO FINANCIAL STATEMENTS | SEMIANNUAL REPORT | JOHN HANCOCK MULTI-ASSET ABSOLUTE RETURN FUND | 21 |
FORWARD FOREIGN CURRENCY CONTRACTS (continued)
| Contract to buy | Contract to sell | Counterparty (OTC) | Contractual
settlement
date | Unrealized
appreciation | Unrealized
depreciation |
| USD | 794,600 | GBP | 597,779 | GSI | 3/3/2020 | $4,660 | — |
| USD | 297,483 | GBP | 225,931 | JPM | 3/3/2020 | — | $(1,075) |
| USD | 1,818,443 | GBP | 1,376,579 | BOA | 3/4/2020 | — | (697) |
| USD | 1,813,634 | GBP | 1,376,580 | BNP | 3/4/2020 | — | (5,507) |
| USD | 7,043,094 | GBP | 5,385,000 | JPM | 3/4/2020 | — | (73,148) |
| USD | 157,190 | HKD | 1,222,000 | BOA | 3/3/2020 | — | (73) |
| USD | 4,023,195 | HKD | 31,478,000 | BNP | 3/3/2020 | — | (27,805) |
| USD | 62,821 | HKD | 490,000 | GSI | 3/3/2020 | — | (238) |
| USD | 30,295,698 | JPY | 3,298,487,672 | BOA | 3/3/2020 | — | (189,334) |
| USD | 393,361 | JPY | 43,177,000 | GSI | 3/3/2020 | — | (5,686) |
| USD | 3,761,272 | JPY | 409,497,000 | JPM | 3/3/2020 | — | (23,350) |
| USD | 952,000 | JPY | 103,636,452 | GSI | 3/4/2020 | — | (5,870) |
| USD | 908,000 | JPY | 98,231,662 | JPM | 3/4/2020 | 84 | — |
| USD | 981,997 | NOK | 8,986,159 | BOA | 3/4/2020 | 4,923 | — |
| USD | 805,000 | NOK | 7,216,335 | JPM | 3/4/2020 | 20,361 | — |
| USD | 8,729,752 | NZD | 13,311,689 | BOA | 3/4/2020 | 122,120 | — |
| USD | 8,698,045 | NZD | 13,311,689 | GSI | 3/4/2020 | 90,413 | — |
| USD | 693,408 | SEK | 6,583,000 | BOA | 3/3/2020 | 8,720 | — |
| USD | 17,553 | SEK | 164,000 | GSI | 3/3/2020 | 495 | — |
| USD | 30,082 | SEK | 285,000 | JPM | 3/3/2020 | 439 | — |
| USD | 7,831,085 | SEK | 73,725,446 | BOA | 3/4/2020 | 162,661 | — |
| USD | 6,844,000 | SEK | 64,913,257 | BNP | 3/4/2020 | 92,160 | — |
| USD | 765,000 | SEK | 7,342,724 | JPM | 3/4/2020 | 1,259 | — |
| USD | 59,900 | SGD | 81,000 | BOA | 3/3/2020 | 540 | — |
| USD | 1,345,792 | SGD | 1,837,000 | GSI | 3/3/2020 | — | (436) |
| USD | 84,868 | SGD | 115,000 | JPM | 3/3/2020 | 591 | — |
| USD | 35,837 | ZAR | 532,208 | BOA | 3/3/2020 | 503 | — |
| ZAR | 39,000 | USD | 2,693 | BOA | 3/3/2020 | — | (104) |
| ZAR | 12,000 | USD | 804 | GSI | 3/3/2020 | — | (7) |
| | | | | | | $3,030,857 | $(2,804,119) |
SWAPS
| Credit default swaps - Buyer |
Counterparty
(OTC)/
Centrally
cleared | Reference
obligation | Notional
amount | Currency | USD
notional
amount | Pay
fixed
rate | Fixed
payment
frequency | Maturity
date | Unamortized
upfront
payment
paid
(received) | Unrealized
appreciation
(depreciation) | Value |
| DB | CDX.NA.HY.33 | 275,220 | USD | $275,220 | 5.000% | Quarterly | Dec 2024 | $(25,189) | $1,644 | $(23,545) |
| DB | iTraxx Europe Crossover Series 32 Version 1 | 442,000 | EUR | 490,202 | 5.000% | Quarterly | Dec 2024 | (63,306) | (3,657) | (66,963) |
| JPM | iTraxx Europe Crossover Series 32 Version 1 | 442,000 | EUR | 490,202 | 5.000% | Quarterly | Dec 2024 | (63,782) | (3,709) | (67,491) |
| | | | | $1,255,624 | | | | $(152,277) | $(5,722) | $(157,999) |
| 22 | JOHN HANCOCK MULTI-ASSET ABSOLUTE RETURN FUND | SEMIANNUAL REPORT | SEE NOTES TO FINANCIAL STATEMENTS |
| Derivatives Currency Abbreviations |
| AUD | Australian Dollar |
| CAD | Canadian Dollar |
| CHF | Swiss Franc |
| DKK | Danish Krone |
| EUR | Euro |
| GBP | Pound Sterling |
| HKD | Hong Kong Dollar |
| JPY | Japanese Yen |
| NOK | Norwegian Krone |
| NZD | New Zealand Dollar |
| SEK | Swedish Krona |
| SGD | Singapore Dollar |
| USD | U.S. Dollar |
| ZAR | South African Rand |
| Derivatives Abbreviations |
| BNP | BNP Paribas |
| BOA | Bank of America, N.A. |
| DB | Deutsche Bank AG |
| GSI | Goldman Sachs International |
| JPM | JPMorgan Chase Bank, N.A. |
| OTC | Over-the-counter |
At 1-31-20, the aggregate cost of investments for federal income tax purposes was $500,308,965. Net unrealized appreciation aggregated to $19,282,403, of which $28,603,495 related to gross unrealized appreciation and $9,321,092 related to gross unrealized depreciation.
See Notes to financial statements regarding investment transactions and other derivatives information.
| SEE NOTES TO FINANCIAL STATEMENTS | SEMIANNUAL REPORT | JOHN HANCOCK MULTI-ASSET ABSOLUTE RETURN FUND | 23 |
STATEMENT OF ASSETS AND LIABILITIES 1-31-20 (unaudited)
| Assets | |
| Unaffiliated investments, at value (Cost $496,058,714) | $518,160,369 |
| Unrealized appreciation on forward foreign currency contracts | 3,030,857 |
| Receivable for futures variation margin | 2,795,767 |
| Cash | 9,271,023 |
| Foreign currency, at value (Cost $6,036,475) | 6,049,341 |
| Collateral held at broker for futures contracts | 10,041,546 |
| Dividends and interest receivable | 4,052,712 |
| Receivable for fund shares sold | 95,644 |
| Receivable for investments sold | 330,212 |
| Other assets | 143,146 |
| Total assets | 553,970,617 |
| Liabilities | |
| Unrealized depreciation on forward foreign currency contracts | 2,804,119 |
| Swap contracts, at value (net unamortized upfront payment of $(152,277)) | 157,999 |
| Payable for investments purchased | 530,083 |
| Payable for fund shares repurchased | 620,304 |
| Payable to affiliates | |
| Accounting and legal services fees | 2,338 |
| Transfer agent fees | 42,402 |
| Distribution and service fees | 228 |
| Trustees' fees | 5,657 |
| Other liabilities and accrued expenses | 256,068 |
| Total liabilities | 4,419,198 |
| Net assets | $549,551,419 |
| Net assets consist of | |
| Paid-in capital | $1,093,542,551 |
| Total distributable earnings (loss) | (543,991,132) |
| Net assets | $549,551,419 |
| |
| 24 | JOHN HANCOCK Multi-Asset Absolute Return Fund | SEMIANNUAL REPORT | SEE NOTES TO FINANCIAL STATEMENTS |
STATEMENT OF ASSETS AND LIABILITIES (continued)
| Net asset value per share | |
| Based on net asset value and shares outstanding - the fund has an unlimited number of shares authorized with no par value | |
| Class A ($38,493,464 ÷ 4,198,385 shares)1 | $9.17 |
| Class C ($41,730,855 ÷ 4,661,632 shares)1 | $8.95 |
| Class I ($317,625,686 ÷ 34,205,482 shares) | $9.29 |
| Class R2 ($554,402 ÷ 60,760 shares) | $9.12 |
| Class R6 ($112,341,469 ÷ 12,048,160 shares) | $9.32 |
| Class NAV ($38,805,543 ÷ 4,163,257 shares) | $9.32 |
| Maximum offering price per share | |
| Class A (net asset value per share ÷ 95%)2 | $9.65 |
| 1 | Redemption price per share is equal to net asset value less any applicable contingent deferred sales charge. |
| 2 | On single retail sales of less than $50,000. On sales of $50,000 or more and on group sales the offering price is reduced. |
| SEE NOTES TO FINANCIAL STATEMENTS | SEMIANNUAL REPORT | JOHN HANCOCK Multi-Asset Absolute Return Fund | 25 |
STATEMENT OF OPERATIONSFor the six months ended 1-31-20 (unaudited)
| Investment income | |
| Dividends | $4,664,992 |
| Interest | 1,883,853 |
| Less foreign taxes withheld | (178,081) |
| Total investment income | 6,370,764 |
| Expenses | |
| Investment management fees | 3,209,380 |
| Distribution and service fees | 301,221 |
| Accounting and legal services fees | 59,508 |
| Transfer agent fees | 299,571 |
| Trustees' fees | 8,400 |
| Custodian fees | 109,630 |
| State registration fees | 42,822 |
| Printing and postage | 59,148 |
| Professional fees | 112,118 |
| Other | 76,159 |
| Total expenses | 4,277,957 |
| Less expense reductions | (24,143) |
| Net expenses | 4,253,814 |
| Net investment income | 2,116,950 |
| Realized and unrealized gain (loss) | |
| Net realized gain (loss) on | |
| Unaffiliated investments and foreign currency transactions | 44,070,929 |
| Futures contracts | (28,213,759) |
| Forward foreign currency contracts | 966,313 |
| Written options | 363,476 |
| Swap contracts | 8,109,968 |
| | 25,296,927 |
| Change in net unrealized appreciation (depreciation) of | |
| Unaffiliated investments and translation of assets and liabilities in foreign currencies | (9,619,609) |
| Futures contracts | 6,439,491 |
| Forward foreign currency contracts | (1,771,938) |
| Written options | (234,081) |
| Swap contracts | (8,562,192) |
| | (13,748,329) |
| Net realized and unrealized gain | 11,548,598 |
| Increase in net assets from operations | $13,665,548 |
| 26 | JOHN HANCOCK Multi-Asset Absolute Return Fund | SEMIANNUAL REPORT | SEE NOTES TO FINANCIAL STATEMENTS |
STATEMENTS OF CHANGES IN NET ASSETS
| | Six months ended
1-31-20
(unaudited) | Year ended
7-31-19 |
| Increase (decrease) in net assets | | |
| From operations | | |
| Net investment income | $2,116,950 | $43,813,084 |
| Net realized gain | 25,296,927 | 55,351,532 |
| Change in net unrealized appreciation (depreciation) | (13,748,329) | (91,308,763) |
| Increase in net assets resulting from operations | 13,665,548 | 7,855,853 |
| Distributions to shareholders | | |
| From earnings | | |
| Class A | (7,249,302) | — |
| Class C | (7,396,250) | — |
| Class I | (74,709,636) | — |
| Class R2 | (106,878) | — |
| Class R6 | (22,147,213) | — |
| Class NAV | (4,683,945) | — |
| Total distributions | (116,293,224) | — |
| From fund share transactions | (168,320,641) | (2,996,015,289) |
| Total decrease | (270,948,317) | (2,988,159,436) |
| Net assets | | |
| Beginning of period | 820,499,736 | 3,808,659,172 |
| End of period | $549,551,419 | $820,499,736 |
| SEE NOTES TO FINANCIAL STATEMENTS | SEMIANNUAL REPORT | JOHN HANCOCK Multi-Asset Absolute Return Fund | 27 |
| CLASS A SHARES Period ended | 1-31-201 | 7-31-19 | 7-31-18 | 7-31-17 | 7-31-16 | 7-31-15 |
| Per share operating performance | | | | | | |
| Net asset value, beginning of period | $10.54 | $10.12 | $10.30 | $9.94 | $11.27 | $11.25 |
| Net investment income2 | 0.02 | 0.20 | 0.14 | 0.06 | 0.04 | 0.03 |
| Net realized and unrealized gain (loss) on investments | 0.17 | 0.22 | (0.32) | 0.30 | (0.69) | 0.53 |
| Total from investment operations | 0.19 | 0.42 | (0.18) | 0.36 | (0.65) | 0.56 |
| Less distributions | | | | | | |
| From net investment income | (1.56) | — | — | — | (0.68) | (0.54) |
| Net asset value, end of period | $9.17 | $10.54 | $10.12 | $10.30 | $9.94 | $11.27 |
| Total return (%)3,4 | 2.115 | 4.15 | (1.75) | 3.62 | (6.00) | 5.15 |
| Ratios and supplemental data | | | | | | |
| Net assets, end of period (in millions) | $38 | $51 | $114 | $194 | $1,047 | $1,080 |
| Ratios (as a percentage of average net assets): | | | | | | |
| Expenses before reductions | 1.566 | 1.69 | 1.65 | 1.65 | 1.64 | 1.67 |
| Expenses including reductions | 1.556 | 1.69 | 1.64 | 1.64 | 1.63 | 1.66 |
| Net investment income | 0.396 | 2.02 | 1.35 | 0.57 | 0.34 | 0.23 |
| Portfolio turnover (%) | 1457 | 50 | 59 | 59 | 80 | 80 |
| 1 | Six months ended 1-31-20. Unaudited. |
| 2 | Based on average daily shares outstanding. |
| 3 | Total returns would have been lower had certain expenses not been reduced during the applicable periods. |
| 4 | Does not reflect the effect of sales charges, if any. |
| 5 | Not annualized. |
| 6 | Annualized. |
| 7 | Increase in portfolio turnover rate resulted from repositioning of the portfolio during the period in accordance with investment policy changes approved by the Board of Trustees. |
| 28 | JOHN HANCOCK Multi-Asset Absolute Return Fund | SEMIANNUAL REPORT | SEE NOTES TO FINANCIAL STATEMENTS |
| CLASS C SHARES Period ended | 1-31-201 | 7-31-19 | 7-31-18 | 7-31-17 | 7-31-16 | 7-31-15 |
| Per share operating performance | | | | | | |
| Net asset value, beginning of period | $10.29 | $9.95 | $10.19 | $9.91 | $11.23 | $11.21 |
| Net investment income (loss)2 | (0.01) | 0.13 | 0.06 | —3 | (0.04) | (0.05) |
| Net realized and unrealized gain (loss) on investments | 0.15 | 0.21 | (0.30) | 0.28 | (0.67) | 0.53 |
| Total from investment operations | 0.14 | 0.34 | (0.24) | 0.28 | (0.71) | 0.48 |
| Less distributions | | | | | | |
| From net investment income | (1.48) | — | — | — | (0.61) | (0.46) |
| Net asset value, end of period | $8.95 | $10.29 | $9.95 | $10.19 | $9.91 | $11.23 |
| Total return (%)4,5 | 1.706 | 3.42 | (2.36) | 2.83 | (6.61) | 4.43 |
| Ratios and supplemental data | | | | | | |
| Net assets, end of period (in millions) | $42 | $52 | $91 | $162 | $309 | $293 |
| Ratios (as a percentage of average net assets): | | | | | | |
| Expenses before reductions | 2.267 | 2.39 | 2.35 | 2.35 | 2.34 | 2.37 |
| Expenses including reductions | 2.257 | 2.39 | 2.34 | 2.34 | 2.33 | 2.36 |
| Net investment income (loss) | (0.31)7 | 1.35 | 0.61 | (0.05) | (0.35) | (0.45) |
| Portfolio turnover (%) | 1458 | 50 | 59 | 59 | 80 | 80 |
| 1 | Six months ended 1-31-20. Unaudited. |
| 2 | Based on average daily shares outstanding. |
| 3 | Less than $0.005 per share. |
| 4 | Total returns would have been lower had certain expenses not been reduced during the applicable periods. |
| 5 | Does not reflect the effect of sales charges, if any. |
| 6 | Not annualized. |
| 7 | Annualized. |
| 8 | Increase in portfolio turnover rate resulted from repositioning of the portfolio during the period in accordance with investment policy changes approved by the Board of Trustees. |
| SEE NOTES TO FINANCIAL STATEMENTS | SEMIANNUAL REPORT | JOHN HANCOCK Multi-Asset Absolute Return Fund | 29 |
| CLASS I SHARES Period ended | 1-31-201 | 7-31-19 | 7-31-18 | 7-31-17 | 7-31-16 | 7-31-15 |
| Per share operating performance | | | | | | |
| Net asset value, beginning of period | $10.67 | $10.22 | $10.36 | $9.97 | $11.30 | $11.29 |
| Net investment income2 | 0.04 | 0.22 | 0.17 | 0.10 | 0.07 | 0.06 |
| Net realized and unrealized gain (loss) on investments | 0.17 | 0.23 | (0.31) | 0.29 | (0.68) | 0.53 |
| Total from investment operations | 0.21 | 0.45 | (0.14) | 0.39 | (0.61) | 0.59 |
| Less distributions | | | | | | |
| From net investment income | (1.59) | — | — | — | (0.72) | (0.58) |
| Net asset value, end of period | $9.29 | $10.67 | $10.22 | $10.36 | $9.97 | $11.30 |
| Total return (%)3 | 2.324 | 4.40 | (1.35) | 3.91 | (5.67) | 5.38 |
| Ratios and supplemental data | | | | | | |
| Net assets, end of period (in millions) | $318 | $535 | $2,413 | $3,481 | $5,316 | $5,093 |
| Ratios (as a percentage of average net assets): | | | | | | |
| Expenses before reductions | 1.265 | 1.41 | 1.35 | 1.33 | 1.32 | 1.36 |
| Expenses including reductions | 1.255 | 1.40 | 1.35 | 1.33 | 1.31 | 1.34 |
| Net investment income | 0.745 | 2.21 | 1.66 | 1.01 | 0.67 | 0.56 |
| Portfolio turnover (%) | 1456 | 50 | 59 | 59 | 80 | 80 |
| 1 | Six months ended 1-31-20. Unaudited. |
| 2 | Based on average daily shares outstanding. |
| 3 | Total returns would have been lower had certain expenses not been reduced during the applicable periods. |
| 4 | Not annualized. |
| 5 | Annualized. |
| 6 | Increase in portfolio turnover rate resulted from repositioning of the portfolio during the period in accordance with investment policy changes approved by the Board of Trustees. |
| 30 | JOHN HANCOCK Multi-Asset Absolute Return Fund | SEMIANNUAL REPORT | SEE NOTES TO FINANCIAL STATEMENTS |
| CLASS R2 SHARES Period ended | 1-31-201 | 7-31-19 | 7-31-18 | 7-31-17 | 7-31-16 | 7-31-15 |
| Per share operating performance | | | | | | |
| Net asset value, beginning of period | $10.49 | $10.08 | $10.27 | $9.92 | $11.25 | $11.24 |
| Net investment income (loss)2 | 0.02 | 0.20 | 0.12 | 0.08 | 0.01 | (0.01) |
| Net realized and unrealized gain (loss) on investments | 0.16 | 0.21 | (0.31) | 0.27 | (0.66) | 0.53 |
| Total from investment operations | 0.18 | 0.41 | (0.19) | 0.35 | (0.65) | 0.52 |
| Less distributions | | | | | | |
| From net investment income | (1.55) | — | — | — | (0.68) | (0.51) |
| Net asset value, end of period | $9.12 | $10.49 | $10.08 | $10.27 | $9.92 | $11.25 |
| Total return (%)3 | 2.164 | 4.07 | (1.85) | 3.53 | (6.08) | 4.75 |
| Ratios and supplemental data | | | | | | |
| Net assets, end of period (in millions) | $1 | $1 | $1 | $2 | $3 | $5 |
| Ratios (as a percentage of average net assets): | | | | | | |
| Expenses before reductions | 1.605 | 1.78 | 1.75 | 1.72 | 1.75 | 1.99 |
| Expenses including reductions | 1.605 | 1.77 | 1.74 | 1.71 | 1.74 | 1.97 |
| Net investment income (loss) | 0.355 | 1.99 | 1.17 | 0.78 | 0.09 | (0.06) |
| Portfolio turnover (%) | 1456 | 50 | 59 | 59 | 80 | 80 |
| 1 | Six months ended 1-31-20. Unaudited. |
| 2 | Based on average daily shares outstanding. |
| 3 | Total returns would have been lower had certain expenses not been reduced during the applicable periods. |
| 4 | Not annualized. |
| 5 | Annualized. |
| 6 | Increase in portfolio turnover rate resulted from repositioning of the portfolio during the period in accordance with investment policy changes approved by the Board of Trustees. |
| SEE NOTES TO FINANCIAL STATEMENTS | SEMIANNUAL REPORT | JOHN HANCOCK Multi-Asset Absolute Return Fund | 31 |
| CLASS R6 SHARES Period ended | 1-31-201 | 7-31-19 | 7-31-18 | 7-31-17 | 7-31-16 | 7-31-15 |
| Per share operating performance | | | | | | |
| Net asset value, beginning of period | $10.71 | $10.24 | $10.38 | $9.97 | $11.30 | $11.29 |
| Net investment income2 | 0.04 | 0.24 | 0.19 | 0.11 | 0.09 | 0.09 |
| Net realized and unrealized gain (loss) on investments | 0.17 | 0.23 | (0.33) | 0.30 | (0.69) | 0.51 |
| Total from investment operations | 0.21 | 0.47 | (0.14) | 0.41 | (0.60) | 0.60 |
| Less distributions | | | | | | |
| From net investment income | (1.60) | — | — | — | (0.73) | (0.59) |
| Net asset value, end of period | $9.32 | $10.71 | $10.24 | $10.38 | $9.97 | $11.30 |
| Total return (%)3 | 2.334 | 4.59 | (1.35) | 4.11 | (5.55) | 5.51 |
| Ratios and supplemental data | | | | | | |
| Net assets, end of period (in millions) | $112 | $150 | $546 | $693 | $639 | $557 |
| Ratios (as a percentage of average net assets): | | | | | | |
| Expenses before reductions | 1.155 | 1.29 | 1.26 | 1.24 | 1.23 | 1.26 |
| Expenses including reductions | 1.155 | 1.29 | 1.24 | 1.22 | 1.20 | 1.23 |
| Net investment income | 0.825 | 2.33 | 1.79 | 1.08 | 0.81 | 0.77 |
| Portfolio turnover (%) | 1456 | 50 | 59 | 59 | 80 | 80 |
| 1 | Six months ended 1-31-20. Unaudited. |
| 2 | Based on average daily shares outstanding. |
| 3 | Total returns would have been lower had certain expenses not been reduced during the applicable periods. |
| 4 | Not annualized. |
| 5 | Annualized. |
| 6 | Increase in portfolio turnover rate resulted from repositioning of the portfolio during the period in accordance with investment policy changes approved by the Board of Trustees. |
| 32 | JOHN HANCOCK Multi-Asset Absolute Return Fund | SEMIANNUAL REPORT | SEE NOTES TO FINANCIAL STATEMENTS |
| CLASS NAV SHARES Period ended | 1-31-201 | 7-31-19 | 7-31-18 | 7-31-17 | 7-31-16 | 7-31-15 |
| Per share operating performance | | | | | | |
| Net asset value, beginning of period | $10.71 | $10.23 | $10.37 | $9.96 | $11.29 | $11.28 |
| Net investment income2 | 0.04 | 0.21 | 0.19 | 0.11 | 0.08 | 0.08 |
| Net realized and unrealized gain (loss) on investments | 0.17 | 0.27 | (0.33) | 0.30 | (0.68) | 0.52 |
| Total from investment operations | 0.21 | 0.48 | (0.14) | 0.41 | (0.60) | 0.60 |
| Less distributions | | | | | | |
| From net investment income | (1.60) | — | — | — | (0.73) | (0.59) |
| Net asset value, end of period | $9.32 | $10.71 | $10.23 | $10.37 | $9.96 | $11.29 |
| Total return (%)3 | 2.334 | 4.59 | (1.35) | 4.12 | (5.56) | 5.51 |
| Ratios and supplemental data | | | | | | |
| Net assets, end of period (in millions) | $39 | $32 | $643 | $936 | $1,119 | $1,260 |
| Ratios (as a percentage of average net assets): | | | | | | |
| Expenses before reductions | 1.145 | 1.28 | 1.24 | 1.22 | 1.21 | 1.24 |
| Expenses including reductions | 1.135 | 1.27 | 1.23 | 1.22 | 1.20 | 1.23 |
| Net investment income | 0.745 | 2.07 | 1.81 | 1.12 | 0.75 | 0.68 |
| Portfolio turnover (%) | 1456 | 50 | 59 | 59 | 80 | 80 |
| 1 | Six months ended 1-31-20. Unaudited. |
| 2 | Based on average daily shares outstanding. |
| 3 | Total returns would have been lower had certain expenses not been reduced during the applicable periods. |
| 4 | Not annualized. |
| 5 | Annualized. |
| 6 | Increase in portfolio turnover rate resulted from repositioning of the portfolio during the period in accordance with investment policy changes approved by the Board of Trustees. |
| SEE NOTES TO FINANCIAL STATEMENTS | SEMIANNUAL REPORT | JOHN HANCOCK Multi-Asset Absolute Return Fund | 33 |
| Notes to financial statements (unaudited) | |
Note 1—Organization
John Hancock Multi-Asset Absolute Return Fund (formerly known as John Hancock Global Absolute Return Strategies Fund) (the fund) is a series of John Hancock Funds II (the Trust), an open-end management investment company organized as a Massachusetts business trust and registered under the Investment Company Act of 1940, as amended (the 1940 Act). The investment objective of the fund is to seek long-term total return.
The fund may offer multiple classes of shares. The shares currently outstanding are detailed in the Statement of assets and liabilities. Class A and Class C shares are offered to all investors. Class I shares are offered to institutions and certain investors. Class R2 shares are available only to certain retirement and 529 plans. Class R6 shares are only available to certain retirement plans, institutions and other investors. Class NAV shares are offered to John Hancock affiliated funds of funds, retirement plans for employees of John Hancock and/or Manulife Financial Corporation, and certain 529 plans. Class C shares convert to Class A shares ten years after purchase (certain exclusions may apply). Shareholders of each class have exclusive voting rights to matters that affect that class. The distribution and service fees, if any, and transfer agent fees for each class may differ.
Note 2—Significant accounting policies
The financial statements have been prepared in conformity with accounting principles generally accepted in the United States of America (US GAAP), which require management to make certain estimates and assumptions as of the date of the financial statements. Actual results could differ from those estimates and those differences could be significant. The fund qualifies as an investment company under Topic 946 of Accounting Standards Codification of US GAAP.
Events or transactions occurring after the end of the fiscal period through the date that the financial statements were issued have been evaluated in the preparation of the financial statements. The following summarizes the significant accounting policies of the fund:
Security valuation. Investments are stated at value as of the scheduled close of regular trading on the New York Stock Exchange (NYSE), normally at 4:00 P.M., Eastern Time. In case of emergency or other disruption resulting in the NYSE not opening for trading or the NYSE closing at a time other than the regularly scheduled close, the net asset value (NAV) may be determined as of the regularly scheduled close of the NYSE pursuant to the fund's Valuation Policies and Procedures.
In order to value the securities, the fund uses the following valuation techniques: Equity securities, including exchange-traded or closed-end funds, are typically valued at the last sale price or official closing price on the exchange or principal market where the security trades. In the event there were no sales during the day or closing prices are not available, the securities are valued using the last available bid price. Debt obligations are typically valued based on the evaluated prices provided by an independent pricing vendor. Independent pricing vendors utilize matrix pricing, which takes into account factors such as institutional-size trading in similar groups of securities, yield, quality, coupon rate, maturity, type of issue, trading characteristics and other market data, as well as broker supplied prices. Futures contracts are typically valued at last traded price on the exchange on which they trade. Foreign equity index futures that trade in the electronic trading market subsequent to the close of regular trading may be valued at the last traded price in the electronic trading market as of 4:00 P.M. ET, or may be fair valued based on fair value adjustment factors provided by an independent pricing vendor in order to adjust for events that may occur between the close of foreign exchanges or markets and the close of the NYSE. Swaps are generally valued using evaluated prices obtained from an independent pricing vendor. Forward foreign currency contracts are valued at the prevailing forward rates which are based on foreign currency exchange spot rates and forward points supplied by an independent pricing vendor. Foreign securities and currencies are valued in U.S. dollars based on foreign currency exchange rates supplied by an independent pricing vendor.
| 34 | JOHN HANCOCK Multi-Asset Absolute Return Fund | SEMIANNUAL REPORT | |
In certain instances, the Pricing Committee may determine to value equity securities using prices obtained from another exchange or market if trading on the exchange or market on which prices are typically obtained did not open for trading as scheduled, or if trading closed earlier than scheduled, and trading occurred as normal on another exchange or market.
Other portfolio securities and assets, for which reliable market quotations are not readily available, are valued at fair value as determined in good faith by the fund's Pricing Committee following procedures established by the Board of Trustees. The frequency with which these fair valuation procedures are used cannot be predicted and fair value of securities may differ significantly from the value that would have been used had a ready market for such securities existed. Trading in foreign securities may be completed before the scheduled daily close of trading on the NYSE. Significant events at the issuer or market level may affect the values of securities between the time when the valuation of the securities is generally determined and the close of the NYSE. If a significant event occurs, these securities may be fair valued, as determined in good faith by the fund's Pricing Committee, following procedures established by the Board of Trustees. The fund uses fair value adjustment factors provided by an independent pricing vendor to value certain foreign securities in order to adjust for events that may occur between the close of foreign exchanges or markets and the close of the NYSE.
The fund uses a three-tier hierarchy to prioritize the pricing assumptions, referred to as inputs, used in valuation techniques to measure fair value. Level 1 includes securities valued using quoted prices in active markets for identical securities, including registered investment companies. Level 2 includes securities valued using other significant observable inputs. Observable inputs may include quoted prices for similar securities, interest rates, prepayment speeds and credit risk. Prices for securities valued using these inputs are received from independent pricing vendors and brokers and are based on an evaluation of the inputs described. Level 3 includes securities valued using significant unobservable inputs when market prices are not readily available or reliable, including the fund's own assumptions in determining the fair value of investments. Factors used in determining value may include market or issuer specific events or trends, changes in interest rates and credit quality. The inputs or methodology used for valuing securities are not necessarily an indication of the risks associated with investing in those securities. Changes in valuation techniques and related inputs may result in transfers into or out of an assigned level within the disclosure hierarchy.
The following is a summary of the values by input classification of the fund's investments as of January 31, 2020, by major security category or type:
| | Total
value at
1-31-20 | Level 1
quoted
price | Level 2
significant
observable
inputs | Level 3
significant
unobservable
inputs |
| Investments in securities: | | | | |
| Assets | | | | |
| Common stocks | | | | |
| Australia | $1,268,601 | — | $1,268,601 | — |
| Brazil | 651,176 | $651,176 | — | — |
| Canada | 19,266,599 | 19,266,599 | — | — |
| China | 16,466,446 | — | 16,429,927 | $36,519 |
| Denmark | 4,212,930 | — | 4,212,930 | — |
| France | 19,101,355 | — | 19,101,355 | — |
| Germany | 11,555,234 | — | 11,555,234 | — |
| Hong Kong | 8,148,250 | — | 8,148,250 | — |
| | SEMIANNUAL REPORT | JOHN HANCOCK Multi-Asset Absolute Return Fund | 35 |
| | Total
value at
1-31-20 | Level 1
quoted
price | Level 2
significant
observable
inputs | Level 3
significant
unobservable
inputs |
| India | $4,531,797 | $3,537,405 | $994,392 | — |
| Indonesia | 2,610,316 | — | 2,610,316 | — |
| Ireland | 11,599,369 | 11,316,322 | 283,047 | — |
| Israel | 7,189,299 | 7,189,299 | — | — |
| Italy | 2,044,456 | — | 2,044,456 | — |
| Japan | 26,164,373 | — | 26,164,373 | — |
| Malaysia | 1,255,400 | — | 1,255,400 | — |
| Mexico | 881,287 | 881,287 | — | — |
| Netherlands | 197,108 | — | 197,108 | — |
| Peru | 2,700,827 | 2,700,827 | — | — |
| Philippines | 154,954 | — | 154,954 | — |
| Singapore | 1,414,180 | — | 1,414,180 | — |
| South Africa | 3,431,352 | — | 3,431,352 | — |
| South Korea | 10,977,268 | 477,543 | 10,499,725 | — |
| Spain | 1,883,522 | — | 1,883,522 | — |
| Sweden | 595,881 | — | 595,881 | — |
| Switzerland | 9,145,932 | 3,017,913 | 6,128,019 | — |
| Taiwan | 3,972,298 | — | 3,972,298 | — |
| Thailand | 883,171 | — | 883,171 | — |
| Turkey | 2,241,213 | — | 2,241,213 | — |
| United Arab Emirates | 207,189 | — | 207,189 | — |
| United Kingdom | 17,772,742 | — | 17,772,742 | — |
| United States | 209,787,393 | 209,787,393 | — | — |
| Preferred securities | 367,100 | 367,100 | — | — |
| U.S. Government and Agency obligations | 54,869,633 | — | 54,869,633 | — |
| Corporate bonds | 60,611,718 | — | 60,611,718 | — |
| Total investments in securities | $518,160,369 | $259,192,864 | $258,930,986 | $36,519 |
| Derivatives: | | | | |
| Assets | | | | |
| Futures | $2,654,281 | $2,654,281 | — | — |
| Forward foreign currency contracts | 3,030,857 | — | $3,030,857 | — |
| Liabilities | | | | |
| Futures | (1,292,021) | (1,292,021) | — | — |
| Forward foreign currency contracts | (2,804,119) | — | (2,804,119) | — |
| Swap contracts | (157,999) | — | (157,999) | — |
Security transactions and related investment income. Investment security transactions are accounted for on a trade date plus one basis for daily NAV calculations. However, for financial reporting purposes, investment transactions are reported on trade date. Interest income is accrued as earned. Interest income includes coupon interest and amortization/accretion of premiums/discounts on debt securities. Debt obligations may be placed in a non-accrual status and related interest income may be reduced by stopping current accruals and writing off interest receivable when the collection of all or a portion of interest has become doubtful. Dividend income is recorded on the ex-date, except for dividends of certain foreign securities where the dividend may not be known until after the ex-date. In those cases, dividend income, net of withholding taxes, is recorded when the fund
| 36 | JOHN HANCOCK Multi-Asset Absolute Return Fund | SEMIANNUAL REPORT | |
becomes aware of the dividends. Non-cash dividends, if any, are recorded at the fair market value of the securities received. Gains and losses on securities sold are determined on the basis of identified cost and may include proceeds from litigation.
Real estate investment trusts. The fund may invest in real estate investment trusts (REITs). Distributions from REITs may be recorded as income and subsequently characterized by the REIT at the end of the fiscal year as a reduction of cost of investments and/or as a realized gain. As a result, the fund will estimate the components of distributions from these securities. Such estimates are revised when the actual components of the distributions are known.
Foreign investing. Assets, including investments, and liabilities denominated in foreign currencies are translated into U.S. dollar values each day at the prevailing exchange rate. Purchases and sales of securities, income and expenses are translated into U.S. dollars at the prevailing exchange rate on the date of the transaction. The effect of changes in foreign currency exchange rates on the value of securities is reflected as a component of the realized and unrealized gains (losses) on investments. Foreign investments are subject to a decline in the value of a foreign currency versus the U.S. dollar, which reduces the dollar value of securities denominated in that currency.
Funds that invest internationally generally carry more risk than funds that invest strictly in U.S. securities. Risks can result from differences in economic and political conditions, regulations, market practices (including higher transaction costs), accounting standards and other factors.
Foreign taxes. The fund may be subject to withholding tax on income, capital gains or repatriation taxes imposed by certain countries, a portion of which may be recoverable. Foreign taxes are accrued based upon the fund's understanding of the tax rules and rates that exist in the foreign markets in which it invests. Taxes are accrued based on gains realized by the fund as a result of certain foreign security sales. In certain circumstances, estimated taxes are accrued based on unrealized appreciation of such securities. Investment income is recorded net of foreign withholding taxes.
Overdraft. The fund may have the ability to borrow from banks for temporary or emergency purposes, including meeting redemption requests that otherwise might require the untimely sale of securities. Pursuant to the fund's custodian agreement, the custodian may loan money to the fund to make properly authorized payments. The fund is obligated to repay the custodian for any overdraft, including any related costs or expenses. The custodian may have a lien, security interest or security entitlement in any fund property that is not otherwise segregated or pledged, to the extent of any overdraft, and to the maximum extent permitted by law.
Line of credit. The fund and other affiliated funds have entered into a syndicated line of credit agreement with Citibank, N.A. as the administrative agent that enables them to participate in a $750 million unsecured committed line of credit. Excluding commitments designated for a certain fund and subject to the needs of all other affiliated funds, the fund can borrow up to an aggregate commitment amount of $500 million, subject to asset coverage and other limitations as specified in the agreement. A commitment fee payable at the end of each calendar quarter, based on the average daily unused portion of the line of credit, is charged to each participating fund based on a combination of fixed and asset based allocations and is reflected in Other expenses on the Statement of operations. For the six months ended January 31, 2020, the fund had no borrowings under the line of credit. Commitment fees for the six months ended January 31, 2020 were $1,845.
| | SEMIANNUAL REPORT | JOHN HANCOCK Multi-Asset Absolute Return Fund | 37 |
Expenses. Within the John Hancock group of funds complex, expenses that are directly attributable to an individual fund are allocated to such fund. Expenses that are not readily attributable to a specific fund are allocated among all funds in an equitable manner, taking into consideration, among other things, the nature and type of expense and the fund’s relative net assets. Expense estimates are accrued in the period to which they relate and adjustments are made when actual amounts are known.
Class allocations. Income, common expenses and realized and unrealized gains (losses) are determined at the fund level and allocated daily to each class of shares based on the net assets of the class. Class-specific expenses, such as distribution and service fees, if any, and transfer agent fees, for all classes, are charged daily at the class level based on the net assets of each class and the specific expense rates applicable to each class.
Change in accounting principle. Accounting Standards Update (ASU) 2017-08,Premium Amortization on Purchased Callable Debt Securities, shortens the premium amortization period for purchased non contingently callable debt securities and is effective for public companies with fiscal years beginning after December 15, 2018. Adoption of the ASU did not have a material impact to the fund.
Federal income taxes. The fund intends to continue to qualify as a regulated investment company by complying with the applicable provisions of the Internal Revenue Code and will not be subject to federal income tax on taxable income that is distributed to shareholders. Therefore, no federal income tax provision is required.
For federal income tax purposes, as of July 31, 2019, the fund has a short-term capital loss carryforward of $589,233,065 available to offset future net realized capital gains. This carryforward does not expire.
As of July 31, 2019, the fund had no uncertain tax positions that would require financial statement recognition, derecognition or disclosure. The fund's federal tax returns are subject to examination by the Internal Revenue Service for a period of three years.
Distribution of income and gains. Distributions to shareholders from net investment income and net realized gains, if any, are recorded on the ex-date. The fund generally declares and pays dividends annually. Capital gain distributions, if any, are typically distributed annually.
Distributions paid by the fund with respect to each class of shares are calculated in the same manner, at the same time and in the same amount, except for the effect of class level expenses that may be applied differently to each class.
Such distributions, on a tax basis, are determined in conformity with income tax regulations, which may differ from US GAAP. Distributions in excess of tax basis earnings and profits, if any, are reported in the fund's financial statements as a return of capital. The final determination of tax characteristics of the fund's distribution will occur at the end of the year and will subsequently be reported to shareholders.
Capital accounts within the financial statements are adjusted for permanent book-tax differences. These adjustments have no impact on net assets or the results of operations. Temporary book-tax differences, if any, will reverse in a subsequent period. Book-tax differences are primarily attributable to foreign currency transactions, investments in passive foreign investment companies, wash sale loss deferrals, derivative transactions, amortization and accretion on debt securities, and treasury inflation protected securities.
Note 3—Derivative instruments
The fund may invest in derivatives in order to meet its investment objective. Derivatives include a variety of different instruments that may be traded in the over-the-counter (OTC) market, on a regulated exchange or through a clearing facility. The risks in using derivatives vary depending upon the structure of the instruments,
| 38 | JOHN HANCOCK Multi-Asset Absolute Return Fund | SEMIANNUAL REPORT | |
including the use of leverage, optionality, the liquidity or lack of liquidity of the contract, the creditworthiness of the counterparty or clearing organization and the volatility of the position. Some derivatives involve risks that are potentially greater than the risks associated with investing directly in the referenced securities or other referenced underlying instrument. Specifically, the fund is exposed to the risk that the counterparty to an OTC derivatives contract will be unable or unwilling to make timely settlement payments or otherwise honor its obligations. OTC derivatives transactions typically can only be closed out with the other party to the transaction.
Derivatives which are typically traded through the OTC market are regulated by the Commodity Futures Trading Commission (the CFTC). Derivative counterparty risk is managed through an ongoing evaluation of the creditworthiness of all potential counterparties and, if applicable, designated clearing organizations. The fund attempts to reduce its exposure to counterparty risk for derivatives traded in the OTC market, whenever possible, by entering into an International Swaps and Derivatives Association (ISDA) Master Agreement with each of its OTC counterparties. The ISDA gives each party to the agreement the right to terminate all transactions traded under the agreement if there is certain deterioration in the credit quality or contractual default of the other party, as defined in the ISDA. Upon an event of default or a termination of the ISDA, the non-defaulting party has the right to close out all transactions and to net amounts owed.
As defined by the ISDA, the fund may have collateral agreements with certain counterparties to mitigate counterparty risk on OTC derivatives. Subject to established minimum levels, collateral for OTC transactions is generally determined based on the net aggregate unrealized gain or loss on contracts with a particular counterparty. Collateral pledged to the fund, if any, is held in a segregated account by a third-party agent or held by the custodian bank for the benefit of the fund and can be in the form of cash or debt securities issued by the U.S. government or related agencies; collateral posted by the fund, if any, for OTC transactions is held in a segregated account at the fund's custodian and is noted in the accompanying Fund's investments, or if cash is posted, on the Statement of assets and liabilities. The fund's risk of loss due to counterparty risk is equal to the asset value of outstanding contracts offset by collateral received.
Certain derivatives are traded or cleared on an exchange or central clearinghouse. Exchange-traded or centrally-cleared transactions generally present less counterparty risk to a fund than OTC transactions. The exchange or clearinghouse stands between the fund and the broker to the contract and therefore, credit risk is generally limited to the failure of the exchange or clearinghouse and the clearing member.
Futures. A futures contract is a contractual agreement to buy or sell a particular currency or financial instrument at a pre-determined price in the future. Risks related to the use of futures contracts include possible illiquidity of the futures markets and contract prices that can be highly volatile and imperfectly correlated to movements in the underlying financial instrument and potential losses in excess of the amounts recognized on the Statement of assets and liabilities. Use of long futures contracts subjects the fund to the risk of loss up to the notional value of the futures contracts. Use of short futures contracts subjects the fund to unlimited risk of loss.
Upon entering into a futures contract, the fund is required to deposit initial margin with the broker in the form of cash or securities. The amount of required margin is set by the broker and is generally based on a percentage of the contract value. The margin deposit must then be maintained at the established level over the life of the contract. Cash that has been pledged by the fund is detailed in the Statement of assets and liabilities as Collateral held at broker for futures contracts. Securities pledged by the fund, if any, are identified in the Fund's investments. Subsequent payments, referred to as variation margin, are made or received by the fund periodically and are based on changes in the market value of open futures contracts. Futures contracts are marked-to-market daily and unrealized gain or loss is recorded by the fund. Receivable for futures variation margin is included on the Statement of assets and liabilities. When the contract is closed, the fund records a realized gain or loss equal to
| | SEMIANNUAL REPORT | JOHN HANCOCK Multi-Asset Absolute Return Fund | 39 |
the difference between the value of the contract at the time it was opened and the value at the time it was closed.
During the six months ended January 31, 2020, the fund used futures contracts to manage against anticipated changes in securities markets and interest rates, gain exposure to certain securities markets and treasuries markets, and maintain diversity of the fund. The fund held futures contracts with USD notional values ranging from $252.5 million to $332.1 million, as measured at each quarter end.
Forward foreign currency contracts. A forward foreign currency contract is an agreement between two parties to buy and sell specific currencies at a price that is set on the date of the contract. The forward contract calls for delivery of the currencies on a future date that is specified in the contract. Risks related to the use of forwards include the possible failure of counterparties to meet the terms of the forward agreement, the failure of the counterparties to timely post collateral if applicable, and the risk that currency movements will not favor the fund thereby reducing the fund's total return, and the potential for losses in excess of the amounts recognized on the Statement of assets and liabilities.
The market value of a forward foreign currency contract fluctuates with changes in foreign currency exchange rates. Forward foreign currency contracts are marked-to-market daily and the change in value is recorded by the fund as an unrealized gain or loss. Realized gains or losses, equal to the difference between the value of the contract at the time it was opened and the value at the time it was closed, are recorded upon delivery or receipt of the currency or settlement with the counterparty.
During the six months ended January 31, 2020, the fund used forward foreign currency contracts to manage against anticipated changes in current exchange rates, gain exposure to foreign currencies and maintain diversity of the fund. The fund held forward foreign currency contracts with USD notional values ranging from $762.2 million to $1.3 billion, as measured at each quarter end.
Options. There are two types of options, put options and call options. Options are traded either OTC or on an exchange. A call option gives the purchaser of the option the right to buy (and the seller the obligation to sell) the underlying instrument at the exercise price. A put option gives the purchaser of the option the right to sell (and the writer the obligation to buy) the underlying instrument at the exercise price. Writing puts and buying calls may increase the fund's exposure to changes in the value of the underlying instrument. Buying puts and writing calls may decrease the fund's exposure to such changes. Risks related to the use of options include the loss of premiums, possible illiquidity of the options markets, trading restrictions imposed by an exchange and movements in underlying security values, and for written options, potential losses in excess of the amounts recognized on the Statement of assets and liabilities. In addition, OTC options are subject to the risks of all OTC derivatives contracts.
When the fund purchases an option, the premium paid is included in the Fund's investments and subsequently “marked-to-market” to reflect current market value. If the purchased option expires, the fund realizes a loss equal to the cost of the option. If the fund exercises a call option, the cost of the securities acquired by exercising the call is increased by the premium paid to buy the call. If the fund exercises a put option, it realizes a gain or loss from the sale of the underlying security and the proceeds from such sale are decreased by the premium paid. If the fund enters into a closing sale transaction, it realizes a gain or loss, depending on whether proceeds from the closing sale are greater or less than the original cost. When the fund writes an option, the premium received is included as a liability and subsequently “marked-to-market” to reflect the current market value of the option written. Premiums received from writing options that expire unexercised are recorded as realized gains. Premiums received from writing options which are exercised or are closed are added to or offset against the proceeds or amount paid on the transaction to determine the realized gain or loss. If a put option on a security is exercised, the premium received reduces the cost basis of the securities purchased by the fund.
| 40 | JOHN HANCOCK Multi-Asset Absolute Return Fund | SEMIANNUAL REPORT | |
During the six months ended January 31, 2020, the fund used purchased options contracts to manage against anticipated currency exchange rates and changes in securities markets, gain exposure to foreign currency exchange rates and certain securities markets, and maintain diversity of the fund. The fund held purchased options contracts with market values ranging up to $6.3 million, as measured at each quarter end. There were no open purchased options contracts as of January 31, 2020.
During the six months ended January 31, 2020, the fund wrote option contracts to manage against anticipated changes in securities markets and gain exposure to certain securities markets. The fund held written option contracts with market values ranging up to $2.4 million, as measured at each quarter end. There were no open written option contracts as of January 31, 2020.
Swaps. Swap agreements are agreements between the fund and a counterparty to exchange cash flows, assets, foreign currencies or market-linked returns at specified intervals. Swap agreements are privately negotiated in the OTC market (OTC swaps) or may be executed on a registered commodities exchange (centrally cleared swaps). Swaps are marked-to-market daily and the change in value is recorded as a component of unrealized appreciation/depreciation of swap contracts. The value of the swap will typically impose collateral posting obligations on the party that is considered out-of-the-money on the swap.
Upfront payments made/received by the fund, if any, are amortized/accreted for financial reporting purposes, with the unamortized/unaccreted portion included in the Statement of assets and liabilities. A termination payment by the counterparty or the fund is recorded as realized gain or loss, as well as the net periodic payments received or paid by the fund.
Entering into swap agreements involves, to varying degrees, elements of credit, market and documentation risk that may provide outcomes that are in excess of the amounts recognized on the Statement of assets and liabilities. Such risks involve the possibility that there will be no liquid market for the swap, or that a counterparty may default on its obligation or delay payment under the swap terms. The counterparty may disagree or contest the terms of the swap. In addition to interest rate risk, market risks may also impact the swap. The fund may also suffer losses if it is unable to terminate or assign outstanding swaps or reduce its exposure through offsetting transactions.
Interest rate swaps. Interest rate swaps represent an agreement between the fund and a counterparty to exchange cash flows based on the difference between two interest rates applied to a notional amount. The payment flows are usually netted against each other, with the difference being paid by one party to the other. The fund settles accrued net interest receivable or payable under the swap contracts at specified, future intervals.
During the six months ended January 31, 2020, the fund used interest rate swap contracts to manage duration of the fund, manage against anticipated interest rate changes, maintain diversity of the fund and gain exposure to treasuries markets. The fund held interest rate swaps with total USD notional amounts ranging up to $1.0 billion, as measured at each quarter end. There were no open interest rate swap contracts as of January 31, 2020.
Credit default swaps. Credit default swaps (CDS) involve the exchange of a fixed rate premium (paid by the Buyer), for protection against the loss in value of an underlying debt instrument, referenced entity or index, in the event of a defined credit event (such as payment default or bankruptcy). Under the terms of the swap, one party acts as a “guarantor” (the Seller), receiving the premium and agreeing to contingent payments that are specified within the credit default agreement. The fund may enter into CDS in which it may act as either Buyer or Seller. By acting as the Seller, the fund may incur economic leverage since it would be obligated to pay the Buyer the notional amount of the contract in the event of a default. The amount of loss in such case could be significant, but would typically be reduced by any recovery value on the underlying credit.
| | SEMIANNUAL REPORT | JOHN HANCOCK Multi-Asset Absolute Return Fund | 41 |
Credit default swaps — Buyer
During the six months ended January 31, 2020, the fund used credit default swap contracts as a buyer to manage against potential credit events. The fund held credit default swaps with total USD notional amounts ranging from $1.3 million to $12.8 million, as measured at each quarter end.
Credit default swaps — Seller
Implied credit spreads are utilized in determining the market value of CDS agreements in which the fund is the Seller at period end. The implied credit spread generally represents the yield of the instrument above a credit-risk free rate, such as the U.S. Treasury Bond Yield, and may include upfront payments required to be made to enter into the agreement. It also serves as an indicator of the current status of the payment/performance risk and represents the likelihood or risk of default for the credit derivative. Wider credit spreads represent a deterioration of the referenced entity’s creditworthiness and an increased risk of default or other credit event occurring as defined under the terms of the agreement.
For CDS agreements where implied credit spreads are not reported or available, the average credit rating on the underlying index is shown. A deterioration of the referenced entity’s creditworthiness would indicate a greater likelihood of a credit event occurring and result in increasing market values, in absolute terms when compared to the notional amount of the swap. The maximum potential amount of future payments (undiscounted) that the fund as the Seller could be required to make under any CDS agreement equals the notional amount of the agreement.
During the six months ended January 31, 2020, the fund used credit default swap contracts as a seller to take a long position in the exposure of the benchmark credit. The fund held credit default swaps with total USD notional amounts ranging up to $217.9 million, as measured at each quarter end.There were no open CDS contracts where the fund acted as seller as of January 31, 2020.
Inflation swaps. In an inflation swap, one party pays a fixed rate on a notional principal amount while the other party pays a floating rate linked to an inflation index on that same notional amount. The party paying the floating rate pays the inflation adjusted rate multiplied by the notional principal amount. If the average inflation rate over the term of the swap is the same as the fixed rate of the swap, the two legs will have the same value and the swap will break even.
During the six months ended January 31, 2020, the fund used inflation swaps to manage inflation duration of the fund, manage against changes in inflation, and maintain diversity of the fund. The fund held inflation swaps with total USD notional amounts ranging up to $204.5 million, as measured at each quarter end. There were no open inflation swaps as of January 31, 2020.
Variance swaps. Variance swap agreements involve two parties agreeing to exchange cash flows based on the measured variance (or square of volatility) of a specified underlying asset. One party agrees to exchange a “fixed rate” or strike price payment for the “floating rate” or realized price variance on the underlying asset with respect to the notional amount. At inception, the strike price is generally chosen such that the fair value of the swap is zero. At the maturity date, a net cash flow is exchanged, where the payoff amount is equivalent to the difference between the realized price variance of the underlying asset and the strike price multiplied by the notional amount. As a receiver of the realized price variance, the fund would receive the payoff amount when the realized price variance of the underlying asset is greater than the strike price and would owe the payoff amount when the price variance is less than the strike price. As a payer of the realized price variance the fund would owe the payoff amount when the realized price variance of the underlying asset is greater than the strike price and would receive the payoff amount when the variance is less than the strike price.
| 42 | JOHN HANCOCK Multi-Asset Absolute Return Fund | SEMIANNUAL REPORT | |
During the six months ended January 31, 2020, the fund used variance swaps to maintain diversity of the fund and manage against volatility and anticipated changes in securities markets. The fund held variance swaps with total USD notional amounts ranging up to $2.7 million, as measured at each quarter end. There were no open variance swaps as of January 31, 2020.
Fair value of derivative instruments by risk category
The table below summarizes the fair value of derivatives held by the fund at January 31, 2020 by risk category:
| Risk | Statement of
assets and
liabilities location | Financial
instruments
location | Assets
derivatives
fair value | Liabilities
derivatives
fair value |
| Interest rate | Receivable/payable for futures variation margin | Futures1 | $317,957 | $(647,750) |
| Equity | Receivable/payable for futures variation margin | Futures1 | 2,336,324 | (644,271) |
| Currency | Unrealized appreciation / depreciation on forward foreign currency contracts | Forward foreign currency contracts | 3,030,857 | (2,804,119) |
| Credit | Swap contracts, at value | Credit default swaps2 | — | (157,999) |
| | | | $5,685,138 | $(4,254,139) |
| 1 | Reflects cumulative appreciation/depreciation on futures as disclosed in Fund's investments. Only the period end variation margin is separately disclosed on the Statement of assets and liabilities. |
| 2 | Reflects cumulative value of swap contracts. Swap contracts at value, which represents OTC swaps, are shown separately on the Statement of assets and liabilities. |
For financial reporting purposes, the fund does not offset OTC derivative assets or liabilities that are subject to master netting arrangements, as defined by the ISDAs, in the Statement of assets and liabilities. In the event of default by the counterparty or a termination of the agreement, the ISDA allows an offset of amounts across the various transactions between the fund and the applicable counterparty.
Effect of derivative instruments on the Statement of operations
The table below summarizes the net realized gain (loss) included in the net increase (decrease) in net assets from operations, classified by derivative instrument and risk category, for the six months ended January 31, 2020:
| | Statement of operations location - Net realized gain (loss) on: |
| Risk | Unaffiliated
investments and
foreign currency
transactions1 | Futures contracts | Forward foreign
currency contracts | Written options | Swap contracts | Total |
| Interest rate | — | $(7,752,522) | — | — | $9,396,548 | $1,644,026 |
| Currency | $511,982 | (20,461,237) | $966,313 | — | — | (18,982,942) |
| Credit | — | — | — | — | 1,114,856 | 1,114,856 |
| Equity | (2,415,138) | — | — | $363,476 | (2,401,436) | (4,453,098) |
| Total | $(1,903,156) | $(28,213,759) | $966,313 | $363,476 | $8,109,968 | $(20,677,158) |
| 1 | Realized gain/loss associated with purchased options is included in this caption on the Statement of operations. |
| | SEMIANNUAL REPORT | JOHN HANCOCK Multi-Asset Absolute Return Fund | 43 |
The table below summarizes the net change in unrealized appreciation (depreciation) included in the net increase (decrease) in net assets from operations, classified by derivative instrument and risk category, for the six months ended January 31, 2020:
| | Statement of operations location - Change in net unrealized appreciation (depreciation) of: |
| Risk | Unaffiliated
investments and
translation of assets
and liabilities in
foreign currencies1 | Futures contracts | Forward foreign
currency contracts | Written options | Swap contracts | Total |
| Interest rate | — | $4,513,390 | — | — | $(9,471,784) | $(4,958,394) |
| Currency | $(398,525) | — | $(1,771,938) | — | — | (2,170,463) |
| Credit | — | — | — | — | (1,648,297) | (1,648,297) |
| Equity | 483,955 | 1,926,101 | — | $(234,081) | 2,557,889 | 4,733,864 |
| Total | $85,430 | $6,439,491 | $(1,771,938) | $(234,081) | $(8,562,192) | $(4,043,290) |
| 1 | Change in unrealized appreciation/depreciation associated with purchased options is included in this caption on the Statement of operations. |
Note 4—Guarantees and indemnifications
Under the Trust's organizational documents, its Officers and Trustees are indemnified against certain liabilities arising out of the performance of their duties to the Trust, including the fund. Additionally, in the normal course of business, the fund enters into contracts with service providers that contain general indemnification clauses. The fund's maximum exposure under these arrangements is unknown, as this would involve future claims that may be made against the fund that have not yet occurred. The risk of material loss from such claims is considered remote.
Note 5—Fees and transactions with affiliates
John Hancock Investment Management LLC (the Advisor) serves as investment advisor for the fund. John Hancock Investment Management Distributors LLC (the Distributor), an affiliate of the Advisor, serves as principal underwriter of the fund. The Advisor and the Distributor are indirect, wholly owned subsidiaries of Manulife Financial Corporation (MFC).
Management fee. The fund has an investment management agreement with the Advisor under which the fund pays a daily management fee to the Advisor equivalent on an annual basis to the sum of: (a) 1.050% of the first $200 million of the fund’s average daily net assets; and (b) 1.000% of the next $300 million of the fund’s average daily net assets provided that net assets are less than or equal to $500 million. If net assets exceed $500 million, the following rates apply; (c) 0.950% of the first $2.0 billion of the fund’s average daily net assets; (d) 0.920% of the next $2.0 billion of the fund’s average daily net assets; and (e) 0.900% of the fund’s average daily net assets in excess of $4.0 billion. Prior to August 28, 2019, the annual rates were (a) 1.300% of the first $200 million of the fund’s average daily net assets; and (b) 1.250% of the next $300 million of the fund’s average daily net assets provided that net assets were less than or equal to $500 million. If net assets exceeded $500 million, the following rates applied; (a) 1.200% of the first $3.0 billion of the fund’s average daily net assets; (b) 1.150% of the next $2.5 billion of the fund’s average daily net assets; (c) 1.120% of the next $1.5 billion of the fund’s average daily net assets; (d) 1.100% of the next $3.0 billion of the fund’s average daily net assets; and (e) 1.070% of the fund’s average daily net assets in excess of $10.0 billion. The Advisor has a subadvisory agreement with Nordea Investment Management North America, Inc. Effective August 28, 2019, Standard Life Investments (Corporate Funds) Limited was replaced by Nordea Investment Management North America, Inc. as the fund's subadvisor. The fund is not responsible for payment of the subadvisory fees.
| 44 | JOHN HANCOCK Multi-Asset Absolute Return Fund | SEMIANNUAL REPORT | |
The Advisor has contractually agreed to waive a portion of its management fee and/or reimburse expenses for certain funds of the John Hancock group of funds complex, including the fund (the participating portfolios). This waiver is based upon aggregate net assets of all the participating portfolios. The amount of the reimbursement is calculated daily and allocated among all the participating portfolios in proportion to the daily net assets of each fund. During the six months ended January 31, 2020, this waiver amounted to 0.01% of the fund’s average daily net assets on an annualized basis. This arrangement expires on July 31, 2021, unless renewed by mutual agreement of the fund and the Advisor based upon a determination that this is appropriate under the circumstances at that time.
For the six months ended January 31, 2020, the expense reductions described above amounted to the following:
| Class | Expense reduction |
| Class A | $1,656 |
| Class C | 1,751 |
| Class I | 14,521 |
| Class R2 | 25 |
| Class | Expense reduction |
| Class R6 | $4,756 |
| Class NAV | 1,434 |
| Total | $24,143 |
Expenses waived or reimbursed in the current fiscal period are not subject to recapture in future fiscal periods.
The investment management fees, including the impact of the waivers and reimbursements as described above, incurred for the six months ended January 31, 2020, were equivalent to a net annual effective rate of 0.99% of the fund's average daily net assets.
Accounting and legal services. Pursuant to a service agreement, the fund reimburses the Advisor for all expenses associated with providing the administrative, financial, legal, compliance, accounting and recordkeeping services to the fund, including the preparation of all tax returns, periodic reports to shareholders and regulatory reports, among other services. These expenses are allocated to each share class based on its relative net assets at the time the expense was incurred. These accounting and legal services fees incurred for the six months ended January 31, 2020 amounted to an annual rate of 0.02% of the fund's average daily net assets.
Distribution and service plans. The fund has a distribution agreement with the Distributor. The fund has adopted distribution and service plans for certain classes as detailed below pursuant to Rule 12b-1 under the 1940 Act, to pay the Distributor for services provided as the distributor of shares of the fund. In addition, under a service plan for certain classes as detailed below, the fund pays for certain other services. The fund may pay up to the following contractual rates of distribution and service fees under these arrangements, expressed as an annual percentage of average daily net assets for each class of the fund's shares:
| Class | Rule 12b-1 Fee | Service fee |
| Class A | 0.30% | — |
| Class C | 1.00% | — |
| Class R2 | 0.25% | 0.25% |
Sales charges. Class A shares are assessed up-front sales charges, which resulted in payments to the Distributor amounting to $14,371 for the six months ended January 31, 2020. Of this amount, $2,289 was retained and used for printing prospectuses, advertising, sales literature and other purposes and $12,082 was paid as sales commissions to broker-dealers.
Class A and Class C shares may be subject to contingent deferred sales charges (CDSCs). Certain Class A shares that are acquired through purchases of $1 million or more and are redeemed within one year of purchase are subject to a 1.00% sales charge. Class C shares that are redeemed within one year of purchase are subject to a
| | SEMIANNUAL REPORT | JOHN HANCOCK Multi-Asset Absolute Return Fund | 45 |
1.00% CDSC. CDSCs are applied to the lesser of the current market value at the time of redemption or the original purchase cost of the shares being redeemed. Proceeds from CDSCs are used to compensate the Distributor for providing distribution-related services in connection with the sale of these shares. During the six months ended January 31, 2020, CDSCs received by the Distributor amounted to $362 for Class C shares. There were no CDSCs received by the Distributor for Class A shares.
Transfer agent fees. The John Hancock group of funds has a complex-wide transfer agent agreement with John Hancock Signature Services, Inc. (Signature Services), an affiliate of the Advisor. The transfer agent fees paid to Signature Services are determined based on the cost to Signature Services (Signature Services Cost) of providing recordkeeping services. It also includes out-of-pocket expenses, including payments made to third-parties for recordkeeping services provided to their clients who invest in one or more John Hancock funds. In addition, Signature Services Cost may be reduced by certain fees that Signature Services receives in connection with retirement and small accounts. Signature Services Cost is calculated monthly and allocated, as applicable, to five categories of share classes: Retail Share and Institutional Share Classes of Non-Municipal Bond Funds, Class R6 Shares, Retirement Share Classes and Municipal Bond Share Classes. Within each of these categories, the applicable costs are allocated to the affected John Hancock affiliated funds and/or classes, based on the relative average daily net assets.
Class level expenses. Class level expenses for the six months ended January 31, 2020 were as follows:
| Class | Distribution and service fees | Transfer agent fees |
| Class A | $66,261 | $26,889 |
| Class C | 233,458 | 28,428 |
| Class I | — | 236,073 |
| Class R2 | 1,502 | 43 |
| Class R6 | — | 8,138 |
| Total | $301,221 | $299,571 |
Trustee expenses. The fund compensates each Trustee who is not an employee of the Advisor or its affiliates. The costs of paying Trustee compensation and expenses are allocated to the fund based on its net assets relative to other funds within the John Hancock group of funds complex.
Interfund lending program. Pursuant to an Exemptive Order issued by the SEC, the fund, along with certain other funds advised by the Advisor or its affiliates, may participate in an interfund lending program. This program provides an alternative credit facility allowing the fund to borrow from, or lend money to, other participating affiliated funds. At period end, no interfund loans were outstanding. Interest expense is included in Other expenses on the Statement of operations. The fund's activity in this program during the period for which loans were outstanding was as follows:
Borrower
or Lender | Weighted Average
Loan Balance | Days
Outstanding | Weighted Average
Interest Rate | Interest Income
(Expense) |
| Borrower | $39,513,911 | 4 | 2.085% | ($9,154) |
| 46 | JOHN HANCOCK Multi-Asset Absolute Return Fund | SEMIANNUAL REPORT | |
Note 6—Fund share transactions
Transactions in fund shares for the six months ended January 31, 2020 and for the year ended July 31, 2019 were as follows:
| | Six Months Ended 1-31-20 | Year Ended 7-31-19 |
| | Shares | Amount | Shares | Amount |
| Class A shares | | | | |
| Sold | 263,907 | $2,405,398 | 625,188 | $6,274,834 |
| Distributions reinvested | 796,538 | 7,136,984 | — | — |
| Repurchased | (1,705,933) | (15,758,133) | (7,014,344) | (70,656,381) |
| Net decrease | (645,488) | $(6,215,751) | (6,389,156) | $(64,381,547) |
| Class C shares | | | | |
| Sold | 37,555 | $332,346 | 60,123 | $597,810 |
| Distributions reinvested | 814,617 | 7,144,191 | — | — |
| Repurchased | (1,286,877) | (11,579,524) | (4,113,011) | (40,562,259) |
| Net decrease | (434,705) | $(4,102,987) | (4,052,888) | $(39,964,449) |
| Class I shares | | | | |
| Sold | 1,868,561 | $17,306,760 | 19,544,689 | $197,475,809 |
| Distributions reinvested | 7,893,840 | 71,518,197 | — | — |
| Repurchased | (25,688,155) | (239,541,381) | (205,587,752) | (2,086,260,407) |
| Net decrease | (15,925,754) | $(150,716,424) | (186,043,063) | $(1,888,784,598) |
| Class R2 shares | | | | |
| Sold | 8,548 | $78,871 | 15,686 | $158,107 |
| Distributions reinvested | 10,219 | 91,053 | — | — |
| Repurchased | (26,752) | (243,864) | (77,295) | (781,172) |
| Net decrease | (7,985) | $(73,940) | (61,609) | $(623,065) |
| Class R6 shares | | | | |
| Sold | 253,121 | $2,373,944 | 1,684,518 | $17,501,312 |
| Distributions reinvested | 2,302,851 | 20,909,885 | — | — |
| Repurchased | (4,498,069) | (41,576,983) | (41,036,851) | (416,128,560) |
| Net decrease | (1,942,097) | $(18,293,154) | (39,352,333) | $(398,627,248) |
| Class NAV shares | | | | |
| Sold | 1,322,824 | $12,115,240 | 58,894 | $607,546 |
| Distributions reinvested | 515,853 | 4,683,945 | — | — |
| Repurchased | (620,486) | (5,717,570) | (59,948,659) | (604,241,928) |
| Net increase (decrease) | 1,218,191 | $11,081,615 | (59,889,765) | $(603,634,382) |
| Total net decrease | (17,737,838) | $(168,320,641) | (295,788,814) | $(2,996,015,289) |
Affiliates of the fund owned 100% of shares of Class NAV on January 31, 2020. Such concentration of shareholders’ capital could have a material effect on the fund if such shareholders redeem from the fund.
| | SEMIANNUAL REPORT | JOHN HANCOCK Multi-Asset Absolute Return Fund | 47 |
Note 7—Purchase and sale of securities
Purchases and sales of securities, other than short-term investments and U.S. Treasury obligations, amounted to $695,370,380 and $661,035,231, respectively, for the six months ended January 31, 2020. Purchases and sales of U.S. Treasury obligations aggregated $138,745,760 and $150,201,985, respectively, for the six months ended January 31, 2020.
Note 8—Investment by affiliated funds
Certain investors in the fund are affiliated funds that are managed by the Advisor and its affiliates. The affiliated funds do not invest in the fund for the purpose of exercising management or control; however, this investment may represent a significant portion of the fund's net assets. At January 31, 2020, funds within the John Hancock group of funds complex held 7.1% of the fund's net assets. There were no affiliated funds with an ownership of 5% or more of the fund's net assets.
| 48 | JOHN HANCOCK Multi-Asset Absolute Return Fund | SEMIANNUAL REPORT | |
| | |
Trustees
Hassell H. McClellan,Chairperson
Steven R. Pruchansky,Vice Chairperson
Andrew G. Arnott†
Charles L. Bardelis*
James R. Boyle
Peter S. Burgess*
William H. Cunningham
Grace K. Fey
Marianne Harrison†
Deborah C. Jackson
James M. Oates*
Gregory A. Russo
Officers
Andrew G. Arnott
President
Francis V. Knox, Jr.
Chief Compliance Officer
Charles A. Rizzo
Chief Financial Officer
Salvatore Schiavone
Treasurer
Christopher (Kit) Sechler
Secretary and Chief Legal Officer
| Investment advisor
John Hancock Investment Management LLC
Subadvisor
Nordea Investment Management North America, Inc.
Portfolio Manager
Dr. Asbjørn Trolle Hansen
Dr. Claus Vorm
Kurt Kongsted
Principal distributor
John Hancock Investment Management Distributors LLC
Custodian
Citibank, N.A.
Transfer agent
John Hancock Signature Services, Inc.
Legal counsel
K&L Gates LLP
|
* Member of the Audit Committee
† Non-Independent Trustee
The fund's proxy voting policies and procedures, as well as the fund proxy voting record for the most recent twelve-month period ended June 30, are available free of charge on the Securities and Exchange Commission (SEC) website at sec.gov or on our website.
All of the fund's holdings as of the end of the third month of every fiscal quarter are filed with the SEC on Form N-PORT within 60 days of the end of the fiscal quarter. The fund's Form N-PORT filings are available on our website and the SEC's website, sec.gov.
We make this information on your fund, as well asmonthly portfolio holdings, and other fund details available on our website at jhinvestments.com or by calling 800-225-5291.
| | | | |
| | You can also contact us: |
| | 800-225-5291
jhinvestments.com | Regular mail:
John Hancock Signature Services, Inc.
P.O. Box 55913
Boston, MA 02205-5913
| Express mail:
John Hancock Signature Services, Inc.
2000 Crown Colony Drive
Suite 55913
Quincy, MA 02169-0953
|
SEMIANNUAL REPORT | JOHN HANCOCK MULTI-ASSET ABSOLUTE RETURN FUND 49
John Hancock family of funds
| | | |
DOMESTIC EQUITY FUNDS
Blue Chip Growth
Classic Value
Disciplined Value
Disciplined Value Mid Cap
Equity Income
Financial Industries
Fundamental All Cap Core
Fundamental Large Cap Core
New Opportunities
Regional Bank
Small Cap Core
Small Cap Growth
Small Cap Value
U.S. Global Leaders Growth
U.S. Quality Growth
GLOBAL AND INTERNATIONAL EQUITY FUNDS
Disciplined Value International
Emerging Markets
Emerging Markets Equity
Fundamental Global Franchise
Global Equity
Global Shareholder Yield
Global Thematic Opportunities
International Dynamic Growth
International Growth
International Small Company
| | INCOME FUNDS
Bond
California Tax-Free Income
Emerging Markets Debt
Floating Rate Income
Government Income
High Yield
High Yield Municipal Bond
Income
Investment Grade Bond
Money Market
Short Duration Bond
Short Duration Credit Opportunities
Strategic Income Opportunities
Tax-Free Bond
ALTERNATIVE AND SPECIALTY FUNDS
Absolute Return Currency
Alternative Asset Allocation
Alternative Risk Premia
Diversified Macro
Infrastructure
Multi-Asset Absolute Return
Seaport Long/Short
|
A fund's investment objectives, risks, charges, and expenses should be considered carefully before investing. The prospectus contains this and other important information about the fund. To obtain a prospectus, contact your financial professional, call John Hancock Investment Management at 800-225-5291, or visit our website at jhinvestments.com. Please read the prospectus carefully before investing or sending money.
| | | |
ASSET ALLOCATION
Balanced
Income Allocation
Multi-Index Lifetime Portfolios
Multi-Index Preservation Portfolios
Multimanager Lifestyle Portfolios
Multimanager Lifetime Portfolios
Retirement Income 2040
EXCHANGE-TRADED FUNDS
John Hancock Multifactor Consumer Discretionary ETF
John Hancock Multifactor Consumer Staples ETF
John Hancock Multifactor Developed International ETF
John Hancock Multifactor Emerging Markets ETF
John Hancock Multifactor Energy ETF
John Hancock Multifactor Financials ETF
John Hancock Multifactor Healthcare ETF
John Hancock Multifactor Industrials ETF
John Hancock Multifactor Large Cap ETF
John Hancock Multifactor Materials ETF
John Hancock Multifactor Media and
Communications ETF
John Hancock Multifactor Mid Cap ETF
John Hancock Multifactor Small Cap ETF
John Hancock Multifactor Technology ETF
John Hancock Multifactor Utilities ETF
| | ENVIRONMENTAL, SOCIAL, AND
GOVERNANCE FUNDS
ESG All Cap Core
ESG Core Bond
ESG International Equity
ESG Large Cap Core
CLOSED-END FUNDS
Financial Opportunities
Hedged Equity & Income
Income Securities Trust
Investors Trust
Preferred Income
Preferred Income II
Preferred Income III
Premium Dividend
Tax-Advantaged Dividend Income
Tax-Advantaged Global Shareholder Yield
|
John Hancock Multifactor ETF shares are bought and sold at market price (not NAV), and are not individually redeemed
from the fund. Brokerage commissions will reduce returns.
John Hancock ETFs are distributed by Foreside Fund Services, LLC, and are subadvised by Dimensional Fund Advisors LP.
Foreside is not affiliated with John Hancock Investment Management Distributors LLC or Dimensional Fund Advisors LP.
Dimensional Fund Advisors LP receives compensation from John Hancock in connection with licensing rights to the
John Hancock Dimensional indexes. Dimensional Fund Advisors LP does not sponsor, endorse, or sell, and makes no
representation as to the advisability of investing in, John Hancock Multifactor ETFs.
John Hancock Investment Management
A trusted brand
John Hancock Investment Management is a premier asset manager
representing one of America's most trusted brands, with a heritage of
financial stewardship dating back to 1862. Helping our shareholders
pursue their financial goals is at the core of everything we do. It's why
we support the role of professional financial advice and operate with
the highest standards of conduct and integrity.
A better way to invest
We serve investors globally through a unique multimanager approach:
We search the world to find proven portfolio teams with specialized
expertise for every strategy we offer, then we apply robust investment
oversight to ensure they continue to meet our uncompromising
standards and serve the best interests of our shareholders.
Results for investors
Our unique approach to asset management enables us to provide
a diverse set of investments backed by some of the world's best
managers, along with strong risk-adjusted returns across asset classes.
John Hancock Investment Management Distributors LLC n Member FINRA, SIPC
200 Berkeley Street n Boston, MA 02116-5010 n 800-225-5291 n jhinvestments.com
This report is for the information of the shareholders of John Hancock Multi-Asset Absolute Return. It is not authorized for distribution to prospective investors unless preceded or accompanied by a prospectus.
| | |
| MF1078041 | 395SA 1/20
3/2020 |
ITEM 2. CODE OF ETHICS.
(a) Not Applicable
(b) Not Applicable
(c) Not Applicable
(d) Not Applicable
(e) Not Applicable
(f) Not Applicable
ITEM 3. AUDIT COMMITTEE FINANCIAL EXPERT.
Not Applicable
ITEM 4. PRINCIPAL ACCOUNTANT FEES AND SERVICES.
(a) Not Applicable
(b) Not Applicable
(c) Not Applicable
(d) Not Applicable
(e) Not Applicable
(f) Not Applicable.
(g) Not Applicable
(h) Not Applicable
ITEM 5. AUDIT COMMITTEE OF LISTED REGISTRANTS
Not Applicable.
ITEM 6. SCHEDULE OF INVESTMENTS.
(a) Included with Item 1.
(b) Not Applicable.
ITEM 7. DISCLOSURE OF PROXY VOTING POLICIES AND PROCEDURES FOR CLOSED-END MANAGEMENT INVESTMENT COMPANIES.
Not Applicable.
ITEM 8. PORTFOLIO MANAGERS OF CLOSED-END MANAGEMENT INVESTMENT COMPANIES.
Not Applicable.
ITEM 9. PURCHASE OF EQUITY SECURITIES BY CLOSED-END MANAGEMENT INVESTMENT COMPANIES AND AFFILIATED PURCHASERS.
Not Applicable.
ITEM 10. SUBMISSION OF MATTERS TO VOTE OF SECURITY HOLDERS.
Not Applicable.
ITEM 11. CONTROLS AND PROCEDURES.
| | (a) | | EVALUATION OF DISCLOSURE CONTROLS AND PROCEDURES. The Registrant maintains disclosure controls and procedures that are designed to ensure that information required to be disclosed in this Form N-CSR is recorded, processed, summarized and reported within the periods specified in the rules and forms of the Securities and Exchange Commission. Such disclosure controls and procedures include controls and procedures designed to ensure that such information is accumulated and communicated to the Registrant's management, including its principal executive officer and principal financial officer, as appropriate, to allow timely decisions regarding required disclosure. Within 90 days prior to the filing date of this Form N-CSR, the Registrant had carried out an evaluation, under the supervision and with the participation of the Registrant's management, including the Registrant's principal executive officer and the Registrant's principal financial officer, of the effectiveness of the design and operation of the Registrant's disclosure controls and procedures relating to information required to be disclosed on Form N-CSR. Based on such evaluation, the Registrant's principal executive officer and principal financial officer concluded that the Registrant's disclosure controls and procedures are operating effectively to ensure that: (i) information required to be disclosed in this Form N-CSR is recorded, processed, summarized and reported within the periods specified in the rules and forms of the Securities and Exchange Commission, and (ii) information is accumulated and communicated to the Registrant’s management, including its principal executive officer and principal financial officer, as appropriate, to allow timely decisions regarding required disclosure. |
| | | |
| (b) | | CHANGE IN REGISTRANT’S INTERNAL CONTROL: Not Applicable. |
ITEM 12. DISCLOSURE OF SECURITIES LENDING ACTIVITIES FOR CLOSED-END MANAGEMENT INVESTMENT COMPANIES.
Not applicable.
ITEM 13. EXHIBITS.
(a)(1) Separate certifications for the registrant's principal executive officer and principal financial officer, as required by Section 302 of the Sarbanes-Oxley Act of 2002 and Rule 30a-2(a) under the Investment Company Act of 1940, are attached.
(b)(1) Separate certifications for the registrant's principal executive officer and principal financial officer, as required by 18 U.S.C. Section 1350, as adopted pursuant to Section 906 of the Sarbanes-Oxley Act of 2002, and Rule 30a-2(b) under the Investment Company Act of 1940, are attached. The certifications furnished pursuant to this paragraph are not deemed to be "filed" for purposes of Section 18 of the Securities Exchange Act of 1934, or otherwise subject to the liability of that section. Such certifications are not deemed to be incorporated by reference into any filing under the Securities Act of 1933 or the Securities Exchange Act of 1934, except to the extent that the Registrant specifically incorporates them by reference.
(c)(1) Submission of Matters to a Vote of Security Holders is attached. See attached “John Hancock Funds – Nominating and Governance Committee Charter”.
SIGNATURES
Pursuant to the requirements of the Securities Exchange Act of 1934 and the Investment Company Act of 1940, the registrant has duly caused this report to be signed on its behalf by the undersigned, thereunto duly authorized.
| JOHN HANCOCK FUNDS II |
| |
| |
| /s/ Andrew G. Arnott |
| Andrew G. Arnott |
| President |
| Date: March 9, 2020 |
Pursuant to the requirements of the Securities Exchange Act of 1934 and the Investment Company Act of 1940, this report has been signed below by the following persons on behalf of the registrant and in the capacities and on the dates indicated.
| /s/ Andrew G. Arnott |
| Andrew G. Arnott |
| President |
| Date: March 9, 2020 |
| |
| |
| /s/ Charles A. Rizzo |
| Charles A. Rizzo |
| Chief Financial Officer |
| Date: March 9, 2020 |