UNITED STATES
SECURITIES AND EXCHANGE COMMISSION
Washington, D.C. 20549
FORM N-CSR
CERTIFIED SHAREHOLDER REPORT OF REGISTERED MANAGEMENT INVESTMENT COMPANIES
Investment Company Act file number 811-21779
JOHN HANCOCK FUNDS II
---------------------------------------------------------
(Exact name of registrant as specified in charter)
200 BERKELEY STREET, BOSTON, MASSACHUSETTS 02116
-------------------------------------------------------------
(Address of principal executive offices) (Zip code)
SALVATORE SCHIAVONE, 200 BERKELEY STREET, BOSTON, MASSACHUSETTS 02116
------------------------------------------------------------------------------------------
(Name and address of agent for service)
Registrant's telephone number, including area code: (617) 663-4497
------------------
Date of fiscal year end: 8/31
Date of reporting period: 2/29/20
ITEM 1. REPORTS TO STOCKHOLDERS.
The Registrant prepared nine semiannual reports to shareholders including twenty-eight funds for the period ended February 29, 2020. The first report applies to Emerging Markets Fund, the second report applies to the Emerging Markets Debt Fund, the third report applies to Floating Rate Income Fund, the fourth applies to International Small Company Fund, the fifth report applies to New Opportunities Fund, the sixth report applies to Small Cap Growth Fund, the seventh report applies to Strategic Income Opportunities Fund, the eighth report applies to 16 Underlying Main Funds, and the ninth report applies to the 5 Underlying Bond Funds of the Registrant.
John Hancock
Emerging Markets Fund
Semiannual report 2/29/2020
Beginning on January 1, 2021, as permitted by regulations adopted by the Securities and Exchange Commission, paper copies of the fund's shareholder reports like this one will no longer be sent by mail, unless you specifically request paper copies of the reports from the fund or from your financial intermediary. Instead, the reports will be made available on a website, and you will be notified by mail each time a report is posted and provided with a website link to access the report.
If you already elected to receive shareholder reports electronically, you will not be affected by this change, and you do not need to take any action. You may elect to receive shareholder reports and other communications electronically by calling John Hancock Investment Management at 800-225-5291 (Class A and Class C shares) or 888-972-8696 (Class I and Class R6 shares) or by contacting your financial intermediary.
You may elect to receive all reports in paper, free of charge, at any time. You can inform John Hancock Investment Management or your financial intermediary that you wish to continue receiving paper copies of your shareholder reports by following the instructions listed above. Your election to receive reports in paper will apply to all funds held with John Hancock Investment Management or your financial intermediary.

A message to shareholders
Dear shareholder,
Global financial markets were on pace to deliver strong returns during the 6 months ended February 29, 2020, until heightened fears over the coronavirus (COVID-19) sent the markets tumbling during the last week of the period. Prior to the turbulence that ended the period, investors in non-U.S. equities saw strong gains, fueled in part by similarly supportive monetary policy and some signs of strength in developing markets.
However, the COVID-19 pandemic and plummeting oil prices put an end to all that good news. Shortly after period end, the U.S. Federal Reserve lowered interest rates while governments around the world embarked on plans to launch fiscal stimulus to mitigate supply chain destruction and support economic growth.
After the longest bull market in U.S. history, we're now in bear market territory. Indeed, the spread of COVID-19, trade disputes, rising unemployment, and other geopolitical tensions may continue to create uncertainty among businesses and investors. Your financial professional can helpposition your portfolio so that it's sufficiently diversified to seek to meet your long-term objectives and to withstand the inevitable bouts of market volatility along the way.
On behalf of everyone at John Hancock Investment Management, I'd like to take this opportunity to welcome new shareholders and thank existing shareholders for the continued trust you've placed in us.
Sincerely,
Andrew G. Arnott
President and CEO,
John Hancock Investment Management
Head of Wealth and Asset Management,
United States and Europe
This commentary reflects the CEO's views as of this report's period end and are subject to change at any time. Diversification does not guarantee investment returns and does not eliminate risk of loss. All investments entail risks, including the possible loss of principal. For more up-to-date information, you can visit our website at jhinvestments.com.
John Hancock
Emerging Markets Fund
Table of contents
| | | |
| 2 | | Your fund at a glance |
| 3 | | Portfolio summary |
| 5 | | A look at performance |
| 7 | | Your expenses |
| 9 | | Fund's investments |
| 13 | | Financial statements |
| 17 | | Financial highlights |
| 22 | | Notes to financial statements |
| 32 | | More information |
SEMIANNUAL REPORT | JOHN HANCOCK EMERGING MARKETS FUND 1
INVESTMENT OBJECTIVE
The fund seeks long-term capital appreciation.
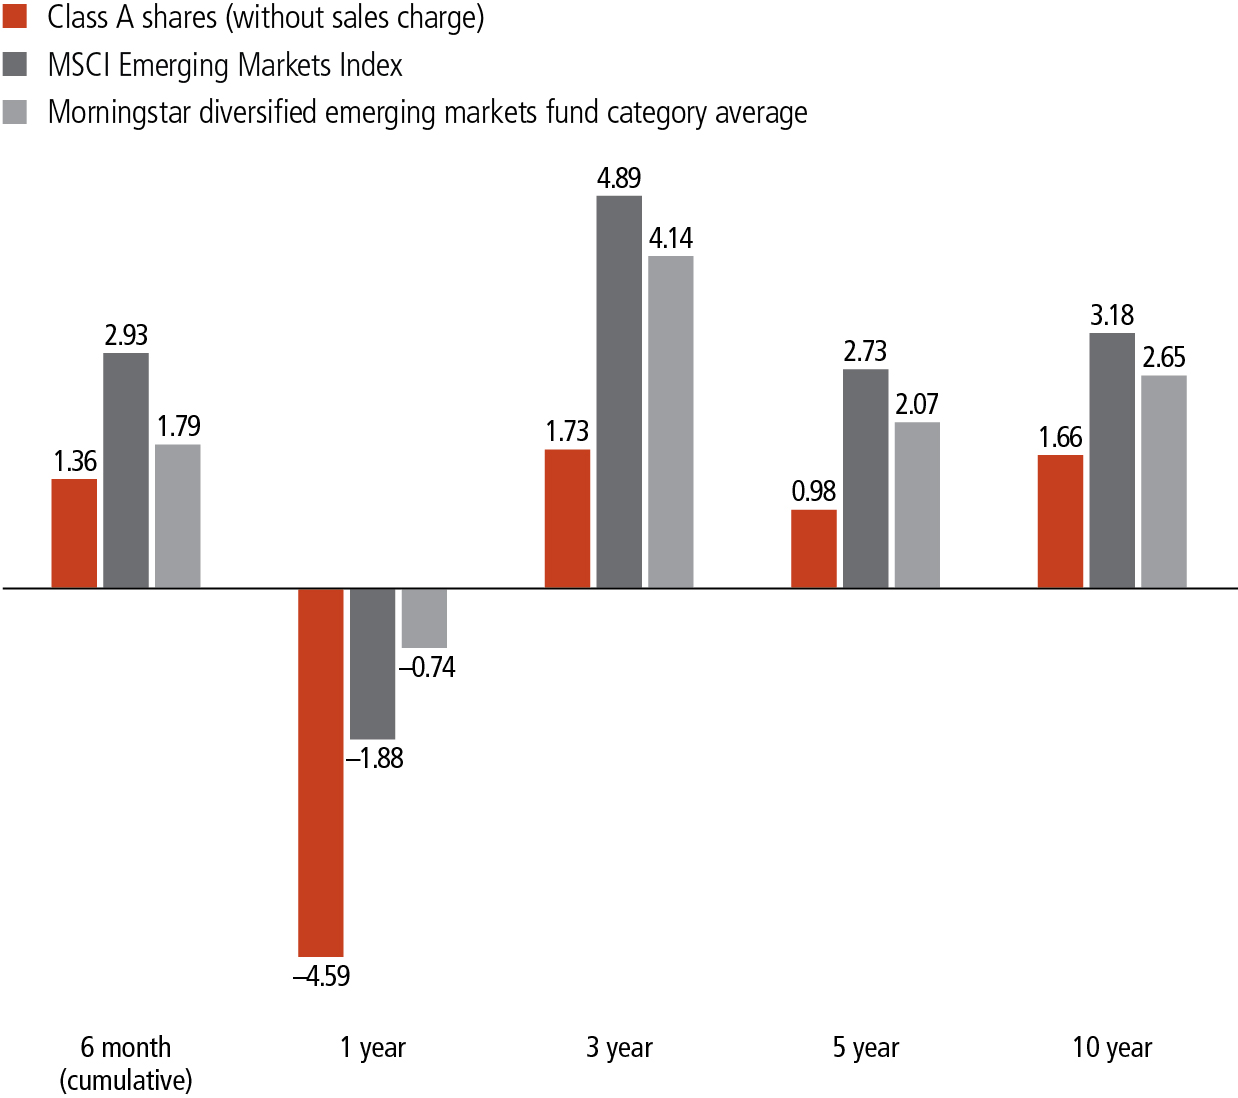
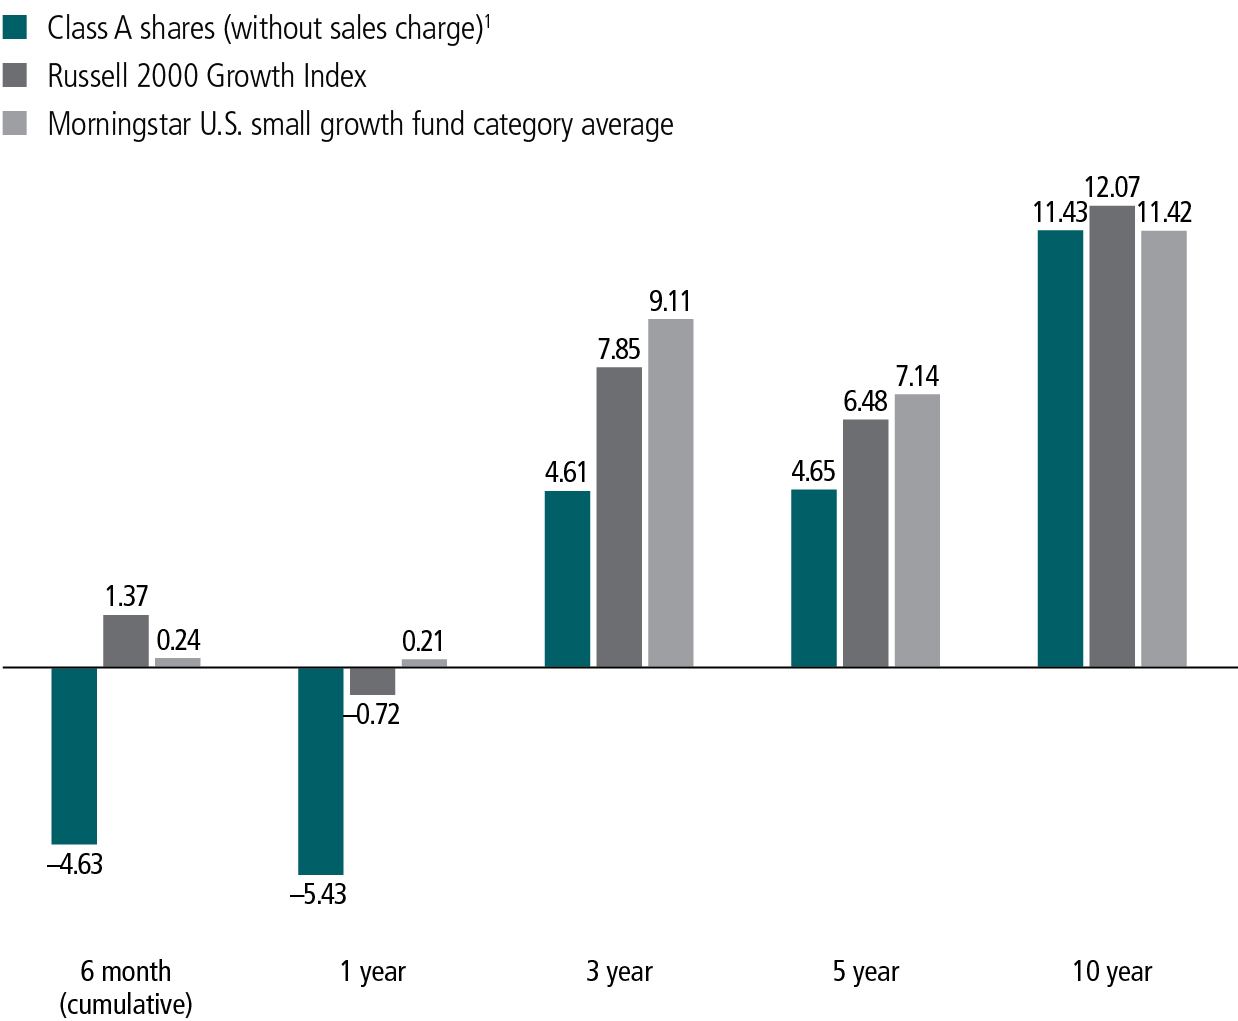
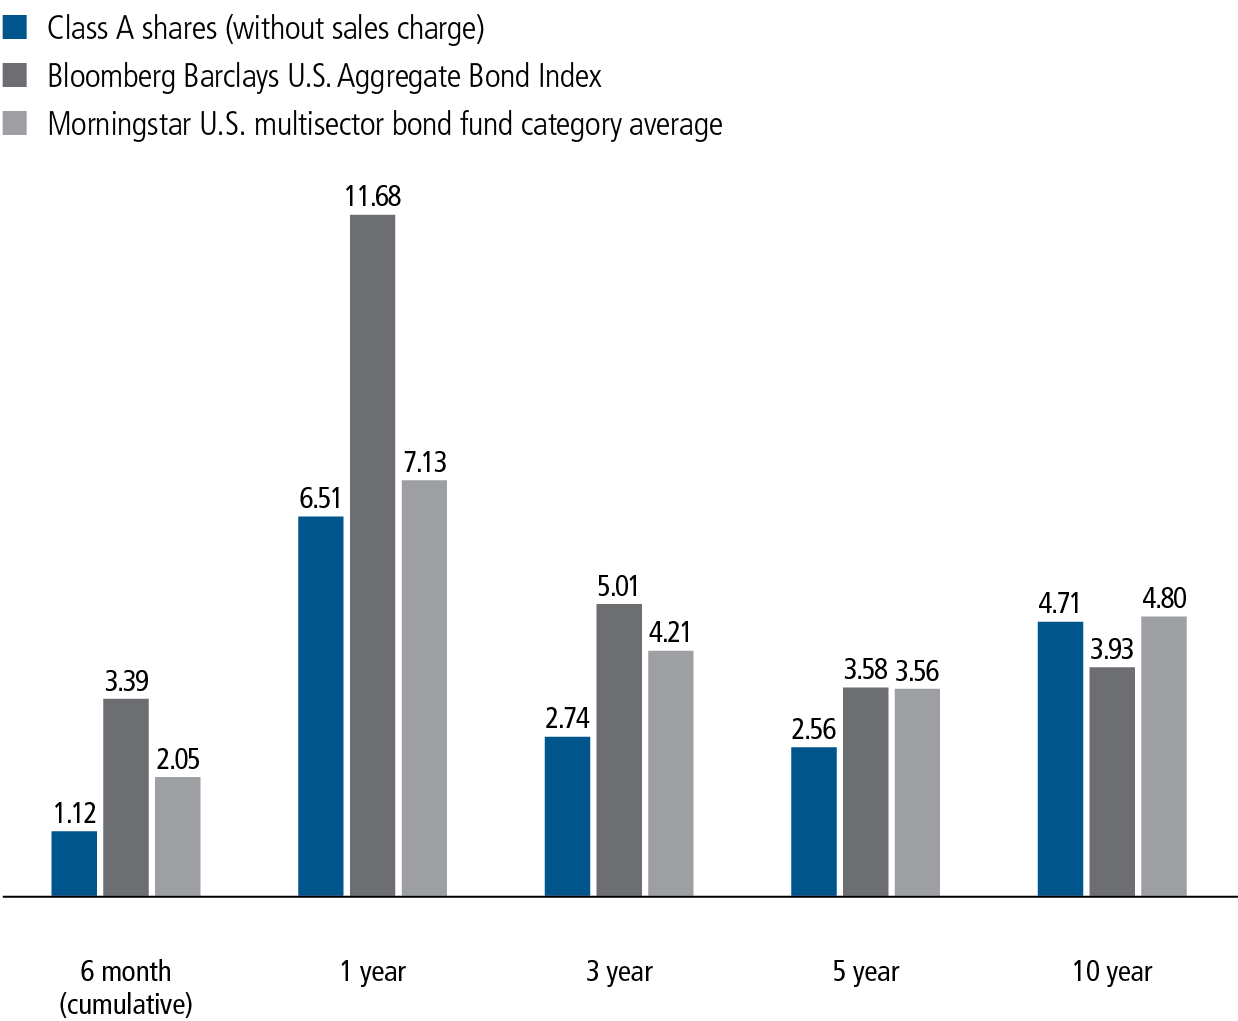
AVERAGE ANNUAL TOTAL RETURNS AS OF 2/29/2020 (%)
The MSCI Emerging Markets Index is an unmanaged index designed to measure the performance of developing markets.
It is not possible to invest directly in an index. Index figures do not reflect expenses or sales charges, which would result in lower returns.
Figures from Morningstar, Inc. include reinvested distributions and do not take into account sales charges. Actual load-adjusted performance is lower.
The past performance shown here reflects reinvested distributions and the beneficial effect of any expense reductions, and does not guarantee future results. Returns for periods shorter than one year are cumulative. Performance of the other share classes will vary based on the difference in the fees and expenses of those classes. Shares will fluctuate in value and, when redeemed, may be worth more or less than their original cost. Current month-end performance may be lower or higher than the performance cited, and can be found at jhinvestments.com or by calling 800-225-5291. For further information on the fund's objectives, risks, and strategy, see the fund's prospectus. The fund recently experienced negative short-term performance due to market volatility associated with the COVID-19 pandemic.
SEMIANNUAL REPORT | JOHN HANCOCK EMERGING MARKETS FUND 2
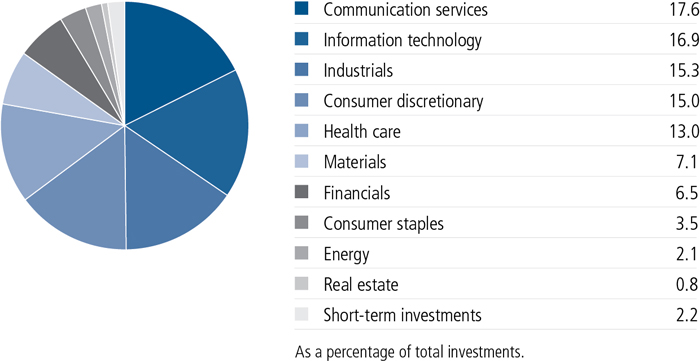
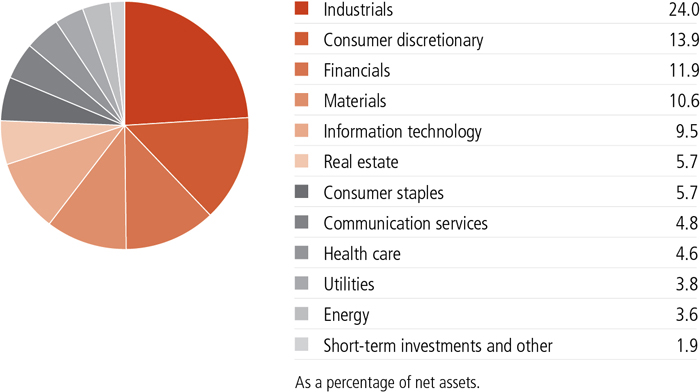
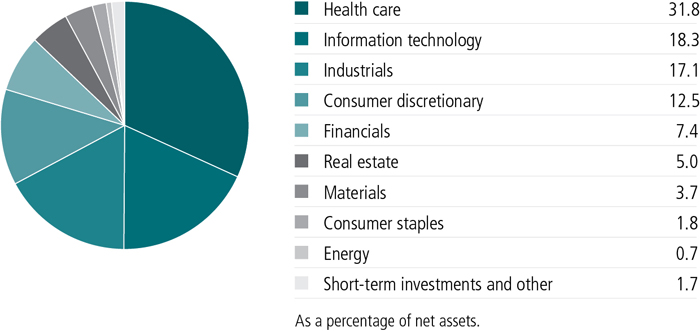
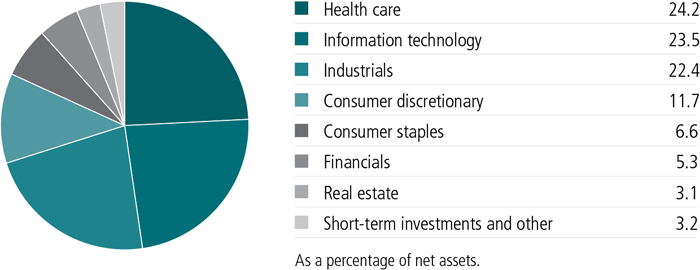
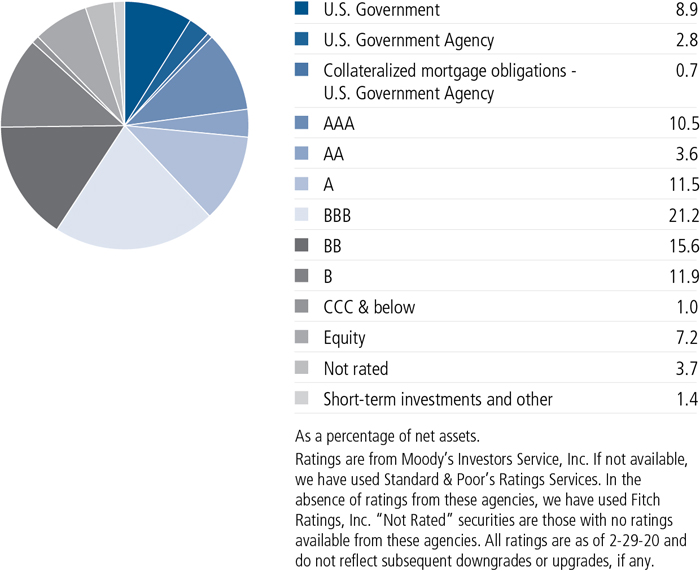
SECTOR COMPOSITION AS OF 2/29/2020 (%)
TOP 10 HOLDINGS AS OF 2/29/2020 (%)
| | |
| Samsung Electronics Company, Ltd. | 4.9 |
| Taiwan Semiconductor Manufacturing Company, Ltd. | 4.4 |
| Tencent Holdings, Ltd. | 3.4 |
| Ping An Insurance Group Company of China, Ltd., H Shares | 1.2 |
| Alibaba Group Holding, Ltd., ADR | 1.2 |
| China Mobile, Ltd., ADR | 1.1 |
| HDFC Bank, Ltd. | 1.0 |
| China Construction Bank Corp., H Shares | 0.9 |
| Vale SA | 0.9 |
| SK Hynix, Inc. | 0.9 |
| TOTAL | 19.9 |
| As a percentage of net assets. |
| Cash and cash equivalents are not included. |
SEMIANNUAL REPORT | JOHN HANCOCK EMERGING MARKETS FUND 3
TOP 10 COUNTRIES AS OF 2/29/2020 (%)
| | |
| China | 21.5 |
| Taiwan | 15.9 |
| South Korea | 13.6 |
| India | 12.0 |
| Brazil | 8.0 |
| Hong Kong | 5.6 |
| South Africa | 4.9 |
| Mexico | 3.3 |
| Thailand | 2.7 |
| Malaysia | 2.3 |
| TOTAL | 89.8 |
| As a percentage of net assets. |
| Cash and cash equivalents are not included. |
A note about risks
The fund may be subject to various risks as described in the fund's prospectus. For more information, please refer to the "Principal risks" section of the prospectus and "Subsequent events" section in the Notes to financial statements.
SEMIANNUAL REPORT | JOHN HANCOCK EMERGING MARKETS FUND 4
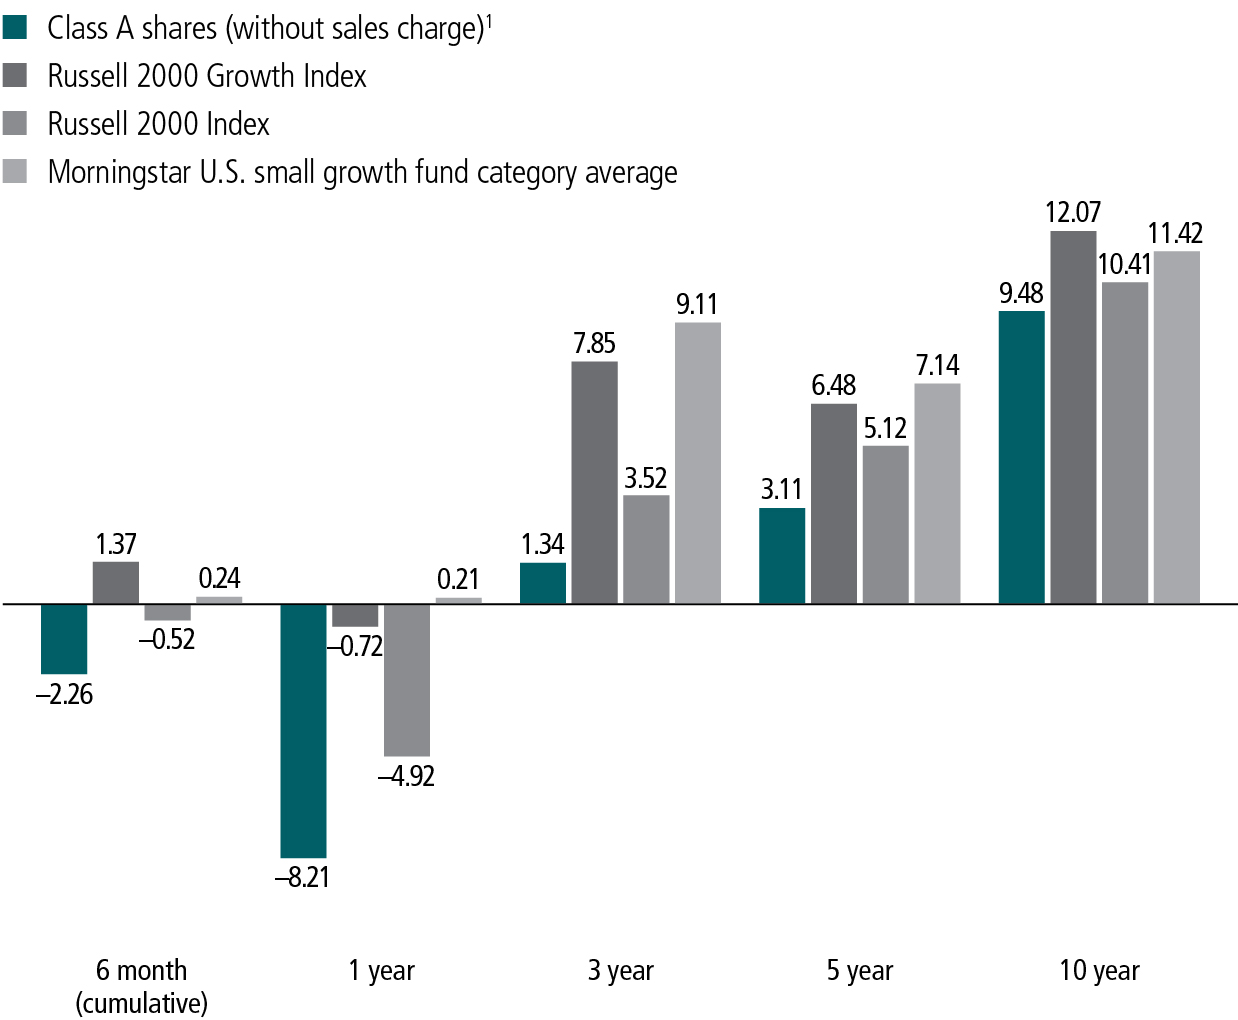
TOTAL RETURNS FOR THE PERIOD ENDED FEBRUARY 29, 2020
| | | | | | | | |
Average annual total returns (%)
with maximum sales charge | | Cumulative total returns (%)
with maximum sales charge |
| | 1-year | 5-year | 10-year | | 6-month | 5-year | 10-year |
| Class A1 | -9.32 | -0.05 | 1.14 | | -3.69 | -0.25 | 12.02 |
| Class C1 | -6.22 | 0.24 | 1.44 | | 0.00 | 1.18 | 15.36 |
| Class I1,2 | -4.33 | 1.26 | 1.97 | | 1.44 | 6.47 | 21.55 |
| Class R61,2 | -4.15 | 1.41 | 2.06 | | 1.55 | 7.23 | 22.61 |
| Class NAV2 | -4.14 | 1.39 | 2.10 | | 1.56 | 7.16 | 23.11 |
| Index† | -1.88 | 2.73 | 3.18 | | 2.93 | 14.41 | 36.77 |
Performance figures assume all distributions are reinvested. Figures reflect maximum sales charges on Class A shares of 5% and the applicable contingent deferred sales charge (CDSC) on Class C shares. Class C shares sold within one year of purchase are subject to a 1% CDSC. Sales charges are not applicable to Class I, Class R6, and Class NAV shares.
The expense ratios of the fund, both net (including any fee waivers and/or expense limitations) and gross (excluding any fee waivers and/or expense limitations), are set forth according to the most recent publicly available prospectuses for the fund and may differ from those disclosed in the Financial highlights tables in this report.Net expenses reflect contractual expense limitations in effect until July 31, 2021 and are subject to change. Had the contractual fee waivers and expense limitations not been in place, gross expenses would apply. The expense ratios are as follows:
| | | | | | |
| | Class A | Class C | Class I | Class R6 | Class NAV |
| Gross (%) | 1.52 | 2.22 | 1.22 | 1.11 | 1.10 |
| Net (%) | 1.51 | 2.21 | 1.21 | 1.10 | 1.09 |
Please refer to the most recent prospectuses and annual or semiannual report for more information on expenses and any expense limitation arrangements for each class.
The returns reflect past results and should not be considered indicative of future performance. The return and principal value of an investment will fluctuate so that shares, when redeemed, may be worth more or less than their original cost. Due to market volatility and other factors, the fund's current performance may be higher or lower than the performance shown. For current to the most recent month-end performance data, please call 800-225-5291 or visit the fund's website at jhinvestments.com.
The performance table above and the chart on the next page do not reflect the deduction of taxes that a shareholder would pay on fund distributions or the redemption of fund shares. The fund's performance results reflect any applicable fee waivers or expense reductions, without which the expenses would increase and results would have been less favorable.
| † | Index is the MSCI Emerging Markets Index. |
See the following page for footnotes.
SEMIANNUAL REPORT | JOHN HANCOCK EMERGING MARKETS FUND 5
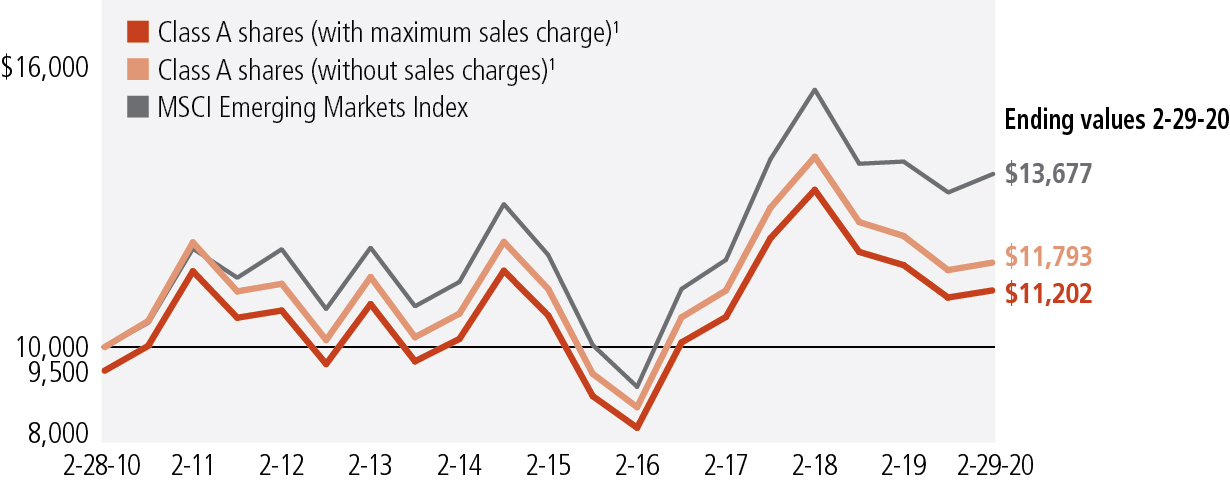
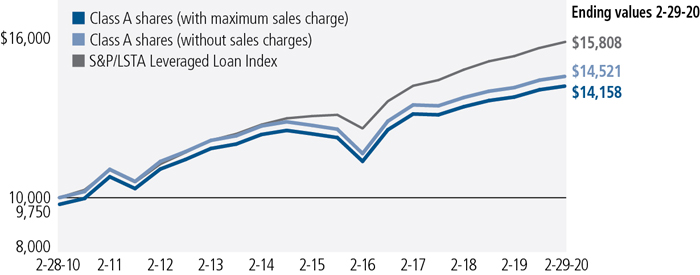
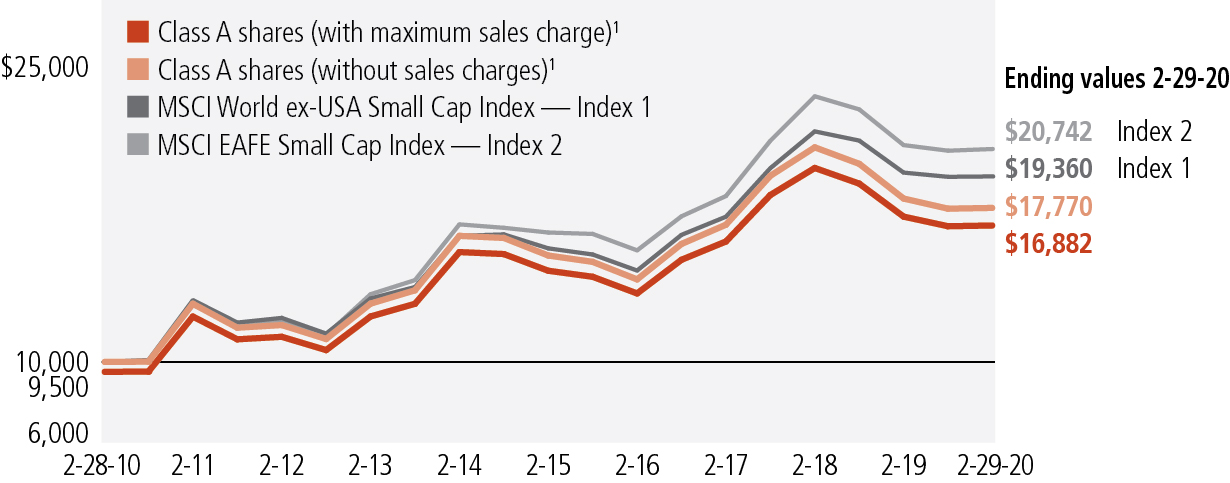
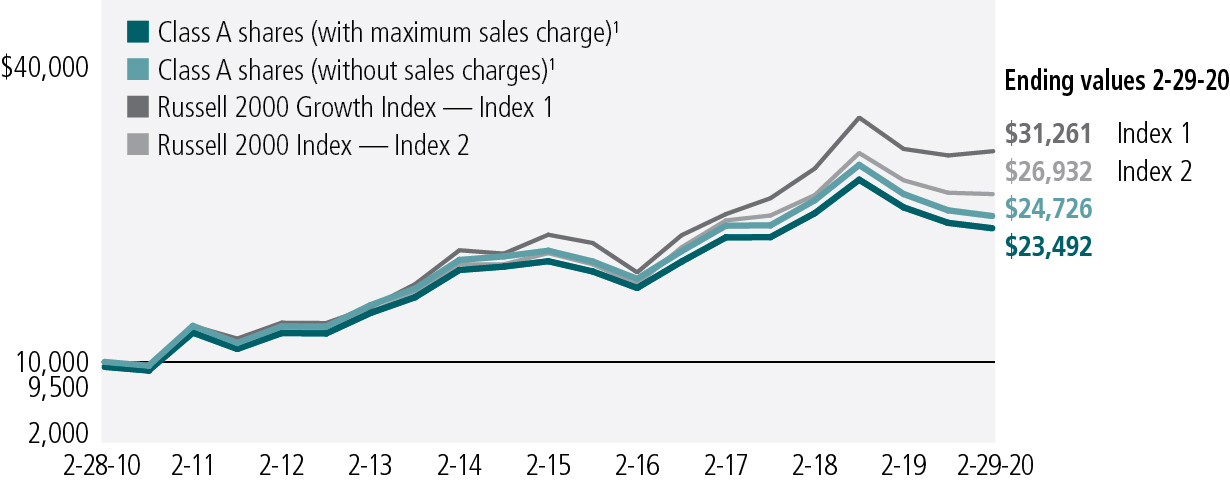
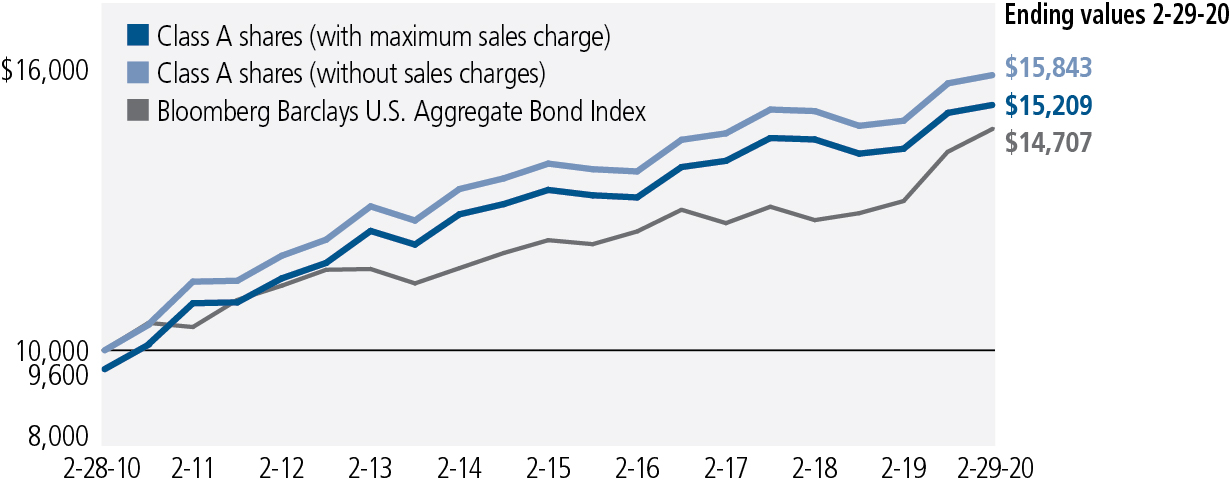
This chart and table show what happened to a hypothetical $10,000 investment in John Hancock Emerging Markets Fund for the share classes and periods indicated, assuming all distributions were reinvested. For comparison, we've shown the same investment in the MSCI Emerging Markets Index.
| | | | | |
| | Start date | With maximum
sales charge ($) | Without
sales charge ($) | Index ($) |
| Class C1,3 | 2-28-10 | 11,536 | 11,536 | 13,677 |
| Class I1,2 | 2-28-10 | 12,155 | 12,155 | 13,677 |
| Class R61,2 | 2-28-10 | 12,261 | 12,261 | 13,677 |
| Class NAV2 | 2-28-10 | 12,311 | 12,311 | 13,677 |
The MSCI Emerging Markets Index (gross of foreign withholding tax on dividends) is an unmanaged index designed to measure the performance of developing markets.
It is not possible to invest directly in an index. Index figures do not reflect expenses or sales charges, which would result in lower returns.
Footnotes related to performance pages
| 1 | Class A shares and Class I shares were first offered on 3-31-11; Class C shares were first offered on 6-27-14; Class R6 shares were first offered on 9-1-11. Returns prior to these dates are those of Class NAV shares (first offered on 5-1-07) that have not been adjusted for class-specific expenses; otherwise, returns would vary. |
| 2 | For certain types of investors, as described in the fund's prospectuses. |
| 3 | The contingent deferred sales charge is not applicable. |
SEMIANNUAL REPORT | JOHN HANCOCK EMERGING MARKETS FUND 6
These examples are intended to help you understand your ongoing operating expenses of investing in the fund so you can compare these costs with the ongoing costs of investing in other mutual funds.
Understanding fund expenses
As a shareholder of the fund, you incur two types of costs:
■Transaction costs,which include sales charges (loads) on purchases or redemptions (varies by share class), minimum account fee charge, etc.
■Ongoing operating expenses, including management fees, distribution and service fees (if applicable), and other fund expenses.
We are presenting only your ongoing operating expenses here.
Actual expenses/actual returns
The first line of each share class in the table on the following page is intended to provide information about the fund’s actual ongoing operating expenses, and is based on the fund’s actual return. It assumes an account value of $1,000.00 on September 1, 2019, with the same investment held until February 29, 2020.
Together with the value of your account, you may use this information to estimate the operating expenses that you paid over the period. Simply divide your account value at February 29, 2020, by $1,000.00, then multiply it by the “expenses paid” for your share class from the table. For example, for an account value of $8,600.00, the operating expenses should be calculated as follows:
Hypothetical example for comparison purposes
The second line of each share class in the table on the following page allows you to compare the fund’s ongoing operating expenses with those of any other fund. It provides an example of the fund’s hypothetical account values and hypothetical expenses based on each class’s actual expense ratio and an assumed 5% annualized return before expenses (which is not the class’s actual return). It assumes an account value of $1,000.00 on September 1, 2019, with the same investment held until February 29, 2020. Look in any other fund shareholder report to find its hypothetical example and you will be able to compare these expenses. Please remember that these hypothetical account values and expenses may not be used to estimate the actual ending account balance or expenses you paid for the period.
| | SEMIANNUAL REPORT | JOHN HANCOCK EMERGING MARKETS FUND | 7 |
Remember, these examples do not include any transaction costs, therefore, these examples will not help you to determine the relative total costs of owning different funds. If transaction costs were included, your expenses would have been higher. See the prospectuses for details regarding transaction costs.
SHAREHOLDER EXPENSE EXAMPLE CHART
| | | Account
value on
9-1-2019 | Ending
value on
2-29-2020 | Expenses
paid during
period ended
2-29-20201 | Annualized
expense
ratio |
| Class A | Actual expenses/actual returns | $1,000.00 | $1,013.60 | $8.01 | 1.60% |
| | Hypothetical example | 1,000.00 | 1,016.90 | 8.02 | 1.60% |
| Class C | Actual expenses/actual returns | 1,000.00 | 1,010.00 | 11.49 | 2.30% |
| | Hypothetical example | 1,000.00 | 1,013.40 | 11.51 | 2.30% |
| Class I | Actual expenses/actual returns | 1,000.00 | 1,014.40 | 6.51 | 1.30% |
| | Hypothetical example | 1,000.00 | 1,018.40 | 6.52 | 1.30% |
| Class R6 | Actual expenses/actual returns | 1,000.00 | 1,015.50 | 5.96 | 1.19% |
| | Hypothetical example | 1,000.00 | 1,018.90 | 5.97 | 1.19% |
| Class NAV | Actual expenses/actual returns | 1,000.00 | 1,015.60 | 5.86 | 1.17% |
| | Hypothetical example | 1,000.00 | 1,019.00 | 5.87 | 1.17% |
| 1 | Expenses are equal to the annualized expense ratio, multiplied by the average account value over the period, multiplied by 182/366 (to reflect the one-half year period). |
| 8 | JOHN HANCOCK EMERGING MARKETS FUND | SEMIANNUAL REPORT | |
Summary of fund’s investments as of 2-29-20 (unaudited)
(showing percentage of total net assets)
This section shows the fund’s 50 largest portfolio holdings in unaffiliated issuers and any holdings exceeding 1% of the fund’s total net assets as of the report date. The remaining securities held by the fund are grouped as “Other Securities” in each category. You can request a complete schedule of portfolio holdings as of the report date, free of charge, by calling 1-800-225-5291. This complete schedule, filed on the fund’s Form N-CSR, is also available on the SEC’s website at http://www.sec.gov.
| | | | | Shares | Value | % of
Net
Assets |
| Common stocks 96.9% | | | | | $228,309,740 | |
| (Cost $205,400,356) | | | | | | |
| Australia 0.0% | | | | | 46,243 | 0.0% |
| Belgium 0.0% | | | | | 34,624 | 0.0% |
| Brazil 6.0% | | | | | 14,110,642 | 6.0% |
| Banco Bradesco SA | | | | 37,802 | 230,689 | 0.1% |
| Itau Unibanco Holding SA | | | | 13,251 | 84,776 | 0.0% |
| Petroleo Brasileiro SA | | | | 271,519 | 1,648,458 | 0.7% |
| Vale SA | | | | 205,653 | 2,037,721 | 0.9% |
| OTHER SECURITIES | | | | | 10,108,998 | 4.3% |
| Canada 0.0% | | | | | 68,752 | 0.0% |
| Chile 0.9% | | | | | 2,114,991 | 0.9% |
| China 21.5% | | | | | 50,556,429 | 21.5% |
| Alibaba Group Holding, Ltd., ADR (A) | | | | 13,313 | 2,769,104 | 1.2% |
| Anhui Conch Cement Company, Ltd., H Shares | | | | 74,000 | 554,200 | 0.2% |
| Aowei Holdings, Ltd. (A) | | | | 10,063,000 | 1,947,682 | 0.8% |
| Baidu, Inc., ADR (A) | | | | 4,963 | 595,461 | 0.3% |
| Bank of China, Ltd., H Shares | | | | 1,860,075 | 743,360 | 0.3% |
| China Construction Bank Corp., H Shares | | | | 2,656,000 | 2,183,847 | 0.9% |
| China Merchants Bank Company, Ltd., H Shares | | | | 177,961 | 856,153 | 0.4% |
| China Petroleum & Chemical Corp., H Shares | | | | 1,484,000 | 768,055 | 0.3% |
| CNOOC, Ltd. | | | | 911,000 | 1,267,303 | 0.6% |
| CNOOC, Ltd., ADR | | | | 1,416 | 195,875 | 0.1% |
| Country Garden Holdings Company, Ltd. | | | | 427,987 | 581,445 | 0.3% |
| Industrial & Commercial Bank of China, Ltd., H Shares | | | | 2,239,000 | 1,542,447 | 0.7% |
| NetEase, Inc., ADR | | | | 2,263 | 721,241 | 0.3% |
| Ping An Insurance Group Company of China, Ltd., H Shares | | | | 255,000 | 2,905,061 | 1.2% |
| Sunac China Holdings, Ltd. | | | | 159,000 | 890,644 | 0.4% |
| Tencent Holdings, Ltd. | | | | 158,700 | 8,046,837 | 3.4% |
| Yum China Holdings, Inc. | | | | 16,131 | 706,376 | 0.3% |
| OTHER SECURITIES | | | | | 23,281,338 | 9.8% |
| Colombia 0.4% | | | | | 837,219 | 0.4% |
| SEE NOTES TO FINANCIAL STATEMENTS | SEMIANNUAL REPORT | JOHN HANCOCK EMERGING MARKETS FUND | 9 |
| | | | | Shares | Value | % of
Net
Assets |
| Czech Republic 0.1% | | | | | $355,050 | 0.1% |
| Egypt 0.1% | | | | | 226,344 | 0.1% |
| Greece 0.3% | | | | | 629,682 | 0.3% |
| Hong Kong 5.6% | | | | | 13,144,220 | 5.6% |
| China Mobile, Ltd., ADR (B) | | | | 61,686 | 2,456,337 | 1.1% |
| China Overseas Land & Investment, Ltd. | | | | 232,000 | 794,517 | 0.4% |
| China Resources Land, Ltd. | | | | 144,444 | 685,878 | 0.3% |
| China Unicom Hong Kong, Ltd., ADR (B) | | | | 72,323 | 580,030 | 0.3% |
| Geely Automobile Holdings, Ltd. | | | | 309,000 | 564,463 | 0.3% |
| OTHER SECURITIES | | | | | 8,062,995 | 3.2% |
| Hungary 0.3% | | | | | 699,535 | 0.3% |
| India 12.0% | | | | | 28,268,154 | 12.0% |
| HDFC Bank, Ltd. | | | | 133,573 | 2,194,591 | 1.0% |
| Hindustan Unilever, Ltd. | | | | 19,832 | 601,213 | 0.3% |
| Housing Development Finance Corp., Ltd. | | | | 23,476 | 715,671 | 0.3% |
| ICICI Bank, Ltd. | | | | 58,534 | 407,803 | 0.2% |
| ICICI Bank, Ltd., ADR | | | | 5,317 | 73,747 | 0.1% |
| Infosys, Ltd. | | | | 132,686 | 1,346,706 | 0.6% |
| Reliance Industries, Ltd. | | | | 105,484 | 1,956,283 | 0.9% |
| Tata Consultancy Services, Ltd. | | | | 27,313 | 760,801 | 0.3% |
| OTHER SECURITIES | | | | | 20,211,339 | 8.3% |
| Indonesia 2.2% | | | | | 5,200,195 | 2.2% |
| Bank Central Asia Tbk PT | | | | 223,300 | 493,250 | 0.2% |
| Bank Rakyat Indonesia Persero Tbk PT | | | | 2,106,500 | 629,479 | 0.3% |
| OTHER SECURITIES | | | | | 4,077,466 | 1.7% |
| Malaysia 2.3% | | | | | 5,507,938 | 2.3% |
| Malta 0.0% | | | | | 29,710 | 0.0% |
| Mexico 3.3% | | | | | 7,868,251 | 3.3% |
| America Movil SAB de CV, Series L | | | | 963,579 | 762,228 | 0.3% |
| Organizacion Soriana SAB de CV, Series B (B) | | | | 966,833 | 1,080,645 | 0.5% |
| OTHER SECURITIES | | | | | 6,025,378 | 2.5% |
| Netherlands 0.0% | | | | | 48,694 | 0.0% |
| Peru 0.2% | | | | | 414,732 | 0.2% |
| Philippines 1.3% | | | | | 3,048,197 | 1.3% |
| Poland 1.0% | | | | | 2,251,716 | 1.0% |
| Romania 0.1% | | | | | 133,588 | 0.1% |
| 10 | JOHN HANCOCK EMERGING MARKETS FUND | SEMIANNUAL REPORT | SEE NOTES TO FINANCIAL STATEMENTS |
| | | | | Shares | Value | % of
Net
Assets |
| Russia 1.4% | | | | | $3,371,292 | 1.4% |
| LUKOIL PJSC, ADR | | | | 10,478 | 903,816 | 0.4% |
| OTHER SECURITIES | | | | | 2,467,476 | 1.0% |
| South Africa 4.9% | | | | | 11,507,626 | 4.9% |
| FirstRand, Ltd. | | | | 195,871 | 699,323 | 0.3% |
| Gold Fields, Ltd., ADR | | | | 82,777 | 490,868 | 0.2% |
| MTN Group, Ltd. | | | | 152,396 | 726,546 | 0.3% |
| Naspers, Ltd., N Shares | | | | 4,877 | 762,549 | 0.3% |
| Standard Bank Group, Ltd. | | | | 74,488 | 715,997 | 0.3% |
| OTHER SECURITIES | | | | | 8,112,343 | 3.5% |
| South Korea 13.5% | | | | | 31,868,212 | 13.5% |
| KB Financial Group, Inc. | | | | 15,308 | 483,936 | 0.2% |
| POSCO | | | | 2,984 | 479,293 | 0.2% |
| Samsung Electronics Company, Ltd. | | | | 255,882 | 11,517,601 | 4.9% |
| SK Hynix, Inc. | | | | 27,358 | 2,021,500 | 0.9% |
| OTHER SECURITIES | | | | | 17,365,882 | 7.3% |
| Spain 0.0% | | | | | 43,848 | 0.0% |
| Taiwan 15.9% | | | | | 37,519,846 | 15.9% |
| ASE Technology Holding Company, Ltd., ADR (B) | | | | 116,793 | 537,234 | 0.3% |
| CTBC Financial Holding Company, Ltd. | | | | 704,967 | 523,201 | 0.2% |
| Hon Hai Precision Industry Company, Ltd. | | | | 230,352 | 601,094 | 0.3% |
| Taiwan Semiconductor Manufacturing Company, Ltd. | | | | 1,000,000 | 10,309,800 | 4.4% |
| OTHER SECURITIES | | | | | 25,548,517 | 10.7% |
| Thailand 2.7% | | | | | 6,341,321 | 2.7% |
| Turkey 0.8% | | | | | 1,866,505 | 0.8% |
| Ukraine 0.0% | | | | | 76,178 | 0.0% |
|
| United States 0.1% | | | | | 120,006 | 0.1% |
| Preferred securities 2.2% | | | | | $5,136,219 | |
| (Cost $4,471,674) | | | | | | |
| Brazil 2.0% | | | | | 4,787,993 | 2.0% |
| Banco Bradesco SA | | | | 126,962 | 866,779 | 0.4% |
| Itau Unibanco Holding SA | | | | 108,661 | 777,556 | 0.3% |
| Petroleo Brasileiro SA | | | | 286,638 | 1,624,233 | 0.7% |
| OTHER SECURITIES | | | | | 1,519,425 | 0.6% |
| Chile 0.1% | | | | | 142,945 | 0.1% |
| Colombia 0.1% | | | | | 176,556 | 0.1% |
| SEE NOTES TO FINANCIAL STATEMENTS | SEMIANNUAL REPORT | JOHN HANCOCK EMERGING MARKETS FUND | 11 |
| | | | | Shares | Value | % of
Net
Assets |
| Panama 0.0% | | | | | $27,567 | 0.0% |
|
| South Korea 0.0% | | | | | 1,158 | 0.0% |
| Investment companies 0.1% | | | | | $165,712 | |
| (Cost $102,673) | | | | | | |
| South Korea 0.1% | | | | | 165,712 | 0.1% |
| Rights 0.0% | | | | | $1,375 | |
| (Cost $0) | | | | | | |
| Warrants 0.0% | | | | | $509 | |
| (Cost $0) | | | | | | |
| | | Yield (%) | | Shares | Value | % of
Net
Assets |
| Short-term investments 2.3% | | | | | $5,393,448 | |
| (Cost $5,391,123) | | | | | | |
| Short-term funds 2.3% | | | | | 5,393,448 | 2.3% |
| John Hancock Collateral Trust (C) | | 1.6968 (D) | | 538,865 | 5,393,448 | 2.3% |
| Total investments (Cost $215,365,826) 101.5% | | | | $239,007,003 | 101.5% |
| Other assets and liabilities, net (1.5%) | | | | (3,469,059) | (1.5)% |
| Total net assets 100.0% | | | | $235,537,944 | 100.0% |
| The percentage shown for each investment category is the total value of the category as a percentage of the net assets of the fund. |
| Security Abbreviations and Legend |
| ADR | American Depositary Receipt |
| (A) | Non-income producing security. |
| (B) | All or a portion of this security is on loan as of 2-29-20. |
| (C) | Investment is an affiliate of the fund, the advisor and/or subadvisor. This security represents the investment of cash collateral received for securities lending. |
| (D) | The rate shown is the annualized seven-day yield as of 2-29-20. |
At 2-29-20, the aggregate cost of investments for federal income tax purposes was $217,888,331. Net unrealized appreciation aggregated to $21,118,672, of which $75,769,107 related to gross unrealized appreciation and $54,650,435 related to gross unrealized depreciation.
| 12 | JOHN HANCOCK EMERGING MARKETS FUND | SEMIANNUAL REPORT | SEE NOTES TO FINANCIAL STATEMENTS |
STATEMENT OF ASSETS AND LIABILITIES 2-29-20 (unaudited)
| Assets | |
| Unaffiliated investments, at value (Cost $209,974,703) including $5,312,573 of securities loaned | $233,613,555 |
| Affiliated investments, at value (Cost $5,391,123) | 5,393,448 |
| Total investments, at value (Cost $215,365,826) | 239,007,003 |
| Cash | 1,496,837 |
| Foreign currency, at value (Cost $309,924) | 308,337 |
| Dividends and interest receivable | 616,711 |
| Receivable for fund shares sold | 525,030 |
| Receivable for investments sold | 14,028 |
| Receivable for securities lending income | 4,296 |
| Receivable from affiliates | 15 |
| Other assets | 66,713 |
| Total assets | 242,038,970 |
| Liabilities | |
| Foreign capital gains tax payable | 42,913 |
| Payable for fund shares repurchased | 822,058 |
| Payable upon return of securities loaned | 5,410,694 |
| Payable to affiliates | |
| Accounting and legal services fees | 6,245 |
| Transfer agent fees | 11,809 |
| Trustees' fees | 3,176 |
| Other liabilities and accrued expenses | 204,131 |
| Total liabilities | 6,501,026 |
| Net assets | $235,537,944 |
| Net assets consist of | |
| Paid-in capital | $257,122,403 |
| Total distributable earnings (loss) | (21,584,459) |
| Net assets | $235,537,944 |
| |
| SEE NOTES TO FINANCIAL STATEMENTS | SEMIANNUAL REPORT | JOHN HANCOCK Emerging Markets Fund | 13 |
STATEMENT OF ASSETS AND LIABILITIES 2-29-20 (unaudited) (continued)
| Net asset value per share | |
| Based on net asset value and shares outstanding - the fund has an unlimited number of shares authorized with no par value | |
| Class A ($51,852,186 ÷ 5,163,346 shares)1 | $10.04 |
| Class C ($2,391,851 ÷ 237,200 shares)1 | $10.08 |
| Class I ($46,381,653 ÷ 4,627,261 shares) | $10.02 |
| Class R6 ($65,121,243 ÷ 6,508,424 shares) | $10.01 |
| Class NAV ($69,791,011 ÷ 6,966,492 shares) | $10.02 |
| Maximum offering price per share | |
| Class A (net asset value per share ÷ 95%)2 | $10.57 |
| 1 | Redemption price per share is equal to net asset value less any applicable contingent deferred sales charge. |
| 2 | On single retail sales of less than $50,000. On sales of $50,000 or more and on group sales the offering price is reduced. |
| 14 | JOHN HANCOCK Emerging Markets Fund | SEMIANNUAL REPORT | SEE NOTES TO FINANCIAL STATEMENTS |
STATEMENT OF OPERATIONS For the six months ended 2-29-20 (unaudited)
| Investment income | |
| Dividends | $3,231,938 |
| Securities lending | 57,516 |
| Interest | 10,683 |
| Less foreign taxes withheld | (273,907) |
| Total investment income | 3,026,230 |
| Expenses | |
| Investment management fees | 1,252,748 |
| Distribution and service fees | 95,992 |
| Accounting and legal services fees | 24,376 |
| Transfer agent fees | 83,832 |
| Trustees' fees | 2,333 |
| Custodian fees | 170,750 |
| State registration fees | 36,969 |
| Printing and postage | 40,673 |
| Professional fees | 43,976 |
| Other | 18,895 |
| Total expenses | 1,770,544 |
| Less expense reductions | (11,216) |
| Net expenses | 1,759,328 |
| Net investment income | 1,266,902 |
| Realized and unrealized gain (loss) | |
| Net realized gain (loss) on | |
| Unaffiliated investments and foreign currency transactions | 7,452,558 |
| Affiliated investments | (235) |
| Futures contracts | 70,671 |
| | 7,522,994 |
| Change in net unrealized appreciation (depreciation) of | |
| Unaffiliated investments and translation of assets and liabilities in foreign currencies | (2,963,295) |
| Affiliated investments | 943 |
| | (2,962,352) |
| Net realized and unrealized gain | 4,560,642 |
| Increase in net assets from operations | $5,827,544 |
| SEE NOTES TO FINANCIAL STATEMENTS | SEMIANNUAL REPORT | JOHN HANCOCK Emerging Markets Fund | 15 |
STATEMENTS OF CHANGES IN NET ASSETS
| | Six months ended
2-29-20
(unaudited) | Year ended
8-31-19 |
| Increase (decrease) in net assets | | |
| From operations | | |
| Net investment income | $1,266,902 | $7,334,194 |
| Net realized gain | 7,522,994 | 146,864,211 |
| Change in net unrealized appreciation (depreciation) | (2,962,352) | (194,621,816) |
| Increase (decrease) in net assets resulting from operations | 5,827,544 | (40,423,411) |
| Distributions to shareholders | | |
| From earnings | | |
| Class A | (1,111,757) | (653,465) |
| Class C | (35,459) | (13,423) |
| Class I | (1,705,378) | (1,003,824) |
| Class R6 | (1,624,479) | (1,181,979) |
| Class NAV | (1,821,714) | (15,176,807) |
| Total distributions | (6,298,787) | (18,029,498) |
| From fund share transactions | (15,351,303) | (847,219,706) |
| Total decrease | (15,822,546) | (905,672,615) |
| Net assets | | |
| Beginning of period | 251,360,490 | 1,157,033,105 |
| End of period | $235,537,944 | $251,360,490 |
| 16 | JOHN HANCOCK Emerging Markets Fund | SEMIANNUAL REPORT | SEE NOTES TO FINANCIAL STATEMENTS |
| CLASS A SHARES Period ended | 2-29-201 | 8-31-19 | 8-31-18 | 8-31-17 | 8-31-16 | 8-31-15 |
| Per share operating performance | | | | | | |
| Net asset value, beginning of period | $10.10 | $11.13 | $11.51 | $9.59 | $8.64 | $11.32 |
| Net investment income2 | 0.043 | 0.14 | 0.13 | 0.03 | 0.09 | 0.10 |
| Net realized and unrealized gain (loss) on investments | 0.12 | (1.04) | (0.39) | 2.03 | 0.99 | (2.68) |
| Total from investment operations | 0.16 | (0.90) | (0.26) | 2.06 | 1.08 | (2.58) |
| Less distributions | | | | | | |
| From net investment income | (0.22) | (0.13) | (0.12) | (0.14) | (0.13) | (0.10) |
| Net asset value, end of period | $10.04 | $10.10 | $11.13 | $11.51 | $9.59 | $8.64 |
| Total return (%)4,5 | 1.366 | (8.06) | (2.34) | 21.89 | 12.71 | (22.90) |
| Ratios and supplemental data | | | | | | |
| Net assets, end of period (in millions) | $52 | $52 | $55 | $51 | $316 | $401 |
| Ratios (as a percentage of average net assets): | | | | | | |
| Expenses before reductions | 1.607 | 1.51 | 1.45 | 1.50 | 1.47 | 1.49 |
| Expenses including reductions | 1.607 | 1.50 | 1.44 | 1.49 | 1.46 | 1.48 |
| Net investment income | 0.663,7 | 1.38 | 1.09 | 0.29 | 1.09 | 1.02 |
| Portfolio turnover (%) | 9 | 13 | 11 | 14 | 6 | 148 |
| 1 | Six months ended 2-29-20. Unaudited. |
| 2 | Based on average daily shares outstanding. |
| 3 | Net investment income is affected by the timing and frequency of the declaration of dividends by the securities in which the fund invests. |
| 4 | Total returns would have been lower had certain expenses not been reduced during the applicable periods. |
| 5 | Does not reflect the effect of sales charges, if any. |
| 6 | Not annualized. |
| 7 | Annualized. |
| 8 | Excludes merger activity. |
| SEE NOTES TO FINANCIAL STATEMENTS | SEMIANNUAL REPORT | JOHN HANCOCK Emerging Markets Fund | 17 |
| CLASS C SHARES Period ended | 2-29-201 | 8-31-19 | 8-31-18 | 8-31-17 | 8-31-16 | 8-31-15 |
| Per share operating performance | | | | | | |
| Net asset value, beginning of period | $10.11 | $11.13 | $11.52 | $9.60 | $8.64 | $11.32 |
| Net investment income2 | —3,4 | 0.06 | 0.04 | 0.04 | 0.06 | 0.05 |
| Net realized and unrealized gain (loss) on investments | 0.12 | (1.03) | (0.39) | 1.96 | 0.96 | (2.72) |
| Total from investment operations | 0.12 | (0.97) | (0.35) | 2.00 | 1.02 | (2.67) |
| Less distributions | | | | | | |
| From net investment income | (0.15) | (0.05) | (0.04) | (0.08) | (0.06) | (0.01) |
| Net asset value, end of period | $10.08 | $10.11 | $11.13 | $11.52 | $9.60 | $8.64 |
| Total return (%)5,6 | 1.007 | (8.71) | (3.04) | 21.03 | 11.92 | (23.57) |
| Ratios and supplemental data | | | | | | |
| Net assets, end of period (in millions) | $2 | $3 | $3 | $3 | $2 | $1 |
| Ratios (as a percentage of average net assets): | | | | | | |
| Expenses before reductions | 2.308 | 2.21 | 2.15 | 2.22 | 2.17 | 3.23 |
| Expenses including reductions | 2.308 | 2.20 | 2.14 | 2.21 | 2.16 | 2.35 |
| Net investment income (loss) | (0.02)3,8 | 0.65 | 0.36 | 0.37 | 0.71 | 0.49 |
| Portfolio turnover (%) | 9 | 13 | 11 | 14 | 6 | 149 |
| 1 | Six months ended 2-29-20. Unaudited. |
| 2 | Based on average daily shares outstanding. |
| 3 | Net investment income is affected by the timing and frequency of the declaration of dividends by the securities in which the fund invests. |
| 4 | Less than $0.005 per share. |
| 5 | Total returns would have been lower had certain expenses not been reduced during the applicable periods. |
| 6 | Does not reflect the effect of sales charges, if any. |
| 7 | Not annualized. |
| 8 | Annualized. |
| 9 | Excludes merger activity. |
| 18 | JOHN HANCOCK Emerging Markets Fund | SEMIANNUAL REPORT | SEE NOTES TO FINANCIAL STATEMENTS |
| CLASS I SHARES Period ended | 2-29-201 | 8-31-19 | 8-31-18 | 8-31-17 | 8-31-16 | 8-31-15 |
| Per share operating performance | | | | | | |
| Net asset value, beginning of period | $10.10 | $11.12 | $11.50 | $9.58 | $8.64 | $11.32 |
| Net investment income2 | 0.053 | 0.17 | 0.15 | 0.18 | 0.13 | 0.10 |
| Net realized and unrealized gain (loss) on investments | 0.12 | (1.03) | (0.38) | 1.91 | 0.97 | (2.65) |
| Total from investment operations | 0.17 | (0.86) | (0.23) | 2.09 | 1.10 | (2.55) |
| Less distributions | | | | | | |
| From net investment income | (0.25) | (0.16) | (0.15) | (0.17) | (0.16) | (0.13) |
| Net asset value, end of period | $10.02 | $10.10 | $11.12 | $11.50 | $9.58 | $8.64 |
| Total return (%)4 | 1.445 | (7.72) | (2.07) | 22.29 | 13.00 | (22.68) |
| Ratios and supplemental data | | | | | | |
| Net assets, end of period (in millions) | $46 | $68 | $64 | $92 | $21 | $13 |
| Ratios (as a percentage of average net assets): | | | | | | |
| Expenses before reductions | 1.306 | 1.22 | 1.15 | 1.21 | 1.16 | 1.20 |
| Expenses including reductions | 1.306 | 1.21 | 1.14 | 1.20 | 1.15 | 1.19 |
| Net investment income | 0.963,6 | 1.69 | 1.29 | 1.73 | 1.56 | 1.00 |
| Portfolio turnover (%) | 9 | 13 | 11 | 14 | 6 | 147 |
| 1 | Six months ended 2-29-20. Unaudited. |
| 2 | Based on average daily shares outstanding. |
| 3 | Net investment income is affected by the timing and frequency of the declaration of dividends by the securities in which the fund invests. |
| 4 | Total returns would have been lower had certain expenses not been reduced during the applicable periods. |
| 5 | Not annualized. |
| 6 | Annualized. |
| 7 | Excludes merger activity. |
| SEE NOTES TO FINANCIAL STATEMENTS | SEMIANNUAL REPORT | JOHN HANCOCK Emerging Markets Fund | 19 |
| CLASS R6 SHARES Period ended | 2-29-201 | 8-31-19 | 8-31-18 | 8-31-17 | 8-31-16 | 8-31-15 |
| Per share operating performance | | | | | | |
| Net asset value, beginning of period | $10.09 | $11.11 | $11.49 | $9.58 | $8.64 | $11.32 |
| Net investment income2 | 0.063 | 0.17 | 0.20 | 0.39 | 0.14 | 0.13 |
| Net realized and unrealized gain (loss) on investments | 0.12 | (1.01) | (0.42) | 1.70 | 0.97 | (2.66) |
| Total from investment operations | 0.18 | (0.84) | (0.22) | 2.09 | 1.11 | (2.53) |
| Less distributions | | | | | | |
| From net investment income | (0.26) | (0.18) | (0.16) | (0.18) | (0.17) | (0.15) |
| Net asset value, end of period | $10.01 | $10.09 | $11.11 | $11.49 | $9.58 | $8.64 |
| Total return (%)4 | 1.555 | (7.56) | (1.99) | 22.31 | 13.16 | (22.54) |
| Ratios and supplemental data | | | | | | |
| Net assets, end of period (in millions) | $65 | $60 | $72 | $11 | $—6 | $—6 |
| Ratios (as a percentage of average net assets): | | | | | | |
| Expenses before reductions | 1.197 | 1.11 | 1.05 | 1.11 | 1.06 | 6.52 |
| Expenses including reductions | 1.197 | 1.10 | 1.04 | 1.11 | 1.04 | 1.06 |
| Net investment income | 1.053,7 | 1.71 | 1.67 | 3.53 | 1.58 | 1.32 |
| Portfolio turnover (%) | 9 | 13 | 11 | 14 | 6 | 148 |
| 1 | Six months ended 2-29-20. Unaudited. |
| 2 | Based on average daily shares outstanding. |
| 3 | Net investment income is affected by the timing and frequency of the declaration of dividends by the securities in which the fund invests. |
| 4 | Total returns would have been lower had certain expenses not been reduced during the applicable periods. |
| 5 | Not annualized. |
| 6 | Less than $500,000. |
| 7 | Annualized. |
| 8 | Excludes merger activity. |
| 20 | JOHN HANCOCK Emerging Markets Fund | SEMIANNUAL REPORT | SEE NOTES TO FINANCIAL STATEMENTS |
| CLASS NAV SHARES Period ended | 2-29-201 | 8-31-19 | 8-31-18 | 8-31-17 | 8-31-16 | 8-31-15 |
| Per share operating performance | | | | | | |
| Net asset value, beginning of period | $10.10 | $11.13 | $11.51 | $9.59 | $8.65 | $11.34 |
| Net investment income2 | 0.063 | 0.10 | 0.17 | 0.15 | 0.13 | 0.13 |
| Net realized and unrealized gain (loss) on investments | 0.12 | (0.95) | (0.39) | 1.95 | 0.98 | (2.67) |
| Total from investment operations | 0.18 | (0.85) | (0.22) | 2.10 | 1.11 | (2.54) |
| Less distributions | | | | | | |
| From net investment income | (0.26) | (0.18) | (0.16) | (0.18) | (0.17) | (0.15) |
| Net asset value, end of period | $10.02 | $10.10 | $11.13 | $11.51 | $9.59 | $8.65 |
| Total return (%)4 | 1.565 | (7.63) | (1.97) | 22.40 | 13.14 | (22.59) |
| Ratios and supplemental data | | | | | | |
| Net assets, end of period (in millions) | $70 | $68 | $962 | $979 | $985 | $1,600 |
| Ratios (as a percentage of average net assets): | | | | | | |
| Expenses before reductions | 1.186 | 1.10 | 1.04 | 1.10 | 1.05 | 1.06 |
| Expenses including reductions | 1.176 | 1.09 | 1.03 | 1.09 | 1.04 | 1.04 |
| Net investment income | 1.073,6 | 0.93 | 1.46 | 1.45 | 1.51 | 1.31 |
| Portfolio turnover (%) | 9 | 13 | 11 | 14 | 6 | 147 |
| 1 | Six months ended 2-29-20. Unaudited. |
| 2 | Based on average daily shares outstanding. |
| 3 | Net investment income is affected by the timing and frequency of the declaration of dividends by the securities in which the fund invests. |
| 4 | Total returns would have been lower had certain expenses not been reduced during the applicable periods. |
| 5 | Not annualized. |
| 6 | Annualized. |
| 7 | Excludes merger activity. |
| SEE NOTES TO FINANCIAL STATEMENTS | SEMIANNUAL REPORT | JOHN HANCOCK Emerging Markets Fund | 21 |
| Notes to financial statements (unaudited) | |
Note 1—Organization
John Hancock Emerging Markets Fund (the fund) is a series of John Hancock Funds II (the Trust), an open-end management investment company organized as a Massachusetts business trust and registered under the Investment Company Act of 1940, as amended (the 1940 Act). The investment objective of the fund is to seek long-term capital appreciation.
The fund may offer multiple classes of shares. The shares currently outstanding are detailed in the Statement of assets and liabilities. Class A and Class C shares are offered to all investors. Class I shares are offered to institutions and certain investors. Class R6 shares are only available to certain retirement plans, institutions and other investors. Class NAV shares are offered to John Hancock affiliated funds of funds, retirement plans for employees of John Hancock and/or Manulife Financial Corporation, and certain 529 plans. Class C shares convert to Class A shares ten years after purchase (certain exclusions may apply). Shareholders of each class have exclusive voting rights to matters that affect that class. The distribution and service fees, if any, and transfer agent fees for each class may differ.
Note 2—Significant accounting policies
The financial statements have been prepared in conformity with accounting principles generally accepted in the United States of America (US GAAP), which require management to make certain estimates and assumptions as of the date of the financial statements. Actual results could differ from those estimates and those differences could be significant. The fund qualifies as an investment company under Topic 946 of Accounting Standards Codification of US GAAP.
Events or transactions occurring after the end of the fiscal period through the date that the financial statements were issued have been evaluated in the preparation of the financial statements. The following summarizes the significant accounting policies of the fund:
Security valuation. Investments are stated at value as of the scheduled close of regular trading on the New York Stock Exchange (NYSE), normally at 4:00 P.M., Eastern Time. In case of emergency or other disruption resulting in the NYSE not opening for trading or the NYSE closing at a time other than the regularly scheduled close, the net asset value (NAV) may be determined as of the regularly scheduled close of the NYSE pursuant to the fund's Valuation Policies and Procedures.
In order to value the securities, the fund uses the following valuation techniques: Equity securities, including exchange-traded or closed-end funds, are typically valued at the last sale price or official closing price on the exchange or principal market where the security trades. In the event there were no sales during the day or closing prices are not available, the securities are valued using the last available bid price. Investments by the fund in open-end mutual funds, including John Hancock Collateral Trust (JHCT), are valued at their respective NAVs each business day. Foreign securities and currencies are valued in U.S. dollars based on foreign currency exchange rates supplied by an independent pricing vendor.
In certain instances, the Pricing Committee may determine to value equity securities using prices obtained from another exchange or market if trading on the exchange or market on which prices are typically obtained did not open for trading as scheduled, or if trading closed earlier than scheduled, and trading occurred as normal on another exchange or market.
Other portfolio securities and assets, for which reliable market quotations are not readily available, are valued at fair value as determined in good faith by the fund's Pricing Committee following procedures established by the Board of Trustees. The frequency with which these fair valuation procedures are used cannot be predicted and fair value of securities may differ significantly from the value that would have been used had a ready market for such securities existed. Trading in foreign securities may be completed before the scheduled daily close of trading on the NYSE. Significant events at the issuer or market level may affect the values of securities between the time when the valuation of the securities is generally determined and the close of the NYSE. If a significant event occurs, these securities may be fair valued, as determined in good faith by the fund's Pricing Committee, following
| 22 | JOHN HANCOCK Emerging Markets Fund | SEMIANNUAL REPORT | |
procedures established by the Board of Trustees. The fund uses fair value adjustment factors provided by an independent pricing vendor to value certain foreign securities in order to adjust for events that may occur between the close of foreign exchanges or markets and the close of the NYSE.
The fund uses a three-tier hierarchy to prioritize the pricing assumptions, referred to as inputs, used in valuation techniques to measure fair value. Level 1 includes securities valued using quoted prices in active markets for identical securities, including registered investment companies. Level 2 includes securities valued using other significant observable inputs. Observable inputs may include quoted prices for similar securities, interest rates, prepayment speeds and credit risk. Prices for securities valued using these inputs are received from independent pricing vendors and brokers and are based on an evaluation of the inputs described. Level 3 includes securities valued using significant unobservable inputs when market prices are not readily available or reliable, including the fund's own assumptions in determining the fair value of investments. Factors used in determining value may include market or issuer specific events or trends, changes in interest rates and credit quality. The inputs or methodology used for valuing securities are not necessarily an indication of the risks associated with investing in those securities. Changes in valuation techniques and related inputs may result in transfers into or out of an assigned level within the disclosure hierarchy.
The following is a summary of the values by input classification of the fund's investments as of February 29, 2020, by major security category or type:
| | Total
value at
2-29-20 | Level 1
quoted
price | Level 2
significant
observable
inputs | Level 3
significant
unobservable
inputs |
| Investments in securities: | | | | |
| Assets | | | | |
| Common stocks | | | | |
| Australia | $46,243 | — | $46,243 | — |
| Belgium | 34,624 | — | 34,624 | — |
| Brazil | 14,110,642 | $14,110,642 | — | — |
| Canada | 68,752 | 68,752 | — | — |
| Chile | 2,114,991 | 149,721 | 1,965,270 | — |
| China | 50,556,429 | 8,437,732 | 41,987,942 | $130,755 |
| Colombia | 837,219 | 837,219 | — | — |
| Czech Republic | 355,050 | — | 355,050 | — |
| Egypt | 226,344 | — | 226,344 | — |
| Greece | 629,682 | — | 618,659 | 11,023 |
| Hong Kong | 13,144,220 | 3,036,367 | 9,930,250 | 177,603 |
| Hungary | 699,535 | — | 699,535 | — |
| India | 28,268,154 | 73,747 | 28,160,736 | 33,671 |
| Indonesia | 5,200,195 | 47,263 | 5,050,603 | 102,329 |
| Malaysia | 5,507,938 | — | 5,507,938 | — |
| Malta | 29,710 | — | 29,710 | — |
| Mexico | 7,868,251 | 7,842,889 | — | 25,362 |
| Netherlands | 48,694 | 48,694 | — | — |
| Peru | 414,732 | 414,732 | — | — |
| Philippines | 3,048,197 | — | 3,046,805 | 1,392 |
| Poland | 2,251,716 | — | 2,251,716 | — |
| Romania | 133,588 | — | 133,588 | — |
| | SEMIANNUAL REPORT | JOHN HANCOCK Emerging Markets Fund | 23 |
| | Total
value at
2-29-20 | Level 1
quoted
price | Level 2
significant
observable
inputs | Level 3
significant
unobservable
inputs |
| Russia | $3,371,292 | $890,892 | $2,480,400 | — |
| South Africa | 11,507,626 | 909,129 | 10,598,497 | — |
| South Korea | 31,868,212 | 223,921 | 31,568,637 | $75,654 |
| Spain | 43,848 | — | 43,848 | — |
| Taiwan | 37,519,846 | 537,234 | 36,982,612 | — |
| Thailand | 6,341,321 | — | 6,320,846 | 20,475 |
| Turkey | 1,866,505 | — | 1,865,673 | 832 |
| Ukraine | 76,178 | — | 76,178 | — |
| United States | 120,006 | — | 120,006 | — |
| Preferred securities | | | | |
| Brazil | 4,787,993 | 4,787,993 | — | — |
| Chile | 142,945 | — | 142,945 | — |
| Colombia | 176,556 | 176,556 | — | — |
| Panama | 27,567 | 27,567 | — | — |
| South Korea | 1,158 | — | 1,158 | — |
| Investment companies | 165,712 | — | 165,712 | — |
| Rights | 1,375 | — | 1,375 | — |
| Warrants | 509 | 509 | — | — |
| Short-term investments | 5,393,448 | 5,393,448 | — | — |
| Total investments in securities | $239,007,003 | $48,015,007 | $190,412,900 | $579,096 |
Security transactions and related investment income. Investment security transactions are accounted for on a trade date plus one basis for daily NAV calculations. However, for financial reporting purposes, investment transactions are reported on trade date. Interest income is accrued as earned. Dividend income is recorded on the ex-date, except for dividends of certain foreign securities where the dividend may not be known until after the ex-date. In those cases, dividend income, net of withholding taxes, is recorded when the fund becomes aware of the dividends. Non-cash dividends, if any, are recorded at the fair market value of the securities received. Gains and losses on securities sold are determined on the basis of identified cost and may include proceeds from litigation.
Securities lending. The fund may lend its securities to earn additional income. The fund receives collateral from the borrower in an amount not less than the market value of the loaned securities. The fund will invest its cash collateral in JHCT, an affiliate of the fund, which has a floating NAV and is registered with the Securities and Exchange Commission (SEC) as an investment company. JHCT invests in short-term money market investments. The fund will receive the benefit of any gains and bear any losses generated by JHCT with respect to the cash collateral.
The fund has the right to recall loaned securities on demand. If a borrower fails to return loaned securities when due, then the lending agent is responsible and indemnifies the fund for the lent securities. The lending agent uses the collateral received from the borrower to purchase replacement securities of the same issue, type, class and series of the loaned securities. If the value of the collateral is less than the purchase cost of replacement securities, the lending agent is responsible for satisfying the shortfall but only to the extent that the shortfall is not due to any decrease in the value of JHCT.
Although the risk of loss on securities lent is mitigated by receiving collateral from the borrower and through lending agent indemnification, the fund could experience a delay in recovering securities or could experience a lower than expected return if the borrower fails to return the securities on a timely basis. The fund receives
| 24 | JOHN HANCOCK Emerging Markets Fund | SEMIANNUAL REPORT | |
compensation for lending its securities by retaining a portion of the return on the investment of the collateral and compensation from fees earned from borrowers of the securities. Securities lending income received by the fund is net of fees retained by the securities lending agent. Net income received from JHCT is a component of securities lending income as recorded on the Statement of operations.
Obligations to repay collateral received by the fund are shown on the Statement of assets and liabilities as Payable upon return of securities loaned and are secured by the loaned securities. As of February 29, 2020, the fund loaned securities valued at $5,312,573 and received $5,410,694 of cash collateral.
In addition, non-cash collateral of approximately $704,306 in the form of U.S. Treasuries was pledged to the fund. This non-cash collateral is not reflected in the fund's net assets, however could be sold by the securities lending agent in the event of default by the borrower.
Foreign investing. Assets, including investments, and liabilities denominated in foreign currencies are translated into U.S. dollar values each day at the prevailing exchange rate. Purchases and sales of securities, income and expenses are translated into U.S. dollars at the prevailing exchange rate on the date of the transaction. The effect of changes in foreign currency exchange rates on the value of securities is reflected as a component of the realized and unrealized gains (losses) on investments. Foreign investments are subject to a decline in the value of a foreign currency versus the U.S. dollar, which reduces the dollar value of securities denominated in that currency.
Funds that invest internationally generally carry more risk than funds that invest strictly in U.S. securities. These risks are heightened for investments in emerging markets. Risks can result from differences in economic and political conditions, regulations, market practices (including higher transaction costs), accounting standards and other factors.
Foreign taxes. The fund may be subject to withholding tax on income, capital gains or repatriation taxes imposed by certain countries, a portion of which may be recoverable. Foreign taxes are accrued based upon the fund's understanding of the tax rules and rates that exist in the foreign markets in which it invests. Taxes are accrued based on gains realized by the fund as a result of certain foreign security sales. In certain circumstances, estimated taxes are accrued based on unrealized appreciation of such securities. Investment income is recorded net of foreign withholding taxes.
Overdraft. The fund may have the ability to borrow from banks for temporary or emergency purposes, including meeting redemption requests that otherwise might require the untimely sale of securities. Pursuant to the fund's custodian agreement, the custodian may loan money to the fund to make properly authorized payments. The fund is obligated to repay the custodian for any overdraft, including any related costs or expenses. The custodian may have a lien, security interest or security entitlement in any fund property that is not otherwise segregated or pledged, to the extent of any overdraft, and to the maximum extent permitted by law.
Line of credit. The fund and other affiliated funds have entered into a syndicated line of credit agreement with Citibank, N.A. as the administrative agent that enables them to participate in a $750 million unsecured committed line of credit. Excluding commitments designated for a certain fund and subject to the needs of all other affiliated funds, the fund can borrow up to an aggregate commitment amount of $500 million, subject to asset coverage and other limitations as specified in the agreement. A commitment fee payable at the end of each calendar quarter, based on the average daily unused portion of the line of credit, is charged to each participating fund based on a combination of fixed and asset based allocations and is reflected in Other expenses on the Statement of operations. Commitment fees for the six months ended February 29, 2020 were $1,713.
Expenses. Within the John Hancock group of funds complex, expenses that are directly attributable to an individual fund are allocated to such fund. Expenses that are not readily attributable to a specific fund are allocated among all funds in an equitable manner, taking into consideration, among other things, the nature and type of expense and the fund’s relative net assets. Expense estimates are accrued in the period to which they relate and adjustments are made when actual amounts are known.
| | SEMIANNUAL REPORT | JOHN HANCOCK Emerging Markets Fund | 25 |
Class allocations. Income, common expenses and realized and unrealized gains (losses) are determined at the fund level and allocated daily to each class of shares based on the net assets of the class. Class-specific expenses, such as distribution and service fees, if any, and transfer agent fees, for all classes, are charged daily at the class level based on the net assets of each class and the specific expense rates applicable to each class.
Federal income taxes. The fund intends to continue to qualify as a regulated investment company by complying with the applicable provisions of the Internal Revenue Code and will not be subject to federal income tax on taxable income that is distributed to shareholders. Therefore, no federal income tax provision is required.
For federal income tax purposes, as of August 31, 2019, the fund has a short-term capital loss carryforward of $30,286,390 and a long-term capital loss carryforward of $19,314,079 available to offset future net realized capital gains.These carryforwards do not expire.
As of August 31, 2019, the fund had no uncertain tax positions that would require financial statement recognition, derecognition or disclosure. The fund's federal tax returns are subject to examination by the Internal Revenue Service for a period of three years.
Distribution of income and gains. Distributions to shareholders from net investment income and net realized gains, if any, are recorded on the ex-date. The fund generally declares and pays dividends annually. Capital gain distributions, if any, are typically distributed annually.
Distributions paid by the fund with respect to each class of shares are calculated in the same manner, at the same time and in the same amount, except for the effect of class level expenses that may be applied differently to each class.
Such distributions, on a tax basis, are determined in conformity with income tax regulations, which may differ from US GAAP. Distributions in excess of tax basis earnings and profits, if any, are reported in the fund's financial statements as a return of capital. The final determination of tax characteristics of the fund's distribution will occur at the end of the year and will subsequently be reported to shareholders.
Capital accounts within the financial statements are adjusted for permanent book-tax differences. These adjustments have no impact on net assets or the results of operations. Temporary book-tax differences, if any, will reverse in a subsequent period. Book-tax differences are primarily attributable to foreign currency transactions, passive foreign investment companies and wash sale loss deferrals.
Note 3—Derivative instruments
The fund may invest in derivatives in order to meet its investment objective. Derivatives include a variety of different instruments that may be traded in the over-the-counter (OTC) market, on a regulated exchange or through a clearing facility. The risks in using derivatives vary depending upon the structure of the instruments, including the use of leverage, optionality, the liquidity or lack of liquidity of the contract, the creditworthiness of the counterparty or clearing organization and the volatility of the position. Some derivatives involve risks that are potentially greater than the risks associated with investing directly in the referenced securities or other referenced underlying instrument. Specifically, the fund is exposed to the risk that the counterparty to an OTC derivatives contract will be unable or unwilling to make timely settlement payments or otherwise honor its obligations. OTC derivatives transactions typically can only be closed out with the other party to the transaction.
Certain derivatives are traded or cleared on an exchange or central clearinghouse. Exchange-traded or centrally-cleared transactions generally present less counterparty risk to a fund than OTC transactions. The exchange or clearinghouse stands between the fund and the broker to the contract and therefore, credit risk is generally limited to the failure of the exchange or clearinghouse and the clearing member.
Futures. A futures contract is a contractual agreement to buy or sell a particular currency or financial instrument at a pre-determined price in the future. Futures are traded on an exchange and cleared through a central clearinghouse. Risks related to the use of futures contracts include possible illiquidity of the futures markets and
| 26 | JOHN HANCOCK Emerging Markets Fund | SEMIANNUAL REPORT | |
contract prices that can be highly volatile and imperfectly correlated to movements in the underlying financial instrument and potential losses in excess of the amounts recognized on the Statement of assets and liabilities. Use of long futures contracts subjects the fund to the risk of loss up to the notional value of the futures contracts. Use of short futures contracts subjects the fund to unlimited risk of loss.
Upon entering into a futures contract, the fund is required to deposit initial margin with the broker in the form of cash or securities. The amount of required margin is set by the broker and is generally based on a percentage of the contract value. The margin deposit must then be maintained at the established level over the life of the contract. Cash that has been pledged by the fund is detailed in the Statement of assets and liabilities as Collateral held at broker for futures contracts. Securities pledged by the fund, if any, are identified in the Fund's investments. Subsequent payments, referred to as variation margin, are made or received by the fund periodically and are based on changes in the market value of open futures contracts. Futures contracts are marked-to-market daily and unrealized gain or loss is recorded by the fund. When the contract is closed, the fund records a realized gain or loss equal to the difference between the value of the contract at the time it was opened and the value at the time it was closed.
During the six months ended February 29, 2020, the fund used futures contracts to equitize cash balances. The fund held futures contracts with USD notional values ranging up to $37.7 million, as measured at each quarter end. There were no open futures contracts as of February 29, 2020.
Effect of derivative instruments on the Statement of operations
The table below summarizes the net realized gain (loss) included in the net increase (decrease) in net assets from operations, classified by derivative instrument and risk category, for the six months ended February 29, 2020:
| | Statement of operations location - Net realized gain (loss) on: |
| Risk | Futures contracts |
| Equity | $70,671 |
Note 4—Guarantees and indemnifications
Under the Trust's organizational documents, its Officers and Trustees are indemnified against certain liabilities arising out of the performance of their duties to the Trust, including the fund. Additionally, in the normal course of business, the fund enters into contracts with service providers that contain general indemnification clauses. The fund's maximum exposure under these arrangements is unknown, as this would involve future claims that may be made against the fund that have not yet occurred. The risk of material loss from such claims is considered remote.
Note 5—Fees and transactions with affiliates
John Hancock Investment Management LLC (the Advisor) serves as investment advisor for the fund. John Hancock Investment Management Distributors LLC (the Distributor), an affiliate of the Advisor, serves as principal underwriter of the fund. The Advisor and the Distributor are indirect, wholly owned subsidiaries of Manulife Financial Corporation (MFC).
Management fee. The fund has an investment management agreement with the Advisor under which the fund pays a monthly management fee to the Advisor equivalent on an annual basis to the sum of: (a) 0.970% of the first $100 million of the fund’s aggregate net assets and (b) 0.920% of the fund’s aggregate net assets in excess of $100 million. Aggregate net assets include the net assets of the fund and Emerging Markets Value Trust, a series of John Hancock Variable Insurance Trust. The Advisor has a subadvisory agreement with Dimensional Fund Advisors LP. The fund is not responsible for payment of the subadvisory fees.
The Advisor has contractually agreed to waive a portion of its management fee and/or reimburse expenses for certain funds of the John Hancock group of funds complex, including the fund (the participating portfolios). This waiver is based upon aggregate net assets of all the participating portfolios. The amount of the reimbursement is
| | SEMIANNUAL REPORT | JOHN HANCOCK Emerging Markets Fund | 27 |
calculated daily and allocated among all the participating portfolios in proportion to the daily net assets of each fund. During the six months ended February 29, 2020, this waiver amounted to 0.01% of the fund’s average daily net assets on an annualized basis. This arrangement expires on July 31, 2021, unless renewed by mutual agreement of the fund and the Advisor based upon a determination that this is appropriate under the circumstances at that time.
For the six months ended February 29, 2020, the expense reductions described above amounted to the following:
| Class | Expense reduction |
| Class A | $2,309 |
| Class C | 114 |
| Class I | 3,036 |
| Class | Expense reduction |
| Class R6 | $2,706 |
| Class NAV | 3,051 |
| Total | $11,216 |
Expenses waived or reimbursed in the current fiscal period are not subject to recapture in future fiscal periods.
The investment management fees, including the impact of the waivers and reimbursements as described above, incurred for the six months ended February 29, 2020, were equivalent to a net annual effective rate of 0.92% of the fund's average daily net assets.
Accounting and legal services. Pursuant to a service agreement, the fund reimburses the Advisor for all expenses associated with providing the administrative, financial, legal, compliance, accounting and recordkeeping services to the fund, including the preparation of all tax returns, periodic reports to shareholders and regulatory reports, among other services. These expenses are allocated to each share class based on its relative net assets at the time the expense was incurred. These accounting and legal services fees incurred for the six months ended February 29, 2020 amounted to an annual rate of 0.02% of the fund's average daily net assets.
Distribution and service plans. The fund has a distribution agreement with the Distributor. The fund has adopted distribution and service plans for certain classes as detailed below pursuant to Rule 12b-1 under the 1940 Act, to pay the Distributor for services provided as the distributor of shares of the fund. The fund may pay up to the following contractual rates of distribution and service fees under these arrangements, expressed as an annual percentage of average daily net assets for each class of the fund's shares:
| Class | Rule 12b-1 Fee |
| Class A | 0.30% |
| Class C | 1.00% |
Sales charges. Class A shares are assessed up-front sales charges, which resulted in payments to the Distributor amounting to $42,718 for the six months ended February 29, 2020. Of this amount, $7,184 was retained and used for printing prospectuses, advertising, sales literature and other purposes and $35,534 was paid as sales commissions to broker-dealers.
Class A and Class C shares may be subject to contingent deferred sales charges (CDSCs). Certain Class A shares that are acquired through purchases of $1 million or more and are redeemed within one year of purchase are subject to a 1.00% sales charge. Class C shares that are redeemed within one year of purchase are subject to a 1.00% CDSC. CDSCs are applied to the lesser of the current market value at the time of redemption or the original purchase cost of the shares being redeemed. Proceeds from CDSCs are used to compensate the Distributor for providing distribution-related services in connection with the sale of these shares. During the six months ended February 29, 2020, CDSCs received by the Distributor amounted to $1,107 and $130 for Class A and Class C shares, respectively.
Transfer agent fees. The John Hancock group of funds has a complex-wide transfer agent agreement with John Hancock Signature Services, Inc. (Signature Services), an affiliate of the Advisor. The transfer agent fees paid to Signature Services are determined based on the cost to Signature Services (Signature Services Cost) of providing recordkeeping services. It also includes out-of-pocket expenses, including payments made to third-parties for
| 28 | JOHN HANCOCK Emerging Markets Fund | SEMIANNUAL REPORT | |
recordkeeping services provided to their clients who invest in one or more John Hancock funds. In addition, Signature Services Cost may be reduced by certain fees that Signature Services receives in connection with retirement and small accounts. Signature Services Cost is calculated monthly and allocated, as applicable, to five categories of share classes: Retail Share and Institutional Share Classes of Non-Municipal Bond Funds, Class R6 Shares, Retirement Share Classes and Municipal Bond Share Classes. Within each of these categories, the applicable costs are allocated to the affected John Hancock affiliated funds and/or classes, based on the relative average daily net assets.
Class level expenses. Class level expenses for the six months ended February 29, 2020 were as follows:
| Class | Distribution and service fees | Transfer agent fees |
| Class A | $82,757 | $33,937 |
| Class C | 13,235 | 1,629 |
| Class I | — | 43,885 |
| Class R6 | — | 4,381 |
| Total | $95,992 | $83,832 |
Trustee expenses. The fund compensates each Trustee who is not an employee of the Advisor or its affiliates. The costs of paying Trustee compensation and expenses are allocated to the fund based on its net assets relative to other funds within the John Hancock group of funds complex.
Interfund lending program. Pursuant to an Exemptive Order issued by the SEC, the fund, along with certain other funds advised by the Advisor or its affiliates, may participate in an interfund lending program. This program provides an alternative credit facility allowing the fund to borrow from, or lend money to, other participating affiliated funds. At period end, no interfund loans were outstanding. Interest expense is included in Other expenses on the Statement of operations. The fund's activity in this program during the period for which loans were outstanding was as follows:
Borrower
or Lender | Weighted Average
Loan Balance | Days
Outstanding | Weighted Average
Interest Rate | Interest Income
(Expense) |
| Borrower | $5,056,517 | 1 | 1.570% | ($221) |
| Lender | $578,192 | 1 | 1.825% | $29 |
Note 6—Fund share transactions
Transactions in fund shares for the six months ended February 29, 2020 and for the year ended August 31, 2019 were as follows:
| | Six Months Ended 2-29-20 | Year Ended 8-31-19 |
| | Shares | Amount | Shares | Amount |
| Class A shares | | | | |
| Sold | 509,358 | $5,500,978 | 1,225,354 | $12,920,186 |
| Distributions reinvested | 98,738 | 1,102,896 | 65,069 | 648,085 |
| Repurchased | (580,828) | (6,258,776) | (1,138,267) | (11,961,482) |
| Net increase | 27,268 | $345,098 | 152,156 | $1,606,789 |
| | SEMIANNUAL REPORT | JOHN HANCOCK Emerging Markets Fund | 29 |
| | Six Months Ended 2-29-20 | Year Ended 8-31-19 |
| | Shares | Amount | Shares | Amount |
| Class C shares | | | | |
| Sold | 12,863 | $138,882 | 45,782 | $478,644 |
| Distributions reinvested | 3,145 | 35,354 | 1,334 | 13,367 |
| Repurchased | (37,434) | (401,027) | (77,493) | (810,102) |
| Net decrease | (21,426) | $(226,791) | (30,377) | $(318,091) |
| Class I shares | | | | |
| Sold | 929,401 | $10,075,357 | 4,139,784 | $43,172,100 |
| Distributions reinvested | 152,929 | 1,705,160 | 100,857 | 1,001,512 |
| Repurchased | (3,222,400) | (35,287,856) | (3,209,898) | (33,395,389) |
| Net increase (decrease) | (2,140,070) | $(23,507,339) | 1,030,743 | $10,778,223 |
| Class R6 shares | | | | |
| Sold | 1,133,576 | $12,227,802 | 2,221,125 | $23,269,091 |
| Distributions reinvested | 145,955 | 1,624,479 | 119,270 | 1,181,968 |
| Repurchased | (764,832) | (8,229,443) | (2,845,731) | (30,002,460) |
| Net increase (decrease) | 514,699 | $5,622,838 | (505,336) | $(5,551,401) |
| Class NAV shares | | | | |
| Sold | 633,722 | $6,865,702 | 3,881,005 | $39,967,252 |
| Distributions reinvested | 163,529 | 1,821,714 | 1,528,379 | 15,176,807 |
| Repurchased | (571,890) | (6,272,525) | (85,118,668) | (908,879,285) |
| Net increase (decrease) | 225,361 | $2,414,891 | (79,709,284) | $(853,735,226) |
| Total net decrease | (1,394,168) | $(15,351,303) | (79,062,098) | $(847,219,706) |
Affiliates of the fund owned 21% of shares of Class NAV on February 29, 2020. Such concentration of shareholders’ capital could have a material effect on the fund if such shareholders redeem from the fund.
Note 7—Purchase and sale of securities
Purchases and sales of securities, other than short-term investments, amounted to $24,028,281 and $41,771,755, respectively, for the six months ended February 29, 2020.
Note 8—Emerging-market risk
Foreign investing especially in emerging markets, has additional risks, such as currency and market volatility and political and social instability. Funds that invest a significant portion of assets in the securities of issuers based in countries with emerging market economies are subject to greater levels of foreign investment risk than funds investing primarily in more-developed foreign markets, since emerging-market securities may present other risks greater than, or in addition to, the risks of investing in developed foreign countries.
Note 9—Investment in affiliated underlying funds
The fund may invest in affiliated underlying funds that are managed by the Advisor and its affiliates. Information regarding the fund's fiscal year to date purchases and sales of the affiliated underlying funds as well as income and capital gains earned by the fund, if any, is as follows:
| 30 | JOHN HANCOCK Emerging Markets Fund | SEMIANNUAL REPORT | |
| | | | | | | | Dividends and distributions |
| Affiliate | Ending
share
amount | Beginning
value | Cost of
purchases | Proceeds
from shares
sold | Realized
gain
(loss) | Change in
unrealized
appreciation
(depreciation) | Income
distributions
received | Capital gain
distributions
received | Ending
value |
| John Hancock Collateral Trust* | 538,865 | $7,481,658 | $12,558,947 | $(14,647,865) | $(235) | $943 | $57,516 | — | $5,393,448 |
| * | Refer to the Securities lending note within Note 2 for details regarding this investment. |
Note 10—Subsequent events
A widespread health crisis such as a global pandemic could cause substantial market volatility, exchange trading suspensions and closures, impact the ability to complete redemptions, and affect fund performance. For example, the novel coronavirus disease (COVID-19) has resulted in significant disruptions to global business activity. The impact of a health crisis and other epidemics and pandemics that may arise in the future, could affect the global economy in ways that cannot necessarily be foreseen at the present time. A health crisis may exacerbate other pre-existing political, social and economic risks. Any such impact could adversely affect the fund's performance, resulting in losses to your investment.
| | SEMIANNUAL REPORT | JOHN HANCOCK Emerging Markets Fund | 31 |
| | |
Trustees
Hassell H. McClellan,Chairperson
Steven R. Pruchansky,Vice Chairperson
Andrew G. Arnott†
Charles L. Bardelis*
James R. Boyle
Peter S. Burgess*
William H. Cunningham
Grace K. Fey
Marianne Harrison†
Deborah C. Jackson
James M. Oates*
Gregory A. Russo
Officers
Andrew G. Arnott
President
Francis V. Knox, Jr.
Chief Compliance Officer
Charles A. Rizzo
Chief Financial Officer
Salvatore Schiavone
Treasurer
Christopher (Kit) Sechler
Secretary and Chief Legal Officer
| Investment advisor
John Hancock Investment Management LLC
Subadvisor
Dimensional Fund Advisors LP
Portfolio Managers
William B. Collins-Dean, CFA
Jed S. Fogdall
Mary T. Phillips, CFA
Bhanu P. Singh
Principal distributor
John Hancock Investment Management Distributors LLC
Custodian
Citibank, N.A.
Transfer agent
John Hancock Signature Services, Inc.
Legal counsel
K&L Gates LLP
|
* Member of the Audit Committee
† Non-Independent Trustee
The fund's proxy voting policies and procedures, as well as the fund proxy voting record for the most recent twelve-month period ended June 30, are available free of charge on the Securities and Exchange Commission (SEC) website at sec.gov or on our website.
All of the fund's holdings as of the end of the third month of every fiscal quarter are filed with the SEC on Form N-PORT within 60 days of the end of the fiscal quarter. The fund's Form N-PORT filings are available on our website and the SEC's website, sec.gov.
We make this information on your fund, as well asmonthly portfolio holdings, and other fund details available on our website at jhinvestments.com or by calling 800-225-5291.
| | | | |
| | You can also contact us: |
| | 800-225-5291
jhinvestments.com | Regular mail:
John Hancock Signature Services, Inc.
P.O. Box 55913
Boston, MA 02205-5913
| Express mail:
John Hancock Signature Services, Inc.
2000 Crown Colony Drive
Suite 55913
Quincy, MA 02169-0953
|
SEMIANNUAL REPORT | JOHN HANCOCK EMERGING MARKETS FUND 32
John Hancock family of funds
| | | |
DOMESTIC EQUITY FUNDS
Blue Chip Growth
Classic Value
Disciplined Value
Disciplined Value Mid Cap
Equity Income
Financial Industries
Fundamental All Cap Core
Fundamental Large Cap Core
New Opportunities
Regional Bank
Small Cap Core
Small Cap Growth
Small Cap Value
U.S. Global Leaders Growth
U.S. Quality Growth
GLOBAL AND INTERNATIONAL EQUITY FUNDS
Disciplined Value International
Emerging Markets
Emerging Markets Equity
Fundamental Global Franchise
Global Equity
Global Shareholder Yield
Global Thematic Opportunities
International Dynamic Growth
International Growth
International Small Company
| | INCOME FUNDS
Bond
California Tax-Free Income
Emerging Markets Debt
Floating Rate Income
Government Income
High Yield
High Yield Municipal Bond
Income
Investment Grade Bond
Money Market
Short Duration Bond
Short Duration Credit Opportunities
Strategic Income Opportunities
Tax-Free Bond
ALTERNATIVE AND SPECIALTY FUNDS
Absolute Return Currency
Alternative Asset Allocation
Alternative Risk Premia
Diversified Macro
Infrastructure
Multi-Asset Absolute Return
Seaport Long/Short
|
A fund's investment objectives, risks, charges, and expenses should be considered carefully before investing. The prospectus contains this and other important information about the fund. To obtain a prospectus, contact your financial professional, call John Hancock Investment Management at 800-225-5291, or visit our website at jhinvestments.com. Please read the prospectus carefully before investing or sending money.
| | | |
ASSET ALLOCATION
Balanced
Income Allocation
Multi-Index Lifetime Portfolios
Multi-Index Preservation Portfolios
Multimanager Lifestyle Portfolios
Multimanager Lifetime Portfolios
Retirement Income 2040
EXCHANGE-TRADED FUNDS
John Hancock Multifactor Consumer Discretionary ETF
John Hancock Multifactor Consumer Staples ETF
John Hancock Multifactor Developed International ETF
John Hancock Multifactor Emerging Markets ETF
John Hancock Multifactor Energy ETF
John Hancock Multifactor Financials ETF
John Hancock Multifactor Healthcare ETF
John Hancock Multifactor Industrials ETF
John Hancock Multifactor Large Cap ETF
John Hancock Multifactor Materials ETF
John Hancock Multifactor Media and
Communications ETF
John Hancock Multifactor Mid Cap ETF
John Hancock Multifactor Small Cap ETF
John Hancock Multifactor Technology ETF
John Hancock Multifactor Utilities ETF
| | ENVIRONMENTAL, SOCIAL, AND
GOVERNANCE FUNDS
ESG All Cap Core
ESG Core Bond
ESG International Equity
ESG Large Cap Core
CLOSED-END FUNDS
Financial Opportunities
Hedged Equity & Income
Income Securities Trust
Investors Trust
Preferred Income
Preferred Income II
Preferred Income III
Premium Dividend
Tax-Advantaged Dividend Income
Tax-Advantaged Global Shareholder Yield
|
John Hancock Multifactor ETF shares are bought and sold at market price (not NAV), and are not individually redeemed
from the fund. Brokerage commissions will reduce returns.
John Hancock ETFs are distributed by Foreside Fund Services, LLC, and are subadvised by Dimensional Fund Advisors LP.
Foreside is not affiliated with John Hancock Investment Management Distributors LLC or Dimensional Fund Advisors LP.
Dimensional Fund Advisors LP receives compensation from John Hancock in connection with licensing rights to the
John Hancock Dimensional indexes. Dimensional Fund Advisors LP does not sponsor, endorse, or sell, and makes no
representation as to the advisability of investing in, John Hancock Multifactor ETFs.
John Hancock Investment Management
A trusted brand
John Hancock Investment Management is a premier asset manager
representing one of America's most trusted brands, with a heritage of
financial stewardship dating back to 1862. Helping our shareholders
pursue their financial goals is at the core of everything we do. It's why
we support the role of professional financial advice and operate with
the highest standards of conduct and integrity.
A better way to invest
We serve investors globally through a unique multimanager approach:
We search the world to find proven portfolio teams with specialized
expertise for every strategy we offer, then we apply robust investment
oversight to ensure they continue to meet our uncompromising
standards and serve the best interests of our shareholders.
Results for investors
Our unique approach to asset management enables us to provide
a diverse set of investments backed by some of the world's best
managers, along with strong risk-adjusted returns across asset classes.
John Hancock Investment Management Distributors LLC n Member FINRA, SIPC
200 Berkeley Street n Boston, MA 02116-5010 n 800-225-5291 n jhinvestments.com
This report is for the information of the shareholders of John Hancock Emerging Markets Fund. It is not authorized for distribution to prospective investors unless preceded or accompanied by a prospectus.
| | |
| MF1105605 | 368SA 2/20
4/2020 |
John Hancock
Emerging Markets Debt Fund
Semiannual report 2/29/2020
Beginning on January 1, 2021, as permitted by regulations adopted by the Securities and Exchange Commission, paper copies of the fund's shareholder reports like this one will no longer be sent by mail, unless you specifically request paper copies of the reports from the fund or from your financial intermediary. Instead, the reports will be made available on a website, and you will be notified by mail each time a report is posted and provided with a website link to access the report.
If you already elected to receive shareholder reports electronically, you will not be affected by this change, and you do not need to take any action. You may elect to receive shareholder reports and other communications electronically by calling John Hancock Investment Management at 800-225-5291 (Class A and Class C shares) or 888-972-8696 (Class I, Class R2, Class R4, and Class R6 shares) or by contacting your financial intermediary.
You may elect to receive all reports in paper, free of charge, at any time. You can inform John Hancock Investment Management or your financial intermediary that you wish to continue receiving paper copies of your shareholder reports by following the instructions listed above. Your election to receive reports in paper will apply to all funds held with John Hancock Investment Management or your financial intermediary.

A message to shareholders
Dear shareholder,
Global financial markets were on pace to deliver strong returns during the 6 months ended February 29, 2020, until heightened fears over the coronavirus (COVID-19) sent the markets skidding during the last week of the period. Prior to the turbulence that ended the period, the investment-grade corporate and high-yield segments of the market had strong gains. Fixed-income investors benefited from a combination of declining interest rates, low inflation, and accommodative central bank policy.
However, the COVID-19 pandemic and plummeting oil prices put an end to all that good news. Shortly after period end, the U.S. Federal Reserve lowered interest rates and lawmakers embarked on a plan to launch major fiscal stimulus to support the economy.
After the longest bull market in U.S. history, we're now in bear market territory. Indeed, the spread of COVID-19, trade disputes, rising unemployment, and other geopolitical tensions may continue to create uncertainty among businesses and investors. Your financial professional can helpposition your portfolio so that it's sufficiently diversified to seek to meet your long-term objectives and to withstand the inevitable bouts of market volatility along the way.
On behalf of everyone at John Hancock Investment Management, I'd like to take this opportunity to welcome new shareholders and thank existing shareholders for the continued trust you've placed in us.
Sincerely,
Andrew G. Arnott
President and CEO,
John Hancock Investment Management
Head of Wealth and Asset Management,
United States and Europe
This commentary reflects the CEO's views as of this report's period end and are subject to change at any time. Diversification does not guarantee investment returns and does not eliminate risk of loss. All investments entail risks, including the possible loss of principal. For more up-to-date information, you can visit our website at jhinvestments.com.
John Hancock
Emerging Markets Debt Fund
Table of contents
| | | |
| 2 | | Your fund at a glance |
| 3 | | Portfolio summary |
| 5 | | A look at performance |
| 7 | | Your expenses |
| 9 | | Fund's investments |
| 19 | | Financial statements |
| 22 | | Financial highlights |
| 28 | | Notes to financial statements |
| 40 | | More information |
SEMIANNUAL REPORT | JOHN HANCOCK EMERGING MARKETS DEBT FUND 1
INVESTMENT OBJECTIVE
The fund seeks total return with an emphasis on current income as well as capital appreciation.
AVERAGE ANNUAL TOTAL RETURNS AS OF 2/29/2020 (%)
The J.P. Morgan EMBI Global Index tracks the total return for traded foreign currency-denominated debt instruments in emerging markets.
It is not possible to invest directly in an index. Index figures do not reflect expenses or sales charges, which would result in lower returns.
Figures from Morningstar, Inc. include reinvested distributions and do not take into account sales charges. Actual load-adjusted performance is lower. Since-inception returns for the Morningstar fund category average are not available.
The past performance shown here reflects reinvested distributions and the beneficial effect of any expense reductions, and does not guarantee future results. Returns for periods shorter than one year are cumulative. Performance of the other share classes will vary based on the difference in the fees and expenses of those classes. Shares will fluctuate in value and, when redeemed, may be worth more or less than their original cost. Current month-end performance may be lower or higher than the performance cited, and can be found at jhinvestments.com or by calling 800-225-5291. For further information on the fund's objectives, risks, and strategy, see the fund's prospectus. The fund recently experienced negative short-term performance due to market volatility associated with the COVID-19 pandemic.
SEMIANNUAL REPORT | JOHN HANCOCK EMERGING MARKETS DEBT FUND 2
PORTFOLIO COMPOSITION AS OF 2/29/2020 (%)
QUALITY COMPOSITION AS OF 2/29/2020 (%)
SEMIANNUAL REPORT | JOHN HANCOCK EMERGING MARKETS DEBT FUND 3
TOP 10 ISSUERS AS OF 2/29/2020 (%)
| | |
| Pertamina Persero PT | 4.6 |
| Republic of Indonesia | 3.3 |
| Republic of Argentina | 2.8 |
| Republic of Turkey | 2.8 |
| Federative Republic of Brazil | 2.7 |
| Kingdom of Saudi Arabia | 2.3 |
| Petroleos Mexicanos | 2.2 |
| State of Qatar | 2.2 |
| Petrobras Global Finance BV | 2.0 |
| Mexico City Airport Trust | 1.9 |
| TOTAL | 26.8 |
| As a percentage of net assets. |
| Cash and cash equivalents are not included. |
TOP 10 COUNTRIES AS OF 2/29/2020 (%)
| | |
| Mexico | 10.1 |
| Indonesia | 9.4 |
| Brazil | 7.0 |
| Turkey | 4.5 |
| Netherlands | 4.0 |
| Argentina | 3.6 |
| Peru | 3.4 |
| Colombia | 3.3 |
| Luxembourg | 2.6 |
| Russia | 2.5 |
| TOTAL | 50.4 |
| As a percentage of net assets. |
| Cash and cash equivalents are not included. |
A note about risks
The fund may be subject to various risks as described in the fund's prospectus. For more information, please refer to the "Principal risks" section of the prospectus and "Subsequent events" section in the Notes to financial statements.
SEMIANNUAL REPORT | JOHN HANCOCK EMERGING MARKETS DEBT FUND 4
TOTAL RETURNS FOR THE PERIOD ENDED FEBRUARY 29, 2020
| | | | | | | | | | | |
Average annual total returns (%)
with maximum sales charge | | Cumulative total returns (%)
with maximum sales charge | | SEC 30-day
yield (%)
subsidized | SEC 30-day
yield (%)
unsubsidized1 |
| | 1-year | 5-year | 10-year | | 6-month | 5-year | 10-year | | as of
2-29-20 | as of
2-29-20 |
| Class A | 5.02 | 4.49 | 5.04 | | 0.41 | 24.53 | 63.48 | | 3.96 | 3.95 |
| Class C3 | 7.53 | 4.54 | 5.03 | | 3.14 | 24.83 | 63.37 | | 3.42 | 3.42 |
| Class I4 | 9.59 | 5.65 | 5.83 | | 4.65 | 31.60 | 76.29 | | 4.43 | 4.43 |
| Class R23,4 | 9.47 | 5.46 | 5.53 | | 4.64 | 30.42 | 71.33 | | 4.20 | 4.19 |
| Class R63,4 | 9.69 | 5.75 | 5.68 | | 4.71 | 32.25 | 73.73 | | 4.55 | 4.54 |
| Class NAV3,4 | 9.74 | 5.77 | 5.78 | | 4.72 | 32.40 | 75.34 | | 4.56 | 4.55 |
| Index† | 9.89 | 5.74 | 6.48 | | 2.65 | 32.20 | 87.37 | | — | — |
Performance figures assume all distributions are reinvested. Figures reflect maximum sales charges on Class A shares of 4.0%, and the applicable contingent deferred sales charge (CDSC) on Class C shares. Class C shares sold within one year of purchase are subject to a 1% CDSC. Sales charges are not applicable to Class I, Class R2, Class R6, and Class NAV shares.
The expense ratios of the fund, both net (including any fee waivers and/or expense limitations) and gross (excluding any fee waivers and/or expense limitations), are set forth according to the most recent publicly available prospectuses for the fund and may differ from those disclosed in the Financial highlights tables in this report. Net expenses reflect contractual expense limitations in effect until July 31, 2021 and are subject to change. Had the contractual fee waivers and expense limitations not been in place, gross expenses would apply. The expense ratios are as follows:
| | | | | | | |
| | Class A | Class C | Class I | Class R2 | Class R6 | Class NAV |
| Gross (%) | 1.19 | 1.89 | 0.89 | 1.28 | 0.78 | 0.77 |
| Net (%) | 1.18 | 1.88 | 0.88 | 1.27 | 0.77 | 0.76 |
Please refer to the most recent prospectuses and annual or semiannual report for more information on expenses and any expense limitation arrangements for each class.
The returns reflect past results and should not be considered indicative of future performance. The return and principal value of an investment will fluctuate so that shares, when redeemed, may be worth more or less than their original cost. Due to market volatility and other factors, the fund's current performance may be higher or lower than the performance shown. For current to the most recent month-end performance data, please call 800-225-5291 or visit the fund's website at jhinvestments.com.
The performance table above and the chart on the next page do not reflect the deduction of taxes that a shareholder would pay on fund distributions or the redemption of fund shares. The fund's performance results reflect any applicable fee waivers or expense reductions, without which the expenses would increase and results would have been less favorable.
| † | Index is the J.P. Morgan EMBI Global Index. |
See the following page for footnotes.
SEMIANNUAL REPORT | JOHN HANCOCK EMERGING MARKETS DEBT FUND 5
This chart and table show what happened to a hypothetical $10,000 investment in John Hancock Emerging Markets Debt Fund for the share classes and periods indicated, assuming all distributions were reinvested. For comparison, we've shown the same investment in the J.P. Morgan EMBI Global Index.
| | | | | |
| | Start date | With maximum
sales charge ($) | Without
sales charge ($) | Index ($) |
| Class C3,5 | 2-28-10 | 16,337 | 16,337 | 18,737 |
| Class I4 | 2-28-10 | 17,629 | 17,629 | 18,737 |
| Class R23,4 | 2-28-10 | 17,133 | 17,133 | 18,737 |
| Class R63,4 | 2-28-10 | 17,373 | 17,373 | 18,737 |
| Class NAV3,4 | 2-28-10 | 17,534 | 17,534 | 18,737 |
The values shown in the chart for Class A shares with maximum sales charge have been adjusted to reflect the reduction in the Class A maximum sales charge from 4.5% to 4.0%, which became effective on 2-3-14.
The J.P. Morgan EMBI Global Index tracks the total return for traded foreign currency-denominated debt instruments in emerging markets.
It is not possible to invest directly in an index. Index figures do not reflect expenses or sales charges, which would result in lower returns.
Footnotes related to performance pages
| 1 | Unsubsidized yield reflects what the yield would have been without the effect of reimbursements and waivers. |
| 2 | From 1-4-10. |
| 3 | Class C shares were first offered on 8-28-14; Class R2, and R6 shares were first offered on 3-27-15; Class NAV shares were first offered on 6-20-13. Returns prior to these dates are those of Class A shares (first offered on 1-4-10) that have not been adjusted for class-specific expenses; otherwise, returns would vary. |
| 4 | For certain types of investors, as described in the fund's prospectuses. |
| 5 | The contingent deferred sales charge is not applicable. |
SEMIANNUAL REPORT | JOHN HANCOCK EMERGING MARKETS DEBT FUND 6
These examples are intended to help you understand your ongoing operating expenses of investing in the fund so you can compare these costs with the ongoing costs of investing in other mutual funds.
Understanding fund expenses
As a shareholder of the fund, you incur two types of costs:
■Transaction costs,which include sales charges (loads) on purchases or redemptions (varies by share class), minimum account fee charge, etc.
■Ongoing operating expenses, including management fees, distribution and service fees (if applicable), and other fund expenses.
We are presenting only your ongoing operating expenses here.
Actual expenses/actual returns
The first line of each share class in the table on the following page is intended to provide information about the fund’s actual ongoing operating expenses, and is based on the fund’s actual return. It assumes an account value of $1,000.00 on September 1, 2019, with the same investment held until February 29, 2020.
Together with the value of your account, you may use this information to estimate the operating expenses that you paid over the period. Simply divide your account value at February 29, 2020, by $1,000.00, then multiply it by the “expenses paid” for your share class from the table. For example, for an account value of $8,600.00, the operating expenses should be calculated as follows:
Hypothetical example for comparison purposes
The second line of each share class in the table on the following page allows you to compare the fund’s ongoing operating expenses with those of any other fund. It provides an example of the fund’s hypothetical account values and hypothetical expenses based on each class’s actual expense ratio and an assumed 5% annualized return before expenses (which is not the class’s actual return). It assumes an account value of $1,000.00 on September 1, 2019, with the same investment held until February 29, 2020. Look in any other fund shareholder report to find its hypothetical example and you will be able to compare these expenses. Please remember that these hypothetical account values and expenses may not be used to estimate the actual ending account balance or expenses you paid for the period.
| | SEMIANNUAL REPORT | JOHN HANCOCK EMERGING MARKETS DEBT FUND | 7 |
Remember, these examples do not include any transaction costs, therefore, these examples will not help you to determine the relative total costs of owning different funds. If transaction costs were included, your expenses would have been higher. See the prospectuses for details regarding transaction costs.
SHAREHOLDER EXPENSE EXAMPLE CHART
| | | Account
value on
9-1-2019 | Ending
value on
2-29-2020 | Expenses
paid during
period ended
2-29-20201 | Annualized
expense
ratio |
| Class A | Actual expenses/actual returns | $1,000.00 | $1,046.10 | $6.00 | 1.18% |
| | Hypothetical example | 1,000.00 | 1,019.00 | 5.92 | 1.18% |
| Class C | Actual expenses/actual returns | 1,000.00 | 1,041.40 | 9.54 | 1.88% |
| | Hypothetical example | 1,000.00 | 1,015.50 | 9.42 | 1.88% |
| Class I | Actual expenses/actual returns | 1,000.00 | 1,046.50 | 4.48 | 0.88% |
| | Hypothetical example | 1,000.00 | 1,020.50 | 4.42 | 0.88% |
| Class R2 | Actual expenses/actual returns | 1,000.00 | 1,046.40 | 5.65 | 1.11% |
| | Hypothetical example | 1,000.00 | 1,019.30 | 5.57 | 1.11% |
| Class R6 | Actual expenses/actual returns | 1,000.00 | 1,047.10 | 3.92 | 0.77% |
| | Hypothetical example | 1,000.00 | 1,021.00 | 3.87 | 0.77% |
| Class NAV | Actual expenses/actual returns | 1,000.00 | 1,047.20 | 3.87 | 0.76% |
| | Hypothetical example | 1,000.00 | 1,021.10 | 3.82 | 0.76% |
| 1 | Expenses are equal to the annualized expense ratio, multiplied by the average account value over the period, multiplied by 182/366 (to reflect the one-half year period). |
| 8 | JOHN HANCOCK EMERGING MARKETS DEBT FUND | SEMIANNUAL REPORT | |
AS OF 2-29-20 (unaudited)
| | Rate (%) | Maturity date | | Par value^ | Value |
| Foreign government obligations 40.9% | | | | $425,786,806 |
| (Cost $438,106,827) | | | | | |
| Angola 1.0% | | | | | 9,887,678 |
| Republic of Angola | | | | | |
| Bond (A) | 9.125 | 11-26-49 | | 3,000,000 | 2,960,508 |
| Bond (A) | 9.500 | 11-12-25 | | 6,200,000 | 6,927,170 |
| Argentina 3.3% | | | | | 34,583,134 |
| Provincia de Buenos Aires | | | | | |
| Bond (A) | 7.875 | 06-15-27 | | 3,850,000 | 1,463,000 |
| Bond (A) | 9.950 | 06-09-21 | | 5,600,000 | 2,464,000 |
Provincia de Rio Negro
Bond (A) | 7.750 | 12-07-25 | | 2,300,000 | 1,035,000 |
| Republic of Argentina | | | | | |
| Bond | 4.625 | 01-11-23 | | 5,500,000 | 2,365,055 |
| Bond | 6.875 | 01-26-27 | | 11,840,000 | 5,002,518 |
| Bond | 7.625 | 04-22-46 | | 20,390,000 | 8,186,789 |
| Bond | 8.280 | 12-31-33 | | 26,540,579 | 14,066,772 |
| Bahrain 0.6% | | | | | 6,175,102 |
| Kingdom of Bahrain | | | | | |
| Bond (A) | 6.125 | 08-01-23 | | 2,000,000 | 2,185,557 |
| Bond (A) | 7.000 | 10-12-28 | | 3,450,000 | 3,989,545 |
| Brazil 2.8% | | | | | 28,641,413 |
| Federative Republic of Brazil | | | | | |
| Bond | 5.625 | 01-07-41 | | 4,300,000 | 5,057,918 |
| Note | 10.000 | 01-01-27 | BRL | 88,000,000 | 23,583,495 |
| China 1.1% | | | | | 11,128,917 |
The Export-Import Bank of China
Bond | 2.875 | 04-26-26 | | 10,400,000 | 11,128,917 |
| Colombia 1.6% | | | | | 16,189,070 |
| Republic of Colombia | | | | | |
| Bond | 4.000 | 02-26-24 | | 7,400,000 | 7,857,320 |
| Bond | 5.000 | 06-15-45 | | 6,900,000 | 8,331,750 |
| Costa Rica 0.1% | | | | | 997,500 |
Republic of Costa Rica
Bond | 4.250 | 01-26-23 | | 1,000,000 | 997,500 |
| Croatia 0.6% | | | | | 6,213,032 |
Republic of Croatia
Bond | 5.500 | 04-04-23 | | 5,650,000 | 6,213,032 |
| Dominican Republic 1.5% | | | | | 15,600,731 |
| Government of Dominican Republic | | | | | |
| Bond | 5.875 | 04-18-24 | | 5,500,000 | 5,912,555 |
| SEE NOTES TO FINANCIAL STATEMENTS | SEMIANNUAL REPORT | JOHN HANCOCK EMERGING MARKETS DEBT FUND | 9 |
| | Rate (%) | Maturity date | | Par value^ | Value |
Dominican
Republic (continued) | | | | | |
| Bond (A) | 5.875 | 01-30-60 | | 4,100,000 | $4,048,750 |
| Bond (A) | 5.950 | 01-25-27 | | 1,500,000 | 1,640,640 |
| Bond | 5.950 | 01-25-27 | | 900,000 | 984,384 |
| Bond (A) | 6.875 | 01-29-26 | | 2,650,000 | 3,014,402 |
| Egypt 1.8% | | | | | 18,570,428 |
| Arab Republic of Egypt | | | | | |
| Bond (A) | 5.875 | 06-11-25 | | 3,000,000 | 3,148,457 |
| Bond (A) | 7.500 | 01-31-27 | | 3,700,000 | 4,116,971 |
| Bond (A) | 7.903 | 02-21-48 | | 9,200,000 | 9,286,250 |
| Bond | 7.903 | 02-21-48 | | 2,000,000 | 2,018,750 |
| Ghana 0.8% | | | | | 7,932,629 |
| Republic of Ghana | | | | | |
| Bond | 7.625 | 05-16-29 | | 3,275,000 | 3,309,440 |
| Bond (A) | 7.875 | 02-11-35 | | 1,200,000 | 1,182,600 |
| Bond | 8.125 | 01-18-26 | | 3,150,000 | 3,440,589 |
| Honduras 0.1% | | | | | 1,169,448 |
Republic of Honduras
Bond (A) | 6.250 | 01-19-27 | | 1,050,000 | 1,169,448 |
| Hungary 1.8% | | | | | 18,878,526 |
| Republic of Hungary | | | | | |
| Bond | 5.375 | 02-21-23 | | 4,700,000 | 5,151,662 |
| Bond | 5.375 | 03-25-24 | | 12,100,000 | 13,726,864 |
| Indonesia 3.3% | | | | | 34,631,621 |
| Republic of Indonesia | | | | | |
| Bond (A) | 4.750 | 01-08-26 | | 6,350,000 | 7,111,193 |
| Bond | 4.750 | 01-08-26 | | 2,250,000 | 2,519,714 |
| Bond (A) | 5.375 | 10-17-23 | | 2,851,000 | 3,180,253 |
| Bond | 5.875 | 01-15-24 | | 1,100,000 | 1,246,376 |
| Bond | 6.625 | 05-15-33 | IDR | 201,923,000,000 | 13,073,783 |
| Bond | 6.625 | 02-17-37 | | 2,421,000 | 3,407,922 |
| Bond | 8.375 | 03-15-34 | IDR | 54,619,000,000 | 4,092,380 |
| Iraq 1.0% | | | | | 10,764,941 |
| Republic of Iraq | | | | | |
| Bond | 5.800 | 01-15-28 | | 10,078,000 | 9,574,100 |
| Bond (A) | 6.752 | 03-09-23 | | 1,200,000 | 1,190,841 |
| Kazakhstan 0.3% | | | | | 3,555,985 |
Republic of Kazakhstan
Bond (A) | 5.125 | 07-21-25 | | 3,100,000 | 3,555,985 |
| Kenya 0.6% | | | | | 6,548,234 |
| Republic of Kenya | | | | | |
| Bond (A) | 8.000 | 05-22-32 | | 3,000,000 | 3,243,414 |
| 10 | JOHN HANCOCK EMERGING MARKETS DEBT FUND | SEMIANNUAL REPORT | SEE NOTES TO FINANCIAL STATEMENTS |
| | Rate (%) | Maturity date | | Par value^ | Value |
| Kenya (continued) | | | | | |
| Bond (A) | 8.250 | 02-28-48 | | 3,100,000 | $3,304,820 |
| Mexico 0.9% | | | | | 9,040,102 |
| Government of Mexico | | | | | |
| Bond | 4.600 | 01-23-46 | | 8,000,000 | 9,040,080 |
| Bond | 7.750 | 05-29-31 | MXN | 400 | 22 |
| Namibia 0.3% | | | | | 3,494,286 |
Republic of Namibia
Bond (A) | 5.250 | 10-29-25 | | 3,400,000 | 3,494,286 |
| Nigeria 1.1% | | | | | 11,397,125 |
| Federal Republic of Nigeria | | | | | |
| Bond | 7.625 | 11-28-47 | | 2,550,000 | 2,370,138 |
| Bond (A) | 7.696 | 02-23-38 | | 2,600,000 | 2,495,996 |
| Bond (A) | 7.875 | 02-16-32 | | 2,000,000 | 2,009,536 |
| Bond | 7.875 | 02-16-32 | | 4,500,000 | 4,521,455 |
| Oman 1.6% | | | | | 16,807,909 |
| Sultanate of Oman | | | | | |
| Bond | 5.625 | 01-17-28 | | 6,000,000 | 5,978,117 |
| Bond | 6.750 | 01-17-48 | | 11,500,000 | 10,829,792 |
| Pakistan 0.4% | | | | | 4,204,404 |
Republic of Pakistan
Bond (A) | 6.875 | 12-05-27 | | 4,000,000 | 4,204,404 |
| Panama 0.6% | | | | | 5,859,978 |
| Republic of Panama | | | | | |
| Bond | 6.700 | 01-26-36 | | 3,050,000 | 4,418,718 |
| Bond | 8.875 | 09-30-27 | | 1,000,000 | 1,441,260 |
| Philippines 1.2% | | | | | 12,921,966 |
| Republic of Philippines | | | | | |
| Bond | 3.950 | 01-20-40 | | 8,600,000 | 10,413,515 |
| Bond | 5.500 | 03-30-26 | | 2,100,000 | 2,508,451 |
| Poland 0.4% | | | | | 4,531,139 |
Republic of Poland
Bond | 3.250 | 04-06-26 | | 4,190,000 | 4,531,139 |
| Qatar 2.2% | | | | | 23,136,596 |
| State of Qatar | | | | | |
| Bond | 4.500 | 04-23-28 | | 4,100,000 | 4,745,812 |
| Bond (A) | 4.817 | 03-14-49 | | 10,000,000 | 12,755,760 |
| Bond (A) | 5.103 | 04-23-48 | | 4,250,000 | 5,635,024 |
| Saudi Arabia 2.3% | | | | | 23,913,963 |
Kingdom of Saudi Arabia
Bond (A) | 5.250 | 01-16-50 | | 18,650,000 | 23,913,963 |
| SEE NOTES TO FINANCIAL STATEMENTS | SEMIANNUAL REPORT | JOHN HANCOCK EMERGING MARKETS DEBT FUND | 11 |
| | Rate (%) | Maturity date | | Par value^ | Value |
| Senegal 0.3% | | | | | $3,252,987 |
| Republic of Senegal | | | | | |
| Bond (A) | 6.250 | 05-23-33 | | 1,600,000 | 1,678,961 |
| Bond | 6.250 | 05-23-33 | | 1,500,000 | 1,574,026 |
| South Africa 1.8% | | | | | 18,521,059 |
| Republic of South Africa | | | | | |
| Bond | 4.300 | 10-12-28 | | 3,300,000 | 3,258,901 |
| Bond | 8.000 | 01-31-30 | ZAR | 256,173,733 | 15,262,158 |
| Sri Lanka 0.7% | | | | | 6,844,258 |
Republic of Sri Lanka
Bond | 6.750 | 04-18-28 | | 7,500,000 | 6,844,258 |
| Turkey 4.0% | | | | | 41,604,604 |
Export Credit Bank of Turkey
Bond (A) | 5.000 | 09-23-21 | | 12,050,000 | 12,100,609 |
| Republic of Turkey | | | | | |
| Bond | 4.250 | 04-14-26 | | 18,500,000 | 16,914,482 |
| Bond | 6.000 | 01-14-41 | | 9,650,000 | 8,607,913 |
| Bond | 6.250 | 09-26-22 | | 3,860,000 | 3,981,600 |
| Uzbekistan 0.4% | | | | | 4,404,768 |
Republic of Uzbekistan
Bond (A) | 5.375 | 02-20-29 | | 4,000,000 | 4,404,768 |
| Vietnam 0.4% | | | | | 4,383,273 |
Socialist Republic of Vietnam
Bond | 4.800 | 11-19-24 | | 4,000,000 | 4,383,273 |
|
| Corporate bonds 53.0% | | | | $552,296,886 |
| (Cost $512,664,733) | | | | | |
| Argentina 0.3% | | | | | 2,606,458 |
| Telecom Argentina SA (A) | 8.000 | 07-18-26 | | 2,830,000 | 2,606,458 |
| Austria 1.2% | | | | | 12,956,150 |
| JBS Investments II GmbH (A) | 5.750 | 01-15-28 | | 4,170,000 | 4,357,650 |
| JBS Investments II GmbH (A) | 7.000 | 01-15-26 | | 3,800,000 | 4,056,500 |
| Klabin Austria GmbH (A) | 7.000 | 04-03-49 | | 4,000,000 | 4,542,000 |
| Azerbaijan 0.7% | | | | | 7,134,319 |
| State Oil Company of the Azerbaijan Republic | 4.750 | 03-13-23 | | 6,800,000 | 7,134,319 |
| Brazil 3.6% | | | | | 37,177,933 |
| Banco BTG Pactual SA | 5.750 | 09-28-22 | | 4,200,000 | 4,378,500 |
| Banco do Brasil SA (6.250% to 4-15-24, then 10 Year CMT + 4.398%) (B) | 6.250 | 04-15-24 | | 3,340,000 | 3,328,310 |
| Globo Comunicacao e Participacoes SA (A) | 4.875 | 01-22-30 | | 6,900,000 | 6,900,000 |
| Odebrecht Finance, Ltd. (C) | 5.250 | 06-27-29 | | 2,200,000 | 110,000 |
| 12 | JOHN HANCOCK EMERGING MARKETS DEBT FUND | SEMIANNUAL REPORT | SEE NOTES TO FINANCIAL STATEMENTS |
| | Rate (%) | Maturity date | | Par value^ | Value |
| Brazil (continued) | | | | | |
| Odebrecht Finance, Ltd. (A)(B)(C) | 7.500 | 03-30-20 | | 2,540,000 | $114,325 |
| Odebrecht Offshore Drilling Finance, Ltd. (A) | 6.720 | 12-01-22 | | 405,887 | 401,828 |
| Odebrecht Offshore Drilling Finance, Ltd. (7.720% Cash or 2.048% PIK) (A) | 7.720 | 12-01-26 | | 1,801,634 | 386,450 |
| Odebrecht Oil & Gas Finance, Ltd. (A)(B) | 0.000 | 03-30-20 | | 253,378 | 1,774 |
| Petrobras Global Finance BV | 6.850 | 06-05-15 | | 11,300,000 | 13,376,375 |
| Vale Overseas, Ltd. | 6.875 | 11-21-36 | | 6,210,000 | 8,180,371 |
| Cayman Islands 2.3% | | | | | 24,333,153 |
| CK Hutchison International 17 II, Ltd. (A) | 3.250 | 09-29-27 | | 7,300,000 | 7,919,009 |
| Latam Finance, Ltd. (A) | 7.000 | 03-01-26 | | 5,350,000 | 5,350,000 |
| Three Gorges Finance I Cayman Islands, Ltd. | 3.150 | 06-02-26 | | 10,400,000 | 11,064,144 |
| Chile 1.7% | | | | | 18,231,724 |
| Colbun SA | 3.950 | 10-11-27 | | 4,000,000 | 4,245,040 |
| Empresa Electrica Angamos SA (A) | 4.875 | 05-25-29 | | 6,195,000 | 6,452,154 |
| Enel Americas SA | 4.000 | 10-25-26 | | 4,000,000 | 4,296,000 |
| Sociedad Quimica y Minera de Chile SA (A) | 4.250 | 05-07-29 | | 3,000,000 | 3,238,530 |
| Colombia 1.7% | | | | | 17,589,605 |
| Ecopetrol SA | 5.875 | 05-28-45 | | 9,700,000 | 11,583,740 |
| Empresas Publicas de Medellin ESP (A) | 4.250 | 07-18-29 | | 2,300,000 | 2,392,115 |
| Promigas SA ESP (A) | 3.750 | 10-16-29 | | 3,500,000 | 3,613,750 |
| Costa Rica 1.2% | | | | | 12,223,675 |
| Banco Nacional de Costa Rica | 6.250 | 11-01-23 | | 2,500,000 | 2,616,175 |
| Instituto Costarricense de Electricidad | 6.375 | 05-15-43 | | 10,980,000 | 9,607,500 |
| Dominican Republic 0.6% | | | | | 6,537,200 |
| Aeropuertos Dominicanos Siglo XXI SA | 6.750 | 03-30-29 | | 1,750,000 | 1,939,000 |
| Aeropuertos Dominicanos Siglo XXI SA (A) | 6.750 | 03-30-29 | | 4,150,000 | 4,598,200 |
| Guatemala 0.6% | | | | | 6,112,560 |
| Comunicaciones Celulares SA | 6.875 | 02-06-24 | | 6,000,000 | 6,112,560 |
| Hong Kong 0.3% | | | | | 3,347,702 |
| CNAC HK Finbridge Company, Ltd. | 4.875 | 03-14-25 | | 3,000,000 | 3,347,702 |
| SEE NOTES TO FINANCIAL STATEMENTS | SEMIANNUAL REPORT | JOHN HANCOCK EMERGING MARKETS DEBT FUND | 13 |
| | Rate (%) | Maturity date | | Par value^ | Value |
| India 1.7% | | | | | $17,400,270 |
| Adani Ports & Special Economic Zone, Ltd. (A) | 4.375 | 07-03-29 | | 3,500,000 | 3,758,482 |
| Shriram Transport Finance Company, Ltd. (A) | 5.100 | 07-16-23 | | 4,000,000 | 4,024,758 |
| Vedanta Resources, Ltd. (A) | 6.375 | 07-30-22 | | 2,990,000 | 2,849,470 |
| Vedanta Resources, Ltd. | 7.125 | 05-31-23 | | 3,020,000 | 2,870,510 |
| Vedanta Resources, Ltd. (A) | 7.125 | 05-31-23 | | 4,100,000 | 3,897,050 |
| Indonesia 6.1% | | | | | 63,717,791 |
| Chandra Asri Petrochemical Tbk PT (A) | 4.950 | 11-08-24 | | 2,000,000 | 1,972,473 |
| Chandra Asri Petrochemical Tbk PT | 4.950 | 11-08-24 | | 4,000,000 | 3,944,947 |
| Pelabuhan Indonesia III Persero PT (A) | 4.875 | 10-01-24 | | 9,100,000 | 9,896,250 |
| Pertamina Persero PT (A) | 4.150 | 02-25-60 | | 1,000,000 | 976,650 |
| Pertamina Persero PT (A) | 4.700 | 07-30-49 | | 7,000,000 | 7,606,032 |
| Pertamina Persero PT | 6.000 | 05-03-42 | | 8,200,000 | 10,192,639 |
| Pertamina Persero PT (A) | 6.000 | 05-03-42 | | 14,300,000 | 17,774,968 |
| Pertamina Persero PT (A) | 6.450 | 05-30-44 | | 8,500,000 | 11,353,832 |
| Ireland 0.0% | | | | | 208,262 |
| Sibur Securities DAC (A) | 4.125 | 10-05-23 | | 200,000 | 208,262 |
| Israel 1.1% | | | | | 11,239,884 |
| Israel Electric Corp., Ltd. (A) | 5.000 | 11-12-24 | | 6,000,000 | 6,675,000 |
| Israel Electric Corp., Ltd. (A) | 6.875 | 06-21-23 | | 4,000,000 | 4,564,884 |
| Luxembourg 2.6% | | | | | 27,266,998 |
| Hidrovias International Finance SARL (A) | 5.950 | 01-24-25 | | 2,800,000 | 2,870,000 |
| Kenbourne Invest SA (A) | 6.875 | 11-26-24 | | 4,000,000 | 4,080,000 |
| Klabin Finance SA (A) | 4.875 | 09-19-27 | | 5,800,000 | 6,082,808 |
| Millicom International Cellular SA (A) | 5.125 | 01-15-28 | | 5,800,000 | 5,974,000 |
| Millicom International Cellular SA (A) | 6.625 | 10-15-26 | | 500,000 | 535,150 |
| Rede D'or Finance Sarl (A) | 4.500 | 01-22-30 | | 7,915,000 | 7,725,040 |
| Mauritius 0.9% | | | | | 9,620,793 |
| MTN Mauritius Investments, Ltd. (A) | 4.755 | 11-11-24 | | 5,950,000 | 6,212,621 |
| MTN Mauritius Investments, Ltd. | 6.500 | 10-13-26 | | 3,000,000 | 3,408,172 |
| Mexico 9.3% | | | | | 96,590,643 |
| Alpek SAB de CV (A) | 4.250 | 09-18-29 | | 2,000,000 | 2,087,500 |
| Banco Mercantil del Norte SA (7.500% to 6-27-29, then 10 Year CMT + 5.470%) (A)(B) | 7.500 | 06-27-29 | | 2,200,000 | 2,486,022 |
| 14 | JOHN HANCOCK EMERGING MARKETS DEBT FUND | SEMIANNUAL REPORT | SEE NOTES TO FINANCIAL STATEMENTS |
| | Rate (%) | Maturity date | | Par value^ | Value |
| Mexico (continued) | | | | | |
| Credito Real SAB de CV (A) | 9.500 | 02-07-26 | | 10,000,000 | $11,300,000 |
| Cydsa SAB de CV | 6.250 | 10-04-27 | | 943,000 | 933,570 |
| Cydsa SAB de CV (A) | 6.250 | 10-04-27 | | 7,600,000 | 7,524,000 |
| Industrias Penoles SAB de CV (A) | 5.650 | 09-12-49 | | 5,600,000 | 6,104,000 |
| Infraestructura Energetica Nova SAB de CV (A) | 4.875 | 01-14-48 | | 2,800,000 | 2,838,500 |
| Mexico City Airport Trust (A) | 5.500 | 10-31-46 | | 7,100,000 | 7,793,670 |
| Mexico City Airport Trust | 5.500 | 07-31-47 | | 4,000,000 | 4,365,000 |
| Mexico City Airport Trust (A) | 5.500 | 07-31-47 | | 6,900,000 | 7,529,625 |
| Petroleos Mexicanos | 6.625 | 06-15-35 | | 10,880,000 | 10,885,440 |
| Petroleos Mexicanos (A) | 7.690 | 01-23-50 | | 12,000,000 | 12,492,000 |
| Trust F/1401 (A) | 6.950 | 01-30-44 | | 6,600,000 | 8,291,316 |
| Unifin Financiera SAB de CV (A) | 8.375 | 01-27-28 | | 11,500,000 | 11,960,000 |
| Mongolia 0.3% | | | | | 3,559,368 |
| Mongolian Mining Corp. (A) | 9.250 | 04-15-24 | | 4,000,000 | 3,559,368 |
| Netherlands 4.7% | | | | | 49,090,875 |
| Braskem Netherlands Finance BV (A) | 4.500 | 01-10-28 | | 11,150,000 | 10,913,063 |
| GTH Finance BV (A) | 7.250 | 04-26-23 | | 1,800,000 | 2,005,056 |
| GTH Finance BV | 7.250 | 04-26-23 | | 5,392,000 | 6,006,257 |
| Kazakhstan Temir Zholy Finance BV | 6.950 | 07-10-42 | | 4,600,000 | 6,394,000 |
| Listrindo Capital BV (A) | 4.950 | 09-14-26 | | 7,750,000 | 7,963,125 |
| Petrobras Global Finance BV (A) | 5.093 | 01-15-30 | | 7,122,000 | 7,620,540 |
| Prosus NV (A) | 4.850 | 07-06-27 | | 3,200,000 | 3,543,164 |
| VEON Holdings BV (A) | 4.950 | 06-16-24 | | 4,350,000 | 4,645,670 |
| Panama 0.5% | | | | | 5,036,425 |
| Banco General SA (A) | 4.125 | 08-07-27 | | 4,750,000 | 5,036,425 |
| Paraguay 0.3% | | | | | 2,612,500 |
| Telefonica Celular del Paraguay SA (A) | 5.875 | 04-15-27 | | 2,500,000 | 2,612,500 |
| Peru 3.4% | | | | | 35,083,440 |
| ABY Transmision Sur SA (A) | 6.875 | 04-30-43 | | 6,121,875 | 8,142,096 |
| Banco BBVA Peru SA (5.250% to 9-22-24, then 5 Year CMT + 2.750%) (A) | 5.250 | 09-22-29 | | 2,300,000 | 2,515,073 |
| Kallpa Generacion SA (A) | 4.875 | 05-24-26 | | 2,890,000 | 3,139,291 |
| Petroleos del Peru SA (A) | 5.625 | 06-19-47 | | 6,180,000 | 7,470,075 |
| SAN Miguel Industrias Pet SA (A) | 4.500 | 09-18-22 | | 9,990,000 | 10,134,855 |
| Volcan Cia Minera SAA | 5.375 | 02-02-22 | | 3,603,000 | 3,682,050 |
| Russia 2.5% | | | | | 25,990,563 |
| Gazprom Neft OAO | 6.000 | 11-27-23 | | 3,700,000 | 4,116,070 |
| SEE NOTES TO FINANCIAL STATEMENTS | SEMIANNUAL REPORT | JOHN HANCOCK EMERGING MARKETS DEBT FUND | 15 |
| | Rate (%) | Maturity date | | Par value^ | Value |
| Russia (continued) | | | | | |
| Mobile Telesystems OJSC | 5.000 | 05-30-23 | | 5,700,000 | $6,056,593 |
| Rosneft Oil Company (A) | 4.199 | 03-06-22 | | 4,100,000 | 4,171,898 |
| Russian Agricultural Bank OJSC | 8.500 | 10-16-23 | | 3,750,000 | 4,243,381 |
| Severstal OAO (A) | 3.850 | 08-27-21 | | 2,500,000 | 2,545,674 |
| Severstal OAO | 5.900 | 10-17-22 | | 4,510,000 | 4,856,947 |
| Singapore 2.0% | | | | | 20,404,771 |
| LLPL Capital Pte, Ltd. (A) | 6.875 | 02-04-39 | | 6,921,360 | 8,288,329 |
| Medco Bell Pte, Ltd. (A) | 6.375 | 01-30-27 | | 6,800,000 | 6,175,192 |
| Medco Oak Tree Pte, Ltd. (A) | 7.375 | 05-14-26 | | 6,100,000 | 5,941,250 |
| Thailand 0.8% | | | | | 7,865,207 |
| GC Treasury Center Company, Ltd. (A) | 4.250 | 09-19-22 | | 1,400,000 | 1,476,076 |
| PTTEP Canada International Finance, Ltd. (A) | 6.350 | 06-12-42 | | 2,600,000 | 3,913,745 |
| Thaioil Treasury Center Company, Ltd. (A) | 5.375 | 11-20-48 | | 1,800,000 | 2,475,386 |
| Togo 0.4% | | | | | 4,555,649 |
| Banque Ouest Africaine de Developpement (A) | 5.000 | 07-27-27 | | 4,200,000 | 4,555,649 |
| Turkey 0.5% | | | | | 5,553,649 |
| Turkcell Iletisim Hizmetleri AS (A) | 5.750 | 10-15-25 | | 5,500,000 | 5,553,649 |
| United Arab Emirates 0.2% | | | | | 2,053,276 |
| ADES International Holding PLC (A) | 8.625 | 04-24-24 | | 2,000,000 | 2,053,276 |
| United Kingdom 0.2% | | | | | 2,074,720 |
| Liquid Telecommunications Financing PLC (A) | 8.500 | 07-13-22 | | 2,050,000 | 2,074,720 |
| United States 0.3% | | | | | 3,220,067 |
| CNOOC Finance 2015 USA LLC | 3.500 | 05-05-25 | | 3,000,000 | 3,220,067 |
| Virgin Islands, British 1.0% | | | | | 10,901,256 |
| State Grid Overseas Investment 2016, Ltd. | 3.500 | 05-04-27 | | 10,000,000 | 10,901,256 |
|
| | | | | Shares | Value |
| Common stocks 0.0% | | | | | $342,215 |
| (Cost $5,909,631) | | | | | |
| Colombia 0.0% | | | | | 342,215 |
| Frontera Energy Corp. | | | 62,290 | 342,215 |
|
| 16 | JOHN HANCOCK EMERGING MARKETS DEBT FUND | SEMIANNUAL REPORT | SEE NOTES TO FINANCIAL STATEMENTS |
| | Yield* (%) | Maturity date | | Par value^ | Value |
| Short-term investments 5.4% | | | | $56,176,004 |
| (Cost $56,175,132) | | | | | |
| U.S. Government Agency2.1% | | | | | 21,843,000 |
| Federal Agricultural Mortgage Corp. Discount Note | 1.390 | 03-02-20 | | 4,287,000 | 4,287,000 |
| Federal Home Loan Bank Discount Note | 1.320 | 03-02-20 | | 17,556,000 | 17,556,000 |
| | | Yield (%) | | Shares | Value |
| Short-term funds 0.1% | | | | | 764,004 |
| JPMorgan U.S. Treasury Plus Money Market Fund, Institutional Class | 1.4286(D) | | 764,004 | 764,004 |
| | | | | Par value^ | Value |
| Repurchase agreement 3.2% | | | | | 33,569,000 |
| Barclays Tri-Party Repurchase Agreement dated 2-28-20 at 1.570% to be repurchased at $33,573,392 on 3-2-20, collateralized by $32,787,100 U.S. Treasury Notes, 1.875% due 6-30-26 (valued at $34,244,885) | | | 33,569,000 | 33,569,000 |
|
| Total investments (Cost $1,012,856,323) 99.3% | | | $1,034,601,911 |
| Other assets and liabilities, net 0.7% | | | 7,729,132 |
| Total net assets 100.0% | | | | | $1,042,331,043 |
| The percentage shown for each investment category is the total value of the category as a percentage of the net assets of the fund. |
| ^All par values are denominated in U.S. dollars unless otherwise indicated. |
| Currency Abbreviations |
| BRL | Brazilian Real |
| IDR | Indonesian Rupiah |
| MXN | Mexican Peso |
| ZAR | South African Rand |
| Security Abbreviations and Legend |
| CMT | Constant Maturity Treasury |
| PIK | Pay-in-Kind Security - Represents a payment-in-kind which may pay interest in additional par and/or cash. Rates shown are the current rate and most recent payment rate. |
| (A) | These securities are exempt from registration under Rule 144A of the Securities Act of 1933. Such securities may be resold, normally to qualified institutional buyers, in transactions exempt from registration. Rule 144A securities amounted to $517,812,362 or 49.7% of the fund's net assets as of 2-29-20. |
| (B) | Perpetual bonds have no stated maturity date. Date shown as maturity date is next call date. |
| (C) | Non-income producing - Issuer is in default. |
| (D) | The rate shown is the annualized seven-day yield as of 2-29-20. |
| * | Yield represents either the annualized yield at the date of purchase, the stated coupon rate or, for floating rate securities, the rate at period end. |
| SEE NOTES TO FINANCIAL STATEMENTS | SEMIANNUAL REPORT | JOHN HANCOCK EMERGING MARKETS DEBT FUND | 17 |
DERIVATIVES
FORWARD FOREIGN CURRENCY CONTRACTS
| Contract to buy | Contract to sell | Counterparty (OTC) | Contractual
settlement
date | Unrealized
appreciation | Unrealized
depreciation |
| COP | 31,005,000,000 | USD | 9,134,297 | GSI | 3/18/2020 | — | $(330,241) |
| EUR | 6,753,000 | USD | 7,570,399 | SSB | 3/18/2020 | — | (108,225) |
| | | | | | | — | $(438,466) |
| Derivatives Currency Abbreviations |
| COP | Colombian Peso |
| EUR | Euro |
| USD | U.S. Dollar |
| Derivatives Abbreviations |
| GSI | Goldman Sachs International |
| OTC | Over-the-counter |
| SSB | State Street Bank and Trust Company |
At 2-29-20, the aggregate cost of investments for federal income tax purposes was $1,018,667,890. Net unrealized appreciation aggregated to $15,495,555, of which $71,545,562 related to gross unrealized appreciation and $56,050,007 related to gross unrealized depreciation.
See Notes to financial statements regarding investment transactions and other derivatives information.
| 18 | JOHN HANCOCK EMERGING MARKETS DEBT FUND | SEMIANNUAL REPORT | SEE NOTES TO FINANCIAL STATEMENTS |
STATEMENT OF ASSETS AND LIABILITIES 2-29-20 (unaudited)
| Assets | |
| Unaffiliated investments, at value (Cost $1,012,856,323) | $1,034,601,911 |
| Cash | 826,198 |
| Foreign currency, at value (Cost $12,892) | 12,898 |
| Collateral segregated at custodian for OTC derivative contracts | 270,391 |
| Dividends and interest receivable | 13,056,298 |
| Other assets | 67,365 |
| Total assets | 1,048,835,061 |
| Liabilities | |
| Unrealized depreciation on forward foreign currency contracts | 438,466 |
| Distributions payable | 296 |
| Payable for fund shares repurchased | 5,930,032 |
| Payable to affiliates | |
| Accounting and legal services fees | 26,851 |
| Transfer agent fees | 1,727 |
| Trustees' fees | 1,847 |
| Other liabilities and accrued expenses | 104,799 |
| Total liabilities | 6,504,018 |
| Net assets | $1,042,331,043 |
| Net assets consist of | |
| Paid-in capital | $1,055,199,974 |
| Total distributable earnings (loss) | (12,868,931) |
| Net assets | $1,042,331,043 |
| |
| Net asset value per share | |
| Based on net asset value and shares outstanding - the fund has an unlimited number of shares authorized with no par value | |
| Class A ($2,788,944 ÷ 292,455 shares)1 | $9.54 |
| Class C ($706,569 ÷ 74,180 shares)1 | $9.53 |
| Class I ($14,605,831 ÷ 1,530,630 shares) | $9.54 |
| Class R2 ($161,389 ÷ 16,935 shares) | $9.53 |
| Class R6 ($3,189,374 ÷ 334,527 shares) | $9.53 |
| Class NAV ($1,020,878,936 ÷ 107,103,962 shares) | $9.53 |
| Maximum offering price per share | |
| Class A (net asset value per share ÷ 96%)2 | $9.94 |
| 1 | Redemption price per share is equal to net asset value less any applicable contingent deferred sales charge. |
| 2 | On single retail sales of less than $100,000. On sales of $100,000 or more and on group sales the offering price is reduced. |
| SEE NOTES TO FINANCIAL STATEMENTS | SEMIANNUAL REPORT | JOHN HANCOCK Emerging Markets Debt Fund | 19 |
STATEMENT OF OPERATIONS For the six months ended 2-29-20 (unaudited)
| Investment income | |
| Interest | $30,997,027 |
| Dividends | 19,444 |
| Less foreign taxes withheld | (53,214) |
| Total investment income | 30,963,257 |
| Expenses | |
| Investment management fees | 3,784,983 |
| Distribution and service fees | 7,398 |
| Accounting and legal services fees | 98,160 |
| Transfer agent fees | 11,147 |
| Trustees' fees | 9,863 |
| Custodian fees | 134,600 |
| State registration fees | 41,938 |
| Printing and postage | 15,288 |
| Professional fees | 55,623 |
| Other | 19,116 |
| Total expenses | 4,178,116 |
| Less expense reductions | (41,079) |
| Net expenses | 4,137,037 |
| Net investment income | 26,826,220 |
| Realized and unrealized gain (loss) | |
| Net realized gain (loss) on | |
| Unaffiliated investments and foreign currency transactions | (164,945) |
| Futures contracts | 118,821 |
| Forward foreign currency contracts | (173,474) |
| | (219,598) |
| Change in net unrealized appreciation (depreciation) of | |
| Unaffiliated investments and translation of assets and liabilities in foreign currencies | 24,468,009 |
| Forward foreign currency contracts | (140,627) |
| | 24,327,382 |
| Net realized and unrealized gain | 24,107,784 |
| Increase in net assets from operations | $50,934,004 |
| 20 | JOHN HANCOCK Emerging Markets Debt Fund | SEMIANNUAL REPORT | SEE NOTES TO FINANCIAL STATEMENTS |
STATEMENTS OF CHANGES IN NET ASSETS
| | Six months ended
2-29-20
(unaudited) | Year ended
8-31-19 |
| Increase (decrease) in net assets | | |
| From operations | | |
| Net investment income | $26,826,220 | $51,586,427 |
| Net realized loss | (219,598) | (766,644) |
| Change in net unrealized appreciation (depreciation) | 24,327,382 | 54,314,492 |
| Increase in net assets resulting from operations | 50,934,004 | 105,134,275 |
| Distributions to shareholders | | |
| From earnings | | |
| Class A | (60,831) | (108,051) |
| Class C | (12,324) | (24,999) |
| Class I | (353,332) | (672,391) |
| Class R2 | (3,198) | (3,437) |
| Class R41 | (454) | (2,357) |
| Class R6 | (81,673) | (88,695) |
| Class NAV | (26,660,484) | (51,081,161) |
| Total distributions | (27,172,296) | (51,981,091) |
| From fund share transactions | (71,778,026) | 178,526,658 |
| Total increase (decrease) | (48,016,318) | 231,679,842 |
| Net assets | | |
| Beginning of period | 1,090,347,361 | 858,667,519 |
| End of period | $1,042,331,043 | $1,090,347,361 |
| 1 | Class R4 shares were fully redeemed on 10-29-19. |
| SEE NOTES TO FINANCIAL STATEMENTS | SEMIANNUAL REPORT | JOHN HANCOCK Emerging Markets Debt Fund | 21 |
| CLASS A SHARES Period ended | 2-29-201 | 8-31-19 | 8-31-18 | 8-31-17 | 8-31-16 | 8-31-15 |
| Per share operating performance | | | | | | |
| Net asset value, beginning of period | $9.33 | $8.86 | $9.87 | $9.69 | $8.82 | $10.14 |
| Net investment income2 | 0.21 | 0.43 | 0.41 | 0.46 | 0.49 | 0.43 |
| Net realized and unrealized gain (loss) on investments | 0.22 | 0.48 | (0.96) | 0.23 | 0.85 | (1.28) |
| Total from investment operations | 0.43 | 0.91 | (0.55) | 0.69 | 1.34 | (0.85) |
| Less distributions | | | | | | |
| From net investment income | (0.22) | (0.44) | (0.46) | (0.51) | (0.47) | (0.44) |
| From tax return of capital | — | — | — | — | — | (0.03) |
| Total distributions | (0.22) | (0.44) | (0.46) | (0.51) | (0.47) | (0.47) |
| Net asset value, end of period | $9.54 | $9.33 | $8.86 | $9.87 | $9.69 | $8.82 |
| Total return (%)3,4 | 4.615 | 10.52 | (5.75) | 7.54 | 15.80 | (8.61) |
| Ratios and supplemental data | | | | | | |
| Net assets, end of period (in millions) | $3 | $2 | $3 | $4 | $2 | $2 |
| Ratios (as a percentage of average net assets): | | | | | | |
| Expenses before reductions | 1.196 | 1.19 | 1.18 | 1.21 | 1.24 | 1.39 |
| Expenses including reductions | 1.186 | 1.18 | 1.17 | 1.20 | 1.23 | 1.35 |
| Net investment income | 4.546 | 4.78 | 4.34 | 4.82 | 5.47 | 4.53 |
| Portfolio turnover (%) | 7 | 7 | 23 | 20 | 26 | 27 |
| 1 | Six months ended 2-29-20. Unaudited. |
| 2 | Based on average daily shares outstanding. |
| 3 | Total returns would have been lower had certain expenses not been reduced during the applicable periods. |
| 4 | Does not reflect the effect of sales charges, if any. |
| 5 | Not annualized. |
| 6 | Annualized. |
| 22 | JOHN HANCOCK Emerging Markets Debt Fund | SEMIANNUAL REPORT | SEE NOTES TO FINANCIAL STATEMENTS |
| CLASS C SHARES Period ended | 2-29-201 | 8-31-19 | 8-31-18 | 8-31-17 | 8-31-16 | 8-31-15 |
| Per share operating performance | | | | | | |
| Net asset value, beginning of period | $9.32 | $8.85 | $9.86 | $9.67 | $8.81 | $10.13 |
| Net investment income2 | 0.18 | 0.37 | 0.35 | 0.39 | 0.43 | 0.34 |
| Net realized and unrealized gain (loss) on investments | 0.21 | 0.48 | (0.96) | 0.25 | 0.84 | (1.28) |
| Total from investment operations | 0.39 | 0.85 | (0.61) | 0.64 | 1.27 | (0.94) |
| Less distributions | | | | | | |
| From net investment income | (0.18) | (0.38) | (0.40) | (0.45) | (0.41) | (0.35) |
| From tax return of capital | — | — | — | — | — | (0.03) |
| Total distributions | (0.18) | (0.38) | (0.40) | (0.45) | (0.41) | (0.38) |
| Net asset value, end of period | $9.53 | $9.32 | $8.85 | $9.86 | $9.67 | $8.81 |
| Total return (%)3,4 | 4.145 | 9.76 | (6.40) | 6.68 | 15.14 | (9.47) |
| Ratios and supplemental data | | | | | | |
| Net assets, end of period (in millions) | $1 | $1 | $1 | $1 | $—6 | $—6 |
| Ratios (as a percentage of average net assets): | | | | | | |
| Expenses before reductions | 1.897 | 1.89 | 1.88 | 1.90 | 1.94 | 3.59 |
| Expenses including reductions | 1.887 | 1.88 | 1.87 | 1.90 | 1.93 | 2.30 |
| Net investment income | 3.827 | 4.09 | 3.68 | 4.05 | 4.88 | 3.65 |
| Portfolio turnover (%) | 7 | 7 | 23 | 20 | 26 | 27 |
| 1 | Six months ended 2-29-20. Unaudited. |
| 2 | Based on average daily shares outstanding. |
| 3 | Total returns would have been lower had certain expenses not been reduced during the applicable periods. |
| 4 | Does not reflect the effect of sales charges, if any. |
| 5 | Not annualized. |
| 6 | Less than $500,000. |
| 7 | Annualized. |
| SEE NOTES TO FINANCIAL STATEMENTS | SEMIANNUAL REPORT | JOHN HANCOCK Emerging Markets Debt Fund | 23 |
| CLASS I SHARES Period ended | 2-29-201 | 8-31-19 | 8-31-18 | 8-31-17 | 8-31-16 | 8-31-15 |
| Per share operating performance | | | | | | |
| Net asset value, beginning of period | $9.34 | $8.86 | $9.88 | $9.70 | $8.83 | $10.15 |
| Net investment income2 | 0.23 | 0.46 | 0.44 | 0.48 | 0.53 | 0.47 |
| Net realized and unrealized gain (loss) on investments | 0.20 | 0.49 | (0.97) | 0.24 | 0.84 | (1.29) |
| Total from investment operations | 0.43 | 0.95 | (0.53) | 0.72 | 1.37 | (0.82) |
| Less distributions | | | | | | |
| From net investment income | (0.23) | (0.47) | (0.49) | (0.54) | (0.50) | (0.47) |
| From tax return of capital | — | — | — | — | — | (0.03) |
| Total distributions | (0.23) | (0.47) | (0.49) | (0.54) | (0.50) | (0.50) |
| Net asset value, end of period | $9.54 | $9.34 | $8.86 | $9.88 | $9.70 | $8.83 |
| Total return (%)3 | 4.654 | 10.95 | (5.56) | 7.87 | 16.14 | (8.23) |
| Ratios and supplemental data | | | | | | |
| Net assets, end of period (in millions) | $15 | $15 | $14 | $14 | $8 | $4 |
| Ratios (as a percentage of average net assets): | | | | | | |
| Expenses before reductions | 0.895 | 0.90 | 0.89 | 0.89 | 0.93 | 0.98 |
| Expenses including reductions | 0.885 | 0.89 | 0.88 | 0.89 | 0.92 | 0.97 |
| Net investment income | 4.825 | 5.06 | 4.64 | 5.01 | 5.97 | 4.89 |
| Portfolio turnover (%) | 7 | 7 | 23 | 20 | 26 | 27 |
| 1 | Six months ended 2-29-20. Unaudited. |
| 2 | Based on average daily shares outstanding. |
| 3 | Total returns would have been lower had certain expenses not been reduced during the applicable periods. |
| 4 | Not annualized. |
| 5 | Annualized. |
| 24 | JOHN HANCOCK Emerging Markets Debt Fund | SEMIANNUAL REPORT | SEE NOTES TO FINANCIAL STATEMENTS |
| CLASS R2 SHARES Period ended | 2-29-201 | 8-31-19 | 8-31-18 | 8-31-17 | 8-31-16 | 8-31-152 |
| Per share operating performance | | | | | | |
| Net asset value, beginning of period | $9.32 | $8.85 | $9.87 | $9.69 | $8.82 | $9.35 |
| Net investment income3 | 0.22 | 0.44 | 0.42 | 0.48 | 0.51 | 0.20 |
| Net realized and unrealized gain (loss) on investments | 0.21 | 0.48 | (0.97) | 0.23 | 0.85 | (0.53) |
| Total from investment operations | 0.43 | 0.92 | (0.55) | 0.71 | 1.36 | (0.33) |
| Less distributions | | | | | | |
| From net investment income | (0.22) | (0.45) | (0.47) | (0.53) | (0.49) | (0.19) |
| From tax return of capital | — | — | — | — | — | (0.01) |
| Total distributions | (0.22) | (0.45) | (0.47) | (0.53) | (0.49) | (0.20) |
| Net asset value, end of period | $9.53 | $9.32 | $8.85 | $9.87 | $9.69 | $8.82 |
| Total return (%)4 | 4.645 | 10.62 | (5.75) | 7.70 | 16.02 | (3.60)5 |
| Ratios and supplemental data | | | | | | |
| Net assets, end of period (in millions) | $—6 | $—6 | $—6 | $—6 | $—6 | $—6 |
| Ratios (as a percentage of average net assets): | | | | | | |
| Expenses before reductions | 1.127 | 1.12 | 1.08 | 1.06 | 1.08 | 1.067 |
| Expenses including reductions | 1.117 | 1.11 | 1.07 | 1.06 | 1.07 | 1.057 |
| Net investment income | 4.647 | 4.85 | 4.40 | 5.02 | 5.78 | 4.917 |
| Portfolio turnover (%) | 7 | 7 | 23 | 20 | 26 | 278 |
| 1 | Six months ended 2-29-20. Unaudited. |
| 2 | The inception date for Class R2 shares is 3-27-15. |
| 3 | Based on average daily shares outstanding. |
| 4 | Total returns would have been lower had certain expenses not been reduced during the applicable periods. |
| 5 | Not annualized. |
| 6 | Less than $500,000. |
| 7 | Annualized. |
| 8 | Portfolio turnover is shown for the period from 9-1-14 to 8-31-15. |
| SEE NOTES TO FINANCIAL STATEMENTS | SEMIANNUAL REPORT | JOHN HANCOCK Emerging Markets Debt Fund | 25 |
| CLASS R6 SHARES Period ended | 2-29-201 | 8-31-19 | 8-31-18 | 8-31-17 | 8-31-16 | 8-31-152 |
| Per share operating performance | | | | | | |
| Net asset value, beginning of period | $9.33 | $8.85 | $9.87 | $9.69 | $8.82 | $9.35 |
| Net investment income3 | 0.23 | 0.48 | 0.46 | 0.48 | 0.49 | 0.21 |
| Net realized and unrealized gain (loss) on investments | 0.21 | 0.47 | (0.98) | 0.25 | 0.89 | (0.53) |
| Total from investment operations | 0.44 | 0.95 | (0.52) | 0.73 | 1.38 | (0.32) |
| Less distributions | | | | | | |
| From net investment income | (0.24) | (0.47) | (0.50) | (0.55) | (0.51) | (0.20) |
| From tax return of capital | — | — | — | — | — | (0.01) |
| Total distributions | (0.24) | (0.47) | (0.50) | (0.55) | (0.51) | (0.21) |
| Net asset value, end of period | $9.53 | $9.33 | $8.85 | $9.87 | $9.69 | $8.82 |
| Total return (%)4 | 4.715 | 11.05 | (5.48) | 7.99 | 16.33 | (3.49)5 |
| Ratios and supplemental data | | | | | | |
| Net assets, end of period (in millions) | $3 | $3 | $1 | $1 | $—6 | $—6 |
| Ratios (as a percentage of average net assets): | | | | | | |
| Expenses before reductions | 0.787 | 0.79 | 0.79 | 0.80 | 0.83 | 0.817 |
| Expenses including reductions | 0.777 | 0.78 | 0.78 | 0.79 | 0.81 | 0.787 |
| Net investment income | 4.957 | 5.22 | 4.83 | 5.04 | 5.37 | 5.177 |
| Portfolio turnover (%) | 7 | 7 | 23 | 20 | 26 | 278 |
| 1 | Six months ended 2-29-20. Unaudited. |
| 2 | The inception date for Class R6 shares is 3-27-15. |
| 3 | Based on average daily shares outstanding. |
| 4 | Total returns would have been lower had certain expenses not been reduced during the applicable periods. |
| 5 | Not annualized. |
| 6 | Less than $500,000. |
| 7 | Annualized. |
| 8 | Portfolio turnover is shown for the period from 9-1-14 to 8-31-15. |
| 26 | JOHN HANCOCK Emerging Markets Debt Fund | SEMIANNUAL REPORT | SEE NOTES TO FINANCIAL STATEMENTS |
| CLASS NAV SHARES Period ended | 2-29-201 | 8-31-19 | 8-31-18 | 8-31-17 | 8-31-16 | 8-31-15 |
| Per share operating performance | | | | | | |
| Net asset value, beginning of period | $9.33 | $8.85 | $9.87 | $9.69 | $8.82 | $10.14 |
| Net investment income2 | 0.23 | 0.47 | 0.45 | 0.50 | 0.54 | 0.49 |
| Net realized and unrealized gain (loss) on investments | 0.21 | 0.49 | (0.97) | 0.24 | 0.84 | (1.29) |
| Total from investment operations | 0.44 | 0.96 | (0.52) | 0.74 | 1.38 | (0.80) |
| Less distributions | | | | | | |
| From net investment income | (0.24) | (0.48) | (0.50) | (0.56) | (0.51) | (0.48) |
| From tax return of capital | — | — | — | — | — | (0.04) |
| Total distributions | (0.24) | (0.48) | (0.50) | (0.56) | (0.51) | (0.52) |
| Net asset value, end of period | $9.53 | $9.33 | $8.85 | $9.87 | $9.69 | $8.82 |
| Total return (%)3 | 4.724 | 11.10 | (5.46) | 8.00 | 16.29 | (8.09) |
| Ratios and supplemental data | | | | | | |
| Net assets, end of period (in millions) | $1,021 | $1,069 | $840 | $797 | $570 | $552 |
| Ratios (as a percentage of average net assets): | | | | | | |
| Expenses before reductions | 0.775 | 0.77 | 0.77 | 0.79 | 0.81 | 0.79 |
| Expenses including reductions | 0.765 | 0.77 | 0.77 | 0.78 | 0.81 | 0.78 |
| Net investment income | 4.955 | 5.21 | 4.79 | 5.28 | 6.03 | 5.17 |
| Portfolio turnover (%) | 7 | 7 | 23 | 20 | 26 | 27 |
| 1 | Six months ended 2-29-20. Unaudited. |
| 2 | Based on average daily shares outstanding. |
| 3 | Total returns would have been lower had certain expenses not been reduced during the applicable periods. |
| 4 | Not annualized. |
| 5 | Annualized. |
| SEE NOTES TO FINANCIAL STATEMENTS | SEMIANNUAL REPORT | JOHN HANCOCK Emerging Markets Debt Fund | 27 |
| Notes to financial statements (unaudited) | |
Note 1—Organization
John Hancock Emerging Markets Debt Fund (the fund) is a series of John Hancock Funds II (the Trust), an open-end management investment company organized as a Massachusetts business trust and registered under the Investment Company Act of 1940, as amended (the 1940 Act). The investment objective of the fund is to seek total return with an emphasis on current income as well as capital appreciation.
The fund may offer multiple classes of shares. The shares currently outstanding are detailed in the Statement of assets and liabilities. Class A and Class C shares are offered to all investors. Class I shares are offered to institutions and certain investors. Class R2 shares are available only to certain retirement and 529 plans. Class R6 shares are only available to certain retirement plans, institutions and other investors. Class NAV shares are offered to John Hancock affiliated funds of funds, retirement plans for employees of John Hancock and/or Manulife Financial Corporation, and certain 529 plans. Class C shares convert to Class A shares ten years after purchase (certain exclusions may apply). Shareholders of each class have exclusive voting rights to matters that affect that class. The distribution and service fees, if any, and transfer agent fees for each class may differ.
All Class R4 shares were redeemed on October 29, 2019.
Note 2—Significant accounting policies
The financial statements have been prepared in conformity with accounting principles generally accepted in the United States of America (US GAAP), which require management to make certain estimates and assumptions as of the date of the financial statements. Actual results could differ from those estimates and those differences could be significant. The fund qualifies as an investment company under Topic 946 of Accounting Standards Codification of US GAAP.
Events or transactions occurring after the end of the fiscal period through the date that the financial statements were issued have been evaluated in the preparation of the financial statements. The following summarizes the significant accounting policies of the fund:
Security valuation. Investments are stated at value as of the scheduled close of regular trading on the New York Stock Exchange (NYSE), normally at 4:00 P.M., Eastern Time. In case of emergency or other disruption resulting in the NYSE not opening for trading or the NYSE closing at a time other than the regularly scheduled close, the net asset value (NAV) may be determined as of the regularly scheduled close of the NYSE pursuant to the fund's Valuation Policies and Procedures.
In order to value the securities, the fund uses the following valuation techniques: Debt obligations are typically valued based on the evaluated prices provided by an independent pricing vendor. Independent pricing vendors utilize matrix pricing, which takes into account factors such as institutional-size trading in similar groups of securities, yield, quality, coupon rate, maturity, type of issue, trading characteristics and other market data, as well as broker supplied prices. Equity securities, including exchange-traded or closed-end funds, are typically valued at the last sale price or official closing price on the exchange or principal market where the security trades. In the event there were no sales during the day or closing prices are not available, the securities are valued using the last available bid price. Investments by the fund in open-end mutual funds are valued at their respective NAVs each business day. Forward foreign currency contracts are valued at the prevailing forward rates which are based on foreign currency exchange spot rates and forward points supplied by an independent pricing vendor. Foreign securities and currencies are valued in U.S. dollars based on foreign currency exchange rates supplied by an independent pricing vendor.
In certain instances, the Pricing Committee may determine to value equity securities using prices obtained from another exchange or market if trading on the exchange or market on which prices are typically obtained did not open for trading as scheduled, or if trading closed earlier than scheduled, and trading occurred as normal on another exchange or market.
| 28 | JOHN HANCOCK Emerging Markets Debt Fund | SEMIANNUAL REPORT | |
Other portfolio securities and assets, for which reliable market quotations are not readily available, are valued at fair value as determined in good faith by the fund's Pricing Committee following procedures established by the Board of Trustees. The frequency with which these fair valuation procedures are used cannot be predicted and fair value of securities may differ significantly from the value that would have been used had a ready market for such securities existed. Trading in foreign securities may be completed before the scheduled daily close of trading on the NYSE. Significant events at the issuer or market level may affect the values of securities between the time when the valuation of the securities is generally determined and the close of the NYSE. If a significant event occurs, these securities may be fair valued, as determined in good faith by the fund's Pricing Committee, following procedures established by the Board of Trustees. The fund uses fair value adjustment factors provided by an independent pricing vendor to value certain foreign securities in order to adjust for events that may occur between the close of foreign exchanges or markets and the close of the NYSE.
The fund uses a three-tier hierarchy to prioritize the pricing assumptions, referred to as inputs, used in valuation techniques to measure fair value. Level 1 includes securities valued using quoted prices in active markets for identical securities, including registered investment companies. Level 2 includes securities valued using other significant observable inputs. Observable inputs may include quoted prices for similar securities, interest rates, prepayment speeds and credit risk. Prices for securities valued using these inputs are received from independent pricing vendors and brokers and are based on an evaluation of the inputs described. Level 3 includes securities valued using significant unobservable inputs when market prices are not readily available or reliable, including the fund's own assumptions in determining the fair value of investments. Factors used in determining value may include market or issuer specific events or trends, changes in interest rates and credit quality. The inputs or methodology used for valuing securities are not necessarily an indication of the risks associated with investing in those securities. Changes in valuation techniques and related inputs may result in transfers into or out of an assigned level within the disclosure hierarchy.
The following is a summary of the values by input classification of the fund's investments as of February 29, 2020, by major security category or type:
| | Total
value at
2-29-20 | Level 1
quoted
price | Level 2
significant
observable
inputs | Level 3
significant
unobservable
inputs |
| Investments in securities: | | | | |
| Assets | | | | |
| Foreign government obligations | $425,786,806 | — | $425,786,806 | — |
| Corporate bonds | 552,296,886 | — | 552,296,886 | — |
| Common stocks | 342,215 | $342,215 | — | — |
| Short-term investments | 56,176,004 | 764,004 | 55,412,000 | — |
| Total investments in securities | $1,034,601,911 | $1,106,219 | $1,033,495,692 | — |
| Derivatives: | | | | |
| Liabilities | | | | |
| Forward foreign currency contracts | $(438,466) | — | $(438,466) | — |
Repurchase agreements. The fund may enter into repurchase agreements. When the fund enters into a repurchase agreement, it receives collateral that is held in a segregated account by the fund's custodian, or for tri-party repurchase agreements, collateral is held at a third-party custodian bank in a segregated account for the benefit of the fund. The collateral amount is marked-to-market and monitored on a daily basis to ensure that the collateral held is in an amount not less than the principal amount of the repurchase agreement plus any accrued interest. Collateral received by the fund for repurchase agreements is disclosed in the Fund's investments as part of the caption related to the repurchase agreement.
Repurchase agreements are typically governed by the terms and conditions of the Master Repurchase Agreement
| | SEMIANNUAL REPORT | JOHN HANCOCK Emerging Markets Debt Fund | 29 |
and/or Global Master Repurchase Agreement (collectively, MRA). Upon an event of default, the non-defaulting party may close out all transactions traded under the MRA and net amounts owed. Absent an event of default, assets and liabilities resulting from repurchase agreements are not offset in the Statement of assets and liabilities. In the event of a default by the counterparty, realization of the collateral proceeds could be delayed, during which time the collateral value may decline or the counterparty may have insufficient assets to pay claims resulting from close-out of the transactions.
Security transactions and related investment income. Investment security transactions are accounted for on a trade date plus one basis for daily NAV calculations. However, for financial reporting purposes, investment transactions are reported on trade date. Interest income is accrued as earned. Interest income includes coupon interest and amortization/accretion of premiums/discounts on debt securities. Debt obligations may be placed in a non-accrual status and related interest income may be reduced by stopping current accruals and writing off interest receivable when the collection of all or a portion of interest has become doubtful. Dividend income is recorded on the ex-date, except for dividends of certain foreign securities where the dividend may not be known until after the ex-date. In those cases, dividend income, net of withholding taxes, is recorded when the fund becomes aware of the dividends. Non-cash dividends, if any, are recorded at the fair market value of the securities received. Gains and losses on securities sold are determined on the basis of identified cost and may include proceeds from litigation.
Foreign investing. Assets, including investments, and liabilities denominated in foreign currencies are translated into U.S. dollar values each day at the prevailing exchange rate. Purchases and sales of securities, income and expenses are translated into U.S. dollars at the prevailing exchange rate on the date of the transaction. The effect of changes in foreign currency exchange rates on the value of securities is reflected as a component of the realized and unrealized gains (losses) on investments. Foreign investments are subject to a decline in the value of a foreign currency versus the U.S. dollar, which reduces the dollar value of securities denominated in that currency.
Funds that invest internationally generally carry more risk than funds that invest strictly in U.S. securities. These risks are heightened for investments in emerging markets. Risks can result from differences in economic and political conditions, regulations, market practices (including higher transaction costs), accounting standards and other factors.
Foreign taxes. The fund may be subject to withholding tax on income, capital gains or repatriation taxes imposed by certain countries, a portion of which may be recoverable. Foreign taxes are accrued based upon the fund's understanding of the tax rules and rates that exist in the foreign markets in which it invests. Taxes are accrued based on gains realized by the fund as a result of certain foreign security sales. In certain circumstances, estimated taxes are accrued based on unrealized appreciation of such securities. Investment income is recorded net of foreign withholding taxes.
Overdraft. The fund may have the ability to borrow from banks for temporary or emergency purposes, including meeting redemption requests that otherwise might require the untimely sale of securities. Pursuant to the fund's custodian agreement, the custodian may loan money to the fund to make properly authorized payments. The fund is obligated to repay the custodian for any overdraft, including any related costs or expenses. The custodian may have a lien, security interest or security entitlement in any fund property that is not otherwise segregated or pledged, to the extent of any overdraft, and to the maximum extent permitted by law.
Line of credit. The fund and other affiliated funds have entered into a syndicated line of credit agreement with Citibank, N.A. as the administrative agent that enables them to participate in a $750 million unsecured committed line of credit. Excluding commitments designated for a certain fund and subject to the needs of all other affiliated funds, the fund can borrow up to an aggregate commitment amount of $500 million, subject to asset coverage and other limitations as specified in the agreement. A commitment fee payable at the end of each calendar quarter, based on the average daily unused portion of the line of credit, is charged to each participating fund
| 30 | JOHN HANCOCK Emerging Markets Debt Fund | SEMIANNUAL REPORT | |
based on a combination of fixed and asset based allocations and is reflected in Other expenses on the Statement of operations. For the six months ended February 29, 2020, the fund had no borrowings under the line of credit. Commitment fees for the six months ended February 29, 2020 were $2,151.
Expenses. Within the John Hancock group of funds complex, expenses that are directly attributable to an individual fund are allocated to such fund. Expenses that are not readily attributable to a specific fund are allocated among all funds in an equitable manner, taking into consideration, among other things, the nature and type of expense and the fund’s relative net assets. Expense estimates are accrued in the period to which they relate and adjustments are made when actual amounts are known.
Class allocations. Income, common expenses and realized and unrealized gains (losses) are determined at the fund level and allocated daily to each class of shares based on the net assets of the class. Class-specific expenses, such as distribution and service fees, if any, and transfer agent fees, for all classes, are charged daily at the class level based on the net assets of each class and the specific expense rates applicable to each class.
Change in accounting principle. Accounting Standards Update (ASU) 2017-08,Premium Amortization on Purchased Callable Debt Securities, shortens the premium amortization period for purchased non contingently callable debt securities and is effective for public companies with fiscal years beginning after December 15, 2018. Adoption of the ASU did not have a material impact to the fund.
Federal income taxes. The fund intends to continue to qualify as a regulated investment company by complying with the applicable provisions of the Internal Revenue Code and will not be subject to federal income tax on taxable income that is distributed to shareholders. Therefore, no federal income tax provision is required.
For federal income tax purposes, as of August 31, 2019, the fund has a short-term capital loss carryforward of $8,888,496 and a long-term capital loss carryforward of $19,179,250 available to offset future net realized capital gains.These carryforwards do not expire.
As of August 31, 2019, the fund had no uncertain tax positions that would require financial statement recognition, derecognition or disclosure. The fund's federal tax returns are subject to examination by the Internal Revenue Service for a period of three years.
Distribution of income and gains. Distributions to shareholders from net investment income and net realized gains, if any, are recorded on the ex-date. The fund generally declares dividends daily and pays them monthly. Capital gain distributions, if any, are typically distributed annually.
Distributions paid by the fund with respect to each class of shares are calculated in the same manner, at the same time and in the same amount, except for the effect of class level expenses that may be applied differently to each class.
Such distributions, on a tax basis, are determined in conformity with income tax regulations, which may differ from US GAAP. Distributions in excess of tax basis earnings and profits, if any, are reported in the fund's financial statements as a return of capital. The final determination of tax characteristics of the fund's distribution will occur at the end of the year and will subsequently be reported to shareholders.
Capital accounts within the financial statements are adjusted for permanent book-tax differences. These adjustments have no impact on net assets or the results of operations. Temporary book-tax differences, if any, will reverse in a subsequent period. Book-tax differences are primarily attributable to foreign currency transactions, characterization of distributions and amortization and accretion of debt securities.
Note 3—Derivative instruments
The fund may invest in derivatives in order to meet its investment objective. Derivatives include a variety of different instruments that may be traded in the over-the-counter (OTC) market, on a regulated exchange or through a clearing facility. The risks in using derivatives vary depending upon the structure of the instruments,
| | SEMIANNUAL REPORT | JOHN HANCOCK Emerging Markets Debt Fund | 31 |
including the use of leverage, optionality, the liquidity or lack of liquidity of the contract, the creditworthiness of the counterparty or clearing organization and the volatility of the position. Some derivatives involve risks that are potentially greater than the risks associated with investing directly in the referenced securities or other referenced underlying instrument. Specifically, the fund is exposed to the risk that the counterparty to an OTC derivatives contract will be unable or unwilling to make timely settlement payments or otherwise honor its obligations. OTC derivatives transactions typically can only be closed out with the other party to the transaction.
Derivatives which are typically traded through the OTC market are regulated by the Commodity Futures Trading Commission (the CFTC). Derivative counterparty risk is managed through an ongoing evaluation of the creditworthiness of all potential counterparties and, if applicable, designated clearing organizations. The fund attempts to reduce its exposure to counterparty risk for derivatives traded in the OTC market, whenever possible, by entering into an International Swaps and Derivatives Association (ISDA) Master Agreement with each of its OTC counterparties. The ISDA gives each party to the agreement the right to terminate all transactions traded under the agreement if there is certain deterioration in the credit quality or contractual default of the other party, as defined in the ISDA. Upon an event of default or a termination of the ISDA, the non-defaulting party has the right to close out all transactions and to net amounts owed.
As defined by the ISDA, the fund may have collateral agreements with certain counterparties to mitigate counterparty risk on OTC derivatives. Subject to established minimum levels, collateral for OTC transactions is generally determined based on the net aggregate unrealized gain or loss on contracts with a particular counterparty. Collateral pledged to the fund, if any, is held in a segregated account by a third-party agent or held by the custodian bank for the benefit of the fund and can be in the form of cash or debt securities issued by the U.S. government or related agencies; collateral posted by the fund, if any, for OTC transactions is held in a segregated account at the fund's custodian and is noted in the accompanying Fund's investments, or if cash is posted, on the Statement of assets and liabilities. The fund's risk of loss due to counterparty risk is equal to the asset value of outstanding contracts offset by collateral received.
Certain derivatives are traded or cleared on an exchange or central clearinghouse. Exchange-traded or centrally-cleared transactions generally present less counterparty risk to a fund than OTC transactions. The exchange or clearinghouse stands between the fund and the broker to the contract and therefore, credit risk is generally limited to the failure of the exchange or clearinghouse and the clearing member.
Futures. A futures contract is a contractual agreement to buy or sell a particular currency or financial instrument at a pre-determined price in the future. Futures are traded on an exchange and cleared through a central clearinghouse. Risks related to the use of futures contracts include possible illiquidity of the futures markets and contract prices that can be highly volatile and imperfectly correlated to movements in the underlying financial instrument and potential losses in excess of the amounts recognized on the Statement of assets and liabilities. Use of long futures contracts subjects the fund to the risk of loss up to the notional value of the futures contracts. Use of short futures contracts subjects the fund to unlimited risk of loss.
Upon entering into a futures contract, the fund is required to deposit initial margin with the broker in the form of cash or securities. The amount of required margin is set by the broker and is generally based on a percentage of the contract value. The margin deposit must then be maintained at the established level over the life of the contract. Cash that has been pledged by the fund is detailed in the Statement of assets and liabilities as Collateral held at broker for futures contracts. Securities pledged by the fund, if any, are identified in the Fund's investments. Subsequent payments, referred to as variation margin, are made or received by the fund periodically and are based on changes in the market value of open futures contracts. Futures contracts are marked-to-market daily and unrealized gain or loss is recorded by the fund. When the contract is closed, the fund records a realized gain or loss equal to the difference between the value of the contract at the time it was opened and the value at the time it was closed.
During the six months ended February 29, 2020, the fund used futures contracts to manage duration of the fund
| 32 | JOHN HANCOCK Emerging Markets Debt Fund | SEMIANNUAL REPORT | |
and manage against anticipated interest rate changes. The fund held futures contracts with USD notional values ranging up to $22.2 million, as measured at each quarter end. There were no open futures contracts as of February 29, 2020.
Forward foreign currency contracts. A forward foreign currency contract is an agreement between two parties to buy and sell specific currencies at a price that is set on the date of the contract. The forward contract calls for delivery of the currencies on a future date that is specified in the contract. Forwards are typically traded OTC. Risks related to the use of forwards include the possible failure of counterparties to meet the terms of the forward agreement, the failure of the counterparties to timely post collateral if applicable, and the risk that currency movements will not favor the fund thereby reducing the fund's total return, and the potential for losses in excess of the amounts recognized on the Statement of assets and liabilities.
The market value of a forward foreign currency contract fluctuates with changes in foreign currency exchange rates. Forward foreign currency contracts are marked-to-market daily and the change in value is recorded by the fund as an unrealized gain or loss. Realized gains or losses, equal to the difference between the value of the contract at the time it was opened and the value at the time it was closed, are recorded upon delivery or receipt of the currency or settlement with the counterparty.
During the six months ended February 29, 2020, the fund used forward foreign currency contracts to manage against anticipated changes in currency exchange rates, gain exposure to foreign currency and to maintain diversity and liquidity of the fund. The fund held forward foreign currency contracts with USD notional values ranging from $16.6 million to $57.5 million, as measured at each quarter end.
Fair value of derivative instruments by risk category
The table below summarizes the fair value of derivatives held by the fund at February 29, 2020 by risk category:
| Risk | Statement of assets
and liabilities
location | Financial
instruments
location | Assets
derivatives
fair value | Liabilities
derivatives
fair value |
| Currency | Unrealized appreciation / depreciation on forward foreign currency contracts | Forward foreign currency contracts | — | $(438,466) |
For financial reporting purposes, the fund does not offset OTC derivative assets or liabilities that are subject to master netting arrangements, as defined by the ISDAs, in the Statement of assets and liabilities. In the event of default by the counterparty or a termination of the agreement, the ISDA allows an offset of amounts across the various transactions between the fund and the applicable counterparty.
Effect of derivative instruments on the Statement of operations
The table below summarizes the net realized gain (loss) included in the net increase (decrease) in net assets from operations, classified by derivative instrument and risk category, for the six months ended February 29, 2020:
| | Statement of operations location - Net realized gain (loss) on: |
| Risk | Futures contracts | Forward foreign
currency contracts | Total |
| Interest rate | $118,821 | — | $118,821 |
| Currency | — | $(173,474) | (173,474) |
| Total | $118,821 | $(173,474) | $(54,653) |
| | SEMIANNUAL REPORT | JOHN HANCOCK Emerging Markets Debt Fund | 33 |
The table below summarizes the net change in unrealized appreciation (depreciation) included in the net increase (decrease) in net assets from operations, classified by derivative instrument and risk category, for the six months ended February 29, 2020:
| | Statement of operations location - Change in net unrealized appreciation (depreciation) of: |
| Risk | Forward foreign
currency contracts |
| Currency | $(140,627) |
Note 4—Guarantees and indemnifications
Under the Trust's organizational documents, its Officers and Trustees are indemnified against certain liabilities arising out of the performance of their duties to the Trust, including the fund. Additionally, in the normal course of business, the fund enters into contracts with service providers that contain general indemnification clauses. The fund's maximum exposure under these arrangements is unknown, as this would involve future claims that may be made against the fund that have not yet occurred. The risk of material loss from such claims is considered remote.
Note 5—Fees and transactions with affiliates
John Hancock Investment Management LLC (the Advisor) serves as investment advisor for the fund. John Hancock Investment Management Distributors LLC (the Distributor), an affiliate of the Advisor, serves as principal underwriter of the fund. The Advisor and the Distributor are indirect, wholly owned subsidiaries of Manulife Financial Corporation (MFC).
Management fee. The fund has an investment management agreement with the Advisor under which the fund pays a monthly management fee to the Advisor equivalent on an annual basis to the sum of: (a) 0.725% of the first $250 million of the fund’s average daily net assets; (b) 0.700% of the next $500 million of the fund’s average daily net assets, and (c) 0.675% of the fund’s average daily net assets in excess of $750 million. The Advisor has a subadvisory agreement with Manulife Investment Management (US) LLC (Subadvisor), an indirectly owned subsidiary of MFC and an affiliate of the Advisor. The fund is not responsible for payment of the subadvisory fees.
The Advisor has contractually agreed to waive a portion of its management fee and/or reimburse expenses for certain funds of the John Hancock group of funds complex, including the fund (the participating portfolios). This waiver is based upon aggregate net assets of all the participating portfolios. The amount of the reimbursement is calculated daily and allocated among all the participating portfolios in proportion to the daily net assets of each fund. During the six months ended February 29, 2020, this waiver amounted to 0.01% of the fund’s average daily net assets on an annualized basis. This arrangement expires on July 31, 2021, unless renewed by mutual agreement of the fund and the Advisor based upon a determination that this is appropriate under the circumstances at that time.
The Advisor contractually agrees to reduce its management fee or, if necessary, make payment to the fund, in an amount equal to the amount by which expenses of the fund exceed 0.78% of average net assets. For purposes of this agreement, “expenses of the fund” means all fund expenses, excluding taxes, brokerage commissions, interest expense, litigation and indemnification expenses and other extraordinary expenses not incurred in the ordinary course of the fund’s business, class specific expenses, acquired fund fees and expenses paid indirectly, borrowing costs, prime brokerage fees, and short dividend expense. This agreement expires on December 31, 2020, unless renewed by mutual agreement of the fund and the Advisor based upon a determination that this is appropriate under the circumstances at that time.
For the six months ended February 29, 2020, the expense reductions described above amounted to the following:
| Class | Expense reduction |
| Class A | $101 |
| Class | Expense reduction |
| Class C | $24 |
| 34 | JOHN HANCOCK Emerging Markets Debt Fund | SEMIANNUAL REPORT | |
| Class | Expense reduction |
| Class I | $547 |
| Class R2 | 5 |
| Class R4 | 1 |
| Class | Expense reduction |
| Class R6 | $124 |
| Class NAV | 40,267 |
| Total | $41,069 |
Expenses waived or reimbursed in the current fiscal period are not subject to recapture in future fiscal periods.
The investment management fees, including the impact of the waivers and reimbursements as described above, incurred for the six months ended February 29, 2020, were equivalent to a net annual effective rate of 0.69% of the fund's average daily net assets.
Accounting and legal services. Pursuant to a service agreement, the fund reimburses the Advisor for all expenses associated with providing the administrative, financial, legal, compliance, accounting and recordkeeping services to the fund, including the preparation of all tax returns, periodic reports to shareholders and regulatory reports, among other services. These expenses are allocated to each share class based on its relative net assets at the time the expense was incurred. These accounting and legal services fees incurred for the six months ended February 29, 2020 amounted to an annual rate of 0.02% of the fund's average daily net assets.
Distribution and service plans. The fund has a distribution agreement with the Distributor. The fund has adopted distribution and service plans for certain classes as detailed below pursuant to Rule 12b-1 under the 1940 Act, to pay the Distributor for services provided as the distributor of shares of the fund. In addition, under a service plan for certain classes as detailed below, the fund pays for certain other services. The fund may pay up to the following contractual rates of distribution and service fees under these arrangements, expressed as an annual percentage of average daily net assets for each class of the fund's shares:
| Class | Rule 12b-1 Fee | Service fee |
| Class A | 0.30% | — |
| Class C | 1.00% | — |
| Class R2 | 0.25% | 0.25% |
| Class R4 | 0.25% | 0.10% |
The fund's Distributor has contractually agreed to waive 0.10% of Rule12b-1 fees for Class R4 shares. The current waiver agreement expires on December 31, 2020, unless renewed by mutual agreement of the fund and the Distributor based upon a determination that this is appropriate under the circumstances at the time. This contractual waiver amounted to $10 for Class R4 shares for the period ended February 29, 2020. Class R4 shares were fully redeemed on October 29, 2019.
Sales charges. Class A shares may be subject to up-front sales charges. For the six months ended February 29, 2020, no sales charges were assessed.
Class A and Class C shares may be subject to contingent deferred sales charges (CDSCs). Certain Class A shares that are acquired through purchases of $1 million or more and are redeemed within one year of purchase are subject to a 1.00% sales charge. Class C shares that are redeemed within one year of purchase are subject to a 1.00% CDSC. CDSCs are applied to the lesser of the current market value at the time of redemption or the original purchase cost of the shares being redeemed. Proceeds from CDSCs are used to compensate the Distributor for providing distribution-related services in connection with the sale of these shares. During the six months ended February 29, 2020, there were no CDSCs received by the Distributor for Class A and Class C shares.
Transfer agent fees. The John Hancock group of funds has a complex-wide transfer agent agreement with John Hancock Signature Services, Inc. (Signature Services), an affiliate of the Advisor. The transfer agent fees paid to Signature Services are determined based on the cost to Signature Services (Signature Services Cost) of providing recordkeeping services. It also includes out-of-pocket expenses, including payments made to third-parties for recordkeeping services provided to their clients who invest in one or more John Hancock funds. In addition,
| | SEMIANNUAL REPORT | JOHN HANCOCK Emerging Markets Debt Fund | 35 |
Signature Services Cost may be reduced by certain fees that Signature Services receives in connection with retirement and small accounts. Signature Services Cost is calculated monthly and allocated, as applicable, to five categories of share classes: Retail Share and Institutional Share Classes of Non-Municipal Bond Funds, Class R6 Shares, Retirement Share Classes and Municipal Bond Share Classes. Within each of these categories, the applicable costs are allocated to the affected John Hancock affiliated funds and/or classes, based on the relative average daily net assets.
Class level expenses. Class level expenses for the six months ended February 29, 2020 were as follows:
| Class | Distribution and service fees | Transfer agent fees |
| Class A | $3,972 | $1,628 |
| Class C | 3,167 | 389 |
| Class I | — | 8,905 |
| Class R2 | 235 | 9 |
| Class R4 | 24 | 1 |
| Class R6 | — | 215 |
| Total | $7,398 | $11,147 |
Trustee expenses. The fund compensates each Trustee who is not an employee of the Advisor or its affiliates. The costs of paying Trustee compensation and expenses are allocated to the fund based on its net assets relative to other funds within the John Hancock group of funds complex.
Note 6—Fund share transactions
Transactions in fund shares for the six months ended February 29, 2020 and for the year ended August 31, 2019 were as follows:
| | Six Months Ended 2-29-20 | Year Ended 8-31-19 |
| | Shares | Amount | Shares | Amount |
| Class A shares | | | | |
| Sold | 78,050 | $738,047 | 48,224 | $443,242 |
| Distributions reinvested | 6,392 | 60,711 | 11,827 | 107,470 |
| Repurchased | (40,780) | (387,112) | (94,544) | (845,173) |
| Net increase (decrease) | 43,662 | $411,646 | (34,493) | $(294,461) |
| Class C shares | | | | |
| Sold | 14,578 | $139,564 | 15,332 | $136,399 |
| Distributions reinvested | 1,287 | 12,209 | 2,710 | 24,651 |
| Repurchased | (10,001) | (93,941) | (20,050) | (178,455) |
| Net increase (decrease) | 5,864 | $57,832 | (2,008) | $(17,405) |
| Class I shares | | | | |
| Sold | 204,407 | $1,949,786 | 620,334 | $5,732,070 |
| Distributions reinvested | 37,192 | 353,332 | 73,954 | 672,353 |
| Repurchased | (277,576) | (2,635,927) | (740,290) | (6,687,510) |
| Net decrease | (35,977) | $(332,809) | (46,002) | $(283,087) |
| 36 | JOHN HANCOCK Emerging Markets Debt Fund | SEMIANNUAL REPORT | |
| | Six Months Ended 2-29-20 | Year Ended 8-31-19 |
| | Shares | Amount | Shares | Amount |
| Class R2 shares | | | | |
| Sold | 7,951 | $74,940 | 2,891 | $26,048 |
| Distributions reinvested | 178 | 1,696 | 64 | 589 |
| Repurchased | (193) | (1,811) | (616) | (5,488) |
| Net increase | 7,936 | $74,825 | 2,339 | $21,149 |
| Class R4 shares1 | | | | |
| Sold | 6,640 | $62,085 | — | — |
| Distributions reinvested | 3 | 25 | — | — |
| Repurchased | (11,730) | (110,243) | — | — |
| Net decrease | (5,087) | $(48,133) | — | — |
| Class R6 shares | | | | |
| Sold | 23,936 | $227,911 | 285,122 | $2,627,140 |
| Distributions reinvested | 8,599 | 81,597 | 9,625 | 88,583 |
| Repurchased | (44,806) | (428,986) | (52,270) | (468,555) |
| Net increase (decrease) | (12,271) | $(119,478) | 242,477 | $2,247,168 |
| Class NAV shares | | | | |
| Sold | 688,817 | $6,666,836 | 14,330,207 | $127,509,918 |
| Distributions reinvested | 2,810,068 | 26,655,888 | 5,606,792 | 51,081,161 |
| Repurchased | (11,031,180) | (105,144,633) | (190,446) | (1,737,785) |
| Net increase (decrease) | (7,532,295) | $(71,821,909) | 19,746,553 | $176,853,294 |
| Total net increase (decrease) | (7,528,168) | $(71,778,026) | 19,908,866 | $178,526,658 |
| 1 | Class R4 shares were fully redeemed on 10-29-19. |
Affiliates of the fund owned 30%, 36% and 100% of shares of Class R2, Class R6 and Class NAV on February 29, 2020. Such concentration of shareholders’ capital could have a material effect on the fund if such shareholders redeem from the fund.
Note 7—Purchase and sale of securities
Purchases and sales of securities, other than short-term investments and U.S. Treasury obligations, amounted to $72,108,991 and $131,185,686, respectively, for the six months ended February 29, 2020. Purchases and sales of U.S. Treasury obligations aggregated $0 and $17,928,539, respectively, for the six months ended February 29, 2020.
Note 8—Emerging-market risk
Foreign investing especially in emerging markets, has additional risks, such as currency and market volatility and political and social instability. Funds that invest a significant portion of assets in the securities of issuers based in countries with emerging market economies are subject to greater levels of foreign investment risk than funds investing primarily in more-developed foreign markets, since emerging-market securities may present other risks greater than, or in addition to, the risks of investing in developed foreign countries.
| | SEMIANNUAL REPORT | JOHN HANCOCK Emerging Markets Debt Fund | 37 |
Note 9—Investment by affiliated funds
Certain investors in the fund are affiliated funds that are managed by the Advisor and its affiliates. The affiliated funds do not invest in the fund for the purpose of exercising management or control; however, this investment may represent a significant portion of the fund's net assets. At February 29, 2020, funds within the John Hancock group of funds complex held 97.9% of the fund's net assets. The following fund(s) had an affiliate ownership of 5% or more of the fund's net assets:
| Fund | Affiliated Concentration |
| John Hancock Funds II Multimanager Lifestyle Balanced Portfolio | 36.7% |
| John Hancock Funds II Multimanager Lifestyle Growth Portfolio | 20.1% |
| John Hancock Funds II Multimanager Lifestyle Moderate Portfolio | 14.1% |
| John Hancock Funds II Multimanager Lifestyle Conservative Portfolio | 12.4% |
Note 10—Subsequent events
A widespread health crisis such as a global pandemic could cause substantial market volatility, exchange trading suspensions and closures, impact the ability to complete redemptions, and affect fund performance. For example, the novel coronavirus disease (COVID-19) has resulted in significant disruptions to global business activity. The impact of a health crisis and other epidemics and pandemics that may arise in the future, could affect the global economy in ways that cannot necessarily be foreseen at the present time. A health crisis may exacerbate other pre-existing political, social and economic risks. Any such impact could adversely affect the fund's performance, resulting in losses to your investment.
| 38 | JOHN HANCOCK Emerging Markets Debt Fund | SEMIANNUAL REPORT | |
| | |
Trustees
Hassell H. McClellan,Chairperson
Steven R. Pruchansky,Vice Chairperson
Andrew G. Arnott†
Charles L. Bardelis*
James R. Boyle
Peter S. Burgess*
William H. Cunningham
Grace K. Fey
Marianne Harrison†
Deborah C. Jackson
James M. Oates*
Gregory A. Russo
Officers
Andrew G. Arnott
President
Francis V. Knox, Jr.
Chief Compliance Officer
Charles A. Rizzo
Chief Financial Officer
Salvatore Schiavone
Treasurer
Christopher (Kit) Sechler
Secretary and Chief Legal Officer
| Investment advisor
John Hancock Investment Management LLC
Subadvisor
Manulife Investment Management (US) LLC
Portfolio Managers
Roberto Sanchez-Dahl, CFA
Paolo H. Valle
Principal distributor
John Hancock Investment Management Distributors LLC
Custodian
Citibank, N.A.
Transfer agent
John Hancock Signature Services, Inc.
Legal counsel
K&L Gates LLP
|
* Member of the Audit Committee
† Non-Independent Trustee
The fund's proxy voting policies and procedures, as well as the fund proxy voting record for the most recent twelve-month period ended June 30, are available free of charge on the Securities and Exchange Commission (SEC) website at sec.gov or on our website.
All of the fund's holdings as of the end of the third month of every fiscal quarter are filed with the SEC on Form N-PORT within 60 days of the end of the fiscal quarter. The fund's Form N-PORT filings are available on our website and the SEC's website, sec.gov.
We make this information on your fund, as well asmonthly portfolio holdings, and other fund details available on our website at jhinvestments.com or by calling 800-225-5291.
| | | | |
| | You can also contact us: |
| | 800-225-5291
jhinvestments.com | Regular mail:
John Hancock Signature Services, Inc.
P.O. Box 55913
Boston, MA 02205-5913
| Express mail:
John Hancock Signature Services, Inc.
2000 Crown Colony Drive
Suite 55913
Quincy, MA 02169-0953
|
SEMIANNUAL REPORT | JOHN HANCOCK EMERGING MARKETS DEBT FUND 40
John Hancock family of funds
| | | |
DOMESTIC EQUITY FUNDS
Blue Chip Growth
Classic Value
Disciplined Value
Disciplined Value Mid Cap
Equity Income
Financial Industries
Fundamental All Cap Core
Fundamental Large Cap Core
New Opportunities
Regional Bank
Small Cap Core
Small Cap Growth
Small Cap Value
U.S. Global Leaders Growth
U.S. Quality Growth
GLOBAL AND INTERNATIONAL EQUITY FUNDS
Disciplined Value International
Emerging Markets
Emerging Markets Equity
Fundamental Global Franchise
Global Equity
Global Shareholder Yield
Global Thematic Opportunities
International Dynamic Growth
International Growth
International Small Company
| | INCOME FUNDS
Bond
California Tax-Free Income
Emerging Markets Debt
Floating Rate Income
Government Income
High Yield
High Yield Municipal Bond
Income
Investment Grade Bond
Money Market
Short Duration Bond
Short Duration Credit Opportunities
Strategic Income Opportunities
Tax-Free Bond
ALTERNATIVE AND SPECIALTY FUNDS
Absolute Return Currency
Alternative Asset Allocation
Alternative Risk Premia
Diversified Macro
Infrastructure
Multi-Asset Absolute Return
Seaport Long/Short
|
A fund's investment objectives, risks, charges, and expenses should be considered carefully before investing. The prospectus contains this and other important information about the fund. To obtain a prospectus, contact your financial professional, call John Hancock Investment Management at 800-225-5291, or visit our website at jhinvestments.com. Please read the prospectus carefully before investing or sending money.
| | | |
ASSET ALLOCATION
Balanced
Income Allocation
Multi-Index Lifetime Portfolios
Multi-Index Preservation Portfolios
Multimanager Lifestyle Portfolios
Multimanager Lifetime Portfolios
Retirement Income 2040
EXCHANGE-TRADED FUNDS
John Hancock Multifactor Consumer Discretionary ETF
John Hancock Multifactor Consumer Staples ETF
John Hancock Multifactor Developed International ETF
John Hancock Multifactor Emerging Markets ETF
John Hancock Multifactor Energy ETF
John Hancock Multifactor Financials ETF
John Hancock Multifactor Healthcare ETF
John Hancock Multifactor Industrials ETF
John Hancock Multifactor Large Cap ETF
John Hancock Multifactor Materials ETF
John Hancock Multifactor Media and
Communications ETF
John Hancock Multifactor Mid Cap ETF
John Hancock Multifactor Small Cap ETF
John Hancock Multifactor Technology ETF
John Hancock Multifactor Utilities ETF
| | ENVIRONMENTAL, SOCIAL, AND
GOVERNANCE FUNDS
ESG All Cap Core
ESG Core Bond
ESG International Equity
ESG Large Cap Core
CLOSED-END FUNDS
Financial Opportunities
Hedged Equity & Income
Income Securities Trust
Investors Trust
Preferred Income
Preferred Income II
Preferred Income III
Premium Dividend
Tax-Advantaged Dividend Income
Tax-Advantaged Global Shareholder Yield
|
John Hancock Multifactor ETF shares are bought and sold at market price (not NAV), and are not individually redeemed
from the fund. Brokerage commissions will reduce returns.
John Hancock ETFs are distributed by Foreside Fund Services, LLC, and are subadvised by Dimensional Fund Advisors LP.
Foreside is not affiliated with John Hancock Investment Management Distributors LLC or Dimensional Fund Advisors LP.
Dimensional Fund Advisors LP receives compensation from John Hancock in connection with licensing rights to the
John Hancock Dimensional indexes. Dimensional Fund Advisors LP does not sponsor, endorse, or sell, and makes no
representation as to the advisability of investing in, John Hancock Multifactor ETFs.
John Hancock Investment Management
A trusted brand
John Hancock Investment Management is a premier asset manager
representing one of America's most trusted brands, with a heritage of
financial stewardship dating back to 1862. Helping our shareholders
pursue their financial goals is at the core of everything we do. It's why
we support the role of professional financial advice and operate with
the highest standards of conduct and integrity.
A better way to invest
We serve investors globally through a unique multimanager approach:
We search the world to find proven portfolio teams with specialized
expertise for every strategy we offer, then we apply robust investment
oversight to ensure they continue to meet our uncompromising
standards and serve the best interests of our shareholders.
Results for investors
Our unique approach to asset management enables us to provide
a diverse set of investments backed by some of the world's best
managers, along with strong risk-adjusted returns across asset classes.
John Hancock Investment Management Distributors LLC n Member FINRA, SIPC
200 Berkeley Street n Boston, MA 02116-5010 n 800-225-5291 n jhinvestments.com
This report is for the information of the shareholders of John Hancock Emerging Markets Debt Fund. It is not authorized for distribution to prospective investors unless preceded or accompanied by a prospectus.
John Hancock
Floating Rate Income Fund
Semiannual report 2/29/2020
Beginning on January 1, 2021, as permitted by regulations adopted by the Securities and Exchange Commission, paper copies of the fund's shareholder reports like this one will no longer be sent by mail, unless you specifically request paper copies of the reports from the fund or from your financial intermediary. Instead, the reports will be made available on a website, and you will be notified by mail each time a report is posted and provided with a website link to access the report.
If you already elected to receive shareholder reports electronically, you will not be affected by this change, and you do not need to take any action. You may elect to receive shareholder reports and other communications electronically by calling John Hancock Investment Management at 800-225-5291 (Class A, Class B and Class C shares) or 888-972-8696 (Class I and Class R6 shares) or by contacting your financial intermediary.
You may elect to receive all reports in paper, free of charge, at any time. You can inform John Hancock Investment Management or your financial intermediary that you wish to continue receiving paper copies of your shareholder reports by following the instructions listed above. Your election to receive reports in paper will apply to all funds held with John Hancock Investment Management or your financial intermediary.
A message to shareholders
Dear shareholder,
Global financial markets were on pace to deliver strong returns during the 6 months ended February 29, 2020, until heightened fears over the coronavirus (COVID-19) sent the markets skidding during the last week of the period. Prior to the turbulence that ended the period, the investment-grade corporate and high-yield segments of the market had strong gains. Fixed-income investors benefited from a combination of declining interest rates, low inflation, and accommodative central bank policy.
However, the COVID-19 pandemic and plummeting oil prices put an end to all that good news. Shortly after period end, the U.S. Federal Reserve lowered interest rates and lawmakers embarked on a plan to launch major fiscal stimulus to support the economy.
After the longest bull market in U.S. history, we're now in bear market territory. Indeed, the spread of COVID-19, trade disputes, rising unemployment, and other geopolitical tensions may continue to create uncertainty among businesses and investors. Your financial professional can helpposition your portfolio so that it's sufficiently diversified to seek to meet your long-term objectives and to withstand the inevitable bouts of market volatility along the way.
On behalf of everyone at John Hancock Investment Management, I'd like to take this opportunity to welcome new shareholders and thank existing shareholders for the continued trust you've placed in us.
Sincerely,
Andrew G. Arnott
President and CEO,
John Hancock Investment Management
Head of Wealth and Asset Management,
United States and Europe
This commentary reflects the CEO's views as of this report's period end and are subject to change at any time. Diversification does not guarantee investment returns and does not eliminate risk of loss. All investments entail risks, including the possible loss of principal. For more up-to-date information, you can visit our website at jhinvestments.com.
John Hancock
Floating Rate Income Fund
Table of contents
| | | |
| 2 | | Your fund at a glance |
| 3 | | Portfolio summary |
| 5 | | A look at performance |
| 7 | | Your expenses |
| 9 | | Fund's investments |
| 33 | | Financial statements |
| 37 | | Financial highlights |
| 44 | | Notes to financial statements |
| 56 | | More information |
SEMIANNUAL REPORT | JOHN HANCOCK FLOATING RATE INCOME FUND 1
INVESTMENT OBJECTIVE
The fund seeks a high level of current income.
AVERAGE ANNUAL TOTAL RETURNS AS OF 2/29/2020 (%)
The S&P/LSTA Leveraged Loan Index tracks returns in the leveraged loan market and captures a broad cross-section of the U.S. leveraged loan market, including dollar-denominated, U.S.-syndicated loans to overseas issuers.
It is not possible to invest directly in an index. Index figures do not reflect expenses or sales charges, which would result in lower returns.
Figures from Morningstar, Inc. include reinvested distributions and do not take into account sales charges. Actual load-adjusted performance is lower.
The past performance shown here reflects reinvested distributions and the beneficial effect of any expense reductions, and does not guarantee future results. Returns for periods shorter than one year are cumulative. Performance of the other share classes will vary based on the difference in the fees and expenses of those classes. Shares will fluctuate in value and, when redeemed, may be worth more or less than their original cost. Current month-end performance may be lower or higher than the performance cited, and can be found at jhinvestments.com or by calling 800-225-5291. For further information on the fund's objectives, risks, and strategy, see the fund's prospectus. The fund recently experienced negative short-term performance due to market volatility associated with the COVID-19 pandemic.
SEMIANNUAL REPORT | JOHN HANCOCK FLOATING RATE INCOME FUND 2
PORTFOLIO COMPOSITION AS OF 2/29/2020 (%)
SECTOR COMPOSITION AS OF 2/29/2020 (%)
SEMIANNUAL REPORT | JOHN HANCOCK FLOATING RATE INCOME FUND 3
QUALITY COMPOSITION AS OF 2/29/2020 (%)
COUNTRY COMPOSITION AS OF 2/29/2020 (%)
| | |
| United States | 81.9 |
| Luxembourg | 5.0 |
| Netherlands | 2.3 |
| Canada | 2.2 |
| France | 2.0 |
| United Kingdom | 1.5 |
| Germany | 1.3 |
| Other countries | 3.8 |
| TOTAL | 100.0 |
| As a percentage of total investments. | |
A note about risks
The fund may be subject to various risks as described in the fund's prospectus. For more information, please refer to the "Principal risks" section of the prospectus and "Subsequent events" section in the Notes to financial statements.
SEMIANNUAL REPORT | JOHN HANCOCK FLOATING RATE INCOME FUND 4
TOTAL RETURNS FOR THE PERIOD ENDED FEBRUARY 29, 2020
| | | | | | | | | | | | |
Average annual total returns (%)
with maximum sales charge | | Cumulative total returns (%)
with maximum sales charge | | SEC 30-day
yield (%)
subsidized | | SEC 30-day
yield (%)
unsubsidized1 |
| | 1-year | 5-year | 10-year | | 6-month | 5-year | 10-year | | as of
2-29-20 | | as of
2-29-20 |
| Class A | 0.38 | 2.20 | 3.54 | | -1.56 | 11.52 | 41.58 | | 4.43 | | 4.25 |
| Class B | -2.82 | 1.64 | 3.05 | | -4.44 | 8.50 | 35.03 | | 3.78 | | 3.59 |
| Class C | 1.22 | 2.01 | 3.08 | | -0.39 | 10.48 | 35.41 | | 3.78 | | 3.59 |
| Class I2 | 3.19 | 3.03 | 4.15 | | 1.08 | 16.08 | 50.10 | | 4.78 | | 4.61 |
| Class R62,3 | 3.31 | 3.11 | 4.03 | | 1.01 | 16.57 | 48.44 | | 4.90 | | 4.72 |
| Class 12 | 3.26 | 3.07 | 4.21 | | 0.99 | 16.31 | 51.06 | | 4.86 | | 4.69 |
| Class NAV2 | 3.31 | 3.12 | 4.26 | | 1.01 | 16.60 | 51.81 | | 4.90 | | 4.74 |
| Index† | 3.47 | 3.92 | 4.69 | | 1.42 | 21.22 | 58.08 | | — | | — |
Performance figures assume all distributions are reinvested. Figures reflect maximum sales charges on Class A shares of 2.5%, and the applicable contingent deferred sales charge (CDSC) on Class B and Class C shares. The returns for Class A shares have been adjusted to reflect the reduction in the maximum sales charge from 3.0% to 2.5%, effective 2-3-14. The Class B shares' CDSC declines annually between years 1 to 6 according to the following schedule: 5%, 4%, 3%, 3%, 2%, and 1%. No sales charge will be assessed after the sixth year. Class C shares held for less than one year are subject to a 1% CDSC. Sales charges are not applicable to Class I, Class R6, Class 1, and Class NAV shares.
The expense ratios of the fund, both net (including any fee waivers and/or expense limitations) and gross (excluding any fee waivers and/or expense limitations), are set forth according to the most recent publicly available prospectuses for the fund and may differ from those disclosed in the Financial highlights tables in this report. Net expenses reflect contractual expense limitations in effect until December 31, 2020 and are subject to change. Had the contractual fee waivers and expense limitations not been in place, gross expenses would apply. The expense ratios are as follows:
| | | | | | | | |
| | Class A | Class B | Class C | Class I | Class R6 | Class 1 | Class NAV |
| Gross (%) | 1.16 | 1.91 | 1.91 | 0.91 | 0.80 | 0.84 | 0.79 |
| Net (%) | 1.01 | 1.76 | 1.76 | 0.78 | 0.67 | 0.71 | 0.67 |
Please refer to the most recent prospectus and annual or semiannual report for more information on expenses and any expense limitation arrangements for each class.
The returns reflect past results and should not be considered indicative of future performance. The return and principal value of an investment will fluctuate so that shares, when redeemed, may be worth more or less than their original cost. Due to market volatility and other factors, the fund's current performance may be higher or lower than the performance shown. For current to the most recent month-end performance data, please call 800-225-5291 or visit the fund's website at jhinvestments.com.
The performance table above and the chart on the next page do not reflect the deduction of taxes that a shareholder would pay on fund distributions or the redemption of fund shares. The fund's performance results reflect any applicable fee waivers or expense reductions, without which the expenses would increase and results would have been less favorable.
| † | Index is the S&P/LSTA Leveraged Loan Index. |
See the following page for footnotes.
SEMIANNUAL REPORT | JOHN HANCOCK FLOATING RATE INCOME FUND 5
This chart and table show what happened to a hypothetical $10,000 investment in John Hancock Floating Rate Income Fund for the share classes and periods indicated, assuming all distributions were reinvested. For comparison, we've shown the same investment in the S&P/LSTA Leveraged Loan Index.
| | | | | |
| | Start date | With maximum
sales charge ($) | Without
sales charge ($) | Index ($) |
| Class B4 | 2-28-10 | 13,503 | 13,503 | 15,808 |
| Class C4 | 2-28-10 | 13,541 | 13,541 | 15,808 |
| Class I2 | 2-28-10 | 15,010 | 15,010 | 15,808 |
| Class R62,3 | 2-28-10 | 14,844 | 14,844 | 15,808 |
| Class 12 | 2-28-10 | 15,106 | 15,106 | 15,808 |
| Class NAV2 | 2-28-10 | 15,181 | 15,181 | 15,808 |
The values shown in the chart for "Class A shares with maximum sales charge" have been adjusted to reflect the reduction in the Class A maximum sales charge from 3.0% to 2.5%, which became effective on 2-3-14.
S&P/LSTA Leveraged Loan Index tracks returns in the leveraged loan market and captures a broad cross-section of the U.S. leveraged loan market, including dollar-denominated, U.S.-syndicated loans to overseas issuers.
It is not possible to invest directly in an index. Index figures do not reflect expenses or sales charges, which would result in lower returns.
Footnotes related to performance pages
| 1 | Unsubsidized yields reflect what the yields would have been without the effect of reimbursements and waivers. |
| 2 | For certain types of investors, as described in the fund's prospectuses. |
| 3 | Class R6 shares were first offered on 9-1-11. Returns prior to this date are those of Class C shares that have not been adjusted for class-specific expenses; otherwise, returns would vary. |
| 4 | The contingent deferred sales charge is not applicable. |
SEMIANNUAL REPORT | JOHN HANCOCK FLOATING RATE INCOME FUND 6
These examples are intended to help you understand your ongoing operating expenses of investing in the fund so you can compare these costs with the ongoing costs of investing in other mutual funds.
Understanding fund expenses
As a shareholder of the fund, you incur two types of costs:
■Transaction costs,which include sales charges (loads) on purchases or redemptions (varies by share class), minimum account fee charge, etc.
■Ongoing operating expenses, including management fees, distribution and service fees (if applicable), and other fund expenses.
We are presenting only your ongoing operating expenses here.
Actual expenses/actual returns
The first line of each share class in the table on the following page is intended to provide information about the fund’s actual ongoing operating expenses, and is based on the fund’s actual return. It assumes an account value of $1,000.00 on September 1, 2019, with the same investment held until February 29, 2020.
Together with the value of your account, you may use this information to estimate the operating expenses that you paid over the period. Simply divide your account value at February 29, 2020, by $1,000.00, then multiply it by the “expenses paid” for your share class from the table. For example, for an account value of $8,600.00, the operating expenses should be calculated as follows:
Hypothetical example for comparison purposes
The second line of each share class in the table on the following page allows you to compare the fund’s ongoing operating expenses with those of any other fund. It provides an example of the fund’s hypothetical account values and hypothetical expenses based on each class’s actual expense ratio and an assumed 5% annualized return before expenses (which is not the class’s actual return). It assumes an account value of $1,000.00 on September 1, 2019, with the same investment held until February 29, 2020. Look in any other fund shareholder report to find its hypothetical example and you will be able to compare these expenses. Please remember that these hypothetical account values and expenses may not be used to estimate the actual ending account balance or expenses you paid for the period.
| | SEMIANNUAL REPORT | JOHN HANCOCK FLOATING RATE INCOME FUND | 7 |
Remember, these examples do not include any transaction costs, therefore, these examples will not help you to determine the relative total costs of owning different funds. If transaction costs were included, your expenses would have been higher. See the prospectuses for details regarding transaction costs.
SHAREHOLDER EXPENSE EXAMPLE CHART
| | | Account
value on
9-1-2019 | Ending
value on
2-29-2020 | Expenses
paid during
period ended
2-29-20201 | Annualized
expense
ratio |
| Class A | Actual expenses/actual returns | $1,000.00 | $1,009.70 | $4.90 | 0.98% |
| | Hypothetical example | 1,000.00 | 1,020.00 | 4.92 | 0.98% |
| Class B | Actual expenses/actual returns | 1,000.00 | 1,004.70 | 8.62 | 1.73% |
| | Hypothetical example | 1,000.00 | 1,016.30 | 8.67 | 1.73% |
| Class C | Actual expenses/actual returns | 1,000.00 | 1,006.00 | 8.63 | 1.73% |
| | Hypothetical example | 1,000.00 | 1,016.30 | 8.67 | 1.73% |
| Class I | Actual expenses/actual returns | 1,000.00 | 1,010.80 | 3.75 | 0.75% |
| | Hypothetical example | 1,000.00 | 1,021.10 | 3.77 | 0.75% |
| Class R6 | Actual expenses/actual returns | 1,000.00 | 1,010.10 | 3.20 | 0.64% |
| | Hypothetical example | 1,000.00 | 1,021.70 | 3.22 | 0.64% |
| Class 1 | Actual expenses/actual returns | 1,000.00 | 1,009.90 | 3.40 | 0.68% |
| | Hypothetical example | 1,000.00 | 1,021.50 | 3.42 | 0.68% |
| Class NAV | Actual expenses/actual returns | 1,000.00 | 1,010.10 | 3.20 | 0.64% |
| | Hypothetical example | 1,000.00 | 1,021.70 | 3.22 | 0.64% |
| 1 | Expenses are equal to the annualized expense ratio, multiplied by the average account value over the period, multiplied by 182/366 (to reflect the one-half year period). |
| 8 | JOHN HANCOCK FLOATING RATE INCOME FUND | SEMIANNUAL REPORT | |
AS OF 2-29-20 (unaudited)
| | Rate (%) | Maturity date | | Par value^ | Value |
| Term loans (A) 88.1% | | | | | $658,933,913 |
| (Cost $681,952,426) | | | | | |
| Communication services 14.3% | 107,281,279 |
| Diversified telecommunication services 4.7% |
| CenturyLink, Inc., 2020 Term Loan B (1 month LIBOR + 2.250%) | 3.853 | 03-15-27 | | 2,095,173 | 2,030,578 |
| Cincinnati Bell, Inc., 2017 Term Loan (1 month LIBOR + 3.250%) | 4.853 | 10-02-24 | | 2,847,790 | 2,837,994 |
| Crown Subsea Communications Holding, Inc., Term Loan B (1 month LIBOR + 6.000%) | 7.655 | 11-02-25 | | 1,663,298 | 1,657,060 |
| Cyxtera DC Holdings, Inc., Term Loan B (1 month LIBOR + 3.000%) | 4.660 | 05-01-24 | | 2,441,732 | 2,066,023 |
| Frontier Communications Corp., 2017 Term Loan B1 (1 and 3 month LIBOR + 3.750%) | 5.350 | 06-15-24 | | 6,659,321 | 6,670,442 |
| Intelsat Jackson Holdings SA, 2017 Term Loan B5 | 6.625 | 01-02-24 | | 3,000,000 | 3,015,000 |
| Iridium Satellite LLC, Term Loan B (1 month LIBOR + 3.750%) | 5.353 | 11-04-26 | | 2,148,253 | 2,145,567 |
| Level 3 Financing, Inc., 2019 Term Loan B (1 month LIBOR + 1.750%) | 3.353 | 03-01-27 | | 4,498,066 | 4,391,237 |
| Masmovil Holdphone SA, 2019 EUR Term Loan B (3 month EURIBOR + 2.625%) | 2.625 | 05-07-26 | EUR | 3,163,808 | 3,483,955 |
| Radiate Holdco LLC, 1st Lien Term Loan (1 month LIBOR + 3.000%) | 4.603 | 02-01-24 | | 4,901,638 | 4,794,439 |
| Telesat LLC, Term Loan B5 (1 month LIBOR + 2.750%) | 4.360 | 12-07-26 | | 1,975,233 | 1,945,604 |
| Entertainment 0.8% |
| Technicolor SA, 2017 USD Term Loan B (3 month LIBOR + 2.750%) | 4.363 | 12-06-23 | | 3,654,334 | 2,777,294 |
| Technicolor SA, EUR Term Loan B (3 month EURIBOR + 3.500%) | 3.500 | 12-06-23 | EUR | 530,772 | 498,054 |
| William Morris Endeavor Entertainment LLC, 2018 1st Lien Term Loan (1 and 3 month LIBOR + 2.750%) | 4.365 | 05-18-25 | | 2,689,302 | 2,598,538 |
| Interactive media and services 1.7% |
| Ancestry.com Operations, Inc., 2019 Extended Term Loan B (1 month LIBOR + 4.250%) | 5.860 | 08-27-26 | | 6,150,136 | 5,504,372 |
| MH Sub I LLC, 2017 1st Lien Term Loan (1 month LIBOR + 3.750%) | 5.353 | 09-13-24 | | 5,153,260 | 5,013,710 |
| Rackspace Hosting, Inc., 2017 Incremental 1st Lien Term Loan (2 and 3 month LIBOR + 3.000%) | 4.763 | 11-03-23 | | 642,603 | 612,324 |
| SEE NOTES TO FINANCIAL STATEMENTS | SEMIANNUAL REPORT | JOHN HANCOCK FLOATING RATE INCOME FUND | 9 |
| | Rate (%) | Maturity date | | Par value^ | Value |
| Communication services (continued) | |
| Interactive media and services (continued) |
| WeddingWire, Inc., 1st Lien Term Loan (1 month LIBOR + 4.500%) | 6.103 | 12-19-25 | | 2,045,857 | $2,004,940 |
| Media 6.2% |
| Advantage Sales & Marketing, Inc., 2014 1st Lien Term Loan (1 month LIBOR + 3.250%) | 4.853 | 07-23-21 | | 1,692,159 | 1,632,409 |
| Altice Financing SA, 2017 USD Term Loan B (2 month LIBOR + 2.750%) | 4.412 | 07-15-25 | | 928,186 | 895,124 |
| Altice Financing SA, USD 2017 1st Lien Term Loan (1 month LIBOR + 2.750%) | 4.389 | 01-31-26 | | 2,346,599 | 2,257,146 |
| Altice France SA, USD Term Loan B11 (1 month LIBOR + 2.750%) | 4.353 | 07-31-25 | | 294,798 | 283,374 |
| Altice France SA, USD Term Loan B12 (1 month LIBOR + 3.688%) | 5.346 | 01-31-26 | | 1,996,831 | 1,936,926 |
| AppLovin Corp., 2018 Term Loan B (1 month LIBOR + 3.500%) | 5.103 | 08-15-25 | | 1,228,137 | 1,220,461 |
| Buzz Merger Sub, Ltd., Term Loan B (1 month LIBOR + 2.750%) | 4.353 | 01-22-27 | | 800,437 | 784,428 |
| CSC Holdings LLC, 2017 1st Lien Term Loan (1 month LIBOR + 2.250%) | 3.909 | 07-17-25 | | 2,210,679 | 2,182,095 |
| CSC Holdings LLC, 2019 Term Loan B5 (1 month LIBOR + 2.500%) | 4.159 | 04-15-27 | | 3,733,112 | 3,686,448 |
| Cumulus Media New Holdings, Inc., Term Loan B (1 month LIBOR + 3.750%) | 5.353 | 03-31-26 | | 1,287,577 | 1,258,606 |
| Entercom Media Corp., 2019 Term Loan (1 month LIBOR + 2.500%) | 4.103 | 11-18-24 | | 475,155 | 468,622 |
| Front Range Bidco, Inc., USD Term Loan (B) | TBD | 02-19-27 | | 2,278,105 | 2,221,973 |
| iHeartCommunications, Inc., 2020 Term Loan (1 week LIBOR + 3.000%) | 4.655 | 05-01-26 | | 1,650,797 | 1,617,782 |
| Mediaocean LLC, Term Loan B (1 month LIBOR + 4.000%) | 5.603 | 08-18-25 | | 533,303 | 529,303 |
| Pug LLC, USD Term Loan (B) | TBD | 01-29-27 | | 2,582,377 | 2,414,523 |
| RB Media, Inc., Term Loan B (B) | TBD | 08-29-25 | | 947,611 | 942,873 |
| Research Now Group, Inc., 2017 1st Lien Term Loan (3 month LIBOR + 5.500%) | 7.263 | 12-20-24 | | 2,874,376 | 2,824,074 |
| Sinclair Television Group, Inc., Term Loan B2B (1 month LIBOR + 2.500%) | 4.160 | 09-30-26 | | 1,021,153 | 1,000,730 |
| Tele Columbus AG, 2018 EUR Term Loan A2 (6 month EURIBOR + 3.000%) | 3.000 | 10-15-24 | EUR | 4,884,940 | 5,153,455 |
| 10 | JOHN HANCOCK FLOATING RATE INCOME FUND | SEMIANNUAL REPORT | SEE NOTES TO FINANCIAL STATEMENTS |
| | Rate (%) | Maturity date | | Par value^ | Value |
| Communication services (continued) | |
| Media (continued) |
| Telenet Financing USD LLC, 2020 USD Term Loan AR (1 month LIBOR + 2.000%) | 3.659 | 04-30-28 | | 1,623,217 | $1,572,491 |
| Terrier Media Buyer, Inc., Term Loan B (3 month LIBOR + 4.250%) | 6.148 | 12-17-26 | | 1,612,805 | 1,599,370 |
| Univision Communications, Inc., Term Loan C5 (1 month LIBOR + 2.750%) | 4.353 | 03-15-24 | | 815,000 | 782,808 |
| UPC Broadband Holding BV, 2020 EUR Term Loan B (B) | TBD | 04-30-29 | EUR | 663,626 | 724,830 |
| UPC Financing Partnership, 2020 USD Term Loan B (1 month LIBOR + 2.250%) | 3.915 | 04-30-28 | | 1,153,790 | 1,148,021 |
| WideOpenWest Finance LLC, 2017 Term Loan B (1 month LIBOR + 3.250%) | 4.889 | 08-18-23 | | 2,417,722 | 2,333,102 |
| Ziggo Financing Partnership, USD Term Loan I (1 month LIBOR + 2.500%) | 4.159 | 04-30-28 | | 5,003,885 | 4,845,400 |
| Wireless telecommunication services 0.9% |
| Matterhorn Telecom SA, EUR Term Loan B (3 month EURIBOR + 3.500%) | 3.500 | 09-15-26 | EUR | 1,392,778 | 1,531,791 |
| SBA Senior Finance II LLC, 2018 Term Loan B (1 month LIBOR + 1.750%) | 3.360 | 04-11-25 | | 4,014,842 | 3,964,657 |
| Sprint Communications, Inc., 2018 Term Loan B (1 month LIBOR + 3.000%) | 4.625 | 02-02-24 | | 1,433,873 | 1,421,326 |
| Consumer discretionary 13.0% | 97,552,560 |
| Auto components 0.5% |
| IXS Holdings, Inc., 2020 Term Loan (B) | TBD | 02-06-27 | | 1,539,625 | 1,524,229 |
| Truck Hero, Inc., 1st Lien Term Loan (1 month LIBOR + 3.750%) | 5.353 | 04-22-24 | | 2,507,649 | 2,464,818 |
| Automobiles 1.8% |
| BBD Bidco, Ltd., GBP Term Loan B1 (1 month GBP LIBOR + 4.750%) | 5.457 | 11-13-26 | GBP | 2,928,114 | 3,749,588 |
| Belron Finance US LLC, 2019 USD Term Loan B (3 month LIBOR + 2.500%) | 4.270 | 10-30-26 | | 811,544 | 806,983 |
| Drive Chassis Holdco LLC, 2019 2nd Lien Term Loan (3 month LIBOR + 8.250%) | 10.084 | 04-10-26 | | 2,959,861 | 2,723,072 |
| OEConnection LLC, 2019 Term Loan B (3 month LIBOR + 4.000%) | 5.603 | 09-25-26 | | 1,490,654 | 1,472,021 |
| Thor Industries, Inc., EUR Term Loan B (1 month EURIBOR + 4.000%) | 4.000 | 02-01-26 | EUR | 1,444,197 | 1,591,340 |
| SEE NOTES TO FINANCIAL STATEMENTS | SEMIANNUAL REPORT | JOHN HANCOCK FLOATING RATE INCOME FUND | 11 |
| | Rate (%) | Maturity date | | Par value^ | Value |
| Consumer discretionary (continued) | |
| Automobiles (continued) |
| Thor Industries, Inc., USD Term Loan B (1 month LIBOR + 3.750%) | 5.438 | 02-01-26 | | 1,033,821 | $1,013,145 |
| Wheel Pros, Inc., 1st Lien Term Loan (1 month LIBOR + 4.750%) | 6.353 | 04-04-25 | | 2,475,476 | 2,434,210 |
| Distributors 0.4% |
| Polyconcept Investments BV, 2019 Term Loan (1 month LIBOR + 4.500%) | 6.005 | 08-16-23 | | 2,989,821 | 2,980,493 |
| Diversified consumer services 2.1% |
| Cambium Learning Group, Inc., Term Loan B (1 month LIBOR + 4.500%) | 6.103 | 12-18-25 | | 2,099,622 | 2,060,255 |
| Legalzoom.com, Inc., 2018 1st Lien Term Loan (1 month LIBOR + 4.500%) | 6.103 | 11-21-24 | | 1,748,033 | 1,741,478 |
| Midas Intermediate Holdco II LLC, Incremental Term Loan B (3 month LIBOR + 2.750%) | 4.697 | 08-18-21 | | 2,917,654 | 2,862,948 |
| SRS Distribution, Inc., 2018 1st Lien Term Loan (1 month LIBOR + 3.000%) | 4.603 | 05-23-25 | | 5,910,481 | 5,728,261 |
| Swordfish Merger Sub LLC, 2018 1st Lien Term Loan (1 month LIBOR + 3.000%) | 4.660 | 02-03-25 | | 1,799,531 | 1,723,051 |
| Verisure Holding AB, EUR Term Loan B1E (3 month EURIBOR + 3.000%) | 3.000 | 10-20-22 | EUR | 1,577,192 | 1,697,613 |
| Hotels, restaurants and leisure 4.1% |
| Aimbridge Acquisition Company, Inc., 2019 Term Loan B (1 month LIBOR + 3.750%) | 5.363 | 02-02-26 | | 2,352,348 | 2,293,539 |
| Aristocrat International Pty, Ltd., 2018 1st Lien Term Loan (3 month LIBOR + 1.750%) | 3.577 | 10-19-24 | | 2,380,635 | 2,327,071 |
| Caesars Resort Collection LLC, 2017 1st Lien Term Loan B (1 month LIBOR + 2.750%) | 4.353 | 12-23-24 | | 4,911,018 | 4,730,931 |
| Carrols Restaurant Group, Inc., Term Loan B (1 month LIBOR + 3.250%) | 4.870 | 04-30-26 | | 1,493,594 | 1,418,914 |
| Connect Finco Sarl, Term Loan B (1 month LIBOR + 4.500%) | 6.110 | 12-11-26 | | 1,382,864 | 1,367,307 |
| Equinox Holdings, Inc., 2017 1st Lien Term Loan (1 month LIBOR + 3.000%) | 4.603 | 03-08-24 | | 2,354,512 | 2,314,297 |
| HNVR Holdco, Ltd., EUR 2017 Term Loan B2 (6 month EURIBOR + 4.250%) | 4.250 | 09-12-23 | EUR | 1,164,659 | 1,236,444 |
| 12 | JOHN HANCOCK FLOATING RATE INCOME FUND | SEMIANNUAL REPORT | SEE NOTES TO FINANCIAL STATEMENTS |
| | Rate (%) | Maturity date | | Par value^ | Value |
| Consumer discretionary (continued) | |
| Hotels, restaurants and leisure (continued) |
| HNVR Holdco, Ltd., EUR Term Loan B (6 month EURIBOR + 4.250%) | 4.250 | 09-12-23 | EUR | 440,675 | $469,457 |
| HNVR Holdco, Ltd., Term Loan C (6 month EURIBOR + 4.500%) | 4.500 | 09-12-25 | EUR | 2,352,406 | 2,499,554 |
| IRB Holding Corp., 2020 Term Loan B (1 month LIBOR + 2.750%) | 4.379 | 02-05-25 | | 1,910,074 | 1,857,547 |
| Motion Finco LLC, Delayed Draw Term Loan B2 (1 month LIBOR + 3.250%) | 4.902 | 11-04-26 | | 103,061 | 98,938 |
| Motion Finco LLC, USD Term Loan B1 (1 month LIBOR + 3.250%) | 4.939 | 11-13-26 | | 784,158 | 752,792 |
| Motion Finco Sarl, EUR Term Loan B (3 month EURIBOR + 3.000%) | 3.000 | 11-13-26 | EUR | 686,801 | 750,930 |
| New Red Finance, Term Loan B4 (1 month LIBOR + 1.750%) | 3.353 | 11-19-26 | | 3,870,937 | 3,803,196 |
| Playa Resorts Holding BV, 2017 Term Loan B (1 month LIBOR + 2.750%) | 4.350 | 04-29-24 | | 2,046,872 | 1,893,357 |
| Scientific Games International, Inc., 2018 Term Loan B5 (1 and 2 month LIBOR + 2.750%) | 4.366 | 08-14-24 | | 3,199,035 | 3,097,082 |
| Household durables 0.6% |
| Acproducts, Inc., Term Loan B (B) | TBD | 02-14-25 | | 1,133,214 | 1,138,880 |
| Keter Group BV, EUR Term Loan B (3 month EURIBOR + 4.250%) | 5.250 | 10-31-23 | EUR | 676,512 | 661,883 |
| Keter Group BV, EUR Term Loan B3A (3 month EURIBOR + 4.250%) | 5.250 | 10-31-23 | EUR | 875,226 | 856,300 |
| LSFX Flavum Bidco SL, 2020 EUR Term Loan (B) | TBD | 02-12-27 | EUR | 1,410,972 | 1,547,425 |
| Internet and direct marketing retail 0.4% |
| Trade Me Group, Ltd., Term Loan (3 month LIBOR + 4.250%) | 6.195 | 05-01-26 | | 2,759,917 | 2,739,218 |
| Leisure products 0.9% |
| Abe Investment Holdings, Inc., 2019 EUR Term Loan B (1 month EURIBOR + 5.000%) | 5.000 | 02-19-26 | EUR | 841,432 | 904,905 |
| Abe Investment Holdings, Inc., 2019 USD Term Loan B (1 month LIBOR + 4.500%) | 6.125 | 02-19-26 | | 2,501,473 | 2,420,175 |
| Diamond Sports Group LLC, Term Loan (1 month LIBOR + 3.250%) | 4.880 | 08-24-26 | | 452,181 | 411,485 |
| Hayward Industries, Inc., 1st Lien Term Loan (1 month LIBOR + 3.500%) | 5.103 | 08-05-24 | | 2,901,855 | 2,836,563 |
| Specialty retail 1.9% |
| Ascena Retail Group, Inc., 2015 Term Loan B (1 month LIBOR + 4.500%) | 6.125 | 08-21-22 | | 3,379,349 | 2,157,140 |
| SEE NOTES TO FINANCIAL STATEMENTS | SEMIANNUAL REPORT | JOHN HANCOCK FLOATING RATE INCOME FUND | 13 |
| | Rate (%) | Maturity date | | Par value^ | Value |
| Consumer discretionary (continued) | |
| Specialty retail (continued) |
| CWGS Group LLC, 2016 Term Loan (1 month LIBOR + 2.750%) | 4.416 | 11-08-23 | | 860,589 | $782,705 |
| Douglas GmbH, 2017 EUR Term Loan B1 (3 month EURIBOR + 3.500%) | 3.500 | 08-12-22 | EUR | 336,755 | 341,953 |
| Douglas GmbH, 2017 EUR Term Loan B2 (3 month EURIBOR + 3.500%) | 3.500 | 08-12-22 | EUR | 94,488 | 95,946 |
| Douglas GmbH, 2017 EUR Term Loan B3 (3 month EURIBOR + 3.500%) | 3.500 | 08-12-22 | EUR | 301,312 | 305,963 |
| Douglas GmbH, 2017 EUR Term Loan B4 (3 month EURIBOR + 3.500%) | 3.500 | 08-12-22 | EUR | 198,633 | 201,699 |
| Douglas GmbH, 2017 EUR Term Loan B5 (3 month EURIBOR + 3.500%) | 3.500 | 08-12-22 | EUR | 36,283 | 36,843 |
| Douglas GmbH, 2017 EUR Term Loan B6 (3 month EURIBOR + 3.500%) | 3.500 | 08-12-22 | EUR | 147,517 | 149,794 |
| Douglas GmbH, 2017 EUR Term Loan B7 (3 month EURIBOR + 3.500%) | 3.500 | 08-12-22 | EUR | 107,490 | 109,149 |
| Douglas GmbH, 2017 EUR Term Loan B8 (3 month EURIBOR + 3.250%) | 3.250 | 08-12-22 | EUR | 846,330 | 843,212 |
| Eyemart Express LLC, 2017 Term Loan B (1 month LIBOR + 3.000%) | 4.625 | 08-04-24 | | 1,277,524 | 1,275,927 |
| Harbor Freight Tools USA, Inc., 2018 Term Loan B (1 month LIBOR + 2.500%) | 4.103 | 08-18-23 | | 3,519,177 | 3,336,637 |
| Mavis Tire Express Services Corp., 2018 1st Lien Term Loan (1 month LIBOR + 3.250%) | 4.853 | 03-20-25 | | 4,480,066 | 4,295,263 |
| Mavis Tire Express Services Corp., 2018 Delayed Draw Term Loan (1 month LIBOR + 3.250%) | 4.861 | 03-20-25 | | 624,159 | 598,413 |
| Textiles, apparel and luxury goods 0.3% |
| Calceus Acquisition, Inc., Term Loan B (1 month LIBOR + 5.500%) | 7.103 | 02-12-25 | | 2,040,627 | 2,020,221 |
| Consumer staples 2.9% | 21,375,890 |
| Food and staples retailing 0.9% |
| Casino Guichard Perrachon SA, EUR Term Loan B (3 month EURIBOR + 5.500%) | 5.500 | 01-31-24 | EUR | 861,619 | 945,753 |
| H-Food Holdings LLC, 2018 Term Loan B (1 month LIBOR + 3.688%) | 5.291 | 05-23-25 | | 3,269,407 | 3,204,019 |
| Sage Borrowco LLC, Term Loan B (1 month LIBOR + 4.750%) | 6.353 | 06-20-26 | | 2,317,648 | 2,312,827 |
| Food products 0.8% |
| Cookie Acquisition SASU, EUR Term Loan (B) | TBD | 02-05-27 | EUR | 1,563,396 | 1,730,226 |
| 14 | JOHN HANCOCK FLOATING RATE INCOME FUND | SEMIANNUAL REPORT | SEE NOTES TO FINANCIAL STATEMENTS |
| | Rate (%) | Maturity date | | Par value^ | Value |
| Consumer staples (continued) | |
| Food products (continued) |
| Froneri Lux FinCo SARL, 2020 EUR Term Loan (B) | TBD | 01-29-27 | EUR | 2,184,776 | $2,363,646 |
| Froneri US, Inc., 2020 USD Term Loan (B) | TBD | 01-29-27 | | 249,488 | 245,122 |
| Upfield BV, 2018 EUR Term Loan B1 (3 month EURIBOR + 3.500%) | 3.500 | 07-02-25 | EUR | 1,630,241 | 1,727,716 |
| Household products 0.7% |
| KIK Custom Products, Inc., 2015 Term Loan B (1 month LIBOR + 4.000%) | 5.603 | 05-15-23 | | 2,688,825 | 2,644,379 |
| Reynolds Consumer Products LLC, Term Loan (3 month LIBOR + 1.750%) | 3.501 | 02-04-27 | | 930,510 | 918,879 |
| Reynolds Group Holdings, Inc., USD 2017 Term Loan (1 month LIBOR + 2.750%) | 4.353 | 02-05-23 | | 1,456,602 | 1,440,521 |
| Personal products 0.5% |
| Coty, Inc., 2018 USD Term Loan B (1 month LIBOR + 2.250%) | 3.921 | 04-07-25 | | 2,068,684 | 2,017,650 |
| Sunshine Luxembourg VII Sarl, USD Term Loan B1 (3 month LIBOR + 4.250%) | 6.195 | 10-01-26 | | 1,860,027 | 1,825,152 |
| Energy 2.2% | 16,247,615 |
| Energy equipment and services 0.3% |
| Keane Group Holdings LLC, 2018 1st Lien Term Loan (1 month LIBOR + 3.750%) | 5.375 | 05-25-25 | | 1,379,000 | 1,320,393 |
| Traverse Midstream Partners LLC, 2017 Term Loan (1 month LIBOR + 4.000%) | 5.610 | 09-27-24 | | 622,162 | 516,395 |
| Oil, gas and consumable fuels 1.9% |
| BCP Renaissance Parent LLC, 2017 Term Loan B (2 month LIBOR + 3.500%) | 5.445 | 10-31-24 | | 854,575 | 747,753 |
| BCP Renaissance Parent LLC, Term Loan B2 (3 month LIBOR + 3.500%) | 6.005 | 11-01-24 | | 522,556 | 428,496 |
| Delek US Holdings, Inc., 2018 Term Loan B (1 month LIBOR + 2.250%) | 3.853 | 03-31-25 | | 2,345,000 | 2,298,100 |
| Granite Acquisition, Inc., Term Loan B (3 month LIBOR + 3.500%) | 5.445 | 12-19-21 | | 2,572,490 | 2,548,900 |
| Lower Cadence Holdings LLC, Term Loan B (1 month LIBOR + 4.000%) | 5.603 | 05-22-26 | | 1,777,496 | 1,669,744 |
| Lucid Energy Group II Borrower LLC, 2018 1st Lien Term Loan (1 month LIBOR + 3.000%) | 4.603 | 02-17-25 | | 601,351 | 551,138 |
| SEE NOTES TO FINANCIAL STATEMENTS | SEMIANNUAL REPORT | JOHN HANCOCK FLOATING RATE INCOME FUND | 15 |
| | Rate (%) | Maturity date | | Par value^ | Value |
| Energy (continued) | |
| Oil, gas and consumable fuels (continued) |
| Murray Energy Corp., 2018 Term Loan B2 (C) | 0.000 | 10-17-22 | | 7,312,904 | $1,159,607 |
| Murray Energy Corp., DIP Term Loan (1 month LIBOR + 11.000%) | 13.000 | 07-31-20 | | 1,296,986 | 1,288,335 |
| Northriver Midstream Finance LP, 2018 Term Loan B (3 month LIBOR + 3.250%) | 5.159 | 10-01-25 | | 1,910,893 | 1,876,268 |
| Quicksilver Resources, Inc., New 2nd Lien Term Loan (C)(D) | 0.000 | 06-21-20 | | 20,001,303 | 20,001 |
| Ultra Resources, Inc., 1st Lien Term Loan (1 month LIBOR + 4.000%) | 5.603 | 04-12-24 | | 3,328,740 | 1,822,485 |
| Financials 6.2% | 45,994,686 |
| Capital markets 2.2% |
| AqGen Ascensus, Inc., 2017 Repriced Term Loan (3 month LIBOR + 4.000%) | 5.945 | 12-03-22 | | 5,409,213 | 5,346,087 |
| ION Trading Finance, Ltd., USD Incremental Term Loan B (3 month LIBOR + 4.000%) | 6.064 | 11-21-24 | | 3,915,684 | 3,732,156 |
| Jane Street Group LLC, 2018 Term Loan B (1 month LIBOR + 3.000%) | 4.603 | 08-25-22 | | 3,857,544 | 3,845,509 |
| Sequa Mezzanine Holdings LLC, 1st Lien Term Loan (3 month LIBOR + 5.000%) | 6.742 | 11-28-21 | | 3,542,138 | 3,528,855 |
| Consumer finance 0.1% |
| Fiserv Investment Solutions, Inc., 2020 Term Loan B (3 month LIBOR + 4.750%) | 6.442 | 02-10-27 | | 640,636 | 642,641 |
| Diversified financial services 1.7% |
| Advisor Group Holdings, Inc., 2019 Term Loan B (1 month LIBOR + 5.000%) | 6.603 | 08-01-26 | | 2,965,183 | 2,898,467 |
| Citadel Securities LP, 2020 Term Loan B (1 month LIBOR + 2.750%) | 4.353 | 02-27-26 | | 4,005,330 | 3,965,277 |
| Crown Finance US, Inc., 2018 USD Term Loan (1 month LIBOR + 2.250%) | 3.853 | 02-28-25 | | 2,057,484 | 1,898,770 |
| Lakeland Tours LLC, 2017 1st Lien Term Loan B (3 month LIBOR + 4.250%) | 6.149 | 12-15-24 | | 1,221,891 | 1,118,030 |
| Marnix SAS, 2019 EUR Term Loan B (6 month EURIBOR + 3.500%) | 3.500 | 11-19-26 | EUR | 1,576,303 | 1,731,233 |
| Nexus Buyer LLC, Term Loan B (1 month LIBOR + 3.750%) | 5.421 | 11-09-26 | | 1,058,029 | 1,045,682 |
| 16 | JOHN HANCOCK FLOATING RATE INCOME FUND | SEMIANNUAL REPORT | SEE NOTES TO FINANCIAL STATEMENTS |
| | Rate (%) | Maturity date | | Par value^ | Value |
| Financials (continued) | |
| Insurance 1.9% |
| Alliant Holdings Intermediate LLC, 2018 Term Loan B (1 month LIBOR + 3.000%) | 4.603 | 05-09-25 | | 3,821,599 | $3,738,785 |
| Amerilife Holdings LLC, 2020 Term Loan (B) | TBD | 02-06-27 | | 966,315 | 956,652 |
| Asurion LLC, 2017 2nd Lien Term Loan (1 month LIBOR + 6.500%) | 8.103 | 08-04-25 | | 1,625,000 | 1,627,031 |
| Asurion LLC, 2017 Term Loan B4 (1 month LIBOR + 3.000%) | 4.603 | 08-04-22 | | 4,814,790 | 4,764,620 |
| HUB International, Ltd., 2018 Term Loan B (2 and 3 month LIBOR + 2.750%) | 4.543 | 04-25-25 | | 3,164,194 | 3,071,261 |
| Mortgage real estate investment trusts 0.3% |
| Claros Mortgage Trust, Inc., Term Loan B (1 month LIBOR + 3.250%) | 4.921 | 08-09-26 | | 2,104,677 | 2,083,630 |
| Health care 12.3% | 91,878,379 |
| Biotechnology 0.2% |
| Grifols Worldwide Operations USA, Inc., USD 2019 Term Loan B (1 week LIBOR + 2.000%) | 3.579 | 11-15-27 | | 1,238,200 | 1,226,672 |
| Health care equipment and supplies 1.5% |
| Auris Luxembourg III Sarl, 2019 USD Term Loan B2 (1 month LIBOR + 3.750%) | 5.353 | 02-27-26 | | 3,768,518 | 3,523,564 |
| Ortho-Clinical Diagnostics SA, 2018 Term Loan B (1 month LIBOR + 3.250%) | 4.905 | 06-30-25 | | 1,630,182 | 1,548,673 |
| Ortho-Clinical Diagnostics SA, EUR Term Loan B (3 month EURIBOR + 3.500%) | 3.500 | 06-30-25 | EUR | 1,382,297 | 1,484,023 |
| Solenis International LLC, 2018 1st Lien Term Loan (1 and 3 month LIBOR + 4.000%) | 5.613 | 06-26-25 | | 2,447,045 | 2,382,810 |
| Solenis International LLC, 2018 2nd Lien Term Loan (3 month LIBOR + 8.500%) | 10.113 | 06-26-26 | | 2,100,000 | 1,991,493 |
| Health care providers and services 4.9% |
| Da Vinci Purchaser Corp., 2019 Term Loan (3 month LIBOR + 4.000%) | 5.872 | 01-08-27 | | 1,129,439 | 1,120,969 |
| DaVita, Inc., 2020 Term Loan B (1 month LIBOR + 1.750%) | 3.353 | 08-12-26 | | 1,706,721 | 1,685,694 |
| Dentalcorp Health Services ULC, 1st Lien Term Loan (1 month LIBOR + 3.750%) | 5.353 | 06-06-25 | | 3,405,640 | 3,346,041 |
| Ensemble RCM LLC, Term Loan (3 month LIBOR + 3.750%) | 5.513 | 08-03-26 | | 1,425,759 | 1,416,249 |
| SEE NOTES TO FINANCIAL STATEMENTS | SEMIANNUAL REPORT | JOHN HANCOCK FLOATING RATE INCOME FUND | 17 |
| | Rate (%) | Maturity date | | Par value^ | Value |
| Health care (continued) | |
| Health care providers and services (continued) |
| Envision Healthcare Corp., 2018 1st Lien Term Loan (1 month LIBOR + 3.750%) | 5.353 | 10-10-25 | | 3,568,335 | $2,861,804 |
| eResearchTechnology, Inc., 2020 1st Lien Term Loan (3 month LIBOR + 4.500%) | 6.231 | 02-04-27 | | 2,604,757 | 2,580,872 |
| MED ParentCo LP, 1st Lien Delayed Draw Term Loan (1 month LIBOR + 4.250%) | 5.853 | 08-31-26 | | 216,825 | 212,897 |
| MED ParentCo LP, 1st Lien Term Loan (1 month LIBOR + 4.250%) | 5.853 | 08-31-26 | | 2,615,051 | 2,567,667 |
| MPH Acquisition Holdings LLC, 2016 Term Loan B (3 month LIBOR + 2.750%) | 4.695 | 06-07-23 | | 2,448,066 | 2,327,695 |
| National Mentor Holdings, Inc., 2019 Term Loan B (1 month LIBOR + 4.000%) | 5.610 | 03-09-26 | | 1,945,311 | 1,936,810 |
| National Mentor Holdings, Inc., 2019 Term Loan C (1 month LIBOR + 4.000%) | 5.610 | 03-09-26 | | 108,228 | 107,755 |
| Option Care Health, Inc., Term Loan B (1 month LIBOR + 4.500%) | 6.103 | 08-06-26 | | 2,467,377 | 2,457,088 |
| PetVet Care Centers LLC, 2018 1st Lien Term Loan (1 month LIBOR + 2.750%) | 4.353 | 02-14-25 | | 4,722,741 | 4,648,972 |
| Select Medical Corp., 2017 Term Loan B (3 month LIBOR + 2.500%) | 4.580 | 03-06-25 | | 2,330,867 | 2,307,558 |
| U.S. Anesthesia Partners, Inc., 2017 Term Loan (1 month LIBOR + 3.000%) | 4.603 | 06-23-24 | | 1,143,926 | 1,072,431 |
| Upstream Newco, Inc., 2019 Term Loan (1 month LIBOR + 4.500%) | 6.103 | 11-20-26 | | 1,026,565 | 1,006,034 |
| Versant Health Holdco, Inc., 1st Lien Term Loan B (1 month LIBOR + 3.000%) | 4.603 | 12-02-24 | | 3,768,968 | 3,693,589 |
| VetCor Professional Practices LLC, USD 1st Lien Term Loan (B) | TBD | 07-02-25 | | 1,539,909 | 1,516,810 |
| Health care technology 1.9% |
| Bioclinica-Synowledge Holdings Corp., 1st Lien Term Loan (1 month LIBOR + 4.250%) | 5.875 | 10-20-23 | | 4,413,841 | 4,318,193 |
| GHX Ultimate Parent Corp., 2017 1st Lien Term Loan (3 month LIBOR + 3.250%) | 5.211 | 06-28-24 | | 2,954,545 | 2,895,455 |
| Netsmart Technologies, Inc., Term Loan D1 (1 month LIBOR + 3.750%) | 5.353 | 04-19-23 | | 4,108,315 | 4,026,149 |
| VVC Holding Corp., 2019 Term Loan B (1 month LIBOR + 4.500%) | 6.158 | 02-11-26 | | 3,139,437 | 3,100,194 |
| 18 | JOHN HANCOCK FLOATING RATE INCOME FUND | SEMIANNUAL REPORT | SEE NOTES TO FINANCIAL STATEMENTS |
| | Rate (%) | Maturity date | | Par value^ | Value |
| Health care (continued) | |
| Life sciences tools and services 1.5% |
| Jaguar Holding Company II, 2018 Term Loan (1 month LIBOR + 2.500%) | 4.103 | 08-18-22 | | 6,589,047 | $6,529,351 |
| Packaging Coordinators Midco, Inc., 1st Lien Term Loan (3 month LIBOR + 4.000%) | 5.950 | 06-30-23 | | 3,014,268 | 3,008,631 |
| PAREXEL International Corp., Term Loan B (1 month LIBOR + 2.750%) | 4.353 | 09-27-24 | | 2,086,437 | 2,020,359 |
| Pharmaceuticals 2.3% |
| AI Sirona Luxembourg Acquisition Sarl, EUR 1st Lien Term Loan B (B) | TBD | 09-29-25 | EUR | 1,440,813 | 1,577,670 |
| Amneal Pharmaceuticals LLC, 2018 Term Loan B (1 month LIBOR + 3.500%) | 5.125 | 05-04-25 | | 3,143,343 | 2,771,391 |
| Bausch Health Americas, Inc., 2018 Term Loan B (1 month LIBOR + 3.000%) | 4.659 | 06-02-25 | | 5,488,162 | 5,449,745 |
| Curium Bidco Sarl, USD Term Loan B (3 month LIBOR + 4.000%) | 5.945 | 07-09-26 | | 1,532,654 | 1,528,822 |
| Elanco Animal Health, Inc., Term Loan B (B) | TBD | 02-04-27 | | 1,928,231 | 1,905,728 |
| Endo International PLC, 2017 Term Loan B (1 month LIBOR + 4.250%) | 5.875 | 04-29-24 | | 1,203,338 | 1,147,431 |
| RPI 2019 Intermediate Finance Trust, 2020 Term Loan B1 (3 month LIBOR + 1.750%) | 3.415 | 02-11-27 | | 1,548,889 | 1,546,953 |
| RPI Intermediate Finance Trust, 2020 Term Loan B1 (3 month LIBOR + 1.750%) | 3.415 | 02-11-27 | | 1,035,249 | 1,028,137 |
| Industrials 14.1% | 105,589,145 |
| Aerospace and defense 2.1% |
| Aernnova Aerospace SA, Term Loan B (B) | TBD | 01-29-27 | EUR | 389,846 | 433,060 |
| Bleriot US Bidco, Inc., Term Loan B (3 month LIBOR + 4.750%) | 6.695 | 10-31-26 | | 1,000,464 | 996,092 |
| Ducommun, Inc., Term Loan B (1 and 3 month LIBOR + 4.000%) | 5.873 | 11-21-25 | | 1,909,890 | 1,897,953 |
| Maxar Technologies, Ltd., Term Loan B (1 month LIBOR + 2.750%) | 4.360 | 10-04-24 | | 1,600,000 | 1,500,000 |
| Standard Aero, Ltd., 2020 CAD Term Loan B2 (3 month LIBOR + 3.500%) | 5.213 | 04-06-26 | | 1,103,484 | 1,080,035 |
| The NORDAM Group, Inc., Term Loan B (1 month LIBOR + 5.500% and 3 month LIBOR + 4.500%) | 7.193 | 04-09-26 | | 2,058,859 | 2,038,271 |
| SEE NOTES TO FINANCIAL STATEMENTS | SEMIANNUAL REPORT | JOHN HANCOCK FLOATING RATE INCOME FUND | 19 |
| | Rate (%) | Maturity date | | Par value^ | Value |
| Industrials (continued) | |
| Aerospace and defense (continued) |
| TransDigm, Inc., 2020 Term Loan E (1 month LIBOR + 2.250%) | 3.853 | 05-30-25 | | 955,123 | $931,846 |
| TransDigm, Inc., 2020 Term Loan F (1 month LIBOR + 2.250%) | 3.853 | 12-09-25 | | 3,883,826 | 3,791,585 |
| WP CPP Holdings LLC, 2018 Term Loan (1 and 3 month LIBOR + 3.750%) | 5.530 | 04-30-25 | | 3,323,113 | 3,226,178 |
| Airlines 0.2% |
| American Airlines, Inc., 2017 Incremental Term Loan (1 month LIBOR + 2.000%) | 3.659 | 12-14-23 | | 1,907,299 | 1,846,113 |
| Building products 2.1% |
| Cornerstone Building Brands, Inc., 2018 Term Loan (1 month LIBOR + 3.750%) | 5.408 | 04-12-25 | | 2,292,074 | 2,223,312 |
| Resideo Funding, Inc., Term Loan B (3 month LIBOR + 2.250%) | 4.200 | 10-24-25 | | 1,620,702 | 1,588,288 |
| Specialty Building Products Holdings LLC, 2018 Term Loan B (1 month LIBOR + 5.750%) | 7.353 | 10-01-25 | | 2,196,813 | 2,178,514 |
| The AZEK Company LLC, 2017 Term Loan (12 month LIBOR + 3.750%) | 5.933 | 05-05-24 | | 5,346,030 | 5,299,253 |
| Wilsonart LLC, 2017 Term Loan B (3 month LIBOR + 3.250%) | 5.200 | 12-19-23 | | 4,181,061 | 4,050,403 |
| Commercial services and supplies 3.5% |
| American Builders & Contractors Supply Company, Inc., 2019 Term Loan (1 month LIBOR + 2.000%) | 3.603 | 01-15-27 | | 3,251,505 | 3,212,032 |
| AVSC Holding Corp., 2018 1st Lien Term Loan (1 and 3 month LIBOR + 3.250%) | 4.936 | 03-03-25 | | 1,892,376 | 1,722,062 |
| AVSC Holding Corp., Incremental Term Loan B (3 month LIBOR + 4.500%) | 6.204 | 10-15-26 | | 163,265 | 153,469 |
| Camelot Finance SA, Term Loan B (1 month LIBOR + 3.250%) | 4.853 | 10-31-26 | | 1,877,212 | 1,864,898 |
| Comet Bidco, Ltd., Institutional Term Loan (B) | TBD | 09-30-24 | | 3,680,000 | 3,509,800 |
| IAA, Inc., Term Loan B (1 month LIBOR + 2.250%) | 3.875 | 06-28-26 | | 1,205,409 | 1,199,381 |
| MHI Holdings LLC, Term Loan B (1 month LIBOR + 5.000%) | 6.603 | 09-21-26 | | 2,040,526 | 2,027,772 |
| Nielsen Finance LLC, USD Term Loan B4 (1 month LIBOR + 2.000%) | 3.671 | 10-04-23 | | 2,935,098 | 2,903,927 |
| Sterling Midco Holdings, Inc., 1st Lien Term Loan (1 month LIBOR + 3.500%) | 5.103 | 06-19-24 | | 3,432,497 | 3,400,746 |
| 20 | JOHN HANCOCK FLOATING RATE INCOME FUND | SEMIANNUAL REPORT | SEE NOTES TO FINANCIAL STATEMENTS |
| | Rate (%) | Maturity date | | Par value^ | Value |
| Industrials (continued) | |
| Commercial services and supplies (continued) |
| Tempo Acquisition LLC, Term Loan (1 month LIBOR + 3.000%) | 4.353 | 05-01-24 | | 6,372,188 | $6,280,619 |
| Construction and engineering 0.7% |
| Amentum Government Services Holdings LLC, Term Loan B (3 month LIBOR + 4.000%) | 5.762 | 02-01-27 | | 1,072,660 | 1,068,637 |
| Kestrel Bidco, Inc., Term Loan B (1 month LIBOR + 3.000%) | 4.653 | 12-11-26 | | 1,381,481 | 1,328,294 |
| Sabre Industries, Inc., 2019 Term Loan B (1 month LIBOR + 3.500%) | 5.879 | 04-15-26 | | 1,202,230 | 1,184,196 |
| USIC Holdings, Inc., 2017 Term Loan B (1 month LIBOR + 3.250%) | 4.853 | 12-08-23 | | 1,841,573 | 1,809,345 |
| Electrical equipment 0.3% |
| Brookfield WEC Holdings, Inc., 2020 Term Loan (1 month LIBOR + 3.000%) | 4.603 | 08-01-25 | | 1,910,599 | 1,873,972 |
| Machinery 1.8% |
| AI Alpine US Bidco, Inc., 2018 USD Term Loan B (3 month LIBOR + 2.750%) | 4.624 | 10-31-25 | | 886,691 | 863,415 |
| Crosby US Acquisition Corp., Term Loan B (1 month LIBOR + 4.750%) | 6.379 | 06-26-26 | | 1,581,338 | 1,551,688 |
| Gardner Denver, Inc., 2017 USD Term Loan B (1 month LIBOR + 2.750%) | 4.353 | 07-30-24 | | 824,182 | 810,789 |
| Granite US Holdings Corp., Term Loan B (3 month LIBOR + 5.250%) | 7.211 | 09-30-26 | | 2,259,504 | 2,157,826 |
| Ingersoll-Rand Services Company, 2020 USD Term Loan B (B) | TBD | 02-05-27 | | 2,083,820 | 2,049,958 |
| Pro Mach Group, Inc., 2018 Term Loan B (1 month LIBOR + 2.750%) | 4.379 | 03-07-25 | | 2,983,655 | 2,861,832 |
| Shape Technologies Group, Inc., Term Loan (3 month LIBOR + 3.000%) | 4.806 | 04-21-25 | | 1,843,200 | 1,677,312 |
| Sundyne US Purchaser, Inc., Term Loan (1 month LIBOR + 4.000%) | 5.603 | 05-15-26 | | 1,098,722 | 1,101,007 |
| Professional services 0.6% |
| Cast & Crew Payroll LLC, 2020 Term Loan B (B) | TBD | 02-09-26 | | 374,865 | 368,774 |
| Cast & Crew Payroll LLC, EUR Term Loan (B) | TBD | 02-09-26 | | 428,417 | 422,527 |
| Fastball Mergersub LLC, Term Loan B (1 month LIBOR + 3.500%) | 5.103 | 01-22-27 | | 1,067,702 | 1,061,701 |
| Stiphout Finance LLC, USD 1st Lien Term Loan (1 month LIBOR + 3.000%) | 4.603 | 10-26-22 | | 2,122,943 | 2,105,705 |
| SEE NOTES TO FINANCIAL STATEMENTS | SEMIANNUAL REPORT | JOHN HANCOCK FLOATING RATE INCOME FUND | 21 |
| | Rate (%) | Maturity date | | Par value^ | Value |
| Industrials (continued) | |
| Professional services (continued) |
| Trans Union LLC, 2019 Term Loan B5 (1 month LIBOR + 1.750%) | 3.353 | 11-16-26 | | 657,544 | $651,173 |
| Road and rail 1.0% |
| AI Convoy Luxembourg Sarl, Term Loan B (B) | TBD | 01-17-27 | EUR | 965,643 | 1,053,368 |
| AI Convoy Luxembourg Sarl, USD Term Loan B (B) | TBD | 01-17-27 | | 1,604,606 | 1,584,548 |
| Genesee & Wyoming, Inc., Term Loan (3 month LIBOR + 2.000%) | 3.906 | 12-30-26 | | 1,289,629 | 1,281,027 |
| Uber Technologies, Inc., 2018 Term Loan (1 month LIBOR + 4.000%) | 5.639 | 04-04-25 | | 3,940,000 | 3,912,578 |
| Trading companies and distributors 1.0% |
| ASP Unifrax Holdings, Inc., EUR Term Loan B (3 month EURIBOR + 3.750%) | 3.750 | 12-12-25 | EUR | 3,166,937 | 3,102,825 |
| ASP Unifrax Holdings, Inc., Term Loan B (3 month LIBOR + 3.750%) | 5.695 | 12-12-25 | | 1,602,450 | 1,458,229 |
| GYP Holdings III Corp., 2018 Term Loan B (1 month LIBOR + 2.750%) | 4.353 | 06-01-25 | | 2,849,791 | 2,818,928 |
| Transportation infrastructure 0.8% |
| Atlantic Aviation FBO, Inc., 2018 Term Loan B (1 month LIBOR + 3.750%) | 5.360 | 12-06-25 | | 2,195,221 | 2,186,989 |
| Dynasty Acquisition Company, Inc., 2020 Term Loan B1 (3 month LIBOR + 3.500%) | 5.213 | 04-06-26 | | 2,052,481 | 2,008,865 |
| Swissport Financing Sarl, 2019 EUR Term Loan (3 month EURIBOR + 4.750%) | 4.750 | 08-14-24 | EUR | 1,786,026 | 1,878,028 |
| Information technology 16.7% | 124,710,014 |
| Communications equipment 0.2% |
| Datto, Inc., 2019 Term Loan B (1 month LIBOR + 4.250%) | 5.853 | 04-02-26 | | 1,292,913 | 1,292,913 |
| Electronic equipment, instruments and components 1.7% |
| C&D Technologies, Inc., Term Loan B (1 month LIBOR + 5.750%) | 7.353 | 12-20-25 | | 2,587,990 | 2,387,421 |
| Celestica, Inc., 2018 1st Lien Term Loan B (1 month LIBOR + 2.125%) | 3.738 | 06-27-25 | | 1,216,911 | 1,198,658 |
| Everest Bidco SASU, 2018 EUR Term Loan (3 month EURIBOR + 4.000%) | 4.000 | 07-04-25 | EUR | 3,174,985 | 3,376,496 |
| Excelitas Technologies Corp., 2018 Add On Term Loan B (3 month LIBOR + 3.500%) | 5.445 | 12-02-24 | | 843,239 | 817,942 |
| 22 | JOHN HANCOCK FLOATING RATE INCOME FUND | SEMIANNUAL REPORT | SEE NOTES TO FINANCIAL STATEMENTS |
| | Rate (%) | Maturity date | | Par value^ | Value |
| Information technology (continued) | |
| Electronic equipment, instruments and components (continued) |
| Excelitas Technologies Corp., USD 2017 1st Lien Term Loan (3 month LIBOR + 3.500%) | 5.445 | 12-02-24 | | 2,896,735 | $2,824,317 |
| Mirion Technologies, Inc., 2019 Term Loan B (3 month LIBOR + 4.000%) | 5.945 | 03-06-26 | | 2,041,212 | 2,016,983 |
| Robertshaw US Holding Corp., 2018 1st Lien Term Loan (B) | TBD | 02-28-25 | | 411,457 | 368,254 |
| IT services 4.0% |
| Boxer Parent Company, Inc., 2018 USD Term Loan B (1 month LIBOR + 4.250%) | 5.853 | 10-02-25 | | 4,775,808 | 4,579,666 |
| Genuine Financial Holdings LLC, 2018 1st Lien Term Loan (1 month LIBOR + 3.750%) | 5.353 | 07-12-25 | | 1,583,741 | 1,540,189 |
| Go Daddy Operating Company LLC, 2017 Repriced Term Loan (1 month LIBOR + 1.750%) | 3.353 | 02-15-24 | | 2,130,415 | 2,094,475 |
| GTT Communications, Inc., 2018 USD Term Loan B (1 month LIBOR + 2.750%) | 4.350 | 05-31-25 | | 4,534,599 | 3,809,516 |
| KBR, Inc., 2020 Term Loan B (1 month LIBOR + 2.750%) | 4.353 | 02-05-27 | | 2,760,465 | 2,736,311 |
| Masergy Holdings, Inc., 2017 1st Lien Term Loan (3 month LIBOR + 3.250%) | 5.195 | 12-15-23 | | 1,939,633 | 1,912,963 |
| Park Place Technologies LLC, 1st Lien Term Loan (1 month LIBOR + 4.000%) | 5.603 | 03-28-25 | | 1,216,911 | 1,205,752 |
| Presidio Holdings, Inc., 2020 Term Loan B (2 month LIBOR + 3.500%) | 5.280 | 01-22-27 | | 836,182 | 823,639 |
| TGG TS Acquisition Company, 2018 Term Loan B (1 month LIBOR + 6.500%) | 8.139 | 12-15-25 | | 1,448,909 | 1,419,931 |
| TNS, Inc., 2013 Term Loan B (3 month LIBOR + 4.000%) | 5.780 | 08-14-22 | | 3,323,446 | 3,201,575 |
| Travelport Finance Luxembourg Sarl, 2019 Term Loan (3 month LIBOR + 5.000%) | 6.945 | 05-29-26 | | 3,320,734 | 2,519,607 |
| WEX, Inc. Term Loan B3 (1 month LIBOR + 2.250%) | 3.853 | 05-15-26 | | 4,200,979 | 4,144,980 |
| Semiconductors and semiconductor equipment 0.9% |
| Cohu, Inc., 2018 Term Loan B (1 month LIBOR + 3.000%) | 4.603 | 10-01-25 | | 737,868 | 715,732 |
| MACOM Technology Solutions Holdings, Inc., Term Loan (B) | TBD | 05-17-24 | | 1,407,000 | 1,348,961 |
| SEE NOTES TO FINANCIAL STATEMENTS | SEMIANNUAL REPORT | JOHN HANCOCK FLOATING RATE INCOME FUND | 23 |
| | Rate (%) | Maturity date | | Par value^ | Value |
| Information technology (continued) | |
| Semiconductors and semiconductor equipment (continued) |
| Microchip Technology, Inc., 2018 Term Loan B (1 month LIBOR + 2.000%) | 3.610 | 05-29-25 | | 3,468,493 | $3,442,479 |
| ON Semiconductor Corp., 2019 Term Loan B (1 month LIBOR + 2.000%) | 3.603 | 09-19-26 | | 944,740 | 932,345 |
| Software 8.7% |
| Barracuda Networks, Inc., 1st Lien Term Loan (1 month LIBOR + 3.250%) | 4.863 | 02-12-25 | | 3,660,937 | 3,638,057 |
| Castle US Holding Corp., USD Term Loan B (B) | TBD | 01-29-27 | | 854,931 | 812,185 |
| Dcert Buyer, Inc., 2019 Term Loan B (1 month LIBOR + 4.000%) | 5.603 | 10-16-26 | | 2,638,812 | 2,609,126 |
| DiscoverOrg LLC, 2019 1st Lien Term Loan (1 month LIBOR + 4.000%) | 5.603 | 02-02-26 | | 2,450,333 | 2,442,688 |
| Greeneden US Holdings II LLC, 2018 USD Term Loan B (1 month LIBOR + 3.250%) | 4.853 | 12-01-23 | | 4,883,305 | 4,818,211 |
| Informatica LLC, 2020 USD 2nd Lien Term Loan (B) | TBD | 02-25-25 | | 569,601 | 572,449 |
| Kronos, Inc., 2017 Term Loan B (3 month LIBOR + 3.000%) | 4.763 | 11-01-23 | | 4,412,023 | 4,372,050 |
| MA FinanceCo LLC, 2017 Term Loan B2 (1 month LIBOR + 2.250%) | 3.853 | 11-19-21 | | 1,137,347 | 1,123,130 |
| MA FinanceCo LLC, USD Term Loan B3 (1 month LIBOR + 2.500%) | 4.103 | 06-21-24 | | 495,297 | 469,294 |
| Mavenir Systems, Inc., 2018 Term Loan B (3 month LIBOR + 6.000%) | 7.680 | 05-08-25 | | 2,333,052 | 2,327,219 |
| Monotype Imaging Holdings, Inc., Term Loan (3 month LIBOR + 5.500%) | 7.445 | 10-09-26 | | 1,679,619 | 1,633,430 |
| nThrive, Inc., 2016 1st Lien Term Loan (1 month LIBOR + 4.500%) | 6.103 | 10-20-22 | | 1,649,541 | 1,468,091 |
| Project Alpha Intermediate Holding, Inc., 2017 Term Loan B (6 month LIBOR + 3.500%) | 5.380 | 04-26-24 | | 2,995,247 | 2,950,318 |
| Project Boost Purchaser LLC, 2019 Term Loan B (1 month LIBOR + 3.500%) | 5.103 | 06-01-26 | | 3,011,155 | 2,928,348 |
| Quest Software US Holdings, Inc., 2018 1st Lien Term Loan (3 month LIBOR + 4.250%) | 6.027 | 05-16-25 | | 2,956,572 | 2,882,658 |
| RP Crown Parent LLC, 2016 Term Loan B (1 month LIBOR + 2.750%) | 4.353 | 10-12-23 | | 3,780,284 | 3,742,481 |
| Salient CRGT, Inc., 2017 Term Loan (1 month LIBOR + 6.500%) | 8.103 | 02-28-22 | | 3,017,386 | 2,911,778 |
| 24 | JOHN HANCOCK FLOATING RATE INCOME FUND | SEMIANNUAL REPORT | SEE NOTES TO FINANCIAL STATEMENTS |
| | Rate (%) | Maturity date | | Par value^ | Value |
| Information technology (continued) | |
| Software (continued) |
| Seattle SpinCo, Inc., USD Term Loan B3 (1 month LIBOR + 2.500%) | 4.103 | 06-21-24 | | 3,344,863 | $3,169,258 |
| SolarWinds Holdings, Inc., 2018 Term Loan B (1 month LIBOR + 2.750%) | 4.353 | 02-05-24 | | 4,942,943 | 4,856,441 |
| Sophia LP, 2017 Term Loan B (3 month LIBOR + 3.250%) | 5.195 | 09-30-22 | | 2,283,303 | 2,265,607 |
| SS&C European Holdings Sarl, 2018 Term Loan B4 (1 month LIBOR + 1.750%) | 3.353 | 04-16-25 | | 838,186 | 826,309 |
| SS&C Technologies, Inc., 2018 Term Loan B3 (1 month LIBOR + 1.750%) | 3.353 | 04-16-25 | | 1,174,640 | 1,157,995 |
| SS&C Technologies, Inc., 2018 Term Loan B5 (1 month LIBOR + 1.750%) | 3.353 | 04-16-25 | | 2,548,140 | 2,514,377 |
| Surf Holdings LLC, USD Term Loan (B) | TBD | 01-15-27 | | 1,091,523 | 1,073,786 |
| Upland Software, Inc., 2019 Term Loan (1 month LIBOR + 3.750%) | 5.353 | 08-06-26 | | 1,935,092 | 1,920,579 |
| VS Buyer LLC, Term Loan B (B) | TBD | 02-28-27 | | 1,807,967 | 1,785,367 |
| Weld North Education LLC, Term Loan B (3 month LIBOR + 4.250%) | 6.200 | 02-15-25 | | 3,742,477 | 3,714,409 |
| Technology hardware, storage and peripherals 1.2% |
| Dell International LLC, 2019 Term Loan B (1 month LIBOR + 2.000%) | 3.610 | 09-19-25 | | 3,769,041 | 3,720,759 |
| Electronics For Imaging, Inc., Term Loan (3 month LIBOR + 5.000%) | 6.945 | 07-23-26 | | 3,152,280 | 2,900,098 |
| HCP Acquisition LLC, 2017 Term Loan B (1 month LIBOR + 3.000%) | 4.603 | 05-16-24 | | 2,433,463 | 2,392,411 |
| Materials 6.0% | 45,218,576 |
| Chemicals 1.9% |
| Ascend Performance Materials Operations LLC, 2019 Term Loan B (3 month LIBOR + 5.250%) | 7.195 | 08-27-26 | | 3,678,275 | 3,664,481 |
| Innophos Holdings, Inc., 2020 Term Loan B (3 month LIBOR + 3.750%) | 5.421 | 02-04-27 | | 1,002,492 | 992,468 |
| Nouryon USA LLC, 2018 USD Term Loan B (1 month LIBOR + 3.000%) | 4.671 | 10-01-25 | | 4,553,333 | 4,393,966 |
| Plaskolite PPC Intermediate II LLC, 1st Lien Term Loan (1 month LIBOR + 4.250%) | 5.879 | 12-15-25 | | 3,601,209 | 3,460,150 |
| Rohm Holding GmbH, Term Loan B (B) | TBD | 07-31-26 | | 1,415,704 | 1,235,202 |
| SEE NOTES TO FINANCIAL STATEMENTS | SEMIANNUAL REPORT | JOHN HANCOCK FLOATING RATE INCOME FUND | 25 |
| | Rate (%) | Maturity date | | Par value^ | Value |
| Materials (continued) | |
| Chemicals (continued) |
| Univar Solutions USA, Inc., 2019 USD Term Loan B5 (1 month LIBOR + 2.000%) | 3.603 | 07-01-26 | | 833,592 | $822,338 |
| Containers and packaging 2.8% |
| Berry Global, Inc., 2019 Term Loan Y (1 month LIBOR + 2.000%) | 3.671 | 07-01-26 | | 1,941,041 | 1,906,258 |
| Irel AcquiCo GmbH, EUR Term Loan B1A (3 month EURIBOR + 3.500%) | 3.500 | 05-26-26 | EUR | 1,590,236 | 1,754,663 |
| Klockner Pentaplast of America, Inc., EUR 2017 Term Loan B1 (3 month EURIBOR + 4.750%) | 4.750 | 06-30-22 | EUR | 469,255 | 436,185 |
| LABL, Inc., 2019 EUR Term Loan (1 month EURIBOR + 5.000%) | 5.000 | 07-01-26 | EUR | 1,723,600 | 1,897,213 |
| LTI Holdings, Inc., 2018 Add On 1st Lien Term Loan (1 month LIBOR + 3.500%) | 5.103 | 09-06-25 | | 4,569,497 | 3,781,259 |
| LTI Holdings, Inc., 2019 Term Loan (1 month LIBOR + 4.750%) | 6.353 | 07-24-26 | | 497,171 | 416,381 |
| Mauser Packaging Solutions Holding Company, 2017 Term Loan B (3 month LIBOR + 3.250%) | 5.084 | 04-03-24 | | 3,263,728 | 3,111,409 |
| NPC International, Inc., 1st Lien Term Loan (C) | 0.000 | 04-19-24 | | 3,085,443 | 1,485,425 |
| NPC International, Inc., Priority Term Loan (1 month LIBOR + 10.000%) | 11.639 | 04-17-20 | | 242,959 | 240,529 |
| Plaze, Inc., 2019 Term Loan B (3 month LIBOR + 3.500%) | 5.145 | 08-03-26 | | 3,664,800 | 3,651,057 |
| Trident TPI Holdings, Inc., 2017 USD Term Loan B1 (1 month LIBOR + 3.000%) | 4.603 | 10-17-24 | | 2,494,734 | 2,401,181 |
| Metals and mining 1.0% |
| TurboCombustor Technology, Inc., New Term Loan B (1 month LIBOR + 4.500%) | 6.103 | 12-02-20 | | 5,192,820 | 4,946,161 |
| WireCo WorldGroup, Inc., 1st Lien Term Loan (1 month LIBOR + 5.000%) | 6.603 | 09-30-23 | | 2,518,592 | 2,386,366 |
| Paper and forest products 0.3% |
| Flex Acquisition Company, Inc., 1st Lien Term Loan (1 and 3 month LIBOR + 3.000%) | 4.900 | 12-29-23 | | 476,781 | 454,930 |
| Flex Acquisition Company, Inc., 2018 Incremental Term Loan (3 month LIBOR + 3.250%) | 5.159 | 06-29-25 | | 1,864,874 | 1,780,954 |
| 26 | JOHN HANCOCK FLOATING RATE INCOME FUND | SEMIANNUAL REPORT | SEE NOTES TO FINANCIAL STATEMENTS |
| | Rate (%) | Maturity date | | Par value^ | Value |
| Real estate 0.4% | $3,085,769 |
| Equity real estate investment trusts 0.4% |
| Iron Mountain, Inc., 2018 Term Loan B (1 month LIBOR + 1.750%) | 3.353 | 01-02-26 | | 1,630,850 | 1,588,040 |
|
| VICI Properties 1 LLC, Replacement Term Loan B (1 month LIBOR + 1.750%) | 3.379 | 12-20-24 | | 1,528,295 | 1,497,729 |
| Corporate bonds 12.3% | | | | | $91,745,938 |
| (Cost $98,048,312) | | | | | |
| Communication services 3.9% | | | | | 28,883,587 |
| Diversified telecommunication services 1.1% | | | |
| CenturyLink, Inc. (E) | 4.000 | 02-15-27 | | 1,011,000 | 1,015,954 |
| Intelsat Jackson Holdings SA (E) | 9.500 | 09-30-22 | | 4,625,000 | 5,237,813 |
| Level 3 Financing, Inc. (E) | 4.625 | 09-15-27 | | 1,840,000 | 1,876,800 |
| Interactive media and services 0.2% | | | |
| National CineMedia LLC (E) | 5.875 | 04-15-28 | | 1,650,000 | 1,685,962 |
| Media 2.5% | | | |
| Altice Financing SA (E) | 5.000 | 01-15-28 | | 692,000 | 678,160 |
| CCO Holdings LLC (E) | 4.500 | 08-15-30 | | 1,212,000 | 1,225,635 |
| CCO Holdings LLC (E) | 5.000 | 02-01-28 | | 1,000,000 | 1,040,000 |
| Cumulus Media New Holdings, Inc. (E)(F) | 6.750 | 07-01-26 | | 1,448,000 | 1,503,676 |
| Front Range BidCo, Inc. (E) | 4.000 | 03-01-27 | | 920,000 | 893,550 |
| Front Range BidCo, Inc. (E) | 6.125 | 03-01-28 | | 836,000 | 824,505 |
| iHeartCommunications, Inc. (E) | 4.750 | 01-15-28 | | 152,000 | 151,240 |
| iHeartCommunications, Inc. (E) | 5.250 | 08-15-27 | | 548,000 | 565,152 |
| iHeartCommunications, Inc. | 6.375 | 05-01-26 | | 1,538,000 | 1,652,889 |
| MDC Partners, Inc. (E) | 6.500 | 05-01-24 | | 1,562,000 | 1,425,325 |
| Sirius XM Radio, Inc. (E) | 5.500 | 07-01-29 | | 2,096,000 | 2,257,497 |
| United Group BV (E) | 3.125 | 02-15-26 | EUR | 1,128,000 | 1,195,766 |
| United Group BV (E) | 3.625 | 02-15-28 | EUR | 1,680,000 | 1,774,065 |
| United Group BV (3 month EURIBOR + 3.250%) (E)(G) | 3.250 | 02-15-26 | EUR | 734,000 | 776,915 |
| Ziggo Bond Company BV (E) | 5.125 | 02-28-30 | | 1,528,000 | 1,522,270 |
| Ziggo Bond Company BV (E) | 6.000 | 01-15-27 | | 1,300,000 | 1,374,763 |
| Wireless telecommunication services 0.1% | | | |
| Sprint Communications, Inc. | 11.500 | 11-15-21 | | 180,000 | 205,650 |
| Consumer discretionary 2.3% | | | | | 17,221,801 |
| Diversified consumer services 0.3% | | | |
| Midas Intermediate Holdco II LLC (E) | 7.875 | 10-01-22 | | 1,250,000 | 1,200,783 |
| Q-Park Holding I BV (E) | 2.000 | 03-01-27 | EUR | 949,000 | 1,032,524 |
| Hotels, restaurants and leisure 0.8% | | | |
| Connect Finco SARL (E) | 6.750 | 10-01-26 | | 815,000 | 829,263 |
| SEE NOTES TO FINANCIAL STATEMENTS | SEMIANNUAL REPORT | JOHN HANCOCK FLOATING RATE INCOME FUND | 27 |
| | Rate (%) | Maturity date | | Par value^ | Value |
Consumer
discretionary (continued) | | | | | |
| Hotels, restaurants and leisure (continued) | | | |
| Scientific Games International, Inc. (E) | 5.000 | 10-15-25 | | 2,058,000 | $2,064,431 |
| Scientific Games International, Inc. (E) | 7.000 | 05-15-28 | | 174,000 | 169,541 |
| Scientific Games International, Inc. (E) | 7.250 | 11-15-29 | | 311,000 | 302,852 |
| Scientific Games International, Inc. (E) | 8.250 | 03-15-26 | | 993,000 | 1,025,273 |
| Station Casinos LLC (E) | 4.500 | 02-15-28 | | 1,694,000 | 1,613,535 |
| Leisure products 0.3% | | | |
| Mattel, Inc. (E) | 5.875 | 12-15-27 | | 1,984,000 | 2,073,280 |
| Specialty retail 0.6% | | | |
| F-Brasile SpA (E) | 7.375 | 08-15-26 | | 1,989,000 | 2,113,313 |
| Maxeda DIY Holding BV | 6.125 | 07-15-22 | EUR | 1,215,000 | 1,195,098 |
| Party City Holdings, Inc. (E) | 6.625 | 08-01-26 | | 1,675,000 | 971,500 |
| Textiles, apparel and luxury goods 0.3% | | | |
| Wolverine Escrow LLC (E) | 9.000 | 11-15-26 | | 2,637,000 | 2,630,408 |
| Consumer staples 0.7% | | | | | 5,118,325 |
| Food and staples retailing 0.1% | | | |
| H-Food Holdings LLC (E) | 8.500 | 06-01-26 | | 1,172,000 | 1,010,850 |
| Food products 0.3% | | | |
| Sigma Holdco BV (E)(F) | 7.875 | 05-15-26 | | 2,345,000 | 2,298,100 |
| Household products 0.3% | | | |
| Kronos Acquisition Holdings, Inc. (E) | 9.000 | 08-15-23 | | 1,875,000 | 1,809,375 |
| Energy 0.0% | | | | | 13 |
| Oil, gas and consumable fuels 0.0% | | | |
| Murray Energy Corp. (9.000% Cash and 3.000% PIK) (C)(E) | 12.000 | 04-15-24 | | 1,279,956 | 13 |
| Financials 0.5% | | | | | 3,855,148 |
| Capital markets 0.5% | | | |
| AG Issuer LLC (E) | 6.250 | 03-01-28 | | 1,938,000 | 1,928,310 |
| LPL Holdings, Inc. (E) | 4.625 | 11-15-27 | | 1,586,000 | 1,605,825 |
| Diversified financial services 0.0% | | | |
| Advisor Group Holdings, Inc. (E) | 10.750 | 08-01-27 | | 305,000 | 321,013 |
| Health care 1.0% | | | | | 7,561,475 |
| Health care equipment and supplies 0.1% | | | |
| Ortho-Clinical Diagnostics, Inc. (E) | 7.250 | 02-01-28 | | 645,000 | 633,713 |
| Health care providers and services 0.3% | | | |
| MPH Acquisition Holdings LLC (E) | 7.125 | 06-01-24 | | 1,145,000 | 1,065,102 |
| 28 | JOHN HANCOCK FLOATING RATE INCOME FUND | SEMIANNUAL REPORT | SEE NOTES TO FINANCIAL STATEMENTS |
| | Rate (%) | Maturity date | | Par value^ | Value |
| Health care (continued) | | | | | |
| Health care providers and services (continued) | | | |
| Select Medical Corp. (E) | 6.250 | 08-15-26 | | 1,285,000 | $1,370,131 |
| Pharmaceuticals 0.6% | | | |
| Bausch Health Companies, Inc. (E) | 5.000 | 01-30-28 | | 762,000 | 751,995 |
| Bausch Health Companies, Inc. (E) | 5.250 | 01-30-30 | | 258,000 | 255,098 |
| Bausch Health Companies, Inc. (E) | 9.000 | 12-15-25 | | 1,077,000 | 1,199,196 |
| Par Pharmaceutical, Inc. (E) | 7.500 | 04-01-27 | | 2,165,000 | 2,286,240 |
| Industrials 1.6% | | | | | 11,934,846 |
| Aerospace and defense 0.2% | | | |
| SSL Robotics LLC (E) | 9.750 | 12-31-23 | | 1,176,000 | 1,249,853 |
| TransDigm, Inc. (E) | 5.500 | 11-15-27 | | 152,000 | 151,818 |
| TransDigm, Inc. (E) | 6.250 | 03-15-26 | | 202,000 | 213,868 |
| Building products 0.3% | | | |
| Resideo Funding, Inc. (E) | 6.125 | 11-01-26 | | 2,023,000 | 1,977,483 |
| Commercial services and supplies 0.2% | | | |
| Aptim Corp. (E) | 7.750 | 06-15-25 | | 396,000 | 225,391 |
| VistaJet Malta Finance PLC (E) | 10.500 | 06-01-24 | | 938,000 | 877,030 |
| Construction and engineering 0.3% | | | |
| Novafives SAS (3 month EURIBOR + 4.500%) (G) | 4.500 | 06-15-25 | EUR | 1,332,000 | 1,209,455 |
| Promontoria Holding 264 BV | 6.750 | 08-15-23 | EUR | 261,000 | 242,030 |
| Promontoria Holding 264 BV (3 month EURIBOR + 6.250%) (G) | 6.250 | 08-15-23 | EUR | 727,000 | 674,160 |
| Marine 0.2% | | | |
| Naviera Armas SA (3 month EURIBOR + 4.250%) (G) | 4.250 | 11-15-24 | EUR | 1,811,000 | 1,159,567 |
| Professional services 0.1% | | | |
| La Financiere Atalian SASU | 4.000 | 05-15-24 | EUR | 962,000 | 838,980 |
| La Financiere Atalian SASU | 5.125 | 05-15-25 | EUR | 100,000 | 87,433 |
| La Financiere Atalian SASU | 6.625 | 05-15-25 | GBP | 117,000 | 117,973 |
| Road and rail 0.0% | | | |
| Uber Technologies, Inc. (E) | 7.500 | 09-15-27 | | 334,000 | 348,195 |
| Trading companies and distributors 0.3% | | | |
| Beacon Roofing Supply, Inc. (E) | 4.500 | 11-15-26 | | 234,000 | 231,859 |
| Beacon Roofing Supply, Inc. (E) | 4.875 | 11-01-25 | | 2,415,000 | 2,329,751 |
| Information technology 0.7% | | | | | 5,117,946 |
| Communications equipment 0.2% | | | |
| CommScope, Inc. (E) | 6.000 | 03-01-26 | | 1,390,000 | 1,426,738 |
| IT services 0.2% | | | |
| Presidio Holdings, Inc. (E) | 4.875 | 02-01-27 | | 1,224,000 | 1,224,000 |
| SEE NOTES TO FINANCIAL STATEMENTS | SEMIANNUAL REPORT | JOHN HANCOCK FLOATING RATE INCOME FUND | 29 |
| | Rate (%) | Maturity date | | Par value^ | Value |
Information
technology (continued) | | | | | |
| Software 0.3% | | | |
| Open Text Corp. (E) | 3.875 | 02-15-28 | | 1,076,000 | $1,070,835 |
| Open Text Holdings, Inc. (E) | 4.125 | 02-15-30 | | 999,000 | 994,005 |
| PTC, Inc. (E) | 4.000 | 02-15-28 | | 405,000 | 402,368 |
| Materials 1.2% | | | | | 9,004,375 |
| Containers and packaging 1.2% | | | |
| Ardagh Packaging Finance PLC (E) | 4.125 | 08-15-26 | | 1,590,000 | 1,584,041 |
| Ardagh Packaging Finance PLC (E) | 5.250 | 08-15-27 | | 786,000 | 798,812 |
| LABL Escrow Issuer LLC (E) | 6.750 | 07-15-26 | | 1,551,000 | 1,624,983 |
| LABL Escrow Issuer LLC (E) | 10.500 | 07-15-27 | | 1,025,000 | 1,056,114 |
| Mauser Packaging Solutions Holding Company (E) | 7.250 | 04-15-25 | | 937,000 | 908,131 |
| Silgan Holdings, Inc. (E) | 2.250 | 06-01-28 | EUR | 363,000 | 396,919 |
| Silgan Holdings, Inc. (E) | 4.125 | 02-01-28 | | 143,000 | 143,358 |
| Trivium Packaging Finance BV (E) | 5.500 | 08-15-26 | | 2,398,000 | 2,484,932 |
| Metals and mining 0.0% | | | |
| Midwest Vanadium Pty, Ltd. (C)(E) | 11.500 | 02-15-18 | | 5,668,325 | 7,085 |
| Real estate 0.4% | | | | | 3,048,422 |
| Equity real estate investment trusts 0.4% | | | |
| SBA Communications Corp. (E) | 3.875 | 02-15-27 | | 1,067,000 | 1,088,660 |
| VICI Properties LP (E) | 3.750 | 02-15-27 | | 312,000 | 309,660 |
| VICI Properties LP (E) | 4.125 | 08-15-30 | | 104,000 | 104,130 |
| VICI Properties LP (E) | 4.250 | 12-01-26 | | 1,092,000 | 1,103,029 |
| VICI Properties LP (E) | 4.625 | 12-01-29 | | 429,000 | 442,943 |
|
| | | | | Shares | Value |
| Common stocks 0.0% | | | | | $191,267 |
| (Cost $11,635,066) | | | | | |
| Energy 0.0% | | | | | 191,267 |
| Energy equipment and services 0.0% | | | |
| Hercules Offshore, Inc. (D)(H) | | | 196,736 | 191,267 |
|
| | Rate (%) | Maturity date | | Par value^ | Value |
| Escrow certificates 0.0% | | | | | $881 |
| (Cost $0) | | | | | |
| Magellan Health, Inc. (D)(H) | 9.750 | 05-15-20 | | 3,400,000 | 881 |
|
| 30 | JOHN HANCOCK FLOATING RATE INCOME FUND | SEMIANNUAL REPORT | SEE NOTES TO FINANCIAL STATEMENTS |
| | | Yield (%) | | Shares | Value |
| Short-term investments 2.3% | | | | | $16,845,204 |
| (Cost $16,844,688) | | | | | |
| Short-term funds 2.3% | | | | | 16,845,204 |
| John Hancock Collateral Trust (I) | 1.6968(J) | | 245,829 | 2,460,473 |
| State Street Institutional U.S. Government Money Market Fund, Premier Class | 1.5386(J) | | 14,384,731 | 14,384,731 |
|
| Total investments (Cost $808,480,492) 102.7% | | | | $767,717,203 |
| Other assets and liabilities, net (2.7%) | | | | (19,946,159) |
| Total net assets 100.0% | | | | | $747,771,044 |
| The percentage shown for each investment category is the total value of the category as a percentage of the net assets of the fund. |
| ^All par values are denominated in U.S. dollars unless otherwise indicated. |
| Currency Abbreviations |
| EUR | Euro |
| GBP | Pound Sterling |
| Security Abbreviations and Legend |
| EURIBOR | Euro Interbank Offered Rate |
| LIBOR | London Interbank Offered Rate |
| PIK | Pay-in-Kind Security - Represents a payment-in-kind which may pay interest in additional par and/or cash. Rates shown are the current rate and most recent payment rate. |
| (A) | Term loans are variable rate obligations. The coupon rate shown represents the rate at period end. |
| (B) | This position represents an unsettled loan commitment at period end. Certain details associated with this purchase are not known prior to the settlement date, including coupon rate, which is disclosed as TBD (To Be Determined). |
| (C) | Non-income producing - Issuer is in default. |
| (D) | Security is valued using significant unobservable inputs and is classified as Level 3 in the fair value hierarchy. Refer to Note 2 to the financial statements. |
| (E) | These securities are exempt from registration under Rule 144A of the Securities Act of 1933. Such securities may be resold, normally to qualified institutional buyers, in transactions exempt from registration. Rule 144A securities amounted to $84,362,703 or 11.3% of the fund's net assets as of 2-29-20. |
| (F) | All or a portion of this security is on loan as of 2-29-20. |
| (G) | Variable rate obligation. The coupon rate shown represents the rate at period end. |
| (H) | Non-income producing security. |
| (I) | Investment is an affiliate of the fund, the advisor and/or subadvisor. This security represents the investment of cash collateral received for securities lending. |
| (J) | The rate shown is the annualized seven-day yield as of 2-29-20. |
| SEE NOTES TO FINANCIAL STATEMENTS | SEMIANNUAL REPORT | JOHN HANCOCK FLOATING RATE INCOME FUND | 31 |
DERIVATIVES
FORWARD FOREIGN CURRENCY CONTRACTS
| Contract to buy | Contract to sell | Counterparty (OTC) | Contractual
settlement
date | Unrealized
appreciation | Unrealized
depreciation |
| EUR | 13,330,000 | USD | 14,723,265 | CITI | 3/20/2020 | $8,101 | — |
| USD | 67,147,403 | EUR | 60,030,000 | CITI | 3/20/2020 | 806,525 | — |
| | | | | | | $814,626 | — |
| Derivatives Currency Abbreviations |
| EUR | Euro |
| USD | U.S. Dollar |
| Derivatives Abbreviations |
| CITI | Citibank, N.A. |
| OTC | Over-the-counter |
At 2-29-20, the aggregate cost of investments for federal income tax purposes was $809,173,712. Net unrealized depreciation aggregated to $40,641,883, of which $4,100,401 related to gross unrealized appreciation and $44,742,284 related to gross unrealized depreciation.
See Notes to financial statements regarding investment transactions and other derivatives information.
| 32 | JOHN HANCOCK FLOATING RATE INCOME FUND | SEMIANNUAL REPORT | SEE NOTES TO FINANCIAL STATEMENTS |
STATEMENT OF ASSETS AND LIABILITIES 2-29-20 (unaudited)
| Assets | |
| Unaffiliated investments, at value (Cost $806,020,535) including $2,411,604 of securities loaned | $765,256,730 |
| Affiliated investments, at value (Cost $2,459,957) | 2,460,473 |
| Total investments, at value (Cost $808,480,492) | 767,717,203 |
| Unrealized appreciation on forward foreign currency contracts | 814,626 |
| Foreign currency, at value (Cost $4,000,664) | 4,069,238 |
| Interest receivable | 3,949,330 |
| Receivable for fund shares sold | 74,067 |
| Receivable for investments sold | 40,443,562 |
| Receivable for securities lending income | 437 |
| Receivable from affiliates | 8,739 |
| Other assets | 92,010 |
| Total assets | 817,169,212 |
| Liabilities | |
| Due to custodian | 18,631 |
| Distributions payable | 53,700 |
| Payable for collateral on OTC derivatives | 752,687 |
| Payable for investments purchased | 62,225,664 |
| Payable for fund shares repurchased | 3,717,578 |
| Payable upon return of securities loaned | 2,459,884 |
| Payable to affiliates | |
| Accounting and legal services fees | 18,989 |
| Transfer agent fees | 20,440 |
| Trustees' fees | 2,369 |
| Other liabilities and accrued expenses | 128,226 |
| Total liabilities | 69,398,168 |
| Net assets | $747,771,044 |
| Net assets consist of | |
| Paid-in capital | $1,125,649,786 |
| Total distributable earnings (loss) | (377,878,742) |
| Net assets | $747,771,044 |
| |
| SEE NOTES TO FINANCIAL STATEMENTS | SEMIANNUAL REPORT | JOHN HANCOCK Floating Rate Income Fund | 33 |
STATEMENT OF ASSETS AND LIABILITIES 2-29-20 (unaudited) (continued)
| Net asset value per share | |
| Based on net asset value and shares outstanding - the fund has an unlimited number of shares authorized with no par value | |
| Class A ($99,949,483 ÷ 12,277,491 shares)1 | $8.14 |
| Class B ($3,198,307 ÷ 392,696 shares)1 | $8.14 |
| Class C ($55,879,374 ÷ 6,834,823 shares)1 | $8.18 |
| Class I ($57,366,120 ÷ 7,051,465 shares) | $8.14 |
| Class R6 ($2,100,842 ÷ 258,012 shares) | $8.14 |
| Class 1 ($22,323,303 ÷ 2,745,045 shares) | $8.13 |
| Class NAV ($506,953,615 ÷ 62,257,070 shares) | $8.14 |
| Maximum offering price per share | |
| Class A (net asset value per share ÷ 97.5%)2 | $8.35 |
| 1 | Redemption price per share is equal to net asset value less any applicable contingent deferred sales charge. |
| 2 | On single retail sales of less than $100,000. On sales of $100,000 or more and on group sales the offering price is reduced. |
| 34 | JOHN HANCOCK Floating Rate Income Fund | SEMIANNUAL REPORT | SEE NOTES TO FINANCIAL STATEMENTS |
STATEMENT OF OPERATIONS For the six months ended 2-29-20 (unaudited)
| Investment income | |
| Interest | $23,089,421 |
| Securities lending | 10,653 |
| Total investment income | 23,100,074 |
| Expenses | |
| Investment management fees | 2,768,727 |
| Distribution and service fees | 468,309 |
| Accounting and legal services fees | 73,697 |
| Transfer agent fees | 143,218 |
| Trustees' fees | 8,339 |
| Custodian fees | 76,555 |
| State registration fees | 41,537 |
| Printing and postage | 29,309 |
| Professional fees | (48,256)1 |
| Other | 234,459 |
| Total expenses | 3,795,894 |
| Less expense reductions | (608,921) |
| Net expenses | 3,186,973 |
| Net investment income | 19,913,101 |
| Realized and unrealized gain (loss) | |
| Net realized gain (loss) on | |
| Unaffiliated investments and foreign currency transactions | (17,078,125) |
| Affiliated investments | 895 |
| Forward foreign currency contracts | 2,360,889 |
| | (14,716,341) |
| Change in net unrealized appreciation (depreciation) of | |
| Unaffiliated investments and translation of assets and liabilities in foreign currencies | 6,318,550 |
| Affiliated investments | (267) |
| Forward foreign currency contracts | (1,771,473) |
| | 4,546,810 |
| Net realized and unrealized loss | (10,169,531) |
| Increase in net assets from operations | $9,743,570 |
| |
| 1 | During the six months ended February 29, 2020, Floating Rate Income Fund received a reimbursement of legal fees. See Note 10 to the Financial statements. As a result of this reimbursement, the fund reflects negative professional fees in the current reporting period. Professional fees incurred by the fund for the six months ended February 29, 2020 prior to these reimbursements were $59,173. |
| SEE NOTES TO FINANCIAL STATEMENTS | SEMIANNUAL REPORT | JOHN HANCOCK Floating Rate Income Fund | 35 |
STATEMENTS OF CHANGES IN NET ASSETS
| | Six months ended
2-29-20
(unaudited) | Year ended
8-31-19 |
| Increase (decrease) in net assets | | |
| From operations | | |
| Net investment income | $19,913,101 | $53,726,042 |
| Net realized loss | (14,716,341) | (27,885,003) |
| Change in net unrealized appreciation (depreciation) | 4,546,810 | 3,560,607 |
| Increase in net assets resulting from operations | 9,743,570 | 29,401,646 |
| Distributions to shareholders | | |
| From earnings | | |
| Class A | (2,783,156) | (5,343,492) |
| Class B | (90,952) | (263,936) |
| Class C | (1,435,171) | (3,399,225) |
| Class I | (1,726,460) | (6,031,201) |
| Class R6 | (70,391) | (267,170) |
| Class 1 | (675,294) | (1,480,774) |
| Class NAV | (15,825,796) | (36,075,340) |
| Total distributions | (22,607,220) | (52,861,138) |
| From fund share transactions | (166,442,150) | (330,154,576) |
| Total decrease | (179,305,800) | (353,614,068) |
| Net assets | | |
| Beginning of period | 927,076,844 | 1,280,690,912 |
| End of period | $747,771,044 | $927,076,844 |
| 36 | JOHN HANCOCK Floating Rate Income Fund | SEMIANNUAL REPORT | SEE NOTES TO FINANCIAL STATEMENTS |
| CLASS A SHARES Period ended | 2-29-201 | 8-31-19 | 8-31-18 | 8-31-17 | 8-31-16 | 8-31-15 |
| Per share operating performance | | | | | | |
| Net asset value, beginning of period | $8.28 | $8.43 | $8.45 | $8.48 | $8.71 | $9.36 |
| Net investment income2 | 0.19 | 0.40 | 0.34 | 0.37 | 0.43 | 0.42 |
| Net realized and unrealized gain (loss) on investments | (0.11) | (0.16) | —3 | — | (0.24) | (0.62) |
| Total from investment operations | 0.08 | 0.24 | 0.34 | 0.37 | 0.19 | (0.20) |
| Less distributions | | | | | | |
| From net investment income | (0.22) | (0.39) | (0.36) | (0.40) | (0.42) | (0.43) |
| From net realized gain | — | — | — | — | — | (0.02) |
| Total distributions | (0.22) | (0.39) | (0.36) | (0.40) | (0.42) | (0.45) |
| Net asset value, end of period | $8.14 | $8.28 | $8.43 | $8.45 | $8.48 | $8.71 |
| Total return (%)4,5 | 0.976 | 2.96 | 4.05 | 4.46 | 2.38 | (2.13) |
| Ratios and supplemental data | | | | | | |
| Net assets, end of period (in millions) | $100 | $109 | $117 | $138 | $165 | $267 |
| Ratios (as a percentage of average net assets): | | | | | | |
| Expenses before reductions | 1.167,8 | 1.16 | 1.13 | 1.17 | 1.16 | 1.14 |
| Expenses including reductions | 0.987,8 | 1.06 | 1.13 | 1.16 | 1.14 | 1.13 |
| Net investment income | 4.697 | 4.77 | 4.03 | 4.31 | 5.12 | 4.59 |
| Portfolio turnover (%) | 42 | 120 | 71 | 66 | 35 | 40 |
| 1 | Six months ended 2-29-20. Unaudited. |
| 2 | Based on average daily shares outstanding. |
| 3 | Less than $0.005 per share. |
| 4 | Total returns would have been lower had certain expenses not been reduced during the applicable periods. |
| 5 | Does not reflect the effect of sales charges, if any. |
| 6 | Not annualized. |
| 7 | Annualized. |
| 8 | Includes reimbursement of legal fees of 0.01%. See Note 10 to the Financial statements. |
| SEE NOTES TO FINANCIAL STATEMENTS | SEMIANNUAL REPORT | JOHN HANCOCK Floating Rate Income Fund | 37 |
| CLASS B SHARES Period ended | 2-29-201 | 8-31-19 | 8-31-18 | 8-31-17 | 8-31-16 | 8-31-15 |
| Per share operating performance | | | | | | |
| Net asset value, beginning of period | $8.29 | $8.44 | $8.45 | $8.49 | $8.71 | $9.36 |
| Net investment income2 | 0.16 | 0.33 | 0.28 | 0.31 | 0.37 | 0.35 |
| Net realized and unrealized gain (loss) on investments | (0.12) | (0.15) | —3 | (0.01) | (0.23) | (0.61) |
| Total from investment operations | 0.04 | 0.18 | 0.28 | 0.30 | 0.14 | (0.26) |
| Less distributions | | | | | | |
| From net investment income | (0.19) | (0.33) | (0.29) | (0.34) | (0.36) | (0.37) |
| From net realized gain | — | — | — | — | — | (0.02) |
| Total distributions | (0.19) | (0.33) | (0.29) | (0.34) | (0.36) | (0.39) |
| Net asset value, end of period | $8.14 | $8.29 | $8.44 | $8.45 | $8.49 | $8.71 |
| Total return (%)4,5 | 0.476 | 2.19 | 3.40 | 3.60 | 1.79 | (2.83) |
| Ratios and supplemental data | | | | | | |
| Net assets, end of period (in millions) | $3 | $5 | $9 | $15 | $18 | $24 |
| Ratios (as a percentage of average net assets): | | | | | | |
| Expenses before reductions | 1.917,8 | 1.91 | 1.88 | 1.88 | 1.86 | 1.86 |
| Expenses including reductions | 1.737,8 | 1.81 | 1.88 | 1.87 | 1.84 | 1.85 |
| Net investment income | 3.957 | 3.96 | 3.27 | 3.61 | 4.45 | 3.89 |
| Portfolio turnover (%) | 42 | 120 | 71 | 66 | 35 | 40 |
| 1 | Six months ended 2-29-20. Unaudited. |
| 2 | Based on average daily shares outstanding. |
| 3 | Less than $0.005 per share. |
| 4 | Total returns would have been lower had certain expenses not been reduced during the applicable periods. |
| 5 | Does not reflect the effect of sales charges, if any. |
| 6 | Not annualized. |
| 7 | Annualized. |
| 8 | Includes reimbursement of legal fees of 0.01%. See Note 10 to the Financial statements. |
| 38 | JOHN HANCOCK Floating Rate Income Fund | SEMIANNUAL REPORT | SEE NOTES TO FINANCIAL STATEMENTS |
| CLASS C SHARES Period ended | 2-29-201 | 8-31-19 | 8-31-18 | 8-31-17 | 8-31-16 | 8-31-15 |
| Per share operating performance | | | | | | |
| Net asset value, beginning of period | $8.32 | $8.47 | $8.49 | $8.52 | $8.74 | $9.40 |
| Net investment income2 | 0.16 | 0.33 | 0.28 | 0.31 | 0.37 | 0.35 |
| Net realized and unrealized gain (loss) on investments | (0.11) | (0.15) | (0.01) | 0.01 | (0.23) | (0.62) |
| Total from investment operations | 0.05 | 0.18 | 0.27 | 0.32 | 0.14 | (0.27) |
| Less distributions | | | | | | |
| From net investment income | (0.19) | (0.33) | (0.29) | (0.35) | (0.36) | (0.37) |
| From net realized gain | — | — | — | — | — | (0.02) |
| Total distributions | (0.19) | (0.33) | (0.29) | (0.35) | (0.36) | (0.39) |
| Net asset value, end of period | $8.18 | $8.32 | $8.47 | $8.49 | $8.52 | $8.74 |
| Total return (%)3,4 | 0.605 | 2.20 | 3.28 | 3.73 | 1.80 | (2.89) |
| Ratios and supplemental data | | | | | | |
| Net assets, end of period (in millions) | $56 | $71 | $102 | $128 | $141 | $190 |
| Ratios (as a percentage of average net assets): | | | | | | |
| Expenses before reductions | 1.916,7 | 1.91 | 1.88 | 1.88 | 1.86 | 1.84 |
| Expenses including reductions | 1.736,7 | 1.81 | 1.88 | 1.87 | 1.84 | 1.83 |
| Net investment income | 3.956 | 3.99 | 3.29 | 3.60 | 4.45 | 3.91 |
| Portfolio turnover (%) | 42 | 120 | 71 | 66 | 35 | 40 |
| 1 | Six months ended 2-29-20. Unaudited. |
| 2 | Based on average daily shares outstanding. |
| 3 | Total returns would have been lower had certain expenses not been reduced during the applicable periods. |
| 4 | Does not reflect the effect of sales charges, if any. |
| 5 | Not annualized. |
| 6 | Annualized. |
| 7 | Includes reimbursement of legal fees of 0.01%. See Note 10 to the Financial statements. |
| SEE NOTES TO FINANCIAL STATEMENTS | SEMIANNUAL REPORT | JOHN HANCOCK Floating Rate Income Fund | 39 |
| CLASS I SHARES Period ended | 2-29-201 | 8-31-19 | 8-31-18 | 8-31-17 | 8-31-16 | 8-31-15 |
| Per share operating performance | | | | | | |
| Net asset value, beginning of period | $8.28 | $8.43 | $8.45 | $8.48 | $8.70 | $9.36 |
| Net investment income2 | 0.20 | 0.41 | 0.36 | 0.39 | 0.45 | 0.44 |
| Net realized and unrealized gain (loss) on investments | (0.11) | (0.15) | —3 | 0.01 | (0.23) | (0.62) |
| Total from investment operations | 0.09 | 0.26 | 0.36 | 0.40 | 0.22 | (0.18) |
| Less distributions | | | | | | |
| From net investment income | (0.23) | (0.41) | (0.38) | (0.43) | (0.44) | (0.46) |
| From net realized gain | — | — | — | — | — | (0.02) |
| Total distributions | (0.23) | (0.41) | (0.38) | (0.43) | (0.44) | (0.48) |
| Net asset value, end of period | $8.14 | $8.28 | $8.43 | $8.45 | $8.48 | $8.70 |
| Total return (%)4 | 1.085 | 3.19 | 4.31 | 4.78 | 2.82 | (1.94) |
| Ratios and supplemental data | | | | | | |
| Net assets, end of period (in millions) | $57 | $66 | $152 | $166 | $158 | $226 |
| Ratios (as a percentage of average net assets): | | | | | | |
| Expenses before reductions | 0.916,7 | 0.92 | 0.89 | 0.87 | 0.84 | 0.83 |
| Expenses including reductions | 0.756,7 | 0.83 | 0.88 | 0.85 | 0.83 | 0.82 |
| Net investment income | 4.926 | 4.94 | 4.29 | 4.57 | 5.45 | 4.90 |
| Portfolio turnover (%) | 42 | 120 | 71 | 66 | 35 | 40 |
| 1 | Six months ended 2-29-20. Unaudited. |
| 2 | Based on average daily shares outstanding. |
| 3 | Less than $0.005 per share. |
| 4 | Total returns would have been lower had certain expenses not been reduced during the applicable periods. |
| 5 | Not annualized. |
| 6 | Annualized. |
| 7 | Includes reimbursement of legal fees of 0.01%. See Note 10 to the Financial statements. |
| 40 | JOHN HANCOCK Floating Rate Income Fund | SEMIANNUAL REPORT | SEE NOTES TO FINANCIAL STATEMENTS |
| CLASS R6 SHARES Period ended | 2-29-201 | 8-31-19 | 8-31-18 | 8-31-17 | 8-31-16 | 8-31-15 |
| Per share operating performance | | | | | | |
| Net asset value, beginning of period | $8.29 | $8.43 | $8.45 | $8.48 | $8.71 | $9.36 |
| Net investment income2 | 0.21 | 0.42 | 0.37 | 0.40 | 0.45 | 0.45 |
| Net realized and unrealized gain (loss) on investments | (0.13) | (0.14) | —3 | 0.01 | (0.23) | (0.61) |
| Total from investment operations | 0.08 | 0.28 | 0.37 | 0.41 | 0.22 | (0.16) |
| Less distributions | | | | | | |
| From net investment income | (0.23) | (0.42) | (0.39) | (0.44) | (0.45) | (0.47) |
| From net realized gain | — | — | — | — | — | (0.02) |
| Total distributions | (0.23) | (0.42) | (0.39) | (0.44) | (0.45) | (0.49) |
| Net asset value, end of period | $8.14 | $8.29 | $8.43 | $8.45 | $8.48 | $8.71 |
| Total return (%)4 | 1.015 | 3.44 | 4.41 | 4.88 | 2.82 | (1.72) |
| Ratios and supplemental data | | | | | | |
| Net assets, end of period (in millions) | $2 | $3 | $6 | $—6 | $—6 | $24 |
| Ratios (as a percentage of average net assets): | | | | | | |
| Expenses before reductions | 0.807,8 | 0.81 | 0.79 | 0.77 | 0.75 | 0.76 |
| Expenses including reductions | 0.647,8 | 0.71 | 0.78 | 0.76 | 0.72 | 0.71 |
| Net investment income | 5.057 | 5.06 | 4.45 | 4.66 | 5.38 | 5.04 |
| Portfolio turnover (%) | 42 | 120 | 71 | 66 | 35 | 40 |
| 1 | Six months ended 2-29-20. Unaudited. |
| 2 | Based on average daily shares outstanding. |
| 3 | Less than $0.005 per share. |
| 4 | Total returns would have been lower had certain expenses not been reduced during the applicable periods. |
| 5 | Not annualized. |
| 6 | Less than $500,000. |
| 7 | Annualized. |
| 8 | Includes reimbursement of legal fees of 0.01%. See Note 10 to the Financial statements. |
| SEE NOTES TO FINANCIAL STATEMENTS | SEMIANNUAL REPORT | JOHN HANCOCK Floating Rate Income Fund | 41 |
| CLASS 1 SHARES Period ended | 2-29-201 | 8-31-19 | 8-31-18 | 8-31-17 | 8-31-16 | 8-31-15 |
| Per share operating performance | | | | | | |
| Net asset value, beginning of period | $8.28 | $8.42 | $8.44 | $8.47 | $8.70 | $9.35 |
| Net investment income2 | 0.21 | 0.42 | 0.37 | 0.40 | 0.46 | 0.45 |
| Net realized and unrealized gain (loss) on investments | (0.13) | (0.14) | (0.01) | — | (0.24) | (0.61) |
| Total from investment operations | 0.08 | 0.28 | 0.36 | 0.40 | 0.22 | (0.16) |
| Less distributions | | | | | | |
| From net investment income | (0.23) | (0.42) | (0.38) | (0.43) | (0.45) | (0.47) |
| From net realized gain | — | — | — | — | — | (0.02) |
| Total distributions | (0.23) | (0.42) | (0.38) | (0.43) | (0.45) | (0.49) |
| Net asset value, end of period | $8.13 | $8.28 | $8.42 | $8.44 | $8.47 | $8.70 |
| Total return (%)3 | 0.994 | 3.39 | 4.37 | 4.84 | 2.76 | (1.76) |
| Ratios and supplemental data | | | | | | |
| Net assets, end of period (in millions) | $22 | $27 | $30 | $30 | $23 | $26 |
| Ratios (as a percentage of average net assets): | | | | | | |
| Expenses before reductions | 0.835,6 | 0.84 | 0.83 | 0.81 | 0.78 | 0.76 |
| Expenses including reductions | 0.685,6 | 0.75 | 0.82 | 0.80 | 0.77 | 0.75 |
| Net investment income | 5.005 | 5.07 | 4.36 | 4.63 | 5.54 | 4.99 |
| Portfolio turnover (%) | 42 | 120 | 71 | 66 | 35 | 40 |
| 1 | Six months ended 2-29-20. Unaudited. |
| 2 | Based on average daily shares outstanding. |
| 3 | Total returns would have been lower had certain expenses not been reduced during the applicable periods. |
| 4 | Not annualized. |
| 5 | Annualized. |
| 6 | Includes reimbursement of legal fees of 0.01%. See Note 10 to the Financial statements. |
| 42 | JOHN HANCOCK Floating Rate Income Fund | SEMIANNUAL REPORT | SEE NOTES TO FINANCIAL STATEMENTS |
| CLASS NAV SHARES Period ended | 2-29-201 | 8-31-19 | 8-31-18 | 8-31-17 | 8-31-16 | 8-31-15 |
| Per share operating performance | | | | | | |
| Net asset value, beginning of period | $8.29 | $8.44 | $8.45 | $8.48 | $8.71 | $9.36 |
| Net investment income2 | 0.21 | 0.42 | 0.37 | 0.40 | 0.46 | 0.46 |
| Net realized and unrealized gain (loss) on investments | (0.13) | (0.15) | 0.01 | 0.01 | (0.24) | (0.62) |
| Total from investment operations | 0.08 | 0.27 | 0.38 | 0.41 | 0.22 | (0.16) |
| Less distributions | | | | | | |
| From net investment income | (0.23) | (0.42) | (0.39) | (0.44) | (0.45) | (0.47) |
| From net realized gain | — | — | — | — | — | (0.02) |
| Total distributions | (0.23) | (0.42) | (0.39) | (0.44) | (0.45) | (0.49) |
| Net asset value, end of period | $8.14 | $8.29 | $8.44 | $8.45 | $8.48 | $8.71 |
| Total return (%)3 | 1.014 | 3.32 | 4.55 | 4.89 | 2.82 | (1.71) |
| Ratios and supplemental data | | | | | | |
| Net assets, end of period (in millions) | $507 | $648 | $865 | $1,202 | $1,518 | $2,200 |
| Ratios (as a percentage of average net assets): | | | | | | |
| Expenses before reductions | 0.785,6 | 0.79 | 0.78 | 0.76 | 0.73 | 0.71 |
| Expenses including reductions | 0.645,6 | 0.71 | 0.77 | 0.75 | 0.72 | 0.70 |
| Net investment income | 5.035 | 5.08 | 4.41 | 4.71 | 5.55 | 5.04 |
| Portfolio turnover (%) | 42 | 120 | 71 | 66 | 35 | 40 |
| 1 | Six months ended 2-29-20. Unaudited. |
| 2 | Based on average daily shares outstanding. |
| 3 | Total returns would have been lower had certain expenses not been reduced during the applicable periods. |
| 4 | Not annualized. |
| 5 | Annualized. |
| 6 | Includes reimbursement of legal fees of 0.01%. See Note 10 to the Financial statements. |
| SEE NOTES TO FINANCIAL STATEMENTS | SEMIANNUAL REPORT | JOHN HANCOCK Floating Rate Income Fund | 43 |
| Notes to financial statements (unaudited) | |
Note 1—Organization
John Hancock Floating Rate Income Fund (the fund) is a series of John Hancock Funds II (the Trust), an open-end management investment company organized as a Massachusetts business trust and registered under the Investment Company Act of 1940, as amended (the 1940 Act). The investment objective of the fund is to seek a high level of current income.
The fund may offer multiple classes of shares. The shares currently outstanding are detailed in the Statement of assets and liabilities. Class A and Class C shares are offered to all investors. Class B shares are closed to new investors. Class I shares are offered to institutions and certain investors. Class R6 shares are only available to certain retirement plans, institutions and other investors. Class 1 shares are offered only to certain affiliates of Manulife Financial Corporation (MFC). Class NAV shares are offered to John Hancock affiliated funds of funds, retirement plans for employees of John Hancock and/or Manulife Financial Corporation, and certain 529 plans. Class B shares convert to Class A shares eight years after purchase. Class C shares convert to Class A shares ten years after purchase (certain exclusions may apply). Shareholders of each class have exclusive voting rights to matters that affect that class. The distribution and service fees, if any, and transfer agent fees for each class may differ.
Note 2—Significant accounting policies
The financial statements have been prepared in conformity with accounting principles generally accepted in the United States of America (US GAAP), which require management to make certain estimates and assumptions as of the date of the financial statements. Actual results could differ from those estimates and those differences could be significant. The fund qualifies as an investment company under Topic 946 of Accounting Standards Codification of US GAAP.
Events or transactions occurring after the end of the fiscal period through the date that the financial statements were issued have been evaluated in the preparation of the financial statements. The following summarizes the significant accounting policies of the fund:
Security valuation. Investments are stated at value as of the scheduled close of regular trading on the New York Stock Exchange (NYSE), normally at 4:00 P.M., Eastern Time. In case of emergency or other disruption resulting in the NYSE not opening for trading or the NYSE closing at a time other than the regularly scheduled close, the net asset value (NAV) may be determined as of the regularly scheduled close of the NYSE pursuant to the fund's Valuation Policies and Procedures.
In order to value the securities, the fund uses the following valuation techniques: Debt obligations are typically valued based on the evaluated prices provided by an independent pricing vendor. Independent pricing vendors utilize matrix pricing, which takes into account factors such as institutional-size trading in similar groups of securities, yield, quality, coupon rate, maturity, type of issue, trading characteristics and other market data, as well as broker supplied prices. Equity securities, including exchange-traded or closed-end funds, are typically valued at the last sale price or official closing price on the exchange or principal market where the security trades. In the event there were no sales during the day or closing prices are not available, the securities are valued using the last available bid price. Investments by the fund in open-end mutual funds, including John Hancock Collateral Trust (JHCT), are valued at their respective NAVs each business day. Forward foreign currency contracts are valued at the prevailing forward rates which are based on foreign currency exchange spot rates and forward points supplied by an independent pricing vendor. Foreign securities and currencies are valued in U.S. dollars based on foreign currency exchange rates supplied by an independent pricing vendor.
In certain instances, the Pricing Committee may determine to value equity securities using prices obtained from another exchange or market if trading on the exchange or market on which prices are typically obtained did not open for trading as scheduled, or if trading closed earlier than scheduled, and trading occurred as normal on another exchange or market.
| 44 | JOHN HANCOCK Floating Rate Income Fund | SEMIANNUAL REPORT | |
Other portfolio securities and assets, for which reliable market quotations are not readily available, are valued at fair value as determined in good faith by the fund's Pricing Committee following procedures established by the Board of Trustees. The frequency with which these fair valuation procedures are used cannot be predicted and fair value of securities may differ significantly from the value that would have been used had a ready market for such securities existed.
The fund uses a three-tier hierarchy to prioritize the pricing assumptions, referred to as inputs, used in valuation techniques to measure fair value. Level 1 includes securities valued using quoted prices in active markets for identical securities, including registered investment companies. Level 2 includes securities valued using other significant observable inputs. Observable inputs may include quoted prices for similar securities, interest rates, prepayment speeds and credit risk. Prices for securities valued using these inputs are received from independent pricing vendors and brokers and are based on an evaluation of the inputs described. Level 3 includes securities valued using significant unobservable inputs when market prices are not readily available or reliable, including the fund's own assumptions in determining the fair value of investments. Factors used in determining value may include market or issuer specific events or trends, changes in interest rates and credit quality. The inputs or methodology used for valuing securities are not necessarily an indication of the risks associated with investing in those securities. Changes in valuation techniques and related inputs may result in transfers into or out of an assigned level within the disclosure hierarchy.
The following is a summary of the values by input classification of the fund's investments as of February 29, 2020, by major security category or type:
| | Total
value at
2-29-20 | Level 1
quoted
price | Level 2
significant
observable
inputs | Level 3
significant
unobservable
inputs |
| Investments in securities: | | | | |
| Assets | | | | |
| Term loans | $658,933,913 | — | $658,913,912 | $20,001 |
| Corporate bonds | 91,745,938 | — | 91,745,938 | — |
| Common stocks | 191,267 | — | — | 191,267 |
| Escrow certificates | 881 | — | — | 881 |
| Short-term investments | 16,845,204 | $16,845,204 | — | — |
| Total investments in securities | $767,717,203 | $16,845,204 | $750,659,850 | $212,149 |
| Derivatives: | | | | |
| Assets | | | | |
| Forward foreign currency contracts | $814,626 | — | $814,626 | — |
Term loans (Floating rate loans). The fund may invest in term loans, which are debt securities and are often rated below investment grade at the time of purchase. Term loans are generally subject to legal or contractual restrictions on resale and generally have longer settlement periods than conventional debt securities. Term loans involve special types of risk, including credit risk, interest-rate risk, counterparty risk, and risk associated with extended settlement. The liquidity of term loans, including the volume and frequency of secondary market trading in such loans, varies significantly over time and among individual loans. During periods of infrequent trading, valuing a term loan can be more difficult and buying and selling a term loan at an acceptable price can be more difficult and delayed, which could result in a loss.
The fund's ability to receive payments of principal, interest and other amounts in connection with term loans will depend primarily on the financial condition of the borrower. The fund's failure to receive scheduled payments on a term loan due to a default, bankruptcy or other reason would adversely affect the fund's income and would likely reduce the value of its assets. Transactions in loan investments typically take a significant amount of time (i.e., seven days or longer) to settle. This could pose a liquidity risk to the fund and, if the fund's exposure to such
| | SEMIANNUAL REPORT | JOHN HANCOCK Floating Rate Income Fund | 45 |
investments is substantial, it could impair the fund's ability to meet redemptions. Because term loans may not be rated by independent credit rating agencies, a decision to invest in a particular loan could depend exclusively on the subadvisor’s credit analysis of the borrower and/or term loan agents. There is greater risk that the fund may have limited rights to enforce the terms of an underlying loan than for other types of debt instruments.
At February 29, 2020, the fund had $958,730 in unfunded loan commitments outstanding.
Security transactions and related investment income. Investment security transactions are accounted for on a trade date plus one basis for daily NAV calculations. However, for financial reporting purposes, investment transactions are reported on trade date. Interest income is accrued as earned. Interest income includes coupon interest and amortization/accretion of premiums/discounts on debt securities. Debt obligations may be placed in a non-accrual status and related interest income may be reduced by stopping current accruals and writing off interest receivable when the collection of all or a portion of interest has become doubtful. Gains and losses on securities sold are determined on the basis of identified cost and may include proceeds from litigation.
Securities lending. The fund may lend its securities to earn additional income. The fund receives collateral from the borrower in an amount not less than the market value of the loaned securities. The fund will invest its cash collateral in JHCT, an affiliate of the fund, which has a floating NAV and is registered with the Securities and Exchange Commission (SEC) as an investment company. JHCT invests in short-term money market investments. The fund will receive the benefit of any gains and bear any losses generated by JHCT with respect to the cash collateral.
The fund has the right to recall loaned securities on demand. If a borrower fails to return loaned securities when due, then the lending agent is responsible and indemnifies the fund for the lent securities. The lending agent uses the collateral received from the borrower to purchase replacement securities of the same issue, type, class and series of the loaned securities. If the value of the collateral is less than the purchase cost of replacement securities, the lending agent is responsible for satisfying the shortfall but only to the extent that the shortfall is not due to any decrease in the value of JHCT.
Although the risk of loss on securities lent is mitigated by receiving collateral from the borrower and through lending agent indemnification, the fund could experience a delay in recovering securities or could experience a lower than expected return if the borrower fails to return the securities on a timely basis. The fund receives compensation for lending its securities by retaining a portion of the return on the investment of the collateral and compensation from fees earned from borrowers of the securities. Securities lending income received by the fund is net of fees retained by the securities lending agent. Net income received from JHCT is a component of securities lending income as recorded on the Statement of operations.
Obligations to repay collateral received by the fund are shown on the Statement of assets and liabilities as Payable upon return of securities loaned and are secured by the loaned securities. As of February 29, 2020, the fund loaned securities valued at $2,411,604 and received $2,459,884 of cash collateral.
Foreign investing. Assets, including investments, and liabilities denominated in foreign currencies are translated into U.S. dollar values each day at the prevailing exchange rate. Purchases and sales of securities, income and expenses are translated into U.S. dollars at the prevailing exchange rate on the date of the transaction. The effect of changes in foreign currency exchange rates on the value of securities is reflected as a component of the realized and unrealized gains (losses) on investments. Foreign investments are subject to a decline in the value of a foreign currency versus the U.S. dollar, which reduces the dollar value of securities denominated in that currency.
Funds that invest internationally generally carry more risk than funds that invest strictly in U.S. securities. Risks can result from differences in economic and political conditions, regulations, market practices (including higher transaction costs), accounting standards and other factors.
| 46 | JOHN HANCOCK Floating Rate Income Fund | SEMIANNUAL REPORT | |
Overdraft. The fund may have the ability to borrow from banks for temporary or emergency purposes, including meeting redemption requests that otherwise might require the untimely sale of securities. Pursuant to the fund's custodian agreement, the custodian may loan money to the fund to make properly authorized payments. The fund is obligated to repay the custodian for any overdraft, including any related costs or expenses. The custodian may have a lien, security interest or security entitlement in any fund property that is not otherwise segregated or pledged, to the extent of any overdraft, and to the maximum extent permitted by law. Overdrafts at period end are presented under the caption Due to custodian in the Statement of assets and liabilities.
Line of credit.The fund and other affiliated funds have entered into a syndicated line of credit agreement with Citibank, N.A. as the administrative agent that enables them to participate in a $750 million unsecured committed line of credit. Subject to the needs of all other affiliated funds, the fund can borrow up to an aggregate commitment amount of $400 million ($250 million is dedicated to the fund), subject to asset coverage and other limitations as specified in the agreement. A commitment fee payable at the end of each calendar quarter, based on the average daily unused portion of the line of credit, is charged to each participating fund based on a combination of fixed and asset based allocations and is reflected in Other expenses on the Statement of operations. For the six months ended February 29, 2020, the fund had no borrowings under the line of credit. Commitment fees for the six months ended February 29, 2020, were $188,701.
Expenses. Within the John Hancock group of funds complex, expenses that are directly attributable to an individual fund are allocated to such fund. Expenses that are not readily attributable to a specific fund are allocated among all funds in an equitable manner, taking into consideration, among other things, the nature and type of expense and the fund’s relative net assets. Expense estimates are accrued in the period to which they relate and adjustments are made when actual amounts are known.
Class allocations. Income, common expenses and realized and unrealized gains (losses) are determined at the fund level and allocated daily to each class of shares based on the net assets of the class. Class-specific expenses, such as distribution and service fees, if any, and transfer agent fees, for all classes, are charged daily at the class level based on the net assets of each class and the specific expense rates applicable to each class.
Change in accounting principle. Accounting Standards Update (ASU) 2017-08,Premium Amortization on Purchased Callable Debt Securities, shortens the premium amortization period for purchased non contingently callable debt securities and is effective for public companies with fiscal years beginning after December 15, 2018. Adoption of the ASU did not have a material impact to the fund.
Federal income taxes. The fund intends to continue to qualify as a regulated investment company by complying with the applicable provisions of the Internal Revenue Code and will not be subject to federal income tax on taxable income that is distributed to shareholders. Therefore, no federal income tax provision is required.
For federal income tax purposes, as of August 31, 2019, the fund has a short-term capital loss carryforward of $34,654,273 and a long-term capital loss carryforward of $288,129,773 available to offset future net realized capital gains.These carryforwards do not expire.
As of August 31, 2019, the fund had no uncertain tax positions that would require financial statement recognition, derecognition or disclosure. The fund's federal tax returns are subject to examination by the Internal Revenue Service for a period of three years.
Distribution of income and gains. Distributions to shareholders from net investment income and net realized gains, if any, are recorded on the ex-date. The fund generally declares dividends daily and pays them monthly. Capital gain distributions, if any, are typically distributed annually.
Distributions paid by the fund with respect to each class of shares are calculated in the same manner, at the same time and in the same amount, except for the effect of class level expenses that may be applied differently to each class.
| | SEMIANNUAL REPORT | JOHN HANCOCK Floating Rate Income Fund | 47 |
Such distributions, on a tax basis, are determined in conformity with income tax regulations, which may differ from US GAAP. Distributions in excess of tax basis earnings and profits, if any, are reported in the fund's financial statements as a return of capital. The final determination of tax characteristics of the fund's distribution will occur at the end of the year and will subsequently be reported to shareholders.
Capital accounts within the financial statements are adjusted for permanent book-tax differences. These adjustments have no impact on net assets or the results of operations. Temporary book-tax differences, if any, will reverse in a subsequent period. Book-tax differences are primarily attributable to foreign currency transactions and derivative transactions.
Note 3—Derivative instruments
The fund may invest in derivatives in order to meet its investment objective. Derivatives include a variety of different instruments that may be traded in the over-the-counter (OTC) market, on a regulated exchange or through a clearing facility. The risks in using derivatives vary depending upon the structure of the instruments, including the use of leverage, optionality, the liquidity or lack of liquidity of the contract, the creditworthiness of the counterparty or clearing organization and the volatility of the position. Some derivatives involve risks that are potentially greater than the risks associated with investing directly in the referenced securities or other referenced underlying instrument. Specifically, the fund is exposed to the risk that the counterparty to an OTC derivatives contract will be unable or unwilling to make timely settlement payments or otherwise honor its obligations. OTC derivatives transactions typically can only be closed out with the other party to the transaction.
Derivatives which are typically traded through the OTC market are regulated by the Commodity Futures Trading Commission (the CFTC). Derivative counterparty risk is managed through an ongoing evaluation of the creditworthiness of all potential counterparties and, if applicable, designated clearing organizations. The fund attempts to reduce its exposure to counterparty risk for derivatives traded in the OTC market, whenever possible, by entering into an International Swaps and Derivatives Association (ISDA) Master Agreement with each of its OTC counterparties. The ISDA gives each party to the agreement the right to terminate all transactions traded under the agreement if there is certain deterioration in the credit quality or contractual default of the other party, as defined in the ISDA. Upon an event of default or a termination of the ISDA, the non-defaulting party has the right to close out all transactions and to net amounts owed.
As defined by the ISDA, the fund may have collateral agreements with certain counterparties to mitigate counterparty risk on OTC derivatives. Subject to established minimum levels, collateral for OTC transactions is generally determined based on the net aggregate unrealized gain or loss on contracts with a particular counterparty. Collateral pledged to the fund, if any, is held in a segregated account by a third-party agent or held by the custodian bank for the benefit of the fund and can be in the form of cash or debt securities issued by the U.S. government or related agencies; collateral posted by the fund, if any, for OTC transactions is held in a segregated account at the fund's custodian and is noted in the accompanying Fund's investments, or if cash is posted, on the Statement of assets and liabilities. The fund's risk of loss due to counterparty risk is equal to the asset value of outstanding contracts offset by collateral received.
Forward foreign currency contracts. A forward foreign currency contract is an agreement between two parties to buy and sell specific currencies at a price that is set on the date of the contract. The forward contract calls for delivery of the currencies on a future date that is specified in the contract. Forwards are typically traded OTC. Risks related to the use of forwards include the possible failure of counterparties to meet the terms of the forward agreement, the failure of the counterparties to timely post collateral if applicable, and the risk that currency movements will not favor the fund thereby reducing the fund's total return, and the potential for losses in excess of the amounts recognized on the Statement of assets and liabilities.
The market value of a forward foreign currency contract fluctuates with changes in foreign currency exchange rates. Forward foreign currency contracts are marked-to-market daily and the change in value is recorded by the fund as an unrealized gain or loss. Realized gains or losses, equal to the difference between the value of the
| 48 | JOHN HANCOCK Floating Rate Income Fund | SEMIANNUAL REPORT | |
contract at the time it was opened and the value at the time it was closed, are recorded upon delivery or receipt of the currency or settlement with the counterparty.
During the six months ended February 29, 2020, the fund used forward foreign currency contracts to manage against anticipated currency exchange rate changes and to gain exposure to foreign currencies. The fund held forward foreign currency contracts with USD notional values ranging from $74.5 million to $81.9 million as measured at each quarter end.
Fair value of derivative instruments by risk category
The table below summarizes the fair value of derivatives held by the fund at February 29, 2020 by risk category:
| Risk | Statement of assets
and liabilities
location | Financial
instruments
location | Assets
derivatives
fair value | Liabilities
derivatives
fair value |
| Currency | Unrealized appreciation / depreciation on forward foreign currency contracts | Forward foreign currency contracts | $814,626 | — |
Effect of derivative instruments on the Statement of operations
The table below summarizes the net realized gain (loss) included in the net increase (decrease) in net assets from operations, classified by derivative instrument and risk category, for the six months ended February 29, 2020:
| | Statement of operations location - Net realized gain (loss) on: |
| Risk | Forward foreign
currency contracts |
| Currency | $2,360,889 |
The table below summarizes the net change in unrealized appreciation (depreciation) included in the net increase (decrease) in net assets from operations, classified by derivative instrument and risk category, for the six months ended February 29, 2020:
| | Statement of operations location - Change in net unrealized appreciation (depreciation) of: |
| Risk | Forward foreign
currency contracts |
| Currency | $(1,771,473) |
Note 4—Guarantees and indemnifications
Under the Trust's organizational documents, its Officers and Trustees are indemnified against certain liabilities arising out of the performance of their duties to the Trust, including the fund. Additionally, in the normal course of business, the fund enters into contracts with service providers that contain general indemnification clauses. The fund's maximum exposure under these arrangements is unknown, as this would involve future claims that may be made against the fund that have not yet occurred. The risk of material loss from such claims is considered remote.
Note 5—Fees and transactions with affiliates
John Hancock Investment Management LLC (the Advisor) serves as investment advisor for the fund. John Hancock Investment Management Distributors LLC (the Distributor), an affiliate of the Advisor, serves as principal underwriter of the fund. The Advisor and the Distributor are indirect, wholly owned subsidiaries of Manulife Financial Corporation (MFC).
| | SEMIANNUAL REPORT | JOHN HANCOCK Floating Rate Income Fund | 49 |
Management fee. The fund has an investment management agreement with the Advisor under which the fund pays a daily management fee to the Advisor equivalent on an annual basis to the sum of: (a) 0.680% of the first $1.10 billion of the fund’s average daily net assets; (b) 0.630% of the next $1.90 billion of the fund’s average daily net assets; (c) 0.605% of the next $1.50 billion of the fund’s average daily net assets; (d) 0.590% of the next $1.50 billion of the fund’s average daily net assets and (e) 0.570% of the fund’s average daily net assets in excess of $6.00 billion. The Advisor has a subadvisory agreement with BCSF Advisors, LP (Bain Capital Credit). The fund is not responsible for payment of the subadvisory fees.
The Advisor has contractually agreed to waive a portion of its management fee and/or reimburse expenses for certain funds of the John Hancock group of funds complex, including the fund (the participating portfolios). This waiver is based upon aggregate net assets of all the participating portfolios. The amount of the reimbursement is calculated daily and allocated among all the participating portfolios in proportion to the daily net assets of each fund. During the six months ended February 29, 2020, this waiver amounted to 0.01% of the fund’s average daily net assets on an annualized basis. This arrangement expires on July 31, 2021, unless renewed by mutual agreement of the fund and the Advisor based upon a determination that this is appropriate under the circumstances at that time.
The Advisor has contractually agreed to reduce its management fee or, if necessary, make payment to the fund in an amount equal to the amount by which expenses of the fund exceed 0.66% of average net assets of the fund. For purposes of this agreement, “expenses of the fund” means all fund expenses, excluding 12b-1 fees, service fee, transfer agent fee, interest expense, acquired fund fees, short dividend expense, litigation and indemnification expenses, taxes and other extraordinary expenses not incurred in the ordinary course of business, and all other Class Level Expenses. This agreement expires on December 31, 2020, unless renewed by mutual agreement of the fund and the Advisor based upon determination that this is appropriate under the circumstances at that time.
The Advisor has contractually agreed to reduce its management fee or, if necessary, make payment to the fund in an amount equal to the amount by which expenses of Class A, Class B, Class C, Class I, Class R6, Class 1 and Class NAV shares exceed 1.00%, 1.75%, 1.75%, 0.77%, 0.66%, 0.70% and 0.66%, respectively, of average net assets attributable to the applicable class. For purposes of this agreement, “expenses of Class A, Class B, Class C, Class I, Class R6, Class 1 and Class NAV shares” means all expenses of the fund plus class specific expenses, excluding interest expense, acquired fund fees, short dividend expense, litigation and indemnification expenses, taxes and other extraordinary expenses not incurred in the ordinary course of business. This agreement expires on December 31, 2020, unless renewed by mutual agreement of the fund and the Advisor based upon determination that this is appropriate under the circumstances at that time.
For the six months ended February 29, 2020, the expense reductions described above amounted to the following:
| Class | Expense reduction |
| Class A | $90,852 |
| Class B | 3,440 |
| Class C | 54,569 |
| Class I | 47,744 |
| Class | Expense reduction |
| Class R6 | $1,911 |
| Class 1 | 18,087 |
| Class NAV | 392,318 |
| Total | $608,921 |
Expenses waived or reimbursed in the current fiscal period are not subject to recapture in future fiscal periods.
The investment management fees, including the impact of the waivers and reimbursements as described above, incurred for the six months ended February 29, 2020, were equivalent to a net annual effective rate of 0.53% of the fund's average daily net assets.
Accounting and legal services. Pursuant to a service agreement, the fund reimburses the Advisor for all expenses associated with providing the administrative, financial, legal, compliance, accounting and recordkeeping services to the fund, including the preparation of all tax returns, periodic reports to shareholders and regulatory
| 50 | JOHN HANCOCK Floating Rate Income Fund | SEMIANNUAL REPORT | |
reports, among other services. These expenses are allocated to each share class based on its relative net assets at the time the expense was incurred. These accounting and legal services fees incurred for the six months ended February 29, 2020 amounted to an annual rate of 0.02% of the fund's average daily net assets.
Distribution and service plans. The fund has a distribution agreement with the Distributor. The fund has adopted distribution and service plans for certain classes as detailed below pursuant to Rule 12b-1 under the 1940 Act, to pay the Distributor for services provided as the distributor of shares of the fund. The fund may pay up to the following contractual rates of distribution and service fees under these arrangements, expressed as an annual percentage of average daily net assets for each class of the fund's shares:
| Class | Rule 12b-1 Fee |
| Class A | 0.25% |
| Class B | 1.00% |
| Class C | 1.00% |
| Class 1 | 0.05% |
Sales charges. Class A shares are assessed up-front sales charges, which resulted in payments to the Distributor amounting to $23,152 for the six months ended February 29, 2020. Of this amount, $5,086 was retained and used for printing prospectuses, advertising, sales literature and other purposes and $18,066 was paid as sales commissions to broker-dealers.
Class A, Class B and Class C shares may be subject to contingent deferred sales charges (CDSCs). Certain Class A shares that are acquired through purchases of $250,000 or more and are redeemed within one year of purchase are subject to a 0.50% sales charge. Class B shares that are redeemed within six years of purchase are subject to CDSCs, at declining rates, beginning at 5.00%. Class C shares that are redeemed within one year of purchase are subject to a 1.00% CDSC. CDSCs are applied to the lesser of the current market value at the time of redemption or the original purchase cost of the shares being redeemed. Proceeds from CDSCs are used to compensate the Distributor for providing distribution-related services in connection with the sale of these shares. During the six months ended February 29, 2020, CDSCs received by the Distributor amounted to $4,236, $24 and $166 for Class A, Class B and Class C shares, respectively.
Transfer agent fees. The John Hancock group of funds has a complex-wide transfer agent agreement with John Hancock Signature Services, Inc. (Signature Services), an affiliate of the Advisor. The transfer agent fees paid to Signature Services are determined based on the cost to Signature Services (Signature Services Cost) of providing recordkeeping services. It also includes out-of-pocket expenses, including payments made to third-parties for recordkeeping services provided to their clients who invest in one or more John Hancock funds. In addition, Signature Services Cost may be reduced by certain fees that Signature Services receives in connection with retirement and small accounts. Signature Services Cost is calculated monthly and allocated, as applicable, to five categories of share classes: Retail Share and Institutional Share Classes of Non-Municipal Bond Funds, Class R6 Shares, Retirement Share Classes and Municipal Bond Share Classes. Within each of these categories, the applicable costs are allocated to the affected John Hancock affiliated funds and/or classes, based on the relative average daily net assets.
Class level expenses. Class level expenses for the six months ended February 29, 2020 were as follows:
| Class | Distribution and service fees | Transfer agent fees |
| Class A | $130,100 | $64,081 |
| Class B | 19,781 | 2,440 |
| Class C | 312,455 | 38,513 |
| Class I | — | 38,020 |
| Class R6 | — | 164 |
| | SEMIANNUAL REPORT | JOHN HANCOCK Floating Rate Income Fund | 51 |
| Class | Distribution and service fees | Transfer agent fees |
| Class 1 | $5,973 | — |
| Total | $468,309 | $143,218 |
Trustee expenses. The fund compensates each Trustee who is not an employee of the Advisor or its affiliates. The costs of paying Trustee compensation and expenses are allocated to the fund based on its net assets relative to other funds within the John Hancock group of funds complex.
Note 6—Fund share transactions
Transactions in fund shares for the six months ended February 29, 2020 and for the year ended August 31, 2019 were as follows:
| | Six Months Ended 2-29-20 | Year Ended 8-31-19 |
| | Shares | Amount | Shares | Amount |
| Class A shares | | | | |
| Sold | 1,871,077 | $15,452,539 | 8,433,786 | $70,069,747 |
| Distributions reinvested | 318,043 | 2,621,247 | 612,616 | 5,082,431 |
| Repurchased | (3,016,418) | (24,901,775) | (9,768,727) | (81,121,847) |
| Net decrease | (827,298) | $(6,827,989) | (722,325) | $(5,969,669) |
| Class B shares | | | | |
| Sold | 568 | $4,682 | 2,664 | $22,682 |
| Distributions reinvested | 9,915 | 81,795 | 27,731 | 230,040 |
| Repurchased | (169,587) | (1,404,099) | (539,292) | (4,482,071) |
| Net decrease | (159,104) | $(1,317,622) | (508,897) | $(4,229,349) |
| Class C shares | | | | |
| Sold | 127,399 | $1,057,637 | 645,446 | $5,383,788 |
| Distributions reinvested | 158,721 | 1,314,412 | 374,998 | 3,122,400 |
| Repurchased | (1,961,101) | (16,260,716) | (4,600,289) | (38,325,555) |
| Net decrease | (1,674,981) | $(13,888,667) | (3,579,845) | $(29,819,367) |
| Class I shares | | | | |
| Sold | 1,022,764 | $8,440,304 | 9,105,406 | $75,891,988 |
| Distributions reinvested | 201,130 | 1,657,394 | 716,889 | 5,942,963 |
| Repurchased | (2,087,432) | (17,232,563) | (19,883,942) | (164,853,257) |
| Net decrease | (863,538) | $(7,134,865) | (10,061,647) | $(83,018,306) |
| Class R6 shares | | | | |
| Sold | 17,597 | $145,635 | 291,528 | $2,429,462 |
| Distributions reinvested | 8,537 | 70,391 | 32,220 | 267,134 |
| Repurchased | (139,003) | (1,147,947) | (632,841) | (5,231,587) |
| Net decrease | (112,869) | $(931,921) | (309,093) | $(2,534,991) |
| 52 | JOHN HANCOCK Floating Rate Income Fund | SEMIANNUAL REPORT | |
| | Six Months Ended 2-29-20 | Year Ended 8-31-19 |
| | Shares | Amount | Shares | Amount |
| Class 1 shares | | | | |
| Sold | 204,944 | $1,691,881 | 811,739 | $6,758,759 |
| Distributions reinvested | 81,998 | 675,294 | 178,724 | 1,480,774 |
| Repurchased | (745,387) | (6,161,509) | (1,386,874) | (11,512,445) |
| Net decrease | (458,445) | $(3,794,334) | (396,411) | $(3,272,912) |
| Class NAV shares | | | | |
| Sold | 723,467 | $5,953,798 | 2,032,562 | $16,864,516 |
| Distributions reinvested | 1,919,203 | 15,825,796 | 4,348,380 | 36,075,340 |
| Repurchased | (18,593,268) | (154,326,346) | (30,732,931) | (254,249,838) |
| Net decrease | (15,950,598) | $(132,546,752) | (24,351,989) | $(201,309,982) |
| Total net decrease | (20,046,833) | $(166,442,150) | (39,930,207) | $(330,154,576) |
Affiliates of the fund owned 100% of shares of Class 1 and Class NAV on February 29, 2020. Such concentration of shareholders’ capital could have a material effect on the fund if such shareholders redeem from the fund.
Note 7—Purchase and sale of securities
Purchases and sales of securities, other than short-term investments, amounted to $338,001,451 and $455,999,279, respectively, for the six months ended February 29, 2020.
Note 8—Investment by affiliated funds
Certain investors in the fund are affiliated funds that are managed by the Advisor and its affiliates. The affiliated funds do not invest in the fund for the purpose of exercising management or control; however, this investment may represent a significant portion of the fund's net assets. At February 29, 2020, funds within the John Hancock group of funds complex held 67.8% of the fund's net assets. The following fund(s) had an affiliate ownership of 5% or more of the fund's net assets:
| Fund | Affiliated Concentration |
| John Hancock Funds II Multimanager Lifestyle Balanced Portfolio | 26.0% |
| John Hancock Funds II Multimanager Lifestyle Growth Portfolio | 13.5% |
| John Hancock Funds II Multimanager Lifestyle Conservative Portfolio | 12.0% |
| John Hancock Funds II Multimanager Lifestyle Moderate Portfolio | 11.6% |
Note 9—Investment in affiliated underlying funds
The fund may invest in affiliated underlying funds that are managed by the Advisor and its affiliates. Information regarding the fund's fiscal year to date purchases and sales of the affiliated underlying funds as well as income and capital gains earned by the fund, if any, is as follows:
| | SEMIANNUAL REPORT | JOHN HANCOCK Floating Rate Income Fund | 53 |
| | | | | | | | Dividends and distributions |
| Affiliate | Ending
share
amount | Beginning
value | Cost of
purchases | Proceeds
from shares
sold | Realized
gain
(loss) | Change in
unrealized
appreciation
(depreciation) | Income
distributions
received | Capital gain
distributions
received | Ending
value |
| John Hancock Collateral Trust* | 245,829 | $2,576,293 | $5,897,221 | $(6,013,669) | $895 | $(267) | $10,653 | — | $2,460,473 |
| * | Refer to the Securities lending note within Note 2 for details regarding this investment. |
Note 10—Other matters
In or around May 2015, certain John Hancock Funds, including Floating Rate Income Fund, were served with a complaint brought by the Motors Liquidation Avoidance Action Trust (the “Motors Trust”). The complaint seeks disgorgement of certain amounts paid to the Term Loan Lenders as holders of indebtedness issued by General Motors pursuant to a $1.5 billion term loan, dated as of November 29, 2006 (as amended, the “Term Loan”). The litigation has now been settled resulting in no payments by the fund. As part of the settlement, the fund received payment of $107,429 representing reimbursement of approximately 73% of the legal fees incurred.
Note 11—LIBOR discontinuation risk
LIBOR (London Interbank Offered Rate) is a measure of the average interest rate at which major global banks can borrow from one another. Following allegations of rate manipulation and concerns regarding its thin liquidity, in July 2017, the U.K. Financial Conduct Authority, which regulates LIBOR, announced that it will stop encouraging banks to provide the quotations needed to sustain LIBOR after 2021. This event will likely cause LIBOR to cease to be published. Before then, it is expected that market participants will transition to the use of different reference or benchmark rates. However, although regulators have suggested alternative rates, there is currently no definitive information regarding the future utilization of LIBOR or of any replacement rate.
It is uncertain what impact the discontinuation of LIBOR will have on the use of LIBOR as a reference rate for securities in which the fund invests. It is expected that market participants will amend financial instruments referencing LIBOR to include fallback provisions and other measures that contemplate the discontinuation of LIBOR or other similar market disruption events, but neither the effect of the transition process nor the viability of such measures is known. In addition, there are obstacles to converting certain longer term securities and transactions to a new benchmark or benchmarks and the effectiveness of one alternative reference rate versus multiple alternative reference rates in new or existing financial instruments and products has not been determined. As market participants transition away from LIBOR, LIBOR's usefulness may deteriorate, which could occur prior to the end of 2021. The transition process may lead to increased volatility and illiquidity in markets that currently rely on LIBOR to determine interest rates. LIBOR's deterioration may adversely affect the liquidity and/or market value of securities that use LIBOR as a benchmark interest rate.
Note 12—Subsequent events
A widespread health crisis such as a global pandemic could cause substantial market volatility, exchange trading suspensions and closures, impact the ability to complete redemptions, and affect fund performance. For example, the novel coronavirus disease (COVID-19) has resulted in significant disruptions to global business activity. The impact of a health crisis and other epidemics and pandemics that may arise in the future, could affect the global economy in ways that cannot necessarily be foreseen at the present time. A health crisis may exacerbate other pre-existing political, social and economic risks. Any such impact could adversely affect the fund's performance, resulting in losses to your investment.
| 54 | JOHN HANCOCK Floating Rate Income Fund | SEMIANNUAL REPORT | |
| | |
Trustees
Hassell H. McClellan,Chairperson
Steven R. Pruchansky,Vice Chairperson
Andrew G. Arnott†
Charles L. Bardelis*
James R. Boyle
Peter S. Burgess*
William H. Cunningham
Grace K. Fey
Marianne Harrison†
Deborah C. Jackson
James M. Oates*
Gregory A. Russo
Officers
Andrew G. Arnott
President
Francis V. Knox, Jr.
Chief Compliance Officer
Charles A. Rizzo
Chief Financial Officer
Salvatore Schiavone
Treasurer
Christopher (Kit) Sechler
Secretary and Chief Legal Officer
| Investment advisor
John Hancock Investment Management LLC
Subadvisor
BCSF Advisors, LP ("Bain Capital Credit")
Portfolio Managers
Andrew Carlino
Kim Harris
Nate Whittier
Principal distributor
John Hancock Investment Management Distributors LLC
Custodian
State Street Bank and Trust Company
Transfer agent
John Hancock Signature Services, Inc.
Legal counsel
K&L Gates LLP
|
* Member of the Audit Committee
† Non-Independent Trustee
The fund's proxy voting policies and procedures, as well as the fund proxy voting record for the most recent twelve-month period ended June 30, are available free of charge on the Securities and Exchange Commission (SEC) website at sec.gov or on our website.
All of the fund's holdings as of the end of the third month of every fiscal quarter are filed with the SEC on Form N-PORT within 60 days of the end of the fiscal quarter. The fund's Form N-PORT filings are available on our website and the SEC's website, sec.gov.
We make this information on your fund, as well asmonthly portfolio holdings, and other fund details available on our website at jhinvestments.com or by calling 800-225-5291.
| | | | |
| | You can also contact us: |
| | 800-225-5291
jhinvestments.com | Regular mail:
John Hancock Signature Services, Inc.
P.O. Box 55913
Boston, MA 02205-5913
| Express mail:
John Hancock Signature Services, Inc.
2000 Crown Colony Drive
Suite 55913
Quincy, MA 02169-0953
|
SEMIANNUAL REPORT | JOHN HANCOCK FLOATING RATE INCOME FUND 56
John Hancock family of funds
| | | |
DOMESTIC EQUITY FUNDS
Blue Chip Growth
Classic Value
Disciplined Value
Disciplined Value Mid Cap
Equity Income
Financial Industries
Fundamental All Cap Core
Fundamental Large Cap Core
New Opportunities
Regional Bank
Small Cap Core
Small Cap Growth
Small Cap Value
U.S. Global Leaders Growth
U.S. Quality Growth
GLOBAL AND INTERNATIONAL EQUITY FUNDS
Disciplined Value International
Emerging Markets
Emerging Markets Equity
Fundamental Global Franchise
Global Equity
Global Shareholder Yield
Global Thematic Opportunities
International Dynamic Growth
International Growth
International Small Company
| | INCOME FUNDS
Bond
California Tax-Free Income
Emerging Markets Debt
Floating Rate Income
Government Income
High Yield
High Yield Municipal Bond
Income
Investment Grade Bond
Money Market
Short Duration Bond
Short Duration Credit Opportunities
Strategic Income Opportunities
Tax-Free Bond
ALTERNATIVE AND SPECIALTY FUNDS
Absolute Return Currency
Alternative Asset Allocation
Alternative Risk Premia
Diversified Macro
Infrastructure
Multi-Asset Absolute Return
Seaport Long/Short
|
A fund's investment objectives, risks, charges, and expenses should be considered carefully before investing. The prospectus contains this and other important information about the fund. To obtain a prospectus, contact your financial professional, call John Hancock Investment Management at 800-225-5291, or visit our website at jhinvestments.com. Please read the prospectus carefully before investing or sending money.
| | | |
ASSET ALLOCATION
Balanced
Income Allocation
Multi-Index Lifetime Portfolios
Multi-Index Preservation Portfolios
Multimanager Lifestyle Portfolios
Multimanager Lifetime Portfolios
Retirement Income 2040
EXCHANGE-TRADED FUNDS
John Hancock Multifactor Consumer Discretionary ETF
John Hancock Multifactor Consumer Staples ETF
John Hancock Multifactor Developed International ETF
John Hancock Multifactor Emerging Markets ETF
John Hancock Multifactor Energy ETF
John Hancock Multifactor Financials ETF
John Hancock Multifactor Healthcare ETF
John Hancock Multifactor Industrials ETF
John Hancock Multifactor Large Cap ETF
John Hancock Multifactor Materials ETF
John Hancock Multifactor Media and
Communications ETF
John Hancock Multifactor Mid Cap ETF
John Hancock Multifactor Small Cap ETF
John Hancock Multifactor Technology ETF
John Hancock Multifactor Utilities ETF
| | ENVIRONMENTAL, SOCIAL, AND
GOVERNANCE FUNDS
ESG All Cap Core
ESG Core Bond
ESG International Equity
ESG Large Cap Core
CLOSED-END FUNDS
Financial Opportunities
Hedged Equity & Income
Income Securities Trust
Investors Trust
Preferred Income
Preferred Income II
Preferred Income III
Premium Dividend
Tax-Advantaged Dividend Income
Tax-Advantaged Global Shareholder Yield
|
John Hancock Multifactor ETF shares are bought and sold at market price (not NAV), and are not individually redeemed
from the fund. Brokerage commissions will reduce returns.
John Hancock ETFs are distributed by Foreside Fund Services, LLC, and are subadvised by Dimensional Fund Advisors LP.
Foreside is not affiliated with John Hancock Investment Management Distributors LLC or Dimensional Fund Advisors LP.
Dimensional Fund Advisors LP receives compensation from John Hancock in connection with licensing rights to the
John Hancock Dimensional indexes. Dimensional Fund Advisors LP does not sponsor, endorse, or sell, and makes no
representation as to the advisability of investing in, John Hancock Multifactor ETFs.
John Hancock Investment Management
A trusted brand
John Hancock Investment Management is a premier asset manager
representing one of America's most trusted brands, with a heritage of
financial stewardship dating back to 1862. Helping our shareholders
pursue their financial goals is at the core of everything we do. It's why
we support the role of professional financial advice and operate with
the highest standards of conduct and integrity.
A better way to invest
We serve investors globally through a unique multimanager approach:
We search the world to find proven portfolio teams with specialized
expertise for every strategy we offer, then we apply robust investment
oversight to ensure they continue to meet our uncompromising
standards and serve the best interests of our shareholders.
Results for investors
Our unique approach to asset management enables us to provide
a diverse set of investments backed by some of the world's best
managers, along with strong risk-adjusted returns across asset classes.
John Hancock Investment Management Distributors LLC n Member FINRA, SIPC
200 Berkeley Street n Boston, MA 02116-5010 n 800-225-5291 n jhinvestments.com
This report is for the information of the shareholders of John Hancock Floating Rate Income Fund. It is not authorized for distribution to prospective investors unless preceded or accompanied by a prospectus.
John Hancock
International Small Company Fund
Semiannual report 2/29/2020
Beginning on January 1, 2021, as permitted by regulations adopted by the Securities and Exchange Commission, paper copies of the fund's shareholder reports like this one will no longer be sent by mail, unless you specifically request paper copies of the reports from the fund or from your financial intermediary. Instead, the reports will be made available on a website, and you will be notified by mail each time a report is posted and provided with a website link to access the report.
If you already elected to receive shareholder reports electronically, you will not be affected by this change, and you do not need to take any action. You may elect to receive shareholder reports and other communications electronically by calling John Hancock Investment Management at 800-225-5291 (Class A and Class C shares) or 888-972-8696 (Class I and Class R6) or by contacting your financial intermediary.
You may elect to receive all reports in paper, free of charge, at any time. You can inform John Hancock Investment Management or your financial intermediary that you wish to continue receiving paper copies of your shareholder reports by following the instructions listed above. Your election to receive reports in paper will apply to all funds held with John Hancock Investment Management or your financial intermediary.
A message to shareholders
Dear shareholder,
Global financial markets were on pace to deliver strong returns during the 6 months ended February 29, 2020, until heightened fears over the coronavirus (COVID-19) sent the markets tumbling during the last week of the period. Prior to the turbulence that ended the period, investors in non-U.S. equities saw strong gains, fueled in part by similarly supportive monetary policy and some signs of strength in developing markets.
However, the COVID-19 pandemic and plummeting oil prices put an end to all that good news. Shortly after period end, the U.S. Federal Reserve lowered interest rates while governments around the world embarked on plans to launch fiscal stimulus to mitigate supply chain destruction and support economic growth.
After the longest bull market in U.S. history, we're now in bear market territory. Indeed, the spread of COVID-19, trade disputes, rising unemployment, and other geopolitical tensions may continue to create uncertainty among businesses and investors. Your financial professional can helpposition your portfolio so that it's sufficiently diversified to seek to meet your long-term objectives and to withstand the inevitable bouts of market volatility along the way.
On behalf of everyone at John Hancock Investment Management, I'd like to take this opportunity to welcome new shareholders and thank existing shareholders for the continued trust you've placed in us.
Sincerely,
Andrew G. Arnott
President and CEO,
John Hancock Investment Management
Head of Wealth and Asset Management,
United States and Europe
This commentary reflects the CEO's views as of this report's period end and are subject to change at any time. Diversification does not guarantee investment returns and does not eliminate risk of loss. All investments entail risks, including the possible loss of principal. For more up-to-date information, you can visit our website at jhinvestments.com.
John Hancock
International Small Company Fund
Table of contents
| | | |
| 2 | | Your fund at a glance |
| 3 | | Portfolio summary |
| 5 | | A look at performance |
| 7 | | Your expenses |
| 9 | | Fund's investments |
| 14 | | Financial statements |
| 17 | | Financial highlights |
| 22 | | Notes to financial statements |
| 33 | | More information |
SEMIANNUAL REPORT | JOHN HANCOCK INTERNATIONAL SMALL COMPANY FUND 1
INVESTMENT OBJECTIVE
The fund seeks long-term capital appreciation.
AVERAGE ANNUAL TOTAL RETURNS AS OF 2/29/2020 (%)
The MSCI World ex-USA Small Cap Index is an equity index that captures small cap representation across developed markets countries, excluding the United States.
The MSCI EAFE Small Cap Index (Europe, Australasia, Far East) is an unmanaged index that is a free float-adjusted market capitalization index that is designed to measure developed market equity performance, and targets 40% of the eligible small-cap universe in each industry group of each country represented by the MSCI EAFE Index.
It is not possible to invest directly in an index. Index figures do not reflect expenses or sales charges, which would result in lower returns.
Figures from Morningstar, Inc. include reinvested distributions and do not take into account sales charges. Actual load-adjusted performance is lower.
| 1 | Class A shares were first offered on 6-27-13. Returns prior to this date are those of Class NAV shares that have not been adjusted for class-specific expenses; otherwise, returns would vary. |
The past performance shown here reflects reinvested distributions and the beneficial effect of any expense reductions, and does not guarantee future results. Returns for periods shorter than one year are cumulative. Performance of the other share classes will vary based on the difference in the fees and expenses of those classes. Shares will fluctuate in value and, when redeemed, may be worth more or less than their original cost. Current month-end performance may be lower or higher than the performance cited, and can be found at jhinvestments.com or by calling 800-225-5291. For further information on the fund's objectives, risks, and strategy, see the fund's prospectus. The fund recently experienced negative short-term performance due to market volatility associated with the COVID-19 pandemic.
SEMIANNUAL REPORT | JOHN HANCOCK INTERNATIONAL SMALL COMPANY FUND 2
SECTOR COMPOSITION AS OF 2/29/2020 (%)
TOP 10 HOLDINGS AS OF 2/29/2020 (%)
| | |
| Ingenico Group SA | 0.5 |
| PSP Swiss Property AG | 0.4 |
| Pennon Group PLC | 0.3 |
| ASM International NV | 0.3 |
| Howden Joinery Group PLC | 0.3 |
| Bellway PLC | 0.3 |
| Travis Perkins PLC | 0.3 |
| OSRAM Licht AG | 0.3 |
| LANXESS AG | 0.3 |
| Rubis SCA | 0.3 |
| TOTAL | 3.3 |
| As a percentage of net assets. |
| Cash and cash equivalents are not included. |
SEMIANNUAL REPORT | JOHN HANCOCK INTERNATIONAL SMALL COMPANY FUND 3
TOP 10 COUNTRIES AS OF 2/29/2020 (%)
| | |
| Japan | 22.9 |
| United Kingdom | 15.1 |
| Canada | 8.1 |
| Germany | 6.1 |
| Australia | 6.0 |
| Switzerland | 5.7 |
| Italy | 4.6 |
| France | 4.3 |
| Sweden | 3.2 |
| Netherlands | 3.1 |
| TOTAL | 79.1 |
| As a percentage of net assets. |
| Cash and cash equivalents are not included. |
A note about risks
The fund may be subject to various risks as described in the fund's prospectus. For more information, please refer to the "Principal risks" section of the prospectus and "Subsequent events" section in the Notes to financial statements.
SEMIANNUAL REPORT | JOHN HANCOCK INTERNATIONAL SMALL COMPANY FUND 4
TOTAL RETURNS FOR THE PERIOD ENDED FEBRUARY 29, 2020
| | | | | | | | |
Average annual total returns (%)
with maximum sales charge | | Cumulative total returns (%)
with maximum sales charge |
| | 1-year | 5-year | 10-year | | 6-month | 5-year | 10-year |
| Class A1 | -7.46 | 1.90 | 5.38 | | -4.79 | 9.85 | 68.82 |
| Class C1 | -4.21 | 2.15 | 5.51 | | -1.17 | 11.24 | 70.98 |
| Class I1,2 | -2.40 | 3.18 | 6.11 | | 0.21 | 16.94 | 80.99 |
| Class R61,2 | -2.31 | 3.30 | 6.20 | | 0.31 | 17.65 | 82.42 |
| Class NAV2 | -2.29 | 3.31 | 6.20 | | 0.33 | 17.70 | 82.50 |
| Index1† | -0.97 | 4.24 | 6.83 | | 0.11 | 23.08 | 93.60 |
| Index 2† | -0.94 | 4.65 | 7.57 | | 0.42 | 25.49 | 107.42 |
Performance figures assume all distributions have been reinvested. Figures reflect maximum sales charges on Class A shares of 5.00%and the applicable contingent deferred sales charge (CDSC) on Class C shares. Class C shares sold within one year of purchase are subject to a 1% CDSC. Sales charges are not applicable to Class I, Class R6, and Class NAV shares.
The expense ratios of the fund, both net (including any fee waivers and/or expense limitations) and gross (excluding any fee waivers and/or expense limitations), are set forth according to the most recent publicly available prospectuses for the fund and may differ from those disclosed in the Financial highlights tables in this report. Net expenses reflect contractual expense limitations in effect until December 31, 2020 and are subject to change. Had the contractual fee waivers and expense limitations not been in place, gross expenses would apply. The expense ratios are as follows:
| | | | | | |
| | Class A | Class C | Class I | Class R6 | Class NAV |
| Gross (%) | 1.49 | 2.19 | 1.19 | 1.08 | 1.07 |
| Net (%) | 1.39 | 2.18 | 1.18 | 1.07 | 1.06 |
Please refer to the most recent prospectuses and annual or semiannual report for more information on expenses and any expense limitation arrangements for each class.
The returns reflect past results and should not be considered indicative of future performance. The return and principal value of an investment will fluctuate so that shares, when redeemed, may be worth more or less than their original cost. Due to market volatility and other factors, the fund's current performance may be higher or lower than the performance shown. For current to the most recent month-end performance data, please call 800-225-5291 or visit the fund's website at jhinvestments.com.
The performance table above and the chart on the next page do not reflect the deduction of taxes that a shareholder would pay on fund distributions or the redemption of fund shares. The fund's performance results reflect any applicable fee waivers or expense reductions, without which the expenses would increase and results would have been less favorable.
| † | Index 1 is the MSCI World ex-USA Small Cap Index; Index 2 is the MSCI EAFE Small Cap Index. |
See the following page for footnotes.
SEMIANNUAL REPORT | JOHN HANCOCK INTERNATIONAL SMALL COMPANY FUND 5
This chart and table show what happened to a hypothetical $10,000 investment in John Hancock International Small Company Fund for the share classes and periods indicated, assuming all distributions were reinvested. For comparison, we've shown the same investment in two separate indexes.
| | | | | | |
| | Start date | With maximum
sales charge ($) | Without
sales charge ($) | Index 1($) | Index 2 ($) |
| Class C1,3 | 2-28-10 | 17,098 | 17,098 | 19,360 | 20,742 |
| Class I1,2 | 2-28-10 | 18,099 | 18,099 | 19,360 | 20,742 |
| Class R61,2 | 2-28-10 | 18,242 | 18,242 | 19,360 | 20,742 |
| Class NAV2 | 2-28-10 | 18,250 | 18,250 | 19,360 | 20,742 |
The MSCI World ex-USA Small Cap Index (gross of foreign withholding taxes on dividends) is an equity index that captures small cap representation across developed markets countries (excluding the United States).
The MSCI EAFE Small Cap Index (gross of foreign withholding taxes on dividends) (Europe, Australasia, Far East) is an unmanaged index that is a free float-adjusted market capitalization index that is designed to measure developed market equity performance, and targets 40% of the eligible small-cap universe in each industry group of each country represented by the MSCI EAFE Index.
It is not possible to invest directly in an index. Index figures do not reflect expenses, sales charges, or foreign currency impact, which would result in lower returns.
Footnotes related to performance pages
| 1 | Class A and Class I shares were first offered on 6-27-13; Class C shares were first offered on 6-27-14; Class R6 shares were first offered on 8-30-17. Returns prior to these dates are those of Class NAV shares that have not been adjusted for class-specific expenses; otherwise, returns would vary. |
| 2 | For certain types of investors, as described in the fund's prospectuses. |
| 3 | The contingent deferred sales charge is not applicable. |
SEMIANNUAL REPORT | JOHN HANCOCK INTERNATIONAL SMALL COMPANY FUND 6
These examples are intended to help you understand your ongoing operating expenses of investing in the fund so you can compare these costs with the ongoing costs of investing in other mutual funds.
Understanding fund expenses
As a shareholder of the fund, you incur two types of costs:
■Transaction costs,which include sales charges (loads) on purchases or redemptions (varies by share class), minimum account fee charge, etc.
■Ongoing operating expenses, including management fees, distribution and service fees (if applicable), and other fund expenses.
We are presenting only your ongoing operating expenses here.
Actual expenses/actual returns
The first line of each share class in the table on the following page is intended to provide information about the fund’s actual ongoing operating expenses, and is based on the fund’s actual return. It assumes an account value of $1,000.00 on September 1, 2019, with the same investment held until February 29, 2020.
Together with the value of your account, you may use this information to estimate the operating expenses that you paid over the period. Simply divide your account value at February 29, 2020, by $1,000.00, then multiply it by the “expenses paid” for your share class from the table. For example, for an account value of $8,600.00, the operating expenses should be calculated as follows:
Hypothetical example for comparison purposes
The second line of each share class in the table on the following page allows you to compare the fund’s ongoing operating expenses with those of any other fund. It provides an example of the fund’s hypothetical account values and hypothetical expenses based on each class’s actual expense ratio and an assumed 5% annualized return before expenses (which is not the class’s actual return). It assumes an account value of $1,000.00 on September 1, 2019, with the same investment held until February 29, 2020. Look in any other fund shareholder report to find its hypothetical example and you will be able to compare these expenses. Please remember that these hypothetical account values and expenses may not be used to estimate the actual ending account balance or expenses you paid for the period.
| | SEMIANNUAL REPORT | JOHN HANCOCK INTERNATIONAL SMALL COMPANY FUND | 7 |
Remember, these examples do not include any transaction costs, therefore, these examples will not help you to determine the relative total costs of owning different funds. If transaction costs were included, your expenses would have been higher. See the prospectuses for details regarding transaction costs.
SHAREHOLDER EXPENSE EXAMPLE CHART
| | | Account
value on
9-1-2019 | Ending
value on
2-29-2020 | Expenses
paid during
period ended
2-29-20201 | Annualized
expense
ratio |
| Class A | Actual expenses/actual returns | $1,000.00 | $1,002.20 | $6.92 | 1.39% |
| | Hypothetical example | 1,000.00 | 1,018.00 | 6.97 | 1.39% |
| Class C | Actual expenses/actual returns | 1,000.00 | 997.90 | 10.78 | 2.17% |
| | Hypothetical example | 1,000.00 | 1,014.10 | 10.87 | 2.17% |
| Class I | Actual expenses/actual returns | 1,000.00 | 1,002.10 | 5.82 | 1.17% |
| | Hypothetical example | 1,000.00 | 1,019.00 | 5.87 | 1.17% |
| Class R6 | Actual expenses/actual returns | 1,000.00 | 1,003.10 | 5.28 | 1.06% |
| | Hypothetical example | 1,000.00 | 1,019.60 | 5.32 | 1.06% |
| Class NAV | Actual expenses/actual returns | 1,000.00 | 1,003.30 | 5.23 | 1.05% |
| | Hypothetical example | 1,000.00 | 1,019.60 | 5.27 | 1.05% |
| 1 | Expenses are equal to the annualized expense ratio, multiplied by the average account value over the period, multiplied by 182/366 (to reflect the one-half year period). |
| 8 | JOHN HANCOCK INTERNATIONAL SMALL COMPANY FUND | SEMIANNUAL REPORT | |
Summary of fund’s investments as of 2-29-20 (unaudited)
(showing percentage of total net assets)
This section shows the fund’s 50 largest portfolio holdings in unaffiliated issuers and any holdings exceeding 1% of the fund’s total net assets as of the report date. The remaining securities held by the fund are grouped as “Other Securities” in each category. You can request a complete schedule of portfolio holdings as of the report date, free of charge, by calling 1-800-225-5291. This complete schedule, filed on the fund’s Form N-CSR, is also available on the SEC’s website at http://www.sec.gov.
| | | | | Shares | Value | % of
Net
Assets |
| Common stocks 97.8% | | | | | $720,329,213 | |
| (Cost $724,522,341) | | | | | | |
| Australia 6.0% | | | | | 43,930,446 | 6.0% |
| Austria 1.5% | | | | | 11,171,535 | 1.5% |
| Belgium 1.5% | | | | | 11,241,401 | 1.5% |
| Ackermans & van Haaren NV | | | | 9,807 | 1,407,391 | 0.2% |
| OTHER SECURITIES | | | | | 9,834,010 | 1.3% |
| Bermuda 0.0% | | | | | 160,495 | 0.0% |
| Canada 8.1% | | | | | 59,592,427 | 8.1% |
| Pan American Silver Corp. (A) | | | | 51,329 | 32,337 | 0.0% |
| Pan American Silver Corp. | | | | 81,735 | 1,617,954 | 0.2% |
| Yamana Gold, Inc. | | | | 400,291 | 1,559,711 | 0.2% |
| OTHER SECURITIES | | | | | 56,382,425 | 7.7% |
| China 0.1% | | | | | 974,264 | 0.1% |
| Colombia 0.0% | | | | | 66,923 | 0.0% |
| Denmark 2.0% | | | | | 14,782,706 | 2.0% |
| Ambu A/S, Class B | | | | 58,087 | 1,322,892 | 0.2% |
| Pandora A/S | | | | 39,112 | 1,762,481 | 0.3% |
| Royal Unibrew A/S | | | | 18,425 | 1,594,050 | 0.2% |
| SimCorp A/S | | | | 15,830 | 1,528,650 | 0.2% |
| OTHER SECURITIES | | | | | 8,574,633 | 1.1% |
| Faeroe Islands 0.0% | | | | | 16,240 | 0.0% |
| Finland 2.4% | | | | | 17,836,542 | 2.4% |
| Huhtamaki OYJ | | | | 40,899 | 1,679,390 | 0.2% |
| Kesko OYJ, A Shares | | | | 4,516 | 290,364 | 0.1% |
| Kesko OYJ, B Shares | | | | 23,294 | 1,587,379 | 0.2% |
| Metso OYJ | | | | 39,181 | 1,275,033 | 0.2% |
| Nokian Renkaat OYJ | | | | 49,046 | 1,283,791 | 0.2% |
| Orion OYJ, Class A (B) | | | | 8,076 | 315,104 | 0.1% |
| Orion OYJ, Class B | | | | 42,444 | 1,693,954 | 0.2% |
| OTHER SECURITIES | | | | | 9,711,527 | 1.2% |
| SEE NOTES TO FINANCIAL STATEMENTS | SEMIANNUAL REPORT | JOHN HANCOCK INTERNATIONAL SMALL COMPANY FUND | 9 |
| | | | | Shares | Value | % of
Net
Assets |
| France 4.3% | | | | | $31,554,667 | 4.3% |
| Ingenico Group SA | | | | 23,409 | 3,336,463 | 0.5% |
| Rexel SA | | | | 115,715 | 1,430,385 | 0.2% |
| Rubis SCA | | | | 33,982 | 1,842,826 | 0.3% |
| OTHER SECURITIES | | | | | 24,944,993 | 3.3% |
| Gabon 0.0% | | | | | 43,122 | 0.0% |
| Georgia 0.1% | | | | | 525,954 | 0.1% |
| Germany 5.8% | | | | | 42,636,918 | 5.8% |
| Bechtle AG | | | | 11,362 | 1,512,126 | 0.2% |
| GEA Group AG | | | | 52,007 | 1,391,648 | 0.2% |
| LANXESS AG | | | | 34,617 | 1,842,990 | 0.3% |
| OSRAM Licht AG (A)(B) | | | | 41,735 | 1,880,515 | 0.3% |
| Rheinmetall AG | | | | 17,240 | 1,600,500 | 0.2% |
| OTHER SECURITIES | | | | | 34,409,139 | 4.6% |
| Gibraltar 0.0% | | | | | 114,684 | 0.0% |
| Greece 0.0% | | | | | 37 | 0.0% |
| Greenland 0.0% | | | | | 24,137 | 0.0% |
| Guernsey, Channel Islands 0.0% | | | | | 70,856 | 0.0% |
| Hong Kong 2.3% | | | | | 16,668,752 | 2.3% |
| Ireland 0.5% | | | | | 4,005,969 | 0.5% |
| Isle of Man 0.1% | | | | | 610,447 | 0.1% |
| Israel 1.3% | | | | | 9,325,543 | 1.3% |
| Italy 4.6% | | | | | 33,651,776 | 4.6% |
| Banco BPM SpA (A) | | | | 714,718 | 1,575,114 | 0.2% |
| Hera SpA | | | | 323,845 | 1,390,001 | 0.2% |
| Prysmian SpA | | | | 62,220 | 1,486,392 | 0.2% |
| Unione di Banche Italiane SpA | | | | 383,598 | 1,587,049 | 0.2% |
| OTHER SECURITIES | | | | | 27,613,220 | 3.8% |
| Japan 22.9% | | | | | 168,353,095 | 22.9% |
| Jersey, Channel Islands 0.1% | | | | | 1,107,571 | 0.1% |
| Liechtenstein 0.1% | | | | | 626,898 | 0.1% |
| Luxembourg 0.5% | | | | | 3,799,023 | 0.5% |
| Macau 0.0% | | | | | 110,119 | 0.0% |
| Malaysia 0.0% | | | | | 328,745 | 0.0% |
| 10 | JOHN HANCOCK INTERNATIONAL SMALL COMPANY FUND | SEMIANNUAL REPORT | SEE NOTES TO FINANCIAL STATEMENTS |
| | | | | Shares | Value | % of
Net
Assets |
| Malta 0.1% | | | | | $406,824 | 0.1% |
| Monaco 0.1% | | | | | 607,341 | 0.1% |
| Netherlands 3.1% | | | | | 23,099,961 | 3.1% |
| Aalberts NV | | | | 39,851 | 1,486,271 | 0.2% |
| Altice Europe NV (A) | | | | 250,941 | 1,332,715 | 0.2% |
| Altice Europe NV, Class B (A) | | | | 13,082 | 67,908 | 0.0% |
| ASM International NV | | | | 18,530 | 2,129,423 | 0.3% |
| Euronext NV (C) | | | | 20,778 | 1,732,272 | 0.2% |
| IMCD NV | | | | 19,362 | 1,584,478 | 0.2% |
| Signify NV (C) | | | | 46,186 | 1,376,177 | 0.2% |
| OTHER SECURITIES | | | | | 13,390,717 | 1.8% |
| New Zealand 0.6% | | | | | 4,164,307 | 0.6% |
| Norway 0.9% | | | | | 6,733,581 | 0.9% |
| Peru 0.0% | | | | | 266,573 | 0.0% |
| Philippines 0.0% | | | | | 11,759 | 0.0% |
| Portugal 0.4% | | | | | 2,819,730 | 0.4% |
| Russia 0.1% | | | | | 754,098 | 0.1% |
| Singapore 1.2% | | | | | 9,184,572 | 1.2% |
| South Africa 0.1% | | | | | 401,502 | 0.1% |
| Spain 2.5% | | | | | 18,512,303 | 2.5% |
| Enagas SA | | | | 53,906 | 1,398,731 | 0.2% |
| OTHER SECURITIES | | | | | 17,113,572 | 2.3% |
| Sweden 3.2% | | | | | 23,301,803 | 3.2% |
| Switzerland 5.7% | | | | | 42,203,930 | 5.7% |
| Allreal Holding AG (A) | | | | 7,369 | 1,578,342 | 0.2% |
| Belimo Holding AG | | | | 194 | 1,268,718 | 0.2% |
| Georg Fischer AG | | | | 1,642 | 1,411,232 | 0.2% |
| Helvetia Holding AG | | | | 11,676 | 1,555,501 | 0.2% |
| PSP Swiss Property AG | | | | 18,145 | 2,685,397 | 0.4% |
| VAT Group AG (A)(C) | | | | 12,413 | 1,687,346 | 0.2% |
| OTHER SECURITIES | | | | | 32,017,394 | 4.3% |
| Turkey 0.0% | | | | | 10,248 | 0.0% |
| United Arab Emirates 0.0% | | | | | 25,073 | 0.0% |
| United Kingdom 15.1% | | | | | 110,989,385 | 15.1% |
| Bellway PLC | | | | 40,150 | 1,943,121 | 0.3% |
| Electrocomponents PLC | | | | 178,138 | 1,397,963 | 0.2% |
| SEE NOTES TO FINANCIAL STATEMENTS | SEMIANNUAL REPORT | JOHN HANCOCK INTERNATIONAL SMALL COMPANY FUND | 11 |
| | | | | Shares | Value | % of
Net
Assets |
| United Kingdom (continued) | | | | | | 15.1% |
| G4S PLC | | | | 572,459 | $1,267,534 | 0.2% |
| Howden Joinery Group PLC | | | | 254,072 | 2,101,346 | 0.3% |
| IMI PLC | | | | 101,413 | 1,312,798 | 0.2% |
| Inchcape PLC | | | | 179,592 | 1,342,438 | 0.2% |
| Pennon Group PLC | | | | 176,255 | 2,465,191 | 0.3% |
| Quilter PLC (C) | | | | 801,170 | 1,522,747 | 0.2% |
| Spectris PLC | | | | 45,118 | 1,591,239 | 0.2% |
| Tate & Lyle PLC | | | | 187,429 | 1,709,069 | 0.2% |
| TP ICAP PLC | | | | 277,113 | 1,307,462 | 0.2% |
| Travis Perkins PLC | | | | 98,857 | 1,889,589 | 0.3% |
| Vistry Group PLC | | | | 86,959 | 1,439,066 | 0.2% |
| OTHER SECURITIES | | | | | 89,699,822 | 12.1% |
|
| United States 0.5% | | | | | 3,504,931 | 0.5% |
| Preferred securities 0.3% | | | | | $2,117,953 | |
| (Cost $2,217,677) | | | | | | |
| Germany 0.3% | | | | | 2,117,953 | 0.3% |
| Rights 0.0% | | | | | $563 | |
| (Cost $0) | | | | | | |
| Warrants 0.0% | | | | | $377 | |
| (Cost $0) | | | | | | |
| | | Yield (%) | | Shares | Value | % of
Net
Assets |
| Short-term investments 3.7% | | | | | $26,867,005 | |
| (Cost $26,851,752) | | | | | | |
| Short-term funds 3.7% | | | | | 26,867,005 | 3.7% |
| John Hancock Collateral Trust (D) | | 1.6968 (E) | | 2,684,311 | 26,867,005 | 3.7% |
| Total investments (Cost $753,591,770) 101.8% | | | | $749,315,111 | 101.8% |
| Other assets and liabilities, net (1.8%) | | | | (12,907,484) | (1.8)% |
| Total net assets 100.0% | | | | $736,407,627 | 100.0% |
| The percentage shown for each investment category is the total value of the category as a percentage of the net assets of the fund. |
| Security Abbreviations and Legend |
| (A) | Non-income producing security. |
| (B) | All or a portion of this security is on loan as of 2-29-20. |
| (C) | These securities are exempt from registration under Rule 144A of the Securities Act of 1933. Such securities may be resold, normally to qualified institutional buyers, in transactions exempt from registration. |
| (D) | Investment is an affiliate of the fund, the advisor and/or subadvisor. This security represents the investment of cash collateral received for securities lending. |
| (E) | The rate shown is the annualized seven-day yield as of 2-29-20. |
| 12 | JOHN HANCOCK INTERNATIONAL SMALL COMPANY FUND | SEMIANNUAL REPORT | SEE NOTES TO FINANCIAL STATEMENTS |
DERIVATIVES
FUTURES
| Open contracts | Number of
contracts | Position | Expiration
date | Notional
basis^ | Notional
value^ | Unrealized
appreciation
(depreciation) |
| Mini MSCI EAFE Index Futures | 63 | Long | Mar 2020 | $6,088,952 | $5,733,945 | $(355,007) |
| | | | | | | $(355,007) |
^ Notional basis refers to the contractual amount agreed upon at inception of open contracts; notional value represents the current value of the open contract.
At 2-29-20, the aggregate cost of investments for federal income tax purposes was $764,147,713. Net unrealized depreciation aggregated to $15,187,609, of which $126,576,579 related to gross unrealized appreciation and $141,764,188 related to gross unrealized depreciation.
See Notes to financial statements regarding investment transactions and other derivatives information.
| SEE NOTES TO FINANCIAL STATEMENTS | SEMIANNUAL REPORT | JOHN HANCOCK INTERNATIONAL SMALL COMPANY FUND | 13 |
STATEMENT OF ASSETS AND LIABILITIES 2-29-20 (unaudited)
| Assets | |
| Unaffiliated investments, at value (Cost $726,740,018) including $35,009,599 of securities loaned | $722,448,106 |
| Affiliated investments, at value (Cost $26,851,752) | 26,867,005 |
| Total investments, at value (Cost $753,591,770) | 749,315,111 |
| Cash | 9,165,026 |
| Foreign currency, at value (Cost $768,778) | 765,458 |
| Collateral held at broker for futures contracts | 283,500 |
| Dividends and interest receivable | 1,497,688 |
| Receivable for fund shares sold | 2,920,851 |
| Receivable for investments sold | 331,789 |
| Receivable for securities lending income | 75,126 |
| Receivable from affiliates | 229 |
| Other assets | 44,197 |
| Total assets | 764,398,975 |
| Liabilities | |
| Payable for futures variation margin | 28,480 |
| Payable for investments purchased | 470,261 |
| Payable for fund shares repurchased | 450,063 |
| Payable upon return of securities loaned | 26,864,216 |
| Payable to affiliates | |
| Accounting and legal services fees | 20,654 |
| Transfer agent fees | 6,221 |
| Trustees' fees | 1,048 |
| Other liabilities and accrued expenses | 150,405 |
| Total liabilities | 27,991,348 |
| Net assets | $736,407,627 |
| Net assets consist of | |
| Paid-in capital | $741,953,216 |
| Total distributable earnings (loss) | (5,545,589) |
| Net assets | $736,407,627 |
| |
| Net asset value per share | |
| Based on net asset value and shares outstanding - the fund has an unlimited number of shares authorized with no par value | |
| Class A ($52,297,845 ÷ 5,387,784 shares)1 | $9.71 |
| Class C ($1,330,231 ÷ 136,506 shares)1 | $9.74 |
| Class I ($1,405,791 ÷ 145,045 shares) | $9.69 |
| Class R6 ($60,263,522 ÷ 6,218,429 shares) | $9.69 |
| Class NAV ($621,110,238 ÷ 64,101,432 shares) | $9.69 |
| Maximum offering price per share | |
| Class A (net asset value per share ÷ 95%)2 | $10.22 |
| 1 | Redemption price per share is equal to net asset value less any applicable contingent deferred sales charge. |
| 2 | On single retail sales of less than $50,000. On sales of $50,000 or more and on group sales the offering price is reduced. |
| 14 | JOHN HANCOCK International Small Company Fund | SEMIANNUAL REPORT | SEE NOTES TO FINANCIAL STATEMENTS |
STATEMENT OF OPERATIONS For the six months ended 2-29-20 (unaudited)
| Investment income | |
| Dividends | $7,855,838 |
| Securities lending | 620,896 |
| Interest | 35,513 |
| Less foreign taxes withheld | (510,568) |
| Total investment income | 8,001,679 |
| Expenses | |
| Investment management fees | 3,842,534 |
| Distribution and service fees | 91,970 |
| Accounting and legal services fees | 73,210 |
| Transfer agent fees | 41,150 |
| Trustees' fees | 7,204 |
| Custodian fees | 212,490 |
| State registration fees | 36,302 |
| Printing and postage | 31,770 |
| Professional fees | 45,558 |
| Other | 21,549 |
| Total expenses | 4,403,737 |
| Less expense reductions | (53,288) |
| Net expenses | 4,350,449 |
| Net investment income | 3,651,230 |
| Realized and unrealized gain (loss) | |
| Net realized gain (loss) on | |
| Unaffiliated investments and foreign currency transactions | 16,864,998 |
| Affiliated investments | 477 |
| Futures contracts | 193,514 |
| | 17,058,989 |
| Change in net unrealized appreciation (depreciation) of | |
| Unaffiliated investments and translation of assets and liabilities in foreign currencies | (13,905,244) |
| Affiliated investments | 4,827 |
| Futures contracts | (280,232) |
| | (14,180,649) |
| Net realized and unrealized gain | 2,878,340 |
| Increase in net assets from operations | $6,529,570 |
| SEE NOTES TO FINANCIAL STATEMENTS | SEMIANNUAL REPORT | JOHN HANCOCK International Small Company Fund | 15 |
STATEMENTS OF CHANGES IN NET ASSETS
| | Six months ended
2-29-20
(unaudited) | Year ended
8-31-19 |
| Increase (decrease) in net assets | | |
| From operations | | |
| Net investment income | $3,651,230 | $12,919,712 |
| Net realized gain | 17,058,989 | 17,130,117 |
| Change in net unrealized appreciation (depreciation) | (14,180,649) | (102,151,685) |
| Increase (decrease) in net assets resulting from operations | 6,529,570 | (72,101,856) |
| Distributions to shareholders | | |
| From earnings | | |
| Class A | (2,279,906) | (4,378,066) |
| Class C | (49,079) | (128,049) |
| Class I | (83,748) | (692,856) |
| Class R6 | (2,807,642) | (5,384,532) |
| Class NAV | (30,025,515) | (41,196,342) |
| Total distributions | (35,245,890) | (51,779,845) |
| From fund share transactions | 10,237,876 | 248,045,421 |
| Total increase (decrease) | (18,478,444) | 124,163,720 |
| Net assets | | |
| Beginning of period | 754,886,071 | 630,722,351 |
| End of period | $736,407,627 | $754,886,071 |
| 16 | JOHN HANCOCK International Small Company Fund | SEMIANNUAL REPORT | SEE NOTES TO FINANCIAL STATEMENTS |
| CLASS A SHARES Period ended | 2-29-201 | 8-31-19 | 8-31-18 | 8-31-17 | 8-31-16 | 8-31-15 |
| Per share operating performance | | | | | | |
| Net asset value, beginning of period | $10.08 | $12.51 | $12.33 | $10.35 | $9.87 | $10.79 |
| Net investment income (loss)2 | 0.033 | 0.16 | 0.17 | 0.15 | 0.16 | 0.11 |
| Net realized and unrealized gain (loss) on investments | 0.04 | (1.66) | 0.22 | 2.03 | 0.43 | (0.91) |
| Total from investment operations | 0.07 | (1.50) | 0.39 | 2.18 | 0.59 | (0.80) |
| Less distributions | | | | | | |
| From net investment income | (0.20) | (0.12) | (0.21) | (0.20) | (0.11) | (0.12) |
| From net realized gain | (0.24) | (0.81) | — | — | — | — |
| Total distributions | (0.44) | (0.93) | (0.21) | (0.20) | (0.11) | (0.12) |
| Net asset value, end of period | $9.71 | $10.08 | $12.51 | $12.33 | $10.35 | $9.87 |
| Total return (%)4,5 | 0.226 | (11.32) | 3.11 | 21.56 | 6.01 | (7.42) |
| Ratios and supplemental data | | | | | | |
| Net assets, end of period (in millions) | $52 | $53 | $55 | $30 | $12 | $2 |
| Ratios (as a percentage of average net assets): | | | | | | |
| Expenses before reductions | 1.487 | 1.48 | 1.49 | 1.50 | 1.48 | 1.65 |
| Expenses including reductions | 1.397 | 1.39 | 1.39 | 1.39 | 1.39 | 1.63 |
| Net investment income (loss) | 0.593,7 | 1.49 | 1.31 | 1.30 | 1.62 | 1.07 |
| Portfolio turnover (%) | 10 | 15 | 19 | 13 | 12 | 11 |
| 1 | Six months ended 2-29-20. Unaudited. |
| 2 | Based on average daily shares outstanding. |
| 3 | Net investment income is affected by the timing and frequency of the declaration of dividends by the securities in which the fund invests. |
| 4 | Total returns would have been lower had certain expenses not been reduced during the applicable periods. |
| 5 | Does not reflect the effect of sales charges, if any. |
| 6 | Not annualized. |
| 7 | Annualized. |
| SEE NOTES TO FINANCIAL STATEMENTS | SEMIANNUAL REPORT | JOHN HANCOCK International Small Company Fund | 17 |
| CLASS C SHARES Period ended | 2-29-201 | 8-31-19 | 8-31-18 | 8-31-17 | 8-31-16 | 8-31-15 |
| Per share operating performance | | | | | | |
| Net asset value, beginning of period | $10.09 | $12.48 | $12.31 | $10.34 | $9.87 | $10.77 |
| Net investment income (loss)2 | (0.01)3 | 0.07 | 0.06 | 0.05 | 0.07 | 0.07 |
| Net realized and unrealized gain (loss) on investments | 0.02 | (1.63) | 0.23 | 2.05 | 0.44 | (0.93) |
| Total from investment operations | 0.01 | (1.56) | 0.29 | 2.10 | 0.51 | (0.86) |
| Less distributions | | | | | | |
| From net investment income | (0.12) | (0.02) | (0.12) | (0.13) | (0.04) | (0.04) |
| From net realized gain | (0.24) | (0.81) | — | — | — | — |
| Total distributions | (0.36) | (0.83) | (0.12) | (0.13) | (0.04) | (0.04) |
| Net asset value, end of period | $9.74 | $10.09 | $12.48 | $12.31 | $10.34 | $9.87 |
| Total return (%)4,5 | (0.21)6 | (11.95) | 2.31 | 20.54 | 5.16 | (7.97) |
| Ratios and supplemental data | | | | | | |
| Net assets, end of period (in millions) | $1 | $1 | $2 | $2 | $3 | $1 |
| Ratios (as a percentage of average net assets): | | | | | | |
| Expenses before reductions | 2.187 | 2.18 | 2.19 | 2.20 | 2.18 | 3.13 |
| Expenses including reductions | 2.177 | 2.17 | 2.18 | 2.19 | 2.17 | 2.35 |
| Net investment income (loss) | (0.17)3,7 | 0.66 | 0.44 | 0.49 | 0.73 | 0.65 |
| Portfolio turnover (%) | 10 | 15 | 19 | 13 | 12 | 11 |
| 1 | Six months ended 2-29-20. Unaudited. |
| 2 | Based on average daily shares outstanding. |
| 3 | Net investment income is affected by the timing and frequency of the declaration of dividends by the securities in which the fund invests. |
| 4 | Total returns would have been lower had certain expenses not been reduced during the applicable periods. |
| 5 | Does not reflect the effect of sales charges, if any. |
| 6 | Not annualized. |
| 7 | Annualized. |
| 18 | JOHN HANCOCK International Small Company Fund | SEMIANNUAL REPORT | SEE NOTES TO FINANCIAL STATEMENTS |
| CLASS I SHARES Period ended | 2-29-201 | 8-31-19 | 8-31-18 | 8-31-17 | 8-31-16 | 8-31-15 |
| Per share operating performance | | | | | | |
| Net asset value, beginning of period | $10.08 | $12.51 | $12.33 | $10.35 | $9.88 | $10.79 |
| Net investment income (loss)2 | 0.053 | 0.13 | 0.09 | 0.17 | 0.12 | 0.18 |
| Net realized and unrealized gain (loss) on investments | 0.03 | (1.60) | 0.33 | 2.04 | 0.49 | (0.93) |
| Total from investment operations | 0.08 | (1.47) | 0.42 | 2.21 | 0.61 | (0.75) |
| Less distributions | | | | | | |
| From net investment income | (0.23) | (0.15) | (0.24) | (0.23) | (0.14) | (0.16) |
| From net realized gain | (0.24) | (0.81) | — | — | — | — |
| Total distributions | (0.47) | (0.96) | (0.24) | (0.23) | (0.14) | (0.16) |
| Net asset value, end of period | $9.69 | $10.08 | $12.51 | $12.33 | $10.35 | $9.88 |
| Total return (%)4 | 0.215 | (11.07) | 3.32 | 21.82 | 6.26 | (6.92) |
| Ratios and supplemental data | | | | | | |
| Net assets, end of period (in millions) | $1 | $2 | $6 | $51 | $6 | $1 |
| Ratios (as a percentage of average net assets): | | | | | | |
| Expenses before reductions | 1.186 | 1.19 | 1.19 | 1.18 | 1.17 | 2.72 |
| Expenses including reductions | 1.176 | 1.19 | 1.18 | 1.18 | 1.16 | 1.23 |
| Net investment income (loss) | 0.893,6 | 1.24 | 0.75 | 1.55 | 1.28 | 1.76 |
| Portfolio turnover (%) | 10 | 15 | 19 | 13 | 12 | 11 |
| 1 | Six months ended 2-29-20. Unaudited. |
| 2 | Based on average daily shares outstanding. |
| 3 | Net investment income is affected by the timing and frequency of the declaration of dividends by the securities in which the fund invests. |
| 4 | Total returns would have been lower had certain expenses not been reduced during the applicable periods. |
| 5 | Not annualized. |
| 6 | Annualized. |
| SEE NOTES TO FINANCIAL STATEMENTS | SEMIANNUAL REPORT | JOHN HANCOCK International Small Company Fund | 19 |
| CLASS R6 SHARES Period ended | 2-29-201 | 8-31-19 | 8-31-18 | 8-31-172 |
| Per share operating performance | | | | |
| Net asset value, beginning of period | $10.08 | $12.51 | $12.33 | $12.21 |
| Net investment income (loss)3 | 0.054 | 0.19 | 0.28 | —5 |
| Net realized and unrealized gain (loss) on investments | 0.04 | (1.65) | 0.15 | 0.12 |
| Total from investment operations | 0.09 | (1.46) | 0.43 | 0.12 |
| Less distributions | | | | |
| From net investment income | (0.24) | (0.16) | (0.25) | — |
| From net realized gain | (0.24) | (0.81) | — | — |
| Total distributions | (0.48) | (0.97) | (0.25) | — |
| Net asset value, end of period | $9.69 | $10.08 | $12.51 | $12.33 |
| Total return (%)6 | 0.317 | (10.97) | 3.41 | 0.987 |
| Ratios and supplemental data | | | | |
| Net assets, end of period (in millions) | $60 | $61 | $68 | $—8 |
| Ratios (as a percentage of average net assets): | | | | |
| Expenses before reductions | 1.079 | 1.08 | 1.10 | 1.099 |
| Expenses including reductions | 1.069 | 1.07 | 1.09 | 1.089 |
| Net investment income (loss) | 0.924,9 | 1.80 | 2.17 | 10.629 |
| Portfolio turnover (%) | 10 | 15 | 19 | 1310 |
| 1 | Six months ended 2-29-20. Unaudited. |
| 2 | The inception date for Class R6 shares is 8-30-17. |
| 3 | Based on average daily shares outstanding. |
| 4 | Net investment income is affected by the timing and frequency of the declaration of dividends by the securities in which the fund invests. |
| 5 | Less than $0.005 per share. |
| 6 | Total returns would have been lower had certain expenses not been reduced during the applicable periods. |
| 7 | Not annualized. |
| 8 | Less than $500,000. |
| 9 | Annualized. |
| 10 | Portfolio turnover is shown for the period from 9-1-16 to 8-31-17. |
| 20 | JOHN HANCOCK International Small Company Fund | SEMIANNUAL REPORT | SEE NOTES TO FINANCIAL STATEMENTS |
| CLASS NAV SHARES Period ended | 2-29-201 | 8-31-19 | 8-31-18 | 8-31-17 | 8-31-16 | 8-31-15 |
| Per share operating performance | | | | | | |
| Net asset value, beginning of period | $10.08 | $12.51 | $12.33 | $10.35 | $9.88 | $10.80 |
| Net investment income (loss)2 | 0.053 | 0.21 | 0.20 | 0.18 | 0.18 | 0.17 |
| Net realized and unrealized gain (loss) on investments | 0.04 | (1.67) | 0.23 | 2.04 | 0.44 | (0.92) |
| Total from investment operations | 0.09 | (1.46) | 0.43 | 2.22 | 0.62 | (0.75) |
| Less distributions | | | | | | |
| From net investment income | (0.24) | (0.16) | (0.25) | (0.24) | (0.15) | (0.17) |
| From net realized gain | (0.24) | (0.81) | — | — | — | — |
| Total distributions | (0.48) | (0.97) | (0.25) | (0.24) | (0.15) | (0.17) |
| Net asset value, end of period | $9.69 | $10.08 | $12.51 | $12.33 | $10.35 | $9.88 |
| Total return (%)4 | 0.335 | (10.96) | 3.42 | 21.96 | 6.36 | (6.87) |
| Ratios and supplemental data | | | | | | |
| Net assets, end of period (in millions) | $621 | $637 | $499 | $531 | $532 | $700 |
| Ratios (as a percentage of average net assets): | | | | | | |
| Expenses before reductions | 1.066 | 1.07 | 1.08 | 1.08 | 1.05 | 1.06 |
| Expenses including reductions | 1.056 | 1.06 | 1.07 | 1.07 | 1.05 | 1.05 |
| Net investment income (loss) | 0.933,6 | 1.97 | 1.56 | 1.61 | 1.79 | 1.66 |
| Portfolio turnover (%) | 10 | 15 | 19 | 13 | 12 | 11 |
| 1 | Six months ended 2-29-20. Unaudited. |
| 2 | Based on average daily shares outstanding. |
| 3 | Net investment income is affected by the timing and frequency of the declaration of dividends by the securities in which the fund invests. |
| 4 | Total returns would have been lower had certain expenses not been reduced during the applicable periods. |
| 5 | Not annualized. |
| 6 | Annualized. |
| SEE NOTES TO FINANCIAL STATEMENTS | SEMIANNUAL REPORT | JOHN HANCOCK International Small Company Fund | 21 |
| Notes to financial statements (unaudited) | |
Note 1—Organization
John Hancock International Small Company Fund (the fund) is a series of John Hancock Funds II (the Trust), an open-end management investment company organized as a Massachusetts business trust and registered under the Investment Company Act of 1940, as amended (the 1940 Act). The investment objective of the fund is to seek long-term capital appreciation.
The fund may offer multiple classes of shares. The shares currently outstanding are detailed in the Statement of assets and liabilities. Class A and Class C shares are offered to all investors. Class I shares are offered to institutions and certain investors. Class R6 shares are only available to certain retirement plans, institutions and other investors. Class NAV shares are offered to John Hancock affiliated funds of funds, retirement plans for employees of John Hancock and/or Manulife Financial Corporation, and certain 529 plans. Class C shares convert to Class A shares ten years after purchase (certain exclusions may apply). Shareholders of each class have exclusive voting rights to matters that affect that class. The distribution and service fees, if any, and transfer agent fees for each class may differ.
Note 2—Significant accounting policies
The financial statements have been prepared in conformity with accounting principles generally accepted in the United States of America (US GAAP), which require management to make certain estimates and assumptions as of the date of the financial statements. Actual results could differ from those estimates and those differences could be significant. The fund qualifies as an investment company under Topic 946 of Accounting Standards Codification of US GAAP.
Events or transactions occurring after the end of the fiscal period through the date that the financial statements were issued have been evaluated in the preparation of the financial statements. The following summarizes the significant accounting policies of the fund:
Security valuation. Investments are stated at value as of the scheduled close of regular trading on the New York Stock Exchange (NYSE), normally at 4:00 P.M., Eastern Time. In case of emergency or other disruption resulting in the NYSE not opening for trading or the NYSE closing at a time other than the regularly scheduled close, the net asset value (NAV) may be determined as of the regularly scheduled close of the NYSE pursuant to the fund's Valuation Policies and Procedures.
In order to value the securities, the fund uses the following valuation techniques: Equity securities, including exchange-traded or closed-end funds, are typically valued at the last sale price or official closing price on the exchange or principal market where the security trades. In the event there were no sales during the day or closing prices are not available, the securities are valued using the last available bid price. Investments by the fund in open-end mutual funds, including John Hancock Collateral Trust (JHCT), are valued at their respective NAVs each business day. Futures contracts are typically valued at last traded price on the exchange on which they trade. Foreign securities and currencies are valued in U.S. dollars based on foreign currency exchange rates supplied by an independent pricing vendor.
In certain instances, the Pricing Committee may determine to value equity securities using prices obtained from another exchange or market if trading on the exchange or market on which prices are typically obtained did not open for trading as scheduled, or if trading closed earlier than scheduled, and trading occurred as normal on another exchange or market.
Other portfolio securities and assets, for which reliable market quotations are not readily available, are valued at fair value as determined in good faith by the fund's Pricing Committee following procedures established by the Board of Trustees. The frequency with which these fair valuation procedures are used cannot be predicted and fair value of securities may differ significantly from the value that would have been used had a ready market for such securities existed. Trading in foreign securities may be completed before the scheduled daily close of trading on the NYSE. Significant events at the issuer or market level may affect the values of securities between the time when the valuation of the securities is generally determined and the close of the NYSE. If a significant event occurs,
| 22 | JOHN HANCOCK International Small Company Fund | SEMIANNUAL REPORT | |
these securities may be fair valued, as determined in good faith by the fund's Pricing Committee, following procedures established by the Board of Trustees. The fund uses fair value adjustment factors provided by an independent pricing vendor to value certain foreign securities in order to adjust for events that may occur between the close of foreign exchanges or markets and the close of the NYSE.
The fund uses a three-tier hierarchy to prioritize the pricing assumptions, referred to as inputs, used in valuation techniques to measure fair value. Level 1 includes securities valued using quoted prices in active markets for identical securities, including registered investment companies. Level 2 includes securities valued using other significant observable inputs. Observable inputs may include quoted prices for similar securities, interest rates, prepayment speeds and credit risk. Prices for securities valued using these inputs are received from independent pricing vendors and brokers and are based on an evaluation of the inputs described. Level 3 includes securities valued using significant unobservable inputs when market prices are not readily available or reliable, including the fund's own assumptions in determining the fair value of investments. Factors used in determining value may include market or issuer specific events or trends, changes in interest rates and credit quality. The inputs or methodology used for valuing securities are not necessarily an indication of the risks associated with investing in those securities. Changes in valuation techniques and related inputs may result in transfers into or out of an assigned level within the disclosure hierarchy.
The following is a summary of the values by input classification of the fund's investments as of February 29, 2020, by major security category or type:
| | Total
value at
2-29-20 | Level 1
quoted
price | Level 2
significant
observable
inputs | Level 3
significant
unobservable
inputs |
| Investments in securities: | | | | |
| Assets | | | | |
| Common stocks | | | | |
| Australia | $43,930,446 | $404,313 | $43,396,766 | $129,367 |
| Austria | 11,171,535 | — | 11,171,535 | — |
| Belgium | 11,241,401 | — | 11,241,401 | — |
| Bermuda | 160,495 | — | 160,495 | — |
| Canada | 59,592,427 | 59,590,891 | 11 | 1,525 |
| China | 974,264 | — | 974,264 | — |
| Colombia | 66,923 | 66,923 | — | — |
| Denmark | 14,782,706 | — | 14,782,706 | — |
| Faeroe Islands | 16,240 | — | 16,240 | — |
| Finland | 17,836,542 | — | 17,836,542 | — |
| France | 31,554,667 | — | 31,554,667 | — |
| Gabon | 43,122 | — | 43,122 | — |
| Georgia | 525,954 | — | 525,954 | — |
| Germany | 42,636,918 | — | 42,636,918 | — |
| Gibraltar | 114,684 | — | 114,684 | — |
| Greece | 37 | — | — | 37 |
| Greenland | 24,137 | — | 24,137 | — |
| Guernsey, Channel Islands | 70,856 | — | 70,856 | — |
| Hong Kong | 16,668,752 | 19,076 | 16,492,059 | 157,617 |
| Ireland | 4,005,969 | — | 4,002,430 | 3,539 |
| Isle of Man | 610,447 | — | 610,447 | — |
| | SEMIANNUAL REPORT | JOHN HANCOCK International Small Company Fund | 23 |
| | Total
value at
2-29-20 | Level 1
quoted
price | Level 2
significant
observable
inputs | Level 3
significant
unobservable
inputs |
| Israel | $9,325,543 | $34,900 | $9,290,643 | — |
| Italy | 33,651,776 | — | 33,651,755 | $21 |
| Japan | 168,353,095 | — | 168,235,302 | 117,793 |
| Jersey, Channel Islands | 1,107,571 | — | 1,107,571 | — |
| Liechtenstein | 626,898 | — | 626,898 | — |
| Luxembourg | 3,799,023 | — | 3,799,023 | — |
| Macau | 110,119 | — | 110,119 | — |
| Malaysia | 328,745 | — | 328,745 | — |
| Malta | 406,824 | — | 406,824 | — |
| Monaco | 607,341 | 523,793 | 83,548 | — |
| Netherlands | 23,099,961 | — | 23,099,961 | — |
| New Zealand | 4,164,307 | — | 4,164,307 | — |
| Norway | 6,733,581 | — | 6,733,581 | — |
| Peru | 266,573 | — | 266,573 | — |
| Philippines | 11,759 | — | 11,759 | — |
| Portugal | 2,819,730 | — | 2,819,730 | — |
| Russia | 754,098 | — | 754,098 | — |
| Singapore | 9,184,572 | — | 9,027,945 | 156,627 |
| South Africa | 401,502 | 1,036 | 400,466 | — |
| Spain | 18,512,303 | — | 18,512,303 | — |
| Sweden | 23,301,803 | — | 23,301,803 | — |
| Switzerland | 42,203,930 | — | 42,203,930 | — |
| Turkey | 10,248 | — | 10,248 | — |
| United Arab Emirates | 25,073 | — | 25,073 | — |
| United Kingdom | 110,989,385 | — | 110,975,335 | 14,050 |
| United States | 3,504,931 | 1,786,372 | 1,718,559 | — |
| Preferred securities | 2,117,953 | — | 2,117,953 | — |
| Rights | 563 | 563 | — | — |
| Warrants | 377 | 377 | — | — |
| Short-term investments | 26,867,005 | 26,867,005 | — | — |
| Total investments in securities | $749,315,111 | $89,295,249 | $659,439,286 | $580,576 |
| Derivatives: | | | | |
| Liabilities | | | | |
| Futures | $(355,007) | $(355,007) | — | — |
Security transactions and related investment income. Investment security transactions are accounted for on a trade date plus one basis for daily NAV calculations. However, for financial reporting purposes, investment transactions are reported on trade date. Interest income is accrued as earned. Dividend income is recorded on the ex-date, except for dividends of certain foreign securities where the dividend may not be known until after the ex-date. In those cases, dividend income, net of withholding taxes, is recorded when the fund becomes aware of the dividends. Non-cash dividends, if any, are recorded at the fair market value of the securities received. Gains and losses on securities sold are determined on the basis of identified cost and may include proceeds from litigation.
| 24 | JOHN HANCOCK International Small Company Fund | SEMIANNUAL REPORT | |
Securities lending. The fund may lend its securities to earn additional income. The fund receives collateral from the borrower in an amount not less than the market value of the loaned securities. The fund will invest its cash collateral in JHCT, an affiliate of the fund, which has a floating NAV and is registered with the Securities and Exchange Commission (SEC) as an investment company. JHCT invests in short-term money market investments. The fund will receive the benefit of any gains and bear any losses generated by JHCT with respect to the cash collateral.
The fund has the right to recall loaned securities on demand. If a borrower fails to return loaned securities when due, then the lending agent is responsible and indemnifies the fund for the lent securities. The lending agent uses the collateral received from the borrower to purchase replacement securities of the same issue, type, class and series of the loaned securities. If the value of the collateral is less than the purchase cost of replacement securities, the lending agent is responsible for satisfying the shortfall but only to the extent that the shortfall is not due to any decrease in the value of JHCT.
Although the risk of loss on securities lent is mitigated by receiving collateral from the borrower and through lending agent indemnification, the fund could experience a delay in recovering securities or could experience a lower than expected return if the borrower fails to return the securities on a timely basis. The fund receives compensation for lending its securities by retaining a portion of the return on the investment of the collateral and compensation from fees earned from borrowers of the securities. Securities lending income received by the fund is net of fees retained by the securities lending agent. Net income received from JHCT is a component of securities lending income as recorded on the Statement of operations.
Obligations to repay collateral received by the fund are shown on the Statement of assets and liabilities as Payable upon return of securities loaned and are secured by the loaned securities. As of February 29, 2020, the fund loaned securities valued at $35,009,599 and received $26,864,216 of cash collateral.
In addition, non-cash collateral of approximately $13,412,508 in the form of U.S. Treasuries was pledged to the fund. This non-cash collateral is not reflected in the fund's net assets, however could be sold by the securities lending agent in the event of default by the borrower.
Foreign investing. Assets, including investments, and liabilities denominated in foreign currencies are translated into U.S. dollar values each day at the prevailing exchange rate. Purchases and sales of securities, income and expenses are translated into U.S. dollars at the prevailing exchange rate on the date of the transaction. The effect of changes in foreign currency exchange rates on the value of securities is reflected as a component of the realized and unrealized gains (losses) on investments. Foreign investments are subject to a decline in the value of a foreign currency versus the U.S. dollar, which reduces the dollar value of securities denominated in that currency.
Funds that invest internationally generally carry more risk than funds that invest strictly in U.S. securities. These risks are heightened for investments in emerging markets. Risks can result from differences in economic and political conditions, regulations, market practices (including higher transaction costs), accounting standards and other factors.
Foreign taxes. The fund may be subject to withholding tax on income, capital gains or repatriation taxes imposed by certain countries, a portion of which may be recoverable. Foreign taxes are accrued based upon the fund's understanding of the tax rules and rates that exist in the foreign markets in which it invests. Taxes are accrued based on gains realized by the fund as a result of certain foreign security sales. In certain circumstances, estimated taxes are accrued based on unrealized appreciation of such securities. Investment income is recorded net of foreign withholding taxes.
Overdraft. The fund may have the ability to borrow from banks for temporary or emergency purposes, including meeting redemption requests that otherwise might require the untimely sale of securities. Pursuant to the fund's custodian agreement, the custodian may loan money to the fund to make properly authorized payments. The fund
| | SEMIANNUAL REPORT | JOHN HANCOCK International Small Company Fund | 25 |
is obligated to repay the custodian for any overdraft, including any related costs or expenses. The custodian may have a lien, security interest or security entitlement in any fund property that is not otherwise segregated or pledged, to the extent of any overdraft, and to the maximum extent permitted by law.
Line of credit. The fund and other affiliated funds have entered into a syndicated line of credit agreement with Citibank, N.A. as the administrative agent that enables them to participate in a $750 million unsecured committed line of credit. Excluding commitments designated for a certain fund and subject to the needs of all other affiliated funds, the fund can borrow up to an aggregate commitment amount of $500 million, subject to asset coverage and other limitations as specified in the agreement. A commitment fee payable at the end of each calendar quarter, based on the average daily unused portion of the line of credit, is charged to each participating fund based on a combination of fixed and asset based allocations and is reflected in Other expenses on the Statement of operations. For the six months ended February 29, 2020, the fund had no borrowings under the line of credit. Commitment fees for the six months ended February 29, 2020 were $1,795.
Expenses. Within the John Hancock group of funds complex, expenses that are directly attributable to an individual fund are allocated to such fund. Expenses that are not readily attributable to a specific fund are allocated among all funds in an equitable manner, taking into consideration, among other things, the nature and type of expense and the fund’s relative net assets. Expense estimates are accrued in the period to which they relate and adjustments are made when actual amounts are known.
Class allocations. Income, common expenses and realized and unrealized gains (losses) are determined at the fund level and allocated daily to each class of shares based on the net assets of the class. Class-specific expenses, such as distribution and service fees, if any, and transfer agent fees, for all classes, are charged daily at the class level based on the net assets of each class and the specific expense rates applicable to each class.
Federal income taxes. The fund intends to continue to qualify as a regulated investment company by complying with the applicable provisions of the Internal Revenue Code and will not be subject to federal income tax on taxable income that is distributed to shareholders. Therefore, no federal income tax provision is required.
As of August 31, 2019, the fund had no uncertain tax positions that would require financial statement recognition, derecognition or disclosure. The fund's federal tax returns are subject to examination by the Internal Revenue Service for a period of three years.
Distribution of income and gains. Distributions to shareholders from net investment income and net realized gains, if any, are recorded on the ex-date. The fund generally declares and pays dividends annually. Capital gain distributions, if any, are typically distributed annually.
Distributions paid by the fund with respect to each class of shares are calculated in the same manner, at the same time and in the same amount, except for the effect of class level expenses that may be applied differently to each class.
Such distributions, on a tax basis, are determined in conformity with income tax regulations, which may differ from US GAAP. Distributions in excess of tax basis earnings and profits, if any, are reported in the fund's financial statements as a return of capital. The final determination of tax characteristics of the fund's distribution will occur at the end of the year and will subsequently be reported to shareholders.
Capital accounts within the financial statements are adjusted for permanent book-tax differences. These adjustments have no impact on net assets or the results of operations. Temporary book-tax differences, if any, will reverse in a subsequent period. Book-tax differences are primarily attributable to passive foreign investment companies, wash sale loss deferrals and characterization of distributions.
| 26 | JOHN HANCOCK International Small Company Fund | SEMIANNUAL REPORT | |
Note 3—Derivative instruments
The fund may invest in derivatives in order to meet its investment objective. Derivatives include a variety of different instruments that may be traded in the over-the-counter (OTC) market, on a regulated exchange or through a clearing facility. The risks in using derivatives vary depending upon the structure of the instruments, including the use of leverage, optionality, the liquidity or lack of liquidity of the contract, the creditworthiness of the counterparty or clearing organization and the volatility of the position. Some derivatives involve risks that are potentially greater than the risks associated with investing directly in the referenced securities or other referenced underlying instrument. Specifically, the fund is exposed to the risk that the counterparty to an OTC derivatives contract will be unable or unwilling to make timely settlement payments or otherwise honor its obligations. OTC derivatives transactions typically can only be closed out with the other party to the transaction.
Certain derivatives are traded or cleared on an exchange or central clearinghouse. Exchange-traded or centrally-cleared transactions generally present less counterparty risk to a fund than OTC transactions. The exchange or clearinghouse stands between the fund and the broker to the contract and therefore, credit risk is generally limited to the failure of the exchange or clearinghouse and the clearing member.
Futures. A futures contract is a contractual agreement to buy or sell a particular currency or financial instrument at a pre-determined price in the future. Futures are traded on an exchange and cleared through a central clearinghouse. Risks related to the use of futures contracts include possible illiquidity of the futures markets and contract prices that can be highly volatile and imperfectly correlated to movements in the underlying financial instrument and potential losses in excess of the amounts recognized on the Statement of assets and liabilities. Use of long futures contracts subjects the fund to the risk of loss up to the notional value of the futures contracts. Use of short futures contracts subjects the fund to unlimited risk of loss.
Upon entering into a futures contract, the fund is required to deposit initial margin with the broker in the form of cash or securities. The amount of required margin is set by the broker and is generally based on a percentage of the contract value. The margin deposit must then be maintained at the established level over the life of the contract. Cash that has been pledged by the fund is detailed in the Statement of assets and liabilities as Collateral held at broker for futures contracts. Securities pledged by the fund, if any, are identified in the Fund's investments. Subsequent payments, referred to as variation margin, are made or received by the fund periodically and are based on changes in the market value of open futures contracts. Futures contracts are marked-to-market daily and unrealized gain or loss is recorded by the fund. Payable for futures variation margin is included on the Statement of assets and liabilities. When the contract is closed, the fund records a realized gain or loss equal to the difference between the value of the contract at the time it was opened and the value at the time it was closed.
During the six months ended February 29, 2020, the fund used futures contracts to gain exposure to certain securities and as a substitute for securities purchased. The fund held futures contracts with USD notional values ranging from $3.8 million to $5.7 million, as measured at each quarter end.
Fair value of derivative instruments by risk category
The table below summarizes the fair value of derivatives held by the fund at February 29, 2020 by risk category:
| Risk | Statement of assets
and liabilities
location | Financial
instruments
location | Assets
derivatives
fair value | Liabilities
derivatives
fair value |
| Equity | Receivable/payable for futures variation margin | Futures1 | — | $(355,007) |
| 1 | Reflects cumulative appreciation/depreciation on futures as disclosed in Fund's investments. Only the period end variation margin is separately disclosed on the Statement of assets and liabilities. |
Effect of derivative instruments on the Statement of operations
| | SEMIANNUAL REPORT | JOHN HANCOCK International Small Company Fund | 27 |
The table below summarizes the net realized gain (loss) included in the net increase (decrease) in net assets from operations, classified by derivative instrument and risk category, for the six months ended February 29, 2020:
| | Statement of operations location - Net realized gain (loss) on: |
| Risk | Futures contracts |
| Equity | $193,514 |
The table below summarizes the net change in unrealized appreciation (depreciation) included in the net increase (decrease) in net assets from operations, classified by derivative instrument and risk category, for the six months ended February 29, 2020:
| | Statement of operations location - Change in net unrealized appreciation (depreciation) of: |
| Risk | Futures contracts |
| Equity | $(280,232) |
Note 4—Guarantees and indemnifications
Under the Trust's organizational documents, its Officers and Trustees are indemnified against certain liabilities arising out of the performance of their duties to the Trust, including the fund. Additionally, in the normal course of business, the fund enters into contracts with service providers that contain general indemnification clauses. The fund's maximum exposure under these arrangements is unknown, as this would involve future claims that may be made against the fund that have not yet occurred. The risk of material loss from such claims is considered remote.
Note 5—Fees and transactions with affiliates
John Hancock Investment Management LLC (the Advisor) serves as investment advisor for the fund. John Hancock Investment Management Distributors LLC (the Distributor), an affiliate of the Advisor, serves as principal underwriter of the fund. The Advisor and the Distributor are indirect, wholly owned subsidiaries of Manulife Financial Corporation (MFC).
Management fee. The fund has an investment management agreement with the Advisor under which the fund pays a monthly management fee to the Advisor equivalent on an annual basis to 0.950% of the fund’s aggregate net assets. Aggregate net assets include the net assets of the fund and International Small Company Trust, a series of John Hancock Variable Insurance Trust. The Advisor has a subadvisory agreement with Dimensional Fund Advisors LP. The fund is not responsible for payment of the subadvisory fees.
The Advisor has contractually agreed to waive a portion of its management fee and/or reimburse expenses for certain funds of the John Hancock group of funds complex, including the fund (the participating portfolios). This waiver is based upon aggregate net assets of all the participating portfolios. The amount of the reimbursement is calculated daily and allocated among all the participating portfolios in proportion to the daily net assets of each fund. During the six months ended February 29, 2020, this waiver amounted to 0.01% of the fund’s average daily net assets on an annualized basis. This arrangement expires on July 31, 2021, unless renewed by mutual agreement of the fund and the Advisor based upon a determination that this is appropriate under the circumstances at that time.
The Advisor contractually agrees to reduce its management fee or, if necessary, make payment to Class A shares in an amount equal to the amount by which expenses of Class A shares exceed 1.39% of average daily net assets attributable to the class. For purposes of this agreement, “expenses of Class A shares” means all expenses of the class (including fund expenses attributable to the class), excluding (a) taxes, (b) brokerage commissions, (c) interest expense, (d) litigation and indemnification expenses and other extraordinary expenses not incurred in the ordinary
| 28 | JOHN HANCOCK International Small Company Fund | SEMIANNUAL REPORT | |
course of the fund’s business, (e) underlying fund expenses (acquired fund fees), and (f) short dividend expense. This agreement expires on December 31, 2020, unless renewed by mutual agreement of the fund and the Advisor based upon a determination that this is appropriate under the circumstances at that time.
For the six months ended February 29, 2020, the expense reductions described above amounted to the following:
| Class | Expense reduction |
| Class A | $24,764 |
| Class C | 57 |
| Class I | 81 |
| Class | Expense reduction |
| Class R6 | $2,456 |
| Class NAV | 25,930 |
| Total | $53,288 |
Expenses waived or reimbursed in the current fiscal period are not subject to recapture in future fiscal periods.
The investment management fees, including the impact of the waivers and reimbursements as described above, incurred for the six months ended February 29, 2020, were equivalent to a net annual effective rate of 0.94% of the fund's average daily net assets.
Accounting and legal services. Pursuant to a service agreement, the fund reimburses the Advisor for all expenses associated with providing the administrative, financial, legal, compliance, accounting and recordkeeping services to the fund, including the preparation of all tax returns, periodic reports to shareholders and regulatory reports, among other services. These expenses are allocated to each share class based on its relative net assets at the time the expense was incurred. These accounting and legal services fees incurred for the six months ended February 29, 2020 amounted to an annual rate of 0.02% of the fund's average daily net assets.
Distribution and service plans. The fund has a distribution agreement with the Distributor. The fund has adopted distribution and service plans for certain classes as detailed below pursuant to Rule 12b-1 under the 1940 Act, to pay the Distributor for services provided as the distributor of shares of the fund. The fund may pay up to the following contractual rates of distribution and service fees under these arrangements, expressed as an annual percentage of average daily net assets for each class of the fund's shares:
| Class | Rule 12b-1 Fee |
| Class A | 0.30% |
| Class C | 1.00% |
Sales charges. Class A shares are assessed up-front sales charges, which resulted in payments to the Distributor amounting to $42,989 for the six months ended February 29, 2020. Of this amount, $7,438 was retained and used for printing prospectuses, advertising, sales literature and other purposes and $35,551 was paid as sales commissions to broker-dealers.
Class A and Class C shares may be subject to contingent deferred sales charges (CDSCs). Certain Class A shares that are acquired through purchases of $1 million or more and are redeemed within one year of purchase are subject to a 1.00% sales charge. Class C shares that are redeemed within one year of purchase are subject to a 1.00% CDSC. CDSCs are applied to the lesser of the current market value at the time of redemption or the original purchase cost of the shares being redeemed. Proceeds from CDSCs are used to compensate the Distributor for providing distribution-related services in connection with the sale of these shares. During the six months ended February 29, 2020, CDSCs received by the Distributor amounted to $805 and $17 for Class A and Class C shares, respectively.
Transfer agent fees. The John Hancock group of funds has a complex-wide transfer agent agreement with John Hancock Signature Services, Inc. (Signature Services), an affiliate of the Advisor. The transfer agent fees paid to Signature Services are determined based on the cost to Signature Services (Signature Services Cost) of providing recordkeeping services. It also includes out-of-pocket expenses, including payments made to third-parties for recordkeeping services provided to their clients who invest in one or more John Hancock funds. In addition, Signature Services Cost may be reduced by certain fees that Signature Services receives in connection with
| | SEMIANNUAL REPORT | JOHN HANCOCK International Small Company Fund | 29 |
retirement and small accounts. Signature Services Cost is calculated monthly and allocated, as applicable, to five categories of share classes: Retail Share and Institutional Share Classes of Non-Municipal Bond Funds, Class R6 Shares, Retirement Share Classes and Municipal Bond Share Classes. Within each of these categories, the applicable costs are allocated to the affected John Hancock affiliated funds and/or classes, based on the relative average daily net assets.
Class level expenses. Class level expenses for the six months ended February 29, 2020 were as follows:
| Class | Distribution and service fees | Transfer agent fees |
| Class A | $84,446 | $34,635 |
| Class C | 7,524 | 926 |
| Class I | — | 1,322 |
| Class R6 | — | 4,267 |
| Total | $91,970 | $41,150 |
Trustee expenses. The fund compensates each Trustee who is not an employee of the Advisor or its affiliates. The costs of paying Trustee compensation and expenses are allocated to the fund based on its net assets relative to other funds within the John Hancock group of funds complex.
Interfund lending program. Pursuant to an Exemptive Order issued by the SEC, the fund, along with certain other funds advised by the Advisor or its affiliates, may participate in an interfund lending program. This program provides an alternative credit facility allowing the fund to borrow from, or lend money to, other participating affiliated funds. At period end, no interfund loans were outstanding. Interest expense is included in Other expenses on the Statement of operations. The fund's activity in this program during the period for which loans were outstanding was as follows:
Borrower
or Lender | Weighted Average
Loan Balance | Days
Outstanding | Weighted Average
Interest Rate | Interest Income
(Expense) |
| Borrower | $5,046,764 | 25 | 1.633% | ($5,725) |
| Lender | 2,800,000 | 3 | 1.550% | 362 |
Note 6—Fund share transactions
Transactions in fund shares for the six months ended February 29, 2020 and for the year ended August 31, 2019 were as follows:
| | Six Months Ended 2-29-20 | Year Ended 8-31-19 |
| | Shares | Amount | Shares | Amount |
| Class A shares | | | | |
| Sold | 613,947 | $6,637,649 | 1,702,290 | $18,208,547 |
| Distributions reinvested | 208,021 | 2,279,906 | 472,793 | 4,378,066 |
| Repurchased | (659,759) | (7,117,663) | (1,357,548) | (14,231,291) |
| Net increase | 162,209 | $1,799,892 | 817,535 | $8,355,322 |
| 30 | JOHN HANCOCK International Small Company Fund | SEMIANNUAL REPORT | |
| | Six Months Ended 2-29-20 | Year Ended 8-31-19 |
| | Shares | Amount | Shares | Amount |
| Class C shares | | | | |
| Sold | 2,854 | $31,088 | 39,241 | $423,507 |
| Distributions reinvested | 4,453 | 49,079 | 13,739 | 128,049 |
| Repurchased | (17,271) | (186,098) | (69,362) | (735,033) |
| Net decrease | (9,964) | $(105,931) | (16,382) | $(183,477) |
| Class I shares | | | | |
| Sold | 18,983 | $203,602 | 397,232 | $4,334,451 |
| Distributions reinvested | 7,655 | 83,748 | 74,984 | 692,855 |
| Repurchased | (124,219) | (1,338,840) | (723,798) | (7,542,028) |
| Net decrease | (97,581) | $(1,051,490) | (251,582) | $(2,514,722) |
| Class R6 shares | | | | |
| Sold | 843,738 | $9,081,845 | 1,880,466 | $19,871,075 |
| Distributions reinvested | 256,640 | 2,807,642 | 582,742 | 5,384,532 |
| Repurchased | (957,281) | (10,266,930) | (1,836,628) | (19,333,172) |
| Net increase | 143,097 | $1,622,557 | 626,580 | $5,922,435 |
| Class NAV shares | | | | |
| Sold | 6,691,037 | $70,568,741 | 21,578,403 | $224,577,480 |
| Distributions reinvested | 2,744,563 | 30,025,515 | 4,458,479 | 41,196,342 |
| Repurchased | (8,534,912) | (92,621,408) | (2,740,238) | (29,307,959) |
| Net increase | 900,688 | $7,972,848 | 23,296,644 | $236,465,863 |
| Total net increase | 1,098,449 | $10,237,876 | 24,472,795 | $248,045,421 |
Affiliates of the fund owned 100% of shares of Class NAV on February 29, 2020. Such concentration of shareholders’ capital could have a material effect on the fund if such shareholders redeem from the fund.
Note 7—Purchase and sale of securities
Purchases and sales of securities, other than short-term investments, amounted to $76,170,685 and $103,130,044, respectively, for the six months ended February 29, 2020.
Note 8—Investment by affiliated funds
Certain investors in the fund are affiliated funds that are managed by the Advisor and its affiliates. The affiliated funds do not invest in the fund for the purpose of exercising management or control; however, this investment may represent a significant portion of the fund's net assets. At February 29, 2020, funds within the John Hancock group of funds complex held 84.3% of the fund's net assets. The following fund(s) had an affiliate ownership of 5% or more of the fund's net assets:
| Portfolio | Affiliated Concentration |
| JHF II Multimanager Lifestyle Growth Portfolio | 31.3% |
| JHF II Multimanager Lifestyle Balanced Portfolio | 17.8% |
| JHF II Multimanager Lifestyle Aggressive Portfolio | 14.2% |
| | SEMIANNUAL REPORT | JOHN HANCOCK International Small Company Fund | 31 |
Note 9—Investment in affiliated underlying funds
The fund may invest in affiliated underlying funds that are managed by the Advisor and its affiliates. Information regarding the fund's fiscal year to date purchases and sales of the affiliated underlying funds as well as income and capital gains earned by the fund, if any, is as follows:
| | | | | | | | Dividends and distributions |
| Affiliate | Ending
share
amount | Beginning
value | Cost of
purchases | Proceeds
from shares
sold | Realized
gain
(loss) | Change in
unrealized
appreciation
(depreciation) | Income
distributions
received | Capital gain
distributions
received | Ending
value |
| John Hancock Collateral Trust* | 2,684,311 | $40,254,443 | $57,712,992 | $(71,105,734) | $477 | $4,827 | $620,896 | — | $26,867,005 |
| * | Refer to the Securities lending note within Note 2 for details regarding this investment. |
Note 10—Subsequent events
A widespread health crisis such as a global pandemic could cause substantial market volatility, exchange trading suspensions and closures, impact the ability to complete redemptions, and affect fund performance. For example, the novel coronavirus disease (COVID-19) has resulted in significant disruptions to global business activity. The impact of a health crisis and other epidemics and pandemics that may arise in the future, could affect the global economy in ways that cannot necessarily be foreseen at the present time. A health crisis may exacerbate other pre-existing political, social and economic risks. Any such impact could adversely affect the fund's performance, resulting in losses to your investment.
| 32 | JOHN HANCOCK International Small Company Fund | SEMIANNUAL REPORT | |
| | |
Trustees
Hassell H. McClellan,Chairperson
Steven R. Pruchansky,Vice Chairperson
Andrew G. Arnott†
Charles L. Bardelis*
James R. Boyle
Peter S. Burgess*
William H. Cunningham
Grace K. Fey
Marianne Harrison†
Deborah C. Jackson
James M. Oates*
Gregory A. Russo
Officers
Andrew G. Arnott
President
Francis V. Knox, Jr.
Chief Compliance Officer
Charles A. Rizzo
Chief Financial Officer
Salvatore Schiavone
Treasurer
Christopher (Kit) Sechler
Secretary and Chief Legal Officer
| Investment advisor
John Hancock Investment Management LLC
Subadvisor
Dimensional Fund Advisors LP
Portfolio Managers
Jed S. Fogdall
Mary T. Phillips, CFA
Arun Keswani, CFA
Bhanu P. Singh
Principal distributor
John Hancock Investment Management Distributors LLC
Custodian
Citibank, N.A.
Transfer agent
John Hancock Signature Services, Inc.
Legal counsel
K&L Gates LLP
|
* Member of the Audit Committee
† Non-Independent Trustee
The fund's proxy voting policies and procedures, as well as the fund proxy voting record for the most recent twelve-month period ended June 30, are available free of charge on the Securities and Exchange Commission (SEC) website at sec.gov or on our website.
All of the fund's holdings as of the end of the third month of every fiscal quarter are filed with the SEC on Form N-PORT within 60 days of the end of the fiscal quarter. The fund's Form N-PORT filings are available on our website and the SEC's website, sec.gov.
We make this information on your fund, as well asmonthly portfolio holdings, and other fund details available on our website at jhinvestments.com or by calling 800-225-5291.
| | | | |
| | You can also contact us: |
| | 800-225-5291
jhinvestments.com | Regular mail:
John Hancock Signature Services, Inc.
P.O. Box 55913
Boston, MA 02205-5913
| Express mail:
John Hancock Signature Services, Inc.
2000 Crown Colony Drive
Suite 55913
Quincy, MA 02169-0953
|
SEMIANNUAL REPORT | JOHN HANCOCK INTERNATIONAL SMALL COMPANY FUND 33
John Hancock family of funds
| | | |
DOMESTIC EQUITY FUNDS
Blue Chip Growth
Classic Value
Disciplined Value
Disciplined Value Mid Cap
Equity Income
Financial Industries
Fundamental All Cap Core
Fundamental Large Cap Core
New Opportunities
Regional Bank
Small Cap Core
Small Cap Growth
Small Cap Value
U.S. Global Leaders Growth
U.S. Quality Growth
GLOBAL AND INTERNATIONAL EQUITY FUNDS
Disciplined Value International
Emerging Markets
Emerging Markets Equity
Fundamental Global Franchise
Global Equity
Global Shareholder Yield
Global Thematic Opportunities
International Dynamic Growth
International Growth
International Small Company
| | INCOME FUNDS
Bond
California Tax-Free Income
Emerging Markets Debt
Floating Rate Income
Government Income
High Yield
High Yield Municipal Bond
Income
Investment Grade Bond
Money Market
Short Duration Bond
Short Duration Credit Opportunities
Strategic Income Opportunities
Tax-Free Bond
ALTERNATIVE AND SPECIALTY FUNDS
Absolute Return Currency
Alternative Asset Allocation
Alternative Risk Premia
Diversified Macro
Infrastructure
Multi-Asset Absolute Return
Seaport Long/Short
|
A fund's investment objectives, risks, charges, and expenses should be considered carefully before investing. The prospectus contains this and other important information about the fund. To obtain a prospectus, contact your financial professional, call John Hancock Investment Management at 800-225-5291, or visit our website at jhinvestments.com. Please read the prospectus carefully before investing or sending money.
| | | |
ASSET ALLOCATION
Balanced
Income Allocation
Multi-Index Lifetime Portfolios
Multi-Index Preservation Portfolios
Multimanager Lifestyle Portfolios
Multimanager Lifetime Portfolios
Retirement Income 2040
EXCHANGE-TRADED FUNDS
John Hancock Multifactor Consumer Discretionary ETF
John Hancock Multifactor Consumer Staples ETF
John Hancock Multifactor Developed International ETF
John Hancock Multifactor Emerging Markets ETF
John Hancock Multifactor Energy ETF
John Hancock Multifactor Financials ETF
John Hancock Multifactor Healthcare ETF
John Hancock Multifactor Industrials ETF
John Hancock Multifactor Large Cap ETF
John Hancock Multifactor Materials ETF
John Hancock Multifactor Media and
Communications ETF
John Hancock Multifactor Mid Cap ETF
John Hancock Multifactor Small Cap ETF
John Hancock Multifactor Technology ETF
John Hancock Multifactor Utilities ETF
| | ENVIRONMENTAL, SOCIAL, AND
GOVERNANCE FUNDS
ESG All Cap Core
ESG Core Bond
ESG International Equity
ESG Large Cap Core
CLOSED-END FUNDS
Financial Opportunities
Hedged Equity & Income
Income Securities Trust
Investors Trust
Preferred Income
Preferred Income II
Preferred Income III
Premium Dividend
Tax-Advantaged Dividend Income
Tax-Advantaged Global Shareholder Yield
|
John Hancock Multifactor ETF shares are bought and sold at market price (not NAV), and are not individually redeemed
from the fund. Brokerage commissions will reduce returns.
John Hancock ETFs are distributed by Foreside Fund Services, LLC, and are subadvised by Dimensional Fund Advisors LP.
Foreside is not affiliated with John Hancock Investment Management Distributors LLC or Dimensional Fund Advisors LP.
Dimensional Fund Advisors LP receives compensation from John Hancock in connection with licensing rights to the
John Hancock Dimensional indexes. Dimensional Fund Advisors LP does not sponsor, endorse, or sell, and makes no
representation as to the advisability of investing in, John Hancock Multifactor ETFs.
John Hancock Investment Management
A trusted brand
John Hancock Investment Management is a premier asset manager
representing one of America's most trusted brands, with a heritage of
financial stewardship dating back to 1862. Helping our shareholders
pursue their financial goals is at the core of everything we do. It's why
we support the role of professional financial advice and operate with
the highest standards of conduct and integrity.
A better way to invest
We serve investors globally through a unique multimanager approach:
We search the world to find proven portfolio teams with specialized
expertise for every strategy we offer, then we apply robust investment
oversight to ensure they continue to meet our uncompromising
standards and serve the best interests of our shareholders.
Results for investors
Our unique approach to asset management enables us to provide
a diverse set of investments backed by some of the world's best
managers, along with strong risk-adjusted returns across asset classes.
John Hancock Investment Management Distributors LLC n Member FINRA, SIPC
200 Berkeley Street n Boston, MA 02116-5010 n 800-225-5291 n jhinvestments.com
This report is for the information of the shareholders of John Hancock International Small Company Fund. It is not authorized for distribution to prospective investors unless preceded or accompanied by a prospectus.
John Hancock
New Opportunities Fund
Semiannual report 2/29/2020
Beginning on January 1, 2021, as permitted by regulations adopted by the Securities and Exchange Commission, paper copies of the fund's shareholder reports like this one will no longer be sent by mail, unless you specifically request paper copies of the reports from the fund or from your financial intermediary. Instead, the reports will be made available on a website, and you will be notified by mail each time a report is posted and provided with a website link to access the report.
If you already elected to receive shareholder reports electronically, you will not be affected by this change, and you do not need to take any action. You may elect to receive shareholder reports and other communications electronically by calling John Hancock Investment Management at 800-225-5291 (Class A and Class C shares) or 888-972-8696 (Class I, Class R1, Class R2, Class R3, Class R4, Class R5, and Class R6 shares) or by contacting your financial intermediary.
You may elect to receive all reports in paper, free of charge, at any time. You can inform John Hancock Investment Management or your financial intermediary that you wish to continue receiving paper copies of your shareholder reports by following the instructions listed above. Your election to receive reports in paper will apply to all funds held with John Hancock Investment Management or your financial intermediary.

A message to shareholders
Dear shareholder,
Global financial markets were on pace to deliver strong returns during the 6 months ended February 29, 2020, until heightened fears over the coronavirus (COVID-19) sent markets tumbling during the last week of the period. Prior to the turbulence that ended the period, investors benefited from a combination of low inflation, accommodative central bank policy, healthy fundamentals, and corporate buybacks of stock.
However, the COVID-19 pandemic and plummeting oil prices put an end to all that good news. Shortly after period end, the U.S. Federal Reserve lowered short-term interest rates while lawmakers embarked on a plan to launch major fiscal stimulus to support the economy.
After the longest bull market in U.S. history, we're now in bear market territory. Indeed, the spread of COVID-19, trade disputes, rising unemployment, and other geopolitical tensions may continue to create uncertainty among businesses and investors. Your financial professional can helpposition your portfolio so that it's sufficiently diversified to seek to meet your long-term objectives and to withstand the inevitable bouts of market volatility along the way.
On behalf of everyone at John Hancock Investment Management, I'd like to take this opportunity to welcome new shareholders and thank existing shareholders for the continued trust you've placed in us.
Sincerely,
Andrew G. Arnott
President and CEO,
John Hancock Investment Management
Head of Wealth and Asset Management,
United States and Europe
This commentary reflects the CEO's views as of this report's period end and are subject to change at any time. Diversification does not guarantee investment returns and does not eliminate risk of loss. All investments entail risks, including the possible loss of principal. For more up-to-date information, you can visit our website at jhinvestments.com.
John Hancock
New Opportunities Fund
Table of contents
| | | |
| 2 | | Your fund at a glance |
| 3 | | Portfolio summary |
| 4 | | A look at performance |
| 6 | | Your expenses |
| 8 | | Fund's investments |
| 12 | | Financial statements |
| 15 | | Financial highlights |
| 24 | | Notes to financial statements |
| 33 | | More information |
SEMIANNUAL REPORT | JOHN HANCOCK NEW OPPORTUNITIES FUND 1
INVESTMENT OBJECTIVE
The fund seeks long-term capital appreciation.
AVERAGE ANNUAL TOTAL RETURNS AS OF 2/29/2020 (%)
The Russell 2000 Growth Index tracks the performance of publicly traded small-cap companies in the United States with higher price-to-book ratios and higher forecasted growth values.
The Russell 2000 Index is an unmanaged index composed of 2,000 U.S. small capitalization stocks.
Prior to September 6, 2019, the fund's primary benchmark was the Russell 2000 Index. Effective September 6, 2019, the fund's primary benchmark index is the Russell 2000 Growth Index. The Russell 2000 Growth Index better reflects the universe of investment opportunities based on the fund's current investment strategy.
It is not possible to invest directly in an index. Index figures do not reflect expenses or sales charges, which would result in lower returns.
Figures from Morningstar, Inc. include reinvested distributions and do not take into account sales charges. Actual load-adjusted performance is lower.
| 1 | Class A shares were first offered on 5-27-15. The returns prior to this date are those of Class NAV shares that have not been adjusted for class-specific expenses; otherwise, returns would vary. Class NAV shares ceased operations on 3-13-19. |
The past performance shown here reflects reinvested distributions and the beneficial effect of any expense reductions, and does not guarantee future results. Returns for periods shorter than one year are cumulative. Performance of the other share classes will vary based on the difference in the fees and expenses of those classes. Shares will fluctuate in value and, when redeemed, may be worth more or less than their original cost. Current month-end performance may be lower or higher than the performance cited, and can be found at jhinvestments.com or by calling 800-225-5291. For further information on the fund's objectives, risks, and strategy, see the fund's prospectus. The fund recently experienced negative short-term performance due to market volatility associated with the COVID-19 pandemic.
SEMIANNUAL REPORT | JOHN HANCOCK NEW OPPORTUNITIES FUND 2
SECTOR COMPOSITION AS OF 2/29/2020 (%)
TOP 10 HOLDINGS AS OF 2/29/2020 (%)
| | |
| HubSpot, Inc. | 2.4 |
| Syneos Health, Inc. | 2.4 |
| Catalent, Inc. | 2.3 |
| Rapid7, Inc. | 2.2 |
| Paylocity Holding Corp. | 2.2 |
| Grand Canyon Education, Inc. | 2.1 |
| RBC Bearings, Inc. | 2.1 |
| QTS Realty Trust, Inc., Class A | 2.0 |
| Mimecast, Ltd. | 1.9 |
| Cardiovascular Systems, Inc. | 1.9 |
| TOTAL | 21.5 |
| As a percentage of net assets. |
| Cash and cash equivalents are not included. |
A note about risks
The fund may be subject to various risks as described in the fund's prospectus. For more information, please refer to the "Principal risks" section of the prospectus and "Subsequent events" section in the Notes to financial statements.
SEMIANNUAL REPORT | JOHN HANCOCK NEW OPPORTUNITIES FUND 3
TOTAL RETURNS FOR THE PERIOD ENDED FEBRUARY 29, 2020
| | | | | | | | |
Average annual total returns (%)
with maximum sales charge | | Cumulative total returns (%)
with maximum sales charge |
| | 1-year | 5-year | 10-year | | 6-month | 5-year | 10-year |
| Class A1 | -12.79 | 2.05 | 8.92 | | -7.15 | 10.70 | 134.92 |
| Class C1 | -9.75 | 2.42 | 9.11 | | -3.56 | 12.68 | 139.10 |
| Class I1,2 | -7.95 | 3.40 | 9.63 | | -2.12 | 18.21 | 150.85 |
| Class R11,2 | -8.52 | 2.89 | 9.36 | | -2.42 | 15.32 | 144.71 |
| Class R21,2 | -8.12 | 3.21 | 9.53 | | -2.21 | 17.13 | 148.55 |
| Class R31,2 | -8.40 | 2.97 | 9.41 | | -2.36 | 15.78 | 145.69 |
| Class R41,2 | -8.00 | 3.35 | 9.60 | | -2.12 | 17.89 | 150.16 |
| Class R61,2 | -7.87 | 3.49 | 9.68 | | -2.07 | 18.70 | 151.88 |
| Class 12 | -7.89 | 3.46 | 9.63 | | -2.06 | 18.54 | 150.78 |
| Index 1† | -0.72 | 6.48 | 12.07 | | 1.37 | 36.90 | 212.61 |
| Index 2† | -4.92 | 5.12 | 10.41 | | -0.52 | 28.38 | 169.32 |
Performance figures assume all distributions are reinvested. Figures reflect maximum sales charges on Class A shares of 5% and the applicable contingent deferred sales charge (CDSC) on Class C shares. Class C shares held for less than one year are subject to a 1% CDSC. Sales charges are not applicable to Class I, Class R1, Class R2, Class R3, Class R4, Class R6 and Class 1.
The expense ratios of the fund, both net (including any fee waivers and/or expense limitations) and gross (excluding any fee waivers and/or expense limitations), are set forth according to the most recent publicly available prospectuses for the fund and may differ from those disclosed in the Financial highlights tables in this report. Net expenses reflect contractual expense limitations in effect until December 31, 2020 and are subject to change. Had the contractual fee waivers and expense limitations not been in place, gross expenses would apply. The expense ratios are as follows:
| | | | | | | | | | |
| | Class A | Class C | Class I | Class R1 | Class R2 | Class R3 | Class R4 | Class R6 | Class 1 | |
| Gross (%) | 1.20 | 1.95 | 0.95 | 1.59 | 1.34 | 1.49 | 1.19 | 0.84 | 0.88 | |
| Net (%) | 1.19 | 1.94 | 0.94 | 1.58 | 1.33 | 1.48 | 1.08 | 0.83 | 0.87 | |
Please refer to the most recent prospectus and annual or semiannual report for more information on expenses and any expense limitation arrangements for each class.
The returns reflect past results and should not be considered indicative of future performance. The return and principal value of an investment will fluctuate so that shares, when redeemed, may be worth more or less than their original cost. Due to market volatility and other factors, the fund's current performance may be higher or lower than the performance shown. For current to the most recent month-end performance data, please call 800-225-5291 or visit the fund's website at jhinvestments.com.
The performance table above and the chart on the next page do not reflect the deduction of taxes that a shareholder would pay on fund distributions or the redemption of fund shares. The fund's performance results reflect any applicable fee waivers or expense reductions, without which the expenses would increase and results would have been less favorable.
| † | Index 1 is the Russell 2000 Growth Index; Index 2 is the Russell 2000 Index. |
See the following page for footnotes.
SEMIANNUAL REPORT | JOHN HANCOCK NEW OPPORTUNITIES FUND 4
This chart and table show what happened to a hypothetical $10,000 investment in John Hancock New Opportunities Fund for the share classes and periods indicated, assuming all distributions were reinvested. For comparison, we've shown the same investment in two separate indexes.
| | | | | | |
| | Start date | With maximum
sales charge ($) | Without
sales charge ($) | Index 1 ($) | Index 2 ($) |
| Class C1,3 | 2-28-10 | 23,910 | 23,910 | 31,261 | 26,932 |
| Class I1,2 | 2-28-10 | 25,085 | 25,085 | 31,261 | 26,932 |
| Class R11,2 | 2-28-10 | 24,471 | 24,471 | 31,261 | 26,932 |
| Class R21,2 | 2-28-10 | 24,855 | 24,855 | 31,261 | 26,932 |
| Class R31,2 | 2-28-10 | 24,569 | 24,569 | 31,261 | 26,932 |
| Class R41,2 | 2-28-10 | 25,016 | 25,016 | 31,261 | 26,932 |
| Class R61,2 | 2-28-10 | 25,188 | 25,188 | 31,261 | 26,932 |
| Class 12 | 2-28-10 | 25,078 | 25,078 | 31,261 | 26,932 |
The Russell 2000 Growth Index tracks the performance of publicly traded small-cap companies in the United States with higher price-to-book ratios and higher forecasted growth values.
The Russell 2000 Index is an unmanaged index composed of 2,000 U.S. small capitalization stocks.
It is not possible to invest directly in an index. Index figures do not reflect expenses or sales charges, which would result in lower returns.
Prior to September 6, 2019, the fund's primary benchmark was the Russell 2000 Index. Effective September 6, 2019, the fund's primary benchmark index is the Russell 2000 Growth Index. The Russell 2000 Growth Index better reflects the universe of investment opportunities based on the fund's current investment strategy.
Footnotes related to performance pages
| 1 | Class A, Class C, Class I, Class R1, Class R2, Class R3, Class R4, and Class R6 shares were first offered on 5-27-15. The returns prior to this date are those of Class NAV shares that have not been adjusted for class-specific expenses; otherwise, returns would vary. Class NAV shares ceased operations on 3-13-19. |
| 2 | For certain type of investors as described in the fund's prospectuses. |
| 3 | The contingent deferred sales charge is not applicable. |
SEMIANNUAL REPORT | JOHN HANCOCK NEW OPPORTUNITIES FUND 5
These examples are intended to help you understand your ongoing operating expenses of investing in the fund so you can compare these costs with the ongoing costs of investing in other mutual funds.
Understanding fund expenses
As a shareholder of the fund, you incur two types of costs:
■Transaction costs,which include sales charges (loads) on purchases or redemptions (varies by share class), minimum account fee charge, etc.
■Ongoing operating expenses, including management fees, distribution and service fees (if applicable), and other fund expenses.
We are presenting only your ongoing operating expenses here.
Actual expenses/actual returns
The first line of each share class in the table on the following page is intended to provide information about the fund’s actual ongoing operating expenses, and is based on the fund’s actual return. It assumes an account value of $1,000.00 on September 1, 2019, with the same investment held until February 29, 2020.
Together with the value of your account, you may use this information to estimate the operating expenses that you paid over the period. Simply divide your account value at February 29, 2020, by $1,000.00, then multiply it by the “expenses paid” for your share class from the table. For example, for an account value of $8,600.00, the operating expenses should be calculated as follows:
Hypothetical example for comparison purposes
The second line of each share class in the table on the following page allows you to compare the fund’s ongoing operating expenses with those of any other fund. It provides an example of the fund’s hypothetical account values and hypothetical expenses based on each class’s actual expense ratio and an assumed 5% annualized return before expenses (which is not the class’s actual return). It assumes an account value of $1,000.00 on September 1, 2019, with the same investment held until February 29, 2020. Look in any other fund shareholder report to find its hypothetical example and you will be able to compare these expenses. Please remember that these hypothetical account values and expenses may not be used to estimate the actual ending account balance or expenses you paid for the period.
| 6 | JOHN HANCOCK NEW OPPORTUNITIES FUND | SEMIANNUAL REPORT | |
Remember, these examples do not include any transaction costs, therefore, these examples will not help you to determine the relative total costs of owning different funds. If transaction costs were included, your expenses would have been higher. See the prospectuses for details regarding transaction costs.
SHAREHOLDER EXPENSE EXAMPLE CHART
| | | Account
value on
9-1-2019 | Ending
value on
2-29-2020 | Expenses
paid during
period ended
2-29-20201 | Annualized
expense
ratio |
| Class A | Actual expenses/actual returns | $1,000.00 | $977.40 | $5.90 | 1.20% |
| | Hypothetical example | 1,000.00 | 1,018.90 | 6.02 | 1.20% |
| Class C | Actual expenses/actual returns | 1,000.00 | 973.80 | 9.57 | 1.95% |
| | Hypothetical example | 1,000.00 | 1,015.20 | 9.77 | 1.95% |
| Class I | Actual expenses/actual returns | 1,000.00 | 978.80 | 4.62 | 0.94% |
| | Hypothetical example | 1,000.00 | 1,020.20 | 4.72 | 0.94% |
| Class R1 | Actual expenses/actual returns | 1,000.00 | 975.80 | 7.71 | 1.57% |
| | Hypothetical example | 1,000.00 | 1,017.10 | 7.87 | 1.57% |
| Class R2 | Actual expenses/actual returns | 1,000.00 | 977.90 | 5.61 | 1.14% |
| | Hypothetical example | 1,000.00 | 1,019.20 | 5.72 | 1.14% |
| Class R3 | Actual expenses/actual returns | 1,000.00 | 976.40 | 7.03 | 1.43% |
| | Hypothetical example | 1,000.00 | 1,017.80 | 7.17 | 1.43% |
| Class R4 | Actual expenses/actual returns | 1,000.00 | 978.80 | 4.87 | 0.99% |
| | Hypothetical example | 1,000.00 | 1,019.90 | 4.97 | 0.99% |
| Class R6 | Actual expenses/actual returns | 1,000.00 | 979.30 | 4.13 | 0.84% |
| | Hypothetical example | 1,000.00 | 1,020.70 | 4.22 | 0.84% |
| Class 1 | Actual expenses/actual returns | 1,000.00 | 979.40 | 4.28 | 0.87% |
| | Hypothetical example | 1,000.00 | 1,020.50 | 4.37 | 0.87% |
| 1 | Expenses are equal to the annualized expense ratio, multiplied by the average account value over the period, multiplied by 182/366 (to reflect the one-half year period). |
| | SEMIANNUAL REPORT | JOHN HANCOCK NEW OPPORTUNITIES FUND | 7 |
AS OF 2-29-20 (unaudited)
| | | | | Shares | Value |
| Common stocks 98.3% | | | | | $279,358,315 |
| (Cost $258,422,042) | | | | | |
| Communication services 0.0% | | | 480 |
| Media 0.0% | | | |
| Media General, Inc. (A)(B) | | | 5,000 | 480 |
| Consumer discretionary 12.5% | | | 35,537,666 |
| Auto components 2.6% | | | |
| Dorman Products, Inc. (B) | | | 36,706 | 2,225,852 |
| Fox Factory Holding Corp. (B) | | | 82,396 | 5,223,906 |
| Distributors 1.3% | | | |
| Pool Corp. | | | 17,995 | 3,796,225 |
| Diversified consumer services 2.1% | | | |
| Grand Canyon Education, Inc. (B) | | | 76,005 | 6,132,083 |
| Hotels, restaurants and leisure 2.2% | | | |
| Churchill Downs, Inc. | | | 30,225 | 3,797,469 |
| Chuy's Holdings, Inc. (B) | | | 110,260 | 2,363,974 |
| Multiline retail 0.7% | | | |
| Ollie's Bargain Outlet Holdings, Inc. (B) | | | 38,703 | 1,968,822 |
| Specialty retail 2.7% | | | |
| Five Below, Inc. (B) | | | 49,218 | 4,771,685 |
| Lithia Motors, Inc., Class A | | | 23,351 | 2,782,505 |
| Textiles, apparel and luxury goods 0.9% | | | |
| Oxford Industries, Inc. | | | 40,986 | 2,475,145 |
| Consumer staples 1.8% | | | 5,157,863 |
| Food and staples retailing 1.8% | | | |
| Performance Food Group Company (B) | | | 79,146 | 3,355,790 |
| PriceSmart, Inc. | | | 32,359 | 1,802,073 |
| Energy 0.7% | | | 2,084,939 |
| Oil, gas and consumable fuels 0.7% | | | |
| Matador Resources Company (B) | | | 216,280 | 2,084,939 |
| Financials 7.4% | | | 21,122,745 |
| Banks 3.7% | | | |
| Ameris Bancorp | | | 112,960 | 3,860,973 |
| Atlantic Union Bankshares Corp. | | | 85,144 | 2,532,183 |
| Pinnacle Financial Partners, Inc. | | | 77,304 | 4,069,283 |
| Capital markets 2.4% | | | |
| Houlihan Lokey, Inc. | | | 87,362 | 4,474,682 |
| Stifel Financial Corp. | | | 42,201 | 2,297,422 |
| 8 | JOHN HANCOCK NEW OPPORTUNITIES FUND | SEMIANNUAL REPORT | SEE NOTES TO FINANCIAL STATEMENTS |
| | | | | Shares | Value |
| Financials (continued) | | | |
| Consumer finance 1.0% | | | |
| Encore Capital Group, Inc. (B) | | | 76,048 | $2,825,944 |
| Diversified financial services 0.0% | | | |
| First Eagle Private Credit LLC (A)(B) | | | 16,196 | 3,911 |
| Insurance 0.3% | | | |
| Heritage Insurance Holdings, Inc. | | | 94,834 | 1,058,347 |
| Health care 31.8% | | | 90,259,631 |
| Biotechnology 9.8% | | | |
| Aimmune Therapeutics, Inc. (B) | | | 124,515 | 2,964,702 |
| Amicus Therapeutics, Inc. (B) | | | 327,330 | 3,124,365 |
| Arena Pharmaceuticals, Inc. (B) | | | 79,596 | 3,549,982 |
| Biohaven Pharmaceutical Holding Company, Ltd. (B) | | | 76,028 | 3,357,396 |
| Global Blood Therapeutics, Inc. (B) | | | 61,166 | 3,912,177 |
| Retrophin, Inc. (B) | | | 200,503 | 3,106,794 |
| Veracyte, Inc. (B) | | | 133,423 | 3,294,214 |
| Vericel Corp. (B) | | | 296,578 | 4,579,164 |
| Health care equipment and supplies 11.1% | | | |
| AtriCure, Inc. (B) | | | 137,619 | 5,287,322 |
| Cardiovascular Systems, Inc. (B) | | | 141,579 | 5,326,202 |
| CryoLife, Inc. (B) | | | 59,465 | 1,524,088 |
| Globus Medical, Inc., Class A (B) | | | 111,812 | 5,057,257 |
| ICU Medical, Inc. (B) | | | 19,940 | 3,904,451 |
| Integra LifeSciences Holdings Corp. (B) | | | 69,564 | 3,624,284 |
| Quidel Corp. (B) | | | 40,056 | 3,093,925 |
| Wright Medical Group NV (B) | | | 124,496 | 3,766,003 |
| Health care providers and services 1.6% | | | |
| Acadia Healthcare Company, Inc. (B) | | | 53,010 | 1,569,096 |
| LHC Group, Inc. (B) | | | 24,905 | 3,024,961 |
| MedCath Corp. (A)(B) | | | 4,104 | 2,052 |
| Health care technology 1.2% | | | |
| HMS Holdings Corp. (B) | | | 147,713 | 3,392,968 |
| Life sciences tools and services 2.4% | | | |
| Syneos Health, Inc. (B) | | | 104,806 | 6,639,380 |
| Pharmaceuticals 5.7% | | | |
| Catalent, Inc. (B) | | | 127,052 | 6,546,990 |
| GW Pharmaceuticals PLC, ADR (B) | | | 31,924 | 3,266,144 |
| Horizon Therapeutics PLC (B) | | | 105,975 | 3,626,465 |
| Zogenix, Inc. (B) | | | 108,423 | 2,719,249 |
| Industrials 17.1% | | | 48,514,161 |
| Aerospace and defense 1.3% | | | |
| AAR Corp. | | | 107,012 | 3,697,265 |
| SEE NOTES TO FINANCIAL STATEMENTS | SEMIANNUAL REPORT | JOHN HANCOCK NEW OPPORTUNITIES FUND | 9 |
| | | | | Shares | Value |
| Industrials (continued) | | | |
| Building products 0.4% | | | |
| JELD-WEN Holding, Inc. (B) | | | 65,063 | $1,223,184 |
| Commercial services and supplies 1.9% | | | |
| Ritchie Brothers Auctioneers, Inc. | | | 133,839 | 5,313,408 |
| Construction and engineering 0.3% | | | |
| Dycom Industries, Inc. (B) | | | 27,370 | 809,057 |
| Electrical equipment 0.8% | | | |
| Thermon Group Holdings, Inc. (B) | | | 120,247 | 2,112,740 |
| Machinery 7.2% | | | |
| Helios Technologies, Inc. | | | 45,622 | 1,813,475 |
| John Bean Technologies Corp. | | | 37,832 | 3,664,408 |
| RBC Bearings, Inc. (B) | | | 35,340 | 6,049,855 |
| Spartan Motors, Inc. | | | 274,484 | 4,048,639 |
| Woodward, Inc. | | | 47,984 | 4,951,949 |
| Professional services 2.8% | | | |
| Exponent, Inc. | | | 69,837 | 5,143,495 |
| Forrester Research, Inc. (B) | | | 80,075 | 2,887,505 |
| Road and rail 0.7% | | | |
| Knight-Swift Transportation Holdings, Inc. | | | 65,661 | 2,097,212 |
| Trading companies and distributors 1.7% | | | |
| SiteOne Landscape Supply, Inc. (B) | | | 47,375 | 4,701,969 |
| Information technology 18.3% | | | 51,925,378 |
| Electronic equipment, instruments and components 1.3% | | | |
| Rogers Corp. (B) | | | 31,315 | 3,632,540 |
| IT services 2.7% | | | |
| ExlService Holdings, Inc. (B) | | | 41,715 | 3,114,025 |
| Virtusa Corp. (B) | | | 100,684 | 4,441,171 |
| Semiconductors and semiconductor equipment 4.8% | | | |
| Cabot Microelectronics Corp. | | | 20,474 | 2,851,619 |
| Entegris, Inc. | | | 63,943 | 3,409,441 |
| MACOM Technology Solutions Holdings, Inc. (B) | | | 87,838 | 2,219,666 |
| Power Integrations, Inc. | | | 33,760 | 2,938,808 |
| Silicon Laboratories, Inc. (B) | | | 26,715 | 2,369,086 |
| Software 9.5% | | | |
| Bottomline Technologies DE, Inc. (B) | | | 52,514 | 2,325,320 |
| HubSpot, Inc. (B) | | | 38,108 | 6,838,481 |
| Mimecast, Ltd. (B) | | | 135,581 | 5,367,652 |
| Paylocity Holding Corp. (B) | | | 47,672 | 6,174,477 |
| Rapid7, Inc. (B) | | | 134,840 | 6,243,092 |
| 10 | JOHN HANCOCK NEW OPPORTUNITIES FUND | SEMIANNUAL REPORT | SEE NOTES TO FINANCIAL STATEMENTS |
| | | | | Shares | Value |
| Materials 3.7% | | | $10,487,149 |
| Chemicals 3.7% | | | |
| Balchem Corp. | | | 41,773 | 3,945,878 |
| PolyOne Corp. | | | 152,698 | 3,780,802 |
| Quaker Chemical Corp. | | | 17,519 | 2,760,469 |
| Real estate 5.0% | | | 14,268,303 |
| Equity real estate investment trusts 5.0% | | | |
| Easterly Government Properties, Inc. | | | 138,335 | 3,288,223 |
| QTS Realty Trust, Inc., Class A | | | 101,265 | 5,688,055 |
| STAG Industrial, Inc. | | | 189,136 | 5,292,025 |
|
| | | Yield (%) | | Shares | Value |
| Short-term investments 2.3% | | | | | $6,387,748 |
| (Cost $6,387,748) | | | | | |
| Short-term funds 2.3% | | | | | 6,387,748 |
| State Street Institutional Treasury Money Market Fund, Premier Class | 1.5045(C) | | 6,387,748 | 6,387,748 |
|
| Total investments (Cost $264,809,790) 100.6% | | | $285,746,063 |
| Other assets and liabilities, net (0.6%) | | | | (1,648,098) |
| Total net assets 100.0% | | | | | $284,097,965 |
| The percentage shown for each investment category is the total value of the category as a percentage of the net assets of the fund. |
| Security Abbreviations and Legend |
| ADR | American Depositary Receipt |
| (A) | Security is valued using significant unobservable inputs and is classified as Level 3 in the fair value hierarchy. Refer to Note 2 to the financial statements. |
| (B) | Non-income producing security. |
| (C) | The rate shown is the annualized seven-day yield as of 2-29-20. |
At 2-29-20, the aggregate cost of investments for federal income tax purposes was $265,855,796. Net unrealized appreciation aggregated to $19,890,267, of which $35,774,140 related to gross unrealized appreciation and $15,883,873 related to gross unrealized depreciation.
| SEE NOTES TO FINANCIAL STATEMENTS | SEMIANNUAL REPORT | JOHN HANCOCK NEW OPPORTUNITIES FUND | 11 |
STATEMENT OF ASSETS AND LIABILITIES 2-29-20 (unaudited)
| Assets | |
| Unaffiliated investments, at value (Cost $264,809,790) | $285,746,063 |
| Dividends and interest receivable | 80,606 |
| Receivable for fund shares sold | 12,816 |
| Receivable for investments sold | 822,532 |
| Other assets | 51,747 |
| Total assets | 286,713,764 |
| Liabilities | |
| Due to custodian | 34,009 |
| Payable for investments purchased | 1,465,849 |
| Payable for fund shares repurchased | 991,240 |
| Payable to affiliates | |
| Accounting and legal services fees | 7,683 |
| Transfer agent fees | 26,034 |
| Distribution and service fees | 168 |
| Trustees' fees | 960 |
| Other liabilities and accrued expenses | 89,856 |
| Total liabilities | 2,615,799 |
| Net assets | $284,097,965 |
| Net assets consist of | |
| Paid-in capital | $268,059,505 |
| Total distributable earnings (loss) | 16,038,460 |
| Net assets | $284,097,965 |
| |
| Net asset value per share | |
| Based on net asset value and shares outstanding - the fund has an unlimited number of shares authorized with no par value | |
| Class A ($240,098,861 ÷ 11,431,112 shares)1 | $21.00 |
| Class C ($3,477,632 ÷ 172,214 shares)1 | $20.19 |
| Class I ($9,321,934 ÷ 442,344 shares) | $21.07 |
| Class R1 ($368,900 ÷ 17,737 shares) | $20.80 |
| Class R2 ($46,669 ÷ 2,219 shares) | $21.03 |
| Class R3 ($73,391 ÷ 3,511 shares) | $20.90 |
| Class R4 ($48,222 ÷ 2,290 shares) | $21.06 |
| Class R6 ($123,934 ÷ 5,878 shares) | $21.08 |
| Class 1 ($30,538,422 ÷ 1,436,499 shares) | $21.26 |
| Maximum offering price per share | |
| Class A (net asset value per share ÷ 95%)2 | $22.11 |
| 1 | Redemption price per share is equal to net asset value less any applicable contingent deferred sales charge. |
| 2 | On single retail sales of less than $50,000. On sales of $50,000 or more and on group sales the offering price is reduced. |
| 12 | JOHN HANCOCK New Opportunities Fund | SEMIANNUAL REPORT | SEE NOTES TO FINANCIAL STATEMENTS |
STATEMENT OF OPERATIONS For the six months ended 2-29-20 (unaudited)
| Investment income | |
| Dividends | $846,060 |
| Interest | 46,675 |
| Less foreign taxes withheld | (8,226) |
| Total investment income | 884,509 |
| Expenses | |
| Investment management fees | 1,168,710 |
| Distribution and service fees | 365,275 |
| Accounting and legal services fees | 28,849 |
| Transfer agent fees | 173,104 |
| Trustees' fees | 3,130 |
| Custodian fees | 51,320 |
| State registration fees | 65,570 |
| Printing and postage | 33,719 |
| Professional fees | 52,483 |
| Other | 16,968 |
| Total expenses | 1,959,128 |
| Less expense reductions | (107,574) |
| Net expenses | 1,851,554 |
| Net investment loss | (967,045) |
| Realized and unrealized gain (loss) | |
| Net realized gain (loss) on | |
| Unaffiliated investments | 5,236,098 |
| | 5,236,098 |
| Change in net unrealized appreciation (depreciation) of | |
| Unaffiliated investments | (9,462,321) |
| | (9,462,321) |
| Net realized and unrealized loss | (4,226,223) |
| Decrease in net assets from operations | $(5,193,268) |
| SEE NOTES TO FINANCIAL STATEMENTS | SEMIANNUAL REPORT | JOHN HANCOCK New Opportunities Fund | 13 |
STATEMENTS OF CHANGES IN NET ASSETS
| | Six months ended
2-29-20
(unaudited) | Year ended
8-31-19 |
| Increase (decrease) in net assets | | |
| From operations | | |
| Net investment income (loss) | $(967,045) | $854,313 |
| Net realized gain | 5,236,098 | 23,214,100 |
| Change in net unrealized appreciation (depreciation) | (9,462,321) | (109,920,422) |
| Decrease in net assets resulting from operations | (5,193,268) | (85,852,009) |
| Distributions to shareholders | | |
| From earnings | | |
| Class A | (8,902,622) | (46,343,706) |
| Class C | (142,651) | (1,235,586) |
| Class I | (342,902) | (1,987,882) |
| Class R1 | (13,318) | (57,184) |
| Class R2 | (1,716) | (9,002) |
| Class R3 | (2,771) | (12,095) |
| Class R4 | (1,758) | (7,668) |
| Class R51 | — | (7,341) |
| Class R6 | (4,472) | (237,404) |
| Class 1 | (1,162,716) | (7,701,038) |
| Class NAV1 | — | (25,256,897) |
| Total distributions | (10,574,926) | (82,855,803) |
| From fund share transactions | (20,990,175) | (130,280,622) |
| Total decrease | (36,758,369) | (298,988,434) |
| Net assets | | |
| Beginning of period | 320,856,334 | 619,844,768 |
| End of period | $284,097,965 | $320,856,334 |
| 1 | Class NAV and Class R5 shares were fully redeemed on 03-13-19 and 10-29-19, respectively. |
| 14 | JOHN HANCOCK New Opportunities Fund | SEMIANNUAL REPORT | SEE NOTES TO FINANCIAL STATEMENTS |
| CLASS A SHARES Period ended | 2-29-201 | 8-31-19 | 8-31-18 | 8-31-17 | 8-31-16 | 8-31-152 |
| Per share operating performance | | | | | | |
| Net asset value, beginning of period | $22.20 | $31.99 | $27.28 | $24.38 | $25.43 | $27.07 |
| Net investment income (loss)3 | (0.07) | 0.02 | 0.01 | 0.01 | 0.01 | (0.01) |
| Net realized and unrealized gain (loss) on investments | (0.35) | (5.49) | 6.75 | 2.98 | 1.15 | (1.63) |
| Total from investment operations | (0.42) | (5.47) | 6.76 | 2.99 | 1.16 | (1.64) |
| Less distributions | | | | | | |
| From net investment income | — | (0.01) | (0.03) | (0.02) | — | — |
| From net realized gain | (0.78) | (4.31) | (2.02) | (0.07) | (2.21) | — |
| Total distributions | (0.78) | (4.32) | (2.05) | (0.09) | (2.21) | — |
| Net asset value, end of period | $21.00 | $22.20 | $31.99 | $27.28 | $24.38 | $25.43 |
| Total return (%)4,5 | (2.26)6 | (15.32) | 25.66 | 12.27 | 5.17 | (6.06)6 |
| Ratios and supplemental data | | | | | | |
| Net assets, end of period (in millions) | $240 | $264 | $352 | $297 | $299 | $—7 |
| Ratios (as a percentage of average net assets): | | | | | | |
| Expenses before reductions | 1.268 | 1.42 | 1.40 | 1.42 | 1.54 | 1.628 |
| Expenses including reductions | 1.208 | 1.20 | 1.20 | 1.21 | 1.22 | 1.448 |
| Net investment income (loss) | (0.64)8 | 0.08 | 0.02 | 0.05 | 0.06 | (0.12)8 |
| Portfolio turnover (%) | 12 | 73 | 52 | 41 | 499 | 7810 |
| 1 | Six months ended 2-29-20. Unaudited. |
| 2 | The inception date for Class A shares is 5-27-15. |
| 3 | Based on average daily shares outstanding. |
| 4 | Total returns would have been lower had certain expenses not been reduced during the applicable periods. |
| 5 | Does not reflect the effect of sales charges, if any. |
| 6 | Not annualized. |
| 7 | Less than $500,000. |
| 8 | Annualized. |
| 9 | Excludes merger activity. |
| 10 | Portfolio turnover is shown for the period from 9-1-14 to 8-31-15. |
| SEE NOTES TO FINANCIAL STATEMENTS | SEMIANNUAL REPORT | JOHN HANCOCK New Opportunities Fund | 15 |
| CLASS C SHARES Period ended | 2-29-201 | 8-31-19 | 8-31-18 | 8-31-17 | 8-31-16 | 8-31-152 |
| Per share operating performance | | | | | | |
| Net asset value, beginning of period | $21.45 | $31.27 | $26.86 | $24.15 | $25.39 | $27.07 |
| Net investment loss3 | (0.15) | (0.15) | (0.19) | (0.17) | (0.15) | (0.06) |
| Net realized and unrealized gain (loss) on investments | (0.33) | (5.36) | 6.62 | 2.95 | 1.12 | (1.62) |
| Total from investment operations | (0.48) | (5.51) | 6.43 | 2.78 | 0.97 | (1.68) |
| Less distributions | | | | | | |
| From net realized gain | (0.78) | (4.31) | (2.02) | (0.07) | (2.21) | — |
| Net asset value, end of period | $20.19 | $21.45 | $31.27 | $26.86 | $24.15 | $25.39 |
| Total return (%)4,5 | (2.62)6 | (15.90) | 24.76 | 11.52 | 4.38 | (6.21)6 |
| Ratios and supplemental data | | | | | | |
| Net assets, end of period (in millions) | $3 | $4 | $9 | $20 | $21 | $—7 |
| Ratios (as a percentage of average net assets): | | | | | | |
| Expenses before reductions | 2.018 | 2.13 | 2.10 | 2.12 | 2.24 | 2.318 |
| Expenses including reductions | 1.958 | 1.91 | 1.90 | 1.91 | 1.93 | 2.148 |
| Net investment loss | (1.39)8 | (0.63) | (0.68) | (0.65) | (0.64) | (0.83)8 |
| Portfolio turnover (%) | 12 | 73 | 52 | 41 | 499 | 7810 |
| 1 | Six months ended 2-29-20. Unaudited. |
| 2 | The inception date for Class C shares is 5-27-15. |
| 3 | Based on average daily shares outstanding. |
| 4 | Total returns would have been lower had certain expenses not been reduced during the applicable periods. |
| 5 | Does not reflect the effect of sales charges, if any. |
| 6 | Not annualized. |
| 7 | Less than $500,000. |
| 8 | Annualized. |
| 9 | Excludes merger activity. |
| 10 | Portfolio turnover is shown for the period from 9-1-14 to 8-31-15. |
| 16 | JOHN HANCOCK New Opportunities Fund | SEMIANNUAL REPORT | SEE NOTES TO FINANCIAL STATEMENTS |
| CLASS I SHARES Period ended | 2-29-201 | 8-31-19 | 8-31-18 | 8-31-17 | 8-31-16 | 8-31-152 |
| Per share operating performance | | | | | | |
| Net asset value, beginning of period | $22.24 | $32.07 | $27.33 | $24.41 | $25.45 | $27.07 |
| Net investment income (loss)3 | (0.04) | 0.09 | 0.09 | 0.10 | 0.09 | 0.01 |
| Net realized and unrealized gain (loss) on investments | (0.35) | (5.51) | 6.78 | 2.98 | 1.15 | (1.63) |
| Total from investment operations | (0.39) | (5.42) | 6.87 | 3.08 | 1.24 | (1.62) |
| Less distributions | | | | | | |
| From net investment income | — | (0.10) | (0.11) | (0.09) | (0.07) | — |
| From net realized gain | (0.78) | (4.31) | (2.02) | (0.07) | (2.21) | — |
| Total distributions | (0.78) | (4.41) | (2.13) | (0.16) | (2.28) | — |
| Net asset value, end of period | $21.07 | $22.24 | $32.07 | $27.33 | $24.41 | $25.45 |
| Total return (%)4 | (2.12)5 | (15.08) | 26.06 | 12.61 | 5.50 | (5.98)5 |
| Ratios and supplemental data | | | | | | |
| Net assets, end of period (in millions) | $9 | $10 | $15 | $11 | $9 | $—6 |
| Ratios (as a percentage of average net assets): | | | | | | |
| Expenses before reductions | 1.017 | 1.14 | 1.11 | 1.11 | 1.23 | 1.307 |
| Expenses including reductions | 0.947 | 0.90 | 0.90 | 0.90 | 0.92 | 1.137 |
| Net investment income (loss) | (0.38)7 | 0.38 | 0.32 | 0.38 | 0.37 | 0.187 |
| Portfolio turnover (%) | 12 | 73 | 52 | 41 | 498 | 789 |
| 1 | Six months ended 2-29-20. Unaudited. |
| 2 | The inception date for Class I shares is 5-27-15. |
| 3 | Based on average daily shares outstanding. |
| 4 | Total returns would have been lower had certain expenses not been reduced during the applicable periods. |
| 5 | Not annualized. |
| 6 | Less than $500,000. |
| 7 | Annualized. |
| 8 | Excludes merger activity. |
| 9 | Portfolio turnover is shown for the period from 9-1-14 to 8-31-15. |
| SEE NOTES TO FINANCIAL STATEMENTS | SEMIANNUAL REPORT | JOHN HANCOCK New Opportunities Fund | 17 |
| CLASS R1 SHARES Period ended | 2-29-201 | 8-31-19 | 8-31-18 | 8-31-17 | 8-31-16 | 8-31-152 |
| Per share operating performance | | | | | | |
| Net asset value, beginning of period | $22.03 | $31.86 | $27.24 | $24.35 | $25.42 | $27.07 |
| Net investment loss3 | (0.12) | (0.07) | (0.09) | (0.01) | (0.02) | (0.02) |
| Net realized and unrealized gain (loss) on investments | (0.33) | (5.45) | 6.74 | 2.97 | 1.16 | (1.63) |
| Total from investment operations | (0.45) | (5.52) | 6.65 | 2.96 | 1.14 | (1.65) |
| Less distributions | | | | | | |
| From net investment income | — | — | (0.01) | — | — | — |
| From net realized gain | (0.78) | (4.31) | (2.02) | (0.07) | (2.21) | — |
| Total distributions | (0.78) | (4.31) | (2.03) | (0.07) | (2.21) | — |
| Net asset value, end of period | $20.80 | $22.03 | $31.86 | $27.24 | $24.35 | $25.42 |
| Total return (%)4 | (2.42)5 | (15.60) | 25.23 | 12.16 | 5.09 | (6.10)5 |
| Ratios and supplemental data | | | | | | |
| Net assets, end of period (in millions) | $—6 | $—6 | $—6 | $—6 | $—6 | $—6 |
| Ratios (as a percentage of average net assets): | | | | | | |
| Expenses before reductions | 1.647 | 1.77 | 1.72 | 1.52 | 1.64 | 1.717 |
| Expenses including reductions | 1.577 | 1.55 | 1.52 | 1.31 | 1.42 | 1.637 |
| Net investment loss | (1.02)7 | (0.27) | (0.29) | (0.04) | (0.07) | (0.32)7 |
| Portfolio turnover (%) | 12 | 73 | 52 | 41 | 498 | 789 |
| 1 | Six months ended 2-29-20. Unaudited. |
| 2 | The inception date for Class R1 shares is 5-27-15. |
| 3 | Based on average daily shares outstanding. |
| 4 | Total returns would have been lower had certain expenses not been reduced during the applicable periods. |
| 5 | Not annualized. |
| 6 | Less than $500,000. |
| 7 | Annualized. |
| 8 | Excludes merger activity. |
| 9 | Portfolio turnover is shown for the period from 9-1-14 to 8-31-15. |
| 18 | JOHN HANCOCK New Opportunities Fund | SEMIANNUAL REPORT | SEE NOTES TO FINANCIAL STATEMENTS |
| CLASS R2 SHARES Period ended | 2-29-201 | 8-31-19 | 8-31-18 | 8-31-17 | 8-31-16 | 8-31-152 |
| Per share operating performance | | | | | | |
| Net asset value, beginning of period | $22.22 | $32.02 | $27.30 | $24.41 | $25.44 | $27.07 |
| Net investment income (loss)3 | (0.07) | 0.04 | 0.04 | 0.03 | 0.04 | (0.01) |
| Net realized and unrealized gain (loss) on investments | (0.34) | (5.49) | 6.76 | 2.98 | 1.16 | (1.62) |
| Total from investment operations | (0.41) | (5.45) | 6.80 | 3.01 | 1.20 | (1.63) |
| Less distributions | | | | | | |
| From net investment income | — | (0.04) | (0.06) | (0.05) | (0.02) | — |
| From net realized gain | (0.78) | (4.31) | (2.02) | (0.07) | (2.21) | — |
| Total distributions | (0.78) | (4.35) | (2.08) | (0.12) | (2.23) | — |
| Net asset value, end of period | $21.03 | $22.22 | $32.02 | $27.30 | $24.41 | $25.44 |
| Total return (%)4 | (2.21)5 | (15.23) | 25.78 | 12.34 | 5.34 | (6.02)5 |
| Ratios and supplemental data | | | | | | |
| Net assets, end of period (in millions) | $—6 | $—6 | $—6 | $—6 | $—6 | $—6 |
| Ratios (as a percentage of average net assets): | | | | | | |
| Expenses before reductions | 1.217 | 1.33 | 1.29 | 1.33 | 1.39 | 1.467 |
| Expenses including reductions | 1.147 | 1.11 | 1.09 | 1.12 | 1.17 | 1.387 |
| Net investment income (loss) | (0.59)7 | 0.18 | 0.14 | 0.13 | 0.17 | (0.07)7 |
| Portfolio turnover (%) | 12 | 73 | 52 | 41 | 498 | 789 |
| 1 | Six months ended 2-29-20. Unaudited. |
| 2 | The inception date for Class R2 shares is 5-27-15. |
| 3 | Based on average daily shares outstanding. |
| 4 | Total returns would have been lower had certain expenses not been reduced during the applicable periods. |
| 5 | Not annualized. |
| 6 | Less than $500,000. |
| 7 | Annualized. |
| 8 | Excludes merger activity. |
| 9 | Portfolio turnover is shown for the period from 9-1-14 to 8-31-15. |
| SEE NOTES TO FINANCIAL STATEMENTS | SEMIANNUAL REPORT | JOHN HANCOCK New Opportunities Fund | 19 |
| CLASS R3 SHARES Period ended | 2-29-201 | 8-31-19 | 8-31-18 | 8-31-17 | 8-31-16 | 8-31-152 |
| Per share operating performance | | | | | | |
| Net asset value, beginning of period | $22.12 | $31.92 | $27.23 | $24.35 | $25.42 | $27.07 |
| Net investment loss3 | (0.10) | (0.03) | (0.03) | (0.01) | (0.02) | (0.02) |
| Net realized and unrealized gain (loss) on investments | (0.34) | (5.46) | 6.74 | 2.96 | 1.16 | (1.63) |
| Total from investment operations | (0.44) | (5.49) | 6.71 | 2.95 | 1.14 | (1.65) |
| Less distributions | | | | | | |
| From net investment income | — | — | —4 | — | — | — |
| From net realized gain | (0.78) | (4.31) | (2.02) | (0.07) | (2.21) | — |
| Total distributions | (0.78) | (4.31) | (2.02) | (0.07) | (2.21) | — |
| Net asset value, end of period | $20.90 | $22.12 | $31.92 | $27.23 | $24.35 | $25.42 |
| Total return (%)5 | (2.36)6 | (15.46) | 25.50 | 12.12 | 5.09 | (6.10)6 |
| Ratios and supplemental data | | | | | | |
| Net assets, end of period (in millions) | $—7 | $—7 | $—7 | $—7 | $—7 | $—7 |
| Ratios (as a percentage of average net assets): | | | | | | |
| Expenses before reductions | 1.508 | 1.61 | 1.53 | 1.53 | 1.64 | 1.718 |
| Expenses including reductions | 1.438 | 1.39 | 1.33 | 1.32 | 1.42 | 1.638 |
| Net investment loss | (0.87)8 | (0.11) | (0.10) | (0.06) | (0.07) | (0.32)8 |
| Portfolio turnover (%) | 12 | 73 | 52 | 41 | 499 | 7810 |
| 1 | Six months ended 2-29-20. Unaudited. |
| 2 | The inception date for Class R3 shares is 5-27-15. |
| 3 | Based on average daily shares outstanding. |
| 4 | Less than $0.005 per share. |
| 5 | Total returns would have been lower had certain expenses not been reduced during the applicable periods. |
| 6 | Not annualized. |
| 7 | Less than $500,000. |
| 8 | Annualized. |
| 9 | Excludes merger activity. |
| 10 | Portfolio turnover is shown for the period from 9-1-14 to 8-31-15. |
| 20 | JOHN HANCOCK New Opportunities Fund | SEMIANNUAL REPORT | SEE NOTES TO FINANCIAL STATEMENTS |
| CLASS R4 SHARES Period ended | 2-29-201 | 8-31-19 | 8-31-18 | 8-31-17 | 8-31-16 | 8-31-152 |
| Per share operating performance | | | | | | |
| Net asset value, beginning of period | $22.23 | $32.05 | $27.34 | $24.41 | $25.44 | $27.07 |
| Net investment income (loss)3 | (0.05) | 0.08 | 0.08 | 0.12 | 0.07 | —4 |
| Net realized and unrealized gain (loss) on investments | (0.34) | (5.51) | 6.75 | 2.95 | 1.16 | (1.63) |
| Total from investment operations | (0.39) | (5.43) | 6.83 | 3.07 | 1.23 | (1.63) |
| Less distributions | | | | | | |
| From net investment income | — | (0.08) | (0.10) | (0.07) | (0.05) | — |
| From net realized gain | (0.78) | (4.31) | (2.02) | (0.07) | (2.21) | — |
| Total distributions | (0.78) | (4.39) | (2.12) | (0.14) | (2.26) | — |
| Net asset value, end of period | $21.06 | $22.23 | $32.05 | $27.34 | $24.41 | $25.44 |
| Total return (%)5 | (2.12)6 | (15.11) | 25.92 | 12.55 | 5.46 | (6.02)6 |
| Ratios and supplemental data | | | | | | |
| Net assets, end of period (in millions) | $—7 | $—7 | $—7 | $1 | $—7 | $—7 |
| Ratios (as a percentage of average net assets): | | | | | | |
| Expenses before reductions | 1.158 | 1.28 | 1.35 | 1.27 | 1.39 | 1.468 |
| Expenses including reductions | 0.998 | 0.96 | 0.96 | 0.95 | 1.07 | 1.288 |
| Net investment income (loss) | (0.43)8 | 0.33 | 0.27 | 0.46 | 0.28 | 0.038 |
| Portfolio turnover (%) | 12 | 73 | 52 | 41 | 499 | 7810 |
| 1 | Six months ended 2-29-20. Unaudited. |
| 2 | The inception date for Class R4 shares is 5-27-15. |
| 3 | Based on average daily shares outstanding. |
| 4 | Less than $0.005 per share. |
| 5 | Total returns would have been lower had certain expenses not been reduced during the applicable periods. |
| 6 | Not annualized. |
| 7 | Less than $500,000. |
| 8 | Annualized. |
| 9 | Excludes merger activity. |
| 10 | Portfolio turnover is shown for the period from 9-1-14 to 8-31-15. |
| SEE NOTES TO FINANCIAL STATEMENTS | SEMIANNUAL REPORT | JOHN HANCOCK New Opportunities Fund | 21 |
| CLASS R6 SHARES Period ended | 2-29-201 | 8-31-19 | 8-31-18 | 8-31-17 | 8-31-16 | 8-31-152 |
| Per share operating performance | | | | | | |
| Net asset value, beginning of period | $22.24 | $32.07 | $27.34 | $24.40 | $25.46 | $27.07 |
| Net investment income (loss)3 | (0.03) | 0.11 | 0.12 | 0.12 | 0.10 | 0.01 |
| Net realized and unrealized gain (loss) on investments | (0.35) | (5.51) | 6.77 | 2.99 | 1.14 | (1.62) |
| Total from investment operations | (0.38) | (5.40) | 6.89 | 3.11 | 1.24 | (1.61) |
| Less distributions | | | | | | |
| From net investment income | — | (0.12) | (0.14) | (0.10) | (0.09) | — |
| From net realized gain | (0.78) | (4.31) | (2.02) | (0.07) | (2.21) | — |
| Total distributions | (0.78) | (4.43) | (2.16) | (0.17) | (2.30) | — |
| Net asset value, end of period | $21.08 | $22.24 | $32.07 | $27.34 | $24.40 | $25.46 |
| Total return (%)4 | (2.07)5 | (14.99) | 26.16 | 12.73 | 5.52 | (5.95)5 |
| Ratios and supplemental data | | | | | | |
| Net assets, end of period (in millions) | $—6 | $—6 | $2 | $2 | $2 | $—6 |
| Ratios (as a percentage of average net assets): | | | | | | |
| Expenses before reductions | 0.917 | 1.03 | 1.00 | 1.02 | 1.14 | 1.217 |
| Expenses including reductions | 0.847 | 0.81 | 0.80 | 0.80 | 0.90 | 1.117 |
| Net investment income (loss) | (0.27)7 | 0.45 | 0.42 | 0.46 | 0.41 | 0.197 |
| Portfolio turnover (%) | 12 | 73 | 52 | 41 | 498 | 789 |
| 1 | Six months ended 2-29-20. Unaudited. |
| 2 | The inception date for Class R6 shares is 5-27-15. |
| 3 | Based on average daily shares outstanding. |
| 4 | Total returns would have been lower had certain expenses not been reduced during the applicable periods. |
| 5 | Not annualized. |
| 6 | Less than $500,000. |
| 7 | Annualized. |
| 8 | Excludes merger activity. |
| 9 | Portfolio turnover is shown for the period from 9-1-14 to 8-31-15. |
| 22 | JOHN HANCOCK New Opportunities Fund | SEMIANNUAL REPORT | SEE NOTES TO FINANCIAL STATEMENTS |
| CLASS 1 SHARES Period ended | 2-29-201 | 8-31-19 | 8-31-18 | 8-31-17 | 8-31-16 | 8-31-15 |
| Per share operating performance | | | | | | |
| Net asset value, beginning of period | $22.42 | $32.29 | $27.51 | $24.56 | $25.59 | $30.84 |
| Net investment income (loss)2 | (0.04) | 0.11 | 0.11 | 0.11 | 0.09 | 0.07 |
| Net realized and unrealized gain (loss) on investments | (0.34) | (5.56) | 6.82 | 3.01 | 1.17 | (0.67) |
| Total from investment operations | (0.38) | (5.45) | 6.93 | 3.12 | 1.26 | (0.60) |
| Less distributions | | | | | | |
| From net investment income | — | (0.11) | (0.13) | (0.10) | (0.08) | (0.03) |
| From net realized gain | (0.78) | (4.31) | (2.02) | (0.07) | (2.21) | (4.62) |
| Total distributions | (0.78) | (4.42) | (2.15) | (0.17) | (2.29) | (4.65) |
| Net asset value, end of period | $21.26 | $22.42 | $32.29 | $27.51 | $24.56 | $25.59 |
| Total return (%)3 | (2.06)4 | (15.04) | 26.10 | 12.71 | 5.56 | (2.44) |
| Ratios and supplemental data | | | | | | |
| Net assets, end of period (in millions) | $31 | $42 | $59 | $56 | $55 | $62 |
| Ratios (as a percentage of average net assets): | | | | | | |
| Expenses before reductions | 0.945 | 1.06 | 1.04 | 1.05 | 1.17 | 1.13 |
| Expenses including reductions | 0.875 | 0.84 | 0.84 | 0.84 | 0.95 | 1.05 |
| Net investment income (loss) | (0.32)5 | 0.44 | 0.38 | 0.43 | 0.40 | 0.25 |
| Portfolio turnover (%) | 12 | 73 | 52 | 41 | 496 | 78 |
| 1 | Six months ended 2-29-20. Unaudited. |
| 2 | Based on average daily shares outstanding. |
| 3 | Total returns would have been lower had certain expenses not been reduced during the applicable periods. |
| 4 | Not annualized. |
| 5 | Annualized. |
| 6 | Excludes merger activity. |
| SEE NOTES TO FINANCIAL STATEMENTS | SEMIANNUAL REPORT | JOHN HANCOCK New Opportunities Fund | 23 |
| Notes to financial statements (unaudited) | |
Note 1—Organization
John Hancock New Opportunities Fund (the fund) is a series of John Hancock Funds II (the Trust), an open-end management investment company organized as a Massachusetts business trust and registered under the Investment Company Act of 1940, as amended (the 1940 Act). The investment objective of the fund is to seek long-term capital appreciation.
The fund may offer multiple classes of shares. The shares currently outstanding are detailed in the Statement of assets and liabilities. Class A and Class C shares are offered to all investors. Class I shares are offered to institutions and certain investors. Class R1, Class R2, Class R3 and Class R4 shares are available only to certain retirement and 529 plans. Class R6 shares are only available to certain retirement plans, institutions and other investors. Class 1 shares are offered only to certain affiliates of Manulife Financial Corporation (MFC). Class C shares convert to Class A shares ten years after purchase (certain exclusions may apply). Shareholders of each class have exclusive voting rights to matters that affect that class. The distribution and service fees, if any, and transfer agent fees for each class may differ.
All Class R5 shares were redeemed on October 29, 2019.
Note 2—Significant accounting policies
The financial statements have been prepared in conformity with accounting principles generally accepted in the United States of America (US GAAP), which require management to make certain estimates and assumptions as of the date of the financial statements. Actual results could differ from those estimates and those differences could be significant. The fund qualifies as an investment company under Topic 946 of Accounting Standards Codification of US GAAP.
Events or transactions occurring after the end of the fiscal period through the date that the financial statements were issued have been evaluated in the preparation of the financial statements. The following summarizes the significant accounting policies of the fund:
Security valuation. Investments are stated at value as of the scheduled close of regular trading on the New York Stock Exchange (NYSE), normally at 4:00 P.M., Eastern Time. In case of emergency or other disruption resulting in the NYSE not opening for trading or the NYSE closing at a time other than the regularly scheduled close, the net asset value (NAV) may be determined as of the regularly scheduled close of the NYSE pursuant to the fund's Valuation Policies and Procedures.
In order to value the securities, the fund uses the following valuation techniques: Equity securities, including exchange-traded or closed-end funds, are typically valued at the last sale price or official closing price on the exchange or principal market where the security trades. In the event there were no sales during the day or closing prices are not available, the securities are valued using the last available bid price. Investments by the fund in open-end mutual funds are valued at their respective NAVs each business day.
In certain instances, the Pricing Committee may determine to value equity securities using prices obtained from another exchange or market if trading on the exchange or market on which prices are typically obtained did not open for trading as scheduled, or if trading closed earlier than scheduled, and trading occurred as normal on another exchange or market.
Other portfolio securities and assets, for which reliable market quotations are not readily available, are valued at fair value as determined in good faith by the fund's Pricing Committee following procedures established by the Board of Trustees. The frequency with which these fair valuation procedures are used cannot be predicted and fair value of securities may differ significantly from the value that would have been used had a ready market for such securities existed.
| 24 | JOHN HANCOCK New Opportunities Fund | SEMIANNUAL REPORT | |
The fund uses a three-tier hierarchy to prioritize the pricing assumptions, referred to as inputs, used in valuation techniques to measure fair value. Level 1 includes securities valued using quoted prices in active markets for identical securities, including registered investment companies. Level 2 includes securities valued using other significant observable inputs. Observable inputs may include quoted prices for similar securities, interest rates, prepayment speeds and credit risk. Prices for securities valued using these inputs are received from independent pricing vendors and brokers and are based on an evaluation of the inputs described. Level 3 includes securities valued using significant unobservable inputs when market prices are not readily available or reliable, including the fund's own assumptions in determining the fair value of investments. Factors used in determining value may include market or issuer specific events or trends, changes in interest rates and credit quality. The inputs or methodology used for valuing securities are not necessarily an indication of the risks associated with investing in those securities. Changes in valuation techniques and related inputs may result in transfers into or out of an assigned level within the disclosure hierarchy.
The following is a summary of the values by input classification of the fund's investments as of February 29, 2020, by major security category or type:
| | Total
value at
2-29-20 | Level 1
quoted
price | Level 2
significant
observable
inputs | Level 3
significant
unobservable
inputs |
| Investments in securities: | | | | |
| Assets | | | | |
| Common stocks | | | | |
| Communication services | $480 | — | — | $480 |
| Consumer discretionary | 35,537,666 | $35,537,666 | — | — |
| Consumer staples | 5,157,863 | 5,157,863 | — | — |
| Energy | 2,084,939 | 2,084,939 | — | — |
| Financials | 21,122,745 | 21,118,834 | — | 3,911 |
| Health care | 90,259,631 | 90,257,579 | — | 2,052 |
| Industrials | 48,514,161 | 48,514,161 | — | — |
| Information technology | 51,925,378 | 51,925,378 | — | — |
| Materials | 10,487,149 | 10,487,149 | — | — |
| Real estate | 14,268,303 | 14,268,303 | — | — |
| Short-term investments | 6,387,748 | 6,387,748 | — | — |
| Total investments in securities | $285,746,063 | $285,739,620 | — | $6,443 |
Security transactions and related investment income. Investment security transactions are accounted for on a trade date plus one basis for daily NAV calculations. However, for financial reporting purposes, investment transactions are reported on trade date. Interest income is accrued as earned. Dividend income is recorded on the ex-date, except for dividends of certain foreign securities where the dividend may not be known until after the ex-date. In those cases, dividend income, net of withholding taxes, is recorded when the fund becomes aware of the dividends. Non-cash dividends, if any, are recorded at the fair market value of the securities received. Gains and losses on securities sold are determined on the basis of identified cost and may include proceeds from litigation.
Real estate investment trusts. The fund may invest in real estate investment trusts (REITs). Distributions from REITs may be recorded as income and subsequently characterized by the REIT at the end of the fiscal year as a reduction of cost of investments and/or as a realized gain. As a result, the fund will estimate the components of distributions from these securities. Such estimates are revised when the actual components of the distributions are known.
| | SEMIANNUAL REPORT | JOHN HANCOCK New Opportunities Fund | 25 |
Foreign taxes. The fund may be subject to withholding tax on income, capital gains or repatriation taxes imposed by certain countries, a portion of which may be recoverable. Foreign taxes are accrued based upon the fund's understanding of the tax rules and rates that exist in the foreign markets in which it invests. Taxes are accrued based on gains realized by the fund as a result of certain foreign security sales. In certain circumstances, estimated taxes are accrued based on unrealized appreciation of such securities. Investment income is recorded net of foreign withholding taxes.
Overdraft. The fund may have the ability to borrow from banks for temporary or emergency purposes, including meeting redemption requests that otherwise might require the untimely sale of securities. Pursuant to the fund's custodian agreement, the custodian may loan money to the fund to make properly authorized payments. The fund is obligated to repay the custodian for any overdraft, including any related costs or expenses. The custodian may have a lien, security interest or security entitlement in any fund property that is not otherwise segregated or pledged, to the extent of any overdraft, and to the maximum extent permitted by law. Overdrafts at period end are presented under the caption Due to custodian in the Statement of assets and liabilities.
Line of credit. The fund and other affiliated funds have entered into a syndicated line of credit agreement with Citibank, N.A. as the administrative agent that enables them to participate in a $750 million unsecured committed line of credit. Excluding commitments designated for a certain fund and subject to the needs of all other affiliated funds, the fund can borrow up to an aggregate commitment amount of $500 million, subject to asset coverage and other limitations as specified in the agreement. A commitment fee payable at the end of each calendar quarter, based on the average daily unused portion of the line of credit, is charged to each participating fund based on a combination of fixed and asset based allocations and is reflected in Other expenses on the Statement of operations. For the six months ended February 29, 2020, the fund had no borrowings under the line of credit. Commitment fees for the six months ended February 29, 2020 were $1,441.
Expenses. Within the John Hancock group of funds complex, expenses that are directly attributable to an individual fund are allocated to such fund. Expenses that are not readily attributable to a specific fund are allocated among all funds in an equitable manner, taking into consideration, among other things, the nature and type of expense and the fund’s relative net assets. Expense estimates are accrued in the period to which they relate and adjustments are made when actual amounts are known.
Class allocations. Income, common expenses and realized and unrealized gains (losses) are determined at the fund level and allocated daily to each class of shares based on the net assets of the class. Class-specific expenses, such as distribution and service fees, if any, and transfer agent fees, for all classes, are charged daily at the class level based on the net assets of each class and the specific expense rates applicable to each class.
Federal income taxes. The fund intends to continue to qualify as a regulated investment company by complying with the applicable provisions of the Internal Revenue Code and will not be subject to federal income tax on taxable income that is distributed to shareholders. Therefore, no federal income tax provision is required.
As of August 31, 2019, the fund had no uncertain tax positions that would require financial statement recognition, derecognition or disclosure. The fund's federal tax returns are subject to examination by the Internal Revenue Service for a period of three years.
Distribution of income and gains. Distributions to shareholders from net investment income and net realized gains, if any, are recorded on the ex-date. The fund generally declares and pays dividends annually. Capital gain distributions, if any, are typically distributed annually.
Distributions paid by the fund with respect to each class of shares are calculated in the same manner, at the same time and in the same amount, except for the effect of class level expenses that may be applied differently to each class.
| 26 | JOHN HANCOCK New Opportunities Fund | SEMIANNUAL REPORT | |
Such distributions, on a tax basis, are determined in conformity with income tax regulations, which may differ from US GAAP. Distributions in excess of tax basis earnings and profits, if any, are reported in the fund's financial statements as a return of capital. The final determination of tax characteristics of the fund's distribution will occur at the end of the year and will subsequently be reported to shareholders.
Capital accounts within the financial statements are adjusted for permanent book-tax differences. These adjustments have no impact on net assets or the results of operations. Temporary book-tax differences, if any, will reverse in a subsequent period. Book-tax differences are primarily attributable to wash sale loss deferrals.
Note 3—Guarantees and indemnifications
Under the Trust's organizational documents, its Officers and Trustees are indemnified against certain liabilities arising out of the performance of their duties to the Trust, including the fund. Additionally, in the normal course of business, the fund enters into contracts with service providers that contain general indemnification clauses. The fund's maximum exposure under these arrangements is unknown, as this would involve future claims that may be made against the fund that have not yet occurred. The risk of material loss from such claims is considered remote.
Note 4—Fees and transactions with affiliates
John Hancock Investment Management LLC (the Advisor) serves as investment advisor for the fund. John Hancock Investment Management Distributors LLC (the Distributor), an affiliate of the Advisor, serves as principal underwriter of the fund. The Advisor and the Distributor are indirect, wholly owned subsidiaries of Manulife Financial Corporation (MFC).
Management fee. Effective September 6, 2019, the fund has an investment management agreement with the Advisor under which the fund pays a monthly management fee to the Advisor equivalent on an annual basis to the sum of: (a) 0.770% of the first $50 million of the fund’s aggregate daily net assets; (b) 0.740% of the next $50 million of the fund’s aggregate daily net assets; (c) 0.720% of the next $300 million of the fund’s aggregate daily net assets and (d) 0.720% on all asset levels when aggregate net assets exceed $400 million. Aggregate net assets include the net assets of the fund and a portion of the net assets of Small Cap Opportunities Trust, a series of John Hancock Variable Investment Trust, managed by GW&K Investment Management, LLC. Prior to September 6, 2019, the fund paid a monthly management fee to the Advisor equivalent on an annual basis to the sum of: (a) 0.900% of the first $2 billion of the fund’s aggregate daily net assets; and (b) 0.850% of the fund’s aggregate daily net assets in excess of $2 billion. Aggregate net assets included the net assets of the fund and Small Cap Opportunities Trust, a series of John Hancock Variable Investment Trust. The Advisor has a subadvisory agreement GW&K Investment Management, LLC. Prior to September 6, 2019, the fund also had subadvisory agreements with Brandywine Global Investment Management, LLC and Dimensional Fund Advisors LP. The fund is not responsible for payment of the subadvisory fees.
The Advisor has contractually agreed to waive a portion of its management fee and/or reimburse expenses for certain funds of the John Hancock group of funds complex, including the fund (the participating portfolios). This waiver is based upon aggregate net assets of all the participating portfolios. The amount of the reimbursement is calculated daily and allocated among all the participating portfolios in proportion to the daily net assets of each fund. During the six months ended February 29, 2020, this waiver amounted to 0.01% of the fund’s average daily net assets on an annualized basis. This arrangement expires on July 31, 2021, unless renewed by mutual agreement of the fund and the Advisor based upon a determination that this is appropriate under the circumstances at that time.
The Advisor had contractually agreed to reduce its management fee or, if necessary, make payment to the fund in an amount equal to the amount by which expenses of the fund exceeded 0.79% of average daily net assets of the fund. For the purpose of this agreement, “expenses of the fund” meant all fund expenses, excluding taxes,
| | SEMIANNUAL REPORT | JOHN HANCOCK New Opportunities Fund | 27 |
brokerage commissions, interest expense, litigation and indemnification expenses and other extraordinary expenses not incurred in the ordinary course of the fund’s business, class specific expenses, acquired fund fees, borrowing costs, prime brokerage fees and short dividend expense. This agreement expired on December 31, 2019.
The Advisor had contractually agreed to reduce its management fee or, if necessary, make payment to the fund in an amount equal to the amount by which expenses of Class A, Class C and Class I shares exceeded 1.21%, 1.91% and 0.90%, respectively, of average net assets attributable to the applicable class. For purposes of this agreement, “expenses of Class A, Class C and Class I shares” meant all expenses of the fund plus class specific expenses, excluding taxes, brokerage commissions, interest expense, litigation and indemnification expenses and other extraordinary expenses not incurred in the ordinary course of the fund’s business, acquired fund fees, borrowing costs, prime brokerage fees and short dividend expense. This agreement expired on December 31, 2019.
Prior to September 6, 2019, the Advisor had contractually agreed to waive its management fee so that the amount retained by the Advisor after payment of the subadvisory fees did not exceed 0.45% of the fund’s average daily net assets.
For the six months ended February 29, 2020, the expense reductions described above amounted to the following:
| Class | Expense reduction |
| Class A | $89,316 |
| Class C | 1,455 |
| Class I | 3,865 |
| Class R1 | 131 |
| Class R2 | 17 |
| Class R3 | 26 |
| Class | Expense reduction |
| Class R4 | $17 |
| Class R5 | 6 |
| Class R6 | 30 |
| Class 1 | 12,685 |
| Total | $107,548 |
Expenses waived or reimbursed in the current fiscal period are not subject to recapture in future fiscal periods.
The investment management fees, including the impact of the waivers and reimbursements as described above, incurred for the six months ended February 29, 2020, were equivalent to a net annual effective rate of 0.67% of the fund's average daily net assets.
Accounting and legal services. Pursuant to a service agreement, the fund reimburses the Advisor for all expenses associated with providing the administrative, financial, legal, compliance, accounting and recordkeeping services to the fund, including the preparation of all tax returns, periodic reports to shareholders and regulatory reports, among other services. These expenses are allocated to each share class based on its relative net assets at the time the expense was incurred. These accounting and legal services fees incurred for the six months ended February 29, 2020 amounted to an annual rate of 0.02% of the fund's average daily net assets.
Distribution and service plans. The fund has a distribution agreement with the Distributor. The fund has adopted distribution and service plans for certain classes as detailed below pursuant to Rule 12b-1 under the 1940 Act, to pay the Distributor for services provided as the distributor of shares of the fund. In addition, under a service plan for certain classes as detailed below, the fund pays for certain other services. The fund may pay up to the following contractual rates of distribution and service fees under these arrangements, expressed as an annual percentage of average daily net assets for each class of the fund's shares:
| 28 | JOHN HANCOCK New Opportunities Fund | SEMIANNUAL REPORT | |
| Class | Rule 12b-1 Fee | Service fee |
| Class A | 0.25% | — |
| Class C | 1.00% | — |
| Class R1 | 0.50% | 0.25% |
| Class R2 | 0.25% | 0.25% |
| Class R3 | 0.50% | 0.15% |
| Class R4 | 0.25% | 0.10% |
| Class R5 | — | 0.05% |
| Class 1 | 0.05% | — |
The fund's Distributor has contractually agreed to waive 0.10% of Rule12b-1 fees for Class R4 shares. The current waiver agreement expires on December 31, 2020, unless renewed by mutual agreement of the fund and the Distributor based upon a determination that this is appropriate under the circumstances at the time. This contractual waiver amounted to $26 for Class R4 shares for the six months ended February 29, 2020. Class R5 shares were fully redeemed on October 29, 2019.
Sales charges. Class A shares are assessed up-front sales charges, which resulted in payments to the Distributor amounting to $25,798 for the six months ended February 29, 2020. Of this amount, $3,884 was retained and used for printing prospectuses, advertising, sales literature and other purposes and $21,914 was paid as sales commissions to broker-dealers.
Class A and Class C shares may be subject to contingent deferred sales charges (CDSCs). Certain Class A shares that are acquired through purchases of $1 million or more and are redeemed within one year of purchase are subject to a 1.00% sales charge. Class C shares that are redeemed within one year of purchase are subject to a 1.00% CDSC. CDSCs are applied to the lesser of the current market value at the time of redemption or the original purchase cost of the shares being redeemed. Proceeds from CDSCs are used to compensate the Distributor for providing distribution-related services in connection with the sale of these shares. During the six months ended February 29, 2020, CDSCs received by the Distributor amounted to $184 and $88 for Class A and Class C shares, respectively.
Transfer agent fees. The John Hancock group of funds has a complex-wide transfer agent agreement with John Hancock Signature Services, Inc. (Signature Services), an affiliate of the Advisor. The transfer agent fees paid to Signature Services are determined based on the cost to Signature Services (Signature Services Cost) of providing recordkeeping services. It also includes out-of-pocket expenses, including payments made to third-parties for recordkeeping services provided to their clients who invest in one or more John Hancock funds. In addition, Signature Services Cost may be reduced by certain fees that Signature Services receives in connection with retirement and small accounts. Signature Services Cost is calculated monthly and allocated, as applicable, to five categories of share classes: Retail Share and Institutional Share Classes of Non-Municipal Bond Funds, Class R6 Shares, Retirement Share Classes and Municipal Bond Share Classes. Within each of these categories, the applicable costs are allocated to the affected John Hancock affiliated funds and/or classes, based on the relative average daily net assets.
Class level expenses. Class level expenses for the six months ended February 29, 2020 were as follows:
| Class | Distribution and service fees | Transfer agent fees |
| Class A | $333,428 | $164,191 |
| Class C | 20,784 | 2,564 |
| Class I | — | 6,304 |
| Class R1 | 1,452 | 26 |
| Class R2 | 78 | 3 |
| | SEMIANNUAL REPORT | JOHN HANCOCK New Opportunities Fund | 29 |
| Class | Distribution and service fees | Transfer agent fees |
| Class R3 | $232 | $5 |
| Class R4 | 65 | 3 |
| Class R5 | — | 1 |
| Class R6 | — | 7 |
| Class 1 | 9,236 | — |
| Total | $365,275 | $173,104 |
Trustee expenses. The fund compensates each Trustee who is not an employee of the Advisor or its affiliates. The costs of paying Trustee compensation and expenses are allocated to the fund based on its net assets relative to other funds within the John Hancock group of funds complex.
Note 5—Fund share transactions
Transactions in fund shares for the six months ended February 29, 2020 and for the year ended August 31, 2019 were as follows:
| | Six Months Ended 2-29-20 | Year Ended 8-31-19 |
| | Shares | Amount | Shares | Amount |
| Class A shares | | | | |
| Sold | 88,189 | $2,031,440 | 383,317 | $9,046,488 |
| Distributions reinvested | 357,659 | 8,383,518 | 2,181,016 | 42,813,326 |
| Repurchased | (894,079) | (20,577,938) | (1,678,654) | (39,690,836) |
| Net increase (decrease) | (448,231) | $(10,162,980) | 885,679 | $12,168,978 |
| Class C shares | | | | |
| Sold | 5,669 | $126,851 | 23,624 | $554,379 |
| Distributions reinvested | 6,174 | 139,358 | 48,347 | 921,498 |
| Repurchased | (46,810) | (1,040,905) | (160,639) | (3,613,473) |
| Net decrease | (34,967) | $(774,696) | (88,668) | $(2,137,596) |
| Class I shares | | | | |
| Sold | 42,026 | $970,755 | 117,637 | $2,874,371 |
| Distributions reinvested | 14,120 | 331,814 | 97,633 | 1,916,539 |
| Repurchased | (58,781) | (1,341,249) | (233,649) | (5,508,527) |
| Net decrease | (2,635) | $(38,680) | (18,379) | $(717,617) |
| Class R1 shares | | | | |
| Sold | 221 | $5,043 | 1,091 | $25,594 |
| Distributions reinvested | 573 | 13,318 | 2,928 | 57,184 |
| Repurchased | (219) | (4,926) | (41) | (1,082) |
| Net increase | 575 | $13,435 | 3,978 | $81,696 |
| 30 | JOHN HANCOCK New Opportunities Fund | SEMIANNUAL REPORT | |
| | Six Months Ended 2-29-20 | Year Ended 8-31-19 |
| | Shares | Amount | Shares | Amount |
| Class R2 shares | | | | |
| Sold | 103 | $2,216 | 197 | $5,167 |
| Distributions reinvested | 18 | 422 | 91 | 1,780 |
| Repurchased | (157) | (3,366) | — | — |
| Net increase (decrease) | (36) | $(728) | 288 | $6,947 |
| Class R3 shares | | | | |
| Sold | 555 | $12,806 | 901 | $22,061 |
| Distributions reinvested | 63 | 1,473 | 251 | 4,922 |
| Repurchased | (764) | (17,454) | (72) | (1,682) |
| Net increase (decrease) | (146) | $(3,175) | 1,080 | $25,301 |
| Class R4 shares | | | | |
| Sold | 19 | $400 | 507 | $11,986 |
| Distributions reinvested | 20 | 466 | 20 | 382 |
| Repurchased | (13) | (300) | — | (1) |
| Net increase | 26 | $566 | 527 | $12,367 |
| Class R5 shares1 | | | | |
| Repurchased | (1,655) | $(37,673) | — | — |
| Net decrease | (1,655) | $(37,673) | — | — |
| Class R6 shares | | | | |
| Sold | 3,471 | $81,863 | 2,846 | $68,092 |
| Distributions reinvested | 190 | 4,472 | 12,100 | 237,404 |
| Repurchased | (537) | (12,140) | (69,059) | (1,673,446) |
| Net increase (decrease) | 3,124 | $74,195 | (54,113) | $(1,367,950) |
| Class 1 shares | | | | |
| Sold | 13,218 | $309,404 | 121,720 | $3,026,397 |
| Distributions reinvested | 49,039 | 1,162,716 | 389,335 | 7,701,038 |
| Repurchased | (506,872) | (11,532,559) | (469,339) | (11,534,099) |
| Net increase (decrease) | (444,615) | $(10,060,439) | 41,716 | $(806,664) |
| Class NAV shares1 | | | | |
| Sold | — | — | 93,479 | $2,437,091 |
| Distributions reinvested | — | — | 1,287,304 | 25,256,897 |
| Repurchased | — | — | (7,059,277) | (165,240,072) |
| Net decrease | — | — | (5,678,494) | $(137,546,084) |
| Total net decrease | (928,560) | $(20,990,175) | (4,906,386) | $(130,280,622) |
| 1 | Class NAV and Class R5 shares were fully redeemed on 03-13-19 and 10-29-19, respectively. |
| | SEMIANNUAL REPORT | JOHN HANCOCK New Opportunities Fund | 31 |
Affiliates of the fund owned shares of the following classes on February 29, 2020. Such concentration of shareholders' capital could have a material effect on the fund if such shareholders redeem from the fund.
| Fund | % by Class |
| Class R2 | 75% |
| Class R3 | 47% |
| Class R4 | 73% |
| Class 1 | 100% |
Note 6—Purchase and sale of securities
Purchases and sales of securities, other than short-term investments, amounted to $36,879,232 and $64,562,386, respectively, for the six months ended February 29, 2020.
Note 7—Subsequent events
A widespread health crisis such as a global pandemic could cause substantial market volatility, exchange trading suspensions and closures, impact the ability to complete redemptions, and affect fund performance. For example, the novel coronavirus disease (COVID-19) has resulted in significant disruptions to global business activity. The impact of a health crisis and other epidemics and pandemics that may arise in the future, could affect the global economy in ways that cannot necessarily be foreseen at the present time. A health crisis may exacerbate other pre-existing political, social and economic risks. Any such impact could adversely affect the fund's performance, resulting in losses to your investment.
| 32 | JOHN HANCOCK New Opportunities Fund | SEMIANNUAL REPORT | |
| | |
Trustees
Hassell H. McClellan,Chairperson
Steven R. Pruchansky,Vice Chairperson
Andrew G. Arnott†
Charles L. Bardelis*
James R. Boyle
Peter S. Burgess*
William H. Cunningham
Grace K. Fey
Marianne Harrison†
Deborah C. Jackson
James M. Oates*
Gregory A. Russo
Officers
Andrew G. Arnott
President
Francis V. Knox, Jr.
Chief Compliance Officer
Charles A. Rizzo
Chief Financial Officer
Salvatore Schiavone
Treasurer
Christopher (Kit) Sechler
Secretary and Chief Legal Officer
| Investment advisor
John Hancock Investment Management LLC
Subadvisor
GW & K Investment Management, LLC
Portfolio Managers
Joseph C. Craigen, CFA
Daniel L. Miller, CFA
Principal distributor
John Hancock Investment Management Distributors LLC
Custodian
State Street Bank and Trust Company
Transfer agent
John Hancock Signature Services, Inc.
Legal counsel
K&L Gates LLP
|
* Member of the Audit Committee
† Non-Independent Trustee
The fund's proxy voting policies and procedures, as well as the fund proxy voting record for the most recent twelve-month period ended June 30, are available free of charge on the Securities and Exchange Commission (SEC) website at sec.gov or on our website.
All of the fund's holdings as of the end of the third month of every fiscal quarter are filed with the SEC on Form N-PORT within 60 days of the end of the fiscal quarter. The fund's Form N-PORT filings are available on our website and the SEC's website, sec.gov.
We make this information on your fund, as well asmonthly portfolio holdings, and other fund details available on our website at jhinvestments.com or by calling 800-225-5291.
| | | | |
| | You can also contact us: |
| | 800-225-5291
jhinvestments.com | Regular mail:
John Hancock Signature Services, Inc.
P.O. Box 55913
Boston, MA 02205-5913
| Express mail:
John Hancock Signature Services, Inc.
2000 Crown Colony Drive
Suite 55913
Quincy, MA 02169-0953
|
SEMIANNUAL REPORT | JOHN HANCOCK NEW OPPORTUNITIES FUND 33
John Hancock family of funds
| | | |
DOMESTIC EQUITY FUNDS
Blue Chip Growth
Classic Value
Disciplined Value
Disciplined Value Mid Cap
Equity Income
Financial Industries
Fundamental All Cap Core
Fundamental Large Cap Core
New Opportunities
Regional Bank
Small Cap Core
Small Cap Growth
Small Cap Value
U.S. Global Leaders Growth
U.S. Quality Growth
GLOBAL AND INTERNATIONAL EQUITY FUNDS
Disciplined Value International
Emerging Markets
Emerging Markets Equity
Fundamental Global Franchise
Global Equity
Global Shareholder Yield
Global Thematic Opportunities
International Dynamic Growth
International Growth
International Small Company
| | INCOME FUNDS
Bond
California Tax-Free Income
Emerging Markets Debt
Floating Rate Income
Government Income
High Yield
High Yield Municipal Bond
Income
Investment Grade Bond
Money Market
Short Duration Bond
Short Duration Credit Opportunities
Strategic Income Opportunities
Tax-Free Bond
ALTERNATIVE AND SPECIALTY FUNDS
Absolute Return Currency
Alternative Asset Allocation
Alternative Risk Premia
Diversified Macro
Infrastructure
Multi-Asset Absolute Return
Seaport Long/Short
|
A fund's investment objectives, risks, charges, and expenses should be considered carefully before investing. The prospectus contains this and other important information about the fund. To obtain a prospectus, contact your financial professional, call John Hancock Investment Management at 800-225-5291, or visit our website at jhinvestments.com. Please read the prospectus carefully before investing or sending money.
| | | |
ASSET ALLOCATION
Balanced
Income Allocation
Multi-Index Lifetime Portfolios
Multi-Index Preservation Portfolios
Multimanager Lifestyle Portfolios
Multimanager Lifetime Portfolios
Retirement Income 2040
EXCHANGE-TRADED FUNDS
John Hancock Multifactor Consumer Discretionary ETF
John Hancock Multifactor Consumer Staples ETF
John Hancock Multifactor Developed International ETF
John Hancock Multifactor Emerging Markets ETF
John Hancock Multifactor Energy ETF
John Hancock Multifactor Financials ETF
John Hancock Multifactor Healthcare ETF
John Hancock Multifactor Industrials ETF
John Hancock Multifactor Large Cap ETF
John Hancock Multifactor Materials ETF
John Hancock Multifactor Media and
Communications ETF
John Hancock Multifactor Mid Cap ETF
John Hancock Multifactor Small Cap ETF
John Hancock Multifactor Technology ETF
John Hancock Multifactor Utilities ETF
| | ENVIRONMENTAL, SOCIAL, AND
GOVERNANCE FUNDS
ESG All Cap Core
ESG Core Bond
ESG International Equity
ESG Large Cap Core
CLOSED-END FUNDS
Financial Opportunities
Hedged Equity & Income
Income Securities Trust
Investors Trust
Preferred Income
Preferred Income II
Preferred Income III
Premium Dividend
Tax-Advantaged Dividend Income
Tax-Advantaged Global Shareholder Yield
|
John Hancock Multifactor ETF shares are bought and sold at market price (not NAV), and are not individually redeemed
from the fund. Brokerage commissions will reduce returns.
John Hancock ETFs are distributed by Foreside Fund Services, LLC, and are subadvised by Dimensional Fund Advisors LP.
Foreside is not affiliated with John Hancock Investment Management Distributors LLC or Dimensional Fund Advisors LP.
Dimensional Fund Advisors LP receives compensation from John Hancock in connection with licensing rights to the
John Hancock Dimensional indexes. Dimensional Fund Advisors LP does not sponsor, endorse, or sell, and makes no
representation as to the advisability of investing in, John Hancock Multifactor ETFs.
John Hancock Investment Management
A trusted brand
John Hancock Investment Management is a premier asset manager
representing one of America's most trusted brands, with a heritage of
financial stewardship dating back to 1862. Helping our shareholders
pursue their financial goals is at the core of everything we do. It's why
we support the role of professional financial advice and operate with
the highest standards of conduct and integrity.
A better way to invest
We serve investors globally through a unique multimanager approach:
We search the world to find proven portfolio teams with specialized
expertise for every strategy we offer, then we apply robust investment
oversight to ensure they continue to meet our uncompromising
standards and serve the best interests of our shareholders.
Results for investors
Our unique approach to asset management enables us to provide
a diverse set of investments backed by some of the world's best
managers, along with strong risk-adjusted returns across asset classes.
John Hancock Investment Management Distributors LLC n Member FINRA, SIPC
200 Berkeley Street n Boston, MA 02116-5010 n 800-225-5291 n jhinvestments.com
This report is for the information of the shareholders of John Hancock New Opportunities Fund. It is not authorized for distribution to prospective investors unless preceded or accompanied by a prospectus.
John Hancock
Small Cap Growth Fund
Semiannual report 2/29/2020
Beginning on January 1, 2021, as permitted by regulations adopted by the Securities and Exchange Commission, paper copies of the fund's shareholder reports like this one will no longer be sent by mail, unless you specifically request paper copies of the reports from the fund or from your financial intermediary. Instead, the reports will be made available on a website, and you will be notified by mail each time a report is posted and provided with a website link to access the report.
If you already elected to receive shareholder reports electronically, you will not be affected by this change, and you do not need to take any action. You may elect to receive shareholder reports and other communications electronically by calling John Hancock Investment Management at 800-225-5291 (Class A and Class C shares) or 888-972-8696 (Class I and Class R6 shares) or by contacting your financial intermediary.
You may elect to receive all reports in paper, free of charge, at any time. You can inform John Hancock Investment Management or your financial intermediary that you wish to continue receiving paper copies of your shareholder reports by following the instructions listed above. Your election to receive reports in paper will apply to all funds held with John Hancock Investment Management or your financial intermediary.
A message to shareholders
Dear shareholder,
Global financial markets were on pace to deliver strong returns during the 6 months ended February 29, 2020, until heightened fears over the coronavirus (COVID-19) sent markets tumbling during the last week of the period. Prior to the turbulence that ended the period, investors benefited from a combination of low inflation, accommodative central bank policy, healthy fundamentals, and corporate buybacks of stock.
However, the COVID-19 pandemic and plummeting oil prices put an end to all that good news. Shortly after period end, the U.S. Federal Reserve lowered short-term interest rates while lawmakers embarked on a plan to launch major fiscal stimulus to support the economy.
After the longest bull market in U.S. history, we're now in bear market territory. Indeed, the spread of COVID-19, trade disputes, rising unemployment, and other geopolitical tensions may continue to create uncertainty among businesses and investors. Your financial professional can helpposition your portfolio so that it's sufficiently diversified to seek to meet your long-term objectives and to withstand the inevitable bouts of market volatility along the way.
On behalf of everyone at John Hancock Investment Management, I'd like to take this opportunity to welcome new shareholders and thank existing shareholders for the continued trust you've placed in us.
Sincerely,
Andrew G. Arnott
President and CEO,
John Hancock Investment Management
Head of Wealth and Asset Management,
United States and Europe
This commentary reflects the CEO's views as of this report's period end and are subject to change at any time. Diversification does not guarantee investment returns and does not eliminate risk of loss. All investments entail risks, including the possible loss of principal. For more up-to-date information, you can visit our website at jhinvestments.com.
John Hancock
Small Cap Growth Fund
Table of contents
| | | |
| 2 | | Your fund at a glance |
| 3 | | Portfolio summary |
| 4 | | A look at performance |
| 6 | | Your expenses |
| 8 | | Fund's investments |
| 11 | | Financial statements |
| 14 | | Financial highlights |
| 19 | | Notes to financial statements |
| 27 | | More information |
SEMIANNUAL REPORT | JOHN HANCOCK SMALL CAP GROWTH FUND 1
INVESTMENT OBJECTIVE
The fund seeks long-term capital appreciation.
AVERAGE ANNUAL TOTAL RETURNS AS OF 2/29/2020 (%)
The Russell 2000 Growth Index is an unmanaged index that measures the performance of those Russell 2000 Index companies with greater than average growth orientation.
It is not possible to invest directly in an index. Index figures do not reflect expenses or sales charges, which would result in lower returns.
Figures from Morningstar, Inc. include reinvested distributions and do not take into account sales charges. Actual load-adjusted performance is lower.
| 1 | Class A shares were first offered on 3-27-18. Returns prior to this date are those of Class NAV shares that have not been adjusted for class-specific expenses; otherwise, returns would vary. |
The past performance shown here reflects reinvested distributions and the beneficial effect of any expense reductions, and does not guarantee future results. Returns for periods shorter than one year are cumulative. Performance of the other share classes will vary based on the difference in the fees and expenses of those classes. Shares will fluctuate in value and, when redeemed, may be worth more or less than their original cost. Current month-end performance may be lower or higher than the performance cited, and can be found at jhinvestments.com or by calling 800-225-5291. For further information on the fund's objectives, risks, and strategy, see the fund's prospectus. The fund recently experienced negative short-term performance due to market volatility associated with the COVID-19 pandemic.
SEMIANNUAL REPORT | JOHN HANCOCK SMALL CAP GROWTH FUND 2
SECTOR COMPOSITION AS OF 2/29/2020 (%)
TOP 10 HOLDINGS AS OF 2/29/2020 (%)
| | |
| Everbridge, Inc. | 3.6 |
| Five9, Inc. | 3.5 |
| QTS Realty Trust, Inc., Class A | 3.1 |
| Exponent, Inc. | 2.8 |
| Horizon Therapeutics PLC | 2.7 |
| Deckers Outdoor Corp. | 2.6 |
| Generac Holdings, Inc. | 2.6 |
| Omnicell, Inc. | 2.5 |
| AMN Healthcare Services, Inc. | 2.5 |
| The Simply Good Foods Company | 2.4 |
| TOTAL | 28.3 |
| As a percentage of net assets. |
| Cash and cash equivalents are not included. |
A note about risks
The fund may be subject to various risks as described in the fund's prospectus. For more information, please refer to the "Principal risks" section of the prospectus and "Subsequent events" section in the Notes to financial statements.
SEMIANNUAL REPORT | JOHN HANCOCK SMALL CAP GROWTH FUND 3
TOTAL RETURNS FOR THE PERIOD ENDED FEBRUARY 29, 2020
| | | | | | | | |
Average annual total returns (%)
with maximum sales charge | | Cumulative total returns (%)
with maximum sales charge |
| | 1-year | 5-year | 10-year | | 6-month | 5-year | 10-year |
| Class A1 | -10.15 | 3.58 | 10.86 | | -9.38 | 19.22 | 180.36 |
| Class C1 | -7.13 | 4.34 | 11.26 | | -6.00 | 23.65 | 190.64 |
| Class I1,2 | -5.24 | 4.73 | 11.47 | | -4.56 | 25.99 | 196.15 |
| Class R61,2 | -5.11 | 4.79 | 11.50 | | -4.43 | 26.38 | 197.06 |
| Class NAV2 | -5.11 | 4.79 | 11.50 | | -4.49 | 26.38 | 197.06 |
| Index† | -0.72 | 6.48 | 12.07 | | 1.37 | 36.90 | 212.61 |
Performance figures assume all distributions have been reinvested. Figures reflect maximum sales charges on Class A shares of 5.0%, and the applicable contingent deferred sales charge (CDSC) on Class C shares. Class C shares sold within one year of purchase are subject to a 1% CDSC. Sales charges are not applicable to Class I, Class R6, and Class NAV shares.
The expense ratios of the fund, both net (including any fee waivers and/or expense limitations) and gross (excluding any fee waivers and/or expense limitations), are set forth according to the most recent publicly available prospectuses for the fund and may differ from those disclosed in the Financial highlights tables in this report. Net expenses reflect contractual expense limitations in effect until July 31, 2021 and are subject to change. Had the contractual fee waivers and expense limitations not been in place, gross expenses would apply. The expense ratios are as follows:
| | | | | | |
| | Class A | Class C | Class I | Class R6 | Class NAV |
| Gross (%) | 1.33 | 2.08 | 1.08 | 0.97 | 0.96 |
| Net (%) | 1.32 | 2.07 | 1.07 | 0.96 | 0.95 |
Please refer to the most recent prospectus and annual or semiannual report for more information on expenses and any expense limitation arrangements for each class.
The returns reflect past results and should not be considered indicative of future performance. The return and principal value of an investment will fluctuate so that shares, when redeemed, may be worth more or less than their original cost. Due to market volatility and other factors, the fund's current performance may be higher or lower than the performance shown. For current to the most recent month-end performance data, please call 800-225-5291 or visit the fund's website at jhinvestments.com.
The performance table above and the chart on the next page do not reflect the deduction of taxes that a shareholder would pay on fund distributions or the redemption of fund shares. The fund's performance results reflect any applicable fee waivers or expense reductions, without which the expenses would increase and results would have been less favorable.
| † | Index is the Russell 2000 Growth Index. |
See the following page for footnotes.
SEMIANNUAL REPORT | JOHN HANCOCK SMALL CAP GROWTH FUND 4
This chart and table show what happened to a hypothetical $10,000 investment in John Hancock Small Cap Growth Fund for the share classes and periods indicated, assuming all distributions were reinvested. For comparison, we've shown the same investment in the Russell 2000 Growth Index.
| | | | | |
| | Start date | With maximum
sales charge ($) | Without
sales charge ($) | Index ($) |
| Class C1,3 | 2-28-10 | 29,064 | 29,064 | 31,261 |
| Class I1,2 | 2-28-10 | 29,615 | 29,615 | 31,261 |
| Class R61,2 | 2-28-10 | 29,706 | 29,706 | 31,261 |
| Class NAV2 | 2-28-10 | 29,706 | 29,706 | 31,261 |
The Russell 2000 Growth Index is an unmanaged index that measures the performance of those Russell 2000 Index companies with greater average growth orientation.
It is not possible to invest directly in an index. Index figures do not reflect expenses or sales charges, which would result in lower returns.
Footnotes related to performance pages
| 1 | Class A, Class C, Class I, and Class R6 shares were first offered on 3-27-18. Returns prior to this date are those of Class NAV shares that have not been adjusted for class-specific expenses; otherwise, returns would vary. |
| 2 | For certain types of investors, as described in the fund's prospectuses. |
| 3 | The contingent deferred sales charge is not applicable. |
SEMIANNUAL REPORT | JOHN HANCOCK SMALL CAP GROWTH FUND 5
These examples are intended to help you understand your ongoing operating expenses of investing in the fund so you can compare these costs with the ongoing costs of investing in other mutual funds.
Understanding fund expenses
As a shareholder of the fund, you incur two types of costs:
■Transaction costs,which include sales charges (loads) on purchases or redemptions (varies by share class), minimum account fee charge, etc.
■Ongoing operating expenses, including management fees, distribution and service fees (if applicable), and other fund expenses.
We are presenting only your ongoing operating expenses here.
Actual expenses/actual returns
The first line of each share class in the table on the following page is intended to provide information about the fund’s actual ongoing operating expenses, and is based on the fund’s actual return. It assumes an account value of $1,000.00 on September 1, 2019, with the same investment held until February 29, 2020.
Together with the value of your account, you may use this information to estimate the operating expenses that you paid over the period. Simply divide your account value at February 29, 2020, by $1,000.00, then multiply it by the “expenses paid” for your share class from the table. For example, for an account value of $8,600.00, the operating expenses should be calculated as follows:
Hypothetical example for comparison purposes
The second line of each share class in the table on the following page allows you to compare the fund’s ongoing operating expenses with those of any other fund. It provides an example of the fund’s hypothetical account values and hypothetical expenses based on each class’s actual expense ratio and an assumed 5% annualized return before expenses (which is not the class’s actual return). It assumes an account value of $1,000.00 on September 1, 2019, with the same investment held until February 29, 2020. Look in any other fund shareholder report to find its hypothetical example and you will be able to compare these expenses. Please remember that these hypothetical account values and expenses may not be used to estimate the actual ending account balance or expenses you paid for the period.
| 6 | JOHN HANCOCK SMALL CAP GROWTH FUND | SEMIANNUAL REPORT | |
Remember, these examples do not include any transaction costs, therefore, these examples will not help you to determine the relative total costs of owning different funds. If transaction costs were included, your expenses would have been higher. See the prospectuses for details regarding transaction costs.
SHAREHOLDER EXPENSE EXAMPLE CHART
| | | Account
value on
9-1-2019 | Ending
value on
2-29-2020 | Expenses
paid during
period ended
2-29-20201 | Annualized
expense
ratio |
| Class A | Actual expenses/actual returns | $1,000.00 | $953.70 | $6.27 | 1.29% |
| | Hypothetical example | 1,000.00 | 1,018.40 | 6.47 | 1.29% |
| Class C | Actual expenses/actual returns | 1,000.00 | 949.50 | 9.89 | 2.04% |
| | Hypothetical example | 1,000.00 | 1,014.70 | 10.22 | 2.04% |
| Class I | Actual expenses/actual returns | 1,000.00 | 954.40 | 5.05 | 1.04% |
| | Hypothetical example | 1,000.00 | 1,019.70 | 5.22 | 1.04% |
| Class R6 | Actual expenses/actual returns | 1,000.00 | 955.70 | 4.52 | 0.93% |
| | Hypothetical example | 1,000.00 | 1,020.20 | 4.67 | 0.93% |
| Class NAV | Actual expenses/actual returns | 1,000.00 | 955.10 | 4.47 | 0.92% |
| | Hypothetical example | 1,000.00 | 1,020.30 | 4.62 | 0.92% |
| 1 | Expenses are equal to the annualized expense ratio, multiplied by the average account value over the period, multiplied by 182/366 (to reflect the one-half year period). |
| | SEMIANNUAL REPORT | JOHN HANCOCK SMALL CAP GROWTH FUND | 7 |
AS OF 2-29-20 (unaudited)
| | | | | Shares | Value |
| Common stocks 96.8% | | | | | $454,972,947 |
| (Cost $394,719,529) | | | | | |
| Consumer discretionary 11.7% | | | 54,722,859 |
| Hotels, restaurants and leisure 3.6% | | | |
| Planet Fitness, Inc., Class A (A) | | | 134,073 | 9,048,587 |
| Wingstop, Inc. | | | 93,651 | 7,908,827 |
| Household durables 3.0% | | | |
| Helen of Troy, Ltd. (A) | | | 41,178 | 6,777,899 |
| KB Home | | | 217,865 | 7,100,220 |
| Specialty retail 2.5% | | | |
| Floor & Decor Holdings, Inc., Class A (A) | | | 92,130 | 4,703,237 |
| Lithia Motors, Inc., Class A | | | 57,009 | 6,793,192 |
| Textiles, apparel and luxury goods 2.6% | | | |
| Deckers Outdoor Corp. (A) | | | 71,294 | 12,390,897 |
| Consumer staples 6.6% | | | 31,087,518 |
| Food products 4.6% | | | |
| Freshpet, Inc. (A) | | | 155,386 | 10,326,954 |
| The Simply Good Foods Company (A) | | | 503,013 | 11,096,467 |
| Household products 2.0% | | | |
| WD-40 Company | | | 56,027 | 9,664,097 |
| Financials 5.3% | | | 24,979,495 |
| Banks 1.9% | | | |
| First Financial Bankshares, Inc. (B) | | | 318,821 | 9,162,916 |
| Insurance 3.4% | | | |
| eHealth, Inc. (A) | | | 87,597 | 10,279,508 |
| Palomar Holdings, Inc. (A) | | | 108,976 | 5,537,071 |
| Health care 24.2% | | | 113,843,168 |
| Biotechnology 2.8% | | | |
| CareDx, Inc. (A) | | | 271,954 | 6,339,248 |
| Vericel Corp. (A) | | | 438,121 | 6,764,588 |
| Health care equipment and supplies 3.3% | | | |
| Penumbra, Inc. (A) | | | 45,128 | 7,484,930 |
| Tandem Diabetes Care, Inc. (A) | | | 110,554 | 8,253,962 |
| Health care providers and services 5.6% | | | |
| Addus HomeCare Corp. (A) | | | 94,046 | 7,172,888 |
| AMN Healthcare Services, Inc. (A) | | | 157,595 | 11,598,992 |
| LHC Group, Inc. (A) | | | 62,344 | 7,572,302 |
| Health care technology 2.5% | | | |
| Omnicell, Inc. (A) | | | 143,134 | 11,661,127 |
| 8 | JOHN HANCOCK SMALL CAP GROWTH FUND | SEMIANNUAL REPORT | SEE NOTES TO FINANCIAL STATEMENTS |
| | | | | Shares | Value |
| Health care (continued) | | | |
| Life sciences tools and services 5.6% | | | |
| Medpace Holdings, Inc. (A) | | | 91,846 | $8,260,629 |
| NeoGenomics, Inc. (A) | | | 255,065 | 7,225,991 |
| Repligen Corp. (A) | | | 126,127 | 10,796,471 |
| Pharmaceuticals 4.4% | | | |
| GW Pharmaceuticals PLC, ADR (A)(B) | | | 76,825 | 7,859,966 |
| Horizon Therapeutics PLC (A) | | | 375,572 | 12,852,074 |
| Industrials 22.4% | | | 105,362,254 |
| Aerospace and defense 4.5% | | | |
| AeroVironment, Inc. (A) | | | 103,402 | 5,313,829 |
| Mercury Systems, Inc. (A) | | | 116,577 | 8,563,746 |
| Moog, Inc., Class A | | | 94,239 | 7,267,712 |
| Building products 1.9% | | | |
| Trex Company, Inc. (A) | | | 91,155 | 8,718,976 |
| Commercial services and supplies 8.9% | | | |
| Brady Corp., Class A | | | 174,854 | 8,277,588 |
| Deluxe Corp. | | | 165,888 | 5,524,070 |
| McGrath RentCorp | | | 117,260 | 8,143,707 |
| Tetra Tech, Inc. | | | 108,918 | 8,808,199 |
| The Brink's Company | | | 141,480 | 11,076,469 |
| Electrical equipment 2.6% | | | |
| Generac Holdings, Inc. (A) | | | 119,580 | 12,315,544 |
| Machinery 1.7% | | | |
| Chart Industries, Inc. (A) | | | 140,444 | 7,994,072 |
| Professional services 2.8% | | | |
| Exponent, Inc. | | | 181,376 | 13,358,342 |
| Information technology 23.5% | | | 110,637,059 |
| Communications equipment 2.2% | | | |
| Viavi Solutions, Inc. (A) | | | 799,190 | 10,541,316 |
| Electronic equipment, instruments and components 1.4% | | | |
| Insight Enterprises, Inc. (A) | | | 117,895 | 6,494,836 |
| Semiconductors and semiconductor equipment 8.3% | | | |
| Advanced Energy Industries, Inc. (A) | | | 141,835 | 8,435,637 |
| Inphi Corp. (A) | | | 115,968 | 8,658,171 |
| Lattice Semiconductor Corp. (A) | | | 298,572 | 5,359,367 |
| Monolithic Power Systems, Inc. | | | 49,091 | 7,787,796 |
| Power Integrations, Inc. | | | 101,769 | 8,858,991 |
| Software 11.6% | | | |
| Avalara, Inc. (A) | | | 96,079 | 8,142,695 |
| Everbridge, Inc. (A)(B) | | | 157,948 | 16,688,786 |
| Five9, Inc. (A) | | | 226,853 | 16,567,075 |
| SEE NOTES TO FINANCIAL STATEMENTS | SEMIANNUAL REPORT | JOHN HANCOCK SMALL CAP GROWTH FUND | 9 |
| | | | | Shares | Value |
| Information technology (continued) | | | |
| Software (continued) | | | |
| LivePerson, Inc. (A)(B) | | | 188,995 | $5,000,808 |
| Workiva, Inc. (A) | | | 189,555 | 8,101,581 |
| Real estate 3.1% | | | 14,340,594 |
| Equity real estate investment trusts 3.1% | | | |
| QTS Realty Trust, Inc., Class A | | | 255,307 | 14,340,594 |
|
| | | Yield (%) | | Shares | Value |
| Short-term investments 6.2% | | | | | $29,000,226 |
| (Cost $28,995,345) | | | | | |
| Short-term funds 6.2% | | | | | 29,000,226 |
| John Hancock Collateral Trust (C) | 1.6968(D) | | 933,676 | 9,345,065 |
| State Street Institutional U.S. Government Money Market Fund, Premier Class | 1.5386(D) | | 19,655,161 | 19,655,161 |
|
| Total investments (Cost $423,714,874) 103.0% | | | $483,973,173 |
| Other assets and liabilities, net (3.0%) | | | | (13,871,256) |
| Total net assets 100.0% | | | | | $470,101,917 |
| The percentage shown for each investment category is the total value of the category as a percentage of the net assets of the fund. |
| Security Abbreviations and Legend |
| ADR | American Depositary Receipt |
| (A) | Non-income producing security. |
| (B) | All or a portion of this security is on loan as of 2-29-20. |
| (C) | Investment is an affiliate of the fund, the advisor and/or subadvisor. This security represents the investment of cash collateral received for securities lending. |
| (D) | The rate shown is the annualized seven-day yield as of 2-29-20. |
At 2-29-20, the aggregate cost of investments for federal income tax purposes was $426,064,573. Net unrealized appreciation aggregated to $57,908,600, of which $79,529,335 related to gross unrealized appreciation and $21,620,735 related to gross unrealized depreciation.
| 10 | JOHN HANCOCK SMALL CAP GROWTH FUND | SEMIANNUAL REPORT | SEE NOTES TO FINANCIAL STATEMENTS |
STATEMENT OF ASSETS AND LIABILITIES 2-29-20 (unaudited)
| Assets | |
| Unaffiliated investments, at value (Cost $414,374,690) including $16,735,316 of securities loaned | $474,628,108 |
| Affiliated investments, at value (Cost $9,340,184) | 9,345,065 |
| Total investments, at value (Cost $423,714,874) | 483,973,173 |
| Dividends and interest receivable | 131,641 |
| Receivable for fund shares sold | 1,256,150 |
| Receivable for investments sold | 2,906,423 |
| Receivable for securities lending income | 5,411 |
| Other assets | 56,339 |
| Total assets | 488,329,137 |
| Liabilities | |
| Payable for investments purchased | 8,784,231 |
| Payable for fund shares repurchased | 46,630 |
| Payable upon return of securities loaned | 9,331,390 |
| Payable to affiliates | |
| Accounting and legal services fees | 14,073 |
| Transfer agent fees | 409 |
| Trustees' fees | 571 |
| Other liabilities and accrued expenses | 49,916 |
| Total liabilities | 18,227,220 |
| Net assets | $470,101,917 |
| Net assets consist of | |
| Paid-in capital | $465,844,770 |
| Total distributable earnings (loss) | 4,257,147 |
| Net assets | $470,101,917 |
| |
| Net asset value per share | |
| Based on net asset value and shares outstanding - the fund has an unlimited number of shares authorized with no par value | |
| Class A ($3,717,798 ÷ 234,601 shares)1 | $15.85 |
| Class C ($166,514 ÷ 10,666 shares)1 | $15.61 |
| Class I ($326,044 ÷ 20,489 shares) | $15.91 |
| Class R6 ($47,157 ÷ 2,956 shares) | $15.962 |
| Class NAV ($465,844,404 ÷ 29,184,678 shares) | $15.96 |
| Maximum offering price per share | |
| Class A (net asset value per share ÷ 95%)3 | $16.68 |
| 1 | Redemption price per share is equal to net asset value less any applicable contingent deferred sales charge. |
| 2 | Net asset value, offering price and redemption price per share of $15.96 is calculated using Net assets of $47,157 and Shares outstanding of 2,955.55. |
| 3 | On single retail sales of less than $50,000. On sales of $50,000 or more and on group sales the offering price is reduced. |
| SEE NOTES TO FINANCIAL STATEMENTS | SEMIANNUAL REPORT | JOHN HANCOCK Small Cap Growth Fund | 11 |
STATEMENT OF OPERATIONSFor the six months ended 2-29-20 (unaudited)
| Investment income | |
| Dividends | $835,668 |
| Interest | 162,879 |
| Securities lending | 54,349 |
| Total investment income | 1,052,896 |
| Expenses | |
| Investment management fees | 2,419,521 |
| Distribution and service fees | 5,093 |
| Accounting and legal services fees | 50,569 |
| Transfer agent fees | 2,290 |
| Trustees' fees | 5,329 |
| Custodian fees | 36,652 |
| State registration fees | 28,842 |
| Printing and postage | 10,407 |
| Professional fees | 28,454 |
| Other | 12,576 |
| Total expenses | 2,599,733 |
| Less expense reductions | (21,164) |
| Net expenses | 2,578,569 |
| Net investment loss | (1,525,673) |
| Realized and unrealized gain (loss) | |
| Net realized gain (loss) on | |
| Unaffiliated investments | (2,958,217) |
| Affiliated investments | 5,310 |
| | (2,952,907) |
| Change in net unrealized appreciation (depreciation) of | |
| Unaffiliated investments | (11,441,371) |
| Affiliated investments | 705 |
| | (11,440,666) |
| Net realized and unrealized loss | (14,393,573) |
| Decrease in net assets from operations | $(15,919,246) |
| 12 | JOHN HANCOCK Small Cap Growth Fund | SEMIANNUAL REPORT | SEE NOTES TO FINANCIAL STATEMENTS |
STATEMENTS OF CHANGES IN NET ASSETS
| | Six months ended
2-29-20
(unaudited) | Year ended
8-31-19 |
| Increase (decrease) in net assets | | |
| From operations | | |
| Net investment loss | $(1,525,673) | $(3,019,667) |
| Net realized loss | (2,952,907) | (40,174,523) |
| Change in net unrealized appreciation (depreciation) | (11,440,666) | 10,459,674 |
| Decrease in net assets resulting from operations | (15,919,246) | (32,734,516) |
| Distributions to shareholders | | |
| Class A | — | (41,824) |
| Class C | — | (5,548) |
| Class I | — | (9,785) |
| Class R6 | — | (1,592) |
| Class NAV | — | (10,878,401) |
| Total distributions | — | (10,937,150) |
| From fund share transactions | (77,075,500) | 245,921,604 |
| Total increase (decrease) | (92,994,746) | 202,249,938 |
| Net assets | | |
| Beginning of period | 563,096,663 | 360,846,725 |
| End of period | $470,101,917 | $563,096,663 |
| SEE NOTES TO FINANCIAL STATEMENTS | SEMIANNUAL REPORT | JOHN HANCOCK Small Cap Growth Fund | 13 |
| CLASS A SHARES Period ended | 2-29-201 | 8-31-19 | 8-31-182 |
| Per share operating performance | | | |
| Net asset value, beginning of period | $16.62 | $19.27 | $17.03 |
| Net investment loss3 | (0.08) | (0.18) | (0.10) |
| Net realized and unrealized gain (loss) on investments | (0.69) | (1.93) | 2.34 |
| Total from investment operations | (0.77) | (2.11) | 2.24 |
| Less distributions | | | |
| From net realized gain | — | (0.54) | — |
| Net asset value, end of period | $15.85 | $16.62 | $19.27 |
| Total return (%)4,5 | (4.63)6 | (10.41) | 13.156 |
| Ratios and supplemental data | | | |
| Net assets, end of period (in millions) | $4 | $3 | $1 |
| Ratios (as a percentage of average net assets): | | | |
| Expenses before reductions | 1.307 | 1.32 | 1.367 |
| Expenses including reductions | 1.297 | 1.31 | 1.357 |
| Net investment loss | (0.92)7 | (1.07) | (1.26)7 |
| Portfolio turnover (%) | 51 | 101 | 1658 |
| 1 | Six months ended 2-29-20. Unaudited. |
| 2 | The inception date for Class A shares is 3-27-18. |
| 3 | Based on average daily shares outstanding. |
| 4 | Total returns would have been lower had certain expenses not been reduced during the applicable periods. |
| 5 | Does not reflect the effect of sales charges, if any. |
| 6 | Not annualized. |
| 7 | Annualized. |
| 8 | Portfolio turnover is shown for the period from 9-1-17 to 8-31-18. |
| 14 | JOHN HANCOCK Small Cap Growth Fund | SEMIANNUAL REPORT | SEE NOTES TO FINANCIAL STATEMENTS |
| CLASS C SHARES Period ended | 2-29-201 | 8-31-19 | 8-31-182 |
| Per share operating performance | | | |
| Net asset value, beginning of period | $16.44 | $19.21 | $17.03 |
| Net investment loss3 | (0.14) | (0.30) | (0.16) |
| Net realized and unrealized gain (loss) on investments | (0.69) | (1.93) | 2.34 |
| Total from investment operations | (0.83) | (2.23) | 2.18 |
| Less distributions | | | |
| From net realized gain | — | (0.54) | — |
| Net asset value, end of period | $15.61 | $16.44 | $19.21 |
| Total return (%)4,5 | (5.05)6 | (11.08) | 12.806 |
| Ratios and supplemental data | | | |
| Net assets, end of period (in millions) | $—7 | $—7 | $—7 |
| Ratios (as a percentage of average net assets): | | | |
| Expenses before reductions | 2.058 | 2.07 | 2.118 |
| Expenses including reductions | 2.048 | 2.06 | 2.108 |
| Net investment loss | (1.69)8 | (1.81) | (2.01)8 |
| Portfolio turnover (%) | 51 | 101 | 1659 |
| 1 | Six months ended 2-29-20. Unaudited. |
| 2 | The inception date for Class C shares is 3-27-18. |
| 3 | Based on average daily shares outstanding. |
| 4 | Total returns would have been lower had certain expenses not been reduced during the applicable periods. |
| 5 | Does not reflect the effect of sales charges, if any. |
| 6 | Not annualized. |
| 7 | Less than $500,000. |
| 8 | Annualized. |
| 9 | Portfolio turnover is shown for the period from 9-1-17 to 8-31-18. |
| SEE NOTES TO FINANCIAL STATEMENTS | SEMIANNUAL REPORT | JOHN HANCOCK Small Cap Growth Fund | 15 |
| CLASS I SHARES Period ended | 2-29-201 | 8-31-19 | 8-31-182 |
| Per share operating performance | | | |
| Net asset value, beginning of period | $16.67 | $19.29 | $17.03 |
| Net investment loss3 | (0.05) | (0.14) | (0.08) |
| Net realized and unrealized gain (loss) on investments | (0.71) | (1.94) | 2.34 |
| Total from investment operations | (0.76) | (2.08) | 2.26 |
| Less distributions | | | |
| From net realized gain | — | (0.54) | — |
| Net asset value, end of period | $15.91 | $16.67 | $19.29 |
| Total return (%)4 | (4.56)5 | (10.23) | 13.275 |
| Ratios and supplemental data | | | |
| Net assets, end of period (in millions) | $—6 | $—6 | $—6 |
| Ratios (as a percentage of average net assets): | | | |
| Expenses before reductions | 1.057 | 1.08 | 1.127 |
| Expenses including reductions | 1.047 | 1.07 | 1.117 |
| Net investment loss | (0.66)7 | (0.80) | (0.99)7 |
| Portfolio turnover (%) | 51 | 101 | 1658 |
| 1 | Six months ended 2-29-20. Unaudited. |
| 2 | The inception date for Class I shares is 3-27-18. |
| 3 | Based on average daily shares outstanding. |
| 4 | Total returns would have been lower had certain expenses not been reduced during the applicable periods. |
| 5 | Not annualized. |
| 6 | Less than $500,000. |
| 7 | Annualized. |
| 8 | Portfolio turnover is shown for the period from 9-1-17 to 8-31-18. |
| 16 | JOHN HANCOCK Small Cap Growth Fund | SEMIANNUAL REPORT | SEE NOTES TO FINANCIAL STATEMENTS |
| CLASS R6 SHARES Period ended | 2-29-201 | 8-31-19 | 8-31-182 |
| Per share operating performance | | | |
| Net asset value, beginning of period | $16.70 | $19.30 | $17.03 |
| Net investment loss3 | (0.05) | (0.12) | (0.07) |
| Net realized and unrealized gain (loss) on investments | (0.69) | (1.94) | 2.34 |
| Total from investment operations | (0.74) | (2.06) | 2.27 |
| Less distributions | | | |
| From net realized gain | — | (0.54) | — |
| Net asset value, end of period | $15.96 | $16.70 | $19.30 |
| Total return (%)4 | (4.43)5 | (10.12) | 13.335 |
| Ratios and supplemental data | | | |
| Net assets, end of period (in millions) | $—6 | $—6 | $—6 |
| Ratios (as a percentage of average net assets): | | | |
| Expenses before reductions | 0.947 | 0.97 | 1.017 |
| Expenses including reductions | 0.937 | 0.96 | 1.017 |
| Net investment loss | (0.56)7 | (0.70) | (0.92)7 |
| Portfolio turnover (%) | 51 | 101 | 1658 |
| 1 | Six months ended 2-29-20. Unaudited. |
| 2 | The inception date for Class R6 shares is 3-27-18. |
| 3 | Based on average daily shares outstanding. |
| 4 | Total returns would have been lower had certain expenses not been reduced during the applicable periods. |
| 5 | Not annualized. |
| 6 | Less than $500,000. |
| 7 | Annualized. |
| 8 | Portfolio turnover is shown for the period from 9-1-17 to 8-31-18. |
| SEE NOTES TO FINANCIAL STATEMENTS | SEMIANNUAL REPORT | JOHN HANCOCK Small Cap Growth Fund | 17 |
| CLASS NAV SHARES Period ended | 2-29-201 | 8-31-19 | 8-31-18 | 8-31-17 | 8-31-16 | 8-31-15 |
| Per share operating performance | | | | | | |
| Net asset value, beginning of period | $16.71 | $19.30 | $20.31 | $18.44 | $19.94 | $21.16 |
| Net investment loss2 | (0.04) | (0.12) | (0.11) | (0.05) | (0.03) | (0.07) |
| Net realized and unrealized gain (loss) on investments | (0.71) | (1.93) | 4.54 | 3.01 | 0.57 | 1.14 |
| Total from investment operations | (0.75) | (2.05) | 4.43 | 2.96 | 0.54 | 1.07 |
| Less distributions | | | | | | |
| From net realized gain | — | (0.54) | (5.44) | (1.09) | (2.04) | (2.29) |
| Net asset value, end of period | $15.96 | $16.71 | $19.30 | $20.31 | $18.44 | $19.94 |
| Total return (%)3 | (4.49)4 | (10.07) | 24.87 | 16.79 | 3.42 | 5.26 |
| Ratios and supplemental data | | | | | | |
| Net assets, end of period (in millions) | $466 | $560 | $360 | $229 | $179 | $188 |
| Ratios (as a percentage of average net assets): | | | | | | |
| Expenses before reductions | 0.935 | 0.96 | 1.00 | 1.06 | 1.06 | 1.05 |
| Expenses including reductions | 0.925 | 0.95 | 0.99 | 1.05 | 1.05 | 1.04 |
| Net investment loss | (0.54)5 | (0.70) | (0.57) | (0.29) | (0.17) | (0.32) |
| Portfolio turnover (%) | 51 | 101 | 1656 | 39 | 26 | 30 |
| 1 | Six months ended 2-29-20. Unaudited. |
| 2 | Based on average daily shares outstanding. |
| 3 | Total returns would have been lower had certain expenses not been reduced during the applicable periods. |
| 4 | Not annualized. |
| 5 | Annualized. |
| 6 | Excludes in-kind transactions. |
| 18 | JOHN HANCOCK Small Cap Growth Fund | SEMIANNUAL REPORT | SEE NOTES TO FINANCIAL STATEMENTS |
| Notes to financial statements (unaudited) | |
Note 1—Organization
John Hancock Small Cap Growth Fund (the fund) is a series of John Hancock Funds II (the Trust), an open-end management investment company organized as a Massachusetts business trust and registered under the Investment Company Act of 1940, as amended (the 1940 Act). The investment objective of the fund is to seek long-term capital appreciation.
The fund may offer multiple classes of shares. The shares currently outstanding are detailed in the Statement of assets and liabilities. Class A and Class C shares are offered to all investors. Class I shares are offered to institutions and certain investors. Class R6 shares are only available to certain retirement plans, institutions and other investors. Class NAV shares are offered to John Hancock affiliated funds of funds, retirement plans for employees of John Hancock and/or Manulife Financial Corporation, and certain 529 plans. Class C shares convert to Class A shares ten years after purchase (certain exclusions may apply). Shareholders of each class have exclusive voting rights to matters that affect that class. The distribution and service fees, if any, and transfer agent fees for each class may differ.
Note 2—Significant accounting policies
The financial statements have been prepared in conformity with accounting principles generally accepted in the United States of America (US GAAP), which require management to make certain estimates and assumptions as of the date of the financial statements. Actual results could differ from those estimates and those differences could be significant. The fund qualifies as an investment company under Topic 946 of Accounting Standards Codification of US GAAP.
Events or transactions occurring after the end of the fiscal period through the date that the financial statements were issued have been evaluated in the preparation of the financial statements. The following summarizes the significant accounting policies of the fund:
Security valuation. Investments are stated at value as of the scheduled close of regular trading on the New York Stock Exchange (NYSE), normally at 4:00 P.M., Eastern Time. In case of emergency or other disruption resulting in the NYSE not opening for trading or the NYSE closing at a time other than the regularly scheduled close, the net asset value (NAV) may be determined as of the regularly scheduled close of the NYSE pursuant to the fund's Valuation Policies and Procedures.
In order to value the securities, the fund uses the following valuation techniques: Equity securities, including exchange-traded or closed-end funds, are typically valued at the last sale price or official closing price on the exchange or principal market where the security trades. In the event there were no sales during the day or closing prices are not available, the securities are valued using the last available bid price. Investments by the fund in open-end mutual funds, including John Hancock Collateral Trust (JHCT), are valued at their respective NAVs each business day.
In certain instances, the Pricing Committee may determine to value equity securities using prices obtained from another exchange or market if trading on the exchange or market on which prices are typically obtained did not open for trading as scheduled, or if trading closed earlier than scheduled, and trading occurred as normal on another exchange or market.
Other portfolio securities and assets, for which reliable market quotations are not readily available, are valued at fair value as determined in good faith by the fund's Pricing Committee following procedures established by the Board of Trustees. The frequency with which these fair valuation procedures are used cannot be predicted and fair value of securities may differ significantly from the value that would have been used had a ready market for such securities existed.
The fund uses a three-tier hierarchy to prioritize the pricing assumptions, referred to as inputs, used in valuation techniques to measure fair value. Level 1 includes securities valued using quoted prices in active markets for identical securities, including registered investment companies. Level 2 includes securities valued using other
| | SEMIANNUAL REPORT | JOHN HANCOCK Small Cap Growth Fund | 19 |
significant observable inputs. Observable inputs may include quoted prices for similar securities, interest rates, prepayment speeds and credit risk. Prices for securities valued using these inputs are received from independent pricing vendors and brokers and are based on an evaluation of the inputs described. Level 3 includes securities valued using significant unobservable inputs when market prices are not readily available or reliable, including the fund's own assumptions in determining the fair value of investments. Factors used in determining value may include market or issuer specific events or trends, changes in interest rates and credit quality. The inputs or methodology used for valuing securities are not necessarily an indication of the risks associated with investing in those securities. Changes in valuation techniques and related inputs may result in transfers into or out of an assigned level within the disclosure hierarchy.
As of February 29, 2020, all investments are categorized as Level 1 under the hierarchy described above.
Security transactions and related investment income. Investment security transactions are accounted for on a trade date plus one basis for daily NAV calculations. However, for financial reporting purposes, investment transactions are reported on trade date. Interest income is accrued as earned. Dividend income is recorded on the ex-date, except for dividends of certain foreign securities where the dividend may not be known until after the ex-date. In those cases, dividend income, net of withholding taxes, is recorded when the fund becomes aware of the dividends. Non-cash dividends, if any, are recorded at the fair market value of the securities received. Gains and losses on securities sold are determined on the basis of identified cost and may include proceeds from litigation.
Real estate investment trusts. The fund may invest in real estate investment trusts (REITs). Distributions from REITs may be recorded as income and subsequently characterized by the REIT at the end of the fiscal year as a reduction of cost of investments and/or as a realized gain. As a result, the fund will estimate the components of distributions from these securities. Such estimates are revised when the actual components of the distributions are known.
Securities lending. The fund may lend its securities to earn additional income. The fund receives collateral from the borrower in an amount not less than the market value of the loaned securities. The fund will invest its cash collateral in JHCT, an affiliate of the fund, which has a floating NAV and is registered with the Securities and Exchange Commission (SEC) as an investment company. JHCT invests in short-term money market investments. The fund will receive the benefit of any gains and bear any losses generated by JHCT with respect to the cash collateral.
The fund has the right to recall loaned securities on demand. If a borrower fails to return loaned securities when due, then the lending agent is responsible and indemnifies the fund for the lent securities. The lending agent uses the collateral received from the borrower to purchase replacement securities of the same issue, type, class and series of the loaned securities. If the value of the collateral is less than the purchase cost of replacement securities, the lending agent is responsible for satisfying the shortfall but only to the extent that the shortfall is not due to any decrease in the value of JHCT.
Although the risk of loss on securities lent is mitigated by receiving collateral from the borrower and through lending agent indemnification, the fund could experience a delay in recovering securities or could experience a lower than expected return if the borrower fails to return the securities on a timely basis. The fund receives compensation for lending its securities by retaining a portion of the return on the investment of the collateral and compensation from fees earned from borrowers of the securities. Securities lending income received by the fund is net of fees retained by the securities lending agent. Net income received from JHCT is a component of securities lending income as recorded on the Statement of operations.
Obligations to repay collateral received by the fund are shown on the Statement of assets and liabilities as Payable upon return of securities loaned and are secured by the loaned securities. As of February 29, 2020, the fund loaned securities valued at $16,735,316 and received $9,331,390 of cash collateral.
| 20 | JOHN HANCOCK Small Cap Growth Fund | SEMIANNUAL REPORT | |
In addition, non-cash collateral of approximately $7,603,147 in the form of U.S. Treasuries was pledged to the fund. This non-cash collateral is not reflected in the fund's net assets, however could be sold by the securities lending agent in the event of default by the borrower.
Overdraft. The fund may have the ability to borrow from banks for temporary or emergency purposes, including meeting redemption requests that otherwise might require the untimely sale of securities. Pursuant to the fund's custodian agreement, the custodian may loan money to the fund to make properly authorized payments. The fund is obligated to repay the custodian for any overdraft, including any related costs or expenses. The custodian may have a lien, security interest or security entitlement in any fund property that is not otherwise segregated or pledged, to the extent of any overdraft, and to the maximum extent permitted by law.
Line of credit. The fund and other affiliated funds have entered into a syndicated line of credit agreement with Citibank, N.A. as the administrative agent that enables them to participate in a $750 million unsecured committed line of credit. Excluding commitments designated for a certain fund and subject to the needs of all other affiliated funds, the fund can borrow up to an aggregate commitment amount of $500 million, subject to asset coverage and other limitations as specified in the agreement. A commitment fee payable at the end of each calendar quarter, based on the average daily unused portion of the line of credit, is charged to each participating fund based on a combination of fixed and asset based allocations and is reflected in Other expenses on the Statement of operations. For the six months ended February 29, 2020, the fund had no borrowings under the line of credit. Commitment fees for the six months ended February 29, 2020 were $1,667.
Expenses. Within the John Hancock group of funds complex, expenses that are directly attributable to an individual fund are allocated to such fund. Expenses that are not readily attributable to a specific fund are allocated among all funds in an equitable manner, taking into consideration, among other things, the nature and type of expense and the fund’s relative net assets. Expense estimates are accrued in the period to which they relate and adjustments are made when actual amounts are known.
Class allocations. Income, common expenses and realized and unrealized gains (losses) are determined at the fund level and allocated daily to each class of shares based on the net assets of the class. Class-specific expenses, such as distribution and service fees, if any, and transfer agent fees, for all classes, are charged daily at the class level based on the net assets of each class and the specific expense rates applicable to each class.
Federal income taxes. The fund intends to continue to qualify as a regulated investment company by complying with the applicable provisions of the Internal Revenue Code and will not be subject to federal income tax on taxable income that is distributed to shareholders. Therefore, no federal income tax provision is required.
For federal income tax purposes, as of August 31, 2019, the fund has a short-term capital loss carryforward of $47,052,869 available to offset future net realized capital gains.This carryforward does not expire.
As of August 31, 2019, the fund had no uncertain tax positions that would require financial statement recognition, derecognition or disclosure. The fund's federal tax returns are subject to examination by the Internal Revenue Service for a period of three years.
Distribution of income and gains. Distributions to shareholders from net investment income and net realized gains, if any, are recorded on the ex-date. The fund generally declares and pays dividends annually. Capital gain distributions, if any, are typically distributed annually.
Distributions paid by the fund with respect to each class of shares are calculated in the same manner, at the same time and in the same amount, except for the effect of class level expenses that may be applied differently to each class.
Such distributions, on a tax basis, are determined in conformity with income tax regulations, which may differ from US GAAP. Distributions in excess of tax basis earnings and profits, if any, are reported in the fund's financial statements as a return of capital. The final determination of tax characteristics of the fund's distribution will occur at the end of the year and will subsequently be reported to shareholders.
| | SEMIANNUAL REPORT | JOHN HANCOCK Small Cap Growth Fund | 21 |
Capital accounts within the financial statements are adjusted for permanent book-tax differences. These adjustments have no impact on net assets or the results of operations. Temporary book-tax differences, if any, will reverse in a subsequent period. Book-tax differences are primarily attributable to net operating losses and wash sale loss deferrals.
Note 3—Guarantees and indemnifications
Under the Trust's organizational documents, its Officers and Trustees are indemnified against certain liabilities arising out of the performance of their duties to the Trust, including the fund. Additionally, in the normal course of business, the fund enters into contracts with service providers that contain general indemnification clauses. The fund's maximum exposure under these arrangements is unknown, as this would involve future claims that may be made against the fund that have not yet occurred. The risk of material loss from such claims is considered remote.
Note 4—Fees and transactions with affiliates
John Hancock Investment Management LLC (the Advisor) serves as investment advisor for the fund. John Hancock Investment Management Distributors LLC (the Distributor), an affiliate of the Advisor, serves as principal underwriter of the fund. The Advisor and the Distributor are indirect, wholly owned subsidiaries of Manulife Financial Corporation (MFC).
Management fee. The fund has an investment management agreement with the Advisor under which the fund pays a management fee to the Advisor equivalent on an annual basis to the sum of: a) 0.880% of the first $300 million of the fund's average daily net assets; b) 0.850% of the next $300 million of average daily net assets; c) 0.830% of the next $300 million of average daily net assets; and d) 0.800% of the excess over $900 million of average daily net assets. The Advisor has a subadvisory agreement with Redwood Investment, LLC. The fund is not responsible for payment of the subadvisory fees.
The Advisor has contractually agreed to waive a portion of its management fee and/or reimburse expenses for certain funds of the John Hancock group of funds complex, including the fund (the participating portfolios). This waiver is based upon aggregate net assets of all the participating portfolios. The amount of the reimbursement is calculated daily and allocated among all the participating portfolios in proportion to the daily net assets of each fund. During the six months ended February 29, 2020, this waiver amounted to 0.01% of the fund’s average daily net assets on an annualized basis. This arrangement expires on July 31, 2021, unless renewed by mutual agreement of the fund and the Advisor based upon a determination that this is appropriate under the circumstances at that time.
For the six months ended February 29, 2020, the expense reductions described above amounted to the following:
| Class | Expense reduction |
| Class A | $122 |
| Class C | 8 |
| Class I | 12 |
| Class | Expense reduction |
| Class R6 | $2 |
| Class NAV | 21,020 |
| Total | $21,164 |
Expenses waived or reimbursed in the current fiscal period are not subject to recapture in future fiscal periods.
The investment management fees, including the impact of the waivers and reimbursements as described above, incurred for the six months ended February 29, 2020, were equivalent to a net annual effective rate of 0.86% of the fund's average daily net assets.
Accounting and legal services. Pursuant to a service agreement, the fund reimburses the Advisor for all expenses associated with providing the administrative, financial, legal, compliance, accounting and recordkeeping services to the fund, including the preparation of all tax returns, periodic reports to shareholders and regulatory
| 22 | JOHN HANCOCK Small Cap Growth Fund | SEMIANNUAL REPORT | |
reports, among other services. These expenses are allocated to each share class based on its relative net assets at the time the expense was incurred. These accounting and legal services fees incurred for the six months ended February 29, 2020 amounted to an annual rate of 0.02% of the fund's average daily net assets.
Distribution and service plans. The fund has a distribution agreement with the Distributor. The fund has adopted distribution and service plans for certain classes as detailed below pursuant to Rule 12b-1 under the 1940 Act, to pay the Distributor for services provided as the distributor of shares of the fund. The fund may pay up to the following contractual rates of distribution and service fees under these arrangements, expressed as an annual percentage of average daily net assets for each class of the fund's shares:
| Class | Rule 12b-1 Fee |
| Class A | 0.25% |
| Class C | 1.00% |
Sales charges. Class A shares are assessed up-front sales charges, which resulted in payments to the Distributor amounting to $1,416 for the six months ended February 29, 2020. Of this amount, $241 was retained and used for printing prospectuses, advertising, sales literature and other purposes and $1,175 was paid as sales commissions to broker-dealers.
Class A and Class C shares may be subject to contingent deferred sales charges (CDSCs). Certain Class A shares that are acquired through purchases of $1 million or more and are redeemed within one year of purchase are subject to a 1.00% sales charge. Class C shares that are redeemed within one year of purchase are subject to a 1.00% CDSC. CDSCs are applied to the lesser of the current market value at the time of redemption or the original purchase cost of the shares being redeemed. Proceeds from CDSCs are used to compensate the Distributor for providing distribution-related services in connection with the sale of these shares. During the six months ended February 29, 2020, there were no CDSCs received by the Distributor for Class A and Class C shares.
Transfer agent fees. The John Hancock group of funds has a complex-wide transfer agent agreement with John Hancock Signature Services, Inc. (Signature Services), an affiliate of the Advisor. The transfer agent fees paid to Signature Services are determined based on the cost to Signature Services (Signature Services Cost) of providing recordkeeping services. It also includes out-of-pocket expenses, including payments made to third-parties for recordkeeping services provided to their clients who invest in one or more John Hancock funds. In addition, Signature Services Cost may be reduced by certain fees that Signature Services receives in connection with retirement and small accounts. Signature Services Cost is calculated monthly and allocated, as applicable, to five categories of share classes: Retail Share and Institutional Share Classes of Non-Municipal Bond Funds, Class R6 Shares, Retirement Share Classes and Municipal Bond Share Classes. Within each of these categories, the applicable costs are allocated to the affected John Hancock affiliated funds and/or classes, based on the relative average daily net assets.
Class level expenses. Class level expenses for the six months ended February 29, 2020 were as follows:
| Class | Distribution and service fees | Transfer agent fees |
| Class A | $4,001 | $1,965 |
| Class C | 1,092 | 135 |
| Class I | — | 187 |
| Class R6 | — | 3 |
| Total | $5,093 | $2,290 |
Trustee expenses. The fund compensates each Trustee who is not an employee of the Advisor or its affiliates. The costs of paying Trustee compensation and expenses are allocated to the fund based on its net assets relative to other funds within the John Hancock group of funds complex.
| | SEMIANNUAL REPORT | JOHN HANCOCK Small Cap Growth Fund | 23 |
Note 5—Fund share transactions
Transactions in fund shares for the six months ended February 29, 2020 and for the year ended August 31, 2019 were as follows:
| | Six Months Ended 2-29-20 | Year Ended 8-31-19 |
| | Shares | Amount | Shares | Amount |
| Class A shares | | | | |
| Sold | 168,925 | $2,818,285 | 167,626 | $2,811,498 |
| Distributions reinvested | — | — | 2,972 | 41,526 |
| Repurchased | (94,958) | (1,555,716) | (51,600) | (849,513) |
| Net increase | 73,967 | $1,262,569 | 118,998 | $2,003,511 |
| Class C shares | | | | |
| Sold | 1,705 | $27,982 | 14,101 | $240,724 |
| Distributions reinvested | — | — | 285 | 3,956 |
| Repurchased | (11,204) | (175,607) | (931) | (15,416) |
| Net increase (decrease) | (9,499) | $(147,625) | 13,455 | $229,264 |
| Class I shares | | | | |
| Sold | 4,621 | $75,632 | 10,974 | $189,811 |
| Distributions reinvested | — | — | 699 | 9,785 |
| Repurchased | (304) | (5,192) | (12,787) | (203,167) |
| Net increase (decrease) | 4,317 | $70,440 | (1,114) | $(3,571) |
| Class R6 shares | | | | |
| Sold | 20 | $325 | 26 | $425 |
| Repurchased | — | — | (26) | (433) |
| Net increase (decrease) | 20 | $325 | — | $(8) |
| Class NAV shares | | | | |
| Sold | 2,615,390 | $41,805,306 | 18,208,973 | $301,527,368 |
| Distributions reinvested | — | — | 776,474 | 10,878,401 |
| Repurchased | (6,929,884) | (120,066,515) | (4,110,428) | (68,713,361) |
| Net increase (decrease) | (4,314,494) | $(78,261,209) | 14,875,019 | $243,692,408 |
| Total net increase (decrease) | (4,245,689) | $(77,075,500) | 15,006,358 | $245,921,604 |
Affiliates of the fund owned 28%, 99% and 100% of shares of Class C, Class R6 and Class NAV, respectively, on February 29, 2020. Such concentration of shareholders’ capital could have a material effect on the fund if such shareholders redeem from the fund.
Note 6—Purchase and sale of securities
Purchases and sales of securities, other than short-term investments, amounted to $271,796,958 and $356,615,393, respectively, for the six months ended February 29, 2020.
| 24 | JOHN HANCOCK Small Cap Growth Fund | SEMIANNUAL REPORT | |
Note 7—Industry or sector risk
The fund generally invests a large percentage of its assets in one or more particular industries or sectors of the economy. If a large percentage of the fund's assets are economically tied to a single or small number of industries or sectors of the economy, the fund will be less diversified than a more broadly diversified fund, and it may cause the fund to underperform if that industry or sector underperforms. In addition, focusing on a particular industry or sector may make the fund’s NAV more volatile. Further, a fund that invests in particular industries or sectors is particularly susceptible to the impact of market, economic, regulatory and other factors affecting those industries or sectors.
Note 8—Investment by affiliated funds
Certain investors in the fund are affiliated funds that are managed by the Advisor and its affiliates. The affiliated funds do not invest in the fund for the purpose of exercising management or control; however, this investment may represent a significant portion of the fund's net assets. At February 29, 2020, funds within the John Hancock group of funds complex held 99.1% of the fund's net assets. The following fund(s) had an affiliate ownership of 5% or more of the fund's net assets:
| Portfolio | Affiliated Concentration |
| John Hancock Funds II Multimanager Lifestyle Growth Portfolio | 27.3% |
| John Hancock Funds II Multimanager Lifestyle Balanced Portfolio | 20.5% |
| John Hancock Funds II Multimanager Lifestyle Aggressive Portfolio | 13.9% |
| John Hancock Variable Insurance Trust Managed Volatility Growth Portfolio | 12.6% |
| John Hancock Variable Insurance Trust Managed Volatility Balanced Portfolio | 7.2% |
Note 9—Investment in affiliated underlying funds
The fund may invest in affiliated underlying funds that are managed by the Advisor and its affiliates. Information regarding the fund's fiscal year to date purchases and sales of the affiliated underlying funds as well as income and capital gains earned by the fund, if any, is as follows:
| | | | | | | | Dividends and distributions |
| Affiliate | Ending
share
amount | Beginning
value | Cost of
purchases | Proceeds
from shares
sold | Realized
gain
(loss) | Change in
unrealized
appreciation
(depreciation) | Income
distributions
received | Capital gain
distributions
received | Ending
value |
| John Hancock Collateral Trust* | 933,676 | $23,250,427 | $101,468,161 | $(115,379,538) | $5,310 | $705 | $54,349 | — | $9,345,065 |
| * | Refer to the Securities lending note within Note 2 for details regarding this investment. |
Note 10—Subsequent events
A widespread health crisis such as a global pandemic could cause substantial market volatility, exchange trading suspensions and closures, impact the ability to complete redemptions, and affect fund performance. For example, the novel coronavirus disease (COVID-19) has resulted in significant disruptions to global business activity. The impact of a health crisis and other epidemics and pandemics that may arise in the future, could affect the global economy in ways that cannot necessarily be foreseen at the present time. A health crisis may exacerbate other pre-existing political, social and economic risks. Any such impact could adversely affect the fund's performance, resulting in losses to your investment.
| | SEMIANNUAL REPORT | JOHN HANCOCK Small Cap Growth Fund | 25 |
| | |
Trustees
Hassell H. McClellan,Chairperson
Steven R. Pruchansky,Vice Chairperson
Andrew G. Arnott†
Charles L. Bardelis*
James R. Boyle
Peter S. Burgess*
William H. Cunningham
Grace K. Fey
Marianne Harrison†
Deborah C. Jackson
James M. Oates*
Gregory A. Russo
Officers
Andrew G. Arnott
President
Francis V. Knox, Jr.
Chief Compliance Officer
Charles A. Rizzo
Chief Financial Officer
Salvatore Schiavone
Treasurer
Christopher (Kit) Sechler
Secretary and Chief Legal Officer
| Investment advisor
John Hancock Investment Management LLC
Subadvisor
Redwood Investments, LLC
Portfolio Managers
Valerie B. Klaiman, CFA
Alexi Makkas
Michael J. Mufson, CFA
Ezra S. Samet, CFA
Jennifer K. Sliver, CFA
Anthony E. Sutton
Principal distributor
John Hancock Investment Management Distributors LLC
Custodian
State Street Bank and Trust Company
Transfer agent
John Hancock Signature Services, Inc.
Legal counsel
K&L Gates LLP
|
* Member of the Audit Committee
† Non-Independent Trustee
The fund's proxy voting policies and procedures, as well as the fund proxy voting record for the most recent twelve-month period ended June 30, are available free of charge on the Securities and Exchange Commission (SEC) website at sec.gov or on our website.
All of the fund's holdings as of the end of the third month of every fiscal quarter are filed with the SEC on Form N-PORT within 60 days of the end of the fiscal quarter. The fund's Form N-PORT filings are available on our website and the SEC's website, sec.gov.
We make this information on your fund, as well asmonthly portfolio holdings, and other fund details available on our website at jhinvestments.com or by calling 800-225-5291.
| | | | |
| | You can also contact us: |
| | 800-225-5291
jhinvestments.com | Regular mail:
John Hancock Signature Services, Inc.
P.O. Box 55913
Boston, MA 02205-5913
| Express mail:
John Hancock Signature Services, Inc.
2000 Crown Colony Drive
Suite 55913
Quincy, MA 02169-0953
|
SEMIANNUAL REPORT | JOHN HANCOCK SMALL CAP GROWTH FUND 27
John Hancock family of funds
| | | |
DOMESTIC EQUITY FUNDS
Blue Chip Growth
Classic Value
Disciplined Value
Disciplined Value Mid Cap
Equity Income
Financial Industries
Fundamental All Cap Core
Fundamental Large Cap Core
New Opportunities
Regional Bank
Small Cap Core
Small Cap Growth
Small Cap Value
U.S. Global Leaders Growth
U.S. Quality Growth
GLOBAL AND INTERNATIONAL EQUITY FUNDS
Disciplined Value International
Emerging Markets
Emerging Markets Equity
Fundamental Global Franchise
Global Equity
Global Shareholder Yield
Global Thematic Opportunities
International Dynamic Growth
International Growth
International Small Company
| | INCOME FUNDS
Bond
California Tax-Free Income
Emerging Markets Debt
Floating Rate Income
Government Income
High Yield
High Yield Municipal Bond
Income
Investment Grade Bond
Money Market
Short Duration Bond
Short Duration Credit Opportunities
Strategic Income Opportunities
Tax-Free Bond
ALTERNATIVE AND SPECIALTY FUNDS
Absolute Return Currency
Alternative Asset Allocation
Alternative Risk Premia
Diversified Macro
Infrastructure
Multi-Asset Absolute Return
Seaport Long/Short
|
A fund's investment objectives, risks, charges, and expenses should be considered carefully before investing. The prospectus contains this and other important information about the fund. To obtain a prospectus, contact your financial professional, call John Hancock Investment Management at 800-225-5291, or visit our website at jhinvestments.com. Please read the prospectus carefully before investing or sending money.
| | | |
ASSET ALLOCATION
Balanced
Income Allocation
Multi-Index Lifetime Portfolios
Multi-Index Preservation Portfolios
Multimanager Lifestyle Portfolios
Multimanager Lifetime Portfolios
Retirement Income 2040
EXCHANGE-TRADED FUNDS
John Hancock Multifactor Consumer Discretionary ETF
John Hancock Multifactor Consumer Staples ETF
John Hancock Multifactor Developed International ETF
John Hancock Multifactor Emerging Markets ETF
John Hancock Multifactor Energy ETF
John Hancock Multifactor Financials ETF
John Hancock Multifactor Healthcare ETF
John Hancock Multifactor Industrials ETF
John Hancock Multifactor Large Cap ETF
John Hancock Multifactor Materials ETF
John Hancock Multifactor Media and
Communications ETF
John Hancock Multifactor Mid Cap ETF
John Hancock Multifactor Small Cap ETF
John Hancock Multifactor Technology ETF
John Hancock Multifactor Utilities ETF
| | ENVIRONMENTAL, SOCIAL, AND
GOVERNANCE FUNDS
ESG All Cap Core
ESG Core Bond
ESG International Equity
ESG Large Cap Core
CLOSED-END FUNDS
Financial Opportunities
Hedged Equity & Income
Income Securities Trust
Investors Trust
Preferred Income
Preferred Income II
Preferred Income III
Premium Dividend
Tax-Advantaged Dividend Income
Tax-Advantaged Global Shareholder Yield
|
John Hancock Multifactor ETF shares are bought and sold at market price (not NAV), and are not individually redeemed
from the fund. Brokerage commissions will reduce returns.
John Hancock ETFs are distributed by Foreside Fund Services, LLC, and are subadvised by Dimensional Fund Advisors LP.
Foreside is not affiliated with John Hancock Investment Management Distributors LLC or Dimensional Fund Advisors LP.
Dimensional Fund Advisors LP receives compensation from John Hancock in connection with licensing rights to the
John Hancock Dimensional indexes. Dimensional Fund Advisors LP does not sponsor, endorse, or sell, and makes no
representation as to the advisability of investing in, John Hancock Multifactor ETFs.
John Hancock Investment Management
A trusted brand
John Hancock Investment Management is a premier asset manager
representing one of America's most trusted brands, with a heritage of
financial stewardship dating back to 1862. Helping our shareholders
pursue their financial goals is at the core of everything we do. It's why
we support the role of professional financial advice and operate with
the highest standards of conduct and integrity.
A better way to invest
We serve investors globally through a unique multimanager approach:
We search the world to find proven portfolio teams with specialized
expertise for every strategy we offer, then we apply robust investment
oversight to ensure they continue to meet our uncompromising
standards and serve the best interests of our shareholders.
Results for investors
Our unique approach to asset management enables us to provide
a diverse set of investments backed by some of the world's best
managers, along with strong risk-adjusted returns across asset classes.
John Hancock Investment Management Distributors LLC n Member FINRA, SIPC
200 Berkeley Street n Boston, MA 02116-5010 n 800-225-5291 n jhinvestments.com
This report is for the information of the shareholders of John Hancock Small Cap Growth Fund. It is not authorized for distribution to prospective investors unless preceded or accompanied by a prospectus.
| | |
| MF1105645 | 470SA 2/20
4/2020 |
John Hancock
Strategic Income Opportunities Fund
Semiannual report 2/29/2020
Beginning on January 1, 2021, as permitted by regulations adopted by the Securities and Exchange Commission, paper copies of the fund's shareholder reports like this one will no longer be sent by mail, unless you specifically request paper copies of the reports from the fund or from your financial intermediary. Instead, the reports will be made available on a website, and you will be notified by mail each time a report is posted and provided with a website link to access the report.
If you already elected to receive shareholder reports electronically, you will not be affected by this change, and you do not need to take any action. You may elect to receive shareholder reports and other communications electronically by calling John Hancock Investment Management at 800-225-5291 (Class A and Class C shares) or 888-972-8696 (Class I, Class R2, and Class R6 shares) or by contacting your financial intermediary.
You may elect to receive all reports in paper, free of charge, at any time. You can inform John Hancock Investment Management or your financial intermediary that you wish to continue receiving paper copies of your shareholder reports by following the instructions listed above. Your election to receive reports in paper will apply to all funds held with John Hancock Investment Management or your financial intermediary.
A message to shareholders
Dear shareholder,
Global financial markets were on pace to deliver strong returns during the 6 months ended February 29, 2020, until heightened fears over the coronavirus (COVID-19) sent the markets skidding during the last week of the period. Prior to the turbulence that ended the period, the investment-grade corporate and high-yield segments of the market had strong gains. Fixed-income investors benefited from a combination of declining interest rates, low inflation, and accommodative central bank policy.
However, the COVID-19 pandemic and plummeting oil prices put an end to all that good news. Shortly after period end, the U.S. Federal Reserve lowered interest rates and lawmakers embarked on a plan to launch major fiscal stimulus to support the economy.
After the longest bull market in U.S. history, we're now in bear market territory. Indeed, the spread of COVID-19, trade disputes, rising unemployment, and other geopolitical tensions may continue to create uncertainty among businesses and investors. Your financial professional can helpposition your portfolio so that it's sufficiently diversified to seek to meet your long-term objectives and to withstand the inevitable bouts of market volatility along the way.
On behalf of everyone at John Hancock Investment Management, I'd like to take this opportunity to welcome new shareholders and thank existing shareholders for the continued trust you've placed in us.
Sincerely,
Andrew G. Arnott
President and CEO,
John Hancock Investment Management
Head of Wealth and Asset Management,
United States and Europe
This commentary reflects the CEO's views as of this report's period end and are subject to change at any time. Diversification does not guarantee investment returns and does not eliminate risk of loss. All investments entail risks, including the possible loss of principal. For more up-to-date information, you can visit our website at jhinvestments.com.
John Hancock
Strategic Income Opportunities Fund
Table of contents
| | | |
| 2 | | Your fund at a glance |
| 3 | | Portfolio summary |
| 5 | | A look at performance |
| 7 | | Your expenses |
| 9 | | Fund's investments |
| 32 | | Financial statements |
| 36 | | Financial highlights |
| 42 | | Notes to financial statements |
| 56 | | More information |
SEMIANNUAL REPORT | JOHN HANCOCK STRATEGIC INCOME OPPORTUNITIES FUND 1
INVESTMENT OBJECTIVE
The fund seeks to maximize total return consisting of current income and capital appreciation.
AVERAGE ANNUAL TOTAL RETURNS AS OF 2/29/2020 (%)
The Bloomberg Barclays U.S. Aggregate Bond Index is an unmanaged index of dollar-denominated and non-convertible investment-grade debt issues.
It is not possible to invest directly in an index. Index figures do not reflect expenses or sales charges, which would result in lower returns.
Figures from Morningstar, Inc. include reinvested distributions and do not take into account sales charges. Actual load-adjusted performance is lower.
The past performance shown here reflects reinvested distributions and the beneficial effect of any expense reductions, and does not guarantee future results. Returns for periods shorter than one year are cumulative. Performance of the other share classes will vary based on the difference in the fees and expenses of those classes. Shares will fluctuate in value and, when redeemed, may be worth more or less than their original cost. Current month-end performance may be lower or higher than the performance cited, and can be found at jhinvestments.com or by calling 800-225-5291. For further information on the fund's objectives, risks, and strategy, see the fund's prospectus. The fund recently experienced negative short-term performance due to market volatility associated with the COVID-19 pandemic.
SEMIANNUAL REPORT | JOHN HANCOCK STRATEGIC INCOME OPPORTUNITIES FUND 2
PORTFOLIO COMPOSITION AS OF 2/29/2020 (%)
NET CURRENCY EXPOSURE AS OF 2/29/2020 (%)
| | |
| United States Dollar | 85.1 |
| Indonesian Rupiah | 2.3 |
| Brazilian Real | 2.1 |
| Euro Currency | 2.1 |
| Other Currencies | 2.1 |
| Malaysian Ringgit | 1.7 |
| Philippines Peso | 1.7 |
| Australian Dollar | 1.3 |
| Singapore Dollar | 1.3 |
| New Zealand Dollar | 1.2 |
| Columbian Peso | 1.2 |
| Mexican Peso | -1.0 |
| Canadian Dollar | -1.1 |
| As a percentage of net assets. | |
| Net currency exposure, after taking into account the effects of forward foreign currency exchange contracts. | |
SEMIANNUAL REPORT | JOHN HANCOCK STRATEGIC INCOME OPPORTUNITIES FUND 3
QUALITY COMPOSITION AS OF 2/29/2020 (%)
COUNTRY COMPOSITION AS OF 2/29/2020 (%)
| | |
| United States | 63.3 |
| Indonesia | 3.6 |
| Canada | 3.3 |
| Supranational | 2.7 |
| Luxembourg | 2.4 |
| Philippines | 2.1 |
| Singapore | 2.1 |
| Netherlands | 2.0 |
| Brazil | 1.9 |
| Germany | 1.8 |
| Other countries | 14.8 |
| TOTAL | 100.0 |
| As a percentage of net assets. | |
A note about risks
The fund may be subject to various risks as described in the fund's prospectus. For more information, please refer to the "Principal risks" section of the prospectus and "Subsequent events" section in the Notes to financial statements.
SEMIANNUAL REPORT | JOHN HANCOCK STRATEGIC INCOME OPPORTUNITIES FUND 4
TOTAL RETURNS FOR THE PERIOD ENDED FEBRUARY 29, 2020
| | | | | | | | | | | | |
Average annual total returns (%)
with maximum sales charge | | Cumulative total returns (%)
with maximum sales charge | | SEC 30-day
yield (%)
subsidized | | SEC 30-day
yield (%)
unsubsidized1 |
| | 1-year | 5-year | 10-year | | 6-month | 5-year | 10-year | | as of
2-29-20 | | as of
2-29-20 |
| Class A | 2.22 | 1.72 | 4.28 | | -2.89 | 8.92 | 52.09 | | 1.87 | | 1.85 |
| Class C | 4.77 | 1.84 | 3.99 | | -0.23 | 9.56 | 47.85 | | 1.25 | | 1.22 |
| Class I2 | 6.72 | 2.87 | 5.04 | | 1.27 | 15.19 | 63.55 | | 2.25 | | 2.23 |
| Class R22,3 | 6.40 | 2.49 | 4.76 | | 1.07 | 13.11 | 59.24 | | 1.86 | | 1.83 |
| Class R62,3 | 6.94 | 3.00 | 5.14 | | 1.42 | 15.91 | 65.11 | | 2.36 | | 2.33 |
| Class NAV2 | 6.95 | 3.01 | 5.18 | | 1.42 | 15.96 | 65.64 | | 2.37 | | 2.34 |
| Index† | 11.68 | 3.58 | 3.93 | | 3.39 | 19.21 | 47.07 | | — | | — |
Performance figures assume all distributions are reinvested. Figures reflect maximum sales charges on Class A shares of 4.0%, and the applicable contingent deferred sales charge (CDSC) on Class C shares. The returns for Class A shares have been adjusted to reflect the reduction in the maximum sales charge from 4.5% to 4.0%, effective 2-3-14. Class C shares sold within one year of purchase are subject to a 1% CDSC. Sales charges are not applicable to Class I, Class R2, Class R6, and Class NAV shares.
The expense ratios of the fund, both net (including any fee waivers and/or expense limitations) and gross (excluding any fee waivers and/or expense limitations), are set forth according to the most recent publicly available prospectuses for the fund and may differ from those disclosed in the Financial highlights tables in this report.Net expenses reflect contractual expense limitations in effect until December 31, 2020 and are subject to change. Had the contractual fee waivers and expense limitations not been in place, gross expenses would apply. The expense ratios are as follows:
| | | | | | | |
| | Class A | Class C | Class I | Class R2 | Class R6 | Class NAV |
| Gross (%) | 1.11 | 1.81 | 0.81 | 1.20 | 0.70 | 0.69 |
| Net (%) | 1.08 | 1.78 | 0.78 | 1.17 | 0.67 | 0.66 |
Please refer to the most recent prospectus and annual or semiannual report for more information on expenses and any expense limitation arrangements for each class.
The returns reflect past results and should not be considered indicative of future performance. The return and principal value of an investment will fluctuate so that shares, when redeemed, may be worth more or less than their original cost. Due to market volatility and other factors, the fund's current performance may be higher or lower than the performance shown. For current to the most recent month-end performance data, please call 800-225-5291 or visit the fund's website at jhinvestments.com.
The performance table above and the chart on the next page do not reflect the deduction of taxes that a shareholder would pay on fund distributions or the redemption of fund shares. The fund's performance results reflect any applicable fee waivers or expense reductions, without which the expenses would increase and results would have been less favorable.
| † | Index is the Bloomberg Barclays U.S. Aggregate Bond Index. |
See the following page for footnotes.
SEMIANNUAL REPORT | JOHN HANCOCK STRATEGIC INCOME OPPORTUNITIES FUND 5
This chart and table show what happened to a hypothetical $10,000 investment in John Hancock Strategic Income Opportunities Fund for the share classes and periods indicated, assuming all distributions were reinvested. For comparison, we've shown the same investment in the Bloomberg Barclays U.S. Aggregate Bond Index.
| | | | | |
| | Start date | With maximum
sales charge ($) | Without
sales charge ($) | Index ($) |
| Class C4 | 2-28-10 | 14,785 | 14,785 | 14,707 |
| Class I2 | 2-28-10 | 16,355 | 16,355 | 14,707 |
| Class R22,3 | 2-28-10 | 15,924 | 15,924 | 14,707 |
| Class R62,3 | 2-28-10 | 16,511 | 16,511 | 14,707 |
| Class NAV2 | 2-28-10 | 16,564 | 16,564 | 14,707 |
The values shown in the chart for "Class A shares with maximum sales charge" have been adjusted to reflect the reduction in the Class A maximum sales charge from 4.5% to 4.0%, which became effective on 2-3-14.
The Bloomberg Barclays U.S. Aggregate Bond Index is an unmanaged index of dollar-denominated and non-convertible investment-grade debt issues.
It is not possible to invest directly in an index. Index figures do not reflect sales charges or foreign currency impact, which would result in lower returns.
Footnotes related to performance pages
| 1 | Unsubsidized yield reflects what the yield would have been without the effect of reimbursements and waivers. |
| 2 | For certain types of investors, as described in the fund's prospectuses. |
| 3 | Class R2 shares were first offered on 3-1-12; Class R6 shares were first offered on 9-1-11. The returns prior to these dates are those of Class NAV shares that have not been adjusted for class-specific expenses; otherwise, returns would vary. |
| 4 | The contingent deferred sales charge is not applicable. |
SEMIANNUAL REPORT | JOHN HANCOCK STRATEGIC INCOME OPPORTUNITIES FUND 6
These examples are intended to help you understand your ongoing operating expenses of investing in the fund so you can compare these costs with the ongoing costs of investing in other mutual funds.
Understanding fund expenses
As a shareholder of the fund, you incur two types of costs:
■Transaction costs,which include sales charges (loads) on purchases or redemptions (varies by share class), minimum account fee charge, etc.
■Ongoing operating expenses, including management fees, distribution and service fees (if applicable), and other fund expenses.
We are presenting only your ongoing operating expenses here.
Actual expenses/actual returns
The first line of each share class in the table on the following page is intended to provide information about the fund’s actual ongoing operating expenses, and is based on the fund’s actual return. It assumes an account value of $1,000.00 on September 1, 2019, with the same investment held until February 29, 2020.
Together with the value of your account, you may use this information to estimate the operating expenses that you paid over the period. Simply divide your account value at February 29, 2020, by $1,000.00, then multiply it by the “expenses paid” for your share class from the table. For example, for an account value of $8,600.00, the operating expenses should be calculated as follows:
| | SEMIANNUAL REPORT | JOHN HANCOCK STRATEGIC INCOME OPPORTUNITIES FUND | 7 |
Remember, these examples do not include any transaction costs, therefore, these examples will not help you to determine the relative total costs of owning different funds. If transaction costs were included, your expenses would have been higher. See the prospectuses for details regarding transaction costs.
SHAREHOLDER EXPENSE EXAMPLE CHART
| | | Account
value on
9-1-2019 | Ending
value on
2-29-2020 | Expenses
paid during
period ended
2-29-20201 | Annualized
expense
ratio |
| Class A | Actual expenses/actual returns | $1,000.00 | $1,011.20 | $5.45 | 1.09% |
| | Hypothetical example | 1,000.00 | 1,019.40 | 5.47 | 1.09% |
| Class C | Actual expenses/actual returns | 1,000.00 | 1,007.70 | 8.94 | 1.79% |
| | Hypothetical example | 1,000.00 | 1,016.00 | 8.97 | 1.79% |
| Class I | Actual expenses/actual returns | 1,000.00 | 1,012.70 | 3.95 | 0.79% |
| | Hypothetical example | 1,000.00 | 1,020.90 | 3.97 | 0.79% |
| Class R2 | Actual expenses/actual returns | 1,000.00 | 1,010.70 | 5.90 | 1.18% |
| | Hypothetical example | 1,000.00 | 1,019.00 | 5.92 | 1.18% |
| Class R6 | Actual expenses/actual returns | 1,000.00 | 1,014.20 | 3.41 | 0.68% |
| | Hypothetical example | 1,000.00 | 1,021.50 | 3.42 | 0.68% |
| Class NAV | Actual expenses/actual returns | 1,000.00 | 1,014.20 | 3.36 | 0.67% |
| | Hypothetical example | 1,000.00 | 1,021.50 | 3.37 | 0.67% |
| 1 | Expenses are equal to the annualized expense ratio, multiplied by the average account value over the period, multiplied by 182/366 (to reflect the one-half year period). |
| 8 | JOHN HANCOCK STRATEGIC INCOME OPPORTUNITIES FUND | SEMIANNUAL REPORT | |
AS OF 2-29-20 (unaudited)
| | Rate (%) | Maturity date | | Par value^ | Value |
| U.S. Government and Agency obligations 11.7% | | | $610,207,178 |
| (Cost $533,143,700) | | | | | |
| U.S. Government 8.9% | | | | 465,965,155 |
| U.S. Treasury | | | | | |
| Bond | 2.750 | 11-15-42 | | 56,240,000 | 68,329,403 |
| Bond | 3.000 | 02-15-49 | | 68,035,000 | 89,008,915 |
| Bond | 3.125 | 02-15-43 | | 47,372,000 | 61,011,805 |
| Bond | 4.375 | 02-15-38 | | 47,125,000 | 69,549,873 |
| Note | 2.000 | 11-15-26 | | 31,370,000 | 33,319,597 |
| Note | 2.375 | 02-29-24 | | 26,420,000 | 27,931,926 |
| Note | 2.375 | 04-30-26 | | 14,140,000 | 15,290,532 |
| Note | 2.375 | 05-15-29 | | 67,775,000 | 75,169,358 |
| Note | 2.625 | 02-15-29 | | 23,355,000 | 26,353,746 |
| U.S. Government Agency 2.8% | | | | 144,242,023 |
Federal Home Loan Mortgage Corp.
30 Yr Pass Thru | 3.500 | 12-01-49 | | 30,202,125 | 31,939,539 |
| Federal National Mortgage Association | | | | | |
| 30 Yr Pass Thru | 3.000 | 04-01-46 | | 16,467,942 | 17,194,035 |
| 30 Yr Pass Thru | 3.000 | 11-01-46 | | 24,429,950 | 25,537,636 |
| 30 Yr Pass Thru | 3.000 | 02-01-49 | | 15,103,740 | 15,722,484 |
| 30 Yr Pass Thru | 3.000 | 11-01-49 | | 17,236,404 | 18,114,880 |
|
| 30 Yr Pass Thru | 3.000 | 12-01-49 | | 34,193,745 | 35,733,449 |
| Foreign government obligations 19.5% | | | | $1,018,809,588 |
| (Cost $1,075,342,107) | | | | | |
| Australia 0.4% | | | | | 19,079,147 |
| New South Wales Treasury Corp. | 4.000 | 04-08-21 | AUD | 8,000,000 | 5,404,386 |
| Queensland Treasury Corp. | 5.500 | 06-21-21 | AUD | 19,750,000 | 13,674,761 |
| Austria 0.3% | | | | | 17,513,741 |
| Republic of Austria (A) | 0.500 | 02-20-29 | EUR | 14,675,000 | 17,513,741 |
| Brazil 1.7% | | | | | 90,634,752 |
| Federative Republic of Brazil | 10.000 | 01-01-21 | BRL | 34,580,000 | 8,210,125 |
| Federative Republic of Brazil | 10.000 | 01-01-23 | BRL | 264,525,000 | 67,020,128 |
| Federative Republic of Brazil | 10.000 | 01-01-25 | BRL | 58,820,000 | 15,404,499 |
| Canada 1.5% | | | | | 79,907,691 |
| Export Development Canada | 2.400 | 06-07-21 | AUD | 4,145,000 | 2,754,217 |
| Government of Canada | 1.500 | 09-01-24 | CAD | 37,425,000 | 28,397,831 |
| Government of Canada | 2.250 | 03-01-24 | CAD | 26,458,000 | 20,605,406 |
| Province of Ontario | 2.900 | 06-02-28 | CAD | 13,400,000 | 10,801,363 |
| Province of Ontario | 3.450 | 06-02-45 | CAD | 11,995,000 | 11,071,593 |
| SEE NOTES TO FINANCIAL STATEMENTS | SEMIANNUAL REPORT | JOHN HANCOCK STRATEGIC INCOME OPPORTUNITIES FUND | 9 |
| | Rate (%) | Maturity date | | Par value^ | Value |
| Canada (continued) | | | | | |
| Province of Quebec | 3.000 | 09-01-23 | CAD | 8,000,000 | $6,277,281 |
| Colombia 1.4% | | | | | 74,620,122 |
| Republic of Colombia | 4.000 | 02-26-24 | | 12,000,000 | 12,741,600 |
| Republic of Colombia | 7.000 | 05-04-22 | COP | 81,417,000,000 | 24,198,196 |
| Republic of Colombia | 10.000 | 07-24-24 | COP | 70,698,700,000 | 23,860,450 |
| Republic of Colombia | 11.000 | 07-24-20 | COP | 47,392,100,000 | 13,819,876 |
| Finland 0.3% | | | | | 15,122,054 |
| Republic of Finland (A) | 0.500 | 09-15-28 | EUR | 12,680,000 | 15,122,054 |
| India 0.1% | | | | | 5,203,986 |
| Republic of India | 6.450 | 10-07-29 | INR | 373,000,000 | 5,203,986 |
| Indonesia 2.6% | | | | | 134,826,152 |
| Perusahaan Penerbit SBSN Indonesia III (A) | 4.150 | 03-29-27 | | 10,060,000 | 11,053,425 |
| Republic of Indonesia (A) | 2.150 | 07-18-24 | EUR | 6,000,000 | 7,092,530 |
| Republic of Indonesia (A) | 2.625 | 06-14-23 | EUR | 11,010,000 | 13,019,733 |
| Republic of Indonesia | 5.625 | 05-15-23 | IDR | 27,514,000,000 | 1,920,858 |
| Republic of Indonesia (A) | 5.875 | 01-15-24 | | 5,125,000 | 5,809,762 |
| Republic of Indonesia | 6.125 | 05-15-28 | IDR | 61,045,000,000 | 3,985,248 |
| Republic of Indonesia | 6.500 | 06-15-25 | IDR | 89,106,000,000 | 6,344,377 |
| Republic of Indonesia | 6.625 | 05-15-33 | IDR | 93,981,000,000 | 6,084,929 |
| Republic of Indonesia | 7.000 | 05-15-22 | IDR | 46,323,000,000 | 3,341,649 |
| Republic of Indonesia | 7.000 | 05-15-27 | IDR | 142,022,000,000 | 10,039,730 |
| Republic of Indonesia | 7.000 | 09-15-30 | IDR | 189,090,000,000 | 13,296,465 |
| Republic of Indonesia | 7.500 | 08-15-32 | IDR | 23,093,000,000 | 1,627,043 |
| Republic of Indonesia | 7.500 | 06-15-35 | IDR | 61,272,000,000 | 4,308,298 |
| Republic of Indonesia | 7.500 | 05-15-38 | IDR | 62,856,000,000 | 4,317,717 |
| Republic of Indonesia | 8.250 | 07-15-21 | IDR | 23,698,000,000 | 1,725,303 |
| Republic of Indonesia | 8.250 | 05-15-29 | IDR | 57,894,000,000 | 4,361,973 |
| Republic of Indonesia | 8.375 | 03-15-24 | IDR | 148,418,000,000 | 11,240,901 |
| Republic of Indonesia | 8.375 | 09-15-26 | IDR | 81,815,000,000 | 6,234,367 |
| Republic of Indonesia | 8.750 | 05-15-31 | IDR | 174,458,000,000 | 13,361,211 |
| Republic of Indonesia | 9.000 | 03-15-29 | IDR | 73,235,000,000 | 5,660,633 |
| Ireland 1.1% | | | | | 58,566,052 |
| Republic of Ireland | 3.400 | 03-18-24 | EUR | 29,580,000 | 37,835,091 |
| Republic of Ireland | 3.900 | 03-20-23 | EUR | 16,520,000 | 20,730,961 |
| Japan 1.1% | | | | | 54,956,599 |
| Government of Japan | 0.100 | 12-20-23 | JPY | 5,843,450,000 | 54,956,599 |
| Malaysia 1.7% | | | | | 89,481,439 |
| Government of Malaysia | 3.620 | 11-30-21 | MYR | 37,200,000 | 8,976,621 |
| Government of Malaysia | 3.733 | 06-15-28 | MYR | 24,975,000 | 6,323,237 |
| Government of Malaysia | 3.828 | 07-05-34 | MYR | 22,120,000 | 5,702,780 |
| 10 | JOHN HANCOCK STRATEGIC INCOME OPPORTUNITIES FUND | SEMIANNUAL REPORT | SEE NOTES TO FINANCIAL STATEMENTS |
| | Rate (%) | Maturity date | | Par value^ | Value |
| Malaysia (continued) | | | | | |
| Government of Malaysia | 3.844 | 04-15-33 | MYR | 57,566,000 | $14,826,953 |
| Government of Malaysia | 3.882 | 03-14-25 | MYR | 36,535,000 | 9,141,141 |
| Government of Malaysia | 3.899 | 11-16-27 | MYR | 43,417,000 | 11,077,038 |
| Government of Malaysia | 4.059 | 09-30-24 | MYR | 37,710,000 | 9,474,264 |
| Government of Malaysia | 4.160 | 07-15-21 | MYR | 65,363,000 | 15,834,333 |
| Government of Malaysia | 4.642 | 11-07-33 | MYR | 29,090,000 | 8,125,072 |
| Norway 1.1% | | | | | 54,803,099 |
| Government of Norway (A) | 2.000 | 05-24-23 | NOK | 196,500,000 | 21,519,623 |
| Government of Norway (A) | 3.750 | 05-25-21 | NOK | 303,765,000 | 33,283,476 |
| Philippines 2.1% | | | | | 109,245,133 |
| Republic of Philippines | 0.875 | 05-17-27 | EUR | 17,540,000 | 19,772,183 |
| Republic of Philippines | 3.375 | 08-20-20 | PHP | 89,890,000 | 1,763,195 |
| Republic of Philippines | 3.500 | 04-21-23 | PHP | 461,100,000 | 8,904,990 |
| Republic of Philippines | 4.625 | 09-09-40 | PHP | 45,902,000 | 856,230 |
| Republic of Philippines | 4.950 | 01-15-21 | PHP | 325,590,000 | 6,440,621 |
| Republic of Philippines | 5.500 | 03-08-23 | PHP | 261,150,000 | 5,336,878 |
| Republic of Philippines | 6.250 | 03-12-24 | PHP | 461,410,000 | 9,806,208 |
| Republic of Philippines | 6.250 | 01-14-36 | PHP | 499,000,000 | 12,232,496 |
| Republic of Philippines | 6.500 | 04-28-21 | PHP | 357,660,000 | 7,212,889 |
| Republic of Philippines | 7.375 | 03-03-21 | PHP | 313,800,000 | 6,373,792 |
| Republic of Philippines | 8.000 | 07-19-31 | PHP | 737,475,000 | 19,221,553 |
| Republic of Philippines | 8.125 | 12-16-35 | PHP | 419,020,160 | 11,324,098 |
| Portugal 1.4% | | | | | 74,426,968 |
| Republic of Portugal (A) | 2.125 | 10-17-28 | EUR | 22,105,000 | 28,415,375 |
| Republic of Portugal (A) | 3.850 | 04-15-21 | EUR | 20,380,000 | 23,589,801 |
| Republic of Portugal (A) | 5.125 | 10-15-24 | | 19,575,000 | 22,421,792 |
| Qatar 0.3% | | | | | 17,462,463 |
| State of Qatar (A) | 4.000 | 03-14-29 | | 10,455,000 | 11,818,039 |
| State of Qatar (A) | 4.817 | 03-14-49 | | 4,425,000 | 5,644,424 |
| Singapore 1.3% | | | | | 68,050,866 |
| Republic of Singapore | 1.750 | 04-01-22 | SGD | 31,630,000 | 22,931,896 |
| Republic of Singapore | 1.875 | 03-01-50 | SGD | 26,057,000 | 19,036,256 |
| Republic of Singapore | 3.250 | 09-01-20 | SGD | 35,985,000 | 26,082,714 |
| Sweden 0.5% | | | | | 24,080,203 |
| Kingdom of Sweden (A) | 0.125 | 04-24-23 | EUR | 21,340,000 | 24,080,203 |
| United Kingdom 0.6% | | | | | 30,829,121 |
| Government of United Kingdom | 0.500 | 07-22-22 | GBP | 10,345,000 | 13,324,826 |
|
| Government of United Kingdom | 3.750 | 09-07-20 | GBP | 13,430,000 | 17,504,295 |
| SEE NOTES TO FINANCIAL STATEMENTS | SEMIANNUAL REPORT | JOHN HANCOCK STRATEGIC INCOME OPPORTUNITIES FUND | 11 |
| | Rate (%) | Maturity date | | Par value^ | Value |
|
| Corporate bonds 48.2% | | | | | $2,521,229,356 |
| (Cost $2,491,172,873) | | | | | |
| Communication services 7.0% | | | | 368,287,983 |
| Diversified telecommunication services 1.5% | | | |
| GCI LLC (A) | 6.625 | 06-15-24 | | 19,505,000 | 20,663,207 |
| Intelsat Jackson Holdings SA (A) | 8.500 | 10-15-24 | | 17,710,000 | 15,496,250 |
| Verizon Communications, Inc. | 4.016 | 12-03-29 | | 14,525,000 | 16,884,183 |
| Verizon Communications, Inc. | 4.329 | 09-21-28 | | 20,424,000 | 23,974,501 |
| Entertainment 0.8% | | | |
| Lions Gate Capital Holdings LLC (A) | 5.875 | 11-01-24 | | 5,635,000 | 5,480,038 |
| Lions Gate Capital Holdings LLC (A) | 6.375 | 02-01-24 | | 16,135,000 | 15,812,300 |
| Live Nation Entertainment, Inc. (A) | 4.750 | 10-15-27 | | 8,025,000 | 8,065,125 |
| Netflix, Inc. (A) | 5.375 | 11-15-29 | | 13,335,000 | 14,497,812 |
| Interactive media and services 0.2% | | | |
| Match Group, Inc. (A) | 4.125 | 08-01-30 | | 7,915,000 | 7,754,326 |
| Twitter, Inc. (A) | 3.875 | 12-15-27 | | 2,056,000 | 2,099,690 |
| Media 4.3% | | | |
| Altice Financing SA (A) | 7.500 | 05-15-26 | | 15,280,000 | 16,082,964 |
| Cablevision Systems Corp. | 5.875 | 09-15-22 | | 8,930,000 | 9,377,840 |
| CCO Holdings LLC (A) | 4.750 | 03-01-30 | | 7,795,000 | 8,028,850 |
| CCO Holdings LLC (A) | 5.125 | 05-01-27 | | 25,845,000 | 26,871,047 |
| CCO Holdings LLC (A) | 5.750 | 02-15-26 | | 4,575,000 | 4,756,628 |
| Charter Communications Operating LLC | 5.125 | 07-01-49 | | 20,905,000 | 23,516,591 |
| Charter Communications Operating LLC | 5.750 | 04-01-48 | | 7,045,000 | 8,401,291 |
| CSC Holdings LLC (A) | 5.375 | 02-01-28 | | 14,225,000 | 14,798,694 |
| CSC Holdings LLC (A) | 5.500 | 04-15-27 | | 12,580,000 | 13,240,450 |
| CSC Holdings LLC (A) | 5.750 | 01-15-30 | | 16,615,000 | 17,570,363 |
| CSC Holdings LLC (A) | 7.500 | 04-01-28 | | 13,955,000 | 15,734,263 |
| DISH DBS Corp. | 5.875 | 07-15-22 | | 9,270,000 | 9,672,782 |
| LCPR Senior Secured Financing DAC (A) | 6.750 | 10-15-27 | | 15,810,000 | 16,625,796 |
| Outfront Media Capital LLC (A) | 5.000 | 08-15-27 | | 11,195,000 | 11,531,410 |
| Sirius XM Radio, Inc. (A) | 4.625 | 05-15-23 | | 2,105,000 | 2,120,788 |
| Sirius XM Radio, Inc. (A) | 5.375 | 07-15-26 | | 7,830,000 | 8,102,484 |
| WMG Acquisition Corp. (A) | 5.500 | 04-15-26 | | 16,304,000 | 17,037,680 |
| Wireless telecommunication services 0.2% | | | |
| Sprint Corp. (A) | 7.250 | 02-01-28 | | 4,116,000 | 4,125,878 |
| T-Mobile USA, Inc. | 6.500 | 01-15-26 | | 9,465,000 | 9,964,752 |
| 12 | JOHN HANCOCK STRATEGIC INCOME OPPORTUNITIES FUND | SEMIANNUAL REPORT | SEE NOTES TO FINANCIAL STATEMENTS |
| | Rate (%) | Maturity date | | Par value^ | Value |
| Consumer discretionary 4.8% | | | | $249,800,164 |
| Automobiles 0.1% | | | |
| BMW Finance NV | 1.000 | 11-14-24 | EUR | 4,785,000 | 5,502,119 |
| Diversified consumer services 0.2% | | | |
| Graham Holdings Company (A) | 5.750 | 06-01-26 | | 11,385,000 | 12,068,100 |
| Hotels, restaurants and leisure 2.3% | | | |
| Connect Finco SARL (A) | 6.750 | 10-01-26 | | 4,970,000 | 5,056,975 |
| ESH Hospitality, Inc. (A) | 5.250 | 05-01-25 | | 11,765,000 | 11,833,590 |
| KFC Holding Company/Pizza Hut Holdings LLC/Taco Bell of America LLC (A) | 5.000 | 06-01-24 | | 6,553,000 | 6,604,638 |
| KFC Holding Company/Pizza Hut Holdings LLC/Taco Bell of America LLC (A) | 5.250 | 06-01-26 | | 16,567,000 | 16,939,923 |
| New Red Finance, Inc. (A) | 3.875 | 01-15-28 | | 16,045,000 | 15,944,719 |
| New Red Finance, Inc. (A) | 4.250 | 05-15-24 | | 14,920,000 | 14,934,174 |
| New Red Finance, Inc. (A) | 5.000 | 10-15-25 | | 22,080,000 | 22,181,126 |
| Yum! Brands, Inc. (A) | 4.750 | 01-15-30 | | 24,625,000 | 25,551,146 |
| Household durables 0.6% | | | |
| Lennar Corp. | 4.500 | 04-30-24 | | 3,145,000 | 3,340,242 |
| Lennar Corp. | 4.750 | 11-29-27 | | 22,295,000 | 24,580,238 |
| Lennar Corp. | 5.875 | 11-15-24 | | 3,190,000 | 3,482,523 |
| Internet and direct marketing retail 0.8% | | | |
| Expedia Group, Inc. (A) | 3.250 | 02-15-30 | | 8,095,000 | 7,911,142 |
| Expedia Group, Inc. | 3.800 | 02-15-28 | | 16,295,000 | 16,744,379 |
| Expedia Group, Inc. (B) | 5.000 | 02-15-26 | | 12,955,000 | 14,593,197 |
| Liberty Interactive LLC | 8.250 | 02-01-30 | | 4,000,000 | 4,060,000 |
| Leisure products 0.8% | | | |
| Diamond Sports Group LLC (A) | 5.375 | 08-15-26 | | 20,125,000 | 18,555,653 |
| Diamond Sports Group LLC (A)(B) | 6.625 | 08-15-27 | | 24,588,000 | 19,916,280 |
| Consumer staples 1.8% | | | | 96,039,850 |
| Beverages 0.1% | | | |
| Molson Coors Beverage Company | 1.250 | 07-15-24 | EUR | 7,370,000 | 8,429,784 |
| Food products 1.4% | | | |
| JBS Investments II GmbH (A) | 7.000 | 01-15-26 | | 4,715,000 | 5,033,263 |
| Post Holdings, Inc. (A) | 5.000 | 08-15-26 | | 25,495,000 | 26,004,900 |
| Post Holdings, Inc. (A) | 5.500 | 12-15-29 | | 3,230,000 | 3,351,125 |
| Post Holdings, Inc. (A) | 5.625 | 01-15-28 | | 14,510,000 | 15,165,997 |
| Post Holdings, Inc. (A) | 5.750 | 03-01-27 | | 21,395,000 | 22,264,600 |
| Personal products 0.3% | | | |
| Natura Cosmeticos SA (A)(B) | 5.375 | 02-01-23 | | 4,245,000 | 4,390,434 |
| Walnut Bidco PLC (A) | 6.750 | 08-01-24 | EUR | 5,705,000 | 6,045,217 |
| SEE NOTES TO FINANCIAL STATEMENTS | SEMIANNUAL REPORT | JOHN HANCOCK STRATEGIC INCOME OPPORTUNITIES FUND | 13 |
| | Rate (%) | Maturity date | | Par value^ | Value |
| Consumer staples (continued) | | | | |
| Personal products (continued) | | | |
| Walnut Bidco PLC (A) | 9.125 | 08-01-24 | | 5,500,000 | $5,354,530 |
| Energy 8.2% | | | | 426,666,186 |
| Oil, gas and consumable fuels 8.2% | | | |
| Aker BP ASA (A) | 3.750 | 01-15-30 | | 11,235,000 | 11,429,394 |
| Aker BP ASA (A) | 4.750 | 06-15-24 | | 8,220,000 | 8,553,763 |
| Aker BP ASA (A) | 5.875 | 03-31-25 | | 590,000 | 619,782 |
| Continental Resources, Inc. | 4.375 | 01-15-28 | | 11,904,000 | 11,555,237 |
| DCP Midstream Operating LP | 5.125 | 05-15-29 | | 12,000,000 | 11,790,000 |
| DCP Midstream Operating LP | 5.375 | 07-15-25 | | 19,670,000 | 20,604,718 |
| Enbridge, Inc. | 4.250 | 12-01-26 | | 20,395,000 | 22,747,375 |
| Energy Transfer Operating LP | 5.500 | 06-01-27 | | 5,005,000 | 5,666,453 |
| Enterprise Products Operating LLC | 3.125 | 07-31-29 | | 25,370,000 | 26,527,017 |
| EOG Resources, Inc. (B) | 4.150 | 01-15-26 | | 5,080,000 | 5,679,130 |
| Indika Energy Capital III Pte, Ltd. (A)(B) | 5.875 | 11-09-24 | | 13,160,000 | 12,080,190 |
| Kinder Morgan, Inc. | 4.300 | 06-01-25 | | 5,250,000 | 5,798,252 |
| Marathon Oil Corp. | 4.400 | 07-15-27 | | 22,375,000 | 24,111,217 |
| Medco Oak Tree Pte, Ltd. (A) | 7.375 | 05-14-26 | | 13,090,000 | 12,749,338 |
| Parsley Energy LLC (A) | 5.375 | 01-15-25 | | 20,960,000 | 20,960,419 |
| Parsley Energy LLC (A) | 5.625 | 10-15-27 | | 23,250,000 | 23,046,563 |
| PBF Holding Company LLC (A)(B) | 6.000 | 02-15-28 | | 5,970,000 | 5,895,375 |
| PBF Holding Company LLC | 7.250 | 06-15-25 | | 22,930,000 | 23,579,607 |
| Pertamina Persero PT (A)(B) | 3.650 | 07-30-29 | | 3,440,000 | 3,569,755 |
| Pertamina Persero PT (A) | 4.300 | 05-20-23 | | 9,830,000 | 10,400,504 |
| Petrobras Global Finance BV (A) | 5.093 | 01-15-30 | | 27,589,000 | 29,520,230 |
| Petrobras Global Finance BV | 5.750 | 02-01-29 | | 5,650,000 | 6,370,375 |
| Petrobras Global Finance BV | 6.900 | 03-19-49 | | 9,265,000 | 11,094,838 |
| Petroleos del Peru SA (A) | 5.625 | 06-19-47 | | 8,126,000 | 9,822,303 |
| Sabine Pass Liquefaction LLC | 4.200 | 03-15-28 | | 4,150,000 | 4,384,959 |
| Sabine Pass Liquefaction LLC | 5.000 | 03-15-27 | | 864,000 | 953,560 |
| Saudi Arabian Oil Company (A) | 3.500 | 04-16-29 | | 12,615,000 | 13,398,879 |
| Saudi Arabian Oil Company (A) | 4.250 | 04-16-39 | | 10,765,000 | 11,936,852 |
| Saudi Arabian Oil Company (A) | 4.375 | 04-16-49 | | 8,315,000 | 9,416,100 |
| Targa Resources Partners LP | 5.875 | 04-15-26 | | 10,745,000 | 11,068,425 |
| The Williams Companies, Inc. | 4.300 | 03-04-24 | | 3,960,000 | 4,287,385 |
| The Williams Companies, Inc. | 4.550 | 06-24-24 | | 13,696,000 | 15,005,572 |
| TransCanada PipeLines, Ltd. | 4.250 | 05-15-28 | | 5,195,000 | 5,816,682 |
| Valero Energy Corp. | 3.400 | 09-15-26 | | 5,490,000 | 5,861,032 |
| WPX Energy, Inc. (B) | 5.750 | 06-01-26 | | 20,525,000 | 20,364,905 |
| 14 | JOHN HANCOCK STRATEGIC INCOME OPPORTUNITIES FUND | SEMIANNUAL REPORT | SEE NOTES TO FINANCIAL STATEMENTS |
| | Rate (%) | Maturity date | | Par value^ | Value |
| Financials 11.7% | | | | $610,911,504 |
| Banks 8.1% | | | |
| Asian Development Bank | 5.000 | 03-09-22 | AUD | 11,300,000 | 7,984,149 |
| Banco Actinver SA (A) | 4.800 | 12-18-32 | | 2,360,000 | 2,402,551 |
| Banco Actinver SA (A) | 9.500 | 12-18-32 | MXN | 138,600,000 | 6,988,797 |
| Bank of America Corp. (3.419% to 12-20-27, then 3 month LIBOR + 1.040%) | 3.419 | 12-20-28 | | 7,646,000 | 8,261,690 |
| Bank of America Corp. (3.974% to 2-7-29, then 3 month LIBOR + 1.210%) | 3.974 | 02-07-30 | | 5,180,000 | 5,872,141 |
| BNG Bank NV | 0.250 | 02-22-23 | EUR | 8,805,000 | 9,938,068 |
| BNG Bank NV | 0.250 | 06-07-24 | EUR | 10,700,000 | 12,174,934 |
| CIT Group, Inc. (5.800% to 6-15-22, then 3 month LIBOR + 3.972%) (B)(C) | 5.800 | 06-15-22 | | 2,085,000 | 2,064,150 |
| Citigroup, Inc. (3 month BBSW + 1.550%) (D) | 2.406 | 05-04-21 | AUD | 13,996,000 | 9,211,851 |
| Citigroup, Inc. (3 month EURIBOR + 0.500%) (D) | 0.102 | 03-21-23 | EUR | 10,835,000 | 11,971,156 |
| Credit Agricole SA (7.875% to 1-23-24, then 5 Year U.S. Swap Rate + 4.898%) (A)(C) | 7.875 | 01-23-24 | | 2,020,000 | 2,240,008 |
| European Investment Bank | 1.500 | 05-12-22 | NOK | 117,270,000 | 12,551,590 |
| European Investment Bank (SONIA + 0.350%) (D) | 1.061 | 06-29-23 | GBP | 6,180,000 | 7,949,359 |
| International Bank for Reconstruction & Development | 1.900 | 01-16-25 | CAD | 15,730,000 | 11,984,332 |
| International Bank for Reconstruction & Development | 2.800 | 01-13-21 | AUD | 10,970,000 | 7,266,986 |
| International Bank for Reconstruction & Development | 3.375 | 01-25-22 | NZD | 18,998,000 | 12,389,687 |
| International Bank for Reconstruction & Development | 3.500 | 01-22-21 | NZD | 13,130,000 | 8,381,935 |
| International Bank for Reconstruction & Development | 4.625 | 10-06-21 | NZD | 12,620,000 | 8,334,184 |
| International Bank for Reconstruction & Development | 7.450 | 08-20-21 | IDR | 213,155,000,000 | 15,036,020 |
| JPMorgan Chase & Co. | 3.625 | 12-01-27 | | 8,525,000 | 9,240,288 |
| KfW (E) | 0.173 | 09-15-23 | EUR | 5,350,000 | 6,020,702 |
| KfW | 0.375 | 03-15-23 | EUR | 10,960,000 | 12,442,318 |
| KfW | 2.125 | 08-15-23 | EUR | 19,615,000 | 23,671,191 |
| KfW | 6.000 | 08-20-20 | AUD | 14,710,000 | 9,812,104 |
| SEE NOTES TO FINANCIAL STATEMENTS | SEMIANNUAL REPORT | JOHN HANCOCK STRATEGIC INCOME OPPORTUNITIES FUND | 15 |
| | Rate (%) | Maturity date | | Par value^ | Value |
| Financials (continued) | | | | |
| Banks (continued) | | | |
| Lloyds Banking Group PLC (7.500% to 9-27-25, then 5 Year U.S. Swap Rate + 4.496%) (C) | 7.500 | 09-27-25 | | 6,103,000 | $6,789,588 |
| National Bank of Canada (A) | 2.150 | 10-07-22 | | 7,805,000 | 7,912,168 |
| Nordea Eiendomskreditt AS (3 month NIBOR + 0.300%) (D) | 2.170 | 06-21-23 | NOK | 88,000,000 | 9,378,405 |
| Nordea Eiendomskreditt AS (3 month NIBOR + 0.340%) (D) | 2.210 | 06-19-24 | NOK | 77,000,000 | 8,212,733 |
| Nordic Investment Bank | 1.375 | 07-15-20 | NOK | 33,590,000 | 3,567,476 |
| Nordic Investment Bank | 1.500 | 01-24-22 | NOK | 58,000,000 | 6,161,527 |
| Nordic Investment Bank | 4.125 | 03-19-20 | NZD | 18,050,000 | 11,296,781 |
| Popular, Inc. | 6.125 | 09-14-23 | | 17,095,000 | 17,928,381 |
| Societe Generale SA (8.000% to 9-29-25, then 5 Year U.S. ISDAFIX + 5.873%) (A)(C) | 8.000 | 09-29-25 | | 5,145,000 | 5,973,345 |
| Synovus Financial Corp. (5.750% to 12-15-20, then 3 month LIBOR + 4.182%) | 5.750 | 12-15-25 | | 18,875,000 | 19,394,063 |
| U.S. Bancorp | 0.850 | 06-07-24 | EUR | 35,085,000 | 39,979,955 |
| U.S. Bancorp | 3.150 | 04-27-27 | | 11,055,000 | 12,097,231 |
| U.S. Bancorp | 3.375 | 02-05-24 | | 5,956,000 | 6,377,790 |
| U.S. Bancorp | 3.600 | 09-11-24 | | 5,578,000 | 6,057,241 |
| U.S. Bank NA | 2.650 | 05-23-22 | | 10,515,000 | 10,805,471 |
| U.S. Bank NA | 2.800 | 01-27-25 | | 6,638,000 | 7,033,497 |
| Wells Fargo & Company (3 month BBSW + 1.320%) (D) | 2.204 | 07-27-21 | AUD | 9,035,000 | 5,937,066 |
| Wells Fargo & Company | 3.250 | 04-27-22 | AUD | 12,300,000 | 8,349,305 |
| Zions Bancorp NA (5.800% to 6-15-23, then 3 month LIBOR + 3.800%) (C) | 5.800 | 06-15-23 | | 4,690,000 | 4,854,150 |
| Capital markets 0.7% | | | |
| Deutsche Bank AG (6.000% to 10-30-25, then 5 Year CMT + 4.524%) (C) | 6.000 | 10-30-25 | | 21,000,000 | 19,425,000 |
| The Goldman Sachs Group, Inc. | 1.375 | 05-15-24 | EUR | 7,713,000 | 8,785,711 |
| The Goldman Sachs Group, Inc. | 2.000 | 11-01-28 | EUR | 4,470,000 | 5,413,380 |
| Diversified financial services 1.3% | | | |
| Berkshire Hathaway Finance Corp. | 2.375 | 06-19-39 | GBP | 7,150,000 | 9,974,445 |
| European Financial Stability Facility | 0.125 | 10-17-23 | EUR | 17,115,000 | 19,336,597 |
| European Financial Stability Facility | 1.875 | 05-23-23 | EUR | 9,155,000 | 10,905,079 |
| Swiss Insured Brazil Power Finance Sarl (A) | 9.850 | 07-16-32 | BRL | 109,135,000 | 28,431,377 |
| 16 | JOHN HANCOCK STRATEGIC INCOME OPPORTUNITIES FUND | SEMIANNUAL REPORT | SEE NOTES TO FINANCIAL STATEMENTS |
| | Rate (%) | Maturity date | | Par value^ | Value |
| Financials (continued) | | | | |
| Insurance 1.2% | | | |
| American International Group, Inc. (8.175% to 5-15-38, then 3 month LIBOR + 4.195%) | 8.175 | 05-15-58 | | 25,595,000 | $34,937,175 |
| Chubb INA Holdings, Inc. | 0.300 | 12-15-24 | EUR | 9,990,000 | 11,077,238 |
| DB Insurance Company, Ltd. | 3.512 | 05-25-24 | KRW | 10,000,000,000 | 8,630,715 |
| DB Insurance Company, Ltd. | 3.865 | 05-25-27 | KRW | 10,000,000,000 | 8,982,213 |
| Thrifts and mortgage finance 0.4% | | | |
| MGIC Investment Corp. | 5.750 | 08-15-23 | | 7,970,000 | 8,707,225 |
| Nationstar Mortgage Holdings, Inc. (A) | 6.000 | 01-15-27 | | 13,790,000 | 14,008,985 |
| Health care 4.2% | | | | 221,457,495 |
| Health care equipment and supplies 0.6% | | | |
| Becton Dickinson Euro Finance Sarl | 1.208 | 06-04-26 | EUR | 8,910,000 | 10,184,778 |
| DH Europe Finance II Sarl | 0.450 | 03-18-28 | EUR | 18,445,000 | 20,231,900 |
| Health care providers and services 1.9% | | | |
| HCA Healthcare, Inc. | 6.250 | 02-15-21 | | 14,583,000 | 15,148,820 |
| HCA, Inc. | 3.500 | 09-01-30 | | 20,756,000 | 20,307,793 |
| HCA, Inc. | 4.125 | 06-15-29 | | 15,255,000 | 16,771,445 |
| HCA, Inc. | 5.375 | 02-01-25 | | 15,280,000 | 16,892,040 |
| Rede D'or Finance Sarl (A) | 4.500 | 01-22-30 | | 7,890,000 | 7,700,640 |
| Select Medical Corp. (A) | 6.250 | 08-15-26 | | 20,250,000 | 21,591,563 |
| Life sciences tools and services 0.3% | | | |
| Thermo Fisher Scientific, Inc. | 0.500 | 03-01-28 | EUR | 6,585,000 | 7,246,207 |
| Thermo Fisher Scientific, Inc. | 0.750 | 09-12-24 | EUR | 3,288,000 | 3,727,533 |
| Thermo Fisher Scientific, Inc. | 1.400 | 01-23-26 | EUR | 4,947,000 | 5,781,606 |
| Pharmaceuticals 1.4% | | | |
| Allergan Funding SCS | 1.250 | 06-01-24 | EUR | 6,760,000 | 7,773,436 |
| Allergan Funding SCS | 2.625 | 11-15-28 | EUR | 3,795,000 | 4,850,493 |
| Bausch Health Companies, Inc. (A) | 5.000 | 01-30-28 | | 18,105,000 | 17,867,281 |
| Bausch Health Companies, Inc. (A) | 5.250 | 01-30-30 | | 29,310,000 | 28,980,263 |
| Bausch Health Companies, Inc. (A) | 5.500 | 11-01-25 | | 5,520,000 | 5,683,282 |
| Bausch Health Companies, Inc. (A) | 5.875 | 05-15-23 | | 1,356,000 | 1,361,085 |
| Bausch Health Companies, Inc. (A) | 6.125 | 04-15-25 | | 2,766,000 | 2,821,320 |
| Bausch Health Companies, Inc. (A) | 9.000 | 12-15-25 | | 5,870,000 | 6,536,010 |
| SEE NOTES TO FINANCIAL STATEMENTS | SEMIANNUAL REPORT | JOHN HANCOCK STRATEGIC INCOME OPPORTUNITIES FUND | 17 |
| | Rate (%) | Maturity date | | Par value^ | Value |
| Industrials 2.5% | | | | $132,369,879 |
| Airlines 0.2% | | | |
| American Airlines Group, Inc. (A) | 5.000 | 06-01-22 | | 7,175,000 | 7,192,938 |
| Delta Air Lines, Inc. | 2.900 | 10-28-24 | | 4,955,000 | 4,992,712 |
| Building products 0.1% | | | |
| Owens Corning | 3.950 | 08-15-29 | | 6,190,000 | 6,878,662 |
| Commercial services and supplies 0.2% | | | |
| Cimpress PLC (A) | 7.000 | 06-15-26 | | 10,985,000 | 11,486,246 |
| Construction and engineering 0.6% | | | |
| AECOM | 5.125 | 03-15-27 | | 9,802,000 | 10,128,113 |
| AECOM | 5.875 | 10-15-24 | | 9,935,000 | 10,903,663 |
| HC2 Holdings, Inc. (A) | 11.500 | 12-01-21 | | 8,930,000 | 9,019,300 |
| Marine 0.2% | | | |
| Pelabuhan Indonesia II PT (A) | 4.250 | 05-05-25 | | 10,110,000 | 10,827,305 |
| Road and rail 0.5% | | | |
| Indian Railway Finance Corp., Ltd. (A) | 3.249 | 02-13-30 | | 7,580,000 | 7,567,256 |
| Uber Technologies, Inc. (A) | 8.000 | 11-01-26 | | 17,455,000 | 18,159,397 |
| Trading companies and distributors 0.5% | | | |
| BOC Aviation, Ltd. (A) | 2.750 | 09-18-22 | | 11,775,000 | 12,008,195 |
| BOC Aviation, Ltd. (3 month LIBOR + 1.050%) (A)(D) | 2.813 | 05-02-21 | | 3,715,000 | 3,735,227 |
| United Rentals North America, Inc. | 4.875 | 01-15-28 | | 7,050,000 | 7,235,415 |
| Transportation infrastructure 0.2% | | | |
| Jasa Marga Persero Tbk PT (A) | 7.500 | 12-11-20 | IDR | 114,350,000,000 | 7,919,907 |
| JSL Europe SA (A) | 7.750 | 07-26-24 | | 4,070,000 | 4,315,543 |
| Information technology 3.2% | | | | 166,622,208 |
| IT services 1.1% | | | |
| Banff Merger Sub, Inc. (A) | 9.750 | 09-01-26 | | 11,650,000 | 11,737,375 |
| Fidelity National Information Services, Inc. | 1.000 | 12-03-28 | EUR | 4,800,000 | 5,419,338 |
| Fidelity National Information Services, Inc. | 1.500 | 05-21-27 | EUR | 9,625,000 | 11,280,418 |
| Fiserv, Inc. | 1.125 | 07-01-27 | EUR | 3,495,000 | 4,018,629 |
| Fiserv, Inc. | 3.500 | 07-01-29 | | 21,025,000 | 22,980,329 |
| Semiconductors and semiconductor equipment 0.7% | | | |
| Broadcom, Inc. (A) | 4.750 | 04-15-29 | | 19,277,000 | 21,440,440 |
| NXP BV (A) | 3.875 | 06-18-26 | | 15,250,000 | 16,499,686 |
| Software 0.3% | | | |
| Camelot Finance SA (A) | 4.500 | 11-01-26 | | 4,330,000 | 4,351,217 |
| SS&C Technologies, Inc. (A) | 5.500 | 09-30-27 | | 11,675,000 | 12,287,938 |
| 18 | JOHN HANCOCK STRATEGIC INCOME OPPORTUNITIES FUND | SEMIANNUAL REPORT | SEE NOTES TO FINANCIAL STATEMENTS |
| | Rate (%) | Maturity date | | Par value^ | Value |
| Information technology (continued) | | | | |
| Technology hardware, storage and peripherals 1.1% | | | |
| Apple, Inc. | 0.875 | 05-24-25 | EUR | 7,156,000 | $8,296,296 |
| Dell International LLC (A) | 5.300 | 10-01-29 | | 15,715,000 | 18,105,237 |
| Dell International LLC (A) | 8.350 | 07-15-46 | | 19,742,000 | 26,823,579 |
| Vericast Corp. (A) | 8.375 | 08-15-22 | | 4,005,000 | 3,381,726 |
| Materials 2.1% | | | | 108,536,172 |
| Chemicals 0.2% | | | |
| Braskem Netherlands Finance BV (A) | 4.500 | 01-10-28 | | 4,175,000 | 4,086,281 |
| Ecolab, Inc. | 1.000 | 01-15-24 | EUR | 4,270,000 | 4,886,405 |
| Construction materials 0.1% | | | |
| St. Mary's Cement, Inc. (A)(B) | 5.750 | 01-28-27 | | 4,140,000 | 4,667,850 |
| Containers and packaging 1.7% | | | |
| Ardagh Packaging Finance PLC (A) | 5.250 | 08-15-27 | | 4,315,000 | 4,385,335 |
| Ball Corp. | 4.000 | 11-15-23 | | 20,360,000 | 20,920,918 |
| Ball Corp. | 4.875 | 03-15-26 | | 12,915,000 | 14,206,500 |
| Ball Corp. | 5.250 | 07-01-25 | | 14,545,000 | 16,084,297 |
| Berry Global, Inc. (A)(B) | 5.625 | 07-15-27 | | 7,670,000 | 7,976,417 |
| Crown Americas LLC | 4.500 | 01-15-23 | | 13,265,000 | 13,450,710 |
| Crown Cork & Seal Company, Inc. | 7.375 | 12-15-26 | | 11,568,000 | 13,563,480 |
| Paper and forest products 0.1% | | | |
| Fibria Overseas Finance, Ltd. (B) | 5.500 | 01-17-27 | | 3,945,000 | 4,307,979 |
| Real estate 1.1% | | | | 56,999,835 |
| Equity real estate investment trusts 1.1% | | | |
| American Tower Corp. | 1.950 | 05-22-26 | EUR | 3,650,000 | 4,392,209 |
| Crown Castle International Corp. | 3.800 | 02-15-28 | | 10,355,000 | 11,371,602 |
| Equinix, Inc. | 3.200 | 11-18-29 | | 6,305,000 | 6,599,039 |
| SBA Communications Corp. (A) | 3.875 | 02-15-27 | | 13,320,000 | 13,590,396 |
| SBA Communications Corp. | 4.875 | 09-01-24 | | 1,067,000 | 1,095,681 |
| SBA Tower Trust (A) | 2.836 | 01-15-25 | | 6,217,000 | 6,513,520 |
| VICI Properties LP (A) | 4.125 | 08-15-30 | | 8,940,000 | 8,951,175 |
| VICI Properties LP (A) | 4.625 | 12-01-29 | | 4,345,000 | 4,486,213 |
| Utilities 1.6% | | | | 83,538,080 |
| Electric utilities 0.9% | | | |
| Israel Electric Corp., Ltd. (A) | 5.000 | 11-12-24 | | 7,220,000 | 8,032,250 |
| Israel Electric Corp., Ltd. (A) | 6.875 | 06-21-23 | | 4,565,000 | 5,209,674 |
| Perusahaan Listrik Negara PT (A) | 4.125 | 05-15-27 | | 16,960,000 | 18,226,912 |
| Vistra Operations Company LLC (A) | 3.550 | 07-15-24 | | 12,720,000 | 13,122,109 |
| SEE NOTES TO FINANCIAL STATEMENTS | SEMIANNUAL REPORT | JOHN HANCOCK STRATEGIC INCOME OPPORTUNITIES FUND | 19 |
| | Rate (%) | Maturity date | | Par value^ | Value |
| Utilities (continued) | | | | |
| Gas utilities 0.0% | | | |
| Southern Gas Networks PLC | 4.875 | 12-21-20 | GBP | 805,000 | $1,063,096 |
| Independent power and renewable electricity producers 0.7% | | | |
| Adani Green Energy UP, Ltd. (A) | 6.250 | 12-10-24 | | 5,330,000 | 5,716,073 |
| Greenko Dutch BV (A) | 5.250 | 07-24-24 | | 10,740,000 | 10,810,798 |
| Greenko Solar Mauritius, Ltd. (A) | 5.550 | 01-29-25 | | 5,260,000 | 5,352,951 |
|
| NRG Energy, Inc. | 6.625 | 01-15-27 | | 15,350,000 | 16,004,217 |
| Convertible bonds 1.5% | | | | | $81,265,323 |
| (Cost $76,137,593) | | | | | |
| Communication services 0.5% | | | 24,712,602 |
| Diversified telecommunication services 0.4% | | | |
| GCI Liberty, Inc. (A) | 1.750 | 09-30-46 | | 13,845,000 | 19,383,000 |
| Media 0.1% | | | |
| DISH Network Corp. | 3.375 | 08-15-26 | | 5,520,000 | 5,329,602 |
| Consumer discretionary 0.2% | | | 11,767,446 |
| Household durables 0.2% | | | |
| Sony Corp. | 0.000 | 09-30-22 | JPY | 940,000,000 | 11,767,446 |
| Health care 0.1% | | | 3,781,171 |
| Health care providers and services 0.1% | | | |
| Anthem, Inc. | 2.750 | 10-15-42 | | 1,050,000 | 3,781,171 |
| Information technology 0.5% | | | 27,175,140 |
| Software 0.5% | | | |
| Avaya Holdings Corp. | 2.250 | 06-15-23 | | 14,020,000 | 12,739,352 |
| IAC Financeco 2, Inc. (A) | 0.875 | 06-15-26 | | 14,115,000 | 14,435,788 |
| Utilities 0.2% | | | 13,828,964 |
| Independent power and renewable electricity producers 0.2% | | | |
|
| NRG Energy, Inc. | 2.750 | 06-01-48 | | 13,080,000 | 13,828,964 |
| Capital preferred securities 1.3% | | | | $68,516,298 |
| (Cost $66,125,308) | | | | | |
| Financials 1.3% | | | | | 68,516,298 |
| Banks 1.3% | | | |
| First Maryland Capital I (3 month LIBOR + 1.000%) (D) | 2.831 | 01-15-27 | | 13,280,000 | 12,616,000 |
| First Maryland Capital II (3 month LIBOR + 0.850%) (D) | 2.613 | 02-01-27 | | 12,524,000 | 11,897,800 |
| 20 | JOHN HANCOCK STRATEGIC INCOME OPPORTUNITIES FUND | SEMIANNUAL REPORT | SEE NOTES TO FINANCIAL STATEMENTS |
| | Rate (%) | Maturity date | | Par value^ | Value |
| Financials (continued) | | | | | |
| Banks (continued) | | | |
| USB Capital IX (Greater of 3 month LIBOR + 1.020% or 3.500%) (C)(D) | 3.500 | 03-30-20 | | 23,552,000 | $21,432,320 |
|
| Wachovia Capital Trust III (Greater of 3 month LIBOR + 0.930% or 5.570%) (C)(D) | 5.570 | 03-30-20 | | 22,542,000 | 22,570,178 |
| Term loans (F) 0.0% | | | | | $432,510 |
| (Cost $440,774) | | | | | |
| Consumer discretionary 0.0% | | | 432,510 |
| Auto components 0.0% | | | | |
|
| American Tire Distributors, Inc., PIK, Exit FILO Term Loan (1 month LIBOR + 6.000%) | 7.928 | 09-01-23 | | 440,774 | 432,510 |
| Collateralized mortgage obligations 5.4% | | | | $280,035,181 |
| (Cost $273,118,428) | | | | | |
| Commercial and residential 4.7% | | | | 242,430,613 |
| Arroyo Mortgage Trust | |
| Series 2018-1, Class A1 (A)(G) | 3.763 | 04-25-48 | | 8,800,767 | 8,937,948 |
| Series 2019-1, Class A1 (A)(G) | 3.805 | 01-25-49 | | 11,623,960 | 11,927,126 |
| Series 2019-2, Class A1 (A)(G) | 3.347 | 04-25-49 | | 16,787,550 | 17,062,473 |
| Series 2019-3, Class A1 (A)(G) | 2.962 | 10-25-48 | | 9,371,959 | 9,490,050 |
BAMLL Commercial Mortgage Securities Trust
Series 2019-BPR, Class ENM (A)(G) | 3.843 | 11-05-32 | | 7,550,000 | 7,395,504 |
BBCMS Mortgage Trust
Series 2018-TALL, Class E (1 month LIBOR + 2.437%) (A)(D) | 4.096 | 03-15-37 | | 10,580,000 | 10,593,218 |
BHMS Mortgage Trust
Series 2018-ATLS, Class C (1 month LIBOR + 1.900%) (A)(D) | 3.559 | 07-15-35 | | 8,770,000 | 8,770,287 |
| BX Commercial Mortgage Trust | |
| Series 2018-BIOA, Class E (1 month LIBOR + 1.951%) (A)(D) | 3.610 | 03-15-37 | | 13,569,000 | 13,568,904 |
| Series 2019-XL, Class A (1 month LIBOR + 0.920%) (A)(D) | 2.579 | 10-15-36 | | 23,259,226 | 23,363,274 |
| Series 2020-BXLP, Class A (1 month LIBOR + 0.800%) (A)(D) | 2.459 | 12-15-29 | | 7,775,000 | 7,778,594 |
| BXP Trust | |
| Series 2017-CC, Class C (A)(G) | 3.552 | 08-13-37 | | 6,835,000 | 7,297,981 |
| SEE NOTES TO FINANCIAL STATEMENTS | SEMIANNUAL REPORT | JOHN HANCOCK STRATEGIC INCOME OPPORTUNITIES FUND | 21 |
| | Rate (%) | Maturity date | | Par value^ | Value |
| Commercial and residential (continued) | | | | |
| Series 2017-GM, Class D (A)(G) | 3.425 | 06-13-39 | | 14,495,000 | $15,417,073 |
| Credit Suisse Mortgage Capital Certificates | |
| Series 2019-ICE4, Class D (1 month LIBOR + 1.600%) (A)(D) | 3.259 | 05-15-36 | | 9,960,000 | 9,963,106 |
| Series 2019-NQM1, Class A1 (A) | 2.656 | 10-25-59 | | 7,509,935 | 7,600,266 |
DBGS Mortgage Trust
Series 2018-BIOD, Class B (1 month LIBOR + 0.888%) (A)(D) | 2.546 | 05-15-35 | | 8,835,883 | 8,825,167 |
GS Mortgage Securities Corp. Trust
Series 2018-TWR, Class A (1 month LIBOR + 0.900%) (A)(D) | 2.559 | 07-15-31 | | 10,880,000 | 10,844,957 |
| HarborView Mortgage Loan Trust | |
| Series 2004-7, Class 4A (G) | 4.232 | 11-19-34 | | 1,643,256 | 1,710,573 |
| Series 2005-9, Class 2A1A (1 month LIBOR + 0.340%) (D) | 1.987 | 06-20-35 | | 1,859,070 | 1,845,303 |
| Series 2005-9, Class 2A1C (1 month LIBOR + 0.450%) (D) | 2.097 | 06-20-35 | | 1,280,959 | 1,278,876 |
| Series 2007-3, Class ES IO (A) | 0.350 | 05-19-47 | | 5,717,612 | 89,186 |
| Series 2007-4, Class ES IO | 0.350 | 07-19-47 | | 5,969,642 | 86,637 |
| Series 2007-6, Class ES IO (A) | 0.343 | 08-19-37 | | 5,321,733 | 75,622 |
| JPMorgan Chase Commercial Mortgage Securities Trust | |
| Series 2016-NINE, Class A (A)(G) | 2.854 | 09-06-38 | | 570,000 | 604,738 |
| Series 2018-AON, Class D (A)(G) | 4.613 | 07-05-31 | | 3,635,000 | 3,897,117 |
| Series 2018-PHH, Class C (1 month LIBOR + 1.360%) (A)(D) | 3.019 | 06-15-35 | | 3,580,000 | 3,575,131 |
Merrill Lynch Mortgage Investors Trust
Series 2005-A2, Class A2 (G) | 3.732 | 02-25-35 | | 1,289,184 | 1,311,243 |
| Morgan Stanley Mortgage Loan Trust | |
| Series 2004-8AR, Class 4A1 (G) | 4.007 | 10-25-34 | | 518,479 | 537,440 |
| Series 2004-9, Class 1A (G) | 5.403 | 11-25-34 | | 1,381,182 | 1,499,393 |
Olympic Tower Mortgage Trust
Series 2017-OT, Class A (A) | 3.566 | 05-10-39 | | 7,045,000 | 7,785,874 |
One Bryant Park Trust
Series 2019-OBP, Class A (A) | 2.516 | 09-15-54 | | 13,505,000 | 14,032,130 |
Verus Securitization Trust
Series 2018-1, Class A1 (A)(G) | 2.929 | 02-25-48 | | 2,871,364 | 2,871,801 |
| 22 | JOHN HANCOCK STRATEGIC INCOME OPPORTUNITIES FUND | SEMIANNUAL REPORT | SEE NOTES TO FINANCIAL STATEMENTS |
| | Rate (%) | Maturity date | | Par value^ | Value |
| Commercial and residential (continued) | | | | |
VNDO Trust
Series 2016-350P, Class D (A)(G) | 3.903 | 01-10-35 | | 9,985,000 | $10,797,488 |
| WaMu Mortgage Pass Through Certificates | |
| Series 2005-AR2, Class 2A2B (1 month LIBOR + 0.380%) (D) | 2.007 | 01-25-45 | | 1,518,671 | 1,496,732 |
| Series 2005-AR8, Class 2AB2 (1 month LIBOR + 0.840%) (D) | 2.467 | 07-25-45 | | 1,782,903 | 1,756,298 |
Worldwide Plaza Trust
Series 2017-WWP, Class D (A)(G) | 3.596 | 11-10-36 | | 7,935,000 | 8,343,103 |
| U.S. Government Agency 0.7% | | | | 37,604,568 |
| Federal Home Loan Mortgage Corp. | |
| Series 2014-DN2, Class M2 (1 month LIBOR + 1.650%) (D) | 3.277 | 04-25-24 | | 422,002 | 423,226 |
| Series 2015-DNA1, Class M2 (1 month LIBOR + 1.850%) (D) | 3.477 | 10-25-27 | | 1,353,095 | 1,361,403 |
| Series 2017-DNA2, Class M1 (1 month LIBOR + 1.200%) (D) | 2.827 | 10-25-29 | | 5,901,035 | 5,918,108 |
| Series 2017-DNA3, Class M1 (1 month LIBOR + 0.750%) (D) | 2.377 | 03-25-30 | | 4,193,744 | 4,189,331 |
| Federal National Mortgage Association | |
| Series 2019-R04, Class 2M2 (1 month LIBOR + 2.100%) (A)(D) | 3.727 | 06-25-39 | | 11,215,000 | 11,271,357 |
|
| Series 2019-R06, Class 2M2 (1 month LIBOR + 2.100%) (A)(D) | 3.727 | 09-25-39 | | 14,360,000 | 14,441,143 |
| Asset backed securities 3.8% | | | | $198,978,532 |
| (Cost $190,443,253) | | | | | |
| Asset backed securities 3.8% | | | | 198,978,532 |
AMSR Trust
Series 2019-SFR1, Class A (A) | 2.774 | 01-19-39 | | 18,845,000 | 19,630,480 |
Bravo Mortgage Asset Trust
Series 2006-1A, Class A2 (1 month LIBOR + 0.240%) (A)(D) | 1.867 | 07-25-36 | | 2,974,011 | 2,973,450 |
CARS-DB4 LP
Series 2020-1A, Class B3 (A) | 4.950 | 02-15-50 | | 9,065,000 | 9,427,600 |
| DB Master Finance LLC | | | | | |
| Series 2017-1A, Class A2I (A) | 3.629 | 11-20-47 | | 7,697,813 | 7,905,346 |
| Series 2019-1A, Class A2I (A) | 3.787 | 05-20-49 | | 10,783,513 | 11,163,847 |
| Series 2019-1A, Class A2II (A) | 4.021 | 05-20-49 | | 5,811,088 | 6,155,220 |
| SEE NOTES TO FINANCIAL STATEMENTS | SEMIANNUAL REPORT | JOHN HANCOCK STRATEGIC INCOME OPPORTUNITIES FUND | 23 |
| | Rate (%) | Maturity date | | Par value^ | Value |
| Asset backed securities (continued) | | | | |
| Domino's Pizza Master Issuer LLC | | | | | |
| Series 2015-1A, Class A2II (A) | 4.474 | 10-25-45 | | 5,857,550 | $6,304,715 |
| Series 2017-1A, Class A2I (3 month LIBOR + 1.250%) (A)(D) | 3.044 | 07-25-47 | | 14,203,075 | 14,133,480 |
Driven Brands Funding LLC
Series 2015-1A, Class A2 (A) | 5.216 | 07-20-45 | | 5,784,258 | 5,968,370 |
FOCUS Brands Funding LLC
Series 2017-1A, Class A2II (A) | 5.093 | 04-30-47 | | 6,637,313 | 7,164,780 |
GSAA Home Equity Trust
Series 2005-MTR1, Class A4 (1 month LIBOR + 0.370%) (D) | 1.997 | 10-25-35 | | 2,825,148 | 2,845,293 |
Home Partners of America Trust
Series 2018-1, Class D (1 month LIBOR + 1.450%) (A)(D) | 3.109 | 07-17-37 | | 7,715,000 | 7,656,455 |
Home Partners of America Trust
Series 2019-1, Class B (A) | 3.157 | 09-17-39 | | 4,958,072 | 5,173,034 |
Jack In The Box Funding LLC
Series 2019-1A, Class A2II (A) | 4.476 | 08-25-49 | | 6,997,463 | 7,301,012 |
METAL LLC
Series 2017-1, Class A (A) | 4.581 | 10-15-42 | | 3,947 | 4,001 |
Mill City Mortgage Loan Trust
Series 2018-3, Class A1 (A)(G) | 3.500 | 08-25-58 | | 15,696,439 | 16,486,780 |
MVW Owner Trust
Series 2018-1A, Class A (A) | 3.450 | 01-21-36 | | 5,949,148 | 6,165,887 |
NextGear Floorplan Master Owner Trust
Series 2018-2A, Class A2 (A) | 3.690 | 10-15-23 | | 11,700,000 | 12,139,722 |
Structured Asset Investment Loan Trust
Series 2005-2, Class M2 (1 month LIBOR + 0.735%) (D) | 2.362 | 03-25-35 | | 4,038,012 | 4,040,514 |
Taco Bell Funding LLC
Series 2016-1A, Class A23 (A) | 4.970 | 05-25-46 | | 19,488,900 | 21,227,310 |
| Towd Point Mortgage Trust | | | | | |
| Series 2018-3, Class A1 (A)(G) | 3.750 | 05-25-58 | | 3,953,487 | 4,176,074 |
| Series 2018-4, Class A1 (A)(G) | 3.000 | 06-25-58 | | 6,872,183 | 7,168,948 |
| Series 2019-1, Class A1 (A)(G) | 3.750 | 03-25-58 | | 5,356,973 | 5,713,194 |
Verizon Owner Trust
Series 2020-A, Class A1A | 1.850 | 07-22-24 | | 7,945,000 | 8,053,020 |
|
| | | | | Shares | Value |
| Common stocks 2.1% | | | | | $110,636,703 |
| (Cost $132,985,845) | | | | | |
| Communication services 0.0% | | | 0 |
| Media 0.0% | | |
| Vertis Holdings, Inc. (H)(I) | | | 110,794 | 0 |
| 24 | JOHN HANCOCK STRATEGIC INCOME OPPORTUNITIES FUND | SEMIANNUAL REPORT | SEE NOTES TO FINANCIAL STATEMENTS |
| | | | | Shares | Value |
| Consumer discretionary 0.4% | | | $22,826,381 |
| Household durables 0.4% | | |
| Lennar Corp., A Shares | | | 378,296 | 22,826,381 |
| Financials 0.9% | | | 47,100,594 |
| Banks 0.2% | | |
| U.S. Bancorp | | | 270,135 | 12,545,069 |
| Capital markets 0.7% | | |
| Deutsche Bank AG | | | 2,694,720 | 23,497,958 |
| The Bank of New York Mellon Corp. | | | 277,132 | 11,057,567 |
| Industrials 0.6% | | | 30,410,148 |
| Aerospace and defense 0.5% | | |
| The Boeing Company | | | 97,940 | 26,944,273 |
| Construction and engineering 0.1% | | |
| HC2 Holdings, Inc. (B)(I) | | | 907,297 | 3,465,875 |
| Real estate 0.2% | | | 10,299,580 |
| Equity real estate investment trusts 0.2% | | |
|
| Americold Realty Trust | | | 335,820 | 10,299,580 |
| Preferred securities 5.1% | | | | | $265,551,271 |
| (Cost $264,876,694) | | | | | |
| Financials 1.3% | | | 66,700,707 |
| Banks 1.3% | | | | |
| First Horizon Bank (Greater of 3 month LIBOR + 0.850% or 3.750%), 3.750% (A)(D) | | | 22,722 | 19,086,480 |
| U.S. Bancorp, 5.500% | | | 356,850 | 9,627,813 |
| U.S. Bancorp (Greater of 3 month LIBOR + 1.020% or 3.500%), 3.500% (D) | | | 22,325 | 19,791,113 |
| Valley National Bancorp (5.500% to 9-30-22, then 3 month LIBOR + 3.578%) | | | 272,325 | 7,110,406 |
| Wells Fargo & Company (5.850% to 9-15-23, then 3 month LIBOR + 3.090%) | | | 228,245 | 5,863,614 |
| Zions Bancorp NA (6.950% to 9-15-23, then 3 month LIBOR + 3.890%) | | | 177,776 | 5,221,281 |
| Health care 0.3% | | | 14,262,944 |
| Health care equipment and supplies 0.3% | | | | |
| Becton, Dickinson and Company, 6.125% | | | 252,040 | 14,262,944 |
| Industrials 0.5% | | | 26,005,224 |
| Machinery 0.5% | | | | |
| Fortive Corp., 5.000% (B) | | | 28,545 | 26,005,224 |
| SEE NOTES TO FINANCIAL STATEMENTS | SEMIANNUAL REPORT | JOHN HANCOCK STRATEGIC INCOME OPPORTUNITIES FUND | 25 |
| | | | | Shares | Value |
| Information technology 0.3% | | | $15,750,105 |
| Semiconductors and semiconductorequipment 0.3% | | | | |
| Broadcom, Inc., 8.000% (B) | | | 15,230 | 15,750,105 |
| Real estate 0.2% | | | 12,921,439 |
| Equity real estate investment trusts 0.2% | | | | |
| Crown Castle International Corp., 6.875% | | | 10,140 | 12,921,439 |
| Utilities 2.5% | | | 129,910,852 |
| Electric utilities 1.7% | | | | |
| American Electric Power Company, Inc., 6.125% | | | 380,600 | 19,745,528 |
| NextEra Energy, Inc., 4.872% | | | 471,900 | 23,920,611 |
| NextEra Energy, Inc., 5.279% | | | 421,350 | 19,155,287 |
| The Southern Company, 6.750% | | | 460,900 | 23,210,924 |
| Gas utilities 0.1% | | | | |
| South Jersey Industries, Inc., 7.250% (B) | | | 128,700 | 5,930,496 |
| Multi-utilities 0.7% | | | | |
| Dominion Energy, Inc., 7.250% | | | 226,500 | 22,683,975 |
| DTE Energy Company, 6.250% | | | 339,050 | 15,264,031 |
|
| | | | | Contracts/
Notional amount | Value |
| Purchased options 0.0% | | | | | $1,045,601 |
| (Cost $2,439,288) | | | | | |
| Calls 0.0% | | | | 1,045,601 |
| Over the Counter Option on the USD vs. AUD (Expiration Date: 6-4-20; Strike Price: AUD 0.69; Counterparty: Goldman Sachs Bank USA) (I)(J) | | 143,100,000 | 296,634 |
| Over the Counter Option on the USD vs. MXN (Expiration Date: 9-11-20; Strike Price: $22.50; Counterparty: Goldman Sachs Bank USA) (I)(J) | | 72,680,000 | 748,967 |
|
| | Yield* (%) | Maturity date | | Par value^ | Value |
| Short-term investments 1.6% | | | | $85,461,774 |
| (Cost $85,456,491) | | | | | |
| U.S. Government Agency 0.2% | | | 11,789,000 |
| Federal Agricultural Mortgage Corp. Discount Note | 1.390 | 03-02-20 | | 2,314,000 | 2,314,000 |
| Federal Home Loan Bank Discount Note | 1.320 | 03-02-20 | | 9,475,000 | 9,475,000 |
| | | Yield (%) | | Shares | Value |
| Short-term funds 1.0% | | | | | 54,892,774 |
| John Hancock Collateral Trust (K) | | 1.6968(L) | | 5,484,396 | 54,892,774 |
| 26 | JOHN HANCOCK STRATEGIC INCOME OPPORTUNITIES FUND | SEMIANNUAL REPORT | SEE NOTES TO FINANCIAL STATEMENTS |
| | | | | Par value^ | Value |
| Repurchase agreement 0.4% | | | | 18,780,000 |
| Barclays Tri-Party Repurchase Agreement dated 2-28-20 at 1.570% to be repurchased at $18,119,370 on 3-2-20, collateralized by $17,695,000 U.S. Treasury Notes, 1.875% due 6-30-26 (valued at $18,481,758) | | | 18,117,000 | 18,117,000 |
| Repurchase Agreement with State Street Corp. dated 2-28-20 at 0.550% to be repurchased at $663,030 on 3-2-20, collateralized by $625,000 U.S. Treasury Inflation Indexed Notes, 0.125% due 4-15-21 (valued at $678,776) | | | 663,000 | 663,000 |
|
| Total investments (Cost $5,191,682,354) 100.2% | | | $5,242,169,315 |
| Other assets and liabilities, net (0.2%) | | | (11,041,280) |
| Total net assets 100.0% | | | $5,231,128,035 |
| The percentage shown for each investment category is the total value of the category as a percentage of the net assets of the fund. |
| ^All par values are denominated in U.S. dollars unless otherwise indicated. |
| Currency Abbreviations |
| AUD | Australian Dollar |
| BRL | Brazilian Real |
| CAD | Canadian Dollar |
| COP | Colombian Peso |
| EUR | Euro |
| GBP | Pound Sterling |
| IDR | Indonesian Rupiah |
| INR | Indian Rupee |
| JPY | Japanese Yen |
| KRW | Korean Won |
| MXN | Mexican Peso |
| MYR | Malaysian Ringgit |
| NOK | Norwegian Krone |
| NZD | New Zealand Dollar |
| PHP | Philippine Peso |
| SGD | Singapore Dollar |
| Security Abbreviations and Legend |
| BBSW | Bank Bill Swap Rate |
| CMT | Constant Maturity Treasury |
| EURIBOR | Euro Interbank Offered Rate |
| IO | Interest-Only Security - (Interest Tranche of Stripped Mortgage Pool). Rate shown is the annualized yield at the end of the period. |
| ISDAFIX | International Swaps and Derivatives Association Fixed Interest Rate Swap Rate |
| LIBOR | London Interbank Offered Rate |
| NIBOR | Norwegian Interbank Offered Rate |
| PIK | Pay-in-Kind Security - Represents a payment-in-kind which may pay interest in additional par and/or cash. Rates shown are the current rate and most recent payment rate. |
| SEE NOTES TO FINANCIAL STATEMENTS | SEMIANNUAL REPORT | JOHN HANCOCK STRATEGIC INCOME OPPORTUNITIES FUND | 27 |
| SONIA | Sterling Overnight Interbank Average Rate |
| (A) | These securities are exempt from registration under Rule 144A of the Securities Act of 1933. Such securities may be resold, normally to qualified institutional buyers, in transactions exempt from registration. Rule 144A securities amounted to $1,937,437,732 or 37.0% of the fund's net assets as of 2-29-20. |
| (B) | All or a portion of this security is on loan as of 2-29-20. |
| (C) | Perpetual bonds have no stated maturity date. Date shown as maturity date is next call date. |
| (D) | Variable rate obligation. The coupon rate shown represents the rate at period end. |
| (E) | Zero coupon bonds are issued at a discount from their principal amount in lieu of paying interest periodically. Rate shown is the effective yield at period end. |
| (F) | Term loans are variable rate obligations. The coupon rate shown represents the rate at period end. |
| (G) | Variable or floating rate security, the interest rate of which adjusts periodically based on a weighted average of interest rates and prepayments on the underlying pool of assets. The interest rate shown is the current rate as of period end. |
| (H) | Security is valued using significant unobservable inputs and is classified as Level 3 in the fair value hierarchy. Refer to Note 2 to the financial statements. |
| (I) | Non-income producing security. |
| (J) | For this type of option, notional amounts are equivalent to number of contracts. |
| (K) | Investment is an affiliate of the fund, the advisor and/or subadvisor. This security represents the investment of cash collateral received for securities lending. |
| (L) | The rate shown is the annualized seven-day yield as of 2-29-20. |
| * | Yield represents either the annualized yield at the date of purchase, the stated coupon rate or, for floating rate securities, the rate at period end. |
| 28 | JOHN HANCOCK STRATEGIC INCOME OPPORTUNITIES FUND | SEMIANNUAL REPORT | SEE NOTES TO FINANCIAL STATEMENTS |
DERIVATIVES
FUTURES
| Open contracts | Number of
contracts | Position | Expiration
date | Notional
basis^ | Notional
value^ | Unrealized
appreciation
(depreciation) |
| German Euro BUND Futures | 127 | Long | Mar 2020 | $24,459,673 | $24,880,188 | $420,515 |
| Euro-BTP Italian Government Bond Futures | 264 | Short | Mar 2020 | (42,528,805) | (42,480,708) | 48,097 |
| Euro-Buxl Futures | 457 | Short | Mar 2020 | (104,449,686) | (110,879,971) | (6,430,285) |
| | | | | | | $(5,961,673) |
^ Notional basis refers to the contractual amount agreed upon at inception of open contracts; notional value represents the current value of the open contract.
FORWARD FOREIGN CURRENCY CONTRACTS
| Contract to buy | Contract to sell | Counterparty (OTC) | Contractual
settlement
date | Unrealized
appreciation | Unrealized
depreciation |
| AUD | 66,520,000 | CAD | 59,596,199 | ANZ | 6/17/2020 | — | $(979,719) |
| AUD | 6,680,000 | USD | 4,388,219 | BNY | 6/17/2020 | — | (28,307) |
| AUD | 19,334,804 | USD | 13,109,631 | MSCS | 6/17/2020 | — | (490,163) |
| AUD | 2,100,000 | USD | 1,379,335 | SSB | 6/17/2020 | — | (8,704) |
| CAD | 29,268,800 | AUD | 33,260,000 | HUS | 6/17/2020 | $95,558 | — |
| CAD | 29,790,300 | GBP | 17,161,250 | CITI | 6/17/2020 | 136,852 | — |
| CAD | 89,032,291 | GBP | 51,975,000 | GSI | 6/17/2020 | — | (473,035) |
| CAD | 88,965,267 | GBP | 51,486,250 | RBC | 6/17/2020 | 105,167 | — |
| CAD | 59,376,360 | GBP | 34,327,500 | SCB | 6/17/2020 | 115,131 | — |
| CAD | 14,534,940 | NZD | 17,178,750 | ANZ | 6/17/2020 | 80,392 | — |
| CAD | 87,044,331 | NZD | 103,057,500 | RBC | 6/17/2020 | 368,583 | — |
| CAD | 14,230,176 | USD | 10,750,113 | CIBC | 6/17/2020 | — | (149,368) |
| CAD | 54,502,003 | USD | 41,082,123 | RBC | 6/17/2020 | — | (480,948) |
| EUR | 7,202,589 | USD | 7,888,258 | SSB | 6/17/2020 | 110,015 | — |
| GBP | 69,122,500 | CAD | 119,870,396 | CIBC | 6/17/2020 | — | (462,048) |
| GBP | 17,166,250 | CAD | 29,442,162 | CITI | 6/17/2020 | 128,918 | — |
| GBP | 17,166,250 | CAD | 29,541,915 | GSI | 6/17/2020 | 54,607 | — |
| GBP | 34,327,500 | CAD | 59,141,893 | MSCS | 6/17/2020 | 59,535 | — |
| GBP | 17,161,250 | CAD | 29,694,282 | SCB | 6/17/2020 | — | (65,324) |
| GBP | 17,115,000 | USD | 21,895,048 | GSI | 6/17/2020 | 100,893 | — |
| GBP | 33,355,000 | USD | 43,616,899 | UBS | 6/17/2020 | — | (749,553) |
| JPY | 3,729,408,255 | USD | 34,327,500 | ANZ | 6/17/2020 | 426,310 | — |
| JPY | 3,601,629,445 | USD | 33,190,000 | GSI | 6/17/2020 | 373,057 | — |
| MXN | 222,127,767 | USD | 11,609,546 | GSI | 6/17/2020 | — | (508,077) |
| NZD | 34,357,500 | CAD | 29,054,935 | ANZ | 6/17/2020 | — | (149,649) |
| NZD | 34,355,000 | CAD | 29,070,895 | CIBC | 6/17/2020 | — | (163,102) |
| NZD | 34,362,780 | CAD | 29,055,964 | NAB | 6/17/2020 | — | (147,112) |
| NZD | 34,345,000 | CAD | 29,289,073 | RBC | 6/17/2020 | — | (331,889) |
| NZD | 34,357,500 | CAD | 29,055,853 | SCB | 6/17/2020 | — | (150,332) |
| NZD | 9,946,948 | USD | 6,465,679 | SSB | 6/17/2020 | — | (242,658) |
| SGD | 25,908,475 | USD | 18,549,167 | HUS | 3/2/2020 | 51,217 | — |
| SEE NOTES TO FINANCIAL STATEMENTS | SEMIANNUAL REPORT | JOHN HANCOCK STRATEGIC INCOME OPPORTUNITIES FUND | 29 |
FORWARD FOREIGN CURRENCY CONTRACTS (continued)
| Contract to buy | Contract to sell | Counterparty (OTC) | Contractual
settlement
date | Unrealized
appreciation | Unrealized
depreciation |
| SGD | 68,867,979 | USD | 50,077,143 | ANZ | 6/17/2020 | — | $(601,884) |
| SGD | 16,059,344 | USD | 11,838,224 | SCB | 6/17/2020 | — | (301,074) |
| USD | 43,979,571 | AUD | 65,173,168 | ANZ | 6/17/2020 | $1,442,253 | — |
| USD | 7,955,445 | BRL | 34,644,373 | CITI | 6/17/2020 | 250,852 | — |
| USD | 141,304,612 | CAD | 187,533,122 | MSCS | 6/17/2020 | 1,602,128 | — |
| USD | 66,485,756 | EUR | 60,143,151 | CITI | 6/17/2020 | — | (301,523) |
| USD | 25,087,706 | EUR | 22,588,818 | GSI | 6/17/2020 | 3,459 | — |
| USD | 35,045,095 | EUR | 31,688,635 | MSCS | 6/17/2020 | — | (144,243) |
| USD | 280,588,319 | EUR | 251,888,180 | UBS | 6/17/2020 | 873,579 | — |
| USD | 29,690,571 | GBP | 22,886,184 | CITI | 6/17/2020 | 277,590 | — |
| USD | 23,312,854 | GBP | 18,150,084 | HUS | 6/17/2020 | — | (13,362) |
| USD | 21,557,170 | GBP | 16,677,500 | UBS | 6/17/2020 | 123,497 | — |
| USD | 67,517,500 | JPY | 7,397,534,632 | CITI | 6/17/2020 | — | (1,419,042) |
| USD | 31,890,446 | JPY | 3,422,036,158 | GSI | 6/17/2020 | 992 | — |
| USD | 63,643,710 | MXN | 1,213,055,483 | CITI | 6/17/2020 | 3,017,804 | — |
| USD | 76,766,079 | NOK | 707,944,453 | HUS | 6/17/2020 | 1,537,966 | — |
| USD | 21,188,712 | NZD | 32,734,901 | ANZ | 6/17/2020 | 709,068 | — |
| USD | 81,492,852 | SGD | 112,089,921 | HUS | 6/17/2020 | 966,635 | — |
| | | | | | | $13,012,058 | $(8,361,116) |
| Derivatives Currency Abbreviations |
| AUD | Australian Dollar |
| BRL | Brazilian Real |
| CAD | Canadian Dollar |
| EUR | Euro |
| GBP | Pound Sterling |
| JPY | Japanese Yen |
| MXN | Mexican Peso |
| NOK | Norwegian Krone |
| NZD | New Zealand Dollar |
| SGD | Singapore Dollar |
| USD | U.S. Dollar |
| Derivatives Abbreviations |
| ANZ | Australia and New Zealand Banking Group Limited |
| BNY | The Bank of New York Mellon |
| CIBC | Canadian Imperial Bank of Commerce |
| CITI | Citibank, N.A. |
| GSI | Goldman Sachs International |
| HUS | HSBC Bank USA, N.A. |
| MSCS | Morgan Stanley Capital Services LLC |
| NAB | National Australia Bank Ltd. |
| OTC | Over-the-counter |
| RBC | Royal Bank of Canada |
| 30 | JOHN HANCOCK STRATEGIC INCOME OPPORTUNITIES FUND | SEMIANNUAL REPORT | SEE NOTES TO FINANCIAL STATEMENTS |
| SCB | Standard Chartered Bank |
| SSB | State Street Bank and Trust Company |
| UBS | UBS AG |
At 2-29-20, the aggregate cost of investments for federal income tax purposes was $5,220,589,579. Net unrealized appreciation aggregated to $20,269,005, of which $192,910,471 related to gross unrealized appreciation and $172,641,466 related to gross unrealized depreciation.
See Notes to financial statements regarding investment transactions and other derivatives information.
| SEE NOTES TO FINANCIAL STATEMENTS | SEMIANNUAL REPORT | JOHN HANCOCK STRATEGIC INCOME OPPORTUNITIES FUND | 31 |
STATEMENT OF ASSETS AND LIABILITIES 2-29-20 (unaudited)
| Assets | |
| Unaffiliated investments, at value (Cost $5,136,794,393) including $53,629,438 of securities loaned | $5,187,276,541 |
| Affiliated investments, at value (Cost $54,887,961) | 54,892,774 |
| Total investments, at value (Cost $5,191,682,354) | 5,242,169,315 |
| Unrealized appreciation on forward foreign currency contracts | 13,012,058 |
| Cash | 583 |
| Foreign currency, at value (Cost $6,342,258) | 6,419,322 |
| Collateral held at broker for futures contracts | 13,514,604 |
| Collateral segregated at custodian for OTC derivative contracts | 2,293,000 |
| Dividends and interest receivable | 46,399,857 |
| Receivable for fund shares sold | 32,006,898 |
| Receivable for investments sold | 49,021,667 |
| Receivable for securities lending income | 39,473 |
| Other assets | 220,651 |
| Total assets | 5,405,097,428 |
| Liabilities | |
| Unrealized depreciation on forward foreign currency contracts | 8,361,116 |
| Payable for futures variation margin | 3,545,477 |
| Distributions payable | 159,761 |
| Foreign capital gains tax payable | 101 |
| Payable for investments purchased | 44,453,303 |
| Payable for fund shares repurchased | 61,318,382 |
| Payable upon return of securities loaned | 54,867,193 |
| Payable to affiliates | |
| Accounting and legal services fees | 133,794 |
| Transfer agent fees | 256,942 |
| Distribution and service fees | 4,594 |
| Trustees' fees | 11,803 |
| Other liabilities and accrued expenses | 856,927 |
| Total liabilities | 173,969,393 |
| Net assets | $5,231,128,035 |
| Net assets consist of | |
| Paid-in capital | $5,424,478,681 |
| Total distributable earnings (loss) | (193,350,646) |
| Net assets | $5,231,128,035 |
| |
| 32 | JOHN HANCOCK Strategic Income Opportunities Fund | SEMIANNUAL REPORT | SEE NOTES TO FINANCIAL STATEMENTS |
STATEMENT OF ASSETS AND LIABILITIES (continued)
| Net asset value per share | |
| Based on net asset value and shares outstanding - the fund has an unlimited number of shares authorized with no par value | |
| Class A ($325,883,858 ÷ 30,507,493 shares)1 | $10.68 |
| Class C ($174,401,161 ÷ 16,325,465 shares)1 | $10.68 |
| Class I ($2,216,965,903 ÷ 207,518,589 shares) | $10.68 |
| Class R2 ($10,422,203 ÷ 974,743 shares) | $10.69 |
| Class R6 ($455,351,631 ÷ 42,596,428 shares) | $10.69 |
| Class NAV ($2,048,103,279 ÷ 191,811,070 shares) | $10.68 |
| Maximum offering price per share | |
| Class A (net asset value per share ÷ 96%)2 | $11.13 |
| 1 | Redemption price per share is equal to net asset value less any applicable contingent deferred sales charge. |
| 2 | On single retail sales of less than $100,000. On sales of $100,000 or more and on group sales the offering price is reduced. |
| SEE NOTES TO FINANCIAL STATEMENTS | SEMIANNUAL REPORT | JOHN HANCOCK Strategic Income Opportunities Fund | 33 |
STATEMENT OF OPERATIONS For the six months ended 2-29-20 (unaudited)
| Investment income | |
| Interest | $88,988,630 |
| Dividends | 7,415,841 |
| Securities lending | 346,851 |
| Less foreign taxes withheld | (1,314,611) |
| Total investment income | 95,436,711 |
| Expenses | |
| Investment management fees | 17,035,124 |
| Distribution and service fees | 1,453,357 |
| Accounting and legal services fees | 486,505 |
| Transfer agent fees | 1,736,687 |
| Trustees' fees | 50,576 |
| Custodian fees | 601,828 |
| State registration fees | 65,029 |
| Printing and postage | 266,757 |
| Professional fees | 106,157 |
| Other | 144,941 |
| Total expenses | 21,946,961 |
| Less expense reductions | (741,119) |
| Net expenses | 21,205,842 |
| Net investment income | 74,230,869 |
| Realized and unrealized gain (loss) | |
| Net realized gain (loss) on | |
| Unaffiliated investments and foreign currency transactions | 61,935,892 |
| Affiliated investments | (1,612) |
| Futures contracts | 4,341,338 |
| Forward foreign currency contracts | 26,812,485 |
| | 93,088,103 |
| Change in net unrealized appreciation (depreciation) of | |
| Unaffiliated investments and translation of assets and liabilities in foreign currencies | (69,997,276) |
| Affiliated investments | 11,046 |
| Futures contracts | (2,891,619) |
| Forward foreign currency contracts | (21,928,702) |
| | (94,806,551) |
| Net realized and unrealized loss | (1,718,448) |
| Increase in net assets from operations | $72,512,421 |
| 34 | JOHN HANCOCK Strategic Income Opportunities Fund | SEMIANNUAL REPORT | SEE NOTES TO FINANCIAL STATEMENTS |
STATEMENTS OF CHANGES IN NET ASSETS
| | Six months ended
2-29-20
(unaudited) | Year ended
8-31-19 |
| Increase (decrease) in net assets | | |
| From operations | | |
| Net investment income | $74,230,869 | $204,676,794 |
| Net realized gain (loss) | 93,088,103 | (296,285,647) |
| Change in net unrealized appreciation (depreciation) | (94,806,551) | 418,122,419 |
| Increase in net assets resulting from operations | 72,512,421 | 326,513,566 |
| Distributions to shareholders | | |
| From earnings | | |
| Class A | (3,356,799) | (10,765,205) |
| Class C | (1,255,967) | (5,358,059) |
| Class I | (26,381,602) | (89,828,701) |
| Class R2 | (114,994) | (428,768) |
| Class R6 | (6,324,359) | (30,825,594) |
| Class NAV | (25,725,294) | (62,949,837) |
| Total distributions | (63,159,015) | (200,156,164) |
| From fund share transactions | (247,560,242) | (2,012,363,901) |
| Total decrease | (238,206,836) | (1,886,006,499) |
| Net assets | | |
| Beginning of period | 5,469,334,871 | 7,355,341,370 |
| End of period | $5,231,128,035 | $5,469,334,871 |
| SEE NOTES TO FINANCIAL STATEMENTS | SEMIANNUAL REPORT | JOHN HANCOCK Strategic Income Opportunities Fund | 35 |
| CLASS A SHARES Period ended | 2-29-201 | 8-31-19 | 8-31-18 | 8-31-17 | 8-31-16 | 8-31-15 |
| Per share operating performance | | | | | | |
| Net asset value, beginning of period | $10.67 | $10.36 | $10.93 | $10.72 | $10.80 | $10.98 |
| Net investment income2 | 0.13 | 0.32 | 0.32 | 0.29 | 0.26 | 0.32 |
| Net realized and unrealized gain (loss) on investments | (0.01) | 0.30 | (0.55) | 0.17 | 0.21 | (0.17) |
| Total from investment operations | 0.12 | 0.62 | (0.23) | 0.46 | 0.47 | 0.15 |
| Less distributions | | | | | | |
| From net investment income | (0.11) | (0.31) | (0.34) | (0.25) | (0.28) | (0.33) |
| From net realized gain | — | — | — | — | (0.27) | — |
| Total distributions | (0.11) | (0.31) | (0.34) | (0.25) | (0.55) | (0.33) |
| Net asset value, end of period | $10.68 | $10.67 | $10.36 | $10.93 | $10.72 | $10.80 |
| Total return (%)3,4 | 1.125 | 6.10 | (2.28) | 4.44 | 4.52 | 1.42 |
| Ratios and supplemental data | | | | | | |
| Net assets, end of period (in millions) | $326 | $331 | $429 | $543 | $1,138 | $1,152 |
| Ratios (as a percentage of average net assets): | | | | | | |
| Expenses before reductions | 1.126 | 1.11 | 1.09 | 1.10 | 1.11 | 1.11 |
| Expenses including reductions | 1.096 | 1.08 | 1.06 | 1.07 | 1.08 | 1.08 |
| Net investment income | 2.466 | 3.09 | 2.99 | 2.73 | 2.42 | 2.95 |
| Portfolio turnover (%) | 36 | 84 | 63 | 42 | 44 | 37 |
| 1 | Six months ended 2-29-20. Unaudited. |
| 2 | Based on average daily shares outstanding. |
| 3 | Total returns would have been lower had certain expenses not been reduced during the applicable periods. |
| 4 | Does not reflect the effect of sales charges, if any. |
| 5 | Not annualized. |
| 6 | Annualized. |
| 36 | JOHN HANCOCK Strategic Income Opportunities Fund | SEMIANNUAL REPORT | SEE NOTES TO FINANCIAL STATEMENTS |
| CLASS C SHARES Period ended | 2-29-201 | 8-31-19 | 8-31-18 | 8-31-17 | 8-31-16 | 8-31-15 |
| Per share operating performance | | | | | | |
| Net asset value, beginning of period | $10.67 | $10.36 | $10.93 | $10.72 | $10.80 | $10.98 |
| Net investment income2 | 0.09 | 0.25 | 0.25 | 0.22 | 0.18 | 0.25 |
| Net realized and unrealized gain (loss) on investments | (0.01) | 0.29 | (0.56) | 0.16 | 0.21 | (0.17) |
| Total from investment operations | 0.08 | 0.54 | (0.31) | 0.38 | 0.39 | 0.08 |
| Less distributions | | | | | | |
| From net investment income | (0.07) | (0.23) | (0.26) | (0.17) | (0.20) | (0.26) |
| From net realized gain | — | — | — | — | (0.27) | — |
| Total distributions | (0.07) | (0.23) | (0.26) | (0.17) | (0.47) | (0.26) |
| Net asset value, end of period | $10.68 | $10.67 | $10.36 | $10.93 | $10.72 | $10.80 |
| Total return (%)3,4 | 0.775 | 5.36 | (2.97) | 3.72 | 3.79 | 0.71 |
| Ratios and supplemental data | | | | | | |
| Net assets, end of period (in millions) | $174 | $202 | $284 | $375 | $447 | $453 |
| Ratios (as a percentage of average net assets): | | | | | | |
| Expenses before reductions | 1.826 | 1.81 | 1.79 | 1.80 | 1.81 | 1.81 |
| Expenses including reductions | 1.796 | 1.78 | 1.76 | 1.77 | 1.78 | 1.78 |
| Net investment income | 1.766 | 2.40 | 2.29 | 2.07 | 1.72 | 2.26 |
| Portfolio turnover (%) | 36 | 84 | 63 | 42 | 44 | 37 |
| 1 | Six months ended 2-29-20. Unaudited. |
| 2 | Based on average daily shares outstanding. |
| 3 | Total returns would have been lower had certain expenses not been reduced during the applicable periods. |
| 4 | Does not reflect the effect of sales charges, if any. |
| 5 | Not annualized. |
| 6 | Annualized. |
| SEE NOTES TO FINANCIAL STATEMENTS | SEMIANNUAL REPORT | JOHN HANCOCK Strategic Income Opportunities Fund | 37 |
| CLASS I SHARES Period ended | 2-29-201 | 8-31-19 | 8-31-18 | 8-31-17 | 8-31-16 | 8-31-15 |
| Per share operating performance | | | | | | |
| Net asset value, beginning of period | $10.67 | $10.36 | $10.93 | $10.73 | $10.80 | $10.98 |
| Net investment income2 | 0.15 | 0.35 | 0.35 | 0.33 | 0.29 | 0.36 |
| Net realized and unrealized gain (loss) on investments | (0.02) | 0.30 | (0.55) | 0.15 | 0.22 | (0.17) |
| Total from investment operations | 0.13 | 0.65 | (0.20) | 0.48 | 0.51 | 0.19 |
| Less distributions | | | | | | |
| From net investment income | (0.12) | (0.34) | (0.37) | (0.28) | (0.31) | (0.37) |
| From net realized gain | — | — | — | — | (0.27) | — |
| Total distributions | (0.12) | (0.34) | (0.37) | (0.28) | (0.58) | (0.37) |
| Net asset value, end of period | $10.68 | $10.67 | $10.36 | $10.93 | $10.73 | $10.80 |
| Total return (%)3 | 1.274 | 6.41 | (2.00) | 4.67 | 4.94 | 1.74 |
| Ratios and supplemental data | | | | | | |
| Net assets, end of period (in millions) | $2,217 | $2,315 | $3,441 | $3,873 | $2,500 | $2,198 |
| Ratios (as a percentage of average net assets): | | | | | | |
| Expenses before reductions | 0.825 | 0.82 | 0.79 | 0.79 | 0.79 | 0.80 |
| Expenses including reductions | 0.795 | 0.79 | 0.76 | 0.76 | 0.76 | 0.76 |
| Net investment income | 2.765 | 3.38 | 3.28 | 3.10 | 2.73 | 3.26 |
| Portfolio turnover (%) | 36 | 84 | 63 | 42 | 44 | 37 |
| 1 | Six months ended 2-29-20. Unaudited. |
| 2 | Based on average daily shares outstanding. |
| 3 | Total returns would have been lower had certain expenses not been reduced during the applicable periods. |
| 4 | Not annualized. |
| 5 | Annualized. |
| 38 | JOHN HANCOCK Strategic Income Opportunities Fund | SEMIANNUAL REPORT | SEE NOTES TO FINANCIAL STATEMENTS |
| CLASS R2 SHARES Period ended | 2-29-201 | 8-31-19 | 8-31-18 | 8-31-17 | 8-31-16 | 8-31-15 |
| Per share operating performance | | | | | | |
| Net asset value, beginning of period | $10.68 | $10.37 | $10.94 | $10.73 | $10.80 | $10.99 |
| Net investment income2 | 0.13 | 0.31 | 0.31 | 0.29 | 0.25 | 0.31 |
| Net realized and unrealized gain (loss) on investments | (0.02) | 0.30 | (0.55) | 0.16 | 0.22 | (0.17) |
| Total from investment operations | 0.11 | 0.61 | (0.24) | 0.45 | 0.47 | 0.14 |
| Less distributions | | | | | | |
| From net investment income | (0.10) | (0.30) | (0.33) | (0.24) | (0.27) | (0.33) |
| From net realized gain | — | — | — | — | (0.27) | — |
| Total distributions | (0.10) | (0.30) | (0.33) | (0.24) | (0.54) | (0.33) |
| Net asset value, end of period | $10.69 | $10.68 | $10.37 | $10.94 | $10.73 | $10.80 |
| Total return (%)3 | 1.074 | 6.01 | (2.36) | 4.32 | 4.52 | 1.30 |
| Ratios and supplemental data | | | | | | |
| Net assets, end of period (in millions) | $10 | $12 | $16 | $19 | $19 | $16 |
| Ratios (as a percentage of average net assets): | | | | | | |
| Expenses before reductions | 1.215 | 1.19 | 1.19 | 1.20 | 1.16 | 1.18 |
| Expenses including reductions | 1.185 | 1.17 | 1.16 | 1.17 | 1.13 | 1.14 |
| Net investment income | 2.375 | 3.01 | 2.89 | 2.68 | 2.37 | 2.85 |
| Portfolio turnover (%) | 36 | 84 | 63 | 42 | 44 | 37 |
| 1 | Six months ended 2-29-20. Unaudited. |
| 2 | Based on average daily shares outstanding. |
| 3 | Total returns would have been lower had certain expenses not been reduced during the applicable periods. |
| 4 | Not annualized. |
| 5 | Annualized. |
| SEE NOTES TO FINANCIAL STATEMENTS | SEMIANNUAL REPORT | JOHN HANCOCK Strategic Income Opportunities Fund | 39 |
| CLASS R6 SHARES Period ended | 2-29-201 | 8-31-19 | 8-31-18 | 8-31-17 | 8-31-16 | 8-31-15 |
| Per share operating performance | | | | | | |
| Net asset value, beginning of period | $10.67 | $10.37 | $10.94 | $10.73 | $10.80 | $10.98 |
| Net investment income2 | 0.15 | 0.37 | 0.36 | 0.35 | 0.30 | 0.36 |
| Net realized and unrealized gain (loss) on investments | — | 0.28 | (0.55) | 0.15 | 0.22 | (0.16) |
| Total from investment operations | 0.15 | 0.65 | (0.19) | 0.50 | 0.52 | 0.20 |
| Less distributions | | | | | | |
| From net investment income | (0.13) | (0.35) | (0.38) | (0.29) | (0.32) | (0.38) |
| From net realized gain | — | — | — | — | (0.27) | — |
| Total distributions | (0.13) | (0.35) | (0.38) | (0.29) | (0.59) | (0.38) |
| Net asset value, end of period | $10.69 | $10.67 | $10.37 | $10.94 | $10.73 | $10.80 |
| Total return (%)3 | 1.424 | 6.42 | (1.89) | 4.87 | 5.06 | 1.84 |
| Ratios and supplemental data | | | | | | |
| Net assets, end of period (in millions) | $455 | $543 | $1,464 | $998 | $31 | $15 |
| Ratios (as a percentage of average net assets): | | | | | | |
| Expenses before reductions | 0.715 | 0.70 | 0.69 | 0.69 | 0.70 | 0.77 |
| Expenses including reductions | 0.685 | 0.68 | 0.66 | 0.66 | 0.65 | 0.65 |
| Net investment income | 2.865 | 3.55 | 3.42 | 3.32 | 2.86 | 3.30 |
| Portfolio turnover (%) | 36 | 84 | 63 | 42 | 44 | 37 |
| 1 | Six months ended 2-29-20. Unaudited. |
| 2 | Based on average daily shares outstanding. |
| 3 | Total returns would have been lower had certain expenses not been reduced during the applicable periods. |
| 4 | Not annualized. |
| 5 | Annualized. |
| 40 | JOHN HANCOCK Strategic Income Opportunities Fund | SEMIANNUAL REPORT | SEE NOTES TO FINANCIAL STATEMENTS |
| CLASS NAV SHARES Period ended | 2-29-201 | 8-31-19 | 8-31-18 | 8-31-17 | 8-31-16 | 8-31-15 |
| Per share operating performance | | | | | | |
| Net asset value, beginning of period | $10.66 | $10.36 | $10.93 | $10.72 | $10.79 | $10.97 |
| Net investment income2 | 0.15 | 0.36 | 0.36 | 0.34 | 0.30 | 0.37 |
| Net realized and unrealized gain (loss) on investments | — | 0.29 | (0.55) | 0.16 | 0.22 | (0.17) |
| Total from investment operations | 0.15 | 0.65 | (0.19) | 0.50 | 0.52 | 0.20 |
| Less distributions | | | | | | |
| From net investment income | (0.13) | (0.35) | (0.38) | (0.29) | (0.32) | (0.38) |
| From net realized gain | — | — | — | — | (0.27) | — |
| Total distributions | (0.13) | (0.35) | (0.38) | (0.29) | (0.59) | (0.38) |
| Net asset value, end of period | $10.68 | $10.66 | $10.36 | $10.93 | $10.72 | $10.79 |
| Total return (%)3 | 1.424 | 6.54 | (1.89) | 4.79 | 5.06 | 1.85 |
| Ratios and supplemental data | | | | | | |
| Net assets, end of period (in millions) | $2,048 | $2,067 | $1,720 | $1,847 | $1,814 | $1,683 |
| Ratios (as a percentage of average net assets): | | | | | | |
| Expenses before reductions | 0.705 | 0.69 | 0.68 | 0.68 | 0.68 | 0.68 |
| Expenses including reductions | 0.675 | 0.66 | 0.65 | 0.65 | 0.65 | 0.65 |
| Net investment income | 2.885 | 3.45 | 3.41 | 3.20 | 2.85 | 3.39 |
| Portfolio turnover (%) | 36 | 84 | 63 | 42 | 44 | 37 |
| 1 | Six months ended 2-29-20. Unaudited. |
| 2 | Based on average daily shares outstanding. |
| 3 | Total returns would have been lower had certain expenses not been reduced during the applicable periods. |
| 4 | Not annualized. |
| 5 | Annualized. |
| SEE NOTES TO FINANCIAL STATEMENTS | SEMIANNUAL REPORT | JOHN HANCOCK Strategic Income Opportunities Fund | 41 |
| Notes to financial statements (unaudited) | |
Note 1—Organization
John Hancock Strategic Income Opportunities Fund (the fund) is a series of John Hancock Funds II (the Trust), an open-end management investment company organized as a Massachusetts business trust and registered under the Investment Company Act of 1940, as amended (the 1940 Act). The investment objective of the fund is to seek to maximize total return consisting of current income and capital appreciation.
The fund may offer multiple classes of shares. The shares currently outstanding are detailed in the Statement of assets and liabilities. Class A and Class C shares are offered to all investors. Class I shares are offered to institutions and certain investors. Class R2 shares are available only to certain retirement and 529 plans. Class R6 shares are only available to certain retirement plans, institutions and other investors. Class NAV shares are offered to John Hancock affiliated funds of funds, retirement plans for employees of John Hancock and/or Manulife Financial Corporation, and certain 529 plans. Class C shares convert to Class A shares ten years after purchase (certain exclusions may apply). Shareholders of each class have exclusive voting rights to matters that affect that class. The distribution and service fees, if any, and transfer agent fees for each class may differ.
Note 2—Significant accounting policies
The financial statements have been prepared in conformity with accounting principles generally accepted in the United States of America (US GAAP), which require management to make certain estimates and assumptions as of the date of the financial statements. Actual results could differ from those estimates and those differences could be significant. The fund qualifies as an investment company under Topic 946 of Accounting Standards Codification of US GAAP.
Events or transactions occurring after the end of the fiscal period through the date that the financial statements were issued have been evaluated in the preparation of the financial statements. The following summarizes the significant accounting policies of the fund:
Security valuation. Investments are stated at value as of the scheduled close of regular trading on the New York Stock Exchange (NYSE), normally at 4:00 P.M., Eastern Time. In case of emergency or other disruption resulting in the NYSE not opening for trading or the NYSE closing at a time other than the regularly scheduled close, the net asset value (NAV) may be determined as of the regularly scheduled close of the NYSE pursuant to the fund's Valuation Policies and Procedures.
In order to value the securities, the fund uses the following valuation techniques: Debt obligations are typically valued based on the evaluated prices provided by an independent pricing vendor. Independent pricing vendors utilize matrix pricing, which takes into account factors such as institutional-size trading in similar groups of securities, yield, quality, coupon rate, maturity, type of issue, trading characteristics and other market data, as well as broker supplied prices. Equity securities, including exchange-traded or closed-end funds, are typically valued at the last sale price or official closing price on the exchange or principal market where the security trades. In the event there were no sales during the day or closing prices are not available, the securities are valued using the last available bid price. Investments by the fund in open-end mutual funds, including John Hancock Collateral Trust (JHCT), are valued at their respective NAVs each business day. Options listed on an exchange are valued at the mid-price of the last quoted bid and ask prices from the primary exchange where the option trades. Unlisted options are valued using evaluated prices obtained from an independent pricing vendor. Futures contracts are typically valued at last traded price on the exchange on which they trade. Forward foreign currency contracts are valued at the prevailing forward rates which are based on foreign currency exchange spot rates and forward points supplied by an independent pricing vendor. Foreign securities and currencies are valued in U.S. dollars based on foreign currency exchange rates supplied by an independent pricing vendor.
In certain instances, the Pricing Committee may determine to value equity securities using prices obtained from another exchange or market if trading on the exchange or market on which prices are typically obtained did not open for trading as scheduled, or if trading closed earlier than scheduled, and trading occurred as normal on another exchange or market.
| 42 | JOHN HANCOCK Strategic Income Opportunities Fund | SEMIANNUAL REPORT | |
Other portfolio securities and assets, for which reliable market quotations are not readily available, are valued at fair value as determined in good faith by the fund's Pricing Committee following procedures established by the Board of Trustees. The frequency with which these fair valuation procedures are used cannot be predicted and fair value of securities may differ significantly from the value that would have been used had a ready market for such securities existed.
The fund uses a three-tier hierarchy to prioritize the pricing assumptions, referred to as inputs, used in valuation techniques to measure fair value. Level 1 includes securities valued using quoted prices in active markets for identical securities, including registered investment companies. Level 2 includes securities valued using other significant observable inputs. Observable inputs may include quoted prices for similar securities, interest rates, prepayment speeds and credit risk. Prices for securities valued using these inputs are received from independent pricing vendors and brokers and are based on an evaluation of the inputs described. Level 3 includes securities valued using significant unobservable inputs when market prices are not readily available or reliable, including the fund's own assumptions in determining the fair value of investments. Factors used in determining value may include market or issuer specific events or trends, changes in interest rates and credit quality. The inputs or methodology used for valuing securities are not necessarily an indication of the risks associated with investing in those securities. Changes in valuation techniques and related inputs may result in transfers into or out of an assigned level within the disclosure hierarchy.
The following is a summary of the values by input classification of the fund's investments as of February 29, 2020, by major security category or type:
| | Total
value at
2-29-20 | Level 1
quoted
price | Level 2
significant
observable
inputs | Level 3
significant
unobservable
inputs |
| Investments in securities: | | | | |
| Assets | | | | |
| U.S. Government and Agency obligations | $610,207,178 | — | $610,207,178 | — |
| Foreign government obligations | 1,018,809,588 | — | 1,018,809,588 | — |
| Corporate bonds | 2,521,229,356 | — | 2,521,229,356 | — |
| Convertible bonds | 81,265,323 | — | 81,265,323 | — |
| Capital preferred securities | 68,516,298 | — | 68,516,298 | — |
| Term loans | 432,510 | — | 432,510 | — |
| Collateralized mortgage obligations | 280,035,181 | — | 280,035,181 | — |
| Asset backed securities | 198,978,532 | — | 198,978,532 | — |
| Common stocks | 110,636,703 | $110,636,703 | — | — |
| Preferred securities | 265,551,271 | 207,538,128 | 58,013,143 | — |
| Purchased options | 1,045,601 | — | 1,045,601 | — |
| Short-term investments | 85,461,774 | 54,892,774 | 30,569,000 | — |
| Total investments in securities | $5,242,169,315 | $373,067,605 | $4,869,101,710 | — |
| Derivatives: | | | | |
| Assets | | | | |
| Futures | $468,612 | $468,612 | — | — |
| Forward foreign currency contracts | 13,012,058 | — | $13,012,058 | — |
| Liabilities | | | | |
| Futures | (6,430,285) | (6,430,285) | — | — |
| | SEMIANNUAL REPORT | JOHN HANCOCK Strategic Income Opportunities Fund | 43 |
| | Total
value at
2-29-20 | Level 1
quoted
price | Level 2
significant
observable
inputs | Level 3
significant
unobservable
inputs |
| Forward foreign currency contracts | $(8,361,116) | — | $(8,361,116) | — |
Repurchase agreements. The fund may enter into repurchase agreements. When the fund enters into a repurchase agreement, it receives collateral that is held in a segregated account by the fund's custodian, or for tri-party repurchase agreements, collateral is held at a third-party custodian bank in a segregated account for the benefit of the fund. The collateral amount is marked-to-market and monitored on a daily basis to ensure that the collateral held is in an amount not less than the principal amount of the repurchase agreement plus any accrued interest. Collateral received by the fund for repurchase agreements is disclosed in the Fund's investments as part of the caption related to the repurchase agreement.
Repurchase agreements are typically governed by the terms and conditions of the Master Repurchase Agreement and/or Global Master Repurchase Agreement (collectively, MRA). Upon an event of default, the non-defaulting party may close out all transactions traded under the MRA and net amounts owed. Absent an event of default, assets and liabilities resulting from repurchase agreements are not offset in the Statement of assets and liabilities. In the event of a default by the counterparty, realization of the collateral proceeds could be delayed, during which time the collateral value may decline or the counterparty may have insufficient assets to pay claims resulting from close-out of the transactions.
Mortgage and asset backed securities. The fund may invest in mortgage-related securities, such as mortgage-backed securities, and other asset-backed securities, which are debt obligations that represent interests in pools of mortgages or other income-bearing assets, such as consumer loans or receivables. Such securities often involve risks that are different from the risks associated with investing in other types of debt securities. Mortgage-backed and other asset-backed securities are subject to changes in the payment patterns of borrowers of the underlying debt. When interest rates fall, borrowers are more likely to refinance or prepay their debt before its stated maturity. This may result in the fund having to reinvest the proceeds in lower yielding securities, effectively reducing the fund's income. Conversely, if interest rates rise and borrowers repay their debt more slowly than expected, the time in which the mortgage-backed and other asset-backed securities are paid off could be extended, reducing the fund's cash available for reinvestment in higher yielding securities. The timely payment of principal and interest of certain mortgage-related securities is guaranteed with the full faith and credit of the U.S. Government. Pools created and guaranteed by non-governmental issuers, including government-sponsored corporations (e.g. FNMA), may be supported by various forms of insurance or guarantees, but there can be no assurance that private insurers or guarantors can meet their obligations under the insurance policies or guarantee arrangements. The fund is also subject to risks associated with securities with contractual cash flows including asset-backed and mortgage related securities such as collateralized mortgage obligations, mortgage pass-through securities and commercial mortgage-backed securities. The value, liquidity and related income of these securities are sensitive to changes in economic conditions, including real estate value, pre-payments, delinquencies and/or defaults, and may be adversely affected by shifts in the market’s perception of the issuers and changes in interest rates.
Security transactions and related investment income. Investment security transactions are accounted for on a trade date plus one basis for daily NAV calculations. However, for financial reporting purposes, investment transactions are reported on trade date. Interest income is accrued as earned. Interest income includes coupon interest and amortization/accretion of premiums/discounts on debt securities. Debt obligations may be placed in a non-accrual status and related interest income may be reduced by stopping current accruals and writing off interest receivable when the collection of all or a portion of interest has become doubtful. Dividend income is recorded on the ex-date, except for dividends of certain foreign securities where the dividend may not be known until after the ex-date. In those cases, dividend income, net of withholding taxes, is recorded when the fund
| 44 | JOHN HANCOCK Strategic Income Opportunities Fund | SEMIANNUAL REPORT | |
becomes aware of the dividends. Non-cash dividends, if any, are recorded at the fair market value of the securities received. Gains and losses on securities sold are determined on the basis of identified cost and may include proceeds from litigation.
Real estate investment trusts. The fund may invest in real estate investment trusts (REITs). Distributions from REITs may be recorded as income and subsequently characterized by the REIT at the end of the fiscal year as a reduction of cost of investments and/or as a realized gain. As a result, the fund will estimate the components of distributions from these securities. Such estimates are revised when the actual components of the distributions are known.
Securities lending. The fund may lend its securities to earn additional income. The fund receives collateral from the borrower in an amount not less than the market value of the loaned securities. The fund will invest its cash collateral in JHCT, an affiliate of the fund, which has a floating NAV and is registered with the Securities and Exchange Commission (SEC) as an investment company. JHCT invests in short-term money market investments. The fund will receive the benefit of any gains and bear any losses generated by JHCT with respect to the cash collateral.
The fund has the right to recall loaned securities on demand. If a borrower fails to return loaned securities when due, then the lending agent is responsible and indemnifies the fund for the lent securities. The lending agent uses the collateral received from the borrower to purchase replacement securities of the same issue, type, class and series of the loaned securities. If the value of the collateral is less than the purchase cost of replacement securities, the lending agent is responsible for satisfying the shortfall but only to the extent that the shortfall is not due to any decrease in the value of JHCT.
Although the risk of loss on securities lent is mitigated by receiving collateral from the borrower and through lending agent indemnification, the fund could experience a delay in recovering securities or could experience a lower than expected return if the borrower fails to return the securities on a timely basis. The fund receives compensation for lending its securities by retaining a portion of the return on the investment of the collateral and compensation from fees earned from borrowers of the securities. Securities lending income received by the fund is net of fees retained by the securities lending agent. Net income received from JHCT is a component of securities lending income as recorded on the Statement of operations.
Obligations to repay collateral received by the fund are shown on the Statement of assets and liabilities as Payable upon return of securities loaned and are secured by the loaned securities. As of February 29, 2020, the fund loaned securities valued at $53,629,438 and received $54,867,193 of cash collateral.
Foreign investing. Assets, including investments, and liabilities denominated in foreign currencies are translated into U.S. dollar values each day at the prevailing exchange rate. Purchases and sales of securities, income and expenses are translated into U.S. dollars at the prevailing exchange rate on the date of the transaction. The effect of changes in foreign currency exchange rates on the value of securities is reflected as a component of the realized and unrealized gains (losses) on investments. Foreign investments are subject to a decline in the value of a foreign currency versus the U.S. dollar, which reduces the dollar value of securities denominated in that currency.
Funds that invest internationally generally carry more risk than funds that invest strictly in U.S. securities. These risks are heightened for investments in emerging markets. Risks can result from differences in economic and political conditions, regulations, market practices (including higher transaction costs), accounting standards and other factors.
Foreign taxes. The fund may be subject to withholding tax on income, capital gains or repatriation taxes imposed by certain countries, a portion of which may be recoverable. Foreign taxes are accrued based upon the fund's understanding of the tax rules and rates that exist in the foreign markets in which it invests. Taxes are accrued based on gains realized by the fund as a result of certain foreign security sales. In certain circumstances, estimated taxes are accrued based on unrealized appreciation of such securities. Investment income is recorded net of foreign withholding taxes.
| | SEMIANNUAL REPORT | JOHN HANCOCK Strategic Income Opportunities Fund | 45 |
Overdraft. The fund may have the ability to borrow from banks for temporary or emergency purposes, including meeting redemption requests that otherwise might require the untimely sale of securities. Pursuant to the fund's custodian agreement, the custodian may loan money to the fund to make properly authorized payments. The fund is obligated to repay the custodian for any overdraft, including any related costs or expenses. The custodian may have a lien, security interest or security entitlement in any fund property that is not otherwise segregated or pledged, to the extent of any overdraft, and to the maximum extent permitted by law.
Line of credit. The fund and other affiliated funds have entered into a syndicated line of credit agreement with Citibank, N.A. as the administrative agent that enables them to participate in a $750 million unsecured committed line of credit. Excluding commitments designated for a certain fund and subject to the needs of all other affiliated funds, the fund can borrow up to an aggregate commitment amount of $500 million, subject to asset coverage and other limitations as specified in the agreement. A commitment fee payable at the end of each calendar quarter, based on the average daily unused portion of the line of credit, is charged to each participating fund based on a combination of fixed and asset based allocations and is reflected in Other expenses on the Statement of operations. For the six months ended February 29, 2020, the fund had no borrowings under the line of credit. Commitment fees for the six months ended February 29, 2020 were $7,686.
Expenses. Within the John Hancock group of funds complex, expenses that are directly attributable to an individual fund are allocated to such fund. Expenses that are not readily attributable to a specific fund are allocated among all funds in an equitable manner, taking into consideration, among other things, the nature and type of expense and the fund’s relative net assets. Expense estimates are accrued in the period to which they relate and adjustments are made when actual amounts are known.
Class allocations. Income, common expenses and realized and unrealized gains (losses) are determined at the fund level and allocated daily to each class of shares based on the net assets of the class. Class-specific expenses, such as distribution and service fees, if any, and transfer agent fees, for all classes, are charged daily at the class level based on the net assets of each class and the specific expense rates applicable to each class.
Change in accounting principle. Accounting Standards Update (ASU) 2017-08,Premium Amortization on Purchased Callable Debt Securities, shortens the premium amortization period for purchased non contingently callable debt securities and is effective for public companies with fiscal years beginning after December 15, 2018. Adoption of the ASU did not have a material impact to the fund.
Federal income taxes. The fund intends to continue to qualify as a regulated investment company by complying with the applicable provisions of the Internal Revenue Code and will not be subject to federal income tax on taxable income that is distributed to shareholders. Therefore, no federal income tax provision is required.
For federal income tax purposes, as of August 31, 2019, the fund has a short-term capital loss carryforward of $165,711,509 and a long-term capital loss carryforward of $112,936,743 available to offset future net realized capital gains.These carryforwards do not expire.
As of August 31, 2019, the fund had no uncertain tax positions that would require financial statement recognition, derecognition or disclosure. The fund's federal tax returns are subject to examination by the Internal Revenue Service for a period of three years.
Distribution of income and gains. Distributions to shareholders from net investment income and net realized gains, if any, are recorded on the ex-date. The fund generally declares dividends daily and pays them monthly. Capital gain distributions, if any, are typically distributed annually.
Distributions paid by the fund with respect to each class of shares are calculated in the same manner, at the same time and in the same amount, except for the effect of class level expenses that may be applied differently to each class.
| 46 | JOHN HANCOCK Strategic Income Opportunities Fund | SEMIANNUAL REPORT | |
Such distributions, on a tax basis, are determined in conformity with income tax regulations, which may differ from US GAAP. Distributions in excess of tax basis earnings and profits, if any, are reported in the fund's financial statements as a return of capital. The final determination of tax characteristics of the fund's distribution will occur at the end of the year and will subsequently be reported to shareholders.
Capital accounts within the financial statements are adjusted for permanent book-tax differences. These adjustments have no impact on net assets or the results of operations. Temporary book-tax differences, if any, will reverse in a subsequent period. Book-tax differences are primarily attributable to straddle loss deferrals, foreign currency transactions, derivative transactions, amortization and accretion on debt securities and contingent payment debt instruments.
Note 3—Derivative instruments
The fund may invest in derivatives in order to meet its investment objective. Derivatives include a variety of different instruments that may be traded in the over-the-counter (OTC) market, on a regulated exchange or through a clearing facility. The risks in using derivatives vary depending upon the structure of the instruments, including the use of leverage, optionality, the liquidity or lack of liquidity of the contract, the creditworthiness of the counterparty or clearing organization and the volatility of the position. Some derivatives involve risks that are potentially greater than the risks associated with investing directly in the referenced securities or other referenced underlying instrument. Specifically, the fund is exposed to the risk that the counterparty to an OTC derivatives contract will be unable or unwilling to make timely settlement payments or otherwise honor its obligations. OTC derivatives transactions typically can only be closed out with the other party to the transaction.
Derivatives which are typically traded through the OTC market are regulated by the Commodity Futures Trading Commission (the CFTC). Derivative counterparty risk is managed through an ongoing evaluation of the creditworthiness of all potential counterparties and, if applicable, designated clearing organizations. The fund attempts to reduce its exposure to counterparty risk for derivatives traded in the OTC market, whenever possible, by entering into an International Swaps and Derivatives Association (ISDA) Master Agreement with each of its OTC counterparties. The ISDA gives each party to the agreement the right to terminate all transactions traded under the agreement if there is certain deterioration in the credit quality or contractual default of the other party, as defined in the ISDA. Upon an event of default or a termination of the ISDA, the non-defaulting party has the right to close out all transactions and to net amounts owed.
As defined by the ISDA, the fund may have collateral agreements with certain counterparties to mitigate counterparty risk on OTC derivatives. Subject to established minimum levels, collateral for OTC transactions is generally determined based on the net aggregate unrealized gain or loss on contracts with a particular counterparty. Collateral pledged to the fund, if any, is held in a segregated account by a third-party agent or held by the custodian bank for the benefit of the fund and can be in the form of cash or debt securities issued by the U.S. government or related agencies; collateral posted by the fund, if any, for OTC transactions is held in a segregated account at the fund's custodian and is noted in the accompanying Fund's investments, or if cash is posted, on the Statement of assets and liabilities. The fund's risk of loss due to counterparty risk is equal to the asset value of outstanding contracts offset by collateral received.
Certain derivatives are traded or cleared on an exchange or central clearinghouse. Exchange-traded or centrally-cleared transactions generally present less counterparty risk to a fund than OTC transactions. The exchange or clearinghouse stands between the fund and the broker to the contract and therefore, credit risk is generally limited to the failure of the exchange or clearinghouse and the clearing member.
Futures. A futures contract is a contractual agreement to buy or sell a particular currency or financial instrument at a pre-determined price in the future. Futures are traded on an exchange and cleared through a central clearinghouse. Risks related to the use of futures contracts include possible illiquidity of the futures markets and contract prices that can be highly volatile and imperfectly correlated to movements in the underlying financial instrument and potential losses in excess of the amounts recognized on the Statement of assets and liabilities. Use
| | SEMIANNUAL REPORT | JOHN HANCOCK Strategic Income Opportunities Fund | 47 |
of long futures contracts subjects the fund to the risk of loss up to the notional value of the futures contracts. Use of short futures contracts subjects the fund to unlimited risk of loss.
Upon entering into a futures contract, the fund is required to deposit initial margin with the broker in the form of cash or securities. The amount of required margin is set by the broker and is generally based on a percentage of the contract value. The margin deposit must then be maintained at the established level over the life of the contract. Cash that has been pledged by the fund is detailed in the Statement of assets and liabilities as Collateral held at broker for futures contracts. Securities pledged by the fund, if any, are identified in the Fund's investments. Subsequent payments, referred to as variation margin, are made or received by the fund periodically and are based on changes in the market value of open futures contracts. Futures contracts are marked-to-market daily and unrealized gain or loss is recorded by the fund. Payable for futures variation margin is included on the Statement of assets and liabilities. When the contract is closed, the fund records a realized gain or loss equal to the difference between the value of the contract at the time it was opened and the value at the time it was closed.
During the six months ended February 29, 2020, the fund used futures contracts to manage duration of the fund and as a substitute for securities purchased. The fund held futures contracts with USD notional values ranging from $14.9 million to $624.9 million, as measured at each quarter end.
Forward foreign currency contracts. A forward foreign currency contract is an agreement between two parties to buy and sell specific currencies at a price that is set on the date of the contract. The forward contract calls for delivery of the currencies on a future date that is specified in the contract. Forwards are typically traded OTC. Risks related to the use of forwards include the possible failure of counterparties to meet the terms of the forward agreement, the failure of the counterparties to timely post collateral if applicable, and the risk that currency movements will not favor the fund thereby reducing the fund's total return, and the potential for losses in excess of the amounts recognized on the Statement of assets and liabilities.
The market value of a forward foreign currency contract fluctuates with changes in foreign currency exchange rates. Forward foreign currency contracts are marked-to-market daily and the change in value is recorded by the fund as an unrealized gain or loss. Realized gains or losses, equal to the difference between the value of the contract at the time it was opened and the value at the time it was closed, are recorded upon delivery or receipt of the currency or settlement with the counterparty.
During the six months ended February 29, 2020, the fund used forward foreign currency contracts to manage against anticipated currency exchange rate changes and to gain exposure to foreign currencies. The fund held forward foreign currency contracts with USD notional values ranging from $2.0 billion to $4.7 billion, as measured at each quarter end.
Options. There are two types of options, put options and call options. Options are traded either OTC or on an exchange. A call option gives the purchaser of the option the right to buy (and the seller the obligation to sell) the underlying instrument at the exercise price. A put option gives the purchaser of the option the right to sell (and the writer the obligation to buy) the underlying instrument at the exercise price. Writing puts and buying calls may increase the fund's exposure to changes in the value of the underlying instrument. Buying puts and writing calls may decrease the fund's exposure to such changes. Risks related to the use of options include the loss of premiums, possible illiquidity of the options markets, trading restrictions imposed by an exchange and movements in underlying security values, and for written options, potential losses in excess of the amounts recognized on the Statement of assets and liabilities. In addition, OTC options are subject to the risks of all OTC derivatives contracts.
When the fund purchases an option, the premium paid is included in the Fund's investments and subsequently “marked-to-market” to reflect current market value. If the purchased option expires, the fund realizes a loss equal to the cost of the option. If the fund exercises a call option, the cost of the securities acquired by exercising the call is increased by the premium paid to buy the call. If the fund exercises a put option, it realizes a gain or loss from the sale of the underlying security and the proceeds from such sale are decreased by the premium paid. If the fund enters into a closing sale transaction, it realizes a gain or loss, depending on whether proceeds from the
| 48 | JOHN HANCOCK Strategic Income Opportunities Fund | SEMIANNUAL REPORT | |
closing sale are greater or less than the original cost.
During the six months ended February 29, 2020, the fund used purchased options contracts to manage against anticipated currency exchange rate changes.. The fund held purchased options contracts with market values ranging from $1.0 million to $1.6 million, as measured at each quarter end.
Fair value of derivative instruments by risk category
The table below summarizes the fair value of derivatives held by the fund at February 29, 2020 by risk category:
| Risk | Statement of assets
and liabilities
location | Financial
instruments
location | Assets
derivatives
fair value | Liabilities
derivatives
fair value |
| Interest rate | Receivable/payable for futures variation margin | Futures1 | $468,612 | $(6,430,285) |
| Currency | Unrealized appreciation / depreciation on forward foreign currency contracts | Forward foreign currency contracts | 13,012,058 | (8,361,116) |
| Currency | Unaffiliated investments, at value2 | Purchased options | 1,045,601 | — |
| | | | $14,526,271 | $(14,791,401) |
| 1 | Reflects cumulative appreciation/depreciation on futures as disclosed in Fund's investments. Only the period end variation margin is separately disclosed on the Statement of assets and liabilities. |
| 2 | Purchased options are included in Fund's investments. |
Effect of derivative instruments on the Statement of operations
The table below summarizes the net realized gain (loss) included in the net increase (decrease) in net assets from operations, classified by derivative instrument and risk category, for the six months ended February 29, 2020:
| | Statement of operations location - Net realized gain (loss) on: |
| Risk | Unaffiliated
investments and
foreign currency
transactions1 | Futures contracts | Forward foreign
currency contracts | Total |
| Interest rate | — | $4,341,338 | — | $4,341,338 |
| Currency | $(1,937,221) | — | $26,812,485 | 24,875,264 |
| Total | $(1,937,221) | $4,341,338 | $26,812,485 | $29,216,602 |
| 1 | Realized gain/loss associated with purchased options is included in this caption on the Statement of operations. |
The table below summarizes the net change in unrealized appreciation (depreciation) included in the net increase (decrease) in net assets from operations, classified by derivative instrument and risk category, for the six months ended February 29, 2020:
| | Statement of operations location - Change in net unrealized appreciation (depreciation) of: |
| Risk | Unaffiliated
investments and
translation of assets
and liabilities in
foreign currencies1 | Futures contracts | Forward foreign
currency contracts | Total |
| Interest rate | — | $(2,891,619) | — | $(2,891,619) |
| Currency | $(1,713,827) | — | $(21,928,702) | (23,642,529) |
| | SEMIANNUAL REPORT | JOHN HANCOCK Strategic Income Opportunities Fund | 49 |
| | Statement of operations location - Change in net unrealized appreciation (depreciation) of: |
| Risk | Unaffiliated
investments and
translation of assets
and liabilities in
foreign currencies1 | Futures contracts | Forward foreign
currency contracts | Total |
| Total | $(1,713,827) | $(2,891,619) | $(21,928,702) | $(26,534,148) |
| 1 | Change in unrealized appreciation/depreciation associated with purchased options is included in this caption on the Statement of operations. |
Note 4—Guarantees and indemnifications
Under the Trust's organizational documents, its Officers and Trustees are indemnified against certain liabilities arising out of the performance of their duties to the Trust, including the fund. Additionally, in the normal course of business, the fund enters into contracts with service providers that contain general indemnification clauses. The fund's maximum exposure under these arrangements is unknown, as this would involve future claims that may be made against the fund that have not yet occurred. The risk of material loss from such claims is considered remote.
Note 5—Fees and transactions with affiliates
John Hancock Investment Management LLC (the Advisor) serves as investment advisor for the fund. John Hancock Investment Management Distributors LLC (the Distributor), an affiliate of the Advisor, serves as principal underwriter of the fund. The Advisor and the Distributor are indirect, wholly owned subsidiaries of Manulife Financial Corporation (MFC).
Management fee. The fund has an investment management agreement with the Advisor under which the fund pays a daily management fee to the Advisor equivalent on an annual basis to the sum of:(a) 0.700% of the first $500 million of the fund’s aggregate daily net assets; (b) 0.650% of the next $3 billion of the fund’s aggregate daily net assets; (c) 0.600% of the next $4 billion of the fund’s aggregate daily net assets; (d) 0.590% of the next $4.5 billion of the fund’s aggregate daily net assets; and (e) 0.575% of the fund’s aggregate daily net assets in excess of $12 billion. Aggregate net assets include the net assets of 1) the fund, 2) Strategic Income Opportunities Trust, a series of John Hancock Variable Insurance Trust, 3) Strategic Income Opportunities Fund, a sub-fund of Manulife Investment Management I PLC (formerly John Hancock Worldwide Investors, PLC) and 4) certain assets of Income Allocation Fund, a fund of the Trust, as defined in the advisory agreement. The Advisor has a subadvisory agreement with Manulife Investment Management (US) LLC, an indirectly owned subsidiary of Manulife Financial Corporation and an affiliate of the Advisor. The fund is not responsible for payment of the subadvisory fees.
The advisor contractually agrees to reduce its management fee (after giving effect to asset breakpoints) by an annual rate of 0.02% of the fund’s average daily net assets. This agreement expires on December 31, 2020, unless renewed by mutual agreement of the fund and the advisor based upon a determination that this is appropriate under the circumstances at that time.
The Advisor has contractually agreed to waive a portion of its management fee and/or reimburse expenses for certain funds of the John Hancock group of funds complex, including the fund (the participating portfolios). This waiver is based upon aggregate net assets of all the participating portfolios. The amount of the reimbursement is calculated daily and allocated among all the participating portfolios in proportion to the daily net assets of each fund. During the six months ended February 29, 2020, this waiver amounted to 0.01% of the fund’s average daily net assets on an annualized basis. This arrangement expires on July 31, 2021, unless renewed by mutual agreement of the fund and the Advisor based upon a determination that this is appropriate under the circumstances at that time.
For the six months ended February 29, 2020, the expense reductions described above amounted to the following:
| 50 | JOHN HANCOCK Strategic Income Opportunities Fund | SEMIANNUAL REPORT | |
| Class | Expense reduction |
| Class A | $45,254 |
| Class C | 25,683 |
| Class I | 310,080 |
| Class R2 | 1,624 |
| Class | Expense reduction |
| Class R6 | $70,993 |
| Class NAV | 287,485 |
| Total | $741,119 |
Expenses waived or reimbursed in the current fiscal period are not subject to recapture in future fiscal periods.
The investment management fees, including the impact of the waivers and reimbursements as described above, incurred for the six months ended February 29, 2020, were equivalent to a net annual effective rate of 0.61% of the fund's average daily net assets.
Accounting and legal services. Pursuant to a service agreement, the fund reimburses the Advisor for all expenses associated with providing the administrative, financial, legal, compliance, accounting and recordkeeping services to the fund, including the preparation of all tax returns, periodic reports to shareholders and regulatory reports, among other services. These expenses are allocated to each share class based on its relative net assets at the time the expense was incurred. These accounting and legal services fees incurred for the six months ended February 29, 2020 amounted to an annual rate of 0.02% of the fund's average daily net assets.
Distribution and service plans. The fund has a distribution agreement with the Distributor. The fund has adopted distribution and service plans for certain classes as detailed below pursuant to Rule 12b-1 under the 1940 Act, to pay the Distributor for services provided as the distributor of shares of the fund. In addition, under a service plan for certain classes as detailed below, the fund pays for certain other services. The fund may pay up to the following contractual rates of distribution and service fees under these arrangements, expressed as an annual percentage of average daily net assets for each class of the fund's shares:
| Class | Rule 12b-1 Fee | Service fee |
| Class A | 0.30% | — |
| Class C | 1.00% | — |
| Class R2 | 0.25% | 0.25% |
Sales charges. Class A shares are assessed up-front sales charges, which resulted in payments to the Distributor amounting to $90,453 for the six months ended February 29, 2020. Of this amount, $12,384 was retained and used for printing prospectuses, advertising, sales literature and other purposes and $78,069 was paid as sales commissions to broker-dealers.
Class A and Class C shares may be subject to contingent deferred sales charges (CDSCs). Certain Class A shares that are acquired through purchases of $1 million or more and are redeemed within one year of purchase are subject to a 1.00% sales charge. Class C shares that are redeemed within one year of purchase are subject to a 1.00% CDSC. CDSCs are applied to the lesser of the current market value at the time of redemption or the original purchase cost of the shares being redeemed. Proceeds from CDSCs are used to compensate the Distributor for providing distribution-related services in connection with the sale of these shares. During the six months ended February 29, 2020, CDSCs received by the Distributor amounted to $860 and $1,058 for Class A and Class C shares, respectively.
Transfer agent fees. The John Hancock group of funds has a complex-wide transfer agent agreement with John Hancock Signature Services, Inc. (Signature Services), an affiliate of the Advisor. The transfer agent fees paid to Signature Services are determined based on the cost to Signature Services (Signature Services Cost) of providing recordkeeping services. It also includes out-of-pocket expenses, including payments made to third-parties for recordkeeping services provided to their clients who invest in one or more John Hancock funds. In addition, Signature Services Cost may be reduced by certain fees that Signature Services receives in connection with retirement and small accounts. Signature Services Cost is calculated monthly and allocated, as applicable, to five categories of share classes: Retail Share and Institutional Share Classes of Non-Municipal Bond Funds, Class R6
| | SEMIANNUAL REPORT | JOHN HANCOCK Strategic Income Opportunities Fund | 51 |
Shares, Retirement Share Classes and Municipal Bond Share Classes. Within each of these categories, the applicable costs are allocated to the affected John Hancock affiliated funds and/or classes, based on the relative average daily net assets.
Class level expenses. Class level expenses for the six months ended February 29, 2020 were as follows:
| Class | Distribution and service fees | Transfer agent fees |
| Class A | $492,293 | $201,982 |
| Class C | 931,714 | 114,766 |
| Class I | — | 1,385,200 |
| Class R2 | 29,350 | 776 |
| Class R6 | — | 33,963 |
| Total | $1,453,357 | $1,736,687 |
Trustee expenses. The fund compensates each Trustee who is not an employee of the Advisor or its affiliates. The costs of paying Trustee compensation and expenses are allocated to the fund based on its net assets relative to other funds within the John Hancock group of funds complex.
Interfund lending program. Pursuant to an Exemptive Order issued by the SEC, the fund, along with certain other funds advised by the Advisor or its affiliates, may participate in an interfund lending program. This program provides an alternative credit facility allowing the fund to borrow from, or lend money to, other participating affiliated funds. At period end, no interfund loans were outstanding. The fund's activity in this program during the period for which loans were outstanding was as follows:
Borrower
or Lender | Weighted Average
Loan Balance | Days
Outstanding | Weighted Average
Interest Rate | Interest Income
(Expense) |
| Lender | $1,548,849 | 3 | 1.550% | $200 |
Note 6—Fund share transactions
Transactions in fund shares for the six months ended February 29, 2020 and for the year ended August 31, 2019 were as follows:
| | Six Months Ended 2-29-20 | Year Ended 8-31-19 |
| | Shares | Amount | Shares | Amount |
| Class A shares | | | | |
| Sold | 3,136,982 | $33,537,000 | 6,020,521 | $61,927,546 |
| Distributions reinvested | 307,412 | 3,288,928 | 1,026,562 | 10,557,843 |
| Repurchased | (3,986,855) | (42,667,267) | (17,427,387) | (179,036,496) |
| Net decrease | (542,461) | $(5,841,339) | (10,380,304) | $(106,551,107) |
| Class C shares | | | | |
| Sold | 435,355 | $4,659,461 | 1,224,242 | $12,587,802 |
| Distributions reinvested | 107,369 | 1,148,446 | 478,415 | 4,914,576 |
| Repurchased | (3,140,631) | (33,562,507) | (10,236,549) | (105,032,496) |
| Net decrease | (2,597,907) | $(27,754,600) | (8,533,892) | $(87,530,118) |
| 52 | JOHN HANCOCK Strategic Income Opportunities Fund | SEMIANNUAL REPORT | |
| | Six Months Ended 2-29-20 | Year Ended 8-31-19 |
| | Shares | Amount | Shares | Amount |
| Class I shares | | | | |
| Sold | 23,690,711 | $253,692,015 | 78,617,400 | $806,137,051 |
| Distributions reinvested | 2,389,436 | 25,563,460 | 8,326,351 | 85,609,827 |
| Repurchased | (35,543,169) | (380,483,859) | (202,080,540) | (2,069,411,994) |
| Net decrease | (9,463,022) | $(101,228,384) | (115,136,789) | $(1,177,665,116) |
| Class R2 shares | | | | |
| Sold | 103,826 | $1,111,710 | 239,045 | $2,469,967 |
| Distributions reinvested | 10,618 | 113,704 | 40,599 | 417,783 |
| Repurchased | (250,310) | (2,703,041) | (756,787) | (7,842,863) |
| Net decrease | (135,866) | $(1,477,627) | (477,143) | $(4,955,113) |
| Class R6 shares | | | | |
| Sold | 6,084,133 | $65,265,710 | 36,288,073 | $370,699,820 |
| Distributions reinvested | 589,050 | 6,306,071 | 3,001,804 | 30,766,675 |
| Repurchased | (14,976,510) | (160,528,357) | (129,579,867) | (1,320,035,805) |
| Net decrease | (8,303,327) | $(88,956,576) | (90,289,990) | $(918,569,310) |
| Class NAV shares | | | | |
| Sold | 8,446,325 | $89,968,965 | 64,780,301 | $663,966,193 |
| Distributions reinvested | 2,404,774 | 25,725,294 | 6,100,993 | 62,922,576 |
| Repurchased | (12,870,850) | (137,995,975) | (43,092,160) | (443,981,906) |
| Net increase (decrease) | (2,019,751) | $(22,301,716) | 27,789,134 | $282,906,863 |
| Total net decrease | (23,062,334) | $(247,560,242) | (197,028,984) | $(2,012,363,901) |
Affiliates of the fund owned 3% and 91% of shares of Class R6 and Class NAV, respectively, on February 29, 2020. Such concentration of shareholders’ capital could have a material effect on the fund if such shareholders redeem from the fund.
Note 7—Purchase and sale of securities
Purchases and sales of securities, other than short-term investments and U.S. Treasury obligations, amounted to $1,888,223,702 and $1,873,338,689, respectively, for the six months ended February 29, 2020. Purchases and sales of U.S. Treasury obligations aggregated $0 and $123,738,788, respectively, for the six months ended February 29, 2020.
Note 8—Investment by affiliated funds
Certain investors in the fund are affiliated funds that are managed by the Advisor and its affiliates. The affiliated funds do not invest in the fund for the purpose of exercising management or control; however, this investment may represent a significant portion of the fund's net assets. At February 29, 2020, funds within the John Hancock group of funds complex held 35.6% of the fund's net assets. The following fund(s) had an affiliate ownership of 5% or more of the fund's net assets:
| Portfolio | Affiliated Concentration |
| John Hancock Funds II Multimanager Lifestyle Balanced Portfolio | 14.2% |
| | SEMIANNUAL REPORT | JOHN HANCOCK Strategic Income Opportunities Fund | 53 |
| Portfolio | Affiliated Concentration |
| John Hancock Funds II Multimanager Lifestyle Growth Portfolio | 6.3% |
| John Hancock Funds II Multimanager Lifestyle Moderate Portfolio | 5.1% |
Note 9—Investment in affiliated underlying funds
The fund may invest in affiliated underlying funds that are managed by the Advisor and its affiliates. Information regarding the fund's fiscal year to date purchases and sales of the affiliated underlying funds as well as income and capital gains earned by the fund, if any, is as follows:
| | | | | | | | Dividends and distributions |
| Affiliate | Ending
share
amount | Beginning
value | Cost of
purchases | Proceeds
from shares
sold | Realized
gain
(loss) | Change in
unrealized
appreciation
(depreciation) | Income
distributions
received | Capital gain
distributions
received | Ending
value |
| John Hancock Collateral Trust* | 5,484,396 | $68,339,096 | $142,684,588 | $(156,140,344) | $(1,612) | $11,046 | $346,851 | — | $54,892,774 |
| * | Refer to the Securities lending note within Note 2 for details regarding this investment. |
Note 10—LIBOR discontinuation risk
LIBOR (London Interbank Offered Rate) is a measure of the average interest rate at which major global banks can borrow from one another. Following allegations of rate manipulation and concerns regarding its thin liquidity, in July 2017, the U.K. Financial Conduct Authority, which regulates LIBOR, announced that it will stop encouraging banks to provide the quotations needed to sustain LIBOR after 2021. This event will likely cause LIBOR to cease to be published. Before then, it is expected that market participants will transition to the use of different reference or benchmark rates. However, although regulators have suggested alternative rates, there is currently no definitive information regarding the future utilization of LIBOR or of any replacement rate.
It is uncertain what impact the discontinuation of LIBOR will have on the use of LIBOR as a reference rate for securities in which the fund invests. It is expected that market participants will amend financial instruments referencing LIBOR to include fallback provisions and other measures that contemplate the discontinuation of LIBOR or other similar market disruption events, but neither the effect of the transition process nor the viability of such measures is known. In addition, there are obstacles to converting certain longer term securities and transactions to a new benchmark or benchmarks and the effectiveness of one alternative reference rate versus multiple alternative reference rates in new or existing financial instruments and products has not been determined. As market participants transition away from LIBOR, LIBOR's usefulness may deteriorate, which could occur prior to the end of 2021. The transition process may lead to increased volatility and illiquidity in markets that currently rely on LIBOR to determine interest rates. LIBOR's deterioration may adversely affect the liquidity and/or market value of securities that use LIBOR as a benchmark interest rate.
Note 11—Subsequent events
A widespread health crisis such as a global pandemic could cause substantial market volatility, exchange trading suspensions and closures, impact the ability to complete redemptions, and affect fund performance. For example, the novel coronavirus disease (COVID-19) has resulted in significant disruptions to global business activity. The impact of a health crisis and other epidemics and pandemics that may arise in the future, could affect the global economy in ways that cannot necessarily be foreseen at the present time. A health crisis may exacerbate other pre-existing political, social and economic risks. Any such impact could adversely affect the fund's performance, resulting in losses to your investment.
| 54 | JOHN HANCOCK Strategic Income Opportunities Fund | SEMIANNUAL REPORT | |
| | |
Trustees
Hassell H. McClellan,Chairperson
Steven R. Pruchansky,Vice Chairperson
Andrew G. Arnott†
Charles L. Bardelis*
James R. Boyle
Peter S. Burgess*
William H. Cunningham
Grace K. Fey
Marianne Harrison†
Deborah C. Jackson
James M. Oates*
Gregory A. Russo
Officers
Andrew G. Arnott
President
Francis V. Knox, Jr.
Chief Compliance Officer
Charles A. Rizzo
Chief Financial Officer
Salvatore Schiavone
Treasurer
Christopher (Kit) Sechler
Secretary and Chief Legal Officer
| Investment advisor
John Hancock Investment Management LLC
Subadvisor
Manulife Investment Management (US) LLC
Portfolio Managers
Christopher M. Chapman, CFA
Thomas C. Goggins
Daniel S. Janis III
Kisoo Park
Principal distributor
John Hancock Investment Management Distributors LLC
Custodian
State Street Bank and Trust Company
Transfer agent
John Hancock Signature Services, Inc.
Legal counsel
K&L Gates LLP
|
* Member of the Audit Committee
† Non-Independent Trustee
The fund's proxy voting policies and procedures, as well as the fund proxy voting record for the most recent twelve-month period ended June 30, are available free of charge on the Securities and Exchange Commission (SEC) website at sec.gov or on our website.
All of the fund's holdings as of the end of the third month of every fiscal quarter are filed with the SEC on Form N-PORT within 60 days of the end of the fiscal quarter. The fund's Form N-PORT filings are available on our website and the SEC's website, sec.gov.
We make this information on your fund, as well asmonthly portfolio holdings, and other fund details available on our website at jhinvestments.com or by calling 800-225-5291.
| | | | |
| | You can also contact us: |
| | 800-225-5291
jhinvestments.com | Regular mail:
John Hancock Signature Services, Inc.
P.O. Box 55913
Boston, MA 02205-5913
| Express mail:
John Hancock Signature Services, Inc.
2000 Crown Colony Drive
Suite 55913
Quincy, MA 02169-0953
|
SEMIANNUAL REPORT | JOHN HANCOCK STRATEGIC INCOME OPPORTUNITIES FUND 56
John Hancock family of funds
| | | |
DOMESTIC EQUITY FUNDS
Blue Chip Growth
Classic Value
Disciplined Value
Disciplined Value Mid Cap
Equity Income
Financial Industries
Fundamental All Cap Core
Fundamental Large Cap Core
New Opportunities
Regional Bank
Small Cap Core
Small Cap Growth
Small Cap Value
U.S. Global Leaders Growth
U.S. Quality Growth
GLOBAL AND INTERNATIONAL EQUITY FUNDS
Disciplined Value International
Emerging Markets
Emerging Markets Equity
Fundamental Global Franchise
Global Equity
Global Shareholder Yield
Global Thematic Opportunities
International Dynamic Growth
International Growth
International Small Company
| | INCOME FUNDS
Bond
California Tax-Free Income
Emerging Markets Debt
Floating Rate Income
Government Income
High Yield
High Yield Municipal Bond
Income
Investment Grade Bond
Money Market
Short Duration Bond
Short Duration Credit Opportunities
Strategic Income Opportunities
Tax-Free Bond
ALTERNATIVE AND SPECIALTY FUNDS
Absolute Return Currency
Alternative Asset Allocation
Alternative Risk Premia
Diversified Macro
Infrastructure
Multi-Asset Absolute Return
Seaport Long/Short
|
A fund's investment objectives, risks, charges, and expenses should be considered carefully before investing. The prospectus contains this and other important information about the fund. To obtain a prospectus, contact your financial professional, call John Hancock Investment Management at 800-225-5291, or visit our website at jhinvestments.com. Please read the prospectus carefully before investing or sending money.
| | | |
ASSET ALLOCATION
Balanced
Income Allocation
Multi-Index Lifetime Portfolios
Multi-Index Preservation Portfolios
Multimanager Lifestyle Portfolios
Multimanager Lifetime Portfolios
Retirement Income 2040
EXCHANGE-TRADED FUNDS
John Hancock Multifactor Consumer Discretionary ETF
John Hancock Multifactor Consumer Staples ETF
John Hancock Multifactor Developed International ETF
John Hancock Multifactor Emerging Markets ETF
John Hancock Multifactor Energy ETF
John Hancock Multifactor Financials ETF
John Hancock Multifactor Healthcare ETF
John Hancock Multifactor Industrials ETF
John Hancock Multifactor Large Cap ETF
John Hancock Multifactor Materials ETF
John Hancock Multifactor Media and
Communications ETF
John Hancock Multifactor Mid Cap ETF
John Hancock Multifactor Small Cap ETF
John Hancock Multifactor Technology ETF
John Hancock Multifactor Utilities ETF
| | ENVIRONMENTAL, SOCIAL, AND
GOVERNANCE FUNDS
ESG All Cap Core
ESG Core Bond
ESG International Equity
ESG Large Cap Core
CLOSED-END FUNDS
Financial Opportunities
Hedged Equity & Income
Income Securities Trust
Investors Trust
Preferred Income
Preferred Income II
Preferred Income III
Premium Dividend
Tax-Advantaged Dividend Income
Tax-Advantaged Global Shareholder Yield
|
John Hancock Multifactor ETF shares are bought and sold at market price (not NAV), and are not individually redeemed
from the fund. Brokerage commissions will reduce returns.
John Hancock ETFs are distributed by Foreside Fund Services, LLC, and are subadvised by Dimensional Fund Advisors LP.
Foreside is not affiliated with John Hancock Investment Management Distributors LLC or Dimensional Fund Advisors LP.
Dimensional Fund Advisors LP receives compensation from John Hancock in connection with licensing rights to the
John Hancock Dimensional indexes. Dimensional Fund Advisors LP does not sponsor, endorse, or sell, and makes no
representation as to the advisability of investing in, John Hancock Multifactor ETFs.
John Hancock Investment Management
A trusted brand
John Hancock Investment Management is a premier asset manager
representing one of America's most trusted brands, with a heritage of
financial stewardship dating back to 1862. Helping our shareholders
pursue their financial goals is at the core of everything we do. It's why
we support the role of professional financial advice and operate with
the highest standards of conduct and integrity.
A better way to invest
We serve investors globally through a unique multimanager approach:
We search the world to find proven portfolio teams with specialized
expertise for every strategy we offer, then we apply robust investment
oversight to ensure they continue to meet our uncompromising
standards and serve the best interests of our shareholders.
Results for investors
Our unique approach to asset management enables us to provide
a diverse set of investments backed by some of the world's best
managers, along with strong risk-adjusted returns across asset classes.
John Hancock Investment Management Distributors LLC n Member FINRA, SIPC
200 Berkeley Street n Boston, MA 02116-5010 n 800-225-5291 n jhinvestments.com
This report is for the information of the shareholders of John Hancock Strategic Income Opportunities Fund. It is not authorized for distribution to prospective investors unless preceded or accompanied by a prospectus.

John Hancock Funds II
Semiannual report — table of contents
Sector or portfolio composition | | 3 |
Shareholder expense example | | 5 |
Portfolio of investments(See below for each fund’s page #) | | 7 |
Statements of assets and liabilities | | 88 |
Statements of operations | | 92 |
Statements of changes in net assets | | 96 |
Notes to financial statements | | 104 |
Fund
| | | | Portfolio of
investments |
|---|
Capital Appreciation Fund | | | | | 7 | |
Capital Appreciation Value Fund | | | | | 8 | |
| | | | | 13 | |
International Strategic Equity Allocation Fund | | | | | 16 | |
| | | | | 33 | |
| | | | | 34 | |
| | | | | 35 | |
Multi-Index Lifestyle Aggressive Portfolio | | | | | 37 | |
Multi-Index Lifestyle Balanced Portfolio | | �� | | | 38 | |
Multi-Index Lifestyle Conservative Portfolio | | | | | 38 | |
Multi-Index Lifestyle Growth Portfolio | | | | | 39 | |
Multi-Index Lifestyle Moderate Portfolio | | | | | 40 | |
Real Estate Securities Fund | | | | | 40 | |
Science & Technology Fund | | | | | 41 | |
Strategic Equity Allocation Fund | | | | | 42 | |
U.S. Sector Rotation Fund
(formerly U.S. Strategic Equity Allocation Fund) | | | | | 80 | |
2
John Hancock Funds II
Sector or portfolio composition
Capital Appreciation Fund
Sector Composition*
| | | | % of
Total |
|---|
| | | | | 41.7 | |
| | | | | 22.5 | |
| | | | | 12.5 | |
| | | | | 8.8 | |
| | | | | 5.9 | |
| | | | | 4.3 | |
| | | | | 2.2 | |
| | | | | 0.4 | |
Short-term investments and other | | | | | 1.7 | |
Capital Appreciation Value Fund
Portfolio Composition*
| | | | % of
Total |
|---|
| | | | | 58.4 | |
| | | | | 17.7 | |
| | | | | 7.2 | |
| | | | | 5.4 | |
Short-term investments and other | | | | | 11.3 | |
Health Sciences Fund
Industry Composition*
| | | | % of
Total |
|---|
| | | | | 37.2 | |
Health care equipment and supplies | | | | | 22.7 | |
Health care providers and services | | | | | 15.6 | |
| | | | | 13.6 | |
Life sciences tools and services | | | | | 7.9 | |
| | | | | 0.4 | |
| | | | | 0.4 | |
| | | | | 0.4 | |
| | | | | 0.4 | |
Short-term investments and other | | | | | 1.4 | |
International Strategic Equity
Allocation Fund
Sector Composition*
| | | | % of
Total |
|---|
| | | | | 21.2 | |
| | | | | 12.0 | |
| | | | | 11.5 | |
| | | | | 11.4 | |
| | | | | 9.2 | |
| | | | | 8.2 | |
| | | | | 6.7 | |
| | | | | 6.4 | |
| | | | | 4.4 | |
| | | | | 3.2 | |
| | | | | 2.8 | |
Short-term investments and other | | | | | 3.0 | |
International Value Fund
Sector Composition*
| | | | % of
Total |
|---|
| | | | | 25.0 | |
| | | | | 14.4 | |
| | | | | 11.1 | |
| | | | | 10.6 | |
| | | | | 9.1 | |
| | | | | 8.7 | |
| | | | | 6.2 | |
| | | | | 4.9 | |
| | | | | 4.6 | |
| | | | | 2.1 | |
Short-term investments and other | | | | | 3.3 | |
Mid Cap Stock Fund
Sector Composition*
| | | | % of
Total |
|---|
| | | | | 28.3 | |
| | | | | 24.4 | |
| | | | | 18.7 | |
| | | | | 12.4 | |
| | | | | 5.5 | |
| | | | | 4.4 | |
| | | | | 1.2 | |
| | | | | 0.4 | |
Short-term investments and other | | | | | 4.7 | |
Mid Value Fund
Sector Composition*
| | | | % of
Total |
|---|
| | | | | 17.9 | |
| | | | | 16.7 | |
| | | | | 10.5 | |
| | | | | 9.7 | |
| | | | | 8.8 | |
| | | | | 8.1 | |
| | | | | 6.0 | |
| | | | | 5.0 | |
| | | | | 4.2 | |
| | | | | 4.0 | |
| | | | | 3.8 | |
Short-term investments and other | | | | | 5.3 | |
Multi-Index Lifestyle
Aggressive Portfolio
Asset Allocation**
| | | | % of
Total |
|---|
Affiliated investment companies | | | | | 65.7 | |
| | | | | 65.7 | |
Unaffiliated investment companies | | | | | 33.1 | |
| | | | | 33.1 | |
| | | | | 1.2 | |
Multi-Index Lifestyle
Balanced Portfolio
Asset Allocation**
| | | | % of
Total |
|---|
Affiliated investment companies | | | | | 35.5 | |
| | | | | 35.5 | |
Unaffiliated investment companies | | | | | 59.7 | |
| | | | | 56.3 | |
| | | | | 3.4 | |
| | | | | 4.8 | |
Multi-Index Lifestyle
Conservative Portfolio
Asset Allocation**
| | | | % of
Total |
|---|
Affiliated investment companies | | | | | 9.6 | |
| | | | | 9.6 | |
Unaffiliated investment companies | | | | | 84.4 | |
| | | | | 77.9 | |
| | | | | 6.5 | |
| | | | | 6.0 | |
Multi-Index Lifestyle
Growth Portfolio
Asset Allocation**
| | | | % of
Total |
|---|
Affiliated investment companies | | | | | 48.6 | |
| | | | | 48.6 | |
Unaffiliated investment companies | | | | | 45.6 | |
| | | | | 44.0 | |
| | | | | 1.6 | |
| | | | | 5.8 | |
Multi-Index Lifestyle
Moderate Portfolio
Asset Allocation**
| | | | % of
Total |
|---|
Affiliated investment companies | | | | | 23.4 | |
| | | | | 23.4 | |
Unaffiliated investment companies | | | | | 73.7 | |
| | | | | 69.0 | |
| | | | | 4.7 | |
| | | | | 2.9 | |
Real Estate Securities Fund
Portfolio Composition*
| | | | % of
Total |
|---|
| | | | | 22.0 | |
| | | | | 16.9 | |
| | | | | 14.7 | |
| | | | | 12.9 | |
| | | | | 12.1 | |
| | | | | 10.9 | |
IT consulting and other services | | | | | 4.4 | |
| | | | | 4.2 | |
| | | | | 1.9 | |
3
John Hancock Funds II
Sector or portfolio composition
Science & Technology Fund
Sector Composition*
| | | | % of
Total |
|---|
| | | | | 53.7 | |
| | | | | 19.6 | |
| | | | | 15.2 | |
| | | | | 1.5 | |
| | | | | 1.0 | |
| | | | | 0.1 | |
Short-term investments and other | | | | | 8.9 | |
Strategic Equity Allocation Fund
Sector Composition*
| | | | % of
Total |
|---|
| | | | | 18.8 | |
| | | | | 15.3 | |
| | | | | 11.6 | |
| | | | | 9.8 | |
| | | | | 9.8 | |
| | | | | 8.9 | |
| | | | | 6.1 | |
| | | | | 4.2 | |
| | | | | 4.2 | |
| | | | | 3.7 | |
| | | | | 3.4 | |
Short-term investments and other | | | | | 4.2 | |
U.S. Sector Rotation Fund
Sector Composition*
| | | | % of
Total |
|---|
| | | | | 24.7 | |
| | | | | 13.5 | |
| | | | | 13.3 | |
| | | | | 11.1 | |
| | | | | 8.4 | |
| | | | | 6.0 | |
| | | | | 5.3 | |
| | | | | 5.0 | |
| | | | | 3.7 | |
| | | | | 2.8 | |
| | | | | 2.6 | |
Short-term investments and other | | | | | 3.6 | |
| * | | As a percentage of net assets. |
| ** | | As a percentage of total investments. |
4
John Hancock Funds II
Shareholder expense example
As a shareholder of John Hancock Funds II, you incur ongoing costs, such as management fees, distribution (Rule 12b-1) fees and other expenses. In the case of Multi-Index Lifestyle Aggressive Portfolio, Multi-Index Lifestyle Balanced Portfolio, Multi-Index Lifestyle Conservative Portfolio, Multi-Index Lifestyle Growth Portfolio and Multi-Index Lifestyle Moderate Portfolio, in addition to the operating expenses which the portfolio bears directly, the portfolio indirectly bears a pro rata share of the operating expenses of the underlying funds in which the portfolio invests. Because the underlying funds have varied operating expenses and transaction costs and the portfolio may own different proportions of the underlying funds at different times, the amount of expenses incurred indirectly by the portfolio will vary. If these indirect expenses were included, your expenses paid during the period would have been higher.
These examples are intended to help you understand your ongoing costs (in dollars) of investing in a fund so you can compare these costs with the ongoing costs of investing in other mutual funds. The examples are based on an investment of $1,000 at the beginning of the period and held for the entire period (September 1, 2019 through February 29, 2020).
Actual expenses:
The first line of each share class in the following table provides information about actual account values and actual expenses. You may use the information in this line, together with the amount you invested, to estimate the expenses that you paid over the period. Simply divide your account value by $1,000 (for example, an $8,600 account value divided by $1,000 = 8.6), then multiply the result by the number in the first line under the heading entitled “Expenses paid during period ended” to estimate the expenses you paid on your account during this period.
Hypothetical example for comparison purposes:
The second line of each share class in the following table provides information about hypothetical account values and hypothetical expenses based on the actual expense ratio for the share class and an assumed annualized rate of return of 5% per year before expenses, which is not the actual return of the share class. The hypothetical account values and expenses may not be used to estimate the actual ending account balance or expenses you paid for the period. You may use this information to compare the ongoing costs of investing in a fund and other funds. To do so, compare this 5% hypothetical example with the 5% hypothetical examples that appear in the shareholder reports of the other funds. Please remember that these hypothetical account values and expenses may not be used to estimate the actual ending account balance or expenses you paid for the period.
Please note that the expenses shown in the table are meant to highlight your ongoing costs only and do not reflect any transactional costs and insurance-related charges. Therefore, the second line of each share class in the table is useful in comparing ongoing costs only, and will not help you determine the relative total costs of owning different funds. In addition, if these transactional costs were included, your costs would have been higher.
| | | Account
value on
9-1-2019 | Ending
value on
2-29-2020 | Expenses
paid during
period ended
2-29-20201 | Annualized
expense
ratio |
| Capital Appreciation Fund |
| Class 1 | Actual expenses/actual returns | $1,000.00 | $1,096.10 | $4.12 | 0.79% |
| | Hypothetical example | 1,000.00 | 1,020.90 | 3.97 | 0.79% |
| Class NAV | Actual expenses/actual returns | 1,000.00 | 1,095.90 | 3.86 | 0.74% |
| | Hypothetical example | 1,000.00 | 1,021.20 | 3.72 | 0.74% |
| Capital Appreciation Value Fund |
| Class NAV | Actual expenses/actual returns | $1,000.00 | $1,026.30 | $4.13 | 0.82% |
| | Hypothetical example | 1,000.00 | 1,020.80 | 4.12 | 0.82% |
| Health Sciences Fund |
| Class NAV | Actual expenses/actual returns | $1,000.00 | $1,066.10 | $5.39 | 1.05% |
| | Hypothetical example | 1,000.00 | 1,019.60 | 5.27 | 1.05% |
| International Strategic Equity Allocation Fund |
| Class NAV | Actual expenses/actual returns | $1,000.00 | $1,009.90 | $2.80 | 0.56% |
| | Hypothetical example | 1,000.00 | 1,022.10 | 2.82 | 0.56% |
| International Value Fund |
| Class 1 | Actual expenses/actual returns | $1,000.00 | $978.60 | $4.72 | 0.96% |
| | Hypothetical example | 1,000.00 | 1,020.10 | 4.82 | 0.96% |
| Class NAV | Actual expenses/actual returns | 1,000.00 | 979.00 | 4.48 | 0.91% |
| | Hypothetical example | 1,000.00 | 1,020.30 | 4.57 | 0.91% |
| Mid Cap Stock Fund |
| Class 1 | Actual expenses/actual returns | $1,000.00 | $1,020.00 | $4.62 | 0.92% |
| | Hypothetical example | 1,000.00 | 1,020.30 | 4.62 | 0.92% |
| Class NAV | Actual expenses/actual returns | 1,000.00 | 1,020.20 | 4.37 | 0.87% |
| | Hypothetical example | 1,000.00 | 1,020.50 | 4.37 | 0.87% |
John Hancock Funds II
Shareholder expense example
| | | Account
value on
9-1-2019 | Ending
value on
2-29-2020 | Expenses
paid during
period ended
2-29-20201 | Annualized
expense
ratio |
| Mid Value Fund |
| Class NAV | Actual expenses/actual returns | $1,000.00 | $998.30 | $4.67 | 0.94% |
| | Hypothetical example | 1,000.00 | 1,020.20 | 4.72 | 0.94% |
| Multi-Index Lifestyle Aggressive Portfolio |
| Class R6 | Actual expenses/actual returns | $1,000.00 | $1,004.20 | $1.30 | 0.26%2 |
| | Hypothetical example | 1,000.00 | 1,023.60 | 1.31 | 0.26%2 |
| Class 1 | Actual expenses/actual returns | 1,000.00 | 1,003.80 | 1.44 | 0.29%2 |
| | Hypothetical example | 1,000.00 | 1,023.40 | 1.46 | 0.29%2 |
| Multi-Index Lifestyle Balanced Portfolio |
| Class R6 | Actual expenses/actual returns | $1,000.00 | $1,013.40 | $1.85 | 0.37%2 |
| | Hypothetical example | 1,000.00 | 1,023.00 | 1.86 | 0.37%2 |
| Class 1 | Actual expenses/actual returns | 1,000.00 | 1,012.20 | 2.00 | 0.40%2 |
| | Hypothetical example | 1,000.00 | 1,022.90 | 2.01 | 0.40%2 |
| Multi-Index Lifestyle Conservative Portfolio |
| Class R6 | Actual expenses/actual returns | $1,000.00 | $1,021.20 | $2.56 | 0.51%2 |
| | Hypothetical example | 1,000.00 | 1,022.30 | 2.56 | 0.51%2 |
| Class 1 | Actual expenses/actual returns | 1,000.00 | 1,021.00 | 2.71 | 0.54%2 |
| | Hypothetical example | 1,000.00 | 1,022.20 | 2.72 | 0.54%2 |
| Multi-Index Lifestyle Growth Portfolio |
| Class R6 | Actual expenses/actual returns | $1,000.00 | $1,008.50 | $1.50 | 0.30%2 |
| | Hypothetical example | 1,000.00 | 1,023.40 | 1.51 | 0.30%2 |
| Class 1 | Actual expenses/actual returns | 1,000.00 | 1,009.00 | 1.70 | 0.34%2 |
| | Hypothetical example | 1,000.00 | 1,023.20 | 1.71 | 0.34%2 |
| Multi-Index Lifestyle Moderate Portfolio |
| Class R6 | Actual expenses/actual returns | $1,000.00 | $1,015.70 | $2.21 | 0.44%2 |
| | Hypothetical example | 1,000.00 | 1,022.70 | 2.21 | 0.44%2 |
| Class 1 | Actual expenses/actual returns | 1,000.00 | 1,015.50 | 2.41 | 0.48%2 |
| | Hypothetical example | 1,000.00 | 1,022.50 | 2.41 | 0.48%2 |
| Real Estate Securities Fund |
| Class 1 | Actual expenses/actual returns | $1,000.00 | $947.40 | $3.87 | 0.80% |
| | Hypothetical example | 1,000.00 | 1,020.90 | 4.02 | 0.80% |
| Science & Technology Fund |
| Class NAV | Actual expenses/actual returns | $1,000.00 | $1,082.60 | $5.49 | 1.06% |
| | Hypothetical example | 1,000.00 | 1,019.60 | 5.32 | 1.06% |
| Strategic Equity Allocation Fund |
| Class NAV | Actual expenses/actual returns | $1,000.00 | $1,010.10 | $2.70 | 0.54% |
| | Hypothetical example | 1,000.00 | 1,022.20 | 2.72 | 0.54% |
| U.S. Sector Rotation Fund |
| Class NAV | Actual expenses/actual returns | $1,000.00 | $1,020.00 | $2.71 | 0.54% |
| | Hypothetical example | 1,000.00 | 1,022.20 | 2.72 | 0.54% |
| 1 | Expenses are equal to the annualized expense ratio, multiplied by the average account value over the period, multiplied by 182/366 (to reflect the one-half year period). |
| 2 | Ratios do not include expenses indirectly incurred by the underlying funds and can vary based on the mix of underlying funds held by the portfolios. |
John Hancock Funds II
Portfolio of Investments — February 29, 2020 (unaudited)(showing percentage of total net assets)
Capital Appreciation Fund
| | | Shares or
Principal
Amount | | Value |
| COMMON STOCKS – 98.3% | | | |
| Communication services – 12.5% | | | | | |
| Entertainment – 3.7% | | | |
| Netflix, Inc. (A) | | 168,607 | | $ | 62,221,041 |
| Interactive media and services – 8.8% | | | |
| Alphabet, Inc., Class A (A) | | 37,539 | | | 50,274,106 |
| Alphabet, Inc., Class C (A) | | 37,533 | | | 50,269,073 |
| Facebook, Inc., Class A (A) | | 240,369 | | | 46,263,821 |
| | | | | | 146,807,000 |
| | | | | | 209,028,041 |
| Consumer discretionary – 22.5% | | | | | |
| Automobiles – 3.1% | | | |
| Tesla, Inc. (A) | | 78,278 | | | 52,288,921 |
| Hotels, restaurants and leisure – 1.3% | | | |
| Chipotle Mexican Grill, Inc. (A) | | 28,668 | | | 22,176,991 |
| Internet and direct marketing retail – 9.6% | | | |
| Alibaba Group Holding, Ltd., ADR (A) | | 275,300 | | | 57,262,400 |
| Amazon.com, Inc. (A) | | 55,023 | | | 103,649,576 |
| | | | | | 160,911,976 |
| Specialty retail – 1.3% | | | |
| The Home Depot, Inc. | | 96,381 | | | 20,995,637 |
| Textiles, apparel and luxury goods – 7.2% | | | |
| adidas AG | | 67,609 | | | 19,035,195 |
| Kering SA | | 58,452 | | | 32,961,299 |
| Lululemon Athletica, Inc. (A) | | 136,438 | | | 29,662,986 |
| LVMH Moet Hennessy Louis Vuitton SE | | 19,678 | | | 8,212,228 |
| NIKE, Inc., Class B | | 335,454 | | | 29,982,879 |
| | | | | | 119,854,587 |
| | | | | | 376,228,112 |
| Consumer staples – 4.3% | | | | | |
| Beverages – 0.7% | | | |
| Constellation Brands, Inc., Class A | | 71,433 | | | 12,313,621 |
| Food and staples retailing – 1.8% | | | |
| Costco Wholesale Corp. | | 106,780 | | | 30,020,129 |
| Personal products – 1.8% | | | |
| The Estee Lauder Companies, Inc., Class A | | 163,786 | | | 30,071,110 |
| | | | | | 72,404,860 |
| Financials – 2.2% | | | | | |
| Banks – 0.5% | | | |
| JPMorgan Chase & Co. | | 68,639 | | | 7,969,674 |
| Capital markets – 1.7% | | | |
| S&P Global, Inc. | | 69,508 | | | 18,482,872 |
| The Goldman Sachs Group, Inc. | | 53,477 | | | 10,736,577 |
| | | | | | 29,219,449 |
| | | | | | 37,189,123 |
| Health care – 8.8% | | | | | |
| Biotechnology – 1.9% | | | |
| BioMarin Pharmaceutical, Inc. (A) | | 105,064 | | | 9,494,634 |
| Exact Sciences Corp. (A) | | 76,124 | | | 6,162,238 |
| Vertex Pharmaceuticals, Inc. (A) | | 72,666 | | | 16,279,364 |
| | | | | | 31,936,236 |
| Health care equipment and supplies – 2.9% | | | |
| Boston Scientific Corp. (A) | | 307,557 | | | 11,499,556 |
| Danaher Corp. | | 15,756 | | | 2,278,002 |
| DexCom, Inc. (A) | | 53,290 | | | 14,708,040 |
| Edwards Lifesciences Corp. (A) | | 35,378 | | | 7,246,830 |
| Intuitive Surgical, Inc. (A) | | 24,478 | | | 13,070,273 |
| | | | | | 48,802,701 |
| Health care providers and services – 0.4% | | | |
| Guardant Health, Inc. (A) | | 67,081 | | | 5,833,364 |
Capital Appreciation Fund (continued)
| | | Shares or
Principal
Amount | | Value |
| COMMON STOCKS (continued) | | | |
| Life sciences tools and services – 0.8% | | | |
| Illumina, Inc. (A) | | 48,983 | | $ | 13,013,314 |
| Pharmaceuticals – 2.8% | | | |
| AstraZeneca PLC, ADR | | 679,958 | | | 29,782,160 |
| Eli Lilly & Company | | 137,868 | | | 17,389,291 |
| | | | | | 47,171,451 |
| | | | | | 146,757,066 |
| Industrials – 5.9% | | | | | |
| Aerospace and defense – 3.3% | | | |
| Airbus SE | | 80,751 | | | 9,746,527 |
| Safran SA | | 134,699 | | | 18,646,154 |
| The Boeing Company | | 99,635 | | | 27,410,585 |
| | | | | | 55,803,266 |
| Road and rail – 2.6% | | | |
| Uber Technologies, Inc. (A) | | 718,826 | | | 24,346,637 |
| Union Pacific Corp. | | 114,782 | | | 18,343,311 |
| | | | | | 42,689,948 |
| | | | | | 98,493,214 |
| Information technology – 41.7% | | | | | |
| IT services – 14.2% | | | |
| Adyen NV (A)(B) | | 28,976 | | | 25,503,073 |
| FleetCor Technologies, Inc. (A) | | 83,492 | | | 22,191,339 |
| Mastercard, Inc., Class A | | 235,508 | | | 68,356,197 |
| PayPal Holdings, Inc. (A) | | 183,823 | | | 19,851,046 |
| Shopify, Inc., Class A (A) | | 43,735 | | | 20,262,863 |
| Square, Inc., Class A (A) | | 122,519 | | | 10,209,508 |
| Twilio, Inc., Class A (A)(C) | | 115,814 | | | 13,045,289 |
| Visa, Inc., Class A | | 322,009 | | | 58,528,356 |
| | | | | | 237,947,671 |
| Semiconductors and semiconductor equipment – 5.3% | | | |
| Broadcom, Inc. | | 65,107 | | | 17,749,470 |
| NVIDIA Corp. | | 195,723 | | | 52,858,911 |
| QUALCOMM, Inc. | | 108,688 | | | 8,510,270 |
| Xilinx, Inc. | | 108,982 | | | 9,098,907 |
| | | | | | 88,217,558 |
| Software – 17.6% | | | |
| Adobe, Inc. (A) | | 150,784 | | | 52,038,574 |
| Coupa Software, Inc. (A) | | 79,293 | | | 11,874,127 |
| Microsoft Corp. | | 607,298 | | | 98,388,349 |
| salesforce.com, Inc. (A) | | 388,355 | | | 66,175,692 |
| ServiceNow, Inc. (A) | | 57,418 | | | 18,723,436 |
| Splunk, Inc. (A) | | 154,404 | | | 22,748,341 |
| The Trade Desk, Inc., Class A (A) | | 8,514 | | | 2,445,647 |
| Workday, Inc., Class A (A) | | 124,325 | | | 21,539,306 |
| | | | | | 293,933,472 |
| Technology hardware, storage and peripherals – 4.6% | | | |
| Apple, Inc. | | 281,770 | | | 77,024,647 |
| | | | | | 697,123,348 |
| Real estate – 0.4% | | | | | |
| Equity real estate investment trusts – 0.4% | | | |
| American Tower Corp. | | 34,394 | | | 7,800,559 |
| TOTAL COMMON STOCKS (Cost $729,687,997) | | $ | 1,645,024,323 |
| The accompanying notes are an integral part of the financial statements. | 7 | |
John Hancock Funds II
Portfolio of Investments — February 29, 2020 (unaudited)(showing percentage of total net assets)
Capital Appreciation Fund (continued)
| | | Shares or
Principal
Amount | | Value |
| SHORT-TERM INVESTMENTS – 1.0% | | | |
| Short-term funds – 1.0% | | | | | |
| John Hancock Collateral Trust, 1.6968% (D)(E) | | 2,674 | | $ | 26,765 |
| State Street Institutional U.S. Government Money Market Fund, Premier Class, 1.5386% (D) | | 15,873,439 | | | 15,873,439 |
| TOTAL SHORT-TERM INVESTMENTS (Cost $15,900,186) | | $ | 15,900,204 |
Total Investments (Capital Appreciation Fund)
(Cost $745,588,183) – 99.3% | | $ | 1,660,924,527 |
| Other assets and liabilities, net – 0.7% | | | 11,838,484 |
| TOTAL NET ASSETS – 100.0% | | $ | 1,672,763,011 |
| Security Abbreviations and Legend |
| ADR | American Depositary Receipt |
| (A) | Non-income producing security. |
| (B) | These securities are exempt from registration under Rule 144A of the Securities Act of 1933. Such securities may be resold, normally to qualified institutional buyers, in transactions exempt from registration. |
| (C) | All or a portion of this security is on loan as of 2-29-20. |
| (D) | The rate shown is the annualized seven-day yield as of 2-29-20. |
| (E) | Investment is an affiliate of the fund, the advisor and/or subadvisor. This security represents the investment of cash collateral received for securities lending. |
Capital Appreciation Value Fund
| | | Shares or
Principal
Amount | | Value |
| COMMON STOCKS – 58.4% | | | |
| Communication services – 3.7% | | | | | |
| Interactive media and services – 3.7% | | | |
| Alphabet, Inc., Class A (A) | | 38 | | $ | 50,892 |
| Alphabet, Inc., Class C (A)(B) | | 23,220 | | | 31,099,243 |
| Facebook, Inc., Class A (A) | | 100,000 | | | 19,247,000 |
| | | | | | 50,397,135 |
| Consumer discretionary – 5.5% | | | | | |
| Auto components – 0.5% | | | |
| Aptiv PLC (B) | | 88,192 | | | 6,888,677 |
| Hotels, restaurants and leisure – 2.8% | | | |
| Hilton Worldwide Holdings, Inc. | | 219,992 | | | 21,383,222 |
| Yum! Brands, Inc. | | 193,177 | | | 17,241,047 |
| | | | | | 38,624,269 |
| Internet and direct marketing retail – 2.2% | | | |
| Amazon.com, Inc. (A) | | 15,564 | | | 29,318,685 |
| | | | | | 74,831,631 |
| Consumer staples – 1.4% | | | | | |
| Beverages – 1.4% | | | |
| Keurig Dr. Pepper, Inc. (C) | | 704,881 | | | 19,652,082 |
| Energy – 0.2% | | | | | |
| Oil, gas and consumable fuels – 0.2% | | | |
| Concho Resources, Inc. | | 44,200 | | | 3,006,484 |
| Financials – 5.1% | | | | | |
| Capital markets – 2.2% | | | |
| Intercontinental Exchange, Inc. | | 198,025 | | | 17,667,791 |
| S&P Global, Inc. (B) | | 47,583 | | | 12,652,796 |
| | | | | | 30,320,587 |
| Insurance – 2.9% | | | |
| Marsh & McLennan Companies, Inc. | | 385,242 | | | 40,280,904 |
| | | | | | 70,601,491 |
| Health care – 14.4% | | | | | |
Capital Appreciation Value Fund (continued)
| | | Shares or
Principal
Amount | | Value |
| COMMON STOCKS (continued) | | | |
| Health care equipment and supplies – 7.5% | | | |
| Alcon, Inc. (A) | | 493,218 | | $ | 30,160,963 |
| Becton, Dickinson and Company (B) | | 114,644 | | | 27,264,636 |
| Danaher Corp. | | 258,952 | | | 37,439,280 |
| Envista Holdings Corp. (A) | | 301,890 | | | 7,661,968 |
| | | | | | 102,526,847 |
| Health care providers and services – 1.8% | | | |
| Humana, Inc. | | 41,100 | | | 13,138,848 |
| UnitedHealth Group, Inc. | | 45,700 | | | 11,651,672 |
| | | | | | 24,790,520 |
| Life sciences tools and services – 5.1% | | | |
| Avantor, Inc. (A) | | 302,057 | | | 4,757,398 |
| PerkinElmer, Inc. | | 407,261 | | | 35,203,641 |
| Thermo Fisher Scientific, Inc. | | 104,734 | | | 30,456,647 |
| | | | | | 70,417,686 |
| | | | | | 197,735,053 |
| Industrials – 9.8% | | | | | |
| Aerospace and defense – 0.3% | | | |
| The Boeing Company | | 16,046 | | | 4,414,415 |
| Commercial services and supplies – 1.1% | | | |
| Waste Connections, Inc. | | 155,569 | | | 15,010,853 |
| Industrial conglomerates – 6.2% | | | |
| General Electric Company | | 4,972,439 | | | 54,100,136 |
| Roper Technologies, Inc. (B) | | 89,033 | | | 31,312,906 |
| | | | | | 85,413,042 |
| Machinery – 2.2% | | | |
| Fortive Corp. | | 431,252 | | | 29,825,388 |
| | | | | | 134,663,698 |
| Information technology – 13.2% | | | | | |
| Electronic equipment, instruments and components – 0.5% | | | |
| TE Connectivity, Ltd. | | 86,932 | | | 7,204,055 |
| IT services – 6.7% | | | |
| Fiserv, Inc. (A)(B) | | 404,841 | | | 44,273,412 |
| Global Payments, Inc. (B) | | 129,315 | | | 23,790,081 |
| Visa, Inc., Class A (B) | | 136,022 | | | 24,723,359 |
| | | | | | 92,786,852 |
| Semiconductors and semiconductor equipment – 2.8% | | | |
| Maxim Integrated Products, Inc. | | 329,069 | | | 18,302,818 |
| NXP Semiconductors NV (B) | | 177,110 | | | 20,135,627 |
| | | | | | 38,438,445 |
| Software – 3.2% | | | |
| Microsoft Corp. (B) | | 268,200 | | | 43,451,082 |
| | | | | | 181,880,434 |
| Utilities – 5.1% | | | | | |
| Electric utilities – 3.3% | | | |
| American Electric Power Company, Inc. | | 203,551 | | | 18,168,962 |
| NextEra Energy, Inc. (B) | | 22,690 | | | 5,735,124 |
| Xcel Energy, Inc. (B) | | 340,452 | | | 21,216,969 |
| | | | | | 45,121,055 |
| Multi-utilities – 1.8% | | | |
| Ameren Corp. | | 114,011 | | | 9,006,869 |
| NiSource, Inc. | | 591,882 | | | 15,992,652 |
| | | | | | 24,999,521 |
| | | | | | 70,120,576 |
| TOTAL COMMON STOCKS (Cost $643,098,567) | | $ | 802,888,584 |
| PREFERRED SECURITIES – 5.4% | | | | | |
| Financials – 1.8% | | | | | |
| Banks – 1.6% | | | |
| JPMorgan Chase & Co., 5.750% | | 104,637 | | | 2,774,973 |
| The accompanying notes are an integral part of the financial statements. | 8 | |
John Hancock Funds II
Portfolio of Investments — February 29, 2020 (unaudited)(showing percentage of total net assets)
Capital Appreciation Value Fund (continued)
| | | Shares or
Principal
Amount | | Value |
| PREFERRED SECURITIES (continued) | | | | | |
| Banks (continued) | | | |
| U.S. Bancorp, 5.500% | | 55,000 | | $ | 1,483,900 |
| U.S. Bancorp (6.500% to 1-15-22, then 3 month LIBOR + 4.468%) | | 27,000 | | | 716,850 |
| Wells Fargo & Company, Series L, 7.500% | | 11,590 | | | 17,442,950 |
| | | | | | 22,418,673 |
| Capital markets – 0.2% | | | |
| The Charles Schwab Corp., 5.950% | | 8,000 | | | 204,560 |
| The Charles Schwab Corp., 6.000% | | 72,000 | | | 1,836,000 |
| | | | | | 2,040,560 |
| | | | | | 24,459,233 |
| Health care – 1.4% | | | | | |
| Health care equipment and supplies – 0.7% | | | |
| Becton, Dickinson and Company, 6.125% | | 169,784 | | | 9,608,077 |
| Life sciences tools and services – 0.7% | | | |
| Avantor, Inc., 6.250% | | 179,751 | | | 10,024,713 |
| Pharmaceuticals – 0.0% | | | |
| Elanco Animal Health, Inc., 5.000% (C) | | 7,527 | | | 384,253 |
| | | | | | 20,017,043 |
| Industrials – 0.2% | | | | | |
| Machinery – 0.2% | | | |
| Fortive Corp., 5.000% | | 3,052 | | | 2,780,450 |
| Utilities – 2.0% | | | | | |
| Electric utilities – 0.9% | | | |
| Alabama Power Company, 5.000% | | 50,000 | | | 1,271,500 |
| American Electric Power Company, Inc., 6.125% | | 36,088 | | | 1,872,245 |
| Duke Energy Corp., 5.625% | | 103,700 | | | 2,724,199 |
| NextEra Energy, Inc., 5.279% | | 76,149 | | | 3,461,863 |
| SCE Trust III (5.750% to 3-15-24, then 3 month LIBOR + 2.990%) | | 4,172 | | | 101,046 |
| SCE Trust IV (5.375% to 9-15-25, then 3 month LIBOR + 3.132%) | | 103,538 | | | 2,350,313 |
| | | | | | 11,781,166 |
| Multi-utilities – 1.1% | | | |
| CMS Energy Corp., 5.875% | | 156,300 | | | 4,091,934 |
| CMS Energy Corp., 5.875% | | 207,800 | | | 5,433,970 |
| DTE Energy Company, 5.250% | | 105,300 | | | 2,643,030 |
| NiSource, Inc. (6.500% to 3-15-24, then 5 Year CMT + 3.632%) | | 120,000 | | | 3,154,800 |
| | | | | | 15,323,734 |
| | | | | | 27,104,900 |
| TOTAL PREFERRED SECURITIES (Cost $69,070,656) | | $ | 74,361,626 |
| CORPORATE BONDS - 17.7% | | | | | |
| Communication services - 5.5% | | | | | |
| CCO Holdings LLC | | | | | |
| 4.000%, 03/01/2023 (D) | $ | 2,235,000 | | | 2,257,350 |
| 5.000%, 02/01/2028 (D) | | 7,597,000 | | | 7,900,880 |
| 5.125%, 02/15/2023 | | 1,097,000 | | | 1,105,228 |
| 5.125%, 05/01/2023 to 05/01/2027 (D) | | 8,225,000 | | | 8,464,593 |
| 5.250%, 09/30/2022 | | 1,680,000 | | | 1,698,396 |
| 5.750%, 09/01/2023 to 01/15/2024 | | 1,423,000 | | | 1,439,684 |
| 5.875%, 04/01/2024 (D) | | 2,390,000 | | | 2,455,008 |
Charter Communications Operating LLC
3.579%, 07/23/2020 | | 575,000 | | | 578,207 |
Comcast Corp. (3 month LIBOR + 0.330%)
2.239%, 10/01/2020 (E) | | 1,490,000 | | | 1,492,906 |
Comcast Corp. (3 month LIBOR + 0.440%)
2.349%, 10/01/2021 (E) | | 1,175,000 | | | 1,180,236 |
Capital Appreciation Value Fund (continued)
| | | Shares or
Principal
Amount | | Value |
| CORPORATE BONDS (continued) | | | | | |
| Communication services (continued) | | | | | |
Level 3 Financing, Inc.
5.375%, 08/15/2022 | $ | 1,414,000 | | $ | 1,420,363 |
| Netflix, Inc. | | | | | |
| 4.375%, 11/15/2026 | | 6,035,000 | | | 6,319,852 |
| 4.875%, 04/15/2028 | | 9,755,000 | | | 10,269,186 |
| 5.375%, 02/01/2021 | | 1,101,000 | | | 1,123,020 |
| 5.500%, 02/15/2022 | | 835,000 | | | 875,456 |
| 5.875%, 02/15/2025 to 11/15/2028 | | 11,618,000 | | | 13,060,914 |
| 6.375%, 05/15/2029 | | 5,640,000 | | | 6,521,250 |
| Sirius XM Radio, Inc. | | | | | |
| 3.875%, 08/01/2022 (D) | | 1,931,000 | | | 1,926,424 |
| 4.625%, 05/15/2023 (D) | | 1,640,000 | | | 1,652,300 |
| T-Mobile USA, Inc. | | | | | |
| 6.000%, 03/01/2023 | | 715,000 | | | 723,938 |
| 6.500%, 01/15/2026 | | 330,000 | | | 347,424 |
Verizon Communications, Inc.
3.125%, 03/16/2022 | | 900,000 | | | 934,039 |
Verizon Communications, Inc. (3 month LIBOR + 1.000%)
2.894%, 03/16/2022 (E) | | 1,250,000 | | | 1,266,575 |
| | | | | | 75,013,229 |
| Consumer discretionary - 2.5% | | | | | |
AutoZone, Inc.
2.500%, 04/15/2021 | | 900,000 | | | 908,124 |
Cedar Fair LP
5.375%, 06/01/2024 to 04/15/2027 | | 3,343,000 | | | 3,413,722 |
Dollar Tree, Inc. (3 month LIBOR + 0.700%)
2.536%, 04/17/2020 (E) | | 203,000 | | | 203,023 |
Hilton Domestic Operating Company, Inc.
4.250%, 09/01/2024 | | 1,280,000 | | | 1,284,262 |
KFC Holding Company/Pizza Hut
Holdings LLC/Taco Bell of America LLC | | | | | |
| 4.750%, 06/01/2027 (D) | | 5,195,000 | | | 5,311,888 |
| 5.000%, 06/01/2024 (D) | | 1,985,000 | | | 2,000,642 |
| 5.250%, 06/01/2026 (D) | | 3,363,000 | | | 3,438,701 |
Marriott International, Inc. (3 month LIBOR + 0.650%)
2.535%, 03/08/2021 (E) | | 575,000 | | | 575,380 |
Service Corp. International
5.375%, 05/15/2024 | | 1,475,000 | | | 1,502,656 |
| Six Flags Entertainment Corp. | | | | | |
| 4.875%, 07/31/2024 (D) | | 770,000 | | | 759,990 |
| 5.500%, 04/15/2027 (D) | | 277,000 | | | 267,492 |
The Home Depot, Inc.
3.250%, 03/01/2022 | | 875,000 | | | 908,156 |
The Home Depot, Inc. (3 month LIBOR + 0.310%)
1.890%, 03/01/2022 (E) | | 1,065,000 | | | 1,068,373 |
| Yum! Brands, Inc. | | | | | |
| 3.750%, 11/01/2021 | | 3,995,000 | | | 4,001,192 |
| 3.875%, 11/01/2020 to 11/01/2023 | | 4,385,000 | | | 4,445,510 |
| 5.350%, 11/01/2043 | | 3,109,000 | | | 3,202,270 |
| 6.875%, 11/15/2037 | | 925,000 | | | 1,091,500 |
| | | | | | 34,382,881 |
| Consumer staples - 1.1% | | | | | |
Conagra Brands, Inc.
3.800%, 10/22/2021 | | 3,355,000 | | | 3,487,485 |
Conagra Brands, Inc. (3 month LIBOR + 0.750%)
2.552%, 10/22/2020 (E) | | 390,000 | | | 390,047 |
Nestle Holdings, Inc.
3.100%, 09/24/2021 (D) | | 4,775,000 | | | 4,898,018 |
| The accompanying notes are an integral part of the financial statements. | 9 | |
John Hancock Funds II
Portfolio of Investments — February 29, 2020 (unaudited)(showing percentage of total net assets)
Capital Appreciation Value Fund (continued)
| | | Shares or
Principal
Amount | | Value |
| CORPORATE BONDS (continued) | | | | | |
| Consumer staples (continued) | | | | | |
Philip Morris International, Inc.
2.625%, 02/18/2022 | $ | 905,000 | | $ | 925,376 |
Reckitt Benckiser Treasury Services PLC
2.375%, 06/24/2022 (D) | | 2,925,000 | | | 2,983,274 |
Reckitt Benckiser Treasury Services PLC (3 month LIBOR + 0.560%)
2.495%, 06/24/2022 (D)(E) | | 1,385,000 | | | 1,387,769 |
Unilever Capital Corp.
3.000%, 03/07/2022 | | 1,035,000 | | | 1,070,451 |
| | | | | | 15,142,420 |
| Energy - 0.3% | | | | | |
Enterprise Products Operating LLC
3.500%, 02/01/2022 | | 1,500,000 | | | 1,562,963 |
NuStar Logistics LP
4.800%, 09/01/2020 | | 1,020,000 | | | 1,026,375 |
Shell International Finance BV (3 month LIBOR + 0.450%)
2.181%, 05/11/2020 (E) | | 1,885,000 | | | 1,886,715 |
| | | | | | 4,476,053 |
| Financials - 1.6% | | | | | |
| Crown Castle International Corp. | | | | | |
| 4.875%, 04/15/2022 | | 2,950,000 | | | 3,131,653 |
| 5.250%, 01/15/2023 | | 4,575,000 | | | 5,020,081 |
| Marsh & McLennan Companies, Inc. | | | | | |
| 2.350%, 03/06/2020 | | 810,000 | | | 810,016 |
| 2.750%, 01/30/2022 | | 865,000 | | | 885,297 |
| 3.300%, 03/14/2023 | | 315,000 | | | 330,173 |
| Refinitiv US Holdings, Inc. | | | | | |
| 6.250%, 05/15/2026 (D) | | 1,620,000 | | | 1,745,550 |
| 8.250%, 11/15/2026 (D) | | 1,935,000 | | | 2,130,435 |
State Street Corp. (5.250% to 9-15-20, then 3 month LIBOR + 3.597%)
09/15/2020 (F) | | 1,550,000 | | | 1,570,600 |
The Bank of New York Mellon Corp. (4.625% to 9-20-26, then 3 month LIBOR + 3.131%)
09/20/2026 (F) | | 810,000 | | | 844,425 |
The Bank of New York Mellon Corp. (4.950% to 6-20-20, then 3 month LIBOR + 3.420%)
06/20/2020 (F) | | 2,450,000 | | | 2,456,125 |
The PNC Financial Services Group, Inc. (5.000% to 11-1-26, then 3 month LIBOR + 3.300%)
11/01/2026 (F) | | 2,005,000 | | | 2,120,288 |
U.S. Bancorp (5.300% to 4-15-27, then 3 month LIBOR + 2.914%)
04/15/2027 (F) | | 1,020,000 | | | 1,127,947 |
| | | | | | 22,172,590 |
| Health care - 2.7% | | | | | |
| Avantor, Inc. | | | | | |
| 6.000%, 10/01/2024 (D) | | 3,895,000 | | | 4,088,114 |
| 9.000%, 10/01/2025 (D) | | 12,276,000 | | | 13,398,026 |
| Becton, Dickinson and Company | | | | | |
| 2.894%, 06/06/2022 | | 3,385,000 | | | 3,475,550 |
| 3.363%, 06/06/2024 | | 1,180,000 | | | 1,255,041 |
Becton, Dickinson and Company (3 month LIBOR + 1.030%)
2.917%, 06/06/2022 (E) | | 1,895,000 | | | 1,915,634 |
Bristol-Myers Squibb Company
2.550%, 05/14/2021 (D) | | 4,015,000 | | | 4,067,681 |
Bristol-Myers Squibb Company (3 month LIBOR + 0.200%)
1.892%, 11/16/2020 (D)(E) | | 2,625,000 | | | 2,627,344 |
Capital Appreciation Value Fund (continued)
| | | Shares or
Principal
Amount | | Value |
| CORPORATE BONDS (continued) | | | | | |
| Health care (continued) | | | | | |
Elanco Animal Health, Inc.
4.662%, 08/27/2021 | $ | 1,775,000 | | $ | 1,861,060 |
Fresenius Medical Care US Finance, Inc.
5.750%, 02/15/2021 (D) | | 575,000 | | | 596,620 |
HCA Healthcare, Inc.
6.250%, 02/15/2021 | | 750,000 | | | 779,100 |
Hologic, Inc.
4.375%, 10/15/2025 (D) | | 1,020,000 | | | 1,038,819 |
| Teleflex, Inc. | | | | | |
| 4.625%, 11/15/2027 | | 892,000 | | | 936,065 |
| 4.875%, 06/01/2026 | | 1,311,000 | | | 1,366,718 |
| | | | | | 37,405,772 |
| Industrials - 1.4% | | | | | |
Continental Airlines 2012-1 Class A Pass Through Trust
4.150%, 04/11/2024 | | 904,504 | | | 965,077 |
Continental Airlines 2012-1 Class B Pass Through Trust
6.250%, 04/11/2020 | | 148,425 | | | 148,657 |
General Electric Company (5.000% to 1-21-21, then 3 month LIBOR + 3.330%)
01/21/2021 (F) | | 6,766,000 | | | 6,581,694 |
Korn Ferry
4.625%, 12/15/2027 (D) | | 330,000 | | | 338,250 |
Lennox International, Inc.
3.000%, 11/15/2023 | | 510,000 | | | 530,599 |
Northrop Grumman Corp.
2.550%, 10/15/2022 | | 2,140,000 | | | 2,202,976 |
Roper Technologies, Inc.
3.650%, 09/15/2023 | | 1,050,000 | | | 1,124,056 |
| Sensata Technologies BV | | | | | |
| 4.875%, 10/15/2023 (D) | | 1,057,000 | | | 1,115,135 |
| 5.000%, 10/01/2025 (D) | | 1,475,000 | | | 1,552,585 |
| 5.625%, 11/01/2024 (D) | | 415,000 | | | 447,266 |
Sensata Technologies UK Financing Company PLC
6.250%, 02/15/2026 (D) | | 350,000 | | | 366,030 |
US Airways 2010-1 Class A Pass Through Trust
6.250%, 04/22/2023 | | 45,125 | | | 47,832 |
US Airways 2012-2 Class A Pass Through Trust
4.625%, 06/03/2025 | | 171,129 | | | 186,997 |
US Airways 2012-2 Class B Pass Through Trust
6.750%, 06/03/2021 | | 239,336 | | | 249,439 |
US Airways 2013-1 Class A Pass Through Trust
3.950%, 11/15/2025 | | 424,034 | | | 447,501 |
US Airways 2013-1 Class B Pass Through Trust
5.375%, 11/15/2021 | | 326,737 | | | 339,511 |
Welbilt, Inc.
9.500%, 02/15/2024 | | 1,545,000 | | | 1,630,941 |
| Xylem, Inc. | | | | | |
| 3.250%, 11/01/2026 | | 355,000 | | | 385,954 |
| 4.875%, 10/01/2021 | | 100,000 | | | 105,312 |
| | | | | | 18,765,812 |
| Information technology - 1.2% | | | | | |
Amphenol Corp.
2.200%, 04/01/2020 | | 1,400,000 | | | 1,400,571 |
| Fiserv, Inc. | | | | | |
| 2.700%, 06/01/2020 | | 1,590,000 | | | 1,591,766 |
| 3.800%, 10/01/2023 | | 1,080,000 | | | 1,156,745 |
| The accompanying notes are an integral part of the financial statements. | 10 | |
John Hancock Funds II
Portfolio of Investments — February 29, 2020 (unaudited)(showing percentage of total net assets)
Capital Appreciation Value Fund (continued)
| | | Shares or
Principal
Amount | | Value |
| CORPORATE BONDS (continued) | | | | | |
| Information technology (continued) | | | | | |
Solera LLC
10.500%, 03/01/2024 (D) | $ | 11,115,000 | | $ | 11,740,330 |
| | | | | | 15,889,412 |
| Materials - 0.2% | | | | | |
Reynolds Group Issuer, Inc.
5.125%, 07/15/2023 (D) | | 1,000,000 | | | 1,010,000 |
Reynolds Group Issuer, Inc. (3 month LIBOR + 3.500%)
5.331%, 07/15/2021 (D)(E) | | 1,485,000 | | | 1,480,174 |
| | | | | | 2,490,174 |
| Real estate - 0.4% | | | | | |
American Tower Corp.
3.300%, 02/15/2021 | | 965,000 | | | 977,582 |
| SBA Communications Corp. | | | | | |
| 3.875%, 02/15/2027 (D) | | 720,000 | | | 734,616 |
| 4.000%, 10/01/2022 | | 2,800,000 | | | 2,830,856 |
| 4.875%, 09/01/2024 | | 1,255,000 | | | 1,288,734 |
| | | | | | 5,831,788 |
| Utilities - 0.8% | | | | | |
American Electric Power Company, Inc.
3.650%, 12/01/2021 | | 340,000 | | | 353,273 |
DTE Energy Company
3.700%, 08/01/2023 | | 935,000 | | | 995,836 |
| Eversource Energy | | | | | |
| 2.750%, 03/15/2022 | | 1,275,000 | | | 1,307,723 |
| 3.800%, 12/01/2023 | | 530,000 | | | 569,709 |
NextEra Energy Capital Holdings, Inc.
2.900%, 04/01/2022 | | 960,000 | | | 987,977 |
| NiSource, Inc. | | | | | |
| 3.490%, 05/15/2027 | | 1,955,000 | | | 2,128,400 |
| 4.375%, 05/15/2047 | | 1,125,000 | | | 1,322,059 |
NiSource, Inc. (5.650% to 6-15-23, then 5 Year CMT + 2.843%)
06/15/2023 (F) | | 2,650,000 | | | 2,703,000 |
Wisconsin Public Service Corp.
3.350%, 11/21/2021 | | 885,000 | | | 913,040 |
| | | | | | 11,281,017 |
| TOTAL CORPORATE BONDS (Cost $233,014,055) | | $ | 242,851,148 |
| TERM LOANS (G) – 7.2% | | | | | |
| Communication services – 0.4% | | | | | |
Formula One Management, Ltd., 2018 USD Term Loan (1 month LIBOR + 2.500%)
4.103%, 02/01/2024 | | 2,025,000 | | | 1,954,125 |
Zayo Group LLC, 2017 Incremental Term Loan (1 month LIBOR + 2.250%)
3.853%, 01/19/2024 | | 2,025,000 | | | 2,023,259 |
Zayo Group LLC, 2017 Term Loan B1 (1 month LIBOR + 2.000%)
3.603%, 01/19/2021 | | 987,310 | | | 986,796 |
| | | | | | 4,964,180 |
| Consumer staples – 0.4% | | | | | |
Prestige Brands, Inc., Term Loan B4 (1 month LIBOR + 2.000%)
3.603%, 01/26/2024 | | 104,052 | | | 102,838 |
Sunshine Luxembourg VII Sarl, USD Term Loan B1 (3 month LIBOR + 4.250%)
6.195%, 10/01/2026 | | 5,520,000 | | | 5,416,500 |
| | | | | | 5,519,338 |
Capital Appreciation Value Fund (continued)
| | | Shares or
Principal
Amount | | Value |
| TERM LOANS (G)(continued) | | | | | |
| Financials – 3.7% | | | | | |
AmWINS Group, Inc., 2017 Term Loan (1 month LIBOR + 2.750%)
4.364%, 01/25/2024 | $ | 438,867 | | $ | 436,673 |
HUB International, Ltd., 2018 Term Loan B (2 and 3 month LIBOR + 2.750%)
4.543%, 04/25/2025 | | 18,996,739 | | | 18,438,804 |
HUB International, Ltd., 2019 Incremental Term Loan B (3 month LIBOR + 4.000%)
5.692%, 04/25/2025 | | 4,500,000 | | | 4,483,935 |
Refinitiv US Holdings, Inc., 2018 USD Term Loan (1 month LIBOR + 3.250%)
4.853%, 10/01/2025 | | 27,835,900 | | | 27,754,620 |
USI, Inc., 2017 Repriced Term Loan (3 month LIBOR + 3.000%)
4.945%, 05/16/2024 | | 609,783 | | | 594,539 |
| | | | | | 51,708,571 |
| Health care – 0.5% | | | | | |
Loire Finco Luxembourg Sarl, Term Loan B
TBD 01/22/2027 (H) | | 4,275,000 | | | 4,239,389 |
NVA Holdings, Inc., 2019 Term Loan A3
TBD 09/24/2022 (H) | | 3,450,000 | | | 3,437,063 |
| | | | | | 7,676,452 |
| Information technology – 2.1% | | | | | |
CCC Information Services, Inc., 2017 1st Lien Term Loan (1 month LIBOR + 2.750%)
4.360%, 04/29/2024 | | 10,429,973 | | | 10,330,054 |
Emerald TopCo, Inc., Term Loan (1 month LIBOR + 3.500%)
5.103%, 07/24/2026 | | 1,670,813 | | | 1,665,934 |
Gartner, Inc., 2016 Term Loan A (1 month LIBOR + 1.500%)
3.103%, 03/20/2022 | | 350,487 | | | 346,982 |
Kronos, Inc., 2017 Term Loan B (3 month LIBOR + 3.000%)
4.763%, 11/01/2023 | | 16,061,340 | | | 15,915,824 |
The Ultimate Software Group, Inc., Term Loan B (1 month LIBOR + 3.750%)
5.353%, 05/04/2026 | | 693,263 | | | 690,184 |
| | | | | | 28,948,978 |
| Materials – 0.1% | | | | | |
HB Fuller Company, 2017 Term Loan B (1 month LIBOR + 2.000%)
3.647%, 10/20/2024 | | 931,857 | | | 917,879 |
| TOTAL TERM LOANS (Cost $100,756,152) | | $ | 99,735,398 |
| SHORT-TERM INVESTMENTS – 14.4% | | | |
| Short-term funds – 14.4% | | | | | |
| John Hancock Collateral Trust, 1.6968% (I)(J) | | 847,910 | | | 8,486,650 |
| State Street Institutional U.S. Government Money Market Fund, Premier Class, 1.5386% (I) | | 15,742,526 | | | 15,742,526 |
| T. Rowe Price Government Reserve Fund, 1.5799% (I) | | 173,822,838 | | | 173,822,838 |
| TOTAL SHORT-TERM INVESTMENTS (Cost $198,049,119) | | $ | 198,052,014 |
Total Investments (Capital Appreciation Value Fund)
(Cost $1,243,988,549) – 103.1% | | $ | 1,417,888,770 |
| Other assets and liabilities, net – (3.1%) | | | (42,843,534) |
| TOTAL NET ASSETS – 100.0% | | $ | 1,375,045,236 |
| The accompanying notes are an integral part of the financial statements. | 11 | |
John Hancock Funds II
Portfolio of Investments — February 29, 2020 (unaudited)(showing percentage of total net assets)
Capital Appreciation Value Fund (continued)
| Security Abbreviations and Legend |
| CMT | Constant Maturity Treasury |
| LIBOR | London Interbank Offered Rate |
| (A) | Non-income producing security. |
| (B) | All or a portion of this security is segregated at the custodian as collateral for certain derivatives. |
| (C) | All or a portion of this security is on loan as of 2-29-20. |
| (D) | These securities are exempt from registration under Rule 144A of the Securities Act of 1933. Such securities may be resold, normally to qualified institutional buyers, in transactions exempt from registration. |
| (E) | Variable rate obligation. The coupon rate shown represents the rate at period end. |
Capital Appreciation Value Fund (continued)
| (F) | Perpetual bonds have no stated maturity date. Date shown as maturity date is next call date. |
| (G) | Term loans are variable rate obligations. The coupon rate shown represents the rate at period end. |
| (H) | This position represents an unsettled loan commitment at period end. Certain details associated with this purchase are not known prior to the settlement date, including coupon rate, which is disclosed as TBD (To Be Determined). |
| (I) | The rate shown is the annualized seven-day yield as of 2-29-20. |
| (J) | Investment is an affiliate of the fund, the advisor and/or subadvisor. This security represents the investment of cash collateral received for securities lending. |
DERIVATIVES
WRITTEN OPTIONS
| Options on securities |
Counterparty (OTC)/
Exchange-traded | Name of issuer | | Exercise
price | Expiration
date | Number of
contracts | Notional
amount | Premium | Value |
| Calls | | | | | | | |
| | | | | | | | | |
| CITI | Alphabet, Inc., Class C | USD | 1,500.00 | Jan 2021 | 8 | 800 | $64,056 | $(67,446) |
| CITI | Alphabet, Inc., Class C | USD | 1,500.00 | Jan 2021 | 8 | 800 | 60,376 | (67,446) |
| CITI | Alphabet, Inc., Class C | USD | 1,500.00 | Jan 2021 | 8 | 800 | 59,096 | (67,446) |
| CITI | Alphabet, Inc., Class C | USD | 1,500.00 | Jan 2021 | 5 | 500 | 31,885 | (42,154) |
| GSI | Alphabet, Inc., Class C | USD | 1,740.00 | Jan 2021 | 3 | 300 | 14,151 | (9,057) |
| GSI | Alphabet, Inc., Class C | USD | 1,740.00 | Jan 2021 | 2 | 200 | 9,374 | (6,038) |
| GSI | Alphabet, Inc., Class C | USD | 1,740.00 | Jan 2021 | 3 | 300 | 13,281 | (9,057) |
| GSI | Alphabet, Inc., Class C | USD | 1,760.00 | Jan 2021 | 3 | 300 | 12,741 | (8,261) |
| GSI | Alphabet, Inc., Class C | USD | 1,760.00 | Jan 2021 | 2 | 200 | 8,454 | (5,507) |
| GSI | Alphabet, Inc., Class C | USD | 1,760.00 | Jan 2021 | 3 | 300 | 11,991 | (8,261) |
| GSI | Alphabet, Inc., Class C | USD | 1,780.00 | Jan 2021 | 3 | 300 | 11,481 | (7,529) |
| GSI | Alphabet, Inc., Class C | USD | 1,780.00 | Jan 2021 | 2 | 200 | 7,654 | (5,019) |
| GSI | Alphabet, Inc., Class C | USD | 1,780.00 | Jan 2021 | 3 | 300 | 10,761 | (7,529) |
| GSI | Alphabet, Inc., Class C | USD | 1,800.00 | Jan 2021 | 3 | 300 | 10,341 | (6,856) |
| GSI | Alphabet, Inc., Class C | USD | 1,800.00 | Jan 2021 | 2 | 200 | 6,874 | (4,571) |
| GSI | Alphabet, Inc., Class C | USD | 1,800.00 | Jan 2021 | 3 | 300 | 9,651 | (6,856) |
| CITI | American Electric Power Company, Inc. | USD | 105.00 | Jan 2021 | 210 | 21,000 | 32,970 | (28,702) |
| CITI | American Electric Power Company, Inc. | USD | 105.00 | Jan 2021 | 208 | 20,800 | 32,656 | (28,429) |
| CITI | American Electric Power Company, Inc. | USD | 115.00 | Jan 2021 | 115 | 11,500 | 20,299 | (4,263) |
| GSI | Aptiv PLC | USD | 97.00 | Jan 2021 | 43 | 4,300 | 23,904 | (15,993) |
| GSI | Aptiv PLC | USD | 97.50 | Jan 2021 | 42 | 4,200 | 28,034 | (15,621) |
| GSI | Aptiv PLC | USD | 100.00 | Jan 2021 | 43 | 4,300 | 20,470 | (13,702) |
| GSI | Aptiv PLC | USD | 100.00 | Jan 2021 | 42 | 4,200 | 24,176 | (13,384) |
| GSI | Becton, Dickinson and Company | USD | 300.00 | Jan 2021 | 16 | 1,600 | 14,972 | (6,987) |
| GSI | Becton, Dickinson and Company | USD | 300.00 | Jan 2021 | 36 | 3,600 | 32,897 | (15,722) |
| GSI | Becton, Dickinson and Company | USD | 300.00 | Jan 2021 | 52 | 5,200 | 51,963 | (22,709) |
| GSI | Becton, Dickinson and Company | USD | 300.00 | Jan 2021 | 45 | 4,500 | 54,590 | (19,652) |
| JPM | Danaher Corp. | USD | 185.00 | Jan 2021 | 68 | 6,800 | 32,174 | (17,214) |
| JPM | Danaher Corp. | USD | 190.00 | Jan 2021 | 68 | 6,800 | 23,038 | (13,260) |
| JPM | Facebook, Inc., Class A | USD | 265.00 | Jan 2021 | 38 | 3,800 | 38,076 | (14,735) |
| JPM | Facebook, Inc., Class A | USD | 265.00 | Jan 2021 | 33 | 3,300 | 32,736 | (12,796) |
| JPM | Facebook, Inc., Class A | USD | 270.00 | Jan 2021 | 38 | 3,800 | 33,706 | (12,738) |
| JPM | Facebook, Inc., Class A | USD | 270.00 | Jan 2021 | 33 | 3,300 | 28,941 | (11,062) |
| JPM | Facebook, Inc., Class A | USD | 275.00 | Jan 2021 | 38 | 3,800 | 29,716 | (10,993) |
| JPM | Facebook, Inc., Class A | USD | 275.00 | Jan 2021 | 33 | 3,300 | 25,311 | (9,547) |
| CSFB | Fiserv, Inc. | USD | 135.00 | Jan 2021 | 16 | 1,600 | 10,378 | (5,345) |
| CSFB | Fiserv, Inc. | USD | 135.00 | Jan 2021 | 45 | 4,500 | 30,591 | (15,032) |
| CSFB | Fiserv, Inc. | USD | 140.00 | Jan 2021 | 16 | 1,600 | 7,642 | (3,919) |
| CSFB | Fiserv, Inc. | USD | 140.00 | Jan 2021 | 45 | 4,500 | 22,631 | (11,022) |
| JPM | General Electric Company | USD | 15.00 | Jan 2021 | 1,312 | 131,200 | 68,224 | (64,499) |
| JPM | General Electric Company | USD | 15.00 | Jan 2021 | 1,312 | 131,200 | 74,154 | (64,499) |
| JPM | General Electric Company | USD | 15.00 | Jan 2021 | 2,441 | 244,100 | 205,410 | (120,002) |
| JPM | General Electric Company | USD | 15.00 | Jan 2021 | 1,221 | 122,100 | 104,249 | (60,026) |
| JPM | General Electric Company | USD | 15.00 | Jan 2021 | 734 | 73,400 | 64,049 | (36,084) |
| GSI | Global Payments, Inc. | USD | 230.00 | Dec 2020 | 12 | 1,200 | 10,090 | (6,164) |
| GSI | Global Payments, Inc. | USD | 230.00 | Dec 2020 | 24 | 2,400 | 22,650 | (12,328) |
| The accompanying notes are an integral part of the financial statements. | 12 | |
John Hancock Funds II
Portfolio of Investments — February 29, 2020 (unaudited)(showing percentage of total net assets)
Capital Appreciation Value Fund (continued)
| Options on securities (continued) |
Counterparty (OTC)/
Exchange-traded | Name of issuer | | Exercise
price | Expiration
date | Number of
contracts | Notional
amount | Premium | Value |
| Calls (continued) | | | | | | | |
| GSI | Global Payments, Inc. | USD | 240.00 | Dec 2020 | 12 | 1,200 | $5,960 | $(4,320) |
| GSI | Global Payments, Inc. | USD | 240.00 | Dec 2020 | 24 | 2,400 | 15,334 | (8,640) |
| CITI | Hilton Worldwide Holdings, Inc. | USD | 125.00 | Jan 2021 | 33 | 3,300 | 17,849 | (13,000) |
| CITI | Hilton Worldwide Holdings, Inc. | USD | 125.00 | Jan 2021 | 1 | 100 | 551 | (394) |
| CITI | Hilton Worldwide Holdings, Inc. | USD | 130.00 | Jan 2021 | 32 | 3,200 | 12,545 | (9,859) |
| CITI | Hilton Worldwide Holdings, Inc. | USD | 130.00 | Jan 2021 | 1 | 100 | 398 | (308) |
| CSFB | Microsoft Corp. | USD | 165.00 | Jan 2021 | 283 | 28,300 | 191,053 | (483,448) |
| CSFB | Microsoft Corp. | USD | 165.00 | Jan 2021 | 270 | 27,000 | 186,840 | (461,240) |
| JPM | Microsoft Corp. | USD | 180.00 | Jan 2021 | 232 | 23,200 | 226,664 | (259,352) |
| JPM | Microsoft Corp. | USD | 180.00 | Jan 2021 | 233 | 23,300 | 209,001 | (260,470) |
| CITI | Microsoft Corp. | USD | 190.00 | Jan 2021 | 96 | 9,600 | 84,192 | (79,538) |
| CITI | Microsoft Corp. | USD | 200.00 | Jan 2021 | 60 | 6,000 | 73,146 | (36,535) |
| CITI | Microsoft Corp. | USD | 210.00 | Jan 2021 | 60 | 6,000 | 53,568 | (26,745) |
| CSFB | NextEra Energy, Inc. | USD | 310.00 | Jan 2021 | 26 | 2,600 | 21,801 | (12,345) |
| CSFB | NextEra Energy, Inc. | USD | 320.00 | Jan 2021 | 27 | 2,700 | 16,033 | (9,222) |
| CSFB | NXP Semiconductors NV | USD | 140.00 | Jan 2021 | 37 | 3,700 | 25,907 | (20,244) |
| CSFB | NXP Semiconductors NV | USD | 140.00 | Jan 2021 | 86 | 8,600 | 63,709 | (47,054) |
| CSFB | NXP Semiconductors NV | USD | 140.00 | Jan 2021 | 204 | 20,400 | 154,550 | (111,617) |
| GSI | Roper Technologies, Inc. | USD | 430.00 | Aug 2020 | 22 | 2,200 | 16,687 | (10,100) |
| CSFB | S&P Global, Inc. | USD | 340.00 | Dec 2020 | 25 | 2,500 | 33,590 | (16,408) |
| CSFB | S&P Global, Inc. | USD | 350.00 | Dec 2020 | 24 | 2,400 | 25,570 | (12,471) |
| JPM | The Boeing Company | USD | 390.00 | Jan 2021 | 34 | 3,400 | 59,928 | (22,581) |
| RBC | Thermo Fisher Scientific, Inc. | USD | 370.00 | Jan 2021 | 22 | 2,200 | 30,928 | (17,128) |
| RBC | Thermo Fisher Scientific, Inc. | USD | 390.00 | Jan 2021 | 23 | 2,300 | 19,048 | (11,686) |
| RBC | Thermo Fisher Scientific, Inc. | USD | 400.00 | Jan 2021 | 37 | 3,700 | 28,848 | (15,075) |
| RBC | Thermo Fisher Scientific, Inc. | USD | 400.00 | Jan 2021 | 69 | 6,900 | 48,803 | (28,113) |
| RBC | Thermo Fisher Scientific, Inc. | USD | 400.00 | Jan 2021 | 15 | 1,500 | 10,643 | (6,112) |
| RBC | Thermo Fisher Scientific, Inc. | USD | 400.00 | Jan 2021 | 6 | 600 | 5,576 | (2,445) |
| CSFB | Visa, Inc., Class A | USD | 230.00 | Jan 2021 | 102 | 10,200 | 79,529 | (47,178) |
| CSFB | Visa, Inc., Class A | USD | 230.00 | Jan 2021 | 62 | 6,200 | 44,082 | (28,677) |
| GSI | Visa, Inc., Class A | USD | 230.00 | Jan 2021 | 24 | 2,400 | 22,625 | (11,101) |
| GSI | Visa, Inc., Class A | USD | 230.00 | Jan 2021 | 29 | 2,900 | 29,669 | (13,413) |
| CSFB | Visa, Inc., Class A | USD | 235.00 | Jan 2021 | 102 | 10,200 | 64,648 | (39,621) |
| CSFB | Visa, Inc., Class A | USD | 235.00 | Jan 2021 | 62 | 6,200 | 35,861 | (24,084) |
| CSFB | Visa, Inc., Class A | USD | 240.00 | Jan 2021 | 102 | 10,200 | 52,316 | (33,212) |
| CSFB | Visa, Inc., Class A | USD | 240.00 | Jan 2021 | 62 | 6,200 | 28,824 | (20,188) |
| GSI | Visa, Inc., Class A | USD | 240.00 | Jan 2021 | 24 | 2,400 | 15,333 | (7,815) |
| GSI | Visa, Inc., Class A | USD | 240.00 | Jan 2021 | 29 | 2,900 | 20,406 | (9,443) |
| CSFB | Xcel Energy, Inc. | USD | 75.00 | Oct 2020 | 128 | 12,800 | 20,262 | (5,425) |
| JPM | Yum! Brands, Inc. | USD | 115.00 | Jan 2021 | 36 | 3,600 | 11,066 | (3,992) |
| JPM | Yum! Brands, Inc. | USD | 115.00 | Jan 2021 | 11 | 1,100 | 3,122 | (1,220) |
| JPM | Yum! Brands, Inc. | USD | 120.00 | Jan 2021 | 36 | 3,600 | 6,868 | (2,567) |
| JPM | Yum! Brands, Inc. | USD | 120.00 | Jan 2021 | 11 | 1,100 | 1,823 | (784) |
| | | | | | | | $3,618,020 | $(3,250,632) |
| Derivatives Currency Abbreviations |
| USD | U.S. Dollar |
| Derivatives Abbreviations |
| CITI | Citibank, N.A. |
| CSFB | Credit Suisse First Boston International |
| GSI | Goldman Sachs International |
| JPM | JPMorgan Chase Bank, N.A. |
| OTC | Over-the-counter |
| RBC | Royal Bank of Canada |
See Notes to financial statements regarding investment transactions and other derivatives information.
Health Sciences Fund
| | | Shares or
Principal
Amount | | Value |
| COMMON STOCKS – 97.2% | | | |
| Consumer discretionary – 0.1% | | | | | |
Health Sciences Fund (continued)
| | | Shares or
Principal
Amount | | Value |
| COMMON STOCKS (continued) | | | |
| Specialty retail – 0.1% | | | |
| JAND, Inc., Class A (A)(B)(C) | | 16,938 | | $ | 307,594 |
| The accompanying notes are an integral part of the financial statements. | 13 | |
John Hancock Funds II
Portfolio of Investments — February 29, 2020 (unaudited)(showing percentage of total net assets)
Health Sciences Fund (continued)
| | | Shares or
Principal
Amount | | Value |
| COMMON STOCKS (continued) | | | |
| Health care – 96.6% | | | | | |
| Biotechnology – 37.2% | | | |
| AbbVie, Inc. | | 74,364 | | $ | 6,373,738 |
| Abcam PLC | | 24,265 | | | 361,361 |
| ACADIA Pharmaceuticals, Inc. (C) | | 72,567 | | | 3,101,514 |
| Acceleron Pharma, Inc. (C) | | 28,550 | | | 2,453,302 |
| Acerta Pharma BV, Class B (A)(B)(C) | | 4,892,850 | | | 457,481 |
| Adverum Biotechnologies, Inc. (C) | | 33,490 | | | 412,262 |
| Agios Pharmaceuticals, Inc. (C) | | 13,616 | | | 646,488 |
| Aimmune Therapeutics, Inc. (C) | | 27,897 | | | 664,228 |
| Akero Therapeutics, Inc. (C) | | 4,748 | | | 103,364 |
| Alector, Inc. (C) | | 10,836 | | | 297,773 |
| Alexion Pharmaceuticals, Inc. (C) | | 36,719 | | | 3,452,688 |
| Alkermes PLC (C) | | 18,850 | | | 392,834 |
| Allakos, Inc. (C) | | 2,459 | | | 153,269 |
| Allogene Therapeutics, Inc. (C) | | 7,330 | | | 197,910 |
| Alnylam Pharmaceuticals, Inc. (C) | | 26,574 | | | 3,126,697 |
| Amarin Corp. PLC, ADR (C) | | 74,524 | | | 1,093,267 |
| Amgen, Inc. | | 28,698 | | | 5,731,852 |
| Apellis Pharmaceuticals, Inc. (C) | | 11,119 | | | 384,940 |
| Applied Therapeutics, Inc. (C) | | 600 | | | 24,930 |
| Arcutis Biotherapeutics, Inc. (C) | | 5,308 | | | 141,060 |
| Ardelyx, Inc. (C) | | 25,120 | | | 173,830 |
| Argenx SE, ADR (C) | | 16,897 | | | 2,388,898 |
| Ascendis Pharma A/S, ADR (C) | | 24,952 | | | 3,253,242 |
| Assembly Biosciences, Inc. (C) | | 7,023 | | | 127,257 |
| Autolus Therapeutics PLC (C) | | 6,368 | | | 52,090 |
| Avrobio, Inc. (C) | | 7,029 | | | 135,660 |
| Beam Therapeutics, Inc. (C) | | 3,590 | | | 80,739 |
| BeiGene, Ltd., ADR (C) | | 5,687 | | | 900,536 |
| BELLUS Health, Inc. (C) | | 6,898 | | | 60,495 |
| BioCryst Pharmaceuticals, Inc. (C) | | 9,800 | | | 29,400 |
| Biogen, Inc. (C) | | 15,783 | | | 4,867,319 |
| BioMarin Pharmaceutical, Inc. (C) | | 22,506 | | | 2,033,867 |
| Bluebird Bio, Inc. (C) | | 11,386 | | | 823,549 |
| Blueprint Medicines Corp. (C) | | 14,861 | | | 804,426 |
| Calithera Biosciences, Inc. (C) | | 4,200 | | | 27,216 |
| ChemoCentryx, Inc. (C) | | 4,382 | | | 196,095 |
| Constellation Pharmaceuticals, Inc. (C) | | 6,800 | | | 240,312 |
| Cortexyme, Inc. (C) | | 1,700 | | | 85,425 |
| CRISPR Therapeutics AG (C) | | 6,672 | | | 356,618 |
| Cyclerion Therapeutics, Inc. (C) | | 8,300 | | | 35,524 |
| Deciphera Pharmaceuticals, Inc. (C) | | 12,550 | | | 668,162 |
| Denali Therapeutics, Inc. (C) | | 10,350 | | | 204,620 |
| Dicerna Pharmaceuticals, Inc. (C) | | 27,212 | | | 537,165 |
| Enanta Pharmaceuticals, Inc. (C) | | 10,552 | | | 536,886 |
| Epizyme, Inc. (C) | | 17,057 | | | 365,532 |
| Esperion Therapeutics, Inc. (C) | | 3,100 | | | 156,519 |
| Exact Sciences Corp. (C) | | 27,817 | | | 2,251,786 |
| Exelixis, Inc. (C) | | 82,645 | | | 1,536,371 |
| Fate Therapeutics, Inc. (C) | | 10,457 | | | 305,344 |
| FibroGen, Inc. (C) | | 15,142 | | | 632,936 |
| Forty Seven, Inc. (C) | | 6,512 | | | 377,696 |
| G1 Therapeutics, Inc. (C) | | 7,497 | | | 134,496 |
| Galapagos NV (C) | | 4,642 | | | 976,321 |
| Global Blood Therapeutics, Inc. (C) | | 26,563 | | | 1,698,969 |
| Gritstone Oncology, Inc. (C) | | 8,700 | | | 73,080 |
| Homology Medicines, Inc. (C) | | 15,013 | | | 240,208 |
| IGM Biosciences, Inc. (C) | | 8,394 | | | 431,536 |
| Immunomedics, Inc. (C) | | 28,303 | | | 452,848 |
| Incyte Corp. (C) | | 35,566 | | | 2,682,032 |
| Insmed, Inc. (C) | | 24,486 | | | 609,701 |
| Intercept Pharmaceuticals, Inc. (C) | | 5,536 | | | 508,980 |
| Ionis Pharmaceuticals, Inc. (C) | | 12,248 | | | 621,953 |
| Iovance Biotherapeutics, Inc. (C) | | 58,417 | | | 1,922,503 |
| Kadmon Holdings, Inc. (C) | | 51,736 | | | 240,055 |
Health Sciences Fund (continued)
| | | Shares or
Principal
Amount | | Value |
| COMMON STOCKS (continued) | | | |
| Biotechnology (continued) | | | |
| KalVista Pharmaceuticals, Inc. (C) | | 1,700 | | $ | 22,865 |
| Karuna Therapeutics, Inc. (C) | | 10,023 | | | 874,607 |
| Karyopharm Therapeutics, Inc. (C) | | 3,100 | | | 50,654 |
| Kodiak Sciences, Inc. (C) | | 27,716 | | | 1,772,993 |
| Krystal Biotech, Inc. (C) | | 6,607 | | | 353,144 |
| MEI Pharma, Inc. (C) | | 11,700 | | | 22,581 |
| Minerva Neurosciences, Inc. (C) | | 16,115 | | | 117,317 |
| Mirati Therapeutics, Inc. (C) | | 9,803 | | | 877,270 |
| Momenta Pharmaceuticals, Inc. (C) | | 17,863 | | | 505,344 |
| MorphoSys AG (C) | | 4,577 | | | 493,346 |
| Neoleukin Therapeutics, Inc. (C) | | 2,200 | | | 21,340 |
| Neurocrine Biosciences, Inc. (C) | | 29,344 | | | 2,778,877 |
| Orchard Therapeutics PLC (C) | | 16,342 | | | 210,648 |
| PhaseBio Pharmaceuticals, Inc. (C) | | 14,617 | | | 61,538 |
| Principia Biopharma, Inc. (C) | | 8,594 | | | 554,829 |
| Progenics Pharmaceuticals, Inc. (C) | | 33,200 | | | 156,704 |
| PTC Therapeutics, Inc. (C) | | 14,598 | | | 800,554 |
| Puma Biotechnology, Inc. (C) | | 17,696 | | | 190,320 |
| Radius Health, Inc. (C) | | 14,535 | | | 306,107 |
| RAPT Therapeutics, Inc. (C) | | 9,177 | | | 181,429 |
| Regeneron Pharmaceuticals, Inc. (C) | | 9,494 | | | 4,220,748 |
| REGENXBIO, Inc. (C) | | 8,507 | | | 340,280 |
| REVOLUTION Medicines, Inc. (C) | | 4,669 | | | 146,000 |
| Rhythm Pharmaceuticals, Inc. (C) | | 4,324 | | | 82,502 |
| Rocket Pharmaceuticals, Inc. (C) | | 17,467 | | | 340,432 |
| Sage Therapeutics, Inc. (C) | | 17,701 | | | 831,947 |
| Sarepta Therapeutics, Inc. (C) | | 14,778 | | | 1,691,638 |
| Scholar Rock Holding Corp. (C) | | 5,074 | | | 71,594 |
| Seattle Genetics, Inc. (C) | | 31,143 | | | 3,545,942 |
| Stoke Therapeutics, Inc. (C) | | 8,348 | | | 206,613 |
| Translate Bio, Inc. (C) | | 3,100 | | | 23,498 |
| Turning Point Therapeutics, Inc. (C) | | 7,729 | | | 383,127 |
| Ultragenyx Pharmaceutical, Inc. (C) | | 20,534 | | | 1,151,547 |
| uniQure NV (C) | | 3,000 | | | 154,380 |
| United Therapeutics Corp. (C) | | 3,300 | | | 339,768 |
| Vertex Pharmaceuticals, Inc. (C) | | 51,107 | | | 11,449,501 |
| X4 Pharmaceuticals, Inc. (C) | | 2,800 | | | 29,904 |
| Xencor, Inc. (C) | | 22,175 | | | 720,466 |
| Zai Lab, Ltd., ADR (C) | | 4,410 | | | 242,418 |
| Zealand Pharma A/S, ADR (C) | | 3,849 | | | 127,671 |
| Zeneca, Inc. (B)(C) | | 33,315 | | | 20,489 |
| Zymeworks, Inc. (C) | | 12,812 | | | 524,395 |
| | | | | | 101,406,482 |
| Health care equipment and supplies – 22.0% | | | |
| Alcon, Inc. (C) | | 38,728 | | | 2,368,271 |
| AtriCure, Inc. (C) | | 13,600 | | | 522,512 |
| Becton, Dickinson and Company | | 38,235 | | | 9,093,048 |
| Danaher Corp. | | 41,047 | | | 5,934,575 |
| DexCom, Inc. (C) | | 10,722 | | | 2,959,272 |
| DiaSorin SpA | | 6,821 | | | 781,514 |
| Envista Holdings Corp. (C) | | 58,205 | | | 1,477,243 |
| GenMark Diagnostics, Inc. (C) | | 38,687 | | | 135,018 |
| Hologic, Inc. (C) | | 63,102 | | | 2,973,366 |
| ICU Medical, Inc. (C) | | 4,478 | | | 876,837 |
| Insulet Corp. (C) | | 7,700 | | | 1,462,769 |
| Intuitive Surgical, Inc. (C) | | 20,641 | | | 11,021,468 |
| iRhythm Technologies, Inc. (C) | | 6,551 | | | 569,740 |
| Lantheus Holdings, Inc. (C) | | 21,366 | | | 332,241 |
| Nevro Corp. (C) | | 14,381 | | | 1,871,687 |
| Novocure, Ltd. (C) | | 10,800 | | | 785,700 |
| Penumbra, Inc. (C) | | 7,994 | | | 1,325,885 |
| Quidel Corp. (C) | | 16,147 | | | 1,247,194 |
| Shockwave Medical, Inc. (C) | | 3,987 | | | 160,038 |
| Silk Road Medical, Inc. (C) | | 2,546 | | | 101,458 |
| Stryker Corp. | | 35,292 | | | 6,726,302 |
| The accompanying notes are an integral part of the financial statements. | 14 | |
John Hancock Funds II
Portfolio of Investments — February 29, 2020 (unaudited)(showing percentage of total net assets)
Health Sciences Fund (continued)
| | | Shares or
Principal
Amount | | Value |
| COMMON STOCKS (continued) | | | |
| Health care equipment and supplies (continued) | | | |
| Tandem Diabetes Care, Inc. (C) | | 4,100 | | $ | 306,106 |
| Teleflex, Inc. | | 6,767 | | | 2,267,080 |
| The Cooper Companies, Inc. | | 6,309 | | | 2,047,712 |
| West Pharmaceutical Services, Inc. | | 11,501 | | | 1,731,591 |
| Zimmer Biomet Holdings, Inc. | | 6,274 | | | 854,205 |
| | | | | | 59,932,832 |
| Health care providers and services – 15.6% | | | |
| Acadia Healthcare Company, Inc. (C) | | 14,417 | | | 426,743 |
| Amedisys, Inc. (C) | | 5,261 | | | 915,467 |
| Anthem, Inc. | | 13,297 | | | 3,418,526 |
| Cardinal Health, Inc. | | 8,300 | | | 432,596 |
| Centene Corp. (C) | | 97,460 | | | 5,167,329 |
| Cigna Corp. | | 29,216 | | | 5,344,775 |
| Guardant Health, Inc. (C) | | 5,772 | | | 501,933 |
| HCA Healthcare, Inc. | | 38,338 | | | 4,869,309 |
| Humana, Inc. | | 13,838 | | | 4,423,732 |
| McKesson Corp. | | 3,200 | | | 447,552 |
| Molina Healthcare, Inc. (C) | | 13,062 | | | 1,600,748 |
| Option Care Health, Inc. (C) | | 11,212 | | | 165,377 |
| The Pennant Group, Inc. (C) | | 17,075 | | | 463,928 |
| UnitedHealth Group, Inc. | | 55,984 | | | 14,273,681 |
| | | | | | 42,451,696 |
| Health care technology – 0.4% | | | |
| HTG Molecular Diagnostics, Inc. (C) | | 30,915 | | | 17,931 |
| Phreesia, Inc. (C) | | 7,652 | | | 237,518 |
| Veeva Systems, Inc., Class A (C) | | 6,314 | | | 896,399 |
| | | | | | 1,151,848 |
| Life sciences tools and services – 7.9% | | | |
| 10X Genomics, Inc., Class A (C) | | 3,849 | | | 306,765 |
| Adaptive Biotechnologies Corp. (C) | | 12,499 | | | 351,222 |
| Agilent Technologies, Inc. | | 54,462 | | | 4,197,386 |
| Avantor, Inc. (C) | | 88,431 | | | 1,392,788 |
| Bruker Corp. | | 32,263 | | | 1,405,376 |
| Evotec SE (C) | | 30,813 | | | 750,201 |
| Lonza Group AG (C) | | 2,016 | | | 804,460 |
| Mettler-Toledo International, Inc. (C) | | 1,181 | | | 828,708 |
| PPD, Inc. (C) | | 17,161 | | | 478,449 |
| PRA Health Sciences, Inc. (C) | | 8,508 | | | 801,454 |
| Quanterix Corp. (C) | | 18,329 | | | 418,084 |
| Thermo Fisher Scientific, Inc. | | 32,961 | | | 9,585,059 |
| Wuxi Biologics Cayman, Inc. (C)(D) | | 23,500 | | | 350,026 |
| | | | | | 21,669,978 |
| Pharmaceuticals – 13.5% | | | |
| Arvinas, Inc. (C) | | 600 | | | 28,278 |
| Astellas Pharma, Inc. | | 59,800 | | | 937,258 |
| AstraZeneca PLC, ADR | | 86,718 | | | 3,798,248 |
| Axsome Therapeutics, Inc. (C) | | 9,241 | | | 720,798 |
| Bayer AG | | 15,140 | | | 1,101,072 |
| Bristol-Myers Squibb Company | | 44,802 | | | 2,646,006 |
| Cara Therapeutics, Inc. (C) | | 23,924 | | | 359,578 |
| Catalent, Inc. (C) | | 15,423 | | | 794,747 |
| Chugai Pharmaceutical Company, Ltd. | | 18,500 | | | 1,990,045 |
| Daiichi Sankyo Company, Ltd. | | 28,100 | | | 1,710,614 |
| Eisai Company, Ltd. | | 16,200 | | | 1,189,662 |
| Elanco Animal Health, Inc. (C) | | 25,319 | | | 693,741 |
| Eli Lilly & Company | | 41,964 | | | 5,292,919 |
| GW Pharmaceuticals PLC, ADR (C) | | 4,391 | | | 449,243 |
| Intra-Cellular Therapies, Inc. (C) | | 13,100 | | | 276,410 |
| Ipsen SA | | 8,435 | | | 551,393 |
| Menlo Therapeutics, Inc. (C) | | 9,500 | | | 28,025 |
| Merck & Company, Inc. | | 54,633 | | | 4,182,702 |
| Milestone Pharmaceuticals, Inc. (C) | | 12,582 | | | 239,058 |
| MyoKardia, Inc. (C) | | 15,282 | | | 968,726 |
| Nektar Therapeutics (C) | | 18,498 | | | 384,943 |
Health Sciences Fund (continued)
| | | Shares or
Principal
Amount | | Value |
| COMMON STOCKS (continued) | | | |
| Pharmaceuticals (continued) | | | |
| Novartis AG | | 21,514 | | $ | 1,809,827 |
| Odonate Therapeutics, Inc. (C) | | 9,501 | | | 281,135 |
| Otsuka Holdings Company, Ltd. | | 4,400 | | | 164,847 |
| Passage Bio, Inc. (C) | | 5,227 | | | 94,086 |
| Perrigo Company PLC | | 273 | | | 13,838 |
| Reata Pharmaceuticals, Inc., Class A (C) | | 8,386 | | | 1,633,174 |
| Relmada Therapeutics, Inc. (C) | | 2,186 | | | 106,633 |
| Roche Holding AG | | 10,287 | | | 3,307,616 |
| Tricida, Inc. (C) | | 25,542 | | | 811,725 |
| WaVe Life Sciences, Ltd. (C) | | 6,128 | | | 51,722 |
| Zogenix, Inc. (C) | | 9,984 | | | 250,399 |
| | | | | | 36,868,468 |
| | | | | | 263,481,304 |
| Industrials – 0.4% | | | | | |
| Industrial conglomerates – 0.4% | | | |
| General Electric Company | | 111,146 | | | 1,209,268 |
| Information technology – 0.1% | | | | | |
| Software – 0.1% | | | |
| Schrodinger, Inc. (C) | | 5,390 | | | 249,988 |
| TOTAL COMMON STOCKS (Cost $217,058,911) | | $ | 265,248,154 |
| PREFERRED SECURITIES – 1.3% | | | | | |
| Consumer discretionary – 0.3% | | | | | |
| Specialty retail – 0.3% | | | |
| JAND, Inc., Series D (A)(B)(C) | | 37,822 | | | 686,848 |
| Health care – 0.7% | | | | | |
| Health care equipment and supplies – 0.7% | | | |
| Becton, Dickinson and Company, 6.125% | | 10,563 | | | 597,760 |
| Sartorius AG | | 5,167 | | | 1,207,892 |
| | | | | | 1,805,652 |
| Pharmaceuticals – 0.0% | | | |
| Elanco Animal Health, Inc., 5.000% | | 1,401 | | | 71,521 |
| | | | | | 1,877,173 |
| Information technology – 0.3% | | | | | |
| Software – 0.3% | | | |
| Doximity, Inc. (A)(B)(C) | | 63,738 | | | 868,749 |
| TOTAL PREFERRED SECURITIES (Cost $2,174,504) | | $ | 3,432,770 |
| RIGHTS – 0.1% | | | | | |
| Bristol-Myers Squibb Company (Expiration Date: 3-31-21) (C)(E) | | 105,654 | | | 353,941 |
| TOTAL RIGHTS (Cost $309,869) | | $ | 353,941 |
| SHORT-TERM INVESTMENTS – 1.5% | | | |
| Short-term funds – 1.5% | | | | | |
| State Street Institutional U.S. Government Money Market Fund, Premier Class, 1.5386% (F) | | 1,000,000 | | | 1,000,000 |
| T. Rowe Price Government Reserve Fund, 1.5799% (F) | | 3,067,270 | | | 3,067,270 |
| TOTAL SHORT-TERM INVESTMENTS (Cost $4,067,270) | | $ | 4,067,270 |
Total Investments (Health Sciences Fund)
(Cost $223,610,554) – 100.1% | | $ | 273,102,135 |
| Other assets and liabilities, net – (0.1%) | | | (213,791) |
| TOTAL NET ASSETS – 100.0% | | $ | 272,888,344 |
| Security Abbreviations and Legend |
| ADR | American Depositary Receipt |
| (A) | Restricted security as to resale, excluding 144A securities. For more information on this security refer to the Notes to financial statements. |
| The accompanying notes are an integral part of the financial statements. | 15 | |
John Hancock Funds II
Portfolio of Investments — February 29, 2020 (unaudited)(showing percentage of total net assets)
Health Sciences Fund (continued)
| (B) | Security is valued using significant unobservable inputs and is classified as Level 3 in the fair value hierarchy. Refer to Note 2 to the financial statements. |
| (C) | Non-income producing security. |
| (D) | These securities are exempt from registration under Rule 144A of the Securities Act of 1933. Such securities may be resold, normally to qualified institutional buyers, in transactions exempt from registration. |
| (E) | Strike price and/or expiration date not available. |
| (F) | The rate shown is the annualized seven-day yield as of 2-29-20. |
International Strategic Equity Allocation Fund
| | | Shares or
Principal
Amount | | Value |
| COMMON STOCKS - 93.3% | | | |
| Australia - 5.1% | | | | | |
| AGL Energy, Ltd. | | 59,649 | | $ | 746,964 |
| Alumina, Ltd. | | 218,345 | | | 279,503 |
| AMP, Ltd. (A) | | 304,689 | | | 336,481 |
| APA Group | | 107,268 | | | 755,983 |
| Aristocrat Leisure, Ltd. | | 52,255 | | | 1,146,158 |
| ASX, Ltd. | | 17,938 | | | 876,298 |
| Aurizon Holdings, Ltd. | | 179,245 | | | 570,637 |
| AusNet Services | | 159,952 | | | 177,347 |
| Australia & New Zealand Banking Group, Ltd. | | 257,065 | | | 4,145,663 |
| Bendigo & Adelaide Bank, Ltd. | | 44,606 | | | 269,334 |
| BHP Group PLC | | 93,107 | | | 1,701,609 |
| BHP Group, Ltd. | | 267,482 | | | 5,813,825 |
| BlueScope Steel, Ltd. | | 47,000 | | | 367,557 |
| Boral, Ltd. | | 106,560 | | | 318,091 |
| Brambles, Ltd. | | 143,921 | | | 1,132,759 |
| Caltex Australia, Ltd. | | 22,601 | | | 486,047 |
| Challenger, Ltd. | | 51,104 | | | 307,557 |
| CIMIC Group, Ltd. | | 8,732 | | | 137,497 |
| Coca-Cola Amatil, Ltd. | | 45,889 | | | 345,595 |
| Cochlear, Ltd. | | 5,243 | | | 718,142 |
| Coles Group, Ltd. | | 102,756 | | | 962,865 |
| Commonwealth Bank of Australia | | 160,974 | | | 8,641,578 |
| Computershare, Ltd. | | 44,515 | | | 451,156 |
| Crown Resorts, Ltd. | | 33,580 | | | 224,095 |
| CSL, Ltd. | | 41,165 | | | 8,408,832 |
| Dexus | | 98,887 | | | 787,752 |
| Flight Centre Travel Group, Ltd. | | 4,978 | | | 106,775 |
| Fortescue Metals Group, Ltd. | | 126,176 | | | 842,776 |
| Goodman Group | | 149,101 | | | 1,463,910 |
| Harvey Norman Holdings, Ltd. | | 50,335 | | | 123,019 |
| Incitec Pivot, Ltd. | | 146,336 | | | 263,543 |
| Insurance Australia Group, Ltd. | | 213,121 | | | 896,862 |
| Lendlease Group | | 51,418 | | | 598,122 |
| Macquarie Group, Ltd. | | 29,746 | | | 2,644,817 |
| Magellan Financial Group, Ltd. | | 11,835 | | | 437,830 |
| Medibank Pvt., Ltd. | | 256,453 | | | 479,072 |
| Mirvac Group | | 356,070 | | | 708,270 |
| National Australia Bank, Ltd. | | 262,140 | | | 4,313,792 |
| Newcrest Mining, Ltd. | | 69,572 | | | 1,141,256 |
| Oil Search, Ltd. | | 123,489 | | | 451,635 |
| Orica, Ltd. | | 34,342 | | | 448,912 |
| Origin Energy, Ltd. | | 159,453 | | | 737,349 |
| Qantas Airways, Ltd. | | 66,844 | | | 244,482 |
| QBE Insurance Group, Ltd. | | 122,742 | | | 1,090,959 |
| Ramsay Health Care, Ltd. | | 14,673 | | | 656,430 |
| REA Group, Ltd. | | 4,740 | | | 307,699 |
| Santos, Ltd. | | 159,864 | | | 729,321 |
| Scentre Group | | 481,680 | | | 1,091,391 |
| SEEK, Ltd. | | 30,307 | | | 415,109 |
| Sonic Healthcare, Ltd. | | 41,031 | | | 778,859 |
| South32, Ltd. | | 453,163 | | | 644,008 |
| Stockland | | 215,731 | | | 666,879 |
International Strategic Equity Allocation Fund (continued)
| | | Shares or
Principal
Amount | | Value |
| COMMON STOCKS (continued) | | | |
| Australia (continued) | | | | | |
| Suncorp Group, Ltd. | | 116,225 | | $ | 868,293 |
| Sydney Airport | | 99,122 | | | 506,555 |
| Tabcorp Holdings, Ltd. | | 182,202 | | | 453,890 |
| Telstra Corp., Ltd. | | 378,709 | | | 854,095 |
| The GPT Group | | 175,251 | | | 662,366 |
| TPG Telecom, Ltd. | | 33,567 | | | 166,014 |
| Transurban Group | | 245,764 | | | 2,396,466 |
| Treasury Wine Estates, Ltd. | | 65,510 | | | 478,234 |
| Vicinity Centres | | 287,635 | | | 407,371 |
| Washington H Soul Pattinson & Company, Ltd. | | 10,615 | | | 136,375 |
| Wesfarmers, Ltd. | | 102,685 | | | 2,748,349 |
| Westpac Banking Corp. | | 316,979 | | | 4,853,650 |
| WiseTech Global, Ltd. | | 13,010 | | | 131,177 |
| Woodside Petroleum, Ltd. | | 84,561 | | | 1,574,416 |
| Woolworths Group, Ltd. | | 114,049 | | | 2,917,222 |
| Worley, Ltd. | | 30,911 | | | 259,767 |
| | | | | | 81,806,642 |
| Austria - 0.2% | | | | | |
| ANDRITZ AG (B) | | 6,948 | | | 245,873 |
| Erste Group Bank AG | | 29,292 | | | 1,002,764 |
| OMV AG | | 13,937 | | | 583,708 |
| Raiffeisen Bank International AG | | 13,968 | | | 288,444 |
| Verbund AG | | 6,528 | | | 310,941 |
| voestalpine AG (B) | | 11,284 | | | 245,705 |
| | | | | | 2,677,435 |
| Belgium - 0.2% | | | | | |
| Ageas | | 5,132 | | | 238,785 |
| Anheuser-Busch InBev SA | | 16,400 | | | 947,607 |
| Colruyt SA | | 967 | | | 44,853 |
| Galapagos NV (A) | | 933 | | | 196,231 |
| Groupe Bruxelles Lambert SA | | 1,732 | | | 157,447 |
| KBC Group NV (B) | | 5,114 | | | 340,727 |
| Proximus SADP | | 2,756 | | | 68,445 |
| Solvay SA | | 1,644 | | | 150,029 |
| Telenet Group Holding NV | | 749 | | | 28,809 |
| UCB SA | | 2,679 | | | 248,037 |
| Umicore SA (B) | | 4,240 | | | 178,549 |
| | | | | | 2,599,519 |
| Brazil - 0.3% | | | | | |
| Ambev SA | | 102,600 | | | 333,595 |
| Atacadao SA | | 8,500 | | | 39,327 |
| B2W Cia Digital (A) | | 4,400 | | | 61,151 |
| B3 SA - Brasil Bolsa Balcao | | 44,820 | | | 481,084 |
| Banco Bradesco SA | | 26,487 | | | 161,638 |
| Banco BTG Pactual SA | | 5,300 | | | 80,071 |
| Banco do Brasil SA | | 18,200 | | | 190,714 |
| Banco Santander Brasil SA | | 8,600 | | | 76,656 |
| BB Seguridade Participacoes SA | | 17,000 | | | 121,078 |
| BR Malls Participacoes SA | | 15,735 | | | 57,495 |
| BRF SA (A) | | 12,300 | | | 74,374 |
| CCR SA | | 26,000 | | | 94,944 |
| Centrais Eletricas Brasileiras SA | | 5,500 | | | 42,469 |
| Cia Brasileira de Distribuicao | | 3,500 | | | 64,179 |
| Cia de Saneamento Basico do Estado de Sao Paulo | | 7,300 | | | 95,904 |
| Cia Siderurgica Nacional SA | | 13,400 | | | 33,501 |
| Cielo SA | | 26,060 | | | 39,918 |
| Cogna Educacao | | 31,700 | | | 71,525 |
| Cosan SA | | 3,700 | | | 60,540 |
| Embraer SA (A) | | 15,100 | | | 57,268 |
| Energisa SA | | 3,200 | | | 38,641 |
| Engie Brasil Energia SA | | 4,225 | | | 44,906 |
| The accompanying notes are an integral part of the financial statements. | 16 | |
John Hancock Funds II
Portfolio of Investments — February 29, 2020 (unaudited)(showing percentage of total net assets)
International Strategic Equity Allocation Fund (continued)
| | | Shares or
Principal
Amount | | Value |
| COMMON STOCKS (continued) | | | |
| Brazil (continued) | | | | | |
| Equatorial Energia SA | | 18,200 | | $ | 100,363 |
| Hapvida Participacoes e Investimentos SA (C) | | 4,600 | | | 56,781 |
| Hypera SA | | 7,900 | | | 60,594 |
| IRB Brasil Resseguros SA | | 15,600 | | | 115,991 |
| JBS SA | | 23,600 | | | 119,797 |
| Klabin SA | | 14,800 | | | 63,709 |
| Localiza Rent a Car SA | | 12,646 | | | 140,090 |
| Lojas Renner SA | | 16,339 | | | 194,742 |
| Magazine Luiza SA | | 15,200 | | | 171,718 |
| Multiplan Empreendimentos Imobiliarios SA | | 5,500 | | | 37,537 |
| Natura & Company Holding SA | | 13,800 | | | 140,441 |
| Notre Dame Intermedica Participacoes SA | | 10,500 | | | 148,464 |
| Petrobras Distribuidora SA | | 14,200 | | | 82,878 |
| Petroleo Brasileiro SA | | 63,600 | | | 386,131 |
| Porto Seguro SA | | 2,500 | | | 34,091 |
| Raia Drogasil SA | | 5,000 | | | 134,059 |
| Rumo SA (A) | | 22,500 | | | 106,264 |
| Sul America SA | | 6,596 | | | 79,738 |
| Suzano SA | | 11,527 | | | 98,312 |
| TIM Participacoes SA | | 19,200 | | | 69,254 |
| Ultrapar Participacoes SA | | 15,200 | | | 64,853 |
| Vale SA | | 68,170 | | | 675,465 |
| WEG SA | | 18,020 | | | 173,878 |
| | | | | | 5,576,128 |
| Canada - 8.2% | | | | | |
| Agnico Eagle Mines, Ltd. | | 23,394 | | | 1,110,049 |
| Air Canada (A) | | 13,321 | | | 339,910 |
| Algonquin Power & Utilities Corp. | | 53,956 | | | 820,043 |
| Alimentation Couche-Tard, Inc., Class B | | 86,432 | | | 2,624,674 |
| AltaGas, Ltd. | | 27,863 | | | 416,622 |
| Atco, Ltd., Class I | | 8,194 | | | 305,722 |
| Aurora Cannabis, Inc. (A)(B) | | 71,545 | | | 96,477 |
| Bank of Montreal | | 63,836 | | | 4,337,852 |
| BCE, Inc. | | 16,461 | | | 722,947 |
| BlackBerry, Ltd. (A) | | 52,504 | | | 271,077 |
| Bombardier, Inc., Class B (A) | | 214,961 | | | 153,744 |
| Brookfield Asset Management, Inc., Class A (B) | | 88,672 | | | 5,302,814 |
| CAE, Inc. | | 27,156 | | | 726,520 |
| Cameco Corp. | | 39,911 | | | 345,216 |
| Canadian Apartment Properties REIT | | 9,020 | | | 377,197 |
| Canadian Imperial Bank of Commerce | | 44,602 | | | 3,394,703 |
| Canadian National Railway Company | | 71,216 | | | 6,037,377 |
| Canadian Natural Resources, Ltd. | | 116,952 | | | 3,010,387 |
| Canadian Pacific Railway, Ltd. | | 13,798 | | | 3,419,766 |
| Canadian Tire Corp., Ltd., Class A | | 6,002 | | | 590,206 |
| Canadian Utilities, Ltd., Class A | | 13,761 | | | 407,217 |
| Canopy Growth Corp. (A)(B) | | 20,638 | | | 387,006 |
| CCL Industries, Inc., Class B | | 15,166 | | | 500,656 |
| Cenovus Energy, Inc. | | 103,496 | | | 761,040 |
| CGI, Inc. (A) | | 24,321 | | | 1,708,857 |
| CI Financial Corp. | | 24,335 | | | 404,118 |
| Constellation Software, Inc. | | 1,989 | | | 2,026,313 |
| Cronos Group, Inc. (A)(B) | | 18,710 | | | 108,587 |
| Dollarama, Inc. | | 29,646 | | | 871,545 |
| Emera, Inc. | | 24,161 | | | 1,018,101 |
| Empire Company, Ltd., Class A | | 17,474 | | | 390,423 |
| Enbridge, Inc. | | 199,028 | | | 7,408,038 |
| Fairfax Financial Holdings, Ltd. | | 2,779 | | | 1,197,128 |
| First Capital Real Estate Investment Trust | | 12,724 | | | 189,782 |
| First Quantum Minerals, Ltd. | | 68,513 | | | 506,351 |
International Strategic Equity Allocation Fund (continued)
| | | Shares or
Principal
Amount | | Value |
| COMMON STOCKS (continued) | | | |
| Canada (continued) | | | | | |
| Fortis, Inc. | | 44,215 | | $ | 1,789,353 |
| Franco-Nevada Corp. | | 18,575 | | | 1,994,157 |
| George Weston, Ltd. | | 8,040 | | | 605,284 |
| Gildan Activewear, Inc. | | 20,812 | | | 504,078 |
| Great-West Lifeco, Inc. | | 32,190 | | | 757,116 |
| H&R Real Estate Investment Trust | | 16,775 | | | 242,580 |
| Husky Energy, Inc. | | 36,582 | | | 174,155 |
| Hydro One, Ltd. (C) | | 33,918 | | | 680,761 |
| iA Financial Corp., Inc. | | 11,877 | | | 565,335 |
| IGM Financial, Inc. | | 10,822 | | | 288,560 |
| Imperial Oil, Ltd. | | 27,506 | | | 602,273 |
| Intact Financial Corp. | | 14,450 | | | 1,566,273 |
| Inter Pipeline, Ltd. (B) | | 41,702 | | | 617,025 |
| Keyera Corp. (B) | | 21,739 | | | 521,833 |
| Kinross Gold Corp. (A) | | 123,409 | | | 620,608 |
| Kirkland Lake Gold, Ltd. | | 19,618 | | | 632,716 |
| Linamar Corp. | | 319 | | | 8,774 |
| Loblaw Companies, Ltd. | | 18,714 | | | 927,160 |
| Lundin Mining Corp. | | 68,140 | | | 347,744 |
| Magna International, Inc. | | 29,756 | | | 1,354,289 |
| Methanex Corp. | | 6,863 | | | 197,569 |
| Metro, Inc. | | 25,790 | | | 1,004,508 |
| National Bank of Canada | | 34,698 | | | 1,803,598 |
| Nutrien, Ltd. | | 56,955 | | | 2,301,962 |
| Onex Corp. | | 8,732 | | | 490,254 |
| Open Text Corp. (B) | | 27,122 | | | 1,135,598 |
| Parkland Fuel Corp. (B) | | 14,712 | | | 462,542 |
| Pembina Pipeline Corp. (B) | | 54,839 | | | 1,975,389 |
| Power Corp. of Canada (B) | | 64,757 | | | 1,431,432 |
| PrairieSky Royalty, Ltd. (B) | | 21,175 | | | 196,408 |
| Quebecor, Inc., Class B | | 18,423 | | | 430,430 |
| Restaurant Brands International, Inc. | | 26,319 | | | 1,551,198 |
| RioCan Real Estate Investment Trust | | 17,666 | | | 329,958 |
| Rogers Communications, Inc., Class B | | 36,162 | | | 1,657,161 |
| Royal Bank of Canada | | 142,304 | | | 10,582,816 |
| Saputo, Inc. | | 23,832 | | | 663,337 |
| Shaw Communications, Inc., Class B | | 47,703 | | | 825,584 |
| Shopify, Inc., Class A (A) | | 9,849 | | | 4,572,988 |
| SmartCentres Real Estate Investment Trust | | 9,275 | | | 198,871 |
| Sun Life Financial, Inc. (B) | | 61,269 | | | 2,647,040 |
| Suncor Energy, Inc. | | 154,362 | | | 4,253,940 |
| TC Energy Corp. | | 91,954 | | | 4,792,775 |
| Teck Resources, Ltd., Class B | | 49,601 | | | 498,874 |
| TELUS Corp. (B) | | 21,127 | | | 762,445 |
| The Bank of Nova Scotia | | 121,074 | | | 6,334,004 |
| The Stars Group, Inc. (A) | | 22,901 | | | 524,816 |
| The Toronto-Dominion Bank | | 179,715 | | | 9,243,825 |
| Thomson Reuters Corp. | | 20,363 | | | 1,512,680 |
| Vermilion Energy, Inc. (B) | | 664 | | | 6,659 |
| West Fraser Timber Company, Ltd. | | 5,395 | | | 201,451 |
| Wheaton Precious Metals Corp. | | 43,937 | | | 1,249,451 |
| WSP Global, Inc. | | 10,789 | | | 711,122 |
| | | | | | 131,639,224 |
| Chile - 0.2% | | | | | |
| Aguas Andinas SA, Class A | | 206,092 | | | 70,807 |
| Antofagasta PLC | | 17,563 | | | 173,598 |
| Banco de Chile | | 3,654,432 | | | 322,823 |
| Banco de Credito e Inversiones SA | | 3,918 | | | 145,868 |
| Banco Santander Chile | | 5,155,458 | | | 230,697 |
| Cencosud SA | | 119,008 | | | 140,665 |
| Cia Cervecerias Unidas SA | | 12,340 | | | 93,080 |
| Colbun SA | | 645,056 | | | 81,400 |
| The accompanying notes are an integral part of the financial statements. | 17 | |
John Hancock Funds II
Portfolio of Investments — February 29, 2020 (unaudited)(showing percentage of total net assets)
International Strategic Equity Allocation Fund (continued)
| | | Shares or
Principal
Amount | | Value |
| COMMON STOCKS (continued) | | | |
| Chile (continued) | | | | | |
| Empresa Nacional de Telecomunicaciones SA (A) | | 12,284 | | $ | 65,469 |
| Empresas CMPC SA | | 91,898 | | | 187,490 |
| Empresas COPEC SA | | 31,899 | | | 249,298 |
| Enel Americas SA | | 3,115,683 | | | 526,482 |
| Enel Chile SA | | 2,290,713 | | | 205,745 |
| Itau CorpBanca | | 9,942,310 | | | 36,387 |
| Latam Airlines Group SA | | 20,097 | | | 134,926 |
| SACI Falabella | | 60,893 | | | 203,873 |
| | | | | | 2,868,608 |
| China - 8.5% | | | | | |
| 3SBio, Inc. (A)(C) | | 105,600 | | | 112,231 |
| 51job, Inc., ADR (A) | | 2,300 | | | 171,971 |
| 58.com, Inc., ADR (A) | | 7,900 | | | 435,843 |
| AAC Technologies Holdings, Inc. | | 61,100 | | | 407,971 |
| Agile Group Holdings, Ltd. | | 113,900 | | | 162,849 |
| Agricultural Bank of China, Ltd., H Shares | | 2,469,200 | | | 1,001,970 |
| Air China, Ltd., H Shares | | 149,300 | | | 123,351 |
| Alibaba Group Holding, Ltd., ADR (A) | | 142,100 | | | 29,556,787 |
| A-Living Services Company, Ltd., H Shares (C) | | 36,500 | | | 167,519 |
| Aluminum Corp. of China, Ltd., H Shares (A) | | 336,600 | | | 91,257 |
| Anhui Conch Cement Company, Ltd., H Shares | | 102,100 | | | 764,646 |
| ANTA Sports Products, Ltd. | | 90,500 | | | 738,541 |
| Autohome, Inc., ADR (A) | | 4,900 | | | 380,583 |
| AviChina Industry & Technology Company, Ltd., H Shares | | 211,000 | | | 93,170 |
| BAIC Motor Corp., Ltd., H Shares (C) | | 140,000 | | | 69,642 |
| Baidu, Inc., ADR (A) | | 23,200 | | | 2,783,536 |
| Bank of China, Ltd., H Shares | | 6,680,600 | | | 2,669,835 |
| Bank of Communications Company, Ltd., H Shares | | 699,900 | | | 455,419 |
| Baozun, Inc., ADR (A)(B) | | 3,700 | | | 117,364 |
| BBMG Corp., H Shares | | 174,000 | | | 49,795 |
| BeiGene, Ltd., ADR (A) | | 1,500 | | | 237,525 |
| Beijing Capital International Airport Company, Ltd., H Shares | | 138,900 | | | 109,373 |
| Best, Inc., ADR (A) | | 16,600 | | | 89,806 |
| BYD Company, Ltd., H Shares (B) | | 53,000 | | | 329,961 |
| BYD Electronic International Company, Ltd. (B) | | 57,400 | | | 110,959 |
| CGN Power Company, Ltd., H Shares (C) | | 873,900 | | | 214,950 |
| China Aoyuan Group, Ltd. | | 102,000 | | | 150,689 |
| China Cinda Asset Management Company, Ltd., H Shares | | 782,200 | | | 165,869 |
| China CITIC Bank Corp., Ltd., H Shares | | 728,000 | | | 381,411 |
| China Coal Energy Company, Ltd., H Shares | | 147,000 | | | 47,888 |
| China Communications Construction Company, Ltd., H Shares | | 367,500 | | | 277,523 |
| China Communications Services Corp., Ltd., H Shares | | 197,200 | | | 154,946 |
| China Conch Venture Holdings, Ltd. | | 135,800 | | | 664,384 |
| China Construction Bank Corp., H Shares | | 8,086,500 | | | 6,648,974 |
| China East Education Holdings, Ltd. (A)(C) | | 36,000 | | | 74,731 |
| China Eastern Airlines Corp., Ltd., H Shares (A)(B) | | 148,000 | | | 65,215 |
| China Everbright Bank Company, Ltd., H Shares | | 253,000 | | | 102,225 |
| China Evergrande Group (B) | | 154,900 | | | 354,876 |
International Strategic Equity Allocation Fund (continued)
| | | Shares or
Principal
Amount | | Value |
| COMMON STOCKS (continued) | | | |
| China (continued) | | | | | |
| China Galaxy Securities Company, Ltd., H Shares | | 313,500 | | $ | 177,391 |
| China Hongqiao Group, Ltd. | | 142,000 | | | 77,658 |
| China Huarong Asset Management Company, Ltd., H Shares (C) | | 878,600 | | | 121,361 |
| China Huishan Dairy Holdings Company, Ltd. (A)(D) | | 175,000 | | | 2,582 |
| China International Capital Corp., Ltd., H Shares (B)(C) | | 114,800 | | | 216,720 |
| China Lesso Group Holdings, Ltd. | | 90,000 | | | 137,369 |
| China Life Insurance Company, Ltd., H Shares | | 637,200 | | | 1,539,738 |
| China Literature, Ltd. (A)(B)(C) | | 21,400 | | | 98,876 |
| China Longyuan Power Group Corp., Ltd., H Shares | | 268,700 | | | 141,188 |
| China Medical System Holdings, Ltd. | | 114,300 | | | 144,534 |
| China Merchants Bank Company, Ltd., H Shares | | 327,200 | | | 1,574,127 |
| China Minsheng Banking Corp., Ltd., H Shares | | 578,520 | | | 395,912 |
| China Molybdenum Company, Ltd., H Shares | | 315,100 | | | 120,416 |
| China National Building Material Company, Ltd., H Shares | | 325,700 | | | 387,104 |
| China Oilfield Services, Ltd., H Shares | | 135,700 | | | 177,354 |
| China Pacific Insurance Group Company, Ltd., H Shares | | 226,000 | | | 758,149 |
| China Petroleum & Chemical Corp., H Shares | | 2,149,300 | | | 1,112,385 |
| China Railway Construction Corp., Ltd., H Shares | | 161,000 | | | 186,267 |
| China Railway Group, Ltd., H Shares | | 311,600 | | | 179,008 |
| China Railway Signal & Communication Corp., Ltd., H Shares (C) | | 119,000 | | | 62,107 |
| China Reinsurance Group Corp., H Shares | | 503,000 | | | 69,129 |
| China Resources Pharmaceutical Group, Ltd. (C) | | 128,100 | | | 112,991 |
| China Shenhua Energy Company, Ltd., H Shares | | 282,500 | | | 496,717 |
| China Southern Airlines Company, Ltd., H Shares (B) | | 136,800 | | | 73,625 |
| China Telecom Corp., Ltd., H Shares | | 1,159,100 | | | 438,148 |
| China Tower Corp., Ltd., H Shares (C) | | 3,524,000 | | | 870,363 |
| China Vanke Company, Ltd., H Shares | | 126,300 | | | 494,603 |
| China Zhongwang Holdings, Ltd. | | 136,400 | | | 46,203 |
| Chongqing Rural Commercial Bank Company, Ltd., H Shares | | 205,700 | | | 93,990 |
| CIFI Holdings Group Company, Ltd. | | 234,000 | | | 183,974 |
| CITIC Securities Company, Ltd., H Shares | | 175,700 | | | 386,476 |
| CNOOC, Ltd. | | 1,498,500 | | | 2,084,582 |
| COSCO SHIPPING Energy Transportation Company, Ltd., H Shares | | 100,000 | | | 39,840 |
| COSCO SHIPPING Holdings Company, Ltd., H Shares (A) | | 206,000 | | | 69,783 |
| Country Garden Holdings Company, Ltd. | | 640,300 | | | 869,884 |
| Country Garden Services Holdings Company, Ltd. | | 100,000 | | | 399,068 |
| CRRC Corp., Ltd., H Shares | | 363,500 | | | 236,738 |
| CSPC Pharmaceutical Group, Ltd. | | 392,300 | | | 914,473 |
| Dali Foods Group Company, Ltd. (C) | | 167,500 | | | 111,379 |
| Datang International Power Generation Company, Ltd., H Shares | | 224,000 | | | 35,506 |
| Dongfeng Motor Group Company, Ltd., H Shares | | 227,300 | | | 182,417 |
| The accompanying notes are an integral part of the financial statements. | 18 | |
John Hancock Funds II
Portfolio of Investments — February 29, 2020 (unaudited)(showing percentage of total net assets)
International Strategic Equity Allocation Fund (continued)
| | | Shares or
Principal
Amount | | Value |
| COMMON STOCKS (continued) | | | |
| China (continued) | | | | | |
| ENN Energy Holdings, Ltd. | | 65,900 | | $ | 743,379 |
| Fosun International, Ltd. | | 217,500 | | | 283,165 |
| Fuyao Glass Industry Group Company, Ltd., H Shares (B)(C) | | 40,500 | | | 117,373 |
| GDS Holdings, Ltd., ADR (A)(B) | | 5,200 | | | 301,444 |
| Genscript Biotech Corp. (A)(B) | | 78,000 | | | 165,025 |
| GF Securities Company, Ltd., H Shares | | 118,600 | | | 144,615 |
| GOME Retail Holdings, Ltd. (A)(B) | | 749,200 | | | 78,119 |
| Great Wall Motor Company, Ltd., H Shares | | 259,400 | | | 191,914 |
| Greentown Service Group Company, Ltd. | | 92,000 | | | 116,781 |
| Guangzhou Automobile Group Company, Ltd., H Shares | | 245,080 | | | 278,077 |
| Guangzhou R&F Properties Company, Ltd., H Shares | | 109,600 | | | 172,803 |
| Guotai Junan Securities Company, Ltd., H Shares (C) | | 66,400 | | | 112,955 |
| Haidilao International Holding, Ltd. (B)(C) | | 30,000 | | | 124,741 |
| Haitian International Holdings, Ltd. | | 53,400 | | | 106,461 |
| Haitong Securities Company, Ltd., H Shares | | 246,100 | | | 271,302 |
| Hansoh Pharmaceutical Group Company, Ltd. (A)(C) | | 38,000 | | | 134,588 |
| Hengan International Group Company, Ltd. | | 60,100 | | | 453,009 |
| Hua Hong Semiconductor, Ltd. (B)(C) | | 38,000 | | | 85,028 |
| Huadian Power International Corp., Ltd., H Shares | | 136,000 | | | 41,225 |
| Huaneng Power International, Inc., H Shares (B) | | 315,700 | | | 128,533 |
| Huatai Securities Company, Ltd., H Shares (B)(C) | | 140,100 | | | 247,784 |
| Huazhu Group, Ltd., ADR | | 11,200 | | | 378,000 |
| Huya, Inc., ADR (A) | | 5,100 | | | 101,031 |
| Industrial & Commercial Bank of China, Ltd., H Shares | | 5,462,800 | | | 3,763,322 |
| Inner Mongolia Yitai Coal Company, Ltd., Class B | | 81,900 | | | 56,360 |
| Innovent Biologics, Inc. (A)(C) | | 62,500 | | | 287,506 |
| iQIYI, Inc., ADR (A)(B) | | 10,700 | | | 240,001 |
| JD.com, Inc., ADR (A) | | 62,100 | | | 2,391,471 |
| Jiangsu Expressway Company, Ltd., H Shares | | 96,900 | | | 112,862 |
| Jiangxi Copper Company, Ltd., H Shares | | 96,400 | | | 114,974 |
| JOYY, Inc., ADR (A) | | 4,900 | | | 264,453 |
| Kaisa Group Holdings, Ltd. (A) | | 209,000 | | | 95,145 |
| Kingdee International Software Group Company, Ltd. | | 193,000 | | | 253,717 |
| Kingsoft Corp., Ltd. (A) | | 69,200 | | | 228,843 |
| KWG Group Holdings, Ltd. (A) | | 108,500 | | | 162,917 |
| Legend Holdings Corp., H Shares (C) | | 31,400 | | | 54,383 |
| Lenovo Group, Ltd. | | 602,000 | | | 378,857 |
| Li Ning Company, Ltd. | | 164,500 | | | 443,134 |
| Logan Property Holdings Company, Ltd. | | 116,000 | | | 202,623 |
| Longfor Group Holdings, Ltd. (C) | | 149,900 | | | 708,983 |
| Luye Pharma Group, Ltd. (C) | | 96,500 | | | 59,964 |
| Maanshan Iron & Steel Company, Ltd., H Shares (B) | | 60,000 | | | 22,109 |
| Meituan Dianping, Class B (A) | | 84,800 | | | 1,094,089 |
| Metallurgical Corp. of China, Ltd., H Shares | | 204,000 | | | 39,951 |
| Momo, Inc., ADR | | 12,600 | | | 354,312 |
| NetEase, Inc., ADR | | 6,000 | | | 1,912,260 |
| New China Life Insurance Company, Ltd., H Shares | | 70,600 | | | 275,984 |
International Strategic Equity Allocation Fund (continued)
| | | Shares or
Principal
Amount | | Value |
| COMMON STOCKS (continued) | | | |
| China (continued) | | | | | |
| New Oriental Education & Technology Group, Inc., ADR (A) | | 12,000 | | $ | 1,534,680 |
| NIO, Inc., ADR (A)(B) | | 55,100 | | | 227,563 |
| Noah Holdings, Ltd., ADR (A)(B) | | 3,000 | | | 85,140 |
| PetroChina Company, Ltd., H Shares | | 1,780,700 | | | 695,618 |
| PICC Property & Casualty Company, Ltd., H Shares | | 594,950 | | | 629,147 |
| Pinduoduo, Inc., ADR (A)(B) | | 16,300 | | | 583,214 |
| Ping An Healthcare and Technology Company, Ltd. (A)(C) | | 26,900 | | | 268,825 |
| Ping An Insurance Group Company of China, Ltd., H Shares (B) | | 469,800 | | | 5,352,148 |
| Postal Savings Bank of China Company, Ltd., H Shares (C) | | 677,000 | | | 431,918 |
| Qudian, Inc., ADR (A)(B) | | 13,200 | | | 34,584 |
| Seazen Group, Ltd. (A) | | 150,000 | | | 157,656 |
| Semiconductor Manufacturing International Corp. (A)(B) | | 254,300 | | | 502,589 |
| Shandong Weigao Group Medical Polymer Company, Ltd., H Shares | | 172,000 | | | 224,439 |
| Shanghai Electric Group Company, Ltd., H Shares | | 200,000 | | | 57,023 |
| Shanghai Fosun Pharmaceutical Group Company, Ltd., H Shares | | 42,100 | | | 120,727 |
| Shanghai Lujiazui Finance & Trade Zone Development Company, Ltd., B Shares | | 83,880 | | | 66,952 |
| Shanghai Pharmaceuticals Holding Company, Ltd., H Shares | | 68,500 | | | 126,524 |
| Shenzhen Expressway Company, Ltd., H Shares | | 58,000 | | | 70,623 |
| Shenzhou International Group Holdings, Ltd. | | 63,000 | | | 797,314 |
| Shui On Land, Ltd. | | 297,000 | | | 59,502 |
| SINA Corp. (A) | | 5,300 | | | 173,575 |
| Sino-Ocean Group Holding, Ltd. | | 260,500 | | | 96,011 |
| Sinopec Engineering Group Company, Ltd., H Shares | | 121,000 | | | 60,236 |
| Sinopec Shanghai Petrochemical Company, Ltd., H Shares | | 277,700 | | | 71,997 |
| Sinopharm Group Company, Ltd., H Shares | | 100,300 | | | 315,100 |
| Sinotrans, Ltd., H Shares | | 169,000 | | | 48,581 |
| Sinotruk Hong Kong, Ltd. | | 57,500 | | | 111,779 |
| SOHO China, Ltd. | | 169,700 | | | 62,055 |
| Sunac China Holdings, Ltd. | | 205,300 | | | 1,149,995 |
| Sunny Optical Technology Group Company, Ltd. | | 59,900 | | | 973,221 |
| TAL Education Group, ADR (A) | | 32,400 | | | 1,762,236 |
| Tencent Holdings, Ltd. (B) | | 481,000 | | | 24,388,964 |
| Tencent Music Entertainment Group, ADR (A) | | 7,900 | | | 95,827 |
| The People's Insurance Company Group of China, Ltd., H Shares | | 726,200 | | | 261,136 |
| Tingyi Cayman Islands Holding Corp. | | 164,700 | | | 302,408 |
| TravelSky Technology, Ltd., H Shares (B) | | 77,500 | | | 153,435 |
| Trip.com Group, Ltd., ADR (A) | | 39,600 | | | 1,202,256 |
| Tsingtao Brewery Company, Ltd., H Shares | | 33,000 | | | 174,316 |
| Uni-President China Holdings, Ltd. | | 107,000 | | | 111,138 |
| Vipshop Holdings, Ltd., ADR (A) | | 37,100 | | | 475,993 |
| Want Want China Holdings, Ltd. | | 420,500 | | | 330,059 |
| Weibo Corp., ADR (A)(B) | | 4,680 | | | 197,215 |
| Weichai Power Company, Ltd., H Shares | | 160,000 | | | 321,018 |
| The accompanying notes are an integral part of the financial statements. | 19 | |
John Hancock Funds II
Portfolio of Investments — February 29, 2020 (unaudited)(showing percentage of total net assets)
International Strategic Equity Allocation Fund (continued)
| | | Shares or
Principal
Amount | | Value |
| COMMON STOCKS (continued) | | | |
| China (continued) | | | | | |
| WuXi AppTec Company, Ltd., H Shares (C) | | 12,340 | | $ | 185,118 |
| Wuxi Biologics Cayman, Inc. (A)(C) | | 47,000 | | | 700,052 |
| Xiaomi Corp., Class B (A)(C) | | 651,600 | | | 1,068,982 |
| Xinjiang Goldwind Science & Technology Company, Ltd., H Shares | | 62,800 | | | 63,356 |
| Xinyi Solar Holdings, Ltd. | | 268,000 | | | 215,576 |
| Yangzijiang Shipbuilding Holdings, Ltd. | | 64,600 | | | 44,822 |
| Yanzhou Coal Mining Company, Ltd., H Shares | | 138,700 | | | 106,584 |
| Yihai International Holding, Ltd. (A) | | 39,000 | | | 264,142 |
| Yum China Holdings, Inc. | | 30,084 | | | 1,317,378 |
| Yuzhou Properties Company, Ltd. | | 153,000 | | | 76,485 |
| Zhaojin Mining Industry Company, Ltd., H Shares | | 80,000 | | | 94,907 |
| Zhejiang Expressway Company, Ltd., H Shares | | 123,800 | | | 94,327 |
| Zhenro Properties Group, Ltd. | | 122,000 | | | 79,844 |
| ZhongAn Online P&C Insurance Company, Ltd., H Shares (A)(C) | | 26,600 | | | 114,102 |
| Zhongsheng Group Holdings, Ltd. | | 47,000 | | | 180,980 |
| Zhuzhou CRRC Times Electric Company, Ltd., H Shares | | 45,600 | | | 161,956 |
| Zijin Mining Group Company, Ltd., H Shares | | 469,200 | | | 211,744 |
| Zoomlion Heavy Industry Science and Technology Company, Ltd., H Shares | | 113,600 | | | 95,845 |
| ZTE Corp., H Shares (A) | | 62,700 | | | 266,665 |
| ZTO Express Cayman, Inc., ADR | | 26,600 | | | 624,036 |
| | | | | | 135,482,930 |
| Colombia - 0.0% | | | | | |
| Bancolombia SA | | 13,430 | | | 148,832 |
| Ecopetrol SA | | 301,038 | | | 265,607 |
| Grupo Argos SA | | 16,482 | | | 70,252 |
| Grupo de Inversiones Suramericana SA | | 14,401 | | | 124,810 |
| Interconexion Electrica SA ESP | | 26,894 | | | 142,143 |
| | | | | | 751,644 |
| Czech Republic - 0.0% | | | | | |
| CEZ AS | | 11,251 | | | 215,665 |
| Komercni banka AS | | 5,181 | | | 160,563 |
| Moneta Money Bank AS (C) | | 35,169 | | | 117,279 |
| | | | | | 493,507 |
| Denmark - 1.9% | | | | | |
| A.P. Moller - Maersk A/S, Series A | | 460 | | | 436,210 |
| A.P. Moller - Maersk A/S, Series B (B) | | 762 | | | 768,942 |
| Carlsberg A/S, Class B | | 12,618 | | | 1,668,828 |
| Chr. Hansen Holding A/S (B) | | 12,373 | | | 892,015 |
| Coloplast A/S, B Shares | | 13,914 | | | 1,867,891 |
| Danske Bank A/S | | 76,602 | | | 1,187,559 |
| Demant A/S (A)(B) | | 12,978 | | | 397,448 |
| DSV Panalpina A/S (B) | | 25,653 | | | 2,602,872 |
| Genmab A/S (A) | | 7,649 | | | 1,729,696 |
| H Lundbeck A/S | | 8,127 | | | 283,333 |
| ISS A/S | | 18,551 | | | 329,640 |
| Novo Nordisk A/S, B Shares | | 208,544 | | | 12,218,376 |
| Novozymes A/S, B Shares (B) | | 25,145 | | | 1,289,073 |
| Orsted A/S (C) | | 22,218 | | | 2,293,760 |
| Pandora A/S (B) | | 11,798 | | | 531,646 |
| Tryg A/S | | 14,853 | | | 416,753 |
| Vestas Wind Systems A/S (B) | | 22,259 | | | 2,147,556 |
| | | | | | 31,061,598 |
International Strategic Equity Allocation Fund (continued)
| | | Shares or
Principal
Amount | | Value |
| COMMON STOCKS (continued) | | | |
| Finland - 0.8% | | | | | |
| Elisa OYJ | | 10,955 | | $ | 631,022 |
| Fortum OYJ | | 34,941 | | | 746,195 |
| Kone OYJ, B Shares | | 26,768 | | | 1,516,198 |
| Metso OYJ | | 8,431 | | | 274,363 |
| Neste OYJ | | 33,106 | | | 1,323,116 |
| Nokia OYJ | | 444,262 | | | 1,697,541 |
| Nokian Renkaat OYJ | | 9,747 | | | 255,130 |
| Nordea Bank ABP | | 282,598 | | | 2,230,358 |
| Orion OYJ, Class B | | 8,136 | | | 324,710 |
| Sampo OYJ, A Shares | | 35,994 | | | 1,470,782 |
| Stora Enso OYJ, R Shares | | 46,109 | | | 546,434 |
| UPM-Kymmene OYJ | | 42,228 | | | 1,299,446 |
| Wartsila OYJ ABP | | 34,898 | | | 364,859 |
| | | | | | 12,680,154 |
| France - 7.8% | | | | | |
| Accor SA (B) | | 14,760 | | | 536,861 |
| Aeroports de Paris | | 2,487 | | | 369,694 |
| Air Liquide SA | | 40,047 | | | 5,454,918 |
| Airbus SE | | 49,771 | | | 6,007,279 |
| Alstom SA | | 16,071 | | | 793,443 |
| Amundi SA (C) | | 5,354 | | | 384,719 |
| Arkema SA | | 5,924 | | | 560,407 |
| Atos SE | | 8,320 | | | 625,974 |
| AXA SA | | 167,632 | | | 3,896,487 |
| BioMerieux (B) | | 3,521 | | | 326,573 |
| BNP Paribas SA | | 95,938 | | | 4,656,851 |
| Bollore SA | | 73,191 | | | 253,114 |
| Bouygues SA | | 18,850 | | | 745,677 |
| Bureau Veritas SA | | 24,897 | | | 612,817 |
| Capgemini SE | | 13,517 | | | 1,497,914 |
| Carrefour SA | | 51,340 | | | 886,692 |
| Casino Guichard Perrachon SA (B) | | 4,567 | | | 179,255 |
| Cie de Saint-Gobain | | 41,897 | | | 1,479,357 |
| Cie Generale des Etablissements Michelin SCA | | 14,534 | | | 1,557,558 |
| CNP Assurances | | 17,198 | | | 270,288 |
| Covivio | | 3,797 | | | 404,110 |
| Credit Agricole SA | | 99,858 | | | 1,200,868 |
| Danone SA | | 52,421 | | | 3,699,789 |
| Dassault Aviation SA (B) | | 217 | | | 227,262 |
| Dassault Systemes SE | | 11,165 | | | 1,771,474 |
| Edenred | | 20,564 | | | 1,076,482 |
| Eiffage SA | | 6,605 | | | 706,534 |
| Electricite de France SA | | 51,522 | | | 723,185 |
| Engie SA | | 155,299 | | | 2,593,336 |
| EssilorLuxottica SA | | 24,059 | | | 3,297,995 |
| Eurazeo SE | | 3,283 | | | 220,688 |
| Eutelsat Communications SA | | 14,638 | | | 197,931 |
| Faurecia SE (B) | | 6,526 | | | 298,416 |
| Gecina SA | | 3,842 | | | 684,014 |
| Getlink SE | | 36,655 | | | 593,499 |
| Hermes International | | 2,689 | | | 1,896,808 |
| ICADE (B) | | 2,432 | | | 243,631 |
| Iliad SA (B) | | 2,256 | | | 317,112 |
| Ingenico Group SA | | 5,161 | | | 735,592 |
| Ipsen SA | | 3,199 | | | 209,117 |
| JCDecaux SA (B) | | 7,258 | | | 167,725 |
| Kering SA | | 6,454 | | | 3,639,429 |
| Klepierre SA | | 16,563 | | | 497,390 |
| Legrand SA | | 22,588 | | | 1,733,669 |
| L'Oreal SA | | 21,509 | | | 5,781,271 |
| LVMH Moet Hennessy Louis Vuitton SE | | 23,675 | | | 9,880,282 |
| Natixis SA | | 86,008 | | | 351,777 |
| The accompanying notes are an integral part of the financial statements. | 20 | |
John Hancock Funds II
Portfolio of Investments — February 29, 2020 (unaudited)(showing percentage of total net assets)
International Strategic Equity Allocation Fund (continued)
| | | Shares or
Principal
Amount | | Value |
| COMMON STOCKS (continued) | | | |
| France (continued) | | | | | |
| Orange SA | | 168,988 | | $ | 2,274,296 |
| Pernod Ricard SA | | 18,039 | | | 2,941,688 |
| Peugeot SA | | 50,064 | | | 970,192 |
| Publicis Groupe SA | | 18,349 | | | 713,577 |
| Remy Cointreau SA | | 1,894 | | | 192,938 |
| Renault SA | | 16,324 | | | 485,220 |
| Safran SA | | 27,923 | | | 3,865,328 |
| Sanofi | | 95,874 | | | 8,941,749 |
| Sartorius Stedim Biotech | | 2,341 | | | 448,427 |
| Schneider Electric SE | | 47,110 | | | 4,786,341 |
| SCOR SE | | 14,450 | | | 523,339 |
| SEB SA (B) | | 1,928 | | | 255,903 |
| Societe Generale SA | | 69,284 | | | 1,963,272 |
| Sodexo SA (B) | | 7,422 | | | 717,334 |
| Suez | | 28,616 | | | 454,387 |
| Teleperformance | | 4,972 | | | 1,212,924 |
| Thales SA | | 9,120 | | | 921,142 |
| TOTAL SA | | 203,825 | | | 8,809,781 |
| Ubisoft Entertainment SA (A)(B) | | 7,155 | | | 536,588 |
| Unibail-Rodamco-Westfield (B) | | 11,735 | | | 1,408,297 |
| Valeo SA (B) | | 20,524 | | | 521,745 |
| Veolia Environnement SA | | 45,525 | | | 1,311,616 |
| Vinci SA | | 43,352 | | | 4,380,613 |
| Vivendi SA | | 72,156 | | | 1,843,529 |
| Wendel SA | | 2,239 | | | 276,580 |
| Worldline SA (A)(C) | | 8,534 | | | 658,323 |
| | | | | | 125,660,393 |
| Germany - 5.6% | | | | | |
| adidas AG | | 15,230 | | | 4,287,970 |
| Allianz SE | | 36,311 | | | 7,910,331 |
| BASF SE | | 77,580 | | | 4,591,499 |
| Bayer AG | | 78,805 | | | 5,731,165 |
| Bayerische Motoren Werke AG | | 27,949 | | | 1,844,148 |
| Beiersdorf AG | | 8,389 | | | 885,861 |
| Brenntag AG | | 12,983 | | | 589,077 |
| Carl Zeiss Meditec AG, Bearer Shares | | 3,370 | | | 358,514 |
| Commerzbank AG (B) | | 84,223 | | | 486,744 |
| Continental AG (B) | | 9,251 | | | 1,057,923 |
| Covestro AG (C) | | 14,747 | | | 571,409 |
| Daimler AG | | 76,828 | | | 3,232,508 |
| Delivery Hero SE (A)(B)(C) | | 9,576 | | | 732,545 |
| Deutsche Bank AG (B) | | 167,920 | | | 1,474,249 |
| Deutsche Boerse AG | | 16,089 | | | 2,531,659 |
| Deutsche Lufthansa AG | | 19,979 | | | 264,220 |
| Deutsche Post AG | | 83,592 | | | 2,515,942 |
| Deutsche Telekom AG | | 280,400 | | | 4,593,363 |
| Deutsche Wohnen SE | | 30,115 | | | 1,229,374 |
| E.ON SE (B) | | 189,080 | | | 2,196,398 |
| Evonik Industries AG | | 17,759 | | | 444,499 |
| Fraport AG Frankfurt Airport Services Worldwide | | 3,386 | | | 216,349 |
| Fresenius Medical Care AG & Company KGaA | | 18,102 | | | 1,396,147 |
| Fresenius SE & Company KGaA | | 35,358 | | | 1,676,853 |
| GEA Group AG | | 12,911 | | | 345,484 |
| Hannover Rueck SE | | 5,483 | | | 992,791 |
| HeidelbergCement AG | | 12,577 | | | 753,751 |
| Henkel AG & Company KGaA | | 8,599 | | | 734,960 |
| HOCHTIEF AG | | 2,060 | | | 205,529 |
| Infineon Technologies AG | | 105,765 | | | 2,257,404 |
| KION Group AG | | 5,486 | | | 296,701 |
| Knorr-Bremse AG | | 4,007 | | | 409,619 |
| LANXESS AG | | 7,110 | | | 378,532 |
International Strategic Equity Allocation Fund (continued)
| | | Shares or
Principal
Amount | | Value |
| COMMON STOCKS (continued) | | | |
| Germany (continued) | | | | | |
| Merck KGaA | | 10,891 | | $ | 1,325,261 |
| METRO AG | | 14,829 | | | 173,215 |
| MTU Aero Engines AG | | 4,405 | | | 1,089,895 |
| Muenchener Rueckversicherungs-Gesellschaft AG | | 12,483 | | | 3,234,561 |
| Puma SE | | 6,964 | | | 539,934 |
| RWE AG (B) | | 49,227 | | | 1,708,619 |
| SAP SE (B) | | 83,026 | | | 10,365,152 |
| Siemens AG | | 64,673 | | | 6,652,985 |
| Siemens Healthineers AG (C) | | 12,601 | | | 515,227 |
| Symrise AG | | 10,822 | | | 1,060,467 |
| Telefonica Deutschland Holding AG (B) | | 71,736 | | | 188,751 |
| thyssenkrupp AG (A)(B) | | 34,025 | | | 333,625 |
| TUI AG | | 19,338 | | | 152,579 |
| Uniper SE | | 16,777 | | | 498,683 |
| United Internet AG | | 8,600 | | | 259,792 |
| Volkswagen AG | | 2,618 | | | 444,696 |
| Vonovia SE | | 43,148 | | | 2,334,649 |
| Wirecard AG (B) | | 9,896 | | | 1,274,716 |
| Zalando SE (A)(C) | | 11,679 | | | 521,897 |
| | | | | | 89,868,222 |
| Hong Kong - 2.3% | | | | | |
| AIA Group, Ltd. | | 482,000 | | | 4,830,819 |
| Alibaba Health Information Technology, Ltd. (A) | | 301,100 | | | 587,312 |
| Alibaba Pictures Group, Ltd. (A)(B) | | 1,205,600 | | | 164,512 |
| ASM Pacific Technology, Ltd. | | 12,000 | | | 145,120 |
| Beijing Enterprises Holdings, Ltd. | | 43,000 | | | 183,042 |
| Beijing Enterprises Water Group, Ltd. (A) | | 422,500 | | | 198,988 |
| BOC Hong Kong Holdings, Ltd. | | 149,000 | | | 521,459 |
| Bosideng International Holdings, Ltd. | | 266,000 | | | 78,509 |
| Brilliance China Automotive Holdings, Ltd. | | 253,500 | | | 219,422 |
| Budweiser Brewing Company APAC, Ltd. (A)(C) | | 52,200 | | | 159,347 |
| China Agri-Industries Holdings, Ltd. | | 199,000 | | | 109,486 |
| China Ding Yi Feng Holdings, Ltd. | | 88,000 | | | 40,641 |
| China Education Group Holdings, Ltd. | | 49,000 | | | 70,512 |
| China Everbright International, Ltd. | | 306,200 | | | 207,284 |
| China Everbright, Ltd. | | 81,100 | | | 137,959 |
| China First Capital Group, Ltd. (A) | | 194,000 | | | 5,384 |
| China Gas Holdings, Ltd. | | 152,600 | | | 567,024 |
| China Jinmao Holdings Group, Ltd. (B) | | 444,900 | | | 331,857 |
| China Mengniu Dairy Company, Ltd. (A) | | 230,900 | | | 843,868 |
| China Merchants Port Holdings Company, Ltd. | | 112,300 | | | 166,890 |
| China Mobile, Ltd. | | 515,900 | | | 4,105,849 |
| China Overseas Land & Investment, Ltd. | | 323,500 | | | 1,107,872 |
| China Power International Development, Ltd. | | 342,000 | | | 64,234 |
| China Resources Beer Holdings Company, Ltd. | | 121,200 | | | 571,959 |
| China Resources Cement Holdings, Ltd. | | 206,000 | | | 264,676 |
| China Resources Gas Group, Ltd. | | 75,100 | | | 378,500 |
| China Resources Land, Ltd. | | 233,700 | | | 1,109,701 |
| China Resources Power Holdings Company, Ltd. | | 161,100 | | | 193,573 |
| China State Construction International Holdings, Ltd. | | 171,500 | | | 140,997 |
| China Taiping Insurance Holdings Company, Ltd. | | 146,200 | | | 305,760 |
| China Traditional Chinese Medicine Holdings Company, Ltd. | | 188,000 | | | 100,199 |
| The accompanying notes are an integral part of the financial statements. | 21 | |
John Hancock Funds II
Portfolio of Investments — February 29, 2020 (unaudited)(showing percentage of total net assets)
International Strategic Equity Allocation Fund (continued)
| | | Shares or
Principal
Amount | | Value |
| COMMON STOCKS (continued) | | | |
| Hong Kong (continued) | | | | | |
| China Unicom Hong Kong, Ltd. | | 513,300 | | $ | 412,471 |
| CITIC, Ltd. | | 492,600 | | | 556,151 |
| CK Asset Holdings, Ltd. | | 102,500 | | | 654,254 |
| CK Hutchison Holdings, Ltd. | | 107,500 | | | 950,307 |
| CK Infrastructure Holdings, Ltd. | | 25,500 | | | 175,466 |
| CLP Holdings, Ltd. | | 64,500 | | | 681,540 |
| COSCO SHIPPING Ports, Ltd. | | 141,700 | | | 95,211 |
| Dairy Farm International Holdings, Ltd. | | 12,100 | | | 58,346 |
| Far East Horizon, Ltd. | | 178,800 | | | 158,562 |
| Galaxy Entertainment Group, Ltd. | | 86,000 | | | 585,338 |
| Geely Automobile Holdings, Ltd. | | 419,300 | | | 765,953 |
| Guangdong Investment, Ltd. | | 244,900 | | | 465,083 |
| Haier Electronics Group Company, Ltd. | | 105,700 | | | 308,223 |
| Hang Lung Properties, Ltd. | | 78,000 | | | 173,139 |
| Hang Seng Bank, Ltd. | | 30,100 | | | 634,825 |
| Henderson Land Development Company, Ltd. | | 56,041 | | | 261,607 |
| HK Electric Investments & HK Electric Investments, Ltd. | | 86,000 | | | 86,631 |
| HKT Trust & HKT, Ltd. | | 141,000 | | | 212,296 |
| Hong Kong & China Gas Company, Ltd. | | 395,646 | | | 767,915 |
| Hong Kong Exchanges & Clearing, Ltd. | | 47,800 | | | 1,599,198 |
| Hongkong Land Holdings, Ltd. | | 46,000 | | | 228,107 |
| Hutchison China MediTech, Ltd., ADR (A) | | 5,100 | | | 118,932 |
| Jardine Matheson Holdings, Ltd. | | 8,700 | | | 476,000 |
| Jardine Strategic Holdings, Ltd. | | 8,700 | | | 252,358 |
| Kerry Properties, Ltd. | | 25,500 | | | 73,452 |
| Kingboard Holdings, Ltd. | | 55,200 | | | 147,937 |
| Kingboard Laminates Holdings, Ltd. | | 91,000 | | | 93,056 |
| Kunlun Energy Company, Ltd. | | 288,900 | | | 204,378 |
| Lee & Man Paper Manufacturing, Ltd. | | 112,500 | | | 89,578 |
| Link REIT | | 82,200 | | | 767,337 |
| Melco Resorts & Entertainment, Ltd., ADR | | 8,700 | | | 150,858 |
| MTR Corp., Ltd. | | 60,000 | | | 342,800 |
| New World Development Company, Ltd. | | 239,000 | | | 313,133 |
| Nine Dragons Paper Holdings, Ltd. | | 138,900 | | | 166,858 |
| NWS Holdings, Ltd. (B) | | 58,000 | | | 71,680 |
| PCCW, Ltd. | | 143,000 | | | 86,415 |
| Power Assets Holdings, Ltd. | | 53,500 | | | 383,777 |
| Shanghai Industrial Holdings, Ltd. | | 40,900 | | | 72,802 |
| Shenzhen International Holdings, Ltd. | | 79,000 | | | 152,779 |
| Shenzhen Investment, Ltd. | | 234,000 | | | 79,090 |
| Shimao Property Holdings, Ltd. | | 97,900 | | | 358,833 |
| Sino Biopharmaceutical, Ltd. (B) | | 580,900 | | | 860,970 |
| Sino Land Company, Ltd. | | 119,000 | | | 164,173 |
| SJM Holdings, Ltd. | | 76,000 | | | 87,997 |
| SSY Group, Ltd. (B) | | 128,000 | | | 108,979 |
| Sun Art Retail Group, Ltd. | | 200,700 | | | 259,392 |
| Sun Hung Kai Properties, Ltd. | | 63,000 | | | 910,565 |
| Swire Pacific, Ltd., Class A | | 19,500 | | | 177,796 |
| Swire Properties, Ltd. | | 45,000 | | | 135,440 |
| Techtronic Industries Company, Ltd. | | 54,500 | | | 452,162 |
| The Bank of East Asia, Ltd. | | 49,600 | | | 106,011 |
| The Wharf Holdings, Ltd. | | 89,000 | | | 190,484 |
| Towngas China Company, Ltd. (A) | | 86,000 | | | 50,523 |
| Vitasoy International Holdings, Ltd. (B) | | 30,000 | | | 108,809 |
| WH Group, Ltd. (C) | | 381,000 | | | 399,826 |
| Wharf Real Estate Investment Company, Ltd. | | 47,000 | | | 216,503 |
| Wheelock & Company, Ltd. | | 33,000 | | | 253,560 |
| Yue Yuen Industrial Holdings, Ltd. | | 28,000 | | | 67,948 |
| Yuexiu Property Company, Ltd. | | 556,000 | | | 115,138 |
| | | | | | 36,811,707 |
International Strategic Equity Allocation Fund (continued)
| | | Shares or
Principal
Amount | | Value |
| COMMON STOCKS (continued) | | | |
| Hungary - 0.1% | | | | | |
| MOL Hungarian Oil & Gas PLC | | 33,301 | | $ | 258,107 |
| OTP Bank Nyrt | | 18,567 | | | 814,964 |
| Richter Gedeon NYRT | | 11,684 | | | 237,988 |
| | | | | | 1,311,059 |
| Indonesia - 0.1% | | | | | |
| Ace Hardware Indonesia Tbk PT | | 104,000 | | | 11,030 |
| Adaro Energy Tbk PT | | 246,800 | | | 20,225 |
| Astra International Tbk PT | | 335,900 | | | 131,437 |
| Bank Central Asia Tbk PT | | 160,600 | | | 354,751 |
| Bank Mandiri Persero Tbk PT | | 308,400 | | | 160,398 |
| Bank Negara Indonesia Persero Tbk PT | | 136,500 | | | 68,375 |
| Bank Rakyat Indonesia Persero Tbk PT | | 916,800 | | | 273,965 |
| Bank Tabungan Negara Persero Tbk PT | | 79,000 | | | 9,553 |
| Barito Pacific Tbk PT (A) | | 435,100 | | | 30,159 |
| Bukit Asam Tbk PT | | 48,400 | | | 7,652 |
| Bumi Serpong Damai Tbk PT (A) | | 140,000 | | | 9,969 |
| Charoen Pokphand Indonesia Tbk PT | | 120,300 | | | 48,650 |
| Gudang Garam Tbk PT | | 7,900 | | | 28,309 |
| Hanjaya Mandala Sampoerna Tbk PT | | 129,700 | | | 15,672 |
| Indah Kiat Pulp & Paper Corp. Tbk PT | | 43,900 | | | 17,649 |
| Indocement Tunggal Prakarsa Tbk PT | | 29,300 | | | 31,386 |
| Indofood CBP Sukses Makmur Tbk PT | | 32,900 | | | 23,637 |
| Indofood Sukses Makmur Tbk PT | | 70,700 | | | 32,607 |
| Jasa Marga Persero Tbk PT | | 31,200 | | | 10,345 |
| Kalbe Farma Tbk PT | | 316,100 | | | 27,329 |
| Pabrik Kertas Tjiwi Kimia Tbk PT | | 22,200 | | | 9,453 |
| Pakuwon Jati Tbk PT | | 306,700 | | | 11,546 |
| Perusahaan Gas Negara Tbk PT | | 165,600 | | | 15,077 |
| Semen Indonesia Persero Tbk PT | | 49,500 | | | 36,948 |
| Telekomunikasi Indonesia Persero Tbk PT | | 823,300 | | | 200,741 |
| Unilever Indonesia Tbk PT | | 110,700 | | | 53,178 |
| United Tractors Tbk PT | | 28,000 | | | 32,863 |
| XL Axiata Tbk PT (A) | | 62,600 | | | 11,514 |
| | | | | | 1,684,418 |
| Ireland - 0.6% | | | | | |
| AerCap Holdings NV (A) | | 9,900 | | | 515,592 |
| AIB Group PLC | | 63,512 | | | 148,199 |
| Bank of Ireland Group PLC | | 77,990 | | | 292,017 |
| CRH PLC | | 64,270 | | | 2,168,220 |
| DCC PLC | | 4,315 | | | 309,053 |
| Experian PLC | | 40,012 | | | 1,331,755 |
| Flutter Entertainment PLC | | 6,262 | | | 665,903 |
| James Hardie Industries PLC, CHESS Depositary Interest | | 40,153 | | | 750,333 |
| Kerry Group PLC, Class A | | 12,701 | | | 1,613,440 |
| Kingspan Group PLC | | 12,034 | | | 764,725 |
| Smurfit Kappa Group PLC | | 18,159 | | | 611,774 |
| | | | | | 9,171,011 |
| Isle of Man - 0.0% | | | | | |
| GVC Holdings PLC | | 25,718 | | | 264,411 |
| Israel - 0.4% | | | | | |
| Azrieli Group, Ltd. | | 3,373 | | | 245,335 |
| Bank Hapoalim BM | | 85,050 | | | 661,698 |
| Bank Leumi Le-Israel BM | | 110,822 | | | 716,342 |
| Check Point Software Technologies, Ltd. (A) | | 9,000 | | | 934,200 |
| CyberArk Software, Ltd. (A) | | 2,800 | | | 293,160 |
| Israel Chemicals, Ltd. | | 53,521 | | | 194,677 |
| Israel Discount Bank, Ltd., Class A | | 90,722 | | | 378,062 |
| Mizrahi Tefahot Bank, Ltd. | | 11,140 | | | 285,749 |
| Nice, Ltd. (A) | | 4,566 | | | 746,846 |
| The accompanying notes are an integral part of the financial statements. | 22 | |
John Hancock Funds II
Portfolio of Investments — February 29, 2020 (unaudited)(showing percentage of total net assets)
International Strategic Equity Allocation Fund (continued)
| | | Shares or
Principal
Amount | | Value |
| COMMON STOCKS (continued) | | | |
| Israel (continued) | | | | | |
| Teva Pharmaceutical Industries, Ltd., ADR (A) | | 79,600 | | $ | 917,788 |
| Wix.com, Ltd. (A) | | 3,400 | | | 455,702 |
| | | | | | 5,829,559 |
| Italy - 0.9% | | | | | |
| Assicurazioni Generali SpA | | 62,395 | | | 1,126,311 |
| Atlantia SpA (B) | | 26,283 | | | 568,468 |
| Davide Campari-Milano SpA (B) | | 30,577 | | | 255,647 |
| Enel SpA | | 431,820 | | | 3,624,339 |
| Eni SpA | | 133,541 | | | 1,663,803 |
| Ferrari NV | | 6,407 | | | 1,009,215 |
| FinecoBank Banca Fineco SpA | | 32,036 | | | 336,154 |
| Intesa Sanpaolo SpA | | 780,193 | | | 1,896,737 |
| Leonardo SpA | | 22,446 | | | 230,195 |
| Mediobanca Banca di Credito Finanziario SpA | | 31,501 | | | 286,451 |
| Moncler SpA | | 9,665 | | | 380,327 |
| Pirelli & C. SpA (B)(C) | | 20,576 | | | 97,971 |
| Poste Italiane SpA (C) | | 28,165 | | | 301,719 |
| Prysmian SpA (B) | | 12,942 | | | 309,175 |
| Recordati SpA | | 5,423 | | | 231,928 |
| Snam SpA | | 104,163 | | | 516,478 |
| Telecom Italia SpA (A) | | 502,612 | | | 279,538 |
| Telecom Italia SpA | | 303,733 | | | 169,932 |
| Terna Rete Elettrica Nazionale SpA (B) | | 72,398 | | | 478,603 |
| UniCredit SpA | | 106,603 | | | 1,370,831 |
| | | | | | 15,133,822 |
| Japan - 16.5% | | | | | |
| ABC-Mart, Inc. (B) | | 2,600 | | | 149,741 |
| Acom Company, Ltd. | | 32,600 | | | 134,008 |
| Advantest Corp. | | 16,200 | | | 745,370 |
| Aeon Company, Ltd. (B) | | 53,000 | | | 990,686 |
| AEON Financial Service Company, Ltd. (B) | | 9,400 | | | 136,345 |
| Aeon Mall Company, Ltd. | | 8,300 | | | 117,580 |
| AGC, Inc. | | 14,900 | | | 426,120 |
| Air Water, Inc. | | 14,800 | | | 196,337 |
| Aisin Seiki Company, Ltd. | | 13,200 | | | 424,575 |
| Ajinomoto Company, Inc. | | 35,300 | | | 592,227 |
| Alfresa Holdings Corp. | | 15,200 | | | 265,045 |
| Alps Alpine Company, Ltd. | | 16,900 | | | 257,385 |
| Amada Holdings Company, Ltd. | | 27,500 | | | 256,406 |
| ANA Holdings, Inc. (B) | | 9,100 | | | 245,005 |
| Aozora Bank, Ltd. | | 9,500 | | | 235,758 |
| Asahi Group Holdings, Ltd. | | 29,400 | | | 1,125,364 |
| Asahi Intecc Company, Ltd. | | 15,700 | | | 379,511 |
| Asahi Kasei Corp. | | 102,900 | | | 842,748 |
| Astellas Pharma, Inc. | | 153,800 | | | 2,410,540 |
| Bandai Namco Holdings, Inc. | | 16,100 | | | 806,302 |
| Benesse Holdings, Inc. | | 5,700 | | | 146,406 |
| Bridgestone Corp. | | 46,000 | | | 1,524,470 |
| Brother Industries, Ltd. | | 18,200 | | | 322,378 |
| Calbee, Inc. | | 6,400 | | | 163,083 |
| Canon, Inc. | | 81,000 | | | 2,038,551 |
| Casio Computer Company, Ltd. (B) | | 15,800 | | | 269,168 |
| Central Japan Railway Company | | 11,700 | | | 1,923,356 |
| Chubu Electric Power Company, Inc. | | 52,100 | | | 678,730 |
| Chugai Pharmaceutical Company, Ltd. | | 18,200 | | | 1,957,775 |
| Coca-Cola Bottlers Japan Holdings, Inc. (B) | | 10,000 | | | 230,641 |
| Concordia Financial Group, Ltd. | | 88,500 | | | 298,632 |
| Credit Saison Company, Ltd. | | 13,000 | | | 187,459 |
| CyberAgent, Inc. | | 8,200 | | | 310,536 |
International Strategic Equity Allocation Fund (continued)
| | | Shares or
Principal
Amount | | Value |
| COMMON STOCKS (continued) | | | |
| Japan (continued) | | | | | |
| Dai Nippon Printing Company, Ltd. | | 19,700 | | $ | 474,715 |
| Daicel Corp. | | 20,300 | | | 174,377 |
| Daifuku Company, Ltd. | | 8,200 | | | 482,015 |
| Dai-ichi Life Holdings, Inc. | | 90,700 | | | 1,230,105 |
| Daiichi Sankyo Company, Ltd. | | 46,100 | | | 2,806,381 |
| Daikin Industries, Ltd. | | 20,200 | | | 2,721,428 |
| Daito Trust Construction Company, Ltd. | | 5,800 | | | 589,907 |
| Daiwa House Industry Company, Ltd. | | 45,900 | | | 1,266,677 |
| Daiwa House REIT Investment Corp. (B) | | 146 | | | 365,101 |
| Daiwa Securities Group, Inc. | | 126,800 | | | 536,391 |
| Denso Corp. | | 35,100 | | | 1,350,425 |
| Dentsu Group, Inc. | | 17,500 | | | 452,522 |
| Disco Corp. | | 2,200 | | | 446,027 |
| East Japan Railway Company | | 24,500 | | | 1,871,381 |
| Eisai Company, Ltd. | | 20,500 | | | 1,505,438 |
| Electric Power Development Company, Ltd. | | 11,700 | | | 250,900 |
| FamilyMart Company, Ltd. (B) | | 20,500 | | | 446,803 |
| FANUC Corp. | | 15,800 | | | 2,594,580 |
| Fast Retailing Company, Ltd. | | 4,700 | | | 2,318,375 |
| Fuji Electric Company, Ltd. | | 10,300 | | | 282,492 |
| FUJIFILM Holdings Corp. | | 29,300 | | | 1,422,877 |
| Fujitsu, Ltd. | | 15,900 | | | 1,657,992 |
| Fukuoka Financial Group, Inc. | | 14,300 | | | 214,003 |
| GMO Payment Gateway, Inc. | | 3,300 | | | 204,758 |
| Hakuhodo DY Holdings, Inc. | | 18,800 | | | 217,262 |
| Hamamatsu Photonics KK | | 11,300 | | | 440,790 |
| Hankyu Hanshin Holdings, Inc. | | 18,400 | | | 604,920 |
| Hikari Tsushin, Inc. | | 1,700 | | | 323,060 |
| Hino Motors, Ltd. | | 23,100 | | | 189,011 |
| Hirose Electric Company, Ltd. | | 2,600 | | | 275,429 |
| Hisamitsu Pharmaceutical Company, Inc. | | 4,300 | | | 190,321 |
| Hitachi Chemical Company, Ltd. | | 8,500 | | | 359,962 |
| Hitachi Construction Machinery Company, Ltd. | | 8,900 | | | 216,759 |
| Hitachi High-Tech Corp. | | 5,600 | | | 415,941 |
| Hitachi Metals, Ltd. (B) | | 17,500 | | | 252,077 |
| Hitachi, Ltd. | | 78,700 | | | 2,628,263 |
| Honda Motor Company, Ltd. | | 132,900 | | | 3,409,477 |
| Hoshizaki Corp. | | 4,400 | | | 372,846 |
| Hoya Corp. | | 31,000 | | | 2,748,729 |
| Hulic Company, Ltd. | | 24,100 | | | 268,449 |
| Idemitsu Kosan Company, Ltd. | | 15,797 | | | 395,316 |
| IHI Corp. | | 12,100 | | | 251,580 |
| Iida Group Holdings Company, Ltd. (B) | | 11,900 | | | 160,817 |
| Inpex Corp. | | 83,000 | | | 730,509 |
| Isetan Mitsukoshi Holdings, Ltd. (B) | | 26,800 | | | 173,773 |
| Isuzu Motors, Ltd. | | 44,800 | | | 419,145 |
| ITOCHU Corp. | | 109,500 | | | 2,481,423 |
| Itochu Techno-Solutions Corp. | | 7,600 | | | 212,871 |
| J Front Retailing Company, Ltd. (B) | | 18,500 | | | 196,572 |
| Japan Airlines Company, Ltd. | | 9,300 | | | 228,873 |
| Japan Airport Terminal Company, Ltd. | | 4,100 | | | 159,379 |
| Japan Exchange Group, Inc. | | 42,300 | | | 707,302 |
| Japan Post Bank Company, Ltd. | | 30,200 | | | 266,661 |
| Japan Post Holdings Company, Ltd. | | 130,400 | | | 1,133,227 |
| Japan Post Insurance Company, Ltd. | | 18,800 | | | 286,844 |
| Japan Prime Realty Investment Corp. | | 61 | | | 269,011 |
| Japan Real Estate Investment Corp. | | 105 | | | 718,005 |
| Japan Retail Fund Investment Corp. | | 206 | | | 390,516 |
| Japan Tobacco, Inc. | | 97,500 | | | 1,927,581 |
| JFE Holdings, Inc. | | 39,800 | | | 364,645 |
| JGC Holdings Corp. | | 18,000 | | | 217,599 |
| JSR Corp. | | 15,800 | | | 274,685 |
| The accompanying notes are an integral part of the financial statements. | 23 | |
John Hancock Funds II
Portfolio of Investments — February 29, 2020 (unaudited)(showing percentage of total net assets)
International Strategic Equity Allocation Fund (continued)
| | | Shares or
Principal
Amount | | Value |
| COMMON STOCKS (continued) | | | |
| Japan (continued) | | | | | |
| JTEKT Corp. | | 16,900 | | $ | 163,027 |
| JXTG Holdings, Inc. | | 255,200 | | | 1,033,850 |
| Kajima Corp. | | 36,500 | | | 391,188 |
| Kakaku.com, Inc. (B) | | 10,700 | | | 228,500 |
| Kamigumi Company, Ltd. | | 8,600 | | | 165,950 |
| Kansai Paint Company, Ltd. | | 14,300 | | | 310,284 |
| Kao Corp. | | 39,100 | | | 2,845,519 |
| Kawasaki Heavy Industries, Ltd. | | 11,900 | | | 213,272 |
| KDDI Corp. | | 143,500 | | | 4,054,386 |
| Keihan Holdings Company, Ltd. | | 7,600 | | | 307,470 |
| Keikyu Corp. | | 17,600 | | | 265,510 |
| Keio Corp. | | 8,100 | | | 388,422 |
| Keisei Electric Railway Company, Ltd. | | 10,200 | | | 323,946 |
| Keyence Corp. | | 14,800 | | | 4,725,722 |
| Kikkoman Corp. | | 11,800 | | | 542,566 |
| Kintetsu Group Holdings Company, Ltd. | | 13,600 | | | 586,611 |
| Kirin Holdings Company, Ltd. | | 66,800 | | | 1,269,485 |
| Kobayashi Pharmaceutical Company, Ltd. | | 4,000 | | | 290,001 |
| Koito Manufacturing Company, Ltd. | | 8,500 | | | 332,985 |
| Komatsu, Ltd. | | 75,300 | | | 1,504,553 |
| Konami Holdings Corp. | | 7,500 | | | 270,175 |
| Konica Minolta, Inc. | | 36,600 | | | 200,277 |
| Kose Corp. | | 2,700 | | | 321,690 |
| Kubota Corp. | | 85,100 | | | 1,193,252 |
| Kuraray Company, Ltd. | | 26,000 | | | 270,354 |
| Kurita Water Industries, Ltd. | | 8,000 | | | 206,333 |
| Kyocera Corp. | | 26,200 | | | 1,638,994 |
| Kyowa Kirin Company, Ltd. | | 19,700 | | | 469,492 |
| Kyushu Electric Power Company, Inc. | | 29,600 | | | 214,282 |
| Kyushu Railway Company | | 12,700 | | | 384,265 |
| Lawson, Inc. (B) | | 3,900 | | | 208,315 |
| LINE Corp. (A) | | 4,800 | | | 238,631 |
| Lion Corp. | | 18,000 | | | 299,979 |
| LIXIL Group Corp. | | 21,500 | | | 320,239 |
| M3, Inc. (B) | | 35,800 | | | 924,217 |
| Makita Corp. (B) | | 18,300 | | | 620,235 |
| Marubeni Corp. | | 127,500 | | | 844,445 |
| Marui Group Company, Ltd. | | 15,200 | | | 296,630 |
| Maruichi Steel Tube, Ltd. | | 4,400 | | | 106,271 |
| Mazda Motor Corp. | | 45,600 | | | 312,200 |
| McDonald's Holdings Company Japan, Ltd. | | 5,100 | | | 215,111 |
| Mebuki Financial Group, Inc. | | 72,900 | | | 140,519 |
| Medipal Holdings Corp. | | 14,900 | | | 271,080 |
| MEIJI Holdings Company, Ltd. | | 9,200 | | | 544,534 |
| Mercari, Inc. (A)(B) | | 6,100 | | | 138,082 |
| MINEBEA MITSUMI, Inc. | | 29,600 | | | 518,082 |
| MISUMI Group, Inc. | | 23,100 | | | 486,555 |
| Mitsubishi Chemical Holdings Corp. | | 104,300 | | | 697,285 |
| Mitsubishi Corp. | | 109,700 | | | 2,730,856 |
| Mitsubishi Electric Corp. | | 148,900 | | | 1,872,008 |
| Mitsubishi Estate Company, Ltd. | | 96,000 | | | 1,638,386 |
| Mitsubishi Gas Chemical Company, Inc. | | 13,200 | | | 197,502 |
| Mitsubishi Heavy Industries, Ltd. | | 26,000 | | | 821,535 |
| Mitsubishi Materials Corp. | | 8,900 | | | 201,906 |
| Mitsubishi Motors Corp. | | 52,600 | | | 172,837 |
| Mitsubishi UFJ Financial Group, Inc. | | 996,700 | | | 4,869,836 |
| Mitsubishi UFJ Lease & Finance Company, Ltd. | | 33,900 | | | 193,891 |
| Mitsui & Company, Ltd. | | 134,700 | | | 2,224,795 |
| Mitsui Chemicals, Inc. | | 15,200 | | | 327,219 |
| Mitsui Fudosan Company, Ltd. | | 72,400 | | | 1,661,628 |
| Mitsui OSK Lines, Ltd. | | 9,500 | | | 195,685 |
| Mizuho Financial Group, Inc. | | 1,953,100 | | | 2,642,266 |
International Strategic Equity Allocation Fund (continued)
| | | Shares or
Principal
Amount | | Value |
| COMMON STOCKS (continued) | | | |
| Japan (continued) | | | | | |
| MonotaRO Company, Ltd. (B) | | 10,100 | | $ | 224,882 |
| MS&AD Insurance Group Holdings, Inc. | | 40,600 | | | 1,308,709 |
| Murata Manufacturing Company, Ltd. | | 46,600 | | | 2,441,239 |
| Nabtesco Corp. | | 9,200 | | | 244,305 |
| Nagoya Railroad Company, Ltd. | | 14,700 | | | 383,815 |
| NEC Corp. | | 20,000 | | | 750,853 |
| Nexon Company, Ltd. (A) | | 39,800 | | | 629,395 |
| NGK Insulators, Ltd. | | 21,500 | | | 337,643 |
| NGK Spark Plug Company, Ltd. | | 12,600 | | | 204,577 |
| NH Foods, Ltd. | | 6,700 | | | 252,423 |
| Nidec Corp. | | 18,200 | | | 2,143,474 |
| Nikon Corp. | | 26,000 | | | 265,584 |
| Nintendo Company, Ltd. | | 9,100 | | | 3,050,634 |
| Nippon Building Fund, Inc. | | 107 | | | 799,960 |
| Nippon Express Company, Ltd. | | 6,400 | | | 306,942 |
| Nippon Paint Holdings Company, Ltd. | | 11,900 | | | 538,306 |
| Nippon Prologis REIT, Inc. | | 158 | | | 427,909 |
| Nippon Shinyaku Company, Ltd. | | 3,700 | | | 277,200 |
| Nippon Steel Corp. | | 65,200 | | | 729,825 |
| Nippon Telegraph & Telephone Corp. | | 104,500 | | | 2,437,961 |
| Nippon Yusen KK (B) | | 12,400 | | | 176,369 |
| Nissan Chemical Corp. | | 10,100 | | | 424,190 |
| Nissan Motor Company, Ltd. | | 187,800 | | | 804,882 |
| Nisshin Seifun Group, Inc. | | 15,900 | | | 268,310 |
| Nissin Foods Holdings Company, Ltd. | | 5,100 | | | 401,436 |
| Nitori Holdings Company, Ltd. | | 6,500 | | | 903,079 |
| Nitto Denko Corp. | | 13,000 | | | 646,406 |
| Nomura Holdings, Inc. | | 271,700 | | | 1,199,691 |
| Nomura Real Estate Holdings, Inc. | | 10,200 | | | 220,072 |
| Nomura Real Estate Master Fund, Inc. | | 324 | | | 514,082 |
| Nomura Research Institute, Ltd. | | 27,500 | | | 603,746 |
| NSK, Ltd. | | 29,300 | | | 221,712 |
| NTT Data Corp. | | 51,100 | | | 609,435 |
| NTT DOCOMO, Inc. | | 108,200 | | | 2,928,855 |
| Obayashi Corp. | | 53,000 | | | 534,668 |
| Obic Company, Ltd. | | 5,200 | | | 642,023 |
| Odakyu Electric Railway Company, Ltd. | | 23,400 | | | 449,701 |
| Oji Holdings Corp. | | 70,300 | | | 332,962 |
| Olympus Corp. | | 94,600 | | | 1,713,389 |
| Omron Corp. | | 15,700 | | | 840,629 |
| Ono Pharmaceutical Company, Ltd. | | 30,900 | | | 626,304 |
| Oracle Corp. Japan | | 3,100 | | | 241,635 |
| Oriental Land Company, Ltd. | | 16,200 | | | 1,844,450 |
| ORIX Corp. | | 108,300 | | | 1,755,337 |
| Orix JREIT, Inc. | | 208 | | | 393,509 |
| Osaka Gas Company, Ltd. | | 29,800 | | | 477,023 |
| Otsuka Corp. | | 8,400 | | | 362,829 |
| Otsuka Holdings Company, Ltd. | | 31,700 | | | 1,187,652 |
| Pan Pacific International Holdings Corp. | | 35,600 | | | 588,555 |
| Panasonic Corp. | | 179,900 | | | 1,706,360 |
| Park24 Company, Ltd. | | 9,400 | | | 185,209 |
| PeptiDream, Inc. (A) | | 7,600 | | | 301,741 |
| Persol Holdings Company, Ltd. | | 14,400 | | | 193,727 |
| Pigeon Corp. | | 9,400 | | | 317,625 |
| Pola Orbis Holdings, Inc. | | 7,500 | | | 142,752 |
| Rakuten, Inc. | | 69,800 | | | 588,128 |
| Recruit Holdings Company, Ltd. | | 110,200 | | | 3,854,003 |
| Renesas Electronics Corp. (A) | | 62,500 | | | 380,636 |
| Resona Holdings, Inc. | | 170,400 | | | 634,312 |
| Ricoh Company, Ltd. | | 54,400 | | | 508,014 |
| Rinnai Corp. | | 2,700 | | | 183,705 |
| Rohm Company, Ltd. | | 7,600 | | | 496,707 |
| Ryohin Keikaku Company, Ltd. | | 19,300 | | | 261,435 |
| Sankyo Company, Ltd. | | 3,300 | | | 108,706 |
| The accompanying notes are an integral part of the financial statements. | 24 | |
John Hancock Funds II
Portfolio of Investments — February 29, 2020 (unaudited)(showing percentage of total net assets)
International Strategic Equity Allocation Fund (continued)
| | | Shares or
Principal
Amount | | Value |
| COMMON STOCKS (continued) | | | |
| Japan (continued) | | | | | |
| Santen Pharmaceutical Company, Ltd. | | 29,100 | | $ | 466,444 |
| SBI Holdings, Inc. | | 19,500 | | | 393,340 |
| Secom Company, Ltd. | | 16,900 | | | 1,340,268 |
| Sega Sammy Holdings, Inc. | | 13,900 | | | 183,522 |
| Seibu Holdings, Inc. | | 15,500 | | | 219,819 |
| Seiko Epson Corp. | | 22,800 | | | 319,649 |
| Sekisui Chemical Company, Ltd. | | 29,600 | | | 442,725 |
| Sekisui House, Ltd. | | 50,500 | | | 990,580 |
| Seven & i Holdings Company, Ltd. (B) | | 61,200 | | | 2,082,229 |
| Seven Bank, Ltd. | | 48,100 | | | 126,506 |
| SG Holdings Company, Ltd. | | 11,600 | | | 229,017 |
| Sharp Corp. | | 17,400 | | | 201,629 |
| Shimadzu Corp. | | 18,100 | | | 437,909 |
| Shimamura Company, Ltd. | | 1,800 | | | 119,373 |
| Shimano, Inc. | | 6,000 | | | 833,576 |
| Shimizu Corp. | | 47,900 | | | 435,524 |
| Shin-Etsu Chemical Company, Ltd. | | 29,600 | | | 3,275,150 |
| Shinsei Bank, Ltd. | | 16,200 | | | 212,201 |
| Shionogi & Company, Ltd. | | 21,800 | | | 1,173,495 |
| Shiseido Company, Ltd. (B) | | 32,500 | | | 1,939,918 |
| Showa Denko KK | | 11,100 | | | 238,564 |
| SMC Corp. | | 4,700 | | | 1,873,454 |
| Softbank Corp. | | 136,000 | | | 1,786,705 |
| SoftBank Group Corp. | | 127,300 | | | 5,914,144 |
| Sohgo Security Services Company, Ltd. | | 5,700 | | | 265,952 |
| Sompo Holdings, Inc. | | 28,100 | | | 1,038,535 |
| Sony Corp. | | 103,300 | | | 6,368,226 |
| Sony Financial Holdings, Inc. | | 13,500 | | | 269,285 |
| Square Enix Holdings Company, Ltd. | | 7,400 | | | 299,602 |
| Stanley Electric Company, Ltd. | | 10,400 | | | 250,527 |
| Subaru Corp. | | 50,000 | | | 1,210,169 |
| SUMCO Corp. | | 20,400 | | | 308,896 |
| Sumitomo Chemical Company, Ltd. | | 121,000 | | | 440,923 |
| Sumitomo Corp. | | 96,300 | | | 1,382,641 |
| Sumitomo Dainippon Pharma Company, Ltd. (B) | | 12,900 | | | 184,064 |
| Sumitomo Electric Industries, Ltd. | | 61,500 | | | 725,926 |
| Sumitomo Heavy Industries, Ltd. | | 9,100 | | | 196,332 |
| Sumitomo Metal Mining Company, Ltd. | | 18,900 | | | 465,557 |
| Sumitomo Mitsui Financial Group, Inc. | | 107,700 | | | 3,417,301 |
| Sumitomo Mitsui Trust Holdings, Inc. | | 26,700 | | | 906,453 |
| Sumitomo Realty & Development Company, Ltd. | | 26,800 | | | 835,177 |
| Sumitomo Rubber Industries, Ltd. | | 13,600 | | | 141,135 |
| Sundrug Company, Ltd. | | 5,800 | | | 180,842 |
| Suntory Beverage & Food, Ltd. | | 11,200 | | | 427,574 |
| Suzuken Company, Ltd. | | 5,800 | | | 191,471 |
| Suzuki Motor Corp. | | 29,800 | | | 1,199,036 |
| Sysmex Corp. | | 13,600 | | | 869,697 |
| T&D Holdings, Inc. | | 47,600 | | | 461,794 |
| Taiheiyo Cement Corp. | | 9,900 | | | 244,301 |
| Taisei Corp. | | 16,400 | | | 556,063 |
| Taisho Pharmaceutical Holdings Company, Ltd. | | 2,700 | | | 165,814 |
| Taiyo Nippon Sanso Corp. | | 10,500 | | | 187,316 |
| Takeda Pharmaceutical Company, Ltd. | | 121,496 | | | 4,195,692 |
| TDK Corp. | | 10,600 | | | 1,010,380 |
| Teijin, Ltd. | | 14,300 | | | 234,487 |
| Terumo Corp. | | 52,400 | | | 1,682,500 |
| The Bank of Kyoto, Ltd. | | 4,500 | | | 149,231 |
| The Chiba Bank, Ltd. | | 46,100 | | | 223,356 |
| The Chugoku Electric Power Company, Inc. | | 21,600 | | | 286,748 |
| The Kansai Electric Power Company, Inc. | | 56,900 | | | 613,261 |
International Strategic Equity Allocation Fund (continued)
| | | Shares or
Principal
Amount | | Value |
| COMMON STOCKS (continued) | | | |
| Japan (continued) | | | | | |
| The Shizuoka Bank, Ltd. | | 37,000 | | $ | 229,596 |
| The Yokohama Rubber Company, Ltd. | | 9,300 | | | 151,173 |
| THK Company, Ltd. | | 9,900 | | | 223,922 |
| Tobu Railway Company, Ltd. | | 15,200 | | | 453,100 |
| Toho Company, Ltd. | | 9,000 | | | 277,821 |
| Toho Gas Company, Ltd. | | 5,800 | | | 197,073 |
| Tohoku Electric Power Company, Inc. | | 33,800 | | | 296,661 |
| Tokio Marine Holdings, Inc. | | 52,800 | | | 2,821,526 |
| Tokyo Century Corp. | | 3,500 | | | 144,526 |
| Tokyo Electric Power Company Holdings, Inc. (A) | | 123,400 | | | 468,256 |
| Tokyo Electron, Ltd. | | 12,700 | | | 2,653,178 |
| Tokyo Gas Company, Ltd. | | 30,200 | | | 606,052 |
| Tokyu Corp. | | 40,100 | | | 614,491 |
| Tokyu Fudosan Holdings Corp. | | 49,800 | | | 314,608 |
| Toppan Printing Company, Ltd. | | 23,100 | | | 403,949 |
| Toray Industries, Inc. | | 112,500 | | | 646,312 |
| Toshiba Corp. | | 40,000 | | | 1,082,630 |
| Tosoh Corp. | | 21,600 | | | 292,316 |
| TOTO, Ltd. | | 11,500 | | | 431,271 |
| Toyo Seikan Group Holdings, Ltd. | | 11,400 | | | 181,786 |
| Toyo Suisan Kaisha, Ltd. | | 7,100 | | | 282,276 |
| Toyoda Gosei Company, Ltd. | | 5,200 | | | 109,857 |
| Toyota Industries Corp. | | 11,900 | | | 620,686 |
| Toyota Motor Corp. | | 185,500 | | | 12,180,805 |
| Toyota Tsusho Corp. | | 17,200 | | | 516,863 |
| Trend Micro, Inc. | | 10,100 | | | 501,235 |
| Tsuruha Holdings, Inc. (B) | | 3,000 | | | 348,324 |
| Unicharm Corp. | | 32,900 | | | 1,065,769 |
| United Urban Investment Corp. | | 235 | | | 376,172 |
| USS Company, Ltd. | | 17,600 | | | 278,888 |
| Welcia Holdings Company, Ltd. | | 3,800 | | | 226,888 |
| West Japan Railway Company | | 13,100 | | | 925,359 |
| Yakult Honsha Company, Ltd. | | 9,700 | | | 442,306 |
| Yamada Denki Company, Ltd. | | 49,400 | | | 237,609 |
| Yamaha Corp. | | 11,700 | | | 572,730 |
| Yamaha Motor Company, Ltd. | | 22,800 | | | 359,907 |
| Yamato Holdings Company, Ltd. (B) | | 25,000 | | | 394,680 |
| Yamazaki Baking Company, Ltd. | | 9,600 | | | 162,546 |
| Yaskawa Electric Corp. (B) | | 19,600 | | | 610,606 |
| Yokogawa Electric Corp. | | 18,500 | | | 300,468 |
| Z Holdings Corp. | | 215,400 | | | 781,966 |
| ZOZO, Inc. (B) | | 8,700 | | | 122,554 |
| | | | | | 263,641,032 |
| Luxembourg - 0.2% | | | | | |
| ArcelorMittal SA (B) | | 56,863 | | | 809,723 |
| Aroundtown SA (B) | | 75,399 | | | 655,060 |
| Eurofins Scientific SE (B) | | 983 | | | 497,053 |
| Millicom International Cellular SA | | 8,311 | | | 383,891 |
| Reinet Investments SCA | | 8,124 | | | 168,578 |
| SES SA | | 30,854 | | | 353,783 |
| Tenaris SA | | 25,183 | | | 230,015 |
| | | | | | 3,098,103 |
| Macau - 0.0% | | | | | |
| Sands China, Ltd. | | 96,800 | | | 464,008 |
| Wynn Macau, Ltd. | | 62,000 | | | 128,767 |
| | | | | | 592,775 |
| Malaysia - 0.4% | | | | | |
| AirAsia Group BHD | | 101,200 | | | 24,240 |
| AMMB Holdings BHD | | 110,000 | | | 96,987 |
| Axiata Group BHD | | 179,600 | | | 179,643 |
| British American Tobacco Malaysia BHD | | 9,000 | | | 26,686 |
| CIMB Group Holdings BHD | | 317,400 | | | 364,368 |
| The accompanying notes are an integral part of the financial statements. | 25 | |
John Hancock Funds II
Portfolio of Investments — February 29, 2020 (unaudited)(showing percentage of total net assets)
International Strategic Equity Allocation Fund (continued)
| | | Shares or
Principal
Amount | | Value |
| COMMON STOCKS (continued) | | | |
| Malaysia (continued) | | | | | |
| Dialog Group BHD | | 235,200 | | $ | 188,608 |
| DiGi.Com BHD | | 195,500 | | | 194,930 |
| Fraser & Neave Holdings BHD | | 9,300 | | | 68,666 |
| Gamuda BHD | | 113,000 | | | 89,335 |
| Genting BHD | | 142,500 | | | 168,000 |
| Genting Malaysia BHD | | 196,100 | | | 135,177 |
| Genting Plantations BHD | | 16,400 | | | 39,982 |
| HAP Seng Consolidated BHD | | 37,200 | | | 79,233 |
| Hartalega Holdings BHD | | 97,300 | | | 143,413 |
| Hong Leong Bank BHD | | 44,200 | | | 161,010 |
| Hong Leong Financial Group BHD | | 15,300 | | | 55,579 |
| IHH Healthcare BHD | | 145,500 | | | 199,655 |
| IJM Corp. BHD | | 177,900 | | | 82,973 |
| IOI Corp. BHD | | 123,500 | | | 123,020 |
| Kuala Lumpur Kepong BHD | | 27,400 | | | 143,484 |
| Malayan Banking BHD | | 253,500 | | | 507,723 |
| Malaysia Airports Holdings BHD | | 62,400 | | | 98,167 |
| Maxis BHD | | 154,400 | | | 201,249 |
| MISC BHD | | 87,600 | | | 159,490 |
| Nestle Malaysia BHD | | 4,300 | | | 146,930 |
| Petronas Chemicals Group BHD | | 155,200 | | | 200,244 |
| Petronas Dagangan BHD | | 17,700 | | | 96,326 |
| Petronas Gas BHD | | 50,800 | | | 201,443 |
| PPB Group BHD | | 37,700 | | | 164,013 |
| Press Metal Aluminium Holdings BHD | | 88,500 | | | 99,242 |
| Public Bank BHD | | 202,200 | | | 822,745 |
| QL Resources BHD | | 40,100 | | | 77,808 |
| RHB Bank BHD | | 102,800 | | | 135,295 |
| Sime Darby BHD | | 177,200 | | | 84,731 |
| Sime Darby Plantation BHD | | 136,600 | | | 162,152 |
| Telekom Malaysia BHD | | 76,300 | | | 67,379 |
| Tenaga Nasional BHD | | 204,000 | | | 589,199 |
| Top Glove Corp. BHD | | 98,300 | | | 131,888 |
| Westports Holdings BHD | | 53,600 | | | 44,237 |
| YTL Corp. BHD | | 176,678 | | | 35,493 |
| | | | | | 6,590,743 |
| Mexico - 0.6% | | | | | |
| Alfa SAB de CV, Class A (B) | | 226,500 | | | 145,799 |
| Alsea SAB de CV (A) | | 40,600 | | | 82,570 |
| America Movil SAB de CV, Series L | | 2,602,200 | | | 2,058,439 |
| Arca Continental SAB de CV | | 33,600 | | | 185,216 |
| Cemex SAB de CV (B) | | 1,177,148 | | | 383,950 |
| Coca-Cola Femsa SAB de CV | | 41,400 | | | 231,704 |
| El Puerto de Liverpool SAB de CV, Series C1 (B) | | 14,100 | | | 66,621 |
| Fibra Uno Administracion SA de CV | | 247,000 | | | 374,083 |
| Fomento Economico Mexicano SAB de CV (B) | | 151,100 | | | 1,232,106 |
| Gruma SAB de CV, Class B | | 16,025 | | | 154,665 |
| Grupo Aeroportuario del Pacifico SAB de CV, B Shares | | 27,300 | | | 295,428 |
| Grupo Aeroportuario del Sureste SAB de CV, B Shares | | 16,105 | | | 268,171 |
| Grupo Bimbo SAB de CV, Series A | | 125,000 | | | 188,551 |
| Grupo Carso SAB de CV, Series A1 (B) | | 34,600 | | | 96,436 |
| Grupo Financiero Banorte SAB de CV, Series O | | 200,400 | | | 1,095,720 |
| Grupo Financiero Inbursa SAB de CV, Series O | | 175,100 | | | 189,930 |
| Grupo Mexico SAB de CV, Series B (B) | | 272,100 | | | 642,959 |
| Grupo Televisa SAB (B) | | 187,100 | | | 352,470 |
| Industrias Penoles SAB de CV | | 10,235 | | | 92,059 |
International Strategic Equity Allocation Fund (continued)
| | | Shares or
Principal
Amount | | Value |
| COMMON STOCKS (continued) | | | |
| Mexico (continued) | | | | | |
| Infraestructura Energetica Nova SAB de CV | | 40,900 | | $ | 179,534 |
| Kimberly-Clark de Mexico SAB de CV, Class A (A)(B) | | 116,200 | | | 221,207 |
| Megacable Holdings SAB de CV | | 23,400 | | | 78,583 |
| Orbia Advance Corp. SAB de CV (B) | | 82,035 | | | 161,503 |
| Promotora y Operadora de Infraestructura SAB de CV | | 17,720 | | | 173,608 |
| Wal-Mart de Mexico SAB de CV | | 403,900 | | | 1,137,027 |
| | | | | | 10,088,339 |
| Netherlands - 2.7% | | | | | |
| ABN AMRO Bank NV (C) | | 33,148 | | | 454,635 |
| Adyen NV (A)(C) | | 821 | | | 722,597 |
| Aegon NV (B) | | 159,880 | | | 544,212 |
| Akzo Nobel NV | | 17,976 | | | 1,438,265 |
| Altice Europe NV (A) | | 53,302 | | | 283,080 |
| ASML Holding NV | | 33,672 | | | 9,336,996 |
| EXOR NV | | 5,933 | | | 423,724 |
| Heineken Holding NV | | 9,006 | | | 799,710 |
| Heineken NV | | 20,450 | | | 2,037,470 |
| ING Groep NV | | 307,070 | | | 2,940,447 |
| Koninklijke Ahold Delhaize NV | | 93,097 | | | 2,174,953 |
| Koninklijke DSM NV | | 14,329 | | | 1,616,198 |
| Koninklijke KPN NV | | 279,440 | | | 677,743 |
| Koninklijke Philips NV | | 71,628 | | | 3,067,405 |
| Koninklijke Vopak NV | | 5,318 | | | 253,161 |
| NN Group NV | | 26,035 | | | 889,827 |
| NXP Semiconductors NV | | 22,100 | | | 2,512,549 |
| Prosus NV (A) | | 38,606 | | | 2,699,708 |
| QIAGEN NV (A)(B) | | 19,166 | | | 708,590 |
| Randstad NV | | 9,473 | | | 488,075 |
| Royal Dutch Shell PLC, A Shares | | 189,610 | | | 4,093,013 |
| Royal Dutch Shell PLC, B Shares | | 164,288 | | | 3,560,981 |
| Wolters Kluwer NV | | 21,872 | | | 1,600,185 |
| | | | | | 43,323,524 |
| New Zealand - 0.1% | | | | | |
| a2 Milk Company, Ltd. (A) | | 31,619 | | | 325,901 |
| Auckland International Airport, Ltd. | | 41,053 | | | 202,829 |
| Fisher & Paykel Healthcare Corp., Ltd. | | 24,802 | | | 401,578 |
| Fletcher Building, Ltd. | | 37,180 | | | 121,370 |
| Mercury NZ, Ltd. | | 28,740 | | | 86,280 |
| Meridian Energy, Ltd. | | 54,604 | | | 158,410 |
| Ryman Healthcare, Ltd. | | 17,620 | | | 168,667 |
| Spark New Zealand, Ltd. | | 78,215 | | | 222,507 |
| | | | | | 1,687,542 |
| Norway - 0.2% | | | | | |
| Aker BP ASA | | 3,272 | | | 80,153 |
| DNB ASA | | 32,241 | | | 540,014 |
| Equinor ASA | | 32,898 | | | 506,704 |
| Gjensidige Forsikring ASA | | 7,812 | | | 158,767 |
| Mowi ASA | | 14,298 | | | 302,902 |
| Norsk Hydro ASA | | 45,555 | | | 132,667 |
| Orkla ASA | | 24,225 | | | 206,045 |
| Schibsted ASA, B Shares | | 3,246 | | | 78,467 |
| Telenor ASA | | 23,694 | | | 383,877 |
| Yara International ASA | | 5,780 | | | 212,210 |
| | | | | | 2,601,806 |
| Peru - 0.1% | | | | | |
| Cia de Minas Buenaventura SAA, ADR | | 15,900 | | | 177,285 |
| Credicorp, Ltd. | | 5,253 | | | 952,211 |
| Southern Copper Corp. | | 6,800 | | | 228,820 |
| | | | | | 1,358,316 |
| The accompanying notes are an integral part of the financial statements. | 26 | |
John Hancock Funds II
Portfolio of Investments — February 29, 2020 (unaudited)(showing percentage of total net assets)
International Strategic Equity Allocation Fund (continued)
| | | Shares or
Principal
Amount | | Value |
| COMMON STOCKS (continued) | | | |
| Philippines - 0.3% | | | | | |
| Aboitiz Equity Ventures, Inc. | | 157,030 | | $ | 132,090 |
| Aboitiz Power Corp. | | 116,700 | | | 62,898 |
| Altus San Nicolas Corp. (A)(D) | | 2,753 | | | 280 |
| Ayala Corp. | | 22,420 | | | 292,274 |
| Ayala Land, Inc. | | 588,780 | | | 453,444 |
| Bank of the Philippine Islands | | 72,130 | | | 104,951 |
| BDO Unibank, Inc. | | 156,230 | | | 427,208 |
| Globe Telecom, Inc. | | 2,640 | | | 92,249 |
| GT Capital Holdings, Inc. | | 7,563 | | | 105,856 |
| International Container Terminal Services, Inc. | | 80,150 | | | 168,471 |
| JG Summit Holdings, Inc. | | 228,580 | | | 303,874 |
| Jollibee Foods Corp. | | 34,000 | | | 113,690 |
| Manila Electric Company | | 16,980 | | | 90,010 |
| Megaworld Corp. | | 895,500 | | | 59,970 |
| Metro Pacific Investments Corp. | | 1,137,700 | | | 68,625 |
| Metropolitan Bank & Trust Company | | 143,759 | | | 158,545 |
| PLDT, Inc. | | 6,840 | | | 132,996 |
| Robinsons Land Corp. | | 167,100 | | | 69,854 |
| Security Bank Corp. | | 18,180 | | | 55,266 |
| SM Investments Corp. | | 19,135 | | | 366,660 |
| SM Prime Holdings, Inc. | | 804,400 | | | 606,899 |
| Universal Robina Corp. | | 70,320 | | | 195,698 |
| | | | | | 4,061,808 |
| Poland - 0.1% | | | | | |
| Bank Millennium SA (A) | | 21,261 | | | 26,405 |
| Bank Polska Kasa Opieki SA | | 6,346 | | | 143,603 |
| CCC SA | | 1,078 | | | 20,049 |
| CD Projekt SA | | 2,543 | | | 182,462 |
| Cyfrowy Polsat SA | | 8,840 | | | 57,203 |
| Dino Polska SA (A)(C) | | 1,811 | | | 65,785 |
| Grupa Lotos SA | | 3,206 | | | 48,990 |
| KGHM Polska Miedz SA (A) | | 5,460 | | | 100,132 |
| LPP SA | | 48 | | | 84,958 |
| mBank SA (A) | | 577 | | | 44,048 |
| Orange Polska SA (A) | | 24,151 | | | 38,395 |
| PGE Polska Grupa Energetyczna SA (A) | | 32,313 | | | 37,148 |
| Polski Koncern Naftowy ORLEN SA | | 11,084 | | | 167,436 |
| Polskie Gornictwo Naftowe i Gazownictwo SA | | 63,938 | | | 52,008 |
| Powszechna Kasa Oszczednosci Bank Polski SA | | 32,608 | | | 261,084 |
| Powszechny Zaklad Ubezpieczen SA | | 25,328 | | | 225,855 |
| Santander Bank Polska SA | | 1,345 | | | 86,915 |
| | | | | | 1,642,476 |
| Portugal - 0.1% | | | | | |
| EDP - Energias de Portugal SA | | 206,070 | | | 962,077 |
| Galp Energia SGPS SA | | 39,807 | | | 549,104 |
| Jeronimo Martins SGPS SA | | 20,137 | | | 355,971 |
| | | | | | 1,867,152 |
| Romania - 0.0% | | | | | |
| NEPI Rockcastle PLC | | 20,177 | | | 149,355 |
| Russia - 0.0% | | | | | |
| Evraz PLC | | 21,720 | | | 92,752 |
| Singapore - 0.3% | | | | | |
| Ascendas Real Estate Investment Trust | | 71,100 | | | 157,165 |
| BOC Aviation, Ltd. (C) | | 17,100 | | | 149,501 |
| CapitaLand Commercial Trust | | 65,700 | | | 88,083 |
| CapitaLand Mall Trust | | 63,000 | | | 103,349 |
| CapitaLand, Ltd. | | 68,000 | | | 174,207 |
| City Developments, Ltd. | | 12,700 | | | 90,773 |
| ComfortDelGro Corp., Ltd. | | 56,300 | | | 79,824 |
International Strategic Equity Allocation Fund (continued)
| | | Shares or
Principal
Amount | | Value |
| COMMON STOCKS (continued) | | | |
| Singapore (continued) | | | | | |
| DBS Group Holdings, Ltd. | | 46,700 | | $ | 816,513 |
| Genting Singapore, Ltd. | | 162,700 | | | 95,908 |
| Jardine Cycle & Carriage, Ltd. | | 2,700 | | | 53,049 |
| Keppel Corp., Ltd. | | 38,400 | | | 177,222 |
| Mapletree Commercial Trust | | 48,800 | | | 73,966 |
| Oversea-Chinese Banking Corp., Ltd. | | 86,900 | | | 668,957 |
| SATS, Ltd. | | 16,500 | | | 48,173 |
| Sembcorp Industries, Ltd. | | 24,400 | | | 32,505 |
| Singapore Airlines, Ltd. | | 13,900 | | | 80,431 |
| Singapore Exchange, Ltd. | | 21,500 | | | 132,764 |
| Singapore Press Holdings, Ltd. | | 42,500 | | | 58,482 |
| Singapore Technologies Engineering, Ltd. | | 41,700 | | | 126,318 |
| Singapore Telecommunications, Ltd. | | 212,460 | | | 460,383 |
| Suntec Real Estate Investment Trust | | 43,900 | | | 53,831 |
| United Overseas Bank, Ltd. | | 33,400 | | | 596,141 |
| UOL Group, Ltd. | | 12,700 | | | 68,107 |
| Venture Corp., Ltd. | | 7,300 | | | 87,982 |
| Wilmar International, Ltd. | | 50,900 | | | 146,918 |
| | | | | | 4,620,552 |
| South Africa - 0.8% | | | | | |
| Absa Group, Ltd. | | 37,662 | | | 324,105 |
| Anglo American Platinum, Ltd. | | 2,831 | | | 190,551 |
| AngloGold Ashanti, Ltd. | | 22,020 | | | 392,138 |
| Aspen Pharmacare Holdings, Ltd. (A) | | 21,192 | | | 136,360 |
| Bid Corp., Ltd. | | 18,066 | | | 326,897 |
| Capitec Bank Holdings, Ltd. | | 2,426 | | | 205,349 |
| Clicks Group, Ltd. | | 13,880 | | | 209,887 |
| Discovery, Ltd. | | 22,697 | | | 141,490 |
| Exxaro Resources, Ltd. | | 13,413 | | | 97,172 |
| FirstRand, Ltd. | | 182,136 | | | 650,285 |
| Fortress REIT, Ltd., Class A | | 54,330 | | | 56,970 |
| Gold Fields, Ltd. | | 43,688 | | | 265,701 |
| Growthpoint Properties, Ltd. | | 156,590 | | | 179,413 |
| Impala Platinum Holdings, Ltd. (A) | | 43,091 | | | 350,251 |
| Investec PLC | | 1,994 | | | 10,215 |
| Investec, Ltd. | | 19,231 | | | 100,315 |
| Kumba Iron Ore, Ltd. | | 3,453 | | | 63,633 |
| Liberty Holdings, Ltd. | | 9,108 | | | 55,538 |
| Life Healthcare Group Holdings, Ltd. | | 74,122 | | | 106,114 |
| Momentum Metropolitan Holdings | | 57,753 | | | 64,929 |
| Mr. Price Group, Ltd. | | 13,560 | | | 133,184 |
| MTN Group, Ltd. | | 91,557 | | | 436,497 |
| MultiChoice Group, Ltd. (A) | | 23,473 | | | 137,150 |
| Naspers, Ltd., N Shares | | 23,739 | | | 3,711,738 |
| Nedbank Group, Ltd. | | 24,331 | | | 278,157 |
| Northam Platinum, Ltd. (A) | | 18,886 | | | 137,202 |
| Old Mutual, Ltd. | | 273,281 | | | 278,011 |
| Pepkor Holdings, Ltd. (C) | | 44,650 | | | 44,199 |
| Pick n Pay Stores, Ltd. | | 18,620 | | | 67,325 |
| PSG Group, Ltd. | | 8,118 | | | 98,600 |
| Rand Merchant Investment Holdings, Ltd. | | 51,089 | | | 81,215 |
| Redefine Properties, Ltd. | | 282,130 | | | 98,404 |
| Remgro, Ltd. | | 28,833 | | | 299,909 |
| RMB Holdings, Ltd. | | 40,518 | | | 185,486 |
| Sanlam, Ltd. | | 106,821 | | | 448,702 |
| Sasol, Ltd. | | 30,420 | | | 371,561 |
| Shoprite Holdings, Ltd. | | 25,054 | | | 182,491 |
| Sibanye Stillwater, Ltd. (A) | | 121,765 | | | 245,637 |
| Standard Bank Group, Ltd. | | 69,711 | | | 670,080 |
| Telkom SA SOC, Ltd. | | 14,300 | | | 24,327 |
| The Bidvest Group, Ltd. | | 15,114 | | | 176,177 |
| The Foschini Group, Ltd. | | 12,325 | | | 99,058 |
| The SPAR Group, Ltd. | | 9,841 | | | 105,709 |
| The accompanying notes are an integral part of the financial statements. | 27 | |
John Hancock Funds II
Portfolio of Investments — February 29, 2020 (unaudited)(showing percentage of total net assets)
International Strategic Equity Allocation Fund (continued)
| | | Shares or
Principal
Amount | | Value |
| COMMON STOCKS (continued) | | | |
| South Africa (continued) | | | | | |
| Tiger Brands, Ltd. | | 8,599 | | $ | 84,570 |
| Vodacom Group, Ltd. | | 35,124 | | | 251,145 |
| Woolworths Holdings, Ltd. | | 51,490 | | | 121,227 |
| | | | | | 12,695,074 |
| South Korea - 4.7% | | | | | |
| Amorepacific Corp. (A) | | 4,054 | | | 536,993 |
| AMOREPACIFIC Group (A) | | 3,655 | | | 187,137 |
| BGF retail Company, Ltd. | | 961 | | | 120,249 |
| BNK Financial Group, Inc. | | 35,946 | | | 182,305 |
| Celltrion Healthcare Company, Ltd. (A) | | 6,625 | | | 360,641 |
| Celltrion Pharm, Inc. (A) | | 95 | | | 3,156 |
| Celltrion, Inc. (A) | | 11,781 | | | 1,680,654 |
| Cheil Worldwide, Inc. | | 8,503 | | | 135,301 |
| CJ CheilJedang Corp. | | 1,039 | | | 208,745 |
| CJ Corp. | | 1,880 | | | 125,218 |
| CJ ENM Company, Ltd. | | 1,353 | | | 141,429 |
| CJ Logistics Corp. (A) | | 1,138 | | | 126,068 |
| Coway Company, Ltd. | | 6,428 | | | 366,394 |
| Daelim Industrial Company, Ltd. (A) | | 3,535 | | | 212,914 |
| Daewoo Engineering & Construction Company, Ltd. (A) | | 24,481 | | | 82,832 |
| Daewoo Shipbuilding & Marine Engineering Company, Ltd. (A) | | 4,661 | | | 86,062 |
| DB Insurance Company, Ltd. | | 6,580 | | | 234,940 |
| Doosan Bobcat, Inc. | | 6,245 | | | 146,239 |
| E-MART, Inc. | | 2,637 | | | 230,313 |
| Fila Holdings Corp. | | 6,082 | | | 193,477 |
| GS Engineering & Construction Corp. | | 7,634 | | | 166,961 |
| GS Holdings Corp. | | 6,544 | | | 224,536 |
| GS Retail Company, Ltd. | | 3,357 | | | 97,580 |
| Hana Financial Group, Inc. | | 37,585 | | | 973,324 |
| Hankook Tire & Technology Company, Ltd. | | 9,414 | | | 198,118 |
| Hanmi Pharm Company, Ltd. (A) | | 817 | | | 175,847 |
| Hanmi Science Company, Ltd. (A) | | 32 | | | 787 |
| Hanon Systems | | 23,093 | | | 200,830 |
| Hanwha Life Insurance Company, Ltd. | | 12,752 | | | 17,440 |
| HDC Hyundai Development Co-Engineering & Construction, Series E | | 3,415 | | | 51,045 |
| Helixmith Company, Ltd. (A) | | 2,389 | | | 124,939 |
| HLB, Inc. (A) | | 4,176 | | | 342,663 |
| Hotel Shilla Company, Ltd. | | 3,970 | | | 260,930 |
| Hyundai Department Store Company, Ltd. | | 1,844 | | | 106,746 |
| Hyundai Engineering & Construction Company, Ltd. | | 9,875 | | | 285,528 |
| Hyundai Glovis Company, Ltd. | | 2,356 | | | 240,336 |
| Hyundai Heavy Industries Holdings Company, Ltd. | | 1,220 | | | 272,034 |
| Hyundai Marine & Fire Insurance Company, Ltd. | | 8,481 | | | 158,111 |
| Hyundai Mobis Company, Ltd. | | 8,337 | | | 1,457,213 |
| Hyundai Motor Company | | 18,587 | | | 1,775,528 |
| Hyundai Steel Company | | 10,095 | | | 200,561 |
| Industrial Bank of Korea | | 33,097 | | | 261,014 |
| Kakao Corp. | | 6,278 | | | 900,526 |
| Kangwon Land, Inc. (A) | | 14,661 | | | 276,504 |
| KB Financial Group, Inc. | | 49,701 | | | 1,571,211 |
| KCC Corp. | | 614 | | | 83,879 |
| KCC Glass Corp. (A) | | 169 | | | 3,701 |
| Kia Motors Corp. | | 32,908 | | | 992,993 |
| KMW Company, Ltd. (A) | | 3,240 | | | 134,766 |
| Korea Aerospace Industries, Ltd. (A) | | 9,273 | | | 198,273 |
International Strategic Equity Allocation Fund (continued)
| | | Shares or
Principal
Amount | | Value |
| COMMON STOCKS (continued) | | | |
| South Korea (continued) | | | | | |
| Korea Electric Power Corp. | | 31,919 | | $ | 558,534 |
| Korea Gas Corp. | | 3,577 | | | 82,867 |
| Korea Investment Holdings Company, Ltd. (A) | | 5,469 | | | 285,218 |
| Korea Shipbuilding & Offshore Engineering Company, Ltd. (A) | | 4,856 | | | 417,483 |
| Korea Zinc Company, Ltd. (A) | | 1,056 | | | 361,295 |
| Korean Air Lines Company, Ltd. (A) | | 5,956 | | | 107,654 |
| KT&G Corp. | | 14,525 | | | 1,010,583 |
| Kumho Petrochemical Company, Ltd. | | 2,345 | | | 115,995 |
| LG Chem, Ltd. | | 5,733 | | | 1,736,932 |
| LG Corp. | | 12,039 | | | 669,181 |
| LG Display Company, Ltd. | | 29,081 | | | 330,667 |
| LG Electronics, Inc. | | 13,365 | | | 672,261 |
| LG Household & Health Care, Ltd. | | 1,174 | | | 1,185,153 |
| LG Innotek Company, Ltd. | | 1,798 | | | 194,527 |
| LG Uplus Corp. | | 13,586 | | | 147,723 |
| Lotte Chemical Corp. | | 2,156 | | | 337,145 |
| Lotte Corp. | | 3,331 | | | 80,304 |
| Lotte Shopping Company, Ltd. | | 1,400 | | | 110,892 |
| Medy-Tox, Inc. | | 563 | | | 139,776 |
| Meritz Securities Company, Ltd. | | 41,428 | | | 119,638 |
| Mirae Asset Daewoo Company, Ltd. (A) | | 52,993 | | | 279,614 |
| NAVER Corp. | | 17,446 | | | 2,504,212 |
| NCSoft Corp. | | 2,048 | | | 1,094,756 |
| Netmarble Corp. (A)(C) | | 3,208 | | | 235,708 |
| NH Investment & Securities Company, Ltd. (A) | | 19,379 | | | 161,355 |
| OCI Company, Ltd. (A) | | 2,430 | | | 99,735 |
| Orion Corp. | | 2,960 | | | 233,755 |
| Ottogi Corp. | | 164 | | | 67,482 |
| Pan Ocean Company, Ltd. (A) | | 34,211 | | | 106,366 |
| Pearl Abyss Corp. (A) | | 794 | | | 117,362 |
| POSCO | | 9,835 | | | 1,579,708 |
| POSCO Chemical Company, Ltd. | | 3,044 | | | 139,525 |
| Posco International Corp. | | 6,269 | | | 77,766 |
| S-1 Corp. | | 2,045 | | | 137,569 |
| Samsung Biologics Company, Ltd. (A)(C) | | 2,068 | | | 793,630 |
| Samsung C&T Corp. | | 10,721 | | | 939,843 |
| Samsung Card Company, Ltd. | | 3,650 | | | 101,323 |
| Samsung Electro-Mechanics Company, Ltd. | | 7,006 | | | 740,106 |
| Samsung Electronics Company, Ltd. | | 594,765 | | | 26,771,191 |
| Samsung Engineering Company, Ltd. (A) | | 19,552 | | | 227,898 |
| Samsung Fire & Marine Insurance Company, Ltd. | | 3,958 | | | 644,689 |
| Samsung Heavy Industries Company, Ltd. (A) | | 54,764 | | | 266,409 |
| Samsung Life Insurance Company, Ltd. | | 9,305 | | | 446,956 |
| Samsung SDI Company, Ltd. | | 6,863 | | | 1,668,182 |
| Samsung SDS Company, Ltd. | | 4,360 | | | 603,309 |
| Samsung Securities Company, Ltd. | | 8,361 | | | 228,873 |
| Shinhan Financial Group Company, Ltd. | | 57,049 | | | 1,525,749 |
| Shinsegae, Inc. | | 935 | | | 179,212 |
| SK Holdings Company, Ltd. | | 4,398 | | | 698,511 |
| SK Hynix, Inc. | | 68,063 | | | 5,029,218 |
| SK Innovation Company, Ltd. | | 6,868 | | | 650,267 |
| SK Telecom Company, Ltd. | | 2,498 | | | 437,357 |
| S-Oil Corp. | | 5,569 | | | 309,566 |
| Woori Financial Group, Inc. | | 59,226 | | | 470,479 |
| Yuhan Corp. | | 1,193 | | | 211,136 |
| | | | | | 75,557,636 |
| The accompanying notes are an integral part of the financial statements. | 28 | |
John Hancock Funds II
Portfolio of Investments — February 29, 2020 (unaudited)(showing percentage of total net assets)
International Strategic Equity Allocation Fund (continued)
| | | Shares or
Principal
Amount | | Value |
| COMMON STOCKS (continued) | | | |
| Spain - 1.8% | | | | | |
| ACS Actividades de Construccion y Servicios SA | | 20,006 | | $ | 596,547 |
| Aena SME SA (C) | | 5,107 | | | 822,569 |
| Amadeus IT Group SA | | 32,774 | | | 2,323,380 |
| AmRest Holdings SE (A) | | 2,582 | | | 26,797 |
| Banco Bilbao Vizcaya Argentaria SA | | 506,131 | | | 2,424,002 |
| Banco de Sabadell SA | | 425,427 | | | 373,392 |
| Banco Santander SA | | 1,260,212 | | | 4,658,186 |
| Bankia SA | | 96,809 | | | 153,513 |
| Bankinter SA | | 49,357 | | | 291,644 |
| CaixaBank SA | | 269,397 | | | 692,412 |
| Cellnex Telecom SA (A)(C) | | 18,964 | | | 924,574 |
| Enagas SA | | 18,617 | | | 483,066 |
| Endesa SA | | 23,764 | | | 611,494 |
| Ferrovial SA | | 37,008 | | | 1,063,011 |
| Grifols SA | | 22,738 | | | 732,864 |
| Iberdrola SA | | 467,773 | | | 5,355,146 |
| Industria de Diseno Textil SA (B) | | 83,072 | | | 2,591,754 |
| Mapfre SA | | 97,738 | | | 219,843 |
| Naturgy Energy Group SA | | 22,029 | | | 513,197 |
| Red Electrica Corp. SA | | 32,061 | | | 612,789 |
| Repsol SA | | 112,118 | | | 1,266,968 |
| Siemens Gamesa Renewable Energy SA | | 18,244 | | | 295,920 |
| Telefonica SA | | 355,849 | | | 2,117,724 |
| | | | | | 29,150,792 |
| Sweden - 1.9% | | | | | |
| Alfa Laval AB | | 27,572 | | | 625,116 |
| Assa Abloy AB, B Shares | | 87,633 | | | 1,970,792 |
| Atlas Copco AB, A Shares | | 59,010 | | | 2,103,998 |
| Atlas Copco AB, B Shares | | 34,104 | | | 1,056,893 |
| Boliden AB | | 24,182 | | | 507,852 |
| Electrolux AB, Series B (B) | | 19,837 | | | 403,526 |
| Epiroc AB, A Shares | | 56,550 | | | 653,217 |
| Epiroc AB, B Shares | | 35,389 | | | 396,968 |
| Essity AB, B Shares | | 52,988 | | | 1,597,477 |
| Hennes & Mauritz AB, B Shares (B) | | 70,277 | | | 1,275,395 |
| Hexagon AB, B Shares | | 23,034 | | | 1,240,821 |
| Husqvarna AB, B Shares (B) | | 36,331 | | | 244,548 |
| ICA Gruppen AB | | 7,759 | | | 291,649 |
| Industrivarden AB, C Shares (B) | | 14,939 | | | 337,835 |
| Investor AB, B Shares | | 40,070 | | | 2,007,088 |
| Kinnevik AB, B Shares (B) | | 21,339 | | | 434,588 |
| L E Lundbergforetagen AB, B Shares | | 7,059 | | | 292,817 |
| Lundin Petroleum AB | | 16,075 | | | 458,914 |
| Sandvik AB | | 99,064 | | | 1,651,343 |
| Securitas AB, B Shares | | 27,152 | | | 368,731 |
| Skandinaviska Enskilda Banken AB, A Shares | | 141,824 | | | 1,359,377 |
| Skanska AB, B Shares (B) | | 29,638 | | | 652,642 |
| SKF AB, B Shares | | 33,865 | | | 598,769 |
| Svenska Handelsbanken AB, A Shares | | 133,078 | | | 1,345,641 |
| Swedbank AB, A Shares (B) | | 78,660 | | | 1,194,704 |
| Swedish Match AB | | 14,807 | | | 868,794 |
| Tele2 AB, B Shares | | 43,374 | | | 631,446 |
| Telefonaktiebolaget LM Ericsson, B Shares | | 268,655 | | | 2,154,810 |
| Telia Company AB | | 237,626 | | | 941,035 |
| Volvo AB, B Shares | | 130,711 | | | 2,051,724 |
| | | | | | 29,718,510 |
| Switzerland - 7.1% | | | | | |
| ABB, Ltd. | | 158,106 | | | 3,426,034 |
| Adecco Group AG | | 13,210 | | | 707,487 |
| Alcon, Inc. (A) | | 35,724 | | | 2,184,573 |
| Baloise Holding AG | | 4,442 | | | 718,276 |
International Strategic Equity Allocation Fund (continued)
| | | Shares or
Principal
Amount | | Value |
| COMMON STOCKS (continued) | | | |
| Switzerland (continued) | | | | | |
| Barry Callebaut AG | | 254 | | $ | 523,957 |
| Chocoladefabriken Lindt & Spruengli AG | | 9 | | | 783,050 |
| Chocoladefabriken Lindt & Spruengli AG, Participation Certificates | | 92 | | | 720,308 |
| Cie Financiere Richemont SA (B) | | 44,834 | | | 3,073,422 |
| Clariant AG (A)(B) | | 16,916 | | | 358,792 |
| Coca-Cola HBC AG | | 8,831 | | | 281,624 |
| Credit Suisse Group AG (A) | | 222,762 | | | 2,502,619 |
| Dufry AG (A) | | 3,436 | | | 252,155 |
| EMS-Chemie Holding AG | | 684 | | | 401,521 |
| Geberit AG | | 3,149 | | | 1,571,355 |
| Givaudan SA | | 785 | | | 2,445,610 |
| Glencore PLC (A) | | 479,234 | | | 1,209,659 |
| Julius Baer Group, Ltd. (A)(B) | | 19,698 | | | 828,657 |
| Kuehne + Nagel International AG (B) | | 4,542 | | | 664,865 |
| LafargeHolcim, Ltd. (A) | | 42,250 | | | 1,966,462 |
| Lonza Group AG (A) | | 6,390 | | | 2,549,851 |
| Nestle SA | | 255,248 | | | 26,266,505 |
| Novartis AG | | 184,320 | | | 15,505,597 |
| Pargesa Holding SA, Bearer Shares | | 3,204 | | | 236,186 |
| Partners Group Holding AG (B) | | 1,612 | | | 1,398,928 |
| Roche Holding AG | | 60,257 | | | 19,374,660 |
| Schindler Holding AG | | 1,598 | | | 344,724 |
| Schindler Holding AG, Participation Certificates | | 3,562 | | | 798,755 |
| SGS SA | | 445 | | | 1,111,430 |
| Sika AG (B) | | 10,913 | | | 1,953,466 |
| Sonova Holding AG | | 4,722 | | | 1,127,822 |
| STMicroelectronics NV (B) | | 58,263 | | | 1,608,042 |
| Straumann Holding AG | | 877 | | | 823,939 |
| Swiss Life Holding AG | | 3,015 | | | 1,384,241 |
| Swiss Prime Site AG (A) | | 6,295 | | | 759,531 |
| Swiss Re AG | | 25,850 | | | 2,459,124 |
| Swisscom AG | | 2,161 | | | 1,153,496 |
| Temenos AG (A)(B) | | 5,573 | | | 796,812 |
| The Swatch Group AG | | 4,189 | | | 181,216 |
| The Swatch Group AG, Bearer Shares | | 2,543 | | | 592,078 |
| UBS Group AG (A) | | 334,164 | | | 3,680,031 |
| Vifor Pharma AG | | 3,891 | | | 653,629 |
| Zurich Insurance Group AG | | 13,036 | | | 5,047,955 |
| | | | | | 114,428,444 |
| Taiwan - 5.9% | | | | | |
| Accton Technology Corp. | | 71,000 | | | 374,566 |
| Acer, Inc. | | 413,000 | | | 218,475 |
| Advantech Company, Ltd. | | 49,699 | | | 475,508 |
| Airtac International Group | | 18,000 | | | 279,433 |
| ASE Technology Holding Company, Ltd. | | 491,000 | | | 1,138,583 |
| Asia Cement Corp. | | 310,000 | | | 451,012 |
| Asustek Computer, Inc. | | 101,000 | | | 675,673 |
| AU Optronics Corp. | | 1,215,000 | | | 376,002 |
| Catcher Technology Company, Ltd. | | 93,000 | | | 697,692 |
| Cathay Financial Holding Company, Ltd. | | 1,136,000 | | | 1,488,453 |
| Chailease Holding Company, Ltd. | | 170,954 | | | 636,169 |
| Chang Hwa Commercial Bank, Ltd. | | 785,854 | | | 600,467 |
| Cheng Shin Rubber Industry Company, Ltd. | | 272,000 | | | 351,137 |
| Chicony Electronics Company, Ltd. | | 82,526 | | | 223,616 |
| China Airlines, Ltd. | | 324,000 | | | 86,776 |
| China Development Financial Holding Corp. | | 1,895,000 | | | 569,104 |
| China Life Insurance Company, Ltd. (A) | | 408,990 | | | 321,018 |
| China Steel Corp. | | 1,658,000 | | | 1,257,070 |
| Chunghwa Telecom Company, Ltd. | | 539,000 | | | 1,910,257 |
| The accompanying notes are an integral part of the financial statements. | 29 | |
John Hancock Funds II
Portfolio of Investments — February 29, 2020 (unaudited)(showing percentage of total net assets)
International Strategic Equity Allocation Fund (continued)
| | | Shares or
Principal
Amount | | Value |
| COMMON STOCKS (continued) | | | |
| Taiwan (continued) | | | | | |
| Compal Electronics, Inc. | | 581,000 | | $ | 350,283 |
| CTBC Financial Holding Company, Ltd. | | 2,626,000 | | | 1,948,923 |
| Delta Electronics, Inc. | | 277,000 | | | 1,255,799 |
| E.Sun Financial Holding Company, Ltd. | | 1,481,776 | | | 1,412,797 |
| Eclat Textile Company, Ltd. | | 27,340 | | | 318,567 |
| Eva Airways Corp. | | 314,465 | | | 123,851 |
| Evergreen Marine Corp. Taiwan, Ltd. (A) | | 328,900 | | | 123,370 |
| Far Eastern New Century Corp. | | 454,000 | | | 418,482 |
| Far EasTone Telecommunications Company, Ltd. | | 221,000 | | | 479,532 |
| Feng TAY Enterprise Company, Ltd. | | 47,100 | | | 259,284 |
| First Financial Holding Company, Ltd. | | 1,394,494 | | | 1,085,234 |
| Formosa Chemicals & Fibre Corp. | | 498,000 | | | 1,337,099 |
| Formosa Petrochemical Corp. | | 175,000 | | | 488,786 |
| Formosa Plastics Corp. | | 633,000 | | | 1,889,654 |
| Formosa Taffeta Company, Ltd. | | 114,000 | | | 124,271 |
| Foxconn Technology Company, Ltd. | | 131,000 | | | 254,306 |
| Fubon Financial Holding Company, Ltd. | | 958,000 | | | 1,386,731 |
| Giant Manufacturing Company, Ltd. | | 42,000 | | | 225,059 |
| Globalwafers Company, Ltd. | | 31,000 | | | 401,152 |
| Highwealth Construction Corp. | | 107,000 | | | 157,718 |
| Hiwin Technologies Corp. | | 33,696 | | | 327,057 |
| Hon Hai Precision Industry Company, Ltd. | | 1,771,800 | | | 4,623,440 |
| Hotai Motor Company, Ltd. | | 43,000 | | | 871,133 |
| Hua Nan Financial Holdings Company, Ltd. | | 1,106,048 | | | 782,614 |
| Innolux Corp. | | 1,197,000 | | | 308,591 |
| Inventec Corp. | | 352,000 | | | 263,748 |
| Largan Precision Company, Ltd. | | 14,000 | | | 1,980,308 |
| Lite-On Technology Corp. | | 297,000 | | | 422,835 |
| MediaTek, Inc. | | 214,000 | | | 2,487,823 |
| Mega Financial Holding Company, Ltd. | | 1,542,000 | | | 1,632,818 |
| Micro-Star International Company, Ltd. | | 96,000 | | | 281,002 |
| Nan Ya Plastics Corp. | | 728,000 | | | 1,626,474 |
| Nanya Technology Corp. | | 173,000 | | | 430,627 |
| Nien Made Enterprise Company, Ltd. | | 23,000 | | | 181,442 |
| Novatek Microelectronics Corp. | | 82,000 | | | 516,055 |
| Pegatron Corp. | | 278,000 | | | 565,645 |
| Phison Electronics Corp. | | 21,000 | | | 224,345 |
| Pou Chen Corp. | | 315,000 | | | 349,737 |
| Powertech Technology, Inc. | | 106,000 | | | 346,725 |
| President Chain Store Corp. | | 81,000 | | | 790,711 |
| Quanta Computer, Inc. | | 382,000 | | | 770,535 |
| Realtek Semiconductor Corp. | | 68,000 | | | 492,046 |
| Ruentex Development Company, Ltd. (A) | | 78,560 | | | 105,790 |
| Ruentex Industries, Ltd. (A) | | 49,000 | | | 107,881 |
| Shin Kong Financial Holding Company, Ltd. | | 1,564,988 | | | 466,609 |
| SinoPac Financial Holdings Company, Ltd. | | 1,514,601 | | | 640,938 |
| Standard Foods Corp. | | 57,600 | | | 128,572 |
| Synnex Technology International Corp. | | 184,000 | | | 226,298 |
| Taishin Financial Holding Company, Ltd. | | 1,333,437 | | | 619,434 |
| Taiwan Business Bank | | 742,516 | | | 290,753 |
| Taiwan Cement Corp. | | 695,936 | | | 961,102 |
| Taiwan Cooperative Financial Holding Company, Ltd. | | 1,257,680 | | | 864,069 |
| Taiwan High Speed Rail Corp. | | 272,000 | | | 306,807 |
| Taiwan Mobile Company, Ltd. | | 228,000 | | | 786,435 |
| Taiwan Semiconductor Manufacturing Company, Ltd. | | 3,493,816 | | | 36,020,543 |
| Tatung Company, Ltd. (A) | | 263,000 | | | 180,421 |
| The Shanghai Commercial & Savings Bank, Ltd. | | 469,000 | | | 772,200 |
| Uni-President Enterprises Corp. | | 684,000 | | | 1,637,098 |
International Strategic Equity Allocation Fund (continued)
| | | Shares or
Principal
Amount | | Value |
| COMMON STOCKS (continued) | | | |
| Taiwan (continued) | | | | | |
| United Microelectronics Corp. | | 1,581,000 | | $ | 788,822 |
| Vanguard International Semiconductor Corp. | | 128,000 | | | 305,284 |
| Walsin Technology Corp. | | 45,000 | | | 307,923 |
| Win Semiconductors Corp. | | 48,000 | | | 418,958 |
| Winbond Electronics Corp. | | 424,000 | | | 216,222 |
| Wistron Corp. | | 401,040 | | | 351,896 |
| Wiwynn Corp. | | 11,000 | | | 256,893 |
| WPG Holdings, Ltd. | | 206,960 | | | 262,901 |
| Yageo Corp. | | 36,556 | | | 472,122 |
| Yuanta Financial Holding Company, Ltd. | | 1,419,000 | | | 887,129 |
| Zhen Ding Technology Holding, Ltd. | | 77,000 | | | 289,666 |
| | | | | | 95,120,386 |
| Thailand - 0.3% | | | | | |
| Advanced Info Service PCL, NVDR | | 40,800 | | | 261,840 |
| Airports of Thailand PCL, NVDR | | 146,500 | | | 282,061 |
| B. Grimm Power PCL, NVDR | | 27,100 | | | 39,384 |
| Bangkok Bank PCL, NVDR | | 26,100 | | | 109,464 |
| Bangkok Dusit Medical Services PCL, NVDR | | 322,400 | | | 229,337 |
| Bangkok Expressway & Metro PCL, NVDR | | 248,800 | | | 73,962 |
| Banpu PCL, NVDR | | 133,800 | | | 30,674 |
| Berli Jucker PCL, NVDR | | 38,000 | | | 44,501 |
| BTS Group Holdings PCL, NVDR | | 232,400 | | | 81,633 |
| Bumrungrad Hospital PCL, NVDR | | 14,600 | | | 60,461 |
| Central Pattana PCL, NVDR | | 78,200 | | | 133,565 |
| Central Retail Corp. PCL, NVDR (A) | | 26,758 | | | 26,711 |
| Charoen Pokphand Foods PCL, NVDR | | 137,900 | | | 118,648 |
| CP ALL PCL, NVDR | | 200,700 | | | 422,966 |
| Electricity Generating PCL, NVDR | | 10,100 | | | 88,124 |
| Energy Absolute PCL, NVDR | | 57,800 | | | 72,969 |
| Global Power Synergy PCL, NVDR | | 24,300 | | | 49,215 |
| Gulf Energy Development PCL, NVDR | | 18,200 | | | 97,313 |
| Home Product Center PCL, NVDR | | 193,800 | | | 79,292 |
| Indorama Ventures PCL, NVDR | | 58,500 | | | 49,681 |
| Intouch Holdings PCL, NVDR | | 77,900 | | | 134,968 |
| IRPC PCL, NVDR | | 339,400 | | | 24,332 |
| Kasikornbank PCL, NVDR | | 107,900 | | | 411,103 |
| Krung Thai Bank PCL, NVDR | | 116,300 | | | 52,030 |
| Land & Houses PCL, NVDR | | 286,600 | | | 77,351 |
| Minor International PCL, NVDR | | 93,600 | | | 82,736 |
| Muangthai Capital PCL, NVDR | | 21,400 | | | 39,710 |
| Osotspa PCL, NVDR | | 26,400 | | | 35,480 |
| PTT Exploration & Production PCL, NVDR | | 47,300 | | | 161,389 |
| PTT Global Chemical PCL, NVDR | | 80,100 | | | 106,574 |
| PTT PCL, NVDR | | 394,500 | | | 494,565 |
| Ratch Group PCL, NVDR | | 26,300 | | | 49,581 |
| Srisawad Corp. PCL, NVDR | | 25,800 | | | 56,064 |
| Thai Oil PCL, NVDR | | 37,400 | | | 52,644 |
| Thai Union Group PCL, NVDR | | 118,600 | | | 58,348 |
| The Siam Cement PCL, NVDR | | 27,000 | | | 268,921 |
| The Siam Commercial Bank PCL, NVDR | | 30,300 | | | 85,059 |
| TMB Bank PCL, NVDR | | 834,300 | | | 29,140 |
| Total Access Communication PCL, NVDR | | 24,300 | | | 28,533 |
| True Corp. PCL, NVDR | | 390,700 | | | 42,133 |
| | | | | | 4,642,462 |
| Turkey - 0.1% | | | | | |
| Akbank T.A.S. (A) | | 95,664 | | | 103,717 |
| Anadolu Efes Biracilik Ve Malt Sanayii AS | | 7,054 | | | 25,118 |
| Arcelik AS (A) | | 6,865 | | | 20,567 |
| Aselsan Elektronik Sanayi Ve Ticaret AS | | 12,499 | | | 55,352 |
| The accompanying notes are an integral part of the financial statements. | 30 | |
John Hancock Funds II
Portfolio of Investments — February 29, 2020 (unaudited)(showing percentage of total net assets)
International Strategic Equity Allocation Fund (continued)
| | | Shares or
Principal
Amount | | Value |
| COMMON STOCKS (continued) | | | |
| Turkey (continued) | | | | | |
| BIM Birlesik Magazalar AS | | 13,873 | | $ | 107,239 |
| Eregli Demir ve Celik Fabrikalari TAS | | 47,418 | | | 63,266 |
| Ford Otomotiv Sanayi AS | | 2,087 | | | 26,342 |
| Haci Omer Sabanci Holding AS | | 32,372 | | | 44,572 |
| KOC Holding AS | | 24,861 | | | 69,279 |
| TAV Havalimanlari Holding AS | | 5,707 | | | 18,696 |
| Tupras Turkiye Petrol Rafinerileri AS | | 3,850 | | | 62,811 |
| Turk Hava Yollari AO (A) | | 16,873 | | | 31,894 |
| Turkcell Iletisim Hizmetleri AS | | 37,572 | | | 83,595 |
| Turkiye Garanti Bankasi AS (A) | | 76,887 | | | 117,705 |
| Turkiye Is Bankasi AS, Class C (A) | | 56,216 | | | 51,768 |
| | | | | | 881,921 |
| United Arab Emirates - 0.0% | | | | | |
| NMC Health PLC | | 5,577 | | | 67,101 |
| United Kingdom - 5.6% | | | | | |
| 3i Group PLC | | 43,803 | | | 576,587 |
| Admiral Group PLC | | 9,608 | | | 263,703 |
| Anglo American PLC | | 45,634 | | | 1,073,653 |
| Ashtead Group PLC | | 20,612 | | | 646,218 |
| Associated British Foods PLC | | 15,729 | | | 459,272 |
| AstraZeneca PLC | | 57,945 | | | 5,085,539 |
| Auto Trader Group PLC (C) | | 39,452 | | | 265,652 |
| AVEVA Group PLC | | 2,803 | | | 159,453 |
| Aviva PLC | | 274,042 | | | 1,255,252 |
| BAE Systems PLC | | 142,864 | | | 1,130,066 |
| Barclays PLC (B) | | 755,281 | | | 1,447,490 |
| Barratt Developments PLC | | 44,774 | | | 441,990 |
| BP PLC | | 898,149 | | | 4,666,430 |
| British American Tobacco PLC | | 101,487 | | | 4,012,721 |
| BT Group PLC | | 371,268 | | | 681,098 |
| Bunzl PLC | | 14,497 | | | 348,104 |
| Burberry Group PLC | | 18,229 | | | 392,831 |
| Centrica PLC | | 253,405 | | | 234,728 |
| CNH Industrial NV (B) | | 54,834 | | | 510,831 |
| Coca-Cola European Partners PLC | | 18,037 | | | 919,166 |
| Compass Group PLC | | 69,752 | | | 1,536,807 |
| Croda International PLC | | 5,539 | | | 327,407 |
| Diageo PLC | | 104,395 | | | 3,724,769 |
| Direct Line Insurance Group PLC | | 65,840 | | | 262,451 |
| easyJet PLC | | 7,078 | | | 102,174 |
| Ferguson PLC | | 10,116 | | | 881,404 |
| Fiat Chrysler Automobiles NV | | 58,010 | | | 730,961 |
| G4S PLC | | 67,605 | | | 149,690 |
| GlaxoSmithKline PLC | | 220,038 | | | 4,440,229 |
| Halma PLC | | 16,715 | | | 420,062 |
| Hargreaves Lansdown PLC | | 12,822 | | | 257,406 |
| HSBC Holdings PLC (B) | | 893,187 | | | 6,032,804 |
| Imperial Brands PLC | | 42,135 | | | 851,211 |
| Informa PLC | | 54,703 | | | 484,145 |
| InterContinental Hotels Group PLC | | 7,513 | | | 416,278 |
| Intertek Group PLC | | 7,082 | | | 483,351 |
| ITV PLC | | 159,247 | | | 242,002 |
| J Sainsbury PLC | | 77,570 | | | 196,519 |
| JD Sports Fashion PLC | | 19,294 | | | 184,570 |
| Johnson Matthey PLC | | 8,695 | | | 284,996 |
| Kingfisher PLC | | 93,966 | | | 230,536 |
| Land Securities Group PLC | | 30,341 | | | 327,019 |
| Legal & General Group PLC | | 277,382 | | | 939,735 |
| Lloyds Banking Group PLC | | 3,098,192 | | | 2,011,027 |
| London Stock Exchange Group PLC | | 13,987 | | | 1,373,860 |
| M&G PLC (A) | | 113,771 | | | 297,091 |
| Marks & Spencer Group PLC | | 85,156 | | | 175,488 |
| Meggitt PLC | | 35,262 | | | 248,318 |
International Strategic Equity Allocation Fund (continued)
| | | Shares or
Principal
Amount | | Value |
| COMMON STOCKS (continued) | | | |
| United Kingdom (continued) | | | | | |
| Melrose Industries PLC | | 216,643 | | $ | 599,153 |
| Micro Focus International PLC | | 14,891 | | | 141,818 |
| Mondi PLC | | 21,492 | | | 436,494 |
| National Grid PLC | | 153,152 | | | 1,930,594 |
| Next PLC | | 5,836 | | | 459,971 |
| Ocado Group PLC (A) | | 20,307 | | | 281,318 |
| Pearson PLC | | 34,070 | | | 247,151 |
| Persimmon PLC | | 14,006 | | | 517,828 |
| Prudential PLC | | 117,963 | | | 1,961,072 |
| Reckitt Benckiser Group PLC | | 31,312 | | | 2,313,733 |
| RELX PLC | | 85,598 | | | 2,071,029 |
| Rentokil Initial PLC | | 80,638 | | | 504,540 |
| Rio Tinto PLC | | 49,867 | | | 2,347,719 |
| Rio Tinto, Ltd. | | 33,732 | | | 1,938,399 |
| Rolls-Royce Holdings PLC (A) | | 77,058 | | | 620,130 |
| RSA Insurance Group PLC | | 51,079 | | | 341,646 |
| Schroders PLC | | 5,970 | | | 222,092 |
| Segro PLC | | 47,024 | | | 498,526 |
| Severn Trent PLC | | 10,168 | | | 322,770 |
| Smith & Nephew PLC | | 38,391 | | | 861,319 |
| Smiths Group PLC | | 17,516 | | | 349,043 |
| Spirax-Sarco Engineering PLC | | 3,223 | | | 353,123 |
| SSE PLC | | 44,798 | | | 880,744 |
| St. James's Place PLC | | 24,756 | | | 328,236 |
| Standard Chartered PLC | | 119,909 | | | 867,672 |
| Standard Life Aberdeen PLC | | 108,031 | | | 387,221 |
| Taylor Wimpey PLC | | 144,994 | | | 382,868 |
| Tesco PLC | | 432,785 | | | 1,289,498 |
| The Berkeley Group Holdings PLC | | 5,190 | | | 320,073 |
| The British Land Company PLC | | 38,261 | | | 247,831 |
| The Royal Bank of Scotland Group PLC | | 215,406 | | | 498,460 |
| The Sage Group PLC | | 47,231 | | | 418,428 |
| The Weir Group PLC | | 11,767 | | | 198,752 |
| Unilever NV | | 115,792 | | | 6,113,490 |
| Unilever PLC | | 48,981 | | | 2,633,213 |
| United Utilities Group PLC | | 29,334 | | | 355,923 |
| Vodafone Group PLC | | 1,184,209 | | | 2,069,699 |
| Whitbread PLC | | 5,800 | | | 292,523 |
| Wm Morrison Supermarkets PLC | | 103,923 | | | 232,599 |
| WPP PLC | | 55,800 | | | 536,130 |
| | | | | | 89,555,922 |
| United States - 0.3% | | | | | |
| Barrick Gold Corp. (A) | | 174,626 | | | 3,330,546 |
| Bausch Health Companies, Inc. (A) | | 31,610 | | | 700,377 |
| Carnival PLC | | 7,201 | | | 227,774 |
| International Flavors & Fragrances, Inc. | | 1 | | | 108 |
| Nexteer Automotive Group, Ltd. | | 73,683 | | | 55,034 |
| Ovintiv, Inc. | | 25,890 | | | 299,165 |
| | | | | | 4,613,004 |
| TOTAL COMMON STOCKS (Cost $1,496,359,169) | | $ | 1,495,219,518 |
| PREFERRED SECURITIES - 0.9% | | | |
| Brazil - 0.2% | | | | | |
| Banco Bradesco SA | | 86,539 | | | 590,808 |
| Braskem SA, A Shares | | 4,000 | | | 24,052 |
| Centrais Eletricas Brasileiras SA, B Shares | | 5,600 | | | 44,894 |
| Cia Energetica de Minas Gerais | | 19,100 | | | 59,625 |
| Gerdau SA | | 23,900 | | | 90,482 |
| Itau Unibanco Holding SA | | 103,500 | | | 740,625 |
| Itausa - Investimentos Itau SA | | 93,060 | | | 249,927 |
| Lojas Americanas SA | | 16,100 | | | 95,767 |
| Petroleo Brasileiro SA | | 90,100 | | | 510,551 |
| The accompanying notes are an integral part of the financial statements. | 31 | |
John Hancock Funds II
Portfolio of Investments — February 29, 2020 (unaudited)(showing percentage of total net assets)
International Strategic Equity Allocation Fund (continued)
| | | Shares or
Principal
Amount | | Value |
| PREFERRED SECURITIES (continued) | | | |
| Brazil (continued) | | | | | |
| Telefonica Brasil SA | | 9,700 | | $ | 115,787 |
| | | | | | 2,522,518 |
| Chile - 0.0% | | | | | |
| Embotelladora Andina SA, B Shares | | 28,335 | | | 68,441 |
| Sociedad Quimica y Minera de Chile SA, B Shares | | 9,350 | | | 247,611 |
| | | | | | 316,052 |
| Colombia - 0.0% | | | | | |
| Bancolombia SA | | 27,760 | | | 331,934 |
| Grupo Aval Acciones y Valores SA | | 244,982 | | | 100,939 |
| | | | | | 432,873 |
| Germany - 0.4% | | | | | |
| Bayerische Motoren Werke AG | | 4,699 | | | 243,639 |
| FUCHS PETROLUB SE (B) | | 5,850 | | | 223,940 |
| Henkel AG & Company KGaA | | 15,177 | | | 1,413,993 |
| Porsche Automobil Holding SE | | 12,972 | | | 808,356 |
| Sartorius AG | | 3,010 | | | 703,648 |
| Volkswagen AG | | 15,803 | | | 2,623,393 |
| | | | | | 6,016,969 |
| South Korea - 0.3% | | | | | |
| Amorepacific Corp. | | 1,075 | | | 65,180 |
| Hyundai Motor Company | | 2,975 | | | 162,693 |
| Hyundai Motor Company, 2nd Preferred | | 4,596 | | | 284,600 |
| LG Chem, Ltd. | | 957 | | | 149,050 |
| LG Household & Health Care, Ltd. | | 259 | | | 157,264 |
| Samsung Electronics Company, Ltd. | | 102,729 | | | 3,921,820 |
| | | | | | 4,740,607 |
| TOTAL PREFERRED SECURITIES (Cost $14,532,791) | | $ | 14,029,019 |
| EXCHANGE-TRADED FUNDS - 2.8% | | | |
| iShares MSCI India ETF (B) | | 247,914 | | | 7,980,352 |
| KraneShares Bosera MSCI China A ETF | | 523,530 | | | 16,658,725 |
| VanEck Vectors Russia ETF | | 752,012 | | | 16,070,496 |
| Xtrackers Harvest CSI 300 China A-Shares ETF (B) | | 139,860 | | | 3,995,800 |
| TOTAL EXCHANGE-TRADED FUNDS (Cost $45,078,008) | | $ | 44,705,373 |
| WARRANTS - 0.0% | | | | | |
| BTS Group Holdings PCL (Expiration Date: 2-16-21; Strike Price: THB 14.00) (A) | | 33,620 | | | 916 |
| BTS Group Holdings PCL (Expiration Date: 2-16-21; Strike Price: THB 14.00) (A) | | 1,820 | | | 50 |
International Strategic Equity Allocation Fund (continued)
| | | Shares or
Principal
Amount | | Value |
| WARRANTS (continued) | | | | | |
| Minor International PCL (Expiration Date: 10-1-21; Strike Price: THB 48.00) (A) | | 1,000 | | $ | 54 |
| TOTAL WARRANTS (Cost $0) | | $ | 1,020 |
| SHORT-TERM INVESTMENTS - 7.1% | | | |
| U.S. Government Agency - 2.2% | | | | | |
| Federal Home Loan Bank Discount Note | | | | | |
| 1.480%, 03/02/2020 * | $ | 5,650,000 | | $ | 5,650,000 |
| 1.550%, 05/18/2020 * | | 30,000,000 | | | 29,907,600 |
| | | | | | 35,557,600 |
| Short-term funds - 4.9% | | | | | |
| John Hancock Collateral Trust, 1.6968% (E)(F) | | 7,790,795 | | | 77,977,284 |
| TOTAL SHORT-TERM INVESTMENTS (Cost $113,508,978) | | $ | 113,534,884 |
Total Investments (International Strategic Equity Allocation Fund)
(Cost $1,669,478,946) - 104.1% | | $ | 1,667,489,814 |
| Other assets and liabilities, net - (4.1%) | | | (66,195,453) |
| TOTAL NET ASSETS - 100.0% | | $ | 1,601,294,361 |
| Currency Abbreviations |
| THB | Thai Bhat |
| Security Abbreviations and Legend |
| ADR | American Depositary Receipt |
| NVDR | Non-Voting Depositary Receipt |
| (A) | Non-income producing security. |
| (B) | All or a portion of this security is on loan as of 2-29-20. |
| (C) | These securities are exempt from registration under Rule 144A of the Securities Act of 1933. Such securities may be resold, normally to qualified institutional buyers, in transactions exempt from registration. |
| (D) | Security is valued using significant unobservable inputs and is classified as Level 3 in the fair value hierarchy. Refer to Note 2 to the financial statements. |
| (E) | The rate shown is the annualized seven-day yield as of 2-29-20. |
| (F) | Investment is an affiliate of the fund, the advisor and/or subadvisor. This security represents the investment of cash collateral received for securities lending. |
| * | Yield represents either the annualized yield at the date of purchase, the stated coupon rate or, for floating rate securities, the rate at period end. |
DERIVATIVES
FUTURES
| Open contracts | Number of
contracts | Position | Expiration
date | Notional
basis^ | Notional
value^ | Unrealized
appreciation
(depreciation) |
| Canadian Dollar Currency Futures | 48 | Long | Mar 2020 | $3,636,929 | $3,576,240 | $(60,689) |
| Mini MSCI EAFE Index Futures | 329 | Long | Mar 2020 | 32,754,921 | 29,943,935 | (2,810,986) |
| Mini MSCI Emerging Markets Index Futures | 220 | Long | Mar 2020 | 11,860,509 | 11,104,500 | (756,009) |
| S&P/TSX 60 Index Futures | 19 | Long | Mar 2020 | 2,863,101 | 2,758,026 | (105,075) |
| | | | | | | $(3,732,759) |
^ Notional basis refers to the contractual amount agreed upon at inception of open contracts; notional value represents the current value of the open contract.
See Notes to financial statements regarding investment transactions and other derivatives information.
| The accompanying notes are an integral part of the financial statements. | 32 | |
John Hancock Funds II
Portfolio of Investments — February 29, 2020 (unaudited)(showing percentage of total net assets)
International Value Fund
| | | Shares or
Principal
Amount | | Value |
| COMMON STOCKS - 96.7% | | | |
| Austria - 0.7% | | | | | |
| Erste Group Bank AG | | 48,461 | | $ | 1,658,983 |
| Belgium - 0.8% | | | | | |
| KBC Group NV | | 25,885 | | | 1,724,622 |
| Bermuda - 1.7% | | | | | |
| Axis Capital Holdings, Ltd. | | 30,575 | | | 1,715,869 |
| Everest Re Group, Ltd. | | 7,792 | | | 1,931,481 |
| | | | | | 3,647,350 |
| Canada - 4.4% | | | | | |
| Barrick Gold Corp. | | 172,594 | | | 3,291,791 |
| Fairfax Financial Holdings, Ltd. | | 6,823 | | | 2,939,189 |
| Yamana Gold, Inc. | | 865,628 | | | 3,306,699 |
| | | | | | 9,537,679 |
| China - 0.4% | | | | | |
| Topsports International Holdings, Ltd. (A) | | 707,000 | | | 838,664 |
| Denmark - 1.9% | | | | | |
| Novo Nordisk A/S, B Shares | | 71,055 | | | 4,163,039 |
| Finland - 2.0% | | | | | |
| Sampo OYJ, A Shares | | 106,214 | | | 4,340,104 |
| France - 15.4% | | | | | |
| Accor SA | | 28,546 | | | 1,038,296 |
| AXA SA | | 110,432 | | | 2,566,913 |
| BNP Paribas SA | | 87,951 | | | 4,269,160 |
| Capgemini SE | | 41,019 | | | 4,545,603 |
| Cie Generale des Etablissements Michelin SCA | | 7,207 | | | 772,349 |
| Danone SA | | 53,910 | | | 3,804,880 |
| Dassault Aviation SA | | 211 | | | 220,978 |
| Eiffage SA | | 36,712 | | | 3,927,067 |
| Peugeot SA | | 86,573 | | | 1,677,701 |
| Sanofi | | 31,057 | | | 2,896,551 |
| TOTAL SA | | 113,328 | | | 4,898,295 |
| Vinci SA | | 29,790 | | | 3,010,206 |
| | | | | | 33,627,999 |
| Germany - 5.2% | | | | | |
| Allianz SE | | 19,178 | | | 4,177,917 |
| Brenntag AG | | 33,538 | | | 1,521,718 |
| HeidelbergCement AG | | 18,094 | | | 1,084,390 |
| Rheinmetall AG | | 10,832 | | | 1,005,604 |
| SAP SE | | 12,599 | | | 1,572,887 |
| Siemens AG | | 19,709 | | | 2,027,487 |
| | | | | | 11,390,003 |
| Greece - 0.5% | | | | | |
| Hellenic Telecommunications Organization SA | | 74,917 | | | 1,065,885 |
| Hong Kong - 2.9% | | | | | |
| China Overseas Land & Investment, Ltd. | | 410,000 | | | 1,404,103 |
| CK Asset Holdings, Ltd. | | 269,500 | | | 1,720,210 |
| CK Hutchison Holdings, Ltd. | | 135,500 | | | 1,197,829 |
| WH Group, Ltd. (A) | | 1,955,000 | | | 2,051,599 |
| | | | | | 6,373,741 |
| Hungary - 1.0% | | | | | |
| OTP Bank Nyrt | | 51,161 | | | 2,245,617 |
| Indonesia - 0.7% | | | | | |
| Bank Rakyat Indonesia Persero Tbk PT | | 4,905,800 | | | 1,465,986 |
| Ireland - 1.2% | | | | | |
| CRH PLC | | 77,036 | | | 2,614,825 |
| Italy - 1.4% | | | | | |
| Leonardo SpA | | 202,707 | | | 2,078,866 |
| UniCredit SpA | | 79,139 | | | 1,017,666 |
| | | | | | 3,096,532 |
International Value Fund (continued)
| | | Shares or
Principal
Amount | | Value |
| COMMON STOCKS (continued) | | | |
| Japan - 20.5% | | | | | |
| Bandai Namco Holdings, Inc. | | 24,500 | | $ | 1,226,981 |
| Fuji Corp. | | 75,300 | | | 1,202,360 |
| Hitachi Construction Machinery Company, Ltd. | | 41,400 | | | 1,008,296 |
| Hitachi, Ltd. | | 153,700 | | | 5,132,960 |
| Kamigumi Company, Ltd. | | 66,200 | | | 1,277,427 |
| KDDI Corp. | | 59,200 | | | 1,672,611 |
| Kinden Corp. | | 82,200 | | | 1,241,055 |
| Koito Manufacturing Company, Ltd. | | 28,600 | | | 1,120,397 |
| Mitsubishi Estate Company, Ltd. | | 84,300 | | | 1,438,708 |
| NEC Corp. | | 45,800 | | | 1,719,453 |
| Nintendo Company, Ltd. | | 3,900 | | | 1,307,415 |
| Nippon Telegraph & Telephone Corp. | | 140,500 | | | 3,277,833 |
| Persol Holdings Company, Ltd. | | 84,600 | | | 1,138,146 |
| Sankyu, Inc. | | 33,300 | | | 1,410,483 |
| Sanwa Holdings Corp. | | 198,400 | | | 1,817,831 |
| Seven & i Holdings Company, Ltd. | | 34,300 | | | 1,167,001 |
| Shionogi & Company, Ltd. | | 33,100 | | | 1,781,774 |
| SoftBank Group Corp. | | 25,100 | | | 1,166,104 |
| Sony Corp. | | 72,300 | | | 4,457,142 |
| Sumitomo Mitsui Financial Group, Inc. | | 59,600 | | | 1,891,097 |
| Taiheiyo Cement Corp. | | 54,100 | | | 1,335,021 |
| Taisei Corp. | | 32,400 | | | 1,098,564 |
| Tokio Marine Holdings, Inc. | | 60,500 | | | 3,232,999 |
| TS Tech Company, Ltd. | | 32,400 | | | 837,904 |
| Zenkoku Hosho Company, Ltd. | | 52,600 | | | 1,962,628 |
| | | | | | 44,922,190 |
| Macau - 0.6% | | | | | |
| Wynn Macau, Ltd. | | 654,000 | | | 1,358,280 |
| Netherlands - 3.5% | | | | | |
| ING Groep NV | | 277,091 | | | 2,653,374 |
| NXP Semiconductors NV | | 15,067 | | | 1,712,967 |
| Royal Dutch Shell PLC, A Shares | | 148,580 | | | 3,207,320 |
| | | | | | 7,573,661 |
| Norway - 1.0% | | | | | |
| DNB ASA | | 126,593 | | | 2,120,344 |
| Singapore - 1.9% | | | | | |
| DBS Group Holdings, Ltd. | | 95,800 | | | 1,674,988 |
| United Overseas Bank, Ltd. | | 142,400 | | | 2,541,632 |
| | | | | | 4,216,620 |
| South Korea - 3.1% | | | | | |
| Hana Financial Group, Inc. | | 55,669 | | | 1,441,638 |
| KB Financial Group, Inc. | | 46,351 | | | 1,465,306 |
| KT Corp., ADR | | 173,210 | | | 1,671,477 |
| Samsung Electronics Company, Ltd. | | 50,813 | | | 2,287,163 |
| | | | | | 6,865,584 |
| Spain - 0.7% | | | | | |
| Applus Services SA | | 127,879 | | | 1,460,226 |
| Sweden - 1.8% | | | | | |
| Husqvarna AB, B Shares | | 162,216 | | | 1,091,895 |
| Loomis AB, B Shares | | 30,400 | | | 1,061,629 |
| Sandvik AB | | 66,135 | | | 1,102,434 |
| Trelleborg AB, B Shares | | 49,018 | | | 765,805 |
| | | | | | 4,021,763 |
| Switzerland - 6.2% | | | | | |
| Glencore PLC (B) | | 339,065 | | | 855,851 |
| Novartis AG | | 73,765 | | | 6,205,352 |
| Roche Holding AG | | 13,913 | | | 4,473,499 |
| STMicroelectronics NV | | 75,889 | | | 2,094,514 |
| | | | | | 13,629,216 |
| United Kingdom - 16.7% | | | | | |
| Associated British Foods PLC | | 66,833 | | | 1,951,461 |
| The accompanying notes are an integral part of the financial statements. | 33 | |
John Hancock Funds II
Portfolio of Investments — February 29, 2020 (unaudited)(showing percentage of total net assets)
International Value Fund (continued)
| | | Shares or
Principal
Amount | | Value |
| COMMON STOCKS (continued) | | | |
| United Kingdom (continued) | | | | | |
| Aviva PLC | | 379,370 | | $ | 1,737,709 |
| BAE Systems PLC | | 242,414 | | | 1,917,514 |
| BP PLC | | 494,847 | | | 2,571,031 |
| Coca-Cola European Partners PLC | | 26,706 | | | 1,360,938 |
| Direct Line Insurance Group PLC | | 525,042 | | | 2,092,917 |
| GlaxoSmithKline PLC | | 236,743 | | | 4,777,325 |
| Imperial Brands PLC | | 102,378 | | | 2,068,240 |
| Legal & General Group PLC | | 486,817 | | | 1,649,275 |
| Next PLC | | 13,455 | | | 1,060,472 |
| Nomad Foods, Ltd. (B) | | 192,160 | | | 3,547,274 |
| Persimmon PLC | | 76,107 | | | 2,813,819 |
| Redrow PLC | | 174,677 | | | 1,697,057 |
| Tesco PLC | | 866,351 | | | 2,581,323 |
| Unilever PLC | | 88,125 | | | 4,737,590 |
| | | | | | 36,563,945 |
| United States - 0.5% | | | | | |
| The Mosaic Company | | 59,842 | | | 1,019,109 |
| TOTAL COMMON STOCKS (Cost $224,908,204) | | $ | 211,541,967 |
| SHORT-TERM INVESTMENTS - 3.5% | | | |
| Short-term funds - 3.5% | | | | | |
| Fidelity Institutional Money Market Government Portfolio, Institutional Class, 1.4657% (C) | | 7,566,997 | | | 7,566,997 |
| TOTAL SHORT-TERM INVESTMENTS (Cost $7,566,997) | | $ | 7,566,997 |
Total Investments (International Value Fund)
(Cost $232,475,201) - 100.2% | | $ | 219,108,964 |
| Other assets and liabilities, net - (0.2%) | | | (360,184) |
| TOTAL NET ASSETS - 100.0% | | $ | 218,748,780 |
| Security Abbreviations and Legend |
| ADR | American Depositary Receipt |
| (A) | These securities are exempt from registration under Rule 144A of the Securities Act of 1933. Such securities may be resold, normally to qualified institutional buyers, in transactions exempt from registration. |
| (B) | Non-income producing security. |
| (C) | The rate shown is the annualized seven-day yield as of 2-29-20. |
Mid Cap Stock Fund
| | | Shares or
Principal
Amount | | Value |
| COMMON STOCKS – 92.7% | | | |
| Communication services – 5.5% | | | | | |
| Entertainment – 4.9% | | | |
| Live Nation Entertainment, Inc. (A) | | 123,245 | | $ | 7,489,599 |
| Spotify Technology SA (A) | | 395,368 | | | 54,212,860 |
| Take-Two Interactive Software, Inc. (A) | | 107,315 | | | 11,534,216 |
| | | | | | 73,236,675 |
| Interactive media and services – 0.6% | | | |
| Match Group, Inc. (A)(B) | | 100,540 | | | 6,535,100 |
| Pinterest, Inc., Class A (A) | | 92,803 | | | 1,809,659 |
| | | | | | 8,344,759 |
| | | | | | 81,581,434 |
| Consumer discretionary – 17.6% | | | | | |
| Diversified consumer services – 1.1% | | | |
| Grand Canyon Education, Inc. (A) | | 198,112 | | | 15,983,676 |
| Hotels, restaurants and leisure – 6.2% | | | |
| Aramark | | 553,848 | | | 19,240,680 |
| Marriott Vacations Worldwide Corp. | | 238,342 | | | 23,066,739 |
| Norwegian Cruise Line Holdings, Ltd. (A) | | 211,472 | | | 7,879,447 |
Mid Cap Stock Fund (continued)
| | | Shares or
Principal
Amount | | Value |
| COMMON STOCKS (continued) | | | |
| Hotels, restaurants and leisure (continued) | | | |
| Planet Fitness, Inc., Class A (A) | | 403,917 | | $ | 27,260,358 |
| Vail Resorts, Inc. | | 71,170 | | | 15,131,454 |
| | | | | | 92,578,678 |
| Household durables – 1.3% | | | |
| Lennar Corp., A Shares | | 306,878 | | | 18,517,019 |
| Leisure products – 3.2% | | | |
| BRP, Inc. | | 388,117 | | | 15,912,146 |
| Peloton Interactive, Inc., Class A (A)(B) | | 594,663 | | | 15,871,555 |
| YETI Holdings, Inc. (A) | | 524,297 | | | 15,859,984 |
| | | | | | 47,643,685 |
| Specialty retail – 4.1% | | | |
| Burlington Stores, Inc. (A) | | 134,754 | | | 29,141,900 |
| Five Below, Inc. (A) | | 140,430 | | | 13,614,689 |
| Floor & Decor Holdings, Inc., Class A (A) | | 345,413 | | | 17,633,334 |
| JAND, Inc., Class A (A)(C)(D) | | 57,523 | | | 1,044,618 |
| | | | | | 61,434,541 |
| Textiles, apparel and luxury goods – 1.7% | | | |
| Carter's, Inc. | | 141,117 | | | 12,907,972 |
| Under Armour, Inc., Class A (A)(B) | | 180,831 | | | 2,565,992 |
| Under Armour, Inc., Class C (A) | | 737,285 | | | 9,201,317 |
| | | | | | 24,675,281 |
| | | | | | 260,832,880 |
| Consumer staples – 4.4% | | | | | |
| Beverages – 3.3% | | | |
| Monster Beverage Corp. (A) | | 480,322 | | | 29,976,896 |
| The Boston Beer Company, Inc., Class A (A) | | 52,702 | | | 19,541,375 |
| | | | | | 49,518,271 |
| Food products – 1.1% | | | |
| Lamb Weston Holdings, Inc. | | 185,182 | | | 16,090,464 |
| | | | | | 65,608,735 |
| Financials – 1.2% | | | | | |
| Capital markets – 1.2% | | | |
| The Blackstone Group, Inc., Class A | | 330,502 | | | 17,794,228 |
| Health care – 24.4% | | | | | |
| Biotechnology – 7.7% | | | |
| Apellis Pharmaceuticals, Inc. (A) | | 205,300 | | | 7,107,486 |
| Argenx SE, ADR (A) | | 53,848 | | | 7,613,030 |
| Ascendis Pharma A/S, ADR (A) | | 103,055 | | | 13,436,311 |
| Exact Sciences Corp. (A) | | 385,195 | | | 31,181,535 |
| Galapagos NV (A) | | 98,418 | | | 20,699,609 |
| Galapagos NV, ADR (A)(B) | | 7,293 | | | 1,541,448 |
| Ionis Pharmaceuticals, Inc. (A) | | 264,846 | | | 13,448,880 |
| Kodiak Sciences, Inc. (A) | | 67,479 | | | 4,316,632 |
| Sage Therapeutics, Inc. (A)(B) | | 79,803 | | | 3,750,741 |
| Seattle Genetics, Inc. (A) | | 100,300 | | | 11,420,158 |
| | | | | | 114,515,830 |
| Health care equipment and supplies – 13.5% | | | |
| ABIOMED, Inc. (A) | | 204,263 | | | 30,692,558 |
| DexCom, Inc. (A) | | 196,964 | | | 54,362,064 |
| Haemonetics Corp. (A) | | 192,021 | | | 20,801,635 |
| Insulet Corp. (A) | | 205,992 | | | 39,132,300 |
| Novocure, Ltd. (A) | | 101,271 | | | 7,367,465 |
| Tandem Diabetes Care, Inc. (A) | | 647,924 | | | 48,374,006 |
| | | | | | 200,730,028 |
| Life sciences tools and services – 1.1% | | | |
| Agilent Technologies, Inc. | | 202,621 | | | 15,616,000 |
| Pharmaceuticals – 2.1% | | | |
| Elanco Animal Health, Inc. (A) | | 848,277 | | | 23,242,790 |
| The accompanying notes are an integral part of the financial statements. | 34 | |
John Hancock Funds II
Portfolio of Investments — February 29, 2020 (unaudited)(showing percentage of total net assets)
Mid Cap Stock Fund (continued)
| | | Shares or
Principal
Amount | | Value |
| COMMON STOCKS (continued) | | | |
| Pharmaceuticals (continued) | | | |
| Reata Pharmaceuticals, Inc., Class A (A)(B) | | 41,214 | | $ | 8,026,427 |
| | | | | | 31,269,217 |
| | | | | | 362,131,075 |
| Industrials – 12.4% | | | | | |
| Aerospace and defense – 2.7% | | | |
| L3Harris Technologies, Inc. | | 203,399 | | | 40,218,084 |
| Commercial services and supplies – 2.7% | | | |
| Copart, Inc. (A) | | 295,077 | | | 24,928,105 |
| The Brink's Company | | 183,403 | | | 14,358,621 |
| | | | | | 39,286,726 |
| Machinery – 4.3% | | | |
| Dover Corp. | | 156,432 | | | 16,071,824 |
| Ingersoll-Rand PLC | | 369,322 | | | 47,657,311 |
| | | | | | 63,729,135 |
| Professional services – 1.8% | | | |
| CoStar Group, Inc. (A) | | 39,952 | | | 26,671,556 |
| Road and rail – 0.9% | | | |
| J.B. Hunt Transport Services, Inc. | | 139,305 | | | 13,434,574 |
| | | | | | 183,340,075 |
| Information technology – 27.2% | | | | | |
| Electronic equipment, instruments and components – 0.5% | | | |
| Zebra Technologies Corp., Class A (A) | | 31,411 | | | 6,626,779 |
| IT services – 5.0% | | | |
| GoDaddy, Inc., Class A (A) | | 432,762 | | | 30,284,685 |
| Square, Inc., Class A (A) | | 525,828 | | | 43,817,247 |
| | | | | | 74,101,932 |
| Semiconductors and semiconductor equipment – 6.1% | | | |
| Advanced Micro Devices, Inc. (A) | | 1,564,557 | | | 71,156,051 |
| Marvell Technology Group, Ltd. | | 915,144 | | | 19,492,567 |
| | | | | | 90,648,618 |
| Software – 15.6% | | | |
| 2U, Inc. (A)(B) | | 234,003 | | | 5,501,411 |
| DraftKings, Inc. (A)(C)(D) | | 2,294,714 | | | 11,824,645 |
| Fair Isaac Corp. (A) | | 57,610 | | | 21,663,088 |
| Guidewire Software, Inc. (A) | | 474,218 | | | 51,979,035 |
| Slack Technologies, Inc., Class A (A)(B) | | 1,076,003 | | | 29,073,601 |
| Splunk, Inc. (A) | | 432,616 | | | 63,737,315 |
| Workday, Inc., Class A (A) | | 227,487 | | | 39,412,123 |
| Zoom Video Communications, Inc., Class A (A)(B) | | 80,645 | | | 8,467,725 |
| | | | | | 231,658,943 |
| | | | | | 403,036,272 |
| TOTAL COMMON STOCKS (Cost $1,109,116,644) | | $ | 1,374,324,699 |
| PREFERRED SECURITIES – 2.6% | | | | | |
| Consumer discretionary – 1.1% | | | | | |
| Diversified consumer services – 0.3% | | | |
| The Honest Company, Inc., Series C (A)(C)(D) | | 142,030 | | | 4,657,164 |
| The Honest Company, Inc., Series D (A)(C)(D) | | 12,795 | | | 496,446 |
| | | | | | 5,153,610 |
| Internet and direct marketing retail – 0.6% | | | |
| Coupang LLC (A)(C)(D) | | 1,381,449 | | | 8,150,549 |
| One Kings Lane, Inc. (A)(D) | | 529,764 | | | 84,762 |
| | | | | | 8,235,311 |
| Specialty retail – 0.2% | | | |
| JAND, Inc., Series D (A)(C)(D) | | 128,449 | | | 2,332,634 |
| | | | | | 15,721,555 |
Mid Cap Stock Fund (continued)
| | | Shares or
Principal
Amount | | Value |
| PREFERRED SECURITIES (continued) | | | | | |
| Information technology – 1.1% | | | | | |
| Software – 1.1% | | | |
| Essence Group Holdings Corp. (A)(C)(D) | | 2,958,957 | | $ | 8,077,953 |
| Lookout, Inc., Series F (A)(C)(D) | | 392,767 | | | 2,796,501 |
| MarkLogic Corp., Series F (A)(C)(D) | | 580,011 | | | 6,072,715 |
| | | | | | 16,947,169 |
| Real estate – 0.4% | | | | | |
| Real estate management and development – 0.4% | | | |
| The We Company, Inc., Series D1 (A)(C)(D) | | 184,328 | | | 2,740,957 |
| The We Company, Inc., Series D2 (A)(C)(D) | | 161,782 | | | 2,405,698 |
| | | | | | 5,146,655 |
| TOTAL PREFERRED SECURITIES (Cost $32,776,728) | | $ | 37,815,379 |
| SHORT-TERM INVESTMENTS – 9.7% | | | |
| Short-term funds – 4.2% | | | | | |
| John Hancock Collateral Trust, 1.6968% (E)(F) | | 6,247,373 | | | 62,529,330 |
| Repurchase agreement – 5.5% | | | | | |
| Societe Generale SA Tri-Party Repurchase Agreement dated 2-28-20 at 1.580% to be repurchased at $81,510,731 on 3-2-20, collateralized by $7,878,836 Federal Home Loan Mortgage Corp., 3.500% - 4.500% due 11-1-40 to 8-1-49 (valued at $8,663,057), $57,860,361 Federal National Mortgage Association, 3.000% - 5.500% due 9-1-40 to 2-1-57 (valued at $62,804,566), $11,228,997 Government National Mortgage Association, 2.500% - 4.500% due 5-20-45 to 2-20-50 (valued at $11,662,337) | $ | 81,500,000 | | | 81,500,000 |
| TOTAL SHORT-TERM INVESTMENTS (Cost $144,007,489) | | $ | 144,029,330 |
Total Investments (Mid Cap Stock Fund)
(Cost $1,285,900,861) – 105.0% | | $ | 1,556,169,408 |
| Other assets and liabilities, net – (5.0%) | | | (74,218,870) |
| TOTAL NET ASSETS – 100.0% | | $ | 1,481,950,538 |
| Security Abbreviations and Legend |
| ADR | American Depositary Receipt |
| (A) | Non-income producing security. |
| (B) | All or a portion of this security is on loan as of 2-29-20. |
| (C) | Restricted security as to resale, excluding 144A securities. For more information on this security refer to the Notes to financial statements. |
| (D) | Security is valued using significant unobservable inputs and is classified as Level 3 in the fair value hierarchy. Refer to Note 2 to the financial statements. |
| (E) | The rate shown is the annualized seven-day yield as of 2-29-20. |
| (F) | Investment is an affiliate of the fund, the advisor and/or subadvisor. This security represents the investment of cash collateral received for securities lending. |
Mid Value Fund
| | | Shares or
Principal
Amount | | Value |
| COMMON STOCKS – 94.4% | | | |
| Communication services – 4.2% | | | | | |
| Media – 4.1% | | | |
| AMC Networks, Inc., Class A (A) | | 56,800 | | $ | 1,760,800 |
| The accompanying notes are an integral part of the financial statements. | 35 | |
John Hancock Funds II
Portfolio of Investments — February 29, 2020 (unaudited)(showing percentage of total net assets)
Mid Value Fund (continued)
| | | Shares or
Principal
Amount | | Value |
| COMMON STOCKS (continued) | | | |
| Media (continued) | | | |
| DISH Network Corp., Class A (A) | | 143,582 | | $ | 4,812,869 |
| Fox Corp., Class A | | 45,842 | | | 1,409,183 |
| News Corp., Class A | | 1,773,626 | | | 21,416,534 |
| Scholastic Corp. | | 118,599 | | | 3,805,842 |
| ViacomCBS, Inc., Class B | | 531,883 | | | 13,089,641 |
| | | | | | 46,294,869 |
| Wireless telecommunication services – 0.1% | | | |
| Telephone & Data Systems, Inc. | | 59,288 | | | 1,194,060 |
| | | | | | 47,488,929 |
| Consumer discretionary – 5.0% | | | | | |
| Diversified consumer services – 1.2% | | | |
| Strategic Education, Inc. | | 86,652 | | | 12,770,772 |
| Multiline retail – 0.4% | | | |
| Nordstrom, Inc. (B) | | 128,901 | | | 4,472,865 |
| Specialty retail – 2.7% | | | |
| Tiffany & Company | | 228,682 | | | 30,549,628 |
| Textiles, apparel and luxury goods – 0.7% | | | |
| Ralph Lauren Corp. | | 72,264 | | | 7,624,575 |
| Under Armour, Inc., Class C (A) | | 49,543 | | | 618,297 |
| | | | | | 8,242,872 |
| | | | | | 56,036,137 |
| Consumer staples – 7.8% | | | | | |
| Beverages – 0.9% | | | |
| Carlsberg A/S, Class B | | 59,123 | | | 7,819,475 |
| Molson Coors Beverage Company, Class B | | 49,152 | | | 2,438,431 |
| | | | | | 10,257,906 |
| Food and staples retailing – 0.9% | | | |
| Sysco Corp. | | 92,310 | | | 6,152,462 |
| The Kroger Company | | 152,287 | | | 4,283,833 |
| | | | | | 10,436,295 |
| Food products – 5.8% | | | |
| Archer-Daniels-Midland Company | | 126,303 | | | 4,755,308 |
| Bunge, Ltd. | | 559,419 | | | 26,264,722 |
| Campbell Soup Company (B) | | 186,543 | | | 8,416,820 |
| Flowers Foods, Inc. | | 1,182,606 | | | 25,461,507 |
| | | | | | 64,898,357 |
| Household products – 0.2% | | | |
| Kimberly-Clark Corp. | | 15,064 | | | 1,976,246 |
| | | | | | 87,568,804 |
| Energy – 10.5% | | | | | |
| Energy equipment and services – 1.2% | | | |
| Frank's International NV (A) | | 1,235,404 | | | 4,842,784 |
| SEACOR Holdings, Inc. (A) | | 81,615 | | | 3,044,240 |
| SEACOR Marine Holdings, Inc. (A) | | 190,011 | | | 1,510,587 |
| Tidewater, Inc. (A)(B) | | 271,748 | | | 3,774,580 |
| | | | | | 13,172,191 |
| Oil, gas and consumable fuels – 9.3% | | | |
| Apache Corp. | | 261,539 | | | 6,517,552 |
| Cameco Corp. | | 1,062,238 | | | 9,220,226 |
| Canadian Natural Resources, Ltd. | | 608,678 | | | 15,703,892 |
| EQT Corp. | | 1,818,792 | | | 10,676,309 |
| Equitrans Midstream Corp. | | 691,716 | | | 4,883,515 |
| Hess Corp. | | 254,531 | | | 14,299,552 |
| Imperial Oil, Ltd. | | 1,027,605 | | | 22,535,378 |
| Murphy Oil Corp. | | 398,593 | | | 7,513,478 |
| NAC Kazatomprom JSC, GDR | | 335,343 | | | 4,112,061 |
| Ovintiv, Inc. (B) | | 656,403 | | | 7,581,455 |
| Peabody Energy Corp. | | 383,878 | | | 2,241,848 |
| | | | | | 105,285,266 |
| | | | | | 118,457,457 |
Mid Value Fund (continued)
| | | Shares or
Principal
Amount | | Value |
| COMMON STOCKS (continued) | | | |
| Financials – 17.9% | | | | | |
| Banks – 3.0% | | | |
| Fifth Third Bancorp | | 858,688 | | $ | 20,951,987 |
| Popular, Inc. | | 39,441 | | | 1,892,379 |
| Westamerica Bancorporation (B) | | 194,500 | | | 11,245,990 |
| | | | | | 34,090,356 |
| Capital markets – 6.2% | | | |
| Franklin Resources, Inc. | | 168,821 | | | 3,673,545 |
| Lazard, Ltd., Class A | | 448,453 | | | 16,063,585 |
| Northern Trust Corp. | | 229,171 | | | 20,112,047 |
| State Street Corp. | | 321,771 | | | 21,915,823 |
| TD Ameritrade Holding Corp. | | 161,308 | | | 6,812,037 |
| The Bank of New York Mellon Corp. | | 28,900 | | | 1,153,110 |
| | | | | | 69,730,147 |
| Consumer finance – 0.7% | | | |
| Ally Financial, Inc. | | 186,107 | | | 4,665,702 |
| Synchrony Financial | | 114,825 | | | 3,341,408 |
| | | | | | 8,007,110 |
| Diversified financial services – 1.0% | | | |
| Groupe Bruxelles Lambert SA | | 28,717 | | | 2,610,512 |
| Pargesa Holding SA, Bearer Shares | | 107,736 | | | 7,941,848 |
| | | | | | 10,552,360 |
| Insurance – 6.4% | | | |
| Brighthouse Financial, Inc. (A) | | 236,855 | | | 8,488,883 |
| Brown & Brown, Inc. | | 361,806 | | | 15,561,276 |
| CNA Financial Corp. | | 334,510 | | | 13,908,926 |
| Kemper Corp. | | 113,892 | | | 7,840,325 |
| Loews Corp. | | 376,296 | | | 17,170,386 |
| Marsh & McLennan Companies, Inc. | | 88,556 | | | 9,259,415 |
| | | | | | 72,229,211 |
| Thrifts and mortgage finance – 0.6% | | | |
| Capitol Federal Financial, Inc. | | 586,085 | | | 7,153,167 |
| | | | | | 201,762,351 |
| Health care – 16.7% | | | | | |
| Biotechnology – 1.7% | | | |
| Alkermes PLC (A) | | 445,016 | | | 9,274,133 |
| Incyte Corp. (A) | | 95,936 | | | 7,234,534 |
| Seattle Genetics, Inc. (A) | | 18,352 | | | 2,089,559 |
| | | | | | 18,598,226 |
| Health care equipment and supplies – 6.7% | | | |
| Alcon, Inc. (A) | | 89,704 | | | 5,485,524 |
| Baxter International, Inc. | | 173,133 | | | 14,451,412 |
| DENTSPLY SIRONA, Inc. | | 325,414 | | | 16,023,385 |
| Envista Holdings Corp. (A) | | 70,647 | | | 1,793,021 |
| Hologic, Inc. (A) | | 457,897 | | | 21,576,107 |
| Zimmer Biomet Holdings, Inc. | | 119,478 | | | 16,266,930 |
| | | | | | 75,596,379 |
| Health care providers and services – 6.3% | | | |
| Cardinal Health, Inc. | | 444,564 | | | 23,170,676 |
| Covetrus, Inc. (A)(B) | | 422,693 | | | 4,696,119 |
| Patterson Companies, Inc. | | 866,589 | | | 20,616,152 |
| Select Medical Holdings Corp. (A) | | 938,994 | | | 22,479,516 |
| | | | | | 70,962,463 |
| Pharmaceuticals – 2.0% | | | |
| Perrigo Company PLC | | 448,693 | | | 22,744,248 |
| | | | | | 187,901,316 |
| Industrials – 8.8% | | | | | |
| Aerospace and defense – 1.9% | | | |
| Textron, Inc. | | 524,468 | | | 21,293,401 |
| Air freight and logistics – 1.7% | | | |
| C.H. Robinson Worldwide, Inc. | | 179,446 | | | 12,363,829 |
| The accompanying notes are an integral part of the financial statements. | 36 | |
John Hancock Funds II
Portfolio of Investments — February 29, 2020 (unaudited)(showing percentage of total net assets)
Mid Value Fund (continued)
| | | Shares or
Principal
Amount | | Value |
| COMMON STOCKS (continued) | | | |
| Air freight and logistics (continued) | | | |
| Expeditors International of Washington, Inc. | | 96,985 | | $ | 6,829,684 |
| | | | | | 19,193,513 |
| Commercial services and supplies – 0.6% | | | |
| Cintas Corp. | | 25,172 | | | 6,714,379 |
| Machinery – 3.1% | | | |
| AGCO Corp. | | 98,351 | | | 5,943,351 |
| CNH Industrial NV | | 469,653 | | | 4,375,278 |
| PACCAR, Inc. | | 144,295 | | | 9,653,336 |
| Wabtec Corp. | | 79,940 | | | 5,491,878 |
| Xylem, Inc. | | 121,140 | | | 9,368,968 |
| | | | | | 34,832,811 |
| Road and rail – 1.5% | | | |
| J.B. Hunt Transport Services, Inc. | | 74,812 | | | 7,214,869 |
| Kansas City Southern | | 51,564 | | | 7,769,664 |
| Ryder System, Inc. | | 56,580 | | | 2,152,303 |
| | | | | | 17,136,836 |
| | | | | | 99,170,940 |
| Information technology – 4.0% | | | | | |
| Electronic equipment, instruments and components – 1.9% | | | |
| AVX Corp. | | 460,266 | | | 10,006,183 |
| National Instruments Corp. | | 274,514 | | | 11,057,424 |
| | | | | | 21,063,607 |
| IT services – 0.5% | | | |
| Cognizant Technology Solutions Corp., Class A | | 89,112 | | | 5,429,594 |
| Semiconductors and semiconductor equipment – 1.6% | | | |
| Applied Materials, Inc. | | 320,164 | | | 18,607,932 |
| Technology hardware, storage and peripherals – 0.0% | | | |
| Western Digital Corp. | | 6,643 | | | 369,085 |
| | | | | | 45,470,218 |
| Materials – 9.7% | | | | | |
| Chemicals – 2.2% | | | |
| Corteva, Inc. | | 391,345 | | | 10,644,584 |
| PPG Industries, Inc. | | 50,998 | | | 5,326,741 |
| RPM International, Inc. | | 15,535 | | | 995,949 |
| Westlake Chemical Corp. | | 137,268 | | | 7,669,163 |
| | | | | | 24,636,437 |
| Construction materials – 1.0% | | | |
| Summit Materials, Inc., Class A (A) | | 215,305 | | | 4,207,060 |
| Vulcan Materials Company | | 55,097 | | | 6,625,965 |
| | | | | | 10,833,025 |
| Metals and mining – 6.5% | | | |
| Barrick Gold Corp. | | 974,450 | | | 18,553,528 |
| Cia de Minas Buenaventura SAA, ADR | | 498,603 | | | 5,559,423 |
| Franco-Nevada Corp. | | 187,570 | | | 20,136,962 |
| Freeport-McMoRan, Inc. | | 1,078,117 | | | 10,738,045 |
| Fresnillo PLC | | 1,135,901 | | | 8,876,322 |
| Gold Fields, Ltd., ADR | | 558,096 | | | 3,309,509 |
| Nucor Corp. | | 152,943 | | | 6,324,193 |
| | | | | | 73,497,982 |
| | | | | | 108,967,444 |
| Real estate – 6.0% | | | | | |
| Equity real estate investment trusts – 5.6% | | | |
| Equity Commonwealth | | 267,566 | | | 8,417,626 |
| Equity Residential | | 130,244 | | | 9,781,324 |
| Rayonier, Inc. | | 670,198 | | | 17,780,353 |
| Regency Centers Corp. | | 134,720 | | | 7,738,317 |
| Weyerhaeuser Company | | 748,226 | | | 19,438,911 |
| | | | | | 63,156,531 |
Mid Value Fund (continued)
| | | Shares or
Principal
Amount | | Value |
| COMMON STOCKS (continued) | | | |
| Real estate management and development – 0.4% | | | |
| The St. Joe Company (A)(B) | | 212,401 | | $ | 4,177,928 |
| | | | | | 67,334,459 |
| Utilities – 3.8% | | | | | |
| Electric utilities – 3.0% | | | |
| Entergy Corp. | | 31,793 | | | 3,716,920 |
| FirstEnergy Corp. | | 457,152 | | | 20,356,979 |
| PG&E Corp. (A) | | 675,878 | | | 10,476,109 |
| | | | | | 34,550,008 |
Independent power and renewable electricity producers –
0.1% | | | |
| Vistra Energy Corp. | | 60,754 | | | 1,168,299 |
| Multi-utilities – 0.7% | | | |
| CenterPoint Energy, Inc. | | 339,574 | | | 7,816,993 |
| | | | | | 43,535,300 |
| TOTAL COMMON STOCKS (Cost $974,926,911) | | $ | 1,063,693,355 |
| PREFERRED SECURITIES – 0.3% | | | | | |
| Consumer staples – 0.3% | | | | | |
| Food products – 0.3% | | | |
| Bunge, Ltd., 4.875% | | 31,449 | | | 3,144,900 |
| TOTAL PREFERRED SECURITIES (Cost $3,563,298) | | $ | 3,144,900 |
| SHORT-TERM INVESTMENTS – 8.3% | | | |
| Short-term funds – 8.3% | | | | | |
| John Hancock Collateral Trust, 1.6968% (C)(D) | | 1,203,406 | | | 12,044,774 |
| State Street Institutional U.S. Government Money Market Fund, Premier Class, 1.5386% (C) | | 2,000,000 | | | 2,000,000 |
| T. Rowe Price Government Reserve Fund, 1.5799% (C) | | 79,620,676 | | | 79,620,676 |
| TOTAL SHORT-TERM INVESTMENTS (Cost $93,660,148) | | $ | 93,665,450 |
Total Investments (Mid Value Fund)
(Cost $1,072,150,357) – 103.0% | | $ | 1,160,503,705 |
| Other assets and liabilities, net – (3.0%) | | | (33,287,691) |
| TOTAL NET ASSETS – 100.0% | | $ | 1,127,216,014 |
| Security Abbreviations and Legend |
| ADR | American Depositary Receipt |
| GDR | Global Depositary Receipt |
| (A) | Non-income producing security. |
| (B) | All or a portion of this security is on loan as of 2-29-20. |
| (C) | The rate shown is the annualized seven-day yield as of 2-29-20. |
| (D) | Investment is an affiliate of the fund, the advisor and/or subadvisor. This security represents the investment of cash collateral received for securities lending. |
Multi-Index Lifestyle Aggressive Portfolio
| | | Shares or
Principal
Amount | | Value |
| AFFILIATED INVESTMENT COMPANIES (A) - 66.7% | | | |
| Equity - 66.7% | | | |
| Strategic Equity Allocation, Class NAV, JHF II (MIM US) (B) | 20,569,737 | | $ | 224,210,131 |
| TOTAL AFFILIATED INVESTMENT COMPANIES (Cost $248,860,288) | | $ | 224,210,131 |
| UNAFFILIATED INVESTMENT COMPANIES - 33.5% | | | |
| Exchange-traded funds - 33.5% | | | |
| Financial Select Sector SPDR Fund | 180,087 | | | 4,788,513 |
| iShares Edge MSCI Min Vol USA ETF | 254,651 | | | 15,602,467 |
| The accompanying notes are an integral part of the financial statements. | 37 | |
John Hancock Funds II
Portfolio of Investments — February 29, 2020 (unaudited)(showing percentage of total net assets)
Multi-Index Lifestyle Aggressive Portfolio (continued)
| | | Shares or
Principal
Amount | | Value |
| UNAFFILIATED INVESTMENT COMPANIES (continued) | | | |
| Exchange-traded funds (continued) | | | |
| iShares Global Infrastructure ETF | 23,188 | | $ | 1,023,518 |
| Schwab U.S. Large-Cap Growth ETF | 64,858 | | | 5,787,279 |
| Vanguard Dividend Appreciation ETF | 97,623 | | | 11,217,859 |
| Vanguard Energy ETF | 63,806 | | | 3,900,461 |
| Vanguard FTSE All World ex-US Small-Cap ETF (C) | 34,937 | | | 3,444,439 |
| Vanguard FTSE Developed Markets ETF | 28,261 | | | 1,115,462 |
| Vanguard FTSE Emerging Markets ETF | 356,466 | | | 14,444,002 |
| Vanguard Global ex-U.S. Real Estate ETF | 19,106 | | | 1,034,399 |
| Vanguard Health Care ETF | 25,709 | | | 4,506,531 |
| Vanguard Information Technology ETF | 18,994 | | | 4,475,936 |
| Vanguard Materials ETF | 17,456 | | | 1,991,555 |
| Vanguard Mid-Cap ETF | 141,278 | | | 22,908,228 |
| Vanguard Real Estate ETF | 33,772 | | | 2,949,309 |
| Vanguard S&P 500 ETF | 10,267 | | | 2,789,955 |
| Vanguard Small-Cap ETF (C) | 72,456 | | | 10,756,092 |
| TOTAL UNAFFILIATED INVESTMENT COMPANIES (Cost $102,330,824) | | $ | 112,736,005 |
| SHORT-TERM INVESTMENTS - 1.2% | | | |
| Short-term funds - 1.2% | | | | | |
| John Hancock Collateral Trust, 1.6968% (D)(E) | 391,721 | | | 3,920,694 |
| State Street Institutional U.S. Government Money Market Fund, Premier Class, 1.5386% (D) | 1,001 | | | 1,001 |
| TOTAL SHORT-TERM INVESTMENTS (Cost $3,920,425) | | $ | 3,921,695 |
| Total Investments (Multi-Index Lifestyle Aggressive Portfolio) (Cost $355,111,537) - 101.4% | | | $ | 340,867,831 |
| Other assets and liabilities, net - (1.4%) | | | | (4,681,374) |
| TOTAL NET ASSETS - 100.0% | | | | $ | 336,186,457 |
| Security Abbreviations and Legend |
| JHF II | John Hancock Funds II |
| MIM US | Manulife Investment Management (US) LLC |
| (A) | The underlying funds' subadvisor is shown parenthetically. |
| (B) | The subadvisor is an affiliate of the advisor. |
| (C) | All or a portion of this security is on loan as of 2-29-20. |
| (D) | The rate shown is the annualized seven-day yield as of 2-29-20. |
| (E) | Investment is an affiliate of the fund, the advisor and/or subadvisor. This security represents the investment of cash collateral received for securities lending. |
Multi-Index Lifestyle Balanced Portfolio
| | | Shares or
Principal
Amount | | Value |
| AFFILIATED INVESTMENT COMPANIES (A) - 38.0% | | | |
| Equity - 38.0% | | | |
| Strategic Equity Allocation, Class NAV, JHF II (MIM US) (B) | 30,560,583 | | $ | 333,110,355 |
| TOTAL AFFILIATED INVESTMENT COMPANIES (Cost $363,646,854) | | $ | 333,110,355 |
| UNAFFILIATED INVESTMENT COMPANIES - 64.0% | | | |
| Exchange-traded funds - 60.4% | | | |
| Financial Select Sector SPDR Fund | 290,092 | | | 7,713,546 |
| Invesco Senior Loan ETF (C) | 803,173 | | | 17,661,774 |
| iShares Edge MSCI Min Vol USA ETF | 678,680 | | | 41,582,724 |
| iShares Global Infrastructure ETF | 40,881 | | | 1,804,487 |
| iShares JP Morgan USD Emerging Markets Bond ETF | 268,573 | | | 30,649,551 |
| Schwab U.S. Large-Cap Growth ETF | 97,291 | | | 8,681,276 |
Multi-Index Lifestyle Balanced Portfolio (continued)
| | | Shares or
Principal
Amount | | Value |
| UNAFFILIATED INVESTMENT COMPANIES (continued) | | | |
| Exchange-traded funds (continued) | | | |
| VanEck Vectors J.P. Morgan EM Local Currency Bond ETF (C) | 134,513 | | $ | 4,359,566 |
| Vanguard Dividend Appreciation ETF | 247,903 | | | 28,486,534 |
| Vanguard Energy ETF (C) | 113,682 | | | 6,949,381 |
| Vanguard FTSE All World ex-US Small-Cap ETF | 21,164 | | | 2,086,559 |
| Vanguard FTSE Developed Markets ETF | 141,461 | | | 5,583,466 |
| Vanguard FTSE Emerging Markets ETF | 317,680 | | | 12,872,394 |
| Vanguard Global ex-U.S. Real Estate ETF | 34,427 | | | 1,863,878 |
| Vanguard Health Care ETF | 36,556 | | | 6,407,901 |
| Vanguard Information Technology ETF (C) | 27,184 | | | 6,405,910 |
| Vanguard Intermediate-Term Corporate Bond ETF | 1,205,519 | | | 113,511,669 |
| Vanguard Materials ETF | 31,036 | | | 3,540,897 |
| Vanguard Mid-Cap ETF | 183,088 | | | 29,687,719 |
| Vanguard Real Estate ETF | 61,566 | | | 5,376,559 |
| Vanguard S&P 500 ETF | 157 | | | 42,663 |
| Vanguard Short-Term Bond ETF (C) | 146,318 | | | 11,990,760 |
| Vanguard Short-Term Corporate Bond ETF (C) | 162,434 | | | 13,337,456 |
| Vanguard Small-Cap ETF | 88,439 | | | 13,128,769 |
| Vanguard Total Bond Market ETF | 1,145,070 | | | 99,346,273 |
| Xtrackers USD High Yield Corporate Bond ETF | 1,133,580 | | | 55,692,785 |
| | | | | | 528,764,497 |
| Fixed income - 3.6% | | | |
| Fidelity Inflation Protected Bond Index Fund | 3,053,179 | | | 31,753,066 |
| TOTAL UNAFFILIATED INVESTMENT COMPANIES (Cost $522,724,544) | | $ | 560,517,563 |
| SHORT-TERM INVESTMENTS - 5.2% | | | |
| Short-term funds - 5.2% | | | | | |
| John Hancock Collateral Trust, 1.6968% (D)(E) | 4,511,276 | | | 45,152,907 |
| State Street Institutional U.S. Government Money Market Fund, Premier Class, 1.5386% (D) | 1,050 | | | 1,050 |
| TOTAL SHORT-TERM INVESTMENTS (Cost $45,148,037) | | $ | 45,153,957 |
| Total Investments (Multi-Index Lifestyle Balanced Portfolio) (Cost $931,519,435) - 107.2% | | | $ | 938,781,875 |
| Other assets and liabilities, net - (7.2%) | | | | (63,080,483) |
| TOTAL NET ASSETS - 100.0% | | | | $ | 875,701,392 |
| Security Abbreviations and Legend |
| JHF II | John Hancock Funds II |
| MIM US | Manulife Investment Management (US) LLC |
| (A) | The underlying funds' subadvisor is shown parenthetically. |
| (B) | The subadvisor is an affiliate of the advisor. |
| (C) | All or a portion of this security is on loan as of 2-29-20. |
| (D) | The rate shown is the annualized seven-day yield as of 2-29-20. |
| (E) | Investment is an affiliate of the fund, the advisor and/or subadvisor. This security represents the investment of cash collateral received for securities lending. |
Multi-Index Lifestyle Conservative Portfolio
| | | Shares or
Principal
Amount | | Value |
| AFFILIATED INVESTMENT COMPANIES (A) - 10.5% | | | |
| Equity - 10.5% | | | |
| Strategic Equity Allocation, Class NAV, JHF II (MIM US) (B) | 1,766,320 | | $ | 19,252,887 |
| TOTAL AFFILIATED INVESTMENT COMPANIES (Cost $19,854,486) | | $ | 19,252,887 |
| The accompanying notes are an integral part of the financial statements. | 38 | |
John Hancock Funds II
Portfolio of Investments — February 29, 2020 (unaudited)(showing percentage of total net assets)
Multi-Index Lifestyle Conservative Portfolio (continued)
| | | Shares or
Principal
Amount | | Value |
| UNAFFILIATED INVESTMENT COMPANIES - 92.9% | | | |
| Exchange-traded funds - 85.8% | | | |
| Invesco Senior Loan ETF (C) | 323,645 | | $ | 7,116,954 |
| iShares Edge MSCI Min Vol USA ETF | 81,401 | | | 4,987,439 |
| iShares Global Infrastructure ETF | 5,822 | | | 256,983 |
| iShares JP Morgan USD Emerging Markets Bond ETF | 79,549 | | | 9,078,132 |
| VanEck Vectors J.P. Morgan EM Local Currency Bond ETF | 39,853 | | | 1,291,636 |
| Vanguard Dividend Appreciation ETF | 31,632 | | | 3,634,833 |
| Vanguard Energy ETF | 17,412 | | | 1,064,396 |
| Vanguard FTSE Developed Markets ETF | 67,097 | | | 2,648,319 |
| Vanguard FTSE Emerging Markets ETF | 16,105 | | | 652,575 |
| Vanguard Global ex-U.S. Real Estate ETF | 4,777 | | | 258,627 |
| Vanguard Intermediate-Term Corporate Bond ETF | 543,017 | | | 51,130,481 |
| Vanguard Materials ETF | 4,540 | | | 517,969 |
| Vanguard Mid-Cap ETF | 8,184 | | | 1,327,035 |
| Vanguard Real Estate ETF | 8,811 | | | 769,465 |
| Vanguard Short-Term Bond ETF (C) | 63,571 | | | 5,209,643 |
| Vanguard Short-Term Corporate Bond ETF | 84,183 | | | 6,912,266 |
| Vanguard Small-Cap ETF | 2,842 | | | 421,893 |
| Vanguard Total Bond Market ETF | 500,520 | | | 43,425,115 |
| Xtrackers USD High Yield Corporate Bond ETF | 318,788 | | | 15,662,054 |
| | | | | | 156,365,815 |
| Fixed income - 7.1% | | | |
| Fidelity Inflation Protected Bond Index Fund | 1,249,463 | | | 12,994,415 |
| TOTAL UNAFFILIATED INVESTMENT COMPANIES (Cost $161,694,609) | | $ | 169,360,230 |
| SHORT-TERM INVESTMENTS - 6.6% | | | |
| Short-term funds - 6.6% | | | | | |
| John Hancock Collateral Trust, 1.6968% (D)(E) | 1,175,125 | | | 11,761,713 |
| State Street Institutional U.S. Government Money Market Fund, Premier Class, 1.5386% (D) | 294,576 | | | 294,576 |
| TOTAL SHORT-TERM INVESTMENTS (Cost $12,055,785) | | $ | 12,056,289 |
| Total Investments (Multi-Index Lifestyle Conservative Portfolio) (Cost $193,604,880) - 110.0% | | | $ | 200,669,406 |
| Other assets and liabilities, net - (10.0%) | | | | (18,279,413) |
| TOTAL NET ASSETS - 100.0% | | | | $ | 182,389,993 |
| Security Abbreviations and Legend |
| JHF II | John Hancock Funds II |
| MIM US | Manulife Investment Management (US) LLC |
| (A) | The underlying funds' subadvisor is shown parenthetically. |
| (B) | The subadvisor is an affiliate of the advisor. |
| (C) | All or a portion of this security is on loan as of 2-29-20. |
| (D) | The rate shown is the annualized seven-day yield as of 2-29-20. |
| (E) | Investment is an affiliate of the fund, the advisor and/or subadvisor. This security represents the investment of cash collateral received for securities lending. |
Multi-Index Lifestyle Growth Portfolio
| | | Shares or
Principal
Amount | | Value |
| AFFILIATED INVESTMENT COMPANIES (A) - 52.2% | | | |
| Equity - 52.2% | | | |
| Strategic Equity Allocation, Class NAV, JHF II (MIM US) (B) | 39,094,783 | | $ | 426,133,131 |
| TOTAL AFFILIATED INVESTMENT COMPANIES (Cost $473,258,984) | | $ | 426,133,131 |
Multi-Index Lifestyle Growth Portfolio (continued)
| | | Shares or
Principal
Amount | | Value |
| UNAFFILIATED INVESTMENT COMPANIES - 49.0% | | | |
| Exchange-traded funds - 47.3% | | | |
| Financial Select Sector SPDR Fund | 361,776 | | $ | 9,619,624 |
| Invesco Senior Loan ETF (C) | 389,020 | | | 8,554,550 |
| iShares Edge MSCI Min Vol USA ETF | 647,214 | | | 39,654,802 |
| iShares Global Infrastructure ETF | 47,612 | | | 2,101,594 |
| iShares JP Morgan USD Emerging Markets Bond ETF | 137,022 | | | 15,636,951 |
| Schwab U.S. Large-Cap Growth ETF | 122,285 | | | 10,911,491 |
| VanEck Vectors J.P. Morgan EM Local Currency Bond ETF | 68,630 | | | 2,224,298 |
| Vanguard Dividend Appreciation ETF (C) | 242,389 | | | 27,852,920 |
| Vanguard Energy ETF | 127,749 | | | 7,809,296 |
| Vanguard FTSE All World ex-US Small-Cap ETF | 20,148 | | | 1,986,391 |
| Vanguard FTSE Developed Markets ETF | 243,793 | | | 9,622,510 |
| Vanguard FTSE Emerging Markets ETF (C) | 607,494 | | | 24,615,657 |
| Vanguard Global ex-U.S. Real Estate ETF (C) | 40,189 | | | 2,175,832 |
| Vanguard Health Care ETF | 45,241 | | | 7,930,295 |
| Vanguard Information Technology ETF | 33,228 | | | 7,830,178 |
| Vanguard Intermediate-Term Corporate Bond ETF (C) | 587,023 | | | 55,274,086 |
| Vanguard Materials ETF | 35,388 | | | 4,037,417 |
| Vanguard Mid-Cap ETF | 252,202 | | | 40,894,554 |
| Vanguard Real Estate ETF | 70,134 | | | 6,124,802 |
| Vanguard S&P 500 ETF | 148 | | | 40,218 |
| Vanguard Short-Term Bond ETF (C) | 56,960 | | | 4,667,872 |
| Vanguard Short-Term Corporate Bond ETF | 63,183 | | | 5,187,956 |
| Vanguard Small-Cap ETF | 103,473 | | | 15,360,567 |
| Vanguard Total Bond Market ETF | 588,004 | | | 51,015,227 |
| Xtrackers USD High Yield Corporate Bond ETF | 504,715 | | | 24,796,648 |
| | | | | | 385,925,736 |
| Fixed income - 1.7% | | | |
| Fidelity Inflation Protected Bond Index Fund | 1,378,987 | | | 14,341,467 |
| TOTAL UNAFFILIATED INVESTMENT COMPANIES (Cost $368,940,692) | | $ | 400,267,203 |
| SHORT-TERM INVESTMENTS - 6.3% | | | |
| Short-term funds - 6.3% | | | | | |
| John Hancock Collateral Trust, 1.6968% (D)(E) | 5,106,658 | | | 51,112,025 |
| State Street Institutional U.S. Government Money Market Fund, Premier Class, 1.5386% (D) | 1,050 | | | 1,050 |
| TOTAL SHORT-TERM INVESTMENTS (Cost $51,107,635) | | $ | 51,113,075 |
| Total Investments (Multi-Index Lifestyle Growth Portfolio) (Cost $893,307,311) - 107.5% | | | $ | 877,513,409 |
| Other assets and liabilities, net - (7.5%) | | | | (61,121,667) |
| TOTAL NET ASSETS - 100.0% | | | | $ | 816,391,742 |
| Security Abbreviations and Legend |
| JHF II | John Hancock Funds II |
| MIM US | Manulife Investment Management (US) LLC |
| (A) | The underlying funds' subadvisor is shown parenthetically. |
| (B) | The subadvisor is an affiliate of the advisor. |
| (C) | All or a portion of this security is on loan as of 2-29-20. |
| (D) | The rate shown is the annualized seven-day yield as of 2-29-20. |
| (E) | Investment is an affiliate of the fund, the advisor and/or subadvisor. This security represents the investment of cash collateral received for securities lending. |
| The accompanying notes are an integral part of the financial statements. | 39 | |
John Hancock Funds II
Portfolio of Investments — February 29, 2020 (unaudited)(showing percentage of total net assets)
Multi-Index Lifestyle Moderate Portfolio
| | | Shares or
Principal
Amount | | Value |
| AFFILIATED INVESTMENT COMPANIES (A) - 24.9% | | | |
| Equity - 24.9% | | | |
| Strategic Equity Allocation, Class NAV, JHF II (MIM US) (B) | 5,672,515 | | $ | 61,830,413 |
| TOTAL AFFILIATED INVESTMENT COMPANIES (Cost $66,433,163) | | $ | 61,830,413 |
| UNAFFILIATED INVESTMENT COMPANIES - 78.5% | | | |
| Exchange-traded funds - 73.5% | | | |
| Invesco Senior Loan ETF (C) | 340,485 | | | 7,487,265 |
| iShares Edge MSCI Min Vol USA ETF | 199,454 | | | 12,220,547 |
| iShares Global Infrastructure ETF | 9,271 | | | 409,222 |
| iShares JP Morgan USD Emerging Markets Bond ETF | 98,346 | | | 11,223,246 |
| VanEck Vectors J.P. Morgan EM Local Currency Bond ETF | 49,245 | | | 1,596,030 |
| Vanguard Dividend Appreciation ETF | 72,475 | | | 8,328,102 |
| Vanguard Energy ETF | 25,492 | | | 1,558,326 |
| Vanguard FTSE Developed Markets ETF | 88,783 | | | 3,504,265 |
| Vanguard FTSE Emerging Markets ETF | 16,941 | | | 686,449 |
| Vanguard Global ex-U.S. Real Estate ETF | 7,824 | | | 423,591 |
| Vanguard Intermediate-Term Corporate Bond ETF | 554,630 | | | 52,223,961 |
| Vanguard Materials ETF | 6,714 | | | 766,000 |
| Vanguard Mid-Cap ETF | 29,438 | | | 4,773,372 |
| Vanguard Real Estate ETF | 13,679 | | | 1,194,587 |
| Vanguard S&P 500 ETF | 44 | | | 11,957 |
| Vanguard Short-Term Bond ETF | 48,822 | | | 4,000,963 |
| Vanguard Short-Term Corporate Bond ETF | 85,567 | | | 7,025,906 |
| Vanguard Small-Cap ETF | 8,993 | | | 1,335,011 |
| Vanguard Total Bond Market ETF | 505,037 | | | 43,817,010 |
| Xtrackers USD High Yield Corporate Bond ETF | 398,899 | | | 19,597,908 |
| | | | | | 182,183,718 |
| Fixed income - 5.0% | | | |
| Fidelity Inflation Protected Bond Index Fund | 1,189,218 | | | 12,367,866 |
| TOTAL UNAFFILIATED INVESTMENT COMPANIES (Cost $183,500,922) | | $ | 194,551,584 |
| SHORT-TERM INVESTMENTS - 3.1% | | | |
| Short-term funds - 3.1% | | | | | |
| John Hancock Collateral Trust, 1.6968% (D)(E) | 762,460 | | | 7,631,384 |
| State Street Institutional U.S. Government Money Market Fund, Premier Class, 1.5386% (D) | 1,050 | | | 1,050 |
| TOTAL SHORT-TERM INVESTMENTS (Cost $7,631,976) | | $ | 7,632,434 |
| Total Investments (Multi-Index Lifestyle Moderate Portfolio) (Cost $257,566,061) - 106.5% | | | $ | 264,014,431 |
| Other assets and liabilities, net - (6.5%) | | | | (16,150,482) |
| TOTAL NET ASSETS - 100.0% | | | | $ | 247,863,949 |
| Security Abbreviations and Legend |
| JHF II | John Hancock Funds II |
| MIM US | Manulife Investment Management (US) LLC |
| (A) | The underlying funds' subadvisor is shown parenthetically. |
| (B) | The subadvisor is an affiliate of the advisor. |
| (C) | All or a portion of this security is on loan as of 2-29-20. |
| (D) | The rate shown is the annualized seven-day yield as of 2-29-20. |
| (E) | Investment is an affiliate of the fund, the advisor and/or subadvisor. This security represents the investment of cash collateral received for securities lending. |
Real Estate Securities Fund
| | | Shares or
Principal
Amount | | Value |
| COMMON STOCKS – 100.0% | | | | | |
| Information technology – 4.4% | | | | | |
| IT services – 4.4% | | | | | |
| IT consulting and other services – 4.4% | | | | | |
| InterXion Holding NV (A) | | 193,816 | | $ | 16,453,039 |
| Real estate – 95.6% | | | | | |
Equity real estate investment trusts –
95.6% | | | | | |
| Diversified REITs – 4.2% | | | | | |
| Essential Properties Realty Trust, Inc. | | 301,224 | | | 6,901,042 |
| STORE Capital Corp. | | 275,283 | | | 9,045,799 |
| | | | | | 15,946,841 |
| Health care REITs – 12.1% | | | | | |
| Healthpeak Properties, Inc. | | 422,903 | | | 13,380,651 |
| Medical Properties Trust, Inc. | | 477,244 | | | 10,084,166 |
| Omega Healthcare Investors, Inc. | | 21,994 | | | 873,782 |
| Ventas, Inc. | | 155,225 | | | 8,346,448 |
| Welltower, Inc. | | 174,090 | | | 13,025,414 |
| | | | | | 45,710,461 |
| Hotel and resort REITs – 1.9% | | | | | |
| Ryman Hospitality Properties, Inc. | | 102,517 | | | 7,125,957 |
| Industrial REITs – 14.7% | | | | | |
| Americold Realty Trust | | 241,090 | | | 7,394,230 |
| EastGroup Properties, Inc. | | 49,122 | | | 6,176,109 |
| Prologis, Inc. | | 366,036 | | | 30,849,514 |
| Rexford Industrial Realty, Inc. | | 240,836 | | | 11,263,900 |
| | | | | | 55,683,753 |
| Office REITs – 10.9% | | | | | |
| Alexandria Real Estate Equities, Inc. | | 91,218 | | | 13,854,190 |
| Cousins Properties, Inc. | | 218,580 | | | 7,801,120 |
| Highwoods Properties, Inc. | | 185,934 | | | 8,344,718 |
| Kilroy Realty Corp. | | 155,247 | | | 11,284,904 |
| | | | | | 41,284,932 |
| Residential REITs – 22.0% | | | | | |
| American Homes 4 Rent, Class A | | 143,820 | | | 3,723,500 |
| Apartment Investment & Management Company, A Shares | | 199,537 | | | 9,545,850 |
| Equity LifeStyle Properties, Inc. | | 219,199 | | | 14,977,868 |
| Equity Residential | | 199,613 | | | 14,990,936 |
| Essex Property Trust, Inc. | | 29,906 | | | 8,474,164 |
| Invitation Homes, Inc. | | 517,382 | | | 14,843,690 |
| Mid-America Apartment Communities, Inc. | | 115,323 | | | 14,906,651 |
| Sun Communities, Inc. | | 11,371 | | | 1,738,398 |
| | | | | | 83,201,057 |
| Retail REITs – 12.9% | | | | | |
| Agree Realty Corp. | | 117,483 | | | 8,437,629 |
| Brixmor Property Group, Inc. | | 321,494 | | | 5,854,406 |
| Kimco Realty Corp. | | 440,011 | | | 7,634,191 |
| Realty Income Corp. | | 231,217 | | | 16,737,799 |
| Simon Property Group, Inc. | | 26,494 | | | 3,260,882 |
| The Macerich Company | | 50,386 | | | 1,028,766 |
| Weingarten Realty Investors | | 209,981 | | | 5,654,788 |
| | | | | | 48,608,461 |
| Specialized REITs – 16.9% | | | | | |
| American Tower Corp. | | 44,082 | | | 9,997,798 |
| Crown Castle International Corp. | | 22,066 | | | 3,161,837 |
| Equinix, Inc. | | 46,172 | | | 26,447,322 |
| Extra Space Storage, Inc. | | 116,616 | | | 11,703,582 |
| Gaming and Leisure Properties, Inc. | | 10,897 | | | 482,472 |
| Life Storage, Inc. | | 110,572 | | | 11,931,825 |
| | | | | | 63,724,836 |
| | | | | | 361,286,298 |
| TOTAL COMMON STOCKS (Cost $322,057,875) | | $ | 377,739,337 |
| The accompanying notes are an integral part of the financial statements. | 40 | |
John Hancock Funds II
Portfolio of Investments — February 29, 2020 (unaudited)(showing percentage of total net assets)
Real Estate Securities Fund (continued)
| | | Shares or
Principal
Amount | | Value |
| SHORT-TERM INVESTMENTS – 0.2% | | | |
| Short-term funds – 0.2% | | | | | |
| State Street Institutional U.S. Government Money Market Fund, Premier Class, 1.5386% (B) | | 667,495 | | $ | 667,495 |
| TOTAL SHORT-TERM INVESTMENTS (Cost $667,495) | | | $ | 667,495 |
Total Investments (Real Estate Securities Fund)
(Cost $322,725,370) – 100.2% | | | | $ | 378,406,832 |
| Other assets and liabilities, net – (0.2%) | | | | (649,542) |
| TOTAL NET ASSETS – 100.0% | | | | $ | 377,757,290 |
| Security Abbreviations and Legend |
| (A) | Non-income producing security. |
| (B) | The rate shown is the annualized seven-day yield as of 2-29-20. |
Science & Technology Fund
| | | Shares or
Principal
Amount | | Value |
| COMMON STOCKS – 90.1% | | | |
| Communication services – 18.9% | | | | | |
| Entertainment – 2.1% | | | |
| Activision Blizzard, Inc. | | 20,300 | | $ | 1,180,039 |
| Electronic Arts, Inc. (A) | | 1,320 | | | 133,808 |
| Netflix, Inc. (A) | | 9,490 | | | 3,502,095 |
| Take-Two Interactive Software, Inc. (A) | | 2,575 | | | 276,761 |
| Zynga, Inc., Class A (A) | | 111,160 | | | 745,884 |
| | | | | | 5,838,587 |
| Interactive media and services – 16.5% | | | |
| 58.com, Inc., ADR (A) | | 90,422 | | | 4,988,582 |
| Alphabet, Inc., Class C (A) | | 12,942 | | | 17,333,610 |
| Facebook, Inc., Class A (A) | | 78,451 | | | 15,099,464 |
| Mail.Ru Group, Ltd., GDR (A) | | 186,658 | | | 3,650,105 |
| NAVER Corp. | | 28,692 | | | 4,118,471 |
| Yandex NV, Class A (A) | | 3,205 | | | 130,155 |
| | | | | | 45,320,387 |
| Media – 0.3% | | | |
| News Corp., Class A | | 56,683 | | | 684,447 |
| | | | | | 51,843,421 |
| Consumer discretionary – 15.2% | | | | | |
| Automobiles – 0.1% | | | |
| Tesla, Inc. (A) | | 605 | | | 404,134 |
| Internet and direct marketing retail – 15.1% | | | |
| Alibaba Group Holding, Ltd., ADR (A) | | 16,998 | | | 3,535,584 |
| Amazon.com, Inc. (A) | | 7,540 | | | 14,203,475 |
| Booking Holdings, Inc. (A) | | 4,145 | | | 7,028,511 |
| GrubHub, Inc. (A) | | 885 | | | 42,577 |
| Naspers, Ltd., N Shares | | 14,630 | | | 2,287,489 |
| Prosus NV (A) | | 15,118 | | | 1,057,200 |
| Tongcheng Elong Holdings, Ltd. (A) | | 158,000 | | | 244,852 |
| Trip.com Group, Ltd., ADR (A) | | 233,000 | | | 7,073,880 |
| Zalando SE (A)(B) | | 132,562 | | | 5,923,782 |
| | | | | | 41,397,350 |
| | | | | | 41,801,484 |
| Health care – 1.0% | | | | | |
| Health care equipment and supplies – 0.8% | | | |
| Intuitive Surgical, Inc. (A) | | 4,089 | | | 2,183,362 |
| Health care technology – 0.2% | | | |
| Veeva Systems, Inc., Class A (A) | | 3,975 | | | 564,331 |
| | | | | | 2,747,693 |
| Industrials – 1.2% | | | | | |
Science & Technology Fund (continued)
| | | Shares or
Principal
Amount | | Value |
| COMMON STOCKS (continued) | | | |
| Aerospace and defense – 1.0% | | | |
| The Boeing Company | | 10,168 | | $ | 2,797,318 |
| Electrical equipment – 0.1% | | | |
| Bloom Energy Corp., Class A (A)(C) | | 26,780 | | | 242,895 |
| Road and rail – 0.1% | | | |
| Uber Technologies, Inc. (A) | | 9,020 | | | 305,507 |
| | | | | | 3,345,720 |
| Information technology – 53.7% | | | | | |
| Communications equipment – 0.1% | | | |
| Telefonaktiebolaget LM Ericsson, ADR (C) | | 31,800 | | | 255,672 |
| Viavi Solutions, Inc. (A) | | 8,575 | | | 113,104 |
| | | | | | 368,776 |
| Electronic equipment, instruments and components – 0.2% | | | |
| CDW Corp. | | 1,660 | | | 189,605 |
| Cognex Corp. | | 4,830 | | | 215,128 |
| Flex, Ltd. (A) | | 10,910 | | | 121,210 |
| | | | | | 525,943 |
| IT services – 8.7% | | | |
| Adyen NV (A)(B) | | 315 | | | 277,246 |
| Akamai Technologies, Inc. (A) | | 14,720 | | | 1,273,427 |
| DXC Technology Company | | 26,685 | | | 643,375 |
| EPAM Systems, Inc. (A) | | 3,180 | | | 709,776 |
| Fidelity National Information Services, Inc. | | 4,717 | | | 659,059 |
| Fiserv, Inc. (A) | | 13,045 | | | 1,426,601 |
| Global Payments, Inc. | | 7,829 | | | 1,440,301 |
| Mastercard, Inc., Class A | | 8,145 | | | 2,364,086 |
| MongoDB, Inc. (A) | | 19,940 | | | 3,040,850 |
| Okta, Inc. (A) | | 35,355 | | | 4,527,561 |
| PayPal Holdings, Inc. (A) | | 6,615 | | | 714,354 |
| Shopify, Inc., Class A (A) | | 1,830 | | | 847,857 |
| Square, Inc., Class A (A) | | 21,030 | | | 1,752,430 |
| Twilio, Inc., Class A (A) | | 33,445 | | | 3,767,245 |
| Visa, Inc., Class A | | 1,405 | | | 255,373 |
| | | | | | 23,699,541 |
| Semiconductors and semiconductor equipment – 11.9% | | | |
| Advanced Micro Devices, Inc. (A) | | 58,405 | | | 2,656,259 |
| Applied Materials, Inc. | | 36,788 | | | 2,138,119 |
| ASML Holding NV | | 500 | | | 138,355 |
| Cree, Inc. (A) | | 10,745 | | | 480,624 |
| KLA Corp. | | 1,925 | | | 295,892 |
| Lam Research Corp. | | 11,995 | | | 3,519,693 |
| Marvell Technology Group, Ltd. | | 41,316 | | | 880,031 |
| Maxim Integrated Products, Inc. | | 47,358 | | | 2,634,052 |
| Micron Technology, Inc. (A) | | 106,520 | | | 5,598,691 |
| NVIDIA Corp. | | 25,044 | | | 6,763,633 |
| NXP Semiconductors NV | | 685 | | | 77,878 |
| QUALCOMM, Inc. | | 51,010 | | | 3,994,083 |
| STMicroelectronics NV | | 14,965 | | | 413,031 |
| STMicroelectronics NV (New York Stock Exchange) (C) | | 32,875 | | | 900,775 |
| Taiwan Semiconductor Manufacturing Company, Ltd., ADR | | 24,070 | | | 1,295,929 |
| Teradyne, Inc. | | 14,640 | | | 860,246 |
| | | | | | 32,647,291 |
| Software – 26.0% | | | |
| Alteryx, Inc., Class A (A) | | 33,985 | | | 4,744,986 |
| Atlassian Corp. PLC, Class A (A) | | 27,665 | | | 4,010,318 |
| Autodesk, Inc. (A) | | 3,180 | | | 606,998 |
| AVEVA Group PLC | | 4,490 | | | 255,421 |
| Coupa Software, Inc. (A) | | 2,545 | | | 381,114 |
| Crowdstrike Holdings, Inc., Class A (A) | | 78,235 | | | 4,665,935 |
| Datadog, Inc., Class A (A) | | 195 | | | 8,804 |
| DocuSign, Inc. (A) | | 2,755 | | | 237,784 |
| Dynatrace, Inc. (A) | | 2,910 | | | 93,993 |
| The accompanying notes are an integral part of the financial statements. | 41 | |
John Hancock Funds II
Portfolio of Investments — February 29, 2020 (unaudited)(showing percentage of total net assets)
Science & Technology Fund (continued)
| | | Shares or
Principal
Amount | | Value |
| COMMON STOCKS (continued) | | | |
| Software (continued) | | | |
| Fortinet, Inc. (A) | | 20,860 | | $ | 2,128,972 |
| HubSpot, Inc. (A) | | 930 | | | 166,889 |
| Intuit, Inc. | | 3,825 | | | 1,016,876 |
| Microsoft Corp. | | 93,486 | | | 15,145,667 |
| NortonLifeLock, Inc. | | 107,777 | | | 2,050,996 |
| Paycom Software, Inc. (A) | | 26,150 | | | 7,391,298 |
| Paylocity Holding Corp. (A) | | 3,045 | | | 394,388 |
| Proofpoint, Inc. (A) | | 4,475 | | | 477,259 |
| Rapid7, Inc. (A) | | 2,680 | | | 124,084 |
| RingCentral, Inc., Class A (A) | | 29,690 | | | 6,999,418 |
| salesforce.com, Inc. (A) | | 51,862 | | | 8,837,285 |
| ServiceNow, Inc. (A) | | 6,650 | | | 2,168,499 |
| Smartsheet, Inc., Class A (A) | | 5,745 | | | 265,994 |
| Splunk, Inc. (A) | | 10,445 | | | 1,538,862 |
| Synopsys, Inc. (A) | | 9,442 | | | 1,302,335 |
| Temenos AG (A) | | 1,765 | | | 252,355 |
| Workday, Inc., Class A (A) | | 19,116 | | | 3,311,847 |
| Zendesk, Inc. (A) | | 7,605 | | | 603,153 |
| Zscaler, Inc. (A)(C) | | 42,980 | | | 2,234,530 |
| | | | | | 71,416,060 |
| Technology hardware, storage and peripherals – 6.8% | | | |
| Apple, Inc. | | 16,025 | | | 4,380,594 |
| NetApp, Inc. | | 9,865 | | | 460,893 |
| Pure Storage, Inc., Class A (A) | | 325,136 | | | 4,961,575 |
| Samsung Electronics Company, Ltd. | | 194,982 | | | 8,776,403 |
| | | | | | 18,579,465 |
| | | | | | 147,237,076 |
| Real estate – 0.1% | | | | | |
| Equity real estate investment trusts – 0.1% | | | |
| Equinix, Inc. | | 350 | | | 200,480 |
| TOTAL COMMON STOCKS (Cost $213,029,560) | | $ | 247,175,874 |
| PREFERRED SECURITIES – 1.0% | | | | | |
| Communication services – 0.7% | | | | | |
| Media – 0.7% | | | |
| Airbnb, Inc., Series E (A)(D)(E) | | 16,398 | | | 1,742,779 |
| Industrials – 0.3% | | | | | |
| Road and rail – 0.3% | | | |
| DiDi Chuxing, Inc. (A)(D)(E) | | 16,798 | | | 855,557 |
| TOTAL PREFERRED SECURITIES (Cost $1,987,267) | | $ | 2,598,336 |
| SHORT-TERM INVESTMENTS – 12.8% | | | |
| Short-term funds – 8.3% | | | | | |
| John Hancock Collateral Trust, 1.6968% (F)(G) | | 375,978 | | | 3,763,121 |
| State Street Institutional U.S. Government Money Market Fund, Premier Class, 1.5386% (F) | | 2,000,000 | | | 2,000,000 |
| T. Rowe Price Government Reserve Fund, 1.5799% (F) | | 17,129,426 | | | 17,129,426 |
| | | | | | 22,892,547 |
Science & Technology Fund (continued)
| | | Shares or
Principal
Amount | | Value |
| SHORT-TERM INVESTMENTS (continued) | | | |
| Repurchase agreement – 4.5% | | | | | |
| Repurchase Agreement with State Street Corp. dated 2-28-20 at 0.550% to be repurchased at $12,285,563 on 3-2-20, collateralized by $12,270,000 U.S. Treasury Notes, 2.375% due 4-15-21(valued at $12,534,222) | $ | 12,285,000 | | $ | 12,285,000 |
| TOTAL SHORT-TERM INVESTMENTS (Cost $35,176,628) | | $ | 35,177,547 |
Total Investments (Science & Technology Fund)
(Cost $250,193,455) – 103.9% | | $ | 284,951,757 |
| Other assets and liabilities, net – (3.9%) | | | (10,699,171) |
| TOTAL NET ASSETS – 100.0% | | $ | 274,252,586 |
| Security Abbreviations and Legend |
| ADR | American Depositary Receipt |
| GDR | Global Depositary Receipt |
| (A) | Non-income producing security. |
| (B) | These securities are exempt from registration under Rule 144A of the Securities Act of 1933. Such securities may be resold, normally to qualified institutional buyers, in transactions exempt from registration. |
| (C) | All or a portion of this security is on loan as of 2-29-20. |
| (D) | Restricted security as to resale, excluding 144A securities. For more information on this security refer to the Notes to financial statements. |
| (E) | Security is valued using significant unobservable inputs and is classified as Level 3 in the fair value hierarchy. Refer to Note 2 to the financial statements. |
| (F) | The rate shown is the annualized seven-day yield as of 2-29-20. |
| (G) | Investment is an affiliate of the fund, the advisor and/or subadvisor. This security represents the investment of cash collateral received for securities lending. |
Strategic Equity Allocation Fund
| | | Shares or
Principal
Amount | | Value |
| COMMON STOCKS – 94.5% | | | |
| Communication services – 9.8% | | | | | |
| Diversified telecommunication services – 1.5% | | | |
| Anterix, Inc. (A) | | 1,394 | | $ | 65,309 |
| AT&T, Inc. | | 848,632 | | | 29,888,819 |
| ATN International, Inc. | | 1,419 | | | 76,484 |
| Bandwidth, Inc., Class A (A) | | 1,994 | | | 125,403 |
| BCE, Inc. | | 25,981 | | | 1,141,054 |
| BT Group PLC | | 585,950 | | | 1,074,935 |
| Cellnex Telecom SA (A)(B) | | 29,928 | | | 1,459,117 |
| CenturyLink, Inc. | | 113,988 | | | 1,375,835 |
| China Telecom Corp., Ltd., H Shares | | 1,829,296 | | | 691,487 |
| China Tower Corp., Ltd., H Shares (B) | | 5,558,400 | | | 1,372,821 |
| China Unicom Hong Kong, Ltd. | | 811,816 | | | 652,349 |
| Chunghwa Telecom Company, Ltd. | | 850,479 | | | 3,014,161 |
| Cincinnati Bell, Inc. (A) | | 6,294 | | | 82,137 |
| Cogent Communications Holdings, Inc. | | 5,204 | | | 379,944 |
| Consolidated Communications Holdings, Inc. | | 9,358 | | | 58,207 |
| Deutsche Telekom AG | | 442,520 | | | 7,249,135 |
| Elisa OYJ | | 17,291 | | | 995,985 |
| HKT Trust & HKT, Ltd. | | 221,322 | | | 333,232 |
| IDT Corp., Class B (A) | | 2,301 | | | 17,718 |
| Iliad SA | | 3,561 | | | 500,549 |
| Intelsat SA (A)(C) | | 8,582 | | | 33,127 |
| Iridium Communications, Inc. (A) | | 12,278 | | | 332,365 |
| Koninklijke KPN NV | | 441,020 | | | 1,069,635 |
| The accompanying notes are an integral part of the financial statements. | 42 | |
John Hancock Funds II
Portfolio of Investments — February 29, 2020 (unaudited)(showing percentage of total net assets)
Strategic Equity Allocation Fund (continued)
| | | Shares or
Principal
Amount | | Value |
| COMMON STOCKS (continued) | | | |
| Diversified telecommunication services (continued) | | | |
| LG Uplus Corp. | | 21,438 | | $ | 233,100 |
| Nippon Telegraph & Telephone Corp. | | 164,900 | | | 3,847,079 |
| Ooma, Inc. (A) | | 2,688 | | | 34,487 |
| Orange Polska SA (A) | | 38,115 | | | 60,595 |
| Orange SA | | 266,699 | | | 3,589,328 |
| ORBCOMM, Inc. (A) | | 10,111 | | | 33,467 |
| PCCW, Ltd. | | 225,000 | | | 135,968 |
| Proximus SADP | | 4,359 | | | 108,256 |
| Singapore Telecommunications, Ltd. | | 106,650 | | | 231,102 |
| Singapore Telecommunications, Ltd. | | 229,178 | | | 497,308 |
| Spark New Zealand, Ltd. | | 123,435 | | | 351,149 |
| Swisscom AG | | 3,411 | | | 1,820,718 |
| Telecom Italia SpA (A) | | 792,863 | | | 440,967 |
| Telecom Italia SpA | | 479,635 | | | 268,345 |
| Telefonica Deutschland Holding AG | | 113,249 | | | 297,980 |
| Telefonica SA | | 561,614 | | | 3,342,275 |
| Telekom Malaysia BHD | | 120,318 | | | 106,251 |
| Telekomunikasi Indonesia Persero Tbk PT | | 1,299,360 | | | 316,816 |
| Telenor ASA | | 37,398 | | | 605,902 |
| Telia Company AB | | 375,025 | | | 1,485,155 |
| Telkom SA SOC, Ltd. | | 22,557 | | | 38,373 |
| Telstra Corp., Ltd. | | 597,688 | | | 1,347,956 |
| TELUS Corp. | | 33,343 | | | 1,203,304 |
| TPG Telecom, Ltd. | | 52,974 | | | 261,997 |
| True Corp. PCL, NVDR (C) | | 617,000 | | | 66,537 |
| United Internet AG | | 13,571 | | | 409,958 |
| Verizon Communications, Inc. | | 480,461 | | | 26,021,768 |
| Vonage Holdings Corp. (A) | | 27,896 | | | 249,948 |
| | | | | | 99,395,897 |
| Entertainment – 1.7% | | | |
| Activision Blizzard, Inc. | | 155,880 | | | 9,061,304 |
| Alibaba Pictures Group, Ltd. (A) | | 1,900,500 | | | 259,335 |
| AMC Entertainment Holdings, Inc., Class A (C) | | 6,466 | | | 40,477 |
| Bollore SA | | 115,523 | | | 399,510 |
| CD Projekt SA | | 4,012 | | | 287,864 |
| Cinemark Holdings, Inc. | | 27,328 | | | 709,435 |
| Electronic Arts, Inc. (A) | | 59,242 | | | 6,005,362 |
| Eros International PLC (A)(C) | | 9,175 | | | 21,194 |
| Glu Mobile, Inc. (A) | | 14,480 | | | 103,098 |
| Huya, Inc., ADR (A) | | 8,100 | | | 160,461 |
| IMAX Corp. (A) | | 6,549 | | | 102,033 |
| iQIYI, Inc., ADR (A) | | 16,900 | | | 379,067 |
| Konami Holdings Corp. | | 11,700 | | | 421,473 |
| Liberty Media Corp.-Liberty Braves, Class A (A) | | 1,435 | | | 37,339 |
| Liberty Media Corp.-Liberty Braves, Class C (A) | | 4,344 | | | 112,857 |
| Live Nation Entertainment, Inc. (A) | | 28,592 | | | 1,737,536 |
| NCSoft Corp. | | 3,233 | | | 1,728,197 |
| NetEase, Inc., ADR | | 9,404 | | | 2,997,149 |
| Netflix, Inc. (A) | | 88,921 | | | 32,814,517 |
| Netmarble Corp. (A)(B) | | 5,063 | | | 372,004 |
| Nexon Company, Ltd. (A) | | 62,800 | | | 993,116 |
| Nintendo Company, Ltd. | | 14,339 | | | 4,806,923 |
| Pearl Abyss Corp. (A) | | 1,253 | | | 185,208 |
| Reading International, Inc., Class A (A) | | 2,622 | | | 21,841 |
| Square Enix Holdings Company, Ltd. | | 11,700 | | | 473,695 |
| Take-Two Interactive Software, Inc. (A) | | 22,964 | | | 2,468,171 |
| Tencent Music Entertainment Group, ADR (A) | | 12,400 | | | 150,412 |
| The Marcus Corp. | | 2,851 | | | 76,179 |
| The Walt Disney Company | | 365,706 | | | 43,025,311 |
| Toho Company, Ltd. | | 14,200 | | | 438,340 |
| Ubisoft Entertainment SA (A) | | 11,287 | | | 846,468 |
Strategic Equity Allocation Fund (continued)
| | | Shares or
Principal
Amount | | Value |
| COMMON STOCKS (continued) | | | |
| Entertainment (continued) | | | |
| Vivendi SA | | 113,878 | | $ | 2,909,497 |
| World Wrestling Entertainment, Inc., Class A (C) | | 12,166 | | | 569,004 |
| | | | | | 114,714,377 |
| Interactive media and services – 4.6% | | | |
| 58.com, Inc., ADR (A) | | 12,500 | | | 689,625 |
| Alphabet, Inc., Class A (A) | | 60,794 | | | 81,418,365 |
| Alphabet, Inc., Class C (A) | | 60,645 | | | 81,223,668 |
| Auto Trader Group PLC (B) | | 62,268 | | | 419,285 |
| Autohome, Inc., ADR (A)(C) | | 7,800 | | | 605,826 |
| Baidu, Inc., ADR (A) | | 36,700 | | | 4,403,266 |
| CarGurus, Inc. (A) | | 9,280 | | | 236,547 |
| Cars.com, Inc. (A) | | 8,365 | | | 75,954 |
| DHI Group, Inc. (A) | | 6,915 | | | 15,766 |
| Eventbrite, Inc., Class A (A) | | 4,586 | | | 67,001 |
| EverQuote, Inc., Class A (A) | | 1,092 | | | 44,357 |
| Facebook, Inc., Class A (A) | | 488,272 | | | 93,977,712 |
| JOYY, Inc., ADR (A) | | 7,700 | | | 415,569 |
| Kakaku.com, Inc. | | 16,900 | | | 360,902 |
| Kakao Corp. | | 9,908 | | | 1,421,218 |
| Liberty TripAdvisor Holdings, Inc., Class A (A) | | 9,343 | | | 40,689 |
| LINE Corp. (A) | | 7,600 | | | 377,832 |
| Momo, Inc., ADR | | 19,900 | | | 559,588 |
| NAVER Corp. | | 27,533 | | | 3,952,108 |
| QuinStreet, Inc. (A) | | 5,705 | | | 73,480 |
| REA Group, Ltd. | | 7,480 | | | 485,567 |
| SINA Corp. (A) | | 8,300 | | | 271,825 |
| Tencent Holdings, Ltd. | | 759,212 | | | 38,495,619 |
| The Meet Group, Inc. (A) | | 8,845 | | | 45,110 |
| TripAdvisor, Inc. | | 26,935 | | | 631,626 |
| TrueCar, Inc. (A) | | 13,215 | | | 34,755 |
| Twitter, Inc. (A) | | 157,523 | | | 5,229,764 |
| Weibo Corp., ADR (A) | | 7,400 | | | 311,836 |
| Yelp, Inc. (A) | | 24,876 | | | 777,873 |
| Z Holdings Corp. | | 339,907 | | | 1,233,963 |
| | | | | | 317,896,696 |
| Media – 1.3% | | | |
| Altice Europe NV (A) | | 84,120 | | | 446,751 |
| AMC Networks, Inc., Class A (A) | | 11,298 | | | 350,238 |
| Boston Omaha Corp., Class A (A) | | 1,365 | | | 26,563 |
| Cable One, Inc. | | 1,288 | | | 2,026,050 |
| Cardlytics, Inc. (A) | | 1,760 | | | 139,726 |
| Central European Media Enterprises, Ltd., Class A (A) | | 11,479 | | | 50,852 |
| Charter Communications, Inc., Class A (A) | | 31,812 | | | 15,688,724 |
| Cheil Worldwide, Inc. | | 13,421 | | | 213,556 |
| China Literature, Ltd. (A)(B) | | 33,800 | | | 156,169 |
| Clear Channel Outdoor Holdings, Inc. (A) | | 7,034 | | | 14,560 |
| Comcast Corp., Class A | | 921,125 | | | 37,241,084 |
| comScore, Inc. (A) | | 6,523 | | | 22,831 |
| Cumulus Media, Inc., Class A (A) | | 1,828 | | | 22,027 |
| CyberAgent, Inc. | | 12,900 | | | 488,526 |
| Cyfrowy Polsat SA | | 13,958 | | | 90,322 |
| Daily Journal Corp. (A)(C) | | 141 | | | 35,250 |
| Dentsu Group, Inc. | | 27,544 | | | 712,243 |
| Discovery, Inc., Series A (A)(C) | | 32,086 | | | 824,610 |
| Discovery, Inc., Series C (A) | | 68,058 | | | 1,708,256 |
| DISH Network Corp., Class A (A) | | 51,946 | | | 1,741,230 |
| Emerald Holding, Inc. | | 3,388 | | | 23,242 |
| Entercom Communications Corp., Class A | | 15,056 | | | 52,244 |
| Entravision Communications Corp., Class A | | 8,549 | | | 17,183 |
| Eutelsat Communications SA | | 23,099 | | | 312,339 |
| Fox Corp., Class A | | 71,930 | | | 2,211,128 |
| The accompanying notes are an integral part of the financial statements. | 43 | |
John Hancock Funds II
Portfolio of Investments — February 29, 2020 (unaudited)(showing percentage of total net assets)
Strategic Equity Allocation Fund (continued)
| | | Shares or
Principal
Amount | | Value |
| COMMON STOCKS (continued) | | | |
| Media (continued) | | | |
| Fox Corp., Class B | | 32,944 | | $ | 1,003,145 |
| Gannett Company, Inc. | | 15,060 | | | 63,252 |
| Gray Television, Inc. (A) | | 11,248 | | | 212,812 |
| Grupo Televisa SAB | | 295,197 | | | 556,110 |
| Hakuhodo DY Holdings, Inc. | | 29,600 | | | 342,072 |
| Hemisphere Media Group, Inc. (A) | | 2,311 | | | 29,188 |
| Informa PLC | | 86,333 | | | 764,084 |
| ITV PLC | | 251,374 | | | 382,004 |
| JCDecaux SA | | 11,452 | | | 264,645 |
| John Wiley & Sons, Inc., Class A | | 11,215 | | | 417,086 |
| Liberty Latin America, Ltd., Class A (A) | | 6,085 | | | 92,188 |
| Liberty Latin America, Ltd., Class C (A) | | 13,803 | | | 209,668 |
| Loral Space & Communications, Inc. (A) | | 1,679 | | | 52,150 |
| Marchex, Inc., Class B (A) | | 5,266 | | | 13,639 |
| MDC Partners, Inc., Class A (A) | | 7,771 | | | 19,505 |
| Media General, Inc. (A)(D) | | 18,354 | | | 1,762 |
| Megacable Holdings SAB de CV | | 36,900 | | | 123,919 |
| Meredith Corp. (C) | | 15,283 | | | 402,707 |
| MSG Networks, Inc., Class A (A) | | 5,416 | | | 68,458 |
| MultiChoice Group, Ltd. (A) | | 37,041 | | | 216,427 |
| National CineMedia, Inc. | | 8,007 | | | 61,574 |
| News Corp., Class A | | 78,844 | | | 952,041 |
| News Corp., Class B | | 24,703 | | | 307,305 |
| Omnicom Group, Inc. | | 44,178 | | | 3,060,652 |
| Pearson PLC | | 53,763 | | | 390,008 |
| Publicis Groupe SA | | 28,959 | | | 1,126,193 |
| Quebecor, Inc., Class B | | 29,073 | | | 679,254 |
| Schibsted ASA, B Shares | | 5,122 | | | 123,816 |
| Scholastic Corp. | | 3,752 | | | 120,402 |
| SES SA | | 48,691 | | | 558,309 |
| Shaw Communications, Inc., Class B | | 75,281 | | | 1,302,870 |
| Singapore Press Holdings, Ltd. | | 67,100 | | | 92,333 |
| TechTarget, Inc. (A) | | 2,825 | | | 65,342 |
| TEGNA, Inc. | | 82,328 | | | 1,178,937 |
| Telenet Group Holding NV | | 1,184 | | | 45,541 |
| The EW Scripps Company, Class A | | 6,867 | | | 81,717 |
| The Interpublic Group of Companies, Inc. | | 78,671 | | | 1,680,413 |
| The New York Times Company, Class A | | 36,851 | | | 1,380,438 |
| Tribune Publishing Company | | 2,235 | | | 25,635 |
| ViacomCBS, Inc., Class B | | 109,648 | | | 2,698,437 |
| WideOpenWest, Inc. (A) | | 3,180 | | | 20,002 |
| WPP PLC | | 88,064 | | | 846,124 |
| | | | | | 86,647,868 |
| Wireless telecommunication services – 0.7% | | | |
| Advanced Info Service PCL, NVDR | | 64,400 | | | 413,297 |
| America Movil SAB de CV, Series L | | 4,106,800 | | | 3,248,635 |
| Axiata Group BHD | | 283,453 | | | 283,521 |
| Boingo Wireless, Inc. (A)(C) | | 5,536 | | | 70,141 |
| China Mobile, Ltd. | | 814,470 | | | 6,482,050 |
| DiGi.Com BHD | | 308,720 | | | 307,820 |
| Empresa Nacional de Telecomunicaciones SA (A) | | 19,380 | | | 103,288 |
| Far EasTone Telecommunications Company, Ltd. | | 347,595 | | | 754,220 |
| Globe Telecom, Inc. | | 4,170 | | | 145,712 |
| Gogo, Inc. (A)(C) | | 7,176 | | | 25,905 |
| Intouch Holdings PCL, NVDR | | 123,000 | | | 213,107 |
| KDDI Corp. | | 226,467 | | | 6,398,498 |
| Maxis BHD | | 243,660 | | | 317,593 |
| Millicom International Cellular SA | | 13,115 | | | 605,791 |
| MTN Group, Ltd. | | 144,496 | | | 688,882 |
| NTT DOCOMO, Inc. | | 170,900 | | | 4,626,070 |
| PLDT, Inc. | | 10,795 | | | 209,896 |
| Rogers Communications, Inc., Class B | | 57,069 | | | 2,615,246 |
| Shenandoah Telecommunications Company | | 5,946 | | | 264,181 |
Strategic Equity Allocation Fund (continued)
| | | Shares or
Principal
Amount | | Value |
| COMMON STOCKS (continued) | | | |
| Wireless telecommunication services (continued) | | | |
| SK Telecom Company, Ltd. | | 3,942 | | $ | 690,176 |
| Softbank Corp. | | 214,600 | | | 2,819,315 |
| SoftBank Group Corp. | | 200,952 | | | 9,335,884 |
| Spok Holdings, Inc. | | 2,521 | | | 25,109 |
| Taiwan Mobile Company, Ltd. | | 361,000 | | | 1,245,189 |
| Tele2 AB, B Shares | | 68,451 | | | 996,521 |
| Telephone & Data Systems, Inc. | | 25,072 | | | 504,950 |
| TIM Participacoes SA | | 30,289 | | | 109,251 |
| T-Mobile US, Inc. (A) | | 36,776 | | | 3,315,724 |
| Total Access Communication PCL, NVDR | | 38,400 | | | 45,089 |
| Turkcell Iletisim Hizmetleri AS | | 59,286 | | | 131,907 |
| Vodacom Group, Ltd. | | 55,434 | | | 396,367 |
| Vodafone Group PLC | | 1,868,866 | | | 3,266,305 |
| XL Axiata Tbk PT (A) | | 98,800 | | | 18,172 |
| | | | | | 50,673,812 |
| | | | | | 669,328,650 |
| Consumer discretionary – 9.7% | | | | | |
| Auto components – 0.5% | | | |
| Adient PLC (A) | | 33,177 | | | 793,926 |
| Aisin Seiki Company, Ltd. | | 20,900 | | | 672,244 |
| American Axle & Manufacturing Holdings, Inc. (A) | | 14,039 | | | 88,867 |
| Aptiv PLC | | 17,868 | | | 1,395,669 |
| BorgWarner, Inc. | | 14,452 | | | 456,683 |
| Bridgestone Corp. | | 72,600 | | | 2,406,010 |
| Cheng Shin Rubber Industry Company, Ltd. | | 429,730 | | | 554,757 |
| China First Capital Group, Ltd. (A) | | 306,700 | | | 8,511 |
| Cie Generale des Etablissements Michelin SCA | | 22,938 | | | 2,458,189 |
| Continental AG | | 14,601 | | | 1,669,739 |
| Cooper Tire & Rubber Company | | 6,231 | | | 158,828 |
| Cooper-Standard Holdings, Inc. (A) | | 2,148 | | | 37,117 |
| Dana, Inc. | | 54,692 | | | 786,471 |
| Delphi Technologies PLC (A) | | 22,064 | | | 311,544 |
| Denso Corp. | | 55,316 | | | 2,128,208 |
| Dorman Products, Inc. (A) | | 3,317 | | | 201,143 |
| Faurecia SE | | 10,299 | | | 470,946 |
| Fox Factory Holding Corp. (A) | | 4,655 | | | 295,127 |
| Fuyao Glass Industry Group Company, Ltd., H Shares (B) | | 63,900 | | | 185,189 |
| Gentex Corp. | | 64,849 | | | 1,731,468 |
| Gentherm, Inc. (A) | | 4,072 | | | 166,056 |
| Hankook Tire & Technology Company, Ltd. | | 14,857 | | | 312,666 |
| Hanon Systems | | 36,452 | | | 317,007 |
| Hyundai Mobis Company, Ltd. | | 13,157 | | | 2,299,694 |
| Koito Manufacturing Company, Ltd. | | 13,376 | | | 524,001 |
| LCI Industries | | 2,996 | | | 289,264 |
| Lear Corp. | | 14,106 | | | 1,568,587 |
| Linamar Corp. | | 510 | | | 14,028 |
| Magna International, Inc. | | 46,956 | | | 2,137,115 |
| Modine Manufacturing Company (A) | | 6,497 | | | 48,468 |
| Motorcar Parts of America, Inc. (A) | | 2,409 | | | 40,327 |
| Nexteer Automotive Group, Ltd. | | 115,950 | | | 86,604 |
| NGK Spark Plug Company, Ltd. | | 19,900 | | | 323,101 |
| Nokian Renkaat OYJ | | 15,382 | | | 402,628 |
| Pirelli & C. SpA (B) | | 32,463 | | | 154,571 |
| Standard Motor Products, Inc. | | 2,562 | | | 112,728 |
| Stanley Electric Company, Ltd. | | 16,500 | | | 397,470 |
| Stoneridge, Inc. (A) | | 3,293 | | | 72,775 |
| Sumitomo Electric Industries, Ltd. | | 97,100 | | | 1,146,137 |
| Sumitomo Rubber Industries, Ltd. | | 21,600 | | | 224,156 |
| Tenneco, Inc., Class A | | 6,381 | | | 58,514 |
| The Goodyear Tire & Rubber Company | | 59,618 | | | 577,400 |
| The accompanying notes are an integral part of the financial statements. | 44 | |
John Hancock Funds II
Portfolio of Investments — February 29, 2020 (unaudited)(showing percentage of total net assets)
Strategic Equity Allocation Fund (continued)
| | | Shares or
Principal
Amount | | Value |
| COMMON STOCKS (continued) | | | |
| Auto components (continued) | | | |
| The Yokohama Rubber Company, Ltd. | | 14,600 | | $ | 237,325 |
| Toyoda Gosei Company, Ltd. | | 8,200 | | | 173,235 |
| Toyota Industries Corp. | | 18,829 | | | 982,092 |
| Valeo SA | | 32,390 | | | 823,395 |
| Visteon Corp. (A) | | 10,616 | | | 690,465 |
| | | | | | 30,990,445 |
| Automobiles – 0.9% | | | |
| Astra International Tbk PT | | 530,108 | | | 207,431 |
| BAIC Motor Corp., Ltd., H Shares (B) | | 221,700 | | | 110,284 |
| Bayerische Motoren Werke AG | | 44,113 | | | 2,910,695 |
| Brilliance China Automotive Holdings, Ltd. | | 400,300 | | | 346,487 |
| BYD Company, Ltd., H Shares (C) | | 83,194 | | | 517,939 |
| Daimler AG | | 121,254 | | | 5,101,725 |
| Dongfeng Motor Group Company, Ltd., H Shares | | 359,680 | | | 288,657 |
| Ferrari NV | | 10,110 | | | 1,592,505 |
| Fiat Chrysler Automobiles NV | | 91,545 | | | 1,153,524 |
| Ford Motor Company | | 272,548 | | | 1,896,934 |
| Ford Otomotiv Sanayi AS | | 3,294 | | | 41,576 |
| Geely Automobile Holdings, Ltd. | | 661,000 | | | 1,207,477 |
| General Motors Company | | 88,001 | | | 2,684,031 |
| Great Wall Motor Company, Ltd., H Shares | | 409,750 | | | 303,149 |
| Guangzhou Automobile Group Company, Ltd., H Shares | | 385,346 | | | 437,228 |
| Harley-Davidson, Inc. | | 10,799 | | | 329,046 |
| Honda Motor Company, Ltd. | | 209,627 | | | 5,377,862 |
| Hyundai Motor Company | | 29,336 | | | 2,802,327 |
| Isuzu Motors, Ltd. | | 70,600 | | | 660,527 |
| Kia Motors Corp. | | 51,933 | | | 1,567,068 |
| Mazda Motor Corp. | | 71,880 | | | 492,125 |
| Mitsubishi Motors Corp. | | 83,000 | | | 272,728 |
| NIO, Inc., ADR (A)(C) | | 87,000 | | | 359,310 |
| Nissan Motor Company, Ltd. | | 296,425 | | | 1,270,432 |
| Peugeot SA | | 79,013 | | | 1,531,198 |
| Renault SA | | 25,762 | | | 765,759 |
| Subaru Corp. | | 78,900 | | | 1,909,646 |
| Suzuki Motor Corp. | | 47,000 | | | 1,891,097 |
| Thor Industries, Inc. | | 14,150 | | | 1,067,052 |
| Toyota Motor Corp. | | 292,700 | | | 19,220,050 |
| Volkswagen AG | | 4,134 | | | 702,207 |
| Winnebago Industries, Inc. | | 3,798 | | | 197,078 |
| Yamaha Motor Company, Ltd. | | 36,000 | | | 568,273 |
| | | | | | 59,783,427 |
| Distributors – 0.1% | | | |
| Core-Mark Holding Company, Inc. | | 5,680 | | | 130,697 |
| Funko, Inc., Class A (A) | | 2,712 | | | 21,994 |
| Genuine Parts Company | | 32,339 | | | 2,821,254 |
| Jardine Cycle & Carriage, Ltd. | | 4,254 | | | 83,581 |
| LKQ Corp. (A) | | 68,213 | | | 2,017,741 |
| Pool Corp. | | 10,264 | | | 2,165,293 |
| Weyco Group, Inc. | | 890 | | | 19,527 |
| | | | | | 7,260,087 |
| Diversified consumer services – 0.2% | | | |
| Adtalem Global Education, Inc. (A) | | 20,531 | | | 633,792 |
| American Public Education, Inc. (A) | | 1,934 | | | 43,051 |
| Benesse Holdings, Inc. | | 9,000 | | | 231,168 |
| Carriage Services, Inc. | | 2,036 | | | 43,061 |
| Chegg, Inc. (A)(C) | | 14,566 | | | 571,133 |
| China East Education Holdings, Ltd. (A)(B) | | 56,500 | | | 117,287 |
| China Education Group Holdings, Ltd. | | 78,000 | | | 112,244 |
| Cogna Educacao | | 49,980 | | | 112,770 |
Strategic Equity Allocation Fund (continued)
| | | Shares or
Principal
Amount | | Value |
| COMMON STOCKS (continued) | | | |
| Diversified consumer services (continued) | | | |
| Collectors Universe, Inc. | | 1,181 | | $ | 27,169 |
| Graham Holdings Company, Class B | | 1,115 | | | 560,711 |
| Grand Canyon Education, Inc. (A) | | 12,362 | | | 997,366 |
| H&R Block, Inc. | | 22,095 | | | 456,704 |
| Houghton Mifflin Harcourt Company (A) | | 13,495 | | | 73,818 |
| K12, Inc. (A) | | 4,808 | | | 95,583 |
| Laureate Education, Inc., Class A (A) | | 14,273 | | | 266,905 |
| New Oriental Education & Technology Group, Inc., ADR (A) | | 19,000 | | | 2,429,910 |
| OneSpaWorld Holdings, Ltd. (A)(C) | | 5,687 | | | 69,495 |
| Perdoceo Education Corp. (A) | | 8,489 | | | 126,741 |
| Regis Corp. (A) | | 2,976 | | | 37,974 |
| Select Interior Concepts, Inc., Class A (A) | | 2,777 | | | 20,744 |
| Service Corp. International | | 46,856 | | | 2,239,248 |
| Strategic Education, Inc. | | 2,638 | | | 388,788 |
| TAL Education Group, ADR (A) | | 51,062 | | | 2,777,262 |
| WW International, Inc. (A) | | 17,710 | | | 531,300 |
| | | | | | 12,964,224 |
| Hotels, restaurants and leisure – 1.4% | | | |
| Accor SA | | 23,296 | | | 847,341 |
| Alsea SAB de CV (A) | | 64,100 | | | 130,362 |
| Altus San Nicolas Corp. (A)(D) | | 4,667 | | | 474 |
| AmRest Holdings SE (A) | | 4,071 | | | 42,250 |
| Aristocrat Leisure, Ltd. | | 82,467 | | | 1,808,829 |
| BBX Capital Corp. | | 8,911 | | | 31,010 |
| Biglari Holdings, Inc., Class B (A) | | 133 | | | 14,026 |
| BJ's Restaurants, Inc. | | 2,472 | | | 81,452 |
| Bloomin' Brands, Inc. | | 10,721 | | | 192,871 |
| Boyd Gaming Corp. | | 30,474 | | | 813,961 |
| Brinker International, Inc. | | 14,216 | | | 488,320 |
| Caesars Entertainment Corp. (A) | | 143,078 | | | 1,818,521 |
| Carnival Corp. | | 45,329 | | | 1,516,708 |
| Carnival PLC | | 11,362 | | | 359,389 |
| Carrols Restaurant Group, Inc. (A) | | 4,682 | | | 19,313 |
| Century Casinos, Inc. (A) | | 4,001 | | | 27,927 |
| Chipotle Mexican Grill, Inc. (A) | | 2,894 | | | 2,238,741 |
| Choice Hotels International, Inc. | | 8,143 | | | 743,293 |
| Churchill Downs, Inc. | | 13,404 | | | 1,684,079 |
| Chuy's Holdings, Inc. (A) | | 2,073 | | | 44,445 |
| Compass Group PLC | | 110,081 | | | 2,425,352 |
| Cracker Barrel Old Country Store, Inc. (C) | | 9,050 | | | 1,297,137 |
| Crown Resorts, Ltd. | | 52,994 | | | 353,655 |
| Darden Restaurants, Inc. | | 13,874 | | | 1,352,715 |
| Dave & Buster's Entertainment, Inc. (C) | | 3,852 | | | 127,155 |
| Del Taco Restaurants, Inc. (A) | | 3,857 | | | 24,685 |
| Denny's Corp. (A) | | 7,236 | | | 125,979 |
| Dine Brands Global, Inc. | | 1,972 | | | 161,408 |
| Domino's Pizza, Inc. | | 9,906 | | | 3,362,691 |
| Drive Shack, Inc. (A) | | 8,234 | | | 23,549 |
| Dunkin' Brands Group, Inc. | | 21,237 | | | 1,412,685 |
| El Pollo Loco Holdings, Inc. (A) | | 2,593 | | | 33,450 |
| Eldorado Resorts, Inc. (A)(C) | | 24,894 | | | 1,249,181 |
| Everi Holdings, Inc. (A) | | 8,579 | | | 89,222 |
| Fiesta Restaurant Group, Inc. (A) | | 3,185 | | | 30,767 |
| Flight Centre Travel Group, Ltd. | | 7,856 | | | 168,506 |
| Flutter Entertainment PLC | | 9,883 | | | 1,050,963 |
| Galaxy Entertainment Group, Ltd. | | 136,000 | | | 925,650 |
| Genting BHD | | 224,900 | | | 265,145 |
| Genting Malaysia BHD | | 309,460 | | | 213,319 |
| Genting Singapore, Ltd. | | 256,800 | | | 151,377 |
| Golden Entertainment, Inc. (A) | | 2,287 | | | 37,232 |
| GVC Holdings PLC | | 40,585 | | | 417,261 |
| Haidilao International Holding, Ltd. (B) | | 47,000 | | | 195,428 |
| Hilton Worldwide Holdings, Inc. | | 31,930 | | | 3,103,596 |
| Huazhu Group, Ltd., ADR | | 17,700 | | | 597,375 |
| The accompanying notes are an integral part of the financial statements. | 45 | |
John Hancock Funds II
Portfolio of Investments — February 29, 2020 (unaudited)(showing percentage of total net assets)
Strategic Equity Allocation Fund (continued)
| | | Shares or
Principal
Amount | | Value |
| COMMON STOCKS (continued) | | | |
| Hotels, restaurants and leisure (continued) | | | |
| InterContinental Hotels Group PLC | | 11,856 | | $ | 656,913 |
| J Alexander's Holdings, Inc. (A) | | 1,838 | | | 15,090 |
| Jack in the Box, Inc. | | 9,257 | | | 637,437 |
| Jollibee Foods Corp. | | 53,660 | | | 179,430 |
| Kangwon Land, Inc. (A) | | 23,139 | | | 436,397 |
| Las Vegas Sands Corp. | | 38,242 | | | 2,229,891 |
| Lindblad Expeditions Holdings, Inc. (A) | | 2,976 | | | 35,414 |
| Marriott International, Inc., Class A | | 30,708 | | | 3,807,792 |
| Marriott Vacations Worldwide Corp. | | 14,691 | | | 1,421,795 |
| McDonald's Corp. | | 85,222 | | | 16,547,556 |
| McDonald's Holdings Company Japan, Ltd. | | 8,100 | | | 341,647 |
| Melco Resorts & Entertainment, Ltd., ADR | | 13,700 | | | 237,558 |
| MGM Resorts International | | 58,277 | | | 1,431,283 |
| Minor International PCL, NVDR | | 147,600 | | | 130,469 |
| Monarch Casino & Resort, Inc. (A) | | 1,489 | | | 70,400 |
| Nathan's Famous, Inc. | | 385 | | | 22,908 |
| Noodles & Company (A) | | 3,942 | | | 32,009 |
| Norwegian Cruise Line Holdings, Ltd. (A) | | 24,076 | | | 897,072 |
| Oriental Land Company, Ltd. | | 25,600 | | | 2,914,686 |
| Papa John's International, Inc. (C) | | 8,389 | | | 483,290 |
| Penn National Gaming, Inc. (A) | | 41,530 | | | 1,228,042 |
| PlayAGS, Inc. (A) | | 3,500 | | | 33,915 |
| RCI Hospitality Holdings, Inc. | | 1,251 | | | 25,208 |
| Red Robin Gourmet Burgers, Inc. (A) | | 1,667 | | | 45,843 |
| Red Rock Resorts, Inc., Class A | | 8,709 | | | 179,492 |
| Restaurant Brands International, Inc. | | 41,538 | | | 2,448,181 |
| Royal Caribbean Cruises, Ltd. | | 19,452 | | | 1,564,135 |
| Ruth's Hospitality Group, Inc. | | 3,523 | | | 67,395 |
| Sands China, Ltd. | | 152,852 | | | 732,692 |
| Scientific Games Corp. (A) | | 20,828 | | | 379,903 |
| SeaWorld Entertainment, Inc. (A)(C) | | 5,799 | | | 157,791 |
| Shake Shack, Inc., Class A (A) | | 3,580 | | | 212,795 |
| Six Flags Entertainment Corp. | | 20,151 | | | 509,417 |
| SJM Holdings, Ltd. | | 119,384 | | | 138,230 |
| Sodexo SA | | 11,715 | | | 1,132,253 |
| Starbucks Corp. | | 133,645 | | | 10,481,777 |
| Tabcorp Holdings, Ltd. | | 287,528 | | | 716,272 |
| Target Hospitality Corp. (A) | | 4,464 | | | 20,892 |
| Texas Roadhouse, Inc. | | 24,899 | | | 1,399,822 |
| The Cheesecake Factory, Inc. (C) | | 15,704 | | | 559,534 |
| The Habit Restaurants, Inc., Class A (A) | | 2,767 | | | 38,627 |
| The Stars Group, Inc. (A) | | 36,141 | | | 828,234 |
| The Wendy's Company | | 47,178 | | | 890,721 |
| TUI AG | | 30,523 | | | 240,830 |
| Twin River Worldwide Holdings, Inc. | | 2,291 | | | 59,566 |
| Whitbread PLC | | 9,154 | | | 461,682 |
| Wingstop, Inc. | | 3,625 | | | 306,131 |
| Wyndham Destinations, Inc. | | 23,252 | | | 927,755 |
| Wyndham Hotels & Resorts, Inc. | | 24,396 | | | 1,242,976 |
| Wynn Macau, Ltd. | | 97,350 | | | 202,184 |
| Wynn Resorts, Ltd. | | 10,934 | | | 1,180,653 |
| Yum China Holdings, Inc. | | 47,508 | | | 2,080,375 |
| Yum! Brands, Inc. | | 34,228 | | | 3,054,849 |
| | | | | | 98,176,004 |
| Household durables – 0.6% | | | |
| Arcelik AS (A) | | 10,830 | | | 32,446 |
| Barratt Developments PLC | | 70,672 | | | 697,644 |
| Bassett Furniture Industries, Inc. | | 1,471 | | | 14,519 |
| Beazer Homes USA, Inc. (A) | | 3,630 | | | 44,504 |
| Casio Computer Company, Ltd. | | 24,900 | | | 424,195 |
| Cavco Industries, Inc. (A) | | 1,076 | | | 217,051 |
| Century Communities, Inc. (A) | | 3,220 | | | 107,323 |
| Coway Company, Ltd. | | 10,145 | | | 578,262 |
| D.R. Horton, Inc. | | 38,397 | | | 2,045,408 |
Strategic Equity Allocation Fund (continued)
| | | Shares or
Principal
Amount | | Value |
| COMMON STOCKS (continued) | | | |
| Household durables (continued) | | | |
| Electrolux AB, Series B | | 31,305 | | $ | 636,809 |
| Ethan Allen Interiors, Inc. | | 3,004 | | | 39,653 |
| Flexsteel Industries, Inc. | | 1,109 | | | 15,238 |
| Garmin, Ltd. | | 16,544 | | | 1,462,324 |
| GoPro, Inc., Class A (A)(C) | | 15,877 | | | 60,253 |
| Green Brick Partners, Inc. (A) | | 3,187 | | | 34,866 |
| Haier Electronics Group Company, Ltd. | | 166,200 | | | 484,642 |
| Hamilton Beach Brands Holding Company, Class A | | 962 | | | 11,159 |
| Hamilton Beach Brands Holding Company, Class B | | 765 | | | 8,874 |
| Helen of Troy, Ltd. (A) | | 9,546 | | | 1,571,272 |
| Hooker Furniture Corp. | | 1,480 | | | 27,839 |
| Husqvarna AB, B Shares | | 57,340 | | | 385,962 |
| Iida Group Holdings Company, Ltd. | | 18,900 | | | 255,415 |
| Installed Building Products, Inc. (A) | | 2,821 | | | 186,327 |
| iRobot Corp. (A)(C) | | 3,435 | | | 164,846 |
| KB Home | | 32,477 | | | 1,058,425 |
| La-Z-Boy, Inc. | | 5,582 | | | 159,924 |
| Leggett & Platt, Inc. | | 15,069 | | | 597,637 |
| Lennar Corp., A Shares | | 32,048 | | | 1,933,776 |
| LG Electronics, Inc. | | 21,093 | | | 1,060,979 |
| LGI Homes, Inc. (A) | | 2,471 | | | 186,190 |
| M/I Homes, Inc. (A) | | 3,263 | | | 121,481 |
| MDC Holdings, Inc. | | 6,124 | | | 240,918 |
| Meritage Homes Corp. (A) | | 4,434 | | | 281,382 |
| Mohawk Industries, Inc. (A) | | 6,807 | | | 824,668 |
| Newell Brands, Inc. | | 43,634 | | | 673,273 |
| Nien Made Enterprise Company, Ltd. | | 36,300 | | | 286,363 |
| Nikon Corp. | | 41,100 | | | 419,827 |
| NVR, Inc. (A) | | 398 | | | 1,459,538 |
| Panasonic Corp. | | 283,820 | | | 2,692,045 |
| Persimmon PLC | | 22,108 | | | 817,374 |
| PulteGroup, Inc. | | 29,170 | | | 1,172,634 |
| Rinnai Corp. | | 4,200 | | | 285,763 |
| SEB SA | | 3,043 | | | 403,898 |
| Sekisui Chemical Company, Ltd. | | 46,800 | | | 699,984 |
| Sekisui House, Ltd. | | 79,700 | | | 1,563,351 |
| Sharp Corp. | | 27,440 | | | 317,971 |
| Skyline Champion Corp. (A) | | 6,298 | | | 160,473 |
| Sonos, Inc. (A) | | 8,861 | | | 102,256 |
| Sony Corp. | | 163,000 | | | 10,048,600 |
| Tatung Company, Ltd. (A) | | 415,000 | | | 284,695 |
| Taylor Morrison Home Corp. (A) | | 49,897 | | | 1,123,680 |
| Taylor Wimpey PLC | | 228,867 | | | 604,341 |
| Tempur Sealy International, Inc. (A) | | 11,647 | | | 870,613 |
| The Berkeley Group Holdings PLC | | 8,193 | | | 505,271 |
| The Lovesac Company (A) | | 1,240 | | | 10,776 |
| Toll Brothers, Inc. | | 30,944 | | | 1,145,856 |
| TopBuild Corp. (A) | | 4,110 | | | 415,110 |
| TRI Pointe Group, Inc. (A) | | 52,692 | | | 807,768 |
| Tupperware Brands Corp. | | 6,154 | | | 17,539 |
| Universal Electronics, Inc. (A) | | 1,691 | | | 71,394 |
| Whirlpool Corp. | | 7,237 | | | 925,323 |
| ZAGG, Inc. (A) | | 3,591 | | | 24,132 |
| | | | | | 43,882,059 |
| Internet and direct marketing retail – 2.8% | | | |
| 1-800-Flowers.com, Inc., Class A (A) | | 3,205 | | | 57,818 |
| Alibaba Group Holding, Ltd., ADR (A) | | 224,256 | | | 46,645,248 |
| Amazon.com, Inc. (A) | | 54,758 | | | 103,150,383 |
| B2W Cia Digital (A) | | 6,900 | | | 95,895 |
| Baozun, Inc., ADR (A)(C) | | 5,900 | | | 187,148 |
| Booking Holdings, Inc. (A) | | 5,503 | | | 9,331,217 |
| CJ ENM Company, Ltd. | | 2,135 | | | 223,172 |
| Delivery Hero SE (A)(B) | | 15,112 | | | 1,156,039 |
| The accompanying notes are an integral part of the financial statements. | 46 | |
John Hancock Funds II
Portfolio of Investments — February 29, 2020 (unaudited)(showing percentage of total net assets)
Strategic Equity Allocation Fund (continued)
| | | Shares or
Principal
Amount | | Value |
| COMMON STOCKS (continued) | | | |
| Internet and direct marketing retail (continued) | | | |
| eBay, Inc. | | 100,547 | | $ | 3,482,948 |
| Etsy, Inc. (A) | | 30,375 | | | 1,755,979 |
| Expedia Group, Inc. | | 18,374 | | | 1,812,044 |
| Groupon, Inc. (A) | | 56,737 | | | 76,028 |
| GrubHub, Inc. (A) | | 23,443 | | | 1,127,843 |
| JD.com, Inc., ADR (A) | | 97,900 | | | 3,770,129 |
| Lands' End, Inc. (A) | | 1,435 | | | 15,125 |
| Liquidity Services, Inc. (A) | | 3,722 | | | 14,590 |
| Meituan Dianping, Class B (A) | | 133,800 | | | 1,726,286 |
| Mercari, Inc. (A)(C) | | 9,600 | | | 217,309 |
| Naspers, Ltd., N Shares | | 37,464 | | | 5,857,722 |
| Ocado Group PLC (A) | | 32,046 | | | 443,940 |
| Overstock.com, Inc. (A) | | 3,596 | | | 23,230 |
| PetMed Express, Inc. | | 2,402 | | | 63,413 |
| Pinduoduo, Inc., ADR (A) | | 25,700 | | | 919,546 |
| Prosus NV (A) | | 60,929 | | | 4,260,758 |
| Quotient Technology, Inc. (A) | | 9,332 | | | 83,521 |
| Rakuten, Inc. | | 110,142 | | | 928,045 |
| Shutterstock, Inc. (A) | | 2,385 | | | 91,918 |
| Stamps.com, Inc. (A) | | 2,061 | | | 290,828 |
| Stitch Fix, Inc., Class A (A) | | 5,143 | | | 123,586 |
| The RealReal, Inc. (A) | | 2,234 | | | 31,254 |
| The Rubicon Project, Inc. (A) | | 6,218 | | | 70,574 |
| Trip.com Group, Ltd., ADR (A) | | 62,500 | | | 1,897,500 |
| Vipshop Holdings, Ltd., ADR (A) | | 58,600 | | | 751,838 |
| Zalando SE (A)(B) | | 18,433 | | | 823,713 |
| ZOZO, Inc. | | 13,800 | | | 194,396 |
| | | | | | 191,700,983 |
| Leisure products – 0.2% | | | |
| Acushnet Holdings Corp. | | 4,343 | | | 110,529 |
| American Outdoor Brands Corp. (A) | | 6,791 | | | 67,638 |
| Bandai Namco Holdings, Inc. | | 25,500 | | | 1,277,060 |
| Brunswick Corp. | | 20,911 | | | 1,112,465 |
| Callaway Golf Company | | 11,572 | | | 196,493 |
| Clarus Corp. | | 3,102 | | | 35,859 |
| Giant Manufacturing Company, Ltd. | | 66,661 | | | 357,206 |
| Hasbro, Inc. | | 14,571 | | | 1,125,610 |
| HLB, Inc. (A) | | 6,591 | | | 540,826 |
| Johnson Outdoors, Inc., Class A | | 629 | | | 39,256 |
| Malibu Boats, Inc., Class A (A) | | 2,599 | | | 114,200 |
| MasterCraft Boat Holdings, Inc. (A) | | 2,367 | | | 38,274 |
| Mattel, Inc. (A)(C) | | 88,880 | | | 1,047,895 |
| Polaris, Inc. | | 14,741 | | | 1,216,575 |
| Sankyo Company, Ltd. | | 5,284 | | | 174,061 |
| Sega Sammy Holdings, Inc. | | 21,900 | | | 289,145 |
| Shimano, Inc. | | 9,500 | | | 1,319,827 |
| Sturm Ruger & Company, Inc. | | 2,075 | | | 99,683 |
| Vista Outdoor, Inc. (A) | | 7,481 | | | 54,985 |
| Yamaha Corp. | | 18,500 | | | 905,598 |
| YETI Holdings, Inc. (A)(C) | | 5,035 | | | 152,309 |
| | | | | | 10,275,494 |
| Multiline retail – 0.3% | | | |
| Big Lots, Inc. | | 4,871 | | | 77,011 |
| Canadian Tire Corp., Ltd., Class A | | 9,471 | | | 931,330 |
| Central Retail Corp. PCL, NVDR (A) | | 42,275 | | | 42,201 |
| Dillard's, Inc., Class A (C) | | 3,764 | | | 211,876 |
| Dollar General Corp. | | 21,571 | | | 3,242,121 |
| Dollar Tree, Inc. (A) | | 20,051 | | | 1,664,835 |
| Dollarama, Inc. | | 46,787 | | | 1,375,463 |
| El Puerto de Liverpool SAB de CV, Series C1 | | 22,175 | | | 104,774 |
| Harvey Norman Holdings, Ltd. | | 79,451 | | | 194,179 |
| Hyundai Department Store Company, Ltd. | | 2,910 | | | 168,455 |
| Isetan Mitsukoshi Holdings, Ltd. | | 42,340 | | | 274,535 |
| J Front Retailing Company, Ltd. | | 29,200 | | | 310,265 |
Strategic Equity Allocation Fund (continued)
| | | Shares or
Principal
Amount | | Value |
| COMMON STOCKS (continued) | | | |
| Multiline retail (continued) | | | |
| J.C. Penney Company, Inc. (A) | | 41,429 | | $ | 28,586 |
| Kohl's Corp. | | 13,265 | | | 519,325 |
| Lojas Renner SA | | 25,925 | | | 308,997 |
| Lotte Shopping Company, Ltd. | | 2,211 | | | 175,130 |
| Macy's, Inc. (C) | | 26,181 | | | 346,375 |
| Magazine Luiza SA | | 24,100 | | | 272,263 |
| Marks & Spencer Group PLC | | 134,393 | | | 276,955 |
| Marui Group Company, Ltd. | | 24,000 | | | 468,363 |
| Next PLC | | 9,212 | | | 726,054 |
| Nordstrom, Inc. (C) | | 9,076 | | | 314,937 |
| Ollie's Bargain Outlet Holdings, Inc. (A)(C) | | 14,019 | | | 713,147 |
| Pan Pacific International Holdings Corp. | | 56,200 | | | 929,123 |
| Ryohin Keikaku Company, Ltd. | | 30,500 | | | 413,149 |
| SACI Falabella | | 96,122 | | | 321,822 |
| Shinsegae, Inc. | | 1,476 | | | 282,905 |
| Target Corp. | | 42,933 | | | 4,422,099 |
| Wesfarmers, Ltd. | | 162,061 | | | 4,337,543 |
| Woolworths Holdings, Ltd. (C) | | 81,271 | | | 191,342 |
| | | | | | 23,645,160 |
| Specialty retail – 1.6% | | | |
| Aaron's, Inc. | | 25,526 | | | 1,003,938 |
| ABC-Mart, Inc. | | 4,067 | | | 234,229 |
| Abercrombie & Fitch Company, Class A | | 7,867 | | | 103,294 |
| Ace Hardware Indonesia Tbk PT | | 163,700 | | | 17,362 |
| Advance Auto Parts, Inc. | | 9,739 | | | 1,295,092 |
| American Eagle Outfitters, Inc. | | 60,411 | | | 778,094 |
| America's Car-Mart, Inc. (A) | | 774 | | | 79,544 |
| Asbury Automotive Group, Inc. (A) | | 2,365 | | | 209,634 |
| At Home Group, Inc. (A) | | 6,098 | | | 30,490 |
| AutoNation, Inc. (A) | | 15,094 | | | 644,967 |
| AutoZone, Inc. (A) | | 3,350 | | | 3,458,909 |
| Barnes & Noble Education, Inc. (A) | | 5,514 | | | 18,251 |
| Bed Bath & Beyond, Inc. (C) | | 47,516 | | | 513,648 |
| Best Buy Company, Inc. | | 32,021 | | | 2,422,389 |
| Boot Barn Holdings, Inc. (A) | | 3,483 | | | 106,824 |
| Caleres, Inc. | | 4,966 | | | 57,258 |
| Camping World Holdings, Inc., Class A (C) | | 4,172 | | | 57,073 |
| CarMax, Inc. (A) | | 23,121 | | | 2,018,695 |
| Chico's FAS, Inc. | | 14,738 | | | 59,099 |
| Citi Trends, Inc. | | 1,544 | | | 30,525 |
| Conn's, Inc. (A)(C) | | 2,371 | | | 19,324 |
| Designer Brands, Inc., Class A (C) | | 7,860 | | | 106,189 |
| Dick's Sporting Goods, Inc. | | 16,303 | | | 593,592 |
| Dufry AG (A) | | 5,421 | | | 397,826 |
| Express, Inc. (A) | | 8,562 | | | 31,679 |
| Fast Retailing Company, Ltd. | | 7,500 | | | 3,699,533 |
| Five Below, Inc. (A) | | 14,272 | | | 1,383,670 |
| Foot Locker, Inc. | | 27,439 | | | 994,664 |
| GameStop Corp., Class A (C) | | 11,193 | | | 40,295 |
| Genesco, Inc. (A) | | 1,830 | | | 62,970 |
| GNC Holdings, Inc., Class A (A)(C) | | 10,248 | | | 17,217 |
| GOME Retail Holdings, Ltd. (A)(C) | | 1,181,541 | | | 123,199 |
| Group 1 Automotive, Inc. | | 2,161 | | | 184,182 |
| Guess?, Inc. | | 5,736 | | | 92,923 |
| Haverty Furniture Companies, Inc. | | 2,274 | | | 38,249 |
| Hennes & Mauritz AB, B Shares | | 110,910 | | | 2,012,806 |
| Hibbett Sports, Inc. (A)(C) | | 2,161 | | | 42,183 |
| Hikari Tsushin, Inc. | | 2,700 | | | 513,095 |
| Home Product Center PCL, NVDR | | 305,800 | | | 125,115 |
| Hotai Motor Company, Ltd. | | 67,000 | | | 1,357,346 |
| Hotel Shilla Company, Ltd. | | 6,265 | | | 411,770 |
| Hudson, Ltd., Class A (A) | | 4,956 | | | 46,140 |
| Industria de Diseno Textil SA | | 131,104 | | | 4,090,308 |
| The accompanying notes are an integral part of the financial statements. | 47 | |
John Hancock Funds II
Portfolio of Investments — February 29, 2020 (unaudited)(showing percentage of total net assets)
Strategic Equity Allocation Fund (continued)
| | | Shares or
Principal
Amount | | Value |
| COMMON STOCKS (continued) | | | |
| Specialty retail (continued) | | | |
| JD Sports Fashion PLC | | 30,451 | | $ | 291,300 |
| Kingfisher PLC | | 148,275 | | | 363,778 |
| L Brands, Inc. | | 32,656 | | | 707,329 |
| Lithia Motors, Inc., Class A | | 2,743 | | | 326,856 |
| Lowe's Companies, Inc. | | 107,778 | | | 11,485,901 |
| Lumber Liquidators Holdings, Inc. (A) | | 3,633 | | | 35,603 |
| MarineMax, Inc. (A) | | 2,637 | | | 44,644 |
| Monro, Inc. | | 4,037 | | | 226,556 |
| Mr. Price Group, Ltd. | | 21,404 | | | 210,226 |
| Murphy USA, Inc. (A) | | 11,001 | | | 1,072,598 |
| National Vision Holdings, Inc. (A) | | 9,721 | | | 338,485 |
| Nitori Holdings Company, Ltd. | | 10,200 | | | 1,417,139 |
| Office Depot, Inc. | | 67,999 | | | 159,798 |
| O'Reilly Automotive, Inc. (A) | | 10,639 | | | 3,922,812 |
| Party City Holdco, Inc. (A) | | 7,709 | | | 15,341 |
| Pepkor Holdings, Ltd. (B) | | 70,440 | | | 69,728 |
| Petrobras Distribuidora SA | | 22,400 | | | 130,736 |
| Rent-A-Center, Inc. | | 6,051 | | | 128,826 |
| RH (A)(C) | | 6,233 | | | 1,130,666 |
| Ross Stores, Inc. | | 50,865 | | | 5,533,095 |
| Sally Beauty Holdings, Inc. (A) | | 44,704 | | | 556,118 |
| Shimamura Company, Ltd. | | 2,800 | | | 185,691 |
| Shoe Carnival, Inc. (C) | | 1,182 | | | 35,354 |
| Signet Jewelers, Ltd. (C) | | 6,532 | | | 152,326 |
| Sleep Number Corp. (A) | | 3,471 | | | 152,898 |
| Sonic Automotive, Inc., Class A | | 3,016 | | | 84,448 |
| Sportsman's Warehouse Holdings, Inc. (A) | | 5,360 | | | 32,160 |
| Tailored Brands, Inc. (C) | | 6,397 | | | 20,918 |
| The Buckle, Inc. (C) | | 3,628 | | | 82,102 |
| The Cato Corp., Class A | | 2,735 | | | 44,225 |
| The Children's Place, Inc. (C) | | 1,891 | | | 108,922 |
| The Foschini Group, Ltd. | | 19,454 | | | 156,355 |
| The Gap, Inc. | | 29,920 | | | 428,754 |
| The Home Depot, Inc. | | 153,387 | | | 33,413,824 |
| The Michaels Companies, Inc. (A) | | 10,445 | | | 44,809 |
| The TJX Companies, Inc. | | 170,519 | | | 10,197,036 |
| Tiffany & Company | | 15,179 | | | 2,027,763 |
| Tilly's, Inc., Class A | | 2,735 | | | 17,778 |
| Tractor Supply Company | | 16,647 | | | 1,473,426 |
| Ulta Beauty, Inc. (A) | | 8,038 | | | 2,066,489 |
| Urban Outfitters, Inc. (A) | | 18,083 | | | 425,131 |
| USS Company, Ltd. | | 27,800 | | | 440,517 |
| Williams-Sonoma, Inc. | | 19,896 | | | 1,241,311 |
| Winmark Corp. | | 300 | | | 60,000 |
| Yamada Denki Company, Ltd. | | 77,900 | | | 374,691 |
| Zhongsheng Group Holdings, Ltd. | | 74,100 | | | 285,332 |
| Zumiez, Inc. (A)(C) | | 2,469 | | | 65,503 |
| | | | | | 111,308,888 |
| Textiles, apparel and luxury goods – 1.1% | | | |
| adidas AG | | 24,036 | | | 6,767,294 |
| ANTA Sports Products, Ltd. | | 142,000 | | | 1,158,816 |
| Bosideng International Holdings, Ltd. | | 420,000 | | | 123,961 |
| Burberry Group PLC | | 28,767 | | | 619,923 |
| Capri Holdings, Ltd. (A) | | 17,364 | | | 448,338 |
| Carter's, Inc. | | 11,317 | | | 1,035,166 |
| CCC SA | | 1,701 | | | 31,636 |
| Cie Financiere Richemont SA | | 70,756 | | | 4,850,402 |
| Columbia Sportswear Company | | 7,443 | | | 605,116 |
| Crocs, Inc. (A) | | 8,472 | | | 221,712 |
| Culp, Inc. | | 1,587 | | | 14,473 |
| Deckers Outdoor Corp. (A) | | 10,623 | | | 1,846,277 |
| Delta Apparel, Inc. (A) | | 758 | | | 14,978 |
| Eclat Textile Company, Ltd. | | 42,957 | | | 500,536 |
| EssilorLuxottica SA | | 37,970 | | | 5,204,914 |
| Feng TAY Enterprise Company, Ltd. | | 73,997 | | | 407,351 |
Strategic Equity Allocation Fund (continued)
| | | Shares or
Principal
Amount | | Value |
| COMMON STOCKS (continued) | | | |
| Textiles, apparel and luxury goods (continued) | | | |
| Fila Holdings Corp. | | 9,599 | | $ | 305,357 |
| Formosa Taffeta Company, Ltd. | | 180,000 | | | 196,217 |
| Fossil Group, Inc. (A) | | 6,015 | | | 27,609 |
| G-III Apparel Group, Ltd. (A) | | 5,514 | | | 123,293 |
| Gildan Activewear, Inc. | | 32,843 | | | 795,475 |
| Hanesbrands, Inc. | | 41,417 | | | 548,361 |
| Hermes International | | 4,244 | | | 2,993,703 |
| Kering SA | | 10,187 | | | 5,744,487 |
| Kontoor Brands, Inc. | | 5,446 | | | 183,748 |
| Li Ning Company, Ltd. | | 259,500 | | | 699,048 |
| LPP SA | | 76 | | | 134,517 |
| LVMH Moet Hennessy Louis Vuitton SE | | 37,363 | | | 15,592,716 |
| Moncler SpA | | 15,250 | | | 600,103 |
| Movado Group, Inc. | | 2,042 | | | 30,017 |
| NIKE, Inc., Class B | | 142,678 | | | 12,752,560 |
| Oxford Industries, Inc. | | 2,054 | | | 124,041 |
| Pandora A/S | | 18,619 | | | 839,017 |
| Pou Chen Corp. | | 496,971 | | | 551,775 |
| Puma SE | | 10,990 | | | 852,080 |
| PVH Corp. | | 8,490 | | | 629,194 |
| Ralph Lauren Corp. | | 5,695 | | | 600,879 |
| Rocky Brands, Inc. | | 915 | | | 22,280 |
| Ruentex Industries, Ltd. (A) | | 77,079 | | | 169,701 |
| Shenzhou International Group Holdings, Ltd. | | 99,500 | | | 1,259,250 |
| Skechers U.S.A., Inc., Class A (A) | | 34,329 | | | 1,135,603 |
| Steven Madden, Ltd. | | 10,353 | | | 338,543 |
| Superior Group of Companies, Inc. | | 1,523 | | | 18,306 |
| Tapestry, Inc. | | 31,596 | | | 740,926 |
| The Swatch Group AG | | 6,623 | | | 286,511 |
| The Swatch Group AG, Bearer Shares | | 4,012 | | | 934,100 |
| Under Armour, Inc., Class A (A)(C) | | 21,549 | | | 305,780 |
| Under Armour, Inc., Class C (A) | | 22,280 | | | 278,054 |
| Unifi, Inc. (A) | | 1,850 | | | 39,535 |
| Vera Bradley, Inc. (A) | | 2,640 | | | 21,806 |
| VF Corp. | | 37,499 | | | 2,699,928 |
| Wolverine World Wide, Inc. | | 9,831 | | | 258,457 |
| Yue Yuen Industrial Holdings, Ltd. | | 44,000 | | | 106,775 |
| | | | | | 76,790,645 |
| | | | | | 666,777,416 |
| Consumer staples – 6.1% | | | | | |
| Beverages – 1.2% | | | |
| Ambev SA | | 161,905 | | | 526,420 |
| Anadolu Efes Biracilik Ve Malt Sanayii AS | | 11,125 | | | 39,613 |
| Anheuser-Busch InBev SA | | 25,884 | | | 1,495,603 |
| Arca Continental SAB de CV | | 53,042 | | | 292,387 |
| Asahi Group Holdings, Ltd. | | 46,461 | | | 1,778,418 |
| Brown-Forman Corp., Class B | | 17,792 | | | 1,092,607 |
| Budweiser Brewing Company APAC, Ltd. (A)(B) | | 82,400 | | | 251,536 |
| Carlsberg A/S, Class B | | 19,911 | | | 2,633,384 |
| Celsius Holdings, Inc. (A) | | 3,964 | | | 23,427 |
| China Resources Beer Holdings Company, Ltd. | | 191,699 | | | 904,652 |
| Cia Cervecerias Unidas SA | | 19,467 | | | 146,838 |
| Coca-Cola Amatil, Ltd. | | 72,416 | | | 545,373 |
| Coca-Cola Bottlers Japan Holdings, Inc. (C) | | 15,800 | | | 364,412 |
| Coca-Cola Consolidated, Inc. | | 576 | | | 113,115 |
| Coca-Cola European Partners PLC | | 28,541 | | | 1,454,449 |
| Coca-Cola Femsa SAB de CV | | 65,258 | | | 365,230 |
| Coca-Cola HBC AG | | 13,935 | | | 444,392 |
| Constellation Brands, Inc., Class A | | 16,357 | | | 2,819,620 |
| Craft Brew Alliance, Inc. (A) | | 1,480 | | | 23,547 |
| Davide Campari-Milano SpA | | 48,238 | | | 403,308 |
| The accompanying notes are an integral part of the financial statements. | 48 | |
John Hancock Funds II
Portfolio of Investments — February 29, 2020 (unaudited)(showing percentage of total net assets)
Strategic Equity Allocation Fund (continued)
| | | Shares or
Principal
Amount | | Value |
| COMMON STOCKS (continued) | | | |
| Beverages (continued) | | | |
| Diageo PLC | | 164,753 | | $ | 5,878,317 |
| Fomento Economico Mexicano SAB de CV | | 238,486 | | | 1,944,673 |
| Fraser & Neave Holdings BHD | | 14,600 | | | 107,798 |
| Heineken Holding NV | | 14,213 | | | 1,262,080 |
| Heineken NV | | 32,275 | | | 3,215,621 |
| Kirin Holdings Company, Ltd. | | 105,327 | | | 2,001,661 |
| MGP Ingredients, Inc. | | 1,632 | | | 46,936 |
| Molson Coors Beverage Company, Class B | | 18,345 | | | 910,095 |
| Monster Beverage Corp. (A) | | 37,280 | | | 2,326,645 |
| National Beverage Corp. (A) | | 1,491 | | | 63,054 |
| New Age Beverages Corp. (A)(C) | | 10,295 | | | 20,796 |
| Osotspa PCL, NVDR | | 41,700 | | | 56,042 |
| PepsiCo, Inc. | | 136,173 | | | 17,978,921 |
| Pernod Ricard SA | | 28,469 | | | 4,642,554 |
| Primo Water Corp. (A) | | 4,532 | | | 63,448 |
| Remy Cointreau SA | | 2,988 | | | 304,383 |
| Suntory Beverage & Food, Ltd. | | 17,600 | | | 671,901 |
| The Boston Beer Company, Inc., Class A (A) | | 3,384 | | | 1,254,753 |
| The Coca-Cola Company | | 376,559 | | | 20,142,141 |
| Treasury Wine Estates, Ltd. | | 103,389 | | | 754,758 |
| Tsingtao Brewery Company, Ltd., H Shares | | 51,700 | | | 273,094 |
| | | | | | 79,638,002 |
| Food and staples retailing – 1.5% | | | |
| Aeon Company, Ltd. | | 83,600 | | | 1,562,667 |
| Alimentation Couche-Tard, Inc., Class B | | 136,404 | | | 4,142,170 |
| Atacadao SA | | 13,400 | | | 61,997 |
| Berli Jucker PCL, NVDR | | 60,000 | | | 70,265 |
| BGF retail Company, Ltd. | | 1,517 | | | 189,821 |
| Bid Corp., Ltd. | | 28,509 | | | 515,859 |
| BIM Birlesik Magazalar AS | | 21,883 | | | 169,157 |
| BJ's Wholesale Club Holdings, Inc. (A) | | 45,089 | | | 868,414 |
| Carrefour SA | | 81,024 | | | 1,399,366 |
| Casey's General Stores, Inc. | | 9,429 | | | 1,537,116 |
| Casino Guichard Perrachon SA (C) | | 7,207 | | | 282,876 |
| Cencosud SA | | 187,782 | | | 221,954 |
| Clicks Group, Ltd. | | 21,906 | | | 331,252 |
| Coles Group, Ltd. | | 162,172 | | | 1,519,620 |
| Colruyt SA | | 1,526 | | | 70,782 |
| Costco Wholesale Corp. | | 73,000 | | | 20,523,220 |
| CP ALL PCL, NVDR | | 316,700 | | | 667,431 |
| Dairy Farm International Holdings, Ltd. | | 19,100 | | | 92,100 |
| Dino Polska SA (A)(B) | | 2,858 | | | 103,817 |
| E-MART, Inc. | | 4,162 | | | 363,505 |
| Empire Company, Ltd., Class A | | 27,577 | | | 616,155 |
| FamilyMart Company, Ltd. | | 32,300 | | | 703,986 |
| George Weston, Ltd. | | 12,688 | | | 955,204 |
| GS Retail Company, Ltd. | | 5,299 | | | 154,029 |
| HF Foods Group, Inc. (A) | | 938 | | | 16,800 |
| ICA Gruppen AB | | 12,244 | | | 460,233 |
| Ingles Markets, Inc., Class A | | 1,764 | | | 63,098 |
| J Sainsbury PLC | | 122,386 | | | 310,058 |
| Jeronimo Martins SGPS SA | | 31,786 | | | 561,896 |
| Koninklijke Ahold Delhaize NV | | 146,929 | | | 3,432,593 |
| Lawson, Inc. | | 6,300 | | | 336,508 |
| Loblaw Companies, Ltd. | | 29,535 | | | 1,463,272 |
| METRO AG | | 23,405 | | | 273,390 |
| Metro, Inc. | | 40,702 | | | 1,585,324 |
| Performance Food Group Company (A) | | 12,673 | | | 537,335 |
| Pick n Pay Stores, Ltd. | | 29,394 | | | 106,281 |
| President Chain Store Corp. | | 127,274 | | | 1,242,430 |
| PriceSmart, Inc. | | 2,776 | | | 154,595 |
| Raia Drogasil SA | | 7,886 | | | 211,438 |
Strategic Equity Allocation Fund (continued)
| | | Shares or
Principal
Amount | | Value |
| COMMON STOCKS (continued) | | | |
| Food and staples retailing (continued) | | | |
| Rite Aid Corp. (A)(C) | | 6,962 | | $ | 94,822 |
| Seven & i Holdings Company, Ltd. | | 96,546 | | | 3,284,818 |
| Shoprite Holdings, Ltd. | | 39,544 | | | 288,036 |
| SpartanNash Company | | 4,558 | | | 56,656 |
| Sprouts Farmers Market, Inc. (A) | | 30,285 | | | 483,954 |
| Sun Art Retail Group, Ltd. | | 316,300 | | | 408,798 |
| Sundrug Company, Ltd. | | 9,100 | | | 283,735 |
| Sysco Corp. | | 84,310 | | | 5,619,262 |
| Tesco PLC | | 683,021 | | | 2,035,083 |
| The Andersons, Inc. | | 3,995 | | | 73,388 |
| The Chefs' Warehouse, Inc. (A) | | 3,065 | | | 93,850 |
| The Kroger Company | | 132,522 | | | 3,727,844 |
| The SPAR Group, Ltd. | | 15,534 | | | 166,861 |
| Tsuruha Holdings, Inc. | | 4,700 | | | 545,707 |
| United Natural Foods, Inc. (A) | | 6,640 | | | 42,961 |
| Village Super Market, Inc., Class A | | 1,093 | | | 22,461 |
| Walgreens Boots Alliance, Inc. | | 123,886 | | | 5,669,023 |
| Wal-Mart de Mexico SAB de CV | | 637,400 | | | 1,794,357 |
| Walmart, Inc. | | 234,407 | | | 25,240,946 |
| Weis Markets, Inc. | | 1,209 | | | 45,035 |
| Welcia Holdings Company, Ltd. | | 6,100 | | | 364,214 |
| Wm Morrison Supermarkets PLC | | 163,981 | | | 367,019 |
| Woolworths Group, Ltd. | | 179,993 | | | 4,603,990 |
| | | | | | 103,190,834 |
| Food products – 1.6% | | | |
| a2 Milk Company, Ltd. (A) | | 49,899 | | | 514,314 |
| Ajinomoto Company, Inc. | | 55,700 | | | 934,478 |
| Alico, Inc. | | 567 | | | 18,467 |
| Archer-Daniels-Midland Company | | 54,363 | | | 2,046,767 |
| Associated British Foods PLC | | 24,824 | | | 724,837 |
| B&G Foods, Inc. (C) | | 7,944 | | | 117,571 |
| Barry Callebaut AG | | 401 | | | 827,191 |
| BRF SA (A) | | 19,410 | | | 117,365 |
| Calavo Growers, Inc. (C) | | 2,018 | | | 146,204 |
| Calbee, Inc. | | 10,000 | | | 254,817 |
| Cal-Maine Foods, Inc. | | 3,907 | | | 136,315 |
| Campbell Soup Company | | 16,496 | | | 744,300 |
| Charoen Pokphand Foods PCL, NVDR | | 217,500 | | | 187,135 |
| Charoen Pokphand Indonesia Tbk PT | | 189,903 | | | 76,798 |
| China Agri-Industries Holdings, Ltd. | | 314,400 | | | 172,976 |
| China Huishan Dairy Holdings Company, Ltd. (A)(D) | | 280,500 | | | 4,138 |
| China Mengniu Dairy Company, Ltd. (A) | | 365,353 | | | 1,335,251 |
| Chocoladefabriken Lindt & Spruengli AG | | 13 | | | 1,131,071 |
| Chocoladefabriken Lindt & Spruengli AG, Participation Certificates | | 144 | | | 1,127,438 |
| CJ CheilJedang Corp. | | 1,639 | | | 329,291 |
| Conagra Brands, Inc. | | 47,524 | | | 1,268,416 |
| Dali Foods Group Company, Ltd. (B) | | 264,300 | | | 175,746 |
| Danone SA | | 82,730 | | | 5,838,960 |
| Darling Ingredients, Inc. (A) | | 62,253 | | | 1,599,902 |
| Farmer Brothers Company (A) | | 1,517 | | | 18,735 |
| Flowers Foods, Inc. | | 49,341 | | | 1,062,312 |
| Fresh Del Monte Produce, Inc. | | 3,793 | | | 104,004 |
| Freshpet, Inc. (A) | | 4,280 | | | 284,449 |
| General Mills, Inc. | | 59,022 | | | 2,892,078 |
| Genting Plantations BHD | | 25,900 | | | 63,142 |
| Gruma SAB de CV, Class B | | 25,283 | | | 244,018 |
| Grupo Bimbo SAB de CV, Series A | | 197,200 | | | 297,458 |
| Hormel Foods Corp. | | 27,154 | | | 1,129,606 |
| Hostess Brands, Inc. (A) | | 14,836 | | | 188,566 |
| Indofood CBP Sukses Makmur Tbk PT | | 51,900 | | | 37,287 |
| Indofood Sukses Makmur Tbk PT | | 111,317 | | | 51,340 |
| Ingredion, Inc. | | 17,115 | | | 1,425,680 |
| IOI Corp. BHD | | 194,800 | | | 194,042 |
| The accompanying notes are an integral part of the financial statements. | 49 | |
John Hancock Funds II
Portfolio of Investments — February 29, 2020 (unaudited)(showing percentage of total net assets)
Strategic Equity Allocation Fund (continued)
| | | Shares or
Principal
Amount | | Value |
| COMMON STOCKS (continued) | | | |
| Food products (continued) | | | |
| J&J Snack Foods Corp. | | 1,854 | | $ | 298,160 |
| JBS SA | | 37,181 | | | 188,736 |
| John B. Sanfilippo & Son, Inc. | | 1,067 | | | 74,893 |
| Kellogg Company | | 24,316 | | | 1,470,389 |
| Kerry Group PLC, Class A | | 17,479 | | | 2,220,405 |
| Kerry Group PLC, Class A (London Stock Exchange) | | 2,564 | | | 326,806 |
| Kikkoman Corp. | | 18,600 | | | 855,230 |
| Kuala Lumpur Kepong BHD | | 43,200 | | | 226,222 |
| Lamb Weston Holdings, Inc. | | 14,264 | | | 1,239,399 |
| Lancaster Colony Corp. | | 7,403 | | | 1,069,363 |
| Landec Corp. (A) | | 3,274 | | | 33,591 |
| Limoneira Company | | 2,094 | | | 34,970 |
| McCormick & Company, Inc. | | 12,067 | | | 1,764,075 |
| MEIJI Holdings Company, Ltd. | | 14,500 | | | 858,233 |
| Mondelez International, Inc., Class A | | 140,605 | | | 7,423,944 |
| Mowi ASA (C) | | 22,572 | | | 478,186 |
| Nestle Malaysia BHD | | 6,700 | | | 228,937 |
| Nestle SA | | 402,831 | | | 41,453,622 |
| NH Foods, Ltd. | | 10,500 | | | 395,588 |
| Nisshin Seifun Group, Inc. | | 25,000 | | | 421,871 |
| Nissin Foods Holdings Company, Ltd. | | 8,117 | | | 638,912 |
| Orion Corp. | | 4,672 | | | 368,953 |
| Orkla ASA | | 38,230 | | | 325,164 |
| Ottogi Corp. | | 260 | | | 106,984 |
| Pilgrim's Pride Corp. (A) | | 13,435 | | | 284,285 |
| Post Holdings, Inc. (A) | | 17,038 | | | 1,725,268 |
| PPB Group BHD | | 59,420 | | | 258,504 |
| QL Resources BHD | | 63,300 | | | 122,824 |
| Sanderson Farms, Inc. | | 7,501 | | | 926,824 |
| Saputo, Inc. | | 37,612 | | | 1,046,887 |
| Seneca Foods Corp., Class A (A) | | 881 | | | 30,588 |
| Sime Darby Plantation BHD | | 215,600 | | | 255,930 |
| Standard Foods Corp. | | 90,402 | | | 201,790 |
| Thai Union Group PCL, NVDR | | 187,000 | | | 91,998 |
| The Hain Celestial Group, Inc. (A) | | 20,594 | | | 488,696 |
| The Hershey Company | | 14,483 | | | 2,085,407 |
| The J.M. Smucker Company | | 11,138 | | | 1,147,103 |
| The Kraft Heinz Company | | 60,818 | | | 1,506,462 |
| The Simply Good Foods Company (A) | | 10,177 | | | 224,505 |
| Tiger Brands, Ltd. | | 13,572 | | | 133,479 |
| Tingyi Cayman Islands Holding Corp. | | 261,100 | | | 479,409 |
| Tootsie Roll Industries, Inc. (C) | | 6,296 | | | 201,976 |
| Toyo Suisan Kaisha, Ltd. | | 11,300 | | | 449,255 |
| TreeHouse Foods, Inc. (A) | | 14,410 | | | 549,165 |
| Tyson Foods, Inc., Class A | | 28,826 | | | 1,955,268 |
| Uni-President China Holdings, Ltd. | | 168,900 | | | 175,432 |
| Uni-President Enterprises Corp. | | 1,079,805 | | | 2,584,423 |
| Universal Robina Corp. | | 110,980 | | | 308,854 |
| Vitasoy International Holdings, Ltd. (C) | | 46,000 | | | 166,841 |
| Want Want China Holdings, Ltd. | | 662,912 | | | 520,333 |
| WH Group, Ltd. (B) | | 601,270 | | | 630,979 |
| Wilmar International, Ltd. | | 80,400 | | | 232,067 |
| Yakult Honsha Company, Ltd. | | 15,300 | | | 697,657 |
| Yamazaki Baking Company, Ltd. | | 15,200 | | | 257,365 |
| Yihai International Holding, Ltd. (A) | | 62,500 | | | 423,304 |
| | | | | | 110,487,976 |
| Household products – 0.7% | | | |
| Central Garden & Pet Company (A) | | 1,377 | | | 36,876 |
| Central Garden & Pet Company, Class A (A) | | 5,083 | | | 128,651 |
| Church & Dwight Company, Inc. | | 19,633 | | | 1,364,886 |
| Colgate-Palmolive Company | | 68,584 | | | 4,634,221 |
| Energizer Holdings, Inc. (C) | | 16,492 | | | 708,991 |
| Essity AB, B Shares | | 83,626 | | | 2,521,149 |
Strategic Equity Allocation Fund (continued)
| | | Shares or
Principal
Amount | | Value |
| COMMON STOCKS (continued) | | | |
| Household products (continued) | | | |
| Henkel AG & Company KGaA | | 13,574 | | $ | 1,160,177 |
| Kimberly-Clark Corp. | | 27,433 | | | 3,598,935 |
| Kimberly-Clark de Mexico SAB de CV, Class A (A) | | 183,435 | | | 349,200 |
| Lion Corp. | | 28,500 | | | 474,966 |
| Oil-Dri Corp. of America | | 664 | | | 20,206 |
| Pigeon Corp. | | 14,800 | | | 500,090 |
| Reckitt Benckiser Group PLC | | 49,417 | | | 3,651,562 |
| The Clorox Company | | 10,043 | | | 1,601,055 |
| The Procter & Gamble Company | | 199,565 | | | 22,596,745 |
| Unicharm Corp. | | 51,888 | | | 1,680,869 |
| Unilever Indonesia Tbk PT | | 174,825 | | | 83,982 |
| WD-40 Company | | 1,685 | | | 290,646 |
| | | | | | 45,403,207 |
| Personal products – 0.6% | | | |
| Amorepacific Corp. (A) | | 6,398 | | | 847,478 |
| AMOREPACIFIC Group (A) | | 5,769 | | | 295,374 |
| Beiersdorf AG | | 13,240 | | | 1,398,118 |
| BellRing Brands, Inc. Class A (A) | | 4,814 | | | 94,595 |
| Coty, Inc., Class A | | 23,648 | | | 218,271 |
| Edgewell Personal Care Company (A) | | 20,575 | | | 624,657 |
| elf Beauty, Inc. (A) | | 3,334 | | | 53,211 |
| Hengan International Group Company, Ltd. | | 95,100 | | | 716,824 |
| Inter Parfums, Inc. | | 2,186 | | | 131,291 |
| Kao Corp. | | 61,800 | | | 4,497,521 |
| Kobayashi Pharmaceutical Company, Ltd. | | 6,300 | | | 456,751 |
| Kose Corp. | | 4,200 | | | 500,406 |
| LG Household & Health Care, Ltd. | | 1,853 | | | 1,870,604 |
| Lifevantage Corp. (A) | | 1,823 | | | 21,712 |
| L'Oreal SA | | 33,945 | | | 9,123,884 |
| Medifast, Inc. (C) | | 1,384 | | | 115,024 |
| Natura & Company Holding SA | | 21,780 | | | 221,653 |
| Nu Skin Enterprises, Inc., Class A | | 14,239 | | | 349,140 |
| Pola Orbis Holdings, Inc. | | 11,800 | | | 224,596 |
| Revlon, Inc., Class A (A)(C) | | 920 | | | 15,925 |
| Shiseido Company, Ltd. | | 51,300 | | | 3,062,086 |
| The Estee Lauder Companies, Inc., Class A | | 17,809 | | | 3,269,732 |
| Unilever NV | | 182,745 | | | 9,648,441 |
| Unilever PLC | | 77,300 | | | 4,155,638 |
| USANA Health Sciences, Inc. (A) | | 1,582 | | | 104,570 |
| | | | | | 42,017,502 |
| Tobacco – 0.5% | | | |
| 22nd Century Group, Inc. (A)(C) | | 16,092 | | | 11,908 |
| Altria Group, Inc. | | 182,431 | | | 7,364,739 |
| British American Tobacco Malaysia BHD | | 14,098 | | | 41,802 |
| British American Tobacco PLC | | 160,165 | | | 6,332,804 |
| Gudang Garam Tbk PT | | 12,482 | | | 44,729 |
| Hanjaya Mandala Sampoerna Tbk PT | | 205,100 | | | 24,783 |
| Imperial Brands PLC | | 66,498 | | | 1,343,392 |
| Japan Tobacco, Inc. | | 153,800 | | | 3,040,632 |
| KT&G Corp. | | 22,921 | | | 1,594,738 |
| Philip Morris International, Inc. | | 151,938 | | | 12,439,164 |
| Swedish Match AB | | 23,368 | | | 1,371,106 |
| Turning Point Brands, Inc. | | 1,065 | | | 27,850 |
| Universal Corp. | | 3,021 | | | 149,086 |
| Vector Group, Ltd. (C) | | 13,886 | | | 161,355 |
| | | | | | 33,948,088 |
| | | | | | 414,685,609 |
| Energy – 3.7% | | | | | |
| Energy equipment and services – 0.2% | | | |
| Apergy Corp. (A)(C) | | 19,857 | | | 369,340 |
| Archrock, Inc. | | 15,972 | | | 112,603 |
| Baker Hughes Company | | 99,089 | | | 1,594,342 |
| The accompanying notes are an integral part of the financial statements. | 50 | |
John Hancock Funds II
Portfolio of Investments — February 29, 2020 (unaudited)(showing percentage of total net assets)
Strategic Equity Allocation Fund (continued)
| | | Shares or
Principal
Amount | | Value |
| COMMON STOCKS (continued) | | | |
| Energy equipment and services (continued) | | | |
| Cactus, Inc., Class A | | 5,785 | | $ | 157,988 |
| China Oilfield Services, Ltd., H Shares | | 213,700 | | | 279,296 |
| Core Laboratories NV | | 11,375 | | | 305,305 |
| Dialog Group BHD | | 371,212 | | | 297,677 |
| Diamond Offshore Drilling, Inc. (A)(C) | | 8,330 | | | 25,407 |
| DMC Global, Inc. (C) | | 1,749 | | | 63,069 |
| Dril-Quip, Inc. (A) | | 4,459 | | | 158,830 |
| Era Group, Inc. (A) | | 2,668 | | | 26,146 |
| Exterran Corp. (A) | | 3,906 | | | 19,921 |
| Forum Energy Technologies, Inc. (A) | | 12,219 | | | 9,531 |
| Frank's International NV (A) | | 13,508 | | | 52,951 |
| Geospace Technologies Corp. (A) | | 1,767 | | | 21,787 |
| Halliburton Company | | 133,845 | | | 2,270,011 |
| Helix Energy Solutions Group, Inc. (A) | | 17,575 | | | 117,928 |
| Helmerich & Payne, Inc. | | 16,536 | | | 610,013 |
| KLX Energy Services Holdings, Inc. (A) | | 3,149 | | | 7,621 |
| Liberty Oilfield Services, Inc., Class A | | 6,784 | | | 45,385 |
| Matrix Service Company (A) | | 3,363 | | | 40,625 |
| McDermott International, Inc. (A) | | 24,875 | | | 945 |
| Nabors Industries, Ltd. | | 44,060 | | | 77,546 |
| National Energy Services Reunited Corp. (A) | | 3,035 | | | 25,221 |
| National Oilwell Varco, Inc. | | 58,830 | | | 1,100,709 |
| Natural Gas Services Group, Inc. (A) | | 1,687 | | | 16,668 |
| Newpark Resources, Inc. (A) | | 11,088 | | | 38,919 |
| NexTier Oilfield Solutions, Inc. (A) | | 19,873 | | | 92,608 |
| Nine Energy Service, Inc. (A) | | 2,350 | | | 9,541 |
| Noble Corp. PLC (A) | | 32,102 | | | 22,510 |
| Oceaneering International, Inc. (A) | | 12,290 | | | 129,537 |
| Oil States International, Inc. (A) | | 7,415 | | | 58,653 |
| Pacific Drilling SA (A) | | 4,231 | | | 6,600 |
| Parker Drilling Company (A) | | 1,296 | | | 16,226 |
| Patterson-UTI Energy, Inc. | | 49,871 | | | 285,761 |
| ProPetro Holding Corp. (A) | | 9,993 | | | 87,539 |
| RPC, Inc. | | 7,811 | | | 26,870 |
| Schlumberger, Ltd. | | 211,087 | | | 5,718,347 |
| SEACOR Holdings, Inc. (A) | | 2,156 | | | 80,419 |
| SEACOR Marine Holdings, Inc. (A) | | 2,456 | | | 19,525 |
| Seadrill, Ltd. (A)(C) | | 7,798 | | | 8,578 |
| Select Energy Services, Inc., Class A (A) | | 7,422 | | | 48,243 |
| Solaris Oilfield Infrastructure, Inc., Class A | | 3,939 | | | 41,753 |
| TechnipFMC PLC | | 64,076 | | | 950,888 |
| Tenaris SA | | 39,747 | | | 363,039 |
| TETRA Technologies, Inc. (A) | | 16,303 | | | 20,542 |
| Tidewater, Inc. (A) | | 4,979 | | | 69,158 |
| Transocean, Ltd. (A) | | 147,439 | | | 493,921 |
| U.S. Silica Holdings, Inc. | | 9,616 | | | 44,137 |
| Worley, Ltd. | | 48,792 | | | 410,034 |
| | | | | | 16,850,213 |
| Oil, gas and consumable fuels – 3.5% | | | |
| Adaro Energy Tbk PT | | 391,345 | | | 32,071 |
| Aker BP ASA | | 5,170 | | | 126,648 |
| Altus Midstream Company, Class A (A)(C) | | 6,905 | | | 10,081 |
| Antero Midstream Corp. (C) | | 76,140 | | | 331,970 |
| Apache Corp. | | 57,337 | | | 1,428,838 |
| Arch Coal, Inc., Class A | | 1,836 | | | 92,443 |
| Ardmore Shipping Corp. | | 4,184 | | | 23,012 |
| Banpu PCL, NVDR | | 211,400 | | | 48,464 |
| Berry Corp. | | 8,075 | | | 51,438 |
| Bonanza Creek Energy, Inc. (A) | | 2,393 | | | 38,982 |
| BP PLC | | 1,417,429 | | | 7,364,403 |
| Brigham Minerals, Inc., Class A | | 2,177 | | | 34,723 |
| Bukit Asam Tbk PT | | 76,200 | | | 12,047 |
| Cabot Oil & Gas Corp. | | 62,199 | | | 866,432 |
| California Resources Corp. (A)(C) | | 6,162 | | | 39,129 |
Strategic Equity Allocation Fund (continued)
| | | Shares or
Principal
Amount | | Value |
| COMMON STOCKS (continued) | | | |
| Oil, gas and consumable fuels (continued) | | | |
| Callon Petroleum Company (A)(C) | | 47,957 | | $ | 108,862 |
| Caltex Australia, Ltd. | | 35,668 | | | 767,061 |
| Cameco Corp. | | 62,975 | | | 544,712 |
| Canadian Natural Resources, Ltd. | | 184,573 | | | 4,750,976 |
| Cenovus Energy, Inc. | | 163,330 | | | 1,201,019 |
| Chesapeake Energy Corp. (A) | | 300,569 | | | 82,656 |
| Chevron Corp. | | 288,314 | | | 26,911,229 |
| China Coal Energy Company, Ltd., H Shares | | 232,900 | | | 75,872 |
| China Petroleum & Chemical Corp., H Shares | | 3,390,139 | | | 1,754,589 |
| China Shenhua Energy Company, Ltd., H Shares | | 445,900 | | | 784,021 |
| Cimarex Energy Company | | 15,524 | | | 513,068 |
| Clean Energy Fuels Corp. (A) | | 17,851 | | | 40,343 |
| CNOOC, Ltd. | | 2,365,116 | | | 3,290,140 |
| CNX Resources Corp. (A) | | 70,923 | | | 376,601 |
| Concho Resources, Inc. | | 30,652 | | | 2,084,949 |
| ConocoPhillips | | 167,308 | | | 8,101,053 |
| CONSOL Energy, Inc. (A) | | 3,342 | | | 19,016 |
| Contura Energy, Inc. (A) | | 2,333 | | | 13,275 |
| Cosan SA | | 5,794 | | | 94,802 |
| COSCO SHIPPING Energy Transportation Company, Ltd., H Shares | | 157,300 | | | 62,668 |
| CVR Energy, Inc. | | 3,624 | | | 102,994 |
| Delek US Holdings, Inc. | | 9,141 | | | 195,435 |
| Denbury Resources, Inc. (A)(C) | | 60,140 | | | 45,249 |
| Devon Energy Corp. | | 59,009 | | | 958,306 |
| DHT Holdings, Inc. | | 10,823 | | | 60,068 |
| Diamond S Shipping, Inc. (A) | | 2,779 | | | 28,624 |
| Diamondback Energy, Inc. | | 24,570 | | | 1,523,340 |
| Dorian LPG, Ltd. (A) | | 3,442 | | | 38,275 |
| Earthstone Energy, Inc., Class A (A) | | 2,967 | | | 11,423 |
| Ecopetrol SA | | 475,053 | | | 419,141 |
| Empresas COPEC SA | | 50,343 | | | 393,441 |
| Enbridge, Inc. | | 314,104 | | | 11,691,291 |
| Energy Fuels, Inc. (A)(C) | | 12,777 | | | 15,077 |
| Eni SpA | | 210,748 | | | 2,625,738 |
| EOG Resources, Inc. | | 88,706 | | | 5,611,542 |
| EQT Corp. | | 65,534 | | | 384,685 |
| Equinor ASA | | 51,924 | | | 799,748 |
| Equitrans Midstream Corp. (C) | | 52,243 | | | 368,836 |
| Evolution Petroleum Corp. | | 4,170 | | | 19,641 |
| Extraction Oil & Gas, Inc. (A) | | 11,191 | | | 7,705 |
| Exxaro Resources, Ltd. | | 21,166 | | | 153,339 |
| Exxon Mobil Corp. | | 645,146 | | | 33,186,310 |
| Falcon Minerals Corp. | | 5,248 | | | 20,966 |
| Formosa Petrochemical Corp. | | 275,900 | | | 770,606 |
| Galp Energia SGPS SA | | 62,824 | | | 866,607 |
| GasLog, Ltd. | | 5,215 | | | 29,256 |
| Golar LNG, Ltd. | | 11,911 | | | 152,639 |
| Green Plains, Inc. | | 4,367 | | | 52,360 |
| Grupa Lotos SA | | 5,062 | | | 77,352 |
| GS Holdings Corp. | | 10,328 | | | 354,371 |
| Gulfport Energy Corp. (A) | | 20,476 | | | 16,782 |
| Hess Corp. | | 39,492 | | | 2,218,661 |
| HighPoint Resources Corp. (A) | | 15,451 | | | 10,518 |
| HollyFrontier Corp. | | 22,639 | | | 762,482 |
| Husky Energy, Inc. | | 57,722 | | | 274,795 |
| Idemitsu Kosan Company, Ltd. | | 24,828 | | | 621,315 |
| Imperial Oil, Ltd. (C) | | 43,407 | | | 950,443 |
| Inner Mongolia Yitai Coal Company, Ltd., Class B | | 129,300 | | | 88,979 |
| Inpex Corp. | | 130,900 | | | 1,152,092 |
| Inter Pipeline, Ltd. (C) | | 65,811 | | | 973,743 |
| The accompanying notes are an integral part of the financial statements. | 51 | |
John Hancock Funds II
Portfolio of Investments — February 29, 2020 (unaudited)(showing percentage of total net assets)
Strategic Equity Allocation Fund (continued)
| | | Shares or
Principal
Amount | | Value |
| COMMON STOCKS (continued) | | | |
| Oil, gas and consumable fuels (continued) | | | |
| International Seaways, Inc. (A) | | 3,126 | | $ | 62,176 |
| IRPC PCL, NVDR | | 535,900 | | | 38,419 |
| JXTG Holdings, Inc. | | 402,650 | | | 1,631,190 |
| Keyera Corp. (C) | | 34,308 | | | 823,545 |
| Kinder Morgan, Inc. | | 297,006 | | | 5,693,605 |
| Koninklijke Vopak NV | | 8,393 | | | 399,546 |
| Laredo Petroleum, Inc. (A) | | 22,891 | | | 24,722 |
| Lundin Petroleum AB | | 25,369 | | | 724,241 |
| Magnolia Oil & Gas Corp., Class A (A)(C) | | 12,678 | | | 95,212 |
| Marathon Oil Corp. | | 121,969 | | | 1,009,903 |
| Marathon Petroleum Corp. | | 99,007 | | | 4,694,912 |
| Matador Resources Company (A) | | 41,969 | | | 404,581 |
| MOL Hungarian Oil & Gas PLC | | 52,564 | | | 407,410 |
| Montage Resources Corp. (A) | | 2,843 | | | 9,922 |
| Murphy Oil Corp. | | 38,290 | | | 721,767 |
| NACCO Industries, Inc., Class A | | 474 | | | 19,538 |
| Neste OYJ | | 52,250 | | | 2,088,231 |
| Noble Energy, Inc. | | 72,928 | | | 1,154,450 |
| Nordic American Tankers, Ltd. | | 17,242 | | | 55,519 |
| Northern Oil and Gas, Inc. (A) | | 36,715 | | | 53,237 |
| Oasis Petroleum, Inc. (A) | | 39,872 | | | 65,191 |
| Occidental Petroleum Corp. | | 136,210 | | | 4,459,515 |
| Oil Search, Ltd. | | 194,905 | | | 712,825 |
| OMV AG | | 21,997 | | | 921,278 |
| ONEOK, Inc. | | 62,986 | | | 4,202,426 |
| Origin Energy, Ltd. | | 251,662 | | | 1,163,748 |
| Overseas Shipholding Group, Inc., Class A (A) | | 9,218 | | | 15,855 |
| Ovintiv, Inc. (C) | | 42,469 | | | 490,739 |
| Panhandle Oil and Gas, Inc., Class A | | 2,217 | | | 14,743 |
| Par Pacific Holdings, Inc. (A) | | 4,360 | | | 72,332 |
| Parkland Fuel Corp. | | 23,217 | | | 729,937 |
| Parsley Energy, Inc., Class A | | 3,816 | | | 51,134 |
| PBF Energy, Inc., Class A | | 26,114 | | | 584,692 |
| PDC Energy, Inc. (A) | | 12,492 | | | 237,723 |
| Peabody Energy Corp. | | 8,097 | | | 47,286 |
| Pembina Pipeline Corp. | | 86,546 | | | 3,117,526 |
| Penn Virginia Corp. (A) | | 1,781 | | | 28,318 |
| PetroChina Company, Ltd., H Shares | | 2,811,239 | | | 1,098,191 |
| Petroleo Brasileiro SA | | 100,409 | | | 609,608 |
| Petronas Dagangan BHD | | 27,900 | | | 151,836 |
| Phillips 66 | | 67,754 | | | 5,072,064 |
| Pioneer Natural Resources Company | | 25,257 | | | 3,101,054 |
| Polski Koncern Naftowy ORLEN SA | | 17,494 | | | 264,266 |
| Polskie Gornictwo Naftowe i Gazownictwo SA | | 100,937 | | | 82,104 |
| PrairieSky Royalty, Ltd. (C) | | 33,420 | | | 309,986 |
| PTT Exploration & Production PCL, NVDR | | 74,700 | | | 254,879 |
| PTT PCL, NVDR | | 622,500 | | | 780,398 |
| QEP Resources, Inc. | | 30,248 | | | 68,058 |
| Renewable Energy Group, Inc. (A) | | 4,550 | | | 120,348 |
| Repsol SA | | 176,941 | | | 1,999,491 |
| REX American Resources Corp. (A) | | 685 | | | 47,957 |
| Ring Energy, Inc. (A) | | 8,779 | | | 12,378 |
| Royal Dutch Shell PLC, A Shares | | 299,196 | | | 6,458,590 |
| Royal Dutch Shell PLC, B Shares | | 259,317 | | | 5,620,753 |
| SandRidge Energy, Inc. (A) | | 4,506 | | | 9,282 |
| Santos, Ltd. | | 252,316 | | | 1,151,100 |
| Scorpio Tankers, Inc. | | 5,389 | | | 106,594 |
| SFL Corp., Ltd. | | 9,860 | | | 119,700 |
| SK Innovation Company, Ltd. | | 10,839 | | | 1,026,244 |
| SM Energy Company | | 13,969 | | | 91,776 |
| S-Oil Corp. | | 8,788 | | | 488,502 |
| Southwestern Energy Company (A)(C) | | 67,374 | | | 95,671 |
Strategic Equity Allocation Fund (continued)
| | | Shares or
Principal
Amount | | Value |
| COMMON STOCKS (continued) | | | |
| Oil, gas and consumable fuels (continued) | | | |
| Suncor Energy, Inc. | | 243,610 | | $ | 6,713,454 |
| Talos Energy, Inc. (A) | | 2,487 | | | 35,315 |
| TC Energy Corp. | | 145,121 | | | 7,563,915 |
| Teekay Corp. (A) | | 8,871 | | | 32,468 |
| Teekay Tankers, Ltd., Class A (A) | | 2,959 | | | 48,971 |
| Tellurian, Inc. (A)(C) | | 11,997 | | | 21,595 |
| Thai Oil PCL, NVDR | | 59,100 | | | 83,189 |
| The Williams Companies, Inc. | | 184,810 | | | 3,520,631 |
| TOTAL SA | | 321,679 | | | 13,903,718 |
| Tupras Turkiye Petrol Rafinerileri AS | | 6,077 | | | 99,144 |
| Ultrapar Participacoes SA | | 24,002 | | | 102,408 |
| United Tractors Tbk PT | | 44,237 | | | 51,921 |
| Uranium Energy Corp. (A) | | 25,324 | | | 15,197 |
| Valero Energy Corp. | | 62,615 | | | 4,148,244 |
| Vermilion Energy, Inc. (C) | | 1,084 | | | 10,870 |
| W&T Offshore, Inc. (A) | | 11,992 | | | 31,179 |
| Washington H. Soul Pattinson & Company, Ltd. | | 16,750 | | | 215,194 |
| Whiting Petroleum Corp. (A)(C) | | 11,558 | | | 21,382 |
| Woodside Petroleum, Ltd. | | 133,461 | | | 2,484,875 |
| World Fuel Services Corp. | | 24,718 | | | 699,025 |
| WPX Energy, Inc. (A) | | 106,831 | | | 996,733 |
| Yanzhou Coal Mining Company, Ltd., H Shares | | 220,010 | | | 169,067 |
| | | | | | 237,248,487 |
| | | | | | 254,098,700 |
| Financials – 14.2% | | | | | |
| Banks – 7.4% | | | |
| 1st Constitution Bancorp | | 1,214 | | | 22,240 |
| 1st Source Corp. | | 1,721 | | | 72,368 |
| ABN AMRO Bank NV (B) | | 52,310 | | | 717,449 |
| Absa Group, Ltd. | | 59,446 | | | 511,570 |
| ACNB Corp. | | 877 | | | 26,731 |
| Agricultural Bank of China, Ltd., H Shares | | 3,896,400 | | | 1,581,108 |
| AIB Group PLC | | 100,237 | | | 233,893 |
| Akbank T.A.S. (A) | | 151,040 | | | 163,754 |
| Allegiance Bancshares, Inc. | | 2,459 | | | 81,565 |
| Amalgamated Bank, Class A | | 1,767 | | | 28,290 |
| Amerant Bancorp, Inc. (A) | | 2,493 | | | 46,021 |
| American National Bankshares, Inc. | | 1,176 | | | 36,327 |
| Ameris Bancorp | | 7,552 | | | 258,127 |
| Ames National Corp. | | 1,307 | | | 33,812 |
| AMMB Holdings BHD | | 173,500 | | | 152,976 |
| Aozora Bank, Ltd. | | 14,870 | | | 369,024 |
| Arrow Financial Corp. | | 1,547 | | | 48,993 |
| Associated Banc-Corp. | | 40,847 | | | 691,540 |
| Atlantic Capital Bancshares, Inc. (A) | | 2,922 | | | 52,976 |
| Atlantic Union Bankshares Corp. | | 9,889 | | | 294,099 |
| Australia & New Zealand Banking Group, Ltd. | | 405,699 | | | 6,542,680 |
| Banc of California, Inc. | | 5,682 | | | 87,105 |
| BancFirst Corp. | | 2,284 | | | 117,169 |
| Banco Bilbao Vizcaya Argentaria SA | | 798,779 | | | 3,825,582 |
| Banco Bradesco SA | | 41,797 | | | 255,068 |
| Banco de Chile | | 5,768,828 | | | 509,602 |
| Banco de Credito e Inversiones SA | | 6,186 | | | 230,307 |
| Banco de Sabadell SA | | 671,447 | | | 589,322 |
| Banco do Brasil SA | | 28,794 | | | 301,726 |
| Banco Espirito Santo SA (A) | | 322,715 | | | 517 |
| Banco Santander Brasil SA | | 13,726 | | | 122,346 |
| Banco Santander Chile | | 8,137,693 | | | 364,147 |
| Banco Santander SA | | 1,988,882 | | | 7,351,621 |
| Bancolombia SA | | 21,205 | | | 234,995 |
| BancorpSouth Bank | | 36,377 | | | 890,145 |
| Bangkok Bank PCL, NVDR | | 26,000 | | | 109,044 |
| The accompanying notes are an integral part of the financial statements. | 52 | |
John Hancock Funds II
Portfolio of Investments — February 29, 2020 (unaudited)(showing percentage of total net assets)
Strategic Equity Allocation Fund (continued)
| | | Shares or
Principal
Amount | | Value |
| COMMON STOCKS (continued) | | | |
| Banks (continued) | | | |
| Bank Central Asia Tbk PT | | 253,430 | | $ | 559,804 |
| Bank First Corp. | | 715 | | | 42,328 |
| Bank Hapoalim BM | | 134,211 | | | 1,044,175 |
| Bank Leumi Le-Israel BM | | 174,886 | | | 1,130,445 |
| Bank Mandiri Persero Tbk PT | | 486,756 | | | 253,160 |
| Bank Millennium SA (A) | | 33,567 | | | 41,688 |
| Bank Negara Indonesia Persero Tbk PT | | 215,453 | | | 107,923 |
| Bank of America Corp. | | 1,283,216 | | | 36,571,656 |
| Bank of China, Ltd., H Shares | | 10,543,122 | | | 4,213,451 |
| Bank of Commerce Holdings | | 2,583 | | | 27,005 |
| Bank of Communications Company, Ltd., H Shares | | 1,103,976 | | | 718,348 |
| Bank of Hawaii Corp. | | 10,324 | | | 768,312 |
| Bank of Ireland Group PLC | | 123,084 | | | 460,863 |
| Bank of Marin Bancorp | | 1,635 | | | 62,343 |
| Bank of Montreal | | 100,744 | | | 6,845,863 |
| Bank of the Philippine Islands | | 113,827 | | | 165,621 |
| Bank OZK | | 30,989 | | | 786,811 |
| Bank Polska Kasa Opieki SA | | 10,017 | | | 226,673 |
| Bank Rakyat Indonesia Persero Tbk PT | | 1,447,210 | | | 432,465 |
| Bank Tabungan Negara Persero Tbk PT | | 124,600 | | | 15,068 |
| BankFinancial Corp. | | 2,029 | | | 23,009 |
| Bankia SA | | 152,780 | | | 242,268 |
| Bankinter SA | | 77,910 | | | 460,360 |
| Bankwell Financial Group, Inc. | | 952 | | | 27,103 |
| Banner Corp. | | 4,236 | | | 193,331 |
| Bar Harbor Bankshares | | 2,014 | | | 41,126 |
| Barclays PLC | | 1,191,966 | | | 2,284,391 |
| Baycom Corp. (A) | | 1,574 | | | 33,542 |
| BCB Bancorp, Inc. | | 2,036 | | | 23,088 |
| BDO Unibank, Inc. | | 246,580 | | | 674,268 |
| Bendigo & Adelaide Bank, Ltd. | | 70,386 | | | 424,995 |
| Berkshire Hills Bancorp, Inc. | | 5,647 | | | 137,843 |
| BNK Financial Group, Inc. | | 56,724 | | | 287,684 |
| BNP Paribas SA | | 151,412 | | | 7,349,583 |
| BOC Hong Kong Holdings, Ltd. | | 235,500 | | | 824,185 |
| Boston Private Financial Holdings, Inc. | | 10,383 | | | 101,286 |
| Bridge Bancorp, Inc. | | 2,081 | | | 57,269 |
| Brookline Bancorp, Inc. | | 9,874 | | | 136,952 |
| Bryn Mawr Bank Corp. | | 2,503 | | | 83,200 |
| Business First Bancshares, Inc. | | 1,413 | | | 34,011 |
| Byline Bancorp, Inc. | | 3,035 | | | 53,113 |
| C&F Financial Corp. | | 429 | | | 19,520 |
| Cadence BanCorp | | 15,640 | | | 220,837 |
| CaixaBank SA | | 425,195 | | | 1,092,849 |
| Cambridge Bancorp | | 582 | | | 39,850 |
| Camden National Corp. | | 1,924 | | | 78,903 |
| Canadian Imperial Bank of Commerce | | 70,388 | | | 5,357,302 |
| Capital City Bank Group, Inc. | | 1,745 | | | 46,504 |
| Capitec Bank Holdings, Ltd. | | 3,828 | | | 324,020 |
| Capstar Financial Holdings, Inc. | | 2,046 | | | 27,498 |
| Carolina Financial Corp. | | 2,604 | | | 84,370 |
| Carter Bank & Trust | | 2,831 | | | 47,844 |
| Cathay General Bancorp | | 28,796 | | | 886,341 |
| CBTX, Inc. | | 2,343 | | | 58,458 |
| CenterState Bank Corp. (C) | | 14,964 | | | 302,722 |
| Central Pacific Financial Corp. | | 3,438 | | | 82,237 |
| Central Valley Community Bancorp | | 1,540 | | | 26,488 |
| Century Bancorp, Inc., Class A | | 379 | | | 27,402 |
| Chang Hwa Commercial Bank, Ltd. | | 1,238,746 | | | 946,519 |
| Chemung Financial Corp. | | 520 | | | 18,668 |
| China CITIC Bank Corp., Ltd., H Shares | | 1,149,400 | | | 602,189 |
| China Construction Bank Corp., H Shares | | 12,762,296 | | | 10,493,558 |
| China Everbright Bank Company, Ltd., H Shares | | 398,595 | | | 161,052 |
Strategic Equity Allocation Fund (continued)
| | | Shares or
Principal
Amount | | Value |
| COMMON STOCKS (continued) | | | |
| Banks (continued) | | | |
| China Merchants Bank Company, Ltd., H Shares | | 516,674 | | $ | 2,485,666 |
| China Minsheng Banking Corp., Ltd., H Shares | | 912,700 | | | 624,609 |
| Chongqing Rural Commercial Bank Company, Ltd., H Shares | | 324,800 | | | 148,411 |
| CIMB Group Holdings BHD | | 500,900 | | | 575,022 |
| CIT Group, Inc. | | 24,282 | | | 964,238 |
| Citigroup, Inc. | | 346,054 | | | 21,960,587 |
| Citizens & Northern Corp. | | 1,607 | | | 36,463 |
| Citizens Financial Group, Inc. | | 68,907 | | | 2,183,663 |
| City Holding Company | | 1,923 | | | 134,456 |
| Civista Bancshares, Inc. | | 2,050 | | | 39,237 |
| CNB Financial Corp. | | 1,861 | | | 46,655 |
| Coastal Financial Corp. (A) | | 1,184 | | | 19,406 |
| Codorus Valley Bancorp, Inc. | | 1,439 | | | 29,643 |
| Colony Bankcorp, Inc. | | 1,360 | | | 20,223 |
| Columbia Banking System, Inc. | | 8,954 | | | 297,273 |
| Comerica, Inc. | | 22,850 | | | 1,202,824 |
| Commerce Bancshares, Inc. | | 26,586 | | | 1,622,809 |
| Commerzbank AG | | 132,914 | | | 768,142 |
| Commonwealth Bank of Australia | | 254,049 | | | 13,638,150 |
| Community Bank System, Inc. (C) | | 6,213 | | | 377,813 |
| Community Bankers Trust Corp. | | 3,182 | | | 25,997 |
| Community Trust Bancorp, Inc. | | 1,921 | | | 74,304 |
| Concordia Financial Group, Ltd. | | 139,600 | | | 471,062 |
| ConnectOne Bancorp, Inc. | | 4,141 | | | 87,002 |
| Credicorp, Ltd. | | 8,400 | | | 1,522,668 |
| Credit Agricole SA | | 157,595 | | | 1,895,203 |
| CTBC Financial Holding Company, Ltd. | | 4,144,090 | | | 3,075,596 |
| Cullen/Frost Bankers, Inc. | | 14,595 | | | 1,144,102 |
| Customers Bancorp, Inc. (A) | | 3,504 | | | 71,096 |
| CVB Financial Corp. | | 16,577 | | | 307,338 |
| Danske Bank A/S | | 120,889 | | | 1,874,138 |
| DBS Group Holdings, Ltd. | | 73,672 | | | 1,288,097 |
| Dime Community Bancshares, Inc. | | 4,092 | | | 68,664 |
| DNB ASA | | 50,874 | | | 852,104 |
| E.Sun Financial Holding Company, Ltd. | | 2,337,646 | | | 2,228,823 |
| Eagle Bancorp, Inc. | | 4,120 | | | 154,170 |
| East West Bancorp, Inc. | | 37,331 | | | 1,446,203 |
| Enterprise Bancorp, Inc. | | 1,197 | | | 32,882 |
| Enterprise Financial Services Corp. | | 3,033 | | | 116,073 |
| Equity Bancshares, Inc., Class A (A) | | 2,024 | | | 52,988 |
| Erste Group Bank AG | | 46,227 | | | 1,582,508 |
| Esquire Financial Holdings, Inc. (A) | | 972 | | | 22,269 |
| Evans Bancorp, Inc. | | 713 | | | 28,000 |
| Farmers & Merchants Bancorp, Inc. | | 1,123 | | | 29,872 |
| Farmers National Banc Corp. | | 3,321 | | | 49,915 |
| FB Financial Corp. (C) | | 2,105 | | | 68,560 |
| Fidelity D&D Bancorp, Inc. | | 366 | | | 18,044 |
| Fifth Third Bancorp | | 112,488 | | | 2,744,707 |
| Financial Institutions, Inc. | | 1,949 | | | 52,448 |
| FinecoBank Banca Fineco SpA | | 50,563 | | | 530,559 |
| First Bancorp (NC) | | 3,621 | | | 116,234 |
| First Bancorp (PR) | | 26,407 | | | 209,672 |
| First Bancorp, Inc. | | 1,408 | | | 35,904 |
| First Bank | | 2,501 | | | 24,385 |
| First Busey Corp. | | 6,450 | | | 142,352 |
| First Business Financial Services, Inc. | | 1,131 | | | 27,144 |
| First Capital, Inc. | | 430 | | | 26,445 |
| First Choice Bancorp | | 1,304 | | | 29,536 |
| First Commonwealth Financial Corp. | | 12,092 | | | 142,686 |
| First Community Bankshares, Inc. | | 1,961 | | | 51,300 |
| First Financial Bancorp | | 12,192 | | | 251,155 |
| First Financial Bankshares, Inc. (C) | | 50,870 | | | 1,462,004 |
| The accompanying notes are an integral part of the financial statements. | 53 | |
John Hancock Funds II
Portfolio of Investments — February 29, 2020 (unaudited)(showing percentage of total net assets)
Strategic Equity Allocation Fund (continued)
| | | Shares or
Principal
Amount | | Value |
| COMMON STOCKS (continued) | | | |
| Banks (continued) | | | |
| First Financial Corp. | | 1,667 | | $ | 66,597 |
| First Financial Holding Company, Ltd. | | 2,200,439 | | | 1,712,442 |
| First Foundation, Inc. | | 4,979 | | | 72,071 |
| First Horizon National Corp. | | 79,771 | | | 1,063,347 |
| First Internet Bancorp | | 1,362 | | | 33,083 |
| First Interstate BancSystem, Inc., Class A | | 4,690 | | | 159,741 |
| First Merchants Corp. | | 6,784 | | | 237,304 |
| First Mid Bancshares, Inc. | | 1,882 | | | 53,016 |
| First Midwest Bancorp, Inc. | | 13,266 | | | 240,778 |
| First Northwest Bancorp | | 1,486 | | | 23,657 |
| First Republic Bank | | 26,712 | | | 2,686,426 |
| Flushing Financial Corp. | | 3,568 | | | 64,777 |
| FNB Corp. | | 83,294 | | | 840,436 |
| FNCB Bancorp, Inc. | | 2,863 | | | 18,924 |
| Franklin Financial Network, Inc. | | 1,651 | | | 55,292 |
| Franklin Financial Services Corp. | | 617 | | | 19,139 |
| Fukuoka Financial Group, Inc. | | 22,600 | | | 338,214 |
| Fulton Financial Corp. | | 61,772 | | | 892,605 |
| FVCBankcorp, Inc. (A) | | 1,761 | | | 27,172 |
| German American Bancorp, Inc. | | 3,096 | | | 92,416 |
| Glacier Bancorp, Inc. | | 10,684 | | | 398,406 |
| Great Southern Bancorp, Inc. | | 1,364 | | | 69,987 |
| Great Western Bancorp, Inc. | | 7,017 | | | 188,547 |
| Grupo Financiero Banorte SAB de CV, Series O | | 316,150 | | | 1,728,601 |
| Grupo Financiero Inbursa SAB de CV, Series O | | 276,400 | | | 299,809 |
| Guaranty Bancshares, Inc. | | 1,073 | | | 29,626 |
| Hana Financial Group, Inc. | | 59,316 | | | 1,536,082 |
| Hancock Whitney Corp. | | 33,007 | | | 1,105,735 |
| Hang Seng Bank, Ltd. | | 47,495 | | | 1,001,694 |
| Hanmi Financial Corp. | | 3,934 | | | 61,370 |
| HarborOne Bancorp, Inc. (A) | | 3,571 | | | 35,692 |
| Hawthorn Bancshares, Inc. | | 838 | | | 18,218 |
| Heartland Financial USA, Inc. | | 4,352 | | | 186,483 |
| Heritage Commerce Corp. | | 5,806 | | | 59,570 |
| Heritage Financial Corp. | | 4,658 | | | 108,019 |
| Hilltop Holdings, Inc. | | 8,615 | | | 179,450 |
| Home BancShares, Inc. | | 58,955 | | | 988,086 |
| HomeTrust Bancshares, Inc. | | 2,029 | | | 48,209 |
| Hong Leong Bank BHD | | 69,800 | | | 254,265 |
| Hong Leong Financial Group BHD | | 24,100 | | | 87,546 |
| Hope Bancorp, Inc. | | 15,173 | | | 185,262 |
| Horizon Bancorp, Inc. | | 4,703 | | | 70,639 |
| Howard Bancorp, Inc. (A) | | 1,803 | | | 28,397 |
| HSBC Holdings PLC | | 1,409,592 | | | 9,520,725 |
| Hua Nan Financial Holdings Company, Ltd. | | 1,745,108 | | | 1,234,798 |
| Huntington Bancshares, Inc. | | 163,702 | | | 2,008,624 |
| IBERIABANK Corp. | | 6,409 | | | 385,758 |
| Independent Bank Corp. (Massachusetts) | | 4,109 | | | 277,481 |
| Independent Bank Corp. (Michigan) | | 2,728 | | | 53,387 |
| Independent Bank Group, Inc. | | 4,451 | | | 206,037 |
| Industrial & Commercial Bank of China, Ltd., H Shares | | 8,621,623 | | | 5,939,429 |
| Industrial Bank of Korea | | 52,226 | | | 411,872 |
| ING Groep NV | | 484,612 | | | 4,640,563 |
| International Bancshares Corp. | | 21,516 | | | 733,696 |
| Intesa Sanpaolo SpA | | 1,231,490 | | | 2,993,895 |
| Investar Holding Corp. | | 1,376 | | | 29,391 |
| Investors Bancorp, Inc. | | 27,796 | | | 292,970 |
| Israel Discount Bank, Ltd., Class A | | 143,166 | | | 596,609 |
| Itau CorpBanca | | 15,692,343 | | | 57,431 |
| Japan Post Bank Company, Ltd. | | 47,700 | | | 421,182 |
| JPMorgan Chase & Co. | | 497,158 | | | 57,725,015 |
Strategic Equity Allocation Fund (continued)
| | | Shares or
Principal
Amount | | Value |
| COMMON STOCKS (continued) | | | |
| Banks (continued) | | | |
| Kasikornbank PCL, NVDR | | 109,300 | | $ | 416,437 |
| KB Financial Group, Inc. | | 78,435 | | | 2,479,586 |
| KBC Group NV | | 8,073 | | | 537,875 |
| KeyCorp | | 156,125 | | | 2,552,644 |
| Komercni banka AS | | 8,182 | | | 253,566 |
| Krung Thai Bank PCL, NVDR | | 183,400 | | | 82,048 |
| Lakeland Bancorp, Inc. | | 6,121 | | | 88,173 |
| Lakeland Financial Corp. | | 3,026 | | | 123,673 |
| LCNB Corp. | | 1,709 | | | 27,053 |
| Level One Bancorp, Inc. | | 887 | | | 21,510 |
| Live Oak Bancshares, Inc. (C) | | 3,235 | | | 49,722 |
| Lloyds Banking Group PLC | | 4,889,560 | | | 3,173,794 |
| M&T Bank Corp. | | 20,917 | | | 2,936,328 |
| Macatawa Bank Corp. | | 3,475 | | | 33,499 |
| MainStreet Bancshares, Inc. (A) | | 1,012 | | | 20,523 |
| Malayan Banking BHD | | 400,133 | | | 801,408 |
| Malvern Bancorp, Inc. (A) | | 1,108 | | | 21,185 |
| mBank SA (A) | | 911 | | | 69,546 |
| Mebuki Financial Group, Inc. | | 115,000 | | | 221,669 |
| Mediobanca Banca di Credito Finanziario SpA | | 49,727 | | | 452,189 |
| Mega Financial Holding Company, Ltd. | | 2,432,275 | | | 2,575,525 |
| Mercantile Bank Corp. | | 1,977 | | | 56,720 |
| Metrocity Bankshares, Inc. | | 1,942 | | | 27,305 |
| Metropolitan Bank & Trust Company | | 226,864 | | | 250,197 |
| Metropolitan Bank Holding Corp. (A) | | 897 | | | 38,347 |
| Mid Penn Bancorp, Inc. | | 1,041 | | | 22,142 |
| Midland States Bancorp, Inc. | | 2,792 | | | 66,505 |
| MidWestOne Financial Group, Inc. | | 1,542 | | | 44,302 |
| Mitsubishi UFJ Financial Group, Inc. | | 1,573,000 | | | 7,685,614 |
| Mizrahi Tefahot Bank, Ltd. | | 17,582 | | | 450,990 |
| Mizuho Financial Group, Inc. | | 3,082,100 | | | 4,169,640 |
| Moneta Money Bank AS (B) | | 55,503 | | | 185,087 |
| MutualFirst Financial, Inc. | | 782 | | | 26,197 |
| MVB Financial Corp. | | 1,342 | | | 23,673 |
| National Australia Bank, Ltd. | | 413,709 | | | 6,808,028 |
| National Bank Holdings Corp., Class A | | 3,628 | | | 110,981 |
| National Bank of Canada | | 54,755 | | | 2,846,159 |
| National Bankshares, Inc. | | 855 | | | 29,882 |
| NBT Bancorp, Inc. | | 5,283 | | | 177,984 |
| Nedbank Group, Ltd. | | 31,968 | | | 365,465 |
| Nicolet Bankshares, Inc. (A) | | 991 | | | 65,852 |
| Nordea Bank ABP | | 445,986 | | | 3,519,868 |
| Northeast Bank | | 1,053 | | | 18,743 |
| Northrim BanCorp, Inc. | | 917 | | | 32,049 |
| Norwood Financial Corp. | | 860 | | | 26,557 |
| OFG Bancorp | | 6,301 | | | 105,479 |
| Old National Bancorp | | 20,830 | | | 328,281 |
| Old Second Bancorp, Inc. | | 4,053 | | | 43,124 |
| Opus Bank | | 2,724 | | | 64,477 |
| Origin Bancorp, Inc. | | 2,371 | | | 71,699 |
| Orrstown Financial Services, Inc. | | 1,459 | | | 25,970 |
| OTP Bank Nyrt | | 29,304 | | | 1,286,244 |
| Oversea-Chinese Banking Corp., Ltd. | | 137,078 | | | 1,055,228 |
| Pacific Mercantile Bancorp (A) | | 3,173 | | | 20,720 |
| Pacific Premier Bancorp, Inc. | | 7,306 | | | 188,714 |
| PacWest Bancorp | | 30,719 | | | 971,949 |
| Park National Corp. | | 1,552 | | | 135,521 |
| Parke Bancorp, Inc. | | 1,275 | | | 23,586 |
| PCB Bancorp | | 1,723 | | | 23,037 |
| Peapack Gladstone Financial Corp. | | 2,394 | | | 65,715 |
| Penns Woods Bancorp, Inc. | | 948 | | | 28,592 |
| Peoples Bancorp of North Carolina, Inc. | | 664 | | | 16,886 |
| Peoples Bancorp, Inc. | | 2,250 | | | 64,238 |
| Peoples Financial Services Corp. | | 909 | | | 39,923 |
| The accompanying notes are an integral part of the financial statements. | 54 | |
John Hancock Funds II
Portfolio of Investments — February 29, 2020 (unaudited)(showing percentage of total net assets)
Strategic Equity Allocation Fund (continued)
| | | Shares or
Principal
Amount | | Value |
| COMMON STOCKS (continued) | | | |
| Banks (continued) | | | |
| People's United Financial, Inc. | | 70,396 | | $ | 984,840 |
| People's Utah Bancorp | | 1,832 | | | 43,913 |
| Pinnacle Financial Partners, Inc. | | 18,450 | | | 971,208 |
| Postal Savings Bank of China Company, Ltd., H Shares (B) | | 1,067,300 | | | 680,925 |
| Powszechna Kasa Oszczednosci Bank Polski SA | | 51,470 | | | 412,108 |
| Preferred Bank | | 1,744 | | | 89,171 |
| Premier Financial Bancorp, Inc. | | 1,776 | | | 29,570 |
| Prosperity Bancshares, Inc. | | 24,200 | | | 1,563,320 |
| Public Bank BHD | | 319,162 | | | 1,298,659 |
| QCR Holdings, Inc. | | 1,855 | | | 70,601 |
| Raiffeisen Bank International AG | | 22,044 | | | 455,218 |
| RBB Bancorp | | 2,261 | | | 38,143 |
| Red River Bancshares, Inc. (A) | | 583 | | | 30,304 |
| Regions Financial Corp. | | 152,904 | | | 2,067,262 |
| Reliant Bancorp, Inc. | | 1,417 | | | 28,127 |
| Renasant Corp. | | 6,959 | | | 197,148 |
| Republic Bancorp, Inc., Class A | | 1,187 | | | 42,423 |
| Republic First Bancorp, Inc. (A) | | 6,959 | | | 21,086 |
| Resona Holdings, Inc. | | 268,900 | | | 1,000,977 |
| RHB Bank BHD | | 162,141 | | | 213,393 |
| Richmond Mutual Bancorporation, Inc. (A) | | 1,960 | | | 26,362 |
| Royal Bank of Canada | | 224,581 | | | 16,701,565 |
| S&T Bancorp, Inc. | | 4,685 | | | 153,996 |
| Sandy Spring Bancorp, Inc. | | 4,299 | | | 132,237 |
| Santander Bank Polska SA | | 2,125 | | | 137,320 |
| SB One Bancorp | | 1,201 | | | 26,326 |
| Seacoast Banking Corp. of Florida (A) | | 6,297 | | | 156,795 |
| Security Bank Corp. | | 28,670 | | | 87,155 |
| Select Bancorp, Inc. (A) | | 2,522 | | | 26,481 |
| ServisFirst Bancshares, Inc. | | 5,981 | | | 206,644 |
| Seven Bank, Ltd. | | 75,900 | | | 199,621 |
| Shinhan Financial Group Company, Ltd. | | 90,034 | | | 2,407,917 |
| Shinsei Bank, Ltd. | | 25,600 | | | 335,330 |
| Shore Bancshares, Inc. | | 1,920 | | | 29,875 |
| Sierra Bancorp | | 1,885 | | | 44,901 |
| Signature Bank | | 13,840 | | | 1,731,384 |
| Simmons First National Corp., Class A | | 11,324 | | | 242,107 |
| SinoPac Financial Holdings Company, Ltd. | | 2,389,772 | | | 1,011,286 |
| Skandinaviska Enskilda Banken AB, A Shares | | 223,828 | | | 2,145,382 |
| SmartFinancial, Inc. | | 1,742 | | | 33,081 |
| Societe Generale SA | | 109,344 | | | 3,098,442 |
| South State Corp. | | 4,096 | | | 279,020 |
| Southern First Bancshares, Inc. (A) | | 931 | | | 35,490 |
| Southern National Bancorp of Virginia, Inc. | | 2,654 | | | 37,660 |
| Southside Bancshares, Inc. | | 3,934 | | | 126,753 |
| Spirit of Texas Bancshares, Inc. (A) | | 1,747 | | | 32,215 |
| Standard Bank Group, Ltd. | | 110,026 | | | 1,057,597 |
| Standard Chartered PLC | | 189,219 | | | 1,369,204 |
| Sterling Bancorp | | 51,794 | | | 858,745 |
| Stock Yards Bancorp, Inc. | | 2,468 | | | 86,232 |
| Sumitomo Mitsui Financial Group, Inc. | | 169,879 | | | 5,390,225 |
| Sumitomo Mitsui Trust Holdings, Inc. | | 42,138 | | | 1,430,564 |
| Summit Financial Group, Inc. | | 1,486 | | | 32,573 |
| SVB Financial Group (A) | | 8,174 | | | 1,701,500 |
| Svenska Handelsbanken AB, A Shares | | 210,020 | | | 2,123,652 |
| Swedbank AB, A Shares | | 124,140 | | | 1,885,462 |
| Synovus Financial Corp. | | 37,567 | | | 1,090,194 |
| Taishin Financial Holding Company, Ltd. | | 2,103,296 | | | 977,063 |
| Taiwan Business Bank | | 1,171,307 | | | 458,657 |
| Taiwan Cooperative Financial Holding Company, Ltd. | | 1,984,569 | | | 1,363,466 |
Strategic Equity Allocation Fund (continued)
| | | Shares or
Principal
Amount | | Value |
| COMMON STOCKS (continued) | | | |
| Banks (continued) | | | |
| TCF Financial Corp. | | 39,326 | | $ | 1,433,039 |
| Texas Capital Bancshares, Inc. (A) | | 12,900 | | | 607,332 |
| The Bancorp, Inc. (A) | | 6,364 | | | 77,450 |
| The Bank of East Asia, Ltd. | | 78,293 | | | 167,336 |
| The Bank of Kyoto, Ltd. | | 7,000 | | | 232,137 |
| The Bank of Nova Scotia | | 191,074 | | | 9,996,064 |
| The Bank of NT Butterfield & Son, Ltd. | | 6,826 | | | 188,944 |
| The Bank of Princeton | | 870 | | | 23,716 |
| The Chiba Bank, Ltd. | | 72,700 | | | 352,234 |
| The Community Financial Corp. | | 715 | | | 22,694 |
| The First Bancshares, Inc. | | 2,111 | | | 62,992 |
| The First of Long Island Corp. | | 2,991 | | | 61,944 |
| The PNC Financial Services Group, Inc. | | 69,453 | | | 8,778,859 |
| The Royal Bank of Scotland Group PLC | | 339,937 | | | 786,629 |
| The Shanghai Commercial & Savings Bank, Ltd. | | 740,000 | | | 1,218,395 |
| The Shizuoka Bank, Ltd. | | 58,300 | | | 361,769 |
| The Siam Commercial Bank PCL, NVDR | | 47,800 | | | 134,185 |
| The Toronto-Dominion Bank | | 283,621 | | | 14,588,336 |
| TMB Bank PCL, NVDR | | 1,316,000 | | | 45,965 |
| Tompkins Financial Corp. | | 1,744 | | | 138,613 |
| Towne Bank | | 8,144 | | | 187,801 |
| TriCo Bancshares | | 3,270 | | | 110,591 |
| TriState Capital Holdings, Inc. (A) | | 3,129 | | | 62,173 |
| Triumph Bancorp, Inc. (A) | | 2,945 | | | 99,747 |
| Truist Financial Corp. | | 212,569 | | | 9,807,934 |
| Trustmark Corp. | | 24,374 | | | 655,661 |
| Turkiye Garanti Bankasi AS (A) | | 121,406 | | | 185,858 |
| Turkiye Is Bankasi AS, Class C (A) | | 88,735 | | | 81,713 |
| U.S. Bancorp | | 225,286 | | | 10,462,282 |
| UMB Financial Corp. | | 16,483 | | | 958,486 |
| Umpqua Holdings Corp. | | 56,452 | | | 868,796 |
| UniCredit SpA | | 168,251 | | | 2,163,581 |
| United Bankshares, Inc. | | 37,970 | | | 1,096,574 |
| United Community Banks, Inc. (C) | | 9,689 | | | 239,997 |
| United Overseas Bank, Ltd. | | 52,657 | | | 939,850 |
| Unity Bancorp, Inc. | | 1,116 | | | 19,117 |
| Univest Financial Corp. | | 3,614 | | | 84,568 |
| Valley National Bancorp | | 148,143 | | | 1,377,730 |
| Veritex Holdings, Inc. | | 6,361 | | | 153,109 |
| Washington Trust Bancorp, Inc. | | 1,871 | | | 80,303 |
| Webster Financial Corp. | | 23,592 | | | 895,788 |
| Wells Fargo & Company | | 610,052 | | | 24,920,624 |
| WesBanco, Inc. | | 8,086 | | | 247,512 |
| Westamerica Bancorporation | | 3,246 | | | 187,684 |
| Westpac Banking Corp. | | 500,257 | | | 7,660,054 |
| Wintrust Financial Corp. | | 14,630 | | | 781,388 |
| Woori Financial Group, Inc. | | 93,476 | | | 742,554 |
| Zions Bancorp NA | | 27,020 | | | 1,079,449 |
| | | | | | 505,855,526 |
| Capital markets – 2.3% | | | |
| 3i Group PLC | | 69,130 | | | 909,971 |
| Affiliated Managers Group, Inc. | | 12,631 | | | 950,104 |
| Ameriprise Financial, Inc. | | 16,861 | | | 2,382,459 |
| Amundi SA (B) | | 8,452 | | | 607,331 |
| Ares Management Corp., Class A | | 8,672 | | | 299,964 |
| Artisan Partners Asset Management, Inc., Class A | | 6,277 | | | 179,397 |
| Assetmark Financial Holdings, Inc. (A) | | 1,725 | | | 45,695 |
| ASX, Ltd. | | 28,307 | | | 1,382,840 |
| B. Riley Financial, Inc. | | 2,572 | | | 60,854 |
| B3 SA - Brasil Bolsa Balcao | | 70,676 | | | 758,614 |
| Banco BTG Pactual SA | | 8,500 | | | 128,415 |
| BlackRock, Inc. | | 15,695 | | | 7,266,942 |
| Blucora, Inc. (A) | | 6,071 | | | 105,635 |
| The accompanying notes are an integral part of the financial statements. | 55 | |
John Hancock Funds II
Portfolio of Investments — February 29, 2020 (unaudited)(showing percentage of total net assets)
Strategic Equity Allocation Fund (continued)
| | | Shares or
Principal
Amount | | Value |
| COMMON STOCKS (continued) | | | |
| Capital markets (continued) | | | |
| Brightsphere Investment Group, Inc. | | 8,415 | | $ | 78,680 |
| Brookfield Asset Management, Inc., Class A (C) | | 139,936 | | | 8,368,532 |
| Cboe Global Markets, Inc. | | 14,753 | | | 1,681,842 |
| China Cinda Asset Management Company, Ltd., H Shares | | 1,235,100 | | | 261,908 |
| China Ding Yi Feng Holdings, Ltd. | | 146,200 | | | 67,520 |
| China Everbright, Ltd. | | 126,984 | | | 216,012 |
| China Galaxy Securities Company, Ltd., H Shares | | 495,100 | | | 280,147 |
| China Huarong Asset Management Company, Ltd., H Shares (B) | | 1,386,200 | | | 191,475 |
| China International Capital Corp., Ltd., H Shares (B) | | 181,000 | | | 341,692 |
| CI Financial Corp. | | 38,403 | | | 637,737 |
| CITIC Securities Company, Ltd., H Shares | | 277,600 | | | 610,619 |
| CME Group, Inc. | | 47,691 | | | 9,481,925 |
| Cohen & Steers, Inc. | | 2,819 | | | 176,610 |
| Cowen, Inc., Class A | | 3,575 | | | 53,518 |
| Credit Suisse Group AG (A) | | 351,546 | | | 3,949,440 |
| Daiwa Securities Group, Inc. | | 200,118 | | | 846,542 |
| Deutsche Bank AG | | 264,993 | | | 2,326,503 |
| Deutsche Boerse AG | | 25,391 | | | 3,995,367 |
| Diamond Hill Investment Group, Inc. | | 408 | | | 51,706 |
| Donnelley Financial Solutions, Inc. (A) | | 4,079 | | | 35,487 |
| E*TRADE Financial Corp. | | 30,066 | | | 1,376,421 |
| Eaton Vance Corp. | | 29,004 | | | 1,196,705 |
| Evercore, Inc., Class A | | 10,020 | | | 667,532 |
| FactSet Research Systems, Inc. | | 9,727 | | | 2,587,285 |
| Federated Hermes, Inc. | | 36,474 | | | 1,052,275 |
| Focus Financial Partners, Inc., Class A (A) | | 3,808 | | | 103,540 |
| Franklin Resources, Inc. | | 37,120 | | | 807,731 |
| GF Securities Company, Ltd., H Shares | | 187,400 | | | 228,506 |
| Greenhill & Company, Inc. | | 2,071 | | | 30,278 |
| Guotai Junan Securities Company, Ltd., H Shares (B) | | 104,700 | | | 178,108 |
| Haitong Securities Company, Ltd., H Shares | | 388,700 | | | 428,505 |
| Hamilton Lane, Inc., Class A | | 2,719 | | | 168,959 |
| Hargreaves Lansdown PLC | | 20,236 | | | 406,244 |
| Hong Kong Exchanges & Clearing, Ltd. | | 75,377 | | | 2,521,814 |
| Houlihan Lokey, Inc. | | 5,103 | | | 261,376 |
| Huatai Securities Company, Ltd., H Shares (B) | | 221,300 | | | 391,396 |
| IGM Financial, Inc. | | 17,075 | | | 455,291 |
| Interactive Brokers Group, Inc., Class A | | 19,675 | | | 1,005,393 |
| Intercontinental Exchange, Inc. | | 74,107 | | | 6,611,827 |
| INTL. FCStone, Inc. (A) | | 2,020 | | | 92,011 |
| Invesco, Ltd. | | 49,533 | | | 713,275 |
| Investec PLC | | 3,447 | | | 17,659 |
| Investec, Ltd. | | 30,311 | | | 158,111 |
| Janus Henderson Group PLC | | 39,892 | | | 845,710 |
| Japan Exchange Group, Inc. | | 66,698 | | | 1,115,262 |
| Julius Baer Group, Ltd. (A) | | 31,086 | | | 1,307,729 |
| Korea Investment Holdings Company, Ltd. (A) | | 8,632 | | | 450,173 |
| Legg Mason, Inc. | | 20,917 | | | 1,042,085 |
| London Stock Exchange Group PLC | | 22,074 | | | 2,168,196 |
| Macquarie Group, Ltd. | | 46,942 | | | 4,173,775 |
| Magellan Financial Group, Ltd. | | 18,677 | | | 690,948 |
| MarketAxess Holdings, Inc. | | 5,047 | | | 1,636,894 |
| Meritz Securities Company, Ltd. | | 65,394 | | | 188,849 |
| Mirae Asset Daewoo Company, Ltd. (A) | | 83,652 | | | 441,384 |
| Moelis & Company, Class A | | 5,950 | | | 190,162 |
| Moody's Corp. | | 21,608 | | | 5,186,568 |
Strategic Equity Allocation Fund (continued)
| | | Shares or
Principal
Amount | | Value |
| COMMON STOCKS (continued) | | | |
| Capital markets (continued) | | | |
| Morgan Stanley | | 163,709 | | $ | 7,371,816 |
| MSCI, Inc. | | 11,273 | | | 3,330,495 |
| Nasdaq, Inc. | | 15,270 | | | 1,565,939 |
| Natixis SA | | 135,732 | | | 555,151 |
| NH Investment & Securities Company, Ltd. (A) | | 30,593 | | | 254,725 |
| Noah Holdings, Ltd., ADR (A) | | 4,700 | | | 133,386 |
| Nomura Holdings, Inc. | | 428,800 | | | 1,893,366 |
| Northern Trust Corp. | | 28,198 | | | 2,474,656 |
| Oppenheimer Holdings, Inc., Class A | | 1,204 | | | 28,571 |
| Partners Group Holding AG | | 2,544 | | | 2,207,738 |
| Piper Sandler Companies | | 1,699 | | | 119,066 |
| PJT Partners, Inc., Class A | | 2,839 | | | 127,613 |
| Pzena Investment Management, Inc., Class A | | 2,625 | | | 17,141 |
| Raymond James Financial, Inc. | | 16,431 | | | 1,374,125 |
| Reinet Investments SCA | | 12,817 | | | 265,961 |
| S&P Global, Inc. | | 32,525 | | | 8,648,723 |
| Safeguard Scientifics, Inc. | | 2,637 | | | 23,285 |
| Samsung Securities Company, Ltd. | | 13,199 | | | 361,308 |
| SBI Holdings, Inc. | | 30,764 | | | 620,549 |
| Schroders PLC | | 9,422 | | | 350,510 |
| Sculptor Capital Management, Inc. | | 2,155 | | | 48,875 |
| SEI Investments Company | | 32,355 | | | 1,770,142 |
| Singapore Exchange, Ltd. | | 34,000 | | | 209,952 |
| St. James's Place PLC | | 39,074 | | | 518,076 |
| Standard Life Aberdeen PLC | | 170,511 | | | 611,171 |
| State Street Corp. | | 48,392 | | | 3,295,979 |
| Stifel Financial Corp. | | 25,726 | | | 1,400,523 |
| T. Rowe Price Group, Inc. | | 31,098 | | | 3,669,875 |
| The Bank of New York Mellon Corp. | | 111,683 | | | 4,456,152 |
| The Charles Schwab Corp. | | 152,150 | | | 6,200,113 |
| The Goldman Sachs Group, Inc. | | 42,411 | | | 8,514,856 |
| UBS Group AG (A) | | 527,353 | | | 5,807,548 |
| Virtus Investment Partners, Inc. | | 834 | | | 92,074 |
| Waddell & Reed Financial, Inc., Class A (C) | | 8,615 | | | 118,542 |
| Westwood Holdings Group, Inc. | | 1,115 | | | 28,299 |
| WisdomTree Investments, Inc. | | 17,096 | | | 69,410 |
| | | | | | 158,165,171 |
| Consumer finance – 0.4% | | | |
| Acom Company, Ltd. | | 51,500 | | | 211,700 |
| AEON Financial Service Company, Ltd. | | 14,800 | | | 214,671 |
| American Express Company | | 89,296 | | | 9,816,309 |
| Capital One Financial Corp. | | 61,979 | | | 5,470,267 |
| Credit Saison Company, Ltd. | | 20,500 | | | 295,609 |
| Curo Group Holdings Corp. | | 2,148 | | | 19,826 |
| Discover Financial Services | | 41,717 | | | 2,735,801 |
| Encore Capital Group, Inc. (A)(C) | | 3,773 | | | 140,205 |
| Enova International, Inc. (A) | | 4,069 | | | 78,206 |
| EZCORP, Inc., Class A (A) | | 6,429 | | | 30,859 |
| FirstCash, Inc. | | 16,121 | | | 1,240,027 |
| Green Dot Corp., Class A (A) | | 6,061 | | | 207,044 |
| LendingClub Corp. (A) | | 8,352 | | | 91,956 |
| LendingTree, Inc. (A) | | 1,966 | | | 542,262 |
| Medallion Financial Corp. (A) | | 2,830 | | | 16,725 |
| Muangthai Capital PCL, NVDR | | 33,800 | | | 62,719 |
| Navient Corp. | | 49,863 | | | 559,961 |
| Nelnet, Inc., Class A | | 2,195 | | | 116,555 |
| Oportun Financial Corp. (A) | | 866 | | | 18,212 |
| PRA Group, Inc. (A) | | 5,553 | | | 215,567 |
| Qudian, Inc., ADR (A) | | 20,800 | | | 54,496 |
| Regional Management Corp. (A) | | 1,134 | | | 29,087 |
| Samsung Card Company, Ltd. | | 5,761 | | | 159,923 |
| SLM Corp. | | 108,223 | | | 1,122,273 |
| The accompanying notes are an integral part of the financial statements. | 56 | |
John Hancock Funds II
Portfolio of Investments — February 29, 2020 (unaudited)(showing percentage of total net assets)
Strategic Equity Allocation Fund (continued)
| | | Shares or
Principal
Amount | | Value |
| COMMON STOCKS (continued) | | | |
| Consumer finance (continued) | | | |
| Srisawad Corp. PCL, NVDR | | 40,800 | | $ | 88,659 |
| Synchrony Financial | | 79,117 | | | 2,302,305 |
| World Acceptance Corp. (A) | | 696 | | | 54,358 |
| | | | | | 25,895,582 |
| Diversified financial services – 1.1% | | | |
| AMP, Ltd. (A) | | 480,845 | | | 531,018 |
| Banco Latinoamericano de Comercio Exterior SA, Class E | | 3,802 | | | 67,980 |
| Berkshire Hathaway, Inc., Class B (A) | | 260,314 | | | 53,713,191 |
| Cannae Holdings, Inc. (A) | | 8,336 | | | 310,849 |
| Chailease Holding Company, Ltd. | | 269,784 | | | 1,003,944 |
| Challenger, Ltd. | | 80,650 | | | 485,374 |
| Eurazeo SE | | 5,180 | | | 348,208 |
| EXOR NV | | 9,362 | | | 668,618 |
| Far East Horizon, Ltd. | | 282,300 | | | 250,348 |
| FGL Holdings | | 17,962 | | | 205,485 |
| First Eagle Private Credit LLC (A)(D) | | 5,608 | | | 1,354 |
| FirstRand, Ltd. | | 287,484 | | | 1,026,411 |
| Groupe Bruxelles Lambert SA | | 2,731 | | | 248,261 |
| Grupo de Inversiones Suramericana SA | | 22,724 | | | 196,943 |
| Haci Omer Sabanci Holding AS | | 51,114 | | | 70,377 |
| Industrivarden AB, C Shares | | 23,568 | | | 532,974 |
| Investor AB, B Shares | | 63,237 | | | 3,167,509 |
| Jefferies Financial Group, Inc. | | 61,319 | | | 1,208,597 |
| Kinnevik AB, B Shares | | 33,673 | | | 685,780 |
| L E Lundbergforetagen AB, B Shares | | 11,137 | | | 461,978 |
| M&G PLC (A) | | 179,540 | | | 468,833 |
| Marlin Business Services Corp. | | 1,189 | | | 23,376 |
| Metro Pacific Investments Corp. | | 1,795,900 | | | 108,327 |
| Mitsubishi UFJ Lease & Finance Company, Ltd. | | 53,500 | | | 305,994 |
| On Deck Capital, Inc. (A) | | 8,604 | | | 30,028 |
| Onex Corp. | | 13,779 | | | 773,616 |
| ORIX Corp. | | 170,900 | | | 2,769,963 |
| Pargesa Holding SA, Bearer Shares | | 5,055 | | | 372,634 |
| PSG Group, Ltd. | | 12,813 | | | 155,624 |
| Remgro, Ltd. | | 45,502 | | | 473,293 |
| RMB Holdings, Ltd. | | 63,990 | | | 292,937 |
| Tokyo Century Corp. | | 5,500 | | | 227,112 |
| Wendel SA | | 3,533 | | | 436,427 |
| Yuanta Financial Holding Company, Ltd. | | 2,239,187 | | | 1,399,893 |
| | | | | | 73,023,256 |
| Insurance – 2.9% | | | |
| Admiral Group PLC | | 15,164 | | | 416,193 |
| Aegon NV | | 252,302 | | | 858,807 |
| Aflac, Inc. | | 59,763 | | | 2,560,845 |
| Ageas | | 8,095 | | | 376,651 |
| AIA Group, Ltd. | | 760,509 | | | 7,622,158 |
| Alleghany Corp. (A) | | 3,690 | | | 2,480,603 |
| Allianz SE | | 57,305 | | | 12,483,886 |
| Ambac Financial Group, Inc. (A) | | 5,540 | | | 106,479 |
| American Equity Investment Life Holding Company | | 11,171 | | | 282,403 |
| American Financial Group, Inc. | | 19,187 | | | 1,773,263 |
| American International Group, Inc. | | 70,830 | | | 2,986,193 |
| AMERISAFE, Inc. | | 2,356 | | | 153,541 |
| Aon PLC | | 19,063 | | | 3,965,104 |
| Argo Group International Holdings, Ltd. | | 4,015 | | | 225,884 |
| Arthur J. Gallagher & Company | | 15,186 | | | 1,480,483 |
| Assicurazioni Generali SpA | | 98,475 | | | 1,777,606 |
| Assurant, Inc. | | 4,937 | | | 595,353 |
| Aviva PLC | | 519,229 | | | 2,378,333 |
| AXA SA | | 264,556 | | | 6,149,429 |
| Baloise Holding AG | | 7,010 | | | 1,133,523 |
| BB Seguridade Participacoes SA | | 26,808 | | | 190,933 |
Strategic Equity Allocation Fund (continued)
| | | Shares or
Principal
Amount | | Value |
| COMMON STOCKS (continued) | | | |
| Insurance (continued) | | | |
| Brighthouse Financial, Inc. (A) | | 28,010 | | $ | 1,003,878 |
| Brown & Brown, Inc. | | 59,947 | | | 2,578,320 |
| BRP Group, Inc., Class A (A) | | 1,898 | | | 29,305 |
| Cathay Financial Holding Company, Ltd. | | 1,792,890 | | | 2,349,147 |
| China Development Financial Holding Corp. | | 2,991,000 | | | 898,253 |
| China Life Insurance Company, Ltd. (A) | | 645,703 | | | 506,815 |
| China Life Insurance Company, Ltd., H Shares | | 1,005,076 | | | 2,428,676 |
| China Pacific Insurance Group Company, Ltd., H Shares | | 356,779 | | | 1,196,866 |
| China Reinsurance Group Corp., H Shares | | 794,300 | | | 109,164 |
| China Taiping Insurance Holdings Company, Ltd. | | 230,800 | | | 482,690 |
| Chubb, Ltd. | | 36,899 | | | 5,351,462 |
| Cincinnati Financial Corp. | | 12,370 | | | 1,153,379 |
| Citizens, Inc. (A) | | 6,616 | | | 38,637 |
| CNO Financial Group, Inc. | | 57,395 | | | 919,468 |
| CNP Assurances | | 27,143 | | | 426,587 |
| Crawford & Company, Class A | | 2,175 | | | 16,182 |
| Dai-ichi Life Holdings, Inc. | | 143,100 | | | 1,940,771 |
| DB Insurance Company, Ltd. | | 10,385 | | | 370,797 |
| Direct Line Insurance Group PLC | | 103,916 | | | 414,228 |
| Discovery, Ltd. | | 35,820 | | | 223,297 |
| eHealth, Inc. (A) | | 2,794 | | | 327,876 |
| Employers Holdings, Inc. | | 3,851 | | | 148,418 |
| Enstar Group, Ltd. (A) | | 1,395 | | | 248,854 |
| Everest Re Group, Ltd. | | 3,320 | | | 822,962 |
| Fairfax Financial Holdings, Ltd. | | 4,386 | | | 1,889,387 |
| FBL Financial Group, Inc., Class A | | 1,226 | | | 58,554 |
| FedNat Holding Company | | 1,638 | | | 21,360 |
| First American Financial Corp. | | 28,797 | | | 1,644,309 |
| Fubon Financial Holding Company, Ltd. | | 1,511,659 | | | 2,188,166 |
| Genworth Financial, Inc., Class A (A) | | 191,694 | | | 747,607 |
| Gjensidige Forsikring ASA | | 12,327 | | | 250,528 |
| Global Indemnity, Ltd. | | 1,068 | | | 33,920 |
| Globe Life, Inc. | | 8,111 | | | 751,565 |
| Goosehead Insurance, Inc., Class A (C) | | 1,424 | | | 77,238 |
| Great-West Lifeco, Inc. | | 50,798 | | | 1,194,780 |
| Greenlight Capital Re, Ltd., Class A (A) | | 3,933 | | | 33,195 |
| Hallmark Financial Services, Inc. (A) | | 1,707 | | | 24,205 |
| Hannover Rueck SE | | 8,653 | | | 1,566,777 |
| Hanwha Life Insurance Company, Ltd. | | 19,772 | | | 27,040 |
| HCI Group, Inc. | | 790 | | | 33,591 |
| Health Insurance Innovations, Inc., Class A (A)(C) | | 1,269 | | | 37,321 |
| Heritage Insurance Holdings, Inc. | | 3,442 | | | 38,413 |
| Horace Mann Educators Corp. | | 5,125 | | | 199,516 |
| Hyundai Marine & Fire Insurance Company, Ltd. | | 13,385 | | | 249,537 |
| iA Financial Corp., Inc. | | 18,742 | | | 892,104 |
| Independence Holding Company | | 631 | | | 23,416 |
| Insurance Australia Group, Ltd. | | 336,356 | | | 1,415,466 |
| Intact Financial Corp. | | 22,804 | | | 2,471,785 |
| Investors Title Company | | 181 | | | 29,677 |
| IRB Brasil Resseguros SA | | 24,700 | | | 183,652 |
| James River Group Holdings, Ltd. | | 3,694 | | | 149,275 |
| Japan Post Holdings Company, Ltd. | | 205,700 | | | 1,787,613 |
| Japan Post Insurance Company, Ltd. | | 29,600 | | | 451,626 |
| Kemper Corp. | | 16,060 | | | 1,105,570 |
| Kinsale Capital Group, Inc. | | 2,520 | | | 306,104 |
| Legal & General Group PLC | | 437,795 | | | 1,483,194 |
| Liberty Holdings, Ltd. | | 14,374 | | | 87,649 |
| Lincoln National Corp. | | 16,148 | | | 732,958 |
| Loews Corp. | | 20,826 | | | 950,290 |
| The accompanying notes are an integral part of the financial statements. | 57 | |
John Hancock Funds II
Portfolio of Investments — February 29, 2020 (unaudited)(showing percentage of total net assets)
Strategic Equity Allocation Fund (continued)
| | | Shares or
Principal
Amount | | Value |
| COMMON STOCKS (continued) | | | |
| Insurance (continued) | | | |
| Mapfre SA | | 154,271 | | $ | 347,004 |
| Marsh & McLennan Companies, Inc. | | 41,089 | | | 4,296,266 |
| MBIA, Inc. (A) | | 9,502 | | | 74,116 |
| Medibank Pvt., Ltd. | | 404,745 | | | 756,092 |
| Mercury General Corp. | | 6,953 | | | 301,134 |
| MetLife, Inc. | | 63,643 | | | 2,718,829 |
| Momentum Metropolitan Holdings | | 91,163 | | | 102,491 |
| MS&AD Insurance Group Holdings, Inc. | | 64,068 | | | 2,065,180 |
| Muenchener Rueckversicherungs-Gesellschaft AG | | 19,701 | | | 5,104,876 |
| National General Holdings Corp. | | 8,359 | | | 162,750 |
| National Western Life Group, Inc., Class A | | 288 | | | 68,812 |
| New China Life Insurance Company, Ltd., H Shares | | 111,600 | | | 436,258 |
| NI Holdings, Inc. (A) | | 1,301 | | | 18,370 |
| NN Group NV | | 41,080 | | | 1,404,040 |
| Old Mutual, Ltd. | | 431,288 | | | 438,753 |
| Old Republic International Corp. | | 73,151 | | | 1,442,538 |
| Palomar Holdings, Inc. (A) | | 1,504 | | | 76,418 |
| PICC Property & Casualty Company, Ltd., H Shares | | 937,848 | | | 991,753 |
| Ping An Insurance Group Company of China, Ltd., H Shares | �� | 742,110 | | | 8,454,407 |
| Porto Seguro SA | | 4,023 | | | 54,859 |
| Poste Italiane SpA (B) | | 44,458 | | | 476,259 |
| Power Corp. of Canada | | 102,188 | | | 2,258,833 |
| Powszechny Zaklad Ubezpieczen SA | | 39,988 | | | 356,582 |
| Primerica, Inc. | | 10,603 | | | 1,180,538 |
| Principal Financial Group, Inc. | | 21,025 | | | 933,300 |
| ProAssurance Corp. | | 6,579 | | | 178,620 |
| ProSight Global, Inc. (A) | | 1,212 | | | 16,241 |
| Protective Insurance Corp., Class B | | 1,474 | | | 21,019 |
| Prudential Financial, Inc. | | 32,730 | | | 2,469,479 |
| Prudential PLC | | 186,167 | | | 3,094,927 |
| QBE Insurance Group, Ltd. | | 193,713 | | | 1,721,767 |
| Rand Merchant Investment Holdings, Ltd. | | 80,648 | | | 128,204 |
| Reinsurance Group of America, Inc. | | 16,050 | | | 1,958,582 |
| RenaissanceRe Holdings, Ltd. | | 11,321 | | | 1,929,098 |
| RLI Corp. | | 15,125 | | | 1,215,748 |
| RSA Insurance Group PLC | | 80,623 | | | 539,253 |
| Safety Insurance Group, Inc. | | 1,805 | | | 142,126 |
| Sampo OYJ, A Shares | | 56,803 | | | 2,321,082 |
| Samsung Fire & Marine Insurance Company, Ltd. | | 6,245 | | | 1,017,200 |
| Samsung Life Insurance Company, Ltd. | | 14,685 | | | 705,378 |
| Sanlam, Ltd. | | 168,598 | | | 708,197 |
| SCOR SE | | 22,802 | | | 825,826 |
| Selective Insurance Group, Inc. | | 22,433 | | | 1,251,313 |
| Shin Kong Financial Holding Company, Ltd. | | 2,469,694 | | | 736,351 |
| Sompo Holdings, Inc. | | 44,360 | | | 1,639,482 |
| Sony Financial Holdings, Inc. | | 21,400 | | | 426,867 |
| State Auto Financial Corp. | | 2,189 | | | 54,681 |
| Stewart Information Services Corp. | | 2,885 | | | 104,379 |
| Sul America SA | | 10,494 | | | 126,860 |
| Sun Life Financial, Inc. (C) | | 96,689 | | | 4,177,311 |
| Suncorp Group, Ltd. | | 183,422 | | | 1,370,310 |
| Swiss Life Holding AG | | 4,759 | | | 2,184,940 |
| Swiss Re AG | | 40,796 | | | 3,880,942 |
| T&D Holdings, Inc. | | 75,200 | | | 729,557 |
| The Allstate Corp. | | 26,376 | | | 2,776,074 |
| The Hanover Insurance Group, Inc. | | 10,098 | | | 1,197,017 |
| The Hartford Financial Services Group, Inc. | | 29,345 | | | 1,465,783 |
Strategic Equity Allocation Fund (continued)
| | | Shares or
Principal
Amount | | Value |
| COMMON STOCKS (continued) | | | |
| Insurance (continued) | | | |
| The People's Insurance Company Group of China, Ltd., H Shares | | 1,146,900 | | $ | 412,417 |
| The Progressive Corp. | | 47,600 | | | 3,482,416 |
| The Travelers Companies, Inc. | | 21,015 | | | 2,517,807 |
| Third Point Reinsurance, Ltd. (A) | | 9,342 | | | 83,331 |
| Tiptree, Inc. | | 3,395 | | | 22,339 |
| Tokio Marine Holdings, Inc. | | 83,314 | | | 4,452,133 |
| Trupanion, Inc. (A)(C) | | 3,589 | | | 110,326 |
| Tryg A/S | | 23,441 | | | 657,719 |
| United Fire Group, Inc. | | 2,610 | | | 100,067 |
| United Insurance Holdings Corp. | | 2,823 | | | 26,536 |
| Universal Insurance Holdings, Inc. | | 3,731 | | | 77,194 |
| Unum Group | | 16,794 | | | 391,468 |
| W.R. Berkley Corp. | | 11,814 | | | 793,192 |
| Watford Holdings, Ltd. (A) | | 2,434 | | | 55,568 |
| Willis Towers Watson PLC | | 10,468 | | | 1,981,069 |
| ZhongAn Online P&C Insurance Company, Ltd., H Shares (A)(B)(C) | | 41,900 | | | 179,733 |
| Zurich Insurance Group AG | | 20,574 | | | 7,966,908 |
| | | | | | 196,066,385 |
| Mortgage real estate investment trusts – 0.0% | | | |
| AG Mortgage Investment Trust, Inc. | | 4,216 | | | 63,114 |
| Anworth Mortgage Asset Corp. | | 13,515 | | | 44,194 |
| Apollo Commercial Real Estate Finance, Inc. | | 18,964 | | | 307,217 |
| Ares Commercial Real Estate Corp. | | 3,325 | | | 50,740 |
| Arlington Asset Investment Corp., Class A | | 4,783 | | | 27,072 |
| ARMOUR Residential REIT, Inc. | | 7,292 | | | 131,839 |
| Blackstone Mortgage Trust, Inc., Class A | | 15,422 | | | 556,117 |
| Capstead Mortgage Corp. | | 11,830 | | | 83,993 |
| Cherry Hill Mortgage Investment Corp. | | 2,156 | | | 30,745 |
| Colony Credit Real Estate, Inc. | | 10,304 | | | 131,170 |
| Dynex Capital, Inc. | | 3,099 | | | 52,993 |
| Ellington Financial, Inc. | | 3,606 | | | 59,607 |
| Exantas Capital Corp. | | 3,928 | | | 45,015 |
| Granite Point Mortgage Trust, Inc. | | 6,705 | | | 110,096 |
| Great Ajax Corp. | | 2,237 | | | 31,609 |
| Invesco Mortgage Capital, Inc. | | 17,730 | | | 285,098 |
| KKR Real Estate Finance Trust, Inc. | | 2,847 | | | 55,915 |
| Ladder Capital Corp. | | 12,750 | | | 194,438 |
| New York Mortgage Trust, Inc. | | 31,810 | | | 181,317 |
| Orchid Island Capital, Inc. | | 8,270 | | | 47,387 |
| PennyMac Mortgage Investment Trust | | 10,540 | | | 218,178 |
| Ready Capital Corp. | | 3,917 | | | 56,797 |
| Redwood Trust, Inc. | | 13,256 | | | 226,412 |
| TPG RE Finance Trust, Inc. | | 5,939 | | | 114,148 |
| Western Asset Mortgage Capital Corp. | | 6,365 | | | 63,777 |
| | | | | | 3,168,988 |
| Thrifts and mortgage finance – 0.1% | | | |
| Axos Financial, Inc. (A)(C) | | 7,184 | | | 178,953 |
| Bridgewater Bancshares, Inc. (A) | | 3,148 | | | 39,350 |
| Capitol Federal Financial, Inc. | | 15,623 | | | 190,679 |
| Columbia Financial, Inc. (A) | | 6,651 | | | 103,224 |
| ESSA Bancorp, Inc. | | 1,552 | | | 25,670 |
| Essent Group, Ltd. | | 11,836 | | | 516,523 |
| Federal Agricultural Mortgage Corp., Class C | | 1,112 | | | 83,467 |
| First Defiance Financial Corp. | | 4,678 | | | 111,874 |
| Flagstar Bancorp, Inc. | | 3,682 | | | 117,382 |
| FS Bancorp, Inc. | | 533 | | | 25,472 |
| Hingham Institution for Savings | | 183 | | | 33,482 |
| Home Bancorp, Inc. | | 1,050 | | | 34,724 |
| HomeStreet, Inc. | | 2,858 | | | 77,423 |
| Kearny Financial Corp. | | 10,382 | | | 113,268 |
| Luther Burbank Corp. | | 2,797 | | | 29,173 |
| The accompanying notes are an integral part of the financial statements. | 58 | |
John Hancock Funds II
Portfolio of Investments — February 29, 2020 (unaudited)(showing percentage of total net assets)
Strategic Equity Allocation Fund (continued)
| | | Shares or
Principal
Amount | | Value |
| COMMON STOCKS (continued) | | | |
| Thrifts and mortgage finance (continued) | | | |
| Merchants Bancorp | | 1,237 | | $ | 22,291 |
| Meridian Bancorp, Inc. | | 6,067 | | | 100,166 |
| Meta Financial Group, Inc. | | 4,417 | | | 145,098 |
| MMA Capital Holdings, Inc. (A) | | 631 | | | 19,050 |
| Mr. Cooper Group, Inc. (A) | | 9,491 | | | 121,770 |
| New York Community Bancorp, Inc. | | 119,805 | | | 1,295,092 |
| NMI Holdings, Inc., Class A (A) | | 8,044 | | | 187,747 |
| Northfield Bancorp, Inc. | | 5,676 | | | 80,202 |
| Northwest Bancshares, Inc. | | 12,487 | | | 173,444 |
| OceanFirst Financial Corp. (C) | | 6,388 | | | 130,571 |
| Ocwen Financial Corp. (A) | | 18,491 | | | 23,114 |
| OP Bancorp | | 2,017 | | | 17,850 |
| PCSB Financial Corp. | | 2,305 | | | 42,320 |
| PennyMac Financial Services, Inc. | | 3,065 | | | 108,072 |
| Pioneer Bancorp, Inc. (A) | | 1,516 | | | 20,648 |
| Provident Financial Services, Inc. | | 7,516 | | | 150,170 |
| Radian Group, Inc. | | 24,816 | | | 527,092 |
| Riverview Bancorp, Inc. | | 3,210 | | | 20,705 |
| Southern Missouri Bancorp, Inc. | | 947 | | | 31,081 |
| Sterling Bancorp, Inc. | | 2,253 | | | 15,771 |
| Territorial Bancorp, Inc. | | 1,080 | | | 27,454 |
| Timberland Bancorp, Inc. | | 937 | | | 21,785 |
| TrustCo Bank Corp. | | 12,386 | | | 84,968 |
| Walker & Dunlop, Inc. | | 3,385 | | | 219,517 |
| Washington Federal, Inc. | | 29,710 | | | 891,003 |
| Waterstone Financial, Inc. | | 2,973 | | | 49,441 |
| Western New England Bancorp, Inc. | | 3,527 | | | 31,179 |
| WSFS Financial Corp. | | 6,370 | | | 219,510 |
| | | | | | 6,457,775 |
| | | | | | 968,632,683 |
| Health care – 11.6% | | | | | |
| Biotechnology – 1.6% | | | |
| 3SBio, Inc. (A)(B) | | 166,800 | | | 177,274 |
| AbbVie, Inc. | | 183,277 | | | 15,708,672 |
| ACADIA Pharmaceuticals, Inc. (A) | | 13,895 | | | 593,872 |
| Acceleron Pharma, Inc. (A) | | 5,629 | | | 483,700 |
| Achillion Pharmaceuticals, Inc. (A)(D) | | 17,157 | | | 7,892 |
| ADMA Biologics, Inc. (A) | | 6,877 | | | 20,046 |
| Adverum Biotechnologies, Inc. (A) | | 6,782 | | | 83,486 |
| Aeglea BioTherapeutics, Inc. (A) | | 3,597 | | | 24,568 |
| Affimed NV (A) | | 9,935 | | | 23,447 |
| Agenus, Inc. (A) | | 13,605 | | | 34,421 |
| Aimmune Therapeutics, Inc. (A)(C) | | 5,572 | | | 132,669 |
| Akcea Therapeutics, Inc. (A) | | 1,679 | | | 28,509 |
| Akebia Therapeutics, Inc. (A) | | 15,078 | | | 133,742 |
| Albireo Pharma, Inc. (A) | | 1,493 | | | 34,906 |
| Alder Biopharmaceuticals, Inc. (A)(C)(D) | | 9,683 | | | 13,130 |
| Aldeyra Therapeutics, Inc. (A) | | 3,215 | | | 12,217 |
| Alector, Inc. (A) | | 3,796 | | | 104,314 |
| Alexion Pharmaceuticals, Inc. (A) | | 27,426 | | | 2,578,867 |
| Allakos, Inc. (A)(C) | | 2,414 | | | 150,465 |
| Allogene Therapeutics, Inc. (A)(C) | | 4,883 | | | 131,841 |
| AMAG Pharmaceuticals, Inc. (A)(C) | | 4,377 | | | 33,922 |
| Amgen, Inc. | | 73,640 | | | 14,708,117 |
| Amicus Therapeutics, Inc. (A) | | 31,929 | | | 304,762 |
| AnaptysBio, Inc. (A) | | 3,292 | | | 49,215 |
| Anavex Life Sciences Corp. (A) | | 6,061 | | | 23,092 |
| Anika Therapeutics, Inc. (A) | | 1,652 | | | 68,988 |
| Apellis Pharmaceuticals, Inc. (A) | | 6,079 | | | 210,455 |
| Applied Therapeutics, Inc. (A) | | 844 | | | 35,068 |
| Aprea Therapeutics, Inc. (A) | | 823 | | | 28,229 |
| Arcus Biosciences, Inc. (A) | | 4,386 | | | 66,755 |
| Ardelyx, Inc. (A) | | 5,983 | | | 41,402 |
| Arena Pharmaceuticals, Inc. (A) | | 6,244 | | | 278,482 |
| Arrowhead Pharmaceuticals, Inc. (A) | | 37,209 | | | 1,315,710 |
Strategic Equity Allocation Fund (continued)
| | | Shares or
Principal
Amount | | Value |
| COMMON STOCKS (continued) | | | |
| Biotechnology (continued) | | | |
| Assembly Biosciences, Inc. (A) | | 2,945 | | $ | 53,363 |
| Atara Biotherapeutics, Inc. (A) | | 6,509 | | | 79,084 |
| Athenex, Inc. (A)(C) | | 8,592 | | | 104,994 |
| Athersys, Inc. (A) | | 19,141 | | | 22,969 |
| Avid Bioservices, Inc. (A) | | 7,160 | | | 45,108 |
| Avrobio, Inc. (A) | | 2,691 | | | 51,936 |
| BeiGene, Ltd., ADR (A)(C) | | 2,400 | | | 380,040 |
| Beyondspring, Inc. (A)(C) | | 1,829 | | | 29,045 |
| BioCryst Pharmaceuticals, Inc. (A) | | 19,018 | | | 57,054 |
| Biogen, Inc. (A) | | 22,363 | | | 6,896,526 |
| Biohaven Pharmaceutical Holding Company, Ltd. (A) | | 4,883 | | | 215,633 |
| BioSpecifics Technologies Corp. (A) | | 801 | | | 44,207 |
| Bioxcel Therapeutics, Inc. (A) | | 957 | | | 35,888 |
| Blueprint Medicines Corp. (A)(C) | | 6,063 | | | 328,190 |
| Bridgebio Pharma, Inc. (A)(C) | | 2,850 | | | 90,858 |
| Calithera Biosciences, Inc. (A) | | 6,270 | | | 40,630 |
| CareDx, Inc. (A) | | 5,106 | | | 119,021 |
| CASI Pharmaceuticals, Inc. (A) | | 7,022 | | | 12,429 |
| Castle Biosciences, Inc. (A) | | 505 | | | 15,120 |
| Catalyst Pharmaceuticals, Inc. (A) | | 12,204 | | | 51,379 |
| Celltrion, Inc. (A) | | 18,591 | | | 2,652,211 |
| Cellular Biomedicine Group, Inc. (A) | | 1,647 | | | 26,286 |
| CEL-SCI Corp. (A)(C) | | 3,505 | | | 38,450 |
| ChemoCentryx, Inc. (A) | | 5,080 | | | 227,330 |
| Chimerix, Inc. (A) | | 6,794 | | | 12,025 |
| Clovis Oncology, Inc. (A)(C) | | 6,363 | | | 47,913 |
| Coherus Biosciences, Inc. (A) | | 7,757 | | | 150,098 |
| Concert Pharmaceuticals, Inc. (A) | | 3,014 | | | 25,498 |
| Constellation Pharmaceuticals, Inc. (A) | | 1,933 | | | 68,312 |
| Corbus Pharmaceuticals Holdings, Inc. (A)(C) | | 7,818 | | | 37,057 |
| Cortexyme, Inc. (A)(C) | | 1,424 | | | 71,556 |
| Crinetics Pharmaceuticals, Inc. (A) | | 1,434 | | | 29,512 |
| CSL, Ltd. | | 64,966 | | | 13,270,711 |
| Cue Biopharma, Inc. (A) | | 2,629 | | | 45,981 |
| Cytokinetics, Inc. (A) | | 7,134 | | | 99,448 |
| CytomX Therapeutics, Inc. (A) | | 5,997 | | | 40,120 |
| Deciphera Pharmaceuticals, Inc. (A) | | 2,445 | | | 130,172 |
| Denali Therapeutics, Inc. (A) | | 6,099 | | | 120,577 |
| Dicerna Pharmaceuticals, Inc. (A) | | 6,490 | | | 128,113 |
| Dynavax Technologies Corp. (A)(C) | | 10,613 | | | 41,868 |
| Eagle Pharmaceuticals, Inc. (A) | | 1,152 | | | 52,877 |
| Editas Medicine, Inc. (A)(C) | | 6,427 | | | 142,551 |
| Eidos Therapeutics, Inc. (A) | | 1,367 | | | 69,143 |
| Eiger BioPharmaceuticals, Inc. (A) | | 3,105 | | | 29,466 |
| Emergent BioSolutions, Inc. (A) | | 5,647 | | | 331,366 |
| Enanta Pharmaceuticals, Inc. (A) | | 2,155 | | | 109,646 |
| Epizyme, Inc. (A) | | 9,641 | | | 206,607 |
| Esperion Therapeutics, Inc. (A)(C) | | 3,130 | | | 158,034 |
| Exelixis, Inc. (A) | | 77,891 | | | 1,447,994 |
| Fate Therapeutics, Inc. (A) | | 7,540 | | | 220,168 |
| FibroGen, Inc. (A) | | 9,702 | | | 405,544 |
| Five Prime Therapeutics, Inc. (A) | | 4,910 | | | 18,805 |
| Flexion Therapeutics, Inc. (A)(C) | | 4,274 | | | 67,486 |
| Forty Seven, Inc. (A) | | 2,762 | | | 160,196 |
| G1 Therapeutics, Inc. (A) | | 4,271 | | | 76,622 |
| Galapagos NV (A) | | 1,472 | | | 309,596 |
| Galectin Therapeutics, Inc. (A) | | 5,843 | | | 12,387 |
| Genmab A/S (A) | | 12,071 | | | 2,729,656 |
| Geron Corp. (A)(C) | | 24,582 | | | 28,269 |
| Gilead Sciences, Inc. | | 156,796 | | | 10,875,371 |
| Global Blood Therapeutics, Inc. (A) | | 7,178 | | | 459,105 |
| GlycoMimetics, Inc. (A) | | 4,586 | | | 16,601 |
| Gossamer Bio, Inc. (A) | | 5,398 | | | 70,876 |
| The accompanying notes are an integral part of the financial statements. | 59 | |
John Hancock Funds II
Portfolio of Investments — February 29, 2020 (unaudited)(showing percentage of total net assets)
Strategic Equity Allocation Fund (continued)
| | | Shares or
Principal
Amount | | Value |
| COMMON STOCKS (continued) | | | |
| Biotechnology (continued) | | | |
| Grifols SA | | 35,879 | | $ | 1,156,412 |
| Gritstone Oncology, Inc. (A) | | 3,486 | | | 29,282 |
| Halozyme Therapeutics, Inc. (A)(C) | | 17,850 | | | 349,325 |
| Helixmith Company, Ltd. (A) | | 3,771 | | | 197,214 |
| Heron Therapeutics, Inc. (A)(C) | | 10,427 | | | 194,464 |
| Homology Medicines, Inc. (A) | | 3,215 | | | 51,440 |
| Hookipa Pharma, Inc. (A) | | 1,448 | | | 14,364 |
| IGM Biosciences, Inc. (A)(C) | | 645 | | | 33,159 |
| ImmunoGen, Inc. (A) | | 18,433 | | | 82,027 |
| Immunomedics, Inc. (A) | | 21,728 | | | 347,648 |
| Incyte Corp. (A) | | 22,157 | | | 1,670,859 |
| Innovent Biologics, Inc. (A)(B) | | 98,500 | | | 453,109 |
| Inovio Pharmaceuticals, Inc. (A)(C) | | 12,968 | | | 55,503 |
| Insmed, Inc. (A) | | 11,118 | | | 276,838 |
| Intellia Therapeutics, Inc. (A)(C) | | 4,928 | | | 65,789 |
| Intercept Pharmaceuticals, Inc. (A) | | 3,121 | | | 286,945 |
| Invitae Corp. (A)(C) | | 10,850 | | | 221,123 |
| Iovance Biotherapeutics, Inc. (A) | | 14,490 | | | 476,866 |
| Ironwood Pharmaceuticals, Inc. (A) | | 19,266 | | | 231,963 |
| Jounce Therapeutics, Inc. (A) | | 2,314 | | | 10,459 |
| Kadmon Holdings, Inc. (A) | | 19,603 | | | 90,958 |
| KalVista Pharmaceuticals, Inc. (A) | | 1,674 | | | 22,515 |
| Karuna Therapeutics, Inc. (A) | | 570 | | | 49,738 |
| Karyopharm Therapeutics, Inc. (A) | | 7,410 | | | 121,079 |
| Kindred Biosciences, Inc. (A) | | 4,985 | | | 54,187 |
| Kiniksa Pharmaceuticals, Ltd., Class A (A) | | 1,897 | | | 35,019 |
| Kodiak Sciences, Inc. (A) | | 2,931 | | | 187,496 |
| Krystal Biotech, Inc. (A) | | 1,312 | | | 70,126 |
| Kura Oncology, Inc. (A) | | 4,366 | | | 52,698 |
| Lexicon Pharmaceuticals, Inc. (A) | | 5,556 | | | 15,418 |
| Ligand Pharmaceuticals, Inc. (A)(C) | | 6,634 | | | 620,942 |
| MacroGenics, Inc. (A) | | 6,210 | | | 54,462 |
| Madrigal Pharmaceuticals, Inc. (A) | | 983 | | | 84,705 |
| Magenta Therapeutics, Inc. (A) | | 2,568 | | | 30,200 |
| MannKind Corp. (A)(C) | | 25,297 | | | 32,127 |
| MediciNova, Inc. (A)(C) | | 5,763 | | | 24,205 |
| Medy-Tox, Inc. | | 889 | | | 220,692 |
| MEI Pharma, Inc. (A) | | 10,149 | | | 19,588 |
| MeiraGTx Holdings PLC (A) | | 2,213 | | | 35,851 |
| Mersana Therapeutics, Inc. (A) | | 4,889 | | | 42,339 |
| Minerva Neurosciences, Inc. (A) | | 4,000 | | | 29,120 |
| Mirati Therapeutics, Inc. (A)(C) | | 3,372 | | | 301,760 |
| Molecular Templates, Inc. (A) | | 2,214 | | | 35,623 |
| Momenta Pharmaceuticals, Inc. (A) | | 12,356 | | | 349,551 |
| Mustang Bio, Inc. (A) | | 4,410 | | | 12,877 |
| Myriad Genetics, Inc. (A)(C) | | 8,779 | | | 154,686 |
| Natera, Inc. (A) | | 7,700 | | | 291,869 |
| NextCure, Inc. (A)(C) | | 1,748 | | | 72,996 |
| Novavax, Inc. (A)(C) | | 3,724 | | | 59,584 |
| OPKO Health, Inc. (A)(C) | | 48,953 | | | 73,430 |
| Oyster Point Pharma, Inc. (A) | | 736 | | | 26,062 |
| Palatin Technologies, Inc. (A) | | 31,183 | | | 15,925 |
| PDL BioPharma, Inc. (A) | | 14,084 | | | 47,886 |
| PeptiDream, Inc. (A) | | 12,000 | | | 476,433 |
| Pfenex, Inc. (A) | | 3,839 | | | 44,532 |
| Pieris Pharmaceuticals, Inc. (A) | | 6,378 | | | 19,836 |
| Portola Pharmaceuticals, Inc. (A)(C) | | 9,473 | | | 95,772 |
| Precigen, Inc. (A)(C) | | 9,381 | | | 35,554 |
| Precision BioSciences, Inc. (A) | | 4,540 | | | 36,365 |
| Prevail Therapeutics, Inc. (A) | | 1,054 | | | 13,470 |
| Principia Biopharma, Inc. (A) | | 2,272 | | | 146,680 |
| Progenics Pharmaceuticals, Inc. (A)(C) | | 11,152 | | | 52,637 |
| Protagonist Therapeutics, Inc. (A) | | 2,505 | | | 19,539 |
| Prothena Corp. PLC (A) | | 5,146 | | | 54,856 |
| PTC Therapeutics, Inc. (A) | | 7,459 | | | 409,052 |
Strategic Equity Allocation Fund (continued)
| | | Shares or
Principal
Amount | | Value |
| COMMON STOCKS (continued) | | | |
| Biotechnology (continued) | | | |
| Puma Biotechnology, Inc. (A)(C) | | 4,056 | | $ | 43,622 |
| Ra Pharmaceuticals, Inc. (A) | | 4,339 | | | 202,892 |
| Radius Health, Inc.��(A) | | 5,655 | | | 119,094 |
| Regeneron Pharmaceuticals, Inc. (A) | | 9,900 | | | 4,401,243 |
| REGENXBIO, Inc. (A)(C) | | 4,180 | | | 167,200 |
| Replimune Group, Inc. (A) | | 1,728 | | | 23,967 |
| Retrophin, Inc. (A) | | 5,260 | | | 81,504 |
| Rhythm Pharmaceuticals, Inc. (A)(C) | | 3,717 | | | 70,920 |
| Rigel Pharmaceuticals, Inc. (A) | | 22,033 | | | 46,710 |
| Rocket Pharmaceuticals, Inc. (A) | | 3,724 | | | 72,581 |
| Rubius Therapeutics, Inc. (A)(C) | | 4,601 | | | 38,510 |
| Sangamo Therapeutics, Inc. (A)(C) | | 14,487 | | | 123,574 |
| Savara, Inc. (A) | | 4,721 | | | 10,811 |
| Scholar Rock Holding Corp. (A) | | 2,456 | | | 34,654 |
| Seres Therapeutics, Inc. (A) | | 5,390 | | | 16,925 |
| Sorrento Therapeutics, Inc. (A)(C) | | 15,906 | | | 34,516 |
| Spectrum Pharmaceuticals, Inc. (A) | | 14,947 | | | 42,748 |
| Spero Therapeutics, Inc. (A) | | 1,702 | | | 16,237 |
| SpringWorks Therapeutics, Inc. (A) | | 1,310 | | | 41,868 |
| Stemline Therapeutics, Inc. (A)(C) | | 5,866 | | | 35,313 |
| Stoke Therapeutics, Inc. (A) | | 1,161 | | | 28,735 |
| Sutro Biopharma, Inc. (A) | | 1,615 | | | 15,714 |
| Syndax Pharmaceuticals, Inc. (A) | | 2,831 | | | 26,640 |
| Syros Pharmaceuticals, Inc. (A) | | 4,739 | | | 27,723 |
| TCR2 Therapeutics, Inc. (A) | | 1,590 | | | 18,889 |
| TG Therapeutics, Inc. (A) | | 10,744 | | | 134,837 |
| Translate Bio, Inc. (A) | | 4,488 | | | 34,019 |
| Turning Point Therapeutics, Inc. (A) | | 3,426 | | | 169,827 |
| Twist Bioscience Corp. (A) | | 2,772 | | | 84,879 |
| Ultragenyx Pharmaceutical, Inc. (A)(C) | | 6,828 | | | 382,914 |
| United Therapeutics Corp. (A) | | 11,249 | | | 1,158,197 |
| UNITY Biotechnology, Inc. (A) | | 4,036 | | | 24,256 |
| UroGen Pharma, Ltd. (A)(C) | | 2,409 | | | 65,669 |
| Vanda Pharmaceuticals, Inc. (A) | | 6,569 | | | 72,456 |
| VBI Vaccines, Inc. (A) | | 20,538 | | | 24,646 |
| Veracyte, Inc. (A) | | 5,891 | | | 145,449 |
| Vericel Corp. (A) | | 5,570 | | | 86,001 |
| Vertex Pharmaceuticals, Inc. (A) | | 31,870 | | | 7,139,836 |
| Viela Bio, Inc. (A) | | 698 | | | 30,461 |
| Viking Therapeutics, Inc. (A)(C) | | 8,309 | | | 49,189 |
| Voyager Therapeutics, Inc. (A) | | 3,124 | | | 34,052 |
| X4 Pharmaceuticals, Inc. (A) | | 1,680 | | | 17,942 |
| XBiotech, Inc. (A) | | 2,443 | | | 29,951 |
| Xencor, Inc. (A) | | 5,923 | | | 192,438 |
| Y-mAbs Therapeutics, Inc. (A) | | 2,919 | | | 85,877 |
| ZIOPHARM Oncology, Inc. (A)(C) | | 20,194 | | | 62,399 |
| | | | | | 108,290,427 |
| Health care equipment and supplies – 2.6% | | | |
| Abbott Laboratories | | 255,488 | | | 19,680,241 |
| ABIOMED, Inc. (A) | | 6,528 | | | 980,897 |
| Accuray, Inc. (A) | | 11,740 | | | 34,809 |
| Alcon, Inc. (A) | | 56,372 | | | 3,447,226 |
| Align Technology, Inc. (A) | | 10,368 | | | 2,263,853 |
| Alphatec Holdings, Inc. (A) | | 5,008 | | | 29,297 |
| AngioDynamics, Inc. (A) | | 4,603 | | | 52,888 |
| Antares Pharma, Inc. (A) | | 20,271 | | | 62,840 |
| Apyx Medical Corp. (A) | | 4,385 | | | 26,529 |
| Asahi Intecc Company, Ltd. | | 24,800 | | | 599,482 |
| AtriCure, Inc. (A) | | 4,656 | | | 178,884 |
| Atrion Corp. | | 178 | | | 109,703 |
| Avanos Medical, Inc. (A) | | 18,202 | | | 589,927 |
| Axogen, Inc. (A) | | 4,268 | | | 52,838 |
| Axonics Modulation Technologies, Inc. (A)(C) | | 1,880 | | | 66,637 |
| Baxter International, Inc. | | 73,804 | | | 6,160,420 |
| The accompanying notes are an integral part of the financial statements. | 60 | |
John Hancock Funds II
Portfolio of Investments — February 29, 2020 (unaudited)(showing percentage of total net assets)
Strategic Equity Allocation Fund (continued)
| | | Shares or
Principal
Amount | | Value |
| COMMON STOCKS (continued) | | | |
| Health care equipment and supplies (continued) | | | |
| Becton, Dickinson and Company | | 39,097 | | $ | 9,298,049 |
| BioMerieux | | 5,555 | | | 515,227 |
| Boston Scientific Corp. (A) | | 201,485 | | | 7,533,524 |
| Cantel Medical Corp. | | 9,605 | | | 606,076 |
| Cardiovascular Systems, Inc. (A) | | 4,280 | | | 161,014 |
| Carl Zeiss Meditec AG, Bearer Shares | | 5,318 | | | 565,750 |
| Cerus Corp. (A) | | 17,860 | | | 91,800 |
| Cochlear, Ltd. | | 8,274 | | | 1,133,305 |
| Coloplast A/S, B Shares | | 21,960 | | | 2,948,029 |
| CONMED Corp. | | 3,353 | | | 317,328 |
| CryoLife, Inc. (A) | | 4,575 | | | 117,257 |
| CryoPort, Inc. (A)(C) | | 3,993 | | | 66,683 |
| Cutera, Inc. (A) | | 1,726 | | | 42,770 |
| CytoSorbents Corp. (A)(C) | | 4,476 | | | 26,990 |
| Danaher Corp. | | 92,410 | | | 13,360,638 |
| Demant A/S (A) | | 20,484 | | | 627,317 |
| DENTSPLY SIRONA, Inc. | | 32,151 | | | 1,583,115 |
| Edwards Lifesciences Corp. (A) | | 30,150 | | | 6,175,926 |
| Fisher & Paykel Healthcare Corp., Ltd. | | 39,142 | | | 633,762 |
| GenMark Diagnostics, Inc. (A) | | 7,447 | | | 25,990 |
| Glaukos Corp. (A) | | 4,839 | | | 212,819 |
| Globus Medical, Inc., Class A (A) | | 29,119 | | | 1,317,052 |
| Haemonetics Corp. (A) | | 19,320 | | | 2,092,936 |
| Hartalega Holdings BHD | | 153,600 | | | 226,395 |
| Heska Corp. (A) | | 873 | | | 83,345 |
| Hill-Rom Holdings, Inc. | | 17,114 | | | 1,643,800 |
| Hologic, Inc. (A) | | 38,762 | | | 1,826,465 |
| Hoya Corp. | | 48,900 | | | 4,335,896 |
| ICU Medical, Inc. (A) | | 4,929 | | | 965,147 |
| IDEXX Laboratories, Inc. (A) | | 12,401 | | | 3,156,179 |
| Inogen, Inc. (A) | | 2,291 | | | 104,882 |
| Integer Holdings Corp. (A) | | 4,014 | | | 361,942 |
| Integra LifeSciences Holdings Corp. (A) | | 18,270 | | | 951,867 |
| IntriCon Corp. (A) | | 1,107 | | | 16,472 |
| Intuitive Surgical, Inc. (A) | | 16,707 | | | 8,920,870 |
| Invacare Corp. | | 4,333 | | | 32,844 |
| iRhythm Technologies, Inc. (A) | | 3,268 | | | 284,218 |
| Koninklijke Philips NV | | 113,042 | | | 4,840,933 |
| Lantheus Holdings, Inc. (A) | | 4,751 | | | 73,878 |
| LeMaitre Vascular, Inc. | | 2,006 | | | 57,171 |
| LivaNova PLC (A) | | 18,425 | | | 1,284,591 |
| Masimo Corp. (A) | | 12,576 | | | 2,054,038 |
| Medtronic PLC | | 193,760 | | | 19,505,819 |
| Meridian Bioscience, Inc. (A) | | 5,420 | | | 43,306 |
| Merit Medical Systems, Inc. (A) | | 6,695 | | | 241,087 |
| Mesa Laboratories, Inc. (C) | | 475 | | | 113,663 |
| Misonix, Inc. (A) | | 1,062 | | | 14,709 |
| Natus Medical, Inc. (A) | | 4,224 | | | 113,541 |
| Neogen Corp. (A) | | 6,358 | | | 386,249 |
| Nevro Corp. (A) | | 3,693 | | | 480,644 |
| Novocure, Ltd. (A) | | 10,748 | | | 781,917 |
| NuVasive, Inc. (A) | | 19,777 | | | 1,301,524 |
| Olympus Corp. | | 149,224 | | | 2,702,733 |
| OraSure Technologies, Inc. (A) | | 7,777 | | | 46,895 |
| Orthofix Medical, Inc. (A) | | 2,274 | | | 80,363 |
| OrthoPediatrics Corp. (A) | | 1,134 | | | 52,640 |
| Penumbra, Inc. (A) | | 8,234 | | | 1,365,691 |
| Pulse Biosciences, Inc. (A) | | 1,550 | | | 10,618 |
| Quidel Corp. (A) | | 4,389 | | | 339,006 |
| ResMed, Inc. | | 20,785 | | | 3,303,984 |
| Rockwell Medical, Inc. (A) | | 8,945 | | | 25,135 |
| RTI Surgical Holdings, Inc. (A) | | 8,138 | | | 30,111 |
| SeaSpine Holdings Corp. (A) | | 2,205 | | | 31,157 |
| Senseonics Holdings, Inc. (A)(C) | | 17,826 | | | 24,956 |
Strategic Equity Allocation Fund (continued)
| | | Shares or
Principal
Amount | | Value |
| COMMON STOCKS (continued) | | | |
| Health care equipment and supplies (continued) | | | |
| Shandong Weigao Group Medical Polymer Company, Ltd., H Shares | | 269,200 | | $ | 351,273 |
| Shockwave Medical, Inc. (A) | | 3,142 | | | 126,120 |
| SI-BONE, Inc. (A) | | 2,095 | | | 40,454 |
| Siemens Healthineers AG (B) | | 19,889 | | | 813,219 |
| Sientra, Inc. (A) | | 5,066 | | | 21,227 |
| Silk Road Medical, Inc. (A) | | 1,971 | | | 78,544 |
| Smith & Nephew PLC | | 60,585 | | | 1,359,252 |
| Sonova Holding AG | | 7,453 | | | 1,780,105 |
| STAAR Surgical Company (A) | | 5,565 | | | 174,630 |
| STERIS PLC | | 12,256 | | | 1,944,047 |
| Straumann Holding AG | | 1,384 | | | 1,300,263 |
| Stryker Corp. | | 46,545 | | | 8,871,012 |
| Surmodics, Inc. (A) | | 1,672 | | | 58,370 |
| Sysmex Corp. | | 21,500 | | | 1,374,888 |
| Tactile Systems Technology, Inc. (A) | | 2,273 | | | 114,582 |
| Tandem Diabetes Care, Inc. (A) | | 6,930 | | | 517,394 |
| Teleflex, Inc. | | 6,692 | | | 2,241,954 |
| Terumo Corp. | | 82,746 | | | 2,656,873 |
| The Cooper Companies, Inc. | | 7,166 | | | 2,325,869 |
| Top Glove Corp. BHD | | 155,100 | | | 208,096 |
| TransMedics Group, Inc. (A) | | 1,841 | | | 28,904 |
| Utah Medical Products, Inc. | | 449 | | | 39,243 |
| Vapotherm, Inc. (A) | | 2,097 | | | 18,160 |
| Varex Imaging Corp. (A) | | 4,731 | | | 109,854 |
| Varian Medical Systems, Inc. (A) | | 13,140 | | | 1,615,826 |
| ViewRay, Inc. (A) | | 9,243 | | | 26,527 |
| West Pharmaceutical Services, Inc. | | 18,968 | | | 2,855,822 |
| Wright Medical Group NV (A)(C) | | 15,636 | | | 472,989 |
| Zimmer Biomet Holdings, Inc. | | 29,733 | | | 4,048,148 |
| Zynex, Inc. (A)(C) | | 2,060 | | | 26,821 |
| | | | | | 181,606,975 |
| Health care providers and services – 1.8% | | | |
| Acadia Healthcare Company, Inc. (A) | | 22,705 | | | 672,068 |
| Addus HomeCare Corp. (A) | | 1,458 | | | 111,202 |
| Alfresa Holdings Corp. | | 24,100 | | | 420,236 |
| Amedisys, Inc. (A) | | 12,149 | | | 2,114,047 |
| American Renal Associates Holdings, Inc. (A) | | 2,535 | | | 20,407 |
| AmerisourceBergen Corp. | | 21,730 | | | 1,832,274 |
| AMN Healthcare Services, Inc. (A) | | 5,674 | | | 417,606 |
| Anthem, Inc. | | 36,654 | | | 9,423,377 |
| Bangkok Dusit Medical Services PCL, NVDR | | 508,700 | | | 361,860 |
| BioTelemetry, Inc. (A) | | 4,167 | | | 178,014 |
| Brookdale Senior Living, Inc. (A) | | 23,222 | | | 152,569 |
| Bumrungrad Hospital PCL, NVDR | | 23,000 | | | 95,246 |
| Cardinal Health, Inc. | | 42,281 | | | 2,203,686 |
| Celltrion Healthcare Company, Ltd. (A) | | 10,457 | | | 569,228 |
| Centene Corp. (A) | | 84,393 | | | 4,474,517 |
| Chemed Corp. | | 4,104 | | | 1,713,912 |
| Cigna Corp. | | 53,981 | | | 9,875,284 |
| Community Health Systems, Inc. (A) | | 11,276 | | | 55,591 |
| CorVel Corp. (A) | | 1,079 | | | 74,386 |
| Cross Country Healthcare, Inc. (A) | | 4,605 | | | 43,655 |
| CVS Health Corp. | | 188,062 | | | 11,129,509 |
| DaVita, Inc. (A) | | 12,963 | | | 1,006,188 |
| Encompass Health Corp. | | 25,276 | | | 1,891,656 |
| Enzo Biochem, Inc. (A) | | 6,284 | | | 13,385 |
| Five Star Senior Living, Inc. (A) | | 2,026 | | | 9,603 |
| Fresenius Medical Care AG & Company KGaA | | 28,566 | | | 2,203,204 |
| Fresenius SE & Company KGaA | | 55,802 | | | 2,646,414 |
| Genesis Healthcare, Inc. (A) | | 11,976 | | | 19,760 |
| Hanger, Inc. (A) | | 4,510 | | | 104,046 |
| The accompanying notes are an integral part of the financial statements. | 61 | |
John Hancock Funds II
Portfolio of Investments — February 29, 2020 (unaudited)(showing percentage of total net assets)
Strategic Equity Allocation Fund (continued)
| | | Shares or
Principal
Amount | | Value |
| COMMON STOCKS (continued) | | | |
| Health care providers and services (continued) | | | |
| Hapvida Participacoes e Investimentos SA (B) | | 7,200 | | $ | 88,875 |
| HCA Healthcare, Inc. | | 38,244 | | | 4,857,370 |
| HealthEquity, Inc. (A) | | 26,744 | | | 1,898,557 |
| Henry Schein, Inc. (A) | | 21,212 | | | 1,292,659 |
| Humana, Inc. | | 19,143 | | | 6,119,634 |
| IHH Healthcare BHD | | 229,509 | | | 314,933 |
| Laboratory Corp. of America Holdings (A) | | 14,036 | | | 2,465,985 |
| LHC Group, Inc. (A) | | 3,723 | | | 452,196 |
| Life Healthcare Group Holdings, Ltd. | | 116,960 | | | 167,441 |
| Magellan Health, Inc. (A) | | 2,723 | | | 163,407 |
| McKesson Corp. (C) | | 26,047 | | | 3,642,933 |
| Medipal Holdings Corp. | | 23,500 | | | 427,542 |
| MEDNAX, Inc. (A) | | 21,610 | | | 369,315 |
| Molina Healthcare, Inc. (A) | | 16,073 | | | 1,969,746 |
| National HealthCare Corp. | | 1,488 | | | 110,424 |
| National Research Corp. | | 1,510 | | | 83,035 |
| NMC Health PLC | | 8,800 | | | 105,879 |
| Notre Dame Intermedica Participacoes SA | | 16,500 | | | 233,300 |
| Option Care Health, Inc. (A) | | 3,957 | | | 58,366 |
| Owens & Minor, Inc. | | 7,892 | | | 53,902 |
| Patterson Companies, Inc. | | 32,555 | | | 774,483 |
| PetIQ, Inc. (A) | | 2,498 | | | 77,688 |
| Progyny, Inc. (A) | | 1,436 | | | 39,533 |
| Quest Diagnostics, Inc. | | 19,471 | | | 2,065,094 |
| R1 RCM, Inc. (A) | | 12,917 | | | 158,621 |
| RadNet, Inc. (A) | | 5,270 | | | 107,666 |
| Ramsay Health Care, Ltd. | | 23,156 | | | 1,035,938 |
| Ryman Healthcare, Ltd. | | 27,808 | | | 266,191 |
| Select Medical Holdings Corp. (A) | | 13,600 | | | 325,584 |
| Shanghai Pharmaceuticals Holding Company, Ltd., H Shares | | 108,100 | | | 199,667 |
| Sinopharm Group Company, Ltd., H Shares | | 157,900 | | | 496,054 |
| Sonic Healthcare, Ltd. | | 64,750 | | | 1,229,100 |
| Surgery Partners, Inc. (A) | | 3,062 | | | 50,278 |
| Suzuken Company, Ltd. | | 9,100 | | | 300,412 |
| Tenet Healthcare Corp. (A) | | 39,378 | | | 1,034,854 |
| The Ensign Group, Inc. | | 6,307 | | | 280,662 |
| The Joint Corp. (A) | | 1,683 | | | 24,959 |
| The Pennant Group, Inc. (A) | | 3,176 | | | 86,292 |
| The Providence Service Corp. (A) | | 1,472 | | | 90,940 |
| Tivity Health, Inc. (A)(C) | | 5,908 | | | 74,854 |
| Triple-S Management Corp., Class B (A) | | 2,868 | | | 42,991 |
| UnitedHealth Group, Inc. | | 136,954 | | | 34,917,792 |
| Universal Health Services, Inc., Class B | | 11,611 | | | 1,436,745 |
| US Physical Therapy, Inc. | | 1,563 | | | 162,896 |
| | | | | | 123,987,723 |
| Health care technology – 0.1% | | | |
| Alibaba Health Information Technology, Ltd. (A) | | 477,100 | | | 930,610 |
| Allscripts Healthcare Solutions, Inc. (A) | | 61,824 | | | 466,153 |
| Castlight Health, Inc., B Shares (A) | | 14,592 | | | 13,225 |
| Cerner Corp. | | 45,404 | | | 3,145,135 |
| Computer Programs & Systems, Inc. | | 1,648 | | | 44,133 |
| Evolent Health, Inc., Class A (A) | | 9,262 | | | 85,581 |
| Health Catalyst, Inc. (A) | | 1,043 | | | 31,686 |
| HealthStream, Inc. (A) | | 3,230 | | | 78,554 |
| HMS Holdings Corp. (A) | | 10,858 | | | 249,408 |
| Inovalon Holdings, Inc., Class A (A) | | 8,917 | | | 173,703 |
| Inspire Medical Systems, Inc. (A) | | 1,656 | | | 142,201 |
| Livongo Health, Inc. (A) | | 1,837 | | | 45,943 |
| M3, Inc. | | 56,600 | | | 1,461,192 |
| NextGen Healthcare, Inc. (A) | | 6,849 | | | 89,585 |
| Omnicell, Inc. (A) | | 5,127 | | | 417,697 |
Strategic Equity Allocation Fund (continued)
| | | Shares or
Principal
Amount | | Value |
| COMMON STOCKS (continued) | | | |
| Health care technology (continued) | | | |
| OptimizeRx Corp. (A) | | 1,893 | | $ | 15,807 |
| Phreesia, Inc. (A) | | 1,303 | | | 40,445 |
| Ping An Healthcare and Technology Company, Ltd. (A)(B) | | 42,500 | | | 424,723 |
| Simulations Plus, Inc. | | 1,476 | | | 48,059 |
| Tabula Rasa HealthCare, Inc. (A)(C) | | 2,425 | | | 136,212 |
| Teladoc Health, Inc. (A)(C) | | 8,899 | | | 1,112,019 |
| Vocera Communications, Inc. (A)(C) | | 3,940 | | | 96,097 |
| | | | | | 9,248,168 |
| Life sciences tools and services – 0.8% | | | |
| Accelerate Diagnostics, Inc. (A)(C) | | 3,522 | | | 45,117 |
| Agilent Technologies, Inc. | | 41,269 | | | 3,180,602 |
| Bio-Rad Laboratories, Inc., Class A (A) | | 5,539 | | | 1,949,839 |
| Bio-Techne Corp. | | 9,770 | | | 1,845,455 |
| Charles River Laboratories International, Inc. (A) | | 12,520 | | | 1,947,736 |
| ChromaDex Corp. (A) | | 5,729 | | | 21,140 |
| Codexis, Inc. (A) | | 6,648 | | | 77,449 |
| Eurofins Scientific SE (C) | | 1,552 | | | 784,768 |
| Fluidigm Corp. (A) | | 9,372 | | | 31,115 |
| Genscript Biotech Corp. (A)(C) | | 125,400 | | | 265,309 |
| Illumina, Inc. (A) | | 19,603 | | | 5,207,929 |
| IQVIA Holdings, Inc. (A) | | 24,065 | | | 3,356,827 |
| Lonza Group AG (A) | | 10,084 | | | 4,023,896 |
| Luminex Corp. | | 5,347 | | | 132,392 |
| Medpace Holdings, Inc. (A) | | 3,426 | | | 308,134 |
| Mettler-Toledo International, Inc. (A) | | 3,248 | | | 2,279,122 |
| NanoString Technologies, Inc. (A) | | 4,214 | | | 150,271 |
| NeoGenomics, Inc. (A) | | 11,803 | | | 334,379 |
| Pacific Biosciences of California, Inc. (A) | | 18,097 | | | 61,530 |
| PerkinElmer, Inc. | | 14,816 | | | 1,280,695 |
| PRA Health Sciences, Inc. (A) | | 16,214 | | | 1,527,359 |
| QIAGEN NV (A) | | 30,245 | | | 1,118,196 |
| Quanterix Corp. (A) | | 1,699 | | | 38,754 |
| Repligen Corp. (A) | | 18,456 | | | 1,579,834 |
| Samsung Biologics Company, Ltd. (A)(B) | | 3,263 | | | 1,252,232 |
| Sartorius Stedim Biotech | | 3,694 | | | 707,600 |
| Syneos Health, Inc. (A) | | 23,682 | | | 1,500,255 |
| Thermo Fisher Scientific, Inc. | | 53,475 | | | 15,550,530 |
| Waters Corp. (A) | | 8,593 | | | 1,674,690 |
| WuXi AppTec Company, Ltd., H Shares (B) | | 19,380 | | | 290,727 |
| Wuxi Biologics Cayman, Inc. (A)(B) | | 74,200 | | | 1,105,188 |
| | | | | | 53,629,070 |
| Pharmaceuticals – 4.7% | | | |
| AcelRx Pharmaceuticals, Inc. (A)(C) | | 11,122 | | | 14,681 |
| Aerie Pharmaceuticals, Inc. (A)(C) | | 5,271 | | | 92,243 |
| Akorn, Inc. (A) | | 12,715 | | | 14,749 |
| Allergan PLC | | 46,083 | | | 8,786,646 |
| Amneal Pharmaceuticals, Inc. (A) | | 15,047 | | | 57,931 |
| Amphastar Pharmaceuticals, Inc. (A) | | 4,530 | | | 69,717 |
| ANI Pharmaceuticals, Inc. (A) | | 1,138 | | | 54,635 |
| Arvinas, Inc. (A) | | 2,629 | | | 123,905 |
| Aspen Pharmacare Holdings, Ltd. (A) | | 33,440 | | | 215,169 |
| Astellas Pharma, Inc. | | 242,800 | | | 3,805,454 |
| AstraZeneca PLC | | 91,448 | | | 8,025,920 |
| Aurora Cannabis, Inc. (A)(C) | | 112,890 | | | 152,230 |
| Axsome Therapeutics, Inc. (A) | | 3,123 | | | 243,594 |
| Bausch Health Companies, Inc. (A) | | 49,881 | | | 1,105,205 |
| Bayer AG | | 124,369 | | | 9,044,865 |
| BioDelivery Sciences International, Inc. (A) | | 10,472 | | | 50,894 |
| Bristol-Myers Squibb Company | | 329,073 | | | 19,435,051 |
| Canopy Growth Corp. (A)(C) | | 32,568 | | | 610,718 |
| Cara Therapeutics, Inc. (A)(C) | | 5,040 | | | 75,751 |
| The accompanying notes are an integral part of the financial statements. | 62 | |
John Hancock Funds II
Portfolio of Investments — February 29, 2020 (unaudited)(showing percentage of total net assets)
Strategic Equity Allocation Fund (continued)
| | | Shares or
Principal
Amount | | Value |
| COMMON STOCKS (continued) | | | |
| Pharmaceuticals (continued) | | | |
| Catalent, Inc. (A) | | 39,671 | | $ | 2,044,247 |
| Celltrion Pharm, Inc. (A) | | 3,525 | | | 117,671 |
| Chiasma, Inc. (A) | | 4,703 | | | 20,928 |
| China Medical System Holdings, Ltd. | | 180,500 | | | 228,245 |
| China Resources Pharmaceutical Group, Ltd. (B) | | 202,500 | | | 178,616 |
| China Traditional Chinese Medicine Holdings Company, Ltd. | | 294,400 | | | 156,907 |
| Chugai Pharmaceutical Company, Ltd. | | 28,700 | | | 3,087,259 |
| Collegium Pharmaceutical, Inc. (A) | | 4,052 | | | 96,235 |
| Corcept Therapeutics, Inc. (A) | | 12,025 | | | 151,756 |
| Corium International, Inc. (A)(D) | | 3,584 | | | 645 |
| CorMedix, Inc. (A)(C) | | 3,539 | | | 18,403 |
| Cronos Group, Inc. (A)(C) | | 29,521 | | | 171,331 |
| CSPC Pharmaceutical Group, Ltd. | | 621,100 | | | 1,447,818 |
| Cymabay Therapeutics, Inc. (A) | | 10,228 | | | 16,978 |
| Daiichi Sankyo Company, Ltd. | | 72,600 | | | 4,419,593 |
| Eisai Company, Ltd. | | 32,254 | | | 2,368,602 |
| Elanco Animal Health, Inc. (A)(D) | | 6,772 | | | 171 |
| Eli Lilly & Company | | 118,608 | | | 14,960,027 |
| Eloxx Pharmaceuticals, Inc. (A) | | 3,436 | | | 10,755 |
| Endo International PLC (A) | | 28,259 | | | 155,990 |
| Evolus, Inc. (A)(C) | | 2,406 | | | 20,668 |
| GlaxoSmithKline PLC | | 347,262 | | | 7,007,528 |
| H Lundbeck A/S | | 12,826 | | | 447,154 |
| Hanmi Pharm Company, Ltd. (A) | | 1,290 | | | 277,653 |
| Hanmi Science Company, Ltd. (A) | | 100 | | | 2,458 |
| Hansoh Pharmaceutical Group Company, Ltd. (A)(B) | | 60,000 | | | 212,507 |
| Hisamitsu Pharmaceutical Company, Inc. | | 6,700 | | | 296,547 |
| Hutchison China MediTech, Ltd., ADR (A) | | 8,000 | | | 186,560 |
| Hypera SA | | 12,479 | | | 95,715 |
| Innoviva, Inc. (A) | | 8,074 | | | 108,757 |
| Intersect ENT, Inc. (A) | | 3,865 | | | 92,219 |
| Intra-Cellular Therapies, Inc. (A) | | 5,558 | | | 117,274 |
| Ipsen SA | | 5,048 | | | 329,986 |
| Johnson & Johnson | | 369,458 | | | 49,684,712 |
| Kalbe Farma Tbk PT | | 499,210 | | | 43,160 |
| Kyowa Kirin Company, Ltd. | | 31,128 | | | 741,845 |
| Lannett Company, Inc. (A) | | 4,062 | | | 35,339 |
| Luye Pharma Group, Ltd. (B) | | 152,100 | | | 94,514 |
| Mallinckrodt PLC (A)(C) | | 10,965 | | | 46,930 |
| Marinus Pharmaceuticals, Inc. (A) | | 7,261 | | | 18,153 |
| Merck & Company, Inc. | | 357,401 | | | 27,362,621 |
| Merck KGaA | | 17,188 | | | 2,091,509 |
| Mylan NV (A) | | 72,453 | | | 1,245,467 |
| MyoKardia, Inc. (A) | | 5,514 | | | 349,532 |
| Nektar Therapeutics (A) | | 45,097 | | | 938,469 |
| NGM Biopharmaceuticals, Inc. (A)(C) | | 3,072 | | | 55,419 |
| Nippon Shinyaku Company, Ltd. | | 5,800 | | | 434,530 |
| Novartis AG | | 290,890 | | | 24,470,605 |
| Novo Nordisk A/S, B Shares | | 329,125 | | | 19,283,084 |
| Ocular Therapeutix, Inc. (A)(C) | | 5,778 | | | 27,185 |
| Odonate Therapeutics, Inc. (A) | | 1,520 | | | 44,977 |
| Omeros Corp. (A) | | 5,950 | | | 70,865 |
| Ono Pharmaceutical Company, Ltd. | | 48,800 | | | 989,113 |
| Optinose, Inc. (A) | | 3,396 | | | 20,546 |
| Orion OYJ, Class B | | 12,842 | | | 512,529 |
| Otsuka Holdings Company, Ltd. | | 50,000 | | | 1,873,267 |
| Pacira BioSciences, Inc. (A) | | 5,084 | | | 220,544 |
| Paratek Pharmaceuticals, Inc. (A) | | 4,703 | | | 22,480 |
| Perrigo Company PLC | | 19,107 | | | 968,534 |
| Pfizer, Inc. | | 776,871 | | | 25,963,029 |
| Phathom Pharmaceuticals, Inc. (A) | | 1,381 | | | 49,882 |
| Phibro Animal Health Corp., Class A | | 2,636 | | | 66,559 |
Strategic Equity Allocation Fund (continued)
| | | Shares or
Principal
Amount | | Value |
| COMMON STOCKS (continued) | | | |
| Pharmaceuticals (continued) | | | |
| Prestige Consumer Healthcare, Inc. (A) | | 19,170 | | $ | 716,191 |
| Reata Pharmaceuticals, Inc., Class A (A) | | 2,765 | | | 538,484 |
| Recordati SpA | | 8,557 | | | 365,962 |
| Recro Pharma, Inc. (A) | | 2,452 | | | 35,162 |
| Revance Therapeutics, Inc. (A) | | 5,753 | | | 133,009 |
| Richter Gedeon NYRT | | 18,435 | | | 375,498 |
| Roche Holding AG | | 95,096 | | | 30,576,562 |
| Sanofi | | 151,307 | | | 14,111,765 |
| Santen Pharmaceutical Company, Ltd. | | 46,000 | | | 737,334 |
| Shanghai Fosun Pharmaceutical Group Company, Ltd., H Shares | | 66,500 | | | 190,697 |
| Shionogi & Company, Ltd. | | 34,463 | | | 1,855,144 |
| SIGA Technologies, Inc. (A) | | 7,135 | | | 35,639 |
| Sino Biopharmaceutical, Ltd. | | 917,350 | | | 1,359,633 |
| SSY Group, Ltd. | | 201,300 | | | 171,386 |
| Sumitomo Dainippon Pharma Company, Ltd. | | 20,300 | | | 289,651 |
| Supernus Pharmaceuticals, Inc. (A) | | 6,236 | | | 112,186 |
| Taisho Pharmaceutical Holdings Company, Ltd. | | 4,300 | | | 264,074 |
| Takeda Pharmaceutical Company, Ltd. | | 191,728 | | | 6,621,052 |
| Teva Pharmaceutical Industries, Ltd., ADR (A) | | 125,636 | | | 1,448,583 |
| TherapeuticsMD, Inc. (A)(C) | | 28,206 | | | 47,668 |
| Theravance Biopharma, Inc. (A)(C) | | 5,581 | | | 135,897 |
| Tricida, Inc. (A)(C) | | 2,747 | | | 87,300 |
| UCB SA | | 4,228 | | | 391,453 |
| Verrica Pharmaceuticals, Inc. (A) | | 1,776 | | | 21,081 |
| Vifor Pharma AG | | 6,140 | | | 1,031,426 |
| WaVe Life Sciences, Ltd. (A)(C) | | 3,188 | | | 26,862 |
| Xeris Pharmaceuticals, Inc. (A) | | 3,746 | | | 13,336 |
| Yuhan Corp. | | 1,881 | | | 332,897 |
| Zoetis, Inc. | | 66,862 | | | 8,908,024 |
| Zogenix, Inc. (A) | | 5,322 | | | 133,476 |
| Zynerba Pharmaceuticals, Inc. (A)(C) | | 3,149 | | | 13,415 |
| | | | | | 319,632,807 |
| | | | | | 796,395,170 |
| Industrials – 8.9% | | | | | |
| Aerospace and defense – 1.1% | | | |
| AAR Corp. | | 4,110 | | | 142,001 |
| Aerojet Rocketdyne Holdings, Inc. (A) | | 9,017 | | | 444,358 |
| AeroVironment, Inc. (A) | | 2,669 | | | 137,160 |
| Airbus SE | | 78,548 | | | 9,480,628 |
| Arconic, Inc. | | 27,182 | | | 797,792 |
| Aselsan Elektronik Sanayi Ve Ticaret AS | | 19,720 | | | 87,330 |
| Astronics Corp. (A) | | 2,925 | | | 59,290 |
| AviChina Industry & Technology Company, Ltd., H Shares | | 332,300 | | | 146,732 |
| Axon Enterprise, Inc. (A) | | 22,422 | | | 1,734,790 |
| BAE Systems PLC | | 225,451 | | | 1,783,336 |
| Bombardier, Inc., Class B (A) | | 339,195 | | | 242,598 |
| CAE, Inc. | | 42,852 | | | 1,146,445 |
| Cubic Corp. | | 3,860 | | | 210,138 |
| Curtiss-Wright Corp. | | 10,943 | | | 1,312,503 |
| Dassault Aviation SA | | 343 | | | 359,221 |
| Ducommun, Inc. (A) | | 1,333 | | | 59,518 |
| Embraer SA (A) | | 23,908 | | | 90,673 |
| General Dynamics Corp. | | 16,444 | | | 2,625,942 |
| Huntington Ingalls Industries, Inc. | | 2,870 | | | 589,871 |
| Korea Aerospace Industries, Ltd. (A) | | 14,634 | | | 312,901 |
| Kratos Defense & Security Solutions, Inc. (A) | | 11,141 | | | 181,153 |
| L3Harris Technologies, Inc. | | 15,513 | | | 3,067,385 |
| Leonardo SpA | | 35,417 | | | 363,220 |
| Lockheed Martin Corp. | | 17,418 | | | 6,442,396 |
| The accompanying notes are an integral part of the financial statements. | 63 | |
John Hancock Funds II
Portfolio of Investments — February 29, 2020 (unaudited)(showing percentage of total net assets)
Strategic Equity Allocation Fund (continued)
| | | Shares or
Principal
Amount | | Value |
| COMMON STOCKS (continued) | | | |
| Aerospace and defense (continued) | | | |
| Maxar Technologies, Inc. | | 7,488 | | $ | 113,892 |
| Meggitt PLC | | 55,631 | | | 391,758 |
| Mercury Systems, Inc. (A) | | 20,949 | | | 1,538,914 |
| Moog, Inc., Class A | | 3,966 | | | 305,858 |
| MTU Aero Engines AG | | 6,952 | | | 1,720,082 |
| National Presto Industries, Inc. | | 618 | | | 48,562 |
| Northrop Grumman Corp. | | 10,998 | | | 3,616,582 |
| Park Aerospace Corp. | | 2,448 | | | 34,052 |
| Parsons Corp. (A) | | 2,373 | | | 92,761 |
| Raytheon Company | | 19,541 | | | 3,684,651 |
| Rolls-Royce Holdings PLC (A) | | 121,591 | | | 978,513 |
| Safran SA | | 44,067 | | | 6,100,120 |
| Singapore Technologies Engineering, Ltd. | | 65,700 | | | 199,019 |
| Teledyne Technologies, Inc. (A) | | 9,349 | | | 3,153,605 |
| Textron, Inc. | | 16,018 | | | 650,331 |
| Thales SA | | 14,393 | | | 1,453,730 |
| The Boeing Company | | 37,518 | | | 10,321,577 |
| TransDigm Group, Inc. | | 3,495 | | | 1,949,546 |
| Triumph Group, Inc. | | 6,112 | | | 116,128 |
| United Technologies Corp. | | 56,932 | | | 7,434,750 |
| Vectrus, Inc. (A) | | 1,386 | | | 72,197 |
| | | | | | 75,794,009 |
| Air freight and logistics – 0.4% | | | |
| Air Transport Services Group, Inc. (A) | | 7,285 | | | 130,402 |
| Atlas Air Worldwide Holdings, Inc. (A) | | 2,935 | | | 78,423 |
| Best, Inc., ADR (A) | | 26,100 | | | 141,201 |
| C.H. Robinson Worldwide, Inc. | | 13,013 | | | 896,596 |
| Deutsche Post AG | | 131,925 | | | 3,970,669 |
| DSV Panalpina A/S | | 40,485 | | | 4,107,794 |
| Echo Global Logistics, Inc. (A) | | 3,461 | | | 63,855 |
| Expeditors International of Washington, Inc. | | 16,386 | | | 1,153,902 |
| FedEx Corp. | | 23,096 | | | 3,260,462 |
| Forward Air Corp. | | 3,487 | | | 205,768 |
| Hub Group, Inc., Class A (A) | | 4,019 | | | 185,798 |
| Hyundai Glovis Company, Ltd. | | 3,718 | | | 379,274 |
| Radiant Logistics, Inc. (A) | | 5,376 | | | 23,654 |
| SG Holdings Company, Ltd. | | 18,300 | | | 361,294 |
| Sinotrans, Ltd., H Shares | | 266,200 | | | 76,523 |
| United Parcel Service, Inc., Class B | | 67,425 | | | 6,101,288 |
| XPO Logistics, Inc. (A) | | 23,661 | | | 1,750,204 |
| Yamato Holdings Company, Ltd. | | 39,500 | | | 623,594 |
| ZTO Express Cayman, Inc., ADR | | 42,000 | | | 985,320 |
| | | | | | 24,496,021 |
| Airlines – 0.2% | | | |
| Air Canada (A) | | 21,020 | | | 536,364 |
| Air China, Ltd., H Shares | | 234,966 | | | 194,128 |
| AirAsia Group BHD | | 159,746 | | | 38,264 |
| Alaska Air Group, Inc. (C) | | 11,851 | | | 598,001 |
| Allegiant Travel Company | | 1,597 | | | 216,457 |
| American Airlines Group, Inc. | | 37,513 | | | 714,623 |
| ANA Holdings, Inc. | | 14,300 | | | 385,007 |
| China Airlines, Ltd. | | 511,000 | | | 136,860 |
| China Eastern Airlines Corp., Ltd., H Shares (A) | | 234,400 | | | 103,287 |
| China Southern Airlines Company, Ltd., H Shares | | 214,900 | | | 115,658 |
| Delta Air Lines, Inc. | | 55,383 | | | 2,554,818 |
| Deutsche Lufthansa AG | | 31,533 | | | 417,021 |
| easyJet PLC | | 11,168 | | | 161,214 |
| Eva Airways Corp. | | 496,066 | | | 195,373 |
| Hawaiian Holdings, Inc. | | 5,776 | | | 120,603 |
| Japan Airlines Company, Ltd. | | 14,600 | | | 359,305 |
| JetBlue Airways Corp. (A) | | 74,006 | | | 1,167,815 |
| Korean Air Lines Company, Ltd. (A) | | 9,401 | | | 169,922 |
Strategic Equity Allocation Fund (continued)
| | | Shares or
Principal
Amount | | Value |
| COMMON STOCKS (continued) | | | |
| Airlines (continued) | | | |
| Latam Airlines Group SA | | 31,710 | | $ | 212,892 |
| Mesa Air Group, Inc. (A) | | 2,678 | | | 15,452 |
| Qantas Airways, Ltd. | | 105,483 | | | 385,805 |
| Singapore Airlines, Ltd. | | 21,940 | | | 126,954 |
| SkyWest, Inc. | | 6,071 | | | 275,623 |
| Southwest Airlines Company | | 45,573 | | | 2,105,017 |
| Spirit Airlines, Inc. (A) | | 8,472 | | | 241,028 |
| Turk Hava Yollari AO (A) | | 26,642 | | | 50,359 |
| United Airlines Holdings, Inc. (A) | | 20,939 | | | 1,289,633 |
| | | | | | 12,887,483 |
| Building products – 0.5% | | | |
| AAON, Inc. | | 5,042 | | | 277,360 |
| Advanced Drainage Systems, Inc. | | 5,133 | | | 214,867 |
| AGC, Inc. | | 23,484 | | | 671,611 |
| Allegion PLC | | 13,902 | | | 1,598,591 |
| American Woodmark Corp. (A) | | 2,083 | | | 174,493 |
| AO Smith Corp. | | 20,506 | | | 811,012 |
| Apogee Enterprises, Inc. | | 3,287 | | | 99,235 |
| Assa Abloy AB, B Shares | | 138,298 | | | 3,110,203 |
| Builders FirstSource, Inc. (A) | | 14,108 | | | 320,393 |
| Caesarstone, Ltd. | | 2,947 | | | 31,857 |
| China Lesso Group Holdings, Ltd. | | 142,000 | | | 216,738 |
| Cie de Saint-Gobain | | 66,122 | | | 2,334,731 |
| Cornerstone Building Brands, Inc. (A) | | 6,126 | | | 45,026 |
| CSW Industrials, Inc. | | 1,828 | | | 120,356 |
| Daikin Industries, Ltd. | | 31,900 | | | 4,297,697 |
| Fortune Brands Home & Security, Inc. | | 20,819 | | | 1,285,573 |
| Geberit AG | | 4,970 | | | 2,480,035 |
| Gibraltar Industries, Inc. (A) | | 4,040 | | | 204,707 |
| Griffon Corp. | | 4,551 | | | 79,187 |
| Insteel Industries, Inc. | | 2,380 | | | 47,338 |
| JELD-WEN Holding, Inc. (A) | | 8,381 | | | 157,563 |
| Johnson Controls International PLC | | 115,417 | | | 4,220,800 |
| KCC Glass Corp. (A) | | 262 | | | 5,738 |
| Kingspan Group PLC | | 19,874 | | | 1,251,478 |
| Lennox International, Inc. | | 8,989 | | | 2,050,661 |
| LIXIL Group Corp. | | 33,900 | | | 504,934 |
| Masco Corp. | | 42,506 | | | 1,756,348 |
| Masonite International Corp. (A) | | 3,063 | | | 225,131 |
| Owens Corning | | 27,887 | | | 1,575,337 |
| Patrick Industries, Inc. | | 2,826 | | | 149,298 |
| PGT Innovations, Inc. (A) | | 7,176 | | | 108,860 |
| Quanex Building Products Corp. | | 4,165 | | | 69,972 |
| Resideo Technologies, Inc. (A) | | 31,484 | | | 338,453 |
| Simpson Manufacturing Company, Inc. | | 5,491 | | | 436,150 |
| TOTO, Ltd. | | 18,100 | | | 678,782 |
| Trex Company, Inc. (A) | | 22,203 | | | 2,123,717 |
| Universal Forest Products, Inc. | | 7,349 | | | 344,374 |
| | | | | | 34,418,606 |
| Commercial services and supplies – 0.6% | | | |
| ABM Industries, Inc. | | 8,194 | | | 269,746 |
| ACCO Brands Corp. | | 12,008 | | | 96,184 |
| Advanced Disposal Services, Inc. (A) | | 8,864 | | | 293,044 |
| A-Living Services Company, Ltd., H Shares (B) | | 57,500 | | | 263,900 |
| Brady Corp., Class A | | 5,847 | | | 276,797 |
| Brambles, Ltd. | | 227,128 | | | 1,787,659 |
| BrightView Holdings, Inc. (A) | | 3,892 | | | 54,488 |
| Casella Waste Systems, Inc., Class A (A) | | 5,552 | | | 268,994 |
| CECO Environmental Corp. (A) | | 4,103 | | | 27,695 |
| China Everbright International, Ltd. | | 483,500 | | | 327,309 |
| Cimpress PLC (A) | | 2,464 | | | 286,834 |
| Cintas Corp. | | 11,513 | | | 3,070,978 |
| Clean Harbors, Inc. (A) | | 13,162 | | | 915,022 |
| Copart, Inc. (A) | | 28,093 | | | 2,373,297 |
| The accompanying notes are an integral part of the financial statements. | 64 | |
John Hancock Funds II
Portfolio of Investments — February 29, 2020 (unaudited)(showing percentage of total net assets)
Strategic Equity Allocation Fund (continued)
| | | Shares or
Principal
Amount | | Value |
| COMMON STOCKS (continued) | | | |
| Commercial services and supplies (continued) | | | |
| Country Garden Services Holdings Company, Ltd. | | 158,400 | | $ | 632,123 |
| Covanta Holding Corp. | | 14,630 | | | 195,457 |
| Dai Nippon Printing Company, Ltd. | | 31,100 | | | 749,424 |
| Deluxe Corp. | | 16,049 | | | 534,432 |
| Ennis, Inc. | | 3,286 | | | 66,049 |
| G4S PLC | | 106,700 | | | 236,254 |
| Greentown Service Group Company, Ltd. | | 145,000 | | | 184,057 |
| Harsco Corp. (A) | | 9,730 | | | 116,663 |
| Healthcare Services Group, Inc. (C) | | 28,350 | | | 780,759 |
| Heritage-Crystal Clean, Inc. (A) | | 1,946 | | | 51,238 |
| Herman Miller, Inc. | | 22,420 | | | 767,661 |
| HNI Corp. | | 16,331 | | | 536,147 |
| Interface, Inc. | | 7,301 | | | 106,522 |
| ISS A/S | | 29,277 | | | 520,235 |
| KAR Auction Services, Inc. | | 33,011 | | | 635,462 |
| Kimball International, Inc., Class B | | 4,556 | | | 73,716 |
| Knoll, Inc. | | 6,137 | | | 108,257 |
| Matthews International Corp., Class A | | 3,900 | | | 115,284 |
| McGrath RentCorp | | 2,977 | | | 206,753 |
| Mobile Mini, Inc. | | 5,468 | | | 213,197 |
| MSA Safety, Inc. | | 13,488 | | | 1,641,085 |
| Park24 Company, Ltd. | | 14,800 | | | 291,606 |
| PICO Holdings, Inc. (A) | | 2,771 | | | 26,297 |
| Pitney Bowes, Inc. (C) | | 21,669 | | | 74,108 |
| Quad/Graphics, Inc. | | 4,643 | | | 22,286 |
| Rentokil Initial PLC | | 127,250 | | | 796,184 |
| Republic Services, Inc. | | 28,927 | | | 2,610,951 |
| Rollins, Inc. | | 19,337 | | | 723,977 |
| RR Donnelley & Sons Company | | 9,016 | | | 17,130 |
| S-1 Corp. | | 3,227 | | | 217,083 |
| Secom Company, Ltd. | | 26,694 | | | 2,116,989 |
| Securitas AB, B Shares | | 42,847 | | | 581,873 |
| Sohgo Security Services Company, Ltd. | | 8,900 | | | 415,259 |
| SP Plus Corp. (A) | | 2,836 | | | 103,542 |
| Steelcase, Inc., Class A | | 10,730 | | | 174,041 |
| Stericycle, Inc. (A) | | 23,361 | | | 1,341,622 |
| Team, Inc. (A)(C) | | 3,720 | | | 47,356 |
| Tetra Tech, Inc. | | 20,721 | | | 1,675,707 |
| The Brink's Company | | 18,989 | | | 1,486,649 |
| Toppan Printing Company, Ltd. | | 36,500 | | | 638,273 |
| UniFirst Corp. | | 1,852 | | | 344,120 |
| US Ecology, Inc. | | 3,027 | | | 127,316 |
| Viad Corp. | | 2,476 | | | 124,295 |
| VSE Corp. | | 1,130 | | | 33,279 |
| Waste Management, Inc. | | 53,601 | | | 5,939,527 |
| | | | | | 38,712,192 |
| Construction and engineering – 0.5% | | | |
| ACS Actividades de Construccion y Servicios SA | | 31,574 | | | 941,488 |
| AECOM (A) | | 40,269 | | | 1,809,689 |
| Aegion Corp. (A) | | 3,860 | | | 69,519 |
| Ameresco, Inc., Class A (A) | | 2,874 | | | 64,780 |
| Arcosa, Inc. | | 5,978 | | | 256,815 |
| Argan, Inc. | | 1,859 | | | 77,576 |
| Bouygues SA | | 29,751 | | | 1,176,906 |
| China Communications Construction Company, Ltd., H Shares | | 579,865 | | | 437,893 |
| China Communications Services Corp., Ltd., H Shares | | 311,200 | | | 244,519 |
| China Railway Construction Corp., Ltd., H Shares | | 254,100 | | | 293,978 |
| China Railway Group, Ltd., H Shares | | 492,200 | | | 282,759 |
| China State Construction International Holdings, Ltd. | | 271,900 | | | 223,540 |
Strategic Equity Allocation Fund (continued)
| | | Shares or
Principal
Amount | | Value |
| COMMON STOCKS (continued) | | | |
| Construction and engineering (continued) | | | |
| CIMIC Group, Ltd. | | 13,781 | | $ | 217,001 |
| Comfort Systems USA, Inc. | | 4,530 | | | 191,257 |
| Construction Partners, Inc., Class A (A) | | 2,098 | | | 35,687 |
| Daelim Industrial Company, Ltd. (A) | | 5,579 | | | 336,024 |
| Daewoo Engineering & Construction Company, Ltd. (A) | | 38,659 | | | 130,803 |
| Dycom Industries, Inc. (A) | | 11,877 | | | 351,084 |
| Eiffage SA | | 10,424 | | | 1,115,053 |
| EMCOR Group, Inc. | | 21,236 | | | 1,633,473 |
| Ferrovial SA | | 58,405 | | | 1,677,618 |
| Fluor Corp. | | 35,933 | | | 334,896 |
| Gamuda BHD | | 178,700 | | | 141,275 |
| Granite Construction, Inc. | | 5,911 | | | 120,112 |
| Great Lakes Dredge & Dock Corp. (A) | | 7,634 | | | 74,050 |
| GS Engineering & Construction Corp. | | 12,049 | | | 263,520 |
| HDC Hyundai Development Co-Engineering & Construction, Series E | | 5,390 | | | 80,566 |
| HOCHTIEF AG | | 3,251 | | | 324,358 |
| Hyundai Engineering & Construction Company, Ltd. | | 15,586 | | | 450,656 |
| IES Holdings, Inc. (A) | | 1,107 | | | 25,804 |
| IJM Corp. BHD | | 280,900 | | | 131,013 |
| Jacobs Engineering Group, Inc. | | 25,184 | | | 2,325,491 |
| JGC Holdings Corp. | | 28,400 | | | 343,323 |
| Kajima Corp. | | 57,600 | | | 617,327 |
| MasTec, Inc. (A) | | 22,836 | | | 1,120,791 |
| Metallurgical Corp. of China, Ltd., H Shares | | 321,800 | | | 63,021 |
| MYR Group, Inc. (A) | | 2,042 | | | 52,091 |
| Northwest Pipe Company (A) | | 1,221 | | | 38,523 |
| NV5 Global, Inc. (A) | | 1,327 | | | 71,034 |
| Obayashi Corp. | | 83,600 | | | 843,362 |
| Primoris Services Corp. | | 5,596 | | | 106,212 |
| Quanta Services, Inc. | | 26,448 | | | 1,008,462 |
| Samsung Engineering Company, Ltd. (A) | | 30,857 | | | 359,668 |
| Shimizu Corp. | | 75,600 | | | 687,382 |
| Sinopec Engineering Group Company, Ltd., H Shares | | 190,600 | | | 94,884 |
| Skanska AB, B Shares | | 46,776 | | | 1,030,027 |
| Sterling Construction Company, Inc. (A) | | 3,354 | | | 45,816 |
| Taisei Corp. | | 25,900 | | | 878,173 |
| Tutor Perini Corp. (A) | | 5,093 | | | 73,849 |
| Valmont Industries, Inc. | | 5,518 | | | 641,302 |
| Vinci SA | | 68,420 | | | 6,913,687 |
| WillScot Corp. (A) | | 6,495 | | | 113,922 |
| WSP Global, Inc. | | 17,025 | | | 1,122,147 |
| | | | | | 32,064,206 |
| Electrical equipment – 0.8% | | | |
| ABB, Ltd. | | 249,523 | | | 5,406,966 |
| Acuity Brands, Inc. | | 10,157 | | | 1,044,749 |
| Allied Motion Technologies, Inc. | | 932 | | | 35,919 |
| American Superconductor Corp. (A) | | 2,956 | | | 20,249 |
| AMETEK, Inc. | | 34,784 | | | 2,991,424 |
| Atkore International Group, Inc. (A) | | 5,738 | | | 211,790 |
| AZZ, Inc. | | 3,264 | | | 120,409 |
| Bloom Energy Corp., Class A (A)(C) | | 7,079 | | | 64,207 |
| Eaton Corp. PLC | | 62,905 | | | 5,706,742 |
| Emerson Electric Company | | 92,691 | | | 5,942,420 |
| Encore Wire Corp. | | 2,553 | | | 125,020 |
| EnerSys | | 16,112 | | | 992,177 |
| Fuji Electric Company, Ltd. | | 16,300 | | | 447,051 |
| Generac Holdings, Inc. (A) | | 23,564 | | | 2,426,856 |
| Hubbell, Inc. | | 13,942 | | | 1,857,632 |
| Legrand SA | | 35,650 | | | 2,736,206 |
| The accompanying notes are an integral part of the financial statements. | 65 | |
John Hancock Funds II
Portfolio of Investments — February 29, 2020 (unaudited)(showing percentage of total net assets)
Strategic Equity Allocation Fund (continued)
| | | Shares or
Principal
Amount | | Value |
| COMMON STOCKS (continued) | | | |
| Electrical equipment (continued) | | | |
| Melrose Industries PLC | | 341,877 | | $ | 945,501 |
| Mitsubishi Electric Corp. | | 234,918 | | | 2,953,447 |
| Neoplux Company, Ltd. (A) | | 255 | | | 639 |
| Nidec Corp. | | 28,700 | | | 3,380,093 |
| nVent Electric PLC | | 39,893 | | | 957,831 |
| Plug Power, Inc. (A)(C) | | 30,348 | | | 131,710 |
| Powell Industries, Inc. | | 1,121 | | | 37,475 |
| Preformed Line Products Company | | 400 | | | 19,520 |
| Prysmian SpA | | 20,424 | | | 487,916 |
| Regal Beloit Corp. | | 10,495 | | | 814,832 |
| Rockwell Automation, Inc. | | 17,582 | | | 3,226,297 |
| Schneider Electric SE | | 72,875 | | | 7,404,058 |
| Schneider Electric SE (Euronext London Exchange) | | 1,474 | | | 151,043 |
| Shanghai Electric Group Company, Ltd., H Shares | | 317,436 | | | 90,506 |
| Siemens Gamesa Renewable Energy SA | | 28,789 | | | 466,962 |
| Sunrun, Inc. (A) | | 13,947 | | | 269,735 |
| Thermon Group Holdings, Inc. (A) | | 4,099 | | | 72,019 |
| TPI Composites, Inc. (A) | | 3,616 | | | 85,844 |
| Vestas Wind Systems A/S | | 35,130 | | | 3,389,352 |
| Vicor Corp. (A) | | 2,230 | | | 96,425 |
| Vivint Solar, Inc. (A) | | 5,661 | | | 63,630 |
| WEG SA | | 28,398 | | | 274,016 |
| Xinjiang Goldwind Science & Technology Company, Ltd., H Shares (C) | | 99,200 | | | 100,079 |
| Zhuzhou CRRC Times Electric Company, Ltd., H Shares | | 72,000 | | | 255,720 |
| | | | | | 55,804,467 |
| Industrial conglomerates – 0.8% | | | |
| 3M Company | | 51,559 | | | 7,694,665 |
| Aboitiz Equity Ventures, Inc. | | 247,860 | | | 208,494 |
| Alfa SAB de CV, Class A | | 357,600 | | | 230,188 |
| Ayala Corp. | | 35,385 | | | 461,290 |
| Carlisle Companies, Inc. | | 14,528 | | | 2,110,773 |
| CITIC, Ltd. | | 777,333 | | | 877,617 |
| CJ Corp. | | 2,969 | | | 197,750 |
| CK Hutchison Holdings, Ltd. | | 169,472 | | | 1,498,144 |
| DCC PLC | | 6,809 | | | 487,681 |
| Far Eastern New Century Corp. | | 717,133 | | | 661,029 |
| Fosun International, Ltd. | | 343,000 | | | 446,554 |
| General Electric Company | | 783,045 | | | 8,519,530 |
| Grupo Carso SAB de CV, Series A1 | | 54,700 | | | 152,459 |
| GT Capital Holdings, Inc. | | 11,928 | | | 166,950 |
| HAP Seng Consolidated BHD | | 58,600 | | | 124,813 |
| Honeywell International, Inc. | | 64,065 | | | 10,389,421 |
| Jardine Matheson Holdings, Ltd. | | 13,732 | | | 751,313 |
| Jardine Strategic Holdings, Ltd. | | 13,800 | | | 400,292 |
| JG Summit Holdings, Inc. | | 360,810 | | | 479,661 |
| Keihan Holdings Company, Ltd. | | 12,000 | | | 485,479 |
| Keppel Corp., Ltd. | | 60,731 | | | 280,283 |
| KOC Holding AS | | 39,262 | | | 109,410 |
| LG Corp. | | 18,998 | | | 1,055,992 |
| Lotte Corp. | | 5,259 | | | 126,785 |
| NWS Holdings, Ltd. | | 91,230 | | | 112,748 |
| Raven Industries, Inc. | | 4,498 | | | 129,138 |
| Roper Technologies, Inc. | | 9,330 | | | 3,281,361 |
| Samsung C&T Corp. | | 16,919 | | | 1,483,182 |
| Sembcorp Industries, Ltd. | | 38,500 | | | 51,289 |
| Shanghai Industrial Holdings, Ltd. | | 64,270 | | | 114,400 |
| Siemens AG | | 102,067 | | | 10,499,763 |
| Sime Darby BHD | | 279,900 | | | 133,838 |
| SK Holdings Company, Ltd. | | 6,941 | | | 1,102,402 |
| SM Investments Corp. | | 30,205 | | | 578,780 |
| Smiths Group PLC | | 27,640 | | | 550,785 |
Strategic Equity Allocation Fund (continued)
| | | Shares or
Principal
Amount | | Value |
| COMMON STOCKS (continued) | | | |
| Industrial conglomerates (continued) | | | |
| The Bidvest Group, Ltd. | | 23,855 | | $ | 278,066 |
| Toshiba Corp. | | 63,200 | | | 1,710,555 |
| | | | | | 57,942,880 |
| Machinery – 1.7% | | | |
| AGCO Corp. | | 16,069 | | | 971,050 |
| Airtac International Group | | 28,000 | | | 434,673 |
| Alamo Group, Inc. | | 1,193 | | | 132,149 |
| Albany International Corp., Class A | | 3,778 | | | 242,056 |
| Alfa Laval AB | | 43,515 | | | 986,577 |
| Alstom SA | | 25,362 | | | 1,252,152 |
| Altra Industrial Motion Corp. | | 7,972 | | | 240,117 |
| Amada Holdings Company, Ltd. | | 43,400 | | | 404,656 |
| ANDRITZ AG | | 10,965 | | | 388,026 |
| Astec Industries, Inc. | | 2,861 | | | 107,431 |
| Atlas Copco AB, A Shares | | 93,127 | | | 3,320,435 |
| Atlas Copco AB, B Shares | | 53,824 | | | 1,668,022 |
| Barnes Group, Inc. | | 5,816 | | | 312,319 |
| Blue Bird Corp. (A) | | 1,950 | | | 34,866 |
| Briggs & Stratton Corp. | | 5,399 | | | 17,115 |
| Caterpillar, Inc. | | 57,208 | | | 7,107,522 |
| Chart Industries, Inc. (A) | | 4,459 | | | 253,806 |
| China Conch Venture Holdings, Ltd. | | 214,400 | | | 1,048,925 |
| CIRCOR International, Inc. (A) | | 2,422 | | | 87,144 |
| CNH Industrial NV | | 86,522 | | | 806,037 |
| Colfax Corp. (A) | | 21,433 | | | 717,363 |
| Columbus McKinnon Corp. | | 2,907 | | | 90,379 |
| Commercial Vehicle Group, Inc. (A) | | 4,000 | | | 17,440 |
| Crane Company | | 13,069 | | | 888,039 |
| CRRC Corp., Ltd., H Shares | | 572,700 | | | 372,984 |
| Cummins, Inc. | | 15,859 | | | 2,399,308 |
| Daewoo Shipbuilding & Marine Engineering Company, Ltd. (A) | | 7,361 | | | 135,916 |
| Daifuku Company, Ltd. | | 13,000 | | | 764,170 |
| Deere & Company | | 32,594 | | | 5,100,309 |
| Donaldson Company, Inc. | | 32,444 | | | 1,462,576 |
| Doosan Bobcat, Inc. | | 9,854 | | | 230,751 |
| Douglas Dynamics, Inc. | | 2,795 | | | 121,666 |
| Dover Corp. | | 15,037 | | | 1,544,901 |
| Energy Recovery, Inc. (A) | | 4,799 | | | 47,222 |
| Enerpac Tool Group Corp. | | 6,780 | | | 144,889 |
| EnPro Industries, Inc. | | 2,530 | | | 136,494 |
| Epiroc AB, A Shares | | 89,260 | | | 1,031,054 |
| Epiroc AB, B Shares | | 55,831 | | | 626,271 |
| ESCO Technologies, Inc. | | 3,134 | | | 284,943 |
| Evoqua Water Technologies Corp. (A) | | 9,392 | | | 196,950 |
| FANUC Corp. | | 24,900 | | | 4,088,926 |
| Federal Signal Corp. | | 7,339 | | | 212,831 |
| Flowserve Corp. | | 13,546 | | | 544,414 |
| Fortive Corp. | | 30,589 | | | 2,115,535 |
| Franklin Electric Company, Inc. | | 5,705 | | | 294,891 |
| GEA Group AG | | 20,378 | | | 545,293 |
| Graco, Inc. | | 42,754 | | | 2,108,627 |
| Graham Corp. | | 1,319 | | | 21,869 |
| Haitian International Holdings, Ltd. | | 85,200 | | | 169,860 |
| Helios Technologies, Inc. | | 3,675 | | | 146,081 |
| Hillenbrand, Inc. | | 9,025 | | | 211,185 |
| Hino Motors, Ltd. | | 36,600 | | | 299,471 |
| Hitachi Construction Machinery Company, Ltd. | | 14,000 | | | 340,970 |
| Hiwin Technologies Corp. | | 52,169 | | | 506,357 |
| Hoshizaki Corp. | | 6,900 | | | 584,690 |
| Hurco Companies, Inc. | | 828 | | | 23,333 |
| Hyster-Yale Materials Handling, Inc. | | 1,278 | | | 61,523 |
| Hyundai Heavy Industries Holdings Company, Ltd. | | 1,925 | | | 429,234 |
| The accompanying notes are an integral part of the financial statements. | 66 | |
John Hancock Funds II
Portfolio of Investments — February 29, 2020 (unaudited)(showing percentage of total net assets)
Strategic Equity Allocation Fund (continued)
| | | Shares or
Principal
Amount | | Value |
| COMMON STOCKS (continued) | | | |
| Machinery (continued) | | | |
| IDEX Corp. | | 7,873 | | $ | 1,165,204 |
| IHI Corp. | | 19,000 | | | 395,043 |
| Illinois Tool Works, Inc. | | 30,276 | | | 5,079,707 |
| Ingersoll-Rand PLC | | 24,802 | | | 3,200,450 |
| ITT, Inc. | | 22,482 | | | 1,352,292 |
| John Bean Technologies Corp. (C) | | 3,845 | | | 372,427 |
| JTEKT Corp. | | 26,600 | | | 256,599 |
| Kadant, Inc. | | 1,348 | | | 122,425 |
| Kawasaki Heavy Industries, Ltd. | | 18,900 | | | 338,725 |
| Kennametal, Inc. | | 31,383 | | | 872,447 |
| KION Group AG | | 8,656 | | | 468,146 |
| Knorr-Bremse AG | | 6,323 | | | 646,375 |
| Komatsu, Ltd. | | 118,800 | | | 2,373,714 |
| Kone OYJ, B Shares | | 42,244 | | | 2,392,798 |
| Korea Shipbuilding & Offshore Engineering Company, Ltd. (A) | | 7,664 | | | 658,894 |
| Kubota Corp. | | 134,300 | | | 1,883,121 |
| Kurita Water Industries, Ltd. | | 12,689 | | | 327,269 |
| LB Foster Company, Class A (A) | | 1,385 | | | 21,828 |
| Lincoln Electric Holdings, Inc. | | 15,675 | | | 1,283,626 |
| Lindsay Corp. | | 1,342 | | | 132,898 |
| Luxfer Holdings PLC | | 3,368 | | | 52,238 |
| Lydall, Inc. (A) | | 2,202 | | | 26,226 |
| Makita Corp. | | 28,800 | | | 976,107 |
| Meritor, Inc. (A) | | 9,250 | | | 209,883 |
| Metso OYJ | | 13,300 | | | 432,811 |
| Miller Industries, Inc. | | 1,378 | | | 40,940 |
| MINEBEA MITSUMI, Inc. | | 46,800 | | | 819,129 |
| MISUMI Group, Inc. | | 36,500 | | | 768,799 |
| Mitsubishi Heavy Industries, Ltd. | | 41,040 | | | 1,296,760 |
| Mueller Industries, Inc. | | 6,919 | | | 193,594 |
| Mueller Water Products, Inc., Class A | | 19,316 | | | 211,510 |
| Nabtesco Corp. | | 14,500 | | | 385,046 |
| Navistar International Corp. (A) | | 6,171 | | | 224,069 |
| NGK Insulators, Ltd. | | 34,000 | | | 533,947 |
| NN, Inc. | | 5,347 | | | 41,439 |
| Nordson Corp. | | 13,116 | | | 1,905,755 |
| NSK, Ltd. | | 46,300 | | | 350,351 |
| Omega Flex, Inc. | | 357 | | | 27,953 |
| Oshkosh Corp. | | 17,446 | | | 1,258,729 |
| PACCAR, Inc. | | 35,803 | | | 2,395,221 |
| Parker-Hannifin Corp. | | 13,298 | | | 2,457,071 |
| Park-Ohio Holdings Corp. | | 1,173 | | | 28,762 |
| Pentair PLC | | 17,400 | | | 685,386 |
| Proto Labs, Inc. (A) | | 3,339 | | | 292,630 |
| RBC Bearings, Inc. (A) | | 2,987 | | | 511,345 |
| REV Group, Inc. | | 3,549 | | | 27,789 |
| Rexnord Corp. | | 13,046 | | | 380,421 |
| Samsung Heavy Industries Company, Ltd. (A) | | 86,438 | | | 420,492 |
| Sandvik AB | | 156,344 | | | 2,606,167 |
| Schindler Holding AG | | 2,524 | | | 544,483 |
| Schindler Holding AG, Participation Certificates | | 5,620 | | | 1,260,247 |
| Sinotruk Hong Kong, Ltd. | | 91,100 | | | 177,097 |
| SKF AB, B Shares | | 53,440 | | | 944,876 |
| SMC Corp. | | 7,296 | | | 2,908,238 |
| Snap-on, Inc. | | 5,677 | | | 821,746 |
| Spartan Motors, Inc. | | 4,257 | | | 62,791 |
| Spirax-Sarco Engineering PLC | | 5,086 | | | 557,240 |
| SPX Corp. (A) | | 5,357 | | | 224,619 |
| SPX FLOW, Inc. (A) | | 5,170 | | | 190,153 |
| Standex International Corp. (C) | | 1,530 | | | 97,048 |
| Stanley Black & Decker, Inc. | | 15,735 | | | 2,261,120 |
| Sumitomo Heavy Industries, Ltd. | | 14,400 | | | 310,679 |
Strategic Equity Allocation Fund (continued)
| | | Shares or
Principal
Amount | | Value |
| COMMON STOCKS (continued) | | | |
| Machinery (continued) | | | |
| Techtronic Industries Company, Ltd. | | 86,000 | | $ | 713,503 |
| Tennant Company | | 2,202 | | | 157,531 |
| Terex Corp. | | 24,649 | | | 542,524 |
| The Eastern Company | | 728 | | | 18,542 |
| The Gorman-Rupp Company | | 2,192 | | | 70,122 |
| The Greenbrier Companies, Inc. | | 4,028 | | | 97,598 |
| The Manitowoc Company, Inc. (A) | | 4,455 | | | 55,554 |
| The Timken Company | | 17,378 | | | 779,230 |
| The Toro Company | | 27,327 | | | 1,951,968 |
| The Weir Group PLC | | 18,568 | | | 313,624 |
| THK Company, Ltd. | | 15,700 | | | 355,108 |
| Titan International, Inc. | | 7,222 | | | 16,033 |
| TriMas Corp. (A) | | 5,538 | | | 140,388 |
| Trinity Industries, Inc. | | 25,160 | | | 512,006 |
| Twin Disc, Inc. (A) | | 1,612 | | | 12,993 |
| Volvo AB, B Shares | | 206,288 | | | 3,238,029 |
| Wabash National Corp. | | 6,672 | | | 73,259 |
| Wabtec Corp. | | 18,850 | | | 1,294,995 |
| Wartsila OYJ ABP | | 55,081 | | | 575,873 |
| Watts Water Technologies, Inc., Class A | | 3,349 | | | 314,505 |
| Weichai Power Company, Ltd., H Shares | | 252,980 | | | 507,569 |
| Welbilt, Inc. (A) | | 15,985 | | | 211,322 |
| Woodward, Inc. | | 14,455 | | | 1,491,756 |
| Xylem, Inc. | | 18,641 | | | 1,441,695 |
| Yangzijiang Shipbuilding Holdings, Ltd. | | 101,900 | | | 70,702 |
| Yaskawa Electric Corp. | | 30,900 | | | 962,640 |
| Zoomlion Heavy Industry Science and Technology Company, Ltd., H Shares | | 179,400 | | | 151,362 |
| | | | | | 118,169,119 |
| Marine – 0.1% | | | |
| A.P. Moller - Maersk A/S, Series A | | 726 | | | 688,453 |
| A.P. Moller - Maersk A/S, Series B | | 1,203 | | | 1,213,959 |
| COSCO SHIPPING Holdings Company, Ltd., H Shares (A) | | 325,300 | | | 110,196 |
| Costamare, Inc. | | 6,157 | | | 40,205 |
| Eagle Bulk Shipping, Inc. (A)(C) | | 5,943 | | | 19,731 |
| Evergreen Marine Corp. Taiwan, Ltd. (A) | | 518,748 | | | 194,582 |
| Genco Shipping & Trading, Ltd. | | 2,027 | | | 15,567 |
| Kirby Corp. (A) | | 15,367 | | | 979,646 |
| Kuehne + Nagel International AG | | 7,169 | | | 1,049,409 |
| Matson, Inc. | | 5,319 | | | 176,644 |
| MISC BHD | | 138,400 | | | 251,979 |
| Mitsui OSK Lines, Ltd. | | 15,000 | | | 308,977 |
| Nippon Yusen KK | | 19,500 | | | 277,354 |
| Pan Ocean Company, Ltd. (A) | | 53,990 | | | 167,862 |
| Scorpio Bulkers, Inc. | | 6,967 | | | 22,434 |
| | | | | | 5,516,998 |
| Professional services – 0.6% | | | |
| 51job, Inc., ADR (A) | | 3,600 | | | 269,172 |
| Acacia Research Corp. (A) | | 7,455 | | | 17,147 |
| Adecco Group AG | | 20,850 | | | 1,116,661 |
| ASGN, Inc. (A) | | 19,845 | | | 1,006,340 |
| Barrett Business Services, Inc. | | 885 | | | 53,012 |
| BG Staffing, Inc. | | 1,317 | | | 20,308 |
| Bureau Veritas SA | | 39,293 | | | 967,164 |
| CBIZ, Inc. (A) | | 6,251 | | | 162,776 |
| CRA International, Inc. | | 966 | | | 44,929 |
| Equifax, Inc. | | 16,629 | | | 2,361,983 |
| Experian PLC | | 63,141 | | | 2,101,578 |
| Exponent, Inc. | | 6,388 | | | 470,476 |
| Forrester Research, Inc. (A) | | 1,344 | | | 48,465 |
| Franklin Covey Company (A) | | 1,244 | | | 39,124 |
| FTI Consulting, Inc. (A) | | 14,220 | | | 1,601,030 |
| GP Strategies Corp. (A) | | 1,778 | | | 19,771 |
| Heidrick & Struggles International, Inc. | | 2,371 | | | 52,873 |
| The accompanying notes are an integral part of the financial statements. | 67 | |
John Hancock Funds II
Portfolio of Investments — February 29, 2020 (unaudited)(showing percentage of total net assets)
Strategic Equity Allocation Fund (continued)
| | | Shares or
Principal
Amount | | Value |
| COMMON STOCKS (continued) | | | |
| Professional services (continued) | | | |
| Huron Consulting Group, Inc. (A) | | 2,751 | | $ | 163,244 |
| ICF International, Inc. | | 2,251 | | | 171,031 |
| IHS Markit, Ltd. | | 55,069 | | | 3,923,116 |
| InnerWorkings, Inc. (A) | | 5,848 | | | 18,363 |
| Insperity, Inc. | | 14,288 | | | 961,154 |
| Intertek Group PLC | | 11,177 | | | 762,838 |
| Kelly Services, Inc., Class A | | 4,111 | | | 68,284 |
| Kforce, Inc. | | 2,531 | | | 77,094 |
| Korn Ferry | | 6,973 | | | 243,916 |
| ManpowerGroup, Inc. | | 15,115 | | | 1,147,833 |
| Mistras Group, Inc. (A) | | 2,422 | | | 19,013 |
| Nielsen Holdings PLC | | 48,865 | | | 889,832 |
| Persol Holdings Company, Ltd. | | 22,800 | | | 306,735 |
| Randstad NV | | 14,952 | | | 770,370 |
| Recruit Holdings Company, Ltd. | | 173,800 | | | 6,078,269 |
| RELX PLC | | 135,088 | | | 3,268,430 |
| Resources Connection, Inc. | | 3,980 | | | 49,869 |
| Robert Half International, Inc. | | 16,145 | | | 813,869 |
| SEEK, Ltd. | | 47,830 | | | 655,119 |
| SGS SA | | 702 | | | 1,753,312 |
| Teleperformance | | 7,847 | | | 1,914,286 |
| Thomson Reuters Corp. | | 32,135 | | | 2,387,171 |
| TriNet Group, Inc. (A) | | 5,524 | | | 291,999 |
| TrueBlue, Inc. (A) | | 4,819 | | | 71,707 |
| Upwork, Inc. (A) | | 7,214 | | | 62,509 |
| Verisk Analytics, Inc. | | 22,505 | | | 3,490,751 |
| Willdan Group, Inc. (A) | | 1,314 | | | 40,406 |
| Wolters Kluwer NV | | 34,518 | | | 2,525,388 |
| | | | | | 43,278,717 |
| Road and rail – 0.9% | | | |
| ArcBest Corp. | | 3,240 | | | 64,184 |
| Aurizon Holdings, Ltd. | | 282,886 | | | 900,585 |
| Avis Budget Group, Inc. (A) | | 21,700 | | | 702,538 |
| BTS Group Holdings PCL, NVDR | | 366,700 | | | 128,807 |
| Canadian National Railway Company | | 112,390 | | | 9,527,926 |
| Canadian Pacific Railway, Ltd. | | 21,775 | | | 5,396,826 |
| Central Japan Railway Company | | 18,388 | | | 3,022,791 |
| CJ Logistics Corp. (A) | | 1,797 | | | 199,073 |
| ComfortDelGro Corp., Ltd. | | 88,700 | | | 125,762 |
| Covenant Transportation Group, Inc., Class A (A) | | 1,689 | | | 20,437 |
| CSX Corp. | | 74,823 | | | 5,271,280 |
| Daseke, Inc. (A) | | 6,689 | | | 22,074 |
| East Japan Railway Company | | 38,600 | | | 2,948,378 |
| Hankyu Hanshin Holdings, Inc. | | 29,100 | | | 956,694 |
| Heartland Express, Inc. | | 5,697 | | | 102,033 |
| Hertz Global Holdings, Inc. (A) | | 12,521 | | | 160,144 |
| J.B. Hunt Transport Services, Inc. | | 8,204 | | | 791,194 |
| Kansas City Southern | | 9,537 | | | 1,437,035 |
| Keikyu Corp. | | 27,700 | | | 417,876 |
| Keio Corp. | | 12,820 | | | 614,762 |
| Keisei Electric Railway Company, Ltd. | | 16,135 | | | 512,439 |
| Kintetsu Group Holdings Company, Ltd. | | 21,500 | | | 927,362 |
| Knight-Swift Transportation Holdings, Inc. (C) | | 31,496 | | | 1,005,982 |
| Kyushu Railway Company | | 20,100 | | | 608,167 |
| Landstar System, Inc. | | 10,116 | | | 1,021,413 |
| Localiza Rent a Car SA | | 19,945 | | | 220,952 |
| Marten Transport, Ltd. | | 4,918 | | | 96,098 |
| MTR Corp., Ltd. | | 94,868 | | | 542,012 |
| Nagoya Railroad Company, Ltd. | | 23,300 | | | 608,360 |
| Nippon Express Company, Ltd. | | 10,080 | | | 483,434 |
| Norfolk Southern Corp. | | 25,089 | | | 4,574,979 |
| Odakyu Electric Railway Company, Ltd. | | 36,900 | | | 709,143 |
| Old Dominion Freight Line, Inc. | | 6,144 | | | 1,190,707 |
Strategic Equity Allocation Fund (continued)
| | | Shares or
Principal
Amount | | Value |
| COMMON STOCKS (continued) | | | |
| Road and rail (continued) | | | |
| Rumo SA (A) | | 35,600 | | $ | 168,133 |
| Ryder System, Inc. | | 13,661 | | | 519,664 |
| Saia, Inc. (A) | | 3,214 | | | 280,614 |
| Seibu Holdings, Inc. | | 24,500 | | | 347,455 |
| Tobu Railway Company, Ltd. | | 24,000 | | | 715,420 |
| Tokyu Corp. | | 63,293 | | | 969,900 |
| Union Pacific Corp. | | 66,795 | | | 10,674,509 |
| Universal Logistics Holdings, Inc. | | 1,123 | | | 17,305 |
| Werner Enterprises, Inc. | | 16,902 | | | 567,907 |
| West Japan Railway Company | | 20,700 | | | 1,462,209 |
| | | | | | 61,034,563 |
| Trading companies and distributors – 0.5% | | | |
| AerCap Holdings NV (A) | | 15,600 | | | 812,448 |
| Aircastle, Ltd. | | 6,413 | | | 204,254 |
| Applied Industrial Technologies, Inc. | | 4,733 | | | 279,200 |
| Ashtead Group PLC | | 32,525 | | | 1,019,708 |
| Beacon Roofing Supply, Inc. (A) | | 8,439 | | | 250,638 |
| BlueLinx Holdings, Inc. (A) | | 1,225 | | | 14,394 |
| BMC Stock Holdings, Inc. (A) | | 8,205 | | | 201,269 |
| BOC Aviation, Ltd. (B) | | 26,900 | | | 235,181 |
| Brenntag AG | | 20,491 | | | 929,739 |
| Bunzl PLC | | 22,878 | | | 549,350 |
| CAI International, Inc. (A) | | 2,024 | | | 50,074 |
| DXP Enterprises, Inc. (A) | | 2,059 | | | 58,455 |
| EVI Industries, Inc. (A) | | 610 | | | 13,463 |
| Fastenal Company | | 82,859 | | | 2,835,435 |
| Ferguson PLC | | 15,965 | | | 1,391,025 |
| Foundation Building Materials, Inc. (A) | | 2,377 | | | 37,081 |
| GATX Corp. | | 13,294 | | | 950,920 |
| General Finance Corp. (A) | | 1,710 | | | 13,321 |
| GMS, Inc. (A) | | 4,819 | | | 110,114 |
| H&E Equipment Services, Inc. | | 3,982 | | | 94,612 |
| Herc Holdings, Inc. (A) | | 2,964 | | | 108,720 |
| ITOCHU Corp. | | 172,737 | | | 3,914,460 |
| Kaman Corp. | | 3,379 | | | 187,399 |
| Lawson Products, Inc. (A) | | 547 | | | 21,880 |
| Marubeni Corp. | | 201,300 | | | 1,333,229 |
| Mitsubishi Corp. | | 173,200 | | | 4,311,614 |
| Mitsui & Company, Ltd. | | 212,500 | | | 3,509,789 |
| MonotaRO Company, Ltd. | | 15,900 | | | 354,022 |
| MRC Global, Inc. (A) | | 9,827 | | | 85,495 |
| MSC Industrial Direct Company, Inc., Class A | | 11,547 | | | 713,836 |
| NOW, Inc. (A) | | 41,232 | | | 364,079 |
| Posco International Corp. | | 9,898 | | | 122,783 |
| Rush Enterprises, Inc., Class A | | 3,261 | | | 136,701 |
| Rush Enterprises, Inc., Class B | | 666 | | | 27,912 |
| SiteOne Landscape Supply, Inc. (A) | | 5,042 | | | 500,419 |
| Sumitomo Corp. | | 151,955 | | | 2,181,714 |
| Systemax, Inc. | | 1,566 | | | 32,667 |
| Textainer Group Holdings, Ltd. (A) | | 6,448 | | | 53,196 |
| Titan Machinery, Inc. (A) | | 2,464 | | | 24,911 |
| Toyota Tsusho Corp. | | 27,093 | | | 814,149 |
| Transcat, Inc. (A) | | 913 | | | 26,377 |
| Triton International, Ltd. | | 6,692 | | | 230,004 |
| United Rentals, Inc. (A) | | 10,858 | | | 1,438,468 |
| Veritiv Corp. (A) | | 1,725 | | | 20,769 |
| W.W. Grainger, Inc. | | 6,304 | | | 1,749,612 |
| Watsco, Inc. | | 8,369 | | | 1,313,766 |
| Willis Lease Finance Corp. (A) | | 351 | | | 19,902 |
| | | | | | 33,648,554 |
| Transportation infrastructure – 0.2% | | | |
| Aena SME SA (B) | | 8,059 | | | 1,298,041 |
| Aeroports de Paris | | 3,925 | | | 583,455 |
| Airports of Thailand PCL, NVDR | | 231,100 | | | 444,944 |
| The accompanying notes are an integral part of the financial statements. | 68 | |
John Hancock Funds II
Portfolio of Investments — February 29, 2020 (unaudited)(showing percentage of total net assets)
Strategic Equity Allocation Fund (continued)
| | | Shares or
Principal
Amount | | Value |
| COMMON STOCKS (continued) | | | |
| Transportation infrastructure (continued) | | | |
| Atlantia SpA | | 41,478 | | $ | 897,118 |
| Auckland International Airport, Ltd. | | 64,791 | | | 320,109 |
| Bangkok Expressway & Metro PCL, NVDR | | 392,700 | | | 116,740 |
| Beijing Capital International Airport Company, Ltd., H Shares | | 220,211 | | | 173,400 |
| CCR SA | | 41,015 | | | 149,774 |
| China Merchants Port Holdings Company, Ltd. | | 178,031 | | | 264,573 |
| COSCO SHIPPING Ports, Ltd. | | 223,108 | | | 149,911 |
| Fraport AG Frankfurt Airport Services Worldwide | | 5,343 | | | 341,393 |
| Getlink SE | | 57,848 | | | 936,647 |
| Grupo Aeroportuario del Pacifico SAB de CV, B Shares | | 43,100 | | | 466,408 |
| Grupo Aeroportuario del Sureste SAB de CV, B Shares | | 25,420 | | | 423,279 |
| International Container Terminal Services, Inc. | | 126,460 | | | 265,812 |
| Japan Airport Terminal Company, Ltd. | | 6,500 | | | 252,674 |
| Jasa Marga Persero Tbk PT | | 49,254 | | | 16,332 |
| Jiangsu Expressway Company, Ltd., H Shares | | 154,055 | | | 179,432 |
| Kamigumi Company, Ltd. | | 13,600 | | | 262,432 |
| Malaysia Airports Holdings BHD | | 98,422 | | | 154,837 |
| Promotora y Operadora de Infraestructura SAB de CV | | 28,050 | | | 274,814 |
| SATS, Ltd. | | 26,000 | | | 75,909 |
| Shenzhen Expressway Company, Ltd., H Shares | | 90,000 | | | 109,588 |
| Shenzhen International Holdings, Ltd. | | 125,000 | | | 241,739 |
| Sydney Airport | | 156,423 | | | 799,387 |
| Taiwan High Speed Rail Corp. | | 429,632 | | | 484,610 |
| TAV Havalimanlari Holding AS | | 9,004 | | | 29,496 |
| Transurban Group | | 387,847 | | | 3,781,934 |
| Westports Holdings BHD | | 84,700 | | | 69,904 |
| Zhejiang Expressway Company, Ltd., H Shares | | 192,982 | | | 147,039 |
| | | | | | 13,711,731 |
| | | | | | 607,479,546 |
| Information technology – 18.7% | | | | | |
| Communications equipment – 0.7% | | | |
| Acacia Communications, Inc. (A) | | 4,679 | | | 320,558 |
| Accton Technology Corp. | | 113,000 | | | 596,141 |
| ADTRAN, Inc. | | 6,246 | | | 50,249 |
| Applied Optoelectronics, Inc. (A)(C) | | 2,542 | | | 22,700 |
| Arista Networks, Inc. (A) | | 7,682 | | | 1,483,548 |
| BYD Electronic International Company, Ltd. (C) | | 90,300 | | | 174,558 |
| CalAmp Corp. (A) | | 4,288 | | | 41,251 |
| Calix, Inc. (A) | | 6,175 | | | 55,575 |
| Casa Systems, Inc. (A) | | 4,626 | | | 15,173 |
| Ciena Corp. (A) | | 39,656 | | | 1,524,773 |
| Cisco Systems, Inc. | | 600,805 | | | 23,990,144 |
| Clearfield, Inc. (A) | | 1,566 | | | 16,788 |
| Comtech Telecommunications Corp. | | 2,934 | | | 82,211 |
| Digi International, Inc. (A) | | 3,521 | | | 46,618 |
| Extreme Networks, Inc. (A) | | 14,774 | | | 74,313 |
| F5 Networks, Inc. (A) | | 8,610 | | | 1,032,770 |
| Harmonic, Inc. (A) | | 10,866 | | | 66,717 |
| Infinera Corp. (A) | | 22,044 | | | 149,899 |
| Inseego Corp. (A) | | 5,594 | | | 38,822 |
| InterDigital, Inc. | | 11,855 | | | 627,011 |
| Juniper Networks, Inc. | | 47,403 | | | 1,005,892 |
| KMW Company, Ltd. (A) | | 5,113 | | | 212,672 |
Strategic Equity Allocation Fund (continued)
| | | Shares or
Principal
Amount | | Value |
| COMMON STOCKS (continued) | | | |
| Communications equipment (continued) | | | |
| KVH Industries, Inc. (A) | | 2,291 | | $ | 23,872 |
| Lumentum Holdings, Inc. (A) | | 29,311 | | | 2,280,982 |
| Motorola Solutions, Inc. | | 24,265 | | | 4,020,225 |
| NETGEAR, Inc. (A) | | 3,768 | | | 71,102 |
| NetScout Systems, Inc. (A) | | 25,849 | | | 664,319 |
| Nokia OYJ | | 701,104 | | | 2,678,946 |
| Plantronics, Inc. | | 4,231 | | | 58,092 |
| Ribbon Communications, Inc. (A) | | 8,117 | | | 26,218 |
| Telefonaktiebolaget LM Ericsson, B Shares | | 423,970 | | | 3,400,548 |
| ViaSat, Inc. (A) | | 14,784 | | | 850,080 |
| Viavi Solutions, Inc. (A) | | 28,447 | | | 375,216 |
| ZTE Corp., H Shares (A) | | 98,915 | | | 420,687 |
| | | | | | 46,498,670 |
| Electronic equipment, instruments and components – 1.3% | | | |
| AAC Technologies Holdings, Inc. | | 96,100 | | | 641,670 |
| Akoustis Technologies, Inc. (A)(C) | | 3,352 | | | 24,268 |
| Alps Alpine Company, Ltd. | | 26,600 | | | 405,115 |
| Amphenol Corp., Class A | | 41,990 | | | 3,849,643 |
| Anixter International, Inc. (A) | | 3,756 | | | 366,248 |
| Arlo Technologies, Inc. (A) | | 10,151 | | | 33,295 |
| Arrow Electronics, Inc. (A) | | 20,879 | | | 1,400,146 |
| AU Optronics Corp. | | 1,916,851 | | | 593,201 |
| Avnet, Inc. | | 25,882 | | | 794,060 |
| AVX Corp. | | 5,883 | | | 127,896 |
| Badger Meter, Inc. | | 3,551 | | | 213,806 |
| Bel Fuse, Inc., Class B | | 1,380 | | | 15,787 |
| Belden, Inc. | | 14,734 | | | 588,329 |
| Benchmark Electronics, Inc. | | 4,553 | | | 123,751 |
| CDW Corp. | | 20,349 | | | 2,324,263 |
| China Railway Signal & Communication Corp., Ltd., H Shares (B) | | 188,500 | | | 98,379 |
| Cognex Corp. | | 43,809 | | | 1,951,253 |
| Coherent, Inc. (A) | | 6,191 | | | 796,844 |
| Corning, Inc. | | 108,924 | | | 2,598,927 |
| CTS Corp. | | 4,082 | | | 106,418 |
| Daktronics, Inc. | | 4,970 | | | 24,452 |
| Delta Electronics, Inc. | | 436,898 | | | 1,980,707 |
| ePlus, Inc. (A) | | 1,669 | | | 126,443 |
| Fabrinet (A) | | 4,512 | | | 248,701 |
| FARO Technologies, Inc. (A) | | 2,182 | | | 124,898 |
| Fitbit, Inc., Class A (A)(C) | | 28,073 | | | 179,386 |
| FLIR Systems, Inc. | | 18,999 | | | 806,888 |
| Foxconn Technology Company, Ltd. | | 206,180 | | | 400,250 |
| Halma PLC | | 26,374 | | | 662,801 |
| Hamamatsu Photonics KK | | 17,800 | | | 694,342 |
| Hexagon AB, B Shares | | 36,351 | | | 1,958,196 |
| Hirose Electric Company, Ltd. | | 4,130 | | | 437,508 |
| Hitachi High-Tech Corp. | | 8,900 | | | 661,048 |
| Hitachi, Ltd. | | 124,100 | | | 4,144,439 |
| Hon Hai Precision Industry Company, Ltd. | | 2,796,172 | | | 7,296,496 |
| II-VI, Inc. (A) | | 33,431 | | | 992,566 |
| Ingenico Group SA | | 8,145 | | | 1,160,901 |
| Innolux Corp. | | 1,889,300 | | | 487,069 |
| Insight Enterprises, Inc. (A) | | 4,312 | | | 237,548 |
| IPG Photonics Corp. (A) | | 5,036 | | | 642,795 |
| Iteris, Inc. (A) | | 5,538 | | | 26,749 |
| Itron, Inc. (A) | | 4,234 | | | 321,107 |
| Jabil, Inc. | | 35,611 | | | 1,141,333 |
| KEMET Corp. | | 6,988 | | | 182,247 |
| Keyence Corp. | | 23,406 | | | 7,473,662 |
| Keysight Technologies, Inc. (A) | | 26,565 | | | 2,517,299 |
| Kimball Electronics, Inc. (A) | | 3,103 | | | 42,046 |
| Kingboard Holdings, Ltd. | | 87,100 | | | 233,429 |
| Kingboard Laminates Holdings, Ltd. | | 144,000 | | | 147,253 |
| Knowles Corp. (A) | | 9,995 | | | 166,117 |
| The accompanying notes are an integral part of the financial statements. | 69 | |
John Hancock Funds II
Portfolio of Investments — February 29, 2020 (unaudited)(showing percentage of total net assets)
Strategic Equity Allocation Fund (continued)
| | | Shares or
Principal
Amount | | Value |
| COMMON STOCKS (continued) | | | |
Electronic equipment, instruments and
components (continued) | | | |
| Kyocera Corp. | | 41,400 | | $ | 2,589,859 |
| Largan Precision Company, Ltd. | | 22,590 | | | 3,195,365 |
| LG Display Company, Ltd. | | 45,894 | | | 521,840 |
| LG Innotek Company, Ltd. | | 2,837 | | | 306,937 |
| Littelfuse, Inc. | | 6,244 | | | 997,042 |
| Methode Electronics, Inc. | | 4,535 | | | 139,043 |
| MTS Systems Corp. | | 2,278 | | | 91,439 |
| Murata Manufacturing Company, Ltd. | | 73,597 | | | 3,855,533 |
| Napco Security Technologies, Inc. (A) | | 1,415 | | | 28,781 |
| National Instruments Corp. | | 30,237 | | | 1,217,946 |
| nLight, Inc. (A) | | 4,171 | | | 68,863 |
| Novanta, Inc. (A) | | 4,163 | | | 371,381 |
| Omron Corp. | | 24,867 | | | 1,331,459 |
| OSI Systems, Inc. (A) | | 2,065 | | | 167,823 |
| PAR Technology Corp. (A) | | 1,357 | | | 35,947 |
| PC Connection, Inc. | | 1,403 | | | 57,060 |
| Plexus Corp. (A) | | 3,559 | | | 236,140 |
| Rogers Corp. (A) | | 2,288 | | | 265,408 |
| Samsung Electro-Mechanics Company, Ltd. | | 11,057 | | | 1,168,047 |
| Samsung SDI Company, Ltd. | | 10,831 | | | 2,632,678 |
| Sanmina Corp. (A) | | 8,430 | | | 221,625 |
| ScanSource, Inc. (A) | | 3,169 | | | 90,095 |
| Shimadzu Corp. | | 28,600 | | | 691,945 |
| Sunny Optical Technology Group Company, Ltd. | | 94,450 | | | 1,534,569 |
| SYNNEX Corp. | | 10,474 | | | 1,309,564 |
| Synnex Technology International Corp. | | 290,544 | | | 357,335 |
| TDK Corp. | | 16,600 | | | 1,582,292 |
| TE Connectivity, Ltd. | | 47,370 | | | 3,925,552 |
| Tech Data Corp. (A) | | 13,451 | | | 1,915,288 |
| Trimble, Inc. (A) | | 63,865 | | | 2,521,390 |
| TTM Technologies, Inc. (A) | | 12,393 | | | 160,985 |
| Venture Corp., Ltd. | | 11,400 | | | 137,396 |
| Vishay Intertechnology, Inc. | | 50,313 | | | 940,853 |
| Vishay Precision Group, Inc. (A) | | 1,303 | | | 35,793 |
| Walsin Technology Corp. | | 71,000 | | | 485,833 |
| WPG Holdings, Ltd. | | 327,360 | | | 415,845 |
| Yageo Corp. | | 57,726 | | | 745,533 |
| Yokogawa Electric Corp. | | 29,200 | | | 474,252 |
| Zebra Technologies Corp., Class A (A) | | 7,637 | | | 1,611,178 |
| Zhen Ding Technology Holding, Ltd. | | 120,817 | | | 454,501 |
| | | | | | 91,462,390 |
| IT services – 4.2% | | | |
| Accenture PLC, Class A | | 111,224 | | | 20,085,942 |
| Adyen NV (A)(B) | | 1,296 | | | 1,140,668 |
| Akamai Technologies, Inc. (A) | | 28,302 | | | 2,448,406 |
| Alliance Data Systems Corp. | | 7,179 | | | 616,533 |
| Amadeus IT Group SA | | 51,713 | | | 3,665,990 |
| Atos SE | | 13,128 | | | 987,717 |
| Automatic Data Processing, Inc. | | 75,782 | | | 11,726,507 |
| Brightcove, Inc. (A) | | 4,967 | | | 38,643 |
| Broadridge Financial Solutions, Inc. | | 20,079 | | | 2,095,444 |
| CACI International, Inc., Class A (A) | | 6,419 | | | 1,572,783 |
| Capgemini SE | | 21,327 | | | 2,363,399 |
| Cardtronics PLC, Class A (A) | | 4,577 | | | 166,008 |
| Cass Information Systems, Inc. | | 1,753 | | | 82,303 |
| CGI, Inc. (A) | | 38,369 | | | 2,695,906 |
| Cielo SA | | 41,124 | | | 62,993 |
| Cognizant Technology Solutions Corp., Class A | | 95,900 | | | 5,843,187 |
| Computershare, Ltd. | | 70,228 | | | 711,756 |
| Conduent, Inc. (A) | | 21,551 | | | 70,472 |
| CoreLogic, Inc. | | 20,385 | | | 924,867 |
Strategic Equity Allocation Fund (continued)
| | | Shares or
Principal
Amount | | Value |
| COMMON STOCKS (continued) | | | |
| IT services (continued) | | | |
| CSG Systems International, Inc. | | 4,095 | | $ | 181,204 |
| DXC Technology Company | | 44,834 | | | 1,080,948 |
| Edenred | | 32,453 | | | 1,698,848 |
| Endurance International Group Holdings, Inc. (A) | | 9,479 | | | 35,357 |
| EVERTEC, Inc. | | 7,475 | | | 221,858 |
| Evo Payments, Inc., Class A (A) | | 4,424 | | | 111,839 |
| ExlService Holdings, Inc. (A) | | 4,139 | | | 308,976 |
| Fidelity National Information Services, Inc. | | 107,833 | | | 15,066,427 |
| Fiserv, Inc. (A) | | 100,024 | | | 10,938,625 |
| FleetCor Technologies, Inc. (A) | | 15,199 | | | 4,039,742 |
| Fujitsu, Ltd. | | 25,100 | | | 2,617,332 |
| Gartner, Inc. (A) | | 15,667 | | | 2,027,153 |
| GDS Holdings, Ltd., ADR (A) | | 8,300 | | | 481,151 |
| Global Payments, Inc. | | 52,637 | | | 9,683,629 |
| GMO Payment Gateway, Inc. | | 5,200 | | | 322,648 |
| GTT Communications, Inc. (A)(C) | | 4,320 | | | 65,405 |
| I3 Verticals, Inc., Class A (A) | | 1,843 | | | 53,410 |
| IBM Corp. | | 155,109 | | | 20,187,436 |
| International Money Express, Inc. (A) | | 2,245 | | | 21,148 |
| Itochu Techno-Solutions Corp. | | 11,900 | | | 333,311 |
| Jack Henry & Associates, Inc. | | 13,475 | | | 2,044,697 |
| KBR, Inc. | | 53,787 | | | 1,396,311 |
| Leidos Holdings, Inc. | | 23,306 | | | 2,392,361 |
| Limelight Networks, Inc. (A) | | 14,289 | | | 72,088 |
| LiveRamp Holdings, Inc. (A) | | 25,652 | | | 909,107 |
| ManTech International Corp., Class A | | 3,290 | | | 246,421 |
| Mastercard, Inc., Class A | | 155,475 | | | 45,126,619 |
| MAXIMUS, Inc. | | 24,214 | | | 1,525,966 |
| NEC Corp. | | 31,600 | | | 1,186,347 |
| NIC, Inc. | | 8,176 | | | 149,539 |
| Nomura Research Institute, Ltd. | | 43,300 | | | 950,625 |
| NTT Data Corp. | | 80,600 | | | 961,261 |
| Obic Company, Ltd. | | 8,300 | | | 1,024,768 |
| Otsuka Corp. | | 13,300 | | | 574,479 |
| Paychex, Inc. | | 55,794 | | | 4,322,919 |
| PayPal Holdings, Inc. (A) | | 205,646 | | | 22,207,712 |
| Paysign, Inc. (A)(C) | | 3,753 | | | 30,137 |
| Perficient, Inc. (A) | | 3,946 | | | 161,668 |
| Perspecta, Inc. | | 52,539 | | | 1,311,899 |
| Sabre Corp. | | 70,210 | | | 955,909 |
| Samsung SDS Company, Ltd. | | 6,880 | | | 952,011 |
| Science Applications International Corp. | | 19,713 | | | 1,579,603 |
| Shopify, Inc., Class A (A) | | 15,542 | | | 7,216,305 |
| StarTek, Inc. (A) | | 2,366 | | | 14,740 |
| Sykes Enterprises, Inc. (A) | | 4,715 | | | 149,371 |
| The Hackett Group, Inc. | | 3,101 | | | 47,755 |
| The Western Union Company | | 73,428 | | | 1,644,053 |
| TravelSky Technology, Ltd., H Shares | | 121,900 | | | 241,338 |
| TTEC Holdings, Inc. | | 1,800 | | | 67,374 |
| Tucows, Inc., Class A (A)(C) | | 1,173 | | | 59,929 |
| Unisys Corp. (A) | | 6,358 | | | 98,740 |
| VeriSign, Inc. (A) | | 18,095 | | | 3,433,526 |
| Verra Mobility Corp. (A)(C) | | 15,289 | | | 231,552 |
| Virtusa Corp. (A) | | 3,593 | | | 158,487 |
| Visa, Inc., Class A | | 299,808 | | | 54,493,102 |
| WEX, Inc. (A) | | 11,097 | | | 2,077,802 |
| Wirecard AG (C) | | 15,617 | | | 2,011,648 |
| Wix.com, Ltd. (A) | | 5,400 | | | 723,762 |
| Worldline SA (A)(B) | | 13,465 | | | 1,038,709 |
| | | | | | 290,566,611 |
| Semiconductors and semiconductor equipment – 4.2% | | | |
| Adesto Technologies Corp. (A) | | 3,548 | | | 43,498 |
| Advanced Energy Industries, Inc. (A) | | 4,703 | | | 279,711 |
| Advanced Micro Devices, Inc. (A) | | 163,086 | | | 7,417,151 |
| The accompanying notes are an integral part of the financial statements. | 70 | |
John Hancock Funds II
Portfolio of Investments — February 29, 2020 (unaudited)(showing percentage of total net assets)
Strategic Equity Allocation Fund (continued)
| | | Shares or
Principal
Amount | | Value |
| COMMON STOCKS (continued) | | | |
| Semiconductors and semiconductor equipment (continued) | | | |
| Advantest Corp. | | 25,500 | | $ | 1,173,266 |
| Alpha & Omega Semiconductor, Ltd. (A) | | 2,620 | | | 28,401 |
| Ambarella, Inc. (A) | | 3,917 | | | 232,866 |
| Amkor Technology, Inc. (A) | | 12,257 | | | 127,902 |
| Analog Devices, Inc. | | 51,353 | | | 5,600,045 |
| Applied Materials, Inc. | | 128,799 | | | 7,485,798 |
| ASE Technology Holding Company, Ltd. | | 774,422 | | | 1,795,812 |
| ASM Pacific Technology, Ltd. | | 18,900 | | | 228,564 |
| ASML Holding NV | | 53,140 | | | 14,735,356 |
| Axcelis Technologies, Inc. (A) | | 4,058 | | | 97,351 |
| AXT, Inc. (A) | | 5,594 | | | 19,467 |
| Broadcom, Inc. | | 55,308 | | | 15,078,067 |
| Brooks Automation, Inc. | | 8,780 | | | 302,998 |
| Cabot Microelectronics Corp. | | 11,039 | | | 1,537,512 |
| CEVA, Inc. (A) | | 2,778 | | | 78,923 |
| Cirrus Logic, Inc. (A) | | 22,008 | | | 1,510,629 |
| Cohu, Inc. | | 5,085 | | | 104,090 |
| Cree, Inc. (A) | | 27,611 | | | 1,235,040 |
| Cypress Semiconductor Corp. | | 94,674 | | | 2,186,023 |
| Diodes, Inc. (A) | | 5,058 | | | 222,603 |
| Disco Corp. | | 3,500 | | | 709,588 |
| DSP Group, Inc. (A) | | 2,806 | | | 38,190 |
| Enphase Energy, Inc. (A) | | 11,342 | | | 555,418 |
| First Solar, Inc. (A) | | 19,455 | | | 890,455 |
| FormFactor, Inc. (A) | | 9,265 | | | 207,258 |
| Globalwafers Company, Ltd. | | 49,000 | | | 634,078 |
| Hua Hong Semiconductor, Ltd. (B) | | 60,100 | | | 134,478 |
| Ichor Holdings, Ltd. (A) | | 2,737 | | | 79,154 |
| Impinj, Inc. (A) | | 2,090 | | | 64,268 |
| Infineon Technologies AG | | 166,917 | | | 3,562,612 |
| Inphi Corp. (A) | | 5,555 | | | 414,736 |
| Intel Corp. | | 606,522 | | | 33,674,101 |
| KLA Corp. | | 22,001 | | | 3,381,774 |
| Lam Research Corp. | | 20,228 | | | 5,935,502 |
| Lattice Semiconductor Corp. (A) | | 15,499 | | | 278,207 |
| MACOM Technology Solutions Holdings, Inc. (A) | | 5,759 | | | 145,530 |
| Maxim Integrated Products, Inc. | | 37,731 | | | 2,098,598 |
| MaxLinear, Inc. (A) | | 8,152 | | | 126,030 |
| MediaTek, Inc. | | 338,752 | | | 3,938,107 |
| Microchip Technology, Inc. | | 33,321 | | | 3,022,548 |
| Micron Technology, Inc. (A) | | 154,356 | | | 8,112,951 |
| MKS Instruments, Inc. | | 13,974 | | | 1,400,055 |
| Monolithic Power Systems, Inc. | | 10,356 | | | 1,642,876 |
| Nanya Technology Corp. | | 272,196 | | | 677,542 |
| NeoPhotonics Corp. (A) | | 4,936 | | | 32,627 |
| Novatek Microelectronics Corp. | | 129,900 | | | 817,507 |
| NVE Corp. | | 606 | | | 38,342 |
| NVIDIA Corp. | | 85,331 | | | 23,045,343 |
| NXP Semiconductors NV | | 34,800 | | | 3,956,412 |
| Onto Innovation, Inc. (A) | | 5,986 | | | 182,992 |
| PDF Solutions, Inc. (A) | | 3,539 | | | 51,811 |
| Phison Electronics Corp. | | 33,884 | | | 361,985 |
| Photronics, Inc. (A) | | 8,097 | | | 100,808 |
| Power Integrations, Inc. | | 3,488 | | | 303,630 |
| Powertech Technology, Inc. | | 167,199 | | | 546,906 |
| Qorvo, Inc. (A) | | 16,198 | | | 1,629,195 |
| QUALCOMM, Inc. | | 159,208 | | | 12,465,986 |
| Rambus, Inc. (A) | | 13,703 | | | 191,568 |
| Realtek Semiconductor Corp. | | 108,584 | | | 785,711 |
| Renesas Electronics Corp. (A) | | 98,600 | | | 600,490 |
| Rohm Company, Ltd. | | 12,000 | | | 784,274 |
| Semiconductor Manufacturing International Corp. (A)(C) | | 400,899 | | | 792,321 |
| Semtech Corp. (A) | | 25,151 | | | 993,213 |
Strategic Equity Allocation Fund (continued)
| | | Shares or
Principal
Amount | | Value |
| COMMON STOCKS (continued) | | | |
| Semiconductors and semiconductor equipment (continued) | | | |
| Silicon Laboratories, Inc. (A) | | 16,430 | | $ | 1,457,012 |
| SK Hynix, Inc. | | 107,414 | | | 7,936,882 |
| Skyworks Solutions, Inc. | | 23,755 | | | 2,379,776 |
| SMART Global Holdings, Inc. (A) | | 1,660 | | | 44,554 |
| SolarEdge Technologies, Inc. (A) | | 12,461 | | | 1,554,136 |
| STMicroelectronics NV | | 91,947 | | | 2,537,716 |
| SUMCO Corp. | | 32,100 | | | 486,057 |
| SunPower Corp. (A)(C) | | 7,986 | | | 68,440 |
| Synaptics, Inc. (A) | | 12,731 | | | 840,883 |
| Taiwan Semiconductor Manufacturing Company, Ltd. | | 5,513,915 | | | 56,847,336 |
| Teradyne, Inc. | | 42,958 | | | 2,524,212 |
| Texas Instruments, Inc. | | 130,336 | | | 14,876,551 |
| Tokyo Electron, Ltd. | | 20,115 | | | 4,202,256 |
| Ultra Clean Holdings, Inc. (A) | | 4,862 | | | 101,664 |
| United Microelectronics Corp. | | 2,495,774 | | | 1,245,237 |
| Universal Display Corp. | | 10,869 | | | 1,725,889 |
| Vanguard International Semiconductor Corp. | | 202,302 | | | 482,496 |
| Veeco Instruments, Inc. (A) | | 6,125 | | | 82,014 |
| Win Semiconductors Corp. | | 76,000 | | | 663,351 |
| Winbond Electronics Corp. | | 669,000 | | | 341,161 |
| Xilinx, Inc. | | 35,062 | | | 2,927,326 |
| Xinyi Solar Holdings, Ltd. | | 423,000 | | | 340,256 |
| Xperi Corp. | | 6,089 | | | 104,670 |
| | | | | | 284,696,125 |
| Software – 4.8% | | | |
| 8x8, Inc. (A) | | 11,673 | | | 215,951 |
| A10 Networks, Inc. (A) | | 6,640 | | | 44,554 |
| ACI Worldwide, Inc. (A) | | 43,863 | | | 1,222,462 |
| Adobe, Inc. (A) | | 67,428 | | | 23,270,751 |
| Agilysys, Inc. (A) | | 2,559 | | | 82,221 |
| Alarm.com Holdings, Inc. (A) | | 4,601 | | | 221,998 |
| Altair Engineering, Inc., Class A (A) | | 4,930 | | | 171,564 |
| American Software, Inc., Class A | | 3,565 | | | 58,644 |
| ANSYS, Inc. (A) | | 11,921 | | | 2,887,147 |
| Appfolio, Inc., Class A (A) | | 1,956 | | | 240,529 |
| Appian Corp. (A)(C) | | 4,190 | | | 184,989 |
| Autodesk, Inc. (A) | | 30,649 | | | 5,850,281 |
| Avaya Holdings Corp. (A) | | 13,852 | | | 179,522 |
| AVEVA Group PLC | | 4,418 | | | 251,325 |
| Benefitfocus, Inc. (A) | | 3,799 | | | 47,412 |
| Blackbaud, Inc. | | 18,651 | | | 1,264,538 |
| BlackBerry, Ltd. (A) | | 82,822 | | | 427,608 |
| Blackline, Inc. (A) | | 5,327 | | | 333,310 |
| Bottomline Technologies DE, Inc. (A) | | 5,366 | | | 237,606 |
| Box, Inc., Class A (A) | | 17,838 | | | 298,787 |
| Cadence Design Systems, Inc. (A) | | 39,084 | | | 2,585,016 |
| CDK Global, Inc. | | 31,120 | | | 1,432,142 |
| Ceridian HCM Holding, Inc. (A) | | 25,836 | | | 1,827,380 |
| ChannelAdvisor Corp. (A) | | 3,525 | | | 33,558 |
| Check Point Software Technologies, Ltd. (A) | | 14,200 | | | 1,473,960 |
| Citrix Systems, Inc. | | 17,050 | | | 1,762,800 |
| Cloudera, Inc. (A)(C) | | 29,729 | | | 264,588 |
| CommVault Systems, Inc. (A) | | 15,827 | | | 659,986 |
| Constellation Software, Inc. | | 3,138 | | | 3,196,867 |
| Cornerstone OnDemand, Inc. (A) | | 7,056 | | | 289,508 |
| CyberArk Software, Ltd. (A) | | 4,300 | | | 450,210 |
| Dassault Systemes SE | | 17,616 | | | 2,795,014 |
| Digimarc Corp. (A)(C) | | 1,491 | | | 29,820 |
| Digital Turbine, Inc. (A) | | 9,690 | | | 59,400 |
| Domo, Inc., Class B (A) | | 2,250 | | | 47,453 |
| Ebix, Inc. (C) | | 2,885 | | | 76,279 |
| eGain Corp. (A) | | 2,794 | | | 22,576 |
| The accompanying notes are an integral part of the financial statements. | 71 | |
John Hancock Funds II
Portfolio of Investments — February 29, 2020 (unaudited)(showing percentage of total net assets)
Strategic Equity Allocation Fund (continued)
| | | Shares or
Principal
Amount | | Value |
| COMMON STOCKS (continued) | | | |
| Software (continued) | | | |
| Envestnet, Inc. (A) | | 5,949 | | $ | 449,031 |
| Everbridge, Inc. (A) | | 4,109 | | | 434,157 |
| Fair Isaac Corp. (A) | | 7,424 | | | 2,791,647 |
| Five9, Inc. (A) | | 7,396 | | | 540,130 |
| ForeScout Technologies, Inc. (A) | | 5,234 | | | 170,314 |
| Fortinet, Inc. (A) | | 19,774 | | | 2,018,134 |
| GTY Technology Holdings, Inc. (A)(C) | | 5,305 | | | 28,541 |
| Instructure, Inc. (A) | | 4,230 | | | 206,255 |
| Intelligent Systems Corp. (A) | | 845 | | | 30,986 |
| Intuit, Inc. | | 36,258 | | | 9,639,189 |
| j2 Global, Inc. | | 17,620 | | | 1,538,755 |
| Kingdee International Software Group Company, Ltd. | | 304,800 | | | 400,688 |
| Kingsoft Corp., Ltd. (A) | | 109,000 | | | 360,461 |
| LivePerson, Inc. (A) | | 7,668 | | | 202,895 |
| LogMeIn, Inc. | | 12,514 | | | 1,066,631 |
| Manhattan Associates, Inc. (A) | | 16,381 | | | 1,103,424 |
| Micro Focus International PLC | | 23,488 | | | 223,693 |
| Microsoft Corp. | | 1,062,625 | | | 172,155,876 |
| MicroStrategy, Inc., Class A (A) | | 1,022 | | | 138,134 |
| Mitek Systems, Inc. (A) | | 4,812 | | | 41,913 |
| MobileIron, Inc. (A) | | 12,615 | | | 51,091 |
| Model N, Inc. (A) | | 4,015 | | | 116,435 |
| Nice, Ltd. (A) | | 7,204 | | | 1,178,335 |
| NortonLifeLock, Inc. | | 79,868 | | | 1,519,888 |
| OneSpan, Inc. (A) | | 4,178 | | | 68,979 |
| Open Text Corp. (C) | | 42,782 | | | 1,791,282 |
| Oracle Corp. | | 301,769 | | | 14,925,495 |
| Oracle Corp. Japan | | 4,800 | | | 374,144 |
| Paycom Software, Inc. (A) | | 6,833 | | | 1,931,347 |
| Ping Identity Holding Corp. (A) | | 1,626 | | | 37,626 |
| Progress Software Corp. | | 5,534 | | | 206,363 |
| PROS Holdings, Inc. (A) | | 4,084 | | | 187,006 |
| PTC, Inc. (A) | | 26,646 | | | 2,013,105 |
| Q2 Holdings, Inc. (A)(C) | | 5,368 | | | 404,586 |
| QAD, Inc., Class A | | 1,372 | | | 67,297 |
| Qualys, Inc. (A) | | 4,169 | | | 334,270 |
| Rapid7, Inc. (A) | | 6,077 | | | 281,365 |
| Rosetta Stone, Inc. (A) | | 2,586 | | | 44,660 |
| SailPoint Technologies Holding, Inc. (A) | | 10,675 | | | 270,291 |
| salesforce.com, Inc. (A) | | 123,551 | | | 21,053,090 |
| SAP SE | | 131,027 | | | 16,357,731 |
| SecureWorks Corp., Class A (A) | | 1,186 | | | 16,474 |
| ServiceNow, Inc. (A) | | 26,270 | | | 8,566,384 |
| SharpSpring, Inc. (A) | | 1,467 | | | 16,724 |
| ShotSpotter, Inc. (A) | | 1,093 | | | 38,911 |
| SPS Commerce, Inc. (A) | | 4,355 | | | 229,073 |
| SVMK, Inc. (A) | | 10,756 | | | 196,082 |
| Synchronoss Technologies, Inc. (A) | | 5,215 | | | 25,658 |
| Synopsys, Inc. (A) | | 20,940 | | | 2,888,254 |
| Telaria, Inc. (A) | | 5,488 | | | 67,063 |
| Telenav, Inc. (A) | | 4,439 | | | 26,479 |
| Temenos AG (A) | | 8,793 | | | 1,257,198 |
| Tenable Holdings, Inc. (A) | | 4,689 | | | 114,974 |
| Teradata Corp. (A) | | 28,839 | | | 575,050 |
| The Sage Group PLC | | 74,477 | | | 659,805 |
| TiVo Corp. | | 15,553 | | | 117,736 |
| Trend Micro, Inc. | | 16,000 | | | 794,036 |
| Tyler Technologies, Inc. (A) | | 9,994 | | | 3,131,620 |
| Upland Software, Inc. (A) | | 2,831 | | | 110,154 |
| Varonis Systems, Inc. (A) | | 3,662 | | | 293,766 |
| Verint Systems, Inc. (A) | | 8,147 | | | 447,107 |
| VirnetX Holding Corp. (A) | | 8,029 | | | 45,043 |
| WiseTech Global, Ltd. (C) | | 20,523 | | | 206,930 |
| Workiva, Inc. (A) | | 4,587 | | | 196,048 |
Strategic Equity Allocation Fund (continued)
| | | Shares or
Principal
Amount | | Value |
| COMMON STOCKS (continued) | | | |
| Software (continued) | | | |
| Yext, Inc. (A)(C) | | 11,707 | | $ | 177,478 |
| Zix Corp. (A) | | 6,922 | | | 54,545 |
| Zuora, Inc., Class A (A) | | 10,938 | | | 144,819 |
| | | | | | 331,650,407 |
| Technology hardware, storage and peripherals – 3.5% | | | |
| 3D Systems Corp. (A)(C) | | 14,528 | | | 133,076 |
| Acer, Inc. | | 651,008 | | | 344,380 |
| Advantech Company, Ltd. | | 77,764 | | | 744,027 |
| Apple, Inc. | | 591,515 | | | 161,696,540 |
| Asustek Computer, Inc. | | 159,354 | | | 1,066,051 |
| Avid Technology, Inc. (A) | | 3,677 | | | 27,173 |
| Brother Industries, Ltd. | | 28,800 | | | 510,136 |
| Canon, Inc. | | 127,896 | | | 3,218,795 |
| Catcher Technology Company, Ltd. | | 146,475 | | | 1,098,865 |
| Chicony Electronics Company, Ltd. | | 129,224 | | | 350,150 |
| Compal Electronics, Inc. | | 918,148 | | | 553,549 |
| Diebold Nixdorf, Inc. (A) | | 9,635 | | | 67,638 |
| FUJIFILM Holdings Corp. | | 46,315 | | | 2,249,165 |
| Hewlett Packard Enterprise Company | | 183,262 | | | 2,343,921 |
| HP, Inc. | | 209,874 | | | 4,363,280 |
| Immersion Corp. (A) | | 4,176 | | | 29,190 |
| Inventec Corp. | | 555,495 | | | 416,223 |
| Konica Minolta, Inc. | | 57,600 | | | 315,191 |
| Legend Holdings Corp., H Shares (B) | | 49,400 | | | 85,557 |
| Lenovo Group, Ltd. | | 949,764 | | | 597,715 |
| Lite-On Technology Corp. | | 469,018 | | | 667,735 |
| Micro-Star International Company, Ltd. | | 151,300 | | | 442,871 |
| NCR Corp. (A) | | 32,710 | | | 824,292 |
| NetApp, Inc. | | 32,322 | | | 1,510,084 |
| Pegatron Corp. | | 438,500 | | | 892,213 |
| Quanta Computer, Inc. | | 603,000 | | | 1,216,316 |
| Ricoh Company, Ltd. | | 85,900 | | | 802,177 |
| Samsung Electronics Company, Ltd. | | 938,651 | | | 42,249,947 |
| Seagate Technology PLC | | 32,742 | | | 1,569,979 |
| Seiko Epson Corp. | | 35,969 | | | 504,274 |
| Stratasys, Ltd. (A)(C) | | 6,456 | | | 103,296 |
| Western Digital Corp. | | 42,120 | | | 2,340,187 |
| Wistron Corp. | | 632,580 | | | 555,063 |
| Wiwynn Corp. | | 17,000 | | | 397,016 |
| Xerox Holdings Corp. | | 26,331 | | | 847,858 |
| Xiaomi Corp., Class B (A)(B) | | 1,028,300 | | | 1,686,976 |
| | | | | | 236,820,906 |
| | | | | | 1,281,695,109 |
| Materials – 4.2% | | | | | |
| Chemicals – 2.3% | | | |
| A. Schulman, Inc. (A)(D) | | 3,214 | | | 1,392 |
| Advanced Emissions Solutions, Inc. | | 2,161 | | | 19,211 |
| AdvanSix, Inc. (A) | | 3,540 | | | 51,436 |
| Air Liquide SA | | 63,200 | | | 8,608,671 |
| Air Products & Chemicals, Inc. | | 33,403 | | | 7,335,633 |
| Air Water, Inc. | | 23,300 | | | 309,099 |
| Akzo Nobel NV | | 28,368 | | | 2,269,736 |
| Albemarle Corp. (C) | | 16,067 | | | 1,315,084 |
| American Vanguard Corp. | | 3,695 | | | 56,349 |
| Amyris, Inc. (A)(C) | | 7,739 | | | 24,649 |
| Arkema SA | | 9,348 | | | 884,316 |
| Asahi Kasei Corp. | | 162,400 | | | 1,330,050 |
| Ashland Global Holdings, Inc. | | 15,439 | | | 1,104,506 |
| Balchem Corp. | | 3,994 | | | 377,273 |
| Barito Pacific Tbk PT (A) | | 683,900 | | | 47,404 |
| BASF SE | | 122,438 | | | 7,246,392 |
| Cabot Corp. | | 14,606 | | | 545,972 |
| Celanese Corp. | | 18,317 | | | 1,717,036 |
| CF Industries Holdings, Inc. | | 32,949 | | | 1,214,500 |
| The accompanying notes are an integral part of the financial statements. | 72 | |
John Hancock Funds II
Portfolio of Investments — February 29, 2020 (unaudited)(showing percentage of total net assets)
Strategic Equity Allocation Fund (continued)
| | | Shares or
Principal
Amount | | Value |
| COMMON STOCKS (continued) | | | |
| Chemicals (continued) | | | |
| Chase Corp. | | 903 | | $ | 80,177 |
| Chr. Hansen Holding A/S | | 19,527 | | | 1,407,772 |
| Clariant AG (A) | | 26,688 | | | 566,058 |
| Corteva, Inc. | | 113,408 | | | 3,084,698 |
| Covestro AG (B) | | 23,271 | | | 901,695 |
| Croda International PLC | | 8,738 | | | 516,498 |
| Daicel Corp. | | 32,000 | | | 274,881 |
| Dow, Inc. | | 112,361 | | | 4,540,508 |
| DuPont de Nemours, Inc. | | 112,257 | | | 4,815,825 |
| Eastman Chemical Company | | 20,606 | | | 1,267,475 |
| Ecolab, Inc. | | 38,000 | | | 6,857,100 |
| EMS-Chemie Holding AG | | 1,080 | | | 633,980 |
| Evonik Industries AG | | 28,029 | | | 701,554 |
| Ferro Corp. (A) | | 10,233 | | | 118,907 |
| Flotek Industries, Inc. (A) | | 7,962 | | | 12,580 |
| FMC Corp. | | 19,641 | | | 1,828,577 |
| Formosa Chemicals & Fibre Corp. | | 786,471 | | | 2,111,626 |
| Formosa Plastics Corp. | | 1,000,040 | | | 2,985,353 |
| FutureFuel Corp. | | 3,473 | | | 35,320 |
| GCP Applied Technologies, Inc. (A) | | 6,790 | | | 132,201 |
| Givaudan SA | | 1,239 | | | 3,860,012 |
| Hawkins, Inc. | | 1,257 | | | 44,938 |
| HB Fuller Company | | 6,275 | | | 246,168 |
| Hitachi Chemical Company, Ltd. | | 13,400 | | | 567,470 |
| Incitec Pivot, Ltd. | | 230,887 | | | 415,815 |
| Indorama Ventures PCL, NVDR (C) | | 92,400 | | | 78,470 |
| Ingevity Corp. (A) | | 15,919 | | | 716,992 |
| Innospec, Inc. | | 2,986 | | | 258,408 |
| International Flavors & Fragrances, Inc. (C) | | 16,180 | | | 1,938,040 |
| Intrepid Potash, Inc. (A) | | 12,739 | | | 22,548 |
| Israel Chemicals, Ltd. | | 84,458 | | | 307,207 |
| Johnson Matthey PLC | | 13,719 | | | 449,667 |
| JSR Corp. | | 24,900 | | | 432,889 |
| Kaneka Corp. | | 500 | | | 13,398 |
| Kansai Paint Company, Ltd. | | 22,600 | | | 490,378 |
| KCC Corp. | | 969 | | | 132,376 |
| Koninklijke DSM NV | | 22,614 | | | 2,550,685 |
| Koppers Holdings, Inc. (A) | | 2,348 | | | 51,327 |
| Kraton Corp. (A) | | 3,929 | | | 39,761 |
| Kronos Worldwide, Inc. | | 2,924 | | | 29,211 |
| Kumho Petrochemical Company, Ltd. | | 3,700 | | | 183,019 |
| Kuraray Company, Ltd. | | 41,000 | | | 426,328 |
| LANXESS AG | | 11,219 | | | 597,294 |
| LG Chem, Ltd. | | 9,048 | | | 2,741,280 |
| Linde PLC | | 81,400 | | | 15,548,214 |
| Livent Corp. (A) | | 18,534 | | | 165,509 |
| Lotte Chemical Corp. | | 3,402 | | | 531,988 |
| LyondellBasell Industries NV, Class A | | 38,903 | | | 2,780,008 |
| Methanex Corp. | | 10,825 | | | 311,625 |
| Minerals Technologies, Inc. | | 13,261 | | | 595,021 |
| Mitsubishi Chemical Holdings Corp. | | 164,550 | | | 1,100,078 |
| Mitsubishi Gas Chemical Company, Inc. | | 20,800 | | | 311,215 |
| Mitsui Chemicals, Inc. | | 24,000 | | | 516,660 |
| Nan Ya Plastics Corp. | | 1,148,610 | | | 2,566,186 |
| NewMarket Corp. | | 1,893 | | | 735,601 |
| Nippon Paint Holdings Company, Ltd. | | 18,700 | | | 845,909 |
| Nissan Chemical Corp. | | 15,900 | | | 667,783 |
| Nitto Denko Corp. | | 20,444 | | | 1,016,547 |
| Novozymes A/S, B Shares | | 39,682 | | | 2,034,319 |
| Nutrien, Ltd. | | 89,885 | | | 3,632,901 |
| OCI Company, Ltd. (A) | | 3,835 | | | 157,400 |
| Olin Corp. | | 40,932 | | | 662,689 |
| OMNOVA Solutions, Inc. (A) | | 5,593 | | | 56,545 |
| Orbia Advance Corp. SAB de CV | | 129,480 | | | 254,908 |
Strategic Equity Allocation Fund (continued)
| | | Shares or
Principal
Amount | | Value |
| COMMON STOCKS (continued) | | | |
| Chemicals (continued) | | | |
| Orica, Ltd. | | 54,194 | | $ | 708,414 |
| Orion Engineered Carbons SA | | 7,567 | | | 107,527 |
| Petronas Chemicals Group BHD | | 245,045 | | | 316,164 |
| PolyOne Corp. | | 32,630 | | | 807,919 |
| PPG Industries, Inc. | | 35,832 | | | 3,742,652 |
| PQ Group Holdings, Inc. (A) | | 4,698 | | | 62,342 |
| PTT Global Chemical PCL, NVDR | | 126,300 | | | 168,043 |
| Quaker Chemical Corp. | | 1,620 | | | 255,263 |
| Rayonier Advanced Materials, Inc. | | 6,712 | | | 16,444 |
| RPM International, Inc. | | 33,243 | | | 2,131,209 |
| Sasol, Ltd. | | 48,004 | | | 586,337 |
| Sensient Technologies Corp. | | 16,050 | | | 789,339 |
| Shin-Etsu Chemical Company, Ltd. | | 46,737 | | | 5,171,302 |
| Showa Denko KK | | 17,400 | | | 373,965 |
| Sika AG | | 17,222 | | | 3,082,799 |
| Sinopec Shanghai Petrochemical Company, Ltd., H Shares | | 438,199 | | | 113,609 |
| Solvay SA | | 2,593 | | | 236,633 |
| Stepan Company | | 2,504 | | | 219,926 |
| Sumitomo Chemical Company, Ltd. | | 191,000 | | | 696,002 |
| Symrise AG | | 17,078 | | | 1,673,506 |
| Taiyo Nippon Sanso Corp. | | 16,500 | | | 294,354 |
| Teijin, Ltd. | | 22,600 | | | 370,587 |
| The Chemours Company | | 41,913 | | | 622,827 |
| The Mosaic Company | | 52,983 | | | 902,300 |
| The Scotts Miracle-Gro Company | | 10,157 | | | 1,076,540 |
| The Sherwin-Williams Company | | 12,449 | | | 6,433,021 |
| Toray Industries, Inc. | | 177,600 | | | 1,020,311 |
| Tosoh Corp. | | 34,100 | | | 461,481 |
| Trecora Resources (A) | | 3,106 | | | 17,549 |
| Tredegar Corp. | | 3,274 | | | 55,854 |
| Trinseo SA | | 4,877 | | | 106,709 |
| Tronox Holdings PLC, Class A | | 11,421 | | | 83,830 |
| Umicore SA | | 6,692 | | | 281,805 |
| Valvoline, Inc. | | 48,295 | | | 941,753 |
| Yara International ASA | | 9,120 | | | 334,836 |
| | | | | | 152,679,433 |
| Construction materials – 0.3% | | | |
| Anhui Conch Cement Company, Ltd., H Shares | | 161,110 | | | 1,206,583 |
| Asia Cement Corp. | | 489,687 | | | 712,434 |
| BBMG Corp., H Shares | | 275,000 | | | 78,699 |
| Boral, Ltd. | | 168,160 | | | 501,973 |
| Cemex SAB de CV | | 1,857,588 | | | 605,889 |
| China National Building Material Company, Ltd., H Shares | | 514,900 | | | 611,973 |
| China Resources Cement Holdings, Ltd. | | 323,900 | | | 416,158 |
| CRH PLC | | 105,412 | | | 3,556,199 |
| Eagle Materials, Inc. | | 10,672 | | | 842,341 |
| Fletcher Building, Ltd. | | 58,661 | | | 191,492 |
| Forterra, Inc. (A) | | 2,447 | | | 33,132 |
| Grupo Argos SA | | 26,010 | | | 110,863 |
| HeidelbergCement AG | | 19,848 | | | 1,189,511 |
| Indocement Tunggal Prakarsa Tbk PT | | 46,320 | | | 49,618 |
| James Hardie Industries PLC, CHESS Depositary Interest | | 63,369 | | | 1,184,168 |
| LafargeHolcim, Ltd. (A) | | 66,679 | | | 3,103,470 |
| Martin Marietta Materials, Inc. | | 9,471 | | | 2,154,937 |
| POSCO Chemical Company, Ltd. | | 4,805 | | | 220,243 |
| Semen Indonesia Persero Tbk PT | | 78,092 | | | 58,290 |
| Summit Materials, Inc., Class A (A) | | 13,914 | | | 271,880 |
| Taiheiyo Cement Corp. | | 15,600 | | | 384,960 |
| Taiwan Cement Corp. | | 1,098,367 | | | 1,516,867 |
| The Siam Cement PCL, NVDR | | 42,600 | | | 424,297 |
| U.S. Concrete, Inc. (A) | | 1,983 | | | 53,224 |
| The accompanying notes are an integral part of the financial statements. | 73 | |
John Hancock Funds II
Portfolio of Investments — February 29, 2020 (unaudited)(showing percentage of total net assets)
Strategic Equity Allocation Fund (continued)
| | | Shares or
Principal
Amount | | Value |
| COMMON STOCKS (continued) | | | |
| Construction materials (continued) | | | |
| United States Lime & Minerals, Inc. | | 262 | | $ | 21,104 |
| Vulcan Materials Company | | 20,056 | | | 2,411,935 |
| | | | | | 21,912,240 |
| Containers and packaging – 0.3% | | | |
| Amcor PLC (C) | | 245,506 | | | 2,288,116 |
| AptarGroup, Inc. | | 16,388 | | | 1,656,335 |
| Avery Dennison Corp. | | 12,653 | | | 1,448,642 |
| Ball Corp. | | 49,571 | | | 3,492,773 |
| CCL Industries, Inc., Class B | | 23,932 | | | 790,037 |
| Greif, Inc., Class A | | 9,853 | | | 348,205 |
| Greif, Inc., Class B | | 798 | | | 31,928 |
| International Paper Company | | 59,419 | | | 2,196,126 |
| Klabin SA | | 23,442 | | | 100,910 |
| Myers Industries, Inc. | | 4,485 | | | 60,861 |
| O-I Glass, Inc. | | 39,896 | | | 430,877 |
| Packaging Corp. of America | | 14,344 | | | 1,299,853 |
| Sealed Air Corp. | | 23,415 | | | 709,709 |
| Silgan Holdings, Inc. | | 19,877 | | | 569,079 |
| Smurfit Kappa Group PLC | | 29,913 | | | 1,007,765 |
| Sonoco Products Company | | 25,660 | | | 1,237,069 |
| Toyo Seikan Group Holdings, Ltd. | | 18,100 | | | 288,626 |
| UFP Technologies, Inc. (A) | | 852 | | | 42,029 |
| Westrock Company | | 39,079 | | | 1,299,377 |
| | | | | | 19,298,317 |
| Metals and mining – 1.2% | | | |
| 1911 Gold Corp. (A) | | 2,060 | | | 471 |
| Agnico Eagle Mines, Ltd. | | 36,922 | | | 1,751,955 |
| AK Steel Holding Corp. (A) | | 39,643 | | | 91,575 |
| Allegheny Technologies, Inc. (A)(C) | | 47,904 | | | 818,679 |
| Alumina, Ltd. | | 344,642 | | | 441,176 |
| Aluminum Corp. of China, Ltd., H Shares (A) | | 530,880 | | | 143,929 |
| Anglo American Platinum, Ltd. | | 4,468 | | | 300,735 |
| Anglo American PLC | | 72,022 | | | 1,694,494 |
| AngloGold Ashanti, Ltd. | | 34,754 | | | 618,908 |
| Antofagasta PLC | | 27,711 | | | 273,903 |
| ArcelorMittal SA | | 89,737 | | | 1,277,848 |
| Barrick Gold Corp. | | 275,597 | | | 5,256,311 |
| BHP Group PLC | | 146,938 | | | 2,685,415 |
| BHP Group, Ltd. | | 422,140 | | | 9,175,388 |
| BlueScope Steel, Ltd. | | 74,171 | | | 580,045 |
| Boliden AB | | 38,162 | | | 801,448 |
| Carpenter Technology Corp. | | 18,064 | | | 663,852 |
| Century Aluminum Company (A) | | 6,477 | | | 37,567 |
| China Hongqiao Group, Ltd. | | 223,800 | | | 122,393 |
| China Molybdenum Company, Ltd., H Shares | | 496,500 | | | 189,738 |
| China Steel Corp. | | 2,616,958 | | | 1,984,137 |
| China Zhongwang Holdings, Ltd. | | 215,400 | | | 72,963 |
| Cia de Minas Buenaventura SAA, ADR | | 25,100 | | | 279,865 |
| Cia Siderurgica Nacional SA | | 21,166 | | | 52,916 |
| Cleveland-Cliffs, Inc. (C) | | 33,192 | | | 192,846 |
| Coeur Mining, Inc. (A) | | 29,392 | | | 122,271 |
| Commercial Metals Company | | 44,981 | | | 821,353 |
| Compass Minerals International, Inc. | | 12,907 | | | 704,077 |
| Eregli Demir ve Celik Fabrikalari TAS | | 74,844 | | | 99,858 |
| Evraz PLC | | 34,284 | | | 146,405 |
| First Quantum Minerals, Ltd. | | 108,120 | | | 799,069 |
| Fortescue Metals Group, Ltd. | | 199,129 | | | 1,330,057 |
| Franco-Nevada Corp. | | 29,316 | | | 3,147,279 |
| Freeport-McMoRan, Inc. | | 219,862 | | | 2,189,826 |
| Glencore PLC (A) | | 756,286 | | | 1,908,979 |
| Gold Fields, Ltd. | | 68,952 | | | 419,351 |
| Gold Resource Corp. | | 7,876 | | | 31,662 |
| Grupo Mexico SAB de CV, Series B | | 429,500 | | | 1,014,888 |
Strategic Equity Allocation Fund (continued)
| | | Shares or
Principal
Amount | | Value |
| COMMON STOCKS (continued) | | | |
| Metals and mining (continued) | | | |
| Haynes International, Inc. | | 1,568 | | $ | 39,686 |
| Hecla Mining Company | | 60,577 | | | 159,923 |
| Hitachi Metals, Ltd. | | 27,600 | | | 397,561 |
| Hyundai Steel Company | | 15,934 | | | 316,566 |
| Impala Platinum Holdings, Ltd. (A) | | 68,002 | | | 552,732 |
| Industrias Penoles SAB de CV | | 16,155 | | | 145,307 |
| JFE Holdings, Inc. | | 62,800 | | | 575,370 |
| Jiangxi Copper Company, Ltd., H Shares | | 151,825 | | | 181,078 |
| Kaiser Aluminum Corp. | | 1,960 | | | 185,318 |
| KGHM Polska Miedz SA (A) | | 8,616 | | | 158,010 |
| Kinross Gold Corp. (A) | | 194,775 | | | 979,498 |
| Kirkland Lake Gold, Ltd. | | 30,962 | | | 998,581 |
| Korea Zinc Company, Ltd. (A) | | 1,666 | | | 569,998 |
| Kumba Iron Ore, Ltd. | | 5,450 | | | 100,435 |
| Lundin Mining Corp. | | 107,526 | | | 548,745 |
| Maanshan Iron & Steel Company, Ltd., H Shares | | 94,500 | | | 34,821 |
| Maruichi Steel Tube, Ltd. | | 6,800 | | | 164,238 |
| Materion Corp. | | 2,488 | | | 112,806 |
| Mitsubishi Materials Corp. | | 14,100 | | | 319,873 |
| Newcrest Mining, Ltd. | | 109,796 | | | 1,801,092 |
| Newmont Corp. | | 124,233 | | | 5,544,519 |
| Nippon Steel Corp. | | 102,878 | | | 1,151,579 |
| Norsk Hydro ASA | | 71,880 | | | 209,331 |
| Northam Platinum, Ltd. (A) | | 29,804 | | | 216,518 |
| Novagold Resources, Inc. (A) | | 28,701 | | | 229,034 |
| Nucor Corp. | | 45,947 | | | 1,899,908 |
| Olympic Steel, Inc. | | 1,280 | | | 15,424 |
| POSCO | | 15,520 | | | 2,492,838 |
| Press Metal Aluminium Holdings BHD | | 139,800 | | | 156,768 |
| Reliance Steel & Aluminum Company | | 17,087 | | | 1,747,829 |
| Rio Tinto PLC | | 78,701 | | | 3,705,212 |
| Rio Tinto, Ltd. | | 53,234 | | | 3,059,081 |
| Royal Gold, Inc. | | 16,814 | | | 1,622,047 |
| Ryerson Holding Corp. (A) | | 2,125 | | | 17,701 |
| Schnitzer Steel Industries, Inc., Class A | | 3,225 | | | 53,148 |
| Sibanye Stillwater, Ltd. (A) | | 192,176 | | | 387,678 |
| South32, Ltd. | | 715,171 | | | 1,016,359 |
| Southern Copper Corp. | | 10,800 | | | 363,420 |
| Steel Dynamics, Inc. | | 55,231 | | | 1,470,802 |
| Sumitomo Metal Mining Company, Ltd. | | 29,900 | | | 736,516 |
| SunCoke Energy, Inc. | | 9,474 | | | 43,675 |
| Teck Resources, Ltd., Class B | | 78,273 | | | 787,249 |
| thyssenkrupp AG (A) | | 53,699 | | | 526,536 |
| TimkenSteel Corp. (A) | | 5,180 | | | 26,263 |
| United States Steel Corp. (C) | | 43,589 | | | 349,584 |
| Vale SA | | 107,571 | | | 1,065,872 |
| voestalpine AG (C) | | 17,805 | | | 387,699 |
| Warrior Met Coal, Inc. | | 6,238 | | | 110,537 |
| Wheaton Precious Metals Corp. | | 69,343 | | | 1,971,929 |
| Worthington Industries, Inc. | | 14,261 | | | 453,500 |
| Zhaojin Mining Industry Company, Ltd., H Shares | | 126,600 | | | 150,191 |
| Zijin Mining Group Company, Ltd., H Shares | | 738,329 | | | 333,198 |
| | | | | | 82,887,215 |
| Paper and forest products – 0.1% | | | |
| Boise Cascade Company | | 4,819 | | | 170,978 |
| Clearwater Paper Corp. (A) | | 2,093 | | | 57,076 |
| Domtar Corp. | | 14,682 | | | 422,401 |
| Empresas CMPC SA | | 145,019 | | | 295,868 |
| Indah Kiat Pulp & Paper Corp. Tbk PT | | 69,300 | | | 27,861 |
| Lee & Man Paper Manufacturing, Ltd. | | 177,500 | | | 141,335 |
| Louisiana-Pacific Corp. | | 44,588 | | | 1,268,529 |
| Mondi PLC | | 33,917 | | | 688,841 |
| The accompanying notes are an integral part of the financial statements. | 74 | |
John Hancock Funds II
Portfolio of Investments — February 29, 2020 (unaudited)(showing percentage of total net assets)
Strategic Equity Allocation Fund (continued)
| | | Shares or
Principal
Amount | | Value |
| COMMON STOCKS (continued) | | | |
| Paper and forest products (continued) | | | |
| Neenah, Inc. | | 2,087 | | $ | 120,566 |
| Nine Dragons Paper Holdings, Ltd. | | 218,200 | | | 262,120 |
| Oji Holdings Corp. | | 110,900 | | | 525,255 |
| Pabrik Kertas Tjiwi Kimia Tbk PT | | 35,100 | | | 14,946 |
| PH Glatfelter Company | | 5,478 | | | 78,116 |
| Schweitzer-Mauduit International, Inc. | | 3,829 | | | 129,114 |
| Stora Enso OYJ, R Shares | | 72,772 | | | 862,416 |
| Suzano SA | | 18,267 | | | 155,796 |
| UPM-Kymmene OYJ | | 66,644 | | | 2,050,783 |
| Verso Corp., Class A (A) | | 4,372 | | | 71,307 |
| West Fraser Timber Company, Ltd. | | 8,513 | | | 317,878 |
| | | | | | 7,661,186 |
| | | | | | 284,438,391 |
| Real estate – 3.4% | | | | | |
| Equity real estate investment trusts – 2.7% | | | |
| Acadia Realty Trust | | 10,391 | | | 237,330 |
| Agree Realty Corp. | | 5,023 | | | 360,752 |
| Alexander & Baldwin, Inc. | | 8,714 | | | 163,823 |
| Alexander's, Inc. | | 268 | | | 83,348 |
| Alexandria Real Estate Equities, Inc. | | 16,396 | | | 2,490,224 |
| American Assets Trust, Inc. | | 5,975 | | | 247,664 |
| American Campus Communities, Inc. | | 35,224 | | | 1,530,131 |
| American Finance Trust, Inc. | | 13,375 | | | 139,100 |
| American Tower Corp. | | 59,237 | | | 13,434,952 |
| Apartment Investment & Management Company, A Shares | | 19,912 | | | 952,590 |
| Armada Hoffler Properties, Inc. | | 6,588 | | | 110,415 |
| Ascendas Real Estate Investment Trust | | 112,200 | | | 248,015 |
| Ashford Hospitality Trust, Inc. | | 12,788 | | | 27,622 |
| AvalonBay Communities, Inc. | | 18,678 | | | 3,746,620 |
| Bluerock Residential Growth REIT, Inc. | | 3,140 | | | 32,625 |
| Boston Properties, Inc. | | 19,231 | | | 2,479,645 |
| Braemar Hotels & Resorts, Inc. | | 4,223 | | | 31,081 |
| Brixmor Property Group, Inc. | | 76,353 | | | 1,390,388 |
| BRT Apartments Corp. | | 1,416 | | | 22,090 |
| Camden Property Trust | | 24,823 | | | 2,630,742 |
| Canadian Apartment Properties REIT | | 14,239 | | | 595,444 |
| CapitaLand Commercial Trust | | 103,700 | | | 139,029 |
| CapitaLand Mall Trust | | 99,400 | | | 163,062 |
| CareTrust REIT, Inc. | | 11,977 | | | 249,960 |
| CatchMark Timber Trust, Inc., Class A | | 6,356 | | | 58,412 |
| CBL & Associates Properties, Inc. | | 23,796 | | | 12,631 |
| Cedar Realty Trust, Inc. | | 11,744 | | | 30,417 |
| Chatham Lodging Trust | | 5,867 | | | 81,786 |
| City Office REIT, Inc. | | 6,386 | | | 74,078 |
| Clipper Realty, Inc. | | 2,314 | | | 26,079 |
| Community Healthcare Trust, Inc. | | 2,273 | | | 108,263 |
| CoreCivic, Inc. | | 45,482 | | | 673,588 |
| CorEnergy Infrastructure Trust, Inc. | | 1,595 | | | 55,666 |
| CorePoint Lodging, Inc. | | 5,530 | | | 44,019 |
| CoreSite Realty Corp. | | 9,661 | | | 1,002,136 |
| Corporate Office Properties Trust | | 28,726 | | | 727,917 |
| Cousins Properties, Inc. | | 37,622 | | | 1,342,729 |
| Covivio | | 5,995 | | | 638,042 |
| Crown Castle International Corp. | | 55,603 | | | 7,967,354 |
| CyrusOne, Inc. | | 29,019 | | | 1,757,971 |
| Daiwa House REIT Investment Corp. | | 231 | | | 577,659 |
| Dexus | | 156,062 | | | 1,243,221 |
| DiamondRock Hospitality Company | | 25,038 | | | 228,347 |
| Digital Realty Trust, Inc. | | 27,913 | | | 3,352,630 |
| Diversified Healthcare Trust | | 90,868 | | | 571,560 |
| Douglas Emmett, Inc. | | 42,254 | | | 1,613,258 |
| Duke Realty Corp. | | 49,157 | | | 1,596,128 |
| Easterly Government Properties, Inc. | | 9,435 | | | 224,270 |
| EastGroup Properties, Inc. | | 14,411 | | | 1,811,895 |
Strategic Equity Allocation Fund (continued)
| | | Shares or
Principal
Amount | | Value |
| COMMON STOCKS (continued) | | | |
| Equity real estate investment trusts (continued) | | | |
| EPR Properties | | 20,113 | | $ | 1,191,494 |
| Equinix, Inc. | | 11,405 | | | 6,532,784 |
| Equity Residential | | 46,683 | | | 3,505,893 |
| Essential Properties Realty Trust, Inc. | | 9,525 | | | 218,218 |
| Essex Property Trust, Inc. | | 8,838 | | | 2,504,336 |
| Extra Space Storage, Inc. | | 17,320 | | | 1,738,235 |
| Farmland Partners, Inc. | | 3,874 | | | 22,895 |
| Federal Realty Investment Trust | | 9,393 | | | 1,092,782 |
| Fibra Uno Administracion SA de CV | | 389,800 | | | 590,354 |
| First Capital Real Estate Investment Trust | | 20,078 | | | 299,468 |
| First Industrial Realty Trust, Inc. | | 48,096 | | | 1,851,696 |
| Fortress REIT, Ltd., Class A | | 85,775 | | | 89,943 |
| Four Corners Property Trust, Inc. | | 8,466 | | | 242,890 |
| Franklin Street Properties Corp. | | 13,088 | | | 93,317 |
| Front Yard Residential Corp. | | 6,372 | | | 80,797 |
| Gecina SA | | 6,064 | | | 1,079,611 |
| Getty Realty Corp. | | 4,117 | | | 116,676 |
| Gladstone Commercial Corp. | | 3,989 | | | 75,272 |
| Gladstone Land Corp. | | 2,647 | | | 35,549 |
| Global Medical REIT, Inc. | | 4,003 | | | 55,922 |
| Global Net Lease, Inc. | | 10,741 | | | 198,171 |
| Goodman Group | | 235,316 | | | 2,310,394 |
| Growthpoint Properties, Ltd. | | 247,142 | | | 283,163 |
| H&R Real Estate Investment Trust | | 26,478 | | | 382,893 |
| Hannon Armstrong Sustainable Infrastructure Capital, Inc. | | 7,910 | | | 268,545 |
| Healthcare Realty Trust, Inc. | | 50,136 | | | 1,719,665 |
| Healthpeak Properties, Inc. | | 66,193 | | | 2,094,347 |
| Hersha Hospitality Trust | | 4,580 | | | 52,807 |
| Highwoods Properties, Inc. | | 26,595 | | | 1,193,584 |
| Host Hotels & Resorts, Inc. | | 95,913 | | | 1,388,820 |
| ICADE | | 3,839 | | | 384,581 |
| Independence Realty Trust, Inc. | | 11,198 | | | 148,485 |
| Industrial Logistics Properties Trust | | 8,072 | | | 166,768 |
| Innovative Industrial Properties, Inc. | | 1,392 | | | 127,980 |
| Investors Real Estate Trust | | 1,455 | | | 102,505 |
| Iron Mountain, Inc. | | 38,402 | | | 1,167,805 |
| iStar, Inc. | | 7,398 | | | 111,932 |
| Japan Prime Realty Investment Corp. | | 95 | | | 418,952 |
| Japan Real Estate Investment Corp. | | 165 | | | 1,128,294 |
| Japan Retail Fund Investment Corp. | | 325 | | | 616,105 |
| JBG SMITH Properties | | 30,257 | | | 1,109,827 |
| Jernigan Capital, Inc. | | 2,772 | | | 49,674 |
| Kilroy Realty Corp. | | 25,002 | | | 1,817,395 |
| Kimco Realty Corp. | | 56,468 | | | 979,720 |
| Kite Realty Group Trust | | 10,365 | | | 167,395 |
| Klepierre SA | | 26,144 | | | 785,110 |
| Lamar Advertising Company, Class A | | 22,049 | | | 1,846,383 |
| Land Securities Group PLC | | 47,892 | | | 516,185 |
| Lexington Realty Trust | | 28,759 | | | 298,231 |
| Life Storage, Inc. | | 11,959 | | | 1,290,496 |
| Link REIT | | 129,725 | | | 1,210,982 |
| LTC Properties, Inc. | | 4,900 | | | 219,667 |
| Mack-Cali Realty Corp. | | 34,101 | | | 647,237 |
| Mapletree Commercial Trust | | 76,900 | | | 116,557 |
| Medical Properties Trust, Inc. | | 132,645 | | | 2,802,789 |
| Mid-America Apartment Communities, Inc. | | 15,255 | | | 1,971,861 |
| Mirvac Group | | 561,961 | | | 1,117,816 |
| Monmouth Real Estate Investment Corp. | | 11,557 | | | 164,109 |
| National Health Investors, Inc. | | 5,137 | | | 419,847 |
| National Retail Properties, Inc. | | 43,999 | | | 2,237,349 |
| National Storage Affiliates Trust | | 7,383 | | | 249,102 |
| New Senior Investment Group, Inc. | | 10,663 | | | 64,724 |
| NexPoint Residential Trust, Inc. | | 2,328 | | | 103,596 |
| Nippon Building Fund, Inc. | | 169 | | | 1,263,488 |
| The accompanying notes are an integral part of the financial statements. | 75 | |
John Hancock Funds II
Portfolio of Investments — February 29, 2020 (unaudited)(showing percentage of total net assets)
Strategic Equity Allocation Fund (continued)
| | | Shares or
Principal
Amount | | Value |
| COMMON STOCKS (continued) | | | |
| Equity real estate investment trusts (continued) | | | |
| Nippon Prologis REIT, Inc. | | 248 | | $ | 671,654 |
| Nomura Real Estate Master Fund, Inc. | | 512 | | | 812,376 |
| Office Properties Income Trust | | 6,042 | | | 176,003 |
| Omega Healthcare Investors, Inc. | | 56,013 | | | 2,218,115 |
| One Liberty Properties, Inc. | | 2,095 | | | 50,490 |
| Orix JREIT, Inc. | | 328 | | | 620,534 |
| Park Hotels & Resorts, Inc. | | 61,367 | | | 1,120,561 |
| Pebblebrook Hotel Trust | | 49,637 | | | 1,003,164 |
| Pennsylvania Real Estate Investment Trust | | 9,468 | | | 22,344 |
| Physicians Realty Trust | | 23,018 | | | 434,119 |
| Piedmont Office Realty Trust, Inc., Class A | | 15,509 | | | 334,839 |
| PotlatchDeltic Corp. | | 25,510 | | | 937,237 |
| Preferred Apartment Communities, Inc., Class A | | 5,690 | | | 54,283 |
| Prologis, Inc. | | 98,730 | | | 8,320,964 |
| PS Business Parks, Inc. | | 7,570 | | | 1,124,524 |
| Public Storage | | 20,090 | | | 4,201,221 |
| QTS Realty Trust, Inc., Class A | | 6,893 | | | 387,180 |
| Rayonier, Inc. | | 33,149 | | | 879,443 |
| Realty Income Corp. | | 43,587 | | | 3,155,263 |
| Redefine Properties, Ltd. | | 445,336 | | | 155,328 |
| Regency Centers Corp. | | 22,409 | | | 1,287,173 |
| Retail Opportunity Investments Corp. | | 14,132 | | | 211,980 |
| Retail Value, Inc. | | 1,981 | | | 55,052 |
| Rexford Industrial Realty, Inc. | | 13,561 | | | 634,248 |
| RioCan Real Estate Investment Trust | | 27,886 | | | 520,843 |
| RLJ Lodging Trust | | 21,186 | | | 279,867 |
| RPT Realty | | 9,720 | | | 125,971 |
| Ryman Hospitality Properties, Inc. | | 5,689 | | | 395,442 |
| Sabra Health Care REIT, Inc. | | 73,209 | | | 1,431,236 |
| Safehold, Inc. | | 1,333 | | | 72,808 |
| Saul Centers, Inc. | | 1,533 | | | 65,934 |
| SBA Communications Corp. | | 15,059 | | | 3,991,990 |
| Scentre Group | | 760,200 | | | 1,722,465 |
| Segro PLC | | 74,231 | | | 786,960 |
| Seritage Growth Properties, Class A | | 4,228 | | | 145,359 |
| Service Properties Trust | | 42,186 | | | 762,723 |
| Simon Property Group, Inc. | | 41,039 | | | 5,051,080 |
| SL Green Realty Corp. | | 10,902 | | | 855,153 |
| SmartCentres Real Estate Investment Trust | | 14,640 | | | 313,905 |
| Spirit Realty Capital, Inc. | | 25,566 | | | 1,163,253 |
| STAG Industrial, Inc. | | 16,094 | | | 450,310 |
| Stockland | | 340,487 | | | 1,052,534 |
| Summit Hotel Properties, Inc. | | 12,947 | | | 120,019 |
| Sunstone Hotel Investors, Inc. | | 27,836 | | | 304,804 |
| Suntec Real Estate Investment Trust | | 69,400 | | | 85,099 |
| Tanger Factory Outlet Centers, Inc. | | 11,502 | | | 137,794 |
| Taubman Centers, Inc. | | 15,694 | | | 817,030 |
| Terreno Realty Corp. | | 7,969 | | | 437,259 |
| The British Land Company PLC | | 60,389 | | | 391,162 |
| The GEO Group, Inc. | | 46,057 | | | 674,274 |
| The GPT Group | | 276,592 | | | 1,045,388 |
| The Macerich Company | | 28,246 | | | 576,783 |
| UDR, Inc. | | 39,192 | | | 1,762,856 |
| UMH Properties, Inc. | | 4,665 | | | 67,689 |
| Unibail-Rodamco-Westfield | | 9,398 | | | 1,127,839 |
| Unibail-Rodamco-Westfield, Stapled Shares | | 9,122 | | | 1,094,717 |
| United Urban Investment Corp. | | 370 | | | 592,271 |
| Uniti Group, Inc. | | 23,444 | | | 228,813 |
| Universal Health Realty Income Trust | | 1,587 | | | 170,952 |
| Urban Edge Properties | | 43,889 | | | 711,002 |
| Urstadt Biddle Properties, Inc., Class A | | 3,711 | | | 76,484 |
| Ventas, Inc. | | 49,848 | | | 2,680,327 |
Strategic Equity Allocation Fund (continued)
| | | Shares or
Principal
Amount | | Value |
| COMMON STOCKS (continued) | | | |
| Equity real estate investment trusts (continued) | | | |
| Vicinity Centres | | 453,966 | | $ | 642,943 |
| Vornado Realty Trust | | 21,185 | | | 1,135,092 |
| Washington Prime Group, Inc. | | 23,732 | | | 65,263 |
| Washington Real Estate Investment Trust | | 9,989 | | | 268,205 |
| Weingarten Realty Investors | | 31,006 | | | 834,992 |
| Welltower, Inc. | | 54,265 | | | 4,060,107 |
| Weyerhaeuser Company | | 99,652 | | | 2,588,959 |
| Whitestone REIT | | 4,904 | | | 60,270 |
| Xenia Hotels & Resorts, Inc. | | 14,158 | | | 211,804 |
| | | | | | 185,486,301 |
| Real estate management and development – 0.7% | | | |
| Aeon Mall Company, Ltd. | | 13,100 | | | 185,578 |
| Agile Group Holdings, Ltd. | | 180,600 | | | 258,214 |
| Aroundtown SA | | 118,996 | | | 1,033,829 |
| Ayala Land, Inc. | | 929,370 | | | 715,746 |
| Azrieli Group, Ltd. | | 5,326 | | | 387,386 |
| BR Malls Participacoes SA | | 24,819 | | | 90,687 |
| Bumi Serpong Damai Tbk PT (A) | | 221,100 | | | 15,743 |
| CapitaLand, Ltd. | | 107,300 | | | 274,889 |
| CBRE Group, Inc., Class A (A) | | 44,769 | | | 2,513,332 |
| Central Pattana PCL, NVDR | | 123,400 | | | 210,765 |
| China Aoyuan Group, Ltd. | | 161,000 | | | 237,852 |
| China Evergrande Group | | 243,035 | | | 556,793 |
| China Jinmao Holdings Group, Ltd. | | 700,400 | | | 522,438 |
| China Overseas Land & Investment, Ltd. | | 511,297 | | | 1,751,008 |
| China Resources Land, Ltd. | | 368,705 | | | 1,750,758 |
| China Vanke Company, Ltd., H Shares | | 199,300 | | | 780,478 |
| CIFI Holdings Group Company, Ltd. | | 370,700 | | | 291,449 |
| City Developments, Ltd. | | 20,000 | | | 142,949 |
| CK Asset Holdings, Ltd. | | 161,198 | | | 1,028,922 |
| Consolidated-Tomoka Land Company | | 629 | | | 36,174 |
| Country Garden Holdings Company, Ltd. | | 1,011,167 | | | 1,373,728 |
| Cushman & Wakefield PLC (A) | | 13,734 | | | 249,821 |
| Daito Trust Construction Company, Ltd. | | 9,100 | | | 925,543 |
| Daiwa House Industry Company, Ltd. | | 72,400 | | | 1,997,981 |
| Dalian Wanda Commercial Properties Company, Ltd., H Shares (A)(B) | | 37,400 | | | 253,332 |
| Deutsche Wohnen SE | | 47,528 | | | 1,940,221 |
| eXp World Holdings, Inc. (A)(C) | | 2,696 | | | 25,774 |
| Forestar Group, Inc. (A) | | 1,428 | | | 25,547 |
| FRP Holdings, Inc. (A) | | 935 | | | 42,290 |
| Guangzhou R&F Properties Company, Ltd., H Shares | | 172,600 | | | 272,134 |
| Hang Lung Properties, Ltd. | | 124,000 | | | 275,246 |
| Henderson Land Development Company, Ltd. | | 88,376 | | | 412,551 |
| Highwealth Construction Corp. | | 168,687 | | | 248,644 |
| Hongkong Land Holdings, Ltd. | | 72,500 | | | 359,516 |
| Hulic Company, Ltd. | | 38,000 | | | 423,280 |
| Jones Lang LaSalle, Inc. | | 13,211 | | | 1,952,189 |
| Kaisa Group Holdings, Ltd. (A) | | 328,800 | | | 149,683 |
| Kennedy-Wilson Holdings, Inc. | | 15,354 | | | 310,304 |
| Kerry Properties, Ltd. | | 40,268 | | | 115,991 |
| KWG Group Holdings, Ltd. (A) | | 171,000 | | | 256,763 |
| Land & Houses PCL, NVDR | | 452,300 | | | 122,072 |
| Lendlease Group | | 81,146 | | | 943,935 |
| Logan Property Holdings Company, Ltd. | | 182,500 | | | 318,782 |
| Longfor Group Holdings, Ltd. (B) | | 236,300 | | | 1,117,629 |
| Marcus & Millichap, Inc. (A) | | 2,893 | | | 92,460 |
| Megaworld Corp. | | 1,412,700 | | | 94,605 |
| Mitsubishi Estate Company, Ltd. | | 151,400 | | | 2,583,872 |
| Mitsui Fudosan Company, Ltd. | | 114,204 | | | 2,621,058 |
| Multiplan Empreendimentos Imobiliarios SA | | 8,701 | | | 59,383 |
| NEPI Rockcastle PLC | | 31,842 | | | 235,702 |
| The accompanying notes are an integral part of the financial statements. | 76 | |
John Hancock Funds II
Portfolio of Investments — February 29, 2020 (unaudited)(showing percentage of total net assets)
Strategic Equity Allocation Fund (continued)
| | | Shares or
Principal
Amount | | Value |
| COMMON STOCKS (continued) | | | |
| Real estate management and development (continued) | | | |
| New World Development Company, Ltd. | | 377,257 | | $ | 494,274 |
| Newmark Group, Inc., Class A | | 18,002 | | | 171,919 |
| Nomura Real Estate Holdings, Inc. | | 16,100 | | | 347,369 |
| Pakuwon Jati Tbk PT | | 484,200 | | | 18,227 |
| Rafael Holdings, Inc., Class B (A) | | 1,405 | | | 26,358 |
| RE/MAX Holdings, Inc., Class A | | 2,255 | | | 65,733 |
| Realogy Holdings Corp. | | 14,247 | | | 132,070 |
| Redfin Corp. (A) | | 11,157 | | | 301,908 |
| Robinsons Land Corp. | | 263,500 | | | 110,153 |
| Ruentex Development Company, Ltd. (A) | | 124,080 | | | 167,088 |
| Seazen Group, Ltd. (A) | | 234,800 | | | 246,784 |
| Shanghai Lujiazui Finance & Trade Zone Development Company, Ltd., B Shares | | 132,551 | | | 105,800 |
| Shenzhen Investment, Ltd. | | 368,900 | | | 124,685 |
| Shimao Property Holdings, Ltd. | | 154,700 | | | 567,023 |
| Shui On Land, Ltd. | | 467,400 | | | 93,640 |
| Sino Land Company, Ltd. | | 186,075 | | | 256,710 |
| Sino-Ocean Group Holding, Ltd. | | 411,358 | | | 151,611 |
| SM Prime Holdings, Inc. | | 1,269,400 | | | 957,729 |
| SOHO China, Ltd. | | 268,000 | | | 98,001 |
| Sumitomo Realty & Development Company, Ltd. | | 42,183 | | | 1,314,562 |
| Sun Hung Kai Properties, Ltd. | | 99,500 | | | 1,438,113 |
| Sunac China Holdings, Ltd. | | 323,700 | | | 1,813,216 |
| Swire Pacific, Ltd., Class A | | 31,000 | | | 282,650 |
| Swire Properties, Ltd. | | 71,000 | | | 213,693 |
| Swiss Prime Site AG (A) | | 9,934 | | | 1,198,598 |
| Tejon Ranch Company (A) | | 2,797 | | | 42,179 |
| The RMR Group, Inc., Class A | | 1,924 | | | 71,688 |
| The St. Joe Company (A) | | 4,224 | | | 83,086 |
| The Wharf Holdings, Ltd. | | 140,125 | | | 299,905 |
| Tokyu Fudosan Holdings Corp. | | 78,600 | | | 496,549 |
| UOL Group, Ltd. | | 20,000 | | | 107,256 |
| Vonovia SE | | 68,097 | | | 3,684,593 |
| Wharf Real Estate Investment Company, Ltd. | | 75,125 | | | 346,059 |
| Wheelock & Company, Ltd. | | 52,000 | | | 399,549 |
| Yuexiu Property Company, Ltd. | | 877,500 | | | 181,714 |
| Yuzhou Properties Company, Ltd. | | 241,600 | | | 120,776 |
| Zhenro Properties Group, Ltd. | | 193,000 | | | 126,311 |
| | | | | | 49,242,605 |
| | | | | | 234,728,906 |
| Utilities – 4.2% | | | | | |
| Electric utilities – 2.4% | | | |
| ALLETE, Inc. | | 19,622 | | | 1,353,722 |
| Alliant Energy Corp. | | 50,939 | | | 2,654,941 |
| American Electric Power Company, Inc. | | 104,686 | | | 9,344,272 |
| AusNet Services | | 252,378 | | | 279,826 |
| Centrais Eletricas Brasileiras SA | | 8,800 | | | 67,950 |
| CEZ AS | | 17,761 | | | 340,453 |
| Chubu Electric Power Company, Inc. | | 82,300 | | | 1,072,158 |
| CK Infrastructure Holdings, Ltd. | | 40,500 | | | 278,681 |
| CLP Holdings, Ltd. | | 101,500 | | | 1,072,501 |
| Duke Energy Corp. | | 154,508 | | | 14,168,384 |
| Edison International | | 76,000 | | | 5,106,440 |
| EDP - Energias de Portugal SA | | 325,223 | | | 1,518,367 |
| El Paso Electric Company | | 5,007 | | | 339,825 |
| Electricite de France SA | | 81,315 | | | 1,141,374 |
| Emera, Inc. | | 38,131 | | | 1,606,772 |
| Endesa SA | | 37,509 | | | 965,182 |
| Enel Americas SA | | 4,916,950 | | | 830,856 |
| Enel Chile SA | | 3,615,494 | | | 324,733 |
| Enel SpA | | 681,522 | | | 5,720,139 |
| Energisa SA | | 5,100 | | | 61,585 |
| Entergy Corp. | | 42,197 | | | 4,933,251 |
Strategic Equity Allocation Fund (continued)
| | | Shares or
Principal
Amount | | Value |
| COMMON STOCKS (continued) | | | |
| Electric utilities (continued) | | | |
| Equatorial Energia SA | | 28,790 | | $ | 158,761 |
| Evergy, Inc. | | 48,301 | | | 3,156,470 |
| Eversource Energy | | 68,616 | | | 5,932,539 |
| Exelon Corp. | | 206,024 | | | 8,881,695 |
| FirstEnergy Corp. | | 114,512 | | | 5,099,219 |
| Fortis, Inc. | | 69,781 | | | 2,823,992 |
| Fortum OYJ | | 55,145 | | | 1,177,670 |
| Genie Energy, Ltd., B Shares | | 2,094 | | | 14,490 |
| Hawaiian Electric Industries, Inc. | | 27,935 | | | 1,196,735 |
| HK Electric Investments & HK Electric Investments, Ltd. | | 135,000 | | | 135,991 |
| Hydro One, Ltd. (B) | | 53,531 | | | 1,074,409 |
| Iberdrola SA | | 738,239 | | | 8,451,501 |
| IDACORP, Inc. | | 12,919 | | | 1,248,492 |
| Interconexion Electrica SA ESP | | 42,443 | | | 224,324 |
| Korea Electric Power Corp. | | 50,372 | | | 881,433 |
| Kyushu Electric Power Company, Inc. | | 46,800 | | | 338,797 |
| Manila Electric Company | | 26,810 | | | 142,119 |
| Mercury NZ, Ltd. | | 45,382 | | | 136,240 |
| MGE Energy, Inc. | | 4,378 | | | 312,327 |
| NextEra Energy, Inc. | | 103,589 | | | 26,183,156 |
| OGE Energy Corp. | | 51,315 | | | 1,955,102 |
| Orsted A/S (B) | | 35,066 | | | 3,620,172 |
| Otter Tail Corp. | | 4,960 | | | 241,106 |
| PGE Polska Grupa Energetyczna SA (A) | | 51,000 | | | 58,632 |
| Pinnacle West Capital Corp. | | 23,824 | | | 2,132,010 |
| PNM Resources, Inc. | | 30,232 | | | 1,423,323 |
| Portland General Electric Company | | 10,980 | | | 597,422 |
| Power Assets Holdings, Ltd. | | 84,000 | | | 602,566 |
| PPL Corp. | | 153,236 | | | 4,598,612 |
| Red Electrica Corp. SA | | 50,606 | | | 967,246 |
| SSE PLC | | 70,708 | | | 1,390,143 |
| Tenaga Nasional BHD | | 321,936 | | | 929,826 |
| Terna Rete Elettrica Nazionale SpA | | 114,269 | | | 755,402 |
| The Chugoku Electric Power Company, Inc. | | 34,100 | | | 452,689 |
| The Kansai Electric Power Company, Inc. | | 89,800 | | | 967,852 |
| The Southern Company | | 222,264 | | | 13,415,855 |
| Tohoku Electric Power Company, Inc. | | 53,300 | | | 467,812 |
| Tokyo Electric Power Company Holdings, Inc. (A) | | 194,700 | | | 738,811 |
| Verbund AG | | 10,301 | | | 490,657 |
| Xcel Energy, Inc. | | 111,136 | | | 6,925,996 |
| | | | | | 163,483,006 |
| Gas utilities – 0.3% | | | |
| AltaGas, Ltd. | | 43,975 | | | 657,536 |
| APA Group | | 169,278 | | | 1,193,007 |
| Atmos Energy Corp. | | 25,293 | | | 2,611,502 |
| Beijing Enterprises Holdings, Ltd. | | 67,714 | | | 288,244 |
| Chesapeake Utilities Corp. | | 1,956 | | | 167,238 |
| China Gas Holdings, Ltd. | | 240,800 | | | 894,753 |
| China Resources Gas Group, Ltd. | | 118,100 | | | 595,217 |
| Enagas SA | | 29,382 | | | 762,394 |
| ENN Energy Holdings, Ltd. | | 104,100 | | | 1,174,290 |
| Hong Kong & China Gas Company, Ltd. | | 622,989 | | | 1,209,168 |
| Infraestructura Energetica Nova SAB de CV | | 64,535 | | | 283,281 |
| Korea Gas Corp. | | 5,644 | | | 130,752 |
| Kunlun Energy Company, Ltd. | | 456,490 | | | 322,936 |
| National Fuel Gas Company | | 22,129 | | | 810,143 |
| Naturgy Energy Group SA | | 34,769 | | | 809,994 |
| New Jersey Resources Corp. | | 35,462 | | | 1,252,163 |
| Northwest Natural Holding Company | | 3,787 | | | 249,071 |
| ONE Gas, Inc. | | 19,929 | | | 1,636,968 |
| Osaka Gas Company, Ltd. | | 47,000 | | | 752,351 |
| The accompanying notes are an integral part of the financial statements. | 77 | |
John Hancock Funds II
Portfolio of Investments — February 29, 2020 (unaudited)(showing percentage of total net assets)
Strategic Equity Allocation Fund (continued)
| | | Shares or
Principal
Amount | | Value |
| COMMON STOCKS (continued) | | | |
| Gas utilities (continued) | | | |
| Perusahaan Gas Negara Tbk PT | | 261,669 | | $ | 23,824 |
| Petronas Gas BHD | | 80,099 | | | 317,625 |
| RGC Resources, Inc. | | 1,068 | | | 29,317 |
| Snam SpA | | 164,396 | | | 815,137 |
| South Jersey Industries, Inc. | | 11,506 | | | 311,237 |
| Southwest Gas Holdings, Inc. | | 20,672 | | | 1,337,065 |
| Spire, Inc. | | 19,163 | | | 1,438,183 |
| Toho Gas Company, Ltd. | | 9,145 | | | 310,730 |
| Tokyo Gas Company, Ltd. | | 47,600 | | | 955,233 |
| Towngas China Company, Ltd. (A) | | 135,900 | | | 79,837 |
| UGI Corp. | | 53,580 | | | 1,931,023 |
| | | | | | 23,350,219 |
Independent power and renewable electricity producers –
0.1% | | | |
| Aboitiz Power Corp. | | 184,200 | | | 99,278 |
| AES Corp. | | 140,703 | | | 2,353,961 |
| Atlantic Power Corp. (A) | | 15,039 | | | 34,139 |
| B. Grimm Power PCL, NVDR | | 42,700 | | | 62,055 |
| CGN Power Company, Ltd., H Shares (B) | | 1,378,700 | | | 339,113 |
| China Common Rich Renewable Energy Investments, Ltd. (A)(D) | | 1,136,000 | | | 31,333 |
| China Longyuan Power Group Corp., Ltd., H Shares | | 423,300 | | | 222,423 |
| China Power International Development, Ltd. | | 540,900 | | | 101,591 |
| China Resources Power Holdings Company, Ltd. | | 256,332 | | | 308,001 |
| Clearway Energy, Inc., Class A | | 4,770 | | | 96,783 |
| Clearway Energy, Inc., Class C | | 8,710 | | | 183,258 |
| Colbun SA | | 1,018,241 | | | 128,493 |
| Datang International Power Generation Company, Ltd., H Shares | | 353,200 | | | 55,985 |
| Electric Power Development Company, Ltd. | | 18,500 | | | 396,721 |
| Electricity Generating PCL, NVDR | | 16,000 | | | 139,602 |
| Energy Absolute PCL, NVDR | | 91,200 | | | 115,135 |
| Engie Brasil Energia SA | | 6,683 | | | 71,031 |
| Global Power Synergy PCL, NVDR | | 38,400 | | | 77,772 |
| Gulf Energy Development PCL, NVDR | | 28,900 | | | 154,524 |
| Huadian Power International Corp., Ltd., H Shares | | 217,100 | | | 65,809 |
| Huaneng Power International, Inc., H Shares | | 495,864 | | | 201,885 |
| Meridian Energy, Ltd. | | 86,225 | | | 250,144 |
| NRG Energy, Inc. | | 53,322 | | | 1,770,824 |
| Ormat Technologies, Inc. | | 4,879 | | | 339,969 |
| Pattern Energy Group, Inc., Class A | | 11,058 | | | 299,119 |
| Ratch Group PCL, NVDR | | 41,400 | | | 78,048 |
| Sunnova Energy International, Inc. (A) | | 1,956 | | | 33,839 |
| TerraForm Power, Inc., Class A | | 9,625 | | | 180,854 |
| Uniper SE | | 26,475 | | | 786,950 |
| | | | | | 8,978,639 |
| Multi-utilities – 1.2% | | | |
| AGL Energy, Ltd. | | 94,132 | | | 1,178,785 |
| Algonquin Power & Utilities Corp. | | 85,159 | | | 1,294,277 |
| Ameren Corp. | | 52,143 | | | 4,119,297 |
| Atco, Ltd., Class I | | 12,932 | | | 482,499 |
| Avista Corp. | | 8,171 | | | 385,263 |
| Black Hills Corp. | | 23,262 | | | 1,679,516 |
| Canadian Utilities, Ltd., Class A | | 21,721 | | | 642,770 |
| CenterPoint Energy, Inc. | | 106,443 | | | 2,450,318 |
| Centrica PLC | | 399,961 | | | 370,482 |
| CMS Energy Corp. | | 60,157 | | | 3,634,686 |
| Consolidated Edison, Inc. | | 70,454 | | | 5,553,184 |
| Dominion Energy, Inc. | | 174,443 | | | 13,637,954 |
Strategic Equity Allocation Fund (continued)
| | | Shares or
Principal
Amount | | Value |
| COMMON STOCKS (continued) | | | |
| Multi-utilities (continued) | | | |
| DTE Energy Company | | 40,714 | | $ | 4,546,532 |
| E.ON SE | | 298,413 | | | 3,466,443 |
| Engie SA | | 245,093 | | | 4,092,810 |
| MDU Resources Group, Inc. | | 51,368 | | | 1,424,435 |
| National Grid PLC | | 241,711 | | | 3,046,944 |
| NiSource, Inc. | | 79,168 | | | 2,139,119 |
| NorthWestern Corp. | | 19,135 | | | 1,345,956 |
| Public Service Enterprise Group, Inc. | | 107,181 | | | 5,499,457 |
| RWE AG | | 77,692 | | | 2,696,613 |
| Sempra Energy | | 59,744 | | | 8,351,016 |
| Suez | | 45,164 | | | 717,150 |
| Unitil Corp. | | 1,823 | | | 102,708 |
| Veolia Environnement SA | | 71,848 | | | 2,070,009 |
| WEC Energy Group, Inc. | | 66,852 | | | 6,172,445 |
| YTL Corp. BHD | | 279,597 | | | 56,169 |
| | | | | | 81,156,837 |
| Water utilities – 0.2% | | | |
| Aguas Andinas SA, Class A | | 325,407 | | | 111,800 |
| American States Water Company | | 4,500 | | | 344,655 |
| American Water Works Company, Inc. | | 38,313 | | | 4,737,786 |
| AquaVenture Holdings, Ltd. (A) | | 1,869 | | | 50,538 |
| Artesian Resources Corp., Class A | | 1,138 | | | 39,068 |
| Beijing Enterprises Water Group, Ltd. (A) | | 667,700 | | | 314,472 |
| Cadiz, Inc. (A)(C) | | 1,848 | | | 16,188 |
| California Water Service Group | | 5,980 | | | 286,801 |
| Cia de Saneamento Basico do Estado de Sao Paulo | | 11,498 | | | 151,056 |
| Consolidated Water Company, Ltd. | | 1,973 | | | 31,884 |
| Essential Utilities, Inc. | | 55,331 | | | 2,379,786 |
| Guangdong Investment, Ltd. | | 383,980 | | | 729,206 |
| Middlesex Water Company | | 2,027 | | | 120,546 |
| Pure Cycle Corp. (A) | | 2,481 | | | 30,690 |
| Severn Trent PLC | | 16,052 | | | 509,550 |
| SJW Group | | 3,258 | | | 199,324 |
| The York Water Company | | 1,672 | | | 70,709 |
| United Utilities Group PLC | | 46,307 | | | 561,864 |
| | | | | | 10,685,923 |
| | | | | | 287,654,624 |
| TOTAL COMMON STOCKS (Cost $6,265,622,746) | | $ | 6,465,914,804 |
| PREFERRED SECURITIES – 0.3% | | | | | |
| Communication services – 0.0% | | | | | |
| Diversified telecommunication services – 0.0% | | | |
| Telefonica Brasil SA | | 15,354 | | | 183,277 |
| Media – 0.0% | | | |
| GCI Liberty, Inc., 7.000% (C) | | 974 | | | 26,347 |
| | | | | | 209,624 |
| Consumer discretionary – 0.1% | | | | | |
| Automobiles – 0.1% | | | |
| Bayerische Motoren Werke AG | | 7,416 | | | 384,514 |
| Hyundai Motor Company | | 4,693 | | | 256,645 |
| Hyundai Motor Company, 2nd Preferred | | 7,252 | | | 449,069 |
| Porsche Automobil Holding SE | | 20,474 | | | 1,275,849 |
| Volkswagen AG | | 24,939 | | | 4,140,032 |
| | | | | | 6,506,109 |
| Multiline retail – 0.0% | | | |
| Lojas Americanas SA | | 25,326 | | | 150,646 |
| | | | | | 6,656,755 |
| Consumer staples – 0.0% | | | | | |
| Beverages – 0.0% | | | |
| Embotelladora Andina SA, B Shares | | 44,722 | | | 108,022 |
| The accompanying notes are an integral part of the financial statements. | 78 | |
John Hancock Funds II
Portfolio of Investments — February 29, 2020 (unaudited)(showing percentage of total net assets)
Strategic Equity Allocation Fund (continued)
| | | Shares or
Principal
Amount | | Value |
| PREFERRED SECURITIES (continued) | | | | | |
| Food and staples retailing – 0.0% | | | |
| Cia Brasileira de Distribuicao | | 5,500 | | $ | 88,688 |
| Household products – 0.0% | | | |
| Henkel AG & Company KGaA | | 23,949 | | | 2,231,256 |
| Personal products – 0.0% | | | |
| Amorepacific Corp. | | 1,696 | | | 102,833 |
| LG Household & Health Care, Ltd. | | 410 | | | 248,950 |
| | | | | | 351,783 |
| | | | | | 2,779,749 |
| Energy – 0.0% | | | | | |
| Oil, gas and consumable fuels – 0.0% | | | |
| Petroleo Brasileiro SA | | 142,233 | | | 805,963 |
| Financials – 0.1% | | | | | |
| Banks – 0.1% | | | |
| Banco Bradesco SA | | 136,586 | | | 932,483 |
| Bancolombia SA | | 43,802 | | | 523,752 |
| Grupo Aval Acciones y Valores SA | | 386,462 | | | 159,232 |
| Itau Unibanco Holding SA | | 163,467 | | | 1,169,736 |
| Itausa - Investimentos Itau SA | | 146,859 | | | 394,413 |
| | | | | | 3,179,616 |
| Health care – 0.0% | | | | | |
| Health care equipment and supplies – 0.0% | | | |
| Sartorius AG | | 4,750 | | | 1,110,409 |
| Information technology – 0.1% | | | | | |
| Technology hardware, storage and peripherals – 0.1% | | | |
| Samsung Electronics Company, Ltd. | | 162,121 | | | 6,189,186 |
| Materials – 0.0% | | | | | |
| Chemicals – 0.0% | | | |
| Braskem SA, A Shares | | 6,383 | | | 38,382 |
| FUCHS PETROLUB SE | | 9,232 | | | 353,404 |
| LG Chem, Ltd. | | 1,510 | | | 235,178 |
| Sociedad Quimica y Minera de Chile SA, B Shares | | 14,754 | | | 390,721 |
| | | | | | 1,017,685 |
| Metals and mining – 0.0% | | | |
| Gerdau SA | | 37,783 | | | 143,041 |
| | | | | | 1,160,726 |
| Utilities – 0.0% | | | | | |
| Electric utilities – 0.0% | | | |
| Centrais Eletricas Brasileiras SA, B Shares | | 8,879 | | | 71,181 |
| Cia Energetica de Minas Gerais | | 30,148 | | | 94,113 |
| | | | | | 165,294 |
| TOTAL PREFERRED SECURITIES (Cost $23,030,251) | | $ | 22,257,322 |
| EXCHANGE-TRADED FUNDS – 1.0% | | | |
| iShares MSCI India ETF (C) | | 390,884 | | | 12,582,556 |
| iShares MSCI Russia ETF | | 23,491 | | | 852,958 |
| KraneShares Bosera MSCI China A ETF (C) | | 380,783 | | | 12,116,515 |
| VanEck Vectors Russia ETF (C) | | 1,153,666 | | | 24,653,842 |
| Xtrackers Harvest CSI 300 China A-Shares ETF (C) | | 712,225 | | | 20,348,268 |
| TOTAL EXCHANGE-TRADED FUNDS (Cost $70,598,028) | | $ | 70,554,139 |
| RIGHTS – 0.0% | | | | | |
| Pan American Silver Corp. (Expiration Date: 2-22-29) (A)(E) | | 37,553 | | | 23,658 |
| Spero Therapeutics, Inc. (Expiration Date: 3-2-20) (A)(E) | | 258 | | | 139 |
| TOTAL RIGHTS (Cost $11,142) | | $ | 23,797 |
Strategic Equity Allocation Fund (continued)
| | | Shares or
Principal
Amount | | Value |
| WARRANTS – 0.0% | | | | | |
| BTS Group Holdings PCL (Expiration Date: 2-16-21; Strike Price: THB 14.00) (A) | | 2,410 | | $ | 66 |
| BTS Group Holdings PCL (Expiration Date: 2-16-21; Strike Price: THB 14.00) (A) | | 63,720 | | | 1,737 |
| Minor International PCL (Expiration Date: 10-1-21; Strike Price: THB 48.00) (A) | | 1,847 | | | 99 |
| TOTAL WARRANTS (Cost $0) | | $ | 1,902 |
| SHORT-TERM INVESTMENTS – 4.4% | | | |
| U.S. Government Agency – 2.4% | | | | | |
| Federal Home Loan Bank Discount Note | | | | | |
| 1.435%, 04/01/2020 * | $ | 15,000,000 | | | 14,981,125 |
| 1.541%, 04/15/2020 * | | 5,000,000 | | | 4,990,772 |
| 1.550%, 04/17/2020 * | | 20,000,000 | | | 19,961,411 |
| 1.550%, 04/20/2020 * | | 8,000,000 | | | 7,983,558 |
| 1.550%, 05/11/2020 * | | 65,000,000 | | | 64,818,000 |
| 1.570%, 05/27/2020 * | | 50,000,000 | | | 49,828,000 |
| | | | | | 162,562,866 |
| Short-term funds – 1.4% | | | | | |
| John Hancock Collateral Trust, 1.6968% (F)(G) | | 9,788,600 | | | 97,973,122 |
| Repurchase agreement – 0.6% | | | | | |
| Repurchase Agreement with State Street Corp. dated 2-28-20 at 0.550% to be repurchased at $41,168,887 on 3-2-20, collateralized by $26,530,000 U.S. Treasury Notes, 2.375% due 4-15-21 (valued at $27,101,297) and $13,720,000 U.S. Treasury Inflation Indexed Notes, 0.125% due 4-15-21 (valued at $14,900,496) | $ | 41,167,000 | | | 41,167,000 |
| TOTAL SHORT-TERM INVESTMENTS (Cost $301,645,711) | | $ | 301,702,988 |
Total Investments (Strategic Equity Allocation Fund)
(Cost $6,660,907,878) – 100.2% | | $ | 6,860,454,952 |
| Other assets and liabilities, net – (0.2%) | | | (16,351,783) |
| TOTAL NET ASSETS – 100.0% | | $ | 6,844,103,169 |
| Currency Abbreviations |
| THB | Thai Bhat |
| Security Abbreviations and Legend |
| ADR | American Depositary Receipt |
| NVDR | Non-Voting Depositary Receipt |
| (A) | Non-income producing security. |
| (B) | These securities are exempt from registration under Rule 144A of the Securities Act of 1933. Such securities may be resold, normally to qualified institutional buyers, in transactions exempt from registration. |
| (C) | All or a portion of this security is on loan as of 2-29-20. |
| (D) | Security is valued using significant unobservable inputs and is classified as Level 3 in the fair value hierarchy. Refer to Note 2 to the financial statements. |
| (E) | Strike price and/or expiration date not available. |
| (F) | The rate shown is the annualized seven-day yield as of 2-29-20. |
| (G) | Investment is an affiliate of the fund, the advisor and/or subadvisor. This security represents the investment of cash collateral received for securities lending. |
| * | Yield represents either the annualized yield at the date of purchase, the stated coupon rate or, for floating rate securities, the rate at period end. |
| The accompanying notes are an integral part of the financial statements. | 79 | |
John Hancock Funds II
Portfolio of Investments — February 29, 2020 (unaudited)(showing percentage of total net assets)
Strategic Equity Allocation Fund (continued)
DERIVATIVES
FUTURES
| Open contracts | Number of
contracts | Position | Expiration
date | Notional
basis^ | Notional
value^ | Unrealized
appreciation
(depreciation) |
| Canadian Dollar Currency Futures | 94 | Long | Mar 2020 | $7,122,201 | $7,013,810 | $(108,391) |
| Mini MSCI EAFE Index Futures | 641 | Long | Mar 2020 | 64,134,053 | 58,202,800 | (5,931,253) |
| Mini MSCI Emerging Markets Index Futures | 403 | Long | Mar 2020 | 21,701,357 | 20,327,320 | (1,374,037) |
| Russell 2000 E-Mini Index Futures | 106 | Long | Mar 2020 | 8,489,457 | 7,816,970 | (672,487) |
| S&P 500 Index E-Mini Futures | 905 | Long | Mar 2020 | 144,935,309 | 134,109,688 | (10,825,621) |
| S&P Mid 400 Index E-Mini Futures | 98 | Long | Mar 2020 | 19,756,044 | 17,759,560 | (1,996,484) |
| S&P/TSX 60 Index Futures | 45 | Long | Mar 2020 | 7,014,113 | 6,512,051 | (502,062) |
| | | | | | | $(21,410,335) |
^ Notional basis refers to the contractual amount agreed upon at inception of open contracts; notional value represents the current value of the open contract.
See Notes to financial statements regarding investment transactions and other derivatives information.
U.S. Sector Rotation Fund
| | | Shares or
Principal
Amount | | Value |
| COMMON STOCKS – 96.4% | | | |
| Communication services – 13.5% | | | | | |
| Diversified telecommunication services – 1.6% | | | |
| AT&T, Inc. | | 274,148 | | $ | 9,655,493 |
| CenturyLink, Inc. | | 36,823 | | | 444,454 |
| Verizon Communications, Inc. | | 155,211 | | | 8,406,228 |
| | | | | | 18,506,175 |
| Entertainment – 2.6% | | | |
| Activision Blizzard, Inc. | | 50,356 | | | 2,927,194 |
| Electronic Arts, Inc. (A) | | 19,138 | | | 1,940,019 |
| Live Nation Entertainment, Inc. (A) | | 9,236 | | | 561,272 |
| Netflix, Inc. (A) | | 28,726 | | | 10,600,756 |
| Take-Two Interactive Software, Inc. (A) | | 7,418 | | | 797,287 |
| The Walt Disney Company | | 118,140 | | | 13,899,171 |
| | | | | | 30,725,699 |
| Interactive media and services – 7.3% | | | |
| Alphabet, Inc., Class A (A) | | 19,639 | | | 26,301,531 |
| Alphabet, Inc., Class C (A) | | 19,591 | | | 26,238,814 |
| Facebook, Inc., Class A (A) | | 157,734 | | | 30,359,063 |
| Twitter, Inc. (A) | | 50,887 | | | 1,689,448 |
| | | | | | 84,588,856 |
| Media – 1.9% | | | |
| Charter Communications, Inc., Class A (A) | | 10,277 | | | 5,068,308 |
| Comcast Corp., Class A | | 297,566 | | | 12,030,593 |
| Discovery, Inc., Series A (A)(B) | | 10,365 | | | 266,381 |
| Discovery, Inc., Series C (A) | | 21,986 | | | 551,849 |
| DISH Network Corp., Class A (A) | | 16,781 | | | 562,499 |
| Fox Corp., Class A | | 23,237 | | | 714,305 |
| Fox Corp., Class B | | 10,643 | | | 324,079 |
| Media General, Inc. (A)(C) | | 7,175 | | | 689 |
| News Corp., Class A | | 25,471 | | | 307,562 |
| News Corp., Class B | | 7,980 | | | 99,271 |
| Omnicom Group, Inc. | | 14,271 | | | 988,695 |
| The Interpublic Group of Companies, Inc. | | 25,414 | | | 542,843 |
| ViacomCBS, Inc., Class B | | 35,421 | | | 871,711 |
| | | | | | 22,328,785 |
| Wireless telecommunication services – 0.1% | | | |
| T-Mobile US, Inc. (A) | | 11,880 | | | 1,071,101 |
| | | | | | 157,220,616 |
| Consumer discretionary – 8.4% | | | | | |
| Auto components – 0.1% | | | |
| Aptiv PLC | | 5,772 | | | 450,851 |
| BorgWarner, Inc. | | 4,669 | | | 147,540 |
| | | | | | 598,391 |
U.S. Sector Rotation Fund (continued)
| | | Shares or
Principal
Amount | | Value |
| COMMON STOCKS (continued) | | | |
| Automobiles – 0.1% | | | |
| Ford Motor Company | | 88,045 | | $ | 612,793 |
| General Motors Company | | 28,429 | | | 867,085 |
| Harley-Davidson, Inc. | | 3,489 | | | 106,310 |
| | | | | | 1,586,188 |
| Distributors – 0.1% | | | |
| Genuine Parts Company | | 10,447 | | | 911,396 |
| LKQ Corp. (A) | | 22,036 | | | 651,825 |
| | | | | | 1,563,221 |
| Diversified consumer services – 0.0% | | | |
| H&R Block, Inc. | | 7,138 | | | 147,542 |
| Hotels, restaurants and leisure – 1.4% | | | |
| Carnival Corp. | | 14,643 | | | 489,955 |
| Chipotle Mexican Grill, Inc. (A) | | 935 | | | 723,297 |
| Darden Restaurants, Inc. | | 4,482 | | | 436,995 |
| Hilton Worldwide Holdings, Inc. | | 10,315 | | | 1,002,618 |
| Las Vegas Sands Corp. | | 12,354 | | | 720,362 |
| Marriott International, Inc., Class A | | 9,920 | | | 1,230,080 |
| McDonald's Corp. | | 27,531 | | | 5,345,694 |
| MGM Resorts International | | 18,826 | | | 462,367 |
| Norwegian Cruise Line Holdings, Ltd. (A) | | 7,778 | | | 289,808 |
| Royal Caribbean Cruises, Ltd. | | 6,284 | | | 505,296 |
| Starbucks Corp. | | 43,173 | | | 3,386,058 |
| Wynn Resorts, Ltd. | | 3,532 | | | 381,385 |
| Yum! Brands, Inc. | | 11,057 | | | 986,837 |
| | | | | | 15,960,752 |
| Household durables – 0.3% | | | |
| D.R. Horton, Inc. | | 12,404 | | | 660,761 |
| Garmin, Ltd. | | 5,344 | | | 472,356 |
| Hamilton Beach Brands Holding Company, Class B | | 294 | | | 3,410 |
| Leggett & Platt, Inc. | | 4,868 | | | 193,065 |
| Lennar Corp., A Shares | | 10,353 | | | 624,700 |
| Mohawk Industries, Inc. (A) | | 2,199 | | | 266,409 |
| Newell Brands, Inc. | | 14,096 | | | 217,501 |
| NVR, Inc. (A) | | 128 | | | 469,399 |
| PulteGroup, Inc. | | 9,423 | | | 378,805 |
| Whirlpool Corp. | | 2,338 | | | 298,937 |
| | | | | | 3,585,343 |
| Internet and direct marketing retail – 3.3% | | | |
| Amazon.com, Inc. (A) | | 17,690 | | | 33,323,538 |
| Booking Holdings, Inc. (A) | | 1,778 | | | 3,014,883 |
| eBay, Inc. | | 32,481 | | | 1,125,142 |
| The accompanying notes are an integral part of the financial statements. | 80 | |
John Hancock Funds II
Portfolio of Investments — February 29, 2020 (unaudited)(showing percentage of total net assets)
U.S. Sector Rotation Fund (continued)
| | | Shares or
Principal
Amount | | Value |
| COMMON STOCKS (continued) | | | |
| Internet and direct marketing retail (continued) | | | |
| Expedia Group, Inc. | | 5,936 | | $ | 585,408 |
| | | | | | 38,048,971 |
| Leisure products – 0.0% | | | |
| Hasbro, Inc. | | 4,707 | | | 363,616 |
| Multiline retail – 0.3% | | | |
| Dollar General Corp. | | 6,968 | | | 1,047,290 |
| Dollar Tree, Inc. (A) | | 6,477 | | | 537,785 |
| Kohl's Corp. | | 4,285 | | | 167,758 |
| Macy's, Inc. (B) | | 8,457 | | | 111,886 |
| Nordstrom, Inc. (B) | | 2,932 | | | 101,740 |
| Target Corp. | | 13,869 | | | 1,428,507 |
| | | | | | 3,394,966 |
| Specialty retail – 2.3% | | | |
| Advance Auto Parts, Inc. | | 3,146 | | | 418,355 |
| AutoZone, Inc. (A) | | 1,082 | | | 1,117,176 |
| Best Buy Company, Inc. | | 10,344 | | | 782,524 |
| CarMax, Inc. (A) | | 7,469 | | | 652,118 |
| L Brands, Inc. | | 10,549 | | | 228,491 |
| Lowe's Companies, Inc. | | 34,817 | | | 3,710,448 |
| O'Reilly Automotive, Inc. (A) | | 3,437 | | | 1,267,291 |
| Ross Stores, Inc. | | 16,432 | | | 1,787,473 |
| The Gap, Inc. | | 9,666 | | | 138,514 |
| The Home Depot, Inc. | | 49,551 | | | 10,794,190 |
| The TJX Companies, Inc. | | 55,086 | | | 3,294,143 |
| Tiffany & Company | | 4,904 | | | 655,125 |
| Tractor Supply Company | | 5,378 | | | 476,007 |
| Ulta Beauty, Inc. (A) | | 2,597 | | | 667,663 |
| | | | | | 25,989,518 |
| Textiles, apparel and luxury goods – 0.5% | | | |
| Capri Holdings, Ltd. (A) | | 5,609 | | | 144,824 |
| Hanesbrands, Inc. | | 13,379 | | | 177,138 |
| NIKE, Inc., Class B | | 46,092 | | | 4,119,703 |
| PVH Corp. | | 2,743 | | | 203,284 |
| Ralph Lauren Corp. | | 1,840 | | | 194,138 |
| Tapestry, Inc. | | 10,207 | | | 239,354 |
| Under Armour, Inc., Class A (A)(B) | | 6,961 | | | 98,777 |
| Under Armour, Inc., Class C (A) | | 7,198 | | | 89,831 |
| VF Corp. | | 12,114 | | | 872,208 |
| | | | | | 6,139,257 |
| | | | | | 97,377,765 |
| Consumer staples – 5.3% | | | | | |
| Beverages – 1.3% | | | |
| Brown-Forman Corp., Class B | | 5,748 | | | 352,985 |
| Constellation Brands, Inc., Class A | | 5,284 | | | 910,856 |
| Molson Coors Beverage Company, Class B | | 5,926 | | | 293,989 |
| Monster Beverage Corp. (A) | | 12,043 | | | 751,604 |
| PepsiCo, Inc. | | 43,990 | | | 5,808,000 |
| The Coca-Cola Company | | 121,646 | | | 6,506,845 |
| | | | | | 14,624,279 |
| Food and staples retailing – 1.7% | | | |
| Costco Wholesale Corp. | | 23,582 | | | 6,629,843 |
| Sysco Corp. | | 27,236 | | | 1,815,279 |
| The Kroger Company | | 42,811 | | | 1,204,273 |
| Walgreens Boots Alliance, Inc. | | 40,021 | | | 1,831,361 |
| Walmart, Inc. | | 75,724 | | | 8,153,960 |
| | | | | | 19,634,716 |
| Food products – 0.7% | | | |
| Archer-Daniels-Midland Company | | 17,562 | | | 661,209 |
| Campbell Soup Company | | 5,329 | | | 240,444 |
| Conagra Brands, Inc. | | 15,352 | | | 409,745 |
| General Mills, Inc. | | 19,067 | | | 934,283 |
| Hormel Foods Corp. | | 8,772 | | | 364,915 |
U.S. Sector Rotation Fund (continued)
| | | Shares or
Principal
Amount | | Value |
| COMMON STOCKS (continued) | | | |
| Food products (continued) | | | |
| Kellogg Company | | 7,855 | | $ | 474,992 |
| Lamb Weston Holdings, Inc. | | 4,608 | | | 400,389 |
| McCormick & Company, Inc. | | 3,898 | | | 569,849 |
| Mondelez International, Inc., Class A | | 45,422 | | | 2,398,282 |
| The Hershey Company | | 4,679 | | | 673,729 |
| The J.M. Smucker Company | | 3,598 | | | 370,558 |
| The Kraft Heinz Company | | 19,647 | | | 486,656 |
| Tyson Foods, Inc., Class A | | 9,312 | | | 631,633 |
| | | | | | 8,616,684 |
| Household products – 0.9% | | | |
| Church & Dwight Company, Inc. | | 6,344 | | | 441,035 |
| Colgate-Palmolive Company | | 22,156 | | | 1,497,081 |
| Kimberly-Clark Corp. | | 8,862 | | | 1,162,606 |
| The Clorox Company | | 3,244 | | | 517,158 |
| The Procter & Gamble Company | | 64,469 | | | 7,299,825 |
| | | | | | 10,917,705 |
| Personal products – 0.1% | | | |
| Coty, Inc., Class A | | 7,641 | | | 70,526 |
| The Estee Lauder Companies, Inc., Class A | | 5,753 | | | 1,056,251 |
| | | | | | 1,126,777 |
| Tobacco – 0.6% | | | |
| Altria Group, Inc. | | 58,934 | | | 2,379,166 |
| Philip Morris International, Inc. | | 49,083 | | | 4,018,425 |
| | | | | | 6,397,591 |
| | | | | | 61,317,752 |
| Energy – 3.7% | | | | | |
| Energy equipment and services – 0.3% | | | |
| Baker Hughes Company | | 32,010 | | | 515,041 |
| Halliburton Company | | 43,238 | | | 733,316 |
| Helmerich & Payne, Inc. | | 5,342 | | | 197,066 |
| National Oilwell Varco, Inc. | | 19,005 | | | 355,584 |
| Schlumberger, Ltd. | | 68,191 | | | 1,847,294 |
| TechnipFMC PLC | | 20,700 | | | 307,188 |
| | | | | | 3,955,489 |
| Oil, gas and consumable fuels – 3.4% | | | |
| Apache Corp. | | 18,522 | | | 461,568 |
| Cabot Oil & Gas Corp. | | 20,093 | | | 279,895 |
| Chevron Corp. | | 93,139 | | | 8,693,594 |
| Cimarex Energy Company | | 5,015 | | | 165,746 |
| Concho Resources, Inc. | | 9,902 | | | 673,534 |
| ConocoPhillips | | 54,048 | | | 2,617,004 |
| Devon Energy Corp. | | 19,063 | | | 309,583 |
| Diamondback Energy, Inc. | | 7,937 | | | 492,094 |
| EOG Resources, Inc. | | 28,656 | | | 1,812,779 |
| Exxon Mobil Corp. | | 208,412 | | | 10,720,713 |
| Hess Corp. | | 12,758 | | | 716,744 |
| HollyFrontier Corp. | | 7,314 | | | 246,336 |
| Kinder Morgan, Inc. | | 95,947 | | | 1,839,304 |
| Marathon Oil Corp. | | 39,402 | | | 326,249 |
| Marathon Petroleum Corp. | | 31,984 | | | 1,516,681 |
| Noble Energy, Inc. | | 23,559 | | | 372,939 |
| Occidental Petroleum Corp. | | 44,002 | | | 1,440,625 |
| ONEOK, Inc. | | 20,347 | | | 1,357,552 |
| Phillips 66 | | 21,888 | | | 1,638,536 |
| Pioneer Natural Resources Company | | 8,159 | | | 1,001,762 |
| The Williams Companies, Inc. | | 59,702 | | | 1,137,323 |
| Valero Energy Corp. | | 20,228 | | | 1,340,105 |
| | | | | | 39,160,666 |
| | | | | | 43,116,155 |
| Financials – 11.1% | | | | | |
| The accompanying notes are an integral part of the financial statements. | 81 | |
John Hancock Funds II
Portfolio of Investments — February 29, 2020 (unaudited)(showing percentage of total net assets)
U.S. Sector Rotation Fund (continued)
| | | Shares or
Principal
Amount | | Value |
| COMMON STOCKS (continued) | | | |
| Banks – 5.3% | | | |
| Bank of America Corp. | | 414,538 | | $ | 11,814,333 |
| Citigroup, Inc. | | 111,791 | | | 7,094,257 |
| Citizens Financial Group, Inc. | | 22,260 | | | 705,419 |
| Comerica, Inc. | | 7,382 | | | 388,588 |
| Fifth Third Bancorp | | 36,339 | | | 886,672 |
| First Republic Bank | | 8,629 | | | 867,819 |
| Huntington Bancshares, Inc. | | 52,883 | | | 648,874 |
| JPMorgan Chase & Co. | | 160,605 | | | 18,647,847 |
| KeyCorp | | 50,436 | | | 824,629 |
| M&T Bank Corp. | | 6,757 | | | 948,548 |
| People's United Financial, Inc. | | 22,741 | | | 318,147 |
| Regions Financial Corp. | | 49,395 | | | 667,820 |
| SVB Financial Group (A) | | 2,641 | | | 549,751 |
| The PNC Financial Services Group, Inc. | | 22,437 | | | 2,836,037 |
| Truist Financial Corp. | | 68,670 | | | 3,168,434 |
| U.S. Bancorp | | 72,778 | | | 3,379,810 |
| Wells Fargo & Company | | 197,075 | | | 8,050,514 |
| Zions Bancorp NA | | 8,729 | | | 348,724 |
| | | | | | 62,146,223 |
| Capital markets – 2.4% | | | |
| Ameriprise Financial, Inc. | | 5,447 | | | 769,661 |
| BlackRock, Inc. | | 5,070 | | | 2,347,461 |
| Cboe Global Markets, Inc. | | 4,766 | | | 543,324 |
| CME Group, Inc. | | 15,407 | | | 3,063,220 |
| E*TRADE Financial Corp. | | 9,713 | | | 444,661 |
| Franklin Resources, Inc. | | 11,991 | | | 260,924 |
| Intercontinental Exchange, Inc. | | 23,940 | | | 2,135,927 |
| Invesco, Ltd. | | 16,001 | | | 230,414 |
| MarketAxess Holdings, Inc. | | 1,630 | | | 528,658 |
| Moody's Corp. | | 6,981 | | | 1,675,649 |
| Morgan Stanley | | 52,886 | | | 2,381,457 |
| MSCI, Inc. | | 3,642 | | | 1,075,992 |
| Nasdaq, Inc. | | 4,933 | | | 505,879 |
| Northern Trust Corp. | | 9,109 | | | 799,406 |
| Raymond James Financial, Inc. | | 5,308 | | | 443,908 |
| S&P Global, Inc. | | 10,507 | | | 2,793,916 |
| State Street Corp. | | 15,633 | | | 1,064,764 |
| T. Rowe Price Group, Inc. | | 10,046 | | | 1,185,528 |
| The Bank of New York Mellon Corp. | | 36,079 | | | 1,439,552 |
| The Charles Schwab Corp. | | 49,151 | | | 2,002,903 |
| The Goldman Sachs Group, Inc. | | 13,701 | | | 2,750,750 |
| | | | | | 28,443,954 |
| Consumer finance – 0.6% | | | |
| American Express Company | | 28,847 | | | 3,171,151 |
| Capital One Financial Corp. | | 20,022 | | | 1,767,142 |
| Discover Financial Services | | 13,477 | | | 883,822 |
| Synchrony Financial | | 25,559 | | | 743,767 |
| | | | | | 6,565,882 |
| Diversified financial services – 1.5% | | | |
| Berkshire Hathaway, Inc., Class B (A) | | 84,093 | | | 17,351,750 |
| First Eagle Private Credit LLC (A)(C) | | 2,317 | | | 560 |
| | | | | | 17,352,310 |
| Insurance – 1.3% | | | |
| Aflac, Inc. | | 19,306 | | | 827,262 |
| American International Group, Inc. | | 22,881 | | | 964,663 |
| Aon PLC | | 6,158 | | | 1,280,864 |
| Arthur J. Gallagher & Company | | 4,906 | | | 478,286 |
| Assurant, Inc. | | 1,595 | | | 192,341 |
| Chubb, Ltd. | | 11,920 | | | 1,728,758 |
| Cincinnati Financial Corp. | | 3,996 | | | 372,587 |
| Everest Re Group, Ltd. | | 1,073 | | | 265,975 |
| Globe Life, Inc. | | 2,620 | | | 242,769 |
| Lincoln National Corp. | | 5,217 | | | 236,800 |
| Loews Corp. | | 6,728 | | | 306,999 |
U.S. Sector Rotation Fund (continued)
| | | Shares or
Principal
Amount | | Value |
| COMMON STOCKS (continued) | | | |
| Insurance (continued) | | | |
| Marsh & McLennan Companies, Inc. | | 13,274 | | $ | 1,387,929 |
| MetLife, Inc. | | 20,560 | | | 878,323 |
| Principal Financial Group, Inc. | | 6,792 | | | 301,497 |
| Prudential Financial, Inc. | | 10,573 | | | 797,733 |
| The Allstate Corp. | | 8,521 | | | 896,835 |
| The Hartford Financial Services Group, Inc. | | 9,480 | | | 473,526 |
| The Progressive Corp. | | 15,377 | | | 1,124,981 |
| The Travelers Companies, Inc. | | 6,789 | | | 813,390 |
| Unum Group | | 5,425 | | | 126,457 |
| W.R. Berkley Corp. | | 3,816 | | | 256,206 |
| Willis Towers Watson PLC | | 3,382 | | | 640,044 |
| | | | | | 14,594,225 |
| | | | | | 129,102,594 |
| Health care – 13.3% | | | | | |
| Biotechnology – 1.8% | | | |
| AbbVie, Inc. | | 59,207 | | | 5,074,632 |
| Alexion Pharmaceuticals, Inc. (A) | | 8,860 | | | 833,106 |
| Amgen, Inc. | | 23,789 | | | 4,751,377 |
| Biogen, Inc. (A) | | 7,224 | | | 2,227,809 |
| Gilead Sciences, Inc. | | 50,652 | | | 3,513,223 |
| Incyte Corp. (A) | | 7,158 | | | 539,785 |
| Regeneron Pharmaceuticals, Inc. (A) | | 3,198 | | | 1,421,735 |
| Vertex Pharmaceuticals, Inc. (A) | | 10,295 | | | 2,306,389 |
| | | | | | 20,668,056 |
| Health care equipment and supplies – 3.4% | | | |
| Abbott Laboratories | | 82,534 | | | 6,357,594 |
| ABIOMED, Inc. (A) | | 2,109 | | | 316,898 |
| Align Technology, Inc. (A) | | 3,349 | | | 731,254 |
| Baxter International, Inc. | | 23,842 | | | 1,990,092 |
| Becton, Dickinson and Company | | 12,630 | | | 3,003,667 |
| Boston Scientific Corp. (A) | | 65,089 | | | 2,433,678 |
| Danaher Corp. | | 29,853 | | | 4,316,147 |
| DENTSPLY SIRONA, Inc. | | 10,386 | | | 511,407 |
| Edwards Lifesciences Corp. (A) | | 9,740 | | | 1,995,142 |
| Hologic, Inc. (A) | | 12,522 | | | 590,037 |
| IDEXX Laboratories, Inc. (A) | | 4,006 | | | 1,019,567 |
| Intuitive Surgical, Inc. (A) | | 5,397 | | | 2,881,782 |
| Medtronic PLC | | 62,593 | | | 6,301,237 |
| ResMed, Inc. | | 6,715 | | | 1,067,416 |
| STERIS PLC | | 3,959 | | | 627,977 |
| Stryker Corp. | | 15,036 | | | 2,865,711 |
| Teleflex, Inc. | | 2,162 | | | 724,313 |
| The Cooper Companies, Inc. | | 2,315 | | | 751,380 |
| Varian Medical Systems, Inc. (A) | | 4,245 | | | 522,008 |
| Zimmer Biomet Holdings, Inc. | | 9,605 | | | 1,307,721 |
| | | | | | 40,315,028 |
| Health care providers and services – 2.7% | | | |
| AmerisourceBergen Corp. | | 7,020 | | | 591,926 |
| Anthem, Inc. | | 11,841 | | | 3,044,203 |
| Cardinal Health, Inc. | | 13,659 | | | 711,907 |
| Centene Corp. (A) | | 27,263 | | | 1,445,484 |
| Cigna Corp. | | 17,438 | | | 3,190,108 |
| CVS Health Corp. | | 60,753 | | | 3,595,363 |
| DaVita, Inc. (A) | | 4,188 | | | 325,073 |
| HCA Healthcare, Inc. | | 12,354 | | | 1,569,082 |
| Henry Schein, Inc. (A) | | 6,853 | | | 417,622 |
| Humana, Inc. | | 6,184 | | | 1,976,901 |
| Laboratory Corp. of America Holdings (A) | | 4,534 | | | 796,578 |
| McKesson Corp. | | 8,414 | | | 1,176,782 |
| Quest Diagnostics, Inc. | | 6,290 | | | 667,117 |
| UnitedHealth Group, Inc. | | 44,243 | | | 11,280,195 |
| The accompanying notes are an integral part of the financial statements. | 82 | |
John Hancock Funds II
Portfolio of Investments — February 29, 2020 (unaudited)(showing percentage of total net assets)
U.S. Sector Rotation Fund (continued)
| | | Shares or
Principal
Amount | | Value |
| COMMON STOCKS (continued) | | | |
| Health care providers and services (continued) | | | |
| Universal Health Services, Inc., Class B | | 3,751 | | $ | 464,149 |
| | | | | | 31,252,490 |
| Health care technology – 0.1% | | | |
| Cerner Corp. | | 14,668 | | | 1,016,052 |
| Life sciences tools and services – 0.9% | | | |
| Agilent Technologies, Inc. | | 13,332 | | | 1,027,497 |
| Illumina, Inc. (A) | | 6,333 | | | 1,682,488 |
| IQVIA Holdings, Inc. (A) | | 7,774 | | | 1,084,395 |
| Mettler-Toledo International, Inc. (A) | | 1,049 | | | 736,083 |
| PerkinElmer, Inc. | | 4,786 | | | 413,702 |
| Thermo Fisher Scientific, Inc. | | 17,275 | | | 5,023,570 |
| Waters Corp. (A) | | 2,776 | | | 541,015 |
| | | | | | 10,508,750 |
| Pharmaceuticals – 4.4% | | | |
| Allergan PLC | | 14,887 | | | 2,838,504 |
| Bristol-Myers Squibb Company | | 106,306 | | | 6,278,432 |
| Corium International, Inc. (A)(C) | | 1,251 | | | 225 |
| Elanco Animal Health, Inc. (A)(C) | | 2,471 | | | 63 |
| Eli Lilly & Company | | 38,316 | | | 4,832,797 |
| Johnson & Johnson | | 119,352 | | | 16,050,457 |
| Merck & Company, Inc. | | 115,457 | | | 8,839,388 |
| Mylan NV (A) | | 23,406 | | | 402,349 |
| Perrigo Company PLC | | 6,172 | | | 312,859 |
| Pfizer, Inc. | | 250,965 | | | 8,387,250 |
| Zoetis, Inc. | | 21,600 | | | 2,877,768 |
| | | | | | 50,820,092 |
| | | | | | 154,580,468 |
| Industrials – 6.0% | | | | | |
| Aerospace and defense – 1.1% | | | |
| Arconic, Inc. | | 8,781 | | | 257,722 |
| General Dynamics Corp. | | 5,312 | | | 848,273 |
| Huntington Ingalls Industries, Inc. | | 927 | | | 190,526 |
| L3Harris Technologies, Inc. | | 5,011 | | | 990,825 |
| Lockheed Martin Corp. | | 5,627 | | | 2,081,258 |
| Northrop Grumman Corp. | | 3,553 | | | 1,168,369 |
| Raytheon Company | | 6,313 | | | 1,190,379 |
| Textron, Inc. | | 5,174 | | | 210,064 |
| The Boeing Company | | 12,120 | | | 3,334,333 |
| TransDigm Group, Inc. | | 1,129 | | | 629,767 |
| United Technologies Corp. | | 18,392 | | | 2,401,811 |
| | | | | | 13,303,327 |
| Air freight and logistics – 0.3% | | | |
| C.H. Robinson Worldwide, Inc. | | 4,204 | | | 289,656 |
| Expeditors International of Washington, Inc. | | 5,293 | | | 372,733 |
| FedEx Corp. | | 7,461 | | | 1,053,269 |
| United Parcel Service, Inc., Class B | | 21,781 | | | 1,970,963 |
| | | | | | 3,686,621 |
| Airlines – 0.2% | | | |
| Alaska Air Group, Inc. (B) | | 3,829 | | | 193,211 |
| American Airlines Group, Inc. | | 12,118 | | | 230,848 |
| Delta Air Lines, Inc. | | 17,891 | | | 825,312 |
| Southwest Airlines Company | | 14,722 | | | 680,009 |
| United Airlines Holdings, Inc. (A) | | 6,764 | | | 416,595 |
| | | | | | 2,345,975 |
| Building products – 0.3% | | | |
| Allegion PLC | | 4,491 | | | 516,420 |
| AO Smith Corp. | | 6,624 | | | 261,979 |
| Fortune Brands Home & Security, Inc. | | 6,726 | | | 415,331 |
| Johnson Controls International PLC | | 37,285 | | | 1,363,512 |
| Masco Corp. | | 13,731 | | | 567,365 |
| | | | | | 3,124,607 |
U.S. Sector Rotation Fund (continued)
| | | Shares or
Principal
Amount | | Value |
| COMMON STOCKS (continued) | | | |
| Commercial services and supplies – 0.4% | | | |
| Cintas Corp. | | 3,719 | | $ | 992,006 |
| Copart, Inc. (A) | | 9,075 | | | 766,656 |
| Republic Services, Inc. | | 9,345 | | | 843,480 |
| Rollins, Inc. | | 6,247 | | | 233,888 |
| Waste Management, Inc. | | 17,316 | | | 1,918,786 |
| | | | | | 4,754,816 |
| Construction and engineering – 0.1% | | | |
| Jacobs Engineering Group, Inc. | | 8,136 | | | 751,278 |
| Quanta Services, Inc. | | 8,544 | | | 325,783 |
| | | | | | 1,077,061 |
| Electrical equipment – 0.5% | | | |
| AMETEK, Inc. | | 11,237 | | | 966,382 |
| Eaton Corp. PLC | | 20,321 | | | 1,843,521 |
| Emerson Electric Company | | 29,944 | | | 1,919,710 |
| Rockwell Automation, Inc. | | 5,680 | | | 1,042,280 |
| | | | | | 5,771,893 |
| Industrial conglomerates – 0.8% | | | |
| 3M Company | | 16,656 | | | 2,485,741 |
| General Electric Company | | 252,960 | | | 2,752,205 |
| Honeywell International, Inc. | | 20,696 | | | 3,356,270 |
| Roper Technologies, Inc. | | 3,014 | | | 1,060,024 |
| | | | | | 9,654,240 |
| Machinery – 1.1% | | | |
| Caterpillar, Inc. | | 18,481 | | | 2,296,079 |
| Cummins, Inc. | | 5,123 | | | 775,059 |
| Deere & Company | | 10,529 | | | 1,647,578 |
| Dover Corp. | | 4,858 | | | 499,111 |
| Flowserve Corp. | | 4,376 | | | 175,871 |
| Fortive Corp. | | 9,882 | | | 683,439 |
| IDEX Corp. | | 2,543 | | | 376,364 |
| Illinois Tool Works, Inc. | | 9,781 | | | 1,641,056 |
| Ingersoll-Rand PLC | | 8,012 | | | 1,033,868 |
| PACCAR, Inc. | | 11,566 | | | 773,765 |
| Parker-Hannifin Corp. | | 4,296 | | | 793,772 |
| Pentair PLC | | 5,621 | | | 221,411 |
| Snap-on, Inc. | | 1,834 | | | 265,472 |
| Stanley Black & Decker, Inc. | | 5,083 | | | 730,427 |
| Wabtec Corp. | | 6,089 | | | 418,314 |
| Xylem, Inc. | | 6,022 | | | 465,741 |
| | | | | | 12,797,327 |
| Professional services – 0.3% | | | |
| Equifax, Inc. | | 5,372 | | | 763,039 |
| IHS Markit, Ltd. | | 17,790 | | | 1,267,360 |
| Nielsen Holdings PLC | | 15,786 | | | 287,463 |
| Robert Half International, Inc. | | 5,216 | | | 262,939 |
| Verisk Analytics, Inc. | | 7,270 | | | 1,127,650 |
| | | | | | 3,708,451 |
| Road and rail – 0.7% | | | |
| CSX Corp. | | 24,171 | | | 1,702,847 |
| J.B. Hunt Transport Services, Inc. | | 2,650 | | | 255,566 |
| Kansas City Southern | | 3,081 | | | 464,245 |
| Norfolk Southern Corp. | | 8,105 | | | 1,477,947 |
| Old Dominion Freight Line, Inc. | | 1,985 | | | 384,693 |
| Union Pacific Corp. | | 21,578 | | | 3,448,380 |
| | | | | | 7,733,678 |
| Trading companies and distributors – 0.2% | | | |
| Fastenal Company | | 26,767 | | | 915,967 |
| United Rentals, Inc. (A) | | 3,508 | | | 464,740 |
| W.W. Grainger, Inc. | | 2,036 | | | 565,071 |
| | | | | | 1,945,778 |
| | | | | | 69,903,774 |
| Information technology – 24.7% | | | | | |
| The accompanying notes are an integral part of the financial statements. | 83 | |
John Hancock Funds II
Portfolio of Investments — February 29, 2020 (unaudited)(showing percentage of total net assets)
U.S. Sector Rotation Fund (continued)
| | | Shares or
Principal
Amount | | Value |
| COMMON STOCKS (continued) | | | |
| Communications equipment – 0.9% | | | |
| Arista Networks, Inc. (A) | | 2,482 | | $ | 479,324 |
| Cisco Systems, Inc. | | 194,088 | | | 7,749,934 |
| F5 Networks, Inc. (A) | | 2,781 | | | 333,581 |
| Juniper Networks, Inc. | | 15,313 | | | 324,942 |
| Motorola Solutions, Inc. | | 7,839 | | | 1,298,766 |
| | | | | | 10,186,547 |
| Electronic equipment, instruments and components – 0.5% | | | |
| Amphenol Corp., Class A | | 13,565 | | | 1,243,639 |
| CDW Corp. | | 6,574 | | | 750,882 |
| Corning, Inc. | | 35,187 | | | 839,562 |
| FLIR Systems, Inc. | | 6,138 | | | 260,681 |
| IPG Photonics Corp. (A) | | 1,627 | | | 207,670 |
| Keysight Technologies, Inc. (A) | | 8,582 | | | 813,230 |
| TE Connectivity, Ltd. | | 15,303 | | | 1,268,160 |
| Zebra Technologies Corp., Class A (A) | | 2,467 | | | 520,463 |
| | | | | | 5,904,287 |
| IT services – 6.7% | | | |
| Accenture PLC, Class A | | 35,930 | | | 6,488,599 |
| Akamai Technologies, Inc. (A) | | 9,143 | | | 790,961 |
| Alliance Data Systems Corp. | | 2,319 | | | 199,156 |
| Automatic Data Processing, Inc. | | 24,481 | | | 3,788,190 |
| Broadridge Financial Solutions, Inc. | | 6,486 | | | 676,879 |
| Cognizant Technology Solutions Corp., Class A | | 30,980 | | | 1,887,611 |
| DXC Technology Company | | 14,484 | | | 349,209 |
| Fidelity National Information Services, Inc. | | 34,773 | | | 4,858,484 |
| Fiserv, Inc. (A) | | 32,312 | | | 3,533,640 |
| FleetCor Technologies, Inc. (A) | | 4,910 | | | 1,305,029 |
| Gartner, Inc. (A) | | 5,061 | | | 654,843 |
| Global Payments, Inc. | | 17,004 | | | 3,128,226 |
| IBM Corp. | | 50,107 | | | 6,521,426 |
| Jack Henry & Associates, Inc. | | 4,353 | | | 660,524 |
| Leidos Holdings, Inc. | | 7,529 | | | 772,852 |
| Mastercard, Inc., Class A | | 50,226 | | | 14,578,097 |
| Paychex, Inc. | | 18,024 | | | 1,396,500 |
| PayPal Holdings, Inc. (A) | | 66,433 | | | 7,174,100 |
| The Western Union Company | | 23,720 | | | 531,091 |
| VeriSign, Inc. (A) | | 5,846 | | | 1,109,279 |
| Visa, Inc., Class A | | 96,852 | | | 17,603,820 |
| | | | | | 78,008,516 |
| Semiconductors and semiconductor equipment – 4.2% | | | |
| Advanced Micro Devices, Inc. (A) | | 52,684 | | | 2,396,068 |
| Analog Devices, Inc. | | 16,589 | | | 1,809,030 |
| Applied Materials, Inc. | | 41,608 | | | 2,418,257 |
| Broadcom, Inc. | | 17,867 | | | 4,870,902 |
| Intel Corp. | | 195,935 | | | 10,878,311 |
| KLA Corp. | | 7,107 | | | 1,092,417 |
| Lam Research Corp. | | 6,535 | | | 1,917,565 |
| Maxim Integrated Products, Inc. | | 12,189 | | | 677,952 |
| Microchip Technology, Inc. | | 10,764 | | | 976,402 |
| Micron Technology, Inc. (A) | | 49,864 | | | 2,620,852 |
| NVIDIA Corp. | | 27,566 | | | 7,444,750 |
| Qorvo, Inc. (A) | | 5,233 | | | 526,335 |
| QUALCOMM, Inc. | | 51,432 | | | 4,027,126 |
| Skyworks Solutions, Inc. | | 7,674 | | | 768,781 |
| Texas Instruments, Inc. | | 42,105 | | | 4,805,865 |
| Xilinx, Inc. | | 11,327 | | | 945,691 |
| | | | | | 48,176,304 |
| Software – 7.5% | | | |
| Adobe, Inc. (A) | | 21,782 | | | 7,517,404 |
| ANSYS, Inc. (A) | | 3,851 | | | 932,674 |
| Autodesk, Inc. (A) | | 9,901 | | | 1,889,903 |
| Cadence Design Systems, Inc. (A) | | 12,626 | | | 835,084 |
| Citrix Systems, Inc. | | 5,508 | | | 569,472 |
U.S. Sector Rotation Fund (continued)
| | | Shares or
Principal
Amount | | Value |
| COMMON STOCKS (continued) | | | |
| Software (continued) | | | |
| Fortinet, Inc. (A) | | 6,388 | | $ | 651,959 |
| Intuit, Inc. | | 11,713 | | | 3,113,901 |
| Microsoft Corp. | | 343,277 | | | 55,614,298 |
| NortonLifeLock, Inc. | | 25,801 | | | 490,993 |
| Oracle Corp. | | 97,485 | | | 4,821,608 |
| Paycom Software, Inc. (A) | | 2,207 | | | 623,809 |
| salesforce.com, Inc. (A) | | 39,913 | | | 6,801,175 |
| ServiceNow, Inc. (A) | | 8,487 | | | 2,767,526 |
| Synopsys, Inc. (A) | | 6,765 | | | 933,096 |
| | | | | | 87,562,902 |
| Technology hardware, storage and peripherals – 4.9% | | | |
| Apple, Inc. | | 191,087 | | | 52,235,542 |
| Hewlett Packard Enterprise Company | | 59,202 | | | 757,194 |
| HP, Inc. | | 67,799 | | | 1,409,541 |
| NetApp, Inc. | | 10,442 | | | 487,850 |
| Seagate Technology PLC | | 10,577 | | | 507,167 |
| Western Digital Corp. | | 13,607 | | | 756,005 |
| Xerox Holdings Corp. | | 8,506 | | | 273,893 |
| | | | | | 56,427,192 |
| | | | | | 286,265,748 |
| Materials – 2.6% | | | | | |
| Chemicals – 1.8% | | | |
| A. Schulman, Inc. (A)(C) | | 1,188 | | | 514 |
| Air Products & Chemicals, Inc. | | 10,791 | | | 2,369,812 |
| Albemarle Corp. | | 5,190 | | | 424,802 |
| Celanese Corp. | | 5,917 | | | 554,660 |
| CF Industries Holdings, Inc. | | 10,644 | | | 392,338 |
| Corteva, Inc. | | 36,636 | | | 996,499 |
| Dow, Inc. | | 36,298 | | | 1,466,802 |
| DuPont de Nemours, Inc. | | 36,264 | | | 1,555,726 |
| Eastman Chemical Company | | 6,657 | | | 409,472 |
| Ecolab, Inc. | | 12,276 | | | 2,215,204 |
| FMC Corp. | | 6,345 | | | 590,720 |
| International Flavors & Fragrances, Inc. (B) | | 5,227 | | | 626,090 |
| Linde PLC | | 26,296 | | | 5,022,799 |
| LyondellBasell Industries NV, Class A | | 12,567 | | | 898,038 |
| PPG Industries, Inc. | | 11,575 | | | 1,209,009 |
| The Mosaic Company | | 17,116 | | | 291,485 |
| The Sherwin-Williams Company | | 4,022 | | | 2,078,369 |
| | | | | | 21,102,339 |
| Construction materials – 0.1% | | | |
| Martin Marietta Materials, Inc. | | 3,060 | | | 696,242 |
| Vulcan Materials Company | | 6,479 | | | 779,165 |
| | | | | | 1,475,407 |
| Containers and packaging – 0.4% | | | |
| Amcor PLC | | 79,310 | | | 739,169 |
| Avery Dennison Corp. | | 4,088 | | | 468,035 |
| Ball Corp. | | 16,014 | | | 1,128,346 |
| International Paper Company | | 19,195 | | | 709,447 |
| Packaging Corp. of America | | 4,634 | | | 419,933 |
| Sealed Air Corp. | | 7,564 | | | 229,265 |
| Westrock Company | | 12,624 | | | 419,748 |
| | | | | | 4,113,943 |
| Metals and mining – 0.3% | | | |
| Freeport-McMoRan, Inc. | | 71,026 | | | 707,419 |
| Newmont Corp. | | 40,133 | | | 1,791,136 |
| Nucor Corp. | | 14,843 | | | 613,758 |
| | | | | | 3,112,313 |
| | | | | | 29,804,002 |
| Real estate – 2.8% | | | | | |
| The accompanying notes are an integral part of the financial statements. | 84 | |
John Hancock Funds II
Portfolio of Investments — February 29, 2020 (unaudited)(showing percentage of total net assets)
U.S. Sector Rotation Fund (continued)
| | | Shares or
Principal
Amount | | Value |
| COMMON STOCKS (continued) | | | |
| Equity real estate investment trusts – 2.7% | | | |
| Alexandria Real Estate Equities, Inc. | | 5,297 | | $ | 804,508 |
| American Tower Corp. | | 19,136 | | | 4,340,045 |
| Apartment Investment & Management Company, A Shares | | 6,432 | | | 307,707 |
| AvalonBay Communities, Inc. | | 6,034 | | | 1,210,360 |
| Boston Properties, Inc. | | 6,213 | | | 801,104 |
| Crown Castle International Corp. | | 17,962 | | | 2,573,775 |
| Digital Realty Trust, Inc. | | 9,017 | | | 1,083,032 |
| Duke Realty Corp. | | 15,880 | | | 515,624 |
| Equinix, Inc. | | 3,684 | | | 2,110,195 |
| Equity Residential | | 15,081 | | | 1,132,583 |
| Essex Property Trust, Inc. | | 2,855 | | | 808,993 |
| Extra Space Storage, Inc. | | 5,595 | | | 561,514 |
| Federal Realty Investment Trust | | 3,034 | | | 352,976 |
| Healthpeak Properties, Inc. | | 21,383 | | | 676,558 |
| Host Hotels & Resorts, Inc. | | 30,984 | | | 448,648 |
| Iron Mountain, Inc. | | 12,406 | | | 377,266 |
| Kimco Realty Corp. | | 18,242 | | | 316,499 |
| Mid-America Apartment Communities, Inc. | | 4,928 | | | 636,993 |
| Prologis, Inc. | | 31,894 | | | 2,688,026 |
| Public Storage | | 6,490 | | | 1,357,189 |
| Realty Income Corp. | | 14,081 | | | 1,019,324 |
| Regency Centers Corp. | | 7,239 | | | 415,808 |
| SBA Communications Corp. | | 4,865 | | | 1,289,663 |
| Simon Property Group, Inc. | | 13,257 | | | 1,631,672 |
| SL Green Realty Corp. | | 3,522 | | | 276,266 |
| UDR, Inc. | | 12,661 | | | 569,492 |
| Ventas, Inc. | | 16,103 | | | 865,858 |
| Vornado Realty Trust | | 6,844 | | | 366,702 |
| Welltower, Inc. | | 17,530 | | | 1,311,595 |
| Weyerhaeuser Company | | 32,192 | | | 836,348 |
| | | | | | 31,686,323 |
| Real estate management and development – 0.1% | | | |
| CBRE Group, Inc., Class A (A) | | 14,462 | | | 811,897 |
| | | | | | 32,498,220 |
| Utilities – 5.0% | | | | | |
| Electric utilities – 3.1% | | | |
| Alliant Energy Corp. | | 16,456 | | | 857,687 |
| American Electric Power Company, Inc. | | 33,818 | | | 3,018,595 |
| Duke Energy Corp. | | 49,913 | | | 4,577,022 |
| Edison International | | 24,552 | | | 1,649,649 |
| Entergy Corp. | | 13,632 | | | 1,593,717 |
| Evergy, Inc. | | 15,603 | | | 1,019,656 |
| Eversource Energy | | 22,166 | | | 1,916,472 |
| Exelon Corp. | | 66,555 | | | 2,869,186 |
| FirstEnergy Corp. | | 36,993 | | | 1,647,298 |
| NextEra Energy, Inc. | | 33,464 | | | 8,458,361 |
| Pinnacle West Capital Corp. | | 7,696 | | | 688,715 |
| PPL Corp. | | 49,502 | | | 1,485,555 |
| The Southern Company | | 71,802 | | | 4,333,969 |
| Xcel Energy, Inc. | | 35,902 | | | 2,237,413 |
| | | | | | 36,353,295 |
| Gas utilities – 0.1% | | | |
| Atmos Energy Corp. | | 8,171 | | | 843,656 |
Independent power and renewable electricity producers –
0.1% | | | |
| AES Corp. | | 45,453 | | | 760,429 |
| NRG Energy, Inc. | | 17,225 | | | 572,042 |
| | | | | | 1,332,471 |
| Multi-utilities – 1.6% | | | |
| Ameren Corp. | | 16,845 | | | 1,330,755 |
| CenterPoint Energy, Inc. | | 34,386 | | | 791,566 |
U.S. Sector Rotation Fund (continued)
| | | Shares or
Principal
Amount | | Value |
| COMMON STOCKS (continued) | | | |
| Multi-utilities (continued) | | | |
| CMS Energy Corp. | | 19,433 | | $ | 1,174,142 |
| Consolidated Edison, Inc. | | 22,760 | | | 1,793,943 |
| Dominion Energy, Inc. | | 56,353 | | | 4,405,678 |
| DTE Energy Company | | 13,152 | | | 1,468,684 |
| NiSource, Inc. | | 25,575 | | | 691,037 |
| Public Service Enterprise Group, Inc. | | 34,625 | | | 1,776,609 |
| Sempra Energy | | 19,300 | | | 2,697,754 |
| WEC Energy Group, Inc. | | 21,596 | | | 1,993,959 |
| | | | | | 18,124,127 |
| Water utilities – 0.1% | | | |
| American Water Works Company, Inc. | | 12,377 | | | 1,530,540 |
| | | | | | 58,184,089 |
| TOTAL COMMON STOCKS (Cost $1,082,132,712) | | $ | 1,119,371,183 |
| PREFERRED SECURITIES – 0.0% | | | | | |
| Communication services – 0.0% | | | | | |
| Media – 0.0% | | | |
| GCI Liberty, Inc., 7.000% | | 361 | | | 9,765 |
| TOTAL PREFERRED SECURITIES (Cost $2,897) | | $ | 9,765 |
| RIGHTS – 0.0% | | | | | |
| Pan American Silver Corp. (Expiration Date: 2-22-29) (A)(D) | | 13,589 | | | 8,561 |
| TOTAL RIGHTS (Cost $4,020) | | $ | 8,561 |
| SHORT-TERM INVESTMENTS – 3.1% | | | |
| U.S. Government Agency – 2.2% | | | | | |
| Federal Home Loan Bank Discount Note | | | | | |
| 1.435%, 04/01/2020 * | $ | 15,000,000 | | | 14,981,125 |
| 1.541%, 04/15/2020 * | | 10,000,000 | | | 9,981,544 |
| | | | | | 24,962,669 |
| Short-term funds – 0.1% | | | | | |
| John Hancock Collateral Trust, 1.6968% (E)(F) | | 98,839 | | | 989,269 |
| Repurchase agreement – 0.8% | | | | | |
| Repurchase Agreement with State Street Corp. dated 2-28-20 at 0.550% to be repurchased at $9,348,428 on 3-2-20, collateralized by $9,315,000 U.S. Treasury Notes, 2.250% - 2.875% due 4-15-21 to 8-15-28 (valued at $9,538,111) | $ | 9,348,000 | | | 9,348,000 |
| TOTAL SHORT-TERM INVESTMENTS (Cost $35,297,929) | | $ | 35,299,938 |
Total Investments (U.S. Sector Rotation Fund)
(Cost $1,117,437,558) – 99.5% | | $ | 1,154,689,447 |
| Other assets and liabilities, net – 0.5% | | | 6,076,534 |
| TOTAL NET ASSETS – 100.0% | | $ | 1,160,765,981 |
| Security Abbreviations and Legend |
| (A) | Non-income producing security. |
| (B) | All or a portion of this security is on loan as of 2-29-20. |
| (C) | Security is valued using significant unobservable inputs and is classified as Level 3 in the fair value hierarchy. Refer to Note 2 to the financial statements. |
| (D) | Strike price and/or expiration date not available. |
| (E) | The rate shown is the annualized seven-day yield as of 2-29-20. |
| (F) | Investment is an affiliate of the fund, the advisor and/or subadvisor. This security represents the investment of cash collateral received for securities lending. |
| * | Yield represents either the annualized yield at the date of purchase, the stated coupon rate or, for floating rate securities, the rate at period end. |
| The accompanying notes are an integral part of the financial statements. | 85 | |
John Hancock Funds II
Portfolio of Investments — February 29, 2020 (unaudited)(showing percentage of total net assets)
U.S. Sector Rotation Fund (continued)
DERIVATIVES
FUTURES
| Open contracts | Number of
contracts | Position | Expiration
date | Notional
basis^ | Notional
value^ | Unrealized
appreciation
(depreciation) |
| S&P 500 Index E-Mini Futures | 256 | Long | Mar 2020 | $41,935,559 | $37,936,000 | $(3,999,559) |
| | | | | | | $(3,999,559) |
^ Notional basis refers to the contractual amount agreed upon at inception of open contracts; notional value represents the current value of the open contract.
See Notes to financial statements regarding investment transactions and other derivatives information.
| The accompanying notes are an integral part of the financial statements. | 86 | |
John Hancock Funds II
Portfolio of Investments — February 29, 2020 (unaudited)(showing percentage of total net assets)
The following funds had the following country composition as a percentage of net assets on 2-29-20:
Capital Appreciation Fund
| United States | 85.0% |
| France | 4.2% |
| China | 3.4% |
| Canada | 3.0% |
| United Kingdom | 1.8% |
| Netherlands | 1.5% |
| Germany | 1.1% |
| TOTAL | 100.0% |
Health Sciences Fund
| United States | 86.6% |
| Switzerland | 3.2% |
| Japan | 2.2% |
| United Kingdom | 1.8% |
| Germany | 1.3% |
| Denmark | 1.2% |
| Netherlands | 1.1% |
| Other countries | 2.6% |
| TOTAL | 100.0% |
Mid Value Fund
| United States | 84.4% |
| Canada | 7.7% |
| Ireland | 2.8% |
| Switzerland | 1.2% |
| Other countries | 3.9% |
| TOTAL | 100.0% |
Science & Technology Fund
| United States | 81.2% |
| China | 6.0% |
| South Korea | 4.7% |
| Germany | 2.1% |
| Australia | 1.5% |
| Russia | 1.4% |
| Other countries | 3.1% |
| TOTAL | 100.0% |
Strategic Equity Allocation Fund
| United States | 63.8% |
| Japan | 6.1% |
| China | 3.1% |
| Canada | 3.1% |
| France | 2.9% |
| Switzerland | 2.8% |
| United Kingdom | 2.6% |
| Germany | 2.2% |
| Taiwan | 2.2% |
| Australia | 1.9% |
| Other countries | 9.3% |
| TOTAL | 100.0% |
The accompanying notes are an integral part of the financial statements.
John Hancock Funds II
Statements of assets and liabilities — February 29, 2020 (unaudited)
| Assets | Capital Appreciation Fund | Capital Appreciation Value Fund | Health Sciences Fund | International Strategic Equity Allocation Fund |
| Unaffiliated investments, at value (including securities loaned) | $1,660,897,762 | $1,409,402,120 | $273,102,135 | $1,589,512,530 |
| Affiliated investments, at value | 26,765 | 8,486,650 | — | 77,977,284 |
| Total investments, at value | 1,660,924,527 | 1,417,888,770 | 273,102,135 | 1,667,489,814 |
| Cash | — | — | — | 103,187 |
| Foreign currency, at value | — | 7 | 4,653 | 1,294,437 |
| Collateral held at broker for futures contracts | — | — | — | 4,362,640 |
| Dividends and interest receivable | 1,941,806 | 5,596,808 | 279,413 | 5,313,869 |
| Receivable for fund shares sold | 2,429,491 | — | — | 1,123,106 |
| Receivable for investments sold | 26,317,751 | 12,042,193 | 139,963 | — |
| Receivable for securities lending income | 3,107 | 1,641 | — | 43,982 |
| Other assets | 36,269 | 35,727 | 7,182 | 53,624 |
| Total assets | 1,691,652,951 | 1,435,565,146 | 273,533,346 | 1,679,784,659 |
| Liabilities | | | | |
| Written options, at value | — | 3,250,632 | — | — |
| Payable for futures variation margin | — | — | — | 260,631 |
| Payable for investments purchased | 15,541,384 | 46,126,197 | 330,922 | 471 |
| Payable for fund shares repurchased | 3,167,683 | 2,520,923 | 265,481 | 5,620 |
| Payable upon return of securities loaned | 14,949 | 8,480,328 | — | 78,021,981 |
| Payable to affiliates | | | | |
| Accounting and legal services fees | 46,941 | 38,257 | 7,480 | 44,702 |
| Trustees' fees | 3,415 | 3,186 | 465 | 3,780 |
| Other liabilities and accrued expenses | 115,568 | 100,387 | 40,654 | 153,113 |
| Total liabilities | 18,889,940 | 60,519,910 | 645,002 | 78,490,298 |
| Net assets | $1,672,763,011 | $1,375,045,236 | $272,888,344 | $1,601,294,361 |
| Net assets consist of | | | | |
| Paid-in capital | $657,967,667 | $1,092,545,492 | $218,285,458 | $1,711,496,114 |
| Total distributable earnings (loss) | 1,014,795,344 | 282,499,744 | 54,602,886 | (110,201,753) |
| Net assets | $1,672,763,011 | $1,375,045,236 | $272,888,344 | $1,601,294,361 |
| Unaffiliated investments, including repurchase agreements, at cost | $745,561,436 | $1,235,504,794 | $223,610,554 | $1,591,518,986 |
| Affiliated investments, at cost | $26,747 | $8,483,755 | — | $77,959,960 |
| Foreign currency, at cost | — | $7 | $4,776 | $1,296,317 |
| Premiums received on written options | — | $3,618,020 | — | — |
| Securities loaned, at value | $14,640 | $8,301,497 | — | $71,616,587 |
| Net asset value per share | | | | |
| The funds have an unlimited number of shares authorized with no par value. Net asset value is calculated by dividing the net assets of each class of shares by the number of outstanding shares in the class. |
| Class 1 | | | | |
| Net assets | $550,816,156 | — | — | — |
| Shares outstanding | 35,590,658 | — | — | — |
| Net asset value, offering price and redemption price per share | $15.48 | — | — | — |
| Class NAV | | | | |
| Net assets | $1,121,946,855 | $1,375,045,236 | $272,888,344 | $1,601,294,361 |
| Shares outstanding | 72,230,918 | 127,394,036 | 58,654,224 | 180,993,924 |
| Net asset value, offering price and redemption price per share | $15.53 | $10.79 | $4.65 | $8.85 |
The accompanying notes are an integral part of the financial statements.
John Hancock Funds II
Statements of assets and liabilities — February 29, 2020 (unaudited)
| Assets | International Value Fund | Mid Cap Stock Fund | Mid Value Fund | Multi-Index Lifestyle Aggressive Portfolio |
| Unaffiliated investments, at value (including securities loaned) | $219,108,964 | $1,412,140,078 | $1,148,458,931 | $112,737,006 |
| Affiliated investments, at value | — | 62,529,330 | 12,044,774 | 228,130,825 |
| Repurchase agreements, at value | — | 81,500,000 | — | — |
| Total investments, at value | 219,108,964 | 1,556,169,408 | 1,160,503,705 | 340,867,831 |
| Cash | — | 38,243 | — | — |
| Foreign currency, at value | 70,954 | 749 | 1,500 | — |
| Dividends and interest receivable | 1,219,886 | 314,109 | 2,902,855 | 469 |
| Receivable for fund shares sold | 523,731 | 2,295,099 | 2,687,612 | — |
| Receivable for investments sold | 1,964,491 | 19,515,328 | 2,772,224 | 4,239,994 |
| Receivable for securities lending income | — | 424,050 | 3,711 | 2,368 |
| Other assets | 24,351 | 223,156 | 23,934 | 6,353 |
| Total assets | 222,912,377 | 1,578,980,142 | 1,168,895,541 | 345,117,015 |
| Liabilities | | | | |
| Due to custodian | — | — | — | 369,683 |
| Payable for investments purchased | 3,444,406 | 29,834,198 | 29,425,060 | 525 |
| Payable for fund shares repurchased | 652,089 | 4,536,397 | 75,849 | 4,608,858 |
| Payable upon return of securities loaned | — | 62,492,064 | 12,059,423 | 3,918,125 |
| Payable to affiliates | | | | |
| Accounting and legal services fees | 5,604 | 44,000 | 31,530 | 9,522 |
| Transfer agent fees | — | — | — | 65 |
| Trustees' fees | 2,972 | 2,977 | 2,473 | 512 |
| Other liabilities and accrued expenses | 58,526 | 119,968 | 85,192 | 23,268 |
| Total liabilities | 4,163,597 | 97,029,604 | 41,679,527 | 8,930,558 |
| Net assets | $218,748,780 | $1,481,950,538 | $1,127,216,014 | $336,186,457 |
| Net assets consist of | | | | |
| Paid-in capital | $215,637,064 | $1,084,007,631 | $1,062,224,844 | $358,616,241 |
| Total distributable earnings (loss) | 3,111,716 | 397,942,907 | 64,991,170 | (22,429,784) |
| Net assets | $218,748,780 | $1,481,950,538 | $1,127,216,014 | $336,186,457 |
| Unaffiliated investments, including repurchase agreements, at cost | $232,475,201 | $1,223,393,372 | $1,060,110,885 | $102,331,825 |
| Affiliated investments, at cost | — | $62,507,489 | $12,039,472 | $252,779,712 |
| Foreign currency, at cost | $70,954 | $698 | $1,499 | — |
| Securities loaned, at value | — | $61,229,613 | $11,566,266 | $3,839,473 |
| Net asset value per share | | | | |
| The funds have an unlimited number of shares authorized with no par value. Net asset value is calculated by dividing the net assets of each class of shares by the number of outstanding shares in the class. |
| Class R6 | | | | |
| Net assets | — | — | — | $6,850,276 |
| Shares outstanding | — | — | — | 645,667 |
| Net asset value, offering price and redemption price per share | — | — | — | $10.61 |
| Class 1 | | | | |
| Net assets | $101,319,847 | $410,229,354 | — | $329,336,181 |
| Shares outstanding | 7,949,528 | 20,497,934 | — | 31,062,874 |
| Net asset value, offering price and redemption price per share | $12.75 | $20.01 | — | $10.60 |
| Class NAV | | | | |
| Net assets | $117,428,933 | $1,071,721,184 | $1,127,216,014 | — |
| Shares outstanding | 9,244,476 | 52,786,146 | 81,339,332 | — |
| Net asset value, offering price and redemption price per share | $12.70 | $20.30 | $13.86 | — |
The accompanying notes are an integral part of the financial statements.
John Hancock Funds II
Statements of assets and liabilities — February 29, 2020 (unaudited)
| Assets | Multi-Index Lifestyle Balanced Portfolio | Multi-Index Lifestyle Conservative Portfolio | Multi-Index Lifestyle Growth Portfolio | Multi-Index Lifestyle Moderate Portfolio |
| Unaffiliated investments, at value (including securities loaned) | $560,518,613 | $169,654,806 | $400,268,253 | $194,552,634 |
| Affiliated investments, at value | 378,263,262 | 31,014,600 | 477,245,156 | 69,461,797 |
| Total investments, at value | 938,781,875 | 200,669,406 | 877,513,409 | 264,014,431 |
| Dividends and interest receivable | 10,190 | 3,971 | 4,976 | 3,862 |
| Receivable for fund shares sold | — | — | 9,551 | 168 |
| Receivable for investments sold | 5,975,983 | 1,147,225 | 4,123,962 | 2,303,790 |
| Receivable for securities lending income | 4,827 | 140 | 4,614 | 4,537 |
| Receivable from affiliates | — | 378 | — | 258 |
| Other assets | 9,849 | 5,157 | 9,476 | 5,339 |
| Total assets | 944,782,724 | 201,826,277 | 881,665,988 | 266,332,385 |
| Liabilities | | | | |
| Due to custodian | 2,973,104 | — | 2,444,426 | 1,114,128 |
| Payable for investments purchased | 2,428,637 | 818,922 | 1,441,086 | 682,353 |
| Payable for fund shares repurchased | 18,498,210 | 6,828,302 | 10,238,810 | 9,010,793 |
| Payable upon return of securities loaned | 45,135,188 | 11,761,209 | 51,106,185 | 7,630,920 |
| Payable to affiliates | | | | |
| Accounting and legal services fees | 24,033 | 4,947 | 22,678 | 6,849 |
| Transfer agent fees | 70 | 5 | 72 | 13 |
| Trustees' fees | 1,511 | 203 | 1,295 | 356 |
| Other liabilities and accrued expenses | 20,579 | 22,696 | 19,694 | 23,024 |
| Total liabilities | 69,081,332 | 19,436,284 | 65,274,246 | 18,468,436 |
| Net assets | $875,701,392 | $182,389,993 | $816,391,742 | $247,863,949 |
| Net assets consist of | | | | |
| Paid-in capital | $881,551,709 | $177,381,783 | $844,413,187 | $245,484,271 |
| Total distributable earnings (loss) | (5,850,317) | 5,008,210 | (28,021,445) | 2,379,678 |
| Net assets | $875,701,392 | $182,389,993 | $816,391,742 | $247,863,949 |
| Unaffiliated investments, including repurchase agreements, at cost | $522,725,594 | $161,989,185 | $368,941,742 | $183,501,972 |
| Affiliated investments, at cost | $408,793,841 | $31,615,695 | $524,365,569 | $74,064,089 |
| Securities loaned, at value | $44,139,849 | $11,447,085 | $49,986,983 | $7,465,104 |
| Net asset value per share | | | | |
| The funds have an unlimited number of shares authorized with no par value. Net asset value is calculated by dividing the net assets of each class of shares by the number of outstanding shares in the class. |
| Class R6 | | | | |
| Net assets | $6,418,241 | $539,998 | $6,763,742 | $1,262,136 |
| Shares outstanding | 597,323 | 50,287 | 626,682 | 117,467 |
| Net asset value, offering price and redemption price per share | $10.75 | $10.74 | $10.79 | $10.74 |
| Class 1 | | | | |
| Net assets | $869,283,151 | $181,849,995 | $809,628,000 | $246,601,813 |
| Shares outstanding | 80,918,279 | 16,946,596 | 75,123,730 | 22,956,739 |
| Net asset value, offering price and redemption price per share | $10.74 | $10.73 | $10.78 | $10.74 |
The accompanying notes are an integral part of the financial statements.
John Hancock Funds II
Statements of assets and liabilities — February 29, 2020 (unaudited)
| Assets | Real Estate Securities Fund | Science & Technology Fund | Strategic Equity Allocation Fund | U.S. Sector Rotation Fund |
| Unaffiliated investments, at value (including securities loaned) | $378,406,832 | $268,903,636 | $6,721,314,830 | $1,144,352,178 |
| Affiliated investments, at value | — | 3,763,121 | 97,973,122 | 989,269 |
| Repurchase agreements, at value | — | 12,285,000 | 41,167,000 | 9,348,000 |
| Total investments, at value | 378,406,832 | 284,951,757 | 6,860,454,952 | 1,154,689,447 |
| Receivable for futures variation margin | — | — | — | 135,223 |
| Cash | — | 211 | 1,642 | 32,601 |
| Foreign currency, at value | — | 222,624 | 1,408,665 | — |
| Collateral held at broker for futures contracts | — | — | 26,040,812 | 1,586,300 |
| Dividends and interest receivable | 267,224 | 218,080 | 16,370,738 | 2,140,061 |
| Receivable for fund shares sold | — | — | 38,485,541 | 3,378,276 |
| Receivable for investments sold | 4,677,889 | 2,025,123 | 456,262 | — |
| Receivable for securities lending income | 121 | 2,140 | 93,058 | 4,205 |
| Other assets | 10,507 | 7,778 | 196,078 | 33,718 |
| Total assets | 383,362,573 | 287,427,713 | 6,943,507,748 | 1,161,999,831 |
| Liabilities | | | | |
| Payable for futures variation margin | — | — | 686,793 | — |
| Payable for investments purchased | 3,561,106 | 8,465,867 | 154 | — |
| Payable for fund shares repurchased | 1,981,016 | 890,032 | 8,109 | 96,826 |
| Payable upon return of securities loaned | — | 3,761,551 | 97,961,305 | 988,485 |
| Payable to affiliates | | | | |
| Accounting and legal services fees | 11,180 | 7,647 | 194,158 | 32,068 |
| Trustees' fees | 618 | 384 | 13,483 | 3,418 |
| Other liabilities and accrued expenses | 51,363 | 49,646 | 540,577 | 113,053 |
| Total liabilities | 5,605,283 | 13,175,127 | 99,404,579 | 1,233,850 |
| Net assets | $377,757,290 | $274,252,586 | $6,844,103,169 | $1,160,765,981 |
| Net assets consist of | | | | |
| Paid-in capital | $313,845,730 | $220,949,881 | $6,633,742,162 | $1,105,988,576 |
| Total distributable earnings (loss) | 63,911,560 | 53,302,705 | 210,361,007 | 54,777,405 |
| Net assets | $377,757,290 | $274,252,586 | $6,844,103,169 | $1,160,765,981 |
| Unaffiliated investments, including repurchase agreements, at cost | $322,725,370 | $246,431,253 | $6,562,954,897 | $1,116,448,635 |
| Affiliated investments, at cost | — | $3,762,202 | $97,952,981 | $988,923 |
| Foreign currency, at cost | — | $214,087 | $1,427,989 | — |
| Securities loaned, at value | — | $3,682,856 | $95,575,853 | $968,741 |
| Net asset value per share | | | | |
| The funds have an unlimited number of shares authorized with no par value. Net asset value is calculated by dividing the net assets of each class of shares by the number of outstanding shares in the class. |
| Class 1 | | | | |
| Net assets | $377,757,290 | — | — | — |
| Shares outstanding | 29,871,639 | — | — | — |
| Net asset value, offering price and redemption price per share | $12.65 | — | — | — |
| Class NAV | | | | |
| Net assets | — | $274,252,586 | $6,844,103,169 | $1,160,765,981 |
| Shares outstanding | — | 71,678,300 | 627,903,233 | 127,683,847 |
| Net asset value, offering price and redemption price per share | — | $3.83 | $10.90 | $9.09 |
The accompanying notes are an integral part of the financial statements.
John Hancock Funds II
Statements of operations —For the six months ended February 29, 2020 (unaudited)
| Investment income | Capital Appreciation Fund | Capital Appreciation Value Fund | Health Sciences Fund | International Strategic Equity Allocation Fund |
| Dividends | $5,757,840 | $6,726,497 | $945,513 | $19,746,515 |
| Interest | 50,943 | 9,372,736 | 18,098 | 444,261 |
| Securities lending | 198,031 | 20,815 | — | 144,949 |
| Less foreign taxes withheld | (31,343) | (24,095) | (3,747) | (1,632,582) |
| Total investment income | 5,975,471 | 16,095,953 | 959,864 | 18,703,143 |
| Expenses | | | | |
| Investment management fees | 6,191,844 | 6,372,083 | 1,460,610 | 5,328,626 |
| Distribution and service fees | 144,386 | — | — | — |
| Accounting and legal services fees | 159,014 | 140,168 | 25,287 | 154,731 |
| Trustees' fees | 16,078 | 14,873 | 2,557 | 15,683 |
| Custodian fees | 120,116 | 101,383 | 24,022 | 308,128 |
| Printing and postage | 6,241 | 6,241 | 6,241 | 6,443 |
| Professional fees | 38,500 | 42,079 | 29,269 | 54,921 |
| Other | 35,748 | 28,283 | 9,927 | 24,441 |
| Total expenses | 6,711,927 | 6,705,110 | 1,557,913 | 5,892,973 |
| Less expense reductions | (66,578) | (318,205) | (85,387) | (1,119,086) |
| Net expenses | 6,645,349 | 6,386,905 | 1,472,526 | 4,773,887 |
| Net investment income (loss) | (669,878) | 9,709,048 | (512,662) | 13,929,256 |
| Realized and unrealized gain (loss) | | | | |
| Net realized gain (loss) on | | | | |
| Unaffiliated investments and foreign currency transactions | 145,162,099 | 117,792,321 | 11,376,955 | (4,496,598) |
| Affiliated investments | 3,638 | 3,422 | — | 3,125 |
| Futures contracts | — | — | — | 5,395,290 |
| Written options | — | 6,945,377 | — | — |
| | 145,165,737 | 124,741,120 | 11,376,955 | 901,817 |
| Change in net unrealized appreciation (depreciation) of | | | | |
| Unaffiliated investments and translation of assets and liabilities in foreign currencies | 19,941,091 | (95,200,513) | 7,301,065 | 6,473,134 |
| Affiliated investments | (3,553) | 2,895 | — | 17,324 |
| Futures contracts | — | — | — | (3,347,535) |
| Written options | — | 10,224,431 | — | — |
| | 19,937,538 | (84,973,187) | 7,301,065 | 3,142,923 |
| Net realized and unrealized gain (loss) | 165,103,275 | 39,767,933 | 18,678,020 | 4,044,740 |
| Increase in net assets from operations | $164,433,397 | $49,476,981 | $18,165,358 | $17,973,996 |
The accompanying notes are an integral part of the financial statements.
John Hancock Funds II
Statements of operations —For the six months ended February 29, 2020 (unaudited)
| Investment income | International Value Fund | Mid Cap Stock Fund | Mid Value Fund | Multi-Index Lifestyle Aggressive Portfolio |
| Dividends | $2,594,611 | $2,854,778 | $14,361,935 | $1,502,596 |
| Interest | 109,643 | 340,959 | 624,410 | 1,475 |
| Securities lending | 9,559 | 967,930 | 66,184 | 11,685 |
| Income distributions received from affiliated investments | — | — | — | 5,177,603 |
| Less foreign taxes withheld | (265,352) | (10,378) | (156,963) | — |
| Total investment income | 2,448,461 | 4,153,289 | 14,895,566 | 6,693,359 |
| Expenses | | | | |
| Investment management fees | 999,470 | 6,627,876 | 5,956,539 | 345,579 |
| Distribution and service fees | 30,588 | 107,656 | — | 88,961 |
| Accounting and legal services fees | 22,679 | 144,126 | 113,488 | 32,609 |
| Transfer agent fees | — | — | — | 293 |
| Trustees' fees | 2,799 | 15,126 | 11,606 | 3,231 |
| Custodian fees | 61,570 | 94,514 | 82,446 | 22,591 |
| State registration fees | — | — | — | 1,631 |
| Printing and postage | 6,212 | 6,241 | 6,241 | 6,295 |
| Professional fees | 33,702 | 54,675 | 38,127 | 16,465 |
| Other | 18,539 | 41,613 | 21,447 | 7,673 |
| Total expenses | 1,175,559 | 7,091,827 | 6,229,894 | 525,328 |
| Less expense reductions | (9,491) | (60,339) | (329,356) | — |
| Net expenses | 1,166,068 | 7,031,488 | 5,900,538 | 525,328 |
| Net investment income (loss) | 1,282,393 | (2,878,199) | 8,995,028 | 6,168,031 |
| Realized and unrealized gain (loss) | | | | |
| Net realized gain (loss) on | | | | |
| Unaffiliated investments and foreign currency transactions | 21,134,720 | 196,352,958 | 18,023,887 | 1,734,640 |
| Affiliated investments | 384 | 14,123 | 608 | (3,664,631) |
| Capital gain distributions received from affiliated investments | — | — | — | 2,568,488 |
| | 21,135,104 | 196,367,081 | 18,024,495 | 638,497 |
| Change in net unrealized appreciation (depreciation) of | | | | |
| Unaffiliated investments and translation of assets and liabilities in foreign currencies | (25,015,297) | (148,317,593) | (20,400,972) | (3,646,479) |
| Affiliated investments | (40) | 21,802 | 3,204 | (1,941,760) |
| | (25,015,337) | (148,295,791) | (20,397,768) | (5,588,239) |
| Net realized and unrealized gain (loss) | (3,880,233) | 48,071,290 | (2,373,273) | (4,949,742) |
| Increase (decrease) in net assets from operations | $(2,597,840) | $45,193,091 | $6,621,755 | $1,218,289 |
The accompanying notes are an integral part of the financial statements.
John Hancock Funds II
Statements of operations —For the six months ended February 29, 2020 (unaudited)
| Investment income | Multi-Index Lifestyle Balanced Portfolio | Multi-Index Lifestyle Conservative Portfolio | Multi-Index Lifestyle Growth Portfolio | Multi-Index Lifestyle Moderate Portfolio |
| Dividends | $8,756,065 | $2,738,329 | $5,947,122 | $3,214,310 |
| Interest | 6,048 | 2,275 | 4,724 | 2,247 |
| Securities lending | 102,532 | 30,828 | 78,187 | 44,450 |
| Income distributions received from affiliated investments | 7,719,979 | 436,120 | 9,856,695 | 1,454,913 |
| Total investment income | 16,584,624 | 3,207,552 | 15,886,728 | 4,715,920 |
| Expenses | | | | |
| Investment management fees | 1,472,278 | 417,009 | 1,107,684 | 503,937 |
| Distribution and service fees | 229,802 | 46,994 | 215,386 | 66,510 |
| Accounting and legal services fees | 83,770 | 17,038 | 78,561 | 24,179 |
| Transfer agent fees | 421 | 19 | 429 | 75 |
| Trustees' fees | 8,043 | 1,643 | 7,582 | 2,390 |
| Custodian fees | 22,591 | 22,591 | 22,591 | 22,591 |
| State registration fees | 1,683 | 3,216 | 1,685 | 1,484 |
| Printing and postage | 6,381 | 6,270 | 6,363 | 6,283 |
| Professional fees | 21,589 | 14,971 | 20,686 | 15,725 |
| Other | 16,086 | 5,602 | 12,149 | 7,258 |
| Total expenses | 1,862,644 | 535,353 | 1,473,116 | 650,432 |
| Less expense reductions | — | (23,812) | — | (11,299) |
| Net expenses | 1,862,644 | 511,541 | 1,473,116 | 639,133 |
| Net investment income | 14,721,980 | 2,696,011 | 14,413,612 | 4,076,787 |
| Realized and unrealized gain (loss) | | | | |
| Net realized gain (loss) on | | | | |
| Unaffiliated investments and foreign currency transactions | 3,845,553 | 832,910 | 3,451,047 | 1,401,451 |
| Affiliated investments | (4,782,838) | (539,279) | (6,406,404) | (1,455,964) |
| Capital gain distributions received from affiliated investments | 3,829,702 | 216,349 | 4,889,677 | 721,748 |
| | 2,892,417 | 509,980 | 1,934,320 | 667,235 |
| Change in net unrealized appreciation (depreciation) of | | | | |
| Unaffiliated investments and translation of assets and liabilities in foreign currencies | (3,591,816) | 558,014 | (5,615,354) | (715,781) |
| Affiliated investments | (1,964,641) | 229,600 | (2,790,565) | 496,571 |
| | (5,556,457) | 787,614 | (8,405,919) | (219,210) |
| Net realized and unrealized gain (loss) | (2,664,040) | 1,297,594 | (6,471,599) | 448,025 |
| Increase in net assets from operations | $12,057,940 | $3,993,605 | $7,942,013 | $4,524,812 |
The accompanying notes are an integral part of the financial statements.
John Hancock Funds II
Statements of operations —For the six months ended February 29, 2020 (unaudited)
| Investment income | Real Estate Securities Fund | Science & Technology Fund | Strategic Equity Allocation Fund | U.S. Sector Rotation Fund |
| Dividends | $6,906,747 | $2,278,693 | $84,754,705 | $12,968,047 |
| Interest | 14,411 | 158,114 | 1,420,727 | 202,332 |
| Securities lending | 1,118 | 39,127 | 885,519 | 36,783 |
| Less foreign taxes withheld | — | (36,830) | (3,039,049) | (80) |
| Non-cash dividends | — | 1,263,249 | — | — |
| Total investment income | 6,922,276 | 3,702,353 | 84,021,902 | 13,207,082 |
| Expenses | | | | |
| Investment management fees | 1,497,553 | 1,470,160 | 23,516,580 | 4,105,854 |
| Distribution and service fees | 106,968 | — | — | — |
| Accounting and legal services fees | 38,723 | 26,022 | 682,857 | 118,834 |
| Trustees' fees | 3,860 | 2,732 | 67,356 | 14,757 |
| Custodian fees | 29,549 | 38,332 | 735,202 | 116,011 |
| Printing and postage | 6,241 | 6,241 | 6,241 | 6,241 |
| Professional fees | 28,612 | 27,848 | 108,166 | 49,061 |
| Other | 14,822 | 11,641 | 104,882 | 25,808 |
| Total expenses | 1,726,328 | 1,582,976 | 25,221,284 | 4,436,566 |
| Less expense reductions | (16,197) | (65,808) | (4,938,951) | (862,092) |
| Net expenses | 1,710,131 | 1,517,168 | 20,282,333 | 3,574,474 |
| Net investment income | 5,212,145 | 2,185,185 | 63,739,569 | 9,632,608 |
| Realized and unrealized gain (loss) | | | | |
| Net realized gain (loss) on | | | | |
| Unaffiliated investments and foreign currency transactions | 18,619,353 | 25,738,585 | 151,672,023 | 72,395,761 |
| Affiliated investments | 1 | 435 | 7,017 | 535 |
| Futures contracts | — | — | 21,174,939 | 4,153,479 |
| | 18,619,354 | 25,739,020 | 172,853,979 | 76,549,775 |
| Change in net unrealized appreciation (depreciation) of | | | | |
| Unaffiliated investments and translation of assets and liabilities in foreign currencies | (44,101,785) | (4,177,224) | (89,936,114) | (41,185,918) |
| Affiliated investments | — | 914 | 10,066 | 36 |
| Futures contracts | — | — | (18,544,585) | (2,909,819) |
| | (44,101,785) | (4,176,310) | (108,470,633) | (44,095,701) |
| Net realized and unrealized gain (loss) | (25,482,431) | 21,562,710 | 64,383,346 | 32,454,074 |
| Increase (decrease) in net assets from operations | $(20,270,286) | $23,747,895 | $128,122,915 | $42,086,682 |
The accompanying notes are an integral part of the financial statements.
John Hancock Funds II
Statements of changes in net assets(unaudited)
| | Capital Appreciation Fund | Capital Appreciation Value Fund | Health Sciences Fund |
| Increase (decrease) in net assets | Six months ended
2-29-20
(unaudited) | Year ended
8-31-19 | Six months ended
2-29-20
(unaudited) | Year ended
8-31-19 | Six months ended
2-29-20
(unaudited) | Year ended
8-31-19 |
| From operations | | | | | | |
| Net investment income (loss) | $(669,878) | $167,684 | $9,709,048 | $27,273,402 | $(512,662) | $(473,891) |
| Net realized gain | 145,165,737 | 161,879,822 | 124,741,120 | 153,187,665 | 11,376,955 | 11,280,327 |
| Change in net unrealized appreciation (depreciation) | 19,937,538 | (150,945,084) | (84,973,187) | (28,230,103) | 7,301,065 | (23,699,008) |
| Increase (decrease) in net assets resulting from operations | 164,433,397 | 11,102,422 | 49,476,981 | 152,230,964 | 18,165,358 | (12,892,572) |
| Distributions to shareholders | | | | | | |
| From earnings | | | | | | |
| Class 1 | (56,812,578) | (94,592,357) | — | — | — | — |
| Class NAV | (118,001,591) | (183,726,482) | (163,904,965) | (198,551,204) | (10,491,735) | (16,432,088) |
| Total distributions | (174,814,169) | (278,318,839) | (163,904,965) | (198,551,204) | (10,491,735) | (16,432,088) |
| From fund share transactions | | | | | | |
| From fund share transactions | (53,670,602) | 188,522,934 | (117,565,195) | (131,905,276) | (6,797,735) | (8,101,801) |
| Total increase (decrease) | (64,051,374) | (78,693,483) | (231,993,179) | (178,225,516) | 875,888 | (37,426,461) |
| Net assets | | | | | | |
| Beginning of period | 1,736,814,385 | 1,815,507,868 | 1,607,038,415 | 1,785,263,931 | 272,012,456 | 309,438,917 |
| End of period | $1,672,763,011 | $1,736,814,385 | $1,375,045,236 | $1,607,038,415 | $272,888,344 | $272,012,456 |
| | International Strategic Equity Allocation Fund | International Value Fund | Mid Cap Stock Fund |
| Increase (decrease) in net assets | Six months ended
2-29-20
(unaudited) | Year ended
8-31-19 | Six months ended
2-29-20
(unaudited) | Year ended
8-31-19 | Six months ended
2-29-20
(unaudited) | Year ended
8-31-19 |
| From operations | | | | | | |
| Net investment income (loss) | $13,929,256 | $46,062,409 | $1,282,393 | $8,865,157 | $(2,878,199) | $(7,991,067) |
| Net realized gain (loss) | 901,817 | (84,375,610) | 21,135,104 | 27,995,017 | 196,367,081 | 156,022,196 |
| Change in net unrealized appreciation (depreciation) | 3,142,923 | (33,038,621) | (25,015,337) | (105,120,709) | (148,295,791) | (70,269,123) |
| Increase (decrease) in net assets resulting from operations | 17,973,996 | (71,351,822) | (2,597,840) | (68,260,535) | 45,193,091 | 77,762,006 |
| Distributions to shareholders | | | | | | |
| From earnings | | | | | | |
| Class 1 | — | — | (9,006,651) | (3,239,198) | (51,552,722) | (64,739,364) |
| Class NAV | (48,976,734) | (260,793,663) | (9,863,048) | (19,064,587) | (139,556,442) | (185,441,862) |
| Total distributions | (48,976,734) | (260,793,663) | (18,869,699) | (22,303,785) | (191,109,164) | (250,181,226) |
| From fund share transactions | | | | | | |
| From fund share transactions | (1,323,489) | 133,266,961 | (3,523,834) | (774,957,085) | 36,750,675 | 34,142,711 |
| Issued in reorganization | — | — | — | — | — | 24,403,159 |
| Fund share transactions | (1,323,489) | 133,266,961 | (3,523,834) | (774,957,085) | 36,750,675 | 58,545,870 |
| Total decrease | (32,326,227) | (198,878,524) | (24,991,373) | (865,521,405) | (109,165,398) | (113,873,350) |
| Net assets | | | | | | |
| Beginning of period | 1,633,620,588 | 1,832,499,112 | 243,740,153 | 1,109,261,558 | 1,591,115,936 | 1,704,989,286 |
| End of period | $1,601,294,361 | $1,633,620,588 | $218,748,780 | $243,740,153 | $1,481,950,538 | $1,591,115,936 |
The accompanying notes are an integral part of the financial statements.
John Hancock Funds II
Statements of changes in net assets(unaudited)
| | Mid Value Fund | Multi-Index Lifestyle Aggressive Portfolio | Multi-Index Lifestyle Balanced Portfolio |
| Increase (decrease) in net assets | Six months ended
2-29-20
(unaudited) | Year ended
8-31-19 | Six months ended
2-29-20
(unaudited) | Year ended
8-31-19 | Six months ended
2-29-20
(unaudited) | Year ended
8-31-19 |
| From operations | | | | | | |
| Net investment income | $8,995,028 | $19,303,493 | $6,168,031 | $5,230,494 | $14,721,980 | $20,058,873 |
| Net realized gain | 18,024,495 | 9,688,613 | 638,497 | 20,418,742 | 2,892,417 | 27,974,987 |
| Change in net unrealized appreciation (depreciation) | (20,397,768) | (153,090,823) | (5,588,239) | (28,066,671) | (5,556,457) | (17,902,425) |
| Increase (decrease) in net assets resulting from operations | 6,621,755 | (124,098,717) | 1,218,289 | (2,417,435) | 12,057,940 | 30,131,435 |
| Distributions to shareholders | | | | | | |
| From earnings | | | | | | |
| Class R6 | — | — | (380,187) | (326,422) | (375,364) | (356,263) |
| Class 1 | — | — | (32,109,372) | (31,418,938) | (54,717,492) | (61,891,267) |
| Class NAV | (34,817,897) | (101,535,887) | — | — | — | — |
| Total distributions | (34,817,897) | (101,535,887) | (32,489,559) | (31,745,360) | (55,092,856) | (62,247,530) |
| From fund share transactions | | | | | | |
| From fund share transactions | (75,135,516) | 16,774,061 | 27,855,933 | 45,895,143 | 21,756,513 | 59,371,272 |
| Total increase (decrease) | (103,331,658) | (208,860,543) | (3,415,337) | 11,732,348 | (21,278,403) | 27,255,177 |
| Net assets | | | | | | |
| Beginning of period | 1,230,547,672 | 1,439,408,215 | 339,601,794 | 327,869,446 | 896,979,795 | 869,724,618 |
| End of period | $1,127,216,014 | $1,230,547,672 | $336,186,457 | $339,601,794 | $875,701,392 | $896,979,795 |
| | Multi-Index Lifestyle Conservative Portfolio | Multi-Index Lifestyle Growth Portfolio | Multi-Index Lifestyle Moderate Portfolio |
| Increase (decrease) in net assets | Six months ended
2-29-20
(unaudited) | Year ended
8-31-19 | Six months ended
2-29-20
(unaudited) | Year ended
8-31-19 | Six months ended
2-29-20
(unaudited) | Year ended
8-31-19 |
| From operations | | | | | | |
| Net investment income | $2,696,011 | $4,493,169 | $14,413,612 | $15,239,646 | $4,076,787 | $6,252,148 |
| Net realized gain | 509,980 | 960,434 | 1,934,320 | 39,895,442 | 667,235 | 4,573,989 |
| Change in net unrealized appreciation (depreciation) | 787,614 | 6,190,858 | (8,405,919) | (43,224,083) | (219,210) | 2,777,145 |
| Increase in net assets resulting from operations | 3,993,605 | 11,644,461 | 7,942,013 | 11,911,005 | 4,524,812 | 13,603,282 |
| Distributions to shareholders | | | | | | |
| From earnings | | | | | | |
| Class R6 | (7,726) | (3,952) | (503,695) | (438,039) | (52,179) | (53,451) |
| Class 1 | (5,714,945) | (6,753,201) | (66,128,412) | (63,603,024) | (12,337,160) | (13,629,279) |
| Total distributions | (5,722,671) | (6,757,153) | (66,632,107) | (64,041,063) | (12,389,339) | (13,682,730) |
| From fund share transactions | | | | | | |
| From fund share transactions | (80,194) | 22,980,029 | 45,802,585 | 120,071,681 | (7,435,148) | 22,829,438 |
| Total increase (decrease) | (1,809,260) | 27,867,337 | (12,887,509) | 67,941,623 | (15,299,675) | 22,749,990 |
| Net assets | | | | | | |
| Beginning of period | 184,199,253 | 156,331,916 | 829,279,251 | 761,337,628 | 263,163,624 | 240,413,634 |
| End of period | $182,389,993 | $184,199,253 | $816,391,742 | $829,279,251 | $247,863,949 | $263,163,624 |
The accompanying notes are an integral part of the financial statements.
John Hancock Funds II
Statements of changes in net assets(unaudited)
| | Real Estate Securities Fund | Science & Technology Fund | Strategic Equity Allocation Fund |
| Increase (decrease) in net assets | Six months ended
2-29-20
(unaudited) | Year ended
8-31-19 | Six months ended
2-29-20
(unaudited) | Year ended
8-31-19 | Six months ended
2-29-20
(unaudited) | Year ended
8-31-19 |
| From operations | | | | | | |
| Net investment income (loss) | $5,212,145 | $9,057,353 | $2,185,185 | $(908,470) | $63,739,569 | $154,713,158 |
| Net realized gain | 18,619,354 | 20,387,808 | 25,739,020 | 19,965,025 | 172,853,979 | 102,651,681 |
| Change in net unrealized appreciation (depreciation) | (44,101,785) | 34,474,373 | (4,176,310) | (10,988,711) | (108,470,633) | (383,128,086) |
| Increase (decrease) in net assets resulting from operations | (20,270,286) | 63,919,534 | 23,747,895 | 8,067,844 | 128,122,915 | (125,763,247) |
| Distributions to shareholders | | | | | | |
| From earnings | | | | | | |
| Class 1 | (34,226,630) | (16,428,402) | — | — | — | — |
| Class NAV | — | — | (25,176,071) | (77,599,763) | (243,595,412) | (1,038,737,526) |
| Total distributions | (34,226,630) | (16,428,402) | (25,176,071) | (77,599,763) | (243,595,412) | (1,038,737,526) |
| From fund share transactions | | | | | | |
| From fund share transactions | (1,235,328) | (34,907,359) | (8,355,837) | 101,198,431 | (369,255,667) | 803,092,859 |
| Total increase (decrease) | (55,732,244) | 12,583,773 | (9,784,013) | 31,666,512 | (484,728,164) | (361,407,914) |
| Net assets | | | | | | |
| Beginning of period | 433,489,534 | 420,905,761 | 284,036,599 | 252,370,087 | 7,328,831,333 | 7,690,239,247 |
| End of period | $377,757,290 | $433,489,534 | $274,252,586 | $284,036,599 | $6,844,103,169 | $7,328,831,333 |
| | U.S. Sector Rotation Fund |
| Increase (decrease) in net assets | Six months ended
2-29-20
(unaudited) | Year ended
8-31-19 |
| From operations | | |
| Net investment income | $9,632,608 | $25,826,558 |
| Net realized gain | 76,549,775 | 103,791,284 |
| Change in net unrealized appreciation (depreciation) | (44,095,701) | (134,682,857) |
| Increase (decrease) in net assets resulting from operations | 42,086,682 | (5,065,015) |
| Distributions to shareholders | | |
| From earnings | | |
| Class NAV | (127,843,285) | (347,530,083) |
| Total distributions | (127,843,285) | (347,530,083) |
| From fund share transactions | | |
| From fund share transactions | (250,432,105) | 135,353,560 |
| Total decrease | (336,188,708) | (217,241,538) |
| Net assets | | |
| Beginning of period | 1,496,954,689 | 1,714,196,227 |
| End of period | $1,160,765,981 | $1,496,954,689 |
The accompanying notes are an integral part of the financial statements.
John Hancock Funds II
Financial highlights
| Per share operating performance for a share outstanding throughout each period | | Ratios and supplemental data | |
| | | | Income (loss) from investment operations | | | Less distributions | | | | Ratios to average net assets | | |
| Period ended | Net asset
value,
beginning
of period ($) | | Net
investment
income
(loss) ($)1 | Net realized and
unrealized
gain (loss)
on investments ($) | Total from
investment
operations ($) | From net
investment
income ($) | From net
realized
gain ($) | Total
distributions ($) | Net asset
value,
end of
period ($) | Total
return
(%)2 | Expenses
before
reductions
(%) | Expenses
including
reductions
(%) | Net
investment
income
(loss) (%) | Net
assets,
end of
period
(in millions) | Portfolio
turnover
(%) |
| Capital Appreciation Fund | |
| Class 1 | |
| 02-29-20203 | 15.66 | | (0.01) | 1.53 | 1.52 | — | (1.70) | (1.70) | 15.48 | 9.614 | 0.805 | 0.795 | (0.11)5 | 551 | 20 |
| 08-31-2019 | 18.80 | | — | (0.46) | (0.46) | (0.02) | (2.66) | (2.68) | 15.66 | 0.84 | 0.80 | 0.79 | (0.03) | 584 | 50 |
| 08-31-2018 | 18.56 | | 0.02 | 4.25 | 4.27 | (0.01) | (4.02) | (4.03) | 18.80 | 26.71 | 0.79 | 0.78 | 0.11 | 687 | 39 |
| 08-31-2017 | 16.60 | | 0.01 | 3.89 | 3.90 | (0.01) | (1.93) | (1.94) | 18.56 | 26.53 | 0.79 | 0.78 | 0.07 | 582 | 45 |
| 08-31-2016 | 18.12 | | 0.01 | 0.83 | 0.84 | —6 | (2.36) | (2.36) | 16.60 | 4.41 | 0.79 | 0.78 | 0.05 | 551 | 32 |
| 08-31-2015 | 18.30 | | —6 | 1.22 | 1.22 | — | (1.40) | (1.40) | 18.12 | 7.01 | 0.78 | 0.77 | 0.01 | 588 | 33 |
| Class NAV | |
| 02-29-20203 | 15.71 | | —6 | 1.52 | 1.52 | —6 | (1.70) | (1.70) | 15.53 | 9.594 | 0.755 | 0.745 | (0.06)5 | 1,122 | 20 |
| 08-31-2019 | 18.85 | | —6 | (0.45) | (0.45) | (0.03) | (2.66) | (2.69) | 15.71 | 0.89 | 0.75 | 0.74 | 0.03 | 1,153 | 50 |
| 08-31-2018 | 18.60 | | 0.03 | 4.26 | 4.29 | (0.02) | (4.02) | (4.04) | 18.85 | 26.76 | 0.74 | 0.73 | 0.15 | 1,128 | 39 |
| 08-31-2017 | 16.63 | | 0.02 | 3.90 | 3.92 | (0.02) | (1.93) | (1.95) | 18.60 | 26.62 | 0.74 | 0.73 | 0.11 | 1,222 | 45 |
| 08-31-2016 | 18.15 | | 0.02 | 0.83 | 0.85 | (0.01) | (2.36) | (2.37) | 16.63 | 4.45 | 0.74 | 0.73 | 0.10 | 1,413 | 32 |
| 08-31-2015 | 18.32 | | 0.01 | 1.22 | 1.23 | — | (1.40) | (1.40) | 18.15 | 7.06 | 0.73 | 0.72 | 0.06 | 1,519 | 33 |
| 1.Based on average daily shares outstanding. 2.Total returns would have been lower had certain expenses not been reduced during the applicable periods. 3.Six months ended 2-29-20. Unaudited. 4.Not annualized. 5.Annualized. 6.Less than $0.005 per share. | |
| Capital Appreciation Value Fund | |
| Class NAV | |
| 02-29-20203 | 11.75 | | 0.07 | 0.27 | 0.34 | (0.20) | (1.10) | (1.30) | 10.79 | 2.634 | 0.875 | 0.825 | 1.255 | 1,375 | 24 |
| 08-31-2019 | 12.27 | | 0.19 | 0.76 | 0.95 | (0.33) | (1.14) | (1.47) | 11.75 | 10.07 | 0.85 | 0.81 | 1.66 | 1,607 | 63 |
| 08-31-2018 | 12.26 | | 0.27 | 1.06 | 1.33 | (0.18) | (1.14) | (1.32) | 12.27 | 11.61 | 0.85 | 0.81 | 2.28 | 1,785 | 78 |
| 08-31-2017 | 11.62 | | 0.18 | 1.06 | 1.24 | (0.20) | (0.40) | (0.60) | 12.26 | 11.26 | 0.85 | 0.81 | 1.51 | 1,880 | 61 |
| 08-31-2016 | 11.86 | | 0.16 | 1.03 | 1.19 | (0.18) | (1.25) | (1.43) | 11.62 | 10.94 | 0.85 | 0.81 | 1.39 | 2,101 | 64 |
| 08-31-2015 | 12.70 | | 0.14 | 0.59 | 0.73 | (0.17) | (1.40) | (1.57) | 11.86 | 5.90 | 0.84 | 0.80 | 1.22 | 2,000 | 90 |
| 1.Based on average daily shares outstanding. 2.Total returns would have been lower had certain expenses not been reduced during the applicable periods. 3.Six months ended 2-29-20. Unaudited. 4.Not annualized. 5.Annualized. | |
| Health Sciences Fund | |
| Class NAV | |
| 02-29-20203 | 4.53 | | (0.01) | 0.32 | 0.31 | — | (0.19) | (0.19) | 4.65 | 6.614 | 1.125 | 1.055 | (0.37)5 | 273 | 26 |
| 08-31-2019 | 5.10 | | (0.01) | (0.28) | (0.29) | — | (0.28) | (0.28) | 4.53 | (4.87) | 1.11 | 1.05 | (0.17) | 272 | 42 |
| 08-31-2018 | 5.01 | | (0.01) | 0.95 | 0.94 | — | (0.85) | (0.85) | 5.10 | 22.04 | 1.10 | 1.04 | (0.30) | 309 | 46 |
| 08-31-2017 | 5.59 | | (0.01) | 0.74 | 0.73 | — | (1.31) | (1.31) | 5.01 | 18.48 | 1.14 | 1.07 | (0.27) | 320 | 131 |
| 08-31-2016 | 18.69 | | (0.03) | (0.64) | (0.67) | (0.02) | (12.41) | (12.43) | 5.59 | (8.77) | 1.10 | 1.04 | (0.32) | 216 | 46 |
| 08-31-2015 | 20.26 | | 0.01 | 4.41 | 4.42 | — | (5.99) | (5.99) | 18.69 | 26.42 | 0.99 | 0.94 | 0.06 | 368 | 44 |
| 1.Based on average daily shares outstanding. 2.Total returns would have been lower had certain expenses not been reduced during the applicable periods. 3.Six months ended 2-29-20. Unaudited. 4.Not annualized. 5.Annualized. | |
| International Strategic Equity Allocation Fund | |
| Class NAV | |
| 02-29-20203 | 9.01 | | 0.084 | 0.03 | 0.11 | (0.27) | — | (0.27) | 8.85 | 0.995 | 0.696 | 0.566 | 1.634, 6 | 1,601 | 35 |
| 08-31-2019 | 11.21 | | 0.26 | (0.85) | (0.59) | (0.26) | (1.35) | (1.61) | 9.01 | (3.97) | 0.69 | 0.56 | 2.74 | 1,634 | 57 |
| 08-31-2018 | 11.78 | | 0.25 | (0.01) | 0.24 | (0.29) | (0.52) | (0.81) | 11.21 | 1.81 | 0.68 | 0.55 | 2.15 | 1,832 | 94 |
| 08-31-20177 | 10.00 | | 0.23 | 1.59 | 1.82 | (0.03) | (0.01) | (0.04) | 11.78 | 18.265 | 0.696 | 0.566 | 2.436 | 2,049 | 112 |
| 1.Based on average daily shares outstanding. 2.Total returns would have been lower had certain expenses not been reduced during the applicable periods. 3.Six months ended 2-29-20. Unaudited. 4.Net investment income is affected by the timing and frequency of the declaration of dividends by the securities in which the fund invests. 5.Not annualized. 6.Annualized. 7.Period from 10-17-16 (commencement of operations) to 8-31-17. | |
The accompanying notes are an integral part of the financial statements.
John Hancock Funds II
Financial highlights
| Per share operating performance for a share outstanding throughout each period | | Ratios and supplemental data | |
| | | | Income (loss) from investment operations | | | Less distributions | | | | Ratios to average net assets | | |
| Period ended | Net asset
value,
beginning
of period ($) | | Net
investment
income
(loss) ($)1 | Net realized and
unrealized
gain (loss)
on investments ($) | Total from
investment
operations ($) | From net
investment
income ($) | From net
realized
gain ($) | Total
distributions ($) | Net asset
value,
end of
period ($) | Total
return
(%)2 | Expenses
before
reductions
(%) | Expenses
including
reductions
(%) | Net
investment
income
(loss) (%) | Net
assets,
end of
period
(in millions) | Portfolio
turnover
(%) |
| International Value Fund | |
| Class 1 | |
| 02-29-20203 | 14.03 | | 0.074 | (0.20) | (0.13) | (0.36) | (0.79) | (1.15) | 12.75 | (2.14)5 | 0.966 | 0.966 | 1.014, 6 | 101 | 1137 |
| 08-31-2019 | 16.45 | | 0.35 | (2.44) | (2.09) | (0.33) | — | (0.33) | 14.03 | (12.73) | 0.93 | 0.92 | 2.32 | 126 | 36 |
| 08-31-2018 | 16.82 | | 0.29 | (0.27) | 0.02 | (0.39) | — | (0.39) | 16.45 | 0.06 | 0.91 | 0.90 | 1.72 | 169 | 29 |
| 08-31-2017 | 14.80 | | 0.29 | 2.09 | 2.38 | (0.36) | — | (0.36) | 16.82 | 16.35 | 0.91 | 0.90 | 1.85 | 206 | 31 |
| 08-31-2016 | 14.53 | | 0.29 | 0.25 | 0.54 | (0.27) | — | (0.27) | 14.80 | 3.86 | 0.90 | 0.90 | 2.06 | 186 | 24 |
| 08-31-2015 | 18.11 | | 0.26 | (3.42) | (3.16) | (0.42) | — | (0.42) | 14.53 | (17.54) | 0.93 | 0.92 | 1.62 | 205 | 32 |
| Class NAV | |
| 02-29-20203 | 13.99 | | 0.084 | (0.22) | (0.14) | (0.36) | (0.79) | (1.15) | 12.70 | (2.10)5 | 0.916 | 0.916 | 1.044, 6 | 117 | 1137 |
| 08-31-2019 | 16.41 | | 0.17 | (2.25) | (2.08) | (0.34) | — | (0.34) | 13.99 | (12.71) | 0.88 | 0.87 | 1.11 | 118 | 36 |
| 08-31-2018 | 16.77 | | 0.31 | (0.27) | 0.04 | (0.40) | — | (0.40) | 16.41 | 0.17 | 0.86 | 0.85 | 1.81 | 940 | 29 |
| 08-31-2017 | 14.76 | | 0.29 | 2.08 | 2.37 | (0.36) | — | (0.36) | 16.77 | 16.38 | 0.86 | 0.85 | 1.85 | 987 | 31 |
| 08-31-2016 | 14.49 | | 0.28 | 0.27 | 0.55 | (0.28) | — | (0.28) | 14.76 | 3.93 | 0.85 | 0.85 | 2.06 | 1,347 | 24 |
| 08-31-2015 | 18.07 | | 0.27 | (3.42) | (3.15) | (0.43) | — | (0.43) | 14.49 | (17.55) | 0.88 | 0.87 | 1.69 | 1,569 | 32 |
| 1.Based on average daily shares outstanding. 2.Total returns would have been lower had certain expenses not been reduced during the applicable periods. 3.Six months ended 2-29-20. Unaudited. 4.Net investment income is affected by the timing and frequency of the declaration of dividends by the securities in which the fund invests. 5.Not annualized. 6.Annualized. 7.Increase in portfolio turnover rate resulted from repositioning of the portfolio during the period in accordance with investment policy changes approved by the Board of Trustees. | |
| Mid Cap Stock Fund | |
| Class 1 | |
| 02-29-20203 | 22.24 | | (0.04) | 0.58 | 0.54 | — | (2.77) | (2.77) | 20.01 | 2.004 | 0.935 | 0.925 | (0.40)5 | 410 | 43 |
| 08-31-2019 | 25.90 | | (0.12) | 0.28 | 0.16 | — | (3.82) | (3.82) | 22.24 | 5.71 | 0.92 | 0.92 | (0.54) | 438 | 616 |
| 08-31-2018 | 22.14 | | (0.10) | 6.01 | 5.91 | — | (2.15) | (2.15) | 25.90 | 28.68 | 0.92 | 0.91 | (0.44) | 447 | 67 |
| 08-31-2017 | 18.86 | | (0.03) | 3.40 | 3.37 | — | (0.09) | (0.09) | 22.14 | 17.86 | 0.92 | 0.91 | (0.16) | 365 | 89 |
| 08-31-2016 | 20.57 | | (0.04) | 0.61 | 0.57 | — | (2.28) | (2.28) | 18.86 | 3.02 | 0.92 | 0.91 | (0.23) | 340 | 79 |
| 08-31-2015 | 22.57 | | (0.06) | 1.03 | 0.97 | — | (2.97) | (2.97) | 20.57 | 4.81 | 0.91 | 0.91 | (0.29) | 366 | 79 |
| Class NAV | |
| 02-29-20203 | 22.52 | | (0.04) | 0.59 | 0.55 | — | (2.77) | (2.77) | 20.30 | 2.024 | 0.885 | 0.875 | (0.35)5 | 1,072 | 43 |
| 08-31-2019 | 26.16 | | (0.11) | 0.29 | 0.18 | — | (3.82) | (3.82) | 22.52 | 5.74 | 0.87 | 0.87 | (0.49) | 1,153 | 616 |
| 08-31-2018 | 22.33 | | (0.09) | 6.07 | 5.98 | — | (2.15) | (2.15) | 26.16 | 28.75 | 0.87 | 0.86 | (0.39) | 1,258 | 67 |
| 08-31-2017 | 19.01 | | (0.02) | 3.43 | 3.41 | — | (0.09) | (0.09) | 22.33 | 17.99 | 0.87 | 0.86 | (0.12) | 1,245 | 89 |
| 08-31-2016 | 20.71 | | (0.03) | 0.61 | 0.58 | — | (2.28) | (2.28) | 19.01 | 3.06 | 0.87 | 0.86 | (0.18) | 1,147 | 79 |
| 08-31-2015 | 22.69 | | (0.05) | 1.04 | 0.99 | — | (2.97) | (2.97) | 20.71 | 4.83 | 0.86 | 0.86 | (0.24) | 1,195 | 79 |
| 1.Based on average daily shares outstanding. 2.Total returns would have been lower had certain expenses not been reduced during the applicable periods. 3.Six months ended 2-29-20. Unaudited. 4.Not annualized. 5.Annualized. 6.Excludes merger activity. | |
| Mid Value Fund | |
| Class NAV | |
| 02-29-20203 | 14.27 | | 0.11 | (0.10) | 0.01 | (0.25) | (0.17) | (0.42) | 13.86 | (0.17)4 | 0.995 | 0.945 | 1.435 | 1,127 | 18 |
| 08-31-2019 | 17.08 | | 0.22 | (1.81) | (1.59) | (0.15) | (1.07) | (1.22) | 14.27 | (8.82) | 0.99 | 0.94 | 1.48 | 1,231 | 42 |
| 08-31-2018 | 16.00 | | 0.12 | 1.90 | 2.02 | (0.13) | (0.81) | (0.94) | 17.08 | 12.96 | 0.99 | 0.94 | 0.72 | 1,439 | 39 |
| 08-31-2017 | 15.88 | | 0.16 | 1.52 | 1.68 | (0.14) | (1.42) | (1.56) | 16.00 | 10.83 | 0.99 | 0.94 | 0.98 | 1,224 | 55 |
| 08-31-2016 | 15.45 | | 0.17 | 1.94 | 2.11 | (0.20) | (1.48) | (1.68) | 15.88 | 15.18 | 0.99 | 0.93 | 1.17 | 922 | 56 |
| 08-31-2015 | 18.20 | | 0.15 | (0.72) | (0.57) | (0.14) | (2.04) | (2.18) | 15.45 | (3.55) | 1.03 | 0.97 | 0.88 | 957 | 47 |
| 1.Based on average daily shares outstanding. 2.Total returns would have been lower had certain expenses not been reduced during the applicable periods. 3.Six months ended 2-29-20. Unaudited. 4.Not annualized. 5.Annualized. | |
The accompanying notes are an integral part of the financial statements.
John Hancock Funds II
Financial highlights
| Per share operating performance for a share outstanding throughout each period | | Ratios and supplemental data | |
| | | | Income (loss) from investment operations | | | Less distributions | | | | Ratios to average net assets | | |
| Period ended | Net asset
value,
beginning
of period ($) | | Net
investment
income
(loss) ($)1 | Net realized and
unrealized
gain (loss)
on investments ($) | Total from
investment
operations ($) | From net
investment
income ($) | From net
realized
gain ($) | Total
distributions ($) | Net asset
value,
end of
period ($) | Total
return
(%)2 | Expenses
before
reductions
(%) | Expenses
including
reductions
(%) | Net
investment
income
(loss) (%) | Net
assets,
end of
period
(in millions) | Portfolio
turnover
(%) |
| Multi-Index Lifestyle Aggressive Portfolio | |
| Class R6 | |
| 02-29-20203 | 11.57 | | 0.194 | (0.04) | 0.15 | (0.23) | (0.88) | (1.11) | 10.61 | 0.425 | 0.266, 7 | 0.266, 7 | 3.224, 6 | 7 | 11 |
| 08-31-2019 | 13.12 | | 0.194 | (0.50) | (0.31) | (0.20) | (1.04) | (1.24) | 11.57 | (0.88) | 0.257 | 0.257 | 1.624 | 4 | 14 |
| 08-31-2018 | 12.31 | | 0.124 | 1.42 | 1.54 | (0.21) | (0.52) | (0.73) | 13.12 | 12.73 | 0.267 | 0.257 | 0.934 | 4 | 15 |
| 08-31-2017 | 10.94 | | 0.184 | 1.54 | 1.72 | (0.19) | (0.16) | (0.35) | 12.31 | 16.07 | 0.277 | 0.257 | 1.574 | —8 | 13 |
| 08-31-2016 | 10.19 | | 0.164 | 0.78 | 0.94 | (0.15) | (0.04) | (0.19) | 10.94 | 9.34 | 0.327 | 0.267 | 1.444 | —8 | 14 |
| 08-31-2015 | 10.77 | | 0.214 | (0.63) | (0.42) | (0.14) | (0.02) | (0.16) | 10.19 | (3.97) | 0.597 | 0.287 | 1.934 | —8 | 14 |
| Class 1 | |
| 02-29-20203 | 11.56 | | 0.204 | (0.05) | 0.15 | (0.23) | (0.88) | (1.11) | 10.60 | 0.385 | 0.296, 7 | 0.296, 7 | 3.434, 6 | 329 | 11 |
| 08-31-2019 | 13.12 | | 0.194 | (0.51) | (0.32) | (0.20) | (1.04) | (1.24) | 11.56 | (1.01) | 0.297 | 0.297 | 1.614 | 336 | 14 |
| 08-31-2018 | 12.31 | | 0.194 | 1.34 | 1.53 | (0.20) | (0.52) | (0.72) | 13.12 | 12.69 | 0.297 | 0.297 | 1.524 | 324 | 15 |
| 08-31-2017 | 10.94 | | 0.164 | 1.55 | 1.71 | (0.18) | (0.16) | (0.34) | 12.31 | 16.04 | 0.317 | 0.297 | 1.374 | 245 | 13 |
| 08-31-2016 | 10.19 | | 0.134 | 0.81 | 0.94 | (0.15) | (0.04) | (0.19) | 10.94 | 9.30 | 0.357 | 0.297 | 1.424 | 105 | 14 |
| 08-31-2015 | 10.77 | | 0.104 | (0.51) | (0.41) | (0.15) | (0.02) | (0.17) | 10.19 | (3.93) | 0.577 | 0.307 | 0.974 | 45 | 14 |
| 1.Based on average daily shares outstanding. 2.Total returns would have been lower had certain expenses not been reduced during the applicable periods. 3.Six months ended 2-29-20. Unaudited. 4.Net investment income is affected by the timing and frequency of the declaration of dividends by the underlying funds in which the portfolio invests. 5.Not annualized. 6.Annualized. 7.Ratios do not include expenses indirectly incurred from underlying funds and can vary based on the mix of underlying funds held by the portfolio. 8.Less than $500,000. | |
| Multi-Index Lifestyle Balanced Portfolio | |
| Class R6 | |
| 02-29-20203 | 11.26 | | 0.184 | —5 | 0.18 | (0.21) | (0.48) | (0.69) | 10.75 | 1.346 | 0.377, 8 | 0.377, 8 | 3.144, 7 | 6 | 23 |
| 08-31-2019 | 11.79 | | 0.264 | 0.03 | 0.29 | (0.26) | (0.56) | (0.82) | 11.26 | 3.26 | 0.368 | 0.368 | 2.324 | 6 | 21 |
| 08-31-2018 | 11.48 | | 0.214 | 0.63 | 0.84 | (0.24) | (0.29) | (0.53) | 11.79 | 7.38 | 0.368 | 0.368 | 1.864 | 5 | 17 |
| 08-31-2017 | 10.78 | | 0.234 | 0.80 | 1.03 | (0.23) | (0.10) | (0.33) | 11.48 | 9.79 | 0.368 | 0.368 | 2.144 | —9 | 22 |
| 08-31-2016 | 10.17 | | 0.264 | 0.59 | 0.85 | (0.22) | (0.02) | (0.24) | 10.78 | 8.49 | 0.378 | 0.378 | 2.384 | —9 | 11 |
| 08-31-2015 | 10.64 | | 0.214 | (0.49) | (0.28) | (0.18) | (0.01) | (0.19) | 10.17 | (2.69) | 0.578 | 0.408 | 2.024 | —9 | 18 |
| Class 1 | |
| 02-29-20203 | 11.26 | | 0.184 | (0.01) | 0.17 | (0.21) | (0.48) | (0.69) | 10.74 | 1.226 | 0.407, 8 | 0.407, 8 | 3.184, 7 | 869 | 23 |
| 08-31-2019 | 11.78 | | 0.254 | 0.05 | 0.30 | (0.26) | (0.56) | (0.82) | 11.26 | 3.31 | 0.408 | 0.408 | 2.304 | 891 | 21 |
| 08-31-2018 | 11.48 | | 0.244 | 0.58 | 0.82 | (0.23) | (0.29) | (0.52) | 11.78 | 7.25 | 0.408 | 0.408 | 2.064 | 865 | 17 |
| 08-31-2017 | 10.78 | | 0.214 | 0.81 | 1.02 | (0.22) | (0.10) | (0.32) | 11.48 | 9.75 | 0.408 | 0.408 | 1.904 | 719 | 22 |
| 08-31-2016 | 10.17 | | 0.204 | 0.64 | 0.84 | (0.21) | (0.02) | (0.23) | 10.78 | 8.44 | 0.418 | 0.418 | 2.094 | 350 | 11 |
| 08-31-2015 | 10.64 | | 0.174 | (0.45) | (0.28) | (0.18) | (0.01) | (0.19) | 10.17 | (2.67) | 0.508 | 0.418 | 1.584 | 141 | 18 |
| 1.Based on average daily shares outstanding. 2.Total returns would have been lower had certain expenses not been reduced during the applicable periods. 3.Six months ended 2-29-20. Unaudited. 4.Net investment income is affected by the timing and frequency of the declaration of dividends by the underlying funds in which the portfolio invests. 5.Less than $0.005 per share. 6.Not annualized. 7.Annualized. 8.Ratios do not include expenses indirectly incurred from underlying funds and can vary based on the mix of underlying funds held by the portfolio. 9.Less than $500,000. | |
| Multi-Index Lifestyle Conservative Portfolio | |
| Class R6 | |
| 02-29-20203 | 10.84 | | 0.134 | 0.10 | 0.23 | (0.18) | (0.15) | (0.33) | 10.74 | 2.125 | 0.536, 7 | 0.516, 7 | 2.484, 6 | 1 | 34 |
| 08-31-2019 | 10.57 | | 0.244 | 0.47 | 0.71 | (0.28) | (0.16) | (0.44) | 10.84 | 7.09 | 0.517 | 0.507 | 2.354 | —8 | 21 |
| 08-31-2018 | 10.75 | | 0.284 | (0.11) | 0.17 | (0.25) | (0.10) | (0.35) | 10.57 | 1.61 | 0.537 | 0.507 | 2.624 | —8 | 24 |
| 08-31-2017 | 10.65 | | 0.244 | 0.17 | 0.41 | (0.24) | (0.07) | (0.31) | 10.75 | 3.95 | 0.557 | 0.507 | 2.324 | —8 | 36 |
| 08-31-2016 | 10.13 | | 0.304 | 0.47 | 0.77 | (0.24) | (0.01) | (0.25) | 10.65 | 7.71 | 0.607 | 0.507 | 2.724 | —8 | 21 |
| 08-31-2015 | 10.49 | | 0.224 | (0.38) | (0.16) | (0.19) | (0.01) | (0.20) | 10.13 | (1.57) | 1.087 | 0.527 | 2.124 | —8 | 18 |
| Class 1 | |
| 02-29-20203 | 10.83 | | 0.154 | 0.08 | 0.23 | (0.18) | (0.15) | (0.33) | 10.73 | 2.105 | 0.576, 7 | 0.546, 7 | 2.864, 6 | 182 | 34 |
| 08-31-2019 | 10.56 | | 0.284 | 0.43 | 0.71 | (0.28) | (0.16) | (0.44) | 10.83 | 7.05 | 0.557 | 0.547 | 2.734 | 184 | 21 |
| 08-31-2018 | 10.74 | | 0.254 | (0.09) | 0.16 | (0.24) | (0.10) | (0.34) | 10.56 | 1.57 | 0.577 | 0.547 | 2.414 | 156 | 24 |
| 08-31-2017 | 10.65 | | 0.234 | 0.16 | 0.39 | (0.23) | (0.07) | (0.30) | 10.74 | 3.82 | 0.597 | 0.547 | 2.194 | 130 | 36 |
| 08-31-2016 | 10.13 | | 0.224 | 0.54 | 0.76 | (0.23) | (0.01) | (0.24) | 10.65 | 7.68 | 0.637 | 0.537 | 2.434 | 74 | 21 |
| 08-31-2015 | 10.49 | | 0.224 | (0.38) | (0.16) | (0.19) | (0.01) | (0.20) | 10.13 | (1.56) | 1.077 | 0.537 | 2.124 | 29 | 18 |
| 1.Based on average daily shares outstanding. 2.Total returns would have been lower had certain expenses not been reduced during the applicable periods. 3.Six months ended 2-29-20. Unaudited. 4.Net investment income is affected by the timing and frequency of the declaration of dividends by the underlying funds in which the portfolio invests. 5.Not annualized. 6.Annualized. 7.Ratios do not include expenses indirectly incurred from underlying funds and can vary based on the mix of underlying funds held by the portfolio. 8.Less than $500,000. | |
The accompanying notes are an integral part of the financial statements.
John Hancock Funds II
Financial highlights
| Per share operating performance for a share outstanding throughout each period | | Ratios and supplemental data | |
| | | | Income (loss) from investment operations | | | Less distributions | | | | Ratios to average net assets | | |
| Period ended | Net asset
value,
beginning
of period ($) | | Net
investment
income
(loss) ($)1 | Net realized and
unrealized
gain (loss)
on investments ($) | Total from
investment
operations ($) | From net
investment
income ($) | From net
realized
gain ($) | Total
distributions ($) | Net asset
value,
end of
period ($) | Total
return
(%)2 | Expenses
before
reductions
(%) | Expenses
including
reductions
(%) | Net
investment
income
(loss) (%) | Net
assets,
end of
period
(in millions) | Portfolio
turnover
(%) |
| Multi-Index Lifestyle Growth Portfolio | |
| Class R6 | |
| 02-29-20203 | 11.56 | | 0.204 | (0.04) | 0.16 | (0.26) | (0.67) | (0.93) | 10.79 | 0.855 | 0.306, 7 | 0.306, 7 | 3.344, 6 | 7 | 16 |
| 08-31-2019 | 12.56 | | 0.234 | (0.21) | 0.02 | (0.23) | (0.79) | (1.02) | 11.56 | 1.30 | 0.307 | 0.307 | 1.994 | 6 | 13 |
| 08-31-2018 | 12.02 | | 0.174 | 1.00 | 1.17 | (0.22) | (0.41) | (0.63) | 12.56 | 9.85 | 0.307 | 0.307 | 1.444 | 5 | 16 |
| 08-31-2017 | 10.97 | | 0.224 | 1.15 | 1.37 | (0.20) | (0.12) | (0.32) | 12.02 | 12.82 | 0.317 | 0.317 | 1.904 | 1 | 15 |
| 08-31-2016 | 10.25 | | 0.224 | 0.69 | 0.91 | (0.16) | (0.03) | (0.19) | 10.97 | 8.95 | 0.327 | 0.327 | 2.014 | 1 | 11 |
| 08-31-2015 | 10.71 | | 0.094 | (0.41) | (0.32) | (0.13) | (0.01) | (0.14) | 10.25 | (3.04) | 0.447 | 0.327 | 0.844 | 1 | 11 |
| Class 1 | |
| 02-29-20203 | 11.54 | | 0.204 | (0.03) | 0.17 | (0.26) | (0.67) | (0.93) | 10.78 | 0.905 | 0.346, 7 | 0.346, 7 | 3.324, 6 | 810 | 16 |
| 08-31-2019 | 12.54 | | 0.224 | (0.20) | 0.02 | (0.23) | (0.79) | (1.02) | 11.54 | 1.27 | 0.347 | 0.347 | 1.964 | 823 | 13 |
| 08-31-2018 | 12.01 | | 0.224 | 0.93 | 1.15 | (0.21) | (0.41) | (0.62) | 12.54 | 9.75 | 0.347 | 0.347 | 1.834 | 756 | 16 |
| 08-31-2017 | 10.96 | | 0.194 | 1.18 | 1.37 | (0.20) | (0.12) | (0.32) | 12.01 | 12.78 | 0.347 | 0.347 | 1.674 | 611 | 15 |
| 08-31-2016 | 10.24 | | 0.164 | 0.75 | 0.91 | (0.16) | (0.03) | (0.19) | 10.96 | 8.92 | 0.367 | 0.357 | 1.714 | 277 | 11 |
| 08-31-2015 | 10.71 | | 0.134 | (0.45) | (0.32) | (0.14) | (0.01) | (0.15) | 10.24 | (3.05) | 0.467 | 0.357 | 1.194 | 116 | 11 |
| 1.Based on average daily shares outstanding. 2.Total returns would have been lower had certain expenses not been reduced during the applicable periods. 3.Six months ended 2-29-20. Unaudited. 4.Net investment income is affected by the timing and frequency of the declaration of dividends by the underlying funds in which the portfolio invests. 5.Not annualized. 6.Annualized. 7.Ratios do not include expenses indirectly incurred from underlying funds and can vary based on the mix of underlying funds held by the portfolio. | |
| Multi-Index Lifestyle Moderate Portfolio | |
| Class R6 | |
| 02-29-20203 | 11.08 | | 0.174 | 0.02 | 0.19 | (0.21) | (0.32) | (0.53) | 10.74 | 1.575 | 0.456, 7 | 0.446, 7 | 3.014, 6 | 1 | 28 |
| 08-31-2019 | 11.15 | | 0.284 | 0.28 | 0.56 | (0.29) | (0.34) | (0.63) | 11.08 | 5.58 | 0.447 | 0.447 | 2.564 | 1 | 21 |
| 08-31-2018 | 11.08 | | 0.264 | 0.21 | 0.47 | (0.24) | (0.16) | (0.40) | 11.15 | 4.37 | 0.457 | 0.447 | 2.374 | 1 | 20 |
| 08-31-2017 | 10.67 | | 0.254 | 0.45 | 0.70 | (0.23) | (0.06) | (0.29) | 11.08 | 6.75 | 0.477 | 0.447 | 2.304 | 1 | 24 |
| 08-31-2016 | 10.12 | | 0.264 | 0.55 | 0.81 | (0.24) | (0.02) | (0.26) | 10.67 | 8.17 | 0.517 | 0.447 | 2.534 | 1 | 15 |
| 08-31-2015 | 10.55 | | 0.224 | (0.45) | (0.23) | (0.19) | (0.01) | (0.20) | 10.12 | (2.25) | 0.887 | 0.457 | 2.144 | 1 | 16 |
| Class 1 | |
| 02-29-20203 | 11.08 | | 0.174 | 0.01 | 0.18 | (0.20) | (0.32) | (0.52) | 10.74 | 1.555 | 0.496, 7 | 0.486, 7 | 3.054, 6 | 247 | 28 |
| 08-31-2019 | 11.14 | | 0.274 | 0.29 | 0.56 | (0.28) | (0.34) | (0.62) | 11.08 | 5.64 | 0.487 | 0.487 | 2.554 | 262 | 21 |
| 08-31-2018 | 11.07 | | 0.254 | 0.22 | 0.47 | (0.24) | (0.16) | (0.40) | 11.14 | 4.34 | 0.497 | 0.487 | 2.284 | 239 | 20 |
| 08-31-2017 | 10.67 | | 0.234 | 0.46 | 0.69 | (0.23) | (0.06) | (0.29) | 11.07 | 6.61 | 0.507 | 0.477 | 2.104 | 198 | 24 |
| 08-31-2016 | 10.12 | | 0.224 | 0.59 | 0.81 | (0.24) | (0.02) | (0.26) | 10.67 | 8.13 | 0.557 | 0.477 | 2.374 | 88 | 15 |
| 08-31-2015 | 10.54 | | 0.214 | (0.43) | (0.22) | (0.19) | (0.01) | (0.20) | 10.12 | (2.15) | 0.817 | 0.477 | 1.994 | 43 | 16 |
| 1.Based on average daily shares outstanding. 2.Total returns would have been lower had certain expenses not been reduced during the applicable periods. 3.Six months ended 2-29-20. Unaudited. 4.Net investment income is affected by the timing and frequency of the declaration of dividends by the underlying funds in which the portfolio invests. 5.Not annualized. 6.Annualized. 7.Ratios do not include expenses indirectly incurred from underlying funds and can vary based on the mix of underlying funds held by the portfolio. | |
| Real Estate Securities Fund | |
| Class 1 | |
| 02-29-20203 | 14.55 | | 0.17 | (0.88) | (0.71) | (0.29) | (0.90) | (1.19) | 12.65 | (5.26)4 | 0.815 | 0.805 | 2.445 | 378 | 63 |
| 08-31-2019 | 12.97 | | 0.29 | 1.82 | 2.11 | (0.26) | (0.27) | (0.53) | 14.55 | 17.35 | 0.81 | 0.80 | 2.25 | 433 | 132 |
| 08-31-2018 | 13.12 | | 0.26 | 0.49 | 0.75 | (0.17) | (0.73) | (0.90) | 12.97 | 6.20 | 0.81 | 0.80 | 2.11 | 421 | 158 |
| 08-31-2017 | 14.95 | | 0.28 | (0.52) | (0.24) | (0.50) | (1.09) | (1.59) | 13.12 | (0.86) | 0.79 | 0.79 | 2.09 | 502 | 159 |
| 08-31-2016 | 13.39 | | 0.456 | 2.79 | 3.24 | (0.27) | (1.41) | (1.68) | 14.95 | 25.93 | 0.79 | 0.78 | 3.206 | 665 | 141 |
| 08-31-2015 | 14.68 | | 0.23 | (0.15) | 0.08 | (0.25) | (1.12) | (1.37) | 13.39 | (0.30) | 0.79 | 0.78 | 1.57 | 521 | 169 |
| 1.Based on average daily shares outstanding. 2.Total returns would have been lower had certain expenses not been reduced during the applicable periods. 3.Six months ended 2-29-20. Unaudited. 4.Not annualized. 5.Annualized. 6.Net investment income (loss) per share and ratio of net investment income (loss) to average net assets reflect a special dividend received by the fund, which amounted to $0.12 and 0.88%, respectively. | |
| Science & Technology Fund | |
| Class NAV | |
| 02-29-20203 | 3.87 | | 0.03 | 0.29 | 0.32 | — | (0.36) | (0.36) | 3.83 | 8.264 | 1.105 | 1.065 | 0.505 | 274 | 50 |
| 08-31-2019 | 5.99 | | (0.01) | (0.32) | (0.33) | — | (1.79) | (1.79) | 3.87 | 3.19 | 1.10 | 1.06 | (0.36) | 284 | 110 |
| 08-31-2018 | 13.85 | | (0.03) | 2.33 | 2.30 | — | (10.16) | (10.16) | 5.99 | 30.59 | 1.10 | 1.05 | (0.47) | 252 | 108 |
| 08-31-2017 | 11.75 | | (0.02) | 3.17 | 3.15 | (0.02) | (1.03) | (1.05) | 13.85 | 29.39 | 1.07 | 1.03 | (0.13) | 355 | 93 |
| 08-31-2016 | 12.56 | | 0.02 | 2.03 | 2.05 | — | (2.86) | (2.86) | 11.75 | 18.08 | 1.07 | 1.02 | 0.18 | 766 | 98 |
| 08-31-2015 | 14.54 | | (0.04) | 0.06 | 0.02 | — | (2.00) | (2.00) | 12.56 | (0.23) | 1.05 | 1.01 | (0.29) | 829 | 113 |
| 1.Based on average daily shares outstanding. 2.Total returns would have been lower had certain expenses not been reduced during the applicable periods. 3.Six months ended 2-29-20. Unaudited. 4.Not annualized. 5.Annualized. | |
The accompanying notes are an integral part of the financial statements.
John Hancock Funds II
Financial highlights
| Per share operating performance for a share outstanding throughout each period | | Ratios and supplemental data | |
| | | | Income (loss) from investment operations | | | Less distributions | | | | Ratios to average net assets | | |
| Period ended | Net asset
value,
beginning
of period ($) | | Net
investment
income
(loss) ($)1 | Net realized and
unrealized
gain (loss)
on investments ($) | Total from
investment
operations ($) | From net
investment
income ($) | From net
realized
gain ($) | Total
distributions ($) | Net asset
value,
end of
period ($) | Total
return
(%)2 | Expenses
before
reductions
(%) | Expenses
including
reductions
(%) | Net
investment
income
(loss) (%) | Net
assets,
end of
period
(in millions) | Portfolio
turnover
(%) |
| Strategic Equity Allocation Fund | |
| Class NAV | |
| 02-29-20203 | 11.14 | | 0.10 | 0.05 | 0.15 | (0.26) | (0.13) | (0.39) | 10.90 | 1.014 | 0.675 | 0.545 | 1.695 | 6,844 | 39 |
| 08-31-2019 | 13.46 | | 0.24 | (0.75) | (0.51) | (0.23) | (1.58) | (1.81) | 11.14 | (1.78) | 0.67 | 0.54 | 2.12 | 7,329 | 80 |
| 08-31-2018 | 13.99 | | 0.22 | 1.42 | 1.64 | (0.26) | (1.91) | (2.17) | 13.46 | 12.48 | 0.66 | 0.54 | 1.64 | 7,690 | 115 |
| 08-31-2017 | 13.14 | | 0.24 | 1.85 | 2.09 | (0.24) | (1.00) | (1.24) | 13.99 | 17.12 | 0.66 | 0.53 | 1.78 | 7,636 | 67 |
| 08-31-2016 | 12.88 | | 0.23 | 0.79 | 1.02 | (0.21) | (0.55) | (0.76) | 13.14 | 8.25 | 0.67 | 0.53 | 1.83 | 7,139 | 47 |
| 08-31-2015 | 13.96 | | 0.23 | (0.72) | (0.49) | (0.24) | (0.35) | (0.59) | 12.88 | (3.71) | 0.66 | 0.53 | 1.67 | 6,118 | 32 |
| 1.Based on average daily shares outstanding. 2.Total returns would have been lower had certain expenses not been reduced during the applicable periods. 3.Six months ended 2-29-20. Unaudited. 4.Not annualized. 5.Annualized. | |
| U.S. Sector Rotation Fund | |
| Class NAV | |
| 02-29-20203 | 9.86 | | 0.07 | 0.21 | 0.28 | (0.19) | (0.86) | (1.05) | 9.09 | 2.004 | 0.675 | 0.545 | 1.465 | 1,161 | 44 |
| 08-31-2019 | 13.13 | | 0.17 | (0.72) | (0.55) | (0.19) | (2.53) | (2.72) | 9.86 | (0.34) | 0.66 | 0.53 | 1.66 | 1,497 | 92 |
| 08-31-2018 | 11.57 | | 0.15 | 2.14 | 2.29 | (0.17) | (0.56) | (0.73) | 13.13 | 20.43 | 0.66 | 0.53 | 1.26 | 1,714 | 128 |
| 08-31-20176 | 10.00 | | 0.15 | 1.46 | 1.61 | (0.04) | — | (0.04) | 11.57 | 16.084 | 0.665 | 0.535 | 1.455 | 1,955 | 119 |
| 1.Based on average daily shares outstanding. 2.Total returns would have been lower had certain expenses not been reduced during the applicable periods. 3.Six months ended 2-29-20. Unaudited. 4.Not annualized. 5.Annualized. 6.Period from 9-26-16 (commencement of operations) to 8-31-17. | |
The accompanying notes are an integral part of the financial statements.
John Hancock Funds II
Notes to financial statements (unaudited)
1. Organization
John Hancock Funds II (the Trust) is an open-end management investment company organized as a Massachusetts business trust. The Trust is registered under the Investment Company Act of 1940, as amended (the 1940 Act). It is a series company with multiple investment series (the funds), sixteen of which are presented in this report.
Multi-Index Lifestyle Aggressive Portfolio, Multi-Index Lifestyle Balanced Portfolio, Multi-Index Lifestyle Conservative Portfolio, Multi-Index Lifestyle Growth Portfolio and Multi-Index Lifestyle Moderate Portfolio (collectively, the Multi-Index Lifestyle Portfolios) operate as “funds of funds,” investing in shares of mutual funds (underlying funds). The accounting policies of the underlying funds in which the Multi-Index Lifestyle Portfolios invest are outlined in the underlying funds’ shareholder reports, which include the underlying funds’ financial statements. These are available on the Securities and Exchange Commission (SEC) website at sec.gov. John Hancock underlying funds' shareholder reports are also available without charge by calling 800-344-1029 or visiting jhinvestments.com. The underlying funds are not covered by this report.
The funds may offer multiple classes of shares. The shares currently offered by a specific fund are detailed in the Statements of assets and liabilities. Class R6 shares are only available to certain retirement plans, institutions and other investors. Class 1 shares are offered only to certain affiliates of Manulife Financial Corporation. Class NAV shares are offered to John Hancock affiliated funds of funds, retirement plans for employees of John Hancock and/or Manulife Financial Corporation, and certain 529 plans. Shareholders of each class have exclusive voting rights to matters that affect that class. The distribution and service fees, if any, and transfer agent fees for each class may differ.
Prior to September 20, 2019, U.S. Sector Rotation Fund was known as U.S. Strategic Equity Alocation Fund.
2. Significant accounting policies
The financial statements have been prepared in conformity with accounting principles generally accepted in the United States of America (US GAAP), which require management to make certain estimates and assumptions as of the date of the financial statements. Actual results could differ from those estimates and those differences could be significant. The funds qualify as investment companies under Topic 946 of Accounting Standards Codification of US GAAP.
Events or transactions occurring after the end of the fiscal period through the date that the financial statements were issued have been evaluated in the preparation of the financial statements. The following summarizes the significant accounting policies of the funds:
Security valuation. Investments are stated at value as of the scheduled close of regular trading on the New York Stock Exchange (NYSE), normally at 4:00 P.M., Eastern Time. In case of emergency or other disruption resulting in the NYSE not opening for trading or the NYSE closing at a time other than the regularly scheduled close, the net asset value (NAV) may be determined as of the regularly scheduled close of the NYSE pursuant to the funds' Valuation Policies and Procedures.
In order to value the securities, the funds use the following valuation techniques: Equity securities, including exchange-traded or closed-end funds, are typically valued at the last sale price or official closing price on the exchange or principal market where the security trades. In the event there were no sales during the day or closing prices are not available, the securities are valued using the last available bid price. Investments in open-end mutual funds, including John Hancock Collateral Trust (JHCT), are valued at their respective NAVs each business day. Debt obligations typically are valued based on the evaluated prices provided by an independent pricing vendor. Independent pricing vendors utilize matrix pricing, which takes into account factors such as institutional-size trading in similar groups of securities, yield, quality, coupon rate, maturity, type of issue, trading characteristics and other market data, as well as broker supplied prices. Options listed on an exchange are valued at the mid-price of the last quoted bid and ask prices from the primary exchange where the option trades. Unlisted options are generally valued using evaluated prices obtained from an independent pricing vendor. Futures contracts are typically valued at the last traded price on the exchange on which they trade. Foreign securities and currencies are valued in U.S. dollars based on foreign currency exchange rates supplied by an independent pricing vendor.
In certain instances, the Pricing Committee may determine to value equity securities using prices obtained from another exchange or market if trading on the exchange or market on which prices are typically obtained did not open for trading as scheduled, or if trading closed earlier than scheduled, and trading occurred as normal on another exchange or market.
Other portfolio securities and assets, for which reliable market quotations are not readily available, are valued at fair value as determined in good faith by the funds' Pricing Committee following procedures established by the Board of Trustees. The frequency with which these fair valuation procedures are used cannot be predicted and fair value of securities may differ significantly from the value that would have been used had a ready market for such securities existed. Trading in foreign securities may be completed before the scheduled daily close of trading on the NYSE. Significant events at the issuer or market level may affect the values of securities between the time when the valuation of the securities is generally determined and the close of the NYSE. If a significant event occurs, these securities may be fair valued, as determined in good faith by the funds' Pricing Committee, following procedures established by the Board of Trustees. The funds use fair value adjustment factors provided by an independent pricing vendor to value certain foreign securities in order to adjust for events that may occur between the close of foreign exchanges or markets and the close of the NYSE.
The funds use a three-tier hierarchy to prioritize the pricing assumptions, referred to as inputs, used in valuation techniques to measure fair value. Level 1 includes securities valued using quoted prices in active markets for identical securities, including registered investment companies. Level 2 includes securities valued using other significant observable inputs. Observable inputs may include quoted prices for similar securities, interest rates, prepayment speeds and credit risk. Prices for securities valued using these inputs are received from independent pricing vendors and brokers and are based on an evaluation of the inputs described. Level 3 includes securities valued using significant unobservable inputs when market prices are not readily available or reliable, including the funds' own assumptions in determining the fair value of investments. Factors used in determining value may include market or issuer specific events or trends, changes in interest rates and credit quality. The inputs or methodology used for valuing securities are not necessarily an indication of the risks associated with investing in those securities. Changes in valuation techniques and related inputs may result in transfers into or out of an assigned level within the disclosure hierarchy.
Significant accounting policies, continued
The following is a summary of the values by input classification of the funds' investments as of February 29, 2020, by major security category or type:
| | Total
value at
2-29-20 | Level 1
quoted
price | Level 2
significant
observable
inputs | Level 3
significant
unobservable
inputs |
| Capital Appreciation Fund |
| Investments in securities: | | | | |
| Assets | | | | |
| Common stocks | | | | |
| Communication services | $209,028,041 | $209,028,041 | — | — |
| Consumer discretionary | 376,228,112 | 316,019,390 | $60,208,722 | — |
| Consumer staples | 72,404,860 | 72,404,860 | — | — |
| Financials | 37,189,123 | 37,189,123 | — | — |
| Health care | 146,757,066 | 146,757,066 | — | — |
| Industrials | 98,493,214 | 70,100,533 | 28,392,681 | — |
| Information technology | 697,123,348 | 671,620,275 | 25,503,073 | — |
| Real estate | 7,800,559 | 7,800,559 | — | — |
| Short-term investments | 15,900,204 | 15,900,204 | — | — |
| Total investments in securities | $1,660,924,527 | $1,546,820,051 | $114,104,476 | — |
| |
| Capital Appreciation Value Fund |
| Investments in securities: | | | | |
| Assets | | | | |
| Common stocks | | | | |
| Communication services | $50,397,135 | $50,397,135 | — | — |
| Consumer discretionary | 74,831,631 | 74,831,631 | — | — |
| Consumer staples | 19,652,082 | 19,652,082 | — | — |
| Energy | 3,006,484 | 3,006,484 | — | — |
| Financials | 70,601,491 | 70,601,491 | — | — |
| Health care | 197,735,053 | 167,574,090 | $30,160,963 | — |
| Industrials | 134,663,698 | 134,663,698 | — | — |
| Information technology | 181,880,434 | 181,880,434 | — | — |
| Utilities | 70,120,576 | 70,120,576 | — | — |
| Preferred securities | | | | |
| Financials | 24,459,233 | 24,459,233 | — | — |
| Health care | 20,017,043 | 20,017,043 | — | — |
| Industrials | 2,780,450 | — | 2,780,450 | — |
| Utilities | 27,104,900 | 27,104,900 | — | — |
| Corporate bonds | 242,851,148 | — | 242,851,148 | — |
| Term loans | 99,735,398 | — | 99,735,398 | — |
| Short-term investments | 198,052,014 | 198,052,014 | — | — |
| Total investments in securities | $1,417,888,770 | $1,042,360,811 | $375,527,959 | — |
| Derivatives: | | | | |
| Liabilities | | | | |
| Written options | $(3,250,632) | — | $(3,250,632) | — |
| |
| Health Sciences Fund |
| Investments in securities: | | | | |
| Assets | | | | |
| Common stocks | | | | |
| Consumer discretionary | $307,594 | — | — | $307,594 |
| Health care | 263,481,304 | $243,355,500 | $19,647,834 | 477,970 |
| Industrials | 1,209,268 | 1,209,268 | — | — |
| Information technology | 249,988 | 249,988 | — | — |
| Preferred securities | | | | |
| Consumer discretionary | 686,848 | — | — | 686,848 |
| Health care | 1,877,173 | 669,281 | 1,207,892 | — |
| Information technology | 868,749 | — | — | 868,749 |
| Rights | 353,941 | 353,941 | — | — |
Significant accounting policies, continued
| | Total
value at
2-29-20 | Level 1
quoted
price | Level 2
significant
observable
inputs | Level 3
significant
unobservable
inputs |
| Health Sciences Fund (continued) |
| Short-term investments | $4,067,270 | $4,067,270 | — | — |
| Total investments in securities | $273,102,135 | $249,905,248 | $20,855,726 | $2,341,161 |
| |
| International Strategic Equity Allocation Fund |
| Investments in securities: | | | | |
| Assets | | | | |
| Common stocks | | | | |
| Australia | $81,806,642 | — | $81,806,642 | — |
| Austria | 2,677,435 | — | 2,677,435 | — |
| Belgium | 2,599,519 | — | 2,599,519 | — |
| Brazil | 5,576,128 | $5,576,128 | — | — |
| Canada | 131,639,224 | 131,639,224 | — | — |
| Chile | 2,868,608 | — | 2,868,608 | — |
| China | 135,482,930 | 48,030,084 | 87,450,264 | $2,582 |
| Colombia | 751,644 | 751,644 | — | — |
| Czech Republic | 493,507 | — | 493,507 | — |
| Denmark | 31,061,598 | — | 31,061,598 | — |
| Finland | 12,680,154 | — | 12,680,154 | — |
| France | 125,660,393 | — | 125,660,393 | — |
| Germany | 89,868,222 | — | 89,868,222 | — |
| Hong Kong | 36,811,707 | 269,790 | 36,541,917 | — |
| Hungary | 1,311,059 | — | 1,311,059 | — |
| Indonesia | 1,684,418 | — | 1,684,418 | — |
| Ireland | 9,171,011 | 515,592 | 8,655,419 | — |
| Isle of Man | 264,411 | — | 264,411 | — |
| Israel | 5,829,559 | 2,600,850 | 3,228,709 | — |
| Italy | 15,133,822 | — | 15,133,822 | — |
| Japan | 263,641,032 | — | 263,641,032 | — |
| Luxembourg | 3,098,103 | — | 3,098,103 | — |
| Macau | 592,775 | — | 592,775 | — |
| Malaysia | 6,590,743 | — | 6,590,743 | — |
| Mexico | 10,088,339 | 10,088,339 | — | — |
| Netherlands | 43,323,524 | 2,512,549 | 40,810,975 | — |
| New Zealand | 1,687,542 | — | 1,687,542 | — |
| Norway | 2,601,806 | — | 2,601,806 | — |
| Peru | 1,358,316 | 1,358,316 | — | — |
| Philippines | 4,061,808 | — | 4,061,528 | 280 |
| Poland | 1,642,476 | — | 1,642,476 | — |
| Portugal | 1,867,152 | — | 1,867,152 | — |
| Romania | 149,355 | — | 149,355 | — |
| Russia | 92,752 | — | 92,752 | — |
| Singapore | 4,620,552 | — | 4,620,552 | — |
| South Africa | 12,695,074 | — | 12,695,074 | — |
| South Korea | 75,557,636 | — | 75,557,636 | — |
| Spain | 29,150,792 | — | 29,150,792 | — |
| Sweden | 29,718,510 | — | 29,718,510 | — |
| Switzerland | 114,428,444 | — | 114,428,444 | — |
| Taiwan | 95,120,386 | — | 95,120,386 | — |
| Thailand | 4,642,462 | — | 4,642,462 | — |
| Turkey | 881,921 | — | 881,921 | — |
| United Arab Emirates | 67,101 | — | 67,101 | — |
| United Kingdom | 89,555,922 | 919,166 | 88,636,756 | — |
| United States | 4,613,004 | 4,330,196 | 282,808 | — |
| Preferred securities | | | | |
| Brazil | 2,522,518 | 2,522,518 | — | — |
| Chile | 316,052 | — | 316,052 | — |
| Colombia | 432,873 | 432,873 | — | — |
Significant accounting policies, continued
| | Total
value at
2-29-20 | Level 1
quoted
price | Level 2
significant
observable
inputs | Level 3
significant
unobservable
inputs |
| International Strategic Equity Allocation Fund (continued) |
| Germany | $6,016,969 | — | $6,016,969 | — |
| South Korea | 4,740,607 | — | 4,740,607 | — |
| Exchange-traded funds | 44,705,373 | $44,705,373 | — | — |
| Warrants | 1,020 | 1,020 | — | — |
| Short-term investments | 113,534,884 | 77,977,284 | 35,557,600 | — |
| Total investments in securities | $1,667,489,814 | $334,230,946 | $1,333,256,006 | $2,862 |
| Derivatives: | | | | |
| Liabilities | | | | |
| Futures | $(3,732,759) | $(3,732,759) | — | — |
| |
| International Value Fund |
| Investments in securities: | | | | |
| Assets | | | | |
| Common stocks | | | | |
| Austria | $1,658,983 | — | $1,658,983 | — |
| Belgium | 1,724,622 | — | 1,724,622 | — |
| Bermuda | 3,647,350 | $3,647,350 | — | — |
| Canada | 9,537,679 | 9,537,679 | — | — |
| China | 838,664 | — | 838,664 | — |
| Denmark | 4,163,039 | — | 4,163,039 | — |
| Finland | 4,340,104 | — | 4,340,104 | — |
| France | 33,627,999 | — | 33,627,999 | — |
| Germany | 11,390,003 | — | 11,390,003 | — |
| Greece | 1,065,885 | — | 1,065,885 | — |
| Hong Kong | 6,373,741 | — | 6,373,741 | — |
| Hungary | 2,245,617 | — | 2,245,617 | — |
| Indonesia | 1,465,986 | — | 1,465,986 | — |
| Ireland | 2,614,825 | — | 2,614,825 | — |
| Italy | 3,096,532 | — | 3,096,532 | — |
| Japan | 44,922,190 | — | 44,922,190 | — |
| Macau | 1,358,280 | — | 1,358,280 | — |
| Netherlands | 7,573,661 | 1,712,967 | 5,860,694 | — |
| Norway | 2,120,344 | — | 2,120,344 | — |
| Singapore | 4,216,620 | — | 4,216,620 | — |
| South Korea | 6,865,584 | 1,671,477 | 5,194,107 | — |
| Spain | 1,460,226 | — | 1,460,226 | — |
| Sweden | 4,021,763 | — | 4,021,763 | — |
| Switzerland | 13,629,216 | — | 13,629,216 | — |
| United Kingdom | 36,563,945 | 4,908,212 | 31,655,733 | — |
| United States | 1,019,109 | 1,019,109 | — | — |
| Short-term investments | 7,566,997 | 7,566,997 | — | — |
| Total investments in securities | $219,108,964 | $30,063,791 | $189,045,173 | — |
| |
| Mid Cap Stock Fund |
| Investments in securities: | | | | |
| Assets | | | | |
| Common stocks | | | | |
| Communication services | $81,581,434 | $81,581,434 | — | — |
| Consumer discretionary | 260,832,880 | 259,788,262 | — | $1,044,618 |
| Consumer staples | 65,608,735 | 65,608,735 | — | — |
| Financials | 17,794,228 | 17,794,228 | — | — |
| Health care | 362,131,075 | 362,131,075 | — | — |
| Industrials | 183,340,075 | 183,340,075 | — | — |
| Information technology | 403,036,272 | 391,211,627 | — | 11,824,645 |
Significant accounting policies, continued
| | Total
value at
2-29-20 | Level 1
quoted
price | Level 2
significant
observable
inputs | Level 3
significant
unobservable
inputs |
| Mid Cap Stock Fund (continued) |
| Preferred securities | $37,815,379 | — | — | $37,815,379 |
| Short-term investments | 144,029,330 | $62,529,330 | $81,500,000 | — |
| Total investments in securities | $1,556,169,408 | $1,423,984,766 | $81,500,000 | $50,684,642 |
| |
| Mid Value Fund |
| Investments in securities: | | | | |
| Assets | | | | |
| Common stocks | | | | |
| Communication services | $47,488,929 | $47,488,929 | — | — |
| Consumer discretionary | 56,036,137 | 56,036,137 | — | — |
| Consumer staples | 87,568,804 | 79,749,329 | $7,819,475 | — |
| Energy | 118,457,457 | 114,345,396 | 4,112,061 | — |
| Financials | 201,762,351 | 191,209,991 | 10,552,360 | — |
| Health care | 187,901,316 | 182,415,792 | 5,485,524 | — |
| Industrials | 99,170,940 | 94,795,662 | 4,375,278 | — |
| Information technology | 45,470,218 | 45,470,218 | — | — |
| Materials | 108,967,444 | 100,091,122 | 8,876,322 | — |
| Real estate | 67,334,459 | 67,334,459 | — | — |
| Utilities | 43,535,300 | 43,535,300 | — | — |
| Preferred securities | 3,144,900 | 3,144,900 | — | — |
| Short-term investments | 93,665,450 | 93,665,450 | — | — |
| Total investments in securities | $1,160,503,705 | $1,119,282,685 | $41,221,020 | — |
| |
| Multi-Index Lifestyle Aggressive Portfolio |
| Investments in securities: | | | | |
| Assets | | | | |
| Affiliated investment companies | $224,210,131 | $224,210,131 | — | — |
| Unaffiliated investment companies | 112,736,005 | 112,736,005 | — | — |
| Short-term investments | 3,921,695 | 3,921,695 | — | — |
| Total investments in securities | $340,867,831 | $340,867,831 | — | — |
| |
| Multi-Index Lifestyle Balanced Portfolio |
| Investments in securities: | | | | |
| Assets | | | | |
| Affiliated investment companies | $333,110,355 | $333,110,355 | — | — |
| Unaffiliated investment companies | 560,517,563 | 560,517,563 | — | — |
| Short-term investments | 45,153,957 | 45,153,957 | — | — |
| Total investments in securities | $938,781,875 | $938,781,875 | — | — |
| |
| Multi-Index Lifestyle Conservative Portfolio |
| Investments in securities: | | | | |
| Assets | | | | |
| Affiliated investment companies | $19,252,887 | $19,252,887 | — | — |
| Unaffiliated investment companies | 169,360,230 | 169,360,230 | — | — |
| Short-term investments | 12,056,289 | 12,056,289 | — | — |
| Total investments in securities | $200,669,406 | $200,669,406 | — | — |
| |
| Multi-Index Lifestyle Growth Portfolio |
| Investments in securities: | | | | |
| Assets | | | | |
| Affiliated investment companies | $426,133,131 | $426,133,131 | — | — |
| Unaffiliated investment companies | 400,267,203 | 400,267,203 | — | — |
Significant accounting policies, continued
| | Total
value at
2-29-20 | Level 1
quoted
price | Level 2
significant
observable
inputs | Level 3
significant
unobservable
inputs |
| Multi-Index Lifestyle Growth Portfolio (continued) |
| Short-term investments | $51,113,075 | $51,113,075 | — | — |
| Total investments in securities | $877,513,409 | $877,513,409 | — | — |
| |
| Multi-Index Lifestyle Moderate Portfolio |
| Investments in securities: | | | | |
| Assets | | | | |
| Affiliated investment companies | $61,830,413 | $61,830,413 | — | — |
| Unaffiliated investment companies | 194,551,584 | 194,551,584 | — | — |
| Short-term investments | 7,632,434 | 7,632,434 | — | — |
| Total investments in securities | $264,014,431 | $264,014,431 | — | — |
| |
| Real Estate Securities Fund |
| Investments in securities: | | | | |
| Assets | | | | |
| Common stocks | $377,739,337 | $377,739,337 | — | — |
| Short-term investments | 667,495 | 667,495 | — | — |
| Total investments in securities | $378,406,832 | $378,406,832 | — | — |
| |
| Science & Technology Fund |
| Investments in securities: | | | | |
| Assets | | | | |
| Common stocks | | | | |
| Communication services | $51,843,421 | $44,074,845 | $7,768,576 | — |
| Consumer discretionary | 41,801,484 | 32,288,161 | 9,513,323 | — |
| Health care | 2,747,693 | 2,747,693 | — | — |
| Industrials | 3,345,720 | 3,345,720 | — | — |
| Information technology | 147,237,076 | 137,262,620 | 9,974,456 | — |
| Real estate | 200,480 | 200,480 | — | — |
| Preferred securities | 2,598,336 | — | — | $2,598,336 |
| Short-term investments | 35,177,547 | 22,892,547 | 12,285,000 | — |
| Total investments in securities | $284,951,757 | $242,812,066 | $39,541,355 | $2,598,336 |
| |
| Strategic Equity Allocation Fund |
| Investments in securities: | | | | |
| Assets | | | | |
| Common stocks | | | | |
| Communication services | $669,328,650 | $522,116,111 | $147,210,777 | $1,762 |
| Consumer discretionary | 666,777,416 | 455,507,290 | 211,269,652 | 474 |
| Consumer staples | 414,685,609 | 227,479,423 | 187,202,048 | 4,138 |
| Energy | 254,098,700 | 186,056,732 | 68,041,968 | — |
| Financials | 968,632,683 | 592,884,844 | 375,746,485 | 1,354 |
| Health care | 796,395,170 | 568,537,168 | 227,836,164 | 21,838 |
| Industrials | 607,479,546 | 343,166,094 | 264,313,452 | — |
| Information technology | 1,281,695,109 | 1,006,285,920 | 275,409,189 | — |
| Materials | 284,438,391 | 149,216,194 | 135,220,805 | 1,392 |
| Real estate | 234,728,906 | 166,647,724 | 68,081,182 | — |
| Utilities | 287,654,624 | 217,232,144 | 70,391,147 | 31,333 |
| Preferred securities | | | | |
| Communication services | 209,624 | 209,624 | — | — |
| Consumer discretionary | 6,656,755 | 150,646 | 6,506,109 | — |
| Consumer staples | 2,779,749 | 88,688 | 2,691,061 | — |
| Energy | 805,963 | 805,963 | — | — |
| Financials | 3,179,616 | 3,179,616 | — | — |
Significant accounting policies, continued
| | Total
value at
2-29-20 | Level 1
quoted
price | Level 2
significant
observable
inputs | Level 3
significant
unobservable
inputs |
| Strategic Equity Allocation Fund (continued) |
| Health care | $1,110,409 | — | $1,110,409 | — |
| Information technology | 6,189,186 | — | 6,189,186 | — |
| Materials | 1,160,726 | $181,423 | 979,303 | — |
| Utilities | 165,294 | 165,294 | — | — |
| Exchange-traded funds | 70,554,139 | 70,554,139 | — | — |
| Rights | 23,797 | 23,658 | 139 | — |
| Warrants | 1,902 | 1,902 | — | — |
| Short-term investments | 301,702,988 | 97,973,122 | 203,729,866 | — |
| Total investments in securities | $6,860,454,952 | $4,608,463,719 | $2,251,928,942 | $62,291 |
| Derivatives: | | | | |
| Liabilities | | | | |
| Futures | $(21,410,335) | $(21,410,335) | — | — |
| |
| U.S. Sector Rotation Fund |
| Investments in securities: | | | | |
| Assets | | | | |
| Common stocks | | | | |
| Communication services | $157,220,616 | $157,219,927 | — | $689 |
| Consumer discretionary | 97,377,765 | 97,374,355 | $3,410 | — |
| Consumer staples | 61,317,752 | 61,317,752 | — | — |
| Energy | 43,116,155 | 43,116,155 | — | — |
| Financials | 129,102,594 | 129,102,034 | — | 560 |
| Health care | 154,580,468 | 154,580,180 | — | 288 |
| Industrials | 69,903,774 | 69,903,774 | — | — |
| Information technology | 286,265,748 | 286,265,748 | — | — |
| Materials | 29,804,002 | 29,803,488 | — | 514 |
| Real estate | 32,498,220 | 32,498,220 | — | — |
| Utilities | 58,184,089 | 58,184,089 | — | — |
| Preferred securities | 9,765 | 9,765 | — | — |
| Rights | 8,561 | 8,561 | — | — |
| Short-term investments | 35,299,938 | 989,269 | 34,310,669 | — |
| Total investments in securities | $1,154,689,447 | $1,120,373,317 | $34,314,079 | $2,051 |
| Derivatives: | | | | |
| Liabilities | | | | |
| Futures | $(3,999,559) | $(3,999,559) | — | — |
The following is a reconciliation of Level 3 assets for which significant unobservable inputs were used to determine fair value. Transfers into or out of Level 3, if any, represent the beginning value of any security or instrument where a change in the level has occurred from the beginning to the end of the period and in all cases were transferred into or out of Level 2.
| Mid Cap Stock Fund | Common
stocks | Preferred
securities | Total |
| Balance as of 8-31-19 | $7,241,730 | $56,410,566 | $63,652,296 |
| Realized gain (loss) | (27,360) | 1,289,303 | 1,261,943 |
| Change in unrealized appreciation (depreciation) | 5,734,234 | (15,288,485) | (9,554,251) |
| Purchases | — | — | — |
| Sales | (79,341) | (4,596,005) | (4,675,346) |
| Transfers into Level 3 | — | — | — |
| Transfers out of Level 3 | — | — | — |
| Balance as of 2-29-20 | $12,869,263 | $37,815,379 | $50,684,642 |
| Change in unrealized at period end1 | $5,666,431 | $(15,288,485) | $(9,622,054) |
| | |
| 1 | Change in unrealized appreciation (depreciation) attributable to Level 3 securities held at period end. This balance is included in change in unrealized appreciation (depreciation) on the Statements of operations. |
Significant accounting policies, continued
The valuation techniques and significant amounts of unobservable inputs used in the fair value measurement of the funds' Level 3 securities are outlined in the table below.
| Mid Cap Stock Fund | Fair Value
at period end | Valuation technique | Significant
unobservable inputs | Input/Range* |
| Common Stocks | $11,824,645 | Transactions Indicative of Value | Exchange Ratio
Discount | 0.3574
10% |
| | $1,044,618 | Transactions Indicative of Value | Prior/recent transactions | $18.16 |
| | $12,869,263 | | | |
| | | | | |
| Preferred Securities | $5,146,655 | Transactions Indicative of Value and
Option Model | Prior/pending transactions
OPM - Volatility
Discount | $11.60/$19.19
40%
10% |
| | $16,228,502 | Market Comparable | EV to revenue multiple
Discount | 0.96x - 1.43x (weighted average 1.19x)
17.5% |
| | $2,332,634 | Transactions Indicative of Value | Prior/recent transactions | $18.16 |
| | $14,022,826 | Market Comparable | EV to revenue multiple
Discount
OPM - Volatility | 3.10x - 5.02x (weighted average 3.84x)
25%
20% - 45% (weighted average 34.8%) |
| | $84,762 | Recovery Value | Expected future value
Discount | 0.355
55% |
| | $37,815,379 | | | |
| | | | | |
| Total | $50,684,642 | | | |
* A weighted average is an average in which each input in the grouping is assigned a weighting before summing to a single average value. The weighting of the input is determined based on a security’s fair value as a percentage of the total fair value.
A change to unobservable inputs of the funds' Level 3 securities as of February 29, 2020, could have resulted in changes to the fair value measurement, as follows:
| Significant Unobservable Input | Impact to Valuation
if input had increased | Impact to Valuation
if input had decreased |
| Discount | Decrease | Increase |
| Enterprise value (“EV”) to revenue multiple | Increase | Decrease |
| Exchange Ratio | Increase | Decrease |
| Expected future value | Increase | Decrease |
| Options Pricing Method (OPM) - Volatility | Variable | Variable |
| Prior/pending transaction value | Increase | Decrease |
| Prior/recent transactions | Increase | Decrease |
Repurchase agreements. The funds may enter into repurchase agreements. When the funds enter into a repurchase agreement, they receive collateral that is held in a segregated account by the funds' custodian, or for tri-party repurchase agreements, collateral is held at a third-party custodian bank in a segregated account for the benefit of the funds. The collateral amount is marked-to-market and monitored on a daily basis to ensure that the collateral held is in an amount not less than the principal amount of the repurchase agreement plus any accrued interest. Collateral received by the fund for repurchase agreements is disclosed in the Portfolio of investments as part of the caption related to the repurchase agreement.
Repurchase agreements are typically governed by the terms and conditions of the Master Repurchase Agreement and/or Global Master Repurchase Agreement (collectively, MRA). Upon an event of default, the non-defaulting party may close out all transactions traded under the MRA and net amounts owed. Absent an event of default, assets and liabilities resulting from repurchase agreements are not offset in the Statements of assets and liabilities. In the event of a default by the counterparty, realization of the collateral proceeds could be delayed, during which time the collateral value may decline or the counterparty may have insufficient assets to pay claims resulting from close-out of the transactions.
Security transactions and related investment income. Investment security transactions are accounted for on a trade date plus one basis for daily NAV calculations. However, for financial reporting purposes, investment transactions are reported on trade date. Interest income is accrued as earned. Interest income includes coupon interest and amortization/accretion of premiums/discounts on debt securities. Debt obligations may be placed in a non-accrual status and related interest income may be reduced by stopping current accruals and writing off interest receivable when the collection of all or a portion of interest has become doubtful. Income and capital gain distributions from underlying funds are recorded on ex-date. Dividend income is recorded on the ex-date, except for dividends of certain foreign securities where the dividend may not be known until after the ex-date. In those cases, dividend income, net of withholding taxes, is recorded when the fund becomes aware of the dividends. Non-cash dividends, if any, are recorded at the fair market value of the securities received. Distributions received on securities that represent a tax return of capital and/or capital gain, if any, are recorded as a reduction of cost of investments and/or as a realized gain, if amounts are estimable. Gains and losses on securities sold are determined on the basis of identified cost and may include proceeds from litigation.
Real estate investment trusts. The funds may invest in real estate investment trusts (REITs). Distributions from REITs may be recorded as income and subsequently characterized by the REIT at the end of the fiscal year as a reduction of cost of investments and/or as a realized gain. As a result, the funds will estimate the components of distributions from these securities. Such estimates are revised when the actual components of the distributions are known.
Significant accounting policies, continued
Securities lending. The funds may lend their securities to earn additional income. The funds receive collateral from the borrower in an amount not less than the market value of the loaned securities. The funds will invest their cash collateral in JHCT, an affiliate of the funds, which has a floating NAV and is registered with the Securities and Exchange Commission (SEC) as an investment company. JHCT invests in short-term money market investments. Each fund will receive the benefit of any gains and bear any losses generated by JHCT with respect to the cash collateral.
The funds have the right to recall loaned securities on demand. If a borrower fails to return loaned securities when due, then the lending agent is responsible and indemnifies the funds for the lent securities. The lending agent uses the collateral received from the borrower to purchase replacement securities of the same issue, type, class and series of the loaned securities. If the value of the collateral is less than the purchase cost of replacement securities, the lending agent is responsible for satisfying the shortfall but only to the extent that the shortfall is not due to any decrease in the value of JHCT.
Although the risk of loss on securities lent is mitigated by receiving collateral from the borrower and through lending agent indemnification, the funds could experience a delay in recovering securities or could experience a lower than expected return if the borrower fails to return the securities on a timely basis. The funds receive compensation for lending their securities by retaining a portion of the return on the investment of the collateral and compensation from fees earned from borrowers of the securities. Securities lending income received by the funds is net of fees retained by the securities lending agent. Net income received from JHCT is a component of securities lending income as recorded on the Statements of operations.
Obligations to repay collateral received by the funds are shown on the Statements of assets and liabilities as Payable upon return of securities loaned and are secured by the loaned securities. The following table summarizes the values of securities loaned by the funds and the corresponding cash collateral received at February 29, 2020:
| Fund | Market value of securities on loan | Cash collateral received |
| Capital Appreciation Fund | $14,640 | $14,949 |
| Capital Appreciation Value Fund | 8,301,497 | 8,480,328 |
| International Strategic Equity Allocation Fund | 71,616,587 | 78,021,981 |
| Mid Cap Stock Fund | 61,229,613 | 62,492,064 |
| Mid Value Fund | 11,566,266 | 12,059,423 |
| Multi-Index Lifestyle Aggressive Portfolio | 3,839,473 | 3,918,125 |
| Multi-Index Lifestyle Balanced Portfolio | 44,139,849 | 45,135,188 |
| Multi-Index Lifestyle Conservative Portfolio | 11,447,085 | 11,761,209 |
| Multi-Index Lifestyle Growth Portfolio | 49,986,983 | 51,106,185 |
| Multi-Index Lifestyle Moderate Portfolio | 7,465,104 | 7,630,920 |
| Science & Technology Fund | 3,682,856 | 3,761,551 |
| Strategic Equity Allocation Fund | 95,575,853 | 97,961,305 |
| U.S. Sector Rotation Fund | 968,741 | 988,485 |
In addition, non-cash collateral of approximately $852,611 in the form of U.S. Treasuries was pledged to Strategic Equity Allocation Fund. This non-cash collateral is not reflected in the fund's net assets, however could be sold by the securities lending agent in the event of default by the borrower.
Foreign investing. Assets, including investments, and liabilities denominated in foreign currencies are translated into U.S. dollar values each day at the prevailing exchange rate. Purchases and sales of securities, income and expenses are translated into U.S. dollars at the prevailing exchange rate on the date of the transaction. The effect of changes in foreign currency exchange rates on the value of securities is reflected as a component of the realized and unrealized gains (losses) on investments. Foreign investments are subject to a decline in the value of a foreign currency versus the U.S. dollar, which reduces the dollar value of securities denominated in that currency.
Funds that invest internationally generally carry more risk than funds that invest strictly in U.S. securities. These risks are heightened for investments in emerging markets. Risks can result from differences in economic and political conditions, regulations, market practices (including higher transaction costs), accounting standards and other factors.
Foreign taxes. The funds may be subject to withholding tax on income, capital gains or repatriation taxes imposed by certain countries, a portion of which may be recoverable. Foreign taxes are accrued based upon the funds' understanding of the tax rules and rates that exist in the foreign markets in which it invests. Taxes are accrued based on gains realized by the fund as a result of certain foreign security sales. In certain circumstances, estimated taxes are accrued based on unrealized appreciation of such securities. Investment income is recorded net of foreign withholding taxes.
Overdraft. The funds may have the ability to borrow from banks for temporary or emergency purposes, including meeting redemption requests that otherwise might require the untimely sale of securities. Pursuant to the funds' custodian agreement, the custodian may loan money to the funds to make properly authorized payments. The funds are obligated to repay the custodian for any overdraft, including any related costs or expenses. The custodian may have a lien, security interest or security entitlement in any fund property that is not otherwise segregated or pledged, to the extent of any overdraft, and to the maximum extent permitted by law. Overdrafts at period end, if any, are presented under the caption Due to custodian in the Statements of assets and liabilities.
Line of credit. The funds and other affiliated funds, excluding Real Estate Securities Fund, have entered into a syndicated line of credit agreement with Citibank, N.A. as the administrative agent that enables them to participate in a $750 million unsecured committed line of credit. Excluding commitments designated for a certain fund and subject to the needs of all other affiliated funds, a fund can borrow up to an aggregate commitment amount of $500 million, subject to asset coverage and other limitations as specified in the agreement. Real Estate Securities Fund and other affiliated funds have entered into a separate unsecured $50 million line of credit agreement with BNP Paribas. Subject to the needs of other affiliated funds, Real Estate Securities Fund can borrow up to the $50 million, subject to asset coverage and other limitations as specified in the agreement.
A commitment fee payable at the end of each calendar quarter, based on the average daily unused portion of each line of credit, is charged to each participating fund based on a combination of fixed and asset based allocations and is reflected in Other expenses on the Statements of operations. For the six months ended February 29, 2020, the funds had no borrowings under the line of credit.
Commitment fees for the six months ended February 29, 2020 were as follows:
Significant accounting policies, continued
| Fund | Commitment fee |
| Capital Appreciation Fund | $3,121 |
| Capital Appreciation Value Fund | 2,941 |
| Health Sciences Fund | 1,354 |
| International Strategic Equity Allocation Fund | 2,941 |
| International Value Fund | 1,711 |
| Mid Cap Stock Fund | 2,930 |
| Mid Value Fund | 2,504 |
| Multi-Index Lifestyle Aggressive Portfolio | 1,420 |
| Multi-Index Lifestyle Balanced Portfolio | 2,049 |
| Multi-Index Lifestyle Conservative Portfolio | 1,229 |
| Multi-Index Lifestyle Growth Portfolio | 1,973 |
| Multi-Index Lifestyle Moderate Portfolio | 1,321 |
| Real Estate Securities Fund | 3,940 |
| Science & Technology Fund | 1,363 |
| Strategic Equity Allocation Fund | 9,622 |
| U.S. Sector Rotation Fund | 2,832 |
Expenses. Within the John Hancock group of funds complex, expenses that are directly attributable to an individual fund are allocated to such fund. Expenses that are not readily attributable to a specific fund are allocated among all funds in an equitable manner, taking into consideration, among other things, the nature and type of expense and the fund’s relative net assets. Expense estimates are accrued in the period to which they relate and adjustments are made when actual amounts are known.
Class allocations. Income, common expenses and realized and unrealized gains (losses) are determined at the fund level and allocated daily to each class of shares based on the net assets of the class. Class-specific expenses, such as distribution and service fees, if any, and transfer agent fees, for all classes, are charged daily at the class level based on the net assets of each class and the specific expense rates applicable to each class.
Federal income taxes. Each fund intends to continue to qualify as a regulated investment company by complying with the applicable provisions of the Internal Revenue Code and will not be subject to federal income tax on taxable income that is distributed to shareholders. Therefore, no federal income tax provision is required.
For federal income tax purposes, as of August 31, 2019, certain funds have capital loss carryforwards available to offset future net realized capital gains. The following table details the capital loss carryforward available as of August 31, 2019:
| | No Expiration Date |
| Fund | Short Term | Long Term |
| International Strategic Equity Allocation Fund | $40,192,222 | $42,140,436 |
As of August 31, 2019, the funds had no uncertain tax positions that would require financial statement recognition, derecognition or disclosure. The funds' federal tax returns are subject to examination by the Internal Revenue Service for a period of three years.
For federal income tax purposes, the costs of investments owned on February 29, 2020, including short-term investments, were as follows:
| Fund | Aggregate
cost | Unrealized
appreciation | Unrealized
(depreciation) | Net unrealized
appreciation/
(depreciation) |
| Capital Appreciation Fund | $755,177,641 | $920,435,961 | $(14,689,075) | $905,746,886 |
| Capital Appreciation Value Fund | 1,248,554,899 | 175,944,404 | (9,861,165) | 166,083,239 |
| Health Sciences Fund | 227,180,744 | 52,311,296 | (6,389,905) | 45,921,391 |
| International Strategic Equity Allocation Fund | 1,694,007,000 | 114,322,042 | (144,571,987) | (30,249,945) |
| International Value Fund | 236,081,729 | 8,200,521 | (25,173,286) | (16,972,765) |
| Mid Cap Stock Fund | 1,289,169,148 | 332,066,070 | (65,065,810) | 267,000,260 |
| Mid Value Fund | 1,106,507,244 | 169,626,144 | (115,629,683) | 53,996,461 |
| Multi-Index Lifestyle Aggressive Portfolio | 363,785,516 | 12,789,693 | (35,707,378) | (22,917,685) |
| Multi-Index Lifestyle Balanced Portfolio | 947,502,178 | 27,163,911 | (35,884,214) | (8,720,303) |
| Multi-Index Lifestyle Conservative Portfolio | 196,391,009 | 5,948,424 | (1,670,027) | 4,278,397 |
| Multi-Index Lifestyle Growth Portfolio | 906,850,298 | 36,188,552 | (65,525,441) | (29,336,889) |
| Multi-Index Lifestyle Moderate Portfolio | 262,466,151 | 7,587,448 | (6,039,168) | 1,548,280 |
| Real Estate Securities Fund | 326,886,032 | 59,374,952 | (7,854,152) | 51,520,800 |
| Science & Technology Fund | 255,894,331 | 34,380,893 | (5,323,467) | 29,057,426 |
| Strategic Equity Allocation Fund | 6,796,991,290 | 465,987,292 | (423,933,965) | 42,053,327 |
| U.S. Sector Rotation Fund | 1,148,144,808 | 57,413,333 | (54,868,253) | 2,545,080 |
Distribution of income and gains. Distributions to shareholders from net investment income and net realized gains, if any, are recorded on the ex-date. Multi-Index Lifestyle Balanced Portfolio, Multi-Index Lifestyle Conservative Portfolio and Multi-Index Lifestyle Moderate Portfolio generally declare and pay dividends from net investment income quarterly. All other funds generally declare and pay dividends from net investment income annually. All funds generally declare and pay capital gain distributions, if any, annually.
Distributions paid by the funds with respect to each class of shares are calculated in the same manner, at the same time and in the same amount, except for the effect of class level expenses that may be applied differently to each class.
Significant accounting policies, continued
Such distributions, on a tax basis, are determined in conformity with income tax regulations, which may differ from US GAAP. Distributions in excess of tax basis earnings and profits, if any, are reported in the funds' financial statements as a return of capital. The final determination of tax characteristics of the fund's distribution will occur at the end of the year and will subsequently be reported to shareholders. Short-term gains from underlying funds are treated as ordinary income for tax purposes.
Capital accounts within the financial statements are adjusted for permanent book-tax differences. These adjustments have no impact on net assets or the results of operations. Temporary book-tax differences, if any, will reverse in a subsequent period. Book-tax differences are primarily attributable to net operating losses, foreign currency transactions, investments in passive foreign investment companies, wash sale loss deferrals, characterization of distributions, derivative transactions and amortization and accretion on debt securities.
3. Derivative instruments
Certain funds may invest in derivatives in order to meet their investment objective. Derivatives include a variety of different instruments that may be traded in the over-the-counter (OTC) market, on a regulated exchange or through a clearing facility. The risks in using derivatives vary depending upon the structure of the instruments, including the use of leverage, optionality, the liquidity or lack of liquidity of the contract, the creditworthiness of the counterparty or clearing organization and the volatility of the position. Some derivatives involve risks that are potentially greater than the risks associated with investing directly in the referenced securities or other referenced underlying instrument. Specifically, the funds are exposed to the risk that the counterparty to an OTC derivatives contract will be unable or unwilling to make timely settlement payments or otherwise honor its obligations. OTC derivatives transactions typically can only be closed out with the other party to the transaction.
Derivatives which are typically traded through the OTC market are regulated by the Commodity Futures Trading Commission (the CFTC). Derivative counterparty risk is managed through an ongoing evaluation of the creditworthiness of all potential counterparties and, if applicable, designated clearing organizations. The funds attempt to reduce their exposure to counterparty risk for derivatives traded in the OTC market, whenever possible, by entering into an International Swaps and Derivatives Association (ISDA) Master Agreement with each of their OTC counterparties. The ISDA gives each party to the agreement the right to terminate all transactions traded under the agreement if there is certain deterioration in the credit quality or contractual default of the other party, as defined in the ISDA. Upon an event of default or a termination of the ISDA, the non-defaulting party has the right to close out all transactions and to net amounts owed.
As defined by the ISDA, the funds may have collateral agreements with certain counterparties to mitigate counterparty risk on OTC derivatives. Subject to established minimum levels, collateral for OTC transactions is generally determined based on the net aggregate unrealized gain or loss on contracts with a particular counterparty. Collateral pledged to the funds, if any, are held in a segregated account by a third-party agent or held by the custodian bank for the benefit of the funds and can be in the form of cash or debt securities issued by the U.S. government or related agencies; collateral posted by the funds, if any, for OTC transactions is held in a segregated account at the funds' custodian and is noted in the accompanying portfolio of investments, or if cash is posted, on the Statements of assets and liabilities. The funds' risk of loss due to counterparty risk is equal to the asset value of outstanding contracts offset by collateral received.
Certain derivatives are traded or cleared on an exchange or central clearinghouse. Exchange-traded or centrally-cleared transactions generally present less counterparty risk to a fund than OTC transactions. The exchange or clearinghouse stands between the funds and the broker to the contract and therefore, credit risk is generally limited to the failure of the exchange or clearinghouse and the clearing member.
Futures. A futures contract is a contractual agreement to buy or sell a particular currency or financial instrument at a pre-determined price in the future. Futures are traded on an exchange and cleared through a central clearinghouse. Risks related to the use of futures contracts include possible illiquidity of the futures markets and contract prices that can be highly volatile and imperfectly correlated to movements in the underlying financial instrument and potential losses in excess of the amounts recognized on the Statements of assets and liabilities. Use of long futures contracts subjects the funds to the risk of loss up to the notional value of the futures contracts. Use of short futures contracts subjects the funds to unlimited risk of loss.
Upon entering into a futures contract, the fund is required to deposit initial margin with the broker in the form of cash or securities. The amount of required margin is set by the broker and is generally based on a percentage of the contract value. The margin deposit must then be maintained at the established level over the life of the contract. Cash that has been pledged by a fund is detailed in the Statements of assets and liabilities as Collateral held at broker for futures contracts. Securities pledged by the funds, if any, are identified in the Portfolio of investments. Subsequent payments, referred to as variation margin, are made or received by a fund periodically and are based on changes in the market value of open futures contracts. Futures contracts are marked-to-market daily and unrealized gain or loss is recorded by the fund. Receivable/Payable for futures variation margin is included in the Statements of assets and liabilities. When the contract is closed, a fund records a realized gain or loss equal to the difference between the value of the contract at the time it was opened and the value at the time it was closed.
The following table details how the funds used futures contracts during the six months ended February 29, 2020. In addition, the table summarizes the range of notional contract amounts held by the funds, as measured at each quarter end:
| Fund | Reason | USD Notional range |
| International Strategic Equity Allocation Fund | To manage against anticipated currency exchange rates, manage against anticipated changes in securities, gain exposure to certain securities markets, and to maintain diversity of the fund. | $47.4 million to $96.5 million |
| Strategic Equity Allocation Fund | To gain exposure to certain securities markets, to manage against anticipated changes in currency exchange rates and to maintain diversity and liquidity of the fund. | $175.1 million to $319.6 million |
| U.S. Sector Rotation Fund | To gain exposure to certain securities markets and to maintain diversity and liquidity of the fund. | $26.9 million to $41.7 million |
Options. There are two types of options, put options and call options. Options are traded either OTC or on an exchange. A call option gives the purchaser of the option the right to buy (and the seller the obligation to sell) the underlying instrument at the exercise price. A put option gives the purchaser of the option the right to sell (and the writer the obligation to buy) the underlying instrument at the exercise price. Writing puts and buying calls may increase the funds' exposure to changes in the value of the underlying instrument. Buying puts and writing calls may decrease the funds' exposure to such changes. Risks related to the use of options include the loss of premiums, possible illiquidity of the options markets, trading restrictions imposed by an exchange and movements in underlying security values, and for written options, potential losses in excess of the amounts recognized on the Statements of assets and liabilities. In addition, OTC options are subject to the risks of all OTC derivatives contracts.
Derivative instruments, continued
When a fund purchases an option, the premium paid is included in the Portfolio of investments and subsequently “marked-to-market” to reflect current market value. If the purchased option expires, a fund realizes a loss equal to the cost of the option. If a fund exercises a call option, the cost of the securities acquired by exercising the call is increased by the premium paid to buy the call. If a fund exercises a put option, it realizes a gain or loss from the sale of the underlying security and the proceeds from such sale are decreased by the premium paid. If a fund enters into a closing sale transaction, it realizes a gain or loss, depending on whether proceeds from the closing sale are greater or less than the original cost. When a fund writes an option, the premium received is included as a liability and subsequently “marked-to-market” to reflect the current market value of the option written. Premiums received from writing options that expire unexercised are recorded as realized gains. Premiums received from writing options which are exercised or are closed are added to or offset against the proceeds or amount paid on the transaction to determine the realized gain or loss. If a put option on a security is exercised, the premium received reduces the cost basis of the securities purchased by a fund.
The following table details how the funds used written options contracts during the six months ended February 29, 2020. In addition, the table summarizes the range of notional contract amounts held by the funds, as measured at each quarter end:
| Fund | Reason | Market value range |
| Capital Appreciation Value Fund | To manage against anticipated changes in securities markets | $3.3 million to $18.1 million |
Fair value of derivative instruments by risk category
The table below summarizes the fair value of derivatives held by the funds at February 29, 2020 by risk category:
| Fund | Risk | Statements of
assets and
liabilities location | Financial
instruments
location | Assets
derivatives
fair value | Liabilities
derivatives
fair value |
| Capital Appreciation Value Fund | Equity | Written options, at value | Written options | — | $(3,250,632) |
| | | | | — | $(3,250,632) |
| International Strategic Equity Allocation Fund | Currency | Receivable/payable for futures variation margin | Futures1 | — | $(60,689) |
| | Equity | Receivable/payable for futures variation margin | Futures1 | — | (3,672,070) |
| | | | | — | $(3,732,759) |
| Strategic Equity Allocation Fund | Currency | Receivable/payable for futures variation margin | Futures1 | — | $(108,391) |
| | Equity | Receivable/payable for futures variation margin | Futures1 | — | (21,301,944) |
| | | | | — | $(21,410,335) |
| U.S. Sector Rotation Fund | Equity | Receivable/payable for futures variation margin | Futures1 | — | $(3,999,559) |
| | | | | — | $(3,999,559) |
| | |
| 1 | Reflects cumulative appreciation/depreciation on futures as disclosed in the Portfolio of investments. Only the period end variation margin is separately disclosed on the Statements of assets and liabilities. |
For financial reporting purposes, the funds do not offset OTC derivative assets or liabilities that are subject to master netting arrangements, as defined by the ISDAs, in the Statements of assets and liabilities. In the event of default by the counterparty or a termination of the agreement, the ISDA allows an offset of amounts across the various transactions between the fund and the applicable counterparty.
Effect of derivative instruments on the Statements of operations
The table below summarizes the net realized gain (loss) included in the net increase (decrease) in net assets from operations, classified by derivative instrument and risk category, for the six months ended February 29, 2020:
| | | Statements of operations location - Net realized gain (loss) on: |
| Fund | Risk | Futures contracts | Written options | Total |
| Capital Appreciation Value Fund | Equity | — | $6,945,377 | $6,945,377 |
| | Total | — | $6,945,377 | $6,945,377 |
| International Strategic Equity Allocation Fund | Currency | $49,493 | — | $49,493 |
| | Equity | 5,345,797 | — | 5,345,797 |
| | Total | $5,395,290 | — | $5,395,290 |
| Strategic Equity Allocation Fund | Currency | $(39,550) | — | $(39,550) |
| | Equity | 21,214,489 | — | 21,214,489 |
| | Total | $21,174,939 | — | $21,174,939 |
| U.S. Sector Rotation Fund | Equity | $4,153,479 | — | $4,153,479 |
| | Total | $4,153,479 | — | $4,153,479 |
Derivative instruments, continued
The table below summarizes the net change in unrealized appreciation (depreciation) included in the net increase (decrease) in net assets from operations, classified by derivative instrument and risk category, for the six months ended February 29, 2020:
| | | Statements of operations location - Change in net unrealized appreciation (depreciation) of: |
| Fund | Risk | Futures contracts | Written options | Total |
| Capital Appreciation Value Fund | Equity | — | $10,224,431 | $10,224,431 |
| | Total | — | $10,224,431 | $10,224,431 |
| International Strategic Equity Allocation Fund | Currency | $(59,321) | — | $(59,321) |
| | Equity | (3,288,214) | — | (3,288,214) |
| | Total | $(3,347,535) | — | $(3,347,535) |
| Strategic Equity Allocation Fund | Currency | $(91,454) | — | $(91,454) |
| | Equity | (18,453,131) | — | (18,453,131) |
| | Total | $(18,544,585) | — | $(18,544,585) |
| U.S. Sector Rotation Fund | Equity | $(2,909,819) | — | $(2,909,819) |
| | Total | $(2,909,819) | — | $(2,909,819) |
4. Guarantees and indemnifications
Under the Trust's organizational documents, its Officers and Trustees are indemnified against certain liabilities arising out of the performance of their duties to the Trust, including the funds. Additionally, in the normal course of business, the Trust enters into contracts with service providers that contain general indemnification clauses. The Trust's maximum exposure under these arrangements is unknown, as this would involve future claims that may be made against the Trust that have not yet occurred. The risk of material loss from such claims is considered remote.
5. Fees and transactions with affiliates
John Hancock Investment Management LLC (the Advisor) serves as investment advisor for the funds. John Hancock Investment Management Distributors LLC (the Distributor), an affiliate of the Advisor, serves as principal underwriter of the funds. The Advisor and the Distributor are indirect, wholly owned subsidiaries of Manulife Financial Corporation.
Management fee. The funds have an investment management agreement with the Advisor under which the funds pay a monthly management fee to the Advisor equivalent on an annual basis as detailed below. Aggregate net assets generally include the net assets of the funds and the net assets of a similar fund of John Hancock Variable Insurance Trust (JHVIT), unless otherwise noted below. JHVIT funds are advised by an affiliate of the Advisor, John Hancock Variable Trust Advisers LLC, and are distributed by an affiliate of the Advisor, John Hancock Distributors, LLC.
• Capital Appreciation Fund — a) 0.800% of the first $500 million of aggregate net assets; b) 0.700% of the next $500 million of aggregate net assets; and c) 0.670% of the excess over $1 billion of aggegate net assets.
• Capital Appreciation Value Fund — If net assets are less than $500 million, then the following fee schedule shall apply: a) 0.950% of the first $250 million of aggregate net assets; and b) 0.850% of the excess over $250 million of aggregate net assets. If net assets equal or exceed $500 million but are less than $2 billion, then the following fee schedule shall apply: a) 0.850% of the first $1 billion of aggregate net assets; and b) 0.800% of the excess over $1 billion of aggregate net assets. If net assets equal or exceed $2 billion but are less than $3 billion, then the following fee schedule shall apply: a) 0.850% of the first $500 million of aggregate net assets; and b) 0.800% of the excess over $500 million of aggregate net assets. If net assets equal or exceed $3 billion, then the management fee to be paid is 0.800% of aggregate net assets.
• Health Sciences Fund — a) 1.050% of the first $500 million of aggregate net assets; and b) 1.000% of the next $250 million of aggregate net assets; and c) 0.950% of excess over $750 million of aggregate net assets. However, when aggregate net assets exceed $750 million, the management fee is 0.950% of aggregate net assets.
• International Strategic Equity Allocation Fund, Strategic Equity Allocation Fund and U.S. Sector Rotation Fund — Aggregate net assets include these three funds and JHVIT Strategic Equity Allocation. The management fee paid is as follows: a) 0.675% of the first $2.5 billion of aggregate net assets; and b) 0.650% of the next $5 billion of aggregate net assets; and c) 0.625% of the next $2.5 billion of aggregate net assets; and d) 0.600% of the next $5 billion of aggregate net assets; e) 0.595% of the next $10 billion of aggregate net assets; and f) 0.590% of the excess over $25 billion of aggregate net assets.
• International Value Fund — Aggregate net assets are the aggregate net assets of the fund, JHVIT Disciplined Value International Trust (formerly JHVIT International Value Trust), Disciplined Value International Fund, a series of John Hancock Investment Trust, and Manulife Global Disciplined Value (Ex-U.S.) Fund, a sub-fund of Manulife Investment Management I, PLC. If aggregate net assets are less than $300 million, then the management fee rate is 0.825% of all aggregate net assets. If aggregate net assets equal or exceed $300 million but are less than $2.5 billion, then the management fee rate is 0.775% of all aggregate net assets. If aggregate net assets exceed $2.5 billion, then the following fee schedule shall apply: a) 0.775% of the first $2.5 billion of aggregate net assets; and b) 0.750% of the next $500 million of aggregate net assets; and c) 0.725% of the excess over $3 billion of aggregate net assets. Prior to February 12, 2020, aggregate net assets were the aggregate net assets of the fund, JHVIT Disciplined Value International Trust, JHVIT Global Trust and JHVIT Mutual Shares Trust. The management fee paid was as follows: a) 0.950% of the first $150 million of aggregate net assets; b) 0.850% of the next $150 million of aggregate net assets; and c) 0.800% of the excess over $300 million of aggregate net assets. However, when aggregate net assets exceeded $300 million, then the management fee rate was 0.800% of aggregate net assets.
• Mid Cap Stock Fund — a) 0.875% of the first $200 million of aggregate net assets; b) 0.850% of the next $300 million of aggregate net assets; and c) 0.825% of the excess over $500 million of aggregate net assets.
• Mid Value Fund — a) 1.050% of the first $20 million of aggregate net assets; b) 0.950% of the next $30 million of aggregate net assets; and c) 0.950% of the excess over $50 million of aggregate net assets. However, when aggregate net assets exceed $50 million, then the management fee rate is 0.950% of aggregate net assets.
• Multi-Index Lifestyle Portfolios — The management fee has two components: (a) a fee on assets invested in a fund of John Hancock Funds II (JHF II) or John Hancock Funds III (JHF III); and (b) a fee on assets invested in investments other than a fund of JHF II or JHF III (other assets). Aggregate net assets include assets of the portfolios, JHVIT Lifestyle Portfolios and Managed Volatility Portfolios, and JHF II Multimanager Lifestyle Portfolios. The fee
Fees and transactions with affiliates, continued
on assets invested in a fund of JHF II or JHF III is equivalent to the sum of: a) 0.050% for the first $7.5 billion of aggregate net assets; and b) 0.040% of the excess over $7.5 billion of aggregate net assets. The fee on other assets is equivalent to the sum of: a) 0.500% of the first $7.5 billion of aggregate net assets and b) 0.490% of the excess over $7.5 billion of aggregate net assets.
• Real Estate Securities Fund — 0.700% of aggregate net assets.
• Science & Technology Fund — a) 1.050% of the first $500 million of aggregate net assets; and (b) 1.000% of the excess over $500 million of aggregate net assets.
The organizations described below act as the subadvisors to the Trust and its funds pursuant to Subadvisory Agreements with the Advisor. Fund management is allocated among the following managers:
| Fund | Subadvisor(s) |
| Science & Technology Fund | Allianz Global Investors U.S. LLC; T. Rowe Price Associates, Inc. |
| International Value Fund | Boston Partners Global Investors, Inc.1 |
| Real Estate Securities Fund | DWS Investment Management Americas, Inc. and RREEF America LLC |
| Capital Appreciation Fund | Jennison Associates LLC |
International Strategic Equity Allocation Fund
Multi-Index Lifestyle Aggressive Portfolio
Multi-Index Lifestyle Balanced Portfolio
Multi-Index Lifestyle Conservative Portfolio
Multi-Index Lifestyle Growth Portfolio
Multi-Index Lifestyle Moderate Portfolio
Strategic Equity Allocation Fund
U.S. Sector Rotation Fund | Manulife Investment Management (US) LLC2 |
Capital Appreciation Value Fund
Health Sciences Fund
Mid Value Fund | T. Rowe Price Associates, Inc. |
| Mid Cap Stock Fund | Wellington Management Company LLP |
1 Effective February 12, 2020, Templeton Investment Counsel, LLC was replaced by Boston Partners Global Investors, Inc. as the fund's subadvisor.
2 An affiliate of the Advisor.
The funds are not responsible for payment of the subadvisory fees.
Expense reimbursements. The Advisor has voluntarily agreed to waive a portion of its management fee if certain expenses of the respective funds exceed the percentage of average net assets as detailed below. Expenses excluded from this waiver are taxes, brokerage commissions, interest expense, litigation and indemnification expenses and other extraordinary expenses not incurred in the ordinary course of the funds’ business, management fees, class specific expenses, acquired fund fees and short dividends. This expense reduction will continue in effect until terminated by the Advisor.
| Fund | Expense
limitation as a
percentage of
average net
assets |
| Capital Appreciation Fund | 0.20 |
| Capital Appreciation Value Fund | 0.20 |
| Health Sciences Fund | 0.20 |
| International Strategic Equity Allocation Fund | 0.25 |
| International Value Fund | 0.25 |
| Mid Cap Stock Fund | 0.20 |
| Fund | Expense
limitation as a
percentage of
average net
assets |
| Mid Value Fund | 0.20 |
| Real Estate Securities Fund | 0.20 |
| Science & Technology Fund | 0.20 |
| Strategic Equity Allocation Fund | 0.20 |
| U.S. Sector Rotation Fund | 0.20 |
The Advisor has contractually agreed to waive a portion of its management fee and/or reimburse expenses for certain funds of the John Hancock group of funds complex, including the fund (the participating portfolios). This waiver is based upon aggregate net assets of all the participating portfolios. The amount of the reimbursement is calculated daily and allocated among all the participating portfolios in proportion to the daily net assets of each fund. During the six months ended February 29, 2020, this waiver amounted to 0.01% of the fund’s average daily net assets on an annualized basis. This arrangement expires on July 31, 2021, unless renewed by mutual agreement of the fund and the Advisor based upon a determination that this is appropriate under the circumstances at that time.
The Advisor has contractually agreed to waive its management fee on International Value Fund so that the amount retained by the Advisor after payment of the subadvisory fees for the fund does not exceed 0.45% of the fund’s average net assets. The current expense limitation agreement expires on December 31, 2020, unless renewed by mutual agreement of the fund and the advisor based upon a determination that this is appropriate under the circumstances at that time.
The Advisor has contractually agreed to waive all or a portion of its management fee and/or reimburse or pay operating expenses of each Multi-Index Lifestyle Portfolio in an amount equal to the amount by which the expenses of the portfolio exceed 0.05% of the average net assets, excluding taxes, brokerage commissions, interest expense, litigation and indemnification expenses and other extraordinary expenses not incurred in the ordinary course of the portfolios’ business, acquired fund fees, short dividend expense, management fees, and class specific expenses. This expense limitation shall continue in effect until December 31, 2020, unless renewed by mutual agreement of the portfolios and the Advisor.
The Advisor has voluntarily agreed to waive its management fee on International Strategic Equity Allocation Fund, Strategic Equity Allocation Fund and U.S. Sector Rotation Fund so that the amount retained by the Advisor after payment of the subadvisory fees for the fund does not exceed 0.45% of the funds’ average net assets. This voluntary expense reimbursement may be terminated at any time by the Advisor on notice to the Trust.
Fees and transactions with affiliates, continued
The Advisor has voluntarily agreed to waive a portion of its management fees for the funds subadvised by T. Rowe Price Associates, Inc. which include Capital Appreciation Value Fund, Health Sciences Fund, Mid Value Fund, and Science & Technology Fund. This voluntary waiver equals the amount by which the subadvisory fee paid to T. Rowe Price Associates, Inc. is reduced. This voluntary expense reimbursement may terminate at any time.
The Advisor has voluntarily agreed to waive its advisory fee for each Multi-Index Lifestyle Portfolio so that the aggregate advisory fee retained by the Advisor with respect to both the portfolio and its underlying investments after payment of subadvisory fees does not exceed 0.50% of the funds’ first $7.5 billion of average annual net assets and 0.49% of the funds’ average annual net assets in excess of $7.5 billion. The advisor may terminate this voluntary waiver at any time upon notice to the funds.
For the six months ended February 29, 2020, the expense reductions described above amounted to the following:
| Expense Reimbursement by Class |
| Fund | Class R6 | Class 1 | Class NAV | Total |
| Capital Appreciation Fund | — | $21,876 | $44,702 | $66,578 |
| Capital Appreciation Value Fund | — | — | 318,205 | 318,205 |
| Health Sciences Fund | — | — | 85,387 | 85,387 |
| International Strategic Equity Allocation Fund | — | — | 1,119,086 | 1,119,086 |
| International Value Fund | — | 4,627 | 4,864 | 9,491 |
| Mid Cap Stock Fund | — | 16,320 | 44,019 | 60,339 |
| Mid Value Fund | — | — | 329,356 | 329,356 |
| Multi-Index Lifestyle Conservative Portfolio | $39 | 23,773 | — | 23,812 |
| Multi-Index Lifestyle Moderate Portfolio | 49 | 11,250 | — | 11,299 |
| Real Estate Securities Fund | — | 16,197 | — | 16,197 |
| Science & Technology Fund | — | — | 65,808 | 65,808 |
| Strategic Equity Allocation Fund | — | — | 4,938,951 | 4,938,951 |
| U.S. Sector Rotation Fund | — | — | 862,092 | 862,092 |
Expenses waived or reimbursed in the current fiscal period are not subject to recapture in future fiscal periods.
The investment management fees, including the impact of the waivers and reimbursements as described above, incurred for the six months ended February 29, 2020, were equivalent to a net annual effective rate of the funds' average daily net assets as follows:
| Fund | Net Annual Effective Rate |
| Capital Appreciation Fund | 0.70% |
| Capital Appreciation Value Fund | 0.78% |
| Health Sciences Fund | 0.98% |
| International Strategic Equity Allocation Fund | 0.49% |
| International Value Fund | 0.79% |
| Mid Cap Stock Fund | 0.82% |
| Mid Value Fund | 0.90% |
| Multi-Index Lifestyle Aggressive Portfolio | 0.19% |
| Fund | Net Annual Effective Rate |
| Multi-Index Lifestyle Balanced Portfolio | 0.32% |
| Multi-Index Lifestyle Conservative Portfolio | 0.42% |
| Multi-Index Lifestyle Growth Portfolio | 0.26% |
| Multi-Index Lifestyle Moderate Portfolio | 0.37% |
| Real Estate Securities Fund | 0.69% |
| Science & Technology Fund | 0.98% |
| Strategic Equity Allocation Fund | 0.49% |
| U.S. Sector Rotation Fund | 0.49% |
Accounting and legal services. Pursuant to a service agreement, the funds reimburse the Advisor for all expenses associated with providing the administrative, financial, legal, compliance, accounting and recordkeeping services to the funds, including the preparation of all tax returns, periodic reports to shareholders and regulatory reports, among other services. These expenses are allocated to each share class based on its relative net assets at the time the expense was incurred. These accounting and legal services fees incurred for the six months ended February 29, 2020 amounted to an annual rate of 0.02% of the funds' average daily net assets.
Distribution and service plans. The funds have a distribution agreement with the Distributor. The funds have adopted distribution and service plans for certain classes as detailed below pursuant to Rule 12b-1 under the 1940 Act, to pay the Distributor for services provided as the distributor of shares of the funds. The funds may pay up to the following contractual rates of distribution and service fees under these arrangements, expressed as an annual percentage of average daily net assets for each class of the funds' shares:
| Class | Rule 12b-1 Fee |
| Class 1 | 0.05% |
Transfer agent fees. The John Hancock group of funds has a complex-wide transfer agent agreement with John Hancock Signature Services, Inc. (Signature Services), an affiliate of the Advisor. The transfer agent fees paid to Signature Services are determined based on the cost to Signature Services (Signature Services Cost) of providing recordkeeping services. It also includes out-of-pocket expenses, including payments made to third-parties for recordkeeping services provided to their clients who invest in one or more John Hancock funds. In addition, Signature Services Cost may be reduced by certain fees that Signature Services receives in connection with retirement and small accounts. Signature Services Cost is calculated monthly and allocated, as applicable, to five categories of share classes: Retail Share and Institutional Share Classes of Non-Municipal Bond Funds, Class R6 Shares, Retirement Share Classes and Municipal Bond Share Classes. Within each of these categories, the applicable costs are allocated to the affected John Hancock affiliated funds and/or classes, based on the relative average daily net assets.
Class level expenses.Class level expenses for the six months ended February 29, 2020 were as follows:
| Fund | Class | Distribution and service fees | Transfer agent fees |
| Capital Appreciation Fund | Class 1 | $144,386 | — |
| | Total | $144,386 | — |
Fees and transactions with affiliates, continued
| Fund | Class | Distribution and service fees | Transfer agent fees |
| International Value Fund | Class 1 | $30,588 | — |
| | Total | $30,588 | — |
| Mid Cap Stock Fund | Class 1 | $107,656 | — |
| | Total | $107,656 | — |
| Multi-Index Lifestyle Aggressive Portfolio | Class R6 | — | $293 |
| | Class 1 | $88,961 | — |
| | Total | $88,961 | $293 |
| Multi-Index Lifestyle Balanced Portfolio | Class R6 | — | $421 |
| | Class 1 | $229,802 | — |
| | Total | $229,802 | $421 |
| Multi-Index Lifestyle Conservative Portfolio | Class R6 | — | $19 |
| | Class 1 | $46,994 | — |
| | Total | $46,994 | $19 |
| Multi-Index Lifestyle Growth Portfolio | Class R6 | — | $429 |
| | Class 1 | $215,386 | — |
| | Total | $215,386 | $429 |
| Multi-Index Lifestyle Moderate Portfolio | Class R6 | — | $75 |
| | Class 1 | $66,510 | — |
| | Total | $66,510 | $75 |
| Real Estate Securities Fund | Class 1 | $106,968 | — |
| | Total | $106,968 | — |
Trustee expenses. The funds compensate each Trustee who is not an employee of the Advisor or its affiliates. The costs of paying Trustee compensation and expenses are allocated to each fund based on their net assets relative to other funds within the John Hancock group of funds complex.
Interfund lending program. Pursuant to an Exemptive Order issued by the SEC, the funds, along with certain other funds advised by the Advisor or its affiliates, may participate in an interfund lending program. This program provides an alternative credit facility allowing the funds to borrow from, or lend money to, other participating affiliated funds. At period end, no interfund loans were outstanding. Interest expense is included in Other expenses on the Statements of operations. The funds' activity in this program during the period for which loans were outstanding was as follows:
| Fund | Borrower
or Lender | Weighted Average
Loan Balance | Days
Outstanding | Weighted Average
Interest Rate | Interest Income
(Expense) |
| Capital Appreciation Fund | Borrower | $14,640,726 | 4 | 1.550% | $(2,521) |
| International Strategic Equity Allocation Fund | Borrower | 3,100,000 | 1 | 1.545% | (133) |
| Capital Appreciation Fund | Lender | 6,600,000 | 3 | 1.550% | 853 |
| Capital Appreciation Value Fund | Lender | 20,842,245 | 2 | 1.644% | 1,904 |
| Health Sciences Fund | Lender | 1,703,330 | 1 | 1.825% | 86 |
| Mid Cap Stock Fund | Lender | 10,338,480 | 1 | 1.550% | 445 |
| Mid Value Fund | Lender | 2,287,206 | 4 | 1.607% | 408 |
| Science & Technology Fund | Lender | 5,055,421 | 2 | 1.750% | 491 |
| Strategic Equity Allocation Fund | Lender | 4,100,000 | 1 | 1.550% | 177 |
6. Fund share transactions
Transactions in funds' shares for the six months ended February 29, 2020 and for the year ended August 31, 2019 were as follows:
| Capital Appreciation Fund | Six Months Ended 2-29-20 | Year Ended 8-31-19 |
| | Shares | Amount | Shares | Amount |
| Class 1 shares | | | | |
| Sold | 428,631 | $7,080,480 | 659,621 | $10,868,208 |
| Distributions reinvested | 3,644,168 | 56,812,578 | 7,430,664 | 94,592,357 |
| Repurchased | (5,772,156) | (92,245,957) | (7,372,687) | (113,680,615) |
| Net increase (decrease) | (1,699,357) | $(28,352,899) | 717,598 | $(8,220,050) |
| Class NAV shares | | | | |
| Sold | 3,642,434 | $59,627,044 | 19,030,365 | $325,951,570 |
| Distributions reinvested | 7,540,038 | 118,001,591 | 14,387,352 | 183,726,482 |
| Repurchased | (12,312,209) | (202,946,338) | (19,909,514) | (312,935,068) |
| Net increase (decrease) | (1,129,737) | $(25,317,703) | 13,508,203 | $196,742,984 |
| Total net increase (decrease) | (2,829,094) | $(53,670,602) | 14,225,801 | $188,522,934 |
Fund share transactions, continued
| Capital Appreciation Value Fund | Six Months Ended 2-29-20 | Year Ended 8-31-19 |
| | Shares | Amount | Shares | Amount |
| Class NAV shares | | | | |
| Sold | 825,869 | $9,673,438 | 3,528,204 | $40,074,942 |
| Distributions reinvested | 14,779,528 | 163,904,965 | 20,157,483 | 198,551,204 |
| Repurchased | (24,986,011) | (291,143,598) | (32,434,022) | (370,531,422) |
| Net decrease | (9,380,614) | $(117,565,195) | (8,748,335) | $(131,905,276) |
| Total net decrease | (9,380,614) | $(117,565,195) | (8,748,335) | $(131,905,276) |
| Health Sciences Fund | Six Months Ended 2-29-20 | Year Ended 8-31-19 |
| | Shares | Amount | Shares | Amount |
| Class NAV shares | | | | |
| Sold | 5,367,179 | $25,871,347 | 7,679,171 | $34,013,118 |
| Distributions reinvested | 2,106,774 | 10,491,735 | 4,191,859 | 16,432,088 |
| Repurchased | (8,871,699) | (43,160,817) | (12,486,593) | (58,547,007) |
| Net decrease | (1,397,746) | $(6,797,735) | (615,563) | $(8,101,801) |
| Total net decrease | (1,397,746) | $(6,797,735) | (615,563) | $(8,101,801) |
| International Strategic Equity Allocation Fund | Six Months Ended 2-29-20 | Year Ended 8-31-19 |
| | Shares | Amount | Shares | Amount |
| Class NAV shares | | | | |
| Sold | 6,128,383 | $58,520,177 | 6,614,176 | $63,373,855 |
| Distributions reinvested | 5,043,948 | 48,976,734 | 31,573,083 | 260,793,663 |
| Repurchased | (11,403,422) | (108,820,400) | (20,499,255) | (190,900,557) |
| Net increase (decrease) | (231,091) | $(1,323,489) | 17,688,004 | $133,266,961 |
| Total net increase (decrease) | (231,091) | $(1,323,489) | 17,688,004 | $133,266,961 |
| International Value Fund | Six Months Ended 2-29-20 | Year Ended 8-31-19 |
| | Shares | Amount | Shares | Amount |
| Class 1 shares | | | | |
| Sold | 82,250 | $1,204,960 | 337,642 | $5,136,956 |
| Distributions reinvested | 611,449 | 9,006,651 | 228,757 | 3,239,198 |
| Repurchased | (1,693,670) | (25,065,548) | (1,879,815) | (28,355,098) |
| Net decrease | (999,971) | $(14,853,937) | (1,313,416) | $(19,978,944) |
| Class NAV shares | | | | |
| Sold | 662,302 | $9,468,277 | 1,577,002 | $23,694,626 |
| Distributions reinvested | 671,870 | 9,863,048 | 1,351,140 | 19,064,587 |
| Repurchased | (542,374) | (8,001,222) | (51,781,258) | (797,737,354) |
| Net increase (decrease) | 791,798 | $11,330,103 | (48,853,116) | $(754,978,141) |
| Total net decrease | (208,173) | $(3,523,834) | (50,166,532) | $(774,957,085) |
| Mid Cap Stock Fund | Six Months Ended 2-29-20 | Year Ended 8-31-19 |
| | Shares | Amount | Shares | Amount |
| Class 1 shares | | | | |
| Sold | 547,057 | $12,009,647 | 1,590,063 | $35,169,709 |
| Distributions reinvested | 2,537,043 | 51,552,722 | 3,855,829 | 64,739,364 |
| Repurchased | (2,299,488) | (49,577,493) | (2,970,307) | (63,445,438) |
| Net increase | 784,612 | $13,984,876 | 2,475,585 | $36,463,635 |
| Class NAV shares | | | | |
| Sold | 2,997,994 | $64,958,199 | 2,064,538 | $44,825,098 |
| Issued in reorganization (Note ) | — | — | 1,098,683 | 24,403,159 |
| Distributions reinvested | 6,771,298 | 139,556,442 | 10,914,765 | 185,441,862 |
| Repurchased | (8,166,753) | (181,748,842) | (11,002,507) | (232,587,884) |
| Net increase | 1,602,539 | $22,765,799 | 3,075,479 | $22,082,235 |
| Total net increase | 2,387,151 | $36,750,675 | 5,551,064 | $58,545,870 |
| Mid Value Fund | Six Months Ended 2-29-20 | Year Ended 8-31-19 |
| | Shares | Amount | Shares | Amount |
| Class NAV shares | | | | |
| Sold | 1,642,434 | $24,034,501 | 5,731,177 | $83,364,648 |
| Distributions reinvested | 2,274,193 | 34,817,897 | 7,628,541 | 101,535,887 |
| Repurchased | (8,795,649) | (133,987,914) | (11,401,030) | (168,126,474) |
| Net increase (decrease) | (4,879,022) | $(75,135,516) | 1,958,688 | $16,774,061 |
| Total net increase (decrease) | (4,879,022) | $(75,135,516) | 1,958,688 | $16,774,061 |
Fund share transactions, continued
| Multi-Index Lifestyle Aggressive Portfolio | Six Months Ended 2-29-20 | Year Ended 8-31-19 |
| | Shares | Amount | Shares | Amount |
| Class R6 shares | | | | |
| Sold | 339,137 | $4,064,895 | 43,277 | $498,740 |
| Distributions reinvested | 32,522 | 380,187 | 32,448 | 326,422 |
| Repurchased | (29,897) | (336,169) | (55,542) | (658,450) |
| Net increase | 341,762 | $4,108,913 | 20,183 | $166,712 |
| Class 1 shares | | | | |
| Sold | 2,332,227 | $27,922,086 | 4,377,332 | $50,813,098 |
| Distributions reinvested | 2,746,738 | 32,109,372 | 3,123,155 | 31,418,938 |
| Repurchased | (3,091,116) | (36,284,438) | (3,140,442) | (36,503,605) |
| Net increase | 1,987,849 | $23,747,020 | 4,360,045 | $45,728,431 |
| Total net increase | 2,329,611 | $27,855,933 | 4,380,228 | $45,895,143 |
| Multi-Index Lifestyle Balanced Portfolio | Six Months Ended 2-29-20 | Year Ended 8-31-19 |
| | Shares | Amount | Shares | Amount |
| Class R6 shares | | | | |
| Sold | 129,531 | $1,470,401 | 46,205 | $516,028 |
| Distributions reinvested | 33,238 | 375,364 | 34,982 | 356,263 |
| Repurchased | (58,637) | (656,080) | (4,540) | (48,691) |
| Net increase | 104,132 | $1,189,685 | 76,647 | $823,600 |
| Class 1 shares | | | | |
| Sold | 4,860,134 | $55,838,597 | 10,600,350 | $117,247,628 |
| Distributions reinvested | 4,845,173 | 54,717,492 | 6,086,235 | 61,891,267 |
| Repurchased | (7,974,934) | (89,989,261) | (10,887,677) | (120,591,223) |
| Net increase | 1,730,373 | $20,566,828 | 5,798,908 | $58,547,672 |
| Total net increase | 1,834,505 | $21,756,513 | 5,875,555 | $59,371,272 |
| Multi-Index Lifestyle Conservative Portfolio | Six Months Ended 2-29-20 | Year Ended 8-31-19 |
| | Shares | Amount | Shares | Amount |
| Class R6 shares | | | | |
| Sold | 28,510 | $310,217 | 25,147 | $259,880 |
| Distributions reinvested | 570 | 6,146 | 172 | 1,828 |
| Repurchased | (1,159) | (12,559) | (2,983) | (31,908) |
| Net increase | 27,921 | $303,804 | 22,336 | $229,800 |
| Class 1 shares | | | | |
| Sold | 1,696,260 | $18,415,957 | 3,245,428 | $33,943,916 |
| Distributions reinvested | 530,537 | 5,714,945 | 667,118 | 6,753,201 |
| Repurchased | (2,265,911) | (24,514,900) | (1,729,603) | (17,946,888) |
| Net increase (decrease) | (39,114) | $(383,998) | 2,182,943 | $22,750,229 |
| Total net increase (decrease) | (11,193) | $(80,194) | 2,205,279 | $22,980,029 |
| Multi-Index Lifestyle Growth Portfolio | Six Months Ended 2-29-20 | Year Ended 8-31-19 |
| | Shares | Amount | Shares | Amount |
| Class R6 shares | | | | |
| Sold | 91,092 | $1,065,853 | 73,347 | $842,497 |
| Distributions reinvested | 43,385 | 503,695 | 43,199 | 438,039 |
| Repurchased | (11,527) | (135,704) | (16,426) | (184,667) |
| Net increase | 122,950 | $1,433,844 | 100,120 | $1,095,869 |
| Class 1 shares | | | | |
| Sold | 4,711,862 | $55,879,579 | 10,941,267 | $125,625,346 |
| Distributions reinvested | 5,705,644 | 66,128,412 | 6,284,884 | 63,603,024 |
| Repurchased | (6,647,168) | (77,639,250) | (6,158,025) | (70,252,558) |
| Net increase | 3,770,338 | $44,368,741 | 11,068,126 | $118,975,812 |
| Total net increase | 3,893,288 | $45,802,585 | 11,168,246 | $120,071,681 |
| Multi-Index Lifestyle Moderate Portfolio | Six Months Ended 2-29-20 | Year Ended 8-31-19 |
| | Shares | Amount | Shares | Amount |
| Class R6 shares | | | | |
| Sold | 14,525 | $161,698 | 11,120 | $119,556 |
| Distributions reinvested | 4,727 | 52,179 | 5,247 | 53,451 |
| Repurchased | (140) | (1,571) | (317) | (3,423) |
| Net increase | 19,112 | $212,306 | 16,050 | $169,584 |
Fund share transactions, continued
Multi-Index Lifestyle Moderate Portfolio
(continued) | Six Months Ended 2-29-20 | Year Ended 8-31-19 |
| | Shares | Amount | Shares | Amount |
| Class 1 shares | | | | |
| Sold | 1,738,969 | $19,440,329 | 3,959,082 | $42,560,307 |
| Distributions reinvested | 1,117,847 | 12,337,160 | 1,339,142 | 13,629,279 |
| Repurchased | (3,556,084) | (39,424,943) | (3,132,869) | (33,529,732) |
| Net increase (decrease) | (699,268) | $(7,647,454) | 2,165,355 | $22,659,854 |
| Total net increase (decrease) | (680,156) | $(7,435,148) | 2,181,405 | $22,829,438 |
| Real Estate Securities Fund | Six Months Ended 2-29-20 | Year Ended 8-31-19 |
| | Shares | Amount | Shares | Amount |
| Class 1 shares | | | | |
| Sold | 1,426,654 | $21,070,035 | 1,334,399 | $17,975,699 |
| Distributions reinvested | 2,571,497 | 34,226,630 | 1,419,914 | 16,428,402 |
| Repurchased | (3,924,912) | (56,531,993) | (5,419,890) | (69,311,460) |
| Net increase (decrease) | 73,239 | $(1,235,328) | (2,665,577) | $(34,907,359) |
| Total net increase (decrease) | 73,239 | $(1,235,328) | (2,665,577) | $(34,907,359) |
| Science & Technology Fund | Six Months Ended 2-29-20 | Year Ended 8-31-19 |
| | Shares | Amount | Shares | Amount |
| Class NAV shares | | | | |
| Sold | 3,686,348 | $14,552,878 | 21,844,302 | $87,505,672 |
| Distributions reinvested | 6,590,594 | 25,176,071 | 25,953,098 | 77,599,763 |
| Repurchased | (12,027,374) | (48,084,786) | (16,478,950) | (63,907,004) |
| Net increase (decrease) | (1,750,432) | $(8,355,837) | 31,318,450 | $101,198,431 |
| Total net increase (decrease) | (1,750,432) | $(8,355,837) | 31,318,450 | $101,198,431 |
| Strategic Equity Allocation Fund | Six Months Ended 2-29-20 | Year Ended 8-31-19 |
| | Shares | Amount | Shares | Amount |
| Class NAV shares | | | | |
| Sold | 22,099,980 | $252,625,191 | 44,961,697 | $519,426,105 |
| Distributions reinvested | 20,435,857 | 243,595,412 | 106,756,169 | 1,038,737,526 |
| Repurchased | (72,565,234) | (865,476,270) | (65,156,903) | (755,070,772) |
| Net increase (decrease) | (30,029,397) | $(369,255,667) | 86,560,963 | $803,092,859 |
| Total net increase (decrease) | (30,029,397) | $(369,255,667) | 86,560,963 | $803,092,859 |
| U.S. Sector Rotation Fund | Six Months Ended 2-29-20 | Year Ended 8-31-19 |
| | Shares | Amount | Shares | Amount |
| Class NAV shares | | | | |
| Sold | 4,210,168 | $41,164,885 | 9,756,848 | $101,975,614 |
| Distributions reinvested | 13,005,421 | 127,843,285 | 41,720,298 | 347,530,083 |
| Repurchased | (41,352,362) | (419,440,275) | (30,176,253) | (314,152,137) |
| Net increase (decrease) | (24,136,773) | $(250,432,105) | 21,300,893 | $135,353,560 |
| Total net increase (decrease) | (24,136,773) | $(250,432,105) | 21,300,893 | $135,353,560 |
Affiliates of the Trust owned 10% of shares of Class R6 of Multi-Index Lifestyle Conservative Portfolio on February 29, 2020. Affiliates of the Trust also owned 100% of Class 1 and Class NAV, respectively, with the exception of Capital Appreciation Fund and International Value Fund, where affiliates held 77% and 0% of Class NAV, respectively, on February 29, 2020. Such concentration of shareholders’ capital could have a material effect on the fund if such shareholders redeem from the fund.
7. Purchase and sale of securities
Purchases and sales of securities, other than short-term investments, amounted to the following for the six months ended February 29, 2020:
| Fund | Purchases | Sales |
| Capital Appreciation Fund | $349,608,025 | $589,820,683 |
| Capital Appreciation Value Fund | 330,220,690 | 622,472,212 |
| Health Sciences Fund | 72,766,908 | 91,903,211 |
| International Strategic Equity Allocation Fund | 573,274,021 | 591,085,979 |
| International Value Fund | 260,380,484 | 267,833,265 |
| Mid Cap Stock Fund | 659,313,842 | 860,174,957 |
| Mid Value Fund | 202,997,043 | 281,287,040 |
| Multi-Index Lifestyle Aggressive Portfolio | 42,567,181 | 37,842,643 |
| Multi-Index Lifestyle Balanced Portfolio | 217,275,187 | 215,835,313 |
| Multi-Index Lifestyle Conservative Portfolio | 67,006,328 | 63,691,302 |
| Multi-Index Lifestyle Growth Portfolio | 147,785,652 | 138,991,775 |
Purchase and sale of securities, continued
| Fund | Purchases | Sales |
| Multi-Index Lifestyle Moderate Portfolio | $74,298,876 | $80,838,523 |
| Real Estate Securities Fund | 268,755,925 | 297,825,799 |
| Science & Technology Fund | 131,700,556 | 170,091,806 |
| Strategic Equity Allocation Fund | 2,854,215,825 | 3,453,077,504 |
| U.S. Sector Rotation Fund | 564,532,071 | 935,265,931 |
8. Industry or sector risk
Certain funds generally invest a large percentage of their assets in one or more particular industries or sectors of the economy. If a large percentage of a fund's assets are economically tied to a single or small number of industries or sectors of the economy, the fund will be less diversified than a more broadly diversified fund, and it may cause the fund to underperform if that industry or sector underperforms. In addition, focusing on a particular industry or sector may make the fund’s NAV more volatile. Further, a fund that invests in particular industries or sectors is particularly susceptible to the impact of market, economic, regulatory and other factors affecting those industries or sectors. Financial services companies can be hurt by economic declines, changes in interest rates regulatory and market impacts.
9. Investment in affiliated underlying funds
John Hancock Multi-Index Lifestyle Portfolios invest in affiliated underlying funds that are managed by the Advisor and its affiliates. The funds do not invest in the affiliated underlying funds for the purpose of exercising management or control; however, the funds' investment may represent a significant portion of each underlying funds’ net assets. At February 29, 2020, the following funds held 5% or more of the net assets of the underlying funds shown below:
| Fund | Affiliated Class NAV | Percentage of
underlying fund
net assets |
| Multi-Index Lifestyle Growth Portfolio | Strategic Equity Allocation Fund | 6.2% |
Information regarding the funds' fiscal year to date purchases and sales of the affiliated underlying funds as well as income and capital gains earned by the funds, if any, is as follows:
| | | | | | | | Dividends and distributions |
| Affiliate | Ending
share
amount | Beginning
value | Cost of
purchases | Proceeds
from shares
sold | Realized
gain
(loss) | Change in
unrealized
appreciation
(depreciation) | Income
distributions
received | Capital gain
distributions
received | Ending
value |
| Capital Appreciation Fund |
| John Hancock Collateral Trust* | 2,674 | $25,457,039 | $229,419,220 | $(254,849,579) | $3,638 | $(3,553) | $198,031 | — | $26,765 |
| Capital Appreciation Value Fund |
| John Hancock Collateral Trust* | 847,910 | — | $53,479,875 | $(44,999,542) | $3,422 | $2,895 | $20,815 | — | $8,486,650 |
| International Strategic Equity Allocation Fund |
| John Hancock Collateral Trust* | 7,790,795 | — | $197,363,683 | $(119,406,848) | $3,125 | $17,324 | $144,949 | — | $77,977,284 |
| International Value Fund |
| John Hancock Collateral Trust* | — | $937,826 | $25,170,992 | $(26,109,162) | $384 | $(40) | $9,559 | — | — |
| Mid Cap Stock Fund |
| John Hancock Collateral Trust* | 6,247,373 | $26,551,791 | $375,441,524 | $(339,499,910) | $14,123 | $21,802 | $967,930 | — | $62,529,330 |
| Mid Value Fund |
| John Hancock Collateral Trust* | 1,203,406 | $10,825,459 | $175,176,275 | $(173,960,772) | $608 | $3,204 | $66,184 | — | $12,044,774 |
| Multi-Index Lifestyle Aggressive Portfolio |
| John Hancock Collateral Trust* | 391,721 | — | $120,181,699 | $(116,263,569) | $1,294 | $1,270 | $11,685 | — | $3,920,694 |
| Strategic Equity Allocation | 20,569,737 | $226,266,576 | 25,219,103 | (21,666,593) | (3,665,925) | (1,943,030) | 5,177,603 | $2,568,488 | 224,210,131 |
| | | | | | $(3,664,631) | $(1,941,760) | $5,189,288 | $2,568,488 | $228,130,825 |
| Multi-Index Lifestyle Balanced Portfolio |
Investment in affiliated underlying funds, continued
| | | | | | | | Dividends and distributions |
| Affiliate | Ending
share
amount | Beginning
value | Cost of
purchases | Proceeds
from shares
sold | Realized
gain
(loss) | Change in
unrealized
appreciation
(depreciation) | Income
distributions
received | Capital gain
distributions
received | Ending
value |
| John Hancock Collateral Trust* | 4,511,276 | $53,581,782 | $274,548,010 | $(282,983,187) | $2,543 | $3,759 | $102,532 | — | $45,152,907 |
| Strategic Equity Allocation | 30,560,583 | 343,540,970 | 33,527,206 | (37,204,040) | (4,785,381) | (1,968,400) | 7,719,979 | $3,829,702 | 333,110,355 |
| | | | | | $(4,782,838) | $(1,964,641) | $7,822,511 | $3,829,702 | $378,263,262 |
| Multi-Index Lifestyle Conservative Portfolio |
| John Hancock Collateral Trust* | 1,175,125 | $12,589,826 | $66,275,315 | $(67,102,465) | $(1,767) | $804 | $30,828 | — | $11,761,713 |
| Strategic Equity Allocation | 1,766,320 | 20,951,644 | 3,931,666 | (5,321,707) | (537,512) | 228,796 | 436,120 | $216,349 | 19,252,887 |
| | | | | | $(539,279) | $229,600 | $466,948 | $216,349 | $31,014,600 |
| Multi-Index Lifestyle Growth Portfolio |
| John Hancock Collateral Trust* | 5,106,658 | $16,547,429 | $336,597,378 | $(302,045,974) | $7,759 | $5,433 | $78,187 | — | $51,112,025 |
| Strategic Equity Allocation | 39,094,783 | 434,224,242 | 40,726,653 | (39,607,603) | (6,414,163) | (2,795,998) | 9,856,695 | $4,889,677 | 426,133,131 |
| | | | | | $(6,406,404) | $(2,790,565) | $9,934,882 | $4,889,677 | $477,245,156 |
| Multi-Index Lifestyle Moderate Portfolio |
| John Hancock Collateral Trust* | 762,460 | $12,169,739 | $203,192,330 | $(207,730,871) | $(334) | $520 | $44,450 | — | $7,631,384 |
| Strategic Equity Allocation | 5,672,515 | 66,838,092 | 8,958,976 | (13,007,076) | (1,455,630) | 496,051 | 1,454,913 | $721,748 | 61,830,413 |
| | | | | | $(1,455,964) | $496,571 | $1,499,363 | $721,748 | $69,461,797 |
| Real Estate Securities Fund |
| John Hancock Collateral Trust* | — | — | $16,729,848 | $(16,729,849) | $1 | — | $1,118 | — | — |
| Science & Technology Fund |
| John Hancock Collateral Trust* | 375,978 | $9,739,733 | $55,685,646 | $(61,663,607) | $435 | $914 | $39,127 | — | $3,763,121 |
| Strategic Equity Allocation Fund |
| John Hancock Collateral Trust* | 9,788,600 | $80,031,817 | $587,342,088 | $(569,417,866) | $7,017 | $10,066 | $885,519 | — | $97,973,122 |
| U.S. Sector Rotation Fund |
| John Hancock Collateral Trust* | 98,839 | $4,141,717 | $20,852,760 | $(24,005,779) | $535 | $36 | $36,783 | — | $989,269 |
| * | Refer to the Securities lending note within Note 2 for details regarding this investment. |
10. Investment by affiliated funds
Certain investors in the funds are affiliated funds that are managed by the Advisor and its affiliates. The affiliated funds do not invest in the funds for the purpose of exercising management or control; however, this investment may represent a significant portion of the funds' net assets. The following fund(s) had an affiliate ownership of 5% or more of the funds' net assets:
| Fund | Affiliated Concentration |
| Capital Appreciation Fund | 51.4% |
| Capital Appreciation Value Fund | 99.1% |
| Health Sciences Fund | 99.9% |
| International Strategic Equity Allocation Fund | 100.0% |
| Mid Cap Stock Fund | 72.3% |
| Mid Value Fund | 100.0% |
Investment by affiliated funds, continued
| Fund | Affiliated Concentration |
| Science & Technology Fund | 100.0% |
| Strategic Equity Allocation Fund | 100.0% |
| U.S. Sector Rotation Fund | 100.0% |
11. Interfund trading
The funds are permitted to purchase or sell securities from or to certain other affiliated funds, as set forth in Rule 17a-7 of the 1940 Act, under specified conditions outlined in procedures adopted by the Board of Trustees of the Trust. The procedures have been designed to ensure that any purchase or sale of securities by the funds from or to another fund that is or could be considered an affiliate complies with Rule 17a-7 of the 1940 Act. Further, as defined under the procedures, each transaction is effected at the current market price. Pursuant to these procedures, for the six months ended February 29, 2020, the funds engaged in securities purchases and sales with affiliated funds, some of which have different fiscal reporting periods, as follows:
| Fund | Purchases | Sales |
| Capital Appreciation Value Fund | $1,543,758 | — |
| Mid Value Fund | — | $125,832 |
12. Restricted securities
The funds may hold restricted securities which are restricted as to resale and the funds have limited rights to registration under the Securities Act of 1933. Disposal may involve time-consuming negotiations and expenses, and prompt sale at an acceptable price may be difficult to achieve. The following table summarizes the restricted securities held at February 29, 2020:
Issuer,
Description | Original
acquisition date | Acquisition
cost | Beginning
share
amount | Shares
purchased | Shares
sold | Ending
share
amount | Value as a
percentage of
net assets | Ending
value |
| Health Sciences Fund | | | | | | | | |
| Acerta Pharma BV, Class B | 2-8-16 | $146,475 | 4,892,850 | — | — | 4,892,850 | 0.2% | $457,481 |
| Doximity, Inc. | 4-10-14 | 307,268 | 63,738 | — | — | 63,738 | 0.3% | 868,749 |
| JAND, Inc., Class A | 4-23-15 | 194,538 | 16,938 | — | — | 16,938 | 0.1% | 307,594 |
| JAND, Inc., Series D | 4-23-15 | 434,397 | 37,822 | — | — | 37,822 | 0.3% | 686,848 |
| | | | | | | | | $2,320,672 |
| Mid Cap Stock Fund | | | | | | | | |
| Coupang LLC | 11-20-14 | $4,300,618 | 2,300,670 | — | (919,221) | 1,381,449 | 0.6% | $8,150,549 |
| DraftKings, Inc. | 12-4-14 | 3,666,693 | 2,294,714 | — | — | 2,294,714 | 0.8% | 11,824,645 |
| Essence Group Holdings Corp. | 5-1-14 | 5,083,384 | 2,958,957 | — | — | 2,958,957 | 0.5% | 8,077,953 |
| JAND, Inc., Class A | 4-23-15 | 635,744 | 57,523 | — | — | 57,523 | 0.1% | 1,044,618 |
| JAND, Inc., Series D | 4-23-15 | 1,419,614 | 128,449 | — | — | 128,449 | 0.2% | 2,332,634 |
| Lookout, Inc., Series F | 7-31-14 | 4,276,874 | 392,767 | — | — | 392,767 | 0.2% | 2,796,501 |
| MarkLogic Corp., Series F | 4-27-15 | 6,431,120 | 580,011 | — | — | 580,011 | 0.4% | 6,072,715 |
| The Honest Company, Inc., Series C | 8-20-14 | 3,966,620 | 142,030 | — | — | 142,030 | 0.3% | 4,657,164 |
| The Honest Company, Inc., Series D | 8-3-15 | 490,560 | 12,795 | — | — | 12,795 | 0.0%* | 496,446 |
| The We Company, Inc., Series D1 | 12-8-14 | 3,335,927 | 184,328 | — | — | 184,328 | 0.2% | 2,740,957 |
| The We Company, Inc., Series D2 | 12-8-14 | 3,472,011 | 161,782 | — | — | 161,782 | 0.2% | 2,405,698 |
| | | | | | | | | $50,599,880 |
| Science & Technology Fund | | | | | | | | |
| Airbnb, Inc., Series E | 7-14-15 | $1,526,562 | 16,398 | — | — | 16,398 | 0.7% | $1,742,779 |
| DiDi Chuxing, Inc. | 10-19-15 | 460,705 | 16,798 | — | — | 16,798 | 0.3% | 855,557 |
| | | | | | | | | $2,598,336 |
13. Reorganization
Fiscal year ended August 31, 2019, fund's mergers:
On August 9, 2019, the shareholders of John Hancock Funds II Small Cap Stock Fund (the Acquired Fund) voted to approve an Agreement and Plan of Reorganization (the Agreement) which provided for an exchange of shares of Mid Cap Stock Fund (the Acquiring Fund) with a value equal to the net assets transferred.
The Agreement provided for (a) the acquisition of all the assets, subject to all of the liabilities, of the Acquired Fund in exchange for shares of the Acquiring Fund with a value equal to the net assets transferred; (b) the liquidation of the Acquired Fund; and (c) the distribution to Acquired Fund’s shareholders of such Acquiring Fund’s shares. The reorganization was intended to consolidate the Acquired Fund with a fund with a similar objective and achieve economies of scale. As a result of the reorganization, the Acquiring Fund is the legal and accounting survivor.
Reorganization, continued
The reorganization did not qualify as a tax-free reorganization for federal income tax purposes; however, it is not expected to be a taxable event for contract owners. Thus, the investments were transferred to the Acquiring Fund at market value. All distributable amounts of net income and realized gains from the Acquired Fund were distributed prior to the reorganization. In addition, the expenses of the reorganization were borne by the Acquired Fund. The effective time of the reorganization occurred immediately after the close of regularly scheduled trading on the New York Stock Exchange (NYSE) on August 23, 2019. The following outlines the reorganization:
Acquiring
Fund | Acquired
Fund | Net Asset
Value of the
Acquired
Fund | Shares
Redeemed
by the
Acquired
Fund | Shares
Issued
by the
Acquiring
Fund | Acquiring
Fund
Net Assets
Prior to
Combination | Acquiring
Fund
Total Net
Assets After
Combination |
| Mid Cap Stock Fund | Small Cap Stock Fund | $24,403,159 | 2,727,995 | 1,098,683 | $1,571,513,969 | $1,595,917,128 |
See Note 6 for capital shares issued in connection with the above referenced reorganizations.
14. Subsequent events
A widespread health crisis such as a global pandemic could cause substantial market volatility, exchange trading suspensions and closures, impact the ability to complete redemptions, and affect fund performance. For example, the novel coronavirus disease (COVID-19) has resulted in significant disruptions to global business activity. The impact of a health crisis and other epidemics and pandemics that may arise in the future, could affect the global economy in ways that cannot necessarily be foreseen at the present time. A health crisis may exacerbate other pre-existing political, social and economic risks. Any such impact could adversely affect the funds' performance, resulting in losses to your investment.
John Hancock Funds II
For more information
The Statement of Additional Information, a separate document with supplemental information not contained in the prospectus, includes additional information on the Board of Trustees and can be obtained without charge by calling 800-344-1029 or on the Securities and Exchange Commission (SEC) website at sec.gov.
PROXY VOTING POLICY A description of the trust’s proxy voting policies and procedures and information regarding how the trust voted proxies relating to portfolio securities during the most recent twelve-month period ended June 30 is available without charge, upon request, by calling 800-344-1029 or on the SEC website at sec.gov.
QUARTERLY PORTFOLIO DISCLOSURE All of the trust’s holdings as of the end of the third month of every fiscal quarter are filed with the SEC on Form N-PORT within 60 days of the end of the fiscal quarter. The trust’s Form N-PORT filings are available electronically on the SEC website (sec.gov).
The report is certified under the Sarbanes-Oxley Act, which requires mutual funds and other public companies to affirm that, to the best of their knowledge, the information in their financial reports is fairly and accurately stated in all material respects.
127


John Hancock Funds II
Semiannual report — table of contents
Sector or portfolio composition | | 3 |
Shareholder expense example | | 4 |
Portfolio of investments(See below for each fund’s page #) | | 5 |
Statements of assets and liabilities | | 33 |
Statements of operations | | 35 |
Statements of changes in net assets | | 37 |
Notes to financial statements | | 40 |
Fund
| | | | Portfolio of
investments |
|---|
Asia Pacific Total Return Bond Fund | | | | | 5 | |
| | | | | 7 | |
| | | | | 17 | |
Opportunistic Fixed Income Fund
(formerly Global Bond Fund) | | | | | 25 | |
U.S. High Yield Bond Fund | | | | | 26 | |
2
John Hancock Funds II
Sector or portfolio composition
Asia Pacific Total Return Bond Fund
Portfolio Composition*
| | | | % of
Total |
|---|
| | | | | 49.3 | |
Foreign government obligations | | | | | 40.3 | |
Short-term investments and other | | | | | 10.4 | |
Core Bond Fund
Portfolio Composition**
| | | | % of
Total |
|---|
| | | | | 30.9 | |
| | | | | 24.6 | |
| | | | | 21.9 | |
Collateralized mortgage obligations | | | | | 9.3 | |
| | | | | 8.8 | |
Foreign government obligations | | | | | 0.8 | |
| | | | | 0.5 | |
| | | | | 3.2 | |
High Yield Fund
Portfolio Composition*
| | | | % of
Total |
|---|
| | | | | 82.4 | |
| | | | | 8.1 | |
| | | | | 4.4 | |
| | | | | 0.9 | |
Foreign government obligations | | | | | 0.8 | |
| | | | | 0.8 | |
| | | | | 0.7 | |
Short-term investments and other | | | | | 1.9 | |
Opportunistic Fixed Income Fund
Portfolio Composition*
| | | | % of
Total |
|---|
| | | | | 96.6 | |
Foreign government obligations | | | | | 3.0 | |
Short-term investments and other | | | | | 0.4 | |
U.S. High Yield Bond Fund
Portfolio Composition*
| | | | % of
Total |
|---|
| | | | | 89.6 | |
| | | | | 4.1 | |
| | | | | 0.8 | |
| | | | | 0.1 | |
Short-term investments and other | | | | | 5.4 | |
| * | | As a percentage of net assets. |
| ** | | As a percentage of total investments. |
3
John Hancock Funds II
Shareholder expense example
As a shareholder of John Hancock Funds II, you incur ongoing costs, such as management fees, distribution (Rule 12b-1) fees and other expenses.
These examples are intended to help you understand your ongoing costs (in dollars) of investing in a fund so you can compare these costs with the ongoing costs of investing in other mutual funds. The examples are based on an investment of $1,000 at the beginning of the period and held for the entire period (September 1, 2019 through February 29, 2020).
Actual expenses:
The first line of each share class in the following table provides information about actual account values and actual expenses. You may use the information in this line, together with the amount you invested, to estimate the expenses that you paid over the period. Simply divide your account value by $1,000 (for example, an $8,600 account value divided by $1,000 = 8.6), then multiply the result by the number in the first line under the heading entitled “Expenses paid during period ended” to estimate the expenses you paid on your account during this period.
Hypothetical example for comparison purposes:
The second line of each share class in the following table provides information about hypothetical account values and hypothetical expenses based on the actual expense ratio for the share class and an assumed annualized rate of return of 5% per year before expenses, which is not the actual return of the share class. The hypothetical account values and expenses may not be used to estimate the actual ending account balance or expenses you paid for the period. You may use this information to compare the ongoing costs of investing in the portfolio and other funds. To do so, compare this 5% hypothetical example with the 5% hypothetical examples that appear in the shareholder reports of the other funds. Please remember that these hypothetical account values and expenses may not be used to estimate the actual ending account balance or expenses you paid for the period.
Please note that the expenses shown in the table are meant to highlight your ongoing costs only and do not reflect any transactional costs and insurance-related charges. Therefore, the second line of each share class in the table is useful in comparing ongoing costs only, and will not help you determine the relative total costs of owning different funds. In addition, if these transactional costs were included, your costs would have been higher.
| | | Account
value on
9-1-2019 | Ending
value on
2-29-2020 | Expenses
paid during
period ended
2-29-20201 | Annualized
expense
ratio |
| Asia Pacific Total Return Bond Fund |
| Class NAV | Actual expenses/actual returns | $1,000.00 | $1,035.20 | $4.15 | 0.82% |
| | Hypothetical example | 1,000.00 | 1,020.80 | 4.12 | 0.82% |
| Core Bond Fund |
| Class 1 | Actual expenses/actual returns | $1,000.00 | $1,030.80 | $3.28 | 0.65% |
| | Hypothetical example | 1,000.00 | 1,021.60 | 3.27 | 0.65% |
| Class NAV | Actual expenses/actual returns | 1,000.00 | 1,031.80 | 3.03 | 0.60% |
| | Hypothetical example | 1,000.00 | 1,021.90 | 3.02 | 0.60% |
| High Yield Fund |
| Class 1 | Actual expenses/actual returns | $1,000.00 | $1,022.50 | $4.22 | 0.84% |
| | Hypothetical example | 1,000.00 | 1,020.70 | 4.22 | 0.84% |
| Opportunistic Fixed Income Fund |
| Class 1 | Actual expenses/actual returns | $1,000.00 | $1,032.10 | $5.41 | 1.07% |
| | Hypothetical example | 1,000.00 | 1,019.50 | 5.37 | 1.07% |
| U.S. High Yield Bond Fund |
| Class 1 | Actual expenses/actual returns | $1,000.00 | $1,010.70 | $3.90 | 0.78% |
| | Hypothetical example | 1,000.00 | 1,021.00 | 3.92 | 0.78% |
| Class NAV | Actual expenses/actual returns | 1,000.00 | 1,010.90 | 3.65 | 0.73% |
| | Hypothetical example | 1,000.00 | 1,021.20 | 3.67 | 0.73% |
| 1 | Expenses are equal to the annualized expense ratio, multiplied by the average account value over the period, multiplied by 182/366 (to reflect the one-half year period). |
John Hancock Funds II
Portfolio of Investments — February 29, 2020 (unaudited)(showing percentage of total net assets)
Asia Pacific Total Return Bond Fund
| | | Shares or
Principal
Amount | | Value |
| FOREIGN GOVERNMENT OBLIGATIONS - 40.3% | | | |
| India - 7.0% | | | | | |
| Republic of India | | | | | |
| 7.590%, 01/11/2026 | INR | 450,000,000 | | $ | 6,618,023 |
| 7.680%, 12/15/2023 | | 85,000,000 | | | 1,248,306 |
| 8.120%, 12/10/2020 | | 450,000,000 | | | 6,358,579 |
| 9.150%, 11/14/2024 | | 250,000,000 | | | 3,887,704 |
| | | | | | 18,112,612 |
| Indonesia - 9.7% | | | | | |
| Republic of Indonesia | | | | | |
| 3.700%, 10/30/2049 | $ | 1,500,000 | | | 1,535,957 |
| 6.125%, 05/15/2028 | IDR | 120,000,000,000 | | | 7,834,053 |
| 6.625%, 05/15/2033 | | 86,945,000,000 | | | 5,629,374 |
| 7.000%, 05/15/2027 | | 24,000,000,000 | | | 1,696,593 |
| 8.375%, 03/15/2024 to 04/15/2039 | | 113,000,000,000 | | | 8,459,158 |
| | | | | | 25,155,135 |
| Malaysia - 9.1% | | | | | |
| Government of Malaysia | | | | | |
| 3.418%, 08/15/2022 | MYR | 7,500,000 | | | 1,811,298 |
| 3.620%, 11/30/2021 | | 36,500,000 | | | 8,807,706 |
| 3.757%, 04/20/2023 | | 26,000,000 | | | 6,371,781 |
| 4.181%, 07/15/2024 | | 18,000,000 | | | 4,531,096 |
| 4.392%, 04/15/2026 | | 8,000,000 | | | 2,072,915 |
| | | | | | 23,594,796 |
| Philippines - 2.1% | | | | | |
| Republic of Philippines | | | | | |
| 3.625%, 09/09/2025 | PHP | 142,233,286 | | | 2,701,954 |
| 3.900%, 11/26/2022 | | 131,000,000 | | | 2,564,368 |
| | | | | | 5,266,322 |
| Singapore - 0.9% | | | | | |
Republic of Singapore
2.750%, 07/01/2023 | SGD | 3,000,000 | | | 2,257,375 |
| South Korea - 9.9% | | | | | |
Export-Import Bank of Korea
6.200%, 08/07/2021 | INR | 137,000,000 | | | 1,904,194 |
| Republic of Korea | | | | | |
| 1.875%, 06/10/2029 | KRW | 7,000,000,000 | | | 6,040,146 |
| 2.000%, 12/10/2021 to 09/10/2022 | | 7,600,000,000 | | | 6,376,026 |
| 2.250%, 06/10/2021 | | 5,300,000,000 | | | 4,427,876 |
| 2.375%, 03/10/2023 | | 8,000,000,000 | | | 6,826,389 |
| | | | | | 25,574,631 |
| Thailand - 1.6% | | | | | |
Kingdom of Thailand
1.200%, 07/14/2021 | THB | 130,774,800 | | | 4,152,432 |
| TOTAL FOREIGN GOVERNMENT OBLIGATIONS (Cost $108,243,426) | | $ | 104,113,303 |
| CORPORATE BONDS - 49.3% | | | |
| Cayman Islands - 1.2% | | | | | |
CK Hutchison International 19 II, Ltd.
3.375%, 09/06/2049 (A) | $ | 2,801,000 | | | 3,128,908 |
| China - 5.9% | | | | | |
21Vianet Group, Inc.
7.875%, 10/15/2021 | | 2,000,000 | | | 2,008,054 |
China Aoyuan Group, Ltd.
7.950%, 09/07/2021 | | 2,500,000 | | | 2,584,321 |
China Hongqiao Group, Ltd.
7.125%, 07/22/2022 | | 1,500,000 | | | 1,383,750 |
China SCE Group Holdings, Ltd.
7.375%, 04/09/2024 | | 3,000,000 | | | 3,063,912 |
Shandong Iron and Steel Xinheng International Company, Ltd.
6.500%, 06/14/2021 | | 800,000 | | | 797,200 |
Asia Pacific Total Return Bond Fund (continued)
| | | Shares or
Principal
Amount | | Value |
| CORPORATE BONDS (continued) | | | |
| China (continued) | | | | | |
Vanke Real Estate Hong Kong Company, Ltd.
3.850%, 06/13/2022 | CNY | 16,000,000 | | $ | 2,311,997 |
Zhenro Properties Group, Ltd.
8.650%, 01/21/2023 | $ | 3,000,000 | | | 3,102,263 |
| | | | | | 15,251,497 |
| Hong Kong - 12.2% | | | | | |
AIA Group, Ltd.
4.875%, 03/11/2044 | | 1,488,000 | | | 1,991,041 |
Bangkok Bank PCL (3.733% to 9-25-29, then 5 Year CMT + 1.900%)
09/25/2034 (A) | | 1,053,000 | | | 1,096,628 |
Chong Hing Bank, Ltd. (3.876% to 7-26-22, then 5 Year CMT + 2.030%)
07/26/2027 | | 3,000,000 | | | 3,071,196 |
CMB Wing Lung Bank, Ltd. (3.750% to 11-22-22, then 5 Year CMT + 1.750%)
11/22/2027 | | 3,000,000 | | | 3,090,446 |
Coastal Emerald, Ltd.
4.300%, 08/01/2024 | | 3,000,000 | | | 3,040,545 |
Concord New Energy Group, Ltd.
7.900%, 01/23/2021 | | 3,000,000 | | | 3,050,655 |
Far East Horizon, Ltd. (3 month LIBOR + 2.000%)
3.908%, 07/03/2021 (B) | | 3,000,000 | | | 3,022,980 |
GET International Investment Holdings, Ltd.
3.750%, 07/18/2022 | | 1,151,000 | | | 1,166,438 |
Shanghai Commercial Bank, Ltd. (3.750% to 11-29-22, then 5 Year CMT + 1.705%)
11/29/2027 | | 3,000,000 | | | 3,087,047 |
Weichai International Hong Kong Energy Group Company, Ltd. (3.750% to 9-14-22, then 5 Year CMT + 6.084%)
09/14/2022 (C) | | 3,000,000 | | | 3,026,461 |
Yingde Gases Investment, Ltd.
6.250%, 01/19/2023 (A) | | 2,800,000 | | | 2,910,131 |
Zoomlion HK SPV Company, Ltd.
6.125%, 12/20/2022 | | 3,000,000 | | | 3,071,550 |
| | | | | | 31,625,118 |
| India - 4.6% | | | | | |
Greenko Investment Company
4.875%, 08/16/2023 | | 2,100,000 | | | 2,092,192 |
Indian Railway Finance Corp., Ltd.
3.950%, 02/13/2050 (A) | | 2,611,000 | | | 2,684,941 |
NTPC, Ltd.
4.250%, 02/26/2026 | | 2,000,000 | | | 2,149,823 |
ReNew Power Synthetic
6.670%, 03/12/2024 | | 2,000,000 | | | 2,080,302 |
Vedanta Resources, Ltd.
7.125%, 05/31/2023 | | 3,000,000 | | | 2,851,500 |
| | | | | | 11,858,758 |
| Indonesia - 5.8% | | | | | |
ABM Investama Tbk PT
7.125%, 08/01/2022 (A) | | 2,800,000 | | | 2,429,948 |
Adaro Indonesia PT
4.250%, 10/31/2024 (A) | | 2,217,000 | | | 2,187,071 |
Bayan Resources Tbk PT
6.125%, 01/24/2023 (A) | | 2,157,000 | | | 2,111,451 |
Chandra Asri Petrochemical Tbk PT
4.950%, 11/08/2024 | | 2,500,000 | | | 2,465,592 |
| The accompanying notes are an integral part of the financial statements. | 5 | |
John Hancock Funds II
Portfolio of Investments — February 29, 2020 (unaudited)(showing percentage of total net assets)
Asia Pacific Total Return Bond Fund (continued)
| | | Shares or
Principal
Amount | | Value |
| CORPORATE BONDS (continued) | | | |
| Indonesia (continued) | | | | | |
Indonesia Asahan Aluminium Persero PT
6.530%, 11/15/2028 | $ | 1,500,000 | | $ | 1,847,414 |
Jasa Marga Persero Tbk PT
7.500%, 12/11/2020 (A) | IDR | 11,300,000,000 | | | 782,641 |
Perusahaan Listrik Negara PT
6.150%, 05/21/2048 | $ | 2,500,000 | | | 3,243,750 |
| | | | | | 15,067,867 |
| Isle of Man - 1.0% | | | | | |
Gohl Capital, Ltd.
4.250%, 01/24/2027 | | 2,500,000 | | | 2,632,224 |
| Japan - 0.3% | | | | | |
Nippon Life Insurance Company (3.400% to 1-23-30 then 5 Year CMT + 2.612%)
01/23/2050 (A) | | 672,000 | | | 692,160 |
| Malaysia - 1.8% | | | | | |
Press Metal Labuan, Ltd.
4.800%, 10/30/2022 | | 2,800,000 | | | 2,749,648 |
SD International Sukuk, Ltd.
6.300%, 05/09/2022 | | 2,000,000 | | | 2,016,327 |
| | | | | | 4,765,975 |
| Mauritius - 1.2% | | | | | |
UPL Corp., Ltd.
4.500%, 03/08/2028 | | 3,000,000 | | | 3,137,644 |
| Singapore - 4.3% | | | | | |
| Indika Energy Capital III Pte, Ltd. | | | | | |
| 5.875%, 11/09/2024 (A) | | 1,200,000 | | | 1,101,537 |
| 5.875%, 11/09/2024 | | 1,800,000 | | | 1,652,306 |
Medco Oak Tree Pte, Ltd.
7.375%, 05/14/2026 (A) | | 2,160,000 | | | 2,103,787 |
Singapore Post, Ltd. (4.250% to 3-2-22, then 10 Year Singapore Swap Offered Rate + 3.692%)
03/02/2022 (C) | SGD | 5,000,000 | | | 3,697,676 |
TBLA International Pte, Ltd.
7.000%, 01/24/2023 | $ | 2,500,000 | | | 2,504,560 |
| | | | | | 11,059,866 |
| South Korea - 4.1% | | | | | |
DB Insurance Company, Ltd.
3.865%, 05/25/2027 | KRW | 8,000,000,000 | | | 7,185,771 |
The Korea Development Bank
7.000%, 11/30/2022 (A) | IDR | 52,000,000,000 | | | 3,526,089 |
| | | | | | 10,711,860 |
| Supranational - 3.1% | | | | | |
| Asian Development Bank | | | | | |
| 2.850%, 10/21/2020 | CNY | 20,000,000 | | | 2,870,594 |
| 6.450%, 08/08/2021 | INR | 360,000,000 | | | 5,054,846 |
| | | | | | 7,925,440 |
| United States - 2.0% | | | | | |
Incitec Pivot Finance LLC
3.950%, 08/03/2027 | $ | 2,225,000 | | | 2,337,135 |
Asia Pacific Total Return Bond Fund (continued)
| | | Shares or
Principal
Amount | | Value |
| CORPORATE BONDS (continued) | | | |
| United States (continued) | | | | | |
| Resorts World Las Vegas LLC | | | | | |
| 4.625%, 04/16/2029 (A) | $ | 2,000,000 | | $ | 2,164,857 |
| 4.625%, 04/16/2029 | | 600,000 | | | 649,457 |
| | | | | | 5,151,449 |
| Virgin Islands, British - 1.8% | | | | | |
Franshion Brilliant, Ltd. (4.000% to 1-3-23, then 5 Year CMT + 5.238%)
01/03/2023 (C) | | 3,000,000 | | | 3,023,311 |
New Metro Global, Ltd.
6.500%, 04/23/2021 | | 1,600,000 | | | 1,606,010 |
| | | | | | 4,629,321 |
| TOTAL CORPORATE BONDS (Cost $125,874,066) | | $ | 127,638,087 |
| SHORT-TERM INVESTMENTS - 7.0% | | | |
| U.S. Government - 5.0% | | | | | |
U.S. Treasury Bill
1.554%, 03/24/2020 * | | 13,000,000 | | | 12,988,630 |
| Foreign government - 2.0% | | | | | |
Monetary Authority of Singapore Bill
1.607%, 03/20/2020 * | SGD | 7,300,000 | | | 5,236,872 |
| TOTAL SHORT-TERM INVESTMENTS (Cost $18,223,286) | | $ | 18,225,502 |
Total Investments (Asia Pacific Total Return Bond Fund)
(Cost $252,340,778) - 96.6% | | $ | 249,976,892 |
| Other assets and liabilities, net - 3.4% | | | 8,824,329 |
| TOTAL NET ASSETS - 100.0% | | $ | 258,801,221 |
| Currency Abbreviations |
| CNY | Chinese Yuan Renminbi |
| IDR | Indonesian Rupiah |
| INR | Indian Rupee |
| KRW | Korean Won |
| MYR | Malaysian Ringgit |
| PHP | Philippine Peso |
| SGD | Singapore Dollar |
| THB | Thai Bhat |
| Security Abbreviations and Legend |
| CMT | Constant Maturity Treasury |
| LIBOR | London Interbank Offered Rate |
| (A) | These securities are exempt from registration under Rule 144A of the Securities Act of 1933. Such securities may be resold, normally to qualified institutional buyers, in transactions exempt from registration. Rule 144A securities amounted to $26,920,149 or 10.4% of the fund's net assets as of 2-29-20. |
| (B) | Variable rate obligation. The coupon rate shown represents the rate at period end. |
| (C) | Perpetual bonds have no stated maturity date. Date shown as maturity date is next call date. |
| * | Yield represents either the annualized yield at the date of purchase, the stated coupon rate or, for floating rate securities, the rate at period end. |
DERIVATIVES
FUTURES
| Open contracts | Number of
contracts | Position | Expiration
date | Notional
basis^ | Notional
value^ | Unrealized
appreciation
(depreciation) |
| 2-Year U.S. Treasury Note Futures | 155 | Short | Jul 2020 | $(33,668,608) | $(33,842,070) | $(173,462) |
| | | | | | | $(173,462) |
| The accompanying notes are an integral part of the financial statements. | 6 | |
John Hancock Funds II
Portfolio of Investments — February 29, 2020 (unaudited)(showing percentage of total net assets)
Asia Pacific Total Return Bond Fund (continued)
FUTURES (continued)
^ Notional basis refers to the contractual amount agreed upon at inception of open contracts; notional value represents the current value of the open contract.
See Notes to financial statements regarding investment transactions and other derivatives information.
Core Bond Fund
| | | Shares or
Principal
Amount | | Value |
U.S. GOVERNMENT AND AGENCY OBLIGATIONS –
57.4% | | | |
| U.S. Government – 23.8% | | | | | |
| U.S. Treasury Bonds | | | | | |
| 2.000%, 02/15/2050 | $ | 8,405,000 | | $ | 9,075,430 |
| 2.250%, 08/15/2046 | | 17,367,000 | | | 19,488,352 |
| 2.375%, 11/15/2049 | | 1,351,000 | | | 1,577,029 |
| 2.500%, 05/15/2046 | | 22,614,000 | | | 26,556,433 |
| 2.750%, 08/15/2042 | | 5,781,000 | | | 7,022,786 |
| 3.000%, 05/15/2045 to 11/15/2045 | | 84,186,000 | | | 107,385,964 |
| 3.125%, 08/15/2044 | | 35,741,000 | | | 46,273,426 |
| U.S. Treasury Notes | | | | | |
| 1.125%, 02/28/2022 | | 1,152,000 | | | 1,157,310 |
| 1.250%, 02/28/2025 | | 17,721,000 | | | 17,881,597 |
| 1.375%, 08/31/2020 to 01/31/2025 | | 48,448,000 | | | 48,912,798 |
| 1.500%, 10/31/2021 to 02/15/2030 | | 66,156,000 | | | 67,277,066 |
| 1.625%, 12/31/2021 to 09/30/2026 | | 125,517,000 | | | 128,870,873 |
| 1.750%, 07/15/2022 to 12/31/2026 | | 9,633,000 | | | 10,006,321 |
| 1.875%, 06/30/2026 | | 15,045,000 | | | 15,836,038 |
| 2.000%, 11/15/2026 | | 29,864,000 | | | 31,720,001 |
| 2.125%, 05/15/2022 | | 11,897,000 | | | 12,213,014 |
| 2.250%, 04/30/2021 to 04/15/2022 | | 18,082,000 | | | 18,520,719 |
| 2.375%, 04/30/2026 | | 32,248,000 | | | 34,871,929 |
| 2.500%, 06/30/2020 to 01/15/2022 | | 25,828,000 | | | 26,507,375 |
| 2.625%, 11/15/2020 | | 55,852,000 | | | 56,423,611 |
| 2.875%, 11/15/2021 | | 8,504,000 | | | 8,779,383 |
| | | | | | 696,357,455 |
| U.S. Government Agency – 33.6% | | | | | |
| Federal Home Loan Mortgage Corp. | | | | | |
| 2.500%, 06/01/2028 to 11/01/2028 | | 13,831,478 | | | 14,225,863 |
| 3.000%, 12/01/2049 to 03/01/2050 | | 11,637,287 | | | 12,079,992 |
| 3.500%, 02/01/2048 to 12/01/2049 | | 34,830,140 | | | 37,055,309 |
| 4.000%, 01/01/2035 to 11/01/2049 | | 69,378,907 | | | 75,336,560 |
| 4.000%, 04/01/2047 (A) | | 10,964,434 | | | 11,867,715 |
| 4.500%, 06/01/2039 to 03/01/2049 | | 1,692,328 | | | 1,882,211 |
| 5.000%, 05/01/2048 | | 3,100,081 | | | 3,483,482 |
| Federal National Mortgage Association | | | | | |
| 2.000%, TBA (A) | | 41,300,000 | | | 41,848,507 |
| 2.500%, 08/01/2031 | | 2,161,466 | | | 2,222,207 |
| 2.500%, 04/01/2035 (A) | | 18,708,000 | | | 19,219,547 |
| 2.614%, (12 month LIBOR + 1.587%), 11/01/2045 (B) | | 773,608 | | | 792,162 |
| 2.619%, (12 month LIBOR + 1.581%), 05/01/2045 (B) | | 2,006,239 | | | 2,051,560 |
| 2.662%, (12 month LIBOR + 1.586%), 01/01/2046 (B) | | 9,190,842 | | | 9,403,971 |
| 2.746%, (12 month LIBOR + 1.578%), 06/01/2045 (B) | | 2,547,783 | | | 2,612,426 |
| 2.958%, (12 month LIBOR + 1.598%), 08/01/2047 (B) | | 1,002,161 | | | 1,038,494 |
| 3.000%, TBA (A) | | 49,400,000 | | | 50,833,190 |
| 3.000%, 12/01/2034 to 02/01/2050 | | 7,147,025 | | | 7,461,104 |
| 3.093%, (12 month LIBOR + 1.620%), 03/01/2047 (B) | | 1,146,728 | | | 1,190,760 |
| 3.500%, 05/01/2049 to 01/01/2050 | | 33,968,765 | | | 35,764,152 |
| 3.500%, 05/01/2049 (A) | | 10,638,109 | | | 11,412,975 |
| 4.000%, 07/01/2033 to 12/01/2049 | | 170,503,306 | | | 184,508,706 |
| 4.000%, 05/01/2049 to 01/01/2059 (A) | | 46,844,375 | | | 50,886,936 |
| 4.500%, 05/01/2034 to 01/01/2059 | | 42,753,732 | | | 47,259,938 |
| 4.500%, 10/01/2048 to 01/01/2049 (A) | | 16,127,935 | | | 17,790,562 |
| 5.000%, 07/01/2044 to 08/01/2049 | | 89,589,842 | | | 100,804,490 |
| 5.500%, 12/01/2048 to 06/01/2049 | | 12,129,087 | | | 13,765,793 |
Core Bond Fund (continued)
| | | Shares or
Principal
Amount | | Value |
U.S. GOVERNMENT AND AGENCY
OBLIGATIONS (continued) | | | |
| U.S. Government Agency (continued) | | | | | |
Government National
Mortgage Association | | | | | |
| 2.500%, TBA (A) | $ | 10,300,000 | | $ | 10,563,144 |
| 3.000%, TBA (A) | | 38,800,000 | | | 40,053,912 |
| 3.000%, 02/20/2050 | | 10,418,000 | | | 10,902,755 |
| 3.000%, 03/20/2050 (A) | | 2,192,000 | | | 2,276,598 |
| 3.500%, 01/20/2048 to 09/20/2049 | | 15,075,892 | | | 15,707,361 |
| 4.000%, 04/20/2047 to 01/20/2050 | | 85,357,387 | | | 90,524,462 |
| 4.500%, 08/15/2047 to 05/20/2049 | | 22,939,003 | | | 24,672,946 |
| 5.000%, 12/20/2039 to 09/20/2049 | | 30,458,107 | | | 32,884,949 |
| | | | | | 984,384,739 |
| TOTAL U.S. GOVERNMENT AND AGENCY OBLIGATIONS (Cost $1,634,327,212) | | $ | 1,680,742,194 |
| FOREIGN GOVERNMENT OBLIGATIONS – 0.9% | | | |
| Colombia – 0.0% | | | | | |
Republic of Colombia
5.200%, 05/15/2049 | | 1,092,000 | | | 1,373,190 |
| Israel – 0.1% | | | | | |
State of Israel
3.375%, 01/15/2050 | | 1,916,000 | | | 2,088,440 |
| Japan – 0.1% | | | | | |
Japan Bank for International Cooperation
1.750%, 10/17/2024 | | 2,664,000 | | | 2,723,366 |
| Mexico – 0.5% | | | | | |
| Government of Mexico | | | | | |
| 3.250%, 04/16/2030 | | 4,828,000 | | | 4,963,184 |
| 4.500%, 04/22/2029 | | 4,911,000 | | | 5,551,935 |
| 4.500%, 01/31/2050 | | 126,000 | | | 142,821 |
| 4.600%, 02/10/2048 | | 1,722,000 | | | 1,965,250 |
| 4.750%, 03/08/2044 | | 550,000 | | | 636,350 |
| | | | | | 13,259,540 |
| Paraguay – 0.1% | | | | | |
Republic of Paraguay
5.400%, 03/30/2050 (C) | | 3,135,000 | | | 3,769,869 |
| United Arab Emirates – 0.1% | | | | | |
| Abu Dhabi Government | | | | | |
| 2.125%, 09/30/2024 (C) | | 1,537,000 | | | 1,556,213 |
| 2.500%, 09/30/2029 (C) | | 1,449,000 | | | 1,486,674 |
| | | | | | 3,042,887 |
| TOTAL FOREIGN GOVERNMENT OBLIGATIONS (Cost $24,337,202) | | $ | 26,257,292 |
| CORPORATE BONDS – 26.7% | | | |
| Communication services – 2.3% | | | | | |
| AT&T, Inc. | | | | | |
| 3.000%, 02/15/2022 to 06/30/2022 | | 3,971,000 | | | 4,089,843 |
| 3.400%, 05/15/2025 | | 1,954,000 | | | 2,084,694 |
| 3.800%, 02/15/2027 | | 779,000 | | | 852,549 |
| 3.900%, 03/11/2024 | | 931,000 | | | 1,010,350 |
| 4.300%, 02/15/2030 | | 679,000 | | | 777,829 |
| 4.500%, 03/09/2048 | | 1,402,000 | | | 1,598,386 |
| 4.850%, 03/01/2039 | | 959,000 | | | 1,149,795 |
| 5.150%, 02/15/2050 | | 3,076,000 | | | 3,854,526 |
| 5.250%, 03/01/2037 | | 571,000 | | | 703,925 |
| 5.350%, 12/15/2043 | | 479,000 | | | 592,963 |
| 5.375%, 10/15/2041 | | 767,000 | | | 953,841 |
| The accompanying notes are an integral part of the financial statements. | 7 | |
John Hancock Funds II
Portfolio of Investments — February 29, 2020 (unaudited)(showing percentage of total net assets)
Core Bond Fund (continued)
| | | Shares or
Principal
Amount | | Value |
| CORPORATE BONDS (continued) | | | |
| Communication services (continued) | | | | | |
| Charter Communications Operating LLC | | | | | |
| 4.464%, 07/23/2022 | $ | 939,000 | | $ | 996,462 |
| 4.800%, 03/01/2050 | | 1,774,000 | | | 1,910,510 |
| 5.375%, 05/01/2047 | | 831,000 | | | 956,183 |
| Comcast Corp. | | | | | |
| 2.650%, 02/01/2030 | | 3,796,000 | | | 3,982,140 |
| 3.450%, 02/01/2050 | | 2,170,000 | | | 2,394,867 |
| 3.700%, 04/15/2024 | | 1,922,000 | | | 2,087,313 |
| 3.950%, 10/15/2025 | | 1,738,000 | | | 1,945,102 |
| 4.000%, 03/01/2048 | | 1,458,000 | | | 1,728,208 |
| 4.150%, 10/15/2028 | | 979,000 | | | 1,134,632 |
| 4.600%, 10/15/2038 | | 2,433,000 | | | 3,063,322 |
| 4.700%, 10/15/2048 | | 487,000 | | | 639,025 |
| 4.950%, 10/15/2058 | | 727,000 | | | 993,342 |
Deutsche Telekom AG
3.625%, 01/21/2050 (C) | | 1,248,000 | | | 1,321,083 |
| The Walt Disney Company | | | | | |
| 1.750%, 08/30/2024 | | 2,921,000 | | | 2,956,927 |
| 2.000%, 09/01/2029 | | 1,946,000 | | | 1,959,582 |
| 2.750%, 09/01/2049 | | 444,000 | | | 448,893 |
Time Warner Cable LLC
6.550%, 05/01/2037 | | 679,000 | | | 884,551 |
| Verizon Communications, Inc. | | | | | |
| 4.016%, 12/03/2029 | | 2,146,000 | | | 2,494,558 |
| 4.125%, 08/15/2046 | | 2,326,000 | | | 2,813,632 |
| 4.272%, 01/15/2036 | | 428,000 | | | 512,271 |
| 4.329%, 09/21/2028 | | 2,602,000 | | | 3,054,331 |
| 4.400%, 11/01/2034 | | 2,082,000 | | | 2,528,119 |
| 4.522%, 09/15/2048 | | 927,000 | | | 1,194,955 |
| 4.672%, 03/15/2055 | | 256,000 | | | 340,022 |
| 5.012%, 04/15/2049 | | 475,000 | | | 656,268 |
| 5.500%, 03/16/2047 | | 927,000 | | | 1,357,311 |
| ViacomCBS, Inc. | | | | | |
| 4.375%, 03/15/2043 | | 286,000 | | | 307,370 |
| 5.850%, 09/01/2043 | | 690,000 | | | 869,827 |
Vodafone Group PLC
4.250%, 09/17/2050 | | 2,820,000 | | | 3,119,470 |
| | | | | | 66,318,977 |
| Consumer discretionary – 0.7% | | | | | |
Ford Motor Company
4.750%, 01/15/2043 | | 3,314,000 | | | 2,844,229 |
Ford Motor Credit Company LLC
4.271%, 01/09/2027 | | 1,283,000 | | | 1,272,268 |
| General Motors Company | | | | | |
| 5.400%, 04/01/2048 | | 1,194,000 | | | 1,204,958 |
| 5.950%, 04/01/2049 | | 1,234,000 | | | 1,350,725 |
Lowe's Companies, Inc.
3.650%, 04/05/2029 | | 2,280,000 | | | 2,527,819 |
| McDonald's Corp. | | | | | |
| 2.625%, 09/01/2029 | | 1,566,000 | | | 1,625,506 |
| 4.450%, 09/01/2048 | | 1,151,000 | | | 1,395,445 |
Starbucks Corp.
3.750%, 12/01/2047 | | 891,000 | | | 977,220 |
Target Corp.
2.350%, 02/15/2030 | | 909,000 | | | 940,060 |
| The Home Depot, Inc. | | | | | |
| 2.950%, 06/15/2029 | | 1,478,000 | | | 1,597,823 |
| 3.125%, 12/15/2049 | | 3,222,000 | | | 3,421,979 |
The Trustees of the University of Pennsylvania
3.610%, 02/15/2119 | | 954,000 | | | 1,180,232 |
Toyota Motor Credit Corp.
2.150%, 02/13/2030 | | 1,958,000 | | | 1,980,323 |
| | | | | | 22,318,587 |
Core Bond Fund (continued)
| | | Shares or
Principal
Amount | | Value |
| CORPORATE BONDS (continued) | | | |
| Consumer staples – 1.6% | | | | | |
Altria Group, Inc.
4.800%, 02/14/2029 | $ | 2,066,000 | | $ | 2,363,492 |
| Anheuser-Busch InBev Worldwide, Inc. | | | | | |
| 4.150%, 01/23/2025 | | 2,094,000 | | | 2,330,078 |
| 4.600%, 04/15/2048 | | 1,327,000 | | | 1,586,620 |
| 4.700%, 02/01/2036 | | 1,802,000 | | | 2,146,422 |
| 4.900%, 02/01/2046 | | 1,569,000 | | | 1,938,720 |
| BAT Capital Corp. | | | | | |
| 3.215%, 09/06/2026 | | 1,043,000 | | | 1,087,880 |
| 3.222%, 08/15/2024 | | 2,533,000 | | | 2,659,816 |
| 3.557%, 08/15/2027 | | 2,813,000 | | | 2,969,613 |
| 4.390%, 08/15/2037 | | 147,000 | | | 155,122 |
| 4.540%, 08/15/2047 | | 654,000 | | | 677,627 |
| Constellation Brands, Inc. | | | | | |
| 3.150%, 08/01/2029 | | 1,878,000 | | | 1,976,301 |
| 3.200%, 02/15/2023 | | 483,000 | | | 502,089 |
| 3.500%, 05/09/2027 | | 691,000 | | | 745,623 |
| 3.600%, 02/15/2028 | | 1,526,000 | | | 1,643,129 |
| 3.700%, 12/06/2026 | | 815,000 | | | 893,758 |
| 4.400%, 11/15/2025 | | 147,000 | | | 166,243 |
Costco Wholesale Corp.
3.000%, 05/18/2027 | | 939,000 | | | 1,020,883 |
Danone SA
2.947%, 11/02/2026 (C) | | 5,715,000 | | | 6,075,895 |
Fomento Economico Mexicano SAB de CV
3.500%, 01/16/2050 | | 1,310,000 | | | 1,384,307 |
General Mills, Inc.
4.700%, 04/17/2048 | | 323,000 | | | 404,071 |
Reynolds American, Inc.
5.850%, 08/15/2045 | | 1,087,000 | | | 1,300,261 |
| The Estee Lauder Companies, Inc. | | | | | |
| 2.375%, 12/01/2029 | | 947,000 | | | 980,973 |
| 3.125%, 12/01/2049 | | 1,798,000 | | | 1,915,753 |
The Hershey Company
2.050%, 11/15/2024 | | 2,030,000 | | | 2,088,065 |
| Walmart, Inc. | | | | | |
| 3.550%, 06/26/2025 | | 2,062,000 | | | 2,273,021 |
| 3.700%, 06/26/2028 | | 4,503,000 | | | 5,109,477 |
| 4.050%, 06/29/2048 | | 22,000 | | | 27,839 |
| | | | | | 46,423,078 |
| Energy – 2.8% | | | | | |
| BP Capital Markets America, Inc. | | | | | |
| 3.000%, 02/24/2050 | | 1,845,000 | | | 1,821,234 |
| 3.796%, 09/21/2025 | | 1,930,000 | | | 2,132,716 |
| 3.937%, 09/21/2028 | | 2,086,000 | | | 2,361,047 |
Canadian Natural Resources, Ltd.
3.900%, 02/01/2025 | | 659,000 | | | 716,074 |
Cimarex Energy Company
4.375%, 03/15/2029 | | 2,693,000 | | | 2,795,424 |
| Devon Energy Corp. | | | | | |
| 5.600%, 07/15/2041 | | 1,586,000 | | | 1,804,783 |
| 5.850%, 12/15/2025 | | 1,545,000 | | | 1,832,324 |
Ecopetrol SA
5.875%, 05/28/2045 | | 755,000 | | | 901,621 |
| Enbridge, Inc. | | | | | |
| 2.500%, 01/15/2025 | | 5,051,000 | | | 5,160,508 |
| 3.125%, 11/15/2029 | | 3,616,000 | | | 3,743,905 |
| Energy Transfer Operating LP | | | | | |
| 3.750%, 05/15/2030 | | 459,000 | | | 465,171 |
| 5.300%, 04/15/2047 | | 467,000 | | | 484,354 |
| 6.050%, 06/01/2041 | | 460,000 | | | 506,276 |
| 6.125%, 12/15/2045 | | 1,063,000 | | | 1,199,193 |
| 6.250%, 04/15/2049 | | 467,000 | | | 538,241 |
| The accompanying notes are an integral part of the financial statements. | 8 | |
John Hancock Funds II
Portfolio of Investments — February 29, 2020 (unaudited)(showing percentage of total net assets)
Core Bond Fund (continued)
| | | Shares or
Principal
Amount | | Value |
| CORPORATE BONDS (continued) | | | |
| Energy (continued) | | | | | |
| Enterprise Products Operating LLC | | | | | |
| 2.800%, 01/31/2030 | $ | 1,590,000 | | $ | 1,623,892 |
| 3.125%, 07/31/2029 | | 1,347,000 | | | 1,408,431 |
| 3.700%, 01/31/2051 | | 917,000 | | | 913,987 |
| 3.950%, 01/31/2060 | | 1,027,000 | | | 1,005,444 |
| 4.200%, 01/31/2050 | | 376,000 | | | 399,202 |
Equinor ASA
3.250%, 11/18/2049 | | 1,414,000 | | | 1,492,941 |
| Hess Corp. | | | | | |
| 5.600%, 02/15/2041 | | 109,000 | | | 117,821 |
| 5.800%, 04/01/2047 | | 176,000 | | | 194,922 |
| 6.000%, 01/15/2040 | | 1,430,000 | | | 1,599,653 |
| 7.125%, 03/15/2033 | | 352,000 | | | 446,235 |
| Marathon Petroleum Corp. | | | | | |
| 3.625%, 09/15/2024 | | 2,617,000 | | | 2,795,095 |
| 4.500%, 04/01/2048 | | 947,000 | | | 1,080,735 |
| 4.750%, 12/15/2023 | | 795,000 | | | 867,846 |
| MPLX LP | | | | | |
| 4.250%, 12/01/2027 (C) | | 939,000 | | | 1,022,582 |
| 4.700%, 04/15/2048 | | 1,563,000 | | | 1,629,184 |
| 4.800%, 02/15/2029 | | 475,000 | | | 532,214 |
| 5.200%, 12/01/2047 (C) | | 1,409,000 | | | 1,512,830 |
| 5.500%, 02/15/2049 | | 382,000 | | | 429,075 |
National Oilwell Varco, Inc.
3.600%, 12/01/2029 | | 318,000 | | | 323,128 |
| Noble Energy, Inc. | | | | | |
| 4.200%, 10/15/2049 | | 1,389,000 | | | 1,337,179 |
| 4.950%, 08/15/2047 | | 2,145,000 | | | 2,229,359 |
| 5.050%, 11/15/2044 | | 1,391,000 | | | 1,426,949 |
Occidental Petroleum Corp.
7.500%, 05/01/2031 | | 515,000 | | | 654,354 |
| Ovintiv, Inc. | | | | | |
| 6.500%, 02/01/2038 | | 995,000 | | | 1,092,621 |
| 6.625%, 08/15/2037 | | 899,000 | | | 988,713 |
| Petroleos Mexicanos | | | | | |
| 2.378%, 04/15/2025 | | 481,250 | | | 494,933 |
| 2.460%, 12/15/2025 | | 2,040,600 | | | 2,114,090 |
| 5.950%, 01/28/2031 (C) | | 1,680,000 | | | 1,638,000 |
| 6.350%, 02/12/2048 | | 4,193,000 | | | 3,896,974 |
| 6.950%, 01/28/2060 (C) | | 2,940,000 | | | 2,822,400 |
| Plains All American Pipeline LP | | | | | |
| 3.550%, 12/15/2029 | | 2,182,000 | | | 2,146,599 |
| 4.900%, 02/15/2045 | | 1,818,000 | | | 1,724,842 |
Schlumberger Finance Canada, Ltd.
2.650%, 11/20/2022 (C) | | 1,003,000 | | | 1,032,570 |
Shell International Finance BV
2.000%, 11/07/2024 | | 2,700,000 | | | 2,753,719 |
| Sunoco Logistics Partners Operations LP | | | | | |
| 5.300%, 04/01/2044 | | 1,326,000 | | | 1,388,436 |
| 5.350%, 05/15/2045 | | 128,000 | | | 132,149 |
Tennessee Gas Pipeline Company LLC
2.900%, 03/01/2030 (C) | | 2,490,000 | | | 2,501,145 |
The Williams Companies, Inc.
3.900%, 01/15/2025 | | 699,000 | | | 751,052 |
TransCanada PipeLines, Ltd.
4.625%, 03/01/2034 | | 692,000 | | | 808,885 |
| Western Midstream Operating LP | | | | | |
| 3.100%, 02/01/2025 | | 2,174,000 | | | 2,172,544 |
| 4.050%, 02/01/2030 | | 1,667,000 | | | 1,642,099 |
| 5.250%, 02/01/2050 | | 1,079,000 | | | 1,008,322 |
| | | | | | 82,616,022 |
| Financials – 6.9% | | | | | |
| American International Group, Inc. | | | | | |
| 4.200%, 04/01/2028 | | 1,490,000 | | | 1,663,728 |
| 4.250%, 03/15/2029 | | 971,000 | | | 1,107,856 |
Core Bond Fund (continued)
| | | Shares or
Principal
Amount | | Value |
| CORPORATE BONDS (continued) | | | |
| Financials (continued) | | | | | |
American International
Group, Inc. (continued) | | | | | |
| 4.500%, 07/16/2044 | $ | 1,319,000 | | $ | 1,617,694 |
| 4.750%, 04/01/2048 | | 1,473,000 | | | 1,862,072 |
ANZ New Zealand International, Ltd.
1.900%, 02/13/2023 (C) | | 1,896,000 | | | 1,919,419 |
Banco Santander SA
3.306%, 06/27/2029 | | 1,600,000 | | | 1,726,551 |
Bank of America Corp.
4.183%, 11/25/2027 | | 2,809,000 | | | 3,119,951 |
| Bank of America Corp. (2.456% to 10-22-24, then 3 month LIBOR + 0.870%) 10/22/2025 | | 4,466,000 | | | 4,578,257 |
| Bank of America Corp. (2.496% to 2-13-30, then 3 month LIBOR + 0.990%) 02/13/2031 | | 3,679,000 | | | 3,735,674 |
| Bank of America Corp. (2.884% to 10-22-29, then 3 month LIBOR + 1.190%) 10/22/2030 | | 4,450,000 | | | 4,657,878 |
| Bank of America Corp. (3.004% to 12-20-22, then 3 month LIBOR + 0.790%) 12/20/2023 | | 3,679,000 | | | 3,812,407 |
| Bank of America Corp. (3.093% to 10-1-24, then 3 month LIBOR + 1.090%) 10/01/2025 | | 4,739,000 | | | 4,976,256 |
| Bank of America Corp. (3.419% to 12-20-27, then 3 month LIBOR + 1.040%) 12/20/2028 | | 6,785,000 | | | 7,331,359 |
| Bank of America Corp. (3.550% to 3-5-23, then 3 month LIBOR + 0.780%) 03/05/2024 | | 644,000 | | | 678,129 |
| Bank of America Corp. (3.559% to 4-23-26, then 3 month LIBOR + 1.060%) 04/23/2027 | | 341,000 | | | 370,247 |
| Bank of America Corp. (4.271% to 7-23-28, then 3 month LIBOR + 1.310%) 07/23/2029 | | 4,999,000 | | | 5,752,763 |
Banque Federative du Credit Mutuel SA
2.375%, 11/21/2024 (C) | | 2,400,000 | | | 2,469,902 |
| Barclays PLC (5.088% to 6-20-29, then 3 month LIBOR + 3.054%) 06/20/2030 | | 2,674,000 | | | 3,036,148 |
| BNP Paribas SA (2.819% to 11-19-24, then 3 month LIBOR + 1.111%) 11/19/2025 (C) | | 3,152,000 | | | 3,264,619 |
| BNP Paribas SA (3.052% to 1-13-30, then SOFR + 1.507%) 01/13/2031 (C) | | 6,018,000 | | | 6,171,682 |
Brighthouse Financial, Inc.
4.700%, 06/22/2047 | | 1,104,000 | | | 1,116,535 |
Canadian Imperial Bank of Commerce
2.250%, 01/28/2025 | | 4,044,000 | | | 4,118,689 |
| Citigroup, Inc. (2.976% to 11-5-29, then SOFR + 1.422%) 11/05/2030 | | 2,833,000 | | | 2,980,309 |
Commonwealth Bank of Australia
3.743%, 09/12/2039 (C) | | 806,000 | | | 866,789 |
| Commonwealth Bank of Australia (3.610% to 9-12-29, then 5 Year CMT + 2.050%) 09/12/2034 (C) | | 2,018,000 | | | 2,145,433 |
Credit Agricole SA
2.375%, 01/22/2025 (C) | | 3,643,000 | | | 3,731,014 |
| Danske Bank A/S (3.001% to 9-20-21, then 3 month LIBOR + 1.249%) 09/20/2022 (C) | | 4,966,000 | | | 5,039,390 |
| The accompanying notes are an integral part of the financial statements. | 9 | |
John Hancock Funds II
Portfolio of Investments — February 29, 2020 (unaudited)(showing percentage of total net assets)
Core Bond Fund (continued)
| | | Shares or
Principal
Amount | | Value |
| CORPORATE BONDS (continued) | | | |
| Financials (continued) | | | | | |
| Danske Bank A/S (3.244% to 12-20-24, then 3 month LIBOR + 1.591%) 12/20/2025 (C) | $ | 4,675,000 | | $ | 4,912,481 |
GE Capital International Funding
Company Unlimited Company | | | | | |
| 2.342%, 11/15/2020 | | 647,000 | | | 648,766 |
| 4.418%, 11/15/2035 | | 5,220,000 | | | 5,960,710 |
JPMorgan Chase & Co.
2.950%, 10/01/2026 | | 1,794,000 | | | 1,901,874 |
| JPMorgan Chase & Co. (2.301% to 10-15-24, then SOFR + 1.160%) 10/15/2025 | | 702,000 | | | 718,310 |
| JPMorgan Chase & Co. (2.739% to 10-15-29, then SOFR + 1.510%) 10/15/2030 | | 4,686,000 | | | 4,883,497 |
| JPMorgan Chase & Co. (3.559% to 4-23-23, then 3 month LIBOR + 0.730%) 04/23/2024 | | 975,000 | | | 1,030,126 |
| JPMorgan Chase & Co. (3.702% to 5-6-29, then 3 month LIBOR + 1.160%) 05/06/2030 | | 2,320,000 | | | 2,583,942 |
| JPMorgan Chase & Co. (3.797% to 7-23-23, then 3 month LIBOR + 0.890%) 07/23/2024 | | 976,000 | | | 1,043,270 |
| JPMorgan Chase & Co. (3.882% to 7-24-37, then 3 month LIBOR + 1.360%) 07/24/2038 | | 1,454,000 | | | 1,666,484 |
| JPMorgan Chase & Co. (3.897% to 1-23-48, then 3 month LIBOR + 1.220%) 01/23/2049 | | 1,794,000 | | | 2,138,716 |
| JPMorgan Chase & Co. (4.005% to 4-23-28, then 3 month LIBOR + 1.120%) 04/23/2029 | | 1,275,000 | | | 1,435,482 |
| JPMorgan Chase & Co. (4.023% to 12-5-23, then 3 month LIBOR + 1.000%) 12/05/2024 | | 947,000 | | | 1,025,792 |
| Liberty Mutual Group, Inc. | | | | | |
| 3.951%, 10/15/2050 (C) | | 216,000 | | | 238,019 |
| 4.569%, 02/01/2029 (C) | | 2,709,000 | | | 3,187,931 |
Lincoln National Corp.
3.050%, 01/15/2030 | | 3,241,000 | | | 3,416,401 |
MDGH - GMTN BV
2.875%, 11/07/2029 (C) | | 2,295,000 | | | 2,358,686 |
MidAmerican Energy Company
3.650%, 08/01/2048 | | 1,055,000 | | | 1,265,388 |
| Mitsubishi UFJ Financial Group, Inc. | | | | | |
| 2.193%, 02/25/2025 | | 4,319,000 | | | 4,364,817 |
| 2.559%, 02/25/2030 | | 2,940,000 | | | 2,956,637 |
Morgan Stanley
2.750%, 05/19/2022 | | 3,691,000 | | | 3,792,220 |
| Morgan Stanley (3.971% to 7-22-37, then 3 month LIBOR + 1.455%) 07/22/2038 | | 471,000 | | | 542,657 |
| Morgan Stanley (4.457% to 4-22-38, then 3 month LIBOR + 1.431%) 04/22/2039 | | 915,000 | | | 1,114,583 |
National Australia Bank, Ltd.
1.875%, 12/13/2022 | | 2,851,000 | | | 2,891,928 |
| Nationwide Building Society (4.363% to 8-1-23, then 3 month LIBOR + 1.392%) 08/01/2024 (C) | | 2,332,000 | | | 2,504,160 |
Nationwide Financial Services, Inc.
3.900%, 11/30/2049 (C) | | 2,417,000 | | | 2,712,440 |
| Nomura Holdings, Inc. | | | | | |
| 2.648%, 01/16/2025 | | 1,791,000 | | | 1,839,595 |
Core Bond Fund (continued)
| | | Shares or
Principal
Amount | | Value |
| CORPORATE BONDS (continued) | | | |
| Financials (continued) | | | | | |
| Nomura Holdings, Inc. (continued) | | | | | |
| 3.103%, 01/16/2030 | $ | 4,886,000 | | $ | 5,076,437 |
Prudential Financial, Inc.
4.350%, 02/25/2050 | | 1,674,000 | | | 1,952,413 |
Societe Generale SA
2.625%, 01/22/2025 (C) | | 3,848,000 | | | 3,921,205 |
Spirit Realty LP
3.400%, 01/15/2030 | | 1,199,000 | | | 1,279,730 |
| Standard Chartered PLC (2.819% to 1-30-25, then 3 month LIBOR + 1.209%) 01/30/2026 (C) | | 4,134,000 | | | 4,213,439 |
| State Street Corp. (2.354% to 11-1-24, then SOFR + 0.940%) 11/01/2025 | | 3,230,000 | | | 3,323,172 |
Sumitomo Mitsui Financial Group, Inc.
3.040%, 07/16/2029 | | 4,922,000 | | | 5,238,545 |
The Charles Schwab Corp.
3.250%, 05/22/2029 | | 2,822,000 | | | 3,106,141 |
The Goldman Sachs Group, Inc.
3.500%, 11/16/2026 | | 2,746,000 | | | 2,952,380 |
The PNC Financial Services Group, Inc.
2.550%, 01/22/2030 | | 3,723,000 | | | 3,840,020 |
| The Royal Bank of Scotland Group PLC (3.754% to 11-1-24, then 5 Year CMT + 2.100%) 11/01/2029 | | 681,000 | | | 710,944 |
| The Royal Bank of Scotland Group PLC (4.445% to 5-8-29, then 3 month LIBOR + 1.871%) 05/08/2030 | | 1,480,000 | | | 1,689,358 |
Truist Bank
2.150%, 12/06/2024 | | 1,993,000 | | | 2,040,769 |
Truist Financial Corp.
2.500%, 08/01/2024 | | 5,111,000 | | | 5,278,164 |
Trust F/1401
6.390%, 01/15/2050 (C) | | 1,271,000 | | | 1,490,248 |
| UBS Group AG (3.126% to 8-13-29, then 3 month LIBOR + 1.468%) 08/13/2030 (C) | | 1,049,000 | | | 1,112,419 |
US Bank NA
2.050%, 01/21/2025 | | 3,335,000 | | | 3,417,091 |
Westpac Banking Corp.
2.000%, 01/13/2023 | | 2,805,000 | | | 2,849,319 |
| Westpac Banking Corp. (4.110% to 7-24-29, then 5 Year CMT + 2.000%) 07/24/2034 | | 887,000 | | | 970,904 |
| | | | | | 201,448,361 |
| Health care – 4.3% | | | | | |
Abbott Laboratories
3.750%, 11/30/2026 | | 4,187,000 | | | 4,722,619 |
| AbbVie, Inc. | | | | | |
| 2.300%, 11/21/2022 (C) | | 7,851,000 | | | 7,982,044 |
| 2.500%, 05/14/2020 | | 3,696,000 | | | 3,698,829 |
| 2.600%, 11/21/2024 (C) | | 3,480,000 | | | 3,596,222 |
| 2.950%, 11/21/2026 (C) | | 1,079,000 | | | 1,131,217 |
| 3.200%, 11/21/2029 (C) | | 3,661,000 | | | 3,861,378 |
| 4.050%, 11/21/2039 (C) | | 1,142,000 | | | 1,261,374 |
| 4.250%, 11/21/2049 (C) | | 3,308,000 | | | 3,729,296 |
Aetna, Inc.
3.875%, 08/15/2047 | | 779,000 | | | 824,178 |
Allergan Funding SCS
3.800%, 03/15/2025 | | 4,626,000 | | | 5,054,537 |
| Becton, Dickinson and Company | | | | | |
| 2.404%, 06/05/2020 | | 3,237,000 | | | 3,243,305 |
| 3.363%, 06/06/2024 | | 1,091,000 | | | 1,160,381 |
| 3.700%, 06/06/2027 | | 486,000 | | | 536,773 |
| 3.734%, 12/15/2024 | | 2,577,000 | | | 2,791,397 |
| 4.685%, 12/15/2044 | | 1,203,000 | | | 1,497,112 |
| The accompanying notes are an integral part of the financial statements. | 10 | |
John Hancock Funds II
Portfolio of Investments — February 29, 2020 (unaudited)(showing percentage of total net assets)
Core Bond Fund (continued)
| | | Shares or
Principal
Amount | | Value |
| CORPORATE BONDS (continued) | | | |
| Health care (continued) | | | | | |
| Boston Scientific Corp. | | | | | |
| 3.750%, 03/01/2026 | $ | 2,456,000 | | $ | 2,700,462 |
| 4.000%, 03/01/2029 | | 2,130,000 | | | 2,445,123 |
| 4.700%, 03/01/2049 | | 1,814,000 | | | 2,367,139 |
| Bristol-Myers Squibb Company | | | | | |
| 2.600%, 05/16/2022 (C) | | 4,208,000 | | | 4,316,910 |
| 2.750%, 02/15/2023 (C) | | 3,704,000 | | | 3,841,228 |
| 2.875%, 02/19/2021 (C) | | 1,027,000 | | | 1,040,274 |
| 2.900%, 07/26/2024 (C) | | 2,294,000 | | | 2,417,154 |
| 3.200%, 06/15/2026 (C) | | 2,010,000 | | | 2,194,024 |
| 3.400%, 07/26/2029 (C) | | 2,457,000 | | | 2,752,470 |
| 3.450%, 11/15/2027 (C) | | 1,435,000 | | | 1,596,886 |
| 3.900%, 02/20/2028 (C) | | 550,000 | | | 624,718 |
| 4.125%, 06/15/2039 (C) | | 244,000 | | | 296,727 |
| 4.250%, 10/26/2049 (C) | | 1,746,000 | | | 2,245,998 |
| 4.350%, 11/15/2047 (C) | | 511,000 | | | 659,698 |
| Cigna Corp. | | | | | |
| 3.400%, 09/17/2021 | | 2,186,000 | | | 2,242,681 |
| 3.400%, 03/01/2027 (C) | | 2,514,000 | | | 2,686,607 |
| 3.750%, 07/15/2023 | | 2,697,000 | | | 2,871,186 |
| 3.875%, 10/15/2047 (C) | | 1,654,000 | | | 1,751,769 |
| 4.900%, 12/15/2048 | | 384,000 | | | 476,432 |
| CVS Health Corp. | | | | | |
| 2.625%, 08/15/2024 | | 1,291,000 | | | 1,333,438 |
| 3.000%, 08/15/2026 | | 1,075,000 | | | 1,126,712 |
| 3.700%, 03/09/2023 | | 987,000 | | | 1,043,146 |
| 4.000%, 12/05/2023 | | 1,446,000 | | | 1,551,375 |
| 4.100%, 03/25/2025 | | 2,138,000 | | | 2,343,164 |
| 4.780%, 03/25/2038 | | 1,055,000 | | | 1,244,222 |
| 5.050%, 03/25/2048 | | 551,000 | | | 678,131 |
Danaher Corp.
3.350%, 09/15/2025 | | 2,002,000 | | | 2,184,652 |
| DH Europe Finance II Sarl | | | | | |
| 2.050%, 11/15/2022 | | 1,586,000 | | | 1,614,191 |
| 2.200%, 11/15/2024 | | 2,717,000 | | | 2,793,376 |
| 2.600%, 11/15/2029 | | 3,375,000 | | | 3,502,040 |
| 3.400%, 11/15/2049 | | 2,026,000 | | | 2,234,304 |
Merck & Company, Inc.
3.700%, 02/10/2045 | | 691,000 | | | 820,009 |
| Novartis Capital Corp. | | | | | |
| 2.000%, 02/14/2027 | | 1,845,000 | | | 1,886,118 |
| 2.200%, 08/14/2030 | | 2,752,000 | | | 2,829,856 |
| 2.750%, 08/14/2050 | | 1,106,000 | | | 1,138,948 |
| Pfizer, Inc. | | | | | |
| 2.800%, 03/11/2022 | | 955,000 | | | 984,781 |
| 3.000%, 12/15/2026 | | 499,000 | | | 540,980 |
| 4.100%, 09/15/2038 | | 547,000 | | | 665,320 |
Shire Acquisitions Investments
Ireland DAC | | | | | |
| 2.875%, 09/23/2023 | | 2,065,000 | | | 2,143,594 |
| 3.200%, 09/23/2026 | | 431,000 | | | 462,287 |
Takeda Pharmaceutical Company, Ltd.
4.400%, 11/26/2023 | | 1,394,000 | | | 1,531,351 |
| UnitedHealth Group, Inc. | | | | | |
| 2.375%, 08/15/2024 | | 1,758,000 | | | 1,815,759 |
| 2.875%, 08/15/2029 | | 815,000 | | | 867,654 |
| 3.500%, 08/15/2039 | | 1,075,000 | | | 1,180,884 |
| 3.700%, 12/15/2025 | | 1,075,000 | | | 1,193,342 |
| 3.875%, 08/15/2059 | | 1,075,000 | | | 1,225,616 |
| | | | | | 125,553,398 |
| Industrials – 1.9% | | | | | |
| Burlington Northern Santa Fe LLC | | | | | |
| 3.550%, 02/15/2050 | | 1,654,000 | | | 1,866,130 |
| 4.900%, 04/01/2044 | | 547,000 | | | 723,643 |
Core Bond Fund (continued)
| | | Shares or
Principal
Amount | | Value |
| CORPORATE BONDS (continued) | | | |
| Industrials (continued) | | | | | |
| Carrier Global Corp. | | | | | |
| 1.923%, 02/15/2023 (C) | $ | 1,016,000 | | $ | 1,029,137 |
| 2.242%, 02/15/2025 (C) | | 3,535,000 | | | 3,596,506 |
| 2.493%, 02/15/2027 (C) | | 2,033,000 | | | 2,068,417 |
| 2.722%, 02/15/2030 (C) | | 1,963,000 | | | 1,991,178 |
| 3.577%, 04/05/2050 (C) | | 376,000 | | | 384,886 |
Crowley Conro LLC
4.181%, 08/15/2043 | | 878,900 | | | 1,058,976 |
| CSX Corp. | | | | | |
| 2.400%, 02/15/2030 | | 299,000 | | | 304,609 |
| 3.350%, 09/15/2049 | | 1,152,000 | | | 1,209,261 |
| 4.300%, 03/01/2048 | | 128,000 | | | 154,649 |
| 4.750%, 11/15/2048 | | 691,000 | | | 895,153 |
| General Electric Company | | | | | |
| 2.700%, 10/09/2022 | | 475,000 | | | 485,378 |
| 3.100%, 01/09/2023 | | 348,000 | | | 361,228 |
| 5.875%, 01/14/2038 | | 1,758,000 | | | 2,254,586 |
Lockheed Martin Corp.
4.070%, 12/15/2042 | | 1,015,000 | | | 1,243,855 |
| Northrop Grumman Corp. | | | | | |
| 2.550%, 10/15/2022 | | 3,141,000 | | | 3,233,434 |
| 2.930%, 01/15/2025 | | 139,000 | | | 147,179 |
| 3.250%, 08/01/2023 to 01/15/2028 | | 4,687,000 | | | 5,008,805 |
| 4.030%, 10/15/2047 | | 1,023,000 | | | 1,219,598 |
Otis Worldwide Corp.
3.112%, 02/15/2040 (C) | | 203,000 | | | 208,022 |
| The Boeing Company | | | | | |
| 2.700%, 05/01/2022 to 02/01/2027 | | 4,795,000 | | | 4,917,604 |
| 2.950%, 02/01/2030 | | 949,000 | | | 995,857 |
| 3.100%, 05/01/2026 | | 3,402,000 | | | 3,604,623 |
| 3.500%, 03/01/2039 | | 1,035,000 | | | 1,100,872 |
| 3.900%, 05/01/2049 | | 821,000 | | | 906,960 |
| Union Pacific Corp. | | | | | |
| 2.150%, 02/05/2027 | | 1,568,000 | | | 1,597,613 |
| 2.400%, 02/05/2030 | | 1,937,000 | | | 1,983,668 |
| 2.950%, 03/01/2022 | | 1,758,000 | | | 1,804,605 |
| 3.150%, 03/01/2024 | | 839,000 | | | 889,161 |
| 3.250%, 02/05/2050 | | 1,384,000 | | | 1,425,470 |
| 3.750%, 02/05/2070 | | 452,000 | | | 472,540 |
| 4.300%, 03/01/2049 | | 260,000 | | | 314,276 |
| United Technologies Corp. | | | | | |
| 3.650%, 08/16/2023 | | 624,000 | | | 673,896 |
| 3.950%, 08/16/2025 | | 1,399,000 | | | 1,566,543 |
| 4.450%, 11/16/2038 | | 1,299,000 | | | 1,614,166 |
| 4.625%, 11/16/2048 | | 1,414,000 | | | 1,898,778 |
Ww Grainger, Inc.
1.850%, 02/15/2025 | | 480,000 | | | 485,594 |
| | | | | | 55,696,856 |
| Information technology – 2.0% | | | | | |
| Adobe, Inc. | | | | | |
| 1.900%, 02/01/2025 | | 1,010,000 | | | 1,033,294 |
| 2.150%, 02/01/2027 | | 2,019,000 | | | 2,065,696 |
| 2.300%, 02/01/2030 | | 3,533,000 | | | 3,623,716 |
| Apple, Inc. | | | | | |
| 1.800%, 09/11/2024 | | 2,653,000 | | | 2,688,126 |
| 2.050%, 09/11/2026 | | 3,185,000 | | | 3,266,091 |
| 2.200%, 09/11/2029 | | 3,846,000 | | | 3,962,243 |
| 2.950%, 09/11/2049 | | 1,778,000 | | | 1,868,203 |
| 3.200%, 05/13/2025 to 05/11/2027 | | 4,227,000 | | | 4,615,861 |
| 4.250%, 02/09/2047 | | 871,000 | | | 1,102,176 |
Broadcom Corp.
3.875%, 01/15/2027 | | 2,405,000 | | | 2,522,137 |
Broadcom, Inc.
4.250%, 04/15/2026 (C) | | 1,702,000 | | | 1,847,047 |
| The accompanying notes are an integral part of the financial statements. | 11 | |
John Hancock Funds II
Portfolio of Investments — February 29, 2020 (unaudited)(showing percentage of total net assets)
Core Bond Fund (continued)
| | | Shares or
Principal
Amount | | Value |
| CORPORATE BONDS (continued) | | | |
| Information technology (continued) | | | | | |
| Fiserv, Inc. | | | | | |
| 3.200%, 07/01/2026 | $ | 1,706,000 | | $ | 1,822,918 |
| 3.500%, 07/01/2029 | | 1,778,000 | | | 1,943,354 |
| 4.200%, 10/01/2028 | | 167,000 | | | 190,952 |
| 4.400%, 07/01/2049 | | 903,000 | | | 1,071,398 |
| IBM Corp. | | | | | |
| 3.300%, 05/15/2026 | | 557,000 | | | 608,724 |
| 4.150%, 05/15/2039 | | 755,000 | | | 910,851 |
| Intel Corp. | | | | | |
| 2.450%, 11/15/2029 | | 4,054,000 | | | 4,216,304 |
| 3.100%, 02/15/2060 | | 1,102,000 | | | 1,143,148 |
| 3.250%, 11/15/2049 | | 1,025,000 | | | 1,118,733 |
KLA Corp.
3.300%, 03/01/2050 | | 1,442,000 | | | 1,416,844 |
Micron Technology, Inc.
4.663%, 02/15/2030 | | 1,335,000 | | | 1,472,843 |
| Microsoft Corp. | | | | | |
| 3.700%, 08/08/2046 | | 483,000 | | | 584,117 |
| 4.000%, 02/12/2055 | | 1,279,000 | | | 1,620,313 |
| 4.100%, 02/06/2037 | | 1,594,000 | | | 1,977,035 |
| 4.250%, 02/06/2047 | | 1,095,000 | | | 1,442,629 |
| 4.500%, 02/06/2057 | | 712,000 | | | 1,000,454 |
| NXP BV | | | | | |
| 3.875%, 06/18/2026 (C) | | 2,897,000 | | | 3,134,399 |
| 4.300%, 06/18/2029 (C) | | 328,000 | | | 367,410 |
| Oracle Corp. | | | | | |
| 2.625%, 02/15/2023 | | 1,315,000 | | | 1,360,331 |
| 2.950%, 11/15/2024 | | 703,000 | | | 746,217 |
| 3.800%, 11/15/2037 | | 719,000 | | | 828,499 |
| 4.000%, 11/15/2047 | | 2,062,000 | | | 2,494,809 |
| | | | | | 60,066,872 |
| Materials – 0.9% | | | | | |
| Barrick North America Finance LLC | | | | | |
| 5.700%, 05/30/2041 | | 1,982,000 | | | 2,692,627 |
| 5.750%, 05/01/2043 | | 464,000 | | | 654,981 |
| DuPont de Nemours, Inc. | | | | | |
| 4.205%, 11/15/2023 | | 2,625,000 | | | 2,851,525 |
| 4.493%, 11/15/2025 | | 1,870,000 | | | 2,108,023 |
| 5.319%, 11/15/2038 | | 1,969,000 | | | 2,395,956 |
| Huntsman International LLC | | | | | |
| 4.500%, 05/01/2029 | | 943,000 | | | 1,038,244 |
| 5.125%, 11/15/2022 | | 803,000 | | | 862,613 |
Minera Mexico SA de CV
4.500%, 01/26/2050 (C) | | 933,000 | | | 940,585 |
Newmont Corp.
3.500%, 03/15/2022 | | 1,403,000 | | | 1,447,874 |
Nutrien, Ltd.
5.000%, 04/01/2049 | | 866,000 | | | 1,077,821 |
Packaging Corp. of America
3.000%, 12/15/2029 | | 1,314,000 | | | 1,382,268 |
| Steel Dynamics, Inc. | | | | | |
| 2.800%, 12/15/2024 | | 1,023,000 | | | 1,059,869 |
| 3.450%, 04/15/2030 | | 563,000 | | | 590,749 |
Teck Resources, Ltd.
6.250%, 07/15/2041 | | 1,986,000 | | | 2,294,038 |
| The Mosaic Company | | | | | |
| 4.050%, 11/15/2027 (D) | | 1,119,000 | | | 1,183,377 |
| 5.450%, 11/15/2033 | | 928,000 | | | 1,078,788 |
| 5.625%, 11/15/2043 | | 901,000 | | | 1,066,393 |
| Westlake Chemical Corp. | | | | | |
| 3.600%, 08/15/2026 | | 188,000 | | | 201,024 |
| 4.375%, 11/15/2047 | | 562,000 | | | 610,764 |
WRKCo, Inc.
4.900%, 03/15/2029 | | 1,125,000 | | | 1,324,817 |
| | | | | | 26,862,336 |
Core Bond Fund (continued)
| | | Shares or
Principal
Amount | | Value |
| CORPORATE BONDS (continued) | | | |
| Real estate – 0.9% | | | | | |
American Tower Corp.
3.800%, 08/15/2029 | $ | 975,000 | | $ | 1,074,946 |
| Equinix, Inc. | | | | | |
| 2.625%, 11/18/2024 | | 2,797,000 | | | 2,872,351 |
| 2.900%, 11/18/2026 | | 2,797,000 | | | 2,905,529 |
| 3.200%, 11/18/2029 | | 1,110,000 | | | 1,161,766 |
| GLP Capital LP | | | | | |
| 4.000%, 01/15/2030 | | 1,662,000 | | | 1,765,858 |
| 5.300%, 01/15/2029 | | 1,007,000 | | | 1,163,689 |
| Mid-America Apartments LP | | | | | |
| 3.600%, 06/01/2027 | | 675,000 | | | 736,443 |
| 3.750%, 06/15/2024 | | 2,377,000 | | | 2,572,828 |
| 3.950%, 03/15/2029 | | 999,000 | | | 1,143,347 |
| 4.000%, 11/15/2025 | | 1,219,000 | | | 1,365,619 |
| 4.300%, 10/15/2023 | | 1,019,000 | | | 1,110,452 |
Regency Centers LP
2.950%, 09/15/2029 | | 2,162,000 | | | 2,291,728 |
SITE Centers Corp.
4.625%, 07/15/2022 | | 847,000 | | | 902,040 |
| STORE Capital Corp. | | | | | |
| 4.500%, 03/15/2028 | | 3,744,000 | | | 4,213,735 |
| 4.625%, 03/15/2029 | | 735,000 | | | 836,426 |
| | | | | | 26,116,757 |
| Utilities – 2.4% | | | | | |
Alabama Power Company
3.450%, 10/01/2049 | | 1,973,000 | | | 2,148,738 |
| Black Hills Corp. | | | | | |
| 3.050%, 10/15/2029 | | 2,899,000 | | | 3,049,715 |
| 3.875%, 10/15/2049 | | 895,000 | | | 1,004,623 |
CenterPoint Energy Resources Corp.
4.100%, 09/01/2047 | | 972,000 | | | 1,141,158 |
| CenterPoint Energy, Inc. | | | | | |
| 2.500%, 09/01/2022 to 09/01/2024 | | 2,366,000 | | | 2,441,448 |
| 2.950%, 03/01/2030 | | 934,000 | | | 971,619 |
| 4.250%, 11/01/2028 | | 493,000 | | | 564,421 |
Dominion Energy, Inc.
2.000%, 08/15/2021 | | 1,399,000 | | | 1,412,708 |
| DTE Electric Company | | | | | |
| 2.250%, 03/01/2030 | | 2,944,000 | | | 2,992,267 |
| 2.950%, 03/01/2050 | | 3,774,000 | | | 3,887,334 |
| DTE Energy Company | | | | | |
| 2.529%, 10/01/2024 | | 1,657,000 | | | 1,709,787 |
| 3.800%, 03/15/2027 | | 461,000 | | | 502,421 |
| Duke Energy Corp. | | | | | |
| 1.800%, 09/01/2021 | | 2,098,000 | | | 2,109,563 |
| 2.650%, 09/01/2026 | | 1,291,000 | | | 1,344,774 |
| Edison International | | | | | |
| 4.125%, 03/15/2028 | | 5,000 | | | 5,454 |
| 5.750%, 06/15/2027 | | 1,489,000 | | | 1,761,000 |
| Enel Finance International NV | | | | | |
| 3.500%, 04/06/2028 (C) | | 924,000 | | | 983,578 |
| 4.625%, 09/14/2025 (C) | | 1,308,000 | | | 1,469,104 |
| 4.750%, 05/25/2047 (C) | | 725,000 | | | 874,715 |
| 4.875%, 06/14/2029 (C) | | 489,000 | | | 565,560 |
| Evergy, Inc. | | | | | |
| 2.450%, 09/15/2024 | | 1,833,000 | | | 1,886,129 |
| 2.900%, 09/15/2029 | | 920,000 | | | 948,904 |
| FirstEnergy Corp. | | | | | |
| 2.650%, 03/01/2030 | | 2,300,000 | | | 2,348,483 |
| 2.850%, 07/15/2022 | | 437,000 | | | 450,034 |
| 3.400%, 03/01/2050 | | 923,000 | | | 930,894 |
| 3.900%, 07/15/2027 | | 965,000 | | | 1,068,719 |
| 4.250%, 03/15/2023 | | 2,525,000 | | | 2,702,399 |
Interstate Power & Light Company
3.500%, 09/30/2049 | | 939,000 | | | 1,043,632 |
| The accompanying notes are an integral part of the financial statements. | 12 | |
John Hancock Funds II
Portfolio of Investments — February 29, 2020 (unaudited)(showing percentage of total net assets)
Core Bond Fund (continued)
| | | Shares or
Principal
Amount | | Value |
| CORPORATE BONDS (continued) | | | |
| Utilities (continued) | | | | | |
ITC Holdings Corp.
2.700%, 11/15/2022 | $ | 2,002,000 | | $ | 2,064,949 |
Jersey Central Power & Light Company
4.300%, 01/15/2026 (C) | | 871,000 | | | 979,877 |
Metropolitan Edison Company
4.300%, 01/15/2029 (C) | | 1,570,000 | | | 1,833,836 |
Mid-Atlantic Interstate Transmission LLC
4.100%, 05/15/2028 (C) | | 1,954,000 | | | 2,227,746 |
| Mississippi Power Company | | | | | |
| 3.950%, 03/30/2028 | | 2,441,000 | | | 2,730,238 |
| 4.250%, 03/15/2042 | | 1,466,000 | | | 1,686,121 |
NiSource, Inc.
4.375%, 05/15/2047 | | 831,000 | | | 976,561 |
Pennsylvania Electric Company
3.250%, 03/15/2028 (C) | | 843,000 | | | 904,425 |
| PPL Capital Funding, Inc. | | | | | |
| 3.100%, 05/15/2026 | | 2,397,000 | | | 2,541,288 |
| 3.400%, 06/01/2023 | | 288,000 | | | 302,454 |
| 5.000%, 03/15/2044 | | 1,331,000 | | | 1,647,578 |
| Southern California Edison Company | | | | | |
| 2.850%, 08/01/2029 (D) | | 1,011,000 | | | 1,053,904 |
| 3.650%, 02/01/2050 | | 1,019,000 | | | 1,083,245 |
| 4.125%, 03/01/2048 | | 1,622,000 | | | 1,861,406 |
| 4.650%, 10/01/2043 | | 475,000 | | | 584,365 |
| Southern California Gas Company | | | | | |
| 2.550%, 02/01/2030 | | 2,250,000 | | | 2,373,650 |
| 2.600%, 06/15/2026 | | 563,000 | | | 589,570 |
Trans-Allegheny Interstate Line Company
3.850%, 06/01/2025 (C) | | 693,000 | | | 764,303 |
Virginia Electric & Power Company
3.300%, 12/01/2049 | | 1,454,000 | | | 1,567,365 |
| | | | | | 70,092,062 |
| TOTAL CORPORATE BONDS (Cost $740,155,547) | | | $ | 783,513,306 |
| MUNICIPAL BONDS – 0.5% | | | | | |
County of Clark Department of Aviation (Nevada)
6.820%, 07/01/2045 | | 1,115,000 | | | 1,946,299 |
Los Angeles Community College District (California)
6.750%, 08/01/2049 | | 2,270,000 | | | 4,118,506 |
North Texas Tollway Authority
6.718%, 01/01/2049 | | 1,390,000 | | | 2,494,049 |
Port Authority of New York & New Jersey
4.458%, 10/01/2062 | | 3,060,000 | | | 4,181,796 |
State of California
7.600%, 11/01/2040 | | 410,000 | | | 724,630 |
The Ohio State University
4.800%, 06/01/2111 | | 600,000 | | | 925,446 |
| TOTAL MUNICIPAL BONDS (Cost $11,209,914) | | $ | 14,390,726 |
| COLLATERALIZED MORTGAGE OBLIGATIONS – 10.1% | | | |
| Commercial and residential – 3.6% | | | | | |
Angel Oak Mortgage Trust I LLC
Series 2019-2, Class A1
3.628%, 03/25/2049 (C)(E) | | 1,333,884 | | | 1,355,078 |
BBCMS Mortgage Trust
Series 2018-C2, Class A5
4.314%, 12/15/2051 | | 3,515,000 | | | 4,141,136 |
Core Bond Fund (continued)
| | | Shares or
Principal
Amount | | Value |
COLLATERALIZED MORTGAGE
OBLIGATIONS (continued) | | | |
Commercial and
residential (continued) | | | | | |
Benchmark Mortgage Trust
Series 2018-B1, Class ASB
3.602%, 01/15/2051 (E) | $ | 532,000 | | $ | 582,869 |
| Bunker Hill Loan Depositary Trust | | | | | |
Series 2019-1, Class A1,
3.613%, 10/26/2048 (C) | | 978,136 | | | 989,639 |
Series 2019-2, Class A1,
2.879%, 07/25/2049 (C) | | 2,733,341 | | | 2,777,019 |
Series 2019-3, Class A1,
2.724%, 11/25/2059 (C) | | 3,148,072 | | | 3,181,184 |
| CD Mortgage Trust | | | | | |
Series 2016-CD1, Class A1,
1.443%, 08/10/2049 | | 196,486 | | | 196,175 |
Series 2017-CD4, Class A4,
3.514%, 05/10/2050 (E) | | 4,839,000 | | | 5,365,931 |
Series 2017-CD4, Class ASB,
3.317%, 05/10/2050 | | 702,000 | | | 755,139 |
Series 2017-CD6, Class ASB,
3.332%, 11/13/2050 | | 1,764,000 | | | 1,905,787 |
| CFCRE Commercial Mortgage Trust | | | | | |
Series 2016-C3, Class A1,
1.793%, 01/10/2048 | | 218,876 | | | 218,827 |
Series 2017-C8, Class A1,
1.965%, 06/15/2050 | | 154,941 | | | 155,078 |
Series 2017-C8, Class ASB,
3.367%, 06/15/2050 | | 733,000 | | | 780,379 |
| Citigroup Commercial Mortgage Trust | | | | | |
Series 2016-P5, Class A1,
1.410%, 10/10/2049 | | 1,278,197 | | | 1,275,966 |
Series 2019-GC43, Class A4,
3.038%, 11/10/2052 | | 984,000 | | | 1,069,583 |
| COLT Mortgage Loan Trust | | | | | |
Series 2019-1, Class A1,
3.705%, 03/25/2049 (C)(E) | | 652,714 | | | 664,316 |
Series 2019-2, Class A1,
3.337%, 05/25/2049 (C)(E) | | 2,180,921 | | | 2,220,379 |
Series 2019-4, Class A1,
2.579%, 11/25/2049 (C)(E) | | 2,617,315 | | | 2,650,656 |
Commercial Mortgage Trust (Cantor Fitzgerald/Deutsche Bank AG)
Series 2016-COR1, Class ASB
2.972%, 10/10/2049 | | 562,000 | | | 590,162 |
| CSAIL Commercial Mortgage Trust | | | | | |
Series 2015-C2, Class A4,
3.504%, 06/15/2057 | | 6,737,176 | | | 7,325,023 |
Series 2015-C4, Class A4,
3.808%, 11/15/2048 | | 1,802,000 | | | 1,996,772 |
Series 2016-C5, Class ASB,
3.533%, 11/15/2048 | | 279,000 | | | 295,322 |
CSMC Trust
Series 2016-NXSR, Class A4
3.795%, 12/15/2049 (E) | | 4,516,000 | | | 5,032,121 |
DBJPM Mortgage Trust
Series 2017-C6, Class ASB
3.121%, 06/10/2050 | | 416,000 | | | 443,717 |
GCAT LLC
Series 2019-NQM1, Class A1
2.985%, 02/25/2059 (C) | | 1,042,503 | | | 1,068,754 |
| GS Mortgage Securities Trust | | | | | |
Series 2012-GCJ7, Class AAB,
2.935%, 05/10/2045 | | 45,369 | | | 45,526 |
Series 2014-GC18, Class A3,
3.801%, 01/10/2047 | | 565,161 | | | 599,204 |
| The accompanying notes are an integral part of the financial statements. | 13 | |
John Hancock Funds II
Portfolio of Investments — February 29, 2020 (unaudited)(showing percentage of total net assets)
Core Bond Fund (continued)
| | | Shares or
Principal
Amount | | Value |
COLLATERALIZED MORTGAGE
OBLIGATIONS (continued) | | | |
Commercial and
residential (continued) | | | | | |
| GS Mortgage Securities Trust (continued) | | | | | |
Series 2015-GC28, Class A5,
3.396%, 02/10/2048 | $ | 675,000 | | $ | 728,364 |
Series 2015-GC34, Class A4,
3.506%, 10/10/2048 | | 1,606,000 | | | 1,756,635 |
Series 2019-GSA1, Class A4,
3.048%, 11/10/2052 | | 1,425,000 | | | 1,541,605 |
Impact Funding Affordable Multifamily Housing Mortgage Loan Trust
Series 2010-1, Class A1
5.314%, 01/25/2051 (C) | | 3,172,877 | | | 3,524,274 |
JPMBB Commercial Mortgage
Securities Trust | | | | | |
Series 2014-C23, Class A4,
3.670%, 09/15/2047 | | 793,000 | | | 855,936 |
Series 2015-C28, Class A2,
2.773%, 10/15/2048 | | 208,148 | | | 208,091 |
Series 2015-C28, Class A3,
2.912%, 10/15/2048 | | 3,160,000 | | | 3,320,664 |
Series 2015-C33, Class A4,
3.770%, 12/15/2048 | | 437,000 | | | 483,983 |
JPMCC Commercial Mortgage Securities Trust
Series 2017-JP6, Class ASB
3.283%, 07/15/2050 | | 781,000 | | | 837,751 |
JPMDB Commercial Mortgage
Securities Trust | | | | | |
Series 2017-C5, Class ASB,
3.492%, 03/15/2050 | | 281,000 | | | 303,379 |
Series 2018-C8, Class ASB,
4.145%, 06/15/2051 | | 841,000 | | | 948,533 |
JPMorgan Chase Commercial Mortgage Securities Trust
Series 2016-JP2, Class A1
1.324%, 08/15/2049 | | 367,422 | | | 366,496 |
Morgan Stanley Bank of America Merrill
Lynch Trust | | | | | |
Series 2013-C10, Class A4,
4.083%, 07/15/2046 (E) | | 260,000 | | | 280,614 |
Series 2015-C20, Class A4,
3.249%, 02/15/2048 | | 231,000 | | | 247,619 |
Series 2015-C25, Class ASB,
3.383%, 10/15/2048 | | 842,000 | | | 889,370 |
Series 2015-C27, Class A4,
3.753%, 12/15/2047 | | 226,000 | | | 249,572 |
| Morgan Stanley Capital I Trust | | | | | |
Series 2016-UB11, Class A1,
1.445%, 08/15/2049 | | 408,275 | | | 407,412 |
Series 2016-UB11, Class ASB,
2.606%, 08/15/2049 | | 646,000 | | | 669,096 |
Series 2018-H3, Class A5,
4.177%, 07/15/2051 | | 450,000 | | | 523,013 |
| New Residential Mortgage Loan Trust | | | | | |
Series 2019-NQM2, Class A1,
3.600%, 04/25/2049 (C)(E) | | 1,367,698 | | | 1,384,377 |
Series 2019-NQM4, Class A1,
2.492%, 09/25/2059 (C)(E) | | 2,149,333 | | | 2,176,830 |
SG Residential Mortgage Trust
Series 2019-3, Class A1
2.703%, 09/25/2059 (C)(E) | | 2,512,992 | | | 2,528,290 |
| Starwood Mortgage Residential Trust | | | | | |
Series 2019-INV1, Class A1,
2.610%, 09/27/2049 (C)(E) | | 2,419,046 | | | 2,425,298 |
Core Bond Fund (continued)
| | | Shares or
Principal
Amount | | Value |
COLLATERALIZED MORTGAGE
OBLIGATIONS (continued) | | | |
Commercial and
residential (continued) | | | | | |
Starwood Mortgage
Residential Trust (continued) | | | | | |
Series 2020-1, Class A1,
2.275%, 02/25/2050 (C)(E) | $ | 4,383,000 | | $ | 4,415,477 |
| Verus Securitization Trust | | | | | |
Series 2019-1, Class A1,
3.836%, 02/25/2059 (C)(E) | | 1,539,457 | | | 1,562,496 |
Series 2019-2, Class A1,
3.211%, 05/25/2059 (C)(E) | | 5,085,803 | | | 5,139,196 |
Series 2019-3, Class A1,
2.784%, 07/25/2059 (C) | | 4,851,363 | | | 4,875,506 |
Series 2019-4, Class A1,
2.642%, 11/25/2059 (C) | | 6,737,776 | | | 6,794,756 |
Series 2019-INV1, Class A1,
3.402%, 12/25/2059 (C)(E) | | 1,353,854 | | | 1,368,550 |
Series 2019-INV2, Class A1,
2.913%, 07/25/2059 (C)(E) | | 2,437,019 | | | 2,464,149 |
Series 2019-INV3, Class A1,
2.692%, 11/25/2059 (C)(E) | | 2,820,887 | | | 2,841,475 |
Series 2020-1, Class A1,
2.417%, 01/25/2060 (C)(E) | | 1,451,692 | | | 1,465,788 |
Visio Trust
Series 2019-1, Class A1
3.572%, 06/25/2054 (C)(E) | | 1,283,275 | | | 1,306,702 |
| | | | | | 106,573,039 |
| U.S. Government Agency – 6.5% | | | | | |
| Federal Home Loan Mortgage Corp. | | | | | |
Series 264, Class 30,
3.000%, 07/15/2042 | | 4,707,014 | | | 4,950,086 |
Series 343, Class F4 (1 month LIBOR + 0.350%),
2.852%, 10/15/2037 (B) | | 2,779,545 | | | 2,764,865 |
Series 4205, Class PA,
1.750%, 05/15/2043 | | 1,970,938 | | | 1,978,856 |
Series 4426, Class QC,
1.750%, 07/15/2037 | | 3,149,764 | | | 3,178,094 |
Series 4705, Class A,
4.500%, 09/15/2042 | | 1,757,261 | | | 1,918,651 |
Series 4742, Class PA,
3.000%, 10/15/2047 | | 5,268,927 | | | 5,505,572 |
Series 4763, Class CA,
3.000%, 09/15/2038 | | 546,299 | | | 581,615 |
Series 4767, Class KA,
3.000%, 03/15/2048 | | 2,615,057 | | | 2,768,403 |
Series 4786, Class DP,
4.500%, 07/15/2042 | | 1,140,073 | | | 1,167,538 |
Series 4796, Class AK,
3.000%, 05/15/2048 | | 4,675,196 | | | 4,855,083 |
Series 4802, Class A,
3.000%, 06/15/2048 | | 4,645,967 | | | 4,821,763 |
Series 4846, Class PF (1 month LIBOR + 0.350%),
2.009%, 12/15/2048 (B) | | 980,771 | | | 977,858 |
Series 4856, Class FD (1 month LIBOR + 0.300%),
1.959%, 08/15/2040 (B) | | 3,347,994 | | | 3,325,363 |
Series 4874, Class AT,
3.000%, 09/15/2048 | | 14,328,564 | | | 14,842,024 |
Series 4880, Class DA,
3.000%, 05/15/2050 | | 4,035,472 | | | 4,256,538 |
Series 4897, Class F (1 month LIBOR + 0.400%),
2.059%, 07/15/2049 (B) | | 1,176,205 | | | 1,169,553 |
| The accompanying notes are an integral part of the financial statements. | 14 | |
John Hancock Funds II
Portfolio of Investments — February 29, 2020 (unaudited)(showing percentage of total net assets)
Core Bond Fund (continued)
| | | Shares or
Principal
Amount | | Value |
COLLATERALIZED MORTGAGE
OBLIGATIONS (continued) | | | |
| U.S. Government Agency (continued) | | | | | |
| Federal National Mortgage Association | | | | | |
Series 1998-61, Class PL,
6.000%, 11/25/2028 | $ | 219,590 | | $ | 247,978 |
Series 2012-151, Class NX,
1.500%, 01/25/2043 | | 2,472,955 | | | 2,482,779 |
Series 2013-11, Class AP,
1.500%, 01/25/2043 | | 5,869,017 | | | 5,892,871 |
Series 2013-30, Class CA,
1.500%, 04/25/2043 | | 547,285 | | | 550,127 |
Series 2013-43, Class BP,
1.750%, 05/25/2043 | | 2,790,823 | | | 2,801,927 |
Series 2014-73, Class MA,
2.500%, 11/25/2044 | | 1,659,439 | | | 1,719,755 |
Series 2015-84, Class PA,
1.700%, 08/25/2033 | | 7,593,465 | | | 7,673,725 |
Series 2016-48, Class MA,
2.000%, 06/25/2038 | | 9,997,454 | | | 10,213,784 |
Series 2016-57, Class PC,
1.750%, 06/25/2046 | | 14,241,891 | | | 14,371,653 |
Series 2017-13, Class PA,
3.000%, 08/25/2046 | | 1,678,849 | | | 1,786,746 |
Series 2017-42, Class H,
3.000%, 11/25/2043 | | 1,995,564 | | | 2,070,589 |
Series 2017-M7, Class A2,
2.961%, 02/25/2027 (E) | | 633,000 | | | 688,170 |
Series 2018-14, Class KC,
3.000%, 03/25/2048 | | 2,462,600 | | | 2,603,547 |
Series 2018-15, Class AB,
3.000%, 03/25/2048 | | 719,896 | | | 765,488 |
Series 2018-45, Class GA,
3.000%, 06/25/2048 | | 5,881,179 | | | 6,074,969 |
Series 2018-79, Class FA (1 month LIBOR + 0.250%),
1.877%, 11/25/2048 (B) | | 5,291,949 | | | 5,256,922 |
Series 2018-8, Class KL,
2.500%, 03/25/2047 | | 2,184,104 | | | 2,264,555 |
Series 2019-14, Class FB (1 month LIBOR + 0.400%),
2.181%, 04/25/2059 (B) | | 1,888,958 | | | 1,887,037 |
Series 2019-18, Class FH (1 month LIBOR + 0.350%),
1.977%, 05/25/2049 (B) | | 3,295,649 | | | 3,271,233 |
Series 2019-25, Class PA,
3.000%, 05/25/2048 | | 3,186,874 | | | 3,372,759 |
Series 2019-25, Class YF (1 month LIBOR + 0.450%),
2.077%, 10/25/2046 (B) | | 6,509,430 | | | 6,505,116 |
Series 2019-35, Class FH (1 month LIBOR + 0.350%),
1.977%, 07/25/2049 (B) | | 1,449,150 | | | 1,443,250 |
Series 2019-35, Class MB,
3.000%, 07/25/2049 | | 3,497,910 | | | 3,754,453 |
Series 2019-42, Class FK (1 month LIBOR + 0.450%),
2.077%, 08/25/2049 (B) | | 7,531,548 | | | 7,512,466 |
Series 2019-60, Class BF (1 month LIBOR + 0.450%),
2.077%, 10/25/2049 (B) | | 2,643,606 | | | 2,633,404 |
Series 2019-60, Class FW (1 month LIBOR + 0.450%),
2.077%, 10/25/2049 (B) | | 1,875,567 | | | 1,872,965 |
Series 2019-67, Class FB (1 month LIBOR +0.450%),
2.077%, 11/25/2049 (B) | | 2,320,478 | | | 2,309,192 |
Core Bond Fund (continued)
| | | Shares or
Principal
Amount | | Value |
COLLATERALIZED MORTGAGE
OBLIGATIONS (continued) | | | |
| U.S. Government Agency (continued) | | | | | |
Federal National
Mortgage Association (continued) | | | | | |
Series 2019-70, Class FL (1 month LIBOR + 0.400%),
2.027%, 12/25/2049 (B) | $ | 4,718,359 | | $ | 4,708,873 |
Series 2019-8, Class GA,
3.000%, 03/25/2049 | | 7,843,107 | | | 8,132,124 |
Series 414, Class A35,
3.500%, 10/25/2042 | | 2,398,212 | | | 2,615,403 |
Government National
Mortgage Association | | | | | |
Series 2012-141, Class WA,
4.525%, 11/16/2041 (E) | | 538,153 | | | 619,767 |
Series 2017-167, Class BQ,
2.500%, 08/20/2044 | | 2,277,806 | | | 2,352,543 |
Series 2019-132, Class NA,
3.500%, 09/20/2049 | | 6,111,536 | | | 6,424,904 |
Series 2019-31, Class JC,
3.500%, 03/20/2049 | | 3,035,942 | | | 3,147,910 |
| | | | | | 189,090,846 |
| TOTAL COLLATERALIZED MORTGAGE OBLIGATIONS (Cost $286,047,194) | | $ | 295,663,885 |
| ASSET BACKED SECURITIES – 9.5% | | | |
Avis Budget Rental Car Funding
AESOP LLC | | | | | |
Series 2017-1A, Class A
3.070%, 09/20/2023 (C) | | 939,000 | | | 973,542 |
Series 2019-3A, Class A
2.360%, 03/20/2026 (C) | | 3,148,000 | | | 3,248,519 |
| College Ave Student Loans LLC | | | | | |
Series 2017-A, Class A1 (1 month LIBOR + 1.650%)
3.277%, 11/26/2046 (B)(C) | | 1,070,655 | | | 1,070,050 |
Series 2018-A, Class A2
4.130%, 12/26/2047 (C) | | 1,207,783 | | | 1,297,453 |
Series 2019-A, Class A2
3.280%, 12/28/2048 (C) | | 1,179,290 | | | 1,212,250 |
| Ford Credit Auto Owner Trust | | | | | |
Series 2017-1, Class A
2.620%, 08/15/2028 (C) | | 2,680,000 | | | 2,749,850 |
Series 2017-2, Class A
2.360%, 03/15/2029 (C) | | 5,660,000 | | | 5,809,897 |
Series 2018-1, Class A
3.190%, 07/15/2031 (C) | | 7,258,000 | | | 7,790,444 |
Series 2018-2, Class A
3.470%, 01/15/2030 (C) | | 3,419,000 | | | 3,637,551 |
Series 2019-1, Class A
3.520%, 07/15/2030 (C) | | 3,514,000 | | | 3,781,015 |
Series 2020-1, Class A
2.040%, 08/15/2031 (C) | | 9,494,000 | | | 9,694,234 |
| Hertz Vehicle Financing II LP | | | | | |
Series 2016-4A, Class A
2.650%, 07/25/2022 (C) | | 224,000 | | | 226,983 |
Series 2017-2A, Class A
3.290%, 10/25/2023 (C) | | 2,646,000 | | | 2,753,459 |
Series 2018-1A, Class A
3.290%, 02/25/2024 (C) | | 4,232,000 | | | 4,427,565 |
Series 2018-3A, Class A
4.030%, 07/25/2024 (C) | | 2,306,000 | | | 2,473,761 |
Series 2019-1A, Class A
3.710%, 03/25/2023 (C) | | 2,463,000 | | | 2,569,156 |
Series 2019-2A, Class A
3.420%, 05/25/2025 (C) | | 3,999,000 | | | 4,250,316 |
| The accompanying notes are an integral part of the financial statements. | 15 | |
John Hancock Funds II
Portfolio of Investments — February 29, 2020 (unaudited)(showing percentage of total net assets)
Core Bond Fund (continued)
| | | Shares or
Principal
Amount | | Value |
| ASSET BACKED SECURITIES (continued) | | | |
Hertz Vehicle Financing
II LP (continued) | | | | | |
Series 2019-3A, Class A
2.670%, 12/26/2025 (C) | $ | 2,848,000 | | $ | 2,942,138 |
| Navient Private Education Loan Trust | | | | | |
Series 2014-CTA, Class A (1 month LIBOR + 0.700%)
2.359%, 09/16/2024 (B)(C) | | 52,428 | | | 52,438 |
Series 2016-AA, Class A2B (1 month LIBOR + 2.150%)
3.809%, 12/15/2045 (B)(C) | | 756,826 | | | 781,936 |
Series 2018-BA, Class A2A
3.610%, 12/15/2059 (C) | | 1,380,000 | | | 1,450,443 |
Navient Private Education Refi
Loan Trust | | | | | |
Series 2018-A, Class A2
3.190%, 02/18/2042 (C) | | 7,668,000 | | | 7,915,884 |
Series 2018-CA, Class A2
3.520%, 06/16/2042 (C) | | 750,000 | | | 780,113 |
Series 2018-DA, Class A2A
4.000%, 12/15/2059 (C) | | 3,186,000 | | | 3,368,664 |
Series 2019-A, Class A2A
3.420%, 01/15/2043 (C) | | 4,873,000 | | | 5,065,008 |
Series 2019-CA, Class A2
3.130%, 02/15/2068 (C) | | 3,693,000 | | | 3,867,989 |
Series 2019-D, Class A2A
3.010%, 12/15/2059 (C) | | 5,091,000 | | | 5,277,775 |
Series 2019-FA, Class A2
2.600%, 08/15/2068 (C) | | 5,797,000 | | | 5,995,715 |
Series 2019-GA, Class A
2.400%, 10/15/2068 (C) | | 5,592,159 | | | 5,726,472 |
Series 2020-A, Class A2A
2.460%, 11/15/2068 (C) | | 2,761,000 | | | 2,849,693 |
Series 2020-A, Class A2B (1 month LIBOR + 0.900%)
3.084%, 11/15/2068 (B)(C) | | 2,393,000 | | | 2,390,781 |
Series 2020-BA, Class A2
2.120%, 01/15/2069 (C) | | 2,124,000 | | | 2,122,513 |
| Navient Student Loan Trust | | | | | |
Series 2014-1, Class A3 (1 month LIBOR + 0.510%)
2.137%, 06/25/2031 (B) | | 2,137,567 | | | 2,103,645 |
Series 2015-1, Class A2 (1 month LIBOR + 0.600%)
2.227%, 04/25/2040 (B) | | 2,252,063 | | | 2,213,238 |
Series 2016-1A, Class A (1 month LIBOR + 0.700%)
2.327%, 02/25/2070 (B)(C) | | 1,981,605 | | | 1,971,646 |
Series 2016-3A, Class A2 (1 month LIBOR + 0.850%)
2.477%, 06/25/2065 (B)(C) | | 287,096 | | | 287,442 |
Series 2017-5A, Class A (1 month LIBOR + 0.800%)
2.427%, 07/26/2066 (B)(C) | | 1,902,802 | | | 1,877,567 |
Series 2018-EA, Class A2
4.000%, 12/15/2059 (C) | | 1,964,000 | | | 2,072,283 |
Series 2019-3A, Class A (1 month LIBOR + 0.830%)
2.457%, 07/25/2068 (B)(C) | | 9,791,088 | | | 9,849,459 |
Series 2019-4A, Class A2 (1 month LIBOR + 0.810%)
2.437%, 07/25/2068 (B)(C) | | 4,733,000 | | | 4,762,672 |
Series 2019-BA, Class A2A
3.390%, 12/15/2059 (C) | | 3,938,000 | | | 4,182,264 |
Core Bond Fund (continued)
| | | Shares or
Principal
Amount | | Value |
| ASSET BACKED SECURITIES (continued) | | | |
| Nelnet Student Loan Trust | | | | | |
Series 2004-3, Class A5 (3 month LIBOR + 0.180%)
1.974%, 10/27/2036 (B) | $ | 652,880 | | $ | 635,777 |
Series 2004-4, Class A5 (3 month LIBOR + 0.160%)
1.954%, 01/25/2037 (B) | | 2,018,894 | | | 1,975,386 |
Series 2005-1, Class A5 (3 month LIBOR + 0.110%)
1.904%, 10/25/2033 (B) | | 7,694,609 | | | 7,508,300 |
Series 2005-2, Class A5 (3 month LIBOR + 0.100%)
2.028%, 03/23/2037 (B) | | 10,051,625 | | | 9,800,940 |
Series 2005-3, Class A5 (3 month LIBOR + 0.120%)
2.048%, 12/24/2035 (B) | | 6,294,802 | | | 6,194,685 |
Series 2005-4, Class A4 (3 month LIBOR + 0.180%)
2.108%, 03/22/2032 (B) | | 670,455 | | | 647,030 |
Series 2012-2A, Class A (1 month LIBOR + 0.800%)
2.427%, 12/26/2033 (B)(C) | | 4,425,367 | | | 4,407,359 |
Series 2012-4A, Class A (1 month LIBOR + 0.700%)
2.327%, 09/27/2038 (B)(C) | | 2,405,577 | | | 2,389,302 |
Series 2013-1A, Class A (1 month LIBOR + 0.600%)
2.227%, 06/25/2041 (B)(C) | | 1,966,004 | | | 1,925,242 |
Series 2014-1A, Class A (1 month LIBOR + 0.570%)
2.197%, 09/25/2041 (B)(C) | | 611,215 | | | 602,550 |
Series 2016-1A, Class A (1 month LIBOR + 0.800%)
2.427%, 09/25/2065 (B)(C) | | 2,289,927 | | | 2,292,807 |
Santander Revolving Auto Loan Trust
Series 2019-A, Class A
2.510%, 01/26/2032 (C) | | 6,020,000 | | | 6,233,277 |
| SLC Student Loan Trust | | | | | |
Series 2007-1, Class A5 (3 month LIBOR + 0.090%)
1.782%, 02/15/2068 (B) | | 1,985,000 | | | 1,835,907 |
Series 2008-1, Class A4A (3 month LIBOR + 1.600%)
3.494%, 12/15/2032 (B) | | 1,723,610 | | | 1,754,008 |
| SLM Student Loan Trust | | | | | |
Series 2003-1, Class A5C (3 month LIBOR + 0.750%)
2.644%, 12/15/2032 (B)(C) | | 928,395 | | | 895,033 |
Series 2007-2, Class A4 (3 month LIBOR + 0.060%)
1.854%, 07/25/2022 (B) | | 2,388,272 | | | 2,326,496 |
Series 2010-1, Class A (1 month LIBOR + 0.400%)
2.027%, 03/25/2025 (B) | | 369,802 | | | 356,691 |
Series 2012-1, Class A3 (1 month LIBOR + 0.950%)
2.577%, 09/25/2028 (B) | | 3,376,802 | | | 3,307,748 |
Series 2012-2, Class A (1 month LIBOR + 0.700%)
2.327%, 01/25/2029 (B) | | 3,101,270 | | | 3,030,686 |
Series 2012-6, Class A3 (1 month LIBOR + 0.750%)
2.377%, 05/26/2026 (B) | | 613,007 | | | 608,886 |
Series 2013-4, Class A (1 month LIBOR + 0.550%)
2.177%, 06/25/2043 (B) | | 4,791,960 | | | 4,746,314 |
| The accompanying notes are an integral part of the financial statements. | 16 | |
John Hancock Funds II
Portfolio of Investments — February 29, 2020 (unaudited)(showing percentage of total net assets)
Core Bond Fund (continued)
| | | Shares or
Principal
Amount | | Value |
| ASSET BACKED SECURITIES (continued) | | | |
| SMB Private Education Loan Trust | | | | | |
Series 2015-A, Class A2B (1 month LIBOR + 1.000%)
2.658%, 06/15/2027 (B)(C) | $ | 963,418 | | $ | 965,851 |
Series 2015-C, Class A2B (1 month LIBOR + 1.400%)
3.059%, 07/15/2027 (B)(C) | | 366,871 | | | 369,527 |
Series 2016-A, Class A2A
2.700%, 05/15/2031 (C) | | 2,126,774 | | | 2,170,143 |
Series 2016-A, Class A2B (1 month LIBOR + 1.500%)
3.159%, 05/15/2031 (B)(C) | | 5,963,903 | | | 6,022,630 |
Series 2016-B, Class A2A
2.430%, 02/17/2032 (C) | | 349,551 | | | 355,124 |
Series 2016-B, Class A2B (1 month LIBOR + 1.450%)
3.109%, 02/17/2032 (B)(C) | | 3,004,953 | | | 3,031,819 |
Series 2016-C, Class A2B (1 month LIBOR + 1.100%)
2.759%, 09/15/2034 (B)(C) | | 1,079,638 | | | 1,083,285 |
Series 2017-A, Class A2B (1 month LIBOR + 0.900%)
2.559%, 09/15/2034 (B)(C) | | 3,361,935 | | | 3,364,136 |
Series 2017-B, Class A2A
2.820%, 10/15/2035 (C) | | 3,359,685 | | | 3,460,246 |
Series 2017-B, Class A2B (1 month LIBOR + 0.750%)
2.409%, 10/15/2035 (B)(C) | | 2,163,502 | | | 2,161,453 |
Series 2018-C, Class A2A
3.630%, 11/15/2035 (C) | | 1,952,000 | | | 2,076,170 |
Series 2019-A, Class A2A
3.440%, 07/15/2036 (C) | | 9,538,000 | | | 10,156,584 |
| SoFi Professional Loan Program LLC | | | | | |
Series 2016-A, Class A2
2.760%, 12/26/2036 (C) | | 1,031,652 | | | 1,045,199 |
Series 2016-D, Class A1 (1 month LIBOR + 0.950%)
2.577%, 01/25/2039 (B)(C) | | 101,270 | | | 101,817 |
Series 2016-E, Class A1 (1 month LIBOR + 0.850%)
2.477%, 07/25/2039 (B)(C) | | 241,223 | | | 241,421 |
Series 2017-A, Class A1 (1 month LIBOR + 0.700%)
2.327%, 03/26/2040 (B)(C) | | 387,841 | | | 389,348 |
Series 2017-C, Class A1 (1 month LIBOR + 0.600%)
2.227%, 07/25/2040 (B)(C) | | 538,751 | | | 540,024 |
Series 2017-D, Class A2FX
2.650%, 09/25/2040 (C) | | 1,203,623 | | | 1,230,847 |
Series 2017-E, Class A1 (1 month LIBOR + 0.500%)
2.127%, 11/26/2040 (B)(C) | | 164,514 | | | 164,607 |
Series 2017-E, Class A2B
2.720%, 11/26/2040 (C) | | 3,269,000 | | | 3,351,689 |
Series 2018-A, Class A2B
2.950%, 02/25/2042 (C) | | 1,487,000 | | | 1,532,350 |
Series 2018-B, Class A2FX
3.340%, 08/25/2047 (C) | | 15,751,000 | | | 16,333,228 |
Series 2020-A, Class A2FX
2.540%, 05/15/2046 (C) | | 4,799,000 | | | 4,971,716 |
Toyota Auto Loan Extended Note Trust
Series 2019-1A, Class A
2.560%, 11/25/2031 (C) | | 5,224,000 | | | 5,464,500 |
Core Bond Fund (continued)
| | | Shares or
Principal
Amount | | Value |
| ASSET BACKED SECURITIES (continued) | | | |
| Verizon Owner Trust | | | | | |
Series 2019-C, Class A1A
1.940%, 04/22/2024 | $ | 2,176,000 | | $ | 2,210,231 |
Series 2020-A, Class A1A
1.850%, 07/22/2024 | | 5,078,000 | | | 5,147,040 |
| TOTAL ASSET BACKED SECURITIES (Cost $273,351,568) | | | $ | 279,289,232 |
| SHORT-TERM INVESTMENTS – 3.5% | | | |
| Short-term funds – 3.5% | | | | | |
| John Hancock Collateral Trust, 1.6968% (F)(G) | | 166,775 | | | 1,669,238 |
| State Street Institutional U.S. Government Money Market Fund, Premier Class, 1.5386% (F) | | 100,800,506 | | | 100,800,506 |
| TOTAL SHORT-TERM INVESTMENTS (Cost $102,469,330) | | $ | 102,469,744 |
Total Investments (Core Bond Fund)
(Cost $3,071,897,967) – 108.6% | | $ | 3,182,326,379 |
| Other assets and liabilities, net – (8.6%) | | | | (252,742,183) |
| TOTAL NET ASSETS – 100.0% | | | | $ | 2,929,584,196 |
| Security Abbreviations and Legend |
| CMT | Constant Maturity Treasury |
| LIBOR | London Interbank Offered Rate |
| SOFR | Secured Overnight Financing Rate |
| TBA | To Be Announced. A forward mortgage-backed securities trade issued by a U.S. Government Agency, to be delivered at an agreed-upon future settlement date. |
| (A) | Security purchased or sold on a when-issued or delayed delivery basis. |
| (B) | Variable rate obligation. The coupon rate shown represents the rate at period end. |
| (C) | These securities are exempt from registration under Rule 144A of the Securities Act of 1933. Such securities may be resold, normally to qualified institutional buyers, in transactions exempt from registration. Rule 144A securities amounted to $433,221,675 or 14.8% of the fund's net assets as of 2-29-20. |
| (D) | All or a portion of this security is on loan as of 2-29-20. |
| (E) | Variable or floating rate security, the interest rate of which adjusts periodically based on a weighted average of interest rates and prepayments on the underlying pool of assets. The interest rate shown is the current rate as of period end. |
| (F) | The rate shown is the annualized seven-day yield as of 2-29-20. |
| (G) | Investment is an affiliate of the fund, the advisor and/or subadvisor. This security represents the investment of cash collateral received for securities lending. |
High Yield Fund
| | | Shares or
Principal
Amount | | Value |
| FOREIGN GOVERNMENT OBLIGATIONS – 0.8% | | | |
| Argentina – 0.4% | | | | | |
Provincia de Buenos Aires
7.875%, 06/15/2027 | $ | 870,000 | | $ | 330,600 |
| Republic of Argentina | | | | | |
| 5.625%, 01/26/2022 | | 470,000 | | | 218,550 |
| 6.875%, 01/26/2027 | | 430,000 | | | 181,679 |
| 7.500%, 04/22/2026 | | 330,000 | | | 142,728 |
| | | | | | 873,557 |
| Brazil – 0.4% | | | | | |
| Federative Republic of Brazil | | | | | |
| 10.000%, 01/01/2021 | BRL | 239,000 | | | 56,744 |
| 10.000%, 01/01/2023 | | 3,531,000 | | | 894,615 |
| The accompanying notes are an integral part of the financial statements. | 17 | |
John Hancock Funds II
Portfolio of Investments — February 29, 2020 (unaudited)(showing percentage of total net assets)
High Yield Fund (continued)
| | | Shares or
Principal
Amount | | Value |
| FOREIGN GOVERNMENT OBLIGATIONS (continued) | | | |
| Brazil (continued) | | | | | |
| Federative Republic of Brazil (continued) | | | | | |
| 10.000%, 01/01/2027 | BRL | 206,000 | | $ | 55,207 |
| | | | | | 1,006,566 |
| Indonesia – 0.0% | | | | | |
Republic of Indonesia
8.375%, 03/15/2034 | IDR | 543,000,000 | | | 40,685 |
| TOTAL FOREIGN GOVERNMENT OBLIGATIONS (Cost $3,369,695) | | $ | 1,920,808 |
| CORPORATE BONDS – 82.4% | | | |
| Communication services – 14.2% | | | | | |
Allen Media LLC
10.500%, 02/15/2028 (A) | $ | 900,000 | | | 864,000 |
Altice France SA
7.375%, 05/01/2026 (A) | | 3,130,000 | | | 3,282,431 |
American Media LLC
10.500%, 12/31/2026 (A) | | 920,000 | | | 998,200 |
| CCO Holdings LLC | | | | | |
| 5.125%, 05/01/2023 to 05/01/2027 (A) | | 3,000,000 | | | 3,070,660 |
| 5.750%, 02/15/2026 (A) | | 215,000 | | | 223,536 |
CenturyLink, Inc.
4.000%, 02/15/2027 (A) | | 370,000 | | | 371,813 |
| Charter Communications Operating LLC | | | | | |
| 4.908%, 07/23/2025 | | 820,000 | | | 918,774 |
| 6.484%, 10/23/2045 | | 250,000 | | | 321,520 |
Cogent Communications Group, Inc.
5.375%, 03/01/2022 (A) | | 1,330,000 | | | 1,363,250 |
CSC Holdings LLC
6.500%, 02/01/2029 (A) | | 1,620,000 | | | 1,784,025 |
iHeartCommunications, Inc.
4.750%, 01/15/2028 (A) | | 280,000 | | | 278,600 |
| Intelsat Jackson Holdings SA | | | | | |
| 5.500%, 08/01/2023 | | 950,000 | | | 817,000 |
| 8.000%, 02/15/2024 (A) | | 330,000 | | | 338,250 |
Lions Gate Capital Holdings LLC
5.875%, 11/01/2024 (A) | | 1,000,000 | | | 972,500 |
| Match Group, Inc. | | | | | |
| 5.000%, 12/15/2027 (A) | | 400,000 | | | 414,000 |
| 6.375%, 06/01/2024 | | 440,000 | | | 454,903 |
| Netflix, Inc. | | | | | |
| 4.375%, 11/15/2026 | | 320,000 | | | 335,104 |
| 4.875%, 06/15/2030 (A) | | 500,000 | | | 526,900 |
| 5.375%, 11/15/2029 (A) | | 770,000 | | | 837,144 |
| 6.375%, 05/15/2029 | | 790,000 | | | 913,438 |
Sirius XM Radio, Inc.
4.625%, 07/15/2024 (A) | | 290,000 | | | 298,976 |
Sprint Capital Corp.
8.750%, 03/15/2032 | | 2,150,000 | | | 2,988,500 |
Sprint Communications, Inc.
11.500%, 11/15/2021 | | 1,591,000 | | | 1,817,718 |
| Sprint Corp. | | | | | |
| 7.250%, 09/15/2021 | | 1,000,000 | | | 1,061,350 |
| 7.625%, 02/15/2025 | | 40,000 | | | 46,400 |
| 7.875%, 09/15/2023 | | 1,470,000 | | | 1,680,695 |
Telecom Italia SpA
5.303%, 05/30/2024 (A) | | 1,000,000 | | | 1,067,500 |
Twitter, Inc.
3.875%, 12/15/2027 (A) | | 590,000 | | | 602,538 |
Univision Communications, Inc.
5.125%, 02/15/2025 (A) | | 650,000 | | | 613,288 |
UPC Holding BV
5.500%, 01/15/2028 (A) | | 370,000 | | | 375,217 |
Virgin Media Secured Finance PLC
5.500%, 08/15/2026 to 05/15/2029 (A) | | 2,740,000 | | | 2,816,020 |
High Yield Fund (continued)
| | | Shares or
Principal
Amount | | Value |
| CORPORATE BONDS (continued) | | | |
| Communication services (continued) | | | | | |
Ypso Finance Bis SA
10.500%, 05/15/2027 (A) | $ | 290,000 | | $ | 328,695 |
| | | | | | 32,782,945 |
| Consumer discretionary – 14.9% | | | | | |
| American Axle & Manufacturing, Inc. | | | | | |
| 6.250%, 03/15/2026 | | 160,000 | | | 153,920 |
| 6.500%, 04/01/2027 | | 670,000 | | | 642,865 |
Boyne USA, Inc.
7.250%, 05/01/2025 (A) | | 630,000 | | | 674,100 |
Brinker International, Inc.
5.000%, 10/01/2024 (A) | | 420,000 | | | 438,060 |
Carriage Services, Inc.
6.625%, 06/01/2026 (A) | | 730,000 | | | 752,185 |
Century Communities, Inc.
5.875%, 07/15/2025 | | 1,390,000 | | | 1,452,550 |
CSC Holdings LLC
10.875%, 10/15/2025 (A) | | 638,000 | | | 700,014 |
Delphi Technologies PLC
5.000%, 10/01/2025 (A) | | 510,000 | | | 558,450 |
DISH DBS Corp.
7.750%, 07/01/2026 (B) | | 3,080,000 | | | 3,309,644 |
| ESH Hospitality, Inc. | | | | | |
| 4.625%, 10/01/2027 (A) | | 420,000 | | | 409,500 |
| 5.250%, 05/01/2025 (A) | | 240,000 | | | 241,399 |
Fontainebleau Las Vegas Holdings LLC
11.000%, 06/15/2015 (A)(C) | | 2,983,778 | | | 11,040 |
frontdoor, Inc.
6.750%, 08/15/2026 (A) | | 1,000,000 | | | 1,094,305 |
Golden Nugget, Inc.
8.750%, 10/01/2025 (A) | | 660,000 | | | 662,779 |
| Hanesbrands, Inc. | | | | | |
| 4.625%, 05/15/2024 (A) | | 570,000 | | | 595,650 |
| 4.875%, 05/15/2026 (A) | | 550,000 | | | 576,125 |
Hilton Worldwide Finance LLC
4.625%, 04/01/2025 | | 240,000 | | | 240,900 |
Installed Building Products, Inc.
5.750%, 02/01/2028 (A) | | 500,000 | | | 532,810 |
L Brands, Inc.
5.250%, 02/01/2028 | | 1,560,000 | | | 1,514,175 |
| Lennar Corp. | | | | | |
| 4.750%, 11/29/2027 | | 970,000 | | | 1,069,425 |
| 5.875%, 11/15/2024 | | 640,000 | | | 698,688 |
Levi Strauss & Company
5.000%, 05/01/2025 | | 800,000 | | | 822,800 |
| Marston's Issuer PLC (3 month GBP LIBOR + 2.550%) 3.275%, 07/15/2035 (D) | GBP | 380,000 | | | 415,278 |
Melco Resorts Finance, Ltd.
5.375%, 12/04/2029 (A) | $ | 340,000 | | | 339,950 |
MGM Growth Properties Operating Partnership LP
4.500%, 09/01/2026 | | 510,000 | | | 527,850 |
Michaels Stores, Inc.
8.000%, 07/15/2027 (A)(B) | | 360,000 | | | 300,096 |
Mohegan Gaming & Entertainment
7.875%, 10/15/2024 (A) | | 1,060,000 | | | 1,048,520 |
NCL Corp., Ltd.
3.625%, 12/15/2024 (A) | | 330,000 | | | 305,715 |
New Red Finance, Inc.
3.875%, 01/15/2028 (A) | | 640,000 | | | 636,000 |
Party City Holdings, Inc.
6.625%, 08/01/2026 (A) | | 670,000 | | | 388,600 |
PetSmart, Inc.
8.875%, 06/01/2025 (A) | | 320,000 | | | 318,400 |
| The accompanying notes are an integral part of the financial statements. | 18 | |
John Hancock Funds II
Portfolio of Investments — February 29, 2020 (unaudited)(showing percentage of total net assets)
High Yield Fund (continued)
| | | Shares or
Principal
Amount | | Value |
| CORPORATE BONDS (continued) | | | |
| Consumer discretionary (continued) | | | | | |
Prime Security Services Borrower LLC
6.250%, 01/15/2028 (A) | $ | 1,060,000 | | $ | 1,025,868 |
Sands China, Ltd.
5.400%, 08/08/2028 | | 200,000 | | | 226,460 |
Scientific Games International, Inc.
7.000%, 05/15/2028 (A) | | 860,000 | | | 837,963 |
| Service Corp. International | | | | | |
| 4.625%, 12/15/2027 | | 680,000 | | | 712,300 |
| 5.125%, 06/01/2029 | | 500,000 | | | 540,625 |
| 5.375%, 05/15/2024 | | 240,000 | | | 244,500 |
Silversea Cruise Finance, Ltd.
7.250%, 02/01/2025 (A) | | 632,000 | | | 649,380 |
Speedway Motorsports LLC
4.875%, 11/01/2027 (A) | | 830,000 | | | 822,779 |
Sugarhouse HSP Gaming Prop Mezz LP
5.875%, 05/15/2025 (A) | | 380,000 | | | 372,400 |
| Taylor Morrison Communities, Inc. | | | | | |
| 5.875%, 01/31/2025 (A) | | 320,000 | | | 327,802 |
| 6.000%, 09/01/2023 (A) | | 890,000 | | | 918,747 |
The ServiceMaster Company LLC
5.125%, 11/15/2024 (A) | | 630,000 | | | 649,688 |
The William Carter Company
5.625%, 03/15/2027 (A) | | 390,000 | | | 414,931 |
Time Warner Cable LLC
7.300%, 07/01/2038 | | 680,000 | | | 923,162 |
TopBuild Corp.
5.625%, 05/01/2026 (A) | | 1,040,000 | | | 1,081,600 |
Viking Cruises, Ltd.
5.875%, 09/15/2027 (A) | | 1,090,000 | | | 968,792 |
VOC Escrow, Ltd.
5.000%, 02/15/2028 (A) | | 690,000 | | | 615,825 |
WW International, Inc.
8.625%, 12/01/2025 (A) | | 1,200,000 | | | 1,251,000 |
Wynn Macau, Ltd.
5.125%, 12/15/2029 (A) | | 300,000 | | | 294,000 |
| | | | | | 34,309,615 |
| Consumer staples – 2.8% | | | | | |
Altria Group, Inc.
5.950%, 02/14/2049 | | 410,000 | | | 520,541 |
Cott Holdings, Inc.
5.500%, 04/01/2025 (A) | | 680,000 | | | 695,864 |
Lamb Weston Holdings, Inc.
4.875%, 11/01/2026 (A) | | 1,200,000 | | | 1,245,060 |
Pactiv LLC
7.950%, 12/15/2025 | | 1,200,000 | | | 1,368,000 |
Pilgrim's Pride Corp.
5.875%, 09/30/2027 (A) | | 230,000 | | | 238,349 |
Sally Holdings LLC
5.625%, 12/01/2025 | | 780,000 | | | 790,530 |
Simmons Foods, Inc.
5.750%, 11/01/2024 (A) | | 680,000 | | | 673,200 |
| Spectrum Brands, Inc. | | | | | |
| 5.000%, 10/01/2029 (A) | | 250,000 | | | 258,158 |
| 5.750%, 07/15/2025 | | 20,000 | | | 20,500 |
| 6.125%, 12/15/2024 | | 520,000 | | | 537,228 |
| | | | | | 6,347,430 |
| Energy – 9.1% | | | | | |
| Blue Racer Midstream LLC | | | | | |
| 6.125%, 11/15/2022 (A) | | 920,000 | | | 841,101 |
| 6.625%, 07/15/2026 (A) | | 1,190,000 | | | 1,011,500 |
Callon Petroleum Company
8.250%, 07/15/2025 | | 510,000 | | | 453,900 |
Chesapeake Energy Corp.
5.375%, 06/15/2021 | | 100,000 | | | 69,420 |
High Yield Fund (continued)
| | | Shares or
Principal
Amount | | Value |
| CORPORATE BONDS (continued) | | | |
| Energy (continued) | | | | | |
Comstock Resources, Inc.
7.500%, 05/15/2025 (A) | $ | 880,000 | | $ | 648,736 |
DCP Midstream LLC
6.450%, 11/03/2036 (A) | | 310,000 | | | 316,975 |
DCP Midstream Operating LP
6.750%, 09/15/2037 (A) | | 700,000 | | | 735,000 |
Endeavor Energy Resources LP
5.500%, 01/30/2026 (A) | | 270,000 | | | 267,975 |
| Extraction Oil & Gas, Inc. | | | | | |
| 5.625%, 02/01/2026 (A) | | 1,600,000 | | | 560,000 |
| 7.375%, 05/15/2024 (A) | | 1,030,000 | | | 354,495 |
Genesis Energy LP
5.625%, 06/15/2024 | | 700,000 | | | 602,000 |
| MEG Energy Corp. | | | | | |
| 7.000%, 03/31/2024 (A) | | 259,000 | | | 245,403 |
| 7.125%, 02/01/2027 (A) | | 1,300,000 | | | 1,235,000 |
Montage Resources Corp.
8.875%, 07/15/2023 | | 500,000 | | | 360,000 |
| NGPL PipeCo LLC | | | | | |
| 4.375%, 08/15/2022 (A) | | 460,000 | | | 480,516 |
| 4.875%, 08/15/2027 (A) | | 300,000 | | | 325,113 |
| Northern Oil and Gas, Inc. (8.500% Cash and 1.000% PIK) 9.500%, 05/15/2023 | | 261,171 | | | 262,477 |
Oasis Petroleum, Inc.
6.875%, 01/15/2023 (B) | | 921,000 | | | 713,775 |
Parsley Energy LLC
4.125%, 02/15/2028 (A) | | 500,000 | | | 468,750 |
| Petrobras Global Finance BV | | | | | |
| 5.750%, 02/01/2029 | | 40,000 | | | 45,100 |
| 6.850%, 06/05/2115 | | 580,000 | | | 686,575 |
Precision Drilling Corp.
7.125%, 01/15/2026 (A) | | 870,000 | | | 803,010 |
| Range Resources Corp. | | | | | |
| 5.000%, 03/15/2023 (B) | | 450,000 | | | 326,115 |
| 9.250%, 02/01/2026 (A) | | 250,000 | | | 169,575 |
| Rockies Express Pipeline LLC | | | | | |
| 6.875%, 04/15/2040 (A) | | 830,000 | | | 850,536 |
| 7.500%, 07/15/2038 (A) | | 710,000 | | | 788,725 |
Shelf Drilling Holdings, Ltd.
8.250%, 02/15/2025 (A) | | 1,000,000 | | | 830,000 |
| Targa Resources Partners LP | | | | | |
| 4.250%, 11/15/2023 | | 400,000 | | | 396,200 |
| 5.375%, 02/01/2027 | | 290,000 | | | 297,250 |
| 5.875%, 04/15/2026 | | 420,000 | | | 432,642 |
| 6.875%, 01/15/2029 | | 210,000 | | | 226,538 |
Teine Energy, Ltd.
6.875%, 09/30/2022 (A) | | 510,000 | | | 507,450 |
The Williams Companies, Inc.
7.500%, 01/15/2031 | | 650,000 | | | 873,684 |
Transocean Guardian, Ltd.
5.875%, 01/15/2024 (A) | | 509,350 | | | 504,307 |
Transocean Pontus, Ltd.
6.125%, 08/01/2025 (A) | | 609,550 | | | 615,646 |
| Transocean, Inc. | | | | | |
| 6.800%, 03/15/2038 | | 410,000 | | | 223,450 |
| 8.000%, 02/01/2027 (A) | | 250,000 | | | 209,375 |
Vesta Energy Corp.
8.125%, 07/24/2023 (A) | CAD | 920,000 | | | 534,625 |
Viper Energy Partners LP
5.375%, 11/01/2027 (A) | $ | 260,000 | | | 264,238 |
| WPX Energy, Inc. | | | | | |
| 4.500%, 01/15/2030 | | 410,000 | | | 391,427 |
| 8.250%, 08/01/2023 | | 1,040,000 | | | 1,159,600 |
| | | | | | 21,088,204 |
| The accompanying notes are an integral part of the financial statements. | 19 | |
John Hancock Funds II
Portfolio of Investments — February 29, 2020 (unaudited)(showing percentage of total net assets)
High Yield Fund (continued)
| | | Shares or
Principal
Amount | | Value |
| CORPORATE BONDS (continued) | | | |
| Financials – 8.2% | | | | | |
Allied Universal Holdco LLC
6.625%, 07/15/2026 (A) | $ | 1,320,000 | | $ | 1,384,350 |
Ally Financial, Inc.
8.000%, 11/01/2031 | | 480,000 | | | 664,483 |
ASP AMC Merger Sub, Inc.
8.000%, 05/15/2025 (A) | | 1,300,000 | | | 848,250 |
| Barclays PLC (5.088% to 6-20-29, then 3 month LIBOR + 3.054%) 06/20/2030 | | 1,470,000 | | | 1,669,087 |
| Barclays PLC (8.000% to 12-15-20, then 5 Year Euro Swap Rate + 6.750%) 12/15/2020 (E) | EUR | 540,000 | | | 622,214 |
| Barclays PLC (8.000% to 6-15-24, then 5 Year CMT + 5.672%) 06/15/2024 (E) | $ | 600,000 | | | 660,000 |
| BNP Paribas SA (7.375% to 8-19-25, then 5 Year U.S. Swap Rate + 5.150%) 08/19/2025 (A)(E) | | 350,000 | | | 396,813 |
CIT Group, Inc.
5.250%, 03/07/2025 | | 170,000 | | | 186,150 |
| Credit Agricole SA (8.125% to 12-23-25, then 5 Year U.S. Swap Rate + 6.185%) 12/23/2025 (A)(E) | | 600,000 | | | 708,933 |
| Credit Suisse Group AG (6.375% to 8-21-26, then 5 Year CMT + 4.822%) 08/21/2026 (A)(E) | | 840,000 | | | 897,750 |
| Credit Suisse Group AG (7.500% to 7-17-23, then 5 Year U.S. Swap Rate + 4.600%) 07/17/2023 (A)(E) | | 210,000 | | | 226,685 |
DAE Funding LLC
5.750%, 11/15/2023 (A) | | 1,530,000 | | | 1,593,113 |
Donnelley Financial Solutions, Inc.
8.250%, 10/15/2024 | | 680,000 | | | 698,496 |
Fidelity & Guaranty Life Holdings, Inc.
5.500%, 05/01/2025 (A) | | 470,000 | | | 521,700 |
FirstCash, Inc.
5.375%, 06/01/2024 (A) | | 710,000 | | | 725,975 |
| HSBC Holdings PLC (6.375% to 3-30-25, then 5 Year ICE Swap Rate + 4.368%) 03/30/2025 (E) | | 200,000 | | | 211,640 |
| HSBC Holdings PLC (6.500% to 3-23-28, then 5 Year ICE Swap Rate + 3.606%) 03/23/2028 (E) | | 720,000 | | | 785,700 |
Intesa Sanpaolo SpA
5.017%, 06/26/2024 (A) | | 200,000 | | | 210,577 |
Ladder Capital Finance Holdings LLLP
4.250%, 02/01/2027 (A) | | 530,000 | | | 502,838 |
NatWest Markets NV
7.750%, 05/15/2023 | | 520,000 | | | 598,725 |
| Navient Corp. | | | | | |
| 5.000%, 03/15/2027 | | 330,000 | | | 319,176 |
| 6.750%, 06/15/2026 (B) | | 270,000 | | | 284,850 |
| Quicken Loans, Inc. | | | | | |
| 5.250%, 01/15/2028 (A) | | 1,540,000 | | | 1,593,438 |
| 5.750%, 05/01/2025 (A) | | 180,000 | | | 184,424 |
| The Royal Bank of Scotland Group PLC (8.625% to 8-15-21, then 5 Year U.S. Swap Rate + 7.598%) 08/15/2021 (E) | | 670,000 | | | 708,860 |
| UBS Group AG (7.000% to 1-31-24, then 5 Year U.S. Swap Rate + 4.344%) 01/31/2024 (A)(E) | | 810,000 | | | 866,700 |
High Yield Fund (continued)
| | | Shares or
Principal
Amount | | Value |
| CORPORATE BONDS (continued) | | | |
| Financials (continued) | | | | | |
| UniCredit SpA (7.296% to 4-2-29, then 5 Year ICE Swap Rate + 4.914%) 04/02/2034 (A) | $ | 690,000 | | $ | 801,265 |
| | | | | | 18,872,192 |
| Health care – 8.4% | | | | | |
Air Medical Group Holdings, Inc.
6.375%, 05/15/2023 (A)(B) | | 230,000 | | | 219,650 |
AMN Healthcare, Inc.
4.625%, 10/01/2027 (A) | | 200,000 | | | 202,500 |
Bausch Health Americas, Inc.
9.250%, 04/01/2026 (A) | | 1,321,000 | | | 1,475,980 |
| Bausch Health Companies, Inc. | | | | | |
| 5.000%, 01/30/2028 (A) | | 690,000 | | | 680,940 |
| 5.250%, 01/30/2030 (A) | | 630,000 | | | 622,913 |
| 5.500%, 11/01/2025 (A) | | 550,000 | | | 566,269 |
| 9.000%, 12/15/2025 (A) | | 1,379,000 | | | 1,535,461 |
| Centene Corp. | | | | | |
| 3.375%, 02/15/2030 (A) | | 250,000 | | | 250,000 |
| 4.250%, 12/15/2027 (A) | | 350,000 | | | 360,080 |
| 4.625%, 12/15/2029 (A) | | 800,000 | | | 856,000 |
| 5.375%, 06/01/2026 (A) | | 970,000 | | | 1,020,925 |
| 6.125%, 02/15/2024 | | 130,000 | | | 133,991 |
| Community Health Systems, Inc. | | | | | |
| 6.625%, 02/15/2025 (A) | | 940,000 | | | 958,800 |
| 8.000%, 03/15/2026 (A) | | 800,000 | | | 826,160 |
DaVita, Inc.
5.000%, 05/01/2025 | | 310,000 | | | 314,573 |
HCA, Inc.
5.625%, 09/01/2028 | | 2,500,000 | | | 2,833,450 |
HLF Financing Sarl LLC
7.250%, 08/15/2026 (A) | | 610,000 | | | 616,100 |
LifePoint Health, Inc.
4.375%, 02/15/2027 (A) | | 530,000 | | | 523,216 |
Par Pharmaceutical, Inc.
7.500%, 04/01/2027 (A) | | 710,000 | | | 749,760 |
| Polaris Intermediate Corp. (8.500% Cash or 9.250% PIK) 8.500%, 12/01/2022 (A)(B) | | 620,000 | | | 527,062 |
Radiology Partners, Inc.
9.250%, 02/01/2028 (A) | | 780,000 | | | 783,900 |
RegionalCare Hospital Partners Holdings, Inc.
9.750%, 12/01/2026 (A) | | 480,000 | | | 514,800 |
Tenet Healthcare Corp.
6.750%, 06/15/2023 | | 1,000,000 | | | 1,070,000 |
Teva Pharmaceutical Finance
Netherlands III BV | | | | | |
| 2.800%, 07/21/2023 | | 800,000 | | | 740,664 |
| 7.125%, 01/31/2025 (A) | | 850,000 | | | 898,875 |
US Renal Care, Inc.
10.625%, 07/15/2027 (A) | | 200,000 | | | 202,500 |
| | | | | | 19,484,569 |
| Industrials – 9.6% | | | | | |
Ahern Rentals, Inc.
7.375%, 05/15/2023 (A) | | 530,000 | | | 410,045 |
Allison Transmission, Inc.
5.000%, 10/01/2024 (A) | | 640,000 | | | 647,174 |
Builders FirstSource, Inc.
5.000%, 03/01/2030 (A) | | 230,000 | | | 230,110 |
BWX Technologies, Inc.
5.375%, 07/15/2026 (A) | | 560,000 | | | 586,211 |
Cleaver-Brooks, Inc.
7.875%, 03/01/2023 (A) | | 400,000 | | | 394,000 |
| The accompanying notes are an integral part of the financial statements. | 20 | |
John Hancock Funds II
Portfolio of Investments — February 29, 2020 (unaudited)(showing percentage of total net assets)
High Yield Fund (continued)
| | | Shares or
Principal
Amount | | Value |
| CORPORATE BONDS (continued) | | | |
| Industrials (continued) | | | | | |
Continental Airlines 2000-1 Class B Pass Through Trust
8.388%, 11/01/2020 | $ | 143 | | $ | 147 |
Covanta Holding Corp.
5.875%, 07/01/2025 | | 500,000 | | | 512,500 |
FXI Holdings, Inc.
7.875%, 11/01/2024 (A) | | 780,000 | | | 733,200 |
| GFL Environmental, Inc. | | | | | |
| 5.125%, 12/15/2026 (A) | | 160,000 | | | 165,600 |
| 5.375%, 03/01/2023 (A) | | 530,000 | | | 540,600 |
| 7.000%, 06/01/2026 (A) | | 480,000 | | | 504,600 |
| 8.500%, 05/01/2027 (A) | | 1,780,000 | | | 1,931,300 |
| Global Aircraft Leasing Company, Ltd. (6.500% Cash or 7.250% PIK) 6.500%, 09/15/2024 (A) | | 2,570,000 | | | 2,523,419 |
Harsco Corp.
5.750%, 07/31/2027 (A) | | 450,000 | | | 443,250 |
Navios Maritime Acquisition Corp.
8.125%, 11/15/2021 (A) | | 1,490,000 | | | 1,009,475 |
Park-Ohio Industries, Inc.
6.625%, 04/15/2027 | | 668,000 | | | 677,739 |
| Prime Security Services Borrower LLC | | | | | |
| 5.250%, 04/15/2024 (A) | | 40,000 | | | 41,400 |
| 5.750%, 04/15/2026 (A) | | 1,630,000 | | | 1,695,200 |
Sensata Technologies, Inc.
4.375%, 02/15/2030 (A) | | 420,000 | | | 423,675 |
Signature Aviation US Holdings, Inc.
5.375%, 05/01/2026 (A) | | 790,000 | | | 806,080 |
| Standard Industries, Inc. | | | | | |
| 4.750%, 01/15/2028 (A) | | 720,000 | | | 740,956 |
| 6.000%, 10/15/2025 (A) | | 240,000 | | | 250,800 |
The ADT Security Corp.
4.125%, 06/15/2023 | | 830,000 | | | 846,081 |
| United Rentals North America, Inc. | | | | | |
| 3.875%, 11/15/2027 | | 180,000 | | | 181,800 |
| 4.875%, 01/15/2028 | | 470,000 | | | 482,361 |
| 5.250%, 01/15/2030 | | 1,960,000 | | | 2,061,920 |
| 5.500%, 05/15/2027 | | 690,000 | | | 721,050 |
Waste Pro USA, Inc.
5.500%, 02/15/2026 (A) | | 580,000 | | | 565,706 |
XPO CNW, Inc.
6.700%, 05/01/2034 | | 890,000 | | | 916,700 |
XPO Logistics, Inc.
6.125%, 09/01/2023 (A) | | 1,085,000 | | | 1,107,384 |
| | | | | | 22,150,483 |
| Information technology – 3.3% | | | | | |
Alliance Data Systems Corp.
4.750%, 12/15/2024 (A) | | 600,000 | | | 588,750 |
Amkor Technology, Inc.
6.625%, 09/15/2027 (A) | | 780,000 | | | 842,400 |
| CDK Global, Inc. | | | | | |
| 5.250%, 05/15/2029 (A) | | 20,000 | | | 21,325 |
| 5.875%, 06/15/2026 | | 820,000 | | | 857,966 |
| CommScope Technologies LLC | | | | | |
| 5.000%, 03/15/2027 (A) | | 250,000 | | | 226,225 |
| 6.000%, 06/15/2025 (A) | | 280,000 | | | 263,200 |
CommScope, Inc.
8.250%, 03/01/2027 (A) | | 1,030,000 | | | 1,039,013 |
Dell International LLC
7.125%, 06/15/2024 (A) | | 490,000 | | | 512,663 |
Fair Isaac Corp.
4.000%, 06/15/2028 (A) | | 440,000 | | | 451,000 |
j2 Cloud Services LLC
6.000%, 07/15/2025 (A) | | 760,000 | | | 792,300 |
High Yield Fund (continued)
| | | Shares or
Principal
Amount | | Value |
| CORPORATE BONDS (continued) | | | |
| Information technology (continued) | | | | | |
Level 3 Financing, Inc.
5.250%, 03/15/2026 | $ | 580,000 | | $ | 598,850 |
Open Text Corp.
3.875%, 02/15/2028 (A) | | 290,000 | | | 288,608 |
Open Text Holdings, Inc.
4.125%, 02/15/2030 (A) | | 470,000 | | | 467,650 |
Western Digital Corp.
4.750%, 02/15/2026 | | 560,000 | | | 578,200 |
| | | | | | 7,528,150 |
| Materials – 7.4% | | | | | |
Alcoa Nederland Holding BV
7.000%, 09/30/2026 (A) | | 530,000 | | | 560,475 |
| ARD Finance SA (6.500% Cash or 7.250% PIK) 6.500%, 06/30/2027 (A) | | 540,000 | | | 543,402 |
Ardagh Packaging Finance PLC
6.000%, 02/15/2025 (A) | | 800,000 | | | 834,000 |
| BHP Billiton Finance USA, Ltd. (6.750% to 10-20-25, then 5 Year U.S. Swap Rate + 5.093%) 10/19/2075 (A) | | 460,000 | | | 534,750 |
| Cascades, Inc. | | | | | |
| 5.125%, 01/15/2026 (A) | | 10,000 | | | 10,350 |
| 5.375%, 01/15/2028 (A) | | 610,000 | | | 628,300 |
| First Quantum Minerals, Ltd. | | | | | |
| 6.875%, 03/01/2026 (A) | | 620,000 | | | 580,506 |
| 7.250%, 04/01/2023 (A) | | 600,000 | | | 576,000 |
| 7.500%, 04/01/2025 (A) | | 1,390,000 | | | 1,323,975 |
Flex Acquisition Company, Inc.
7.875%, 07/15/2026 (A) | | 810,000 | | | 822,150 |
| Freeport-McMoRan, Inc. | | | | | |
| 3.550%, 03/01/2022 | | 337,000 | | | 339,999 |
| 4.550%, 11/14/2024 | | 470,000 | | | 475,875 |
| 5.450%, 03/15/2043 | | 2,880,000 | | | 2,793,600 |
Greif, Inc.
6.500%, 03/01/2027 (A) | | 1,179,000 | | | 1,268,132 |
Hudbay Minerals, Inc.
7.625%, 01/15/2025 (A) | | 310,000 | | | 298,632 |
| Mercer International, Inc. | | | | | |
| 5.500%, 01/15/2026 | | 590,000 | | | 556,488 |
| 7.375%, 01/15/2025 | | 890,000 | | | 898,900 |
Midwest Vanadium Pty, Ltd.
11.500%, 02/15/2018 (A)(C) | | 1,953,148 | | | 2,441 |
Northwest Acquisitions ULC
7.125%, 11/01/2022 (A) | | 1,140,000 | | | 866,400 |
Olin Corp.
5.000%, 02/01/2030 | | 560,000 | | | 539,728 |
Summit Materials LLC
6.500%, 03/15/2027 (A) | | 790,000 | | | 841,350 |
Teck Resources, Ltd.
5.200%, 03/01/2042 | | 970,000 | | | 968,377 |
| Trivium Packaging Finance BV | | | | | |
| 5.500%, 08/15/2026 (A) | | 200,000 | | | 207,250 |
| 8.500%, 08/15/2027 (A) | | 350,000 | | | 367,955 |
U.S. Concrete, Inc.
6.375%, 06/01/2024 | | 260,000 | | | 264,576 |
| | | | | | 17,103,611 |
| Real estate – 4.1% | | | | | |
| CoreCivic, Inc. | | | | | |
| 4.625%, 05/01/2023 | | 280,000 | | | 280,616 |
| 5.000%, 10/15/2022 | | 370,000 | | | 377,585 |
CTR Partnership LP
5.250%, 06/01/2025 | | 410,000 | | | 426,400 |
Five Point Operating Company LP
7.875%, 11/15/2025 (A) | | 1,240,000 | | | 1,245,431 |
| The accompanying notes are an integral part of the financial statements. | 21 | |
John Hancock Funds II
Portfolio of Investments — February 29, 2020 (unaudited)(showing percentage of total net assets)
High Yield Fund (continued)
| | | Shares or
Principal
Amount | | Value |
| CORPORATE BONDS (continued) | | | |
| Real estate (continued) | | | | | |
| Forestar Group, Inc. | | | | | |
| 5.000%, 03/01/2028 (A) | $ | 700,000 | | $ | 687,750 |
| 8.000%, 04/15/2024 (A) | | 780,000 | | | 845,325 |
Iron Mountain, Inc.
4.875%, 09/15/2029 (A) | | 1,160,000 | | | 1,149,583 |
| MPT Operating Partnership LP | | | | | |
| 4.625%, 08/01/2029 | | 380,000 | | | 399,239 |
| 5.000%, 10/15/2027 | | 720,000 | | | 751,327 |
| The GEO Group, Inc. | | | | | |
| 5.875%, 10/15/2024 | | 850,000 | | | 794,750 |
| 6.000%, 04/15/2026 | | 1,500,000 | | | 1,357,500 |
VICI Properties LP
4.125%, 08/15/2030 (A) | | 1,080,000 | | | 1,081,350 |
| | | | | | 9,396,856 |
| Utilities – 0.4% | | | | | |
| Talen Energy Supply LLC | | | | | |
| 6.625%, 01/15/2028 (A) | | 510,000 | | | 488,172 |
| 10.500%, 01/15/2026 (A) | | 400,000 | | | 356,000 |
| | | | | | 844,172 |
| TOTAL CORPORATE BONDS (Cost $193,354,117) | | | $ | 189,908,227 |
| CONVERTIBLE BONDS – 0.9% | | | |
| Communication services – 0.5% | | | | | |
| DISH Network Corp. | | | | | |
| 2.375%, 03/15/2024 | | 830,000 | | | 771,626 |
| 3.375%, 08/15/2026 | | 220,000 | | | 212,412 |
Live Nation Entertainment, Inc.
2.000%, 02/15/2025 (A) | | 110,000 | | | 108,233 |
Vonage Holdings Corp.
1.750%, 06/01/2024 (A) | | 120,000 | | | 113,956 |
| | | | | | 1,206,227 |
| Energy – 0.1% | | | | | |
Cheniere Energy, Inc.
4.250%, 03/15/2045 | | 360,000 | | | 262,731 |
| Financials – 0.1% | | | | | |
BofA Finance LLC
0.125%, 09/01/2022 | | 100,000 | | | 101,875 |
| Information technology – 0.2% | | | | | |
RingCentral, Inc.
0.286%, 03/01/2025 (A)(F) | | 60,000 | | | 59,138 |
Vishay Intertechnology, Inc.
2.250%, 06/15/2025 | | 460,000 | | | 455,124 |
| | | | | | 514,262 |
| TOTAL CONVERTIBLE BONDS (Cost $2,157,244) | | | $ | 2,085,095 |
| TERM LOANS (G) – 8.1% | | | |
| Communication services – 0.8% | | | | | |
| Allen Media LLC, 2020 Term Loan B (3 month LIBOR + 5.500%) 7.231%, 02/10/2027 | | 300,000 | | | 294,750 |
| AMC Entertainment Holdings, Inc., 2019 Term Loan B (1 month LIBOR + 3.000%) 4.610%, 04/22/2026 | | 558,593 | | | 539,394 |
| iHeartCommunications, Inc., 2020 Term Loan (1 week LIBOR + 3.000%) 4.655%, 05/01/2026 | | 445,853 | | | 436,936 |
| Terrier Media Buyer, Inc., Term Loan B (3 month LIBOR + 4.250%) 6.148%, 12/17/2026 | | 610,000 | | | 604,919 |
| | | | | | 1,875,999 |
High Yield Fund (continued)
| | | Shares or
Principal
Amount | | Value |
| TERM LOANS (G) (continued) | | | |
| Consumer discretionary – 1.4% | | | | | |
| CEOC LLC, Exit Term Loan (1 month LIBOR + 2.000%) 3.603%, 10/07/2024 | $ | 867,005 | | $ | 862,185 |
| Diamond Sports Group LLC, Term Loan (1 month LIBOR + 3.250%) 4.880%, 08/24/2026 | | 99,750 | | | 90,773 |
Michaels Stores, Inc., Term Loan
01/30/2023 TBD (H) | | 270,000 | | | 243,000 |
| Mohegan Gaming & Entertainment, 2016 Term Loan B (1 month LIBOR + 4.000%) 5.603%, 10/13/2023 | | 700,000 | | | 674,331 |
| Panther BF Aggregator 2 LP, USD Term Loan B (1 month LIBOR + 3.500%) 5.103%, 04/30/2026 | | 578,550 | | | 563,363 |
| Spencer Spirit IH LLC, Term Loan B (1 month LIBOR + 6.000%) 7.629%, 06/19/2026 | | 793,835 | | | 792,843 |
| | | | | | 3,226,495 |
| Energy – 0.6% | | | | | |
| Chesapeake Energy Corp., 2019 Last Out Term Loan (3 month LIBOR + 8.000%) 9.928%, 06/24/2024 | | 630,000 | | | 570,673 |
| Eastern Power LLC, Term Loan B (1 month LIBOR + 3.750%) 5.353%, 10/02/2025 | | 510,000 | | | 502,350 |
Permian Production Partners LLC, Term Loan
0.000%, 05/20/2024 (C) | | 807,500 | | | 290,700 |
| | | | | | 1,363,723 |
| Financials – 0.9% | | | | | |
| Acrisure LLC, 2020 Term Loan B (3 month LIBOR + 3.500%) 5.207%, 02/15/2027 | | 540,000 | | | 530,998 |
| Allied Universal Holdco LLC, 2019 Term Loan B (1 month LIBOR + 4.250%) 5.853%, 07/10/2026 | | 980,814 | | | 969,368 |
Amerilife Holdings LLC, 2020 Term Loan
02/06/2027 TBD (H) | | 159,545 | | | 157,950 |
| Jane Street Group LLC, 2020 Term Loan (1 and 3 month LIBOR + 3.000%) 4.613%, 01/31/2025 | | 417,884 | | | 416,580 |
| | | | | | 2,074,896 |
| Health care – 2.4% | | | | | |
Eyecare Partners LLC, 2020 2nd Lien Term Loan
02/04/2028 TBD (H)(I) | | 430,000 | | | 425,700 |
| Eyecare Partners LLC, 2020 Term Loan (1 month LIBOR + 3.750%) 5.418%, 02/05/2027 | | 470,270 | | | 462,041 |
| Immucor, Inc., Extended Term Loan B (3 month LIBOR + 5.000%) 6.945%, 06/15/2021 | | 825,384 | | | 813,003 |
| McAfee LLC, 2018 USD Term Loan B (1 month LIBOR + 3.750%) 5.353%, 09/30/2024 | | 825,819 | | | 816,272 |
| Option Care Health, Inc., Term Loan B (1 month LIBOR + 4.500%) 6.103%, 08/06/2026 | | 770,000 | | | 766,789 |
| RegionalCare Hospital Partners Holdings, Inc., 2018 Term Loan B (1 month LIBOR + 3.750%) 5.353%, 11/17/2025 | | 482,528 | | | 477,703 |
| The accompanying notes are an integral part of the financial statements. | 22 | |
John Hancock Funds II
Portfolio of Investments — February 29, 2020 (unaudited)(showing percentage of total net assets)
High Yield Fund (continued)
| | | Shares or
Principal
Amount | | Value |
| TERM LOANS (G) (continued) | | | |
| Health care (continued) | | | | | |
| US Renal Care, Inc., 2019 Term Loan B (1 month LIBOR + 5.000%) 6.625%, 06/26/2026 | $ | 1,376,550 | | $ | 1,361,064 |
| VVC Holding Corp., 2019 Term Loan B (1 month LIBOR + 4.500%) 6.158%, 02/11/2026 | | 486,325 | | | 480,246 |
| | | | | | 5,602,818 |
| Industrials – 1.3% | | | | | |
| Amentum Government Services Holdings LLC, Term Loan B (3 month LIBOR + 4.000%) 5.762%, 02/01/2027 | | 360,000 | | | 358,650 |
| Cornerstone Building Brands, Inc., 2018 Term Loan (1 month LIBOR + 3.750%) 5.408%, 04/12/2025 | | 1,103,200 | | | 1,070,104 |
| Garda World Security Corp., 2019 1st Lien Term Loan B (3 month LIBOR + 4.750%) 6.390%, 10/30/2026 | | 772,239 | | | 767,643 |
Rockwood Service Corp., 2020 Term Loan B
01/23/2027 TBD (H) | | 50,000 | | | 50,500 |
| Temple Generation I LLC, 2nd Lien Term Loan (1 month LIBOR + 8.000%) 9.603%, 02/07/2023 | | 651,917 | | | 651,917 |
| | | | | | 2,898,814 |
| Information technology – 0.5% | | | | | |
Castle US Holding Corp., USD Term Loan B
01/29/2027 TBD (H) | | 240,000 | | | 228,000 |
| Global Tel*Link Corp., 2018 1st Lien Term Loan (1 month LIBOR + 4.250%) 5.853%, 11/29/2025 | | 815,879 | | | 775,665 |
| | | | | | 1,003,665 |
| Real estate – 0.2% | | | | | |
| CoreCivic, Inc., 2019 Term Loan, 2019 Term Loan (1 month LIBOR + 4.500%) 6.110%, 12/12/2024 | | 520,000 | | | 513,500 |
| TOTAL TERM LOANS (Cost $19,396,746) | | | $ | 18,559,910 |
| ASSET BACKED SECURITIES – 4.4% | | | |
| BlueMountain CLO, Ltd. | | | | | |
Series 2012-2A, Class ER2 (3 month LIBOR + 5.750%)
7.445%, 11/20/2028 (A)(D) | | 500,000 | | | 477,339 |
Series 2016-2A, Class DR (3 month LIBOR + 7.790%)
9.485%, 08/20/2032 (A)(D) | | 375,000 | | | 375,087 |
Bowman Park CLO, Ltd.
Series 2014-1A, Class D1R (3 month LIBOR + 3.350%)
5.033%, 11/23/2025 (A)(D) | | 500,000 | | | 500,783 |
Cook Park CLO, Ltd.
Series 2018-1A, Class E (3 month LIBOR + 5.400%)
7.236%, 04/17/2030 (A)(D) | | 250,000 | | | 230,491 |
Cumberland Park CLO, Ltd.
Series 2015-2A, Class ER (3 month LIBOR + 5.650%)
7.469%, 07/20/2028 (A)(D) | | 250,000 | | | 243,708 |
| Greenwood Park CLO, Ltd. | | | | | |
Series 2018-1A, Class D (3 month LIBOR + 2.500%)
4.331%, 04/15/2031 (A)(D) | | 530,000 | | | 512,022 |
High Yield Fund (continued)
| | | Shares or
Principal
Amount | | Value |
| ASSET BACKED SECURITIES (continued) | | | |
| Greenwood Park CLO, Ltd. (continued) | | | | | |
Series 2018-1A, Class E (3 month LIBOR + 4.950%)
6.781%, 04/15/2031 (A)(D) | $ | 750,000 | | $ | 670,330 |
Greywolf CLO, Ltd.
Series 2019-1A, Class C (3 month LIBOR + 3.950%)
5.786%, 04/17/2030 (A)(D) | | 430,000 | | | 430,205 |
Halseypoint CLO, Ltd.
Series 2019-1A, Class E (3 month LIBOR + 7.700%)
9.607%, 01/20/2033 (A)(D) | | 600,000 | | | 600,113 |
Jackson Mill CLO, Ltd.
Series 2015-1A, Class DR (3 month LIBOR + 2.800%)
4.631%, 04/15/2027 (A)(D) | | 250,000 | | | 248,878 |
LCM, Ltd. Partnership
Series 2022-A, Class DR (3 month LIBOR + 5.500%)
7.319%, 10/20/2028 (A)(D) | | 500,000 | | | 463,747 |
Madison Park Funding, Ltd.
Series 2014-13A, Class DR2 (3 month LIBOR + 2.850%)
4.669%, 04/19/2030 (A)(D) | | 1,000,000 | | | 979,463 |
Oaktree CLO, Ltd.
Series 2019-1A, Class D (3 month LIBOR + 3.800%)
5.602%, 04/22/2030 (A)(D) | | 250,000 | | | 237,016 |
Octagon Investment Partners XWIII, Ltd.
Series 2015-1A, Class ER (3 month LIBOR + 5.750%)
7.581%, 07/15/2027 (A)(D) | | 400,000 | | | 379,620 |
| OZLM, Ltd. | | | | | |
Series 2014-7RA, Class DR (3 month LIBOR + 6.110%)
7.946%, 07/17/2029 (A)(D) | | 500,000 | | | 405,619 |
Series 2015-11A, Class CR (3 month LIBOR + 3.600%)
5.370%, 10/30/2030 (A)(D) | | 1,000,000 | | | 976,125 |
Shackleton CLO, Ltd.
Series 2013-3A, Class DR (3 month LIBOR + 3.020%)
4.851%, 07/15/2030 (A)(D) | | 500,000 | | | 469,998 |
Sound Point CLO, Ltd.
Series 2013-2RA, Class E (3 month LIBOR + 6.000%)
7.831%, 04/15/2029 (A)(D) | | 850,000 | | | 709,356 |
TCI-Symphony CLO, Ltd.
Series 2016-1A, Class DR (3 month LIBOR + 3.000%)
4.848%, 10/13/2029 (A)(D) | | 540,000 | | | 535,346 |
Thayer Park CLO, Ltd.
Series 2017-1A, Class C (3 month LIBOR + 3.700%)
5.519%, 04/20/2029 (A)(D) | | 250,000 | | | 250,089 |
Voya CLO, Ltd.
Series 2017-1A, Class C (3 month LIBOR + 3.330%)
5.166%, 04/17/2030 (A)(D) | | 500,000 | | | 491,084 |
| TOTAL ASSET BACKED SECURITIES (Cost $10,526,061) | | | $ | 10,186,419 |
| COMMON STOCKS – 0.8% | | | | |
| Communication services – 0.0% | | | | | |
| New Cotai, Inc., Class B (I)(J)(K) | | 11 | | | 0 |
| The accompanying notes are an integral part of the financial statements. | 23 | |
John Hancock Funds II
Portfolio of Investments — February 29, 2020 (unaudited)(showing percentage of total net assets)
High Yield Fund (continued)
| | | Shares or
Principal
Amount | | Value |
| COMMON STOCKS (continued) | | | | |
| Energy – 0.8% | | | | | |
| Berry Corp. | | 211,334 | | $ | 1,346,198 |
| Hercules Offshore, Inc. (I)(K) | | 120,022 | | | 116,685 |
| KCAD Holdings I, Ltd. (I)(J)(K) | | 752,218,031 | | | 752 |
| Montage Resources Corp. (B)(K) | | 66,492 | | | 232,057 |
| MWO Holdings LLC (I)(J)(K) | | 1,134 | | | 65,851 |
| | | | | | 1,761,543 |
| TOTAL COMMON STOCKS (Cost $22,029,828) | | $ | 1,761,543 |
| PREFERRED SECURITIES – 0.7% | | | | |
| Financials – 0.6% | | | | | |
| B. Riley Financial, Inc., 6.875% | | 16,425 | | | 406,519 |
| GMAC Capital Trust I (3 month LIBOR + 5.785%), 7.477% (D) | | 43,100 | | | 1,099,050 |
| | | | | | 1,505,569 |
| Utilities – 0.1% | | | | | |
| NextEra Energy, Inc., 5.279% | | 3,850 | | | 175,028 |
| TOTAL PREFERRED SECURITIES (Cost $1,718,887) | | $ | 1,680,597 |
| ESCROW SHARES – 0.0% | | | | | |
| Bossier Casino Venture Holdco, Inc. (I)(K) | | 163,507 | | | 42,512 |
| TOTAL ESCROW SHARES (Cost $0) | | $ | 42,512 |
| ESCROW CERTIFICATES – 0.0% | | | | | |
Magellan Health, Inc.
9.750%, 05/15/2020 (I)(K) | $ | 4,380,000 | | | 1,134 |
| TOTAL ESCROW CERTIFICATES (Cost $0) | | $ | 1,134 |
| PURCHASED OPTIONS – 0.0% | | | | | |
| Calls – 0.0% | | | | | |
| Over the Counter Option on iShares iBoxx High Yield Corporate Bond ETF (Expiration Date: 3-5-20; Strike Price: $88.50; Counterparty: Citigroup Global Markets, Inc.) (K)(L) | | 76,553 | | | 13,122 |
| TOTAL PURCHASED OPTIONS (Cost $33,683) | | $ | 13,122 |
| SHORT-TERM INVESTMENTS – 4.7% | | | |
| Short-term funds – 4.7% | | | | | |
| John Hancock Collateral Trust, 1.6968% (M)(N) | | 626,132 | | | 6,266,896 |
| State Street Institutional Treasury Plus Money Market Fund, Premier Class, 1.5207% (M) | | 4,587,660 | | | 4,587,660 |
| TOTAL SHORT-TERM INVESTMENTS (Cost $10,852,943) | | $ | 10,854,556 |
Total Investments (High Yield Fund)
(Cost $263,439,204) – 102.8% | | $ | 237,013,923 |
| Other assets and liabilities, net – (2.8%) | | | | (6,461,808) |
| TOTAL NET ASSETS – 100.0% | | | | $ | 230,552,115 |
High Yield Fund (continued)
| Currency Abbreviations |
| BRL | Brazilian Real |
| CAD | Canadian Dollar |
| EUR | Euro |
| GBP | Pound Sterling |
| IDR | Indonesian Rupiah |
| Security Abbreviations and Legend |
| CMT | Constant Maturity Treasury |
| ICE | Intercontinental Exchange |
| LIBOR | London Interbank Offered Rate |
| PIK | Pay-in-Kind Security - Represents a payment-in-kind which may pay interest in additional par and/or cash. Rates shown are the current rate and most recent payment rate. |
| (A) | These securities are exempt from registration under Rule 144A of the Securities Act of 1933. Such securities may be resold, normally to qualified institutional buyers, in transactions exempt from registration. Rule 144A securities amounted to $132,606,144 or 57.5% of the fund's net assets as of 2-29-20. |
| (B) | All or a portion of this security is on loan as of 2-29-20. |
| (C) | Non-income producing - Issuer is in default. |
| (D) | Variable rate obligation. The coupon rate shown represents the rate at period end. |
| (E) | Perpetual bonds have no stated maturity date. Date shown as maturity date is next call date. |
| (F) | Zero coupon bonds are issued at a discount from their principal amount in lieu of paying interest periodically. Rate shown is the effective yield at period end. |
| (G) | Term loans are variable rate obligations. The coupon rate shown represents the rate at period end. |
| (H) | This position represents an unsettled loan commitment at period end. Certain details associated with this purchase are not known prior to the settlement date, including coupon rate, which is disclosed as TBD (To Be Determined). |
| (I) | Security is valued using significant unobservable inputs and is classified as Level 3 in the fair value hierarchy. Refer to Note 2 to the financial statements. |
| (J) | Restricted security as to resale, excluding 144A securities. For more information on this security refer to the Notes to financial statements. |
| (K) | Non-income producing security. |
| (L) | For this type of option, notional amounts are equivalent to number of contracts. |
| (M) | The rate shown is the annualized seven-day yield as of 2-29-20. |
| (N) | Investment is an affiliate of the fund, the advisor and/or subadvisor. This security represents the investment of cash collateral received for securities lending. |
DERIVATIVES
FUTURES
| Open contracts | Number of
contracts | Position | Expiration
date | Notional
basis^ | Notional
value^ | Unrealized
appreciation
(depreciation) |
| 5-Year U.S. Treasury Note Futures | 177 | Long | Jun 2020 | $21,351,457 | $21,726,750 | $375,293 |
| 10-Year U.S. Treasury Note Futures | 61 | Short | Jun 2020 | (7,991,834) | (8,219,750) | (227,916) |
| U.S. Treasury Long Bond Futures | 16 | Short | Jun 2020 | (2,637,622) | (2,724,000) | (86,378) |
| | | | | | | $60,999 |
^ Notional basis refers to the contractual amount agreed upon at inception of open contracts; notional value represents the current value of the open contract.
| The accompanying notes are an integral part of the financial statements. | 24 | |
John Hancock Funds II
Portfolio of Investments — February 29, 2020 (unaudited)(showing percentage of total net assets)
High Yield Fund (continued)
FORWARD FOREIGN CURRENCY CONTRACTS
| Contract to buy | Contract to sell | Counterparty (OTC) | Contractual
settlement
date | Unrealized
appreciation | Unrealized
depreciation |
| GBP | 587,667 | USD | 772,009 | JPM | 4/17/2020 | — | $(17,629) |
| MXN | 3,526,523 | USD | 185,328 | JPM | 4/17/2020 | — | (7,424) |
| USD | 676,407 | CAD | 880,827 | BNP | 4/17/2020 | $20,169 | — |
| USD | 807,036 | EUR | 722,900 | BNP | 4/17/2020 | 6,824 | — |
| USD | 164,302 | EUR | 146,843 | JPM | 4/17/2020 | 1,754 | — |
| | | | | | | $28,747 | $(25,053) |
WRITTEN OPTIONS
| Options on securities |
Counterparty (OTC)/
Exchange-traded | Name of issuer | | Exercise
price | Expiration
date | Number of
contracts | Notional
amount | Premium | Value |
| Puts |
| CITI | iShares iBoxx High Yield Corporate Bond ETF | USD | 86.00 | Mar 2020 | 76,553 | 76,553 | $19,904 | $(118,821) |
| | | | | | | | $19,904 | $(118,821) |
SWAPS
| Credit default swaps - Buyer |
Counterparty
(OTC)/
Centrally
cleared | Reference
obligation | Notional
amount | Currency | USD
notional
amount | Pay
fixed
rate | Fixed
payment
frequency | Maturity
date | Unamortized
upfront
payment
paid
(received) | Unrealized
appreciation
(depreciation) | Value |
| Centrally cleared | Kraft Heinz Foods Company | 744,000 | USD | $744,000 | 1.000% | Quarterly | Dec 2020 | $3,352 | $1,295 | $4,647 |
| | | | | $744,000 | | | | $3,352 | $1,295 | $4,647 |
| Derivatives Currency Abbreviations |
| CAD | Canadian Dollar |
| EUR | Euro |
| GBP | Pound Sterling |
| MXN | Mexican Peso |
| USD | U.S. Dollar |
| Derivatives Abbreviations |
| BNP | BNP Paribas |
| CITI | Citibank, N.A. |
| JPM | JPMorgan Chase Bank, N.A. |
| OTC | Over-the-counter |
See Notes to financial statements regarding investment transactions and other derivatives information.
Opportunistic Fixed Income Fund
| | | Shares or
Principal
Amount | | Value |
U.S. GOVERNMENT AND AGENCY
OBLIGATIONS - 96.6% | | | | | |
| U.S. Government - 96.6% | | | | | |
| U.S. Treasury Bonds | | | | | |
| 2.375%, 11/15/2049 | $ | 7,980,000 | | $ | 9,315,091 |
| 2.750%, 11/15/2042 | | 400,000 | | | 485,984 |
| 3.000%, 05/15/2045 | | 300,000 | | | 382,090 |
| U.S. Treasury Notes | | | | | |
| 1.375%, 01/31/2022 to 01/31/2025 | | 19,810,000 | | | 20,139,184 |
| 1.750%, 11/15/2029 | | 9,040,000 | | | 9,544,969 |
| 2.000%, 08/15/2025 to 11/15/2026 | | 500,000 | | | 528,090 |
| 2.625%, 06/15/2021 | | 52,000 | | | 53,054 |
| 2.875%, 04/30/2025 | | 1,300,000 | | | 1,426,293 |
| | | | | | 41,874,755 |
| TOTAL U.S. GOVERNMENT AND AGENCY OBLIGATIONS (Cost $40,561,739) | | $ | 41,874,755 |
Opportunistic Fixed Income Fund (continued)
| | | Shares or
Principal
Amount | | Value |
| FOREIGN GOVERNMENT OBLIGATIONS - 3.0% | | | |
| Canada - 1.0% | | | | | |
Government of Canada
4.250%, 12/01/2026 | CAD | 434,862 | | $ | 421,041 |
| Japan - 2.0% | | | | | |
Government of Japan, CPI Linked Bond
0.100%, 03/10/2029 | JPY | 90,710,100 | | | 861,607 |
| TOTAL FOREIGN GOVERNMENT OBLIGATIONS (Cost $1,258,628) | | $ | 1,282,648 |
| The accompanying notes are an integral part of the financial statements. | 25 | |
John Hancock Funds II
Portfolio of Investments — February 29, 2020 (unaudited)(showing percentage of total net assets)
Opportunistic Fixed Income Fund (continued)
| | | Shares or
Principal
Amount | | Value |
| SHORT-TERM INVESTMENTS - 1.0% | | | |
| Repurchase agreement - 1.0% | | | | | |
| Repurchase Agreement with State Street Corp. dated 2-28-20 at 0.550% to be repurchased at $421,019 on 3-2-20, collateralized by $400,000 U.S. Treasury Inflation Indexed Notes, 0.125% due 4-15-21 (valued at $434,417) | $ | 421,000 | | $ | 421,000 |
| TOTAL SHORT-TERM INVESTMENTS (Cost $421,000) | | $ | 421,000 |
Total Investments (Opportunistic Fixed Income Fund)
(Cost $42,241,367) - 100.6% | | $ | 43,578,403 |
| Other assets and liabilities, net - (0.6%) | | | (251,140) |
| TOTAL NET ASSETS - 100.0% | | $ | 43,327,263 |
| Currency Abbreviations |
| CAD | Canadian Dollar |
| JPY | Japanese Yen |
| Security Abbreviations and Legend |
| CPI | Consumer Price Index |
U.S. High Yield Bond Fund
| | | Shares or
Principal
Amount | | Value |
| CORPORATE BONDS – 89.6% | | | |
| Communication services – 15.8% | | | | | |
Block Communications, Inc.
4.875%, 03/01/2028 (A) | $ | 125,000 | | $ | 125,440 |
| CCO Holdings LLC | | | | | |
| 4.000%, 03/01/2023 (A) | | 50,000 | | | 50,500 |
| 4.500%, 08/15/2030 (A) | | 250,000 | | | 252,813 |
| 5.000%, 02/01/2028 (A) | | 125,000 | | | 130,000 |
| 5.125%, 02/15/2023 | | 20,000 | | | 20,150 |
| 5.125%, 05/01/2023 to 05/01/2027 (A) | | 1,250,000 | | | 1,271,625 |
| 5.250%, 09/30/2022 | | 310,000 | | | 313,395 |
| 5.375%, 05/01/2025 (A) | | 2,350,000 | | | 2,414,860 |
| 5.750%, 02/15/2026 (A) | | 2,700,000 | | | 2,807,190 |
| 5.875%, 04/01/2024 (A) | | 175,000 | | | 179,760 |
| CSC Holdings LLC | | | | | |
| 5.375%, 07/15/2023 to 02/01/2028 (A) | | 1,105,000 | | | 1,137,936 |
| 5.500%, 05/15/2026 (A) | | 1,125,000 | | | 1,164,774 |
| 7.500%, 04/01/2028 (A) | | 550,000 | | | 620,125 |
| 7.750%, 07/15/2025 (A) | | 1,125,000 | | | 1,184,063 |
Front Range BidCo, Inc.
4.000%, 03/01/2027 (A) | | 200,000 | | | 194,250 |
| Gray Television, Inc. | | | | | |
| 5.125%, 10/15/2024 (A)(B) | | 975,000 | | | 999,375 |
| 5.875%, 07/15/2026 (A)(B) | | 2,000,000 | | | 2,056,900 |
| 7.000%, 05/15/2027 (A) | | 200,000 | | | 216,950 |
Intelsat Connect Finance SA
9.500%, 02/15/2023 (A)(B) | | 275,000 | | | 167,750 |
| Intelsat Jackson Holdings SA | | | | | |
| 5.500%, 08/01/2023 (B) | | 3,050,000 | | | 2,623,000 |
| 8.500%, 10/15/2024 (A) | | 1,100,000 | | | 962,500 |
Intelsat Luxembourg SA
8.125%, 06/01/2023 (B) | | 650,000 | | | 273,000 |
| Lamar Media Corp. | | | | | |
| 3.750%, 02/15/2028 (A) | | 700,000 | | | 701,960 |
| 4.000%, 02/15/2030 (A) | | 700,000 | | | 700,000 |
| 5.750%, 02/01/2026 | | 50,000 | | | 52,003 |
| Level 3 Financing, Inc. | | | | | |
| 5.125%, 05/01/2023 | | 665,000 | | | 666,663 |
| 5.375%, 08/15/2022 to 01/15/2024 | | 845,000 | | | 845,836 |
| 5.625%, 02/01/2023 | | 310,000 | | | 311,163 |
U.S. High Yield Bond Fund (continued)
| | | Shares or
Principal
Amount | | Value |
| CORPORATE BONDS (continued) | | | |
| Communication services (continued) | | | | | |
Match Group, Inc.
4.125%, 08/01/2030 (A) | $ | 125,000 | | $ | 122,463 |
Nexstar Broadcasting, Inc.
5.625%, 07/15/2027 (A) | | 2,095,000 | | | 2,168,430 |
Nielsen Finance LLC
5.000%, 04/15/2022 (A) | | 2,825,000 | | | 2,810,875 |
| Outfront Media Capital LLC | | | | | |
| 4.625%, 03/15/2030 (A) | | 175,000 | | | 175,488 |
| 5.000%, 08/15/2027 (A) | | 25,000 | | | 25,751 |
| 5.625%, 02/15/2024 | | 375,000 | | | 382,031 |
Salem Media Group, Inc.
6.750%, 06/01/2024 (A)(B) | | 2,100,000 | | | 2,016,000 |
Scripps Escrow, Inc.
5.875%, 07/15/2027 (A) | | 125,000 | | | 129,688 |
| Sprint Capital Corp. | | | | | |
| 6.875%, 11/15/2028 | | 140,000 | | | 166,732 |
| 8.750%, 03/15/2032 | | 650,000 | | | 903,500 |
The EW Scripps Company
5.125%, 05/15/2025 (A) | | 2,050,000 | | | 2,055,125 |
The Nielsen Company Luxembourg Sarl
5.000%, 02/01/2025 (A)(B) | | 400,000 | | | 395,000 |
| T-Mobile USA, Inc. | | | | | |
| 4.000%, 04/15/2022 (B) | | 375,000 | | | 384,844 |
| 4.500%, 02/01/2026 | | 75,000 | | | 76,009 |
| 4.750%, 02/01/2028 | | 325,000 | | | 338,406 |
| 5.125%, 04/15/2025 | | 250,000 | | | 256,875 |
| 5.375%, 04/15/2027 | | 875,000 | | | 925,313 |
| 6.375%, 03/01/2025 | | 1,550,000 | | | 1,593,602 |
Zayo Group LLC
6.375%, 05/15/2025 | | 1,418,000 | | | 1,449,905 |
| | | | | | 38,820,018 |
| Consumer discretionary – 13.1% | | | | | |
| Asbury Automotive Group, Inc. | | | | | |
| 4.500%, 03/01/2028 (A) | | 675,000 | | | 676,350 |
| 4.750%, 03/01/2030 (A) | | 650,000 | | | 661,375 |
| 6.000%, 12/15/2024 | | 2,445,000 | | | 2,518,350 |
Carriage Services, Inc.
6.625%, 06/01/2026 (A) | | 1,400,000 | | | 1,442,546 |
CCM Merger, Inc.
6.000%, 03/15/2022 (A) | | 3,050,000 | | | 3,080,500 |
Connect Finco SARL
6.750%, 10/01/2026 (A) | | 900,000 | | | 915,750 |
Cooper Tire & Rubber Company
7.625%, 03/15/2027 | | 2,410,000 | | | 2,807,650 |
| Diamond Sports Group LLC | | | | | |
| 5.375%, 08/15/2026 (A) | | 125,000 | | | 115,253 |
| 6.625%, 08/15/2027 (A)(B) | | 125,000 | | | 101,250 |
| ESH Hospitality, Inc. | | | | | |
| 4.625%, 10/01/2027 (A) | | 175,000 | | | 170,625 |
| 5.250%, 05/01/2025 (A) | | 1,800,000 | | | 1,810,494 |
| GLP Capital LP | | | | | |
| 4.375%, 04/15/2021 | | 75,000 | | | 76,649 |
| 5.375%, 11/01/2023 | | 625,000 | | | 681,844 |
| Group 1 Automotive, Inc. | | | | | |
| 5.000%, 06/01/2022 | | 925,000 | | | 921,544 |
| 5.250%, 12/15/2023 (A) | | 500,000 | | | 504,585 |
Hilton Domestic Operating Company, Inc.
4.875%, 01/15/2030 | | 125,000 | | | 129,531 |
KFC Holding Company/Pizza Hut
Holdings LLC/Taco Bell of America LLC | | | | | |
| 5.000%, 06/01/2024 (A) | | 650,000 | | | 655,122 |
| 5.250%, 06/01/2026 (A) | | 650,000 | | | 664,632 |
| The accompanying notes are an integral part of the financial statements. | 26 | |
John Hancock Funds II
Portfolio of Investments — February 29, 2020 (unaudited)(showing percentage of total net assets)
U.S. High Yield Bond Fund (continued)
| | | Shares or
Principal
Amount | | Value |
| CORPORATE BONDS (continued) | | | |
| Consumer discretionary (continued) | | | | | |
Levi Strauss & Company
5.000%, 05/01/2025 | $ | 175,000 | | $ | 179,988 |
| Lithia Motors, Inc. | | | | | |
| 4.625%, 12/15/2027 (A) | | 200,000 | | | 204,736 |
| 5.250%, 08/01/2025 (A) | | 1,025,000 | | | 1,068,563 |
Panther BF Aggregator 2 LP
6.250%, 05/15/2026 (A) | | 100,000 | | | 102,720 |
| Penske Automotive Group, Inc. | | | | | |
| 3.750%, 08/15/2020 | | 415,000 | | | 416,038 |
| 5.375%, 12/01/2024 | | 1,125,000 | | | 1,151,719 |
| 5.750%, 10/01/2022 | | 2,000,000 | | | 2,020,000 |
| Service Corp. International | | | | | |
| 4.625%, 12/15/2027 | | 425,000 | | | 445,188 |
| 5.125%, 06/01/2029 | | 1,175,000 | | | 1,270,469 |
| 7.500%, 04/01/2027 | | 450,000 | | | 549,000 |
| 8.000%, 11/15/2021 | | 2,145,000 | | | 2,295,150 |
Sonic Automotive, Inc.
6.125%, 03/15/2027 | | 350,000 | | | 365,750 |
Telesat Canada
6.500%, 10/15/2027 (A) | | 350,000 | | | 362,250 |
The William Carter Company
5.625%, 03/15/2027 (A) | | 1,000,000 | | | 1,063,925 |
Wolverine World Wide, Inc.
5.000%, 09/01/2026 (A) | | 1,200,000 | | | 1,239,504 |
Wyndham Hotels & Resorts, Inc.
5.375%, 04/15/2026 (A) | | 1,270,000 | | | 1,316,488 |
Yum! Brands, Inc.
4.750%, 01/15/2030 (A) | | 150,000 | | | 155,607 |
| | | | | | 32,141,145 |
| Consumer staples – 1.5% | | | | | |
| Albertsons Companies, Inc. | | | | | |
| 4.625%, 01/15/2027 (A) | | 150,000 | | | 147,750 |
| 4.875%, 02/15/2030 (A) | | 150,000 | | | 150,000 |
Central Garden & Pet Company
5.125%, 02/01/2028 | | 150,000 | | | 156,375 |
Cott Holdings, Inc.
5.500%, 04/01/2025 (A) | | 375,000 | | | 383,749 |
Darling Ingredients, Inc.
5.250%, 04/15/2027 (A) | | 500,000 | | | 525,000 |
Lamb Weston Holdings, Inc.
4.625%, 11/01/2024 (A) | | 25,000 | | | 26,021 |
| Pilgrim's Pride Corp. | | | | | |
| 5.750%, 03/15/2025 (A) | | 940,000 | | | 958,518 |
| 5.875%, 09/30/2027 (A) | | 125,000 | | | 129,538 |
| Prestige Brands, Inc. | | | | | |
| 5.125%, 01/15/2028 (A) | | 125,000 | | | 130,625 |
| 6.375%, 03/01/2024 (A)(B) | | 725,000 | | | 747,352 |
Spectrum Brands, Inc.
5.750%, 07/15/2025 | | 275,000 | | | 281,875 |
| | | | | | 3,636,803 |
| Energy – 15.3% | | | | | |
Antero Midstream Partners LP
5.750%, 01/15/2028 (A) | | 1,875,000 | | | 1,287,094 |
Antero Resources Corp.
5.375%, 11/01/2021 | | 350,000 | | | 291,813 |
| Archrock Partners LP | | | | | |
| 6.000%, 10/01/2022 | | 300,000 | | | 300,270 |
| 6.250%, 04/01/2028 (A) | | 200,000 | | | 192,520 |
| 6.875%, 04/01/2027 (A) | | 450,000 | | | 457,052 |
| Baytex Energy Corp. | | | | | |
| 5.625%, 06/01/2024 (A) | | 1,400,000 | | | 1,260,000 |
| 8.750%, 04/01/2027 (A) | | 2,100,000 | | | 1,995,000 |
Buckeye Partners LP
5.850%, 11/15/2043 | | 1,075,000 | | | 989,000 |
U.S. High Yield Bond Fund (continued)
| | | Shares or
Principal
Amount | | Value |
| CORPORATE BONDS (continued) | | | |
| Energy (continued) | | | | | |
| Callon Petroleum Company | | | | | |
| 6.250%, 04/15/2023 | $ | 225,000 | | $ | 190,130 |
| 8.250%, 07/15/2025 | | 850,000 | | | 756,500 |
Cheniere Corpus Christi Holdings LLC
5.125%, 06/30/2027 | | 75,000 | | | 81,460 |
| Cheniere Energy Partners LP | | | | | |
| 4.500%, 10/01/2029 (A) | | 350,000 | | | 334,705 |
| 5.250%, 10/01/2025 | | 3,175,000 | | | 3,183,001 |
| 5.625%, 10/01/2026 | | 400,000 | | | 402,000 |
Continental Resources, Inc.
3.800%, 06/01/2024 | | 325,000 | | | 330,407 |
| Denbury Resources, Inc. | | | | | |
| 7.750%, 02/15/2024 (A) | | 743,000 | | | 416,452 |
| 9.000%, 05/15/2021 (A) | | 1,300,000 | | | 1,137,500 |
| 9.250%, 03/31/2022 (A) | | 451,000 | | | 360,800 |
Diamond Offshore Drilling, Inc.
4.875%, 11/01/2043 | | 1,086,000 | | | 437,799 |
EnLink Midstream LLC
5.375%, 06/01/2029 (B) | | 1,725,000 | | | 1,488,468 |
| EnLink Midstream Partners LP | | | | | |
| 4.150%, 06/01/2025 | | 75,000 | | | 63,390 |
| 4.400%, 04/01/2024 | | 700,000 | | | 638,911 |
| 4.850%, 07/15/2026 | | 725,000 | | | 620,781 |
| 5.050%, 04/01/2045 | | 800,000 | | | 581,640 |
| 5.450%, 06/01/2047 | | 125,000 | | | 90,588 |
Enviva Partners LP
6.500%, 01/15/2026 (A) | | 825,000 | | | 858,017 |
Era Group, Inc.
7.750%, 12/15/2022 (B) | | 1,600,000 | | | 1,600,000 |
Gulfport Energy Corp.
6.000%, 10/15/2024 | | 2,000,000 | | | 665,000 |
| Hilcorp Energy I LP | | | | | |
| 5.000%, 12/01/2024 (A) | | 1,250,000 | | | 987,500 |
| 5.750%, 10/01/2025 (A) | | 1,325,000 | | | 1,060,000 |
| 6.250%, 11/01/2028 (A) | | 225,000 | | | 163,692 |
Indigo Natural Resources LLC
6.875%, 02/15/2026 (A) | | 525,000 | | | 447,563 |
| MPLX LP | | | | | |
| 5.250%, 01/15/2025 (A) | | 425,000 | | | 447,833 |
| 6.375%, 05/01/2024 (A) | | 275,000 | | | 285,907 |
| Murphy Oil Corp. | | | | | |
| 5.750%, 08/15/2025 | | 125,000 | | | 121,346 |
| 5.875%, 12/01/2027 | | 125,000 | | | 122,010 |
| 6.875%, 08/15/2024 | | 585,000 | | | 583,479 |
Murphy Oil USA, Inc.
4.750%, 09/15/2029 | | 75,000 | | | 78,660 |
| NGPL PipeCo LLC | | | | | |
| 4.375%, 08/15/2022 (A) | | 225,000 | | | 235,035 |
| 7.768%, 12/15/2037 (A) | | 275,000 | | | 355,932 |
Oceaneering International, Inc.
6.000%, 02/01/2028 | | 1,350,000 | | | 1,232,820 |
| Rockies Express Pipeline LLC | | | | | |
| 3.600%, 05/15/2025 (A) | | 725,000 | | | 722,870 |
| 4.800%, 05/15/2030 (A)(B) | | 725,000 | | | 702,897 |
| 5.625%, 04/15/2020 (A)(B) | | 2,250,000 | | | 2,256,908 |
| 6.875%, 04/15/2040 (A) | | 957,000 | | | 980,679 |
| 7.500%, 07/15/2038 (A) | | 201,000 | | | 223,287 |
| Southwestern Energy Company | | | | | |
| 6.200%, 01/23/2025 | | 15,000 | | | 11,100 |
| 7.500%, 04/01/2026 (B) | | 250,000 | | | 190,625 |
| 7.750%, 10/01/2027 (B) | | 850,000 | | | 643,875 |
Summit Midstream Holdings LLC
5.750%, 04/15/2025 | | 125,000 | | | 92,500 |
Tallgrass Energy Partners LP
5.500%, 09/15/2024 (A) | | 2,500,000 | | | 2,319,000 |
| The accompanying notes are an integral part of the financial statements. | 27 | |
John Hancock Funds II
Portfolio of Investments — February 29, 2020 (unaudited)(showing percentage of total net assets)
U.S. High Yield Bond Fund (continued)
| | | Shares or
Principal
Amount | | Value |
| CORPORATE BONDS (continued) | | | |
| Energy (continued) | | | | | |
Ultra Resources, Inc.
7.125%, 04/15/2025 (A)(C) | $ | 2,675,000 | | $ | 173,875 |
USA Compression Partners LP
6.875%, 04/01/2026 to 09/01/2027 | | 900,000 | | | 870,960 |
| Valaris PLC | | | | | |
| 4.875%, 06/01/2022 | | 725,000 | | | 471,250 |
| 5.750%, 10/01/2044 | | 2,575,000 | | | 786,997 |
| | | | | | 37,578,898 |
| Financials – 4.0% | | | | | |
Ally Financial, Inc.
8.000%, 03/15/2020 | | 200,000 | | | 200,380 |
AmWINS Group, Inc.
7.750%, 07/01/2026 (A) | | 1,175,000 | | | 1,219,803 |
| CIT Group, Inc. | | | | | |
| 4.125%, 03/09/2021 | | 40,000 | | | 40,400 |
| 6.125%, 03/09/2028 | | 50,000 | | | 60,000 |
FirstCash, Inc.
5.375%, 06/01/2024 (A) | | 1,175,000 | | | 1,201,438 |
HUB International, Ltd.
7.000%, 05/01/2026 (A) | | 950,000 | | | 959,453 |
LPL Holdings, Inc.
5.750%, 09/15/2025 (A) | | 2,425,000 | | | 2,515,938 |
NFP Corp.
6.875%, 07/15/2025 (A) | | 275,000 | | | 275,006 |
| Springleaf Finance Corp. | | | | | |
| 5.375%, 11/15/2029 | | 625,000 | | | 638,313 |
| 6.125%, 03/15/2024 | | 400,000 | | | 421,536 |
| 6.625%, 01/15/2028 | | 400,000 | | | 439,000 |
| 7.125%, 03/15/2026 | | 600,000 | | | 666,000 |
| 8.250%, 10/01/2023 | | 225,000 | | | 256,500 |
USI, Inc.
6.875%, 05/01/2025 (A) | | 875,000 | | | 870,958 |
| | | | | | 9,764,725 |
| Health care – 7.9% | | | | | |
Bausch Health Americas, Inc.
8.500%, 01/31/2027 (A) | | 300,000 | | | 329,184 |
| Bausch Health Companies, Inc. | | | | | |
| 5.000%, 01/30/2028 (A) | | 250,000 | | | 246,718 |
| 5.250%, 01/30/2030 (A) | | 250,000 | | | 247,188 |
| 5.500%, 03/01/2023 to 11/01/2025 (A) | | 1,034,000 | | | 1,041,957 |
| 5.750%, 08/15/2027 (A) | | 50,000 | | | 53,188 |
| 5.875%, 05/15/2023 (A) | | 138,000 | | | 138,518 |
| 6.125%, 04/15/2025 (A) | | 1,265,000 | | | 1,290,300 |
| 6.500%, 03/15/2022 (A) | | 175,000 | | | 177,188 |
| 7.000%, 03/15/2024 to 01/15/2028 (A) | | 425,000 | | | 441,624 |
| 7.250%, 05/30/2029 (A) | | 50,000 | | | 55,000 |
| Centene Corp. | | | | | |
| 5.375%, 08/15/2026 (A) | | 100,000 | | | 105,000 |
| 6.125%, 02/15/2024 | | 200,000 | | | 206,140 |
Change Healthcare Holdings LLC
5.750%, 03/01/2025 (A) | | 2,150,000 | | | 2,174,188 |
Charles River Laboratories
International, Inc. | | | | | |
| 4.250%, 05/01/2028 (A) | | 75,000 | | | 75,473 |
| 5.500%, 04/01/2026 (A) | | 250,000 | | | 262,856 |
Community Health Systems, Inc.
6.625%, 02/15/2025 (A)(B) | | 800,000 | | | 816,000 |
DaVita, Inc.
5.000%, 05/01/2025 | | 675,000 | | | 684,956 |
| Encompass Health Corp. | | | | | |
| 4.500%, 02/01/2028 | | 125,000 | | | 126,413 |
| 4.750%, 02/01/2030 | | 150,000 | | | 154,845 |
| 5.125%, 03/15/2023 | | 245,000 | | | 245,613 |
| 5.750%, 11/01/2024 to 09/15/2025 | | 65,000 | | | 66,841 |
U.S. High Yield Bond Fund (continued)
| | | Shares or
Principal
Amount | | Value |
| CORPORATE BONDS (continued) | | | |
| Health care (continued) | | | | | |
| Hill-Rom Holdings, Inc. | | | | | |
| 4.375%, 09/15/2027 (A) | $ | 650,000 | | $ | 672,815 |
| 5.000%, 02/15/2025 (A) | | 50,000 | | | 51,860 |
| Hologic, Inc. | | | | | |
| 4.375%, 10/15/2025 (A) | | 1,300,000 | | | 1,323,985 |
| 4.625%, 02/01/2028 (A) | | 150,000 | | | 155,582 |
IQVIA, Inc.
5.000%, 10/15/2026 to 05/15/2027 (A) | | 700,000 | | | 723,196 |
| MEDNAX, Inc. | | | | | |
| 5.250%, 12/01/2023 (A)(B) | | 175,000 | | | 171,281 |
| 6.250%, 01/15/2027 (A) | | 325,000 | | | 311,984 |
MPH Acquisition Holdings LLC
7.125%, 06/01/2024 (A) | | 2,225,000 | | | 2,069,740 |
Ortho-Clinical Diagnostics, Inc.
7.250%, 02/01/2028 (A) | | 150,000 | | | 147,375 |
| Polaris Intermediate Corp. (8.500% Cash or 9.250% PIK) 8.500%, 12/01/2022 (A) | | 400,000 | | | 340,040 |
Select Medical Corp.
6.250%, 08/15/2026 (A) | | 850,000 | | | 906,313 |
Surgery Center Holdings, Inc.
6.750%, 07/01/2025 (A)(B) | | 325,000 | | | 319,085 |
| Tenet Healthcare Corp. | | | | | |
| 4.625%, 07/15/2024 | | 775,000 | | | 775,016 |
| 4.875%, 01/01/2026 (A) | | 400,000 | | | 407,500 |
| 5.125%, 11/01/2027 (A) | | 100,000 | | | 103,875 |
Teva Pharmaceutical Finance
Netherlands III BV | | | | | |
| 4.100%, 10/01/2046 | | 500,000 | | | 388,750 |
| 6.750%, 03/01/2028 (B) | | 1,500,000 | | | 1,591,875 |
Vizient, Inc.
6.250%, 05/15/2027 (A) | | 125,000 | | | 133,438 |
| | | | | | 19,532,900 |
| Industrials – 11.0% | | | | | |
ACCO Brands Corp.
5.250%, 12/15/2024 (A) | | 25,000 | | | 25,698 |
Advanced Disposal Services, Inc.
5.625%, 11/15/2024 (A) | | 1,925,000 | | | 2,007,486 |
| Allison Transmission, Inc. | | | | | |
| 4.750%, 10/01/2027 (A) | | 750,000 | | | 768,750 |
| 5.000%, 10/01/2024 (A) | | 2,625,000 | | | 2,654,426 |
| 5.875%, 06/01/2029 (A) | | 350,000 | | | 379,313 |
Cargo Aircraft Management, Inc.
4.750%, 02/01/2028 (A) | | 400,000 | | | 396,500 |
| Covanta Holding Corp. | | | | | |
| 5.875%, 03/01/2024 to 07/01/2025 | | 1,250,000 | | | 1,270,938 |
| 6.000%, 01/01/2027 | | 475,000 | | | 489,250 |
Fortress Transportation & Infrastructure Investors LLC
6.500%, 10/01/2025 (A) | | 1,650,000 | | | 1,728,375 |
Harsco Corp.
5.750%, 07/31/2027 (A) | | 50,000 | | | 49,250 |
IAA, Inc.
5.500%, 06/15/2027 (A) | | 2,300,000 | | | 2,435,125 |
KAR Auction Services, Inc.
5.125%, 06/01/2025 (A)(B) | | 3,425,000 | | | 3,518,845 |
Moog, Inc.
4.250%, 12/15/2027 (A) | | 150,000 | | | 152,625 |
RBS Global, Inc.
4.875%, 12/15/2025 (A) | | 1,825,000 | | | 1,843,487 |
Ritchie Bros Auctioneers, Inc.
5.375%, 01/15/2025 (A) | | 2,650,000 | | | 2,737,265 |
Sensata Technologies BV
5.625%, 11/01/2024 (A) | | 1,600,000 | | | 1,724,400 |
| The accompanying notes are an integral part of the financial statements. | 28 | |
John Hancock Funds II
Portfolio of Investments — February 29, 2020 (unaudited)(showing percentage of total net assets)
U.S. High Yield Bond Fund (continued)
| | | Shares or
Principal
Amount | | Value |
| CORPORATE BONDS (continued) | | | |
| Industrials (continued) | | | | | |
Sensata Technologies UK Financing Company PLC
6.250%, 02/15/2026 (A) | $ | 250,000 | | $ | 261,450 |
| Signature Aviation US Holdings, Inc. | | | | | |
| 4.000%, 03/01/2028 (A) | | 525,000 | | | 518,385 |
| 5.375%, 05/01/2026 (A) | | 1,375,000 | | | 1,402,988 |
Stevens Holding Company, Inc.
6.125%, 10/01/2026 (A) | | 1,250,000 | | | 1,355,119 |
TriMas Corp.
4.875%, 10/15/2025 (A) | | 1,325,000 | | | 1,348,188 |
| | | | | | 27,067,863 |
| Information technology – 5.5% | | | | | |
Alliance Data Systems Corp.
4.750%, 12/15/2024 (A) | | 325,000 | | | 318,906 |
Cardtronics, Inc.
5.500%, 05/01/2025 (A) | | 2,350,000 | | | 2,408,750 |
| CDK Global, Inc. | | | | | |
| 4.875%, 06/01/2027 | | 150,000 | | | 154,500 |
| 5.000%, 10/15/2024 (B) | | 600,000 | | | 650,520 |
| 5.250%, 05/15/2029 (A) | | 100,000 | | | 106,625 |
| 5.875%, 06/15/2026 | | 125,000 | | | 130,788 |
CommScope Technologies LLC
6.000%, 06/15/2025 (A) | | 525,000 | | | 493,500 |
CommScope, Inc.
8.250%, 03/01/2027 (A) | | 450,000 | | | 453,938 |
| Dell International LLC | | | | | |
| 5.875%, 06/15/2021 (A) | | 1,207,000 | | | 1,214,182 |
| 7.125%, 06/15/2024 (A)(B) | | 2,275,000 | | | 2,380,219 |
| Fair Isaac Corp. | | | | | |
| 4.000%, 06/15/2028 (A) | | 125,000 | | | 128,125 |
| 5.250%, 05/15/2026 (A) | | 725,000 | | | 802,938 |
Gartner, Inc.
5.125%, 04/01/2025 (A) | | 615,000 | | | 635,049 |
Infor US, Inc.
6.500%, 05/15/2022 | | 355,000 | | | 356,061 |
| NCR Corp. | | | | | |
| 5.000%, 07/15/2022 | | 1,510,000 | | | 1,517,550 |
| 6.375%, 12/15/2023 | | 750,000 | | | 764,528 |
NortonLifeLock, Inc.
5.000%, 04/15/2025 (A) | | 125,000 | | | 126,895 |
Qorvo, Inc.
4.375%, 10/15/2029 (A) | | 200,000 | | | 208,000 |
SS&C Technologies, Inc.
5.500%, 09/30/2027 (A) | | 700,000 | | | 736,750 |
| | | | | | 13,587,824 |
| Materials – 5.3% | | | | | |
| Ardagh Packaging Finance PLC | | | | | |
| 4.125%, 08/15/2026 (A) | | 600,000 | | | 597,751 |
| 4.250%, 09/15/2022 (A) | | 200,000 | | | 199,304 |
| Ball Corp. | | | | | |
| 4.875%, 03/15/2026 | | 250,000 | | | 275,000 |
| 5.000%, 03/15/2022 | | 175,000 | | | 182,865 |
| 5.250%, 07/01/2025 | | 75,000 | | | 82,937 |
| Berry Global, Inc. | | | | | |
| 4.875%, 07/15/2026 (A) | | 350,000 | | | 356,020 |
| 5.125%, 07/15/2023 | | 250,000 | | | 250,123 |
| 5.625%, 07/15/2027 (A)(B) | | 100,000 | | | 103,995 |
| 6.000%, 10/15/2022 | | 320,000 | | | 325,104 |
Clearwater Paper Corp.
5.375%, 02/01/2025 (A)(B) | | 275,000 | | | 284,625 |
| Crown Americas LLC | | | | | |
| 4.250%, 09/30/2026 | | 775,000 | | | 797,711 |
| 4.750%, 02/01/2026 | | 800,000 | | | 825,000 |
| Flex Acquisition Company, Inc. | | | | | |
| 6.875%, 01/15/2025 (A) | | 1,350,000 | | | 1,312,902 |
U.S. High Yield Bond Fund (continued)
| | | Shares or
Principal
Amount | | Value |
| CORPORATE BONDS (continued) | | | |
| Materials (continued) | | | | | |
Flex Acquisition
Company, Inc. (continued) | | | | | |
| 7.875%, 07/15/2026 (A)(B) | $ | 350,000 | | $ | 355,250 |
Kaiser Aluminum Corp.
4.625%, 03/01/2028 (A) | | 275,000 | | | 272,250 |
Novelis Corp.
5.875%, 09/30/2026 (A) | | 250,000 | | | 258,214 |
OI European Group BV
4.000%, 03/15/2023 (A)(B) | | 350,000 | | | 353,938 |
| Owens-Brockway Glass Container, Inc. | | | | | |
| 5.000%, 01/15/2022 (A) | | 175,000 | | | 180,250 |
| 5.375%, 01/15/2025 (A)(B) | | 850,000 | | | 891,888 |
| 5.875%, 08/15/2023 (A) | | 913,000 | | | 965,607 |
| 6.375%, 08/15/2025 (A)(B) | | 800,000 | | | 882,000 |
QVC, Inc.
4.750%, 02/15/2027 | | 125,000 | | | 123,002 |
Reynolds Group Issuer, Inc.
5.125%, 07/15/2023 (A) | | 450,000 | | | 454,500 |
Sealed Air Corp.
5.125%, 12/01/2024 (A) | | 1,165,000 | | | 1,249,463 |
| Silgan Holdings, Inc. | | | | | |
| 4.125%, 02/01/2028 (A) | | 650,000 | | | 651,625 |
| 4.750%, 03/15/2025 | | 125,000 | | | 126,459 |
| Trivium Packaging Finance BV | | | | | |
| 5.500%, 08/15/2026 (A) | | 250,000 | | | 259,063 |
| 8.500%, 08/15/2027 (A) | | 150,000 | | | 157,695 |
| Valvoline, Inc. | | | | | |
| 4.250%, 02/15/2030 (A) | | 125,000 | | | 123,281 |
| 5.500%, 07/15/2024 | | 250,000 | | | 260,375 |
| | | | | | 13,158,197 |
| Real estate – 3.5% | | | | | |
| CoreCivic, Inc. | | | | | |
| 4.625%, 05/01/2023 | | 300,000 | | | 300,660 |
| 5.000%, 10/15/2022 | | 800,000 | | | 816,400 |
| Iron Mountain, Inc. | | | | | |
| 4.375%, 06/01/2021 (A) | | 975,000 | | | 971,607 |
| 6.000%, 08/15/2023 | | 250,000 | | | 254,375 |
| MPT Operating Partnership LP | | | | | |
| 4.625%, 08/01/2029 | | 275,000 | | | 288,923 |
| 5.000%, 10/15/2027 | | 725,000 | | | 756,545 |
| 5.250%, 08/01/2026 | | 800,000 | | | 832,284 |
| 5.500%, 05/01/2024 | | 715,000 | | | 727,513 |
| 6.375%, 03/01/2024 | | 60,000 | | | 61,875 |
| SBA Communications Corp. | | | | | |
| 3.875%, 02/15/2027 (A) | | 300,000 | | | 306,090 |
| 4.000%, 10/01/2022 | | 525,000 | | | 530,786 |
| The GEO Group, Inc. | | | | | |
| 5.125%, 04/01/2023 | | 210,000 | | | 198,492 |
| 5.875%, 01/15/2022 to 10/15/2024 | | 1,665,000 | | | 1,619,450 |
| 6.000%, 04/15/2026 | | 975,000 | | | 882,375 |
| | | | | | 8,547,375 |
| Utilities – 6.7% | | | | | |
AmeriGas Partners LP
5.750%, 05/20/2027 | | 100,000 | | | 104,000 |
| NextEra Energy Operating Partners LP | | | | | |
| 4.250%, 07/15/2024 to 09/15/2024 (A) | | 825,000 | | | 838,493 |
| 4.500%, 09/15/2027 (A)(B) | | 725,000 | | | 756,186 |
NSG Holdings LLC
7.750%, 12/15/2025 (A) | | 2,371,547 | | | 2,632,417 |
Pattern Energy Group, Inc.
5.875%, 02/01/2024 (A) | | 3,800,000 | | | 3,876,000 |
Rockpoint Gas Storage Canada, Ltd.
7.000%, 03/31/2023 (A) | | 987,000 | | | 927,780 |
Southern Star Central Corp.
5.125%, 07/15/2022 (A) | | 1,900,000 | | | 1,925,140 |
| The accompanying notes are an integral part of the financial statements. | 29 | |
John Hancock Funds II
Portfolio of Investments — February 29, 2020 (unaudited)(showing percentage of total net assets)
U.S. High Yield Bond Fund (continued)
| | | Shares or
Principal
Amount | | Value |
| CORPORATE BONDS (continued) | | | |
| Utilities (continued) | | | | | |
Suburban Propane Partners LP
5.875%, 03/01/2027 | $ | 175,000 | | $ | 180,250 |
TerraForm Global Operating LLC
6.125%, 03/01/2026 (A) | | 950,000 | | | 983,250 |
| TerraForm Power Operating LLC | | | | | |
| 4.250%, 01/31/2023 (A) | | 2,250,000 | | | 2,286,608 |
| 4.750%, 01/15/2030 (A) | | 325,000 | | | 337,594 |
| 5.000%, 01/31/2028 (A) | | 1,525,000 | | | 1,641,358 |
| | | | | | 16,489,076 |
| TOTAL CORPORATE BONDS (Cost $222,221,622) | | | $ | 220,324,824 |
| CONVERTIBLE BONDS – 0.8% | | | |
| Communication services – 0.2% | | | | | |
DISH Network Corp.
3.375%, 08/15/2026 | | 575,000 | | | 555,167 |
| Energy – 0.6% | | | | | |
Denbury Resources, Inc.
6.375%, 12/31/2024 (A) | | 531,000 | | | 280,130 |
Whiting Petroleum Corp.
1.250%, 04/01/2020 | | 1,345,000 | | | 1,200,413 |
| | | | | | 1,480,543 |
| TOTAL CONVERTIBLE BONDS (Cost $2,271,010) | | | $ | 2,035,710 |
| TERM LOANS (D) – 4.1% | | | |
| Communication services – 1.7% | | | | | |
| Advantage Sales & Marketing, Inc., 2014 1st Lien Term Loan (1 month LIBOR + 3.250%) 4.853%, 07/23/2021 | | 916,158 | | | 883,808 |
| Ancestry.com Operations, Inc., 2019 Extended Term Loan B (1 month LIBOR + 4.250%) 5.860%, 08/27/2026 | | 3,699,454 | | | 3,311,011 |
| | | | | | 4,194,819 |
| Consumer discretionary – 0.6% | | | | | |
| CCM Merger, Inc., New Term Loan B (1 month LIBOR + 2.250%) 3.853%, 08/08/2021 | | 283,045 | | | 282,479 |
| Montreign Operating Company LLC, Term Loan B (1 month LIBOR + 8.250%) 9.853%, 01/24/2023 | | 1,419,551 | | | 1,240,078 |
| | | | | | 1,522,557 |
| Consumer staples – 0.1% | | | | | |
| Atkins Nutritionals Holdings, Inc., 2017 Term Loan B (1 month LIBOR + 3.750%) 5.403%, 07/07/2024 | | 145,423 | | | 145,060 |
| Energy – 0.4% | | | | | |
| EPIC Crude Services LP, Term Loan B (3 month LIBOR + 5.000%) 6.620%, 03/02/2026 | | 600,000 | | | 578,400 |
| Ultra Resources, Inc., 1st Lien Term Loan (1 month LIBOR + 4.000%) 5.603%, 04/12/2024 | | 670,678 | | | 367,196 |
| | | | | | 945,596 |
| Financials – 0.9% | | | | | |
| HUB International, Ltd., 2019 Incremental Term Loan B (3 month LIBOR + 4.000%) 5.692%, 04/25/2025 | | 450,000 | | | 448,394 |
U.S. High Yield Bond Fund (continued)
| | | Shares or
Principal
Amount | | Value |
| TERM LOANS (D) (continued) | | | |
| Financials (continued) | | | | | |
| Nexus Buyer LLC, Term Loan B (1 month LIBOR + 3.750%) 5.421%, 11/09/2026 | $ | 475,000 | | $ | 469,457 |
| USI, Inc., 2019 Incremental Term Loan B (1 month LIBOR + 4.000%) 5.945%, 12/02/2026 | | 150,000 | | | 149,000 |
| Victory Capital Holdings, Inc., 2020 Term Loan B (3 month LIBOR + 2.500%) 4.155%, 07/01/2026 | | 1,309,045 | | | 1,291,046 |
| | | | | | 2,357,897 |
| Information technology – 0.3% | | | | | |
| Emerald TopCo, Inc., Term Loan (1 month LIBOR + 3.500%) 5.103%, 07/24/2026 | | 673,313 | | | 671,346 |
| Materials – 0.1% | | | | | |
| Clearwater Paper Corp., Term Loan B (1 month LIBOR + 3.250%) 4.938%, 07/26/2026 | | 150,000 | | | 148,875 |
| TOTAL TERM LOANS (Cost $10,680,607) | | | $ | 9,986,150 |
| RIGHTS – 0.1% | | | | | |
| Texas Competitive Electric Holdings Company LLC (E)(F) | | 215,025 | | | 215,025 |
| TOTAL RIGHTS (Cost $1,079,996) | | $ | 215,025 |
| ESCROW CERTIFICATES – 0.0% | | | | | |
Texas Competitive Electric Holdings Company LLC
11.500%, 10/01/2020 (E)(G) | $ | 13,200,000 | | | 19,800 |
| TOTAL ESCROW CERTIFICATES (Cost $6,477) | | $ | 19,800 |
| SHORT-TERM INVESTMENTS – 8.8% | | | |
| Short-term funds – 8.8% | | | | | |
| John Hancock Collateral Trust, 1.6968% (H)(I) | | 1,631,217 | | | 16,326,685 |
| State Street Institutional U.S. Government Money Market Fund, Premier Class, 1.5386% (H) | | 5,273,559 | | | 5,273,559 |
| TOTAL SHORT-TERM INVESTMENTS (Cost $21,596,224) | | $ | 21,600,244 |
Total Investments (U.S. High Yield Bond Fund)
(Cost $257,855,936) – 103.4% | | $ | 254,181,753 |
| Other assets and liabilities, net – (3.4%) | | | | (8,287,903) |
| TOTAL NET ASSETS – 100.0% | | | | $ | 245,893,850 |
| Security Abbreviations and Legend |
| LIBOR | London Interbank Offered Rate |
| PIK | Pay-in-Kind Security - Represents a payment-in-kind which may pay interest in additional par and/or cash. Rates shown are the current rate and most recent payment rate. |
| (A) | These securities are exempt from registration under Rule 144A of the Securities Act of 1933. Such securities may be resold, normally to qualified institutional buyers, in transactions exempt from registration. Rule 144A securities amounted to $151,739,410 or 61.7% of the fund's net assets as of 2-29-20. |
| (B) | All or a portion of this security is on loan as of 2-29-20. |
| (C) | Non-income producing - Issuer is in default. |
| (D) | Term loans are variable rate obligations. The coupon rate shown represents the rate at period end. |
| (E) | Non-income producing security. |
| (F) | Strike price and/or expiration date not available. |
| (G) | Security is valued using significant unobservable inputs and is classified as Level 3 in the fair value hierarchy. Refer to Note 2 to the financial statements. |
| (H) | The rate shown is the annualized seven-day yield as of 2-29-20. |
| The accompanying notes are an integral part of the financial statements. | 30 | |
John Hancock Funds II
Portfolio of Investments — February 29, 2020 (unaudited)(showing percentage of total net assets)
U.S. High Yield Bond Fund (continued)
| (I) | Investment is an affiliate of the fund, the advisor and/or subadvisor. This security represents the investment of cash collateral received for securities lending. |
| The accompanying notes are an integral part of the financial statements. | 31 | |
John Hancock Funds II
Portfolio of Investments — February 29, 2020 (unaudited)(showing percentage of total net assets)
The following fund had the following country composition as a percentage of net assets on 2-29-20:
High Yield Fund
| United States | 74.5% |
| Canada | 6.1% |
| Cayman Islands | 6.0% |
| United Kingdom | 3.7% |
| France | 1.9% |
| Netherlands | 1.6% |
| United Arab Emirates | 1.1% |
| Other countries | 5.1% |
| TOTAL | 100.0% |
The accompanying notes are an integral part of the financial statements.
John Hancock Funds II
Statements of assets and liabilities — February 29, 2020 (unaudited)
| Assets | Asia Pacific Total Return Bond Fund | Core Bond Fund | High Yield Fund | Opportunistic Fixed Income Fund |
| Unaffiliated investments, at value | $249,976,892 | $3,180,657,141 | $230,747,027 | $43,157,403 |
| Affiliated investments, at value | — | 1,669,238 | 6,266,896 | — |
| Repurchase agreements, at value | — | — | — | 421,000 |
| Total investments, at value | 249,976,892 | 3,182,326,379 | 237,013,923 | 43,578,403 |
| Receivable for centrally cleared swaps | — | — | 22,301 | — |
| Unrealized appreciation on forward foreign currency contracts | — | — | 28,747 | — |
| Receivable for futures variation margin | — | — | 37,469 | — |
| Cash | 5,550,730 | 8,619,907 | — | 819 |
| Foreign currency, at value | 1,724,713 | — | 277,197 | — |
| Collateral held at broker for futures contracts | 109,517 | — | 56,130 | — |
| Collateral segregated at custodian for OTC derivative contracts | — | — | 60,000 | — |
| Interest receivable | 2,828,978 | 13,187,250 | 3,356,555 | 162,056 |
| Receivable for fund shares sold | — | 2,727,875 | — | — |
| Receivable for investments sold | — | 73,293,156 | 2,368,385 | — |
| Receivable for delayed delivery securities sold | — | 205,256,373 | — | 26,893,902 |
| Receivable for securities lending income | — | 183 | 1,273 | — |
| Receivable from affiliates | — | — | — | 1,040 |
| Other assets | 8,354 | 40,839 | 9,403 | 11,655 |
| Total assets | 260,199,184 | 3,485,451,962 | 243,231,383 | 70,647,875 |
| Liabilities | | | | |
| Unrealized depreciation on forward foreign currency contracts | — | — | 25,053 | — |
| Written options, at value | — | — | 118,821 | — |
| Payable for futures variation margin | 122,305 | — | — | — |
| Due to custodian | — | — | 594,289 | — |
| Payable for collateral on sale commitments | — | 77,000 | — | 105,000 |
| Payable for investments purchased | — | 75,181,727 | 4,078,250 | — |
| Payable for delayed delivery securities purchased | — | 448,086,651 | — | 26,826,125 |
| Payable for fund shares repurchased | 1,205,028 | 30,635,312 | 1,529,091 | 317,670 |
| Payable upon return of securities loaned | — | 1,668,746 | 6,265,792 | — |
| Payable to affiliates | | | | |
| Accounting and legal services fees | 7,066 | 76,300 | 5,983 | 965 |
| Trustees' fees | 708 | 3,109 | 652 | 395 |
| Other liabilities and accrued expenses | 62,856 | 138,921 | 61,337 | 70,457 |
| Total liabilities | 1,397,963 | 555,867,766 | 12,679,268 | 27,320,612 |
| Net assets | $258,801,221 | $2,929,584,196 | $230,552,115 | $43,327,263 |
| Net assets consist of | | | | |
| Paid-in capital | $268,319,309 | $2,786,008,723 | $335,154,617 | $48,865,838 |
| Total distributable earnings (loss) | (9,518,088) | 143,575,473 | (104,602,502) | (5,538,575) |
| Net assets | $258,801,221 | $2,929,584,196 | $230,552,115 | $43,327,263 |
| Unaffiliated investments, including repurchase agreements, at cost | $252,340,778 | $3,070,229,143 | $257,173,921 | $42,241,367 |
| Affiliated investments, at cost | — | $1,668,824 | $6,265,283 | — |
| Foreign currency, at cost | $1,740,923 | — | $287,052 | — |
| Premiums received on written options | — | — | $19,904 | — |
| Collateral held at broker for centrally cleared swaps | — | — | $20,000 | — |
| Securities loaned, at value | — | $1,633,621 | $5,972,555 | — |
| Net asset value per share | | | | |
| The funds have an unlimited number of shares authorized with no par value. Net asset value is calculated by dividing the net assets of each class of shares by the number of outstanding shares in the class. |
| Class 1 | | | | |
| Net assets | — | $189,484,618 | $230,552,115 | $43,327,263 |
| Shares outstanding | — | 13,939,638 | 28,910,492 | 3,275,430 |
| Net asset value, offering price and redemption price per share | — | $13.59 | $7.97 | $13.23 |
| Class NAV | | | | |
| Net assets | $258,801,221 | $2,740,099,578 | — | — |
| Shares outstanding | 26,362,976 | 201,895,650 | — | — |
| Net asset value, offering price and redemption price per share | $9.82 | $13.57 | — | — |
The accompanying notes are an integral part of the financial statements.
John Hancock Funds II
Statements of assets and liabilities — February 29, 2020 (unaudited)
| Assets | U.S. High Yield Bond Fund |
| Unaffiliated investments, at value | $237,855,068 |
| Affiliated investments, at value | 16,326,685 |
| Total investments, at value | 254,181,753 |
| Cash | 2,688 |
| Interest receivable | 3,808,564 |
| Receivable for fund shares sold | 224,387 |
| Receivable for investments sold | 7,489,320 |
| Receivable for securities lending income | 10,502 |
| Other assets | 6,849 |
| Total assets | 265,724,063 |
| Liabilities | |
| Payable for investments purchased | 2,423,737 |
| Payable for fund shares repurchased | 1,030,226 |
| Payable upon return of securities loaned | 16,320,863 |
| Payable to affiliates | |
| Accounting and legal services fees | 6,418 |
| Trustees' fees | 416 |
| Other liabilities and accrued expenses | 48,553 |
| Total liabilities | 19,830,213 |
| Net assets | $245,893,850 |
| Net assets consist of | |
| Paid-in capital | $265,933,506 |
| Total distributable earnings (loss) | (20,039,656) |
| Net assets | $245,893,850 |
| Unaffiliated investments, including repurchase agreements, at cost | $241,533,271 |
| Affiliated investments, at cost | $16,322,665 |
| Securities loaned, at value | $15,975,585 |
| Net asset value per share | |
| The funds have an unlimited number of shares authorized with no par value. Net asset value is calculated by dividing the net assets of each class of shares by the number of outstanding shares in the class. |
| Class 1 | |
| Net assets | $70,307,128 |
| Shares outstanding | 6,400,334 |
| Net asset value, offering price and redemption price per share | $10.98 |
| Class NAV | |
| Net assets | $175,586,722 |
| Shares outstanding | 16,001,805 |
| Net asset value, offering price and redemption price per share | $10.97 |
The accompanying notes are an integral part of the financial statements.
John Hancock Funds II
Statements of operations —For the six months ended February 29, 2020 (unaudited)
| Investment income | Asia Pacific Total Return Bond Fund | Core Bond Fund | High Yield Fund | Opportunistic Fixed Income Fund |
| Interest | $7,096,448 | $38,496,435 | $7,238,114 | $510,616 |
| Dividends | — | — | 108,389 | — |
| Securities lending | — | 2,258 | 15,825 | — |
| Less foreign taxes withheld | (283,783) | — | (315) | — |
| Total investment income | 6,812,665 | 38,498,693 | 7,362,013 | 510,616 |
| Expenses | | | | |
| Investment management fees | 1,062,505 | 8,157,403 | 838,621 | 147,943 |
| Distribution and service fees | — | 43,790 | 59,902 | 10,576 |
| Interest expense | — | — | — | 37,561 |
| Accounting and legal services fees | 26,670 | 260,376 | 21,684 | 3,828 |
| Trustees' fees | 2,978 | 27,103 | 2,139 | 269 |
| Custodian fees | 69,340 | 159,611 | 28,200 | 45,783 |
| Printing and postage | 6,152 | 6,401 | 6,401 | 6,401 |
| Professional fees | 41,462 | 58,812 | 43,841 | 55,116 |
| Other | 9,363 | 52,988 | 9,936 | 9,976 |
| Total expenses | 1,218,470 | 8,766,484 | 1,010,724 | 317,453 |
| Less expense reductions | (11,156) | (108,964) | (9,070) | (90,467) |
| Net expenses | 1,207,314 | 8,657,520 | 1,001,654 | 226,986 |
| Net investment income | 5,605,351 | 29,841,173 | 6,360,359 | 283,630 |
| Realized and unrealized gain (loss) | | | | |
| Net realized gain (loss) on | | | | |
| Unaffiliated investments and foreign currency transactions | 4,432,725 | 54,856,803 | 1,597,731 | 1,214,443 |
| Affiliated investments | — | 140 | (494) | — |
| Securities sold short | — | — | — | (14,950) |
| Futures contracts | (47,225) | — | 3,401 | 15,770 |
| Forward foreign currency contracts | — | — | 62,257 | (535,501) |
| Written options | — | — | — | 113,156 |
| Swap contracts | — | — | 1,155 | 9,410 |
| | 4,385,500 | 54,856,943 | 1,664,050 | 802,328 |
| Change in net unrealized appreciation (depreciation) of | | | | |
| Unaffiliated investments and translation of assets and liabilities in foreign currencies | 961,767 | 8,118,593 | (2,503,218) | 260,878 |
| Affiliated investments | — | 384 | 1,661 | — |
| Securities sold short | — | — | — | (1,163) |
| Futures contracts | (169,534) | — | 36,516 | (64,540) |
| Forward foreign currency contracts | — | — | (5,451) | 194,733 |
| Written options | — | — | (98,917) | (22,273) |
| Swap contracts | — | — | 1,295 | (107,009) |
| | 792,233 | 8,118,977 | (2,568,114) | 260,626 |
| Net realized and unrealized gain (loss) | 5,177,733 | 62,975,920 | (904,064) | 1,062,954 |
| Increase in net assets from operations | $10,783,084 | $92,817,093 | $5,456,295 | $1,346,584 |
The accompanying notes are an integral part of the financial statements.
John Hancock Funds II
Statements of operations —For the six months ended February 29, 2020 (unaudited)
| Investment income | U.S. High Yield Bond Fund |
| Interest | $7,125,199 |
| Securities lending | 59,233 |
| Total investment income | 7,184,432 |
| Expenses | |
| Investment management fees | 923,113 |
| Distribution and service fees | 18,129 |
| Accounting and legal services fees | 22,456 |
| Trustees' fees | 2,300 |
| Custodian fees | 25,614 |
| Printing and postage | 6,401 |
| Professional fees | (69,943)1 |
| Other | 10,160 |
| Total expenses | 938,230 |
| Less expense reductions | (9,397) |
| Net expenses | 928,833 |
| Net investment income | 6,255,599 |
| Realized and unrealized gain (loss) | |
| Net realized gain (loss) on | |
| Unaffiliated investments and foreign currency transactions | 2,310,600 |
| Affiliated investments | 1,611 |
| | 2,312,211 |
| Change in net unrealized appreciation (depreciation) of | |
| Unaffiliated investments and translation of assets and liabilities in foreign currencies | (5,949,737) |
| Affiliated investments | 2,027 |
| | (5,947,710) |
| Net realized and unrealized gain (loss) | (3,635,499) |
| Increase in net assets from operations | $2,620,100 |
| | |
| 1 | During the six months ended February 29, 2020, U.S. High Yield Bond Fund received a reimbursement of legal fees. See Note 14 to the Financial statements. As a result of this reimbursement, the fund reflects negative professional fees in the current reporting period. Professional fees incurred by the fund for the six months ended February 29, 2020 prior to these reimbursements were $37,486. |
The accompanying notes are an integral part of the financial statements.
John Hancock Funds II
Statements of changes in net assets(unaudited)
| | Asia Pacific Total Return Bond Fund | Core Bond Fund | High Yield Fund |
| Increase (decrease) in net assets | Six months ended
2-29-20
(unaudited) | Year ended
8-31-19 | Six months ended
2-29-20
(unaudited) | Year ended
8-31-19 | Six months ended
2-29-20
(unaudited) | Year ended
8-31-19 |
| From operations | | | | | | |
| Net investment income | $5,605,351 | $12,615,853 | $29,841,173 | $58,157,740 | $6,360,359 | $18,833,797 |
| Net realized gain (loss) | 4,385,500 | (5,799,107) | 54,856,943 | 56,391,733 | 1,664,050 | (3,955,082) |
| Change in net unrealized appreciation (depreciation) | 792,233 | 14,826,404 | 8,118,977 | 119,059,741 | (2,568,114) | (2,204,231) |
| Increase in net assets resulting from operations | 10,783,084 | 21,643,150 | 92,817,093 | 233,609,214 | 5,456,295 | 12,674,484 |
| Distributions to shareholders | | | | | | |
| From earnings | | | | | | |
| Class 1 | — | — | (4,093,228) | (4,342,494) | (7,499,538) | (15,929,257) |
| Class NAV | (11,534,899) | (9,927,876) | (64,043,068) | (52,735,636) | — | (4,816,452)1 |
| Total distributions | (11,534,899) | (9,927,876) | (68,136,296) | (57,078,130) | (7,499,538) | (20,745,709) |
| From fund share transactions | | | | | | |
| From fund share transactions | (42,154,932) | (61,348,396) | 37,162,182 | 981,800,705 | (17,824,790) | (159,645,877) |
| Total increase (decrease) | (42,906,747) | (49,633,122) | 61,842,979 | 1,158,331,789 | (19,868,033) | (167,717,102) |
| Net assets | | | | | | |
| Beginning of period | 301,707,968 | 351,341,090 | 2,867,741,217 | 1,709,409,428 | 250,420,148 | 418,137,250 |
| End of period | $258,801,221 | $301,707,968 | $2,929,584,196 | $2,867,741,217 | $230,552,115 | $250,420,148 |
| | |
| 1 | Class NAV shares were fully redeemed on 3-28-19. |
| | Opportunistic Fixed Income Fund | U.S. High Yield Bond Fund |
| Increase (decrease) in net assets | Six months ended
2-29-20
(unaudited) | Year ended
8-31-19 | Six months ended
2-29-20
(unaudited) | Year ended
8-31-19 |
| From operations | | | | |
| Net investment income | $283,630 | $3,243,762 | $6,255,599 | $13,484,264 |
| Net realized gain (loss) | 802,328 | (140,160) | 2,312,211 | (2,068,507) |
| Change in net unrealized appreciation (depreciation) | 260,626 | 1,017,544 | (5,947,710) | 2,038,468 |
| Increase in net assets resulting from operations | 1,346,584 | 4,121,146 | 2,620,100 | 13,454,225 |
| Distributions to shareholders | | | | |
| From earnings | | | | |
| Class 1 | (1,410,083) | (648,896) | (2,152,284) | (4,094,406) |
| Class NAV | — | (2,845,170)2 | (5,227,793) | (10,019,828) |
| Total distributions | (1,410,083) | (3,494,066) | (7,380,077) | (14,114,234) |
| From fund share transactions | | | | |
| From fund share transactions | (3,903,642) | (230,201,605) | 3,245,702 | (23,515,780) |
| Total increase (decrease) | (3,967,141) | (229,574,525) | (1,514,275) | (24,175,789) |
| Net assets | | | | |
| Beginning of period | 47,294,404 | 276,868,929 | 247,408,125 | 271,583,914 |
| End of period | $43,327,263 | $47,294,404 | $245,893,850 | $247,408,125 |
| | |
| 2 | Class NAV shares were fully redeemed on 4-17-19. |
The accompanying notes are an integral part of the financial statements.
John Hancock Funds II
Financial highlights
| Per share operating performance for a share outstanding throughout each period | | Ratios and supplemental data | |
| | | | Income (loss) from investment operations | | | Less distributions | | | | Ratios to average net assets | | |
| Period ended | Net asset
value,
beginning
of period ($) | | Net
investment
income
(loss) ($)1 | Net realized and
unrealized
gain (loss)
on investments ($) | Total from
investment
operations ($) | From net
investment
income ($) | From net
realized
gain ($) | Total
distributions ($) | Net asset
value,
end of
period ($) | Total
return
(%)2 | Expenses
before
reductions
(%) | Expenses
including
reductions
(%) | Net
investment
income
(loss) (%) | Net
assets,
end of
period
(in millions) | Portfolio
turnover
(%) |
| Asia Pacific Total Return Bond Fund | |
| Class NAV | |
| 02-29-20203 | 9.86 | | 0.19 | 0.15 | 0.34 | (0.38) | — | (0.38) | 9.82 | 3.524 | 0.835 | 0.825 | 3.805 | 259 | 24 |
| 08-31-2019 | 9.49 | | 0.38 | 0.29 | 0.67 | (0.30) | — | (0.30) | 9.86 | 7.31 | 0.83 | 0.82 | 3.97 | 302 | 60 |
| 08-31-2018 | 9.80 | | 0.34 | (0.44) | (0.10) | (0.21) | — | (0.21) | 9.49 | (1.05) | 0.80 | 0.79 | 3.48 | 351 | 70 |
| 08-31-2017 | 9.64 | | 0.32 | (0.01) | 0.31 | (0.15) | — | (0.15) | 9.80 | 3.30 | 0.80 | 0.79 | 3.32 | 382 | 53 |
| 08-31-2016 | 8.94 | | 0.32 | 0.64 | 0.96 | (0.26) | — | (0.26) | 9.64 | 10.96 | 0.81 | 0.80 | 3.44 | 412 | 54 |
| 08-31-2015 | 9.63 | | 0.30 | (0.74) | (0.44) | (0.25) | — | (0.25) | 8.94 | (4.65) | 0.83 | 0.82 | 3.21 | 422 | 35 |
| 1.Based on average daily shares outstanding. 2.Total returns would have been lower had certain expenses not been reduced during the applicable periods. 3.Six months ended 2-29-20. Unaudited. 4.Not annualized. 5.Annualized. | |
| Core Bond Fund | |
| Class 1 | |
| 02-29-20203 | 13.50 | | 0.13 | 0.27 | 0.40 | (0.19) | (0.12) | (0.31) | 13.59 | 3.084 | 0.665 | 0.655 | 2.035 | 189 | 171 |
| 08-31-2019 | 12.66 | | 0.33 | 0.86 | 1.19 | (0.35) | — | (0.35) | 13.50 | 9.59 | 0.66 | 0.65 | 2.60 | 175 | 447 |
| 08-31-2018 | 13.15 | | 0.27 | (0.48) | (0.21) | (0.28) | — | (0.28) | 12.66 | (1.58) | 0.67 | 0.66 | 2.08 | 161 | 277 |
| 08-31-2017 | 13.49 | | 0.22 | (0.17) | 0.05 | (0.24) | (0.15) | (0.39) | 13.15 | 0.46 | 0.67 | 0.66 | 1.70 | 190 | 363 |
| 08-31-2016 | 13.01 | | 0.21 | 0.51 | 0.72 | (0.24) | — | (0.24) | 13.49 | 5.59 | 0.67 | 0.66 | 1.59 | 220 | 471 |
| 08-31-2015 | 13.08 | | 0.18 | (0.03) | 0.15 | (0.22) | — | (0.22) | 13.01 | 1.14 | 0.68 | 0.67 | 1.39 | 168 | 408 |
| Class NAV | |
| 02-29-20203 | 13.47 | | 0.14 | 0.27 | 0.41 | (0.19) | (0.12) | (0.31) | 13.57 | 3.184 | 0.615 | 0.605 | 2.085 | 2,740 | 171 |
| 08-31-2019 | 12.64 | | 0.34 | 0.84 | 1.18 | (0.35) | — | (0.35) | 13.47 | 9.58 | 0.61 | 0.60 | 2.63 | 2,693 | 447 |
| 08-31-2018 | 13.13 | | 0.27 | (0.47) | (0.20) | (0.29) | — | (0.29) | 12.64 | (1.54) | 0.62 | 0.61 | 2.14 | 1,548 | 277 |
| 08-31-2017 | 13.47 | | 0.23 | (0.17) | 0.06 | (0.25) | (0.15) | (0.40) | 13.13 | 0.51 | 0.62 | 0.61 | 1.77 | 1,615 | 363 |
| 08-31-2016 | 12.99 | | 0.22 | 0.50 | 0.72 | (0.24) | — | (0.24) | 13.47 | 5.65 | 0.62 | 0.61 | 1.64 | 1,226 | 471 |
| 08-31-2015 | 13.06 | | 0.19 | (0.04) | 0.15 | (0.22) | — | (0.22) | 12.99 | 1.19 | 0.63 | 0.62 | 1.44 | 1,044 | 408 |
| 1.Based on average daily shares outstanding. 2.Total returns would have been lower had certain expenses not been reduced during the applicable periods. 3.Six months ended 2-29-20. Unaudited. 4.Not annualized. 5.Annualized. | |
| High Yield Fund | |
| Class 1 | |
| 02-29-20203 | 8.04 | | 0.21 | (0.03) | 0.18 | (0.25) | — | (0.25) | 7.97 | 2.254 | 0.845 | 0.845 | 5.315 | 231 | 33 |
| 08-31-2019 | 8.17 | | 0.46 | (0.10) | 0.36 | (0.49) | — | (0.49) | 8.04 | 4.32 | 0.82 | 0.81 | 5.77 | 250 | 51 |
| 08-31-2018 | 8.30 | | 0.47 | (0.12) | 0.35 | (0.48) | — | (0.48) | 8.17 | 4.81 | 0.79 | 0.79 | 5.69 | 282 | 60 |
| 08-31-2017 | 8.17 | | 0.49 | 0.17 | 0.66 | (0.53) | — | (0.53) | 8.30 | 8.31 | 0.79 | 0.78 | 5.89 | 339 | 56 |
| 08-31-2016 | 8.33 | | 0.55 | (0.14) | 0.41 | (0.57) | — | (0.57) | 8.17 | 5.60 | 0.79 | 0.78 | 7.10 | 343 | 58 |
| 08-31-2015 | 9.63 | | 0.60 | (1.23) | (0.63) | (0.67) | — | (0.67) | 8.33 | (6.78) | 0.77 | 0.76 | 6.72 | 384 | 59 |
| 1.Based on average daily shares outstanding. 2.Total returns would have been lower had certain expenses not been reduced during the applicable periods. 3.Six months ended 2-29-20. Unaudited. 4.Not annualized. 5.Annualized. | |
| Opportunistic Fixed Income Fund | |
| Class 1 | |
| 02-29-20203 | 13.27 | | 0.09 | 0.33 | 0.42 | (0.46) | — | (0.46) | 13.23 | 3.214 | 1.505, 6 | 1.075, 6 | 1.345 | 43 | 1037 |
| 08-31-2019 | 12.72 | | 0.24 | 0.48 | 0.72 | (0.17) | — | (0.17) | 13.27 | 5.75 | 1.206 | 1.166 | 2.05 | 47 | 53 |
| 08-31-2018 | 12.84 | | 0.26 | (0.38) | (0.12) | — | — | — | 12.72 | (0.93) | 0.86 | 0.85 | 2.04 | 51 | 31 |
| 08-31-2017 | 13.09 | | 0.18 | (0.08) | 0.10 | (0.31) | (0.04) | (0.35) | 12.84 | 1.05 | 0.83 | 0.82 | 1.48 | 59 | 56 |
| 08-31-2016 | 11.87 | | 0.19 | 1.03 | 1.22 | —8 | — | —8 | 13.09 | 10.30 | 0.82 | 0.81 | 1.55 | 66 | 71 |
| 08-31-2015 | 12.64 | | 0.20 | (0.97) | (0.77) | — | — | — | 11.87 | (6.09) | 0.83 | 0.82 | 1.64 | 57 | 61 |
| 1.Based on average daily shares outstanding. 2.Total returns would have been lower had certain expenses not been reduced during the applicable periods. 3.Six months ended 2-29-20. Unaudited. 4.Not annualized. 5.Annualized. 6.Includes interest expense of 0.18% (annualized) and 0.26% for the six months ended February 29, 2020 and the year ended August 31, 2019, respectively. 7.Increase in portfolio turnover rate resulted from repositioning of the portfolio during the period in accordance with investment policy changes approved by the Board of Trustees. 8.Less than $0.005 per share. | |
The accompanying notes are an integral part of the financial statements.
John Hancock Funds II
Financial highlights
| Per share operating performance for a share outstanding throughout each period | | Ratios and supplemental data | |
| | | | Income (loss) from investment operations | | | Less distributions | | | | Ratios to average net assets | | |
| Period ended | Net asset
value,
beginning
of period ($) | | Net
investment
income
(loss) ($)1 | Net realized and
unrealized
gain (loss)
on investments ($) | Total from
investment
operations ($) | From net
investment
income ($) | From net
realized
gain ($) | Total
distributions ($) | Net asset
value,
end of
period ($) | Total
return
(%)2 | Expenses
before
reductions
(%) | Expenses
including
reductions
(%) | Net
investment
income
(loss) (%) | Net
assets,
end of
period
(in millions) | Portfolio
turnover
(%) |
| U.S. High Yield Bond Fund | |
| Class 1 | |
| 02-29-20203 | 11.20 | | 0.28 | (0.17) | 0.11 | (0.33) | — | (0.33) | 10.98 | 1.074 | 0.835, 6 | 0.825, 6 | 4.975 | 70 | 41 |
| 08-31-2019 | 11.21 | | 0.58 | 0.02 | 0.60 | (0.61) | — | (0.61) | 11.20 | 5.58 | 0.87 | 0.86 | 5.25 | 73 | 41 |
| 08-31-2018 | 11.41 | | 0.58 | (0.19) | 0.39 | (0.59) | — | (0.59) | 11.21 | 3.52 | 0.86 | 0.86 | 5.14 | 75 | 51 |
| 08-31-2017 | 11.15 | | 0.61 | 0.31 | 0.92 | (0.66) | — | (0.66) | 11.41 | 8.53 | 0.88 | 0.87 | 5.42 | 84 | 68 |
| 08-31-2016 | 11.20 | | 0.64 | 0.02 | 0.66 | (0.71) | — | (0.71) | 11.15 | 6.50 | 0.85 | 0.84 | 6.01 | 80 | 59 |
| 08-31-2015 | 12.59 | | 0.66 | (0.82) | (0.16) | (0.75) | (0.48) | (1.23) | 11.20 | (1.29) | 0.83 | 0.82 | 5.61 | 87 | 40 |
| Class NAV | |
| 02-29-20203 | 11.18 | | 0.28 | (0.16) | 0.12 | (0.33) | — | (0.33) | 10.97 | 1.094 | 0.785, 6 | 0.775, 6 | 5.025 | 176 | 41 |
| 08-31-2019 | 11.20 | | 0.58 | 0.01 | 0.59 | (0.61) | — | (0.61) | 11.18 | 5.55 | 0.82 | 0.81 | 5.30 | 174 | 41 |
| 08-31-2018 | 11.40 | | 0.59 | (0.19) | 0.40 | (0.60) | — | (0.60) | 11.20 | 3.58 | 0.81 | 0.81 | 5.20 | 196 | 51 |
| 08-31-2017 | 11.14 | | 0.62 | 0.30 | 0.92 | (0.66) | — | (0.66) | 11.40 | 8.59 | 0.83 | 0.82 | 5.52 | 212 | 68 |
| 08-31-2016 | 11.19 | | 0.64 | 0.03 | 0.67 | (0.72) | — | (0.72) | 11.14 | 6.56 | 0.80 | 0.80 | 6.03 | 281 | 59 |
| 08-31-2015 | 12.58 | | 0.67 | (0.82) | (0.15) | (0.76) | (0.48) | (1.24) | 11.19 | (1.24) | 0.78 | 0.77 | 5.65 | 261 | 40 |
| 1.Based on average daily shares outstanding. 2.Total returns would have been lower had certain expenses not been reduced during the applicable periods. 3.Six months ended 2-29-20. Unaudited. 4.Not annualized. 5.Annualized. 6.Includes reimbursement of legal fees of 0.04%. See Note 14 to the Financial statements. | |
The accompanying notes are an integral part of the financial statements.
John Hancock Funds II
Notes to financial statements (unaudited)
1. Organization
John Hancock Funds II (the Trust) is an open-end management investment company organized as a Massachusetts business trust. The Trust is registered under the Investment Company Act of 1940, as amended (the 1940 Act). It is a series company with multiple investment series (the funds), five of which are presented in this report.
The funds may offer multiple classes of shares. The shares currently offered by a specific fund are detailed in the Statements of assets and liabilities. Class 1 shares are offered only to certain affiliates of Manulife Financial Corporation. Class NAV shares are offered to John Hancock affiliated funds of funds, retirement plans for employees of John Hancock and/or Manulife Financial Corporation, and certain 529 plans. Shareholders of each class have exclusive voting rights to matters that affect that class. The distribution and service fees, if any, and transfer agent fees for each class may differ.
Prior to February 28, 2020, Opportunistic Fixed Income Fund was known as Global Bond Fund.
2. Significant accounting policies
The financial statements have been prepared in conformity with accounting principles generally accepted in the United States of America (US GAAP), which require management to make certain estimates and assumptions as of the date of the financial statements. Actual results could differ from those estimates and those differences could be significant. The funds qualify as investment companies under Topic 946 of Accounting Standards Codification of US GAAP.
Events or transactions occurring after the end of the fiscal period through the date that the financial statements were issued have been evaluated in the preparation of the financial statements. The following summarizes the significant accounting policies of the funds:
Security valuation. Investments are stated at value as of the scheduled close of regular trading on the New York Stock Exchange (NYSE), normally at 4:00 P.M., Eastern Time. In case of emergency or other disruption resulting in the NYSE not opening for trading or the NYSE closing at a time other than the regularly scheduled close, the net asset value (NAV) may be determined as of the regularly scheduled close of the NYSE pursuant to the funds' Valuation Policies and Procedures.
In order to value the securities, the funds use the following valuation techniques: Debt obligations typically are valued based on the evaluated prices provided by an independent pricing vendor. Independent pricing vendors utilize matrix pricing, which takes into account factors such as institutional-size trading in similar groups of securities, yield, quality, coupon rate, maturity, type of issue, trading characteristics and other market data, as well as broker supplied prices. Equity securities, including exchange-traded or closed-end funds, are typically valued at the last sale price or official closing price on the exchange or principal market where the security trades. In the event there were no sales during the day or closing prices are not available, the securities are valued using the last available bid price. Investments in open-end mutual funds, including John Hancock Collateral Trust (JHCT), are valued at their respective NAVs each business day. Options listed on an exchange are valued at the mid-price of the last quoted bid and ask prices from the primary exchange where the option trades. Unlisted options are generally valued using evaluated prices obtained from an independent pricing vendor. Futures contracts are typically valued at the last traded price on the exchange on which they trade. Swaps are valued using evaluated prices obtained from an independent pricing vendor. Forward foreign currency contracts are valued at the prevailing forward rates which are based on foreign currency exchange spot rates and forward points supplied by an independent pricing vendor. Foreign securities and currencies are valued in U.S. dollars based on foreign currency exchange rates supplied by an independent pricing vendor.
In certain instances, the Pricing Committee may determine to value equity securities using prices obtained from another exchange or market if trading on the exchange or market on which prices are typically obtained did not open for trading as scheduled, or if trading closed earlier than scheduled, and trading occurred as normal on another exchange or market.
Other portfolio securities and assets, for which reliable market quotations are not readily available, are valued at fair value as determined in good faith by the funds' Pricing Committee following procedures established by the Board of Trustees. The frequency with which these fair valuation procedures are used cannot be predicted and fair value of securities may differ significantly from the value that would have been used had a ready market for such securities existed. Trading in foreign securities may be completed before the scheduled daily close of trading on the NYSE. Significant events at the issuer or market level may affect the values of securities between the time when the valuation of the securities is generally determined and the close of the NYSE. If a significant event occurs, these securities may be fair valued, as determined in good faith by the funds' Pricing Committee, following procedures established by the Board of Trustees. The funds use fair value adjustment factors provided by an independent pricing vendor to value certain foreign securities in order to adjust for events that may occur between the close of foreign exchanges or markets and the close of the NYSE.
The funds use a three-tier hierarchy to prioritize the pricing assumptions, referred to as inputs, used in valuation techniques to measure fair value. Level 1 includes securities valued using quoted prices in active markets for identical securities, including registered investment companies. Level 2 includes securities valued using other significant observable inputs. Observable inputs may include quoted prices for similar securities, interest rates, prepayment speeds and credit risk. Prices for securities valued using these inputs are received from independent pricing vendors and brokers and are based on an evaluation of the inputs described. Level 3 includes securities valued using significant unobservable inputs when market prices are not readily available or reliable, including the funds' own assumptions in determining the fair value of investments. Factors used in determining value may include market or issuer specific events or trends, changes in interest rates and credit quality. The inputs or methodology used for valuing securities are not necessarily an indication of the risks associated with investing in those securities. Changes in valuation techniques and related inputs may result in transfers into or out of an assigned level within the disclosure hierarchy.
Significant accounting policies, continued
The following is a summary of the values by input classification of the funds' investments as of February 29, 2020, by major security category or type:
| | Total
value at
2-29-20 | Level 1
quoted
price | Level 2
significant
observable
inputs | Level 3
significant
unobservable
inputs |
| Asia Pacific Total Return Bond Fund |
| Investments in securities: | | | | |
| Assets | | | | |
| Foreign government obligations | $104,113,303 | — | $104,113,303 | — |
| Corporate bonds | 127,638,087 | — | 127,638,087 | — |
| Short-term investments | 18,225,502 | — | 18,225,502 | — |
| Total investments in securities | $249,976,892 | — | $249,976,892 | — |
| Derivatives: | | | | |
| Liabilities | | | | |
| Futures | $(173,462) | $(173,462) | — | — |
| |
| Core Bond Fund |
| Investments in securities: | | | | |
| Assets | | | | |
| U.S. Government and Agency obligations | $1,680,742,194 | — | $1,680,742,194 | — |
| Foreign government obligations | 26,257,292 | — | 26,257,292 | — |
| Corporate bonds | 783,513,306 | — | 783,513,306 | — |
| Municipal bonds | 14,390,726 | — | 14,390,726 | — |
| Collateralized mortgage obligations | 295,663,885 | — | 295,663,885 | — |
| Asset backed securities | 279,289,232 | — | 279,289,232 | — |
| Short-term investments | 102,469,744 | $102,469,744 | — | — |
| Total investments in securities | $3,182,326,379 | $102,469,744 | $3,079,856,635 | — |
| |
| High Yield Fund |
| Investments in securities: | | | | |
| Assets | | | | |
| Foreign government obligations | $1,920,808 | — | $1,920,808 | — |
| Corporate bonds | 189,908,227 | — | 189,908,227 | — |
| Convertible bonds | 2,085,095 | — | 2,085,095 | — |
| Term loans | 18,559,910 | — | 18,134,210 | $425,700 |
| Asset backed securities | 10,186,419 | — | 10,186,419 | — |
| Common stocks | 1,761,543 | $1,578,255 | — | 183,288 |
| Preferred securities | 1,680,597 | 1,680,597 | — | — |
| Escrow shares | 42,512 | — | — | 42,512 |
| Escrow certificates | 1,134 | — | — | 1,134 |
| Purchased options | 13,122 | — | 13,122 | — |
| Short-term investments | 10,854,556 | 10,854,556 | — | — |
| Total investments in securities | $237,013,923 | $14,113,408 | $222,247,881 | $652,634 |
| Derivatives: | | | | |
| Assets | | | | |
| Futures | $375,293 | $375,293 | — | — |
| Forward foreign currency contracts | 28,747 | — | $28,747 | — |
| Swap contracts | 4,647 | — | 4,647 | — |
| Liabilities | | | | |
| Futures | (314,294) | (314,294) | — | — |
| Forward foreign currency contracts | (25,053) | — | (25,053) | — |
| Written options | (118,821) | — | (118,821) | — |
| |
| Opportunistic Fixed Income Fund |
| Investments in securities: | | | | |
| Assets | | | | |
| U.S. Government and Agency obligations | $41,874,755 | — | $41,874,755 | — |
| Foreign government obligations | 1,282,648 | — | 1,282,648 | — |
Significant accounting policies, continued
| | Total
value at
2-29-20 | Level 1
quoted
price | Level 2
significant
observable
inputs | Level 3
significant
unobservable
inputs |
| Opportunistic Fixed Income Fund (continued) |
| Short-term investments | $421,000 | — | $421,000 | — |
| Total investments in securities | $43,578,403 | — | $43,578,403 | — |
| |
| U.S. High Yield Bond Fund |
| Investments in securities: | | | | |
| Assets | | | | |
| Corporate bonds | $220,324,824 | — | $220,324,824 | — |
| Convertible bonds | 2,035,710 | — | 2,035,710 | — |
| Term loans | 9,986,150 | — | 9,986,150 | — |
| Rights | 215,025 | — | 215,025 | — |
| Escrow certificates | 19,800 | — | — | $19,800 |
| Short-term investments | 21,600,244 | $21,600,244 | — | — |
| Total investments in securities | $254,181,753 | $21,600,244 | $232,561,709 | $19,800 |
Repurchase agreements. The funds may enter into repurchase agreements. When the funds enter into a repurchase agreement, they receive collateral that is held in a segregated account by the funds' custodian, or for tri-party repurchase agreements, collateral is held at a third-party custodian bank in a segregated account for the benefit of the funds. The collateral amount is marked-to-market and monitored on a daily basis to ensure that the collateral held is in an amount not less than the principal amount of the repurchase agreement plus any accrued interest. Collateral received by the fund for repurchase agreements is disclosed in the Portfolio of investments as part of the caption related to the repurchase agreement.
Repurchase agreements are typically governed by the terms and conditions of the Master Repurchase Agreement and/or Global Master Repurchase Agreement (collectively, MRA). Upon an event of default, the non-defaulting party may close out all transactions traded under the MRA and net amounts owed. Absent an event of default, assets and liabilities resulting from repurchase agreements are not offset in the Statements of assets and liabilities. In the event of a default by the counterparty, realization of the collateral proceeds could be delayed, during which time the collateral value may decline or the counterparty may have insufficient assets to pay claims resulting from close-out of the transactions.
In a reverse repurchase agreement, the funds deliver a security, as collateral, in exchange for cash to a financial institution, the counterparty, with a simultaneous agreement to repurchase the same or substantially the same security at an agreed upon price and date. The funds are entitled to receive principal and interest payments, if any, made on the security delivered to the counterparty during the term of the agreement. There were no open reverse repurchase agreement contracts at February 29, 2020.
The average borrowings by the fund and the weighted average interest rate for the period ended February 29, 2020 were as follows:
| Fund | Average Borrowings | Weighted average annual interest rate |
| Opportunistic Fixed Income Fund | $5,789,110 | (0.47%) |
When-issued/delayed-delivery securities. The funds may purchase or sell debt securities on a when-issued or delayed-delivery basis, or in a “To Be Announced” (TBA) or “forward commitment” transaction, with delivery or payment to occur at a later date beyond the normal settlement period. TBA securities resulting from these transactions are included in the portfolio or in a schedule to the portfolio (Sale Commitments Outstanding). At the time a fund enters into a commitment to purchase or sell a security, the transaction is recorded and the value of the security is reflected in its NAV. The price of such security and the date that the security will be delivered and paid for are fixed at the time the transaction is negotiated. The value of the security may vary with market fluctuations. No interest accrues until settlement takes place. At the time that the fund enters into this type of transaction, the fund is required to have sufficient cash and/or liquid securities to cover its commitments.
Certain risks may arise upon entering into when-issued or delayed-delivery securities transactions, including the potential inability of counterparties to meet the terms of their contracts, and the issuer’s failure to issue the securities due to political, economic or other factors. Additionally, losses may arise due to declines in the value of the securities purchased or increase in the value of securities sold prior to settlement date.
As a result, the funds have received the following amount of cash collateral from certain counterparties to these transactions which is recorded as a Payable for collateral on sale commitments:
| Fund | Counterparty | Collateral Paid/ (Received) |
| Core Bond Fund | Citigroup, Inc. | $(77,000) |
| Opportunistic Fixed Income Fund | Morgan Stanley & Co. LLC. | $(105,000) |
Securities sold short. The funds may make short sales of securities or maintain a short position, provided that at all times when a short position is open a fund owns an equal amount of such securities or securities convertible into or exchangeable, without payment of any further consideration, for an equal amount of the securities of the same issuer as the securities sold short (a short sale “against-the-box”).
In addition, the funds may also sell a security they do not own in anticipation of a decline in the market value of that security (a short sale “not against-the-box”). To complete such a transaction, a fund must borrow the security to make delivery to the buyer. The fund is then obligated to replace the security borrowed by purchasing it at market price at the time of replacement. The price at such time may be more or less than the price at which the security was sold by the fund. Until the security is replaced, the fund is required to pay the lender any dividends or interest that accrues during the period of the loan. To borrow the security, the fund also may be required to pay a premium, which would increase the cost of the security sold. The proceeds of the
Significant accounting policies, continued
short sale will be retained by the broker, to the extent necessary to meet margin requirements, until the short position is closed out.
Until a fund replaces a borrowed security, it will maintain cash or other liquid assets at such a level that will equal the current value of the security sold short; and will not be less than the market value of the security at the time it was sold short. A fund will incur a loss as a result of the short sale if the price of the security increases between the date of the short sale and the date on which the fund replaced the borrowed security. The fund will realize a gain if the security declines in price between those dates. The amount of any gain will be decreased, and the amount of any loss increased, by the amount of any premium, dividends or interest the fund may be required to pay in connection with a short sale.
Interest or short dividend expense relates to a funds' liability with respect to short sale transactions by the funds. Interest or short dividend expense is recorded as incurred.
Sale-Buybacks. Certain funds may enter into financing transactions referred to as sale-buybacks, which are governed by the terms of the MRA. A sale-buyback transaction consists of a sale of a security by a portfolio to counterparty, with a simultaneous agreement to repurchase the same or substantially the same security at an agreed-upon price and date. The fund is not entitled to receive principal and interest payments, if any, made on the security sold to the counterparty during the term of the agreement. The agreed-upon repurchase value of the securities to be repurchased by the fund are reflected as a liability on the Statements of Assets and Liabilities. The fund will recognize income represented by the price differential between the price received for the transferred security and the agreed-upon repurchase price. This is commonly referred to as the price drop. A price drop consists of the foregone interest and inflationary income adjustments, if any, the fund would have otherwise received had the security not been sold along with negotiated financing terms. Foregone interest and inflationary income adjustments, if any, are recorded as components of interest income on the Statements of Operations. Interest payments based upon negotiated financing terms made by the fund to counterparties are recorded as a component of interest expense on the Statements of Operations. In periods of increased demand for the security, the fund may receive a fee for use of the security by the counterparty, which may result in income to the fund. The average borrowings by the fund and the weighted average interest rate for the six months ended February 29, 2020 were as follows:
| Fund | Average Borrowing | Weighted average interest rate |
| Opportunistic Fixed Income Fund | $233,232 | (1.89%) |
Term loans (Floating rate loans). The funds may invest in term loans, which are debt securities and are often rated below investment grade at the time of purchase. Term loans are generally subject to legal or contractual restrictions on resale and generally have longer settlement periods than conventional debt securities. Term loans involve special types of risk, including credit risk, interest-rate risk, counterparty risk, and risk associated with extended settlement. The liquidity of term loans, including the volume and frequency of secondary market trading in such loans, varies significantly over time and among individual loans. During periods of infrequent trading, valuing a term loan can be more difficult and buying and selling a term loan at an acceptable price can be more difficult and delayed, which could result in a loss.
The funds' ability to receive payments of principal, interest and other amounts in connection with term loans will depend primarily on the financial condition of the borrower. The funds' failure to receive scheduled payments on a term loan due to a default, bankruptcy or other reason would adversely affect the funds' income and would likely reduce the value of its assets. Transactions in loan investments typically take a significant amount of time (i.e., seven days or longer) to settle. This could pose a liquidity risk to the funds and, if the funds' exposure to such investments is substantial, it could impair the funds' ability to meet redemptions. Because term loans may not be rated by independent credit rating agencies, a decision to invest in a particular loan could depend exclusively on the subadvisor’s credit analysis of the borrower and/or term loan agents. There is greater risk that the funds may have limited rights to enforce the terms of an underlying loan than for other types of debt instruments.
At February 29, 2020, High Yield Fund had $128,059 in unfunded loan commitments outstanding.
Security transactions and related investment income. Investment security transactions are accounted for on a trade date plus one basis for daily NAV calculations. However, for financial reporting purposes, investment transactions are reported on trade date. Interest income is accrued as earned. Interest income includes coupon interest and amortization/accretion of premiums/discounts on debt securities. Debt obligations may be placed in a non-accrual status and related interest income may be reduced by stopping current accruals and writing off interest receivable when the collection of all or a portion of interest has become doubtful. Dividend income is recorded on the ex-date, except for dividends of certain foreign securities where the dividend may not be known until after the ex-date. In those cases, dividend income, net of withholding taxes, is recorded when the fund becomes aware of the dividends. Non-cash dividends, if any, are recorded at the fair market value of the securities received. Gains and losses on securities sold are determined on the basis of identified cost and may include proceeds from litigation.
Inflation-indexed bonds. Inflation-indexed bonds are securities that generally have a lower coupon interest rate fixed at issuance but whose principal value is periodically adjusted based on a rate of inflation, such as the Consumer Price Index. Over the life of an inflation-indexed bond, interest is paid on the inflation adjusted principal value as described above. Increases in the principal amount of these securities are recorded as interest income. Decreases in the principal amount of these securities may reduce interest income to the extent of income previously recorded. If these decreases are in excess of income previously recorded, an adjustment to the cost of the security is made.
Payment-in-kind bonds. The funds may invest in payment-in-kind bonds (PIK Bonds). PIK Bonds allow the issuer, at its option, to make current interest payments on the bonds either in cash or in additional bonds. The market prices of PIK Bonds are affected to a greater extent by interest rate changes and thereby tend to be more volatile than securities which pay cash interest periodically. Income on these securities is computed at the contractual rate specified and is added to the principal balance of the bond. This income is required to be distributed to shareholders. Because no cash is received at the time income accrues on these securities, the funds may need to sell other investments to make distributions.
Securities lending. The funds may lend their securities to earn additional income. The funds receive collateral from the borrower in an amount not less than the market value of the loaned securities. The funds will invest their cash collateral in John Hancock Collateral Trust (JHCT), an affiliate of the funds, which has a floating NAV and is registered with the Securities and Exchange Commission (SEC) as an investment company. JHCT invests in short-term money market investments. Each fund will receive the benefit of any gains and bear any losses generated by JHCT with respect to the cash collateral.
The funds have the right to recall loaned securities on demand. If a borrower fails to return loaned securities when due, then the lending agent is responsible and indemnifies the funds for the lent securities. The lending agent uses the collateral received from the borrower to purchase replacement securities of the same issue, type, class and series of the loaned securities. If the value of the collateral is less than the purchase cost of replacement securities, the lending agent is responsible for satisfying the shortfall but only to the extent that the shortfall is not due to any decrease in the value of
Significant accounting policies, continued
JHCT.
Although the risk of loss on securities lent is mitigated by receiving collateral from the borrower and through lending agent indemnification, the funds could experience a delay in recovering securities or could experience a lower than expected return if the borrower fails to return the securities on a timely basis. The funds receive compensation for lending their securities by retaining a portion of the return on the investment of the collateral and compensation from fees earned from borrowers of the securities. Securities lending income received by the funds is net of fees retained by the securities lending agent. Net income received from JHCT is a component of securities lending income as recorded on the Statements of operations.
Obligations to repay collateral received by the funds are shown on the Statements of assets and liabilities as Payable upon return of securities loaned and are secured by the loaned securities. The following table summarizes the values of securities loaned by the funds and the corresponding cash collateral received at February 29, 2020:
| Fund | Market value of securities on loan | Cash collateral received |
| Core Bond Fund | $1,633,621 | $1,668,746 |
| High Yield Fund | 5,972,555 | 6,265,792 |
| U.S. High Yield Bond Fund | 15,975,585 | 16,320,863 |
Foreign investing. Assets, including investments, and liabilities denominated in foreign currencies are translated into U.S. dollar values each day at the prevailing exchange rate. Purchases and sales of securities, income and expenses are translated into U.S. dollars at the prevailing exchange rate on the date of the transaction. The effect of changes in foreign currency exchange rates on the value of securities is reflected as a component of the realized and unrealized gains (losses) on investments. Foreign investments are subject to a decline in the value of a foreign currency versus the U.S. dollar, which reduces the dollar value of securities denominated in that currency.
Funds that invest internationally generally carry more risk than funds that invest strictly in U.S. securities. These risks are heightened for investments in emerging markets. Risks can result from differences in economic and political conditions, regulations, market practices (including higher transaction costs), accounting standards and other factors.
Foreign taxes. The funds may be subject to withholding tax on income, capital gains or repatriation taxes imposed by certain countries, a portion of which may be recoverable. Foreign taxes are accrued based upon the funds' understanding of the tax rules and rates that exist in the foreign markets in which it invests. Taxes are accrued based on gains realized by the fund as a result of certain foreign security sales. In certain circumstances, estimated taxes are accrued based on unrealized appreciation of such securities. Investment income is recorded net of foreign withholding taxes.
Mortgage and asset backed securities. The funds may invest in mortgage-related securities, such as mortgage-backed securities, and other asset-backed securities, which are debt obligations that represent interests in pools of mortgages or other income-bearing assets, such as consumer loans or receivables. Such securities often involve risks that are different from the risks associated with investing in other types of debt securities. Mortgage-backed and other asset-backed securities are subject to changes in the payment patterns of borrowers of the underlying debt. When interest rates fall, borrowers are more likely to refinance or prepay their debt before its stated maturity. This may result in the funds having to reinvest the proceeds in lower yielding securities, effectively reducing the funds' income. Conversely, if interest rates rise and borrowers repay their debt more slowly than expected, the time in which the mortgage-backed and other asset-backed securities are paid off could be extended, reducing the funds' cash available for reinvestment in higher yielding securities. The timely payment of principal and interest of certain mortgage-related securities is guaranteed with the full faith and credit of the U.S. Government. Pools created and guaranteed by non-governmental issuers, including government-sponsored corporations (e.g. FNMA), may be supported by various forms of insurance or guarantees, but there can be no assurance that private insurers or guarantors can meet their obligations under the insurance policies or guarantee arrangements. The funds is also subject to risks associated with securities with contractual cash flows including asset-backed and mortgage related securities such as collateralized mortgage obligations, mortgage pass-through securities and commercial mortgage-backed securities. The value, liquidity and related income of these securities are sensitive to changes in economic conditions, including real estate value, pre-payments, delinquencies and/or defaults, and may be adversely affected by shifts in the market’s perception of the issuers and changes in interest rates.
Overdraft. The funds may have the ability to borrow from banks for temporary or emergency purposes, including meeting redemption requests that otherwise might require the untimely sale of securities. Pursuant to the funds' custodian agreement, the custodian may loan money to the funds to make properly authorized payments. The funds are obligated to repay the custodian for any overdraft, including any related costs or expenses. The custodian may have a lien, security interest or security entitlement in any fund property that is not otherwise segregated or pledged, to the extent of any overdraft, and to the maximum extent permitted by law. Overdrafts at period end, if any, are presented under the caption Due to custodian in the Statements of assets and liabilities.
Line of credit. The funds and other affiliated funds, excluding Core Bond Fund and U.S. High Yield Bond Fund, have entered into a syndicated line of credit agreement with Citibank, N.A. as the administrative agent that enables them to participate in a $750 million unsecured committed line of credit. Excluding commitments designated for a certain fund and subject to the needs of all other affiliated funds, a fund can borrow up to an aggregate commitment amount of $500 million, subject to asset coverage and other limitations as specified in the agreement. Core Bond Fund, U.S. High Yield Bond Fund, and other affiliated funds have entered into a separate unsecured $50 million line of credit agreement with BNP Paribas. Subject to the needs of other affiliated funds, Core Bond Fund and U.S. High Yield Bond Fund can borrow up to the $50 million, subject to asset coverage and other limitations as specified in the agreement.
A commitment fee payable at the end of each calendar quarter, based on the average daily unused portion of each line of credit, is charged to each participating fund based on a combination of fixed and asset based allocations and is reflected in Other expenses on the Statements of operations. For the six months ended February 29, 2020, the funds had no borrowings under the line of credit.
Commitment fees for the six months ended February 29, 2020 were as follows:
| Fund | Commitment fee |
| Asia Pacific Total Return Bond Fund | $1,372 |
| Core Bond Fund | 11,006 |
| High Yield Fund | 1,329 |
| Opportunistic Fixed Income Fund | 1,085 |
Significant accounting policies, continued
| Fund | Commitment fee |
| U.S. High Yield Bond Fund | $3,478 |
Expenses. Within the John Hancock group of funds complex, expenses that are directly attributable to an individual fund are allocated to such fund. Expenses that are not readily attributable to a specific fund are allocated among all funds in an equitable manner, taking into consideration, among other things, the nature and type of expense and the fund’s relative net assets. Expense estimates are accrued in the period to which they relate and adjustments are made when actual amounts are known.
Class allocations. Income, common expenses and realized and unrealized gains (losses) are determined at the fund level and allocated daily to each class of shares based on the net assets of the class. Class-specific expenses, such as distribution and service fees, if any, and transfer agent fees, for all classes, are charged daily at the class level based on the net assets of each class and the specific expense rates applicable to each class.
Change in accounting principle. Accounting Standards Update (ASU) 2017-08,Premium Amortization on Purchased Callable Debt Securities, shortens the premium amortization period for purchased non contingently callable debt securities and is effective for public companies with fiscal years beginning after December 15, 2018. Adoption of the ASU did not have a material impact to the funds.
Federal income taxes. Each fund intends to continue to qualify as a regulated investment company by complying with the applicable provisions of the Internal Revenue Code and will not be subject to federal income tax on taxable income that is distributed to shareholders. Therefore, no federal income tax provision is required.
For federal income tax purposes, as of August 31, 2019, certain funds have capital loss carryforwards available to offset future net realized capital gains. The following table details the capital loss carryforward available as of August 31, 2019:
| | No Expiration Date |
| Fund | Short Term | Long Term |
| Asia Pacific Total Return Bond Fund | $629,592 | $11,148,515 |
| High Yield Fund | 3,033,788 | 77,622,985 |
| Opportunistic Fixed Income Fund | 1,953,537 | 5,393,040 |
| U.S. High Yield Bond Fund | 13,692 | 19,242,745 |
As of August 31, 2019, the funds had no uncertain tax positions that would require financial statement recognition, derecognition or disclosure. The funds' federal tax returns are subject to examination by the Internal Revenue Service for a period of three years.
For federal income tax purposes, the costs of investments owned on February 29, 2020, including short-term investments, were as follows:
| Fund | Aggregate
cost | Unrealized
appreciation | Unrealized
(depreciation) | Net unrealized
appreciation/
(depreciation) |
| Asia Pacific Total Return Bond Fund | $258,615,304 | $5,733,945 | $(14,545,819) | $(8,811,874) |
| Core Bond Fund | 3,074,631,523 | 109,315,815 | (1,620,959) | 107,694,856 |
| High Yield Fund | 264,253,348 | 7,416,820 | (34,705,726) | (27,288,906) |
| Opportunistic Fixed Income Fund | 42,393,391 | 1,191,776 | (6,764) | 1,185,012 |
| U.S. High Yield Bond Fund | 258,965,524 | 5,825,942 | (10,609,713) | (4,783,771) |
Distribution of income and gains. Distributions to shareholders from net investment income and net realized gains, if any, are recorded on the ex-date. Core Bond Fund, High Yield Fund and U.S. High Yield Bond Fund generally declare and pay dividends from net investment income quarterly. All other funds generally declare and pay dividends from net investment income annually. All funds generally declare and pay capital gain distributions, if any, annually.
Such distributions, on a tax basis, are determined in conformity with income tax regulations, which may differ from US GAAP. Distributions in excess of tax basis earnings and profits, if any, are reported in the funds' financial statements as a return of capital. The final determination of tax characteristics of the fund's distribution will occur at the end of the year and will subsequently be reported to shareholders.
Capital accounts within the financial statements are adjusted for permanent book-tax differences. These adjustments have no impact on net assets or the results of operations. Temporary book-tax differences, if any, will reverse in a subsequent period. Book-tax differences are primarily attributable to foreign currency transactions, wash sale loss deferrals, derivative transactions, amortization and accretion on debt securities and straddle loss deferrals.
3. Derivative instruments
Certain funds may invest in derivatives in order to meet their investment objective. Derivatives include a variety of different instruments that may be traded in the over-the-counter (OTC) market, on a regulated exchange or through a clearing facility. The risks in using derivatives vary depending upon the structure of the instruments, including the use of leverage, optionality, the liquidity or lack of liquidity of the contract, the creditworthiness of the counterparty or clearing organization and the volatility of the position. Some derivatives involve risks that are potentially greater than the risks associated with investing directly in the referenced securities or other referenced underlying instrument. Specifically, the funds are exposed to the risk that the counterparty to an OTC derivatives contract will be unable or unwilling to make timely settlement payments or otherwise honor its obligations. OTC derivatives transactions typically can only be closed out with the other party to the transaction.
Derivatives which are typically traded through the OTC market are regulated by the Commodity Futures Trading Commission (the CFTC). Derivative counterparty risk is managed through an ongoing evaluation of the creditworthiness of all potential counterparties and, if applicable, designated clearing organizations. The funds attempt to reduce their exposure to counterparty risk for derivatives traded in the OTC market, whenever possible, by entering into an International Swaps and Derivatives Association (ISDA) Master Agreement with each of their OTC counterparties. The ISDA gives each party to the agreement the right to terminate all transactions traded under the agreement if there is certain deterioration in the credit quality or contractual default of the other party, as defined in the ISDA. Upon an event of default or a termination of the ISDA, the non-defaulting party has the right to close out all transactions and to net amounts owed.
Derivative instruments, continued
As defined by the ISDA, the funds may have collateral agreements with certain counterparties to mitigate counterparty risk on OTC derivatives. Subject to established minimum levels, collateral for OTC transactions is generally determined based on the net aggregate unrealized gain or loss on contracts with a particular counterparty. Collateral pledged to the funds, if any, are held in a segregated account by a third-party agent or held by the custodian bank for the benefit of the funds and can be in the form of cash or debt securities issued by the U.S. government or related agencies; collateral posted by the funds, if any, for OTC transactions is held in a segregated account at the funds' custodian and is noted in the accompanying portfolio of investments, or if cash is posted, on the Statements of assets and liabilities. The funds' risk of loss due to counterparty risk is equal to the asset value of outstanding contracts offset by collateral received.
Certain derivatives are traded or cleared on an exchange or central clearinghouse. Exchange-traded or centrally-cleared transactions generally present less counterparty risk to a fund than OTC transactions. The exchange or clearinghouse stands between the funds and the broker to the contract and therefore, credit risk is generally limited to the failure of the exchange or clearinghouse and the clearing member.
Centrally-cleared swap contracts are subject to clearinghouse rules, including initial and variation margin requirements, daily settlement of obligations and the clearinghouse guarantee of payments to the broker. There is, however, still counterparty risk due to the potential insolvency of the broker with respect to any margin held in the brokers’ customer accounts. While clearing members are required to segregate customer assets from their own assets, in the event of insolvency, there may be a shortfall in the amount of margin held by the broker for its clients. Collateral or margin requirements for centrally-cleared derivatives are set by the broker or applicable clearinghouse. Margin for centrally-cleared transactions is detailed in the Statements of assets and liabilities as Receivable/Payable for centrally-cleared swaps. Securities pledged by the funds for centrally-cleared transactions, if any, are identified in the Portfolio of investments.
Futures. A futures contract is a contractual agreement to buy or sell a particular currency or financial instrument at a pre-determined price in the future. Futures are traded on an exchange and cleared through a central clearinghouse. Risks related to the use of futures contracts include possible illiquidity of the futures markets and contract prices that can be highly volatile and imperfectly correlated to movements in the underlying financial instrument and potential losses in excess of the amounts recognized on the Statements of assets and liabilities. Use of long futures contracts subjects the funds to the risk of loss up to the notional value of the futures contracts. Use of short futures contracts subjects the funds to unlimited risk of loss.
Upon entering into a futures contract, the fund is required to deposit initial margin with the broker in the form of cash or securities. The amount of required margin is set by the broker and is generally based on a percentage of the contract value. The margin deposit must then be maintained at the established level over the life of the contract. Cash that has been pledged by a fund is detailed in the Statements of assets and liabilities as Collateral held at broker for futures contracts. Securities pledged by the funds, if any, are identified in the Portfolio of investments. Subsequent payments, referred to as variation margin, are made or received by a fund periodically and are based on changes in the market value of open futures contracts. Futures contracts are marked-to-market daily and unrealized gain or loss is recorded by the fund. Receivable/Payable for futures variation margin is included in the Statements of assets and liabilities. When the contract is closed, a fund records a realized gain or loss equal to the difference between the value of the contract at the time it was opened and the value at the time it was closed.
The following table details how the funds used futures contracts during the six months ended February 29, 2020. In addition, the table summarizes the range of notional contract amounts held by the funds, as measured at each quarter end:
| Fund | Reason | USD Notional range |
| Asia Pacific Total Return Bond Fund | To manage against anticipated interest rate changes and manage duration. | $33.4 million to $33.8 million |
| High Yield Fund | To manage duration of the portfolio, to manage against anticipated interest rate changes, gain exposure to treasuries market and maintain diversity of the fund. | $23.6 million to $32.7 million |
| Opportunistic Fixed Income Fund | To manage against anticipated interest rate changes, gain exposure to foreign bond markets, gain exposure to treasuries market, maintain diversity of the fund, manage duration and as a substitute for securities purchased. At February 29, 2020, there were no open futures contacts. | Up to $28.5 million |
Forward foreign currency contracts. A forward foreign currency contract is an agreement between two parties to buy and sell specific currencies at a price that is set on the date of the contract. The forward contract calls for delivery of the currencies on a future date that is specified in the contract. Forwards are typically traded OTC. Risks related to the use of forwards include the possible failure of counterparties to meet the terms of the forward agreement, the failure of the counterparties to timely post collateral if applicable, and the risk that currency movements will not favor the funds thereby reducing the funds' total return, and the potential for losses in excess of the amounts recognized on the Statements of assets and liabilities.
The market value of a forward foreign currency contract fluctuates with changes in foreign currency exchange rates. Forward foreign currency contracts are marked-to-market daily and the change in value is recorded by the fund as an unrealized gain or loss. Realized gains or losses, equal to the difference between the value of the contract at the time it was opened and the value at the time it was closed, are recorded upon delivery or receipt of the currency or settlement with the counterparty.
The following table details how the funds used forward foreign currency contracts during the six months ended February 29, 2020. In addition, the table summarizes the range of notional contract amounts held by the funds, as measured at each quarter end:
| Fund | Reason | USD Notional range |
| High Yield Fund | To manage against anticipated changes in currency exchange rates, manage currency exposure, and to maintain diversity and liquidity of the fund. | $2.5 million to $2.6 million |
| Opportunistic Fixed Income Fund | To manage against anticipated changes in currency exchange rates, manage currency exposure and maintain diversity of the fund. At February 29, 2020, there were no open forward foreign currency contacts. | Up to $63.5 million |
Options. There are two types of options, put options and call options. Options are traded either OTC or on an exchange. A call option gives the purchaser of the option the right to buy (and the seller the obligation to sell) the underlying instrument at the exercise price. A put option gives the purchaser of the option the right to sell (and the writer the obligation to buy) the underlying instrument at the exercise price. Writing puts and buying calls may increase the funds' exposure to changes in the value of the underlying instrument. Buying puts and writing calls may decrease the funds' exposure to such changes. Risks related to the use of options include the loss of premiums, possible illiquidity of the options markets, trading restrictions imposed by an exchange and movements in underlying security values, and for written options, potential losses in excess of the amounts recognized on the Statements of assets and
Derivative instruments, continued
liabilities. In addition, OTC options are subject to the risks of all OTC derivatives contracts.
When a fund purchases an option, the premium paid is included in the Portfolio of investments and subsequently “marked-to-market” to reflect current market value. If the purchased option expires, a fund realizes a loss equal to the cost of the option. If a fund exercises a call option, the cost of the securities acquired by exercising the call is increased by the premium paid to buy the call. If a fund exercises a put option, it realizes a gain or loss from the sale of the underlying security and the proceeds from such sale are decreased by the premium paid. If a fund enters into a closing sale transaction, it realizes a gain or loss, depending on whether proceeds from the closing sale are greater or less than the original cost. When a fund writes an option, the premium received is included as a liability and subsequently “marked-to-market” to reflect the current market value of the option written. Premiums received from writing options that expire unexercised are recorded as realized gains. Premiums received from writing options which are exercised or are closed are added to or offset against the proceeds or amount paid on the transaction to determine the realized gain or loss. If a put option on a security is exercised, the premium received reduces the cost basis of the securities purchased by a fund. An interest rate swaption is an option to enter into an interest rate swap.
The following table details how the funds used purchased options contracts during the six months ended February 29, 2020. In addition, the table summarizes the range of notional contract amounts held by the funds, as measured at each quarter end:
| Fund | Reason | Market value range |
| High Yield Fund | To manage duration of the fund, manage against anticipated interest rate change and anticipated changes in securities markets, to gain exposure to bond market and certain securities markets, and maintain diversity in the fund. | $6,000 to $31,000 |
| Opportunistic Fixed Income Fund | To gain exposure to the bond market and foreign currency, manage against anticipated currency exchange rates and interest rate changes, manage duration of the fund, maintain diversity of the fund and as a substitute for securities purchased. At February 29, 2020, there were no open purchased options contacts. | Up to $51,000 |
The following table details how the funds used written options contracts during the six months ended February 29, 2020. In addition, the table summarizes the range of notional contract amounts held by the funds, as measured at each quarter end:
| Fund | Reason | Market value range |
| High Yield Fund | To gain exposure to certain securities markets and as a substitute for securities purchased. At August 31, 2019, there were no open written options contacts. | Up to $119,000 |
| Opportunistic Fixed Income Fund | To gain exposure to the bond market and foreign currency, manage against anticipated currency exchange rates and interest rate changes, manage duration of the fund, maintain diversity of the fund and as a substitute for securities purchased. At February 29, 2020, there were no open written options contacts. | Up to $67,000 |
Swaps. Swap agreements are agreements between the fund and a counterparty to exchange cash flows, assets, foreign currencies or market-linked returns at specified intervals. Swap agreements are privately negotiated in the OTC market (OTC swaps) or may be executed on a registered commodities exchange (centrally cleared swaps). Swaps are marked-to-market daily and the change in value is recorded as a component of unrealized appreciation/depreciation of swap contracts. The value of the swap will typically impose collateral posting obligations on the party that is considered out-of-the-money on the swap.
Upfront payments made/received by the funds, if any, are amortized/accreted for financial reporting purposes, with the unamortized/unaccreted portion included in the Statement of assets and liabilities. A termination payment by the counterparty or the funds is recorded as realized gain or loss, as well as the net periodic payments received or paid by the funds.
Entering into swap agreements involves, to varying degrees, elements of credit, market and documentation risk that may provide outcomes that are in excess of the amounts recognized on the Statement of assets and liabilities. Such risks involve the possibility that there will be no liquid market for the swap, or that a counterparty may default on its obligation or delay payment under the swap terms. The counterparty may disagree or contest the terms of the swap. In addition to interest rate risk, market risks may also impact the swap. The funds may also suffer losses if it is unable to terminate or assign outstanding swaps or reduce its exposure through offsetting transactions.
Interest rate swaps. Interest rate swaps represent an agreement between the fund and a counterparty to exchange cash flows based on the difference between two interest rates applied to a notional amount. The payment flows are usually netted against each other, with the difference being paid by one party to the other. The funds settles accrued net interest receivable or payable under the swap contracts at specified, future intervals.
The following table details how the funds used interest rate swaps contracts during the six months ended February 29, 2020. In addition, the table summarizes the range of notional contract amounts held by the funds, as measured at each quarter end:
| Fund | Reason | USD Notional range |
| Opportunistic Fixed Income Fund | To manage duration of the fund, manage against anticipated interest rate changes and as a substitute for securities purchased. At February 29, 2020, there were no open interest rate swaps contacts. | Up to $138.1 million |
Credit default swaps. Credit default swaps (CDS) involve the exchange of a fixed rate premium (paid by the Buyer), for protection against the loss in value of an underlying debt instrument, referenced entity or index, in the event of a defined credit event (such as payment default or bankruptcy). Under the terms of the swap, one party acts as a “guarantor” (the Seller), receiving the premium and agreeing to contingent payments that are specified within the credit default agreement. The funds may enter into CDS in which it may act as either Buyer or Seller. By acting as the Seller, the funds may incur economic leverage since it would be obligated to pay the Buyer the notional amount of the contract in the event of a default. The amount of loss in such case could be significant, but would typically be reduced by any recovery value on the underlying credit.
Credit default swaps — Buyer
The following table details how the funds used credit default swap contracts as a buyer during the six months ended February 29, 2020. In addition, the table summarizes the range of notional contract amounts held by the funds, as measured at each quarter end:
Derivative instruments, continued
| Fund | Reason | USD Notional range |
| High Yield Fund | To manage against potential credit events, gain exposure to a credit index and as a substitute for securities purchased. | Up to $744,000 |
| Opportunistic Fixed Income Fund | To manage against potential credit events, gain exposure to a credit index and as a substitute for securities purchased. At February 29, 2020, there were no open credit default swaps — buyer contacts. | Up to $7.1 million |
Credit default swaps — Seller
Implied credit spreads are utilized in determining the market value of CDS agreements in which the fund is the Seller at period end. The implied credit spread generally represents the yield of the instrument above a credit-risk free rate, such as the U.S. Treasury Bond Yield, and may include upfront payments required to be made to enter into the agreement. It also serves as an indicator of the current status of the payment/performance risk and represents the likelihood or risk of default for the credit derivative. Wider credit spreads represent a deterioration of the referenced entity’s creditworthiness and an increased risk of default or other credit event occurring as defined under the terms of the agreement.
For CDS agreements where implied credit spreads are not reported or available, the average credit rating on the underlying index is shown. A deterioration of the referenced entity’s creditworthiness would indicate a greater likelihood of a credit event occurring and result in increasing market values, in absolute terms when compared to the notional amount of the swap. The maximum potential amount of future payments (undiscounted) that the fund as the Seller could be required to make under any CDS agreement equals the notional amount of the agreement.
The following table details how the funds used credit default swap contracts as a seller during the six months ended February 29, 2020. In addition, the table summarizes the range of notional contract amounts held by the funds, as measured at each quarter end:
| Fund | Reason | USD Notional range |
| Opportunistic Fixed Income Fund | To take a long position in the exposure of the benchmark credit, gain exposure to a credit index and as a substitute for securities purchased. At February 29, 2020, there were no open credit default swaps — seller contacts. | Up to $2.9 million |
Currency swaps. A currency swap is an agreement between the fund and a counterparty to exchange cash flows based on the notional difference among two or more currencies.
The following table details how the funds used currency swap contracts as a seller during the six months ended February 29, 2020. In addition, the table summarizes the range of notional contract amounts held by the funds, as measured at each quarter end:
| Fund | Reason | USD Notional range |
| Opportunistic Fixed Income Fund | To manage against anticipated currency exchange rate changes. At February 29, 2020, there were no open currency swaps contacts. | Up to $1.0 million |
Total Return Swaps. The funds may enter into total return swap contracts to obtain synthetic exposure to a specific reference asset or index without owning, taking physical custody of, or short selling the underlying assets. Total return swaps are commitments where one party pays a fixed or variable rate premium (the Buyer) in exchange for a market-linked return (the Seller). The Seller pays the total return of a specific reference asset or index and in return receives interest payments from the Buyer. To the extent the total return of the underlying asset or index exceeds or falls short of the offsetting interest rate obligation, the Buyer will receive or make a payment to the Seller. A fund may enter into total return swaps in which it may act as either the Buyer or the Seller. Total return swap contracts are subject to the risk associated with the investment in the underlying reference asset or index. The risk in the case of short total return swap contracts is unlimited based on the potential for unlimited increases in the market value of the underlying reference asset or index.
The following table details how the funds used total return swaps during the six months ended February 29, 2020. In addition, the table summarizes the range of notional contract amounts held by the funds, as measured at each quarter end:
| Fund | Reason | USD Notional range |
| Opportunistic Fixed Income Fund | As a substitute for securities purchased. At February 29, 2020, there were no open total return swaps contacts. | Up to $1.0 million |
Fair value of derivative instruments by risk category
The table below summarizes the fair value of derivatives held by the funds at February 29, 2020 by risk category:
| Fund | Risk | Statements of
assets and
liabilities location | Financial
instruments
location | Assets
derivatives
fair value | Liabilities
derivatives
fair value |
| Asia Pacific Total Return Bond Fund | Interest rate | Receivable/payable for futures variation margin | Futures1 | — | $(173,462) |
| | | | | — | $(173,462) |
Derivative instruments, continued
| Fund | Risk | Statements of
assets and
liabilities location | Financial
instruments
location | Assets
derivatives
fair value | Liabilities
derivatives
fair value |
| High Yield Fund | Interest rate | Receivable/payable for futures variation margin | Futures1 | $375,293 | $(314,294) |
| | Currency | Unrealized appreciation / depreciation on forward foreign currency contracts | Forward foreign currency contracts | 28,747 | (25,053) |
| | Interest rate | Unaffiliated investments, at value2 | Purchased options | 13,122 | — |
| | Interest rate | Written options, at value | Written options | — | (118,821) |
| | Credit | Swap contracts, at value | Credit default swaps3 | 4,647 | — |
| | | | | $421,809 | $(458,168) |
| | |
| 1 | Reflects cumulative appreciation/depreciation on futures as disclosed in the Portfolio of investments. Only the period end variation margin is separately disclosed on the Statements of assets and liabilities. |
| 2 | Purchased options are included in the Portfolio of investments. |
| 3 | Reflects cumulative value of swap contracts. Receivable/payable for centrally cleared swaps, which includes value and margin, are shown separately on the Statements of assets and liabilities. |
Effect of derivative instruments on the Statements of operations
The table below summarizes the net realized gain (loss) included in the net increase (decrease) in net assets from operations, classified by derivative instrument and risk category, for the six months ended February 29, 2020:
| | | Statements of operations location - Net realized gain (loss) on: |
| Fund | Risk | Unaffiliated
investments and
foreign currency
transactions1 | Futures contracts | Forward foreign
currency contracts | Written options | Swap contracts | Total |
| Asia Pacific Total Return Bond Fund | Interest rate | — | $(47,225) | — | — | — | $(47,225) |
| | Total | — | $(47,225) | — | — | — | $(47,225) |
| High Yield Fund | Interest rate | — | $3,401 | — | — | — | $3,401 |
| | Currency | — | — | $62,257 | — | — | 62,257 |
| | Credit | — | — | — | — | $1,155 | 1,155 |
| | Equity | $(51,822) | — | — | — | — | (51,822) |
| | Total | $(51,822) | $3,401 | $62,257 | — | $1,155 | $14,991 |
| Opportunistic Fixed Income Fund | Interest rate | $(3,253) | $15,770 | — | $89,830 | $130,768 | $233,115 |
| | Currency | (7,018) | — | $(535,501) | 20,729 | (41,066) | (562,856) |
| | Credit | — | — | — | 2,597 | (80,292) | (77,695) |
| | Total | $(10,271) | $15,770 | $(535,501) | $113,156 | $9,410 | $(407,436) |
| | |
| 1 | Realized gain/loss associated with purchased options is included in this caption on the Statements of operations. |
The table below summarizes the net change in unrealized appreciation (depreciation) included in the net increase (decrease) in net assets from operations, classified by derivative instrument and risk category, for the six months ended February 29, 2020:
| | | Statements of operations location - Change in net unrealized appreciation (depreciation) of: |
| Fund | Risk | Unaffiliated
investments and
translation of assets
and liabilities in
foreign currencies1 | Futures contracts | Forward foreign
currency contracts | Written options | Swap contracts | Total |
| Asia Pacific Total Return Bond Fund | Interest rate | — | $(169,534) | — | — | — | $(169,534) |
| | Total | — | $(169,534) | — | — | — | $(169,534) |
| High Yield Fund | Interest rate | $(20,561) | $36,516 | — | $(98,917) | — | $(82,962) |
| | Currency | — | — | $(5,451) | — | — | (5,451) |
| | Credit | — | — | — | — | $1,295 | 1,295 |
| | Equity | 5,682 | — | — | — | — | 5,682 |
| | Total | $(14,879) | $36,516 | $(5,451) | $(98,917) | $1,295 | $(81,436) |
Derivative instruments, continued
| | | Statements of operations location - Change in net unrealized appreciation (depreciation) of: |
| Fund | Risk | Unaffiliated
investments and
translation of assets
and liabilities in
foreign currencies1 | Futures contracts | Forward foreign
currency contracts | Written options | Swap contracts | Total |
| Opportunistic Fixed Income Fund | Interest rate | $7,088 | $(64,540) | — | $(21,416) | $(148,334) | $(227,202) |
| | Currency | 7,398 | — | $194,733 | 2,510 | 16,344 | 220,985 |
| | Credit | — | — | — | (3,367) | 24,981 | 21,614 |
| | Total | $14,486 | $(64,540) | $194,733 | $(22,273) | $(107,009) | $15,397 |
| | |
| 1 | Change in unrealized appreciation/depreciation associated with purchased options is included in this caption on the Statements of operations. |
4. Guarantees and indemnifications
Under the Trust's organizational documents, its Officers and Trustees are indemnified against certain liabilities arising out of the performance of their duties to the Trust, including the funds. Additionally, in the normal course of business, the Trust enters into contracts with service providers that contain general indemnification clauses. The Trust's maximum exposure under these arrangements is unknown, as this would involve future claims that may be made against the Trust that have not yet occurred. The risk of material loss from such claims is considered remote.
5. Fees and transactions with affiliates
John Hancock Investment Management LLC (the Advisor) serves as investment advisor for the funds. John Hancock Investment Management Distributors LLC (the Distributor), an affiliate of the Advisor, serves as principal underwriter of the funds. The Advisor and the Distributor are indirect, wholly owned subsidiaries of Manulife Financial Corporation.
Management fee. The funds have an investment management agreement with the Advisor under which the funds pay a monthly management fee to the Advisor equivalent on an annual basis as detailed below. Aggregate net assets generally include the net assets of the funds and the net assets of a similar fund of John Hancock Variable Insurance Trust (JHVIT), unless otherwise noted below. JHVIT funds are advised by an affiliate of the Advisor, John Hancock Variable Trust Advisers LLC, and are distributed by an affiliate of the Advisor, John Hancock Distributors, LLC.
• Asia Pacific Total Return Bond Fund — a) 0.725% of the first $250 million of average net assets; b) 0.700% of the next 250 million of average net assets and c) 0.600% of the excess over $500 million of average net assets.
• Core Bond Fund — a) 0.690% of the first $200 million of aggregate net assets; b) 0.640% of the next $200 million of aggregate net assets; c) 0.570% of the next $600 million of aggregate net assets.; d) 0.560% of the next $1 billion of aggregate net assets; and e) 0.550% of the excess over $2 billion of aggregate net assets.
• High Yield Fund — a) 0.700% of the first $500 million of aggregate net assets and b) 0.650% of the excess over $500 million of aggregate net assets.
• Opportunistic Fixed Income Fund — 0.650% on aggregate net assets. Prior to February 28, 2020, management fee was a) 0.700% of the first $1 billion of aggregate net assets and b) 0.650% of the excess over $1 billion of aggregate net assets.
• U.S. High Yield Bond Fund — a) 0.750% of the first $200 million of average net assets and b) 0.720% of the excess over $200 million of average net assets.
The organizations described below act as the subadvisors to the Trust and its funds pursuant to Subadvisory Agreements with the Advisor. Fund management is allocated among the following managers:
| Fund | Subadvisor(s) |
| Asia Pacific Total Return Bond Fund | Manulife Investment Management (US) LLC1 |
| Opportunistic Fixed Income Fund | Wellington Management Company LLP2 |
Core Bond Fund
U.S. High Yield Bond Fund | Wells Capital Management, Incorporated |
| High Yield Fund | Western Asset Management Company |
1 An affiliate of the Advisor.
2 Effective February 28, 2020, Wellington Management Company LLP replaced Pacific Investment Management Company LLC as subadvisor.
The funds are not responsible for payment of the subadvisory fees.
Expense reimbursements. The Advisor has voluntarily agreed to waive a portion of its management fee if certain expenses of the respective funds exceed the percentage of average net assets as detailed below. Expenses excluded from this waiver are taxes, brokerage commissions, interest expense, litigation and indemnification expenses and other extraordinary expenses not incurred in the ordinary course of the funds’ business, management fees, class specific expenses, acquired fund fees and short dividends. This expense reduction will continue in effect until terminated by the Advisor.
| Fund | Expense
limitation as a
percentage of
average net
assets |
| Asia Pacific Total Return Bond Fund | 0.15% |
| Core Bond Fund | 0.15% |
| Fund | Expense
limitation as a
percentage of
average net
assets |
| High Yield Fund | 0.15% |
| Opportunistic Fixed Income Fund | 0.15% |
Fees and transactions with affiliates, continued
| Fund | Expense
limitation as a
percentage of
average net
assets |
| U.S. High Yield Bond Fund | 0.15% |
The Advisor has contractually agreed to waive a portion of its management fee and/or reimburse expenses for certain funds of the John Hancock group of funds complex, including the fund (the participating portfolios). This waiver is based upon aggregate net assets of all the participating portfolios. The amount of the reimbursement is calculated daily and allocated among all the participating portfolios in proportion to the daily net assets of each fund. During the six months ended February 29, 2020, this waiver amounted to 0.01% of the fund’s average daily net assets on an annualized basis. This arrangement expires on July 31, 2021, unless renewed by mutual agreement of the fund and the Advisor based upon a determination that this is appropriate under the circumstances at that time.
For the six months ended February 29, 2020, the expense reductions described above amounted to the following:
| Expense Reimbursement by Class |
| Fund | Class 1 | Class NAV | Total |
| Asia Pacific Total Return Bond Fund | — | $11,156 | $11,156 |
| Core Bond Fund | $6,633 | 102,331 | 108,964 |
| High Yield Fund | 9,070 | — | 9,070 |
| Opportunistic Fixed Income Fund | 90,467 | — | 90,467 |
| U.S. High Yield Bond Fund | 2,745 | 6,652 | 9,397 |
Expenses waived or reimbursed in the current fiscal period are not subject to recapture in future fiscal periods.
The investment management fees, including the impact of the waivers and reimbursements as described above, incurred for the six months ended February 29, 2020, were equivalent to a net annual effective rate of the funds' average daily net assets as follows:
| Fund | Net Annual Effective Rate |
| Asia Pacific Total Return Bond Fund | 0.71% |
| Core Bond Fund | 0.56% |
| High Yield Fund | 0.69% |
| Fund | Net Annual Effective Rate |
| Opportunistic Fixed Income Fund | 0.27% |
| U.S. High Yield Bond Fund | 0.74% |
Accounting and legal services. Pursuant to a service agreement, the funds reimburse the Advisor for all expenses associated with providing the administrative, financial, legal, compliance, accounting and recordkeeping services to the funds, including the preparation of all tax returns, periodic reports to shareholders and regulatory reports, among other services. These expenses are allocated to each share class based on its relative net assets at the time the expense was incurred. These accounting and legal services fees incurred for the six months ended February 29, 2020 amounted to an annual rate of 0.02% of the funds' average daily net assets.
Distribution and service plans. The funds have a distribution agreement with the Distributor. The funds have adopted distribution and service plans for certain classes as detailed below pursuant to Rule 12b-1 under the 1940 Act, to pay the Distributor for services provided as the distributor of shares of the funds. The funds may pay up to the following contractual rates of distribution and service fees under these arrangements, expressed as an annual percentage of average daily net assets for each class of the funds' shares:
| Class | Rule 12b-1 Fee |
| Class 1 | 0.05% |
Trustee expenses. The funds compensate each Trustee who is not an employee of the Advisor or its affiliates. The costs of paying Trustee compensation and expenses are allocated to each fund based on their net assets relative to other funds within the John Hancock group of funds complex.
6. Fund share transactions
Transactions in funds' shares for the six months ended February 29, 2020 and for the year ended August 31, 2019 were as follows:
| Asia Pacific Total Return Bond Fund | Six Months Ended 2-29-20 | Year Ended 8-31-19 |
| | Shares | Amount | Shares | Amount |
| Class NAV shares | | | | |
| Sold | 366,343 | $3,645,723 | 2,357,811 | $22,559,494 |
| Distributions reinvested | 1,187,940 | 11,534,899 | 1,069,814 | 9,927,876 |
| Repurchased | (5,789,696) | (57,335,554) | (9,834,752) | (93,835,766) |
| Net decrease | (4,235,413) | $(42,154,932) | (6,407,127) | $(61,348,396) |
| Total net decrease | (4,235,413) | $(42,154,932) | (6,407,127) | $(61,348,396) |
| Core Bond Fund | Six Months Ended 2-29-20 | Year Ended 8-31-19 |
| | Shares | Amount | Shares | Amount |
| Class 1 shares | | | | |
| Sold | 1,731,047 | $23,103,446 | 2,476,833 | $31,829,228 |
| Distributions reinvested | 310,372 | 4,093,228 | 342,715 | 4,342,494 |
| Repurchased | (1,033,901) | (13,743,587) | (2,600,640) | (33,029,680) |
| Net increase | 1,007,518 | $13,453,087 | 218,908 | $3,142,042 |
Fund share transactions, continued
| Core Bond Fund (continued) | Six Months Ended 2-29-20 | Year Ended 8-31-19 |
| | Shares | Amount | Shares | Amount |
| Class NAV shares | | | | |
| Sold | 13,664,011 | $180,811,020 | 122,829,292 | $1,565,914,512 |
| Distributions reinvested | 4,864,383 | 64,043,068 | 4,144,403 | 52,735,636 |
| Repurchased | (16,509,913) | (221,144,993) | (49,605,775) | (639,991,485) |
| Net increase | 2,018,481 | $23,709,095 | 77,367,920 | $978,658,663 |
| Total net increase | 3,025,999 | $37,162,182 | 77,586,828 | $981,800,705 |
| High Yield Fund | Six Months Ended 2-29-20 | Year Ended 8-31-19 |
| | Shares | Amount | Shares | Amount |
| Class 1 shares | | | | |
| Sold | 1,268,518 | $10,257,841 | 1,520,532 | $12,191,321 |
| Distributions reinvested | 933,029 | 7,499,538 | 2,030,292 | 15,929,257 |
| Repurchased | (4,428,505) | (35,582,169) | (6,940,528) | (54,913,514) |
| Net decrease | (2,226,958) | $(17,824,790) | (3,389,704) | $(26,792,936) |
| Class NAV shares1 | | | | |
| Sold | — | — | 61,648 | $480,103 |
| Distributions reinvested | — | — | 626,974 | 4,816,452 |
| Repurchased | — | — | (17,556,929) | (138,149,496) |
| Net decrease | — | — | (16,868,307) | $(132,852,941) |
| Total net decrease | (2,226,958) | $(17,824,790) | (20,258,011) | $(159,645,877) |
| | |
| 1 | Class NAV shares were fully redeemed on 3/28/19. |
| Opportunistic Fixed Income Fund | Six Months Ended 2-29-20 | Year Ended 8-31-19 |
| | Shares | Amount | Shares | Amount |
| Class 1 shares | | | | |
| Sold | 366,507 | $4,757,938 | 520,704 | $6,606,636 |
| Distributions reinvested | 110,682 | 1,410,083 | 52,415 | 648,896 |
| Repurchased | (766,335) | (10,071,663) | (979,631) | (12,432,894) |
| Net decrease | (289,146) | $(3,903,642) | (406,512) | $(5,177,362) |
| Class NAV shares1 | | | | |
| Sold | — | — | 48,422 | $604,726 |
| Distributions reinvested | — | — | 230,192 | 2,845,170 |
| Repurchased | — | — | (18,087,028) | (228,474,139) |
| Net decrease | — | — | (17,808,414) | $(225,024,243) |
| Total net decrease | (289,146) | $(3,903,642) | (18,214,926) | $(230,201,605) |
| | |
| 1 | Class NAV shares were fully redeemed on 4/17/19. |
| U.S. High Yield Bond Fund | Six Months Ended 2-29-20 | Year Ended 8-31-19 |
| | Shares | Amount | Shares | Amount |
| Class 1 shares | | | | |
| Sold | 637,951 | $7,136,885 | 1,118,013 | $12,311,473 |
| Distributions reinvested | 193,003 | 2,152,284 | 375,923 | 4,094,406 |
| Repurchased | (963,862) | (10,780,105) | (1,673,286) | (18,424,154) |
| Net decrease | (132,908) | $(1,490,936) | (179,350) | $(2,018,275) |
| Class NAV shares | | | | |
| Sold | 674,902 | $7,543,823 | 1,009,198 | $11,090,690 |
| Distributions reinvested | 469,435 | 5,227,793 | 920,914 | 10,019,828 |
| Repurchased | (723,540) | (8,034,978) | (3,875,556) | (42,608,023) |
| Net increase (decrease) | 420,797 | $4,736,638 | (1,945,444) | $(21,497,505) |
| Total net increase (decrease) | 287,889 | $3,245,702 | (2,124,794) | $(23,515,780) |
Affiliates of the Trust owned 100% of shares of Class 1 and Class NAV, with the exception of Core Bond Fund where affiliates owned 74% of shares of Class NAV on February 29, 2020. Such concentration of shareholders’ capital could have a material effect on the fund if such shareholders redeem from the fund.
7. Purchase and sale of securities
Purchases and sales of securities, other than short-term investments, amounted to the following for the six months ended February 29, 2020:
| | Purchases | Sales |
| Fund | U.S. Government | Other issuers | U.S. Government | Other issuers |
| Asia Pacific Total Return Bond Fund | $18,395,414 | $47,209,454 | $37,989,141 | $93,381,655 |
Purchase and sale of securities, continued
| | Purchases | Sales |
| Fund | U.S. Government | Other issuers | U.S. Government | Other issuers |
| Core Bond Fund | $3,427,547,271 | $1,729,705,722 | $3,579,767,687 | $1,567,631,290 |
| High Yield Fund | — | 76,301,240 | — | 90,310,033 |
| Opportunistic Fixed Income Fund | 38,257,671 | 18,773,053 | 3,376,626 | 61,241,472 |
| U.S. High Yield Bond Fund | — | 97,932,978 | — | 104,041,938 |
8. Industry or sector risk
Certain funds generally invest a large percentage of their assets in one or more particular industries or sectors of the economy. If a large percentage of a fund's assets are economically tied to a single or small number of industries or sectors of the economy, the fund will be less diversified than a more broadly diversified fund, and it may cause the fund to underperform if that industry or sector underperforms. In addition, focusing on a particular industry or sector may make the fund’s NAV more volatile. Further, a fund that invests in particular industries or sectors is particularly susceptible to the impact of market, economic, regulatory and other factors affecting those industries or sectors. Financial services companies can be hurt by economic declines, changes in interest rates regulatory and market impacts.
9. Investment in affiliated underlying funds
The fund may invest in affiliated underlying funds that are managed by the Advisor and its affiliates. Information regarding the funds' fiscal year to date purchases and sales of the affiliated underlying funds as well as income and capital gains earned by the funds, if any, is as follows:
| | | | | | | | Dividends and distributions |
| Affiliate | Ending
share
amount | Beginning
value | Cost of
purchases | Proceeds
from shares
sold | Realized
gain
(loss) | Change in
unrealized
appreciation
(depreciation) | Income
distributions
received | Capital gain
distributions
received | Ending
value |
| Core Bond Fund |
| John Hancock Collateral Trust* | 166,775 | $1,019,314 | $5,366,145 | $(4,716,745) | $140 | $384 | $2,258 | — | $1,669,238 |
| High Yield Fund |
| John Hancock Collateral Trust* | 626,132 | $877,204 | $18,291,049 | $(12,902,524) | $(494) | $1,661 | $15,825 | — | $6,266,896 |
| U.S. High Yield Bond Fund |
| John Hancock Collateral Trust* | 1,631,217 | $12,857,869 | $42,999,716 | $(39,534,538) | $1,611 | $2,027 | $59,233 | — | $16,326,685 |
| * | Refer to the Securities lending note within Note 2 for details regarding this investment. |
10. Investment by affiliated funds
Certain investors in the funds are affiliated funds that are managed by the Advisor and its affiliates. The affiliated funds do not invest in the funds for the purpose of exercising management or control; however, this investment may represent a significant portion of the funds' net assets. The following fund(s) had an affiliate ownership of 5% or more of the funds' net assets:
| Fund | Affiliated Concentration |
| Asia Pacific Total Return Bond Fund | 100.0% |
| Core Bond Fund | 74.0% |
| U.S. High Yield Bond Fund | 71.4% |
11. Interfund trading
The funds are permitted to purchase or sell securities from or to certain other affiliated funds, as set forth in Rule 17a-7 of the 1940 Act, under specified conditions outlined in procedures adopted by the Board of Trustees of the Trust. The procedures have been designed to ensure that any purchase or sale of securities by the funds from or to another fund that is or could be considered an affiliate complies with Rule 17a-7 of the 1940 Act. Further, as defined under the procedures, each transaction is effected at the current market price. Pursuant to these procedures, for the six months ended February 29, 2020, the funds engaged in securities purchases and sales with affiliated funds, some of which have different fiscal reporting periods, as follows:
| Fund | Purchases | Sales |
| Opportunistic Fixed Income Fund | $325,632 | $10,489,027 |
| U.S. High Yield Bond Fund | $1,250,547 | - |
12. Restricted securities
The funds may hold restricted securities which are restricted as to resale and the funds have limited rights to registration under the Securities Act of 1933. Disposal may involve time-consuming negotiations and expenses, and prompt sale at an acceptable price may be difficult to achieve. The following table summarizes the restricted securities held at February 29, 2020:
Restricted securities, continued
Issuer,
Description | Original
acquisition date | Acquisition
cost | Beginning
share
amount | Shares
purchased | Shares
sold | Ending
share
amount | Value as a
percentage of
net assets | Ending
value |
| High Yield Fund | | | | | | | | |
| KCAD Holdings I, Ltd. | 3-21-11 | $6,150,520 | 752,218,031 | — | — | 752,218,031 | 0.0%* | $752 |
| MWO Holdings LLC | 8-30-16 | 1,116,559 | 1,134 | — | — | 1,134 | 0.0%* | 65,851 |
| New Cotai, Inc., Class B | 4-12-13 | — | 11 | — | — | 11 | 0.0% | — |
| | | | | | | | | $66,603 |
13. LIBOR discontinuation risk
LIBOR (London Interbank Offered Rate) is a measure of the average interest rate at which major global banks can borrow from one another. Following allegations of rate manipulation and concerns regarding its thin liquidity, in July 2017, the U.K. Financial Conduct Authority, which regulates LIBOR, announced that it will stop encouraging banks to provide the quotations needed to sustain LIBOR after 2021. This event will likely cause LIBOR to cease to be published. Before then, it is expected that market participants will transition to the use of different reference or benchmark rates. However, although regulators have suggested alternative rates, there is currently no definitive information regarding the future utilization of LIBOR or of any replacement rate.
It is uncertain what impact the discontinuation of LIBOR will have on the use of LIBOR as a reference rate for securities in which the fund invests. It is expected that market participants will amend financial instruments referencing LIBOR to include fallback provisions and other measures that contemplate the discontinuation of LIBOR or other similar market disruption events, but neither the effect of the transition process nor the viability of such measures is known. In addition, there are obstacles to converting certain longer term securities and transactions to a new benchmark or benchmarks and the effectiveness of one alternative reference rate versus multiple alternative reference rates in new or existing financial instruments and products has not been determined. As market participants transition away from LIBOR, LIBOR's usefulness may deteriorate, which could occur prior to the end of 2021. The transition process may lead to increased volatility and illiquidity in markets that currently rely on LIBOR to determine interest rates. LIBOR's deterioration may adversely affect the liquidity and/or market value of securities that use LIBOR as a benchmark interest rate.
14. Other matters
In or around May 2015, certain John Hancock Funds, including U.S. High Yield Bond Fund, were served with a complaint brought by the Motors Liquidation Avoidance Action Trust (the “Motors Trust”). The complaint seeks disgorgement of certain amounts paid to the Term Loan Lenders as holders of indebtedness issued by General Motors pursuant to a $1.5 billion term loan, dated as of November 29, 2006 (as amended, the “Term Loan”). The litigation has now been settled resulting in no payments by the fund. As part of the settlement, the fund received payment of $107,429 representing reimbursement of approximately 73% of the legal fees incurred.
15. Subsequent events
A widespread health crisis such as a global pandemic could cause substantial market volatility, exchange trading suspensions and closures, impact the ability to complete redemptions, and affect fund performance. For example, the novel coronavirus disease (COVID-19) has resulted in significant disruptions to global business activity. The impact of a health crisis and other epidemics and pandemics that may arise in the future, could affect the global economy in ways that cannot necessarily be foreseen at the present time. A health crisis may exacerbate other pre-existing political, social and economic risks. Any such impact could adversely affect the funds' performance, resulting in losses to your investment.
John Hancock Funds II
For more information
The Statement of Additional Information, a separate document with supplemental information not contained in the prospectus, includes additional information on the Board of Trustees and can be obtained without charge by calling 800-344-1029 or on the Securities and Exchange Commission (SEC) website at sec.gov.
PROXY VOTING POLICY A description of the trust’s proxy voting policies and procedures and information regarding how the trust voted proxies relating to portfolio securities during the most recent twelve-month period ended June 30 is available without charge, upon request, by calling 800-344-1029 or on the SEC website at sec.gov.
QUARTERLY PORTFOLIO DISCLOSURE All of the trust’s holdings as of the end of the third month of every fiscal quarter are filed with the SEC on Form N-PORT within 60 days of the end of the fiscal quarter. The trust’s Form N-PORT filings are available electronically on the SEC website (sec.gov).
The report is certified under the Sarbanes-Oxley Act, which requires mutual funds and other public companies to affirm that, to the best of their knowledge, the information in their financial reports is fairly and accurately stated in all material respects.
55

ITEM 2. CODE OF ETHICS.
ITEM 3. AUDIT COMMITTEE FINANCIAL EXPERT.
Not Applicable
ITEM 4. PRINCIPAL ACCOUNTANT FEES AND SERVICES.
ITEM 5. AUDIT COMMITTEE OF LISTED REGISTRANTS
Not Applicable.
ITEM 6. SCHEDULE OF INVESTMENTS.
AS OF 2-29-20 (unaudited)
| | | | | Shares | Value |
| Common stocks 96.9% | | | | | $228,309,740 |
| (Cost $205,400,356) | | | | | |
| Australia 0.0% | | | | | 46,243 |
| MMG, Ltd. (A) | | | 220,000 | 46,243 |
| Belgium 0.0% | | | | | 34,624 |
| Titan Cement International SA (A) | | | 2,468 | 34,624 |
| Brazil 6.0% | | | | | 14,110,642 |
| AES Tiete Energia SA | | | 18,846 | 64,100 |
| AES Tiete Energia SA | | | 83 | 68 |
| Alliar Medicos A Frente SA | | | 3,900 | 16,439 |
| Alupar Investimento SA | | | 12,050 | 75,988 |
| Ambev SA | | | 8,500 | 27,637 |
| Ambev SA, ADR | | | 137,104 | 440,104 |
| Arezzo Industria e Comercio SA | | | 4,191 | 56,325 |
| Atacadao SA | | | 12,800 | 59,221 |
| B3 SA - Brasil Bolsa Balcao | | | 30,078 | 322,848 |
| Banco Bradesco SA | | | 37,802 | 230,689 |
| Banco BTG Pactual SA | | | 3,188 | 48,163 |
| Banco do Brasil SA | | | 15,437 | 161,761 |
| Banco Santander Brasil SA | | | 7,500 | 66,851 |
| BB Seguridade Participacoes SA | | | 24,029 | 171,141 |
| BR Malls Participacoes SA | | | 41,304 | 150,922 |
| BR Properties SA (A) | | | 8,524 | 26,266 |
| BrasilAgro - Co Brasileira de Propriedades Agricolas | | | 4,216 | 17,441 |
| Braskem SA, ADR | | | 5,886 | 71,221 |
| BRF SA (A) | | | 18,790 | 113,616 |
| Camil Alimentos SA | | | 11,340 | 21,453 |
| CCR SA | | | 63,269 | 231,039 |
| Centrais Eletricas Brasileiras SA | | | 5,600 | 43,241 |
| Cia Brasileira de Distribuicao | | | 10,117 | 185,513 |
| Cia de Locacao das Americas | | | 23,748 | 112,370 |
| Cia de Saneamento Basico do Estado de Sao Paulo | | | 15,692 | 206,155 |
| Cia de Saneamento de Minas Gerais-COPASA | | | 4,135 | 55,766 |
| Cia de Saneamento do Parana | | | 6,940 | 155,967 |
| Cia de Saneamento do Parana | | | 1,000 | 4,633 |
| Cia Energetica de Minas Gerais | | | 7,404 | 24,620 |
| Cia Hering | | | 4,235 | 21,346 |
| Cia Paranaense de Energia | | | 1,600 | 28,061 |
| Cia Siderurgica Nacional SA | | | 77,620 | 194,054 |
| Cielo SA | | | 36,815 | 56,393 |
| Cogna Educacao | | | 79,561 | 179,514 |
| Construtora Tenda SA | | | 3,166 | 24,829 |
| SEE NOTES TO FINANCIAL STATEMENTS | SEMIANNUAL REPORT | JOHN HANCOCK EMERGING MARKETS FUND | 1 |
| | | | | Shares | Value |
| Brazil (continued) | | | | | |
| Cosan Logistica SA (A) | | | 10,845 | $43,992 |
| Cosan SA | | | 7,044 | 115,255 |
| CSU Cardsystem SA | | | 6,521 | 17,834 |
| CVC Brasil Operadora e Agencia de Viagens SA | | | 10,802 | 62,152 |
| Cyrela Brazil Realty SA Empreendimentos e Participacoes | | | 11,455 | 76,411 |
| Cyrela Commercial Properties SA Empreendimentos e Participacoes (A) | | | 2,100 | 11,848 |
| Dimed SA Distribuidora da Medicamentos | | | 300 | 53,668 |
| Direcional Engenharia SA | | | 7,825 | 26,265 |
| Duratex SA | | | 18,441 | 71,712 |
| EcoRodovias Infraestrutura e Logistica SA (A) | | | 14,116 | 49,811 |
| EDP - Energias do Brasil SA | | | 16,667 | 76,144 |
| Embraer SA (A) | | | 46,700 | 177,113 |
| Enauta Participacoes SA | | | 7,100 | 21,100 |
| Energisa SA | | | 14,568 | 175,914 |
| Eneva SA (A) | | | 7,600 | 72,654 |
| Engie Brasil Energia SA | | | 6,293 | 66,886 |
| Equatorial Energia SA | | | 54,785 | 302,108 |
| Even Construtora e Incorporadora SA (A) | | | 7,057 | 22,630 |
| Ez Tec Empreendimentos e Participacoes SA | | | 4,711 | 48,986 |
| Fleury SA | | | 13,465 | 89,608 |
| Gafisa SA (A) | | | 7,901 | 12,156 |
| Grendene SA | | | 9,503 | 20,613 |
| Guararapes Confeccoes SA | | | 5,552 | 34,142 |
| Helbor Empreendimentos SA (A) | | | 31,832 | 24,202 |
| Hypera SA | | | 8,932 | 68,509 |
| Instituto Hermes Pardini SA | | | 4,000 | 25,716 |
| International Meal Company Alimentacao SA | | | 15,000 | 26,163 |
| Iochpe Maxion SA | | | 14,621 | 63,560 |
| IRB Brasil Resseguros SA | | | 19,926 | 148,156 |
| Itau Unibanco Holding SA | | | 13,251 | 84,776 |
| JBS SA | | | 65,822 | 334,122 |
| JHSF Participacoes SA | | | 17,839 | 27,964 |
| JSL SA | | | 4,600 | 28,514 |
| Klabin SA | | | 34,118 | 146,866 |
| Light SA | | | 9,244 | 44,836 |
| Localiza Rent a Car SA | | | 22,644 | 250,853 |
| LOG Commercial Properties e Participacoes SA | | | 4,489 | 27,685 |
| Lojas Americanas SA | | | 4,826 | 24,260 |
| Lojas Renner SA | | | 35,856 | 427,363 |
| M Dias Branco SA | | | 2,200 | 20,170 |
| Magazine Luiza SA | | | 22,910 | 258,819 |
| Mahle-Metal Leve SA | | | 3,156 | 19,020 |
| Marisa Lojas SA (A) | | | 6,873 | 21,088 |
| 2 | JOHN HANCOCK EMERGING MARKETS FUND | SEMIANNUAL REPORT | SEE NOTES TO FINANCIAL STATEMENTS |
| | | | | Shares | Value |
| Brazil (continued) | | | | | |
| Mills Estruturas e Servicos de Engenharia SA (A) | | | 15,517 | $29,737 |
| Movida Participacoes SA | | | 6,397 | 25,749 |
| MRV Engenharia e Participacoes SA | | | 13,204 | 57,547 |
| Natura & Company Holding SA | | | 20,670 | 210,356 |
| Notre Dame Intermedica Participacoes SA | | | 9,420 | 133,193 |
| Odontoprev SA | | | 27,009 | 99,595 |
| Omega Geracao SA (A) | | | 3,124 | 27,070 |
| Petrobras Distribuidora SA | | | 15,245 | 88,977 |
| Petroleo Brasileiro SA | | | 271,519 | 1,648,458 |
| Porto Seguro SA | | | 7,284 | 99,327 |
| Portobello SA | | | 11,800 | 13,457 |
| Profarma Distribuidora de Produtos Farmaceuticos SA (A) | | | 1,556 | 2,004 |
| Qualicorp Consultoria e Corretora de Seguros SA | | | 32,757 | 250,884 |
| Raia Drogasil SA | | | 11,976 | 321,099 |
| Restoque Comercio e Confeccoes de Roupas SA | | | 9,075 | 30,805 |
| Rumo SA (A) | | | 49,929 | 235,806 |
| Sao Carlos Empreendimentos e Participacoes SA | | | 2,200 | 22,827 |
| Sao Martinho SA | | | 17,485 | 103,575 |
| Ser Educacional SA (B) | | | 3,448 | 19,893 |
| SLC Agricola SA | | | 4,752 | 21,433 |
| Smiles Fidelidade SA | | | 6,000 | 43,981 |
| Springs Global Participacoes SA (A) | | | 59 | 155 |
| Sul America SA | | | 16,479 | 199,212 |
| Suzano SA | | | 17,626 | 150,329 |
| T4F Entretenimento SA | | | 3,900 | 3,680 |
| Tecnisa SA (A) | | | 42,403 | 14,223 |
| Tegma Gestao Logistica SA | | | 2,700 | 21,253 |
| TIM Participacoes SA | | | 40,000 | 144,279 |
| Transmissora Alianca de Energia Eletrica SA | | | 18,411 | 123,470 |
| Trisul SA | | | 7,593 | 24,518 |
| Tupy SA | | | 4,722 | 23,114 |
| Ultrapar Participacoes SA | | | 16,386 | 69,913 |
| Unipar Carbocloro SA | | | 1,400 | 9,508 |
| Usinas Siderurgicas de Minas Gerais SA | | | 14,444 | 28,650 |
| Vale SA | | | 205,653 | 2,037,721 |
| Valid Solucoes e Servicos de Seguranca em Meios de Pagamento e Identificacao SA | | | 7,438 | 24,417 |
| Vulcabras Azaleia SA (A) | | | 965 | 1,705 |
| WEG SA | | | 9,682 | 93,423 |
| Wiz Solucoes e Corretagem de Seguros SA | | | 9,413 | 29,679 |
| YDUQS Part | | | 20,530 | 238,221 |
| Canada 0.0% | | | | | 68,752 |
| Atlas Corp. | | | 6,486 | 68,752 |
| SEE NOTES TO FINANCIAL STATEMENTS | SEMIANNUAL REPORT | JOHN HANCOCK EMERGING MARKETS FUND | 3 |
| | | | | Shares | Value |
| Chile 0.9% | | | | | $2,114,991 |
| AES Gener SA | | | 251,124 | 37,131 |
| Aguas Andinas SA, Class A | | | 134,923 | 46,355 |
| Banco de Chile | | | 146,860 | 12,973 |
| Banco de Chile, ADR | | | 1,901 | 34,351 |
| Banco de Credito e Inversiones SA | | | 1,196 | 44,527 |
| Banco Santander Chile | | | 1,585,820 | 70,963 |
| Besalco SA | | | 49,676 | 20,151 |
| CAP SA | | | 5,024 | 28,670 |
| Cementos BIO BIO SA | | | 2,795 | 2,650 |
| Cencosud SA | | | 65,404 | 77,306 |
| Cia Cervecerias Unidas SA | | | 4,993 | 37,662 |
| Cia Sud Americana de Vapores SA (A) | | | 690,005 | 20,494 |
| Colbun SA | | | 184,862 | 23,328 |
| Cristalerias de Chile SA | | | 40,829 | 243,159 |
| Empresa Nacional de Telecomunicaciones SA (A) | | | 15,781 | 84,107 |
| Empresas CMPC SA | | | 21,806 | 44,489 |
| Empresas COPEC SA | | | 6,380 | 49,861 |
| Empresas Hites SA | | | 55,395 | 8,363 |
| Enel Americas SA | | | 2,196,149 | 371,101 |
| Enel Chile SA, ADR | | | 18,382 | 80,697 |
| Engie Energia Chile SA | | | 23,657 | 30,817 |
| Forus SA | | | 5,056 | 6,142 |
| Grupo Security SA | | | 128,502 | 25,723 |
| Inversiones Aguas Metropolitanas SA | | | 29,967 | 26,187 |
| Inversiones La Construccion SA | | | 2,123 | 15,981 |
| Itau CorpBanca | | | 5,398,734 | 19,758 |
| Latam Airlines Group SA | | | 6,596 | 44,284 |
| Latam Airlines Group SA, ADR | | | 5,099 | 34,673 |
| Masisa SA (A) | | | 722,331 | 22,064 |
| Molibdenos y Metales SA | | | 7,542 | 67,683 |
| Multiexport Foods SA | | | 85,351 | 32,940 |
| Parque Arauco SA | | | 32,773 | 67,844 |
| PAZ Corp. SA | | | 60,171 | 43,741 |
| Ripley Corp. SA | | | 79,393 | 31,361 |
| SACI Falabella | | | 16,183 | 54,182 |
| Salfacorp SA | | | 20,240 | 9,579 |
| Sigdo Koppers SA | | | 64,066 | 69,402 |
| SMU SA | | | 80,372 | 12,217 |
| Sociedad Matriz SAAM SA | | | 638,979 | 44,051 |
| Socovesa SA | | | 306,550 | 71,281 |
| SONDA SA | | | 29,383 | 21,246 |
| Vina Concha y Toro SA | | | 15,327 | 25,497 |
| 4 | JOHN HANCOCK EMERGING MARKETS FUND | SEMIANNUAL REPORT | SEE NOTES TO FINANCIAL STATEMENTS |
| | | | | Shares | Value |
| China 21.5% | | | | | $50,556,429 |
| 21Vianet Group, Inc., ADR (A) | | | 1,999 | 29,945 |
| 361 Degrees International, Ltd. | | | 46,000 | 8,382 |
| 3SBio, Inc. (A)(B) | | | 77,000 | 81,835 |
| 51job, Inc., ADR (A) | | | 755 | 56,451 |
| 58.com, Inc., ADR (A) | | | 3,440 | 189,785 |
| AAC Technologies Holdings, Inc. (C) | | | 48,500 | 323,840 |
| Acorn International, Inc., ADR | | | 300 | 3,858 |
| Agile Group Holdings, Ltd. | | | 101,250 | 144,763 |
| Agricultural Bank of China, Ltd., H Shares | | | 975,000 | 395,642 |
| Air China, Ltd., H Shares | | | 78,000 | 64,443 |
| Alibaba Group Holding, Ltd., ADR (A) | | | 13,313 | 2,769,104 |
| Aluminum Corp. of China, Ltd., H Shares (A) | | | 162,000 | 43,920 |
| Angang Steel Company, Ltd., H Shares | | | 102,200 | 34,741 |
| Anhui Conch Cement Company, Ltd., H Shares | | | 74,000 | 554,200 |
| Anhui Expressway Company, Ltd., H Shares | | | 20,000 | 11,299 |
| ANTA Sports Products, Ltd. | | | 33,000 | 269,302 |
| Anton Oilfield Services Group (C) | | | 144,000 | 13,980 |
| Aowei Holdings, Ltd. (A) | | | 10,063,000 | 1,947,682 |
| Asia Cement China Holdings Corp. | | | 36,500 | 49,310 |
| AviChina Industry & Technology Company, Ltd., H Shares | | | 124,000 | 54,754 |
| BAIC Motor Corp., Ltd., H Shares (B) | | | 151,000 | 75,114 |
| Baidu, Inc., ADR (A) | | | 4,963 | 595,461 |
| BAIOO Family Interactive, Ltd. (B) | | | 206,000 | 30,594 |
| Bank of China, Ltd., H Shares | | | 1,860,075 | 743,360 |
| Bank of Chongqing Company, Ltd., H Shares | | | 37,000 | 20,255 |
| Bank of Communications Company, Ltd., H Shares | | | 217,858 | 141,758 |
| Bank of Zhengzhou Company, Ltd., H Shares (B) | | | 60,000 | 19,708 |
| Baoye Group Company, Ltd., H Shares (A) | | | 46,000 | 25,734 |
| Baozun, Inc., ADR (A)(C) | | | 2,429 | 77,048 |
| BBI Life Sciences Corp. (A) | | | 51,000 | 21,970 |
| BBMG Corp., H Shares | | | 115,500 | 33,054 |
| Beijing Capital International Airport Company, Ltd., H Shares | | | 116,415 | 91,668 |
| Beijing Capital Land, Ltd., H Shares | | | 127,000 | 34,755 |
| Beijing Jingneng Clean Energy Company, Ltd., H Shares | | | 50,000 | 8,053 |
| Beijing North Star Company, Ltd., H Shares | | | 40,000 | 11,167 |
| Best Pacific International Holdings, Ltd. | | | 84,000 | 20,558 |
| Billion Industrial Holdings, Ltd. | | | 12,000 | 8,411 |
| Bitauto Holdings, Ltd., ADR (A) | | | 2,485 | 37,027 |
| BYD Company, Ltd., H Shares (C) | | | 30,500 | 189,883 |
| BYD Electronic International Company, Ltd. (C) | | | 51,983 | 100,488 |
| CAR, Inc. (A) | | | 42,000 | 26,393 |
| Cayman Engley Industrial Company, Ltd. | | | 4,589 | 11,700 |
| Central China Real Estate, Ltd. | | | 54,538 | 32,680 |
| Central China Securities Company, Ltd., H Shares | | | 53,000 | 10,687 |
| SEE NOTES TO FINANCIAL STATEMENTS | SEMIANNUAL REPORT | JOHN HANCOCK EMERGING MARKETS FUND | 5 |
| | | | | Shares | Value |
| China (continued) | | | | | |
| CGN Power Company, Ltd., H Shares (B) | | | 293,000 | $72,068 |
| Changshouhua Food Company, Ltd. | | | 71,000 | 24,083 |
| Changyou.com, Ltd., ADR (C) | | | 979 | 10,534 |
| Chaowei Power Holdings, Ltd. | | | 70,000 | 22,295 |
| Cheetah Mobile, Inc., ADR | | | 1,459 | 4,246 |
| China Animal Healthcare, Ltd. (A)(D) | | | 182,000 | 233 |
| China Aoyuan Group, Ltd. | | | 94,000 | 138,870 |
| China BlueChemical, Ltd., H Shares | | | 101,000 | 19,348 |
| China Cinda Asset Management Company, Ltd., H Shares | | | 384,000 | 81,429 |
| China CITIC Bank Corp., Ltd., H Shares | | | 277,962 | 145,629 |
| China Coal Energy Company, Ltd., H Shares | | | 89,000 | 28,994 |
| China Common Rich Renewable Energy Investments, Ltd. (A)(D) | | | 2,486,000 | 68,568 |
| China Communications Construction Company, Ltd., H Shares | | | 152,202 | 114,938 |
| China Communications Services Corp., Ltd., H Shares | | | 131,200 | 103,088 |
| China Conch Venture Holdings, Ltd. | | | 55,500 | 271,527 |
| China Construction Bank Corp., H Shares | | | 2,656,000 | 2,183,847 |
| China Datang Corp. Renewable Power Company, Ltd., H Shares | | | 175,000 | 14,254 |
| China Dili Group (A)(C) | | | 120,400 | 22,220 |
| China Distance Education Holdings, Ltd., ADR (A) | | | 302 | 2,265 |
| China Dongxiang Group Company, Ltd. | | | 152,000 | 15,285 |
| China Eastern Airlines Corp., Ltd. (A)(C) | | | 1,460 | 31,273 |
| China Eastern Airlines Corp., Ltd., H Shares (A) | | | 36,000 | 15,863 |
| China Electronics Optics Valley Union Holding Company, Ltd. | | | 184,000 | 9,044 |
| China Energy Engineering Corp., Ltd., H Shares | | | 354,000 | 39,769 |
| China Everbright Bank Company, Ltd., H Shares | | | 96,000 | 38,789 |
| China Evergrande Group (C) | | | 81,566 | 186,868 |
| China Financial Services Holdings, Ltd. | | | 94,000 | 3,876 |
| China Galaxy Securities Company, Ltd., H Shares | | | 114,500 | 64,789 |
| China Greenland Broad Greenstate Group Company, Ltd. (A) | | | 44,000 | 2,488 |
| China Hanking Holdings, Ltd. | | | 54,000 | 15,187 |
| China Harmony New Energy Auto Holding, Ltd. | | | 65,500 | 32,750 |
| China Hongqiao Group, Ltd. | | | 176,000 | 96,252 |
| China Huarong Asset Management Company, Ltd., H Shares (B) | | | 403,000 | 55,666 |
| China Huiyuan Juice Group, Ltd. (A)(D) | | | 141,000 | 26,491 |
| China Index Holdings, Ltd., ADR (A) | | | 2,348 | 4,931 |
| China International Capital Corp., Ltd., H Shares (B) | | | 42,800 | 80,798 |
| China International Marine Containers Group Company, Ltd., H Shares | | | 23,520 | 21,759 |
| China Lesso Group Holdings, Ltd. | | | 81,000 | 123,632 |
| China Life Insurance Company, Ltd., H Shares | | | 128,000 | 309,301 |
| China Lilang, Ltd. | | | 25,000 | 16,342 |
| China Logistics Property Holdings Company, Ltd. (A)(B) | | | 73,000 | 28,167 |
| China Longyuan Power Group Corp., Ltd., H Shares | | | 145,000 | 76,190 |
| China Machinery Engineering Corp., H Shares | | | 92,000 | 34,275 |
| 6 | JOHN HANCOCK EMERGING MARKETS FUND | SEMIANNUAL REPORT | SEE NOTES TO FINANCIAL STATEMENTS |
| | | | | Shares | Value |
| China (continued) | | | | | |
| China Maple Leaf Educational Systems, Ltd. | | | 56,000 | $19,842 |
| China Medical System Holdings, Ltd. | | | 94,800 | 119,876 |
| China Meidong Auto Holdings, Ltd. | | | 42,000 | 63,058 |
| China Merchants Bank Company, Ltd., H Shares | | | 177,961 | 856,153 |
| China Merchants Securities Company, Ltd., H Shares (B) | | | 7,800 | 9,536 |
| China Minsheng Banking Corp., Ltd., H Shares | | | 213,840 | 146,342 |
| China Modern Dairy Holdings, Ltd. (A) | | | 167,000 | 20,327 |
| China Molybdenum Company, Ltd., H Shares | | | 159,000 | 60,762 |
| China National Building Material Company, Ltd., H Shares | | | 284,600 | 338,255 |
| China Oilfield Services, Ltd., H Shares | | | 102,000 | 133,310 |
| China Oriental Group Company, Ltd. | | | 84,000 | 29,041 |
| China Pacific Insurance Group Company, Ltd., H Shares | | | 120,400 | 403,899 |
| China Petroleum & Chemical Corp., H Shares | | | 1,484,000 | 768,055 |
| China Railway Construction Corp., Ltd., H Shares | | | 96,335 | 111,454 |
| China Railway Group, Ltd., H Shares | | | 169,000 | 97,087 |
| China Railway Signal & Communication Corp., Ltd., H Shares (B) | | | 76,000 | 39,665 |
| China Reinsurance Group Corp., H Shares | | | 156,000 | 21,440 |
| China Resources Medical Holdings Company, Ltd. | | | 33,500 | 17,560 |
| China Resources Pharmaceutical Group, Ltd. (B) | | | 48,500 | 42,780 |
| China Sanjiang Fine Chemicals Company, Ltd. | | | 72,000 | 13,967 |
| China SCE Group Holdings, Ltd. | | | 177,000 | 98,014 |
| China Shenhua Energy Company, Ltd., H Shares | | | 186,500 | 327,921 |
| China Shineway Pharmaceutical Group, Ltd. | | | 17,000 | 14,898 |
| China Southern Airlines Company, Ltd., H Shares (C) | | | 136,000 | 73,194 |
| China Suntien Green Energy Corp., Ltd., H Shares | | | 88,000 | 21,776 |
| China Taifeng Beddings Holdings, Ltd. (A)(D) | | | 46,000 | 2,868 |
| China Telecom Corp., Ltd., ADR | | | 1,069 | 40,483 |
| China Telecom Corp., Ltd., H Shares | | | 300,000 | 113,402 |
| China Tian Lun Gas Holdings, Ltd. | | | 14,422 | 11,891 |
| China Tianrui Group Cement Company, Ltd. (A) | | | 25,000 | 22,014 |
| China Vanke Company, Ltd., H Shares | | | 78,500 | 307,414 |
| China XLX Fertiliser, Ltd. | | | 50,000 | 15,476 |
| China Yuhua Education Corp., Ltd. (B) | | | 48,000 | 37,706 |
| China Yurun Food Group, Ltd. (A)(C) | | | 32,000 | 2,949 |
| China ZhengTong Auto Services Holdings, Ltd. | | | 72,500 | 20,516 |
| China Zhongwang Holdings, Ltd. (C) | | | 173,400 | 58,737 |
| Chinasoft International, Ltd. (A)(C) | | | 108,000 | 67,888 |
| Chlitina Holding, Ltd. | | | 4,000 | 24,168 |
| Chongqing Rural Commercial Bank Company, Ltd., H Shares | | | 152,000 | 69,453 |
| CIFI Holdings Group Company, Ltd. | | | 169,488 | 133,253 |
| CITIC Securities Company, Ltd., H Shares | | | 58,000 | 127,579 |
| CNOOC, Ltd. | | | 911,000 | 1,267,303 |
| CNOOC, Ltd., ADR | | | 1,416 | 195,875 |
| Cogobuy Group (A)(B) | | | 44,000 | 6,132 |
| SEE NOTES TO FINANCIAL STATEMENTS | SEMIANNUAL REPORT | JOHN HANCOCK EMERGING MARKETS FUND | 7 |
| | | | | Shares | Value |
| China (continued) | | | | | |
| Colour Life Services Group Company, Ltd. (A) | | | 39,000 | $21,064 |
| Consun Pharmaceutical Group, Ltd. | | | 29,000 | 14,345 |
| COSCO SHIPPING Development Company, Ltd., H Shares | | | 181,000 | 22,767 |
| COSCO SHIPPING Energy Transportation Company, Ltd., H Shares | | | 84,000 | 33,466 |
| COSCO SHIPPING Holdings Company, Ltd., H Shares (A) | | | 103,500 | 35,061 |
| Country Garden Holdings Company, Ltd. | | | 427,987 | 581,445 |
| Country Garden Services Holdings Company, Ltd. | | | 49,642 | 198,105 |
| CPMC Holdings, Ltd. | | | 27,000 | 10,431 |
| CRRC Corp., Ltd., H Shares | | | 78,000 | 50,799 |
| CSC Financial Company, Ltd., H Shares (B) | | | 13,500 | 12,231 |
| CSPC Pharmaceutical Group, Ltd. | | | 156,000 | 363,645 |
| CT Environmental Group, Ltd. (A)(D) | | | 154,000 | 6,045 |
| Dali Foods Group Company, Ltd. (B) | | | 117,000 | 77,799 |
| Datang International Power Generation Company, Ltd., H Shares | | | 132,000 | 20,923 |
| Differ Group Holding Company, Ltd. (A) | | | 316,000 | 18,485 |
| Dongfang Electric Corp., Ltd., H Shares | | | 18,600 | 10,448 |
| Dongfeng Motor Group Company, Ltd., H Shares | | | 122,000 | 97,910 |
| Dongjiang Environmental Company, Ltd., H Shares | | | 27,600 | 22,496 |
| Dongyue Group, Ltd. | | | 111,000 | 58,730 |
| Dynagreen Environmental Protection Group Company, Ltd., H Shares | | | 26,000 | 11,220 |
| E-Commodities Holdings, Ltd. | | | 300,000 | 11,660 |
| EEKA Fashion Holdings, Ltd. | | | 51,000 | 51,403 |
| ENN Energy Holdings, Ltd. | | | 25,000 | 282,010 |
| Everbright Securities Company, Ltd., H Shares (B) | | | 9,800 | 7,296 |
| Fang Holdings, Ltd., ADR (A)(C) | | | 2,348 | 5,119 |
| Fanhua, Inc., ADR (C) | | | 1,300 | 26,390 |
| Fantasia Holdings Group Company, Ltd. (A) | | | 192,000 | 37,536 |
| Flat Glass Group Company, Ltd., H Shares | | | 46,000 | 39,657 |
| Fosun International, Ltd. | | | 79,193 | 103,102 |
| Fu Shou Yuan International Group, Ltd. | | | 70,000 | 60,407 |
| Fufeng Group, Ltd. (A) | | | 88,000 | 34,472 |
| Fuguiniao Company, Ltd., H Shares (A)(D) | | | 116,600 | 5,804 |
| Fuyao Glass Industry Group Company, Ltd., H Shares (B)(C) | | | 30,800 | 89,262 |
| GDS Holdings, Ltd., ADR (A)(C) | | | 1,617 | 93,737 |
| Genertec Universal Medical Group Company, Ltd. (B)(C) | | | 53,000 | 37,143 |
| GF Securities Company, Ltd., H Shares | | | 38,400 | 46,823 |
| Golden Eagle Retail Group, Ltd. | | | 50,000 | 48,976 |
| GOME Retail Holdings, Ltd. (A)(C) | | | 746,000 | 77,785 |
| Grand Baoxin Auto Group, Ltd. (A) | | | 48,950 | 8,149 |
| Great Wall Motor Company, Ltd., H Shares | | | 105,500 | 78,053 |
| Greatview Aseptic Packaging Company, Ltd. | | | 54,000 | 21,217 |
| Greenland Hong Kong Holdings, Ltd. | | | 76,250 | 30,214 |
| Greentown China Holdings, Ltd. | | | 54,000 | 72,249 |
| 8 | JOHN HANCOCK EMERGING MARKETS FUND | SEMIANNUAL REPORT | SEE NOTES TO FINANCIAL STATEMENTS |
| | | | | Shares | Value |
| China (continued) | | | | | |
| Greentown Service Group Company, Ltd. | | | 56,000 | $71,084 |
| Guangshen Railway Company, Ltd., ADR | | | 7,224 | 91,095 |
| Guangzhou Automobile Group Company, Ltd., H Shares (C) | | | 68,000 | 77,155 |
| Guangzhou Baiyunshan Pharmaceutical Holdings Company, Ltd., H Shares | | | 12,000 | 37,282 |
| Guangzhou R&F Properties Company, Ltd., H Shares | | | 96,199 | 151,674 |
| Guorui Properties, Ltd. | | | 53,000 | 9,486 |
| Guotai Junan Securities Company, Ltd., H Shares (B) | | | 11,400 | 19,393 |
| Haichang Ocean Park Holdings, Ltd. (A)(B) | | | 86,000 | 8,402 |
| Hailiang Education Group, Inc., ADR (A) | | | 667 | 38,879 |
| Hainan Meilan International Airport Company, Ltd., H Shares (A) | | | 12,000 | 10,141 |
| Haitian International Holdings, Ltd. | | | 42,000 | 83,734 |
| Haitong Securities Company, Ltd., H Shares | | | 84,400 | 93,043 |
| Harbin Bank Company, Ltd., H Shares (A)(B) | | | 190,000 | 35,313 |
| Harbin Electric Company, Ltd., H Shares (A) | | | 44,000 | 11,993 |
| Harmonicare Medical Holdings, Ltd. (A)(B)(D) | | | 44,000 | 10,364 |
| HC Group, Inc. (A)(C) | | | 53,500 | 14,628 |
| Hengan International Group Company, Ltd. | | | 44,000 | 331,654 |
| Hilong Holding, Ltd. | | | 99,000 | 9,057 |
| Hiroca Holdings, Ltd. | | | 7,000 | 13,168 |
| Hisense Home Appliances Group Company, Ltd., H Shares | | | 19,000 | 18,956 |
| Honghua Group, Ltd. (A) | | | 191,000 | 10,330 |
| Honworld Group, Ltd. (B) | | | 20,500 | 7,193 |
| Hopefluent Group Holdings, Ltd. | | | 16,000 | 2,993 |
| HOSA International, Ltd. (A)(D) | | | 86,000 | 2,080 |
| Hua Hong Semiconductor, Ltd. (B)(C) | | | 26,000 | 58,177 |
| Huadian Fuxin Energy Corp., Ltd., H Shares | | | 112,000 | 19,159 |
| Huadian Power International Corp., Ltd., H Shares | | | 84,000 | 25,463 |
| Huaneng Power International, Inc., H Shares | | | 160,000 | 65,142 |
| Huatai Securities Company, Ltd., H Shares (B)(C) | | | 39,200 | 69,330 |
| Huazhu Group, Ltd., ADR | | | 5,055 | 170,606 |
| Huishang Bank Corp., Ltd., H Shares | | | 40,200 | 14,896 |
| Industrial & Commercial Bank of China, Ltd., H Shares | | | 2,239,000 | 1,542,447 |
| Inner Mongolia Yitai Coal Company, Ltd., H Shares | | | 473,000 | 332,258 |
| JD.com, Inc., ADR (A) | | | 8,566 | 329,877 |
| Jiangsu Expressway Company, Ltd., H Shares | | | 58,000 | 67,554 |
| Jiangxi Copper Company, Ltd., H Shares | | | 50,000 | 59,634 |
| Jingrui Holdings, Ltd. | | | 40,000 | 12,831 |
| JinkoSolar Holding Company, Ltd., ADR (A)(C) | | | 2,760 | 63,038 |
| JNBY Design, Ltd. | | | 18,500 | 20,179 |
| JOYY, Inc., ADR (A) | | | 1,940 | 104,702 |
| Jumei International Holding, Ltd., ADR (A) | | | 629 | 12,184 |
| Kaisa Group Holdings, Ltd. (A) | | | 184,000 | 83,764 |
| Kasen International Holdings, Ltd. (A) | | | 50,000 | 9,418 |
| SEE NOTES TO FINANCIAL STATEMENTS | SEMIANNUAL REPORT | JOHN HANCOCK EMERGING MARKETS FUND | 9 |
| | | | | Shares | Value |
| China (continued) | | | | | |
| Kinetic Mines and Energy, Ltd. | | | 156,000 | $7,735 |
| KWG Group Holdings, Ltd. (A) | | | 116,012 | 174,196 |
| Legend Holdings Corp., H Shares (B) | | | 9,000 | 15,587 |
| Lenovo Group, Ltd. | | | 522,000 | 328,510 |
| LexinFintech Holdings, Ltd., ADR (A)(C) | | | 3,302 | 38,435 |
| Li Ning Company, Ltd. | | | 67,000 | 180,486 |
| Lifetech Scientific Corp. (A) | | | 134,000 | 26,435 |
| Link Motion, Inc., ADR (A)(D) | | | 6,959 | 964 |
| Logan Property Holdings Company, Ltd. | | | 100,000 | 174,675 |
| Longfor Group Holdings, Ltd. (B) | | | 85,000 | 402,025 |
| Lonking Holdings, Ltd. | | | 157,000 | 44,400 |
| Luye Pharma Group, Ltd. (B)(C) | | | 77,000 | 47,847 |
| Metallurgical Corp. of China, Ltd., H Shares | | | 93,000 | 18,213 |
| Minth Group, Ltd. | | | 46,000 | 163,982 |
| Modern Land China Company, Ltd. | | | 116,000 | 15,726 |
| Momo, Inc., ADR | | | 8,201 | 230,612 |
| NetEase, Inc., ADR | | | 2,263 | 721,241 |
| New Century Healthcare Holding Company, Ltd. (A)(B) | | | 31,500 | 6,216 |
| New China Life Insurance Company, Ltd., H Shares | | | 34,100 | 133,301 |
| New Oriental Education & Technology Group, Inc., ADR (A) | | | 3,479 | 444,929 |
| Noah Holdings, Ltd., ADR (A)(C) | | | 409 | 11,607 |
| NVC International Holdings, Ltd. | | | 168,000 | 5,203 |
| On-Bright Electronics, Inc. | | | 4,160 | 30,142 |
| O-Net Technologies Group, Ltd. | | | 20,000 | 10,968 |
| Orient Securities Company, Ltd., H Shares (B) | | | 29,200 | 17,230 |
| Pacific Online, Ltd. | | | 50,000 | 10,296 |
| PetroChina Company, Ltd., H Shares | | | 1,192,000 | 465,647 |
| PICC Property & Casualty Company, Ltd., H Shares | | | 192,894 | 203,981 |
| Ping An Insurance Group Company of China, Ltd., H Shares | | | 255,000 | 2,905,061 |
| Postal Savings Bank of China Company, Ltd., H Shares (B) | | | 225,000 | 143,547 |
| Powerlong Real Estate Holdings, Ltd. | | | 92,000 | 58,542 |
| Q Technology Group Company, Ltd. (A) | | | 17,000 | 24,768 |
| Qingdao Port International Company, Ltd., H Shares (B) | | | 40,000 | 26,231 |
| Qingling Motors Company, Ltd., H Shares | | | 34,000 | 7,447 |
| Qinqin Foodstuffs Group Cayman Company, Ltd. (A) | | | 36,100 | 11,681 |
| Qunxing Paper Holdings Company, Ltd. (A)(D) | | | 969,268 | 0 |
| Red Star Macalline Group Corp., Ltd., H Shares (B) | | | 13,880 | 10,281 |
| Redco Properties Group, Ltd. (B) | | | 96,000 | 44,424 |
| Ronshine China Holdings, Ltd. (A) | | | 30,000 | 33,837 |
| Sany Heavy Equipment International Holdings Company, Ltd. | | | 39,000 | 23,553 |
| Seazen Group, Ltd. (A) | | | 148,000 | 155,554 |
| Secoo Holding, Ltd., ADR (A) | | | 313 | 1,722 |
| Semiconductor Manufacturing International Corp. (A)(C) | | | 104,500 | 206,530 |
| Shandong Chenming Paper Holdings, Ltd., H Shares | | | 19,376 | 7,930 |
| 10 | JOHN HANCOCK EMERGING MARKETS FUND | SEMIANNUAL REPORT | SEE NOTES TO FINANCIAL STATEMENTS |
| | | | | Shares | Value |
| China (continued) | | | | | |
| Shandong Weigao Group Medical Polymer Company, Ltd., H Shares | | | 96,000 | $125,268 |
| Shanghai Electric Group Company, Ltd., H Shares | | | 92,000 | 26,231 |
| Shanghai Fosun Pharmaceutical Group Company, Ltd., H Shares | | | 19,000 | 54,485 |
| Shanghai Fudan-Zhangjiang Bio-Pharmaceutical Company, Ltd., H Shares | | | 28,000 | 16,409 |
| Shanghai Haohai Biological Technology Company, Ltd., H Shares (B) | | | 1,900 | 9,818 |
| Shanghai Jin Jiang Capital Company, Ltd., H Shares | | | 134,000 | 23,515 |
| Shanghai Pharmaceuticals Holding Company, Ltd., H Shares | | | 28,900 | 53,380 |
| Shanghai Prime Machinery Company, Ltd., H Shares | | | 60,000 | 5,675 |
| Shenguan Holdings Group, Ltd. (A) | | | 214,000 | 8,126 |
| Shenzhen Expressway Company, Ltd., H Shares | | | 42,000 | 51,141 |
| Shenzhou International Group Holdings, Ltd. | | | 25,200 | 318,926 |
| Shui On Land, Ltd. | | | 313,067 | 62,721 |
| Sichuan Expressway Company, Ltd., H Shares | | | 64,000 | 17,297 |
| Sihuan Pharmaceutical Holdings Group, Ltd. (C) | | | 288,000 | 34,735 |
| Silergy Corp. | | | 2,000 | 66,406 |
| SINA Corp. (A) | | | 3,144 | 102,966 |
| Sino-Ocean Group Holding, Ltd. | | | 242,181 | 89,259 |
| Sinopec Engineering Group Company, Ltd., H Shares | | | 82,500 | 41,070 |
| Sinopec Oilfield Service Corp., H Shares (A) | | | 174,000 | 16,292 |
| Sinopec Shanghai Petrochemical Company, Ltd., H Shares | | | 124,000 | 32,149 |
| Sinopharm Group Company, Ltd., H Shares | | | 46,800 | 147,026 |
| Sinosoft Technology Group, Ltd. | | | 103,000 | 21,942 |
| Sinotrans, Ltd., H Shares | | | 114,574 | 32,936 |
| Sinotruk Hong Kong, Ltd. | | | 43,055 | 83,698 |
| Skyfame Realty Holdings, Ltd. | | | 338,000 | 44,337 |
| SOHO China, Ltd. | | | 136,500 | 49,915 |
| Sohu.com, Ltd., ADR (A)(C) | | | 975 | 9,292 |
| Springland International Holdings, Ltd. | | | 70,000 | 20,654 |
| Sun King Power Electronics Group | | | 54,000 | 9,176 |
| Sunac China Holdings, Ltd. | | | 159,000 | 890,644 |
| Sunny Optical Technology Group Company, Ltd. | | | 20,600 | 334,697 |
| TAL Education Group, ADR (A) | | | 2,021 | 109,922 |
| Tencent Holdings, Ltd. | | | 158,700 | 8,046,837 |
| Tenwow International Holdings, Ltd. (A)(D) | | | 177,000 | 6,471 |
| The People's Insurance Company Group of China, Ltd., H Shares | | | 196,000 | 70,480 |
| Tian Ge Interactive Holdings, Ltd. (A)(B) | | | 32,000 | 7,165 |
| Tian Shan Development Holding, Ltd. | | | 32,000 | 12,507 |
| Tiangong International Company, Ltd. | | | 50,000 | 17,839 |
| Tianjin Capital Environmental Protection Group Company, Ltd., H Shares | | | 16,000 | 5,147 |
| Tianneng Power International, Ltd. | | | 48,700 | 36,310 |
| Tingyi Cayman Islands Holding Corp. | | | 138,000 | 253,384 |
| SEE NOTES TO FINANCIAL STATEMENTS | SEMIANNUAL REPORT | JOHN HANCOCK EMERGING MARKETS FUND | 11 |
| | | | | Shares | Value |
| China (continued) | | | | | |
| Tong Ren Tang Technologies Company, Ltd., H Shares | | | 44,000 | $40,811 |
| TravelSky Technology, Ltd., H Shares | | | 56,500 | 111,859 |
| Trigiant Group, Ltd. | | | 82,000 | 21,073 |
| Trip.com Group, Ltd., ADR (A) | | | 10,253 | 311,281 |
| Tsaker Chemical Group, Ltd. (B) | | | 22,500 | 4,960 |
| Tsingtao Brewery Company, Ltd., H Shares | | | 22,000 | 116,210 |
| Tuniu Corp., ADR (A) | | | 1,300 | 2,080 |
| Uni-President China Holdings, Ltd. | | | 78,600 | 81,640 |
| Vipshop Holdings, Ltd., ADR (A) | | | 28,374 | 364,038 |
| Want Want China Holdings, Ltd. | | | 290,000 | 227,627 |
| Weibo Corp., ADR (A)(C) | | | 2,978 | 125,493 |
| Weichai Power Company, Ltd., H Shares | | | 116,600 | 233,942 |
| West China Cement, Ltd. | | | 162,000 | 26,653 |
| Wisdom Education International Holdings Company, Ltd. (C) | | | 38,000 | 14,722 |
| Xiabuxiabu Catering Management China Holdings Company, Ltd. (A)(B)(C) | | | 26,500 | 27,280 |
| Xiamen International Port Company, Ltd., H Shares | | | 88,662 | 10,227 |
| Xingda International Holdings, Ltd. | | | 40,000 | 11,995 |
| Xinhua Winshare Publishing and Media Company, Ltd., H Shares | | | 22,650 | 15,655 |
| Xinjiang Goldwind Science & Technology Company, Ltd., H Shares | | | 33,298 | 33,593 |
| Xinyi Solar Holdings, Ltd. | | | 185,600 | 149,294 |
| Xinyuan Real Estate Company, Ltd., ADR | | | 4,413 | 12,754 |
| Xtep International Holdings, Ltd. | | | 68,949 | 28,296 |
| Xunlei, Ltd., ADR (A)(C) | | | 3,300 | 14,355 |
| Yadea Group Holdings, Ltd. (B) | | | 82,000 | 22,426 |
| Yanzhou Coal Mining Company, Ltd., H Shares | | | 136,000 | 104,510 |
| Yashili International Holdings, Ltd. | | | 114,000 | 8,733 |
| YiChang HEC ChangJiang Pharmaceutical Company, Ltd., H Shares (B) | | | 5,600 | 34,674 |
| Yida China Holdings, Ltd. (A) | | | 28,000 | 7,844 |
| Yihai International Holding, Ltd. (A) | | | 21,000 | 142,230 |
| Yiren Digital, Ltd., ADR (A)(C) | | | 1,046 | 4,351 |
| Youyuan International Holdings, Ltd. (A)(D) | | | 26,000 | 867 |
| Yum China Holdings, Inc. | | | 16,131 | 706,376 |
| Yuzhou Properties Company, Ltd. | | | 142,508 | 71,240 |
| Zhejiang Expressway Company, Ltd., H Shares | | | 68,000 | 51,811 |
| Zhejiang Glass Company, Ltd., H Shares (A)(D) | | | 172,000 | 0 |
| Zhengzhou Coal Mining Machinery Group Company, Ltd., H Shares | | | 15,800 | 8,031 |
| Zhong An Group, Ltd. (A) | | | 314,400 | 8,939 |
| Zhongsheng Group Holdings, Ltd. | | | 43,500 | 167,502 |
| Zhou Hei Ya International Holdings Company, Ltd. (B)(C) | | | 37,500 | 20,080 |
| Zhuzhou CRRC Times Electric Company, Ltd., H Shares | | | 31,900 | 113,298 |
| Zijin Mining Group Company, Ltd., H Shares | | | 311,384 | 140,523 |
| Zoomlion Heavy Industry Science and Technology Company, Ltd., H Shares | | | 59,600 | 50,285 |
| 12 | JOHN HANCOCK EMERGING MARKETS FUND | SEMIANNUAL REPORT | SEE NOTES TO FINANCIAL STATEMENTS |
| | | | | Shares | Value |
| China (continued) | | | | | |
| ZTE Corp., H Shares (A) | | | 24,600 | $104,624 |
| ZTO Express Cayman, Inc., ADR | | | 10,331 | 242,365 |
| Colombia 0.4% | | | | | 837,219 |
| Banco de Bogota SA | | | 5,904 | 144,345 |
| Bancolombia SA | | | 4,563 | 50,567 |
| Bolsa de Valores de Colombia | | | 6,297 | 18,537 |
| Celsia SA ESP | | | 85,502 | 109,331 |
| Cementos Argos SA | | | 29,845 | 44,947 |
| CEMEX Latam Holdings SA (A) | | | 25,752 | 26,197 |
| Corp. Financiera Colombiana SA (A) | | | 12,127 | 110,960 |
| Ecopetrol SA | | | 127,985 | 112,922 |
| Empresa de Telecomunicaciones de Bogota (A) | | | 50,637 | 3,540 |
| Grupo Argos SA | | | 8,087 | 34,469 |
| Grupo de Inversiones Suramericana SA | | | 6,239 | 54,072 |
| Grupo Energia Bogota SA ESP | | | 37,258 | 25,515 |
| Grupo Nutresa SA | | | 4,184 | 27,844 |
| Interconexion Electrica SA ESP | | | 13,996 | 73,973 |
| Czech Republic 0.1% | | | | | 355,050 |
| CEZ AS | | | 3,442 | 65,978 |
| Komercni banka AS | | | 2,295 | 71,124 |
| Moneta Money Bank AS (B) | | | 49,057 | 163,591 |
| O2 Czech Republic AS | | | 3,507 | 32,374 |
| Philip Morris CR AS | | | 36 | 21,983 |
| Egypt 0.1% | | | | | 226,344 |
| Commercial International Bank Egypt SAE, GDR | | | 46,543 | 226,344 |
| Greece 0.3% | | | | | 629,682 |
| Aegean Airlines SA | | | 2,916 | 20,571 |
| Alpha Bank AE (A) | | | 17,901 | 26,134 |
| Athens Water Supply & Sewage Company SA | | | 2,393 | 16,974 |
| Bank of Greece | | | 1,576 | 24,688 |
| Ellaktor SA (A) | | | 5,945 | 8,114 |
| FF Group (A)(D) | | | 6,657 | 11,023 |
| Fourlis Holdings SA (A) | | | 4,382 | 24,128 |
| GEK Terna Holding Real Estate Construction SA (A) | | | 8,220 | 55,269 |
| Hellenic Exchanges - Athens Stock Exchange SA | | | 1,960 | 7,808 |
| Hellenic Petroleum SA | | | 1,686 | 11,801 |
| Hellenic Telecommunications Organization SA | | | 7,889 | 112,241 |
| Holding Company ADMIE IPTO SA | | | 8,138 | 19,503 |
| JUMBO SA | | | 3,666 | 57,915 |
| LAMDA Development SA (A) | | | 4,393 | 34,494 |
| Marfin Investment Group Holdings SA (A) | | | 119,450 | 11,004 |
| Motor Oil Hellas Corinth Refineries SA | | | 2,868 | 47,360 |
| SEE NOTES TO FINANCIAL STATEMENTS | SEMIANNUAL REPORT | JOHN HANCOCK EMERGING MARKETS FUND | 13 |
| | | | | Shares | Value |
| Greece (continued) | | | | | |
| Mytilineos SA | | | 4,640 | $35,318 |
| National Bank of Greece SA (A) | | | 2,934 | 6,671 |
| Piraeus Bank SA (A) | | | 12,603 | 28,397 |
| Piraeus Port Authority SA | | | 904 | 16,410 |
| Public Power Corp. SA (A) | | | 8,232 | 27,236 |
| Terna Energy SA (A) | | | 3,187 | 26,623 |
| Hong Kong 5.6% | | | | | 13,144,220 |
| Ajisen China Holdings, Ltd. | | | 58,000 | 14,842 |
| Alibaba Health Information Technology, Ltd. (A) | | | 32,000 | 62,418 |
| Alibaba Pictures Group, Ltd. (A) | | | 250,000 | 34,114 |
| AMVIG Holdings, Ltd. | | | 117,333 | 27,768 |
| Anxin-China Holdings, Ltd. (A)(D) | | | 1,988,000 | 0 |
| Asian Citrus Holdings, Ltd. (A)(D) | | | 144,000 | 5,542 |
| Ausnutria Dairy Corp., Ltd. (A) | | | 37,000 | 60,483 |
| AVIC International Holding HK, Ltd. | | | 186,799 | 3,709 |
| Beijing Enterprises Clean Energy Group, Ltd. (A) | | | 1,342,857 | 9,258 |
| Beijing Enterprises Holdings, Ltd. | | | 21,430 | 91,223 |
| Beijing Enterprises Water Group, Ltd. (A) | | | 242,000 | 113,977 |
| Beijing Properties Holdings, Ltd. (A) | | | 834,000 | 20,035 |
| Bosideng International Holdings, Ltd. | | | 186,000 | 54,897 |
| Brilliance China Automotive Holdings, Ltd. (C) | | | 168,000 | 145,416 |
| C C Land Holdings, Ltd. | | | 240,540 | 55,720 |
| CA Cultural Technology Group, Ltd. | | | 17,000 | 4,598 |
| Canvest Environmental Protection Group Company, Ltd. (C) | | | 36,000 | 17,430 |
| CECEP COSTIN New Materials Group, Ltd. (A)(D) | | | 162,000 | 0 |
| CGN New Energy Holdings Company, Ltd. | | | 186,000 | 28,759 |
| China Agri-Industries Holdings, Ltd. | | | 165,600 | 91,110 |
| China Aircraft Leasing Group Holdings, Ltd. | | | 15,000 | 14,624 |
| China Chengtong Development Group, Ltd. (A) | | | 158,000 | 4,492 |
| China Everbright Greentech, Ltd. (B) | | | 22,000 | 10,752 |
| China Everbright International, Ltd. | | | 196,111 | 132,759 |
| China Everbright, Ltd. | | | 55,000 | 93,560 |
| China Fiber Optic Network System Group, Ltd. (A)(D) | | | 419,600 | 15,072 |
| China Foods, Ltd. | | | 58,000 | 21,742 |
| China Gas Holdings, Ltd. | | | 62,600 | 232,606 |
| China Grand Pharmaceutical and Healthcare Holdings, Ltd. | | | 64,000 | 40,930 |
| China High Precision Automation Group, Ltd. (A)(D) | | | 74,000 | 8,829 |
| China High Speed Transmission Equipment Group Company, Ltd. | | | 25,000 | 16,023 |
| China Jinmao Holdings Group, Ltd. | | | 206,000 | 153,658 |
| China Lumena New Materials Corp. (A)(C)(D) | | | 1,272,000 | 0 |
| China Mengniu Dairy Company, Ltd. (A) | | | 87,000 | 317,958 |
| China Merchants Land, Ltd. (A) | | | 86,000 | 12,988 |
| China Merchants Port Holdings Company, Ltd. | | | 54,496 | 80,987 |
| 14 | JOHN HANCOCK EMERGING MARKETS FUND | SEMIANNUAL REPORT | SEE NOTES TO FINANCIAL STATEMENTS |
| | | | | Shares | Value |
| Hong Kong (continued) | | | | | |
| China Metal Recycling Holdings, Ltd. (A)(D) | | | 14,579,934 | $0 |
| China Minsheng Financial Holding Corp., Ltd. (A) | | | 360,000 | 4,352 |
| China Mobile, Ltd., ADR (C) | | | 61,686 | 2,456,337 |
| China New Town Development Company, Ltd. | | | 1,070,332 | 18,004 |
| China Oceanwide Holdings, Ltd. (A) | | | 240,000 | 7,037 |
| China Oil & Gas Group, Ltd. (A) | | | 337,040 | 12,079 |
| China Overseas Grand Oceans Group, Ltd. | | | 113,000 | 78,992 |
| China Overseas Land & Investment, Ltd. | | | 232,000 | 794,517 |
| China Overseas Property Holdings, Ltd. (C) | | | 100,667 | 82,875 |
| China Power International Development, Ltd. | | | 278,666 | 52,339 |
| China Properties Group, Ltd. (A) | | | 19,000 | 1,735 |
| China Resources Beer Holdings Company, Ltd. | | | 47,981 | 226,429 |
| China Resources Cement Holdings, Ltd. | | | 173,518 | 222,942 |
| China Resources Gas Group, Ltd. | | | 42,000 | 211,678 |
| China Resources Land, Ltd. | | | 144,444 | 685,878 |
| China Resources Power Holdings Company, Ltd. | | | 70,882 | 85,170 |
| China South City Holdings, Ltd. | | | 344,000 | 38,179 |
| China State Construction International Holdings, Ltd. | | | 103,600 | 85,174 |
| China Taiping Insurance Holdings Company, Ltd. | | | 70,110 | 146,627 |
| China Traditional Chinese Medicine Holdings Company, Ltd. | | | 142,000 | 75,682 |
| China Travel International Investment Hong Kong, Ltd. | | | 146,000 | 23,326 |
| China Unicom Hong Kong, Ltd., ADR (C) | | | 72,323 | 580,030 |
| China Vast Industrial Urban Development Company, Ltd. (B) | | | 47,000 | 18,395 |
| China Water Affairs Group, Ltd. (C) | | | 62,000 | 49,797 |
| China Water Industry Group, Ltd. (A) | | | 40,000 | 2,012 |
| CIMC Enric Holdings, Ltd. | | | 60,000 | 31,707 |
| CITIC Resources Holdings, Ltd. | | | 310,000 | 17,013 |
| CITIC, Ltd. | | | 231,923 | 261,844 |
| Citychamp Watch & Jewellery Group, Ltd. (A) | | | 65,800 | 13,870 |
| Clear Media, Ltd. | | | 21,000 | 12,751 |
| Concord New Energy Group, Ltd. | | | 440,000 | 19,378 |
| COSCO SHIPPING International Hong Kong Company, Ltd. | | | 82,000 | 24,278 |
| COSCO SHIPPING Ports, Ltd. | | | 88,291 | 59,325 |
| CP Pokphand Company, Ltd. | | | 458,000 | 39,028 |
| CWT International, Ltd. (A)(D) | | | 790,000 | 679 |
| Dawnrays Pharmaceutical Holdings, Ltd. | | | 123,000 | 20,877 |
| DBA Telecommunication Asia Holdings, Ltd. (A)(D) | | | 32,000 | 0 |
| Digital China Holdings, Ltd. | | | 62,000 | 31,481 |
| Essex Bio-technology, Ltd. | | | 23,000 | 16,215 |
| Far East Horizon, Ltd. | | | 105,000 | 93,115 |
| Fullshare Holdings, Ltd. (A) | | | 110,000 | 1,800 |
| GCL New Energy Holdings, Ltd. (A) | | | 440,000 | 8,024 |
| GCL-Poly Energy Holdings, Ltd. (A) | | | 1,301,000 | 62,972 |
| Geely Automobile Holdings, Ltd. | | | 309,000 | 564,463 |
| SEE NOTES TO FINANCIAL STATEMENTS | SEMIANNUAL REPORT | JOHN HANCOCK EMERGING MARKETS FUND | 15 |
| | | | | Shares | Value |
| Hong Kong (continued) | | | | | |
| Gemdale Properties & Investment Corp., Ltd. | | | 288,000 | $51,897 |
| Glorious Property Holdings, Ltd. (A) | | | 516,000 | 11,187 |
| Goldlion Holdings, Ltd. | | | 122,000 | 32,025 |
| Guangdong Investment, Ltd. | | | 94,000 | 178,513 |
| Haier Electronics Group Company, Ltd. | | | 80,000 | 233,282 |
| Health & Happiness H&H International Holdings, Ltd. | | | 13,000 | 56,727 |
| Hi Sun Technology China, Ltd. (A) | | | 105,000 | 14,795 |
| HKC Holdings, Ltd. | | | 12,016 | 9,648 |
| Hopson Development Holdings, Ltd. | | | 40,000 | 36,569 |
| Hua Han Health Industry Holdings, Ltd. (A)(D) | | | 1,415,910 | 38,508 |
| Huanxi Media Group, Ltd. (A) | | | 120,000 | 24,133 |
| IMAX China Holding, Inc. (B) | | | 15,700 | 29,563 |
| Inspur International, Ltd. | | | 28,000 | 11,572 |
| Jiayuan International Group, Ltd. | | | 37,748 | 15,004 |
| Jinmao Hotel and Jinmao China Hotel Investments and Management, Ltd. | | | 16,000 | 6,931 |
| Joy City Property, Ltd. | | | 316,000 | 30,510 |
| Ju Teng International Holdings, Ltd. | | | 121,722 | 27,204 |
| K Wah International Holdings, Ltd. | | | 33,990 | 16,554 |
| Kingboard Holdings, Ltd. | | | 48,148 | 129,037 |
| Kingboard Laminates Holdings, Ltd. | | | 66,000 | 67,491 |
| Kunlun Energy Company, Ltd. | | | 252,000 | 178,273 |
| Lai Fung Holdings, Ltd. | | | 31,237 | 37,815 |
| Lee & Man Chemical Company, Ltd. | | | 14,000 | 6,478 |
| Lee & Man Paper Manufacturing, Ltd. | | | 87,000 | 69,274 |
| Lee's Pharmaceutical Holdings, Ltd. | | | 38,500 | 19,689 |
| Lifestyle China Group, Ltd. (A) | | | 9,000 | 2,354 |
| LVGEM China Real Estate Investment Company, Ltd. | | | 32,000 | 9,603 |
| Mingfa Group International Company, Ltd. (A)(D) | | | 995,000 | 84,438 |
| Minmetals Land, Ltd. | | | 126,000 | 20,813 |
| Nan Hai Corp., Ltd. | | | 1,900,000 | 20,501 |
| NetDragon Websoft Holdings, Ltd. | | | 14,000 | 39,222 |
| New World Department Store China, Ltd. (A) | | | 145,000 | 23,688 |
| Nine Dragons Paper Holdings, Ltd. | | | 136,000 | 163,374 |
| Panda Green Energy Group, Ltd. (A)(C) | | | 146,000 | 4,092 |
| PAX Global Technology, Ltd. | | | 72,000 | 36,022 |
| Phoenix Media Investment Holdings, Ltd. | | | 76,000 | 4,715 |
| Poly Property Group Company, Ltd. | | | 153,000 | 58,217 |
| Pou Sheng International Holdings, Ltd. | | | 144,000 | 37,104 |
| REXLot Holdings, Ltd. (A)(D) | | | 2,065,304 | 5,008 |
| Road King Infrastructure, Ltd. | | | 13,000 | 22,436 |
| Shanghai Industrial Holdings, Ltd. | | | 34,041 | 60,593 |
| Shanghai Industrial Urban Development Group, Ltd. | | | 108,541 | 12,295 |
| Shenzhen International Holdings, Ltd. | | | 64,538 | 124,811 |
| 16 | JOHN HANCOCK EMERGING MARKETS FUND | SEMIANNUAL REPORT | SEE NOTES TO FINANCIAL STATEMENTS |
| | | | | Shares | Value |
| Hong Kong (continued) | | | | | |
| Shenzhen Investment, Ltd. | | | 197,175 | $66,644 |
| Shimao Property Holdings, Ltd. | | | 55,500 | 203,424 |
| Shougang Concord International Enterprises Company, Ltd. | | | 778,000 | 33,987 |
| Shougang Fushan Resources Group, Ltd. | | | 194,000 | 37,717 |
| Silver Grant International Holdings Group, Ltd. (A) | | | 72,334 | 10,543 |
| Sino Biopharmaceutical, Ltd. | | | 310,500 | 460,202 |
| Sinofert Holdings, Ltd. (A) | | | 118,000 | 11,921 |
| Sinolink Worldwide Holdings, Ltd. (A) | | | 320,000 | 16,533 |
| Sinopec Kantons Holdings, Ltd. | | | 102,000 | 41,514 |
| Skyworth Group, Ltd. (C) | | | 158,000 | 40,385 |
| SMI Holdings Group, Ltd. (A)(C)(D) | | | 228,889 | 14,682 |
| SRE Group, Ltd. (A) | | | 908,000 | 5,711 |
| SSY Group, Ltd. | | | 118,733 | 101,089 |
| Sun Art Retail Group, Ltd. | | | 144,500 | 186,757 |
| TCL Electronics Holdings, Ltd. | | | 39,600 | 22,352 |
| Tech Pro Technology Development, Ltd. (A)(D) | | | 966,000 | 4,845 |
| Texhong Textile Group, Ltd. (C) | | | 19,000 | 20,112 |
| Tian An China Investment Company, Ltd. | | | 202,000 | 81,100 |
| Tianjin Port Development Holdings, Ltd. | | | 154,000 | 13,803 |
| Tibet Water Resources, Ltd. (A)(C) | | | 149,000 | 8,608 |
| Time Watch Investments, Ltd. | | | 62,000 | 6,463 |
| Tongda Group Holdings, Ltd. | | | 270,000 | 26,403 |
| Truly International Holdings, Ltd. (A) | | | 101,000 | 13,927 |
| United Energy Group, Ltd. | | | 846,000 | 158,082 |
| Vinda International Holdings, Ltd. | | | 24,000 | 61,965 |
| Wasion Holdings, Ltd. | | | 32,000 | 13,101 |
| Yuexiu Property Company, Ltd. | | | 627,516 | 129,947 |
| Yuexiu Transport Infrastructure, Ltd. | | | 36,000 | 28,069 |
| Zhongyu Gas Holdings, Ltd. | | | 20,006 | 17,243 |
| Zhuguang Holdings Group Company, Ltd. (A) | | | 60,000 | 8,441 |
| Hungary 0.3% | | | | | 699,535 |
| Magyar Telekom Telecommunications PLC | | | 35,337 | 46,052 |
| MOL Hungarian Oil & Gas PLC | | | 41,027 | 317,990 |
| OTP Bank Nyrt | | | 5,525 | 242,510 |
| Richter Gedeon NYRT | | | 4,565 | 92,983 |
| India 12.0% | | | | | 28,268,154 |
| 3M India, Ltd. (A) | | | 61 | 17,447 |
| 5Paisa Capital, Ltd. (A) | | | 11,326 | 24,944 |
| Aarti Industries, Ltd. | | | 2,428 | 33,123 |
| ABB India, Ltd. | | | 936 | 15,466 |
| ABB Power Products & Systems India, Ltd. (A)(D) | | | 187 | 1,916 |
| Abbott India, Ltd. | | | 478 | 104,346 |
| ACC, Ltd. | | | 2,457 | 45,311 |
| SEE NOTES TO FINANCIAL STATEMENTS | SEMIANNUAL REPORT | JOHN HANCOCK EMERGING MARKETS FUND | 17 |
| | | | | Shares | Value |
| India (continued) | | | | | |
| Adani Enterprises, Ltd. | | | 10,171 | $31,032 |
| Adani Gas, Ltd. | | | 33,738 | 63,740 |
| Adani Green Energy, Ltd. (A) | | | 16,948 | 36,845 |
| Adani Ports & Special Economic Zone, Ltd. | | | 28,640 | 138,030 |
| Adani Power, Ltd. (A) | | | 35,840 | 23,837 |
| Adani Transmission, Ltd. (A) | | | 42,123 | 146,855 |
| Aditya Birla Capital, Ltd. (A) | | | 27,085 | 29,453 |
| Aditya Birla Fashion and Retail, Ltd. (A) | | | 7,683 | 27,013 |
| Aegis Logistics, Ltd. | | | 4,413 | 13,914 |
| Agro Tech Foods, Ltd. | | | 1,095 | 9,818 |
| AIA Engineering, Ltd. | | | 1,625 | 40,612 |
| Ajanta Pharma, Ltd. | | | 2,166 | 41,626 |
| Akzo Nobel India, Ltd. | | | 1,340 | 44,245 |
| Alembic Pharmaceuticals, Ltd. | | | 4,801 | 42,244 |
| Alkyl Amines Chemicals | | | 1,212 | 26,604 |
| Allahabad Bank (A) | | | 67,566 | 10,672 |
| Amara Raja Batteries, Ltd. | | | 1,107 | 9,887 |
| Ambuja Cements, Ltd. | | | 17,762 | 51,581 |
| Andhra Bank (A) | | | 20,905 | 3,851 |
| APL Apollo Tubes, Ltd. | | | 842 | 22,543 |
| Apollo Hospitals Enterprise, Ltd. | | | 2,918 | 70,883 |
| Apollo Tyres, Ltd. | | | 19,720 | 39,277 |
| Arti Surfactants, Ltd. (A)(D) | | | 243 | 715 |
| Arvind Fashions, Ltd. (A) | | | 7,149 | 34,488 |
| Arvind, Ltd. | | | 13,022 | 6,819 |
| Asahi India Glass, Ltd. | | | 13,159 | 45,564 |
| Ashok Leyland, Ltd. | | | 88,960 | 87,377 |
| Ashoka Buildcon, Ltd. (A) | | | 9,141 | 11,659 |
| Asian Paints, Ltd. | | | 8,491 | 213,833 |
| Astra Microwave Products, Ltd. | | | 3,253 | 3,981 |
| Astral Poly Technik, Ltd. | | | 1,843 | 29,478 |
| Atul, Ltd. | | | 603 | 43,411 |
| Aurobindo Pharma, Ltd. | | | 18,355 | 128,658 |
| Automotive Axles, Ltd. | | | 923 | 8,942 |
| Avanti Feeds, Ltd. | | | 3,600 | 23,459 |
| Avenue Supermarts, Ltd. (A)(B) | | | 6,840 | 223,706 |
| Axis Bank, Ltd. | | | 37,615 | 368,367 |
| Bajaj Auto, Ltd. | | | 2,739 | 110,191 |
| Bajaj Consumer Care, Ltd. (A) | | | 5,535 | 14,661 |
| Bajaj Electricals, Ltd. | | | 1,698 | 9,630 |
| Bajaj Finance, Ltd. | | | 3,895 | 245,378 |
| Bajaj Finserv, Ltd. | | | 1,367 | 174,131 |
| Bajaj Hindusthan Sugar, Ltd. (A) | | | 14,500 | 1,031 |
| Bajaj Holdings & Investment, Ltd. | | | 2,189 | 103,231 |
| 18 | JOHN HANCOCK EMERGING MARKETS FUND | SEMIANNUAL REPORT | SEE NOTES TO FINANCIAL STATEMENTS |
| | | | | Shares | Value |
| India (continued) | | | | | |
| Balkrishna Industries, Ltd. | | | 6,050 | $92,403 |
| Balrampur Chini Mills, Ltd. | | | 11,268 | 22,723 |
| Bandhan Bank, Ltd. (B) | | | 4,533 | 24,158 |
| Bank of Baroda (A) | | | 25,551 | 27,626 |
| Bank of Maharashtra (A) | | | 75,955 | 10,948 |
| BASF India, Ltd. | | | 543 | 7,914 |
| Bata India, Ltd. | | | 1,019 | 23,708 |
| Bayer CropScience, Ltd. | | | 196 | 12,107 |
| Berger Paints India, Ltd. | | | 10,302 | 81,690 |
| Bhansali Engineering Polymers, Ltd. | | | 13,362 | 7,737 |
| Bharat Electronics, Ltd. | | | 33,210 | 34,353 |
| Bharat Forge, Ltd. | | | 14,723 | 89,658 |
| Bharat Heavy Electricals, Ltd. | | | 58,913 | 25,101 |
| Bharat Petroleum Corp., Ltd. | | | 21,375 | 125,669 |
| Bharti Airtel, Ltd. (A) | | | 60,578 | 440,268 |
| Bharti Infratel, Ltd. | | | 9,404 | 28,309 |
| Biocon, Ltd. | | | 9,991 | 40,415 |
| Birla Corp., Ltd. | | | 1,911 | 18,341 |
| Birlasoft, Ltd. | | | 12,247 | 14,970 |
| Bliss Gvs Pharma, Ltd. | | | 6,312 | 8,729 |
| Blue Dart Express, Ltd. | | | 848 | 32,920 |
| Blue Star, Ltd. | | | 2,873 | 32,172 |
| Bombay Dyeing & Manufacturing Company, Ltd. | | | 7,879 | 7,681 |
| Borosil Renewables, Ltd. | | | 3,051 | 7,836 |
| Bosch, Ltd. | | | 389 | 65,702 |
| Brigade Enterprises, Ltd. | | | 7,041 | 22,523 |
| Britannia Industries, Ltd. | | | 1,201 | 49,520 |
| BSE, Ltd. | | | 1,351 | 8,519 |
| Cadila Healthcare, Ltd. | | | 7,082 | 25,543 |
| Can Fin Homes, Ltd. | | | 3,284 | 22,958 |
| Canara Bank (A) | | | 13,338 | 26,649 |
| Capacit'e Infraprojects, Ltd. | | | 2,705 | 6,053 |
| Caplin Point Laboratories, Ltd. | | | 5,016 | 21,104 |
| Carborundum Universal, Ltd. | | | 5,595 | 25,357 |
| Care Ratings, Ltd. | | | 2,031 | 13,574 |
| Castrol India, Ltd. | | | 11,199 | 22,510 |
| CCL Products India, Ltd. | | | 8,455 | 27,915 |
| Ceat, Ltd. | | | 1,368 | 19,491 |
| Central Depository Services India, Ltd. | | | 1,657 | 6,122 |
| Century Plyboards India, Ltd. | | | 7,851 | 17,143 |
| Century Textiles & Industries, Ltd. | | | 1,858 | 13,108 |
| Cera Sanitaryware, Ltd. | | | 845 | 28,868 |
| CESC, Ltd. | | | 3,387 | 30,311 |
| CG Power and Industrial Solutions, Ltd. (A) | | | 38,640 | 3,848 |
| SEE NOTES TO FINANCIAL STATEMENTS | SEMIANNUAL REPORT | JOHN HANCOCK EMERGING MARKETS FUND | 19 |
| | | | | Shares | Value |
| India (continued) | | | | | |
| Chambal Fertilizers & Chemicals, Ltd. | | | 11,943 | $23,330 |
| Chennai Petroleum Corp., Ltd. (A) | | | 3,148 | 4,454 |
| Chennai Super Kings Cricket, Ltd. (A)(D) | | | 271,316 | 8,459 |
| Cholamandalam Financial Holdings, Ltd. | | | 6,543 | 46,042 |
| Cholamandalam Investment and Finance Company, Ltd. | | | 17,243 | 73,814 |
| Cipla, Ltd. | | | 16,085 | 90,798 |
| City Union Bank, Ltd. | | | 16,091 | 47,921 |
| Coal India, Ltd. | | | 37,238 | 87,235 |
| Colgate-Palmolive India, Ltd. | | | 2,924 | 52,277 |
| Container Corp. of India, Ltd. | | | 8,172 | 58,100 |
| Coromandel International, Ltd. | | | 5,759 | 49,104 |
| Corp. Bank (A) | | | 67,269 | 15,789 |
| Cox & Kings, Ltd. (A) | | | 12,150 | 134 |
| CRISIL, Ltd. | | | 2,497 | 52,692 |
| Crompton Greaves Consumer Electricals, Ltd. | | | 38,063 | 146,361 |
| Cummins India, Ltd. | | | 3,376 | 23,842 |
| Cyient, Ltd. | | | 7,633 | 45,255 |
| Dabur India, Ltd. | | | 15,302 | 105,200 |
| DB Corp., Ltd. | | | 10,044 | 15,344 |
| DCB Bank, Ltd. | | | 11,434 | 26,154 |
| DCM Shriram, Ltd. | | | 3,338 | 15,493 |
| Deepak Fertilisers & Petrochemicals Corp., Ltd. | | | 2,991 | 3,598 |
| Deepak Nitrite, Ltd. | | | 2,523 | 16,193 |
| Delta Corp., Ltd. | | | 8,433 | 15,801 |
| Dhampur Sugar Mills, Ltd. | | | 2,251 | 5,034 |
| Dilip Buildcon, Ltd. (B) | | | 2,723 | 11,417 |
| Dish TV India, Ltd. (A) | | | 46,324 | 5,400 |
| Dishman Carbogen Amcis, Ltd. | | | 1,354 | 1,464 |
| Divi's Laboratories, Ltd. | | | 3,279 | 96,609 |
| DLF, Ltd. | | | 13,190 | 37,392 |
| Dr. Lal PathLabs, Ltd. (B) | | | 1,089 | 24,871 |
| Dr. Reddy's Laboratories, Ltd. | | | 4,595 | 186,354 |
| Dynamatic Technologies, Ltd. (A) | | | 876 | 10,398 |
| eClerx Services, Ltd. | | | 2,550 | 19,432 |
| Edelweiss Financial Services, Ltd. | | | 26,662 | 32,913 |
| Eicher Motors, Ltd. | | | 548 | 127,759 |
| EID Parry India, Ltd. | | | 6,483 | 17,284 |
| EIH, Ltd. | | | 9,617 | 17,636 |
| Elgi Equipments, Ltd. | | | 15,157 | 46,233 |
| Emami, Ltd. | | | 9,857 | 35,245 |
| Endurance Technologies, Ltd. (B) | | | 4,141 | 55,760 |
| Engineers India, Ltd. | | | 8,807 | 8,621 |
| Entertainment Network India, Ltd. | | | 1,131 | 3,094 |
| Eris Lifesciences, Ltd. (A)(B) | | | 3,927 | 23,910 |
| 20 | JOHN HANCOCK EMERGING MARKETS FUND | SEMIANNUAL REPORT | SEE NOTES TO FINANCIAL STATEMENTS |
| | | | | Shares | Value |
| India (continued) | | | | | |
| Escorts, Ltd. | | | 3,193 | $34,849 |
| Essel Propack, Ltd. | | | 2,501 | 5,957 |
| Excel Industries, Ltd. | | | 557 | 5,287 |
| Exide Industries, Ltd. | | | 11,933 | 27,233 |
| Federal Bank, Ltd. | | | 101,872 | 122,327 |
| Finolex Cables, Ltd. | | | 7,048 | 31,748 |
| Finolex Industries, Ltd. | | | 4,543 | 34,427 |
| Firstsource Solutions, Ltd. | | | 20,707 | 11,641 |
| Fortis Healthcare, Ltd. (A) | | | 29,932 | 63,406 |
| Future Lifestyle Fashions, Ltd. | | | 2,234 | 10,690 |
| Future Retail, Ltd. (A) | | | 4,980 | 21,362 |
| Gabriel India, Ltd. | | | 9,247 | 12,362 |
| GAIL India, Ltd. | | | 66,880 | 96,331 |
| Garware Technical Fibres, Ltd. | | | 570 | 12,364 |
| GE T&D India, Ltd. | | | 7,991 | 13,453 |
| GHCL, Ltd. | | | 5,141 | 12,316 |
| GIC Housing Finance, Ltd. | | | 1,826 | 2,445 |
| Gillette India, Ltd. | | | 722 | 58,483 |
| GlaxoSmithKline Consumer Healthcare, Ltd. | | | 409 | 53,743 |
| GlaxoSmithKline Pharmaceuticals, Ltd. | | | 911 | 16,572 |
| Glenmark Pharmaceuticals, Ltd. | | | 9,568 | 36,965 |
| GMR Infrastructure, Ltd. (A) | | | 121,737 | 34,299 |
| Godfrey Phillips India, Ltd. | | | 824 | 13,072 |
| Godrej Agrovet, Ltd. (B) | | | 1,286 | 8,319 |
| Godrej Consumer Products, Ltd. | | | 9,235 | 72,829 |
| Godrej Industries, Ltd. | | | 3,907 | 21,250 |
| Godrej Properties, Ltd. (A) | | | 1,212 | 17,242 |
| Granules India, Ltd. | | | 10,612 | 23,757 |
| Graphite India, Ltd. | | | 3,367 | 10,555 |
| Grasim Industries, Ltd. | | | 9,194 | 88,279 |
| Greaves Cotton, Ltd. (A) | | | 6,447 | 11,692 |
| Greenpanel Industries, Ltd. (A) | | | 10,228 | 6,994 |
| Greenply Industries, Ltd. | | | 10,228 | 18,411 |
| Grindwell Norton, Ltd. | | | 4,815 | 38,260 |
| Gujarat Alkalies & Chemicals, Ltd. | | | 2,634 | 12,528 |
| Gujarat Ambuja Exports, Ltd. | | | 4,928 | 11,027 |
| Gujarat Fluorochemicals, Ltd. (A) | | | 2,756 | 19,443 |
| Gujarat Gas, Ltd. | | | 10,223 | 39,351 |
| Gujarat Narmada Valley Fertilizers & Chemicals, Ltd. | | | 3,833 | 8,316 |
| Gujarat Pipavav Port, Ltd. | | | 28,730 | 28,610 |
| Gujarat State Fertilizers & Chemicals, Ltd. | | | 20,632 | 17,541 |
| Gujarat State Petronet, Ltd. | | | 14,293 | 44,378 |
| Gulf Oil Lubricants India, Ltd. | | | 1,642 | 17,780 |
| Hatsun Agro Product, Ltd. | | | 3,134 | 29,998 |
| SEE NOTES TO FINANCIAL STATEMENTS | SEMIANNUAL REPORT | JOHN HANCOCK EMERGING MARKETS FUND | 21 |
| | | | | Shares | Value |
| India (continued) | | | | | |
| Hatsun Agro Product, Ltd., Partly Paid Shares (D) | | | 160 | $980 |
| Havells India, Ltd. | | | 7,034 | 60,001 |
| HCL Technologies, Ltd. | | | 50,992 | 382,545 |
| HDFC Bank, Ltd. | | | 133,573 | 2,194,591 |
| HDFC Life Insurance Company, Ltd. (B) | | | 10,142 | 76,989 |
| HEG, Ltd. | | | 690 | 8,509 |
| HeidelbergCement India, Ltd. | | | 5,347 | 15,106 |
| Hemisphere Properties India, Ltd. (A)(D) | | | 2,825 | 6,529 |
| Heritage Foods, Ltd. | | | 1,223 | 6,158 |
| Hero MotoCorp, Ltd. | | | 3,996 | 113,867 |
| Hexaware Technologies, Ltd. | | | 8,718 | 43,543 |
| HFCL, Ltd. | | | 51,247 | 10,221 |
| Hikal, Ltd. | | | 4,873 | 9,025 |
| HIL, Ltd. | | | 253 | 3,716 |
| Himadri Speciality Chemical, Ltd. | | | 8,292 | 5,706 |
| Himatsingka Seide, Ltd. | | | 6,490 | 8,843 |
| Hindalco Industries, Ltd. | | | 54,965 | 119,746 |
| Hinduja Global Solutions, Ltd. | | | 3,258 | 37,244 |
| Hindustan Oil Exploration Company, Ltd. (A) | | | 2,006 | 2,107 |
| Hindustan Petroleum Corp., Ltd. | | | 26,715 | 73,462 |
| Hindustan Unilever, Ltd. | | | 19,832 | 601,213 |
| Honeywell Automation India, Ltd. | | | 125 | 57,446 |
| Housing Development Finance Corp., Ltd. | | | 23,476 | 715,671 |
| Huhtamaki PPL, Ltd. | | | 7,301 | 27,064 |
| ICICI Bank, Ltd. | | | 58,534 | 407,803 |
| ICICI Bank, Ltd., ADR | | | 5,317 | 73,747 |
| ICICI Lombard General Insurance Company, Ltd. (B) | | | 4,220 | 73,140 |
| ICICI Prudential Life Insurance Company, Ltd. (B) | | | 4,445 | 29,143 |
| IDFC First Bank, Ltd. (A) | | | 117,777 | 60,668 |
| IDFC, Ltd. | | | 60,709 | 27,126 |
| IFB Industries, Ltd. (A) | | | 1,789 | 12,016 |
| IFCI, Ltd. (A) | | | 60,997 | 4,552 |
| IIFL Finance, Ltd. (A) | | | 25,419 | 58,662 |
| IIFL Securities, Ltd. | | | 72,539 | 50,886 |
| IIFL Wealth Management, Ltd. | | | 10,362 | 210,608 |
| India Glycols, Ltd. | | | 1,050 | 5,003 |
| Indiabulls Housing Finance, Ltd. | | | 23,318 | 92,470 |
| Indiabulls Real Estate, Ltd. (A) | | | 24,645 | 26,096 |
| Indiabulls Ventures, Ltd., Partly Paid Shares | | | 5,473 | 5,302 |
| Indian Bank (A) | | | 5,399 | 5,593 |
| Indian Oil Corp., Ltd. | | | 75,896 | 112,335 |
| Indraprastha Gas, Ltd. | | | 8,878 | 54,749 |
| IndusInd Bank, Ltd. | | | 4,916 | 75,818 |
| Infibeam Avenues, Ltd. | | | 1,962 | 1,543 |
| 22 | JOHN HANCOCK EMERGING MARKETS FUND | SEMIANNUAL REPORT | SEE NOTES TO FINANCIAL STATEMENTS |
| | | | | Shares | Value |
| India (continued) | | | | | |
| Info Edge India, Ltd. | | | 626 | $23,010 |
| Infosys, Ltd. | | | 132,686 | 1,346,706 |
| Inox Leisure, Ltd. | | | 4,238 | 25,613 |
| Insecticides India, Ltd. | | | 990 | 6,155 |
| Intellect Design Arena, Ltd. (A) | | | 4,460 | 7,193 |
| InterGlobe Aviation, Ltd. (B) | | | 2,710 | 49,381 |
| Ipca Laboratories, Ltd. | | | 2,728 | 51,920 |
| IRB Infrastructure Developers, Ltd. (A) | | | 7,984 | 9,367 |
| ITC, Ltd. | | | 102,862 | 281,564 |
| J Kumar Infraprojects, Ltd. | | | 4,863 | 8,576 |
| Jain Irrigation Systems, Ltd. (A) | | | 19,825 | 1,498 |
| Jaiprakash Associates, Ltd. (A) | | | 100,214 | 2,631 |
| Jaiprakash Power Ventures, Ltd. (A) | | | 246,265 | 4,291 |
| Jamna Auto Industries, Ltd. | | | 8,736 | 4,253 |
| JB Chemicals & Pharmaceuticals, Ltd. | | | 3,043 | 22,856 |
| Jindal Saw, Ltd. | | | 11,500 | 12,123 |
| Jindal Stainless Hisar, Ltd. (A) | | | 8,000 | 7,600 |
| Jindal Stainless, Ltd. (A) | | | 16,249 | 8,911 |
| Jindal Steel & Power, Ltd. (A) | | | 30,545 | 66,055 |
| JK Cement, Ltd. | | | 1,769 | 34,057 |
| JK Lakshmi Cement, Ltd. | | | 4,546 | 19,627 |
| JK Paper, Ltd. | | | 7,345 | 11,886 |
| JK Tyre & Industries, Ltd. | | | 5,594 | 4,896 |
| JM Financial, Ltd. | | | 20,631 | 30,781 |
| Johnson Controls-Hitachi Air Conditioning India, Ltd. | | | 608 | 24,073 |
| JSW Energy, Ltd. | | | 33,800 | 26,446 |
| JSW Steel, Ltd. | | | 74,874 | 246,025 |
| Jubilant Foodworks, Ltd. | | | 3,066 | 75,741 |
| Jubilant Life Sciences, Ltd. | | | 7,891 | 55,902 |
| Just Dial, Ltd. (A) | | | 1,510 | 9,816 |
| Jyothy Laboratories, Ltd. | | | 3,881 | 6,691 |
| Kajaria Ceramics, Ltd. | | | 4,103 | 30,389 |
| Kalpataru Power Transmission, Ltd. | | | 4,585 | 21,476 |
| Kalyani Steels, Ltd. | | | 3,418 | 9,813 |
| Kansai Nerolac Paints, Ltd. | | | 3,086 | 21,593 |
| Kaveri Seed Company, Ltd. | | | 2,285 | 13,346 |
| KEC International, Ltd. | | | 5,101 | 22,010 |
| KEI Industries, Ltd. | | | 4,692 | 32,022 |
| Kirloskar Brothers, Ltd. | | | 3,765 | 7,554 |
| Kirloskar Oil Engines, Ltd. | | | 5,185 | 9,141 |
| KNR Constructions, Ltd. | | | 5,450 | 20,324 |
| Kolte-Patil Developers, Ltd. | | | 2,398 | 7,134 |
| Kotak Mahindra Bank, Ltd. | | | 12,507 | 282,976 |
| KPIT Technologies, Ltd. | | | 68,007 | 76,183 |
| SEE NOTES TO FINANCIAL STATEMENTS | SEMIANNUAL REPORT | JOHN HANCOCK EMERGING MARKETS FUND | 23 |
| | | | | Shares | Value |
| India (continued) | | | | | |
| KPR Mill, Ltd. | | | 3,888 | $31,654 |
| KRBL, Ltd. | | | 3,905 | 13,674 |
| L&T Finance Holdings, Ltd. | | | 24,332 | 34,306 |
| LA Opala RG, Ltd. | | | 2,816 | 8,507 |
| Lakshmi Machine Works, Ltd. | | | 116 | 5,233 |
| Larsen & Toubro Infotech, Ltd. (B) | | | 2,658 | 70,647 |
| Larsen & Toubro, Ltd. | | | 13,164 | 219,223 |
| Laurus Labs, Ltd. (B) | | | 4,538 | 25,937 |
| LG Balakrishnan & Bros, Ltd. | | | 2,528 | 8,845 |
| LIC Housing Finance, Ltd. | | | 21,165 | 94,486 |
| Linde India, Ltd. | | | 3,823 | 34,661 |
| LT Foods, Ltd. | | | 10,845 | 3,602 |
| Lupin, Ltd. | | | 13,719 | 122,250 |
| LUX Industries, Ltd. | | | 400 | 7,803 |
| Magma Fincorp, Ltd. | | | 17,569 | 11,213 |
| Mahanagar Gas, Ltd. | | | 2,409 | 33,417 |
| Mahindra & Mahindra Financial Services, Ltd. | | | 20,916 | 103,179 |
| Mahindra & Mahindra, Ltd. | | | 28,331 | 180,772 |
| Mahindra CIE Automotive, Ltd. (A) | | | 10,554 | 19,634 |
| Mahindra Holidays & Resorts India, Ltd. (A) | | | 6,255 | 18,435 |
| Mahindra Lifespace Developers, Ltd. | | | 1,108 | 5,506 |
| Majesco, Ltd. | | | 1,421 | 7,272 |
| Manappuram Finance, Ltd. | | | 29,162 | 67,041 |
| Mangalore Refinery & Petrochemicals, Ltd. | | | 16,715 | 8,842 |
| Marico, Ltd. | | | 13,995 | 58,336 |
| Marksans Pharma, Ltd. | | | 20,609 | 4,915 |
| Maruti Suzuki India, Ltd. | | | 3,284 | 287,617 |
| Mastek, Ltd. | | | 812 | 4,699 |
| Mayur Uniquoters, Ltd. | | | 4,014 | 14,170 |
| Meghmani Organics, Ltd. | | | 8,623 | 6,260 |
| Minda Industries, Ltd. | | | 5,101 | 26,052 |
| Mindtree, Ltd. | | | 1,858 | 25,238 |
| MM Forgings, Ltd. | | | 1,399 | 7,557 |
| MOIL, Ltd. | | | 5,355 | 9,046 |
| Morepen Laboratories, Ltd. (A) | | | 26,894 | 4,569 |
| Motherson Sumi Systems, Ltd. | | | 60,455 | 89,223 |
| Motilal Oswal Financial Services, Ltd. | | | 2,377 | 24,766 |
| Mphasis, Ltd. | | | 5,533 | 68,473 |
| MRF, Ltd. | | | 78 | 71,723 |
| Multi Commodity Exchange of India, Ltd. | | | 573 | 10,225 |
| Muthoot Capital Services, Ltd. (A) | | | 931 | 6,568 |
| Muthoot Finance, Ltd. | | | 7,879 | 97,286 |
| Narayana Hrudayalaya, Ltd. | | | 5,281 | 24,389 |
| Natco Pharma, Ltd. | | | 6,282 | 52,943 |
| 24 | JOHN HANCOCK EMERGING MARKETS FUND | SEMIANNUAL REPORT | SEE NOTES TO FINANCIAL STATEMENTS |
| | | | | Shares | Value |
| India (continued) | | | | | |
| National Aluminium Company, Ltd. | | | 30,687 | $14,289 |
| Nava Bharat Ventures, Ltd. | | | 16,853 | 15,240 |
| Navin Fluorine International, Ltd. | | | 1,518 | 30,757 |
| Navneet Education, Ltd. | | | 22,671 | 26,338 |
| NBCC India, Ltd. | | | 20,368 | 7,543 |
| NCC, Ltd. | | | 22,228 | 11,144 |
| NESCO, Ltd. | | | 2,747 | 27,990 |
| Nestle India, Ltd. | | | 576 | 125,947 |
| NHPC, Ltd. | | | 108,939 | 31,356 |
| NIIT Technologies, Ltd. | | | 141 | 3,281 |
| NIIT, Ltd. | | | 4,810 | 6,659 |
| Nilkamal, Ltd. | | | 570 | 11,100 |
| NLC India, Ltd. | | | 29,563 | 24,698 |
| NOCIL, Ltd. | | | 4,078 | 5,128 |
| NRB Bearings, Ltd. | | | 7,992 | 9,357 |
| NTPC, Ltd. | | | 65,672 | 97,493 |
| Oberoi Realty, Ltd. | | | 5,897 | 41,893 |
| Odisha Cement, Ltd. | | | 4,457 | 48,901 |
| Oil & Natural Gas Corp., Ltd. | | | 119,683 | 153,869 |
| Oil India, Ltd. | | | 11,025 | 16,612 |
| Omaxe, Ltd. | | | 3,052 | 6,700 |
| Oracle Financial Services Software, Ltd. (A) | | | 1,238 | 45,649 |
| Orient Cement, Ltd. | | | 11,602 | 12,912 |
| Orient Electric, Ltd. | | | 7,442 | 27,477 |
| Oriental Bank of Commerce (A) | | | 10,020 | 4,882 |
| Page Industries, Ltd. | | | 254 | 79,109 |
| Parag Milk Foods, Ltd. (B) | | | 3,025 | 3,401 |
| PC Jeweller, Ltd. (A) | | | 14,194 | 3,047 |
| Persistent Systems, Ltd. | | | 2,797 | 27,132 |
| Petronet LNG, Ltd. | | | 49,070 | 169,552 |
| Pfizer, Ltd. | | | 365 | 21,443 |
| Phillips Carbon Black, Ltd. | | | 6,456 | 9,610 |
| PI Industries, Ltd. | | | 5,797 | 121,193 |
| Pidilite Industries, Ltd. | | | 3,776 | 80,018 |
| Piramal Enterprises, Ltd. | | | 3,991 | 73,358 |
| PNB Housing Finance, Ltd. (B) | | | 3,296 | 16,645 |
| PNC Infratech, Ltd. | | | 3,706 | 8,879 |
| Power Finance Corp., Ltd. | | | 29,969 | 45,812 |
| Power Grid Corp. of India, Ltd. | | | 54,410 | 137,336 |
| Power Mech Projects, Ltd. | | | 840 | 8,290 |
| Praj Industries, Ltd. | | | 5,641 | 7,518 |
| Prakash Industries, Ltd. | | | 5,538 | 2,841 |
| Prestige Estates Projects, Ltd. | | | 19,188 | 80,006 |
| Procter & Gamble Health, Ltd. | | | 219 | 12,781 |
| SEE NOTES TO FINANCIAL STATEMENTS | SEMIANNUAL REPORT | JOHN HANCOCK EMERGING MARKETS FUND | 25 |
| | | | | Shares | Value |
| India (continued) | | | | | |
| Procter & Gamble Hygiene & Health Care, Ltd. | | | 979 | $149,696 |
| PSP Projects, Ltd. | | | 1,686 | 11,486 |
| PTC India, Ltd. | | | 18,544 | 12,818 |
| Punjab National Bank (A) | | | 36,633 | 23,198 |
| PVR, Ltd. | | | 2,148 | 57,600 |
| Quess Corp., Ltd. (A)(B) | | | 1,654 | 11,821 |
| Radico Khaitan, Ltd. | | | 2,854 | 16,266 |
| Rain Industries, Ltd. | | | 8,295 | 11,935 |
| Rajesh Exports, Ltd. | | | 4,377 | 40,229 |
| Rallis India, Ltd. | | | 4,796 | 14,929 |
| Rashtriya Chemicals & Fertilizers, Ltd. | | | 12,255 | 6,550 |
| Ratnamani Metals & Tubes, Ltd. | | | 1,835 | 33,851 |
| Raymond, Ltd. | | | 2,169 | 15,190 |
| RBL Bank, Ltd. (B) | | | 19,118 | 77,645 |
| REC, Ltd. | | | 37,469 | 61,825 |
| Redington India, Ltd. | | | 23,557 | 36,210 |
| Relaxo Footwears, Ltd. | | | 3,026 | 29,540 |
| Reliance Industries, Ltd. | | | 105,484 | 1,956,283 |
| Reliance Infrastructure, Ltd. (A) | | | 7,999 | 2,085 |
| Reliance Power, Ltd. (A) | | | 70,059 | 1,696 |
| Repco Home Finance, Ltd. | | | 2,373 | 9,455 |
| Sadbhav Engineering, Ltd. | | | 12,476 | 12,534 |
| Sadbhav Infrastructure Project, Ltd. | | | 11,584 | 3,762 |
| Sagar Cements, Ltd. | | | 364 | 2,229 |
| Sanghi Industries, Ltd. (A) | | | 4,276 | 1,936 |
| Sanofi India, Ltd. | | | 330 | 33,215 |
| Sasken Technologies, Ltd. | | | 1,127 | 8,635 |
| SBI Life Insurance Company, Ltd. (B) | | | 2,278 | 28,190 |
| Schaeffler India, Ltd. | | | 663 | 40,033 |
| Sequent Scientific, Ltd. | | | 6,725 | 7,459 |
| Seshasayee Paper & Boards, Ltd. | | | 3,700 | 7,288 |
| SH Kelkar & Company, Ltd. (A)(B) | | | 2,917 | 4,162 |
| Shankara Building Products, Ltd. | | | 773 | 4,888 |
| Sharda Cropchem, Ltd. | | | 6,824 | 19,899 |
| Sheela Foam, Ltd. (A) | | | 521 | 11,740 |
| Shree Cement, Ltd. | | | 238 | 75,082 |
| Shriram City Union Finance, Ltd. | | | 2,014 | 40,401 |
| Shriram Transport Finance Company, Ltd. | | | 8,555 | 144,991 |
| Siemens, Ltd. | | | 2,156 | 39,266 |
| Siyaram Silk Mills, Ltd. | | | 2,360 | 7,403 |
| SKF India, Ltd. | | | 1,784 | 46,447 |
| Sobha, Ltd. | | | 4,249 | 17,641 |
| Solar Industries India, Ltd. | | | 2,164 | 34,674 |
| Somany Home Innovation, Ltd. (A) | | | 2,451 | 4,517 |
| 26 | JOHN HANCOCK EMERGING MARKETS FUND | SEMIANNUAL REPORT | SEE NOTES TO FINANCIAL STATEMENTS |
| | | | | Shares | Value |
| India (continued) | | | | | |
| Sonata Software, Ltd. | | | 2,617 | $12,145 |
| SRF, Ltd. | | | 858 | 46,904 |
| Star Cement, Ltd. | | | 15,221 | 18,387 |
| State Bank of India (A) | | | 31,708 | 135,869 |
| Steel Authority of India, Ltd. | | | 35,661 | 17,885 |
| Sterlite Technologies, Ltd. | | | 5,984 | 7,713 |
| Strides Pharma Science, Ltd. | | | 3,193 | 20,874 |
| Sudarshan Chemical Industries, Ltd. | | | 4,463 | 28,900 |
| Sun Pharmaceutical Industries, Ltd. | | | 21,143 | 109,861 |
| Sun TV Network, Ltd. | | | 6,569 | 38,073 |
| Sundaram Finance Holdings, Ltd. | | | 6,835 | 5,697 |
| Sundaram Finance, Ltd. | | | 1,639 | 36,205 |
| Sundaram-Clayton, Ltd. | | | 697 | 18,973 |
| Sundram Fasteners, Ltd. | | | 4,560 | 26,365 |
| Sunteck Realty, Ltd. | | | 3,702 | 18,710 |
| Suprajit Engineering, Ltd. | | | 7,705 | 21,150 |
| Supreme Industries, Ltd. | | | 2,097 | 39,458 |
| Supreme Petrochem, Ltd. | | | 9,949 | 20,680 |
| Surya Roshni, Ltd. | | | 2,932 | 6,017 |
| Suven Life Sciences, Ltd. (A) | | | 3,881 | 3,321 |
| Suven Pharmaceuticals, Ltd. (A)(D) | | | 3,881 | 15,072 |
| Swaraj Engines, Ltd. | | | 1,579 | 27,039 |
| Symphony, Ltd. | | | 1,012 | 18,266 |
| Syndicate Bank (A) | | | 66,001 | 17,022 |
| Syngene International, Ltd. (B) | | | 5,386 | 22,352 |
| TAKE Solutions, Ltd. | | | 6,117 | 7,499 |
| Tasty Bite Eatables, Ltd. | | | 94 | 15,649 |
| Tata Chemicals, Ltd. | | | 2,841 | 28,428 |
| Tata Communications, Ltd. | | | 2,825 | 14,200 |
| Tata Consultancy Services, Ltd. | | | 27,313 | 760,801 |
| Tata Consumer Products, Ltd. | | | 14,964 | 72,659 |
| Tata Elxsi, Ltd. | | | 1,315 | 16,162 |
| Tata Metaliks, Ltd. | | | 1,562 | 13,034 |
| Tata Motors, Ltd. (A) | | | 130,207 | 238,175 |
| Tata Sponge Iron, Ltd. | | | 1,408 | 6,733 |
| Tata Steel, Ltd. | | | 20,118 | 108,214 |
| TCI Express, Ltd. | | | 2,682 | 31,902 |
| Tech Mahindra, Ltd. | | | 23,766 | 246,471 |
| Techno Electric & Engineering Company, Ltd. (A) | | | 4,395 | 18,415 |
| Texmaco Rail & Engineering, Ltd. | | | 7,462 | 2,634 |
| The Great Eastern Shipping Company, Ltd. | | | 4,812 | 16,484 |
| The India Cements, Ltd. | | | 13,187 | 17,864 |
| The Indian Hotels Company, Ltd. | | | 21,970 | 41,288 |
| The Indian Hume Pipe Company, Ltd. | | | 2,579 | 6,561 |
| SEE NOTES TO FINANCIAL STATEMENTS | SEMIANNUAL REPORT | JOHN HANCOCK EMERGING MARKETS FUND | 27 |
| | | | | Shares | Value |
| India (continued) | | | | | |
| The Jammu & Kashmir Bank, Ltd. (A) | | | 20,026 | $5,577 |
| The Karnataka Bank, Ltd. | | | 10,008 | 9,767 |
| The Karur Vysya Bank, Ltd. | | | 30,314 | 17,648 |
| The Phoenix Mills, Ltd. | | | 3,443 | 40,788 |
| The Ramco Cements, Ltd. | | | 3,284 | 34,904 |
| The South Indian Bank, Ltd. | | | 46,489 | 6,059 |
| The Tata Power Company, Ltd. | | | 51,479 | 33,482 |
| The Tinplate Company of India, Ltd. | | | 3,175 | 5,222 |
| Thermax, Ltd. | | | 1,264 | 16,222 |
| Thirumalai Chemicals, Ltd. | | | 3,472 | 2,961 |
| Thomas Cook India, Ltd. | | | 8,758 | 5,739 |
| Thyrocare Technologies, Ltd. (B) | | | 2,982 | 24,651 |
| Time Technoplast, Ltd. | | | 22,266 | 14,565 |
| Timken India, Ltd. | | | 2,917 | 39,151 |
| Titan Company, Ltd. | | | 9,308 | 162,972 |
| Torrent Pharmaceuticals, Ltd. | | | 2,798 | 83,160 |
| Torrent Power, Ltd. | | | 6,822 | 28,759 |
| Tourism Finance Corp. of India, Ltd. | | | 2,921 | 2,687 |
| Transport Corp. of India, Ltd. | | | 6,063 | 19,390 |
| Trent, Ltd. | | | 3,674 | 37,571 |
| Trident, Ltd. | | | 74,360 | 5,741 |
| Triveni Engineering & Industries, Ltd. | | | 7,321 | 6,425 |
| Triveni Turbine, Ltd. | | | 24,757 | 33,181 |
| TTK Prestige, Ltd. | | | 108 | 8,568 |
| Tube Investments of India, Ltd. | | | 9,786 | 71,573 |
| TV Today Network, Ltd. | | | 5,027 | 15,154 |
| TV18 Broadcast, Ltd. (A) | | | 45,800 | 14,488 |
| UCO Bank (A) | | | 133,446 | 23,069 |
| Uflex, Ltd. | | | 4,634 | 13,546 |
| UltraTech Cement, Ltd. | | | 3,803 | 223,823 |
| Union Bank of India (A) | | | 24,015 | 12,484 |
| United Breweries, Ltd. | | | 1,730 | 29,801 |
| United Spirits, Ltd. (A) | | | 9,003 | 86,610 |
| UPL, Ltd. | | | 24,039 | 175,577 |
| VA Tech Wabag, Ltd. (A) | | | 1,854 | 4,833 |
| Vaibhav Global, Ltd. | | | 1,887 | 28,632 |
| Vakrangee, Ltd. | | | 23,506 | 12,928 |
| Vardhman Textiles, Ltd. | | | 1,602 | 23,241 |
| Varun Beverages, Ltd. | | | 2,536 | 28,643 |
| Vedanta, Ltd. | | | 88,318 | 140,753 |
| Venky's India, Ltd. | | | 337 | 5,865 |
| Vesuvius India, Ltd. | | | 690 | 10,937 |
| V-Guard Industries, Ltd. | | | 5,667 | 16,073 |
| Vinati Organics, Ltd. | | | 1,364 | 18,720 |
| 28 | JOHN HANCOCK EMERGING MARKETS FUND | SEMIANNUAL REPORT | SEE NOTES TO FINANCIAL STATEMENTS |
| | | | | Shares | Value |
| India (continued) | | | | | |
| VIP Industries, Ltd. | | | 2,251 | $12,845 |
| V-Mart Retail, Ltd. | | | 527 | 16,161 |
| Vodafone Idea, Ltd. (A) | | | 475,993 | 25,113 |
| VRL Logistics, Ltd. | | | 5,104 | 16,556 |
| VST Industries, Ltd. | | | 649 | 36,505 |
| VST Tillers Tractors, Ltd. | | | 456 | 7,192 |
| WABCO India, Ltd. | | | 368 | 34,420 |
| Welspun Corp., Ltd. | | | 6,625 | 17,055 |
| Welspun Enterprises, Ltd. | | | 5,021 | 4,689 |
| Welspun India, Ltd. | | | 19,448 | 11,118 |
| West Coast Paper Mills, Ltd. | | | 2,240 | 6,622 |
| Wheels India, Ltd. | | | 626 | 4,482 |
| Whirlpool of India, Ltd. | | | 1,179 | 36,028 |
| Wipro, Ltd. | | | 44,725 | 138,523 |
| Wockhardt, Ltd. (A) | | | 2,843 | 12,024 |
| Yes Bank, Ltd. | | | 94,414 | 45,410 |
| Zee Entertainment Enterprises, Ltd. | | | 24,349 | 80,951 |
| Zensar Technologies, Ltd. | | | 8,469 | 16,061 |
| Zydus Wellness, Ltd. | | | 1,037 | 20,934 |
| Indonesia 2.2% | | | | | 5,200,195 |
| Ace Hardware Indonesia Tbk PT | | | 416,900 | 44,217 |
| Adaro Energy Tbk PT | | | 1,192,600 | 97,733 |
| Adhi Karya Persero Tbk PT | | | 204,038 | 10,887 |
| AKR Corporindo Tbk PT | | | 65,100 | 12,192 |
| Alam Sutera Realty Tbk PT (A) | | | 750,400 | 8,042 |
| Aneka Tambang Tbk PT | | | 481,054 | 19,631 |
| Arwana Citramulia Tbk PT | | | 1,053,200 | 31,618 |
| Asahimas Flat Glass Tbk PT | | | 113,500 | 22,259 |
| Astra Agro Lestari Tbk PT | | | 43,433 | 29,854 |
| Astra International Tbk PT | | | 544,600 | 213,101 |
| Astrindo Nusantara Infrastructure Tbk PT (A) | | | 3,785,000 | 13,190 |
| Asuransi Kresna Mitra Tbk PT (A) | | | 277,300 | 24,204 |
| Bakrie Telecom Tbk PT (A)(D) | | | 22,579,900 | 39,345 |
| Bank Central Asia Tbk PT | | | 223,300 | 493,250 |
| Bank Danamon Indonesia Tbk PT | | | 205,471 | 45,662 |
| Bank Mandiri Persero Tbk PT | | | 474,792 | 246,937 |
| Bank Negara Indonesia Persero Tbk PT | | | 161,703 | 80,999 |
| Bank Pan Indonesia Tbk PT (A) | | | 191,900 | 14,674 |
| Bank Pembangunan Daerah Jawa Barat Dan Banten Tbk PT | | | 306,100 | 19,029 |
| Bank Pembangunan Daerah Jawa Timur Tbk PT | | | 373,700 | 16,088 |
| Bank Permata Tbk PT (A) | | | 197,864 | 15,825 |
| Bank Rakyat Indonesia Persero Tbk PT | | | 2,106,500 | 629,479 |
| Bank Tabungan Negara Persero Tbk PT | | | 190,698 | 23,061 |
| SEE NOTES TO FINANCIAL STATEMENTS | SEMIANNUAL REPORT | JOHN HANCOCK EMERGING MARKETS FUND | 29 |
| | | | | Shares | Value |
| Indonesia (continued) | | | | | |
| Barito Pacific Tbk PT (A) | | | 326,600 | $22,638 |
| Bayan Resources Tbk PT | | | 94,800 | 101,749 |
| BISI International Tbk PT | | | 514,000 | 33,816 |
| Bukit Asam Tbk PT | | | 184,700 | 29,201 |
| Bumi Serpong Damai Tbk PT (A) | | | 427,200 | 30,419 |
| Bumi Teknokultura Unggul Tbk PT (A) | | | 1,489,900 | 5,218 |
| Capital Financial Indonesia Tbk PT (A) | | | 369,300 | 10,512 |
| Charoen Pokphand Indonesia Tbk PT | | | 282,920 | 114,414 |
| Ciputra Development Tbk PT | | | 455,461 | 30,723 |
| Citra Marga Nusaphala Persada Tbk PT (A) | | | 201,775 | 21,829 |
| City Retail Developments Tbk PT (A) | | | 1,918,900 | 19,310 |
| Delta Dunia Makmur Tbk PT (A) | | | 590,800 | 6,772 |
| Dharma Satya Nusantara Tbk PT | | | 603,500 | 16,354 |
| Eagle High Plantations Tbk PT (A) | | | 1,002,100 | 6,059 |
| Elnusa Tbk PT | | | 400,600 | 5,880 |
| Erajaya Swasembada Tbk PT | | | 162,100 | 18,675 |
| Garuda Indonesia Persero Tbk PT (A) | | | 361,400 | 6,335 |
| Global Mediacom Tbk PT (A) | | | 819,500 | 17,957 |
| Gudang Garam Tbk PT | | | 29,743 | 106,583 |
| Hanson International Tbk PT (A)(D) | | | 4,000,200 | 13,940 |
| Harum Energy Tbk PT | | | 27,900 | 2,301 |
| Indah Kiat Pulp & Paper Corp. Tbk PT | | | 98,200 | 39,480 |
| Indika Energy Tbk PT | | | 129,600 | 6,902 |
| Indo Tambangraya Megah Tbk PT | | | 23,700 | 19,006 |
| Indocement Tunggal Prakarsa Tbk PT | | | 39,800 | 42,634 |
| Indofood CBP Sukses Makmur Tbk PT | | | 43,100 | 30,965 |
| Indofood Sukses Makmur Tbk PT | | | 230,100 | 106,124 |
| Indo-Rama Synthetics Tbk PT | | | 54,900 | 7,040 |
| Indosat Tbk PT (A) | | | 110,300 | 15,815 |
| Industri Jamu Dan Farmasi Sido Muncul Tbk PT | | | 337,700 | 29,049 |
| Inovisi Infracom Tbk PT (A)(D) | | | 671,012 | 131 |
| Intiland Development Tbk PT | | | 1,393,100 | 24,812 |
| Japfa Comfeed Indonesia Tbk PT | | | 311,000 | 30,761 |
| Jasa Marga Persero Tbk PT | | | 128,752 | 42,691 |
| Kalbe Farma Tbk PT | | | 681,200 | 58,895 |
| Kapuas Prima Coal Tbk PT | | | 551,200 | 12,239 |
| Kawasan Industri Jababeka Tbk PT (A) | | | 2,007,762 | 38,768 |
| Link Net Tbk PT | | | 145,300 | 35,292 |
| Lippo Karawaci Tbk PT (A) | | | 1,947,337 | 31,144 |
| Malindo Feedmill Tbk PT | | | 149,200 | 7,157 |
| Matahari Department Store Tbk PT | | | 186,500 | 41,701 |
| Mayora Indah Tbk PT | | | 234,200 | 29,553 |
| Medco Energi Internasional Tbk PT (A) | | | 506,566 | 22,738 |
| Media Nusantara Citra Tbk PT | | | 543,100 | 49,222 |
| 30 | JOHN HANCOCK EMERGING MARKETS FUND | SEMIANNUAL REPORT | SEE NOTES TO FINANCIAL STATEMENTS |
| | | | | Shares | Value |
| Indonesia (continued) | | | | | |
| Mitra Adiperkasa Tbk PT | | | 1,077,700 | $60,564 |
| Mitra Keluarga Karyasehat Tbk PT | | | 145,600 | 25,364 |
| MNC Sky Vision Tbk PT (A) | | | 430,900 | 38,368 |
| Modernland Realty Tbk PT (A) | | | 2,009,300 | 22,721 |
| Nippon Indosari Corpindo Tbk PT | | | 156,811 | 14,048 |
| Pabrik Kertas Tjiwi Kimia Tbk PT | | | 42,900 | 18,268 |
| Pakuwon Jati Tbk PT | | | 1,030,900 | 38,808 |
| Pan Brothers Tbk PT | | | 1,101,200 | 28,500 |
| Panin Financial Tbk PT (A) | | | 1,137,200 | 20,196 |
| Panin Sekuritas Tbk PT | | | 22,500 | 1,580 |
| Paninvest Tbk PT (A) | | | 397,600 | 27,521 |
| Pelayaran Tamarin Samudra Tbk PT (A) | | | 250,000 | 1,648 |
| Perusahaan Gas Negara Tbk PT | | | 367,300 | 33,442 |
| Perusahaan Perkebunan London Sumatra Indonesia Tbk PT | | | 237,500 | 16,098 |
| Pool Advista Indonesia Tbk PT (A) | | | 37,300 | 130 |
| PP Persero Tbk PT | | | 214,287 | 18,429 |
| Puradelta Lestari Tbk PT | | | 506,700 | 8,414 |
| Ramayana Lestari Sentosa Tbk PT | | | 152,300 | 11,133 |
| Rimo International Lestari Tbk PT (A)(D) | | | 2,464,700 | 8,589 |
| Sampoerna Agro Tbk PT (A) | | | 618,600 | 95,067 |
| Sarana Menara Nusantara Tbk PT | | | 1,085,300 | 61,400 |
| Selamat Sempurna Tbk PT | | | 374,800 | 38,546 |
| Semen Indonesia Persero Tbk PT | | | 57,000 | 42,546 |
| Sinar Mas Multiartha Tbk PT (A) | | | 37,000 | 34,386 |
| Smartfren Telecom Tbk PT (A) | | | 914,700 | 6,114 |
| Sri Rejeki Isman Tbk PT | | | 937,100 | 13,161 |
| Sugih Energy Tbk PT (A)(D) | | | 8,409,300 | 29,306 |
| Summarecon Agung Tbk PT | | | 339,900 | 20,166 |
| Surya Citra Media Tbk PT | | | 403,800 | 32,164 |
| Surya Semesta Internusa Tbk PT | | | 132,900 | 6,026 |
| Suryainti Permata Tbk PT (A)(D) | | | 1,802,000 | 0 |
| Telekomunikasi Indonesia Persero Tbk PT | | | 1,384,000 | 337,454 |
| Telekomunikasi Indonesia Persero Tbk PT, ADR | | | 1,949 | 47,263 |
| Tempo Scan Pacific Tbk PT | | | 65,700 | 5,676 |
| Tiga Pilar Sejahtera Food Tbk PT (A)(D) | | | 801,600 | 6,336 |
| Tiphone Mobile Indonesia Tbk PT | | | 179,500 | 1,455 |
| Tower Bersama Infrastructure Tbk PT | | | 385,100 | 29,849 |
| Trada Alam Minera Tbk PT (A)(D) | | | 1,919,200 | 4,682 |
| Trias Sentosa Tbk PT | | | 706,000 | 18,749 |
| Truba Alam Manunggal Engineering PT (A)(D) | | | 19,436,000 | 0 |
| Tunas Baru Lampung Tbk PT | | | 369,300 | 15,910 |
| Tunas Ridean Tbk PT | | | 542,200 | 46,991 |
| Ultrajaya Milk Industry & Trading Company Tbk PT | | | 211,100 | 23,747 |
| Unilever Indonesia Tbk PT | | | 266,000 | 127,781 |
| SEE NOTES TO FINANCIAL STATEMENTS | SEMIANNUAL REPORT | JOHN HANCOCK EMERGING MARKETS FUND | 31 |
| | | | | Shares | Value |
| Indonesia (continued) | | | | | |
| United Tractors Tbk PT | | | 111,900 | $131,337 |
| Vale Indonesia Tbk PT (A) | | | 109,900 | 19,057 |
| Visi Media Asia Tbk PT (A) | | | 1,475,500 | 5,143 |
| Waskita Beton Precast Tbk PT | | | 592,800 | 7,742 |
| Waskita Karya Persero Tbk PT | | | 287,002 | 20,013 |
| Wijaya Karya Beton Tbk PT | | | 351,700 | 8,026 |
| Wijaya Karya Persero Tbk PT | | | 178,676 | 24,057 |
| XL Axiata Tbk PT (A) | | | 283,500 | 52,143 |
| Malaysia 2.3% | | | | | 5,507,938 |
| 7-Eleven Malaysia Holdings BHD | | | 75,139 | 24,944 |
| Aeon Company M BHD | | | 55,700 | 18,287 |
| AEON Credit Service M BHD | | | 11,340 | 37,333 |
| AFFIN Bank BHD (A) | | | 206,384 | 87,240 |
| AirAsia Group BHD | | | 117,800 | 28,217 |
| Alliance Bank Malaysia BHD | | | 67,700 | 37,369 |
| AMMB Holdings BHD | | | 75,450 | 66,525 |
| Astro Malaysia Holdings BHD | | | 58,000 | 16,464 |
| Axiata Group BHD (C) | | | 98,907 | 98,931 |
| Batu Kawan BHD | | | 18,700 | 69,081 |
| Berjaya Assets BHD (A) | | | 350,600 | 24,261 |
| Berjaya Sports Toto BHD | | | 58,778 | 35,039 |
| Bermaz Auto BHD | | | 45,300 | 19,178 |
| BIMB Holdings BHD | | | 24,100 | 21,465 |
| Bintulu Port Holdings BHD | | | 300 | 334 |
| Boustead Holdings BHD (A) | | | 87,707 | 16,959 |
| Boustead Plantations BHD | | | 760 | 89 |
| British American Tobacco Malaysia BHD | | | 6,400 | 18,977 |
| Bursa Malaysia BHD | | | 31,800 | 41,755 |
| Cahya Mata Sarawak BHD (C) | | | 29,300 | 13,410 |
| Carlsberg Brewery Malaysia BHD | | | 6,900 | 52,432 |
| CIMB Group Holdings BHD | | | 175,328 | 201,273 |
| Cypark Resources BHD | | | 34,200 | 9,395 |
| D&O Green Technologies BHD | | | 64,700 | 11,001 |
| Datasonic Group BHD | | | 65,000 | 16,591 |
| Dayang Enterprise Holdings BHD (A) | | | 35,200 | 19,812 |
| Dialog Group BHD | | | 81,160 | 65,083 |
| DiGi.Com BHD | | | 101,380 | 101,084 |
| DRB-Hicom BHD | | | 45,900 | 24,413 |
| Duopharma Biotech BHD | | | 33,699 | 12,131 |
| Dutch Lady Milk Industries BHD | | | 1,500 | 15,153 |
| Eco World Development Group BHD (A) | | | 30,700 | 4,691 |
| FGV Holdings BHD (A) | | | 111,600 | 30,473 |
| Fraser & Neave Holdings BHD | | | 2,800 | 20,674 |
| 32 | JOHN HANCOCK EMERGING MARKETS FUND | SEMIANNUAL REPORT | SEE NOTES TO FINANCIAL STATEMENTS |
| | | | | Shares | Value |
| Malaysia (continued) | | | | | |
| Frontken Corp. BHD | | | 52,100 | $28,435 |
| Gabungan AQRS BHD | | | 26,010 | 6,334 |
| Gadang Holdings BHD | | | 55,300 | 7,628 |
| Gamuda BHD | | | 40,633 | 32,123 |
| Gas Malaysia BHD | | | 51,300 | 34,231 |
| Genting BHD | | | 48,400 | 57,061 |
| Genting Malaysia BHD | | | 61,800 | 42,600 |
| Genting Plantations BHD | | | 10,000 | 24,379 |
| George Kent Malaysia BHD | | | 33,700 | 6,631 |
| Globetronics Technology BHD | | | 39,686 | 19,884 |
| HAP Seng Consolidated BHD | | | 29,039 | 61,851 |
| Hartalega Holdings BHD | | | 39,500 | 58,220 |
| Heineken Malaysia BHD | | | 8,400 | 51,049 |
| Hengyuan Refining Company BHD (A) | | | 11,200 | 9,558 |
| Hibiscus Petroleum BHD (A)(C) | | | 88,200 | 15,948 |
| Hong Leong Bank BHD | | | 9,434 | 34,366 |
| Hong Leong Financial Group BHD | | | 8,261 | 30,009 |
| Hong Leong Industries BHD | | | 12,100 | 26,895 |
| IGB BHD | | | 45,726 | 35,144 |
| IHH Healthcare BHD | | | 21,200 | 29,091 |
| IJM Corp. BHD | | | 107,260 | 50,026 |
| Inari Amertron BHD | | | 145,436 | 49,779 |
| IOI Corp. BHD | | | 20,500 | 20,420 |
| IOI Properties Group BHD | | | 48,571 | 11,737 |
| JAKS Resources BHD (A) | | | 43,900 | 13,166 |
| Keck Seng Malaysia BHD | | | 65,150 | 68,410 |
| Kenanga Investment Bank BHD | | | 151,217 | 15,388 |
| Kerjaya Prospek Group BHD | | | 79,420 | 23,546 |
| Kim Loong Resources BHD | | | 100 | 28 |
| Kossan Rubber Industries | | | 47,700 | 54,547 |
| KPJ Healthcare BHD | | | 34,900 | 8,041 |
| KSL Holdings BHD (A) | | | 46,010 | 7,802 |
| Kuala Lumpur Kepong BHD | | | 9,705 | 50,821 |
| Land & General BHD | | | 972,340 | 28,709 |
| LBS Bina Group BHD | | | 117,300 | 13,027 |
| Lingkaran Trans Kota Holdings BHD | | | 20,100 | 21,653 |
| LPI Capital BHD | | | 14,220 | 48,936 |
| Magni-Tech Industries BHD | | | 38,933 | 21,088 |
| Magnum BHD | | | 35,300 | 20,196 |
| Malakoff Corp. BHD | | | 78,100 | 16,300 |
| Malayan Banking BHD | | | 108,055 | 216,418 |
| Malaysia Airports Holdings BHD | | | 43,288 | 68,100 |
| Malaysia Building Society BHD | | | 70,044 | 12,824 |
| Malaysian Pacific Industries BHD | | | 10,938 | 28,526 |
| SEE NOTES TO FINANCIAL STATEMENTS | SEMIANNUAL REPORT | JOHN HANCOCK EMERGING MARKETS FUND | 33 |
| | | | | Shares | Value |
| Malaysia (continued) | | | | | |
| Malaysian Resources Corp. BHD | | | 121,600 | $16,554 |
| Matrix Concepts Holdings BHD | | | 68,378 | 31,625 |
| Maxis BHD | | | 51,585 | 67,237 |
| Media Prima BHD (A) | | | 161,180 | 6,784 |
| Mega First Corp. BHD | | | 26,200 | 31,954 |
| MISC BHD | | | 27,650 | 50,341 |
| MMC Corp. BHD | | | 121,000 | 25,585 |
| MPHB Capital BHD (A) | | | 99,200 | 23,628 |
| Muhibbah Engineering (M) BHD | | | 10,300 | 3,989 |
| Mulpha International BHD (A) | | | 15,370 | 6,300 |
| My EG Services BHD (C) | | | 151,850 | 40,763 |
| Nestle Malaysia BHD | | | 1,400 | 47,838 |
| Oriental Holdings BHD | | | 26,820 | 40,064 |
| OSK Holdings BHD | | | 98,117 | 21,668 |
| Padini Holdings BHD | | | 21,500 | 15,502 |
| Panasonic Manufacturing Malaysia BHD | | | 4,800 | 38,104 |
| Pentamaster Corp. BHD (A)(C) | | | 34,608 | 38,005 |
| Petron Malaysia Refining & Marketing BHD | | | 8,800 | 9,581 |
| Petronas Chemicals Group BHD | | | 91,900 | 118,572 |
| Petronas Dagangan BHD | | | 5,900 | 32,109 |
| Petronas Gas BHD | | | 19,700 | 78,118 |
| PPB Group BHD | | | 11,300 | 49,160 |
| Press Metal Aluminium Holdings BHD | | | 41,000 | 45,976 |
| Public Bank BHD | | | 105,360 | 428,706 |
| QL Resources BHD | | | 24,090 | 46,743 |
| RHB Bank BHD | | | 48,262 | 63,518 |
| Sam Engineering & Equipment M BHD | | | 3,000 | 5,372 |
| Sapura Energy BHD | | | 592,857 | 26,590 |
| Sarawak Oil Palms BHD | | | 15,542 | 12,188 |
| Scientex BHD | | | 20,700 | 44,410 |
| SEG International BHD | | | 33,942 | 5,065 |
| Serba Dinamik Holdings BHD | | | 57,750 | 30,471 |
| Shangri-La Hotels Malaysia BHD | | | 21,000 | 24,383 |
| Sime Darby BHD | | | 93,374 | 44,648 |
| Sime Darby Plantation BHD | | | 46,274 | 54,930 |
| Sime Darby Property BHD | | | 130,274 | 24,180 |
| SKP Resources BHD | | | 73,100 | 23,238 |
| SP Setia BHD Group | | | 53,308 | 16,171 |
| Sunway BHD | | | 66,077 | 27,827 |
| Sunway Construction Group BHD (C) | | | 33,862 | 15,056 |
| Supermax Corp. BHD | | | 59,298 | 22,562 |
| Syarikat Takaful Malaysia Keluarga BHD (C) | | | 23,400 | 26,470 |
| Ta Ann Holdings BHD (A) | | | 46,508 | 33,136 |
| TA Enterprise BHD | | | 260,800 | 36,419 |
| 34 | JOHN HANCOCK EMERGING MARKETS FUND | SEMIANNUAL REPORT | SEE NOTES TO FINANCIAL STATEMENTS |
| | | | | Shares | Value |
| Malaysia (continued) | | | | | |
| Tan Chong Motor Holdings BHD | | | 62,800 | $18,617 |
| Telekom Malaysia BHD | | | 44,656 | 39,435 |
| Tenaga Nasional BHD | | | 76,300 | 220,372 |
| TIME dotCom BHD | | | 37,440 | 83,005 |
| Top Glove Corp. BHD | | | 76,000 | 101,969 |
| Tropicana Corp. BHD (A) | | | 101,628 | 21,101 |
| Uchi Technologies BHD | | | 31,330 | 19,806 |
| UEM Sunrise BHD (A) | | | 113,366 | 16,128 |
| UMW Holdings BHD | | | 14,100 | 10,724 |
| United Malacca BHD | | | 29,750 | 35,430 |
| United Plantations BHD | | | 13,300 | 82,585 |
| UOA Development BHD | | | 70,500 | 32,511 |
| Velesto Energy BHD (A) | | | 250,631 | 18,232 |
| ViTrox Corp. BHD | | | 8,000 | 16,054 |
| VS Industry BHD | | | 78,131 | 24,148 |
| Wellcall Holdings BHD | | | 92,150 | 23,808 |
| Westports Holdings BHD | | | 54,500 | 44,980 |
| Yinson Holdings BHD | | | 33,600 | 56,897 |
| YTL Corp. BHD | | | 246,930 | 49,607 |
| Malta 0.0% | | | | | 29,710 |
| Brait SE (A) | | | 71,955 | 29,710 |
| Mexico 3.3% | | | | | 7,868,251 |
| ALEATICA SAB de CV (C) | | | 9,600 | 13,949 |
| Alfa SAB de CV, Class A | | | 285,550 | 183,809 |
| Alpek SAB de CV | | | 28,981 | 19,671 |
| Alsea SAB de CV (A) | | | 43,810 | 89,098 |
| America Movil SAB de CV, Series L | | | 963,579 | 762,228 |
| Arca Continental SAB de CV | | | 9,545 | 52,616 |
| Axtel SAB de CV (A) | | | 182,316 | 38,903 |
| Banco del Bajio SA (B) | | | 31,497 | 49,319 |
| Becle SAB de CV | | | 12,935 | 19,577 |
| Bolsa Mexicana de Valores SAB de CV | | | 33,174 | 70,467 |
| Cemex SAB de CV | | | 366,838 | 119,651 |
| Coca-Cola Femsa SAB de CV | | | 5,951 | 33,306 |
| Coca-Cola Femsa SAB de CV, ADR | | | 600 | 33,318 |
| Controladora Vuela Cia de Aviacion SAB de CV, Class A (A) | | | 41,201 | 42,388 |
| Corp. Inmobiliaria Vesta SAB de CV | | | 22,784 | 36,220 |
| Dine SAB de CV (C) | | | 103,700 | 56,953 |
| El Puerto de Liverpool SAB de CV, Series C1 (C) | | | 5,226 | 24,692 |
| Elementia SAB de CV (A)(B)(C) | | | 22,179 | 10,367 |
| Fomento Economico Mexicano SAB de CV | | | 18,657 | 152,134 |
| Genomma Lab Internacional SAB de CV, Class B (A) | | | 55,254 | 56,705 |
| Gentera SAB de CV | | | 80,333 | 77,301 |
| SEE NOTES TO FINANCIAL STATEMENTS | SEMIANNUAL REPORT | JOHN HANCOCK EMERGING MARKETS FUND | 35 |
| | | | | Shares | Value |
| Mexico (continued) | | | | | |
| Gruma SAB de CV, Class B | | | 11,725 | $113,164 |
| Grupo Aeromexico SAB de CV (A) | | | 37,795 | 26,268 |
| Grupo Aeroportuario del Centro Norte SAB de CV | | | 21,262 | 139,187 |
| Grupo Aeroportuario del Pacifico SAB de CV, ADR | | | 1,455 | 157,693 |
| Grupo Aeroportuario del Sureste SAB de CV, ADR | | | 882 | 147,294 |
| Grupo Bimbo SAB de CV, Series A (C) | | | 71,327 | 107,590 |
| Grupo Carso SAB de CV, Series A1 | | | 10,209 | 28,454 |
| Grupo Cementos de Chihuahua SAB de CV (C) | | | 8,843 | 43,880 |
| Grupo Comercial Chedraui SA de CV | | | 18,846 | 25,852 |
| Grupo Elektra SAB de CV | | | 2,897 | 195,753 |
| Grupo Financiero Banorte SAB de CV, Series O | | | 81,325 | 444,658 |
| Grupo Financiero Inbursa SAB de CV, Series O | | | 41,050 | 44,527 |
| Grupo Gigante SAB de CV (A) | | | 166,920 | 245,932 |
| Grupo Herdez SAB de CV | | | 9,671 | 17,624 |
| Grupo Hotelero Santa Fe SAB de CV (A) | | | 83,186 | 24,301 |
| Grupo Industrial Saltillo SAB de CV | | | 50,407 | 55,035 |
| Grupo KUO SAB de CV, Series B | | | 136,788 | 368,326 |
| Grupo Lala SAB de CV | | | 23,373 | 17,361 |
| Grupo Mexico SAB de CV, Series B | | | 116,315 | 274,847 |
| Grupo Pochteca SAB de CV (A) | | | 20,836 | 6,965 |
| Grupo Sanborns SAB de CV | | | 187,200 | 212,280 |
| Grupo Simec SAB de CV, Series B (A) | | | 12,062 | 37,860 |
| Grupo Sports World SAB de CV (A) | | | 27,369 | 26,975 |
| Grupo Televisa SAB | | | 165,953 | 312,632 |
| Hoteles City Express SAB de CV (A)(C) | | | 17,674 | 10,712 |
| Impulsora del Desarrollo y el Empleo en America Latina SAB de CV (A) | | | 116,601 | 216,106 |
| Industrias Bachoco SAB de CV, Series B | | | 7,795 | 28,146 |
| Industrias CH SAB de CV, Series B (A) | | | 14,379 | 61,379 |
| Industrias Penoles SAB de CV | | | 7,848 | 70,589 |
| Infraestructura Energetica Nova SAB de CV | | | 15,405 | 67,621 |
| Kimberly-Clark de Mexico SAB de CV, Class A (A) | | | 75,222 | 143,198 |
| La Comer SAB de CV (A)(C) | | | 12,689 | 15,021 |
| Megacable Holdings SAB de CV | | | 37,270 | 125,161 |
| Minera Frisco SAB de CV, Series A1 (A) | | | 210,063 | 27,001 |
| Minera Frisco SAB de CV, Series A2 (A)(D) | | | 161,033 | 25,362 |
| Nemak SAB de CV (B) | | | 27,159 | 8,969 |
| Orbia Advance Corp. SAB de CV (C) | | | 99,955 | 196,782 |
| Organizacion Cultiba SAB de CV | | | 45,332 | 27,522 |
| Organizacion Soriana SAB de CV, Series B (C) | | | 966,833 | 1,080,645 |
| Promotora y Operadora de Infraestructura SAB de CV | | | 7,906 | 77,457 |
| Promotora y Operadora de Infraestructura SAB de CV, L Shares | | | 4,040 | 29,144 |
| Qualitas Controladora SAB de CV | | | 12,704 | 54,539 |
| Regional SAB de CV | | | 21,424 | 119,185 |
| 36 | JOHN HANCOCK EMERGING MARKETS FUND | SEMIANNUAL REPORT | SEE NOTES TO FINANCIAL STATEMENTS |
| | | | | Shares | Value |
| Mexico (continued) | | | | | |
| Telesites SAB de CV (A)(C) | | | 99,552 | $75,715 |
| TV Azteca SAB de CV | | | 389,865 | 13,568 |
| Unifin Financiera SAB de CV | | | 7,055 | 10,961 |
| Vitro SAB de CV, Series A (A) | | | 21,684 | 42,965 |
| Wal-Mart de Mexico SAB de CV | | | 114,870 | 323,373 |
| Netherlands 0.0% | | | | | 48,694 |
| VEON, Ltd. | | | 24,593 | 48,694 |
| Peru 0.2% | | | | | 414,732 |
| Cementos Pacasmayo SAA, ADR | | | 4,994 | 43,398 |
| Cia de Minas Buenaventura SAA, ADR | | | 2,497 | 27,842 |
| Credicorp, Ltd. | | | 1,894 | 343,325 |
| Fossal SAA, ADR (A) | | | 633 | 167 |
| Philippines 1.3% | | | | | 3,048,197 |
| 8990 Holdings, Inc. (A) | | | 111,700 | 31,077 |
| Aboitiz Equity Ventures, Inc. | | | 50,150 | 42,185 |
| Aboitiz Power Corp. | | | 37,100 | 19,996 |
| ACR Mining Corp. (A)(D) | | | 3,145 | 1,104 |
| Alliance Global Group, Inc. (A) | | | 165,600 | 32,755 |
| Alsons Consolidated Resources, Inc. | | | 629,000 | 13,279 |
| Altus San Nicolas Corp. (A)(D) | | | 2,834 | 288 |
| Apex Mining Company, Inc. (A) | | | 479,000 | 9,391 |
| Atlas Consolidated Mining & Development Corp. (A) | | | 78,800 | 3,411 |
| Ayala Corp. | | | 4,630 | 60,358 |
| Ayala Land, Inc. | | | 208,000 | 160,189 |
| Bank of the Philippine Islands | | | 14,300 | 20,807 |
| BDO Unibank, Inc. | | | 55,472 | 151,687 |
| Belle Corp. | | | 887,000 | 26,878 |
| Bloomberry Resorts Corp. | | | 237,900 | 38,116 |
| Cebu Air, Inc. | | | 20,490 | 29,616 |
| Century Pacific Food, Inc. | | | 130,950 | 37,874 |
| China Banking Corp. | | | 182,335 | 88,760 |
| COL Financial Group, Inc. | | | 10,000 | 3,497 |
| Cosco Capital, Inc. | | | 248,400 | 30,529 |
| D&L Industries, Inc. | | | 183,300 | 26,025 |
| DMCI Holdings, Inc. | | | 313,100 | 32,669 |
| DoubleDragon Properties Corp. (A) | | | 86,110 | 28,763 |
| Eagle Cement Corp. | | | 35,100 | 7,094 |
| East West Banking Corp. (A) | | | 89,050 | 19,280 |
| EEI Corp. | | | 102,800 | 16,024 |
| Emperador, Inc. | | | 274,100 | 43,198 |
| Empire East Land Holdings, Inc. (A) | | | 2,941,000 | 21,330 |
| Filinvest Land, Inc. | | | 909,750 | 22,066 |
| SEE NOTES TO FINANCIAL STATEMENTS | SEMIANNUAL REPORT | JOHN HANCOCK EMERGING MARKETS FUND | 37 |
| | | | | Shares | Value |
| Philippines (continued) | | | | | |
| First Gen Corp. | | | 70,400 | $25,439 |
| First Philippine Holdings Corp. | | | 30,300 | 36,483 |
| Global Ferronickel Holdings, Inc. (A) | | | 297,000 | 5,734 |
| Globe Telecom, Inc. | | | 1,645 | 57,481 |
| GT Capital Holdings, Inc. | | | 2,746 | 38,434 |
| Integrated Micro-Electronics, Inc. | | | 67,155 | 6,475 |
| International Container Terminal Services, Inc. | | | 49,970 | 105,034 |
| JG Summit Holdings, Inc. | | | 68,990 | 91,715 |
| Jollibee Foods Corp. | | | 15,620 | 52,231 |
| Lepanto Consolidated Mining Company, Class B (A) | | | 3,304,363 | 6,135 |
| Lopez Holdings Corp. | | | 365,600 | 26,559 |
| LT Group, Inc. | | | 136,600 | 24,072 |
| Manila Electric Company | | | 5,260 | 27,883 |
| Max's Group, Inc. | | | 52,200 | 9,005 |
| Megawide Construction Corp. | | | 57,870 | 14,367 |
| Megaworld Corp. | | | 515,500 | 34,522 |
| Metro Pacific Investments Corp. | | | 610,300 | 36,813 |
| Metro Retail Stores Group, Inc. | | | 118,000 | 3,689 |
| Metropolitan Bank & Trust Company | | | 28,144 | 31,039 |
| Nickel Asia Corp. | | | 347,160 | 14,952 |
| Petron Corp. | | | 316,900 | 20,835 |
| Philex Mining Corp. (A) | | | 67,800 | 3,847 |
| Philippine National Bank (A) | | | 40,319 | 23,097 |
| Phoenix Petroleum Philippines, Inc. | | | 100,600 | 20,925 |
| Pilipinas Shell Petroleum Corp. | | | 33,380 | 17,040 |
| PLDT, Inc. | | | 5,735 | 111,510 |
| Premium Leisure Corp. | | | 977,000 | 10,005 |
| Puregold Price Club, Inc. | | | 40,400 | 29,345 |
| RFM Corp. | | | 101,000 | 9,966 |
| Rizal Commercial Banking Corp. | | | 184,093 | 71,388 |
| Robinsons Land Corp. | | | 147,196 | 61,533 |
| Robinsons Retail Holdings, Inc. | | | 27,050 | 35,540 |
| San Miguel Corp. | | | 28,434 | 70,312 |
| San Miguel Food and Beverage, Inc. | | | 21,830 | 31,136 |
| Security Bank Corp. | | | 10,247 | 31,150 |
| Semirara Mining & Power Corp. | | | 82,220 | 31,288 |
| SM Investments Corp. | | | 1,650 | 31,617 |
| SM Prime Holdings, Inc. | | | 191,904 | 144,787 |
| The Philippine Stock Exchange, Inc. | | | 12,074 | 40,743 |
| Top Frontier Investment Holdings, Inc. (A) | | | 24,482 | 76,618 |
| Union Bank of the Philippines | | | 300,071 | 337,992 |
| Universal Robina Corp. | | | 32,630 | 90,808 |
| Vista Land & Lifescapes, Inc. | | | 295,200 | 36,512 |
| Vistamalls, Inc. | | | 172,400 | 16,667 |
| 38 | JOHN HANCOCK EMERGING MARKETS FUND | SEMIANNUAL REPORT | SEE NOTES TO FINANCIAL STATEMENTS |
| | | | | Shares | Value |
| Philippines (continued) | | | | | |
| Wilcon Depot, Inc. | | | 76,500 | $27,228 |
| Poland 1.0% | | | | | 2,251,716 |
| Agora SA | | | 6,899 | 20,527 |
| Alior Bank SA (A) | | | 6,720 | 36,267 |
| Amica SA | | | 1,022 | 29,048 |
| Apator SA | | | 4,522 | 23,891 |
| Bank Handlowy w Warszawie SA | | | 1,958 | 26,504 |
| Bank Millennium SA (A) | | | 25,326 | 31,453 |
| Bank Polska Kasa Opieki SA | | | 1,680 | 38,016 |
| Budimex SA | | | 1,187 | 52,827 |
| CCC SA | | | 1,846 | 34,333 |
| CD Projekt SA | | | 767 | 55,033 |
| Ciech SA (A) | | | 2,152 | 19,289 |
| ComArch SA | | | 706 | 34,341 |
| Cyfrowy Polsat SA | | | 9,812 | 63,493 |
| Develia SA | | | 47,624 | 30,853 |
| Dino Polska SA (A)(B) | | | 1,595 | 57,939 |
| Dom Development SA | | | 481 | 11,435 |
| Enea SA (A) | | | 18,050 | 25,963 |
| Eurocash SA | | | 6,185 | 28,628 |
| Famur SA | | | 36,449 | 24,370 |
| Firma Oponiarska Debica SA | | | 1,550 | 30,459 |
| Getin Noble Bank SA (A) | | | 162,956 | 10,300 |
| Globe Trade Centre SA | | | 18,851 | 44,174 |
| Grupa Azoty SA (A) | | | 2,417 | 12,652 |
| Grupa Kety SA | | | 1,153 | 107,136 |
| Grupa Lotos SA | | | 6,937 | 106,003 |
| ING Bank Slaski SA | | | 812 | 37,940 |
| Inter Cars SA | | | 1,150 | 57,552 |
| Jastrzebska Spolka Weglowa SA | | | 2,183 | 7,700 |
| KGHM Polska Miedz SA (A) | | | 7,305 | 133,967 |
| KRUK SA | | | 627 | 22,275 |
| LPP SA | | | 54 | 95,578 |
| Lubelski Wegiel Bogdanka SA | | | 888 | 3,749 |
| mBank SA (A) | | | 266 | 20,306 |
| Netia SA (A) | | | 53,777 | 55,308 |
| Neuca SA | | | 461 | 43,966 |
| Orange Polska SA (A) | | | 32,489 | 51,651 |
| PGE Polska Grupa Energetyczna SA (A) | | | 22,745 | 26,149 |
| PKP Cargo SA | | | 4,841 | 15,677 |
| Polski Koncern Naftowy ORLEN SA | | | 19,195 | 289,961 |
| Polskie Gornictwo Naftowe i Gazownictwo SA | | | 37,755 | 30,711 |
| Powszechna Kasa Oszczednosci Bank Polski SA | | | 19,550 | 156,532 |
| Powszechny Zaklad Ubezpieczen SA | | | 14,477 | 129,095 |
| SEE NOTES TO FINANCIAL STATEMENTS | SEMIANNUAL REPORT | JOHN HANCOCK EMERGING MARKETS FUND | 39 |
| | | | | Shares | Value |
| Poland (continued) | | | | | |
| Santander Bank Polska SA | | | 752 | $48,595 |
| Stalprodukt SA | | | 215 | 8,905 |
| Tauron Polska Energia SA (A) | | | 63,876 | 18,046 |
| Warsaw Stock Exchange | | | 2,268 | 22,118 |
| Wawel SA | | | 80 | 12,411 |
| Zespol Elektrowni Patnow Adamow Konin SA (A) | | | 5,285 | 8,590 |
| Romania 0.1% | | | | | 133,588 |
| NEPI Rockcastle PLC | | | 18,047 | 133,588 |
| Russia 1.4% | | | | | 3,371,292 |
| Etalon Group PLC, GDR | | | 2,625 | 5,055 |
| Gazprom PJSC, ADR | | | 46,190 | 282,719 |
| Globaltrans Investment PLC, GDR | | | 4,853 | 35,887 |
| LUKOIL PJSC, ADR | | | 10,478 | 903,816 |
| Magnitogorsk Iron & Steel Works PJSC, GDR | | | 5,310 | 40,360 |
| Mail.Ru Group, Ltd., GDR (A) | | | 1,868 | 36,529 |
| MMC Norilsk Nickel PJSC, ADR | | | 10,956 | 331,275 |
| Mobile TeleSystems PJSC, ADR | | | 13,877 | 134,607 |
| Novatek PJSC, GDR | | | 528 | 77,039 |
| Novolipetsk Steel PJSC, GDR | | | 4,896 | 94,008 |
| PhosAgro PJSC, GDR | | | 4,506 | 50,120 |
| Polyus PJSC, GDR | | | 827 | 51,418 |
| Ros Agro PLC, GDR | | | 1,484 | 13,571 |
| Rosneft Oil Company PJSC, GDR | | | 36,143 | 221,340 |
| Rostelecom PJSC, ADR | | | 6,378 | 50,002 |
| RusHydro PJSC, ADR | | | 28,619 | 26,276 |
| Sberbank of Russia PJSC, ADR | | | 31,315 | 445,612 |
| Severstal PJSC, GDR | | | 5,333 | 65,380 |
| Tatneft PJSC, ADR | | | 5,239 | 310,673 |
| TMK PJSC, GDR | | | 7,122 | 21,570 |
| VTB Bank PJSC, GDR | | | 56,984 | 73,273 |
| X5 Retail Group NV, GDR | | | 3,217 | 100,762 |
| South Africa 4.9% | | | | | 11,507,626 |
| Absa Group, Ltd. | | | 31,862 | 274,193 |
| Adcock Ingram Holdings, Ltd. | | | 6,499 | 17,031 |
| Adcorp Holdings, Ltd. | | | 25,714 | 16,801 |
| Advtech, Ltd. | | | 63,637 | 37,508 |
| AECI, Ltd. | | | 17,546 | 117,174 |
| African Oxygen, Ltd. | | | 25,659 | 30,874 |
| African Phoenix Investments, Ltd. (A) | | | 552,678 | 13,369 |
| African Rainbow Minerals, Ltd. | | | 10,363 | 93,383 |
| Afrimat, Ltd. | | | 16,248 | 29,979 |
| Alexander Forbes Group Holdings, Ltd. | | | 77,526 | 23,569 |
| 40 | JOHN HANCOCK EMERGING MARKETS FUND | SEMIANNUAL REPORT | SEE NOTES TO FINANCIAL STATEMENTS |
| | | | | Shares | Value |
| South Africa (continued) | | | | | |
| Allied Electronics Corp., Ltd., A Shares | | | 31,513 | $40,526 |
| Alviva Holdings, Ltd. | | | 32,176 | 13,978 |
| Anglo American Platinum, Ltd. | | | 1,316 | 88,578 |
| AngloGold Ashanti, Ltd. | | | 16,287 | 290,043 |
| AngloGold Ashanti, Ltd., ADR | | | 4,794 | 83,655 |
| ArcelorMittal South Africa, Ltd. (A) | | | 32,131 | 1,869 |
| Ascendis Health, Ltd. (A) | | | 20,332 | 651 |
| Aspen Pharmacare Holdings, Ltd. (A) | | | 15,603 | 100,397 |
| Assore, Ltd. | | | 3,466 | 39,364 |
| Astral Foods, Ltd. | | | 3,430 | 41,087 |
| AVI, Ltd. | | | 24,363 | 114,103 |
| Barloworld, Ltd. | | | 19,494 | 101,407 |
| Bid Corp., Ltd. | | | 10,651 | 192,726 |
| Blue Label Telecoms, Ltd. (A) | | | 73,110 | 11,720 |
| Capitec Bank Holdings, Ltd. | | | 1,471 | 124,513 |
| Cashbuild, Ltd. | | | 1,875 | 19,709 |
| Caxton & CTP Publishers & Printers, Ltd. | | | 83,154 | 33,104 |
| City Lodge Hotels, Ltd. | | | 4,027 | 12,774 |
| Clicks Group, Ltd. | | | 18,360 | 277,631 |
| Coronation Fund Managers, Ltd. | | | 17,193 | 44,036 |
| Curro Holdings, Ltd. | | | 21,916 | 16,241 |
| DataTec, Ltd. | | | 15,352 | 30,706 |
| Dis-Chem Pharmacies, Ltd. (B) | | | 12,218 | 17,437 |
| Discovery, Ltd. | | | 21,150 | 131,846 |
| Distell Group Holdings, Ltd. | | | 2,740 | 17,339 |
| enX Group, Ltd. (A) | | | 8,796 | 4,535 |
| EOH Holdings, Ltd. (A) | | | 5,728 | 1,123 |
| Exxaro Resources, Ltd. | | | 18,381 | 133,163 |
| Famous Brands, Ltd. | | | 5,195 | 18,522 |
| FirstRand, Ltd. | | | 195,871 | 699,323 |
| Gold Fields, Ltd., ADR | | | 82,777 | 490,868 |
| Grand Parade Investments, Ltd. (A) | | | 66,516 | 15,022 |
| Grindrod, Ltd. | | | 70,015 | 19,212 |
| Harmony Gold Mining Company, Ltd., ADR (A) | | | 34,532 | 117,409 |
| Hudaco Industries, Ltd. | | | 5,058 | 30,988 |
| Impala Platinum Holdings, Ltd. (A) | | | 32,983 | 268,092 |
| Imperial Logistics, Ltd. | | | 16,702 | 49,549 |
| Investec, Ltd. | | | 14,490 | 75,584 |
| Invicta Holdings, Ltd. (A) | | | 10,662 | 6,650 |
| Italtile, Ltd. | | | 38,046 | 28,367 |
| JSE, Ltd. | | | 3,574 | 23,225 |
| KAP Industrial Holdings, Ltd. | | | 207,408 | 39,459 |
| Kumba Iron Ore, Ltd. | | | 3,105 | 57,220 |
| Lewis Group, Ltd. | | | 15,881 | 27,975 |
| SEE NOTES TO FINANCIAL STATEMENTS | SEMIANNUAL REPORT | JOHN HANCOCK EMERGING MARKETS FUND | 41 |
| | | | | Shares | Value |
| South Africa (continued) | | | | | |
| Liberty Holdings, Ltd. | | | 13,913 | $84,838 |
| Life Healthcare Group Holdings, Ltd. | | | 132,612 | 189,849 |
| Long4Life, Ltd. (A) | | | 66,103 | 13,481 |
| Massmart Holdings, Ltd. | | | 16,996 | 51,364 |
| Merafe Resources, Ltd. | | | 516,988 | 14,571 |
| Metair Investments, Ltd. | | | 21,395 | 28,496 |
| MiX Telematics, Ltd., ADR | | | 2,273 | 30,163 |
| Momentum Metropolitan Holdings | | | 120,832 | 135,847 |
| Motus Holdings, Ltd. | | | 12,498 | 58,555 |
| Mpact, Ltd. | | | 30,462 | 25,502 |
| Mr. Price Group, Ltd. | | | 12,178 | 119,610 |
| MTN Group, Ltd. | | | 152,396 | 726,546 |
| MultiChoice Group, Ltd. (A) | | | 19,711 | 115,169 |
| Murray & Roberts Holdings, Ltd. | | | 132,715 | 79,256 |
| Nampak, Ltd. (A) | | | 75,737 | 16,744 |
| Naspers, Ltd., N Shares | | | 4,877 | 762,549 |
| Nedbank Group, Ltd. | | | 24,080 | 275,288 |
| Netcare, Ltd. | | | 123,309 | 146,242 |
| Northam Platinum, Ltd. (A) | | | 21,500 | 156,192 |
| Novus Holdings, Ltd. | | | 5,844 | 612 |
| Oceana Group, Ltd. | | | 6,345 | 22,428 |
| Old Mutual, Ltd. | | | 36,548 | 37,181 |
| Omnia Holdings, Ltd. (A) | | | 25,387 | 40,632 |
| Peregrine Holdings, Ltd. | | | 28,331 | 32,755 |
| Pick n Pay Stores, Ltd. | | | 30,615 | 110,696 |
| PPC, Ltd. (A) | | | 133,079 | 12,634 |
| PSG Group, Ltd. | | | 7,268 | 88,276 |
| Raubex Group, Ltd. | | | 23,582 | 32,499 |
| RCL Foods, Ltd. | | | 10,269 | 7,227 |
| Reunert, Ltd. | | | 18,429 | 67,004 |
| Rhodes Food Group Pty, Ltd. | | | 25,474 | 23,522 |
| Royal Bafokeng Platinum, Ltd. (A) | | | 21,494 | 70,318 |
| Sanlam, Ltd. | | | 52,020 | 218,510 |
| Santam, Ltd. | | | 2,914 | 47,649 |
| Sappi, Ltd. (A) | | | 66,524 | 125,143 |
| Sasol, Ltd. | | | 20,349 | 248,550 |
| Shoprite Holdings, Ltd. | | | 24,189 | 176,191 |
| Sibanye Stillwater, Ltd., ADR (A) | | | 22,108 | 187,034 |
| Spur Corp., Ltd. | | | 15,386 | 22,903 |
| Standard Bank Group, Ltd. | | | 74,488 | 715,997 |
| Steinhoff International Holdings NV (A) | | | 277,666 | 24,283 |
| Sun International, Ltd. (A) | | | 18,286 | 37,932 |
| Super Group, Ltd. (A) | | | 32,550 | 44,865 |
| Telkom SA SOC, Ltd. | | | 31,617 | 53,786 |
| 42 | JOHN HANCOCK EMERGING MARKETS FUND | SEMIANNUAL REPORT | SEE NOTES TO FINANCIAL STATEMENTS |
| | | | | Shares | Value |
| South Africa (continued) | | | | | |
| The Bidvest Group, Ltd. | | | 34,476 | $401,870 |
| The Foschini Group, Ltd. | | | 16,894 | 135,780 |
| The SPAR Group, Ltd. | | | 10,952 | 117,643 |
| Tiger Brands, Ltd. | | | 11,117 | 109,335 |
| Tongaat Hulett, Ltd. (A) | | | 16,506 | 3,458 |
| Transaction Capital, Ltd. | | | 37,010 | 44,568 |
| Trencor, Ltd. (A) | | | 22,683 | 12,762 |
| Truworths International, Ltd. | | | 25,703 | 76,149 |
| Tsogo Sun Gaming, Ltd. | | | 46,649 | 28,462 |
| Vodacom Group, Ltd. | | | 44,493 | 318,136 |
| Wilson Bayly Holmes-Ovcon, Ltd. | | | 6,887 | 43,890 |
| Woolworths Holdings, Ltd. | | | 55,674 | 131,077 |
| South Korea 13.5% | | | | | 31,868,212 |
| Able C&C Company, Ltd. (A) | | | 359 | 2,999 |
| Ace Technologies Corp. (A) | | | 2,228 | 14,415 |
| Advanced Cosmeceutical Technology Company, Ltd. (A)(D) | | | 724 | 2,671 |
| Advanced Nano Products Company, Ltd. | | | 473 | 6,030 |
| Advanced Process Systems Corp. (A) | | | 1,012 | 22,952 |
| Aekyung Petrochemical Company, Ltd. | | | 1,138 | 6,480 |
| AfreecaTV Company, Ltd. | | | 660 | 30,063 |
| Ahnlab, Inc. | | | 288 | 12,867 |
| AJ Networks Company, Ltd. | | | 3,192 | 10,742 |
| Ajin Industrial Company, Ltd. (A) | | | 2,965 | 5,406 |
| AK Holdings, Inc. | | | 593 | 11,826 |
| ALUKO Company, Ltd. (A) | | | 3,314 | 6,036 |
| Amorepacific Corp. (A) | | | 521 | 69,012 |
| AMOREPACIFIC Group (A) | | | 487 | 24,935 |
| Aprogen KIC, Inc. (A) | | | 1,612 | 3,197 |
| Asia Cement Company, Ltd. | | | 198 | 10,201 |
| ASIA Holdings Company, Ltd. | | | 194 | 14,897 |
| Asia Paper Manufacturing Company, Ltd. | | | 752 | 19,070 |
| Atinum Investment Company, Ltd. | | | 3,880 | 5,277 |
| Aurora World Corp. (A) | | | 555 | 4,912 |
| Austem Company, Ltd. | | | 1,208 | 1,771 |
| Avaco Company, Ltd. | | | 1,745 | 8,359 |
| Baiksan Company, Ltd. | | | 1,511 | 8,113 |
| Bcworld Pharm Company, Ltd. | | | 18 | 254 |
| BGF Company, Ltd. | | | 2,408 | 9,030 |
| BGF retail Company, Ltd. | | | 358 | 44,796 |
| BH Company, Ltd. (A) | | | 1,811 | 27,060 |
| Binex Company, Ltd. (A) | | | 1,385 | 8,143 |
| Binggrae Company, Ltd. (A) | | | 278 | 12,283 |
| BioSmart Company, Ltd. | | | 1,334 | 4,058 |
| SEE NOTES TO FINANCIAL STATEMENTS | SEMIANNUAL REPORT | JOHN HANCOCK EMERGING MARKETS FUND | 43 |
| | | | | Shares | Value |
| South Korea (continued) | | | | | |
| Biovill Company, Ltd. (A)(D) | | | 4,344 | $5,848 |
| BIT Computer Company, Ltd. | | | 489 | 2,103 |
| BNK Financial Group, Inc. | | | 10,877 | 55,164 |
| Boditech Med, Inc. | | | 681 | 6,837 |
| Bookook Securities Company, Ltd. | | | 368 | 5,803 |
| Boryung Pharmaceutical Company, Ltd. | | | 635 | 6,267 |
| Bosung Power Technology Company, Ltd. (A) | | | 1,899 | 2,789 |
| Busan City Gas Company, Ltd. | | | 186 | 5,050 |
| Byucksan Corp. (A) | | | 3,406 | 4,437 |
| Capro Corp. (A) | | | 3,485 | 8,062 |
| Caregen Company, Ltd. (A)(D) | | | 219 | 13,795 |
| Cell Biotech Company, Ltd. | | | 375 | 4,623 |
| Celltrion Pharm, Inc. (A) | | | 438 | 14,616 |
| Celltrion, Inc. (A)(C) | | | 2,861 | 408,189 |
| Cheil Worldwide, Inc. | | | 2,237 | 35,595 |
| Chemtronics Company, Ltd. | | | 1,041 | 13,242 |
| Cheryong Electric Company, Ltd. | | | 496 | 1,941 |
| ChinHung International, Inc. (A) | | | 1,998 | 3,301 |
| Choa Pharmaceutical Company (A) | | | 887 | 2,551 |
| Chong Kun Dang Pharmaceutical Corp. (A) | | | 517 | 36,952 |
| Chongkundang Holdings Corp. | | | 208 | 18,609 |
| Chosun Refractories Company, Ltd. | | | 99 | 6,383 |
| Chungdahm Learning, Inc. | | | 580 | 7,196 |
| CJ CGV Company, Ltd. (A) | | | 706 | 13,989 |
| CJ CheilJedang Corp. | | | 492 | 98,848 |
| CJ Corp. | | | 1,166 | 77,662 |
| CJ ENM Company, Ltd. | | | 738 | 77,143 |
| CJ Freshway Corp. | | | 785 | 13,844 |
| CJ Logistics Corp. (A) | | | 437 | 48,411 |
| Clean & Science Company, Ltd. | | | 436 | 9,677 |
| CMG Pharmaceutical Company, Ltd. (A) | | | 4,018 | 12,015 |
| Com2uS Corp. | | | 423 | 34,448 |
| Coreana Cosmetics Company, Ltd. (A) | | | 428 | 1,523 |
| COSMAX NBT, Inc. (A) | | | 1,250 | 5,765 |
| Cosmax, Inc. | | | 417 | 25,880 |
| CosmoAM&T Company, Ltd. (A) | | | 1,343 | 10,066 |
| Cosmochemical Company, Ltd. (A) | | | 950 | 5,987 |
| COSON Company, Ltd. (A) | | | 581 | 2,707 |
| Coway Company, Ltd. | | | 1,927 | 109,839 |
| COWELL FASHION Company, Ltd. | | | 3,245 | 12,659 |
| CS Wind Corp. | | | 207 | 6,167 |
| CTC BIO, Inc. (A) | | | 644 | 2,874 |
| Cuckoo Holdings Company, Ltd. (A) | | | 129 | 10,351 |
| Cuckoo Homesys Company, Ltd. (A) | | | 761 | 23,768 |
| 44 | JOHN HANCOCK EMERGING MARKETS FUND | SEMIANNUAL REPORT | SEE NOTES TO FINANCIAL STATEMENTS |
| | | | | Shares | Value |
| South Korea (continued) | | | | | |
| D.I. Corp. | | | 851 | $1,937 |
| Dae Dong Industrial Company, Ltd. (A) | | | 657 | 2,466 |
| Dae Han Flour Mills Company, Ltd. | | | 120 | 12,856 |
| Dae Hwa Pharmaceutical Company, Ltd. | | | 763 | 6,243 |
| Dae Won Kang Up Company, Ltd. | | | 3,502 | 9,547 |
| Dae Young Packaging Company, Ltd. (A) | | | 4,196 | 3,779 |
| Daea TI Company, Ltd. | | | 1,930 | 6,484 |
| Daehan New Pharm Company, Ltd. (A) | | | 1,118 | 9,099 |
| Daehan Steel Company, Ltd. | | | 1,190 | 4,960 |
| Daejoo Electronic Materials Company, Ltd. (A) | | | 405 | 5,688 |
| Daekyo Company, Ltd. | | | 3,192 | 13,001 |
| Daelim Industrial Company, Ltd. (A) | | | 1,867 | 112,450 |
| Daesang Corp. (A) | | | 1,153 | 18,798 |
| Daesang Holdings Company, Ltd. | | | 1,433 | 6,498 |
| Daewon Cable Company, Ltd. (A) | | | 2,197 | 1,743 |
| Daewon Pharmaceutical Company, Ltd. | | | 680 | 7,878 |
| Daewon San Up Company, Ltd. | | | 1,661 | 7,018 |
| Daewoo Engineering & Construction Company, Ltd. (A) | | | 10,866 | 36,765 |
| Daewoong Company, Ltd. | | | 1,309 | 11,023 |
| Daewoong Pharmaceutical Company, Ltd. | | | 135 | 11,758 |
| Daihan Pharmaceutical Company, Ltd. | | | 428 | 10,561 |
| Daishin Securities Company, Ltd. (A) | | | 1,799 | 14,080 |
| Daou Data Corp. | | | 1,820 | 10,994 |
| Daou Technology, Inc. | | | 1,699 | 22,575 |
| Dasan Networks, Inc. (A) | | | 946 | 5,544 |
| Dawonsys Company, Ltd. | | | 926 | 12,404 |
| DB Financial Investment Company, Ltd. (A) | | | 3,443 | 10,178 |
| DB HiTek Company, Ltd. | | | 2,268 | 45,938 |
| DB Insurance Company, Ltd. | | | 5,286 | 188,737 |
| DB, Inc. (A) | | | 6,345 | 3,775 |
| Deutsch Motors, Inc. (A) | | | 2,601 | 14,368 |
| DGB Financial Group, Inc. | | | 6,891 | 32,011 |
| DHP Korea Company, Ltd. | | | 549 | 3,268 |
| DI Dong Il Corp. (A) | | | 113 | 6,658 |
| DIO Corp. (A) | | | 618 | 17,134 |
| DMS Company, Ltd. | | | 2,801 | 9,744 |
| Dong A Eltek Company, Ltd. | | | 876 | 5,234 |
| Dong-A ST Company, Ltd. | | | 230 | 16,850 |
| Dong-Ah Geological Engineering Company, Ltd. | | | 855 | 10,068 |
| Dongjin Semichem Company, Ltd. (A) | | | 1,855 | 23,223 |
| DongKook Pharmaceutical Company, Ltd. | | | 356 | 24,767 |
| Dongkuk Steel Mill Company, Ltd. (A) | | | 7,284 | 28,332 |
| Dongsuh Companies, Inc. | | | 1,160 | 14,894 |
| DONGSUNG Corp. | | | 982 | 3,452 |
| SEE NOTES TO FINANCIAL STATEMENTS | SEMIANNUAL REPORT | JOHN HANCOCK EMERGING MARKETS FUND | 45 |
| | | | | Shares | Value |
| South Korea (continued) | | | | | |
| Dongsung Finetec Company, Ltd. | | | 639 | $5,045 |
| Dongwha Pharmaceutical Company, Ltd. | | | 1,513 | 8,474 |
| Dongwon Development Company, Ltd. | | | 8,327 | 26,192 |
| Dongwon F&B Company, Ltd. | | | 69 | 11,887 |
| Dongwon Industries Company, Ltd. | | | 102 | 16,569 |
| Dongwon Systems Corp. | | | 324 | 5,882 |
| Doosan Bobcat, Inc. | | | 2,428 | 56,856 |
| Doosan Company, Ltd. | | | 217 | 10,053 |
| Doosan Fuel Cell Company, Ltd. (A) | | | 727 | 4,058 |
| Doosan Heavy Industries & Construction Company, Ltd. (A) | | | 10,131 | 42,307 |
| Doosan Infracore Company, Ltd. (A) | | | 12,806 | 44,764 |
| Doosan Solus Company, Ltd. (A) | | | 400 | 8,224 |
| DoubleUGames Company, Ltd. | | | 350 | 11,891 |
| Douzone Bizon Company, Ltd. | | | 1,172 | 84,381 |
| Duk San Neolux Company, Ltd. (A) | | | 786 | 21,773 |
| DY Corp. | | | 2,484 | 8,690 |
| DY POWER Corp. | | | 1,051 | 7,019 |
| e Tec E&C, Ltd. | | | 168 | 7,580 |
| E1 Corp. | | | 642 | 21,545 |
| Eagon Holdings Company, Ltd. (A) | | | 10,839 | 19,912 |
| Easy Bio, Inc. (A) | | | 4,817 | 17,740 |
| Ecopro Company, Ltd. | | | 781 | 14,836 |
| Ehwa Technologies Information Company, Ltd. (A) | | | 41,722 | 6,782 |
| E-MART, Inc. | | | 688 | 60,089 |
| EM-Tech Company, Ltd. (A) | | | 1,048 | 7,109 |
| EMW Company, Ltd. (A)(D) | | | 8,120 | 13,940 |
| ENF Technology Company, Ltd. | | | 1,124 | 22,393 |
| Eo Technics Company, Ltd. (A) | | | 333 | 24,649 |
| Estechpharma Company, Ltd. | | | 422 | 3,270 |
| Eugene Corp. | | | 3,338 | 10,553 |
| Eugene Investment & Securities Company, Ltd. (A) | | | 7,899 | 12,948 |
| Eugene Technology Company, Ltd. | | | 1,539 | 24,274 |
| F&F Company, Ltd. | | | 346 | 27,007 |
| Feelux Company, Ltd. (A) | | | 1,369 | 5,963 |
| Fila Holdings Corp. | | | 1,790 | 56,942 |
| Fine Semitech Corp. | | | 1,874 | 12,452 |
| Foosung Company, Ltd. | | | 2,863 | 17,296 |
| Fursys, Inc. | | | 336 | 7,826 |
| Gabia, Inc. (A) | | | 1,060 | 8,391 |
| Gamevil, Inc. (A) | | | 325 | 5,758 |
| Gaon Cable Company, Ltd. | | | 244 | 3,738 |
| Geumhwa PSC Company, Ltd. (A) | | | 327 | 6,558 |
| GNCO Company, Ltd. (A) | | | 3,240 | 3,341 |
| GOLFZON Company, Ltd. (A) | | | 304 | 12,019 |
| 46 | JOHN HANCOCK EMERGING MARKETS FUND | SEMIANNUAL REPORT | SEE NOTES TO FINANCIAL STATEMENTS |
| | | | | Shares | Value |
| South Korea (continued) | | | | | |
| Grand Korea Leisure Company, Ltd. | | | 2,113 | $29,203 |
| Green Cross Cell Corp. | | | 117 | 3,366 |
| Green Cross Corp. | | | 186 | 17,319 |
| Green Cross Holdings Corp. | | | 976 | 14,131 |
| GS Engineering & Construction Corp. | | | 4,553 | 99,577 |
| GS Global Corp. (A) | | | 4,428 | 6,326 |
| GS Holdings Corp. | | | 4,858 | 166,686 |
| GS Home Shopping, Inc. | | | 189 | 19,403 |
| GS Retail Company, Ltd. | | | 1,539 | 44,735 |
| Hae In Corp. | | | 703 | 2,238 |
| HAESUNG DS Company, Ltd. | | | 1,272 | 17,128 |
| Haimarrow Food Service Company, Ltd. | | | 7,718 | 17,236 |
| Halla Holdings Corp. | | | 659 | 19,309 |
| Hana Financial Group, Inc. | | | 7,654 | 198,213 |
| Hana Tour Service, Inc. | | | 594 | 20,347 |
| Hanall Biopharma Company, Ltd. (A) | | | 1,203 | 23,679 |
| Hancom, Inc. (A) | | | 1,410 | 11,750 |
| Handok, Inc. | | | 440 | 8,032 |
| Handsome Company, Ltd. | | | 592 | 12,068 |
| Hanil Cement Company, Ltd. | | | 130 | 7,853 |
| Hanil Holdings Company, Ltd. | | | 261 | 7,245 |
| Hanil Hyundai Cement Company, Ltd. | | | 101 | 2,038 |
| Hanjin Heavy Industries & Construction Company, Ltd. (A) | | | 3,306 | 11,556 |
| Hanjin Kal Corp. (A) | | | 579 | 32,544 |
| Hanjin Transportation Company, Ltd. (A) | | | 479 | 12,402 |
| Hankook Shell Oil Company, Ltd. | | | 74 | 15,817 |
| Hankook Tire & Technology Company, Ltd. | | | 5,223 | 109,918 |
| Hanmi Pharm Company, Ltd. (A) | | | 190 | 40,895 |
| Hanmi Science Company, Ltd. (A) | | | 363 | 8,923 |
| HanmiGlobal Company, Ltd. | | | 473 | 2,987 |
| Hanon Systems | | | 7,452 | 64,807 |
| Hans Biomed Corp. | | | 412 | 7,265 |
| Hansae Company, Ltd. | | | 698 | 7,838 |
| Hansae Yes24 Holdings Company, Ltd. (A) | | | 769 | 3,768 |
| Hanshin Construction Company, Ltd. (A) | | | 985 | 11,025 |
| Hansol Chemical Company, Ltd. | | | 596 | 46,103 |
| Hansol Holdings Company, Ltd. (A) | | | 6,093 | 15,170 |
| Hansol Paper Company, Ltd. | | | 1,635 | 17,517 |
| Hansol Technics Company, Ltd. (A) | | | 4,255 | 24,647 |
| Hanssem Company, Ltd. | | | 268 | 14,070 |
| Hanwha Aerospace Company, Ltd. (A) | | | 1,538 | 35,034 |
| Hanwha Corp. | | | 1,297 | 21,646 |
| Hanwha General Insurance Company, Ltd. (A) | | | 6,667 | 12,168 |
| Hanwha Investment & Securities Company, Ltd. (A) | | | 11,414 | 16,793 |
| SEE NOTES TO FINANCIAL STATEMENTS | SEMIANNUAL REPORT | JOHN HANCOCK EMERGING MARKETS FUND | 47 |
| | | | | Shares | Value |
| South Korea (continued) | | | | | |
| Hanwha Life Insurance Company, Ltd. | | | 25,921 | $35,450 |
| Hanwha Solutions Corp. | | | 4,198 | 62,773 |
| Hanyang Eng Company, Ltd. | | | 1,161 | 9,201 |
| Hanyang Securities Company, Ltd. (A) | | | 2 | 13 |
| Harim Holdings Company, Ltd. | | | 2,199 | 12,864 |
| HB Technology Company, Ltd. | | | 4,557 | 10,155 |
| HDC Holdings Company, Ltd. | | | 2,820 | 21,386 |
| HDC I-Controls Company, Ltd. (A) | | | 262 | 1,765 |
| Heungkuk Fire & Marine Insurance Company, Ltd. (A) | | | 8,032 | 18,719 |
| Hite Jinro Company, Ltd. (A) | | | 899 | 19,786 |
| Hitejinro Holdings Company, Ltd. (A) | | | 5 | 48 |
| HJ Magnolia Yongpyong Hotel & Resort Corp. (A) | | | 1,056 | 3,964 |
| HLB, Inc. (A) | | | 429 | 35,202 |
| Homecast Company, Ltd. (A) | | | 1,134 | 3,873 |
| Hotel Shilla Company, Ltd. | | | 1,652 | 108,579 |
| HS Industries Company, Ltd. (A) | | | 3,265 | 29,352 |
| HS R&A Company, Ltd. (A) | | | 5,930 | 9,486 |
| HSD Engine Company, Ltd. (A) | | | 1,919 | 5,660 |
| Huchems Fine Chemical Corp. | | | 1,256 | 18,999 |
| Hugel, Inc. (A) | | | 57 | 17,843 |
| Humax Company, Ltd. (A) | | | 1,565 | 5,583 |
| Humedix Company, Ltd. | | | 475 | 7,520 |
| Huneed Technologies (A) | | | 2,215 | 10,321 |
| Huons Company, Ltd. | | | 1,022 | 37,561 |
| Huons Global Company, Ltd. | | | 1,862 | 44,447 |
| Huvis Corp. | | | 1,370 | 7,020 |
| Huvitz Company, Ltd. | | | 672 | 4,905 |
| Hwa Shin Company, Ltd. | | | 1,306 | 2,894 |
| Hwajin Company, Ltd. (A)(D) | | | 8,174 | 18,535 |
| HwaSung Industrial Company, Ltd. | | | 1,690 | 12,777 |
| Hy-Lok Corp. | | | 1,026 | 12,119 |
| Hyosung Advanced Materials Corp. (A) | | | 243 | 16,837 |
| Hyosung Chemical Corp. | | | 174 | 15,010 |
| Hyosung Corp. | | | 456 | 26,557 |
| Hyosung Heavy Industries Corp. (A) | | | 591 | 9,695 |
| Hyosung TNC Company, Ltd. | | | 189 | 23,082 |
| Hyundai Bioscience Company, Ltd. (A) | | | 1,208 | 11,122 |
| Hyundai BNG Steel Company, Ltd. (A) | | | 218 | 1,317 |
| Hyundai Construction Equipment Company, Ltd. (A) | | | 1,282 | 21,785 |
| Hyundai Corp. | | | 702 | 7,960 |
| Hyundai Corp. Holdings, Inc. | | | 587 | 4,618 |
| Hyundai Department Store Company, Ltd. | | | 380 | 21,998 |
| Hyundai Electric & Energy System Company, Ltd. (A) | | | 1,095 | 7,861 |
| Hyundai Elevator Company, Ltd. (A) | | | 631 | 28,294 |
| 48 | JOHN HANCOCK EMERGING MARKETS FUND | SEMIANNUAL REPORT | SEE NOTES TO FINANCIAL STATEMENTS |
| | | | | Shares | Value |
| South Korea (continued) | | | | | |
| Hyundai Engineering & Construction Company, Ltd. | | | 1,753 | $50,687 |
| Hyundai Glovis Company, Ltd. | | | 827 | 84,363 |
| Hyundai Greenfood Company, Ltd. | | | 3,412 | 24,362 |
| Hyundai Heavy Industries Holdings Company, Ltd. | | | 407 | 90,752 |
| Hyundai Home Shopping Network Corp. | | | 441 | 26,866 |
| Hyundai Livart Furniture Company, Ltd. | | | 1,313 | 10,180 |
| Hyundai Marine & Fire Insurance Company, Ltd. | | | 5,989 | 111,653 |
| Hyundai Merchant Marine Company, Ltd. (A) | | | 10,849 | 29,269 |
| Hyundai Mipo Dockyard Company, Ltd. | | | 934 | 28,378 |
| Hyundai Mobis Company, Ltd. | | | 1,258 | 219,884 |
| Hyundai Motor Company | | | 3,923 | 374,746 |
| Hyundai Pharmaceutical Company, Ltd. | | | 1,136 | 4,015 |
| Hyundai Rotem Company, Ltd. (A) | | | 712 | 7,851 |
| Hyundai Steel Company | | | 2,774 | 55,112 |
| Hyundai Telecommunication Company, Ltd. (A) | | | 353 | 1,975 |
| Hyundai Wia Corp. | | | 1,183 | 37,647 |
| IHQ, Inc. (A) | | | 4,680 | 6,133 |
| Il Dong Pharmaceutical Company, Ltd. | | | 2,264 | 25,444 |
| Iljin Diamond Company, Ltd. (A) | | | 359 | 7,142 |
| Iljin Materials Company, Ltd. (A) | | | 546 | 21,051 |
| Ilshin Spinning Company, Ltd. | | | 170 | 8,645 |
| Ilyang Pharmaceutical Company, Ltd. | | | 639 | 10,880 |
| iMarketKorea, Inc. | | | 1,567 | 12,045 |
| InBody Company, Ltd. (A) | | | 1,161 | 18,966 |
| Industrial Bank of Korea | | | 10,089 | 79,565 |
| Innocean Worldwide, Inc. | | | 383 | 21,212 |
| Innox Advanced Materials Company, Ltd. (A) | | | 1,959 | 68,973 |
| Inscobee, Inc. (A) | | | 4,497 | 10,590 |
| Insun ENT Company, Ltd. (A) | | | 1,874 | 10,904 |
| Interojo Company, Ltd. | | | 1,072 | 21,468 |
| Interpark Holdings Corp. | | | 2,562 | 3,756 |
| INTOPS Company, Ltd. | | | 1,885 | 18,690 |
| IS Dongseo Company, Ltd. | | | 1,458 | 32,428 |
| i-SENS, Inc. | | | 526 | 8,964 |
| ISU Chemical Company, Ltd. | | | 968 | 6,659 |
| IsuPetasys Company, Ltd. | | | 1,131 | 3,069 |
| It's Hanbul Company, Ltd. (A) | | | 350 | 4,329 |
| J.ESTINA Company, Ltd. (A) | | | 443 | 1,044 |
| Jahwa Electronics Company, Ltd. (A) | | | 827 | 6,066 |
| Jayjun Cosmetic Company, Ltd. (A) | | | 1,190 | 3,140 |
| JB Financial Group Company, Ltd. | | | 11,063 | 45,825 |
| Jcontentree Corp. (A) | | | 206 | 6,017 |
| Jeil Savings Bank (A)(D) | | | 1,850 | 0 |
| Jeju Air Company, Ltd. (A) | | | 631 | 10,353 |
| SEE NOTES TO FINANCIAL STATEMENTS | SEMIANNUAL REPORT | JOHN HANCOCK EMERGING MARKETS FUND | 49 |
| | | | | Shares | Value |
| South Korea (continued) | | | | | |
| Jinsung T.E.C. (A) | | | 2,276 | $10,291 |
| JS Corp. | | | 384 | 3,158 |
| Jusung Engineering Company, Ltd. | | | 2,598 | 13,240 |
| JVM Company, Ltd. | | | 109 | 1,973 |
| JW Life Science Corp. | | | 981 | 14,126 |
| JW Pharmaceutical Corp. | | | 597 | 11,978 |
| JYP Entertainment Corp. | | | 1,091 | 18,984 |
| Kakao Corp. | | | 431 | 61,823 |
| Kanglim Company, Ltd. (A) | | | 1,810 | 2,596 |
| Kangnam Jevisco Company, Ltd. (A) | | | 439 | 6,495 |
| Kangwon Land, Inc. (A) | | | 1,985 | 37,437 |
| KAON Media Company, Ltd. | | | 350 | 1,778 |
| KB Financial Group, Inc. | | | 15,308 | 483,936 |
| KC Company, Ltd. | | | 858 | 9,891 |
| KC Tech Company, Ltd. | | | 460 | 6,984 |
| KCC Corp. | | | 194 | 26,502 |
| KCC Engineering & Construction Company, Ltd. | | | 812 | 3,488 |
| KCC Glass Corp. (A) | | | 183 | 4,008 |
| KEPCO Engineering & Construction Company, Inc. (A) | | | 427 | 6,340 |
| KEPCO Plant Service & Engineering Company, Ltd. (A) | | | 1,384 | 38,022 |
| KEYEAST Company, Ltd. (A) | | | 5,530 | 13,783 |
| KG Eco Technology Service Company, Ltd. | | | 1,004 | 2,938 |
| Kginicis Company, Ltd. | | | 1,735 | 29,028 |
| KGMobilians Company, Ltd. | | | 1,431 | 6,733 |
| KH Vatec Company, Ltd. (A) | | | 1,223 | 20,606 |
| Kia Motors Corp. | | | 7,524 | 227,035 |
| KINX, Inc. | | | 402 | 13,922 |
| KISCO Corp. | | | 2,054 | 6,465 |
| KISCO Holdings Company, Ltd. | | | 939 | 8,281 |
| KISWIRE, Ltd. (A) | | | 1,181 | 16,581 |
| KIWOOM Securities Company, Ltd. (A) | | | 814 | 44,643 |
| KMH Company, Ltd. | | | 601 | 2,642 |
| KMW Company, Ltd. (A) | | | 436 | 18,135 |
| Kodaco Company, Ltd. (A)(D) | | | 7,499 | 13,553 |
| Koentec Company, Ltd. | | | 2,009 | 14,267 |
| Koh Young Technology, Inc. (A) | | | 486 | 38,708 |
| Kolmar BNH Company, Ltd. (A) | | | 1,146 | 25,587 |
| Kolmar Korea Holdings Company, Ltd. (A) | | | 571 | 10,150 |
| Kolon Industries, Inc. | | | 1,191 | 33,175 |
| KoMiCo, Ltd. | | | 583 | 13,839 |
| Korea Aerospace Industries, Ltd. (A) | | | 1,205 | 25,765 |
| Korea Asset In Trust Company, Ltd. | | | 15,958 | 32,731 |
| Korea Autoglass Corp. | | | 1,054 | 11,726 |
| Korea Circuit Company, Ltd. (A) | | | 1,133 | 10,291 |
| 50 | JOHN HANCOCK EMERGING MARKETS FUND | SEMIANNUAL REPORT | SEE NOTES TO FINANCIAL STATEMENTS |
| | | | | Shares | Value |
| South Korea (continued) | | | | | |
| Korea District Heating Corp. (A) | | | 413 | $12,998 |
| Korea Electric Power Corp. | | | 6,387 | 111,763 |
| Korea Electric Terminal Company, Ltd. | | | 438 | 11,734 |
| Korea Gas Corp. | | | 1,625 | 37,646 |
| Korea Investment Holdings Company, Ltd. (A) | | | 2,507 | 130,744 |
| Korea Line Corp. (A) | | | 1,420 | 20,012 |
| Korea Materials & Analysis Corp. (A) | | | 218 | 1,919 |
| Korea Petrochemical Industrial Company, Ltd. | | | 246 | 17,509 |
| Korea Real Estate Investment & Trust Company, Ltd. | | | 13,600 | 21,512 |
| Korea Shipbuilding & Offshore Engineering Company, Ltd. (A) | | | 826 | 71,013 |
| Korea United Pharm, Inc. | | | 596 | 7,717 |
| Korea Zinc Company, Ltd. (A) | | | 267 | 91,350 |
| Korean Air Lines Company, Ltd. (A) | | | 3,868 | 69,914 |
| Korean Reinsurance Company | | | 5,180 | 34,967 |
| Kortek Corp. | | | 1,000 | 8,378 |
| KPM Tech Company, Ltd. (A) | | | 4,649 | 3,056 |
| KPX Chemical Company, Ltd. | | | 134 | 5,476 |
| KSS LINE, Ltd. | | | 3,146 | 19,885 |
| KT Corp. | | | 1,250 | 24,623 |
| KT Skylife Company, Ltd. | | | 2,656 | 16,065 |
| KT&G Corp. | | | 2,995 | 208,378 |
| Kukdo Chemical Company, Ltd. | | | 223 | 7,375 |
| Kumho Industrial Company, Ltd. (A) | | | 1,164 | 7,553 |
| Kumho Petrochemical Company, Ltd. | | | 1,219 | 60,298 |
| Kumho Tire Company, Inc. (A) | | | 6,125 | 18,617 |
| Kwang Dong Pharmaceutical Company, Ltd. | | | 1,959 | 9,250 |
| Kyeryong Construction Industrial Company, Ltd. | | | 847 | 11,599 |
| Kyongbo Pharmaceutical Company, Ltd. | | | 455 | 2,833 |
| Kyung Dong Navien Company, Ltd. | | | 334 | 10,275 |
| Kyungbang Company, Ltd. | | | 1,157 | 8,682 |
| KyungDong Invest Company, Ltd. | | | 30 | 828 |
| Kyung-In Synthetic Corp. | | | 2,070 | 12,994 |
| L&F Company, Ltd. | | | 652 | 11,862 |
| LB Semicon, Inc. (A) | | | 3,114 | 18,217 |
| Leaders Cosmetics Company, Ltd. (A) | | | 484 | 1,633 |
| LEENO Industrial, Inc. | | | 515 | 34,665 |
| LF Corp. | | | 1,828 | 18,994 |
| LG Chem, Ltd. | | | 911 | 276,006 |
| LG Corp. | | | 2,246 | 124,843 |
| LG Display Company, Ltd., ADR (C) | | | 22,102 | 128,192 |
| LG Electronics, Inc. | | | 7,463 | 375,390 |
| LG Hausys, Ltd. | | | 473 | 17,693 |
| LG HelloVision Company, Ltd. | | | 2,843 | 10,259 |
| LG Household & Health Care, Ltd. | | | 315 | 317,993 |
| SEE NOTES TO FINANCIAL STATEMENTS | SEMIANNUAL REPORT | JOHN HANCOCK EMERGING MARKETS FUND | 51 |
| | | | | Shares | Value |
| South Korea (continued) | | | | | |
| LG Innotek Company, Ltd. | | | 920 | $99,536 |
| LG International Corp. | | | 2,319 | 21,671 |
| LG Uplus Corp. | | | 7,805 | 84,865 |
| LIG Nex1 Company, Ltd. | | | 395 | 8,531 |
| Lion Chemtech Company, Ltd. | | | 824 | 5,139 |
| Livefinancial Company, Ltd. (A) | | | 1,085 | 1,428 |
| Lock&Lock Company, Ltd. (A) | | | 920 | 9,090 |
| Lotte Chemical Corp. | | | 446 | 69,743 |
| Lotte Chilsung Beverage Company, Ltd. (A) | | | 242 | 22,307 |
| Lotte Confectionery Company, Ltd. | | | 114 | 12,748 |
| Lotte Corp. | | | 1,028 | 24,783 |
| LOTTE Fine Chemical Company, Ltd. | | | 1,260 | 34,765 |
| Lotte Food Company, Ltd. (A) | | | 33 | 8,973 |
| Lotte Himart Company, Ltd. | | | 604 | 10,559 |
| Lotte Non-Life Insurance Company, Ltd. (A) | | | 7,292 | 9,017 |
| Lotte Shopping Company, Ltd. | | | 386 | 30,574 |
| LS Corp. | | | 896 | 26,749 |
| LS Industrial Systems Company, Ltd. | | | 999 | 36,058 |
| Macrogen, Inc. (A) | | | 335 | 6,947 |
| Maeil Dairies Company, Ltd. (A) | | | 256 | 17,216 |
| Maeil Holdings Company, Ltd. (A) | | | 480 | 3,883 |
| Magicmicro Company, Ltd. (A) | | | 2,534 | 1,241 |
| Mando Corp. | | | 2,262 | 56,172 |
| Mcnex Company, Ltd. | | | 1,165 | 31,539 |
| ME2ON Company, Ltd. (A) | | | 2,810 | 12,299 |
| Medience Comapny, Ltd. (A) | | | 476 | 3,252 |
| Medy-Tox, Inc. | | | 1,274 | 316,295 |
| Meerecompany, Inc. | | | 737 | 15,622 |
| MegaStudyEdu Company, Ltd. (A) | | | 785 | 27,466 |
| Meritz Financial Group, Inc. | | | 3,755 | 31,556 |
| Meritz Fire & Marine Insurance Company, Ltd. | | | 4,421 | 54,048 |
| Meritz Securities Company, Ltd. | | | 19,208 | 55,470 |
| MiCo, Ltd. | | | 2,851 | 18,400 |
| Minwise Company, Ltd. (A) | | | 1,182 | 12,364 |
| Mirae Asset Daewoo Company, Ltd. (A) | | | 10,763 | 56,790 |
| Mirae Asset Life Insurance Company, Ltd. | | | 6,888 | 22,725 |
| MK Electron Company, Ltd. | | | 1,581 | 9,585 |
| Modetour Network, Inc. (A) | | | 724 | 8,413 |
| Moorim P&P Company, Ltd. | | | 2,438 | 7,279 |
| Multicampus Company, Ltd. | | | 178 | 5,341 |
| MyungMoon Pharm Company, Ltd. (A) | | | 862 | 2,955 |
| Namhae Chemical Corp. (A) | | | 1,084 | 6,224 |
| Namyang Dairy Products Company, Ltd. (A) | | | 49 | 15,258 |
| Nasmedia Company, Ltd. | | | 634 | 18,526 |
| 52 | JOHN HANCOCK EMERGING MARKETS FUND | SEMIANNUAL REPORT | SEE NOTES TO FINANCIAL STATEMENTS |
| | | | | Shares | Value |
| South Korea (continued) | | | | | |
| NAVER Corp. | | | 2,187 | $313,924 |
| NCSoft Corp. | | | 337 | 180,143 |
| NeoPharm Company, Ltd. | | | 409 | 11,418 |
| NEPES Corp. (A) | | | 1,937 | 47,241 |
| Netmarble Corp. (A)(B) | | | 311 | 22,851 |
| New Power Plasma Company, Ltd. (A) | | | 1,100 | 3,425 |
| Nexen Corp. | | | 3,411 | 14,032 |
| Nexen Tire Corp. (A) | | | 4,056 | 21,396 |
| NextEye Company, Ltd. (A) | | | 397 | 377 |
| NH Investment & Securities Company, Ltd. (A) | | | 3,814 | 31,756 |
| NHN Corp. (A) | | | 665 | 38,165 |
| NHN KCP Corp. | | | 1,022 | 25,673 |
| NICE Holdings Company, Ltd. (A) | | | 1,125 | 19,053 |
| Nice Information & Telecommunication, Inc. (A) | | | 598 | 15,358 |
| NICE Information Service Company, Ltd. (A) | | | 1,825 | 23,973 |
| NICE Total Cash Management Company, Ltd. (A) | | | 2,194 | 12,452 |
| Nong Woo Bio Company, Ltd. | | | 564 | 4,443 |
| NongShim Company, Ltd. | | | 117 | 25,240 |
| NOROO Paint & Coatings Company, Ltd. (A) | | | 430 | 2,349 |
| OCI Company, Ltd. (A) | | | 554 | 22,738 |
| Opto Device Technology Company, Ltd. | | | 373 | 1,277 |
| OPTRON-TEC, Inc. (A) | | | 2,457 | 12,704 |
| Orion Holdings Corp. | | | 1,265 | 14,911 |
| Osstem Implant Company, Ltd. (A) | | | 379 | 10,381 |
| Ottogi Corp. | | | 37 | 15,225 |
| Paik Kwang Industrial Company, Ltd. (A) | | | 3,130 | 7,751 |
| Pan Ocean Company, Ltd. (A) | | | 9,495 | 29,521 |
| Pan-Pacific Company, Ltd. | | | 5,799 | 10,910 |
| Paradise Company, Ltd. | | | 1,307 | 17,909 |
| Partron Company, Ltd. | | | 4,282 | 32,123 |
| Pearl Abyss Corp. (A) | | | 209 | 30,893 |
| PHARMA RESEARCH PRODUCTS Company, Ltd. (A) | | | 170 | 5,762 |
| Pharmicell Company, Ltd. (A) | | | 3,253 | 20,917 |
| PNE Solution Company, Ltd. (A) | | | 529 | 6,217 |
| Poonglim Industrial Company, Ltd. (A)(D) | | | 276 | 19 |
| Poongsan Corp. | | | 1,263 | 21,519 |
| Poongsan Holdings Corp. | | | 406 | 10,088 |
| POSCO | | | 2,984 | 479,293 |
| POSCO Chemical Company, Ltd. | | | 848 | 38,869 |
| Posco ICT Company, Ltd. | | | 4,009 | 14,962 |
| Posco International Corp. | | | 3,312 | 41,085 |
| Posco M-Tech Company, Ltd. | | | 2,114 | 6,552 |
| Power Logics Company, Ltd. | | | 1,809 | 12,961 |
| Protec Company, Ltd. | | | 1,269 | 16,129 |
| SEE NOTES TO FINANCIAL STATEMENTS | SEMIANNUAL REPORT | JOHN HANCOCK EMERGING MARKETS FUND | 53 |
| | | | | Shares | Value |
| South Korea (continued) | | | | | |
| PSK, Inc. | | | 1,236 | $24,156 |
| Pulmuone Company, Ltd. | | | 2,010 | 18,260 |
| Pyeong Hwa Automotive Company, Ltd. | | | 901 | 5,144 |
| RFHIC Corp. | | | 538 | 13,532 |
| S&T Dynamics Company, Ltd. | | | 7,663 | 37,122 |
| S&T Holdings Company, Ltd. | | | 302 | 3,282 |
| S&T Motiv Company, Ltd. | | | 643 | 20,821 |
| S.Y. Company, Ltd. (A) | | | 981 | 4,167 |
| S-1 Corp. | | | 1,084 | 72,922 |
| Sam Chun Dang Pharm Company, Ltd. | | | 567 | 18,932 |
| Sam Young Electronics Company, Ltd. | | | 1,158 | 7,372 |
| Sam Yung Trading Company, Ltd. | | | 1,857 | 22,325 |
| Sambon Electronics Company, Ltd. (A) | | | 1,293 | 2,074 |
| Samchully Company, Ltd. (A) | | | 240 | 15,542 |
| Samho Development Company, Ltd. | | | 1,773 | 5,979 |
| Samho International Company, Ltd. | | | 32 | 418 |
| Samick THK Company, Ltd. | | | 534 | 5,548 |
| Samjin Pharmaceutical Company, Ltd. | | | 502 | 9,292 |
| Sammok S-Form Company, Ltd. | | | 1,048 | 5,795 |
| SAMPYO Cement Company, Ltd. | | | 2,549 | 6,380 |
| Samsung Biologics Company, Ltd. (A)(B) | | | 97 | 37,225 |
| Samsung C&T Corp. | | | 1,210 | 106,073 |
| Samsung Card Company, Ltd. | | | 1,362 | 37,809 |
| Samsung Electro-Mechanics Company, Ltd. | | | 2,426 | 256,280 |
| Samsung Electronics Company, Ltd. | | | 255,882 | 11,517,601 |
| Samsung Engineering Company, Ltd. (A) | | | 5,388 | 62,802 |
| Samsung Fire & Marine Insurance Company, Ltd. | | | 1,597 | 260,123 |
| Samsung Heavy Industries Company, Ltd. (A) | | | 9,256 | 45,027 |
| Samsung Life Insurance Company, Ltd. | | | 1,740 | 83,579 |
| Samsung Pharmaceutical Company, Ltd. (A)(C) | | | 3,416 | 9,737 |
| Samsung SDI Company, Ltd. | | | 389 | 94,554 |
| Samsung SDS Company, Ltd. | | | 912 | 126,197 |
| Samsung Securities Company, Ltd. | | | 2,538 | 69,475 |
| SAMT Company, Ltd. | | | 5,773 | 10,191 |
| Samwha Capacitor Company, Ltd. | | | 526 | 25,894 |
| Samyang Corp. | | | 486 | 15,091 |
| Samyang Foods Company, Ltd. | | | 292 | 20,922 |
| Samyang Holdings Corp. | | | 435 | 17,601 |
| Samyang Tongsang Company, Ltd. | | | 232 | 10,701 |
| Sang-A Frontec Company, Ltd. | | | 430 | 5,129 |
| Sangbo Corp. (A) | | | 2,204 | 1,553 |
| Sangsangin Company, Ltd. | | | 3,162 | 20,619 |
| Sangsin Energy Display Precision Company, Ltd. | | | 990 | 5,914 |
| SaraminHR Company, Ltd. | | | 326 | 7,105 |
| 54 | JOHN HANCOCK EMERGING MARKETS FUND | SEMIANNUAL REPORT | SEE NOTES TO FINANCIAL STATEMENTS |
| | | | | Shares | Value |
| South Korea (continued) | | | | | |
| SBS Media Holdings Company, Ltd. (A) | | | 945 | $1,395 |
| S-Connect Company, Ltd. (A) | | | 6,872 | 12,982 |
| Seah Besteel Corp. | | | 1,593 | 14,345 |
| SeAH Holdings Corp. | | | 94 | 5,158 |
| SeAH Steel Corp. | | | 352 | 14,190 |
| Sebang Company, Ltd. (A) | | | 1,104 | 8,435 |
| Sebang Global Battery Company, Ltd. | | | 496 | 12,904 |
| Seegene, Inc. (A) | | | 879 | 26,944 |
| Sejong Industrial Company, Ltd. | | | 995 | 3,246 |
| Seobu T&D (A) | | | 4,436 | 25,236 |
| Seohan Company, Ltd. (A) | | | 9,774 | 7,944 |
| Seohee Construction Company, Ltd. (A) | | | 18,520 | 14,849 |
| Seojin System Company, Ltd. (A) | | | 696 | 15,154 |
| Seoul Semiconductor Company, Ltd. (A) | | | 1,598 | 19,990 |
| SEOWONINTECH Company, Ltd. | | | 540 | 2,446 |
| Seoyon E-Hwa Company, Ltd. (A) | | | 105 | 355 |
| Sewon Cellontech Company, Ltd. (A) | | | 2,245 | 4,118 |
| SEWOONMEDICAL Company, Ltd. | | | 1,931 | 4,851 |
| SFA Engineering Corp. | | | 833 | 25,764 |
| SFA Semicon Company, Ltd. (A) | | | 6,891 | 32,286 |
| SFC Company, Ltd. (A)(D) | | | 3,804 | 5,685 |
| SH Energy & Chemical Company, Ltd. (A) | | | 2,681 | 2,005 |
| Shin Poong Pharmaceutical Company, Ltd. (A) | | | 1,448 | 8,716 |
| Shindaeyang Paper Company, Ltd. (A) | | | 237 | 10,687 |
| Shinhan Financial Group Company, Ltd. | | | 14,173 | 379,050 |
| Shinhan Financial Group Company, Ltd., ADR | | | 3,580 | 95,729 |
| Shinil Industrial Company, Ltd. | | | 4,362 | 6,072 |
| Shinsegae Engineering & Construction Company, Ltd. | | | 261 | 4,657 |
| Shinsegae Food Company, Ltd. | | | 212 | 10,219 |
| Shinsegae Information & Communication Company, Ltd. | | | 72 | 5,666 |
| Shinsegae International, Inc. | | | 109 | 16,468 |
| Shinsegae, Inc. | | | 301 | 57,693 |
| Shinyoung Securities Company, Ltd. | | | 686 | 28,124 |
| SHOWBOX Corp. | | | 5,970 | 16,187 |
| Silicon Works Company, Ltd. | | | 652 | 18,100 |
| SIMMTECH Company, Ltd. | | | 1,480 | 13,017 |
| Sindoh Company, Ltd. | | | 703 | 17,386 |
| SK Bioland Company, Ltd. | | | 727 | 13,636 |
| SK Chemicals Company, Ltd. | | | 424 | 20,001 |
| SK D&D Company, Ltd. | | | 481 | 10,997 |
| SK Discovery Company, Ltd. | | | 1,163 | 20,816 |
| SK Gas, Ltd. | | | 463 | 29,729 |
| SK Holdings Company, Ltd. | | | 1,346 | 213,778 |
| SK Hynix, Inc. | | | 27,358 | 2,021,500 |
| SEE NOTES TO FINANCIAL STATEMENTS | SEMIANNUAL REPORT | JOHN HANCOCK EMERGING MARKETS FUND | 55 |
| | | | | Shares | Value |
| South Korea (continued) | | | | | |
| SK Innovation Company, Ltd. | | | 2,574 | $243,708 |
| SK Materials Company, Ltd. | | | 267 | 32,922 |
| SK Networks Company, Ltd. | | | 9,038 | 32,429 |
| SK Securities Company, Ltd. (A) | | | 33,889 | 15,026 |
| SK Telecom Company, Ltd. | | | 644 | 112,753 |
| SKC Company, Ltd. | | | 1,009 | 42,837 |
| SKC Solmics Company, Ltd. (A) | | | 3,773 | 9,004 |
| SKCKOLONPI, Inc. | | | 558 | 15,764 |
| SL Corp. (A) | | | 916 | 11,281 |
| SM Entertainment Company, Ltd. (A) | | | 668 | 15,780 |
| S-MAC Company, Ltd. (A) | | | 13,579 | 10,651 |
| S-Oil Corp. | | | 823 | 45,748 |
| Songwon Industrial Company, Ltd. | | | 862 | 8,062 |
| Soulbrain Company, Ltd. | | | 450 | 32,960 |
| SPC Samlip Company, Ltd. (A) | | | 232 | 12,895 |
| Spigen Korea Company, Ltd. | | | 296 | 11,091 |
| Ssangyong Cement Industrial Company, Ltd. | | | 4,522 | 18,389 |
| Ssangyong Motor Company (A) | | | 3,936 | 6,045 |
| ST Pharm Company, Ltd. (A) | | | 358 | 8,705 |
| Suheung Company, Ltd. | | | 920 | 28,411 |
| SundayToz Corp. (A) | | | 201 | 2,876 |
| Sung Kwang Bend Company, Ltd. | | | 2,199 | 14,851 |
| Sungshin Cement Company, Ltd. | | | 1,538 | 7,246 |
| Sungwoo Hitech Company, Ltd. | | | 6,093 | 15,515 |
| Sunjin Company, Ltd. | | | 1,060 | 6,978 |
| Sunny Electronics Corp. (A) | | | 1,058 | 3,329 |
| Suprema, Inc. (A) | | | 225 | 6,534 |
| Synopex, Inc. (A) | | | 6,863 | 12,658 |
| Systems Technology, Inc. | | | 787 | 10,739 |
| Tae Kyung Industrial Company, Ltd. | | | 604 | 2,535 |
| Taekwang Industrial Company, Ltd. (A) | | | 45 | 29,886 |
| Taeyoung Engineering & Construction Company, Ltd. | | | 4,251 | 45,971 |
| Taihan Electric Wire Company, Ltd. (A) | | | 15,121 | 7,053 |
| Taihan Fiberoptics Company, Ltd. (A) | | | 3,088 | 7,234 |
| Taihan Textile Company, Ltd. (A) | | | 263 | 4,082 |
| TechWing, Inc. | | | 1,236 | 14,928 |
| Telcon RF Pharmaceutical, Inc. (A) | | | 4,349 | 16,434 |
| Telechips, Inc. | | | 543 | 3,790 |
| Theragen Etex Company, Ltd. (A) | | | 1,048 | 6,360 |
| TK Chemical Corp. (A) | | | 4,083 | 6,984 |
| TK Corp. | | | 1,609 | 11,880 |
| Tokai Carbon Korea Company, Ltd. | | | 315 | 17,629 |
| Tongyang Life Insurance Company, Ltd. | | | 7,524 | 19,872 |
| Tongyang, Inc. (A) | | | 13,328 | 15,310 |
| 56 | JOHN HANCOCK EMERGING MARKETS FUND | SEMIANNUAL REPORT | SEE NOTES TO FINANCIAL STATEMENTS |
| | | | | Shares | Value |
| South Korea (continued) | | | | | |
| Tonymoly Company, Ltd. (A) | | | 241 | $2,082 |
| Top Engineering Company, Ltd. | | | 1,152 | 11,481 |
| Toptec Company, Ltd. | | | 1,541 | 12,391 |
| Tovis Company, Ltd. | | | 2,914 | 18,200 |
| Ubiquoss Holdings, Inc. | | | 528 | 13,151 |
| Unid Company, Ltd. | | | 821 | 26,296 |
| Union Semiconductor Equipment & Materials Company, Ltd. | | | 2,789 | 12,613 |
| Unison Company, Ltd. (A) | | | 101 | 69 |
| UniTest, Inc. | | | 2,037 | 23,616 |
| Value Added Technology Company, Ltd. | | | 533 | 11,424 |
| Vieworks Company, Ltd. | | | 627 | 15,676 |
| Vitzrocell Company, Ltd. | | | 1,287 | 16,238 |
| Webzen, Inc. (A) | | | 1,268 | 15,386 |
| Wemade Company, Ltd. | | | 670 | 17,017 |
| Whanin Pharmaceutical Company, Ltd. | | | 637 | 6,996 |
| WiSoL Company, Ltd. | | | 1,676 | 17,419 |
| WIZIT Company, Ltd. (A) | | | 3,288 | 1,905 |
| WONIK CUBE Corp. (A) | | | 1,133 | 1,450 |
| Wonik Holdings Company, Ltd. (A) | | | 3,450 | 12,396 |
| WONIK IPS Company, Ltd. (A) | | | 731 | 19,449 |
| Wonik Materials Company, Ltd. | | | 871 | 16,731 |
| Woongjin Energy Company, Ltd. (A)(D) | | | 2,513 | 1,608 |
| Woori Financial Group, Inc. | | | 11,908 | 94,595 |
| Woori Investment Bank Company, Ltd. (A) | | | 13,076 | 6,077 |
| Woori Technology Investment Company, Ltd. (A) | | | 6,580 | 12,064 |
| Woori Technology, Inc. (A) | | | 3,129 | 2,105 |
| Woorison F&G Company, Ltd. (A) | | | 2,437 | 3,430 |
| Woory Industrial Company, Ltd. | | | 508 | 9,298 |
| Y G-1 Company, Ltd. | | | 2,396 | 11,016 |
| YG Entertainment, Inc. (A) | | | 319 | 7,920 |
| YJM Games Company, Ltd. (A) | | | 1,588 | 2,132 |
| Young Poong Corp. (A) | | | 45 | 22,021 |
| Youngone Corp. | | | 961 | 25,224 |
| Youngone Holdings Company, Ltd. | | | 879 | 29,166 |
| Yuanta Securities Korea Company, Ltd. (A) | | | 8,310 | 16,260 |
| Yuhan Corp. | | | 158 | 27,963 |
| YuHwa Securities Company, Ltd. (A) | | | 2,191 | 19,709 |
| Yungjin Pharmaceutical Company, Ltd. (A) | | | 3,547 | 14,771 |
| Zeus Company, Ltd. | | | 624 | 5,830 |
| Spain 0.0% | | | | | 43,848 |
| AmRest Holdings SE (A) | | | 4,225 | 43,848 |
| Taiwan 15.9% | | | | | 37,519,846 |
| Ability Enterprise Company, Ltd. | | | 24,782 | 11,288 |
| SEE NOTES TO FINANCIAL STATEMENTS | SEMIANNUAL REPORT | JOHN HANCOCK EMERGING MARKETS FUND | 57 |
| | | | | Shares | Value |
| Taiwan (continued) | | | | | |
| Ability Opto-Electronics Technology Company, Ltd. | | | 6,753 | $8,223 |
| Accton Technology Corp. | | | 19,796 | 104,435 |
| Acer, Inc. | | | 116,510 | 61,633 |
| Acter Group Corp., Ltd. | | | 3,550 | 20,143 |
| Actron Technology Corp. | | | 6,206 | 20,032 |
| Adlink Technology, Inc. | | | 5,920 | 10,767 |
| Advanced Ceramic X Corp. | | | 2,000 | 19,110 |
| Advanced International Multitech Company, Ltd. | | | 18,000 | 21,556 |
| Advanced Optoelectronic Technology, Inc. (A) | | | 9,000 | 4,478 |
| Advancetek Enterprise Company, Ltd. | | | 32,761 | 19,151 |
| Advantech Company, Ltd. | | | 8,854 | 84,713 |
| Aerospace Industrial Development Corp. | | | 48,000 | 49,436 |
| AGV Products Corp. (A) | | | 47,000 | 11,424 |
| Airtac International Group | | | 5,736 | 89,046 |
| Alchip Technologies, Ltd. | | | 5,000 | 35,144 |
| Allied Circuit Company, Ltd. | | | 3,000 | 13,378 |
| Allis Electric Company, Ltd. | | | 16,480 | 10,589 |
| Alltek Technology Corp. | | | 9,999 | 6,274 |
| Alpha Networks, Inc. (A) | | | 32,000 | 21,787 |
| Altek Corp. | | | 20,000 | 13,067 |
| Amazing Microelectronic Corp. | | | 7,916 | 23,237 |
| AMPOC Far-East Company, Ltd. | | | 7,000 | 6,257 |
| AmTRAN Technology Company, Ltd. (A) | | | 85,775 | 25,888 |
| APCB, Inc. | | | 23,000 | 17,438 |
| Apex Biotechnology Corp. | | | 8,060 | 6,490 |
| Apex International Company, Ltd. | | | 16,030 | 28,477 |
| Arcadyan Technology Corp. | | | 8,898 | 22,647 |
| Ardentec Corp. | | | 31,363 | 26,813 |
| ASE Technology Holding Company, Ltd., ADR (C) | | | 116,793 | 537,234 |
| Asia Cement Corp. | | | 91,608 | 133,278 |
| Asia Optical Company, Inc. | | | 9,710 | 26,215 |
| Asia Pacific Telecom Company, Ltd. (A) | | | 116,666 | 28,524 |
| Asia Polymer Corp. | | | 32,171 | 14,705 |
| Asia Vital Components Company, Ltd. | | | 19,667 | 20,852 |
| ASMedia Technology, Inc. | | | 1,260 | 31,066 |
| ASPEED Technology, Inc. | | | 2,000 | 61,419 |
| Asustek Computer, Inc. | | | 22,528 | 150,709 |
| Aten International Company, Ltd. | | | 8,000 | 22,243 |
| AU Optronics Corp. | | | 279,000 | 86,341 |
| Aurora Corp. | | | 8,600 | 24,619 |
| AVY Precision Technology, Inc. (A) | | | 10,871 | 10,220 |
| Bank of Kaohsiung Company, Ltd. | | | 39,311 | 12,675 |
| Basso Industry Corp. | | | 8,700 | 13,107 |
| BenQ Materials Corp. | | | 19,000 | 11,534 |
| 58 | JOHN HANCOCK EMERGING MARKETS FUND | SEMIANNUAL REPORT | SEE NOTES TO FINANCIAL STATEMENTS |
| | | | | Shares | Value |
| Taiwan (continued) | | | | | |
| BES Engineering Corp. | | | 98,200 | $22,682 |
| Biostar Microtech International Corp. (A) | | | 6,000 | 1,969 |
| Bioteque Corp. | | | 6,000 | 22,746 |
| Boardtek Electronics Corp. (A) | | | 8,000 | 6,315 |
| Brighton-Best International Taiwan, Inc. | | | 19,817 | 18,507 |
| C Sun Manufacturing, Ltd. | | | 22,000 | 16,756 |
| Capital Futures Corp. | | | 9,600 | 13,637 |
| Capital Securities Corp. | | | 105,826 | 34,268 |
| Career Technology MFG. Company, Ltd. | | | 29,019 | 29,846 |
| Casetek Holdings, Ltd. | | | 15,378 | 20,719 |
| Caswell, Inc. | | | 3,000 | 10,130 |
| Catcher Technology Company, Ltd. | | | 31,000 | 232,564 |
| Cathay Financial Holding Company, Ltd. | | | 347,161 | 454,870 |
| Cathay Real Estate Development Company, Ltd. | | | 41,000 | 28,294 |
| Celxpert Energy Corp. | | | 8,000 | 7,061 |
| Central Reinsurance Company, Ltd. | | | 18,666 | 12,237 |
| Chailease Holding Company, Ltd. | | | 49,397 | 183,821 |
| ChainQui Construction Development Company, Ltd. | | | 15,906 | 10,846 |
| Champion Building Materials Company, Ltd. (A) | | | 33,852 | 6,512 |
| Chang Hwa Commercial Bank, Ltd. | | | 100,669 | 76,921 |
| Chang Wah Electromaterials, Inc. | | | 2,909 | 15,122 |
| Chang Wah Technology Company, Ltd. | | | 30,000 | 27,145 |
| Channel Well Technology Company, Ltd. | | | 21,000 | 16,112 |
| Charoen Pokphand Enterprise | | | 11,465 | 23,039 |
| Chaun-Choung Technology Corp. | | | 4,000 | 29,393 |
| CHC Healthcare Group | | | 12,000 | 14,143 |
| Chen Full International Company, Ltd. | | | 11,000 | 12,333 |
| Chenbro Micom Company, Ltd. | | | 8,000 | 22,724 |
| Cheng Loong Corp. | | | 87,480 | 67,795 |
| Cheng Mei Materials Technology Corp. (A) | | | 46,050 | 10,243 |
| Cheng Shin Rubber Industry Company, Ltd. | | | 78,031 | 100,734 |
| Cheng Uei Precision Industry Company, Ltd. | | | 27,335 | 32,443 |
| Chia Chang Company, Ltd. | | | 10,000 | 12,012 |
| Chia Hsin Cement Corp. | | | 62,089 | 40,829 |
| Chian Hsing Forging Industrial Company, Ltd. | | | 4,000 | 5,750 |
| Chicony Electronics Company, Ltd. | | | 34,455 | 93,361 |
| Chicony Power Technology Company, Ltd. | | | 16,305 | 31,292 |
| Chilisin Electronics Corp. | | | 8,270 | 28,321 |
| China Airlines, Ltd. | | | 255,820 | 68,516 |
| China Bills Finance Corp. | | | 82,000 | 41,106 |
| China Chemical & Pharmaceutical Company, Ltd. | | | 24,000 | 15,843 |
| China Development Financial Holding Corp. | | | 292,531 | 87,853 |
| China Electric Manufacturing Corp. | | | 42,200 | 17,262 |
| China General Plastics Corp. | | | 23,847 | 15,263 |
| SEE NOTES TO FINANCIAL STATEMENTS | SEMIANNUAL REPORT | JOHN HANCOCK EMERGING MARKETS FUND | 59 |
| | | | | Shares | Value |
| Taiwan (continued) | | | | | |
| China Life Insurance Company, Ltd. (A) | | | 86,437 | $67,845 |
| China Man-Made Fiber Corp. | | | 56,732 | 13,527 |
| China Metal Products Company, Ltd. | | | 14,966 | 14,249 |
| China Motor Corp. | | | 17,162 | 19,865 |
| China Petrochemical Development Corp. | | | 210,047 | 55,554 |
| China Steel Chemical Corp. | | | 11,000 | 42,445 |
| China Steel Corp. | | | 549,038 | 416,272 |
| China Steel Structure Company, Ltd. | | | 7,000 | 5,407 |
| Ching Feng Home Fashions Company, Ltd. (A) | | | 11,000 | 12,595 |
| Chin-Poon Industrial Company, Ltd. | | | 28,642 | 27,802 |
| Chipbond Technology Corp. | | | 42,000 | 79,907 |
| ChipMOS Technologies, Inc. | | | 51,638 | 49,310 |
| Chong Hong Construction Company, Ltd. | | | 12,024 | 32,325 |
| Chroma ATE, Inc. | | | 12,440 | 57,363 |
| Chun YU Works & Company, Ltd. | | | 75,000 | 47,784 |
| Chun Yuan Steel Industry Company, Ltd. | | | 69,381 | 22,802 |
| Chung Hung Steel Corp. | | | 91,226 | 27,064 |
| Chung Hwa Pulp Corp. | | | 72,898 | 22,119 |
| Chung-Hsin Electric & Machinery Manufacturing Corp. | | | 37,125 | 31,683 |
| Chunghwa Telecom Company, Ltd. (C) | | | 107,000 | 379,216 |
| Cleanaway Company, Ltd. | | | 6,000 | 31,412 |
| Clevo Company | | | 34,120 | 34,262 |
| CMC Magnetics Corp. (A) | | | 72,201 | 18,763 |
| Compal Electronics, Inc. | | | 281,895 | 169,954 |
| Compeq Manufacturing Company, Ltd. | | | 97,000 | 121,816 |
| Concord Securities Company, Ltd. (A) | | | 88,940 | 20,645 |
| Concraft Holding Company, Ltd. | | | 4,972 | 21,590 |
| Continental Holdings Corp. | | | 48,950 | 19,735 |
| Contrel Technology Company, Ltd. | | | 18,000 | 8,759 |
| Coremax Corp. | | | 3,543 | 7,367 |
| Coretronic Corp. | | | 38,000 | 45,799 |
| Co-Tech Development Corp. | | | 21,743 | 25,913 |
| CTBC Financial Holding Company, Ltd. | | | 704,967 | 523,201 |
| CTCI Corp. | | | 32,000 | 38,829 |
| Cub Elecparts, Inc. | | | 3,958 | 25,868 |
| CviLux Corp. | | | 10,200 | 7,904 |
| CyberPower Systems, Inc. | | | 4,000 | 13,252 |
| CyberTAN Technology, Inc. | | | 43,000 | 20,533 |
| Cypress Technology Company, Ltd. | | | 4,500 | 11,332 |
| Dadi Early-Childhood Education Group, Ltd. | | | 4,123 | 28,484 |
| Dafeng TV, Ltd. | | | 9,097 | 12,289 |
| Darfon Electronics Corp. | | | 28,000 | 34,074 |
| Darwin Precisions Corp. | | | 39,894 | 16,935 |
| Daxin Materials Corp. | | | 6,000 | 16,512 |
| 60 | JOHN HANCOCK EMERGING MARKETS FUND | SEMIANNUAL REPORT | SEE NOTES TO FINANCIAL STATEMENTS |
| | | | | Shares | Value |
| Taiwan (continued) | | | | | |
| De Licacy Industrial Company, Ltd. | | | 37,187 | $27,890 |
| Delta Electronics, Inc. | | | 57,253 | 259,561 |
| Depo Auto Parts Industrial Company, Ltd. | | | 17,000 | 29,297 |
| D-Link Corp. (A) | | | 46,657 | 19,230 |
| Dynapack International Technology Corp. | | | 10,000 | 18,964 |
| E Ink Holdings, Inc. | | | 48,000 | 47,935 |
| E.Sun Financial Holding Company, Ltd. | | | 441,798 | 421,232 |
| Eastern Media International Corp. | | | 31,931 | 12,344 |
| Eclat Textile Company, Ltd. | | | 6,532 | 76,111 |
| ECOVE Environment Corp. | | | 4,000 | 28,962 |
| Edimax Technology Company, Ltd. (A) | | | 25,359 | 7,142 |
| Egis Technology, Inc. | | | 4,000 | 27,349 |
| Elan Microelectronics Corp. | | | 16,400 | 43,985 |
| E-LIFE MALL Corp. | | | 15,000 | 32,982 |
| Elite Advanced Laser Corp. | | | 12,276 | 27,670 |
| Elite Material Company, Ltd. | | | 17,831 | 69,695 |
| Elite Semiconductor Memory Technology, Inc. | | | 18,000 | 20,157 |
| Elitegroup Computer Systems Company, Ltd. (A) | | | 61,284 | 22,369 |
| eMemory Technology, Inc. | | | 5,000 | 51,105 |
| Ennoconn Corp. | | | 4,758 | 33,431 |
| EnTie Commercial Bank Company, Ltd. | | | 123,000 | 61,622 |
| Epistar Corp. (A) | | | 69,810 | 64,417 |
| Eson Precision Ind Company, Ltd. | | | 10,000 | 10,704 |
| Eternal Materials Company, Ltd. | | | 68,966 | 61,165 |
| Etron Technology, Inc. (A) | | | 7,000 | 1,615 |
| Eurocharm Holdings Company, Ltd. | | | 3,000 | 11,718 |
| Eva Airways Corp. | | | 348,332 | 137,189 |
| Everest Textile Company, Ltd. (A) | | | 53,492 | 14,015 |
| Evergreen International Storage & Transport Corp. | | | 35,320 | 16,086 |
| Evergreen Marine Corp. Taiwan, Ltd. (A) | | | 157,182 | 58,959 |
| Everlight Chemical Industrial Corp. | | | 61,748 | 29,966 |
| Everlight Electronics Company, Ltd. | | | 46,000 | 47,381 |
| Excelsior Medical Company, Ltd. | | | 10,760 | 18,613 |
| Far Eastern Department Stores, Ltd. | | | 79,558 | 63,233 |
| Far Eastern International Bank | | | 152,234 | 58,764 |
| Far Eastern New Century Corp. | | | 154,878 | 142,761 |
| Far EasTone Telecommunications Company, Ltd. | | | 63,000 | 136,699 |
| Faraday Technology Corp. | | | 15,751 | 22,494 |
| Farglory Land Development Company, Ltd. | | | 26,526 | 32,842 |
| Federal Corp. (A) | | | 44,137 | 16,552 |
| Feedback Technology Corp. | | | 4,300 | 8,594 |
| Feng Hsin Steel Company, Ltd. | | | 38,000 | 68,018 |
| Feng TAY Enterprise Company, Ltd. | | | 12,912 | 71,080 |
| First Financial Holding Company, Ltd. | | | 323,095 | 251,442 |
| SEE NOTES TO FINANCIAL STATEMENTS | SEMIANNUAL REPORT | JOHN HANCOCK EMERGING MARKETS FUND | 61 |
| | | | | Shares | Value |
| Taiwan (continued) | | | | | |
| First Hi-Tec Enterprise Company, Ltd. | | | 7,000 | $8,703 |
| First Hotel | | | 14,923 | 7,183 |
| First Steamship Company, Ltd. | | | 47,229 | 14,223 |
| FLEXium Interconnect, Inc. | | | 24,352 | 88,694 |
| Flytech Technology Company, Ltd. | | | 6,125 | 14,905 |
| FocalTech Systems Company, Ltd. (A) | | | 25,000 | 24,701 |
| Formosa Advanced Technologies Company, Ltd. | | | 20,000 | 26,245 |
| Formosa Chemicals & Fibre Corp. | | | 49,440 | 132,743 |
| Formosa International Hotels Corp. | | | 5,171 | 25,052 |
| Formosa Petrochemical Corp. | | | 15,000 | 41,896 |
| Formosa Plastics Corp. | | | 59,880 | 178,756 |
| Formosa Sumco Technology Corp. | | | 5,000 | 22,673 |
| Formosa Taffeta Company, Ltd. | | | 29,000 | 31,613 |
| Formosan Rubber Group, Inc. | | | 18,180 | 10,982 |
| Formosan Union Chemical | | | 52,566 | 25,804 |
| Founding Construction & Development Company, Ltd. | | | 49,908 | 25,893 |
| Foxconn Technology Company, Ltd. | | | 30,617 | 59,436 |
| Foxsemicon Integrated Technology, Inc. | | | 2,427 | 13,170 |
| FSP Technology, Inc. | | | 21,603 | 14,549 |
| Fubon Financial Holding Company, Ltd. | | | 250,422 | 362,493 |
| Fulgent Sun International Holding Company, Ltd. | | | 8,738 | 30,504 |
| Fulltech Fiber Glass Corp. | | | 33,357 | 13,104 |
| G Shank Enterprise Company, Ltd. | | | 16,562 | 11,882 |
| Gamania Digital Entertainment Company, Ltd. | | | 13,000 | 24,092 |
| GEM Services, Inc. | | | 8,580 | 16,210 |
| Gemtek Technology Corp. (A) | | | 26,496 | 19,577 |
| General Interface Solution Holding, Ltd. | | | 19,000 | 60,298 |
| Genius Electronic Optical Company, Ltd. | | | 4,952 | 79,006 |
| GeoVision, Inc. (A) | | | 1,703 | 1,472 |
| Getac Technology Corp. | | | 20,000 | 31,843 |
| Giant Manufacturing Company, Ltd. | | | 11,000 | 58,944 |
| Gigabyte Technology Company, Ltd. | | | 17,719 | 29,860 |
| Ginko International Company, Ltd. | | | 3,000 | 17,288 |
| Global Brands Manufacture, Ltd. | | | 26,611 | 12,173 |
| Global Lighting Technologies, Inc. | | | 7,000 | 29,161 |
| Global Mixed Mode Technology, Inc. | | | 2,000 | 7,006 |
| Global PMX Company, Ltd. | | | 4,000 | 19,713 |
| Global Unichip Corp. | | | 5,000 | 35,892 |
| Globalwafers Company, Ltd. | | | 13,000 | 168,225 |
| Globe Union Industrial Corp. | | | 27,450 | 14,752 |
| Gloria Material Technology Corp. | | | 41,300 | 22,757 |
| Gold Circuit Electronics, Ltd. (A) | | | 40,071 | 19,140 |
| Goldsun Building Materials Company, Ltd. | | | 61,005 | 25,852 |
| Gourmet Master Company, Ltd. | | | 4,494 | 13,768 |
| 62 | JOHN HANCOCK EMERGING MARKETS FUND | SEMIANNUAL REPORT | SEE NOTES TO FINANCIAL STATEMENTS |
| | | | | Shares | Value |
| Taiwan (continued) | | | | | |
| Grand Ocean Retail Group, Ltd. | | | 10,000 | $7,158 |
| Grand Pacific Petrochemical (A) | | | 92,000 | 49,347 |
| GrandTech CG Systems, Inc. | | | 11,550 | 15,837 |
| Grape King Bio, Ltd. | | | 7,000 | 50,058 |
| Great China Metal Industry | | | 35,000 | 26,614 |
| Great Taipei Gas Company, Ltd. | | | 60,000 | 62,822 |
| Great Wall Enterprise Company, Ltd. | | | 35,307 | 46,571 |
| Greatek Electronics, Inc. | | | 20,000 | 30,817 |
| Hannstar Board Corp. | | | 21,895 | 25,347 |
| HannStar Display Corp. | | | 120,980 | 26,036 |
| HannsTouch Solution, Inc. (A) | | | 53,514 | 19,070 |
| Hey Song Corp. | | | 38,250 | 40,907 |
| Highwealth Construction Corp. | | | 47,860 | 70,545 |
| Hitron Technology, Inc. | | | 8,267 | 6,443 |
| Hiwin Technologies Corp. | | | 9,118 | 88,500 |
| Ho Tung Chemical Corp. | | | 55,773 | 14,134 |
| Holtek Semiconductor, Inc. | | | 12,000 | 25,562 |
| Holy Stone Enterprise Company, Ltd. | | | 7,000 | 22,499 |
| Hon Hai Precision Industry Company, Ltd. | | | 230,352 | 601,094 |
| Hong Pu Real Estate Development Company, Ltd. | | | 25,000 | 19,130 |
| Hota Industrial Manufacturing Company, Ltd. | | | 12,396 | 46,141 |
| Hotai Motor Company, Ltd. | | | 10,000 | 202,589 |
| Hotron Precision Electronic Industrial Company, Ltd. | | | 11,991 | 14,731 |
| Hsin Yung Chien Company, Ltd. | | | 4,410 | 11,817 |
| Hsing TA Cement Company, Ltd. | | | 21,812 | 12,096 |
| HTC Corp. | | | 26,700 | 30,157 |
| Hu Lane Associate, Inc. | | | 9,066 | 23,724 |
| HUA ENG Wire & Cable Company, Ltd. (A) | | | 59,000 | 16,999 |
| Hua Nan Financial Holdings Company, Ltd. | | | 296,022 | 209,458 |
| Huaku Development Company, Ltd. | | | 12,353 | 35,031 |
| Huang Hsiang Construction Corp. | | | 18,000 | 19,730 |
| Hung Ching Development & Construction Company, Ltd. | | | 2,000 | 1,300 |
| Hung Sheng Construction, Ltd. (A) | | | 51,655 | 34,910 |
| Hwa Fong Rubber Industrial Company, Ltd. (A) | | | 24,324 | 10,037 |
| IBF Financial Holdings Company, Ltd. | | | 301,409 | 112,647 |
| IEI Integration Corp. | | | 19,080 | 28,492 |
| Innodisk Corp. | | | 6,471 | 38,164 |
| Innolux Corp. | | | 298,219 | 76,882 |
| Inpaq Technology Company, Ltd. | | | 6,650 | 6,727 |
| Intai Technology Corp. | | | 3,000 | 11,648 |
| Integrated Service Technology, Inc. (A) | | | 9,642 | 12,106 |
| International CSRC Investment Holdings Company | | | 55,797 | 49,123 |
| International Games System Company, Ltd. | | | 5,000 | 98,046 |
| Inventec Corp. | | | 144,705 | 108,425 |
| SEE NOTES TO FINANCIAL STATEMENTS | SEMIANNUAL REPORT | JOHN HANCOCK EMERGING MARKETS FUND | 63 |
| | | | | Shares | Value |
| Taiwan (continued) | | | | | |
| Iron Force Industrial Company, Ltd. | | | 6,000 | $17,812 |
| I-Sheng Electric Wire & Cable Company, Ltd. | | | 18,000 | 26,061 |
| ITE Technology, Inc. | | | 15,881 | 23,007 |
| ITEQ Corp. | | | 11,700 | 54,128 |
| Jarllytec Company, Ltd. | | | 6,000 | 16,269 |
| Jih Lin Technology Company, Ltd. | | | 5,000 | 9,087 |
| Jih Sun Financial Holdings Company, Ltd. | | | 95,843 | 31,303 |
| Jinli Group Holdings, Ltd. | | | 12,367 | 3,918 |
| Jourdeness Group, Ltd. | | | 3,000 | 8,667 |
| Kaimei Electronic Corp. | | | 4,093 | 5,015 |
| KEE TAI Properties Company, Ltd. | | | 24,973 | 9,176 |
| Kenda Rubber Industrial Company, Ltd. | | | 39,372 | 36,394 |
| Kenmec Mechanical Engineering Company, Ltd. (A) | | | 23,000 | 11,814 |
| Kerry TJ Logistics Company, Ltd. | | | 21,000 | 28,034 |
| Kindom Development Company, Ltd. | | | 23,000 | 19,641 |
| King Slide Works Company, Ltd. | | | 2,000 | 22,773 |
| King Yuan Electronics Company, Ltd. | | | 104,762 | 110,763 |
| Kingpak Technology, Inc. | | | 4,417 | 25,027 |
| King's Town Bank Company, Ltd. | | | 52,000 | 62,648 |
| King's Town Construction Company, Ltd. (A) | | | 9,514 | 9,438 |
| Kinik Company | | | 12,000 | 24,189 |
| Kinko Optical Company, Ltd. (A) | | | 10,000 | 7,839 |
| Kinpo Electronics, Inc. | | | 103,724 | 45,335 |
| Kinsus Interconnect Technology Corp. | | | 18,000 | 30,244 |
| KMC Kuei Meng International, Inc. | | | 10,150 | 33,025 |
| KS Terminals, Inc. | | | 14,000 | 18,407 |
| Kung Long Batteries Industrial Company, Ltd. | | | 5,000 | 24,396 |
| Kwong Lung Enterprise Company, Ltd. | | | 7,000 | 9,998 |
| L&K Engineering Company, Ltd. | | | 21,952 | 20,424 |
| LandMark Optoelectronics Corp. | | | 4,000 | 34,072 |
| Lanner Electronics, Inc. | | | 7,422 | 14,565 |
| Largan Precision Company, Ltd. | | | 3,000 | 424,352 |
| Lealea Enterprise Company, Ltd. | | | 54,863 | 15,824 |
| Lelon Electronics Corp. | | | 7,085 | 8,326 |
| Lextar Electronics Corp. | | | 28,000 | 14,089 |
| Li Cheng Enterprise Company, Ltd. | | | 11,261 | 13,659 |
| Li Peng Enterprise Company, Ltd. | | | 102,760 | 22,008 |
| Lian HWA Food Corp. | | | 13,301 | 17,898 |
| Lida Holdings, Ltd. | | | 4,640 | 5,258 |
| Lien Hwa Industrial Holdings Corp. | | | 22,265 | 27,677 |
| Lingsen Precision Industries, Ltd. (A) | | | 43,101 | 15,141 |
| Lite-On Technology Corp. | | | 131,250 | 186,859 |
| Long Bon International Company, Ltd. | | | 26,340 | 11,997 |
| Longchen Paper & Packaging Company, Ltd. | | | 44,511 | 26,369 |
| 64 | JOHN HANCOCK EMERGING MARKETS FUND | SEMIANNUAL REPORT | SEE NOTES TO FINANCIAL STATEMENTS |
| | | | | Shares | Value |
| Taiwan (continued) | | | | | |
| Longwell Company | | | 10,000 | $19,909 |
| Lotes Company, Ltd. | | | 5,139 | 49,075 |
| Lumax International Corp., Ltd. | | | 6,855 | 15,720 |
| Lung Yen Life Service Corp. | | | 13,000 | 25,883 |
| Macauto Industrial Company, Ltd. | | | 8,000 | 19,669 |
| Machvision, Inc. | | | 2,000 | 23,356 |
| Macronix International | | | 116,706 | 122,691 |
| Makalot Industrial Company, Ltd. | | | 13,253 | 64,584 |
| Materials Analysis Technology, Inc. | | | 5,810 | 12,743 |
| Mayer Steel Pipe Corp. | | | 16,407 | 8,354 |
| MediaTek, Inc. | | | 22,000 | 255,758 |
| Mega Financial Holding Company, Ltd. | | | 152,531 | 161,515 |
| Mercuries & Associates Holding, Ltd. (A) | | | 36,448 | 26,103 |
| Mercuries Life Insurance Company, Ltd. (A) | | | 64,285 | 24,674 |
| Merida Industry Company, Ltd. | | | 8,162 | 39,222 |
| Merry Electronics Company, Ltd. | | | 12,592 | 57,084 |
| Microbio Company, Ltd. (A) | | | 27,000 | 12,662 |
| Micro-Star International Company, Ltd. | | | 30,488 | 89,242 |
| Mildef Crete, Inc. | | | 4,000 | 5,775 |
| Mirle Automation Corp. | | | 20,033 | 22,863 |
| Mitac Holdings Corp. | | | 53,079 | 58,587 |
| momo.com, Inc. | | | 2,000 | 23,051 |
| Motech Industries, Inc. (A) | | | 44,364 | 10,036 |
| MPI Corp. | | | 7,000 | 16,011 |
| Nak Sealing Technologies Corp. | | | 5,000 | 10,945 |
| Namchow Holdings Company, Ltd. | | | 12,000 | 19,233 |
| Nan Kang Rubber Tire Company, Ltd. | | | 23,711 | 33,333 |
| Nan Liu Enterprise Company, Ltd. | | | 7,000 | 38,482 |
| Nan Ya Plastics Corp. | | | 77,860 | 173,952 |
| Nan Ya Printed Circuit Board Corp. (A) | | | 17,930 | 30,307 |
| Nantex Industry Company, Ltd. | | | 21,039 | 20,886 |
| Nanya Technology Corp. | | | 48,985 | 121,932 |
| National Petroleum Company, Ltd. | | | 17,000 | 23,799 |
| New Era Electronics Company, Ltd. | | | 9,000 | 4,670 |
| Nichidenbo Corp. | | | 13,477 | 23,014 |
| Nien Made Enterprise Company, Ltd. | | | 9,000 | 70,999 |
| Novatek Microelectronics Corp. | | | 30,000 | 188,801 |
| Nuvoton Technology Corp. | | | 13,083 | 17,521 |
| O-Bank Company, Ltd. (A) | | | 154,000 | 38,087 |
| OptoTech Corp. | | | 23,033 | 16,802 |
| Orient Semiconductor Electronics, Ltd. (A) | | | 30,000 | 12,470 |
| Oriental Union Chemical Corp. | | | 36,300 | 23,516 |
| Pacific Construction Company | | | 85,002 | 28,436 |
| Pacific Hospital Supply Company, Ltd. | | | 5,000 | 11,979 |
| SEE NOTES TO FINANCIAL STATEMENTS | SEMIANNUAL REPORT | JOHN HANCOCK EMERGING MARKETS FUND | 65 |
| | | | | Shares | Value |
| Taiwan (continued) | | | | | |
| Pan Jit International, Inc. | | | 44,100 | $34,674 |
| Pan-International Industrial Corp. | | | 35,443 | 22,474 |
| Parade Technologies, Ltd. | | | 4,000 | 86,218 |
| PCL Technologies, Inc. | | | 3,282 | 11,355 |
| Pegatron Corp. | | | 93,321 | 189,880 |
| Pharmally International Holding Company, Ltd. | | | 3,533 | 23,921 |
| Phihong Technology Company, Ltd. (A) | | | 40,786 | 10,849 |
| Phison Electronics Corp. | | | 5,000 | 53,415 |
| Planet Technology Corp. | | | 8,000 | 16,515 |
| Polytronics Technology Corp. | | | 4,000 | 8,266 |
| Pou Chen Corp. | | | 90,448 | 100,422 |
| Powertech Technology, Inc. | | | 64,000 | 209,343 |
| Poya International Company, Ltd. | | | 4,866 | 75,590 |
| President Chain Store Corp. | | | 27,000 | 263,570 |
| President Securities Corp. | | | 71,942 | 32,454 |
| Primax Electronics, Ltd. | | | 28,000 | 44,075 |
| Prince Housing & Development Corp. | | | 67,943 | 23,957 |
| Prodisc Technology, Inc. (A)(D) | | | 540,000 | 0 |
| Promate Electronic Company, Ltd. | | | 13,000 | 14,461 |
| Prosperity Dielectrics Company, Ltd. | | | 10,086 | 19,569 |
| Qisda Corp. | | | 120,440 | 73,652 |
| QST International Corp. | | | 8,000 | 15,815 |
| Quang Viet Enterprise Company, Ltd. | | | 5,000 | 21,978 |
| Quanta Computer, Inc. | | | 80,000 | 161,369 |
| Quanta Storage, Inc. | | | 14,000 | 13,801 |
| Radiant Opto-Electronics Corp. | | | 27,343 | 86,616 |
| Radium Life Tech Company, Ltd. | | | 42,476 | 14,023 |
| Rafael Microelectronics, Inc. | | | 3,000 | 12,465 |
| Realtek Semiconductor Corp. | | | 14,706 | 106,412 |
| Rechi Precision Company, Ltd. | | | 28,038 | 19,059 |
| Rich Development Company, Ltd. | | | 95,000 | 28,802 |
| Ritek Corp. (A) | | | 108,681 | 18,762 |
| Roo Hsing Company, Ltd. (A) | | | 43,000 | 14,149 |
| Ruentex Development Company, Ltd. (A) | | | 36,907 | 49,700 |
| Ruentex Industries, Ltd. (A) | | | 25,280 | 55,658 |
| Samebest Company, Ltd. | | | 3,360 | 9,914 |
| Sampo Corp. | | | 16,197 | 9,879 |
| San Fang Chemical Industry Company, Ltd. | | | 26,012 | 18,793 |
| San Far Property, Ltd. (A) | | | 19,688 | 13,288 |
| San Shing Fastech Corp. | | | 19,479 | 31,773 |
| Sanyang Motor Company, Ltd. | | | 50,389 | 34,079 |
| SCI Pharmtech, Inc. | | | 4,000 | 15,808 |
| Scientech Corp. | | | 5,000 | 8,520 |
| SDI Corp. | | | 9,000 | 17,190 |
| 66 | JOHN HANCOCK EMERGING MARKETS FUND | SEMIANNUAL REPORT | SEE NOTES TO FINANCIAL STATEMENTS |
| | | | | Shares | Value |
| Taiwan (continued) | | | | | |
| Senao Networks, Inc. | | | 4,000 | $13,933 |
| Sercomm Corp. | | | 17,000 | 40,777 |
| Sesoda Corp. | | | 36,104 | 28,729 |
| Shan-Loong Transportation Company, Ltd. | | | 21,000 | 20,648 |
| Sheng Yu Steel Company, Ltd. | | | 12,000 | 7,647 |
| Shihlin Electric & Engineering Corp. | | | 54,213 | 78,359 |
| Shin Hai Gas Corp. | | | 2,491 | 3,501 |
| Shin Kong Financial Holding Company, Ltd. | | | 228,305 | 68,070 |
| Shin Zu Shing Company, Ltd. | | | 8,933 | 39,805 |
| Shining Building Business Company, Ltd. (A) | | | 29,397 | 8,848 |
| Shinkong Insurance Company, Ltd. | | | 17,000 | 21,605 |
| Shinkong Synthetic Fibers Corp. | | | 77,287 | 30,684 |
| Shinkong Textile Company, Ltd. | | | 45,000 | 59,645 |
| Shiny Chemical Industrial Company, Ltd. | | | 7,954 | 24,516 |
| Sigurd Microelectronics Corp. | | | 30,842 | 34,184 |
| Silicon Integrated Systems Corp. (A) | | | 51,000 | 12,238 |
| Simplo Technology Company, Ltd. | | | 6,520 | 59,767 |
| Sinbon Electronics Company, Ltd. | | | 15,043 | 63,848 |
| Sincere Navigation Corp. | | | 31,930 | 14,058 |
| Sinmag Equipment Corp. | | | 8,441 | 28,384 |
| Sino-American Electronic Company, Ltd. (A)(D) | | | 10,961 | 0 |
| Sino-American Silicon Products, Inc. | | | 41,000 | 138,146 |
| Sinon Corp. | | | 65,150 | 41,367 |
| SinoPac Financial Holdings Company, Ltd. | | | 252,419 | 106,817 |
| Sinphar Pharmaceutical Company, Ltd. | | | 23,177 | 15,820 |
| Sinyi Realty, Inc. | | | 17,628 | 16,845 |
| Sirtec International Company, Ltd. | | | 9,600 | 9,046 |
| Sitronix Technology Corp. | | | 5,000 | 23,174 |
| Siward Crystal Technology Company, Ltd. | | | 23,000 | 13,818 |
| Solar Applied Materials Technology Company (A) | | | 34,843 | 25,062 |
| Solomon Technology Corp. | | | 11,000 | 7,035 |
| Sonix Technology Company, Ltd. | | | 21,000 | 23,413 |
| Southeast Cement Company, Ltd. | | | 70,000 | 38,449 |
| Sporton International, Inc. | | | 5,794 | 39,863 |
| St. Shine Optical Company, Ltd. | | | 4,000 | 51,898 |
| Standard Foods Corp. | | | 26,221 | 58,529 |
| Stark Technology, Inc. | | | 10,600 | 20,914 |
| Sunny Friend Environmental Technology Company, Ltd. | | | 5,000 | 40,546 |
| Sunonwealth Electric Machine Industry Company, Ltd. | | | 16,000 | 20,471 |
| Sunplus Technology Company, Ltd. (A) | | | 28,000 | 9,914 |
| Sunrex Technology Corp. | | | 21,937 | 22,654 |
| Sunspring Metal Corp. | | | 14,000 | 11,049 |
| Supreme Electronics Company, Ltd. | | | 22,890 | 23,195 |
| Swancor Holding Company, Ltd. | | | 4,402 | 10,738 |
| SEE NOTES TO FINANCIAL STATEMENTS | SEMIANNUAL REPORT | JOHN HANCOCK EMERGING MARKETS FUND | 67 |
| | | | | Shares | Value |
| Taiwan (continued) | | | | | |
| Sweeten Real Estate Development Company, Ltd. | | | 29,563 | $19,941 |
| Syncmold Enterprise Corp. | | | 14,250 | 39,874 |
| Synnex Technology International Corp. | | | 36,188 | 44,507 |
| Systex Corp. | | | 9,000 | 23,382 |
| TA Chen Stainless Pipe | | | 47,544 | 48,099 |
| Tah Hsin Industrial Corp. | | | 19,500 | 30,753 |
| TA-I Technology Company, Ltd. | | | 7,958 | 18,603 |
| Taichung Commercial Bank Company, Ltd. | | | 180,166 | 72,779 |
| Taiflex Scientific Company, Ltd. | | | 15,220 | 23,266 |
| Taimide Tech, Inc. | | | 13,492 | 18,452 |
| Tainan Spinning Company, Ltd. | | | 85,397 | 28,123 |
| Taishin Financial Holding Company, Ltd. | | | 355,210 | 165,009 |
| Taita Chemical Company, Ltd. | | | 18,360 | 5,667 |
| Taiwan Business Bank | | | 164,357 | 64,359 |
| Taiwan Cement Corp. | | | 225,041 | 310,786 |
| Taiwan Chinsan Electronic Industrial Company, Ltd. | | | 14,955 | 16,601 |
| Taiwan Cogeneration Corp. | | | 30,137 | 33,537 |
| Taiwan Cooperative Financial Holding Company, Ltd. | | | 190,002 | 130,538 |
| Taiwan FamilyMart Company, Ltd. | | | 2,000 | 14,427 |
| Taiwan Fertilizer Company, Ltd. | | | 25,000 | 39,369 |
| Taiwan Fire & Marine Insurance Company, Ltd. | | | 20,000 | 13,549 |
| Taiwan FU Hsing Industrial Company, Ltd. | | | 21,000 | 28,246 |
| Taiwan Glass Industry Corp. | | | 84,894 | 28,075 |
| Taiwan High Speed Rail Corp. | | | 84,000 | 94,749 |
| Taiwan Hon Chuan Enterprise Company, Ltd. | | | 20,329 | 39,397 |
| Taiwan Kolin Company, Ltd. (A)(D) | | | 400,000 | 0 |
| Taiwan Land Development Corp. (A) | | | 58,353 | 14,008 |
| Taiwan Mobile Company, Ltd. | | | 57,700 | 199,023 |
| Taiwan Navigation Company, Ltd. | | | 21,000 | 10,895 |
| Taiwan Paiho, Ltd. | | | 15,342 | 34,565 |
| Taiwan PCB Techvest Company, Ltd. | | | 30,227 | 31,606 |
| Taiwan Pulp & Paper Corp. | | | 24,000 | 16,039 |
| Taiwan Sakura Corp. | | | 18,924 | 28,941 |
| Taiwan Secom Company, Ltd. | | | 21,430 | 62,407 |
| Taiwan Semiconductor Company, Ltd. | | | 16,000 | 22,655 |
| Taiwan Semiconductor Manufacturing Company, Ltd. | | | 1,000,000 | 10,309,800 |
| Taiwan Shin Kong Security Company, Ltd. | | | 35,460 | 44,434 |
| Taiwan Styrene Monomer | | | 36,821 | 22,320 |
| Taiwan Surface Mounting Technology Corp. | | | 14,636 | 43,675 |
| Taiwan TEA Corp. | | | 43,723 | 22,649 |
| Taiwan Union Technology Corp. | | | 15,000 | 63,761 |
| Taiyen Biotech Company, Ltd. | | | 13,000 | 13,702 |
| Tatung Company, Ltd. (A) | | | 45,526 | 31,231 |
| TCI Company, Ltd. | | | 6,977 | 48,375 |
| 68 | JOHN HANCOCK EMERGING MARKETS FUND | SEMIANNUAL REPORT | SEE NOTES TO FINANCIAL STATEMENTS |
| | | | | Shares | Value |
| Taiwan (continued) | | | | | |
| Te Chang Construction Company, Ltd. | | | 6,282 | $6,174 |
| Teco Electric & Machinery Company, Ltd. | | | 56,109 | 49,029 |
| Tehmag Foods Corp. | | | 4,300 | 30,214 |
| Test Research, Inc. | | | 16,596 | 27,586 |
| Test Rite International Company, Ltd. | | | 17,549 | 11,632 |
| The Ambassador Hotel | | | 17,000 | 13,800 |
| The First Insurance Company, Ltd. | | | 51,165 | 23,350 |
| Thinking Electronic Industrial Company, Ltd. | | | 9,000 | 24,486 |
| Ton Yi Industrial Corp. | | | 77,000 | 27,085 |
| Tong Hsing Electronic Industries, Ltd. | | | 8,951 | 43,655 |
| Tong Yang Industry Company, Ltd. | | | 26,043 | 33,154 |
| Tong-Tai Machine & Tool Company, Ltd. | | | 18,590 | 9,674 |
| TOPBI International Holdings, Ltd. | | | 9,432 | 23,226 |
| Topco Scientific Company, Ltd. | | | 10,048 | 34,045 |
| Topco Technologies Corp. | | | 5,248 | 11,772 |
| Topkey Corp. | | | 5,000 | 19,862 |
| Topoint Technology Company, Ltd. | | | 17,223 | 11,135 |
| TPK Holding Company, Ltd. (A) | | | 23,000 | 33,416 |
| Transcend Information, Inc. | | | 10,000 | 25,577 |
| Tripod Technology Corp. | | | 32,770 | 117,624 |
| Tsang Yow Industrial Company, Ltd. | | | 8,000 | 4,505 |
| Tsann Kuen Enterprise Company, Ltd. | | | 12,220 | 6,420 |
| TSC Auto ID Technology Company, Ltd. | | | 3,190 | 21,979 |
| TSRC Corp. | | | 42,706 | 30,007 |
| Ttet Union Corp. | | | 8,000 | 32,274 |
| TTY Biopharm Company, Ltd. | | | 10,094 | 25,915 |
| Tung Ho Steel Enterprise Corp. | | | 89,138 | 65,740 |
| TURVO International Company, Ltd. | | | 7,162 | 14,103 |
| TXC Corp. | | | 16,659 | 25,742 |
| TYC Brother Industrial Company, Ltd. | | | 34,531 | 27,081 |
| Tycoons Group Enterprise (A) | | | 53,869 | 7,884 |
| Tyntek Corp. | | | 21,000 | 8,814 |
| Ultra Chip, Inc. | | | 4,000 | 3,242 |
| U-Ming Marine Transport Corp. | | | 31,000 | 29,575 |
| Unimicron Technology Corp. | | | 86,855 | 111,265 |
| Union Bank of Taiwan (A) | | | 104,449 | 37,713 |
| Uni-President Enterprises Corp. | | | 162,803 | 389,656 |
| Unitech Computer Company, Ltd. | | | 10,039 | 7,482 |
| Unitech Printed Circuit Board Corp. | | | 40,326 | 35,619 |
| United Integrated Services Company, Ltd. | | | 8,200 | 48,760 |
| United Microelectronics Corp. | | | 556,468 | 277,643 |
| United Orthopedic Corp. | | | 10,836 | 14,129 |
| United Renewable Energy Company, Ltd. (A) | | | 125,642 | 28,498 |
| Universal Cement Corp. | | | 20,819 | 12,145 |
| SEE NOTES TO FINANCIAL STATEMENTS | SEMIANNUAL REPORT | JOHN HANCOCK EMERGING MARKETS FUND | 69 |
| | | | | Shares | Value |
| Taiwan (continued) | | | | | |
| Universal Microwave Technology, Inc. | | | 3,734 | $9,691 |
| Unizyx Holding Corp. (A) | | | 32,000 | 16,067 |
| UPC Technology Corp. | | | 56,164 | 18,339 |
| USI Corp. | | | 60,318 | 23,694 |
| Utechzone Company, Ltd. | | | 4,000 | 6,876 |
| Vanguard International Semiconductor Corp. | | | 48,000 | 114,482 |
| Ve Wong Corp. | | | 9,450 | 8,339 |
| VHQ Media Holdings, Ltd. (A) | | | 3,000 | 8,863 |
| Victory New Materials, Ltd., Company | | | 22,077 | 9,515 |
| Visual Photonics Epitaxy Company, Ltd. | | | 9,275 | 29,332 |
| Voltronic Power Technology Corp. | | | 3,200 | 73,381 |
| Wafer Works Corp. | | | 37,000 | 40,635 |
| Waffer Technology Corp. | | | 13,000 | 5,012 |
| Wah Lee Industrial Corp. | | | 23,000 | 41,129 |
| Walsin Lihwa Corp. | | | 111,000 | 50,434 |
| Walsin Technology Corp. | | | 26,805 | 183,419 |
| Walton Advanced Engineering, Inc. | | | 35,000 | 11,656 |
| Wan Hai Lines, Ltd. | | | 68,216 | 38,729 |
| WAN HWA Enterprise Company | | | 2,975 | 1,252 |
| Wei Chuan Foods Corp. | | | 34,000 | 24,040 |
| Weikeng Industrial Company, Ltd. | | | 46,137 | 25,366 |
| Win Semiconductors Corp. | | | 16,582 | 144,733 |
| Winbond Electronics Corp. | | | 214,519 | 109,396 |
| Wintek Corp. (A)(D) | | | 819,661 | 0 |
| Wisdom Marine Lines Company, Ltd. (A) | | | 29,671 | 26,484 |
| Wistron Corp. | | | 211,382 | 185,479 |
| Wistron NeWeb Corp. | | | 13,483 | 30,413 |
| Wowprime Corp. | | | 5,000 | 11,122 |
| WPG Holdings, Ltd. | | | 90,779 | 115,317 |
| WT Microelectronics Company, Ltd. | | | 17,497 | 22,181 |
| WUS Printed Circuit Company, Ltd. | | | 19,260 | 20,023 |
| Xxentria Technology Materials Corp. | | | 12,124 | 24,741 |
| Yageo Corp. (C) | | | 12,284 | 158,648 |
| Yang Ming Marine Transport Corp. (A) | | | 73,613 | 16,771 |
| YC INOX Company, Ltd. | | | 27,100 | 22,804 |
| Yea Shin International Development Company, Ltd. | | | 27,260 | 13,631 |
| Yem Chio Company, Ltd. | | | 40,084 | 14,171 |
| YFC-Boneagle Electric Company, Ltd. | | | 20,000 | 14,558 |
| YFY, Inc. | | | 105,614 | 48,062 |
| Yieh Phui Enterprise Company, Ltd. | | | 113,896 | 33,892 |
| Yonyu Plastics Company, Ltd. | | | 10,450 | 11,290 |
| Youngtek Electronics Corp. | | | 9,058 | 14,703 |
| Yuanta Financial Holding Company, Ltd. | | | 414,369 | 259,055 |
| Yuanta Futures Company, Ltd. | | | 10,000 | 17,535 |
| 70 | JOHN HANCOCK EMERGING MARKETS FUND | SEMIANNUAL REPORT | SEE NOTES TO FINANCIAL STATEMENTS |
| | | | | Shares | Value |
| Taiwan (continued) | | | | | |
| Yulon Finance Corp. | | | 15,400 | $53,084 |
| Yulon Motor Company, Ltd. | | | 57,900 | 38,535 |
| YungShin Global Holding Corp. | | | 16,250 | 23,654 |
| Yungtay Engineering Company, Ltd. | | | 6,000 | 11,722 |
| Zeng Hsing Industrial Company, Ltd. | | | 7,232 | 30,533 |
| Zenitron Corp. | | | 21,000 | 13,907 |
| Zero One Technology Company, Ltd. | | | 9,000 | 8,796 |
| Zhen Ding Technology Holding, Ltd. | | | 27,450 | 103,264 |
| Zinwell Corp. | | | 28,000 | 15,622 |
| Zippy Technology Corp. | | | 18,000 | 21,026 |
| Thailand 2.7% | | | | | 6,341,321 |
| AAPICO Hitech PCL | | | 11,700 | 3,961 |
| Advanced Info Service PCL | | | 35,491 | 227,769 |
| AEON Thana Sinsap Thailand PCL, NVDR | | | 5,300 | 23,628 |
| After You PCL | | | 39,700 | 8,403 |
| Airports of Thailand PCL | | | 111,200 | 214,097 |
| Allianz Ayudhya General Insurance PCL | | | 12,100 | 14,646 |
| Amata Corp. PCL | | | 40,900 | 19,129 |
| Amata VN PCL | | | 1,500 | 190 |
| Ananda Development PCL | | | 153,600 | 7,604 |
| AP Thailand PCL | | | 139,778 | 27,399 |
| Asia Aviation PCL, NVDR (A) | | | 182,700 | 7,550 |
| Asian Insulators PCL | | | 1,650,880 | 55,293 |
| B Grimm Power PCL | | | 31,000 | 45,052 |
| Bangchak Corp. PCL | | | 47,400 | 36,661 |
| Bangkok Airways PCL | | | 63,400 | 9,477 |
| Bangkok Aviation Fuel Services PCL | | | 27,825 | 21,200 |
| Bangkok Bank PCL | | | 5,505 | 23,067 |
| Bangkok Chain Hospital PCL | | | 94,925 | 39,881 |
| Bangkok Dusit Medical Services PCL | | | 266,700 | 189,715 |
| Bangkok Expressway & Metro PCL | | | 320,625 | 95,314 |
| Bangkok Insurance PCL | | | 8,770 | 68,699 |
| Bangkok Land PCL | | | 927,800 | 30,525 |
| Bangkok Life Assurance PCL, NVDR | | | 48,860 | 24,238 |
| Banpu PCL (C) | | | 257,600 | 59,055 |
| Banpu Power PCL | | | 31,100 | 11,585 |
| Beauty Community PCL | | | 107,900 | 6,673 |
| BEC World PCL (A) | | | 97,000 | 13,731 |
| Berli Jucker PCL | | | 47,600 | 55,744 |
| Better World Green PCL | | | 256,000 | 2,822 |
| BTS Group Holdings PCL | | | 100,400 | 35,267 |
| Bumrungrad Hospital PCL | | | 16,200 | 67,087 |
| Cal-Comp Electronics Thailand PCL | | | 450,992 | 24,208 |
| SEE NOTES TO FINANCIAL STATEMENTS | SEMIANNUAL REPORT | JOHN HANCOCK EMERGING MARKETS FUND | 71 |
| | | | | Shares | Value |
| Thailand (continued) | | | | | |
| Carabao Group PCL | | | 8,300 | $19,063 |
| Central Pattana PCL | | | 71,200 | 121,609 |
| Central Plaza Hotel PCL | | | 26,800 | 15,578 |
| CH Karnchang PCL | | | 59,423 | 35,902 |
| Charoen Pokphand Foods PCL | | | 179,933 | 154,813 |
| Chularat Hospital PCL | | | 433,000 | 34,809 |
| CIMB Thai Bank PCL (A) | | | 279,200 | 4,380 |
| Com7 PCL | | | 38,300 | 27,419 |
| Country Group Development PCL (A) | | | 792,800 | 20,829 |
| CP ALL PCL | | | 172,800 | 364,168 |
| Delta Electronics Thailand PCL | | | 6,800 | 10,878 |
| Dhipaya Insurance PCL | | | 47,100 | 34,663 |
| Diamond Building Products PCL | | | 44,900 | 8,232 |
| Do Day Dream PCL | | | 13,600 | 7,405 |
| Dynasty Ceramic PCL | | | 351,500 | 19,326 |
| Eastern Polymer Group PCL | | | 43,500 | 5,677 |
| Eastern Water Resources Development & Management PCL | | | 84,800 | 29,011 |
| Electricity Generating PCL | | | 6,800 | 59,331 |
| Energy Absolute PCL | | | 43,100 | 54,411 |
| Esso Thailand PCL | | | 100,900 | 19,698 |
| Forth Smart Service PCL | | | 46,400 | 10,141 |
| GFPT PCL | | | 38,500 | 13,147 |
| Global Green Chemicals PCL | | | 34,900 | 10,397 |
| Global Power Synergy PCL | | | 25,782 | 52,216 |
| GMM Grammy PCL | | | 60,740 | 17,170 |
| Group Lease PCL, NVDR (A) | | | 54,000 | 5,497 |
| Gunkul Engineering PCL | | | 209,600 | 16,509 |
| Hana Microelectronics PCL | | | 30,200 | 32,684 |
| Home Product Center PCL | | | 187,212 | 76,596 |
| Indorama Ventures PCL | | | 64,100 | 54,437 |
| Intouch Holdings PCL | | | 16,900 | 29,281 |
| IRPC PCL | | | 258,800 | 18,554 |
| Italian-Thai Development PCL | | | 498,176 | 18,588 |
| Jasmine International PCL | | | 321,338 | 49,741 |
| JMT Network Services PCL | | | 28,100 | 16,535 |
| Kang Yong Electric PCL | | | 130 | 1,127 |
| Karmarts PCL | | | 68,500 | 7,136 |
| Kasikornbank PCL | | | 28,900 | 110,234 |
| KCE Electronics PCL | | | 30,300 | 21,702 |
| KGI Securities Thailand PCL | | | 114,400 | 15,632 |
| Khon Kaen Sugar Industry PCL | | | 152,300 | 10,373 |
| Kiatnakin Bank PCL | | | 18,000 | 35,775 |
| Krung Thai Bank PCL | | | 88,450 | 39,570 |
| Krungthai Card PCL | | | 40,000 | 49,957 |
| 72 | JOHN HANCOCK EMERGING MARKETS FUND | SEMIANNUAL REPORT | SEE NOTES TO FINANCIAL STATEMENTS |
| | | | | Shares | Value |
| Thailand (continued) | | | | | |
| Lam Soon Thailand PCL | | | 33,200 | $5,072 |
| Land & Houses PCL | | | 190,300 | 51,360 |
| LH Financial Group PCL | | | 781,500 | 31,504 |
| Loxley PCL (A) | | | 406,500 | 13,720 |
| LPN Development PCL | | | 58,200 | 7,827 |
| Major Cineplex Group PCL | | | 38,400 | 23,203 |
| Maybank Kim Eng Securities Thailand PCL | | | 75,200 | 13,669 |
| MBK PCL | | | 60,200 | 34,430 |
| MCOT PCL (A) | | | 41,000 | 8,711 |
| Mega Lifesciences PCL | | | 23,300 | 18,929 |
| Minor International PCL | | | 55,645 | 49,186 |
| MK Restaurants Group PCL | | | 19,500 | 37,367 |
| Muang Thai Insurance PCL | | | 2,600 | 6,003 |
| Muangthai Capital PCL | | | 24,600 | 45,648 |
| Namyong Terminal PCL | | | 75,400 | 8,302 |
| Netbay PCL | | | 13,600 | 12,207 |
| Origin Property PCL | | | 97,750 | 16,089 |
| PCS Machine Group Holding PCL | | | 93,600 | 16,498 |
| Plan B Media PCL | | | 115,800 | 19,108 |
| Polyplex Thailand PCL | | | 65,700 | 23,910 |
| Precious Shipping PCL (A) | | | 65,500 | 9,841 |
| Premier Marketing PCL | | | 40,200 | 7,831 |
| Prima Marine PCL | | | 49,900 | 7,697 |
| Property Perfect PCL | | | 853,200 | 16,827 |
| Pruksa Holding PCL | | | 55,600 | 25,403 |
| PTG Energy PCL | | | 64,500 | 29,307 |
| PTT Exploration & Production PCL | | | 74,328 | 253,610 |
| PTT Global Chemical PCL | | | 50,692 | 67,446 |
| PTT PCL | | | 346,400 | 434,265 |
| Pylon PCL | | | 52,000 | 7,792 |
| Quality Houses PCL | | | 489,271 | 35,299 |
| Raimon Land PCL | | | 304,600 | 6,648 |
| Rajthanee Hospital PCL | | | 15,900 | 11,529 |
| Ratch Group PCL | | | 21,600 | 40,721 |
| Ratchthani Leasing PCL | | | 108,812 | 17,823 |
| Regional Container Lines PCL (A) | | | 70,400 | 5,025 |
| Rojana Industrial Park PCL | | | 126,160 | 17,903 |
| RS PCL | | | 31,900 | 10,849 |
| Sabina PCL | | | 12,700 | 7,498 |
| Sahamitr Pressure Container PCL | | | 44,500 | 7,542 |
| Saha-Union PCL | | | 53,300 | 68,086 |
| Sahaviriya Steel Industries PCL (A)(D) | | | 447,113 | 20,475 |
| Samart Corp. PCL | | | 27,900 | 5,917 |
| Samart Telcoms PCL | | | 61,600 | 13,165 |
| SEE NOTES TO FINANCIAL STATEMENTS | SEMIANNUAL REPORT | JOHN HANCOCK EMERGING MARKETS FUND | 73 |
| | | | | Shares | Value |
| Thailand (continued) | | | | | |
| Sansiri PCL (C) | | | 773,509 | $17,617 |
| Sappe PCL | | | 17,100 | 9,005 |
| SC Asset Corp. PCL | | | 163,193 | 11,830 |
| SCG Ceramics PCL (A) | | | 245,263 | 8,556 |
| SEAFCO PCL | | | 64,500 | 11,483 |
| Sena Development PCL | | | 126,400 | 9,980 |
| Sermsang Power Corp. Company, Ltd. | | | 21,000 | 4,729 |
| Siam City Cement PCL | | | 2,541 | 12,664 |
| Siam Future Development PCL | | | 149,451 | 25,389 |
| Siam Global House PCL | | | 59,482 | 26,509 |
| Siam Wellness Group PCL | | | 24,400 | 7,965 |
| Siamgas & Petrochemicals PCL | | | 54,100 | 13,711 |
| Singha Estate PCL | | | 157,900 | 10,830 |
| Sino-Thai Engineering & Construction PCL | | | 50,900 | 24,437 |
| SNC Former PCL | | | 29,400 | 7,115 |
| Somboon Advance Technology PCL | | | 19,007 | 8,070 |
| SPCG PCL | | | 58,600 | 32,848 |
| Sri Trang Agro-Industry PCL | | | 72,700 | 27,567 |
| Srisawad Corp. PCL | | | 28,800 | 62,583 |
| Srithai Superware PCL | | | 372,800 | 5,734 |
| Star Petroleum Refining PCL | | | 119,000 | 30,470 |
| STP & I PCL | | | 122,600 | 18,588 |
| Supalai PCL | | | 77,450 | 40,294 |
| Super Energy Corp. PCL | | | 1,382,000 | 17,457 |
| Symphony Communication PCL | | | 52,750 | 3,847 |
| Synnex Thailand PCL | | | 53,020 | 9,745 |
| Taokaenoi Food & Marketing PCL | | | 45,400 | 11,701 |
| Tata Steel Thailand PCL (A) | | | 909,000 | 9,038 |
| Thai Agro Energy PCL | | | 101,300 | 8,071 |
| Thai Airways International PCL (A) | | | 101,911 | 12,804 |
| Thai Oil PCL | | | 41,300 | 58,134 |
| Thai Stanley Electric PCL | | | 4,900 | 22,158 |
| Thai Union Group PCL | | | 107,300 | 52,788 |
| Thai Vegetable Oil PCL | | | 23,500 | 20,629 |
| Thai Wah PCL | | | 59,300 | 6,373 |
| Thaicom PCL | | | 15,900 | 1,432 |
| Thaifoods Group PCL | | | 213,500 | 23,113 |
| Thanachart Capital PCL | | | 27,800 | 47,005 |
| The Erawan Group PCL | | | 96,000 | 11,171 |
| The Siam Cement PCL | | | 19,350 | 192,727 |
| The Siam Commercial Bank PCL | | | 31,231 | 87,672 |
| Thitikorn PCL | | | 62,000 | 17,798 |
| Tipco Asphalt PCL, NVDR | | | 31,100 | 18,769 |
| Tisco Financial Group PCL | | | 14,100 | 44,373 |
| 74 | JOHN HANCOCK EMERGING MARKETS FUND | SEMIANNUAL REPORT | SEE NOTES TO FINANCIAL STATEMENTS |
| | | | | Shares | Value |
| Thailand (continued) | | | | | |
| TMB Bank PCL | | | 1,424,210 | $49,745 |
| TMT Steel PCL | | | 109,600 | 13,312 |
| TOA Paint Thailand PCL | | | 10,900 | 10,873 |
| Total Access Communication PCL, NVDR | | | 43,800 | 51,430 |
| TPI Polene PCL | | | 404,300 | 16,131 |
| TPI Polene Power PCL | | | 106,000 | 13,421 |
| True Corp. PCL | | | 1,009,088 | 108,819 |
| TTCL PCL | | | 38,600 | 3,715 |
| TTW PCL | | | 81,700 | 36,062 |
| U City PCL (A) | | | 237,300 | 9,361 |
| Unique Engineering & Construction PCL | | | 61,580 | 12,497 |
| United Paper PCL | | | 53,800 | 16,199 |
| Univanich Palm Oil PCL | | | 42,900 | 6,255 |
| Univentures PCL | | | 60,000 | 6,118 |
| Vanachai Group PCL | | | 170,080 | 18,153 |
| VGI PCL | | | 52,800 | 11,292 |
| Vibhavadi Medical Center PCL | | | 102,900 | 4,831 |
| Vinythai PCL | | | 18,200 | 13,666 |
| WHA Corp. PCL | | | 343,300 | 30,277 |
| Workpoint Entertainment PCL | | | 11,640 | 3,272 |
| Turkey 0.8% | | | | | 1,866,505 |
| Akbank T.A.S. (A) | | | 67,088 | 72,735 |
| Aksa Akrilik Kimya Sanayii AS | | | 15,418 | 19,578 |
| Aksa Enerji Uretim AS (A) | | | 16,223 | 9,287 |
| Aksigorta AS | | | 18,431 | 18,738 |
| Alarko Holding AS | | | 17,568 | 15,854 |
| Anadolu Anonim Turk Sigorta Sirketi | | | 30,541 | 23,674 |
| Anadolu Cam Sanayii AS | | | 19,843 | 12,087 |
| Anadolu Efes Biracilik Ve Malt Sanayii AS | | | 5,894 | 20,987 |
| Arcelik AS (A) | | | 9,571 | 28,674 |
| Aselsan Elektronik Sanayi Ve Ticaret AS | | | 4,607 | 20,402 |
| Aygaz AS | | | 6,627 | 12,110 |
| BIM Birlesik Magazalar AS | | | 19,900 | 153,828 |
| Brisa Bridgestone Sabanci Sanayi ve Ticaret AS (A) | | | 1,525 | 2,167 |
| Cimsa Cimento Sanayi ve Ticaret AS (A) | | | 5,408 | 7,843 |
| Coca-Cola Icecek AS | | | 5,083 | 36,665 |
| Dogan Sirketler Grubu Holding AS | | | 109,297 | 30,401 |
| EGE Endustri VE Ticaret AS | | | 135 | 14,416 |
| EIS Eczacibasi Ilac ve Sinai ve Finansal Yatirimlar Sanayi ve Ticaret AS | | | 18,801 | 11,580 |
| Enerjisa Enerji AS (B) | | | 21,617 | 26,993 |
| Enka Insaat ve Sanayi AS | | | 23,762 | 24,605 |
| Eregli Demir ve Celik Fabrikalari TAS | | | 64,505 | 86,064 |
| Fenerbahce Futbol AS (A) | | | 3,066 | 5,788 |
| SEE NOTES TO FINANCIAL STATEMENTS | SEMIANNUAL REPORT | JOHN HANCOCK EMERGING MARKETS FUND | 75 |
| | | | | Shares | Value |
| Turkey (continued) | | | | | |
| Ford Otomotiv Sanayi AS | | | 2,343 | $29,573 |
| Goldas Kuyumculuk Sanayi Ithalat Ve Bagli Ortakliklari (A)(D) | | | 54,847 | 832 |
| Goodyear Lastikleri TAS | | | 8,064 | 5,664 |
| Gozde Girisim Sermayesi Yatirim Ortakligi AS (A) | | | 18,570 | 11,209 |
| Gubre Fabrikalari TAS (A)(C) | | | 14,222 | 38,729 |
| Hektas Ticaret TAS (C) | | | 10,299 | 15,925 |
| Ipek Dogal Enerji Kaynaklari Arastirma Ve Uretim AS (A) | | | 8,657 | 12,982 |
| Kardemir Karabuk Demir Celik Sanayi ve Ticaret AS, Class A | | | 28,833 | 11,963 |
| Kardemir Karabuk Demir Celik Sanayi ve Ticaret AS, Class D | | | 92,916 | 39,203 |
| Kerevitas Gida Sanayi ve Ticaret AS (A) | | | 15,040 | 8,208 |
| KOC Holding AS | | | 12,619 | 35,165 |
| Kordsa Teknik Tekstil AS | | | 9,990 | 22,311 |
| Koza Altin Isletmeleri AS (A) | | | 2,415 | 28,314 |
| Koza Anadolu Metal Madencilik Isletmeleri AS (A) | | | 17,083 | 31,068 |
| Logo Yazilim Sanayi Ve Ticaret AS (A) | | | 1,627 | 19,752 |
| Migros Ticaret AS (A) | | | 5,109 | 17,954 |
| NET Holding AS (A) | | | 21,691 | 6,954 |
| Netas Telekomunikasyon AS (A) | | | 3,698 | 7,666 |
| Otokar Otomotiv ve Savunma Sanayi AS | | | 263 | 6,363 |
| Pegasus Hava Tasimaciligi AS (A) | | | 3,928 | 34,107 |
| Petkim Petrokimya Holding AS (A) | | | 53,903 | 31,497 |
| Sasa Polyester Sanayi AS | | | 9,888 | 13,844 |
| Sekerbank Turk AS (A) | | | 38,101 | 6,772 |
| Selcuk Ecza Deposu Ticaret ve Sanayi AS | | | 19,385 | 20,676 |
| Soda Sanayii AS | | | 16,232 | 15,049 |
| TAV Havalimanlari Holding AS | | | 14,239 | 46,646 |
| Tekfen Holding AS | | | 13,332 | 31,869 |
| Tofas Turk Otomobil Fabrikasi AS | | | 7,397 | 31,545 |
| Trakya Cam Sanayii AS | | | 27,339 | 14,655 |
| Tupras Turkiye Petrol Rafinerileri AS | | | 4,130 | 67,379 |
| Turk Hava Yollari AO (A) | | | 41,064 | 77,620 |
| Turk Telekomunikasyon AS (A) | | | 16,647 | 20,145 |
| Turk Traktor ve Ziraat Makineleri AS (A) | | | 1,046 | 9,977 |
| Turkcell Iletisim Hizmetleri AS | | | 54,660 | 121,614 |
| Turkiye Garanti Bankasi AS (A) | | | 77,923 | 119,291 |
| Turkiye Halk Bankasi AS (A) | | | 19,041 | 18,244 |
| Turkiye Is Bankasi AS, Class C (A) | | | 32,898 | 30,295 |
| Turkiye Sinai Kalkinma Bankasi AS (A) | | | 138,276 | 24,467 |
| Turkiye Sise ve Cam Fabrikalari AS | | | 38,799 | 30,253 |
| Turkiye Vakiflar Bankasi TAO, Class D (A) | | | 34,357 | 29,228 |
| Ulker Biskuvi Sanayi AS (A) | | | 4,197 | 13,914 |
| Vestel Elektronik Sanayi ve Ticaret AS (A) | | | 8,546 | 19,195 |
| Yapi ve Kredi Bankasi AS (A) | | | 46,073 | 16,948 |
| Yatas Yatak ve Yorgan Sanayi ve Ticaret AS (A) | | | 13,870 | 16,964 |
| 76 | JOHN HANCOCK EMERGING MARKETS FUND | SEMIANNUAL REPORT | SEE NOTES TO FINANCIAL STATEMENTS |
| | | | | Shares | Value |
| Ukraine 0.0% | | | | | $76,178 |
| Kernel Holding SA | | | 6,902 | 76,178 |
| United States 0.1% | | | | | 120,006 |
| Bizlink Holding, Inc. | | | 7,064 | 43,168 |
| Nexteer Automotive Group, Ltd. | | | 71,000 | 53,030 |
|
| Textainer Group Holdings, Ltd. (A) | | | 3,173 | 23,808 |
| Preferred securities 2.2% | | | | | $5,136,219 |
| (Cost $4,471,674) | | | | | |
| Brazil 2.0% | | | | | 4,787,993 |
| AES Tiete Energia SA | | | 677 | 436 |
| Alpargatas SA | | | 9,378 | 66,142 |
| Azul SA (A) | | | 14,874 | 147,812 |
| Banco ABC Brasil SA | | | 5,183 | 23,157 |
| Banco Bradesco SA | | | 126,962 | 866,779 |
| Banco do Estado do Rio Grande do Sul SA, B Shares | | | 15,855 | 64,350 |
| Banco Pan SA | | | 10,065 | 20,256 |
| Centrais Eletricas Brasileiras SA, B Shares | | | 6,554 | 52,542 |
| Centrais Eletricas Santa Catarina | | | 2,300 | 30,731 |
| Cia de Saneamento do Parana | | | 30,381 | 134,516 |
| Cia de Transmissao de Energia Eletrica Paulista | | | 8,072 | 39,783 |
| Cia Energetica de Minas Gerais | | | 33,044 | 103,154 |
| Cia Energetica de Sao Paulo, B Shares | | | 8,098 | 59,034 |
| Cia Energetica do Ceara, A Shares | | | 1,300 | 18,253 |
| Cia Ferro Ligas da Bahia | | | 4,476 | 17,856 |
| Cia Paranaense de Energia, B Shares | | | 5,700 | 91,403 |
| Eucatex SA Industria e Comercio | | | 10,900 | 16,575 |
| Gerdau SA | | | 55,200 | 208,980 |
| Gol Linhas Aereas Inteligentes SA (A) | | | 6,900 | 39,500 |
| Itau Unibanco Holding SA | | | 108,661 | 777,556 |
| Lojas Americanas SA | | | 7,675 | 45,653 |
| Marcopolo SA | | | 33,745 | 36,975 |
| Petroleo Brasileiro SA | | | 286,638 | 1,624,233 |
| Randon SA Implementos e Participacoes | | | 12,025 | 31,408 |
| Telefonica Brasil SA | | | 15,999 | 190,976 |
| Unipar Carbocloro SA | | | 4,601 | 27,574 |
| Usinas Siderurgicas de Minas Gerais SA, A Shares | | | 28,659 | 52,359 |
| Chile 0.1% | | | | | 142,945 |
| Coca-Cola Embonor SA, B Shares | | | 18,333 | 25,265 |
| Embotelladora Andina SA, B Shares | | | 20,258 | 48,932 |
| Sociedad Quimica y Minera de Chile SA, B Shares | | | 2,596 | 68,748 |
| Colombia 0.1% | | | | | 176,556 |
| Bancolombia SA | | | 7,600 | 90,875 |
| Grupo Argos SA | | | 4,425 | 15,717 |
| SEE NOTES TO FINANCIAL STATEMENTS | SEMIANNUAL REPORT | JOHN HANCOCK EMERGING MARKETS FUND | 77 |
| | | | | Shares | Value |
| Colombia (continued) | | | | | |
| Grupo Aval Acciones y Valores SA | | | 106,446 | $43,858 |
| Grupo de Inversiones Suramericana SA | | | 3,480 | 26,106 |
| Panama 0.0% | | | | | 27,567 |
| Avianca Holdings SA | | | 59,155 | 27,567 |
| South Korea 0.0% | | | | | 1,158 |
|
| AMOREPACIFIC Group (A) | | | 33 | 1,158 |
| Investment companies 0.1% | | | | | $165,712 |
| (Cost $102,673) | | | | | |
| South Korea 0.1% | | | | | 165,712 |
|
| Macquarie Korea Infrastructure Fund (C) | | | | 18,095 | 165,712 |
| Rights 0.0% | | | | | $1,375 |
| (Cost $0) | | | | | |
| Bajaj Electricals, Ltd. (Expiration Date: 3-4-20; Strike Price: INR 310.00) (A) | | 187 | 242 |
| ITEQ Corp. (Expiration Date: 3-26-20; Strike Price: TWD 110.00) (A) | | 926 | 1,024 |
| Yuanta Futures Company, Ltd. (Expiration Date: 3-23-20; Strike Price: TWD 48.00) (A) | | 609 | 109 |
| Warrants 0.0% | | | | | $509 |
| (Cost $0) | | | | | |
| BTS Group Holdings PCL (Expiration Date: 2-16-21; Strike Price: THB 14.00) (A) | | 18,690 | 509 |
|
| | | Yield (%) | | Shares | Value |
| Short-term investments 2.3% | | | | $5,393,448 |
| (Cost $5,391,123) | | | | | |
| Short-term funds 2.3% | | | | | 5,393,448 |
| John Hancock Collateral Trust (E) | 1.6968(F) | | 538,865 | 5,393,448 |
|
| Total investments (Cost $215,365,826) 101.5% | | | $239,007,003 |
| Other assets and liabilities, net (1.5%) | | | (3,469,059) |
| Total net assets 100.0% | | | | | $235,537,944 |
| The percentage shown for each investment category is the total value of the category as a percentage of the net assets of the fund. |
| Currency Abbreviations |
| INR | Indian Rupee |
| THB | Thai Bhat |
| TWD | New Taiwan Dollar |
| Security Abbreviations and Legend |
| ADR | American Depositary Receipt |
| GDR | Global Depositary Receipt |
| NVDR | Non-Voting Depositary Receipt |
| (A) | Non-income producing security. |
| (B) | These securities are exempt from registration under Rule 144A of the Securities Act of 1933. Such securities may be resold, normally to qualified institutional buyers, in transactions exempt from registration. |
| (C) | All or a portion of this security is on loan as of 2-29-20. |
| 78 | JOHN HANCOCK EMERGING MARKETS FUND | SEMIANNUAL REPORT | SEE NOTES TO FINANCIAL STATEMENTS |
| (D) | Security is valued using significant unobservable inputs and is classified as Level 3 in the fair value hierarchy. Refer to Note 2 to the financial statements. |
| (E) | Investment is an affiliate of the fund, the advisor and/or subadvisor. This security represents the investment of cash collateral received for securities lending. |
| (F) | The rate shown is the annualized seven-day yield as of 2-29-20. |
At 2-29-20, the aggregate cost of investments for federal income tax purposes was $217,888,331. Net unrealized appreciation aggregated to $21,118,672, of which $75,769,107 related to gross unrealized appreciation and $54,650,435 related to gross unrealized depreciation.
| SEE NOTES TO FINANCIAL STATEMENTS | SEMIANNUAL REPORT | JOHN HANCOCK EMERGING MARKETS FUND | 79 |
AS OF 2-29-20 (unaudited)
| | | | | Shares | Value |
| Common stocks 97.8% | | | | | $720,329,213 |
| (Cost $724,522,341) | | | | | |
| Australia 6.0% | | | | | 43,930,446 |
| 3P Learning, Ltd. (A) | | | 21,580 | 9,652 |
| 88 Energy, Ltd. (A)(B) | | | 1,302,538 | 17,243 |
| A2B Australia, Ltd. | | | 32,294 | 25,857 |
| Accent Group, Ltd. | | | 152,916 | 165,834 |
| Adairs, Ltd. | | | 62,064 | 98,758 |
| Adelaide Brighton, Ltd. | | | 165,602 | 327,142 |
| Aeon Metals, Ltd. (A) | | | 46,964 | 3,490 |
| Ainsworth Game Technology, Ltd. (A) | | | 47,462 | 21,710 |
| Alkane Resources, Ltd. (A)(B) | | | 70,849 | 35,919 |
| Alliance Aviation Services, Ltd. | | | 39,423 | 60,784 |
| ALS, Ltd. | | | 23,278 | 128,711 |
| Altium, Ltd. | | | 1,815 | 37,234 |
| AMA Group, Ltd. | | | 219,236 | 74,871 |
| Amaysim Australia, Ltd. (A) | | | 59,212 | 11,420 |
| Ansell, Ltd. | | | 46,494 | 909,546 |
| AP Eagers, Ltd. | | | 60,022 | 348,503 |
| Appen, Ltd. | | | 2,641 | 36,552 |
| ARB Corp., Ltd. | | | 31,149 | 351,761 |
| Ardent Leisure Group, Ltd. (A) | | | 246,137 | 145,859 |
| ARQ Group, Ltd. | | | 37,941 | 2,858 |
| Asaleo Care, Ltd. (A) | | | 161,404 | 110,924 |
| AUB Group, Ltd. | | | 32,860 | 297,628 |
| Aurelia Metals, Ltd. | | | 370,198 | 94,938 |
| Austal, Ltd. | | | 131,483 | 303,650 |
| Austin Engineering, Ltd. (A) | | | 63,990 | 6,522 |
| Australian Agricultural Company, Ltd. (A)(B) | | | 176,180 | 126,618 |
| Australian Finance Group, Ltd. (B) | | | 36,142 | 61,028 |
| Australian Pharmaceutical Industries, Ltd. | | | 171,294 | 134,255 |
| Australian Vintage, Ltd. | | | 84,634 | 26,264 |
| Auswide Bank, Ltd. | | | 4,752 | 18,320 |
| AVJennings, Ltd. | | | 46,118 | 16,167 |
| AVZ Minerals, Ltd. (A)(B) | | | 229,173 | 13,152 |
| Baby Bunting Group, Ltd. | | | 24,483 | 48,187 |
| Bank of Queensland, Ltd. (B) | | | 138,661 | 682,005 |
| Bapcor, Ltd. | | | 117,060 | 450,846 |
| Base Resources, Ltd. (A) | | | 88,900 | 11,080 |
| Bega Cheese, Ltd. (B) | | | 74,305 | 189,805 |
| Bell Financial Group, Ltd. | | | 16,891 | 12,482 |
| Bingo Industries, Ltd. | | | 94,154 | 177,967 |
| Blackmores, Ltd. (B) | | | 3,336 | 140,974 |
| SEE NOTES TO FINANCIAL STATEMENTS | SEMIANNUAL REPORT | JOHN HANCOCK INTERNATIONAL SMALL COMPANY FUND | 1 |
| | | | | Shares | Value |
| Australia (continued) | | | | | |
| Blue Energy, Ltd. (A) | | | 150,000 | $3,563 |
| Blue Sky Alternative Investments, Ltd. (A)(C) | | | 12,467 | 1,278 |
| Bravura Solutions, Ltd. | | | 110,298 | 330,903 |
| Breville Group, Ltd. | | | 35,116 | 451,659 |
| Brickworks, Ltd. | | | 30,318 | 357,907 |
| Buru Energy, Ltd. (A) | | | 64,288 | 5,682 |
| BWX, Ltd. (B) | | | 43,716 | 116,915 |
| Capitol Health, Ltd. | | | 292,400 | 57,815 |
| Capral, Ltd. (B) | | | 185,374 | 14,178 |
| Cardno, Ltd. (A) | | | 82,690 | 22,746 |
| Carnarvon Petroleum, Ltd. (A) | | | 148,061 | 23,828 |
| carsales.com, Ltd. | | | 80,566 | 861,753 |
| Cash Converters International, Ltd. (A) | | | 122,755 | 15,643 |
| Castile Resources Pty, Ltd. (A) | | | 38,038 | 3,965 |
| Catapult Group International, Ltd. (A) | | | 14,492 | 14,406 |
| Cedar Woods Properties, Ltd. | | | 23,251 | 107,140 |
| Centuria Capital Group | | | 70,912 | 117,394 |
| Champion Iron, Ltd. (A) | | | 40,246 | 53,460 |
| City Chic Collective, Ltd. | | | 45,494 | 83,054 |
| Civmec, Ltd. | | | 40,300 | 10,910 |
| Class, Ltd. | | | 16,518 | 16,739 |
| Clean Seas Seafood, Ltd. (A) | | | 16,659 | 7,185 |
| Clean TeQ Holdings, Ltd. (A)(B) | | | 52,229 | 7,195 |
| Cleanaway Waste Management, Ltd. | | | 580,292 | 868,037 |
| ClearView Wealth, Ltd. (A) | | | 34,533 | 7,614 |
| Clinuvel Pharmaceuticals, Ltd. (B) | | | 13,676 | 160,650 |
| Clover Corp., Ltd. | | | 51,463 | 87,288 |
| CML Group, Ltd. | | | 30,000 | 10,214 |
| Codan, Ltd. | | | 50,990 | 239,931 |
| Collection House, Ltd. (C) | | | 61,068 | 43,164 |
| Collins Foods, Ltd. | | | 50,133 | 289,462 |
| Cooper Energy, Ltd. (A) | | | 789,650 | 254,346 |
| Corporate Travel Management, Ltd. | | | 33,243 | 305,324 |
| Costa Group Holdings, Ltd. (B) | | | 163,641 | 319,891 |
| Credit Corp. Group, Ltd. | | | 25,443 | 553,230 |
| CSR, Ltd. | | | 212,881 | 588,926 |
| CuDeco, Ltd. (A)(C) | | | 21,846 | 2,760 |
| Data#3, Ltd. | | | 57,191 | 154,416 |
| Decmil Group, Ltd. | | | 73,791 | 18,832 |
| Dicker Data, Ltd. | | | 6,644 | 25,794 |
| Domain Holdings Australia, Ltd. | | | 101,226 | 212,932 |
| Domino's Pizza Enterprises, Ltd. | | | 1,364 | 49,925 |
| Dongfang Modern Agriculture Holding Group, Ltd. (A)(C) | | | 26,600 | 14,383 |
| Downer EDI, Ltd. | | | 8,343 | 31,511 |
| 2 | JOHN HANCOCK INTERNATIONAL SMALL COMPANY FUND | SEMIANNUAL REPORT | SEE NOTES TO FINANCIAL STATEMENTS |
| | | | | Shares | Value |
| Australia (continued) | | | | | |
| DWS, Ltd. | | | 21,883 | $14,028 |
| Eclipx Group, Ltd. (A)(B) | | | 121,486 | 116,307 |
| Elanor Investor Group | | | 10,005 | 13,251 |
| Elders, Ltd. | | | 64,462 | 329,933 |
| Electro Optic Systems Holdings, Ltd. (A) | | | 21,990 | 105,939 |
| Ellex Medical Lasers, Ltd. (A) | | | 38,902 | 17,789 |
| Emeco Holdings, Ltd. (A) | | | 105,418 | 132,920 |
| EML Payments, Ltd. (A) | | | 107,172 | 257,173 |
| Energy World Corp., Ltd. (A)(B) | | | 226,411 | 9,678 |
| Enero Group, Ltd. | | | 10,415 | 10,953 |
| EQT Holdings, Ltd. | | | 5,831 | 107,835 |
| Estia Health, Ltd. | | | 90,635 | 114,841 |
| Euroz, Ltd. | | | 51,500 | 31,756 |
| EVENT Hospitality and Entertainment, Ltd. | | | 33,983 | 256,024 |
| FAR, Ltd. (A) | | | 1,355,490 | 19,619 |
| Finbar Group, Ltd. | | | 71,892 | 41,756 |
| Fleetwood Corp., Ltd. (A) | | | 32,879 | 38,943 |
| FlexiGroup, Ltd. | | | 133,394 | 134,960 |
| Flight Centre Travel Group, Ltd. | | | 5,544 | 118,915 |
| Freedom Foods Group, Ltd. (B) | | | 26,992 | 72,761 |
| G8 Education, Ltd. | | | 181,312 | 194,163 |
| Galaxy Resources, Ltd. (A)(B) | | | 116,511 | 68,621 |
| Gascoyne Resources, Ltd. (Australian Securities Exchange) (A)(C) | | | 38,731 | 984 |
| Genworth Mortgage Insurance Australia, Ltd. | | | 113,830 | 240,415 |
| Gold Road Resources, Ltd. (A) | | | 107,334 | 101,202 |
| GrainCorp, Ltd., Class A (A) | | | 78,923 | 405,388 |
| Grange Resources, Ltd. (B) | | | 312,240 | 45,832 |
| Greenland Minerals, Ltd. (A) | | | 176,827 | 9,425 |
| GUD Holdings, Ltd. | | | 37,892 | 265,275 |
| GWA Group, Ltd. | | | 96,436 | 209,038 |
| Hansen Technologies, Ltd. | | | 82,044 | 171,378 |
| Healius, Ltd. | | | 201,676 | 404,830 |
| Helloworld Travel, Ltd. | | | 18,369 | 39,122 |
| Highfield Resources, Ltd. (A) | | | 40,292 | 16,163 |
| Horizon Oil, Ltd. (A) | | | 443,056 | 21,989 |
| HT&E, Ltd. | | | 111,610 | 98,456 |
| HUB24, Ltd. | | | 17,864 | 119,436 |
| Huon Aquaculture Group, Ltd. | | | 8,993 | 25,089 |
| IGO, Ltd. | | | 175,402 | 609,718 |
| Iluka Resources, Ltd. | | | 117,851 | 647,971 |
| Imdex, Ltd. | | | 170,178 | 174,611 |
| IMF Bentham, Ltd. | | | 124,788 | 349,924 |
| Infigen Energy | | | 395,869 | 166,369 |
| Infomedia, Ltd. | | | 116,729 | 163,716 |
| SEE NOTES TO FINANCIAL STATEMENTS | SEMIANNUAL REPORT | JOHN HANCOCK INTERNATIONAL SMALL COMPANY FUND | 3 |
| | | | | Shares | Value |
| Australia (continued) | | | | | |
| Inghams Group, Ltd. | | | 113,255 | $256,654 |
| Intega Group, Ltd. (A) | | | 82,690 | 23,833 |
| Integral Diagnostics, Ltd. | | | 42,727 | 111,434 |
| Integrated Research, Ltd. | | | 23,574 | 43,235 |
| International Ferro Metals, Ltd. (A)(C) | | | 9,556 | 0 |
| InvoCare, Ltd. (B) | | | 46,351 | 441,627 |
| IOOF Holdings, Ltd. | | | 138,916 | 521,139 |
| IPH, Ltd. | | | 75,044 | 418,336 |
| IRESS, Ltd. | | | 61,852 | 483,765 |
| iSelect, Ltd. (A) | | | 77,196 | 16,183 |
| iSentia Group, Ltd. (A) | | | 35,198 | 4,871 |
| IVE Group, Ltd. | | | 65,357 | 74,697 |
| Japara Healthcare, Ltd. | | | 86,081 | 50,757 |
| JB Hi-Fi, Ltd. | | | 43,039 | 1,040,776 |
| Johns Lyng Group, Ltd. | | | 5,584 | 9,323 |
| Jumbo Interactive, Ltd. | | | 11,374 | 82,996 |
| Jupiter Mines, Ltd. | | | 501,589 | 79,178 |
| Karoon Energy, Ltd. (A) | | | 207,617 | 116,406 |
| Kingsgate Consolidated, Ltd. (A) | | | 71,822 | 21,091 |
| Kogan.com, Ltd. (B) | | | 14,203 | 41,865 |
| Lifestyle Communities, Ltd. (B) | | | 19,235 | 102,358 |
| Link Administration Holdings, Ltd. | | | 99,342 | 308,056 |
| Lovisa Holdings, Ltd. | | | 17,541 | 111,064 |
| Lucapa Diamond Company, Ltd. (A)(B) | | | 145,168 | 14,162 |
| Lycopodium, Ltd. | | | 4,375 | 15,770 |
| MACA, Ltd. | | | 115,026 | 67,687 |
| Macmahon Holdings, Ltd. | | | 604,299 | 111,076 |
| Mayne Pharma Group, Ltd. (A)(B) | | | 612,338 | 131,286 |
| McMillan Shakespeare, Ltd. | | | 30,415 | 217,017 |
| McPherson's, Ltd. | | | 20,700 | 29,216 |
| Medusa Mining, Ltd. (A) | | | 57,795 | 21,112 |
| Mesoblast, Ltd. (A) | | | 83,871 | 121,549 |
| Metals X, Ltd. (A) | | | 183,307 | 8,788 |
| Metcash, Ltd. | | | 372,183 | 605,467 |
| Metro Mining, Ltd. (A) | | | 78,405 | 6,169 |
| Michael Hill International, Ltd. | | | 43,259 | 15,666 |
| Michael Hill International, Ltd. (Australian Securities Exchange) | | | 8,882 | 3,312 |
| Midway, Ltd. | | | 3,396 | 3,266 |
| Millennium Minerals, Ltd. (A)(C) | | | 86,302 | 2,867 |
| Mineral Resources, Ltd. | | | 60,656 | 662,492 |
| MMA Offshore, Ltd. (A) | | | 237,016 | 22,418 |
| MNF Group, Ltd. | | | 8,989 | 23,512 |
| Moelis Australia, Ltd. | | | 8,129 | 26,759 |
| Monadelphous Group, Ltd. | | | 38,258 | 364,836 |
| 4 | JOHN HANCOCK INTERNATIONAL SMALL COMPANY FUND | SEMIANNUAL REPORT | SEE NOTES TO FINANCIAL STATEMENTS |
| | | | | Shares | Value |
| Australia (continued) | | | | | |
| Monash IVF Group, Ltd. | | | 78,433 | $46,859 |
| Money3 Corp., Ltd. | | | 41,772 | 76,926 |
| Mortgage Choice, Ltd. | | | 31,859 | 20,453 |
| Mosaic Brands, Ltd. | | | 5,190 | 3,788 |
| Motorcycle Holdings, Ltd. (A) | | | 5,321 | 5,250 |
| Mount Gibson Iron, Ltd. | | | 261,442 | 118,224 |
| Myer Holdings, Ltd. (A)(B) | | | 373,667 | 83,190 |
| MyState, Ltd. | | | 29,609 | 113,199 |
| Navigator Global Investments, Ltd. | | | 45,400 | 89,830 |
| Netwealth Group, Ltd. (B) | | | 28,403 | 143,168 |
| New Hope Corp., Ltd. (B) | | | 127,847 | 121,442 |
| NEXTDC, Ltd. (A) | | | 141,190 | 735,532 |
| nib holdings, Ltd. | | | 175,110 | 535,041 |
| Nick Scali, Ltd. | | | 24,884 | 116,947 |
| Nine Entertainment Company Holdings, Ltd. | | | 349,156 | 365,840 |
| NRW Holdings, Ltd. | | | 182,976 | 292,051 |
| Nufarm, Ltd. (A) | | | 118,255 | 398,395 |
| Objective Corp., Ltd. | | | 2,756 | 9,882 |
| OceanaGold Corp. | | | 276,882 | 404,313 |
| OFX Group, Ltd. | | | 100,657 | 85,179 |
| Onevue Holdings, Ltd. (A) | | | 26,955 | 4,688 |
| oOh!media, Ltd. (B) | | | 112,365 | 207,342 |
| Orora, Ltd. | | | 437,532 | 786,222 |
| OZ Minerals, Ltd. | | | 144,120 | 854,302 |
| Pacific Current Group, Ltd. | | | 18,085 | 68,597 |
| Pacific Smiles Group, Ltd. | | | 11,867 | 13,682 |
| Pact Group Holdings, Ltd. (A) | | | 76,599 | 99,757 |
| Paladin Energy, Ltd. (A)(B) | | | 444,857 | 23,634 |
| Panoramic Resources, Ltd. (A) | | | 177,491 | 24,386 |
| Pantoro, Ltd. (A) | | | 140,826 | 7,450 |
| Paragon Care, Ltd. | | | 76,290 | 9,687 |
| Peet, Ltd. | | | 111,550 | 92,376 |
| Pendal Group, Ltd. | | | 116,948 | 571,433 |
| Perenti Global, Ltd. (B) | | | 316,674 | 281,588 |
| Perpetual, Ltd. | | | 18,810 | 475,920 |
| Perseus Mining, Ltd. (A) | | | 469,500 | 314,015 |
| Pilbara Minerals, Ltd. (A)(B) | | | 134,374 | 22,266 |
| Pioneer Credit, Ltd. | | | 11,509 | 12,549 |
| Platinum Asset Management, Ltd. | | | 92,139 | 247,265 |
| Praemium, Ltd. (A) | | | 68,020 | 15,964 |
| Premier Investments, Ltd. | | | 38,018 | 423,397 |
| Prime Media Group, Ltd. (A) | | | 115,482 | 10,569 |
| Pro Medicus, Ltd. | | | 14,966 | 200,029 |
| PSC Insurance Group, Ltd. | | | 9,460 | 19,438 |
| SEE NOTES TO FINANCIAL STATEMENTS | SEMIANNUAL REPORT | JOHN HANCOCK INTERNATIONAL SMALL COMPANY FUND | 5 |
| | | | | Shares | Value |
| Australia (continued) | | | | | |
| PWR Holdings, Ltd. | | | 18,240 | $51,482 |
| Ramelius Resources, Ltd. | | | 265,306 | 196,638 |
| Reckon, Ltd. | | | 25,906 | 12,137 |
| Red 5, Ltd. (A)(B) | | | 287,711 | 58,497 |
| Red River Resources, Ltd. (A)(B) | | | 130,095 | 6,262 |
| Regis Healthcare, Ltd. | | | 64,599 | 75,010 |
| Regis Resources, Ltd. | | | 194,363 | 508,429 |
| Resolute Mining, Ltd. (A) | | | 378,835 | 249,649 |
| Rhipe, Ltd. | | | 41,656 | 47,588 |
| Ridley Corp., Ltd. | | | 92,822 | 52,487 |
| RPMGlobal Holdings, Ltd. (A) | | | 25,725 | 16,699 |
| RXP Services, Ltd. | | | 37,930 | 9,568 |
| Salmat, Ltd. | | | 15,825 | 8,129 |
| Sandfire Resources NL | | | 76,326 | 214,470 |
| Saracen Mineral Holdings, Ltd. (A) | | | 425,264 | 1,035,949 |
| SeaLink Travel Group, Ltd. | | | 32,984 | 88,994 |
| Select Harvests, Ltd. | | | 41,734 | 172,267 |
| Senetas Corp., Ltd. (A) | | | 199,918 | 7,031 |
| Senex Energy, Ltd. (A)(B) | | | 645,507 | 107,886 |
| Servcorp, Ltd. | | | 13,949 | 38,666 |
| Service Stream, Ltd. | | | 145,109 | 200,870 |
| Seven West Media, Ltd. (A) | | | 295,377 | 32,104 |
| SG Fleet Group, Ltd. | | | 34,699 | 47,655 |
| Sheffield Resources, Ltd. (A) | | | 30,777 | 2,345 |
| Shine Corporate, Ltd. | | | 13,336 | 7,797 |
| Sigma Healthcare, Ltd. | | | 413,072 | 150,930 |
| Silver Lake Resources, Ltd. (A) | | | 339,550 | 352,348 |
| SmartGroup Corp., Ltd. | | | 30,300 | 127,196 |
| Southern Cross Electrical Engineering, Ltd. | | | 17,582 | 6,129 |
| Southern Cross Media Group, Ltd. | | | 250,649 | 113,608 |
| Spark Infrastructure Group | | | 609,514 | 842,180 |
| SpeedCast International, Ltd. (B)(C) | | | 103,025 | 53,021 |
| SRG Global, Ltd. | | | 83,829 | 20,903 |
| St. Barbara, Ltd. | | | 262,614 | 399,285 |
| Stanmore Coal, Ltd. | | | 10,323 | 5,530 |
| Steadfast Group, Ltd. | | | 334,580 | 831,833 |
| Strike Energy, Ltd. (A) | | | 54,422 | 4,784 |
| Sunland Group, Ltd. | | | 30,172 | 33,244 |
| Super Retail Group, Ltd. | | | 64,951 | 347,482 |
| Superloop, Ltd. (A) | | | 80,772 | 41,172 |
| Syrah Resources, Ltd. (A)(B) | | | 103,821 | 26,210 |
| Tassal Group, Ltd. | | | 107,851 | 272,604 |
| Technology One, Ltd. | | | 100,719 | 525,668 |
| The Citadel Group, Ltd. | | | 12,943 | 36,105 |
| 6 | JOHN HANCOCK INTERNATIONAL SMALL COMPANY FUND | SEMIANNUAL REPORT | SEE NOTES TO FINANCIAL STATEMENTS |
| | | | | Shares | Value |
| Australia (continued) | | | | | |
| The Citadel Group, Ltd. (A) | | | 4,566 | $12,737 |
| The Reject Shop, Ltd. | | | 7,826 | 15,666 |
| The Star Entertainment Group, Ltd. | | | 13,995 | 33,685 |
| Thorn Group, Ltd. (A) | | | 45,862 | 5,083 |
| Tiger Resources, Ltd. (A)(C) | | | 420,741 | 10,087 |
| Troy Resources, Ltd. (A) | | | 137,215 | 7,504 |
| Village Roadshow, Ltd. | | | 47,287 | 108,889 |
| Virgin Australia Holdings, Ltd. (A) | | | 305,078 | 20,897 |
| Virgin Australia Holdings, Ltd. (A)(C) | | | 252,517 | 823 |
| Virtus Health, Ltd. | | | 32,868 | 89,310 |
| Vita Group, Ltd. | | | 63,529 | 59,879 |
| Vocus Group, Ltd. (A) | | | 259,001 | 588,431 |
| Webjet, Ltd. (B) | | | 46,612 | 295,114 |
| Western Areas, Ltd. | | | 149,173 | 238,504 |
| Westgold Resources, Ltd. (A) | | | 152,153 | 200,264 |
| Whitehaven Coal, Ltd. | | | 169,391 | 223,283 |
| WPP AUNZ, Ltd. | | | 101,689 | 40,353 |
| Austria 1.5% | | | | | 11,171,535 |
| Agrana Beteiligungs AG | | | 6,869 | 133,951 |
| ams AG (A) | | | 22,285 | 773,187 |
| ANDRITZ AG | | | 29,804 | 1,054,692 |
| AT&S Austria Technologie & Systemtechnik AG | | | 9,986 | 174,199 |
| CA Immobilien Anlagen AG | | | 29,399 | 1,193,204 |
| DO & CO AG | | | 2,892 | 250,513 |
| EVN AG | | | 15,415 | 258,946 |
| FACC AG (B) | | | 6,411 | 63,367 |
| Flughafen Wien AG | | | 2,437 | 81,524 |
| IMMOFINANZ AG (A) | | | 39,468 | 1,016,682 |
| Kapsch TrafficCom AG (B) | | | 2,742 | 63,655 |
| Lenzing AG (B) | | | 5,945 | 397,916 |
| Mayr Melnhof Karton AG | | | 2,785 | 366,848 |
| Oesterreichische Post AG | | | 11,750 | 375,211 |
| Palfinger AG | | | 5,414 | 135,325 |
| POLYTEC Holding AG | | | 4,411 | 31,036 |
| Porr AG (B) | | | 3,596 | 63,838 |
| Rhi Magnesita NV | | | 5,454 | 208,057 |
| Rhi Magnesita NV (London Stock Exchange) | | | 4,273 | 166,301 |
| Rosenbauer International AG (B) | | | 1,314 | 53,354 |
| S IMMO AG | | | 25,315 | 671,104 |
| S&T AG (B) | | | 16,517 | 369,019 |
| Schoeller-Bleckmann Oilfield Equipment AG | | | 4,222 | 172,339 |
| Semperit AG Holding (A) | | | 3,480 | 41,640 |
| Strabag SE | | | 6,784 | 204,002 |
| SEE NOTES TO FINANCIAL STATEMENTS | SEMIANNUAL REPORT | JOHN HANCOCK INTERNATIONAL SMALL COMPANY FUND | 7 |
| | | | | Shares | Value |
| Austria (continued) | | | | | |
| Telekom Austria AG | | | 64,655 | $489,241 |
| UBM Development AG | | | 1,455 | 67,598 |
| UNIQA Insurance Group AG | | | 60,485 | 543,763 |
| Vienna Insurance Group AG | | | 18,069 | 439,457 |
| voestalpine AG (B) | | | 15,535 | 338,269 |
| Wienerberger AG | | | 33,730 | 863,511 |
| Zumtobel Group AG (A) | | | 13,940 | 109,786 |
| Belgium 1.5% | | | | | 11,241,401 |
| Ackermans & van Haaren NV | | | 9,807 | 1,407,391 |
| AGFA-Gevaert NV (A) | | | 78,536 | 349,698 |
| Akka Technologies | | | 4,152 | 230,301 |
| Atenor | | | 1,543 | 98,275 |
| Banque Nationale de Belgique | | | 55 | 132,998 |
| Barco NV | | | 3,836 | 824,768 |
| Bekaert SA | | | 18,102 | 393,301 |
| Biocartis NV (A)(B)(D) | | | 13,216 | 73,102 |
| bpost SA | | | 33,248 | 273,022 |
| Celyad SA (A) | | | 1,226 | 10,755 |
| Cie d'Entreprises CFE (B) | | | 2,943 | 259,129 |
| Deceuninck NV (B) | | | 27,625 | 52,422 |
| D'ieteren SA | | | 11,456 | 672,887 |
| Econocom Group SA (B) | | | 37,385 | 105,585 |
| Elia System Operator SA | | | 11,436 | 1,140,375 |
| Euronav NV | | | 69,674 | 636,269 |
| EVS Broadcast Equipment SA | | | 6,476 | 129,629 |
| Exmar NV (A)(B) | | | 13,915 | 71,971 |
| Fagron | | | 19,779 | 418,697 |
| Gimv NV | | | 8,106 | 468,236 |
| Immobel SA | | | 1,203 | 92,870 |
| Ion Beam Applications (A)(B) | | | 4,559 | 45,059 |
| Jensen-Group NV | | | 1,485 | 49,544 |
| Kinepolis Group NV | | | 6,285 | 331,637 |
| Lotus Bakeries NV | | | 94 | 290,935 |
| MDxHealth (A) | | | 13,603 | 12,795 |
| Melexis NV | | | 7,373 | 509,901 |
| Ontex Group NV | | | 28,363 | 428,664 |
| Orange Belgium SA | | | 13,880 | 264,892 |
| Oxurion NV (A)(B) | | | 15,093 | 46,518 |
| Picanol | | | 683 | 45,436 |
| Recticel SA | | | 16,816 | 125,141 |
| Resilux | | | 305 | 43,320 |
| Roularta Media Group NV | | | 668 | 9,746 |
| Sioen Industries NV | | | 2,343 | 48,242 |
| 8 | JOHN HANCOCK INTERNATIONAL SMALL COMPANY FUND | SEMIANNUAL REPORT | SEE NOTES TO FINANCIAL STATEMENTS |
| | | | | Shares | Value |
| Belgium (continued) | | | | | |
| Sipef NV | | | 2,705 | $136,187 |
| Telenet Group Holding NV | | | 12,331 | 474,296 |
| TER Beke SA | | | 176 | 19,291 |
| Tessenderlo Group SA (A) | | | 13,214 | 400,523 |
| Van de Velde NV | | | 2,367 | 64,358 |
| Viohalco SA (A) | | | 18,237 | 53,235 |
| Bermuda 0.0% | | | | | 160,495 |
| Hiscox, Ltd. | | | 10,083 | 160,495 |
| Canada 8.1% | | | | | 59,592,427 |
| 5N Plus, Inc. (A)(B) | | | 38,389 | 58,345 |
| Absolute Software Corp. | | | 19,002 | 135,056 |
| Acadian Timber Corp. | | | 3,534 | 43,706 |
| Advantage Oil & Gas, Ltd. (A) | | | 82,428 | 124,049 |
| Aecon Group, Inc. | | | 27,803 | 325,413 |
| Africa Oil Corp. (A)(B) | | | 10,700 | 9,885 |
| Ag Growth International, Inc. (B) | | | 8,025 | 231,199 |
| AGF Management, Ltd., Class B (B) | | | 35,942 | 163,342 |
| Aimia, Inc. (A) | | | 43,727 | 105,225 |
| AirBoss of America Corp. | | | 4,809 | 30,490 |
| Alamos Gold, Inc., Class A | | | 170,880 | 994,280 |
| Alaris Royalty Corp. | | | 21,297 | 314,953 |
| Alcanna, Inc. (A)(B) | | | 10,576 | 26,711 |
| Alexco Resource Corp. (A)(B) | | | 35,137 | 52,617 |
| Algoma Central Corp. | | | 4,052 | 36,679 |
| Alio Gold, Inc. (A)(B) | | | 9,897 | 6,194 |
| Altius Minerals Corp. (B) | | | 14,000 | 95,228 |
| Altus Group, Ltd. | | | 11,003 | 367,901 |
| Americas Gold & Silver Corp. (A) | | | 8,321 | 19,528 |
| Amerigo Resources, Ltd. (A)(B) | | | 49,100 | 11,340 |
| Andrew Peller, Ltd., Class A | | | 13,393 | 93,893 |
| ARC Resources, Ltd. (B) | | | 114,450 | 497,961 |
| Aritzia, Inc. (A) | | | 32,100 | 529,001 |
| Asanko Gold, Inc. (A)(B) | | | 31,531 | 27,485 |
| Athabasca Oil Corp. (A) | | | 150,957 | 40,488 |
| ATS Automation Tooling Systems, Inc. (A) | | | 28,891 | 385,931 |
| AutoCanada, Inc. (B) | | | 8,443 | 71,079 |
| Badger Daylighting, Ltd. | | | 11,768 | 275,295 |
| Baytex Energy Corp. (A) | | | 232,629 | 214,908 |
| Birch Mountain Resources, Ltd. (A)(C) | | | 11,200 | 1 |
| Birchcliff Energy, Ltd. | | | 125,472 | 141,153 |
| Bird Construction, Inc. | | | 10,185 | 44,466 |
| Black Diamond Group, Ltd. (A)(B) | | | 17,717 | 22,175 |
| BlackBerry, Ltd. (A) | | | 9,477 | 48,929 |
| SEE NOTES TO FINANCIAL STATEMENTS | SEMIANNUAL REPORT | JOHN HANCOCK INTERNATIONAL SMALL COMPANY FUND | 9 |
| | | | | Shares | Value |
| Canada (continued) | | | | | |
| BlackBerry, Ltd. (A) | | | 8,110 | $41,929 |
| BMTC Group, Inc. | | | 4,096 | 24,718 |
| Bombardier, Inc., Class B (A) | | | 57,987 | 41,473 |
| Bonavista Energy Corp. | | | 160,337 | 39,420 |
| Bonterra Energy Corp. (B) | | | 10,135 | 18,122 |
| Boralex, Inc., Class A | | | 31,567 | 673,790 |
| Bridgemarq Real Estate Services | | | 2,800 | 29,977 |
| BRP, Inc. | | | 3,653 | 149,767 |
| Calfrac Well Services, Ltd. (A)(B) | | | 36,548 | 19,060 |
| Calian Group, Ltd. | | | 2,739 | 91,439 |
| Canaccord Genuity Group, Inc. (B) | | | 22,630 | 84,467 |
| Canacol Energy, Ltd. | | | 37,069 | 118,201 |
| Canadian Western Bank | | | 36,657 | 816,572 |
| Canfor Corp. (A) | | | 18,680 | 155,035 |
| Canfor Pulp Products, Inc. (B) | | | 11,968 | 63,752 |
| CanWel Building Materials Group, Ltd. | | | 27,055 | 95,945 |
| Capital Power Corp. | | | 41,767 | 1,043,981 |
| Capstone Mining Corp. (A) | | | 159,933 | 76,258 |
| Cardinal Energy, Ltd. (B) | | | 41,663 | 59,907 |
| Cargojet, Inc. | | | 900 | 68,654 |
| Cascades, Inc. | | | 27,305 | 221,939 |
| Celestica, Inc. (A) | | | 48,994 | 308,802 |
| Centerra Gold, Inc. (A) | | | 94,176 | 594,980 |
| Centerra Gold, Inc. (New York Stock Exchange) (A) | | | 1,244 | 7,887 |
| Cervus Equipment Corp. | | | 3,597 | 21,412 |
| CES Energy Solutions Corp. | | | 112,004 | 169,393 |
| Chesswood Group, Ltd. (B) | | | 5,000 | 34,234 |
| China Gold International Resources Corp., Ltd. (A)(B) | | | 90,882 | 71,094 |
| Cineplex, Inc. | | | 26,405 | 648,986 |
| Clearwater Seafoods, Inc. (B) | | | 7,000 | 24,511 |
| Cogeco Communications, Inc. | | | 3,254 | 257,508 |
| Cogeco, Inc. | | | 2,092 | 143,607 |
| Colliers International Group, Inc. | | | 8,066 | 653,813 |
| Colliers International Group, Inc. (New York Stock Exchange) | | | 4,844 | 391,686 |
| Computer Modelling Group, Ltd. (B) | | | 30,133 | 156,474 |
| Continental Gold, Inc. (A) | | | 79,176 | 323,252 |
| Copper Mountain Mining Corp. (A)(B) | | | 78,268 | 30,322 |
| Corby Spirit and Wine, Ltd. | | | 5,444 | 62,461 |
| Corridor Resources, Inc. (A) | | | 24,100 | 23,521 |
| Corus Entertainment, Inc., B Shares | | | 74,231 | 232,827 |
| Crescent Point Energy Corp. | | | 149,175 | 405,654 |
| Crew Energy, Inc. (A) | | | 57,594 | 14,374 |
| CRH Medical Corp. (A) | | | 30,192 | 98,747 |
| Denison Mines Corp. (A)(B) | | | 171,019 | 63,706 |
| 10 | JOHN HANCOCK INTERNATIONAL SMALL COMPANY FUND | SEMIANNUAL REPORT | SEE NOTES TO FINANCIAL STATEMENTS |
| | | | | Shares | Value |
| Canada (continued) | | | | | |
| DIRTT Environmental Solutions (A) | | | 18,708 | $33,729 |
| Dorel Industries, Inc., Class B | | | 8,944 | 24,721 |
| DREAM Unlimited Corp., Class A | | | 28,038 | 266,332 |
| Dundee Precious Metals, Inc. (A) | | | 71,270 | 278,761 |
| Dynacor Gold Mines, Inc. | | | 9,900 | 11,949 |
| Echelon Financial Holdings, Inc. | | | 2,400 | 10,853 |
| ECN Capital Corp. | | | 103,129 | 421,813 |
| EcoSynthetix, Inc. (A)(B) | | | 3,185 | 5,647 |
| E-L Financial Corp., Ltd. | | | 274 | 158,613 |
| Eldorado Gold Corp. (A) | | | 77,919 | 676,295 |
| Element Fleet Management Corp. | | | 53,438 | 500,042 |
| Endeavour Silver Corp. (A) | | | 21,684 | 34,572 |
| Endeavour Silver Corp. (New York Stock Exchange) (A)(B) | | | 1,400 | 2,184 |
| Enerflex, Ltd. | | | 41,952 | 231,287 |
| Enerplus Corp. (B) | | | 91,948 | 399,372 |
| Enghouse Systems, Ltd. | | | 16,491 | 625,362 |
| Ensign Energy Services, Inc. (B) | | | 50,538 | 79,069 |
| Equitable Group, Inc. | | | 4,656 | 309,070 |
| ERO Copper Corp. (A) | | | 8,256 | 88,511 |
| Essential Energy Services, Ltd. (A) | | | 57,270 | 11,947 |
| Evertz Technologies, Ltd. | | | 11,517 | 141,834 |
| Excellon Resources, Inc. (A)(B) | | | 17,200 | 6,279 |
| Exchange Income Corp. | | | 2,691 | 81,858 |
| Exco Technologies, Ltd. | | | 11,690 | 65,494 |
| EXFO, Inc. (A) | | | 3,008 | 10,678 |
| EXFO, Inc. (Toronto Stock Exchange) (A) | | | 1,146 | 4,056 |
| Extendicare, Inc. | | | 34,995 | 202,057 |
| Fiera Capital Corp. | | | 26,167 | 210,740 |
| Finning International, Inc. (B) | | | 28,025 | 414,659 |
| Firm Capital Mortgage Investment Corp. | | | 7,600 | 76,948 |
| First Majestic Silver Corp. (A) | | | 52,181 | 393,812 |
| First Mining Gold Corp. (A) | | | 127,000 | 19,397 |
| First National Financial Corp. | | | 4,398 | 112,551 |
| Fission Uranium Corp. (A) | | | 139,747 | 23,946 |
| Fortuna Silver Mines, Inc. (A) | | | 70,707 | 207,024 |
| Freehold Royalties, Ltd. | | | 42,409 | 190,205 |
| Gamehost, Inc. | | | 6,100 | 35,766 |
| GDI Integrated Facility Services, Inc. (A) | | | 2,500 | 67,312 |
| Gear Energy, Ltd. (A) | | | 60,000 | 12,516 |
| Genworth MI Canada, Inc. | | | 17,245 | 670,014 |
| Gibson Energy, Inc. | | | 58,759 | 1,121,554 |
| Glacier Media, Inc. (A) | | | 8,800 | 2,950 |
| GMP Capital, Inc. | | | 29,908 | 36,765 |
| goeasy, Ltd. (B) | | | 3,130 | 146,001 |
| SEE NOTES TO FINANCIAL STATEMENTS | SEMIANNUAL REPORT | JOHN HANCOCK INTERNATIONAL SMALL COMPANY FUND | 11 |
| | | | | Shares | Value |
| Canada (continued) | | | | | |
| Golden Star Resources, Ltd. (A) | | | 20,650 | $53,231 |
| Golden Star Resources, Ltd. (New York Stock Exchange) (A)(B) | | | 2,760 | 7,507 |
| GoldMining, Inc. (A)(B) | | | 17,500 | 18,905 |
| GoldMoney, Inc. | | | 18,000 | 23,736 |
| Gran Tierra Energy, Inc. (A)(B) | | | 159,029 | 122,034 |
| Great Canadian Gaming Corp. (A) | | | 20,138 | 590,075 |
| Guardian Capital Group, Ltd., Class A | | | 4,600 | 89,961 |
| Guyana Goldfields, Inc. (A)(B) | | | 57,265 | 15,999 |
| Hanfeng Evergreen, Inc. (A)(C) | | | 3,700 | 6 |
| Heroux-Devtek, Inc. (A) | | | 15,443 | 207,096 |
| High Arctic Energy Services, Inc. | | | 12,900 | 13,263 |
| High Liner Foods, Inc. | | | 6,893 | 37,848 |
| Home Capital Group, Inc. (A)(B) | | | 27,960 | 592,633 |
| Horizon North Logistics, Inc. | | | 82,170 | 49,587 |
| Hudbay Minerals, Inc. | | | 115,305 | 280,907 |
| IAMGOLD Corp. (A) | | | 200,998 | 572,034 |
| IBI Group, Inc. (A) | | | 7,200 | 27,625 |
| Imperial Metals Corp. (A) | | | 20,280 | 24,325 |
| Indigo Books & Music, Inc. (A) | | | 2,900 | 7,130 |
| Information Services Corp. | | | 3,300 | 40,197 |
| Innergex Renewable Energy, Inc. | | | 42,327 | 620,596 |
| Interfor Corp. (A) | | | 29,229 | 259,789 |
| International Petroleum Corp. (A) | | | 23,520 | 77,626 |
| International Tower Hill Mines, Ltd. (A) | | | 4,097 | 1,892 |
| Intertape Polymer Group, Inc. | | | 24,129 | 255,087 |
| IPL Plastics, Inc. (A) | | | 13,952 | 84,611 |
| Ivanhoe Mines, Ltd., Class A (A) | | | 228,395 | 532,596 |
| Jamieson Wellness, Inc. | | | 13,163 | 254,679 |
| Just Energy Group, Inc. | | | 44,930 | 42,846 |
| KAB Distribution, Inc. (A)(C) | | | 18,405 | 0 |
| K-Bro Linen, Inc. | | | 3,186 | 105,603 |
| Kelt Exploration, Ltd. (A)(B) | | | 60,355 | 143,890 |
| Kinaxis, Inc. (A) | | | 6,391 | 537,325 |
| Kirkland Lake Gold, Ltd. | | | 11,488 | 370,509 |
| Knight Therapeutics, Inc. (A) | | | 59,373 | 295,040 |
| KP Tissue, Inc. | | | 5,100 | 39,250 |
| Labrador Iron Ore Royalty Corp. | | | 23,200 | 336,700 |
| Largo Resources, Ltd. (A) | | | 36,500 | 24,474 |
| Lassonde Industries, Inc., Class A | | | 1,000 | 101,010 |
| Laurentian Bank of Canada | | | 19,550 | 556,241 |
| Leagold Mining Corp. (A) | | | 25,100 | 60,775 |
| Leon's Furniture, Ltd. | | | 13,541 | 163,935 |
| Lightstream Resources, Ltd. (A)(C) | | | 75,972 | 0 |
| Linamar Corp. | | | 19,504 | 536,478 |
| 12 | JOHN HANCOCK INTERNATIONAL SMALL COMPANY FUND | SEMIANNUAL REPORT | SEE NOTES TO FINANCIAL STATEMENTS |
| | | | | Shares | Value |
| Canada (continued) | | | | | |
| Lucara Diamond Corp. | | | 124,430 | $62,111 |
| Lundin Gold, Inc. (A) | | | 14,300 | 110,692 |
| Magellan Aerospace Corp. | | | 8,083 | 68,831 |
| Mainstreet Equity Corp. (A) | | | 2,022 | 130,517 |
| Major Drilling Group International, Inc. (A) | | | 38,938 | 134,024 |
| Maple Leaf Foods, Inc. | | | 28,911 | 482,047 |
| Marathon Gold Corp. (A) | | | 15,600 | 14,644 |
| Martinrea International, Inc. | | | 46,611 | 399,349 |
| Maxim Power Corp. (A) | | | 6,300 | 9,106 |
| Medical Facilities Corp. | | | 15,230 | 35,855 |
| MEG Energy Corp. (A) | | | 125,078 | 575,885 |
| Melcor Developments, Ltd. | | | 4,800 | 43,521 |
| Methanex Corp. | | | 7,500 | 215,906 |
| Morguard Corp. | | | 1,478 | 216,924 |
| Morneau Shepell, Inc. | | | 25,570 | 631,320 |
| Mountain Province Diamonds, Inc. (A)(B) | | | 10,600 | 7,107 |
| MTY Food Group, Inc. | | | 7,815 | 298,568 |
| Mullen Group, Ltd. | | | 45,050 | 263,470 |
| New Gold, Inc. (A) | | | 288,778 | 221,599 |
| NFI Group, Inc. | | | 16,830 | 369,138 |
| Norbord, Inc. | | | 15,046 | 399,620 |
| North American Construction Group, Ltd. | | | 9,037 | 83,688 |
| NuVista Energy, Ltd. (A) | | | 69,005 | 101,792 |
| Obsidian Energy, Ltd. (A)(B) | | | 23,831 | 14,559 |
| Orbite Technologies, Inc. (A) | | | 105,500 | 11 |
| Orla Mining, Ltd. (A) | | | 24,200 | 41,828 |
| Osisko Gold Royalties, Ltd. | | | 44,164 | 362,920 |
| Osisko Mining, Inc. (A) | | | 12,500 | 26,076 |
| Painted Pony Energy, Ltd. (A)(B) | | | 41,196 | 13,504 |
| Pan American Silver Corp. | | | 81,735 | 1,617,954 |
| Pan American Silver Corp. (A) | | | 51,329 | 32,337 |
| Papiers Fraser, Inc. (A)(C) | | | 4,800 | 0 |
| Paramount Resources, Ltd., Class A (A)(B) | | | 25,426 | 81,075 |
| Parex Resources, Inc. (A) | | | 55,004 | 752,374 |
| Park Lawn Corp. | | | 10,627 | 208,858 |
| Pason Systems, Inc. | | | 31,237 | 286,480 |
| Peyto Exploration & Development Corp. (B) | | | 68,868 | 112,877 |
| Photon Control, Inc. (A) | | | 33,806 | 26,445 |
| PHX Energy Services Corp. (A) | | | 11,019 | 17,896 |
| Pinnacle Renewable Energy, Inc. (B) | | | 6,600 | 44,500 |
| Pivot Technology Solutions, Inc. | | | 9,400 | 11,835 |
| Pizza Pizza Royalty Corp. | | | 13,878 | 93,571 |
| Points International, Ltd. (A) | | | 4,210 | 66,777 |
| Polaris Infrastructure, Inc. | | | 9,000 | 102,254 |
| SEE NOTES TO FINANCIAL STATEMENTS | SEMIANNUAL REPORT | JOHN HANCOCK INTERNATIONAL SMALL COMPANY FUND | 13 |
| | | | | Shares | Value |
| Canada (continued) | | | | | |
| Pollard Banknote, Ltd. | | | 2,700 | $34,760 |
| PolyMet Mining Corp. (A)(B) | | | 20,250 | 7,543 |
| PrairieSky Royalty, Ltd. (B) | | | 46,569 | 431,949 |
| Precision Drilling Corp. (A) | | | 131,081 | 162,112 |
| Premier Gold Mines, Ltd. (A) | | | 92,145 | 85,126 |
| Premium Brands Holdings Corp. | | | 12,007 | 842,033 |
| Pretium Resources, Inc. (A) | | | 65,800 | 468,162 |
| Pulse Seismic, Inc. (A) | | | 10,151 | 11,798 |
| Quarterhill, Inc. | | | 46,498 | 62,702 |
| Questerre Energy Corp., Class A (A) | | | 41,900 | 5,775 |
| Real Matters, Inc. (A) | | | 14,600 | 147,822 |
| Recipe Unlimited Corp. | | | 5,964 | 71,537 |
| Reitmans Canada, Ltd., Class A | | | 15,656 | 8,748 |
| Richelieu Hardware, Ltd. | | | 23,454 | 480,001 |
| Rocky Mountain Dealerships, Inc. | | | 6,328 | 28,758 |
| Rogers Sugar, Inc. | | | 42,487 | 156,369 |
| Roxgold, Inc. (A) | | | 113,200 | 72,529 |
| Russel Metals, Inc. | | | 25,886 | 379,925 |
| Sabina Gold & Silver Corp. (A) | | | 44,568 | 44,161 |
| Sandstorm Gold, Ltd. (A) | | | 73,873 | 431,488 |
| Savaria Corp. | | | 13,000 | 112,252 |
| Seabridge Gold, Inc. (A) | | | 2,300 | 22,653 |
| Secure Energy Services, Inc. | | | 71,004 | 212,126 |
| SEMAFO, Inc. (A) | | | 154,067 | 305,322 |
| Seven Generations Energy, Ltd., Class A (A) | | | 86,504 | 355,748 |
| ShawCor, Ltd. | | | 31,578 | 198,090 |
| Sienna Senior Living, Inc. | | | 28,226 | 359,804 |
| Sierra Metals, Inc. (A)(B) | | | 4,000 | 5,364 |
| Sierra Wireless, Inc. (A) | | | 13,360 | 103,914 |
| Sleep Country Canada Holdings, Inc. (D) | | | 13,709 | 186,600 |
| Spin Master Corp. (A)(D) | | | 2,800 | 62,415 |
| Sprott, Inc. (B) | | | 55,451 | 115,260 |
| SSR Mining, Inc. (A) | | | 53,597 | 838,545 |
| Stantec, Inc. | | | 36,793 | 1,099,199 |
| Stelco Holdings, Inc. (B) | | | 11,605 | 61,732 |
| Stella-Jones, Inc. | | | 22,206 | 563,980 |
| Storm Resources, Ltd. (A) | | | 26,800 | 25,158 |
| Stornoway Diamond Corp. (A)(C) | | | 43,566 | 649 |
| Strad, Inc. (A) | | | 8,902 | 15,453 |
| SunOpta, Inc. (A) | | | 22,645 | 61,241 |
| SunOpta, Inc. (New York Stock Exchange) (A)(B) | | | 2,100 | 5,670 |
| Superior Plus Corp. | | | 67,540 | 504,695 |
| Supremex, Inc. | | | 5,000 | 7,450 |
| Surge Energy, Inc. (B) | | | 91,176 | 59,097 |
| 14 | JOHN HANCOCK INTERNATIONAL SMALL COMPANY FUND | SEMIANNUAL REPORT | SEE NOTES TO FINANCIAL STATEMENTS |
| | | | | Shares | Value |
| Canada (continued) | | | | | |
| Tamarack Valley Energy, Ltd. (A) | | | 82,250 | $79,048 |
| Taseko Mines, Ltd. (A) | | | 84,702 | 29,028 |
| Taseko Mines, Ltd. (New York Stock Exchange) (A) | | | 5,290 | 1,857 |
| TeraGo, Inc. (A) | | | 2,000 | 11,309 |
| Teranga Gold Corp. (A) | | | 54,503 | 280,991 |
| Tervita Corp. (A) | | | 3,214 | 16,642 |
| TFI International, Inc. | | | 33,499 | 1,033,234 |
| The Descartes Systems Group, Inc. (A) | | | 6,386 | 265,146 |
| The North West Company, Inc. | | | 18,430 | 352,741 |
| The Supreme Cannabis Company, Inc. (A)(B) | | | 41,000 | 9,316 |
| Tidewater Midstream and Infrastructure, Ltd. | | | 113,465 | 76,925 |
| Timbercreek Financial Corp. | | | 32,686 | 233,289 |
| TMAC Resources, Inc. (A) | | | 2,100 | 2,503 |
| TMX Group, Ltd. | | | 553 | 46,024 |
| TORC Oil & Gas, Ltd. | | | 71,817 | 174,961 |
| Torex Gold Resources, Inc. (A) | | | 35,220 | 466,539 |
| Total Energy Services, Inc. | | | 19,706 | 75,902 |
| Tourmaline Oil Corp. | | | 51,100 | 424,485 |
| TransAlta Corp. | | | 117,856 | 882,438 |
| TransAlta Renewables, Inc. | | | 46,339 | 566,529 |
| Transcontinental, Inc., Class A | | | 26,283 | 317,609 |
| TransGlobe Energy Corp. | | | 27,604 | 29,409 |
| Trevali Mining Corp. (A) | | | 206,096 | 21,496 |
| Trican Well Service, Ltd. (A)(B) | | | 130,270 | 84,437 |
| Tricon Capital Group, Inc. | | | 62,087 | 524,080 |
| Trisura Group, Ltd. (A) | | | 1,900 | 68,441 |
| Turquoise Hill Resources, Ltd. (A) | | | 105,466 | 56,573 |
| Uni-Select, Inc. | | | 17,505 | 140,588 |
| Vecima Networks, Inc. | | | 1,797 | 13,602 |
| Vermilion Energy, Inc. (B) | | | 60,324 | 604,925 |
| VersaBank | | | 2,000 | 10,177 |
| Wajax Corp. | | | 6,547 | 64,238 |
| Wesdome Gold Mines, Ltd. (A) | | | 68,261 | 434,307 |
| West Fraser Timber Company, Ltd. | | | 12,033 | 449,316 |
| Western Forest Products, Inc. (B) | | | 181,626 | 144,787 |
| Westport Fuel Systems, Inc. (A) | | | 2,300 | 4,278 |
| Westshore Terminals Investment Corp. | | | 20,465 | 214,827 |
| Whitecap Resources, Inc. (B) | | | 166,343 | 488,278 |
| WildBrain, Ltd. (A) | | | 59,897 | 55,334 |
| Winpak, Ltd. | | | 12,336 | 404,108 |
| Yamana Gold, Inc. | | | 400,291 | 1,559,711 |
| Yangarra Resources, Ltd. (A)(B) | | | 22,853 | 14,983 |
| Yellow Pages, Ltd. (A) | | | 4,514 | 33,428 |
| Zenith Capital Corp. (A)(C) | | | 5,300 | 869 |
| SEE NOTES TO FINANCIAL STATEMENTS | SEMIANNUAL REPORT | JOHN HANCOCK INTERNATIONAL SMALL COMPANY FUND | 15 |
| | | | | Shares | Value |
| China 0.1% | | | | | $974,264 |
| Bund Center Investment, Ltd. | | | 55,500 | 22,144 |
| China New Higher Education Group, Ltd. (D) | | | 70,000 | 24,280 |
| FIH Mobile, Ltd. (A) | | | 1,654,000 | 256,270 |
| Goodbaby International Holdings, Ltd. (A) | | | 335,000 | 57,229 |
| Huan Yue Interactive Holdings, Ltd. (A) | | | 176,000 | 16,655 |
| TK Group Holdings, Ltd. | | | 74,000 | 32,906 |
| Yangzijiang Shipbuilding Holdings, Ltd. | | | 814,000 | 564,780 |
| Colombia 0.0% | | | | | 66,923 |
| Frontera Energy Corp. | | | 11,835 | 66,923 |
| Denmark 2.0% | | | | | 14,782,706 |
| Agat Ejendomme A/S (A) | | | 17,289 | 8,978 |
| ALK-Abello A/S (A) | | | 2,301 | 590,063 |
| Alm Brand A/S | | | 33,758 | 282,094 |
| Ambu A/S, Class B | | | 58,087 | 1,322,892 |
| Bang & Olufsen A/S (A)(B) | | | 13,814 | 68,418 |
| Bavarian Nordic A/S (A) | | | 7,896 | 262,887 |
| Brodrene Hartmann A/S | | | 809 | 37,876 |
| Columbus A/S | | | 26,124 | 30,262 |
| D/S Norden A/S | | | 13,049 | 150,611 |
| Dfds A/S (B) | | | 12,308 | 430,855 |
| FLSmidth & Company A/S | | | 15,800 | 543,460 |
| Fluegger Group A/S | | | 225 | 9,658 |
| H+H International A/S, Class B (A) | | | 8,339 | 150,211 |
| Harboes Bryggeri A/S, Class B (A) | | | 1,452 | 12,265 |
| ISS A/S | | | 8,209 | 145,869 |
| Jeudan A/S | | | 602 | 118,992 |
| Jyske Bank A/S (A) | | | 24,373 | 839,427 |
| Matas A/S | | | 17,216 | 143,174 |
| Nilfisk Holding A/S (A) | | | 9,424 | 194,218 |
| NKT A/S (A) | | | 8,273 | 205,270 |
| NNIT A/S (D) | | | 4,165 | 64,577 |
| North Media AS | | | 1,803 | 14,121 |
| Pandora A/S | | | 39,112 | 1,762,481 |
| Parken Sport & Entertainment A/S | | | 1,870 | 25,522 |
| Per Aarsleff Holding A/S | | | 9,215 | 268,063 |
| Ringkjoebing Landbobank A/S | | | 11,315 | 749,912 |
| Rockwool International A/S, A Shares | | | 206 | 42,424 |
| Rockwool International A/S, B Shares | | | 818 | 190,845 |
| Royal Unibrew A/S | | | 18,425 | 1,594,050 |
| RTX A/S | | | 3,288 | 98,167 |
| Scandinavian Tobacco Group A/S (D) | | | 30,155 | 387,544 |
| Schouw & Company A/S | | | 5,524 | 416,296 |
| SimCorp A/S | | | 15,830 | 1,528,650 |
| 16 | JOHN HANCOCK INTERNATIONAL SMALL COMPANY FUND | SEMIANNUAL REPORT | SEE NOTES TO FINANCIAL STATEMENTS |
| | | | | Shares | Value |
| Denmark (continued) | | | | | |
| Solar A/S, B Shares | | | 2,343 | $100,244 |
| Spar Nord Bank A/S | | | 44,014 | 369,772 |
| Sydbank A/S (B) | | | 21,448 | 396,841 |
| The Drilling Company of 1972 A/S (A) | | | 1,938 | 85,817 |
| Tivoli A/S | | | 691 | 70,575 |
| Topdanmark A/S | | | 13,758 | 600,933 |
| United International Enterprises | | | 535 | 105,449 |
| Vestjysk Bank A/S (A) | | | 144,692 | 68,692 |
| Zealand Pharma A/S (A) | | | 8,130 | 294,251 |
| Faeroe Islands 0.0% | | | | | 16,240 |
| BankNordik P/F | | | 953 | 16,240 |
| Finland 2.4% | | | | | 17,836,542 |
| Adapteo OYJ (A) | | | 17,291 | 184,547 |
| Afarak Group OYJ (A) | | | 6,433 | 2,840 |
| Ahlstrom-Munksjo OYJ | | | 11,986 | 165,539 |
| Aktia Bank OYJ | | | 22,366 | 254,558 |
| Alma Media OYJ | | | 11,325 | 99,256 |
| Apetit OYJ | | | 1,524 | 13,502 |
| Asiakastieto Group OYJ (D) | | | 4,679 | 159,872 |
| Aspo OYJ | | | 5,505 | 45,937 |
| Atria OYJ (B) | | | 6,047 | 55,497 |
| BasWare OYJ (A) | | | 2,688 | 77,837 |
| Bittium OYJ (B) | | | 10,462 | 64,432 |
| Cargotec OYJ, B Shares (B) | | | 16,105 | 468,491 |
| Caverion OYJ | | | 33,497 | 234,361 |
| Citycon OYJ (B) | | | 24,077 | 238,719 |
| Digia OYJ | | | 7,562 | 38,431 |
| Ferratum OYJ | | | 2,783 | 31,775 |
| Finnair OYJ | | | 25,769 | 138,776 |
| Fiskars OYJ ABP | | | 13,792 | 163,911 |
| F-Secure OYJ (A) | | | 36,119 | 119,401 |
| HKScan OYJ, A Shares (A) | | | 11,127 | 23,471 |
| Huhtamaki OYJ | | | 40,899 | 1,679,390 |
| Ilkka-Yhtyma OYJ | | | 9,901 | 38,025 |
| Kemira OYJ | | | 39,782 | 506,519 |
| Kesko OYJ, A Shares | | | 4,516 | 290,364 |
| Kesko OYJ, B Shares | | | 23,294 | 1,587,379 |
| Konecranes OYJ | | | 24,880 | 734,415 |
| Lassila & Tikanoja OYJ | | | 11,200 | 185,768 |
| Lehto Group OYJ | | | 1,623 | 3,489 |
| Metsa Board OYJ | | | 72,124 | 415,402 |
| Metso OYJ | | | 39,181 | 1,275,033 |
| Nokian Renkaat OYJ | | | 49,046 | 1,283,791 |
| SEE NOTES TO FINANCIAL STATEMENTS | SEMIANNUAL REPORT | JOHN HANCOCK INTERNATIONAL SMALL COMPANY FUND | 17 |
| | | | | Shares | Value |
| Finland (continued) | | | | | |
| Olvi OYJ, A Shares | | | 4,942 | $200,261 |
| Oriola OYJ, A Shares | | | 8,342 | 17,882 |
| Oriola OYJ, B Shares | | | 49,342 | 106,201 |
| Orion OYJ, Class A (B) | | | 8,076 | 315,104 |
| Orion OYJ, Class B | | | 42,444 | 1,693,954 |
| Outokumpu OYJ (B) | | | 108,692 | 417,127 |
| Outotec OYJ (A) | | | 57,501 | 295,595 |
| Pihlajalinna OYJ | | | 643 | 10,770 |
| Ponsse OYJ | | | 4,062 | 113,765 |
| QT Group OYJ (A)(B) | | | 2,996 | 69,424 |
| Raisio OYJ, V Shares | | | 60,748 | 206,481 |
| Rapala VMC OYJ | | | 5,592 | 16,740 |
| Raute OYJ, A Shares | | | 728 | 18,796 |
| Revenio Group OYJ | | | 4,168 | 126,212 |
| Sanoma OYJ | | | 27,196 | 310,368 |
| SRV Group OYJ (A) | | | 8,532 | 10,720 |
| Stockmann OYJ ABP, A Shares (A) | | | 1,949 | 5,590 |
| Stockmann OYJ ABP, B Shares (A) | | | 10,220 | 29,523 |
| Teleste OYJ | | | 3,860 | 20,104 |
| TietoEVRY OYJ | | | 17,430 | 493,097 |
| Tikkurila OYJ | | | 14,249 | 217,037 |
| Tokmanni Group Corp. | | | 21,252 | 285,008 |
| Uponor OYJ | | | 24,512 | 322,265 |
| Vaisala OYJ, A Shares (B) | | | 6,527 | 223,714 |
| Valmet OYJ | | | 52,685 | 1,257,924 |
| YIT OYJ (B) | | | 70,357 | 472,152 |
| France 4.3% | | | �� | | 31,554,667 |
| ABC arbitrage | | | 9,943 | 72,041 |
| Actia Group | | | 2,573 | 9,036 |
| Air France-KLM (A) | | | 74,726 | 570,689 |
| AKWEL | | | 3,689 | 59,889 |
| Albioma SA | | | 11,683 | 385,882 |
| Altamir | | | 5,040 | 101,334 |
| Alten SA | | | 8,846 | 990,694 |
| Amplitude Surgical SAS (A) | | | 7,915 | 12,621 |
| Assystem SA | | | 2,731 | 81,041 |
| Aubay | | | 2,888 | 90,147 |
| Axway Software SA | | | 2,311 | 44,245 |
| Bastide le Confort Medical (A) | | | 1,540 | 59,109 |
| Beneteau SA (B) | | | 17,098 | 163,101 |
| Bigben Interactive (B) | | | 7,638 | 124,637 |
| Boiron SA | | | 2,468 | 88,027 |
| Bonduelle SCA | | | 7,695 | 173,756 |
| 18 | JOHN HANCOCK INTERNATIONAL SMALL COMPANY FUND | SEMIANNUAL REPORT | SEE NOTES TO FINANCIAL STATEMENTS |
| | | | | Shares | Value |
| France (continued) | | | | | |
| Bourbon Corp. (London Stock Exchange) (A)(C) | | | 1,464 | $0 |
| Burelle SA | | | 85 | 63,048 |
| Casino Guichard Perrachon SA (B) | | | 5,970 | 234,323 |
| Catering International Services | | | 1,089 | 12,559 |
| Cegedim SA (A) | | | 1,780 | 52,720 |
| CGG SA (A) | | | 246,907 | 686,475 |
| Chargeurs SA (B) | | | 8,233 | 132,120 |
| Cie des Alpes | | | 6,231 | 159,925 |
| Cie Plastic Omnium SA | | | 20,563 | 459,932 |
| Coface SA (A) | | | 49,209 | 540,778 |
| Derichebourg SA | | | 51,800 | 174,377 |
| Devoteam SA | | | 1,949 | 175,593 |
| Electricite de Strasbourg SA | | | 351 | 46,391 |
| Elior Group SA (D) | | | 41,524 | 523,628 |
| Elis SA | | | 60,129 | 1,050,012 |
| Eramet (B) | | | 2,724 | 90,000 |
| Erytech Pharma SA (A) | | | 6,297 | 36,221 |
| Esso SA Francaise (A) | | | 871 | 17,898 |
| Etablissements Maurel et Prom SA | | | 16,287 | 41,994 |
| Europcar Mobility Group (B)(D) | | | 52,342 | 202,901 |
| Eutelsat Communications SA | | | 75,101 | 1,015,494 |
| Exel Industries SA, A Shares (A) | | | 444 | 16,855 |
| Faurecia SE | | | 1,315 | 60,131 |
| Fleury Michon SA | | | 344 | 10,999 |
| Fnac Darty SA (A) | | | 7,145 | 327,023 |
| Gaumont SA | | | 489 | 61,713 |
| Gaztransport Et Technigaz SA | | | 7,628 | 683,201 |
| GEA | | | 126 | 13,712 |
| GL Events | | | 4,616 | 87,397 |
| Groupe Crit | | | 1,323 | 86,698 |
| Groupe Gorge | | | 1,279 | 18,802 |
| Groupe Open | | | 1,805 | 23,889 |
| Guerbet | | | 2,827 | 105,560 |
| Haulotte Group SA | | | 3,951 | 17,433 |
| HERIGE SADCS | | | 539 | 13,866 |
| HEXAOM | | | 1,083 | 40,220 |
| ID Logistics Group (A) | | | 981 | 173,626 |
| Iliad SA | | | 7,753 | 1,089,792 |
| Imerys SA | | | 12,100 | 475,850 |
| Ingenico Group SA | | | 23,409 | 3,336,463 |
| IPSOS | | | 17,414 | 539,644 |
| Jacquet Metal Service SA (B) | | | 5,053 | 71,032 |
| JCDecaux SA | | | 12,093 | 279,458 |
| Kaufman & Broad SA | | | 6,965 | 281,498 |
| SEE NOTES TO FINANCIAL STATEMENTS | SEMIANNUAL REPORT | JOHN HANCOCK INTERNATIONAL SMALL COMPANY FUND | 19 |
| | | | | Shares | Value |
| France (continued) | | | | | |
| Korian SA | | | 22,659 | $1,034,416 |
| Lagardere SCA | | | 22,776 | 396,394 |
| Laurent-Perrier | | | 1,118 | 101,587 |
| Le Belier | | | 808 | 30,817 |
| Lectra | | | 11,512 | 251,286 |
| Linedata Services | | | 1,472 | 43,225 |
| LISI | | | 8,173 | 254,031 |
| LNA Sante SA | | | 2,246 | 113,665 |
| Maisons du Monde SA (B)(D) | | | 20,412 | 252,230 |
| Manitou BF SA | | | 5,572 | 100,700 |
| Manutan International | | | 906 | 55,988 |
| Mersen SA | | | 7,790 | 229,350 |
| METabolic EXplorer SA (A) | | | 8,100 | 13,178 |
| Metropole Television SA | | | 10,149 | 149,393 |
| Nexans SA | | | 14,240 | 656,427 |
| Nexity SA | | | 18,168 | 840,677 |
| Nicox (A) | | | 6,072 | 25,534 |
| NRJ Group | | | 6,595 | 40,768 |
| Oeneo SA | | | 5,761 | 78,754 |
| Onxeo SA (A)(B) | | | 11,077 | 6,029 |
| Onxeo SA (Copenhagen Stock Exchange) (A) | | | 2,056 | 1,135 |
| Pierre & Vacances SA (A) | | | 1,671 | 44,167 |
| Plastivaloire (B) | | | 1,440 | 9,037 |
| Quadient | | | 18,336 | 396,105 |
| Rallye SA | | | 7,709 | 69,021 |
| Recylex SA (A)(B) | | | 4,454 | 12,431 |
| Rexel SA | | | 115,715 | 1,430,385 |
| Robertet SA (B) | | | 238 | 231,513 |
| Rothschild & Company | | | 11,722 | 278,339 |
| Rubis SCA | | | 33,982 | 1,842,826 |
| Samse SA | | | 285 | 46,257 |
| Savencia SA | | | 1,977 | 125,222 |
| Seche Environnement SA | | | 2,029 | 88,854 |
| Societe BIC SA | | | 10,283 | 625,087 |
| Societe Marseillaise du Tunnel Prado-Carenage SA | | | 219 | 5,148 |
| Societe pour l'Informatique Industrielle | | | 2,435 | 59,810 |
| SOITEC (A) | | | 7,142 | 595,237 |
| Solocal Group (A)(B) | | | 280,018 | 143,363 |
| Somfy SA | | | 2,444 | 229,193 |
| Sopra Steria Group | | | 5,038 | 815,712 |
| SPIE SA | | | 47,755 | 921,921 |
| Stef SA | | | 1,253 | 103,076 |
| Synergie SA | | | 3,330 | 88,419 |
| Tarkett SA | | | 14,189 | 228,362 |
| 20 | JOHN HANCOCK INTERNATIONAL SMALL COMPANY FUND | SEMIANNUAL REPORT | SEE NOTES TO FINANCIAL STATEMENTS |
| | | | | Shares | Value |
| France (continued) | | | | | |
| Technicolor SA (A)(B) | | | 88,478 | $23,391 |
| Television Francaise 1 | | | 20,913 | 160,732 |
| Thermador Groupe | | | 2,187 | 118,923 |
| Trigano SA | | | 3,138 | 239,086 |
| Union Financiere de France BQE SA | | | 1,451 | 31,111 |
| Valeo SA | | | 13,660 | 347,254 |
| Vallourec SA (A)(B) | | | 81,681 | 158,973 |
| Valneva SE (A) | | | 7,027 | 21,817 |
| Vetoquinol SA | | | 1,228 | 93,600 |
| Vicat SA | | | 8,427 | 330,961 |
| VIEL & Cie SA | | | 6,888 | 35,571 |
| Vilmorin & Cie SA | | | 2,792 | 124,209 |
| Virbac SA (A) | | | 1,000 | 227,503 |
| Vranken-Pommery Monopole SA | | | 923 | 18,967 |
| Gabon 0.0% | | | | | 43,122 |
| Total Gabon | | | 325 | 43,122 |
| Georgia 0.1% | | | | | 525,954 |
| Bank of Georgia Group PLC | | | 20,020 | 435,420 |
| Georgia Capital PLC (A) | | | 10,443 | 90,534 |
| Germany 5.8% | | | | | 42,636,918 |
| 1&1 Drillisch AG | | | 17,524 | 381,342 |
| 7C Solarparken AG | | | 7,705 | 28,769 |
| Aareal Bank AG | | | 26,021 | 723,005 |
| Adler Modemaerkte AG (A) | | | 2,325 | 10,245 |
| ADLER Real Estate AG (A)(B) | | | 18,846 | 237,179 |
| ADO Properties SA (D) | | | 11,749 | 349,569 |
| ADVA Optical Networking SE (A) | | | 21,806 | 146,371 |
| AIXTRON SE (A) | | | 30,137 | 309,683 |
| All for One Group AG | | | 784 | 38,904 |
| Allgeier SE | | | 2,876 | 98,048 |
| Amadeus Fire AG | | | 2,181 | 307,388 |
| Atoss Software AG | | | 627 | 111,972 |
| Aurubis AG | | | 16,726 | 801,336 |
| Basler AG (B) | | | 1,070 | 54,952 |
| Bauer AG | | | 6,102 | 94,937 |
| BayWa AG | | | 6,365 | 171,244 |
| Bechtle AG | | | 11,362 | 1,512,126 |
| Bertrandt AG | | | 2,816 | 132,083 |
| bet-at-home.com AG | | | 1,430 | 63,674 |
| Bijou Brigitte AG | | | 1,450 | 65,126 |
| Bilfinger SE | | | 12,863 | 391,894 |
| Borussia Dortmund GmbH & Company KGaA | | | 24,608 | 209,453 |
| SEE NOTES TO FINANCIAL STATEMENTS | SEMIANNUAL REPORT | JOHN HANCOCK INTERNATIONAL SMALL COMPANY FUND | 21 |
| | | | | Shares | Value |
| Germany (continued) | | | | | |
| CANCOM SE | | | 11,873 | $591,364 |
| CECONOMY AG (A) | | | 77,015 | 371,388 |
| CENIT AG | | | 2,412 | 31,155 |
| Centrotec SE | | | 983 | 15,971 |
| Cewe Stiftung & Company KGAA | | | 2,408 | 258,425 |
| comdirect bank AG | | | 10,187 | 155,651 |
| CompuGroup Medical SE | | | 7,962 | 500,036 |
| CropEnergies AG | | | 14,129 | 146,685 |
| CTS Eventim AG & Company KGaA | | | 22,260 | 1,192,907 |
| Data Modul AG | | | 635 | 33,160 |
| Deutsche Beteiligungs AG | | | 6,398 | 230,564 |
| Deutsche EuroShop AG | | | 21,051 | 515,629 |
| Deutsche Pfandbriefbank AG (D) | | | 70,447 | 999,942 |
| Deutz AG | | | 61,717 | 294,160 |
| DIC Asset AG | | | 21,568 | 377,483 |
| DMG Mori AG | | | 4,750 | 215,838 |
| Dr. Hoenle AG | | | 1,598 | 68,186 |
| Draegerwerk AG & Company KGaA | | | 1,433 | 66,012 |
| Duerr AG | | | 22,237 | 705,311 |
| Eckert & Ziegler Strahlen- und Medizintechnik AG | | | 1,781 | 302,868 |
| Elmos Semiconductor AG | | | 6,299 | 149,233 |
| ElringKlinger AG (A) | | | 9,007 | 60,955 |
| Energiekontor AG (B) | | | 2,199 | 48,353 |
| Fielmann AG | | | 7,017 | 492,793 |
| First Sensor AG | | | 2,622 | 110,979 |
| FORTEC Elektronik AG | | | 601 | 10,236 |
| Francotyp-Postalia Holding AG | | | 2,607 | 11,775 |
| Freenet AG | | | 51,632 | 1,016,350 |
| FUCHS PETROLUB SE | | | 5,851 | 207,711 |
| GEA Group AG | | | 52,007 | 1,391,648 |
| Gerresheimer AG | | | 12,232 | 889,103 |
| Gesco AG | | | 3,651 | 75,903 |
| GFT Technologies SE | | | 5,329 | 64,015 |
| H&R GmbH & Company KGaA (A)(B) | | | 8,359 | 46,725 |
| Hamburger Hafen und Logistik AG | | | 10,617 | 226,596 |
| Hawesko Holding AG | | | 27 | 880 |
| Heidelberger Druckmaschinen AG (A)(B) | | | 90,943 | 81,653 |
| Hella GmbH & Company KGaA | | | 13,544 | 568,702 |
| HolidayCheck Group AG | | | 12,523 | 26,113 |
| Hornbach Baumarkt AG | | | 3,479 | 65,647 |
| Hornbach Holding AG & Company KGaA | | | 5,469 | 310,545 |
| HUGO BOSS AG | | | 24,493 | 1,091,734 |
| Hypoport AG (A) | | | 306 | 103,940 |
| Indus Holding AG | | | 8,954 | 325,471 |
| 22 | JOHN HANCOCK INTERNATIONAL SMALL COMPANY FUND | SEMIANNUAL REPORT | SEE NOTES TO FINANCIAL STATEMENTS |
| | | | | Shares | Value |
| Germany (continued) | | | | | |
| Instone Real Estate Group AG (A)(D) | | | 402 | $10,389 |
| Isra Vision AG | | | 3,594 | 199,951 |
| IVU Traffic Technologies AG | | | 7,116 | 100,782 |
| Jenoptik AG | | | 22,145 | 529,068 |
| JOST Werke AG (D) | | | 1,929 | 65,692 |
| K+S AG (B) | | | 88,187 | 730,175 |
| Kloeckner & Company SE | | | 27,626 | 154,159 |
| Koenig & Bauer AG (B) | | | 4,359 | 105,923 |
| Krones AG (B) | | | 6,768 | 429,065 |
| KSB SE & Company KGaA | | | 73 | 23,218 |
| KWS Saat SE & Company KGaA | | | 4,300 | 242,224 |
| LANXESS AG | | | 34,617 | 1,842,990 |
| Leifheit AG | | | 4,376 | 108,287 |
| Leoni AG (A)(B) | | | 12,042 | 121,775 |
| LPKF Laser & Electronics AG (A) | | | 6,979 | 161,155 |
| Manz AG (A) | | | 1,315 | 25,006 |
| MasterFlex SE | | | 414 | 2,089 |
| Mediclin AG | | | 8,179 | 46,562 |
| Medigene AG (A) | | | 4,102 | 19,871 |
| METRO AG | | | 19,775 | 230,988 |
| MLP SE | | | 32,818 | 178,486 |
| New Work SE | | | 1,026 | 276,825 |
| Nexus AG | | | 6,676 | 241,244 |
| Nordex SE (A)(B) | | | 31,647 | 379,358 |
| Norma Group SE | | | 14,871 | 491,829 |
| OHB SE | | | 2,007 | 78,269 |
| OSRAM Licht AG (A)(B) | | | 41,735 | 1,880,515 |
| Paragon GmbH & Company KGaA | | | 613 | 9,510 |
| PATRIZIA AG | | | 18,660 | 439,697 |
| Pfeiffer Vacuum Technology AG | | | 3,079 | 466,556 |
| PNE AG | | | 27,801 | 128,926 |
| Progress-Werk Oberkirch AG | | | 386 | 9,513 |
| ProSiebenSat.1 Media SE | | | 88,466 | 1,077,607 |
| PSI Software AG | | | 4,102 | 92,698 |
| QSC AG (B) | | | 45,774 | 57,169 |
| R Stahl AG (A) | | | 823 | 25,453 |
| Rheinmetall AG | | | 17,240 | 1,600,500 |
| RHOEN-KLINIKUM AG | | | 9,450 | 188,286 |
| RIB Software SE (B) | | | 16,448 | 533,934 |
| Rocket Internet SE (A)(D) | | | 28,857 | 633,062 |
| SAF-Holland SA | | | 22,781 | 139,947 |
| Salzgitter AG | | | 11,171 | 187,306 |
| Schaltbau Holding AG (A) | | | 1,534 | 51,605 |
| Scout24 AG (D) | | | 14,380 | 946,114 |
| SEE NOTES TO FINANCIAL STATEMENTS | SEMIANNUAL REPORT | JOHN HANCOCK INTERNATIONAL SMALL COMPANY FUND | 23 |
| | | | | Shares | Value |
| Germany (continued) | | | | | |
| Secunet Security Networks AG | | | 439 | $57,004 |
| SGL Carbon SE (A)(B) | | | 17,099 | 65,491 |
| Siltronic AG | | | 7,643 | 725,880 |
| Sixt Leasing SE | | | 3,517 | 72,909 |
| Sixt SE | | | 5,080 | 447,076 |
| SMA Solar Technology AG (A) | | | 5,354 | 183,878 |
| SMT Scharf AG (A) | | | 1,261 | 13,656 |
| Softing AG | | | 2,069 | 14,809 |
| Software AG | | | 18,193 | 598,532 |
| STRATEC SE (B) | | | 1,791 | 128,923 |
| Stroeer SE & Company KGaA | | | 10,097 | 755,757 |
| Suedzucker AG (B) | | | 32,557 | 509,161 |
| SUESS MicroTec SE (A) | | | 7,921 | 78,254 |
| Surteco Group SE | | | 2,163 | 53,602 |
| Syzygy AG | | | 471 | 3,399 |
| TAG Immobilien AG (A) | | | 50,856 | 1,249,691 |
| Takkt AG | | | 17,528 | 225,035 |
| Technotrans SE (B) | | | 2,893 | 54,752 |
| Tele Columbus AG (A)(D) | | | 36,372 | 108,584 |
| Traffic Systems SE | | | 1,525 | 37,528 |
| VERBIO Vereinigte BioEnergie AG | | | 12,056 | 128,222 |
| Vossloh AG (B) | | | 4,139 | 164,273 |
| Wacker Chemie AG | | | 5,508 | 391,799 |
| Wacker Neuson SE | | | 13,709 | 193,530 |
| Washtec AG | | | 4,114 | 222,477 |
| Wuestenrot & Wuerttembergische AG | | | 10,582 | 199,823 |
| Gibraltar 0.0% | | | | | 114,684 |
| 888 Holdings PLC | | | 77,379 | 114,684 |
| Greece 0.0% | | | | | 37 |
| Alapis Holding Industrial & Commercial SA of Pharmaceutical Chemical Products (A)(C) | | | 1,810 | 37 |
| TT Hellenic Postbank SA (A)(C) | | | 20,725 | 0 |
| Greenland 0.0% | | | | | 24,137 |
| GronlandsBANKEN A/S | | | 313 | 24,137 |
| Guernsey, Channel Islands 0.0% | | | | | 70,856 |
| Raven Property Group, Ltd. (A)(B) | | | 123,414 | 70,856 |
| Hong Kong 2.3% | | | | | 16,668,752 |
| Aeon Credit Service Asia Company, Ltd. | | | 60,000 | 46,380 |
| Aeon Stores Hong Kong Company, Ltd. | | | 22,000 | 8,559 |
| Agritrade Resources, Ltd. | | | 975,000 | 24,476 |
| Allied Group, Ltd. | | | 18,000 | 88,624 |
| Allied Properties HK, Ltd. | | | 546,000 | 103,677 |
| 24 | JOHN HANCOCK INTERNATIONAL SMALL COMPANY FUND | SEMIANNUAL REPORT | SEE NOTES TO FINANCIAL STATEMENTS |
| | | | | Shares | Value |
| Hong Kong (continued) | | | | | |
| APAC Resources, Ltd. | | | 182,171 | $21,798 |
| Applied Development Holdings, Ltd. (A) | | | 555,000 | 13,485 |
| APT Satellite Holdings, Ltd. | | | 118,500 | 55,004 |
| Asia Financial Holdings, Ltd. | | | 94,000 | 43,509 |
| Asia Standard International Group, Ltd. | | | 236,000 | 36,124 |
| Asiasec Properties, Ltd. | | | 103,000 | 16,220 |
| Associated International Hotels, Ltd. | | | 26,000 | 63,142 |
| Best Food Holding Company, Ltd. (A) | | | 62,000 | 8,664 |
| BOCOM International Holdings Company, Ltd. | | | 209,000 | 29,001 |
| BOE Varitronix, Ltd. | | | 257,000 | 82,624 |
| Boill Healthcare Holdings, Ltd. (A) | | | 1,480,000 | 8,881 |
| Bonjour Holdings, Ltd. (A) | | | 635,000 | 9,449 |
| Bright Smart Securities & Commodities Group, Ltd. | | | 220,000 | 30,640 |
| Brightoil Petroleum Holdings, Ltd. (A)(C) | | | 563,000 | 62,295 |
| Build King Holdings, Ltd. | | | 150,000 | 15,865 |
| Burwill Holdings, Ltd. (A)(C) | | | 1,216,000 | 11,076 |
| Cafe de Coral Holdings, Ltd. | | | 138,000 | 304,776 |
| Camsing International Holding, Ltd. (A)(C) | | | 124,000 | 18,453 |
| Century City International Holdings, Ltd. | | | 452,000 | 31,104 |
| CGN Mining Company, Ltd. | | | 535,000 | 18,421 |
| Chen Hsong Holdings | | | 40,000 | 10,944 |
| Chevalier International Holdings, Ltd. | | | 45,524 | 63,728 |
| China Baoli Technologies Holdings, Ltd. (A)(C) | | | 517,500 | 5,258 |
| China Best Group Holding, Ltd. (A) | | | 700,000 | 15,906 |
| China Display Optoelectronics Technology Holdings, Ltd. (A) | | | 344,000 | 23,897 |
| China Energy Development Holdings, Ltd. (A) | | | 2,266,000 | 53,387 |
| China Flavors & Fragrances Company, Ltd. | | | 96,000 | 15,806 |
| China Motor Bus Company, Ltd. | | | 1,600 | 25,840 |
| China Solar Energy Holdings, Ltd. (A)(C) | | | 127,000 | 0 |
| China Star Entertainment, Ltd. | | | 758,000 | 149,108 |
| China Strategic Holdings, Ltd. (A) | | | 4,597,500 | 17,904 |
| China Tonghai International Financial, Ltd. (A) | | | 80,000 | 3,836 |
| China Touyun Tech Group, Ltd. (A) | | | 155,000 | 10,170 |
| Chinese Estates Holdings, Ltd. (B) | | | 172,000 | 113,870 |
| Chinlink International Holdings, Ltd. (A) | | | 105,000 | 9,766 |
| Chinney Investments, Ltd. | | | 36,000 | 9,769 |
| Chong Hing Bank, Ltd. | | | 57,000 | 87,346 |
| Chow Sang Sang Holdings International, Ltd. | | | 135,000 | 159,562 |
| Chuang's China Investments, Ltd. | | | 210,000 | 11,853 |
| Chuang's Consortium International, Ltd. | | | 340,021 | 56,232 |
| CITIC Telecom International Holdings, Ltd. | | | 608,000 | 222,401 |
| CK Life Sciences International Holdings, Inc. | | �� | 724,000 | 90,229 |
| CNQC International Holdings, Ltd. | | | 85,000 | 10,328 |
| Convenience Retail Asia, Ltd. | | | 68,000 | 31,307 |
| SEE NOTES TO FINANCIAL STATEMENTS | SEMIANNUAL REPORT | JOHN HANCOCK INTERNATIONAL SMALL COMPANY FUND | 25 |
| | | | | Shares | Value |
| Hong Kong (continued) | | | | | |
| Convoy Global Holdings, Ltd. (A)(C) | | | 630,000 | $9,133 |
| Cosmopolitan International Holdings, Ltd. (A) | | | 320,000 | 49,466 |
| Cowell e Holdings, Inc. | | | 112,000 | 24,992 |
| Crocodile Garments (A) | | | 106,000 | 6,858 |
| CSI Properties, Ltd. | | | 1,976,333 | 67,828 |
| CST Group, Ltd. (A) | | | 8,135,040 | 25,411 |
| Dah Sing Banking Group, Ltd. | | | 150,448 | 187,765 |
| Dah Sing Financial Holdings, Ltd. | | | 60,344 | 213,756 |
| Dickson Concepts International, Ltd. | | | 63,500 | 38,182 |
| Digital Domain Holdings, Ltd. (A) | | | 1,000,000 | 8,677 |
| Dingyi Group Investment, Ltd. (A) | | | 535,000 | 14,932 |
| DMX Technologies Group, Ltd. (A)(C) | | | 34,000 | 0 |
| Dynamic Holdings, Ltd. | | | 36,000 | 50,652 |
| Eagle Nice International Holdings, Ltd. | | | 46,000 | 15,819 |
| EcoGreen International Group, Ltd. | | | 76,000 | 13,434 |
| eForce Holdings, Ltd. (A) | | | 488,000 | 9,086 |
| EganaGoldpfeil Holdings, Ltd. (A)(C) | | | 131,750 | 0 |
| Emperor Capital Group, Ltd. (A)(B) | | | 1,143,000 | 25,215 |
| Emperor Entertainment Hotel, Ltd. | | | 185,000 | 31,004 |
| Emperor International Holdings, Ltd. | | | 436,250 | 83,583 |
| Emperor Watch & Jewellery, Ltd. | | | 1,270,000 | 23,619 |
| Energy International Investments Holdings, Ltd. (A) | | | 700,000 | 8,606 |
| ENM Holdings, Ltd. (A) | | | 368,000 | 30,375 |
| Esprit Holdings, Ltd. (A)(B) | | | 851,650 | 143,043 |
| Fairwood Holdings, Ltd. | | | 30,500 | 74,712 |
| Far East Consortium International, Ltd. | | | 506,763 | 223,097 |
| Far East Holdings International, Ltd. (A) | | | 321,000 | 8,128 |
| First Pacific Company, Ltd. | | | 1,056,000 | 299,966 |
| First Shanghai Investments, Ltd. (A) | | | 192,000 | 10,042 |
| Fountain SET Holdings, Ltd. | | | 188,000 | 28,588 |
| Freeman FinTech Corp., Ltd. (A) | | | 260,000 | 3,009 |
| Genting Hong Kong, Ltd. (A) | | | 174,000 | 12,365 |
| Get Nice Holdings, Ltd. | | | 2,604,000 | 61,855 |
| Giordano International, Ltd. | | | 535,708 | 126,281 |
| Global Brands Group Holding, Ltd. | | | 166,600 | 8,801 |
| Glorious Sun Enterprises, Ltd. | | | 146,000 | 17,243 |
| Glory Sun Land Group, Ltd. (A) | | | 112,500 | 10,757 |
| Gold Peak Industries Holdings, Ltd. | | | 90,000 | 8,795 |
| Golden Resources Development International, Ltd. | | | 148,000 | 12,828 |
| Gold-Finance Holdings, Ltd. (A)(C) | | | 214,000 | 1,977 |
| Good Resources Holdings, Ltd. (A) | | | 270,000 | 3,471 |
| GR Properties, Ltd. (A) | | | 140,000 | 32,711 |
| Great Eagle Holdings, Ltd. | | | 66,000 | 196,507 |
| Great Harvest Maeta Group Holdings, Ltd. (A) | | | 115,000 | 15,635 |
| 26 | JOHN HANCOCK INTERNATIONAL SMALL COMPANY FUND | SEMIANNUAL REPORT | SEE NOTES TO FINANCIAL STATEMENTS |
| | | | | Shares | Value |
| Hong Kong (continued) | | | | | |
| Greater Bay Area Investments Group Holdings, Ltd. (A) | | | 16,480,000 | $21,142 |
| Greentech Technology International, Ltd. (A) | | | 510,000 | 9,268 |
| G-Resources Group, Ltd. (A) | | | 10,684,800 | 72,002 |
| Guangnan Holdings, Ltd. | | | 108,000 | 10,436 |
| Guotai Junan International Holdings, Ltd. | | | 1,316,600 | 222,123 |
| Haitong International Securities Group, Ltd. (B) | | | 894,288 | 263,426 |
| Hang Fung Gold Technology, Ltd. (A)(C) | | | 310,000 | 0 |
| Hang Lung Group, Ltd. | | | 64,000 | 162,558 |
| Hanison Construction Holdings, Ltd. | | | 143,631 | 20,704 |
| Hao Tian Development Group, Ltd. (A) | | | 451,733 | 11,229 |
| Harbour Centre Development, Ltd. | | | 37,500 | 48,988 |
| HKBN, Ltd. | | | 140,000 | 251,466 |
| HKBridge Financial Holdings, Ltd. (A) | | | 102,000 | 6,578 |
| HKR International, Ltd. | | | 361,840 | 146,213 |
| Hon Kwok Land Investment Company, Ltd. | | | 64,000 | 23,954 |
| Hong Kong Ferry Holdings Company, Ltd. | | | 46,000 | 40,123 |
| Hong Kong Finance Investment Holding Group, Ltd. (A) | | | 416,000 | 42,709 |
| Hong Kong Television Network, Ltd., ADR (A) | | | 1,717 | 19,076 |
| Hongkong Chinese, Ltd. | | | 224,000 | 23,626 |
| Hop Hing Group Holdings, Ltd. | | | 920,000 | 10,739 |
| Hsin Chong Group Holdings, Ltd. (A)(C) | | | 736,000 | 33,047 |
| Hung Hing Printing Group, Ltd. | | | 76,216 | 12,182 |
| Hutchison Port Holdings Trust | | | 636,700 | 94,193 |
| Hutchison Telecommunications Hong Kong Holdings, Ltd. | | | 632,000 | 122,716 |
| Hysan Development Company, Ltd. | | | 117,000 | 427,667 |
| I-CABLE Communications, Ltd. (A) | | | 680,000 | 6,036 |
| Imagi International Holdings, Ltd. (A) | | | 117,281 | 15,007 |
| International Housewares Retail Company, Ltd. | | | 124,000 | 30,773 |
| IPE Group, Ltd. (A) | | | 220,000 | 21,964 |
| IRC, Ltd. (A) | | | 1,194,000 | 14,379 |
| IT, Ltd. | | | 174,808 | 34,881 |
| ITC Properties Group, Ltd. | | | 128,699 | 17,490 |
| Jacobson Pharma Corp., Ltd. | | | 176,000 | 36,480 |
| Johnson Electric Holdings, Ltd. | | | 120,500 | 280,757 |
| Kader Holdings Company, Ltd. | | | 248,000 | 24,538 |
| Kaisa Health Group Holdings, Ltd. (A) | | | 540,000 | 15,443 |
| Karrie International Holdings, Ltd. | | | 130,000 | 19,139 |
| Keck Seng Investments | | | 19,000 | 10,530 |
| Kerry Logistics Network, Ltd. | | | 237,500 | 342,104 |
| Kerry Properties, Ltd. | | | 27,000 | 77,773 |
| Kingmaker Footwear Holdings, Ltd. | | | 54,000 | 6,387 |
| Kingston Financial Group, Ltd. | | | 174,000 | 18,548 |
| Kowloon Development Company, Ltd. | | | 117,000 | 139,962 |
| Kwoon Chung Bus Holdings, Ltd. | | | 20,000 | 6,803 |
| SEE NOTES TO FINANCIAL STATEMENTS | SEMIANNUAL REPORT | JOHN HANCOCK INTERNATIONAL SMALL COMPANY FUND | 27 |
| | | | | Shares | Value |
| Hong Kong (continued) | | | | | |
| Lai Sun Development Company, Ltd. | | | 84,786 | $103,105 |
| Lai Sun Garment International, Ltd. | | | 31,231 | 37,380 |
| Landing International Development, Ltd. (A) | | | 523,200 | 45,666 |
| Landsea Green Properties Company, Ltd. (A) | | | 404,000 | 36,510 |
| Langham Hospitality Investments and Langham Hospitality Investments, Ltd. | | | 244,500 | 56,332 |
| Lerthai Group, Ltd. (A) | | | 18,000 | 8,175 |
| Leyou Technologies Holdings, Ltd. (A) | | | 370,000 | 129,847 |
| Li & Fung, Ltd. (B) | | | 2,304,000 | 195,775 |
| Lifestyle International Holdings, Ltd. | | | 169,000 | 157,324 |
| Lippo China Resources, Ltd. | | | 1,028,000 | 23,949 |
| Lippo, Ltd. | | | 31,250 | 11,064 |
| Liu Chong Hing Investment, Ltd. | | | 76,000 | 91,003 |
| Luk Fook Holdings International, Ltd. | | | 144,000 | 353,714 |
| Lung Kee Bermuda Holdings, Ltd. | | | 48,000 | 15,206 |
| Magnificent Hotel Investment, Ltd. | | | 438,000 | 8,225 |
| Man Wah Holdings, Ltd. | | | 593,600 | 440,426 |
| Mandarin Oriental International, Ltd. | | | 48,800 | 79,707 |
| Mason Group Holdings, Ltd. | | | 9,029,000 | 49,189 |
| Maxnerva Technology Services, Ltd. (A) | | | 66,000 | 3,668 |
| Melco International Development, Ltd. | | | 194,000 | 405,733 |
| Midland Holdings, Ltd. (A) | | | 162,090 | 23,232 |
| Ming Fai International Holdings, Ltd. | | | 41,000 | 4,324 |
| Miramar Hotel & Investment | | | 62,000 | 114,505 |
| Modern Dental Group, Ltd. | | | 135,000 | 23,789 |
| Nameson Holdings, Ltd. | | | 196,000 | 13,804 |
| National Electronics Holdings | | | 88,000 | 12,423 |
| National United Resources Holdings, Ltd. (A)(C) | | | 1,090,000 | 14,892 |
| Neo-Neon Holdings, Ltd. (A) | | | 134,000 | 9,279 |
| NewOcean Energy Holdings, Ltd. (A) | | | 336,000 | 49,521 |
| Nimble Holdings Company, Ltd. (A) | | | 120,000 | 7,850 |
| NOVA Group Holdings, Ltd. (A) | | | 195,000 | 37,774 |
| OP Financial, Ltd. | | | 376,000 | 48,262 |
| Oriental Press Group, Ltd. | | | 96,000 | 6,401 |
| Oriental Watch Holdings | | | 190,000 | 41,692 |
| Oshidori International Holdings, Ltd. | | | 1,588,200 | 155,776 |
| Pacific Andes International Holdings, Ltd. (A)(C) | | | 2,171,305 | 0 |
| Pacific Basin Shipping, Ltd. | | | 1,962,000 | 296,209 |
| Pacific Textiles Holdings, Ltd. | | | 329,000 | 206,388 |
| Pak Fah Yeow International, Ltd. | | | 20,000 | 6,454 |
| Paliburg Holdings, Ltd. | | | 101,380 | 32,819 |
| Paradise Entertainment, Ltd. | | | 176,000 | 15,655 |
| PC Partner Group, Ltd. (A) | | | 24,000 | 5,521 |
| PCCW, Ltd. | | | 74,000 | 44,718 |
| 28 | JOHN HANCOCK INTERNATIONAL SMALL COMPANY FUND | SEMIANNUAL REPORT | SEE NOTES TO FINANCIAL STATEMENTS |
| | | | | Shares | Value |
| Hong Kong (continued) | | | | | |
| Peace Mark Holdings, Ltd. (A)(C) | | | 180,000 | $0 |
| Perfect Shape Medical, Ltd. | | | 172,000 | 58,174 |
| Pico Far East Holdings, Ltd. | | | 254,000 | 64,394 |
| Playmates Holdings, Ltd. | | | 640,000 | 92,191 |
| Playmates Toys, Ltd. (A) | | | 164,000 | 7,359 |
| Plover Bay Technologies, Ltd. | | | 88,000 | 13,181 |
| Polytec Asset Holdings, Ltd. | | | 611,700 | 71,208 |
| PT International Development Company, Ltd. (A) | | | 453,327 | 21,875 |
| Public Financial Holdings, Ltd. | | | 126,000 | 44,797 |
| PYI Corp., Ltd. (A) | | | 1,336,801 | 13,233 |
| Rare Earth Magnesium Technology Group Holdings, Ltd. | | | 620,000 | 20,469 |
| Regal Hotels International Holdings, Ltd. | | | 99,200 | 44,435 |
| Regina Miracle International Holdings, Ltd. (D) | | | 67,000 | 37,530 |
| Sa Sa International Holdings, Ltd. (B) | | | 505,018 | 97,326 |
| Samson Holding, Ltd. (A) | | | 120,000 | 6,228 |
| SAS Dragon Holdings, Ltd. | | | 84,000 | 26,173 |
| SEA Holdings, Ltd. | | | 68,484 | 54,291 |
| Shangri-La Asia, Ltd. | | | 40,000 | 35,145 |
| Shenwan Hongyuan HK, Ltd. | | | 120,000 | 17,491 |
| Shun Ho Property Investments, Ltd. | | | 7,227 | 1,775 |
| Shun Tak Holdings, Ltd. | | | 641,250 | 276,091 |
| Sincere Watch Hong Kong, Ltd. (A) | | | 1,190,000 | 16,934 |
| Sing Tao News Corp., Ltd. | | | 118,000 | 21,032 |
| Singamas Container Holdings, Ltd. | | | 682,000 | 66,030 |
| SITC International Holdings Company, Ltd. | | | 429,000 | 499,122 |
| Sitoy Group Holdings, Ltd. | | | 135,000 | 12,185 |
| SmarTone Telecommunications Holdings, Ltd. | | | 141,089 | 100,175 |
| SOCAM Development, Ltd. (A) | | | 25,426 | 6,718 |
| Solomon Systech International, Ltd. (A) | | | 504,000 | 8,852 |
| Soundwill Holdings, Ltd. | | | 39,500 | 47,024 |
| Stella International Holdings, Ltd. | | | 178,000 | 227,682 |
| Success Universe Group, Ltd. (A) | | | 360,000 | 7,989 |
| Summit Ascent Holdings, Ltd. (A) | | | 210,000 | 23,581 |
| Sun Hung Kai & Company, Ltd. | | | 193,318 | 86,734 |
| SUNeVision Holdings, Ltd. | | | 173,000 | 112,733 |
| Synergy Group Holdings International, Ltd. (A) | | | 104,000 | 3,996 |
| TAI Cheung Holdings, Ltd. | | | 115,000 | 89,081 |
| Tai United Holdings, Ltd. | | | 115,000 | 1,923 |
| Tan Chong International, Ltd. | | | 63,000 | 16,489 |
| Tao Heung Holdings, Ltd. | | | 95,000 | 13,170 |
| Television Broadcasts, Ltd. | | | 124,100 | 176,599 |
| Texwinca Holdings, Ltd. | | | 304,000 | 66,040 |
| The Cross-Harbour Holdings, Ltd. | | | 117,833 | 181,874 |
| The Hongkong & Shanghai Hotels, Ltd. | | | 197,000 | 203,189 |
| SEE NOTES TO FINANCIAL STATEMENTS | SEMIANNUAL REPORT | JOHN HANCOCK INTERNATIONAL SMALL COMPANY FUND | 29 |
| | | | | Shares | Value |
| Hong Kong (continued) | | | | | |
| The United Laboratories International Holdings, Ltd. | | | 308,500 | $208,430 |
| Theme International Holdings, Ltd. (A) | | | 855,000 | 12,613 |
| TOM Group, Ltd. (A) | | | 718,000 | 126,163 |
| Tradelink Electronic Commerce, Ltd. | | | 186,000 | 27,953 |
| Transport International Holdings, Ltd. (B) | | | 81,215 | 200,305 |
| Trinity, Ltd. (A) | | | 408,000 | 9,288 |
| Tsui Wah Holdings, Ltd. | | | 170,000 | 8,698 |
| Union Medical Healthcare, Ltd. | | | 59,000 | 38,522 |
| Up Energy Development Group, Ltd. (A)(C) | | | 898,000 | 1,486 |
| Upbest Group, Ltd. | | | 8,000 | 955 |
| Value Convergence Holdings, Ltd. (A) | | | 172,000 | 6,966 |
| Valuetronics Holdings, Ltd. | | | 125,150 | 57,400 |
| Vanke Property Overseas, Ltd. | | | 35,000 | 15,497 |
| Vantage International Holdings, Ltd. | | | 120,000 | 7,827 |
| Vedan International Holdings, Ltd. | | | 168,000 | 16,410 |
| Vitasoy International Holdings, Ltd. (B) | | | 94,000 | 340,935 |
| VPower Group International Holdings, Ltd. (D) | | | 111,000 | 31,152 |
| VSTECS Holdings, Ltd. | | | 324,400 | 156,575 |
| VTech Holdings, Ltd. | | | 58,600 | 518,846 |
| Wai Kee Holdings, Ltd. | | | 72,000 | 41,626 |
| Wang On Group, Ltd. | | | 1,780,000 | 17,333 |
| We Solutions, Ltd. (A) | | | 392,000 | 21,805 |
| Win Hanverky Holdings, Ltd. | | | 152,000 | 8,778 |
| Winfull Group Holdings, Ltd. (A) | | | 1,368,000 | 12,762 |
| Wing On Company International, Ltd. (B) | | | 28,000 | 77,866 |
| Wing Tai Properties, Ltd. | | | 118,000 | 74,734 |
| Wonderful Sky Financial Group Holdings, Ltd. | | | 46,000 | 3,846 |
| Xinyi Glass Holdings, Ltd. | | | 162,000 | 202,832 |
| YGM Trading, Ltd. | | | 22,000 | 9,830 |
| YT Realty Group, Ltd. | | | 47,109 | 13,269 |
| YTO Express Holdings, Ltd. | | | 36,000 | 8,721 |
| Yue Yuen Industrial Holdings, Ltd. | | | 40,500 | 98,281 |
| Zhaobangji Properties Holdings, Ltd. (A) | | | 320,000 | 71,187 |
| Ireland 0.5% | | | | | 4,005,969 |
| Bank of Ireland Group PLC | | | 59,095 | 221,269 |
| C&C Group PLC | | | 110,907 | 467,352 |
| Cairn Homes PLC | | | 113,544 | 152,999 |
| Datalex PLC (A)(C) | | | 4,124 | 3,539 |
| FBD Holdings PLC | | | 8,155 | 77,682 |
| Flutter Entertainment PLC | | | 678 | 72,099 |
| Glanbia PLC | | | 41,335 | 485,613 |
| Grafton Group PLC | | | 101,737 | 1,132,658 |
| Greencore Group PLC | | | 227,934 | 620,387 |
| 30 | JOHN HANCOCK INTERNATIONAL SMALL COMPANY FUND | SEMIANNUAL REPORT | SEE NOTES TO FINANCIAL STATEMENTS |
| | | | | Shares | Value |
| Ireland (continued) | | | | | |
| Hostelworld Group PLC (D) | | | 10,851 | $14,352 |
| Irish Continental Group PLC | | | 42,651 | 183,158 |
| Permanent TSB Group Holdings PLC (A) | | | 11,820 | 10,804 |
| San Leon Energy PLC (A) | | | 20,803 | 6,725 |
| UDG Healthcare PLC | | | 61,090 | 557,332 |
| Isle of Man 0.1% | | | | | 610,447 |
| Hansard Global PLC | | | 11,952 | 5,811 |
| Playtech PLC | | | 155,097 | 505,028 |
| Strix Group PLC | | | 45,890 | 99,608 |
| Israel 1.3% | | | | | 9,325,543 |
| Adgar Investment and Development, Ltd. (B) | | | 21,013 | 46,646 |
| Afcon Holdings, Ltd. (A)(B) | | | 661 | 27,862 |
| AFI Properties, Ltd. (A) | | | 4,884 | 203,267 |
| Africa Israel Residences, Ltd. | | | 512 | 17,978 |
| Airport City, Ltd. (A) | | | 1 | 10 |
| Allot, Ltd. (A) | | | 11,145 | 119,900 |
| Alrov Properties and Lodgings, Ltd. | | | 2,216 | 95,563 |
| Arad, Ltd. | | | 2,993 | 46,576 |
| Arko Holdings, Ltd. (A) | | | 77,819 | 26,750 |
| Ashtrom Group, Ltd. | | | 8,537 | 124,060 |
| Ashtrom Properties, Ltd. | | | 14,979 | 93,640 |
| Atreyu Capital Markets, Ltd. | | | 1,856 | 33,550 |
| AudioCodes, Ltd. | | | 10,166 | 215,980 |
| Avgol Industries 1953, Ltd. (A) | | | 33,538 | 20,987 |
| Azorim-Investment Development & Construction Company, Ltd. (A) | | | 37,724 | 91,541 |
| Bayside Land Corp. | | | 371 | 305,105 |
| Bet Shemesh Engines Holdings 1997, Ltd. | | | 2,169 | 69,384 |
| Big Shopping Centers, Ltd. | | | 1,867 | 201,837 |
| Blue Square Real Estate, Ltd. | | | 1,795 | 121,939 |
| Bonus Biogroup, Ltd. (A) | | | 66,790 | 6,798 |
| Brainsway, Ltd. (A) | | | 5,096 | 27,445 |
| Camtek, Ltd. | | | 7,005 | 69,316 |
| Carasso Motors, Ltd. | | | 5,531 | 23,020 |
| Cellcom Israel, Ltd. (A) | | | 20,646 | 75,416 |
| Cellcom Israel, Ltd. (New York Stock Exchange) (A) | | | 1,000 | 3,610 |
| Ceragon Networks, Ltd. (A) | | | 14,289 | 24,148 |
| Clal Insurance Enterprises Holdings, Ltd. (A) | | | 10,232 | 107,739 |
| Compugen, Ltd. (A)(B) | | | 21,052 | 161,454 |
| Danel Adir Yeoshua, Ltd. | | | 1,256 | 110,162 |
| Delek Automotive Systems, Ltd. | | | 12,459 | 67,079 |
| Delek Group, Ltd. | | | 241 | 23,383 |
| Delta Galil Industries, Ltd. | | | 3,337 | 63,686 |
| Dor Alon Energy in Israel 1988, Ltd. (A) | | | 1,448 | 31,761 |
| SEE NOTES TO FINANCIAL STATEMENTS | SEMIANNUAL REPORT | JOHN HANCOCK INTERNATIONAL SMALL COMPANY FUND | 31 |
| | | | | Shares | Value |
| Israel (continued) | | | | | |
| Duniec Brothers, Ltd. | | | 328 | $12,308 |
| El Al Israel Airlines (A) | | | 137,546 | 27,742 |
| Electra Consumer Products 1970, Ltd. | | | 2,575 | 47,179 |
| Electra Real Estate, Ltd. (A) | | | 4,640 | 29,353 |
| Electra, Ltd. | | | 660 | 319,168 |
| Electreon Wireless, Ltd. (A) | | | 414 | 14,517 |
| Energix-Renewable Energies, Ltd. (A) | | | 48,578 | 163,079 |
| Enlight Renewable Energy, Ltd. (A) | | | 116,899 | 164,149 |
| Equital, Ltd. (A) | | | 5,723 | 138,306 |
| Evogene, Ltd. (A) | | | 5,330 | 7,050 |
| First International Bank of Israel, Ltd. | | | 5,748 | 153,975 |
| FMS Enterprises Migun, Ltd. | | | 962 | 30,235 |
| Formula Systems 1985, Ltd. | | | 3,729 | 247,945 |
| Fox Wizel, Ltd. | | | 3,426 | 144,283 |
| Gilat Satellite Networks, Ltd. | | | 11,617 | 109,306 |
| Gilat Satellite Networks, Ltd. (New York Stock Exchange) | | | 759 | 7,142 |
| Hadera Paper, Ltd. | | | 1,499 | 45,464 |
| Ham-Let Israel-Canada, Ltd. (A) | | | 2,259 | 39,106 |
| Harel Insurance Investments & Financial Services, Ltd. | | | 28,816 | 169,414 |
| Hilan, Ltd. | | | 5,426 | 206,955 |
| IDI Insurance Company, Ltd. | | | 2,166 | 60,237 |
| IES Holdings, Ltd. | | | 762 | 41,295 |
| Industrial Buildings Corp., Ltd. (A) | | | 28,040 | 80,490 |
| Inrom Construction Industries, Ltd. | | | 19,017 | 79,137 |
| Intercure, Ltd. (A)(B) | | | 17,839 | 16,004 |
| Israel Canada T.R., Ltd. | | | 33,166 | 66,211 |
| Israel Land Development - Urban Renewal, Ltd. | | | 2,268 | 33,178 |
| Isras Investment Company, Ltd. | | | 393 | 89,183 |
| Issta Lines, Ltd. | | | 1,677 | 30,562 |
| Kamada, Ltd. (A) | | | 11,932 | 70,596 |
| Kerur Holdings, Ltd. | | | 1,874 | 47,235 |
| Klil Industries, Ltd. (A) | | | 300 | 22,388 |
| Levinstein Properties, Ltd. | | | 504 | 13,021 |
| Magic Software Enterprises, Ltd. | | | 10,744 | 104,837 |
| Malam - Team, Ltd. | | | 214 | 41,276 |
| Matrix IT, Ltd. | | | 15,061 | 275,326 |
| Maytronics, Ltd. | | | 16,549 | 132,838 |
| Mediterranean Towers, Ltd. | | | 22,264 | 65,449 |
| Mega Or Holdings, Ltd. | | | 6,183 | 170,814 |
| Mehadrin, Ltd. (A) | | | 167 | 5,897 |
| Meitav Dash Investments, Ltd. | | | 9,168 | 32,471 |
| Menora Mivtachim Holdings, Ltd. | | | 8,988 | 105,389 |
| Migdal Insurance & Financial Holdings, Ltd. | | | 140,977 | 102,089 |
| Minrav Holdings, Ltd. | | | 126 | 20,718 |
| 32 | JOHN HANCOCK INTERNATIONAL SMALL COMPANY FUND | SEMIANNUAL REPORT | SEE NOTES TO FINANCIAL STATEMENTS |
| | | | | Shares | Value |
| Israel (continued) | | | | | |
| Mivtach Shamir Holdings, Ltd. | | | 1,455 | $29,822 |
| Naphtha Israel Petroleum Corp., Ltd. (A) | | | 14,316 | 59,023 |
| Nawi Brothers, Ltd. (A) | | | 6,442 | 45,697 |
| Neto ME Holdings, Ltd. | | | 616 | 32,874 |
| Nova Measuring Instruments, Ltd. (A) | | | 8,081 | 278,457 |
| Novolog, Ltd. | | | 19,324 | 11,281 |
| NR Spuntech Industries, Ltd. (A) | | | 7,555 | 10,004 |
| Oil Refineries, Ltd. | | | 526,893 | 178,508 |
| One Software Technologies, Ltd. | | | 1,189 | 78,349 |
| OPC Energy, Ltd. | | | 8,151 | 56,313 |
| Partner Communications Company, Ltd. (A) | | | 38,688 | 186,496 |
| Paz Oil Company, Ltd. | | | 3,230 | 354,187 |
| Perion Network, Ltd. (A) | | | 4,172 | 29,145 |
| Plasson Industries, Ltd. | | | 1,357 | 58,554 |
| Plus500, Ltd. | | | 19,766 | 243,137 |
| Priortech, Ltd. | | | 2,125 | 19,283 |
| Rami Levy Chain Stores Hashikma Marketing 2006, Ltd. | | | 2,696 | 150,216 |
| Scope Metals Group, Ltd. | | | 2,885 | 63,645 |
| Shapir Engineering and Industry, Ltd. | | | 32,037 | 222,333 |
| Shikun & Binui, Ltd. | | | 64,196 | 345,805 |
| Shufersal, Ltd. | | | 4,123 | 25,939 |
| Summit Real Estate Holdings, Ltd. | | | 9,897 | 157,763 |
| Suny Cellular Communication, Ltd. (A) | | | 18,682 | 7,698 |
| Tadiran Holdings, Ltd. | | | 472 | 19,043 |
| The Phoenix Holdings, Ltd. | | | 31,036 | 155,677 |
| Tower Semiconductor, Ltd. (A) | | | 1 | 12 |
| Union Bank of Israel | | | 5,355 | 29,063 |
| YH Dimri Construction & Development, Ltd. | | | 1,062 | 36,310 |
| Italy 4.6% | | | | | 33,651,776 |
| A2A SpA | | | 651,803 | 1,136,434 |
| ACEA SpA | | | 22,534 | 474,584 |
| Aeffe SpA (A) | | | 24,188 | 36,042 |
| Amplifon SpA | | | 43,379 | 1,244,476 |
| Anima Holding SpA (D) | | | 146,027 | 644,707 |
| Aquafil SpA (B) | | | 2,427 | 13,520 |
| Arnoldo Mondadori Editore SpA (A) | | | 86,730 | 148,812 |
| AS Roma SpA (A) | | | 56,520 | 37,882 |
| Ascopiave SpA | | | 30,571 | 133,069 |
| ASTM SpA | | | 4,755 | 118,240 |
| Autogrill SpA | | | 46,822 | 378,524 |
| Autostrade Meridionali SpA | | | 562 | 15,959 |
| Avio SpA | | | 10,093 | 155,926 |
| Azimut Holding SpA | | | 52,391 | 1,117,168 |
| SEE NOTES TO FINANCIAL STATEMENTS | SEMIANNUAL REPORT | JOHN HANCOCK INTERNATIONAL SMALL COMPANY FUND | 33 |
| | | | | Shares | Value |
| Italy (continued) | | | | | |
| B&C Speakers SpA | | | 959 | $14,278 |
| Banca Carige SpA (A)(C) | | | 14,180 | 21 |
| Banca Farmafactoring SpA (D) | | | 46,719 | 287,353 |
| Banca Finnat Euramerica SpA | | | 29,383 | 9,341 |
| Banca Generali SpA | | | 21,107 | 656,111 |
| Banca IFIS SpA (B) | | | 11,788 | 180,767 |
| Banca Mediolanum SpA | | | 9,882 | 80,766 |
| Banca Monte dei Paschi di Siena SpA (A) | | | 1,513 | 3,066 |
| Banca Popolare di Sondrio SCPA | | | 152,984 | 365,640 |
| Banca Profilo SpA | | | 121,842 | 27,459 |
| Banca Sistema SpA (D) | | | 23,962 | 45,731 |
| Banco BPM SpA (A) | | | 714,718 | 1,575,114 |
| Banco di Desio e della Brianza SpA | | | 13,389 | 41,511 |
| BasicNet SpA | | | 5,209 | 25,927 |
| BE SpA | | | 26,372 | 34,781 |
| BF SpA (A) | | | 3,630 | 14,244 |
| Biesse SpA | | | 5,189 | 70,495 |
| BPER Banca | | | 191,149 | 765,862 |
| Brunello Cucinelli SpA (B) | | | 13,152 | 440,043 |
| Buzzi Unicem SpA | | | 33,537 | 735,629 |
| Cairo Communication SpA | | | 39,540 | 95,896 |
| Carel Industries SpA (D) | | | 820 | 10,100 |
| Carraro SpA | | | 6,932 | 13,086 |
| Cementir Holding NV | | | 23,005 | 148,370 |
| Cerved Group SpA | | | 75,982 | 723,640 |
| CIR SpA-Compagnie Industriali | | | 340,106 | 190,610 |
| Credito Emiliano SpA | | | 45,504 | 238,903 |
| Credito Valtellinese SpA (A) | | | 2,313,120 | 191,029 |
| Danieli & C Officine Meccaniche SpA (B) | | | 6,990 | 105,121 |
| Datalogic SpA (B) | | | 8,307 | 125,800 |
| De' Longhi SpA | | | 26,040 | 454,159 |
| DeA Capital SpA (A) | | | 51,454 | 79,191 |
| DiaSorin SpA | | | 2,337 | 267,760 |
| doValue SpA (D) | | | 16,243 | 203,007 |
| El.En. SpA | | | 5,348 | 149,736 |
| Elica SpA (A) | | | 10,005 | 34,235 |
| Emak SpA | | | 28,372 | 24,929 |
| Enav SpA (D) | | | 60,977 | 363,089 |
| ERG SpA | | | 25,126 | 590,094 |
| Esprinet SpA | | | 17,722 | 96,871 |
| Eurotech SpA (A) | | | 15,408 | 115,421 |
| Falck Renewables SpA | | | 62,064 | 406,806 |
| Fiera Milano SpA | | | 13,870 | 67,979 |
| Fila SpA | | | 780 | 9,786 |
| 34 | JOHN HANCOCK INTERNATIONAL SMALL COMPANY FUND | SEMIANNUAL REPORT | SEE NOTES TO FINANCIAL STATEMENTS |
| | | | | Shares | Value |
| Italy (continued) | | | | | |
| Fincantieri SpA (B) | | | 239,241 | $191,037 |
| FinecoBank Banca Fineco SpA | | | 34,544 | 362,470 |
| FNM SpA (B) | | | 72,366 | 54,024 |
| Freni Brembo SpA | | | 58,131 | 583,084 |
| GEDI Gruppo Editoriale SpA (A) | | | 54,336 | 27,444 |
| Gefran SpA | | | 1,600 | 9,841 |
| Geox SpA | | | 22,422 | 22,883 |
| Gruppo MutuiOnline SpA | | | 10,709 | 242,873 |
| Guala Closures SpA (A) | | | 1,594 | 12,521 |
| Hera SpA | | | 323,845 | 1,390,001 |
| Illimity Bank SpA (A) | | | 8,861 | 96,644 |
| IMA Industria Macchine Automatiche SpA (B) | | | 5,235 | 325,003 |
| IMMSI SpA (A)(B) | | | 101,365 | 53,013 |
| Intek Group SpA (A) | | | 66,972 | 18,105 |
| Interpump Group SpA | | | 27,899 | 844,633 |
| Iren SpA | | | 248,032 | 767,768 |
| Italgas SpA | | | 206,901 | 1,264,389 |
| Italmobiliare SpA | | | 6,529 | 190,779 |
| Juventus Football Club SpA (A)(B) | | | 130,865 | 141,755 |
| La Doria SpA | | | 6,327 | 57,482 |
| Leonardo SpA | | | 10,643 | 109,150 |
| LU-VE SpA | | | 2,562 | 36,786 |
| Maire Tecnimont SpA | | | 65,851 | 170,903 |
| MARR SpA | | | 13,640 | 252,948 |
| Massimo Zanetti Beverage Group SpA (D) | | | 3,791 | 22,060 |
| Mediaset SpA (A)(B) | | | 170,993 | 399,800 |
| Openjobmetis SpA Agenzia per il Lavoro | | | 2,352 | 18,010 |
| OVS SpA (A)(B)(D) | | | 86,493 | 142,632 |
| Piaggio & C SpA | | | 78,379 | 187,494 |
| Pirelli & C. SpA (D) | | | 166,095 | 790,850 |
| Prima Industrie SpA | | | 1,462 | 23,506 |
| Prysmian SpA | | | 62,220 | 1,486,392 |
| RAI Way SpA (D) | | | 40,725 | 247,073 |
| Reno de Medici SpA (B) | | | 86,273 | 61,034 |
| Reply SpA | | | 8,288 | 630,284 |
| Retelit SpA | | | 39,468 | 64,123 |
| Rizzoli Corriere Della Sera Mediagroup SpA (B) | | | 44,608 | 43,102 |
| Sabaf SpA | | | 2,928 | 40,192 |
| SAES Getters SpA | | | 2,224 | 60,829 |
| Safilo Group SpA (A) | | | 16,568 | 18,092 |
| Saipem SpA (A)(B) | | | 256,962 | 981,864 |
| Salini Impregilo SpA (A) | | | 63,047 | 93,594 |
| Salvatore Ferragamo SpA | | | 24,955 | 397,116 |
| Saras SpA | | | 260,853 | 308,422 |
| SEE NOTES TO FINANCIAL STATEMENTS | SEMIANNUAL REPORT | JOHN HANCOCK INTERNATIONAL SMALL COMPANY FUND | 35 |
| | | | | Shares | Value |
| Italy (continued) | | | | | |
| Servizi Italia SpA | | | 3,687 | $10,672 |
| Sesa SpA | | | 2,556 | 134,569 |
| Societa Cattolica di Assicurazioni SC | | | 85,898 | 631,608 |
| Sogefi SpA (A) | | | 10,059 | 12,013 |
| SOL SpA (B) | | | 9,408 | 100,219 |
| Tamburi Investment Partners SpA | | | 55,134 | 384,800 |
| Technogym SpA (D) | | | 36,463 | 385,064 |
| Tinexta SpA | | | 8,122 | 110,409 |
| Tod's SpA (B) | | | 3,519 | 120,625 |
| TXT e-solutions SpA | | | 3,737 | 33,247 |
| Unieuro SpA (D) | | | 5,335 | 65,744 |
| Unione di Banche Italiane SpA | | | 383,598 | 1,587,049 |
| Unipol Gruppo SpA | | | 186,141 | 927,457 |
| Zignago Vetro SpA | | | 12,499 | 171,195 |
| Japan 22.9% | | | | | 168,353,095 |
| A&D Company, Ltd. | | | 8,600 | 62,328 |
| Abist Company, Ltd. | | | 1,300 | 25,803 |
| Access Company, Ltd. (B) | | | 11,600 | 93,933 |
| Achilles Corp. | | | 5,800 | 91,424 |
| AD Works Company, Ltd. | | | 105,400 | 23,389 |
| Adastria Company, Ltd. (B) | | | 11,440 | 184,792 |
| ADEKA Corp. | | | 34,891 | 453,130 |
| Ad-sol Nissin Corp. (B) | | | 2,800 | 56,333 |
| Advan Company, Ltd. | | | 9,100 | 87,508 |
| Advance Create Company, Ltd. | | | 1,600 | 23,112 |
| Advanex, Inc. | | | 1,000 | 11,470 |
| Advantage Risk Management Company, Ltd. | | | 1,800 | 12,193 |
| Adventure, Inc. | | | 600 | 14,073 |
| Adways, Inc. | | | 4,800 | 12,795 |
| Aeon Delight Company, Ltd. | | | 5,800 | 177,051 |
| Aeon Fantasy Company, Ltd. | | | 3,300 | 57,068 |
| Aeon Hokkaido Corp. (B) | | | 7,700 | 54,628 |
| Aeria, Inc. (A) | | | 4,300 | 24,211 |
| AFC-HD AMS Life Science Company, Ltd. | | | 1,800 | 9,856 |
| Agro-Kanesho Company, Ltd. | | | 200 | 2,380 |
| Ahresty Corp. | | | 9,400 | 37,615 |
| Ai Holdings Corp. | | | 14,600 | 205,579 |
| Aichi Corp. | | | 15,500 | 89,197 |
| Aichi Steel Corp. | | | 4,700 | 130,121 |
| Aichi Tokei Denki Company, Ltd. | | | 1,100 | 40,926 |
| Aida Engineering, Ltd. | | | 23,500 | 172,811 |
| Aiful Corp. (A) | | | 147,400 | 363,025 |
| Aigan Company, Ltd. | | | 4,300 | 8,660 |
| 36 | JOHN HANCOCK INTERNATIONAL SMALL COMPANY FUND | SEMIANNUAL REPORT | SEE NOTES TO FINANCIAL STATEMENTS |
| | | | | Shares | Value |
| Japan (continued) | | | | | |
| Ainavo Holdings Company, Ltd. | | | 2,400 | $19,833 |
| Aiphone Company, Ltd. | | | 4,600 | 64,867 |
| Airport Facilities Company, Ltd. | | | 8,500 | 36,171 |
| Airtech Japan, Ltd. (B) | | | 2,500 | 20,903 |
| Aisan Industry Company, Ltd. | | | 17,500 | 100,875 |
| Aizawa Securities Company, Ltd. | | | 16,600 | 92,308 |
| Ajis Company, Ltd. | | | 1,600 | 40,705 |
| Akatsuki Corp. | | | 6,800 | 19,123 |
| Akatsuki, Inc. | | | 2,200 | 84,548 |
| Akebono Brake Industry Company, Ltd. (A) | | | 25,300 | 40,174 |
| Albis Company, Ltd. | | | 2,200 | 38,996 |
| Alconix Corp. | | | 8,400 | 86,518 |
| Alinco, Inc. (B) | | | 5,400 | 48,321 |
| Alpen Company, Ltd. | | | 8,400 | 124,345 |
| Alpha Corp. | | | 2,500 | 23,734 |
| Alpha Systems, Inc. | | | 2,920 | 70,681 |
| AlphaPolis Company, Ltd. (A) | | | 1,100 | 20,802 |
| Alps Logistics Company, Ltd. | | | 6,000 | 40,762 |
| Altech Corp. | | | 7,130 | 106,720 |
| Amano Corp. | | | 2,400 | 59,029 |
| Amiyaki Tei Company, Ltd. | | | 2,000 | 56,375 |
| Amuse, Inc. | | | 1,400 | 28,993 |
| Anabuki Kosan, Inc. | | | 1,000 | 13,284 |
| Anest Iwata Corp. | | | 13,300 | 119,791 |
| AOI Electronics Company, Ltd. | | | 1,600 | 30,534 |
| AOI TYO Holdings, Inc. | | | 12,810 | 77,244 |
| AOKI Holdings, Inc. | | | 15,800 | 133,486 |
| Aoyama Trading Company, Ltd. | | | 17,900 | 200,308 |
| Aoyama Zaisan Networks Company, Ltd. | | | 2,200 | 27,519 |
| Apaman Company, Ltd. | | | 3,100 | 17,434 |
| Arakawa Chemical Industries, Ltd. | | | 8,200 | 97,104 |
| Arata Corp. | | | 5,700 | 217,277 |
| Araya Industrial Company, Ltd. | | | 1,200 | 14,040 |
| Arcland Sakamoto Company, Ltd. (B) | | | 12,500 | 125,852 |
| Arcland Service Holdings Company, Ltd. | | | 6,900 | 105,672 |
| Arcs Company, Ltd. | | | 17,884 | 283,662 |
| Arealink Company, Ltd. | | | 3,600 | 26,672 |
| Argo Graphics, Inc. | | | 6,500 | 194,030 |
| Arisawa Manufacturing Company, Ltd. | | | 15,000 | 111,911 |
| Arrk Corp. (A) | | | 24,300 | 17,326 |
| Artnature, Inc. | | | 6,300 | 37,254 |
| ArtSpark Holdings, Inc. | | | 500 | 2,837 |
| As One Corp. | | | 600 | 44,440 |
| Asahi Broadcasting Group Holdings Corp. | | | 4,000 | 25,301 |
| SEE NOTES TO FINANCIAL STATEMENTS | SEMIANNUAL REPORT | JOHN HANCOCK INTERNATIONAL SMALL COMPANY FUND | 37 |
| | | | | Shares | Value |
| Japan (continued) | | | | | |
| Asahi Company, Ltd. | | | 7,500 | $75,355 |
| Asahi Diamond Industrial Company, Ltd. | | | 23,100 | 112,065 |
| Asahi Holdings, Inc. | | | 14,500 | 330,260 |
| Asahi Kogyosha Company, Ltd. | | | 1,700 | 43,506 |
| Asahi Net, Inc. | | | 6,800 | 41,120 |
| Asahi Printing Company, Ltd. | | | 3,100 | 26,975 |
| ASAHI YUKIZAI Corp. | | | 6,100 | 80,311 |
| Asante, Inc. | | | 2,700 | 44,131 |
| Asanuma Corp. | | | 3,100 | 127,480 |
| Asax Company, Ltd. | | | 4,100 | 24,144 |
| Ashimori Industry Company, Ltd. | | | 1,599 | 15,627 |
| Asia Pile Holdings Corp. | | | 11,600 | 49,763 |
| ASKA Pharmaceutical Company, Ltd. | | | 10,100 | 90,625 |
| ASKUL Corp. | | | 6,000 | 169,402 |
| Asti Corp. | | | 700 | 9,945 |
| Asukanet Company, Ltd. | | | 2,200 | 23,186 |
| Ateam, Inc. | | | 7,200 | 51,838 |
| Atom Corp. | | | 26,000 | 217,436 |
| Atrae, Inc. (A) | | | 3,500 | 75,194 |
| Atsugi Company, Ltd. | | | 6,700 | 42,973 |
| Aucfan Company, Ltd. (A) | | | 1,700 | 11,053 |
| Aucnet, Inc. | | | 1,000 | 9,670 |
| Autobacs Seven Company, Ltd. | | | 17,300 | 221,279 |
| Avant Corp. | | | 8,200 | 64,038 |
| Avantia Company, Ltd. | | | 5,700 | 40,416 |
| Avex, Inc. | | | 15,000 | 140,462 |
| Axell Corp. (A) | | | 1,700 | 10,894 |
| Axial Retailing, Inc. | | | 5,800 | 183,695 |
| Axyz Company, Ltd. | | | 500 | 10,750 |
| Azia Company, Ltd. | | | 1,000 | 12,020 |
| Bando Chemical Industries, Ltd. | | | 14,800 | 95,458 |
| Bank of the Ryukyus, Ltd. | | | 13,000 | 120,675 |
| Baroque Japan, Ltd. | | | 2,500 | 18,792 |
| BayCurrent Consulting, Inc. | | | 4,800 | 288,143 |
| Beaglee, Inc. (A) | | | 1,800 | 21,977 |
| Beauty Garage, Inc. | | | 100 | 1,512 |
| Beenos, Inc. (A) | | | 2,400 | 21,408 |
| Belc Company, Ltd. | | | 4,400 | 211,925 |
| Bell System24 Holdings, Inc. | | | 13,500 | 160,271 |
| Belluna Company, Ltd. | | | 21,300 | 107,178 |
| BeNEXT Group, Inc. | | | 9,600 | 74,723 |
| Bengo4.com, Inc. (A)(B) | | | 1,800 | 65,946 |
| Biofermin Pharmaceutical Company, Ltd. | | | 2,100 | 44,071 |
| B-Lot Company, Ltd. | | | 1,500 | 19,460 |
| 38 | JOHN HANCOCK INTERNATIONAL SMALL COMPANY FUND | SEMIANNUAL REPORT | SEE NOTES TO FINANCIAL STATEMENTS |
| | | | | Shares | Value |
| Japan (continued) | | | | | |
| BML, Inc. | | | 9,900 | $265,470 |
| Bookoff Group Holdings, Ltd. | | | 2,900 | 20,945 |
| Bourbon Corp. | | | 1,500 | 23,655 |
| BP Castrol KK | | | 2,600 | 29,078 |
| Br. Holdings Corp. | | | 9,900 | 44,168 |
| BrainPad, Inc. (A)(B) | | | 1,300 | 50,799 |
| Broadleaf Company, Ltd. | | | 37,100 | 153,291 |
| BRONCO BILLY Company, Ltd. | | | 4,100 | 81,313 |
| Bull-Dog Sauce Company, Ltd. | | | 2,800 | 28,950 |
| Bunka Shutter Company, Ltd. | | | 24,200 | 172,208 |
| Business Brain Showa-Ota, Inc. | | | 800 | 21,299 |
| C Uyemura & Company, Ltd. | | | 2,000 | 125,833 |
| CAC Holdings Corp. | | | 5,500 | 55,277 |
| Can Do Company, Ltd. | | | 3,800 | 53,753 |
| Canare Electric Company, Ltd. | | | 1,500 | 22,476 |
| Canon Electronics, Inc. | | | 9,800 | 167,738 |
| Capital Asset Planning, Inc. | | | 200 | 1,888 |
| Career Design Center Company, Ltd. | | | 2,500 | 23,272 |
| CareerIndex, Inc. (A) | | | 1,600 | 3,580 |
| Carenet, Inc. | | | 700 | 4,633 |
| Carlit Holdings Company, Ltd. | | | 7,200 | 31,813 |
| Cawachi, Ltd. | | | 7,900 | 147,087 |
| C'BON COSMETICS Company, Ltd. | | | 500 | 9,632 |
| Central Automotive Products, Ltd. | | | 3,600 | 62,386 |
| Central Glass Company, Ltd. | | | 12,286 | 234,119 |
| Central Security Patrols Company, Ltd. | | | 3,200 | 130,892 |
| Central Sports Company, Ltd. | | | 2,400 | 54,459 |
| Ceres, Inc. (B) | | | 2,700 | 26,007 |
| Charm Care Corp. KK | | | 5,400 | 38,378 |
| Chikaranomoto Holdings Company, Ltd. | | | 1,000 | 6,557 |
| Chilled & Frozen Logistics Holdings Company, Ltd. | | | 6,200 | 61,404 |
| CHIMNEY Company, Ltd. | | | 1,800 | 31,787 |
| Chino Corp. | | | 2,500 | 26,611 |
| Chiyoda Company, Ltd. | | | 8,800 | 99,085 |
| Chiyoda Integre Company, Ltd. | | | 5,200 | 86,506 |
| Chodai Company, Ltd. | | | 2,800 | 24,552 |
| Chofu Seisakusho Company, Ltd. | | | 7,900 | 153,956 |
| Chori Company, Ltd. | | | 5,300 | 87,406 |
| Chubu Shiryo Company, Ltd. | | | 9,900 | 130,435 |
| Chudenko Corp. | | | 12,400 | 257,146 |
| Chuetsu Pulp & Paper Company, Ltd. | | | 3,000 | 36,706 |
| Chugai Mining Company, Ltd. (A) | | | 34,900 | 5,121 |
| Chugai Ro Company, Ltd. | | | 2,400 | 33,348 |
| Chugoku Marine Paints, Ltd. | | | 22,800 | 193,506 |
| SEE NOTES TO FINANCIAL STATEMENTS | SEMIANNUAL REPORT | JOHN HANCOCK INTERNATIONAL SMALL COMPANY FUND | 39 |
| | | | | Shares | Value |
| Japan (continued) | | | | | |
| Chuo Gyorui Company, Ltd. | | | 300 | $7,481 |
| Chuo Spring Company, Ltd. | | | 1,000 | 24,106 |
| CI Takiron Corp. | | | 16,400 | 93,970 |
| Citizen Watch Company, Ltd. | | | 113,200 | 446,231 |
| CKD Corp. | | | 3,000 | 45,477 |
| CK-San-Etsu Company, Ltd. | | | 800 | 21,506 |
| Cleanup Corp. | | | 9,700 | 46,437 |
| CMC Corp. | | | 800 | 13,277 |
| CMIC Holdings Company, Ltd. | | | 5,600 | 70,875 |
| CMK Corp. | | | 27,300 | 117,880 |
| cocokara fine, Inc. | | | 8,130 | 376,429 |
| Colowide Company, Ltd. (B) | | | 22,200 | 364,170 |
| Comany, Inc. | | | 1,000 | 11,301 |
| Computer Engineering & Consulting, Ltd. | | | 11,000 | 170,377 |
| Computer Institute of Japan, Ltd. | | | 5,100 | 35,021 |
| Comture Corp. | | | 8,600 | 168,774 |
| CONEXIO Corp. | | | 6,300 | 79,054 |
| Core Corp. | | | 2,100 | 22,290 |
| Corona Corp. | | | 5,500 | 48,641 |
| Cosel Company, Ltd. | | | 11,500 | 106,154 |
| Cosmo Energy Holdings Company, Ltd. | | | 16,300 | 274,825 |
| Cosmos Initia Company, Ltd. | | | 6,900 | 35,466 |
| Cota Company, Ltd. | | | 5,038 | 59,534 |
| Create Medic Company, Ltd. | | | 2,400 | 23,541 |
| Create Restaurants Holdings, Inc. | | | 34,000 | 268,347 |
| Create SD Holdings Company, Ltd. | | | 11,000 | 248,147 |
| Creek & River Company, Ltd. | | | 4,600 | 37,806 |
| Cresco, Ltd. | | | 5,800 | 86,358 |
| CTI Engineering Company, Ltd. | | | 5,100 | 85,159 |
| CTS Company, Ltd. | | | 11,100 | 59,556 |
| Cube System, Inc. | | | 2,300 | 13,053 |
| Curves Holdings Company, Ltd. (A)(C) | | | 15,800 | 117,793 |
| Cyber Com Company, Ltd. | | | 900 | 13,143 |
| Cybernet Systems Company, Ltd. | | | 6,300 | 37,916 |
| Cybozu, Inc. | | | 8,100 | 136,905 |
| Dai Nippon Toryo Company, Ltd. | | | 9,800 | 81,383 |
| Daibiru Corp. | | | 19,000 | 211,395 |
| Dai-Dan Company, Ltd. | | | 5,100 | 124,050 |
| Daido Kogyo Company, Ltd. | | | 3,900 | 26,005 |
| Daido Metal Company, Ltd. | | | 18,600 | 101,011 |
| Daido Steel Company, Ltd. | | | 10,700 | 385,493 |
| Daidoh, Ltd. | | | 7,200 | 14,202 |
| Daihatsu Diesel Manufacturing Company, Ltd. | | | 7,100 | 37,874 |
| Daihen Corp. | | | 7,400 | 194,365 |
| 40 | JOHN HANCOCK INTERNATIONAL SMALL COMPANY FUND | SEMIANNUAL REPORT | SEE NOTES TO FINANCIAL STATEMENTS |
| | | | | Shares | Value |
| Japan (continued) | | | | | |
| Daiho Corp. | | | 6,700 | $142,746 |
| Dai-Ichi Cutter Kogyo KK | | | 600 | 9,392 |
| Daiichi Jitsugyo Company, Ltd. | | | 3,900 | 120,680 |
| Daiichi Kigenso Kagaku-Kogyo Company, Ltd. | | | 7,000 | 49,416 |
| Dai-ichi Seiko Company, Ltd. | | | 5,000 | 88,802 |
| Daiken Corp. | | | 4,800 | 73,202 |
| Daiken Medical Company, Ltd. | | | 2,900 | 15,467 |
| Daiki Aluminium Industry Company, Ltd. (B) | | | 14,800 | 79,566 |
| Daiki Axis Company, Ltd. | | | 1,500 | 9,128 |
| Daiko Denshi Tsushin, Ltd. | | | 2,000 | 14,442 |
| Daikoku Denki Company, Ltd. | | | 3,600 | 41,814 |
| Daikokutenbussan Company, Ltd. | | | 2,700 | 75,894 |
| Daikokuya Holdings Company, Ltd. (A) | | | 28,200 | 6,401 |
| Daikyonishikawa Corp. | | | 14,800 | 82,489 |
| Dainichi Company, Ltd. | | | 5,000 | 27,804 |
| Dainichiseika Color & Chemicals Manufacturing Company, Ltd. | | | 5,900 | 126,930 |
| Daio Paper Corp. | | | 9,500 | 125,415 |
| Daiohs Corp. | | | 1,700 | 18,287 |
| Daiseki Company, Ltd. | | | 15,300 | 365,424 |
| Daishi Hokuetsu Financial Group, Inc. | | | 15,600 | 317,920 |
| Daishinku Corp. (B) | | | 2,600 | 39,676 |
| Daisue Construction Company, Ltd. | | | 2,300 | 17,854 |
| Daito Pharmaceutical Company, Ltd. | | | 4,450 | 117,779 |
| Daitron Company, Ltd. | | | 4,500 | 67,798 |
| Daiwa Industries, Ltd. | | | 14,400 | 131,562 |
| Daiwabo Holdings Company, Ltd. | | | 7,200 | 363,145 |
| DCM Holdings Company, Ltd. | | | 50,020 | 453,580 |
| DD Holdings Company, Ltd. | | | 4,400 | 50,125 |
| DDS, Inc. (A) | | | 3,900 | 8,104 |
| Dear Life Company, Ltd. | | | 6,600 | 29,364 |
| Delica Foods Holdings Company, Ltd. | | | 1,800 | 10,078 |
| Demae-Can Company, Ltd. | | | 3,500 | 32,349 |
| Denki Kogyo Company, Ltd. | | | 3,900 | 98,018 |
| Densan System Company, Ltd. | | | 2,900 | 58,519 |
| Denyo Company, Ltd. | | | 6,900 | 118,203 |
| Descente, Ltd. | | | 11,900 | 162,462 |
| Dexerials Corp. | | | 24,100 | 175,790 |
| Digital Arts, Inc. | | | 4,500 | 215,016 |
| Digital Garage, Inc. | | | 5,500 | 173,912 |
| Digital Hearts Holdings Company, Ltd. | | | 3,200 | 23,985 |
| Digital Information Technologies Corp. | | | 1,800 | 23,834 |
| Dip Corp. | | | 11,500 | 278,053 |
| DKK-Toa Corp. | | | 3,100 | 23,986 |
| DKS Company, Ltd. | | | 3,600 | 119,738 |
| SEE NOTES TO FINANCIAL STATEMENTS | SEMIANNUAL REPORT | JOHN HANCOCK INTERNATIONAL SMALL COMPANY FUND | 41 |
| | | | | Shares | Value |
| Japan (continued) | | | | | |
| DMG Mori Company, Ltd. | | | 43,100 | $538,042 |
| Doshisha Company, Ltd. | | | 10,100 | 129,278 |
| Double Standard, Inc. | | | 400 | 12,454 |
| Doutor Nichires Holdings Company, Ltd. | | | 14,793 | 247,476 |
| Dowa Holdings Company, Ltd. | | | 3,600 | 116,950 |
| Drecom Company, Ltd. (A) | | | 4,400 | 23,940 |
| DSB Company, Ltd. | | | 2,200 | 10,680 |
| DTS Corp. | | | 15,300 | 277,909 |
| Duskin Company, Ltd. | | | 15,600 | 403,729 |
| Dvx, Inc. | | | 1,200 | 9,512 |
| DyDo Group Holdings, Inc. (B) | | | 4,700 | 152,906 |
| Dynic Corp. | | | 2,300 | 14,406 |
| Eagle Industry Company, Ltd. | | | 10,900 | 82,212 |
| Earth Corp. | | | 4,100 | 212,444 |
| EAT&Company, Ltd. | | | 1,800 | 26,428 |
| Ebara Foods Industry, Inc. | | | 1,600 | 29,536 |
| Ebara Jitsugyo Company, Ltd. | | | 3,100 | 53,501 |
| Ebase Company, Ltd. | | | 4,700 | 65,855 |
| Eco's Company, Ltd. | | | 3,500 | 45,977 |
| EDION Corp. | | | 35,300 | 295,566 |
| EF-ON, Inc. | | | 10,380 | 52,398 |
| eGuarantee, Inc. | | | 11,500 | 128,710 |
| E-Guardian, Inc. | | | 2,900 | 43,833 |
| Eidai Company, Ltd. | | | 8,000 | 21,079 |
| Eiken Chemical Company, Ltd. | | | 12,800 | 225,972 |
| Eizo Corp. | | | 6,800 | 218,114 |
| Elan Corp. | | | 5,500 | 68,492 |
| Elecom Company, Ltd. | | | 8,000 | 269,284 |
| Elematec Corp. | | | 6,800 | 57,700 |
| EM Systems Company, Ltd. | | | 13,400 | 109,542 |
| Endo Lighting Corp. | | | 3,000 | 17,548 |
| Enigmo, Inc. | | | 10,300 | 71,755 |
| Enomoto Company, Ltd. | | | 900 | 7,991 |
| Enplas Corp. | | | 3,900 | 93,514 |
| Enshu, Ltd. | | | 1,800 | 15,859 |
| Entrust, Inc. | | | 3,300 | 18,261 |
| EPCO Company, Ltd. | | | 700 | 6,254 |
| EPS Holdings, Inc. | | | 13,200 | 136,324 |
| eRex Company, Ltd. | | | 8,000 | 95,725 |
| ES-Con Japan, Ltd. | | | 15,500 | 99,966 |
| ESCRIT, Inc. | | | 1,400 | 7,617 |
| Escrow Agent Japan, Inc. | | | 4,000 | 6,398 |
| Eslead Corp. | | | 3,700 | 56,691 |
| ESPEC Corp. | | | 8,000 | 146,763 |
| 42 | JOHN HANCOCK INTERNATIONAL SMALL COMPANY FUND | SEMIANNUAL REPORT | SEE NOTES TO FINANCIAL STATEMENTS |
| | | | | Shares | Value |
| Japan (continued) | | | | | |
| Excel Company, Ltd. | | | 2,900 | $42,922 |
| Exedy Corp. | | | 13,400 | 248,492 |
| Extreme Company, Ltd. | | | 700 | 11,708 |
| F&M Company, Ltd. | | | 1,500 | 18,583 |
| F@N Communications, Inc. | | | 24,900 | 101,721 |
| Faith, Inc. | | | 3,110 | 20,355 |
| FALCO HOLDINGS Company, Ltd. | | | 3,200 | 48,152 |
| FCC Company, Ltd. | | | 13,200 | 235,340 |
| FDK Corp. (A) | | | 5,300 | 35,339 |
| Feed One Company, Ltd. | | | 40,540 | 58,347 |
| Felissimo Corp. | | | 1,900 | 16,521 |
| Fenwal Controls of Japan, Ltd. | | | 700 | 9,201 |
| Ferrotec Holdings Corp. (B) | | | 15,600 | 95,799 |
| FFRI, Inc. (A) | | | 600 | 11,613 |
| FIDEA Holdings Company, Ltd. | | | 65,406 | 66,342 |
| Fields Corp. | | | 6,400 | 23,201 |
| Financial Products Group Company, Ltd. | | | 7,100 | 56,410 |
| FINDEX, Inc. | | | 3,900 | 25,577 |
| First Brothers Company, Ltd. | | | 900 | 7,836 |
| First Juken Company, Ltd. | | | 3,400 | 31,153 |
| First-corp, Inc. | | | 2,000 | 9,018 |
| Fixstars Corp. (B) | | | 4,000 | 41,429 |
| FJ Next Company, Ltd. | | | 7,600 | 66,256 |
| Focus Systems Corp. | | | 2,900 | 21,190 |
| Forval Corp. | | | 1,600 | 15,340 |
| Foster Electric Company, Ltd. | | | 10,100 | 134,155 |
| France Bed Holdings Company, Ltd. | | | 8,800 | 69,949 |
| Freebit Company, Ltd. | | | 3,500 | 21,859 |
| Freund Corp. | | | 3,000 | 16,375 |
| F-Tech, Inc. | | | 5,900 | 33,194 |
| FTGroup Company, Ltd. | | | 3,900 | 47,273 |
| Fudo Tetra Corp. | | | 7,520 | 100,682 |
| Fuji Company, Ltd. (B) | | | 9,700 | 144,178 |
| Fuji Corp. | | | 25,200 | 402,383 |
| Fuji Corp.(Miyagi) | | | 1,900 | 32,874 |
| Fuji Corp., Ltd. | | | 11,200 | 60,063 |
| Fuji Die Company, Ltd. | | | 1,000 | 5,244 |
| Fuji Kosan Company, Ltd. | | | 1,100 | 5,894 |
| Fuji Kyuko Company, Ltd. | | | 3,200 | 82,274 |
| Fuji Oil Company, Ltd. | | | 19,700 | 37,402 |
| Fuji Pharma Company, Ltd. | | | 6,400 | 63,070 |
| Fuji Seal International, Inc. | | | 15,200 | 273,189 |
| Fuji Soft, Inc. | | | 6,600 | 216,744 |
| Fujibo Holdings, Inc. | | | 4,500 | 123,021 |
| SEE NOTES TO FINANCIAL STATEMENTS | SEMIANNUAL REPORT | JOHN HANCOCK INTERNATIONAL SMALL COMPANY FUND | 43 |
| | | | | Shares | Value |
| Japan (continued) | | | | | |
| Fujicco Company, Ltd. | | | 7,900 | $127,880 |
| Fujikura Composites, Inc. | | | 6,700 | 23,225 |
| Fujikura Kasei Company, Ltd. | | | 9,900 | 42,470 |
| Fujikura, Ltd. (B) | | | 100,500 | 322,595 |
| Fujimori Kogyo Company, Ltd. | | | 6,300 | 166,039 |
| Fujio Food System Company, Ltd. | | | 5,600 | 73,660 |
| Fujisash Company, Ltd. | | | 26,500 | 18,204 |
| Fujishoji Company, Ltd. | | | 2,400 | 19,383 |
| Fujita Kanko, Inc. | | | 3,500 | 64,353 |
| Fujitec Company, Ltd. | | | 11,500 | 157,930 |
| Fujitsu Frontech, Ltd. | | | 4,600 | 48,519 |
| Fujitsu General, Ltd. | | | 10,700 | 212,405 |
| Fujiya Company, Ltd. | | | 4,200 | 74,454 |
| FuKoKu Company, Ltd. | | | 3,000 | 17,254 |
| Fukuda Corp. | | | 3,000 | 108,777 |
| Fukuda Denshi Company, Ltd. | | | 1,100 | 68,729 |
| Fukui Computer Holdings, Inc. | | | 3,300 | 82,084 |
| Fukushima Galilei Company, Ltd. | | | 5,200 | 166,342 |
| Fukuyama Transporting Company, Ltd. | | | 4,900 | 146,196 |
| Full Speed, Inc. | | | 1,100 | 4,344 |
| FULLCAST Holdings Company, Ltd. | | | 7,900 | 138,096 |
| Funai Electric Company, Ltd. (A) | | | 9,500 | 49,874 |
| Funai Soken Holdings, Inc. | | | 13,830 | 317,839 |
| Furukawa Company, Ltd. | | | 13,600 | 151,624 |
| Furukawa Electric Company, Ltd. | | | 16,800 | 365,918 |
| Furuno Electric Company, Ltd. | | | 11,800 | 99,522 |
| Furusato Industries, Ltd. | | | 4,000 | 54,707 |
| Furuya Metal Company, Ltd. | | | 700 | 34,128 |
| Furyu Corp. | | | 4,800 | 45,647 |
| Fuso Chemical Company, Ltd. | | | 7,500 | 208,659 |
| Fuso Pharmaceutical Industries, Ltd. | | | 2,500 | 40,536 |
| Futaba Corp. | | | 13,857 | 133,569 |
| Futaba Industrial Company, Ltd. | | | 25,700 | 136,696 |
| Future Corp. | | | 9,300 | 136,140 |
| Fuyo General Lease Company, Ltd. | | | 8,400 | 472,653 |
| G-7 Holdings, Inc. | | | 4,200 | 85,444 |
| Gakken Holdings Company, Ltd. | | | 2,000 | 124,532 |
| Gakkyusha Company, Ltd. | | | 2,400 | 26,982 |
| GCA Corp. | | | 7,500 | 48,567 |
| Gecoss Corp. | | | 6,500 | 53,983 |
| Genki Sushi Company, Ltd. | | | 2,100 | 45,556 |
| Genky DrugStores Company, Ltd. (B) | | | 3,000 | 49,778 |
| Geo Holdings Corp. | | | 13,300 | 143,833 |
| Geomatec Company, Ltd. | | | 900 | 4,063 |
| 44 | JOHN HANCOCK INTERNATIONAL SMALL COMPANY FUND | SEMIANNUAL REPORT | SEE NOTES TO FINANCIAL STATEMENTS |
| | | | | Shares | Value |
| Japan (continued) | | | | | |
| Geostr Corp. | | | 4,600 | $14,378 |
| Gfoot Company, Ltd. | | | 5,700 | 26,653 |
| Giken, Ltd. | | | 6,100 | 204,201 |
| GL Sciences, Inc. | | | 2,800 | 32,268 |
| GLOBERIDE, Inc. | | | 3,600 | 63,761 |
| Glory, Ltd. | | | 9,000 | 240,391 |
| Glosel Company, Ltd. | | | 4,400 | 16,294 |
| GMO Cloud K.K. | | | 2,300 | 43,653 |
| GMO Financial Holdings, Inc. | | | 22,700 | 110,160 |
| GMO internet, Inc. | | | 2,000 | 33,127 |
| Godo Steel, Ltd. | | | 4,300 | 98,137 |
| Gokurakuyu Holdings Company, Ltd. | | | 3,200 | 10,785 |
| Goldcrest Company, Ltd. | | | 8,570 | 131,802 |
| Golf Digest Online, Inc. | | | 2,700 | 13,826 |
| Good Com Asset Company, Ltd. | | | 800 | 11,038 |
| Grace Technology, Inc. | | | 900 | 23,338 |
| Grandy House Corp. | | | 5,700 | 20,875 |
| Gree, Inc. | | | 56,900 | 233,802 |
| Greens Company, Ltd. | | | 2,000 | 13,203 |
| GS Yuasa Corp. | | | 26,900 | 472,457 |
| GSI Creos Corp. | | | 1,100 | 10,880 |
| G-Tekt Corp. | | | 8,600 | 103,231 |
| Gun-Ei Chemical Industry Company, Ltd. | | | 1,900 | 40,334 |
| GungHo Online Entertainment, Inc. | | | 1,200 | 18,982 |
| Gunosy, Inc. (A) | | | 2,500 | 22,835 |
| Gunze, Ltd. | | | 5,700 | 202,350 |
| Gurunavi, Inc. | | | 11,900 | 80,309 |
| H2O Retailing Corp. | | | 35,900 | 276,177 |
| HABA Laboratories, Inc. | | | 700 | 30,174 |
| Hagihara Industries, Inc. | | | 6,900 | 94,980 |
| Hagiwara Electric Holdings Company, Ltd. | | | 2,600 | 54,707 |
| Hakudo Company, Ltd. | | | 3,200 | 36,619 |
| Hakuto Company, Ltd. | | | 6,200 | 62,664 |
| Hakuyosha Company, Ltd. | | | 800 | 18,909 |
| Halows Company, Ltd. | | | 4,200 | 96,211 |
| Hamakyorex Company, Ltd. | | | 6,300 | 164,373 |
| Hamee Corp. | | | 1,000 | 13,032 |
| Handsman Company, Ltd. | | | 1,300 | 14,949 |
| Hanwa Company, Ltd. | | | 14,500 | 296,458 |
| Happinet Corp. | | | 6,900 | 73,513 |
| Harada Industry Company, Ltd. | | | 2,900 | 21,335 |
| Hard Off Corp. Company, Ltd. | | | 3,900 | 25,802 |
| Harima Chemicals Group, Inc. | | | 6,000 | 51,289 |
| Haruyama Holdings, Inc. | | | 2,700 | 18,511 |
| SEE NOTES TO FINANCIAL STATEMENTS | SEMIANNUAL REPORT | JOHN HANCOCK INTERNATIONAL SMALL COMPANY FUND | 45 |
| | | | | Shares | Value |
| Japan (continued) | | | | | |
| Hayashikane Sangyo Company, Ltd. | | | 1,900 | $10,251 |
| Hazama Ando Corp. | | | 68,500 | 501,840 |
| Heiwa Corp. | | | 5,800 | 108,193 |
| Heiwa Real Estate Company, Ltd. | | | 12,800 | 356,920 |
| Heiwado Company, Ltd. (B) | | | 14,400 | 223,134 |
| Helios Techno Holding Company, Ltd. | | | 6,400 | 19,435 |
| Hibino Corp. | | | 700 | 10,124 |
| Hibiya Engineering, Ltd. | | | 7,600 | 122,887 |
| Hiday Hidaka Corp. (B) | | | 8,827 | 133,497 |
| HI-LEX Corp. | | | 8,000 | 121,538 |
| Himaraya Company, Ltd. | | | 1,700 | 11,380 |
| Hinokiya Group Company, Ltd. | | | 2,200 | 36,728 |
| Hioki EE Corp. | | | 4,300 | 128,452 |
| Hirakawa Hewtech Corp. | | | 3,600 | 38,101 |
| Hiramatsu, Inc. (A) | | | 16,400 | 29,890 |
| Hirano Tecseed Company, Ltd. | | | 2,700 | 29,847 |
| Hirata Corp. | | | 400 | 18,577 |
| Hirose Tusyo, Inc. | | | 600 | 9,015 |
| Hiroshima Gas Company, Ltd. | | | 16,200 | 48,278 |
| HIS Company, Ltd. | | | 10,200 | 201,356 |
| Hisaka Works, Ltd. | | | 9,000 | 66,378 |
| Hitachi Zosen Corp. | | | 68,580 | 238,603 |
| Hito Communications Holdings, Inc. | | | 1,300 | 14,278 |
| Hochiki Corp. | | | 5,500 | 61,118 |
| Hoden Seimitsu Kako Kenkyusho Company, Ltd. | | | 1,000 | 6,256 |
| Hodogaya Chemical Company, Ltd. | | | 2,800 | 94,826 |
| Hogy Medical Company, Ltd. | | | 8,900 | 252,461 |
| Hokkaido Coca-Cola Bottling Company, Ltd. | | | 200 | 6,468 |
| Hokkaido Electric Power Company, Inc. | | | 73,000 | 316,987 |
| Hokkaido Gas Company, Ltd. | | | 7,200 | 99,035 |
| Hokkan Holdings, Ltd. | | | 3,400 | 49,221 |
| Hokko Chemical Industry Company, Ltd. | | | 8,600 | 43,012 |
| Hokuetsu Corp. | | | 56,000 | 226,196 |
| Hokuetsu Industries Company, Ltd. | | | 9,000 | 92,317 |
| Hokuhoku Financial Group, Inc. | | | 53,400 | 446,547 |
| Hokuriku Electric Industry Company, Ltd. | | | 3,100 | 26,275 |
| Hokuriku Electric Power Company (A) | | | 71,300 | 477,896 |
| Hokuriku Electrical Construction Company, Ltd. | | | 5,600 | 50,771 |
| Hokuto Corp. | | | 9,800 | 167,208 |
| Honda Tsushin Kogyo Company, Ltd. | | | 8,400 | 34,000 |
| H-One Company, Ltd. | | | 7,700 | 44,124 |
| Honeys Holdings Company, Ltd. | | | 8,860 | 94,197 |
| Honma Golf, Ltd. (D) | | | 30,500 | 17,711 |
| Hoosiers Holdings | | | 11,500 | 66,314 |
| 46 | JOHN HANCOCK INTERNATIONAL SMALL COMPANY FUND | SEMIANNUAL REPORT | SEE NOTES TO FINANCIAL STATEMENTS |
| | | | | Shares | Value |
| Japan (continued) | | | | | |
| Hosiden Corp. | | | 24,900 | $214,865 |
| Hosokawa Micron Corp. | | | 3,500 | 159,160 |
| Hotland Company, Ltd. | | | 1,800 | 16,962 |
| House Do Company, Ltd. | | | 1,400 | 12,676 |
| Howa Machinery, Ltd. (B) | | | 5,300 | 32,919 |
| HyAS&Company, Inc. | | | 2,500 | 4,675 |
| I K K, Inc. | | | 3,000 | 18,273 |
| IBJ, Inc. | | | 7,700 | 68,655 |
| Ichibanya Company, Ltd. | | | 5,600 | 228,052 |
| Ichigo, Inc. | | | 22,800 | 69,160 |
| Ichiken Company, Ltd. | | | 2,300 | 32,790 |
| Ichikoh Industries, Ltd. | | | 14,100 | 85,196 |
| Ichimasa Kamaboko Company, Ltd. | | | 1,100 | 8,168 |
| Ichinen Holdings Company, Ltd. | | | 10,700 | 112,458 |
| Ichiyoshi Securities Company, Ltd. | | | 18,600 | 91,172 |
| Icom, Inc. | | | 4,600 | 98,361 |
| ID Holdings Corp. | | | 3,300 | 44,897 |
| Idec Corp. | | | 13,600 | 206,511 |
| IDOM, Inc. | | | 26,500 | 125,278 |
| Ihara Science Corp. | | | 2,200 | 26,546 |
| Iino Kaiun Kaisha, Ltd. | | | 36,600 | 111,533 |
| IJTT Company, Ltd. | | | 7,760 | 37,337 |
| Ikegami Tsushinki Company, Ltd. | | | 1,900 | 16,069 |
| IMAGICA GROUP, Inc. | | | 5,400 | 20,344 |
| Imasen Electric Industrial | | | 7,000 | 49,761 |
| Imuraya Group Company, Ltd. | | | 2,700 | 39,299 |
| Inaba Denki Sangyo Company, Ltd. | | | 19,200 | 423,183 |
| Inaba Seisakusho Company, Ltd. | | | 4,900 | 54,169 |
| Inabata & Company, Ltd. | | | 18,200 | 209,670 |
| Inageya Company, Ltd. | | | 3,100 | 36,357 |
| Ines Corp. | | | 7,100 | 96,758 |
| I-Net Corp. | | | 5,400 | 62,924 |
| Infocom Corp. | | | 9,800 | 246,060 |
| Infomart Corp. | | | 8,600 | 51,282 |
| Information Services International-Dentsu, Ltd. | | | 4,400 | 189,354 |
| Innotech Corp. | | | 6,900 | 60,296 |
| Insource Company, Ltd. | | | 2,000 | 47,185 |
| Intage Holdings, Inc. | | | 14,000 | 101,413 |
| Intellex Company, Ltd. | | | 1,800 | 8,973 |
| Intelligent Wave, Inc. | | | 2,900 | 16,545 |
| Inter Action Corp. (B) | | | 3,100 | 65,687 |
| Internet Initiative Japan, Inc. | | | 10,100 | 278,623 |
| Inui Global Logistics Company, Ltd. | | | 5,990 | 59,129 |
| I-O Data Device, Inc. | | | 3,600 | 27,643 |
| SEE NOTES TO FINANCIAL STATEMENTS | SEMIANNUAL REPORT | JOHN HANCOCK INTERNATIONAL SMALL COMPANY FUND | 47 |
| | | | | Shares | Value |
| Japan (continued) | | | | | |
| IR Japan Holdings, Ltd. | | | 1,700 | $103,130 |
| Iriso Electronics Company, Ltd. | | | 8,000 | 270,800 |
| I'rom Group Company, Ltd. | | | 2,800 | 29,873 |
| ISB Corp. | | | 1,300 | 23,670 |
| Ise Chemicals Corp. | | | 600 | 15,461 |
| Iseki & Company, Ltd. | | | 9,900 | 105,249 |
| Ishihara Chemical Company, Ltd. | | | 1,800 | 29,335 |
| Ishihara Sangyo Kaisha, Ltd. | | | 18,200 | 120,077 |
| Ishii Iron Works Company, Ltd. | | | 900 | 20,711 |
| Ishizuka Glass Company, Ltd. | | | 1,000 | 19,516 |
| Isolite Insulating Products Company, Ltd. | | | 2,200 | 9,857 |
| Istyle, Inc. (A) | | | 7,800 | 20,941 |
| Itfor, Inc. | | | 11,200 | 67,375 |
| ITmedia, Inc. | | | 1,600 | 14,120 |
| Itochu Enex Company, Ltd. | | | 22,300 | 173,507 |
| Itochu-Shokuhin Company, Ltd. | | | 2,400 | 99,524 |
| Itoham Yonekyu Holdings, Inc. | | | 31,300 | 172,912 |
| Itoki Corp. | | | 16,100 | 52,888 |
| Itokuro, Inc. (A)(B) | | | 3,000 | 38,538 |
| IwaiCosmo Holdings, Inc. | | | 7,900 | 81,817 |
| Iwaki & Company, Ltd. | | | 12,400 | 51,806 |
| Iwaki Company, Ltd. | | | 2,600 | 22,835 |
| Iwasaki Electric Company, Ltd. | | | 3,000 | 39,625 |
| Iwatani Corp. (B) | | | 14,000 | 459,659 |
| Iwatsu Electric Company, Ltd. | | | 3,700 | 27,502 |
| Iwatsuka Confectionery Company, Ltd. | | | 1,100 | 38,545 |
| J Trust Company, Ltd. | | | 30,000 | 95,178 |
| JAC Recruitment Company, Ltd. | | | 6,000 | 77,870 |
| Jaccs Company, Ltd. | | | 9,600 | 191,799 |
| Jafco Company, Ltd. | | | 12,000 | 454,337 |
| Jalux, Inc. | | | 2,600 | 46,980 |
| Jamco Corp. | | | 4,500 | 44,516 |
| Janome Sewing Machine Company, Ltd. | | | 8,500 | 26,244 |
| Japan Animal Referral Medical Center Company, Ltd. (A) | | | 600 | 10,724 |
| Japan Asia Group, Ltd. | | | 9,200 | 26,237 |
| Japan Asia Investment Company, Ltd. (A) | | | 5,400 | 10,099 |
| Japan Asset Marketing Company, Ltd. (A) | | | 85,600 | 97,938 |
| Japan Aviation Electronics Industry, Ltd. | | | 20,200 | 323,191 |
| Japan Best Rescue System Company, Ltd. | | | 6,400 | 44,592 |
| Japan Cash Machine Company, Ltd. | | | 7,500 | 45,461 |
| Japan Display, Inc. (A) | | | 192,500 | 107,798 |
| Japan Electronic Materials Corp. | | | 2,600 | 19,686 |
| Japan Elevator Service Holdings Company, Ltd. | | | 3,400 | 65,557 |
| Japan Foundation Engineering Company, Ltd. | | | 8,200 | 23,587 |
| 48 | JOHN HANCOCK INTERNATIONAL SMALL COMPANY FUND | SEMIANNUAL REPORT | SEE NOTES TO FINANCIAL STATEMENTS |
| | | | | Shares | Value |
| Japan (continued) | | | | | |
| Japan Investment Adviser Company, Ltd. (B) | | | 4,600 | $63,513 |
| Japan Lifeline Company, Ltd. | | | 21,800 | 265,645 |
| Japan Material Company, Ltd. | | | 23,300 | 274,155 |
| Japan Medical Dynamic Marketing, Inc. | | | 6,300 | 93,864 |
| Japan Oil Transportation Company, Ltd. | | | 1,100 | 28,184 |
| Japan Petroleum Exploration Company, Ltd. | | | 14,200 | 309,226 |
| Japan Property Management Center Company, Ltd. | | | 6,100 | 62,262 |
| Japan Pulp & Paper Company, Ltd. | | | 4,500 | 144,874 |
| Japan Securities Finance Company, Ltd. | | | 42,900 | 185,815 |
| Japan Transcity Corp. | | | 14,700 | 58,256 |
| Jastec Company, Ltd. | | | 3,500 | 29,201 |
| JBCC Holdings, Inc. | | | 5,800 | 88,524 |
| JCU Corp. | | | 8,200 | 189,561 |
| Jeol, Ltd. | | | 14,700 | 385,122 |
| JFE Systems, Inc. | | | 400 | 12,763 |
| JFLA Holdings, Inc. | | | 2,400 | 8,247 |
| JIG-SAW, Inc. (A) | | | 900 | 31,316 |
| Jimoto Holdings, Inc. | | | 71,800 | 62,645 |
| JINS Holdings, Inc. | | | 5,200 | 318,123 |
| JK Holdings Company, Ltd. | | | 6,100 | 35,606 |
| JM Holdings Company, Ltd. | | | 4,800 | 94,686 |
| JMS Company, Ltd. | | | 6,400 | 43,262 |
| Joban Kosan Company, Ltd. | | | 2,000 | 24,458 |
| J-Oil Mills, Inc. | | | 4,500 | 167,508 |
| Joshin Denki Company, Ltd. | | | 7,200 | 118,688 |
| Joyful Honda Company, Ltd. | | | 3,000 | 31,258 |
| JP-Holdings, Inc. | | | 14,400 | 36,202 |
| JSB Company, Ltd. | | | 600 | 24,133 |
| JSP Corp. | | | 6,100 | 92,077 |
| Juki Corp. | | | 16,500 | 104,198 |
| JVCKenwood Corp. | | | 73,828 | 148,948 |
| K&O Energy Group, Inc. | | | 6,900 | 97,393 |
| Kadokawa Corp. | | | 18,657 | 243,635 |
| Kadoya Sesame Mills, Inc. | | | 400 | 12,634 |
| Kaga Electronics Company, Ltd. | | | 7,300 | 131,936 |
| Kakiyasu Honten Company, Ltd. (B) | | | 3,900 | 92,191 |
| Kamakura Shinsho, Ltd. (A) | | | 4,400 | 53,876 |
| Kameda Seika Company, Ltd. | | | 4,400 | 178,536 |
| Kamei Corp. | | | 10,000 | 90,120 |
| Kanaden Corp. | | | 7,400 | 80,332 |
| Kanagawa Chuo Kotsu Company, Ltd. | | | 1,600 | 53,388 |
| Kanamic Network Company, Ltd. | | | 7,800 | 41,506 |
| Kanamoto Company, Ltd. | | | 15,100 | 331,990 |
| Kandenko Company, Ltd. | | | 33,000 | 278,903 |
| SEE NOTES TO FINANCIAL STATEMENTS | SEMIANNUAL REPORT | JOHN HANCOCK INTERNATIONAL SMALL COMPANY FUND | 49 |
| | | | | Shares | Value |
| Japan (continued) | | | | | |
| Kaneka Corp. | | | 1,100 | $29,475 |
| Kaneko Seeds Company, Ltd. | | | 3,900 | 41,494 |
| Kanematsu Corp. | | | 30,800 | 334,430 |
| Kanematsu Electronics, Ltd. | | | 4,700 | 133,670 |
| Kanemi Company, Ltd. | | | 500 | 13,308 |
| Kansai Super Market, Ltd. | | | 5,300 | 42,582 |
| Kanto Denka Kogyo Company, Ltd. | | | 19,000 | 161,714 |
| Kappa Create Company, Ltd. | | | 10,800 | 127,520 |
| Kasai Kogyo Company, Ltd. | | | 11,900 | 73,233 |
| Katakura & Co-op Agri Corp. | | | 1,100 | 10,427 |
| Katakura Industries Company, Ltd. | | | 12,500 | 144,039 |
| Kato Sangyo Company, Ltd. | | | 8,500 | 234,202 |
| Kato Works Company, Ltd. | | | 3,800 | 45,897 |
| KAWADA TECHNOLOGIES, Inc. | | | 1,900 | 98,077 |
| Kawagishi Bridge Works Company, Ltd. | | | 600 | 12,985 |
| Kawai Musical Instruments Manufacturing Company, Ltd. | | | 2,500 | 60,895 |
| Kawasaki Kisen Kaisha, Ltd. (A) | | | 18,500 | 206,417 |
| Kawasumi Laboratories, Inc. | | | 5,500 | 51,348 |
| Kawata Manufacturing Company, Ltd. | | | 1,600 | 12,713 |
| KeePer Technical Laboratory Company, Ltd. | | | 2,300 | 22,800 |
| Keihanshin Building Company, Ltd. | | | 16,300 | 200,156 |
| Keihin Corp. | | | 16,400 | 392,973 |
| Keiyo Company, Ltd. | | | 19,100 | 82,744 |
| KEL Corp. | | | 1,900 | 14,145 |
| Kenedix, Inc. | | | 61,100 | 327,944 |
| Kenko Mayonnaise Company, Ltd. | | | 5,300 | 96,481 |
| Key Coffee, Inc. | | | 500 | 9,413 |
| KFC Holdings Japan, Ltd. | | | 3,500 | 76,478 |
| KH Neochem Company, Ltd. | | | 12,800 | 248,034 |
| Kimoto Company, Ltd. | | | 15,600 | 19,947 |
| Kimura Chemical Plants Company, Ltd. (B) | | | 5,900 | 26,467 |
| Kimura Unity Company, Ltd. | | | 600 | 5,470 |
| King Company, Ltd. | | | 2,300 | 10,672 |
| King Jim Company, Ltd. | | | 3,700 | 25,715 |
| Kintetsu Department Store Company, Ltd. | | | 2,900 | 67,725 |
| Kintetsu World Express, Inc. | | | 15,800 | 247,024 |
| Kirindo Holdings Company, Ltd. | | | 3,800 | 54,453 |
| Kissei Pharmaceutical Company, Ltd. | | | 10,800 | 260,919 |
| Ki-Star Real Estate Company, Ltd. | | | 2,800 | 36,393 |
| Kitagawa Corp. | | | 3,400 | 54,470 |
| Kitano Construction Corp. | | | 1,500 | 33,816 |
| Kitanotatsujin Corp. (B) | | | 9,900 | 47,881 |
| Kito Corp. | | | 8,100 | 102,761 |
| Kitz Corp. | | | 25,300 | 148,898 |
| 50 | JOHN HANCOCK INTERNATIONAL SMALL COMPANY FUND | SEMIANNUAL REPORT | SEE NOTES TO FINANCIAL STATEMENTS |
| | | | | Shares | Value |
| Japan (continued) | | | | | |
| KLab, Inc. (A) | | | 7,500 | $42,598 |
| KNT-CT Holdings Company, Ltd. (A) | | | 2,200 | 19,121 |
| Koa Corp. | | | 9,000 | 87,049 |
| Koatsu Gas Kogyo Company, Ltd. | | | 13,600 | 83,269 |
| Kobe Electric Railway Company, Ltd. (A) | | | 3,200 | 115,489 |
| Kobe Steel, Ltd. | | | 80,300 | 295,547 |
| Kobelco Eco-Solutions Company, Ltd. | | | 1,200 | 21,492 |
| Kohnan Shoji Company, Ltd. | | | 9,300 | 187,295 |
| Kohsoku Corp. | | | 3,200 | 30,885 |
| Koike Sanso Kogyo Company, Ltd. | | | 500 | 10,021 |
| Kojima Company, Ltd. | | | 13,300 | 50,336 |
| Kokusai Company, Ltd. | | | 2,400 | 18,049 |
| Kokuyo Company, Ltd. | | | 30,973 | 437,397 |
| KOMAIHALTEC, Inc. | | | 1,200 | 16,455 |
| Komatsu Matere Company, Ltd. | | | 10,700 | 71,892 |
| Komatsu Wall Industry Company, Ltd. | | | 2,700 | 47,217 |
| KOMEDA Holdings Company, Ltd. | | | 17,900 | 303,308 |
| Komehyo Company, Ltd. | | | 3,100 | 24,779 |
| Komeri Company, Ltd. | | | 12,900 | 233,138 |
| Komori Corp. | | | 20,724 | 157,470 |
| Konaka Company, Ltd. | | | 10,500 | 33,795 |
| Kondotec, Inc. | | | 7,100 | 62,780 |
| Konishi Company, Ltd. | | | 11,200 | 137,692 |
| Konoike Transport Company, Ltd. | | | 10,300 | 126,835 |
| Konoshima Chemical Company, Ltd. | | | 1,800 | 15,558 |
| Kosaido Company, Ltd. (A)(B) | | | 6,200 | 44,797 |
| Koshidaka Holdings Company, Ltd. | | | 15,800 | 82,587 |
| Kotobuki Spirits Company, Ltd. | | | 3,200 | 153,979 |
| Kourakuen Holdings Corp. | | | 4,800 | 67,464 |
| Kozo Keikaku Engineering, Inc. | | | 800 | 18,103 |
| Krosaki Harima Corp. | | | 2,100 | 107,299 |
| KRS Corp. | | | 3,000 | 48,685 |
| KU Holdings Company, Ltd. | | | 3,500 | 24,712 |
| Kumagai Gumi Company, Ltd. | | | 14,800 | 390,316 |
| Kumiai Chemical Industry Company, Ltd. | | | 17,290 | 115,218 |
| Kunimine Industries Company, Ltd. | | | 2,100 | 20,104 |
| Kura Sushi, Inc. | | | 4,100 | 173,333 |
| Kurabo Industries, Ltd. | | | 5,000 | 89,593 |
| Kureha Corp. | | | 7,300 | 365,068 |
| Kurimoto, Ltd. | | | 4,400 | 74,314 |
| Kuriyama Holdings Corp. | | | 6,900 | 40,631 |
| Kushikatsu Tanaka Holdings Company | | | 1,300 | 18,821 |
| Kusuri no Aoki Holdings Company, Ltd. | | | 2,700 | 165,693 |
| KVK Corp. | | | 1,500 | 18,808 |
| SEE NOTES TO FINANCIAL STATEMENTS | SEMIANNUAL REPORT | JOHN HANCOCK INTERNATIONAL SMALL COMPANY FUND | 51 |
| | | | | Shares | Value |
| Japan (continued) | | | | | |
| KYB Corp. (A) | | | 7,300 | $161,142 |
| Kyoden Company, Ltd. | | | 10,400 | 29,111 |
| Kyodo Printing Company, Ltd. | | | 2,200 | 51,894 |
| Kyoei Steel, Ltd. | | | 8,600 | 129,626 |
| Kyokuto Boeki Kaisha, Ltd. | | | 2,700 | 39,484 |
| Kyokuto Kaihatsu Kogyo Company, Ltd. | | | 13,500 | 153,183 |
| Kyokuto Securities Company, Ltd. | | | 12,900 | 78,053 |
| Kyokuyo Company, Ltd. | | | 4,800 | 114,998 |
| KYORIN Holdings, Inc. | | | 16,100 | 322,178 |
| Kyoritsu Maintenance Company, Ltd. | | | 11,280 | 345,667 |
| Kyoritsu Printing Company, Ltd. | | | 9,100 | 12,896 |
| Kyosan Electric Manufacturing Company, Ltd. | | | 18,000 | 77,218 |
| Kyoto Kimono Yuzen Company, Ltd. | | | 2,600 | 6,259 |
| Kyowa Electronic Instruments Company, Ltd. | | | 11,400 | 42,765 |
| Kyowa Leather Cloth Company, Ltd. | | | 5,000 | 30,182 |
| Kyushu Financial Group, Inc. | | | 54,100 | 182,424 |
| Kyushu Leasing Service Company, Ltd. | | | 3,500 | 17,632 |
| LAC Company, Ltd. (B) | | | 4,100 | 33,488 |
| Lacto Japan Company, Ltd. | | | 1,400 | 45,539 |
| Land Business Company, Ltd. | | | 1,700 | 11,511 |
| Laox Company, Ltd. (A)(B) | | | 12,200 | 18,940 |
| LEC, Inc. (B) | | | 8,500 | 73,947 |
| Leopalace21 Corp. (A) | | | 16,500 | 49,548 |
| Life Corp. | | | 7,200 | 156,573 |
| LIFULL Company, Ltd. | | | 7,400 | 28,611 |
| Like Company, Ltd. | | | 3,100 | 42,403 |
| Linical Company, Ltd. | | | 4,600 | 36,318 |
| Link And Motivation, Inc. | | | 8,500 | 35,002 |
| Lintec Corp. | | | 18,100 | 387,156 |
| Litalico, Inc. (A) | | | 2,100 | 41,307 |
| LIXIL VIVA Corp. | | | 9,900 | 186,840 |
| Lonseal Corp. | | | 500 | 8,243 |
| Look Holdings, Inc. | | | 1,800 | 14,401 |
| M&A Capital Partners Company, Ltd. (A) | | | 4,000 | 116,741 |
| Macnica Fuji Electronics Holdings, Inc. | | | 18,100 | 252,766 |
| Macromill, Inc. | | | 15,200 | 118,818 |
| Maeda Corp. | | | 59,500 | 524,011 |
| Maeda Kosen Company, Ltd. (B) | | | 8,800 | 161,766 |
| Maeda Road Construction Company, Ltd. (B) | | | 15,900 | 466,863 |
| Maezawa Industries, Inc. | | | 5,000 | 15,389 |
| Maezawa Kasei Industries Company, Ltd. | | | 4,300 | 40,366 |
| Maezawa Kyuso Industries Company, Ltd. | | | 4,100 | 75,689 |
| Makino Milling Machine Company, Ltd. | | | 9,815 | 330,070 |
| Mamezou Holdings Company, Ltd. | | | 7,000 | 123,229 |
| 52 | JOHN HANCOCK INTERNATIONAL SMALL COMPANY FUND | SEMIANNUAL REPORT | SEE NOTES TO FINANCIAL STATEMENTS |
| | | | | Shares | Value |
| Japan (continued) | | | | | |
| Mamiya-Op Company, Ltd. | | | 2,000 | $16,718 |
| MarkLines Company, Ltd. | | | 4,500 | 69,180 |
| Mars Group Holdings Corp. | | | 5,300 | 86,800 |
| Marubun Corp. | | | 7,700 | 36,946 |
| Marudai Food Company, Ltd. | | | 9,300 | 151,808 |
| Marufuji Sheet Piling Company, Ltd. | | | 300 | 5,720 |
| Maruha Nichiro Corp. | | | 16,581 | 346,261 |
| Maruka Corp. (B) | | | 3,200 | 54,381 |
| Marumae Company, Ltd. (B) | | | 3,000 | 20,090 |
| Marusan Securities Company, Ltd. | | | 25,061 | 100,734 |
| Maruwa Company, Ltd. | | | 3,800 | 242,911 |
| Maruwa Unyu Kikan Company, Ltd. | | | 6,000 | 96,883 |
| Maruyama Manufacturing Company, Inc. (B) | | | 900 | 12,123 |
| Maruzen CHI Holdings Company, Ltd. | | | 4,800 | 14,264 |
| Maruzen Company, Ltd. | | | 4,100 | 73,755 |
| Maruzen Showa Unyu Company, Ltd. | | | 5,200 | 115,683 |
| Marvelous, Inc. | | | 12,700 | 72,142 |
| Matching Service Japan Company, Ltd. | | | 2,000 | 18,797 |
| Matsuda Sangyo Company, Ltd. | | | 6,020 | 78,676 |
| Matsui Construction Company, Ltd. | | | 8,500 | 49,317 |
| Matsuya Company, Ltd. | | | 1,100 | 6,482 |
| Matsuyafoods Holdings Company, Ltd. | | | 3,400 | 119,846 |
| Max Company, Ltd. | | | 4,500 | 74,069 |
| Maxell Holdings, Ltd. | | | 20,000 | 239,188 |
| Maxvalu Tokai Company, Ltd. | | | 2,100 | 37,869 |
| MCJ Company, Ltd. | | | 26,900 | 154,506 |
| MEC Company, Ltd. | | | 4,900 | 56,199 |
| Media Do Holdings Company, Ltd. | | | 1,700 | 44,831 |
| Medical Data Vision Company, Ltd. (A) | | | 4,400 | 30,043 |
| Medical System Network Company, Ltd. | | | 6,600 | 26,188 |
| Medius Holdings Company, Ltd. | | | 2,500 | 15,522 |
| MedPeer, Inc. (A) | | | 2,400 | 26,771 |
| Megachips Corp. | | | 6,800 | 92,574 |
| Megmilk Snow Brand Company, Ltd. | | | 18,700 | 374,936 |
| Meidensha Corp. | | | 14,717 | 234,946 |
| Meiji Electric Industries Company, Ltd. | | | 2,800 | 33,873 |
| Meiji Shipping Company, Ltd. | | | 6,300 | 18,324 |
| Meiko Electronics Company, Ltd. | | | 8,600 | 127,114 |
| Meiko Network Japan Company, Ltd. | | | 9,200 | 68,948 |
| Meisei Industrial Company, Ltd. | | | 16,200 | 107,624 |
| Meitec Corp. | | | 9,900 | 464,917 |
| Meito Sangyo Company, Ltd. | | | 4,300 | 51,027 |
| Meiwa Corp. | | | 10,600 | 48,897 |
| Meiwa Estate Company, Ltd. | | | 3,300 | 17,112 |
| SEE NOTES TO FINANCIAL STATEMENTS | SEMIANNUAL REPORT | JOHN HANCOCK INTERNATIONAL SMALL COMPANY FUND | 53 |
| | | | | Shares | Value |
| Japan (continued) | | | | | |
| Melco Holdings, Inc. | | | 2,900 | $56,715 |
| Members Company, Ltd. | | | 2,700 | 33,798 |
| Menicon Company, Ltd. | | | 9,200 | 374,919 |
| Mercuria Investment Company, Ltd. | | | 1,700 | 9,526 |
| Metaps, Inc. (A) | | | 3,700 | 20,906 |
| METAWATER Company, Ltd. | | | 4,900 | 173,302 |
| Micronics Japan Company, Ltd. | | | 10,900 | 96,731 |
| Mie Kotsu Group Holdings, Inc. | | | 19,600 | 89,024 |
| Mikuni Corp. | | | 8,400 | 22,178 |
| Milbon Company, Ltd. | | | 9,320 | 451,367 |
| Mimaki Engineering Company, Ltd. | | | 5,100 | 19,667 |
| Mimasu Semiconductor Industry Company, Ltd. | | | 8,100 | 150,194 |
| Ministop Company, Ltd. (B) | | | 7,100 | 94,766 |
| Miraca Holdings, Inc. | | | 22,200 | 553,264 |
| Miraial Company, Ltd. | | | 3,700 | 34,189 |
| Mirait Holdings Corp. | | | 30,020 | 394,951 |
| Miroku Jyoho Service Company, Ltd. (B) | | | 6,900 | 153,761 |
| Mitani Corp. | | | 4,200 | 226,459 |
| Mitani Sangyo Company, Ltd. | | | 8,100 | 24,622 |
| Mitani Sekisan Company, Ltd. | | | 3,200 | 105,318 |
| Mito Securities Company, Ltd. | | | 24,200 | 39,466 |
| Mitsuba Corp. | | | 16,500 | 92,854 |
| Mitsubishi Kakoki Kaisha, Ltd. | | | 2,600 | 41,496 |
| Mitsubishi Logisnext Company, Ltd. | | | 10,700 | 134,774 |
| Mitsubishi Paper Mills, Ltd. | | | 13,838 | 50,534 |
| Mitsubishi Pencil Company, Ltd. | | | 8,100 | 111,099 |
| Mitsubishi Research Institute, Inc. | | | 2,100 | 73,103 |
| Mitsubishi Shokuhin Company, Ltd. | | | 5,900 | 142,024 |
| Mitsubishi Steel Manufacturing Company, Ltd. | | | 4,800 | 36,524 |
| Mitsuboshi Belting, Ltd. | | | 9,300 | 127,276 |
| Mitsui E&S Holdings Company, Ltd. (A) | | | 32,900 | 234,630 |
| Mitsui High-Tec, Inc. | | | 6,600 | 83,351 |
| Mitsui Matsushima Holdings Company, Ltd. | | | 6,500 | 60,271 |
| Mitsui Mining & Smelting Company, Ltd. | | | 25,100 | 594,681 |
| Mitsui Sugar Company, Ltd. | | | 7,300 | 128,240 |
| Mitsui-Soko Holdings Company, Ltd. | | | 9,500 | 137,067 |
| Mitsumura Printing Company, Ltd. | | | 400 | 5,972 |
| Mitsuuroko Group Holdings Company, Ltd. | | | 13,800 | 129,472 |
| Mixi, Inc. | | | 17,800 | 283,817 |
| Miyaji Engineering Group, Inc. | | | 2,600 | 41,753 |
| Miyoshi Oil & Fat Company, Ltd. | | | 2,600 | 23,785 |
| Mizuho Leasing Company, Ltd. | | | 10,600 | 277,291 |
| Mizuho Medy Company, Ltd. | | | 800 | 14,348 |
| Mizuno Corp. | | | 8,600 | 171,188 |
| 54 | JOHN HANCOCK INTERNATIONAL SMALL COMPANY FUND | SEMIANNUAL REPORT | SEE NOTES TO FINANCIAL STATEMENTS |
| | | | | Shares | Value |
| Japan (continued) | | | | | |
| Mobile Factory, Inc. (A) | | | 2,400 | $32,800 |
| Mochida Pharmaceutical Company, Ltd. | | | 1,000 | 34,933 |
| Modec, Inc. | | | 8,400 | 140,696 |
| Molitec Steel Company, Ltd. | | | 6,100 | 14,835 |
| Monex Group, Inc. | | | 74,300 | 143,271 |
| Money Partners Group Company, Ltd. | | | 4,700 | 8,393 |
| MORESCO Corp. | | | 3,000 | 30,712 |
| Mori-Gumi Company, Ltd. | | | 3,900 | 10,256 |
| Morinaga Milk Industry Company, Ltd. | | | 13,400 | 472,221 |
| Morita Holdings Corp. | | | 11,100 | 171,390 |
| Morito Company, Ltd. | | | 9,500 | 59,985 |
| Morningstar Japan KK | | | 3,300 | 10,847 |
| Morozoff, Ltd. | | | 1,000 | 42,643 |
| Mory Industries, Inc. | | | 2,200 | 44,573 |
| MrMax Holdings, Ltd. (B) | | | 11,300 | 39,159 |
| MTI, Ltd. | | | 11,700 | 60,752 |
| Mugen Estate Company, Ltd. | | | 4,300 | 20,101 |
| Murakami Corp. | | | 2,600 | 62,302 |
| Musashi Company, Ltd. | | | 900 | 14,788 |
| Musashi Seimitsu Industry Company, Ltd. | | | 18,700 | 204,491 |
| Mutoh Holdings Company, Ltd. | | | 600 | 8,318 |
| N Field Company, Ltd. | | | 3,200 | 13,677 |
| NAC Company, Ltd. | | | 5,500 | 44,795 |
| Nachi-Fujikoshi Corp. | | | 6,300 | 207,058 |
| Nadex Company, Ltd. | | | 1,200 | 8,804 |
| Nafco Company, Ltd. | | | 5,000 | 58,284 |
| Nagano Keiki Company, Ltd. | | | 5,500 | 41,455 |
| Nagase & Company, Ltd. | | | 22,900 | 273,528 |
| Nagatanien Holdings Company, Ltd. | | | 4,500 | 83,862 |
| Nagawa Company, Ltd. (B) | | | 2,300 | 114,113 |
| Naigai Trans Line, Ltd. | | | 2,800 | 27,036 |
| Nakabayashi Company, Ltd. | | | 8,300 | 43,245 |
| Nakamoto Packs Company, Ltd. | | | 800 | 9,815 |
| Nakamuraya Company, Ltd. | | | 1,600 | 56,283 |
| Nakanishi, Inc. | | | 3,900 | 58,992 |
| Nakano Corp. | | | 4,800 | 18,035 |
| Nakayama Steel Works, Ltd. | | | 10,000 | 37,917 |
| Nakayamafuku Company, Ltd. | | | 4,400 | 18,781 |
| Nakayo, Inc. | | | 1,000 | 13,802 |
| Namura Shipbuilding Company, Ltd. | | | 21,772 | 40,928 |
| Narasaki Sangyo Company, Ltd. | | | 1,600 | 25,851 |
| Natori Company, Ltd. | | | 4,000 | 57,820 |
| NEC Capital Solutions, Ltd. | | | 3,800 | 74,810 |
| NEC Networks & System Integration Corp. | | | 3,900 | 144,245 |
| SEE NOTES TO FINANCIAL STATEMENTS | SEMIANNUAL REPORT | JOHN HANCOCK INTERNATIONAL SMALL COMPANY FUND | 55 |
| | | | | Shares | Value |
| Japan (continued) | | | | | |
| NET One Systems Company, Ltd. | | | 9,200 | $192,339 |
| Neturen Company, Ltd. | | | 15,300 | 95,846 |
| New Art Holdings Company, Ltd. | | | 1,800 | 12,088 |
| New Japan Chemical Company, Ltd. (A) | | | 8,300 | 12,316 |
| Nextage Company, Ltd. (B) | | | 5,800 | 45,346 |
| Nexyz Group Corp. (B) | | | 2,600 | 30,468 |
| NF Corp. | | | 2,500 | 41,959 |
| NFC Holdings, Inc. | | | 600 | 10,172 |
| NHK Spring Company, Ltd. | | | 16,500 | 124,896 |
| Nicca Chemical Company, Ltd. (B) | | | 2,500 | 15,667 |
| Nice Holdings, Inc. (A) | | | 2,300 | 22,101 |
| Nichia Steel Works, Ltd. | | | 11,800 | 29,587 |
| Nichias Corp. | | | 24,200 | 496,631 |
| Nichiban Company, Ltd. | | | 4,700 | 66,211 |
| Nichicon Corp. | | | 19,873 | 144,333 |
| Nichiden Corp. | | | 6,200 | 96,947 |
| Nichiha Corp. | | | 9,700 | 202,825 |
| NichiiGakkan Company, Ltd. | | | 14,000 | 145,823 |
| Nichi-iko Pharmaceutical Company, Ltd. | | | 15,600 | 166,992 |
| Nichimo Company, Ltd. | | | 700 | 11,712 |
| Nichireki Company, Ltd. | | | 11,100 | 132,813 |
| Nichirin Company, Ltd. | | | 4,690 | 69,535 |
| Nihon Chouzai Company, Ltd. | | | 2,480 | 82,374 |
| Nihon Dempa Kogyo Company, Ltd. (A) | | | 4,700 | 17,397 |
| Nihon Dengi Company, Ltd. | | | 1,100 | 34,052 |
| Nihon Denkei Company, Ltd. | | | 1,400 | 13,958 |
| Nihon Flush Company, Ltd. (B) | | | 4,300 | 91,341 |
| Nihon House Holdings Company, Ltd. | | | 20,500 | 73,929 |
| Nihon Kagaku Sangyo Company, Ltd. | | | 3,200 | 27,217 |
| Nihon Nohyaku Company, Ltd. | | | 15,800 | 73,891 |
| Nihon Parkerizing Company, Ltd. | | | 31,500 | 286,483 |
| Nihon Plast Company, Ltd. | | | 7,300 | 39,296 |
| Nihon Tokushu Toryo Company, Ltd. | | | 6,000 | 55,516 |
| Nihon Yamamura Glass Company, Ltd. | | | 2,800 | 26,656 |
| Niitaka Company, Ltd. | | | 800 | 20,286 |
| Nikkato Corp. | | | 2,200 | 11,198 |
| Nikkiso Company, Ltd. | | | 21,700 | 191,968 |
| Nikko Company, Ltd. | | | 11,600 | 70,577 |
| Nikkon Holdings Company, Ltd. | | | 21,400 | 410,846 |
| Nippi, Inc. | | | 400 | 12,854 |
| Nippon Air Conditioning Services Company, Ltd. (B) | | | 12,100 | 77,390 |
| Nippon Aqua Company, Ltd. | | | 2,800 | 13,118 |
| Nippon Beet Sugar Manufacturing Company, Ltd. | | | 4,800 | 76,306 |
| Nippon Carbide Industries Company, Inc. | | | 2,500 | 26,284 |
| 56 | JOHN HANCOCK INTERNATIONAL SMALL COMPANY FUND | SEMIANNUAL REPORT | SEE NOTES TO FINANCIAL STATEMENTS |
| | | | | Shares | Value |
| Japan (continued) | | | | | |
| Nippon Carbon Company, Ltd. | | | 5,600 | $185,830 |
| Nippon Chemical Industrial Company, Ltd. (B) | | | 2,500 | 53,999 |
| Nippon Chemi-Con Corp. | | | 6,927 | 98,717 |
| Nippon Chemiphar Company, Ltd. | | | 1,100 | 23,346 |
| Nippon Coke & Engineering Company, Ltd. | | | 61,100 | 36,755 |
| Nippon Commercial Development Company, Ltd. (B) | | | 3,700 | 52,577 |
| Nippon Concept Corp. | | | 3,300 | 40,373 |
| Nippon Concrete Industries Company, Ltd. | | | 18,600 | 45,890 |
| Nippon Denko Company, Ltd. (A) | | | 51,000 | 68,663 |
| Nippon Densetsu Kogyo Company, Ltd. | | | 12,900 | 234,447 |
| Nippon Dry-Chemical Company, Ltd. | | | 900 | 12,508 |
| Nippon Electric Glass Company, Ltd. | | | 5,600 | 93,659 |
| Nippon Felt Company, Ltd. | | | 2,700 | 10,854 |
| Nippon Filcon Company, Ltd. | | | 5,600 | 23,573 |
| Nippon Fine Chemical Company, Ltd. | | | 4,400 | 51,846 |
| Nippon Flour Mills Company, Ltd. | | | 18,500 | 274,267 |
| Nippon Gas Company, Ltd. | | | 14,200 | 448,907 |
| Nippon Hume Corp. | | | 8,600 | 50,943 |
| Nippon Kanzai Company, Ltd. | | | 2,700 | 44,749 |
| Nippon Kayaku Company, Ltd. | | | 2,500 | 27,469 |
| Nippon Kinzoku Company, Ltd. | | | 1,300 | 8,698 |
| Nippon Kodoshi Corp. | | | 2,000 | 22,488 |
| Nippon Koei Company, Ltd. | | | 6,800 | 185,641 |
| Nippon Koshuha Steel Company, Ltd. | | | 2,400 | 7,835 |
| Nippon Light Metal Holdings Company, Ltd. | | | 234,200 | 409,073 |
| Nippon Paper Industries Company, Ltd. | | | 12,500 | 180,755 |
| Nippon Parking Development Company, Ltd. | | | 87,100 | 97,461 |
| Nippon Pillar Packing Company, Ltd. | | | 9,400 | 109,209 |
| Nippon Piston Ring Company, Ltd. | | | 3,400 | 40,730 |
| Nippon Rietec Company, Ltd. (B) | | | 3,000 | 42,095 |
| Nippon Seiki Company, Ltd. | | | 14,900 | 195,694 |
| Nippon Seisen Company, Ltd. | | | 1,600 | 46,361 |
| Nippon Sharyo, Ltd. (A) | | | 3,600 | 85,836 |
| Nippon Sheet Glass Company, Ltd. | | | 45,000 | 201,545 |
| Nippon Signal Company, Ltd. | | | 18,400 | 194,691 |
| Nippon Soda Company, Ltd. | | | 10,000 | 257,312 |
| Nippon Steel Trading Corp. | | | 5,968 | 241,736 |
| Nippon Suisan Kaisha, Ltd. | | | 77,800 | 367,959 |
| Nippon Systemware Company, Ltd. | | | 3,800 | 67,343 |
| Nippon Thompson Company, Ltd. | | | 27,200 | 93,492 |
| Nippon Yakin Kogyo Company, Ltd. | | | 5,920 | 93,331 |
| Nipro Corp. | | | 28,300 | 298,903 |
| Nireco Corp. | | | 1,900 | 13,629 |
| Nishikawa Rubber Company, Ltd. | | | 4,100 | 63,344 |
| SEE NOTES TO FINANCIAL STATEMENTS | SEMIANNUAL REPORT | JOHN HANCOCK INTERNATIONAL SMALL COMPANY FUND | 57 |
| | | | | Shares | Value |
| Japan (continued) | | | | | |
| Nishimatsu Construction Company, Ltd. | | | 22,500 | $469,308 |
| Nishimatsuya Chain Company, Ltd. | | | 24,400 | 176,813 |
| Nishimoto Company, Ltd. | | | 1,500 | 39,541 |
| Nishi-Nippon Financial Holdings, Inc. | | | 50,700 | 285,493 |
| Nishi-Nippon Railroad Company, Ltd. (B) | | | 18,200 | 398,536 |
| Nishio Rent All Company, Ltd. | | | 8,800 | 217,128 |
| Nissan Shatai Company, Ltd. | | | 22,700 | 206,007 |
| Nissan Tokyo Sales Holdings Company, Ltd. | | | 8,300 | 17,796 |
| Nissei ASB Machine Company, Ltd. | | | 3,300 | 105,152 |
| Nissei Corp. | | | 1,100 | 11,887 |
| Nissei Plastic Industrial Company, Ltd. | | | 7,100 | 59,409 |
| Nissha Company, Ltd. | | | 9,700 | 73,836 |
| Nisshin Fudosan Company, Ltd. | | | 12,000 | 50,603 |
| Nisshinbo Holdings, Inc. | | | 70,057 | 596,666 |
| Nissin Corp. | | | 6,000 | 82,369 |
| Nissin Electric Company, Ltd. | | | 19,300 | 183,713 |
| Nissin Kogyo Company, Ltd. | | | 16,000 | 332,781 |
| Nissin Sugar Company, Ltd. | | | 4,100 | 72,953 |
| Nissui Pharmaceutical Company, Ltd. | | | 3,800 | 46,233 |
| Nitta Corp. | | | 7,900 | 177,802 |
| Nitta Gelatin, Inc. | | | 3,400 | 16,861 |
| Nittan Valve Company, Ltd. | | | 4,000 | 9,061 |
| Nittetsu Mining Company, Ltd. | | | 2,400 | 84,983 |
| Nitto Boseki Company, Ltd. | | | 1,945 | 74,851 |
| Nitto Fuji Flour Milling Company, Ltd. | | | 400 | 22,013 |
| Nitto Kogyo Corp. | | | 10,200 | 178,320 |
| Nitto Kohki Company, Ltd. | | | 3,400 | 64,855 |
| Nitto Seiko Company, Ltd. | | | 17,000 | 74,280 |
| Nittoc Construction Company, Ltd. | | | 9,000 | 63,963 |
| NJS Company, Ltd. | | | 3,400 | 51,645 |
| nms Holdings Company | | | 2,400 | 6,837 |
| Noda Corp. | | | 2,500 | 15,007 |
| Noevir Holdings Company, Ltd. | | | 5,300 | 224,618 |
| Nohmi Bosai, Ltd. | | | 5,600 | 104,684 |
| Nojima Corp. | | | 11,800 | 208,450 |
| Nomura Company, Ltd. | | | 31,000 | 281,703 |
| Noritake Company, Ltd. | | | 4,200 | 146,778 |
| Noritsu Koki Company, Ltd. | | | 8,700 | 103,383 |
| Noritz Corp. | | | 12,900 | 130,390 |
| North Pacific Bank, Ltd. | | | 112,600 | 209,650 |
| Nozawa Corp. | | | 2,600 | 16,319 |
| NS Tool Company, Ltd. (B) | | | 2,700 | 63,075 |
| NS United Kaiun Kaisha, Ltd. | | | 3,800 | 60,192 |
| NSD Company, Ltd. | | | 26,612 | 427,973 |
| 58 | JOHN HANCOCK INTERNATIONAL SMALL COMPANY FUND | SEMIANNUAL REPORT | SEE NOTES TO FINANCIAL STATEMENTS |
| | | | | Shares | Value |
| Japan (continued) | | | | | |
| NTN Corp. | | | 169,500 | $402,195 |
| NuFlare Technology, Inc. | | | 1,900 | 211,394 |
| OAK Capital Corp. | | | 16,400 | 14,225 |
| Oat Agrio Company, Ltd. | | | 400 | 4,388 |
| Obara Group, Inc. | | | 4,200 | 111,678 |
| Odelic Company, Ltd. | | | 2,000 | 114,180 |
| Oenon Holdings, Inc. | | | 22,800 | 73,374 |
| Ohara, Inc. | | | 2,700 | 26,483 |
| Ohashi Technica, Inc. | | | 4,900 | 58,893 |
| Ohba Company, Ltd. | | | 600 | 3,273 |
| Ohmoto Gumi Company, Ltd. | | | 400 | 17,945 |
| Ohsho Food Service Corp. | | | 4,500 | 239,419 |
| Oiles Corp. | | | 9,372 | 122,391 |
| Okabe Company, Ltd. | | | 20,200 | 142,825 |
| Okada Aiyon Corp. | | | 2,200 | 18,462 |
| Okamoto Industries, Inc. | | | 4,700 | 141,552 |
| Okamoto Machine Tool Works, Ltd. | | | 1,300 | 25,532 |
| Okamura Corp. | | | 24,600 | 205,082 |
| Okasan Securities Group, Inc. | | | 70,300 | 221,856 |
| Okaya Electric Industries Company, Ltd. | | | 2,700 | 7,448 |
| Oki Electric Industry Company, Ltd. | | | 34,600 | 382,180 |
| Okinawa Cellular Telephone Company | | | 4,100 | 148,081 |
| OKK Corp. | | | 2,500 | 11,704 |
| OKUMA Corp. | | | 8,976 | 376,679 |
| Okumura Corp. | | | 11,100 | 269,568 |
| Okura Industrial Company, Ltd. | | | 3,400 | 46,528 |
| Okuwa Company, Ltd. | | | 12,500 | 153,020 |
| Olympic Group Corp. | | | 3,100 | 14,344 |
| ONO Sokki Company, Ltd. | | | 2,000 | 9,133 |
| Onoken Company, Ltd. | | | 7,100 | 76,506 |
| Onward Holdings Company, Ltd. | | | 49,300 | 238,362 |
| Ootoya Holdings Company, Ltd. | | | 2,000 | 35,795 |
| Open Door, Inc. (A) | | | 4,800 | 45,997 |
| Optex Group Company, Ltd. | | | 8,200 | 93,770 |
| Organo Corp. | | | 3,300 | 194,530 |
| Origin Company, Ltd. | | | 2,200 | 27,592 |
| Oro Company, Ltd. | | | 1,400 | 35,512 |
| Osaka Organic Chemical Industry, Ltd. | | | 7,300 | 100,304 |
| Osaka Soda Company, Ltd. | | | 5,800 | 136,723 |
| Osaka Steel Company, Ltd. | | | 5,800 | 75,434 |
| OSAKA Titanium Technologies Company, Ltd. | | | 7,500 | 76,034 |
| Osaki Electric Company, Ltd. | | | 18,300 | 92,462 |
| OSG Corp. | | | 11,500 | 172,386 |
| OSJB Holdings Corp. | | | 59,900 | 137,991 |
| SEE NOTES TO FINANCIAL STATEMENTS | SEMIANNUAL REPORT | JOHN HANCOCK INTERNATIONAL SMALL COMPANY FUND | 59 |
| | | | | Shares | Value |
| Japan (continued) | | | | | |
| OUG Holdings, Inc. | | | 1,200 | $26,327 |
| Outsourcing, Inc. | | | 39,900 | 290,017 |
| Oyo Corp. | | | 10,900 | 124,976 |
| Ozu Corp. | | | 2,000 | 27,254 |
| Pacific Industrial Company, Ltd. | | | 16,600 | 179,179 |
| Pacific Metals Company, Ltd. (B) | | | 7,700 | 139,770 |
| PAL GROUP Holdings Company, Ltd. | | | 10,200 | 135,908 |
| Paltek Corp. | | | 1,800 | 7,090 |
| PAPYLESS Company, Ltd. | | | 600 | 10,724 |
| Paraca, Inc. | | | 2,500 | 39,705 |
| Paramount Bed Holdings Company, Ltd. | | | 7,500 | 289,708 |
| Paris Miki Holdings, Inc. | | | 9,700 | 23,278 |
| Parker Corp. | | | 4,000 | 16,412 |
| Pasona Group, Inc. | | | 9,900 | 102,168 |
| PC Depot Corp. | | | 13,900 | 64,499 |
| PCA Corp. (B) | | | 1,200 | 39,663 |
| PCI Holdings, Inc. | | | 800 | 14,483 |
| Pegasus Sewing Machine Manufacturing Company, Ltd. | | | 7,800 | 28,368 |
| Penta-Ocean Construction Company, Ltd. | | | 114,000 | 611,297 |
| Pepper Food Service Company, Ltd. (B) | | | 2,900 | 18,850 |
| Phil Company, Inc. (B) | | | 1,400 | 39,829 |
| PIA Corp. | | | 1,500 | 40,321 |
| Pickles Corp. | | | 2,100 | 41,563 |
| Pilot Corp. | | | 5,000 | 161,857 |
| Piolax, Inc. | | | 13,100 | 186,202 |
| Plant Company, Ltd. | | | 900 | 3,746 |
| Plenus Company, Ltd. | | | 4,800 | 75,696 |
| Poletowin Pitcrew Holdings, Inc. | | | 12,800 | 98,237 |
| Press Kogyo Company, Ltd. | | | 35,700 | 102,033 |
| Pressance Corp. (B) | | | 14,400 | 151,209 |
| Prestige International, Inc. | | | 40,100 | 307,889 |
| Prima Meat Packers, Ltd. | | | 12,300 | 252,994 |
| Pronexus, Inc. | | | 6,000 | 55,068 |
| Properst Company, Ltd. | | | 9,300 | 13,683 |
| Pro-Ship, Inc. | | | 1,000 | 12,761 |
| Prospect Company, Ltd. (A) | | | 148,000 | 30,363 |
| Proto Corp. | | | 10,200 | 102,561 |
| PS Mitsubishi Construction Company, Ltd. | | | 15,900 | 84,707 |
| Punch Industry Company, Ltd. | | | 6,700 | 21,524 |
| Qol Holdings Company, Ltd. | | | 9,400 | 108,099 |
| Quick Company, Ltd. | | | 5,200 | 58,640 |
| Raccoon Holdings, Inc. | | | 6,900 | 43,587 |
| Raito Kogyo Company, Ltd. | | | 18,200 | 220,380 |
| Raiznext Corp. | | | 17,500 | 194,668 |
| 60 | JOHN HANCOCK INTERNATIONAL SMALL COMPANY FUND | SEMIANNUAL REPORT | SEE NOTES TO FINANCIAL STATEMENTS |
| | | | | Shares | Value |
| Japan (continued) | | | | | |
| Rakus Company, Ltd. (B) | | | 14,000 | $198,367 |
| Rasa Corp. | | | 2,900 | 22,293 |
| Rasa Industries, Ltd. | | | 3,800 | 42,522 |
| Raysum Company, Ltd. | | | 6,600 | 49,262 |
| RECOMM Company, Ltd. | | | 19,800 | 15,135 |
| Relia, Inc. | | | 15,300 | 171,413 |
| Renaissance, Inc. | | | 5,400 | 68,725 |
| Rengo Company, Ltd. | | | 23,500 | 160,381 |
| RENOVA, Inc. (A) | | | 5,000 | 44,356 |
| Renown, Inc. (A)(B) | | | 15,500 | 12,239 |
| Resorttrust, Inc. | | | 33,600 | 442,115 |
| Restar Holdings Corp. | | | 2,900 | 42,790 |
| Retail Partners Company, Ltd. | | | 5,300 | 34,083 |
| Rheon Automatic Machinery Company, Ltd. | | | 8,900 | 95,184 |
| Rhythm Watch Company, Ltd. | | | 2,000 | 15,107 |
| Riberesute Corp. | | | 2,000 | 14,388 |
| Ricoh Leasing Company, Ltd. | | | 6,900 | 237,367 |
| Ride On Express Holdings Company, Ltd. | | | 3,400 | 44,716 |
| Right On Company, Ltd. (B) | | | 7,900 | 34,750 |
| Riken Corp. | | | 3,700 | 102,577 |
| Riken Keiki Company, Ltd. | | | 5,400 | 98,907 |
| Riken Technos Corp. | | | 19,000 | 74,587 |
| Riken Vitamin Company, Ltd. | | | 3,900 | 136,510 |
| Ringer Hut Company, Ltd. (B) | | | 9,000 | 174,510 |
| Rion Company, Ltd. | | | 3,400 | 78,090 |
| Riso Kagaku Corp. | | | 5,600 | 86,060 |
| Riso Kyoiku Company, Ltd. | | | 42,300 | 120,487 |
| Rock Field Company, Ltd. | | | 6,500 | 75,934 |
| Rokko Butter Company, Ltd. | | | 5,800 | 72,328 |
| Roland DG Corp. | | | 6,300 | 94,901 |
| Rorze Corp. | | | 4,000 | 124,395 |
| Round One Corp. | | | 27,500 | 204,316 |
| Royal Holdings Company, Ltd. | | | 11,300 | 187,540 |
| Rozetta Corp. (A) | | | 1,800 | 47,962 |
| RS Technologies Company, Ltd. | | | 1,500 | 32,544 |
| Ryobi, Ltd. | | | 12,600 | 162,748 |
| Ryoden Corp. | | | 6,900 | 95,506 |
| Ryosan Company, Ltd. | | | 7,729 | 158,797 |
| Ryoyo Electro Corp. (B) | | | 8,200 | 134,391 |
| S Foods, Inc. | | | 6,600 | 135,860 |
| S Line Company, Ltd. | | | 2,000 | 15,978 |
| S&B Foods, Inc. | | | 1,500 | 53,934 |
| Sac's Bar Holdings, Inc. | | | 7,300 | 49,179 |
| Sagami Rubber Industries Company, Ltd. | | | 2,000 | 28,167 |
| SEE NOTES TO FINANCIAL STATEMENTS | SEMIANNUAL REPORT | JOHN HANCOCK INTERNATIONAL SMALL COMPANY FUND | 61 |
| | | | | Shares | Value |
| Japan (continued) | | | | | |
| Saibu Gas Company, Ltd. | | | 10,900 | $220,371 |
| Saison Information Systems Company, Ltd. | | | 1,000 | 19,078 |
| Saizeriya Company, Ltd. | | | 12,700 | 242,330 |
| Sakai Chemical Industry Company, Ltd. | | | 5,800 | 102,905 |
| Sakai Heavy Industries, Ltd. | | | 1,600 | 35,569 |
| Sakai Moving Service Company, Ltd. | | | 3,600 | 170,298 |
| Sakai Ovex Company, Ltd. | | | 2,000 | 32,787 |
| Sakata INX Corp. | | | 21,700 | 187,138 |
| Sakura Internet, Inc. | | | 4,500 | 20,575 |
| Sala Corp. | | | 28,600 | 145,291 |
| SAMTY Company, Ltd. | | | 10,400 | 149,064 |
| San Holdings, Inc. | | | 3,400 | 37,657 |
| San ju San Financial Group, Inc. | | | 8,020 | 108,954 |
| San-A Company, Ltd. (B) | | | 6,900 | 248,984 |
| San-Ai Oil Company, Ltd. | | | 23,600 | 203,080 |
| Sanden Holdings Corp. (A)(B) | | | 8,800 | 41,585 |
| Sanei Architecture Planning Company, Ltd. | | | 4,100 | 49,427 |
| Sangetsu Corp. | | | 7,500 | 114,332 |
| Sanix, Inc. (A) | | | 12,300 | 42,791 |
| Sanken Electric Company, Ltd. | | | 8,587 | 203,767 |
| Sanki Engineering Company, Ltd. | | | 18,100 | 212,378 |
| Sanko Gosei, Ltd. | | | 3,100 | 8,317 |
| Sanko Metal Industrial Company, Ltd. | | | 600 | 12,692 |
| Sankyo Frontier Company, Ltd. | | | 1,300 | 43,400 |
| Sankyo Seiko Company, Ltd. | | | 10,400 | 48,186 |
| Sankyo Tateyama, Inc. | | | 13,500 | 135,581 |
| Sanoh Industrial Company, Ltd. | | | 12,900 | 99,352 |
| Sanoyas Holdings Corp. | | | 9,400 | 13,272 |
| Sansei Landic Company, Ltd. | | | 1,100 | 7,297 |
| Sansei Technologies, Inc. (B) | | | 3,900 | 27,791 |
| Sansha Electric Manufacturing Company, Ltd. | | | 4,100 | 23,222 |
| Sanshin Electronics Company, Ltd. | | | 5,500 | 75,908 |
| Sanyo Chemical Industries, Ltd. | | | 5,200 | 211,086 |
| Sanyo Denki Company, Ltd. | | | 4,000 | 160,799 |
| Sanyo Electric Railway Company, Ltd. | | | 7,300 | 130,224 |
| Sanyo Engineering & Construction, Inc. | | | 1,900 | 11,747 |
| Sanyo Shokai, Ltd. | | | 6,600 | 81,954 |
| Sanyo Special Steel Company, Ltd. | | | 8,829 | 96,407 |
| Sanyo Trading Company, Ltd. | | | 7,600 | 72,482 |
| Sapporo Holdings, Ltd. | | | 19,200 | 385,488 |
| Sata Construction Company, Ltd. | | | 1,800 | 5,785 |
| Sato Holdings Corp. | | | 10,700 | 240,570 |
| Sato Shoji Corp. | | | 4,900 | 36,072 |
| Satori Electric Company, Ltd. | | | 7,100 | 49,771 |
| 62 | JOHN HANCOCK INTERNATIONAL SMALL COMPANY FUND | SEMIANNUAL REPORT | SEE NOTES TO FINANCIAL STATEMENTS |
| | | | | Shares | Value |
| Japan (continued) | | | | | |
| Sawada Holdings Company, Ltd. | | | 9,800 | $91,123 |
| Saxa Holdings, Inc. | | | 1,800 | 27,241 |
| SB Technology Corp. | | | 3,400 | 64,439 |
| SBS Holdings, Inc. | | | 7,700 | 113,873 |
| Scala, Inc. | | | 7,500 | 42,112 |
| Scroll Corp. (B) | | | 12,700 | 35,512 |
| SEC Carbon, Ltd. | | | 500 | 33,262 |
| Seed Company, Ltd. | | | 3,300 | 24,426 |
| Seika Corp. | | | 3,800 | 40,426 |
| Seikagaku Corp. | | | 14,500 | 134,600 |
| Seikitokyu Kogyo Company, Ltd. | | | 13,200 | 98,872 |
| Seiko Holdings Corp. | | | 9,500 | 183,479 |
| Seiko PMC Corp. | | | 5,600 | 38,802 |
| Seiren Company, Ltd. | | | 19,400 | 247,751 |
| Sekisui Jushi Corp. | | | 10,300 | 201,697 |
| Sekisui Plastics Company, Ltd. | | | 9,800 | 56,686 |
| Senko Group Holdings Company, Ltd. | | | 39,400 | 286,145 |
| Senshu Electric Company, Ltd. | | | 4,100 | 99,830 |
| Senshu Ikeda Holdings, Inc. | | | 92,900 | 142,855 |
| Senshukai Company, Ltd. | | | 17,000 | 64,363 |
| Seria Company, Ltd. | | | 3,800 | 102,451 |
| SFP Holdings Company, Ltd. | | | 2,300 | 37,328 |
| Shibaura Electronics Company, Ltd. | | | 2,700 | 60,748 |
| Shibaura Mechatronics Corp. | | | 1,600 | 41,539 |
| Shibuya Corp. | | | 6,300 | 152,774 |
| Shidax Corp. (A) | | | 6,600 | 18,420 |
| SHIFT, Inc. (A) | | | 600 | 36,109 |
| Shikibo, Ltd. | | | 2,100 | 22,136 |
| Shikoku Chemicals Corp. | | | 13,800 | 137,756 |
| Shikoku Electric Power Company, Inc. | | | 18,900 | 143,213 |
| Shima Seiki Manufacturing, Ltd. | | | 11,200 | 174,837 |
| Shimachu Company, Ltd. (B) | | | 16,400 | 403,342 |
| Shimojima Company, Ltd. | | | 3,900 | 36,152 |
| Shin Nippon Air Technologies Company, Ltd. | | | 5,200 | 88,227 |
| Shin Nippon Biomedical Laboratories, Ltd. (A)(B) | | | 10,300 | 52,506 |
| Shinagawa Refractories Company, Ltd. | | | 2,800 | 67,573 |
| Shindengen Electric Manufacturing Company, Ltd. | | | 3,400 | 95,399 |
| Shin-Etsu Polymer Company, Ltd. | | | 19,800 | 154,590 |
| Shin-Keisei Electric Railway Company, Ltd. | | | 2,200 | 46,812 |
| Shinko Electric Industries Company, Ltd. | | | 27,700 | 309,243 |
| Shinko Shoji Company, Ltd. | | | 13,400 | 85,586 |
| Shinmaywa Industries, Ltd. | | | 22,000 | 249,154 |
| Shinnihon Corp. | | | 9,600 | 67,327 |
| Shinoken Group Company, Ltd. | | | 6,400 | 60,830 |
| SEE NOTES TO FINANCIAL STATEMENTS | SEMIANNUAL REPORT | JOHN HANCOCK INTERNATIONAL SMALL COMPANY FUND | 63 |
| | | | | Shares | Value |
| Japan (continued) | | | | | |
| Shinsho Corp. | | | 1,500 | $30,258 |
| Shinwa Company, Ltd. | | | 4,600 | 81,291 |
| Shizuki Electric Company, Inc. | | | 5,000 | 24,652 |
| Shizuoka Gas Company, Ltd. | | | 25,300 | 200,908 |
| Shobunsha Publications, Inc. (A) | | | 4,100 | 11,703 |
| Shoei Company, Ltd. | | | 5,000 | 222,916 |
| Shoei Foods Corp. | | | 2,900 | 85,738 |
| Shofu, Inc. | | | 3,500 | 53,727 |
| Shoko Company, Ltd. (A) | | | 1,700 | 9,321 |
| Showa Aircraft Industry Company, Ltd. | | | 800 | 15,725 |
| Showa Corp. | | | 20,400 | 436,072 |
| Showa Sangyo Company, Ltd. | | | 6,300 | 172,551 |
| Showa Shinku Company, Ltd. | | | 900 | 11,736 |
| Sigma Koki Company, Ltd. | | | 1,800 | 18,874 |
| SIGMAXYZ, Inc. | | | 6,500 | 89,048 |
| Siix Corp. | | | 13,100 | 145,312 |
| Sinanen Holdings Company, Ltd. | | | 3,100 | 57,618 |
| Sinfonia Technology Company, Ltd. | | | 10,000 | 94,218 |
| Sinko Industries, Ltd. | | | 8,100 | 113,517 |
| Sintokogio, Ltd. | | | 16,800 | 120,103 |
| SK Kaken Company, Ltd. | | | 200 | 83,521 |
| SK-Electronics Company, Ltd. | | | 3,800 | 41,083 |
| SKY Perfect JSAT Holdings, Inc. | | | 55,800 | 239,137 |
| SMK Corp. | | | 1,800 | 37,636 |
| SMS Company, Ltd. | | | 2,800 | 52,991 |
| Snow Peak, Inc. | | | 5,100 | 32,073 |
| SNT Corp. | | | 11,900 | 33,812 |
| Soda Nikka Company, Ltd. | | | 5,800 | 26,723 |
| Sodick Company, Ltd. | | | 22,400 | 148,825 |
| Soft99 Corp. | | | 2,200 | 19,893 |
| Softbrain Company, Ltd. | | | 6,100 | 23,885 |
| Softcreate Holdings Corp. | | | 2,100 | 27,395 |
| Software Service, Inc. | | | 900 | 75,474 |
| Sogo Medical Holdings Company, Ltd. | | | 6,800 | 159,177 |
| Soiken Holdings, Inc. | | | 2,500 | 9,266 |
| Soken Chemical & Engineering Company, Ltd. | | | 2,800 | 29,631 |
| Solasto Corp. | | | 17,900 | 162,956 |
| SoldOut, Inc. | | | 500 | 8,066 |
| Soliton Systems KK | | | 3,800 | 33,529 |
| Soshin Electric Company, Ltd. | | | 2,400 | 6,983 |
| Sotoh Company, Ltd. | | | 2,400 | 20,429 |
| Sourcenext Corp. | | | 10,100 | 29,102 |
| Space Company, Ltd. | | | 2,970 | 28,318 |
| Space Value Holdings Company, Ltd. | | | 14,700 | 62,114 |
| 64 | JOHN HANCOCK INTERNATIONAL SMALL COMPANY FUND | SEMIANNUAL REPORT | SEE NOTES TO FINANCIAL STATEMENTS |
| | | | | Shares | Value |
| Japan (continued) | | | | | |
| Sparx Group Company, Ltd. | | | 33,900 | $69,705 |
| SPK Corp. | | | 900 | 19,260 |
| S-Pool, Inc. | | | 23,200 | 143,208 |
| SRA Holdings | | | 4,000 | 83,697 |
| SRS Holdings Company, Ltd. | | | 11,400 | 96,847 |
| ST Corp. | | | 4,300 | 58,356 |
| St. Marc Holdings Company, Ltd. | | | 6,600 | 118,393 |
| Star Mica Holdings Company, Ltd. | | | 4,200 | 50,590 |
| Star Micronics Company, Ltd. | | | 15,600 | 173,955 |
| Starts Corp., Inc. | | | 12,800 | 263,761 |
| Starzen Company, Ltd. | | | 2,900 | 112,934 |
| St-Care Holding Corp. | | | 3,300 | 12,932 |
| Stella Chemifa Corp. | | | 3,500 | 86,190 |
| Step Company, Ltd. | | | 2,000 | 26,448 |
| Strike Company, Ltd. | | | 2,900 | 107,976 |
| Studio Alice Company, Ltd. | | | 4,200 | 60,281 |
| Subaru Enterprise Company, Ltd. | | | 700 | 48,163 |
| Sugimoto & Company, Ltd. | | | 4,500 | 70,980 |
| Sumida Corp. | | | 10,600 | 93,502 |
| Suminoe Textile Company, Ltd. | | | 2,199 | 39,550 |
| Sumiseki Holdings, Inc. | | | 21,100 | 23,253 |
| Sumitomo Bakelite Company, Ltd. | | | 3,900 | 115,551 |
| Sumitomo Densetsu Company, Ltd. | | | 7,500 | 154,613 |
| Sumitomo Mitsui Construction Company, Ltd. | | | 62,760 | 316,008 |
| Sumitomo Osaka Cement Company, Ltd. | | | 16,000 | 543,231 |
| Sumitomo Precision Products Company, Ltd. (A) | | | 900 | 22,450 |
| Sumitomo Riko Company, Ltd. | | | 15,300 | 101,682 |
| Sumitomo Seika Chemicals Company, Ltd. | | | 3,900 | 101,361 |
| Sun Frontier Fudousan Company, Ltd. | | | 14,200 | 140,033 |
| Suncall Corp. | | | 7,800 | 34,059 |
| Sun-Wa Technos Corp. | | | 3,900 | 31,394 |
| Sushiro Global Holdings, Ltd. | | | 500 | 35,942 |
| Suzuden Corp. | | | 900 | 10,163 |
| Suzuki Company, Ltd. | | | 3,500 | 24,320 |
| SWCC Showa Holdings Company, Ltd. (B) | | | 11,300 | 113,622 |
| Synchro Food Company, Ltd. (A) | | | 1,500 | 4,497 |
| System Information Company, Ltd. | | | 2,200 | 14,521 |
| System Research Company, Ltd. | | | 800 | 12,151 |
| Systemsoft Corp. | | | 10,000 | 6,955 |
| Systena Corp. | | | 25,600 | 333,199 |
| Syuppin Company, Ltd. | | | 5,600 | 41,544 |
| T Hasegawa Company, Ltd. | | | 12,700 | 235,133 |
| T RAD Company, Ltd. | | | 1,900 | 28,227 |
| T&K Toka Company, Ltd. | | | 8,000 | 60,153 |
| SEE NOTES TO FINANCIAL STATEMENTS | SEMIANNUAL REPORT | JOHN HANCOCK INTERNATIONAL SMALL COMPANY FUND | 65 |
| | | | | Shares | Value |
| Japan (continued) | | | | | |
| Tachibana Eletech Company, Ltd. | | | 6,500 | $93,328 |
| Tachikawa Corp. | | | 3,700 | 35,674 |
| Tachi-S Company, Ltd. | | | 13,500 | 125,747 |
| Tadano, Ltd. | | | 42,500 | 353,909 |
| Taihei Dengyo Kaisha, Ltd. | | | 6,400 | 135,453 |
| Taiheiyo Kouhatsu, Inc. | | | 1,200 | 7,436 |
| Taiho Kogyo Company, Ltd. | | | 8,000 | 42,345 |
| Taikisha, Ltd. | | | 7,700 | 220,325 |
| Taisei Lamick Company, Ltd. | | | 2,500 | 57,762 |
| Taiyo Holdings Company, Ltd. | | | 6,000 | 237,752 |
| Takachiho Koheki Company, Ltd. | | | 1,300 | 12,668 |
| Takagi Seiko Corp. | | | 400 | 7,529 |
| Takamatsu Construction Group Company, Ltd. | | | 5,900 | 127,426 |
| Takamatsu Machinery Company, Ltd. | | | 1,100 | 7,178 |
| Takamiya Company, Ltd. | | | 9,700 | 46,108 |
| Takano Company, Ltd. | | | 2,400 | 14,738 |
| Takaoka Toko Company, Ltd. | | | 3,970 | 38,158 |
| Takara Leben Company, Ltd. | | | 37,000 | 146,498 |
| Takara Printing Company, Ltd. | | | 4,400 | 62,575 |
| Takara Standard Company, Ltd. | | | 13,200 | 186,039 |
| Takasago International Corp. | | | 5,600 | 105,832 |
| Takasago Thermal Engineering Company, Ltd. | | | 18,500 | 284,653 |
| Takashima & Company, Ltd. | | | 1,400 | 22,014 |
| Takashimaya Company, Ltd. (B) | | | 11,600 | 108,026 |
| Take And Give Needs Company, Ltd. | | | 3,980 | 29,920 |
| TAKEBISHI Corp. | | | 2,500 | 28,895 |
| Takeei Corp. | | | 9,900 | 80,307 |
| Takemoto Yohki Company, Ltd. | | | 4,400 | 29,680 |
| Takeuchi Manufacturing Company, Ltd. | | | 16,600 | 250,549 |
| Takihyo Company, Ltd. | | | 1,600 | 21,069 |
| Takisawa Machine Tool Company, Ltd. | | | 2,600 | 27,929 |
| Takuma Company, Ltd. | | | 25,700 | 279,414 |
| Tama Home Company, Ltd. | | | 6,900 | 80,740 |
| Tamron Company, Ltd. | | | 7,600 | 167,575 |
| Tamura Corp. | | | 23,200 | 105,108 |
| Tanabe Consulting Company, Ltd. | | | 900 | 10,298 |
| TANABE ENGINEERING Corp. | | | 1,900 | 12,776 |
| Tanseisha Company, Ltd. | | | 16,400 | 148,432 |
| Taoka Chemical Company, Ltd. | | | 500 | 26,773 |
| Tatsuta Electric Wire & Cable Company, Ltd. | | | 18,300 | 87,647 |
| Tayca Corp. | | | 6,700 | 91,779 |
| Tazmo Company, Ltd. | | | 2,100 | 20,326 |
| TBK Company, Ltd. | | | 6,000 | 24,447 |
| TDC Soft, Inc. | | | 6,600 | 50,053 |
| 66 | JOHN HANCOCK INTERNATIONAL SMALL COMPANY FUND | SEMIANNUAL REPORT | SEE NOTES TO FINANCIAL STATEMENTS |
| | | | | Shares | Value |
| Japan (continued) | | | | | |
| Tear Corp. | | | 4,900 | $24,316 |
| TechMatrix Corp. (B) | | | 7,900 | 180,881 |
| TECHNO ASSOCIE Company, Ltd. | | | 1,000 | 8,351 |
| TECHNO HORIZON HOLDINGS Company, Ltd. (B) | | | 2,700 | 16,216 |
| Techno Medica Company, Ltd. | | | 1,500 | 26,731 |
| Techno Ryowa, Ltd. | | | 3,800 | 29,073 |
| Techno Smart Corp. | | | 3,200 | 21,199 |
| Teikoku Electric Manufacturing Company, Ltd. | | | 7,200 | 84,527 |
| Teikoku Sen-I Company, Ltd. | | | 6,300 | 111,829 |
| Teikoku Tsushin Kogyo Company, Ltd. | | | 2,800 | 29,699 |
| Tekken Corp. | | | 5,800 | 128,774 |
| Temairazu, Inc. | | | 800 | 35,578 |
| Tenma Corp. | | | 7,100 | 107,213 |
| Tenox Corp. | | | 2,100 | 16,341 |
| Tenpos Holdings Company, Ltd. | | | 900 | 16,710 |
| Teraoka Seisakusho Company, Ltd. | | | 2,900 | 11,528 |
| Terilogy Company, Ltd. (A) | | | 2,100 | 17,174 |
| TESEC Corp. | | | 1,400 | 12,695 |
| T-Gaia Corp. | | | 8,200 | 155,380 |
| The 77 Bank, Ltd. | | | 24,500 | 310,615 |
| The Aichi Bank, Ltd. | | | 3,600 | 107,217 |
| The Akita Bank, Ltd. | | | 6,800 | 104,682 |
| The Aomori Bank, Ltd. | | | 8,000 | 164,950 |
| The Awa Bank, Ltd. | | | 13,700 | 274,921 |
| The Bank of Iwate, Ltd. | | | 6,700 | 138,049 |
| The Bank of Kochi, Ltd. | | | 2,600 | 16,696 |
| The Bank of Nagoya, Ltd. | | | 5,200 | 138,603 |
| The Bank of Okinawa, Ltd. | | | 8,905 | 249,607 |
| The Bank of Saga, Ltd. | | | 6,500 | 81,082 |
| The Bank of Toyama, Ltd. | | | 500 | 7,420 |
| The Chiba Kogyo Bank, Ltd. | | | 26,000 | 67,929 |
| The Chugoku Bank, Ltd. | | | 22,300 | 173,751 |
| The Chukyo Bank, Ltd. | | | 4,600 | 90,231 |
| The Daito Bank, Ltd. | | | 2,800 | 14,288 |
| The Ehime Bank, Ltd. | | | 14,250 | 133,467 |
| The First Bank of Toyama, Ltd. | | | 18,300 | 46,679 |
| The Fukui Bank, Ltd. | | | 8,918 | 119,655 |
| The Fukushima Bank, Ltd. | | | 7,400 | 12,200 |
| The Furukawa Battery Company, Ltd. | | | 5,900 | 32,860 |
| The Gunma Bank, Ltd. | | | 59,800 | 178,638 |
| The Hachijuni Bank, Ltd. | | | 9,600 | 32,265 |
| The Hiroshima Bank, Ltd. | | | 50,400 | 214,655 |
| The Hokkoku Bank, Ltd. | | | 10,700 | 270,463 |
| The Hyakugo Bank, Ltd. | | | 83,700 | 237,292 |
| SEE NOTES TO FINANCIAL STATEMENTS | SEMIANNUAL REPORT | JOHN HANCOCK INTERNATIONAL SMALL COMPANY FUND | 67 |
| | | | | Shares | Value |
| Japan (continued) | | | | | |
| The Hyakujushi Bank, Ltd. | | | 10,100 | $169,682 |
| The Iyo Bank, Ltd. | | | 54,000 | 239,996 |
| The Japan Steel Works, Ltd. | | | 25,000 | 357,301 |
| The Japan Wool Textile Company, Ltd. | | | 24,500 | 202,199 |
| The Juroku Bank, Ltd. | | | 11,600 | 195,989 |
| The Keihin Company, Ltd. | | | 1,000 | 11,222 |
| The Keiyo Bank, Ltd. | | | 41,900 | 195,845 |
| The Kinki Sharyo Company, Ltd. (A) | | | 1,200 | 13,374 |
| The Kita-Nippon Bank, Ltd. | | | 2,600 | 43,602 |
| The Kiyo Bank, Ltd. | | | 22,939 | 297,767 |
| The Kosei Securities Company, Ltd. | | | 1,900 | 9,544 |
| The Michinoku Bank, Ltd. | | | 6,400 | 64,900 |
| The Miyazaki Bank, Ltd. | | | 4,700 | 92,872 |
| The Monogatari Corp. | | | 2,100 | 133,387 |
| The Musashino Bank, Ltd. | | | 11,600 | 158,916 |
| The Nagano Bank, Ltd. | | | 3,900 | 45,478 |
| The Nanto Bank, Ltd. | | | 12,400 | 244,800 |
| The Nippon Road Company, Ltd. | | | 2,800 | 168,706 |
| The Nisshin Oillio Group, Ltd. | | | 9,500 | 293,291 |
| The Ogaki Kyoritsu Bank, Ltd. | | | 14,800 | 275,421 |
| The Oita Bank, Ltd. | | | 4,000 | 76,376 |
| The Okinawa Electric Power Company, Inc. | | | 17,300 | 296,915 |
| The Pack Corp. | | | 5,900 | 192,571 |
| The San-In Godo Bank, Ltd. | | | 56,000 | 279,871 |
| The Shibusawa Warehouse Company, Ltd. | | | 3,500 | 57,111 |
| The Shiga Bank, Ltd. | | | 16,500 | 367,330 |
| The Shikoku Bank, Ltd. | | | 14,900 | 115,192 |
| The Shimane Bank, Ltd. | | | 200 | 943 |
| The Shimizu Bank, Ltd. | | | 3,900 | 62,221 |
| The Sumitomo Warehouse Company, Ltd. | | | 23,876 | 280,411 |
| The Taiko Bank, Ltd. | | | 3,400 | 44,692 |
| The Tochigi Bank, Ltd. | | | 38,700 | 59,062 |
| The Toho Bank, Ltd. | | | 84,600 | 170,548 |
| The Tohoku Bank, Ltd. | | | 3,800 | 32,317 |
| The Torigoe Company, Ltd. | | | 5,900 | 41,201 |
| The Tottori Bank, Ltd. | | | 3,400 | 38,357 |
| The Towa Bank, Ltd. | | | 14,100 | 90,203 |
| The Yamagata Bank, Ltd. | | | 10,600 | 107,670 |
| The Yamanashi Chuo Bank, Ltd. | | | 11,251 | 84,742 |
| The Zenitaka Corp. | | | 600 | 18,039 |
| Tigers Polymer Corp. | | | 3,800 | 17,188 |
| TKC Corp. | | | 3,800 | 171,947 |
| Toa Corp. (Hyogo) | | | 8,800 | 73,533 |
| Toa Corp. (Tokyo) | | | 6,800 | 98,433 |
| 68 | JOHN HANCOCK INTERNATIONAL SMALL COMPANY FUND | SEMIANNUAL REPORT | SEE NOTES TO FINANCIAL STATEMENTS |
| | | | | Shares | Value |
| Japan (continued) | | | | | |
| Toa Oil Company, Ltd. | | | 3,500 | $63,917 |
| TOA ROAD Corp. | | | 1,500 | 42,621 |
| Toabo Corp. | | | 3,800 | 16,102 |
| Toagosei Company, Ltd. | | | 48,000 | 472,611 |
| Toba, Inc. | | | 800 | 20,673 |
| Tobishima Corp. | | | 9,420 | 101,436 |
| TOC Company, Ltd. | | | 18,000 | 114,026 |
| Tocalo Company, Ltd. | | | 25,600 | 223,170 |
| Toda Corp. | | | 19,600 | 116,292 |
| Toda Kogyo Corp. | | | 1,300 | 21,579 |
| Toei Animation Company, Ltd. | | | 2,700 | 110,458 |
| Toei Company, Ltd. | | | 100 | 11,292 |
| Toell Company, Ltd. | | | 3,900 | 23,329 |
| Toenec Corp. | | | 3,100 | 94,783 |
| Togami Electric Manufacturing Company, Ltd. | | | 600 | 9,162 |
| Toho Acetylene Company, Ltd. | | | 900 | 10,021 |
| Toho Company, Ltd. | | | 3,700 | 53,760 |
| Toho Holdings Company, Ltd. | | | 17,500 | 328,323 |
| Toho Titanium Company, Ltd. | | | 15,700 | 103,811 |
| Toho Zinc Company, Ltd. (B) | | | 5,500 | 77,440 |
| Tohoku Steel Company, Ltd. | | | 500 | 6,501 |
| Tohokushinsha Film Corp. | | | 5,400 | 30,464 |
| Tohto Suisan Company, Ltd. | | | 1,200 | 29,517 |
| Tokai Corp. | | | 6,800 | 145,942 |
| TOKAI Holdings Corp. | | | 33,300 | 271,039 |
| Tokai Lease Company, Ltd. | | | 300 | 4,162 |
| Tokai Rika Company, Ltd. | | | 20,900 | 311,028 |
| Tokai Tokyo Financial Holdings, Inc. | | | 89,800 | 235,979 |
| Token Corp. | | | 3,850 | 264,884 |
| Tokushu Tokai Paper Company, Ltd. | | | 3,900 | 129,062 |
| Tokuyama Corp. | | | 25,000 | 557,499 |
| Tokyo Base Company, Ltd. (A) | | | 7,500 | 26,376 |
| Tokyo Dome Corp. | | | 32,300 | 246,559 |
| Tokyo Electron Device, Ltd. | | | 3,000 | 63,479 |
| Tokyo Energy & Systems, Inc. | | | 10,200 | 73,974 |
| Tokyo Individualized Educational Institute, Inc. | | | 3,300 | 17,029 |
| Tokyo Keiki, Inc. | | | 4,200 | 30,465 |
| Tokyo Kiraboshi Financial Group, Inc. | | | 11,358 | 114,279 |
| Tokyo Ohka Kogyo Company, Ltd. | | | 8,300 | 299,731 |
| Tokyo Rakutenchi Company, Ltd. | | | 1,200 | 51,942 |
| Tokyo Rope Manufacturing Company, Ltd. (B) | | | 7,200 | 53,564 |
| Tokyo Sangyo Company, Ltd. | | | 6,600 | 31,721 |
| Tokyo Seimitsu Company, Ltd. | | | 15,800 | 498,514 |
| Tokyo Steel Manufacturing Company, Ltd. | | | 43,200 | 276,701 |
| SEE NOTES TO FINANCIAL STATEMENTS | SEMIANNUAL REPORT | JOHN HANCOCK INTERNATIONAL SMALL COMPANY FUND | 69 |
| | | | | Shares | Value |
| Japan (continued) | | | | | |
| Tokyo Tekko Company, Ltd. | | | 3,500 | $40,085 |
| Tokyo Theatres Company, Inc. | | | 2,400 | 25,347 |
| Tokyotokeiba Company, Ltd. | | | 5,000 | 152,281 |
| Tokyu Construction Company, Ltd. | | | 35,000 | 218,212 |
| Tokyu Recreation Company, Ltd. | | | 800 | 33,416 |
| Toli Corp. | | | 17,800 | 42,583 |
| Tomato Bank, Ltd. | | | 3,200 | 28,099 |
| Tomen Devices Corp. | | | 900 | 28,065 |
| Tomoe Corp. | | | 7,600 | 22,733 |
| Tomoe Engineering Company, Ltd. | | | 3,700 | 64,306 |
| Tomoegawa Company, Ltd. (A) | | | 400 | 2,440 |
| Tomoku Company, Ltd. | | | 4,200 | 60,406 |
| TOMONY Holdings, Inc. | | | 47,000 | 129,394 |
| Tomy Company, Ltd. | | | 33,800 | 297,618 |
| Tonami Holdings Company, Ltd. | | | 2,200 | 90,244 |
| Topcon Corp. | | | 40,700 | 404,754 |
| Toppan Forms Company, Ltd. | | | 20,200 | 192,137 |
| Topre Corp. | | | 14,800 | 192,359 |
| Topy Industries, Ltd. | | | 5,700 | 79,144 |
| Torex Semiconductor, Ltd. | | | 900 | 10,453 |
| Toridoll Holdings Corp. | | | 9,000 | 184,115 |
| Torii Pharmaceutical Company, Ltd. | | | 6,500 | 194,368 |
| Torikizoku Company, Ltd. (B) | | | 3,300 | 60,364 |
| Torishima Pump Manufacturing Company, Ltd. | | | 6,200 | 40,335 |
| Tosei Corp. | | | 16,000 | 171,601 |
| Toshiba Machine Company, Ltd. (B) | | | 9,300 | 255,279 |
| Toshiba TEC Corp. | | | 3,300 | 121,714 |
| Tosho Company, Ltd. | | | 6,600 | 96,694 |
| Totech Corp. | | | 1,400 | 27,335 |
| Totetsu Kogyo Company, Ltd. | | | 8,800 | 226,654 |
| Totoku Electric Company, Ltd. | | | 500 | 10,681 |
| Toukei Computer Company, Ltd. | | | 300 | 11,395 |
| Tow Company, Ltd. | | | 8,800 | 59,521 |
| Towa Corp. | | | 8,800 | 72,480 |
| Towa Pharmaceutical Company, Ltd. | | | 10,900 | 215,698 |
| Toyo Construction Company, Ltd. | | | 34,600 | 146,437 |
| Toyo Corp. | | | 8,200 | 69,114 |
| Toyo Denki Seizo KK | | | 3,100 | 34,417 |
| Toyo Engineering Corp. (A) | | | 14,700 | 63,376 |
| Toyo Gosei Company, Ltd. | | | 2,000 | 68,349 |
| Toyo Ink SC Holdings Company, Ltd. | | | 15,200 | 293,740 |
| Toyo Kanetsu KK | | | 3,100 | 62,965 |
| Toyo Logistics Company, Ltd. | | | 6,100 | 15,624 |
| Toyo Machinery & Metal Company, Ltd. | | | 6,200 | 25,739 |
| 70 | JOHN HANCOCK INTERNATIONAL SMALL COMPANY FUND | SEMIANNUAL REPORT | SEE NOTES TO FINANCIAL STATEMENTS |
| | | | | Shares | Value |
| Japan (continued) | | | | | |
| Toyo Securities Company, Ltd. | | | 22,000 | $26,507 |
| Toyo Tanso Company, Ltd. | | | 6,900 | 106,879 |
| Toyo Tire Corp. | | | 10,800 | 143,188 |
| Toyo Wharf & Warehouse Company, Ltd. | | | 1,900 | 22,149 |
| Toyobo Company, Ltd. | | | 33,706 | 422,361 |
| TPR Company, Ltd. | | | 9,600 | 131,871 |
| Trancom Company, Ltd. | | | 2,500 | 159,166 |
| Transaction Company, Ltd. | | | 2,400 | 18,777 |
| Treasure Factory Company, Ltd. | | | 2,400 | 15,472 |
| Tri Chemical Laboratories, Inc. | | | 2,400 | 189,227 |
| Trinity Industrial Corp. | | | 2,000 | 14,939 |
| Trusco Nakayama Corp. | | | 10,700 | 212,875 |
| TS Tech Company, Ltd. | | | 3,000 | 77,584 |
| TSI Holdings Company, Ltd. | | | 28,105 | 109,157 |
| Tsubaki Nakashima Company, Ltd. | | | 19,700 | 185,447 |
| Tsubakimoto Chain Company | | | 10,400 | 280,820 |
| Tsubakimoto Kogyo Company, Ltd. | | | 1,400 | 46,758 |
| Tsudakoma Corp. (A) | | | 700 | 5,617 |
| Tsugami Corp. | | | 18,200 | 146,381 |
| Tsukada Global Holdings, Inc. | | | 4,800 | 20,400 |
| Tsukishima Kikai Company, Ltd. | | | 11,500 | 131,959 |
| Tsukuba Bank, Ltd. | | | 31,600 | 49,871 |
| Tsukui Corp. | | | 22,500 | 102,690 |
| Tsumura & Company | | | 2,900 | 66,724 |
| Tsurumi Manufacturing Company, Ltd. | | | 6,300 | 99,882 |
| Tsutsumi Jewelry Company, Ltd. | | | 2,500 | 43,076 |
| Tsuzuki Denki Company, Ltd. | | | 2,100 | 23,312 |
| TV Asahi Holdings Corp. | | | 6,900 | 115,825 |
| Tv Tokyo Holdings Corp. | | | 5,600 | 110,201 |
| TYK Corp. | | | 6,400 | 15,907 |
| UACJ Corp. | | | 12,671 | 220,890 |
| Ube Industries, Ltd. | | | 2,000 | 36,395 |
| Uchida Yoko Company, Ltd. | | | 3,300 | 150,084 |
| Uchiyama Holdings Company, Ltd. | | | 3,300 | 11,934 |
| Ueki Corp. | | | 600 | 12,947 |
| Ulvac, Inc. | | | 6,700 | 194,087 |
| UMC Electronics Company, Ltd. | | | 3,000 | 8,369 |
| Umenohana Company, Ltd. (A) | | | 1,300 | 27,203 |
| Uniden Holdings Corp. (A) | | | 2,000 | 35,547 |
| UNIMAT Retirement Community Company, Ltd. | | | 2,000 | 22,018 |
| Union Tool Company | | | 3,100 | 76,260 |
| Unipres Corp. | | | 15,600 | 167,335 |
| United Arrows, Ltd. | | | 8,700 | 194,146 |
| United Super Markets Holdings, Inc. | | | 24,400 | 193,400 |
| SEE NOTES TO FINANCIAL STATEMENTS | SEMIANNUAL REPORT | JOHN HANCOCK INTERNATIONAL SMALL COMPANY FUND | 71 |
| | | | | Shares | Value |
| Japan (continued) | | | | | |
| UNITED, Inc. | | | 1,300 | $11,525 |
| Unitika, Ltd. (A) | | | 27,000 | 72,428 |
| Unizo Holdings Company, Ltd. | | | 8,800 | 488,332 |
| Urbanet Corp. Company, Ltd. | | | 3,800 | 10,803 |
| Usen-Next Holdings Company, Ltd. (B) | | | 2,900 | 39,715 |
| Ushio, Inc. | | | 43,800 | 546,332 |
| UT Group Company, Ltd. | | | 9,400 | 184,793 |
| Utoc Corp. | | | 4,300 | 19,124 |
| V Technology Company, Ltd. | | | 3,700 | 130,763 |
| Valor Holdings Company, Ltd. | | | 15,300 | 231,387 |
| Valqua, Ltd. | | | 7,100 | 133,493 |
| Value HR Company, Ltd. | | | 800 | 20,844 |
| ValueCommerce Company, Ltd. | | | 6,900 | 132,295 |
| V-Cube, Inc. (B) | | | 2,400 | 15,337 |
| Vector, Inc. (A) | | | 11,800 | 98,713 |
| Vertex Corp. | | | 1,440 | 22,448 |
| VIA Holdings, Inc. (A) | | | 4,700 | 23,940 |
| Village Vanguard Company, Ltd. | | | 1,400 | 11,056 |
| VINX Corp. | | | 1,300 | 9,614 |
| Vision, Inc. (A) | | | 9,500 | 94,723 |
| Visionary Holdings Company, Ltd. (A) | | | 3,260 | 13,126 |
| Vital KSK Holdings, Inc. | | | 16,600 | 153,705 |
| VT Holdings Company, Ltd. | | | 34,000 | 113,404 |
| Wacoal Holdings Corp. | | | 14,800 | 344,610 |
| Wacom Company, Ltd. | | | 58,400 | 181,101 |
| Waida Manufacturing Company, Ltd. | | | 1,100 | 11,614 |
| Wakachiku Construction Company, Ltd. | | | 5,000 | 64,203 |
| Wakamoto Pharmaceutical Company, Ltd. (A) | | | 4,500 | 8,993 |
| Wakita & Company, Ltd. | | | 19,100 | 153,034 |
| Warabeya Nichiyo Holdings Company, Ltd. | | | 7,000 | 105,618 |
| Waseda Academy Company, Ltd. | | | 1,200 | 9,314 |
| Watahan & Company, Ltd. | | | 2,800 | 41,870 |
| WATAMI Company, Ltd. (B) | | | 9,700 | 86,566 |
| Watts Company, Ltd. | | | 5,600 | 26,769 |
| WDB Holdings Company, Ltd. | | | 3,600 | 73,725 |
| Weathernews, Inc. | | | 2,700 | 85,977 |
| West Holdings Corp. | | | 6,630 | 73,220 |
| Will Group, Inc. | | | 5,700 | 42,342 |
| WIN-Partners Company, Ltd. | | | 4,900 | 43,066 |
| Wood One Company, Ltd. | | | 3,600 | 30,757 |
| World Holdings Company, Ltd. | | | 3,900 | 60,069 |
| Wowow, Inc. | | | 3,100 | 69,335 |
| Xebio Holdings Company, Ltd. | | | 11,200 | 101,904 |
| YAC Holdings Company, Ltd. | | | 2,200 | 9,868 |
| 72 | JOHN HANCOCK INTERNATIONAL SMALL COMPANY FUND | SEMIANNUAL REPORT | SEE NOTES TO FINANCIAL STATEMENTS |
| | | | | Shares | Value |
| Japan (continued) | | | | | |
| Yachiyo Industry Company, Ltd. | | | 2,500 | $13,711 |
| Yagi & Company, Ltd. | | | 800 | 11,804 |
| Yahagi Construction Company, Ltd. | | | 9,700 | 71,166 |
| Yaizu Suisankagaku Industry Company, Ltd. | | | 2,900 | 25,971 |
| YAKUODO Holdings Company, Ltd. | | | 4,800 | 98,455 |
| YAMABIKO Corp. | | | 15,600 | 124,979 |
| YAMADA Consulting Group Company, Ltd. | | | 3,700 | 45,105 |
| Yamaguchi Financial Group, Inc. | | | 36,600 | 190,837 |
| Yamaha Motor Robotics Holdings Company, Ltd. (A) | | | 11,100 | 77,078 |
| Yamaichi Electronics Company, Ltd. | | | 9,600 | 141,383 |
| YA-MAN, Ltd. (B) | | | 13,000 | 62,883 |
| Yamashina Corp. | | | 24,800 | 14,899 |
| Yamatane Corp. | | | 2,900 | 35,195 |
| Yamato Corp. | | | 5,900 | 33,186 |
| Yamato International, Inc. | | | 5,700 | 19,134 |
| Yamato Kogyo Company, Ltd. | | | 16,600 | 347,523 |
| Yamaura Corp. | | | 1,600 | 12,796 |
| Yamaya Corp. | | | 1,000 | 19,190 |
| Yamazawa Company, Ltd. | | | 1,800 | 24,268 |
| Yamazen Corp. | | | 21,500 | 172,282 |
| Yaoko Company, Ltd. | | | 4,400 | 238,024 |
| Yashima Denki Company, Ltd. | | | 3,600 | 25,629 |
| Yasuda Logistics Corp. | | | 7,200 | 59,907 |
| Yasunaga Corp. | | | 2,700 | 22,643 |
| Yellow Hat, Ltd. | | | 12,000 | 159,997 |
| Yodogawa Steel Works, Ltd. | | | 8,765 | 146,416 |
| Yokogawa Bridge Holdings Corp. | | | 13,100 | 237,121 |
| Yokohama Reito Company, Ltd. | | | 19,600 | 154,640 |
| Yokowo Company, Ltd. | | | 6,100 | 136,388 |
| Yomeishu Seizo Company, Ltd. | | | 2,800 | 49,163 |
| Yomiuri Land Company, Ltd. | | | 1,100 | 35,904 |
| Yondenko Corp. | | | 1,600 | 35,084 |
| Yondoshi Holdings, Inc. | | | 6,459 | 122,324 |
| Yorozu Corp. | | | 7,800 | 92,769 |
| Yoshinoya Holdings Company, Ltd. (B) | | | 18,300 | 364,832 |
| Yossix Company, Ltd. | | | 1,700 | 34,212 |
| Yotai Refractories Company, Ltd. | | | 6,700 | 39,397 |
| Yuasa Funashoku Company, Ltd. | | | 1,100 | 35,005 |
| Yuasa Trading Company, Ltd. | | | 7,000 | 196,785 |
| Yuken Kogyo Company, Ltd. | | | 1,200 | 16,966 |
| Yumeshin Holdings Company, Ltd. (B) | | | 15,300 | 100,780 |
| Yurtec Corp. | | | 16,300 | 85,478 |
| Yushin Precision Equipment Company, Ltd. | | | 1,200 | 8,919 |
| Yushiro Chemical Industry Company, Ltd. | | | 3,700 | 41,402 |
| SEE NOTES TO FINANCIAL STATEMENTS | SEMIANNUAL REPORT | JOHN HANCOCK INTERNATIONAL SMALL COMPANY FUND | 73 |
| | | | | Shares | Value |
| Japan (continued) | | | | | |
| Yutaka Giken Company, Ltd. | | | 1,600 | $25,837 |
| Zaoh Company, Ltd. | | | 1,800 | 22,546 |
| Zappallas, Inc. (A) | | | 800 | 2,295 |
| Zenrin Company, Ltd. | | | 12,800 | 148,881 |
| Zensho Holdings Company, Ltd. (B) | | | 1,809 | 33,091 |
| ZIGExN Company, Ltd. | | | 26,300 | 93,041 |
| Zojirushi Corp. | | | 700 | 10,730 |
| Zuiko Corp. | | | 1,100 | 40,996 |
| Zuken, Inc. | | | 600 | 11,910 |
| Jersey, Channel Islands 0.1% | | | | | 1,107,571 |
| Atrium European Real Estate, Ltd. (A) | | | 51,589 | 186,394 |
| Centamin PLC | | | 552,846 | 921,177 |
| Liechtenstein 0.1% | | | | | 626,898 |
| Liechtensteinische Landesbank AG | | | 4,908 | 309,246 |
| VP Bank AG | | | 1,947 | 317,652 |
| Luxembourg 0.5% | | | | | 3,799,023 |
| APERAM SA | | | 17,849 | 532,512 |
| Aroundtown SA | | | 128,774 | 1,118,778 |
| Corestate Capital Holding SA (A) | | | 6,240 | 281,611 |
| d'Amico International Shipping SA (A) | | | 70,483 | 7,277 |
| Grand City Properties SA | | | 47,662 | 1,124,462 |
| IVS Group SA (B) | | | 5,204 | 47,417 |
| L'Occitane International SA | | | 64,250 | 112,817 |
| Stabilus SA | | | 8,899 | 487,264 |
| Sword Group | | | 2,509 | 86,885 |
| Macau 0.0% | | | | | 110,119 |
| Macau Legend Development, Ltd. (A) | | | 887,000 | 110,119 |
| Malaysia 0.0% | | | | | 328,745 |
| Lynas Corp., Ltd. (A) | | | 270,789 | 328,745 |
| Malta 0.1% | | | | | 406,824 |
| Kindred Group PLC (B) | | | 82,942 | 406,824 |
| Monaco 0.1% | | | | | 607,341 |
| Endeavour Mining Corp. (A) | | | 29,665 | 523,793 |
| Societe des Bains de Mer et du Cercle des Etrangers a Monaco (A) | | | 1,252 | 83,548 |
| Netherlands 3.1% | | | | | 23,099,961 |
| Aalberts NV | | | 39,851 | 1,486,271 |
| Accell Group NV | | | 7,181 | 196,613 |
| Altice Europe NV (A) | | | 250,941 | 1,332,715 |
| Altice Europe NV, Class B (A) | | | 13,082 | 67,908 |
| AMG Advanced Metallurgical Group NV (B) | | | 9,104 | 212,734 |
| 74 | JOHN HANCOCK INTERNATIONAL SMALL COMPANY FUND | SEMIANNUAL REPORT | SEE NOTES TO FINANCIAL STATEMENTS |
| | | | | Shares | Value |
| Netherlands (continued) | | | | | |
| Amsterdam Commodities NV | | | 7,587 | $164,527 |
| Arcadis NV | | | 35,886 | 814,915 |
| ASM International NV | | | 18,530 | 2,129,423 |
| ASR Nederland NV | | | 34,028 | 1,145,115 |
| Basic-Fit NV (A)(D) | | | 12,628 | 419,645 |
| BE Semiconductor Industries NV | | | 31,047 | 1,207,524 |
| Beter Bed Holding NV (A) | | | 4,223 | 9,041 |
| Boskalis Westminster | | | 28,871 | 632,806 |
| Brack Capital Properties NV (A) | | | 790 | 76,577 |
| Brunel International NV (B) | | | 9,698 | 80,677 |
| Corbion NV | | | 20,335 | 739,349 |
| Euronext NV (D) | | | 20,778 | 1,732,272 |
| Flow Traders (D) | | | 12,423 | 298,224 |
| ForFarmers NV | | | 16,665 | 102,131 |
| Fugro NV (A) | | | 27,979 | 224,017 |
| Funcom NV (A) | | | 18,595 | 33,608 |
| GrandVision NV (D) | | | 12,174 | 371,581 |
| Heijmans NV (A)(B) | | | 10,798 | 87,477 |
| Hunter Douglas NV | | | 2,162 | 129,731 |
| IMCD NV | | | 19,362 | 1,584,478 |
| Intertrust NV (D) | | | 27,343 | 458,669 |
| Just Eat Takeaway (A)(D) | | | 13,433 | 1,177,562 |
| Kendrion NV | | | 5,035 | 101,039 |
| Koninklijke BAM Groep NV (B) | | | 100,804 | 273,007 |
| Koninklijke Vopak NV | | | 17,942 | 854,121 |
| Lucas Bols NV (D) | | | 2,262 | 30,258 |
| Nederland Apparatenfabriek | | | 1,772 | 92,614 |
| OCI NV (A) | | | 27,089 | 453,498 |
| Ordina NV | | | 48,833 | 125,420 |
| PostNL NV | | | 189,046 | 286,716 |
| PPHE Hotel Group, Ltd. | | | 252 | 5,677 |
| SBM Offshore NV | | | 73,325 | 1,160,686 |
| Shop Apotheke Europe NV (A)(D) | | | 3,166 | 155,902 |
| SIF Holding NV | | | 1,808 | 26,221 |
| Signify NV (D) | | | 46,186 | 1,376,177 |
| Sligro Food Group NV (B) | | | 9,045 | 220,953 |
| TKH Group NV | | | 14,187 | 640,511 |
| TomTom NV (A) | | | 27,336 | 278,310 |
| Van Lanschot Kempen NV | | | 5,033 | 103,261 |
| New Zealand 0.6% | | | | | 4,164,307 |
| Abano Healthcare Group, Ltd. | | | 1,845 | 5,966 |
| Air New Zealand, Ltd. | | | 56,556 | 80,518 |
| Arvida Group, Ltd. | | | 53,490 | 56,628 |
| SEE NOTES TO FINANCIAL STATEMENTS | SEMIANNUAL REPORT | JOHN HANCOCK INTERNATIONAL SMALL COMPANY FUND | 75 |
| | | | | Shares | Value |
| New Zealand (continued) | | | | | |
| Briscoe Group, Ltd. | | | 5,405 | $12,670 |
| Chorus, Ltd. | | | 112,628 | 471,073 |
| Comvita, Ltd. (A) | | | 2,243 | 3,156 |
| Eroad, Ltd. (A) | | | 5,969 | 9,614 |
| Freightways, Ltd. | | | 39,290 | 178,494 |
| Genesis Energy, Ltd. | | | 41,589 | 79,680 |
| Gentrack Group, Ltd. | | | 9,421 | 12,408 |
| Hallenstein Glasson Holdings, Ltd. | | | 18,758 | 56,363 |
| Heartland Group Holdings, Ltd. | | | 138,248 | 146,504 |
| Infratil, Ltd. | | | 191,480 | 617,079 |
| Investore Property, Ltd. | | | 67,547 | 74,410 |
| Kathmandu Holdings, Ltd. | | | 44,089 | 84,440 |
| Mainfreight, Ltd. | | | 6,706 | 157,728 |
| Metlifecare, Ltd. | | | 48,016 | 206,665 |
| Metro Performance Glass, Ltd. (A) | | | 22,396 | 3,939 |
| NEW Zealand King Salmon Investments, Ltd. | | | 10,031 | 11,920 |
| NZME, Ltd. (A) | | | 72,696 | 17,459 |
| NZX, Ltd. | | | 65,501 | 54,556 |
| Oceania Healthcare, Ltd. | | | 93,082 | 65,861 |
| Pacific Edge, Ltd. (A) | | | 105,378 | 8,203 |
| PGG Wrightson, Ltd. | | | 1,878 | 2,740 |
| Pushpay Holdings, Ltd. (A) | | | 35,736 | 90,476 |
| Restaurant Brands New Zealand, Ltd. (A) | | | 11,599 | 87,127 |
| Sanford, Ltd. | | | 15,655 | 69,721 |
| Scales Corp., Ltd. | | | 29,692 | 80,664 |
| Serko, Ltd. (A) | | | 6,476 | 16,324 |
| Skellerup Holdings, Ltd. | | | 44,514 | 55,530 |
| SKY Network Television, Ltd. | | | 109,970 | 37,239 |
| SKYCITY Entertainment Group, Ltd. | | | 192,820 | 387,609 |
| Steel & Tube Holdings, Ltd. | | | 21,933 | 10,718 |
| Summerset Group Holdings, Ltd. | | | 59,760 | 293,408 |
| Synlait Milk, Ltd. (A) | | | 17,940 | 67,516 |
| The New Zealand Refining Company, Ltd. | | | 43,399 | 33,168 |
| The Warehouse Group, Ltd. | | | 25,288 | 34,161 |
| Tourism Holdings, Ltd. | | | 30,975 | 48,413 |
| TOWER, Ltd. (A) | | | 76,655 | 33,573 |
| Trustpower, Ltd. | | | 10,579 | 42,087 |
| Turners Automotive Group, Ltd. | | | 6,890 | 10,488 |
| Vista Group International, Ltd. | | | 41,964 | 83,079 |
| Z Energy, Ltd. | | | 104,279 | 264,932 |
| Norway 0.9% | | | | | 6,733,581 |
| ABG Sundal Collier Holding ASA | | | 136,334 | 52,091 |
| AF Gruppen ASA | | | 6,710 | 121,665 |
| 76 | JOHN HANCOCK INTERNATIONAL SMALL COMPANY FUND | SEMIANNUAL REPORT | SEE NOTES TO FINANCIAL STATEMENTS |
| | | | | Shares | Value |
| Norway (continued) | | | | | |
| Aker Solutions ASA (A) | | | 60,118 | $84,897 |
| Aker Solutions ASA (A) | | | 61,659 | 55,055 |
| American Shipping Company ASA (A) | | | 18,608 | 58,672 |
| Archer, Ltd. (A) | | | 30,245 | 9,396 |
| Atea ASA (A) | | | 30,881 | 346,122 |
| Austevoll Seafood ASA | | | 22,966 | 203,812 |
| Avance Gas Holding, Ltd. (A)(D) | | | 16,253 | 69,570 |
| Axactor SE (A) | | | 52,150 | 73,969 |
| B2Holding ASA (B) | | | 89,745 | 60,951 |
| Bonheur ASA | | | 8,472 | 168,766 |
| Borregaard ASA | | | 38,562 | 409,518 |
| BW Energy, Ltd. (A) | | | 6,326 | 11,449 |
| BW Offshore, Ltd. (A) | | | 31,002 | 123,145 |
| DNO ASA | | | 56,039 | 40,308 |
| Europris ASA (D) | | | 79,891 | 266,843 |
| FLEX LNG, Ltd. (B) | | | 15,744 | 105,218 |
| Frontline, Ltd. | | | 33,077 | 259,905 |
| Grieg Seafood ASA | | | 17,675 | 225,746 |
| Hexagon Composites ASA (A)(B) | | | 32,197 | 98,118 |
| Hoegh LNG Holdings, Ltd. | | | 23,852 | 53,515 |
| IDEX Biometrics ASA (A) | | | 60,820 | 4,658 |
| Itera ASA | | | 21,736 | 24,378 |
| Kongsberg Gruppen ASA | | | 4,313 | 73,308 |
| Kvaerner ASA | | | 47,283 | 43,835 |
| NEL ASA (A) | | | 326,953 | 353,339 |
| Nordic Nanovector ASA (A)(B) | | | 21,058 | 39,060 |
| Nordic Semiconductor ASA (A) | | | 56,404 | 301,076 |
| Norway Royal Salmon ASA | | | 3,734 | 86,240 |
| Norwegian Air Shuttle ASA (A)(B) | | | 29,583 | 62,693 |
| Norwegian Finans Holding ASA (A) | | | 43,782 | 414,157 |
| Norwegian Property ASA | | | 13,155 | 20,401 |
| Ocean Yield ASA | | | 24,143 | 99,607 |
| Odfjell Drilling, Ltd. (A)(B) | | | 35,662 | 95,389 |
| Odfjell SE, A Shares (A) | | | 7,780 | 22,262 |
| Olav Thon Eiendomsselskap ASA | | | 4,520 | 80,908 |
| Otello Corp. ASA (A) | | | 46,949 | 84,205 |
| Panoro Energy ASA (A) | | | 7,899 | 13,103 |
| PGS ASA (A) | | | 123,829 | 180,148 |
| PhotoCure ASA (A) | | | 3,308 | 28,219 |
| Protector Forsikring ASA (A)(B) | | | 28,159 | 105,022 |
| Q-Free ASA (A) | | | 14,930 | 10,694 |
| Sbanken ASA (D) | | | 31,896 | 219,312 |
| Scatec Solar ASA (D) | | | 32,290 | 563,871 |
| Selvaag Bolig ASA | | | 20,891 | 134,777 |
| SEE NOTES TO FINANCIAL STATEMENTS | SEMIANNUAL REPORT | JOHN HANCOCK INTERNATIONAL SMALL COMPANY FUND | 77 |
| | | | | Shares | Value |
| Norway (continued) | | | | | |
| Solon Eiendom ASA | | | 6,054 | $23,728 |
| Treasure ASA | | | 15,273 | 18,910 |
| Veidekke ASA | | | 46,827 | 571,649 |
| Wallenius Wilhelmsen ASA | | | 36,026 | 67,835 |
| Wilh Wilhelmsen Holding ASA, Class A | | | 3,793 | 61,929 |
| XXL ASA (A)(B)(D) | | | 25,884 | 30,137 |
| Peru 0.0% | | | | | 266,573 |
| Hochschild Mining PLC | | | 129,080 | 266,573 |
| Philippines 0.0% | | | | | 11,759 |
| Del Monte Pacific, Ltd. | | | 136,300 | 11,759 |
| Portugal 0.4% | | | | | 2,819,730 |
| Altri SGPS SA | | | 33,463 | 181,850 |
| Banco Comercial Portugues SA | | | 3,603,145 | 652,975 |
| CTT-Correios de Portugal SA | | | 70,715 | 182,422 |
| Mota-Engil SGPS SA | | | 47,309 | 69,357 |
| NOS SGPS SA | | | 109,940 | 434,233 |
| Novabase SGPS SA | | | 2,054 | 6,964 |
| REN - Redes Energeticas Nacionais SGPS SA | | | 183,066 | 508,094 |
| Semapa-Sociedade de Investimento e Gestao | | | 12,183 | 153,147 |
| Sonae Capital SGPS SA | | | 38,685 | 29,067 |
| Sonae SGPS SA | | | 382,234 | 300,307 |
| The Navigator Company SA | | | 97,510 | 301,314 |
| Russia 0.1% | | | | | 754,098 |
| Highland Gold Mining, Ltd. | | | 163,037 | 443,368 |
| Petropavlovsk PLC (A) | | | 1,298,348 | 310,730 |
| Singapore 1.2% | | | | | 9,184,572 |
| Accordia Golf Trust | | | 278,200 | 123,884 |
| AEM Holdings, Ltd. | | | 101,600 | 160,617 |
| Amara Holdings, Ltd. | | | 80,000 | 23,365 |
| Ascendas India Trust | | | 340,900 | 405,591 |
| Avarga, Ltd. | | | 74,200 | 8,091 |
| Banyan Tree Holdings, Ltd. | | | 78,000 | 19,675 |
| Best World International, Ltd. (C) | | | 84,600 | 82,602 |
| Bonvests Holdings, Ltd. | | | 36,400 | 30,130 |
| Boustead Projects, Ltd. | | | 28,557 | 18,532 |
| Boustead Singapore, Ltd. | | | 92,989 | 48,366 |
| BreadTalk Group, Ltd. | | | 52,000 | 28,446 |
| Bukit Sembawang Estates, Ltd. | | | 56,200 | 181,091 |
| BW LPG, Ltd. (D) | | | 38,538 | 240,570 |
| Centurion Corp., Ltd. | | | 85,000 | 27,157 |
| China Aviation Oil Singapore Corp., Ltd. | | | 112,100 | 92,689 |
| 78 | JOHN HANCOCK INTERNATIONAL SMALL COMPANY FUND | SEMIANNUAL REPORT | SEE NOTES TO FINANCIAL STATEMENTS |
| | | | | Shares | Value |
| Singapore (continued) | | | | | |
| China Sunsine Chemical Holdings, Ltd. | | | 89,600 | $27,909 |
| Chip Eng Seng Corp., Ltd. | | | 127,300 | 54,335 |
| Chuan Hup Holdings, Ltd. | | | 109,000 | 17,365 |
| ComfortDelGro Corp., Ltd. | | | 381,600 | 541,044 |
| COSCO Shipping International Singapore Company, Ltd. (A) | | | 390,100 | 75,269 |
| Creative Technology, Ltd. (A) | | | 11,500 | 21,910 |
| CSE Global, Ltd. | | | 136,600 | 51,374 |
| CW Group Holdings, Ltd. (A)(C) | | | 135,000 | 3,201 |
| Dasin Retail Trust | | | 31,000 | 18,109 |
| Delfi, Ltd. | | | 46,000 | 31,452 |
| Elec & Eltek International Company, Ltd. | | | 5,000 | 7,646 |
| Ezion Holdings, Ltd. (A)(C) | | | 1,126,020 | 34,761 |
| Ezra Holdings, Ltd. (A)(C) | | | 438,996 | 867 |
| Far East Orchard, Ltd. | | | 58,394 | 47,582 |
| First Resources, Ltd. | | | 158,600 | 181,731 |
| Food Empire Holdings, Ltd. | | | 72,000 | 34,513 |
| Fragrance Group, Ltd. (A) | | | 200,000 | 19,577 |
| Fraser and Neave, Ltd. | | | 63,800 | 74,239 |
| Frencken Group, Ltd. | | | 107,100 | 64,779 |
| Fu Yu Corp., Ltd. | | | 142,200 | 25,149 |
| Gallant Venture, Ltd. (A) | | | 264,000 | 22,984 |
| Geo Energy Resources, Ltd. | | | 105,900 | 10,370 |
| GK Goh Holdings, Ltd. | | | 21,000 | 12,539 |
| GL, Ltd. | | | 159,200 | 87,751 |
| Golden Agri-Resources, Ltd. | | | 1,784,400 | 257,393 |
| Golden Energy & Resources, Ltd. | | | 67,800 | 7,502 |
| GSH Corp., Ltd. (A) | | | 51,600 | 11,919 |
| GuocoLand, Ltd. | | | 87,600 | 105,850 |
| Halcyon Agri Corp., Ltd. (A) | | | 88,757 | 27,414 |
| Haw Par Corp., Ltd. | | | 39,200 | 335,985 |
| Hiap Hoe, Ltd. | | | 38,000 | 20,744 |
| Hi-P International, Ltd. | | | 39,800 | 31,124 |
| Ho Bee Land, Ltd. | | | 58,600 | 94,784 |
| Hong Fok Corp., Ltd. | | | 123,036 | 62,134 |
| Hong Leong Asia, Ltd. (A) | | | 92,000 | 36,382 |
| Hong Leong Finance, Ltd. | | | 45,000 | 83,163 |
| Hotel Grand Central, Ltd. | | | 47,475 | 39,952 |
| Hwa Hong Corp., Ltd. | | | 55,000 | 13,355 |
| Hyflux, Ltd. (A)(B) | | | 154,800 | 15 |
| iFAST Corp., Ltd. | | | 38,400 | 27,598 |
| IGG, Inc. | | | 343,000 | 253,100 |
| Indofood Agri Resources, Ltd. | | | 58,100 | 12,950 |
| Japfa, Ltd. | | | 168,520 | 68,550 |
| k1 Ventures, Ltd. (A)(C) | | | 36,000 | 0 |
| SEE NOTES TO FINANCIAL STATEMENTS | SEMIANNUAL REPORT | JOHN HANCOCK INTERNATIONAL SMALL COMPANY FUND | 79 |
| | | | | Shares | Value |
| Singapore (continued) | | | | | |
| Kenon Holdings, Ltd. | | | 6,234 | $103,117 |
| Keppel Infrastructure Trust | | | 934,455 | 350,895 |
| KSH Holdings, Ltd. | | | 32,400 | 8,814 |
| Lian Beng Group, Ltd. | | | 111,000 | 39,583 |
| Low Keng Huat Singapore, Ltd. | | | 64,000 | 18,436 |
| Lum Chang Holdings, Ltd. | | | 41,200 | 10,515 |
| Metro Holdings, Ltd. | | | 127,600 | 78,288 |
| Midas Holdings, Ltd. (A)(B)(C) | | | 249,000 | 29,174 |
| mm2 Asia, Ltd. (A) | | | 181,400 | 29,177 |
| Nera Telecommunications, Ltd. | | | 47,200 | 8,862 |
| NetLink NBN Trust | | | 604,200 | 425,994 |
| NSL, Ltd. | | | 29,000 | 17,693 |
| OM Holdings, Ltd. | | | 69,157 | 18,207 |
| OUE, Ltd. | | | 103,900 | 103,100 |
| Oxley Holdings, Ltd. | | | 297,811 | 66,855 |
| Pacific Century Regional Developments, Ltd. | | | 52,900 | 11,944 |
| Pan-United Corp., Ltd. | | | 68,750 | 18,686 |
| Penguin International, Ltd. | | | 41,333 | 19,572 |
| Perennial Real Estate Holdings, Ltd. | | | 40,800 | 14,416 |
| Q&M Dental Group Singapore, Ltd. | | | 48,100 | 15,518 |
| QAF, Ltd. | | | 59,334 | 35,616 |
| Raffles Education Corp., Ltd. (A) | | | 279,802 | 16,824 |
| Raffles Medical Group, Ltd. | | | 271,854 | 194,655 |
| Riverstone Holdings, Ltd. | | | 93,700 | 69,108 |
| Roxy-Pacific Holdings, Ltd. | | | 95,550 | 25,274 |
| SBS Transit, Ltd. | | | 27,700 | 65,873 |
| Sembcorp Industries, Ltd. | | | 174,400 | 232,333 |
| Sembcorp Marine, Ltd. (A) | | | 244,900 | 193,922 |
| Sheng Siong Group, Ltd. | | | 156,700 | 139,979 |
| SHS Holdings, Ltd. (A) | | | 84,000 | 10,197 |
| SIA Engineering Company, Ltd. | | | 109,800 | 193,369 |
| SIIC Environment Holdings, Ltd. | | | 298,280 | 53,000 |
| Sinarmas Land, Ltd. | | | 300,000 | 45,812 |
| Sing Holdings, Ltd. | | | 79,000 | 22,506 |
| Sing Investments & Finance, Ltd. | | | 28,600 | 28,371 |
| Singapore Post, Ltd. | | | 475,800 | 269,325 |
| Singapore Press Holdings, Ltd. | | | 427,200 | 587,850 |
| Singapore Reinsurance Corp., Ltd. | | | 47,000 | 9,579 |
| Singapore Shipping Corp., Ltd. | | | 83,800 | 17,161 |
| Stamford Land Corp., Ltd. | | | 142,600 | 48,319 |
| StarHub, Ltd. | | | 242,200 | 260,330 |
| Straits Trading Company, Ltd. | | | 14,200 | 20,761 |
| Sunningdale Tech, Ltd. | | | 50,360 | 43,990 |
| Swiber Holdings, Ltd. (A)(C) | | | 128,250 | 6,022 |
| 80 | JOHN HANCOCK INTERNATIONAL SMALL COMPANY FUND | SEMIANNUAL REPORT | SEE NOTES TO FINANCIAL STATEMENTS |
| | | | | Shares | Value |
| Singapore (continued) | | | | | |
| The Hour Glass, Ltd. | | | 68,900 | $35,976 |
| Tuan Sing Holdings, Ltd. | | | 160,475 | 33,600 |
| UMS Holdings, Ltd. | | | 115,450 | 75,904 |
| United Industrial Corp., Ltd. | | | 22,000 | 42,876 |
| United Overseas Insurance, Ltd. | | | 2,400 | 12,026 |
| UOB-Kay Hian Holdings, Ltd. | | | 123,529 | 108,602 |
| Vicom, Ltd. | | | 6,500 | 36,952 |
| Wee Hur Holdings, Ltd. | | | 102,000 | 15,555 |
| Wing Tai Holdings, Ltd. | | | 140,617 | 197,156 |
| XP Power, Ltd. | | | 4,540 | 178,827 |
| Yeo Hiap Seng, Ltd. | | | 8,834 | 5,498 |
| Yongnam Holdings, Ltd. (A) | | | 147,375 | 15,402 |
| South Africa 0.1% | | | | | 401,502 |
| Caledonia Mining Corp. PLC | | | 100 | 1,036 |
| Mediclinic International PLC | | | 87,417 | 385,913 |
| Petra Diamonds, Ltd. (A) | | | 277,924 | 14,553 |
| Spain 2.5% | | | | | 18,512,303 |
| Acciona SA | | | 9,302 | 1,178,859 |
| Acerinox SA (A) | | | 65,357 | 608,833 |
| Alantra Partners SA | | | 6,267 | 105,147 |
| Almirall SA | | | 25,038 | 328,085 |
| Amper SA (A) | | | 307,165 | 83,279 |
| Applus Services SA | | | 49,354 | 563,564 |
| Atresmedia Corp. de Medios de Comunicacion SA | | | 33,653 | 122,825 |
| Azkoyen SA | | | 4,660 | 30,750 |
| Banco de Sabadell SA | | | 22,759 | 19,975 |
| Bankia SA | | | 486,858 | 772,024 |
| Bankinter SA | | | 157,339 | 929,694 |
| Bolsas y Mercados Espanoles SHMSF SA | | | 30,962 | 1,180,875 |
| Caja de Ahorros del Mediterraneo (A)(C) | | | 1,684 | 0 |
| Cia de Distribucion Integral Logista Holdings SA | | | 17,212 | 351,374 |
| CIE Automotive SA | | | 27,424 | 559,319 |
| Construcciones y Auxiliar de Ferrocarriles SA | | | 8,460 | 364,828 |
| Distribuidora Internacional de Alimentacion SA (A)(B) | | | 217,976 | 19,016 |
| Ebro Foods SA (B) | | | 27,230 | 516,684 |
| eDreams ODIGEO SA (A) | | | 22,487 | 94,100 |
| Elecnor SA | | | 9,042 | 94,106 |
| Enagas SA | | | 53,906 | 1,398,731 |
| Ence Energia y Celulosa SA (B) | | | 57,514 | 206,271 |
| Ercros SA (B) | | | 34,424 | 87,924 |
| Euskaltel SA (D) | | | 33,676 | 298,648 |
| Faes Farma SA | | | 120,865 | 584,188 |
| Fluidra SA (A) | | | 18,385 | 253,816 |
| SEE NOTES TO FINANCIAL STATEMENTS | SEMIANNUAL REPORT | JOHN HANCOCK INTERNATIONAL SMALL COMPANY FUND | 81 |
| | | | | Shares | Value |
| Spain (continued) | | | | | |
| Fomento de Construcciones y Contratas SA | | | 17,116 | $202,651 |
| Global Dominion Access SA (A)(D) | | | 43,047 | 166,771 |
| Grupo Catalana Occidente SA | | | 14,843 | 467,234 |
| Grupo Empresarial San Jose SA (A)(B) | | | 8,498 | 53,929 |
| Grupo Ezentis SA (A)(B) | | | 65,836 | 24,366 |
| Iberpapel Gestion SA | | | 2,945 | 74,354 |
| Indra Sistemas SA (A)(B) | | | 59,571 | 651,514 |
| Laboratorios Farmaceuticos Rovi SA | | | 4,986 | 134,453 |
| Liberbank SA | | | 808,287 | 252,539 |
| Masmovil Ibercom SA (A) | | | 31,730 | 630,256 |
| Mediaset Espana Comunicacion SA | | | 48,282 | 243,997 |
| Melia Hotels International SA | | | 50,493 | 350,547 |
| Miquel y Costas & Miquel SA | | | 6,049 | 90,028 |
| Neinor Homes SA (A)(D) | | | 2,905 | 33,364 |
| Obrascon Huarte Lain SA (A) | | | 48,890 | 54,780 |
| Pharma Mar SA (A) | | | 62,310 | 272,700 |
| Prim SA | | | 3,271 | 40,747 |
| Promotora de Informaciones SA, Class A (A) | | | 66,046 | 99,941 |
| Prosegur Cia de Seguridad SA | | | 99,140 | 367,854 |
| Quabit Inmobiliaria SA (A) | | | 29,207 | 26,637 |
| Realia Business SA (A) | | | 115,998 | 110,585 |
| Renta 4 Banco SA | | | 1,156 | 8,214 |
| Sacyr SA (B) | | | 173,860 | 463,945 |
| Solaria Energia y Medio Ambiente SA (A)(B) | | | 28,522 | 273,988 |
| Talgo SA (A)(D) | | | 43,775 | 255,663 |
| Tecnicas Reunidas SA (A) | | | 8,641 | 195,381 |
| Tubacex SA | | | 47,684 | 114,755 |
| Unicaja Banco SA (D) | | | 86,199 | 79,806 |
| Vidrala SA | | | 7,305 | 711,140 |
| Viscofan SA | | | 15,094 | 807,662 |
| Vocento SA | | | 21,446 | 26,931 |
| Zardoya Otis SA | | | 62,790 | 472,656 |
| Sweden 3.2% | | | | | 23,301,803 |
| AcadeMedia AB (D) | | | 32,406 | 181,633 |
| AddLife AB, B Shares | | | 3,786 | 125,854 |
| AddNode Group AB | | | 8,634 | 158,215 |
| AddTech AB, B Shares | | | 21,540 | 627,223 |
| AF POYRY AB | | | 22,120 | 499,611 |
| Alimak Group AB (D) | | | 16,391 | 191,039 |
| Arjo AB, B Shares | | | 92,960 | 470,321 |
| Atrium Ljungberg AB, B Shares | | | 16,324 | 331,917 |
| Attendo AB (D) | | | 26,723 | 135,835 |
| Avanza Bank Holding AB | | | 14,827 | 147,632 |
| 82 | JOHN HANCOCK INTERNATIONAL SMALL COMPANY FUND | SEMIANNUAL REPORT | SEE NOTES TO FINANCIAL STATEMENTS |
| | | | | Shares | Value |
| Sweden (continued) | | | | | |
| BE Group AB | | | 1,076 | $3,903 |
| Beijer Alma AB | | | 14,313 | 174,597 |
| Beijer Electronics Group AB | | | 9,584 | 46,457 |
| Beijer Ref AB | | | 9,445 | 257,063 |
| Bergman & Beving AB | | | 10,573 | 80,677 |
| Besqab AB | | | 1,686 | 22,774 |
| Betsson AB (A) | | | 57,085 | 292,511 |
| Bilia AB, A Shares | | | 36,380 | 351,088 |
| BillerudKorsnas AB | | | 63,006 | 765,988 |
| BioGaia AB, B Shares | | | 5,662 | 258,825 |
| Biotage AB | | | 19,960 | 238,832 |
| Bjorn Borg AB (A) | | | 6,665 | 13,729 |
| Bonava AB, B Shares | | | 32,907 | 262,692 |
| Bravida Holding AB (D) | | | 74,949 | 687,048 |
| Bufab AB | | | 13,625 | 152,037 |
| Bulten AB | | | 5,708 | 40,570 |
| Bure Equity AB | | | 22,573 | 429,077 |
| Byggmax Group AB (A) | | | 22,742 | 62,654 |
| Catena AB | | | 11,646 | 388,259 |
| Clas Ohlson AB, B Shares | | | 9,715 | 95,856 |
| Cloetta AB, B Shares | | | 97,061 | 300,072 |
| Collector AB (A)(B) | | | 4,116 | 11,583 |
| Coor Service Management Holding AB (D) | | | 13,165 | 113,049 |
| Corem Property Group AB, B Shares | | | 46,654 | 113,693 |
| Dios Fastigheter AB | | | 37,895 | 339,816 |
| Dometic Group AB (D) | | | 20,908 | 178,542 |
| Doro AB (A) | | | 6,824 | 28,312 |
| Duni AB | | | 16,017 | 212,431 |
| Dustin Group AB (D) | | | 31,182 | 205,607 |
| Eastnine AB | | | 9,541 | 142,202 |
| Elanders AB, B Shares | | | 2,728 | 22,410 |
| Eltel AB (A)(D) | | | 12,277 | 21,601 |
| Enea AB (A) | | | 6,885 | 106,138 |
| eWork Group AB | | | 1,387 | 10,475 |
| Fagerhult AB | | | 18,978 | 102,790 |
| FastPartner AB | | | 7,767 | 80,935 |
| Fingerprint Cards AB, B Shares (A)(B) | | | 82,439 | 122,103 |
| GHP Specialty Care AB | | | 12,106 | 21,298 |
| Granges AB | | | 37,020 | 298,514 |
| Gunnebo AB | | | 22,598 | 49,917 |
| Haldex AB | | | 17,850 | 84,871 |
| Heba Fastighets AB, Class B | | | 7,465 | 65,739 |
| HIQ International AB (A) | | | 15,047 | 72,251 |
| HMS Networks AB | | | 4,648 | 61,081 |
| SEE NOTES TO FINANCIAL STATEMENTS | SEMIANNUAL REPORT | JOHN HANCOCK INTERNATIONAL SMALL COMPANY FUND | 83 |
| | | | | Shares | Value |
| Sweden (continued) | | | | | |
| Hoist Finance AB (A)(D) | | | 30,122 | $144,504 |
| Humana AB | | | 17,267 | 87,193 |
| Inwido AB | | | 29,503 | 257,243 |
| ITAB Shop Concept AB, Class B (A) | | | 7,377 | 9,986 |
| JM AB | | | 29,739 | 818,237 |
| Klovern AB, B Shares | | | 219,610 | 506,722 |
| KNOW IT AB | | | 9,668 | 177,438 |
| Kungsleden AB | | | 75,213 | 777,472 |
| Lagercrantz Group AB, B Shares | | | 24,548 | 348,015 |
| Lindab International AB | | | 37,162 | 443,097 |
| Loomis AB, B Shares | | | 5,093 | 177,858 |
| Medivir AB, B Shares (A) | | | 6,375 | 9,284 |
| Mekonomen AB (A) | | | 13,422 | 106,143 |
| Modern Times Group MTG AB, B Shares (A) | | | 17,781 | 158,566 |
| Momentum Group AB, Class B | | | 10,018 | 116,315 |
| Mycronic AB | | | 30,142 | 426,035 |
| NCC AB, B Shares | | | 9,071 | 159,514 |
| Nederman Holding AB | | | 5,899 | 78,098 |
| Net Insight AB, B Shares (A) | | | 29,909 | 5,578 |
| New Wave Group AB, B Shares | | | 21,560 | 117,676 |
| Nobia AB | | | 45,222 | 292,447 |
| Nobina AB (D) | | | 32,299 | 226,413 |
| Nolato AB, B Shares | | | 6,329 | 335,656 |
| Nordic Entertainment Group AB, B Shares | | | 5,005 | 150,988 |
| Nordic Waterproofing Holding AS (D) | | | 11,956 | 126,556 |
| NP3 Fastigheter AB | | | 11,518 | 134,617 |
| Nyfosa AB (A) | | | 86,202 | 705,487 |
| OEM International AB, B Shares | | | 5,357 | 132,329 |
| Peab AB, Class B | | | 13,643 | 137,292 |
| Platzer Fastigheter Holding AB, Series B | | | 19,635 | 204,929 |
| Pricer AB, B Shares | | | 44,707 | 105,971 |
| Proact IT Group AB | | | 4,258 | 61,320 |
| Qliro Group AB (A) | | | 41,364 | 27,715 |
| Ratos AB, B Shares | | | 90,286 | 278,121 |
| RaySearch Laboratories AB (A) | | | 9,341 | 80,836 |
| Recipharm AB, B Shares | | | 22,917 | 318,531 |
| Resurs Holding AB (D) | | | 53,512 | 289,660 |
| Rottneros AB | | | 39,993 | 41,182 |
| Sagax AB, B Shares | | | 24,458 | 334,659 |
| Samhallsbyggnadsbolaget i Norden AB | | | 280,832 | 792,920 |
| SAS AB (A) | | | 97,964 | 103,312 |
| Scandi Standard AB | | | 23,577 | 155,059 |
| Scandic Hotels Group AB (D) | | | 11,171 | 105,532 |
| Sectra AB, B Shares (A) | | | 7,562 | 275,741 |
| 84 | JOHN HANCOCK INTERNATIONAL SMALL COMPANY FUND | SEMIANNUAL REPORT | SEE NOTES TO FINANCIAL STATEMENTS |
| | | | | Shares | Value |
| Sweden (continued) | | | | | |
| Semcon AB | | | 4,746 | $34,430 |
| Sensys Gatso Group AB (A) | | | 223,958 | 30,150 |
| Sintercast AB | | | 764 | 14,045 |
| SkiStar AB | | | 15,355 | 152,371 |
| Sweco AB, B Shares | | | 11,449 | 369,860 |
| Systemair AB | | | 5,179 | 75,898 |
| The Thule Group AB (D) | | | 37,356 | 818,531 |
| Troax Group AB | | | 15,646 | 198,661 |
| VBG Group AB, B Shares | | | 2,280 | 34,606 |
| Vitrolife AB | | | 5,525 | 93,848 |
| Wihlborgs Fastigheter AB | | | 45,694 | 877,809 |
| Switzerland 5.7% | | | | | 42,203,930 |
| Allreal Holding AG (A) | | | 7,369 | 1,578,342 |
| ALSO Holding AG (A) | | | 3,005 | 514,268 |
| APG SGA SA | | | 562 | 150,828 |
| Arbonia AG (A) | | | 17,476 | 194,864 |
| Aryzta AG (A) | | | 302,276 | 260,312 |
| Ascom Holding AG | | | 14,735 | 130,541 |
| Autoneum Holding AG (B) | | | 1,174 | 115,250 |
| Bachem Holding AG, Class B | | | 101 | 17,328 |
| Banque Cantonale de Geneve | | | 621 | 128,053 |
| Banque Cantonale Vaudoise | | | 782 | 631,612 |
| Belimo Holding AG | | | 194 | 1,268,718 |
| Bell Food Group AG (A) | | | 1,091 | 281,147 |
| Bellevue Group AG | | | 4,031 | 106,572 |
| Berner Kantonalbank AG | | | 1,920 | 449,444 |
| BKW AG | | | 9,218 | 790,842 |
| Bobst Group SA (B) | | | 4,648 | 223,198 |
| Bossard Holding AG, Class A | | | 2,312 | 316,052 |
| Bucher Industries AG | | | 2,667 | 835,705 |
| Burckhardt Compression Holding AG | | | 529 | 125,808 |
| Burkhalter Holding AG | | | 1,735 | 130,972 |
| Calida Holding AG (A) | | | 2,395 | 78,704 |
| Carlo Gavazzi Holding AG | | | 168 | 38,673 |
| Cavotec SA (A) | | | 8,496 | 17,750 |
| Cembra Money Bank AG | | | 10,480 | 1,179,578 |
| Cicor Technologies, Ltd. (A) | | | 495 | 24,569 |
| Cie Financiere Tradition SA | | | 559 | 59,634 |
| Clariant AG (A) | | | 6,249 | 132,543 |
| Coltene Holding AG | | | 1,519 | 137,926 |
| Conzzeta AG | | | 556 | 568,619 |
| Daetwyler Holding AG | | | 3,476 | 559,949 |
| DKSH Holding AG | | | 8,582 | 484,122 |
| SEE NOTES TO FINANCIAL STATEMENTS | SEMIANNUAL REPORT | JOHN HANCOCK INTERNATIONAL SMALL COMPANY FUND | 85 |
| | | | | Shares | Value |
| Switzerland (continued) | | | | | |
| dormakaba Holding AG (A) | | | 1,228 | $732,915 |
| Dottikon Es Holding AG (A) | | | 20 | 11,648 |
| Dufry AG (A) | | | 13,341 | 979,045 |
| EDAG Engineering Group AG (A) | | | 3,415 | 34,780 |
| EFG International AG (A)(B) | | | 44,297 | 251,441 |
| Emmi AG | | | 639 | 555,684 |
| Energiedienst Holding AG | | | 1,466 | 51,073 |
| Evolva Holding SA (A) | | | 222,970 | 48,316 |
| Feintool International Holding AG (A) | | | 656 | 32,113 |
| Fenix Outdoor International AG | | | 1,557 | 142,274 |
| Ferrexpo PLC | | | 125,786 | 210,434 |
| Flughafen Zurich AG | | | 6,738 | 1,021,936 |
| Forbo Holding AG | | | 359 | 530,112 |
| GAM Holding AG (A)(B) | | | 89,726 | 303,820 |
| Georg Fischer AG | | | 1,642 | 1,411,232 |
| Gurit Holding AG | | | 135 | 201,130 |
| Helvetia Holding AG | | | 11,676 | 1,555,501 |
| Hiag Immobilien Holding AG | | | 1,911 | 214,863 |
| Highlight Communications AG (A) | | | 4,309 | 20,307 |
| HOCHDORF Holding AG (A)(B) | | | 291 | 20,779 |
| Huber & Suhner AG | | | 6,738 | 452,184 |
| Hypothekarbank Lenzburg AG | | | 12 | 55,757 |
| Implenia AG | | | 7,880 | 391,168 |
| Inficon Holding AG | | | 851 | 599,364 |
| Interroll Holding AG | | | 247 | 441,328 |
| Intershop Holding AG | | | 607 | 407,943 |
| Investis Holding SA (A) | | | 864 | 76,397 |
| IWG PLC | | | 250,490 | 1,136,489 |
| Jungfraubahn Holding AG | | | 1,530 | 213,841 |
| Kardex AG | | | 2,367 | 374,163 |
| Komax Holding AG (B) | | | 337 | 64,715 |
| Kongsberg Automotive ASA (A) | | | 102,136 | 46,744 |
| Kudelski SA (A)(B) | | | 14,739 | 69,144 |
| Lastminute.com NV (A) | | | 1,444 | 48,311 |
| LEM Holding SA | | | 196 | 254,126 |
| Logitech International SA | | | 18,696 | 725,133 |
| Luzerner Kantonalbank AG (B) | | | 1,285 | 539,219 |
| Meier Tobler Group AG (A) | | | 876 | 13,496 |
| Metall Zug AG, B Shares | | | 81 | 163,036 |
| Mikron Holding AG (A) | | | 1,756 | 10,268 |
| Mobilezone Holding AG (A) | | | 18,744 | 206,364 |
| Mobimo Holding AG (A) | | | 3,859 | 1,159,944 |
| OC Oerlikon Corp. AG | | | 95,415 | 889,954 |
| Orascom Development Holding AG (A) | | | 6,368 | 76,242 |
| 86 | JOHN HANCOCK INTERNATIONAL SMALL COMPANY FUND | SEMIANNUAL REPORT | SEE NOTES TO FINANCIAL STATEMENTS |
| | | | | Shares | Value |
| Switzerland (continued) | | | | | |
| Orell Fuessli Holding AG | | | 223 | $23,145 |
| Orior AG (A) | | | 2,567 | 237,140 |
| Phoenix Mecano AG | | | 213 | 95,408 |
| Plazza AG, Class A | | | 560 | 169,098 |
| PSP Swiss Property AG | | | 18,145 | 2,685,397 |
| Rieter Holding AG | | | 1,430 | 170,099 |
| Romande Energie Holding SA | | | 120 | 148,410 |
| Schaffner Holding AG | | | 165 | 32,814 |
| Schmolz + Bickenbach AG (A)(B) | | | 218,185 | 41,192 |
| Schweiter Technologies AG | | | 462 | 540,270 |
| SFS Group AG | | | 6,148 | 513,266 |
| Siegfried Holding AG (A) | | | 1,933 | 840,358 |
| St. Galler Kantonalbank AG, Class A | | | 1,024 | 469,972 |
| Sulzer AG | | | 7,851 | 722,876 |
| Sunrise Communications Group AG (A)(D) | | | 14,036 | 1,141,658 |
| Swiss Prime Site AG (A) | | | 1,457 | 175,796 |
| Swissquote Group Holding SA | | | 3,830 | 216,760 |
| Thurgauer Kantonalbank | | | 384 | 43,327 |
| Tornos Holding AG (A) | | | 3,182 | 14,444 |
| TX Group AG | | | 974 | 96,234 |
| u-blox Holding AG (A)(B) | | | 2,977 | 234,089 |
| Valiant Holding AG | | | 5,508 | 548,172 |
| Valora Holding AG (A) | | | 1,841 | 459,494 |
| Varia US Properties AG | | | 290 | 12,900 |
| VAT Group AG (A)(D) | | | 12,413 | 1,687,346 |
| Vaudoise Assurances Holding SA | | | 381 | 212,048 |
| Vetropack Holding AG | | | 89 | 238,174 |
| Von Roll Holding AG (A) | | | 24,922 | 17,893 |
| Vontobel Holding AG | | | 11,798 | 781,843 |
| VZ Holding AG | | | 1,059 | 365,455 |
| Walliser Kantonalbank | | | 566 | 62,506 |
| Warteck Invest AG (A) | | | 61 | 136,640 |
| Ypsomed Holding AG (A) | | | 857 | 122,093 |
| Zehnder Group AG | | | 4,662 | 218,358 |
| Zug Estates Holding AG, B Shares (A) | | | 69 | 158,670 |
| Zuger Kantonalbank AG | | | 44 | 293,929 |
| Turkey 0.0% | | | | | 10,248 |
| Global Ports Holding PLC (D) | | | 4,112 | 10,248 |
| United Arab Emirates 0.0% | | | | | 25,073 |
| Lamprell PLC (A) | | | 68,445 | 25,073 |
| United Kingdom 15.1% | | | | | 110,989,385 |
| 4imprint Group PLC | | | 6,295 | 225,292 |
| SEE NOTES TO FINANCIAL STATEMENTS | SEMIANNUAL REPORT | JOHN HANCOCK INTERNATIONAL SMALL COMPANY FUND | 87 |
| | | | | Shares | Value |
| United Kingdom (continued) | | | | | |
| A.G. Barr PLC | | | 46,755 | $323,234 |
| AA PLC | | | 299,708 | 168,912 |
| Advanced Medical Solutions Group PLC | | | 3,350 | 11,099 |
| Afren PLC (A)(C) | | | 310,484 | 0 |
| Aggreko PLC | | | 108,740 | 950,038 |
| Air Partner PLC | | | 6,000 | 5,529 |
| Alliance Pharma PLC | | | 70,053 | 67,841 |
| Anglo Pacific Group PLC | | | 63,590 | 105,416 |
| Anglo-Eastern Plantations PLC | | | 5,600 | 38,238 |
| Appreciate Group PLC | | | 10,000 | 7,286 |
| Arrow Global Group PLC | | | 69,821 | 218,063 |
| Ascential PLC (D) | | | 27,693 | 123,284 |
| Ashmore Group PLC | | | 48,521 | 293,098 |
| ASOS PLC (A) | | | 7,111 | 279,559 |
| Avon Rubber PLC | | | 14,704 | 523,554 |
| B&M European Value Retail SA | | | 189,706 | 821,769 |
| Babcock International Group PLC | | | 142,149 | 818,142 |
| Balfour Beatty PLC | | | 268,665 | 854,490 |
| Beazley PLC | | | 154,594 | 1,071,664 |
| Begbies Traynor Group PLC | | | 24,310 | 22,647 |
| Bellway PLC | | | 40,150 | 1,943,121 |
| Biffa PLC (D) | | | 44,954 | 153,005 |
| Bloomsbury Publishing PLC | | | 42,391 | 135,656 |
| Bodycote PLC | | | 76,773 | 755,277 |
| boohoo Group PLC (A) | | | 295,010 | 1,120,342 |
| Braemar Shipping Services PLC | | | 7,806 | 15,068 |
| Brewin Dolphin Holdings PLC | | | 136,809 | 537,232 |
| Britvic PLC | | | 100,237 | 1,110,003 |
| Cairn Energy PLC (A) | | | 326,402 | 593,395 |
| Camellia PLC | | | 87 | 9,328 |
| Capita PLC (A) | | | 193,468 | 321,006 |
| Capital & Counties Properties PLC | | | 303,042 | 781,493 |
| Card Factory PLC | | | 156,781 | 159,418 |
| CareTech Holdings PLC | | | 19,375 | 111,075 |
| Carillion PLC (A)(C) | | | 114,263 | 14,050 |
| Carr's Group PLC | | | 15,261 | 26,432 |
| Castings PLC | | | 8,508 | 41,178 |
| Centaur Media PLC | | | 19,732 | 10,188 |
| Central Asia Metals PLC | | | 17,762 | 43,011 |
| Charles Stanley Group PLC | | | 5,789 | 21,679 |
| Chemring Group PLC | | | 118,173 | 367,640 |
| Chesnara PLC | | | 50,220 | 181,613 |
| Cineworld Group PLC (B) | | | 258,746 | 525,503 |
| Circassia Pharmaceuticals PLC (A) | | | 16,959 | 4,409 |
| 88 | JOHN HANCOCK INTERNATIONAL SMALL COMPANY FUND | SEMIANNUAL REPORT | SEE NOTES TO FINANCIAL STATEMENTS |
| | | | | Shares | Value |
| United Kingdom (continued) | | | | | |
| City of London Investment Group PLC | | | 4,643 | $24,956 |
| Clarkson PLC | | | 11,044 | 356,634 |
| Clinigen Group PLC | | | 10,178 | 93,531 |
| Clipper Logistics PLC | | | 21,784 | 73,824 |
| Close Brothers Group PLC | | | 61,911 | 1,030,415 |
| CLS Holdings PLC | | | 73,678 | 234,663 |
| CMC Markets PLC (D) | | | 42,777 | 82,247 |
| Coats Group PLC | | | 34,451 | 26,598 |
| Computacenter PLC | | | 49,299 | 1,045,126 |
| Concentric AB | | | 16,536 | 234,701 |
| Connect Group PLC | | | 6,966 | 2,452 |
| ConvaTec Group PLC (D) | | | 378,354 | 1,008,268 |
| Costain Group PLC | | | 45,591 | 98,096 |
| Countryside Properties PLC (D) | | | 179,569 | 1,092,154 |
| Countrywide PLC (A) | | | 915 | 3,577 |
| Cranswick PLC | | | 21,639 | 929,318 |
| Crest Nicholson Holdings PLC | | | 121,051 | 705,980 |
| CVS Group PLC | | | 4,990 | 68,812 |
| Daejan Holdings PLC | | | 2,744 | 282,286 |
| Daily Mail & General Trust PLC, Class A | | | 69,998 | 670,834 |
| Dart Group PLC | | | 31,645 | 506,812 |
| De La Rue PLC | | | 55,608 | 97,017 |
| Debenhams PLC (A)(B)(C) | | | 306,827 | 0 |
| Devro PLC | | | 83,807 | 159,458 |
| DFS Furniture PLC | | | 45,929 | 145,111 |
| Dialight PLC (A) | | | 10,395 | 28,771 |
| Dialog Semiconductor PLC (A) | | | 32,335 | 1,115,488 |
| Dignity PLC | | | 16,385 | 118,911 |
| Diploma PLC | | | 46,520 | 1,117,965 |
| DiscoverIE Group PLC | | | 27,942 | 188,843 |
| Dixons Carphone PLC | | | 330,358 | 526,920 |
| Domino's Pizza Group PLC | | | 218,450 | 835,529 |
| Drax Group PLC | | | 190,576 | 661,768 |
| Dunelm Group PLC | | | 39,411 | 562,621 |
| EI Group PLC (A) | | | 250,859 | 910,548 |
| EKF Diagnostics Holdings PLC (A)(B) | | | 106,847 | 40,997 |
| Electrocomponents PLC | | | 178,138 | 1,397,963 |
| Elementis PLC | | | 269,119 | 351,637 |
| EMIS Group PLC | | | 20,606 | 305,243 |
| EnQuest PLC (A) | | | 570,177 | 153,222 |
| Equiniti Group PLC (D) | | | 166,902 | 433,072 |
| Essentra PLC | | | 128,669 | 599,993 |
| Euromoney Institutional Investor PLC | | | 47,350 | 660,565 |
| FDM Group Holdings PLC | | | 31,365 | 346,538 |
| SEE NOTES TO FINANCIAL STATEMENTS | SEMIANNUAL REPORT | JOHN HANCOCK INTERNATIONAL SMALL COMPANY FUND | 89 |
| | | | | Shares | Value |
| United Kingdom (continued) | | | | | |
| Fevertree Drinks PLC | | | 30,546 | $499,834 |
| First Derivatives PLC | | | 507 | 18,155 |
| Firstgroup PLC (A) | | | 662,348 | 1,006,380 |
| Forterra PLC (D) | | | 75,840 | 316,694 |
| Foxtons Group PLC (A) | | | 83,664 | 85,890 |
| Frasers Group PLC (A) | | | 71,214 | 349,716 |
| Frontier Developments PLC (A) | | | 1,958 | 29,012 |
| Fuller Smith & Turner PLC, Class A | | | 9,499 | 100,910 |
| G4S PLC | | | 572,459 | 1,267,534 |
| Galliford Try Holdings PLC | | | 41,061 | 82,536 |
| Games Workshop Group PLC | | | 13,669 | 1,119,331 |
| Gamesys Group PLC (A) | | | 29,307 | 266,877 |
| Gamma Communications PLC | | | 7,337 | 115,948 |
| Gem Diamonds, Ltd. (A) | | | 43,118 | 30,325 |
| Genel Energy PLC | | | 66,947 | 128,435 |
| Genus PLC | | | 2,012 | 82,132 |
| GoCo Group PLC | | | 109,854 | 114,990 |
| Gooch & Housego PLC | | | 1,549 | 23,794 |
| Goodwin PLC | | | 801 | 28,209 |
| Grainger PLC | | | 229,484 | 877,536 |
| Greggs PLC | | | 39,738 | 1,070,836 |
| Gulf Keystone Petroleum, Ltd. | | | 114,672 | 220,106 |
| H&T Group PLC | | | 64 | 270 |
| Halfords Group PLC | | | 68,278 | 131,215 |
| Hastings Group Holdings PLC (D) | | | 124,620 | 260,661 |
| Hays PLC | | | 559,083 | 998,375 |
| Headlam Group PLC | | | 32,304 | 210,029 |
| Helical PLC | | | 52,047 | 312,050 |
| Henry Boot PLC | | | 21,120 | 82,596 |
| Hill & Smith Holdings PLC | | | 34,047 | 594,592 |
| Hilton Food Group PLC | | | 13,839 | 183,940 |
| Hollywood Bowl Group PLC | | | 26,798 | 84,354 |
| HomeServe PLC | | | 24,857 | 378,672 |
| Horizon Discovery Group PLC (A)(B) | | | 41,518 | 73,630 |
| Howden Joinery Group PLC | | | 254,072 | 2,101,346 |
| Hunting PLC | | | 55,986 | 232,167 |
| Huntsworth PLC | | | 104,978 | 99,782 |
| Hurricane Energy PLC (A)(B) | | | 147,875 | 28,313 |
| Hyve Group PLC | | | 279,042 | 275,660 |
| Ibstock PLC (D) | | | 187,308 | 660,351 |
| IG Group Holdings PLC | | | 133,746 | 1,166,788 |
| IGas Energy PLC (A) | | | 10,408 | 4,996 |
| IMI PLC | | | 101,413 | 1,312,798 |
| Inchcape PLC | | | 179,592 | 1,342,438 |
| 90 | JOHN HANCOCK INTERNATIONAL SMALL COMPANY FUND | SEMIANNUAL REPORT | SEE NOTES TO FINANCIAL STATEMENTS |
| | | | | Shares | Value |
| United Kingdom (continued) | | | | | |
| Indivior PLC (A) | | | 217,064 | $120,601 |
| Intermediate Capital Group PLC | | | 45,166 | 934,085 |
| International Personal Finance PLC | | | 94,592 | 180,809 |
| iomart Group PLC | | | 17,378 | 77,790 |
| IP Group PLC (A) | | | 193,772 | 167,652 |
| ITM Power PLC (A)(B) | | | 46,106 | 60,169 |
| J.D. Wetherspoon PLC | | | 26,898 | 466,552 |
| James Fisher & Sons PLC | | | 18,699 | 440,717 |
| James Halstead PLC | | | 1,989 | 12,495 |
| John Laing Group PLC (D) | | | 213,636 | 930,649 |
| John Menzies PLC (B) | | | 26,768 | 101,797 |
| John Wood Group PLC | | | 202,764 | 972,304 |
| Johnson Service Group PLC | | | 53,472 | 127,626 |
| Joules Group PLC | | | 1,304 | 2,295 |
| Jupiter Fund Management PLC | | | 173,262 | 677,629 |
| Just Group PLC (A) | | | 395,778 | 371,273 |
| Kainos Group PLC | | | 25,158 | 244,294 |
| KAZ Minerals PLC | | | 75,941 | 406,535 |
| Keller Group PLC | | | 24,320 | 204,802 |
| Kier Group PLC | | | 59,696 | 86,154 |
| Kin & Carta PLC | | | 79,983 | 96,725 |
| Lancashire Holdings, Ltd. | | | 99,728 | 932,003 |
| Liontrust Asset Management PLC | | | 6,119 | 87,879 |
| Lookers PLC | | | 168,184 | 97,281 |
| Low & Bonar PLC (A) | | | 76,904 | 11,099 |
| LSL Property Services PLC | | | 25,300 | 101,151 |
| Luceco PLC (D) | | | 36,040 | 51,391 |
| M&C Saatchi PLC | | | 32 | 36 |
| Man Group PLC | | | 625,026 | 1,186,876 |
| Marshalls PLC | | | 112,594 | 1,054,952 |
| Marston's PLC | | | 357,940 | 415,655 |
| McBride PLC (A) | | | 60,511 | 53,059 |
| McCarthy & Stone PLC (D) | | | 215,246 | 372,107 |
| McColl's Retail Group PLC | | | 6,093 | 2,557 |
| Mears Group PLC | | | 35,368 | 129,676 |
| Meggitt PLC | | | 149,609 | 1,053,559 |
| Metro Bank PLC (A) | | | 2,940 | 6,335 |
| Midwich Group PLC | | | 408 | 2,919 |
| Mitchells & Butlers PLC (A) | | | 113,453 | 492,028 |
| Mitie Group PLC | | | 163,110 | 287,573 |
| MJ Gleeson PLC | | | 10,820 | 128,030 |
| Moneysupermarket.com Group PLC | | | 199,309 | 801,790 |
| Morgan Advanced Materials PLC | | | 122,589 | 437,666 |
| Morgan Sindall Group PLC | | | 18,950 | 431,768 |
| SEE NOTES TO FINANCIAL STATEMENTS | SEMIANNUAL REPORT | JOHN HANCOCK INTERNATIONAL SMALL COMPANY FUND | 91 |
| | | | | Shares | Value |
| United Kingdom (continued) | | | | | |
| Morses Club PLC | | | 5,182 | $7,195 |
| Mortgage Advice Bureau Holdings, Ltd. | | | 5,006 | 48,413 |
| Mothercare PLC (A) | | | 111,664 | 18,456 |
| Motorpoint group PLC | | | 12,238 | 47,886 |
| MP Evans Group PLC | | | 2,671 | 22,754 |
| N. Brown Group PLC | | | 58,390 | 42,869 |
| NAHL Group PLC | | | 7,962 | 6,194 |
| Naked Wines PLC | | | 12,217 | 33,073 |
| National Express Group PLC | | | 190,812 | 1,040,563 |
| NCC Group PLC | | | 74,855 | 201,466 |
| Next Fifteen Communications Group PLC | | | 1,094 | 6,770 |
| Nichols PLC | | | 1,615 | 27,124 |
| Non-Standard Finance PLC (D) | | | 65,542 | 21,035 |
| Norcros PLC | | | 15,627 | 42,655 |
| Numis Corp. PLC | | | 5,248 | 17,198 |
| On the Beach Group PLC (D) | | | 50,914 | 212,655 |
| OneSavings Bank PLC | | | 76,933 | 401,702 |
| Oxford Instruments PLC | | | 20,756 | 375,006 |
| Pagegroup PLC | | | 121,548 | 634,492 |
| Pan African Resources PLC | | | 407,545 | 64,979 |
| Pantheon Resources PLC (A) | | | 88,778 | 13,704 |
| Paragon Banking Group PLC | | | 135,278 | 795,704 |
| PayPoint PLC | | | 27,433 | 294,400 |
| Pendragon PLC | | | 507,217 | 80,545 |
| Pennon Group PLC | | | 176,255 | 2,465,191 |
| Petrofac, Ltd. | | | 90,291 | 376,652 |
| Pets at Home Group PLC | | | 247,826 | 828,561 |
| Pharos Energy PLC | | | 103,615 | 41,332 |
| Phoenix Group Holdings PLC | | | 101,804 | 914,154 |
| Photo-Me International PLC | | | 85,323 | 91,575 |
| Polar Capital Holdings PLC | | | 7,068 | 44,975 |
| Polypipe Group PLC | | | 98,834 | 687,120 |
| Porvair PLC | | | 10,112 | 87,101 |
| Premier Foods PLC (A) | | | 372,961 | 156,241 |
| Premier Oil PLC (A)(B) | | | 257,019 | 261,758 |
| Provident Financial PLC | | | 46,597 | 244,111 |
| PZ Cussons PLC | | | 130,951 | 304,288 |
| QinetiQ Group PLC | | | 259,850 | 1,163,063 |
| Quilter PLC (D) | | | 801,170 | 1,522,747 |
| R.E.A. Holdings PLC (A) | | | 2,867 | 4,345 |
| Rank Group PLC | | | 69,151 | 237,842 |
| Rathbone Brothers PLC | | | 13,785 | 297,169 |
| Reach PLC | | | 122,730 | 235,946 |
| Redde Northgate PLC | | | 68,991 | 219,278 |
| 92 | JOHN HANCOCK INTERNATIONAL SMALL COMPANY FUND | SEMIANNUAL REPORT | SEE NOTES TO FINANCIAL STATEMENTS |
| | | | | Shares | Value |
| United Kingdom (continued) | | | | | |
| Redrow PLC | | | 104,113 | $1,011,500 |
| Renew Holdings PLC | | | 2,962 | 18,753 |
| Renewi PLC | | | 216,355 | 100,914 |
| Renishaw PLC | | | 7,756 | 351,547 |
| Renold PLC (A) | | | 36,501 | 5,459 |
| Revolution Bars Group PLC (A) | | | 9,512 | 7,408 |
| Ricardo PLC | | | 16,777 | 147,225 |
| River & Mercantile Group PLC | | | 4,888 | 16,447 |
| RM PLC | | | 12,019 | 40,857 |
| Robert Walters PLC | | | 17,111 | 120,744 |
| Rotork PLC | | | 323,170 | 1,181,685 |
| Royal Mail PLC | | | 155,112 | 325,291 |
| RPS Group PLC | | | 79,867 | 128,114 |
| Sabre Insurance Group PLC (D) | | | 7,463 | 26,967 |
| Saga PLC | | | 621,079 | 258,581 |
| Savannah Petroleum PLC (A) | | | 164,277 | 29,214 |
| Savills PLC | | | 62,671 | 876,877 |
| Scapa Group PLC | | | 15,161 | 33,592 |
| SDL PLC | | | 28,039 | 197,363 |
| Senior PLC | | | 155,861 | 283,944 |
| Severfield PLC | | | 89,306 | 97,946 |
| SIG PLC | | | 284,842 | 232,695 |
| Signature Aviation PLC | | | 346,865 | 1,254,907 |
| Sirius Minerals PLC (A) | | | 105,282 | 6,023 |
| Smart Metering Systems PLC (B) | | | 8,497 | 52,481 |
| Softcat PLC | | | 45,182 | 618,274 |
| Spectris PLC | | | 45,118 | 1,591,239 |
| Speedy Hire PLC | | | 228,382 | 224,219 |
| Spire Healthcare Group PLC (D) | | | 65,246 | 97,099 |
| Spirent Communications PLC | | | 220,046 | 593,692 |
| Sportech PLC (A) | | | 21,102 | 7,843 |
| SSP Group PLC | | | 167,498 | 1,107,691 |
| St. Modwen Properties PLC | | | 93,796 | 577,286 |
| Staffline Group PLC (A) | | | 1,328 | 571 |
| Stagecoach Group PLC | | | 189,614 | 320,108 |
| SThree PLC | | | 50,330 | 207,590 |
| Stobart Group, Ltd. (B) | | | 92,179 | 91,223 |
| Stock Spirits Group PLC | | | 73,315 | 183,106 |
| Stolt-Nielsen, Ltd. | | | 9,140 | 101,702 |
| Studio Retail Group PLC (A) | | | 18,987 | 51,400 |
| STV Group PLC | | | 8,759 | 46,989 |
| Superdry PLC | | | 17,005 | 68,476 |
| Synthomer PLC | | | 134,097 | 488,602 |
| TalkTalk Telecom Group PLC | | | 234,292 | 331,737 |
| SEE NOTES TO FINANCIAL STATEMENTS | SEMIANNUAL REPORT | JOHN HANCOCK INTERNATIONAL SMALL COMPANY FUND | 93 |
| | | | | Shares | Value |
| United Kingdom (continued) | | | | | |
| Tate & Lyle PLC | | | 187,429 | $1,709,069 |
| TClarke PLC | | | 22,432 | 30,994 |
| Ted Baker PLC (B) | | | 15,431 | 57,741 |
| Telecom Plus PLC | | | 24,896 | 429,383 |
| Telit Communications PLC (A) | | | 27,359 | 48,472 |
| The Go-Ahead Group PLC | | | 18,544 | 471,483 |
| The Gym Group PLC (D) | | | 50,921 | 168,055 |
| The Parkmead Group PLC (A) | | | 14,125 | 6,570 |
| The Restaurant Group PLC | | | 80,676 | 111,679 |
| The Vitec Group PLC | | | 8,599 | 98,813 |
| The Weir Group PLC | | | 7,619 | 128,689 |
| Thomas Cook Group PLC (A)(C) | | | 415,078 | 0 |
| Topps Tiles PLC | | | 62,375 | 46,969 |
| TORM PLC (A) | | | 14,303 | 108,807 |
| TP ICAP PLC | | | 277,113 | 1,307,462 |
| Travis Perkins PLC | | | 98,857 | 1,889,589 |
| Trifast PLC | | | 23,116 | 38,366 |
| TT Electronics PLC | | | 56,789 | 146,782 |
| Tullow Oil PLC | | | 630,952 | 276,433 |
| Tyman PLC | | | 11,635 | 36,150 |
| U & I Group PLC | | | 64,085 | 130,456 |
| Ultra Electronics Holdings PLC | | | 37,164 | 941,677 |
| Urban & Civic PLC | | | 32,432 | 146,629 |
| Vectura Group PLC | | | 322,207 | 359,777 |
| Vertu Motors PLC | | | 25,510 | 10,461 |
| Vesuvius PLC | | | 99,312 | 544,988 |
| Victrex PLC | | | 34,713 | 946,557 |
| Virgin Money UK PLC (A) | | | 258,771 | 514,268 |
| Vistry Group PLC | | | 86,959 | 1,439,066 |
| Volex PLC | | | 21,791 | 32,542 |
| Volution Group PLC | | | 18,773 | 51,449 |
| Vp PLC | | | 2,803 | 37,331 |
| Watkin Jones PLC | | | 37,962 | 125,323 |
| WH Smith PLC | | | 43,193 | 1,082,170 |
| William Hill PLC | | | 350,487 | 668,919 |
| Wilmington PLC | | | 8,311 | 24,266 |
| Wincanton PLC | | | 47,781 | 163,699 |
| Xaar PLC (A) | | | 22,542 | 10,801 |
| Zeal Network SE (A)(B) | | | 2,472 | 61,545 |
| United States 0.5% | | | | | 3,504,931 |
| Alacer Gold Corp. (A) | | | 165,039 | 746,349 |
| Argonaut Gold, Inc. (A) | | | 94,222 | 90,554 |
| Burford Capital, Ltd. | | | 9,672 | 68,623 |
| 94 | JOHN HANCOCK INTERNATIONAL SMALL COMPANY FUND | SEMIANNUAL REPORT | SEE NOTES TO FINANCIAL STATEMENTS |
| | | | | Shares | Value |
| United States (continued) | | | | | |
| Cott Corp. | | | 51,861 | $735,269 |
| Cott Corp. (New York Stock Exchange) | | | 3,270 | 46,598 |
| Energy Fuels, Inc. (A) | | | 20,569 | 25,285 |
| Epsilon Energy, Ltd. (A) | | | 9,600 | 29,520 |
| Invesque, Inc. | | | 13,800 | 92,322 |
| Kingsway Financial Services, Inc. (A) | | | 2,175 | 3,893 |
| PureTech Health PLC (A) | | | 45,684 | 172,154 |
| REC Silicon ASA (A)(B) | | | 120,455 | 52,444 |
| Reliance Worldwide Corp., Ltd. (B) | | | 187,558 | 419,587 |
| Samsonite International SA (D) | | | 295,200 | 519,838 |
| Sims, Ltd. | | | 76,679 | 485,913 |
|
| Sundance Energy, Inc. (A) | | | 2,208 | 16,582 |
| Preferred securities 0.3% | | | | | $2,117,953 |
| (Cost $2,217,677) | | | | | |
| Germany 0.3% | | | | | 2,117,953 |
| Biotest AG | | | 8,385 | 196,172 |
| Draegerwerk AG & Company KGaA | | | 3,510 | 226,224 |
| FUCHS PETROLUB SE | | | 18,995 | 727,134 |
| Jungheinrich AG | | | 19,726 | 398,190 |
| Sixt SE | | | 6,477 | 397,223 |
| STO SE & Company KGaA | | | 1,172 | 122,652 |
| Villeroy & Boch AG | | | 3,600 | 50,358 |
| Rights 0.0% | | | | | $563 |
| (Cost $0) | | | | | |
| Guotai Junan International Holdings, Ltd. (Expiration Date: 3-10-20; Strike Price: HKD 1.45) (A) | | 438,866 | 563 |
| Warrants 0.0% | | | | | $377 |
| (Cost $0) | | | | | |
| Anoto Group AB (Expiration Date: 4-30-21; Strike Price: SEK 4.00) (A) | | 2,373 | 62 |
| METabolic EXplorer SA (Expiration Date: 3-19-21; Strike Price: EUR 1.61) (A) | | 8,100 | 312 |
| Tervita Corp. (Expiration Date: 7-19-20; Strike Price: CAD 18.75) (A) | | 671 | 3 |
|
| | | Yield (%) | | Shares | Value |
| Short-term investments 3.7% | | | | $26,867,005 |
| (Cost $26,851,752) | | | | | |
| Short-term funds 3.7% | | | | | 26,867,005 |
| John Hancock Collateral Trust (E) | 1.6968(F) | | 2,684,311 | 26,867,005 |
|
| Total investments (Cost $753,591,770) 101.8% | | | $749,315,111 |
| Other assets and liabilities, net (1.8%) | | | (12,907,484) |
| Total net assets 100.0% | | | | | $736,407,627 |
| The percentage shown for each investment category is the total value of the category as a percentage of the net assets of the fund. |
| SEE NOTES TO FINANCIAL STATEMENTS | SEMIANNUAL REPORT | JOHN HANCOCK INTERNATIONAL SMALL COMPANY FUND | 95 |
| Currency Abbreviations |
| CAD | Canadian Dollar |
| EUR | Euro |
| HKD | Hong Kong Dollar |
| SEK | Swedish Krona |
| Security Abbreviations and Legend |
| ADR | American Depositary Receipt |
| (A) | Non-income producing security. |
| (B) | All or a portion of this security is on loan as of 2-29-20. |
| (C) | Security is valued using significant unobservable inputs and is classified as Level 3 in the fair value hierarchy. Refer to Note 2 to the financial statements. |
| (D) | These securities are exempt from registration under Rule 144A of the Securities Act of 1933. Such securities may be resold, normally to qualified institutional buyers, in transactions exempt from registration. |
| (E) | Investment is an affiliate of the fund, the advisor and/or subadvisor. This security represents the investment of cash collateral received for securities lending. |
| (F) | The rate shown is the annualized seven-day yield as of 2-29-20. |
| 96 | JOHN HANCOCK INTERNATIONAL SMALL COMPANY FUND | SEMIANNUAL REPORT | SEE NOTES TO FINANCIAL STATEMENTS |
DERIVATIVES
FUTURES
| Open contracts | Number of
contracts | Position | Expiration
date | Notional
basis^ | Notional
value^ | Unrealized
appreciation
(depreciation) |
| Mini MSCI EAFE Index Futures | 63 | Long | Mar 2020 | $6,088,952 | $5,733,945 | $(355,007) |
| | | | | | | $(355,007) |
^ Notional basis refers to the contractual amount agreed upon at inception of open contracts; notional value represents the current value of the open contract.
At 2-29-20, the aggregate cost of investments for federal income tax purposes was $764,147,713. Net unrealized depreciation aggregated to $15,187,609, of which $126,576,579 related to gross unrealized appreciation and $141,764,188 related to gross unrealized depreciation.
See Notes to financial statements regarding investment transactions and other derivatives information.
| SEE NOTES TO FINANCIAL STATEMENTS | SEMIANNUAL REPORT | JOHN HANCOCK INTERNATIONAL SMALL COMPANY FUND | 97 |
ITEM 7. DISCLOSURE OF PROXY VOTING POLICIES AND PROCEDURES FOR CLOSED-END MANAGEMENT INVESTMENT COMPANIES.
Not Applicable.
ITEM 8. PORTFOLIO MANAGERS OF CLOSED-END MANAGEMENT INVESTMENT COMPANIES.
Not Applicable.
ITEM 9. PURCHASE OF EQUITY SECURITIES BY CLOSED-END MANAGEMENT INVESTMENT COMPANIES AND AFFILIATED PURCHASERS.
Not Applicable.
ITEM 10. SUBMISSION OF MATTERS TO VOTE OF SECURITY HOLDERS.
Not Applicable.
ITEM 11. CONTROLS AND PROCEDURES.
| (a) | EVALUATION OF DISCLOSURE CONTROLS AND PROCEDURES. The Registrant maintains disclosure controls and procedures that are designed to ensure that information required to be disclosed in this Form N-CSR is recorded, processed, summarized and reported within the periods specified in the rules and forms of the Securities and Exchange Commission. Such disclosure controls and procedures include controls and procedures designed to ensure that such information is accumulated and communicated to the Registrant's management, including its principal executive officer and principal financial officer, as appropriate, to allow timely decisions regarding required disclosure. |
Within 90 days prior to the filing date of this Form N-CSR, the Registrant had carried out an evaluation, under the supervision and with the participation of the Registrant's management, including the Registrant's principal executive officer and the Registrant's principal financial officer, of the effectiveness of the design and operation of the Registrant's disclosure controls and procedures relating to information required to be disclosed on Form N-CSR. Based on such evaluation, the Registrant's principal executive officer and principal financial officer concluded that the Registrant's disclosure controls and procedures are operating effectively to ensure that:
(i) information required to be disclosed in this Form N-CSR is recorded, processed, summarized and reported within the periods specified in the rules and forms of the Securities and Exchange Commission, and
(ii) information is accumulated and communicated to the Registrant’s management, including its principal executive officer and principal financial officer, as appropriate, to allow timely decisions regarding required disclosure.
(b) CHANGE IN REGISTRANT’S INTERNAL CONTROL: Not Applicable.
ITEM 12. DISCLOSURE OF SECURITIES LENDING ACTIVITIES FOR CLOSED-END MANAGEMENT INVESTMENT COMPANIES.
Not applicable.
ITEM 13. EXHIBITS.
(a)(1) Separate certifications for the registrant's principal executive officer and principal financial officer, as required by Section 302 of the Sarbanes-Oxley Act of 2002 and Rule 30a-2(a) under the Investment Company Act of 1940, are attached.
(b)(1) Separate certifications for the registrant's principal executive officer and principal financial officer, as required by 18 U.S.C. Section 1350, as adopted pursuant to Section 906 of the Sarbanes-Oxley Act of 2002, and Rule 30a-2(b) under the Investment Company Act of 1940, are attached. The certifications furnished pursuant to this paragraph are not deemed to be "filed" for purposes of Section 18 of the Securities Exchange Act of 1934, or otherwise subject to the liability of that section. Such certifications are not deemed to be incorporated by reference into any filing under the Securities Act of 1933 or the Securities Exchange Act of 1934, except to the extent that the Registrant specifically incorporates them by reference.
(c)(1) Submission of Matters to a Vote of Security Holders is attached. See attached “John Hancock Funds – Nominating and Governance Committee Charter”.
SIGNATURES
Pursuant to the requirements of the Securities Exchange Act of 1934 and the Investment Company Act of 1940, the registrant has duly caused this report to be signed on its behalf by the undersigned, thereunto duly authorized.
JOHN HANCOCK FUNDS II
/s/ Andrew Arnott
_______________________________
Andrew Arnott
President
Date: April 15, 2020
Pursuant to the requirements of the Securities Exchange Act of 1934 and the Investment Company Act of 1940, this report has been signed below by the following persons on behalf of the registrant and in the capacities and on the dates indicated.
/s/ Andrew Arnott
_______________________________
Andrew Arnott
President
Date: April 15, 2020
/s/ Charles A. Rizzo
_______________________________
Charles A. Rizzo
Chief Financial Officer
Date: April 15, 2020