UNITED STATES
SECURITIES AND EXCHANGE COMMISSION
Washington, D.C. 20549
FORM N-CSR
CERTIFIED SHAREHOLDER REPORT OF REGISTERED MANAGEMENT INVESTMENT COMPANIES
Investment Company Act file number 811-21779
JOHN HANCOCK FUNDS II
---------------------------------------------------------
(Exact name of registrant as specified in charter)
200 BERKELEY STREET, BOSTON, MASSACHUSETTS 02116
-------------------------------------------------------------
(Address of principal executive offices) (Zip code)
SALVATORE SCHIAVONE, 200 BERKELEY STREET, BOSTON, MASSACHUSETTS 02116
------------------------------------------------------------------------------------------
(Name and address of agent for service)
Registrant's telephone number, including area code: (617) 663-4497
------------------
Date of fiscal year end: 8/31
Date of reporting period: 2/29/20
ITEM 1. REPORTS TO STOCKHOLDERS.
The Registrant prepared ten semiannual reports to shareholders including thirty-nine funds for the period ended February 29, 2020. The first report applies to Alternative Asset Allocation Fund, the second report applies to Blue Chip Growth Fund, the third report applies to Equity Income Fund, the fourth report applies to Fundamental Global Franchise Fund, the fifth report applies to Global Equity Fund, the sixth report applies to Income Allocation Fund, the seventh report applies to Small Cap Value Fund, the eighth report applies to 11 Multi-Index Lifetime Portfolios, the ninth report applies to 10 Multi-Index Preservation Portfolios, the tenth report applies to 11 Multimanager Lifetime Portfolios of the Registrant.
John Hancock
Alternative Asset Allocation Fund
Semiannual report 2/29/2020
Beginning on January 1, 2021, as permitted by regulations adopted by the Securities and Exchange Commission, paper copies of the fund's shareholder reports like this one will no longer be sent by mail, unless you specifically request paper copies of the reports from the fund or from your financial intermediary. Instead, the reports will be made available on a website, and you will be notified by mail each time a report is posted and provided with a website link to access the report.
If you already elected to receive shareholder reports electronically, you will not be affected by this change, and you do not need to take any action. You may elect to receive shareholder reports and other communications electronically by calling John Hancock Investment Management at 800-225-5291 (Class A and Class C shares) or 888-972-8696 (Class I, Class R2, Class R4, and Class R6 shares) or by contacting your financial intermediary.
You may elect to receive all reports in paper, free of charge, at any time. You can inform John Hancock Investment Management or your financial intermediary that you wish to continue receiving paper copies of your shareholder reports by following the instructions listed above. Your election to receive reports in paper will apply to all funds held with John Hancock Investment Management or your financial intermediary.

A message to shareholders
Dear shareholder,
Global financial markets were on pace to deliver strong returns during the 6 months ended February 29, 2020, until heightened fears over the coronavirus (COVID-19) sent the markets skidding during the last week of the period. Prior to the turbulence, investors benefited from a combination of low inflation, accommodative central bank policy, healthy fundamentals, and corporate buybacks of stock. Investors in non-U.S. equities also saw strong gains, fueled in part by similarly supportive monetary policy and some signs of strength in developing markets. In an environment of low inflation and declining interest rates, bonds were also faring well.
However, the COVID-19 pandemic and plummeting oil prices put an end to all that good news. Shortly after period end, the U.S. Federal Reserve lowered interest rates and lawmakers embarked on a plan to launch major fiscal stimulus to support the economy.
After the longest bull market in U.S. history, we're now in bear market territory. Indeed, the spread of COVID-19, trade disputes, rising unemployment, and other geopolitical tensions may continue to create uncertainty among businesses and investors. Your financial professional can helpposition your portfolio so that it's sufficiently diversified to seek to meet your long-term objectives and to withstand the inevitable bouts of market volatility along the way.
On behalf of everyone at John Hancock Investment Management, I'd like to take this opportunity to welcome new shareholders and thank existing shareholders for the continued trust you've placed in us.
Sincerely,
Andrew G. Arnott
President and CEO,
John Hancock Investment Management
Head of Wealth and Asset Management,
United States and Europe
This commentary reflects the CEO's views as of this report's period end and are subject to change at any time. Diversification does not guarantee investment returns and does not eliminate risk of loss. All investments entail risks, including the possible loss of principal. For more up-to-date information, you can visit our website at jhinvestments.com.
John Hancock
Alternative Asset Allocation Fund
Table of contents
| | | |
| 2 | | Your fund at a glance |
| 3 | | Portfolio summary |
| 4 | | A look at performance |
| 6 | | Your expenses |
| 8 | | Fund's investments |
| 10 | | Financial statements |
| 13 | | Financial highlights |
| 19 | | Notes to financial statements |
| 29 | | More information |
SEMIANNUAL REPORT | JOHN HANCOCK ALTERNATIVE ASSET ALLOCATION FUND 1
INVESTMENT OBJECTIVE
The fund seeks long-term growth of capital.
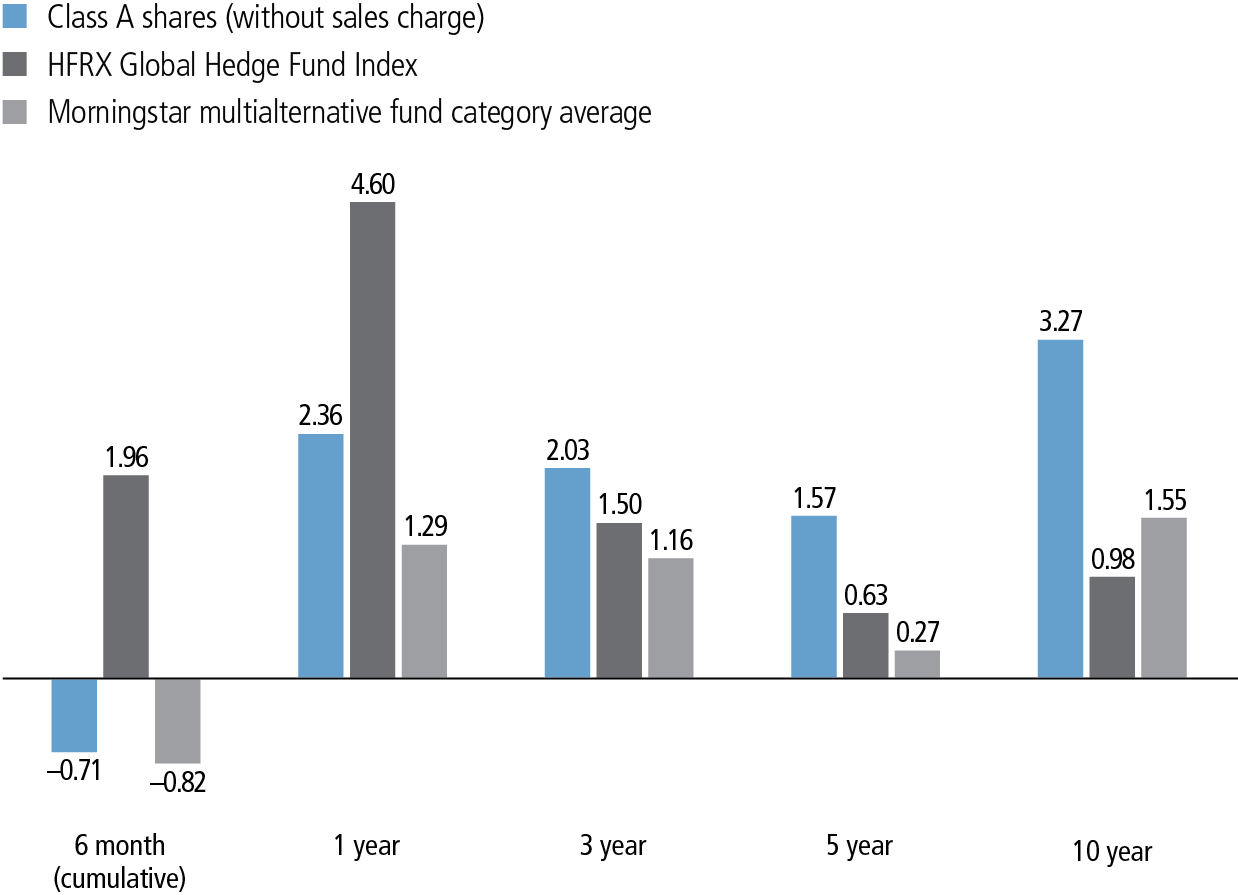
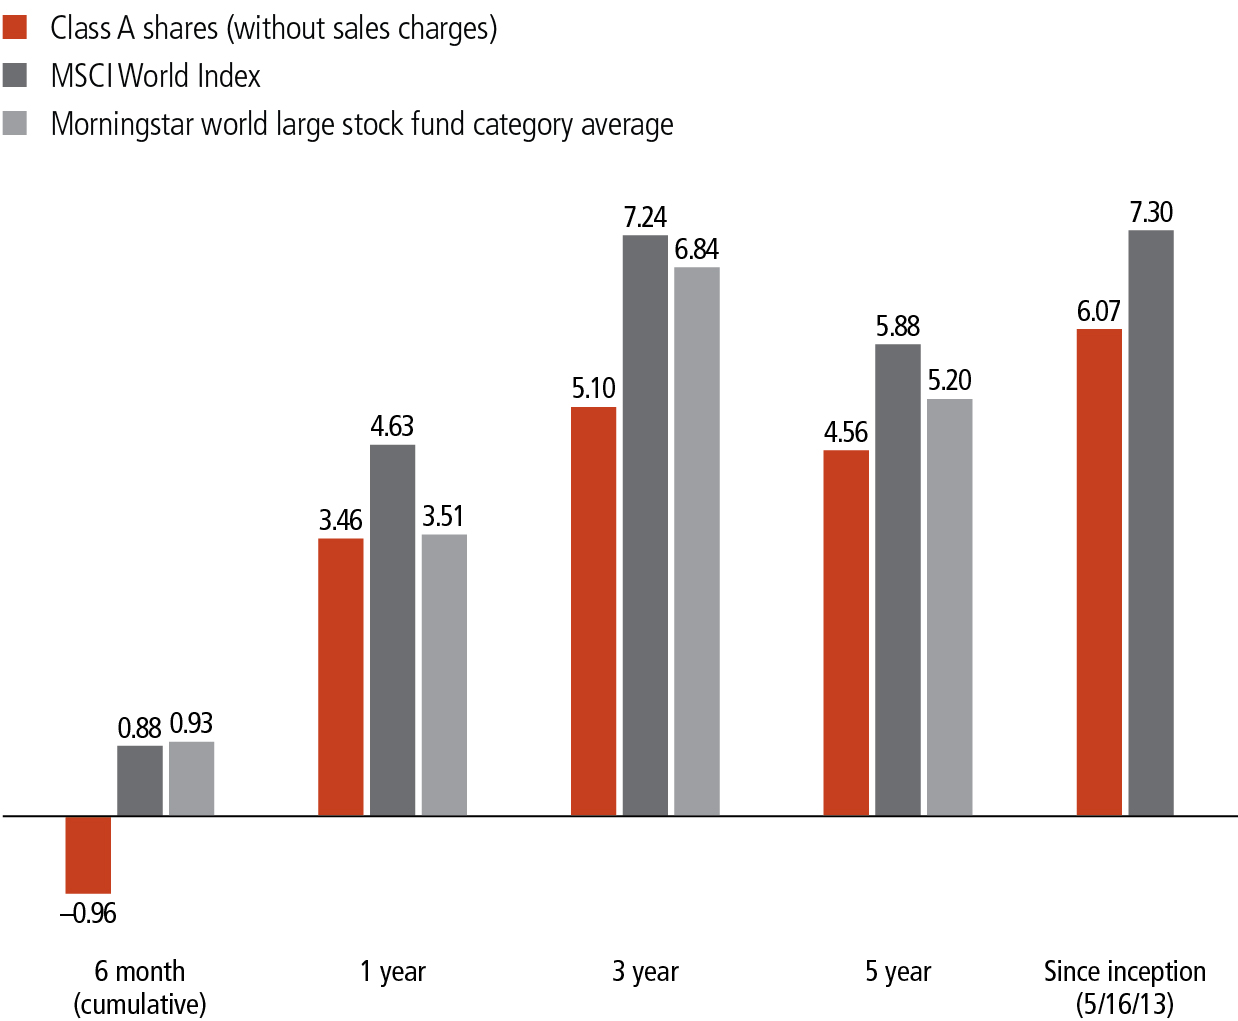
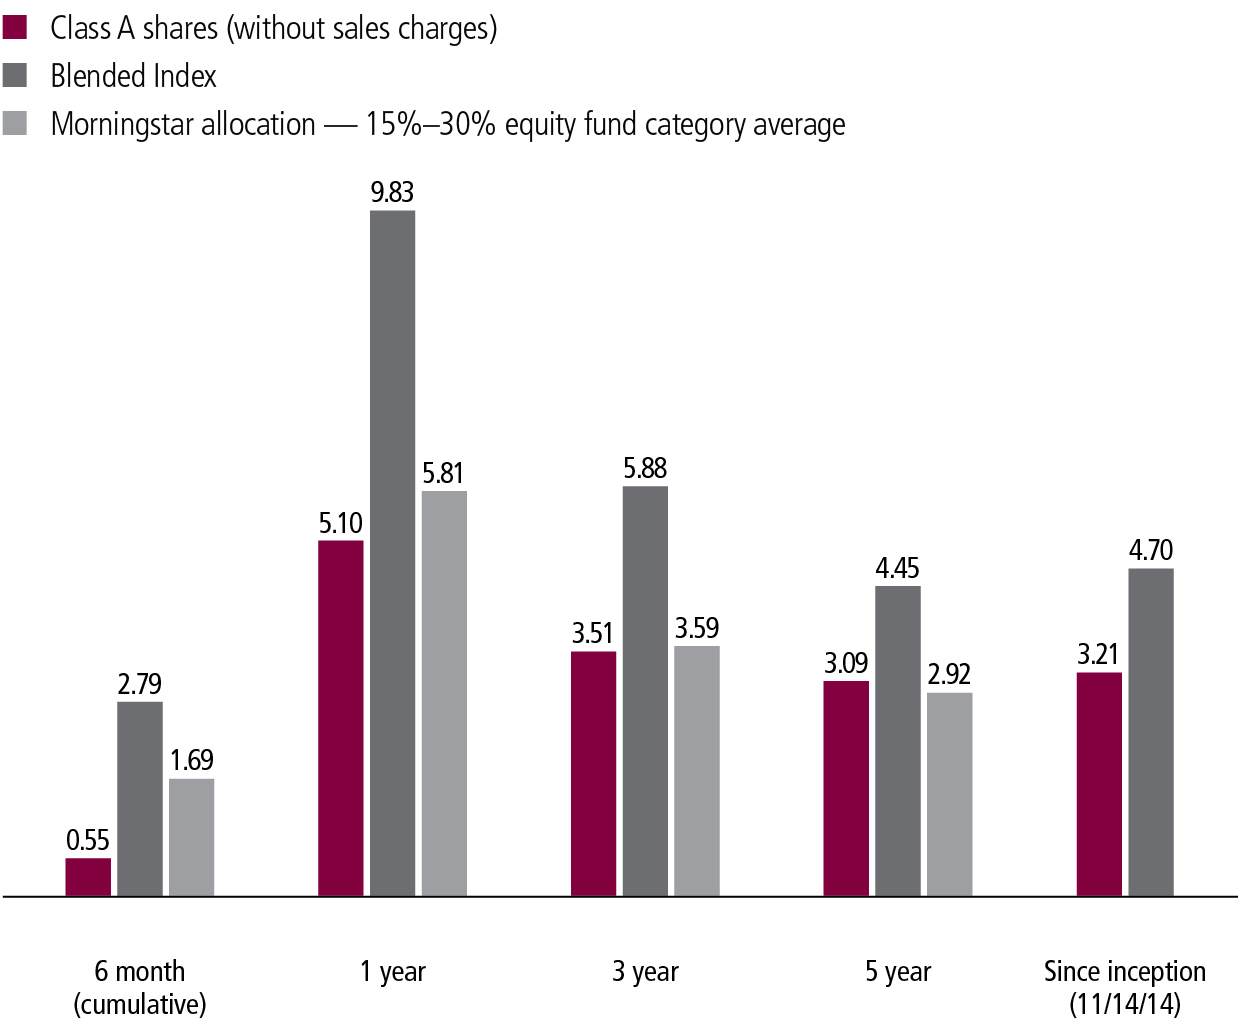
AVERAGE ANNUAL TOTAL RETURNS AS OF 2/29/2020 (%)
The HFRX Global Hedge Fund Index is composed of all eligible hedge fund strategies including four principal strategies: equity hedge, event driven, macro/managed futures, and relative value arbitrage.
It is not possible to invest directly in an index. Index figures do not reflect expenses or sales charges, which would result in lower returns.
Figures from Morningstar, Inc. include reinvested distributions and do not take into account sales charges. Actual load-adjusted performance is lower. Since-inception returns for the Morningstar fund category average are not available.
The past performance shown here reflects reinvested distributions and the beneficial effect of any expense reductions, and does not guarantee future results. Returns for periods shorter than one year are cumulative. Performance of the other share classes will vary based on the difference in the fees and expenses of those classes. Shares will fluctuate in value and, when redeemed, may be worth more or less than their original cost. Current month-end performance may be lower or higher than the performance cited, and can be found at jhinvestments.com or by calling 800-225-5291. For further information on the fund's objectives, risks, and strategy, see the fund's prospectus. The fund recently experienced negative short-term performance due to market volatility associated with the COVID-19 pandemic.
SEMIANNUAL REPORT | JOHN HANCOCK ALTERNATIVE ASSET ALLOCATION FUND 2
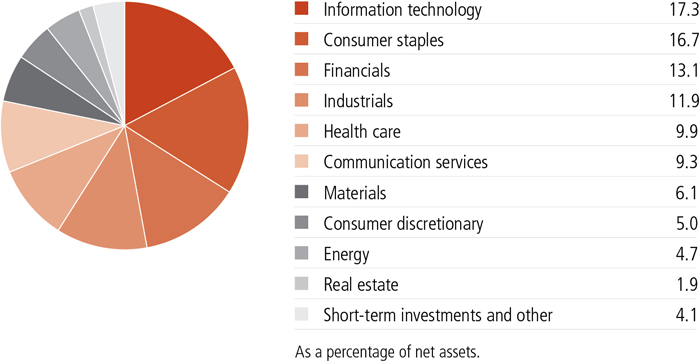
ASSET ALLOCATION AS OF 2/29/2020 (%)
| | | |
| Affiliated investment companies | 72.4 |
| | Alternative investment approaches | 33.5 |
| | Absolute return strategies | 32.5 |
| | Alternative markets | 6.4 |
| Unaffiliated investment companies | 26.5 |
| | Alternative investment approaches | 11.2 |
| | Absolute return strategies | 11.2 |
| | Alternative markets | 4.1 |
| Short-term investments and other | 1.1 |
As a percentage of net assets.
A note about risks
The fund may be subject to various risks as described in the fund's prospectus. For more information, please refer to the "Principal risks" section of the prospectus and "Subsequent events" section in the Notes to financial statements.
SEMIANNUAL REPORT | JOHN HANCOCK ALTERNATIVE ASSET ALLOCATION FUND 3
TOTAL RETURNS FOR THE PERIOD ENDED FEBRUARY 29, 2020
| | | | | | | | |
Average annual total returns (%)
with maximum sales charge | | Cumulative total returns (%)
with maximum sales charge |
| | 1-year | 5-year | 10-year1 | | 6-month | 5-year | 10-year1 |
| Class A | -2.76 | 0.53 | 2.74 | | -5.68 | 2.67 | 31.09 |
| Class C2 | 0.67 | 0.87 | 2.65 | | -2.01 | 4.42 | 29.89 |
| Class I2,3 | 2.73 | 1.89 | 3.59 | | -0.49 | 9.82 | 42.26 |
| Class R22,3 | 2.27 | 1.47 | 3.16 | | -0.73 | 7.58 | 36.54 |
| Class R42,3 | 2.52 | 1.73 | 3.37 | | -0.62 | 8.95 | 39.27 |
| Class R62,3 | 2.84 | 2.00 | 3.62 | | -0.45 | 10.40 | 42.70 |
| Index† | 4.60 | 0.63 | 0.98 | | 1.96 | 3.20 | 10.26 |
Performance figures assume all distributions are reinvested. Figures reflect maximum sales charges on Class A shares of 5% and the applicable contingent deferred sales charge (CDSC) on Class C shares. Class C shares held for less than one year are subject to a 1% CDSC. Sales charges are not applicable to Class I, Class R2, Class R4, and Class R6 shares.
The expense ratios of the fund, both net (including any fee waivers and/or expense limitations) and gross (excluding any fee waivers and/or expense limitations), are set forth according to the most recent publicly available prospectuses for the fund and may differ from those disclosed in the Financial highlights tables in this report. Net expenses reflect contractual expense limitations in effect until December 31, 2020 and are subject to change. Had the contractual fee waivers and expense limitations not been in place, gross expenses would apply. The following expense ratios include expenses of the affiliated underlying funds in which the fund invests. The expense ratios are as follows:
| | | | | | | |
| | Class A | Class C | Class I | Class R2 | Class R4 | Class R6 |
| Gross (%) | 1.78 | 2.48 | 1.48 | 1.87 | 1.72 | 1.37 |
| Net (%) | 1.70 | 2.40 | 1.40 | 1.79 | 1.54 | 1.29 |
Please refer to the most recent prospectus and annual or semiannual report for more information on expenses and any expense limitation arrangements for each class.
The returns reflect past results and should not be considered indicative of future performance. The return and principal value of an investment will fluctuate so that shares, when redeemed, may be worth more or less than their original cost. Due to market volatility and other factors, the fund's current performance may be higher or lower than the performance shown. For current to the most recent month-end performance data, please call 800-225-5291 or visit the fund's website at jhinvestments.com.
The performance table above and the chart on the next page do not reflect the deduction of taxes that a shareholder would pay on fund distributions or the redemption of fund shares. The fund's performance results reflect any applicable fee waivers or expense reductions, without which the expenses would increase and results would have been less favorable.
| † | Index is the HFRX Global Hedge Fund Index. |
See the following page for footnotes.
SEMIANNUAL REPORT | JOHN HANCOCK ALTERNATIVE ASSET ALLOCATION FUND 4
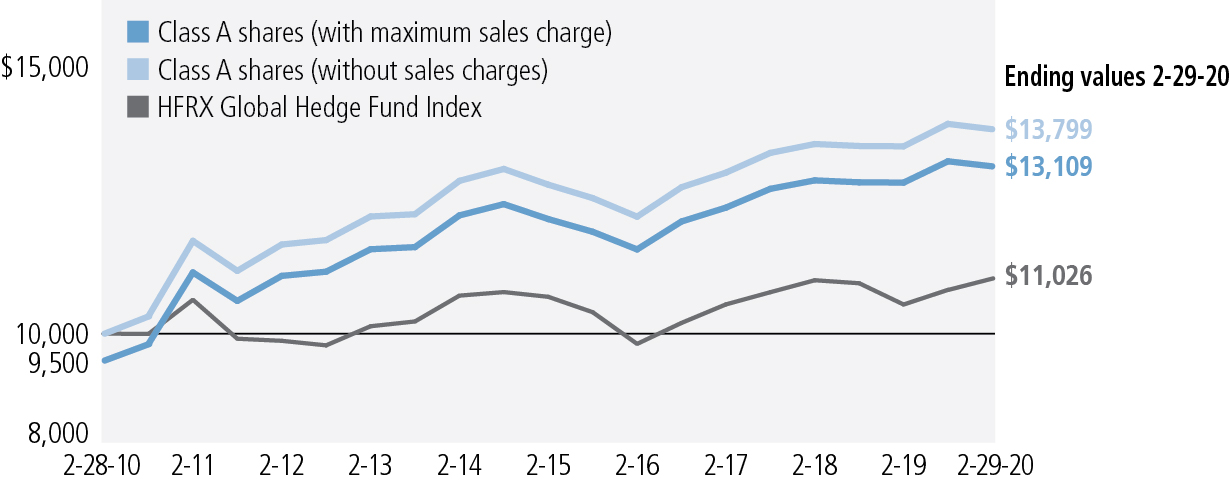
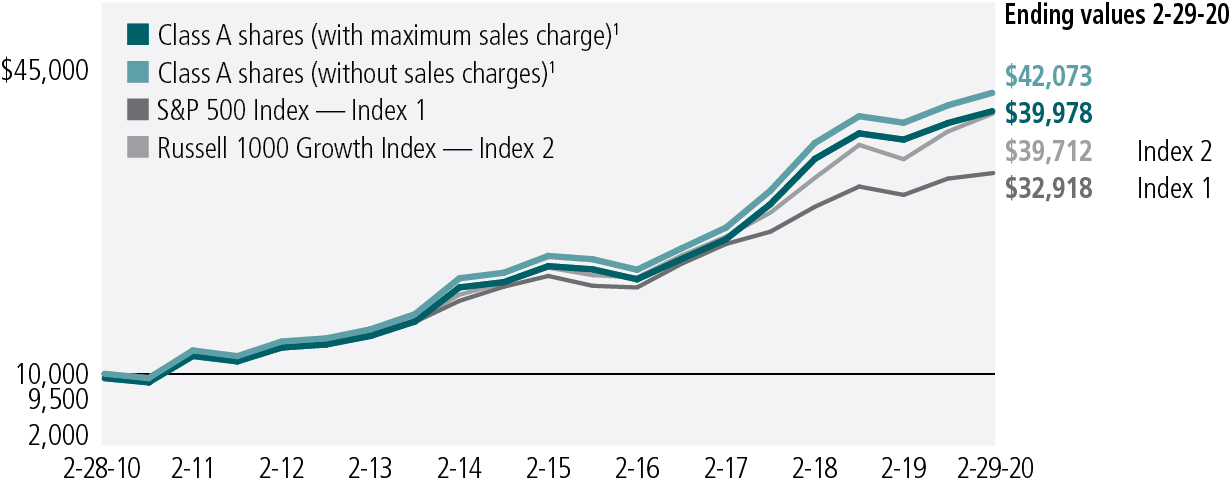
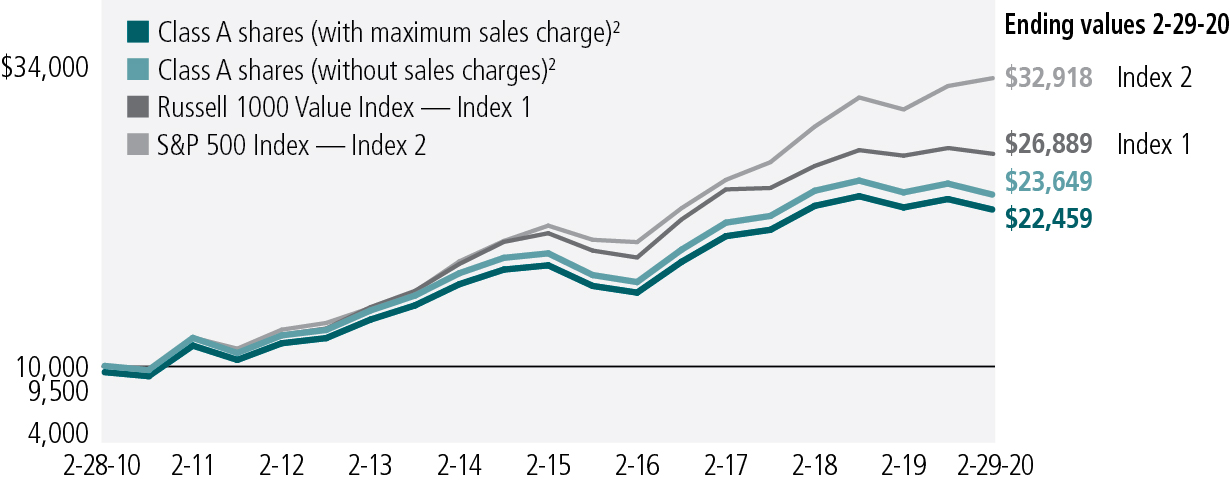
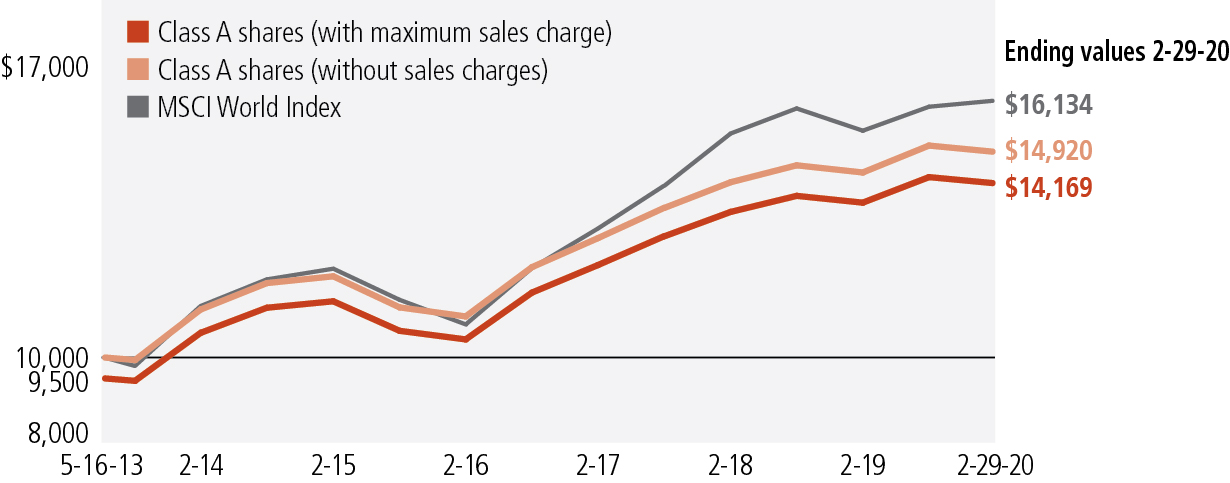
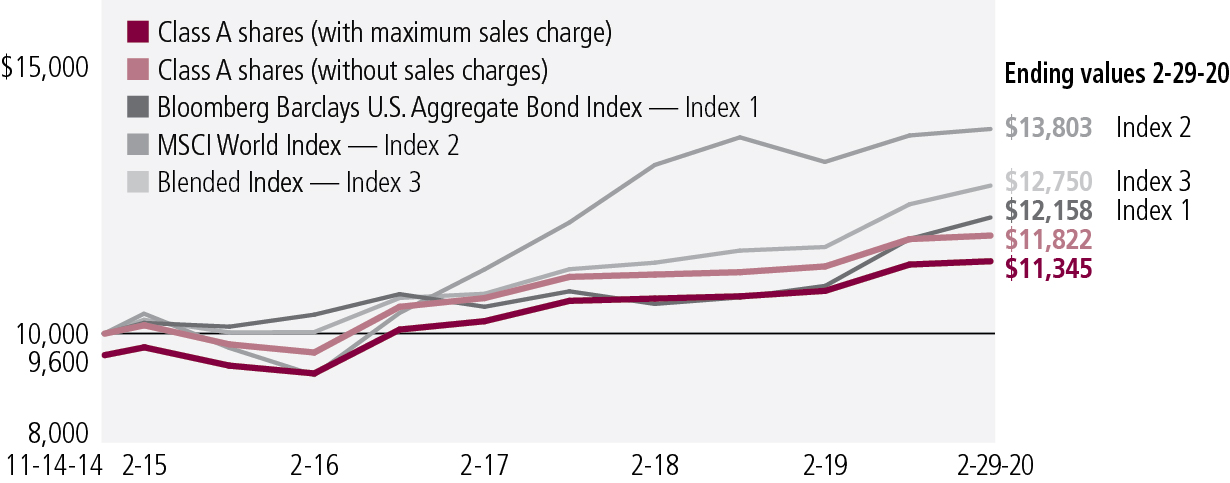
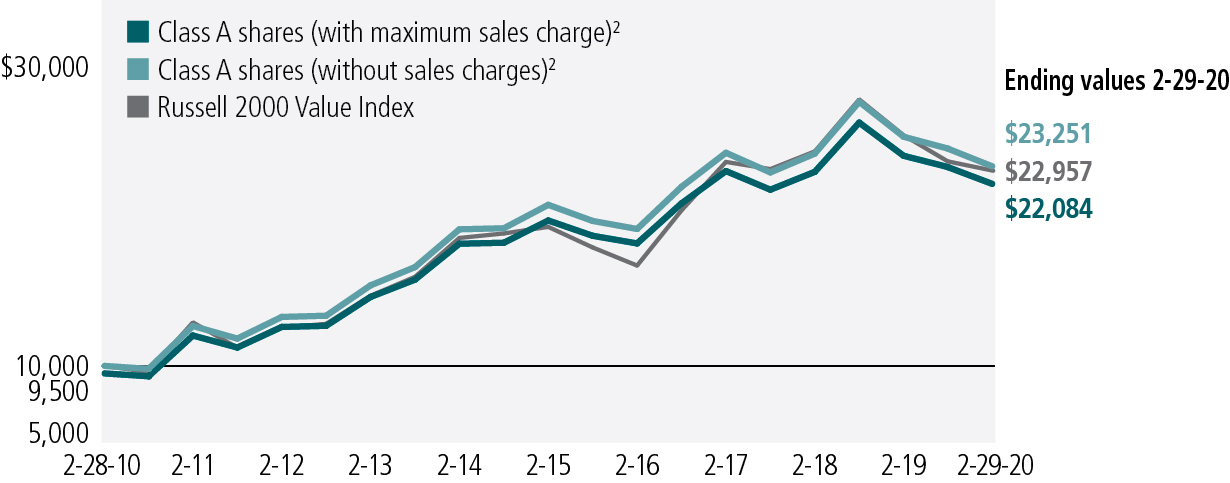
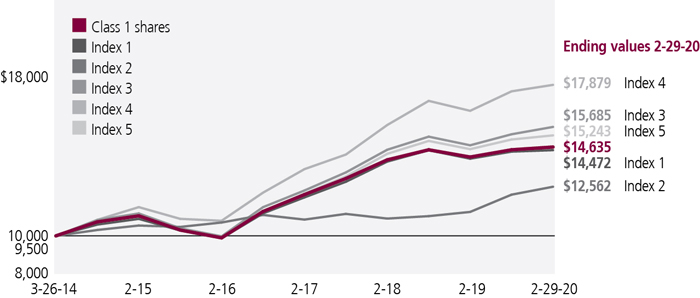
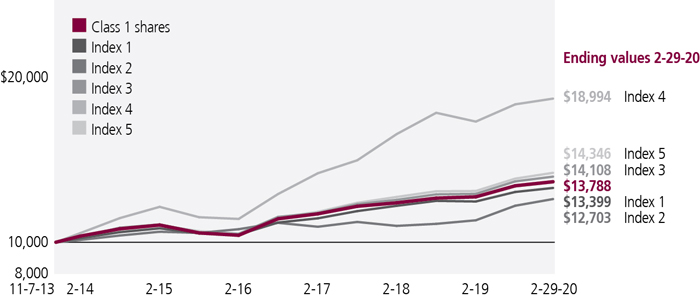
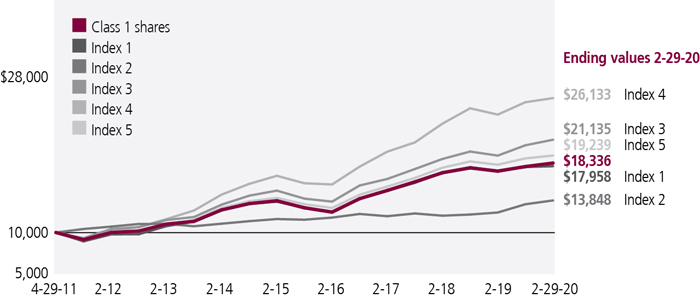
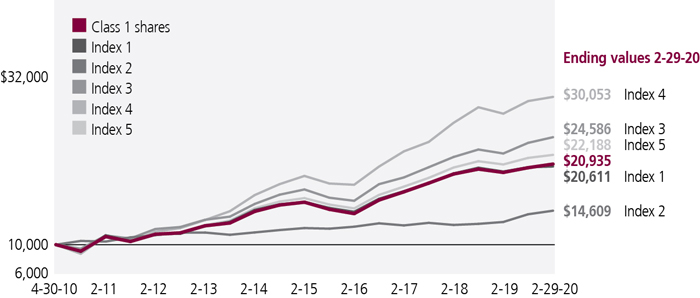
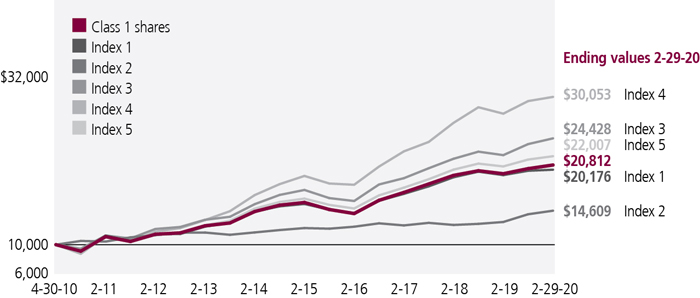
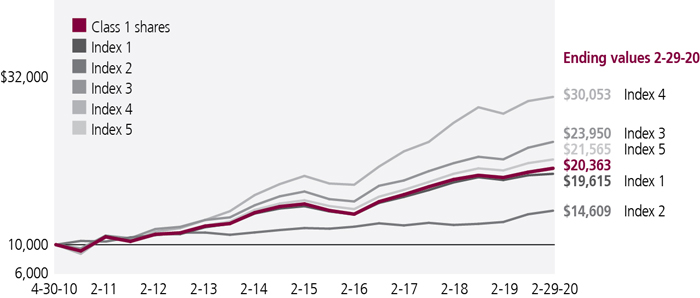
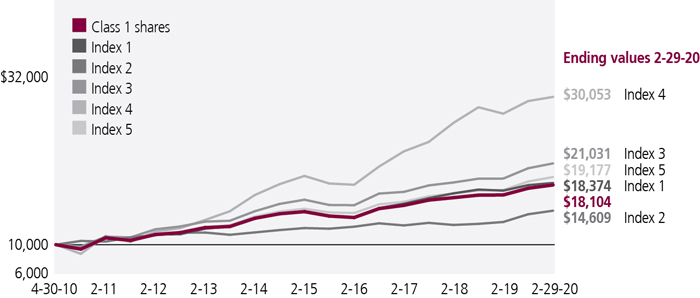
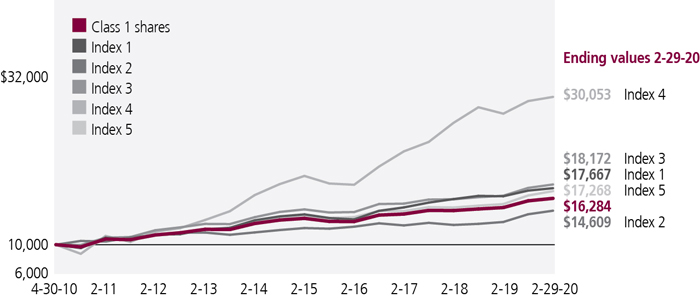
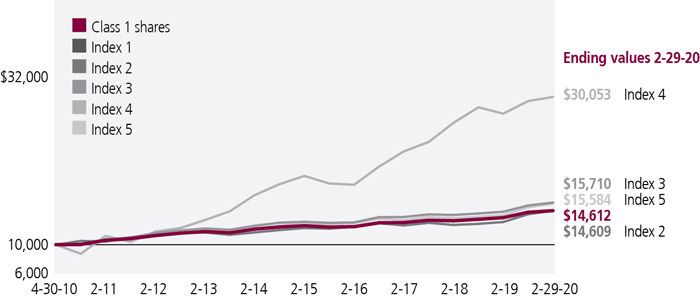
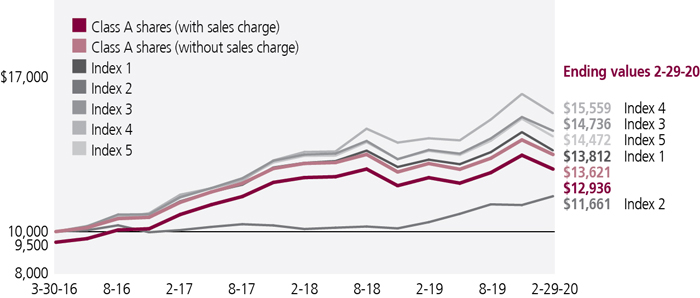
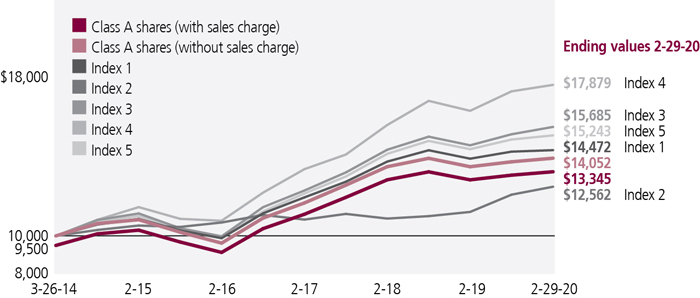
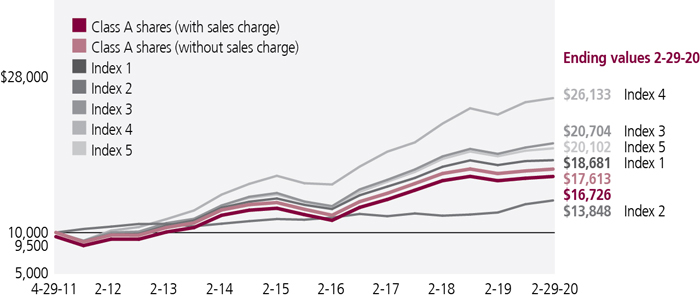
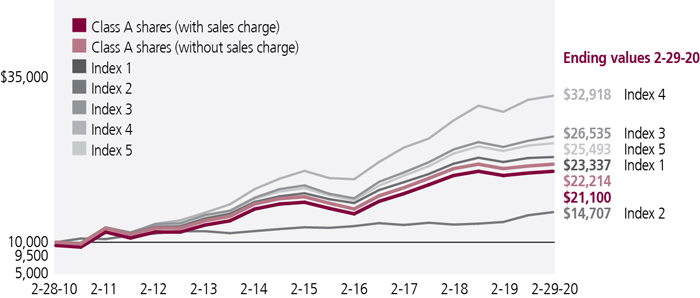
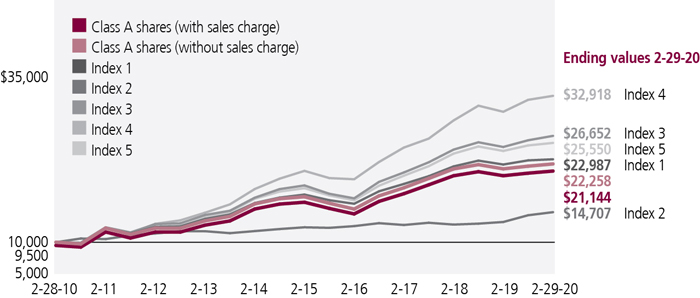
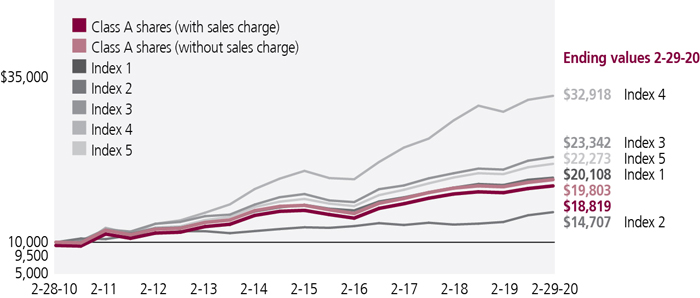
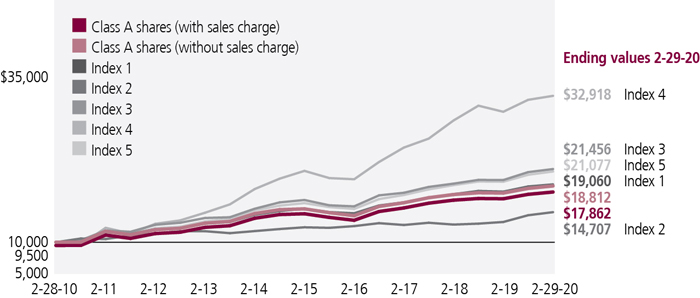
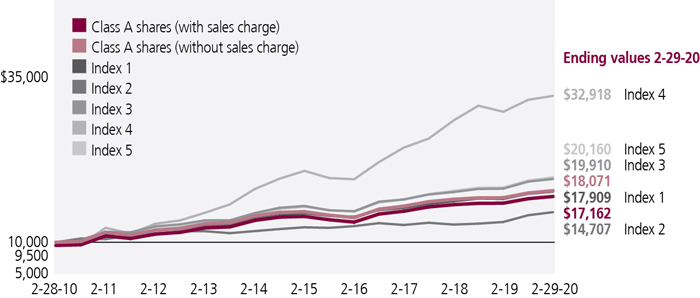
This chart and table show what happened to a hypothetical $10,000 investment in John Hancock Alternative Asset Allocation Fund for the share classes and periods indicated, assuming all distributions were reinvested. For comparison, we've shown the same investment in the HFRX Global Hedge Fund Index.
| | | | | |
| | Start date | With maximum
sales charge ($) | Without
sales charge ($) | Index ($) |
| Class C2,.4 | 2-28-10 | 12,989 | 12,989 | 11,026 |
| Class I2,3 | 2-28-10 | 14,226 | 14,226 | 11,026 |
| Class R22,3 | 2-28-10 | 13,654 | 13,654 | 11,026 |
| Class R42,3 | 2-28-10 | 13,927 | 13,927 | 11,026 |
| Class R62,3 | 2-28-10 | 14,270 | 14,270 | 11,026 |
The HFRX Global Hedge Fund Index is composed of all eligible hedge fund strategies, including four principal strategies: equity hedge, event driven, macro/managed futures, and relative value arbitrage.
It is not possible to invest directly in an index. Index figures do not reflect expenses or sales charges, which would result in lower returns.
Footnotes related to performance pages
| 1 | Performance information prior to 12-20-10 reflects an allocation to a different mix of underlying funds, and would have been different if the fund's investments had been allocated to its current mix of underlying funds. |
| 2 | Class C shares were first offered on 6-14-11; Class I shares were first offered on 12-31-10; Class R2 shares were first offered on 3-1-12; Class R4 shares were first offered on 6-27-13; Class R6 shares were first offered on 9-1-11. Returns prior to these dates are those of Class A shares that have not been adjusted for class-specific expenses; otherwise, returns would vary. |
| 3 | For certain types of investors, as described in the fund's prospectus. |
| 4 | The contingent deferred sales charge is not applicable. |
SEMIANNUAL REPORT | JOHN HANCOCK ALTERNATIVE ASSET ALLOCATION FUND 5
These examples are intended to help you understand your ongoing operating expenses of investing in the fund so you can compare these costs with the ongoing costs of investing in other mutual funds.
Understanding fund expenses
As a shareholder of the fund, you incur two types of costs:
■Transaction costs,which include sales charges (loads) on purchases or redemptions (varies by share class), minimum account fee charge, etc.
■Ongoing operating expenses, including management fees, distribution and service fees (if applicable), and other fund expenses.
We are presenting only your ongoing operating expenses here.
Actual expenses/actual returns
The first line of each share class in the table on the following page is intended to provide information about the fund’s actual ongoing operating expenses, and is based on the fund’s actual return. It assumes an account value of $1,000.00 on September 1, 2019, with the same investment held until February 29, 2020.
Together with the value of your account, you may use this information to estimate the operating expenses that you paid over the period. Simply divide your account value at February 29, 2020, by $1,000.00, then multiply it by the “expenses paid” for your share class from the table. For example, for an account value of $8,600.00, the operating expenses should be calculated as follows:
Hypothetical example for comparison purposes
The second line of each share class in the table on the following page allows you to compare the fund’s ongoing operating expenses with those of any other fund. It provides an example of the fund’s hypothetical account values and hypothetical expenses based on each class’s actual expense ratio and an assumed 5% annualized return before expenses (which is not the class’s actual return). It assumes an account value of $1,000.00 on September 1, 2019, with the same investment held until February 29, 2020. Look in any other fund shareholder report to find its hypothetical example and you will be able to compare these expenses. Please remember that these hypothetical account values and expenses may not be used to estimate the actual ending account balance or expenses you paid for the period.
| 6 | JOHN HANCOCK ALTERNATIVE ASSET ALLOCATION FUND | SEMIANNUAL REPORT | |
Remember, these examples do not include any transaction costs, therefore, these examples will not help you to determine the relative total costs of owning different funds. If transaction costs were included, your expenses would have been higher. See the prospectus for details regarding transaction costs.
SHAREHOLDER EXPENSE EXAMPLE CHART
| | | Account
value on
9-1-2019 | Ending
value on
2-29-2020 | Expenses
paid during
period ended
2-29-20201 | Annualized
expense
ratio2 |
| Class A | Actual expenses/actual returns | $1,000.00 | $992.90 | $3.27 | 0.66% |
| | Hypothetical example | 1,000.00 | 1,021.60 | 3.32 | 0.66% |
| Class C | Actual expenses/actual returns | 1,000.00 | 989.60 | 6.73 | 1.36% |
| | Hypothetical example | 1,000.00 | 1,018.10 | 6.82 | 1.36% |
| Class I | Actual expenses/actual returns | 1,000.00 | 995.10 | 1.79 | 0.36% |
| | Hypothetical example | 1,000.00 | 1,023.10 | 1.81 | 0.36% |
| Class R2 | Actual expenses/actual returns | 1,000.00 | 992.70 | 3.72 | 0.75% |
| | Hypothetical example | 1,000.00 | 1,021.10 | 3.77 | 0.75% |
| Class R4 | Actual expenses/actual returns | 1,000.00 | 993.80 | 2.48 | 0.50% |
| | Hypothetical example | 1,000.00 | 1,022.40 | 2.51 | 0.50% |
| Class R6 | Actual expenses/actual returns | 1,000.00 | 995.50 | 1.24 | 0.25% |
| | Hypothetical example | 1,000.00 | 1,023.60 | 1.26 | 0.25% |
| 1 | Expenses are equal to the annualized expense ratio, multiplied by the average account value over the period, multiplied by 182/366 (to reflect the one-half year period). |
| 2 | Ratios do not include fees and expenses indirectly incurred by the underlying funds and can vary based on mixed of underlying funds held by the fund. |
| | SEMIANNUAL REPORT | JOHN HANCOCK ALTERNATIVE ASSET ALLOCATION FUND | 7 |
AS OF 2-29-20 (unaudited)
| | | | | Shares | Value |
| Affiliated investment companies (A) 72.4% | | | $387,667,674 |
| (Cost $387,159,226) | | | | | |
| Absolute return strategies 32.5% | | | 174,163,387 |
| Absolute Return Currency, Class NAV, JHF II (First Quadrant) | | | | 2,522,368 | 23,382,349 |
| Alternative Risk Premia, Class NAV, JHIT (Unigestion) | | | | 3,378,538 | 32,366,397 |
| Credit Suisse Managed Futures Strategy Fund (B) | | | | 2,656,220 | 24,543,473 |
| Diversified Macro, Class NAV, JHIT (Graham) | | | | 4,554,558 | 41,264,299 |
| Multi-Asset Absolute Return, Class NAV, JHF II (NIMNAI) | | | | 5,755,675 | 52,606,869 |
| Alternative investment approaches 33.5% | | | 179,325,949 |
| Seaport Long/Short, Class NAV, JHIT (Wellington) | | | | 6,538,507 | 75,650,521 |
| Short Duration Credit Opportunities, Class NAV, JHF II (Stone Harbor) | | | | 4,387,528 | 41,813,142 |
| Strategic Income Opportunities, Class NAV, JHF II (MIM US) (C) | | | | 5,792,349 | 61,862,286 |
| Alternative markets 6.4% | | | 34,178,338 |
| Infrastructure, Class NAV, JHIT (Wellington) | | | | 1,952,333 | 25,106,997 |
|
| Invesco DB Gold Fund (B) | | | | 194,372 | 9,071,341 |
| Unaffiliated investment companies 26.5% | | | $142,144,102 |
| (Cost $140,017,264) | | | | | |
| Absolute return strategies 11.2% | | | 59,841,817 |
| IQ Merger Arbitrage ETF (D) | | | | 613,755 | 20,229,365 |
| The Arbitrage Fund, Class I | | | | 2,967,225 | 39,612,452 |
| Alternative investment approaches 11.2% | | | 60,134,602 |
| JPMorgan Hedged Equity Fund | | | | 2,924,835 | 60,134,602 |
| Alternative markets 4.1% | | | 22,167,683 |
| Invesco Optimum Yield Diversified Commodity Strategy No. K-1 ETF | | | | 1,046,640 | 14,809,956 |
| Vanguard Real Estate ETF | | | | 84,252 | 7,357,727 |
| | Yield* (%) | Maturity date | | Par value^ | Value |
| Short-term investments 1.1% | | | | | $5,689,207 |
| (Cost $5,688,949) | | | | | |
| U.S. Government 1.1% | | | | | 5,629,310 |
| U.S. Treasury Bill | 1.515 | 03-05-20 | | 5,630,000 | 5,629,310 |
| 8 | JOHN HANCOCK ALTERNATIVE ASSET ALLOCATION FUND | SEMIANNUAL REPORT | SEE NOTES TO FINANCIAL STATEMENTS |
| | | Yield (%) | | Shares | Value |
| Short-term funds 0.0% | | | | | 59,897 |
| State Street Institutional U.S. Government Money Market Fund, Premier Class | 1.5386(E) | | 59,897 | 59,897 |
|
| Total investments (Cost $532,865,439) 100.0% | | | $535,500,983 |
| Other assets and liabilities, net 0.0% | | | | 235,130 |
| Total net assets 100.0% | | | | | $535,736,113 |
| The percentage shown for each investment category is the total value of the category as a percentage of the net assets of the fund. |
| ^All par values are denominated in U.S. dollars unless otherwise indicated. |
| Security Abbreviations and Legend |
| JHF II | John Hancock Funds II |
| JHIT | John Hancock Investment Trust |
| (A) | The underlying funds' subadvisor is shown parenthetically. |
| (B) | The fund owns 5% or more of the outstanding voting shares of the issuer and the security is considered an affiliate of the fund. For more information on this security refer to the Notes to financial statements. |
| (C) | The subadvisor is an affiliate of the advisor. |
| (D) | Non-income producing. |
| (E) | The rate shown is the annualized seven-day yield as of 2-29-20. |
| * | Yield represents either the annualized yield at the date of purchase, the stated coupon rate or, for floating rate securities, the rate at period end. |
At 2-29-20, the aggregate cost of investments for federal income tax purposes was $543,812,299. Net unrealized depreciation aggregated to $8,311,316, of which $5,200,227 related to gross unrealized appreciation and $13,511,543 related to gross unrealized depreciation.
| Subadvisors of Affiliated Underlying Funds | |
| First Quadrant, L.P. | (First Quadrant) |
| Graham Capital Management, L.P. | (Graham) |
| Manulife Investment Management (US) LLC | (MIM US) |
| Nordea Investment Management North America, Inc. | (NIMNAI) |
| Stone Harbor Investment Partners LP | (Stone Harbor) |
| Unigestion (UK) Limited | (Unigestion) |
| Wellington Management Company LLP | (Wellington) |
| SEE NOTES TO FINANCIAL STATEMENTS | SEMIANNUAL REPORT | JOHN HANCOCK ALTERNATIVE ASSET ALLOCATION FUND | 9 |
STATEMENT OF ASSETS AND LIABILITIES 2-29-20 (unaudited)
| Assets | |
| Unaffiliated investments, at value (Cost $145,706,213) | $147,833,309 |
| Affiliated investments, at value (Cost $387,159,226) | 387,667,674 |
| Total investments, at value (Cost $532,865,439) | 535,500,983 |
| Dividends and interest receivable | 242,078 |
| Receivable for fund shares sold | 935,787 |
| Receivable for investments sold | 1,139,227 |
| Receivable for securities lending income | 20 |
| Receivable from affiliates | 9,033 |
| Other assets | 67,469 |
| Total assets | 537,894,597 |
| Liabilities | |
| Due to custodian | 63,187 |
| Payable for investments purchased | 241,628 |
| Payable for fund shares repurchased | 1,717,081 |
| Payable to affiliates | |
| Accounting and legal services fees | 13,960 |
| Transfer agent fees | 49,133 |
| Distribution and service fees | 593 |
| Trustees' fees | 1,110 |
| Other liabilities and accrued expenses | 71,792 |
| Total liabilities | 2,158,484 |
| Net assets | $535,736,113 |
| Net assets consist of | |
| Paid-in capital | $590,773,573 |
| Total distributable earnings (loss) | (55,037,460) |
| Net assets | $535,736,113 |
| |
| Net asset value per share | |
| Based on net asset value and shares outstanding - the fund has an unlimited number of shares authorized with no par value | |
| Class A ($67,096,312 ÷ 4,764,204 shares)1 | $14.08 |
| Class C ($36,775,371 ÷ 2,600,800 shares)1 | $14.14 |
| Class I ($409,904,718 ÷ 29,101,632 shares) | $14.09 |
| Class R2 ($1,368,027 ÷ 97,234 shares) | $14.07 |
| Class R4 ($87,730 ÷ 6,223 shares) | $14.10 |
| Class R6 ($20,503,955 ÷ 1,455,569 shares) | $14.09 |
| Maximum offering price per share | |
| Class A (net asset value per share ÷ 95%)2 | $14.82 |
| 1 | Redemption price per share is equal to net asset value less any applicable contingent deferred sales charge. |
| 2 | On single retail sales of less than $50,000. On sales of $50,000 or more and on group sales the offering price is reduced. |
| 10 | JOHN HANCOCK Alternative Asset Allocation Fund | SEMIANNUAL REPORT | SEE NOTES TO FINANCIAL STATEMENTS |
STATEMENT OF OPERATIONS For the six months ended 2-29-20 (unaudited)
| Investment income | |
| Income distributions received from affiliated investments | $4,606,637 |
| Dividends | 695,116 |
| Interest | 52,443 |
| Securities lending | 8,916 |
| Total investment income | 5,363,112 |
| Expenses | |
| Investment management fees | 981,422 |
| Distribution and service fees | 310,195 |
| Accounting and legal services fees | 50,541 |
| Transfer agent fees | 330,144 |
| Trustees' fees | 5,171 |
| Custodian fees | 24,675 |
| State registration fees | 45,447 |
| Printing and postage | 39,267 |
| Professional fees | 28,277 |
| Other | 26,952 |
| Total expenses | 1,842,091 |
| Less expense reductions | (549,347) |
| Net expenses | 1,292,744 |
| Net investment income | 4,070,368 |
| Realized and unrealized gain (loss) | |
| Net realized gain (loss) on | |
| Unaffiliated investments | 150,321 |
| Affiliated investments | (4,513,541) |
| Capital gain distributions received from unaffiliated investments | 780,190 |
| Capital gain distributions received from affiliated investments | 9,639,956 |
| | 6,056,926 |
| Change in net unrealized appreciation (depreciation) of | |
| Unaffiliated investments | (1,534,710) |
| Affiliated investments | (11,380,879) |
| | (12,915,589) |
| Net realized and unrealized loss | (6,858,663) |
| Decrease in net assets from operations | $(2,788,295) |
| SEE NOTES TO FINANCIAL STATEMENTS | SEMIANNUAL REPORT | JOHN HANCOCK Alternative Asset Allocation Fund | 11 |
STATEMENTS OF CHANGES IN NET ASSETS
| | Six months ended
2-29-20
(unaudited) | Year ended
8-31-19 |
| Increase (decrease) in net assets | | |
| From operations | | |
| Net investment income | $4,070,368 | $11,584,852 |
| Net realized gain (loss) | 6,056,926 | (8,139,442) |
| Change in net unrealized appreciation (depreciation) | (12,915,589) | 13,005,662 |
| Increase (decrease) in net assets resulting from operations | (2,788,295) | 16,451,072 |
| Distributions to shareholders | | |
| From earnings | | |
| Class A | (2,347,118) | (1,639,841) |
| Class C | (1,030,673) | (598,120) |
| Class I | (15,281,356) | (9,760,461) |
| Class R2 | (44,843) | (43,758) |
| Class R4 | (1,208) | (4,113) |
| Class R6 | (800,607) | (649,346) |
| Total distributions | (19,505,805) | (12,695,639) |
| From fund share transactions | (9,626,003) | (119,232,261) |
| Total decrease | (31,920,103) | (115,476,828) |
| Net assets | | |
| Beginning of period | 567,656,216 | 683,133,044 |
| End of period | $535,736,113 | $567,656,216 |
| 12 | JOHN HANCOCK Alternative Asset Allocation Fund | SEMIANNUAL REPORT | SEE NOTES TO FINANCIAL STATEMENTS |
| CLASS A SHARES Period ended | 2-29-201 | 8-31-19 | 8-31-18 | 8-31-17 | 8-31-16 | 8-31-15 |
| Per share operating performance | | | | | | |
| Net asset value, beginning of period | $14.66 | $14.51 | $14.55 | $13.96 | $14.12 | $15.35 |
| Net investment income2,3 | 0.09 | 0.25 | 0.13 | 0.10 | 0.22 | 0.19 |
| Net realized and unrealized gain (loss) on investments | (0.18) | 0.17 | 0.01 | 0.60 | —4 | (0.81) |
| Total from investment operations | (0.09) | 0.42 | 0.14 | 0.70 | 0.22 | (0.62) |
| Less distributions | | | | | | |
| From net investment income | (0.27) | (0.17) | (0.11) | (0.08) | (0.21) | (0.19) |
| From net realized gain | (0.22) | (0.10) | (0.07) | (0.03) | (0.17) | (0.42) |
| Total distributions | (0.49) | (0.27) | (0.18) | (0.11) | (0.38) | (0.61) |
| Net asset value, end of period | $14.08 | $14.66 | $14.51 | $14.55 | $13.96 | $14.12 |
| Total return (%)5,6 | (0.71)7 | 3.05 | 0.95 | 5.03 | 1.60 | (4.14) |
| Ratios and supplemental data | | | | | | |
| Net assets, end of period (in millions) | $67 | $73 | $95 | $136 | $278 | $404 |
| Ratios (as a percentage of average net assets): | | | | | | |
| Expenses before reductions8 | 0.859 | 0.77 | 0.72 | 0.72 | 0.73 | 0.70 |
| Expenses including reductions8 | 0.669 | 0.64 | 0.59 | 0.59 | 0.59 | 0.56 |
| Net investment income3 | 1.279 | 1.73 | 0.86 | 0.71 | 1.56 | 1.29 |
| Portfolio turnover (%) | 25 | 39 | 18 | 10 | 17 | 45 |
| 1 | Six months ended 2-29-20. Unaudited. |
| 2 | Based on average daily shares outstanding. |
| 3 | Net investment income is affected by the timing and frequency of the declaration of dividends by the underlying funds in which the fund invests. |
| 4 | Less than $0.005 per share. |
| 5 | Total returns would have been lower had certain expenses not been reduced during the applicable periods. |
| 6 | Does not reflect the effect of sales charges, if any. |
| 7 | Not annualized. |
| 8 | Ratios do not include expenses indirectly incurred from underlying funds and can vary based on the mix of underlying funds held by the fund. |
| 9 | Annualized. |
| SEE NOTES TO FINANCIAL STATEMENTS | SEMIANNUAL REPORT | JOHN HANCOCK Alternative Asset Allocation Fund | 13 |
| CLASS C SHARES Period ended | 2-29-201 | 8-31-19 | 8-31-18 | 8-31-17 | 8-31-16 | 8-31-15 |
| Per share operating performance | | | | | | |
| Net asset value, beginning of period | $14.67 | $14.51 | $14.56 | $13.97 | $14.12 | $15.35 |
| Net investment income2,3 | 0.04 | 0.15 | 0.02 | —4 | 0.12 | 0.09 |
| Net realized and unrealized gain (loss) on investments | (0.18) | 0.18 | 0.01 | 0.60 | 0.01 | (0.82) |
| Total from investment operations | (0.14) | 0.33 | 0.03 | 0.60 | 0.13 | (0.73) |
| Less distributions | | | | | | |
| From net investment income | (0.17) | (0.07) | (0.01) | — | (0.11) | (0.08) |
| From net realized gain | (0.22) | (0.10) | (0.07) | (0.01) | (0.17) | (0.42) |
| Total distributions | (0.39) | (0.17) | (0.08) | (0.01) | (0.28) | (0.50) |
| Net asset value, end of period | $14.14 | $14.67 | $14.51 | $14.56 | $13.97 | $14.12 |
| Total return (%)5,6 | (1.04)7 | 2.37 | 0.19 | 4.30 | 0.94 | (4.83) |
| Ratios and supplemental data | | | | | | |
| Net assets, end of period (in millions) | $37 | $42 | $57 | $72 | $99 | $135 |
| Ratios (as a percentage of average net assets): | | | | | | |
| Expenses before reductions8 | 1.559 | 1.47 | 1.42 | 1.42 | 1.43 | 1.41 |
| Expenses including reductions8 | 1.369 | 1.34 | 1.29 | 1.29 | 1.29 | 1.26 |
| Net investment income3 | 0.559 | 1.02 | 0.17 | —10 | 0.85 | 0.59 |
| Portfolio turnover (%) | 25 | 39 | 18 | 10 | 17 | 45 |
| 1 | Six months ended 2-29-20. Unaudited. |
| 2 | Based on average daily shares outstanding. |
| 3 | Net investment income is affected by the timing and frequency of the declaration of dividends by the underlying funds in which the fund invests. |
| 4 | Less than $0.005 per share. |
| 5 | Total returns would have been lower had certain expenses not been reduced during the applicable periods. |
| 6 | Does not reflect the effect of sales charges, if any. |
| 7 | Not annualized. |
| 8 | Ratios do not include expenses indirectly incurred from underlying funds and can vary based on the mix of underlying funds held by the fund. |
| 9 | Annualized. |
| 10 | Less than 0.005%. |
| 14 | JOHN HANCOCK Alternative Asset Allocation Fund | SEMIANNUAL REPORT | SEE NOTES TO FINANCIAL STATEMENTS |
| CLASS I SHARES Period ended | 2-29-201 | 8-31-19 | 8-31-18 | 8-31-17 | 8-31-16 | 8-31-15 |
| Per share operating performance | | | | | | |
| Net asset value, beginning of period | $14.68 | $14.53 | $14.58 | $13.99 | $14.15 | $15.37 |
| Net investment income2,3 | 0.11 | 0.29 | 0.17 | 0.14 | 0.26 | 0.24 |
| Net realized and unrealized gain (loss) on investments | (0.17) | 0.18 | —4 | 0.60 | —4 | (0.81) |
| Total from investment operations | (0.06) | 0.47 | 0.17 | 0.74 | 0.26 | (0.57) |
| Less distributions | | | | | | |
| From net investment income | (0.31) | (0.22) | (0.15) | (0.12) | (0.25) | (0.23) |
| From net realized gain | (0.22) | (0.10) | (0.07) | (0.03) | (0.17) | (0.42) |
| Total distributions | (0.53) | (0.32) | (0.22) | (0.15) | (0.42) | (0.65) |
| Net asset value, end of period | $14.09 | $14.68 | $14.53 | $14.58 | $13.99 | $14.15 |
| Total return (%)5 | (0.49)6 | 3.39 | 1.18 | 5.34 | 1.93 | (3.80) |
| Ratios and supplemental data | | | | | | |
| Net assets, end of period (in millions) | $410 | $423 | $510 | $495 | $433 | $532 |
| Ratios (as a percentage of average net assets): | | | | | | |
| Expenses before reductions7 | 0.558 | 0.49 | 0.42 | 0.40 | 0.42 | 0.39 |
| Expenses including reductions7 | 0.368 | 0.35 | 0.30 | 0.28 | 0.28 | 0.24 |
| Net investment income3 | 1.578 | 2.04 | 1.16 | 1.01 | 1.88 | 1.63 |
| Portfolio turnover (%) | 25 | 39 | 18 | 10 | 17 | 45 |
| 1 | Six months ended 2-29-20. Unaudited. |
| 2 | Based on average daily shares outstanding. |
| 3 | Net investment income is affected by the timing and frequency of the declaration of dividends by the underlying funds in which the fund invests. |
| 4 | Less than $0.005 per share. |
| 5 | Total returns would have been lower had certain expenses not been reduced during the applicable periods. |
| 6 | Not annualized. |
| 7 | Ratios do not include expenses indirectly incurred from underlying funds and can vary based on the mix of underlying funds held by the fund. |
| 8 | Annualized. |
| SEE NOTES TO FINANCIAL STATEMENTS | SEMIANNUAL REPORT | JOHN HANCOCK Alternative Asset Allocation Fund | 15 |
| CLASS R2 SHARES Period ended | 2-29-201 | 8-31-19 | 8-31-18 | 8-31-17 | 8-31-16 | 8-31-15 |
| Per share operating performance | | | | | | |
| Net asset value, beginning of period | $14.64 | $14.49 | $14.53 | $13.95 | $14.11 | $15.33 |
| Net investment income2,3 | 0.08 | 0.24 | 0.11 | 0.08 | 0.20 | 0.14 |
| Net realized and unrealized gain (loss) on investments | (0.17) | 0.17 | 0.01 | 0.60 | 0.01 | (0.79) |
| Total from investment operations | (0.09) | 0.41 | 0.12 | 0.68 | 0.21 | (0.65) |
| Less distributions | | | | | | |
| From net investment income | (0.26) | (0.16) | (0.09) | (0.07) | (0.20) | (0.15) |
| From net realized gain | (0.22) | (0.10) | (0.07) | (0.03) | (0.17) | (0.42) |
| Total distributions | (0.48) | (0.26) | (0.16) | (0.10) | (0.37) | (0.57) |
| Net asset value, end of period | $14.07 | $14.64 | $14.49 | $14.53 | $13.95 | $14.11 |
| Total return (%)4 | (0.73)5 | 2.95 | 0.85 | 4.87 | 1.51 | (4.31) |
| Ratios and supplemental data | | | | | | |
| Net assets, end of period (in millions) | $1 | $2 | $3 | $4 | $7 | $2 |
| Ratios (as a percentage of average net assets): | | | | | | |
| Expenses before reductions6 | 0.947 | 0.87 | 0.83 | 0.82 | 0.81 | 1.02 |
| Expenses including reductions6 | 0.757 | 0.74 | 0.70 | 0.69 | 0.67 | 0.69 |
| Net investment income3 | 1.047 | 1.67 | 0.78 | 0.60 | 1.43 | 1.02 |
| Portfolio turnover (%) | 25 | 39 | 18 | 10 | 17 | 45 |
| 1 | Six months ended 2-29-20. Unaudited. |
| 2 | Based on average daily shares outstanding. |
| 3 | Net investment income is affected by the timing and frequency of the declaration of dividends by the underlying funds in which the fund invests. |
| 4 | Total returns would have been lower had certain expenses not been reduced during the applicable periods. |
| 5 | Not annualized. |
| 6 | Ratios do not include expenses indirectly incurred from underlying funds and can vary based on the mix of underlying funds held by the fund. |
| 7 | Annualized. |
| 16 | JOHN HANCOCK Alternative Asset Allocation Fund | SEMIANNUAL REPORT | SEE NOTES TO FINANCIAL STATEMENTS |
| CLASS R4 SHARES Period ended | 2-29-201 | 8-31-19 | 8-31-18 | 8-31-17 | 8-31-16 | 8-31-15 |
| Per share operating performance | | | | | | |
| Net asset value, beginning of period | $14.69 | $14.54 | $14.58 | $13.99 | $14.15 | $15.36 |
| Net investment income2,3 | 0.05 | 0.27 | 0.15 | 0.12 | 0.14 | 0.20 |
| Net realized and unrealized gain (loss) on investments | (0.13) | 0.18 | 0.01 | 0.60 | 0.10 | (0.80) |
| Total from investment operations | (0.08) | 0.45 | 0.16 | 0.72 | 0.24 | (0.60) |
| Less distributions | | | | | | |
| From net investment income | (0.29) | (0.20) | (0.13) | (0.10) | (0.23) | (0.19) |
| From net realized gain | (0.22) | (0.10) | (0.07) | (0.03) | (0.17) | (0.42) |
| Total distributions | (0.51) | (0.30) | (0.20) | (0.13) | (0.40) | (0.61) |
| Net asset value, end of period | $14.10 | $14.69 | $14.54 | $14.58 | $13.99 | $14.15 |
| Total return (%)4 | (0.62)5 | 3.22 | 1.10 | 5.18 | 1.79 | (3.99) |
| Ratios and supplemental data | | | | | | |
| Net assets, end of period (in millions) | $—6 | $—6 | $1 | $5 | $4 | $—6 |
| Ratios (as a percentage of average net assets): | | | | | | |
| Expenses before reductions7 | 0.798 | 0.73 | 0.67 | 0.66 | 0.67 | 2.23 |
| Expenses including reductions7 | 0.508 | 0.50 | 0.44 | 0.44 | 0.43 | 0.40 |
| Net investment income3 | 0.658 | 1.76 | 1.05 | 0.85 | 1.00 | 1.44 |
| Portfolio turnover (%) | 25 | 39 | 18 | 10 | 17 | 45 |
| 1 | Six months ended 2-29-20. Unaudited. |
| 2 | Based on average daily shares outstanding. |
| 3 | Net investment income is affected by the timing and frequency of the declaration of dividends by the underlying funds in which the fund invests. |
| 4 | Total returns would have been lower had certain expenses not been reduced during the applicable periods. |
| 5 | Not annualized. |
| 6 | Less than $500,000. |
| 7 | Ratios do not include expenses indirectly incurred from underlying funds and can vary based on the mix of underlying funds held by the fund. |
| 8 | Annualized. |
| SEE NOTES TO FINANCIAL STATEMENTS | SEMIANNUAL REPORT | JOHN HANCOCK Alternative Asset Allocation Fund | 17 |
| CLASS R6 SHARES Period ended | 2-29-201 | 8-31-19 | 8-31-18 | 8-31-17 | 8-31-16 | 8-31-15 |
| Per share operating performance | | | | | | |
| Net asset value, beginning of period | $14.69 | $14.54 | $14.58 | $13.99 | $14.15 | $15.39 |
| Net investment income2,3 | 0.12 | 0.32 | 0.18 | 0.16 | 0.21 | 0.24 |
| Net realized and unrealized gain (loss) on investments | (0.17) | 0.16 | 0.02 | 0.60 | 0.07 | (0.81) |
| Total from investment operations | (0.05) | 0.48 | 0.20 | 0.76 | 0.28 | (0.57) |
| Less distributions | | | | | | |
| From net investment income | (0.33) | (0.23) | (0.17) | (0.14) | (0.27) | (0.25) |
| From net realized gain | (0.22) | (0.10) | (0.07) | (0.03) | (0.17) | (0.42) |
| Total distributions | (0.55) | (0.33) | (0.24) | (0.17) | (0.44) | (0.67) |
| Net asset value, end of period | $14.09 | $14.69 | $14.54 | $14.58 | $13.99 | $14.15 |
| Total return (%)4 | (0.45)5 | 3.49 | 1.34 | 5.45 | 2.05 | (3.74) |
| Ratios and supplemental data | | | | | | |
| Net assets, end of period (in millions) | $21 | $26 | $18 | $15 | $16 | $9 |
| Ratios (as a percentage of average net assets): | | | | | | |
| Expenses before reductions6 | 0.447 | 0.37 | 0.32 | 0.31 | 0.32 | 0.34 |
| Expenses including reductions6 | 0.257 | 0.24 | 0.20 | 0.18 | 0.17 | 0.13 |
| Net investment income3 | 1.637 | 2.23 | 1.26 | 1.11 | 1.52 | 1.66 |
| Portfolio turnover (%) | 25 | 39 | 18 | 10 | 17 | 45 |
| 1 | Six months ended 2-29-20. Unaudited. |
| 2 | Based on average daily shares outstanding. |
| 3 | Net investment income is affected by the timing and frequency of the declaration of dividends by the underlying funds in which the fund invests. |
| 4 | Total returns would have been lower had certain expenses not been reduced during the applicable periods. |
| 5 | Not annualized. |
| 6 | Ratios do not include expenses indirectly incurred from underlying funds and can vary based on the mix of underlying funds held by the fund. |
| 7 | Annualized. |
| 18 | JOHN HANCOCK Alternative Asset Allocation Fund | SEMIANNUAL REPORT | SEE NOTES TO FINANCIAL STATEMENTS |
| Notes to financial statements (unaudited) | |
Note 1—Organization
John Hancock Alternative Asset Allocation Fund (the fund) is a series of John Hancock Funds II (the Trust), an open-end management investment company organized as a Massachusetts business trust and registered under the Investment Company Act of 1940, as amended (the 1940 Act). The investment objective of the fund is to seek long-term growth of capital.
The fund operates as a “fund of funds", investing in affiliated underlying funds of the Trust, other series of the Trust, other funds in John Hancock group of funds complex, non-John Hancock funds and certain other permitted investments.
The fund may offer multiple classes of shares. The shares currently outstanding are detailed in the Statement of assets and liabilities. Class A and Class C shares are offered to all investors. Class I shares are offered to institutions and certain investors. Class R2 and Class R4 shares are available only to certain retirement and 529 plans. Class R6 shares are only available to certain retirement plans, institutions and other investors. Class C shares convert to Class A shares ten years after purchase (certain exclusions may apply). Shareholders of each class have exclusive voting rights to matters that affect that class. The distribution and service fees, if any, and transfer agent fees for each class may differ.
The accounting policies of the John Hancock underlying funds in which the fund invests are outlined in the underlying funds’ shareholder reports, which include the underlying funds’ financial statements, available without charge by calling 800-344-1029 or visiting jhinvestments.com, on the Securities and Exchange Commission (SEC) website at sec.gov or at the SEC’s public reference room in Washington, D.C. The underlying funds are not covered by this report.
Note 2—Significant accounting policies
The financial statements have been prepared in conformity with accounting principles generally accepted in the United States of America (US GAAP), which require management to make certain estimates and assumptions as of the date of the financial statements. Actual results could differ from those estimates and those differences could be significant. The fund qualifies as an investment company under Topic 946 of Accounting Standards Codification of US GAAP.
Events or transactions occurring after the end of the fiscal period through the date that the financial statements were issued have been evaluated in the preparation of the financial statements. The following summarizes the significant accounting policies of the fund:
Security valuation. Investments are stated at value as of the scheduled close of regular trading on the New York Stock Exchange (NYSE), normally at 4:00 P.M., Eastern Time. In case of emergency or other disruption resulting in the NYSE not opening for trading or the NYSE closing at a time other than the regularly scheduled close, the net asset value (NAV) may be determined as of the regularly scheduled close of the NYSE pursuant to the fund's Valuation Policies and Procedures.
In order to value the securities, the fund uses the following valuation techniques: Equity securities, including exchange-traded or closed-end funds, are typically valued at the last sale price or official closing price on the exchange or principal market where the security trades. In the event there were no sales during the day or closing prices are not available, the securities are valued using the last available bid price. Investments in affiliated underlying funds and/or other open-end management investment companies, other than exchange-traded funds (ETFs), are valued at their respective NAVs each business day. Debt obligations are typically valued based on the evaluated prices provided by an independent pricing vendor. Independent pricing vendors utilize matrix pricing, which takes into account factors such as institutional-size trading in similar groups of securities, yield, quality,
| | SEMIANNUAL REPORT | JOHN HANCOCK Alternative Asset Allocation Fund | 19 |
coupon rate, maturity, type of issue, trading characteristics and other market data, as well as broker supplied prices. Debt obligations are typically valued based on the evaluated prices provided by an independent pricing vendor. Independent pricing vendors utilize matrix pricing, which takes into account factors such as institutional-size trading in similar groups of securities, yield, quality, coupon rate, maturity, type of issue, trading characteristics and other market data, as well as broker supplied prices.
In certain instances, the Pricing Committee may determine to value equity securities using prices obtained from another exchange or market if trading on the exchange or market on which prices are typically obtained did not open for trading as scheduled, or if trading closed earlier than scheduled, and trading occurred as normal on another exchange or market.
Other portfolio securities and assets, for which reliable market quotations are not readily available, are valued at fair value as determined in good faith by the fund's Pricing Committee following procedures established by the Board of Trustees. The frequency with which these fair valuation procedures are used cannot be predicted and fair value of securities may differ significantly from the value that would have been used had a ready market for such securities existed.
The fund uses a three-tier hierarchy to prioritize the pricing assumptions, referred to as inputs, used in valuation techniques to measure fair value. Level 1 includes securities valued using quoted prices in active markets for identical securities, including registered investment companies. Level 2 includes securities valued using other significant observable inputs. Observable inputs may include quoted prices for similar securities, interest rates, prepayment speeds and credit risk. Prices for securities valued using these inputs are received from independent pricing vendors and brokers and are based on an evaluation of the inputs described. Level 3 includes securities valued using significant unobservable inputs when market prices are not readily available or reliable, including the fund's own assumptions in determining the fair value of investments. Factors used in determining value may include market or issuer specific events or trends, changes in interest rates and credit quality. The inputs or methodology used for valuing securities are not necessarily an indication of the risks associated with investing in those securities. Changes in valuation techniques and related inputs may result in transfers into or out of an assigned level within the disclosure hierarchy.
The following is a summary of the values by input classification of the fund's investments as of February 29, 2020, by major security category or type:
| | Total
value at
2-29-20 | Level 1
quoted
price | Level 2
significant
observable
inputs | Level 3
significant
unobservable
inputs |
| Investments in securities: | | | | |
| Assets | | | | |
| Affiliated investment companies | $387,667,674 | $387,667,674 | — | — |
| Unaffiliated investment companies | 142,144,102 | 142,144,102 | — | — |
| Short-term investments | 5,689,207 | 59,897 | $5,629,310 | — |
| Total investments in securities | $535,500,983 | $529,871,673 | $5,629,310 | — |
Security transactions and related investment income. Investment security transactions are accounted for on a trade date plus one basis for daily NAV calculations. However, for financial reporting purposes, investment transactions are reported on trade date. Interest income is accrued as earned. Interest income includes coupon interest and amortization/accretion of premiums/discounts on debt securities. Debt obligations may be placed in a non-accrual status and related interest income may be reduced by stopping current accruals and writing off
| 20 | JOHN HANCOCK Alternative Asset Allocation Fund | SEMIANNUAL REPORT | |
interest receivable when the collection of all or a portion of interest has become doubtful. Income and capital gain distributions from underlying funds are recorded on ex-date. Dividend income is recorded on the ex-date, except for dividends of certain foreign securities where the dividend may not be known until after the ex-date. In those cases, dividend income, net of withholding taxes, is recorded when the fund becomes aware of the dividends. Non-cash dividends, if any, are recorded at the fair market value of the securities received. Gains and losses on securities sold are determined on the basis of identified cost and may include proceeds from litigation.
Securities lending. The fund may lend its securities to earn additional income. The fund receives collateral from the borrower in an amount not less than the market value of the loaned securities. The fund will invest its cash collateral in John Hancock Collateral Trust (JHCT), an affiliate of the fund, which has a floating NAV and is registered with the SEC as an investment company. JHCT invests in short-term money market investments. The fund will receive the benefit of any gains and bear any losses generated by JHCT with respect to the cash collateral.
The fund has the right to recall loaned securities on demand. If a borrower fails to return loaned securities when due, then the lending agent is responsible and indemnifies the fund for the lent securities. The lending agent uses the collateral received from the borrower to purchase replacement securities of the same issue, type, class and series of the loaned securities. If the value of the collateral is less than the purchase cost of replacement securities, the lending agent is responsible for satisfying the shortfall but only to the extent that the shortfall is not due to any decrease in the value of JHCT.
Although the risk of loss on securities lent is mitigated by receiving collateral from the borrower and through lending agent indemnification, the fund could experience a delay in recovering securities or could experience a lower than expected return if the borrower fails to return the securities on a timely basis. The fund receives compensation for lending its securities by retaining a portion of the return on the investment of the collateral and compensation from fees earned from borrowers of the securities. Securities lending income received by the fund is net of fees retained by the securities lending agent. Net income received from JHCT is a component of securities lending income as recorded on the Statement of operations. As of February 29, 2020, there were no securities on loan.
Overdraft. The fund may have the ability to borrow from banks for temporary or emergency purposes, including meeting redemption requests that otherwise might require the untimely sale of securities. Pursuant to the fund's custodian agreement, the custodian may loan money to the fund to make properly authorized payments. The fund is obligated to repay the custodian for any overdraft, including any related costs or expenses. The custodian may have a lien, security interest or security entitlement in any fund property that is not otherwise segregated or pledged, to the extent of any overdraft, and to the maximum extent permitted by law. Overdrafts at period end are presented under the caption Due to custodian in the Statement of assets and liabilities.
Line of credit. The fund and other affiliated funds have entered into a syndicated line of credit agreement with Citibank, N.A. as the administrative agent that enables them to participate in a $750 million unsecured committed line of credit. Excluding commitments designated for a certain fund and subject to the needs of all other affiliated funds, the fund can borrow up to an aggregate commitment amount of $500 million, subject to asset coverage and other limitations as specified in the agreement. A commitment fee payable at the end of each calendar quarter, based on the average daily unused portion of the line of credit, is charged to each participating fund based on a combination of fixed and asset based allocations and is reflected in Other expenses on the Statement of operations. For the six months ended February 29, 2020, the fund had no borrowings under the line of credit. Commitment fees for the six months ended February 29, 2020 were $1,698.
| | SEMIANNUAL REPORT | JOHN HANCOCK Alternative Asset Allocation Fund | 21 |
Expenses. Within the John Hancock group of funds complex, expenses that are directly attributable to an individual fund are allocated to such fund. Expenses that are not readily attributable to a specific fund are allocated among all funds in an equitable manner, taking into consideration, among other things, the nature and type of expense and the fund’s relative net assets. Expense estimates are accrued in the period to which they relate and adjustments are made when actual amounts are known.
Class allocations. Income, common expenses and realized and unrealized gains (losses) are determined at the fund level and allocated daily to each class of shares based on the net assets of the class. Class-specific expenses, such as distribution and service fees, if any, and transfer agent fees, for all classes, are charged daily at the class level based on the net assets of each class and the specific expense rates applicable to each class.
Federal income taxes. The fund intends to continue to qualify as a regulated investment company by complying with the applicable provisions of the Internal Revenue Code and will not be subject to federal income tax on taxable income that is distributed to shareholders. Therefore, no federal income tax provision is required.
For federal income tax purposes, as of August 31, 2019, the fund has a short-term capital loss carryforward of $12,132,478 and a long-term capital loss carryforward of $32,016,353 available to offset future net realized capital gains.These carryforwards do not expire.
As of August 31, 2019, the fund had no uncertain tax positions that would require financial statement recognition, derecognition or disclosure. The fund's federal tax returns are subject to examination by the Internal Revenue Service for a period of three years.
Distribution of income and gains. Distributions to shareholders from net investment income and net realized gains, if any, are recorded on the ex-date. The fund generally declares and pays dividends annually. Capital gain distributions, if any, are typically distributed annually.
Distributions paid by the fund with respect to each class of shares are calculated in the same manner, at the same time and in the same amount, except for the effect of class level expenses that may be applied differently to each class.
Such distributions, on a tax basis, are determined in conformity with income tax regulations, which may differ from US GAAP. Distributions in excess of tax basis earnings and profits, if any, are reported in the fund's financial statements as a return of capital. The final determination of tax characteristics of the fund's distribution will occur at the end of the year and will subsequently be reported to shareholders. Short-term gains from underlying funds are treated as ordinary income for tax purposes.
Capital accounts within the financial statements are adjusted for permanent book-tax differences. These adjustments have no impact on net assets or the results of operations. Temporary book-tax differences, if any, will reverse in a subsequent period. Book-tax differences are primarily attributable to wash sale loss deferrals.
Note 3—Guarantees and indemnifications
Under the Trust's organizational documents, its Officers and Trustees are indemnified against certain liabilities arising out of the performance of their duties to the Trust, including the fund. Additionally, in the normal course of business, the fund enters into contracts with service providers that contain general indemnification clauses. The fund's maximum exposure under these arrangements is unknown, as this would involve future claims that may be made against the fund that have not yet occurred. The risk of material loss from such claims is considered remote.
| 22 | JOHN HANCOCK Alternative Asset Allocation Fund | SEMIANNUAL REPORT | |
Note 4—Fees and transactions with affiliates
John Hancock Investment Management LLC (the Advisor) serves as investment advisor for the fund. John Hancock Investment Management Distributors LLC (the Distributor), an affiliate of the Advisor, serves as principal underwriter of the fund. The Advisor and the Distributor are indirect, wholly owned subsidiaries of Manulife Financial Corporation (MFC).
Management fee. The fund pays the Advisor a management fee for its services to the fund. Manulife Investment Management (US) LLC, a division of Manulife Asset Management (US) LLC, acts as the fund’s sole subadvisor. The fund is not responsible for payment of the subadvisory fees.
The management fee has two components: (1) a fee on assets invested in a fund of the Trust or John Hancock Funds III (JHF III); and (2) a fee on assets invested in investments other than a fund of the Trust or JHF III (Other assets).
Management fees are determined in accordance with the following schedule:
| | First $5.0 billion of average net assets | Excess over $5.0 billion of average net assets |
| Assets in a fund of the JHF II or JHF III | 0.100% | 0.075% |
| Other assets | 0.550% | 0.525% |
The Advisor has contractually agreed to reduce its management fee and/or make payment to the fund in an amount equal to the amount by which “Other expenses” of the fund exceed 0.04% of the average net assets of the fund. “Other expenses” means all of the expenses of the fund, excluding: advisory fees, taxes, brokerage commissions, interest expense, litigation and indemnification expenses and other extraordinary expenses not incurred in the ordinary course of the fund’s business, class specific expenses, underlying fund expenses (acquired fund fees), and short dividend expense. The current expense limitation agreement expires on December 31, 2020, unless renewed by mutual agreement of the fund and the Advisor based upon a determination that this is appropriate under the circumstances at that time.
The Advisor has contractually agreed to reduce its management fee by 0.05% of the fund’s average daily net assets up to $5 billion, and by 0.025% of the fund’s average daily net assets over $5 billion. The current expense limitation agreement expires on December 31, 2020, unless renewed by mutual agreement of the fund and the Advisor based upon a determination that this is appropriate under the circumstances at that time.
The Advisor has voluntarily agreed to waive its management fee for the fund so that the aggregate advisory fee retained by the Advisor with respect to both the fund and its underlying investments (after payment of subadvisory fees) does not exceed 0.55% of the fund’s first $5 billion of average daily net assets and 0.525% of the fund’s average daily net assets in excess of $5 billion. The Advisor may terminate this voluntary waiver at any time upon notice to the Trust
For the six months ended February 29, 2020, the expense reductions described above amounted to the following:
| Class | Expense reduction |
| Class A | $69,829 |
| Class C | 39,012 |
| Class I | 416,329 |
| Class R2 | 1,588 |
| Class | Expense reduction |
| Class R4 | $142 |
| Class R6 | 22,369 |
| Total | $549,269 |
Expenses waived or reimbursed in the current fiscal period are not subject to recapture in future fiscal periods.
| | SEMIANNUAL REPORT | JOHN HANCOCK Alternative Asset Allocation Fund | 23 |
The investment management fees, including the impact of the waivers and reimbursements as described above, incurred for the six months ended February 29, 2020, were equivalent to a net annual effective rate of 0.15% of the fund's average daily net assets.
Accounting and legal services. Pursuant to a service agreement, the fund reimburses the Advisor for all expenses associated with providing the administrative, financial, legal, compliance, accounting and recordkeeping services to the fund, including the preparation of all tax returns, periodic reports to shareholders and regulatory reports, among other services. These expenses are allocated to each share class based on its relative net assets at the time the expense was incurred. These accounting and legal services fees incurred for the six months ended February 29, 2020 amounted to an annual rate of 0.02% of the fund's average daily net assets.
Distribution and service plans. The fund has a distribution agreement with the Distributor. The fund has adopted distribution and service plans for certain classes as detailed below pursuant to Rule 12b-1 under the 1940 Act, to pay the Distributor for services provided as the distributor of shares of the fund. In addition, under a service plan for certain classes as detailed below, the fund pays for certain other services. The fund may pay up to the following contractual rates of distribution and service fees under these arrangements, expressed as an annual percentage of average daily net assets for each class of the fund's shares:
| Class | Rule 12b-1 Fee | Service fee |
| Class A | 0.30% | — |
| Class C | 1.00% | — |
| Class R2 | 0.25% | 0.25% |
| Class R4 | 0.25% | 0.10% |
The fund's Distributor has contractually agreed to waive 0.10% of Rule12b-1 fees for Class R4 shares. The current waiver agreement expires on December 31, 2020, unless renewed by mutual agreement of the fund and the Distributor based upon a determination that this is appropriate under the circumstances at the time. This contractual waiver amounted to $78 for Class R4 shares for the six months ended February 29, 2020.
Sales charges. Class A shares are assessed up-front sales charges, which resulted in payments to the Distributor amounting to $37,246 for the six months ended February 29, 2020. Of this amount, $5,975 was retained and used for printing prospectuses, advertising, sales literature and other purposes and $31,271 was paid as sales commissions to broker-dealers.
Class A and Class C shares may be subject to contingent deferred sales charges (CDSCs). Certain Class A shares that are acquired through purchases of $1 million or more and are redeemed within one year of purchase are subject to a 1.00% sales charge. Class C shares that are redeemed within one year of purchase are subject to a 1.00% CDSC. CDSCs are applied to the lesser of the current market value at the time of redemption or the original purchase cost of the shares being redeemed. Proceeds from CDSCs are used to compensate the Distributor for providing distribution-related services in connection with the sale of these shares. During the six months ended February 29, 2020, CDSCs received by the Distributor amounted to $1,604 and $98 for Class A and Class C shares, respectively.
Transfer agent fees. The John Hancock group of funds has a complex-wide transfer agent agreement with John Hancock Signature Services, Inc. (Signature Services), an affiliate of the Advisor. The transfer agent fees paid to Signature Services are determined based on the cost to Signature Services (Signature Services Cost) of providing recordkeeping services. It also includes out-of-pocket expenses, including payments made to third-parties for recordkeeping services provided to their clients who invest in one or more John Hancock funds. In addition, Signature Services Cost may be reduced by certain fees that Signature Services receives in connection with
| 24 | JOHN HANCOCK Alternative Asset Allocation Fund | SEMIANNUAL REPORT | |
retirement and small accounts. Signature Services Cost is calculated monthly and allocated, as applicable, to five categories of share classes: Retail Share and Institutional Share Classes of Non-Municipal Bond Funds, Class R6 Shares, Retirement Share Classes and Municipal Bond Share Classes. Within each of these categories, the applicable costs are allocated to the affected John Hancock affiliated funds and/or classes, based on the relative average daily net assets.
Class level expenses. Class level expenses for the six months ended February 29, 2020 were as follows:
| Class | Distribution and service fees | Transfer agent fees |
| Class A | $106,684 | $43,786 |
| Class C | 199,120 | 24,524 |
| Class I | — | 260,204 |
| Class R2 | 4,118 | 109 |
| Class R4 | 273 | 10 |
| Class R6 | — | 1,511 |
| Total | $310,195 | $330,144 |
Trustee expenses. The fund compensates each Trustee who is not an employee of the Advisor or its affiliates. The costs of paying Trustee compensation and expenses are allocated to the fund based on its net assets relative to other funds within the John Hancock group of funds complex.
Note 5—Fund share transactions
Transactions in fund shares for the six months ended February 29, 2020 and for the year ended August 31, 2019 were as follows:
| | Six Months Ended 2-29-20 | Year Ended 8-31-19 |
| | Shares | Amount | Shares | Amount |
| Class A shares | | | | |
| Sold | 254,191 | $3,718,817 | 795,055 | $11,305,156 |
| Distributions reinvested | 154,878 | 2,244,177 | 115,120 | 1,574,839 |
| Repurchased | (647,917) | (9,475,017) | (2,428,928) | (34,635,963) |
| Net decrease | (238,848) | $(3,512,023) | (1,518,753) | $(21,755,968) |
| Class C shares | | | | |
| Sold | 26,153 | $384,098 | 96,697 | $1,388,854 |
| Distributions reinvested | 68,875 | 1,002,820 | 42,160 | 579,700 |
| Repurchased | (385,620) | (5,653,107) | (1,146,343) | (16,394,140) |
| Net decrease | (290,592) | $(4,266,189) | (1,007,486) | $(14,425,586) |
| Class I shares | | | | |
| Sold | 3,263,746 | $47,758,838 | 9,148,547 | $130,782,292 |
| Distributions reinvested | 942,827 | 13,652,128 | 620,211 | 8,484,484 |
| Repurchased | (3,943,947) | (57,633,529) | (16,047,812) | (228,661,790) |
| Net increase (decrease) | 262,626 | $3,777,437 | (6,279,054) | $(89,395,014) |
| | SEMIANNUAL REPORT | JOHN HANCOCK Alternative Asset Allocation Fund | 25 |
| | Six Months Ended 2-29-20 | Year Ended 8-31-19 |
| | Shares | Amount | Shares | Amount |
| Class R2 shares | | | | |
| Sold | 9,324 | $136,066 | 31,389 | $448,503 |
| Distributions reinvested | 2,864 | 41,474 | 2,947 | 40,280 |
| Repurchased | (74,503) | (1,092,618) | (54,897) | (777,693) |
| Net decrease | (62,315) | $(915,078) | (20,561) | $(288,910) |
| Class R4 shares | | | | |
| Sold | 5,051 | $73,964 | 6,916 | $98,951 |
| Distributions reinvested | 83 | 1,208 | 300 | 4,113 |
| Repurchased | (16,325) | (242,275) | (86,274) | (1,248,855) |
| Net decrease | (11,191) | $(167,103) | (79,058) | $(1,145,791) |
| Class R6 shares | | | | |
| Sold | 198,325 | $2,905,953 | 1,309,202 | $18,559,247 |
| Distributions reinvested | 55,291 | 800,607 | 47,502 | 649,346 |
| Repurchased | (561,751) | (8,249,607) | (801,314) | (11,429,585) |
| Net increase (decrease) | (308,135) | $(4,543,047) | 555,390 | $7,779,008 |
| Total net decrease | (648,455) | $(9,626,003) | (8,349,522) | $(119,232,261) |
Note 6—Purchase and sale of securities
Purchases and sales of securities, other than short-term investments, amounted to $140,777,150 and $155,763,726, respectively, for the six months ended February 29, 2020.
Note 7—Investment in affiliated underlying funds
The fund invests primarily in affiliated underlying funds that are managed by the Advisor and its affiliates. The fund does not invest in the affiliated underlying funds for the purpose of exercising management or control; however, the fund's investment may represent a significant portion of each underlying funds’ net assets. At February 29, 2020, the fund held 5% or more of the net assets of the underlying funds shown below:
| Portfolio | Underlying fund’s net assets |
| JHF Alternative Risk Premia Fund | 22.2% |
| JHF Diversified Macro Fund | 17.4% |
| JHF Seaport Long/Short Fund | 10.3% |
| JHF II Multi-Asset Absolute Return Fund | 9.2% |
| JHF Infrastructure Fund | 5.8% |
| JHF II Short Duration Credit Opportunities Fund | 5.2% |
| JHF II Absolute Return Currency Fund | 5.0% |
Information regarding the fund's fiscal year to date purchases and sales of the affiliated underlying funds as well as income and capital gains earned by the fund, if any, is as follows:
| 26 | JOHN HANCOCK Alternative Asset Allocation Fund | SEMIANNUAL REPORT | |
| | | | | | | | Dividends and distributions |
| Affiliate | Ending
share
amount | Beginning
value | Cost of
purchases | Proceeds
from shares
sold | Realized
gain
(loss) | Change in
unrealized
appreciation
(depreciation) | Income
distributions
received | Capital gain
distributions
received | Ending
value |
| Absolute Return Currency | 2,522,368 | $40,391,711 | $2,443,781 | $(19,808,530) | $(776,996) | $1,132,383 | $714,019 | — | $23,382,349 |
| Alternative Risk Premia | 3,378,538 | — | 34,774,414 | (993,772) | (2,990) | (1,411,255) | 12,260 | — | 32,366,397 |
| Disciplined Alternative Yield | — | 66,558,006 | 7,831,656 | (69,333,617) | (2,983,177) | (2,072,868) | 604,346 | $7,227,310 | — |
| Diversified Macro | 4,554,558 | 45,326,846 | 3,667,285 | (2,005,400) | 19,617 | (5,744,049) | — | 1,592,220 | 41,264,299 |
| Infrastructure | 1,952,333 | 26,629,522 | 2,692,422 | (3,991,445) | 462,505 | (686,007) | 251,041 | 820,426 | 25,106,997 |
| John Hancock Collateral Trust* | — | 885,879 | 48,485,210 | (49,372,039) | 923 | 27 | 8,916 | — | — |
| Multi-Asset Absolute Return | 5,755,675 | 28,253,887 | 27,484,135 | (2,672,699) | (453,353) | (5,101) | — | — | 52,606,869 |
| Seaport Long/Short | 6,538,507 | 50,138,430 | 26,527,501 | (986,662) | 84,750 | (113,498) | 697,955 | — | 75,650,521 |
| Short Duration Credit Opportunities | 4,387,528 | 62,204,274 | 1,513,642 | (21,975,076) | (1,145,396) | 1,215,698 | 927,839 | — | 41,813,142 |
| Strategic Income Opportunities | 5,792,349 | 74,789,294 | 1,540,397 | (14,550,736) | (151,293) | 234,624 | 774,866 | — | 61,862,286 |
| | | | | | $(4,945,410) | $(7,450,046) | $3,991,242 | $9,639,956 | $354,052,860 |
| * | Refer to the Securities lending note within Note 2 for details regarding this investment. |
| | SEMIANNUAL REPORT | JOHN HANCOCK Alternative Asset Allocation Fund | 27 |
Note 8—Transactions in securities of affiliated issuers
Affiliated issuers, as defiined by the 1940 Act, are those in which the fund's holdings of an issuer represent 5% or more of the outstanding voting securities of the issuer. A summary of the fund's transactions in the securities of these issuers during the six months ended February 29, 2020, is set forth below:
| | | | | | | | Dividends and distributions |
| Affiliate | Ending
share
amount | Beginning
value | Cost of
purchases | Proceeds
from shares
sold | Realized
gain
(loss) | Change in
unrealized
appreciation
(depreciation) | Income
distributions
received | Capital gain
distributions
received | Ending
value |
| | | | | | | | | | |
| Credit Suisse Managed Futures Strategy Fund | 2,656,220 | $24,056,171 | $5,058,784 | $(969,242) | $(49,805) | $(3,552,435) | $428,413 | — | $24,543,473 |
| Invesco DB Gold Fund | 194,372 | 10,651,123 | 979,824 | (2,662,882) | 481,674 | (378,398) | 195,898 | — | 9,071,341 |
| | | | | | $431,869 | $(3,930,833) | $624,311 | — | $33,614,814 |
Note 9—Subsequent events
A widespread health crisis such as a global pandemic could cause substantial market volatility, exchange trading suspensions and closures, impact the ability to complete redemptions, and affect fund performance. For example, the novel coronavirus disease (COVID-19) has resulted in significant disruptions to global business activity. The impact of a health crisis and other epidemics and pandemics that may arise in the future, could affect the global economy in ways that cannot necessarily be foreseen at the present time. A health crisis may exacerbate other pre-existing political, social and economic risks. Any such impact could adversely affect the fund's performance, resulting in losses to your investment.
| 28 | JOHN HANCOCK Alternative Asset Allocation Fund | SEMIANNUAL REPORT | |
| | |
Trustees
Hassell H. McClellan,Chairperson
Steven R. Pruchansky,Vice Chairperson
Andrew G. Arnott†
Charles L. Bardelis*
James R. Boyle
Peter S. Burgess*
William H. Cunningham
Grace K. Fey
Marianne Harrison†
Deborah C. Jackson
James M. Oates*
Gregory A. Russo
Officers
Andrew G. Arnott
President
Francis V. Knox, Jr.
Chief Compliance Officer
Charles A. Rizzo
Chief Financial Officer
Salvatore Schiavone
Treasurer
Christopher (Kit) Sechler
Secretary and Chief Legal Officer
| Investment advisor
John Hancock Investment Management LLC
Subadvisor
Manulife Investment Management (US) LLC
Portfolio Managers
Nathan W. Thooft, CFA
Christopher Walsh, CFA
Principal distributor
John Hancock Investment Management Distributors LLC
Custodian
State Street Bank and Trust Company
Transfer agent
John Hancock Signature Services, Inc.
Legal counsel
K&L Gates LLP
|
* Member of the Audit Committee
† Non-Independent Trustee
The fund's proxy voting policies and procedures, as well as the fund proxy voting record for the most recent twelve-month period ended June 30, are available free of charge on the Securities and Exchange Commission (SEC) website at sec.gov or on our website.
All of the fund's holdings as of the end of the third month of every fiscal quarter are filed with the SEC on Form N-PORT within 60 days of the end of the fiscal quarter. The fund's Form N-PORT filings are available on our website and the SEC's website, sec.gov.
We make this information on your fund, as well asmonthly portfolio holdings, and other fund details available on our website at jhinvestments.com or by calling 800-225-5291.
| | | | |
| | You can also contact us: |
| | 800-225-5291
jhinvestments.com | Regular mail:
John Hancock Signature Services, Inc.
P.O. Box 55913
Boston, MA 02205-5913
| Express mail:
John Hancock Signature Services, Inc.
2000 Crown Colony Drive
Suite 55913
Quincy, MA 02169-0953
|
SEMIANNUAL REPORT | JOHN HANCOCK ALTERNATIVE ASSET ALLOCATION FUND 29
John Hancock family of funds
| | | |
DOMESTIC EQUITY FUNDS
Blue Chip Growth
Classic Value
Disciplined Value
Disciplined Value Mid Cap
Equity Income
Financial Industries
Fundamental All Cap Core
Fundamental Large Cap Core
New Opportunities
Regional Bank
Small Cap Core
Small Cap Growth
Small Cap Value
U.S. Global Leaders Growth
U.S. Quality Growth
GLOBAL AND INTERNATIONAL EQUITY FUNDS
Disciplined Value International
Emerging Markets
Emerging Markets Equity
Fundamental Global Franchise
Global Equity
Global Shareholder Yield
Global Thematic Opportunities
International Dynamic Growth
International Growth
International Small Company
| | INCOME FUNDS
Bond
California Tax-Free Income
Emerging Markets Debt
Floating Rate Income
Government Income
High Yield
High Yield Municipal Bond
Income
Investment Grade Bond
Money Market
Short Duration Bond
Short Duration Credit Opportunities
Strategic Income Opportunities
Tax-Free Bond
ALTERNATIVE AND SPECIALTY FUNDS
Absolute Return Currency
Alternative Asset Allocation
Alternative Risk Premia
Diversified Macro
Infrastructure
Multi-Asset Absolute Return
Seaport Long/Short
|
A fund's investment objectives, risks, charges, and expenses should be considered carefully before investing. The prospectus contains this and other important information about the fund. To obtain a prospectus, contact your financial professional, call John Hancock Investment Management at 800-225-5291, or visit our website at jhinvestments.com. Please read the prospectus carefully before investing or sending money.
| | | |
ASSET ALLOCATION
Balanced
Income Allocation
Multi-Index Lifetime Portfolios
Multi-Index Preservation Portfolios
Multimanager Lifestyle Portfolios
Multimanager Lifetime Portfolios
Retirement Income 2040
EXCHANGE-TRADED FUNDS
John Hancock Multifactor Consumer Discretionary ETF
John Hancock Multifactor Consumer Staples ETF
John Hancock Multifactor Developed International ETF
John Hancock Multifactor Emerging Markets ETF
John Hancock Multifactor Energy ETF
John Hancock Multifactor Financials ETF
John Hancock Multifactor Healthcare ETF
John Hancock Multifactor Industrials ETF
John Hancock Multifactor Large Cap ETF
John Hancock Multifactor Materials ETF
John Hancock Multifactor Media and
Communications ETF
John Hancock Multifactor Mid Cap ETF
John Hancock Multifactor Small Cap ETF
John Hancock Multifactor Technology ETF
John Hancock Multifactor Utilities ETF
| | ENVIRONMENTAL, SOCIAL, AND
GOVERNANCE FUNDS
ESG All Cap Core
ESG Core Bond
ESG International Equity
ESG Large Cap Core
CLOSED-END FUNDS
Financial Opportunities
Hedged Equity & Income
Income Securities Trust
Investors Trust
Preferred Income
Preferred Income II
Preferred Income III
Premium Dividend
Tax-Advantaged Dividend Income
Tax-Advantaged Global Shareholder Yield
|
John Hancock Multifactor ETF shares are bought and sold at market price (not NAV), and are not individually redeemed
from the fund. Brokerage commissions will reduce returns.
John Hancock ETFs are distributed by Foreside Fund Services, LLC, and are subadvised by Dimensional Fund Advisors LP.
Foreside is not affiliated with John Hancock Investment Management Distributors LLC or Dimensional Fund Advisors LP.
Dimensional Fund Advisors LP receives compensation from John Hancock in connection with licensing rights to the
John Hancock Dimensional indexes. Dimensional Fund Advisors LP does not sponsor, endorse, or sell, and makes no
representation as to the advisability of investing in, John Hancock Multifactor ETFs.
John Hancock Investment Management
A trusted brand
John Hancock Investment Management is a premier asset manager
representing one of America's most trusted brands, with a heritage of
financial stewardship dating back to 1862. Helping our shareholders
pursue their financial goals is at the core of everything we do. It's why
we support the role of professional financial advice and operate with
the highest standards of conduct and integrity.
A better way to invest
We serve investors globally through a unique multimanager approach:
We search the world to find proven portfolio teams with specialized
expertise for every strategy we offer, then we apply robust investment
oversight to ensure they continue to meet our uncompromising
standards and serve the best interests of our shareholders.
Results for investors
Our unique approach to asset management enables us to provide
a diverse set of investments backed by some of the world's best
managers, along with strong risk-adjusted returns across asset classes.
John Hancock Investment Management Distributors LLC n Member FINRA, SIPC
200 Berkeley Street n Boston, MA 02116-5010 n 800-225-5291 n jhinvestments.com
This report is for the information of the shareholders of John Hancock Alternative Asset Allocation Fund. It is not authorized for distribution to prospective investors unless preceded or accompanied by a prospectus.
| | |
| MF1105592 | 345SA 2/20
4/2020 |
John Hancock
Blue Chip Growth Fund
Semiannual report 2/29/2020
Beginning on January 1, 2021, as permitted by regulations adopted by the Securities and Exchange Commission, paper copies of the fund's shareholder reports like this one will no longer be sent by mail, unless you specifically request paper copies of the reports from the fund or from your financial intermediary. Instead, the reports will be made available on a website, and you will be notified by mail each time a report is posted and provided with a website link to access the report.
If you already elected to receive shareholder reports electronically, you will not be affected by this change, and you do not need to take any action. You may elect to receive shareholder reports and other communications electronically by calling John Hancock Investment Management at 800-225-5291 (Class A and Class C shares) or by contacting your financial intermediary.
You may elect to receive all reports in paper, free of charge, at any time. You can inform John Hancock Investment Management or your financial intermediary that you wish to continue receiving paper copies of your shareholder reports by following the instructions listed above. Your election to receive reports in paper will apply to all funds held with John Hancock Investment Management or your financial intermediary.

A message to shareholders
Dear shareholder,
Global financial markets were on pace to deliver strong returns during the 6 months ended February 29, 2020, until heightened fears over the coronavirus (COVID-19) sent markets tumbling during the last week of the period. Prior to the turbulence that ended the period, investors benefited from a combination of low inflation, accommodative central bank policy, healthy fundamentals, and corporate buybacks of stock.
However, the COVID-19 pandemic and plummeting oil prices put an end to all that good news. Shortly after period end, the U.S. Federal Reserve lowered short-term interest rates while lawmakers embarked on a plan to launch major fiscal stimulus to support the economy.
After the longest bull market in U.S. history, we're now in bear market territory. Indeed, the spread of COVID-19, trade disputes, rising unemployment, and other geopolitical tensions may continue to create uncertainty among businesses and investors. Your financial professional can helpposition your portfolio so that it's sufficiently diversified to seek to meet your long-term objectives and to withstand the inevitable bouts of market volatility along the way.
On behalf of everyone at John Hancock Investment Management, I'd like to take this opportunity to welcome new shareholders and thank existing shareholders for the continued trust you've placed in us.
Sincerely,
Andrew G. Arnott
President and CEO,
John Hancock Investment Management
Head of Wealth and Asset Management,
United States and Europe
This commentary reflects the CEO's views as of this report's period end and are subject to change at any time. Diversification does not guarantee investment returns and does not eliminate risk of loss. All investments entail risks, including the possible loss of principal. For more up-to-date information, you can visit our website at jhinvestments.com.
John Hancock
Blue Chip Growth Fund
Table of contents
| | | |
| 2 | | Your fund at a glance |
| 3 | | Portfolio summary |
| 5 | | A look at performance |
| 7 | | Your expenses |
| 9 | | Fund's investments |
| 14 | | Financial statements |
| 17 | | Financial highlights |
| 21 | | Notes to financial statements |
| 30 | | More information |
SEMIANNUAL REPORT | JOHN HANCOCK BLUE CHIP GROWTH FUND 1
INVESTMENT OBJECTIVE
The fund seeks to provide long-term growth of capital. Current income is a secondary objective.
AVERAGE ANNUAL TOTAL RETURNS AS OF 2/29/2020 (%)
The S&P 500 Index is an unmanaged index that includes 500 widely traded common stocks.
The Russell 1000 Growth Index is an unmanaged index of stocks in the Russell 1000 Index (the 1,000 largest U.S. publicly traded companies) with higher price-to-book ratios and higher forecasted growth values.
It is not possible to invest directly in an index. Index figures do not reflect expenses or sales charges, which would result in lower returns.
Figures from Morningstar, Inc. include reinvested distributions and do not take into account sales charges. Actual load-adjusted performance is lower.
| 1 | Class A shares were first offered on 3-27-15. Returns prior to this date are those of Class NAV shares and have not been adjusted for class-specific expenses; otherwise, returns would vary. |
The past performance shown here reflects reinvested distributions and the beneficial effect of any expense reductions, and does not guarantee future results. Returns for periods shorter than one year are cumulative. Performance of the other share classes will vary based on the difference in the fees and expenses of those classes. Shares will fluctuate in value and, when redeemed, may be worth more or less than their original cost. Current month-end performance may be lower or higher than the performance cited, and can be found at jhinvestments.com or by calling 800-225-5291. For further information on the fund's objectives, risks, and strategy, see the fund's prospectus. The fund recently experienced negative short-term performance due to market volatility associated with the COVID-19 pandemic.
SEMIANNUAL REPORT | JOHN HANCOCK BLUE CHIP GROWTH FUND 2
SECTOR COMPOSITION AS OF 2/29/2020 (%)
TOP 10 HOLDINGS AS OF 2/29/2020 (%)
| | |
| Amazon.com, Inc. | 9.4 |
| Facebook, Inc., Class A | 6.4 |
| Alphabet, Inc., Class C | 5.7 |
| Microsoft Corp. | 5.4 |
| Alibaba Group Holding, Ltd., ADR | 4.5 |
| Visa, Inc., Class A | 3.7 |
| Mastercard, Inc., Class A | 3.2 |
| Apple, Inc. | 3.0 |
| Tencent Holdings, Ltd. | 2.6 |
| ServiceNow, Inc. | 2.3 |
| TOTAL | 46.2 |
| As a percentage of net assets. |
| Cash and cash equivalents are not included. |
SEMIANNUAL REPORT | JOHN HANCOCK BLUE CHIP GROWTH FUND 3
COUNTRY COMPOSITION AS OF 2/29/2020 (%)
| | |
| United States | 89.5 |
| China | 7.2 |
| United Kingdom | 1.4 |
| Other countries | 1.9 |
| TOTAL | 100.0 |
| As a percentage of net assets. | |
A note about risks
The fund may be subject to various risks as described in the fund's prospectus. For more information, please refer to the "Principal risks" section of the prospectus and "Subsequent events" section in the Notes to financial statements.
SEMIANNUAL REPORT | JOHN HANCOCK BLUE CHIP GROWTH FUND 4
TOTAL RETURNS FOR THE PERIOD ENDED FEBRUARY 29, 2020
| | | | | | | | |
Average annual total returns (%)
with maximum sales charge | | Cumulative total returns (%)
with maximum sales charge |
| | 1-year | 5-year | 10-year | | 6-month | 5-year | 10-year |
| Class A1 | 3.37 | 11.24 | 14.86 | | -1.68 | 70.37 | 299.78 |
| Class C1 | 7.05 | 11.58 | 15.03 | | 2.13 | 72.92 | 305.64 |
| Class 12 | 9.21 | 12.74 | 15.60 | | 3.69 | 82.16 | 326.21 |
| Class NAV2 | 9.27 | 12.80 | 15.66 | | 3.70 | 82.64 | 328.44 |
| Index 1† | 8.19 | 9.23 | 12.65 | | 1.92 | 55.49 | 229.18 |
| Index 2† | 15.11 | 12.41 | 14.79 | | 5.40 | 79.51 | 297.12 |
Performance figures assume all distributions have been reinvested. Figures reflect maximum sales charges on Class A shares of 5% and the applicable contingent deferred sales charge (CDSC) on Class C shares. Class C shares sold within one year of purchase are subject to a 1% CDSC. Sales charges are not applicable to Class 1 and Class NAV shares.
The expense ratios of the fund, both net (including any fee waivers and/or expense limitations) and gross (excluding any fee waivers and/or expense limitations), are set forth according to the most recent publicly available prospectuses for the fund and may differ from those disclosed in the Financial highlights tables in this report. Net expenses reflect contractual expense limitations in effect until December 31, 2020 and are subject to change. Had the contractual fee waivers and expense limitations not been in place, gross expenses would apply. The expense ratios are as follows:
| | | | | |
| | Class A | Class C | Class 1 | Class NAV | | | |
| Gross (%) | 1.21 | 1.91 | 0.84 | 0.79 | | | |
| Net (%) | 1.14 | 1.89 | 0.83 | 0.78 | | | |
Please refer to the most recent prospectus and annual or semiannual report for more information on expenses and any expense limitation arrangements for each class.
The returns reflect past results and should not be considered indicative of future performance. The return and principal value of an investment will fluctuate so that shares, when redeemed, may be worth more or less than their original cost. Due to market volatility and other factors, the fund's current performance may be higher or lower than the performance shown. For current to the most recent month-end performance data, please call 800-225-5291 or visit the fund's website at jhinvestments.com.
The performance table above and the chart on the next page do not reflect the deduction of taxes that a shareholder would pay on fund distributions or the redemption of fund shares. The fund's performance results reflect any applicable fee waivers or expense reductions, without which the expenses would increase and results would have been less favorable.
| † | Index 1 is the S&P 500 Index; Index 2 is the Russell 1000 Growth Index. |
See the following page for footnotes.
SEMIANNUAL REPORT | JOHN HANCOCK BLUE CHIP GROWTH FUND 5
This chart and table show what happened to a hypothetical $10,000 investment in John Hancock Blue Chip Growth Fund for the share classes and periods indicated, assuming all distributions were reinvested. For comparison, we've shown the same investment in two separate indexes.
| | | | | | |
| | Start date | With maximum
sales charge ($) | Without
sales charge ($) | Index 1 ($) | Index 2 ($) |
| Class C1,3 | 2-28-10 | 40,564 | 40,564 | 32,918 | 39,712 |
| Class 12 | 2-28-10 | 42,621 | 42,621 | 32,918 | 39,712 |
| Class NAV2 | 2-28-10 | 42,844 | 42,844 | 32,918 | 39,712 |
The S&P 500 Index is an unmanaged index that includes 500 widely traded common stocks.
The Russell 1000 Growth Index is an unmanaged index of stocks in the Russell 1000 Index (the 1,000 largest U.S. publicly traded companies) with high price-to-book ratios and higher forecasted growth expectations.
It is not possible to invest directly in an index. Index figures do not reflect expenses or sales charges, which would result in lower returns.
Footnotes related to performance pages
| 1 | Class A and Class C shares were first offered on 3-27-15. Returns prior to this date are those of Class NAV shares that have not been adjusted for class-specific expenses; otherwise, returns would vary. |
| 2 | For certain types of investors, as described in the fund's prospectuses. |
| 3 | The contingent deferred sales charge is not applicable. |
SEMIANNUAL REPORT | JOHN HANCOCK BLUE CHIP GROWTH FUND 6
These examples are intended to help you understand your ongoing operating expenses of investing in the fund so you can compare these costs with the ongoing costs of investing in other mutual funds.
Understanding fund expenses
As a shareholder of the fund, you incur two types of costs:
■Transaction costs,which include sales charges (loads) on purchases or redemptions (varies by share class), minimum account fee charge, etc.
■Ongoing operating expenses, including management fees, distribution and service fees (if applicable), and other fund expenses.
We are presenting only your ongoing operating expenses here.
Actual expenses/actual returns
The first line of each share class in the table on the following page is intended to provide information about the fund’s actual ongoing operating expenses, and is based on the fund’s actual return. It assumes an account value of $1,000.00 on September 1, 2019, with the same investment held until February 29, 2020.
Together with the value of your account, you may use this information to estimate the operating expenses that you paid over the period. Simply divide your account value at February 29, 2020, by $1,000.00, then multiply it by the “expenses paid” for your share class from the table. For example, for an account value of $8,600.00, the operating expenses should be calculated as follows:
Hypothetical example for comparison purposes
The second line of each share class in the table on the following page allows you to compare the fund’s ongoing operating expenses with those of any other fund. It provides an example of the fund’s hypothetical account values and hypothetical expenses based on each class’s actual expense ratio and an assumed 5% annualized return before expenses (which is not the class’s actual return). It assumes an account value of $1,000.00 on September 1, 2019, with the same investment held until February 29, 2020. Look in any other fund shareholder report to find its hypothetical example and you will be able to compare these expenses. Please remember that these hypothetical account values and expenses may not be used to estimate the actual ending account balance or expenses you paid for the period.
| | SEMIANNUAL REPORT | JOHN HANCOCK BLUE CHIP GROWTH FUND | 7 |
Remember, these examples do not include any transaction costs, therefore, these examples will not help you to determine the relative total costs of owning different funds. If transaction costs were included, your expenses would have been higher. See the prospectuses for details regarding transaction costs.
SHAREHOLDER EXPENSE EXAMPLE CHART
| | | Account
value on
9-1-2019 | Ending
value on
2-29-2020 | Expenses
paid during
period ended
2-29-20201 | Annualized
expense
ratio |
| Class A | Actual expenses/actual returns | $1,000.00 | $1,035.00 | $5.77 | 1.14% |
| | Hypothetical example | 1,000.00 | 1,019.20 | 5.72 | 1.14% |
| Class C | Actual expenses/actual returns | 1,000.00 | 1,031.30 | 9.49 | 1.88% |
| | Hypothetical example | 1,000.00 | 1,015.50 | 9.42 | 1.88% |
| Class 1 | Actual expenses/actual returns | 1,000.00 | 1,036.90 | 4.10 | 0.81% |
| | Hypothetical example | 1,000.00 | 1,020.80 | 4.07 | 0.81% |
| Class NAV | Actual expenses/actual returns | 1,000.00 | 1,037.00 | 3.85 | 0.76% |
| | Hypothetical example | 1,000.00 | 1,021.10 | 3.82 | 0.76% |
| 1 | Expenses are equal to the annualized expense ratio, multiplied by the average account value over the period, multiplied by 182/366 (to reflect the one-half year period). |
| 8 | JOHN HANCOCK BLUE CHIP GROWTH FUND | SEMIANNUAL REPORT | |
AS OF 2-29-20 (unaudited)
| | | | | Shares | Value |
| Common stocks 100.0% | | | | | $3,901,163,958 |
| (Cost $1,890,987,697) | | | | | |
| Communication services 19.1% | | | 744,718,047 |
| Entertainment 2.6% | | | |
| Electronic Arts, Inc. (A) | | | 58,500 | 5,930,145 |
| Netflix, Inc. (A) | | | 227,302 | 83,881,257 |
| Spotify Technology SA (A) | | | 71,438 | 9,795,579 |
| Interactive media and services 16.5% | | | |
| Alphabet, Inc., Class A (A) | | | 38,306 | 51,301,311 |
| Alphabet, Inc., Class C (A) | | | 167,033 | 223,712,308 |
| Facebook, Inc., Class A (A) | | | 1,290,531 | 248,388,502 |
| InterActiveCorp (A) | | | 103,157 | 21,037,839 |
| Match Group, Inc. (A)(B) | | | 4,165 | 270,725 |
| Tencent Holdings, Ltd. | | | 1,980,100 | 100,400,381 |
| Consumer discretionary 20.2% | | | 789,324,214 |
| Auto components 0.3% | | | |
| Aptiv PLC | | | 155,122 | 12,116,579 |
| Automobiles 0.1% | | | |
| Ferrari NV | | | 22,515 | 3,551,738 |
| Hotels, restaurants and leisure 1.2% | | | |
| Chipotle Mexican Grill, Inc. (A) | | | 4,927 | 3,811,429 |
| Hilton Worldwide Holdings, Inc. | | | 165,362 | 16,073,186 |
| Marriott International, Inc., Class A | | | 105,142 | 13,037,608 |
| McDonald's Corp. | | | 14,000 | 2,718,380 |
| Restaurant Brands International, Inc. | | | 15,970 | 934,245 |
| Wynn Resorts, Ltd. | | | 51,279 | 5,537,106 |
| Yum! Brands, Inc. | | | 46,222 | 4,125,314 |
| Internet and direct marketing retail 15.1% | | | |
| Alibaba Group Holding, Ltd., ADR (A) | | | 840,459 | 174,815,472 |
| Amazon.com, Inc. (A) | | | 194,414 | 366,227,373 |
| Booking Holdings, Inc. (A) | | | 25,492 | 43,225,765 |
| Trip.com Group, Ltd., ADR (A) | | | 163,494 | 4,963,678 |
| Multiline retail 1.3% | | | |
| Dollar General Corp. | | | 305,613 | 45,933,634 |
| Dollar Tree, Inc. (A) | | | 79,005 | 6,559,785 |
| Specialty retail 1.2% | | | |
| Ross Stores, Inc. | | | 335,749 | 36,522,776 |
| The TJX Companies, Inc. | | | 150,605 | 9,006,179 |
| Textiles, apparel and luxury goods 1.0% | | | |
| Lululemon Athletica, Inc. (A) | | | 90,403 | 19,654,516 |
| NIKE, Inc., Class B | | | 223,289 | 19,957,571 |
| SEE NOTES TO FINANCIAL STATEMENTS | SEMIANNUAL REPORT | JOHN HANCOCK BLUE CHIP GROWTH FUND | 9 |
| | | | | Shares | Value |
| Consumer discretionary (continued) | | | |
| Textiles, apparel and luxury goods (continued) | | | |
| VF Corp. | | | 7,665 | $551,880 |
| Consumer staples 0.0% | | | 397,411 |
| Beverages 0.0% | | | |
| Constellation Brands, Inc., Class A | | | 1,783 | 307,354 |
| Tobacco 0.0% | | | |
| Philip Morris International, Inc. | | | 1,100 | 90,057 |
| Energy 0.1% | | | 2,125,261 |
| Oil, gas and consumable fuels 0.1% | | | |
| Concho Resources, Inc. | | | 3,102 | 210,998 |
| Pioneer Natural Resources Company | | | 15,591 | 1,914,263 |
| Financials 4.5% | | | 173,586,484 |
| Banks 0.0% | | | |
| Citigroup, Inc. | | | 15,124 | 959,769 |
| JPMorgan Chase & Co. | | | 5,861 | 680,521 |
| Capital markets 2.8% | | | |
| Intercontinental Exchange, Inc. | | | 222,296 | 19,833,249 |
| Morgan Stanley | | | 377,869 | 17,015,441 |
| MSCI, Inc. | | | 5,500 | 1,624,920 |
| S&P Global, Inc. | | | 87,564 | 23,284,143 |
| State Street Corp. | | | 138,307 | 9,420,090 |
| TD Ameritrade Holding Corp. | | | 383,658 | 16,201,877 |
| The Charles Schwab Corp. | | | 265,255 | 10,809,141 |
| The Goldman Sachs Group, Inc. | | | 47,550 | 9,546,614 |
| Insurance 1.7% | | | |
| American International Group, Inc. | | | 68,282 | 2,878,769 |
| Chubb, Ltd. | | | 73,212 | 10,617,936 |
| Marsh & McLennan Companies, Inc. | | | 134,659 | 14,079,945 |
| Willis Towers Watson PLC | | | 193,575 | 36,634,069 |
| Health care 14.7% | | | 574,998,404 |
| Biotechnology 2.6% | | | |
| AbbVie, Inc. | | | 65,500 | 5,614,005 |
| Alexion Pharmaceuticals, Inc. (A) | | | 109,374 | 10,284,437 |
| Amgen, Inc. | | | 947 | 189,144 |
| Biogen, Inc. (A) | | | 11,400 | 3,515,646 |
| Exact Sciences Corp. (A) | | | 92,881 | 7,518,717 |
| Incyte Corp. (A) | | | 16,208 | 1,222,245 |
| Regeneron Pharmaceuticals, Inc. (A) | | | 4,754 | 2,113,486 |
| Seattle Genetics, Inc. (A) | | | 29,669 | 3,378,112 |
| Vertex Pharmaceuticals, Inc. (A) | | | 299,283 | 67,048,370 |
| 10 | JOHN HANCOCK BLUE CHIP GROWTH FUND | SEMIANNUAL REPORT | SEE NOTES TO FINANCIAL STATEMENTS |
| | | | | Shares | Value |
| Health care (continued) | | | |
| Health care equipment and supplies 5.3% | | | |
| Abbott Laboratories | | | 26,428 | $2,035,749 |
| Becton, Dickinson and Company | | | 161,992 | 38,524,937 |
| Danaher Corp. | | | 315,684 | 45,641,593 |
| Intuitive Surgical, Inc. (A) | | | 101,291 | 54,085,342 |
| Stryker Corp. | | | 340,089 | 64,817,563 |
| Teleflex, Inc. | | | 2,592 | 868,372 |
| Health care providers and services 5.4% | | | |
| Anthem, Inc. | | | 102,831 | 26,436,822 |
| Centene Corp. (A) | | | 497,186 | 26,360,802 |
| Cigna Corp. | | | 369,640 | 67,621,942 |
| HCA Healthcare, Inc. | | | 170,002 | 21,591,954 |
| UnitedHealth Group, Inc. | | | 272,530 | 69,484,249 |
| Health care technology 0.1% | | | |
| Veeva Systems, Inc., Class A (A) | | | 30,871 | 4,382,756 |
| Life sciences tools and services 1.1% | | | |
| Agilent Technologies, Inc. | | | 8,894 | 685,461 |
| Thermo Fisher Scientific, Inc. | | | 143,637 | 41,769,640 |
| Pharmaceuticals 0.2% | | | |
| Zoetis, Inc. | | | 73,610 | 9,807,060 |
| Industrials 5.4% | | | 212,538,182 |
| Aerospace and defense 2.4% | | | |
| L3Harris Technologies, Inc. | | | 55,231 | 10,920,826 |
| Northrop Grumman Corp. | | | 45,104 | 14,831,999 |
| The Boeing Company | | | 244,317 | 67,214,050 |
| Airlines 0.2% | | | |
| United Airlines Holdings, Inc. (A) | | | 92,299 | 5,684,695 |
| Commercial services and supplies 0.1% | | | |
| Cintas Corp. | | | 15,694 | 4,186,218 |
| Industrial conglomerates 1.0% | | | |
| General Electric Company | | | 528,000 | 5,744,640 |
| Honeywell International, Inc. | | | 53,423 | 8,663,608 |
| Roper Technologies, Inc. | | | 74,305 | 26,133,069 |
| Machinery 0.0% | | | |
| Fortive Corp. | | | 18,743 | 1,296,266 |
| Professional services 0.9% | | | |
| CoStar Group, Inc. (A) | | | 33,627 | 22,449,049 |
| Equifax, Inc. | | | 70,890 | 10,069,216 |
| IHS Markit, Ltd. | | | 54,385 | 3,874,387 |
| Road and rail 0.8% | | | |
| Canadian Pacific Railway, Ltd. | | | 35,365 | 8,797,751 |
| SEE NOTES TO FINANCIAL STATEMENTS | SEMIANNUAL REPORT | JOHN HANCOCK BLUE CHIP GROWTH FUND | 11 |
| | | | | Shares | Value |
| Industrials (continued) | | | |
| Road and rail (continued) | | | |
| Kansas City Southern | | | 26,380 | $3,974,938 |
| Norfolk Southern Corp. | | | 47,639 | 8,686,972 |
| Union Pacific Corp. | | | 62,640 | 10,010,498 |
| Information technology 35.3% | | | 1,376,871,449 |
| Communications equipment 0.0% | | | |
| Motorola Solutions, Inc. | | | 2,045 | 338,816 |
| IT services 14.3% | | | |
| Automatic Data Processing, Inc. | | | 13,204 | 2,043,187 |
| Fidelity National Information Services, Inc. | | | 480,957 | 67,199,312 |
| Fiserv, Inc. (A) | | | 543,080 | 59,391,229 |
| FleetCor Technologies, Inc. (A) | | | 55,386 | 14,721,045 |
| Global Payments, Inc. | | | 423,260 | 77,867,142 |
| Mastercard, Inc., Class A | | | 436,563 | 126,712,411 |
| PayPal Holdings, Inc. (A) | | | 603,381 | 65,159,114 |
| Visa, Inc., Class A | | | 802,185 | 145,805,146 |
| Semiconductors and semiconductor equipment 2.9% | | | |
| Advanced Micro Devices, Inc. (A) | | | 288,289 | 13,111,384 |
| Applied Materials, Inc. | | | 319,525 | 18,570,793 |
| Broadcom, Inc. | | | 1,091 | 297,428 |
| KLA Corp. | | | 17,757 | 2,729,428 |
| Lam Research Corp. | | | 46,563 | 13,662,981 |
| Marvell Technology Group, Ltd. | | | 605,308 | 12,893,060 |
| Maxim Integrated Products, Inc. | | | 61,033 | 3,394,655 |
| Microchip Technology, Inc. (B) | | | 23,894 | 2,167,425 |
| NVIDIA Corp. | | | 123,688 | 33,404,418 |
| QUALCOMM, Inc. | | | 94,055 | 7,364,507 |
| Texas Instruments, Inc. | | | 52,648 | 6,009,243 |
| Software 15.1% | | | |
| Atlassian Corp. PLC, Class A (A) | | | 69,192 | 10,030,072 |
| Coupa Software, Inc. (A) | | | 10,172 | 1,523,257 |
| DocuSign, Inc. (A) | | | 127,590 | 11,012,293 |
| Intuit, Inc. | | | 289,991 | 77,094,107 |
| Microsoft Corp. | | | 1,291,657 | 209,261,351 |
| Paycom Software, Inc. (A) | | | 31,419 | 8,880,580 |
| salesforce.com, Inc. (A) | | | 466,573 | 79,504,039 |
| ServiceNow, Inc. (A) | | | 274,289 | 89,442,900 |
| Splunk, Inc. (A) | | | 217,685 | 32,071,531 |
| Synopsys, Inc. (A) | | | 68,667 | 9,471,239 |
| VMware, Inc., Class A (A) | | | 131,859 | 15,891,647 |
| Workday, Inc., Class A (A) | | | 248,325 | 43,022,306 |
| 12 | JOHN HANCOCK BLUE CHIP GROWTH FUND | SEMIANNUAL REPORT | SEE NOTES TO FINANCIAL STATEMENTS |
| | | | | Shares | Value |
| Information technology (continued) | | | |
| Technology hardware, storage and peripherals 3.0% | | | |
| Apple, Inc. | | | 427,361 | $116,823,403 |
| Materials 0.5% | | | 19,404,099 |
| Chemicals 0.5% | | | |
| Air Products & Chemicals, Inc. | | | 1,936 | 425,165 |
| Linde PLC | | | 64,938 | 12,403,807 |
| The Sherwin-Williams Company | | | 12,724 | 6,575,127 |
| Real estate 0.0% | | | 202,306 |
| Equity real estate investment trusts 0.0% | | | |
| American Tower Corp. | | | 892 | 202,306 |
| Utilities 0.2% | | | 6,998,101 |
| Electric utilities 0.0% | | | |
| NextEra Energy, Inc. | | | 1,585 | 400,625 |
| Multi-utilities 0.2% | | | |
| Sempra Energy | | | 47,199 | 6,597,476 |
|
| | | Yield (%) | | Shares | Value |
| Short-term investments 0.6% | | | | | $23,644,269 |
| (Cost $23,644,006) | | | | | |
| Short-term funds 0.6% | | | | | 23,644,269 |
| John Hancock Collateral Trust (C) | 1.6968(D) | | 72,235 | 722,990 |
| State Street Institutional U.S. Government Money Market Fund, Premier Class | 1.5386(D) | | 500,000 | 500,000 |
| T. Rowe Price Government Reserve Fund | 1.5799(D) | | 22,421,279 | 22,421,279 |
|
| Total investments (Cost $1,914,631,703) 100.6% | | | $3,924,808,227 |
| Other assets and liabilities, net (0.6%) | | | | (21,596,018) |
| Total net assets 100.0% | | | | | $3,903,212,209 |
| The percentage shown for each investment category is the total value of the category as a percentage of the net assets of the fund. |
| Security Abbreviations and Legend |
| ADR | American Depositary Receipt |
| (A) | Non-income producing security. |
| (B) | All or a portion of this security is on loan as of 2-29-20. |
| (C) | Investment is an affiliate of the fund, the advisor and/or subadvisor. This security represents the investment of cash collateral received for securities lending. |
| (D) | The rate shown is the annualized seven-day yield as of 2-29-20. |
At 2-29-20, the aggregate cost of investments for federal income tax purposes was $1,931,901,876. Net unrealized appreciation aggregated to $1,992,906,351, of which $2,018,273,793 related to gross unrealized appreciation and $25,367,442 related to gross unrealized depreciation.
| SEE NOTES TO FINANCIAL STATEMENTS | SEMIANNUAL REPORT | JOHN HANCOCK BLUE CHIP GROWTH FUND | 13 |
STATEMENT OF ASSETS AND LIABILITIES 2-29-20 (unaudited)
| Assets | |
| Unaffiliated investments, at value (Cost $1,913,908,976) including $707,676 of securities loaned | $3,924,085,237 |
| Affiliated investments, at value (Cost $722,727) | 722,990 |
| Total investments, at value (Cost $1,914,631,703) | 3,924,808,227 |
| Dividends and interest receivable | 2,297,789 |
| Receivable for fund shares sold | 5,215,242 |
| Receivable for investments sold | 6,284,655 |
| Receivable for securities lending income | 8,989 |
| Receivable from affiliates | 3,485 |
| Other assets | 116,727 |
| Total assets | 3,938,735,114 |
| Liabilities | |
| Payable for investments purchased | 14,140,670 |
| Payable for fund shares repurchased | 20,261,234 |
| Payable upon return of securities loaned | 722,193 |
| Payable to affiliates | |
| Accounting and legal services fees | 108,338 |
| Transfer agent fees | 71,141 |
| Trustees' fees | 6,935 |
| Other liabilities and accrued expenses | 212,394 |
| Total liabilities | 35,522,905 |
| Net assets | $3,903,212,209 |
| Net assets consist of | |
| Paid-in capital | $1,830,104,151 |
| Total distributable earnings (loss) | 2,073,108,058 |
| Net assets | $3,903,212,209 |
| |
| Net asset value per share | |
| Based on net asset value and shares outstanding - the fund has an unlimited number of shares authorized with no par value | |
| Class A ($634,227,266 ÷ 15,362,915 shares)1 | $41.28 |
| Class C ($74,543,664 ÷ 1,889,128 shares)1 | $39.46 |
| Class 1 ($1,743,350,820 ÷ 41,478,877 shares) | $42.03 |
| Class NAV ($1,451,090,459 ÷ 34,445,933 shares) | $42.13 |
| Maximum offering price per share | |
| Class A (net asset value per share ÷ 95%)2 | $43.45 |
| 1 | Redemption price per share is equal to net asset value less any applicable contingent deferred sales charge. |
| 2 | On single retail sales of less than $50,000. On sales of $50,000 or more and on group sales the offering price is reduced. |
| 14 | JOHN HANCOCK Blue Chip Growth Fund | SEMIANNUAL REPORT | SEE NOTES TO FINANCIAL STATEMENTS |
STATEMENT OF OPERATIONS For the six months ended 2-29-20 (unaudited)
| Investment income | |
| Dividends | $12,095,374 |
| Securities lending | 185,052 |
| Interest | 137,460 |
| Less foreign taxes withheld | (31,457) |
| Total investment income | 12,386,429 |
| Expenses | |
| Investment management fees | 15,242,581 |
| Distribution and service fees | 1,777,368 |
| Accounting and legal services fees | 367,854 |
| Transfer agent fees | 429,934 |
| Trustees' fees | 35,841 |
| Custodian fees | 237,063 |
| State registration fees | 37,295 |
| Printing and postage | 31,919 |
| Professional fees | 57,648 |
| Other | 59,281 |
| Total expenses | 18,276,784 |
| Less expense reductions | (825,869) |
| Net expenses | 17,450,915 |
| Net investment loss | (5,064,486) |
| Realized and unrealized gain (loss) | |
| Net realized gain (loss) on | |
| Unaffiliated investments and foreign currency transactions | 103,195,319 |
| Affiliated investments | 584 |
| | 103,195,903 |
| Change in net unrealized appreciation (depreciation) of | |
| Unaffiliated investments | 50,031,997 |
| Affiliated investments | 456 |
| | 50,032,453 |
| Net realized and unrealized gain | 153,228,356 |
| Increase in net assets from operations | $148,163,870 |
| SEE NOTES TO FINANCIAL STATEMENTS | SEMIANNUAL REPORT | JOHN HANCOCK Blue Chip Growth Fund | 15 |
STATEMENTS OF CHANGES IN NET ASSETS
| | Six months ended
2-29-20
(unaudited) | Year ended
8-31-19 |
| Increase (decrease) in net assets | | |
| From operations | | |
| Net investment loss | $(5,064,486) | $(274,920) |
| Net realized gain | 103,195,903 | 42,366,967 |
| Change in net unrealized appreciation (depreciation) | 50,032,453 | 86,886,027 |
| Increase in net assets resulting from operations | 148,163,870 | 128,978,074 |
| Distributions to shareholders | | |
| From earnings | | |
| Class A | (9,393,035) | (31,876,159) |
| Class C | (1,190,326) | (4,536,502) |
| Class 1 | (27,066,770) | (107,986,260) |
| Class NAV | (22,236,121) | (96,204,768) |
| Total distributions | (59,886,252) | (240,603,689) |
| From fund share transactions | (143,254,493) | 881,241,204 |
| Total increase (decrease) | (54,976,875) | 769,615,589 |
| Net assets | | |
| Beginning of period | 3,958,189,084 | 3,188,573,495 |
| End of period | $3,903,212,209 | $3,958,189,084 |
| 16 | JOHN HANCOCK Blue Chip Growth Fund | SEMIANNUAL REPORT | SEE NOTES TO FINANCIAL STATEMENTS |
| CLASS A SHARES Period ended | 2-29-201 | 8-31-19 | 8-31-18 | 8-31-17 | 8-31-16 | 8-31-152 |
| Per share operating performance | | | | | | |
| Net asset value, beginning of period | $40.48 | $42.40 | $38.65 | $32.33 | $34.71 | $34.99 |
| Net investment loss3 | (0.11) | (0.12) | (0.16) | (0.09) | (0.10) | (0.07) |
| Net realized and unrealized gain (loss) on investments | 1.55 | 0.84 | 9.76 | 8.37 | 2.01 | (0.21) |
| Total from investment operations | 1.44 | 0.72 | 9.60 | 8.28 | 1.91 | (0.28) |
| Less distributions | | | | | | |
| From net realized gain | (0.64) | (2.64) | (5.85) | (1.96) | (4.29) | — |
| Net asset value, end of period | $41.28 | $40.48 | $42.40 | $38.65 | $32.33 | $34.71 |
| Total return (%)4 | 3.505 | 3.14 | 27.50 | 27.10 | 5.37 | (0.80)5 |
| Ratios and supplemental data | | | | | | |
| Net assets, end of period (in millions) | $634 | $579 | $477 | $286 | $222 | $46 |
| Ratios (as a percentage of average net assets): | | | | | | |
| Expenses before reductions | 1.217 | 1.20 | 1.20 | 1.24 | 1.24 | 1.247 |
| Expenses including reductions | 1.147 | 1.14 | 1.14 | 1.14 | 1.14 | 1.147 |
| Net investment loss | (0.53)7 | (0.30) | (0.40) | (0.25) | (0.31) | (0.44)7 |
| Portfolio turnover (%) | 17 | 38 | 25 | 26 | 34 | 318 |
| 1 | Six months ended 2-29-20. Unaudited. |
| 2 | The inception date for Class A shares is 3-27-15. |
| 3 | Based on average daily shares outstanding. |
| 4 | Total returns would have been lower had certain expenses not been reduced during the applicable periods. |
| 5 | Not annualized. |
| 6 | Does not reflect the effect of sales charges, if any. |
| 7 | Annualized. |
| 8 | Portfolio turnover is shown for the period from 9-1-14 to 8-31-15. |
| SEE NOTES TO FINANCIAL STATEMENTS | SEMIANNUAL REPORT | JOHN HANCOCK Blue Chip Growth Fund | 17 |
| CLASS C SHARES Period ended | 2-29-201 | 8-31-19 | 8-31-18 | 8-31-17 | 8-31-16 | 8-31-152 |
| Per share operating performance | | | | | | |
| Net asset value, beginning of period | $38.86 | $41.11 | $37.89 | $31.96 | $34.60 | $34.99 |
| Net investment loss3 | (0.26) | (0.39) | (0.43) | (0.34) | (0.33) | (0.18) |
| Net realized and unrealized gain (loss) on investments | 1.50 | 0.78 | 9.50 | 8.23 | 1.98 | (0.21) |
| Total from investment operations | 1.24 | 0.39 | 9.07 | 7.89 | 1.65 | (0.39) |
| Less distributions | | | | | | |
| From net realized gain | (0.64) | (2.64) | (5.85) | (1.96) | (4.29) | — |
| Net asset value, end of period | $39.46 | $38.86 | $41.11 | $37.89 | $31.96 | $34.60 |
| Total return (%)4 | 3.135 | 2.40 | 26.56 | 26.16 | 4.57 | (1.11)5 |
| Ratios and supplemental data | | | | | | |
| Net assets, end of period (in millions) | $75 | $74 | $66 | $36 | $36 | $10 |
| Ratios (as a percentage of average net assets): | | | | | | |
| Expenses before reductions | 1.917 | 1.90 | 1.90 | 1.94 | 1.94 | 1.947 |
| Expenses including reductions | 1.887 | 1.87 | 1.86 | 1.89 | 1.89 | 1.897 |
| Net investment loss | (1.27)7 | (1.03) | (1.12) | (1.00) | (1.06) | (1.19)7 |
| Portfolio turnover (%) | 17 | 38 | 25 | 26 | 34 | 318 |
| 1 | Six months ended 2-29-20. Unaudited. |
| 2 | The inception date for Class C shares is 3-27-15. |
| 3 | Based on average daily shares outstanding. |
| 4 | Total returns would have been lower had certain expenses not been reduced during the applicable periods. |
| 5 | Not annualized. |
| 6 | Does not reflect the effect of sales charges, if any. |
| 7 | Annualized. |
| 8 | Portfolio turnover is shown for the period from 9-1-14 to 8-31-15. |
| 18 | JOHN HANCOCK Blue Chip Growth Fund | SEMIANNUAL REPORT | SEE NOTES TO FINANCIAL STATEMENTS |
| CLASS 1 SHARES Period ended | 2-29-201 | 8-31-19 | 8-31-18 | 8-31-17 | 8-31-16 | 8-31-15 |
| Per share operating performance | | | | | | |
| Net asset value, beginning of period | $41.13 | $42.89 | $38.92 | $32.46 | $34.75 | $35.98 |
| Net investment income (loss)2 | (0.04) | 0.01 | (0.03) | 0.02 | (0.01) | —3 |
| Net realized and unrealized gain (loss) on investments | 1.58 | 0.87 | 9.85 | 8.41 | 2.02 | 2.44 |
| Total from investment operations | 1.54 | 0.88 | 9.82 | 8.43 | 2.01 | 2.44 |
| Less distributions | | | | | | |
| From net investment income | — | — | — | (0.01) | (0.01) | — |
| From net realized gain | (0.64) | (2.64) | (5.85) | (1.96) | (4.29) | (3.67) |
| Total distributions | (0.64) | (2.64) | (5.85) | (1.97) | (4.30) | (3.67) |
| Net asset value, end of period | $42.03 | $41.13 | $42.89 | $38.92 | $32.46 | $34.75 |
| Total return (%)4 | 3.695 | 3.50 | 27.92 | 27.49 | 5.67 | 7.25 |
| Ratios and supplemental data | | | | | | |
| Net assets, end of period (in millions) | $1,743 | $1,804 | $1,763 | $1,306 | $1,065 | $969 |
| Ratios (as a percentage of average net assets): | | | | | | |
| Expenses before reductions | 0.846 | 0.84 | 0.84 | 0.87 | 0.87 | 0.86 |
| Expenses including reductions | 0.816 | 0.81 | 0.80 | 0.83 | 0.83 | 0.82 |
| Net investment income (loss) | (0.20)6 | 0.04 | (0.07) | 0.06 | (0.03) | 0.01 |
| Portfolio turnover (%) | 17 | 38 | 25 | 26 | 34 | 31 |
| 1 | Six months ended 2-29-20. Unaudited. |
| 2 | Based on average daily shares outstanding. |
| 3 | Less than $0.005 per share. |
| 4 | Total returns would have been lower had certain expenses not been reduced during the applicable periods. |
| 5 | Not annualized. |
| 6 | Annualized. |
| SEE NOTES TO FINANCIAL STATEMENTS | SEMIANNUAL REPORT | JOHN HANCOCK Blue Chip Growth Fund | 19 |
| CLASS NAV SHARES Period ended | 2-29-201 | 8-31-19 | 8-31-18 | 8-31-17 | 8-31-16 | 8-31-15 |
| Per share operating performance | | | | | | |
| Net asset value, beginning of period | $41.22 | $42.95 | $38.95 | $32.48 | $34.76 | $35.97 |
| Net investment income (loss)2 | (0.03) | 0.04 | (0.01) | 0.04 | 0.01 | 0.02 |
| Net realized and unrealized gain (loss) on investments | 1.58 | 0.87 | 9.86 | 8.41 | 2.02 | 2.44 |
| Total from investment operations | 1.55 | 0.91 | 9.85 | 8.45 | 2.03 | 2.46 |
| Less distributions | | | | | | |
| From net investment income | — | — | — | (0.02) | (0.02) | — |
| From net realized gain | (0.64) | (2.64) | (5.85) | (1.96) | (4.29) | (3.67) |
| Total distributions | (0.64) | (2.64) | (5.85) | (1.98) | (4.31) | (3.67) |
| Net asset value, end of period | $42.13 | $41.22 | $42.95 | $38.95 | $32.48 | $34.76 |
| Total return (%)3 | 3.704 | 3.57 | 27.98 | 27.54 | 5.74 | 7.31 |
| Ratios and supplemental data | | | | | | |
| Net assets, end of period (in millions) | $1,451 | $1,501 | $882 | $995 | $1,364 | $1,501 |
| Ratios (as a percentage of average net assets): | | | | | | |
| Expenses before reductions | 0.795 | 0.79 | 0.79 | 0.82 | 0.82 | 0.81 |
| Expenses including reductions | 0.765 | 0.76 | 0.75 | 0.78 | 0.78 | 0.77 |
| Net investment income (loss) | (0.15)5 | 0.09 | (0.02) | 0.11 | 0.02 | 0.06 |
| Portfolio turnover (%) | 17 | 38 | 25 | 26 | 34 | 31 |
| 1 | Six months ended 2-29-20. Unaudited. |
| 2 | Based on average daily shares outstanding. |
| 3 | Total returns would have been lower had certain expenses not been reduced during the applicable periods. |
| 4 | Not annualized. |
| 5 | Annualized. |
| 20 | JOHN HANCOCK Blue Chip Growth Fund | SEMIANNUAL REPORT | SEE NOTES TO FINANCIAL STATEMENTS |
| Notes to financial statements (unaudited) | |
Note 1—Organization
John Hancock Blue Chip Growth Fund (the fund) is a series of John Hancock Funds II (the Trust), an open-end management investment company organized as a Massachusetts business trust and registered under the Investment Company Act of 1940, as amended (the 1940 Act). The investment objective of the fund is to seek to provide long-term growth of capital. Current income is a secondary objective.
The fund may offer multiple classes of shares. The shares currently outstanding are detailed in the Statement of assets and liabilities. Class A and Class C shares are offered to all investors. Class 1 shares are offered only to certain affiliates of Manulife Financial Corporation (MFC). Class NAV shares are offered to John Hancock affiliated funds of funds, retirement plans for employees of John Hancock and/or Manulife Financial Corporation, and certain 529 plans. Class C shares convert to Class A shares ten years after purchase (certain exclusions may apply). Shareholders of each class have exclusive voting rights to matters that affect that class. The distribution and service fees, if any, and transfer agent fees for each class may differ.
Note 2—Significant accounting policies
The financial statements have been prepared in conformity with accounting principles generally accepted in the United States of America (US GAAP), which require management to make certain estimates and assumptions as of the date of the financial statements. Actual results could differ from those estimates and those differences could be significant. The fund qualifies as an investment company under Topic 946 of Accounting Standards Codification of US GAAP.
Events or transactions occurring after the end of the fiscal period through the date that the financial statements were issued have been evaluated in the preparation of the financial statements. The following summarizes the significant accounting policies of the fund:
Security valuation. Investments are stated at value as of the scheduled close of regular trading on the New York Stock Exchange (NYSE), normally at 4:00 P.M., Eastern Time. In case of emergency or other disruption resulting in the NYSE not opening for trading or the NYSE closing at a time other than the regularly scheduled close, the net asset value (NAV) may be determined as of the regularly scheduled close of the NYSE pursuant to the fund's Valuation Policies and Procedures.
In order to value the securities, the fund uses the following valuation techniques: Equity securities, including exchange-traded or closed-end funds, are typically valued at the last sale price or official closing price on the exchange or principal market where the security trades. In the event there were no sales during the day or closing prices are not available, the securities are valued using the last available bid price. Investments by the fund in open-end mutual funds, including John Hancock Collateral Trust (JHCT), are valued at their respective NAVs each business day. Foreign securities and currencies are valued in U.S. dollars based on foreign currency exchange rates supplied by an independent pricing vendor.
In certain instances, the Pricing Committee may determine to value equity securities using prices obtained from another exchange or market if trading on the exchange or market on which prices are typically obtained did not open for trading as scheduled, or if trading closed earlier than scheduled, and trading occurred as normal on another exchange or market.
Other portfolio securities and assets, for which reliable market quotations are not readily available, are valued at fair value as determined in good faith by the fund's Pricing Committee following procedures established by the Board of Trustees. The frequency with which these fair valuation procedures are used cannot be predicted and fair value of securities may differ significantly from the value that would have been used had a ready market for such securities existed. Trading in foreign securities may be completed before the scheduled daily close of trading on the
| | SEMIANNUAL REPORT | JOHN HANCOCK Blue Chip Growth Fund | 21 |
NYSE. Significant events at the issuer or market level may affect the values of securities between the time when the valuation of the securities is generally determined and the close of the NYSE. If a significant event occurs, these securities may be fair valued, as determined in good faith by the fund's Pricing Committee, following procedures established by the Board of Trustees. The fund uses fair value adjustment factors provided by an independent pricing vendor to value certain foreign securities in order to adjust for events that may occur between the close of foreign exchanges or markets and the close of the NYSE.
The fund uses a three-tier hierarchy to prioritize the pricing assumptions, referred to as inputs, used in valuation techniques to measure fair value. Level 1 includes securities valued using quoted prices in active markets for identical securities, including registered investment companies. Level 2 includes securities valued using other significant observable inputs. Observable inputs may include quoted prices for similar securities, interest rates, prepayment speeds and credit risk. Prices for securities valued using these inputs are received from independent pricing vendors and brokers and are based on an evaluation of the inputs described. Level 3 includes securities valued using significant unobservable inputs when market prices are not readily available or reliable, including the fund's own assumptions in determining the fair value of investments. Factors used in determining value may include market or issuer specific events or trends, changes in interest rates and credit quality. The inputs or methodology used for valuing securities are not necessarily an indication of the risks associated with investing in those securities. Changes in valuation techniques and related inputs may result in transfers into or out of an assigned level within the disclosure hierarchy.
The following is a summary of the values by input classification of the fund's investments as of February 29, 2020, by major security category or type:
| | Total
value at
2-29-20 | Level 1
quoted
price | Level 2
significant
observable
inputs | Level 3
significant
unobservable
inputs |
| Investments in securities: | | | | |
| Assets | | | | |
| Common stocks | | | | |
| Communication services | $744,718,047 | $644,317,666 | $100,400,381 | — |
| Consumer discretionary | 789,324,214 | 789,324,214 | — | — |
| Consumer staples | 397,411 | 397,411 | — | — |
| Energy | 2,125,261 | 2,125,261 | — | — |
| Financials | 173,586,484 | 173,586,484 | — | — |
| Health care | 574,998,404 | 574,998,404 | — | — |
| Industrials | 212,538,182 | 212,538,182 | — | — |
| Information technology | 1,376,871,449 | 1,376,871,449 | — | — |
| Materials | 19,404,099 | 19,404,099 | — | — |
| Real estate | 202,306 | 202,306 | — | — |
| Utilities | 6,998,101 | 6,998,101 | — | — |
| Short-term investments | 23,644,269 | 23,644,269 | — | — |
| Total investments in securities | $3,924,808,227 | $3,824,407,846 | $100,400,381 | — |
Security transactions and related investment income. Investment security transactions are accounted for on a trade date plus one basis for daily NAV calculations. However, for financial reporting purposes, investment transactions are reported on trade date. Interest income is accrued as earned. Dividend income is recorded on the ex-date, except for dividends of certain foreign securities where the dividend may not be known until after the
| 22 | JOHN HANCOCK Blue Chip Growth Fund | SEMIANNUAL REPORT | |
ex-date. In those cases, dividend income, net of withholding taxes, is recorded when the fund becomes aware of the dividends. Non-cash dividends, if any, are recorded at the fair market value of the securities received. Gains and losses on securities sold are determined on the basis of identified cost and may include proceeds from litigation.
Real estate investment trusts. The fund may invest in real estate investment trusts (REITs). Distributions from REITs may be recorded as income and subsequently characterized by the REIT at the end of the fiscal year as a reduction of cost of investments and/or as a realized gain. As a result, the fund will estimate the components of distributions from these securities. Such estimates are revised when the actual components of the distributions are known.
Securities lending. The fund may lend its securities to earn additional income. The fund receives collateral from the borrower in an amount not less than the market value of the loaned securities. The fund will invest its cash collateral in JHCT, an affiliate of the fund, which has a floating NAV and is registered with the Securities and Exchange Commission (SEC) as an investment company. JHCT invests in short-term money market investments. The fund will receive the benefit of any gains and bear any losses generated by JHCT with respect to the cash collateral.
The fund has the right to recall loaned securities on demand. If a borrower fails to return loaned securities when due, then the lending agent is responsible and indemnifies the fund for the lent securities. The lending agent uses the collateral received from the borrower to purchase replacement securities of the same issue, type, class and series of the loaned securities. If the value of the collateral is less than the purchase cost of replacement securities, the lending agent is responsible for satisfying the shortfall but only to the extent that the shortfall is not due to any decrease in the value of JHCT.
Although the risk of loss on securities lent is mitigated by receiving collateral from the borrower and through lending agent indemnification, the fund could experience a delay in recovering securities or could experience a lower than expected return if the borrower fails to return the securities on a timely basis. The fund receives compensation for lending its securities by retaining a portion of the return on the investment of the collateral and compensation from fees earned from borrowers of the securities. Securities lending income received by the fund is net of fees retained by the securities lending agent. Net income received from JHCT is a component of securities lending income as recorded on the Statement of operations.
Obligations to repay collateral received by the fund are shown on the Statement of assets and liabilities as Payable upon return of securities loaned and are secured by the loaned securities. As of February 29, 2020, the fund loaned securities valued at $707,676 and received $722,193 of cash collateral.
Foreign investing. Assets, including investments, and liabilities denominated in foreign currencies are translated into U.S. dollar values each day at the prevailing exchange rate. Purchases and sales of securities, income and expenses are translated into U.S. dollars at the prevailing exchange rate on the date of the transaction. The effect of changes in foreign currency exchange rates on the value of securities is reflected as a component of the realized and unrealized gains (losses) on investments. Foreign investments are subject to a decline in the value of a foreign currency versus the U.S. dollar, which reduces the dollar value of securities denominated in that currency.
Funds that invest internationally generally carry more risk than funds that invest strictly in U.S. securities. These risks are heightened for investments in emerging markets. Risks can result from differences in economic and political conditions, regulations, market practices (including higher transaction costs), accounting standards and other factors.
| | SEMIANNUAL REPORT | JOHN HANCOCK Blue Chip Growth Fund | 23 |
Foreign taxes. The fund may be subject to withholding tax on income, capital gains or repatriation taxes imposed by certain countries, a portion of which may be recoverable. Foreign taxes are accrued based upon the fund's understanding of the tax rules and rates that exist in the foreign markets in which it invests. Taxes are accrued based on gains realized by the fund as a result of certain foreign security sales. In certain circumstances, estimated taxes are accrued based on unrealized appreciation of such securities. Investment income is recorded net of foreign withholding taxes.
Overdraft. The fund may have the ability to borrow from banks for temporary or emergency purposes, including meeting redemption requests that otherwise might require the untimely sale of securities. Pursuant to the fund's custodian agreement, the custodian may loan money to the fund to make properly authorized payments. The fund is obligated to repay the custodian for any overdraft, including any related costs or expenses. The custodian may have a lien, security interest or security entitlement in any fund property that is not otherwise segregated or pledged, to the extent of any overdraft, and to the maximum extent permitted by law.
Line of credit. The fund and other affiliated funds have entered into a syndicated line of credit agreement with Citibank, N.A. as the administrative agent that enables them to participate in a $750 million unsecured committed line of credit. Excluding commitments designated for a certain fund and subject to the needs of all other affiliated funds, the fund can borrow up to an aggregate commitment amount of $500 million, subject to asset coverage and other limitations as specified in the agreement. A commitment fee payable at the end of each calendar quarter, based on the average daily unused portion of the line of credit, is charged to each participating fund based on a combination of fixed and asset based allocations and is reflected in Other expenses on the Statement of operations. For the six months ended February 29, 2020, the fund had no borrowings under the line of credit. Commitment fees for the six months ended February 29, 2020 were $5,633.
Expenses. Within the John Hancock group of funds complex, expenses that are directly attributable to an individual fund are allocated to such fund. Expenses that are not readily attributable to a specific fund are allocated among all funds in an equitable manner, taking into consideration, among other things, the nature and type of expense and the fund’s relative net assets. Expense estimates are accrued in the period to which they relate and adjustments are made when actual amounts are known.
Class allocations. Income, common expenses and realized and unrealized gains (losses) are determined at the fund level and allocated daily to each class of shares based on the net assets of the class. Class-specific expenses, such as distribution and service fees, if any, and transfer agent fees, for all classes, are charged daily at the class level based on the net assets of each class and the specific expense rates applicable to each class.
Federal income taxes. The fund intends to continue to qualify as a regulated investment company by complying with the applicable provisions of the Internal Revenue Code and will not be subject to federal income tax on taxable income that is distributed to shareholders. Therefore, no federal income tax provision is required.
As of August 31, 2019, the fund had no uncertain tax positions that would require financial statement recognition, derecognition or disclosure. The fund's federal tax returns are subject to examination by the Internal Revenue Service for a period of three years.
Distribution of income and gains. Distributions to shareholders from net investment income and net realized gains, if any, are recorded on the ex-date. The fund generally declares and pays dividends annually. Capital gain distributions, if any, are typically distributed annually.
Distributions paid by the fund with respect to each class of shares are calculated in the same manner, at the same time and in the same amount, except for the effect of class level expenses that may be applied differently to each class.
| 24 | JOHN HANCOCK Blue Chip Growth Fund | SEMIANNUAL REPORT | |
Such distributions, on a tax basis, are determined in conformity with income tax regulations, which may differ from US GAAP. Distributions in excess of tax basis earnings and profits, if any, are reported in the fund's financial statements as a return of capital. The final determination of tax characteristics of the fund's distribution will occur at the end of the year and will subsequently be reported to shareholders.
Capital accounts within the financial statements are adjusted for permanent book-tax differences. These adjustments have no impact on net assets or the results of operations. Temporary book-tax differences, if any, will reverse in a subsequent period. Book-tax differences are primarily attributable to net operating losses and wash sale loss deferrals.
Note 3—Guarantees and indemnifications
Under the Trust's organizational documents, its Officers and Trustees are indemnified against certain liabilities arising out of the performance of their duties to the Trust, including the fund. Additionally, in the normal course of business, the fund enters into contracts with service providers that contain general indemnification clauses. The fund's maximum exposure under these arrangements is unknown, as this would involve future claims that may be made against the fund that have not yet occurred. The risk of material loss from such claims is considered remote.
Note 4—Fees and transactions with affiliates
John Hancock Investment Management LLC (the Advisor) serves as investment advisor for the fund. John Hancock Investment Management Distributors LLC (the Distributor), an affiliate of the Advisor, serves as principal underwriter of the fund. The Advisor and the Distributor are indirect, wholly owned subsidiaries of Manulife Financial Corporation (MFC).
Management fee. The fund has an investment management agreement with the Advisor under which the fund pays a daily management fee to the Advisor equivalent on an annual basis to the sum of: a) 0.825% of the first $500 million of the fund’s aggregate net assets; b) 0.800% of the next $500 million of the fund’s aggregate net assets; and c) 0.750% of the fund’s aggregate net assets in excess of $1 billion. However, when aggregate net assets exceed $1 billion on any day, the annual rate of advisory fee for that day is 0.750% on all asset levels. Aggregate net assets include the net assets of the fund and Blue Chip Growth Trust, a series of John Hancock Variable Insurance Trust. The Advisor has a subadvisory agreement with T.Rowe Price Associates, Inc. The fund is not responsible for payment of the subadvisory fees.
The Advisor has contractually agreed to waive a portion of its management fee and/or reimburse expenses for certain funds of the John Hancock group of funds complex, including the fund (the participating portfolios). This waiver is based upon aggregate net assets of all the participating portfolios. The amount of the reimbursement is calculated daily and allocated among all the participating portfolios in proportion to the daily net assets of each fund. During the six months ended February 29, 2020, this waiver amounted to 0.01% of the fund’s average daily net assets on an annualized basis. This arrangement expires on July 31, 2021, unless renewed by mutual agreement of the fund and the Advisor based upon a determination that this is appropriate under the circumstances at that time.
The Advisor has contractually agreed to reduce its management fee or, if necessary,make payment to each of Class A and Class C shares in an amount equal to the amount by which the expenses of Class A and Class C shares, as applicable, exceed 1.14% and 1.89%, respectively, of the average net assets attributable, to the applicable class. For purposes of this agreement, “expenses of Class A and Class C shares” means all expenses of the applicable class (including fund expenses attributable to the class), excluding taxes, brokerage commissions, interest expense, underlying fund expenses (acquired fund fees), litigation and indemnification expenses and other
| | SEMIANNUAL REPORT | JOHN HANCOCK Blue Chip Growth Fund | 25 |
extraordinary expenses not incurred in the ordinary course of business, and short dividend expense. This agreement expires on December 31, 2020, unless renewed by mutual agreement of the fund and the Advisor based upon a determination that this is appropriate under the circumstances at that time.
The Advisor has voluntarily agreed to waive a portion of its management fees for this fund. This voluntary waiver is the amount that the subadvisory fee is reduced by T.Rowe Price Associates, Inc. This voluntary expense reimbursement may be terminated at any time.
For the six months ended February 29, 2020, the expense reductions described above amounted to the following:
| Class | Expense reduction |
| Class A | $231,334 |
| Class C | 13,218 |
| Class 1 | 318,336 |
| Class | Expense reduction |
| Class NAV | $262,981 |
| Total | $825,869 |
Expenses waived or reimbursed in the current fiscal period are not subject to recapture in future fiscal periods.
The investment management fees, including the impact of the waivers and reimbursements as described above, incurred for the six months ended February 29, 2020, were equivalent to a net annual effective rate of 0.71% of the fund's average daily net assets.
Accounting and legal services. Pursuant to a service agreement, the fund reimburses the Advisor for all expenses associated with providing the administrative, financial, legal, compliance, accounting and recordkeeping services to the fund, including the preparation of all tax returns, periodic reports to shareholders and regulatory reports, among other services. These expenses are allocated to each share class based on its relative net assets at the time the expense was incurred. These accounting and legal services fees incurred for the six months ended February 29, 2020 amounted to an annual rate of 0.02% of the fund's average daily net assets.
Distribution and service plans. The fund has a distribution agreement with the Distributor. The fund has adopted distribution and service plans for certain classes as detailed below pursuant to Rule 12b-1 under the 1940 Act, to pay the Distributor for services provided as the distributor of shares of the fund. The fund may pay up to the following contractual rates of distribution and service fees under these arrangements, expressed as an annual percentage of average daily net assets for each class of the fund's shares:
| Class | Rule 12b-1 Fee |
| Class A | 0.30% |
| Class C | 1.00% |
| Class 1 | 0.05% |
Sales charges. Class A shares are assessed up-front sales charges, which resulted in payments to the Distributor amounting to $676,069 for the six months ended February 29, 2020. Of this amount, $113,078 was retained and used for printing prospectuses, advertising, sales literature and other purposes and $562,991 was paid as sales commissions to broker-dealers.
Class A and Class C shares may be subject to contingent deferred sales charges (CDSCs). Certain Class A shares that are acquired through purchases of $1 million or more and are redeemed within one year of purchase are subject to a 1.00% sales charge. Class C shares that are redeemed within one year of purchase are subject to a 1.00% CDSC. CDSCs are applied to the lesser of the current market value at the time of redemption or the original purchase cost of the shares being redeemed. Proceeds from CDSCs are used to compensate the Distributor for
| 26 | JOHN HANCOCK Blue Chip Growth Fund | SEMIANNUAL REPORT | |
providing distribution-related services in connection with the sale of these shares. During the six months ended February 29, 2020, CDSCs received by the Distributor amounted to $2,661 and $2,857 for Class A and Class C shares, respectively.
Transfer agent fees. The John Hancock group of funds has a complex-wide transfer agent agreement with John Hancock Signature Services, Inc. (Signature Services), an affiliate of the Advisor. The transfer agent fees paid to Signature Services are determined based on the cost to Signature Services (Signature Services Cost) of providing recordkeeping services. It also includes out-of-pocket expenses, including payments made to third-parties for recordkeeping services provided to their clients who invest in one or more John Hancock funds. In addition, Signature Services Cost may be reduced by certain fees that Signature Services receives in connection with retirement and small accounts. Signature Services Cost is calculated monthly and allocated, as applicable, to five categories of share classes: Retail Share and Institutional Share Classes of Non-Municipal Bond Funds, Class R6 Shares, Retirement Share Classes and Municipal Bond Share Classes. Within each of these categories, the applicable costs are allocated to the affected John Hancock affiliated funds and/or classes, based on the relative average daily net assets.
Class level expenses. Class level expenses for the six months ended February 29, 2020 were as follows:
| Class | Distribution and service fees | Transfer agent fees |
| Class A | $934,201 | $382,885 |
| Class C | 382,474 | 47,049 |
| Class 1 | 460,693 | — |
| Total | $1,777,368 | $429,934 |
Trustee expenses. The fund compensates each Trustee who is not an employee of the Advisor or its affiliates. The costs of paying Trustee compensation and expenses are allocated to the fund based on its net assets relative to other funds within the John Hancock group of funds complex.
Interfund lending program. Pursuant to an Exemptive Order issued by the SEC, the fund, along with certain other funds advised by the Advisor or its affiliates, may participate in an interfund lending program. This program provides an alternative credit facility allowing the fund to borrow from, or lend money to, other participating affiliated funds. At period end, no interfund loans were outstanding. Interest expense is included in Other expenses on the Statement of operations. The fund's activity in this program during the period for which loans were outstanding was as follows:
Borrower
or Lender | Weighted Average
Loan Balance | Days
Outstanding | Weighted Average
Interest Rate | Interest Income
(Expense) |
| Lender | $5,174,265 | 3 | 1.550% | $668 |
| | SEMIANNUAL REPORT | JOHN HANCOCK Blue Chip Growth Fund | 27 |
Note 5—Fund share transactions
Transactions in fund shares for the six months ended February 29, 2020 and for the year ended August 31, 2019 were as follows:
| | Six Months Ended 2-29-20 | Year Ended 8-31-19 |
| | Shares | Amount | Shares | Amount |
| Class A shares | | | | |
| Sold | 2,207,338 | $93,984,530 | 5,015,903 | $194,760,060 |
| Distributions reinvested | 219,942 | 9,389,308 | 968,455 | 31,823,443 |
| Repurchased | (1,374,464) | (58,134,358) | (2,924,763) | (113,145,520) |
| Net increase | 1,052,816 | $45,239,480 | 3,059,595 | $113,437,983 |
| Class C shares | | | | |
| Sold | 165,280 | $6,767,287 | 613,911 | $23,111,190 |
| Distributions reinvested | 29,033 | 1,186,280 | 142,720 | 4,524,235 |
| Repurchased | (218,888) | (8,850,270) | (456,488) | (17,132,805) |
| Net increase (decrease) | (24,575) | $(896,703) | 300,143 | $10,502,620 |
| Class 1 shares | | | | |
| Sold | 550,439 | $23,703,184 | 2,720,603 | $108,259,458 |
| Distributions reinvested | 623,227 | 27,066,770 | 3,241,857 | 107,986,260 |
| Repurchased | (3,542,454) | (152,004,045) | (3,213,804) | (124,782,695) |
| Net increase (decrease) | (2,368,788) | $(101,234,091) | 2,748,656 | $91,463,023 |
| Class NAV shares | | | | |
| Sold | 2,019,585 | $90,909,372 | 20,543,504 | $872,256,5961 |
| Distributions reinvested | 510,823 | 22,236,121 | 2,882,972 | 96,204,768 |
| Repurchased | (4,502,276) | (199,508,672) | (7,550,727) | (302,623,786) |
| Net increase (decrease) | (1,971,868) | $(86,363,179) | 15,875,749 | $665,837,578 |
| Total net increase (decrease) | (3,312,415) | $(143,254,493) | 21,984,143 | $881,241,204 |
| 1 | Includes in-kind subscriptions of approximately $676.7 million by affiliates of the fund. The cost basis of the contributed securities is equal to the market value of the securities on the date of the subscription. |
Affiliates of the fund owned 100% of shares of Class 1 and Class NAV on February 29, 2020. Such concentration of shareholders’ capital could have a material effect on the fund if such shareholders redeem from the fund.
Note 6—Purchase and sale of securities
Purchases and sales of securities, other than short-term investments, amounted to $681,924,149 and $877,851,251, respectively, for the six months ended February 29, 2020.
Note 7—Industry or sector risk
The fund may invest a large percentage of its assets in one or more particular industries or sectors of the economy. If a large percentage of the fund’s assets are economically tied to a single or small number of industries or sectors of the economy, the fund will be less diversified than a more broadly diversified fund, and it may cause the fund to
| 28 | JOHN HANCOCK Blue Chip Growth Fund | SEMIANNUAL REPORT | |
underperform if that industry or sector underperforms. In addition, focusing on a particular industry or sector may make the fund’s NAV more volatile. Further, a fund that invests in particular industries or sectors is particularly susceptible to the impact of market, economic, regulatory and other factors affecting those industries or sectors.
Note 8—Investment by affiliated funds
Certain investors in the fund are affiliated funds that are managed by the Advisor and its affiliates. The affiliated funds do not invest in the fund for the purpose of exercising management or control; however, this investment may represent a significant portion of the fund's net assets. At February 29, 2020, funds within the John Hancock group of funds complex held 37.2% of the fund's net assets. The following fund(s) had an affiliate ownership of 5% or more of the fund's net assets:
| Portfolio | Affiliated Concentration |
| John Hancock Funds II Multimanager Lifestyle Growth Portfolio | 13.0% |
| John Hancock Funds II Multimanager Lifestyle Balanced Portfolio | 9.3% |
| John Hancock Funds II Multimanager Lifestyle Aggressive Portfolio | 5.5% |
Note 9—Investment in affiliated underlying funds
The fund may invest in affiliated underlying funds that are managed by the Advisor and its affiliates. Information regarding the fund's fiscal year to date purchases and sales of the affiliated underlying funds as well as income and capital gains earned by the fund, if any, is as follows:
| | | | | | | | Dividends and distributions |
| Affiliate | Ending
share
amount | Beginning
value | Cost of
purchases | Proceeds
from shares
sold | Realized
gain
(loss) | Change in
unrealized
appreciation
(depreciation) | Income
distributions
received | Capital gain
distributions
received | Ending
value |
| John Hancock Collateral Trust* | 72,235 | $5,547,856 | $112,036,614 | $(116,862,520) | $584 | $456 | $185,052 | — | $722,990 |
| * | Refer to the Securities lending note within Note 2 for details regarding this investment. |
Note 10—Interfund trading
The fund is permitted to purchase or sell securities from or to certain other affiliated funds, as set forth in Rule 17a-7 of the 1940 Act, under specified conditions outlined in procedures adopted by the Board of Trustees of the Trust. The procedures have been designed to ensure that any purchase or sale of securities by the fund from or to another fund that is or could be considered an affiliate complies with Rule 17a-7 of the 1940 Act. Further, as defined under the procedures, each transaction is effected at the current market price. Pursuant to these procedures, for the six months ended February 29, 2020, the fund engaged in securities purchases and sales amounting to $409,281 and $1,378,267, respectively.
Note 11—Subsequent events
A widespread health crisis such as a global pandemic could cause substantial market volatility, exchange trading suspensions and closures, impact the ability to complete redemptions, and affect fund performance. For example, the novel coronavirus disease (COVID-19) has resulted in significant disruptions to global business activity. The impact of a health crisis and other epidemics and pandemics that may arise in the future, could affect the global economy in ways that cannot necessarily be foreseen at the present time. A health crisis may exacerbate other pre-existing political, social and economic risks. Any such impact could adversely affect the fund's performance, resulting in losses to your investment.
| | SEMIANNUAL REPORT | JOHN HANCOCK Blue Chip Growth Fund | 29 |
| | |
Trustees
Hassell H. McClellan,Chairperson
Steven R. Pruchansky,Vice Chairperson
Andrew G. Arnott†
Charles L. Bardelis*
James R. Boyle
Peter S. Burgess*
William H. Cunningham
Grace K. Fey
Marianne Harrison†
Deborah C. Jackson
James M. Oates*
Gregory A. Russo
Officers
Andrew G. Arnott
President
Francis V. Knox, Jr.
Chief Compliance Officer
Charles A. Rizzo
Chief Financial Officer
Salvatore Schiavone
Treasurer
Christopher (Kit) Sechler
Secretary and Chief Legal Officer
| Investment advisor
John Hancock Investment Management LLC
Subadvisor
T. Rowe Price Associates, Inc.
Portfolio Manager
Larry J. Puglia, CFA, CPA
Principal distributor
John Hancock Investment Management Distributors LLC
Custodian
State Street Bank and Trust Company
Transfer agent
John Hancock Signature Services, Inc.
Legal counsel
K&L Gates LLP
|
* Member of the Audit Committee
† Non-Independent Trustee
The fund's proxy voting policies and procedures, as well as the fund proxy voting record for the most recent twelve-month period ended June 30, are available free of charge on the Securities and Exchange Commission (SEC) website at sec.gov or on our website.
All of the fund's holdings as of the end of the third month of every fiscal quarter are filed with the SEC on Form N-PORT within 60 days of the end of the fiscal quarter. The fund's Form N-PORT filings are available on our website and the SEC's website, sec.gov.
We make this information on your fund, as well asmonthly portfolio holdings, and other fund details available on our website at jhinvestments.com or by calling 800-225-5291.
| | | | |
| | You can also contact us: |
| | 800-225-5291
jhinvestments.com | Regular mail:
John Hancock Signature Services, Inc.
P.O. Box 55913
Boston, MA 02205-5913
| Express mail:
John Hancock Signature Services, Inc.
2000 Crown Colony Drive
Suite 55913
Quincy, MA 02169-0953
|
SEMIANNUAL REPORT | JOHN HANCOCK BLUE CHIP GROWTH FUND 30
John Hancock family of funds
| | | |
DOMESTIC EQUITY FUNDS
Blue Chip Growth
Classic Value
Disciplined Value
Disciplined Value Mid Cap
Equity Income
Financial Industries
Fundamental All Cap Core
Fundamental Large Cap Core
New Opportunities
Regional Bank
Small Cap Core
Small Cap Growth
Small Cap Value
U.S. Global Leaders Growth
U.S. Quality Growth
GLOBAL AND INTERNATIONAL EQUITY FUNDS
Disciplined Value International
Emerging Markets
Emerging Markets Equity
Fundamental Global Franchise
Global Equity
Global Shareholder Yield
Global Thematic Opportunities
International Dynamic Growth
International Growth
International Small Company
| | INCOME FUNDS
Bond
California Tax-Free Income
Emerging Markets Debt
Floating Rate Income
Government Income
High Yield
High Yield Municipal Bond
Income
Investment Grade Bond
Money Market
Short Duration Bond
Short Duration Credit Opportunities
Strategic Income Opportunities
Tax-Free Bond
ALTERNATIVE AND SPECIALTY FUNDS
Absolute Return Currency
Alternative Asset Allocation
Alternative Risk Premia
Diversified Macro
Infrastructure
Multi-Asset Absolute Return
Seaport Long/Short
|
A fund's investment objectives, risks, charges, and expenses should be considered carefully before investing. The prospectus contains this and other important information about the fund. To obtain a prospectus, contact your financial professional, call John Hancock Investment Management at 800-225-5291, or visit our website at jhinvestments.com. Please read the prospectus carefully before investing or sending money.
| | | |
ASSET ALLOCATION
Balanced
Income Allocation
Multi-Index Lifetime Portfolios
Multi-Index Preservation Portfolios
Multimanager Lifestyle Portfolios
Multimanager Lifetime Portfolios
Retirement Income 2040
EXCHANGE-TRADED FUNDS
John Hancock Multifactor Consumer Discretionary ETF
John Hancock Multifactor Consumer Staples ETF
John Hancock Multifactor Developed International ETF
John Hancock Multifactor Emerging Markets ETF
John Hancock Multifactor Energy ETF
John Hancock Multifactor Financials ETF
John Hancock Multifactor Healthcare ETF
John Hancock Multifactor Industrials ETF
John Hancock Multifactor Large Cap ETF
John Hancock Multifactor Materials ETF
John Hancock Multifactor Media and
Communications ETF
John Hancock Multifactor Mid Cap ETF
John Hancock Multifactor Small Cap ETF
John Hancock Multifactor Technology ETF
John Hancock Multifactor Utilities ETF
| | ENVIRONMENTAL, SOCIAL, AND
GOVERNANCE FUNDS
ESG All Cap Core
ESG Core Bond
ESG International Equity
ESG Large Cap Core
CLOSED-END FUNDS
Financial Opportunities
Hedged Equity & Income
Income Securities Trust
Investors Trust
Preferred Income
Preferred Income II
Preferred Income III
Premium Dividend
Tax-Advantaged Dividend Income
Tax-Advantaged Global Shareholder Yield
|
John Hancock Multifactor ETF shares are bought and sold at market price (not NAV), and are not individually redeemed
from the fund. Brokerage commissions will reduce returns.
John Hancock ETFs are distributed by Foreside Fund Services, LLC, and are subadvised by Dimensional Fund Advisors LP.
Foreside is not affiliated with John Hancock Investment Management Distributors LLC or Dimensional Fund Advisors LP.
Dimensional Fund Advisors LP receives compensation from John Hancock in connection with licensing rights to the
John Hancock Dimensional indexes. Dimensional Fund Advisors LP does not sponsor, endorse, or sell, and makes no
representation as to the advisability of investing in, John Hancock Multifactor ETFs.
John Hancock Investment Management
A trusted brand
John Hancock Investment Management is a premier asset manager
representing one of America's most trusted brands, with a heritage of
financial stewardship dating back to 1862. Helping our shareholders
pursue their financial goals is at the core of everything we do. It's why
we support the role of professional financial advice and operate with
the highest standards of conduct and integrity.
A better way to invest
We serve investors globally through a unique multimanager approach:
We search the world to find proven portfolio teams with specialized
expertise for every strategy we offer, then we apply robust investment
oversight to ensure they continue to meet our uncompromising
standards and serve the best interests of our shareholders.
Results for investors
Our unique approach to asset management enables us to provide
a diverse set of investments backed by some of the world's best
managers, along with strong risk-adjusted returns across asset classes.
John Hancock Investment Management Distributors LLC n Member FINRA, SIPC
200 Berkeley Street n Boston, MA 02116-5010 n 800-225-5291 n jhinvestments.com
This report is for the information of the shareholders of John Hancock Blue Chip Growth Fund. It is not authorized for distribution to prospective investors unless preceded or accompanied by a prospectus.
| | |
| MF1105602 | 457SA 2/20
4/2020 |
John Hancock
Equity Income Fund
Semiannual report 2/29/2020
Beginning on January 1, 2021, as permitted by regulations adopted by the Securities and Exchange Commission, paper copies of the fund's shareholder reports like this one will no longer be sent by mail, unless you specifically request paper copies of the reports from the fund or from your financial intermediary. Instead, the reports will be made available on a website, and you will be notified by mail each time a report is posted and provided with a website link to access the report.
If you already elected to receive shareholder reports electronically, you will not be affected by this change, and you do not need to take any action. You may elect to receive shareholder reports and other communications electronically by calling John Hancock Investment Management at 800-225-5291 (Class A and Class C shares) or by contacting your financial intermediary.
You may elect to receive all reports in paper, free of charge, at any time. You can inform John Hancock Investment Management or your financial intermediary that you wish to continue receiving paper copies of your shareholder reports by following the instructions listed above. Your election to receive reports in paper will apply to all funds held with John Hancock Investment Management or your financial intermediary.
A message to shareholders
Dear shareholder,
Global financial markets were on pace to deliver strong returns during the 6 months ended February 29, 2020, until heightened fears over the coronavirus (COVID-19) sent markets tumbling during the last week of the period. Prior to the turbulence that ended the period, investors benefited from a combination of low inflation, accommodative central bank policy, healthy fundamentals, and corporate buybacks of stock.
However, the COVID-19 pandemic and plummeting oil prices put an end to all that good news. Shortly after period end, the U.S. Federal Reserve lowered short-term interest rates while lawmakers embarked on a plan to launch major fiscal stimulus to support the economy.
After the longest bull market in U.S. history, we're now in bear market territory. Indeed, the spread of COVID-19, trade disputes, rising unemployment, and other geopolitical tensions may continue to create uncertainty among businesses and investors. Your financial professional can helpposition your portfolio so that it's sufficiently diversified to seek to meet your long-term objectives and to withstand the inevitable bouts of market volatility along the way.
On behalf of everyone at John Hancock Investment Management, I'd like to take this opportunity to welcome new shareholders and thank existing shareholders for the continued trust you've placed in us.
Sincerely,
Andrew G. Arnott
President and CEO,
John Hancock Investment Management
Head of Wealth and Asset Management,
United States and Europe
This commentary reflects the CEO's views as of this report's period end and are subject to change at any time. Diversification does not guarantee investment returns and does not eliminate risk of loss. All investments entail risks, including the possible loss of principal. For more up-to-date information, you can visit our website at jhinvestments.com.
John Hancock
Equity Income Fund
Table of contents
| | | |
| 2 | | Your fund at a glance |
| 3 | | Portfolio summary |
| 5 | | A look at performance |
| 7 | | Your expenses |
| 9 | | Fund's investments |
| 15 | | Financial statements |
| 18 | | Financial highlights |
| 22 | | Notes to financial statements |
| 33 | | More information |
SEMIANNUAL REPORT | JOHN HANCOCK EQUITY INCOME FUND 1
INVESTMENT OBJECTIVE
The fund seeks to provide substantial dividend income and also long-term growth of capital.
AVERAGE ANNUAL TOTAL RETURNS AS OF 2/29/2020 (%)
The Russell 1000 Value Index is an unmanaged index containing those securities in the Russell 1000 Index with a less-than-average growth orientation.
The S&P 500 Index is an unmanaged index that includes 500 widely traded common stocks.
It is not possible to invest directly in an index. Index figures do not reflect expenses or sales charges, which would result in lower returns.
Figures from Morningstar, Inc. include reinvested distributions and do not take into account sales charges. Actual load-adjusted performance is lower.
| 1 | Class A shares were first offered on 3-27-15. Returns prior to this date are those of Class NAV shares and have not been adjusted for class-specific expenses; otherwise, returns would vary. |
The past performance shown here reflects reinvested distributions and the beneficial effect of any expense reductions, and does not guarantee future results. Returns for periods shorter than one year are cumulative. Performance of the other share classes will vary based on the difference in the fees and expenses of those classes. Shares will fluctuate in value and, when redeemed, may be worth more or less than their original cost. Current month-end performance may be lower or higher than the performance cited, and can be found at jhinvestments.com or by calling 800-225-5291. For further information on the fund's objectives, risks, and strategy, see the fund's prospectus. The fund recently experienced negative short-term performance due to market volatility associated with the COVID-19 pandemic.
SEMIANNUAL REPORT | JOHN HANCOCK EQUITY INCOME FUND 2
SECTOR COMPOSITION AS OF 2/29/2020 (%)
TOP 10 HOLDINGS AS OF 2/29/2020 (%)
| | |
| Wells Fargo & Company | 3.5 |
| JPMorgan Chase & Co. | 3.0 |
| The Southern Company | 2.6 |
| QUALCOMM, Inc. | 2.6 |
| Johnson & Johnson | 2.3 |
| Chubb, Ltd. | 2.2 |
| TOTAL SA, ADR | 2.2 |
| General Electric Company | 2.1 |
| TC Energy Corp. | 2.0 |
| Philip Morris International, Inc. | 1.9 |
| TOTAL | 24.4 |
| As a percentage of net assets. |
| Cash and cash equivalents are not included. |
SEMIANNUAL REPORT | JOHN HANCOCK EQUITY INCOME FUND 3
COUNTRY COMPOSITION AS OF 2/29/2020 (%)
| | |
| United States | 89.8 |
| France | 2.4 |
| Switzerland | 2.3 |
| Canada | 2.0 |
| Ireland | 1.5 |
| United Kingdom | 1.2 |
| Other Countries | 0.8 |
| TOTAL | 100.0 |
| As a percentage of net assets. | |
A note about risks
The fund may be subject to various risks as described in the fund's prospectus. For more information, please refer to the "Principal risks" section of the prospectus and "Subsequent events" section in the Notes to financial statements.
SEMIANNUAL REPORT | JOHN HANCOCK EQUITY INCOME FUND 4
TOTAL RETURNS FOR THE PERIOD ENDED FEBRUARY 29, 2020
| | | | | | | | | | | | |
Average annual total returns (%)
with maximum sales charge | | Cumulative total returns (%)
with maximum sales charge | | SEC 30-day
yield (%)
subsidized | | SEC 30-day
yield (%)
unsubsidized1 |
| | 1-year | 5-year | 10-year | | 6-month | 5-year | 10-year | | as of
2-29-20 | | as of
2-29-20 |
| Class A2 | -5.67 | 3.45 | 8.43 | | -8.38 | 18.48 | 124.59 | | 2.01 | | 1.98 |
| Class C2 | -2.37 | 3.77 | 8.60 | | -4.80 | 20.32 | 128.18 | | 1.34 | | 1.31 |
| Class 13 | -0.36 | 4.87 | 9.14 | | -3.39 | 26.84 | 139.72 | | 2.53 | | 2.50 |
| Class NAV3 | -0.31 | 4.92 | 9.20 | | -3.37 | 27.13 | 141.10 | | 2.59 | | 2.55 |
| Index 1† | 0.54 | 5.51 | 10.40 | | -1.69 | 30.73 | 168.89 | | — | | — |
| Index 2† | 8.19 | 9.23 | 12.65 | | 1.92 | 55.49 | 229.18 | | — | | — |
Performance figures assume all distributions have been reinvested. Figures reflect maximum sales charges on Class A shares of 5.00% and the applicable contingent deferred sales charge (CDSC) on Class C shares. Class C shares sold within one year of purchase are subject to a 1% CDSC. Sales charges are not applicable to Class1 and Class NAV shares.
The expense ratios of the fund, both net (including any fee waivers and/or expense limitations) and gross (excluding any fee waivers and/or expense limitations), are set forth according to the most recent publicly available prospectuses for the fund and may differ from those disclosed in the Financial highlights tables in this report. Net expenses reflect contractual expense limitations in effect until December 31, 2020 and are subject to change. Had the contractual fee waivers and expense limitations not been in place, gross expenses would apply. The expense ratios are as follows:
| | | | | |
| | Class A | Class C | Class 1 | Class NAV |
| Gross (%) | 1.17 | 1.87 | 0.80 | 0.75 |
| Net (%) | 1.14 | 1.86 | 0.79 | 0.74 |
Please refer to the most recent prospectus and annual or semiannual report for more information on expenses and any expense limitation arrangements for each class.
The returns reflect past results and should not be considered indicative of future performance. The return and principal value of an investment will fluctuate so that shares, when redeemed, may be worth more or less than their original cost. Due to market volatility and other factors, the fund's current performance may be higher or lower than the performance shown. For current to the most recent month-end performance data, please call 800-225-5291 or visit the fund's website at jhinvestments.com.
The performance table above and the chart on the next page do not reflect the deduction of taxes that a shareholder would pay on fund distributions or the redemption of fund shares. The fund's performance results reflect any applicable fee waivers or expense reductions, without which the expenses would increase and results would have been less favorable.
| † | Index 1 is the Russell 1000 Value Index; Index 2 is the S&P 500 Index. |
See the following page for footnotes.
SEMIANNUAL REPORT | JOHN HANCOCK EQUITY INCOME FUND 5
This chart and table show what happened to a hypothetical $10,000 investment in John Hancock Equity Income Fund for the share classes and periods indicated, assuming all distributions were reinvested. For comparison, we've shown the same investment in two separate indexes.
| | | | | | |
| | Start date | With maximum
sales charge ($) | Without
sales charge ($) | Index 1 ($) | Index 2 ($) |
| Class C2,4 | 2-28-10 | 22,818 | 22,818 | 26,889 | 32,918 |
| Class 13 | 2-28-10 | 23,972 | 23,972 | 26,889 | 32,918 |
| Class NAV3 | 2-28-10 | 24,110 | 24,110 | 26,889 | 32,918 |
The Russell 1000 Value Index is an unmanaged index containing those securities in the Russell 1000 Index with a less-than-average growth orientation.
The S&P 500 Index is an unmanaged index that includes 500 widely traded common stocks.
It is not possible to invest directly in an index. Index figures do not reflect expenses or sales charges, which would result in lower returns.
Footnotes related to performance pages
| 1 | Unsubsidized yield reflects what the yield would have been without the effect of reimbursements and waivers. |
| 2 | Class A and Class C shares were first offered on 3-27-15. Returns prior to this date are those of Class NAV shares that have not been adjusted for class-specific expenses; otherwise, returns would vary. |
| 3 | For certain types of investors as described in the fund's prospectuses. |
| 4 | The contingent deferred sales charge is not applicable. |
SEMIANNUAL REPORT | JOHN HANCOCK EQUITY INCOME FUND 6
These examples are intended to help you understand your ongoing operating expenses of investing in the fund so you can compare these costs with the ongoing costs of investing in other mutual funds.
Understanding fund expenses
As a shareholder of the fund, you incur two types of costs:
■Transaction costs,which include sales charges (loads) on purchases or redemptions (varies by share class), minimum account fee charge, etc.
■Ongoing operating expenses, including management fees, distribution and service fees (if applicable), and other fund expenses.
We are presenting only your ongoing operating expenses here.
Actual expenses/actual returns
The first line of each share class in the table on the following page is intended to provide information about the fund’s actual ongoing operating expenses, and is based on the fund’s actual return. It assumes an account value of $1,000.00 on September 1, 2019, with the same investment held until February 29, 2020.
Together with the value of your account, you may use this information to estimate the operating expenses that you paid over the period. Simply divide your account value at February 29, 2020, by $1,000.00, then multiply it by the “expenses paid” for your share class from the table. For example, for an account value of $8,600.00, the operating expenses should be calculated as follows:
Hypothetical example for comparison purposes
The second line of each share class in the table on the following page allows you to compare the fund’s ongoing operating expenses with those of any other fund. It provides an example of the fund’s hypothetical account values and hypothetical expenses based on each class’s actual expense ratio and an assumed 5% annualized return before expenses (which is not the class’s actual return). It assumes an account value of $1,000.00 on September 1, 2019, with the same investment held until February 29, 2020. Look in any other fund shareholder report to find its hypothetical example and you will be able to compare these expenses. Please remember that these hypothetical account values and expenses may not be used to estimate the actual ending account balance or expenses you paid for the period.
| | SEMIANNUAL REPORT | JOHN HANCOCK EQUITY INCOME FUND | 7 |
Remember, these examples do not include any transaction costs, therefore, these examples will not help you to determine the relative total costs of owning different funds. If transaction costs were included, your expenses would have been higher. See the prospectuses for details regarding transaction costs.
SHAREHOLDER EXPENSE EXAMPLE CHART
| | | Account
value on
9-1-2019 | Ending
value on
2-29-2020 | Expenses
paid during
period ended
2-29-20201 | Annualized
expense
ratio |
| Class A | Actual expenses/actual returns | $1,000.00 | $964.30 | $5.57 | 1.14% |
| | Hypothetical example | 1,000.00 | 1,019.20 | 5.72 | 1.14% |
| Class C | Actual expenses/actual returns | 1,000.00 | 961.00 | 8.97 | 1.84% |
| | Hypothetical example | 1,000.00 | 1,015.70 | 9.22 | 1.84% |
| Class 1 | Actual expenses/actual returns | 1,000.00 | 966.10 | 3.72 | 0.76% |
| | Hypothetical example | 1,000.00 | 1,021.10 | 3.82 | 0.76% |
| Class NAV | Actual expenses/actual returns | 1,000.00 | 966.30 | 3.47 | 0.71% |
| | Hypothetical example | 1,000.00 | 1,021.30 | 3.57 | 0.71% |
| 1 | Expenses are equal to the annualized expense ratio, multiplied by the average account value over the period, multiplied by 182/366 (to reflect the one-half year period). |
| 8 | JOHN HANCOCK EQUITY INCOME FUND | SEMIANNUAL REPORT | |
AS OF 2-29-20 (unaudited)
| | | | | Shares | Value |
| Common stocks 95.6% | | | | | $1,598,208,267 |
| (Cost $1,440,831,449) | | | | | |
| Communication services 6.0% | | | 100,471,902 |
| Diversified telecommunication services 2.4% | | | |
| AT&T, Inc. | | | 117,890 | 4,152,086 |
| CenturyLink, Inc. | | | 146,598 | 1,769,438 |
| Telefonica SA | | | 987,694 | 5,877,961 |
| Verizon Communications, Inc. | | | 515,960 | 27,944,394 |
| Entertainment 0.5% | | | |
| The Walt Disney Company | | | 70,209 | 8,260,089 |
| Media 3.1% | | | |
| Comcast Corp., Class A | | | 488,970 | 19,769,057 |
| Fox Corp., Class B | | | 600,437 | 18,283,307 |
| News Corp., Class A | | | 1,193,836 | 14,415,570 |
| Consumer discretionary 2.4% | | | 40,203,943 |
| Hotels, restaurants and leisure 1.1% | | | |
| Las Vegas Sands Corp. | | | 271,141 | 15,810,232 |
| MGM Resorts International | | | 132,900 | 3,264,024 |
| Leisure products 0.5% | | | |
| Mattel, Inc. (A)(B) | | | 716,662 | 8,449,445 |
| Multiline retail 0.5% | | | |
| Kohl's Corp. | | | 207,006 | 8,104,285 |
| Specialty retail 0.3% | | | |
| L Brands, Inc. | | | 211,263 | 4,575,957 |
| Consumer staples 7.9% | | | 132,305,611 |
| Food and staples retailing 0.7% | | | |
| Walmart, Inc. | | | 115,492 | 12,436,179 |
| Food products 3.6% | | | |
| Bunge, Ltd. | | | 144,171 | 6,768,828 |
| Conagra Brands, Inc. | | | 798,827 | 21,320,693 |
| Kellogg Company | | | 54,481 | 3,294,466 |
| Tyson Foods, Inc., Class A | | | 411,084 | 27,883,828 |
| Household products 1.7% | | | |
| Kimberly-Clark Corp. | | | 216,842 | 28,447,502 |
| Tobacco 1.9% | | | |
| Philip Morris International, Inc. | | | 392,746 | 32,154,115 |
| Energy 8.3% | | | 138,867,347 |
| Oil, gas and consumable fuels 8.3% | | | |
| Chevron Corp. | | | 47,897 | 4,470,706 |
| SEE NOTES TO FINANCIAL STATEMENTS | SEMIANNUAL REPORT | JOHN HANCOCK EQUITY INCOME FUND | 9 |
| | | | | Shares | Value |
| Energy (continued) | | | |
| Oil, gas and consumable fuels (continued) | | | |
| EOG Resources, Inc. | | | 24,900 | $1,575,174 |
| Equitrans Midstream Corp. (B) | | | 196,208 | 1,385,228 |
| Exxon Mobil Corp. | | | 482,558 | 24,822,784 |
| Hess Corp. | | | 80,432 | 4,518,670 |
| Occidental Petroleum Corp. | | | 584,151 | 19,125,104 |
| Pioneer Natural Resources Company | | | 75,098 | 9,220,532 |
| Targa Resources Corp. | | | 151,800 | 4,918,320 |
| TC Energy Corp. | | | 625,681 | 32,754,400 |
| TOTAL SA, ADR | | | 836,264 | 36,076,429 |
| Financials 22.5% | | | 376,401,122 |
| Banks 9.9% | | | |
| Bank of America Corp. | | | 49,922 | 1,422,777 |
| Fifth Third Bancorp | | | 984,196 | 24,014,382 |
| JPMorgan Chase & Co. | | | 434,232 | 50,418,678 |
| The PNC Financial Services Group, Inc. | | | 132,148 | 16,703,507 |
| U.S. Bancorp | | | 316,734 | 14,709,127 |
| Wells Fargo & Company | | | 1,422,375 | 58,104,016 |
| Capital markets 4.9% | | | |
| Franklin Resources, Inc. | | | 376,697 | 8,196,927 |
| Morgan Stanley | | | 688,089 | 30,984,648 |
| Northern Trust Corp. | | | 60,115 | 5,275,692 |
| Raymond James Financial, Inc. | | | 108,000 | 9,032,040 |
| State Street Corp. | | | 372,130 | 25,345,774 |
| The Bank of New York Mellon Corp. | | | 98,852 | 3,944,195 |
| Diversified financial services 0.6% | | | |
| Equitable Holdings, Inc. | | | 462,819 | 9,904,327 |
| Insurance 7.1% | | | |
| American International Group, Inc. | | | 641,528 | 27,046,820 |
| Chubb, Ltd. | | | 250,065 | 36,266,927 |
| Loews Corp. | | | 293,627 | 13,398,200 |
| Marsh & McLennan Companies, Inc. | | | 86,483 | 9,042,662 |
| MetLife, Inc. | | | 550,306 | 23,509,072 |
| Willis Towers Watson PLC | | | 47,986 | 9,081,351 |
| Health care 13.0% | | | 217,252,698 |
| Biotechnology 2.2% | | | |
| AbbVie, Inc. | | | 203,400 | 17,433,414 |
| Gilead Sciences, Inc. | | | 289,482 | 20,078,472 |
| Health care equipment and supplies 2.3% | | | |
| Becton, Dickinson and Company | | | 29,255 | 6,957,424 |
| Medtronic PLC | | | 256,168 | 25,788,433 |
| Zimmer Biomet Holdings, Inc. | | | 43,700 | 5,949,755 |
| 10 | JOHN HANCOCK EQUITY INCOME FUND | SEMIANNUAL REPORT | SEE NOTES TO FINANCIAL STATEMENTS |
| | | | | Shares | Value |
| Health care (continued) | | | |
| Health care providers and services 2.9% | | | |
| Anthem, Inc. | | | 90,334 | $23,223,968 |
| CVS Health Corp. | | | 424,295 | 25,109,778 |
| Pharmaceuticals 5.6% | | | |
| Allergan PLC | | | 86,156 | 16,427,365 |
| Bristol-Myers Squibb Company | | | 108,617 | 6,414,920 |
| GlaxoSmithKline PLC | | | 281,598 | 5,682,470 |
| Johnson & Johnson | | | 286,134 | 38,479,300 |
| Pfizer, Inc. | | | 769,222 | 25,707,399 |
| Industrials 12.1% | | | 201,880,132 |
| Aerospace and defense 3.4% | | | |
| L3Harris Technologies, Inc. | | | 136,800 | 27,049,464 |
| The Boeing Company | | | 97,111 | 26,716,207 |
| United Technologies Corp. | | | 29,100 | 3,800,169 |
| Air freight and logistics 1.4% | | | |
| United Parcel Service, Inc., Class B | | | 256,523 | 23,212,766 |
| Airlines 1.1% | | | |
| Alaska Air Group, Inc. (B) | | | 227,826 | 11,496,100 |
| Delta Air Lines, Inc. | | | 65,813 | 3,035,954 |
| Southwest Airlines Company | | | 69,633 | 3,216,348 |
| Building products 0.8% | | | |
| Johnson Controls International PLC | | | 356,289 | 13,029,489 |
| Commercial services and supplies 0.7% | | | |
| Stericycle, Inc. (A)(B) | | | 212,458 | 12,201,463 |
| Electrical equipment 0.8% | | | |
| Emerson Electric Company | | | 129,792 | 8,320,965 |
| nVent Electric PLC | | | 201,400 | 4,835,614 |
| Industrial conglomerates 2.1% | | | |
| General Electric Company | | | 3,169,594 | 34,485,183 |
| Machinery 1.0% | | | |
| Flowserve Corp. | | | 42,585 | 1,711,491 |
| PACCAR, Inc. | | | 95,649 | 6,398,918 |
| Snap-on, Inc. | | | 59,800 | 8,656,050 |
| Professional services 0.8% | | | |
| Nielsen Holdings PLC | | | 753,100 | 13,713,951 |
| Information technology 8.1% | | | 136,122,059 |
| Communications equipment 1.1% | | | |
| Cisco Systems, Inc. | | | 454,885 | 18,163,558 |
| Electronic equipment, instruments and components 0.1% | | | |
| TE Connectivity, Ltd. | | | 28,400 | 2,353,508 |
| SEE NOTES TO FINANCIAL STATEMENTS | SEMIANNUAL REPORT | JOHN HANCOCK EQUITY INCOME FUND | 11 |
| | | | | Shares | Value |
| Information technology (continued) | | | |
| IT services 0.6% | | | |
| Cognizant Technology Solutions Corp., Class A | | | 172,932 | $10,536,747 |
| Semiconductors and semiconductor equipment 4.6% | | | |
| Applied Materials, Inc. | | | 224,873 | 13,069,619 |
| NXP Semiconductors NV | | | 40,500 | 4,604,445 |
| QUALCOMM, Inc. | | | 552,498 | 43,260,593 |
| Texas Instruments, Inc. | | | 134,410 | 15,341,557 |
| Software 1.6% | | | |
| Microsoft Corp. | | | 162,336 | 26,300,055 |
| Technology hardware, storage and peripherals 0.1% | | | |
| Western Digital Corp. | | | 44,852 | 2,491,977 |
| Materials 4.1% | | | 68,143,465 |
| Chemicals 3.2% | | | |
| Akzo Nobel NV | | | 35,710 | 2,857,172 |
| CF Industries Holdings, Inc. | | | 444,790 | 16,394,959 |
| Corteva, Inc. | | | 34,323 | 933,586 |
| Dow, Inc. | | | 253,913 | 10,260,624 |
| DuPont de Nemours, Inc. | | | 483,823 | 20,756,007 |
| PPG Industries, Inc. | | | 20,800 | 2,172,560 |
| Containers and packaging 0.8% | | | |
| International Paper Company | | | 374,846 | 13,854,308 |
| Metals and mining 0.1% | | | |
| Nucor Corp. | | | 22,110 | 914,249 |
| Real estate 3.6% | | | 59,565,090 |
| Equity real estate investment trusts 3.6% | | | |
| Equity Residential | | | 216,264 | 16,241,426 |
| Rayonier, Inc. | | | 414,445 | 10,995,226 |
| SL Green Realty Corp. | | | 142,299 | 11,161,934 |
| Weyerhaeuser Company | | | 814,723 | 21,166,504 |
| Utilities 7.6% | | | 126,994,898 |
| Electric utilities 4.9% | | | |
| Edison International | | | 349,732 | 23,498,493 |
| NextEra Energy, Inc. | | | 57,928 | 14,641,881 |
| The Southern Company | | | 722,637 | 43,618,369 |
| Multi-utilities 2.7% | | | |
| CenterPoint Energy, Inc. | | | 320,700 | 7,382,514 |
| NiSource, Inc. | | | 1,025,753 | 27,715,846 |
| Sempra Energy | | | 69,514 | 9,716,667 |
| Water utilities 0.0% | | | |
|
| Essential Utilities, Inc. (A) | | | 7,396 | 421,128 |
| 12 | JOHN HANCOCK EQUITY INCOME FUND | SEMIANNUAL REPORT | SEE NOTES TO FINANCIAL STATEMENTS |
| | | | | Shares | Value |
|
| Preferred securities 2.3% | | | | | $38,526,147 |
| (Cost $36,585,982) | | | | | |
| Energy 0.7% | | | | | 11,982,706 |
| Oil, gas and consumable fuels 0.7% | | | |
| Sempra Energy, 6.000% | | 81,226 | 9,099,749 |
| Sempra Energy, 6.750% | | 25,877 | 2,882,957 |
| Health care 0.8% | | | | | 14,027,020 |
| Health care equipment and supplies 0.8% | | | |
| Becton, Dickinson and Company, 6.125% | | 247,871 | 14,027,020 |
| Utilities 0.8% | | | | | 12,516,421 |
| Electric utilities 0.8% | | | |
| NextEra Energy, Inc., 5.279% | | 116,537 | 5,297,970 |
| The Southern Company, 6.750% | | 143,337 | 7,218,451 |
|
| | Rate (%) | Maturity date | | Par value^ | Value |
| Convertible bonds 0.2% | | | | | $3,652,299 |
| (Cost $3,635,176) | | | | | |
| Financials 0.2% | | | 3,652,299 |
| Insurance 0.2% | | | |
| AXA SA (C) | 7.250 | 05-15-21 | | 3,613,000 | 3,652,299 |
|
| | | Yield (%) | | Shares | Value |
| Short-term investments 2.5% | | | | | $41,899,214 |
| (Cost $41,896,186) | | | | | |
| Short-term funds 2.5% | | | | | 41,899,214 |
| John Hancock Collateral Trust (D) | 1.6968(E) | | 989,304 | 9,901,843 |
| State Street Institutional U.S. Government Money Market Fund, Premier Class | 1.5386(E) | | 1,500,000 | 1,500,000 |
| T. Rowe Price Government Reserve Fund | 1.5799(E) | | 30,497,371 | 30,497,371 |
|
| Total investments (Cost $1,522,948,793) 100.6% | | | $1,682,285,927 |
| Other assets and liabilities, net (0.6%) | | | | (10,479,821) |
| Total net assets 100.0% | | | | | $1,671,806,106 |
| The percentage shown for each investment category is the total value of the category as a percentage of the net assets of the fund. |
| ^All par values are denominated in U.S. dollars unless otherwise indicated. |
| Security Abbreviations and Legend |
| ADR | American Depositary Receipt |
| (A) | Non-income producing security. |
| (B) | All or a portion of this security is on loan as of 2-29-20. |
| (C) | These securities are exempt from registration under Rule 144A of the Securities Act of 1933. Such securities may be resold, normally to qualified institutional buyers, in transactions exempt from registration. |
| SEE NOTES TO FINANCIAL STATEMENTS | SEMIANNUAL REPORT | JOHN HANCOCK EQUITY INCOME FUND | 13 |
| (D) | Investment is an affiliate of the fund, the advisor and/or subadvisor. This security represents the investment of cash collateral received for securities lending. |
| (E) | The rate shown is the annualized seven-day yield as of 2-29-20. |
At 2-29-20, the aggregate cost of investments for federal income tax purposes was $1,534,639,050. Net unrealized appreciation aggregated to $147,646,877, of which $255,137,425 related to gross unrealized appreciation and $107,490,548 related to gross unrealized depreciation.
| 14 | JOHN HANCOCK EQUITY INCOME FUND | SEMIANNUAL REPORT | SEE NOTES TO FINANCIAL STATEMENTS |
STATEMENT OF ASSETS AND LIABILITIES 2-29-20 (unaudited)
| Assets | |
| Unaffiliated investments, at value (Cost $1,513,049,978) including $8,904,495 of securities loaned | $1,672,384,084 |
| Affiliated investments, at value (Cost $9,898,815) | 9,901,843 |
| Total investments, at value (Cost $1,522,948,793) | 1,682,285,927 |
| Dividends and interest receivable | 4,836,090 |
| Receivable for fund shares sold | 8,242,713 |
| Receivable for investments sold | 1,521,428 |
| Receivable for securities lending income | 2,333 |
| Other assets | 68,873 |
| Total assets | 1,696,957,364 |
| Liabilities | |
| Payable for investments purchased | 13,177,976 |
| Payable for fund shares repurchased | 1,910,360 |
| Payable upon return of securities loaned | 9,913,704 |
| Payable to affiliates | |
| Accounting and legal services fees | 46,746 |
| Transfer agent fees | 5,812 |
| Trustees' fees | 2,761 |
| Other liabilities and accrued expenses | 93,899 |
| Total liabilities | 25,151,258 |
| Net assets | $1,671,806,106 |
| Net assets consist of | |
| Paid-in capital | $1,492,630,992 |
| Total distributable earnings (loss) | 179,175,114 |
| Net assets | $1,671,806,106 |
| |
| Net asset value per share | |
| Based on net asset value and shares outstanding - the fund has an unlimited number of shares authorized with no par value | |
| Class A ($54,785,973 ÷ 3,326,539 shares)1 | $16.47 |
| Class C ($2,335,742 ÷ 141,518 shares)1 | $16.50 |
| Class 1 ($173,675,633 ÷ 10,530,542 shares) | $16.49 |
| Class NAV ($1,441,008,758 ÷ 87,491,943 shares) | $16.47 |
| Maximum offering price per share | |
| Class A (net asset value per share ÷ 95%)2 | $17.34 |
| 1 | Redemption price per share is equal to net asset value less any applicable contingent deferred sales charge. |
| 2 | On single retail sales of less than $50,000. On sales of $50,000 or more and on group sales the offering price is reduced. |
| SEE NOTES TO FINANCIAL STATEMENTS | SEMIANNUAL REPORT | JOHN HANCOCK EQUITY INCOME FUND | 15 |
STATEMENT OF OPERATIONS For the six months ended 2-29-20 (unaudited)
| Investment income | |
| Dividends | $27,360,873 |
| Interest | 402,030 |
| Securities lending | 36,836 |
| Less foreign taxes withheld | (313,071) |
| Total investment income | 27,486,668 |
| Expenses | |
| Investment management fees | 6,328,937 |
| Distribution and service fees | 149,065 |
| Accounting and legal services fees | 163,648 |
| Transfer agent fees | 36,594 |
| Trustees' fees | 16,527 |
| Custodian fees | 104,603 |
| State registration fees | 21,178 |
| Printing and postage | 15,093 |
| Professional fees | 41,463 |
| Other | 27,195 |
| Total expenses | 6,904,303 |
| Less expense reductions | (271,742) |
| Net expenses | 6,632,561 |
| Net investment income | 20,854,107 |
| Realized and unrealized gain (loss) | |
| Net realized gain (loss) on | |
| Unaffiliated investments and foreign currency transactions | 55,603,613 |
| Affiliated investments | 245 |
| Futures contracts | 163,606 |
| | 55,767,464 |
| Change in net unrealized appreciation (depreciation) of | |
| Unaffiliated investments and translation of assets and liabilities in foreign currencies | (133,393,880) |
| Affiliated investments | 1,451 |
| Futures contracts | (167) |
| | (133,392,596) |
| Net realized and unrealized loss | (77,625,132) |
| Decrease in net assets from operations | $(56,771,025) |
| 16 | JOHN HANCOCK EQUITY INCOME FUND | SEMIANNUAL REPORT | SEE NOTES TO FINANCIAL STATEMENTS |
STATEMENTS OF CHANGES IN NET ASSETS
| | Six months ended
2-29-20
(unaudited) | Year ended
8-31-19 |
| Increase (decrease) in net assets | | |
| From operations | | |
| Net investment income | $20,854,107 | $37,220,566 |
| Net realized gain | 55,767,464 | 94,641,004 |
| Change in net unrealized appreciation (depreciation) | (133,392,596) | (137,630,542) |
| Decrease in net assets resulting from operations | (56,771,025) | (5,768,972) |
| Distributions to shareholders | | |
| From earnings | | |
| Class A | (3,998,340) | (4,741,672) |
| Class C | (179,814) | (279,512) |
| Class 1 | (14,351,352) | (23,950,238) |
| Class NAV | (109,280,765) | (142,398,287) |
| Total distributions | (127,810,271) | (171,369,709) |
| From fund share transactions | 111,103,539 | 298,302,070 |
| Total increase (decrease) | (73,477,757) | 121,163,389 |
| Net assets | | |
| Beginning of period | 1,745,283,863 | 1,624,120,474 |
| End of period | $1,671,806,106 | $1,745,283,863 |
| SEE NOTES TO FINANCIAL STATEMENTS | SEMIANNUAL REPORT | JOHN HANCOCK EQUITY INCOME FUND | 17 |
| CLASS A SHARES Period ended | 2-29-201 | 8-31-19 | 8-31-18 | 8-31-17 | 8-31-16 | 8-31-152 |
| Per share operating performance | | | | | | |
| Net asset value, beginning of period | $18.31 | $20.97 | $20.22 | $18.50 | $18.38 | $19.76 |
| Net investment income3 | 0.18 | 0.36 | 0.31 | 0.36 | 0.36 | 0.15 |
| Net realized and unrealized gain (loss) on investments | (0.67) | (0.84) | 2.22 | 2.17 | 1.62 | (1.38) |
| Total from investment operations | (0.49) | (0.48) | 2.53 | 2.53 | 1.98 | (1.23) |
| Less distributions | | | | | | |
| From net investment income | (0.27) | (0.36) | (0.33) | (0.40) | (0.33) | (0.15) |
| From net realized gain | (1.08) | (1.82) | (1.45) | (0.41) | (1.53) | — |
| Total distributions | (1.35) | (2.18) | (1.78) | (0.81) | (1.86) | (0.15) |
| Net asset value, end of period | $16.47 | $18.31 | $20.97 | $20.22 | $18.50 | $18.38 |
| Total return (%)4,5 | (3.57)6 | (0.94) | 12.83 | 13.96 | 11.72 | (6.31)6 |
| Ratios and supplemental data | | | | | | |
| Net assets, end of period (in millions) | $55 | $51 | $43 | $36 | $22 | $4 |
| Ratios (as a percentage of average net assets): | | | | | | |
| Expenses before reductions | 1.177 | 1.16 | 1.18 | 1.19 | 1.23 | 1.247 |
| Expenses including reductions | 1.147 | 1.13 | 1.14 | 1.14 | 1.14 | 1.127 |
| Net investment income | 1.907 | 1.97 | 1.52 | 1.85 | 2.08 | 1.797 |
| Portfolio turnover (%) | 14 | 26 | 19 | 21 | 40 | 198 |
| 1 | Six months ended 2-29-20. Unaudited. |
| 2 | The inception date for Class A shares is 3-27-15. |
| 3 | Based on average daily shares outstanding. |
| 4 | Total returns would have been lower had certain expenses not been reduced during the applicable periods. |
| 5 | Does not reflect the effect of sales charges, if any. |
| 6 | Not annualized. |
| 7 | Annualized. |
| 8 | Portfolio turnover is shown for the period from 9-1-14 to 8-31-15. |
| 18 | JOHN HANCOCK Equity Income Fund | SEMIANNUAL REPORT | SEE NOTES TO FINANCIAL STATEMENTS |
| CLASS C SHARES Period ended | 2-29-201 | 8-31-19 | 8-31-18 | 8-31-17 | 8-31-16 | 8-31-152 |
| Per share operating performance | | | | | | |
| Net asset value, beginning of period | $18.34 | $21.00 | $20.25 | $18.52 | $18.39 | $19.76 |
| Net investment income3 | 0.11 | 0.24 | 0.17 | 0.22 | 0.24 | 0.08 |
| Net realized and unrealized gain (loss) on investments | (0.67) | (0.86) | 2.22 | 2.18 | 1.61 | (1.38) |
| Total from investment operations | (0.56) | (0.62) | 2.39 | 2.40 | 1.85 | (1.30) |
| Less distributions | | | | | | |
| From net investment income | (0.20) | (0.22) | (0.19) | (0.26) | (0.19) | (0.07) |
| From net realized gain | (1.08) | (1.82) | (1.45) | (0.41) | (1.53) | — |
| Total distributions | (1.28) | (2.04) | (1.64) | (0.67) | (1.72) | (0.07) |
| Net asset value, end of period | $16.50 | $18.34 | $21.00 | $20.25 | $18.52 | $18.39 |
| Total return (%)4,5 | (3.90)6 | (1.66) | 12.00 | 13.16 | 10.89 | (6.61)6 |
| Ratios and supplemental data | | | | | | |
| Net assets, end of period (in millions) | $2 | $3 | $3 | $3 | $2 | $—7 |
| Ratios (as a percentage of average net assets): | | | | | | |
| Expenses before reductions | 1.878 | 1.86 | 1.88 | 1.89 | 1.93 | 1.948 |
| Expenses including reductions | 1.848 | 1.83 | 1.84 | 1.86 | 1.89 | 1.878 |
| Net investment income | 1.208 | 1.28 | 0.80 | 1.12 | 1.39 | 0.948 |
| Portfolio turnover (%) | 14 | 26 | 19 | 21 | 40 | 199 |
| 1 | Six months ended 2-29-20. Unaudited. |
| 2 | The inception date for Class C shares is 3-27-15. |
| 3 | Based on average daily shares outstanding. |
| 4 | Total returns would have been lower had certain expenses not been reduced during the applicable periods. |
| 5 | Does not reflect the effect of sales charges, if any. |
| 6 | Not annualized. |
| 7 | Less than $500,000. |
| 8 | Annualized. |
| 9 | Portfolio turnover is shown for the period from 9-1-14 to 8-31-15. |
| SEE NOTES TO FINANCIAL STATEMENTS | SEMIANNUAL REPORT | JOHN HANCOCK Equity Income Fund | 19 |
| CLASS 1 SHARES Period ended | 2-29-201 | 8-31-19 | 8-31-18 | 8-31-17 | 8-31-16 | 8-31-15 |
| Per share operating performance | | | | | | |
| Net asset value, beginning of period | $18.33 | $20.99 | $20.24 | $18.51 | $18.39 | $21.47 |
| Net investment income2 | 0.22 | 0.43 | 0.39 | 0.44 | 0.40 | 0.36 |
| Net realized and unrealized gain (loss) on investments | (0.68) | (0.85) | 2.21 | 2.16 | 1.63 | (1.78) |
| Total from investment operations | (0.46) | (0.42) | 2.60 | 2.60 | 2.03 | (1.42) |
| Less distributions | | | | | | |
| From net investment income | (0.30) | (0.42) | (0.40) | (0.46) | (0.38) | (0.52) |
| From net realized gain | (1.08) | (1.82) | (1.45) | (0.41) | (1.53) | (1.14) |
| Total distributions | (1.38) | (2.24) | (1.85) | (0.87) | (1.91) | (1.66) |
| Net asset value, end of period | $16.49 | $18.33 | $20.99 | $20.24 | $18.51 | $18.39 |
| Total return (%)3 | (3.39)4 | (0.57) | 13.21 | 14.36 | 12.06 | (7.33) |
| Ratios and supplemental data | | | | | | |
| Net assets, end of period (in millions) | $174 | $197 | $235 | $255 | $271 | $297 |
| Ratios (as a percentage of average net assets): | | | | | | |
| Expenses before reductions | 0.795 | 0.80 | 0.82 | 0.83 | 0.85 | 0.86 |
| Expenses including reductions | 0.765 | 0.77 | 0.78 | 0.79 | 0.81 | 0.82 |
| Net investment income | 2.285 | 2.32 | 1.86 | 2.23 | 2.29 | 1.77 |
| Portfolio turnover (%) | 14 | 26 | 19 | 21 | 40 | 19 |
| 1 | Six months ended 2-29-20. Unaudited. |
| 2 | Based on average daily shares outstanding. |
| 3 | Total returns would have been lower had certain expenses not been reduced during the applicable periods. |
| 4 | Not annualized. |
| 5 | Annualized. |
| 20 | JOHN HANCOCK Equity Income Fund | SEMIANNUAL REPORT | SEE NOTES TO FINANCIAL STATEMENTS |
| CLASS NAV SHARES Period ended | 2-29-201 | 8-31-19 | 8-31-18 | 8-31-17 | 8-31-16 | 8-31-15 |
| Per share operating performance | | | | | | |
| Net asset value, beginning of period | $18.31 | $20.97 | $20.22 | $18.49 | $18.37 | $21.45 |
| Net investment income2 | 0.22 | 0.44 | 0.40 | 0.45 | 0.41 | 0.37 |
| Net realized and unrealized gain (loss) on investments | (0.67) | (0.85) | 2.21 | 2.16 | 1.63 | (1.78) |
| Total from investment operations | (0.45) | (0.41) | 2.61 | 2.61 | 2.04 | (1.41) |
| Less distributions | | | | | | |
| From net investment income | (0.31) | (0.43) | (0.41) | (0.47) | (0.39) | (0.53) |
| From net realized gain | (1.08) | (1.82) | (1.45) | (0.41) | (1.53) | (1.14) |
| Total distributions | (1.39) | (2.25) | (1.86) | (0.88) | (1.92) | (1.67) |
| Net asset value, end of period | $16.47 | $18.31 | $20.97 | $20.22 | $18.49 | $18.37 |
| Total return (%)3 | (3.37)4 | (0.52) | 13.28 | 14.44 | 12.13 | (7.27) |
| Ratios and supplemental data | | | | | | |
| Net assets, end of period (in millions) | $1,441 | $1,495 | $1,344 | $1,377 | $1,485 | $1,553 |
| Ratios (as a percentage of average net assets): | | | | | | |
| Expenses before reductions | 0.745 | 0.75 | 0.77 | 0.78 | 0.80 | 0.81 |
| Expenses including reductions | 0.715 | 0.72 | 0.73 | 0.74 | 0.76 | 0.77 |
| Net investment income | 2.335 | 2.38 | 1.92 | 2.30 | 2.34 | 1.83 |
| Portfolio turnover (%) | 14 | 26 | 19 | 21 | 40 | 19 |
| 1 | Six months ended 2-29-20. Unaudited. |
| 2 | Based on average daily shares outstanding. |
| 3 | Total returns would have been lower had certain expenses not been reduced during the applicable periods. |
| 4 | Not annualized. |
| 5 | Annualized. |
| SEE NOTES TO FINANCIAL STATEMENTS | SEMIANNUAL REPORT | JOHN HANCOCK Equity Income Fund | 21 |
| Notes to financial statements (unaudited) | |
Note 1—Organization
John Hancock Equity Income Fund (the fund) is a series of John Hancock Funds II (the Trust), an open-end management investment company organized as a Massachusetts business trust and registered under the Investment Company Act of 1940, as amended (the 1940 Act). The investment objective of the fund is to provide substantial dividend income and also long-term growth of capital.
The fund may offer multiple classes of shares. The shares currently outstanding are detailed in the Statement of assets and liabilities. Class A and Class C shares are offered to all investors. Class 1 shares are offered only to certain affiliates of Manulife Financial Corporation (MFC). Class NAV shares are offered to John Hancock affiliated funds of funds, retirement plans for employees of John Hancock and/or Manulife Financial Corporation, and certain 529 plans. Class C shares convert to Class A shares ten years after purchase (certain exclusions may apply). Shareholders of each class have exclusive voting rights to matters that affect that class. The distribution and service fees, if any, and transfer agent fees for each class may differ.
Note 2—Significant accounting policies
The financial statements have been prepared in conformity with accounting principles generally accepted in the United States of America (US GAAP), which require management to make certain estimates and assumptions as of the date of the financial statements. Actual results could differ from those estimates and those differences could be significant. The fund qualifies as an investment company under Topic 946 of Accounting Standards Codification of US GAAP.
Events or transactions occurring after the end of the fiscal period through the date that the financial statements were issued have been evaluated in the preparation of the financial statements. The following summarizes the significant accounting policies of the fund:
Security valuation. Investments are stated at value as of the scheduled close of regular trading on the New York Stock Exchange (NYSE), normally at 4:00 P.M., Eastern Time. In case of emergency or other disruption resulting in the NYSE not opening for trading or the NYSE closing at a time other than the regularly scheduled close, the net asset value (NAV) may be determined as of the regularly scheduled close of the NYSE pursuant to the fund's Valuation Policies and Procedures.
In order to value the securities, the fund uses the following valuation techniques: Equity securities, including exchange-traded or closed-end funds, are typically valued at the last sale price or official closing price on the exchange or principal market where the security trades. In the event there were no sales during the day or closing prices are not available, the securities are valued using the last available bid price. Investments by the fund in open-end mutual funds, including John Hancock Collateral Trust (JHCT), are valued at their respective NAVs each business day. Debt obligations are typically valued based on the evaluated prices provided by an independent pricing vendor. Independent pricing vendors utilize matrix pricing, which takes into account factors such as institutional-size trading in similar groups of securities, yield, quality, coupon rate, maturity, type of issue, trading characteristics and other market data, as well as broker supplied prices. Foreign securities and currencies are valued in U.S. dollars based on foreign currency exchange rates supplied by an independent pricing vendor.
In certain instances, the Pricing Committee may determine to value equity securities using prices obtained from another exchange or market if trading on the exchange or market on which prices are typically obtained did not open for trading as scheduled, or if trading closed earlier than scheduled, and trading occurred as normal on another exchange or market.
| 22 | JOHN HANCOCK Equity Income Fund | SEMIANNUAL REPORT | |
Other portfolio securities and assets, for which reliable market quotations are not readily available, are valued at fair value as determined in good faith by the fund's Pricing Committee following procedures established by the Board of Trustees. The frequency with which these fair valuation procedures are used cannot be predicted and fair value of securities may differ significantly from the value that would have been used had a ready market for such securities existed. Trading in foreign securities may be completed before the scheduled daily close of trading on the NYSE. Significant events at the issuer or market level may affect the values of securities between the time when the valuation of the securities is generally determined and the close of the NYSE. If a significant event occurs, these securities may be fair valued, as determined in good faith by the fund's Pricing Committee, following procedures established by the Board of Trustees. The fund uses fair value adjustment factors provided by an independent pricing vendor to value certain foreign securities in order to adjust for events that may occur between the close of foreign exchanges or markets and the close of the NYSE.
The fund uses a three-tier hierarchy to prioritize the pricing assumptions, referred to as inputs, used in valuation techniques to measure fair value. Level 1 includes securities valued using quoted prices in active markets for identical securities, including registered investment companies. Level 2 includes securities valued using other significant observable inputs. Observable inputs may include quoted prices for similar securities, interest rates, prepayment speeds and credit risk. Prices for securities valued using these inputs are received from independent pricing vendors and brokers and are based on an evaluation of the inputs described. Level 3 includes securities valued using significant unobservable inputs when market prices are not readily available or reliable, including the fund's own assumptions in determining the fair value of investments. Factors used in determining value may include market or issuer specific events or trends, changes in interest rates and credit quality. The inputs or methodology used for valuing securities are not necessarily an indication of the risks associated with investing in those securities. Changes in valuation techniques and related inputs may result in transfers into or out of an assigned level within the disclosure hierarchy.
The following is a summary of the values by input classification of the fund's investments as of February 29, 2020, by major security category or type:
| | Total
value at
2-29-20 | Level 1
quoted
price | Level 2
significant
observable
inputs | Level 3
significant
unobservable
inputs |
| Investments in securities: | | | | |
| Assets | | | | |
| Common stocks | | | | |
| Communication services | $100,471,902 | $94,593,941 | $5,877,961 | — |
| Consumer discretionary | 40,203,943 | 40,203,943 | — | — |
| Consumer staples | 132,305,611 | 132,305,611 | — | — |
| Energy | 138,867,347 | 138,867,347 | — | — |
| Financials | 376,401,122 | 376,401,122 | — | — |
| Health care | 217,252,698 | 211,570,228 | 5,682,470 | — |
| Industrials | 201,880,132 | 201,880,132 | — | — |
| Information technology | 136,122,059 | 136,122,059 | — | — |
| Materials | 68,143,465 | 65,286,293 | 2,857,172 | — |
| Real estate | 59,565,090 | 59,565,090 | — | — |
| Utilities | 126,994,898 | 126,994,898 | — | — |
| | SEMIANNUAL REPORT | JOHN HANCOCK Equity Income Fund | 23 |
| | Total
value at
2-29-20 | Level 1
quoted
price | Level 2
significant
observable
inputs | Level 3
significant
unobservable
inputs |
| Preferred securities | $38,526,147 | $38,526,147 | — | — |
| Convertible bonds | 3,652,299 | — | $3,652,299 | — |
| Short-term investments | 41,899,214 | 41,899,214 | — | — |
| Total investments in securities | $1,682,285,927 | $1,664,216,025 | $18,069,902 | — |
Security transactions and related investment income. Investment security transactions are accounted for on a trade date plus one basis for daily NAV calculations. However, for financial reporting purposes, investment transactions are reported on trade date. Interest income is accrued as earned. Interest income includes coupon interest and amortization/accretion of premiums/discounts on debt securities. Debt obligations may be placed in a non-accrual status and related interest income may be reduced by stopping current accruals and writing off interest receivable when the collection of all or a portion of interest has become doubtful. Dividend income is recorded on the ex-date, except for dividends of certain foreign securities where the dividend may not be known until after the ex-date. In those cases, dividend income, net of withholding taxes, is recorded when the fund becomes aware of the dividends. Non-cash dividends, if any, are recorded at the fair market value of the securities received. Gains and losses on securities sold are determined on the basis of identified cost and may include proceeds from litigation.
Real estate investment trusts. The fund may invest in real estate investment trusts (REITs). Distributions from REITs may be recorded as income and subsequently characterized by the REIT at the end of the fiscal year as a reduction of cost of investments and/or as a realized gain. As a result, the fund will estimate the components of distributions from these securities. Such estimates are revised when the actual components of the distributions are known.
Securities lending. The fund may lend its securities to earn additional income. The fund receives collateral from the borrower in an amount not less than the market value of the loaned securities. The fund will invest its cash collateral in JHCT, an affiliate of the fund, which has a floating NAV and is registered with the Securities and Exchange Commission (SEC) as an investment company. JHCT invests in short-term money market investments. The fund will receive the benefit of any gains and bear any losses generated by JHCT with respect to the cash collateral.
The fund has the right to recall loaned securities on demand. If a borrower fails to return loaned securities when due, then the lending agent is responsible and indemnifies the fund for the lent securities. The lending agent uses the collateral received from the borrower to purchase replacement securities of the same issue, type, class and series of the loaned securities. If the value of the collateral is less than the purchase cost of replacement securities, the lending agent is responsible for satisfying the shortfall but only to the extent that the shortfall is not due to any decrease in the value of JHCT.
Although the risk of loss on securities lent is mitigated by receiving collateral from the borrower and through lending agent indemnification, the fund could experience a delay in recovering securities or could experience a lower than expected return if the borrower fails to return the securities on a timely basis. The fund receives compensation for lending its securities by retaining a portion of the return on the investment of the collateral and compensation from fees earned from borrowers of the securities. Securities lending income received by the fund is net of fees retained by the securities lending agent. Net income received from JHCT is a component of securities lending income as recorded on the Statement of operations.
| 24 | JOHN HANCOCK Equity Income Fund | SEMIANNUAL REPORT | |
Obligations to repay collateral received by the fund are shown on the Statement of assets and liabilities as Payable upon return of securities loaned and are secured by the loaned securities. As of February 29, 2020, the fund loaned securities valued at $8,904,495 and received $9,913,704 of cash collateral.
Foreign investing. Assets, including investments, and liabilities denominated in foreign currencies are translated into U.S. dollar values each day at the prevailing exchange rate. Purchases and sales of securities, income and expenses are translated into U.S. dollars at the prevailing exchange rate on the date of the transaction. The effect of changes in foreign currency exchange rates on the value of securities is reflected as a component of the realized and unrealized gains (losses) on investments. Foreign investments are subject to a decline in the value of a foreign currency versus the U.S. dollar, which reduces the dollar value of securities denominated in that currency.
Funds that invest internationally generally carry more risk than funds that invest strictly in U.S. securities. Risks can result from differences in economic and political conditions, regulations, market practices (including higher transaction costs), accounting standards and other factors.
Foreign taxes. The fund may be subject to withholding tax on income, capital gains or repatriation taxes imposed by certain countries, a portion of which may be recoverable. Foreign taxes are accrued based upon the fund's understanding of the tax rules and rates that exist in the foreign markets in which it invests. Taxes are accrued based on gains realized by the fund as a result of certain foreign security sales. In certain circumstances, estimated taxes are accrued based on unrealized appreciation of such securities. Investment income is recorded net of foreign withholding taxes.
Overdraft. The fund may have the ability to borrow from banks for temporary or emergency purposes, including meeting redemption requests that otherwise might require the untimely sale of securities. Pursuant to the fund's custodian agreement, the custodian may loan money to the fund to make properly authorized payments. The fund is obligated to repay the custodian for any overdraft, including any related costs or expenses. The custodian may have a lien, security interest or security entitlement in any fund property that is not otherwise segregated or pledged, to the extent of any overdraft, and to the maximum extent permitted by law.
Line of credit. The fund and other affiliated funds have entered into a syndicated line of credit agreement with Citibank, N.A. as the administrative agent that enables them to participate in a $750 million unsecured committed line of credit. Excluding commitments designated for a certain fund and subject to the needs of all other affiliated funds, the fund can borrow up to an aggregate commitment amount of $500 million, subject to asset coverage and other limitations as specified in the agreement. A commitment fee payable at the end of each calendar quarter, based on the average daily unused portion of the line of credit, is charged to each participating fund based on a combination of fixed and asset based allocations and is reflected in Other expenses on the Statement of operations. For the six months ended February 29, 2020, the fund had no borrowings under the line of credit. Commitment fees for the six months ended February 29, 2020 were $2,961.
Expenses. Within the John Hancock group of funds complex, expenses that are directly attributable to an individual fund are allocated to such fund. Expenses that are not readily attributable to a specific fund are allocated among all funds in an equitable manner, taking into consideration, among other things, the nature and type of expense and the fund’s relative net assets. Expense estimates are accrued in the period to which they relate and adjustments are made when actual amounts are known.
Class allocations. Income, common expenses and realized and unrealized gains (losses) are determined at the fund level and allocated daily to each class of shares based on the net assets of the class. Class-specific expenses, such as distribution and service fees, if any, and transfer agent fees, for all classes, are charged daily at the class level based on the net assets of each class and the specific expense rates applicable to each class.
| | SEMIANNUAL REPORT | JOHN HANCOCK Equity Income Fund | 25 |
Federal income taxes. The fund intends to continue to qualify as a regulated investment company by complying with the applicable provisions of the Internal Revenue Code and will not be subject to federal income tax on taxable income that is distributed to shareholders. Therefore, no federal income tax provision is required.
As of August 31, 2019, the fund had no uncertain tax positions that would require financial statement recognition, derecognition or disclosure. The fund's federal tax returns are subject to examination by the Internal Revenue Service for a period of three years.
Distribution of income and gains. Distributions to shareholders from net investment income and net realized gains, if any, are recorded on the ex-date. The fund generally declares and pays dividends quarterly. Capital gain distributions, if any, are typically distributed annually.
Distributions paid by the fund with respect to each class of shares are calculated in the same manner, at the same time and in the same amount, except for the effect of class level expenses that may be applied differently to each class.
Such distributions, on a tax basis, are determined in conformity with income tax regulations, which may differ from US GAAP. Distributions in excess of tax basis earnings and profits, if any, are reported in the fund's financial statements as a return of capital. The final determination of tax characteristics of the fund's distribution will occur at the end of the year and will subsequently be reported to shareholders.
Capital accounts within the financial statements are adjusted for permanent book-tax differences. These adjustments have no impact on net assets or the results of operations. Temporary book-tax differences, if any, will reverse in a subsequent period. Book-tax differences are primarily attributable to wash sale loss deferrals.
Note 3—Derivative instruments
The fund may invest in derivatives in order to meet its investment objective. Derivatives include a variety of different instruments that may be traded in the over-the-counter (OTC) market, on a regulated exchange or through a clearing facility. The risks in using derivatives vary depending upon the structure of the instruments, including the use of leverage, optionality, the liquidity or lack of liquidity of the contract, the creditworthiness of the counterparty or clearing organization and the volatility of the position. Some derivatives involve risks that are potentially greater than the risks associated with investing directly in the referenced securities or other referenced underlying instrument. Specifically, the fund is exposed to the risk that the counterparty to an OTC derivatives contract will be unable or unwilling to make timely settlement payments or otherwise honor its obligations. OTC derivatives transactions typically can only be closed out with the other party to the transaction.
Certain derivatives are traded or cleared on an exchange or central clearinghouse. Exchange-traded or centrally-cleared transactions generally present less counterparty risk to a fund than OTC transactions. The exchange or clearinghouse stands between the fund and the broker to the contract and therefore, credit risk is generally limited to the failure of the exchange or clearinghouse and the clearing member.
Futures. A futures contract is a contractual agreement to buy or sell a particular currency or financial instrument at a pre-determined price in the future. Futures are traded on an exchange and cleared through a central clearinghouse. Risks related to the use of futures contracts include possible illiquidity of the futures markets and contract prices that can be highly volatile and imperfectly correlated to movements in the underlying financial instrument and potential losses in excess of the amounts recognized on the Statement of assets and liabilities. Use of long futures contracts subjects the fund to the risk of loss up to the notional value of the futures contracts. Use of short futures contracts subjects the fund to unlimited risk of loss.
Upon entering into a futures contract, the fund is required to deposit initial margin with the broker in the form of
| 26 | JOHN HANCOCK Equity Income Fund | SEMIANNUAL REPORT | |
cash or securities. The amount of required margin is set by the broker and is generally based on a percentage of the contract value. The margin deposit must then be maintained at the established level over the life of the contract. Cash that has been pledged by the fund is detailed in the Statement of assets and liabilities as Collateral held at broker for futures contracts. Securities pledged by the fund, if any, are identified in the Fund's investments. Subsequent payments, referred to as variation margin, are made or received by the fund periodically and are based on changes in the market value of open futures contracts. Futures contracts are marked-to-market daily and unrealized gain or loss is recorded by the fund. When the contract is closed, the fund records a realized gain or loss equal to the difference between the value of the contract at the time it was opened and the value at the time it was closed.
During the six months ended February 29, 2020, the fund used futures contracts to substitute for securities purchased. The fund held futures contracts with USD notional values ranging up to $3.1 million, as measured at each quarter end. There were no open futures contracts as of February 29, 2020.
Effect of derivative instruments on the Statement of operations
The table below summarizes the net realized gain (loss) included in the net increase (decrease) in net assets from operations, classified by derivative instrument and risk category, for the six months ended February 29, 2020:
| | Statement of operations location - Net realized gain (loss) on: |
| Risk | Futures contracts |
| Equity | $163,606 |
The table below summarizes the net change in unrealized appreciation (depreciation) included in the net increase (decrease) in net assets from operations, classified by derivative instrument and risk category, for the six months ended February 29, 2020:
| | Statement of operations location - Change in net unrealized appreciation (depreciation) of: |
| Risk | Futures contracts |
| Equity | $(167) |
Note 4—Guarantees and indemnifications
Under the Trust's organizational documents, its Officers and Trustees are indemnified against certain liabilities arising out of the performance of their duties to the Trust, including the fund. Additionally, in the normal course of business, the fund enters into contracts with service providers that contain general indemnification clauses. The fund's maximum exposure under these arrangements is unknown, as this would involve future claims that may be made against the fund that have not yet occurred. The risk of material loss from such claims is considered remote.
Note 5—Fees and transactions with affiliates
John Hancock Investment Management LLC (the Advisor) serves as investment advisor for the fund. John Hancock Investment Management Distributors LLC (the Distributor), an affiliate of the Advisor, serves as principal underwriter of the fund. The Advisor and the Distributor are indirect, wholly owned subsidiaries of Manulife Financial Corporation (MFC).
Management fee. The fund has an investment management agreement with the Advisor under which the fund pays a daily management fee to the Advisor equivalent on an annual basis to the sum of: a) 0.800% of the first $100 million of aggregate net assets; b) 0.775% of the aggregate net assets between $100 million and $200 million; c) 0.750% of the aggregate net assets between $200 million and $500 million; d) 0.725% of the
| | SEMIANNUAL REPORT | JOHN HANCOCK Equity Income Fund | 27 |
aggregate net assets between $500 million and $1 billion; e) 0.725% of the aggregate net assets between $1 billion and $1.5 billion and f) 0.700% of aggregate net assets excess over $1.5 billion. When aggregate net assets exceed $200 million on any day, the annual rate of management fee for that day is 0.775% on the first $200 million of aggregate net assets. When aggregate net assets exceed $500 million on any day, the annual rate of management fee for that day is 0.750% on the first $500 million of aggregate net assets and 0.725% on the amount above $500 million. When aggregate net assets exceed $1 billion on any day, the annual rate of management fee for that day is 0.725% on the first $1 billion of aggregate net assets. When aggregate net assets exceed $1.5 billion on any day, the annual rate of management fee for that day is 0.700% on the first $1.5 billion of aggregate net assets. Aggregate net assets include the net assets of the fund and Equity Income Trust, a series of John Hancock Variable Insurance Trust. The Advisor has a subadvisory agreement with T.Rowe Price Associates, Inc. The fund is not responsible for payment of the subadvisory fees.
The Advisor has contractually agreed to waive a portion of its management fee and/or reimburse expenses for certain funds of the John Hancock group of funds complex, including the fund (the participating portfolios). This waiver is based upon aggregate net assets of all the participating portfolios. The amount of the reimbursement is calculated daily and allocated among all the participating portfolios in proportion to the daily net assets of each fund. During the six months ended February 29, 2020, this waiver amounted to 0.01% of the fund’s average daily net assets on an annualized basis. This arrangement expires on July 31, 2021, unless renewed by mutual agreement of the fund and the Advisor based upon a determination that this is appropriate under the circumstances at that time.
The Advisor has contractually agreed to reduce its management fee or, if necessary, make payment to each of Class A and Class C shares in an amount equal to the amount by which the expenses of each class as applicable, exceed 1.14% and 1.89%, respectively, of the average net assets attributable to the class. Expenses exclude taxes, brokerage commissions, interest expense, acquired fund fees and expenses paid indirectly, litigation and indemnification expenses and other extraordinary expenses not incurred in the ordinary course of business, and short dividend expense. This agreement expires December 31, 2020, unless renewed by mutual agreement of the fund and the Advisor based upon a determination that this is appropriate under the circumstances at that time.
The Advisor has voluntarily agreed to waive a portion of its management fees for the fund. This voluntary waiver equals the amount by which the subadvisory fee paid to T. Rowe Price Associates, Inc. is reduced. This voluntary expense reimbursement may terminate at any time.
For the six months ended February 29, 2020, the expense reductions described above amounted to the following:
| Class | Expense reduction |
| Class A | $8,545 |
| Class C | 408 |
| Class 1 | 30,207 |
| Class | Expense reduction |
| Class NAV | $232,582 |
| Total | $271,742 |
Expenses waived or reimbursed in the current fiscal period are not subject to recapture in future fiscal periods.
The investment management fees, including the impact of the waivers and reimbursements as described above, incurred for the six months ended February 29, 2020, were equivalent to a net annual effective rate of 0.67% of the fund's average daily net assets.
Accounting and legal services. Pursuant to a service agreement, the fund reimburses the Advisor for all expenses associated with providing the administrative, financial, legal, compliance, accounting and recordkeeping services to the fund, including the preparation of all tax returns, periodic reports to shareholders and regulatory
| 28 | JOHN HANCOCK Equity Income Fund | SEMIANNUAL REPORT | |
reports, among other services. These expenses are allocated to each share class based on its relative net assets at the time the expense was incurred. These accounting and legal services fees incurred for the six months ended February 29, 2020 amounted to an annual rate of 0.02% of the fund's average daily net assets.
Distribution and service plans. The fund has a distribution agreement with the Distributor. The fund has adopted distribution and service plans for certain classes as detailed below pursuant to Rule 12b-1 under the 1940 Act, to pay the Distributor for services provided as the distributor of shares of the fund. The fund may pay up to the following contractual rates of distribution and service fees under these arrangements, expressed as an annual percentage of average daily net assets for each class of the fund's shares:
| Class | Rule 12b-1 Fee |
| Class A | 0.30% |
| Class C | 1.00% |
| Class 1 | 0.05% |
Sales charges. Class A shares are assessed up-front sales charges, which resulted in payments to the Distributor amounting to $92,222 for the six months ended February 29, 2020. Of this amount, $16,011 was retained and used for printing prospectuses, advertising, sales literature and other purposes and $76,211 was paid as sales commissions to broker-dealers.
Class A and Class C shares may be subject to contingent deferred sales charges (CDSCs). Certain Class A shares that are acquired through purchases of $1 million or more and are redeemed within one year of purchase are subject to a 1.00% sales charge. Class C shares that are redeemed within one year of purchase are subject to a 1.00% CDSC. CDSCs are applied to the lesser of the current market value at the time of redemption or the original purchase cost of the shares being redeemed. Proceeds from CDSCs are used to compensate the Distributor for providing distribution-related services in connection with the sale of these shares. During the six months ended February 29, 2020, CDSCs received by the Distributor amounted to $379 and $13 for Class A and Class C shares, respectively.
Transfer agent fees. The John Hancock group of funds has a complex-wide transfer agent agreement with John Hancock Signature Services, Inc. (Signature Services), an affiliate of the Advisor. The transfer agent fees paid to Signature Services are determined based on the cost to Signature Services (Signature Services Cost) of providing recordkeeping services. It also includes out-of-pocket expenses, including payments made to third-parties for recordkeeping services provided to their clients who invest in one or more John Hancock funds. In addition, Signature Services Cost may be reduced by certain fees that Signature Services receives in connection with retirement and small accounts. Signature Services Cost is calculated monthly and allocated, as applicable, to five categories of share classes: Retail Share and Institutional Share Classes of Non-Municipal Bond Funds, Class R6 Shares, Retirement Share Classes and Municipal Bond Share Classes. Within each of these categories, the applicable costs are allocated to the affected John Hancock affiliated funds and/or classes, based on the relative average daily net assets.
Class level expenses. Class level expenses for the six months ended February 29, 2020 were as follows:
| Class | Distribution and service fees | Transfer agent fees |
| Class A | $85,206 | $34,924 |
| Class C | 13,572 | 1,670 |
| Class 1 | 50,287 | — |
| Total | $149,065 | $36,594 |
| | SEMIANNUAL REPORT | JOHN HANCOCK Equity Income Fund | 29 |
Trustee expenses. The fund compensates each Trustee who is not an employee of the Advisor or its affiliates. The costs of paying Trustee compensation and expenses are allocated to the fund based on its net assets relative to other funds within the John Hancock group of funds complex.
Interfund lending program. Pursuant to an Exemptive Order issued by the SEC, the fund, along with certain other funds advised by the Advisor or its affiliates, may participate in an interfund lending program. This program provides an alternative credit facility allowing the fund to borrow from, or lend money to, other participating affiliated funds. At period end, no interfund loans were outstanding. The fund's activity in this program during the period for which loans were outstanding was as follows:
Borrower
or Lender | Weighted Average
Loan Balance | Days
Outstanding | Weighted Average
Interest Rate | Interest Income
(Expense) |
| Lender | $15,206,699 | 5 | 1.601% | $3,382 |
Note 6—Fund share transactions
Transactions in fund shares for the six months ended February 29, 2020 and for the year ended August 31, 2019 were as follows:
| | Six Months Ended 2-29-20 | Year Ended 8-31-19 |
| | Shares | Amount | Shares | Amount |
| Class A shares | | | | |
| Sold | 610,263 | $11,501,932 | 995,444 | $17,988,634 |
| Distributions reinvested | 212,538 | 3,995,710 | 288,610 | 4,727,196 |
| Repurchased | (274,145) | (5,135,770) | (557,710) | (10,146,117) |
| Net increase | 548,656 | $10,361,872 | 726,344 | $12,569,713 |
| Class C shares | | | | |
| Sold | 16,168 | $305,922 | 70,676 | $1,286,919 |
| Distributions reinvested | 9,438 | 178,006 | 17,131 | 279,512 |
| Repurchased | (27,755) | (533,553) | (71,343) | (1,303,611) |
| Net increase (decrease) | (2,149) | $(49,625) | 16,464 | $262,820 |
| Class 1 shares | | | | |
| Sold | 196,602 | $3,722,603 | 254,975 | $4,695,379 |
| Distributions reinvested | 762,964 | 14,351,352 | 1,457,283 | 23,950,239 |
| Repurchased | (1,158,589) | (21,805,047) | (2,166,593) | (40,425,568) |
| Net decrease | (199,023) | $(3,731,092) | (454,335) | $(11,779,950) |
| Class NAV shares | | | | |
| Sold | 7,354,683 | $136,036,385 | 17,559,676 | $320,289,388 |
| Distributions reinvested | 5,818,997 | 109,280,765 | 8,660,727 | 142,398,287 |
| Repurchased | (7,356,975) | (140,794,766) | (8,615,631) | (165,438,188) |
| Net increase | 5,816,705 | $104,522,384 | 17,604,772 | $297,249,487 |
| Total net increase | 6,164,189 | $111,103,539 | 17,893,245 | $298,302,070 |
| 30 | JOHN HANCOCK Equity Income Fund | SEMIANNUAL REPORT | |
Affiliates of the fund owned 100% of shares of Class 1 and Class NAV on February 29, 2020. Such concentration of shareholders’ capital could have a material effect on the fund if such shareholders redeem from the fund.
Note 7—Purchase and sale of securities
Purchases and sales of securities, other than short-term investments, amounted to $260,354,975 and $250,623,652, respectively, for the six months ended February 29, 2020.
Note 8—Industry or sector risk
The fund may invest a large percentage of its assets in one or more particular industries or sectors of the economy. If a large percentage of the fund’s assets are economically tied to a single or small number of industries or sectors of the economy, the fund will be less diversified than a more broadly diversified fund, and it may cause the fund to underperform if that industry or sector underperforms. In addition, focusing on a particular industry or sector may make the fund’s NAV more volatile. Further, a fund that invests in particular industries or sectors is particularly susceptible to the impact of market, economic, regulatory and other factors affecting those industries or sectors.
Note 9—Investment by affiliated funds
Certain investors in the fund are affiliated funds that are managed by the Advisor and its affiliates. The affiliated funds do not invest in the fund for the purpose of exercising management or control; however, this investment may represent a significant portion of the fund's net assets. At February 29, 2020, funds within the John Hancock group of funds complex held 86.2% of the fund's net assets. The following fund(s) had an affiliate ownership of 5% or more of the fund's net assets:
| Portfolio | Affiliated Concentration |
| John Hancock Funds II Multimanager Lifestyle Growth Fund | 30.4% |
| John Hancock Funds II Multimanager Lifestyle Balanced Fund | 22.0% |
| John Hancock Funds II Multimanager Lifestyle Aggressive Fund | 12.4% |
Note 10—Investment in affiliated underlying funds
The fund may invest in affiliated underlying funds that are managed by the Advisor and its affiliates. Information regarding the fund's fiscal year to date purchases and sales of the affiliated underlying funds as well as income and capital gains earned by the fund, if any, is as follows:
| | | | | | | | Dividends and distributions |
| Affiliate | Ending
share
amount | Beginning
value | Cost of
purchases | Proceeds
from shares
sold | Realized
gain
(loss) | Change in
unrealized
appreciation
(depreciation) | Income
distributions
received | Capital gain
distributions
received | Ending
value |
| John Hancock Collateral Trust* | 989,304 | $8,171,462 | $86,279,423 | $(84,550,738) | $245 | $1,451 | $36,836 | — | $9,901,843 |
| * | Refer to the Securities lending note within Note 2 for details regarding this investment. |
Note 11—Other Matters
The Trust and several of its funds, including the Equity Income Fund (the “fund”), have been named as defendants in a number of adversary proceedings in state and Federal courts across the country arising out of an $8 billion leveraged buyout (“LBO”) transaction in 2007 whereby the Tribune Company (“Tribune”) converted to a privately held company. In Kirchner v. FitzSimons, No.12-2652 (S.D.N.Y.) (the “FitzSimons Action”), the plaintiff alleges that Tribune insiders and shareholders were overpaid for their Tribune stock and is attempting to obtain from former
| | SEMIANNUAL REPORT | JOHN HANCOCK Equity Income Fund | 31 |
shareholders the proceeds received in connection with the LBO. This claim was brought as a putative defendant class action that names certain shareholders as representatives of a potential class comprised of all Tribune shareholders that tendered their shares in the LBO and received proceeds as a result, including certain John Hancock mutual funds. Certain John Hancock mutual funds received a total of approximately $49 million in connection with the LBO. The total amount at issue for the Equity Income Fund is approximately $12 million. In addition, a group of Tribune creditors filed fifty three actions in various state and federal courts against former Tribune shareholders asserting state law constructive fraudulent conveyance claims arising out of the 2007 LBO (the “SLCFC Actions”). The FitzSimons Action and the SLCFC Actions have been consolidated with the majority of the other LBO-related lawsuits in a multidistrict litigation proceeding captioned In re Tribune Company Fraudulent Conveyance Litigation, No.11-md-2696 (S.D.N.Y.).
As of August 1, 2019, all claims in the FitzSimons Action had been dismissed by the District Court. However, prior to this dismissal on July 15, 2019, the plaintiff in the FitzSimons case filed a notice of appeal with the Second Circuit appealing, among other things, the dismissal of his intentional fraudulent transfer claim against the shareholder defendants; and the District Court’s denial of his motion for leave to amend the complaint to add a constructive fraudulent transfer claim against certain shareholder defendants (FitzSimons appeal). The separate individual creditor actions remain at the Second Circuit pending a resolution of the state law plaintiffs’ request to have those actions sent back to the District Court for a determination of whether the Section 546(e) of the Bankruptcy Code - the statutory safe harbor for settlement payments - continues to protect all share-holder defendants following the Supreme Court’s ruling in a separate case involving Section 546(e) Merit Management.
On December 19, 2019, the Court of Appeals for the Second Circuit issued a new ruling and affirmed the dismissal of the state law constructive fraudulent transfer conveyance claims. Among other things, the Second Circuit held that all shareholder defendants can take advantage of the Section 546(e) safe harbor and that Section 546(e) preempts state law claims.
Regarding the FitzSimons appeal, on January 2, 2020, the plaintiffs filed a Petition for Panel Rehearing before all the judges of the court. On February 26, 2020, the Second Circuit denied this Petition.
At this time, the fund cannot predict the outcome of these proceedings. If the proceeding were to be decided in a manner adverse to the fund or if the fund enters into a settlement agreement with the plaintiffs, depending upon the circumstances, the payment of such judgement or settlement could have an adverse effect on the fund’s net asset value.
Note 12—Subsequent events
A widespread health crisis such as a global pandemic could cause substantial market volatility, exchange trading suspensions and closures, impact the ability to complete redemptions, and affect fund performance. For example, the novel coronavirus disease (COVID-19) has resulted in significant disruptions to global business activity. The impact of a health crisis and other epidemics and pandemics that may arise in the future, could affect the global economy in ways that cannot necessarily be foreseen at the present time. A health crisis may exacerbate other pre-existing political, social and economic risks. Any such impact could adversely affect the fund's performance, resulting in losses to your investment.
| 32 | JOHN HANCOCK Equity Income Fund | SEMIANNUAL REPORT | |
| | |
Trustees
Hassell H. McClellan,Chairperson
Steven R. Pruchansky,Vice Chairperson
Andrew G. Arnott†
Charles L. Bardelis*
James R. Boyle
Peter S. Burgess*
William H. Cunningham
Grace K. Fey
Marianne Harrison†
Deborah C. Jackson
James M. Oates*
Gregory A. Russo
Officers
Andrew G. Arnott
President
Francis V. Knox, Jr.
Chief Compliance Officer
Charles A. Rizzo
Chief Financial Officer
Salvatore Schiavone
Treasurer
Christopher (Kit) Sechler
Secretary and Chief Legal Officer
| Investment advisor
John Hancock Investment Management LLC
Subadvisor
T. Rowe Price Associates, Inc.
Portfolio Manager
John D. Linehan, CFA
Principal distributor
John Hancock Investment Management Distributors LLC
Custodian
State Street Bank and Trust Company
Transfer agent
John Hancock Signature Services, Inc.
Legal counsel
K&L Gates LLP
|
* Member of the Audit Committee
† Non-Independent Trustee
The fund's proxy voting policies and procedures, as well as the fund proxy voting record for the most recent twelve-month period ended June 30, are available free of charge on the Securities and Exchange Commission (SEC) website at sec.gov or on our website.
All of the fund's holdings as of the end of the third month of every fiscal quarter are filed with the SEC on Form N-PORT within 60 days of the end of the fiscal quarter. The fund's Form N-PORT filings are available on our website and the SEC's website, sec.gov.
We make this information on your fund, as well asmonthly portfolio holdings, and other fund details available on our website at jhinvestments.com or by calling 800-225-5291.
| | | | |
| | You can also contact us: |
| | 800-225-5291
jhinvestments.com | Regular mail:
John Hancock Signature Services, Inc.
P.O. Box 55913
Boston, MA 02205-5913
| Express mail:
John Hancock Signature Services, Inc.
2000 Crown Colony Drive
Suite 55913
Quincy, MA 02169-0953
|
SEMIANNUAL REPORT | JOHN HANCOCK EQUITY INCOME FUND 33
John Hancock family of funds
| | | |
DOMESTIC EQUITY FUNDS
Blue Chip Growth
Classic Value
Disciplined Value
Disciplined Value Mid Cap
Equity Income
Financial Industries
Fundamental All Cap Core
Fundamental Large Cap Core
New Opportunities
Regional Bank
Small Cap Core
Small Cap Growth
Small Cap Value
U.S. Global Leaders Growth
U.S. Quality Growth
GLOBAL AND INTERNATIONAL EQUITY FUNDS
Disciplined Value International
Emerging Markets
Emerging Markets Equity
Fundamental Global Franchise
Global Equity
Global Shareholder Yield
Global Thematic Opportunities
International Dynamic Growth
International Growth
International Small Company
| | INCOME FUNDS
Bond
California Tax-Free Income
Emerging Markets Debt
Floating Rate Income
Government Income
High Yield
High Yield Municipal Bond
Income
Investment Grade Bond
Money Market
Short Duration Bond
Short Duration Credit Opportunities
Strategic Income Opportunities
Tax-Free Bond
ALTERNATIVE AND SPECIALTY FUNDS
Absolute Return Currency
Alternative Asset Allocation
Alternative Risk Premia
Diversified Macro
Infrastructure
Multi-Asset Absolute Return
Seaport Long/Short
|
A fund's investment objectives, risks, charges, and expenses should be considered carefully before investing. The prospectus contains this and other important information about the fund. To obtain a prospectus, contact your financial professional, call John Hancock Investment Management at 800-225-5291, or visit our website at jhinvestments.com. Please read the prospectus carefully before investing or sending money.
| | | |
ASSET ALLOCATION
Balanced
Income Allocation
Multi-Index Lifetime Portfolios
Multi-Index Preservation Portfolios
Multimanager Lifestyle Portfolios
Multimanager Lifetime Portfolios
Retirement Income 2040
EXCHANGE-TRADED FUNDS
John Hancock Multifactor Consumer Discretionary ETF
John Hancock Multifactor Consumer Staples ETF
John Hancock Multifactor Developed International ETF
John Hancock Multifactor Emerging Markets ETF
John Hancock Multifactor Energy ETF
John Hancock Multifactor Financials ETF
John Hancock Multifactor Healthcare ETF
John Hancock Multifactor Industrials ETF
John Hancock Multifactor Large Cap ETF
John Hancock Multifactor Materials ETF
John Hancock Multifactor Media and
Communications ETF
John Hancock Multifactor Mid Cap ETF
John Hancock Multifactor Small Cap ETF
John Hancock Multifactor Technology ETF
John Hancock Multifactor Utilities ETF
| | ENVIRONMENTAL, SOCIAL, AND
GOVERNANCE FUNDS
ESG All Cap Core
ESG Core Bond
ESG International Equity
ESG Large Cap Core
CLOSED-END FUNDS
Financial Opportunities
Hedged Equity & Income
Income Securities Trust
Investors Trust
Preferred Income
Preferred Income II
Preferred Income III
Premium Dividend
Tax-Advantaged Dividend Income
Tax-Advantaged Global Shareholder Yield
|
John Hancock Multifactor ETF shares are bought and sold at market price (not NAV), and are not individually redeemed
from the fund. Brokerage commissions will reduce returns.
John Hancock ETFs are distributed by Foreside Fund Services, LLC, and are subadvised by Dimensional Fund Advisors LP.
Foreside is not affiliated with John Hancock Investment Management Distributors LLC or Dimensional Fund Advisors LP.
Dimensional Fund Advisors LP receives compensation from John Hancock in connection with licensing rights to the
John Hancock Dimensional indexes. Dimensional Fund Advisors LP does not sponsor, endorse, or sell, and makes no
representation as to the advisability of investing in, John Hancock Multifactor ETFs.
John Hancock Investment Management
A trusted brand
John Hancock Investment Management is a premier asset manager
representing one of America's most trusted brands, with a heritage of
financial stewardship dating back to 1862. Helping our shareholders
pursue their financial goals is at the core of everything we do. It's why
we support the role of professional financial advice and operate with
the highest standards of conduct and integrity.
A better way to invest
We serve investors globally through a unique multimanager approach:
We search the world to find proven portfolio teams with specialized
expertise for every strategy we offer, then we apply robust investment
oversight to ensure they continue to meet our uncompromising
standards and serve the best interests of our shareholders.
Results for investors
Our unique approach to asset management enables us to provide
a diverse set of investments backed by some of the world's best
managers, along with strong risk-adjusted returns across asset classes.
John Hancock Investment Management Distributors LLC n Member FINRA, SIPC
200 Berkeley Street n Boston, MA 02116-5010 n 800-225-5291 n jhinvestments.com
This report is for the information of the shareholders of John Hancock Equity Income Fund. It is not authorized for distribution to prospective investors unless preceded or accompanied by a prospectus.
| | |
| MF1105613 | 458SA 2/20
4/2020 |
John Hancock
Fundamental Global Franchise Fund
Semiannual report 2/29/2020
Beginning on January 1, 2021, as permitted by regulations adopted by the Securities and Exchange Commission, paper copies of the fund's shareholder reports like this one will no longer be sent by mail, unless you specifically request paper copies of the reports from the fund or from your financial intermediary. Instead, the reports will be made available on a website, and you will be notified by mail each time a report is posted and provided with a website link to access the report.
If you already elected to receive shareholder reports electronically, you will not be affected by this change, and you do not need to take any action. You may elect to receive shareholder reports and other communications electronically by calling John Hancock Investment Management at 800-225-5291 (Class A shares) or 888-972-8696 (Class I and Class R6 shares) or by contacting your financial intermediary.
You may elect to receive all reports in paper, free of charge, at any time. You can inform John Hancock Investment Management or your financial intermediary that you wish to continue receiving paper copies of your shareholder reports by following the instructions listed above. Your election to receive reports in paper will apply to all funds held with John Hancock Investment Management or your financial intermediary.

A message to shareholders
Dear shareholder,
Global financial markets were on pace to deliver strong returns during the 6 months ended February 29, 2020, until heightened fears over the coronavirus (COVID-19) sent the markets tumbling during the last week of the period. Prior to the turbulence that ended the period, investors in non-U.S. equities saw strong gains, fueled in part by similarly supportive monetary policy and some signs of strength in developing markets.
However, the COVID-19 pandemic and plummeting oil prices put an end to all that good news. Shortly after period end, the U.S. Federal Reserve lowered interest rates while governments around the world embarked on plans to launch fiscal stimulus to mitigate supply chain destruction and support economic growth.
After the longest bull market in U.S. history, we're now in bear market territory. Indeed, the spread of COVID-19, trade disputes, rising unemployment, and other geopolitical tensions may continue to create uncertainty among businesses and investors. Your financial professional can helpposition your portfolio so that it's sufficiently diversified to seek to meet your long-term objectives and to withstand the inevitable bouts of market volatility along the way.
On behalf of everyone at John Hancock Investment Management, I'd like to take this opportunity to welcome new shareholders and thank existing shareholders for the continued trust you've placed in us.
Sincerely,
Andrew G. Arnott
President and CEO,
John Hancock Investment Management
Head of Wealth and Asset Management,
United States and Europe
This commentary reflects the CEO's views as of this report's period end and are subject to change at any time. Diversification does not guarantee investment returns and does not eliminate risk of loss. All investments entail risks, including the possible loss of principal. For more up-to-date information, you can visit our website at jhinvestments.com.
John Hancock
Fundamental Global Franchise Fund
Table of contents
| | | |
| 2 | | Your fund at a glance |
| 3 | | Portfolio summary |
| 5 | | A look at performance |
| 7 | | Your expenses |
| 9 | | Fund's investments |
| 11 | | Financial statements |
| 14 | | Financial highlights |
| 18 | | Notes to financial statements |
| 26 | | More information |
SEMIANNUAL REPORT | JOHN HANCOCK FUNDAMENTAL GLOBAL FRANCHISE FUND 1
INVESTMENT OBJECTIVE
The fund seeks to provide capital appreciation.
AVERAGE ANNUAL TOTAL RETURNS AS OF 2/29/2020 (%)
The MSCI World Index is a free float-adjusted market capitalization weighted index that is designed to measure the equity market performance of developed markets.
It is not possible to invest directly in an index. Index figures do not reflect expenses or sales charges, which would result in lower returns.
Figures from Morningstar, Inc. include reinvested distributions and do not take into account sales charges. Actual load-adjusted performance is lower. Since-inception returns for the Morningstar fund category average are not available.
The past performance shown here reflects reinvested distributions and the beneficial effect of any expense reductions, and does not guarantee future results. Returns for periods shorter than one year are cumulative. Performance of the other share classes will vary based on the difference in the fees and expenses of those classes. Shares will fluctuate in value and, when redeemed, may be worth more or less than their original cost. Current month-end performance may be lower or higher than the performance cited, and can be found at jhinvestments.com or by calling 800-225-5291. For further information on the fund's objectives, risks, and strategy, see the fund's prospectus. The fund recently experienced negative short-term performance due to market volatility associated with the COVID-19 pandemic.
SEMIANNUAL REPORT | JOHN HANCOCK FUNDAMENTAL GLOBAL FRANCHISE FUND 2
SECTOR COMPOSITION AS OF 2/29/2020 (%)
TOP 10 HOLDINGS AS OF 2/29/2020 (%)
| | |
| eBay, Inc. | 7.6 |
| Heineken Holding NV | 6.4 |
| Berkshire Hathaway, Inc., Class B | 6.2 |
| Anheuser-Busch InBev SA | 5.9 |
| Amazon.com, Inc. | 5.5 |
| Danone SA | 5.3 |
| Ferrari NV | 5.1 |
| Cie Financiere Richemont SA | 4.8 |
| Walmart, Inc. | 4.1 |
| Reckitt Benckiser Group PLC | 4.0 |
| TOTAL | 54.9 |
| As a percentage of net assets. |
| Cash and cash equivalents are not included. |
SEMIANNUAL REPORT | JOHN HANCOCK FUNDAMENTAL GLOBAL FRANCHISE FUND 3
COUNTRY COMPOSITION AS OF 2/29/2020 (%)
| | |
| United States | 59.0 |
| United Kingdom | 8.2 |
| France | 7.5 |
| Italy | 7.2 |
| Netherlands | 6.4 |
| Belgium | 5.9 |
| Switzerland | 4.8 |
| Japan | 1.0 |
| TOTAL | 100.0 |
| As a percentage of net assets. | |
A note about risks
The fund may be subject to various risks as described in the fund's prospectus. For more information, please refer to the "Principal risks" section of the prospectus and "Subsequent events" section in the Notes to financial statements.
SEMIANNUAL REPORT | JOHN HANCOCK FUNDAMENTAL GLOBAL FRANCHISE FUND 4
TOTAL RETURNS FOR THE PERIOD ENDED FEBRUARY 29, 2020
| | | | | | | | |
Average annual total returns (%)
with maximum sales charge | | Cumulative total returns (%)
with maximum sales charge |
| | 1-year | 5-year | Since
inception1 | | 6-month | 5-year | Since
inception1 |
| Class A | -2.13 | 5.64 | 9.02 | | -10.92 | 31.58 | 94.00 |
| Class I2 | 3.29 | 7.05 | 10.12 | | -6.11 | 40.61 | 109.47 |
| Class R62,3 | 3.30 | 6.98 | 9.92 | | -6.10 | 40.10 | 106.55 |
| Class NAV2 | 3.31 | 7.17 | 10.23 | | -6.09 | 41.39 | 111.17 |
| Index† | 4.63 | 5.88 | 9.96 | | 0.88 | 33.09 | 107.10 |
Performance figures assume all distributions have been reinvested. Figures reflect maximum sales charges on Class A shares of 5%. Sales charges are not applicable to Class I, Class R6, and Class NAV shares.
The expense ratios of the fund, both net (including any fee waivers and/or expense limitations) and gross (excluding any fee waivers and/or expense limitations), are set forth according to the most recent publicly available prospectuses for the fund and may differ from those disclosed in the Financial highlights tables in this report. Net expenses reflect contractual expense limitations in effect until July 31, 2021 and are subject to change.Had the contractual fee waivers and expense limitations not been in place, gross expenses would apply. The expense ratios are as follows:
| | | | | |
| | Class A | Class I | Class R6 | Class NAV |
| Gross (%) | 1.31 | 1.01 | 0.90 | 0.89 |
| Net (%) | 1.30 | 1.00 | 0.89 | 0.88 |
Please refer to the most recent prospectuses and annual or semiannual report for more information on expenses and any expense limitation arrangements for each class.
The returns reflect past results and should not be considered indicative of future performance. The return and principal value of an investment will fluctuate so that shares, when redeemed, may be worth more or less than their original cost. Due to market volatility and other factors, the fund's current performance may be higher or lower than the performance shown. For current to the most recent month-end performance data, please call 800-225-5291 or visit the fund's website at jhinvestments.com.
The performance table above and the chart on the next page do not reflect the deduction of taxes that a shareholder would pay on fund distributions or the redemption of fund shares. The fund's performance results reflect any applicable fee waivers or expense reductions, without which the expenses would increase and results would have been less favorable.
| † | Index is the MSCI World Index. |
See the following page for footnotes.
SEMIANNUAL REPORT | JOHN HANCOCK FUNDAMENTAL GLOBAL FRANCHISE FUND 5
This chart and table show what happened to a hypothetical $10,000 investment in John Hancock Fundamental Global Franchise Fund for the share classes and periods indicated, assuming all distributions were reinvested. For comparison, we've shown the same investment in MSCI World Index.
| | | | | |
| | Start date | With maximum
sales charge ($) | Without
sales charge ($) | Index ($) |
| Class I2 | 6-29-12 | 20,947 | 20,947 | 20,710 |
| Class R62,3 | 6-29-12 | 20,655 | 20,655 | 20,710 |
| Class NAV2 | 6-29-12 | 21,117 | 21,117 | 20,710 |
The MSCI World Index is a free float-adjusted market capitalization weighted index that is designed to measure the equity market performance of developed markets.
It is not possible to invest directly in an index. Index figures do not reflect expenses or sales charges, which would result in lower returns.
Footnotes related to performance pages
| 1 | From 6-29-12. |
| 2 | For certain types of investors, as described in the fund's prospectuses. |
| 3 | Class R6 shares were first offered on 2-13-17. Returns prior to this date are those of Class A shares that have not been adjusted for class-specific expenses; otherwise, returns would vary. |
SEMIANNUAL REPORT | JOHN HANCOCK FUNDAMENTAL GLOBAL FRANCHISE FUND 6
These examples are intended to help you understand your ongoing operating expenses of investing in the fund so you can compare these costs with the ongoing costs of investing in other mutual funds.
Understanding fund expenses
As a shareholder of the fund, you incur two types of costs:
■Transaction costs,which include sales charges (loads) on purchases or redemptions (varies by share class), minimum account fee charge, etc.
■Ongoing operating expenses, including management fees, distribution and service fees (if applicable), and other fund expenses.
We are presenting only your ongoing operating expenses here.
Actual expenses/actual returns
The first line of each share class in the table on the following page is intended to provide information about the fund’s actual ongoing operating expenses, and is based on the fund’s actual return. It assumes an account value of $1,000.00 on September 1, 2019, with the same investment held until February 29, 2020.
Together with the value of your account, you may use this information to estimate the operating expenses that you paid over the period. Simply divide your account value at February 29, 2020, by $1,000.00, then multiply it by the “expenses paid” for your share class from the table. For example, for an account value of $8,600.00, the operating expenses should be calculated as follows:
Hypothetical example for comparison purposes
The second line of each share class in the table on the following page allows you to compare the fund’s ongoing operating expenses with those of any other fund. It provides an example of the fund’s hypothetical account values and hypothetical expenses based on each class’s actual expense ratio and an assumed 5% annualized return before expenses (which is not the class’s actual return). It assumes an account value of $1,000.00 on September 1, 2019, with the same investment held until February 29, 2020. Look in any other fund shareholder report to find its hypothetical example and you will be able to compare these expenses. Please remember that these hypothetical account values and expenses may not be used to estimate the actual ending account balance or expenses you paid for the period.
| | SEMIANNUAL REPORT | JOHN HANCOCK FUNDAMENTAL GLOBAL FRANCHISE FUND | 7 |
Remember, these examples do not include any transaction costs, therefore, these examples will not help you to determine the relative total costs of owning different funds. If transaction costs were included, your expenses would have been higher. See the prospectuses for details regarding transaction costs.
SHAREHOLDER EXPENSE EXAMPLE CHART
| | | Account
value on
9-1-2019 | Ending
value on
2-29-2020 | Expenses
paid during
period ended
2-29-20201 | Annualized
expense
ratio |
| Class A | Actual expenses/actual returns | $1,000.00 | $937.70 | $6.26 | 1.30% |
| | Hypothetical example | 1,000.00 | 1,018.40 | 6.52 | 1.30% |
| Class I | Actual expenses/actual returns | 1,000.00 | 938.90 | 4.82 | 1.00% |
| | Hypothetical example | 1,000.00 | 1,019.90 | 5.02 | 1.00% |
| Class R6 | Actual expenses/actual returns | 1,000.00 | 939.00 | 4.29 | 0.89% |
| | Hypothetical example | 1,000.00 | 1,020.40 | 4.47 | 0.89% |
| Class NAV | Actual expenses/actual returns | 1,000.00 | 939.10 | 4.24 | 0.88% |
| | Hypothetical example | 1,000.00 | 1,020.50 | 4.42 | 0.88% |
| 1 | Expenses are equal to the annualized expense ratio, multiplied by the average account value over the period, multiplied by 182/366 (to reflect the one-half year period). |
| 8 | JOHN HANCOCK FUNDAMENTAL GLOBAL FRANCHISE FUND | SEMIANNUAL REPORT | |
AS OF 2-29-20 (unaudited)
| | | | | Shares | Value |
| Common stocks 92.1% | | | | | $381,756,427 |
| (Cost $336,124,430) | | | | | |
| Belgium 5.9% | | | | | 24,258,276 |
| Anheuser-Busch InBev SA | | | 419,832 | 24,258,276 |
| France 7.5% | | | | | 31,257,890 |
| Danone SA | | | 313,188 | 22,104,298 |
| Sodexo SA | | | 94,709 | 9,153,592 |
| Italy 7.2% | | | | | 29,690,688 |
| Ferrari NV | | | 133,952 | 21,130,928 |
| Salvatore Ferragamo SpA | | | 537,900 | 8,559,760 |
| Japan 1.0% | | | | | 4,230,743 |
| Asics Corp. | | | 393,400 | 4,230,743 |
| Netherlands 6.4% | | | | | 26,719,590 |
| Heineken Holding NV | | | 300,905 | 26,719,590 |
| Switzerland 4.8% | | | | | 19,805,387 |
| Cie Financiere Richemont SA | | | 288,914 | 19,805,387 |
| United Kingdom 8.2% | | | | | 33,835,306 |
| Associated British Foods PLC | | | 347,778 | 10,154,792 |
| Diageo PLC | | | 199,190 | 7,107,015 |
| Reckitt Benckiser Group PLC | | | 224,291 | 16,573,499 |
| United States 51.1% | | | | | 211,958,547 |
| Alnylam Pharmaceuticals, Inc. (A) | | | 35,523 | 4,179,636 |
| Alphabet, Inc., Class A (A) | | | 3,209 | 4,297,653 |
| Alphabet, Inc., Class C (A) | | | 3,210 | 4,299,249 |
| Amazon.com, Inc. (A) | | | 12,020 | 22,642,675 |
| American Tower Corp. | | | 49,264 | 11,173,075 |
| Berkshire Hathaway, Inc., Class B (A) | | | 124,495 | 25,688,298 |
| CarGurus, Inc. (A) | | | 177,016 | 4,512,138 |
| Comcast Corp., Class A | | | 308,230 | 12,461,739 |
| Dollar Tree, Inc. (A) | | | 52,457 | 4,355,505 |
| eBay, Inc. | | | 905,821 | 31,377,639 |
| Fox Corp., Class A | | | 276,563 | 8,501,547 |
| Gilead Sciences, Inc. | | | 91,820 | 6,368,635 |
| Liberty Media Corp.-Liberty Formula One, Series A (A) | | | 284,491 | 10,665,568 |
| Liberty Media Corp.-Liberty Formula One, Series C (A) | | | 290,079 | 11,330,486 |
| Post Holdings, Inc. (A) | | | 65,683 | 6,651,061 |
| Ralph Lauren Corp. | | | 76,024 | 8,021,292 |
| Tempur Sealy International, Inc. (A) | | | 48,506 | 3,625,824 |
| The Hain Celestial Group, Inc. (A) | | | 218,390 | 5,182,395 |
| SEE NOTES TO FINANCIAL STATEMENTS | SEMIANNUAL REPORT | JOHN HANCOCK FUNDAMENTAL GLOBAL FRANCHISE FUND | 9 |
| | | | | Shares | Value |
| United States (continued) | | | | | |
| UnitedHealth Group, Inc. | | | 37,727 | $9,618,876 |
| Walmart, Inc. | | | 157,924 | 17,005,256 |
|
| | Yield* (%) | Maturity date | | Par value^ | Value |
| Short-term investments 8.6% | | | | $35,458,762 |
| (Cost $35,457,419) | | | | | |
| U.S. Government Agency 8.1% | | | | | 33,669,000 |
| Federal Agricultural Mortgage Corp. Discount Note | 1.390 | 03-02-20 | | 6,608,000 | 6,608,000 |
| Federal Home Loan Bank Discount Note | 1.320 | 03-02-20 | | 27,061,000 | 27,061,000 |
| | | Yield (%) | | Shares | Value |
| Short-term funds 0.5% | | | | | 1,789,762 |
|
| JPMorgan U.S. Treasury Plus Money Market Fund, Institutional Class | 1.4286(B) | | 1,789,762 | 1,789,762 |
|
| Total investments (Cost $371,581,849) 100.7% | | | $417,215,189 |
| Other assets and liabilities, net (0.7%) | | | (2,737,063) |
| Total net assets 100.0% | | | | | $414,478,126 |
| The percentage shown for each investment category is the total value of the category as a percentage of the net assets of the fund. |
| ^All par values are denominated in U.S. dollars unless otherwise indicated. |
| Security Abbreviations and Legend |
| (A) | Non-income producing security. |
| (B) | The rate shown is the annualized seven-day yield as of 2-29-20. |
| * | Yield represents either the annualized yield at the date of purchase, the stated coupon rate or, for floating rate securities, the rate at period end. |
At 2-29-20, the aggregate cost of investments for federal income tax purposes was $373,377,839. Net unrealized appreciation aggregated to $43,837,350, of which $65,348,484 related to gross unrealized appreciation and $21,511,134 related to gross unrealized depreciation.
| 10 | JOHN HANCOCK FUNDAMENTAL GLOBAL FRANCHISE FUND | SEMIANNUAL REPORT | SEE NOTES TO FINANCIAL STATEMENTS |
STATEMENT OF ASSETS AND LIABILITIES 2-29-20 (unaudited)
| Assets | |
| Unaffiliated investments, at value (Cost $371,581,849) | $417,215,189 |
| Foreign currency, at value (Cost $240) | 237 |
| Dividends and interest receivable | 1,071,712 |
| Receivable for fund shares sold | 1,595,295 |
| Receivable for investments sold | 4,317,725 |
| Receivable due from advisor | 172,949 |
| Other assets | 58,704 |
| Total assets | 424,431,811 |
| Liabilities | |
| Payable for investments purchased | 9,259,803 |
| Payable for fund shares repurchased | 610,066 |
| Payable to affiliates | |
| Accounting and legal services fees | 10,939 |
| Transfer agent fees | 6,094 |
| Trustees' fees | 815 |
| Other liabilities and accrued expenses | 65,968 |
| Total liabilities | 9,953,685 |
| Net assets | $414,478,126 |
| Net assets consist of | |
| Paid-in capital | $359,218,510 |
| Total distributable earnings (loss) | 55,259,616 |
| Net assets | $414,478,126 |
| |
| Net asset value per share | |
| Based on net asset value and shares outstanding - the fund has an unlimited number of shares authorized with no par value | |
| Class A ($4,418,583 ÷ 420,716 shares)1 | $10.50 |
| Class I ($68,378,603 ÷ 6,486,231 shares) | $10.54 |
| Class R6 ($7,078,733 ÷ 670,988 shares) | $10.55 |
| Class NAV ($334,602,207 ÷ 31,717,128 shares) | $10.55 |
| Maximum offering price per share | |
| Class A (net asset value per share ÷ 95%)2 | $11.05 |
| 1 | Redemption price per share is equal to net asset value less any applicable contingent deferred sales charge. |
| 2 | On single retail sales of less than $50,000. On sales of $50,000 or more and on group sales the offering price is reduced. |
| SEE NOTES TO FINANCIAL STATEMENTS | SEMIANNUAL REPORT | JOHN HANCOCK FUNDAMENTAL GLOBAL FRANCHISE FUND | 11 |
STATEMENT OF OPERATIONSFor the six months ended 2-29-20 (unaudited)
| Investment income | |
| Dividends | $2,383,853 |
| Interest | 296,357 |
| Less foreign taxes withheld | (197,543) |
| Total investment income | 2,482,667 |
| Expenses | |
| Investment management fees | 1,864,024 |
| Distribution and service fees | 7,236 |
| Accounting and legal services fees | 42,174 |
| Transfer agent fees | 25,418 |
| Trustees' fees | 4,697 |
| Custodian fees | 70,615 |
| State registration fees | 27,412 |
| Printing and postage | 13,583 |
| Professional fees | 31,045 |
| Other | 13,481 |
| Total expenses | 2,099,685 |
| Less expense reductions | (17,637) |
| Net expenses | 2,082,048 |
| Net investment income | 400,619 |
| Realized and unrealized gain (loss) | |
| Net realized gain (loss) on | |
| Unaffiliated investments and foreign currency transactions | 23,584,776 |
| Realized loss on investments not meeting investment restrictions | (172,949) |
| Payment from investment advisor for loss on investments not meeting investment restrictions | 172,949 |
| | 23,584,776 |
| Change in net unrealized appreciation (depreciation) of | |
| Unaffiliated investments and translation of assets and liabilities in foreign currencies | (49,107,530) |
| | (49,107,530) |
| Net realized and unrealized loss | (25,522,754) |
| Decrease in net assets from operations | $(25,122,135) |
| 12 | JOHN HANCOCK FUNDAMENTAL GLOBAL FRANCHISE FUND | SEMIANNUAL REPORT | SEE NOTES TO FINANCIAL STATEMENTS |
STATEMENTS OF CHANGES IN NET ASSETS
| | Six months ended
2-29-20
(unaudited) | Year ended
8-31-19 |
| Increase (decrease) in net assets | | |
| From operations | | |
| Net investment income | $400,619 | $2,800,922 |
| Net realized gain | 23,584,776 | 13,933,118 |
| Change in net unrealized appreciation (depreciation) | (49,107,530) | 10,525,960 |
| Increase (decrease) in net assets resulting from operations | (25,122,135) | 27,260,000 |
| Distributions to shareholders | | |
| From earnings | | |
| Class A | (299,153) | (344,649) |
| Class I | (1,973,680) | (489,827) |
| Class R6 | (497,140) | (435,154) |
| Class NAV | (26,399,740) | (47,517,438) |
| Total distributions | (29,169,713) | (48,787,068) |
| From fund share transactions | (18,577,108) | 72,454,278 |
| Total increase (decrease) | (72,868,956) | 50,927,210 |
| Net assets | | |
| Beginning of period | 487,347,082 | 436,419,872 |
| End of period | $414,478,126 | $487,347,082 |
| SEE NOTES TO FINANCIAL STATEMENTS | SEMIANNUAL REPORT | JOHN HANCOCK FUNDAMENTAL GLOBAL FRANCHISE FUND | 13 |
| CLASS A SHARES Period ended | 2-29-201 | 8-31-19 | 8-31-18 | 8-31-17 | 8-31-16 | 8-31-15 |
| Per share operating performance | | | | | | |
| Net asset value, beginning of period | $11.91 | $13.03 | $14.21 | $13.78 | $12.71 | $13.24 |
| Net investment income (loss)2 | (0.01)3 | 0.02 | 0.05 | 0.05 | 0.07 | 0.05 |
| Net realized and unrealized gain (loss) on investments | (0.66) | 0.26 | 0.84 | 1.68 | 2.35 | 0.14 |
| Total from investment operations | (0.67) | 0.28 | 0.89 | 1.73 | 2.42 | 0.19 |
| Less distributions | | | | | | |
| From net investment income | (0.05) | (0.02) | (0.08) | (0.04) | (0.07) | (0.07) |
| From net realized gain | (0.69) | (1.38) | (1.99) | (1.26) | (1.28) | (0.65) |
| Total distributions | (0.74) | (1.40) | (2.07) | (1.30) | (1.35) | (0.72) |
| Net asset value, end of period | $10.50 | $11.91 | $13.03 | $14.21 | $13.78 | $12.71 |
| Total return (%)4,5 | (6.23)6 | 4.61 | 6.80 | 14.58 | 19.84 | 1.51 |
| Ratios and supplemental data | | | | | | |
| Net assets, end of period (in millions) | $4 | $5 | $3 | $1 | $—7 | $—7 |
| Ratios (as a percentage of average net assets): | | | | | | |
| Expenses before reductions | 1.318 | 1.31 | 1.29 | 1.28 | 1.28 | 1.33 |
| Expenses including reductions | 1.308 | 1.30 | 1.28 | 1.27 | 1.28 | 1.32 |
| Net investment income (loss) | (0.24)3,8 | 0.20 | 0.41 | 0.34 | 0.50 | 0.38 |
| Portfolio turnover (%) | 28 | 26 | 40 | 54 | 38 | 28 |
| 1 | Six months ended 2-29-20. Unaudited. |
| 2 | Based on average daily shares outstanding. |
| 3 | Net investment income is affected by the timing and frequency of the declaration of dividends by the securities in which the fund invests. |
| 4 | Total returns would have been lower had certain expenses not been reduced during the applicable periods. |
| 5 | Does not reflect the effect of sales charges, if any. |
| 6 | Not annualized. |
| 7 | Less than $500,000. |
| 8 | Annualized. |
| 14 | JOHN HANCOCK FUNDAMENTAL GLOBAL FRANCHISE FUND | SEMIANNUAL REPORT | SEE NOTES TO FINANCIAL STATEMENTS |
| CLASS I SHARES Period ended | 2-29-201 | 8-31-19 | 8-31-18 | 8-31-17 | 8-31-16 | 8-31-15 |
| Per share operating performance | | | | | | |
| Net asset value, beginning of period | $11.97 | $13.10 | $14.28 | $13.84 | $12.76 | $13.29 |
| Net investment income2 | —3,4 | 0.09 | 0.07 | 0.10 | 0.13 | 0.11 |
| Net realized and unrealized gain (loss) on investments | (0.66) | 0.22 | 0.86 | 1.68 | 2.34 | 0.12 |
| Total from investment operations | (0.66) | 0.31 | 0.93 | 1.78 | 2.47 | 0.23 |
| Less distributions | | | | | | |
| From net investment income | (0.08) | (0.06) | (0.12) | (0.08) | (0.11) | (0.11) |
| From net realized gain | (0.69) | (1.38) | (1.99) | (1.26) | (1.28) | (0.65) |
| Total distributions | (0.77) | (1.44) | (2.11) | (1.34) | (1.39) | (0.76) |
| Net asset value, end of period | $10.54 | $11.97 | $13.10 | $14.28 | $13.84 | $12.76 |
| Total return (%)5 | (6.11)6 | 4.90 | 7.10 | 14.97 | 20.22 | 1.86 |
| Ratios and supplemental data | | | | | | |
| Net assets, end of period (in millions) | $68 | $31 | $5 | $4 | $2 | $1 |
| Ratios (as a percentage of average net assets): | | | | | | |
| Expenses before reductions | 1.017 | 1.01 | 1.00 | 0.97 | 0.97 | 0.98 |
| Expenses including reductions | 1.007 | 1.01 | 0.99 | 0.96 | 0.97 | 0.98 |
| Net investment income | 0.073,7 | 0.77 | 0.56 | 0.74 | 0.96 | 0.83 |
| Portfolio turnover (%) | 28 | 26 | 40 | 54 | 38 | 28 |
| 1 | Six months ended 2-29-20. Unaudited. |
| 2 | Based on average daily shares outstanding. |
| 3 | Net investment income is affected by the timing and frequency of the declaration of dividends by the securities in which the fund invests. |
| 4 | Less than $0.005 per share. |
| 5 | Total returns would have been lower had certain expenses not been reduced during the applicable periods. |
| 6 | Not annualized. |
| 7 | Annualized. |
| SEE NOTES TO FINANCIAL STATEMENTS | SEMIANNUAL REPORT | JOHN HANCOCK FUNDAMENTAL GLOBAL FRANCHISE FUND | 15 |
| CLASS R6 SHARES Period ended | 2-29-201 | 8-31-19 | 8-31-18 | 8-31-172 |
| Per share operating performance | | | | |
| Net asset value, beginning of period | $11.98 | $13.11 | $14.29 | $12.32 |
| Net investment income3 | 0.014 | 0.08 | 0.13 | 0.09 |
| Net realized and unrealized gain (loss) on investments | (0.65) | 0.24 | 0.81 | 1.88 |
| Total from investment operations | (0.64) | 0.32 | 0.94 | 1.97 |
| Less distributions | | | | |
| From net investment income | (0.10) | (0.07) | (0.13) | — |
| From net realized gain | (0.69) | (1.38) | (1.99) | — |
| Total distributions | (0.79) | (1.45) | (2.12) | — |
| Net asset value, end of period | $10.55 | $11.98 | $13.11 | $14.29 |
| Total return (%)5 | (6.10)6 | 5.02 | 7.19 | 15.996 |
| Ratios and supplemental data | | | | |
| Net assets, end of period (in millions) | $7 | $7 | $4 | $—7 |
| Ratios (as a percentage of average net assets): | | | | |
| Expenses before reductions | 0.908 | 0.90 | 0.89 | 0.888 |
| Expenses including reductions | 0.898 | 0.90 | 0.89 | 0.878 |
| Net investment income | 0.174,8 | 0.71 | 1.05 | 1.178 |
| Portfolio turnover (%) | 28 | 26 | 40 | 549 |
| 1 | Six months ended 2-29-20. Unaudited. |
| 2 | The inception date for Class R6 shares is 2-13-17. |
| 3 | Based on average daily shares outstanding. |
| 4 | Net investment income is affected by the timing and frequency of the declaration of dividends by the securities in which the fund invests. |
| 5 | Total returns would have been lower had certain expenses not been reduced during the applicable periods. |
| 6 | Not annualized. |
| 7 | Less than $500,000. |
| 8 | Annualized. |
| 9 | Portfolio turnover is shown for the period from 9-1-16 to 8-31-17. |
| 16 | JOHN HANCOCK FUNDAMENTAL GLOBAL FRANCHISE FUND | SEMIANNUAL REPORT | SEE NOTES TO FINANCIAL STATEMENTS |
| CLASS NAV SHARES Period ended | 2-29-201 | 8-31-19 | 8-31-18 | 8-31-17 | 8-31-16 | 8-31-15 |
| Per share operating performance | | | | | | |
| Net asset value, beginning of period | $11.98 | $13.11 | $14.29 | $13.85 | $12.77 | $13.30 |
| Net investment income2 | 0.013 | 0.07 | 0.09 | 0.10 | 0.12 | 0.11 |
| Net realized and unrealized gain (loss) on investments | (0.65) | 0.26 | 0.85 | 1.69 | 2.37 | 0.14 |
| Total from investment operations | (0.64) | 0.33 | 0.94 | 1.79 | 2.49 | 0.25 |
| Less distributions | | | | | | |
| From net investment income | (0.10) | (0.08) | (0.13) | (0.09) | (0.13) | (0.13) |
| From net realized gain | (0.69) | (1.38) | (1.99) | (1.26) | (1.28) | (0.65) |
| Total distributions | (0.79) | (1.46) | (2.12) | (1.35) | (1.41) | (0.78) |
| Net asset value, end of period | $10.55 | $11.98 | $13.11 | $14.29 | $13.85 | $12.77 |
| Total return (%)4 | (6.09)5 | 5.04 | 7.21 | 15.09 | 20.34 | 1.99 |
| Ratios and supplemental data | | | | | | |
| Net assets, end of period (in millions) | $335 | $444 | $425 | $548 | $451 | $449 |
| Ratios (as a percentage of average net assets): | | | | | | |
| Expenses before reductions | 0.896 | 0.89 | 0.88 | 0.86 | 0.86 | 0.87 |
| Expenses including reductions | 0.886 | 0.88 | 0.87 | 0.86 | 0.85 | 0.87 |
| Net investment income | 0.193,6 | 0.63 | 0.65 | 0.77 | 0.92 | 0.83 |
| Portfolio turnover (%) | 28 | 26 | 40 | 54 | 38 | 28 |
| 1 | Six months ended 2-29-20. Unaudited. |
| 2 | Based on average daily shares outstanding. |
| 3 | Net investment income is affected by the timing and frequency of the declaration of dividends by the securities in which the fund invests. |
| 4 | Total returns would have been lower had certain expenses not been reduced during the applicable periods. |
| 5 | Not annualized. |
| 6 | Annualized. |
| SEE NOTES TO FINANCIAL STATEMENTS | SEMIANNUAL REPORT | JOHN HANCOCK FUNDAMENTAL GLOBAL FRANCHISE FUND | 17 |
| Notes to financial statements (unaudited) | |
Note 1—Organization
John Hancock Fundamental Global Franchise Fund (the fund) is a series of John Hancock Funds II (the Trust), an open-end management investment company organized as a Massachusetts business trust and registered under the Investment Company Act of 1940, as amended (the 1940 Act). The investment objective of the fund is to to seek to provide capital appreciation.
The fund may offer multiple classes of shares. The shares currently outstanding are detailed in the Statement of assets and liabilities. Class A shares are offered to all investors. Class I shares are offered to institutions and certain investors. Class R6 shares are only available to certain retirement plans, institutions and other investors. Class NAV shares are offered to John Hancock affiliated funds of funds, retirement plans for employees of John Hancock and/or Manulife Financial Corporation, and certain 529 plans. Shareholders of each class have exclusive voting rights to matters that affect that class. The distribution and service fees, if any, and transfer agent fees for each class may differ.
Note 2—Significant accounting policies
The financial statements have been prepared in conformity with accounting principles generally accepted in the United States of America (US GAAP), which require management to make certain estimates and assumptions as of the date of the financial statements. Actual results could differ from those estimates and those differences could be significant. The fund qualifies as an investment company under Topic 946 of Accounting Standards Codification of US GAAP.
Events or transactions occurring after the end of the fiscal period through the date that the financial statements were issued have been evaluated in the preparation of the financial statements. The following summarizes the significant accounting policies of the fund:
Security valuation. Investments are stated at value as of the scheduled close of regular trading on the New York Stock Exchange (NYSE), normally at 4:00 P.M., Eastern Time. In case of emergency or other disruption resulting in the NYSE not opening for trading or the NYSE closing at a time other than the regularly scheduled close, the net asset value (NAV) may be determined as of the regularly scheduled close of the NYSE pursuant to the fund's Valuation Policies and Procedures.
In order to value the securities, the fund uses the following valuation techniques: Equity securities, including exchange-traded or closed-end funds, are typically valued at the last sale price or official closing price on the exchange or principal market where the security trades. In the event there were no sales during the day or closing prices are not available, the securities are valued using the last available bid price. Investments by the fund in open-end mutual funds are valued at their respective NAVs each business day. Debt obligations are typically valued based on the evaluated prices provided by an independent pricing vendor. Independent pricing vendors utilize matrix pricing, which takes into account factors such as institutional-size trading in similar groups of securities, yield, quality, coupon rate, maturity, type of issue, trading characteristics and other market data, as well as broker supplied prices. Foreign securities and currencies are valued in U.S. dollars based on foreign currency exchange rates supplied by an independent pricing vendor.
In certain instances, the Pricing Committee may determine to value equity securities using prices obtained from another exchange or market if trading on the exchange or market on which prices are typically obtained did not open for trading as scheduled, or if trading closed earlier than scheduled, and trading occurred as normal on another exchange or market.
| 18 | JOHN HANCOCK Fundamental Global Franchise Fund | SEMIANNUAL REPORT | |
Other portfolio securities and assets, for which reliable market quotations are not readily available, are valued at fair value as determined in good faith by the fund's Pricing Committee following procedures established by the Board of Trustees. The frequency with which these fair valuation procedures are used cannot be predicted and fair value of securities may differ significantly from the value that would have been used had a ready market for such securities existed. Trading in foreign securities may be completed before the scheduled daily close of trading on the NYSE. Significant events at the issuer or market level may affect the values of securities between the time when the valuation of the securities is generally determined and the close of the NYSE. If a significant event occurs, these securities may be fair valued, as determined in good faith by the fund's Pricing Committee, following procedures established by the Board of Trustees. The fund uses fair value adjustment factors provided by an independent pricing vendor to value certain foreign securities in order to adjust for events that may occur between the close of foreign exchanges or markets and the close of the NYSE.
The fund uses a three-tier hierarchy to prioritize the pricing assumptions, referred to as inputs, used in valuation techniques to measure fair value. Level 1 includes securities valued using quoted prices in active markets for identical securities, including registered investment companies. Level 2 includes securities valued using other significant observable inputs. Observable inputs may include quoted prices for similar securities, interest rates, prepayment speeds and credit risk. Prices for securities valued using these inputs are received from independent pricing vendors and brokers and are based on an evaluation of the inputs described. Level 3 includes securities valued using significant unobservable inputs when market prices are not readily available or reliable, including the fund's own assumptions in determining the fair value of investments. Factors used in determining value may include market or issuer specific events or trends, changes in interest rates and credit quality. The inputs or methodology used for valuing securities are not necessarily an indication of the risks associated with investing in those securities. Changes in valuation techniques and related inputs may result in transfers into or out of an assigned level within the disclosure hierarchy.
The following is a summary of the values by input classification of the fund's investments as of February 29, 2020, by major security category or type:
| | Total
value at
2-29-20 | Level 1
quoted
price | Level 2
significant
observable
inputs | Level 3
significant
unobservable
inputs |
| Investments in securities: | | | | |
| Assets | | | | |
| Common stocks | | | | |
| Belgium | $24,258,276 | — | $24,258,276 | — |
| France | 31,257,890 | — | 31,257,890 | — |
| Italy | 29,690,688 | $21,130,928 | 8,559,760 | — |
| Japan | 4,230,743 | — | 4,230,743 | — |
| Netherlands | 26,719,590 | — | 26,719,590 | — |
| Switzerland | 19,805,387 | — | 19,805,387 | — |
| United Kingdom | 33,835,306 | — | 33,835,306 | — |
| United States | 211,958,547 | 211,958,547 | — | — |
| Short-term investments | 35,458,762 | 1,789,762 | 33,669,000 | — |
| Total investments in securities | $417,215,189 | $234,879,237 | $182,335,952 | — |
| | SEMIANNUAL REPORT | JOHN HANCOCK Fundamental Global Franchise Fund | 19 |
Security transactions and related investment income. Investment security transactions are accounted for on a trade date plus one basis for daily NAV calculations. However, for financial reporting purposes, investment transactions are reported on trade date. Interest income is accrued as earned. Interest income includes coupon interest and amortization/accretion of premiums/discounts on debt securities. Debt obligations may be placed in a non-accrual status and related interest income may be reduced by stopping current accruals and writing off interest receivable when the collection of all or a portion of interest has become doubtful. Dividend income is recorded on the ex-date, except for dividends of certain foreign securities where the dividend may not be known until after the ex-date. In those cases, dividend income, net of withholding taxes, is recorded when the fund becomes aware of the dividends. Non-cash dividends, if any, are recorded at the fair market value of the securities received. Gains and losses on securities sold are determined on the basis of identified cost and may include proceeds from litigation.
During the six months ended February 29, 2020, the fund realized losses of $172,949 on the disposal of investments not meeting the fund’s respective investment guidelines. The loss was reimbursed by the advisor subsequent to period end and is reflected in Receivable due from advisor on the Statement of Assets and Liabilities.
Real estate investment trusts. The fund may invest in real estate investment trusts (REITs). Distributions from REITs may be recorded as income and subsequently characterized by the REIT at the end of the fiscal year as a reduction of cost of investments and/or as a realized gain. As a result, the fund will estimate the components of distributions from these securities. Such estimates are revised when the actual components of the distributions are known.
Foreign investing. Assets, including investments, and liabilities denominated in foreign currencies are translated into U.S. dollar values each day at the prevailing exchange rate. Purchases and sales of securities, income and expenses are translated into U.S. dollars at the prevailing exchange rate on the date of the transaction. The effect of changes in foreign currency exchange rates on the value of securities is reflected as a component of the realized and unrealized gains (losses) on investments. Foreign investments are subject to a decline in the value of a foreign currency versus the U.S. dollar, which reduces the dollar value of securities denominated in that currency.
Funds that invest internationally generally carry more risk than funds that invest strictly in U.S. securities. Risks can result from differences in economic and political conditions, regulations, market practices (including higher transaction costs), accounting standards and other factors.
Foreign taxes. The fund may be subject to withholding tax on income, capital gains or repatriation taxes imposed by certain countries, a portion of which may be recoverable. Foreign taxes are accrued based upon the fund's understanding of the tax rules and rates that exist in the foreign markets in which it invests. Taxes are accrued based on gains realized by the fund as a result of certain foreign security sales. In certain circumstances, estimated taxes are accrued based on unrealized appreciation of such securities. Investment income is recorded net of foreign withholding taxes.
Overdraft. The fund may have the ability to borrow from banks for temporary or emergency purposes, including meeting redemption requests that otherwise might require the untimely sale of securities. Pursuant to the fund's custodian agreement, the custodian may loan money to the fund to make properly authorized payments. The fund is obligated to repay the custodian for any overdraft, including any related costs or expenses. The custodian may have a lien, security interest or security entitlement in any fund property that is not otherwise segregated or pledged, to the extent of any overdraft, and to the maximum extent permitted by law.
| 20 | JOHN HANCOCK Fundamental Global Franchise Fund | SEMIANNUAL REPORT | |
Line of credit. The fund and other affiliated funds have entered into a syndicated line of credit agreement with Citibank, N.A. as the administrative agent that enables them to participate in a $750 million unsecured committed line of credit. Excluding commitments designated for a certain fund and subject to the needs of all other affiliated funds, the fund can borrow up to an aggregate commitment amount of $500 million, subject to asset coverage and other limitations as specified in the agreement. A commitment fee payable at the end of each calendar quarter, based on the average daily unused portion of the line of credit, is charged to each participating fund based on a combination of fixed and asset based allocations and is reflected in Other expenses on the Statement of operations. For the six months ended February 29, 2020, the fund had no borrowings under the line of credit. Commitment fees for the six months ended February 29, 2020 were $1,522.
Expenses. Within the John Hancock group of funds complex, expenses that are directly attributable to an individual fund are allocated to such fund. Expenses that are not readily attributable to a specific fund are allocated among all funds in an equitable manner, taking into consideration, among other things, the nature and type of expense and the fund’s relative net assets. Expense estimates are accrued in the period to which they relate and adjustments are made when actual amounts are known.
Class allocations. Income, common expenses and realized and unrealized gains (losses) are determined at the fund level and allocated daily to each class of shares based on the net assets of the class. Class-specific expenses, such as distribution and service fees, if any, and transfer agent fees, for all classes, are charged daily at the class level based on the net assets of each class and the specific expense rates applicable to each class.
Federal income taxes. The fund intends to continue to qualify as a regulated investment company by complying with the applicable provisions of the Internal Revenue Code and will not be subject to federal income tax on taxable income that is distributed to shareholders. Therefore, no federal income tax provision is required.
As of August 31, 2019, the fund had no uncertain tax positions that would require financial statement recognition, derecognition or disclosure. The fund's federal tax returns are subject to examination by the Internal Revenue Service for a period of three years.
Distribution of income and gains. Distributions to shareholders from net investment income and net realized gains, if any, are recorded on the ex-date. The fund generally declares and pays dividends annually. Capital gain distributions, if any, are typically distributed annually.
Distributions paid by the fund with respect to each class of shares are calculated in the same manner, at the same time and in the same amount, except for the effect of class level expenses that may be applied differently to each class.
Such distributions, on a tax basis, are determined in conformity with income tax regulations, which may differ from US GAAP. Distributions in excess of tax basis earnings and profits, if any, are reported in the fund's financial statements as a return of capital. The final determination of tax characteristics of the fund's distribution will occur at the end of the year and will subsequently be reported to shareholders.
Capital accounts within the financial statements are adjusted for permanent book-tax differences. These adjustments have no impact on net assets or the results of operations. Temporary book-tax differences, if any, will reverse in a subsequent period. Book-tax differences are primarily attributable to wash sale loss deferrals.
| | SEMIANNUAL REPORT | JOHN HANCOCK Fundamental Global Franchise Fund | 21 |
Note 3—Guarantees and indemnifications
Under the Trust's organizational documents, its Officers and Trustees are indemnified against certain liabilities arising out of the performance of their duties to the Trust, including the fund. Additionally, in the normal course of business, the fund enters into contracts with service providers that contain general indemnification clauses. The fund's maximum exposure under these arrangements is unknown, as this would involve future claims that may be made against the fund that have not yet occurred. The risk of material loss from such claims is considered remote.
Note 4—Fees and transactions with affiliates
John Hancock Investment Management LLC (the Advisor) serves as investment advisor for the fund. John Hancock Investment Management Distributors LLC (the Distributor), an affiliate of the Advisor, serves as principal underwriter of the fund. The Advisor and the Distributor are indirect, wholly owned subsidiaries of Manulife Financial Corporation (MFC).
Management fee. The fund has an investment management agreement with the Advisor under which the fund pays a monthly management fee to the Advisor equivalent on an annual basis to the sum of: (a) 0.800% of the first $1 billion of the fund’s average daily net assets and (b) 0.780% of the fund’s average daily net assets in excess of $1 billion. The Advisor has a subadvisory agreement with Manulife Investment Management (US) LLC (Subadvisor), an indirectly owned subsidiary of MFC and an affiliate of the Advisor. The fund is not responsible for payment of the subadvisory fees.
The Advisor has contractually agreed to waive a portion of its management fee and/or reimburse expenses for certain funds of the John Hancock group of funds complex, including the fund (the participating portfolios). This waiver is based upon aggregate net assets of all the participating portfolios. The amount of the reimbursement is calculated daily and allocated among all the participating portfolios in proportion to the daily net assets of each fund. During the six months ended February 29, 2020, this waiver amounted to 0.01% of the fund’s average daily net assets on an annualized basis. This arrangement expires on July 31, 2021, unless renewed by mutual agreement of the fund and the Advisor based upon a determination that this is appropriate under the circumstances at that time.
For the six months ended February 29, 2020, the expense reductions described above amounted to the following:
| Class | Expense reduction |
| Class A | $183 |
| Class I | 1,371 |
| Class R6 | 288 |
| Class | Expense reduction |
| Class NAV | $15,795 |
| Total | $17,637 |
Expenses waived or reimbursed in the current fiscal period are not subject to recapture in future fiscal periods.
The investment management fees, including the impact of the waivers and reimbursements as described above, incurred for the six months ended February 29, 2020, were equivalent to a net annual effective rate of 0.79% of the fund's average daily net assets.
Accounting and legal services. Pursuant to a service agreement, the fund reimburses the Advisor for all expenses associated with providing the administrative, financial, legal, compliance, accounting and recordkeeping services to the fund, including the preparation of all tax returns, periodic reports to shareholders and regulatory reports, among other services. These expenses are allocated to each share class based on its relative net assets at the time the expense was incurred. These accounting and legal services fees incurred for the six months ended February 29, 2020 amounted to an annual rate of 0.02% of the fund's average daily net assets.
| 22 | JOHN HANCOCK Fundamental Global Franchise Fund | SEMIANNUAL REPORT | |
Distribution and service plans. The fund has a distribution agreement with the Distributor. The fund has adopted distribution and service plans for certain classes as detailed below pursuant to Rule 12b-1 under the 1940 Act, to pay the Distributor for services provided as the distributor of shares of the fund. The fund may pay up to the following contractual rates of distribution and service fees under these arrangements, expressed as an annual percentage of average daily net assets for each class of the fund's shares:
| Class | Rule 12b-1 Fee |
| Class A | 0.30% |
Sales charges. Class A shares are assessed up-front sales charges, which resulted in payments to the Distributor amounting to $4,487 for the six months ended February 29, 2020. Of this amount, $831 was retained and used for printing prospectuses, advertising, sales literature and other purposes and $3,656 was paid as sales commissions to broker-dealers.
Class A shares may be subject to contingent deferred sales charges (CDSCs). Certain Class A shares that are acquired through purchases of $1 million or more and are redeemed within one year of purchase are subject to a 1.00% sales charge. CDSCs are applied to the lesser of the current market value at the time of redemption or the original purchase cost of the shares being redeemed. Proceeds from CDSCs are used to compensate the Distributor for providing distribution-related services in connection with the sale of these shares. During the six months ended February 29, 2020, there were no CDSCs received by the Distributor for Class A shares.
Transfer agent fees. The John Hancock group of funds has a complex-wide transfer agent agreement with John Hancock Signature Services, Inc. (Signature Services), an affiliate of the Advisor. The transfer agent fees paid to Signature Services are determined based on the cost to Signature Services (Signature Services Cost) of providing recordkeeping services. It also includes out-of-pocket expenses, including payments made to third-parties for recordkeeping services provided to their clients who invest in one or more John Hancock funds. In addition, Signature Services Cost may be reduced by certain fees that Signature Services receives in connection with retirement and small accounts. Signature Services Cost is calculated monthly and allocated, as applicable, to five categories of share classes: Retail Share and Institutional Share Classes of Non-Municipal Bond Funds, Class R6 Shares, Retirement Share Classes and Municipal Bond Share Classes. Within each of these categories, the applicable costs are allocated to the affected John Hancock affiliated funds and/or classes, based on the relative average daily net assets.
Class level expenses. Class level expenses for the six months ended February 29, 2020 were as follows:
| Class | Distribution and service fees | Transfer agent fees |
| Class A | $7,236 | $2,968 |
| Class I | — | 21,949 |
| Class R6 | — | 501 |
| Total | $7,236 | $25,418 |
Trustee expenses. The fund compensates each Trustee who is not an employee of the Advisor or its affiliates. The costs of paying Trustee compensation and expenses are allocated to the fund based on its net assets relative to other funds within the John Hancock group of funds complex.
| | SEMIANNUAL REPORT | JOHN HANCOCK Fundamental Global Franchise Fund | 23 |
Interfund lending program. Pursuant to an Exemptive Order issued by the SEC, the fund, along with certain other funds advised by the Advisor or its affiliates, may participate in an interfund lending program. This program provides an alternative credit facility allowing the fund to borrow from, or lend money to, other participating affiliated funds. At period end, no interfund loans were outstanding. The fund's activity in this program during the period for which loans were outstanding was as follows:
Borrower
or Lender | Weighted Average
Loan Balance | Days
Outstanding | Weighted Average
Interest Rate | Interest Income
(Expense) |
| Lender | $1,733,649 | 1 | 1.825% | $88 |
Note 5—Fund share transactions
Transactions in fund shares for the six months ended February 29, 2020 and for the year ended August 31, 2019 were as follows:
| | Six Months Ended 2-29-20 | Year Ended 8-31-19 |
| | Shares | Amount | Shares | Amount |
| Class A shares | | | | |
| Sold | 56,352 | $664,390 | 198,557 | $2,299,834 |
| Distributions reinvested | 25,538 | 296,748 | 35,253 | 341,956 |
| Repurchased | (50,464) | (593,393) | (70,265) | (807,619) |
| Net increase | 31,426 | $367,745 | 163,545 | $1,834,171 |
| Class I shares | | | | |
| Sold | 4,252,448 | $49,846,232 | 2,931,806 | $31,205,381 |
| Distributions reinvested | 169,269 | 1,973,681 | 50,342 | 489,827 |
| Repurchased | (556,457) | (6,516,993) | (723,255) | (8,138,863) |
| Net increase | 3,865,260 | $45,302,920 | 2,258,893 | $23,556,345 |
| Class R6 shares | | | | |
| Sold | 33,017 | $394,771 | 285,622 | $3,154,342 |
| Distributions reinvested | 42,636 | 497,139 | 44,723 | 435,154 |
| Repurchased | (20,633) | (244,988) | (13,772) | (156,980) |
| Net increase | 55,020 | $646,922 | 316,573 | $3,432,516 |
| Class NAV shares | | | | |
| Sold | 654,341 | $7,347,811 | 2,268,870 | $25,666,221 |
| Distributions reinvested | 2,264,129 | 26,399,739 | 4,883,601 | 47,517,438 |
| Repurchased | (8,254,868) | (98,642,245) | (2,511,975) | (29,552,413) |
| Net increase (decrease) | (5,336,398) | $(64,894,695) | 4,640,496 | $43,631,246 |
| Total net increase (decrease) | (1,384,692) | $(18,577,108) | 7,379,507 | $72,454,278 |
Affiliates of the fund owned 69% and 100% of shares of Class R6 and Class NAV on February 29, 2020. Such concentration of shareholders’ capital could have a material effect on the fund if such shareholders redeem from the fund.
| 24 | JOHN HANCOCK Fundamental Global Franchise Fund | SEMIANNUAL REPORT | |
Note 6—Purchase and sale of securities
Purchases and sales of securities, other than short-term investments, amounted to $119,246,416 and $157,003,464, respectively, for the six months ended February 29, 2020.
Note 7—Investment by affiliated funds
Certain investors in the fund are affiliated funds that are managed by the Advisor and its affiliates. The affiliated funds do not invest in the fund for the purpose of exercising management or control; however, this investment may represent a significant portion of the fund's net assets. At February 29, 2020, funds within the John Hancock group of funds complex held 80.7% of the fund's net assets. The following fund(s) had an affiliate ownership of 5% or more of the fund's net assets:
| Fund | Affiliated Concentration |
| John Hancock Funds II Multimanager Lifestyle Balanced Portfolio | 25.7% |
| John Hancock Funds II Multimanager Lifestyle Growth Portfolio | 22.5% |
| John Hancock Funds II Multimanager Lifestyle Moderate Portfolio | 8.3% |
| John Hancock Funds II Multimanager Lifestyle Aggressive Portfolio | 6.4% |
Note 8—Subsequent events
A widespread health crisis such as a global pandemic could cause substantial market volatility, exchange trading suspensions and closures, impact the ability to complete redemptions, and affect fund performance. For example, the novel coronavirus disease (COVID-19) has resulted in significant disruptions to global business activity. The impact of a health crisis and other epidemics and pandemics that may arise in the future, could affect the global economy in ways that cannot necessarily be foreseen at the present time. A health crisis may exacerbate other pre-existing political, social and economic risks. Any such impact could adversely affect the fund's performance, resulting in losses to your investment.
| | SEMIANNUAL REPORT | JOHN HANCOCK Fundamental Global Franchise Fund | 25 |
| | |
Trustees
Hassell H. McClellan,Chairperson
Steven R. Pruchansky,Vice Chairperson
Andrew G. Arnott†
Charles L. Bardelis*
James R. Boyle
Peter S. Burgess*
William H. Cunningham
Grace K. Fey
Marianne Harrison†
Deborah C. Jackson
James M. Oates*
Gregory A. Russo
Officers
Andrew G. Arnott
President
Francis V. Knox, Jr.
Chief Compliance Officer
Charles A. Rizzo
Chief Financial Officer
Salvatore Schiavone
Treasurer
Christopher (Kit) Sechler
Secretary and Chief Legal Officer
| Investment advisor
John Hancock Investment Management LLC
Subadvisor
Manulife Investment Management (US) LLC
Portfolio Managers
Emory W. (Sandy) Sanders, Jr., CFA
Jonathan T. White, CFA
Principal distributor
John Hancock Investment Management Distributors LLC
Custodian
Citibank, N.A.
Transfer agent
John Hancock Signature Services, Inc.
Legal counsel
K&L Gates LLP
|
* Member of the Audit Committee
† Non-Independent Trustee
The fund's proxy voting policies and procedures, as well as the fund proxy voting record for the most recent twelve-month period ended June 30, are available free of charge on the Securities and Exchange Commission (SEC) website at sec.gov or on our website.
All of the fund's holdings as of the end of the third month of every fiscal quarter are filed with the SEC on Form N-PORT within 60 days of the end of the fiscal quarter. The fund's Form N-PORT filings are available on our website and the SEC's website, sec.gov.
We make this information on your fund, as well asmonthly portfolio holdings, and other fund details available on our website at jhinvestments.com or by calling 800-225-5291.
| | | | |
| | You can also contact us: |
| | 800-225-5291
jhinvestments.com | Regular mail:
John Hancock Signature Services, Inc.
P.O. Box 55913
Boston, MA 02205-5913
| Express mail:
John Hancock Signature Services, Inc.
2000 Crown Colony Drive
Suite 55913
Quincy, MA 02169-0953
|
SEMIANNUAL REPORT | JOHN HANCOCK FUNDAMENTAL GLOBAL FRANCHISE FUND 26
John Hancock family of funds
| | | |
DOMESTIC EQUITY FUNDS
Blue Chip Growth
Classic Value
Disciplined Value
Disciplined Value Mid Cap
Equity Income
Financial Industries
Fundamental All Cap Core
Fundamental Large Cap Core
New Opportunities
Regional Bank
Small Cap Core
Small Cap Growth
Small Cap Value
U.S. Global Leaders Growth
U.S. Quality Growth
GLOBAL AND INTERNATIONAL EQUITY FUNDS
Disciplined Value International
Emerging Markets
Emerging Markets Equity
Fundamental Global Franchise
Global Equity
Global Shareholder Yield
Global Thematic Opportunities
International Dynamic Growth
International Growth
International Small Company
| | INCOME FUNDS
Bond
California Tax-Free Income
Emerging Markets Debt
Floating Rate Income
Government Income
High Yield
High Yield Municipal Bond
Income
Investment Grade Bond
Money Market
Short Duration Bond
Short Duration Credit Opportunities
Strategic Income Opportunities
Tax-Free Bond
ALTERNATIVE AND SPECIALTY FUNDS
Absolute Return Currency
Alternative Asset Allocation
Alternative Risk Premia
Diversified Macro
Infrastructure
Multi-Asset Absolute Return
Seaport Long/Short
|
A fund's investment objectives, risks, charges, and expenses should be considered carefully before investing. The prospectus contains this and other important information about the fund. To obtain a prospectus, contact your financial professional, call John Hancock Investment Management at 800-225-5291, or visit our website at jhinvestments.com. Please read the prospectus carefully before investing or sending money.
| | | |
ASSET ALLOCATION
Balanced
Income Allocation
Multi-Index Lifetime Portfolios
Multi-Index Preservation Portfolios
Multimanager Lifestyle Portfolios
Multimanager Lifetime Portfolios
Retirement Income 2040
EXCHANGE-TRADED FUNDS
John Hancock Multifactor Consumer Discretionary ETF
John Hancock Multifactor Consumer Staples ETF
John Hancock Multifactor Developed International ETF
John Hancock Multifactor Emerging Markets ETF
John Hancock Multifactor Energy ETF
John Hancock Multifactor Financials ETF
John Hancock Multifactor Healthcare ETF
John Hancock Multifactor Industrials ETF
John Hancock Multifactor Large Cap ETF
John Hancock Multifactor Materials ETF
John Hancock Multifactor Media and
Communications ETF
John Hancock Multifactor Mid Cap ETF
John Hancock Multifactor Small Cap ETF
John Hancock Multifactor Technology ETF
John Hancock Multifactor Utilities ETF
| | ENVIRONMENTAL, SOCIAL, AND
GOVERNANCE FUNDS
ESG All Cap Core
ESG Core Bond
ESG International Equity
ESG Large Cap Core
CLOSED-END FUNDS
Financial Opportunities
Hedged Equity & Income
Income Securities Trust
Investors Trust
Preferred Income
Preferred Income II
Preferred Income III
Premium Dividend
Tax-Advantaged Dividend Income
Tax-Advantaged Global Shareholder Yield
|
John Hancock Multifactor ETF shares are bought and sold at market price (not NAV), and are not individually redeemed
from the fund. Brokerage commissions will reduce returns.
John Hancock ETFs are distributed by Foreside Fund Services, LLC, and are subadvised by Dimensional Fund Advisors LP.
Foreside is not affiliated with John Hancock Investment Management Distributors LLC or Dimensional Fund Advisors LP.
Dimensional Fund Advisors LP receives compensation from John Hancock in connection with licensing rights to the
John Hancock Dimensional indexes. Dimensional Fund Advisors LP does not sponsor, endorse, or sell, and makes no
representation as to the advisability of investing in, John Hancock Multifactor ETFs.
John Hancock Investment Management
A trusted brand
John Hancock Investment Management is a premier asset manager
representing one of America's most trusted brands, with a heritage of
financial stewardship dating back to 1862. Helping our shareholders
pursue their financial goals is at the core of everything we do. It's why
we support the role of professional financial advice and operate with
the highest standards of conduct and integrity.
A better way to invest
We serve investors globally through a unique multimanager approach:
We search the world to find proven portfolio teams with specialized
expertise for every strategy we offer, then we apply robust investment
oversight to ensure they continue to meet our uncompromising
standards and serve the best interests of our shareholders.
Results for investors
Our unique approach to asset management enables us to provide
a diverse set of investments backed by some of the world's best
managers, along with strong risk-adjusted returns across asset classes.
John Hancock Investment Management Distributors LLC n Member FINRA, SIPC
200 Berkeley Street n Boston, MA 02116-5010 n 800-225-5291 n jhinvestments.com
This report is for the information of the shareholders of John Hancock Fundamental Global Franchise Fund. It is not authorized for distribution to prospective investors unless preceded or accompanied by a prospectus.
| | |
| MF1105618 | 398SA 2/20
4/2020 |
John Hancock
Global Equity Fund
Semiannual report 2/29/2020
Beginning on January 1, 2021, as permitted by regulations adopted by the Securities and Exchange Commission, paper copies of the fund's shareholder reports like this one will no longer be sent by mail, unless you specifically request paper copies of the reports from the fund or from your financial intermediary. Instead, the reports will be made available on a website, and you will be notified by mail each time a report is posted and provided with a website link to access the report.
If you already elected to receive shareholder reports electronically, you will not be affected by this change, and you do not need to take any action. You may elect to receive shareholder reports and other communications electronically by calling John Hancock Investment Management at 800-225-5291 (Class A and Class C shares) or 888-972-8696 (Class I, Class R2, Class R4, and Class R6 shares) or by contacting your financial intermediary.
You may elect to receive all reports in paper, free of charge, at any time. You can inform John Hancock Investment Management or your financial intermediary that you wish to continue receiving paper copies of your shareholder reports by following the instructions listed above. Your election to receive reports in paper will apply to all funds held with John Hancock Investment Management or your financial intermediary.
A message to shareholders
Dear shareholder,
Global financial markets were on pace to deliver strong returns during the 6 months ended February 29, 2020, until heightened fears over the coronavirus (COVID-19) sent the markets tumbling during the last week of the period. Prior to the turbulence that ended the period, investors in non-U.S. equities saw strong gains, fueled in part by similarly supportive monetary policy and some signs of strength in developing markets.
However, the COVID-19 pandemic and plummeting oil prices put an end to all that good news. Shortly after period end, the U.S. Federal Reserve lowered interest rates while governments around the world embarked on plans to launch fiscal stimulus to mitigate supply chain destruction and support economic growth.
After the longest bull market in U.S. history, we're now in bear market territory. Indeed, the spread of COVID-19, trade disputes, rising unemployment, and other geopolitical tensions may continue to create uncertainty among businesses and investors. Your financial professional can helpposition your portfolio so that it's sufficiently diversified to seek to meet your long-term objectives and to withstand the inevitable bouts of market volatility along the way.
On behalf of everyone at John Hancock Investment Management, I'd like to take this opportunity to welcome new shareholders and thank existing shareholders for the continued trust you've placed in us.
Sincerely,
Andrew G. Arnott
President and CEO,
John Hancock Investment Management
Head of Wealth and Asset Management,
United States and Europe
This commentary reflects the CEO's views as of this report's period end and are subject to change at any time. Diversification does not guarantee investment returns and does not eliminate risk of loss. All investments entail risks, including the possible loss of principal. For more up-to-date information, you can visit our website at jhinvestments.com.
John Hancock
Global Equity Fund
Table of contents
| | | |
| 2 | | Your fund at a glance |
| 3 | | Portfolio summary |
| 5 | | A look at performance |
| 7 | | Your expenses |
| 9 | | Fund's investments |
| 13 | | Financial statements |
| 17 | | Financial highlights |
| 24 | | Notes to financial statements |
| 36 | | More information |
SEMIANNUAL REPORT | JOHN HANCOCK GLOBAL EQUITY FUND 1
INVESTMENT OBJECTIVE
The fund seeks long-term capital appreciation.
AVERAGE ANNUAL TOTAL RETURNS AS OF 2/29/2020 (%)
The MSCI World Index is a free float-adjusted market capitalization weighted index that is designed to measure the equity market performance of developed markets.
It is not possible to invest directly in an index. Index figures do not reflect expenses or sales charges, which would result in lower returns.
Figures from Morningstar, Inc. include reinvested distributions and do not take into account sales charges. Actual load-adjusted performance is lower. Since-inception returns for the Morningstar fund category average are not available.
The past performance shown here reflects reinvested distributions and the beneficial effect of any expense reductions, and does not guarantee future results. Returns for periods shorter than one year are cumulative. Performance of the other share classes will vary based on the difference in the fees and expenses of those classes. Shares will fluctuate in value and, when redeemed, may be worth more or less than their original cost. Current month-end performance may be lower or higher than the performance cited, and can be found at jhinvestments.com or by calling 800-225-5291. For further information on the fund's objectives, risks, and strategy, see the fund's prospectus. The fund recently experienced negative short-term performance due to market volatility associated with the COVID-19 pandemic.
SEMIANNUAL REPORT | JOHN HANCOCK GLOBAL EQUITY FUND 2
SECTOR COMPOSITION AS OF 2/29/2020 (%)
TOP 10 HOLDINGS AS OF 2/29/2020 (%)
| | |
| Apple, Inc. | 4.9 |
| Microsoft Corp. | 4.7 |
| United Technologies Corp. | 3.6 |
| Johnson & Johnson | 3.0 |
| CRH PLC | 2.7 |
| Verizon Communications, Inc. | 2.7 |
| Alphabet, Inc., Class A | 2.7 |
| Oracle Corp. | 2.5 |
| TOTAL SA | 2.5 |
| Cie Generale des Etablissements Michelin SCA | 2.5 |
| TOTAL | 31.8 |
| As a percentage of net assets. |
| Cash and cash equivalents are not included. |
SEMIANNUAL REPORT | JOHN HANCOCK GLOBAL EQUITY FUND 3
TOP 10 COUNTRIES AS OF 2/29/2020 (%)
| | |
| United States | 53.0 |
| United Kingdom | 11.7 |
| France | 10.9 |
| Netherlands | 8.1 |
| Switzerland | 6.4 |
| Ireland | 3.9 |
| Japan | 1.9 |
| South Korea | 1.9 |
| Hong Kong | 1.0 |
| Taiwan | 0.8 |
| TOTAL | 99.6 |
| As a percentage of net assets. |
| Cash and cash equivalents are not included. |
A note about risks
The fund may be subject to various risks as described in the fund's prospectus. For more information, please refer to the "Principal risks" section of the prospectus and "Subsequent events" section in the Notes to financial statements.
SEMIANNUAL REPORT | JOHN HANCOCK GLOBAL EQUITY FUND 4
TOTAL RETURNS FOR THE PERIOD ENDED FEBRUARY 29, 2020
| | | | | | | | |
Average annual total returns (%)
with maximum sales charge | | Cumulative total returns (%)
with maximum sales charge |
| | 1-year | 5-year | Since
inception1 | | 6-month | 5-year | Since
inception1 |
| Class A | -1.73 | 3.50 | 5.27 | | -5.88 | 18.75 | 41.69 |
| Class C2 | 1.71 | 3.83 | 5.53 | | -2.30 | 20.67 | 44.09 |
| Class I3 | 3.75 | 4.84 | 6.36 | | -0.86 | 26.66 | 52.04 |
| Class R22,3 | 3.36 | 4.55 | 6.06 | | -1.05 | 24.90 | 49.15 |
| Class R42,3 | 3.77 | 4.81 | 6.26 | | -0.84 | 26.50 | 51.06 |
| Class R62,3 | 3.84 | 4.97 | 6.38 | | -0.77 | 27.45 | 52.19 |
| Class NAV3 | 3.95 | 5.00 | 6.51 | | -0.76 | 27.62 | 53.46 |
| Index† | 4.63 | 5.88 | 7.30 | | 0.88 | 33.09 | 61.34 |
Performance figures assume all distributions have been reinvested. Figures reflect maximum sales charges on Class A shares of 5% and the applicable contingent deferred sales charge (CDSC) on Class C shares. Class C shares sold within one year of purchase are subject to a 1% CDSC. Sales charges are not applicable to Class I, Class R2, Class R4, Class R6, and Class NAV shares.
The expense ratios of the fund, both net (including any fee waivers and/or expense limitations) and gross (excluding any fee waivers and/or expense limitations), are set forth according to the most recent publicly available prospectuses for the fund and may differ from those disclosed in the Financial highlights tables in this report. Net expenses reflect contractual expense limitations in effect until December 31, 2020 and are subject to change. Had the contractual fee waivers and expense limitations not been in place, gross expenses would apply. The expense ratios are as follows:
| | | | | | | | |
| | Class A | Class C | Class I | Class R2 | Class R4 | Class R6 | Class NAV |
| Gross (%) | 1.30 | 2.00 | 1.00 | 1.39 | 1.24 | 0.89 | 0.88 |
| Net (%) | 1.29 | 1.99 | 0.99 | 1.38 | 1.13 | 0.88 | 0.87 |
Please refer to the most recent prospectuses and annual or semiannual report for more information on expenses and any expense limitation arrangements for each class.
The returns reflect past results and should not be considered indicative of future performance. The return and principal value of an investment will fluctuate so that shares, when redeemed, may be worth more or less than their original cost. Due to market volatility and other factors, the fund's current performance may be higher or lower than the performance shown. For current to the most recent month-end performance data, please call 800-225-5291 or visit the fund's website at jhinvestments.com.
The performance table above and the chart on the next page do not reflect the deduction of taxes that a shareholder would pay on fund distributions or the redemption of fund shares. The fund's performance results reflect any applicable fee waivers or expense reductions, without which the expenses would increase and results would have been less favorable.
| † | Index is the MSCI World Index. |
See the following page for footnotes.
SEMIANNUAL REPORT | JOHN HANCOCK GLOBAL EQUITY FUND 5
This chart and table show what happened to a hypothetical $10,000 investment in John Hancock Global Equity Fund for the share classes and periods indicated, assuming all distributions were reinvested. For comparison, we've shown the same investment in the MSCI World Index.
| | | | | |
| | Start date | With maximum
sales charge ($) | Without
sales charge ($) | Index ($) |
| Class C2,4 | 5-16-13 | 14,409 | 14,409 | 16,134 |
| Class I3 | 5-16-13 | 15,204 | 15,204 | 16,134 |
| Class R22,3 | 5-16-13 | 14,915 | 14,915 | 16,134 |
| Class R42,3 | 5-16-13 | 15,106 | 15,106 | 16,134 |
| Class R62,3 | 5-16-13 | 15,219 | 15,219 | 16,134 |
| Class NAV3 | 5-16-13 | 15,346 | 15,346 | 16,134 |
The MSCI World Index (gross of foreign withholding tax on dividends) is a free float-adjusted market capitalization weighted index that is designed to measure the equity market performance of developed markets.
It is not possible to invest directly in an index. Index figures do not reflect expenses or sales charges, which would result in lower returns.
Footnotes related to performance pages
| 1 | From 5-16-13. |
| 2 | Class C, Class R2, Class R4, and Class R6 shares were first offered on 3-27-15. The returns prior to this date are those of Class A shares that have not been adjusted for class-specific expenses; otherwise, returns would vary. |
| 3 | For certain types of investors, as described in the fund's prospectuses. |
| 4 | The contingent deferred sales charge is not applicable. |
SEMIANNUAL REPORT | JOHN HANCOCK GLOBAL EQUITY FUND 6
These examples are intended to help you understand your ongoing operating expenses of investing in the fund so you can compare these costs with the ongoing costs of investing in other mutual funds.
Understanding fund expenses
As a shareholder of the fund, you incur two types of costs:
■Transaction costs,which include sales charges (loads) on purchases or redemptions (varies by share class), minimum account fee charge, etc.
■Ongoing operating expenses, including management fees, distribution and service fees (if applicable), and other fund expenses.
We are presenting only your ongoing operating expenses here.
Actual expenses/actual returns
The first line of each share class in the table on the following page is intended to provide information about the fund’s actual ongoing operating expenses, and is based on the fund’s actual return. It assumes an account value of $1,000.00 on September 1, 2019, with the same investment held until February 29, 2020.
Together with the value of your account, you may use this information to estimate the operating expenses that you paid over the period. Simply divide your account value at February 29, 2020, by $1,000.00, then multiply it by the “expenses paid” for your share class from the table. For example, for an account value of $8,600.00, the operating expenses should be calculated as follows:
Hypothetical example for comparison purposes
The second line of each share class in the table on the following page allows you to compare the fund’s ongoing operating expenses with those of any other fund. It provides an example of the fund’s hypothetical account values and hypothetical expenses based on each class’s actual expense ratio and an assumed 5% annualized return before expenses (which is not the class’s actual return). It assumes an account value of $1,000.00 on September 1, 2019, with the same investment held until February 29, 2020. Look in any other fund shareholder report to find its hypothetical example and you will be able to compare these expenses. Please remember that these hypothetical account values and expenses may not be used to estimate the actual ending account balance or expenses you paid for the period.
| | SEMIANNUAL REPORT | JOHN HANCOCK GLOBAL EQUITY FUND | 7 |
Remember, these examples do not include any transaction costs, therefore, these examples will not help you to determine the relative total costs of owning different funds. If transaction costs were included, your expenses would have been higher. See the prospectuses for details regarding transaction costs.
SHAREHOLDER EXPENSE EXAMPLE CHART
| | | Account
value on
9-1-2019 | Ending
value on
2-29-2020 | Expenses
paid during
period ended
2-29-20201 | Annualized
expense
ratio |
| Class A | Actual expenses/actual returns | $1,000.00 | $990.40 | $6.43 | 1.30% |
| | Hypothetical example | 1,000.00 | 1,018.40 | 6.52 | 1.30% |
| Class C | Actual expenses/actual returns | 1,000.00 | 986.70 | 9.88 | 2.00% |
| | Hypothetical example | 1,000.00 | 1,014.90 | 10.02 | 2.00% |
| Class I | Actual expenses/actual returns | 1,000.00 | 991.40 | 4.95 | 1.00% |
| | Hypothetical example | 1,000.00 | 1,019.90 | 5.02 | 1.00% |
| Class R2 | Actual expenses/actual returns | 1,000.00 | 989.50 | 6.88 | 1.39% |
| | Hypothetical example | 1,000.00 | 1,018.00 | 6.97 | 1.39% |
| Class R4 | Actual expenses/actual returns | 1,000.00 | 991.60 | 5.15 | 1.04% |
| | Hypothetical example | 1,000.00 | 1,019.70 | 5.22 | 1.04% |
| Class R6 | Actual expenses/actual returns | 1,000.00 | 992.30 | 4.41 | 0.89% |
| | Hypothetical example | 1,000.00 | 1,020.40 | 4.47 | 0.89% |
| Class NAV | Actual expenses/actual returns | 1,000.00 | 992.40 | 4.31 | 0.87% |
| | Hypothetical example | 1,000.00 | 1,020.50 | 4.37 | 0.87% |
| 1 | Expenses are equal to the annualized expense ratio, multiplied by the average account value over the period, multiplied by 182/366 (to reflect the one-half year period). |
| 8 | JOHN HANCOCK GLOBAL EQUITY FUND | SEMIANNUAL REPORT | |
AS OF 2-29-20 (unaudited)
| | | | | Shares | Value |
| Common stocks 94.0% | | | | | $586,654,404 |
| (Cost $534,755,606) | | | | | |
| France 10.9% | | | | | 68,271,694 |
| Airbus SE | | | 62,305 | 7,520,112 |
| Capgemini SE | | | 100,287 | 11,113,507 |
| Cie Generale des Etablissements Michelin SCA | | | 143,332 | 15,360,390 |
| Danone SA | | | 178,188 | 12,576,218 |
| Sanofi | | | 66,476 | 6,199,926 |
| TOTAL SA | | | 358,647 | 15,501,541 |
| Hong Kong 1.0% | | | | | 6,275,368 |
| China Mobile, Ltd. | | | 788,500 | 6,275,368 |
| Ireland 3.9% | | | | | 24,307,778 |
| CRH PLC | | | 494,442 | 16,782,796 |
| Medtronic PLC | | | 74,749 | 7,524,982 |
| Japan 1.9% | | | | | 12,086,511 |
| Mitsubishi Estate Company, Ltd. | | | 708,200 | 12,086,511 |
| Netherlands 8.1% | | | | | 50,565,775 |
| Akzo Nobel NV | | | 75,932 | 6,075,340 |
| Heineken NV | | | 131,772 | 13,128,680 |
| Koninklijke Ahold Delhaize NV | | | 593,123 | 13,856,674 |
| Koninklijke Philips NV | | | 218,728 | 9,366,831 |
| Wolters Kluwer NV | | | 111,237 | 8,138,250 |
| Switzerland 6.4% | | | | | 39,879,602 |
| Chubb, Ltd. | | | 81,693 | 11,847,936 |
| Nestle SA | | | 74,975 | 7,715,364 |
| Novartis AG | | | 140,192 | 11,793,407 |
| Roche Holding AG | | | 26,507 | 8,522,895 |
| Taiwan 0.8% | | | | | 4,776,792 |
| Taiwan Semiconductor Manufacturing Company, Ltd., ADR | | | 88,722 | 4,776,792 |
| United Kingdom 11.7% | | | | | 72,802,512 |
| Amcor PLC (A) | | | 1,595,700 | 15,170,290 |
| Associated British Foods PLC | | | 261,810 | 7,644,607 |
| Direct Line Insurance Group PLC | | | 1,565,816 | 6,241,639 |
| Ferguson PLC | | | 69,242 | 6,033,034 |
| Informa PLC | | | 662,539 | 5,863,758 |
| Reckitt Benckiser Group PLC | | | 108,220 | 7,996,683 |
| Tesco PLC | | | 3,422,767 | 10,198,254 |
| Unilever NV | | | 258,617 | 13,654,247 |
| SEE NOTES TO FINANCIAL STATEMENTS | SEMIANNUAL REPORT | JOHN HANCOCK GLOBAL EQUITY FUND | 9 |
| | | | | Shares | Value |
| United States 49.3% | | | | | $307,688,372 |
| Advance Auto Parts, Inc. | | | 73,570 | 9,783,337 |
| Alphabet, Inc., Class A (B) | | | 12,412 | 16,622,771 |
| Apple, Inc. | | | 110,898 | 30,315,077 |
| Arthur J. Gallagher & Company | | | 79,531 | 7,753,477 |
| Cisco Systems, Inc. | | | 119,311 | 4,764,088 |
| Comcast Corp., Class A | | | 312,557 | 12,636,680 |
| Exxon Mobil Corp. | | | 264,707 | 13,616,528 |
| Fortune Brands Home & Security, Inc. | | | 160,346 | 9,901,366 |
| Huntington Bancshares, Inc. | | | 809,802 | 9,936,271 |
| Johnson & Johnson | | | 137,911 | 18,546,271 |
| Johnson Controls International PLC | | | 374,245 | 13,686,140 |
| JPMorgan Chase & Co. | | | 111,170 | 12,907,949 |
| KeyCorp | | | 684,168 | 11,186,147 |
| Microsoft Corp. | | | 181,114 | 29,342,279 |
| Mondelez International, Inc., Class A | | | 121,850 | 6,433,680 |
| Oracle Corp. | | | 316,353 | 15,646,819 |
| Philip Morris International, Inc. | | | 136,496 | 11,174,928 |
| Raytheon Company | | | 33,213 | 6,262,643 |
| Synchrony Financial | | | 286,543 | 8,338,401 |
| United Technologies Corp. | | | 173,421 | 22,647,048 |
| Verizon Communications, Inc. | | | 308,097 | 16,686,534 |
| Wells Fargo & Company | | | 330,890 | 13,516,857 |
|
| Whirlpool Corp. (A) | | | 46,794 | 5,983,081 |
| Preferred securities 1.9% | | | | | $11,791,191 |
| (Cost $10,092,864) | | | | | |
| South Korea 1.9% | | | | | 11,791,191 |
| Samsung Electronics Company, Ltd. | | | 308,861 | 11,791,191 |
|
| | | Yield (%) | | Shares | Value |
| Short-term investments 3.7% | | | | $23,437,083 |
| (Cost $23,436,615) | | | | | |
| Short-term funds 3.7% | | | | | 23,437,083 |
| John Hancock Collateral Trust (C) | 1.6968(D) | | 126,463 | 1,265,760 |
| JPMorgan U.S. Treasury Plus Money Market Fund, Institutional Class | 1.4286(D) | | 22,171,323 | 22,171,323 |
|
| Total investments (Cost $568,285,085) 99.6% | | | $621,882,678 |
| Other assets and liabilities, net 0.4% | | | 2,441,739 |
| Total net assets 100.0% | | | | | $624,324,417 |
| The percentage shown for each investment category is the total value of the category as a percentage of the net assets of the fund. |
| Security Abbreviations and Legend |
| ADR | American Depositary Receipt |
| (A) | All or a portion of this security is on loan as of 2-29-20. |
| 10 | JOHN HANCOCK GLOBAL EQUITY FUND | SEMIANNUAL REPORT | SEE NOTES TO FINANCIAL STATEMENTS |
| (B) | Non-income producing security. |
| (C) | Investment is an affiliate of the fund, the advisor and/or subadvisor. This security represents the investment of cash collateral received for securities lending. |
| (D) | The rate shown is the annualized seven-day yield as of 2-29-20. |
| SEE NOTES TO FINANCIAL STATEMENTS | SEMIANNUAL REPORT | JOHN HANCOCK GLOBAL EQUITY FUND | 11 |
DERIVATIVES
FORWARD FOREIGN CURRENCY CONTRACTS
| Contract to buy | Contract to sell | Counterparty (OTC) | Contractual
settlement
date | Unrealized
appreciation | Unrealized
depreciation |
| USD | 38,256,016 | EUR | 34,345,907 | RBCD | 6/17/2020 | $111,484 | — |
| | | | | | | $111,484 | — |
| Derivatives Currency Abbreviations |
| EUR | Euro |
| USD | U.S. Dollar |
| Derivatives Abbreviations |
| OTC | Over-the-counter |
| RBCD | RBC Dominion Securities, Inc. |
At 2-29-20, the aggregate cost of investments for federal income tax purposes was $568,970,498. Net unrealized appreciation aggregated to $53,023,664, of which $87,908,748 related to gross unrealized appreciation and $34,885,084 related to gross unrealized depreciation.
See Notes to financial statements regarding investment transactions and other derivatives information.
| 12 | JOHN HANCOCK GLOBAL EQUITY FUND | SEMIANNUAL REPORT | SEE NOTES TO FINANCIAL STATEMENTS |
STATEMENT OF ASSETS AND LIABILITIES 2-29-20 (unaudited)
| Assets | |
| Unaffiliated investments, at value (Cost $567,019,793) including $1,233,020 of securities loaned | $620,616,918 |
| Affiliated investments, at value (Cost $1,265,292) | 1,265,760 |
| Total investments, at value (Cost $568,285,085) | 621,882,678 |
| Unrealized appreciation on forward foreign currency contracts | 111,484 |
| Foreign currency, at value (Cost $1,238) | 1,218 |
| Interest receivable | 1,982,577 |
| Receivable for fund shares sold | 2,005,182 |
| Receivable for investments sold | 20,379,118 |
| Receivable for securities lending income | 1,335 |
| Other assets | 80,412 |
| Total assets | 646,444,004 |
| Liabilities | |
| Payable for investments purchased | 20,520,094 |
| Payable for fund shares repurchased | 225,723 |
| Payable upon return of securities loaned | 1,262,504 |
| Payable to affiliates | |
| Accounting and legal services fees | 17,547 |
| Transfer agent fees | 6,650 |
| Distribution and service fees | 58 |
| Trustees' fees | 1,633 |
| Other liabilities and accrued expenses | 85,378 |
| Total liabilities | 22,119,587 |
| Net assets | $624,324,417 |
| Net assets consist of | |
| Paid-in capital | $757,169,445 |
| Total distributable earnings (loss) | (132,845,028) |
| Net assets | $624,324,417 |
| |
| SEE NOTES TO FINANCIAL STATEMENTS | SEMIANNUAL REPORT | JOHN HANCOCK Global Equity Fund | 13 |
STATEMENT OF ASSETS AND LIABILITIES 2-29-20 (unaudited) (continued)
| Net asset value per share | |
| Based on net asset value and shares outstanding - the fund has an unlimited number of shares authorized with no par value | |
| Class A ($40,973,507 ÷ 3,682,050 shares)1 | $11.13 |
| Class C ($7,869,812 ÷ 707,049 shares)1 | $11.13 |
| Class I ($13,559,806 ÷ 1,218,745 shares) | $11.13 |
| Class R2 ($131,484 ÷ 11,788 shares) | $11.15 |
| Class R4 ($49,531 ÷ 4,451 shares) | $11.13 |
| Class R6 ($26,756,020 ÷ 2,405,371 shares) | $11.12 |
| Class NAV ($534,984,257 ÷ 48,119,180 shares) | $11.12 |
| Maximum offering price per share | |
| Class A (net asset value per share ÷ 95%)2 | $11.72 |
| 1 | Redemption price per share is equal to net asset value less any applicable contingent deferred sales charge. |
| 2 | On single retail sales of less than $50,000. On sales of $50,000 or more and on group sales the offering price is reduced. |
| 14 | JOHN HANCOCK Global Equity Fund | SEMIANNUAL REPORT | SEE NOTES TO FINANCIAL STATEMENTS |
STATEMENT OF OPERATIONS For the six months ended 2-29-20 (unaudited)
| Investment income | |
| Dividends | $6,472,037 |
| Interest | 126,834 |
| Securities lending | 5,152 |
| Less foreign taxes withheld | (203,367) |
| Total investment income | 6,400,656 |
| Expenses | |
| Investment management fees | 2,865,838 |
| Distribution and service fees | 114,720 |
| Accounting and legal services fees | 64,840 |
| Transfer agent fees | 43,319 |
| Trustees' fees | 7,031 |
| Custodian fees | 102,373 |
| State registration fees | 38,799 |
| Printing and postage | 21,886 |
| Professional fees | 34,494 |
| Other | 17,939 |
| Total expenses | 3,311,239 |
| Less expense reductions | (27,163) |
| Net expenses | 3,284,076 |
| Net investment income | 3,116,580 |
| Realized and unrealized gain (loss) | |
| Net realized gain (loss) on | |
| Unaffiliated investments and foreign currency transactions | 17,930,416 |
| Affiliated investments | 2,785 |
| Forward foreign currency contracts | 1,516,235 |
| | 19,449,436 |
| Change in net unrealized appreciation (depreciation) of | |
| Unaffiliated investments and translation of assets and liabilities in foreign currencies | (18,896,821) |
| Affiliated investments | 468 |
| Forward foreign currency contracts | (1,150,539) |
| | (20,046,892) |
| Net realized and unrealized loss | (597,456) |
| Increase in net assets from operations | $2,519,124 |
| SEE NOTES TO FINANCIAL STATEMENTS | SEMIANNUAL REPORT | JOHN HANCOCK Global Equity Fund | 15 |
STATEMENTS OF CHANGES IN NET ASSETS
| | Six months ended
2-29-20
(unaudited) | Year ended
8-31-19 |
| Increase (decrease) in net assets | | |
| From operations | | |
| Net investment income | $3,116,580 | $14,284,640 |
| Net realized gain | 19,449,436 | 5,192,970 |
| Change in net unrealized appreciation (depreciation) | (20,046,892) | 5,026,624 |
| Increase in net assets resulting from operations | 2,519,124 | 24,504,234 |
| Distributions to shareholders | | |
| From earnings | | |
| Class A | (930,247) | (2,585,019) |
| Class C | (132,508) | (623,606) |
| Class I | (352,089) | (1,027,952) |
| Class R2 | (2,544) | (9,810) |
| Class R4 | (1,244) | (3,214) |
| Class R6 | (330,603) | (471,887) |
| Class NAV | (15,698,858) | (43,948,882) |
| Total distributions | (17,448,093) | (48,670,370) |
| From fund share transactions | (72,737,951) | (59,762,846) |
| Total decrease | (87,666,920) | (83,928,982) |
| Net assets | | |
| Beginning of period | 711,991,337 | 795,920,319 |
| End of period | $624,324,417 | $711,991,337 |
| 16 | JOHN HANCOCK Global Equity Fund | SEMIANNUAL REPORT | SEE NOTES TO FINANCIAL STATEMENTS |
| CLASS A SHARES Period ended | 2-29-201 | 8-31-19 | 8-31-18 | 8-31-17 | 8-31-16 | 8-31-15 |
| Per share operating performance | | | | | | |
| Net asset value, beginning of period | $11.47 | $11.92 | $12.03 | $10.94 | $10.24 | $11.66 |
| Net investment income (loss)2 | 0.033 | 0.18 | 0.16 | 0.15 | 0.19 | 0.19 |
| Net realized and unrealized gain (loss) on investments | (0.12) | 0.08 | 0.72 | 1.11 | 0.68 | (0.74) |
| Total from investment operations | (0.09) | 0.26 | 0.88 | 1.26 | 0.87 | (0.55) |
| Less distributions | | | | | | |
| From net investment income | (0.19) | (0.20) | (0.17) | (0.17) | (0.17) | (0.24) |
| From net realized gain | (0.06) | (0.51) | (0.82) | — | — | (0.63) |
| Total distributions | (0.25) | (0.71) | (0.99) | (0.17) | (0.17) | (0.87) |
| Net asset value, end of period | $11.13 | $11.47 | $11.92 | $12.03 | $10.94 | $10.24 |
| Total return (%)4,5 | (0.96)6 | 3.23 | 7.50 | 11.64 | 8.59 | (4.95) |
| Ratios and supplemental data | | | | | | |
| Net assets, end of period (in millions) | $41 | $42 | $44 | $46 | $56 | $70 |
| Ratios (as a percentage of average net assets): | | | | | | |
| Expenses before reductions | 1.307 | 1.30 | 1.28 | 1.29 | 1.36 | 1.36 |
| Expenses including reductions | 1.307 | 1.29 | 1.27 | 1.28 | 1.35 | 1.32 |
| Net investment income (loss) | 0.493,7 | 1.60 | 1.36 | 1.34 | 1.86 | 1.69 |
| Portfolio turnover (%) | 17 | 18 | 43 | 46 | 35 | 458 |
| 1 | Six months ended 2-29-20. Unaudited. |
| 2 | Based on average daily shares outstanding. |
| 3 | Net investment income is affected by the timing and frequency of the declaration of dividends by the securities in which the fund invests. |
| 4 | Total returns would have been lower had certain expenses not been reduced during the applicable periods. |
| 5 | Does not reflect the effect of sales charges, if any. |
| 6 | Not annualized. |
| 7 | Annualized. |
| 8 | Excludes merger activity. |
| SEE NOTES TO FINANCIAL STATEMENTS | SEMIANNUAL REPORT | JOHN HANCOCK Global Equity Fund | 17 |
| CLASS C SHARES Period ended | 2-29-201 | 8-31-19 | 8-31-18 | 8-31-17 | 8-31-16 | 8-31-152 |
| Per share operating performance | | | | | | |
| Net asset value, beginning of period | $11.44 | $11.87 | $11.99 | $10.91 | $10.21 | $10.75 |
| Net investment income (loss)3 | (0.01)4 | 0.10 | 0.08 | 0.08 | 0.12 | 0.04 |
| Net realized and unrealized gain (loss) on investments | (0.12) | 0.10 | 0.71 | 1.09 | 0.67 | (0.58) |
| Total from investment operations | (0.13) | 0.20 | 0.79 | 1.17 | 0.79 | (0.54) |
| Less distributions | | | | | | |
| From net investment income | (0.12) | (0.12) | (0.09) | (0.09) | (0.09) | — |
| From net realized gain | (0.06) | (0.51) | (0.82) | — | — | — |
| Total distributions | (0.18) | (0.63) | (0.91) | (0.09) | (0.09) | — |
| Net asset value, end of period | $11.13 | $11.44 | $11.87 | $11.99 | $10.91 | $10.21 |
| Total return (%)5,6 | (1.33)7 | 2.59 | 6.69 | 10.83 | 7.82 | (5.02)7 |
| Ratios and supplemental data | | | | | | |
| Net assets, end of period (in millions) | $8 | $10 | $13 | $17 | $18 | $21 |
| Ratios (as a percentage of average net assets): | | | | | | |
| Expenses before reductions | 2.008 | 2.00 | 1.98 | 1.98 | 2.06 | 2.038 |
| Expenses including reductions | 2.008 | 1.99 | 1.97 | 1.98 | 2.05 | 2.028 |
| Net investment income (loss) | (0.20)4,8 | 0.89 | 0.66 | 0.69 | 1.17 | 0.948 |
| Portfolio turnover (%) | 17 | 18 | 43 | 46 | 35 | 459,10 |
| 1 | Six months ended 2-29-20. Unaudited. |
| 2 | The inception date for Class C shares is 3-27-15. |
| 3 | Based on average daily shares outstanding. |
| 4 | Net investment income is affected by the timing and frequency of the declaration of dividends by the securities in which the fund invests. |
| 5 | Total returns would have been lower had certain expenses not been reduced during the applicable periods. |
| 6 | Does not reflect the effect of sales charges, if any. |
| 7 | Not annualized. |
| 8 | Annualized. |
| 9 | Excludes merger activity. |
| 10 | Portfolio turnover is shown for the period from 9-1-14 to 8-31-15. |
| 18 | JOHN HANCOCK Global Equity Fund | SEMIANNUAL REPORT | SEE NOTES TO FINANCIAL STATEMENTS |
| CLASS I SHARES Period ended | 2-29-201 | 8-31-19 | 8-31-18 | 8-31-17 | 8-31-16 | 8-31-15 |
| Per share operating performance | | | | | | |
| Net asset value, beginning of period | $11.48 | $11.94 | $12.05 | $10.96 | $10.26 | $11.70 |
| Net investment income (loss)2 | 0.053 | 0.21 | 0.19 | 0.21 | 0.23 | 0.22 |
| Net realized and unrealized gain (loss) on investments | (0.11) | 0.07 | 0.72 | 1.08 | 0.67 | (0.75) |
| Total from investment operations | (0.06) | 0.28 | 0.91 | 1.29 | 0.90 | (0.53) |
| Less distributions | | | | | | |
| From net investment income | (0.23) | (0.23) | (0.20) | (0.20) | (0.20) | (0.28) |
| From net realized gain | (0.06) | (0.51) | (0.82) | — | — | (0.63) |
| Total distributions | (0.29) | (0.74) | (1.02) | (0.20) | (0.20) | (0.91) |
| Net asset value, end of period | $11.13 | $11.48 | $11.94 | $12.05 | $10.96 | $10.26 |
| Total return (%)4 | (0.86)5 | 3.52 | 7.80 | 11.95 | 8.93 | (4.79) |
| Ratios and supplemental data | | | | | | |
| Net assets, end of period (in millions) | $14 | $14 | $19 | $26 | $17 | $18 |
| Ratios (as a percentage of average net assets): | | | | | | |
| Expenses before reductions | 1.006 | 1.01 | 0.98 | 0.97 | 1.05 | 1.07 |
| Expenses including reductions | 1.006 | 1.00 | 0.97 | 0.97 | 1.04 | 1.06 |
| Net investment income (loss) | 0.793,6 | 1.86 | 1.61 | 1.83 | 2.22 | 1.96 |
| Portfolio turnover (%) | 17 | 18 | 43 | 46 | 35 | 457 |
| 1 | Six months ended 2-29-20. Unaudited. |
| 2 | Based on average daily shares outstanding. |
| 3 | Net investment income is affected by the timing and frequency of the declaration of dividends by the securities in which the fund invests. |
| 4 | Total returns would have been lower had certain expenses not been reduced during the applicable periods. |
| 5 | Not annualized. |
| 6 | Annualized. |
| 7 | Excludes merger activity. |
| SEE NOTES TO FINANCIAL STATEMENTS | SEMIANNUAL REPORT | JOHN HANCOCK Global Equity Fund | 19 |
| CLASS R2 SHARES Period ended | 2-29-201 | 8-31-19 | 8-31-18 | 8-31-17 | 8-31-16 | 8-31-152 |
| Per share operating performance | | | | | | |
| Net asset value, beginning of period | $11.49 | $11.93 | $12.05 | $10.96 | $10.25 | $10.75 |
| Net investment income (loss)3 | 0.024 | 0.16 | 0.13 | 0.16 | 0.20 | 0.09 |
| Net realized and unrealized gain (loss) on investments | (0.12) | 0.10 | 0.74 | 1.10 | 0.67 | (0.59) |
| Total from investment operations | (0.10) | 0.26 | 0.87 | 1.26 | 0.87 | (0.50) |
| Less distributions | | | | | | |
| From net investment income | (0.18) | (0.19) | (0.17) | (0.17) | (0.16) | — |
| From net realized gain | (0.06) | (0.51) | (0.82) | — | — | — |
| Total distributions | (0.24) | (0.70) | (0.99) | (0.17) | (0.16) | — |
| Net asset value, end of period | $11.15 | $11.49 | $11.93 | $12.05 | $10.96 | $10.25 |
| Total return (%)5 | (1.05)6 | 3.21 | 7.43 | 11.69 | 8.59 | (4.65)6 |
| Ratios and supplemental data | | | | | | |
| Net assets, end of period (in millions) | $—7 | $—7 | $—7 | $—7 | $—7 | $—7 |
| Ratios (as a percentage of average net assets): | | | | | | |
| Expenses before reductions | 1.398 | 1.39 | 1.30 | 1.23 | 1.29 | 1.188 |
| Expenses including reductions | 1.398 | 1.39 | 1.29 | 1.22 | 1.28 | 1.178 |
| Net investment income (loss) | 0.404,8 | 1.40 | 1.10 | 1.44 | 1.97 | 1.878 |
| Portfolio turnover (%) | 17 | 18 | 43 | 46 | 35 | 459,10 |
| 1 | Six months ended 2-29-20. Unaudited. |
| 2 | The inception date for Class R2 shares is 3-27-15. |
| 3 | Based on average daily shares outstanding. |
| 4 | Net investment income is affected by the timing and frequency of the declaration of dividends by the securities in which the fund invests. |
| 5 | Total returns would have been lower had certain expenses not been reduced during the applicable periods. |
| 6 | Not annualized. |
| 7 | Less than $500,000. |
| 8 | Annualized. |
| 9 | Excludes merger activity. |
| 10 | Portfolio turnover is shown for the period from 9-1-14 to 8-31-15. |
| 20 | JOHN HANCOCK Global Equity Fund | SEMIANNUAL REPORT | SEE NOTES TO FINANCIAL STATEMENTS |
| CLASS R4 SHARES Period ended | 2-29-201 | 8-31-19 | 8-31-18 | 8-31-17 | 8-31-16 | 8-31-152 |
| Per share operating performance | | | | | | |
| Net asset value, beginning of period | $11.48 | $11.93 | $12.04 | $10.95 | $10.25 | $10.75 |
| Net investment income (loss)3 | 0.044 | 0.21 | 0.16 | 0.19 | 0.22 | 0.10 |
| Net realized and unrealized gain (loss) on investments | (0.11) | 0.08 | 0.75 | 1.09 | 0.67 | (0.60) |
| Total from investment operations | (0.07) | 0.29 | 0.91 | 1.28 | 0.89 | (0.50) |
| Less distributions | | | | | | |
| From net investment income | (0.22) | (0.23) | (0.20) | (0.19) | (0.19) | — |
| From net realized gain | (0.06) | (0.51) | (0.82) | — | — | — |
| Total distributions | (0.28) | (0.74) | (1.02) | (0.19) | (0.19) | — |
| Net asset value, end of period | $11.13 | $11.48 | $11.93 | $12.04 | $10.95 | $10.25 |
| Total return (%)5 | (0.84)6 | 3.54 | 7.74 | 11.91 | 8.86 | (4.65)6 |
| Ratios and supplemental data | | | | | | |
| Net assets, end of period (in millions) | $—7 | $—7 | $—7 | $—7 | $—7 | $—7 |
| Ratios (as a percentage of average net assets): | | | | | | |
| Expenses before reductions | 1.158 | 1.16 | 1.13 | 1.13 | 1.20 | 1.188 |
| Expenses including reductions | 1.048 | 1.05 | 1.02 | 1.02 | 1.09 | 1.078 |
| Net investment income (loss) | 0.744,8 | 1.84 | 1.33 | 1.67 | 2.16 | 2.018 |
| Portfolio turnover (%) | 17 | 18 | 43 | 46 | 35 | 459,10 |
| 1 | Six months ended 2-29-20. Unaudited. |
| 2 | The inception date for Class R4 shares is 3-27-15. |
| 3 | Based on average daily shares outstanding. |
| 4 | Net investment income is affected by the timing and frequency of the declaration of dividends by the securities in which the fund invests. |
| 5 | Total returns would have been lower had certain expenses not been reduced during the applicable periods. |
| 6 | Not annualized. |
| 7 | Less than $500,000. |
| 8 | Annualized. |
| 9 | Excludes merger activity. |
| 10 | Portfolio turnover is shown for the period from 9-1-14 to 8-31-15. |
| SEE NOTES TO FINANCIAL STATEMENTS | SEMIANNUAL REPORT | JOHN HANCOCK Global Equity Fund | 21 |
| CLASS R6 SHARES Period ended | 2-29-201 | 8-31-19 | 8-31-18 | 8-31-17 | 8-31-16 | 8-31-152 |
| Per share operating performance | | | | | | |
| Net asset value, beginning of period | $11.48 | $11.94 | $12.04 | $10.95 | $10.26 | $10.75 |
| Net investment income (loss)3 | 0.054 | 0.22 | 0.22 | 0.24 | 0.27 | 0.10 |
| Net realized and unrealized gain (loss) on investments | (0.11) | 0.07 | 0.72 | 1.06 | 0.64 | (0.59) |
| Total from investment operations | (0.06) | 0.29 | 0.94 | 1.30 | 0.91 | (0.49) |
| Less distributions | | | | | | |
| From net investment income | (0.24) | (0.24) | (0.22) | (0.21) | (0.22) | — |
| From net realized gain | (0.06) | (0.51) | (0.82) | — | — | — |
| Total distributions | (0.30) | (0.75) | (1.04) | (0.21) | (0.22) | — |
| Net asset value, end of period | $11.12 | $11.48 | $11.94 | $12.04 | $10.95 | $10.26 |
| Total return (%)5 | (0.77)6 | 3.63 | 7.99 | 12.09 | 8.97 | (4.56)6 |
| Ratios and supplemental data | | | | | | |
| Net assets, end of period (in millions) | $27 | $7 | $7 | $5 | $2 | $—7 |
| Ratios (as a percentage of average net assets): | | | | | | |
| Expenses before reductions | 0.898 | 0.90 | 0.88 | 0.88 | 0.95 | 0.938 |
| Expenses including reductions | 0.898 | 0.89 | 0.87 | 0.87 | 0.93 | 0.918 |
| Net investment income (loss) | 0.914,8 | 1.99 | 1.88 | 2.11 | 2.52 | 2.158 |
| Portfolio turnover (%) | 17 | 18 | 43 | 46 | 35 | 459,10 |
| 1 | Six months ended 2-29-20. Unaudited. |
| 2 | The inception date for Class R6 shares is 3-27-15. |
| 3 | Based on average daily shares outstanding. |
| 4 | Net investment income is affected by the timing and frequency of the declaration of dividends by the securities in which the fund invests. |
| 5 | Total returns would have been lower had certain expenses not been reduced during the applicable periods. |
| 6 | Not annualized. |
| 7 | Less than $500,000. |
| 8 | Annualized. |
| 9 | Excludes merger activity. |
| 10 | Portfolio turnover is shown for the period from 9-1-14 to 8-31-15. |
| 22 | JOHN HANCOCK Global Equity Fund | SEMIANNUAL REPORT | SEE NOTES TO FINANCIAL STATEMENTS |
| CLASS NAV SHARES Period ended | 2-29-201 | 8-31-19 | 8-31-18 | 8-31-17 | 8-31-16 | 8-31-15 |
| Per share operating performance | | | | | | |
| Net asset value, beginning of period | $11.48 | $11.93 | $12.04 | $10.95 | $10.26 | $11.70 |
| Net investment income (loss)2 | 0.063 | 0.22 | 0.21 | 0.21 | 0.24 | 0.22 |
| Net realized and unrealized gain (loss) on investments | (0.12) | 0.09 | 0.72 | 1.09 | 0.67 | (0.72) |
| Total from investment operations | (0.06) | 0.31 | 0.93 | 1.30 | 0.91 | (0.50) |
| Less distributions | | | | | | |
| From net investment income | (0.24) | (0.25) | (0.22) | (0.21) | (0.22) | (0.31) |
| From net realized gain | (0.06) | (0.51) | (0.82) | — | — | (0.63) |
| Total distributions | (0.30) | (0.76) | (1.04) | (0.21) | (0.22) | (0.94) |
| Net asset value, end of period | $11.12 | $11.48 | $11.93 | $12.04 | $10.95 | $10.26 |
| Total return (%)4 | (0.76)5 | 3.73 | 7.92 | 12.09 | 8.97 | (4.54) |
| Ratios and supplemental data | | | | | | |
| Net assets, end of period (in millions) | $535 | $638 | $713 | $747 | $762 | $478 |
| Ratios (as a percentage of average net assets): | | | | | | |
| Expenses before reductions | 0.886 | 0.88 | 0.87 | 0.87 | 0.93 | 0.91 |
| Expenses including reductions | 0.876 | 0.88 | 0.86 | 0.86 | 0.93 | 0.91 |
| Net investment income (loss) | 0.913,6 | 2.00 | 1.78 | 1.82 | 2.31 | 1.99 |
| Portfolio turnover (%) | 17 | 18 | 43 | 46 | 35 | 457 |
| 1 | Six months ended 2-29-20. Unaudited. |
| 2 | Based on average daily shares outstanding. |
| 3 | Net investment income is affected by the timing and frequency of the declaration of dividends by the securities in which the fund invests. |
| 4 | Total returns would have been lower had certain expenses not been reduced during the applicable periods. |
| 5 | Not annualized. |
| 6 | Annualized. |
| 7 | Excludes merger activity. |
| SEE NOTES TO FINANCIAL STATEMENTS | SEMIANNUAL REPORT | JOHN HANCOCK Global Equity Fund | 23 |
| Notes to financial statements (unaudited) | |
Note 1—Organization
John Hancock Global Equity Fund (the fund) is a series of John Hancock Funds II (the Trust), an open-end management investment company organized as a Massachusetts business trust and registered under the Investment Company Act of 1940, as amended (the 1940 Act). The investment objective of the fund is to seek long-term capital appreciation.
The fund may offer multiple classes of shares. The shares currently outstanding are detailed in the Statement of assets and liabilities. Class A and Class C shares are offered to all investors. Class I shares are offered to institutions and certain investors. Class R2 and Class R4 shares are available only to certain retirement and 529 plans. Class R6 shares are only available to certain retirement plans, institutions and other investors. Class NAV shares are offered to John Hancock affiliated funds of funds, retirement plans for employees of John Hancock and/or Manulife Financial Corporation, and certain 529 plans. Class C shares convert to Class A shares ten years after purchase (certain exclusions may apply). Shareholders of each class have exclusive voting rights to matters that affect that class. The distribution and service fees, if any, and transfer agent fees for each class may differ.
Note 2—Significant accounting policies
The financial statements have been prepared in conformity with accounting principles generally accepted in the United States of America (US GAAP), which require management to make certain estimates and assumptions as of the date of the financial statements. Actual results could differ from those estimates and those differences could be significant. The fund qualifies as an investment company under Topic 946 of Accounting Standards Codification of US GAAP.
Events or transactions occurring after the end of the fiscal period through the date that the financial statements were issued have been evaluated in the preparation of the financial statements. The following summarizes the significant accounting policies of the fund:
Security valuation. Investments are stated at value as of the scheduled close of regular trading on the New York Stock Exchange (NYSE), normally at 4:00 P.M., Eastern Time. In case of emergency or other disruption resulting in the NYSE not opening for trading or the NYSE closing at a time other than the regularly scheduled close, the net asset value (NAV) may be determined as of the regularly scheduled close of the NYSE pursuant to the fund's Valuation Policies and Procedures.
In order to value the securities, the fund uses the following valuation techniques: Equity securities, including exchange-traded or closed-end funds, are typically valued at the last sale price or official closing price on the exchange or principal market where the security trades. In the event there were no sales during the day or closing prices are not available, the securities are valued using the last available bid price. Investments by the fund in open-end mutual funds, including John Hancock Collateral Trust (JHCT), are valued at their respective NAVs each business day. Forward foreign currency contracts are valued at the prevailing forward rates which are based on foreign currency exchange spot rates and forward points supplied by an independent pricing vendor. Foreign securities and currencies are valued in U.S. dollars based on foreign currency exchange rates supplied by an independent pricing vendor.
In certain instances, the Pricing Committee may determine to value equity securities using prices obtained from another exchange or market if trading on the exchange or market on which prices are typically obtained did not open for trading as scheduled, or if trading closed earlier than scheduled, and trading occurred as normal on another exchange or market.
| 24 | JOHN HANCOCK Global Equity Fund | SEMIANNUAL REPORT | |
Other portfolio securities and assets, for which reliable market quotations are not readily available, are valued at fair value as determined in good faith by the fund's Pricing Committee following procedures established by the Board of Trustees. The frequency with which these fair valuation procedures are used cannot be predicted and fair value of securities may differ significantly from the value that would have been used had a ready market for such securities existed. Trading in foreign securities may be completed before the scheduled daily close of trading on the NYSE. Significant events at the issuer or market level may affect the values of securities between the time when the valuation of the securities is generally determined and the close of the NYSE. If a significant event occurs, these securities may be fair valued, as determined in good faith by the fund's Pricing Committee, following procedures established by the Board of Trustees. The fund uses fair value adjustment factors provided by an independent pricing vendor to value certain foreign securities in order to adjust for events that may occur between the close of foreign exchanges or markets and the close of the NYSE.
The fund uses a three-tier hierarchy to prioritize the pricing assumptions, referred to as inputs, used in valuation techniques to measure fair value. Level 1 includes securities valued using quoted prices in active markets for identical securities, including registered investment companies. Level 2 includes securities valued using other significant observable inputs. Observable inputs may include quoted prices for similar securities, interest rates, prepayment speeds and credit risk. Prices for securities valued using these inputs are received from independent pricing vendors and brokers and are based on an evaluation of the inputs described. Level 3 includes securities valued using significant unobservable inputs when market prices are not readily available or reliable, including the fund's own assumptions in determining the fair value of investments. Factors used in determining value may include market or issuer specific events or trends, changes in interest rates and credit quality. The inputs or methodology used for valuing securities are not necessarily an indication of the risks associated with investing in those securities. Changes in valuation techniques and related inputs may result in transfers into or out of an assigned level within the disclosure hierarchy.
The following is a summary of the values by input classification of the fund's investments as of February 29, 2020, by major security category or type:
| | Total
value at
2-29-20 | Level 1
quoted
price | Level 2
significant
observable
inputs | Level 3
significant
unobservable
inputs |
| Investments in securities: | | | | |
| Assets | | | | |
| Common stocks | | | | |
| France | $68,271,694 | — | $68,271,694 | — |
| Hong Kong | 6,275,368 | — | 6,275,368 | — |
| Ireland | 24,307,778 | $7,524,982 | 16,782,796 | — |
| Japan | 12,086,511 | — | 12,086,511 | — |
| Netherlands | 50,565,775 | — | 50,565,775 | — |
| Switzerland | 39,879,602 | 11,847,936 | 28,031,666 | — |
| Taiwan | 4,776,792 | 4,776,792 | — | — |
| United Kingdom | 72,802,512 | — | 72,802,512 | — |
| United States | 307,688,372 | 307,688,372 | — | — |
| Preferred securities | 11,791,191 | — | 11,791,191 | — |
| Short-term investments | 23,437,083 | 23,437,083 | — | — |
| Total investments in securities | $621,882,678 | $355,275,165 | $266,607,513 | — |
| | SEMIANNUAL REPORT | JOHN HANCOCK Global Equity Fund | 25 |
| | Total
value at
2-29-20 | Level 1
quoted
price | Level 2
significant
observable
inputs | Level 3
significant
unobservable
inputs |
| Derivatives: | | | | |
| Assets | | | | |
| Forward foreign currency contracts | $111,484 | — | $111,484 | — |
Security transactions and related investment income. Investment security transactions are accounted for on a trade date plus one basis for daily NAV calculations. However, for financial reporting purposes, investment transactions are reported on trade date. Interest income is accrued as earned. Dividend income is recorded on the ex-date, except for dividends of certain foreign securities where the dividend may not be known until after the ex-date. In those cases, dividend income, net of withholding taxes, is recorded when the fund becomes aware of the dividends. Non-cash dividends, if any, are recorded at the fair market value of the securities received. Gains and losses on securities sold are determined on the basis of identified cost and may include proceeds from litigation.
Securities lending. The fund may lend its securities to earn additional income. The fund receives collateral from the borrower in an amount not less than the market value of the loaned securities. The fund will invest its cash collateral in JHCT, an affiliate of the fund, which has a floating NAV and is registered with the Securities and Exchange Commission (SEC) as an investment company. JHCT invests in short-term money market investments. The fund will receive the benefit of any gains and bear any losses generated by JHCT with respect to the cash collateral.
The fund has the right to recall loaned securities on demand. If a borrower fails to return loaned securities when due, then the lending agent is responsible and indemnifies the fund for the lent securities. The lending agent uses the collateral received from the borrower to purchase replacement securities of the same issue, type, class and series of the loaned securities. If the value of the collateral is less than the purchase cost of replacement securities, the lending agent is responsible for satisfying the shortfall but only to the extent that the shortfall is not due to any decrease in the value of JHCT.
Although the risk of loss on securities lent is mitigated by receiving collateral from the borrower and through lending agent indemnification, the fund could experience a delay in recovering securities or could experience a lower than expected return if the borrower fails to return the securities on a timely basis. The fund receives compensation for lending its securities by retaining a portion of the return on the investment of the collateral and compensation from fees earned from borrowers of the securities. Securities lending income received by the fund is net of fees retained by the securities lending agent. Net income received from JHCT is a component of securities lending income as recorded on the Statement of operations.
Obligations to repay collateral received by the fund are shown on the Statement of assets and liabilities as Payable upon return of securities loaned and are secured by the loaned securities. As of February 29, 2020, the fund loaned securities valued at $1,233,020 and received $1,262,504 of cash collateral.
Foreign investing. Assets, including investments, and liabilities denominated in foreign currencies are translated into U.S. dollar values each day at the prevailing exchange rate. Purchases and sales of securities, income and expenses are translated into U.S. dollars at the prevailing exchange rate on the date of the transaction. The effect of changes in foreign currency exchange rates on the value of securities is reflected as a component of the realized and unrealized gains (losses) on investments. Foreign investments are subject to a decline in the value of a foreign currency versus the U.S. dollar, which reduces the dollar value of securities denominated in that currency.
| 26 | JOHN HANCOCK Global Equity Fund | SEMIANNUAL REPORT | |
Funds that invest internationally generally carry more risk than funds that invest strictly in U.S. securities. These risks are heightened for investments in emerging markets. Risks can result from differences in economic and political conditions, regulations, market practices (including higher transaction costs), accounting standards and other factors.
Foreign taxes. The fund may be subject to withholding tax on income, capital gains or repatriation taxes imposed by certain countries, a portion of which may be recoverable. Foreign taxes are accrued based upon the fund's understanding of the tax rules and rates that exist in the foreign markets in which it invests. Taxes are accrued based on gains realized by the fund as a result of certain foreign security sales. In certain circumstances, estimated taxes are accrued based on unrealized appreciation of such securities. Investment income is recorded net of foreign withholding taxes.
Overdraft. The fund may have the ability to borrow from banks for temporary or emergency purposes, including meeting redemption requests that otherwise might require the untimely sale of securities. Pursuant to the fund's custodian agreement, the custodian may loan money to the fund to make properly authorized payments. The fund is obligated to repay the custodian for any overdraft, including any related costs or expenses. The custodian may have a lien, security interest or security entitlement in any fund property that is not otherwise segregated or pledged, to the extent of any overdraft, and to the maximum extent permitted by law.
Line of credit. The fund and other affiliated funds have entered into a syndicated line of credit agreement with Citibank, N.A. as the administrative agent that enables them to participate in a $750 million unsecured committed line of credit. Excluding commitments designated for a certain fund and subject to the needs of all other affiliated funds, the fund can borrow up to an aggregate commitment amount of $500 million, subject to asset coverage and other limitations as specified in the agreement. A commitment fee payable at the end of each calendar quarter, based on the average daily unused portion of the line of credit, is charged to each participating fund based on a combination of fixed and asset based allocations and is reflected in Other expenses on the Statement of operations. For the six months ended February 29, 2020, the fund had no borrowings under the line of credit. Commitment fees for the six months ended February 29, 2020 were $1,845.
Expenses. Within the John Hancock group of funds complex, expenses that are directly attributable to an individual fund are allocated to such fund. Expenses that are not readily attributable to a specific fund are allocated among all funds in an equitable manner, taking into consideration, among other things, the nature and type of expense and the fund’s relative net assets. Expense estimates are accrued in the period to which they relate and adjustments are made when actual amounts are known.
Class allocations. Income, common expenses and realized and unrealized gains (losses) are determined at the fund level and allocated daily to each class of shares based on the net assets of the class. Class-specific expenses, such as distribution and service fees, if any, and transfer agent fees, for all classes, are charged daily at the class level based on the net assets of each class and the specific expense rates applicable to each class.
Federal income taxes. The fund intends to continue to qualify as a regulated investment company by complying with the applicable provisions of the Internal Revenue Code and will not be subject to federal income tax on taxable income that is distributed to shareholders. Therefore, no federal income tax provision is required.
For federal income tax purposes, as of August 31, 2019, the fund has a short-term capital loss carryforward of $23,041,608 and a long-term capital loss carryforward of $178,158,526 available to offset future net realized capital gains. The utilization of the loss carryforwards, which were acquired in a merger, are limited to $3,061,922 each fiscal year due to IRC Section 382 limitations. Any unused portion of this limitation will carryforward to the following fiscal year. These carryforwards do not expire.
| | SEMIANNUAL REPORT | JOHN HANCOCK Global Equity Fund | 27 |
As of August 31, 2019, the fund had no uncertain tax positions that would require financial statement recognition, derecognition or disclosure. The fund's federal tax returns are subject to examination by the Internal Revenue Service for a period of three years.
Distribution of income and gains. Distributions to shareholders from net investment income and net realized gains, if any, are recorded on the ex-date. The fund generally declares and pays dividends annually. Capital gain distributions, if any, are typically distributed annually.
Distributions paid by the fund with respect to each class of shares are calculated in the same manner, at the same time and in the same amount, except for the effect of class level expenses that may be applied differently to each class.
Such distributions, on a tax basis, are determined in conformity with income tax regulations, which may differ from US GAAP. Distributions in excess of tax basis earnings and profits, if any, are reported in the fund's financial statements as a return of capital. The final determination of tax characteristics of the fund's distribution will occur at the end of the year and will subsequently be reported to shareholders.
Capital accounts within the financial statements are adjusted for permanent book-tax differences. These adjustments have no impact on net assets or the results of operations. Temporary book-tax differences, if any, will reverse in a subsequent period. Book-tax differences are primarily attributable to foreign currency transactions, wash sale loss deferrals, characterization of distributions and derivative transactions.
Note 3—Derivative instruments
The fund may invest in derivatives in order to meet its investment objective. Derivatives include a variety of different instruments that may be traded in the over-the-counter (OTC) market, on a regulated exchange or through a clearing facility. The risks in using derivatives vary depending upon the structure of the instruments, including the use of leverage, optionality, the liquidity or lack of liquidity of the contract, the creditworthiness of the counterparty or clearing organization and the volatility of the position. Some derivatives involve risks that are potentially greater than the risks associated with investing directly in the referenced securities or other referenced underlying instrument. Specifically, the fund is exposed to the risk that the counterparty to an OTC derivatives contract will be unable or unwilling to make timely settlement payments or otherwise honor its obligations. OTC derivatives transactions typically can only be closed out with the other party to the transaction.
Derivatives which are typically traded through the OTC market are regulated by the Commodity Futures Trading Commission (the CFTC). Derivative counterparty risk is managed through an ongoing evaluation of the creditworthiness of all potential counterparties and, if applicable, designated clearing organizations. The fund attempts to reduce its exposure to counterparty risk for derivatives traded in the OTC market, whenever possible, by entering into an International Swaps and Derivatives Association (ISDA) Master Agreement with each of its OTC counterparties. The ISDA gives each party to the agreement the right to terminate all transactions traded under the agreement if there is certain deterioration in the credit quality or contractual default of the other party, as defined in the ISDA. Upon an event of default or a termination of the ISDA, the non-defaulting party has the right to close out all transactions and to net amounts owed.
As defined by the ISDA, the fund may have collateral agreements with certain counterparties to mitigate counterparty risk on OTC derivatives. Subject to established minimum levels, collateral for OTC transactions is generally determined based on the net aggregate unrealized gain or loss on contracts with a particular counterparty. Collateral pledged to the fund, if any, is held in a segregated account by a third-party agent or held by the custodian bank for the benefit of the fund and can be in the form of cash or debt securities issued by the U.S. government or related agencies; collateral posted by the fund, if any, for OTC transactions is held in a
| 28 | JOHN HANCOCK Global Equity Fund | SEMIANNUAL REPORT | |
segregated account at the fund's custodian and is noted in the accompanying Fund's investments, or if cash is posted, on the Statement of assets and liabilities. The fund's risk of loss due to counterparty risk is equal to the asset value of outstanding contracts offset by collateral received.
Forward foreign currency contracts. A forward foreign currency contract is an agreement between two parties to buy and sell specific currencies at a price that is set on the date of the contract. The forward contract calls for delivery of the currencies on a future date that is specified in the contract. Forwards are typically traded OTC. Risks related to the use of forwards include the possible failure of counterparties to meet the terms of the forward agreement, the failure of the counterparties to timely post collateral if applicable, and the risk that currency movements will not favor the fund thereby reducing the fund's total return, and the potential for losses in excess of the amounts recognized on the Statement of assets and liabilities.
The market value of a forward foreign currency contract fluctuates with changes in foreign currency exchange rates. Forward foreign currency contracts are marked-to-market daily and the change in value is recorded by the fund as an unrealized gain or loss. Realized gains or losses, equal to the difference between the value of the contract at the time it was opened and the value at the time it was closed, are recorded upon delivery or receipt of the currency or settlement with the counterparty.
During the six months ended February 29, 2020, the fund used forward foreign currency contracts to manage against anticipated changes in currency exchange rates. The fund held forward foreign currency contracts with USD notional values ranging from $38.3 million to $39.1 million, as measured at each quarter end.
Fair value of derivative instruments by risk category
The table below summarizes the fair value of derivatives held by the fund at February 29, 2020 by risk category:
| Risk | Statement of assets
and liabilities
location | Financial
instruments
location | Assets
derivatives
fair value | Liabilities
derivatives
fair value |
| Currency | Unrealized appreciation / depreciation on forward foreign currency contracts | Forward foreign currency contracts | $111,484 | — |
For financial reporting purposes, the fund does not offset OTC derivative assets or liabilities that are subject to master netting arrangements, as defined by the ISDAs, in the Statement of assets and liabilities. In the event of default by the counterparty or a termination of the agreement, the ISDA allows an offset of amounts across the various transactions between the fund and the applicable counterparty.
Effect of derivative instruments on the Statement of operations
The table below summarizes the net realized gain (loss) included in the net increase (decrease) in net assets from operations, classified by derivative instrument and risk category, for the six months ended February 29, 2020:
| | Statement of operations location - Net realized gain (loss) on: |
| Risk | Forward foreign
currency contracts |
| Currency | $1,516,235 |
| | SEMIANNUAL REPORT | JOHN HANCOCK Global Equity Fund | 29 |
The table below summarizes the net change in unrealized appreciation (depreciation) included in the net increase (decrease) in net assets from operations, classified by derivative instrument and risk category, for the six months ended February 29, 2020:
| | Statement of operations location - Change in net unrealized appreciation (depreciation) of: |
| Risk | Forward foreign
currency contracts |
| Currency | $(1,150,539) |
Note 4—Guarantees and indemnifications
Under the Trust's organizational documents, its Officers and Trustees are indemnified against certain liabilities arising out of the performance of their duties to the Trust, including the fund. Additionally, in the normal course of business, the fund enters into contracts with service providers that contain general indemnification clauses. The fund's maximum exposure under these arrangements is unknown, as this would involve future claims that may be made against the fund that have not yet occurred. The risk of material loss from such claims is considered remote.
Note 5—Fees and transactions with affiliates
John Hancock Investment Management LLC (the Advisor) serves as investment advisor for the fund. John Hancock Investment Management Distributors LLC (the Distributor), an affiliate of the Advisor, serves as principal underwriter of the fund. The Advisor and the Distributor are indirect, wholly owned subsidiaries of Manulife Financial Corporation (MFC).
Management fee. The fund has an investment management agreement with the Advisor under which the fund pays a monthly management fee to the Advisor equivalent on an annual basis to the sum of: (a) 0.825% of the first $500 million of average net assets and (b) 0.800% of excess over $500 million of average net assets. When average net assets exceed $500 million, the management fee is 0.800% on all net assets. The Advisor has a subadvisory agreement with Manulife Investment Management (US) LLC a division of Manulife Asset Management (US) LLC, an indirectly owned subsidiary of MFC and an affiliate of the Advisor. The fund is not responsible for payment of the subadvisory fees.
The Advisor has contractually agreed to waive a portion of its management fee and/or reimburse expenses for certain funds of the John Hancock group of funds complex, including the fund (the participating portfolios). This waiver is based upon aggregate net assets of all the participating portfolios. The amount of the reimbursement is calculated daily and allocated among all the participating portfolios in proportion to the daily net assets of each fund. During the six months ended February 29, 2020, this waiver amounted to 0.01% of the fund’s average daily net assets on an annualized basis. This arrangement expires on July 31, 2021, unless renewed by mutual agreement of the fund and the Advisor based upon a determination that this is appropriate under the circumstances at that time.
The Advisor contractually agreed to reduce its management fee or, if necessary,make payment to the fund, in an amount equal to the amount by which expenses of the fund exceed 0.89% of average net assets. For purposes of this agreement, “expenses of the fund” means all fund expenses, excluding taxes, brokerage commissions, interest expense, litigation and indemnification expenses and other extraordinary expenses not incurred in the ordinary course of the fund’s business, class specific expenses, acquired fund fees and expenses paid indirectly, borrowing costs, prime brokerage fees, and short dividend expense. This agreement expires on December 31, 2020, unless renewed by mutual agreement of the fund and the advisor based upon a determination that this is appropriate under the circumstances at that time.
| 30 | JOHN HANCOCK Global Equity Fund | SEMIANNUAL REPORT | |
For the six months ended February 29, 2020, the expense reductions described above amounted to the following:
| Class | Expense reduction |
| Class A | $1,696 |
| Class C | 358 |
| Class I | 563 |
| Class R2 | 5 |
| Class | Expense reduction |
| Class R4 | $2 |
| Class R6 | 498 |
| Class NAV | 24,014 |
| Total | $27,136 |
Expenses waived or reimbursed in the current fiscal period are not subject to recapture in future fiscal periods.
The investment management fees, including the impact of the waivers and reimbursements as described above, incurred for the six months ended February 29, 2020, were equivalent to a net annual effective rate of 0.79% of the fund's average daily net assets.
Accounting and legal services. Pursuant to a service agreement, the fund reimburses the Advisor for all expenses associated with providing the administrative, financial, legal, compliance, accounting and recordkeeping services to the fund, including the preparation of all tax returns, periodic reports to shareholders and regulatory reports, among other services. These expenses are allocated to each share class based on its relative net assets at the time the expense was incurred. These accounting and legal services fees incurred for the six months ended February 29, 2020 amounted to an annual rate of 0.02% of the fund's average daily net assets.
Distribution and service plans. The fund has a distribution agreement with the Distributor. The fund has adopted distribution and service plans for certain classes as detailed below pursuant to Rule 12b-1 under the 1940 Act, to pay the Distributor for services provided as the distributor of shares of the fund. In addition, under a service plan for certain classes as detailed below, the fund pays for certain other services. The fund may pay up to the following contractual rates of distribution and service fees under these arrangements, expressed as an annual percentage of average daily net assets for each class of the fund's shares:
| Class | Rule 12b-1 Fee | Service fee |
| Class A | 0.30% | — |
| Class C | 1.00% | — |
| Class R2 | 0.25% | 0.25% |
| Class R4 | 0.25% | 0.10% |
The fund's Distributor has contractually agreed to waive 0.10% of Rule12b-1 fees for Class R4 shares. The current waiver agreement expires on December 31, 2020, unless renewed by mutual agreement of the fund and the Distributor based upon a determination that this is appropriate under the circumstances at the time. This contractual waiver amounted to $27 for Class R4 shares for the six months ended February 29, 2020.
Sales charges. Class A shares may be subject to up-front sales charges. For the six months ended February 29, 2020, no sales charges were assessed.
Class A and Class C shares may be subject to contingent deferred sales charges (CDSCs). Certain Class A shares that are acquired through purchases of $1 million or more and are redeemed within one year of purchase are subject to a 1.00% sales charge. Class C shares that are redeemed within one year of purchase are subject to a 1.00% CDSC. CDSCs are applied to the lesser of the current market value at the time of redemption or the original purchase cost of the shares being redeemed. Proceeds from CDSCs are used to compensate the Distributor for providing distribution-related services in connection with the sale of these shares. During the six months ended February 29, 2020, there were no CDSCs received by the Distributor for Class A and Class C shares.
| | SEMIANNUAL REPORT | JOHN HANCOCK Global Equity Fund | 31 |
Transfer agent fees. The John Hancock group of funds has a complex-wide transfer agent agreement with John Hancock Signature Services, Inc. (Signature Services), an affiliate of the Advisor. The transfer agent fees paid to Signature Services are determined based on the cost to Signature Services (Signature Services Cost) of providing recordkeeping services. It also includes out-of-pocket expenses, including payments made to third-parties for recordkeeping services provided to their clients who invest in one or more John Hancock funds. In addition, Signature Services Cost may be reduced by certain fees that Signature Services receives in connection with retirement and small accounts. Signature Services Cost is calculated monthly and allocated, as applicable, to five categories of share classes: Retail Share and Institutional Share Classes of Non-Municipal Bond Funds, Class R6 Shares, Retirement Share Classes and Municipal Bond Share Classes. Within each of these categories, the applicable costs are allocated to the affected John Hancock affiliated funds and/or classes, based on the relative average daily net assets.
Class level expenses. Class level expenses for the six months ended February 29, 2020 were as follows:
| Class | Distribution and service fees | Transfer agent fees |
| Class A | $67,071 | $27,505 |
| Class C | 47,250 | 5,819 |
| Class I | — | 9,145 |
| Class R2 | 330 | 9 |
| Class R4 | 69 | 4 |
| Class R6 | — | 837 |
| Total | $114,720 | $43,319 |
Trustee expenses. The fund compensates each Trustee who is not an employee of the Advisor or its affiliates. The costs of paying Trustee compensation and expenses are allocated to the fund based on its net assets relative to other funds within the John Hancock group of funds complex.
Interfund lending program. Pursuant to an Exemptive Order issued by the SEC, the fund, along with certain other funds advised by the Advisor or its affiliates, may participate in an interfund lending program. This program provides an alternative credit facility allowing the fund to borrow from, or lend money to, other participating affiliated funds. At period end, no interfund loans were outstanding. Interest expense is included in Other expenses on the Statement of operations. The fund's activity in this program during the period for which loans were outstanding was as follows:
Borrower
or Lender | Weighted Average
Loan Balance | Days
Outstanding | Weighted Average
Interest Rate | Interest Income
(Expense) |
| Borrower | $4,272,951 | 1 | 1.550% | $(184) |
| 32 | JOHN HANCOCK Global Equity Fund | SEMIANNUAL REPORT | |
Note 6—Fund share transactions
Transactions in fund shares for the six months ended February 29, 2020 and for the year ended August 31, 2019 were as follows:
| | Six Months Ended 2-29-20 | Year Ended 8-31-19 |
| | Shares | Amount | Shares | Amount |
| Class A shares | | | | |
| Sold | 269,955 | $3,279,423 | 586,538 | $6,515,404 |
| Distributions reinvested | 73,170 | 900,721 | 256,366 | 2,494,441 |
| Repurchased | (364,889) | (4,426,714) | (804,762) | (8,926,539) |
| Net increase (decrease) | (21,764) | $(246,570) | 38,142 | $83,306 |
| Class C shares | | | | |
| Sold | 31,591 | $384,507 | 101,402 | $1,030,409 |
| Distributions reinvested | 10,012 | 123,450 | 60,406 | 588,957 |
| Repurchased | (207,496) | (2,497,329) | (382,376) | (4,225,894) |
| Net decrease | (165,893) | $(1,989,372) | (220,568) | $(2,606,528) |
| Class I shares | | | | |
| Sold | 76,294 | $919,727 | 264,757 | $2,960,161 |
| Distributions reinvested | 28,299 | 348,073 | 103,799 | 1,008,926 |
| Repurchased | (123,848) | (1,509,570) | (720,899) | (8,088,514) |
| Net decrease | (19,255) | $(241,770) | (352,343) | $(4,119,427) |
| Class R2 shares | | | | |
| Sold | 1,408 | $17,370 | 1,945 | $21,374 |
| Distributions reinvested | 206 | 2,543 | 702 | 6,845 |
| Repurchased | (492) | (6,066) | (7,033) | (77,228) |
| Net increase (decrease) | 1,122 | $13,847 | (4,386) | $(49,009) |
| Class R4 shares | | | | |
| Sold | 30 | $360 | 65 | $720 |
| Distributions reinvested | 11 | 133 | 30 | 291 |
| Repurchased | (1) | (8) | (16) | (177) |
| Net increase | 40 | $485 | 79 | $834 |
| Class R6 shares | | | | |
| Sold | 2,067,939 | $25,646,083 | 167,081 | $1,836,366 |
| Distributions reinvested | 26,878 | 330,604 | 48,599 | 471,887 |
| Repurchased | (285,867) | (3,568,844) | (235,265) | (2,393,742) |
| Net increase (decrease) | 1,808,950 | $22,407,843 | (19,585) | $(85,489) |
| | SEMIANNUAL REPORT | JOHN HANCOCK Global Equity Fund | 33 |
| | Six Months Ended 2-29-20 | Year Ended 8-31-19 |
| | Shares | Amount | Shares | Amount |
| Class NAV shares | | | | |
| Sold | 1,347,360 | $15,807,168 | 1,702,222 | $18,648,862 |
| Distributions reinvested | 1,277,368 | 15,698,858 | 4,526,146 | 43,948,882 |
| Repurchased | (10,119,430) | (124,188,440) | (10,347,463) | (115,584,277) |
| Net decrease | (7,494,702) | $(92,682,414) | (4,119,095) | $(52,986,533) |
| Total net decrease | (5,891,502) | $(72,737,951) | (4,677,756) | $(59,762,846) |
Affiliates of the fund owned 89%, 12% and 100% of shares of Class R4, Class R6 and Class NAV, respectively on February 29, 2020. Such concentration of shareholders’ capital could have a material effect on the fund if such shareholders redeem from the fund.
Note 7—Purchase and sale of securities
Purchases and sales of securities, other than short-term investments, amounted to $113,545,392 and $201,833,062, respectively, for the six months ended February 29, 2020.
Note 8—Investment by affiliated funds
Certain investors in the fund are affiliated funds that are managed by the Advisor and its affiliates. The affiliated funds do not invest in the fund for the purpose of exercising management or control; however, this investment may represent a significant portion of the fund's net assets. At February 29, 2020, funds within the John Hancock group of funds complex held 83.5% of the fund's net assets. The following fund(s) had an affiliate ownership of 5% or more of the fund's net assets:
| Portfolio | Affiliated Concentration |
| John Hancock Funds II Multimanager Lifestyle Growth Portfolio | 27.2% |
| John Hancock Funds II Multimanager Lifestyle Balanced Portfolio | 25.6% |
| John Hancock Funds II Multimanager Lifestyle Aggressive Portfolio | 9.0% |
| John Hancock Funds II Multimanager Lifestyle Moderate Portfolio | 7.9% |
Note 9—Investment in affiliated underlying funds
The fund may invest in affiliated underlying funds that are managed by the Advisor and its affiliates. Information regarding the fund's fiscal year to date purchases and sales of the affiliated underlying funds as well as income and capital gains earned by the fund, if any, is as follows:
| | | | | | | | Dividends and distributions |
| Affiliate | Ending
share
amount | Beginning
value | Cost of
purchases | Proceeds
from shares
sold | Realized
gain
(loss) | Change in
unrealized
appreciation
(depreciation) | Income
distributions
received | Capital gain
distributions
received | Ending
value |
| John Hancock Collateral Trust* | 126,463 | $42,017 | $74,759,593 | $(73,539,103) | $2,785 | $468 | $5,152 | — | $1,265,760 |
| * | Refer to the Securities lending note within Note 2 for details regarding this investment. |
| 34 | JOHN HANCOCK Global Equity Fund | SEMIANNUAL REPORT | |
Note 10—Subsequent events
A widespread health crisis such as a global pandemic could cause substantial market volatility, exchange trading suspensions and closures, impact the ability to complete redemptions, and affect fund performance. For example, the novel coronavirus disease (COVID-19) has resulted in significant disruptions to global business activity. The impact of a health crisis and other epidemics and pandemics that may arise in the future, could affect the global economy in ways that cannot necessarily be foreseen at the present time. A health crisis may exacerbate other pre-existing political, social and economic risks. Any such impact could adversely affect the fund's performance, resulting in losses to your investment.
| | SEMIANNUAL REPORT | JOHN HANCOCK Global Equity Fund | 35 |
| | |
Trustees
Hassell H. McClellan,Chairperson
Steven R. Pruchansky,Vice Chairperson
Andrew G. Arnott†
Charles L. Bardelis*
James R. Boyle
Peter S. Burgess*
William H. Cunningham
Grace K. Fey
Marianne Harrison†
Deborah C. Jackson
James M. Oates*
Gregory A. Russo
Officers
Andrew G. Arnott
President
Francis V. Knox, Jr.
Chief Compliance Officer
Charles A. Rizzo
Chief Financial Officer
Salvatore Schiavone
Treasurer
Christopher (Kit) Sechler
Secretary and Chief Legal Officer
| Investment advisor
John Hancock Investment Management LLC
Subadvisor
Manulife Investment Management (US) LLC
Portfolio Managers
Paul G. Boyne
Stephen G. Hermsdorf
Principal distributor
John Hancock Investment Management Distributors LLC
Custodian
Citibank, N.A.
Transfer agent
John Hancock Signature Services, Inc.
Legal counsel
K&L Gates LLP
|
* Member of the Audit Committee
† Non-Independent Trustee
The fund's proxy voting policies and procedures, as well as the fund proxy voting record for the most recent twelve-month period ended June 30, are available free of charge on the Securities and Exchange Commission (SEC) website at sec.gov or on our website.
All of the fund's holdings as of the end of the third month of every fiscal quarter are filed with the SEC on Form N-PORT within 60 days of the end of the fiscal quarter. The fund's Form N-PORT filings are available on our website and the SEC's website, sec.gov.
We make this information on your fund, as well asmonthly portfolio holdings, and other fund details available on our website at jhinvestments.com or by calling 800-225-5291.
| | | | |
| | You can also contact us: |
| | 800-225-5291
jhinvestments.com | Regular mail:
John Hancock Signature Services, Inc.
P.O. Box 55913
Boston, MA 02205-5913
| Express mail:
John Hancock Signature Services, Inc.
2000 Crown Colony Drive
Suite 55913
Quincy, MA 02169-0953
|
SEMIANNUAL REPORT | JOHN HANCOCK GLOBAL EQUITY FUND 36
John Hancock family of funds
| | | |
DOMESTIC EQUITY FUNDS
Blue Chip Growth
Classic Value
Disciplined Value
Disciplined Value Mid Cap
Equity Income
Financial Industries
Fundamental All Cap Core
Fundamental Large Cap Core
New Opportunities
Regional Bank
Small Cap Core
Small Cap Growth
Small Cap Value
U.S. Global Leaders Growth
U.S. Quality Growth
GLOBAL AND INTERNATIONAL EQUITY FUNDS
Disciplined Value International
Emerging Markets
Emerging Markets Equity
Fundamental Global Franchise
Global Equity
Global Shareholder Yield
Global Thematic Opportunities
International Dynamic Growth
International Growth
International Small Company
| | INCOME FUNDS
Bond
California Tax-Free Income
Emerging Markets Debt
Floating Rate Income
Government Income
High Yield
High Yield Municipal Bond
Income
Investment Grade Bond
Money Market
Short Duration Bond
Short Duration Credit Opportunities
Strategic Income Opportunities
Tax-Free Bond
ALTERNATIVE AND SPECIALTY FUNDS
Absolute Return Currency
Alternative Asset Allocation
Alternative Risk Premia
Diversified Macro
Infrastructure
Multi-Asset Absolute Return
Seaport Long/Short
|
A fund's investment objectives, risks, charges, and expenses should be considered carefully before investing. The prospectus contains this and other important information about the fund. To obtain a prospectus, contact your financial professional, call John Hancock Investment Management at 800-225-5291, or visit our website at jhinvestments.com. Please read the prospectus carefully before investing or sending money.
| | | |
ASSET ALLOCATION
Balanced
Income Allocation
Multi-Index Lifetime Portfolios
Multi-Index Preservation Portfolios
Multimanager Lifestyle Portfolios
Multimanager Lifetime Portfolios
Retirement Income 2040
EXCHANGE-TRADED FUNDS
John Hancock Multifactor Consumer Discretionary ETF
John Hancock Multifactor Consumer Staples ETF
John Hancock Multifactor Developed International ETF
John Hancock Multifactor Emerging Markets ETF
John Hancock Multifactor Energy ETF
John Hancock Multifactor Financials ETF
John Hancock Multifactor Healthcare ETF
John Hancock Multifactor Industrials ETF
John Hancock Multifactor Large Cap ETF
John Hancock Multifactor Materials ETF
John Hancock Multifactor Media and
Communications ETF
John Hancock Multifactor Mid Cap ETF
John Hancock Multifactor Small Cap ETF
John Hancock Multifactor Technology ETF
John Hancock Multifactor Utilities ETF
| | ENVIRONMENTAL, SOCIAL, AND
GOVERNANCE FUNDS
ESG All Cap Core
ESG Core Bond
ESG International Equity
ESG Large Cap Core
CLOSED-END FUNDS
Financial Opportunities
Hedged Equity & Income
Income Securities Trust
Investors Trust
Preferred Income
Preferred Income II
Preferred Income III
Premium Dividend
Tax-Advantaged Dividend Income
Tax-Advantaged Global Shareholder Yield
|
John Hancock Multifactor ETF shares are bought and sold at market price (not NAV), and are not individually redeemed
from the fund. Brokerage commissions will reduce returns.
John Hancock ETFs are distributed by Foreside Fund Services, LLC, and are subadvised by Dimensional Fund Advisors LP.
Foreside is not affiliated with John Hancock Investment Management Distributors LLC or Dimensional Fund Advisors LP.
Dimensional Fund Advisors LP receives compensation from John Hancock in connection with licensing rights to the
John Hancock Dimensional indexes. Dimensional Fund Advisors LP does not sponsor, endorse, or sell, and makes no
representation as to the advisability of investing in, John Hancock Multifactor ETFs.
John Hancock Investment Management
A trusted brand
John Hancock Investment Management is a premier asset manager
representing one of America's most trusted brands, with a heritage of
financial stewardship dating back to 1862. Helping our shareholders
pursue their financial goals is at the core of everything we do. It's why
we support the role of professional financial advice and operate with
the highest standards of conduct and integrity.
A better way to invest
We serve investors globally through a unique multimanager approach:
We search the world to find proven portfolio teams with specialized
expertise for every strategy we offer, then we apply robust investment
oversight to ensure they continue to meet our uncompromising
standards and serve the best interests of our shareholders.
Results for investors
Our unique approach to asset management enables us to provide
a diverse set of investments backed by some of the world's best
managers, along with strong risk-adjusted returns across asset classes.
John Hancock Investment Management Distributors LLC n Member FINRA, SIPC
200 Berkeley Street n Boston, MA 02116-5010 n 800-225-5291 n jhinvestments.com
This report is for the information of the shareholders of John Hancock Global Equity Fund . It is not authorized for distribution to prospective investors unless preceded or accompanied by a prospectus.
| | |
| MF1105620 | 425SA 2/20
4/2020 |
John Hancock
Income Allocation Fund
Semiannual report 2/29/2020
Beginning on January 1, 2021, as permitted by regulations adopted by the Securities and Exchange Commission, paper copies of the fund's shareholder reports like this one will no longer be sent by mail, unless you specifically request paper copies of the reports from the fund or from your financial intermediary. Instead, the reports will be made available on a website, and you will be notified by mail each time a report is posted and provided with a website link to access the report.
If you already elected to receive shareholder reports electronically, you will not be affected by this change, and you do not need to take any action. You may elect to receive shareholder reports and other communications electronically by calling John Hancock Investment Management at 800-225-5291 (Class A and Class C shares) or 888-972-8696 (Class I and Class R6 shares) or by contacting your financial intermediary.
You may elect to receive all reports in paper, free of charge, at any time. You can inform John Hancock Investment Management or your financial intermediary that you wish to continue receiving paper copies of your shareholder reports by following the instructions listed above. Your election to receive reports in paper will apply to all funds held with John Hancock Investment Management or your financial intermediary.

A message to shareholders
Dear shareholder,
Global financial markets were on pace to deliver strong returns during the 6 months ended February 29, 2020, until heightened fears over the coronavirus (COVID-19) sent the markets skidding during the last week of the period. Prior to the turbulence, investors benefited from a combination of low inflation, accommodative central bank policy, healthy fundamentals, and corporate buybacks of stock. Investors in non-U.S. equities also saw strong gains, fueled in part by similarly supportive monetary policy and some signs of strength in developing markets. In an environment of low inflation and declining interest rates, bonds were also faring well.
However, the COVID-19 pandemic and plummeting oil prices put an end to all that good news. Shortly after period end, the U.S. Federal Reserve lowered interest rates and lawmakers embarked on a plan to launch major fiscal stimulus to support the economy.
After the longest bull market in U.S. history, we're now in bear market territory. Indeed, the spread of COVID-19, trade disputes, rising unemployment, and other geopolitical tensions may continue to create uncertainty among businesses and investors. Your financial professional can helpposition your portfolio so that it's sufficiently diversified to seek to meet your long-term objectives and to withstand the inevitable bouts of market volatility along the way.
On behalf of everyone at John Hancock Investment Management, I'd like to take this opportunity to welcome new shareholders and thank existing shareholders for the continued trust you've placed in us.
Sincerely,
Andrew G. Arnott
President and CEO,
John Hancock Investment Management
Head of Wealth and Asset Management,
United States and Europe
This commentary reflects the CEO's views as of this report's period end and are subject to change at any time. Diversification does not guarantee investment returns and does not eliminate risk of loss. All investments entail risks, including the possible loss of principal. For more up-to-date information, you can visit our website at jhinvestments.com.
John Hancock
Income Allocation Fund
Table of contents
| | | |
| 2 | | Your fund at a glance |
| 3 | | Portfolio summary |
| 4 | | A look at performance |
| 6 | | Your expenses |
| 8 | | Fund's investments |
| 10 | | Financial statements |
| 13 | | Financial highlights |
| 17 | | Notes to financial statements |
| 27 | | More information |
SEMIANNUAL REPORT | JOHN HANCOCK INCOME ALLOCATION FUND 1
INVESTMENT OBJECTIVE
The fund seeks to provide a high level of current income with consideration for capital appreciation and preservation.
AVERAGE ANNUAL TOTAL RETURNS AS OF 2/29/2020(%)
The Blended Index comprises 70% Bloomberg Barclays U.S. Aggregate Bond Index and 30% MSCI World Index.
It is not possible to invest in an index. Index figures do not reflect expenses or sales charges, which would result in lower returns.
Figures from Morningstar, Inc. include reinvested distributions and do not take into account sales charges. Actual load-adjusted performance is lower. Since-inception returns for the Morningstar fund category average are not available.
The past performance shown here reflects reinvested distributions and the beneficial effect of any expense reductions, and does not guarantee future results. Returns for periods shorter than one year are cumulative. Performance of the other share classes will vary based on the difference in the fees and expenses of those classes. Shares will fluctuate in value and, when redeemed, may be worth more or less than their original cost. Current month-end performance may be lower or higher than the performance cited, and can be found at jhinvestments.com or by calling 800-225-5291. For further information on the fund's objectives, risks, and strategy, see the fund's prospectus. The fund recently experienced negative short-term performance due to market volatility associated with the COVID-19 pandemic.
SEMIANNUAL REPORT | JOHN HANCOCK INCOME ALLOCATION FUND 2
ASSET ALLOCATION AS OF 2/29/2020 (%)
| | | |
| Equity | 13.0 |
| | International Equity | 13.0 |
| Fixed income | 70.9 |
| | Multi-Sector Bond | 26.1 |
| | Intermediate Bond | 22.0 |
| | High Yield Bond | 10.4 |
| | Emerging-Market Debt | 8.3 |
| | Bank Loan | 4.1 |
| Exchange-traded funds | 15.2 |
| Short-term investments and other | 0.9 |
As a percentage of net assets.
A note about risks
The fund may be subject to various risks as described in the fund's prospectus. For more information, please refer to the "Principal risks" section of the prospectus and "Subsequent events" section in the Notes to financial statements.
SEMIANNUAL REPORT | JOHN HANCOCK INCOME ALLOCATION FUND 3
TOTAL RETURNS FOR THE PERIOD ENDED FEBRUARY 29, 2020
| | | | | | | | | | | | |
Average annual total returns (%)
with maximum sales charge | | Cumulative total returns (%)
with maximum sales charge | | SEC 30-day
yield (%)
subsidized | | SEC 30-day
yield (%)
unsubsidized1 |
| | 1-year | 5-year | Since
inception2 | | 6-month | 5-year | Since
inception2 | | as of
2-29-20 | | as of
2-29-20 |
| Class A | 0.88 | 2.24 | 2.41 | | -3.46 | 11.73 | 13.45 | | 3.15 | | -0.72 |
| Class C | 3.41 | 2.34 | 2.48 | | -0.76 | 12.27 | 13.83 | | 2.57 | | -1.46 |
| Class I3 | 5.40 | 3.39 | 3.53 | | 0.69 | 18.12 | 20.19 | | 3.60 | | -0.45 |
| Class R63 | 5.51 | 3.49 | 3.64 | | 0.74 | 18.71 | 20.82 | | 3.71 | | -0.34 |
| Index 1† | 11.68 | 3.58 | 3.76 | | 3.39 | 19.21 | 21.58 | | — | | — |
| Index 2† | 4.63 | 5.88 | 6.28 | | 0.88 | 33.09 | 38.03 | | — | | — |
| Index 3† | 9.83 | 4.45 | 4.70 | | 2.79 | 24.30 | 27.50 | | — | | — |
Performance figures assume all distributions have been reinvested. Figures reflect maximum sales charges on Class A shares of 4.00% and the applicable contingent deferred sales charge (CDSC) on Class C shares. Class C shares sold within one year of purchase are subject to a 1% CDSC. Sales charges are not applicable to Class I and Class R6 shares.
The expense ratios of the fund, both net (including any fee waivers and/or expense limitations) and gross (excluding any fee waivers and/or expense limitations), are set forth according to the most recent publicly available prospectus for the fund and may differ from those disclosed in the Financial highlights tables in this report. Net expenses reflect contractual expense limitations in effect until December 31, 2020 and are subject to change. Had the contractual fee waivers and expense limitations not been in place, gross expenses would apply. The following expense ratios include the expenses of the underlying funds in which the fund invests. The expense ratios are as follows:
| | | | | |
| | Class A | Class C | Class I | Class R6 |
| Gross (%) | 4.46 | 5.16 | 4.16 | 4.05 |
| Net (%) | 1.30 | 2.00 | 1.00 | 0.89 |
Please refer to the most recent prospectus and annual or semiannual report for more information on expenses and any expense limitation arrangements for each class.
The returns reflect past results and should not be considered indicative of future performance. The return and principal value of an investment will fluctuate so that shares, when redeemed, may be worth more or less than their original cost. Due to market volatility and other factors, the fund's current performance may be higher or lower than the performance shown. For current to the most recent month-end performance data, please call 800-225-5291 or visit the fund's website at jhinvestments.com.
The performance table above and the chart on the next page do not reflect the deduction of taxes that a shareholder would pay on fund distributions or the redemption of fund shares. The fund's performance results reflect any applicable fee waivers or expense reductions, without which the expenses would increase and results would have been less favorable.
| † | Index 1 is the Bloomberg Barclays U.S. Aggregate Bond Index; Index 2 is the MSCI World Index; Index 3 is 70% Bloomberg Barclays U.S. Aggregate Bond Index and 30% MSCI World Index. |
See the following page for footnotes.
SEMIANNUAL REPORT | JOHN HANCOCK INCOME ALLOCATION FUND 4
This chart and table show what happened to a hypothetical $10,000 investment in John Hancock Income Allocation Fund for the share classes and periods indicated, assuming all distributions were reinvested. For comparison, we've shown the same investment in a blended index and two separate indexes.
| | | | | | | |
| | Start date | With maximum
sales charge ($) | Without
sales charge ($) | Index 1 ($) | Index 2 ($) | Index 3 ($) |
| Class C4 | 11-14-14 | 11,383 | 11,383 | 12,158 | 13,803 | 12,750 |
| Class I3 | 11-14-14 | 12,019 | 12,019 | 12,158 | 13,803 | 12,750 |
| Class R63 | 11-14-14 | 12,082 | 12,082 | 12,158 | 13,803 | 12,750 |
The Bloomberg Barclays U.S. Aggregate Bond Index is an unmanaged index of dollar-denominated and non-convertible investment-grade debt issue.
The MSCI World Index (gross of foreign withholding tax on dividends) is a free float-adjusted market capitalization weighted index that is designed to measure the equity market performance of developed markets.
The Blended Index comprises 70% Bloomberg Barclays U.S. Aggregate Bond Index and 30% MSCI World Index.
It is not possible to invest in an index. Index figures do not reflect expenses or sales charges, which would result in lower returns.
Footnotes related to performance pages
| 1 | Unsubsidized yield reflects what the yield would have been without the effect of reimbursements and waivers. |
| 2 | From 11-14-14. |
| 3 | For certain types of investors, as described in the fund's prospectus. |
| 4 | The contingent deferred sales charge is not applicable. |
SEMIANNUAL REPORT | JOHN HANCOCK INCOME ALLOCATION FUND 5
These examples are intended to help you understand your ongoing operating expenses of investing in the fund so you can compare these costs with the ongoing costs of investing in other mutual funds.
Understanding fund expenses
As a shareholder of the fund, you incur two types of costs:
■Transaction costs,which include sales charges (loads) on purchases or redemptions (varies by share class), minimum account fee charge, etc.
■Ongoing operating expenses, including management fees, distribution and service fees (if applicable), and other fund expenses.
We are presenting only your ongoing operating expenses here.
Actual expenses/actual returns
The first line of each share class in the table on the following page is intended to provide information about the fund’s actual ongoing operating expenses, and is based on the fund’s actual return. It assumes an account value of $1,000.00 on September 1, 2019, with the same investment held until February 29, 2020.
Together with the value of your account, you may use this information to estimate the operating expenses that you paid over the period. Simply divide your account value at February 29, 2020, by $1,000.00, then multiply it by the “expenses paid” for your share class from the table. For example, for an account value of $8,600.00, the operating expenses should be calculated as follows:
Hypothetical example for comparison purposes
The second line of each share class in the table on the following page allows you to compare the fund’s ongoing operating expenses with those of any other fund. It provides an example of the fund’s hypothetical account values and hypothetical expenses based on each class’s actual expense ratio and an assumed 5% annualized return before expenses (which is not the class’s actual return). It assumes an account value of $1,000.00 on September 1, 2019, with the same investment held until February 29, 2020. Look in any other fund shareholder report to find its hypothetical example and you will be able to compare these expenses. Please remember that these hypothetical account values and expenses may not be used to estimate the actual ending account balance or expenses you paid for the period.
| 6 | JOHN HANCOCK INCOME ALLOCATION FUND | SEMIANNUAL REPORT | |
Remember, these examples do not include any transaction costs, therefore, these examples will not help you to determine the relative total costs of owning different funds. If transaction costs were included, your expenses would have been higher. See the prospectus for details regarding transaction costs.
SHAREHOLDER EXPENSE EXAMPLE CHART
| | | Account
value on
9-1-2019 | Ending
value on
2-29-2020 | Expenses
paid during
period ended
2-29-20201 | Annualized
expense
ratio2 |
| Class A | Actual expenses/actual returns | $1,000.00 | $1,005.50 | $3.34 | 0.67% |
| | Hypothetical example | 1,000.00 | 1,021.50 | 3.37 | 0.67% |
| Class C | Actual expenses/actual returns | 1,000.00 | 1,002.30 | 6.82 | 1.37% |
| | Hypothetical example | 1,000.00 | 1,018.10 | 6.87 | 1.37% |
| Class I | Actual expenses/actual returns | 1,000.00 | 1,006.90 | 1.85 | 0.37% |
| | Hypothetical example | 1,000.00 | 1,023.00 | 1.86 | 0.37% |
| Class R6 | Actual expenses/actual returns | 1,000.00 | 1,007.40 | 1.30 | 0.26% |
| | Hypothetical example | 1,000.00 | 1,023.60 | 1.31 | 0.26% |
| 1 | Expenses are equal to the annualized expense ratio, multiplied by the average account value over the period, multiplied by 182/366 (to reflect the one-half year period). |
| 2 | Ratios do not include expense indirectly incurred from underlying funds and can vary based on the mix of underlying funds held by the fund. |
| | SEMIANNUAL REPORT | JOHN HANCOCK INCOME ALLOCATION FUND | 7 |
AS OF 2-29-20 (unaudited)
| | | | | Shares | Value |
| Affiliated investment companies (A) 83.9% | | | $4,921,016 |
| (Cost $4,856,304) | | | | | |
| Equity 13.0% | | | 762,209 |
| Global Equity, Class NAV, JHF II (MIM US) (B) | | | | 22,488 | 250,062 |
| Global Shareholder Yield, Class NAV, JHF III (Epoch) | | | | 49,435 | 512,147 |
| Fixed income 70.9% | | | 4,158,807 |
| Bond, Class NAV, JHSB (MIM US) (B) | | | | 77,890 | 1,289,853 |
| Emerging Markets Debt, Class NAV, JHF II (MIM US) (B) | | | | 51,234 | 488,259 |
| Floating Rate Income, Class NAV, JHF II (Bain Capital) | | | | 29,289 | 238,413 |
| High Yield, Class NAV, JHBT (MIM US) (B) | | | | 97,301 | 326,930 |
| Short Duration Credit Opportunities, Class NAV, JHF II (Stone Harbor) | | | | 26,944 | 256,777 |
| Strategic Income Opportunities, Class NAV, JHF II (MIM US) (B) | | | | 119,655 | 1,277,912 |
|
| U.S. High Yield Bond, Class NAV, JHF II (Wells Capital) | | | | 25,585 | 280,663 |
| Unaffiliated investment companies 15.2% | | | $889,245 |
| (Cost $922,182) | | | | | |
| Exchange-traded funds 15.2% | | | 889,245 |
| Global X MLP ETF (C) | | | | 17,553 | 106,371 |
| iShares Preferred & Income Securities ETF | | | | 3,216 | 116,741 |
| SPDR S&P International Dividend ETF (C) | | | | 4,765 | 176,019 |
| Vanguard Global ex-U.S. Real Estate ETF (C) | | | | 1,051 | 56,901 |
| Vanguard High Dividend Yield ETF | | | | 4,599 | 379,418 |
| Vanguard Real Estate ETF | | | | 616 | 53,795 |
| | Yield* (%) | Maturity date | | Par value^ | Value |
| Short-term investments 7.7% | | | | | $453,711 |
| (Cost $453,628) | | | | | |
| U.S. Government 0.3% | | | | | 19,998 |
| U.S. Treasury Bill | 1.515 | 03-05-20 | | 20,000 | 19,998 |
| | | Yield (%) | | Shares | Value |
| Short-term funds 7.4% | | | | | 433,713 |
| John Hancock Collateral Trust (D) | 1.6968(E) | | 27,734 | 277,589 |
| State Street Institutional U.S. Government Money Market Fund, Premier Class | 1.5386(E) | | 156,124 | 156,124 |
|
| Total investments (Cost $6,232,114) 106.8% | | | $6,263,972 |
| Other assets and liabilities, net (6.8%) | | | | (400,019) |
| Total net assets 100.0% | | | | | $5,863,953 |
| 8 | JOHN HANCOCK INCOME ALLOCATION FUND | SEMIANNUAL REPORT | SEE NOTES TO FINANCIAL STATEMENTS |
| The percentage shown for each investment category is the total value of the category as a percentage of the net assets of the fund. |
| ^All par values are denominated in U.S. dollars unless otherwise indicated. |
| Security Abbreviations and Legend |
| JHBT | John Hancock Bond Trust |
| JHF II | John Hancock Funds II |
| JHF III | John Hancock Funds III |
| JHSB | John Hancock Sovereign Bond Fund |
| (A) | The underlying funds' subadvisor is shown parenthetically. |
| (B) | The subadvisor is an affiliate of the advisor. |
| (C) | All or a portion of this security is on loan as of 2-29-20. |
| (D) | Investment is an affiliate of the fund, the advisor and/or subadvisor. This security represents the investment of cash collateral received for securities lending. |
| (E) | The rate shown is the annualized seven-day yield as of 2-29-20. |
| * | Yield represents either the annualized yield at the date of purchase, the stated coupon rate or, for floating rate securities, the rate at period end. |
At 2-29-20, the aggregate cost of investments for federal income tax purposes was $6,360,903. Net unrealized depreciation aggregated to $96,931, of which $123,561 related to gross unrealized appreciation and $220,492 related to gross unrealized depreciation.
| Subadvisors of Affiliated Underlying Funds | |
| BCSF Advisors, LP (Bain Capital Credit) | (Bain Capital) |
| Epoch Investment Partners, Inc. | (Epoch) |
| Manulife Investment Management (US) LLC | (MIM US) |
| Stone Harbor Investment Partners LP | (Stone Harbor) |
| Wells Capital Management, Incorporated | (Wells Capital) |
| SEE NOTES TO FINANCIAL STATEMENTS | SEMIANNUAL REPORT | JOHN HANCOCK INCOME ALLOCATION FUND | 9 |
STATEMENT OF ASSETS AND LIABILITIES 2-29-20 (unaudited)
| Assets | |
| Unaffiliated investments, at value (Cost $1,098,303) including $271,099 of securities loaned | $1,065,367 |
| Affiliated investments, at value (Cost $5,133,811) | 5,198,605 |
| Total investments, at value (Cost $6,232,114) | 6,263,972 |
| Foreign currency, at value (Cost $1) | 1 |
| Dividends and interest receivable | 12,179 |
| Receivable for fund shares sold | 500 |
| Receivable for investments sold | 31,195 |
| Receivable for securities lending income | 290 |
| Receivable from affiliates | 1,332 |
| Other assets | 41,384 |
| Total assets | 6,350,853 |
| Liabilities | |
| Due to custodian | 145 |
| Payable for investments purchased | 131,818 |
| Payable for fund shares repurchased | 31,523 |
| Payable upon return of securities loaned | 277,540 |
| Payable to affiliates | |
| Accounting and legal services fees | 163 |
| Transfer agent fees | 569 |
| Other liabilities and accrued expenses | 45,142 |
| Total liabilities | 486,900 |
| Net assets | $5,863,953 |
| Net assets consist of | |
| Paid-in capital | $10,109,973 |
| Total distributable earnings (loss) | (4,246,020) |
| Net assets | $5,863,953 |
| |
| Net asset value per share | |
| Based on net asset value and shares outstanding - the fund has an unlimited number of shares authorized with no par value | |
| Class A ($4,519,597 ÷ 462,945 shares)1 | $9.76 |
| Class C ($776,415 ÷ 79,817 shares)1 | $9.73 |
| Class I ($390,043 ÷ 39,920 shares) | $9.77 |
| Class R6 ($177,898 ÷ 18,200 shares) | $9.77 |
| Maximum offering price per share | |
| Class A (net asset value per share ÷ 96%)2 | $10.17 |
| 1 | Redemption price per share is equal to net asset value less any applicable contingent deferred sales charge. |
| 2 | On single retail sales of less than $50,000. On sales of $50,000 or more and on group sales the offering price is reduced. |
| 10 | JOHN HANCOCK Income Allocation Fund | SEMIANNUAL REPORT | SEE NOTES TO FINANCIAL STATEMENTS |
STATEMENT OF OPERATIONSFor the six months ended 2-29-20 (unaudited)
| Investment income | |
| Income distributions received from affiliated investments | $92,653 |
| Dividends | 28,424 |
| Securities lending | 1,643 |
| Interest | 511 |
| Total investment income | 123,231 |
| Expenses | |
| Investment management fees | 12,310 |
| Distribution and service fees | 11,264 |
| Accounting and legal services fees | 565 |
| Transfer agent fees | 3,723 |
| Trustees' fees | 135 |
| Custodian fees | 24,813 |
| State registration fees | 24,818 |
| Printing and postage | 11,206 |
| Professional fees | 33,406 |
| Other | 5,188 |
| Total expenses | 127,428 |
| Less expense reductions | (104,824) |
| Net expenses | 22,604 |
| Net investment income | 100,627 |
| Realized and unrealized gain (loss) | |
| Net realized gain (loss) on | |
| Unaffiliated investments | 4,649 |
| Affiliated investments | 12,154 |
| Capital gain distributions received from affiliated investments | 19,641 |
| Futures contracts | 2,027 |
| | 38,471 |
| Change in net unrealized appreciation (depreciation) of | |
| Unaffiliated investments | (71,120) |
| Affiliated investments | (25,296) |
| Futures contracts | 283 |
| | (96,133) |
| Net realized and unrealized loss | (57,662) |
| Increase in net assets from operations | $42,965 |
| SEE NOTES TO FINANCIAL STATEMENTS | SEMIANNUAL REPORT | JOHN HANCOCK Income Allocation Fund | 11 |
STATEMENTS OF CHANGES IN NET ASSETS
| | Six months ended
2-29-20
(unaudited) | Year ended
8-31-19 |
| Increase (decrease) in net assets | | |
| From operations | | |
| Net investment income | $100,627 | $186,616 |
| Net realized gain (loss) | 38,471 | (47,176) |
| Change in net unrealized appreciation (depreciation) | (96,133) | 183,504 |
| Increase in net assets resulting from operations | 42,965 | 322,944 |
| Distributions to shareholders | | |
| From earnings | | |
| Class A | (86,356) | (149,223) |
| Class C | (11,104) | (20,264) |
| Class I | (6,028) | (11,271) |
| Class R6 | (4,360) | (5,900) |
| Total distributions | (107,848) | (186,658) |
| From fund share transactions | (146,716) | (234,379) |
| Total decrease | (211,599) | (98,093) |
| Net assets | | |
| Beginning of period | 6,075,552 | 6,173,645 |
| End of period | $5,863,953 | $6,075,552 |
| 12 | JOHN HANCOCK Income Allocation Fund | SEMIANNUAL REPORT | SEE NOTES TO FINANCIAL STATEMENTS |
| CLASS A SHARES Period ended | 2-29-201 | 8-31-19 | 8-31-18 | 8-31-17 | 8-31-16 | 8-31-152 |
| Per share operating performance | | | | | | |
| Net asset value, beginning of period | $9.88 | $9.67 | $9.93 | $9.75 | $9.55 | $10.00 |
| Net investment income3,4 | 0.16 | 0.31 | 0.32 | 0.29 | 0.31 | 0.23 |
| Net realized and unrealized gain (loss) on investments | (0.10) | 0.21 | (0.24) | 0.21 | 0.34 | (0.42) |
| Total from investment operations | 0.06 | 0.52 | 0.08 | 0.50 | 0.65 | (0.19) |
| Less distributions | | | | | | |
| From net investment income | (0.16) | (0.31) | (0.34) | (0.32) | (0.43) | (0.25) |
| From net realized gain | (0.02) | — | —5 | —5 | (0.02) | (0.01) |
| Total distributions | (0.18) | (0.31) | (0.34) | (0.32) | (0.45) | (0.26) |
| Net asset value, end of period | $9.76 | $9.88 | $9.67 | $9.93 | $9.75 | $9.55 |
| Total return (%)6,7 | 0.558 | 5.52 | 0.80 | 5.30 | 7.13 | (2.00)8 |
| Ratios and supplemental data | | | | | | |
| Net assets, end of period (in millions) | $5 | $5 | $5 | $6 | $3 | $4 |
| Ratios (as a percentage of average net assets): | | | | | | |
| Expenses before reductions9 | 4.0310 | 3.88 | 2.28 | 2.77 | 4.17 | 1.1710 |
| Expenses including reductions9 | 0.6710 | 0.62 | 0.62 | 0.63 | 0.62 | 0.8510 |
| Net investment income4 | 3.2810 | 3.20 | 3.26 | 2.96 | 3.33 | 2.8510 |
| Portfolio turnover (%) | 18 | 29 | 50 | 17 | 34 | 131 |
| 1 | Six months ended 2-29-20. Unaudited. |
| 2 | Period from 11-14-14 (commencement of operations) to 8-31-15. |
| 3 | Based on average daily shares outstanding. |
| 4 | Net investment income is affected by the timing and frequency of the declaration of dividends by the underlying funds in which the fund invests. |
| 5 | Less than $0.005 per share. |
| 6 | Total returns would have been lower had certain expenses not been reduced during the applicable periods. |
| 7 | Does not reflect the effect of sales charges, if any. |
| 8 | Not annualized. |
| 9 | Ratios do not include expenses indirectly incurred from underlying funds and can vary based on the mix of underlying funds held by the fund. |
| 10 | Annualized. |
| SEE NOTES TO FINANCIAL STATEMENTS | SEMIANNUAL REPORT | JOHN HANCOCK Income Allocation Fund | 13 |
| CLASS C SHARES Period ended | 2-29-201 | 8-31-19 | 8-31-18 | 8-31-17 | 8-31-16 | 8-31-152 |
| Per share operating performance | | | | | | |
| Net asset value, beginning of period | $9.85 | $9.64 | $9.90 | $9.72 | $9.53 | $10.00 |
| Net investment income3,4 | 0.13 | 0.24 | 0.25 | 0.22 | 0.24 | 0.17 |
| Net realized and unrealized gain (loss) on investments | (0.10) | 0.21 | (0.24) | 0.22 | 0.35 | (0.44) |
| Total from investment operations | 0.03 | 0.45 | 0.01 | 0.44 | 0.59 | (0.27) |
| Less distributions | | | | | | |
| From net investment income | (0.13) | (0.24) | (0.27) | (0.26) | (0.38) | (0.19) |
| From net realized gain | (0.02) | — | —5 | —5 | (0.02) | (0.01) |
| Total distributions | (0.15) | (0.24) | (0.27) | (0.26) | (0.40) | (0.20) |
| Net asset value, end of period | $9.73 | $9.85 | $9.64 | $9.90 | $9.72 | $9.53 |
| Total return (%)6,7 | 0.238 | 4.80 | 0.09 | 4.58 | 6.41 | (2.71)8 |
| Ratios and supplemental data | | | | | | |
| Net assets, end of period (in millions) | $1 | $1 | $1 | $2 | $1 | $1 |
| Ratios (as a percentage of average net assets): | | | | | | |
| Expenses before reductions9 | 4.7310 | 4.58 | 2.98 | 3.47 | 4.86 | 1.8710 |
| Expenses including reductions9 | 1.3710 | 1.32 | 1.32 | 1.33 | 1.32 | 1.5510 |
| Net investment income4 | 2.5810 | 2.51 | 2.54 | 2.30 | 2.58 | 2.1610 |
| Portfolio turnover (%) | 18 | 29 | 50 | 17 | 34 | 131 |
| 1 | Six months ended 2-29-20. Unaudited. |
| 2 | Period from 11-14-14 (commencement of operations) to 8-31-15. |
| 3 | Based on average daily shares outstanding. |
| 4 | Net investment income is affected by the timing and frequency of the declaration of dividends by the underlying funds in which the fund invests. |
| 5 | Less than $0.005 per share. |
| 6 | Total returns would have been lower had certain expenses not been reduced during the applicable periods. |
| 7 | Does not reflect the effect of sales charges, if any. |
| 8 | Not annualized. |
| 9 | Ratios do not include expenses indirectly incurred from underlying funds and can vary based on the mix of underlying funds held by the fund. |
| 10 | Annualized. |
| 14 | JOHN HANCOCK Income Allocation Fund | SEMIANNUAL REPORT | SEE NOTES TO FINANCIAL STATEMENTS |
| CLASS I SHARES Period ended | 2-29-201 | 8-31-19 | 8-31-18 | 8-31-17 | 8-31-16 | 8-31-152 |
| Per share operating performance | | | | | | |
| Net asset value, beginning of period | $9.89 | $9.67 | $9.93 | $9.76 | $9.55 | $10.00 |
| Net investment income3,4 | 0.18 | 0.34 | 0.36 | 0.32 | 0.33 | 0.26 |
| Net realized and unrealized gain (loss) on investments | (0.11) | 0.22 | (0.25) | 0.20 | 0.36 | (0.43) |
| Total from investment operations | 0.07 | 0.56 | 0.11 | 0.52 | 0.69 | (0.17) |
| Less distributions | | | | | | |
| From net investment income | (0.17) | (0.34) | (0.37) | (0.35) | (0.46) | (0.27) |
| From net realized gain | (0.02) | — | —5 | —5 | (0.02) | (0.01) |
| Total distributions | (0.19) | (0.34) | (0.37) | (0.35) | (0.48) | (0.28) |
| Net asset value, end of period | $9.77 | $9.89 | $9.67 | $9.93 | $9.76 | $9.55 |
| Total return (%)6 | 0.697 | 5.94 | 1.11 | 5.51 | 7.51 | (1.76)7 |
| Ratios and supplemental data | | | | | | |
| Net assets, end of period (in millions) | $—8 | $—8 | $—8 | $3 | $2 | $2 |
| Ratios (as a percentage of average net assets): | | | | | | |
| Expenses before reductions9 | 3.7310 | 3.60 | 1.98 | 2.46 | 3.86 | 0.8410 |
| Expenses including reductions9 | 0.3710 | 0.34 | 0.32 | 0.31 | 0.31 | 0.5310 |
| Net investment income4 | 3.5710 | 3.50 | 3.59 | 3.32 | 3.48 | 3.1710 |
| Portfolio turnover (%) | 18 | 29 | 50 | 17 | 34 | 131 |
| 1 | Six months ended 2-29-20. Unaudited. |
| 2 | Period from 11-14-14 (commencement of operations) to 8-31-15. |
| 3 | Based on average daily shares outstanding. |
| 4 | Net investment income is affected by the timing and frequency of the declaration of dividends by the underlying funds in which the fund invests. |
| 5 | Less than $0.005 per share. |
| 6 | Total returns would have been lower had certain expenses not been reduced during the applicable periods. |
| 7 | Not annualized. |
| 8 | Less than $500,000. |
| 9 | Ratios do not include expenses indirectly incurred from underlying funds and can vary based on the mix of underlying funds held by the fund. |
| 10 | Annualized. |
| SEE NOTES TO FINANCIAL STATEMENTS | SEMIANNUAL REPORT | JOHN HANCOCK Income Allocation Fund | 15 |
| CLASS R6 SHARES Period ended | 2-29-201 | 8-31-19 | 8-31-18 | 8-31-17 | 8-31-16 | 8-31-152 |
| Per share operating performance | | | | | | |
| Net asset value, beginning of period | $9.89 | $9.68 | $9.94 | $9.76 | $9.55 | $10.00 |
| Net investment income3,4 | 0.19 | 0.34 | 0.37 | 0.33 | 0.34 | 0.26 |
| Net realized and unrealized gain (loss) on investments | (0.11) | 0.22 | (0.25) | 0.21 | 0.35 | (0.42) |
| Total from investment operations | 0.08 | 0.56 | 0.12 | 0.54 | 0.69 | (0.16) |
| Less distributions | | | | | | |
| From net investment income | (0.18) | (0.35) | (0.38) | (0.36) | (0.46) | (0.28) |
| From net realized gain | (0.02) | — | —5 | —5 | (0.02) | (0.01) |
| Total distributions | (0.20) | (0.35) | (0.38) | (0.36) | (0.48) | (0.29) |
| Net asset value, end of period | $9.77 | $9.89 | $9.68 | $9.94 | $9.76 | $9.55 |
| Total return (%)6 | 0.747 | 5.94 | 1.20 | 5.73 | 7.62 | (1.68)7 |
| Ratios and supplemental data | | | | | | |
| Net assets, end of period (in millions) | $—8 | $—8 | $—8 | $1 | $1 | $—8 |
| Ratios (as a percentage of average net assets): | | | | | | |
| Expenses before reductions9 | 3.6210 | 3.48 | 1.88 | 2.37 | 3.76 | 0.7410 |
| Expenses including reductions9 | 0.2610 | 0.22 | 0.22 | 0.22 | 0.20 | 0.4210 |
| Net investment income4 | 3.8010 | 3.53 | 3.69 | 3.42 | 3.57 | 3.3110 |
| Portfolio turnover (%) | 18 | 29 | 50 | 17 | 34 | 131 |
| 1 | Six months ended 2-29-20. Unaudited. |
| 2 | Period from 11-14-14 (commencement of operations) to 8-31-15. |
| 3 | Based on average daily shares outstanding. |
| 4 | Net investment income is affected by the timing and frequency of the declaration of dividends by the underlying funds in which the fund invests. |
| 5 | Less than $0.005 per share. |
| 6 | Total returns would have been lower had certain expenses not been reduced during the applicable periods. |
| 7 | Not annualized. |
| 8 | Less than $500,000. |
| 9 | Ratios do not include expenses indirectly incurred from underlying funds and can vary based on the mix of underlying funds held by the fund. |
| 10 | Annualized. |
| 16 | JOHN HANCOCK Income Allocation Fund | SEMIANNUAL REPORT | SEE NOTES TO FINANCIAL STATEMENTS |
| Notes to financial statements (unaudited) | |
Note 1—Organization
John Hancock Income Allocation Fund (the fund) is a series of John Hancock Funds II (the Trust), an open-end management investment company organized as a Massachusetts business trust and registered under the Investment Company Act of 1940, as amended (the 1940 Act). The investment objective of the fund is to seek to provide a high level of current income with consideration for capital appreciation and preservation.
The fund operates as a “fund of funds", investing in affiliated underlying funds of the Trust, other series of the Trust, other funds in John Hancock group of funds complex, non-John Hancock funds and certain other permitted investments.
The fund may offer multiple classes of shares. The shares currently outstanding are detailed in the Statement of assets and liabilities. Class A and Class C shares are offered to all investors. Class I shares are offered to institutions and certain investors. Class R6 shares are only available to certain retirement plans, institutions and other investors. Class C shares convert to Class A shares ten years after purchase (certain exclusions may apply). Shareholders of each class have exclusive voting rights to matters that affect that class. The distribution and service fees, if any, and transfer agent fees for each class may differ.
The accounting policies of the underlying funds in which the fund invests are outlined in the underlying funds’ shareholder reports, which include the underlying funds’ financial statements. These are available on the Securities and Exchange Commission (SEC) website at sec.gov. John Hancock underlying funds' shareholder reports are also available without charge by calling 800-225-5291 or visiting jhinvestments.com. The underlying funds are not covered by this report.
Note 2—Significant accounting policies
The financial statements have been prepared in conformity with accounting principles generally accepted in the United States of America (US GAAP), which require management to make certain estimates and assumptions as of the date of the financial statements. Actual results could differ from those estimates and those differences could be significant. The fund qualifies as an investment company under Topic 946 of Accounting Standards Codification of US GAAP.
Events or transactions occurring after the end of the fiscal period through the date that the financial statements were issued have been evaluated in the preparation of the financial statements. The following summarizes the significant accounting policies of the fund:
Security valuation. Investments are stated at value as of the scheduled close of regular trading on the New York Stock Exchange (NYSE), normally at 4:00 P.M., Eastern Time. In case of emergency or other disruption resulting in the NYSE not opening for trading or the NYSE closing at a time other than the regularly scheduled close, the net asset value (NAV) may be determined as of the regularly scheduled close of the NYSE pursuant to the fund's Valuation Policies and Procedures.
In order to value the securities, the fund uses the following valuation techniques: Equity securities, including exchange-traded or closed-end funds, are typically valued at the last sale price or official closing price on the exchange or principal market where the security trades. In the event there were no sales during the day or closing prices are not available, the securities are valued using the last available bid price. Investments in affiliated underlying funds, including John Hancock Collateral Trust (JHCT), and/or other open-end management investment companies, other than exchange-traded funds (ETFs), are valued at their respective NAVs each business day. Debt obligations are typically valued based on the evaluated prices provided by an independent pricing vendor.
| | SEMIANNUAL REPORT | JOHN HANCOCK Income Allocation Fund | 17 |
Independent pricing vendors utilize matrix pricing, which takes into account factors such as institutional-size trading in similar groups of securities, yield, quality, coupon rate, maturity, type of issue, trading characteristics and other market data, as well as broker supplied prices.
In certain instances, the Pricing Committee may determine to value equity securities using prices obtained from another exchange or market if trading on the exchange or market on which prices are typically obtained did not open for trading as scheduled, or if trading closed earlier than scheduled, and trading occurred as normal on another exchange or market.
Other portfolio securities and assets, for which reliable market quotations are not readily available, are valued at fair value as determined in good faith by the fund's Pricing Committee following procedures established by the Board of Trustees. The frequency with which these fair valuation procedures are used cannot be predicted and fair value of securities may differ significantly from the value that would have been used had a ready market for such securities existed.
The fund uses a three-tier hierarchy to prioritize the pricing assumptions, referred to as inputs, used in valuation techniques to measure fair value. Level 1 includes securities valued using quoted prices in active markets for identical securities, including registered investment companies. Level 2 includes securities valued using other significant observable inputs. Observable inputs may include quoted prices for similar securities, interest rates, prepayment speeds and credit risk. Prices for securities valued using these inputs are received from independent pricing vendors and brokers and are based on an evaluation of the inputs described. Level 3 includes securities valued using significant unobservable inputs when market prices are not readily available or reliable, including the fund's own assumptions in determining the fair value of investments. Factors used in determining value may include market or issuer specific events or trends, changes in interest rates and credit quality. The inputs or methodology used for valuing securities are not necessarily an indication of the risks associated with investing in those securities. Changes in valuation techniques and related inputs may result in transfers into or out of an assigned level within the disclosure hierarchy.
The following is a summary of the values by input classification of the fund's investments as of February 29, 2020, by major security category or type:
| | Total
value at
2-29-20 | Level 1
quoted
price | Level 2
significant
observable
inputs | Level 3
significant
unobservable
inputs |
| Investments in securities: | | | | |
| Assets | | | | |
| Affiliated investment companies | $4,921,016 | $4,921,016 | — | — |
| Unaffiliated investment companies | 889,245 | 889,245 | — | — |
| Short-term investments | 453,711 | 433,713 | $19,998 | — |
| Total investments in securities | $6,263,972 | $6,243,974 | $19,998 | — |
Security transactions and related investment income. Investment security transactions are accounted for on a trade date plus one basis for daily NAV calculations. However, for financial reporting purposes, investment transactions are reported on trade date. Interest income is accrued as earned. Interest income includes coupon interest and amortization/accretion of premiums/discounts on debt securities. Debt obligations may be placed in a non-accrual status and related interest income may be reduced by stopping current accruals and writing off interest receivable when the collection of all or a portion of interest has become doubtful. Dividend income is recorded on the ex-date, except for dividends of certain foreign securities where the dividend may not be known
| 18 | JOHN HANCOCK Income Allocation Fund | SEMIANNUAL REPORT | |
until after the ex-date. In those cases, dividend income, net of withholding taxes, is recorded when the fund becomes aware of the dividends. Non-cash dividends, if any, are recorded at the fair market value of the securities received. Gains and losses on securities sold are determined on the basis of identified cost and may include proceeds from litigation.
Securities lending. The fund may lend its securities to earn additional income. The fund receives collateral from the borrower in an amount not less than the market value of the loaned securities. The fund will invest its cash collateral in JHCT, an affiliate of the fund, which has a floating NAV and is registered with the SEC as an investment company. JHCT invests in short-term money market investments. The fund will receive the benefit of any gains and bear any losses generated by JHCT with respect to the cash collateral.
The fund has the right to recall loaned securities on demand. If a borrower fails to return loaned securities when due, then the lending agent is responsible and indemnifies the fund for the lent securities. The lending agent uses the collateral received from the borrower to purchase replacement securities of the same issue, type, class and series of the loaned securities. If the value of the collateral is less than the purchase cost of replacement securities, the lending agent is responsible for satisfying the shortfall but only to the extent that the shortfall is not due to any decrease in the value of JHCT.
Although the risk of loss on securities lent is mitigated by receiving collateral from the borrower and through lending agent indemnification, the fund could experience a delay in recovering securities or could experience a lower than expected return if the borrower fails to return the securities on a timely basis. The fund receives compensation for lending its securities by retaining a portion of the return on the investment of the collateral and compensation from fees earned from borrowers of the securities. Securities lending income received by the fund is net of fees retained by the securities lending agent. Net income received from JHCT is a component of securities lending income as recorded on the Statement of operations.
Obligations to repay collateral received by the fund are shown on the Statement of assets and liabilities as Payable upon return of securities loaned and are secured by the loaned securities. As of February 29, 2020, the fund loaned securities valued at $271,099 and received $277,540 of cash collateral.
Overdraft. The fund may have the ability to borrow from banks for temporary or emergency purposes, including meeting redemption requests that otherwise might require the untimely sale of securities. Pursuant to the fund's custodian agreement, the custodian may loan money to the fund to make properly authorized payments. The fund is obligated to repay the custodian for any overdraft, including any related costs or expenses. The custodian may have a lien, security interest or security entitlement in any fund property that is not otherwise segregated or pledged, to the extent of any overdraft, and to the maximum extent permitted by law. Overdrafts at period end are presented under the caption Due to custodian in the Statement of assets and liabilities.
Line of credit. The fund and other affiliated funds have entered into a syndicated line of credit agreement with Citibank, N.A. as the administrative agent that enables them to participate in a $750 million unsecured committed line of credit. Excluding commitments designated for a certain fund and subject to the needs of all other affiliated funds, the fund can borrow up to an aggregate commitment amount of $500 million, subject to asset coverage and other limitations as specified in the agreement. A commitment fee payable at the end of each calendar quarter, based on the average daily unused portion of the line of credit, is charged to each participating fund based on a combination of fixed and asset based allocations and is reflected in Other expenses on the Statement of operations. For the six months ended February 29, 2020, the fund had no borrowings under the line of credit. Commitment fees for the six months ended February 29, 2020 were $1,037.
| | SEMIANNUAL REPORT | JOHN HANCOCK Income Allocation Fund | 19 |
Expenses. Within the John Hancock group of funds complex, expenses that are directly attributable to an individual fund are allocated to such fund. Expenses that are not readily attributable to a specific fund are allocated among all funds in an equitable manner, taking into consideration, among other things, the nature and type of expense and the fund’s relative net assets. Expense estimates are accrued in the period to which they relate and adjustments are made when actual amounts are known.
Class allocations. Income, common expenses and realized and unrealized gains (losses) are determined at the fund level and allocated daily to each class of shares based on the net assets of the class. Class-specific expenses, such as distribution and service fees, if any, and transfer agent fees, for all classes, are charged daily at the class level based on the net assets of each class and the specific expense rates applicable to each class.
Federal income taxes. The fund intends to continue to qualify as a regulated investment company by complying with the applicable provisions of the Internal Revenue Code and will not be subject to federal income tax on taxable income that is distributed to shareholders. Therefore, no federal income tax provision is required.
For federal income tax purposes, as of August 31, 2019, the fund has a short-term capital loss carryforward of $4,180,315 and a long-term capital loss carryforward of $1,162 available to offset future net realized capital gains.These carryforwards do not expire.
As of August 31, 2019, the fund had no uncertain tax positions that would require financial statement recognition, derecognition or disclosure. The fund's federal tax returns are subject to examination by the Internal Revenue Service for a period of three years.
Distribution of income and gains. Distributions to shareholders from net investment income and net realized gains, if any, are recorded on the ex-date. The fund generally declares and pays dividends monthly. Capital gain distributions, if any, are typically distributed annually.
Distributions paid by the fund with respect to each class of shares are calculated in the same manner, at the same time and in the same amount, except for the effect of class level expenses that may be applied differently to each class.
Such distributions, on a tax basis, are determined in conformity with income tax regulations, which may differ from US GAAP. Distributions in excess of tax basis earnings and profits, if any, are reported in the fund's financial statements as a return of capital. The final determination of tax characteristics of the fund's distribution will occur at the end of the year and will subsequently be reported to shareholders.
Capital accounts within the financial statements are adjusted for permanent book-tax differences. These adjustments have no impact on net assets or the results of operations. Temporary book-tax differences, if any, will reverse in a subsequent period. Book-tax differences are primarily attributable to wash sale loss deferrals.
Note 3—Derivative instruments
The fund may invest in derivatives in order to meet its investment objective. Derivatives include a variety of different instruments that may be traded in the over-the-counter (OTC) market, on a regulated exchange or through a clearing facility. The risks in using derivatives vary depending upon the structure of the instruments, including the use of leverage, optionality, the liquidity or lack of liquidity of the contract, the creditworthiness of the counterparty or clearing organization and the volatility of the position. Some derivatives involve risks that are potentially greater than the risks associated with investing directly in the referenced securities or other referenced underlying instrument. Specifically, the fund is exposed to the risk that the counterparty to an OTC derivatives contract will be unable or unwilling to make timely settlement payments or otherwise honor its obligations. OTC derivatives transactions typically can only be closed out with the other party to the transaction.
| 20 | JOHN HANCOCK Income Allocation Fund | SEMIANNUAL REPORT | |
Certain derivatives are traded or cleared on an exchange or central clearinghouse. Exchange-traded or centrally-cleared transactions generally present less counterparty risk to a fund than OTC transactions. The exchange or clearinghouse stands between the fund and the broker to the contract and therefore, credit risk is generally limited to the failure of the exchange or clearinghouse and the clearing member.
Futures. A futures contract is a contractual agreement to buy or sell a particular currency or financial instrument at a pre-determined price in the future. Futures are traded on an exchange and cleared through a central clearinghouse. Risks related to the use of futures contracts include possible illiquidity of the futures markets and contract prices that can be highly volatile and imperfectly correlated to movements in the underlying financial instrument and potential losses in excess of the amounts recognized on the Statement of assets and liabilities. Use of long futures contracts subjects the fund to the risk of loss up to the notional value of the futures contracts. Use of short futures contracts subjects the fund to unlimited risk of loss.
Upon entering into a futures contract, the fund is required to deposit initial margin with the broker in the form of cash or securities. The amount of required margin is set by the broker and is generally based on a percentage of the contract value. The margin deposit must then be maintained at the established level over the life of the contract. Cash that has been pledged by the fund is detailed in the Statement of assets and liabilities as Collateral held at broker for futures contracts. Securities pledged by the fund, if any, are identified in the Fund's investments. Subsequent payments, referred to as variation margin, are made or received by the fund periodically and are based on changes in the market value of open futures contracts. Futures contracts are marked-to-market daily and unrealized gain or loss is recorded by the fund. When the contract is closed, the fund records a realized gain or loss equal to the difference between the value of the contract at the time it was opened and the value at the time it was closed.
During the six months ended February 29, 2020, the fund used futures contracts to manage against anticipated interest rate changes and gain exposure to treasuries market. The fund held futures contracts with USD notional values ranging up to $130,000 as measured at each quarter end. There were no open futures contracts as of February 29, 2020.
Effect of derivative instruments on the Statement of operations
The table below summarizes the net realized gain (loss) included in the net increase (decrease) in net assets from operations, classified by derivative instrument and risk category, for the six months ended February 29, 2020:
| | Statement of operations location - Net realized gain (loss) on: |
| Risk | Futures contracts |
| Interest rate | $2,027 |
The table below summarizes the net change in unrealized appreciation (depreciation) included in the net increase (decrease) in net assets from operations, classified by derivative instrument and risk category, for the six months ended February 29, 2020:
| | Statement of operations location - Change in net unrealized appreciation (depreciation) of: |
| Risk | Futures contracts |
| Interest rate | $283 |
| | SEMIANNUAL REPORT | JOHN HANCOCK Income Allocation Fund | 21 |
Note 4—Guarantees and indemnifications
Under the Trust's organizational documents, its Officers and Trustees are indemnified against certain liabilities arising out of the performance of their duties to the Trust, including the fund. Additionally, in the normal course of business, the fund enters into contracts with service providers that contain general indemnification clauses. The fund's maximum exposure under these arrangements is unknown, as this would involve future claims that may be made against the fund that have not yet occurred. The risk of material loss from such claims is considered remote.
Note 5—Fees and transactions with affiliates
John Hancock Investment Management LLC (the Advisor) serves as investment advisor for the fund. John Hancock Investment Management Distributors LLC (the Distributor), an affiliate of the Advisor, serves as principal underwriter of the fund. The Advisor and the Distributor are indirect, wholly owned subsidiaries of Manulife Financial Corporation (MFC).
Management fee. The fund has an investment management agreement with the Advisor. The Advisor has a subadvisory agreement with Manulife Investment Management (US) LLC, an indirectly owned subsidiary of MFC and an affiliate of the Advisor. The fund is not responsible for payment of the subadvisory fees.
The management fee has two components: (1) a fee on assets invested in a fund of the Trust or John Hancock Funds III (JHF III); and (2) a fee on assets invested in investments other than a fund of the Trust or JHF III (Other assets).
Management Fees are determined in accordance with the following schedule:
| | First $5.0 billion of average net assets | Excess over $5.0 billion of average net assets |
| Assets in a fund of the Trust or JHF III | 0.200% | 0.175% |
| Other assets | 0.650% | 0.625% |
Effective January 1, 2020, the Advisor has contractually agreed to reduce its management fee or make payments to the fund if other expenses of the fund exceed 0.14% of average net assets. Expenses excluded from this waiver include management fees, taxes, brokerage commissions, interest expense, litigation and indemnification expenses, and other extraordinary expenses not incurred in the ordinary course of the fund’s business, class specific expenses, underlying fund expenses (acquired fund fees) and short dividend expense. The current expense limitation agreement expires on December 31, 2020, unless renewed by mutual agreement of the fund and the Advisor based upon a determination that this is appropriate under the circumstances at that time. Prior to January 1, 2020, the Advisor contractually agreed to reduce its management fee, or if necessary make payment to the fund, in an amount equal to the amount by which the expenses of the fund, excluding management fees, exceed 0.04% of the average net assets of the fund.
The Advisor has contractually agreed to waive its management fees so that the aggregate management fee amount retained by the Advisor, with respect to both the fund and its underlying investments, after payment of subadvisory fees for the fund does not exceed 0.45% of the fund’s average net assets. The current expense limitation agreement expires on December 31, 2020, unless renewed by mutual agreement of the fund and the Advisor based upon a determination that this is appropriate under the circumstances at that time.
For the six months ended February 29, 2020, the expense reductions described above amounted to the following:
| Class | Expense reduction |
| Class A | $83,033 |
| Class | Expense reduction |
| Class C | $12,920 |
| 22 | JOHN HANCOCK Income Allocation Fund | SEMIANNUAL REPORT | |
| Class | Expense reduction |
| Class I | $5,348 |
| Class R6 | 3,523 |
| Class | Expense reduction |
| Total | $104,824 |
Expenses waived or reimbursed in the current fiscal period are not subject to recapture in future fiscal periods.
The investment management fees, including the impact of the waivers and reimbursements as described above, incurred for the six months ended February 29, 2020, were equivalent to a net annual effective rate of 0.00% of the fund's average daily net assets.
Accounting and legal services. Pursuant to a service agreement, the fund reimburses the Advisor for all expenses associated with providing the administrative, financial, legal, compliance, accounting and recordkeeping services to the fund, including the preparation of all tax returns, periodic reports to shareholders and regulatory reports, among other services. These expenses are allocated to each share class based on its relative net assets at the time the expense was incurred. These accounting and legal services fees incurred for the six months ended February 29, 2020 amounted to an annual rate of 0.02% of the fund's average daily net assets.
Distribution and service plans. The fund has a distribution agreement with the Distributor. The fund has adopted distribution and service plans for certain classes as detailed below pursuant to Rule 12b-1 under the 1940 Act, to pay the Distributor for services provided as the distributor of shares of the fund. The fund may pay up to the following contractual rates of distribution and service fees under these arrangements, expressed as an annual percentage of average daily net assets for each class of the fund's shares:
| Class | Rule 12b-1 Fee |
| Class A | 0.30% |
| Class C | 1.00% |
Sales charges. Class A shares are assessed up-front sales charges, which resulted in payments to the Distributor amounting to $178 for the six months ended February 29, 2020. Of this amount, $26 was retained and used for printing prospectuses, advertising, sales literature and other purposes and $152 was paid as sales commissions to broker-dealers.
Class A and Class C shares may be subject to contingent deferred sales charges (CDSCs). Certain Class A shares that are acquired through purchases of $1 million or more and are redeemed within one year of purchase are subject to a 1.00% sales charge. Class C shares that are redeemed within one year of purchase are subject to a 1.00% CDSC. CDSCs are applied to the lesser of the current market value at the time of redemption or the original purchase cost of the shares being redeemed. Proceeds from CDSCs are used to compensate the Distributor for providing distribution-related services in connection with the sale of these shares. During the six months ended February 29, 2020, CDSCs received by the Distributor amounted to $2 for Class C shares. There were no CDSCs received by the Distributor for Class A shares.
Transfer agent fees. The John Hancock group of funds has a complex-wide transfer agent agreement with John Hancock Signature Services, Inc. (Signature Services), an affiliate of the Advisor. The transfer agent fees paid to Signature Services are determined based on the cost to Signature Services (Signature Services Cost) of providing recordkeeping services. It also includes out-of-pocket expenses, including payments made to third-parties for recordkeeping services provided to their clients who invest in one or more John Hancock funds. In addition, Signature Services Cost may be reduced by certain fees that Signature Services receives in connection with retirement and small accounts. Signature Services Cost is calculated monthly and allocated, as applicable, to five categories of share classes: Retail Share and Institutional Share Classes of Non-Municipal Bond Funds, Class R6
| | SEMIANNUAL REPORT | JOHN HANCOCK Income Allocation Fund | 23 |
Shares, Retirement Share Classes and Municipal Bond Share Classes. Within each of these categories, the applicable costs are allocated to the affected John Hancock affiliated funds and/or classes, based on the relative average daily net assets.
Class level expenses. Class level expenses for the six months ended February 29, 2020 were as follows:
| Class | Distribution and service fees | Transfer agent fees |
| Class A | $7,422 | $3,043 |
| Class C | 3,842 | 473 |
| Class I | — | 193 |
| Class R6 | — | 14 |
| Total | $11,264 | $3,723 |
Trustee expenses. The fund compensates each Trustee who is not an employee of the Advisor or its affiliates. The costs of paying Trustee compensation and expenses are allocated to the fund based on its net assets relative to other funds within the John Hancock group of funds complex.
Note 6—Fund share transactions
Transactions in fund shares for the six months ended February 29, 2020 and for the year ended August 31, 2019 were as follows:
| | Six Months Ended 2-29-20 | Year Ended 8-31-19 |
| | Shares | Amount | Shares | Amount |
| Class A shares | | | | |
| Sold | 77,437 | $774,952 | 91,909 | $877,445 |
| Distributions reinvested | 8,634 | 86,242 | 15,609 | 149,203 |
| Repurchased | (102,836) | (1,037,272) | (132,006) | (1,268,049) |
| Net decrease | (16,765) | $(176,078) | (24,488) | $(241,401) |
| Class C shares | | | | |
| Sold | 9,636 | $97,118 | 26,389 | $253,592 |
| Distributions reinvested | 1,037 | 10,325 | 1,991 | 18,933 |
| Repurchased | (13,363) | (133,120) | (38,724) | (366,644) |
| Net decrease | (2,690) | $(25,677) | (10,344) | $(94,119) |
| Class I shares | | | | |
| Sold | 12,688 | $128,297 | 13,655 | $129,770 |
| Distributions reinvested | 603 | 6,028 | 1,180 | 11,271 |
| Repurchased | (3,461) | (34,741) | (13,720) | (132,570) |
| Net increase | 9,830 | $99,584 | 1,115 | $8,471 |
| 24 | JOHN HANCOCK Income Allocation Fund | SEMIANNUAL REPORT | |
| | Six Months Ended 2-29-20 | Year Ended 8-31-19 |
| | Shares | Amount | Shares | Amount |
| Class R6 shares | | | | |
| Sold | 200 | $2,000 | 9,234 | $88,679 |
| Distributions reinvested | 328 | 3,279 | 414 | 3,991 |
| Repurchased | (4,943) | (49,824) | — | — |
| Net increase (decrease) | (4,415) | $(44,545) | 9,648 | $92,670 |
| Total net decrease | (14,040) | $(146,716) | (24,069) | $(234,379) |
Affiliates of the fund owned 100% of shares of Class R6 on February 29, 2020. Such concentration of shareholders’ capital could have a material effect on the fund if such shareholders redeem from the fund.
Note 7—Purchase and sale of securities
Purchases and sales of securities, other than short-term investments, amounted to $1,135,947 and $1,298,134, respectively, for the six months ended February 29, 2020.
Note 8—Investment in affiliated underlying funds
The fund invests primarily in affiliated underlying funds that are managed by the Advisor and its affiliates. The fund does not invest in the affiliated underlying funds for the purpose of exercising management or control; however, the fund's investment may represent a significant portion of each underlying funds’ net assets. At February 29, 2020, the fund did not hold 5% or more of the net assets of any underlying funds.
Information regarding the fund's fiscal year to date purchases and sales of the affiliated underlying funds as well as income and capital gains earned by the fund, if any, is as follows:
| | | | | | | | Dividends and distributions |
| Affiliate | Ending
share
amount | Beginning
value | Cost of
purchases | Proceeds
from shares
sold | Realized
gain
(loss) | Change in
unrealized
appreciation
(depreciation) | Income
distributions
received | Capital gain
distributions
received | Ending
value |
| Bond | 77,890 | $1,398,561 | $262,949 | $(387,700) | $13,163 | $2,880 | $24,162 | $8,619 | $1,289,853 |
| Emerging Markets Debt | 51,234 | 498,669 | 75,059 | (97,299) | 148 | 11,682 | 8,614 | — | 488,259 |
| Floating Rate Income | 29,289 | 242,857 | 40,403 | (40,556) | (877) | (3,414) | 7,069 | — | 238,413 |
| Global Equity | 22,488 | 274,288 | 43,953 | (61,498) | 3,054 | (9,735) | 5,412 | 1,342 | 250,062 |
| Global Shareholder Yield | 49,435 | 563,815 | 85,627 | (112,534) | 817 | (25,578) | 7,728 | 9,680 | 512,147 |
| High Yield | 97,301 | 334,515 | 51,698 | (54,726) | (414) | (4,143) | 9,448 | — | 326,930 |
| John Hancock Collateral Trust* | 27,734 | 50,150 | 3,787,705 | (3,560,315) | (33) | 82 | 1,643 | — | 277,589 |
| Short Duration Credit Opportunities | 26,944 | 260,431 | 40,543 | (44,331) | (659) | 793 | 4,744 | — | 256,777 |
| Strategic Income Opportunities | 119,655 | 1,338,627 | 206,393 | (271,422) | (2,572) | 6,886 | 16,863 | — | 1,277,912 |
| U.S. High Yield Bond | 25,585 | 285,320 | 46,011 | (45,446) | (473) | (4,749) | 8,613 | — | 280,663 |
| | | | | | $12,154 | $(25,296) | $94,296 | $19,641 | $5,198,605 |
| | SEMIANNUAL REPORT | JOHN HANCOCK Income Allocation Fund | 25 |
| * | Refer to the Securities lending note within Note 2 for details regarding this investment. |
Note 9—Subsequent events
Effective April 17, 2020, the fund’s name is changing to John Hancock Multi-Asset High Income Fund in connection with changes to the fund’s principal investment strategies occurring on or about May 18, 2020. These changes were approved by the Board of Trustees on March 17, 2020.
A widespread health crisis such as a global pandemic could cause substantial market volatility, exchange trading suspensions and closures, impact the ability to complete redemptions, and affect fund performance. For example, the novel coronavirus disease (COVID-19) has resulted in significant disruptions to global business activity. The impact of a health crisis and other epidemics and pandemics that may arise in the future, could affect the global economy in ways that cannot necessarily be foreseen at the present time. A health crisis may exacerbate other pre-existing political, social and economic risks. Any such impact could adversely affect the fund's performance, resulting in losses to your investment.
| 26 | JOHN HANCOCK Income Allocation Fund | SEMIANNUAL REPORT | |
| | |
Trustees
Hassell H. McClellan,Chairperson
Steven R. Pruchansky,Vice Chairperson
Andrew G. Arnott†
Charles L. Bardelis*
James R. Boyle
Peter S. Burgess*
William H. Cunningham
Grace K. Fey
Marianne Harrison†
Deborah C. Jackson
James M. Oates*
Gregory A. Russo
Officers
Andrew G. Arnott
President
Francis V. Knox, Jr.
Chief Compliance Officer
Charles A. Rizzo
Chief Financial Officer
Salvatore Schiavone
Treasurer
Christopher (Kit) Sechler
Secretary and Chief Legal Officer
| Investment advisor
John Hancock Investment Management LLC
Subadvisor
Manulife Investment Management (US) LLC
Portfolio Managers
Nathan W. Thooft, CFA
Christopher Walsh, CFA
Principal distributor
John Hancock Investment Management Distributors LLC
Custodian
State Street Bank and Trust Company
Transfer agent
John Hancock Signature Services, Inc.
Legal counsel
K&L Gates LLP
|
* Member of the Audit Committee
† Non-Independent Trustee
The fund's proxy voting policies and procedures, as well as the fund proxy voting record for the most recent twelve-month period ended June 30, are available free of charge on the Securities and Exchange Commission (SEC) website at sec.gov or on our website.
All of the fund's holdings as of the end of the third month of every fiscal quarter are filed with the SEC on Form N-PORT within 60 days of the end of the fiscal quarter. The fund's Form N-PORT filings are available on our website and the SEC's website, sec.gov.
We make this information on your fund, as well asmonthly portfolio holdings, and other fund details available on our website at jhinvestments.com or by calling 800-225-5291.
| | | | |
| | You can also contact us: |
| | 800-225-5291
jhinvestments.com | Regular mail:
John Hancock Signature Services, Inc.
P.O. Box 55913
Boston, MA 02205-5913
| Express mail:
John Hancock Signature Services, Inc.
2000 Crown Colony Drive
Suite 55913
Quincy, MA 02169-0953
|
SEMIANNUAL REPORT | JOHN HANCOCK INCOME ALLOCATION FUND 27
John Hancock family of funds
| | | |
DOMESTIC EQUITY FUNDS
Blue Chip Growth
Classic Value
Disciplined Value
Disciplined Value Mid Cap
Equity Income
Financial Industries
Fundamental All Cap Core
Fundamental Large Cap Core
New Opportunities
Regional Bank
Small Cap Core
Small Cap Growth
Small Cap Value
U.S. Global Leaders Growth
U.S. Quality Growth
GLOBAL AND INTERNATIONAL EQUITY FUNDS
Disciplined Value International
Emerging Markets
Emerging Markets Equity
Fundamental Global Franchise
Global Equity
Global Shareholder Yield
Global Thematic Opportunities
International Dynamic Growth
International Growth
International Small Company
| | INCOME FUNDS
Bond
California Tax-Free Income
Emerging Markets Debt
Floating Rate Income
Government Income
High Yield
High Yield Municipal Bond
Income
Investment Grade Bond
Money Market
Short Duration Bond
Short Duration Credit Opportunities
Strategic Income Opportunities
Tax-Free Bond
ALTERNATIVE AND SPECIALTY FUNDS
Absolute Return Currency
Alternative Asset Allocation
Alternative Risk Premia
Diversified Macro
Infrastructure
Multi-Asset Absolute Return
Seaport Long/Short
|
A fund's investment objectives, risks, charges, and expenses should be considered carefully before investing. The prospectus contains this and other important information about the fund. To obtain a prospectus, contact your financial professional, call John Hancock Investment Management at 800-225-5291, or visit our website at jhinvestments.com. Please read the prospectus carefully before investing or sending money.
| | | |
ASSET ALLOCATION
Balanced
Income Allocation
Multi-Index Lifetime Portfolios
Multi-Index Preservation Portfolios
Multimanager Lifestyle Portfolios
Multimanager Lifetime Portfolios
Retirement Income 2040
EXCHANGE-TRADED FUNDS
John Hancock Multifactor Consumer Discretionary ETF
John Hancock Multifactor Consumer Staples ETF
John Hancock Multifactor Developed International ETF
John Hancock Multifactor Emerging Markets ETF
John Hancock Multifactor Energy ETF
John Hancock Multifactor Financials ETF
John Hancock Multifactor Healthcare ETF
John Hancock Multifactor Industrials ETF
John Hancock Multifactor Large Cap ETF
John Hancock Multifactor Materials ETF
John Hancock Multifactor Media and
Communications ETF
John Hancock Multifactor Mid Cap ETF
John Hancock Multifactor Small Cap ETF
John Hancock Multifactor Technology ETF
John Hancock Multifactor Utilities ETF
| | ENVIRONMENTAL, SOCIAL, AND
GOVERNANCE FUNDS
ESG All Cap Core
ESG Core Bond
ESG International Equity
ESG Large Cap Core
CLOSED-END FUNDS
Financial Opportunities
Hedged Equity & Income
Income Securities Trust
Investors Trust
Preferred Income
Preferred Income II
Preferred Income III
Premium Dividend
Tax-Advantaged Dividend Income
Tax-Advantaged Global Shareholder Yield
|
John Hancock Multifactor ETF shares are bought and sold at market price (not NAV), and are not individually redeemed
from the fund. Brokerage commissions will reduce returns.
John Hancock ETFs are distributed by Foreside Fund Services, LLC, and are subadvised by Dimensional Fund Advisors LP.
Foreside is not affiliated with John Hancock Investment Management Distributors LLC or Dimensional Fund Advisors LP.
Dimensional Fund Advisors LP receives compensation from John Hancock in connection with licensing rights to the
John Hancock Dimensional indexes. Dimensional Fund Advisors LP does not sponsor, endorse, or sell, and makes no
representation as to the advisability of investing in, John Hancock Multifactor ETFs.
John Hancock Investment Management
A trusted brand
John Hancock Investment Management is a premier asset manager
representing one of America's most trusted brands, with a heritage of
financial stewardship dating back to 1862. Helping our shareholders
pursue their financial goals is at the core of everything we do. It's why
we support the role of professional financial advice and operate with
the highest standards of conduct and integrity.
A better way to invest
We serve investors globally through a unique multimanager approach:
We search the world to find proven portfolio teams with specialized
expertise for every strategy we offer, then we apply robust investment
oversight to ensure they continue to meet our uncompromising
standards and serve the best interests of our shareholders.
Results for investors
Our unique approach to asset management enables us to provide
a diverse set of investments backed by some of the world's best
managers, along with strong risk-adjusted returns across asset classes.
John Hancock Investment Management Distributors LLC n Member FINRA, SIPC
200 Berkeley Street n Boston, MA 02116-5010 n 800-225-5291 n jhinvestments.com
This report is for the information of the shareholders of John Hancock Income Allocation Fund. It is not authorized for distribution to prospective investors unless preceded or accompanied by a prospectus.
| | |
| MF1105626 | 448SA 2/20
4/2020 |
John Hancock
Small Cap Value Fund
Semiannual report 2/29/2020
Beginning on January 1, 2021, as permitted by regulations adopted by the Securities and Exchange Commission, paper copies of the fund's shareholder reports like this one will no longer be sent by mail, unless you specifically request paper copies of the reports from the fund or from your financial intermediary. Instead, the reports will be made available on a website, and you will be notified by mail each time a report is posted and provided with a website link to access the report.
If you already elected to receive shareholder reports electronically, you will not be affected by this change, and you do not need to take any action. You may elect to receive shareholder reports and other communications electronically by calling John Hancock Investment Management at 800-225-5291 (Class A shares) or 888-972-8696 (Class I and Class R6 shares) or by contacting your financial intermediary.
You may elect to receive all reports in paper, free of charge, at any time. You can inform John Hancock Investment Management or your financial intermediary that you wish to continue receiving paper copies of your shareholder reports by following the instructions listed above. Your election to receive reports in paper will apply to all funds held with John Hancock Investment Management or your financial intermediary.
A message to shareholders
Dear shareholder,
Global financial markets were on pace to deliver strong returns during the 6 months ended February 29, 2020, until heightened fears over the coronavirus (COVID-19) sent markets tumbling during the last week of the period. Prior to the turbulence that ended the period, investors benefited from a combination of low inflation, accommodative central bank policy, healthy fundamentals, and corporate buybacks of stock.
However, the COVID-19 pandemic and plummeting oil prices put an end to all that good news. Shortly after period end, the U.S. Federal Reserve lowered short-term interest rates while lawmakers embarked on a plan to launch major fiscal stimulus to support the economy.
After the longest bull market in U.S. history, we're now in bear market territory. Indeed, the spread of COVID-19, trade disputes, rising unemployment, and other geopolitical tensions may continue to create uncertainty among businesses and investors. Your financial professional can helpposition your portfolio so that it's sufficiently diversified to seek to meet your long-term objectives and to withstand the inevitable bouts of market volatility along the way.
On behalf of everyone at John Hancock Investment Management, I'd like to take this opportunity to welcome new shareholders and thank existing shareholders for the continued trust you've placed in us.
Sincerely,
Andrew G. Arnott
President and CEO,
John Hancock Investment Management
Head of Wealth and Asset Management,
United States and Europe
This commentary reflects the CEO's views as of this report's period end and are subject to change at any time. Diversification does not guarantee investment returns and does not eliminate risk of loss. All investments entail risks, including the possible loss of principal. For more up-to-date information, you can visit our website at jhinvestments.com.
John Hancock
Small Cap Value Fund
Table of contents
| | | |
| 2 | | Your fund at a glance |
| 3 | | Portfolio summary |
| 4 | | A look at performance |
| 6 | | Your expenses |
| 8 | | Fund's investments |
| 13 | | Financial statements |
| 16 | | Financial highlights |
| 20 | | Notes to financial statements |
| 29 | | More information |
SEMIANNUAL REPORT | JOHN HANCOCK SMALL CAP VALUE FUND 1
INVESTMENT OBJECTIVE
The fund seeks long-term capital appreciation.
AVERAGE ANNUAL TOTAL RETURNS AS OF 2/29/2020 (%)
The Russell 2000 Value Index is an unmanaged index that measures the performance of those Russell 2000 Index companies with lower price-to-book ratios and lower forecasted growth values.
It is not possible to invest directly in an index. Index figures do not reflect expenses or sales charges, which would result in lower returns.
Figures from Morningstar, Inc. include reinvested distributions and do not take into account sales charges. Actual load-adjusted performance is lower. Since-inception returns for the Morningstar fund category average are not available.
| 1 | Class A shares were first offered on 12-30-13. The returns prior to this date are those of Class NAV shares that have not been adjusted for class-specific expenses; otherwise, returns would vary. |
The past performance shown here reflects reinvested distributions and the beneficial effect of any expense reductions, and does not guarantee future results. Returns for periods shorter than one year are cumulative. Performance of the other share classes will vary based on the difference in the fees and expenses of those classes. Shares will fluctuate in value and, when redeemed, may be worth more or less than their original cost. Current month-end performance may be lower or higher than the performance cited, and can be found at jhinvestments.com or by calling 800-225-5291. For further information on the fund's objectives, risks, and strategy, see the fund's prospectus. The fund recently experienced negative short-term performance due to market volatility associated with the COVID-19 pandemic.
SEMIANNUAL REPORT | JOHN HANCOCK SMALL CAP VALUE FUND 2
SECTOR COMPOSITION AS OF 2/29/2020 (%)
TOP 10 HOLDINGS AS OF 2/29/2020 (%)
| | |
| Physicians Realty Trust | 2.2 |
| TriMas Corp. | 2.1 |
| Huron Consulting Group, Inc. | 2.0 |
| Mueller Industries, Inc. | 2.0 |
| RPT Realty | 2.0 |
| First Midwest Bancorp, Inc. | 1.9 |
| American Woodmark Corp. | 1.8 |
| Belden, Inc. | 1.8 |
| Spectrum Brands Holdings, Inc. | 1.7 |
| Banc of California, Inc. | 1.6 |
| TOTAL | 19.1 |
| As a percentage of net assets. |
| Cash and cash equivalents are not included. |
A note about risks
The fund may be subject to various risks as described in the fund's prospectus. For more information, please refer to the "Principal risks" section of the prospectus and "Subsequent events" section in the Notes to financial statements.
SEMIANNUAL REPORT | JOHN HANCOCK SMALL CAP VALUE FUND 3
TOTAL RETURNS FOR THE PERIOD ENDED FEBRUARY 29, 2020
| | | | | | | | |
Average annual total returns (%)
with maximum sales charge | | Cumulative total returns (%)
with maximum sales charge |
| | 1-year | 5-year | 10-year | | 6-month | 5-year | 10-year |
| Class A1 | -12.38 | 1.31 | 8.24 | | -9.57 | 6.75 | 120.84 |
| Class I1,2 | -7.47 | 2.68 | 9.00 | | -4.63 | 14.15 | 136.84 |
| Class R61,2 | -7.38 | 2.78 | 9.09 | | -4.59 | 14.70 | 138.63 |
| Class NAV2 | -7.33 | 2.80 | 9.09 | | -4.54 | 14.82 | 138.75 |
| Index† | -9.29 | 3.61 | 8.67 | | -2.58 | 19.40 | 129.57 |
Performance figures assume all distributions have been reinvested. Figures reflect maximum sales charges on Class A shares of 5.0%. Sales charges are not applicable to Class I, Class R6, and Class NAV shares.
The expense ratios of the fund, both net (including any fee waivers and/or expense limitations) and gross (excluding any fee waivers and/or expense limitations), are set forth according to the most recent publicly available prospectuses for the fund and may differ from those disclosed in the Financial highlights tables in this report. Net expenses reflect contractual expense limitations in effect until July 31, 2021 and are subject to change. Had the contractual fee waivers and expense limitations not been in place, gross expenses would apply. The expense ratios are as follows:
| | | | | |
| | Class A | Class I | Class R6 | Class NAV |
| Gross (%) | 1.56 | 1.26 | 1.15 | 1.14 |
| Net (%) | 1.55 | 1.25 | 1.14 | 1.13 |
Please refer to the most recent prospectus and annual or semiannual report for more information on expenses and any expense limitation arrangements for each class.
The returns reflect past results and should not be considered indicative of future performance. The return and principal value of an investment will fluctuate so that shares, when redeemed, may be worth more or less than their original cost. Due to market volatility and other factors, the fund's current performance may be higher or lower than the performance shown. For current to the most recent month-end performance data, please call 800-225-5291 or visit the fund's website at jhinvestments.com.
The performance table above and the chart on the next page do not reflect the deduction of taxes that a shareholder would pay on fund distributions or the redemption of fund shares. The fund's performance results reflect any applicable fee waivers or expense reductions, without which the expenses would increase and results would have been less favorable.
| † | Index is the Russell 2000 Value Index. |
See the following page for footnotes.
SEMIANNUAL REPORT | JOHN HANCOCK SMALL CAP VALUE FUND 4
This chart and table show what happened to a hypothetical $10,000 investment in John Hancock Small Cap Value Fund for the share classes and periods indicated, assuming all distributions were reinvested. For comparison, we've shown the same investment in the Russell 2000 Value Index.
| | | | | |
| | Start date | With maximum
sales charge ($) | Without
sales charge ($) | Index ($) |
| Class I1,2 | 2-28-10 | 23,684 | 23,684 | 22,957 |
| Class R61,2 | 2-28-10 | 23,863 | 23,863 | 22,957 |
| Class NAV2 | 2-28-10 | 23,875 | 23,875 | 22,957 |
The Russell 2000 Value Index is an unmanaged index that measures the performance of those Russell 2000 Index companies with lower price-to-book ratios and lower forecasted growth values.
It is not possible to invest directly in an index. Index figures do not reflect expenses or sales charges, which would result in lower returns.
Footnotes related to performance pages
| 1 | Class A, Class I, and Class R6 shares were first offered on 12-30-13. Returns prior to this date are those of Class NAV shares that include applicable sales charges and have not been adjusted for class-specific expenses; otherwise, returns would vary. |
| 2 | For certain types of investors, as described in the fund's prospectuses. |
SEMIANNUAL REPORT | JOHN HANCOCK SMALL CAP VALUE FUND 5
These examples are intended to help you understand your ongoing operating expenses of investing in the fund so you can compare these costs with the ongoing costs of investing in other mutual funds.
Understanding fund expenses
As a shareholder of the fund, you incur two types of costs:
■Transaction costs,which include sales charges (loads) on purchases or redemptions (varies by share class), minimum account fee charge, etc.
■Ongoing operating expenses, including management fees, distribution and service fees (if applicable), and other fund expenses.
We are presenting only your ongoing operating expenses here.
Actual expenses/actual returns
The first line of each share class in the table on the following page is intended to provide information about the fund’s actual ongoing operating expenses, and is based on the fund’s actual return. It assumes an account value of $1,000.00 on September 1, 2019, with the same investment held until February 29, 2020.
Together with the value of your account, you may use this information to estimate the operating expenses that you paid over the period. Simply divide your account value at February 29, 2020, by $1,000.00, then multiply it by the “expenses paid” for your share class from the table. For example, for an account value of $8,600.00, the operating expenses should be calculated as follows:
Hypothetical example for comparison purposes
The second line of each share class in the table on the following page allows you to compare the fund’s ongoing operating expenses with those of any other fund. It provides an example of the fund’s hypothetical account values and hypothetical expenses based on each class’s actual expense ratio and an assumed 5% annualized return before expenses (which is not the class’s actual return). It assumes an account value of $1,000.00 on September 1, 2019, with the same investment held until February 29, 2020. Look in any other fund shareholder report to find its hypothetical example and you will be able to compare these expenses. Please remember that these hypothetical account values and expenses may not be used to estimate the actual ending account balance or expenses you paid for the period.
| 6 | JOHN HANCOCK SMALL CAP VALUE FUND | SEMIANNUAL REPORT | |
Remember, these examples do not include any transaction costs, therefore, these examples will not help you to determine the relative total costs of owning different funds. If transaction costs were included, your expenses would have been higher. See the prospectuses for details regarding transaction costs.
SHAREHOLDER EXPENSE EXAMPLE CHART
| | | Account
value on
9-1-2019 | Ending
value on
2-29-2020 | Expenses
paid during
period ended
2-29-20201 | Annualized
expense
ratio |
| Class A | Actual expenses/actual returns | $1,000.00 | $952.00 | $7.09 | 1.46% |
| | Hypothetical example | 1,000.00 | 1,017.60 | 7.32 | 1.46% |
| Class I | Actual expenses/actual returns | 1,000.00 | 953.70 | 5.63 | 1.16% |
| | Hypothetical example | 1,000.00 | 1,019.10 | 5.82 | 1.16% |
| Class R6 | Actual expenses/actual returns | 1,000.00 | 954.10 | 5.10 | 1.05% |
| | Hypothetical example | 1,000.00 | 1,019.60 | 5.27 | 1.05% |
| Class NAV | Actual expenses/actual returns | 1,000.00 | 954.60 | 5.05 | 1.04% |
| | Hypothetical example | 1,000.00 | 1,019.70 | 5.22 | 1.04% |
| 1 | Expenses are equal to the annualized expense ratio, multiplied by the average account value over the period, multiplied by 182/366 (to reflect the one-half year period). |
| | SEMIANNUAL REPORT | JOHN HANCOCK SMALL CAP VALUE FUND | 7 |
AS OF 2-29-20 (unaudited)
| | | | | Shares | Value |
| Common stocks 94.9% | | | | | $457,427,533 |
| (Cost $427,762,843) | | | | | |
| Consumer discretionary 6.6% | | | 32,009,431 |
| Auto components 2.0% | | | |
| Cooper Tire & Rubber Company | | | 165,470 | 4,217,830 |
| Gentherm, Inc. (A) | | | 139,740 | 5,698,597 |
| Hotels, restaurants and leisure 0.6% | | | |
| Aramark | | | 58,740 | 2,040,628 |
| Wyndham Hotels & Resorts, Inc. | | | 14,750 | 751,513 |
| Household durables 2.4% | | | |
| Helen of Troy, Ltd. (A) | | | 24,950 | 4,106,770 |
| TRI Pointe Group, Inc. (A) | | | 491,180 | 7,529,789 |
| Specialty retail 0.5% | | | |
| The Cato Corp., Class A | | | 157,720 | 2,550,332 |
| Textiles, apparel and luxury goods 1.1% | | | |
| Kontoor Brands, Inc. (B) | | | 151,570 | 5,113,972 |
| Consumer staples 4.5% | | | 21,668,629 |
| Beverages 1.2% | | | |
| C&C Group PLC | | | 1,296,311 | 5,462,530 |
| Food products 1.6% | | | |
| Cranswick PLC | | | 161,472 | 6,934,646 |
| Post Holdings, Inc. (A) | | | 9,133 | 924,808 |
| Household products 1.7% | | | |
| Spectrum Brands Holdings, Inc. | | | 154,883 | 8,346,645 |
| Energy 5.1% | | | 24,815,016 |
| Energy equipment and services 1.9% | | | |
| Era Group, Inc. (A) | | | 218,945 | 2,145,661 |
| SEACOR Holdings, Inc. (A) | | | 147,021 | 5,483,883 |
| SEACOR Marine Holdings, Inc. (A) | | | 185,778 | 1,476,935 |
| Oil, gas and consumable fuels 3.2% | | | |
| Dorian LPG, Ltd. (A) | | | 415,933 | 4,625,175 |
| Kosmos Energy, Ltd. | | | 1,179,600 | 3,597,780 |
| Magnolia Oil & Gas Corp., Class A (A) | | | 517,570 | 3,886,951 |
| Scorpio Tankers, Inc. | | | 181,933 | 3,598,631 |
| Financials 18.9% | | | 91,258,332 |
| Banks 12.4% | | | |
| 1st Source Corp. | | | 112,050 | 4,711,703 |
| Atlantic Union Bankshares Corp. | | | 208,050 | 6,187,407 |
| Banc of California, Inc. | | | 516,408 | 7,916,535 |
| 8 | JOHN HANCOCK SMALL CAP VALUE FUND | SEMIANNUAL REPORT | SEE NOTES TO FINANCIAL STATEMENTS |
| | | | | Shares | Value |
| Financials (continued) | | | |
| Banks (continued) | | | |
| First Busey Corp. | | | 222,430 | $4,909,030 |
| First Midwest Bancorp, Inc. | | | 495,310 | 8,989,877 |
| Flushing Financial Corp. | | | 252,888 | 4,591,182 |
| Great Western Bancorp, Inc. | | | 262,250 | 7,046,658 |
| Hancock Whitney Corp. | | | 42,637 | 1,428,340 |
| International Bancshares Corp. | | | 212,400 | 7,242,840 |
| Synovus Financial Corp. | | | 194,354 | 5,640,153 |
| Webster Financial Corp. | | | 26,746 | 1,015,546 |
| Capital markets 0.8% | | | |
| Solar Capital, Ltd. | | | 225,879 | 4,217,161 |
| Insurance 4.1% | | | |
| Alleghany Corp. (A) | | | 3,600 | 2,420,100 |
| Argo Group International Holdings, Ltd. | | | 31,610 | 1,778,379 |
| Assured Guaranty, Ltd. | | | 26,175 | 1,068,202 |
| Kemper Corp. | | | 109,191 | 7,516,708 |
| Reinsurance Group of America, Inc. | | | 9,810 | 1,197,114 |
| White Mountains Insurance Group, Ltd. | | | 5,785 | 5,727,729 |
| Thrifts and mortgage finance 1.6% | | | |
| Northwest Bancshares, Inc. | | | 551,020 | 7,653,668 |
| Health care 3.6% | | | 17,507,357 |
| Health care equipment and supplies 1.2% | | | |
| Lantheus Holdings, Inc. (A) | | | 212,930 | 3,311,062 |
| Natus Medical, Inc. (A) | | | 99,949 | 2,686,629 |
| Health care providers and services 1.1% | | | |
| AMN Healthcare Services, Inc. (A) | | | 68,866 | 5,068,538 |
| Health care technology 1.3% | | | |
| Allscripts Healthcare Solutions, Inc. (A) | | | 854,261 | 6,441,128 |
| Industrials 27.8% | | | 134,051,674 |
| Aerospace and defense 0.8% | | | |
| Astronics Corp. (A) | | | 189,815 | 3,847,550 |
| Air freight and logistics 1.4% | | | |
| Forward Air Corp. | | | 114,110 | 6,733,631 |
| Building products 3.4% | | | |
| American Woodmark Corp. (A) | | | 105,340 | 8,824,332 |
| Tyman PLC | | | 2,357,927 | 7,326,005 |
| Commercial services and supplies 5.3% | | | |
| ACCO Brands Corp. | | | 754,130 | 6,040,581 |
| BrightView Holdings, Inc. (A) | | | 266,956 | 3,737,384 |
| Clean Harbors, Inc. (A) | | | 19,700 | 1,369,544 |
| Matthews International Corp., Class A | | | 131,740 | 3,894,234 |
| SEE NOTES TO FINANCIAL STATEMENTS | SEMIANNUAL REPORT | JOHN HANCOCK SMALL CAP VALUE FUND | 9 |
| | | | | Shares | Value |
| Industrials (continued) | | | |
| Commercial services and supplies (continued) | | | |
| SP Plus Corp. (A) | | | 156,148 | $5,700,963 |
| Steelcase, Inc., Class A | | | 298,940 | 4,848,807 |
| Construction and engineering 2.0% | | | |
| Primoris Services Corp. | | | 163,580 | 3,104,748 |
| Valmont Industries, Inc. | | | 57,470 | 6,679,163 |
| Electrical equipment 1.2% | | | |
| Thermon Group Holdings, Inc. (A) | | | 337,118 | 5,923,163 |
| Machinery 6.6% | | | |
| Albany International Corp., Class A | | | 26,440 | 1,694,011 |
| ESCO Technologies, Inc. | | | 38,867 | 3,533,788 |
| Luxfer Holdings PLC | | | 418,358 | 6,488,733 |
| Mueller Industries, Inc. | | | 347,030 | 9,709,899 |
| TriMas Corp. (A) | | | 401,807 | 10,185,807 |
| Professional services 4.8% | | | |
| CBIZ, Inc. (A) | | | 88,585 | 2,306,753 |
| Forrester Research, Inc. (A) | | | 144,309 | 5,203,783 |
| Huron Consulting Group, Inc. (A) | | | 165,500 | 9,820,770 |
| ICF International, Inc. | | | 78,380 | 5,955,312 |
| Road and rail 0.9% | | | |
| Saia, Inc. (A) | | | 50,448 | 4,404,615 |
| Trading companies and distributors 1.4% | | | |
| GATX Corp. | | | 93,920 | 6,718,098 |
| Information technology 7.8% | | | 37,373,141 |
| Electronic equipment, instruments and components 4.4% | | | |
| Belden, Inc. | | | 215,630 | 8,610,106 |
| Coherent, Inc. (A) | | | 30,460 | 3,920,507 |
| CTS Corp. | | | 220,100 | 5,738,007 |
| Rogers Corp. (A) | | | 22,600 | 2,621,600 |
| IT services 1.6% | | | |
| WNS Holdings, Ltd., ADR (A) | | | 117,475 | 7,734,554 |
| Semiconductors and semiconductor equipment 1.5% | | | |
| Onto Innovation, Inc. (A) | | | 235,157 | 7,188,749 |
| Software 0.3% | | | |
| CDK Global, Inc. | | | 33,890 | 1,559,618 |
| Materials 5.9% | | | 28,253,210 |
| Chemicals 3.7% | | | |
| Element Solutions, Inc. (A) | | | 268,070 | 2,785,247 |
| Orion Engineered Carbons SA | | | 508,100 | 7,220,101 |
| Sensient Technologies Corp. | | | 44,010 | 2,164,412 |
| Stepan Company | | | 65,800 | 5,779,214 |
| 10 | JOHN HANCOCK SMALL CAP VALUE FUND | SEMIANNUAL REPORT | SEE NOTES TO FINANCIAL STATEMENTS |
| | | | | Shares | Value |
| Materials (continued) | | | |
| Containers and packaging 0.3% | | | |
| Sealed Air Corp. | | | 48,940 | $1,483,371 |
| Paper and forest products 1.9% | | | |
| Louisiana-Pacific Corp. | | | 67,150 | 1,910,418 |
| Neenah, Inc. | | | 119,620 | 6,910,447 |
| Real estate 12.7% | | | 61,068,504 |
| Equity real estate investment trusts 12.7% | | | |
| Alexander & Baldwin, Inc. | | | 393,140 | 7,391,032 |
| Brandywine Realty Trust | | | 532,840 | 7,235,967 |
| Corporate Office Properties Trust | | | 292,260 | 7,405,868 |
| DiamondRock Hospitality Company | | | 492,332 | 4,490,068 |
| Lexington Realty Trust | | | 226,150 | 2,345,176 |
| Physicians Realty Trust | | | 551,640 | 10,403,930 |
| PotlatchDeltic Corp. | | | 214,058 | 7,864,491 |
| RPT Realty | | | 733,610 | 9,507,586 |
| Summit Hotel Properties, Inc. | | | 477,280 | 4,424,386 |
| Utilities 2.0% | | | 9,422,239 |
| Gas utilities 2.0% | | | |
| New Jersey Resources Corp. | | | 91,730 | 3,238,986 |
| Spire, Inc. | | | 60,642 | 4,551,182 |
| UGI Corp. | | | 45,285 | 1,632,071 |
|
| | | Yield (%) | | Shares | Value |
| Short-term investments 6.6% | | | | | $31,594,269 |
| (Cost $31,594,199) | | | | | |
| Short-term funds 0.1% | | | | | 194,269 |
| John Hancock Collateral Trust (C) | 1.6968(D) | | 19,410 | 194,269 |
| | | | | Par value^ | Value |
| Repurchase agreement 6.5% | | | | | 31,400,000 |
| Deutsche Bank Tri-Party Repurchase Agreement dated 2-28-20 at 1.600% to be repurchased at $27,203,627 on 3-2-20, collateralized by $27,201,100 U.S. Treasury Notes, 1.500% due 1-31-27 (valued at $27,744,030) | | | | 27,200,000 | 27,200,000 |
| Nomura Securities International, Inc. Tri-Party Repurchase Agreement dated 2-28-20 at 1.580% to be repurchased at $4,200,553 on 3-2-20, collateralized by $4,132,600 U.S. Treasury Notes, 2.125% due 12-31-22 (valued at $4,284,037) | | | | 4,200,000 | 4,200,000 |
|
| Total investments (Cost $459,357,042) 101.5% | | | $489,021,802 |
| Other assets and liabilities, net (1.5%) | | | | (7,047,702) |
| Total net assets 100.0% | | | | | $481,974,100 |
| SEE NOTES TO FINANCIAL STATEMENTS | SEMIANNUAL REPORT | JOHN HANCOCK SMALL CAP VALUE FUND | 11 |
| The percentage shown for each investment category is the total value of the category as a percentage of the net assets of the fund. |
| ^All par values are denominated in U.S. dollars unless otherwise indicated. |
| Security Abbreviations and Legend |
| ADR | American Depositary Receipt |
| (A) | Non-income producing security. |
| (B) | All or a portion of this security is on loan as of 2-29-20. |
| (C) | Investment is an affiliate of the fund, the advisor and/or subadvisor. This security represents the investment of cash collateral received for securities lending. |
| (D) | The rate shown is the annualized seven-day yield as of 2-29-20. |
At 2-29-20, the aggregate cost of investments for federal income tax purposes was $463,801,568. Net unrealized appreciation aggregated to $25,220,234, of which $59,961,870 related to gross unrealized appreciation and $34,741,636 related to gross unrealized depreciation.
| 12 | JOHN HANCOCK SMALL CAP VALUE FUND | SEMIANNUAL REPORT | SEE NOTES TO FINANCIAL STATEMENTS |
STATEMENT OF ASSETS AND LIABILITIES 2-29-20 (unaudited)
| Assets | |
| Unaffiliated investments, at value (Cost $459,162,843) including $190,456 of securities loaned | $488,827,533 |
| Affiliated investments, at value (Cost $194,199) | 194,269 |
| Total investments, at value (Cost $459,357,042) | 489,021,802 |
| Cash | 65,931 |
| Foreign currency, at value (Cost $61) | 60 |
| Dividends and interest receivable | 268,103 |
| Receivable for fund shares sold | 2,717,252 |
| Receivable for investments sold | 547,386 |
| Receivable for securities lending income | 86 |
| Other assets | 47,675 |
| Total assets | 492,668,295 |
| Liabilities | |
| Payable for investments purchased | 9,714,083 |
| Payable for fund shares repurchased | 682,665 |
| Payable upon return of securities loaned | 194,320 |
| Payable to affiliates | |
| Accounting and legal services fees | 14,465 |
| Transfer agent fees | 12,025 |
| Trustees' fees | 825 |
| Other liabilities and accrued expenses | 75,812 |
| Total liabilities | 10,694,195 |
| Net assets | $481,974,100 |
| Net assets consist of | |
| Paid-in capital | $446,908,370 |
| Total distributable earnings (loss) | 35,065,730 |
| Net assets | $481,974,100 |
| |
| Net asset value per share | |
| Based on net asset value and shares outstanding - the fund has an unlimited number of shares authorized with no par value | |
| Class A ($26,852,950 ÷ 1,496,545 shares)1 | $17.94 |
| Class I ($88,628,973 ÷ 4,933,600 shares) | $17.96 |
| Class R6 ($9,377,312 ÷ 521,965 shares) | $17.97 |
| Class NAV ($357,114,865 ÷ 19,895,670 shares) | $17.95 |
| Maximum offering price per share | |
| Class A (net asset value per share ÷ 95%)2 | $18.88 |
| 1 | Redemption price per share is equal to net asset value less any applicable contingent deferred sales charge. |
| 2 | On single retail sales of less than $50,000. On sales of $50,000 or more and on group sales the offering price is reduced. |
| SEE NOTES TO FINANCIAL STATEMENTS | SEMIANNUAL REPORT | JOHN HANCOCK Small Cap Value Fund | 13 |
STATEMENT OF OPERATIONSFor the six months ended 2-29-20 (unaudited)
| Investment income | |
| Dividends | $5,562,771 |
| Interest | 176,748 |
| Securities lending | 8,776 |
| Less foreign taxes withheld | (34,743) |
| Total investment income | 5,713,552 |
| Expenses | |
| Investment management fees | 2,989,349 |
| Distribution and service fees | 47,457 |
| Accounting and legal services fees | 54,959 |
| Transfer agent fees | 84,148 |
| Trustees' fees | 5,926 |
| Custodian fees | 41,981 |
| State registration fees | 21,395 |
| Printing and postage | 21,207 |
| Professional fees | 31,255 |
| Other | 13,635 |
| Total expenses | 3,311,312 |
| Less expense reductions | (22,994) |
| Net expenses | 3,288,318 |
| Net investment income | 2,425,234 |
| Realized and unrealized gain (loss) | |
| Net realized gain (loss) on | |
| Unaffiliated investments and foreign currency transactions | 16,718,072 |
| Affiliated investments | (247) |
| | 16,717,825 |
| Change in net unrealized appreciation (depreciation) of | |
| Unaffiliated investments and translation of assets and liabilities in foreign currencies | (31,346,921) |
| Affiliated investments | 97 |
| | (31,346,824) |
| Net realized and unrealized loss | (14,628,999) |
| Decrease in net assets from operations | $(12,203,765) |
| 14 | JOHN HANCOCK Small Cap Value Fund | SEMIANNUAL REPORT | SEE NOTES TO FINANCIAL STATEMENTS |
STATEMENTS OF CHANGES IN NET ASSETS
| | Six months ended
2-29-20
(unaudited) | Year ended
8-31-19 |
| Increase (decrease) in net assets | | |
| From operations | | |
| Net investment income | $2,425,234 | $5,448,388 |
| Net realized gain | 16,717,825 | 15,947,928 |
| Change in net unrealized appreciation (depreciation) | (31,346,824) | (83,066,485) |
| Decrease in net assets resulting from operations | (12,203,765) | (61,670,169) |
| Distributions to shareholders | | |
| From earnings | | |
| Class A | (1,163,817) | (1,502,336) |
| Class I | (4,209,273) | (3,978,218) |
| Class R6 | (428,294) | (494,301) |
| Class NAV | (19,106,751) | (14,343,868) |
| Total distributions | (24,908,135) | (20,318,723) |
| From fund share transactions | (85,040,314) | 154,237,259 |
| Total increase (decrease) | (122,152,214) | 72,248,367 |
| Net assets | | |
| Beginning of period | 604,126,314 | 531,877,947 |
| End of period | $481,974,100 | $604,126,314 |
| SEE NOTES TO FINANCIAL STATEMENTS | SEMIANNUAL REPORT | JOHN HANCOCK Small Cap Value Fund | 15 |
| CLASS A SHARES Period ended | 2-29-201 | 8-31-19 | 8-31-18 | 8-31-17 | 8-31-16 | 8-31-15 |
| Per share operating performance | | | | | | |
| Net asset value, beginning of period | $19.54 | $23.06 | $20.15 | $20.18 | $18.89 | $19.30 |
| Net investment income2 | 0.04 | 0.12 | 0.03 | 0.143 | 0.02 | —4 |
| Net realized and unrealized gain (loss) on investments | (0.85) | (2.83) | 4.00 | 0.80 | 2.09 | 0.51 |
| Total from investment operations | (0.81) | (2.71) | 4.03 | 0.94 | 2.11 | 0.51 |
| Less distributions | | | | | | |
| From net investment income | (0.12) | (0.07) | (0.11) | (0.06) | —4 | —4 |
| From net realized gain | (0.67) | (0.74) | (1.01) | (0.91) | (0.82) | (0.92) |
| Total distributions | (0.79) | (0.81) | (1.12) | (0.97) | (0.82) | (0.92) |
| Net asset value, end of period | $17.94 | $19.54 | $23.06 | $20.15 | $20.18 | $18.89 |
| Total return (%)5,6 | (4.80)7 | (11.28) | 20.52 | 4.37 | 11.55 | 2.53 |
| Ratios and supplemental data | | | | | | |
| Net assets, end of period (in millions) | $27 | $31 | $45 | $59 | $86 | $9 |
| Ratios (as a percentage of average net assets): | | | | | | |
| Expenses before reductions | 1.478 | 1.46 | 1.50 | 1.52 | 1.54 | 1.75 |
| Expenses including reductions | 1.468 | 1.46 | 1.49 | 1.52 | 1.53 | 1.58 |
| Net investment income (loss) | 0.418 | 0.60 | 0.14 | 0.693 | 0.11 | (0.02) |
| Portfolio turnover (%) | 10 | 29 | 25 | 26 | 25 | 22 |
| 1 | Six months ended 2-29-20. Unaudited. |
| 2 | Based on average daily shares outstanding. |
| 3 | Net investment income (loss) per share and ratio of net investment income (loss) to average net assets reflect a special dividend received by the fund, which amounted to $0.12 and 0.57%, respectively. |
| 4 | Less than $0.005 per share. |
| 5 | Total returns would have been lower had certain expenses not been reduced during the applicable periods. |
| 6 | Does not reflect the effect of sales charges, if any. |
| 7 | Not annualized. |
| 8 | Annualized. |
| 16 | JOHN HANCOCK Small Cap Value Fund | SEMIANNUAL REPORT | SEE NOTES TO FINANCIAL STATEMENTS |
| CLASS I SHARES Period ended | 2-29-201 | 8-31-19 | 8-31-18 | 8-31-17 | 8-31-16 | 8-31-15 |
| Per share operating performance | | | | | | |
| Net asset value, beginning of period | $19.58 | $23.13 | $20.20 | $20.22 | $18.93 | $19.34 |
| Net investment income2 | 0.07 | 0.18 | 0.09 | 0.203 | 0.09 | 0.04 |
| Net realized and unrealized gain (loss) on investments | (0.84) | (2.86) | 4.03 | 0.82 | 2.08 | 0.53 |
| Total from investment operations | (0.77) | (2.68) | 4.12 | 1.02 | 2.17 | 0.57 |
| Less distributions | | | | | | |
| From net investment income | (0.18) | (0.13) | (0.18) | (0.13) | (0.06) | (0.06) |
| From net realized gain | (0.67) | (0.74) | (1.01) | (0.91) | (0.82) | (0.92) |
| Total distributions | (0.85) | (0.87) | (1.19) | (1.04) | (0.88) | (0.98) |
| Net asset value, end of period | $17.96 | $19.58 | $23.13 | $20.20 | $20.22 | $18.93 |
| Total return (%)4 | (4.63)5 | (11.08) | 20.93 | 4.70 | 11.87 | 2.82 |
| Ratios and supplemental data | | | | | | |
| Net assets, end of period (in millions) | $89 | $93 | $108 | $99 | $82 | $53 |
| Ratios (as a percentage of average net assets): | | | | | | |
| Expenses before reductions | 1.176 | 1.18 | 1.20 | 1.21 | 1.22 | 1.29 |
| Expenses including reductions | 1.166 | 1.17 | 1.20 | 1.20 | 1.21 | 1.27 |
| Net investment income | 0.706 | 0.91 | 0.42 | 0.963 | 0.47 | 0.21 |
| Portfolio turnover (%) | 10 | 29 | 25 | 26 | 25 | 22 |
| 1 | Six months ended 2-29-20. Unaudited. |
| 2 | Based on average daily shares outstanding. |
| 3 | Net investment income (loss) per share and ratio of net investment income (loss) to average net assets reflect a special dividend received by the fund, which amounted to $0.12 and 0.57%, respectively. |
| 4 | Total returns would have been lower had certain expenses not been reduced during the applicable periods. |
| 5 | Not annualized. |
| 6 | Annualized. |
| SEE NOTES TO FINANCIAL STATEMENTS | SEMIANNUAL REPORT | JOHN HANCOCK Small Cap Value Fund | 17 |
| CLASS R6 SHARES Period ended | 2-29-201 | 8-31-19 | 8-31-18 | 8-31-17 | 8-31-16 | 8-31-15 |
| Per share operating performance | | | | | | |
| Net asset value, beginning of period | $19.59 | $23.14 | $20.21 | $20.23 | $18.94 | $19.36 |
| Net investment income2 | 0.08 | 0.20 | 0.11 | 0.173 | 0.11 | 0.08 |
| Net realized and unrealized gain (loss) on investments | (0.83) | (2.85) | 4.03 | 0.86 | 2.09 | 0.52 |
| Total from investment operations | (0.75) | (2.65) | 4.14 | 1.03 | 2.20 | 0.60 |
| Less distributions | | | | | | |
| From net investment income | (0.20) | (0.16) | (0.20) | (0.14) | (0.09) | (0.10) |
| From net realized gain | (0.67) | (0.74) | (1.01) | (0.91) | (0.82) | (0.92) |
| Total distributions | (0.87) | (0.90) | (1.21) | (1.05) | (0.91) | (1.02) |
| Net asset value, end of period | $17.97 | $19.59 | $23.14 | $20.21 | $20.23 | $18.94 |
| Total return (%)4 | (4.59)5 | (10.95) | 21.03 | 4.78 | 12.02 | 3.00 |
| Ratios and supplemental data | | | | | | |
| Net assets, end of period (in millions) | $9 | $10 | $14 | $1 | $—6 | $—6 |
| Ratios (as a percentage of average net assets): | | | | | | |
| Expenses before reductions | 1.067 | 1.06 | 1.10 | 1.12 | 1.13 | 7.67 |
| Expenses including reductions | 1.057 | 1.06 | 1.09 | 1.11 | 1.10 | 1.09 |
| Net investment income | 0.827 | 1.00 | 0.50 | 0.833 | 0.59 | 0.40 |
| Portfolio turnover (%) | 10 | 29 | 25 | 26 | 25 | 22 |
| 1 | Six months ended 2-29-20. Unaudited. |
| 2 | Based on average daily shares outstanding. |
| 3 | Net investment income (loss) per share and ratio of net investment income (loss) to average net assets reflect a special dividend received by the fund, which amounted to $0.12 and 0.57%, respectively. |
| 4 | Total returns would have been lower had certain expenses not been reduced during the applicable periods. |
| 5 | Not annualized. |
| 6 | Less than $500,000. |
| 7 | Annualized. |
| 18 | JOHN HANCOCK Small Cap Value Fund | SEMIANNUAL REPORT | SEE NOTES TO FINANCIAL STATEMENTS |
| CLASS NAV SHARES Period ended | 2-29-201 | 8-31-19 | 8-31-18 | 8-31-17 | 8-31-16 | 8-31-15 |
| Per share operating performance | | | | | | |
| Net asset value, beginning of period | $19.57 | $23.12 | $20.20 | $20.22 | $18.94 | $19.35 |
| Net investment income2 | 0.09 | 0.21 | 0.11 | 0.223 | 0.10 | 0.09 |
| Net realized and unrealized gain (loss) on investments | (0.84) | (2.86) | 4.02 | 0.82 | 2.10 | 0.52 |
| Total from investment operations | (0.75) | (2.65) | 4.13 | 1.04 | 2.20 | 0.61 |
| Less distributions | | | | | | |
| From net investment income | (0.20) | (0.16) | (0.20) | (0.15) | (0.10) | (0.10) |
| From net realized gain | (0.67) | (0.74) | (1.01) | (0.91) | (0.82) | (0.92) |
| Total distributions | (0.87) | (0.90) | (1.21) | (1.06) | (0.92) | (1.02) |
| Net asset value, end of period | $17.95 | $19.57 | $23.12 | $20.20 | $20.22 | $18.94 |
| Total return (%)4 | (4.54)5 | (10.95) | 21.01 | 4.80 | 12.01 | 3.05 |
| Ratios and supplemental data | | | | | | |
| Net assets, end of period (in millions) | $357 | $470 | $365 | $285 | $255 | $271 |
| Ratios (as a percentage of average net assets): | | | | | | |
| Expenses before reductions | 1.056 | 1.05 | 1.09 | 1.10 | 1.11 | 1.12 |
| Expenses including reductions | 1.046 | 1.04 | 1.08 | 1.10 | 1.10 | 1.09 |
| Net investment income | 0.856 | 1.07 | 0.52 | 1.023 | 0.59 | 0.48 |
| Portfolio turnover (%) | 10 | 29 | 25 | 26 | 25 | 22 |
| 1 | Six months ended 2-29-20. Unaudited. |
| 2 | Based on average daily shares outstanding. |
| 3 | Net investment income (loss) per share and ratio of net investment income (loss) to average net assets reflect a special dividend received by the fund, which amounted to $0.12 and 0.57%, respectively. |
| 4 | Total returns would have been lower had certain expenses not been reduced during the applicable periods. |
| 5 | Not annualized. |
| 6 | Annualized. |
| SEE NOTES TO FINANCIAL STATEMENTS | SEMIANNUAL REPORT | JOHN HANCOCK Small Cap Value Fund | 19 |
| Notes to financial statements (unaudited) | |
Note 1—Organization
John Hancock Small Cap Value Fund (the fund) is a series of John Hancock Funds II (the Trust), an open-end management investment company organized as a Massachusetts business trust and registered under the Investment Company Act of 1940, as amended (the 1940 Act). The investment objective of the fund is to seek long-term capital appreciation.
The fund may offer multiple classes of shares. The shares currently outstanding are detailed in the Statement of assets and liabilities. Class A shares are offered to all investors. Class I shares are offered to institutions and certain investors. Class R6 shares are only available to certain retirement plans, institutions and other investors. Class NAV shares are offered to John Hancock affiliated funds of funds, retirement plans for employees of John Hancock and/or Manulife Financial Corporation, and certain 529 plans. Shareholders of each class have exclusive voting rights to matters that affect that class. The distribution and service fees, if any, and transfer agent fees for each class may differ.
Note 2—Significant accounting policies
The financial statements have been prepared in conformity with accounting principles generally accepted in the United States of America (US GAAP), which require management to make certain estimates and assumptions as of the date of the financial statements. Actual results could differ from those estimates and those differences could be significant. The fund qualifies as an investment company under Topic 946 of Accounting Standards Codification of US GAAP.
Events or transactions occurring after the end of the fiscal period through the date that the financial statements were issued have been evaluated in the preparation of the financial statements. The following summarizes the significant accounting policies of the fund:
Security valuation. Investments are stated at value as of the scheduled close of regular trading on the New York Stock Exchange (NYSE), normally at 4:00 P.M., Eastern Time. In case of emergency or other disruption resulting in the NYSE not opening for trading or the NYSE closing at a time other than the regularly scheduled close, the net asset value (NAV) may be determined as of the regularly scheduled close of the NYSE pursuant to the fund's Valuation Policies and Procedures.
In order to value the securities, the fund uses the following valuation techniques: Equity securities, including exchange-traded or closed-end funds, are typically valued at the last sale price or official closing price on the exchange or principal market where the security trades. In the event there were no sales during the day or closing prices are not available, the securities are valued using the last available bid price. Investments by the fund in open-end mutual funds, including John Hancock Collateral Trust (JHCT), are valued at their respective NAVs each business day. Debt obligations are typically valued based on the evaluated prices provided by an independent pricing vendor. Independent pricing vendors utilize matrix pricing, which takes into account factors such as institutional-size trading in similar groups of securities, yield, quality, coupon rate, maturity, type of issue, trading characteristics and other market data, as well as broker supplied prices. Foreign securities and currencies are valued in U.S. dollars based on foreign currency exchange rates supplied by an independent pricing vendor.
In certain instances, the Pricing Committee may determine to value equity securities using prices obtained from another exchange or market if trading on the exchange or market on which prices are typically obtained did not open for trading as scheduled, or if trading closed earlier than scheduled, and trading occurred as normal on another exchange or market.
| 20 | JOHN HANCOCK Small Cap Value Fund | SEMIANNUAL REPORT | |
Other portfolio securities and assets, for which reliable market quotations are not readily available, are valued at fair value as determined in good faith by the fund's Pricing Committee following procedures established by the Board of Trustees. The frequency with which these fair valuation procedures are used cannot be predicted and fair value of securities may differ significantly from the value that would have been used had a ready market for such securities existed. Trading in foreign securities may be completed before the scheduled daily close of trading on the NYSE. Significant events at the issuer or market level may affect the values of securities between the time when the valuation of the securities is generally determined and the close of the NYSE. If a significant event occurs, these securities may be fair valued, as determined in good faith by the fund's Pricing Committee, following procedures established by the Board of Trustees. The fund uses fair value adjustment factors provided by an independent pricing vendor to value certain foreign securities in order to adjust for events that may occur between the close of foreign exchanges or markets and the close of the NYSE.
The fund uses a three-tier hierarchy to prioritize the pricing assumptions, referred to as inputs, used in valuation techniques to measure fair value. Level 1 includes securities valued using quoted prices in active markets for identical securities, including registered investment companies. Level 2 includes securities valued using other significant observable inputs. Observable inputs may include quoted prices for similar securities, interest rates, prepayment speeds and credit risk. Prices for securities valued using these inputs are received from independent pricing vendors and brokers and are based on an evaluation of the inputs described. Level 3 includes securities valued using significant unobservable inputs when market prices are not readily available or reliable, including the fund's own assumptions in determining the fair value of investments. Factors used in determining value may include market or issuer specific events or trends, changes in interest rates and credit quality. The inputs or methodology used for valuing securities are not necessarily an indication of the risks associated with investing in those securities. Changes in valuation techniques and related inputs may result in transfers into or out of an assigned level within the disclosure hierarchy.
The following is a summary of the values by input classification of the fund's investments as of February 29, 2020, by major security category or type:
| | Total
value at
2-29-20 | Level 1
quoted
price | Level 2
significant
observable
inputs | Level 3
significant
unobservable
inputs |
| Investments in securities: | | | | |
| Assets | | | | |
| Common stocks | | | | |
| Consumer discretionary | $32,009,431 | $32,009,431 | — | — |
| Consumer staples | 21,668,629 | 9,271,453 | $12,397,176 | — |
| Energy | 24,815,016 | 24,815,016 | — | — |
| Financials | 91,258,332 | 91,258,332 | — | — |
| Health care | 17,507,357 | 17,507,357 | — | — |
| Industrials | 134,051,674 | 126,725,669 | 7,326,005 | — |
| Information technology | 37,373,141 | 37,373,141 | — | — |
| Materials | 28,253,210 | 28,253,210 | — | — |
| Real estate | 61,068,504 | 61,068,504 | — | — |
| Utilities | 9,422,239 | 9,422,239 | — | — |
| Short-term investments | 31,594,269 | 194,269 | 31,400,000 | — |
| Total investments in securities | $489,021,802 | $437,898,621 | $51,123,181 | — |
| | SEMIANNUAL REPORT | JOHN HANCOCK Small Cap Value Fund | 21 |
Repurchase agreements. The fund may enter into repurchase agreements. When the fund enters into a repurchase agreement, it receives collateral that is held in a segregated account by the fund's custodian, or for tri-party repurchase agreements, collateral is held at a third-party custodian bank in a segregated account for the benefit of the fund. The collateral amount is marked-to-market and monitored on a daily basis to ensure that the collateral held is in an amount not less than the principal amount of the repurchase agreement plus any accrued interest. Collateral received by the fund for repurchase agreements is disclosed in the Fund's investments as part of the caption related to the repurchase agreement.
Repurchase agreements are typically governed by the terms and conditions of the Master Repurchase Agreement and/or Global Master Repurchase Agreement (collectively, MRA). Upon an event of default, the non-defaulting party may close out all transactions traded under the MRA and net amounts owed. Absent an event of default, assets and liabilities resulting from repurchase agreements are not offset in the Statement of assets and liabilities. In the event of a default by the counterparty, realization of the collateral proceeds could be delayed, during which time the collateral value may decline or the counterparty may have insufficient assets to pay claims resulting from close-out of the transactions.
Security transactions and related investment income. Investment security transactions are accounted for on a trade date plus one basis for daily NAV calculations. However, for financial reporting purposes, investment transactions are reported on trade date. Interest income is accrued as earned. Dividend income is recorded on the ex-date, except for dividends of certain foreign securities where the dividend may not be known until after the ex-date. In those cases, dividend income, net of withholding taxes, is recorded when the fund becomes aware of the dividends. Non-cash dividends, if any, are recorded at the fair market value of the securities received. Gains and losses on securities sold are determined on the basis of identified cost and may include proceeds from litigation.
Real estate investment trusts. The fund may invest in real estate investment trusts (REITs). Distributions from REITs may be recorded as income and subsequently characterized by the REIT at the end of the fiscal year as a reduction of cost of investments and/or as a realized gain. As a result, the fund will estimate the components of distributions from these securities. Such estimates are revised when the actual components of the distributions are known.
Securities lending. The fund may lend its securities to earn additional income. The fund receives collateral from the borrower in an amount not less than the market value of the loaned securities. The fund will invest its cash collateral in JHCT, an affiliate of the fund, which has a floating NAV and is registered with the Securities and Exchange Commission (SEC) as an investment company. JHCT invests in short-term money market investments. The fund will receive the benefit of any gains and bear any losses generated by JHCT with respect to the cash collateral.
The fund has the right to recall loaned securities on demand. If a borrower fails to return loaned securities when due, then the lending agent is responsible and indemnifies the fund for the lent securities. The lending agent uses the collateral received from the borrower to purchase replacement securities of the same issue, type, class and series of the loaned securities. If the value of the collateral is less than the purchase cost of replacement securities, the lending agent is responsible for satisfying the shortfall but only to the extent that the shortfall is not due to any decrease in the value of JHCT.
Although the risk of loss on securities lent is mitigated by receiving collateral from the borrower and through lending agent indemnification, the fund could experience a delay in recovering securities or could experience a lower than expected return if the borrower fails to return the securities on a timely basis. The fund receives compensation for lending its securities by retaining a portion of the return on the investment of the collateral and
| 22 | JOHN HANCOCK Small Cap Value Fund | SEMIANNUAL REPORT | |
compensation from fees earned from borrowers of the securities. Securities lending income received by the fund is net of fees retained by the securities lending agent. Net income received from JHCT is a component of securities lending income as recorded on the Statement of operations.
Obligations to repay collateral received by the fund are shown on the Statement of assets and liabilities as Payable upon return of securities loaned and are secured by the loaned securities. As of February 29, 2020, the fund loaned securities valued at $190,456 and received $194,320 of cash collateral.
Foreign investing. Assets, including investments, and liabilities denominated in foreign currencies are translated into U.S. dollar values each day at the prevailing exchange rate. Purchases and sales of securities, income and expenses are translated into U.S. dollars at the prevailing exchange rate on the date of the transaction. The effect of changes in foreign currency exchange rates on the value of securities is reflected as a component of the realized and unrealized gains (losses) on investments. Foreign investments are subject to a decline in the value of a foreign currency versus the U.S. dollar, which reduces the dollar value of securities denominated in that currency.
Funds that invest internationally generally carry more risk than funds that invest strictly in U.S. securities. Risks can result from differences in economic and political conditions, regulations, market practices (including higher transaction costs), accounting standards and other factors.
Foreign taxes. The fund may be subject to withholding tax on income, capital gains or repatriation taxes imposed by certain countries, a portion of which may be recoverable. Foreign taxes are accrued based upon the fund's understanding of the tax rules and rates that exist in the foreign markets in which it invests. Taxes are accrued based on gains realized by the fund as a result of certain foreign security sales. In certain circumstances, estimated taxes are accrued based on unrealized appreciation of such securities. Investment income is recorded net of foreign withholding taxes.
Overdraft. The fund may have the ability to borrow from banks for temporary or emergency purposes, including meeting redemption requests that otherwise might require the untimely sale of securities. Pursuant to the fund's custodian agreement, the custodian may loan money to the fund to make properly authorized payments. The fund is obligated to repay the custodian for any overdraft, including any related costs or expenses. The custodian may have a lien, security interest or security entitlement in any fund property that is not otherwise segregated or pledged, to the extent of any overdraft, and to the maximum extent permitted by law.
Line of credit. The fund and other affiliated funds have entered into a syndicated line of credit agreement with Citibank, N.A. as the administrative agent that enables them to participate in a $750 million unsecured committed line of credit. Excluding commitments designated for a certain fund and subject to the needs of all other affiliated funds, the fund can borrow up to an aggregate commitment amount of $500 million, subject to asset coverage and other limitations as specified in the agreement. A commitment fee payable at the end of each calendar quarter, based on the average daily unused portion of the line of credit, is charged to each participating fund based on a combination of fixed and asset based allocations and is reflected in Other expenses on the Statement of operations. For the six months ended February 29, 2020, the fund had no borrowings under the line of credit. Commitment fees for the six months ended February 29, 2020 were $1,754.
Expenses. Within the John Hancock group of funds complex, expenses that are directly attributable to an individual fund are allocated to such fund. Expenses that are not readily attributable to a specific fund are allocated among all funds in an equitable manner, taking into consideration, among other things, the nature and type of expense and the fund’s relative net assets. Expense estimates are accrued in the period to which they relate and adjustments are made when actual amounts are known.
| | SEMIANNUAL REPORT | JOHN HANCOCK Small Cap Value Fund | 23 |
Class allocations. Income, common expenses and realized and unrealized gains (losses) are determined at the fund level and allocated daily to each class of shares based on the net assets of the class. Class-specific expenses, such as distribution and service fees, if any, and transfer agent fees, for all classes, are charged daily at the class level based on the net assets of each class and the specific expense rates applicable to each class.
Federal income taxes. The fund intends to continue to qualify as a regulated investment company by complying with the applicable provisions of the Internal Revenue Code and will not be subject to federal income tax on taxable income that is distributed to shareholders. Therefore, no federal income tax provision is required.
As of August 31, 2019, the fund had no uncertain tax positions that would require financial statement recognition, derecognition or disclosure. The fund's federal tax returns are subject to examination by the Internal Revenue Service for a period of three years.
Distribution of income and gains. Distributions to shareholders from net investment income and net realized gains, if any, are recorded on the ex-date. The fund generally declares and pays dividends annually. Capital gain distributions, if any, are typically distributed annually.
Distributions paid by the fund with respect to each class of shares are calculated in the same manner, at the same time and in the same amount, except for the effect of class level expenses that may be applied differently to each class.
Such distributions, on a tax basis, are determined in conformity with income tax regulations, which may differ from US GAAP. Distributions in excess of tax basis earnings and profits, if any, are reported in the fund's financial statements as a return of capital. The final determination of tax characteristics of the fund's distribution will occur at the end of the year and will subsequently be reported to shareholders.
Capital accounts within the financial statements are adjusted for permanent book-tax differences. These adjustments have no impact on net assets or the results of operations. Temporary book-tax differences, if any, will reverse in a subsequent period. Book-tax differences are primarily attributable to wash sale loss deferrals.
Note 3—Guarantees and indemnifications
Under the Trust's organizational documents, its Officers and Trustees are indemnified against certain liabilities arising out of the performance of their duties to the Trust, including the fund. Additionally, in the normal course of business, the fund enters into contracts with service providers that contain general indemnification clauses. The fund's maximum exposure under these arrangements is unknown, as this would involve future claims that may be made against the fund that have not yet occurred. The risk of material loss from such claims is considered remote.
Note 4—Fees and transactions with affiliates
John Hancock Investment Management LLC (the Advisor) serves as investment advisor for the fund. John Hancock Investment Management Distributors LLC (the Distributor), an affiliate of the Advisor, serves as principal underwriter of the fund. The Advisor and the Distributor are indirect, wholly owned subsidiaries of Manulife Financial Corporation (MFC).
Management fee. The fund has an investment management agreement with the Advisor under which the fund pays a daily management fee to the Advisor equivalent on an annual basis to the sum of: (a) 1.03% of the first $100 million of the fund’s aggregate daily net assets and (b) 0.98% of the fund’s aggregate daily net assets in excess of $100 million. Aggregate net assets include the net assets of the fund and Small Cap Value Trust, a series of John Hancock Variable Insurance Trust. The Advisor has a subadvisory agreement with Wellington Management Company LLP. The fund is not responsible for payment of the subadvisory fees.
| 24 | JOHN HANCOCK Small Cap Value Fund | SEMIANNUAL REPORT | |
The Advisor has contractually agreed to waive a portion of its management fee and/or reimburse expenses for certain funds of the John Hancock group of funds complex, including the fund (the participating portfolios). This waiver is based upon aggregate net assets of all the participating portfolios. The amount of the reimbursement is calculated daily and allocated among all the participating portfolios in proportion to the daily net assets of each fund. During the six months ended February 29, 2020, this waiver amounted to 0.01% of the fund’s average daily net assets on an annualized basis. This arrangement expires on July 31, 2021, unless renewed by mutual agreement of the fund and the Advisor based upon a determination that this is appropriate under the circumstances at that time.
For the six months ended February 29, 2020, the expense reductions described above amounted to the following:
| Class | Expense reduction |
| Class A | $1,200 |
| Class I | 3,946 |
| Class R6 | 394 |
| Class | Expense reduction |
| Class NAV | $17,454 |
| Total | $22,994 |
Expenses waived or reimbursed in the current fiscal period are not subject to recapture in future fiscal periods.
The investment management fees, including the impact of the waivers and reimbursements as described above, incurred for the six months ended February 29, 2020, were equivalent to a net annual effective rate of 0.98% of the fund's average daily net assets.
Accounting and legal services. Pursuant to a service agreement, the fund reimburses the Advisor for all expenses associated with providing the administrative, financial, legal, compliance, accounting and recordkeeping services to the fund, including the preparation of all tax returns, periodic reports to shareholders and regulatory reports, among other services. These expenses are allocated to each share class based on its relative net assets at the time the expense was incurred. These accounting and legal services fees incurred for the six months ended February 29, 2020 amounted to an annual rate of 0.02% of the fund's average daily net assets.
Distribution and service plans. The fund has a distribution agreement with the Distributor. The fund has adopted distribution and service plans for certain classes as detailed below pursuant to Rule 12b-1 under the 1940 Act, to pay the Distributor for services provided as the distributor of shares of the fund. The fund may pay up to the following contractual rates of distribution and service fees under these arrangements, expressed as an annual percentage of average daily net assets for each class of the fund's shares:
| Class | Rule 12b-1 Fee |
| Class A | 0.30% |
Sales charges. Class A shares are assessed up-front sales charges, which resulted in payments to the Distributor amounting to $17,020 for the six months ended February 29, 2020. Of this amount, $2,875 was retained and used for printing prospectuses, advertising, sales literature and other purposes and $14,145 was paid as sales commissions to broker-dealers.
Class A shares may be subject to contingent deferred sales charges (CDSCs). Certain Class A shares that are acquired through purchases of $1 million or more and are redeemed within one year of purchase are subject to a 1.00% sales charge. CDSCs are applied to the lesser of the current market value at the time of redemption or the original purchase cost of the shares being redeemed. Proceeds from CDSCs are used to compensate the Distributor for providing distribution-related services in connection with the sale of these shares. During the six months ended February 29, 2020, CDSCs received by the Distributor amounted to $7 for Class A.
| | SEMIANNUAL REPORT | JOHN HANCOCK Small Cap Value Fund | 25 |
Transfer agent fees. The John Hancock group of funds has a complex-wide transfer agent agreement with John Hancock Signature Services, Inc. (Signature Services), an affiliate of the Advisor. The transfer agent fees paid to Signature Services are determined based on the cost to Signature Services (Signature Services Cost) of providing recordkeeping services. It also includes out-of-pocket expenses, including payments made to third-parties for recordkeeping services provided to their clients who invest in one or more John Hancock funds. In addition, Signature Services Cost may be reduced by certain fees that Signature Services receives in connection with retirement and small accounts. Signature Services Cost is calculated monthly and allocated, as applicable, to five categories of share classes: Retail Share and Institutional Share Classes of Non-Municipal Bond Funds, Class R6 Shares, Retirement Share Classes and Municipal Bond Share Classes. Within each of these categories, the applicable costs are allocated to the affected John Hancock affiliated funds and/or classes, based on the relative average daily net assets.
Class level expenses. Class level expenses for the six months ended February 29, 2020 were as follows:
| Class | Distribution and service fees | Transfer agent fees |
| Class A | $47,457 | $19,471 |
| Class I | — | 63,993 |
| Class R6 | — | 684 |
| Total | $47,457 | $84,148 |
Trustee expenses. The fund compensates each Trustee who is not an employee of the Advisor or its affiliates. The costs of paying Trustee compensation and expenses are allocated to the fund based on its net assets relative to other funds within the John Hancock group of funds complex.
Interfund lending program. Pursuant to an Exemptive Order issued by the SEC, the fund, along with certain other funds advised by the Advisor or its affiliates, may participate in an interfund lending program. This program provides an alternative credit facility allowing the fund to borrow from, or lend money to, other participating affiliated funds. At period end, no interfund loans were outstanding. The fund's activity in this program during the period for which loans were outstanding was as follows:
Borrower
or Lender | Weighted Average
Loan Balance | Days
Outstanding | Weighted Average
Interest Rate | Interest Income
(Expense) |
| Lender | $5,900,000 | 1 | 1.550% | $254 |
Note 5—Fund share transactions
Transactions in fund shares for the six months ended February 29, 2020 and for the year ended August 31, 2019 were as follows:
| | Six Months Ended 2-29-20 | Year Ended 8-31-19 |
| | Shares | Amount | Shares | Amount |
| Class A shares | | | | |
| Sold | 100,829 | $2,118,547 | 284,043 | $5,691,875 |
| Distributions reinvested | 54,079 | 1,154,043 | 86,467 | 1,494,143 |
| Repurchased | (238,112) | (4,915,611) | (756,047) | (14,720,730) |
| Net decrease | (83,204) | $(1,643,021) | (385,537) | $(7,534,712) |
| 26 | JOHN HANCOCK Small Cap Value Fund | SEMIANNUAL REPORT | |
| | Six Months Ended 2-29-20 | Year Ended 8-31-19 |
| | Shares | Amount | Shares | Amount |
| Class I shares | | | | |
| Sold | 756,186 | $15,612,654 | 1,140,130 | $22,959,704 |
| Distributions reinvested | 196,142 | 4,187,626 | 229,355 | 3,965,557 |
| Repurchased | (780,217) | (15,934,835) | (1,267,130) | (23,975,618) |
| Net increase | 172,111 | $3,865,445 | 102,355 | $2,949,643 |
| Class R6 shares | | | | |
| Sold | 85,784 | $1,799,700 | 78,713 | $1,575,755 |
| Distributions reinvested | 20,061 | 428,294 | 28,606 | 494,301 |
| Repurchased | (86,440) | (1,807,100) | (189,027) | (3,777,979) |
| Net increase (decrease) | 19,405 | $420,894 | (81,708) | $(1,707,923) |
| Class NAV shares | | | | |
| Sold | 851,256 | $16,705,559 | 11,335,652 | $224,376,376 |
| Distributions reinvested | 895,769 | 19,106,751 | 830,566 | 14,343,868 |
| Repurchased | (5,871,846) | (123,495,942) | (3,941,810) | (78,189,993) |
| Net increase (decrease) | (4,124,821) | $(87,683,632) | 8,224,408 | $160,530,251 |
| Total net increase (decrease) | (4,016,509) | $(85,040,314) | 7,859,518 | $154,237,259 |
Affiliates of the fund owned 100% of shares of Class NAV on February 29, 2020. Such concentration of shareholders’ capital could have a material effect on the fund if such shareholders redeem from the fund.
Note 6—Purchase and sale of securities
Purchases and sales of securities, other than short-term investments, amounted to $57,603,315 and $164,278,176, respectively, for the six months ended February 29, 2020.
Note 7—Industry or sector risk
The fund generally invests a large percentage of its assets in one or more particular industries or sectors of the economy. If a large percentage of the fund's assets are economically tied to a single or small number of industries or sectors of the economy, the fund will be less diversified than a more broadly diversified fund, and it may cause the fund to underperform if that industry or sector underperforms. In addition, focusing on a particular industry or sector may make the fund’s NAV more volatile. Further, a fund that invests in particular industries or sectors is particularly susceptible to the impact of market, economic, regulatory and other factors affecting those industries or sectors. Financial services companies can be hurt by economic declines, changes in interest rates regulatory and market impacts.
Note 8—Investment by affiliated funds
Certain investors in the fund are affiliated funds that are managed by the Advisor and its affiliates. The affiliated funds do not invest in the fund for the purpose of exercising management or control; however, this investment may represent a significant portion of the fund's net assets. At February 29, 2020, funds within the John Hancock group of funds complex held 74.1% of the fund's net assets. The following fund(s) had an affiliate ownership of 5% or more of the fund's net assets:
| | SEMIANNUAL REPORT | JOHN HANCOCK Small Cap Value Fund | 27 |
| Portfolio | Affiliated Concentration |
| John Hancock Funds II Multimanager Lifestyle Growth Portfolio | 26.2% |
| John Hancock Funds II Multimanager Lifestyle Balanced Portfolio | 19.9% |
| John Hancock Funds II Multimanager Lifestyle Aggressive Portfolio | 13.0% |
Note 9—Investment in affiliated underlying funds
The fund may invest in affiliated underlying funds that are managed by the Advisor and its affiliates. Information regarding the fund's fiscal year to date purchases and sales of the affiliated underlying funds as well as income and capital gains earned by the fund, if any, is as follows:
| | | | | | | | Dividends and distributions |
| Affiliate | Ending
share
amount | Beginning
value | Cost of
purchases | Proceeds
from shares
sold | Realized
gain
(loss) | Change in
unrealized
appreciation
(depreciation) | Income
distributions
received | Capital gain
distributions
received | Ending
value |
| John Hancock Collateral Trust* | 19,410 | $2,867,284 | $27,757,183 | $(30,430,048) | $(247) | $97 | $8,776 | — | $194,269 |
| * | Refer to the Securities lending note within Note 2 for details regarding this investment. |
Note 10—Subsequent events
A widespread health crisis such as a global pandemic could cause substantial market volatility, exchange trading suspensions and closures, impact the ability to complete redemptions, and affect fund performance. For example, the novel coronavirus disease (COVID-19) has resulted in significant disruptions to global business activity. The impact of a health crisis and other epidemics and pandemics that may arise in the future, could affect the global economy in ways that cannot necessarily be foreseen at the present time. A health crisis may exacerbate other pre-existing political, social and economic risks. Any such impact could adversely affect the fund's performance, resulting in losses to your investment.
| 28 | JOHN HANCOCK Small Cap Value Fund | SEMIANNUAL REPORT | |
| | |
Trustees
Hassell H. McClellan,Chairperson
Steven R. Pruchansky,Vice Chairperson
Andrew G. Arnott†
Charles L. Bardelis*
James R. Boyle
Peter S. Burgess*
William H. Cunningham
Grace K. Fey
Marianne Harrison†
Deborah C. Jackson
James M. Oates*
Gregory A. Russo
Officers
Andrew G. Arnott
President
Francis V. Knox, Jr.
Chief Compliance Officer
Charles A. Rizzo
Chief Financial Officer
Salvatore Schiavone
Treasurer
Christopher (Kit) Sechler
Secretary and Chief Legal Officer
| Investment advisor
John Hancock Investment Management LLC
Subadvisor
Wellington Management Company LLP
Portfolio Managers
Edmond C. Griffin, CFA
Timothy J. McCormack, CFA
Shaun F. Pedersen
Principal distributor
John Hancock Investment Management Distributors LLC
Custodian
State Street Bank and Trust Company
Transfer agent
John Hancock Signature Services, Inc.
Legal counsel
K&L Gates LLP
|
* Member of the Audit Committee
† Non-Independent Trustee
The fund's proxy voting policies and procedures, as well as the fund proxy voting record for the most recent twelve-month period ended June 30, are available free of charge on the Securities and Exchange Commission (SEC) website at sec.gov or on our website.
All of the fund's holdings as of the end of the third month of every fiscal quarter are filed with the SEC on Form N-PORT within 60 days of the end of the fiscal quarter. The fund's Form N-PORT filings are available on our website and the SEC's website, sec.gov.
We make this information on your fund, as well asmonthly portfolio holdings, and other fund details available on our website at jhinvestments.com or by calling 800-225-5291.
| | | | |
| | You can also contact us: |
| | 800-225-5291
jhinvestments.com | Regular mail:
John Hancock Signature Services, Inc.
P.O. Box 55913
Boston, MA 02205-5913
| Express mail:
John Hancock Signature Services, Inc.
2000 Crown Colony Drive
Suite 55913
Quincy, MA 02169-0953
|
SEMIANNUAL REPORT | JOHN HANCOCK SMALL CAP VALUE FUND 29
John Hancock family of funds
| | | |
DOMESTIC EQUITY FUNDS
Blue Chip Growth
Classic Value
Disciplined Value
Disciplined Value Mid Cap
Equity Income
Financial Industries
Fundamental All Cap Core
Fundamental Large Cap Core
New Opportunities
Regional Bank
Small Cap Core
Small Cap Growth
Small Cap Value
U.S. Global Leaders Growth
U.S. Quality Growth
GLOBAL AND INTERNATIONAL EQUITY FUNDS
Disciplined Value International
Emerging Markets
Emerging Markets Equity
Fundamental Global Franchise
Global Equity
Global Shareholder Yield
Global Thematic Opportunities
International Dynamic Growth
International Growth
International Small Company
| | INCOME FUNDS
Bond
California Tax-Free Income
Emerging Markets Debt
Floating Rate Income
Government Income
High Yield
High Yield Municipal Bond
Income
Investment Grade Bond
Money Market
Short Duration Bond
Short Duration Credit Opportunities
Strategic Income Opportunities
Tax-Free Bond
ALTERNATIVE AND SPECIALTY FUNDS
Absolute Return Currency
Alternative Asset Allocation
Alternative Risk Premia
Diversified Macro
Infrastructure
Multi-Asset Absolute Return
Seaport Long/Short
|
A fund's investment objectives, risks, charges, and expenses should be considered carefully before investing. The prospectus contains this and other important information about the fund. To obtain a prospectus, contact your financial professional, call John Hancock Investment Management at 800-225-5291, or visit our website at jhinvestments.com. Please read the prospectus carefully before investing or sending money.
| | | |
ASSET ALLOCATION
Balanced
Income Allocation
Multi-Index Lifetime Portfolios
Multi-Index Preservation Portfolios
Multimanager Lifestyle Portfolios
Multimanager Lifetime Portfolios
Retirement Income 2040
EXCHANGE-TRADED FUNDS
John Hancock Multifactor Consumer Discretionary ETF
John Hancock Multifactor Consumer Staples ETF
John Hancock Multifactor Developed International ETF
John Hancock Multifactor Emerging Markets ETF
John Hancock Multifactor Energy ETF
John Hancock Multifactor Financials ETF
John Hancock Multifactor Healthcare ETF
John Hancock Multifactor Industrials ETF
John Hancock Multifactor Large Cap ETF
John Hancock Multifactor Materials ETF
John Hancock Multifactor Media and
Communications ETF
John Hancock Multifactor Mid Cap ETF
John Hancock Multifactor Small Cap ETF
John Hancock Multifactor Technology ETF
John Hancock Multifactor Utilities ETF
| | ENVIRONMENTAL, SOCIAL, AND
GOVERNANCE FUNDS
ESG All Cap Core
ESG Core Bond
ESG International Equity
ESG Large Cap Core
CLOSED-END FUNDS
Financial Opportunities
Hedged Equity & Income
Income Securities Trust
Investors Trust
Preferred Income
Preferred Income II
Preferred Income III
Premium Dividend
Tax-Advantaged Dividend Income
Tax-Advantaged Global Shareholder Yield
|
John Hancock Multifactor ETF shares are bought and sold at market price (not NAV), and are not individually redeemed
from the fund. Brokerage commissions will reduce returns.
John Hancock ETFs are distributed by Foreside Fund Services, LLC, and are subadvised by Dimensional Fund Advisors LP.
Foreside is not affiliated with John Hancock Investment Management Distributors LLC or Dimensional Fund Advisors LP.
Dimensional Fund Advisors LP receives compensation from John Hancock in connection with licensing rights to the
John Hancock Dimensional indexes. Dimensional Fund Advisors LP does not sponsor, endorse, or sell, and makes no
representation as to the advisability of investing in, John Hancock Multifactor ETFs.
John Hancock Investment Management
A trusted brand
John Hancock Investment Management is a premier asset manager
representing one of America's most trusted brands, with a heritage of
financial stewardship dating back to 1862. Helping our shareholders
pursue their financial goals is at the core of everything we do. It's why
we support the role of professional financial advice and operate with
the highest standards of conduct and integrity.
A better way to invest
We serve investors globally through a unique multimanager approach:
We search the world to find proven portfolio teams with specialized
expertise for every strategy we offer, then we apply robust investment
oversight to ensure they continue to meet our uncompromising
standards and serve the best interests of our shareholders.
Results for investors
Our unique approach to asset management enables us to provide
a diverse set of investments backed by some of the world's best
managers, along with strong risk-adjusted returns across asset classes.
John Hancock Investment Management Distributors LLC n Member FINRA, SIPC
200 Berkeley Street n Boston, MA 02116-5010 n 800-225-5291 n jhinvestments.com
This report is for the information of the shareholders of John Hancock Small Cap Value Fund. It is not authorized for distribution to prospective investors unless preceded or accompanied by a prospectus.
| | |
| MF1105650 | 439SA 2/20
4/2020 |
John Hancock
Multi-Index Lifetime Portfolios
Semiannual report 2/29/2020

Beginning on January 1, 2021, as permitted by regulations adopted by the Securities and Exchange Commission, paper copies of the fund's shareholder reports like this one will no longer be sent by mail, unless you specifically request paper copies of the reports from the fund or from your financial intermediary. Instead, the reports will be made available on a website, and you will be notified by mail each time a report is posted and provided with a website link to access the report.
If you already elected to receive shareholder reports electronically, you will not be affected by this change, and you do not need to take any action. You may elect to receive shareholder reports and other communications electronically by calling John Hancock Investment Management at 888-972-8696 (Class R4 and Class R6 shares) or by contacting your financial intermediary.
You may elect to receive all reports in paper, free of charge, at any time. You can inform John Hancock Investment Management or your financial intermediary that you wish to continue receiving paper copies of your shareholder reports by following the instructions listed above. Your election to receive reports in paper will apply to all funds held with John Hancock Investment Management or your financial intermediary.
A message to shareholders
Dear shareholder,
Global financial markets were on pace to deliver strong returns during the 6 months ended February 29, 2020, until heightened fears over the coronavirus (COVID-19) sent the markets skidding during the last week of the period. Prior to the turbulence, investors benefited from a combination of low inflation, accommodative central bank policy, healthy fundamentals, and corporate buybacks of stock. Investors in non-U.S. equities also saw strong gains, fueled in part by similarly supportive monetary policy and some signs of strength in developing markets. In an environment of low inflation and declining interest rates, bonds were also faring well.
However, the COVID-19 pandemic and plummeting oil prices put an end to all that good news. Shortly after period end, the U.S. Federal Reserve lowered interest rates and lawmakers embarked on a plan to launch major fiscal stimulus to support the economy.
After the longest bull market in U.S. history, we're now in bear market territory. Indeed, the spread of COVID-19, trade disputes, rising unemployment, and other geopolitical tensions may continue to create uncertainty among businesses and investors. Your financial professional can helpposition your portfolio so that it's sufficiently diversified to seek to meet your long-term objectives and to withstand the inevitable bouts of market volatility along the way.
On behalf of everyone at John Hancock Investment Management, I'd like to take this opportunity to welcome new shareholders and thank existing shareholders for the continued trust you've placed in us.
Sincerely,
Andrew G. Arnott
President and CEO,
John Hancock Investment Management
Head of Wealth and Asset Management,
United States and Europe
This commentary reflects the CEO's views as of this report's period end and are subject to change at any time. Diversification does not guarantee investment returns and does not eliminate risk of loss. All investments entail risks, including the possible loss of principal. For more up-to-date information, you can visit our website at jhinvestments.com.
.
John Hancock
Multi-Index Lifetime Portfolios
Table of contents
| | | |
| 2 | | Multi-Index Lifetime Portfolios' strategy at a glance |
| 3 | | Portfolio summary |
| 4 | | Multi-Index 2060 Lifetime Portfolio |
| 5 | | Multi-Index 2055 Lifetime Portfolio |
| 6 | | Multi-Index 2050 Lifetime Portfolio |
| 7 | | Multi-Index 2045 Lifetime Portfolio |
| 8 | | Multi-Index 2040 Lifetime Portfolio |
| 9 | | Multi-Index 2035 Lifetime Portfolio |
| 10 | | Multi-Index 2030 Lifetime Portfolio |
| 11 | | Multi-Index 2025 Lifetime Portfolio |
| 12 | | Multi-Index 2020 Lifetime Portfolio |
| 13 | | Multi-Index 2015 Lifetime Portfolio |
| 14 | | Multi-Index 2010 Lifetime Portfolio |
| 15 | | Your expenses |
| 18 | | Portfolios' investments |
| 25 | | Financial statements |
| 35 | | Financial highlights |
| 46 | | Notes to financial statements |
| 61 | | More information |
SEMIANNUAL REPORT | JOHN HANCOCK MULTI-INDEX LIFETIME PORTFOLIOS 1
Multi-Index Lifetime Portfolios' strategy at a glance
A SIMPLE, STRATEGIC PATH TO HELP YOU REACH YOUR RETIREMENT GOALS
Multi-Index Lifetime Portfolios make diversification easy because the asset mix of each portfolio automatically changes over time.
| • | Portfolios with dates further off initially invest more aggressively in stock funds. |
| • | As a portfolio approaches its target date,1 the allocation will gradually migrate to more conservative fixed-income funds. |
| • | Once the target date is reached, the allocation will continue to become increasingly conservative until it reaches the end of its glide path, investing primarily in fixed-income funds. |
JOHN HANCOCK MULTI-INDEX LIFETIME PORTFOLIOS—AUTOMATICALLY ADJUST OVER TIME2
The chart below illustrates how the asset allocation mix of John Hancock Multi-Index Lifetime Portfolio adjusts over time.
The principal value of each portfolio is not guaranteed and you could lose money at any time, including at or after the target date.
1 Based on an estimated retirement date.
2 Allocations may vary as a result of market activity or cash allocations held during unusual market or economic conditions.
SEMIANNUAL REPORT | JOHN HANCOCK MULTI-INDEX LIFETIME PORTFOLIOS 2
MULTI-INDEX 2060-2010 LIFETIME PORTFOLIOS' CLASS 1 SHARE RETURNS (%)
For the six months ended 2/29/2020
MARKET INDEX TOTAL RETURNS
For the six month period ended 2/29/20
| | | |
| U.S. Stocks | S&P 500 Index | 1.92% |
| Russell Midcap Index | -1.11% |
| Russell 2000 Index | -0.52% |
| FTSE NAREIT All Equity REIT Index | -3.95% |
| International Stocks | MSCI EAFE Index | -0.91% |
| MSCI Emerging Markets Index | 2.93% |
| MSCI EAFE Small Cap Index | 0.42% |
| Fixed Income | Bloomberg Barclays U.S. Aggregate Bond Index | 3.39% |
| ICE Bank of America U.S. High Yield Master II Index | 1.31% |
| JP Morgan Global Government Bonds Unhedged Index | 1.11% |
SEMIANNUAL REPORT | JOHN HANCOCK MULTI-INDEX LIFETIME PORTFOLIOS 3
Multi-Index 2060 Lifetime Portfolio
GROWTH OF $10,000
This chart shows what happened to a hypothetical $10,000 investment in John Hancock Multi-Index 2060 Lifetime Portfolio for the share classes and periods indicated, assuming all distributions were reinvested. For comparison, we've shown the same investment in two blended indexes and three separate indexes.
Index 1is the S&P Target Date 2060+ Index, an unmanaged index comprised of a set of indices aligned with specific target date years.
Index 2is the Bloomberg Barclays U.S. Aggregate Bond Index, an unmanaged index of dollar-denominated and non-convertible investment-grade debt issues.
Index 3is the John Hancock 2060 Lifetime Index, which is based on the fund's asset allocation glide path and will reflect a more conservative allocation over time. The index is a customized blended index comprising some or all of the following component indices (ordered alphabetically): Bloomberg Barclays U.S. Aggregate Bond Index, Bloomberg Barclays U.S. Corporate Bond 1-5 Year Index, Bloomberg Barclays U.S. Treasury TIPS 1-5 Year Index, ICE BofA Long U.S. Treasury Principal STRIPS Index, ICE BofA U.S. High Yield Index, JP Morgan Emerging Markets Bond Index Global, MSCI Emerging Markets Index, MSCI World Energy Index, MSCI World ex-USA Index, MSCI World Metals & Mining Index, Russell 2500 Index, S&P 500 Index, S&P Global ex-U.S. REIT Index, S&P Global Infrastructure Index, S&P U.S. REIT Index, and S&P/LSTA Leveraged Loan Index.
Index 4is the S&P 500 Index, an unmanaged index that includes 500 widely traded common stocks.
Index 5is 66.50% Russell 3000 Index, 28.50% MSCI ACWI ex-USA Index, 4.00% Bloomberg Barclays U.S. Aggregate Bond Index, and 1.00% the ICE BofA U.S. High Yield Master II Index.
Prior to January 1, 2020, the fund's primary benchmark was the S&P 500 Index. Effective January 1, 2020, the fund's primary benchmark index is the S&P Target Date 2060+ Index. The S&P Target Date 2060+ Index better reflects the universe of investment opportunities based on the fund's current investment strategy
It is not possible to invest directly in an index. Index figures do not reflect expenses or sales charges, which would result in lower returns.
ASSET ALLOCATION (%)
| | | |
| Affiliated investment companies | 57.4 |
| | Large blend | 57.4 |
Unaffiliated investment companies/
Exchange-traded funds | 38.1 |
| | Equity | 35.2 |
| | Fixed income | 2.9 |
| U.S. Government | 2.5 |
| Short-term investments | 2.0 |
As a percentage of total investments.
PERFORMANCE CHART
Total returns for the period ended 2-29-20 (%)
| | | | | | | | | |
| | Class R41,2 | Class R62 | Class 12 | Index 1 | Index 2 | Index 3 | Index 4 | Index 5 |
| Inception | 3-30-16 | 3-30-16 | 3-30-16 | 3-30-16 | 3-30-16 | 3-30-16 | 3-30-16 | 3-30-16 |
| Average annual total returns | | |
| 1-year | 3.60 | 3.77 | 3.71 | 3.25 | 11.68 | 6.51 | 8.19 | 4.95 |
| Since inception | 8.44 | 8.57 | 8.51 | 8.59 | 4.00 | 10.39 | 11.94 | 9.89 |
| Cumulative returns | | |
| 6-months | 0.94 | 1.02 | 0.96 | 0.58 | 3.39 | 2.51 | 1.92 | 1.44 |
| Since inception | 37.39 | 38.03 | 37.75 | 38.12 | 16.61 | 47.36 | 55.59 | 44.72 |
Performance figures assume all distributions have been reinvested.
The expense ratios of the portfolio, both net (including any fee waivers and/or expense limitations) and gross (excluding any fee waivers and/or expense limitations), are set forth according to the most recent publicly available prospectuses for the portfolio and may differ from those disclosed in the Financial highlights tables in this report. Net expenses reflect contractual expense limitations in effect until December 31, 2020 and are subject to change. Had the contractual fee waivers and expense limitations not been in place, gross expenses would apply. The following expense ratios include the expenses of the underlying funds in which the portfolio invests. The expense ratios are as follows:
| | | | |
| | Class R4 | Class R6 | Class 1 |
| Gross (%) | 1.46 | 1.11 | 1.15 |
| Net (%) | 0.62 | 0.36 | 0.41 |
Please refer to the most recent prospectus and annual or semiannual report for more information on expenses and any expense limitation arrangements for each class.
The returns reflect past results and should not be considered indicative of future performance. The return and principal value of an investment will fluctuate so that shares, when redeemed, may be worth more or less than their original cost. Due to market volatility and other factors, the portfolio's current performance may be higher or lower than the performance shown. For current to the most recent month-end performance data, please call 800-225-5291 or visit the portfolio's website at jhinvestments.com.
The performance information does not reflect the deduction of taxes that a shareholder would pay on portfolio distributions or the redemption of portfolio shares. The portfolio's performance results reflect any applicable fee waivers or expense reductions, without which the expenses would increase and results would have been less favorable.
| 1 | Class R4 shares were first offered on 4-7-17. Returns prior to this date are those of Class 1 shares that have not been adjusted for class-specific expenses; otherwise, returns would vary. |
| 2 | For certain types of investors, as described in the portfolio's prospectuses. |
SEMIANNUAL REPORT | JOHN HANCOCK MULTI-INDEX LIFETIME PORTFOLIOS 4
Multi-Index 2055 Lifetime Portfolio
GROWTH OF $10,000
This chart shows what happened to a hypothetical $10,000 investment in John Hancock Multi-Index 2055 Lifetime Portfolio for the share classes and periods indicated, assuming all distributions were reinvested. For comparison, we've shown the same investment in two blended indexes and three separate indexes.
Index 1is theS&P Target Date 2055 Index, an unmanaged index comprised of a set of indices aligned with specific target date years.
Index 2is the Bloomberg Barclays U.S. Aggregate Bond Index, an unmanaged index of dollar-denominated and non-convertible investment-grade debt issues.
Index 3is the John Hancock 2055 Lifetime Index, which is based on the fund's asset allocation glide path and will reflect a more conservative allocation over time. The index is a customized blended index comprising some or all of the following component indices (ordered alphabetically): Bloomberg Barclays U.S. Aggregate Bond Index, Bloomberg Barclays U.S. Corporate Bond 1-5 Year Index, Bloomberg Barclays U.S. Treasury TIPS 1-5 Year Index, ICE BofA Long U.S. Treasury Principal STRIPS Index, ICE BofA U.S. High Yield Index, JP Morgan Emerging Markets Bond Index Global, MSCI Emerging Markets Index, MSCI World Energy Index, MSCI World ex-USA Index, MSCI World Metals & Mining Index, Russell 2500 Index, S&P 500 Index, S&P Global ex-U.S. REIT Index, S&P Global Infrastructure Index, S&P U.S. REIT Index, and S&P/LSTA Leveraged Loan Index.
Index 4is the S&P 500 Index, an unmanaged index that includes 500 widely traded common stocks.
Index 5is 66.50% Russell 3000 Index, 28.50% MSCI ACWI ex-USA Index, 4.00% Bloomberg Barclays U.S. Aggregate Bond Index, and 1.00% the ICE BofA U.S. High Yield Master II Index.
Prior to January 1, 2020, the fund's primary benchmark was the S&P 500 Index. Effective January 1, 2020, the fund's primary benchmark index is the S&P Target Date 2055 Index. The S&P Target Date 2055 Index better reflects the universe of investment opportunities based on the fund's current investment strategy.
It is not possible to invest directly in an index. Index figures do not reflect expenses or sales charges, which would result in lower returns.
ASSET ALLOCATION (%)
| | | |
| Affiliated investment companies | 57.6 |
| | Large blend | 57.6 |
Unaffiliated investment companies/
Exchange-traded funds | 38.3 |
| | Equity | 35.4 |
| | Fixed income | 2.9 |
| U.S. Government | 2.6 |
| Short-term investments | 1.5 |
As a percentage of total investments.
PERFORMANCE CHART
Total returns for the period ended 2-29-20 (%)
| | | | | | | | | |
| | Class R41,2 | Class R62 | Class 12 | Index 1 | Index 2 | Index 3 | Index 4 | Index 5 |
| Inception | 3-26-14 | 3-26-14 | 3-26-14 | 3-26-14 | 3-26-14 | 3-26-14 | 3-26-14 | 3-26-14 |
| Average annual total returns | | |
| 1-year | 3.60 | 3.77 | 3.71 | 3.17 | 11.68 | 6.51 | 8.19 | 4.95 |
| 5-year | 5.70 | 5.85 | 5.79 | 5.86 | 3.58 | 7.03 | 9.23 | 6.67 |
| Since inception | 6.51 | 6.68 | 6.63 | 6.43 | 3.92 | 7.88 | 10.29 | 7.37 |
| Cumulative returns | | |
| 6-months | 0.99 | 1.05 | 1.00 | 0.54 | 3.39 | 2.51 | 1.92 | 1.44 |
| 5-year | 31.92 | 32.88 | 32.51 | 32.93 | 19.21 | 40.45 | 55.49 | 38.11 |
| Since inception | 45.41 | 46.74 | 46.35 | 44.72 | 25.62 | 56.85 | 78.79 | 52.43 |
Performance figures assume all distributions have been reinvested.
The expense ratios of the portfolio, both net (including any fee waivers and/or expense limitations) and gross (excluding any fee waivers and/or expense limitations), are set forth according to the most recent publicly available prospectuses for the portfolio and may differ from those disclosed in the Financial highlights tables in this report. Net expenses reflect contractual expense limitations in effect until December 31, 2020 and are subject to change. Had the contractual fee waivers and expense limitations not been in place, gross expenses would apply. The following expense ratios include the expenses of the underlying funds in which the portfolio invests. The expense ratios are as follows:
| | | | |
| | Class R4 | Class R6 | Class 1 |
| Gross (%) | 1.12 | 0.77 | 0.81 |
| Net (%) | 0.62 | 0.36 | 0.41 |
Please refer to the most recent prospectus and annual or semiannual report for more information on expenses and any expense limitation arrangements for each class.
The returns reflect past results and should not be considered indicative of future performance. The return and principal value of an investment will fluctuate so that shares, when redeemed, may be worth more or less than their original cost. Due to market volatility and other factors, the portfolio's current performance may be higher or lower than the performance shown. For current to the most recent month-end performance data, please call 800-225-5291 or visit the portfolio's website at jhinvestments.com.
The performance information does not reflect the deduction of taxes that a shareholder would pay on portfolio distributions or the redemption of portfolio shares. The portfolio's performance results reflect any applicable fee waivers or expense reductions, without which the expenses would increase and results would have been less favorable.
| 1 | Class R4 shares were first offered on 3-26-14 and ceased operations between 6-15-16 and 4-7-17. Returns while Class R4 shares were not offered are those of Class 1 shares that have not been adjusted for class-specific expenses; otherwise, returns would vary. |
| 2 | For certain types of investors, as described in the portfolio's prospectuses. |
SEMIANNUAL REPORT | JOHN HANCOCK MULTI-INDEX LIFETIME PORTFOLIOS 5
Multi-Index 2050 Lifetime Portfolio
GROWTH OF $10,000
This chart shows what happened to a hypothetical $10,000 investment in John Hancock Multi-Index 2050 Lifetime Portfolio for the share classes and periods indicated, assuming all distributions were reinvested. For comparison, we've shown the same investment in two blended indexes and three separate indexes.
Index 1isthe S&P Target Date 2050 Index, an unmanaged index comprised of a set of indices aligned with specific target date years.
Index 2is the Bloomberg Barclays U.S. Aggregate Bond Index, an unmanaged index of dollar-denominated and non-convertible investment-grade debt issues.
Index 3is the John Hancock 2050 Lifetime Index, which is based on the fund's asset allocation glide path and will reflect a more conservative allocation over time. The index is a customized blended index comprising some or all of the following component indices (ordered alphabetically): Bloomberg Barclays U.S. Aggregate Bond Index, Bloomberg Barclays U.S. Corporate Bond 1-5 Year Index, Bloomberg Barclays U.S. Treasury TIPS 1-5 Year Index, ICE BofA Long U.S. Treasury Principal STRIPS Index, ICE BofA U.S. High Yield Index, JP Morgan Emerging Markets Bond Index Global, MSCI Emerging Markets Index, MSCI World Energy Index, MSCI World ex-USA Index, MSCI World Metals & Mining Index, Russell 2500 Index, S&P 500 Index, S&P Global ex-U.S. REIT Index, S&P Global Infrastructure Index, S&P U.S. REIT Index, and S&P/LSTA Leveraged Loan Index.
Index 4is the S&P 500 Index, an unmanaged index that includes 500 widely traded common stocks.
Index 5is 66.50% Russell 3000 Index, 28.50% MSCI ACWI ex-USA Index, 4.00% Bloomberg Barclays U.S. Aggregate Bond Index, and 1.00% ICE BofA U.S. High Yield Master II Index.
Prior to January 1, 2020, the fund's primary benchmark was the S&P 500 Index. Effective January 1, 2020, the fund's primary benchmark index is the S&P Target Date 2050 Index. The S&P Target Date 2050 Index better reflects the universe of investment opportunities based on the fund's current investment strategy.
It is not possible to invest directly in an index. Index figures do not reflect expenses or sales charges, which would result in lower returns.
ASSET ALLOCATION (%)
| | | |
| Affiliated investment companies | 57.7 |
| | Large blend | 57.7 |
Unaffiliated investment companies/
Exchange-traded funds | 38.4 |
| | Equity | 35.5 |
| | Fixed income | 2.9 |
| U.S. Government | 2.6 |
| Short-term investments | 1.3 |
As a percentage of total investments.
PERFORMANCE CHART
Total returns for the period ended 2-29-20 (%)
| | | | | | | | | |
| | Class R41,2 | Class R62 | Class 12 | Index 1 | Index 2 | Index 3 | Index 4 | Index 5 |
| Inception | 11-7-13 | 11-7-13 | 11-7-13 | 11-7-13 | 11-7-13 | 11-7-13 | 11-7-13 | 11-7-13 |
| Average annual total returns | | |
| 1-year | 3.47 | 3.72 | 3.75 | 3.24 | 11.68 | 6.51 | 8.19 | 4.95 |
| 5-year | 5.67 | 5.85 | 5.81 | 5.81 | 3.58 | 7.03 | 9.23 | 6.67 |
| Since inception | 6.88 | 7.07 | 7.02 | 6.66 | 3.86 | 8.09 | 10.70 | 7.62 |
| Cumulative returns | | |
| 6-months | 0.88 | 0.95 | 0.98 | 0.58 | 3.39 | 2.51 | 1.92 | 1.44 |
| 5-year | 31.78 | 32.89 | 32.64 | 32.63 | 19.21 | 40.45 | 55.49 | 38.11 |
| Since inception | 52.16 | 53.87 | 53.41 | 50.25 | 27.03 | 63.44 | 89.94 | 58.99 |
Performance figures assume all distributions have been reinvested.
The expense ratios of the portfolio, both net (including any fee waivers and/or expense limitations) and gross (excluding any fee waivers and/or expense limitations), are set forth according to the most recent publicly available prospectuses for the portfolio and may differ from those disclosed in the Financial highlights tables in this report. Net expenses reflect contractual expense limitations in effect until December 31, 2020 and are subject to change. Had the contractual fee waivers and expense limitations not been in place, gross expenses would apply. The following expense ratios include the expenses of the underlying funds in which the portfolio invests. The expense ratios are as follows:
| | | | |
| | Class R4 | Class R6 | Class 1 |
| Gross (%) | 1.07 | 0.72 | 0.76 |
| Net (%) | 0.62 | 0.36 | 0.41 |
Please refer to the most recent prospectus and annual or semiannual report for more information on expenses and any expense limitation arrangements for each class.
The returns reflect past results and should not be considered indicative of future performance. The return and principal value of an investment will fluctuate so that shares, when redeemed, may be worth more or less than their original cost. Due to market volatility and other factors, the portfolio's current performance may be higher or lower than the performance shown. For current to the most recent month-end performance data, please call 800-225-5291 or visit the portfolio's website at jhinvestments.com.
The performance information does not reflect the deduction of taxes that a shareholder would pay on portfolio distributions or the redemption of portfolio shares. The portfolio's performance results reflect any applicable fee waivers or expense reductions, without which the expenses would increase and results would have been less favorable.
| 1 | Class R4 shares were first offered on 11-7-13 and ceased operations between 6-15-16 and 4-7-17. Returns while Class R4 shares were not offered are those of Class 1 shares that have not been adjusted for class-specific expenses; otherwise, returns would vary. |
| 2 | For certain types of investors, as described in the portfolio's prospectuses. |
SEMIANNUAL REPORT | JOHN HANCOCK MULTI-INDEX LIFETIME PORTFOLIOS 6
Multi-Index 2045 Lifetime Portfolio
GROWTH OF $10,000
This chart shows what happened to a hypothetical $10,000 investment in John Hancock Multi-Index 2045 Lifetime Portfolio for the share classes and periods indicated, assuming all distributions were reinvested. For comparison, we've shown the same investment in two blended indexes and three separate indexes.
Index 1is the S&P Target Date 2045 Index, an unmanaged index comprised of a set of indices aligned with specific target date years.
Index 2is the Bloomberg Barclays U.S. Aggregate Bond Index, an unmanaged index of dollar-denominated and non-convertible investment-grade debt issues.
Index 3 is the John Hancock 2045 Lifetime Index, which is based on the fund's asset allocation glide path and will reflect a more conservative allocation over time. The index is a customized blended index comprising some or all of the following component indices (ordered alphabetically): Bloomberg Barclays U.S. Aggregate Bond Index, Bloomberg Barclays U.S. Corporate Bond 1-5 Year Index, Bloomberg Barclays U.S. Treasury TIPS 1-5 Year Index, ICE BofA Long U.S. Treasury Principal STRIPS Index, ICE BofA U.S. High Yield Index, JP Morgan Emerging Markets Bond Index Global, MSCI Emerging Markets Index, MSCI World Energy Index, MSCI World ex-USA Index, MSCI World Metals & Mining Index, Russell 2500 Index, S&P 500 Index, S&P Global ex-U.S. REIT Index, S&P Global Infrastructure Index, S&P U.S. REIT Index, and S&P/LSTA Leveraged Loan Index.
Index 4 is the S&P 500 Index, an unmanaged index that includes 500 widely traded common stocks.
Index 5 is 66.50% Russell 3000 Index, 28.50% MSCI ACWI ex-USA Index, 4.00% Bloomberg Barclays U.S. Aggregate Bond Index, and 1.00% ICE BofA U.S. High Yield Master II Index.
Prior to January 1, 2020, the fund's primary benchmark was the S&P 500 Index. Effective January 1, 2020, the fund's primary benchmark index is the S&P Target Date 2045 Index. The S&P Target Date 2045 Index better reflects the universe of investment opportunities based on the fund's current investment strategy.
It is not possible to invest directly in an index. Index figures do not reflect expenses or sales charges, which would result in lower returns.
ASSET ALLOCATION (%)
| | | |
| Affiliated investment companies | 56.9 |
| | Large blend | 56.9 |
Unaffiliated investment companies/
Exchange-traded funds | 38.1 |
| | Equity | 35.1 |
| | Fixed income | 3.0 |
| U.S. Government | 2.6 |
| Short-term investments | 2.4 |
As a percentage of total investments.
PERFORMANCE CHART
Total returns for the period ended 2-29-20 (%)
| | | | | | | | | |
| | Class R41,2 | Class R62 | Class 12 | Index 1 | Index 2 | Index 3 | Index 4 | Index 5 |
| Inception | 11-7-13 | 11-7-13 | 11-7-13 | 11-7-13 | 11-7-13 | 11-7-13 | 11-7-13 | 11-7-13 |
| Average annual total returns | | |
| 1-year | 3.56 | 3.81 | 3.77 | 3.43 | 11.68 | 6.51 | 8.19 | 4.95 |
| 5-year | 5.67 | 5.84 | 5.80 | 5.73 | 3.58 | 7.03 | 9.23 | 6.67 |
| Since inception | 6.86 | 7.04 | 6.99 | 6.55 | 3.86 | 8.09 | 10.70 | 7.62 |
| Cumulative returns | | |
| 6-months | 0.94 | 1.02 | 1.06 | 0.63 | 3.39 | 2.51 | 1.92 | 1.44 |
| 5-year | 31.73 | 32.79 | 32.58 | 32.11 | 19.21 | 40.45 | 55.49 | 38.11 |
| Since inception | 51.99 | 53.62 | 53.16 | 49.25 | 27.03 | 63.44 | 89.94 | 58.99 |
Performance figures assume all distributions have been reinvested.
The expense ratios of the portfolio, both net (including any fee waivers and/or expense limitations) and gross (excluding any fee waivers and/or expense limitations), are set forth according to the most recent publicly available prospectuses for the portfolio and may differ from those disclosed in the Financial highlights tables in this report. Net expenses reflect contractual expense limitations in effect until December 31, 2020 and are subject to change. Had the contractual fee waivers and expense limitations not been in place, gross expenses would apply. The following expense ratios include the expenses of the underlying funds in which the portfolio invests. The expense ratios are as follows:
| | | | |
| | Class R4 | Class R6 | Class 1 |
| Gross (%) | 1.05 | 0.70 | 0.74 |
| Net (%) | 0.62 | 0.36 | 0.41 |
Please refer to the most recent prospectus and annual or semiannual report for more information on expenses and any expense limitation arrangements for each class.
The returns reflect past results and should not be considered indicative of future performance. The return and principal value of an investment will fluctuate so that shares, when redeemed, may be worth more or less than their original cost. Due to market volatility and other factors, the portfolio's current performance may be higher or lower than the performance shown. For current to the most recent month-end performance data, please call 800-225-5291 or visit the portfolio's website at jhinvestments.com.
The performance information does not reflect the deduction of taxes that a shareholder would pay on portfolio distributions or the redemption of portfolio shares. The portfolio's performance results reflect any applicable fee waivers or expense reductions, without which the expenses would increase and results would have been less favorable.
| 1 | Class R4 shares were first offered on 11-7-13 and ceased operations between 6-15-16 and 4-7-17. Returns while Class R4 shares were not offered are those of Class 1 shares that have not been adjusted for class-specific expenses; otherwise, returns would vary. |
| 2 | For certain types of investors, as described in the portfolio's prospectuses. |
SEMIANNUAL REPORT | JOHN HANCOCK MULTI-INDEX LIFETIME PORTFOLIOS 7
Multi-Index 2040 Lifetime Portfolio
GROWTH OF $10,000
This chart shows what happened to a hypothetical $10,000 investment in John Hancock Multi-Index 2040 Lifetime Portfolio for the share classes and periods indicated, assuming all distributions were reinvested. For comparison, we've shown the same investment in two blended indexes and three separate indexes.
Index 1is the S&P Target Date 2040 Index, an unmanaged index comprised of a set of indices aligned with specific target date years.
Index 2is the Bloomberg Barclays U.S. Aggregate Bond Index, an unmanaged index of dollar-denominated and non-convertible investment-grade debt issues.
Index 3is the John Hancock 2040 Lifetime Index, which is based on the fund's asset allocation glide path and will reflect a more conservative allocation over time. The index is a customized blended index comprising some or all of the following component indices (ordered alphabetically): Bloomberg Barclays U.S. Aggregate Bond Index, Bloomberg Barclays U.S. Corporate Bond 1-5 Year Index, Bloomberg Barclays U.S. Treasury TIPS 1-5 Year Index, ICE BofA Long U.S. Treasury Principal STRIPS Index, ICE BofA U.S. High Yield Index, JP Morgan Emerging Markets Bond Index Global, MSCI Emerging Markets Index, MSCI World Energy Index, MSCI World ex-USA Index, MSCI World Metals & Mining Index, Russell 2500 Index, S&P 500 Index, S&P Global ex-U.S. REIT Index, S&P Global Infrastructure Index, S&P U.S. REIT Index, and S&P/LSTA Leveraged Loan Index.
Index 4is theS&P 500 Index, an unmanaged index that includes 500 widely traded common stocks.
Index 5is 64.40% Russell 3000 Index, 27.60% MSCI ACWI ex-USA Index, 6.40% Bloomberg Barclays U.S. Aggregate Bond Index, and 1.60% ICE BofA U.S. High Yield Master II Index.
Prior to January 1, 2020, the fund's primary benchmark was the S&P 500 Index. Effective January 1, 2020, the fund's primary benchmark index is the S&P Target Date 2040 Index. The S&P Target Date 2040 Index better reflects the universe of investment opportunities based on the fund's current investment strategy.
It is not possible to invest directly in an index. Index figures do not reflect expenses or sales charges, which would result in lower returns.
ASSET ALLOCATION (%)
| | | |
| Affiliated investment companies | 55.2 |
| | Large blend | 55.2 |
Unaffiliated investment companies/
Exchange-traded funds | 39.0 |
| | Equity | 33.7 |
| | Fixed income | 5.3 |
| U.S. Government | 4.2 |
| Short-term investments | 1.6 |
As a percentage of total investments.
PERFORMANCE CHART
Total returns for the period ended 2-29-20 (%)
| | | | | | | | | |
| | Class R41,2 | Class R62 | Class 12 | Index 1 | Index 2 | Index 3 | Index 4 | Index 5 |
| Inception | 11-7-13 | 11-7-13 | 11-7-13 | 11-7-13 | 11-7-13 | 11-7-13 | 11-7-13 | 11-7-13 |
| Average annual total returns | | |
| 1-year | 4.02 | 4.29 | 4.14 | 3.70 | 11.68 | 6.98 | 8.19 | 5.19 |
| 5-year | 5.81 | 5.93 | 5.89 | 5.65 | 3.58 | 7.12 | 9.23 | 6.72 |
| Since inception | 6.97 | 7.13 | 7.08 | 6.45 | 3.86 | 8.17 | 10.70 | 7.66 |
| Cumulative returns | | |
| 6-months | 1.31 | 1.39 | 1.33 | 0.75 | 3.39 | 2.65 | 1.92 | 1.58 |
| 5-year | 32.60 | 33.36 | 33.13 | 31.64 | 19.21 | 41.07 | 55.49 | 38.43 |
| Since inception | 53.02 | 54.47 | 53.98 | 48.39 | 27.03 | 64.16 | 89.94 | 59.35 |
Performance figures assume all distributions have been reinvested.
The expense ratios of the portfolio, both net (including any fee waivers and/or expense limitations) and gross (excluding any fee waivers and/or expense limitations), are set forth according to the most recent publicly available prospectuses for the portfolio and may differ from those disclosed in the Financial highlights tables in this report. Net expenses reflect contractual expense limitations in effect until December 31, 2020 and are subject to change. Had the contractual fee waivers and expense limitations not been in place, gross expenses would apply. The following expense ratios include the expenses of the underlying funds in which the portfolio invests. The expense ratios are as follows:
| | | | |
| | Class R4 | Class R6 | Class 1 |
| Gross (%) | 1.04 | 0.69 | 0.73 |
| Net (%) | 0.62 | 0.36 | 0.41 |
Please refer to the most recent prospectus and annual or semiannual report for more information on expenses and any expense limitation arrangements for each class.
The returns reflect past results and should not be considered indicative of future performance. The return and principal value of an investment will fluctuate so that shares, when redeemed, may be worth more or less than their original cost. Due to market volatility and other factors, the portfolio's current performance may be higher or lower than the performance shown. For current to the most recent month-end performance data, please call 800-225-5291 or visit the portfolio's website at jhinvestments.com.
The performance information does not reflect the deduction of taxes that a shareholder would pay on portfolio distributions or the redemption of portfolio shares. The portfolio's performance results reflect any applicable fee waivers or expense reductions, without which the expenses would increase and results would have been less favorable.
| 1 | Class R4 shares were first offered on 11-7-13 and ceased operations from 6-15-16 to 4-7-17. Returns while Class R4 shares were not offered are those of Class 1 shares that have not been adjusted for class-specific expenses; otherwise, returns would vary. |
| 2 | For certain types of investors, as described in the portfolio's prospectuses. |
SEMIANNUAL REPORT | JOHN HANCOCK MULTI-INDEX LIFETIME PORTFOLIOS 8
Multi-Index 2035 Lifetime Portfolio
GROWTH OF $10,000
This chart shows what happened to a hypothetical $10,000 investment in John Hancock Multi-Index 2035 Lifetime Portfolio for the share classes and periods indicated, assuming all distributions were reinvested. For comparison, we've shown the same investment in two blended indexes and three separate indexes.
Index 1is the S&P Target Date 2035 Index, an unmanaged index comprised of a set of indices aligned with specific target date years.
Index 2is the Bloomberg Barclays U.S. Aggregate Bond Index, an unmanaged index of dollar-denominated and non-convertible investment-grade debt issues.
Index 3is the John Hancock 2035 Lifetime Index, which is based on the fund's asset allocation glide path and will reflect a more conservative allocation over time. The index is a customized blended index comprising some or all of the following component indices (ordered alphabetically): Bloomberg Barclays U.S. Aggregate Bond Index, Bloomberg Barclays U.S. Corporate Bond 1-5 Year Index, Bloomberg Barclays U.S. Treasury TIPS 1-5 Year Index, ICE BofA Long U.S. Treasury Principal STRIPS Index, ICE BofA U.S. High Yield Index, JP Morgan Emerging Markets Bond Index Global, MSCI Emerging Markets Index, MSCI World Energy Index, MSCI World ex-USA Index, MSCI World Metals & Mining Index, Russell 2500 Index, S&P 500 Index, S&P Global ex-U.S. REIT Index, S&P Global Infrastructure Index, S&P U.S. REIT Index, and S&P/LSTA Leveraged Loan Index.
Index 4is the S&P 500 Index, an unmanaged index that includes 500 widely traded common stocks.
Index 5is 59.50% Russell 3000 Index, 25.50% MSCI ACWI ex-USA Index, 12% Bloomberg Barclays U.S. Aggregate Bond Index, and 3% ICE BofA U.S. High Yield Master II Index.
Prior to January 1, 2020, the fund's primary benchmark was the S&P 500 Index. Effective January 1, 2020, the fund's primary benchmark index is the S&P Target Date 2035 Index. The S&P Target Date 2060 Index better reflects the universe of investment opportunities based on the fund's current investment strategy.
It is not possible to invest directly in an index. Index figures do not reflect expenses or sales charges, which would result in lower returns.
ASSET ALLOCATION (%)
| | | |
| Affiliated investment companies | 50.8 |
| | Large blend | 50.8 |
Unaffiliated investment companies/
Exchange-traded funds | 43.4 |
| | Equity | 31.0 |
| | Fixed income | 12.4 |
| U.S. Government | 5.5 |
| Short-term investments | 0.3 |
As a percentage of total investments.
PERFORMANCE CHART
Total returns for the period ended 2-29-20 (%)
| | | | | | | | | |
| | Class R41,2 | Class R62 | Class 12 | Index 1 | Index 2 | Index 3 | Index 4 | Index 5 |
| Inception | 11-7-13 | 11-7-13 | 11-7-13 | 11-7-13 | 11-7-13 | 11-7-13 | 11-7-13 | 11-7-13 |
| Average annual total returns | | |
| 1-year | 4.71 | 5.00 | 4.95 | 4.15 | 11.68 | 7.94 | 8.19 | 5.66 |
| 5-year | 5.65 | 5.82 | 5.76 | 5.52 | 3.58 | 6.99 | 9.23 | 6.59 |
| Since inception | 6.82 | 7.01 | 6.95 | 6.30 | 3.86 | 8.07 | 10.70 | 7.53 |
| Cumulative returns | | |
| 6-months | 1.59 | 1.77 | 1.73 | 0.93 | 3.39 | 2.72 | 1.92 | 1.73 |
| 5-year | 31.64 | 32.66 | 32.33 | 30.85 | 19.21 | 40.20 | 55.49 | 37.60 |
| Since inception | 51.65 | 53.39 | 52.84 | 47.03 | 27.03 | 63.21 | 89.94 | 58.17 |
Performance figures assume all distributions have been reinvested.
The expense ratios of the portfolio, both net (including any fee waivers and/or expense limitations) and gross (excluding any fee waivers and/or expense limitations), are set forth according to the most recent publicly available prospectuses for the portfolio and may differ from those disclosed in the Financial highlights tables in this report. Net expenses reflect contractual expense limitations in effect until December 31, 2020 and are subject to change. Had the contractual fee waivers and expense limitations not been in place, gross expenses would apply. The following expense ratios include the expenses of the underlying funds in which the portfolio invests. The expense ratios are as follows:
| | | | |
| | Class R4 | Class R6 | Class 1 |
| Gross (%) | 1.04 | 0.69 | 0.73 |
| Net (%) | 0.62 | 0.36 | 0.41 |
Please refer to the most recent prospectus and annual or semiannual report for more information on expenses and any expense limitation arrangements for each class.
The returns reflect past results and should not be considered indicative of future performance. The return and principal value of an investment will fluctuate so that shares, when redeemed, may be worth more or less than their original cost. Due to market volatility and other factors, the portfolio's current performance may be higher or lower than the performance shown. For current to the most recent month-end performance data, please call 800-225-5291 or visit the portfolio's website at jhinvestments.com.
The performance information does not reflect the deduction of taxes that a shareholder would pay on portfolio distributions or the redemption of portfolio shares. The portfolio's performance results reflect any applicable fee waivers or expense reductions, without which the expenses would increase and results would have been less favorable.
| 1 | Class R4 shares were first offered on 11-7-13 and ceased operations between 6-15-16 and 4-7-17. Returns while Class R4 shares were not offered are those of Class 1 shares that have not been adjusted for class-specific expenses; otherwise, returns would vary. |
| 2 | For certain types of investors, as described in the portfolio's prospectuses. |
SEMIANNUAL REPORT | JOHN HANCOCK MULTI-INDEX LIFETIME PORTFOLIOS 9
Multi-Index 2030 Lifetime Portfolio
GROWTH OF $10,000
This chart shows what happened to a hypothetical $10,000 investment in John Hancock Multi-Index 2030 Lifetime Portfolio for the share classes and periods indicated, assuming all distributions were reinvested. For comparison, we've shown the same investment in two blended indexes and three separate indexes.
Index 1is the S&P Target Date 2030 Index, an unmanaged index comprised of a set of indices aligned with specific target date years.
Index 2is the Bloomberg Barclays U.S. Aggregate Bond Index, an unmanaged index of dollar-denominated and non-convertible investment-grade debt issues.
Index 3is the John Hancock 2030 Lifetime Index, which is based on the fund's asset allocation glide path and will reflect a more conservative allocation over time. The index is a customized blended index comprising some or all of the following component indices (ordered alphabetically): Bloomberg Barclays U.S. Aggregate Bond Index, Bloomberg Barclays U.S. Corporate Bond 1-5 Year Index, Bloomberg Barclays U.S. Treasury TIPS 1-5 Year Index, ICE BofA Long U.S. Treasury Principal STRIPS Index, ICE BofA U.S. High Yield Index, JP Morgan Emerging Markets Bond Index Global, MSCI Emerging Markets Index, MSCI World Energy Index, MSCI World ex-USA Index, MSCI World Metals & Mining Index, Russell 2500 Index, S&P 500 Index, S&P Global ex-U.S. REIT Index, S&P Global Infrastructure Index, S&P U.S. REIT Index, and S&P/LSTA Leveraged Loan Index.
Index 4is the S&P 500 Index, an unmanaged index that includes 500 widely traded common stocks.
Index 5is 51.80% Russell 3000 Index, 22.20% MSCI ACWI ex-USA Index, 20.80% Bloomberg Barclays U.S. Aggregate Bond Index, and 5.20% ICE BofA U.S. High Yield Master II Index.
Prior to January 1, 2020, the fund's primary benchmark was the S&P 500 Index. Effective January 1, 2020, the fund's primary benchmark index is the S&P Target Date 2030 Index. The S&P Target Date 2030 Index better reflects the universe of investment opportunities based on the fund's current investment strategy.
It is not possible to invest directly in an index. Index figures do not reflect expenses or sales charges, which would result in lower returns.
ASSET ALLOCATION (%)
| | | |
| Affiliated investment companies | 45.3 |
| | Large blend | 45.3 |
Unaffiliated investment companies/
Exchange-traded funds | 48.0 |
| | Equity | 27.6 |
| | Fixed income | 20.4 |
| U.S. Government | 6.7 |
As a percentage of total investments.
PERFORMANCE CHART
Total returns for the period ended 2-29-20 (%)
| | | | | | | | | |
| | Class R41,2 | Class R62 | Class 12 | Index 1 | Index 2 | Index 3 | Index 4 | Index 5 |
| Inception | 11-7-13 | 11-7-13 | 11-7-13 | 11-7-13 | 11-7-13 | 11-7-13 | 11-7-13 | 11-7-13 |
| Average annual total returns | | |
| 1-year | 5.52 | 5.69 | 5.64 | 4.83 | 11.68 | 8.95 | 8.19 | 6.46 |
| 5-year | 5.51 | 5.67 | 5.62 | 5.34 | 3.58 | 6.80 | 9.23 | 6.45 |
| Since inception | 6.62 | 6.79 | 6.73 | 6.07 | 3.86 | 7.90 | 10.70 | 7.33 |
| Cumulative returns | | |
| 6-months | 1.97 | 1.95 | 2.00 | 1.19 | 3.39 | 2.80 | 1.92 | 2.10 |
| 5-year | 30.78 | 31.77 | 31.44 | 29.72 | 19.21 | 38.97 | 55.49 | 36.68 |
| Since inception | 49.88 | 51.43 | 50.89 | 45.06 | 27.03 | 61.63 | 89.94 | 56.30 |
Performance figures assume all distributions have been reinvested.
The expense ratios of the portfolio, both net (including any fee waivers and/or expense limitations) and gross (excluding any fee waivers and/or expense limitations), are set forth according to the most recent publicly available prospectuses for the portfolio and may differ from those disclosed in the Financial highlights tables in this report. Net expenses reflect contractual expense limitations in effect until December 31, 2020 and are subject to change. Had the fee contractual waivers and expense limitations not been in place, gross expenses would apply. The following expense ratios include the expenses of the underlying funds in which the portfolio invests. The expense ratios are as follows:
| | | | |
| | Class R4 | Class R6 | Class 1 |
| Gross (%) | 1.05 | 0.70 | 0.74 |
| Net (%) | 0.63 | 0.37 | 0.42 |
Please refer to the most recent prospectus and annual or semiannual report for more information on expenses and any expense limitation arrangements for each class.
The returns reflect past results and should not be considered indicative of future performance. The return and principal value of an investment will fluctuate so that shares, when redeemed, may be worth more or less than their original cost. Due to market volatility and other factors, the portfolio's current performance may be higher or lower than the performance shown. For current to the most recent month-end performance data, please call 800-225-5291 or visit the portfolio's website at jhinvestments.com.
The performance information does not reflect the deduction of taxes that a shareholder would pay on portfolio distributions or the redemption of portfolio shares. The portfolio's performance results reflect any applicable fee waivers or expense reductions, without which the expenses would increase and results would have been less favorable.
| 1 | Class R4 shares were first offered on 11-7-13 and ceased operations between 6-15-16 and 4-7-17. Returns while Class R4 shares were not offered are those of Class 1 shares that have not been adjusted for class-specific expenses; otherwise, returns would vary. |
| 2 | For certain types of investors, as described in the portfolio's prospectuses. |
SEMIANNUAL REPORT | JOHN HANCOCK MULTI-INDEX LIFETIME PORTFOLIOS 10
Multi-Index 2025 Lifetime Portfolio
GROWTH OF $10,000
This chart shows what happened to a hypothetical $10,000 investment in John Hancock Multi-Index 2025 Lifetime Portfolio for the share classes and periods indicated, assuming all distributions were reinvested. For comparison, we've shown the same investment in two blended indexes and three separate indexes.
Index 1isthe S&P Target Date 2025 Index, an unmanaged index comprised of a set of indices aligned with specific target date years.
Index 2is the Bloomberg Barclays U.S. Aggregate Bond Index, an unmanaged index of dollar-denominated and non-convertible investment-grade debt issues.
Index 3is the John Hancock 2025 Lifetime Index, which is based on the fund's asset allocation glide path and will reflect a more conservative allocation over time. The index is a customized blended index comprising some or all of the following component indices (ordered alphabetically): Bloomberg Barclays U.S. Aggregate Bond Index, Bloomberg Barclays U.S. Corporate Bond 1-5 Year Index, Bloomberg Barclays U.S. Treasury TIPS 1-5 Year Index, ICE BofA Long U.S. Treasury Principal STRIPS Index, ICE BofA U.S. High Yield Index, JP Morgan Emerging Markets Bond Index Global, MSCI Emerging Markets Index, MSCI World Energy Index, MSCI World ex-USA Index, MSCI World Metals & Mining Index, Russell 2500 Index, S&P 500 Index, S&P Global ex-U.S. REIT Index, S&P Global Infrastructure Index, S&P U.S. REIT Index, and S&P/LSTA Leveraged Loan Index.
Index 4is the S&P 500 Index, an unmanaged index that includes 500 widely traded common stocks.
Index 5is 43.40% Russell 3000 Index, 18.60% MSCI ACWI ex-USA Index, 30.40% Bloomberg Barclays U.S. Aggregate Bond Index, and 7.60% ICE BofA U.S. High Yield Master II Index.
Prior to January 1, 2020, the fund's primary benchmark was the S&P 500 Index. Effective January 1, 2020, the fund's primary benchmark index is the S&P Target Date 2025 Index. The S&P Target Date 2025 Index better reflects the universe of investment opportunities based on the fund's current investment strategy.
It is not possible to invest directly in an index. Index figures do not reflect expenses or sales charges, which would result in lower returns.
ASSET ALLOCATION (%)
| | | |
| Affiliated investment companies | 37.4 |
| | Large blend | 37.4 |
Unaffiliated investment companies/
Exchange-traded funds | 50.8 |
| | Fixed income | 28.1 |
| | Equity | 22.7 |
| U.S. Government | 7.8 |
| Short-term investments | 4.0 |
As a percentage of total investments.
PERFORMANCE CHART
Total returns for the period ended 2-29-20 (%)
| | | | | | | | | |
| | Class R41,2 | Class R62 | Class 12 | Index 1 | Index 2 | Index 3 | Index 4 | Index 5 |
| Inception | 11-7-13 | 11-7-13 | 11-7-13 | 11-7-13 | 11-7-13 | 11-7-13 | 11-7-13 | 11-7-13 |
| Average annual total returns | | |
| 1-year | 6.02 | 6.26 | 6.11 | 5.49 | 11.68 | 9.34 | 8.19 | 7.22 |
| 5-year | 5.23 | 5.40 | 5.33 | 5.13 | 3.58 | 6.42 | 9.23 | 6.18 |
| Since inception | 6.27 | 6.45 | 6.38 | 5.81 | 3.86 | 7.57 | 10.70 | 7.00 |
| Cumulative returns | | |
| 6-months | 1.93 | 2.07 | 2.01 | 1.43 | 3.39 | 2.71 | 1.92 | 2.33 |
| 5-year | 29.05 | 30.07 | 29.63 | 28.43 | 19.21 | 36.52 | 55.49 | 34.97 |
| Since inception | 46.76 | 48.34 | 47.75 | 42.84 | 27.03 | 58.46 | 89.94 | 53.26 |
Performance figures assume all distributions have been reinvested.
The expense ratios of the portfolio, both net (including any fee waivers and/or expense limitations) and gross (excluding any fee waivers and/or expense limitations), are set forth according to the most recent publicly available prospectuses for the portfolio and may differ from those disclosed in the Financial highlights tables in this report. Net expenses reflect contractual expense limitations in effect until December 31, 2020 and are subject to change. Had the contractual fee waivers and expense limitations not been in place, gross expenses would apply. The following expense ratios include the expenses of the underlying funds in which the portfolio invests. The expense ratios are as follows:
| | | | |
| | Class R4 | Class R6 | Class 1 |
| Gross (%) | 1.06 | 0.71 | 0.75 |
| Net (%) | 0.65 | 0.39 | 0.44 |
Please refer to the most recent prospectus and annual or semiannual report for more information on expenses and any expense limitation arrangements for each class.
The returns reflect past results and should not be considered indicative of future performance. The return and principal value of an investment will fluctuate so that shares, when redeemed, may be worth more or less than their original cost. Due to market volatility and other factors, the portfolio's current performance may be higher or lower than the performance shown. For current to the most recent month-end performance data, please call 800-225-5291 or visit the portfolio's website at jhinvestments.com.
The performance information does not reflect the deduction of taxes that a shareholder would pay on portfolio distributions or the redemption of portfolio shares. The portfolio's performance results reflect any applicable fee waivers or expense reductions, without which the expenses would increase and results would have been less favorable.
| 1 | Class R4 shares were first offered on 11-7-13 and ceased operations between 6-15-16 and 4-7-17. Returns while Class R4 shares were not offered are those of Class 1 shares that have not been adjusted for class-specific expenses; otherwise, returns would vary. |
| 2 | For certain types of investors, as described in the portfolio's prospectuses. |
SEMIANNUAL REPORT | JOHN HANCOCK MULTI-INDEX LIFETIME PORTFOLIOS 11
Multi-Index 2020 Lifetime Portfolio
GROWTH OF $10,000
This chart shows what happened to a hypothetical $10,000 investment in John Hancock Multi-Index 2020 Lifetime Portfolio for the share classes and periods indicated, assuming all distributions were reinvested. For comparison, we've shown the same investment in two blended indexes and three separate indexes.
Index 1isthe S&P Target Date 2020 Index, an unmanaged index comprised of a set of indices aligned with specific target date years.
Index 2is the Bloomberg Barclays U.S. Aggregate Bond Index, an unmanaged index of dollar-denominated and non-convertible investment-grade debt issues.
Index 3is the John Hancock 2020 Lifetime Index, which is based on the fund's asset allocation glide path and will reflect a more conservative allocation over time. The index is a customized blended index comprising some or all of the following component indices (ordered alphabetically): Bloomberg Barclays U.S. Aggregate Bond Index, Bloomberg Barclays U.S. Corporate Bond 1-5 Year Index, Bloomberg Barclays U.S. Treasury TIPS 1-5 Year Index, ICE BofA Long U.S. Treasury Principal STRIPS Index, ICE BofA U.S. High Yield Index, JP Morgan Emerging Markets Bond Index Global, MSCI Emerging Markets Index, MSCI World Energy Index, MSCI World ex-USA Index, MSCI World Metals & Mining Index, Russell 2500 Index, S&P 500 Index, S&P Global ex-U.S. REIT Index, S&P Global Infrastructure Index, S&P U.S. REIT Index, and S&P/LSTA Leveraged Loan Index.
Index 4is the S&P 500 Index, an unmanaged index that includes 500 widely traded common stocks.
Index 5is 36.40% Russell 3000 Index, 15.60% MSCI ACWI ex-USA Index, 38.40% Bloomberg Barclays U.S. Aggregate Bond Index, and 9.60% ICE BofA U.S. High Yield Master II Index.
Prior to January 1, 2020, the fund's primary benchmark was the S&P 500 Index. Effective January 1, 2020, the fund's primary benchmark index is the S&P Target Date 2020 Index. The S&P Target Date 2020 Index better reflects the universe of investment opportunities based on the fund's current investment strategy.
It is not possible to invest directly in an index. Index figures do not reflect expenses or sales charges, which would result in lower returns.
ASSET ALLOCATION (%)
| | | |
| Affiliated investment companies | 24.9 |
| | Large blend | 24.9 |
Unaffiliated investment companies/
Exchange-traded funds | 61.9 |
| | Fixed income | 39.0 |
| | Equity | 22.9 |
| U.S. Government | 7.8 |
| Short-term investments | 5.4 |
As a percentage of total investments.
PERFORMANCE CHART
Total returns for the period ended 2-29-20 (%)
| | | | | | | | | |
| | Class R41,2 | Class R62 | Class 12 | Index 1 | Index 2 | Index 3 | Index 4 | Index 5 |
| Inception | 11-7-13 | 11-7-13 | 11-7-13 | 11-7-13 | 11-7-13 | 11-7-13 | 11-7-13 | 11-7-13 |
| Average annual total returns | | |
| 1-year | 6.47 | 6.78 | 6.73 | 6.06 | 11.68 | 9.21 | 8.19 | 7.80 |
| 5-year | 4.90 | 5.06 | 5.04 | 4.86 | 3.58 | 5.88 | 9.23 | 5.83 |
| Since inception | 5.80 | 6.00 | 5.95 | 5.52 | 3.86 | 6.96 | 10.70 | 6.56 |
| Cumulative returns | | |
| 6-months | 1.92 | 2.03 | 2.08 | 1.65 | 3.39 | 2.55 | 1.92 | 2.43 |
| 5-year | 27.03 | 28.02 | 27.84 | 26.79 | 19.21 | 33.04 | 55.49 | 32.76 |
| Since inception | 42.78 | 44.42 | 44.01 | 40.39 | 27.03 | 52.92 | 89.94 | 49.33 |
Performance figures assume all distributions have been reinvested.
The expense ratios of the portfolio, both net (including any fee waivers and/or expense limitations) and gross (excluding any fee waivers and/or expense limitations), are set forth according to the most recent publicly available prospectuses for the portfolio and may differ from those disclosed in the Financial highlights tables in this report. Net expenses reflect contractual expense limitations in effect until December 31, 2020 and are subject to change. Had the contractual fee waivers and expense limitations not been in place, gross expenses would apply. The following expense ratios include the expenses of the underlying funds in which the portfolio invests. The expense ratios are as follows:
| | | | |
| | Class R4 | Class R6 | Class 1 |
| Gross (%) | 1.09 | 0.74 | 0.78 |
| Net (%) | 0.64 | 0.38 | 0.43 |
Please refer to the most recent prospectus and annual or semiannual report for more information on expenses and any expense limitation arrangements for each class.
The returns reflect past results and should not be considered indicative of future performance. The return and principal value of an investment will fluctuate so that shares, when redeemed, may be worth more or less than their original cost. Due to market volatility and other factors, the portfolio's current performance may be higher or lower than the performance shown. For current to the most recent month-end performance data, please call 800-225-5291 or visit the portfolio's website at jhinvestments.com.
The performance information does not reflect the deduction of taxes that a shareholder would pay on portfolio distributions or the redemption of portfolio shares. The portfolio's performance results reflect any applicable fee waivers or expense reductions, without which the expenses would increase and results would have been less favorable.
| 1 | Class R4 shares were first offered on 11-7-13 and ceased operations between 6-15-16 and 4-7-17. Returns while Class R4 shares were not offered are those of Class 1 shares that have not been adjusted for class-specific expenses; otherwise, returns would vary. |
| 2 | For certain types of investors, as described in the portfolio's prospectuses. |
SEMIANNUAL REPORT | JOHN HANCOCK MULTI-INDEX LIFETIME PORTFOLIOS 12
Multi-Index 2015 Lifetime Portfolio
GROWTH OF $10,000
This chart shows what happened to a hypothetical $10,000 investment in John Hancock Multi-Index 2015 Lifetime Portfolio for the share classes and periods indicated, assuming all distributions were reinvested. For comparison, we've shown the same investment in two blended indexes and three separate indexes.
Index 1is the S&P Target Date 2015 Index, an unmanaged index comprised of a set of indices aligned with specific target date years.
Index 2is the Bloomberg Barclays U.S. Aggregate Bond Index, an unmanaged index of dollar-denominated and non-convertible investment-grade debt issues.
Index 3is the John Hancock 2015 Lifetime Index, which is based on the fund's asset allocation glide path and will reflect a more conservative allocation over time. The index is a customized blended index comprising some or all of the following component indices (ordered alphabetically): Bloomberg Barclays U.S. Aggregate Bond Index, Bloomberg Barclays U.S. Corporate Bond 1-5 Year Index, Bloomberg Barclays U.S. Treasury TIPS 1-5 Year Index, ICE BofA Long U.S. Treasury Principal STRIPS Index, ICE BofA U.S. High Yield Index, JP Morgan Emerging Markets Bond Index Global, MSCI Emerging Markets Index, MSCI World Energy Index, MSCI World ex-USA Index, MSCI World Metals & Mining Index, Russell 2500 Index, S&P 500 Index, S&P Global ex-U.S. REIT Index, S&P Global Infrastructure Index, S&P U.S. REIT Index, and S&P/LSTA Leveraged Loan Index.
Index 4is the S&P 500 Index, an unmanaged index that includes 500 widely traded common stocks.
Index 5is 30.60% Russell 3000 Index, 13.10% MSCI ACWI ex-USA Index, 45.00% Bloomberg Barclays U.S. Aggregate Bond Index, and 11.30% ICE BofA U.S. High Yield Master II Index.
Prior to January 1, 2020, the fund's primary benchmark was the Bloomberg Barclays U.S. Aggregate Bond Index. Effective January 1, 2020, the fund's primary benchmark index is the S&P Target Date 2015 Index. The S&P Target Date 2015 Index better reflects the universe of investment opportunities based on the fund's current investment strategy.
It is not possible to invest directly in an index. Index figures do not reflect expenses or sales charges, which would result in lower returns.
ASSET ALLOCATION (%)
| | | |
| Affiliated investment companies | 21.1 |
| | Large blend | 21.1 |
Unaffiliated investment companies/
Exchange-traded funds | 68.3 |
| | Fixed income | 48.2 |
| | Equity | 20.1 |
| U.S. Government | 8.1 |
| Short-term investments | 2.5 |
As a percentage of total investments.
PERFORMANCE CHART
Total returns for the period ended 2-29-20 (%)
| | | | | | | | | |
| | Class R41,2 | Class R62 | Class 12 | Index 1 | Index 2 | Index 3 | Index 4 | Index 5 |
| Inception | 11-7-13 | 11-7-13 | 11-7-13 | 11-7-13 | 11-7-13 | 11-7-13 | 11-7-13 | 11-7-13 |
| Average annual total returns | | |
| 1-year | 6.99 | 7.15 | 7.00 | 6.33 | 11.68 | 8.72 | 8.19 | 8.26 |
| 5-year | 4.63 | 4.76 | 4.69 | 4.58 | 3.58 | 5.25 | 9.23 | 5.50 |
| Since inception | 5.38 | 5.55 | 5.48 | 5.16 | 3.86 | 6.17 | 10.70 | 6.15 |
| Cumulative returns | | |
| 6-months | 1.85 | 2.00 | 1.85 | 1.75 | 3.39 | 2.29 | 1.92 | 2.51 |
| 5-year | 25.40 | 26.19 | 25.75 | 25.08 | 19.21 | 29.15 | 55.49 | 30.72 |
| Since inception | 39.23 | 40.63 | 40.07 | 37.39 | 27.03 | 45.89 | 89.94 | 45.78 |
Performance figures assume all distributions have been reinvested.
The expense ratios of the portfolio, both net (including any fee waivers and/or expense limitations) and gross (excluding any fee waivers and/or expense limitations), are set forth according to the most recent publicly available prospectuses for the portfolio and may differ from those disclosed in the Financial highlights tables in this report. Net expenses reflect contractual expense limitations in effect until December 31, 2020 and are subject to change. Had the contractual fee waivers and expense limitations not been in place, gross expenses would apply. The following expense ratios include the expenses of the underlying funds in which the portfolio invests. The expense ratios are as follows:
| | | | |
| | Class R4 | Class R6 | Class 1 |
| Gross (%) | 1.26 | 0.91 | 0.95 |
| Net (%) | 0.63 | 0.37 | 0.42 |
Please refer to the most recent prospectus and annual or semiannual report for more information on expenses and any expense limitation arrangements for each class.
The returns reflect past results and should not be considered indicative of future performance. The return and principal value of an investment will fluctuate so that shares, when redeemed, may be worth more or less than their original cost. Due to market volatility and other factors, the portfolio's current performance may be higher or lower than the performance shown. For current to the most recent month-end performance data, please call 800-225-5291 or visit the portfolio's website at jhinvestments.com.
The performance information does not reflect the deduction of taxes that a shareholder would pay on portfolio distributions or the redemption of portfolio shares. The portfolio's performance results reflect any applicable fee waivers or expense reductions, without which the expenses would increase and results would have been less favorable.
| 1 | Class R4 shares were first offered on 11-7-13 and ceased operations between 6-15-16 and 4-7-17. Returns while Class R4 shares were not offered are those of Class 1 shares that have not been adjusted for class-specific expenses; otherwise, returns would vary. |
| 2 | For certain types of investors, as described in the portfolio's prospectuses. |
SEMIANNUAL REPORT | JOHN HANCOCK MULTI-INDEX LIFETIME PORTFOLIOS 13
Multi-Index 2010 Lifetime Portfolio
GROWTH OF $10,000
This chart shows what happened to a hypothetical $10,000 investment in John Hancock Multi-Index 2010 Lifetime Portfolio for the share classes and periods indicated, assuming all distributions were reinvested. For comparison, we've shown the same investment in two blended indexes and three separate indexes.
Index 1is the S&P Target Date 2010 Index, an unmanaged index comprised of a set of indices aligned with specific target date years.
Index 2is the Bloomberg Barclays U.S. Aggregate Bond Index, an unmanaged index of dollar-denominated and non-convertible investment-grade debt issues.
Index 3is the John Hancock 2010 Lifetime Index, which is based on the fund's asset allocation glide path and will reflect a more conservative allocation over time. The index is a customized blended index comprising some or all of the following component indices (ordered alphabetically): Bloomberg Barclays U.S. Aggregate Bond Index, Bloomberg Barclays U.S. Corporate Bond 1-5 Year Index, Bloomberg Barclays U.S. Treasury TIPS 1-5 Year Index, ICE BofA Long U.S. Treasury Principal STRIPS Index, ICE BofA U.S. High Yield Index, JP Morgan Emerging Markets Bond Index Global, MSCI Emerging Markets Index, MSCI World Energy Index, MSCI World ex-USA Index, MSCI World Metals & Mining Index, Russell 2500 Index, S&P 500 Index, S&P Global ex-U.S. REIT Index, S&P Global Infrastructure Index, S&P U.S. REIT Index, and S&P/LSTA Leveraged Loan Index.
Index 4is the S&P 500 Index, an unmanaged index that includes 500 widely traded common stocks.
Index 5is 26.25% Russell 3000 Index, 11.25% MSCI ACWI ex-USA Index, 50.00% Bloomberg Barclays U.S. Aggregate Bond Index, and 12.50% ICE BofA U.S. High Yield Master II Index.
Prior to January 1, 2020, the fund's primary benchmark was the Bloomberg Barclays U.S. Aggregate Bond Index. Effective January 1, 2020, the fund's primary benchmark index is the S&P Target Date 2010 Index. The S&P Target Date 2010 Index better reflects the universe of investment opportunities based on the fund's current investment strategy.
It is not possible to invest directly in an index. Index figures do not reflect expenses or sales charges, which would result in lower returns.
ASSET ALLOCATION (%)
| | | |
| Affiliated investment companies | 15.5 |
| | Large blend | 15.5 |
Unaffiliated investment companies/
Exchange-traded funds | 73.3 |
| | Fixed income | 54.2 |
| | Equity | 19.1 |
| U.S. Government | 8.0 |
| Short-term investments | 3.2 |
As a percentage of total investments.
PERFORMANCE CHART
Total returns for the period ended 2-29-20 (%)
| | | | | | | | | | | | |
| | Class R41,2 | Class R62 | Class 12 | Index 1 | Index 2 | Index 3 | Index 4 | Index 5 |
| Inception | 11-7-13 | 11-7-13 | 11-7-13 | 11-7-13 | 11-7-13 | 11-7-13 | 11-7-13 | 11-7-13 |
| 1-year | 7.25 | 7.42 | 7.36 | 6.76 | 11.68 | 8.27 | 8.19 | 8.62 |
| 5-year | 4.38 | 4.55 | 4.48 | 4.27 | 3.58 | 4.89 | 9.23 | 5.32 |
| Since inception | 5.10 | 5.28 | 5.22 | 4.74 | 3.86 | 5.60 | 10.70 | 5.88 |
| 6-months | 1.85 | 1.92 | 1.86 | 1.92 | 3.39 | 2.16 | 1.92 | 2.60 |
| 5-year | 23.90 | 24.90 | 24.48 | 23.27 | 19.21 | 26.97 | 55.49 | 29.59 |
| Since inception | 36.92 | 38.41 | 37.88 | 33.99 | 27.03 | 41.08 | 89.94 | 43.46 |
Performance figures assume all distributions have been reinvested.
The expense ratios of the portfolio, both net (including any fee waivers and/or expense limitations) and gross (excluding any fee waivers and/or expense limitations), are set forth according to the most recent publicly available prospectuses for the portfolio and may differ from those disclosed in the Financial highlights tables in this report. Net expenses reflect contractual expense limitations in effect until December 31, 2020 and are subject to change. Had the contractual fee waivers and expense limitations not been in place, gross expenses would apply. The following expense ratios include the expenses of the underlying funds in which the portfolio invests. The expense ratios are as follows:
| | | | |
| | Class R4 | Class R6 | Class 1 |
| Gross (%) | 1.41 | 1.06 | 1.10 |
| Net (%) | 0.61 | 0.35 | 0.40 |
Please refer to the most recent prospectus and annual or semiannual report for more information on expenses and any expense limitation arrangements for each class.
The returns reflect past results and should not be considered indicative of future performance. The return and principal value of an investment will fluctuate so that shares, when redeemed, may be worth more or less than their original cost. Due to market volatility and other factors, the portfolio's current performance may be higher or lower than the performance shown. For current to the most recent month-end performance data, please call 800-225-5291 or visit the portfolio's website at jhinvestments.com.
The performance information does not reflect the deduction of taxes that a shareholder would pay on portfolio distributions or the redemption of portfolio shares. The portfolio's performance results reflect any applicable fee waivers or expense reductions, without which the expenses would increase and results would have been less favorable.
| 1 | Class R4 shares were first offered on 11-7-13 and ceased operations between 6-15-16 and 4-7-17. Returns while Class R4 shares were not offered are those of Class 1 shares that have not been adjusted for class-specific expenses; otherwise, returns would vary. |
| 2 | For certain types of investors, as described in the portfolio's prospectuses. |
SEMIANNUAL REPORT | JOHN HANCOCK MULTI-INDEX LIFETIME PORTFOLIOS 14
As a shareholder of a John Hancock Funds II Multi-Index Lifetime Portfolio, you incur two types of costs: (1) transaction costs, including sales charges (loads) on certain purchases or redemptions, and (2) ongoing costs, including management fees, distribution and service (Rule 12b-1) fees, and other portfolio expenses. In addition to the operating expenses which each portfolio bears directly, each portfolio indirectly bears a pro rata share of the operating expenses of the underlying funds in which each portfolio invests. Because underlying funds have varied operating expenses and transaction costs, and a portfolio may own different proportions of the underlying funds at different times, the amount of expenses incurred indirectly by the portfolio will vary. Had these indirect expenses been reflected in the following analysis, total expenses would have been higher than the amounts shown.
These examples are intended to help you understand your ongoing costs (in dollars) of investing in a portfolio so you can compare these costs with the ongoing costs of investing in other mutual funds. The examples are based on an investment of $1,000 at the beginning of the period and held for the entire period (September 1, 2019 through February 29, 2020).
Actual expenses:
The first line of each share class in the following table provides information about actual account values and actual expenses. You may use the information in this line, together with the amount you invested, to estimate the expenses that you paid over the period. Simply divide your account value by $1,000 (for example, an $8,600 account value divided by $1,000 = 8.6), then multiply the result by the number in the first line under the heading entitled “Expenses paid during period ended” to estimate the expenses you paid on your account during this period.
Hypothetical example for comparison purposes:
The second line of each share class in the following table provides information about hypothetical account values and hypothetical expenses based on the actual expense ratio for the share class and an assumed annualized rate of return of 5% per year before expenses, which is not the actual return of the share class. The hypothetical account values and expenses may not be used to estimate the actual ending account balance or expenses you paid for the period. You may use this information to compare the ongoing costs of investing in a portfolio and other funds. To do so, compare this 5% hypothetical example with the 5% hypothetical examples that appear in the shareholder reports of the other funds. Please remember that these hypothetical account values and expenses may not be used to estimate the actual ending account balance or expenses you paid for the period.
Please note that the expenses shown in the table are meant to highlight your ongoing costs only and do not reflect any transactional costs. Therefore, the second line of each share class in the table is useful in comparing ongoing costs only, and will not help you determine the relative total costs of owning different funds. In addition, if these transactional costs were included, your costs would have been higher. See the portfolios’ prospectuses for details regarding transaction costs.
SHAREHOLDER EXPENSE EXAMPLE CHART
| | | Account
value on
9-1-2019 | Ending
value on
2-29-2020 | Expenses
paid during
period ended
2-29-20201 | Annualized
expense
ratio2 |
| Multi-Index 2060 Lifetime Portfolio |
| Class R4 | Actual expenses/actual returns | $1,000.00 | $1,009.40 | $0.80 | 0.16% |
| | Hypothetical example | 1,000.00 | 1,024.10 | 0.81 | 0.16% |
| Class R6 | Actual expenses/actual returns | 1,000.00 | 1,010.20 | 0.00 | 0.00% |
| | Hypothetical example | 1,000.00 | 1,024.90 | 0.00 | 0.00% |
| Class 1 | Actual expenses/actual returns | 1,000.00 | 1,009.60 | 0.25 | 0.05% |
| | Hypothetical example | 1,000.00 | 1,024.60 | 0.25 | 0.05% |
| Multi-Index 2055 Lifetime Portfolio |
| Class R4 | Actual expenses/actual returns | $1,000.00 | $1,009.90 | $0.85 | 0.17% |
| | Hypothetical example | 1,000.00 | 1,024.00 | 0.86 | 0.17% |
| Class R6 | Actual expenses/actual returns | 1,000.00 | 1,010.50 | 0.00 | 0.00% |
| | Hypothetical example | 1,000.00 | 1,024.90 | 0.00 | 0.00% |
| Class 1 | Actual expenses/actual returns | 1,000.00 | 1,010.00 | 0.25 | 0.05% |
| | Hypothetical example | 1,000.00 | 1,024.60 | 0.25 | 0.05% |
| Multi-Index 2050 Lifetime Portfolio |
| Class R4 | Actual expenses/actual returns | $1,000.00 | $1,008.80 | $1.25 | 0.25% |
| | Hypothetical example | 1,000.00 | 1,023.60 | 1.26 | 0.25% |
| Class R6 | Actual expenses/actual returns | 1,000.00 | 1,009.50 | 0.00 | 0.00% |
| | Hypothetical example | 1,000.00 | 1,024.90 | 0.00 | 0.00% |
| Class 1 | Actual expenses/actual returns | 1,000.00 | 1,009.80 | 0.25 | 0.05% |
| | Hypothetical example | 1,000.00 | 1,024.60 | 0.25 | 0.05% |
| | SEMIANNUAL REPORT | JOHN HANCOCK MULTI-INDEX LIFETIME PORTFOLIOS | 15 |
SHAREHOLDER EXPENSE EXAMPLE CHART (continued)
| | | Account
value on
9-1-2019 | Ending
value on
2-29-2020 | Expenses
paid during
period ended
2-29-20201 | Annualized
expense
ratio2 |
| Multi-Index 2045 Lifetime Portfolio |
| Class R4 | Actual expenses/actual returns | $1,000.00 | $1,009.40 | $0.85 | 0.17% |
| | Hypothetical example | 1,000.00 | 1,024.00 | 0.86 | 0.17% |
| Class R6 | Actual expenses/actual returns | 1,000.00 | 1,010.20 | 0.00 | 0.00% |
| | Hypothetical example | 1,000.00 | 1,024.90 | 0.00 | 0.00% |
| Class 1 | Actual expenses/actual returns | 1,000.00 | 1,010.60 | 0.25 | 0.05% |
| | Hypothetical example | 1,000.00 | 1,024.60 | 0.25 | 0.05% |
| Multi-Index 2040 Lifetime Portfolio |
| Class R4 | Actual expenses/actual returns | $1,000.00 | $1,013.10 | $0.85 | 0.17% |
| | Hypothetical example | 1,000.00 | 1,024.00 | 0.86 | 0.17% |
| Class R6 | Actual expenses/actual returns | 1,000.00 | 1,013.90 | 0.00 | 0.00% |
| | Hypothetical example | 1,000.00 | 1,024.90 | 0.00 | 0.00% |
| Class 1 | Actual expenses/actual returns | 1,000.00 | 1,013.30 | 0.25 | 0.05% |
| | Hypothetical example | 1,000.00 | 1,024.60 | 0.25 | 0.05% |
| Multi-Index 2035 Lifetime Portfolio |
| Class R4 | Actual expenses/actual returns | $1,000.00 | $1,015.90 | $1.00 | 0.20% |
| | Hypothetical example | 1,000.00 | 1,023.90 | 1.01 | 0.20% |
| Class R6 | Actual expenses/actual returns | 1,000.00 | 1,017.70 | 0.10 | 0.02% |
| | Hypothetical example | 1,000.00 | 1,024.80 | 0.10 | 0.02% |
| Class 1 | Actual expenses/actual returns | 1,000.00 | 1,017.30 | 0.35 | 0.07% |
| | Hypothetical example | 1,000.00 | 1,024.50 | 0.35 | 0.07% |
| Multi-Index 2030 Lifetime Portfolio |
| Class R4 | Actual expenses/actual returns | $1,000.00 | $1,019.70 | $1.10 | 0.22% |
| | Hypothetical example | 1,000.00 | 1,023.80 | 1.11 | 0.22% |
| Class R6 | Actual expenses/actual returns | 1,000.00 | 1,019.50 | 0.25 | 0.05% |
| | Hypothetical example | 1,000.00 | 1,024.60 | 0.25 | 0.05% |
| Class 1 | Actual expenses/actual returns | 1,000.00 | 1,020.00 | 0.50 | 0.10% |
| | Hypothetical example | 1,000.00 | 1,024.40 | 0.50 | 0.10% |
| Multi-Index 2025 Lifetime Portfolio |
| Class R4 | Actual expenses/actual returns | $1,000.00 | $1,019.30 | $1.31 | 0.26% |
| | Hypothetical example | 1,000.00 | 1,023.60 | 1.31 | 0.26% |
| Class R6 | Actual expenses/actual returns | 1,000.00 | 1,020.70 | 0.45 | 0.09% |
| | Hypothetical example | 1,000.00 | 1,024.40 | 0.45 | 0.09% |
| Class 1 | Actual expenses/actual returns | 1,000.00 | 1,020.10 | 0.70 | 0.14% |
| | Hypothetical example | 1,000.00 | 1,024.20 | 0.70 | 0.14% |
| Multi-Index 2020 Lifetime Portfolio |
| Class R4 | Actual expenses/actual returns | $1,000.00 | $1,019.20 | $1.61 | 0.32% |
| | Hypothetical example | 1,000.00 | 1,023.30 | 1.61 | 0.32% |
| Class R6 | Actual expenses/actual returns | 1,000.00 | 1,020.30 | 0.55 | 0.11% |
| | Hypothetical example | 1,000.00 | 1,024.30 | 0.55 | 0.11% |
| Class 1 | Actual expenses/actual returns | 1,000.00 | 1,020.80 | 0.80 | 0.16% |
| | Hypothetical example | 1,000.00 | 1,024.10 | 0.81 | 0.16% |
| Multi-Index 2015 Lifetime Portfolio |
| Class R4 | Actual expenses/actual returns | $1,000.00 | $1,018.50 | $1.41 | 0.28% |
| | Hypothetical example | 1,000.00 | 1,023.50 | 1.41 | 0.28% |
| Class R6 | Actual expenses/actual returns | 1,000.00 | 1,020.00 | 0.60 | 0.12% |
| | Hypothetical example | 1,000.00 | 1,024.30 | 0.60 | 0.12% |
| Class 1 | Actual expenses/actual returns | 1,000.00 | 1,018.50 | 0.85 | 0.17% |
| | Hypothetical example | 1,000.00 | 1,024.00 | 0.86 | 0.17% |
| 16 | JOHN HANCOCK MULTI-INDEX LIFETIME PORTFOLIOS | SEMIANNUAL REPORT | |
SHAREHOLDER EXPENSE EXAMPLE CHART (continued)
| | | Account
value on
9-1-2019 | Ending
value on
2-29-2020 | Expenses
paid during
period ended
2-29-20201 | Annualized
expense
ratio2 |
| Multi-Index 2010 Lifetime Portfolio |
| Class R4 | Actual expenses/actual returns | $1,000.00 | $1,018.50 | $1.41 | 0.28% |
| | Hypothetical example | 1,000.00 | 1,023.50 | 1.41 | 0.28% |
| Class R6 | Actual expenses/actual returns | 1,000.00 | 1,019.20 | 0.55 | 0.11% |
| | Hypothetical example | 1,000.00 | 1,024.30 | 0.55 | 0.11% |
| Class 1 | Actual expenses/actual returns | 1,000.00 | 1,018.60 | 0.80 | 0.16% |
| | Hypothetical example | 1,000.00 | 1,024.10 | 0.81 | 0.16% |
| 1 | Expenses are equal to the annualized expense ratio, multiplied by the average account value over the period, multiplied by 182/366 (to reflect the one-half year period). |
| 2 | Ratios do not include expenses indirectly incurred by the underlying funds and can vary based on the mix of underlying funds held by the portfolios. |
| | SEMIANNUAL REPORT | JOHN HANCOCK MULTI-INDEX LIFETIME PORTFOLIOS | 17 |
MULTI-INDEX 2060 LIFETIME PORTFOLIO
As of 2-29-20 (unaudited)
| | Shares or
Principal
Amount | Value |
| AFFILIATED INVESTMENT COMPANIES (A) - 58.3% | |
| Equity - 58.3% | | |
| Strategic Equity Allocation, Class NAV, JHF II (MIM US) (B) | 1,680,598 | $18,318,515 |
|
TOTAL AFFILIATED INVESTMENT COMPANIES (Cost
$19,762,733) | $18,318,515 |
| UNAFFILIATED INVESTMENT COMPANIES - 38.6% | |
| Exchange-traded funds - 38.6% | | |
| Financial Select Sector SPDR Fund | 15,212 | 404,487 |
| iShares Edge MSCI Min Vol USA ETF | 8,708 | 533,539 |
| iShares JP Morgan USD Emerging Markets Bond ETF | 1,692 | 193,091 |
| Schwab U.S. Large-Cap Growth ETF | 7,401 | 660,391 |
| Vanguard Dividend Appreciation ETF (C) | 3,337 | 383,455 |
| Vanguard FTSE All World ex-US Small-Cap ETF | 7,553 | 744,650 |
| Vanguard FTSE Developed Markets ETF | 11,273 | 444,945 |
| Vanguard FTSE Emerging Markets ETF | 43,881 | 1,778,058 |
| Vanguard Health Care ETF | 2,158 | 378,276 |
| Vanguard Information Technology ETF | 1,638 | 385,995 |
| Vanguard Intermediate-Term Corporate Bond ETF | 3,589 | 337,940 |
| Vanguard Mid-Cap ETF | 14,014 | 2,272,370 |
| Vanguard S&P 500 ETF | 10,015 | 2,721,477 |
| Vanguard Small-Cap ETF | 3,448 | 511,856 |
| Vanguard Total Bond Market ETF | 2,140 | 185,666 |
| Xtrackers USD High Yield Corporate Bond ETF | 3,934 | 193,277 |
|
TOTAL UNAFFILIATED INVESTMENT COMPANIES (Cost
$12,442,102) | $12,129,473 |
| U.S. GOVERNMENT AND AGENCY OBLIGATIONS - 2.6% | |
| U.S. Government - 2.6% | | |
| U.S. Treasury STRIPS, PO, 1.687%, 11/15/2048 | 328,700 | 201,916 |
| U.S. Treasury STRIPS, PO, 1.704%, 02/15/2047 | 318,900 | 200,868 |
| U.S. Treasury STRIPS, PO, 1.712%, 05/15/2047 | 320,000 | 200,282 |
| U.S. Treasury STRIPS, PO, 1.716%, 08/15/2046 | 317,800 | 201,252 |
|
TOTAL U.S. GOVERNMENT AND AGENCY OBLIGATIONS (Cost
$703,322) | $804,318 |
| SHORT-TERM INVESTMENTS - 2.0% | |
| Short-term funds - 2.0% | | |
| John Hancock Collateral Trust, 1.6968% (D)(E) | 38,069 | 381,028 |
| State Street Institutional U.S. Government Money Market Fund, Premier Class, 1.5386% (D) | 263,207 | 263,207 |
|
| TOTAL SHORT-TERM INVESTMENTS (Cost $644,186) | $644,235 |
| Total investments (Cost $33,552,343) - 101.5% | $31,896,541 |
| Other assets and liabilities, net - (1.5%) | (485,848) |
| TOTAL NET ASSETS - 100.0% | $31,410,693 |
MULTI-INDEX 2055 LIFETIME PORTFOLIO
As of 2-29-20 (unaudited)
| | Shares or
Principal
Amount | Value |
| AFFILIATED INVESTMENT COMPANIES (A) - 58.1% | |
| Equity - 58.1% | | |
| Strategic Equity Allocation, Class NAV, JHF II (MIM US) (B) | 4,752,466 | $51,801,878 |
|
TOTAL AFFILIATED INVESTMENT COMPANIES (Cost
$56,395,722) | $51,801,878 |
| UNAFFILIATED INVESTMENT COMPANIES - 38.6% | |
| Exchange-traded funds - 38.6% | | |
| Financial Select Sector SPDR Fund | 42,577 | 1,132,122 |
| iShares Edge MSCI Min Vol USA ETF | 24,999 | 1,531,689 |
| iShares JP Morgan USD Emerging Markets Bond ETF | 4,949 | 564,780 |
| Schwab U.S. Large-Cap Growth ETF | 20,767 | 1,853,039 |
| Vanguard Dividend Appreciation ETF (C) | 9,428 | 1,083,371 |
| Vanguard FTSE All World ex-US Small-Cap ETF | 21,732 | 2,142,558 |
| Vanguard FTSE Developed Markets ETF | 32,413 | 1,279,341 |
| Vanguard FTSE Emerging Markets ETF | 127,128 | 5,151,227 |
| Vanguard Health Care ETF | 6,158 | 1,079,436 |
| Vanguard Information Technology ETF | 4,588 | 1,081,162 |
| Vanguard Intermediate-Term Corporate Bond ETF | 10,395 | 978,793 |
| Vanguard Mid-Cap ETF | 39,187 | 6,354,172 |
| Vanguard S&P 500 ETF | 28,073 | 7,628,558 |
| Vanguard Small-Cap ETF | 9,658 | 1,433,730 |
| Vanguard Total Bond Market ETF | 6,173 | 535,569 |
| Xtrackers USD High Yield Corporate Bond ETF | 11,537 | 566,813 |
|
TOTAL UNAFFILIATED INVESTMENT COMPANIES (Cost
$33,933,877) | $34,396,360 |
| U.S. GOVERNMENT AND AGENCY OBLIGATIONS - 2.7% | |
| U.S. Government - 2.7% | | |
| U.S. Treasury STRIPS, PO, 1.687%, 11/15/2048 | 975,100 | 598,990 |
| U.S. Treasury STRIPS, PO, 1.704%, 02/15/2047 | 942,300 | 593,534 |
| U.S. Treasury STRIPS, PO, 1.712%, 05/15/2047 | 948,800 | 593,836 |
| U.S. Treasury STRIPS, PO, 1.716%, 08/15/2046 | 938,400 | 594,256 |
|
TOTAL U.S. GOVERNMENT AND AGENCY OBLIGATIONS (Cost
$2,081,187) | $2,380,616 |
| SHORT-TERM INVESTMENTS - 1.4% | |
| Short-term funds - 1.4% | | |
| John Hancock Collateral Trust, 1.6968% (D)(E) | 110,604 | 1,107,022 |
| State Street Institutional U.S. Government Money Market Fund, Premier Class, 1.5386% (D) | 197,388 | 197,388 |
|
| TOTAL SHORT-TERM INVESTMENTS (Cost $1,304,255) | $1,304,410 |
| Total investments (Cost $93,715,041) - 100.8% | $89,883,264 |
| Other assets and liabilities, net - (0.8%) | (744,833) |
| TOTAL NET ASSETS - 100.0% | $89,138,431 |
| 18 | JOHN HANCOCK MULTI-INDEX LIFETIME PORTFOLIOS | SEMIANNUAL REPORT | SEE NOTES TO FINANCIAL STATEMENTS |
MULTI-INDEX 2050 LIFETIME PORTFOLIO
As of 2-29-20 (unaudited)
| | Shares or
Principal
Amount | Value |
| AFFILIATED INVESTMENT COMPANIES (A) - 58.2% | |
| Equity - 58.2% | | |
| Strategic Equity Allocation, Class NAV, JHF II (MIM US) (B) | 6,801,076 | $74,131,725 |
|
TOTAL AFFILIATED INVESTMENT COMPANIES (Cost
$80,952,899) | $74,131,725 |
| UNAFFILIATED INVESTMENT COMPANIES - 38.6% | |
| Exchange-traded funds - 38.6% | | |
| Financial Select Sector SPDR Fund | 60,933 | 1,620,208 |
| iShares Edge MSCI Min Vol USA ETF | 35,812 | 2,194,201 |
| iShares JP Morgan USD Emerging Markets Bond ETF | 6,947 | 792,792 |
| Schwab U.S. Large-Cap Growth ETF | 29,721 | 2,652,005 |
| Vanguard Dividend Appreciation ETF (C) | 13,524 | 1,554,043 |
| Vanguard FTSE All World ex-US Small-Cap ETF | 31,129 | 3,069,008 |
| Vanguard FTSE Developed Markets ETF | 46,547 | 1,837,210 |
| Vanguard FTSE Emerging Markets ETF | 182,104 | 7,378,854 |
| Vanguard Health Care ETF | 8,823 | 1,546,584 |
| Vanguard Information Technology ETF | 6,565 | 1,547,042 |
| Vanguard Intermediate-Term Corporate Bond ETF | 14,593 | 1,374,077 |
| Vanguard Mid-Cap ETF | 56,122 | 9,100,182 |
| Vanguard S&P 500 ETF | 40,173 | 10,916,611 |
| Vanguard Small-Cap ETF | 13,833 | 2,053,509 |
| Vanguard Total Bond Market ETF | 8,684 | 753,424 |
| Xtrackers USD High Yield Corporate Bond ETF | 16,197 | 795,759 |
|
TOTAL UNAFFILIATED INVESTMENT COMPANIES (Cost
$48,413,966) | $49,185,509 |
| U.S. GOVERNMENT AND AGENCY OBLIGATIONS - 2.6% | |
| U.S. Government - 2.6% | | |
| U.S. Treasury STRIPS, PO, 1.687%, 11/15/2048 | 1,380,200 | 847,836 |
| U.S. Treasury STRIPS, PO, 1.704%, 02/15/2047 | 1,334,400 | 840,510 |
| U.S. Treasury STRIPS, PO, 1.712%, 05/15/2047 | 1,344,300 | 841,372 |
| U.S. Treasury STRIPS, PO, 1.716%, 08/15/2046 | 1,330,100 | 842,306 |
|
TOTAL U.S. GOVERNMENT AND AGENCY OBLIGATIONS (Cost
$2,947,797) | $3,372,024 |
| SHORT-TERM INVESTMENTS - 1.3% | |
| Short-term funds - 1.3% | | |
| John Hancock Collateral Trust, 1.6968% (D)(E) | 158,247 | 1,583,879 |
| State Street Institutional U.S. Government Money Market Fund, Premier Class, 1.5386% (D) | 133,353 | 133,353 |
|
| TOTAL SHORT-TERM INVESTMENTS (Cost $1,717,027) | $1,717,232 |
| Total investments (Cost $134,031,689) - 100.7% | $128,406,490 |
| Other assets and liabilities, net - (0.7%) | (950,184) |
| TOTAL NET ASSETS - 100.0% | $127,456,306 |
MULTI-INDEX 2045 LIFETIME PORTFOLIO
As of 2-29-20 (unaudited)
| | Shares or
Principal
Amount | Value |
| AFFILIATED INVESTMENT COMPANIES (A) - 58.0% | |
| Equity - 58.0% | | |
| Strategic Equity Allocation, Class NAV, JHF II (MIM US) (B) | 9,030,367 | $98,430,995 |
|
TOTAL AFFILIATED INVESTMENT COMPANIES (Cost
$107,799,590) | $98,430,995 |
| UNAFFILIATED INVESTMENT COMPANIES - 38.9% | |
| Exchange-traded funds - 38.9% | | |
| Financial Select Sector SPDR Fund | 81,809 | 2,175,301 |
| iShares Edge MSCI Min Vol USA ETF | 47,346 | 2,900,889 |
| iShares JP Morgan USD Emerging Markets Bond ETF | 9,624 | 1,098,291 |
| Schwab U.S. Large-Cap Growth ETF | 39,822 | 3,553,317 |
| Vanguard Dividend Appreciation ETF (C) | 17,952 | 2,062,864 |
| Vanguard FTSE All World ex-US Small-Cap ETF (C) | 41,304 | 4,072,161 |
| Vanguard FTSE Developed Markets ETF | 61,731 | 2,436,523 |
| Vanguard FTSE Emerging Markets ETF | 241,434 | 9,782,906 |
| Vanguard Health Care ETF | 11,707 | 2,052,120 |
| Vanguard Information Technology ETF | 8,816 | 2,077,490 |
| Vanguard Intermediate-Term Corporate Bond ETF | 20,667 | 1,946,005 |
| Vanguard Mid-Cap ETF | 75,359 | 12,219,462 |
| Vanguard S&P 500 ETF | 53,874 | 14,639,722 |
| Vanguard Small-Cap ETF | 18,544 | 2,752,857 |
| Vanguard Total Bond Market ETF | 12,351 | 1,071,573 |
| Xtrackers USD High Yield Corporate Bond ETF | 22,204 | 1,090,883 |
|
TOTAL UNAFFILIATED INVESTMENT COMPANIES (Cost
$64,792,301) | $65,932,364 |
| U.S. GOVERNMENT AND AGENCY OBLIGATIONS - 2.7% | |
| U.S. Government - 2.7% | | |
| U.S. Treasury STRIPS, PO, 1.687%, 11/15/2048 | 1,844,100 | 1,132,803 |
| U.S. Treasury STRIPS, PO, 1.704%, 02/15/2047 | 1,783,800 | 1,123,577 |
| U.S. Treasury STRIPS, PO, 1.712%, 05/15/2047 | 1,795,700 | 1,123,894 |
| U.S. Treasury STRIPS, PO, 1.716%, 08/15/2046 | 1,776,500 | 1,124,995 |
|
TOTAL U.S. GOVERNMENT AND AGENCY OBLIGATIONS (Cost
$3,937,492) | $4,505,269 |
| SHORT-TERM INVESTMENTS - 2.4% | |
| Short-term funds - 2.4% | | |
| John Hancock Collateral Trust, 1.6968% (D)(E) | 305,664 | 3,059,365 |
| State Street Institutional U.S. Government Money Market Fund, Premier Class, 1.5386% (D) | 1,024,233 | 1,024,233 |
|
| TOTAL SHORT-TERM INVESTMENTS (Cost $4,083,203) | $4,083,598 |
| Total investments (Cost $180,612,586) - 102.0% | $172,952,226 |
| Other assets and liabilities, net - (2.0%) | (3,382,134) |
| TOTAL NET ASSETS - 100.0% | $169,570,092 |
| SEE NOTES TO FINANCIAL STATEMENTS | SEMIANNUAL REPORT | JOHN HANCOCK MULTI-INDEX LIFETIME PORTFOLIOS | 19 |
MULTI-INDEX 2040 LIFETIME PORTFOLIO
As of 2-29-20 (unaudited)
| | Shares or
Principal
Amount | Value |
| AFFILIATED INVESTMENT COMPANIES (A) - 56.0% | |
| Equity - 56.0% | | |
| Strategic Equity Allocation, Class NAV, JHF II (MIM US) (B) | 10,061,500 | $109,670,355 |
|
TOTAL AFFILIATED INVESTMENT COMPANIES (Cost
$119,275,137) | $109,670,355 |
| UNAFFILIATED INVESTMENT COMPANIES - 39.5% | |
| Exchange-traded funds - 39.5% | | |
| Financial Select Sector SPDR Fund | 94,192 | 2,504,565 |
| iShares Edge MSCI Min Vol USA ETF | 54,054 | 3,311,889 |
| iShares Global Infrastructure ETF | 3,222 | 142,219 |
| iShares JP Morgan USD Emerging Markets Bond ETF | 21,852 | 2,493,750 |
| Schwab U.S. Large-Cap Growth ETF | 43,720 | 3,901,136 |
| Vanguard Dividend Appreciation ETF (C) | 20,746 | 2,383,923 |
| Vanguard Energy ETF (C) | 9,248 | 565,330 |
| Vanguard FTSE All World ex-US Small-Cap ETF | 46,343 | 4,568,956 |
| Vanguard FTSE Developed Markets ETF | 81,249 | 3,206,898 |
| Vanguard FTSE Emerging Markets ETF | 234,449 | 9,499,873 |
| Vanguard Global ex-U.S. Real Estate ETF (C) | 2,666 | 144,337 |
| Vanguard Health Care ETF | 13,562 | 2,377,283 |
| Vanguard Information Technology ETF | 10,070 | 2,372,996 |
| Vanguard Intermediate-Term Corporate Bond ETF | 36,840 | 3,468,854 |
| Vanguard Materials ETF | 2,463 | 281,004 |
| Vanguard Mid-Cap ETF | 78,139 | 12,670,239 |
| Vanguard Real Estate ETF | 4,760 | 415,691 |
| Vanguard S&P 500 ETF | 57,987 | 15,757,389 |
| Vanguard Small-Cap ETF | 18,622 | 2,764,436 |
| Vanguard Total Bond Market ETF | 28,197 | 2,446,372 |
| Xtrackers USD High Yield Corporate Bond ETF | 42,268 | 2,076,627 |
|
TOTAL UNAFFILIATED INVESTMENT COMPANIES (Cost
$75,315,866) | $77,353,767 |
| U.S. GOVERNMENT AND AGENCY OBLIGATIONS - 4.2% | |
| U.S. Government - 4.2% | | |
| U.S. Treasury STRIPS, PO, 1.687%, 11/15/2048 | 3,388,700 | 2,081,628 |
| U.S. Treasury STRIPS, PO, 1.704%, 02/15/2047 | 3,277,700 | 2,064,552 |
| U.S. Treasury STRIPS, PO, 1.712%, 05/15/2047 | 3,299,200 | 2,064,906 |
| U.S. Treasury STRIPS, PO, 1.716%, 08/15/2046 | 3,263,300 | 2,066,533 |
|
TOTAL U.S. GOVERNMENT AND AGENCY OBLIGATIONS (Cost
$7,235,794) | $8,277,619 |
| SHORT-TERM INVESTMENTS - 1.7% | |
| Short-term funds - 1.7% | | |
| John Hancock Collateral Trust, 1.6968% (D)(E) | 314,459 | 3,147,388 |
| State Street Institutional U.S. Government Money Market Fund, Premier Class, 1.5386% (D) | 98,307 | 98,307 |
|
| TOTAL SHORT-TERM INVESTMENTS (Cost $3,245,035) | $3,245,695 |
| Total investments (Cost $205,071,832) - 101.4% | $198,547,436 |
| Other assets and liabilities, net - (1.4%) | (2,687,336) |
| TOTAL NET ASSETS - 100.0% | $195,860,100 |
MULTI-INDEX 2035 LIFETIME PORTFOLIO
As of 2-29-20 (unaudited)
| | Shares or
Principal
Amount | Value |
| AFFILIATED INVESTMENT COMPANIES (A) - 50.8% | |
| Equity - 50.8% | | |
| Strategic Equity Allocation, Class NAV, JHF II (MIM US) (B) | 10,727,994 | $116,935,140 |
|
TOTAL AFFILIATED INVESTMENT COMPANIES (Cost
$127,087,915) | $116,935,140 |
| UNAFFILIATED INVESTMENT COMPANIES - 43.4% | |
| Exchange-traded funds - 43.4% | | |
| Financial Select Sector SPDR Fund | 86,197 | 2,291,978 |
| iShares Edge MSCI Min Vol USA ETF | 72,385 | 4,435,029 |
| iShares Global Infrastructure ETF | 8,918 | 393,641 |
| iShares JP Morgan USD Emerging Markets Bond ETF | 49,779 | 5,680,779 |
| Schwab U.S. Large-Cap Growth ETF | 45,699 | 4,077,722 |
| Vanguard Dividend Appreciation ETF | 27,225 | 3,128,425 |
| Vanguard Energy ETF | 24,810 | 1,516,635 |
| Vanguard FTSE All World ex-US Small-Cap ETF | 50,309 | 4,959,964 |
| Vanguard FTSE Developed Markets ETF | 104,669 | 4,131,285 |
| Vanguard FTSE Emerging Markets ETF | 208,894 | 8,464,385 |
| Vanguard Global ex-U.S. Real Estate ETF | 7,492 | 405,617 |
| Vanguard Health Care ETF (C) | 12,435 | 2,179,731 |
| Vanguard Information Technology ETF (C) | 9,230 | 2,175,050 |
| Vanguard Intermediate-Term Corporate Bond ETF | 103,446 | 9,740,475 |
| Vanguard Materials ETF | 6,838 | 780,147 |
| Vanguard Mid-Cap ETF | 74,787 | 12,126,712 |
| Vanguard Real Estate ETF | 13,309 | 1,162,275 |
| Vanguard S&P 500 ETF | 61,152 | 16,617,446 |
| Vanguard Small-Cap ETF | 16,736 | 2,484,459 |
| Vanguard Total Bond Market ETF | 94,486 | 8,197,605 |
| Xtrackers USD High Yield Corporate Bond ETF | 103,587 | 5,089,229 |
|
TOTAL UNAFFILIATED INVESTMENT COMPANIES (Cost
$96,006,559) | $100,038,589 |
| U.S. GOVERNMENT AND AGENCY OBLIGATIONS - 5.5% | |
| U.S. Government - 5.5% | | |
| U.S. Treasury STRIPS, PO, 1.687%, 11/15/2048 | 5,151,900 | 3,164,736 |
| U.S. Treasury STRIPS, PO, 1.704%, 02/15/2047 | 4,982,900 | 3,138,621 |
| U.S. Treasury STRIPS, PO, 1.712%, 05/15/2047 | 5,015,600 | 3,139,168 |
| U.S. Treasury STRIPS, PO, 1.716%, 08/15/2046 | 4,961,400 | 3,141,881 |
|
TOTAL U.S. GOVERNMENT AND AGENCY OBLIGATIONS (Cost
$10,999,246) | $12,584,406 |
| SHORT-TERM INVESTMENTS - 0.3% | |
| Short-term funds - 0.3% | | |
| John Hancock Collateral Trust, 1.6968% (D)(E) | 42,667 | 427,053 |
| State Street Institutional U.S. Government Money Market Fund, Premier Class, 1.5386% (D) | 175,698 | 175,698 |
|
| TOTAL SHORT-TERM INVESTMENTS (Cost $602,606) | $602,751 |
| Total investments (Cost $234,696,326) - 100.0% | $230,160,886 |
| Other assets and liabilities, net - 0.0% | 66,572 |
| TOTAL NET ASSETS - 100.0% | $230,227,458 |
| 20 | JOHN HANCOCK MULTI-INDEX LIFETIME PORTFOLIOS | SEMIANNUAL REPORT | SEE NOTES TO FINANCIAL STATEMENTS |
MULTI-INDEX 2030 LIFETIME PORTFOLIO
As of 2-29-20 (unaudited)
| | Shares or
Principal
Amount | Value |
| AFFILIATED INVESTMENT COMPANIES (A) - 45.2% | |
| Equity - 45.2% | | |
| Strategic Equity Allocation, Class NAV, JHF II (MIM US) (B) | 10,623,915 | $115,800,678 |
|
TOTAL AFFILIATED INVESTMENT COMPANIES (Cost
$124,786,836) | $115,800,678 |
| UNAFFILIATED INVESTMENT COMPANIES - 48.0% | |
| Exchange-traded funds - 48.0% | | |
| Financial Select Sector SPDR Fund | 90,204 | 2,398,524 |
| iShares Edge MSCI Min Vol USA ETF | 128,695 | 7,885,143 |
| iShares Global Infrastructure ETF | 15,585 | 687,922 |
| iShares JP Morgan USD Emerging Markets Bond ETF | 77,654 | 8,861,874 |
| Schwab U.S. Large-Cap Growth ETF | 42,364 | 3,780,140 |
| VanEck Vectors J.P. Morgan EM Local Currency Bond ETF | 38,753 | 1,255,985 |
| Vanguard Dividend Appreciation ETF | 48,392 | 5,560,725 |
| Vanguard Energy ETF | 43,078 | 2,633,358 |
| Vanguard FTSE All World ex-US Small-Cap ETF | 50,918 | 5,020,006 |
| Vanguard FTSE Developed Markets ETF | 116,730 | 4,607,333 |
| Vanguard FTSE Emerging Markets ETF | 158,877 | 6,437,696 |
| Vanguard Global ex-U.S. Real Estate ETF | 13,099 | 709,180 |
| Vanguard Health Care ETF | 12,939 | 2,268,077 |
| Vanguard Information Technology ETF | 9,687 | 2,282,742 |
| Vanguard Intermediate-Term Corporate Bond ETF | 180,237 | 16,971,114 |
| Vanguard Materials ETF | 11,979 | 1,366,684 |
| Vanguard Mid-Cap ETF | 65,669 | 10,648,228 |
| Vanguard Real Estate ETF | 23,445 | 2,047,452 |
| Vanguard S&P 500 ETF | 37,608 | 10,219,598 |
| Vanguard Small-Cap ETF | 13,534 | 2,009,122 |
| Vanguard Total Bond Market ETF | 186,068 | 16,143,260 |
| Xtrackers USD High Yield Corporate Bond ETF | 185,327 | 9,105,116 |
|
TOTAL UNAFFILIATED INVESTMENT COMPANIES (Cost
$116,500,574) | $122,899,279 |
| U.S. GOVERNMENT AND AGENCY OBLIGATIONS - 6.7% | |
| U.S. Government - 6.7% | | |
| U.S. Treasury STRIPS, PO, 1.687%, 11/15/2048 | 7,023,600 | 4,314,494 |
| U.S. Treasury STRIPS, PO, 1.704%, 02/15/2047 | 6,794,000 | 4,279,393 |
| U.S. Treasury STRIPS, PO, 1.712%, 05/15/2047 | 6,838,300 | 4,279,962 |
| U.S. Treasury STRIPS, PO, 1.716%, 08/15/2046 | 6,765,500 | 4,284,354 |
|
TOTAL U.S. GOVERNMENT AND AGENCY OBLIGATIONS (Cost
$14,996,630) | $17,158,203 |
| SHORT-TERM INVESTMENTS - 0.0% | |
| Short-term funds - 0.0% | | |
| State Street Institutional U.S. Government Money Market Fund, Premier Class, 1.5386% (D) | 1,049 | 1,049 |
|
| TOTAL SHORT-TERM INVESTMENTS (Cost $1,049) | $1,049 |
| Total investments (Cost $256,285,089) - 99.9% | $255,859,209 |
| Other assets and liabilities, net - 0.1% | 231,619 |
| TOTAL NET ASSETS - 100.0% | $256,090,828 |
MULTI-INDEX 2025 LIFETIME PORTFOLIO
As of 2-29-20 (unaudited)
| | Shares or
Principal
Amount | Value |
| AFFILIATED INVESTMENT COMPANIES (A) - 38.9% | |
| Equity - 38.9% | | |
| Strategic Equity Allocation, Class NAV, JHF II (MIM US) (B) | 8,051,026 | $87,756,185 |
|
TOTAL AFFILIATED INVESTMENT COMPANIES (Cost
$92,730,193) | $87,756,185 |
| UNAFFILIATED INVESTMENT COMPANIES - 52.8% | |
| Exchange-traded funds - 52.8% | | |
| Financial Select Sector SPDR Fund | 65,351 | 1,737,683 |
| Invesco Senior Loan ETF (C) | 92,559 | 2,035,372 |
| iShares Edge MSCI Min Vol USA ETF | 156,069 | 9,562,348 |
| iShares Global Infrastructure ETF | 18,671 | 824,138 |
| iShares JP Morgan USD Emerging Markets Bond ETF | 88,672 | 10,119,249 |
| Schwab U.S. Large-Cap Growth ETF | 28,718 | 2,562,507 |
| VanEck Vectors J.P. Morgan EM Local Currency Bond ETF | 44,261 | 1,434,499 |
| Vanguard Dividend Appreciation ETF (C) | 58,046 | 6,670,066 |
| Vanguard Energy ETF (C) | 52,005 | 3,179,066 |
| Vanguard FTSE All World ex-US Small-Cap ETF | 38,691 | 3,814,546 |
| Vanguard FTSE Developed Markets ETF | 89,950 | 3,550,327 |
| Vanguard FTSE Emerging Markets ETF | 81,870 | 3,317,372 |
| Vanguard Global ex-U.S. Real Estate ETF | 15,715 | 850,810 |
| Vanguard Health Care ETF (C) | 9,404 | 1,648,427 |
| Vanguard Information Technology ETF | 7,007 | 1,651,200 |
| Vanguard Intermediate-Term Corporate Bond ETF | 222,501 | 20,950,692 |
| Vanguard Materials ETF | 14,320 | 1,633,769 |
| Vanguard Mid-Cap ETF | 43,293 | 7,019,960 |
| Vanguard Real Estate ETF | 28,083 | 2,452,488 |
| Vanguard S&P 500 ETF | 5,770 | 1,567,940 |
| Vanguard Short-Term Corporate Bond ETF | 40,724 | 3,343,848 |
| Vanguard Small-Cap ETF | 7,918 | 1,175,427 |
| Vanguard Total Bond Market ETF | 203,301 | 17,638,395 |
| Xtrackers USD High Yield Corporate Bond ETF | 214,827 | 10,554,451 |
|
TOTAL UNAFFILIATED INVESTMENT COMPANIES (Cost
$112,677,786) | $119,294,580 |
| U.S. GOVERNMENT AND AGENCY OBLIGATIONS - 8.2% | |
| U.S. Government - 8.2% | | |
| U.S. Treasury Inflation Protected Security, 0.125%, 01/15/2023 | 1,326,087 | 1,341,717 |
| U.S. Treasury Inflation Protected Security, 0.125%, 07/15/2024 | 1,022,646 | 1,047,905 |
| U.S. Treasury Inflation Protected Security, 0.625%, 07/15/2021 | 585,493 | 593,732 |
| U.S. Treasury STRIPS, PO, 1.687%, 11/15/2048 | 6,321,700 | 3,883,327 |
| U.S. Treasury STRIPS, PO, 1.704%, 02/15/2047 | 6,115,300 | 3,851,895 |
| U.S. Treasury STRIPS, PO, 1.712%, 05/15/2047 | 6,156,000 | 3,852,923 |
| U.S. Treasury STRIPS, PO, 1.716%, 08/15/2046 | 6,088,800 | 3,855,823 |
|
TOTAL U.S. GOVERNMENT AND AGENCY OBLIGATIONS (Cost
$16,453,751) | $18,427,322 |
| SEE NOTES TO FINANCIAL STATEMENTS | SEMIANNUAL REPORT | JOHN HANCOCK MULTI-INDEX LIFETIME PORTFOLIOS | 21 |
MULTI-INDEX 2025 LIFETIME PORTFOLIO (continued)
| | Shares or
Principal
Amount | Value |
|
| SHORT-TERM INVESTMENTS - 4.1% | |
| Short-term funds - 4.1% | | |
| John Hancock Collateral Trust, 1.6968% (D)(E) | 938,021 | $9,388,556 |
| State Street Institutional U.S. Government Money Market Fund, Premier Class, 1.5386% (D) | 1,049 | 1,049 |
|
| TOTAL SHORT-TERM INVESTMENTS (Cost $9,389,012) | $9,389,605 |
| Total investments (Cost $231,250,742) - 104.0% | $234,867,692 |
| Other assets and liabilities, net - (4.0%) | (9,059,260) |
| TOTAL NET ASSETS - 100.0% | $225,808,432 |
MULTI-INDEX 2020 LIFETIME PORTFOLIO
As of 2-29-20 (unaudited)
| | Shares or
Principal
Amount | Value |
| AFFILIATED INVESTMENT COMPANIES (A) - 26.5% | |
| Equity - 26.5% | | |
| Strategic Equity Allocation, Class NAV, JHF II (MIM US) (B) | 3,570,039 | $38,913,425 |
|
TOTAL AFFILIATED INVESTMENT COMPANIES (Cost
$40,104,995) | $38,913,425 |
| UNAFFILIATED INVESTMENT COMPANIES - 65.8% | |
| Exchange-traded funds - 65.8% | | |
| Financial Select Sector SPDR Fund | 39,949 | 1,062,244 |
| Invesco Senior Loan ETF (C) | 109,131 | 2,399,791 |
| iShares Edge MSCI Min Vol USA ETF | 130,699 | 8,007,928 |
| iShares Global Infrastructure ETF | 15,439 | 681,477 |
| iShares JP Morgan USD Emerging Markets Bond ETF | 70,605 | 8,057,443 |
| VanEck Vectors J.P. Morgan EM Local Currency Bond ETF | 35,359 | 1,145,985 |
| Vanguard Dividend Appreciation ETF (C) | 47,670 | 5,477,760 |
| Vanguard Energy ETF | 42,022 | 2,568,805 |
| Vanguard FTSE All World ex-US Small-Cap ETF | 20,061 | 1,977,814 |
| Vanguard FTSE Developed Markets ETF | 92,301 | 3,643,120 |
| Vanguard FTSE Emerging Markets ETF | 41,075 | 1,664,359 |
| Vanguard Global ex-U.S. Real Estate ETF | 12,912 | 699,056 |
| Vanguard Health Care ETF | 5,721 | 1,002,834 |
| Vanguard Information Technology ETF | 4,269 | 1,005,990 |
| Vanguard Intermediate-Term Corporate Bond ETF | 207,737 | 19,560,514 |
| Vanguard Materials ETF | 11,960 | 1,364,516 |
| Vanguard Mid-Cap ETF | 23,000 | 3,729,450 |
| Vanguard Real Estate ETF | 23,113 | 2,018,458 |
| Vanguard S&P 500 ETF | 974 | 264,675 |
| Vanguard Short-Term Corporate Bond ETF | 56,599 | 4,647,344 |
| Vanguard Small-Cap ETF | 4,872 | 723,248 |
| Vanguard Total Bond Market ETF | 193,699 | 16,805,325 |
| Xtrackers USD High Yield Corporate Bond ETF | 170,301 | 8,366,888 |
|
TOTAL UNAFFILIATED INVESTMENT COMPANIES (Cost
$92,890,537) | $96,875,024 |
MULTI-INDEX 2020 LIFETIME PORTFOLIO (continued)
| | Shares or
Principal
Amount | Value |
|
| U.S. GOVERNMENT AND AGENCY OBLIGATIONS - 8.3% | |
| U.S. Government - 8.3% | | |
| U.S. Treasury Inflation Protected Security, 0.125%, 01/15/2023 | 1,796,469 | $1,817,643 |
| U.S. Treasury Inflation Protected Security, 0.125%, 07/15/2024 | 1,385,318 | 1,419,534 |
| U.S. Treasury Inflation Protected Security, 0.625%, 07/15/2021 | 793,123 | 804,284 |
| U.S. Treasury STRIPS, PO, 1.687%, 11/15/2048 | 3,360,300 | 2,064,183 |
| U.S. Treasury STRIPS, PO, 1.704%, 02/15/2047 | 3,249,500 | 2,046,790 |
| U.S. Treasury STRIPS, PO, 1.712%, 05/15/2047 | 3,272,100 | 2,047,945 |
| U.S. Treasury STRIPS, PO, 1.716%, 08/15/2046 | 3,236,800 | 2,049,752 |
|
TOTAL U.S. GOVERNMENT AND AGENCY OBLIGATIONS (Cost
$11,179,404) | $12,250,131 |
| SHORT-TERM INVESTMENTS - 5.7% | |
| Short-term funds - 5.7% | | |
| John Hancock Collateral Trust, 1.6968% (D)(E) | 795,943 | 7,966,519 |
| State Street Institutional U.S. Government Money Market Fund, Premier Class, 1.5386% (D) | 471,238 | 471,238 |
|
| TOTAL SHORT-TERM INVESTMENTS (Cost $8,437,272) | $8,437,757 |
| Total investments (Cost $152,612,208) - 106.3% | $156,476,337 |
| Other assets and liabilities, net - (6.3%) | (9,255,425) |
| TOTAL NET ASSETS - 100.0% | $147,220,912 |
MULTI-INDEX 2015 LIFETIME PORTFOLIO
As of 2-29-20 (unaudited)
| | Shares or
Principal
Amount | Value |
| AFFILIATED INVESTMENT COMPANIES (A) - 21.6% | |
| Equity - 21.6% | | |
| Strategic Equity Allocation, Class NAV, JHF II (MIM US) (B) | 838,761 | $9,142,491 |
|
TOTAL AFFILIATED INVESTMENT COMPANIES (Cost
$9,105,436) | $9,142,491 |
| UNAFFILIATED INVESTMENT COMPANIES - 70.3% | |
| Exchange-traded funds - 70.3% | | |
| Invesco Senior Loan ETF (C) | 45,286 | 995,839 |
| iShares Edge MSCI Min Vol USA ETF | 38,282 | 2,345,538 |
| iShares Global Infrastructure ETF | 4,510 | 199,071 |
| iShares JP Morgan USD Emerging Markets Bond ETF | 22,219 | 2,535,632 |
| VanEck Vectors J.P. Morgan EM Local Currency Bond ETF | 11,088 | 359,362 |
| Vanguard Dividend Appreciation ETF | 13,895 | 1,596,674 |
| Vanguard Energy ETF | 12,681 | 775,190 |
| Vanguard FTSE All World ex-US Small-Cap ETF | 4,774 | 470,669 |
| Vanguard FTSE Developed Markets ETF | 23,182 | 914,994 |
| Vanguard FTSE Emerging Markets ETF | 5,765 | 233,598 |
| Vanguard Global ex-U.S. Real Estate ETF | 3,793 | 205,353 |
| Vanguard Intermediate-Term Corporate Bond ETF | 71,084 | 6,693,269 |
| 22 | JOHN HANCOCK MULTI-INDEX LIFETIME PORTFOLIOS | SEMIANNUAL REPORT | SEE NOTES TO FINANCIAL STATEMENTS |
MULTI-INDEX 2015 LIFETIME PORTFOLIO (continued)
| | Shares or
Principal
Amount | Value |
| Exchange-traded funds - (continued) | | |
| Vanguard Materials ETF | 3,491 | $398,288 |
| Vanguard Mid-Cap ETF | 4,374 | 709,244 |
| Vanguard Real Estate ETF | 6,766 | 590,875 |
| Vanguard S&P 500 ETF | 558 | 151,631 |
| Vanguard Short-Term Corporate Bond ETF | 25,063 | 2,057,923 |
| Vanguard Small-Cap ETF | 776 | 115,197 |
| Vanguard Total Bond Market ETF | 65,738 | 5,703,429 |
| Xtrackers USD High Yield Corporate Bond ETF | 53,238 | 2,615,583 |
|
TOTAL UNAFFILIATED INVESTMENT COMPANIES (Cost
$28,906,044) | $29,667,359 |
| U.S. GOVERNMENT AND AGENCY OBLIGATIONS - 8.3% | |
| U.S. Government - 8.3% | | |
| U.S. Treasury Inflation Protected Security, 0.125%, 01/15/2023 | 781,224 | 790,431 |
| U.S. Treasury Inflation Protected Security, 0.125%, 07/15/2024 | 602,830 | 617,719 |
| U.S. Treasury Inflation Protected Security, 0.625%, 07/15/2021 | 344,454 | 349,301 |
| U.S. Treasury STRIPS, PO, 1.687%, 11/15/2048 | 717,100 | 440,504 |
| U.S. Treasury STRIPS, PO, 1.704%, 02/15/2047 | 693,700 | 436,947 |
| U.S. Treasury STRIPS, PO, 1.712%, 05/15/2047 | 698,200 | 436,990 |
| U.S. Treasury STRIPS, PO, 1.716%, 08/15/2046 | 691,600 | 437,966 |
|
TOTAL U.S. GOVERNMENT AND AGENCY OBLIGATIONS (Cost
$3,272,680) | $3,509,858 |
| SHORT-TERM INVESTMENTS - 2.6% | |
| Short-term funds - 2.6% | | |
| John Hancock Collateral Trust, 1.6968% (D)(E) | 101,211 | 1,013,012 |
| State Street Institutional U.S. Government Money Market Fund, Premier Class, 1.5386% (D) | 76,350 | 76,350 |
|
| TOTAL SHORT-TERM INVESTMENTS (Cost $1,089,301) | $1,089,362 |
| Total investments (Cost $42,373,461) - 102.8% | $43,409,070 |
| Other assets and liabilities, net - (2.8%) | (1,199,444) |
| TOTAL NET ASSETS - 100.0% | $42,209,626 |
MULTI-INDEX 2010 LIFETIME PORTFOLIO
As of 2-29-20 (unaudited)
| | Shares or
Principal
Amount | Value |
| AFFILIATED INVESTMENT COMPANIES (A) - 16.0% | |
| Equity - 16.0% | | |
| Strategic Equity Allocation, Class NAV, JHF II (MIM US) (B) | 465,899 | $5,078,296 |
|
TOTAL AFFILIATED INVESTMENT COMPANIES (Cost
$5,187,774) | $5,078,296 |
| UNAFFILIATED INVESTMENT COMPANIES - 76.2% | |
| Exchange-traded funds - 76.2% | | |
| Invesco Senior Loan ETF (C) | 44,400 | 976,356 |
| iShares Edge MSCI Min Vol USA ETF | 28,833 | 1,766,598 |
| iShares Global Infrastructure ETF | 3,381 | 149,237 |
MULTI-INDEX 2010 LIFETIME PORTFOLIO (continued)
| | Shares or
Principal
Amount | Value |
| Exchange-traded funds - (continued) | | |
| iShares JP Morgan USD Emerging Markets Bond ETF | 17,885 | $2,041,036 |
| VanEck Vectors J.P. Morgan EM Local Currency Bond ETF | 8,890 | 288,125 |
| Vanguard Dividend Appreciation ETF | 10,328 | 1,186,790 |
| Vanguard Energy ETF | 9,267 | 566,492 |
| Vanguard FTSE All World ex-US Small-Cap ETF | 3,104 | 306,023 |
| Vanguard FTSE Developed Markets ETF | 20,743 | 818,726 |
| Vanguard FTSE Emerging Markets ETF | 2,232 | 90,441 |
| Vanguard Global ex-U.S. Real Estate ETF | 2,844 | 153,974 |
| Vanguard Intermediate-Term Corporate Bond ETF | 59,466 | 5,599,319 |
| Vanguard Materials ETF | 2,602 | 296,862 |
| Vanguard Mid-Cap ETF | 2,060 | 334,029 |
| Vanguard Real Estate ETF | 5,118 | 446,955 |
| Vanguard S&P 500 ETF | 468 | 127,174 |
| Vanguard Short-Term Corporate Bond ETF | 25,242 | 2,072,621 |
| Vanguard Small-Cap ETF | 296 | 43,941 |
| Vanguard Total Bond Market ETF | 54,710 | 4,746,640 |
| Xtrackers USD High Yield Corporate Bond ETF | 42,665 | 2,096,131 |
|
TOTAL UNAFFILIATED INVESTMENT COMPANIES (Cost
$23,579,322) | $24,107,470 |
| U.S. GOVERNMENT AND AGENCY OBLIGATIONS - 8.3% | |
| U.S. Government - 8.3% | | |
| U.S. Treasury Inflation Protected Security, 0.125%, 01/15/2023 | 783,673 | 792,909 |
| U.S. Treasury Inflation Protected Security, 0.125%, 07/15/2024 | 604,129 | 619,050 |
| U.S. Treasury Inflation Protected Security, 0.625%, 07/15/2021 | 345,595 | 350,458 |
| U.S. Treasury STRIPS, PO, 1.687%, 11/15/2048 | 355,700 | 218,501 |
| U.S. Treasury STRIPS, PO, 1.704%, 02/15/2047 | 344,500 | 216,993 |
| U.S. Treasury STRIPS, PO, 1.712%, 05/15/2047 | 347,200 | 217,306 |
| U.S. Treasury STRIPS, PO, 1.716%, 08/15/2046 | 343,200 | 217,337 |
|
TOTAL U.S. GOVERNMENT AND AGENCY OBLIGATIONS (Cost
$2,506,629) | $2,632,554 |
| SHORT-TERM INVESTMENTS - 3.3% | |
| Short-term funds - 3.3% | | |
| John Hancock Collateral Trust, 1.6968% (D)(E) | 99,187 | 992,751 |
| State Street Institutional U.S. Government Money Market Fund, Premier Class, 1.5386% (D) | 50,491 | 50,491 |
|
| TOTAL SHORT-TERM INVESTMENTS (Cost $1,043,183) | $1,043,242 |
| Total investments (Cost $32,316,908) - 103.8% | $32,861,562 |
| Other assets and liabilities, net - (3.8%) | (1,205,730) |
| TOTAL NET ASSETS - 100.0% | $31,655,832 |
Percentages are based upon net assets.
Security Abbreviations and Legend
| JHF II | John Hancock Funds II |
| MIM US | Manulife Investment Management (US) LLC |
| SEE NOTES TO FINANCIAL STATEMENTS | SEMIANNUAL REPORT | JOHN HANCOCK MULTI-INDEX LIFETIME PORTFOLIOS | 23 |
| PO | Principal-Only Security - (Principal Tranche of Stripped Security). Rate shown is the annualized yield on date of purchase. |
| STRIPS | Separate Trading of Registered Interest and Principal Securities |
| (A) | The underlying funds' subadvisor is shown parenthetically. |
| (B) | The subadvisor is an affiliate of the advisor. |
| (C) | All or a portion of this security is on loan as of 2-29-20. |
| (D) | The rate shown is the annualized seven-day yield as of 2-29-20. |
| (E) | Investment is an affiliate of the fund, the advisor and/or subadvisor. This security represents the investment of cash collateral received for securities lending. |
| 24 | JOHN HANCOCK MULTI-INDEX LIFETIME PORTFOLIOS | SEMIANNUAL REPORT | SEE NOTES TO FINANCIAL STATEMENTS |
STATEMENTS OF ASSETS AND LIABILITIES 2-29-20 (unaudited)
| | Multi-Index 2060 Lifetime Portfolio | Multi-Index 2055 Lifetime Portfolio | Multi-Index 2050 Lifetime Portfolio | Multi-Index 2045 Lifetime Portfolio |
| Assets | | | | |
| Unaffiliated investments, at value | $13,196,998 | $36,974,364 | $52,690,886 | $71,461,866 |
| Affiliated investments, at value | 18,699,543 | 52,908,900 | 75,715,604 | 101,490,360 |
| Total investments, at value | 31,896,541 | 89,883,264 | 128,406,490 | 172,952,226 |
| Interest receivable | 167 | 296 | 472 | 639 |
| Receivable for fund shares sold | 135,964 | 414,118 | 485,648 | 409,017 |
| Receivable for investments sold | 45,903 | 69,769 | 235,242 | — |
| Receivable for securities lending income | 310 | 958 | 849 | 995 |
| Receivable from affiliates | 1,281 | 2,133 | 2,790 | 3,422 |
| Other assets | 29,649 | 28,835 | 25,957 | 26,240 |
| Total assets | 32,109,815 | 90,399,373 | 129,157,448 | 173,392,539 |
| Liabilities | | | | |
| Payable for investments purchased | 292,074 | 125,158 | 61,622 | 731,789 |
| Payable for fund shares repurchased | — | 2,692 | 28,849 | 3,141 |
| Payable upon return of securities loaned | 380,800 | 1,106,700 | 1,582,700 | 3,058,050 |
| Payable to affiliates | | | | |
| Accounting and legal services fees | 865 | 2,500 | 3,543 | 4,685 |
| Transfer agent fees | 53 | 181 | 394 | 583 |
| Trustees' fees | — | 51 | 112 | 198 |
| Other liabilities and accrued expenses | 25,330 | 23,660 | 23,922 | 24,001 |
| Total liabilities | 699,122 | 1,260,942 | 1,701,142 | 3,822,447 |
| Net assets | $31,410,693 | $89,138,431 | $127,456,306 | $169,570,092 |
| Net assets consist of | | | | |
| Paid-in capital | $33,107,790 | $92,522,324 | $132,961,258 | $176,289,193 |
| Total distributable earnings (loss) | (1,697,097) | (3,383,893) | (5,504,952) | (6,719,101) |
| Net assets | $31,410,693 | $89,138,431 | $127,456,306 | $169,570,092 |
| Unaffiliated investments, at cost | $13,408,631 | $36,212,452 | $51,495,116 | $69,754,026 |
| Affiliated investments, at cost | 20,143,712 | 57,502,589 | 82,536,573 | 110,858,560 |
| Total investments, at cost | 33,552,343 | 93,715,041 | 134,031,689 | 180,612,586 |
| Securities loaned, at value | $372,672 | $1,083,078 | $1,548,918 | $2,994,010 |
| Net asset value per share | | | | |
| The portfolios have an unlimited number of shares authorized with no par value. Net asset value is calculated by dividing the net assets of each class of shares by the number of outstanding shares in the class. | | | | |
| Class R4 | | | | |
| Net assets | $91,180 | $118,495 | $338,692 | $593,618 |
| Shares outstanding | 7,988 | 11,076 | 31,353 | 55,677 |
| Net asset value, offering price and redemption price per share | $11.41 | $10.70 | $10.80 | $10.66 |
| Class R6 | | | | |
| Net assets | $5,262,946 | $16,507,086 | $36,165,238 | $52,329,421 |
| Shares outstanding | 461,561 | 1,543,829 | 3,350,635 | 4,904,204 |
| Net asset value, offering price and redemption price per share | $11.40 | $10.69 | $10.79 | $10.67 |
| Class 1 | | | | |
| Net assets | $26,056,567 | $72,512,850 | $90,952,376 | $116,647,053 |
| Shares outstanding | 2,284,833 | 6,775,927 | 8,420,474 | 10,935,354 |
| Net asset value, offering price and redemption price per share | $11.40 | $10.70 | $10.80 | $10.67 |
| SEE NOTES TO FINANCIAL STATEMENTS | SEMIANNUAL REPORT | JOHN HANCOCK MULTI-INDEX LIFETIME PORTFOLIOS | 25 |
STATEMENTS OF ASSETS AND LIABILITIES 2-29-20 (unaudited)
Continued
| | Multi-Index 2040 Lifetime Portfolio | Multi-Index 2035 Lifetime Portfolio | Multi-Index 2030 Lifetime Portfolio | Multi-Index 2025 Lifetime Portfolio |
| Assets | | | | |
| Unaffiliated investments, at value | $85,729,693 | $112,798,693 | $140,058,531 | $137,722,951 |
| Affiliated investments, at value | 112,817,743 | 117,362,193 | 115,800,678 | 97,144,741 |
| Total investments, at value | 198,547,436 | 230,160,886 | 255,859,209 | 234,867,692 |
| Interest receivable | 553 | 744 | 836 | 1,390 |
| Receivable for fund shares sold | 167,000 | 219,224 | 190,156 | 333,211 |
| Receivable for investments sold | 484,746 | 691,827 | 1,560,589 | 2,973,599 |
| Receivable for securities lending income | 1,264 | 1,101 | 1,860 | 833 |
| Receivable from affiliates | 3,861 | 4,408 | 4,593 | 3,966 |
| Other assets | 26,420 | 26,624 | 26,529 | 26,351 |
| Total assets | 199,231,280 | 231,104,814 | 257,643,772 | 238,207,042 |
| Liabilities | | | | |
| Due to custodian | — | — | 639,161 | 2,132,717 |
| Payable for investments purchased | — | 420,579 | 625,411 | 629,939 |
| Payable for fund shares repurchased | 195,307 | 181 | 256,709 | 216,650 |
| Payable upon return of securities loaned | 3,145,400 | 425,133 | — | 9,388,762 |
| Payable to affiliates | | | | |
| Accounting and legal services fees | 5,494 | 6,333 | 6,960 | 6,182 |
| Transfer agent fees | 532 | 568 | 479 | 455 |
| Trustees' fees | 247 | 307 | 337 | 286 |
| Other liabilities and accrued expenses | 24,200 | 24,255 | 23,887 | 23,619 |
| Total liabilities | 3,371,180 | 877,356 | 1,552,944 | 12,398,610 |
| Net assets | $195,860,100 | $230,227,458 | $256,090,828 | $225,808,432 |
| Net assets consist of | | | | |
| Paid-in capital | $201,786,442 | $234,094,842 | $256,325,149 | $224,042,921 |
| Total distributable earnings (loss) | (5,926,342) | (3,867,384) | (234,321) | 1,765,511 |
| Net assets | $195,860,100 | $230,227,458 | $256,090,828 | $225,808,432 |
| Unaffiliated investments, at cost | $82,649,967 | $107,181,503 | $131,498,253 | $129,132,586 |
| Affiliated investments, at cost | 122,421,865 | 127,514,823 | 124,786,836 | 102,118,156 |
| Total investments, at cost | 205,071,832 | 234,696,326 | 256,285,089 | 231,250,742 |
| Securities loaned, at value | $3,078,783 | $416,548 | — | $9,188,859 |
| Net asset value per share | | | | |
| The portfolios have an unlimited number of shares authorized with no par value. Net asset value is calculated by dividing the net assets of each class of shares by the number of outstanding shares in the class. | | | | |
| Class R4 | | | | |
| Net assets | $158,363 | $812,190 | $2,849,275 | $1,869,776 |
| Shares outstanding | 14,795 | 76,039 | 265,742 | 176,385 |
| Net asset value, offering price and redemption price per share | $10.70 | $10.68 | $10.72 | $10.60 |
| Class R6 | | | | |
| Net assets | $47,776,902 | $51,368,042 | $41,534,607 | $39,921,759 |
| Shares outstanding | 4,468,723 | 4,811,651 | 3,877,097 | 3,767,359 |
| Net asset value, offering price and redemption price per share | $10.69 | $10.68 | $10.71 | $10.60 |
| Class 1 | | | | |
| Net assets | $147,924,835 | $178,047,226 | $211,706,946 | $184,016,897 |
| Shares outstanding | 13,834,117 | 16,674,768 | 19,767,667 | 17,374,558 |
| Net asset value, offering price and redemption price per share | $10.69 | $10.68 | $10.71 | $10.59 |
| 26 | JOHN HANCOCK MULTI-INDEX LIFETIME PORTFOLIOS | SEMIANNUAL REPORT | SEE NOTES TO FINANCIAL STATEMENTS |
STATEMENTS OF ASSETS AND LIABILITIES 2-29-20 (unaudited)
Continued
| | Multi-Index 2020 Lifetime Portfolio | Multi-Index 2015 Lifetime Portfolio | Multi-Index 2010 Lifetime Portfolio |
| Assets | | | |
| Unaffiliated investments, at value | $109,596,393 | $33,253,567 | $26,790,515 |
| Affiliated investments, at value | 46,879,944 | 10,155,503 | 6,071,047 |
| Total investments, at value | 156,476,337 | 43,409,070 | 32,861,562 |
| Interest receivable | 1,584 | 633 | 604 |
| Receivable for fund shares sold | 12,179 | 2,533 | 401 |
| Receivable for investments sold | 507,183 | 169,757 | 134,774 |
| Receivable for securities lending income | 930 | 58 | 57 |
| Receivable from affiliates | 3,198 | 1,566 | 1,441 |
| Other assets | 25,846 | 25,181 | 25,115 |
| Total assets | 157,027,257 | 43,608,798 | 33,023,954 |
| Liabilities | | | |
| Payable for investments purchased | 708,659 | 186,506 | 132,547 |
| Payable for fund shares repurchased | 1,103,125 | 174,958 | 218,444 |
| Payable upon return of securities loaned | 7,966,020 | 1,012,950 | 992,691 |
| Payable to affiliates | | | |
| Accounting and legal services fees | 3,980 | 1,126 | 854 |
| Transfer agent fees | 382 | 164 | 86 |
| Trustees' fees | 157 | 4 | — |
| Other liabilities and accrued expenses | 24,022 | 23,464 | 23,500 |
| Total liabilities | 9,806,345 | 1,399,172 | 1,368,122 |
| Net assets | $147,220,912 | $42,209,626 | $31,655,832 |
| Net assets consist of | | | |
| Paid-in capital | $145,168,609 | $41,269,188 | $31,385,534 |
| Total distributable earnings (loss) | 2,052,303 | 940,438 | 270,298 |
| Net assets | $147,220,912 | $42,209,626 | $31,655,832 |
| Unaffiliated investments, at cost | $104,541,179 | $32,255,074 | $26,136,442 |
| Affiliated investments, at cost | 48,071,029 | 10,118,387 | 6,180,466 |
| Total investments, at cost | 152,612,208 | 42,373,461 | 32,316,908 |
| Securities loaned, at value | $7,795,048 | $992,700 | $972,846 |
| Net asset value per share | | | |
| The portfolios have an unlimited number of shares authorized with no par value. Net asset value is calculated by dividing the net assets of each class of shares by the number of outstanding shares in the class. | | | |
| Class R4 | | | |
| Net assets | $3,478,440 | $1,099,008 | $212,548 |
| Shares outstanding | 329,945 | 106,434 | 20,768 |
| Net asset value, offering price and redemption price per share | $10.54 | $10.33 | $10.23 |
| Class R6 | | | |
| Net assets | $32,867,958 | $14,612,163 | $8,043,030 |
| Shares outstanding | 3,117,342 | 1,415,095 | 785,669 |
| Net asset value, offering price and redemption price per share | $10.54 | $10.33 | $10.24 |
| Class 1 | | | |
| Net assets | $110,874,514 | $26,498,455 | $23,400,254 |
| Shares outstanding | 10,524,192 | 2,566,423 | 2,286,991 |
| Net asset value, offering price and redemption price per share | $10.54 | $10.33 | $10.23 |
| SEE NOTES TO FINANCIAL STATEMENTS | SEMIANNUAL REPORT | JOHN HANCOCK MULTI-INDEX LIFETIME PORTFOLIOS | 27 |
STATEMENTS OF OPERATIONS For the six months ended 2-29-20 (unaudited)
| | Multi-Index 2060 Lifetime Portfolio | Multi-Index 2055 Lifetime Portfolio | Multi-Index 2050 Lifetime Portfolio | Multi-Index 2045 Lifetime Portfolio |
| Investment income | | | | |
| Income distributions received from affiliated investments | $421,492 | $1,225,268 | $1,742,769 | $2,367,406 |
| Dividends | 157,265 | 466,919 | 665,158 | 913,544 |
| Interest | 2,681 | 7,065 | 9,736 | 12,829 |
| Securities lending | 1,138 | 2,736 | 9,372 | 7,782 |
| Other income received from advisor | 1,335 | 3,745 | 5,776 | 7,642 |
| Total investment income | 583,911 | 1,705,733 | 2,432,811 | 3,309,203 |
| Expenses | | | | |
| Investment management fees | 35,733 | 105,582 | 150,569 | 205,397 |
| Distribution and service fees | 6,791 | 19,243 | 24,881 | 31,999 |
| Accounting and legal services fees | 2,795 | 8,266 | 11,800 | 16,091 |
| Transfer agent fees | 273 | 977 | 2,203 | 3,458 |
| Trustees' fees | 320 | 826 | 1,159 | 1,618 |
| Custodian fees | 23,088 | 23,088 | 23,088 | 23,088 |
| State registration fees | 16,107 | 16,062 | 14,800 | 14,847 |
| Printing and postage | 9,031 | 9,107 | 9,131 | 9,180 |
| Professional fees | 14,517 | 13,140 | 13,466 | 13,896 |
| Other | 4,956 | 5,323 | 5,432 | 5,875 |
| Total expenses | 113,611 | 201,614 | 256,529 | 325,449 |
| Less expense reductions | (106,859) | (182,419) | (231,824) | (293,686) |
| Net expenses | 6,752 | 19,195 | 24,705 | 31,763 |
| Net investment income | 577,159 | 1,686,538 | 2,408,106 | 3,277,440 |
| Realized and unrealized gain (loss) | | | | |
| Net realized gain (loss) on | | | | |
| Unaffiliated investments | 562,986 | 2,196,678 | 3,030,398 | 4,549,832 |
| Affiliated investments | (362,066) | (495,096) | (924,217) | (1,649,435) |
| Capital gain distributions received from affiliated investments | 209,092 | 607,827 | 864,547 | 1,174,415 |
| | 410,012 | 2,309,409 | 2,970,728 | 4,074,812 |
| Change in net unrealized appreciation (depreciation) of | | | | |
| Unaffiliated investments | (746,503) | (2,669,845) | (3,730,942) | (5,275,534) |
| Affiliated investments | (109,795) | (699,948) | (771,131) | (200,942) |
| | (856,298) | (3,369,793) | (4,502,073) | (5,476,476) |
| Net realized and unrealized loss | (446,286) | (1,060,384) | (1,531,345) | (1,401,664) |
| Increase in net assets from operations | $130,873 | $626,154 | $876,761 | $1,875,776 |
| 28 | JOHN HANCOCK MULTI-INDEX LIFETIME PORTFOLIOS | SEMIANNUAL REPORT | SEE NOTES TO FINANCIAL STATEMENTS |
STATEMENTS OF OPERATIONS For the six months ended 2-29-20 (unaudited)
Continued
| | Multi-Index 2040 Lifetime Portfolio | Multi-Index 2035 Lifetime Portfolio | Multi-Index 2030 Lifetime Portfolio | Multi-Index 2025 Lifetime Portfolio |
| Investment income | | | | |
| Income distributions received from affiliated investments | $2,667,458 | $2,835,462 | $2,713,178 | $2,108,634 |
| Dividends | 1,114,321 | 1,506,380 | 1,936,923 | 2,085,333 |
| Interest | 20,630 | 29,769 | 39,993 | 35,289 |
| Securities lending | 9,113 | 12,904 | 21,819 | 23,303 |
| Other income received from advisor | 1,420 | — | — | — |
| Total investment income | 3,812,942 | 4,384,515 | 4,711,913 | 4,252,559 |
| Expenses | | | | |
| Investment management fees | 246,396 | 312,477 | 378,354 | 380,995 |
| Distribution and service fees | 40,133 | 48,722 | 58,797 | 52,243 |
| Accounting and legal services fees | 18,632 | 21,713 | 23,585 | 21,523 |
| Transfer agent fees | 3,026 | 3,238 | 2,460 | 2,541 |
| Trustees' fees | 1,829 | 2,133 | 2,277 | 2,064 |
| Custodian fees | 23,088 | 23,088 | 23,088 | 23,088 |
| State registration fees | 14,843 | 14,594 | 14,709 | 14,490 |
| Printing and postage | 9,198 | 9,237 | 9,257 | 9,235 |
| Professional fees | 14,138 | 14,449 | 14,625 | 14,414 |
| Other | 6,130 | 6,097 | 6,628 | 6,355 |
| Total expenses | 377,413 | 455,748 | 533,780 | 526,948 |
| Less expense reductions | (337,342) | (389,246) | (408,538) | (365,110) |
| Net expenses | 40,071 | 66,502 | 125,242 | 161,838 |
| Net investment income | 3,772,871 | 4,318,013 | 4,586,671 | 4,090,721 |
| Realized and unrealized gain (loss) | | | | |
| Net realized gain (loss) on | | | | |
| Unaffiliated investments | 5,525,221 | 5,728,422 | 5,023,781 | 3,914,141 |
| Affiliated investments | (2,227,030) | (2,220,217) | (1,709,975) | (2,107,108) |
| Capital gain distributions received from affiliated investments | 1,323,264 | 1,406,607 | 1,345,945 | 1,046,044 |
| | 4,621,455 | 4,914,812 | 4,659,751 | 2,853,077 |
| Change in net unrealized appreciation (depreciation) of | | | | |
| Unaffiliated investments | (5,777,592) | (5,373,494) | (3,728,343) | (2,535,953) |
| Affiliated investments | 150,499 | 310,802 | (460,422) | 1,018,826 |
| | (5,627,093) | (5,062,692) | (4,188,765) | (1,517,127) |
| Net realized and unrealized gain (loss) | (1,005,638) | (147,880) | 470,986 | 1,335,950 |
| Increase in net assets from operations | $2,767,233 | $4,170,133 | $5,057,657 | $5,426,671 |
| SEE NOTES TO FINANCIAL STATEMENTS | SEMIANNUAL REPORT | JOHN HANCOCK MULTI-INDEX LIFETIME PORTFOLIOS | 29 |
STATEMENTS OF OPERATIONS For the six months ended 2-29-20 (unaudited)
Continued
| | Multi-Index 2020 Lifetime Portfolio | Multi-Index 2015 Lifetime Portfolio | Multi-Index 2010 Lifetime Portfolio |
| Investment income | | | |
| Income distributions received from affiliated investments | $1,140,650 | $277,297 | $181,746 |
| Dividends | 1,545,912 | 489,779 | 371,226 |
| Interest | 20,495 | 5,351 | 3,036 |
| Securities lending | 20,982 | 3,093 | 2,551 |
| Total investment income | 2,728,039 | 775,520 | 558,559 |
| Expenses | | | |
| Investment management fees | 272,773 | 83,918 | 63,105 |
| Distribution and service fees | 34,676 | 9,110 | 6,566 |
| Accounting and legal services fees | 13,804 | 4,007 | 2,876 |
| Transfer agent fees | 1,995 | 847 | 430 |
| Trustees' fees | 1,307 | 448 | 328 |
| Custodian fees | 23,088 | 23,088 | 23,088 |
| State registration fees | 14,709 | 14,709 | 14,709 |
| Printing and postage | 9,156 | 9,067 | 9,100 |
| Professional fees | 13,739 | 12,836 | 12,689 |
| Other | 6,826 | 5,661 | 5,103 |
| Total expenses | 392,073 | 163,691 | 137,994 |
| Less expense reductions | (273,790) | (128,812) | (113,512) |
| Net expenses | 118,283 | 34,879 | 24,482 |
| Net investment income | 2,609,756 | 740,641 | 534,077 |
| Realized and unrealized gain (loss) | | | |
| Net realized gain (loss) on | | | |
| Unaffiliated investments | 2,041,586 | 1,255,068 | 500,874 |
| Affiliated investments | (1,332,025) | (283,943) | (77,724) |
| Capital gain distributions received from affiliated investments | 565,850 | 137,561 | 90,160 |
| | 1,275,411 | 1,108,686 | 513,310 |
| Change in net unrealized appreciation (depreciation) of | | | |
| Unaffiliated investments | (2,033,207) | (1,324,466) | (651,412) |
| Affiliated investments | 1,679,670 | 510,958 | 242,728 |
| | (353,537) | (813,508) | (408,684) |
| Net realized and unrealized gain | 921,874 | 295,178 | 104,626 |
| Increase in net assets from operations | $3,531,630 | $1,035,819 | $638,703 |
| 30 | JOHN HANCOCK MULTI-INDEX LIFETIME PORTFOLIOS | SEMIANNUAL REPORT | SEE NOTES TO FINANCIAL STATEMENTS |
STATEMENTS OF CHANGES IN NET ASSETS
| | Multi-Index 2060 Lifetime Portfolio | Multi-Index 2055 Lifetime Portfolio | Multi-Index 2050 Lifetime Portfolio |
| | Six months ended
2-29-20
(unaudited) | Year ended
8-31-19
| Six months ended
2-29-20
(unaudited) | Year ended
8-31-19
| Six months ended
2-29-20
(unaudited) | Year ended
8-31-19
|
| Increase (decrease) in net assets | | | | | | |
| From operations | | | | | | |
| Net investment income | $577,159 | $408,295 | $1,686,538 | $1,490,699 | $2,408,106 | $2,197,958 |
| Net realized gain | 410,012 | 1,110,812 | 2,309,409 | 4,240,390 | 2,970,728 | 6,078,892 |
| Change in net unrealized appreciation (depreciation) | (856,298) | (1,187,284) | (3,369,793) | (5,402,591) | (4,502,073) | (7,850,139) |
| Increase in net assets resulting from operations | 130,873 | 331,823 | 626,154 | 328,498 | 876,761 | 426,711 |
| Distributions to shareholders | | | | | | |
| From earnings | | | | | | |
| Class R4 | (6,782) | (3,183) | (9,882) | (4,626) | (35,576) | (4,613) |
| Class R6 | (291,929) | (88,096) | (1,271,854) | (542,717) | (2,867,100) | (1,795,031) |
| Class 1 | (1,805,083) | (1,086,850) | (6,205,398) | (5,896,320) | (7,984,116) | (7,638,917) |
| Total distributions | (2,103,794) | (1,178,129) | (7,487,134) | (6,443,663) | (10,886,792) | (9,438,561) |
| Portfolio share transactions | | | | | | |
| From portfolio share transactions | 6,300,664 | 11,755,690 | 13,767,321 | 17,520,466 | 19,344,323 | 20,019,559 |
| Total increase | 4,327,743 | 10,909,384 | 6,906,341 | 11,405,301 | 9,334,292 | 11,007,709 |
| Net assets | | | | | | |
| Beginning of period | 27,082,950 | 16,173,566 | 82,232,090 | 70,826,789 | 118,122,014 | 107,114,305 |
| End of period | $31,410,693 | $27,082,950 | $89,138,431 | $82,232,090 | $127,456,306 | $118,122,014 |
| SEE NOTES TO FINANCIAL STATEMENTS | SEMIANNUAL REPORT | JOHN HANCOCK MULTI-INDEX LIFETIME PORTFOLIOS | 31 |
STATEMENTS OF CHANGES IN NET ASSETS 2-29-20 (unaudited)
Continued
| | Multi-Index 2045 Lifetime Portfolio | Multi-Index 2040 Lifetime Portfolio | Multi-Index 2035 Lifetime Portfolio |
| | Six months ended
2-29-20
(unaudited) | Year ended
8-31-19
| Six months ended
2-29-20
(unaudited) | Year ended
8-31-19
| Six months ended
2-29-20
(unaudited) | Year ended
8-31-19
|
| Increase (decrease) in net assets | | | | | | |
| From operations | | | | | | |
| Net investment income | $3,277,440 | $3,113,951 | $3,772,871 | $3,688,751 | $4,318,013 | $4,664,086 |
| Net realized gain | 4,074,812 | 9,508,386 | 4,621,455 | 10,727,595 | 4,914,812 | 12,054,807 |
| Change in net unrealized appreciation (depreciation) | (5,476,476) | (12,046,149) | (5,627,093) | (13,556,965) | (5,062,692) | (14,354,733) |
| Increase in net assets resulting from operations | 1,875,776 | 576,188 | 2,767,233 | 859,381 | 4,170,133 | 2,364,160 |
| Distributions to shareholders | | | | | | |
| From earnings | | | | | | |
| Class R4 | (57,580) | (4,741) | (13,948) | (4,945) | (67,938) | (4,649) |
| Class R6 | (4,588,538) | (3,236,000) | (4,104,547) | (2,881,773) | (4,128,607) | (2,689,468) |
| Class 1 | (10,566,473) | (10,461,096) | (13,649,327) | (13,954,863) | (15,362,027) | (16,405,162) |
| Total distributions | (15,212,591) | (13,701,837) | (17,767,822) | (16,841,581) | (19,558,572) | (19,099,279) |
| Portfolio share transactions | | | | | | |
| From portfolio share transactions | 18,397,933 | 23,955,142 | 21,045,517 | 27,233,941 | 21,949,689 | 24,674,774 |
| Total increase | 5,061,118 | 10,829,493 | 6,044,928 | 11,251,741 | 6,561,250 | 7,939,655 |
| Net assets | | | | | | |
| Beginning of period | 164,508,974 | 153,679,481 | 189,815,172 | 178,563,431 | 223,666,208 | 215,726,553 |
| End of period | $169,570,092 | $164,508,974 | $195,860,100 | $189,815,172 | $230,227,458 | $223,666,208 |
| 32 | JOHN HANCOCK MULTI-INDEX LIFETIME PORTFOLIOS | SEMIANNUAL REPORT | SEE NOTES TO FINANCIAL STATEMENTS |
STATEMENTS OF CHANGES IN NET ASSETS 2-29-20 (unaudited)
Continued
| | Multi-Index 2030 Lifetime Portfolio | Multi-Index 2025 Lifetime Portfolio | Multi-Index 2020 Lifetime Portfolio |
| | Six months ended
2-29-20
(unaudited) | Year ended
8-31-19
| Six months ended
2-29-20
(unaudited) | Year ended
8-31-19
| Six months ended
2-29-20
(unaudited) | Year ended
8-31-19
|
| Increase (decrease) in net assets | | | | | | |
| From operations | | | | | | |
| Net investment income | $4,586,671 | $5,427,306 | $4,090,721 | $5,278,814 | $2,609,756 | $3,741,424 |
| Net realized gain | 4,659,751 | 10,771,150 | 2,853,077 | 8,126,315 | 1,275,411 | 4,407,735 |
| Change in net unrealized appreciation (depreciation) | (4,188,765) | (11,541,713) | (1,517,127) | (7,181,016) | (353,537) | (2,556,097) |
| Increase in net assets resulting from operations | 5,057,657 | 4,656,743 | 5,426,671 | 6,224,113 | 3,531,630 | 5,593,062 |
| Distributions to shareholders | | | | | | |
| From earnings | | | | | | |
| Class R4 | (210,191) | (4,314) | (132,382) | (4,197) | (217,405) | (3,823) |
| Class R6 | (2,753,408) | (1,322,271) | (2,840,092) | (663,656) | (1,946,565) | (467,775) |
| Class 1 | (16,332,135) | (18,396,185) | (13,685,709) | (16,489,542) | (7,530,767) | (10,111,423) |
| Total distributions | (19,295,734) | (19,722,770) | (16,658,183) | (17,157,395) | (9,694,737) | (10,583,021) |
| Portfolio share transactions | | | | | | |
| From portfolio share transactions | 32,402,295 | 16,651,177 | 19,231,824 | 8,854,475 | 19,042,598 | (5,006,860) |
| Total increase (decrease) | 18,164,218 | 1,585,150 | 8,000,312 | (2,078,807) | 12,879,491 | (9,996,819) |
| Net assets | | | | | | |
| Beginning of period | 237,926,610 | 236,341,460 | 217,808,120 | 219,886,927 | 134,341,421 | 144,338,240 |
| End of period | $256,090,828 | $237,926,610 | $225,808,432 | $217,808,120 | $147,220,912 | $134,341,421 |
| SEE NOTES TO FINANCIAL STATEMENTS | SEMIANNUAL REPORT | JOHN HANCOCK MULTI-INDEX LIFETIME PORTFOLIOS | 33 |
STATEMENTS OF CHANGES IN NET ASSETS 2-29-20 (unaudited)
Continued
| | Multi-Index 2015 Lifetime Portfolio | Multi-Index 2010 Lifetime Portfolio |
| | Six months ended
2-29-20
(unaudited) | Year ended
8-31-19
| Six months ended
2-29-20
(unaudited) | Year ended
8-31-19
|
| Increase (decrease) in net assets | | | | |
| From operations | | | | |
| Net investment income | $740,641 | $1,179,684 | $534,077 | $764,306 |
| Net realized gain | 1,108,686 | 985,024 | 513,310 | 612,870 |
| Change in net unrealized appreciation (depreciation) | (813,508) | (10,817) | (408,684) | 110,696 |
| Increase in net assets resulting from operations | 1,035,819 | 2,153,891 | 638,703 | 1,487,872 |
| Distributions to shareholders | | | | |
| From earnings | | | | |
| Class R4 | (70,004) | (3,423) | (10,060) | (3,901) |
| Class R6 | (929,232) | (134,018) | (401,163) | (103,392) |
| Class 1 | (1,881,062) | (2,757,989) | (1,201,493) | (1,879,472) |
| Total distributions | (2,880,298) | (2,895,430) | (1,612,716) | (1,986,765) |
| Portfolio share transactions | | | | |
| From portfolio share transactions | 4,211,868 | (2,529,618) | 5,851,384 | (2,461,465) |
| Total increase (decrease) | 2,367,389 | (3,271,157) | 4,877,371 | (2,960,358) |
| Net assets | | | | |
| Beginning of period | 39,842,237 | 43,113,394 | 26,778,461 | 29,738,819 |
| End of period | $42,209,626 | $39,842,237 | $31,655,832 | $26,778,461 |
| 34 | JOHN HANCOCK MULTI-INDEX LIFETIME PORTFOLIOS | SEMIANNUAL REPORT | SEE NOTES TO FINANCIAL STATEMENTS |
Multi-Index 2060 Lifetime Portfolio
| Per share operating performance for a share outstanding throughout each period | | Ratios and supplemental data | |
| | | | Income (loss) from investment operations | | | | Less distributions | | | | Ratios to average net assets | | | |
| Period ended | Net asset
value,
beginning
of period ($) | | Net
investment
income
(loss) ($)1, 2 | Net realized and
unrealized
gain (loss)
on investments ($) | | Total from
investment
operations ($) | | From net
investment
income ($) | From net
realized
gain ($) | Total
distributions ($) | Net asset
value,
end of
period ($) | Total
return
(%)3 | Expenses
before
reductions
(%)4 | Expenses
including
reductions
(%)4 | Net
investment
income
(loss) (%)2 | Net
assets,
end of
period
(in thousands) | Portfolio
turnover
(%) |
| Multi-Index 2060 Lifetime Portfolio | |
| Class R4 | |
| 02-29-20205 | 12.06 | | 0.246 | (0.06) | | 0.18 | | (0.26) | (0.57) | (0.83) | 11.41 | 0.947 | 0.958 | 0.168 | 3.858 | 91 | 27 |
| 08-31-2019 | 12.89 | | 0.246 | (0.35) | | (0.11) | | (0.21) | (0.51) | (0.72) | 12.06 | (0.04) | 1.00 | 0.16 | 1.976 | 53 | 13 |
| 08-31-2018 | 12.03 | | 0.236 | 1.12 | | 1.35 | | (0.20) | (0.29) | (0.49) | 12.89 | 11.35 | 1.65 | 0.16 | 1.846 | 57 | 24 |
| 08-31-20179 | 11.31 | | 0.02 | 0.70 | | 0.72 | | — | — | — | 12.03 | 6.377 | 4.248 | 0.188 | 0.448 | 53 | 4610 |
| Class R6 | |
| 02-29-20205 | 12.06 | | 0.246 | (0.05) | | 0.19 | | (0.28) | (0.57) | (0.85) | 11.40 | 1.027 | 0.708 | —8 | 3.858 | 5,263 | 27 |
| 08-31-2019 | 12.90 | | 0.226 | (0.32) | | (0.10) | | (0.23) | (0.51) | (0.74) | 12.06 | 0.08 | 0.75 | — | 1.886 | 2,758 | 13 |
| 08-31-2018 | 12.03 | | 0.266 | 1.12 | | 1.38 | | (0.22) | (0.29) | (0.51) | 12.90 | 11.61 | 1.40 | — | 2.086 | 948 | 24 |
| 08-31-2017 | 10.60 | | 0.21 | 1.40 | | 1.61 | | (0.18) | — | (0.18) | 12.03 | 15.40 | 3.99 | 0.02 | 1.91 | 188 | 46 |
| 08-31-201611 | 10.00 | | 0.03 | 0.57 | | 0.60 | | — | — | — | 10.60 | 6.007 | 52.888 | 0.108 | 0.608 | 106 | 1 |
| Class 1 | |
| 02-29-20205 | 12.06 | | 0.236 | (0.04) | | 0.19 | | (0.28) | (0.57) | (0.85) | 11.40 | 0.967 | 0.748 | 0.058 | 3.728 | 26,057 | 27 |
| 08-31-2019 | 12.90 | | 0.236 | (0.33) | | (0.10) | | (0.23) | (0.51) | (0.74) | 12.06 | 0.03 | 0.78 | 0.05 | 1.926 | 24,271 | 13 |
| 08-31-2018 | 12.03 | | 0.226 | 1.15 | | 1.37 | | (0.21) | (0.29) | (0.50) | 12.90 | 11.56 | 1.44 | 0.05 | 1.756 | 15,168 | 24 |
| 08-31-2017 | 10.60 | | 0.18 | 1.43 | | 1.61 | | (0.18) | — | (0.18) | 12.03 | 15.36 | 4.03 | 0.07 | 1.60 | 5,691 | 46 |
| 08-31-201611 | 10.00 | | 0.01 | 0.59 | | 0.60 | | — | — | — | 10.60 | 6.007 | 52.918 | 0.158 | 0.318 | 558 | 1 |
| 1 Based on average daily shares outstanding. |
| 2 Net investment income is affected by the timing and frequency of the declaration of dividends by the underlying funds in which the portfolio invests. Accordingly, a significant portion of income is recorded in December. |
| 3 Total returns would have been lower had certain expenses not been reduced and other income not been received from the Advisor for reimbursement of indirect net expenses associated with the portfolio’s investments in underlying investment companies during the applicable periods. |
| 4 Ratios do not include expenses indirectly incurred from underlying funds and can vary based on the mix of underlying funds held by the portfolio. |
| 5 Six months ended 2-29-20. Unaudited. |
| 6 Net investment income (loss) per share and net investment income (loss) ratio reflect other income received from the Advisor for reimbursement of indirect net expenses associated with the portfolio's investments in underlying investment companies of less than $0.005 per share, and 0.01% and less than 0.005% for the periods ended 2-29-20 and 8-31-19 and 8-31-18, respectively. |
| 7 Not annualized. |
| 8 Annualized. |
| 9 The inception date for Class R4 shares is 4-7-17. |
| 10 Portfolio turnover is shown for the period from 9-1-16 to 8-31-17. |
| 11 Period from 3-30-16 (commencement of operations) to 8-31-16. |
| SEE NOTES TO FINANCIAL STATEMENTS | SEMIANNUAL REPORT | JOHN HANCOCK MULTI-INDEX LIFETIME PORTFOLIOS | 35 |
| Financial highlights continued |
Multi-Index 2055 Lifetime Portfolio
| Per share operating performance for a share outstanding throughout each period | | Ratios and supplemental data | |
| | | | Income (loss) from investment operations | | | | Less distributions | | | | Ratios to average net assets | | | |
| Period ended | Net asset
value,
beginning
of period ($) | | Net
investment
income
(loss) ($)1, 2 | Net realized and
unrealized
gain (loss)
on investments ($) | | Total from
investment
operations ($) | | From net
investment
income ($) | From net
realized
gain ($) | Total
distributions ($) | Net asset
value,
end of
period ($) | Total
return
(%)3 | Expenses
before
reductions
(%)4 | Expenses
including
reductions
(%)4 | Net
investment
income
(loss) (%)2 | Net
assets,
end of
period
(in thousands) | Portfolio
turnover
(%) |
| Multi-Index 2055 Lifetime Portfolio | |
| Class R4 | |
| 02-29-20205 | 11.48 | | 0.236 | (0.04) | | 0.19 | | (0.25) | (0.72) | (0.97) | 10.70 | 0.997 | 0.668 | 0.178 | 3.838 | 118 | 23 |
| 08-31-2019 | 12.71 | | 0.236 | (0.40) | | (0.17) | | (0.23) | (0.83) | (1.06) | 11.48 | (0.14) | 0.65 | 0.16 | 1.966 | 52 | 18 |
| 08-31-2018 | 12.18 | | 0.236 | 1.13 | | 1.36 | | (0.23) | (0.60) | (0.83) | 12.71 | 11.42 | 0.73 | 0.16 | 1.866 | 55 | 17 |
| 08-31-20179 | 11.45 | | 0.02 | 0.71 | | 0.73 | | — | — | — | 12.18 | 6.387 | 0.728 | 0.188 | 0.458 | 53 | 1510 |
| 08-31-2015 | 10.72 | | 0.17 | (0.60) | | (0.43) | | (0.14) | (0.02) | (0.16) | 10.13 | (4.09) | 10.02 | 0.39 | 1.57 | 101 | 17 |
| Class R6 | |
| 02-29-20205 | 11.48 | | 0.236 | (0.03) | | 0.20 | | (0.27) | (0.72) | (0.99) | 10.69 | 1.057 | 0.418 | —8 | 3.828 | 16,507 | 23 |
| 08-31-2019 | 12.71 | | 0.216 | (0.36) | | (0.15) | | (0.25) | (0.83) | (1.08) | 11.48 | 0.06 | 0.40 | — | 1.866 | 10,711 | 18 |
| 08-31-2018 | 12.19 | | 0.206 | 1.17 | | 1.37 | | (0.25) | (0.60) | (0.85) | 12.71 | 11.49 | 0.48 | — | 1.646 | 4,456 | 17 |
| 08-31-2017 | 10.91 | | 0.10 | 1.53 | | 1.63 | | (0.21) | (0.14) | (0.35) | 12.19 | 15.35 | 0.47 | 0.01 | 0.84 | 1,746 | 15 |
| 08-31-2016 | 10.14 | | 0.19 | 0.75 | | 0.94 | | (0.15) | (0.02) | (0.17) | 10.91 | 9.45 | 0.69 | 0.07 | 1.90 | 109 | 8 |
| 08-31-2015 | 10.73 | | 0.19 | (0.60) | | (0.41) | | (0.16) | (0.02) | (0.18) | 10.14 | (3.91) | 10.27 | 0.19 | 1.76 | 101 | 17 |
| Class 1 | |
| 02-29-20205 | 11.49 | | 0.226 | (0.02) | | 0.20 | | (0.27) | (0.72) | (0.99) | 10.70 | 1.007 | 0.458 | 0.058 | 3.678 | 72,513 | 23 |
| 08-31-2019 | 12.72 | | 0.236 | (0.39) | | (0.16) | | (0.24) | (0.83) | (1.07) | 11.49 | 0.0011 | 0.44 | 0.05 | 2.016 | 71,469 | 18 |
| 08-31-2018 | 12.19 | | 0.246 | 1.13 | | 1.37 | | (0.24) | (0.60) | (0.84) | 12.72 | 11.52 | 0.51 | 0.05 | 1.906 | 66,316 | 17 |
| 08-31-2017 | 10.91 | | 0.21 | 1.42 | | 1.63 | | (0.21) | (0.14) | (0.35) | 12.19 | 15.28 | 0.51 | 0.06 | 1.86 | 52,950 | 15 |
| 08-31-2016 | 10.14 | | 0.16 | 0.78 | | 0.94 | | (0.15) | (0.02) | (0.17) | 10.91 | 9.39 | 0.73 | 0.12 | 1.61 | 33,895 | 8 |
| 08-31-2015 | 10.73 | | 0.08 | (0.50) | | (0.42) | | (0.15) | (0.02) | (0.17) | 10.14 | (3.98) | 3.08 | 0.24 | 0.75 | 10,587 | 17 |
| 1 Based on average daily shares outstanding. |
| 2 Net investment income is affected by the timing and frequency of the declaration of dividends by the underlying funds in which the portfolio invests. Accordingly, a significant portion of income is recorded in December. |
| 3 Total returns would have been lower had certain expenses not been reduced and other income not been received from the Advisor for reimbursement of indirect net expenses associated with the portfolio’s investments in underlying investment companies during the applicable periods. |
| 4 Ratios do not include expenses indirectly incurred from underlying funds and can vary based on the mix of underlying funds held by the portfolio. |
| 5 Six months ended 2-29-20. Unaudited. |
| 6 Net investment income (loss) per share and net investment income (loss) ratio reflect other income received from the Advisor for reimbursement of indirect net expenses associated with the portfolio's investments in underlying investment companies of less than $0.005 per share and 0.01% for the periods ended 2-29-20, 8-31-19 and 8-31-18. |
| 7 Not annualized. |
| 8 Annualized. |
| 9 Period from 4-7-17 (relaunch date) to 8-31-17. Class R4 liquidated on 6-15-16, accordingly, there were no shares of this class outstanding 8-31-16. |
| 10 Portfolio turnover is shown for the period from 9-1-16 to 8-31-17. |
| 11 Less than 0.005%. |
| 36 | JOHN HANCOCK MULTI-INDEX LIFETIME PORTFOLIOS | SEMIANNUAL REPORT | SEE NOTES TO FINANCIAL STATEMENTS |
Multi-Index 2050 Lifetime Portfolio
| Per share operating performance for a share outstanding throughout each period | | Ratios and supplemental data | |
| | | | Income (loss) from investment operations | | | | Less distributions | | | | Ratios to average net assets | | | |
| Period ended | Net asset
value,
beginning
of period ($) | | Net
investment
income
(loss) ($)1, 2 | Net realized and
unrealized
gain (loss)
on investments ($) | | Total from
investment
operations ($) | | From net
investment
income ($) | From net
realized
gain ($) | Total
distributions ($) | Net asset
value,
end of
period ($) | Total
return
(%)3 | Expenses
before
reductions
(%)4 | Expenses
including
reductions
(%)4 | Net
investment
income
(loss) (%)2 | Net
assets,
end of
period
(in thousands) | Portfolio
turnover
(%) |
| Multi-Index 2050 Lifetime Portfolio | |
| Class R4 | |
| 02-29-20205 | 11.61 | | 0.226 | (0.03) | | 0.19 | | (0.25) | (0.75) | (1.00) | 10.80 | 0.887 | 0.708 | 0.258 | 3.638 | 339 | 27 |
| 08-31-2019 | 12.85 | | 0.106 | (0.28) | | (0.18) | | (0.23) | (0.83) | (1.06) | 11.61 | (0.18) | 0.68 | 0.24 | 0.876 | 241 | 19 |
| 08-31-2018 | 12.26 | | 0.236 | 1.14 | | 1.37 | | (0.22) | (0.56) | (0.78) | 12.85 | 11.44 | 0.66 | 0.16 | 1.866 | 56 | 14 |
| 08-31-20179 | 11.53 | | 0.02 | 0.71 | | 0.73 | | — | — | — | 12.26 | 6.337 | 0.698 | 0.188 | 0.448 | 53 | 1610 |
| 08-31-2015 | 10.80 | | 0.17 | (0.61) | | (0.44) | | (0.13) | (0.02) | (0.15) | 10.21 | (4.11) | 7.11 | 0.39 | 1.58 | 102 | 11 |
| Class R6 | |
| 02-29-20205 | 11.62 | | 0.236 | (0.03) | | 0.20 | | (0.28) | (0.75) | (1.03) | 10.79 | 0.957 | 0.378 | —8 | 3.788 | 36,165 | 27 |
| 08-31-2019 | 12.85 | | 0.236 | (0.38) | | (0.15) | | (0.25) | (0.83) | (1.08) | 11.62 | 0.11 | 0.36 | — | 1.986 | 26,188 | 19 |
| 08-31-2018 | 12.26 | | 0.236 | 1.16 | | 1.39 | | (0.24) | (0.56) | (0.80) | 12.85 | 11.61 | 0.41 | — | 1.846 | 18,646 | 14 |
| 08-31-2017 | 10.99 | | 0.04 | 1.60 | | 1.64 | | (0.22) | (0.15) | (0.37) | 12.26 | 15.26 | 0.44 | 0.01 | 0.31 | 10,359 | 16 |
| 08-31-2016 | 10.22 | | 0.20 | 0.77 | | 0.97 | | (0.16) | (0.04) | (0.20) | 10.99 | 9.52 | 0.65 | 0.07 | 1.91 | 110 | 8 |
| 08-31-2015 | 10.82 | | 0.19 | (0.61) | | (0.42) | | (0.16) | (0.02) | (0.18) | 10.22 | (3.96) | 6.93 | 0.20 | 1.77 | 102 | 11 |
| Class 1 | |
| 02-29-20205 | 11.62 | | 0.226 | (0.02) | | 0.20 | | (0.27) | (0.75) | (1.02) | 10.80 | 0.987 | 0.408 | 0.058 | 3.668 | 90,952 | 27 |
| 08-31-2019 | 12.85 | | 0.236 | (0.38) | | (0.15) | | (0.25) | (0.83) | (1.08) | 11.62 | 0.05 | 0.39 | 0.05 | 2.016 | 91,692 | 19 |
| 08-31-2018 | 12.27 | | 0.246 | 1.13 | | 1.37 | | (0.23) | (0.56) | (0.79) | 12.85 | 11.46 | 0.45 | 0.05 | 1.906 | 88,412 | 14 |
| 08-31-2017 | 10.99 | | 0.22 | 1.42 | | 1.64 | | (0.21) | (0.15) | (0.36) | 12.27 | 15.29 | 0.48 | 0.06 | 1.90 | 70,115 | 16 |
| 08-31-2016 | 10.22 | | 0.17 | 0.79 | | 0.96 | | (0.15) | (0.04) | (0.19) | 10.99 | 9.46 | 0.68 | 0.12 | 1.61 | 47,118 | 8 |
| 08-31-2015 | 10.82 | | 0.10 | (0.53) | | (0.43) | | (0.15) | (0.02) | (0.17) | 10.22 | (4.06) | 1.38 | 0.25 | 0.95 | 17,035 | 11 |
| 1 Based on average daily shares outstanding. |
| 2 Net investment income is affected by the timing and frequency of the declaration of dividends by the underlying funds in which the portfolio invests. Accordingly, a significant portion of income is recorded in December. |
| 3 Total returns would have been lower had certain expenses not been reduced and other income not been received from the Advisor for reimbursement of indirect net expenses associated with the portfolio’s investments in underlying investment companies during the applicable periods. |
| 4 Ratios do not include expenses indirectly incurred from underlying funds and can vary based on the mix of underlying funds held by the portfolio. |
| 5 Six months ended 2-29-20. Unaudited. |
| 6 Net investment income (loss) per share and net investment income (loss) ratio reflect other income received from the Advisor for reimbursement of indirect net expenses associated with the portfolio's investments in underlying investment companies of less than $0.005 per share and 0.01% for the periods ended 2-29-20, 8-31-19 and 8-31-18. |
| 7 Not annualized. |
| 8 Annualized. |
| 9 Period from 4-7-17 (relaunch date) to 8-31-17. Class R4 liquidated on 6-15-16, accordingly, there were no shares of this class outstanding 8-31-16. |
| 10 Portfolio turnover is shown for the period from 9-1-16 to 8-31-17. |
| SEE NOTES TO FINANCIAL STATEMENTS | SEMIANNUAL REPORT | JOHN HANCOCK MULTI-INDEX LIFETIME PORTFOLIOS | 37 |
| Financial highlights continued |
Multi-Index 2045 Lifetime Portfolio
| Per share operating performance for a share outstanding throughout each period | | Ratios and supplemental data | |
| | | | Income (loss) from investment operations | | | | Less distributions | | | | Ratios to average net assets | | | |
| Period ended | Net asset
value,
beginning
of period ($) | | Net
investment
income
(loss) ($)1, 2 | Net realized and
unrealized
gain (loss)
on investments ($) | | Total from
investment
operations ($) | | From net
investment
income ($) | From net
realized
gain ($) | Total
distributions ($) | Net asset
value,
end of
period ($) | Total
return
(%)3 | Expenses
before
reductions
(%)4 | Expenses
including
reductions
(%)4 | Net
investment
income
(loss) (%)2 | Net
assets,
end of
period
(in thousands) | Portfolio
turnover
(%) |
| Multi-Index 2045 Lifetime Portfolio | |
| Class R4 | |
| 02-29-20205 | 11.49 | | 0.246 | (0.05) | | 0.19 | | (0.26) | (0.76) | (1.02) | 10.66 | 0.947 | 0.608 | 0.178 | 4.018 | 594 | 26 |
| 08-31-2019 | 12.76 | | 0.206 | (0.38) | | (0.18) | | (0.23) | (0.86) | (1.09) | 11.49 | (0.11) | 0.60 | 0.18 | 1.726 | 50 | 19 |
| 08-31-2018 | 12.21 | | 0.236 | 1.14 | | 1.37 | | (0.22) | (0.60) | (0.82) | 12.76 | 11.37 | 0.62 | 0.16 | 1.876 | 56 | 12 |
| 08-31-20179 | 11.48 | | 0.02 | 0.71 | | 0.73 | | — | — | — | 12.21 | 6.357 | 0.638 | 0.188 | 0.448 | 53 | 2110 |
| 08-31-2015 | 10.80 | | 0.17 | (0.61) | | (0.44) | | (0.14) | (0.02) | (0.16) | 10.20 | (4.19) | 6.65 | 0.39 | 1.57 | 102 | 16 |
| Class R6 | |
| 02-29-20205 | 11.51 | | 0.226 | (0.02) | | 0.20 | | (0.28) | (0.76) | (1.04) | 10.67 | 1.027 | 0.348 | —8 | 3.778 | 52,329 | 26 |
| 08-31-2019 | 12.77 | | 0.226 | (0.37) | | (0.15) | | (0.25) | (0.86) | (1.11) | 11.51 | 0.09 | 0.33 | — | 1.966 | 44,013 | 19 |
| 08-31-2018 | 12.22 | | 0.236 | 1.15 | | 1.38 | | (0.23) | (0.60) | (0.83) | 12.77 | 11.61 | 0.37 | — | 1.856 | 32,149 | 12 |
| 08-31-2017 | 10.96 | | 0.03 | 1.60 | | 1.63 | | (0.22) | (0.15) | (0.37) | 12.22 | 15.29 | 0.37 | 0.01 | 0.24 | 21,476 | 21 |
| 08-31-2016 | 10.21 | | 0.20 | 0.75 | | 0.95 | | (0.16) | (0.04) | (0.20) | 10.96 | 9.35 | 0.50 | 0.07 | 1.91 | 110 | 7 |
| 08-31-2015 | 10.82 | | 0.19 | (0.62) | | (0.43) | | (0.16) | (0.02) | (0.18) | 10.21 | (4.04) | 6.46 | 0.20 | 1.77 | 102 | 16 |
| Class 1 | |
| 02-29-20205 | 11.50 | | 0.226 | (0.02) | | 0.20 | | (0.27) | (0.76) | (1.03) | 10.67 | 1.067 | 0.388 | 0.058 | 3.658 | 116,647 | 26 |
| 08-31-2019 | 12.76 | | 0.236 | (0.39) | | (0.16) | | (0.24) | (0.86) | (1.10) | 11.50 | 0.03 | 0.37 | 0.05 | 2.026 | 120,446 | 19 |
| 08-31-2018 | 12.22 | | 0.246 | 1.13 | | 1.37 | | (0.23) | (0.60) | (0.83) | 12.76 | 11.47 | 0.40 | 0.05 | 1.906 | 121,475 | 12 |
| 08-31-2017 | 10.96 | | 0.22 | 1.40 | | 1.62 | | (0.21) | (0.15) | (0.36) | 12.22 | 15.24 | 0.41 | 0.06 | 1.93 | 100,206 | 21 |
| 08-31-2016 | 10.20 | | 0.17 | 0.78 | | 0.95 | | (0.15) | (0.04) | (0.19) | 10.96 | 9.41 | 0.53 | 0.12 | 1.64 | 74,804 | 7 |
| 08-31-2015 | 10.81 | | 0.11 | (0.54) | | (0.43) | | (0.16) | (0.02) | (0.18) | 10.20 | (4.09) | 0.91 | 0.25 | 1.03 | 30,197 | 16 |
| 1 Based on average daily shares outstanding. |
| 2 Net investment income is affected by the timing and frequency of the declaration of dividends by the underlying funds in which the portfolio invests. Accordingly, a significant portion of income is recorded in December. |
| 3 Total returns would have been lower had certain expenses not been reduced and other income not been received from the Advisor for reimbursement of indirect net expenses associated with the portfolio’s investments in underlying investment companies during the applicable periods. |
| 4 Ratios do not include expenses indirectly incurred from underlying funds and can vary based on the mix of underlying funds held by the portfolio. |
| 5 Six months ended 2-29-20. Unaudited. |
| 6 Net investment income (loss) per share and net investment income (loss) ratio reflect other income received from the Advisor for reimbursement of indirect net expenses associated with the portfolio's investments in underlying investment companies of less than $0.005 per share and 0.01% for the periods ended 2-29-20, 8-31-19 and 8-31-18. |
| 7 Not annualized. |
| 8 Annualized. |
| 9 Period from 4-7-17 (relaunch date) to 8-31-17. Class R4 liquidated on 6-15-16, accordingly, there were no shares of this class outstanding 8-31-16. |
| 10 Portfolio turnover is shown for the period from 9-1-16 to 8-31-17. |
| 38 | JOHN HANCOCK MULTI-INDEX LIFETIME PORTFOLIOS | SEMIANNUAL REPORT | SEE NOTES TO FINANCIAL STATEMENTS |
Multi-Index 2040 Lifetime Portfolio
| Per share operating performance for a share outstanding throughout each period | | Ratios and supplemental data | |
| | | | Income (loss) from investment operations | | | | Less distributions | | | | Ratios to average net assets | | | |
| Period ended | Net asset
value,
beginning
of period ($) | | Net
investment
income
(loss) ($)1, 2 | Net realized and
unrealized
gain (loss)
on investments ($) | | Total from
investment
operations ($) | | From net
investment
income ($) | From net
realized
gain ($) | Total
distributions ($) | Net asset
value,
end of
period ($) | Total
return
(%)3 | Expenses
before
reductions
(%)4 | Expenses
including
reductions
(%)4 | Net
investment
income
(loss) (%)2 | Net
assets,
end of
period
(in thousands) | Portfolio
turnover
(%) |
| Multi-Index 2040 Lifetime Portfolio | |
| Class R4 | |
| 02-29-20205 | 11.50 | | 0.226 | 0.01 | | 0.23 | | (0.26) | (0.77) | (1.03) | 10.70 | 1.317 | 0.598 | 0.178 | 3.798 | 158 | 28 |
| 08-31-2019 | 12.79 | | 0.236 | (0.38) | | (0.15) | | (0.23) | (0.91) | (1.14) | 11.50 | 0.11 | 0.58 | 0.17 | 1.966 | 54 | 18 |
| 08-31-2018 | 12.25 | | 0.24 | 1.10 | | 1.34 | | (0.22) | (0.58) | (0.80) | 12.79 | 11.20 | 0.61 | 0.16 | 1.87 | 56 | 15 |
| 08-31-20179 | 11.52 | | 0.02 | 0.71 | | 0.73 | | — | — | — | 12.25 | 6.347 | 0.618 | 0.188 | 0.468 | 53 | 1910 |
| 08-31-2015 | 10.80 | | 0.17 | (0.60) | | (0.43) | | (0.14) | (0.02) | (0.16) | 10.21 | (4.07) | 6.55 | 0.40 | 1.58 | 102 | 19 |
| Class R6 | |
| 02-29-20205 | 11.50 | | 0.226 | 0.02 | | 0.24 | | (0.28) | (0.77) | (1.05) | 10.69 | 1.397 | 0.348 | —8 | 3.748 | 47,777 | 28 |
| 08-31-2019 | 12.80 | | 0.236 | (0.37) | | (0.14) | | (0.25) | (0.91) | (1.16) | 11.50 | 0.23 | 0.33 | — | 2.016 | 37,168 | 18 |
| 08-31-2018 | 12.25 | | 0.24 | 1.13 | | 1.37 | | (0.24) | (0.58) | (0.82) | 12.80 | 11.46 | 0.36 | — | 1.90 | 27,193 | 15 |
| 08-31-2017 | 10.99 | | 0.03 | 1.60 | | 1.63 | | (0.22) | (0.15) | (0.37) | 12.25 | 15.24 | 0.36 | 0.02 | 0.25 | 20,326 | 19 |
| 08-31-2016 | 10.22 | | 0.20 | 0.76 | | 0.96 | | (0.16) | (0.03) | (0.19) | 10.99 | 9.46 | 0.45 | 0.07 | 1.90 | 110 | 10 |
| 08-31-2015 | 10.82 | | 0.19 | (0.61) | | (0.42) | | (0.16) | (0.02) | (0.18) | 10.22 | (3.92) | 6.36 | 0.20 | 1.77 | 102 | 19 |
| Class 1 | |
| 02-29-20205 | 11.50 | | 0.216 | 0.02 | | 0.23 | | (0.27) | (0.77) | (1.04) | 10.69 | 1.337 | 0.378 | 0.058 | 3.648 | 147,925 | 28 |
| 08-31-2019 | 12.79 | | 0.246 | (0.38) | | (0.14) | | (0.24) | (0.91) | (1.15) | 11.50 | 0.25 | 0.37 | 0.05 | 2.046 | 152,593 | 18 |
| 08-31-2018 | 12.25 | | 0.24 | 1.11 | | 1.35 | | (0.23) | (0.58) | (0.81) | 12.79 | 11.32 | 0.39 | 0.05 | 1.92 | 151,315 | 15 |
| 08-31-2017 | 10.98 | | 0.22 | 1.41 | | 1.63 | | (0.21) | (0.15) | (0.36) | 12.25 | 15.29 | 0.39 | 0.07 | 1.92 | 130,499 | 19 |
| 08-31-2016 | 10.21 | | 0.17 | 0.78 | | 0.95 | | (0.15) | (0.03) | (0.18) | 10.98 | 9.42 | 0.49 | 0.12 | 1.60 | 94,444 | 10 |
| 08-31-2015 | 10.81 | | 0.10 | (0.52) | | (0.42) | | (0.16) | (0.02) | (0.18) | 10.21 | (3.98) | 0.81 | 0.25 | 0.98 | 36,205 | 19 |
| 1 Based on average daily shares outstanding. |
| 2 Net investment income is affected by the timing and frequency of the declaration of dividends by the underlying funds in which the portfolio invests. Accordingly, a significant portion of income is recorded in December. |
| 3 Total returns would have been lower had certain expenses not been reduced and other income not been received from the Advisor for reimbursement of indirect net expenses associated with the portfolio’s investments in underlying investment companies during the applicable periods. |
| 4 Ratios do not include expenses indirectly incurred from underlying funds and can vary based on the mix of underlying funds held by the portfolio. |
| 5 Six months ended 2-29-20. Unaudited. |
| 6 Net investment income (loss) per share and net investment income (loss) ratio reflect other income received from the Advisor for reimbursement of indirect net expenses associated with the portfolio's investments in underlying investment companies of less than $0.005 per share and less than 0.005% for the periods ended 2-29-20 and 8-31-19. |
| 7 Not annualized. |
| 8 Annualized. |
| 9 Period from 4-7-17 (relaunch date) to 8-31-17. Class R4 liquidated on 6-15-16, accordingly, there were no shares of this class outstanding 8-31-16. |
| 10 Portfolio turnover is shown for the period from 9-1-16 to 8-31-17. |
| SEE NOTES TO FINANCIAL STATEMENTS | SEMIANNUAL REPORT | JOHN HANCOCK MULTI-INDEX LIFETIME PORTFOLIOS | 39 |
| Financial highlights continued |
Multi-Index 2035 Lifetime Portfolio
| Per share operating performance for a share outstanding throughout each period | | Ratios and supplemental data | |
| | | | Income (loss) from investment operations | | | | Less distributions | | | | Ratios to average net assets | | | |
| Period ended | Net asset
value,
beginning
of period ($) | | Net
investment
income
(loss) ($)1, 2 | Net realized and
unrealized
gain (loss)
on investments ($) | | Total from
investment
operations ($) | | From net
investment
income ($) | From net
realized
gain ($) | Total
distributions ($) | Net asset
value,
end of
period ($) | Total
return
(%)3 | Expenses
before
reductions
(%)4 | Expenses
including
reductions
(%)4 | Net
investment
income
(loss) (%)2 | Net
assets,
end of
period
(in thousands) | Portfolio
turnover
(%) |
| Multi-Index 2035 Lifetime Portfolio | |
| Class R4 | |
| 02-29-20205 | 11.40 | | 0.19 | 0.06 | | 0.25 | | (0.27) | (0.70) | (0.97) | 10.68 | 1.596 | 0.627 | 0.207 | 3.297 | 812 | 33 |
| 08-31-2019 | 12.52 | | 0.22 | (0.28) | | (0.06) | | (0.24) | (0.82) | (1.06) | 11.40 | 0.72 | 0.61 | 0.19 | 1.92 | 66 | 19 |
| 08-31-2018 | 12.11 | | 0.24 | 0.98 | | 1.22 | | (0.23) | (0.58) | (0.81) | 12.52 | 10.35 | 0.61 | 0.18 | 1.96 | 55 | 15 |
| 08-31-20178 | 11.42 | | 0.03 | 0.66 | | 0.69 | | — | — | — | 12.11 | 6.046 | 0.607 | 0.207 | 0.597 | 53 | 229 |
| 08-31-2015 | 10.80 | | 0.17 | (0.61) | | (0.44) | | (0.14) | (0.02) | (0.16) | 10.20 | (4.14) | 6.39 | 0.41 | 1.61 | 102 | 15 |
| Class R6 | |
| 02-29-20205 | 11.40 | | 0.22 | 0.05 | | 0.27 | | (0.29) | (0.70) | (0.99) | 10.68 | 1.776 | 0.357 | 0.027 | 3.697 | 51,368 | 33 |
| 08-31-2019 | 12.52 | | 0.24 | (0.28) | | (0.04) | | (0.26) | (0.82) | (1.08) | 11.40 | 0.93 | 0.34 | 0.01 | 2.11 | 38,369 | 19 |
| 08-31-2018 | 12.11 | | 0.24 | 1.00 | | 1.24 | | (0.25) | (0.58) | (0.83) | 12.52 | 10.51 | 0.36 | 0.01 | 1.96 | 20,590 | 15 |
| 08-31-2017 | 10.94 | | 0.05 | 1.50 | | 1.55 | | (0.22) | (0.16) | (0.38) | 12.11 | 14.56 | 0.35 | 0.03 | 0.42 | 14,013 | 22 |
| 08-31-2016 | 10.21 | | 0.20 | 0.73 | | 0.93 | | (0.16) | (0.04) | (0.20) | 10.94 | 9.20 | 0.42 | 0.09 | 1.98 | 109 | 10 |
| 08-31-2015 | 10.82 | | 0.19 | (0.61) | | (0.42) | | (0.17) | (0.02) | (0.19) | 10.21 | (3.99) | 6.20 | 0.21 | 1.81 | 102 | 15 |
| Class 1 | |
| 02-29-20205 | 11.40 | | 0.21 | 0.05 | | 0.26 | | (0.28) | (0.70) | (0.98) | 10.68 | 1.736 | 0.397 | 0.077 | 3.587 | 178,047 | 33 |
| 08-31-2019 | 12.52 | | 0.25 | (0.29) | | (0.04) | | (0.26) | (0.82) | (1.08) | 11.40 | 0.88 | 0.38 | 0.06 | 2.19 | 185,231 | 19 |
| 08-31-2018 | 12.11 | | 0.25 | 0.99 | | 1.24 | | (0.25) | (0.58) | (0.83) | 12.52 | 10.46 | 0.40 | 0.06 | 2.01 | 195,082 | 15 |
| 08-31-2017 | 10.95 | | 0.22 | 1.31 | | 1.53 | | (0.21) | (0.16) | (0.37) | 12.11 | 14.39 | 0.39 | 0.08 | 1.97 | 169,855 | 22 |
| 08-31-2016 | 10.21 | | 0.18 | 0.76 | | 0.94 | | (0.16) | (0.04) | (0.20) | 10.95 | 9.24 | 0.45 | 0.14 | 1.72 | 121,902 | 10 |
| 08-31-2015 | 10.82 | | 0.12 | (0.55) | | (0.43) | | (0.16) | (0.02) | (0.18) | 10.21 | (4.09) | 0.64 | 0.26 | 1.08 | 51,032 | 15 |
| 1 Based on average daily shares outstanding. |
| 2 Net investment income is affected by the timing and frequency of the declaration of dividends by the underlying funds in which the portfolio invests. Accordingly, a significant portion of income is recorded in December. |
| 3 Total returns would have been lower had certain expenses not been reduced during the applicable periods. |
| 4 Ratios do not include expenses indirectly incurred from underlying funds and can vary based on the mix of underlying funds held by the portfolio. |
| 5 Six months ended 2-29-20. Unaudited. |
| 6 Not annualized. |
| 7 Annualized. |
| 8 Period from 4-7-17 (relaunch date) to 8-31-17. Class R4 liquidated on 6-15-16, accordingly, there were no shares of this class outstanding 8-31-16. |
| 9 Portfolio turnover is shown for the period from 9-1-16 to 8-31-17. |
| 40 | JOHN HANCOCK MULTI-INDEX LIFETIME PORTFOLIOS | SEMIANNUAL REPORT | SEE NOTES TO FINANCIAL STATEMENTS |
Multi-Index 2030 Lifetime Portfolio
| Per share operating performance for a share outstanding throughout each period | | Ratios and supplemental data | |
| | | | Income (loss) from investment operations | | | | Less distributions | | | | Ratios to average net assets | | | |
| Period ended | Net asset
value,
beginning
of period ($) | | Net
investment
income
(loss) ($)1, 2 | Net realized and
unrealized
gain (loss)
on investments ($) | | Total from
investment
operations ($) | | From net
investment
income ($) | From net
realized
gain ($) | Total
distributions ($) | Net asset
value,
end of
period ($) | Total
return
(%)3 | Expenses
before
reductions
(%)4 | Expenses
including
reductions
(%)4 | Net
investment
income
(loss) (%)2 | Net
assets,
end of
period
(in thousands) | Portfolio
turnover
(%) |
| Multi-Index 2030 Lifetime Portfolio | |
| Class R4 | |
| 02-29-20205 | 11.31 | | 0.20 | 0.07 | | 0.27 | | (0.27) | (0.59) | (0.86) | 10.72 | 1.976 | 0.637 | 0.227 | 3.557 | 2,849 | 29 |
| 08-31-2019 | 12.20 | | 0.24 | (0.15) | | 0.09 | | (0.25) | (0.73) | (0.98) | 11.31 | 1.80 | 0.62 | 0.21 | 2.18 | 56 | 24 |
| 08-31-2018 | 11.95 | | 0.25 | 0.80 | | 1.05 | | (0.23) | (0.57) | (0.80) | 12.20 | 9.03 | 0.63 | 0.21 | 2.07 | 54 | 19 |
| 08-31-20178 | 11.31 | | 0.04 | 0.60 | | 0.64 | | — | — | — | 11.95 | 5.666 | 0.627 | 0.227 | 0.777 | 53 | 259 |
| 08-31-2015 | 10.75 | | 0.19 | (0.59) | | (0.40) | | (0.13) | (0.02) | (0.15) | 10.20 | (3.75) | 6.34 | 0.43 | 1.75 | 102 | 22 |
| Class R6 | |
| 02-29-20205 | 11.32 | | 0.21 | 0.06 | | 0.27 | | (0.29) | (0.59) | (0.88) | 10.71 | 1.956 | 0.387 | 0.057 | 3.567 | 41,535 | 29 |
| 08-31-2019 | 12.21 | | 0.25 | (0.14) | | 0.11 | | (0.27) | (0.73) | (1.00) | 11.32 | 2.01 | 0.37 | 0.04 | 2.29 | 21,285 | 24 |
| 08-31-2018 | 11.95 | | 0.24 | 0.84 | | 1.08 | | (0.25) | (0.57) | (0.82) | 12.21 | 9.30 | 0.38 | 0.05 | 1.98 | 6,635 | 19 |
| 08-31-2017 | 10.92 | | 0.08 | 1.32 | | 1.40 | | (0.23) | (0.14) | (0.37) | 11.95 | 13.22 | 0.37 | 0.06 | 0.75 | 4,730 | 25 |
| 08-31-2016 | 10.21 | | 0.22 | 0.70 | | 0.92 | | (0.17) | (0.04) | (0.21) | 10.92 | 9.10 | 0.41 | 0.11 | 2.11 | 109 | 8 |
| 08-31-2015 | 10.77 | | 0.21 | (0.59) | | (0.38) | | (0.16) | (0.02) | (0.18) | 10.21 | (3.61) | 6.16 | 0.24 | 1.94 | 102 | 22 |
| Class 1 | |
| 02-29-20205 | 11.31 | | 0.20 | 0.08 | | 0.28 | | (0.29) | (0.59) | (0.88) | 10.71 | 2.006 | 0.417 | 0.107 | 3.517 | 211,707 | 29 |
| 08-31-2019 | 12.20 | | 0.26 | (0.16) | | 0.10 | | (0.26) | (0.73) | (0.99) | 11.31 | 1.94 | 0.41 | 0.09 | 2.33 | 216,585 | 24 |
| 08-31-2018 | 11.95 | | 0.25 | 0.82 | | 1.07 | | (0.25) | (0.57) | (0.82) | 12.20 | 9.16 | 0.42 | 0.10 | 2.12 | 229,653 | 19 |
| 08-31-2017 | 10.92 | | 0.24 | 1.16 | | 1.40 | | (0.23) | (0.14) | (0.37) | 11.95 | 13.16 | 0.40 | 0.11 | 2.10 | 205,698 | 25 |
| 08-31-2016 | 10.21 | | 0.19 | 0.72 | | 0.91 | | (0.16) | (0.04) | (0.20) | 10.92 | 9.05 | 0.44 | 0.16 | 1.85 | 155,730 | 8 |
| 08-31-2015 | 10.76 | | 0.14 | (0.52) | | (0.38) | | (0.15) | (0.02) | (0.17) | 10.21 | (3.61) | 0.58 | 0.29 | 1.35 | 64,587 | 22 |
| 1 Based on average daily shares outstanding. |
| 2 Net investment income is affected by the timing and frequency of the declaration of dividends by the underlying funds in which the portfolio invests. Accordingly, a significant portion of income is recorded in December. |
| 3 Total returns would have been lower had certain expenses not been reduced during the applicable periods. |
| 4 Ratios do not include expenses indirectly incurred from underlying funds and can vary based on the mix of underlying funds held by the portfolio. |
| 5 Six months ended 2-29-20. Unaudited. |
| 6 Not annualized. |
| 7 Annualized. |
| 8 Period from 4-7-17 (relaunch date) to 8-31-17. Class R4 liquidated on 6-15-16, accordingly, there were no shares of this class outstanding 8-31-16. |
| 9 Portfolio turnover is shown for the period from 9-1-16 to 8-31-17. |
| SEE NOTES TO FINANCIAL STATEMENTS | SEMIANNUAL REPORT | JOHN HANCOCK MULTI-INDEX LIFETIME PORTFOLIOS | 41 |
| Financial highlights continued |
Multi-Index 2025 Lifetime Portfolio
| Per share operating performance for a share outstanding throughout each period | | Ratios and supplemental data | |
| | | | Income (loss) from investment operations | | | | Less distributions | | | | Ratios to average net assets | | | |
| Period ended | Net asset
value,
beginning
of period ($) | | Net
investment
income
(loss) ($)1, 2 | Net realized and
unrealized
gain (loss)
on investments ($) | | Total from
investment
operations ($) | | From net
investment
income ($) | From net
realized
gain ($) | Total
distributions ($) | Net asset
value,
end of
period ($) | Total
return
(%)3 | Expenses
before
reductions
(%)4 | Expenses
including
reductions
(%)4 | Net
investment
income
(loss) (%)2 | Net
assets,
end of
period
(in thousands) | Portfolio
turnover
(%) |
| Multi-Index 2025 Lifetime Portfolio | |
| Class R4 | |
| 02-29-20205 | 11.15 | | 0.16 | 0.09 | | 0.25 | | (0.28) | (0.52) | (0.80) | 10.60 | 1.936 | 0.667 | 0.267 | 2.917 | 1,870 | 40 |
| 08-31-2019 | 11.86 | | 0.27 | (0.04)8 | | 0.23 | | (0.27) | (0.67) | (0.94) | 11.15 | 2.94 | 0.66 | 0.25 | 2.40 | 55 | 25 |
| 08-31-2018 | 11.72 | | 0.26 | 0.62 | | 0.88 | | (0.24) | (0.50) | (0.74) | 11.86 | 7.72 | 0.67 | 0.25 | 2.20 | 53 | 23 |
| 08-31-20179 | 11.15 | | 0.05 | 0.52 | | 0.57 | | — | — | — | 11.72 | 5.116 | 0.657 | 0.267 | 0.997 | 53 | 2810 |
| 08-31-2015 | 10.69 | | 0.20 | (0.56) | | (0.36) | | (0.12) | (0.02) | (0.14) | 10.19 | (3.43) | 6.38 | 0.46 | 1.92 | 102 | 24 |
| Class R6 | |
| 02-29-20205 | 11.15 | | 0.20 | 0.07 | | 0.27 | | (0.30) | (0.52) | (0.82) | 10.60 | 2.076 | 0.417 | 0.097 | 3.497 | 39,922 | 40 |
| 08-31-2019 | 11.87 | | 0.24 | —8, 11 | | 0.24 | | (0.29) | (0.67) | (0.96) | 11.15 | 3.05 | 0.41 | 0.08 | 2.23 | 17,092 | 25 |
| 08-31-2018 | 11.72 | | 0.27 | 0.64 | | 0.91 | | (0.26) | (0.50) | (0.76) | 11.87 | 7.96 | 0.42 | 0.08 | 2.29 | 4,587 | 23 |
| 08-31-2017 | 10.90 | | 0.11 | 1.10 | | 1.21 | | (0.25) | (0.14) | (0.39) | 11.72 | 11.46 | 0.40 | 0.09 | 1.03 | 3,001 | 28 |
| 08-31-2016 | 10.21 | | 0.24 | 0.66 | | 0.90 | | (0.18) | (0.03) | (0.21) | 10.90 | 8.92 | 0.43 | 0.14 | 2.31 | 109 | 12 |
| 08-31-2015 | 10.70 | | 0.23 | (0.56) | | (0.33) | | (0.14) | (0.02) | (0.16) | 10.21 | (3.10) | 6.20 | 0.26 | 2.11 | 102 | 24 |
| Class 1 | |
| 02-29-20205 | 11.14 | | 0.19 | 0.07 | | 0.26 | | (0.29) | (0.52) | (0.81) | 10.59 | 2.016 | 0.457 | 0.147 | 3.447 | 184,017 | 40 |
| 08-31-2019 | 11.86 | | 0.28 | (0.05)8 | | 0.23 | | (0.28) | (0.67) | (0.95) | 11.14 | 2.99 | 0.44 | 0.13 | 2.52 | 200,661 | 25 |
| 08-31-2018 | 11.72 | | 0.27 | 0.63 | | 0.90 | | (0.26) | (0.50) | (0.76) | 11.86 | 7.83 | 0.46 | 0.13 | 2.26 | 215,247 | 23 |
| 08-31-2017 | 10.89 | | 0.25 | 0.97 | | 1.22 | | (0.25) | (0.14) | (0.39) | 11.72 | 11.50 | 0.44 | 0.14 | 2.25 | 198,109 | 28 |
| 08-31-2016 | 10.20 | | 0.22 | 0.67 | | 0.89 | | (0.17) | (0.03) | (0.20) | 10.89 | 8.87 | 0.46 | 0.19 | 2.11 | 158,969 | 12 |
| 08-31-2015 | 10.70 | | 0.16 | (0.50) | | (0.34) | | (0.14) | (0.02) | (0.16) | 10.20 | (3.24) | 0.59 | 0.31 | 1.53 | 78,157 | 24 |
| 1 Based on average daily shares outstanding. |
| 2 Net investment income is affected by the timing and frequency of the declaration of dividends by the underlying funds in which the portfolio invests. Accordingly, a significant portion of income is recorded in December. |
| 3 Total returns would have been lower had certain expenses not been reduced during the applicable periods. |
| 4 Ratios do not include expenses indirectly incurred from underlying funds and can vary based on the mix of underlying funds held by the portfolio. |
| 5 Six months ended 2-29-20. Unaudited. |
| 6 Not annualized. |
| 7 Annualized. |
| 8 The amount shown for a share outstanding does not correspond with the aggregate net gain (loss) on investments for the period due to the timing of the sales and repurchases of shares in relation to fluctuating market values of the investments of the portfolio. |
| 9 Period from 4-7-17 (relaunch date) to 8-31-17. Class R4 liquidated on 6-15-16, accordingly, there were no shares of this class outstanding 8-31-16. |
| 10 Portfolio turnover is shown for the period from 9-1-16 to 8-31-17. |
| 11 Less than $0.005 per share. |
| 42 | JOHN HANCOCK MULTI-INDEX LIFETIME PORTFOLIOS | SEMIANNUAL REPORT | SEE NOTES TO FINANCIAL STATEMENTS |
Multi-Index 2020 Lifetime Portfolio
| Per share operating performance for a share outstanding throughout each period | | Ratios and supplemental data | |
| | | | Income (loss) from investment operations | | | | Less distributions | | | | Ratios to average net assets | | | |
| Period ended | Net asset
value,
beginning
of period ($) | | Net
investment
income
(loss) ($)1, 2 | Net realized and
unrealized
gain (loss)
on investments ($) | | Total from
investment
operations ($) | | From net
investment
income ($) | From net
realized
gain ($) | Total
distributions ($) | Net asset
value,
end of
period ($) | Total
return
(%)3 | Expenses
before
reductions
(%)4 | Expenses
including
reductions
(%)4 | Net
investment
income
(loss) (%)2 | Net
assets,
end of
period
(in thousands) | Portfolio
turnover
(%) |
| Multi-Index 2020 Lifetime Portfolio | |
| Class R4 | |
| 02-29-20205 | 11.01 | | 0.18 | 0.06 | | 0.24 | | (0.29) | (0.42) | (0.71) | 10.54 | 1.926 | 0.787 | 0.327 | 3.247 | 3,478 | 47 |
| 08-31-2019 | 11.48 | | 0.24 | 0.13 | | 0.37 | | (0.28) | (0.56) | (0.84) | 11.01 | 4.12 | 0.75 | 0.29 | 2.25 | 101 | 24 |
| 08-31-2018 | 11.45 | | 0.27 | 0.43 | | 0.70 | | (0.26) | (0.41) | (0.67) | 11.48 | 6.25 | 0.74 | 0.26 | 2.34 | 52 | 30 |
| 08-31-20178 | 10.96 | | 0.06 | 0.43 | | 0.49 | | — | — | — | 11.45 | 4.476 | 0.717 | 0.287 | 1.257 | 52 | 379 |
| 08-31-2015 | 10.61 | | 0.22 | (0.54) | | (0.32) | | (0.12) | (0.01) | (0.13) | 10.16 | (3.10) | 6.54 | 0.49 | 2.08 | 102 | 31 |
| Class R6 | |
| 02-29-20205 | 11.02 | | 0.18 | 0.07 | | 0.25 | | (0.31) | (0.42) | (0.73) | 10.54 | 2.036 | 0.487 | 0.117 | 3.347 | 32,868 | 47 |
| 08-31-2019 | 11.49 | | 0.27 | 0.12 | | 0.39 | | (0.30) | (0.56) | (0.86) | 11.02 | 4.32 | 0.47 | 0.10 | 2.54 | 9,368 | 24 |
| 08-31-2018 | 11.46 | | 0.25 | 0.47 | | 0.72 | | (0.28) | (0.41) | (0.69) | 11.49 | 6.42 | 0.49 | 0.10 | 2.21 | 2,816 | 30 |
| 08-31-2017 | 10.84 | | 0.21 | 0.79 | | 1.00 | | (0.25) | (0.13) | (0.38) | 11.46 | 9.62 | 0.46 | 0.11 | 1.97 | 622 | 37 |
| 08-31-2016 | 10.17 | | 0.26 | 0.61 | | 0.87 | | (0.18) | (0.02) | (0.20) | 10.84 | 8.78 | 0.50 | 0.16 | 2.53 | 108 | 18 |
| 08-31-2015 | 10.63 | | 0.24 | (0.55) | | (0.31) | | (0.14) | (0.01) | (0.15) | 10.17 | (2.96) | 6.36 | 0.29 | 2.28 | 102 | 31 |
| Class 1 | |
| 02-29-20205 | 11.01 | | 0.19 | 0.07 | | 0.26 | | (0.31) | (0.42) | (0.73) | 10.54 | 2.086 | 0.527 | 0.167 | 3.457 | 110,875 | 47 |
| 08-31-2019 | 11.48 | | 0.30 | 0.08 | | 0.38 | | (0.29) | (0.56) | (0.85) | 11.01 | 4.27 | 0.50 | 0.15 | 2.73 | 124,872 | 24 |
| 08-31-2018 | 11.46 | | 0.28 | 0.42 | | 0.70 | | (0.27) | (0.41) | (0.68) | 11.48 | 6.28 | 0.52 | 0.15 | 2.44 | 141,470 | 30 |
| 08-31-2017 | 10.83 | | 0.26 | 0.76 | | 1.02 | | (0.26) | (0.13) | (0.39) | 11.46 | 9.67 | 0.50 | 0.16 | 2.41 | 144,223 | 37 |
| 08-31-2016 | 10.17 | | 0.24 | 0.62 | | 0.86 | | (0.18) | (0.02) | (0.20) | 10.83 | 8.62 | 0.53 | 0.21 | 2.35 | 120,211 | 18 |
| 08-31-2015 | 10.62 | | 0.18 | (0.48) | | (0.30) | | (0.14) | (0.01) | (0.15) | 10.17 | (2.91) | 0.70 | 0.34 | 1.76 | 60,619 | 31 |
| 1 Based on average daily shares outstanding. |
| 2 Net investment income is affected by the timing and frequency of the declaration of dividends by the underlying funds in which the portfolio invests. Accordingly, a significant portion of income is recorded in December. |
| 3 Total returns would have been lower had certain expenses not been reduced during the applicable periods. |
| 4 Ratios do not include expenses indirectly incurred from underlying funds and can vary based on the mix of underlying funds held by the portfolio. |
| 5 Six months ended 2-29-20. Unaudited. |
| 6 Not annualized. |
| 7 Annualized. |
| 8 Period from 4-7-17 (relaunch date) to 8-31-17. Class R4 liquidated on 6-15-16, accordingly, there were no shares of this class outstanding 8-31-16. |
| 9 Portfolio turnover is shown for the period from 9-1-16 to 8-31-17. |
| SEE NOTES TO FINANCIAL STATEMENTS | SEMIANNUAL REPORT | JOHN HANCOCK MULTI-INDEX LIFETIME PORTFOLIOS | 43 |
| Financial highlights continued |
Multi-Index 2015 Lifetime Portfolio
| Per share operating performance for a share outstanding throughout each period | | Ratios and supplemental data | |
| | | | Income (loss) from investment operations | | | | Less distributions | | | | Ratios to average net assets | | | |
| Period ended | Net asset
value,
beginning
of period ($) | | Net
investment
income
(loss) ($)1, 2 | Net realized and
unrealized
gain (loss)
on investments ($) | | Total from
investment
operations ($) | | From net
investment
income ($) | From net
realized
gain ($) | Total
distributions ($) | Net asset
value,
end of
period ($) | Total
return
(%)3 | Expenses
before
reductions
(%)4 | Expenses
including
reductions
(%)4 | Net
investment
income
(loss) (%)2 | Net
assets,
end of
period
(in thousands) | Portfolio
turnover
(%) |
| Multi-Index 2015 Lifetime Portfolio | |
| Class R4 | |
| 02-29-20205 | 10.82 | | 0.15 | 0.07 | | 0.22 | | (0.30) | (0.41) | (0.71) | 10.33 | 1.856 | 0.967 | 0.287 | 2.767 | 1,099 | 68 |
| 08-31-2019 | 11.07 | | 0.29 | 0.20 | | 0.49 | | (0.29) | (0.45) | (0.74) | 10.82 | 5.20 | 0.90 | 0.27 | 2.73 | 50 | 27 |
| 08-31-2018 | 11.18 | | 0.27 | 0.28 | | 0.55 | | (0.28) | (0.38) | (0.66) | 11.07 | 5.01 | 0.96 | 0.27 | 2.47 | 52 | 28 |
| 08-31-20178 | 10.74 | | 0.07 | 0.37 | | 0.44 | | — | — | — | 11.18 | 4.106 | 0.887 | 0.297 | 1.487 | 52 | 479 |
| 08-31-2015 | 10.52 | | 0.23 | (0.54) | | (0.31) | | (0.10) | (0.01) | (0.11) | 10.10 | (2.94) | 7.10 | 0.52 | 2.23 | 101 | 59 |
| Class R6 | |
| 02-29-20205 | 10.82 | | 0.18 | 0.06 | | 0.24 | | (0.32) | (0.41) | (0.73) | 10.33 | 2.006 | 0.717 | 0.127 | 3.387 | 14,612 | 68 |
| 08-31-2019 | 11.07 | | 0.27 | 0.23 | | 0.50 | | (0.30) | (0.45) | (0.75) | 10.82 | 5.39 | 0.65 | 0.10 | 2.57 | 3,227 | 27 |
| 08-31-2018 | 11.18 | | 0.31 | 0.26 | | 0.57 | | (0.30) | (0.38) | (0.68) | 11.07 | 5.17 | 0.71 | 0.11 | 2.80 | 880 | 28 |
| 08-31-2017 | 10.74 | | 0.24 | 0.59 | | 0.83 | | (0.27) | (0.12) | (0.39) | 11.18 | 8.04 | 0.63 | 0.12 | 2.26 | 383 | 47 |
| 08-31-2016 | 10.12 | | 0.27 | 0.57 | | 0.84 | | (0.19) | (0.03) | (0.22) | 10.74 | 8.41 | 0.76 | 0.17 | 2.68 | 107 | 26 |
| 08-31-2015 | 10.53 | | 0.25 | (0.52) | | (0.27) | | (0.13) | (0.01) | (0.14) | 10.12 | (2.60) | 6.92 | 0.33 | 2.42 | 101 | 59 |
| Class 1 | |
| 02-29-20205 | 10.82 | | 0.18 | 0.05 | | 0.23 | | (0.31) | (0.41) | (0.72) | 10.33 | 1.856 | 0.747 | 0.177 | 3.357 | 26,498 | 68 |
| 08-31-2019 | 11.07 | | 0.30 | 0.20 | | 0.50 | | (0.30) | (0.45) | (0.75) | 10.82 | 5.33 | 0.69 | 0.15 | 2.84 | 36,564 | 27 |
| 08-31-2018 | 11.18 | | 0.28 | 0.28 | | 0.56 | | (0.29) | (0.38) | (0.67) | 11.07 | 5.12 | 0.75 | 0.16 | 2.56 | 42,181 | 28 |
| 08-31-2017 | 10.74 | | 0.27 | 0.56 | | 0.83 | | (0.27) | (0.12) | (0.39) | 11.18 | 7.98 | 0.66 | 0.17 | 2.52 | 44,768 | 47 |
| 08-31-2016 | 10.11 | | 0.25 | 0.59 | | 0.84 | | (0.18) | (0.03) | (0.21) | 10.74 | 8.47 | 0.79 | 0.22 | 2.47 | 46,862 | 26 |
| 08-31-2015 | 10.53 | | 0.20 | (0.49) | | (0.29) | | (0.12) | (0.01) | (0.13) | 10.11 | (2.75) | 1.21 | 0.38 | 1.96 | 19,945 | 59 |
| 1 Based on average daily shares outstanding. |
| 2 Net investment income is affected by the timing and frequency of the declaration of dividends by the underlying funds in which the portfolio invests. Accordingly, a significant portion of income is recorded in December. |
| 3 Total returns would have been lower had certain expenses not been reduced during the applicable periods. |
| 4 Ratios do not include expenses indirectly incurred from underlying funds and can vary based on the mix of underlying funds held by the portfolio. |
| 5 Six months ended 2-29-20. Unaudited. |
| 6 Not annualized. |
| 7 Annualized. |
| 8 Period from 4-7-17 (relaunch date) to 8-31-17. Class R4 liquidated on 6-15-16, accordingly, there were no shares of this class outstanding 8-31-16. |
| 9 Portfolio turnover is shown for the period from 9-1-16 to 8-31-17. |
| 44 | JOHN HANCOCK MULTI-INDEX LIFETIME PORTFOLIOS | SEMIANNUAL REPORT | SEE NOTES TO FINANCIAL STATEMENTS |
Multi-Index 2010 Lifetime Portfolio
| Per share operating performance for a share outstanding throughout each period | | Ratios and supplemental data | |
| | | | Income (loss) from investment operations | | | | Less distributions | | | | Ratios to average net assets | | | |
| Period ended | Net asset
value,
beginning
of period ($) | | Net
investment
income
(loss) ($)1, 2 | Net realized and
unrealized
gain (loss)
on investments ($) | | Total from
investment
operations ($) | | From net
investment
income ($) | From net
realized
gain ($) | Total
distributions ($) | Net asset
value,
end of
period ($) | Total
return
(%)3 | Expenses
before
reductions
(%)4 | Expenses
including
reductions
(%)4 | Net
investment
income
(loss) (%)2 | Net
assets,
end of
period
(in thousands) | Portfolio
turnover
(%) |
| Multi-Index 2010 Lifetime Portfolio | |
| Class R4 | |
| 02-29-20205 | 10.53 | | 0.16 | 0.05 | | 0.21 | | (0.27) | (0.24) | (0.51) | 10.23 | 1.856 | 1.097 | 0.287 | 2.967 | 213 | 56 |
| 08-31-2019 | 10.81 | | 0.29 | 0.25 | | 0.54 | | (0.31) | (0.51) | (0.82) | 10.53 | 5.91 | 1.07 | 0.28 | 2.84 | 50 | 35 |
| 08-31-2018 | 10.93 | | 0.28 | 0.15 | | 0.43 | | (0.28) | (0.27) | (0.55) | 10.81 | 3.97 | 1.13 | 0.27 | 2.57 | 51 | 49 |
| 08-31-20178 | 10.53 | | 0.07 | 0.33 | | 0.40 | | — | — | — | 10.93 | 3.806 | 1.047 | 0.297 | 1.627 | 52 | 529 |
| 08-31-2015 | 10.47 | | 0.24 | (0.49) | | (0.25) | | (0.12) | (0.01) | (0.13) | 10.09 | (2.46) | 7.41 | 0.56 | 2.34 | 101 | 115 |
| Class R6 | |
| 02-29-20205 | 10.55 | | 0.19 | 0.02 | | 0.21 | | (0.28) | (0.24) | (0.52) | 10.24 | 1.926 | 0.847 | 0.117 | 3.537 | 8,043 | 56 |
| 08-31-2019 | 10.83 | | 0.28 | 0.28 | | 0.56 | | (0.33) | (0.51) | (0.84) | 10.55 | 6.10 | 0.82 | 0.11 | 2.77 | 2,172 | 35 |
| 08-31-2018 | 10.94 | | 0.31 | 0.14 | | 0.45 | | (0.29) | (0.27) | (0.56) | 10.83 | 4.22 | 0.88 | 0.10 | 2.88 | 964 | 49 |
| 08-31-2017 | 10.68 | | 0.16 | 0.56 | | 0.72 | | (0.30) | (0.16) | (0.46) | 10.94 | 6.98 | 0.79 | 0.13 | 1.59 | 1,953 | 52 |
| 08-31-2016 | 10.10 | | 0.29 | 0.53 | | 0.82 | | (0.18) | (0.06) | (0.24) | 10.68 | 8.31 | 0.95 | 0.17 | 2.81 | 107 | 46 |
| 08-31-2015 | 10.48 | | 0.26 | (0.49) | | (0.23) | | (0.14) | (0.01) | (0.15) | 10.10 | (2.22) | 7.31 | 0.38 | 2.54 | 101 | 115 |
| Class 1 | |
| 02-29-20205 | 10.54 | | 0.18 | 0.03 | | 0.21 | | (0.28) | (0.24) | (0.52) | 10.23 | 1.866 | 0.877 | 0.167 | 3.327 | 23,400 | 56 |
| 08-31-2019 | 10.82 | | 0.30 | 0.25 | | 0.55 | | (0.32) | (0.51) | (0.83) | 10.54 | 6.05 | 0.86 | 0.16 | 2.95 | 24,556 | 35 |
| 08-31-2018 | 10.93 | | 0.29 | 0.16 | | 0.45 | | (0.29) | (0.27) | (0.56) | 10.82 | 4.17 | 0.92 | 0.15 | 2.67 | 28,723 | 49 |
| 08-31-2017 | 10.68 | | 0.28 | 0.42 | | 0.70 | | (0.29) | (0.16) | (0.45) | 10.93 | 6.83 | 0.83 | 0.18 | 2.59 | 29,065 | 52 |
| 08-31-2016 | 10.09 | | 0.27 | 0.56 | | 0.83 | | (0.18) | (0.06) | (0.24) | 10.68 | 8.36 | 0.99 | 0.22 | 2.64 | 29,563 | 46 |
| 08-31-2015 | 10.48 | | 0.24 | (0.48) | | (0.24) | | (0.14) | (0.01) | (0.15) | 10.09 | (2.36) | 1.49 | 0.41 | 2.27 | 12,576 | 115 |
| 1 Based on average daily shares outstanding. |
| 2 Net investment income is affected by the timing and frequency of the declaration of dividends by the underlying funds in which the portfolio invests. Accordingly, a significant portion of income is recorded in December. |
| 3 Total returns would have been lower had certain expenses not been reduced during the applicable periods. |
| 4 Ratios do not include expenses indirectly incurred from underlying funds and can vary based on the mix of underlying funds held by the portfolio. |
| 5 Six months ended 2-29-20. Unaudited. |
| 6 Not annualized. |
| 7 Annualized. |
| 8 Period from 4-7-17 (relaunch date) to 8-31-17. Class R4 liquidated on 6-15-16, accordingly, there were no shares of this class outstanding 8-31-16. |
| 9 Portfolio turnover is shown for the period from 9-1-16 to 8-31-17. |
| SEE NOTES TO FINANCIAL STATEMENTS | SEMIANNUAL REPORT | JOHN HANCOCK MULTI-INDEX LIFETIME PORTFOLIOS | 45 |
| Notes to financial statements (unaudited) | |
Note 1—Organization
John Hancock Funds II (the Trust) is an open-end management investment company organized as a Massachusetts business trust. The Trust is registered under the Investment Company Act of 1940, as amended (the 1940 Act). It is a series company with multiple investment series (collectively, the Multi-Index Lifetime Portfolios, or the portfolios and individually, the portfolio), eleven of which are presented in this report. The portfolios operate as “funds of funds” that may invest in affiliated underlying funds of the Trust, other funds in John Hancock group of funds complex, non-John Hancock funds and certain other permitted investments.
The portfolios may offer multiple classes of shares. The shares currently offered by the portfolios are detailed in the Statements of assets and liabilities. Class R4 shares are available only to certain retirement and 529 plans. Class R6 shares are only available to certain retirement plans, institutions and other investors. Class 1 shares are offered only to certain affiliates of Manulife Financial Corporation (MFC). Shareholders of each class have exclusive voting rights to matters that affect that class. The distribution and service fees, if any, and transfer agent fees for each class may differ.
The investment objective of each portfolio is to seek high total return through each portfolio’s target retirement dates, with a greater focus on income beyond the target dates. Total return, commonly understood as the combination of income and capital appreciation, includes interest, capital gains, dividends, and distributions realized over a given period of time.
The accounting policies of the underlying funds in which the portfolios invest are outlined in the underlying funds’ shareholder reports, which include the underlying funds’ financial statements. These are available on the Securities and Exchange Commission (SEC) website at sec.gov. John Hancock underlying funds' shareholder reports are also available without charge by calling 800-225-5291 or visiting jhinvestments.com. The underlying funds are not covered by this report.
Note 2—Significant accounting policies
The financial statements have been prepared in conformity with accounting principles generally accepted in the United States of America (US GAAP), which require management to make certain estimates and assumptions as of the date of the financial statements. Actual results could differ from those estimates and those differences could be significant. The portfolios qualify as investment companies under Topic 946 of Accounting Standards Codification of US GAAP.
Events or transactions occurring after the end of the fiscal period through the date that the financial statements were issued have been evaluated in the preparation of the financial statements. The following summarizes the significant accounting policies of the portfolios:
Security valuation. Investments are stated at value as of the scheduled close of regular trading on the New York Stock Exchange (NYSE), normally at 4:00 P.M., Eastern Time. In case of emergency or other disruption resulting in the NYSE not opening for trading or the NYSE closing at a time other than the regularly scheduled close, the net asset value (NAV) may be determined as of the regularly scheduled close of the NYSE pursuant to the portfolios' Valuation Policies and Procedures.
In order to value the securities, the portfolios use the following valuation techniques: Investments by the portfolios in underlying affiliated funds and other open end mutual funds, including John Hancock Collateral Trust (JHCT), are valued at their respective NAVs each business day. ETFs held by the portfolios are valued at the last sale price or official closing price on the exchange or principal market where the security trades. In the event there were no sales during the day or closing prices are not available, the securities are valued using the last available bid price. Debt obligations are valued based on the evaluated prices provided by an independent pricing vendor. Independent pricing vendors utilize matrix pricing, which takes into account factors such as institutional-size trading in similar groups of securities, yield, quality, coupon rate, maturity, type of issue, trading characteristics and other market data, as well as broker supplied prices.
In certain instances, the Pricing Committee may determine to value equity securities using prices obtained from another exchange or market if trading on the exchange or market on which prices are typically obtained did not open for trading as scheduled, or if trading closed earlier than scheduled, and trading occurred as normal on another exchange or market.
Other portfolio securities and assets, for which reliable market quotations are not readily available, are valued at fair value as determined in good faith by the portfolios' Pricing Committee following procedures established by the Board of Trustees. The frequency with which these fair valuation procedures are used cannot be predicted and fair value of securities may differ significantly from the value that would have been used had a ready market for such securities existed.
The portfolios use a three-tier hierarchy to prioritize the pricing assumptions, referred to as inputs, used in valuation techniques to measure fair value. Level 1 includes securities valued using quoted prices in active markets for identical securities, including registered investment companies. Level 2 includes securities valued using other significant observable inputs. Observable inputs may include quoted prices for similar securities, interest rates, prepayment speeds and credit risk. Prices for securities valued using these inputs are received from independent pricing vendors and brokers and are based on an evaluation of the inputs described. Level 3 includes securities valued using significant unobservable inputs when market prices are not readily available or reliable, including the portfolios' own assumptions in determining the fair value of investments. Factors used in determining value may include market or issuer specific events or trends, changes in interest rates and credit quality. The inputs or methodology used for valuing securities are not necessarily an indication of the risks associated with investing in those securities. Changes in valuation techniques and related inputs may result in transfers into or out of an assigned level within the disclosure hierarchy.
| 46 | JOHN HANCOCK MULTI-INDEX LIFETIME PORTFOLIOS | SEMIANNUAL REPORT | |
The following is a summary of the values by input classification of the portfolios' investments as of February 29, 2020, by major security category or type:
| | Total
value at
2-29-20 | Level 1
quoted price | Level 2
significant
observable
inputs | Level 3
significant
unobservable
inputs |
| Multi-Index 2060 Lifetime Portfolio | | | | |
| Investments in securities: | | | | |
| Assets | | | | |
| Affiliated investment companies | $18,318,515 | $18,318,515 | — | — |
| Unaffiliated investment companies | 12,129,473 | 12,129,473 | — | — |
| U.S. Government and Agency obligations | 804,318 | — | $804,318 | — |
| Short-term investments | 644,235 | 644,235 | — | — |
| Total investments in securities | $31,896,541 | $31,092,223 | $804,318 | — |
| |
| Multi-Index 2055 Lifetime Portfolio | | | | |
| Investments in securities: | | | | |
| Assets | | | | |
| Affiliated investment companies | $51,801,878 | $51,801,878 | — | — |
| Unaffiliated investment companies | 34,396,360 | 34,396,360 | — | — |
| U.S. Government and Agency obligations | 2,380,616 | — | $2,380,616 | — |
| Short-term investments | 1,304,410 | 1,304,410 | — | — |
| Total investments in securities | $89,883,264 | $87,502,648 | $2,380,616 | — |
| |
| Multi-Index 2050 Lifetime Portfolio | | | | |
| Investments in securities: | | | | |
| Assets | | | | |
| Affiliated investment companies | $74,131,725 | $74,131,725 | — | — |
| Unaffiliated investment companies | 49,185,509 | 49,185,509 | — | — |
| U.S. Government and Agency obligations | 3,372,024 | — | $3,372,024 | — |
| Short-term investments | 1,717,232 | 1,717,232 | — | — |
| Total investments in securities | $128,406,490 | $125,034,466 | $3,372,024 | — |
| |
| Multi-Index 2045 Lifetime Portfolio | | | | |
| Investments in securities: | | | | |
| Assets | | | | |
| Affiliated investment companies | $98,430,995 | $98,430,995 | — | — |
| Unaffiliated investment companies | 65,932,364 | 65,932,364 | — | — |
| U.S. Government and Agency obligations | 4,505,269 | — | $4,505,269 | — |
| Short-term investments | 4,083,598 | 4,083,598 | — | — |
| Total investments in securities | $172,952,226 | $168,446,957 | $4,505,269 | — |
| |
| Multi-Index 2040 Lifetime Portfolio | | | | |
| Investments in securities: | | | | |
| Assets | | | | |
| Affiliated investment companies | $109,670,355 | $109,670,355 | — | — |
| Unaffiliated investment companies | 77,353,767 | 77,353,767 | — | — |
| U.S. Government and Agency obligations | 8,277,619 | — | $8,277,619 | — |
| Short-term investments | 3,245,695 | 3,245,695 | — | — |
| Total investments in securities | $198,547,436 | $190,269,817 | $8,277,619 | — |
| |
| Multi-Index 2035 Lifetime Portfolio | | | | |
| Investments in securities: | | | | |
| Assets | | | | |
| | SEMIANNUAL REPORT | JOHN HANCOCK MULTI-INDEX LIFETIME PORTFOLIOS | 47 |
| | Total
value at
2-29-20 | Level 1
quoted price | Level 2
significant
observable
inputs | Level 3
significant
unobservable
inputs |
| Multi-Index 2035 Lifetime Portfolio (continued) | | | | |
| Affiliated investment companies | $116,935,140 | $116,935,140 | — | — |
| Unaffiliated investment companies | 100,038,589 | 100,038,589 | — | — |
| U.S. Government and Agency obligations | 12,584,406 | — | $12,584,406 | — |
| Short-term investments | 602,751 | 602,751 | — | — |
| Total investments in securities | $230,160,886 | $217,576,480 | $12,584,406 | — |
| |
| Multi-Index 2030 Lifetime Portfolio | | | | |
| Investments in securities: | | | | |
| Assets | | | | |
| Affiliated investment companies | $115,800,678 | $115,800,678 | — | — |
| Unaffiliated investment companies | 122,899,279 | 122,899,279 | — | — |
| U.S. Government and Agency obligations | 17,158,203 | — | $17,158,203 | — |
| Short-term investments | 1,049 | 1,049 | — | — |
| Total investments in securities | $255,859,209 | $238,701,006 | $17,158,203 | — |
| |
| Multi-Index 2025 Lifetime Portfolio | | | | |
| Investments in securities: | | | | |
| Assets | | | | |
| Affiliated investment companies | $87,756,185 | $87,756,185 | — | — |
| Unaffiliated investment companies | 119,294,580 | 119,294,580 | — | — |
| U.S. Government and Agency obligations | 18,427,322 | — | $18,427,322 | — |
| Short-term investments | 9,389,605 | 9,389,605 | — | — |
| Total investments in securities | $234,867,692 | $216,440,370 | $18,427,322 | — |
| |
| Multi-Index 2020 Lifetime Portfolio | | | | |
| Investments in securities: | | | | |
| Assets | | | | |
| Affiliated investment companies | $38,913,425 | $38,913,425 | — | — |
| Unaffiliated investment companies | 96,875,024 | 96,875,024 | — | — |
| U.S. Government and Agency obligations | 12,250,131 | — | $12,250,131 | — |
| Short-term investments | 8,437,757 | 8,437,757 | — | — |
| Total investments in securities | $156,476,337 | $144,226,206 | $12,250,131 | — |
| |
| Multi-Index 2015 Lifetime Portfolio | | | | |
| Investments in securities: | | | | |
| Assets | | | | |
| Affiliated investment companies | $9,142,491 | $9,142,491 | — | — |
| Unaffiliated investment companies | 29,667,359 | 29,667,359 | — | — |
| U.S. Government and Agency obligations | 3,509,858 | — | $3,509,858 | — |
| Short-term investments | 1,089,362 | 1,089,362 | — | — |
| Total investments in securities | $43,409,070 | $39,899,212 | $3,509,858 | — |
| |
| Multi-Index 2010 Lifetime Portfolio | | | | |
| Investments in securities: | | | | |
| Assets | | | | |
| Affiliated investment companies | $5,078,296 | $5,078,296 | — | — |
| Unaffiliated investment companies | 24,107,470 | 24,107,470 | — | — |
| U.S. Government and Agency obligations | 2,632,554 | — | $2,632,554 | — |
| Short-term investments | 1,043,242 | 1,043,242 | — | — |
| Total investments in securities | $32,861,562 | $30,229,008 | $2,632,554 | — |
Security transactions and related investment income. Investment security transactions are accounted for on a trade date plus one basis for daily NAV calculations. However, for financial reporting purposes, investment transactions are reported on trade date. Interest income is accrued as earned. Interest income includes coupon interest and amortization/accretion of premiums/discounts on debt securities. Debt obligations may be placed in a non-accrual status and related
| 48 | JOHN HANCOCK MULTI-INDEX LIFETIME PORTFOLIOS | SEMIANNUAL REPORT | |
interest income may be reduced by stopping current accruals and writing off interest receivable when the collection of all or a portion of interest has become doubtful. Income and capital gain distributions from underlying funds are recorded on ex-date. Dividend income is recorded on the ex-date, except for dividends of certain foreign securities where the dividend may not be known until after the ex-date. In those cases, dividend income, net of withholding taxes, is recorded when the portfolio becomes aware of the dividends. Non-cash dividends, if any, are recorded at the fair market value of the securities received. Gains and losses on securities sold are determined on the basis of identified cost and may include proceeds from litigation.
Inflation-indexed bonds. Inflation-indexed bonds are securities that generally have a lower coupon interest rate fixed at issuance but whose principal value is periodically adjusted based on a rate of inflation, such as the Consumer Price Index. Over the life of an inflation-indexed bond, interest is paid on the inflation adjusted principal value as described above. Increases in the principal amount of these securities are recorded as interest income. Decreases in the principal amount of these securities may reduce interest income to the extent of income previously recorded. If these decreases are in excess of income previously recorded, an adjustment to the cost of the security is made.
Stripped securities.Stripped securities are financial instruments structured to separate principal and interest cash flows so that one class receives principal payments from the underlying assets (PO or principal only), while the other class receives the interest cash flows (IO or interest only). Both PO and IO investments represent an interest in the cash flows of an underlying stripped security. If the underlying assets experience greater than anticipated prepayments of principal, the portfolio may fail to fully recover its initial investment in an IO security. The market value of these securities can be extremely volatile in response to changes in interest rates or prepayments on the underlying securities. In addition, these securities also have the risk that the portfolio may not receive all or part of its principal or interest payments because the borrower or issuer has defaulted on its obligation.
Securities lending. The portfolios may lend their securities to earn additional income. The portfolios receive collateral from the borrower in an amount not less than the market value of the loaned securities. The portfolios will invest their cash collateral in JHCT, an affiliate of the portfolios, which has a floating NAV and is registered with the SEC as an investment company. JHCT invests in short-term money market investments. Each portfolio will receive the benefit of any gains and bear any losses generated by JHCT with respect to the cash collateral.
The portfolios have the right to recall loaned securities on demand. If a borrower fails to return loaned securities when due, then the lending agent is responsible and indemnifies the portfolios for the lent securities. The lending agent uses the collateral received from the borrower to purchase replacement securities of the same issue, type, class and series of the loaned securities. If the value of the collateral is less than the purchase cost of replacement securities, the lending agent is responsible for satisfying the shortfall but only to the extent that the shortfall is not due to any decrease in the value of JHCT.
Although the risk of loss on securities lent is mitigated by receiving collateral from the borrower and through lending agent indemnification, the portfolios could experience a delay in recovering securities or could experience a lower than expected return if the borrower fails to return the securities on a timely basis. The portfolios receive compensation for lending their securities by retaining a portion of the return on the investment of the collateral and compensation from fees earned from borrowers of the securities. Securities lending income received by the portfolios is net of fees retained by the securities lending agent. Net income received from JHCT is a component of securities lending income as recorded on the Statements of operations.
Obligations to repay collateral received by the portfolios are shown on the Statements of assets and liabilities as Payable upon return of securities loaned and are secured by the loaned securities. The following table summarizes the values of securities loaned by the portfolios and the corresponding cash collateral received at February 29, 2020:
| Portfolio | Market value of securities on loan | Cash collateral received |
| Multi-Index 2060 Lifetime Portfolio | $372,672 | $380,800 |
| Multi-Index 2055 Lifetime Portfolio | 1,083,078 | 1,106,700 |
| Multi-Index 2050 Lifetime Portfolio | 1,548,918 | 1,582,700 |
| Multi-Index 2045 Lifetime Portfolio | 2,994,010 | 3,058,050 |
| Multi-Index 2040 Lifetime Portfolio | 3,078,783 | 3,145,400 |
| Multi-Index 2035 Lifetime Portfolio | 416,548 | 425,133 |
| Multi-Index 2025 Lifetime Portfolio | 9,188,859 | 9,388,762 |
| Multi-Index 2020 Lifetime Portfolio | 7,795,048 | 7,966,020 |
| Multi-Index 2015 Lifetime Portfolio | 992,700 | 1,012,950 |
| Multi-Index 2010 Lifetime Portfolio | 972,846 | 992,691 |
Overdraft. The portfolios may have the ability to borrow from banks for temporary or emergency purposes, including meeting redemption requests that otherwise might require the untimely sale of securities. Pursuant to the portfolios' custodian agreement, the custodian may loan money to the portfolios to make properly authorized payments. The portfolios are obligated to repay the custodian for any overdraft, including any related costs or expenses. The custodian may have a lien, security interest or security entitlement in any portfolio property that is not otherwise segregated or pledged, to the extent of any overdraft, and to the maximum extent permitted by law. Overdrafts at period end, if any, are presented under the caption Due to custodian in the Statements of assets and liabilities.
Line of credit. The portfolios and other affiliated funds have entered into a syndicated line of credit agreement with Citibank, N.A. as the administrative agent that enables them to participate in a $750 million unsecured committed line of credit. Excluding commitments designated for a certain fund and subject to the needs of all other affiliated funds, a portfolio can borrow up to an aggregate commitment amount of $500 million, subject to asset coverage and other limitations as specified in the agreement. A commitment fee payable at the end of each calendar quarter, based on the average daily unused portion of each line of credit, is charged to each
| | SEMIANNUAL REPORT | JOHN HANCOCK MULTI-INDEX LIFETIME PORTFOLIOS | 49 |
participating portfolio based on a combination of fixed and asset based allocations and is reflected in Other expenses on the Statements of operations. For the six months ended February 29, 2020, the portfolios had no borrowings under the line of credit.
Commitment fees for the six months ended February 29, 2020 were as follows:
| Portfolio | Commitment fee |
| Multi-Index 2060 Lifetime Portfolio | $1,057 |
| Multi-Index 2055 Lifetime Portfolio | 1,121 |
| Multi-Index 2050 Lifetime Portfolio | 1,165 |
| Multi-Index 2045 Lifetime Portfolio | 1,221 |
| Multi-Index 2040 Lifetime Portfolio | 1,250 |
| Multi-Index 2035 Lifetime Portfolio | 1,287 |
| Multi-Index 2030 Lifetime Portfolio | 1,309 |
| Multi-Index 2025 Lifetime Portfolio | 1,279 |
| Multi-Index 2020 Lifetime Portfolio | 1,192 |
| Multi-Index 2015 Lifetime Portfolio | 1,079 |
| Multi-Index 2010 Lifetime Portfolio | 1,061 |
Expenses. Within the John Hancock group of funds complex, expenses that are directly attributable to an individual portfolio are allocated to such portfolio. Expenses that are not readily attributable to a specific portfolio are allocated among all portfolios in an equitable manner, taking into consideration, among other things, the nature and type of expense and the portfolio’s relative net assets. Expense estimates are accrued in the period to which they relate and adjustments are made when actual amounts are known.
Class allocations. Income, common expenses and realized and unrealized gains (losses) are determined at the portfolio level and allocated daily to each class of shares based on the net assets of the class. Class-specific expenses, such as distribution and service fees, if any, and transfer agent fees, for all classes, are charged daily at the class level based on the net assets of each class and the specific expense rates applicable to each class.
Federal income taxes. Each portfolio intends to continue to qualify as a regulated investment company by complying with the applicable provisions of the Internal Revenue Code and will not be subject to federal income tax on taxable income that is distributed to shareholders. Therefore, no federal income tax provision is required.
As of August 31, 2019, the portfolios had no uncertain tax positions that would require financial statement recognition, derecognition or disclosure. The portfolios' federal tax returns are subject to examination by the Internal Revenue Service for a period of three years.
For federal income tax purposes, the costs of investments owned on February 29, 2020, including short-term investments, were as follows:
| Portfolio | Aggregate
cost | Unrealized
appreciation | Unrealized
(depreciation) | Net unrealized
appreciation/
(depreciation) |
| Multi-Index 2060 Lifetime Portfolio | $33,987,748 | $273,364 | $(2,364,571) | $(2,091,207) |
| Multi-Index 2055 Lifetime Portfolio | 95,534,502 | 1,945,037 | (7,596,275) | (5,651,238) |
| Multi-Index 2050 Lifetime Portfolio | 136,795,632 | 2,908,844 | (11,297,986) | (8,389,142) |
| Multi-Index 2045 Lifetime Portfolio | 183,625,960 | 3,963,042 | (14,636,776) | (10,673,734) |
| Multi-Index 2040 Lifetime Portfolio | 208,932,463 | 5,763,860 | (16,148,887) | (10,385,027) |
| Multi-Index 2035 Lifetime Portfolio | 238,846,239 | 8,863,298 | (17,548,651) | (8,685,353) |
| Multi-Index 2030 Lifetime Portfolio | 260,387,757 | 11,420,612 | (15,949,160) | (4,528,548) |
| Multi-Index 2025 Lifetime Portfolio | 235,697,672 | 6,427,846 | (7,257,826) | (829,980) |
| Multi-Index 2020 Lifetime Portfolio | 155,639,392 | 3,880,025 | (3,043,080) | 836,945 |
| Multi-Index 2015 Lifetime Portfolio | 43,305,264 | 651,534 | (547,728) | 103,806 |
| Multi-Index 2010 Lifetime Portfolio | 33,099,440 | 334,181 | (572,059) | (237,878) |
Distribution of income and gains. Distributions to shareholders from net investment income and net realized gains, if any, are recorded on the ex-date. The portfolios generally declare and pay dividends and capital gain distributions, if any, annually.
Distributions paid by the portfolios with respect to each class of shares are calculated in the same manner, at the same time and in the same amount, except for the effect of class level expenses that may be applied differently to each class.
Such distributions, on a tax basis, are determined in conformity with income tax regulations, which may differ from US GAAP. Distributions in excess of tax basis earnings and profits, if any, are reported in the portfolios' financial statements as a return of capital. The final determination of tax characteristics of the portfolio's distribution will occur at the end of the year and will subsequently be reported to shareholders. Short-term gains from underlying funds are treated as ordinary income for tax purposes.
Capital accounts within the financial statements are adjusted for permanent book-tax differences. These adjustments have no impact on net assets or the results of operations. Temporary book-tax differences, if any, will reverse in a subsequent period. Book-tax differences are primarily attributable to wash sale loss deferrals.
| 50 | JOHN HANCOCK MULTI-INDEX LIFETIME PORTFOLIOS | SEMIANNUAL REPORT | |
Note 3—Guarantees and indemnifications
Under the Trust's organizational documents, its Officers and Trustees are indemnified against certain liabilities arising out of the performance of their duties to the Trust, including the portfolios. Additionally, in the normal course of business, the Trust enters into contracts with service providers that contain general indemnification clauses. The Trust's maximum exposure under these arrangements is unknown, as this would involve future claims that may be made against the Trust that have not yet occurred. The risk of material loss from such claims is considered remote.
Note 4—Fees and transactions with affiliates
John Hancock Investment Management LLC (the Advisor) serves as investment advisor for the portfolios. John Hancock Investment Management Distributors LLC (the Distributor), an affiliate of the Advisor, serves as principal underwriter of the portfolios. The Advisor and the Distributor are indirect, wholly owned subsidiaries of MFC.
Management fee. The portfolios have an investment management agreement with the Advisor under which the portfolios pay a daily management fee to the Advisor as detailed below. The Advisor has a subadvisory agreement with Manulife Investment Management (US) LLC, an indirect, wholly owned subsidiary of MFC and an affiliate of the Advisor. The portfolios are not responsible for payment of the subadvisory fees.
The management fee has two components: (1) a fee on assets invested in a fund of the Trust or John Hancock Funds III (JHF III) (Assets in a fund of the Trust or JHF III); and (2) a fee on assets invested in investments other than a fund of the Trust or JHF III (Other assets). Aggregate net assets include the net assets of the portfolios, similar portfolios of John Hancock Variable Insurance Trust (JHVIT), and similar portfolios of the Trust. JHVIT funds are advised by an affiliate of the Advisor, John Hancock Variable Trust Advisers LLC and are distributed by an affiliate of the Advisor, John Hancock Distributors, LLC.
Management fees are determined in accordance with the following schedule:
| | First $7.5 billion of aggregate net assets | Excess over $7.5 billion of aggregate net assets |
| Assets in a fund of the Trust or JHF III | 0.060% | 0.050% |
| Other assets | 0.510% | 0.500% |
Expense reimbursements. The Advisor has contractually agreed to waive and/or reimburse all class-specific expenses for Class R6 shares of the portfolios to the extent they exceed 0.00% of the average net assets attributable to the class. This expense limitation agreement expires on December 31, 2020, unless renewed by mutual agreement of the portfolios and the advisor based upon a determination that this is appropriate under the circumstances at that time.
The Advisor has contractually agreed to reduce its management fees or if necessary, make payment to the portfolio in an amount by which certain expenses including underlying fund expenses (Acquired fund fees), exceed the amount indicated below of the respective portfolio’s average net assets. This agreement expires on December 31, 2020, unless renewed by mutual agreement of the portfolio and the advisor based upon a determination that this is appropriate under the circumstances at that time.
| Portfolio | Expense
limitation as a
percentage of
average net
assets |
| Multi-Index 2060 Lifetime Portfolio | 0.36% |
| Multi-Index 2055 Lifetime Portfolio | 0.36% |
| Multi-Index 2050 Lifetime Portfolio | 0.36% |
| Multi-Index 2045 Lifetime Portfolio | 0.36% |
| Multi-Index 2040 Lifetime Portfolio | 0.36% |
| Multi-Index 2035 Lifetime Portfolio | 0.36% |
| Portfolio | Expense
limitation as a
percentage of
average net
assets |
| Multi-Index 2030 Lifetime Portfolio | 0.37% |
| Multi-Index 2025 Lifetime Portfolio | 0.39% |
| Multi-Index 2020 Lifetime Portfolio | 0.38% |
| Multi-Index 2015 Lifetime Portfolio | 0.37% |
| Multi-Index 2010 Lifetime Portfolio | 0.35% |
Payments under this arrangement are intended to reimburse the portfolios for a portion of the indirect net expenses associated with the portfolios’ investment in underlying funds. Amounts received in excess of portfolio level operating expenses are included as Other income received from advisor in the Statements of operations.
The Advisor has voluntarily agreed to waive its management fee for each portfolio so that the aggregate management fee retained by the Advisor with respect to both the portfolio and its underlying investments (after payment of subadvisory fees) does not exceed 0.51% of the portfolio’s first $7.5 billion of average net assets and 0.50% of the portfolio’s average net assets in excess of $7.5 billion. The Advisor may terminate this voluntary waiver at any time upon notice to the Trust.
For the six months ended February 29, 2020, the expense reductions under these agreements amounted to the following and are reflected as a reduction of total expenses in the Statements of operations:
| | Expense reimbursement by class |
| Portfolio | Class R4 | Class R6 | Class 1 | Total |
| Multi-Index 2060 Lifetime Portfolio | $316 | $14,500 | $91,997 | $106,813 |
| Multi-Index 2055 Lifetime Portfolio | 216 | 30,568 | 151,581 | 182,365 |
| Multi-Index 2050 Lifetime Portfolio | 706 | 60,871 | 170,046 | 231,623 |
| Multi-Index 2045 Lifetime Portfolio | 896 | 88,617 | 203,901 | 293,414 |
| Multi-Index 2040 Lifetime Portfolio | 233 | 77,914 | 259,124 | 337,271 |
| | SEMIANNUAL REPORT | JOHN HANCOCK MULTI-INDEX LIFETIME PORTFOLIOS | 51 |
| | Expense reimbursement by class |
| Portfolio | Class R4 | Class R6 | Class 1 | Total |
| Multi-Index 2035 Lifetime Portfolio | $1,269 | $81,582 | $306,001 | $388,852 |
| Multi-Index 2030 Lifetime Portfolio | 3,694 | 57,323 | 346,338 | 407,355 |
| Multi-Index 2025 Lifetime Portfolio | 2,962 | 58,543 | 302,622 | 364,127 |
| Multi-Index 2020 Lifetime Portfolio | 5,001 | 51,219 | 216,168 | 272,388 |
| Multi-Index 2015 Lifetime Portfolio | 2,913 | 35,852 | 89,536 | 128,301 |
| Multi-Index 2010 Lifetime Portfolio | 727 | 23,488 | 89,193 | 113,408 |
Expenses waived or reimbursed in the current fiscal period are not subject to recapture in future fiscal periods.
The investment management fees, including the impact of the waivers and reimbursements as described above, incurred for the six months ended February 29, 2020, were equivalent to a net annual effective rate of the portfolios' average daily net assets as follows:
| Portfolio | Net Annual Effective Rate |
| Multi-Index 2060 Lifetime Portfolio | 0.00% |
| Multi-Index 2055 Lifetime Portfolio | 0.00% |
| Multi-Index 2050 Lifetime Portfolio | 0.00% |
| Multi-Index 2045 Lifetime Portfolio | 0.00% |
| Multi-Index 2040 Lifetime Portfolio | 0.00% |
| Multi-Index 2035 Lifetime Portfolio | 0.00% |
| Portfolio | Net Annual Effective Rate |
| Multi-Index 2030 Lifetime Portfolio | 0.00% |
| Multi-Index 2025 Lifetime Portfolio | 0.01% |
| Multi-Index 2020 Lifetime Portfolio | 0.00% |
| Multi-Index 2015 Lifetime Portfolio | 0.00% |
| Multi-Index 2010 Lifetime Portfolio | 0.00% |
Accounting and legal services. Pursuant to a service agreement, the portfolios reimburse the Advisor for all expenses associated with providing the administrative, financial, legal, compliance, accounting and recordkeeping services to the portfolios, including the preparation of all tax returns, periodic reports to shareholders and regulatory reports, among other services. These expenses are allocated to each share class based on its relative net assets at the time the expense was incurred. These accounting and legal services fees incurred for the six months ended February 29, 2020 amounted to an annual rate of 0.02% of the portfolios' average daily net assets.
Distribution and service plans. The portfolios have a distribution agreement with the Distributor. The portfolios have adopted distribution and service plans for certain classes as detailed below pursuant to Rule 12b-1 under the 1940 Act, to pay the Distributor for services provided as the distributor of shares of the portfolios. In addition, under a service plan for certain classes as detailed below, the portfolios pay for certain other services. The portfolios may pay up to the following contractual rates of distribution and service fees under these arrangements, expressed as an annual percentage of average daily net assets for each class of the portfolios' shares:
| Class | Rule 12b-1 Fee | Service fee |
| Class R4 | 0.25% | 0.10% |
| Class 1 | 0.05% | — |
The portfolios' Distributor has contractually agreed to waive 0.10% of Rule12b-1 fees for Class R4 shares. The current waiver agreement expires on December 31, 2020, unless renewed by mutual agreement of the portfolios and the Distributor based upon a determination that this is appropriate under the circumstances at the time. This contractual waiver amounted to the following for Class R4 shares for the six months ended February 29, 2020:
| Portfolio | Class R4 |
| Multi-Index 2060 Lifetime Portfolio | $46 |
| Multi-Index 2055 Lifetime Portfolio | 54 |
| Multi-Index 2050 Lifetime Portfolio | 201 |
| Multi-Index 2045 Lifetime Portfolio | 272 |
| Multi-Index 2040 Lifetime Portfolio | 71 |
| Multi-Index 2035 Lifetime Portfolio | 394 |
| Portfolio | Class R4 |
| Multi-Index 2030 Lifetime Portfolio | $1,183 |
| Multi-Index 2025 Lifetime Portfolio | 983 |
| Multi-Index 2020 Lifetime Portfolio | 1,402 |
| Multi-Index 2015 Lifetime Portfolio | 511 |
| Multi-Index 2010 Lifetime Portfolio | 104 |
Transfer agent fees. The John Hancock group of funds has a complex-wide transfer agent agreement with John Hancock Signature Services, Inc. (Signature Services), an affiliate of the Advisor. The transfer agent fees paid to Signature Services are determined based on the cost to Signature Services (Signature Services Cost) of providing recordkeeping services. It also includes out-of-pocket expenses, including payments made to third-parties for recordkeeping services provided to their clients who invest in one or more John Hancock funds. In addition, Signature Services Cost may be reduced by certain fees that Signature Services receives in connection with retirement and small accounts. Signature Services Cost is calculated monthly and allocated, as applicable, to five categories of share classes: Retail Share and Institutional Share Classes of Non-Municipal Bond Funds, Class R6 Shares, Retirement Share Classes and Municipal Bond Share Classes. Within each of these categories, the applicable costs are allocated to the affected John Hancock affiliated funds and/or classes, based on the relative average daily net assets.
| 52 | JOHN HANCOCK MULTI-INDEX LIFETIME PORTFOLIOS | SEMIANNUAL REPORT | |
Class level expenses. Class level expenses for the six months ended February 29, 2020 were as follows:
| Portfolio | Class | Distribution and service fees | Transfer agent fees |
| Multi-Index 2060 Lifetime Portfolio | Class R4 | $114 | $6 |
| | Class R6 | — | 267 |
| | Class 1 | 6,677 | — |
| | Total | $6,791 | $273 |
| Multi-Index 2055 Lifetime Portfolio | Class R4 | $136 | $7 |
| | Class R6 | — | 970 |
| | Class 1 | 19,107 | — |
| | Total | $19,243 | $977 |
| Multi-Index 2050 Lifetime Portfolio | Class R4 | $678 | $26 |
| | Class R6 | — | 2,177 |
| | Class 1 | 24,203 | — |
| | Total | $24,881 | $2,203 |
| Multi-Index 2045 Lifetime Portfolio | Class R4 | $707 | $36 |
| | Class R6 | — | 3,422 |
| | Class 1 | 31,292 | — |
| | Total | $31,999 | $3,458 |
| Multi-Index 2040 Lifetime Portfolio | Class R4 | $181 | $9 |
| | Class R6 | — | 3,017 |
| | Class 1 | 39,952 | — |
| | Total | $40,133 | $3,026 |
| Multi-Index 2035 Lifetime Portfolio | Class R4 | $1,075 | $51 |
| | Class R6 | — | 3,187 |
| | Class 1 | 47,647 | — |
| | Total | $48,722 | $3,238 |
| Multi-Index 2030 Lifetime Portfolio | Class R4 | $3,039 | $155 |
| | Class R6 | — | 2,305 |
| | Class 1 | 55,758 | — |
| | Total | $58,797 | $2,460 |
| Multi-Index 2025 Lifetime Portfolio | Class R4 | $2,487 | $129 |
| | Class R6 | — | 2,412 |
| | Class 1 | 49,756 | — |
| | Total | $52,243 | $2,541 |
| Multi-Index 2020 Lifetime Portfolio | Class R4 | $4,174 | $183 |
| | Class R6 | — | 1,812 |
| | Class 1 | 30,502 | — |
| | Total | $34,676 | $1,995 |
| Multi-Index 2015 Lifetime Portfolio | Class R4 | $1,278 | $67 |
| | Class R6 | — | 780 |
| | Class 1 | 7,832 | — |
| | Total | $9,110 | $847 |
| Multi-Index 2010 Lifetime Portfolio | Class R4 | $259 | $13 |
| | Class R6 | — | 417 |
| | Class 1 | 6,307 | — |
| | Total | $6,566 | $430 |
Trustee expenses. The portfolios compensate each Trustee who is not an employee of the Advisor or its affiliates. The costs of paying Trustee compensation and expenses are allocated to each portfolio based on their net assets relative to other funds within the John Hancock group of funds complex.
| | SEMIANNUAL REPORT | JOHN HANCOCK MULTI-INDEX LIFETIME PORTFOLIOS | 53 |
Note 5—Portfolio share transactions
Transactions in portfolios' shares for the six months ended February 29, 2020 and for the year ended August 31, 2019 were as follows:
| Multi-Index 2060 Lifetime Portfolio | Six Months Ended 2-29-20 | Year Ended 8-31-19 |
| | Shares | Amount | Shares | Amount |
| Class R4 shares | | | | |
| Sold | 3,951 | $48,067 | — | — |
| Distributions reinvested | 249 | 3,100 | — | — |
| Repurchased | (633) | (8,048) | — | — |
| Net increase | 3,567 | $43,119 | — | — |
| Class R6 shares | | | | |
| Sold | 246,507 | $3,041,844 | 177,424 | $2,130,715 |
| Distributions reinvested | 23,486 | 291,929 | 8,374 | 88,096 |
| Repurchased | (37,133) | (465,663) | (30,626) | (372,605) |
| Net increase | 232,860 | $2,868,110 | 155,172 | $1,846,206 |
| Class 1 shares | | | | |
| Sold | 427,136 | $5,362,751 | 856,501 | $10,266,972 |
| Distributions reinvested | 145,103 | 1,805,083 | 103,313 | 1,086,850 |
| Repurchased | (300,337) | (3,778,399) | (123,139) | (1,444,338) |
| Net increase | 271,902 | $3,389,435 | 836,675 | $9,909,484 |
| Total net increase | 508,329 | $6,300,664 | 991,847 | $11,755,690 |
| Multi-Index 2055 Lifetime Portfolio | Six Months Ended 2-29-20 | Year Ended 8-31-19 |
| | Shares | Amount | Shares | Amount |
| Class R4 shares | | | | |
| Sold | 6,042 | $69,395 | 185 | $1,976 |
| Distributions reinvested | 482 | 5,627 | — | — |
| Net increase | 6,524 | $75,022 | 185 | $1,976 |
| Class R6 shares | | | | |
| Sold | 627,954 | $7,423,181 | 707,183 | $8,205,938 |
| Distributions reinvested | 109,078 | 1,271,854 | 54,163 | 542,717 |
| Repurchased | (125,908) | (1,475,828) | (179,081) | (2,130,975) |
| Net increase | 611,124 | $7,219,207 | 582,265 | $6,617,680 |
| Class 1 shares | | | | |
| Sold | 530,262 | $6,265,926 | 1,117,118 | $12,832,313 |
| Distributions reinvested | 531,739 | 6,205,398 | 587,868 | 5,896,320 |
| Repurchased | (506,427) | (5,998,232) | (698,658) | (7,827,823) |
| Net increase | 555,574 | $6,473,092 | 1,006,328 | $10,900,810 |
| Total net increase | 1,173,222 | $13,767,321 | 1,588,778 | $17,520,466 |
| Multi-Index 2050 Lifetime Portfolio | Six Months Ended 2-29-20 | Year Ended 8-31-19 |
| | Shares | Amount | Shares | Amount |
| Class R4 shares | | | | |
| Sold | 31,954 | $371,354 | 21,758 | $234,692 |
| Distributions reinvested | 3,017 | 35,576 | — | — |
| Repurchased | (24,388) | (292,411) | (5,325) | (61,492) |
| Net increase | 10,583 | $114,519 | 16,433 | $173,200 |
| Class R6 shares | | | | |
| Sold | 953,174 | $11,373,770 | 1,110,400 | $12,974,782 |
| Distributions reinvested | 243,594 | 2,867,100 | 177,200 | 1,795,031 |
| Repurchased | (100,782) | (1,199,286) | (483,884) | (5,688,389) |
| 54 | JOHN HANCOCK MULTI-INDEX LIFETIME PORTFOLIOS | SEMIANNUAL REPORT | |
| Multi-Index 2050 Lifetime Portfolio (continued) | Six Months Ended 2-29-20 | Year Ended 8-31-19 |
| | Shares | Amount | Shares | Amount |
| Net increase | 1,095,986 | $13,041,584 | 803,716 | $9,081,424 |
| Class 1 shares | | | | |
| Sold | 614,590 | $7,360,007 | 1,275,226 | $14,805,046 |
| Distributions reinvested | 677,769 | 7,984,116 | 753,345 | 7,638,917 |
| Repurchased | (763,327) | (9,155,903) | (1,015,322) | (11,679,028) |
| Net increase | 529,032 | $6,188,220 | 1,013,249 | $10,764,935 |
| Total net increase | 1,635,601 | $19,344,323 | 1,833,398 | $20,019,559 |
| Multi-Index 2045 Lifetime Portfolio | Six Months Ended 2-29-20 | Year Ended 8-31-19 |
| | Shares | Amount | Shares | Amount |
| Class R4 shares | | | | |
| Sold | 59,118 | $676,960 | 1,711 | $18,246 |
| Distributions reinvested | 4,951 | 57,580 | — | — |
| Repurchased | (12,754) | (151,925) | (1,704) | (19,543) |
| Net increase (decrease) | 51,315 | $582,615 | 7 | $(1,297) |
| Class R6 shares | | | | |
| Sold | 1,123,429 | $13,212,330 | 1,643,030 | $19,106,579 |
| Distributions reinvested | 394,204 | 4,588,538 | 322,311 | 3,236,000 |
| Repurchased | (438,423) | (5,207,562) | (657,995) | (7,752,542) |
| Net increase | 1,079,210 | $12,593,306 | 1,307,346 | $14,590,037 |
| Class 1 shares | | | | |
| Sold | 795,617 | $9,362,100 | 1,396,984 | $16,105,902 |
| Distributions reinvested | 908,553 | 10,566,473 | 1,041,942 | 10,461,096 |
| Repurchased | (1,241,754) | (14,706,561) | (1,483,845) | (17,200,596) |
| Net increase | 462,416 | $5,222,012 | 955,081 | $9,366,402 |
| Total net increase | 1,592,941 | $18,397,933 | 2,262,434 | $23,955,142 |
| Multi-Index 2040 Lifetime Portfolio | Six Months Ended 2-29-20 | Year Ended 8-31-19 |
| | Shares | Amount | Shares | Amount |
| Class R4 shares | | | | |
| Sold | 13,535 | $155,270 | 375 | $4,092 |
| Distributions reinvested | 816 | 9,472 | — | — |
| Repurchased | (4,271) | (49,962) | — | — |
| Net increase | 10,080 | $114,780 | 375 | $4,092 |
| Class R6 shares | | | | |
| Sold | 1,544,364 | $18,218,989 | 1,295,707 | $15,049,361 |
| Distributions reinvested | 354,146 | 4,104,547 | 287,029 | 2,881,773 |
| Repurchased | (661,791) | (7,783,852) | (475,768) | (5,504,192) |
| Net increase | 1,236,719 | $14,539,684 | 1,106,968 | $12,426,942 |
| Class 1 shares | | | | |
| Sold | 742,483 | $8,812,038 | 1,653,872 | $19,160,926 |
| Distributions reinvested | 1,176,666 | 13,649,327 | 1,389,927 | 13,954,863 |
| Repurchased | (1,357,185) | (16,070,312) | (1,599,972) | (18,312,882) |
| Net increase | 561,964 | $6,391,053 | 1,443,827 | $14,802,907 |
| Total net increase | 1,808,763 | $21,045,517 | 2,551,170 | $27,233,941 |
| | SEMIANNUAL REPORT | JOHN HANCOCK MULTI-INDEX LIFETIME PORTFOLIOS | 55 |
| Multi-Index 2035 Lifetime Portfolio | Six Months Ended 2-29-20 | Year Ended 8-31-19 |
| | Shares | Amount | Shares | Amount |
| Class R4 shares | | | | |
| Sold | 144,942 | $1,645,237 | 1,369 | $14,477 |
| Distributions reinvested | 5,923 | 67,938 | — | — |
| Repurchased | (80,573) | (952,982) | — | — |
| Net increase | 70,292 | $760,193 | 1,369 | $14,477 |
| Class R6 shares | | | | |
| Sold | 1,428,071 | $16,602,853 | 1,758,628 | $20,266,330 |
| Distributions reinvested | 360,262 | 4,128,607 | 269,486 | 2,689,468 |
| Repurchased | (342,732) | (4,012,585) | (306,561) | (3,457,173) |
| Net increase | 1,445,601 | $16,718,875 | 1,721,553 | $19,498,625 |
| Class 1 shares | | | | |
| Sold | 889,615 | $10,372,063 | 1,702,392 | $19,407,029 |
| Distributions reinvested | 1,340,491 | 15,362,027 | 1,643,804 | 16,405,162 |
| Repurchased | (1,805,566) | (21,263,469) | (2,678,519) | (30,650,519) |
| Net increase | 424,540 | $4,470,621 | 667,677 | $5,161,672 |
| Total net increase | 1,940,433 | $21,949,689 | 2,390,599 | $24,674,774 |
| Multi-Index 2030 Lifetime Portfolio | Six Months Ended 2-29-20 | Year Ended 8-31-19 |
| | Shares | Amount | Shares | Amount |
| Class R4 shares | | | | |
| Sold | 303,392 | $3,421,743 | 560 | $5,892 |
| Distributions reinvested | 18,470 | 210,191 | — | — |
| Repurchased | (61,101) | (711,070) | — | — |
| Net increase | 260,761 | $2,920,864 | 560 | $5,892 |
| Class R6 shares | | | | |
| Sold | 2,343,828 | $26,791,099 | 1,596,310 | $18,081,696 |
| Distributions reinvested | 242,164 | 2,753,408 | 133,025 | 1,322,271 |
| Repurchased | (589,901) | (6,793,776) | (391,741) | (4,322,601) |
| Net increase | 1,996,091 | $22,750,731 | 1,337,594 | $15,081,366 |
| Class 1 shares | | | | |
| Sold | 1,269,160 | $14,720,065 | 1,801,137 | $20,207,717 |
| Distributions reinvested | 1,436,423 | 16,332,135 | 1,850,723 | 18,396,185 |
| Repurchased | (2,086,105) | (24,321,500) | (3,323,481) | (37,039,983) |
| Net increase | 619,478 | $6,730,700 | 328,379 | $1,563,919 |
| Total net increase | 2,876,330 | $32,402,295 | 1,666,533 | $16,651,177 |
| Multi-Index 2025 Lifetime Portfolio | Six Months Ended 2-29-20 | Year Ended 8-31-19 |
| | Shares | Amount | Shares | Amount |
| Class R4 shares | | | | |
| Sold | 305,933 | $3,400,330 | 421 | $4,496 |
| Distributions reinvested | 11,894 | 132,382 | — | — |
| Repurchased | (146,347) | (1,700,222) | — | — |
| Net increase | 171,480 | $1,832,490 | 421 | $4,496 |
| Class R6 shares | | | | |
| Sold | 3,484,301 | $39,149,963 | 1,413,515 | $15,435,236 |
| Distributions reinvested | 255,404 | 2,840,092 | 67,376 | 663,656 |
| Repurchased | (1,504,916) | (17,138,724) | (334,731) | (3,644,025) |
| Net increase | 2,234,789 | $24,851,331 | 1,146,160 | $12,454,867 |
| 56 | JOHN HANCOCK MULTI-INDEX LIFETIME PORTFOLIOS | SEMIANNUAL REPORT | |
| Multi-Index 2025 Lifetime Portfolio (continued) | Six Months Ended 2-29-20 | Year Ended 8-31-19 |
| | Shares | Amount | Shares | Amount |
| Class 1 shares | | | | |
| Sold | 814,758 | $9,269,196 | 1,673,932 | $18,405,904 |
| Distributions reinvested | 1,230,729 | 13,685,709 | 1,674,065 | 16,489,542 |
| Repurchased | (2,678,185) | (30,406,902) | (3,487,333) | (38,500,334) |
| Net decrease | (632,698) | $(7,451,997) | (139,336) | $(3,604,888) |
| Total net increase | 1,773,571 | $19,231,824 | 1,007,245 | $8,854,475 |
| Multi-Index 2020 Lifetime Portfolio | Six Months Ended 2-29-20 | Year Ended 8-31-19 |
| | Shares | Amount | Shares | Amount |
| Class R4 shares | | | | |
| Sold | 323,338 | $3,551,375 | 4,635 | $47,290 |
| Distributions reinvested | 19,872 | 217,404 | — | — |
| Repurchased | (22,462) | (251,645) | — | — |
| Net increase | 320,748 | $3,517,134 | 4,635 | $47,290 |
| Class R6 shares | | | | |
| Sold | 2,869,400 | $31,727,405 | 840,404 | $9,055,205 |
| Distributions reinvested | 177,931 | 1,946,565 | 47,830 | 467,775 |
| Repurchased | (780,073) | (8,765,353) | (283,192) | (3,091,043) |
| Net increase | 2,267,258 | $24,908,617 | 605,042 | $6,431,937 |
| Class 1 shares | | | | |
| Sold | 679,962 | $7,570,931 | 787,629 | $8,581,941 |
| Distributions reinvested | 689,000 | 7,530,767 | 1,034,946 | 10,111,423 |
| Repurchased | (2,185,049) | (24,484,851) | (2,802,055) | (30,179,451) |
| Net decrease | (816,087) | $(9,383,153) | (979,480) | $(11,486,087) |
| Total net increase (decrease) | 1,771,919 | $19,042,598 | (369,803) | $(5,006,860) |
| Multi-Index 2015 Lifetime Portfolio | Six Months Ended 2-29-20 | Year Ended 8-31-19 |
| | Shares | Amount | Shares | Amount |
| Class R4 shares | | | | |
| Sold | 386,384 | $4,173,114 | — | — |
| Distributions reinvested | 6,586 | 70,004 | — | — |
| Repurchased | (291,191) | (3,180,855) | — | — |
| Net increase | 101,779 | $1,062,263 | — | — |
| Class R6 shares | | | | |
| Sold | 1,174,558 | $12,742,560 | 311,702 | $3,242,639 |
| Distributions reinvested | 87,416 | 929,232 | 13,902 | 134,018 |
| Repurchased | (145,056) | (1,574,602) | (106,928) | (1,129,480) |
| Net increase | 1,116,918 | $12,097,190 | 218,676 | $2,247,177 |
| Class 1 shares | | | | |
| Sold | 120,554 | $1,318,434 | 313,123 | $3,303,006 |
| Distributions reinvested | 176,958 | 1,881,062 | 286,098 | 2,757,989 |
| Repurchased | (1,110,076) | (12,147,081) | (1,031,071) | (10,837,790) |
| Net decrease | (812,564) | $(8,947,585) | (431,850) | $(4,776,795) |
| Total net increase (decrease) | 406,133 | $4,211,868 | (213,174) | $(2,529,618) |
| | SEMIANNUAL REPORT | JOHN HANCOCK MULTI-INDEX LIFETIME PORTFOLIOS | 57 |
| Multi-Index 2010 Lifetime Portfolio | Six Months Ended 2-29-20 | Year Ended 8-31-19 |
| | Shares | Amount | Shares | Amount |
| Class R4 shares | | | | |
| Sold | 23,440 | $246,678 | — | — |
| Distributions reinvested | 730 | 7,653 | — | — |
| Repurchased | (8,150) | (88,178) | — | — |
| Net increase | 16,020 | $166,153 | — | — |
| Class R6 shares | | | | |
| Sold | 798,395 | $8,526,999 | 181,284 | $1,833,744 |
| Distributions reinvested | 38,279 | 401,163 | 10,976 | 103,392 |
| Repurchased | (256,946) | (2,749,720) | (75,371) | (772,917) |
| Net increase | 579,728 | $6,178,442 | 116,889 | $1,164,219 |
| Class 1 shares | | | | |
| Sold | 340,494 | $3,599,169 | 442,971 | $4,598,861 |
| Distributions reinvested | 114,756 | 1,201,493 | 199,731 | 1,879,472 |
| Repurchased | (498,176) | (5,293,873) | (967,845) | (10,104,017) |
| Net decrease | (42,926) | $(493,211) | (325,143) | $(3,625,684) |
| Total net increase (decrease) | 552,822 | $5,851,384 | (208,254) | $(2,461,465) |
Affiliates of the Trust owned shares of the following classes of the portfolios on February 29, 2020. Such concentration of shareholders’ capital could have a material effect on the portfolios if such shareholders redeem from the portfolios.
| Portfolio | Class | % by Class |
| Multi-Index 2060 Lifetime Portfolio | R4 | 55% |
| Multi-Index 2060 Lifetime Portfolio | 1 | 100% |
| Multi-Index 2055 Lifetime Portfolio | R4 | 39% |
| Multi-Index 2055 Lifetime Portfolio | 1 | 100% |
| Multi-Index 2050 Lifetime Portfolio | 1 | 100% |
| Multi-Index 2045 Lifetime Portfolio | 1 | 100% |
| Multi-Index 2040 Lifetime Portfolio | R4 | 29% |
| Multi-Index 2040 Lifetime Portfolio | 1 | 100% |
| Multi-Index 2035 Lifetime Portfolio | 1 | 100% |
| Multi-Index 2030 Lifetime Portfolio | 1 | 100% |
| Multi-Index 2025 Lifetime Portfolio | 1 | 100% |
| Multi-Index 2020 Lifetime Portfolio | 1 | 100% |
| Multi-Index 2015 Lifetime Portfolio | 1 | 100% |
| Multi-Index 2010 Lifetime Portfolio | R4 | 23% |
| Multi-Index 2010 Lifetime Portfolio | 1 | 100% |
Note 6—Purchase and sale of securities
Purchases and sales of securities, other than short-term investments, amounted to the following for the six months ended February 29, 2020:
| | Purchases | Sales |
| Portfolio | U.S. Government | Other issuers | Other issuers |
| Multi-Index 2060 Lifetime Portfolio | $701,824 | $12,569,414 | $8,357,450 |
| Multi-Index 2055 Lifetime Portfolio | 2,076,746 | 26,767,058 | 20,661,222 |
| Multi-Index 2050 Lifetime Portfolio | 2,941,506 | 38,195,182 | 29,989,946 |
| Multi-Index 2045 Lifetime Portfolio | 3,929,074 | 48,715,091 | 45,733,361 |
| Multi-Index 2040 Lifetime Portfolio | 7,220,343 | 57,151,542 | 57,175,311 |
| Multi-Index 2035 Lifetime Portfolio | 10,975,739 | 63,930,367 | 67,566,406 |
| Multi-Index 2030 Lifetime Portfolio | 14,964,575 | 76,851,567 | 74,366,284 |
| Multi-Index 2025 Lifetime Portfolio | 16,427,770 | 83,393,712 | 93,361,306 |
| Multi-Index 2020 Lifetime Portfolio | 11,167,974 | 72,264,690 | 69,826,785 |
| Multi-Index 2015 Lifetime Portfolio | 3,271,099 | 28,928,542 | 29,762,109 |
| Multi-Index 2010 Lifetime Portfolio | 2,506,707 | 20,093,427 | 17,516,524 |
| 58 | JOHN HANCOCK MULTI-INDEX LIFETIME PORTFOLIOS | SEMIANNUAL REPORT | |
Note 7—Investment in affiliated underlying funds
The portfolios invest primarily in affiliated underlying funds that are managed by the Advisor and its affiliates. The portfolios do not invest in the affiliated underlying funds for the purpose of exercising management or control; however, the portfolios' investment may represent a significant portion of each underlying funds’ net assets. At February 29, 2020, the portfolios did not hold 5% or more of the net assets of any underlying funds.
Information regarding the portfolios' fiscal year to date purchases and sales of the affiliated underlying funds as well as income and capital gains earned by the portfolios, if any, is as follows:
| | | | | | | | Dividends and distributions |
| Affiliate | Ending
share
amount | Beginning
value | Cost of
purchases | Proceeds
from shares
sold | Realized
gain
(loss) | Change in
unrealized
appreciation
(depreciation) | Income
distributions
received | Capital gain
distributions
received | Ending
value |
| Multi-Index 2060 Lifetime Portfolio |
| John Hancock Collateral Trust* | 38,069 | $106,254 | $21,087,325 | $(20,812,832) | $226 | $55 | $1,138 | — | $381,028 |
| Strategic Equity Allocation | 1,680,598 | 16,497,725 | 4,777,317 | (2,484,385) | (362,292) | (109,850) | 421,492 | $209,092 | 18,318,515 |
| | | | | | $(362,066) | $(109,795) | $422,630 | $209,092 | $18,699,543 |
| Multi-Index 2055 Lifetime Portfolio |
| John Hancock Collateral Trust* | 110,604 | $325,876 | $57,823,653 | $(57,043,145) | $477 | $161 | $2,736 | — | $1,107,022 |
| Strategic Equity Allocation | 4,752,466 | 49,934,023 | 7,421,010 | (4,357,473) | (495,573) | (700,109) | 1,225,268 | $607,827 | 51,801,878 |
| | | | | | $(495,096) | $(699,948) | $1,228,004 | $607,827 | $52,908,900 |
| Multi-Index 2050 Lifetime Portfolio |
| John Hancock Collateral Trust* | 158,247 | $466,220 | $65,021,470 | $(63,905,673) | $1,654 | $208 | $9,372 | — | $1,583,879 |
| Strategic Equity Allocation | 6,801,076 | 71,866,814 | 11,065,148 | (7,103,027) | (925,871) | (771,339) | 1,742,769 | $864,547 | 74,131,725 |
| | | | | | $(924,217) | $(771,131) | $1,752,141 | $864,547 | $75,715,604 |
| Multi-Index 2045 Lifetime Portfolio |
| John Hancock Collateral Trust* | 305,664 | $683,321 | $89,325,074 | $(86,949,762) | $341 | $391 | $7,782 | — | $3,059,365 |
| Strategic Equity Allocation | 9,030,367 | 100,695,504 | 11,568,148 | (11,981,548) | (1,649,776) | (201,333) | 2,367,406 | $1,174,415 | 98,430,995 |
| | | | | | $(1,649,435) | $(200,942) | $2,375,188 | $1,174,415 | $101,490,360 |
| Multi-Index 2040 Lifetime Portfolio |
| John Hancock Collateral Trust* | 314,459 | $881,175 | $67,275,839 | $(65,011,924) | $1,629 | $669 | $9,113 | — | $3,147,388 |
| Strategic Equity Allocation | 10,061,500 | 112,814,336 | 15,921,781 | (16,986,933) | (2,228,659) | 149,830 | 2,667,458 | $1,323,264 | 109,670,355 |
| | | | | | $(2,227,030) | $150,499 | $2,676,571 | $1,323,264 | $112,817,743 |
| Multi-Index 2035 Lifetime Portfolio |
| John Hancock Collateral Trust* | 42,667 | $2,989,582 | $79,730,631 | $(82,294,638) | $1,187 | $291 | $12,904 | — | $427,053 |
| Strategic Equity Allocation | 10,727,994 | 121,475,015 | 16,335,226 | (18,964,208) | (2,221,404) | 310,511 | 2,835,462 | $1,406,607 | 116,935,140 |
| | | | | | $(2,220,217) | $310,802 | $2,848,366 | $1,406,607 | $117,362,193 |
| Multi-Index 2030 Lifetime Portfolio |
| John Hancock Collateral Trust* | — | $4,980,747 | $89,242,595 | $(94,223,663) | $226 | $95 | $21,819 | — | — |
| Strategic Equity Allocation | 10,623,915 | 113,757,467 | 20,494,434 | (16,280,505) | (1,710,201) | (460,517) | 2,713,178 | $1,345,945 | $115,800,678 |
| | | | | | $(1,709,975) | $(460,422) | $2,734,997 | $1,345,945 | $115,800,678 |
| | SEMIANNUAL REPORT | JOHN HANCOCK MULTI-INDEX LIFETIME PORTFOLIOS | 59 |
| | | | | | | | Dividends and distributions |
| Affiliate | Ending
share
amount | Beginning
value | Cost of
purchases | Proceeds
from shares
sold | Realized
gain
(loss) | Change in
unrealized
appreciation
(depreciation) | Income
distributions
received | Capital gain
distributions
received | Ending
value |
| Multi-Index 2025 Lifetime Portfolio |
| John Hancock Collateral Trust* | 938,021 | $8,456,657 | $114,669,294 | $(113,737,442) | $(799) | $846 | $23,303 | — | $9,388,556 |
| Strategic Equity Allocation | 8,051,026 | 89,423,933 | 22,686,122 | (23,265,541) | (2,106,309) | 1,017,980 | 2,108,634 | $1,046,044 | 87,756,185 |
| | | | | | $(2,107,108) | $1,018,826 | $2,131,937 | $1,046,044 | $97,144,741 |
| Multi-Index 2020 Lifetime Portfolio |
| John Hancock Collateral Trust* | 795,943 | $11,030,601 | $82,880,427 | $(85,944,603) | $(530) | $624 | $20,982 | — | $7,966,519 |
| Strategic Equity Allocation | 3,570,039 | 45,026,474 | 16,250,617 | (22,711,217) | (1,331,495) | 1,679,046 | 1,140,650 | $565,850 | 38,913,425 |
| | | | | | $(1,332,025) | $1,679,670 | $1,161,632 | $565,850 | $46,879,944 |
| Multi-Index 2015 Lifetime Portfolio |
| John Hancock Collateral Trust* | 101,211 | $2,191,766 | $7,573,670 | $(8,752,389) | $(113) | $78 | $3,093 | — | $1,013,012 |
| Strategic Equity Allocation | 838,761 | 11,588,272 | 5,800,905 | (8,473,736) | (283,830) | 510,880 | 277,297 | $137,561 | 9,142,491 |
| | | | | | $(283,943) | $510,958 | $280,390 | $137,561 | $10,155,503 |
| Multi-Index 2010 Lifetime Portfolio |
| John Hancock Collateral Trust* | 99,187 | $1,492,241 | $4,441,569 | $(4,941,067) | $(151) | $159 | $2,551 | — | $992,751 |
| Strategic Equity Allocation | 465,899 | 6,801,083 | 3,251,455 | (5,139,238) | (77,573) | 242,569 | 181,746 | $90,160 | 5,078,296 |
| | | | | | $(77,724) | $242,728 | $184,297 | $90,160 | $6,071,047 |
| * | Refer to the Securities lending note within Note 2 for details regarding this investment. |
Note 8—Subsequent events
A widespread health crisis such as a global pandemic could cause substantial market volatility, exchange trading suspensions and closures, impact the ability to complete redemptions, and affect fund performance. For example, the novel coronavirus disease (COVID-19) has resulted in significant disruptions to global business activity. The impact of a health crisis and other epidemics and pandemics that may arise in the future, could affect the global economy in ways that cannot necessarily be foreseen at the present time. A health crisis may exacerbate other pre-existing political, social and economic risks. Any such impact could adversely affect the funds' performance, resulting in losses to your investment.
| 60 | JOHN HANCOCK MULTI-INDEX LIFETIME PORTFOLIOS | SEMIANNUAL REPORT | |
| | |
Trustees
Hassell H. McClellan,Chairperson
Steven R. Pruchansky,Vice Chairperson
Andrew G. Arnott†
Charles L. Bardelis*
James R. Boyle
Peter S. Burgess*
William H. Cunningham
Grace K. Fey
Marianne Harrison†
Deborah C. Jackson
James M. Oates*
Gregory A. Russo
Officers
Andrew G. Arnott
President
Francis V. Knox, Jr.
Chief Compliance Officer
Charles A. Rizzo
Chief Financial Officer
Salvatore Schiavone
Treasurer
Christopher (Kit) Sechler
Secretary and Chief Legal Officer
| Investment advisor
John Hancock Investment Management LLC
Subadvisor
Manulife Investment Management (US) LLC
Portfolio Managers
Nathan W. Thooft, CFA
Robert E. Sykes, CFA
Principal distributor
John Hancock Investment Management Distributors LLC
Custodian
State Street Bank and Trust Company
Transfer agent
John Hancock Signature Services, Inc.
Legal counsel
K&L Gates LLP
|
* Member of the Audit Committee
† Non-Independent Trustee
The portfolios' proxy voting policies and procedures, as well as the portfolio proxy voting record for the most recent twelve-month period ended June 30, are available free of charge on the Securities and Exchange Commission (SEC) website at sec.gov or on our website.
All of the portfolios' holdings as of the end of the third month of every fiscal quarter are filed with the SEC on Form N-PORT within 60 days of the end of the fiscal quarter. The portfolios' Form N-PORT filings are available on our website and the SEC's website, sec.gov.
We make this information on your portfolio, as well asmonthly portfolio holdings, and other portfolio details available on our website at jhinvestments.com or by calling 800-225-5291.
| | | | |
| | You can also contact us: |
| | 800-225-5291
jhinvestments.com | Regular mail:
John Hancock Signature Services, Inc.
P.O. Box 55913
Boston, MA 02205-5913
| Express mail:
John Hancock Signature Services, Inc.
2000 Crown Colony Drive
Suite 55913
Quincy, MA 02169-0953
|
SEMIANNUAL REPORT | JOHN HANCOCK MULTI-INDEX LIFETIME PORTFOLIOS 61
John Hancock family of funds
| | | |
DOMESTIC EQUITY FUNDS
Blue Chip Growth
Classic Value
Disciplined Value
Disciplined Value Mid Cap
Equity Income
Financial Industries
Fundamental All Cap Core
Fundamental Large Cap Core
New Opportunities
Regional Bank
Small Cap Core
Small Cap Growth
Small Cap Value
U.S. Global Leaders Growth
U.S. Quality Growth
GLOBAL AND INTERNATIONAL EQUITY FUNDS
Disciplined Value International
Emerging Markets
Emerging Markets Equity
Fundamental Global Franchise
Global Equity
Global Shareholder Yield
Global Thematic Opportunities
International Dynamic Growth
International Growth
International Small Company
| | INCOME FUNDS
Bond
California Tax-Free Income
Emerging Markets Debt
Floating Rate Income
Government Income
High Yield
High Yield Municipal Bond
Income
Investment Grade Bond
Money Market
Short Duration Bond
Short Duration Credit Opportunities
Strategic Income Opportunities
Tax-Free Bond
ALTERNATIVE AND SPECIALTY FUNDS
Absolute Return Currency
Alternative Asset Allocation
Alternative Risk Premia
Diversified Macro
Infrastructure
Multi-Asset Absolute Return
Seaport Long/Short
|
A fund's investment objectives, risks, charges, and expenses should be considered carefully before investing. The prospectus contains this and other important information about the fund. To obtain a prospectus, contact your financial professional, call John Hancock Investment Management at 800-225-5291, or visit our website at jhinvestments.com. Please read the prospectus carefully before investing or sending money.
| | | |
ASSET ALLOCATION
Balanced
Income Allocation
Multi-Index Lifetime Portfolios
Multi-Index Preservation Portfolios
Multimanager Lifestyle Portfolios
Multimanager Lifetime Portfolios
Retirement Income 2040
EXCHANGE-TRADED FUNDS
John Hancock Multifactor Consumer Discretionary ETF
John Hancock Multifactor Consumer Staples ETF
John Hancock Multifactor Developed International ETF
John Hancock Multifactor Emerging Markets ETF
John Hancock Multifactor Energy ETF
John Hancock Multifactor Financials ETF
John Hancock Multifactor Healthcare ETF
John Hancock Multifactor Industrials ETF
John Hancock Multifactor Large Cap ETF
John Hancock Multifactor Materials ETF
John Hancock Multifactor Media and
Communications ETF
John Hancock Multifactor Mid Cap ETF
John Hancock Multifactor Small Cap ETF
John Hancock Multifactor Technology ETF
John Hancock Multifactor Utilities ETF
| | ENVIRONMENTAL, SOCIAL, AND
GOVERNANCE FUNDS
ESG All Cap Core
ESG Core Bond
ESG International Equity
ESG Large Cap Core
CLOSED-END FUNDS
Financial Opportunities
Hedged Equity & Income
Income Securities Trust
Investors Trust
Preferred Income
Preferred Income II
Preferred Income III
Premium Dividend
Tax-Advantaged Dividend Income
Tax-Advantaged Global Shareholder Yield
|
John Hancock Multifactor ETF shares are bought and sold at market price (not NAV), and are not individually redeemed from the fund. Brokerage commissions will reduce returns.
John Hancock ETFs are distributed by Foreside Fund Services, LLC, and are subadvised by Dimensional Fund Advisors LP. Foreside is not affiliated with John Hancock Investment Management Distributors LLC or Dimensional Fund Advisors LP.
Dimensional Fund Advisors LP receives compensation from John Hancock in connection with licensing rights to the John Hancock Dimensional indexes. Dimensional Fund Advisors LP does not sponsor, endorse, or sell, and makes no representation as to the advisability of investing in, John Hancock Multifactor ETFs.
John Hancock Investment Management
A trusted brand
John Hancock Investment Management is a premier asset manager representing one of America's most
trusted brands, with a heritage of financial stewardship dating back to 1862. Helping our shareholders
pursue their financial goals is at the core of everything we do. It's why we support the role of professional
financial advice and operate with the highest standards of conduct and integrity.
A better way to invest
We serve investors globally through a unique multimanager approach: We search the world to find
proven portfolio teams with specialized expertise for every strategy we offer, then we apply robust
investment oversight to ensure they continue to meet our uncompromising standards and serve the
best interests of our shareholders.
Results for investors
Our unique approach to asset management enables us to provide a diverse set of investments backed
by some of the world's best managers, along with strong risk-adjusted returns across asset classes.
John Hancock Investment Management Distributors LLC n Member FINRA, SIPC
200 Berkeley Street n Boston, MA 02116-5010 n 800-225-5291 n jhinvestments.com
This report is for the information of the shareholders of John Hancock Multi-Index Lifetime Portfolios. It is not authorized for distribution to prospective investors unless preceded or accompanied by a prospectus.
John Hancock
Multi-Index Preservation Portfolios
Semiannual report 2/29/2020
Beginning on January 1, 2021, as permitted by regulations adopted by the Securities and Exchange Commission, paper copies of the fund's shareholder reports like this one will no longer be sent by mail, unless you specifically request paper copies of the reports from the fund or from your financial intermediary. Instead, the reports will be made available on a website, and you will be notified by mail each time a report is posted and provided with a website link to access the report.
If you already elected to receive shareholder reports electronically, you will not be affected by this change, and you do not need to take any action. You may elect to receive shareholder reports and other communications electronically by calling John Hancock Investment Management at 888-972-8696 (Class R1, Class R2, Class R4, and Class R6 shares) or by contacting your financial intermediary.
You may elect to receive all reports in paper, free of charge, at any time. You can inform John Hancock Investment Management or your financial intermediary that you wish to continue receiving paper copies of your shareholder reports by following the instructions listed above. Your election to receive reports in paper will apply to all funds held with John Hancock Investment Management or your financial intermediary.
A message to shareholders
Dear shareholder,
Global financial markets were on pace to deliver strong returns during the 6 months ended February 29, 2020, until heightened fears over the coronavirus (COVID-19) sent the markets skidding during the last week of the period. Prior to the turbulence, investors benefited from a combination of low inflation, accommodative central bank policy, healthy fundamentals, and corporate buybacks of stock. Investors in non-U.S. equities also saw strong gains, fueled in part by similarly supportive monetary policy and some signs of strength in developing markets. In an environment of low inflation and declining interest rates, bonds were also faring well.
However, the COVID-19 pandemic and plummeting oil prices put an end to all that good news. Shortly after period end, the U.S. Federal Reserve lowered interest rates and lawmakers embarked on a plan to launch major fiscal stimulus to support the economy.
After the longest bull market in U.S. history, we're now in bear market territory. Indeed, the spread of COVID-19, trade disputes, rising unemployment, and other geopolitical tensions may continue to create uncertainty among businesses and investors. Your financial professional can helpposition your portfolio so that it's sufficiently diversified to seek to meet your long-term objectives and to withstand the inevitable bouts of market volatility along the way.
On behalf of everyone at John Hancock Investment Management, I'd like to take this opportunity to welcome new shareholders and thank existing shareholders for the continued trust you've placed in us.
Sincerely,
Andrew G. Arnott
President and CEO,
John Hancock Investment Management
Head of Wealth and Asset Management,
United States and Europe
This commentary reflects the CEO's views as of this report's period end and are subject to change at any time. Diversification does not guarantee investment returns and does not eliminate risk of loss. All investments entail risks, including the possible loss of principal. For more up-to-date information, you can visit our website at jhinvestments.com.
.
John Hancock
Multi-Index Preservation Portfolios
Table of contents
| | | | |
| 2 | | Multi-Index Preservation Portfolios at a glance |
| 3 | | Portfolio summary |
| 4 | | Multi-Index 2060 Preservation Portfolio |
| 5 | | Multi-Index 2055 Preservation Portfolio |
| 6 | | Multi-Index 2050 Preservation Portfolio |
| 7 | | Multi-Index 2045 Preservation Portfolio |
| 8 | | Multi-Index 2040 Preservation Portfolio |
| 9 | | Multi-Index 2035 Preservation Portfolio |
| 10 | | Multi-Index 2030 Preservation Portfolio |
| 11 | | Multi-Index 2025 Preservation Portfolio |
| 12 | | Multi-Index 2020 Preservation Portfolio |
| 13 | | Multi-Index Income Preservation Portfolio |
| 14 | | Your expenses |
| 17 | | Portfolios' investments |
| 23 | | Financial statements |
| 33 | | Financial highlights |
| 43 | | Notes to financial statements |
| 60 | | More information |
SEMIANNUAL REPORT | JOHN HANCOCK MULTI-INDEX PRESERVATION PORTFOLIOS 1
Multi-Index Preservation Portfolios at a glance
A SIMPLE, STRATEGIC PATH TO HELP YOU REACH YOUR RETIREMENT GOALS
Multi-Index Preservation Portfolios make diversification easy because the asset mix of each portfolio automatically changes over time.
| • | Portfolios with dates further off initially invest more aggressively in stock funds. |
| • | As a portfolio approaches its target date,1 the allocation will gradually migrate to a more conservative mix to lessen risk and narrow the range of possible outcomes at the retirement date. |
| • | On reaching the retirement date, the allocation ceases to shift; we expect that the participant may then wish to use the savings to seek a retirement income solution. |
JOHN HANCOCK MULTI-INDEX PRESERVATION PORTFOLIOS—AUTOMATICALLY ADJUST OVER TIME2
The chart below illustrates how the asset allocation mix of John Hancock Multi-Index Preservation Portfolio adjusts over time.
The principal value of each portfolio is not guaranteed and you could lose money at any time, including at or after the target date.
The portfolios recently experienced negative short-term performance due to market volatility associated with the COVID-19 pandemic.
1 Based on an estimated retirement date.
2 Allocations may vary as a result of market activity or cash allocations held during unusual market or economic conditions.
SEMIANNUAL REPORT | JOHN HANCOCK MULTI-INDEX PRESERVATION PORTFOLIOS 2
MULTI-INDEX 2060-2020 AND INCOME PRESERVATION PORTFOLIOS' CLASS 1 SHARE RETURNS (%)
For the six months ended 2/29/2020
MARKET INDEX TOTAL RETURNS
For the six month period ended 2/29/20
| | | |
| U.S. Stocks | S&P 500 Index | 1.92% |
| Russell Midcap Index | -1.11% |
| Russell 2000 Index | -0.52% |
| FTSE NAREIT All Equity REIT Index | -3.95% |
| International Stocks | MSCI EAFE Index | -0.91% |
| MSCI Emerging Markets Index | 2.93% |
| MSCI EAFE Small Cap Index | 0.42% |
| Fixed Income | Bloomberg Barclays U.S. Aggregate Bond Index | 3.39% |
| ICE Bank of America U.S. High Yield Master II Index | 1.31% |
| JP Morgan Global Government Bonds Unhedged Index | 1.11% |
SEMIANNUAL REPORT | JOHN HANCOCK MULTI-INDEX PRESERVATION PORTFOLIOS 3
Multi-Index 2060 Preservation Portfolio
GROWTH OF $10,000
This chart shows what happened to a hypothetical $10,000 investment in John Hancock Multi-Index 2060 Preservation Portfolio for the share classes and periods indicated, assuming all distributions were reinvested. For comparison, we've shown the same investment in two blended indexes and three separate indexes.
Index 1 is the S&P Target Date to 2060+ Index, an unmanaged index comprised of a set of indices aligned with specific target date years.
Index 2 is the Bloomberg Barclays U.S. Aggregate Bond Index, an unmanaged index of dollar-denominated and nonconvertible investment-grade debt issues.
Index 3 is the John Hancock 2060 Preservation Index, which is based on the fund's asset allocation glide path and will reflect a more conservative allocation over time. The index is a customized blended index comprising some or all of the following component indices (ordered alphabetically): Bloomberg Barclays U.S. Aggregate Bond Index, Bloomberg Barclays U.S. Corporate Bond 1-5 Year Index, Bloomberg Barclays U.S. Treasury TIPS 1-5 Year Index, ICE BofA Long U.S. Treasury Principal STRIPS Index, ICE BofA U.S. High Yield Index, JP Morgan Emerging Markets Bond Index Global, MSCI Emerging Markets Index, MSCI World Energy Index, MSCI World ex-USA Index, MSCI World Metals & Mining Index, Russell 2500 Index, S&P 500 Index, S&P Global ex-U.S. REIT Index, S&P Global Infrastructure Index, S&P U.S. REIT Index, and S&P/LSTA Leveraged Loan Index.
Index 4 is the S&P 500 Index, an unmanaged index that includes 500 widely traded common stocks.
Index 5 is 57.40% Russell 3000 Index, 24.60% MSCI ACWI ex-USA Index, 18.00% Bloomberg Barclays U.S. Aggregate Bond Index.
Prior to January 1, 2020, the fund's primary benchmark was the S&P 500 Index. Effective January 1, 2020, the fund's primary benchmark index is the S&P Target Date to 2060+ Index. The S&P Target Date to 2060+ Index better reflects the universe of investment opportunities based on the fund's current investment strategy.
It is not possible to invest directly in an index. Index figures do not reflect expenses or sales charges, which would result in lower returns.
ASSET ALLOCATION (%)
| | | |
| Affiliated investment companies | 68.2 |
| | Large blend | 68.2 |
Unaffiliated investment companies/
Exchange-traded funds | 23.8 |
| | Fixed income | 11.9 |
| | Equity | 11.9 |
| U.S. Government | 7.9 |
| Short-term investments | 0.1 |
As a percentage of total investments.
PERFORMANCE CHART
Total returns for the period ended 2-29-20 (%)
| | | | | | | | | | | |
| | Class R11 | Class R21 | Class R41 | Class R61 | Class 11 | Index 1 | Index 2 | Index 3 | Index 4 | Index 5 | |
| Inception | 3-30-16 | 3-30-16 | 3-30-16 | 3-30-16 | 3-30-16 | 3-30-16 | 3-30-16 | 3-30-16 | 3-30-16 | 3-30-16 | |
| Average annual total returns | | | | | | | | | | | |
| 1-year | 5.08 | 5.17 | 5.44 | 5.60 | 5.55 | 3.33 | 11.68 | 9.89 | 8.19 | 6.06 | |
| Since inception | 8.04 | 8.27 | 8.42 | 8.59 | 8.54 | 8.37 | 4.00 | 10.09 | 11.94 | 9.12 | |
| Cumulative returns | | | | | | | | | | | |
| 6-months | 2.04 | 2.21 | 2.30 | 2.28 | 2.32 | 0.54 | 3.39 | 3.25 | 1.92 | 1.80 | |
| Since inception | 35.40 | 36.55 | 37.30 | 38.14 | 37.90 | 37.03 | 16.61 | 45.76 | 55.59 | 40.82 | |
Performance figures assume all distributions have been reinvested.
The expense ratios of the portfolio, both net (including any fee waivers and/or expense limitations) and gross (excluding any fee waivers and/or expense limitations), are set forth according to the most recent publicly available prospectuses for the portfolio and may differ from those disclosed in the Financial highlights tables in this report. Net expenses reflect contractual expense limitations in effect until December 31, 2020 and are subject to change. Had the contractual fee waivers and expense limitations not been in place, gross expenses would apply. The following expense ratios include the expenses of the underlying funds in which the portfolio invests. The expense ratios are as follows:
| | | | | | |
| | Class R1 | Class R2 | Class R4 | Class R6 | Class 1 |
| Gross (%) | 1.60 | 1.35 | 1.20 | 0.85 | 0.89 |
| Net (%) | 1.13 | 0.88 | 0.63 | 0.37 | 0.42 |
Please refer to the most recent prospectus and annual or semiannual report for more information on expenses and any expense limitation arrangements for each class.
The returns reflect past results and should not be considered indicative of future performance. The return and principal value of an investment will fluctuate so that shares, when redeemed, may be worth more or less than their original cost. Due to market volatility and other factors, the portfolio's current performance may be higher or lower than the performance shown. For current to the most recent month-end performance data, please call 800-225-5291 or visit the portfolio's website at jhinvestments.com.
This performance information does not reflect the deduction of taxes that a shareholder may pay on portfolio distributions or the redemption of portfolio shares. The portfolio's performance results reflect any applicable fee waivers or expense reductions, without which the expenses would increase and results would have been less favorable.
| 1 | For certain types of investors, as described in the portfolio's prospectuses. |
SEMIANNUAL REPORT | JOHN HANCOCK MULTI-INDEX PRESERVATION PORTFOLIOS 4
Multi-Index 2055 Preservation Portfolio
GROWTH OF $10,000
This chart shows what happened to a hypothetical $10,000 investment in John Hancock Multi-Index 2055 Preservation Portfolio for the share classes and periods indicated, assuming all distributions were reinvested. For comparison, we've shown the same investment in two blended indexes and three separate indexes.
Index 1 is the S&P Target Date to 2055 Index, an unmanaged index comprised of a set of indices aligned with specific target date years.
Index 2 is the Bloomberg Barclays U.S. Aggregate Bond Index, an unmanaged index of dollar-denominated and nonconvertible investment-grade debt issues.
Index 3 isthe John Hancock 2055 Preservation Index, which is based on the fund's asset allocation glide path and will reflect a more conservative allocation over time. The index is a customized blended index comprising some or all of the following component indices (ordered alphabetically): Bloomberg Barclays U.S. Aggregate Bond Index, Bloomberg Barclays U.S. Corporate Bond 1-5 Year Index, Bloomberg Barclays U.S. Treasury TIPS 1-5 Year Index, ICE BofA Long U.S. Treasury Principal STRIPS Index, ICE BofA U.S. High Yield Index, JP Morgan Emerging Markets Bond Index Global, MSCI Emerging Markets Index, MSCI World Energy Index, MSCI World ex-USA Index, MSCI World Metals & Mining Index, Russell 2500 Index, S&P 500 Index, S&P Global ex-U.S. REIT Index, S&P Global Infrastructure Index, S&P U.S. REIT Index, and S&P/LSTA Leveraged Loan Index.
Index 4 is the S&P 500 Index, an unmanaged index that includes 500 widely traded common stocks.
Index 5 is 57.40% Russell 3000 Index, 24.60% MSCI ACWI ex-USA Index, 18.00% Bloomberg Barclays U.S. Aggregate Bond Index.
Prior to January 1, 2020, the fund's primary benchmark was the S&P 500 Index. Effective January 1, 2020, the fund's primary benchmark index is the S&P Target Date to 2055 Index. The S&P Target Date to 2055 Index better reflects the universe of investment opportunities based on the fund's current investment strategy.
It is not possible to invest directly in an index. Index figures do not reflect expenses or sales charges, which would result in lower returns.
ASSET ALLOCATION (%)
| | | |
| Affiliated investment companies | 68.0 |
| | Large blend | 68.0 |
Unaffiliated investment companies/
Exchange-traded funds | 23.6 |
| | Fixed income | 12.0 |
| | Equity | 11.6 |
| U.S. Government | 8.3 |
| Short-term investments | 0.1 |
As a percentage of total investments.
PERFORMANCE CHART
Total returns for the period ended 2-29-20 (%)
| | | | | | | | | | | |
| | Class R11 | Class R21 | Class R41 | Class R61 | Class 11 | Index 1 | Index 2 | Index 3 | Index 4 | Index 5 |
| Inception | 3-26-14 | 3-26-14 | 3-26-14 | 3-26-14 | 3-26-14 | 3-26-14 | 3-26-14 | 3-26-14 | 3-26-14 | 3-26-14 |
| Average annual total returns | | | | | | | | | | |
| 1-year | 5.16 | 5.21 | 5.51 | 5.67 | 5.61 | 3.07 | 11.68 | 9.89 | 8.19 | 6.06 |
| 5-year | 5.36 | 5.55 | 5.74 | 5.89 | 5.84 | 5.60 | 3.58 | 7.06 | 9.23 | 6.33 |
| Since inception | 5.99 | 6.21 | 6.40 | 6.56 | 6.51 | 6.05 | 3.92 | 8.11 | 10.29 | 6.97 |
| Cumulative returns | | | | | | | | | | |
| 6-months | 2.16 | 2.20 | 2.41 | 2.37 | 2.41 | 0.36 | 3.39 | 3.25 | 1.92 | 1.80 |
| 5-year | 29.83 | 31.01 | 32.21 | 33.15 | 32.83 | 31.29 | 19.21 | 40.62 | 55.49 | 35.92 |
| Since inception | 41.23 | 42.92 | 44.49 | 45.79 | 45.39 | 41.66 | 25.62 | 58.78 | 78.79 | 49.17 |
Performance figures assume all distributions have been reinvested.
The expense ratios of the portfolio, both net (including any fee waivers and/or expense limitations) and gross (excluding any fee waivers and/or expense limitations), are set forth according to the most recent publicly available prospectuses for the portfolio and may differ from those disclosed in the Financial highlights tables in this report. Net expenses reflect contractual expense limitations in effect until December 31, 2020 and are subject to change. Had the contractual fee waivers and expense limitations not been in place, gross expenses would apply. The following expense ratios include the expenses of the underlying funds in which the portfolio invests. The expense ratios are as follows:
| | | | | | |
| | Class R1 | Class R2 | Class R4 | Class R6 | Class 1 |
| Gross (%) | 1.46 | 1.21 | 1.06 | 0.71 | 0.75 |
| Net (%) | 1.14 | 0.89 | 0.64 | 0.38 | 0.43 |
Please refer to the most recent prospectus and annual or semiannual report for more information on expenses and any expense limitation arrangements for each class.
The returns reflect past results and should not be considered indicative of future performance. The return and principal value of an investment will fluctuate so that shares, when redeemed, may be worth more or less than their original cost. Due to market volatility and other factors, the portfolio's current performance may be higher or lower than the performance shown. For current to the most recent month-end performance data, please call 800-225-5291 or visit the portfolio's website at jhinvestments.com.
This performance information does not reflect the deduction of taxes that a shareholder may pay on portfolio distributions or the redemption of portfolio shares. The portfolio's performance results reflect any applicable fee waivers or expense reductions, without which the expenses would increase and results would have been less favorable.
| 1 | For certain types of investors as described in the portfolio's prospectuses. |
SEMIANNUAL REPORT | JOHN HANCOCK MULTI-INDEX PRESERVATION PORTFOLIOS 5
Multi-Index 2050 Preservation Portfolio
GROWTH OF $10,000
This chart shows what happened to a hypothetical $10,000 investment in John Hancock Multi-Index 2050 Preservation Portfolio for the share classes and periods indicated, assuming all distributions were reinvested. For comparison, we've shown the same investment in two blended indexes and three separate indexes.
Index 1 isthe S&P Target Date to 2050 Index, an unmanaged index comprised of a set of indices aligned with specific target date years.
Index 2 is the Bloomberg Barclays U.S. Aggregate Bond Index, an unmanaged index of dollar-denominated and nonconvertible investment-grade debt issues.
Index 3 isthe John Hancock 2050 Preservation Index, which is based on the fund's asset allocation glide path and will reflect a more conservative allocation over time. The index is a customized blended index comprising some or all of the following component indices (ordered alphabetically): Bloomberg Barclays U.S. Aggregate Bond Index, Bloomberg Barclays U.S. Corporate Bond 1-5 Year Index, Bloomberg Barclays U.S. Treasury TIPS 1-5 Year Index, ICE BofA Long U.S. Treasury Principal STRIPS Index, ICE BofA U.S. High Yield Index, JP Morgan Emerging Markets Bond Index Global, MSCI Emerging Markets Index, MSCI World Energy Index, MSCI World ex-USA Index, MSCI World Metals & Mining Index, Russell 2500 Index, S&P 500 Index, S&P Global ex-U.S. REIT Index, S&P Global Infrastructure Index, S&P U.S. REIT Index, and S&P/LSTA Leveraged Loan Index..
Index 4 is the S&P 500 Index, an unmanaged index that includes 500 widely traded common stocks.
Index 5 is 57.40% Russell 3000 Index, 24.60% MSCI ACWI ex-USA Index, 18.00% Bloomberg Barclays U.S. Aggregate Bond Index.
Prior to January 1, 2020, the fund's primary benchmark was the S&P 500 Index. Effective January 1, 2020, the fund's primary benchmark index is the S&P Target Date to 2050 Index. The S&P Target Date to 2050 Index better reflects the universe of investment opportunities based on the fund's current investment strategy.
It is not possible to invest directly in an index. Index figures do not reflect expenses or sales charges, which would result in lower returns.
ASSET ALLOCATION (%)
| | | |
| Affiliated investment companies | 68.0 |
| | Large blend | 68.0 |
Unaffiliated investment companies/
Exchange-traded funds | 23.6 |
| | Fixed income | 11.9 |
| | Equity | 11.7 |
| U.S. Government | 8.3 |
| Short-term investments | 0.1 |
As a percentage of total investments.
PERFORMANCE CHART
Total returns for the period ended 2-29-20 (%)
| | | | | | | | | | | |
| | Class R11,2 | Class R21,2 | Class R41,2 | Class R61,2 | Class 11 | Index 1 | Index 2 | Index 3 | Index 4 | Index 5 |
| Inception | 4-29-11 | 4-29-11 | 4-29-11 | 4-29-11 | 4-29-11 | 4-29-11 | 4-29-11 | 4-29-11 | 4-29-11 | 4-29-11 |
| Average annual total returns | | | | | | | | | | |
| 1-year | 4.86 | 5.11 | 5.44 | 5.72 | 5.57 | 3.36 | 11.68 | 9.89 | 8.19 | 6.06 |
| 5-year | 5.16 | 5.43 | 5.69 | 5.89 | 5.84 | 5.56 | 3.58 | 7.06 | 9.23 | 6.33 |
| Since inception | 6.51 | 6.74 | 6.94 | 7.15 | 7.10 | 6.85 | 3.75 | 8.84 | 11.48 | 7.68 |
| Cumulative returns | | | | | | | | | | |
| 6-months | 2.01 | 2.17 | 2.33 | 2.41 | 2.36 | 0.54 | 3.39 | 3.25 | 1.92 | 1.80 |
| 5-year | 28.62 | 30.26 | 31.91 | 33.16 | 32.81 | 31.04 | 19.21 | 40.62 | 55.49 | 35.92 |
| Since inception | 74.58 | 77.94 | 81.01 | 84.11 | 83.36 | 79.58 | 38.48 | 111.35 | 161.33 | 92.39 |
Performance figures assume all distributions have been reinvested.
The expense ratios of the portfolio, both net (including any fee waivers and/or expense limitations) and gross (excluding any fee waivers and/or expense limitations), are set forth according to the most recent publicly available prospectuses for the portfolio and may differ from those disclosed in the Financial highlights tables in this report. Net expenses reflect contractual expense limitations in effect until December 31, 2020 and are subject to change. Had the contractual fee waivers and expense limitations not been in place, gross expenses would apply. The following expense ratios include the expenses of the underlying funds in which the portfolio invests. The expense ratios are as follows:
| | | | | | |
| | Class R1 | Class R2 | Class R4 | Class R6 | Class 1 |
| Gross (%) | 1.43 | 1.18 | 1.03 | 0.68 | 0.72 |
| Net (%) | 1.14 | 0.89 | 0.64 | 0.38 | 0.43 |
Please refer to the most recent prospectus and annual or semiannual report for more information on expenses and any expense limitation arrangements for each class.
The returns reflect past results and should not be considered indicative of future performance. The return and principal value of an investment will fluctuate so that shares, when redeemed, may be worth more or less than their original cost. Due to market volatility and other factors, the portfolio's current performance may be higher or lower than the performance shown. For current to the most recent month-end performance data, please call 800-225-5291 or visit the portfolio's website at jhinvestments.com.
This performance information does not reflect the deduction of taxes that a shareholder may pay on portfolio distributions or the redemption of portfolio shares. The portfolio's performance results reflect any applicable fee waivers or expense reductions, without which the expenses would increase and results would have been less favorable.
| 1 | For certain types of investors as described in the portfolio's prospectuses. |
| 2 | Class R1, Class R2, and Class R6 shares were first offered on 9-4-12. Class R4 shares were first offered on 5-1-12. Returns prior to these dates are those of Class 1 shares that have not been adjusted for class-specific expenses; otherwise, returns would vary. |
SEMIANNUAL REPORT | JOHN HANCOCK MULTI-INDEX PRESERVATION PORTFOLIOS 6
Multi-Index 2045 Preservation Portfolio
GROWTH OF $10,000
This chart shows what happened to a hypothetical $10,000 investment in John Hancock Multi-Index 2045 Preservation Portfolio for the share classes and periods indicated, assuming all distributions were reinvested. For comparison, we've shown the same investment in two blended indexes and three separate indexes.
Index 1 isthe S&P Target Date to 2045 Index, an unmanaged index comprised of a set of indices aligned with specific target date years.
Index 2 is the Bloomberg Barclays U.S. Aggregate Bond Index, an unmanaged index of dollar-denominated and nonconvertible investment-grade debt issues.
Index 3 is the John Hancock 2045 Preservation Index, which is based on the fund's asset allocation glide path and will reflect a more conservative allocation over time. The index is a customized blended index comprising some or all of the following component indices (ordered alphabetically): Bloomberg Barclays U.S. Aggregate Bond Index, Bloomberg Barclays U.S. Corporate Bond 1-5 Year Index, Bloomberg Barclays U.S. Treasury TIPS 1-5 Year Index, ICE BofA Long U.S. Treasury Principal STRIPS Index, ICE BofA U.S. High Yield Index, JP Morgan Emerging Markets Bond Index Global, MSCI Emerging Markets Index, MSCI World Energy Index, MSCI World ex-USA Index, MSCI World Metals & Mining Index, Russell 2500 Index, S&P 500 Index, S&P Global ex-U.S. REIT Index, S&P Global Infrastructure Index, S&P U.S. REIT Index, and S&P/LSTA Leveraged Loan Index.
Index 4 is the S&P 500 Index, an unmanaged index that includes 500 widely traded common stocks.
Index 5 is 56.00% Russell 3000 Index, 24.00% MSCI ACWI ex-USA Index, 20.00% Bloomberg Barclays U.S. Aggregate Bond Index.
Prior to January 1, 2020, the fund's primary benchmark was the S&P 500 Index. Effective January 1, 2020, the fund's primary benchmark index is the S&P Target Date to 2045 Index. The S&P Target Date to 2045 Index better reflects the universe of investment opportunities based on the fund's current investment strategy.
It is not possible to invest directly in an index. Index figures do not reflect expenses or sales charges, which would result in lower returns.
ASSET ALLOCATION (%)
| | | |
| Affiliated investment companies | 66.3 |
| | Large blend | 66.3 |
Unaffiliated investment companies/
Exchange-traded funds | 24.7 |
| | Fixed income | 13.0 |
| | Equity | 11.7 |
| U.S. Government | 8.2 |
| Short-term investments | 0.8 |
As a percentage of total investments.
PERFORMANCE CHART
Total returns for the period ended 2-29-20 (%)
| | | | | | | | | | | |
| | Class R11,2 | Class R21,2 | Class R41,2 | Class R61,2 | Class 11 | Index 1 | Index 2 | Index 3 | Index 4 | Index 5 |
| Inception | 4-30-10 | 4-30-10 | 4-30-10 | 4-30-10 | 4-30-10 | 4-30-10 | 4-30-10 | 4-30-10 | 4-30-10 | 4-30-10 |
| Average annual total returns | | | | | | | | | | |
| 1-year | 4.93 | 5.16 | 5.56 | 5.75 | 5.70 | 3.42 | 11.68 | 9.89 | 8.19 | 6.23 |
| 5-year | 5.09 | 5.35 | 5.70 | 5.89 | 5.84 | 5.45 | 3.58 | 7.04 | 9.23 | 6.34 |
| Since inception | 7.23 | 7.44 | 7.67 | 7.84 | 7.80 | 7.63 | 3.93 | 9.58 | 11.84 | 8.44 |
| Cumulative returns | | | | | | | | | | |
| 6-months | 2.01 | 2.09 | 2.27 | 2.43 | 2.38 | 0.49 | 3.39 | 3.23 | 1.92 | 1.89 |
| 5-year | 28.19 | 29.78 | 31.94 | 33.12 | 32.79 | 30.41 | 19.21 | 40.54 | 55.49 | 36.00 |
| Since inception | 98.74 | 102.53 | 106.90 | 110.16 | 109.35 | 106.11 | 46.09 | 145.86 | 200.53 | 121.88 |
Performance figures assume all distributions have been reinvested.
The expense ratios of the portfolio, both net (including any fee waivers and/or expense limitations) and gross (excluding any fee waivers and/or expense limitations), are set forth according to the most recent publicly available prospectuses for the portfolio and may differ from those disclosed in the Financial highlights tables in this report. Net expenses reflect contractual expense limitations in effect until December 31, 2020 and are subject to change. Had the contractual fee waivers and expense limitations not been in place, gross expenses would apply. The following expense ratios include the expenses of the underlying funds in which the portfolio invests. The expense ratios are as follows:
| | | | | | |
| | Class R1 | Class R2 | Class R4 | Class R6 | Class 1 |
| Gross (%) | 1.43 | 1.18 | 1.03 | 0.68 | 0.72 |
| Net (%) | 1.13 | 0.88 | 0.63 | 0.37 | 0.42 |
Please refer to the most recent prospectus and annual or semiannual report for more information on expenses and any expense limitation arrangements for each class.
The returns reflect past results and should not be considered indicative of future performance. The return and principal value of an investment will fluctuate so that shares, when redeemed, may be worth more or less than their original cost. Due to market volatility and other factors, the portfolio's current performance may be higher or lower than the performance shown. For current to the most recent month-end performance data, please call 800-225-5291 or visit the portfolio's website at jhinvestments.com.
This performance information does not reflect the deduction of taxes that a shareholder may pay on portfolio distributions or the redemption of portfolio shares. The portfolio's performance results reflect any applicable fee waivers or expense reductions, without which the expenses would increase and results would have been less favorable.
| 1 | For certain types of investors as described in the portfolio's prospectuses. |
| 2 | Class R1, Class R2, and Class R6 shares were first offered on 9-4-12. Class R4 shares were first offered on 5-1-12. Returns prior to these dates are those of Class 1 shares that have not been adjusted for class-specific expenses; otherwise, returns would vary. |
SEMIANNUAL REPORT | JOHN HANCOCK MULTI-INDEX PRESERVATION PORTFOLIOS 7
Multi-Index 2040 Preservation Portfolio
GROWTH OF $10,000
This chart shows what happened to a hypothetical $10,000 investment in John Hancock Multi-Index 2040 Preservation Portfolio for the share classes and periods indicated, assuming all distributions were reinvested. For comparison, we've shown the same investment in two blended indexes and three separate indexes.
Index 1 isthe S&P Target Date to 2040 Index, an unmanaged index comprised of a set of indices aligned with specific target date years.
Index 2 is the Bloomberg Barclays U.S. Aggregate Bond Index, an unmanaged index of dollar-denominated and nonconvertible investment-grade debt issues.
Index 3 isthe John Hancock 2040 Preservation Index, which is based on the fund's asset allocation glide path and will reflect a more conservative allocation over time. The index is a customized blended index comprising some or all of the following component indices (ordered alphabetically): Bloomberg Barclays U.S. Aggregate Bond Index, Bloomberg Barclays U.S. Corporate Bond 1-5 Year Index, Bloomberg Barclays U.S. Treasury TIPS 1-5 Year Index, ICE BofA Long U.S. Treasury Principal STRIPS Index, ICE BofA U.S. High Yield Index, JP Morgan Emerging Markets Bond Index Global, MSCI Emerging Markets Index, MSCI World Energy Index, MSCI World ex-USA Index, MSCI World Metals & Mining Index, Russell 2500 Index, S&P 500 Index, S&P Global ex-U.S. REIT Index, S&P Global Infrastructure Index, S&P U.S. REIT Index, and S&P/LSTA Leveraged Loan Index.
Index 4 is the S&P 500 Index, an unmanaged index that includes 500 widely traded common stocks.
Index 5 is 51.80% Russell 3000 Index, 22.20% MSCI ACWI ex-USA Index, 26.00% Bloomberg Barclays U.S. Aggregate Bond Index.
Prior to January 1, 2020, the fund's primary benchmark was the S&P 500 Index. Effective January 1, 2020, the fund's primary benchmark index is the S&P Target Date to 2040 Index. The S&P Target Date to 2040 Index better reflects the universe of investment opportunities based on the fund's current investment strategy.
It is not possible to invest directly in an index. Index figures do not reflect expenses or sales charges, which would result in lower returns.
ASSET ALLOCATION (%)
| | | |
| Affiliated investment companies | 62.9 |
| | Large blend | 62.9 |
Unaffiliated investment companies/
Exchange-traded funds | 28.8 |
| | Fixed income | 17.9 |
| | Equity | 10.9 |
| U.S. Government | 8.2 |
| Short-term investments | 0.1 |
As a percentage of total investments.
PERFORMANCE CHART
Total returns for the period ended 2-29-20 (%)
| | | | | | | | | | | |
| | Class R11,2 | Class R21,2 | Class R41,2 | Class R61,2 | Class 11 | Index 1 | Index 2 | Index 3 | Index 4 | Index 5 |
| Inception | 4-30-10 | 4-30-10 | 4-30-10 | 4-30-10 | 4-30-10 | 4-30-10 | 4-30-10 | 4-30-10 | 4-30-10 | 4-30-10 |
| Average annual total returns | | | | | | | | | | |
| 1-year | 5.35 | 5.57 | 5.82 | 6.11 | 6.03 | 3.78 | 11.68 | 10.27 | 8.19 | 6.73 |
| 5-year | 5.11 | 5.36 | 5.62 | 5.81 | 5.76 | 5.38 | 3.58 | 6.99 | 9.23 | 6.25 |
| Since inception | 7.21 | 7.39 | 7.61 | 7.77 | 7.74 | 7.40 | 3.93 | 9.51 | 11.84 | 8.35 |
| Cumulative returns | | | | | | | | | | |
| 6-months | 2.17 | 2.30 | 2.33 | 2.50 | 2.44 | 0.74 | 3.39 | 3.30 | 1.92 | 2.12 |
| 5-year | 28.30 | 29.80 | 31.45 | 32.61 | 32.31 | 29.96 | 19.21 | 40.16 | 55.49 | 35.42 |
| Since inception | 98.33 | 101.68 | 105.65 | 108.74 | 108.12 | 101.76 | 46.09 | 144.28 | 200.53 | 120.07 |
Performance figures assume all distributions have been reinvested.
The expense ratios of the portfolio, both net (including any fee waivers and/or expense limitations) and gross (excluding any fee waivers and/or expense limitations), are set forth according to the most recent publicly available prospectuses for the portfolio and may differ from those disclosed in the Financial highlights tables in this report. Net expenses reflect contractual expense limitations in effect until December 31, 2020 and are subject to change. Had the contractual fee waivers and expense limitations not been in place, gross expenses would apply. The following expense ratios include the expenses of the underlying funds in which the portfolio invests. The expense ratios are as follows:
| | | | | | |
| | Class R1 | Class R2 | Class R4 | Class R6 | Class 1 |
| Gross (%) | 1.42 | 1.17 | 1.02 | 0.67 | 0.71 |
| Net (%) | 1.12 | 0.87 | 0.62 | 0.36 | 0.41 |
Please refer to the most recent prospectus and annual or semiannual report for more information on expenses and any expense limitation arrangements for each class.
The returns reflect past results and should not be considered indicative of future performance. The return and principal value of an investment will fluctuate so that shares, when redeemed, may be worth more or less than their original cost. Due to market volatility and other factors, the portfolio's current performance may be higher or lower than the performance shown. For current to the most recent month-end performance data, please call 800-225-5291 or visit the portfolio's website at jhinvestments.com.
This performance information does not reflect the deduction of taxes that a shareholder may pay on portfolio distributions or the redemption of portfolio shares. The portfolio's performance results reflect any applicable fee waivers or expense reductions, without which the expenses would increase and results would have been less favorable.
| 1 | For certain types of investors as described in the portfolio's prospectuses. |
| 2 | Class R1, Class R2, and Class R6 shares were first offered on 9-4-12. Class R4 shares were first offered on 5-1-12. Returns prior to these dates are those of Class 1 shares that have not been adjusted for class- specific expenses; otherwise, returns would vary. |
SEMIANNUAL REPORT | JOHN HANCOCK MULTI-INDEX PRESERVATION PORTFOLIOS 8
Multi-Index 2035 Preservation Portfolio
GROWTH OF $10,000
This chart shows what happened to a hypothetical $10,000 investment in John Hancock Multi-Index 2035 Preservation Portfolio for the share classes and periods indicated, assuming all distributions were reinvested. For comparison, we've shown the same investment in two blended indexes and three separate indexes.
Index 1 isthe S&P Target Date to 2035 Index, an unmanaged index comprised of a set of indices aligned with specific target date years.
Index 2 is the Bloomberg Barclays U.S. Aggregate Bond Index, an unmanaged index of dollar-denominated and nonconvertible investment-grade debt issues.
Index 3 isthe John Hancock 2035 Preservation Index, which is based on the fund's asset allocation glide path and will reflect a more conservative allocation over time. The index is a customized blended index comprising some or all of the following component indices (ordered alphabetically): Bloomberg Barclays U.S. Aggregate Bond Index, Bloomberg Barclays U.S. Corporate Bond 1-5 Year Index, Bloomberg Barclays U.S. Treasury TIPS 1-5 Year Index, ICE BofA Long U.S. Treasury Principal STRIPS Index, ICE BofA U.S. High Yield Index, JP Morgan Emerging Markets Bond Index Global, MSCI Emerging Markets Index, MSCI World Energy Index, MSCI World ex-USA Index, MSCI World Metals & Mining Index, Russell 2500 Index, S&P 500 Index, S&P Global ex-U.S. REIT Index, S&P Global Infrastructure Index, S&P U.S. REIT Index, and S&P/LSTA Leveraged Loan Index.
Index 4 is the S&P 500 Index, an unmanaged index that includes 500 widely traded common stocks.
Index 5 is 45.50% Russell 3000 Index, 19.50% MSCI ACWI ex-USA Index, 35.00% Bloomberg Barclays U.S. Aggregate Bond Index.
Prior to January 1, 2020, the fund's primary benchmark was the S&P 500 Index. Effective January 1, 2020, the fund's primary benchmark index is the S&P Target Date to 2035 Index. The S&P Target Date to 2035 Index better reflects the universe of investment opportunities based on the fund's current investment strategy.
It is not possible to invest directly in an index. Index figures do not reflect expenses or sales charges, which would result in lower returns.
ASSET ALLOCATION (%)
| | | |
| Affiliated investment companies | 55.2 |
| | Large blend | 55.2 |
Unaffiliated investment companies/
Exchange-traded funds | 36.0 |
| | Fixed income | 26.5 |
| | Equity | 9.5 |
| U.S. Government | 8.1 |
| Short-term investments | 0.7 |
As a percentage of total investments.
PERFORMANCE CHART
Total returns for the period ended 2-29-20 (%)
| | | | | | | | | | | |
| | Class R11,2 | Class R21,2 | Class R41,2 | Class R61,2 | Class 11 | Index 1 | Index 2 | Index 3 | Index 4 | Index 5 |
| Inception | 4-30-10 | 4-30-10 | 4-30-10 | 4-30-10 | 4-30-10 | 4-30-10 | 4-30-10 | 4-30-10 | 4-30-10 | 4-30-10 |
| Average annual total returns | | | | | | | | | | |
| 1-year | 6.02 | 6.09 | 6.48 | 6.61 | 6.56 | 4.48 | 11.68 | 10.99 | 8.19 | 7.43 |
| 5-year | 4.91 | 5.10 | 5.45 | 5.62 | 5.57 | 5.20 | 3.58 | 6.83 | 9.23 | 6.12 |
| Since inception | 6.97 | 7.13 | 7.38 | 7.55 | 7.50 | 7.09 | 3.93 | 9.29 | 11.84 | 8.13 |
| Cumulative returns | | | | | | | | | | |
| 6-months | 2.31 | 2.45 | 2.61 | 2.64 | 2.66 | 1.04 | 3.39 | 3.43 | 1.92 | 2.37 |
| 5-year | 27.10 | 28.23 | 30.36 | 31.46 | 31.15 | 28.87 | 19.21 | 39.13 | 55.49 | 34.57 |
| Since inception | 94.07 | 96.94 | 101.48 | 104.55 | 103.63 | 96.15 | 46.09 | 139.50 | 200.53 | 115.65 |
Performance figures assume all distributions have been reinvested.
The expense ratios of the portfolio, both net (including any fee waivers and/or expense limitations) and gross (excluding any fee waivers and/or expense limitations), are set forth according to the most recent publicly available prospectuses for the portfolio and may differ from those disclosed in the Financial highlights tables in this report. Net expenses reflect contractual expense limitations in effect until December 31, 2020 and are subject to change. Had the contractual fee waivers and expense limitations not been in place, gross expenses would apply. The following expense ratios include the expenses of the underlying funds in which the portfolio invests. The expense ratios are as follows:
| | | | | | |
| | Class R1 | Class R2 | Class R4 | Class R6 | Class 1 |
| Gross (%) | 1.42 | 1.17 | 1.02 | 0.67 | 0.71 |
| Net (%) | 1.12 | 0.87 | 0.62 | 0.36 | 0.41 |
Please refer to the most recent prospectus and annual or semiannual report for more information on expenses and any expense limitation arrangements for each class.
The returns reflect past results and should not be considered indicative of future performance. The return and principal value of an investment will fluctuate so that shares, when redeemed, may be worth more or less than their original cost. Due to market volatility and other factors, the portfolio's current performance may be higher or lower than the performance shown. For current to the most recent month-end performance data, please call 800-225-5291 or visit the portfolio's website at jhinvestments.com.
This performance information does not reflect the deduction of taxes that a shareholder may pay on portfolio distributions or the redemption of portfolio shares. The portfolio's performance results reflect any applicable fee waivers or expense reductions, without which the expenses would increase and results would have been less favorable.
| 1 | For certain types of investors as described in the portfolio's prospectuses. |
| 2 | Class R1, Class R2, and Class R6 shares were first offered on 9-4-12. Class R4 shares were first offered on 5-1-12. Returns prior to these dates are those of Class 1 shares that have not been adjusted for class-specific expenses; otherwise, returns would vary. |
SEMIANNUAL REPORT | JOHN HANCOCK MULTI-INDEX PRESERVATION PORTFOLIOS 9
Multi-Index 2030 Preservation Portfolio
GROWTH OF $10,000
This chart shows what happened to a hypothetical $10,000 investment in John Hancock Multi-Index 2030 Preservation Portfolio for the share classes and periods indicated, assuming all distributions were reinvested. For comparison, we've shown the same investment in two blended indexes and three separate indexes.
Index 1 isthe S&P Target Date to 2030 Index, an unmanaged index comprised of a set of indices aligned with specific target date years.
Index 2 is the Bloomberg Barclays U.S. Aggregate Bond Index, an unmanaged index of dollar-denominated and nonconvertible investment-grade debt issues.
Index 3 isthe John Hancock 2030 Preservation Index, which is based on the fund's asset allocation glide path and will reflect a more conservative allocation over time. The index is a customized blended index comprising some or all of the following component indices (ordered alphabetically): Bloomberg Barclays U.S. Aggregate Bond Index, Bloomberg Barclays U.S. Corporate Bond 1-5 Year Index, Bloomberg Barclays U.S. Treasury TIPS 1-5 Year Index, ICE BofA Long U.S. Treasury Principal STRIPS Index, ICE BofA U.S. High Yield Index, JP Morgan Emerging Markets Bond Index Global, MSCI Emerging Markets Index, MSCI World Energy Index, MSCI World ex-USA Index, MSCI World Metals & Mining Index, Russell 2500 Index, S&P 500 Index, S&P Global ex-U.S. REIT Index, S&P Global Infrastructure Index, S&P U.S. REIT Index, and S&P/LSTA Leveraged Loan Index.
Index 4 is the S&P 500 Index, an unmanaged index that includes 500 widely traded common stocks.
Index 5 is 33.25% Russell 3000 Index, 14.25% MSCI ACWI ex-USA Index, 52.50% Bloomberg Barclays U.S. Aggregate Bond Index.
Prior to January 1, 2020, the fund's primary benchmark was the Bloomberg Barclays U.S. Aggregate Bond Index. Effective January 1, 2020, the fund's primary benchmark index is the S&P Target Date to 2030 Index. The S&P Target Date to 2030 Index better reflects the universe of investment opportunities based on the fund's current investment strategy.
It is not possible to invest directly in an index. Index figures do not reflect expenses or sales charges, which would result in lower returns.
ASSET ALLOCATION (%)
| | | |
| Affiliated investment companies | 39.8 |
| | Large blend | 39.8 |
Unaffiliated investment companies/
Exchange-traded funds | 51.5 |
| | Fixed income | 41.8 |
| | Equity | 9.7 |
| U.S. Government | 7.9 |
| Short-term investments | 0.8 |
As a percentage of total investments.
PERFORMANCE CHART
Total returns for the period ended 2-29-20 (%)
| | | | | | | | | | | |
| | Class R11,2 | Class R21,2 | Class R41,2 | Class R61,2 | Class 11 | Index 1 | Index 2 | Index 3 | Index 4 | Index 5 |
| Inception | 4-30-10 | 4-30-10 | 4-30-10 | 4-30-10 | 4-30-10 | 4-30-10 | 4-30-10 | 4-30-10 | 4-30-10 | 4-30-10 |
| Average annual total returns | | | | | | | | | | |
| 1-year | 6.78 | 7.01 | 7.30 | 7.62 | 7.48 | 5.21 | 11.68 | 11.92 | 8.19 | 8.77 |
| 5-year | 4.57 | 4.76 | 5.12 | 5.30 | 5.24 | 5.10 | 3.58 | 6.49 | 9.23 | 5.83 |
| Since inception | 6.51 | 6.69 | 6.93 | 7.10 | 7.05 | 6.78 | 3.93 | 8.84 | 11.84 | 7.69 |
| Cumulative returns | | | | | | | | | | |
| 6-months | 2.48 | 2.62 | 2.69 | 2.88 | 2.83 | 1.34 | 3.39 | 3.51 | 1.92 | 2.90 |
| 5-year | 25.01 | 26.19 | 28.35 | 29.46 | 29.12 | 28.22 | 19.21 | 36.92 | 55.49 | 32.77 |
| Since inception | 86.02 | 88.99 | 93.33 | 96.31 | 95.51 | 90.68 | 46.09 | 130.04 | 200.53 | 107.26 |
Performance figures assume all distributions have been reinvested.
The expense ratios of the portfolio, both net (including any fee waivers and/or expense limitations) and gross (excluding any fee waivers and/or expense limitations), are set forth according to the most recent publicly available prospectuses for the portfolio and may differ from those disclosed in the Financial highlights tables in this report. Net expenses reflect contractual expense limitations in effect until December 31, 2020 and are subject to change. Had the contractual fee waivers and expense limitations not been in place, gross expenses would apply. The following expense ratios include the expenses of the underlying funds in which the portfolio invests. The expense ratios are as follows:
| | | | | | |
| | Class R1 | Class R2 | Class R4 | Class R6 | Class 1 |
| Gross (%) | 1.40 | 1.15 | 1.00 | 0.65 | 0.69 |
| Net (%) | 1.12 | 0.87 | 0.62 | 0.36 | 0.41 |
Please refer to the most recent prospectus and annual or semiannual report for more information on expenses and any expense limitation arrangements for each class.
The returns reflect past results and should not be considered indicative of future performance. The return and principal value of an investment will fluctuate so that shares, when redeemed, may be worth more or less than their original cost. Due to market volatility and other factors, the portfolio's current performance may be higher or lower than the performance shown. For current to the most recent month-end performance data, please call 800-225-5291 or visit the portfolio's website at jhinvestments.com.
This performance information does not reflect the deduction of taxes that a shareholder may pay on portfolio distributions or the redemption of portfolio shares. The portfolio's performance results reflect any applicable fee waivers or expense reductions, without which the expenses would increase and results would have been less favorable.
| 1 | For certain types of investors as described in the portfolio's prospectuses. |
| 2 | Class R1, Class R2, and Class R6 shares were first offered on 9-4-12. Class R4 shares were first offered on 5-1-12. Returns prior to these dates are those of Class 1 shares that have not been adjusted for class-specific expenses; otherwise, returns would vary. |
SEMIANNUAL REPORT | JOHN HANCOCK MULTI-INDEX PRESERVATION PORTFOLIOS 10
Multi-Index 2025 Preservation Portfolio
GROWTH OF $10,000
This chart shows what happened to a hypothetical $10,000 investment in John Hancock Multi-Index 2025 Preservation Portfolio for the share classes and periods indicated, assuming all distributions were reinvested. For comparison, we've shown the same investment in two blended indexes and three separate indexes.
Index 1 isthe S&P Target Date to 2025 Index, an unmanaged index comprised of a set of indices aligned with specific target date years.
Index 2 is the Bloomberg Barclays U.S. Aggregate Bond Index, an unmanaged index of dollar-denominated and nonconvertible investment-grade debt issues.
Index 3 isthe John Hancock 2025 Preservation Index, which is based on the fund's asset allocation glide path and will reflect a more conservative allocation over time. The index is a customized blended index comprising some or all of the following component indices (ordered alphabetically): Bloomberg Barclays U.S. Aggregate Bond Index, Bloomberg Barclays U.S. Corporate Bond 1-5 Year Index, Bloomberg Barclays U.S. Treasury TIPS 1-5 Year Index, ICE BofA Long U.S. Treasury Principal STRIPS Index, ICE BofA U.S. High Yield Index, JP Morgan Emerging Markets Bond Index Global, MSCI Emerging Markets Index, MSCI World Energy Index, MSCI World ex-USA Index, MSCI World Metals & Mining Index, Russell 2500 Index, S&P 500 Index, S&P Global ex-U.S. REIT Index, S&P Global Infrastructure Index, S&P U.S. REIT Index, and S&P/LSTA Leveraged Loan Index.
Index 4 is the S&P 500 Index, an unmanaged index that includes 500 widely traded common stocks.
Index 5 is 19.60% Russell 3000 Index, 8.40% MSCI ACWI ex-USA Index, 72.00% Bloomberg Barclays U.S. Aggregate Bond Index.
Prior to January 1, 2020, the fund's primary benchmark was the Bloomberg Barclays U.S. Aggregate Bond Index. Effective January 1, 2020, the fund's primary benchmark index is the S&P Target Date to 2025 Index. The S&P Target Date to 2025 Index better reflects the universe of investment opportunities based on the fund's current investment strategy.
It is not possible to invest directly in an index. Index figures do not reflect expenses or sales charges, which would result in lower returns.
ASSET ALLOCATION (%)
| | | |
| Affiliated investment companies | 25.0 |
| | Large blend | 25.0 |
Unaffiliated investment companies/
Exchange-traded funds | 64.6 |
| | Fixed income | 58.5 |
| | Equity | 6.1 |
| U.S Government | 10.4 |
As a percentage of total investments.
PERFORMANCE CHART
Total returns for the period ended 2-29-20 (%)
| | | | | | | | | | | |
| | Class R11,2 | Class R21,2 | Class R41,2 | Class R61,2 | Class 11 | Index 1 | Index 2 | Index 3 | Index 4 | Index 5 |
| Inception | 4-30-10 | 4-30-10 | 4-30-10 | 4-30-10 | 4-30-10 | 4-30-10 | 4-30-10 | 4-30-10 | 4-30-10 | 4-30-10 |
| Average annual total returns | | | | | | | | | | |
| 1-year | 7.41 | 7.69 | 7.93 | 8.15 | 8.10 | 6.00 | 11.68 | 10.86 | 8.19 | 10.11 |
| 5-year | 3.84 | 4.18 | 4.43 | 4.61 | 4.56 | 4.87 | 3.58 | 5.49 | 9.23 | 5.21 |
| Since inception | 5.67 | 5.91 | 6.10 | 6.26 | 6.22 | 6.38 | 3.93 | 7.85 | 11.84 | 6.84 |
| Cumulative returns | | | | | | | | | | |
| 6-months | 2.23 | 2.41 | 2.48 | 2.59 | 2.54 | 1.63 | 3.39 | 3.23 | 1.92 | 3.27 |
| 5-year | 20.73 | 22.71 | 24.20 | 25.30 | 24.99 | 26.83 | 19.21 | 30.61 | 55.49 | 28.91 |
| Since inception | 71.98 | 75.95 | 79.02 | 81.75 | 81.04 | 83.74 | 46.09 | 110.31 | 200.53 | 91.77 |
Performance figures assume all distributions have been reinvested.
The expense ratios of the portfolio, both net (including any fee waivers and/or expense limitations) and gross (excluding any fee waivers and/or expense limitations), are set forth according to the most recent publicly available prospectuses for the portfolio and may differ from those disclosed in the Financial highlights tables in this report. Net expenses reflect contractual expense limitations in effect until December 31, 2020 and are subject to change. Had the contractual fee waivers and expense limitations not been in place, gross expenses would apply. The following expense ratios include the expenses of the underlying funds in which the portfolio invests. The expense ratios are as follows:
| | | | | | |
| | Class R1 | Class R2 | Class R4 | Class R6 | Class 1 |
| Gross (%) | 1.40 | 1.15 | 1.00 | 0.65 | 0.69 |
| Net (%) | 0.11 | 0.86 | 0.61 | 0.35 | 0.40 |
Please refer to the most recent prospectus and annual or semiannual report for more information on expenses and any expense limitation arrangements for each class.
The returns reflect past results and should not be considered indicative of future performance. The return and principal value of an investment will fluctuate so that shares, when redeemed, may be worth more or less than their original cost. Due to market volatility and other factors, the portfolio's current performance may be higher or lower than the performance shown. For current to the most recent month-end performance data, please call 800-225-5291 or visit the portfolio's website at jhinvestments.com.
This performance information does not reflect the deduction of taxes that a shareholder may pay on portfolio distributions or the redemption of portfolio shares. The portfolio's performance results reflect any applicable fee waivers or expense reductions, without which the expenses would increase and results would have been less favorable.
| 1 | For certain types of investors as described in the portfolio's prospectuses. |
| 2 | Class R1, Class R2, and Class R6 shares were first offered on 9-4-12. Class R4 shares were first offered on 5-1-12. Returns prior to these dates are those of Class 1 shares that have not been adjusted for class-specific expenses; otherwise, returns would vary. |
SEMIANNUAL REPORT | JOHN HANCOCK MULTI-INDEX PRESERVATION PORTFOLIOS 11
Multi-Index 2020 Preservation Portfolio
GROWTH OF $10,000
This chart shows what happened to a hypothetical $10,000 investment in John Hancock Multi-Index 2020 Preservation Portfolio for the share classes and periods indicated, assuming all distributions were reinvested. For comparison, we've shown the same investment in two blended indexes and three separate indexes.
Index 1 isthe S&P Target Date to 2020 Index, an unmanaged index comprised of a set of indices aligned with specific target date years.
Index 2 is the Bloomberg Barclays U.S. Aggregate Bond Index, an unmanaged index of dollar-denominated and nonconvertible investment-grade debt issues.
Index 3 isthe John Hancock 2020 Preservation Index, which is based on the fund's asset allocation glide path and will reflect a more conservative allocation over time. The index is a customized blended index comprising some or all of the following component indices (ordered alphabetically): Bloomberg Barclays U.S. Aggregate Bond Index, Bloomberg Barclays U.S. Corporate Bond 1-5 Year Index, Bloomberg Barclays U.S. Treasury TIPS 1-5 Year Index, ICE BofA Long U.S. Treasury Principal STRIPS Index, ICE BofA U.S. High Yield Index, JP Morgan Emerging Markets Bond Index Global, MSCI Emerging Markets Index, MSCI World Energy Index, MSCI World ex-USA Index, MSCI World Metals & Mining Index, Russell 2500 Index, S&P 500 Index, S&P Global ex-U.S. REIT Index, S&P Global Infrastructure Index, S&P U.S. REIT Index, and S&P/LSTA Leveraged Loan Index.
Index 4 is the S&P 500 Index, an unmanaged index that includes 500 widely traded common stocks.
Index 5 is 5.60% Russell 3000 Index, 2.40% MSCI ACWI ex-USA Index, 92.00% Bloomberg Barclays U.S. Aggregate Bond Index.
Prior to January 1, 2020, the fund's primary benchmark was the Bloomberg Barclays U.S. Aggregate Bond Index. Effective January 1, 2020, the fund's primary benchmark index is the S&P Target Date to 2020 Index. The S&P Target Date to 2020 Index better reflects the universe of investment opportunities based on the fund's current investment strategy.
It is not possible to invest directly in an index. Index figures do not reflect expenses or sales charges, which would result in lower returns.
ASSET ALLOCATION (%)
| | | |
| Affiliated investment companies | 5.3 |
| | Large blend | 5.3 |
Unaffiliated investment companies/
Exchange-traded funds | 77.5 |
| | Fixed income | 71.3 |
| | Equity | 6.2 |
| U.S. Government | 11.6 |
| Short-term investments | 5.6 |
As a percentage of total investments.
PERFORMANCE CHART
Total returns for the period ended 2-29-20 (%)
| | | | | | | | | | | |
| | Class R11,2 | Class R21,2 | Class R41,2 | Class R61,2 | Class 11 | Index 1 | Index 2 | Index 3 | Index 4 | Index 5 |
| Inception | 4-30-10 | 4-30-10 | 4-30-10 | 4-30-10 | 4-30-10 | 4-30-10 | 4-30-10 | 4-30-10 | 4-30-10 | 4-30-10 |
| Average annual total returns | | | | | | | | | | |
| 1-year | 7.52 | 7.88 | 8.08 | 8.44 | 8.29 | 6.61 | 11.68 | 9.19 | 8.19 | 11.36 |
| 5-year | 3.07 | 3.26 | 3.59 | 3.78 | 3.72 | 4.60 | 3.58 | 4.21 | 9.23 | 4.38 |
| Since inception | 4.57 | 4.73 | 4.96 | 5.13 | 5.08 | 5.96 | 3.93 | 6.26 | 11.84 | 5.71 |
| Cumulative returns | | | | | | | | | | |
| 6-months | 1.74 | 1.90 | 2.01 | 2.14 | 2.10 | 1.88 | 3.39 | 2.64 | 1.92 | 3.56 |
| 5-year | 16.34 | 17.40 | 19.30 | 20.39 | 20.01 | 25.20 | 19.21 | 22.87 | 55.49 | 23.92 |
| Since inception | 55.24 | 57.56 | 61.00 | 63.59 | 62.84 | 76.67 | 46.09 | 81.72 | 200.53 | 72.68 |
Performance figures assume all distributions have been reinvested.
The expense ratios of the portfolio, both net (including any fee waivers and/or expense limitations) and gross (excluding any fee waivers and/or expense limitations), are set forth according to the most recent publicly available prospectuses for the portfolio and may differ from those disclosed in the Financial highlights tables in this report. Net expenses reflect contractual expense limitations in effect until December 31, 2020 and are subject to change. Had the contractual fee waivers and expense limitations not been in place, gross expenses would apply. The following expense ratios include the expenses of the underlying funds in which the portfolio invests. The expense ratios are as follows:
| | | | | | |
| | Class R1 | Class R2 | Class R4 | Class R6 | Class 1 |
| Gross (%) | 1.40 | 1.15 | 1.00 | 0.65 | 0.69 |
| Net (%) | 1.09 | 0.84 | 0.59 | 0.33 | 0.38 |
Please refer to the most recent prospectus and annual or semiannual report for more information on expenses and any expense limitation arrangements for each class.
The returns reflect past results and should not be considered indicative of future performance. The return and principal value of an investment will fluctuate so that shares, when redeemed, may be worth more or less than their original cost. Due to market volatility and other factors, the portfolio's current performance may be higher or lower than the performance shown. For current to the most recent month-end performance data, please call 800-225-5291 or visit the portfolio's website at jhinvestments.com.
This performance information does not reflect the deduction of taxes that a shareholder may pay on portfolio distributions or the redemption of portfolio shares. The portfolio's performance results reflect any applicable fee waivers or expense reductions, without which the expenses would increase and results would have been less favorable.
| 1 | For certain types of investors as described in the portfolio's prospectuses. |
| 2 | Class R1, Class R2, and Class R6 shares were first offered on 9-4-12. Class R4 shares were first offered on 5-1-12. Returns prior to these dates are those of Class 1 shares that have not been adjusted for class-specific expenses; otherwise, returns would vary. |
SEMIANNUAL REPORT | JOHN HANCOCK MULTI-INDEX PRESERVATION PORTFOLIOS 12
Multi-Index Income Preservation Portfolio
GROWTH OF $10,000
This chart shows what happened to a hypothetical $10,000 investment in John Hancock Multi-Index Income Preservation Portfolio for the share classes and periods indicated, assuming all distributions were reinvested. For comparison, we've shown the same investment in two blended indexes and three separate indexes.
Index 1 isthe S&P Target Date to Retirement Income Index, an unmanaged index comprised of a set of indices aligned with specific target date years. Index performance inception was May 30, 2014. Returns since fund inception are not available.
Index 2 is the Bloomberg Barclays U.S. Aggregate Bond Index, an unmanaged index of dollar-denominated and nonconvertible investment-grade debt issues.
Index 3 isthe John Hancock Income Preservation Index, which is based on the fund's asset allocation glide path and will reflect a more conservative allocation over time. The index is a customized blended index comprising some or all of the following component indices (ordered alphabetically): Bloomberg Barclays U.S. Aggregate Bond Index, Bloomberg Barclays U.S. Corporate Bond 1-5 Year Index, Bloomberg Barclays U.S. Treasury TIPS 1-5 Year Index, ICE BofA Long U.S. Treasury Principal STRIPS Index, ICE BofA U.S. High Yield Index, JP Morgan Emerging Markets Bond Index Global, MSCI Emerging Markets Index, MSCI World Energy Index, MSCI World ex-USA Index, MSCI World Metals & Mining Index, Russell 2500 Index, S&P 500 Index, S&P Global ex-U.S. REIT Index, S&P Global Infrastructure Index, S&P U.S. REIT Index, and S&P/LSTA Leveraged Loan Index.
Index 4 is the S&P 500 Index, an unmanaged index that includes 500 widely traded common stocks.
Index 5 is 5.60% Russell 3000 Index, 2.40% MSCI ACWI ex-USA Index, 92.00% Bloomberg Barclays U.S. Aggregate Bond Index.
Prior to January 1, 2020, the fund's primary benchmark was the Bloomberg Barclays U.S. Aggregate Bond Index. Effective January 1, 2020, the fund's primary benchmark index is the S&P Target Date to Retirement Income Index. The S&P Target Date to Retirement Income Index better reflects the universe of investment opportunities based on the fund's current investment strategy.
It is not possible to invest directly in an index. Index figures do not reflect expenses or sales charges, which would result in lower returns.
ASSET ALLOCATION (%)
| | | |
| Affiliated investment companies | 5.2 |
| | Large blend | 5.2 |
Unaffiliated investment companies/
Exchange-traded funds | 76.3 |
| | Fixed income | 70.3 |
| | Equity | 6.0 |
| U.S. Government | 11.5 |
| Short-term investments | 7.0 |
As a percentage of total investments.
PERFORMANCE CHART
Total returns for the period ended 2-29-20 (%)
| | | | | | | | | | | |
| | Class R11,2 | Class R21,2 | Class R41,2 | Class R61,2 | Class 11 | Index 1 | Index 2 | Index 3 | Index 4 | Index 5 |
| Inception | 4-30-10 | 4-30-10 | 4-30-10 | 4-30-10 | 4-30-10 | 4-30-10 | 4-30-10 | 4-30-10 | 4-30-10 | 4-30-10 |
| Average annual total returns | | | | | | | | | | |
| 1-year | 6.23 | 6.50 | 6.78 | 6.95 | 6.89 | 7.24 | 11.68 | 8.55 | 8.19 | 11.21 |
| 5-year | 2.47 | 2.68 | 2.92 | 3.08 | 3.05 | 3.73 | 3.58 | 3.69 | 9.23 | 3.89 |
| Since inception | 3.45 | 3.62 | 3.80 | 3.97 | 3.93 | — | 3.93 | 4.70 | 11.84 | 4.61 |
| Cumulative returns | | | | | | | | | | |
| 6-months | 1.13 | 1.29 | 1.47 | 1.53 | 1.48 | 2.05 | 3.39 | 2.51 | 1.92 | 3.28 |
| 5-year | 12.97 | 14.12 | 15.49 | 16.40 | 16.20 | 20.07 | 19.21 | 19.85 | 55.49 | 21.05 |
| Since inception | 39.60 | 41.84 | 44.36 | 46.59 | 46.12 | — | 46.09 | 57.10 | 200.53 | 55.84 |
Performance figures assume all distributions have been reinvested.
The expense ratios of the portfolio, both net (including any fee waivers and/or expense limitations) and gross (excluding any fee waivers and/or expense limitations), are set forth according to the most recent publicly available prospectuses for the portfolio and may differ from those disclosed in the Financial highlights tables in this report. Net expenses reflect contractual expense limitations in effect until December 31, 2020 and are subject to change. Had the contractual fee waivers and expense limitations not been in place, gross expenses would apply. The following expense ratios include the expenses of the underlying funds in which the portfolio invests. The expense ratios are as follows:
| | | | | | |
| | Class R1 | Class R2 | Class R4 | Class R6 | Class 1 |
| Gross (%) | 1.42 | 1.17 | 1.02 | 0.67 | 0.71 |
| Net (%) | 1.10 | 0.85 | 0.60 | 0.34 | 0.39 |
Please refer to the most recent prospectus and annual or semiannual report for more information on expenses and any expense limitation arrangements for each class.
The returns reflect past results and should not be considered indicative of future performance. The return and principal value of an investment will fluctuate so that shares, when redeemed, may be worth more or less than their original cost. Due to market volatility and other factors, the portfolio's current performance may be higher or lower than the performance shown. For current to the most recent month-end performance data, please call 800-225-5291 or visit the portfolio's website at jhinvestments.com.
This performance information does not reflect the deduction of taxes that a shareholder may pay on portfolio distributions or the redemption of portfolio shares. The portfolio's performance results reflect any applicable fee waivers or expense reductions, without which the expenses would increase and results would have been less favorable.
| 1 | For certain types of investors as described in the portfolio's prospectuses. |
| 2 | Class R1, Class R2, and Class R6 shares were first offered on 9-4-12. Class R4 shares were first offered on 5-1-12. Returns prior to these dates are those of Class 1 shares that have not been adjusted for class-specific expenses; otherwise, returns would vary. |
SEMIANNUAL REPORT | JOHN HANCOCK MULTI-INDEX PRESERVATION PORTFOLIOS 13
As a shareholder of a John Hancock Funds II Multi-Index Preservation Portfolio, you incur two types of costs: (1) transaction costs, including sales charges (loads) on certain purchases or redemptions, and (2) ongoing costs, including management fees, distribution and service (Rule 12b-1) fees, and other portfolio expenses. In addition to the operating expenses which each portfolio bears directly, each portfolio indirectly bears a pro rata share of the operating expenses of the underlying funds in which each portfolio invests. Because underlying funds have varied operating expenses and transaction costs, and a portfolio may own different proportions of the underlying funds at different times, the amount of expenses incurred indirectly by the portfolio will vary. Had these indirect expenses been reflected in the following analysis, total expenses would have been higher than the amounts shown.
These examples are intended to help you understand your ongoing costs (in dollars) of investing in a portfolio so you can compare these costs with the ongoing costs of investing in other mutual funds. The examples are based on an investment of $1,000 at the beginning of the period and held for the entire period (September 1, 2019 through February 29, 2020).
Actual expenses:
The first line of each share class in the following table provides information about actual account values and actual expenses. You may use the information in this line, together with the amount you invested, to estimate the expenses that you paid over the period. Simply divide your account value by $1,000 (for example, an $8,600 account value divided by $1,000 = 8.6), then multiply the result by the number in the first line under the heading entitled “Expenses paid during period ended” to estimate the expenses you paid on your account during this period.
Hypothetical example for comparison purposes:
The second line of each share class in the following table provides information about hypothetical account values and hypothetical expenses based on the actual expense ratio for the share class and an assumed annualized rate of return of 5% per year before expenses, which is not the actual return of the share class. The hypothetical account values and expenses may not be used to estimate the actual ending account balance or expenses you paid for the period. You may use this information to compare the ongoing costs of investing in a portfolio and other funds. To do so, compare this 5% hypothetical example with the 5% hypothetical examples that appear in the shareholder reports of the other funds. Please remember that these hypothetical account values and expenses may not be used to estimate the actual ending account balance or expenses you paid for the period.
Please note that the expenses shown in the table are meant to highlight your ongoing costs only and do not reflect any transactional costs. Therefore, the second line of each share class in the table is useful in comparing ongoing costs only, and will not help you determine the relative total costs of owning different funds. In addition, if these transactional costs were included, your costs would have been higher. See the portfolios’ prospectuses for details regarding transaction costs.
SHAREHOLDER EXPENSE EXAMPLE CHART
| | | Account
value on
9-1-2019 | Ending
value on
2-29-2020 | Expenses
paid during
period ended
2-29-20201 | Annualized
expense
ratio2 |
| Multi-Index 2060 Preservation Portfolio |
| Class R1 | Actual expenses/actual returns | $1,000.00 | $1,020.40 | $2.71 | 0.54% |
| | Hypothetical example | 1,000.00 | 1,022.20 | 2.72 | 0.54% |
| Class R2 | Actual expenses/actual returns | 1,000.00 | 1,022.10 | 2.21 | 0.44% |
| | Hypothetical example | 1,000.00 | 1,022.70 | 2.21 | 0.44% |
| Class R4 | Actual expenses/actual returns | 1,000.00 | 1,023.00 | 0.80 | 0.16% |
| | Hypothetical example | 1,000.00 | 1,024.10 | 0.81 | 0.16% |
| Class R6 | Actual expenses/actual returns | 1,000.00 | 1,022.80 | 0.00 | 0.00% |
| | Hypothetical example | 1,000.00 | 1,024.90 | 0.00 | 0.00% |
| Class 1 | Actual expenses/actual returns | 1,000.00 | 1,023.20 | 0.25 | 0.05% |
| | Hypothetical example | 1,000.00 | 1,024.60 | 0.25 | 0.05% |
| Multi-Index 2055 Preservation Portfolio |
| Class R1 | Actual expenses/actual returns | $1,000.00 | $1,021.60 | $2.61 | 0.52% |
| | Hypothetical example | 1,000.00 | 1,022.30 | 2.61 | 0.52% |
| Class R2 | Actual expenses/actual returns | 1,000.00 | 1,022.00 | 2.31 | 0.46% |
| | Hypothetical example | 1,000.00 | 1,022.60 | 2.31 | 0.46% |
| Class R4 | Actual expenses/actual returns | 1,000.00 | 1,024.10 | 0.81 | 0.16% |
| | Hypothetical example | 1,000.00 | 1,024.10 | 0.81 | 0.16% |
| Class R6 | Actual expenses/actual returns | 1,000.00 | 1,023.70 | 0.00 | 0.00% |
| | Hypothetical example | 1,000.00 | 1,024.90 | 0.00 | 0.00% |
| Class 1 | Actual expenses/actual returns | 1,000.00 | 1,024.10 | 0.25 | 0.05% |
| | Hypothetical example | 1,000.00 | 1,024.60 | 0.25 | 0.05% |
| 14 | JOHN HANCOCK MULTI-INDEX PRESERVATION PORTFOLIOS | SEMIANNUAL REPORT | |
SHAREHOLDER EXPENSE EXAMPLE CHART (continued)
| | | Account
value on
9-1-2019 | Ending
value on
2-29-2020 | Expenses
paid during
period ended
2-29-20201 | Annualized
expense
ratio2 |
| Multi-Index 2050 Preservation Portfolio |
| Class R1 | Actual expenses/actual returns | $1,000.00 | $1,020.10 | $3.82 | 0.76% |
| | Hypothetical example | 1,000.00 | 1,021.10 | 3.82 | 0.76% |
| Class R2 | Actual expenses/actual returns | 1,000.00 | 1,021.70 | 2.56 | 0.51% |
| | Hypothetical example | 1,000.00 | 1,022.30 | 2.56 | 0.51% |
| Class R4 | Actual expenses/actual returns | 1,000.00 | 1,023.30 | 1.26 | 0.25% |
| | Hypothetical example | 1,000.00 | 1,023.60 | 1.26 | 0.25% |
| Class R6 | Actual expenses/actual returns | 1,000.00 | 1,024.10 | 0.00 | 0.00% |
| | Hypothetical example | 1,000.00 | 1,024.90 | 0.00 | 0.00% |
| Class 1 | Actual expenses/actual returns | 1,000.00 | 1,023.60 | 0.25 | 0.05% |
| | Hypothetical example | 1,000.00 | 1,024.60 | 0.25 | 0.05% |
| Multi-Index 2045 Preservation Portfolio |
| Class R1 | Actual expenses/actual returns | $1,000.00 | $1,020.10 | $3.72 | 0.74% |
| | Hypothetical example | 1,000.00 | 1,021.20 | 3.72 | 0.74% |
| Class R2 | Actual expenses/actual returns | 1,000.00 | 1,020.90 | 2.56 | 0.51% |
| | Hypothetical example | 1,000.00 | 1,022.30 | 2.56 | 0.51% |
| Class R4 | Actual expenses/actual returns | 1,000.00 | 1,022.70 | 0.80 | 0.16% |
| | Hypothetical example | 1,000.00 | 1,024.10 | 0.81 | 0.16% |
| Class R6 | Actual expenses/actual returns | 1,000.00 | 1,024.30 | 0.00 | 0.00% |
| | Hypothetical example | 1,000.00 | 1,024.90 | 0.00 | 0.00% |
| Class 1 | Actual expenses/actual returns | 1,000.00 | 1,023.80 | 0.25 | 0.05% |
| | Hypothetical example | 1,000.00 | 1,024.60 | 0.25 | 0.05% |
| Multi-Index 2040 Preservation Portfolio |
| Class R1 | Actual expenses/actual returns | $1,000.00 | $1,021.70 | $3.67 | 0.73% |
| | Hypothetical example | 1,000.00 | 1,021.20 | 3.67 | 0.73% |
| Class R2 | Actual expenses/actual returns | 1,000.00 | 1,023.00 | 2.57 | 0.51% |
| | Hypothetical example | 1,000.00 | 1,022.30 | 2.56 | 0.51% |
| Class R4 | Actual expenses/actual returns | 1,000.00 | 1,023.30 | 1.11 | 0.22% |
| | Hypothetical example | 1,000.00 | 1,023.80 | 1.11 | 0.22% |
| Class R6 | Actual expenses/actual returns | 1,000.00 | 1,025.00 | 0.00 | 0.00% |
| | Hypothetical example | 1,000.00 | 1,024.90 | 0.00 | 0.00% |
| Class 1 | Actual expenses/actual returns | 1,000.00 | 1,024.40 | 0.25 | 0.05% |
| | Hypothetical example | 1,000.00 | 1,024.60 | 0.25 | 0.05% |
| Multi-Index 2035 Preservation Portfolio |
| Class R1 | Actual expenses/actual returns | $1,000.00 | $1,023.10 | $3.27 | 0.65% |
| | Hypothetical example | 1,000.00 | 1,021.60 | 3.27 | 0.65% |
| Class R2 | Actual expenses/actual returns | 1,000.00 | 1,024.50 | 2.57 | 0.51% |
| | Hypothetical example | 1,000.00 | 1,022.30 | 2.56 | 0.51% |
| Class R4 | Actual expenses/actual returns | 1,000.00 | 1,026.10 | 0.91 | 0.18% |
| | Hypothetical example | 1,000.00 | 1,024.00 | 0.91 | 0.18% |
| Class R6 | Actual expenses/actual returns | 1,000.00 | 1,026.40 | 0.00 | 0.00% |
| | Hypothetical example | 1,000.00 | 1,024.90 | 0.00 | 0.00% |
| Class 1 | Actual expenses/actual returns | 1,000.00 | 1,026.60 | 0.25 | 0.05% |
| | Hypothetical example | 1,000.00 | 1,024.60 | 0.25 | 0.05% |
| | SEMIANNUAL REPORT | JOHN HANCOCK MULTI-INDEX PRESERVATION PORTFOLIOS | 15 |
SHAREHOLDER EXPENSE EXAMPLE CHART (continued)
| | | Account
value on
9-1-2019 | Ending
value on
2-29-2020 | Expenses
paid during
period ended
2-29-20201 | Annualized
expense
ratio2 |
| Multi-Index 2030 Preservation Portfolio |
| Class R1 | Actual expenses/actual returns | $1,000.00 | $1,024.80 | $3.93 | 0.78% |
| | Hypothetical example | 1,000.00 | 1,021.00 | 3.92 | 0.78% |
| Class R2 | Actual expenses/actual returns | 1,000.00 | 1,026.20 | 2.87 | 0.57% |
| | Hypothetical example | 1,000.00 | 1,022.00 | 2.87 | 0.57% |
| Class R4 | Actual expenses/actual returns | 1,000.00 | 1,026.90 | 1.61 | 0.32% |
| | Hypothetical example | 1,000.00 | 1,023.30 | 1.61 | 0.32% |
| Class R6 | Actual expenses/actual returns | 1,000.00 | 1,028.80 | 0.30 | 0.06% |
| | Hypothetical example | 1,000.00 | 1,024.60 | 0.30 | 0.06% |
| Class 1 | Actual expenses/actual returns | 1,000.00 | 1,028.30 | 0.55 | 0.11% |
| | Hypothetical example | 1,000.00 | 1,024.30 | 0.55 | 0.11% |
| Multi-Index 2025 Preservation Portfolio |
| Class R1 | Actual expenses/actual returns | $1,000.00 | $1,022.30 | $4.17 | 0.83% |
| | Hypothetical example | 1,000.00 | 1,020.70 | 4.17 | 0.83% |
| Class R2 | Actual expenses/actual returns | 1,000.00 | 1,024.10 | 3.27 | 0.65% |
| | Hypothetical example | 1,000.00 | 1,021.60 | 3.27 | 0.65% |
| Class R4 | Actual expenses/actual returns | 1,000.00 | 1,024.80 | 1.66 | 0.33% |
| | Hypothetical example | 1,000.00 | 1,023.20 | 1.66 | 0.33% |
| Class R6 | Actual expenses/actual returns | 1,000.00 | 1,025.90 | 0.71 | 0.14% |
| | Hypothetical example | 1,000.00 | 1,024.20 | 0.70 | 0.14% |
| Class 1 | Actual expenses/actual returns | 1,000.00 | 1,025.40 | 0.96 | 0.19% |
| | Hypothetical example | 1,000.00 | 1,023.90 | 0.96 | 0.19% |
| Multi-Index 2020 Preservation Portfolio |
| Class R1 | Actual expenses/actual returns | $1,000.00 | $1,017.40 | $4.82 | 0.96% |
| | Hypothetical example | 1,000.00 | 1,020.10 | 4.82 | 0.96% |
| Class R2 | Actual expenses/actual returns | 1,000.00 | 1,019.00 | 3.56 | 0.71% |
| | Hypothetical example | 1,000.00 | 1,021.30 | 3.57 | 0.71% |
| Class R4 | Actual expenses/actual returns | 1,000.00 | 1,020.10 | 2.16 | 0.43% |
| | Hypothetical example | 1,000.00 | 1,022.70 | 2.16 | 0.43% |
| Class R6 | Actual expenses/actual returns | 1,000.00 | 1,021.40 | 1.01 | 0.20% |
| | Hypothetical example | 1,000.00 | 1,023.90 | 1.01 | 0.20% |
| Class 1 | Actual expenses/actual returns | 1,000.00 | 1,021.00 | 1.26 | 0.25% |
| | Hypothetical example | 1,000.00 | 1,023.60 | 1.26 | 0.25% |
| Multi-Index Income Preservation Portfolio |
| Class R1 | Actual expenses/actual returns | $1,000.00 | $1,011.30 | $4.60 | 0.92% |
| | Hypothetical example | 1,000.00 | 1,020.30 | 4.62 | 0.92% |
| Class R2 | Actual expenses/actual returns | 1,000.00 | 1,012.90 | 3.75 | 0.75% |
| | Hypothetical example | 1,000.00 | 1,021.10 | 3.77 | 0.75% |
| Class R4 | Actual expenses/actual returns | 1,000.00 | 1,014.70 | 2.40 | 0.48% |
| | Hypothetical example | 1,000.00 | 1,022.50 | 2.41 | 0.48% |
| Class R6 | Actual expenses/actual returns | 1,000.00 | 1,015.30 | 1.20 | 0.24% |
| | Hypothetical example | 1,000.00 | 1,023.70 | 1.21 | 0.24% |
| Class 1 | Actual expenses/actual returns | 1,000.00 | 1,014.80 | 1.45 | 0.29% |
| | Hypothetical example | 1,000.00 | 1,023.40 | 1.46 | 0.29% |
| 1 | Expenses are equal to the annualized expense ratio, multiplied by the average account value over the period, multiplied by 182/366 (to reflect the one-half year period). |
| 2 | Ratios do not include expenses indirectly incurred by the underlying funds and can vary based on the mix of underlying funds held by the portfolios. |
| 16 | JOHN HANCOCK MULTI-INDEX PRESERVATION PORTFOLIOS | SEMIANNUAL REPORT | |
MULTI-INDEX 2060 PRESERVATION PORTFOLIO
As of 2-29-20 (unaudited)
| | Shares or
Principal
Amount | Value |
| AFFILIATED INVESTMENT COMPANIES (A) - 68.3% | |
| Equity - 68.3% | | |
| Strategic Equity Allocation, Class NAV, JHF II (MIM US) (B) | 7,017,623 | $76,492,089 |
|
TOTAL AFFILIATED INVESTMENT COMPANIES (Cost
$83,607,681) | $76,492,089 |
| UNAFFILIATED INVESTMENT COMPANIES - 23.8% | |
| Exchange-traded funds - 23.8% | | |
| Financial Select Sector SPDR Fund | 44,516 | 1,183,680 |
| iShares JP Morgan USD Emerging Markets Bond ETF | 10,373 | 1,183,767 |
| Vanguard FTSE Emerging Markets ETF | 44,279 | 1,794,185 |
| Vanguard Health Care ETF | 6,629 | 1,161,997 |
| Vanguard Information Technology ETF | 5,018 | 1,182,492 |
| Vanguard Intermediate-Term Corporate Bond ETF | 25,973 | 2,445,618 |
| Vanguard Mid-Cap ETF | 37,679 | 6,109,650 |
| Vanguard S&P 500 ETF | 3,394 | 922,286 |
| Vanguard Small-Cap ETF | 6,864 | 1,018,960 |
| Vanguard Total Bond Market ETF | 98,376 | 8,535,102 |
| Xtrackers USD High Yield Corporate Bond ETF | 23,912 | 1,174,797 |
|
TOTAL UNAFFILIATED INVESTMENT COMPANIES (Cost
$26,718,237) | $26,712,534 |
| U.S. GOVERNMENT AND AGENCY OBLIGATIONS - 7.9% | |
| U.S. Government - 7.9% | | |
| U.S. Treasury STRIPS, PO, 1.687%, 11/15/2048 | 3,626,000 | 2,227,398 |
| U.S. Treasury STRIPS, PO, 1.704%, 02/15/2047 | 3,508,200 | 2,209,739 |
| U.S. Treasury STRIPS, PO, 1.712%, 05/15/2047 | 3,531,000 | 2,209,986 |
| U.S. Treasury STRIPS, PO, 1.716%, 08/15/2046 | 3,493,100 | 2,212,058 |
|
TOTAL U.S. GOVERNMENT AND AGENCY OBLIGATIONS (Cost
$7,746,389) | $8,859,181 |
| SHORT-TERM INVESTMENTS - 0.1% | |
| Short-term funds - 0.1% | | |
| State Street Institutional U.S. Government Money Market Fund, Premier Class, 1.5386% (C) | 128,681 | 128,681 |
|
| TOTAL SHORT-TERM INVESTMENTS (Cost $128,681) | $128,681 |
| Total investments (Cost $118,200,988) - 100.1% | $112,192,485 |
| Other assets and liabilities, net - (0.1%) | (91,565) |
| TOTAL NET ASSETS - 100.0% | $112,100,920 |
MULTI-INDEX 2055 PRESERVATION PORTFOLIO
As of 2-29-20 (unaudited)
| | Shares or
Principal
Amount | Value |
| AFFILIATED INVESTMENT COMPANIES (A) - 68.2% | |
| Equity - 68.2% | | |
| Strategic Equity Allocation, Class NAV, JHF II (MIM US) (B) | 17,100,897 | $186,399,773 |
|
TOTAL AFFILIATED INVESTMENT COMPANIES (Cost
$204,888,286) | $186,399,773 |
MULTI-INDEX 2055 PRESERVATION PORTFOLIO (continued)
| | Shares or
Principal
Amount | Value |
|
| UNAFFILIATED INVESTMENT COMPANIES - 23.6% | |
| Exchange-traded funds - 23.6% | | |
| Financial Select Sector SPDR Fund | 108,935 | $2,896,582 |
| iShares JP Morgan USD Emerging Markets Bond ETF | 24,974 | 2,850,033 |
| Vanguard FTSE Emerging Markets ETF | 108,875 | 4,411,615 |
| Vanguard Health Care ETF | 16,287 | 2,854,948 |
| Vanguard Information Technology ETF | 12,276 | 2,892,839 |
| Vanguard Intermediate-Term Corporate Bond ETF | 62,122 | 5,849,408 |
| Vanguard Mid-Cap ETF | 92,224 | 14,954,122 |
| Vanguard S&P 500 ETF | 8,306 | 2,257,072 |
| Vanguard Small-Cap ETF | 16,802 | 2,494,258 |
| Vanguard Total Bond Market ETF | 234,944 | 20,383,741 |
| Xtrackers USD High Yield Corporate Bond ETF | 57,746 | 2,837,061 |
|
TOTAL UNAFFILIATED INVESTMENT COMPANIES (Cost
$63,210,454) | $64,681,679 |
| U.S. GOVERNMENT AND AGENCY OBLIGATIONS - 8.3% | |
| U.S. Government - 8.3% | | |
| U.S. Treasury STRIPS, PO, 1.687%, 11/15/2048 | 9,244,200 | 5,678,575 |
| U.S. Treasury STRIPS, PO, 1.704%, 02/15/2047 | 8,941,400 | 5,631,994 |
| U.S. Treasury STRIPS, PO, 1.712%, 05/15/2047 | 9,000,600 | 5,633,304 |
| U.S. Treasury STRIPS, PO, 1.716%, 08/15/2046 | 8,905,400 | 5,639,477 |
|
TOTAL U.S. GOVERNMENT AND AGENCY OBLIGATIONS (Cost
$19,736,756) | $22,583,350 |
| SHORT-TERM INVESTMENTS - 0.1% | |
| Short-term funds - 0.1% | | |
| State Street Institutional U.S. Government Money Market Fund, Premier Class, 1.5386% (C) | 178,954 | 178,954 |
|
| TOTAL SHORT-TERM INVESTMENTS (Cost $178,954) | $178,954 |
| Total investments (Cost $288,014,450) - 100.2% | $273,843,756 |
| Other assets and liabilities, net - (0.2%) | (419,581) |
| TOTAL NET ASSETS - 100.0% | $273,424,175 |
MULTI-INDEX 2050 PRESERVATION PORTFOLIO
As of 2-29-20 (unaudited)
| | Shares or
Principal
Amount | Value |
| AFFILIATED INVESTMENT COMPANIES (A) - 68.2% | |
| Equity - 68.2% | | |
| Strategic Equity Allocation, Class NAV, JHF II (MIM US) (B) | 38,376,788 | $418,306,994 |
|
TOTAL AFFILIATED INVESTMENT COMPANIES (Cost
$431,585,494) | $418,306,994 |
| UNAFFILIATED INVESTMENT COMPANIES - 23.7% | |
| Exchange-traded funds - 23.7% | | |
| Financial Select Sector SPDR Fund | 243,458 | 6,473,548 |
| iShares JP Morgan USD Emerging Markets Bond ETF | 55,972 | 6,387,525 |
| Vanguard FTSE Emerging Markets ETF | 244,421 | 9,903,939 |
| Vanguard Health Care ETF | 36,563 | 6,409,128 |
| SEE NOTES TO FINANCIAL STATEMENTS | SEMIANNUAL REPORT | JOHN HANCOCK MULTI-INDEX PRESERVATION PORTFOLIOS | 17 |
MULTI-INDEX 2050 PRESERVATION PORTFOLIO (continued)
| | Shares or
Principal
Amount | Value |
| Exchange-traded funds - (continued) | | |
| Vanguard Information Technology ETF | 27,397 | $6,456,103 |
| Vanguard Intermediate-Term Corporate Bond ETF | 139,547 | 13,139,746 |
| Vanguard Mid-Cap ETF | 206,560 | 33,493,704 |
| Vanguard S&P 500 ETF | 18,532 | 5,035,886 |
| Vanguard Small-Cap ETF | 37,756 | 5,604,878 |
| Vanguard Total Bond Market ETF | 527,769 | 45,789,238 |
| Xtrackers USD High Yield Corporate Bond ETF | 129,361 | 6,355,505 |
|
TOTAL UNAFFILIATED INVESTMENT COMPANIES (Cost
$139,941,513) | $145,049,200 |
| U.S. GOVERNMENT AND AGENCY OBLIGATIONS - 8.3% | |
| U.S. Government - 8.3% | | |
| U.S. Treasury STRIPS, PO, 1.687%, 11/15/2048 | 20,753,600 | 12,748,629 |
| U.S. Treasury STRIPS, PO, 1.704%, 02/15/2047 | 20,072,400 | 12,643,170 |
| U.S. Treasury STRIPS, PO, 1.712%, 05/15/2047 | 20,205,500 | 12,646,238 |
| U.S. Treasury STRIPS, PO, 1.716%, 08/15/2046 | 19,988,500 | 12,658,016 |
|
TOTAL U.S. GOVERNMENT AND AGENCY OBLIGATIONS (Cost
$44,308,829) | $50,696,053 |
| SHORT-TERM INVESTMENTS - 0.0% | |
| Short-term funds - 0.0% | | |
| State Street Institutional U.S. Government Money Market Fund, Premier Class, 1.5386% (C) | 278,440 | 278,440 |
|
| TOTAL SHORT-TERM INVESTMENTS (Cost $278,440) | $278,440 |
| Total investments (Cost $616,114,276) - 100.2% | $614,330,687 |
| Other assets and liabilities, net - (0.2%) | (1,192,567) |
| TOTAL NET ASSETS - 100.0% | $613,138,120 |
MULTI-INDEX 2045 PRESERVATION PORTFOLIO
As of 2-29-20 (unaudited)
| | Shares or
Principal
Amount | Value |
| AFFILIATED INVESTMENT COMPANIES (A) - 66.9% | |
| Equity - 66.9% | | |
| Strategic Equity Allocation, Class NAV, JHF II (MIM US) (B) | 46,358,012 | $505,302,327 |
|
TOTAL AFFILIATED INVESTMENT COMPANIES (Cost
$509,481,025) | $505,302,327 |
| UNAFFILIATED INVESTMENT COMPANIES - 24.9% | |
| Exchange-traded funds - 24.9% | | |
| Financial Select Sector SPDR Fund | 300,422 | 7,988,221 |
| iShares Edge MSCI Min Vol USA ETF | 55,915 | 3,425,912 |
| iShares Global Infrastructure ETF | 7,304 | 322,399 |
| iShares JP Morgan USD Emerging Markets Bond ETF | 96,733 | 11,039,170 |
| Vanguard Dividend Appreciation ETF | 20,012 | 2,299,579 |
| Vanguard Energy ETF | 20,330 | 1,242,773 |
| Vanguard FTSE Emerging Markets ETF | 252,305 | 10,223,399 |
| Vanguard Global ex-U.S. Real Estate ETF | 6,165 | 333,773 |
| Vanguard Health Care ETF (D) | 44,932 | 7,876,130 |
MULTI-INDEX 2045 PRESERVATION PORTFOLIO (continued)
| | Shares or
Principal
Amount | Value |
| Exchange-traded funds - (continued) | | |
| Vanguard Information Technology ETF | 33,870 | $7,981,466 |
| Vanguard Intermediate-Term Corporate Bond ETF | 183,082 | 17,239,001 |
| Vanguard Materials ETF | 5,659 | 645,635 |
| Vanguard Mid-Cap ETF | 238,043 | 38,598,672 |
| Vanguard Real Estate ETF | 11,022 | 962,551 |
| Vanguard S&P 500 ETF | 1,579 | 429,077 |
| Vanguard Small-Cap ETF | 41,364 | 6,140,486 |
| Vanguard Total Bond Market ETF | 708,178 | 61,441,523 |
| Xtrackers USD High Yield Corporate Bond ETF | 194,960 | 9,578,386 |
|
TOTAL UNAFFILIATED INVESTMENT COMPANIES (Cost
$174,864,173) | $187,768,153 |
| U.S. GOVERNMENT AND AGENCY OBLIGATIONS - 8.3% | |
| U.S. Government - 8.3% | | |
| U.S. Treasury STRIPS, PO, 1.687%, 11/15/2048 | 25,478,800 | 15,651,250 |
| U.S. Treasury STRIPS, PO, 1.704%, 02/15/2047 | 24,643,600 | 15,522,470 |
| U.S. Treasury STRIPS, PO, 1.712%, 05/15/2047 | 24,807,200 | 15,526,354 |
| U.S. Treasury STRIPS, PO, 1.716%, 08/15/2046 | 24,540,700 | 15,540,764 |
|
TOTAL U.S. GOVERNMENT AND AGENCY OBLIGATIONS (Cost
$54,399,267) | $62,240,838 |
| SHORT-TERM INVESTMENTS - 0.8% | |
| Short-term funds - 0.8% | | |
| John Hancock Collateral Trust, 1.6968% (C)(E) | 574,759 | 5,752,708 |
| State Street Institutional U.S. Government Money Market Fund, Premier Class, 1.5386% (C) | 503,568 | 503,568 |
|
| TOTAL SHORT-TERM INVESTMENTS (Cost $6,255,357) | $6,256,276 |
| Total investments (Cost $744,999,822) - 100.9% | $761,567,594 |
| Other assets and liabilities, net - (0.9%) | (6,934,186) |
| TOTAL NET ASSETS - 100.0% | $754,633,408 |
MULTI-INDEX 2040 PRESERVATION PORTFOLIO
As of 2-29-20 (unaudited)
| | Shares or
Principal
Amount | Value |
| AFFILIATED INVESTMENT COMPANIES (A) - 63.1% | |
| Equity - 63.1% | | |
| Strategic Equity Allocation, Class NAV, JHF II (MIM US) (B) | 53,301,705 | $580,988,587 |
|
TOTAL AFFILIATED INVESTMENT COMPANIES (Cost
$576,205,816) | $580,988,587 |
| UNAFFILIATED INVESTMENT COMPANIES - 28.8% | |
| Exchange-traded funds - 28.8% | | |
| Financial Select Sector SPDR Fund | 331,561 | 8,816,207 |
| iShares Edge MSCI Min Vol USA ETF | 110,067 | 6,743,805 |
| iShares Global Infrastructure ETF | 12,510 | 552,191 |
| iShares JP Morgan USD Emerging Markets Bond ETF | 190,326 | 21,720,003 |
| Vanguard Dividend Appreciation ETF | 39,269 | 4,512,401 |
| Vanguard Energy ETF (D) | 34,632 | 2,117,054 |
| 18 | JOHN HANCOCK MULTI-INDEX PRESERVATION PORTFOLIOS | SEMIANNUAL REPORT | SEE NOTES TO FINANCIAL STATEMENTS |
MULTI-INDEX 2040 PRESERVATION PORTFOLIO (continued)
| | Shares or
Principal
Amount | Value |
| Exchange-traded funds - (continued) | | |
| Vanguard FTSE Emerging Markets ETF | 152,508 | $6,179,624 |
| Vanguard Global ex-U.S. Real Estate ETF | 10,560 | 571,718 |
| Vanguard Health Care ETF (D) | 50,132 | 8,787,638 |
| Vanguard Information Technology ETF | 37,209 | 8,768,301 |
| Vanguard Intermediate-Term Corporate Bond ETF | 233,174 | 21,955,664 |
| Vanguard Materials ETF | 9,594 | 1,094,579 |
| Vanguard Mid-Cap ETF | 234,799 | 38,072,658 |
| Vanguard Real Estate ETF | 18,951 | 1,654,991 |
| Vanguard S&P 500 ETF | 29,756 | 8,085,895 |
| Vanguard Small-Cap ETF | 33,673 | 4,998,759 |
| Vanguard Total Bond Market ETF | 1,178,120 | 102,213,691 |
| Xtrackers USD High Yield Corporate Bond ETF | 382,510 | 18,792,716 |
|
TOTAL UNAFFILIATED INVESTMENT COMPANIES (Cost
$247,419,728) | $265,637,895 |
| U.S. GOVERNMENT AND AGENCY OBLIGATIONS - 8.2% | |
| U.S. Government - 8.2% | | |
| U.S. Treasury STRIPS, PO, 1.687%, 11/15/2048 | 31,111,900 | 19,111,580 |
| U.S. Treasury STRIPS, PO, 1.704%, 02/15/2047 | 30,091,700 | 18,954,110 |
| U.S. Treasury STRIPS, PO, 1.712%, 05/15/2047 | 30,291,500 | 18,958,873 |
| U.S. Treasury STRIPS, PO, 1.716%, 08/15/2046 | 29,967,600 | 18,977,430 |
|
TOTAL U.S. GOVERNMENT AND AGENCY OBLIGATIONS (Cost
$66,420,911) | $76,001,993 |
| SHORT-TERM INVESTMENTS - 0.1% | |
| Short-term funds - 0.1% | | |
| John Hancock Collateral Trust, 1.6968% (C)(E) | 73,876 | 739,422 |
| State Street Institutional U.S. Government Money Market Fund, Premier Class, 1.5386% (C) | 1,012 | 1,012 |
|
| TOTAL SHORT-TERM INVESTMENTS (Cost $739,939) | $740,434 |
| Total investments (Cost $890,786,394) - 100.2% | $923,368,909 |
| Other assets and liabilities, net - (0.2%) | (2,267,832) |
| TOTAL NET ASSETS - 100.0% | $921,101,077 |
MULTI-INDEX 2035 PRESERVATION PORTFOLIO
As of 2-29-20 (unaudited)
| | Shares or
Principal
Amount | Value |
| AFFILIATED INVESTMENT COMPANIES (A) - 55.7% | |
| Equity - 55.7% | | |
| Strategic Equity Allocation, Class NAV, JHF II (MIM US) (B) | 59,343,790 | $646,847,310 |
|
TOTAL AFFILIATED INVESTMENT COMPANIES (Cost
$624,539,782) | $646,847,310 |
| UNAFFILIATED INVESTMENT COMPANIES - 36.3% | |
| Exchange-traded funds - 36.3% | | |
| Financial Select Sector SPDR Fund | 380,570 | 10,119,356 |
| iShares Edge MSCI Min Vol USA ETF | 189,760 | 11,626,595 |
| iShares Global Infrastructure ETF | 20,162 | 889,951 |
MULTI-INDEX 2035 PRESERVATION PORTFOLIO (continued)
| | Shares or
Principal
Amount | Value |
| Exchange-traded funds - (continued) | | |
| iShares JP Morgan USD Emerging Markets Bond ETF | 328,794 | $37,521,971 |
| Vanguard Dividend Appreciation ETF | 67,702 | 7,779,637 |
| Vanguard Energy ETF | 55,705 | 3,405,247 |
| Vanguard Global ex-U.S. Real Estate ETF | 16,984 | 919,514 |
| Vanguard Health Care ETF (D) | 58,023 | 10,170,852 |
| Vanguard Information Technology ETF | 42,962 | 10,123,995 |
| Vanguard Intermediate-Term Corporate Bond ETF | 682,510 | 64,265,142 |
| Vanguard Materials ETF | 15,329 | 1,748,886 |
| Vanguard Mid-Cap ETF | 197,243 | 31,982,952 |
| Vanguard Real Estate ETF | 30,356 | 2,650,989 |
| Vanguard S&P 500 ETF | 56,134 | 15,253,853 |
| Vanguard Small-Cap ETF | 32,652 | 4,847,189 |
| Vanguard Total Bond Market ETF | 2,024,987 | 175,687,872 |
| Xtrackers USD High Yield Corporate Bond ETF | 661,107 | 32,480,187 |
|
TOTAL UNAFFILIATED INVESTMENT COMPANIES (Cost
$392,775,093) | $421,474,188 |
| U.S. GOVERNMENT AND AGENCY OBLIGATIONS - 8.2% | |
| U.S. Government - 8.2% | | |
| U.S. Treasury STRIPS, PO, 1.687%, 11/15/2048 | 38,999,800 | 23,957,000 |
| U.S. Treasury STRIPS, PO, 1.704%, 02/15/2047 | 37,718,700 | 23,758,192 |
| U.S. Treasury STRIPS, PO, 1.712%, 05/15/2047 | 37,970,400 | 23,764,950 |
| U.S. Treasury STRIPS, PO, 1.716%, 08/15/2046 | 37,564,400 | 23,788,217 |
|
TOTAL U.S. GOVERNMENT AND AGENCY OBLIGATIONS (Cost
$83,256,910) | $95,268,359 |
| SHORT-TERM INVESTMENTS - 0.7% | |
| Short-term funds - 0.7% | | |
| John Hancock Collateral Trust, 1.6968% (C)(E) | 803,044 | 8,037,587 |
| State Street Institutional U.S. Government Money Market Fund, Premier Class, 1.5386% (C) | 1,030 | 1,030 |
|
| TOTAL SHORT-TERM INVESTMENTS (Cost $8,033,245) | $8,038,617 |
| Total investments (Cost $1,108,605,030) - 100.9% | $1,171,628,474 |
| Other assets and liabilities, net - (0.9%) | (9,899,096) |
| TOTAL NET ASSETS - 100.0% | $1,161,729,378 |
MULTI-INDEX 2030 PRESERVATION PORTFOLIO
As of 2-29-20 (unaudited)
| | Shares or
Principal
Amount | Value |
| AFFILIATED INVESTMENT COMPANIES (A) - 40.3% | |
| Equity - 40.3% | | |
| Strategic Equity Allocation, Class NAV, JHF II (MIM US) (B) | 49,031,904 | $534,447,758 |
|
TOTAL AFFILIATED INVESTMENT COMPANIES (Cost
$495,711,120) | $534,447,758 |
| UNAFFILIATED INVESTMENT COMPANIES - 52.1% | |
| Exchange-traded funds - 52.1% | | |
| Financial Select Sector SPDR Fund | 384,323 | 10,219,149 |
| SEE NOTES TO FINANCIAL STATEMENTS | SEMIANNUAL REPORT | JOHN HANCOCK MULTI-INDEX PRESERVATION PORTFOLIOS | 19 |
MULTI-INDEX 2030 PRESERVATION PORTFOLIO (continued)
| | Shares or
Principal
Amount | Value |
| Exchange-traded funds - (continued) | | |
| Invesco Senior Loan ETF (D) | 274,319 | $6,032,275 |
| iShares Edge MSCI Min Vol USA ETF | 273,383 | 16,750,176 |
| iShares Global Infrastructure ETF | 27,849 | 1,229,255 |
| iShares JP Morgan USD Emerging Markets Bond ETF | 476,321 | 54,357,753 |
| SPDR Portfolio Short Term Corporate Bond ETF | 110,884 | 3,446,275 |
| Vanguard Dividend Appreciation ETF | 97,539 | 11,208,206 |
| Vanguard Energy ETF | 76,879 | 4,699,613 |
| Vanguard FTSE Developed Markets ETF | 230,821 | 9,110,505 |
| Vanguard Global ex-U.S. Real Estate ETF | 23,468 | 1,270,558 |
| Vanguard Health Care ETF (D) | 59,416 | 10,415,031 |
| Vanguard Information Technology ETF | 44,200 | 10,415,730 |
| Vanguard Intermediate-Term Corporate Bond ETF | 1,183,102 | 111,400,884 |
| Vanguard Materials ETF | 21,335 | 2,434,110 |
| Vanguard Mid-Cap ETF | 125,178 | 20,297,613 |
| Vanguard Real Estate ETF | 41,979 | 3,666,026 |
| Vanguard S&P 500 ETF | 92,575 | 25,156,331 |
| Vanguard Short-Term Corporate Bond ETF | 42,053 | 3,452,972 |
| Vanguard Small-Cap ETF | 24,173 | 3,588,480 |
| Vanguard Total Bond Market ETF | 3,871,986 | 335,933,505 |
| Xtrackers USD High Yield Corporate Bond ETF | 955,950 | 46,965,824 |
|
TOTAL UNAFFILIATED INVESTMENT COMPANIES (Cost
$652,429,926) | $692,050,271 |
| U.S. GOVERNMENT AND AGENCY OBLIGATIONS - 8.0% | |
| U.S. Government - 8.0% | | |
| U.S. Treasury Inflation Protected Security, 0.125%, 01/15/2023 | 3,094,946 | 3,131,424 |
| U.S. Treasury Inflation Protected Security, 0.125%, 07/15/2024 | 2,387,077 | 2,446,035 |
| U.S. Treasury Inflation Protected Security, 0.625%, 07/15/2021 | 1,366,530 | 1,385,759 |
| U.S. Treasury STRIPS, PO, 1.687%, 11/15/2048 | 40,836,700 | 25,085,380 |
| U.S. Treasury STRIPS, PO, 1.704%, 02/15/2047 | 39,495,300 | 24,877,234 |
| U.S. Treasury STRIPS, PO, 1.712%, 05/15/2047 | 39,758,500 | 24,884,088 |
| U.S. Treasury STRIPS, PO, 1.716%, 08/15/2046 | 39,333,200 | 24,908,336 |
|
TOTAL U.S. GOVERNMENT AND AGENCY OBLIGATIONS (Cost
$94,086,281) | $106,718,256 |
| SHORT-TERM INVESTMENTS - 0.8% | |
| Short-term funds - 0.8% | | |
| John Hancock Collateral Trust, 1.6968% (C)(E) | 1,068,782 | 10,697,329 |
| State Street Institutional U.S. Government Money Market Fund, Premier Class, 1.5386% (C) | 1,036 | 1,036 |
|
| TOTAL SHORT-TERM INVESTMENTS (Cost $10,694,793) | $10,698,365 |
| Total investments (Cost $1,252,922,120) - 101.2% | $1,343,914,650 |
| Other assets and liabilities, net - (1.2%) | (15,726,358) |
| TOTAL NET ASSETS - 100.0% | $1,328,188,292 |
MULTI-INDEX 2025 PRESERVATION PORTFOLIO
As of 2-29-20 (unaudited)
| | Shares or
Principal
Amount | Value |
| AFFILIATED INVESTMENT COMPANIES (A) - 25.1% | |
| Equity - 25.1% | | |
| Strategic Equity Allocation, Class NAV, JHF II (MIM US) (B) | 27,610,783 | $300,957,540 |
|
TOTAL AFFILIATED INVESTMENT COMPANIES (Cost
$273,447,885) | $300,957,540 |
| UNAFFILIATED INVESTMENT COMPANIES - 64.7% | |
| Exchange-traded funds - 64.7% | | |
| Invesco Senior Loan ETF | 1,262,105 | 27,753,689 |
| iShares Edge MSCI Min Vol USA ETF | 294,336 | 18,033,967 |
| iShares Global Infrastructure ETF | 29,280 | 1,292,419 |
| iShares JP Morgan USD Emerging Markets Bond ETF | 516,395 | 58,930,997 |
| SPDR Portfolio Short Term Corporate Bond ETF | 1,454,081 | 45,192,837 |
| Vanguard Dividend Appreciation ETF | 105,192 | 12,087,613 |
| Vanguard Energy ETF | 80,457 | 4,918,336 |
| Vanguard Global ex-U.S. Real Estate ETF | 24,638 | 1,333,901 |
| Vanguard Intermediate-Term Corporate Bond ETF | 1,657,768 | 156,095,435 |
| Vanguard Materials ETF | 22,548 | 2,572,501 |
| Vanguard Mid-Cap ETF | 20,343 | 3,298,617 |
| Vanguard Real Estate ETF | 43,998 | 3,842,345 |
| Vanguard S&P 500 ETF | 88,448 | 24,034,860 |
| Vanguard Short-Term Corporate Bond ETF | 551,463 | 45,280,627 |
| Vanguard Small-Cap ETF | 9,985 | 1,482,275 |
| Vanguard Total Bond Market ETF | 3,672,527 | 318,628,443 |
| Xtrackers USD High Yield Corporate Bond ETF | 1,035,962 | 50,896,813 |
|
TOTAL UNAFFILIATED INVESTMENT COMPANIES (Cost
$736,634,908) | $775,675,675 |
| U.S. GOVERNMENT AND AGENCY OBLIGATIONS - 10.5% | |
| U.S. Government - 10.5% | | |
| U.S. Treasury Inflation Protected Security, 0.125%, 01/15/2023 | 34,244,138 | 34,647,744 |
| U.S. Treasury Inflation Protected Security, 0.125%, 07/15/2024 | 26,410,987 | 27,063,308 |
| U.S. Treasury Inflation Protected Security, 0.625%, 07/15/2021 | 15,124,411 | 15,337,237 |
| U.S. Treasury STRIPS, PO, 1.687%, 11/15/2048 | 19,691,500 | 12,096,197 |
| U.S. Treasury STRIPS, PO, 1.704%, 02/15/2047 | 19,044,200 | 11,995,529 |
| U.S. Treasury STRIPS, PO, 1.712%, 05/15/2047 | 19,171,900 | 11,999,327 |
| U.S. Treasury STRIPS, PO, 1.716%, 08/15/2046 | 18,965,500 | 12,010,186 |
|
TOTAL U.S. GOVERNMENT AND AGENCY OBLIGATIONS (Cost
$118,391,966) | $125,149,528 |
| SHORT-TERM INVESTMENTS - 0.0% | |
| Short-term funds - 0.0% | | |
| State Street Institutional U.S. Government Money Market Fund, Premier Class, 1.5386% (C) | 1,052 | 1,052 |
|
| TOTAL SHORT-TERM INVESTMENTS (Cost $1,052) | $1,052 |
| Total investments (Cost $1,128,475,811) - 100.3% | $1,201,783,795 |
| Other assets and liabilities, net - (0.3%) | (3,051,996) |
| TOTAL NET ASSETS - 100.0% | $1,198,731,799 |
| 20 | JOHN HANCOCK MULTI-INDEX PRESERVATION PORTFOLIOS | SEMIANNUAL REPORT | SEE NOTES TO FINANCIAL STATEMENTS |
MULTI-INDEX 2020 PRESERVATION PORTFOLIO
As of 2-29-20 (unaudited)
| | Shares or
Principal
Amount | Value |
| AFFILIATED INVESTMENT COMPANIES (A) - 5.6% | |
| Equity - 5.6% | | |
| Strategic Equity Allocation, Class NAV, JHF II (MIM US) (B) | 2,955,684 | $32,216,960 |
|
TOTAL AFFILIATED INVESTMENT COMPANIES (Cost
$28,723,970) | $32,216,960 |
| UNAFFILIATED INVESTMENT COMPANIES - 82.0% | |
| Exchange-traded funds - 82.0% | | |
| Invesco Senior Loan ETF (D) | 1,153,845 | 25,373,052 |
| iShares Edge MSCI Min Vol USA ETF | 165,128 | 10,117,393 |
| iShares Global Infrastructure ETF | 16,213 | 715,642 |
| iShares JP Morgan USD Emerging Markets Bond ETF | 286,516 | 32,697,206 |
| SPDR Portfolio Short Term Corporate Bond ETF | 1,333,372 | 41,441,202 |
| Vanguard Dividend Appreciation ETF (D) | 59,662 | 6,855,760 |
| Vanguard Energy ETF | 44,190 | 2,701,335 |
| Vanguard Global ex-U.S. Real Estate ETF | 13,482 | 729,915 |
| Vanguard Intermediate-Term Corporate Bond ETF | 1,251,769 | 117,866,569 |
| Vanguard Materials ETF | 12,551 | 1,431,944 |
| Vanguard Real Estate ETF | 24,141 | 2,108,233 |
| Vanguard S&P 500 ETF | 48,534 | 13,188,629 |
| Vanguard Short-Term Corporate Bond ETF | 505,943 | 41,542,980 |
| Vanguard Total Bond Market ETF | 1,716,411 | 148,915,818 |
| Xtrackers USD High Yield Corporate Bond ETF | 576,149 | 28,306,200 |
|
TOTAL UNAFFILIATED INVESTMENT COMPANIES (Cost
$455,688,500) | $473,991,878 |
| U.S. GOVERNMENT AND AGENCY OBLIGATIONS - 12.3% | |
| U.S. Government - 12.3% | | |
| U.S. Treasury Inflation Protected Security, 0.125%, 01/15/2023 | 31,656,871 | 32,029,983 |
| U.S. Treasury Inflation Protected Security, 0.125%, 07/15/2024 | 24,415,479 | 25,018,513 |
| U.S. Treasury Inflation Protected Security, 0.625%, 07/15/2021 | 13,981,018 | 14,177,755 |
|
TOTAL U.S. GOVERNMENT AND AGENCY OBLIGATIONS (Cost
$70,586,309) | $71,226,251 |
| SHORT-TERM INVESTMENTS - 5.9% | |
| Short-term funds - 5.9% | | |
| John Hancock Collateral Trust, 1.6968% (C)(E) | 3,262,395 | 32,652,986 |
| State Street Institutional U.S. Government Money Market Fund, Premier Class, 1.5386% (C) | 1,620,907 | 1,620,907 |
|
| TOTAL SHORT-TERM INVESTMENTS (Cost $34,272,177) | $34,273,893 |
| Total investments (Cost $589,270,956) - 105.8% | $611,708,982 |
| Other assets and liabilities, net - (5.8%) | (33,457,434) |
| TOTAL NET ASSETS - 100.0% | $578,251,548 |
MULTI-INDEX INCOME PRESERVATION PORTFOLIO
As of 2-29-20 (unaudited)
| | Shares or
Principal
Amount | Value |
| AFFILIATED INVESTMENT COMPANIES (A) - 5.6% | |
| Equity - 5.6% | | |
| Strategic Equity Allocation, Class NAV, JHF II (MIM US) (B) | 1,644,214 | $17,921,937 |
|
TOTAL AFFILIATED INVESTMENT COMPANIES (Cost
$16,709,202) | $17,921,937 |
| UNAFFILIATED INVESTMENT COMPANIES - 81.8% | |
| Exchange-traded funds - 81.8% | | |
| Invesco Senior Loan ETF (D) | 646,927 | 14,225,925 |
| iShares Edge MSCI Min Vol USA ETF | 106,381 | 6,517,964 |
| iShares Global Infrastructure ETF | 8,945 | 394,832 |
| iShares JP Morgan USD Emerging Markets Bond ETF | 160,458 | 18,311,467 |
| SPDR Portfolio Short Term Corporate Bond ETF | 747,168 | 23,221,981 |
| Vanguard Dividend Appreciation ETF (D) | 24,919 | 2,863,442 |
| Vanguard Energy ETF (D) | 24,830 | 1,517,858 |
| Vanguard Global ex-U.S. Real Estate ETF (D) | 7,523 | 407,295 |
| Vanguard Intermediate-Term Corporate Bond ETF (D) | 699,993 | 65,911,341 |
| Vanguard Materials ETF | 6,913 | 788,704 |
| Vanguard Real Estate ETF | 13,457 | 1,175,199 |
| Vanguard S&P 500 ETF | 26,706 | 7,257,088 |
| Vanguard Short-Term Corporate Bond ETF | 283,320 | 23,263,405 |
| Vanguard Total Bond Market ETF | 959,587 | 83,253,768 |
| Xtrackers USD High Yield Corporate Bond ETF | 322,698 | 15,854,153 |
|
TOTAL UNAFFILIATED INVESTMENT COMPANIES (Cost
$254,448,890) | $264,964,422 |
| U.S. GOVERNMENT AND AGENCY OBLIGATIONS - 12.4% | |
| U.S. Government - 12.4% | | |
| U.S. Treasury Inflation Protected Security, 0.125%, 01/15/2023 | 17,785,335 | 17,994,956 |
| U.S. Treasury Inflation Protected Security, 0.125%, 07/15/2024 | 13,717,791 | 14,056,604 |
| U.S. Treasury Inflation Protected Security, 0.625%, 07/15/2021 | 7,855,066 | 7,965,600 |
|
TOTAL U.S. GOVERNMENT AND AGENCY OBLIGATIONS (Cost
$39,657,453) | $40,017,160 |
| SHORT-TERM INVESTMENTS - 7.5% | |
| Short-term funds - 7.5% | | |
| John Hancock Collateral Trust, 1.6968% (C)(E) | 2,391,880 | 23,940,091 |
| State Street Institutional U.S. Government Money Market Fund, Premier Class, 1.5386% (C) | 502,636 | 502,636 |
|
| TOTAL SHORT-TERM INVESTMENTS (Cost $24,441,734) | $24,442,727 |
| Total investments (Cost $335,257,279) - 107.3% | $347,346,246 |
| Other assets and liabilities, net - (7.3%) | (23,494,870) |
| TOTAL NET ASSETS - 100.0% | $323,851,376 |
Percentages are based upon net assets.
Security Abbreviations and Legend
| JHF II | John Hancock Funds II |
| MIM US | Manulife Investment Management (US) LLC |
| SEE NOTES TO FINANCIAL STATEMENTS | SEMIANNUAL REPORT | JOHN HANCOCK MULTI-INDEX PRESERVATION PORTFOLIOS | 21 |
| PO | Principal-Only Security - (Principal Tranche of Stripped Security). Rate shown is the annualized yield on date of purchase. |
| STRIPS | Separate Trading of Registered Interest and Principal Securities |
| (A) | The underlying funds' subadvisor is shown parenthetically. |
| (B) | The subadvisor is an affiliate of the advisor. |
| (C) | The rate shown is the annualized seven-day yield as of 2-29-20. |
| (D) | All or a portion of this security is on loan as of 2-29-20. |
| (E) | Investment is an affiliate of the fund, the advisor and/or subadvisor. This security represents the investment of cash collateral received for securities lending. |
| 22 | JOHN HANCOCK MULTI-INDEX PRESERVATION PORTFOLIOS | SEMIANNUAL REPORT | SEE NOTES TO FINANCIAL STATEMENTS |
STATEMENTS OF ASSETS AND LIABILITIES 2-29-20 (unaudited)
| | Multi-Index 2060 Preservation Portfolio | Multi-Index 2055 Preservation Portfolio | Multi-Index 2050 Preservation Portfolio | Multi-Index 2045 Preservation Portfolio |
| Assets | | | | |
| Unaffiliated investments, at value | $35,700,396 | $87,443,983 | $196,023,693 | $250,512,559 |
| Affiliated investments, at value | 76,492,089 | 186,399,773 | 418,306,994 | 511,055,035 |
| Total investments, at value | 112,192,485 | 273,843,756 | 614,330,687 | 761,567,594 |
| Cash | — | — | 11,013 | — |
| Interest receivable | 644 | 1,033 | 2,256 | 2,879 |
| Receivable for fund shares sold | 750,606 | 321,115 | 97,714 | 269,828 |
| Receivable for investments sold | 423,708 | 1,073,466 | 2,392,530 | 2,798,256 |
| Receivable for securities lending income | — | — | 1,471 | 1,674 |
| Receivable from affiliates | 2,618 | 4,777 | 9,814 | 12,270 |
| Other assets | 49,891 | 49,633 | 32,669 | 32,544 |
| Total assets | 113,419,952 | 275,293,780 | 616,878,154 | 764,685,045 |
| Liabilities | | | | |
| Payable for investments purchased | 1,076,767 | 1,829,703 | 3,580,899 | 4,177,485 |
| Payable for fund shares repurchased | 205,115 | — | 102,067 | 61,076 |
| Payable upon return of securities loaned | — | — | — | 5,751,666 |
| Payable to affiliates | | | | |
| Accounting and legal services fees | 3,010 | 7,431 | 16,579 | 20,306 |
| Transfer agent fees | 67 | 24 | 903 | 834 |
| Distribution and service fees | 54 | 84 | 751 | 418 |
| Trustees' fees | 26 | 364 | 989 | 1,317 |
| Other liabilities and accrued expenses | 33,993 | 31,999 | 37,846 | 38,535 |
| Total liabilities | 1,319,032 | 1,869,605 | 3,740,034 | 10,051,637 |
| Net assets | $112,100,920 | $273,424,175 | $613,138,120 | $754,633,408 |
| Net assets consist of | | | | |
| Paid-in capital | $117,702,324 | $285,534,374 | $607,301,397 | $728,307,508 |
| Total distributable earnings (loss) | (5,601,404) | (12,110,199) | 5,836,723 | 26,325,900 |
| Net assets | $112,100,920 | $273,424,175 | $613,138,120 | $754,633,408 |
| Unaffiliated investments, at cost | $34,593,307 | $83,126,164 | $184,528,782 | $229,767,008 |
| Affiliated investments, at cost | 83,607,681 | 204,888,286 | 431,585,494 | 515,232,814 |
| Total investments, at cost | 118,200,988 | 288,014,450 | 616,114,276 | 744,999,822 |
| Securities loaned, at value | — | — | — | $5,638,776 |
| Net asset value per share | | | | |
| The portfolios have an unlimited number of shares authorized with no par value. Net asset value is calculated by dividing the net assets of each class of shares by the number of outstanding shares in the class. | | | | |
| Class R1 | | | | |
| Net assets | $107,177 | $40,649 | $493,149 | $410,652 |
| Shares outstanding | 9,603 | 4,033 | 43,789 | 32,406 |
| Net asset value, offering price and redemption price per share | $11.16 | $10.08 | $11.26 | $12.67 |
| Class R2 | | | | |
| Net assets | $178,426 | $202,011 | $786,138 | $557,661 |
| Shares outstanding | 15,980 | 20,027 | 69,869 | 44,023 |
| Net asset value, offering price and redemption price per share | $11.17 | $10.09 | $11.25 | $12.67 |
| Class R4 | | | | |
| Net assets | $119,285 | $43,292 | $1,176,584 | $47,431 |
| Shares outstanding | 10,678 | 4,288 | 104,339 | 3,731 |
| Net asset value, offering price and redemption price per share | $11.17 | $10.10 | $11.28 | $12.71 |
| Class R6 | | | | |
| Net assets | $5,885,356 | $2,078,626 | $82,918,174 | $77,369,823 |
| Shares outstanding | 526,679 | 205,972 | 7,391,285 | 6,120,926 |
| Net asset value, offering price and redemption price per share | $11.17 | $10.09 | $11.22 | $12.64 |
| Class 1 | | | | |
| Net assets | $105,810,676 | $271,059,597 | $527,764,075 | $676,247,841 |
| Shares outstanding | 9,472,183 | 26,870,673 | 47,028,924 | 53,503,017 |
| Net asset value, offering price and redemption price per share | $11.17 | $10.09 | $11.22 | $12.64 |
| SEE NOTES TO FINANCIAL STATEMENTS | SEMIANNUAL REPORT | JOHN HANCOCK MULTI-INDEX PRESERVATION PORTFOLIOS | 23 |
STATEMENTS OF ASSETS AND LIABILITIES 2-29-20 (unaudited)
Continued
| | Multi-Index 2040 Preservation Portfolio | Multi-Index 2035 Preservation Portfolio | Multi-Index 2030 Preservation Portfolio | Multi-Index 2025 Preservation Portfolio |
| Assets | | | | |
| Unaffiliated investments, at value | $341,640,900 | $516,743,577 | $798,769,563 | $900,826,255 |
| Affiliated investments, at value | 581,728,009 | 654,884,897 | 545,145,087 | 300,957,540 |
| Total investments, at value | 923,368,909 | 1,171,628,474 | 1,343,914,650 | 1,201,783,795 |
| Interest receivable | 3,393 | 4,168 | 6,668 | 25,593 |
| Receivable for fund shares sold | 181,019 | 498,706 | 86,090 | 151,214 |
| Receivable for investments sold | 3,840,555 | 6,204,388 | 9,406,112 | 6,582,073 |
| Receivable for securities lending income | 611 | 2,363 | 2,591 | — |
| Receivable from affiliates | 15,078 | 18,543 | 21,111 | 18,620 |
| Other assets | 34,830 | 35,393 | 36,631 | 35,407 |
| Total assets | 927,444,395 | 1,178,392,035 | 1,353,473,853 | 1,208,596,702 |
| Liabilities | | | | |
| Due to custodian | 54,018 | 1,616,394 | 4,037,941 | 1,725,195 |
| Payable for investments purchased | 5,056,073 | 6,901,291 | 7,885,841 | 6,302,649 |
| Payable for fund shares repurchased | 438,836 | 57,069 | 2,610,893 | 1,761,461 |
| Payable upon return of securities loaned | 727,601 | 8,012,541 | 10,670,784 | — |
| Payable to affiliates | | | | |
| Accounting and legal services fees | 24,707 | 30,986 | 34,843 | 30,956 |
| Transfer agent fees | 958 | 1,054 | 1,143 | 848 |
| Distribution and service fees | 285 | 946 | 822 | 734 |
| Trustees' fees | 1,662 | 2,127 | 2,460 | 2,327 |
| Other liabilities and accrued expenses | 39,178 | 40,249 | 40,834 | 40,733 |
| Total liabilities | 6,343,318 | 16,662,657 | 25,285,561 | 9,864,903 |
| Net assets | $921,101,077 | $1,161,729,378 | $1,328,188,292 | $1,198,731,799 |
| Net assets consist of | | | | |
| Paid-in capital | $875,951,759 | $1,086,400,193 | $1,221,742,278 | $1,102,755,158 |
| Total distributable earnings (loss) | 45,149,318 | 75,329,185 | 106,446,014 | 95,976,641 |
| Net assets | $921,101,077 | $1,161,729,378 | $1,328,188,292 | $1,198,731,799 |
| Unaffiliated investments, at cost | $313,841,651 | $476,033,033 | $746,517,243 | $855,027,926 |
| Affiliated investments, at cost | 576,944,743 | 632,571,997 | 506,404,877 | 273,447,885 |
| Total investments, at cost | 890,786,394 | 1,108,605,030 | 1,252,922,120 | 1,128,475,811 |
| Securities loaned, at value | $713,318 | $7,855,276 | $10,457,502 | — |
| Net asset value per share | | | | |
| The portfolios have an unlimited number of shares authorized with no par value. Net asset value is calculated by dividing the net assets of each class of shares by the number of outstanding shares in the class. | | | | |
| Class R1 | | | | |
| Net assets | $279,628 | $653,886 | $565,706 | $338,303 |
| Shares outstanding | 22,183 | 51,810 | 45,060 | 27,914 |
| Net asset value, offering price and redemption price per share | $12.61 | $12.62 | $12.55 | $12.12 |
| Class R2 | | | | |
| Net assets | $359,285 | $1,246,848 | $673,296 | $1,573,109 |
| Shares outstanding | 28,524 | 99,120 | 53,782 | 129,844 |
| Net asset value, offering price and redemption price per share | $12.60 | $12.58 | $12.52 | $12.12 |
| Class R4 | | | | |
| Net assets | $182,494 | $66,661 | $1,689,241 | $78,611 |
| Shares outstanding | 14,424 | 5,276 | 134,172 | 6,476 |
| Net asset value, offering price and redemption price per share | $12.65 | $12.641 | $12.59 | $12.14 |
| Class R6 | | | | |
| Net assets | $89,636,250 | $98,867,834 | $107,958,075 | $81,233,097 |
| Shares outstanding | 7,144,539 | 7,871,765 | 8,637,762 | 6,725,469 |
| Net asset value, offering price and redemption price per share | $12.55 | $12.56 | $12.50 | $12.08 |
| Class 1 | | | | |
| Net assets | $830,643,420 | $1,060,894,149 | $1,217,301,974 | $1,115,508,679 |
| Shares outstanding | 66,094,383 | 84,538,205 | 97,352,627 | 92,342,225 |
| Net asset value, offering price and redemption price per share | $12.57 | $12.55 | $12.50 | $12.08 |
| 1 | Net asset value, offering price and redemption price per share of $12.64 is calculated using Net assets of $66,661 and Shares outstanding of 5,275.69. |
| 24 | JOHN HANCOCK MULTI-INDEX PRESERVATION PORTFOLIOS | SEMIANNUAL REPORT | SEE NOTES TO FINANCIAL STATEMENTS |
STATEMENTS OF ASSETS AND LIABILITIES 2-29-20 (unaudited)
Continued
| | Multi-Index 2020 Preservation Portfolio | Multi-Index Income Preservation Portfolio |
| Assets | | |
| Unaffiliated investments, at value | $546,839,036 | $305,484,218 |
| Affiliated investments, at value | 64,869,946 | 41,862,028 |
| Total investments, at value | 611,708,982 | 347,346,246 |
| Interest receivable | 21,240 | 11,828 |
| Receivable for fund shares sold | 162,386 | 598,916 |
| Receivable for investments sold | 1,380,705 | 934,478 |
| Receivable for securities lending income | 728 | 320 |
| Receivable from affiliates | 10,497 | 5,706 |
| Other assets | 31,539 | 29,230 |
| Total assets | 613,316,077 | 348,926,724 |
| Liabilities | | |
| Payable for investments purchased | 1,800,875 | 1,084,554 |
| Payable for fund shares repurchased | 557,277 | 5,785 |
| Payable upon return of securities loaned | 32,651,240 | 23,939,275 |
| Payable to affiliates | | |
| Accounting and legal services fees | 14,626 | 8,183 |
| Transfer agent fees | 450 | 256 |
| Distribution and service fees | 603 | 367 |
| Trustees' fees | 1,241 | 679 |
| Other liabilities and accrued expenses | 38,217 | 36,249 |
| Total liabilities | 35,064,529 | 25,075,348 |
| Net assets | $578,251,548 | $323,851,376 |
| Net assets consist of | | |
| Paid-in capital | $546,379,060 | $308,739,235 |
| Total distributable earnings (loss) | 31,872,488 | 15,112,141 |
| Net assets | $578,251,548 | $323,851,376 |
| Unaffiliated investments, at cost | $527,895,716 | $294,608,979 |
| Affiliated investments, at cost | 61,375,240 | 40,648,300 |
| Total investments, at cost | 589,270,956 | 335,257,279 |
| Securities loaned, at value | $31,754,504 | $23,307,281 |
| Net asset value per share | | |
| The portfolios have an unlimited number of shares authorized with no par value. Net asset value is calculated by dividing the net assets of each class of shares by the number of outstanding shares in the class. | | |
| Class R1 | | |
| Net assets | $211,633 | $178,077 |
| Shares outstanding | 18,527 | 15,850 |
| Net asset value, offering price and redemption price per share | $11.42 | $11.24 |
| Class R2 | | |
| Net assets | $1,209,154 | $631,601 |
| Shares outstanding | 105,907 | 56,300 |
| Net asset value, offering price and redemption price per share | $11.42 | $11.22 |
| Class R4 | | |
| Net assets | $135,263 | $658,096 |
| Shares outstanding | 11,845 | 58,729 |
| Net asset value, offering price and redemption price per share | $11.42 | $11.21 |
| Class R6 | | |
| Net assets | $43,114,349 | $23,804,002 |
| Shares outstanding | 3,789,664 | 2,129,007 |
| Net asset value, offering price and redemption price per share | $11.38 | $11.18 |
| Class 1 | | |
| Net assets | $533,581,149 | $298,579,600 |
| Shares outstanding | 46,936,637 | 26,683,360 |
| Net asset value, offering price and redemption price per share | $11.37 | $11.19 |
| SEE NOTES TO FINANCIAL STATEMENTS | SEMIANNUAL REPORT | JOHN HANCOCK MULTI-INDEX PRESERVATION PORTFOLIOS | 25 |
STATEMENTS OF OPERATIONSFor the six months ended 2-29-20 (unaudited)
| | Multi-Index 2060 Preservation Portfolio | Multi-Index 2055 Preservation Portfolio | Multi-Index 2050 Preservation Portfolio | Multi-Index 2045 Preservation Portfolio |
| Investment income | | | | |
| Income distributions received from affiliated investments | $1,643,536 | $4,319,952 | $9,622,532 | $11,681,136 |
| Dividends | 477,181 | 1,287,522 | 2,876,734 | 3,792,778 |
| Interest | 25,992 | 65,468 | 147,169 | 173,205 |
| Securities lending | 3,805 | 19,942 | 33,137 | 45,328 |
| Other income received from advisor | 27,967 | 60,023 | 134,848 | 193,084 |
| Total investment income | 2,178,481 | 5,752,907 | 12,814,420 | 15,885,531 |
| Expenses | | | | |
| Investment management fees | 100,406 | 265,703 | 594,435 | 758,986 |
| Distribution and service fees | 26,113 | 70,849 | 144,066 | 181,336 |
| Accounting and legal services fees | 9,643 | 25,610 | 57,384 | 71,139 |
| Transfer agent fees | 339 | 130 | 5,138 | 4,743 |
| Trustees' fees | 895 | 2,515 | 5,611 | 7,045 |
| Custodian fees | 24,083 | 24,083 | 24,083 | 24,083 |
| State registration fees | 27,350 | 27,260 | 31,249 | 30,672 |
| Printing and postage | 9,233 | 9,062 | 11,186 | 11,022 |
| Professional fees | 24,050 | 22,930 | 29,076 | 30,621 |
| Other | 5,906 | 6,983 | 9,423 | 10,597 |
| Total expenses | 228,018 | 455,125 | 911,651 | 1,130,244 |
| Less expense reductions | (201,939) | (384,280) | (767,857) | (948,867) |
| Net expenses | 26,079 | 70,845 | 143,794 | 181,377 |
| Net investment income | 2,152,402 | 5,682,062 | 12,670,626 | 15,704,154 |
| Realized and unrealized gain (loss) | | | | |
| Net realized gain (loss) on | | | | |
| Unaffiliated investments | 1,391,343 | 6,270,198 | 16,707,159 | 19,344,962 |
| Affiliated investments | (357,907) | (1,272,322) | (2,222,785) | (3,240,186) |
| Capital gain distributions received from affiliated investments | 815,320 | 2,143,028 | 4,773,515 | 5,794,740 |
| | 1,848,756 | 7,140,904 | 19,257,889 | 21,899,516 |
| Change in net unrealized appreciation (depreciation) of | | | | |
| Unaffiliated investments | (464,418) | (3,643,842) | (10,858,850) | (12,107,238) |
| Affiliated investments | (1,963,057) | (2,608,991) | (6,478,807) | (6,729,358) |
| | (2,427,475) | (6,252,833) | (17,337,657) | (18,836,596) |
| Net realized and unrealized gain (loss) | (578,719) | 888,071 | 1,920,232 | 3,062,920 |
| Increase in net assets from operations | $1,573,683 | $6,570,133 | $14,590,858 | $18,767,074 |
| 26 | JOHN HANCOCK MULTI-INDEX PRESERVATION PORTFOLIOS | SEMIANNUAL REPORT | SEE NOTES TO FINANCIAL STATEMENTS |
STATEMENTS OF OPERATIONSFor the six months ended 2-29-20 (unaudited)
Continued
| | Multi-Index 2040 Preservation Portfolio | Multi-Index 2035 Preservation Portfolio | Multi-Index 2030 Preservation Portfolio | Multi-Index 2025 Preservation Portfolio |
| Investment income | | | | |
| Income distributions received from affiliated investments | $13,452,248 | $15,108,780 | $12,966,560 | $7,237,151 |
| Dividends | 5,188,850 | 7,691,473 | 11,321,358 | 12,907,774 |
| Interest | 211,255 | 322,506 | 353,968 | 250,742 |
| Securities lending | 81,194 | 98,268 | 120,519 | 101,452 |
| Other income received from advisor | 190,927 | 32,580 | — | — |
| Total investment income | 19,124,474 | 23,253,607 | 24,762,405 | 20,497,119 |
| Expenses | | | | |
| Investment management fees | 1,016,624 | 1,469,843 | 2,098,883 | 2,360,725 |
| Distribution and service fees | 221,784 | 284,574 | 323,929 | 295,480 |
| Accounting and legal services fees | 87,152 | 109,556 | 124,079 | 112,170 |
| Transfer agent fees | 5,542 | 6,163 | 6,722 | 5,119 |
| Trustees' fees | 8,667 | 10,860 | 12,369 | 11,229 |
| Custodian fees | 24,083 | 24,083 | 24,083 | 24,083 |
| State registration fees | 31,088 | 31,781 | 31,616 | 30,802 |
| Printing and postage | 10,924 | 11,029 | 10,809 | 10,605 |
| Professional fees | 32,289 | 34,616 | 36,249 | 35,448 |
| Other | 11,984 | 13,133 | 15,856 | 17,713 |
| Total expenses | 1,450,137 | 1,995,638 | 2,684,595 | 2,903,374 |
| Less expense reductions | (1,228,372) | (1,710,963) | (1,939,382) | (1,757,125) |
| Net expenses | 221,765 | 284,675 | 745,213 | 1,146,249 |
| Net investment income | 18,902,709 | 22,968,932 | 24,017,192 | 19,350,870 |
| Realized and unrealized gain (loss) | | | | |
| Net realized gain (loss) on | | | | |
| Unaffiliated investments | 22,821,178 | 24,167,123 | 23,843,957 | 23,316,739 |
| Affiliated investments | (3,960,916) | (3,015,470) | 2,685,551 | 7,540,878 |
| Capital gain distributions received from affiliated investments | 6,673,348 | 7,495,115 | 6,432,409 | 3,590,182 |
| | 25,533,610 | 28,646,768 | 32,961,917 | 34,447,799 |
| Change in net unrealized appreciation (depreciation) of | | | | |
| Unaffiliated investments | (13,250,056) | (10,307,680) | (8,690,271) | (11,057,515) |
| Affiliated investments | (7,052,096) | (8,455,810) | (8,994,802) | (10,515,055) |
| | (20,302,152) | (18,763,490) | (17,685,073) | (21,572,570) |
| Net realized and unrealized gain | 5,231,458 | 9,883,278 | 15,276,844 | 12,875,229 |
| Increase in net assets from operations | $24,134,167 | $32,852,210 | $39,294,036 | $32,226,099 |
| SEE NOTES TO FINANCIAL STATEMENTS | SEMIANNUAL REPORT | JOHN HANCOCK MULTI-INDEX PRESERVATION PORTFOLIOS | 27 |
STATEMENTS OF OPERATIONSFor the six months ended 2-29-20 (unaudited)
Continued
| | Multi-Index 2020 Preservation Portfolio | Multi-Index Income Preservation Portfolio |
| Investment income | | |
| Income distributions received from affiliated investments | $1,348,449 | $324,008 |
| Dividends | 7,685,392 | 4,408,592 |
| Interest | 47,814 | 27,934 |
| Securities lending | 54,781 | 25,777 |
| Total investment income | 9,136,436 | 4,786,311 |
| Expenses | | |
| Investment management fees | 1,386,697 | 821,777 |
| Distribution and service fees | 144,054 | 82,178 |
| Accounting and legal services fees | 54,577 | 30,784 |
| Transfer agent fees | 2,790 | 1,537 |
| Trustees' fees | 5,613 | 3,210 |
| Custodian fees | 24,083 | 24,083 |
| State registration fees | 31,028 | 30,044 |
| Printing and postage | 10,066 | 9,721 |
| Professional fees | 29,808 | 27,107 |
| Other | 14,831 | 12,019 |
| Total expenses | 1,703,547 | 1,042,460 |
| Less expense reductions | (953,600) | (551,388) |
| Net expenses | 749,947 | 491,072 |
| Net investment income | 8,386,489 | 4,295,239 |
| Realized and unrealized gain (loss) | | |
| Net realized gain (loss) on | | |
| Unaffiliated investments | 9,908,722 | 8,519,658 |
| Affiliated investments | 6,956,548 | 403,659 |
| Capital gain distributions received from affiliated investments | 668,934 | 160,733 |
| | 17,534,204 | 9,084,050 |
| Change in net unrealized appreciation (depreciation) of | | |
| Unaffiliated investments | (8,788,280) | (7,275,468) |
| Affiliated investments | (4,552,377) | (911,273) |
| | (13,340,657) | (8,186,741) |
| Net realized and unrealized gain | 4,193,547 | 897,309 |
| Increase in net assets from operations | $12,580,036 | $5,192,548 |
| 28 | JOHN HANCOCK MULTI-INDEX PRESERVATION PORTFOLIOS | SEMIANNUAL REPORT | SEE NOTES TO FINANCIAL STATEMENTS |
STATEMENTS OF CHANGES IN NET ASSETS
| | Multi-Index 2060 Preservation Portfolio | Multi-Index 2055 Preservation Portfolio | Multi-Index 2050 Preservation Portfolio |
| | Six months ended
2-29-20
(unaudited) | Year ended
8-31-19
| Six months ended
2-29-20
(unaudited) | Year ended
8-31-19
| Six months ended
2-29-20
(unaudited) | Year ended
8-31-19
|
| Increase (decrease) in net assets | | | | | | |
| From operations | | | | | | |
| Net investment income | $2,152,402 | $1,608,281 | $5,682,062 | $5,736,221 | $12,670,626 | $13,609,170 |
| Net realized gain | 1,848,756 | 4,520,044 | 7,140,904 | 18,286,176 | 19,257,889 | 43,976,117 |
| Change in net unrealized appreciation (depreciation) | (2,427,475) | (4,677,201) | (6,252,833) | (21,408,890) | (17,337,657) | (52,922,880) |
| Increase in net assets resulting from operations | 1,573,683 | 1,451,124 | 6,570,133 | 2,613,507 | 14,590,858 | 4,662,407 |
| Distributions to shareholders | | | | | | |
| From earnings | | | | | | |
| Class R1 | (7,282) | (3,300) | (4,327) | (4,825) | (43,915) | (30,901) |
| Class R2 | (12,677) | (9,240) | (18,763) | (12,938) | (74,748) | (117,143) |
| Class R4 | (9,184) | (6,707) | (4,717) | (4,975) | (121,210) | (5,721) |
| Class R6 | (394,138) | (99,454) | (173,850) | (40,594) | (8,007,679) | (4,194,100) |
| Class 1 | (7,773,171) | (4,728,450) | (27,599,428) | (26,093,220) | (56,088,706) | (64,114,967) |
| Total distributions | (8,196,452) | (4,847,151) | (27,801,085) | (26,156,552) | (64,336,258) | (68,462,832) |
| Portfolio share transactions | | | | | | |
| From portfolio share transactions | 25,194,815 | 37,682,343 | 27,130,503 | 39,662,470 | 58,152,726 | 59,317,349 |
| Total increase (decrease) | 18,572,046 | 34,286,316 | 5,899,551 | 16,119,425 | 8,407,326 | (4,483,076) |
| Net assets | | | | | | |
| Beginning of period | 93,528,874 | 59,242,558 | 267,524,624 | 251,405,199 | 604,730,794 | 609,213,870 |
| End of period | $112,100,920 | $93,528,874 | $273,424,175 | $267,524,624 | $613,138,120 | $604,730,794 |
| SEE NOTES TO FINANCIAL STATEMENTS | SEMIANNUAL REPORT | JOHN HANCOCK MULTI-INDEX PRESERVATION PORTFOLIOS | 29 |
STATEMENTS OF CHANGES IN NET ASSETS
Continued
| | Multi-Index 2045 Preservation Portfolio | Multi-Index 2040 Preservation Portfolio | Multi-Index 2035 Preservation Portfolio |
| | Six months ended
2-29-20
(unaudited) | Year ended
8-31-19
| Six months ended
2-29-20
(unaudited) | Year ended
8-31-19
| Six months ended
2-29-20
(unaudited) | Year ended
8-31-19
|
| Increase (decrease) in net assets | | | | | | |
| From operations | | | | | | |
| Net investment income | $15,704,154 | $17,832,487 | $18,902,709 | $22,185,721 | $22,968,932 | $28,907,327 |
| Net realized gain | 21,899,516 | 56,220,738 | 25,533,610 | 66,866,854 | 28,646,768 | 74,106,002 |
| Change in net unrealized appreciation (depreciation) | (18,836,596) | (67,728,965) | (20,302,152) | (77,657,317) | (18,763,490) | (79,147,229) |
| Increase in net assets resulting from operations | 18,767,074 | 6,324,260 | 24,134,167 | 11,395,258 | 32,852,210 | 23,866,100 |
| Distributions to shareholders | | | | | | |
| From earnings | | | | | | |
| Class R1 | (39,313) | (53,034) | (26,327) | (28,767) | (57,096) | (140,921) |
| Class R2 | (53,859) | (84,340) | (33,924) | (67,035) | (109,633) | (165,236) |
| Class R4 | (5,251) | (5,387) | (17,841) | (5,793) | (6,155) | (5,195) |
| Class R6 | (7,509,848) | (4,338,812) | (8,512,645) | (5,122,069) | (8,661,162) | (5,823,282) |
| Class 1 | (71,885,959) | (83,001,677) | (86,000,544) | (104,487,193) | (101,080,336) | (126,172,725) |
| Total distributions | (79,494,230) | (87,483,250) | (94,591,281) | (109,710,857) | (109,914,382) | (132,307,359) |
| Portfolio share transactions | | | | | | |
| From portfolio share transactions | 54,500,464 | 48,602,041 | 56,089,010 | 50,069,603 | 51,495,879 | 46,084,240 |
| Total decrease | (6,226,692) | (32,556,949) | (14,368,104) | (48,245,996) | (25,566,293) | (62,357,019) |
| Net assets | | | | | | |
| Beginning of period | 760,860,100 | 793,417,049 | 935,469,181 | 983,715,177 | 1,187,295,671 | 1,249,652,690 |
| End of period | $754,633,408 | $760,860,100 | $921,101,077 | $935,469,181 | $1,161,729,378 | $1,187,295,671 |
| 30 | JOHN HANCOCK MULTI-INDEX PRESERVATION PORTFOLIOS | SEMIANNUAL REPORT | SEE NOTES TO FINANCIAL STATEMENTS |
STATEMENTS OF CHANGES IN NET ASSETS
Continued
| | Multi-Index 2030 Preservation Portfolio | Multi-Index 2025 Preservation Portfolio | Multi-Index 2020 Preservation Portfolio |
| | Six months ended
2-29-20
(unaudited) | Year ended
8-31-19
| Six months ended
2-29-20
(unaudited) | Year ended
8-31-19
| Six months ended
2-29-20
(unaudited) | Year ended
8-31-19
|
| Increase (decrease) in net assets | | | | | | |
| From operations | | | | | | |
| Net investment income | $24,017,192 | $34,234,186 | $19,350,870 | $33,355,388 | $8,386,489 | $18,178,492 |
| Net realized gain | 32,961,917 | 64,396,893 | 34,447,799 | 47,553,129 | 17,534,204 | 10,607,548 |
| Change in net unrealized appreciation (depreciation) | (17,685,073) | (51,320,361) | (21,572,570) | (14,670,929) | (13,340,657) | 17,039,183 |
| Increase in net assets resulting from operations | 39,294,036 | 47,310,718 | 32,226,099 | 66,237,588 | 12,580,036 | 45,825,223 |
| Distributions to shareholders | | | | | | |
| From earnings | | | | | | |
| Class R1 | (57,451) | (127,860) | (21,889) | (27,406) | (8,736) | (10,037) |
| Class R2 | (49,243) | (111,033) | (99,769) | (122,395) | (52,934) | (70,881) |
| Class R4 | (128,526) | (4,731) | (4,679) | (5,068) | (6,458) | (2,941) |
| Class R6 | (8,067,775) | (4,906,584) | (5,378,612) | (3,551,857) | (2,084,851) | (1,623,624) |
| Class 1 | (98,923,584) | (132,543,363) | (79,097,274) | (106,252,510) | (27,127,950) | (41,826,866) |
| Total distributions | (107,226,579) | (137,693,571) | (84,602,223) | (109,959,236) | (29,280,929) | (43,534,349) |
| Portfolio share transactions | | | | | | |
| From portfolio share transactions | 30,642,268 | 33,549,758 | (7,881,286) | (47,453,126) | (39,203,931) | (89,146,185) |
| Total decrease | (37,290,275) | (56,833,095) | (60,257,410) | (91,174,774) | (55,904,824) | (86,855,311) |
| Net assets | | | | | | |
| Beginning of period | 1,365,478,567 | 1,422,311,662 | 1,258,989,209 | 1,350,163,983 | 634,156,372 | 721,011,683 |
| End of period | $1,328,188,292 | $1,365,478,567 | $1,198,731,799 | $1,258,989,209 | $578,251,548 | $634,156,372 |
| SEE NOTES TO FINANCIAL STATEMENTS | SEMIANNUAL REPORT | JOHN HANCOCK MULTI-INDEX PRESERVATION PORTFOLIOS | 31 |
STATEMENTS OF CHANGES IN NET ASSETS
Continued
| | Multi-Index Income Preservation Portfolio |
| | Six months ended
2-29-20
(unaudited) | Year ended
8-31-19
|
| Increase (decrease) in net assets | | |
| From operations | | |
| Net investment income | $4,295,239 | $9,703,192 |
| Net realized gain | 9,084,050 | 3,332,104 |
| Change in net unrealized appreciation (depreciation) | (8,186,741) | 11,736,721 |
| Increase in net assets resulting from operations | 5,192,548 | 24,772,017 |
| Distributions to shareholders | | |
| From earnings | | |
| Class R1 | (6,013) | (4,897) |
| Class R2 | (22,708) | (18,208) |
| Class R4 | (23,560) | (1,751) |
| Class R6 | (885,176) | (402,849) |
| Class 1 | (11,757,001) | (13,175,471) |
| Total distributions | (12,694,458) | (13,603,176) |
| Portfolio share transactions | | |
| From portfolio share transactions | (28,663,472) | (55,822,345) |
| Total decrease | (36,165,382) | (44,653,504) |
| Net assets | | |
| Beginning of period | 360,016,758 | 404,670,262 |
| End of period | $323,851,376 | $360,016,758 |
| 32 | JOHN HANCOCK MULTI-INDEX PRESERVATION PORTFOLIOS | SEMIANNUAL REPORT | SEE NOTES TO FINANCIAL STATEMENTS |
Multi-Index 2060 Preservation Portfolio
| Per share operating performance for a share outstanding throughout each period | | Ratios and supplemental data | |
| | | | Income (loss) from investment operations | | | | Less distributions | | | | Ratios to average net assets | | | |
| Period ended | Net asset
value,
beginning
of period ($) | | Net
investment
income
(loss) ($)1, 2 | Net realized and
unrealized
gain (loss)
on investments ($) | | Total from
investment
operations ($) | | From net
investment
income ($) | From net
realized
gain ($) | Total
distributions ($) | Net asset
value,
end of
period ($) | Total
return
(%)3 | Expenses
before
reductions
(%)4 | Expenses
including
reductions
(%)4 | Net
investment
income
(loss) (%)2 | Net
assets,
end of
period
(in millions) | Portfolio
turnover
(%) |
| Class R1 | |
| 02-29-20205 | 11.73 | | 0.226 | 0.097 | | 0.31 | | (0.24) | (0.64) | (0.88) | 11.16 | 2.048 | 0.929 | 0.549 | 3.716, 9 | —10 | 21 |
| 08-31-2019 | 12.62 | | 0.216 | (0.28) | | (0.07) | | (0.19) | (0.63) | (0.82) | 11.73 | 0.43 | 0.93 | 0.52 | 1.846 | —10 | 11 |
| 08-31-2018 | 11.88 | | 0.176 | 0.99 | | 1.16 | | (0.18) | (0.24) | (0.42) | 12.62 | 9.87 | 1.13 | 0.51 | 1.366 | —10 | 10 |
| 08-31-2017 | 10.56 | | 0.196 | 1.26 | | 1.45 | | (0.13) | — | (0.13) | 11.88 | 13.89 | 2.17 | 0.51 | 1.686 | —10 | 14 |
| 08-31-201611 | 10.00 | | 0.01 | 0.55 | | 0.56 | | — | — | — | 10.56 | 5.608 | 22.829 | 0.569 | 0.279 | —10 | —12 |
| Class R2 | |
| 02-29-20205 | 11.74 | | 0.226 | 0.107 | | 0.32 | | (0.25) | (0.64) | (0.89) | 11.17 | 2.218 | 0.829 | 0.449 | 3.646, 9 | —10 | 21 |
| 08-31-2019 | 12.64 | | 0.236 | (0.28) | | (0.05) | | (0.22) | (0.63) | (0.85) | 11.74 | 0.53 | 0.83 | 0.42 | 2.016 | —10 | 11 |
| 08-31-2018 | 11.90 | | 0.206 | 0.99 | | 1.19 | | (0.21) | (0.24) | (0.45) | 12.64 | 10.11 | 0.88 | 0.27 | 1.586 | —10 | 10 |
| 08-31-2017 | 10.58 | | 0.216 | 1.26 | | 1.47 | | (0.15) | — | (0.15) | 11.90 | 14.07 | 1.92 | 0.26 | 1.936 | —10 | 14 |
| 08-31-201611 | 10.00 | | 0.02 | 0.56 | | 0.58 | | — | — | — | 10.58 | 5.808 | 22.579 | 0.319 | 0.529 | —10 | —12 |
| Class R4 | |
| 02-29-20205 | 11.76 | | 0.246 | 0.097 | | 0.33 | | (0.28) | (0.64) | (0.92) | 11.17 | 2.308 | 0.649 | 0.169 | 4.046, 9 | —10 | 21 |
| 08-31-2019 | 12.66 | | 0.266 | (0.29) | | (0.03) | | (0.24) | (0.63) | (0.87) | 11.76 | 0.75 | 0.68 | 0.16 | 2.196 | —10 | 11 |
| 08-31-2018 | 11.90 | | 0.226 | 1.00 | | 1.22 | | (0.22) | (0.24) | (0.46) | 12.66 | 10.29 | 0.88 | 0.16 | 1.766 | —10 | 10 |
| 08-31-2017 | 10.58 | | 0.236 | 1.25 | | 1.48 | | (0.16) | — | (0.16) | 11.90 | 14.16 | 1.92 | 0.16 | 2.046 | —10 | 14 |
| 08-31-201611 | 10.00 | | 0.03 | 0.55 | | 0.58 | | — | — | — | 10.58 | 5.808 | 22.579 | 0.219 | 0.629 | —10 | —12 |
| Class R6 | |
| 02-29-20205 | 11.78 | | 0.256 | 0.087 | | 0.33 | | (0.30) | (0.64) | (0.94) | 11.17 | 2.288 | 0.399 | —9 | 4.176, 9 | 6 | 21 |
| 08-31-2019 | 12.67 | | 0.246 | (0.24) | | —13 | | (0.26) | (0.63) | (0.89) | 11.78 | 0.94 | 0.43 | — | 2.056 | 3 | 11 |
| 08-31-2018 | 11.92 | | 0.166 | 1.07 | | 1.23 | | (0.24) | (0.24) | (0.48) | 12.67 | 10.46 | 0.63 | — | 1.386 | 1 | 10 |
| 08-31-2017 | 10.59 | | 0.246 | 1.26 | | 1.50 | | (0.17) | — | (0.17) | 11.92 | 14.38 | 1.67 | — | 2.176 | —10 | 14 |
| 08-31-201611 | 10.00 | | 0.03 | 0.56 | | 0.59 | | — | — | — | 10.59 | 5.908 | 22.329 | 0.059 | 0.799 | —10 | —12 |
| Class 1 | |
| 02-29-20205 | 11.77 | | 0.246 | 0.097 | | 0.33 | | (0.29) | (0.64) | (0.93) | 11.17 | 2.328 | 0.439 | 0.059 | 4.046, 9 | 106 | 21 |
| 08-31-2019 | 12.66 | | 0.256 | (0.26) | | (0.01) | | (0.25) | (0.63) | (0.88) | 11.77 | 0.89 | 0.46 | 0.05 | 2.186 | 90 | 11 |
| 08-31-2018 | 11.91 | | 0.246 | 0.98 | | 1.22 | | (0.23) | (0.24) | (0.47) | 12.66 | 10.41 | 0.67 | 0.05 | 1.996 | 58 | 10 |
| 08-31-2017 | 10.58 | | 0.176 | 1.33 | | 1.50 | | (0.17) | — | (0.17) | 11.91 | 14.35 | 1.70 | 0.05 | 1.516 | 26 | 14 |
| 08-31-201611 | 10.00 | | 0.01 | 0.57 | | 0.58 | | — | — | — | 10.58 | 5.808 | 22.369 | 0.109 | 0.359 | 3 | —12 |
| 1 Based on average daily shares outstanding. |
| 2 Net investment income is affected by the timing and frequency of the declaration of dividends by the underlying funds in which the portfolio invests. Accordingly, a significant portion of income is recorded in December. |
| 3 Total returns would have been lower had certain expenses not been reduced and other income not been received from the Advisor for reimbursement of indirect net expenses associated with the portfolio’s investments in underlying investment companies during the applicable periods. |
| 4 Ratios do not include expenses indirectly incurred from underlying funds and can vary based on the mix of underlying funds held by the portfolio. |
| 5 Six months ended 2-29-20. Unaudited. |
| 6 Net investment income (loss) per share and net investment income (loss) ratio reflect other income received from the Advisor for reimbursement of indirect net expenses associated with the portfolio's investments in underlying investment companies of less than $0.005, $0.01, $0.01 and less than $0.005 per share and 0.05%, 0.06%, 0.05% and 0.04% for the periods ended 2-29-20, 8-31-19, 8-31-18 and 8-31-17, respectively. |
| 7 The amount shown for a share outstanding does not correspond with the aggregate net gain (loss) on investments for the period due to the timing of the sales and repurchases of shares in relation to fluctuating market values of the investments of the portfolio. |
| 8 Not annualized. |
| 9 Annualized. |
| 10 Less than $500,000. |
| 11 Period from 3-30-16 (commencement of operations) to 8-31-16. |
| 12 Less than 1%. |
| 13 Less than $0.005 per share. |
| SEE NOTES TO FINANCIAL STATEMENTS | SEMIANNUAL REPORT | JOHN HANCOCK MULTI-INDEX PRESERVATION PORTFOLIOS | 33 |
| Financial highlights continued |
Multi-Index 2055 Preservation Portfolio
| Per share operating performance for a share outstanding throughout each period | | Ratios and supplemental data | |
| | | | Income (loss) from investment operations | | | | Less distributions | | | | Ratios to average net assets | | | |
| Period ended | Net asset
value,
beginning
of period ($) | | Net
investment
income
(loss) ($)1, 2 | Net realized and
unrealized
gain (loss)
on investments ($) | | Total from
investment
operations ($) | | From net
investment
income ($) | From net
realized
gain ($) | Total
distributions ($) | Net asset
value,
end of
period ($) | Total
return
(%)3 | Expenses
before
reductions
(%)4 | Expenses
including
reductions
(%)4 | Net
investment
income
(loss) (%)2 | Net
assets,
end of
period
(in millions) | Portfolio
turnover
(%) |
| Class R1 | |
| 02-29-20205 | 10.85 | | 0.206 | 0.10 | | 0.30 | | (0.24) | (0.83) | (1.07) | 10.08 | 2.167 | 0.798 | 0.528 | 3.666, 8 | —9 | 23 |
| 08-31-2019 | 12.16 | | 0.226 | (0.33) | | (0.11) | | (0.21) | (0.99) | (1.20) | 10.85 | 0.39 | 0.78 | 0.51 | 1.966 | —9 | 13 |
| 08-31-2018 | 11.82 | | 0.176 | 0.97 | | 1.14 | | (0.20) | (0.60) | (0.80) | 12.16 | 9.89 | 0.80 | 0.51 | 1.386 | —9 | 10 |
| 08-31-2017 | 10.71 | | 0.196 | 1.25 | | 1.44 | | (0.17) | (0.16) | (0.33) | 11.82 | 13.85 | 0.80 | 0.51 | 1.686 | —9 | 11 |
| 08-31-2016 | 10.08 | | 0.16 | 0.63 | | 0.79 | | (0.12) | (0.04) | (0.16) | 10.71 | 8.00 | 0.87 | 0.55 | 1.59 | —9 | 3 |
| 08-31-2015 | 10.62 | | 0.14 | (0.56) | | (0.42) | | (0.10) | (0.02) | (0.12) | 10.08 | (4.04) | 7.62 | 0.77 | 1.32 | —9 | 13 |
| Class R2 | |
| 02-29-20205 | 10.86 | | 0.206 | 0.11 | | 0.31 | | (0.25) | (0.83) | (1.08) | 10.09 | 2.207 | 0.738 | 0.468 | 3.646, 8 | —9 | 23 |
| 08-31-2019 | 12.18 | | 0.206 | (0.31) | | (0.11) | | (0.22) | (0.99) | (1.21) | 10.86 | 0.47 | 0.70 | 0.43 | 1.806 | —9 | 13 |
| 08-31-2018 | 11.84 | | 0.166 | 1.01 | | 1.17 | | (0.23) | (0.60) | (0.83) | 12.18 | 10.13 | 0.60 | 0.31 | 1.356 | —9 | 10 |
| 08-31-2017 | 10.73 | | 0.216 | 1.26 | | 1.47 | | (0.20) | (0.16) | (0.36) | 11.84 | 14.11 | 0.55 | 0.27 | 1.936 | —9 | 11 |
| 08-31-2016 | 10.10 | | 0.19 | 0.63 | | 0.82 | | (0.15) | (0.04) | (0.19) | 10.73 | 8.26 | 0.62 | 0.30 | 1.84 | —9 | 3 |
| 08-31-2015 | 10.64 | | 0.17 | (0.57) | | (0.40) | | (0.12) | (0.02) | (0.14) | 10.10 | (3.85) | 7.39 | 0.52 | 1.57 | —9 | 13 |
| Class R4 | |
| 02-29-20205 | 10.88 | | 0.236 | 0.10 | | 0.33 | | (0.28) | (0.83) | (1.11) | 10.10 | 2.417 | 0.548 | 0.168 | 4.076, 8 | —9 | 23 |
| 08-31-2019 | 12.20 | | 0.256 | (0.33) | | (0.08) | | (0.25) | (0.99) | (1.24) | 10.88 | 0.72 | 0.53 | 0.16 | 2.316 | —9 | 13 |
| 08-31-2018 | 11.85 | | 0.216 | 0.98 | | 1.19 | | (0.24) | (0.60) | (0.84) | 12.20 | 10.32 | 0.55 | 0.16 | 1.736 | —9 | 10 |
| 08-31-2017 | 10.74 | | 0.236 | 1.25 | | 1.48 | | (0.21) | (0.16) | (0.37) | 11.85 | 14.21 | 0.55 | 0.17 | 2.036 | —9 | 11 |
| 08-31-2016 | 10.11 | | 0.20 | 0.63 | | 0.83 | | (0.16) | (0.04) | (0.20) | 10.74 | 8.37 | 0.62 | 0.20 | 1.94 | —9 | 3 |
| 08-31-2015 | 10.65 | | 0.18 | (0.56) | | (0.38) | | (0.14) | (0.02) | (0.16) | 10.11 | (3.67) | 7.38 | 0.37 | 1.72 | —9 | 13 |
| Class R6 | |
| 02-29-20205 | 10.89 | | 0.236 | 0.10 | | 0.33 | | (0.30) | (0.83) | (1.13) | 10.09 | 2.377 | 0.288 | —8 | 4.136, 8 | 2 | 23 |
| 08-31-2019 | 12.21 | | 0.196 | (0.25) | | (0.06) | | (0.27) | (0.99) | (1.26) | 10.89 | 0.92 | 0.28 | — | 1.796 | 1 | 13 |
| 08-31-2018 | 11.86 | | 0.196 | 1.02 | | 1.21 | | (0.26) | (0.60) | (0.86) | 12.21 | 10.48 | 0.30 | — | 1.616 | —9 | 10 |
| 08-31-2017 | 10.75 | | 0.246 | 1.26 | | 1.50 | | (0.23) | (0.16) | (0.39) | 11.86 | 14.38 | 0.30 | — | 2.116 | —9 | 11 |
| 08-31-2016 | 10.12 | | 0.21 | 0.64 | | 0.85 | | (0.18) | (0.04) | (0.22) | 10.75 | 8.54 | 0.37 | 0.03 | 2.04 | —9 | 3 |
| 08-31-2015 | 10.66 | | 0.20 | (0.56) | | (0.36) | | (0.16) | (0.02) | (0.18) | 10.12 | (3.48) | 7.75 | 0.18 | 1.91 | —9 | 13 |
| Class 1 | |
| 02-29-20205 | 10.88 | | 0.226 | 0.11 | | 0.33 | | (0.29) | (0.83) | (1.12) | 10.09 | 2.417 | 0.328 | 0.058 | 4.026, 8 | 271 | 23 |
| 08-31-2019 | 12.21 | | 0.256 | (0.33) | | (0.08) | | (0.26) | (0.99) | (1.25) | 10.88 | 0.78 | 0.32 | 0.05 | 2.296 | 266 | 13 |
| 08-31-2018 | 11.85 | | 0.266 | 0.96 | | 1.22 | | (0.26) | (0.60) | (0.86) | 12.21 | 10.52 | 0.33 | 0.05 | 2.136 | 251 | 10 |
| 08-31-2017 | 10.74 | | 0.236 | 1.26 | | 1.49 | | (0.22) | (0.16) | (0.38) | 11.85 | 14.34 | 0.34 | 0.05 | 2.076 | 210 | 11 |
| 08-31-2016 | 10.11 | | 0.18 | 0.66 | | 0.84 | | (0.17) | (0.04) | (0.21) | 10.74 | 8.50 | 0.40 | 0.08 | 1.79 | 152 | 3 |
| 08-31-2015 | 10.65 | | 0.14 | (0.51) | | (0.37) | | (0.15) | (0.02) | (0.17) | 10.11 | (3.52) | 0.69 | 0.23 | 1.32 | 62 | 13 |
| 1 Based on average daily shares outstanding. |
| 2 Net investment income is affected by the timing and frequency of the declaration of dividends by the underlying funds in which the portfolio invests. Accordingly, a significant portion of income is recorded in December. |
| 3 Total returns would have been lower had certain expenses not been reduced and other income not been received from the Advisor for reimbursement of indirect net expenses associated with the portfolio’s investments in underlying investment companies during the applicable periods. |
| 4 Ratios do not include expenses indirectly incurred from underlying funds and can vary based on the mix of underlying funds held by the portfolio. |
| 5 Six months ended 2-29-20. Unaudited. |
| 6 Net investment income (loss) per share and net investment income (loss) ratio reflect other income received from the Advisor for reimbursement of indirect net expenses associated with the portfolio's investments in underlying investment companies of less than $0.005, $0.01, $0.01 and less than $0.005 per share and 0.04%, 0.05%, 0.04% and 0.03% for the periods ended 2-29-20, 8-31-19, 8-31-18 and 8-31-17, respectively. |
| 7 Not annualized. |
| 8 Annualized. |
| 9 Less than $500,000. |
| 34 | JOHN HANCOCK MULTI-INDEX PRESERVATION PORTFOLIOS | SEMIANNUAL REPORT | SEE NOTES TO FINANCIAL STATEMENTS |
Multi-Index 2050 Preservation Portfolio
| Per share operating performance for a share outstanding throughout each period | | Ratios and supplemental data | |
| | | | Income (loss) from investment operations | | | | Less distributions | | | | Ratios to average net assets | | | |
| Period ended | Net asset
value,
beginning
of period ($) | | Net
investment
income
(loss) ($)1, 2 | Net realized and
unrealized
gain (loss)
on investments ($) | | Total from
investment
operations ($) | | From net
investment
income ($) | From net
realized
gain ($) | Total
distributions ($) | Net asset
value,
end of
period ($) | Total
return
(%)3 | Expenses
before
reductions
(%)4 | Expenses
including
reductions
(%)4 | Net
investment
income
(loss) (%)2 | Net
assets,
end of
period
(in millions) | Portfolio
turnover
(%) |
| Class R1 | |
| 02-29-20205 | 12.15 | | 0.206 | 0.12 | | 0.32 | | (0.23) | (0.98) | (1.21) | 11.26 | 2.017 | 1.008 | 0.768 | 3.296, 8 | —9 | 23 |
| 08-31-2019 | 13.80 | | 0.176 | (0.35) | | (0.18) | | (0.21) | (1.26) | (1.47) | 12.15 | 0.09 | 1.00 | 0.76 | 1.426 | —9 | 16 |
| 08-31-2018 | 13.55 | | 0.196 | 1.09 | | 1.28 | | (0.22) | (0.81) | (1.03) | 13.80 | 9.80 | 0.96 | 0.72 | 1.416 | —9 | 13 |
| 08-31-2017 | 12.45 | | 0.196 | 1.45 | | 1.64 | | (0.20) | (0.34) | (0.54) | 13.55 | 13.60 | 0.90 | 0.67 | 1.456 | —9 | 12 |
| 08-31-2016 | 11.87 | | 0.17 | 0.75 | | 0.92 | | (0.16) | (0.18) | (0.34) | 12.45 | 7.90 | 0.86 | 0.66 | 1.43 | —9 | 6 |
| 08-31-2015 | 12.64 | | 0.15 | (0.70) | | (0.55) | | (0.14) | (0.08) | (0.22) | 11.87 | (4.41) | 3.77 | 0.83 | 1.20 | —9 | 5 |
| Class R2 | |
| 02-29-20205 | 12.16 | | 0.216 | 0.12 | | 0.33 | | (0.26) | (0.98) | (1.24) | 11.25 | 2.177 | 0.758 | 0.518 | 3.396, 8 | 1 | 23 |
| 08-31-2019 | 13.80 | | 0.216 | (0.35) | | (0.14) | | (0.24) | (1.26) | (1.50) | 12.16 | 0.38 | 0.75 | 0.51 | 1.736 | 1 | 16 |
| 08-31-2018 | 13.56 | | 0.176 | 1.14 | | 1.31 | | (0.26) | (0.81) | (1.07) | 13.80 | 9.91 | 0.74 | 0.50 | 1.296 | 1 | 13 |
| 08-31-2017 | 12.46 | | 0.186 | 1.49 | | 1.67 | | (0.23) | (0.34) | (0.57) | 13.56 | 13.96 | 0.62 | 0.39 | 1.446 | 1 | 12 |
| 08-31-2016 | 11.87 | | 0.20 | 0.76 | | 0.96 | | (0.19) | (0.18) | (0.37) | 12.46 | 8.24 | 0.61 | 0.41 | 1.73 | —9 | 6 |
| 08-31-2015 | 12.64 | | 0.20 | (0.72) | | (0.52) | | (0.17) | (0.08) | (0.25) | 11.87 | (4.18) | 3.12 | 0.59 | 1.56 | —9 | 5 |
| Class R4 | |
| 02-29-20205 | 12.19 | | 0.336 | 0.03 | | 0.36 | | (0.29) | (0.98) | (1.27) | 11.28 | 2.337 | 0.598 | 0.258 | 5.306, 8 | 1 | 23 |
| 08-31-2019 | 13.85 | | 0.146 | (0.25) | | (0.11) | | (0.29) | (1.26) | (1.55) | 12.19 | 0.73 | 0.56 | 0.22 | 1.196 | —9 | 16 |
| 08-31-2018 | 13.59 | | 0.236 | 1.13 | | 1.36 | | (0.29) | (0.81) | (1.10) | 13.85 | 10.29 | 0.50 | 0.16 | 1.686 | —9 | 13 |
| 08-31-2017 | 12.49 | | 0.256 | 1.45 | | 1.70 | | (0.26) | (0.34) | (0.60) | 13.59 | 14.14 | 0.59 | 0.25 | 1.986 | —9 | 12 |
| 08-31-2016 | 11.91 | | 0.23 | 0.74 | | 0.97 | | (0.21) | (0.18) | (0.39) | 12.49 | 8.31 | 0.51 | 0.20 | 1.97 | —9 | 6 |
| 08-31-2015 | 12.68 | | 0.22 | (0.71) | | (0.49) | | (0.20) | (0.08) | (0.28) | 11.91 | (3.93) | 4.22 | 0.39 | 1.73 | —9 | 5 |
| Class R6 | |
| 02-29-20205 | 12.15 | | 0.256 | 0.13 | | 0.38 | | (0.33) | (0.98) | (1.31) | 11.22 | 2.417 | 0.258 | —8 | 4.096, 8 | 83 | 23 |
| 08-31-2019 | 13.81 | | 0.256 | (0.34) | | (0.09) | | (0.31) | (1.26) | (1.57) | 12.15 | 0.93 | 0.25 | — | 2.036 | 65 | 16 |
| 08-31-2018 | 13.55 | | 0.266 | 1.12 | | 1.38 | | (0.31) | (0.81) | (1.12) | 13.81 | 10.49 | 0.25 | — | 1.936 | 30 | 13 |
| 08-31-2017 | 12.45 | | 0.196 | 1.53 | | 1.72 | | (0.28) | (0.34) | (0.62) | 13.55 | 14.38 | 0.25 | — | 1.456 | 11 | 12 |
| 08-31-2016 | 11.87 | | 0.18 | 0.81 | | 0.99 | | (0.23) | (0.18) | (0.41) | 12.45 | 8.54 | 0.26 | 0.04 | 1.57 | —9 | 6 |
| 08-31-2015 | 12.64 | | 0.23 | (0.69) | | (0.46) | | (0.23) | (0.08) | (0.31) | 11.87 | (3.71) | 3.41 | 0.19 | 1.83 | —9 | 5 |
| Class 1 | |
| 02-29-20205 | 12.15 | | 0.256 | 0.12 | | 0.37 | | (0.32) | (0.98) | (1.30) | 11.22 | 2.367 | 0.298 | 0.058 | 3.986, 8 | 528 | 23 |
| 08-31-2019 | 13.81 | | 0.296 | (0.39) | | (0.10) | | (0.30) | (1.26) | (1.56) | 12.15 | 0.87 | 0.29 | 0.05 | 2.346 | 538 | 16 |
| 08-31-2018 | 13.55 | | 0.306 | 1.07 | | 1.37 | | (0.30) | (0.81) | (1.11) | 13.81 | 10.44 | 0.29 | 0.05 | 2.176 | 578 | 13 |
| 08-31-2017 | 12.45 | | 0.276 | 1.44 | | 1.71 | | (0.27) | (0.34) | (0.61) | 13.55 | 14.33 | 0.28 | 0.05 | 2.146 | 573 | 12 |
| 08-31-2016 | 11.87 | | 0.24 | 0.75 | | 0.99 | | (0.23) | (0.18) | (0.41) | 12.45 | 8.49 | 0.29 | 0.09 | 2.01 | 522 | 6 |
| 08-31-2015 | 12.64 | | 0.23 | (0.69) | | (0.46) | | (0.23) | (0.08) | (0.31) | 11.87 | (3.75) | 0.28 | 0.24 | 1.81 | 424 | 5 |
| 1 Based on average daily shares outstanding. |
| 2 Net investment income is affected by the timing and frequency of the declaration of dividends by the underlying funds in which the portfolio invests. Accordingly, a significant portion of income is recorded in December. |
| 3 Total returns would have been lower had certain expenses not been reduced and other income not been received from the Advisor for reimbursement of indirect net expenses associated with the portfolio’s investments in underlying investment companies during the applicable periods. |
| 4 Ratios do not include expenses indirectly incurred from underlying funds and can vary based on the mix of underlying funds held by the portfolio. |
| 5 Six months ended 2-29-20. Unaudited. |
| 6 Net investment income (loss) per share and net investment income (loss) ratio reflect other income received from the Advisor for reimbursement of indirect net expenses associated with the portfolio's investments in underlying investment companies of less than $0.005 per share, $0.01, $0.01 and less than $0.005 per share and 0.04%, 0.05%, 0.04% and 0.03% for the periods ended 2-29-20, 8-31-19, 8-31-18 and 8-31-17, respectively. |
| 7 Not annualized. |
| 8 Annualized. |
| 9 Less than $500,000. |
| SEE NOTES TO FINANCIAL STATEMENTS | SEMIANNUAL REPORT | JOHN HANCOCK MULTI-INDEX PRESERVATION PORTFOLIOS | 35 |
| Financial highlights continued |
Multi-Index 2045 Preservation Portfolio
| Per share operating performance for a share outstanding throughout each period | | Ratios and supplemental data | |
| | | | Income (loss) from investment operations | | | | Less distributions | | | | Ratios to average net assets | | | |
| Period ended | Net asset
value,
beginning
of period ($) | | Net
investment
income
(loss) ($)1, 2 | Net realized and
unrealized
gain (loss)
on investments ($) | | Total from
investment
operations ($) | | From net
investment
income ($) | From net
realized
gain ($) | Total
distributions ($) | Net asset
value,
end of
period ($) | Total
return
(%)3 | Expenses
before
reductions
(%)4 | Expenses
including
reductions
(%)4 | Net
investment
income
(loss) (%)2 | Net
assets,
end of
period
(in millions) | Portfolio
turnover
(%) |
| Class R1 | |
| 02-29-20205 | 13.68 | | 0.236 | 0.13 | | 0.36 | | (0.27) | (1.10) | (1.37) | 12.67 | 2.017 | 0.988 | 0.748 | 3.346, 8 | —9 | 25 |
| 08-31-2019 | 15.50 | | 0.256 | (0.43) | | (0.18) | | (0.24) | (1.40) | (1.64) | 13.68 | 0.24 | 0.99 | 0.75 | 1.776 | —9 | 16 |
| 08-31-2018 | 15.19 | | 0.246 | 1.18 | | 1.42 | | (0.24) | (0.87) | (1.11) | 15.50 | 9.62 | 0.99 | 0.75 | 1.546 | 1 | 12 |
| 08-31-2017 | 13.97 | | 0.196 | 1.62 | | 1.81 | | (0.21) | (0.38) | (0.59) | 15.19 | 13.47 | 0.96 | 0.73 | 1.316 | 1 | 12 |
| 08-31-2016 | 13.33 | | 0.17 | 0.85 | | 1.02 | | (0.18) | (0.20) | (0.38) | 13.97 | 7.74 | 0.97 | 0.77 | 1.29 | —9 | 6 |
| 08-31-2015 | 14.17 | | 0.16 | (0.78) | | (0.62) | | (0.15) | (0.07) | (0.22) | 13.33 | (4.45) | 2.77 | 0.90 | 1.14 | —9 | 5 |
| Class R2 | |
| 02-29-20205 | 13.69 | | 0.256 | 0.13 | | 0.38 | | (0.30) | (1.10) | (1.40) | 12.67 | 2.097 | 0.758 | 0.518 | 3.556, 8 | 1 | 25 |
| 08-31-2019 | 15.52 | | 0.266 | (0.42) | | (0.16) | | (0.27) | (1.40) | (1.67) | 13.69 | 0.53 | 0.75 | 0.51 | 1.876 | —9 | 16 |
| 08-31-2018 | 15.20 | | 0.246 | 1.22 | | 1.46 | | (0.27) | (0.87) | (1.14) | 15.52 | 9.80 | 0.75 | 0.51 | 1.606 | 1 | 12 |
| 08-31-2017 | 13.97 | | 0.166 | 1.69 | | 1.85 | | (0.24) | (0.38) | (0.62) | 15.20 | 13.88 | 0.74 | 0.50 | 1.146 | 1 | 12 |
| 08-31-2016 | 13.33 | | 0.20 | 0.85 | | 1.05 | | (0.21) | (0.20) | (0.41) | 13.97 | 8.04 | 0.77 | 0.53 | 1.53 | —9 | 6 |
| 08-31-2015 | 14.17 | | 0.23 | (0.81) | | (0.58) | | (0.19) | (0.07) | (0.26) | 13.33 | (4.22) | 2.98 | 0.61 | 1.66 | —9 | 5 |
| Class R4 | |
| 02-29-20205 | 13.76 | | 0.296 | 0.11 | | 0.40 | | (0.35) | (1.10) | (1.45) | 12.71 | 2.277 | 0.508 | 0.168 | 4.156, 8 | —9 | 25 |
| 08-31-2019 | 15.59 | | 0.336 | (0.43) | | (0.10) | | (0.33) | (1.40) | (1.73) | 13.76 | 0.87 | 0.50 | 0.16 | 2.366 | —9 | 16 |
| 08-31-2018 | 15.27 | | 0.276 | 1.24 | | 1.51 | | (0.32) | (0.87) | (1.19) | 15.59 | 10.21 | 0.50 | 0.16 | 1.716 | —9 | 12 |
| 08-31-2017 | 14.03 | | 0.306 | 1.61 | | 1.91 | | (0.29) | (0.38) | (0.67) | 15.27 | 14.19 | 0.49 | 0.16 | 2.076 | —9 | 12 |
| 08-31-2016 | 13.37 | | 0.26 | 0.84 | | 1.10 | | (0.24) | (0.20) | (0.44) | 14.03 | 8.40 | 0.50 | 0.20 | 1.97 | —9 | 6 |
| 08-31-2015 | 14.21 | | 0.24 | (0.79) | | (0.55) | | (0.22) | (0.07) | (0.29) | 13.37 | (3.97) | 4.22 | 0.38 | 1.73 | —9 | 5 |
| Class R6 | |
| 02-29-20205 | 13.69 | | 0.286 | 0.14 | | 0.42 | | (0.37) | (1.10) | (1.47) | 12.64 | 2.437 | 0.258 | —8 | 4.096, 8 | 77 | 25 |
| 08-31-2019 | 15.53 | | 0.306 | (0.39) | | (0.09) | | (0.35) | (1.40) | (1.75) | 13.69 | 1.01 | 0.25 | — | 2.196 | 59 | 16 |
| 08-31-2018 | 15.22 | | 0.296 | 1.24 | | 1.53 | | (0.35) | (0.87) | (1.22) | 15.53 | 10.35 | 0.25 | — | 1.916 | 32 | 12 |
| 08-31-2017 | 13.99 | | 0.206 | 1.72 | | 1.92 | | (0.31) | (0.38) | (0.69) | 15.22 | 14.35 | 0.24 | — | 1.366 | 10 | 12 |
| 08-31-2016 | 13.33 | | 0.27 | 0.86 | | 1.13 | | (0.27) | (0.20) | (0.47) | 13.99 | 8.62 | 0.25 | 0.03 | 2.02 | —9 | 6 |
| 08-31-2015 | 14.18 | | 0.23 | (0.76) | | (0.53) | | (0.25) | (0.07) | (0.32) | 13.33 | (3.82) | 3.09 | 0.19 | 1.64 | —9 | 5 |
| Class 1 | |
| 02-29-20205 | 13.69 | | 0.286 | 0.14 | | 0.42 | | (0.37) | (1.10) | (1.47) | 12.64 | 2.387 | 0.298 | 0.058 | 3.996, 8 | 676 | 25 |
| 08-31-2019 | 15.53 | | 0.336 | (0.42) | | (0.09) | | (0.35) | (1.40) | (1.75) | 13.69 | 0.95 | 0.29 | 0.05 | 2.386 | 701 | 16 |
| 08-31-2018 | 15.21 | | 0.346 | 1.19 | | 1.53 | | (0.34) | (0.87) | (1.21) | 15.53 | 10.37 | 0.29 | 0.05 | 2.206 | 760 | 12 |
| 08-31-2017 | 13.98 | | 0.316 | 1.60 | | 1.91 | | (0.30) | (0.38) | (0.68) | 15.21 | 14.30 | 0.28 | 0.05 | 2.156 | 741 | 12 |
| 08-31-2016 | 13.33 | | 0.27 | 0.84 | | 1.11 | | (0.26) | (0.20) | (0.46) | 13.98 | 8.49 | 0.28 | 0.08 | 2.01 | 678 | 6 |
| 08-31-2015 | 14.17 | | 0.26 | (0.78) | | (0.52) | | (0.25) | (0.07) | (0.32) | 13.33 | (3.80) | 0.28 | 0.24 | 1.83 | 554 | 5 |
| 1 Based on average daily shares outstanding. |
| 2 Net investment income is affected by the timing and frequency of the declaration of dividends by the underlying funds in which the portfolio invests. Accordingly, a significant portion of income is recorded in December. |
| 3 Total returns would have been lower had certain expenses not been reduced and other income not been received from the Advisor for reimbursement of indirect net expenses associated with the portfolio’s investments in underlying investment companies during the applicable periods. |
| 4 Ratios do not include expenses indirectly incurred from underlying funds and can vary based on the mix of underlying funds held by the portfolio. |
| 5 Six months ended 2-29-20. Unaudited. |
| 6 Net investment income (loss) per share and net investment income (loss) ratio reflect other income received from the Advisor for reimbursement of indirect net expenses associated with the portfolio's investments in underlying investment companies of less than $0.005, $0.01, $0.01 and less than $0.005 per share and 0.05%, 0.06%, 0.05% and 0.03% for the periods ended 2-29-20, 8-31-19, 8-31-18 and 8-31-17, respectively. |
| 7 Not annualized. |
| 8 Annualized. |
| 9 Less than $500,000. |
| 36 | JOHN HANCOCK MULTI-INDEX PRESERVATION PORTFOLIOS | SEMIANNUAL REPORT | SEE NOTES TO FINANCIAL STATEMENTS |
Multi-Index 2040 Preservation Portfolio
| Per share operating performance for a share outstanding throughout each period | | Ratios and supplemental data | |
| | | | Income (loss) from investment operations | | | | Less distributions | | | | Ratios to average net assets | | | |
| Period ended | Net asset
value,
beginning
of period ($) | | Net
investment
income
(loss) ($)1, 2 | Net realized and
unrealized
gain (loss)
on investments ($) | | Total from
investment
operations ($) | | From net
investment
income ($) | From net
realized
gain ($) | Total
distributions ($) | Net asset
value,
end of
period ($) | Total
return
(%)3 | Expenses
before
reductions
(%)4 | Expenses
including
reductions
(%)4 | Net
investment
income
(loss) (%)2 | Net
assets,
end of
period
(in millions) | Portfolio
turnover
(%) |
| Class R1 | |
| 02-29-20205 | 13.56 | | 0.236 | 0.14 | | 0.37 | | (0.27) | (1.05) | (1.32) | 12.61 | 2.177 | 0.988 | 0.738 | 3.306, 8 | —9 | 26 |
| 08-31-2019 | 15.32 | | 0.246 | (0.36) | | (0.12) | | (0.24) | (1.40) | (1.64) | 13.56 | 0.64 | 1.00 | 0.75 | 1.756 | —9 | 18 |
| 08-31-2018 | 15.09 | | 0.236 | 1.12 | | 1.35 | | (0.26) | (0.86) | (1.12) | 15.32 | 9.16 | 0.96 | 0.71 | 1.506 | —9 | 16 |
| 08-31-2017 | 13.92 | | 0.196 | 1.58 | | 1.77 | | (0.23) | (0.37) | (0.60) | 15.09 | 13.15 | 0.88 | 0.65 | 1.366 | —9 | 13 |
| 08-31-2016 | 13.29 | | 0.19 | 0.83 | | 1.02 | | (0.19) | (0.20) | (0.39) | 13.92 | 7.79 | 0.83 | 0.63 | 1.45 | —9 | 7 |
| 08-31-2015 | 14.12 | | 0.16 | (0.76) | | (0.60) | | (0.15) | (0.08) | (0.23) | 13.29 | (4.34) | 4.03 | 0.80 | 1.15 | —9 | 5 |
| Class R2 | |
| 02-29-20205 | 13.57 | | 0.246 | 0.14 | | 0.38 | | (0.30) | (1.05) | (1.35) | 12.60 | 2.307 | 0.778 | 0.518 | 3.396, 8 | —9 | 26 |
| 08-31-2019 | 15.33 | | 0.276 | (0.35) | | (0.08) | | (0.28) | (1.40) | (1.68) | 13.57 | 0.87 | 0.76 | 0.51 | 1.956 | —9 | 18 |
| 08-31-2018 | 15.10 | | 0.186 | 1.20 | | 1.38 | | (0.29) | (0.86) | (1.15) | 15.33 | 9.40 | 0.73 | 0.48 | 1.196 | 1 | 16 |
| 08-31-2017 | 13.92 | | 0.216 | 1.60 | | 1.81 | | (0.26) | (0.37) | (0.63) | 15.10 | 13.51 | 0.61 | 0.38 | 1.466 | —9 | 13 |
| 08-31-2016 | 13.26 | | 0.23 | 0.82 | | 1.05 | | (0.19) | (0.20) | (0.39) | 13.92 | 8.10 | 0.53 | 0.33 | 1.72 | —9 | 7 |
| 08-31-2015 | 14.12 | | 0.36 | (0.96) | | (0.60) | | (0.18) | (0.08) | (0.26) | 13.26 | (4.32) | 2.06 | 0.69 | 2.57 | —9 | 5 |
| Class R4 | |
| 02-29-20205 | 13.64 | | 0.316 | 0.09 | | 0.40 | | (0.34) | (1.05) | (1.39) | 12.65 | 2.337 | 0.588 | 0.228 | 4.546, 8 | —9 | 26 |
| 08-31-2019 | 15.41 | | 0.276 | (0.31) | | (0.04) | | (0.33) | (1.40) | (1.73) | 13.64 | 1.27 | 0.54 | 0.19 | 1.956 | —9 | 18 |
| 08-31-2018 | 15.16 | | 0.276 | 1.17 | | 1.44 | | (0.33) | (0.86) | (1.19) | 15.41 | 9.76 | 0.51 | 0.17 | 1.766 | —9 | 16 |
| 08-31-2017 | 13.97 | | 0.286 | 1.57 | | 1.85 | | (0.29) | (0.37) | (0.66) | 15.16 | 13.72 | 0.50 | 0.17 | 1.976 | —9 | 13 |
| 08-31-2016 | 13.33 | | 0.26 | 0.82 | | 1.08 | | (0.24) | (0.20) | (0.44) | 13.97 | 8.27 | 0.50 | 0.20 | 1.95 | —9 | 7 |
| 08-31-2015 | 14.17 | | 0.24 | (0.79) | | (0.55) | | (0.21) | (0.08) | (0.29) | 13.33 | (3.93) | 4.24 | 0.39 | 1.72 | —9 | 5 |
| Class R6 | |
| 02-29-20205 | 13.55 | | 0.276 | 0.15 | | 0.42 | | (0.37) | (1.05) | (1.42) | 12.55 | 2.507 | 0.278 | —8 | 4.006, 8 | 90 | 26 |
| 08-31-2019 | 15.33 | | 0.296 | (0.31) | | (0.02) | | (0.36) | (1.40) | (1.76) | 13.55 | 1.42 | 0.26 | — | 2.166 | 72 | 18 |
| 08-31-2018 | 15.09 | | 0.306 | 1.15 | | 1.45 | | (0.35) | (0.86) | (1.21) | 15.33 | 9.90 | 0.26 | — | 2.016 | 37 | 16 |
| 08-31-2017 | 13.91 | | 0.206 | 1.66 | | 1.86 | | (0.31) | (0.37) | (0.68) | 15.09 | 13.90 | 0.25 | — | 1.406 | 14 | 13 |
| 08-31-2016 | 13.27 | | 0.25 | 0.85 | | 1.10 | | (0.26) | (0.20) | (0.46) | 13.91 | 8.50 | 0.25 | 0.03 | 1.94 | 1 | 7 |
| 08-31-2015 | 14.12 | | 0.16 | (0.68) | | (0.52) | | (0.25) | (0.08) | (0.33) | 13.27 | (3.78) | 1.07 | 0.19 | 1.19 | 1 | 5 |
| Class 1 | |
| 02-29-20205 | 13.57 | | 0.276 | 0.14 | | 0.41 | | (0.36) | (1.05) | (1.41) | 12.57 | 2.447 | 0.308 | 0.058 | 3.926, 8 | 831 | 26 |
| 08-31-2019 | 15.34 | | 0.336 | (0.35) | | (0.02) | | (0.35) | (1.40) | (1.75) | 13.57 | 1.44 | 0.30 | 0.05 | 2.406 | 862 | 18 |
| 08-31-2018 | 15.10 | | 0.336 | 1.11 | | 1.44 | | (0.34) | (0.86) | (1.20) | 15.34 | 9.84 | 0.29 | 0.05 | 2.206 | 946 | 16 |
| 08-31-2017 | 13.92 | | 0.306 | 1.55 | | 1.85 | | (0.30) | (0.37) | (0.67) | 15.10 | 13.83 | 0.28 | 0.05 | 2.146 | 969 | 13 |
| 08-31-2016 | 13.28 | | 0.26 | 0.83 | | 1.09 | | (0.25) | (0.20) | (0.45) | 13.92 | 8.44 | 0.28 | 0.08 | 2.00 | 892 | 7 |
| 08-31-2015 | 14.13 | | 0.25 | (0.78) | | (0.53) | | (0.24) | (0.08) | (0.32) | 13.28 | (3.83) | 0.28 | 0.24 | 1.82 | 743 | 5 |
| 1 Based on average daily shares outstanding. |
| 2 Net investment income is affected by the timing and frequency of the declaration of dividends by the underlying funds in which the portfolio invests. Accordingly, a significant portion of income is recorded in December. |
| 3 Total returns would have been lower had certain expenses not been reduced and other income not been received from the Advisor for reimbursement of indirect net expenses associated with the portfolio’s investments in underlying investment companies during the applicable periods. |
| 4 Ratios do not include expenses indirectly incurred from underlying funds and can vary based on the mix of underlying funds held by the portfolio. |
| 5 Six months ended 2-29-20. Unaudited. |
| 6 Net investment income (loss) per share and net investment income (loss) ratio reflect other income received from the Advisor for reimbursement of indirect net expenses associated with the portfolio's investments in underlying investment companies of less than $0.005 per share, $0.01, $0.01 and less than $0.005 per share and 0.04%, 0.05%, 0.05% and 0.03% for the periods ended 2-29-20, 8-31-19, 8-31-18 and 8-31-17, respectively. |
| 7 Not annualized. |
| 8 Annualized. |
| 9 Less than $500,000. |
| SEE NOTES TO FINANCIAL STATEMENTS | SEMIANNUAL REPORT | JOHN HANCOCK MULTI-INDEX PRESERVATION PORTFOLIOS | 37 |
| Financial highlights continued |
Multi-Index 2035 Preservation Portfolio
| Per share operating performance for a share outstanding throughout each period | | Ratios and supplemental data | |
| | | | Income (loss) from investment operations | | | | Less distributions | | | | Ratios to average net assets | | | |
| Period ended | Net asset
value,
beginning
of period ($) | | Net
investment
income
(loss) ($)1, 2 | Net realized and
unrealized
gain (loss)
on investments ($) | | Total from
investment
operations ($) | | From net
investment
income ($) | From net
realized
gain ($) | Total
distributions ($) | Net asset
value,
end of
period ($) | Total
return
(%)3 | Expenses
before
reductions
(%)4 | Expenses
including
reductions
(%)4 | Net
investment
income
(loss) (%)2 | Net
assets,
end of
period
(in millions) | Portfolio
turnover
(%) |
| Class R1 | |
| 02-29-20205 | 13.45 | | 0.226 | 0.15 | | 0.37 | | (0.28) | (0.92) | (1.20) | 12.62 | 2.317 | 0.938 | 0.658 | 3.206, 8 | 1 | 28 |
| 08-31-2019 | 14.94 | | 0.336 | (0.28) | | 0.05 | | (0.25) | (1.29) | (1.54) | 13.45 | 1.65 | 0.91 | 0.63 | 2.376 | 1 | 19 |
| 08-31-2018 | 14.82 | | 0.246 | 0.93 | | 1.17 | | (0.24) | (0.81) | (1.05) | 14.94 | 8.06 | 0.93 | 0.66 | 1.596 | 1 | 17 |
| 08-31-2017 | 13.77 | | 0.166 | 1.43 | | 1.59 | | (0.20) | (0.34) | (0.54) | 14.82 | 12.02 | 0.96 | 0.71 | 1.156 | 1 | 15 |
| 08-31-2016 | 13.18 | | 0.17 | 0.78 | | 0.95 | | (0.17) | (0.19) | (0.36) | 13.77 | 7.39 | 1.04 | 0.80 | 1.29 | 1 | 7 |
| 08-31-2015 | 13.98 | | 0.08 | (0.64) | | (0.56) | | (0.15) | (0.09) | (0.24) | 13.18 | (4.09) | 2.39 | 0.87 | 0.56 | 1 | 6 |
| Class R2 | |
| 02-29-20205 | 13.41 | | 0.226 | 0.17 | | 0.39 | | (0.30) | (0.92) | (1.22) | 12.58 | 2.457 | 0.808 | 0.518 | 3.286, 8 | 1 | 28 |
| 08-31-2019 | 14.92 | | 0.266 | (0.21) | | 0.05 | | (0.27) | (1.29) | (1.56) | 13.41 | 1.71 | 0.79 | 0.51 | 1.936 | 1 | 19 |
| 08-31-2018 | 14.81 | | 0.206 | 0.99 | | 1.19 | | (0.27) | (0.81) | (1.08) | 14.92 | 8.21 | 0.79 | 0.52 | 1.366 | 2 | 17 |
| 08-31-2017 | 13.77 | | 0.216 | 1.41 | | 1.62 | | (0.24) | (0.34) | (0.58) | 14.81 | 12.22 | 0.73 | 0.48 | 1.476 | 1 | 15 |
| 08-31-2016 | 13.17 | | 0.21 | 0.78 | | 0.99 | | (0.20) | (0.19) | (0.39) | 13.77 | 7.73 | 0.78 | 0.55 | 1.61 | —9 | 7 |
| 08-31-2015 | 13.98 | | 0.24 | (0.77) | | (0.53) | | (0.19) | (0.09) | (0.28) | 13.17 | (3.93) | 2.16 | 0.67 | 1.71 | —9 | 6 |
| Class R4 | |
| 02-29-20205 | 13.49 | | 0.276 | 0.14 | | 0.41 | | (0.34) | (0.92) | (1.26) | 12.64 | 2.617 | 0.568 | 0.188 | 3.936, 8 | —9 | 28 |
| 08-31-2019 | 15.00 | | 0.326 | (0.22) | | 0.10 | | (0.32) | (1.29) | (1.61) | 13.49 | 2.09 | 0.54 | 0.17 | 2.346 | —9 | 19 |
| 08-31-2018 | 14.88 | | 0.276 | 0.98 | | 1.25 | | (0.32) | (0.81) | (1.13) | 15.00 | 8.61 | 0.53 | 0.16 | 1.796 | —9 | 17 |
| 08-31-2017 | 13.83 | | 0.296 | 1.38 | | 1.67 | | (0.28) | (0.34) | (0.62) | 14.88 | 12.61 | 0.52 | 0.16 | 2.056 | —9 | 15 |
| 08-31-2016 | 13.22 | | 0.26 | 0.78 | | 1.04 | | (0.24) | (0.19) | (0.43) | 13.83 | 8.06 | 0.52 | 0.22 | 1.96 | —9 | 7 |
| 08-31-2015 | 14.03 | | 0.24 | (0.74) | | (0.50) | | (0.22) | (0.09) | (0.31) | 13.22 | (3.68) | 4.29 | 0.40 | 1.72 | —9 | 6 |
| Class R6 | |
| 02-29-20205 | 13.43 | | 0.266 | 0.16 | | 0.42 | | (0.37) | (0.92) | (1.29) | 12.56 | 2.647 | 0.298 | —8 | 3.876, 8 | 99 | 28 |
| 08-31-2019 | 14.95 | | 0.316 | (0.19) | | 0.12 | | (0.35) | (1.29) | (1.64) | 13.43 | 2.25 | 0.29 | — | 2.306 | 81 | 19 |
| 08-31-2018 | 14.83 | | 0.306 | 0.97 | | 1.27 | | (0.34) | (0.81) | (1.15) | 14.95 | 8.81 | 0.28 | — | 2.036 | 44 | 17 |
| 08-31-2017 | 13.78 | | 0.196 | 1.50 | | 1.69 | | (0.30) | (0.34) | (0.64) | 14.83 | 12.84 | 0.27 | — | 1.346 | 15 | 15 |
| 08-31-2016 | 13.18 | | 0.26 | 0.79 | | 1.05 | | (0.26) | (0.19) | (0.45) | 13.78 | 8.21 | 0.27 | 0.05 | 1.99 | —9 | 7 |
| 08-31-2015 | 13.99 | | 0.24 | (0.71) | | (0.47) | | (0.25) | (0.09) | (0.34) | 13.18 | (3.46) | 1.29 | 0.21 | 1.76 | —9 | 6 |
| Class 1 | |
| 02-29-20205 | 13.41 | | 0.266 | 0.16 | | 0.42 | | (0.36) | (0.92) | (1.28) | 12.55 | 2.667 | 0.338 | 0.058 | 3.796, 8 | 1,061 | 28 |
| 08-31-2019 | 14.93 | | 0.336 | (0.22) | | 0.11 | | (0.34) | (1.29) | (1.63) | 13.41 | 2.19 | 0.33 | 0.05 | 2.466 | 1,105 | 19 |
| 08-31-2018 | 14.82 | | 0.336 | 0.92 | | 1.25 | | (0.33) | (0.81) | (1.14) | 14.93 | 8.70 | 0.32 | 0.05 | 2.236 | 1,202 | 17 |
| 08-31-2017 | 13.77 | | 0.306 | 1.39 | | 1.69 | | (0.30) | (0.34) | (0.64) | 14.82 | 12.80 | 0.30 | 0.05 | 2.146 | 1,244 | 15 |
| 08-31-2016 | 13.17 | | 0.26 | 0.78 | | 1.04 | | (0.25) | (0.19) | (0.44) | 13.77 | 8.16 | 0.30 | 0.10 | 2.03 | 1,192 | 7 |
| 08-31-2015 | 13.98 | | 0.25 | (0.72) | | (0.47) | | (0.25) | (0.09) | (0.34) | 13.17 | (3.50) | 0.29 | 0.26 | 1.82 | 1,024 | 6 |
| 1 Based on average daily shares outstanding. |
| 2 Net investment income is affected by the timing and frequency of the declaration of dividends by the underlying funds in which the portfolio invests. Accordingly, a significant portion of income is recorded in December. |
| 3 Total returns would have been lower had certain expenses not been reduced and other income not been received from the Advisor for reimbursement of indirect net expenses associated with the portfolio’s investments in underlying investment companies during the applicable periods. |
| 4 Ratios do not include expenses indirectly incurred from underlying funds and can vary based on the mix of underlying funds held by the portfolio. |
| 5 Six months ended 2-29-20. Unaudited. |
| 6 Net investment income (loss) per share and net investment income (loss) ratio reflect other income received from the Advisor for reimbursement of indirect net expenses associated with the portfolio's investments in underlying investment companies of less than $0.005, less than $0.005, less than $0.005 and less than $0.005 per share and 0.01%, 0.02%, 0.02% and 0.03% for the periods ended 2-29-20, 8-31-19, 8-31-18 and 8-31-17, respectively. |
| 7 Not annualized. |
| 8 Annualized. |
| 9 Less than $500,000. |
| 38 | JOHN HANCOCK MULTI-INDEX PRESERVATION PORTFOLIOS | SEMIANNUAL REPORT | SEE NOTES TO FINANCIAL STATEMENTS |
Multi-Index 2030 Preservation Portfolio
| Per share operating performance for a share outstanding throughout each period | | Ratios and supplemental data | |
| | | | Income (loss) from investment operations | | | | Less distributions | | | | Ratios to average net assets | | | |
| Period ended | Net asset
value,
beginning
of period ($) | | Net
investment
income
(loss) ($)1, 2 | Net realized and
unrealized
gain (loss)
on investments ($) | | Total from
investment
operations ($) | | From net
investment
income ($) | From net
realized
gain ($) | Total
distributions ($) | Net asset
value,
end of
period ($) | Total
return
(%)3 | Expenses
before
reductions
(%)4 | Expenses
including
reductions
(%)4 | Net
investment
income
(loss) (%)2 | Net
assets,
end of
period
(in millions) | Portfolio
turnover
(%) |
| Class R1 | |
| 02-29-20205 | 13.18 | | 0.19 | 0.17 | | 0.36 | | (0.27) | (0.72) | (0.99) | 12.55 | 2.486 | 1.067 | 0.787 | 2.867 | 1 | 35 |
| 08-31-2019 | 14.25 | | 0.31 | (0.04)8 | | 0.27 | | (0.25) | (1.09) | (1.34) | 13.18 | 2.98 | 1.03 | 0.75 | 2.30 | 1 | 22 |
| 08-31-2018 | 14.33 | | 0.22 | 0.64 | | 0.86 | | (0.23) | (0.71) | (0.94) | 14.25 | 6.11 | 1.00 | 0.71 | 1.53 | 1 | 18 |
| 08-31-2017 | 13.47 | | 0.18 | 1.14 | | 1.32 | | (0.19) | (0.27) | (0.46) | 14.33 | 10.14 | 0.99 | 0.73 | 1.28 | 1 | 15 |
| 08-31-2016 | 12.92 | | 0.13 | 0.79 | | 0.92 | | (0.17) | (0.20) | (0.37) | 13.47 | 7.23 | 1.06 | 0.84 | 1.03 | —9 | 7 |
| 08-31-2015 | 13.64 | | 0.17 | (0.67) | | (0.50) | | (0.14) | (0.08) | (0.22) | 12.92 | (3.70) | 3.12 | 0.92 | 1.23 | —9 | 7 |
| Class R2 | |
| 02-29-20205 | 13.16 | | 0.20 | 0.18 | | 0.38 | | (0.30) | (0.72) | (1.02) | 12.52 | 2.626 | 0.867 | 0.577 | 2.987 | 1 | 35 |
| 08-31-2019 | 14.24 | | 0.26 | 0.02 | | 0.28 | | (0.27) | (1.09) | (1.36) | 13.16 | 3.21 | 0.85 | 0.56 | 2.00 | 1 | 22 |
| 08-31-2018 | 14.32 | | 0.22 | 0.66 | | 0.88 | | (0.25) | (0.71) | (0.96) | 14.24 | 6.24 | 0.84 | 0.55 | 1.53 | 1 | 18 |
| 08-31-2017 | 13.46 | | 0.18 | 1.18 | | 1.36 | | (0.23) | (0.27) | (0.50) | 14.32 | 10.42 | 0.79 | 0.53 | 1.33 | 1 | 15 |
| 08-31-2016 | 12.92 | | 0.16 | 0.77 | | 0.93 | | (0.19) | (0.20) | (0.39) | 13.46 | 7.38 | 0.81 | 0.59 | 1.25 | —9 | 7 |
| 08-31-2015 | 13.65 | | 0.29 | (0.76) | | (0.47) | | (0.18) | (0.08) | (0.26) | 12.92 | (3.53) | 2.20 | 0.74 | 2.10 | —9 | 7 |
| Class R4 | |
| 02-29-20205 | 13.25 | | 0.25 | 0.14 | | 0.39 | | (0.33) | (0.72) | (1.05) | 12.59 | 2.696 | 0.707 | 0.327 | 3.837 | 2 | 35 |
| 08-31-2019 | 14.32 | | 0.19 | 0.15 | | 0.34 | | (0.32) | (1.09) | (1.41) | 13.25 | 3.57 | 0.67 | 0.28 | 1.48 | 1 | 22 |
| 08-31-2018 | 14.39 | | 0.28 | 0.66 | | 0.94 | | (0.30) | (0.71) | (1.01) | 14.32 | 6.72 | 0.58 | 0.19 | 1.91 | —9 | 18 |
| 08-31-2017 | 13.53 | | 0.28 | 1.12 | | 1.40 | | (0.27) | (0.27) | (0.54) | 14.39 | 10.73 | 0.56 | 0.20 | 2.03 | —9 | 15 |
| 08-31-2016 | 12.97 | | 0.25 | 0.74 | | 0.99 | | (0.23) | (0.20) | (0.43) | 13.53 | 7.80 | 0.55 | 0.25 | 1.94 | —9 | 7 |
| 08-31-2015 | 13.69 | | 0.23 | (0.66) | | (0.43) | | (0.21) | (0.08) | (0.29) | 12.97 | (3.21) | 4.41 | 0.43 | 1.71 | —9 | 7 |
| Class R6 | |
| 02-29-20205 | 13.17 | | 0.23 | 0.18 | | 0.41 | | (0.36) | (0.72) | (1.08) | 12.50 | 2.886 | 0.367 | 0.067 | 3.557 | 108 | 35 |
| 08-31-2019 | 14.25 | | 0.30 | 0.05 | | 0.35 | | (0.34) | (1.09) | (1.43) | 13.17 | 3.73 | 0.35 | 0.04 | 2.33 | 88 | 22 |
| 08-31-2018 | 14.33 | | 0.29 | 0.67 | | 0.96 | | (0.33) | (0.71) | (1.04) | 14.25 | 6.84 | 0.33 | 0.03 | 2.10 | 43 | 18 |
| 08-31-2017 | 13.47 | | 0.21 | 1.21 | | 1.42 | | (0.29) | (0.27) | (0.56) | 14.33 | 10.96 | 0.31 | 0.04 | 1.56 | 16 | 15 |
| 08-31-2016 | 12.92 | | 0.20 | 0.80 | | 1.00 | | (0.25) | (0.20) | (0.45) | 13.47 | 7.95 | 0.30 | 0.09 | 1.63 | 1 | 7 |
| 08-31-2015 | 13.64 | | 0.19 | (0.59) | | (0.40) | | (0.24) | (0.08) | (0.32) | 12.92 | (2.99) | 1.21 | 0.24 | 1.42 | 1 | 7 |
| Class 1 | |
| 02-29-20205 | 13.17 | | 0.23 | 0.17 | | 0.40 | | (0.35) | (0.72) | (1.07) | 12.50 | 2.836 | 0.397 | 0.117 | 3.507 | 1,217 | 35 |
| 08-31-2019 | 14.25 | | 0.33 | 0.02 | | 0.35 | | (0.34) | (1.09) | (1.43) | 13.17 | 3.67 | 0.38 | 0.09 | 2.54 | 1,275 | 22 |
| 08-31-2018 | 14.33 | | 0.32 | 0.63 | | 0.95 | | (0.32) | (0.71) | (1.03) | 14.25 | 6.79 | 0.37 | 0.08 | 2.28 | 1,377 | 18 |
| 08-31-2017 | 13.48 | | 0.29 | 1.11 | | 1.40 | | (0.28) | (0.27) | (0.55) | 14.33 | 10.83 | 0.35 | 0.09 | 2.14 | 1,468 | 15 |
| 08-31-2016 | 12.93 | | 0.26 | 0.73 | | 0.99 | | (0.24) | (0.20) | (0.44) | 13.48 | 7.89 | 0.34 | 0.14 | 2.02 | 1,440 | 7 |
| 08-31-2015 | 13.65 | | 0.25 | (0.65) | | (0.40) | | (0.24) | (0.08) | (0.32) | 12.93 | (3.03) | 0.32 | 0.29 | 1.82 | 1,245 | 7 |
| 1 Based on average daily shares outstanding. |
| 2 Net investment income is affected by the timing and frequency of the declaration of dividends by the underlying funds in which the portfolio invests. Accordingly, a significant portion of income is recorded in December. |
| 3 Total returns would have been lower had certain expenses not been reduced during the applicable periods. |
| 4 Ratios do not include expenses indirectly incurred from underlying funds and can vary based on the mix of underlying funds held by the portfolio. |
| 5 Six months ended 2-29-20. Unaudited. |
| 6 Not annualized. |
| 7 Annualized. |
| 8 The amount shown for a share outstanding does not correspond with the aggregate net gain (loss) on investments for the period due to the timing of the sales and repurchases of shares in relation to fluctuating market values of the investments of the portfolio. |
| 9 Less than $500,000. |
| SEE NOTES TO FINANCIAL STATEMENTS | SEMIANNUAL REPORT | JOHN HANCOCK MULTI-INDEX PRESERVATION PORTFOLIOS | 39 |
| Financial highlights continued |
Multi-Index 2025 Preservation Portfolio
| Per share operating performance for a share outstanding throughout each period | | Ratios and supplemental data | |
| | | | Income (loss) from investment operations | | | | Less distributions | | | | Ratios to average net assets | | | |
| Period ended | Net asset
value,
beginning
of period ($) | | Net
investment
income
(loss) ($)1, 2 | Net realized and
unrealized
gain (loss)
on investments ($) | | Total from
investment
operations ($) | | From net
investment
income ($) | From net
realized
gain ($) | Total
distributions ($) | Net asset
value,
end of
period ($) | Total
return
(%)3 | Expenses
before
reductions
(%)4 | Expenses
including
reductions
(%)4 | Net
investment
income
(loss) (%)2 | Net
assets,
end of
period
(in millions) | Portfolio
turnover
(%) |
| Class R1 | |
| 02-29-20205 | 12.64 | | 0.16 | 0.13 | | 0.29 | | (0.28) | (0.53) | (0.81) | 12.12 | 2.236 | 1.117 | 0.837 | 2.497 | —8 | 32 |
| 08-31-2019 | 13.15 | | 0.24 | 0.29 | | 0.53 | | (0.23) | (0.81) | (1.04) | 12.64 | 4.84 | 1.14 | 0.85 | 1.93 | —8 | 17 |
| 08-31-2018 | 13.49 | | 0.21 | 0.25 | | 0.46 | | (0.21) | (0.59) | (0.80) | 13.15 | 3.46 | 1.12 | 0.83 | 1.57 | —8 | 14 |
| 08-31-2017 | 12.97 | | 0.13 | 0.75 | | 0.88 | | (0.18) | (0.18) | (0.36) | 13.49 | 7.03 | 1.15 | 0.86 | 1.00 | —8 | 14 |
| 08-31-2016 | 12.52 | | 0.17 | 0.63 | | 0.80 | | (0.16) | (0.19) | (0.35) | 12.97 | 6.52 | 1.11 | 0.90 | 1.35 | —8 | 9 |
| 08-31-2015 | 13.09 | | 0.18 | (0.55) | | (0.37) | | (0.13) | (0.07) | (0.20) | 12.52 | (2.88) | 3.61 | 0.99 | 1.38 | —8 | 9 |
| Class R2 | |
| 02-29-20205 | 12.65 | | 0.17 | 0.14 | | 0.31 | | (0.31) | (0.53) | (0.84) | 12.12 | 2.416 | 0.937 | 0.657 | 2.647 | 2 | 32 |
| 08-31-2019 | 13.16 | | 0.26 | 0.30 | | 0.56 | | (0.26) | (0.81) | (1.07) | 12.65 | 5.04 | 0.92 | 0.63 | 2.12 | 1 | 17 |
| 08-31-2018 | 13.51 | | 0.17 | 0.33 | | 0.50 | | (0.26) | (0.59) | (0.85) | 13.16 | 3.74 | 0.88 | 0.59 | 1.36 | 1 | 14 |
| 08-31-2017 | 12.99 | | 0.23 | 0.71 | | 0.94 | | (0.24) | (0.18) | (0.42) | 13.51 | 7.47 | 0.70 | 0.44 | 1.75 | —8 | 14 |
| 08-31-2016 | 12.53 | | 0.22 | 0.64 | | 0.86 | | (0.21) | (0.19) | (0.40) | 12.99 | 6.99 | 0.70 | 0.50 | 1.77 | —8 | 9 |
| 08-31-2015 | 13.09 | | 0.19 | (0.52) | | (0.33) | | (0.16) | (0.07) | (0.23) | 12.53 | (2.56) | 4.41 | 0.65 | 1.49 | —8 | 9 |
| Class R4 | |
| 02-29-20205 | 12.69 | | 0.18 | 0.15 | | 0.33 | | (0.35) | (0.53) | (0.88) | 12.14 | 2.486 | 0.717 | 0.337 | 2.927 | —8 | 32 |
| 08-31-2019 | 13.20 | | 0.31 | 0.29 | | 0.60 | | (0.30) | (0.81) | (1.11) | 12.69 | 5.47 | 0.70 | 0.30 | 2.49 | —8 | 17 |
| 08-31-2018 | 13.54 | | 0.28 | 0.26 | | 0.54 | | (0.29) | (0.59) | (0.88) | 13.20 | 4.05 | 0.66 | 0.27 | 2.06 | —8 | 14 |
| 08-31-2017 | 13.02 | | 0.26 | 0.70 | | 0.96 | | (0.26) | (0.18) | (0.44) | 13.54 | 7.64 | 0.63 | 0.27 | 2.03 | —8 | 14 |
| 08-31-2016 | 12.55 | | 0.25 | 0.63 | | 0.88 | | (0.22) | (0.19) | (0.41) | 13.02 | 7.18 | 0.62 | 0.32 | 1.96 | —8 | 9 |
| 08-31-2015 | 13.12 | | 0.22 | (0.53) | | (0.31) | | (0.19) | (0.07) | (0.26) | 12.55 | (2.39) | 4.62 | 0.50 | 1.71 | —8 | 9 |
| Class R6 | |
| 02-29-20205 | 12.64 | | 0.20 | 0.14 | | 0.34 | | (0.37) | (0.53) | (0.90) | 12.08 | 2.596 | 0.437 | 0.147 | 3.167 | 81 | 32 |
| 08-31-2019 | 13.16 | | 0.31 | 0.30 | | 0.61 | | (0.32) | (0.81) | (1.13) | 12.64 | 5.62 | 0.42 | 0.12 | 2.52 | 70 | 17 |
| 08-31-2018 | 13.50 | | 0.29 | 0.27 | | 0.56 | | (0.31) | (0.59) | (0.90) | 13.16 | 4.24 | 0.40 | 0.10 | 2.21 | 35 | 14 |
| 08-31-2017 | 12.98 | | 0.21 | 0.77 | | 0.98 | | (0.28) | (0.18) | (0.46) | 13.50 | 7.84 | 0.38 | 0.11 | 1.67 | 13 | 14 |
| 08-31-2016 | 12.52 | | 0.22 | 0.67 | | 0.89 | | (0.24) | (0.19) | (0.43) | 12.98 | 7.30 | 0.37 | 0.15 | 1.80 | 1 | 9 |
| 08-31-2015 | 13.09 | | 0.22 | (0.49) | | (0.27) | | (0.23) | (0.07) | (0.30) | 12.52 | (2.16) | 1.14 | 0.30 | 1.70 | 1 | 9 |
| Class 1 | |
| 02-29-20205 | 12.64 | | 0.20 | 0.13 | | 0.33 | | (0.36) | (0.53) | (0.89) | 12.08 | 2.546 | 0.477 | 0.197 | 3.127 | 1,116 | 32 |
| 08-31-2019 | 13.16 | | 0.33 | 0.28 | | 0.61 | | (0.32) | (0.81) | (1.13) | 12.64 | 5.57 | 0.46 | 0.17 | 2.64 | 1,187 | 17 |
| 08-31-2018 | 13.50 | | 0.31 | 0.24 | | 0.55 | | (0.30) | (0.59) | (0.89) | 13.16 | 4.19 | 0.44 | 0.15 | 2.32 | 1,313 | 14 |
| 08-31-2017 | 12.98 | | 0.28 | 0.69 | | 0.97 | | (0.27) | (0.18) | (0.45) | 13.50 | 7.79 | 0.42 | 0.16 | 2.15 | 1,477 | 14 |
| 08-31-2016 | 12.52 | | 0.25 | 0.64 | | 0.89 | | (0.24) | (0.19) | (0.43) | 12.98 | 7.25 | 0.40 | 0.20 | 2.04 | 1,528 | 9 |
| 08-31-2015 | 13.09 | | 0.24 | (0.52) | | (0.28) | | (0.22) | (0.07) | (0.29) | 12.52 | (2.20) | 0.39 | 0.35 | 1.82 | 1,352 | 9 |
| 1 Based on average daily shares outstanding. |
| 2 Net investment income is affected by the timing and frequency of the declaration of dividends by the underlying funds in which the portfolio invests. Accordingly, a significant portion of income is recorded in December. |
| 3 Total returns would have been lower had certain expenses not been reduced during the applicable periods. |
| 4 Ratios do not include expenses indirectly incurred from underlying funds and can vary based on the mix of underlying funds held by the portfolio. |
| 5 Six months ended 2-29-20. Unaudited. |
| 6 Not annualized. |
| 7 Annualized. |
| 8 Less than $500,000. |
| 40 | JOHN HANCOCK MULTI-INDEX PRESERVATION PORTFOLIOS | SEMIANNUAL REPORT | SEE NOTES TO FINANCIAL STATEMENTS |
Multi-Index 2020 Preservation Portfolio
| Per share operating performance for a share outstanding throughout each period | | Ratios and supplemental data | |
| | | | Income (loss) from investment operations | | | | Less distributions | | | | Ratios to average net assets | | | |
| Period ended | Net asset
value,
beginning
of period ($) | | Net
investment
income
(loss) ($)1, 2 | Net realized and
unrealized
gain (loss)
on investments ($) | | Total from
investment
operations ($) | | From net
investment
income ($) | From net
realized
gain ($) | Total
distributions ($) | Net asset
value,
end of
period ($) | Total
return
(%)3 | Expenses
before
reductions
(%)4 | Expenses
including
reductions
(%)4 | Net
investment
income
(loss) (%)2 | Net
assets,
end of
period
(in millions) | Portfolio
turnover
(%) |
| Class R1 | |
| 02-29-20205 | 11.72 | | 0.12 | 0.08 | | 0.20 | | (0.27) | (0.23) | (0.50) | 11.42 | 1.746 | 1.287 | 0.967 | 2.047 | —8 | 40 |
| 08-31-2019 | 11.68 | | 0.23 | 0.48 | | 0.71 | | (0.22) | (0.45) | (0.67) | 11.72 | 6.59 | 1.26 | 0.95 | 1.99 | —8 | 12 |
| 08-31-2018 | 12.39 | | 0.21 | (0.14) | | 0.07 | | (0.21) | (0.57) | (0.78) | 11.68 | 0.61 | 1.20 | 0.89 | 1.73 | —8 | 11 |
| 08-31-2017 | 12.26 | | 0.16 | 0.31 | | 0.47 | | (0.20) | (0.14) | (0.34) | 12.39 | 3.94 | 1.10 | 0.82 | 1.35 | —8 | 13 |
| 08-31-2016 | 11.92 | | 0.18 | 0.52 | | 0.70 | | (0.16) | (0.20) | (0.36) | 12.26 | 6.02 | 0.97 | 0.75 | 1.54 | —8 | 13 |
| 08-31-2015 | 12.36 | | 0.15 | (0.38) | | (0.23) | | (0.12) | (0.09) | (0.21) | 11.92 | (1.88) | 4.84 | 0.99 | 1.25 | —8 | 13 |
| Class R2 | |
| 02-29-20205 | 11.73 | | 0.13 | 0.09 | | 0.22 | | (0.30) | (0.23) | (0.53) | 11.42 | 1.906 | 1.037 | 0.717 | 2.287 | 1 | 40 |
| 08-31-2019 | 11.69 | | 0.26 | 0.48 | | 0.74 | | (0.25) | (0.45) | (0.70) | 11.73 | 6.87 | 1.01 | 0.70 | 2.25 | 1 | 12 |
| 08-31-2018 | 12.39 | | 0.20 | (0.09) | | 0.11 | | (0.24) | (0.57) | (0.81) | 11.69 | 0.84 | 0.99 | 0.68 | 1.70 | 1 | 11 |
| 08-31-2017 | 12.24 | | 0.19 | 0.30 | | 0.49 | | (0.20) | (0.14) | (0.34) | 12.39 | 4.16 | 0.96 | 0.67 | 1.59 | —8 | 13 |
| 08-31-2016 | 11.91 | | 0.20 | 0.50 | | 0.70 | | (0.17) | (0.20) | (0.37) | 12.24 | 6.00 | 0.95 | 0.71 | 1.67 | —8 | 13 |
| 08-31-2015 | 12.37 | | 0.15 | (0.37) | | (0.22) | | (0.15) | (0.09) | (0.24) | 11.91 | (1.80) | 1.91 | 0.88 | 1.27 | 1 | 13 |
| Class R4 | |
| 02-29-20205 | 11.75 | | 0.15 | 0.08 | | 0.23 | | (0.33) | (0.23) | (0.56) | 11.42 | 2.016 | 0.847 | 0.437 | 2.627 | —8 | 40 |
| 08-31-2019 | 11.71 | | 0.27 | 0.51 | | 0.78 | | (0.29) | (0.45) | (0.74) | 11.75 | 7.23 | 0.79 | 0.37 | 2.41 | —8 | 12 |
| 08-31-2018 | 12.41 | | 0.27 | (0.12) | | 0.15 | | (0.28) | (0.57) | (0.85) | 11.71 | 1.19 | 0.74 | 0.33 | 2.22 | —8 | 11 |
| 08-31-2017 | 12.26 | | 0.24 | 0.29 | | 0.53 | | (0.24) | (0.14) | (0.38) | 12.41 | 4.50 | 0.72 | 0.34 | 2.01 | —8 | 13 |
| 08-31-2016 | 11.93 | | 0.23 | 0.51 | | 0.74 | | (0.21) | (0.20) | (0.41) | 12.26 | 6.34 | 0.70 | 0.38 | 1.94 | —8 | 13 |
| 08-31-2015 | 12.38 | | 0.20 | (0.38) | | (0.18) | | (0.18) | (0.09) | (0.27) | 11.93 | (1.47) | 4.93 | 0.57 | 1.65 | —8 | 13 |
| Class R6 | |
| 02-29-20205 | 11.72 | | 0.16 | 0.09 | | 0.25 | | (0.36) | (0.23) | (0.59) | 11.38 | 2.146 | 0.537 | 0.207 | 2.797 | 43 | 40 |
| 08-31-2019 | 11.68 | | 0.30 | 0.50 | | 0.80 | | (0.31) | (0.45) | (0.76) | 11.72 | 7.46 | 0.51 | 0.18 | 2.68 | 38 | 12 |
| 08-31-2018 | 12.38 | | 0.27 | (0.10) | | 0.17 | | (0.30) | (0.57) | (0.87) | 11.68 | 1.37 | 0.49 | 0.17 | 2.33 | 21 | 11 |
| 08-31-2017 | 12.24 | | 0.23 | 0.31 | | 0.54 | | (0.26) | (0.14) | (0.40) | 12.38 | 4.61 | 0.47 | 0.17 | 1.92 | 10 | 13 |
| 08-31-2016 | 11.91 | | 0.19 | 0.57 | | 0.76 | | (0.23) | (0.20) | (0.43) | 12.24 | 6.55 | 0.45 | 0.21 | 1.68 | 2 | 13 |
| 08-31-2015 | 12.36 | | 0.22 | (0.37) | | (0.15) | | (0.21) | (0.09) | (0.30) | 11.91 | (1.23) | 1.35 | 0.38 | 1.77 | —8 | 13 |
| Class 1 | |
| 02-29-20205 | 11.71 | | 0.16 | 0.08 | | 0.24 | | (0.35) | (0.23) | (0.58) | 11.37 | 2.106 | 0.577 | 0.257 | 2.787 | 534 | 40 |
| 08-31-2019 | 11.67 | | 0.31 | 0.48 | | 0.79 | | (0.30) | (0.45) | (0.75) | 11.71 | 7.41 | 0.55 | 0.23 | 2.75 | 595 | 12 |
| 08-31-2018 | 12.37 | | 0.28 | (0.12) | | 0.16 | | (0.29) | (0.57) | (0.86) | 11.67 | 1.33 | 0.53 | 0.22 | 2.38 | 699 | 11 |
| 08-31-2017 | 12.23 | | 0.26 | 0.27 | | 0.53 | | (0.25) | (0.14) | (0.39) | 12.37 | 4.56 | 0.50 | 0.22 | 2.14 | 881 | 13 |
| 08-31-2016 | 11.90 | | 0.24 | 0.51 | | 0.75 | | (0.22) | (0.20) | (0.42) | 12.23 | 6.50 | 0.48 | 0.26 | 2.04 | 1,003 | 13 |
| 08-31-2015 | 12.36 | | 0.22 | (0.38) | | (0.16) | | (0.21) | (0.09) | (0.30) | 11.90 | (1.36) | 0.46 | 0.43 | 1.78 | 939 | 13 |
| 1 Based on average daily shares outstanding. |
| 2 Net investment income is affected by the timing and frequency of the declaration of dividends by the underlying funds in which the portfolio invests. Accordingly, a significant portion of income is recorded in December. |
| 3 Total returns would have been lower had certain expenses not been reduced during the applicable periods. |
| 4 Ratios do not include expenses indirectly incurred from underlying funds and can vary based on the mix of underlying funds held by the portfolio. |
| 5 Six months ended 2-29-20. Unaudited. |
| 6 Not annualized. |
| 7 Annualized. |
| 8 Less than $500,000. |
| SEE NOTES TO FINANCIAL STATEMENTS | SEMIANNUAL REPORT | JOHN HANCOCK MULTI-INDEX PRESERVATION PORTFOLIOS | 41 |
| Financial highlights continued |
Multi-Index Income Preservation Portfolio
| Per share operating performance for a share outstanding throughout each period | | Ratios and supplemental data | |
| | | | Income (loss) from investment operations | | | | Less distributions | | | | Ratios to average net assets | | | |
| Period ended | Net asset
value,
beginning
of period ($) | | Net
investment
income
(loss) ($)1, 2 | Net realized and
unrealized
gain (loss)
on investments ($) | | Total from
investment
operations ($) | | From net
investment
income ($) | From net
realized
gain ($) | Total
distributions ($) | Net asset
value,
end of
period ($) | Total
return
(%)3 | Expenses
before
reductions
(%)4 | Expenses
including
reductions
(%)4 | Net
investment
income
(loss) (%)2 | Net
assets,
end of
period
(in millions) | Portfolio
turnover
(%) |
| Class R1 | |
| 02-29-20205 | 11.47 | | 0.11 | 0.03 | | 0.14 | | (0.25) | (0.12) | (0.37) | 11.24 | 1.136 | 1.247 | 0.927 | 1.897 | —8 | 50 |
| 08-31-2019 | 11.12 | | 0.21 | 0.47 | | 0.68 | | (0.21) | (0.12) | (0.33) | 11.47 | 6.37 | 1.22 | 0.90 | 1.94 | —8 | 11 |
| 08-31-2018 | 11.44 | | 0.18 | (0.13) | | 0.05 | | (0.19) | (0.18) | (0.37) | 11.12 | 0.43 | 1.17 | 0.85 | 1.58 | —8 | 7 |
| 08-31-2017 | 11.40 | | 0.15 | 0.08 | | 0.23 | | (0.15) | (0.04) | (0.19) | 11.44 | 2.08 | 1.09 | 0.79 | 1.37 | —8 | 5 |
| 08-31-2016 | 11.23 | | 0.13 | 0.34 | | 0.47 | | (0.14) | (0.16) | (0.30) | 11.40 | 4.26 | 1.11 | 0.85 | 1.23 | —8 | 179 |
| 08-31-2015 | 11.50 | | 0.12 | (0.19) | | (0.07) | | (0.11) | (0.09) | (0.20) | 11.23 | (0.63) | 5.44 | 1.06 | 1.05 | —8 | 32 |
| Class R2 | |
| 02-29-20205 | 11.46 | | 0.12 | 0.03 | | 0.15 | | (0.27) | (0.12) | (0.39) | 11.22 | 1.296 | 1.087 | 0.757 | 2.077 | 1 | 50 |
| 08-31-2019 | 11.11 | | 0.23 | 0.47 | | 0.70 | | (0.23) | (0.12) | (0.35) | 11.46 | 6.55 | 1.06 | 0.73 | 2.07 | 1 | 11 |
| 08-31-2018 | 11.44 | | 0.18 | (0.12) | | 0.06 | | (0.21) | (0.18) | (0.39) | 11.11 | 0.54 | 1.01 | 0.68 | 1.67 | 1 | 7 |
| 08-31-2017 | 11.39 | | 0.18 | 0.08 | | 0.26 | | (0.17) | (0.04) | (0.21) | 11.44 | 2.34 | 0.89 | 0.59 | 1.61 | —8 | 5 |
| 08-31-2016 | 11.23 | | 0.15 | 0.33 | | 0.48 | | (0.16) | (0.16) | (0.32) | 11.39 | 4.41 | 0.94 | 0.67 | 1.39 | —8 | 179 |
| 08-31-2015 | 11.50 | | 0.14 | (0.18) | | (0.04) | | (0.14) | (0.09) | (0.23) | 11.23 | (0.38) | 4.59 | 0.82 | 1.24 | —8 | 32 |
| Class R4 | |
| 02-29-20205 | 11.46 | | 0.13 | 0.04 | | 0.17 | | (0.30) | (0.12) | (0.42) | 11.21 | 1.476 | 0.917 | 0.487 | 2.357 | 1 | 50 |
| 08-31-2019 | 11.12 | | 0.24 | 0.49 | | 0.73 | | (0.27) | (0.12) | (0.39) | 11.46 | 6.83 | 0.85 | 0.43 | 2.20 | —8 | 11 |
| 08-31-2018 | 11.44 | | 0.23 | (0.13) | | 0.10 | | (0.24) | (0.18) | (0.42) | 11.12 | 0.87 | 0.80 | 0.37 | 2.05 | —8 | 7 |
| 08-31-2017 | 11.39 | | 0.21 | 0.07 | | 0.28 | | (0.19) | (0.04) | (0.23) | 11.44 | 2.55 | 0.78 | 0.38 | 1.83 | —8 | 5 |
| 08-31-2016 | 11.22 | | 0.18 | 0.33 | | 0.51 | | (0.18) | (0.16) | (0.34) | 11.39 | 4.65 | 0.81 | 0.45 | 1.64 | —8 | 179 |
| 08-31-2015 | 11.50 | | 0.17 | (0.19) | | (0.02) | | (0.17) | (0.09) | (0.26) | 11.22 | (0.22) | 5.29 | 0.65 | 1.46 | —8 | 32 |
| Class R6 | |
| 02-29-20205 | 11.45 | | 0.14 | 0.03 | | 0.17 | | (0.32) | (0.12) | (0.44) | 11.18 | 1.536 | 0.587 | 0.247 | 2.517 | 24 | 50 |
| 08-31-2019 | 11.11 | | 0.28 | 0.47 | | 0.75 | | (0.29) | (0.12) | (0.41) | 11.45 | 7.03 | 0.56 | 0.22 | 2.51 | 20 | 11 |
| 08-31-2018 | 11.42 | | 0.24 | (0.11) | | 0.13 | | (0.26) | (0.18) | (0.44) | 11.11 | 1.13 | 0.55 | 0.21 | 2.17 | 10 | 7 |
| 08-31-2017 | 11.37 | | 0.21 | 0.09 | | 0.30 | | (0.21) | (0.04) | (0.25) | 11.42 | 2.73 | 0.53 | 0.21 | 1.86 | 6 | 5 |
| 08-31-2016 | 11.22 | | 0.16 | 0.35 | | 0.51 | | (0.20) | (0.16) | (0.36) | 11.37 | 4.66 | 0.56 | 0.28 | 1.55 | 2 | 179 |
| 08-31-2015 | 11.51 | | 0.19 | (0.19) | | — | | (0.20) | (0.09) | (0.29) | 11.22 | (0.05) | 2.82 | 0.46 | 1.65 | —8 | 32 |
| Class 1 | |
| 02-29-20205 | 11.46 | | 0.14 | 0.03 | | 0.17 | | (0.32) | (0.12) | (0.44) | 11.19 | 1.486 | 0.617 | 0.297 | 2.537 | 299 | 50 |
| 08-31-2019 | 11.11 | | 0.29 | 0.46 | | 0.75 | | (0.28) | (0.12) | (0.40) | 11.46 | 7.06 | 0.60 | 0.27 | 2.59 | 339 | 11 |
| 08-31-2018 | 11.43 | | 0.24 | (0.13) | | 0.11 | | (0.25) | (0.18) | (0.43) | 11.11 | 0.99 | 0.59 | 0.26 | 2.19 | 394 | 7 |
| 08-31-2017 | 11.38 | | 0.22 | 0.08 | | 0.30 | | (0.21) | (0.04) | (0.25) | 11.43 | 2.68 | 0.56 | 0.26 | 1.96 | 499 | 5 |
| 08-31-2016 | 11.22 | | 0.20 | 0.31 | | 0.51 | | (0.19) | (0.16) | (0.35) | 11.38 | 4.70 | 0.59 | 0.33 | 1.78 | 627 | 179 |
| 08-31-2015 | 11.51 | | 0.18 | (0.19) | | (0.01) | | (0.19) | (0.09) | (0.28) | 11.22 | (0.10) | 0.55 | 0.51 | 1.60 | 404 | 32 |
| 1 Based on average daily shares outstanding. |
| 2 Net investment income is affected by the timing and frequency of the declaration of dividends by the underlying funds in which the portfolio invests. Accordingly, a significant portion of income is recorded in December. |
| 3 Total returns would have been lower had certain expenses not been reduced during the applicable periods. |
| 4 Ratios do not include expenses indirectly incurred from underlying funds and can vary based on the mix of underlying funds held by the portfolio. |
| 5 Six months ended 2-29-20. Unaudited. |
| 6 Not annualized. |
| 7 Annualized. |
| 8 Less than $500,000. |
| 9 Excludes merger activity. |
| 42 | JOHN HANCOCK MULTI-INDEX PRESERVATION PORTFOLIOS | SEMIANNUAL REPORT | SEE NOTES TO FINANCIAL STATEMENTS |
| Notes to financial statements (unaudited) | |
Note 1—Organization
John Hancock Funds II (the Trust) is an open-end management investment company organized as a Massachusetts business trust. The Trust is registered under the Investment Company Act of 1940, as amended (the 1940 Act). It is a series company with multiple investment series (collectively, Multi-Index Preservation Portfolios, or the portfolios and individually, the portfolio), ten of which are presented in this report. The portfolios operate as “funds of funds” that may invest in affiliated underlying funds of the Trust, other funds in John Hancock group of funds complex, non-John Hancock funds and certain other permitted investments.
The portfolios may offer multiple classes of shares. The shares currently offered by the portfolios are detailed in the Statements of assets and liabilities. Class R1, Class R2 and Class R4 shares are available only to certain retirement and 529 plans. Class R6 shares are only available to certain retirement plans, institutions and other investors. Class 1 shares are offered only to certain affiliates of Manulife Financial Corporation (MFC). Shareholders of each class have exclusive voting rights to matters that affect that class. The distribution and service fees, if any, and transfer agent fees for each class may differ.
The investment objective of each portfolio, with the exception of Multi-Index Income Preservation Portfolio, is to seek high total return until the portfolio’s target retirement date, with a greater focus on income as the target date approaches. The investment objective of Multi-Index Income Preservation Portfolio is to seek total return with a focus on current income. Total return, commonly understood as the combination of income and capital appreciation, includes interest, capital gains, dividends, and distributions realized over a given period of time.
The accounting policies of the underlying funds in which the portfolios invest are outlined in the underlying funds’ shareholder reports, which include the underlying funds’ financial statements. These are available on the Securities and Exchange Commission (SEC) website at sec.gov. John Hancock underlying funds' shareholder reports are also available without charge by calling 800-225-5291 or visiting jhinvestments.com. The underlying funds are not covered by this report.
Note 2—Significant accounting policies
The financial statements have been prepared in conformity with accounting principles generally accepted in the United States of America (US GAAP), which require management to make certain estimates and assumptions as of the date of the financial statements. Actual results could differ from those estimates and those differences could be significant. The portfolios qualify as investment companies under Topic 946 of Accounting Standards Codification of US GAAP.
Events or transactions occurring after the end of the fiscal period through the date that the financial statements were issued have been evaluated in the preparation of the financial statements. The following summarizes the significant accounting policies of the portfolios:
Security valuation. Investments are stated at value as of the scheduled close of regular trading on the New York Stock Exchange (NYSE), normally at 4:00 P.M., Eastern Time. In case of emergency or other disruption resulting in the NYSE not opening for trading or the NYSE closing at a time other than the regularly scheduled close, the net asset value (NAV) may be determined as of the regularly scheduled close of the NYSE pursuant to the portfolios' Valuation Policies and Procedures.
In order to value the securities, the portfolios use the following valuation techniques: Investments by the portfolios in underlying affiliated funds and other open end mutual funds, including John Hancock Collateral Trust (JHCT), are valued at their respective NAVs each business day. ETFs held by the portfolios are valued at the last sale price or official closing price on the exchange or principal market where the security trades. In the event there were no sales during the day or closing prices are not available, the securities are valued using the last available bid price. Debt obligations are valued based on the evaluated prices provided by an independent pricing vendor. Independent pricing vendors utilize matrix pricing, which takes into account factors such as institutional-size trading in similar groups of securities, yield, quality, coupon rate, maturity, type of issue, trading characteristics and other market data, as well as broker supplied prices.
In certain instances, the Pricing Committee may determine to value equity securities using prices obtained from another exchange or market if trading on the exchange or market on which prices are typically obtained did not open for trading as scheduled, or if trading closed earlier than scheduled, and trading occurred as normal on another exchange or market.
Other portfolio securities and assets, for which reliable market quotations are not readily available, are valued at fair value as determined in good faith by the portfolios' Pricing Committee following procedures established by the Board of Trustees. The frequency with which these fair valuation procedures are used cannot be predicted and fair value of securities may differ significantly from the value that would have been used had a ready market for such securities existed.
The portfolios use a three-tier hierarchy to prioritize the pricing assumptions, referred to as inputs, used in valuation techniques to measure fair value. Level 1 includes securities valued using quoted prices in active markets for identical securities, including registered investment companies. Level 2 includes securities valued using other significant observable inputs. Observable inputs may include quoted prices for similar securities, interest rates, prepayment speeds and credit risk. Prices for securities valued using these inputs are received from independent pricing vendors and brokers and are based on an evaluation of the inputs described. Level 3 includes securities valued using significant unobservable inputs when market prices are not readily available or reliable, including the portfolios' own assumptions in determining the fair value of investments. Factors used in determining value may include market or issuer specific events or trends, changes in interest rates and credit quality. The inputs or methodology used for valuing securities are not necessarily an indication of the risks associated with investing in those securities. Changes in valuation techniques and related inputs may result in transfers into or out of an assigned level within the disclosure hierarchy.
The following is a summary of the values by input classification of the portfolios' investments as of February 29, 2020, by major security category or type:
| | Total
value at
2-29-20 | Level 1
quoted
price | Level 2
significant
observable
inputs | Level 3
significant
unobservable
inputs |
| Multi-Index 2060 Preservation Portfolio | | | | |
| Investments in securities: | | | | |
| | SEMIANNUAL REPORT | JOHN HANCOCK MULTI-INDEX PRESERVATION PORTFOLIOS | 43 |
| | Total
value at
2-29-20 | Level 1
quoted
price | Level 2
significant
observable
inputs | Level 3
significant
unobservable
inputs |
| Multi-Index 2060 Preservation Portfolio (continued) | | | | |
| Assets | | | | |
| Affiliated investment companies | $76,492,089 | $76,492,089 | — | — |
| Unaffiliated investment companies | 26,712,534 | 26,712,534 | — | — |
| U.S. Government and Agency obligations | 8,859,181 | — | $8,859,181 | — |
| Short-term investments | 128,681 | 128,681 | — | — |
| Total investments in securities | $112,192,485 | $103,333,304 | $8,859,181 | — |
| |
| Multi-Index 2055 Preservation Portfolio | | | | |
| Investments in securities: | | | | |
| Assets | | | | |
| Affiliated investment companies | $186,399,773 | $186,399,773 | — | — |
| Unaffiliated investment companies | 64,681,679 | 64,681,679 | — | — |
| U.S. Government and Agency obligations | 22,583,350 | — | $22,583,350 | — |
| Short-term investments | 178,954 | 178,954 | — | — |
| Total investments in securities | $273,843,756 | $251,260,406 | $22,583,350 | — |
| |
| Multi-Index 2050 Preservation Portfolio | | | | |
| Investments in securities: | | | | |
| Assets | | | | |
| Affiliated investment companies | $418,306,994 | $418,306,994 | — | — |
| Unaffiliated investment companies | 145,049,200 | 145,049,200 | — | — |
| U.S. Government and Agency obligations | 50,696,053 | — | $50,696,053 | — |
| Short-term investments | 278,440 | 278,440 | — | — |
| Total investments in securities | $614,330,687 | $563,634,634 | $50,696,053 | — |
| |
| Multi-Index 2045 Preservation Portfolio | | | | |
| Investments in securities: | | | | |
| Assets | | | | |
| Affiliated investment companies | $505,302,327 | $505,302,327 | — | — |
| Unaffiliated investment companies | 187,768,153 | 187,768,153 | — | — |
| U.S. Government and Agency obligations | 62,240,838 | — | $62,240,838 | — |
| Short-term investments | 6,256,276 | 6,256,276 | — | — |
| Total investments in securities | $761,567,594 | $699,326,756 | $62,240,838 | — |
| |
| Multi-Index 2040 Preservation Portfolio | | | | |
| Investments in securities: | | | | |
| Assets | | | | |
| Affiliated investment companies | $580,988,587 | $580,988,587 | — | — |
| Unaffiliated investment companies | 265,637,895 | 265,637,895 | — | — |
| U.S. Government and Agency obligations | 76,001,993 | — | $76,001,993 | — |
| Short-term investments | 740,434 | 740,434 | — | — |
| Total investments in securities | $923,368,909 | $847,366,916 | $76,001,993 | — |
| |
| Multi-Index 2035 Preservation Portfolio | | | | |
| Investments in securities: | | | | |
| Assets | | | | |
| Affiliated investment companies | $646,847,310 | $646,847,310 | — | — |
| Unaffiliated investment companies | 421,474,188 | 421,474,188 | — | — |
| U.S. Government and Agency obligations | 95,268,359 | — | $95,268,359 | — |
| Short-term investments | 8,038,617 | 8,038,617 | — | — |
| Total investments in securities | $1,171,628,474 | $1,076,360,115 | $95,268,359 | — |
| |
| 44 | JOHN HANCOCK MULTI-INDEX PRESERVATION PORTFOLIOS | SEMIANNUAL REPORT | |
| | Total
value at
2-29-20 | Level 1
quoted
price | Level 2
significant
observable
inputs | Level 3
significant
unobservable
inputs |
| Multi-Index 2030 Preservation Portfolio | | | | |
| Investments in securities: | | | | |
| Assets | | | | |
| Affiliated investment companies | $534,447,758 | $534,447,758 | — | — |
| Unaffiliated investment companies | 692,050,271 | 692,050,271 | — | — |
| U.S. Government and Agency obligations | 106,718,256 | — | $106,718,256 | — |
| Short-term investments | 10,698,365 | 10,698,365 | — | — |
| Total investments in securities | $1,343,914,650 | $1,237,196,394 | $106,718,256 | — |
| |
| Multi-Index 2025 Preservation Portfolio | | | | |
| Investments in securities: | | | | |
| Assets | | | | |
| Affiliated investment companies | $300,957,540 | $300,957,540 | — | — |
| Unaffiliated investment companies | 775,675,675 | 775,675,675 | — | — |
| U.S. Government and Agency obligations | 125,149,528 | — | $125,149,528 | — |
| Short-term investments | 1,052 | 1,052 | — | — |
| Total investments in securities | $1,201,783,795 | $1,076,634,267 | $125,149,528 | — |
| |
| Multi-Index 2020 Preservation Portfolio | | | | |
| Investments in securities: | | | | |
| Assets | | | | |
| Affiliated investment companies | $32,216,960 | $32,216,960 | — | — |
| Unaffiliated investment companies | 473,991,878 | 473,991,878 | — | — |
| U.S. Government and Agency obligations | 71,226,251 | — | $71,226,251 | — |
| Short-term investments | 34,273,893 | 34,273,893 | — | — |
| Total investments in securities | $611,708,982 | $540,482,731 | $71,226,251 | — |
| |
| Multi-Index Income Preservation Portfolio | | | | |
| Investments in securities: | | | | |
| Assets | | | | |
| Affiliated investment companies | $17,921,937 | $17,921,937 | — | — |
| Unaffiliated investment companies | 264,964,422 | 264,964,422 | — | — |
| U.S. Government and Agency obligations | 40,017,160 | — | $40,017,160 | — |
| Short-term investments | 24,442,727 | 24,442,727 | — | — |
| Total investments in securities | $347,346,246 | $307,329,086 | $40,017,160 | — |
Security transactions and related investment income. Investment security transactions are accounted for on a trade date plus one basis for daily NAV calculations. However, for financial reporting purposes, investment transactions are reported on trade date. Interest income is accrued as earned. Interest income includes coupon interest and amortization/accretion of premiums/discounts on debt securities. Debt obligations may be placed in a non-accrual status and related interest income may be reduced by stopping current accruals and writing off interest receivable when the collection of all or a portion of interest has become doubtful. Income and capital gain distributions from underlying funds are recorded on ex-date. Dividend income is recorded on the ex-date, except for dividends of certain foreign securities where the dividend may not be known until after the ex-date. In those cases, dividend income, net of withholding taxes, is recorded when the portfolio becomes aware of the dividends. Non-cash dividends, if any, are recorded at the fair market value of the securities received. Gains and losses on securities sold are determined on the basis of identified cost and may include proceeds from litigation.
Inflation-indexed bonds. Inflation-indexed bonds are securities that generally have a lower coupon interest rate fixed at issuance but whose principal value is periodically adjusted based on a rate of inflation, such as the Consumer Price Index. Over the life of an inflation-indexed bond, interest is paid on the inflation adjusted principal value as described above. Increases in the principal amount of these securities are recorded as interest income. Decreases in the principal amount of these securities may reduce interest income to the extent of income previously recorded. If these decreases are in excess of income previously recorded, an adjustment to the cost of the security is made.
Stripped securities.Stripped securities are financial instruments structured to separate principal and interest cash flows so that one class receives principal payments from the underlying assets (PO or principal only), while the other class receives the interest cash flows (IO or interest only). Both PO and IO investments represent an interest in the cash flows of an underlying stripped security. If the underlying assets experience greater than anticipated prepayments of principal, the portfolio may fail
| | SEMIANNUAL REPORT | JOHN HANCOCK MULTI-INDEX PRESERVATION PORTFOLIOS | 45 |
to fully recover its initial investment in an IO security. The market value of these securities can be extremely volatile in response to changes in interest rates or prepayments on the underlying securities. In addition, these securities also have the risk that the portfolio may not receive all or part of its principal or interest payments because the borrower or issuer has defaulted on its obligation.
Securities lending. The portfolios may lend their securities to earn additional income. The portfolios receive collateral from the borrower in an amount not less than the market value of the loaned securities. The portfolios will invest their cash collateral in JHCT, an affiliate of the portfolios, which has a floating NAV and is registered with the SEC as an investment company. JHCT invests in short-term money market investments. Each portfolio will receive the benefit of any gains and bear any losses generated by JHCT with respect to the cash collateral.
The portfolios have the right to recall loaned securities on demand. If a borrower fails to return loaned securities when due, then the lending agent is responsible and indemnifies the portfolios for the lent securities. The lending agent uses the collateral received from the borrower to purchase replacement securities of the same issue, type, class and series of the loaned securities. If the value of the collateral is less than the purchase cost of replacement securities, the lending agent is responsible for satisfying the shortfall but only to the extent that the shortfall is not due to any decrease in the value of JHCT.
Although the risk of loss on securities lent is mitigated by receiving collateral from the borrower and through lending agent indemnification, the portfolios could experience a delay in recovering securities or could experience a lower than expected return if the borrower fails to return the securities on a timely basis. The portfolios receive compensation for lending their securities by retaining a portion of the return on the investment of the collateral and compensation from fees earned from borrowers of the securities. Securities lending income received by the portfolios is net of fees retained by the securities lending agent. Net income received from JHCT is a component of securities lending income as recorded on the Statements of operations.
Obligations to repay collateral received by the portfolios are shown on the Statements of assets and liabilities as Payable upon return of securities loaned and are secured by the loaned securities. The following table summarizes the values of securities loaned by the portfolios and the corresponding cash collateral received at February 29, 2020:
| Portfolio | Market value of securities on loan | Cash collateral received |
| Multi-Index 2045 Preservation Portfolio | $5,638,776 | $5,751,666 |
| Multi-Index 2040 Preservation Portfolio | 713,318 | 727,601 |
| Multi-Index 2035 Preservation Portfolio | 7,855,276 | 8,012,541 |
| Multi-Index 2030 Preservation Portfolio | 10,457,502 | 10,670,784 |
| Multi-Index 2020 Preservation Portfolio | 31,754,504 | 32,651,240 |
| Multi-Index Income Preservation Portfolio | 23,307,281 | 23,939,275 |
Overdraft. The portfolios may have the ability to borrow from banks for temporary or emergency purposes, including meeting redemption requests that otherwise might require the untimely sale of securities. Pursuant to the portfolios' custodian agreement, the custodian may loan money to the portfolios to make properly authorized payments. The portfolios are obligated to repay the custodian for any overdraft, including any related costs or expenses. The custodian may have a lien, security interest or security entitlement in any portfolio property that is not otherwise segregated or pledged, to the extent of any overdraft, and to the maximum extent permitted by law. Overdrafts at period end, if any, are presented under the caption Due to custodian in the Statements of assets and liabilities.
Line of credit. The portfolios and other affiliated funds have entered into a syndicated line of credit agreement with Citibank, N.A. as the administrative agent that enables them to participate in a $750 million unsecured committed line of credit. Excluding commitments designated for a certain fund and subject to the needs of all other affiliated funds, a portfolio can borrow up to an aggregate commitment amount of $500 million, subject to asset coverage and other limitations as specified in the agreement. A commitment fee payable at the end of each calendar quarter, based on the average daily unused portion of each line of credit, is charged to each participating portfolio based on a combination of fixed and asset based allocations and is reflected in Other expenses on the Statements of operations. For the six months ended February 29, 2020, the portfolios had no borrowings under the line of credit.
Commitment fees for the six months ended February 29, 2020 were as follows:
| Portfolio | Commitment fee |
| Multi-Index 2060 Preservation Portfolio | $1,127 |
| Multi-Index 2055 Preservation Portfolio | 1,336 |
| Multi-Index 2050 Preservation Portfolio | 1,734 |
| Multi-Index 2045 Preservation Portfolio | 1,922 |
| Multi-Index 2040 Preservation Portfolio | 2,129 |
| Multi-Index 2035 Preservation Portfolio | 2,421 |
| Multi-Index 2030 Preservation Portfolio | 2,626 |
| Multi-Index 2025 Preservation Portfolio | 2,501 |
| Multi-Index 2020 Preservation Portfolio | 1,789 |
| Multi-Index Income Preservation Portfolio | 1,461 |
Expenses. Within the John Hancock group of funds complex, expenses that are directly attributable to an individual portfolio are allocated to such portfolio. Expenses that are not readily attributable to a specific portfolio are allocated among all portfolios in an equitable manner, taking into consideration, among other things, the nature and type of expense and the portfolio’s relative net assets. Expense estimates are accrued in the period to which they relate and adjustments are made when actual amounts are known.
| 46 | JOHN HANCOCK MULTI-INDEX PRESERVATION PORTFOLIOS | SEMIANNUAL REPORT | |
Class allocations. Income, common expenses and realized and unrealized gains (losses) are determined at the portfolio level and allocated daily to each class of shares based on the net assets of the class. Class-specific expenses, such as distribution and service fees, if any, and transfer agent fees, for all classes, are charged daily at the class level based on the net assets of each class and the specific expense rates applicable to each class.
Federal income taxes. Each portfolio intends to continue to qualify as a regulated investment company by complying with the applicable provisions of the Internal Revenue Code and will not be subject to federal income tax on taxable income that is distributed to shareholders. Therefore, no federal income tax provision is required.
As of August 31, 2019, the portfolios had no uncertain tax positions that would require financial statement recognition, derecognition or disclosure. The portfolios' federal tax returns are subject to examination by the Internal Revenue Service for a period of three years.
For federal income tax purposes, the costs of investments owned on February 29, 2020, including short-term investments, were as follows:
| Portfolio | Aggregate
cost | Unrealized
appreciation | Unrealized
(depreciation) | Net unrealized
appreciation/
(depreciation) |
| Multi-Index 2060 Preservation Portfolio | $119,614,034 | $2,181,947 | $(9,603,496) | $(7,421,549) |
| Multi-Index 2055 Preservation Portfolio | 292,926,639 | 6,800,934 | (25,883,817) | (19,082,883) |
| Multi-Index 2050 Preservation Portfolio | 627,483,850 | 17,069,898 | (30,223,061) | (13,153,163) |
| Multi-Index 2045 Preservation Portfolio | 757,535,305 | 14,312,624 | (10,280,335) | 4,032,289 |
| Multi-Index 2040 Preservation Portfolio | 904,386,169 | 26,220,128 | (7,237,388) | 18,982,740 |
| Multi-Index 2035 Preservation Portfolio | 1,125,991,306 | 53,592,093 | (7,954,925) | 45,637,168 |
| Multi-Index 2030 Preservation Portfolio | 1,271,462,551 | 81,945,410 | (9,493,311) | 72,452,099 |
| Multi-Index 2025 Preservation Portfolio | 1,140,322,852 | 68,722,601 | (7,261,658) | 61,460,943 |
| Multi-Index 2020 Preservation Portfolio | 597,279,450 | 18,463,624 | (4,034,092) | 14,429,532 |
| Multi-Index Income Preservation Portfolio | 341,082,197 | 8,624,246 | (2,360,197) | 6,264,049 |
Distribution of income and gains. Distributions to shareholders from net investment income and net realized gains, if any, are recorded on the ex-date. The portfolios generally declare and pay dividends and capital gain distributions, if any, annually.
Distributions paid by the portfolios with respect to each class of shares are calculated in the same manner, at the same time and in the same amount, except for the effect of class level expenses that may be applied differently to each class.
Such distributions, on a tax basis, are determined in conformity with income tax regulations, which may differ from US GAAP. Distributions in excess of tax basis earnings and profits, if any, are reported in the portfolios' financial statements as a return of capital. The final determination of tax characteristics of the portfolio's distribution will occur at the end of the year and will subsequently be reported to shareholders. Short-term gains from underlying funds are treated as ordinary income for tax purposes.
Capital accounts within the financial statements are adjusted for permanent book-tax differences. These adjustments have no impact on net assets or the results of operations. Temporary book-tax differences, if any, will reverse in a subsequent period. Book-tax differences are primarily attributable to wash sale loss deferrals.
Note 3—Guarantees and indemnifications
Under the Trust's organizational documents, its Officers and Trustees are indemnified against certain liabilities arising out of the performance of their duties to the Trust, including the portfolios. Additionally, in the normal course of business, the Trust enters into contracts with service providers that contain general indemnification clauses. The Trust's maximum exposure under these arrangements is unknown, as this would involve future claims that may be made against the Trust that have not yet occurred. The risk of material loss from such claims is considered remote.
Note 4—Fees and transactions with affiliates
John Hancock Investment Management LLC (the Advisor) serves as investment advisor for the portfolios. John Hancock Investment Management Distributors LLC (the Distributor), an affiliate of the Advisor, serves as principal underwriter of the portfolios. The Advisor and the Distributor are indirect, wholly owned subsidiaries of MFC.
Management fee. The portfolios have an investment management agreement with the Advisor under which the portfolios pay a daily management fee to the Advisor as detailed below. The Advisor has a subadvisory agreement with Manulife Investment Management (US) LLC, an indirect, wholly owned subsidiary of MFC and an affiliate of the Advisor. The portfolios are not responsible for payment of the subadvisory fees.
The management fee has two components: (1) a fee on assets invested in a fund of the Trust or John Hancock Funds III (JHF III) (Assets in a fund of the Trust or JHF III); and (2) a fee on assets invested in investments other than a fund of the Trust or JHF III (Other assets). Aggregate net assets include the net assets of the portfolios, similar portfolios of John Hancock Variable Insurance Trust (JHVIT), and similar portfolios of the Trust. JHVIT funds are advised by an affiliate of the Advisor, John Hancock Variable Trust Advisers LLC and are distributed by an affiliate of the Advisor, John Hancock Distributors, LLC.
Management fees are determined in accordance with the following schedule:
| | First $7.5 billion of aggregate net assets | Excess over $7.5 billion of aggregate net assets |
| Assets in a fund of the Trust or JHF III | 0.060% | 0.050% |
| | SEMIANNUAL REPORT | JOHN HANCOCK MULTI-INDEX PRESERVATION PORTFOLIOS | 47 |
| | First $7.5 billion of aggregate net assets | Excess over $7.5 billion of aggregate net assets |
| Other assets | 0.510% | 0.500% |
Expense reimbursements. The Advisor has contractually agreed to reduce its management fees or if necessary make payment to each portfolio in an amount by which certain expenses, including underlying fund expenses (acquired fund fees), exceed the amount indicated below of the respective portfolio’s average net assets. This expense limitation agreement expires on December 31, 2020, unless renewed by mutual agreement of the portfolios and the Advisor based upon a determination that this is appropriate under the circumstances at that time.
| Portfolio | Expense
limitation as a
percentage of
average net
assets |
| Multi-Index 2060 Preservation Portfolio | 0.37% |
| Multi-Index 2055 Preservation Portfolio | 0.38% |
| Multi-Index 2050 Preservation Portfolio | 0.38% |
| Multi-Index 2045 Preservation Portfolio | 0.37% |
| Multi-Index 2040 Preservation Portfolio | 0.36% |
| Portfolio | Expense
limitation as a
percentage of
average net
assets |
| Multi-Index 2035 Preservation Portfolio | 0.36% |
| Multi-Index 2030 Preservation Portfolio | 0.36% |
| Multi-Index 2025 Preservation Portfolio | 0.35% |
| Multi-Index 2020 Preservation Portfolio | 0.33% |
| Multi-Index Income Preservation Portfolio | 0.34% |
Payments under this arrangement are intended to reimburse the portfolios for indirect net expenses associated with the portfolios’ investments in underlying funds. Amounts received in excess of portfolio level operating expenses are included as a portion of the Other income received from advisor in the Statements of operations.
The Advisor has contractually agreed to waive and/or reimburse all class-specific expenses for Class R6 shares of each portfolio, as applicable, to the extent they exceed 0.00% of average net assets attributable to the class. The current expense limitation agreement expires on December 31, 2020, unless renewed by mutual agreement of the portfolios and the Advisor based upon a determination that this is appropriate under the circumstances at that time.
Additionally, the Advisor has voluntarily agreed to waive its management fee for each portfolio so that the aggregate management fee retained by the Advisor with respect to both the portfolio and its underlying investments (after payment of subadvisory fees) does not exceed 0.51% of the portfolio’s first $7.5 billion of average annual net assets and 0.50% of the portfolio’s average annual net assets in excess of $7.5 billion. The Advisor may terminate this voluntary waiver at any time upon notice to the Trust.
For the six months ended February 29, 2020, the expense reductions under these agreements amounted to the following and are reflected as a reduction of total expenses in the Statements of operations:
| | Expense reimbursement by class |
| Portfolio | Class R1 | Class R2 | Class R4 | Class R6 | Class 1 | Total |
| Multi-Index 2060 Preservation Portfolio | $180 | $327 | $223 | $9,411 | $191,739 | $201,880 |
| Multi-Index 2055 Preservation Portfolio | 61 | 261 | 62 | 2,436 | 381,437 | 384,257 |
| Multi-Index 2050 Preservation Portfolio | 551 | 953 | 1,008 | 96,867 | 668,069 | 767,448 |
| Multi-Index 2045 Preservation Portfolio | 490 | 641 | 58 | 90,564 | 857,090 | 948,843 |
| Multi-Index 2040 Preservation Portfolio | 355 | 459 | 184 | 111,899 | 1,115,403 | 1,228,300 |
| Multi-Index 2035 Preservation Portfolio | 937 | 1,790 | 87 | 135,607 | 1,572,511 | 1,710,932 |
| Multi-Index 2030 Preservation Portfolio | 1,114 | 963 | 1,860 | 147,133 | 1,787,659 | 1,938,729 |
| Multi-Index 2025 Preservation Portfolio | 486 | 2,163 | 99 | 112,506 | 1,641,836 | 1,757,090 |
| Multi-Index 2020 Preservation Portfolio | 321 | 1,853 | 201 | 67,388 | 883,773 | 953,536 |
| Multi-Index Income Preservation Portfolio | 294 | 1,082 | 715 | 37,259 | 511,821 | 551,171 |
Expenses waived or reimbursed in the current fiscal period are not subject to recapture in future fiscal periods.
The investment management fees, including the impact of the waivers and reimbursements as described above, incurred for the six months ended February 29, 2020, were equivalent to a net annual effective rate of the portfolios' average daily net assets as follows:
| Portfolio | Net Annual Effective Rate |
| Multi-Index 2060 Preservation Portfolio | 0.00% |
| Multi-Index 2055 Preservation Portfolio | 0.00% |
| Multi-Index 2050 Preservation Portfolio | 0.00% |
| Multi-Index 2045 Preservation Portfolio | 0.00% |
| Multi-Index 2040 Preservation Portfolio | 0.00% |
| Portfolio | Net Annual Effective Rate |
| Multi-Index 2035 Preservation Portfolio | 0.00% |
| Multi-Index 2030 Preservation Portfolio | 0.02% |
| Multi-Index 2025 Preservation Portfolio | 0.10% |
| Multi-Index 2020 Preservation Portfolio | 0.14% |
| Multi-Index Income Preservation Portfolio | 0.16% |
| 48 | JOHN HANCOCK MULTI-INDEX PRESERVATION PORTFOLIOS | SEMIANNUAL REPORT | |
Accounting and legal services. Pursuant to a service agreement, the portfolios reimburse the Advisor for all expenses associated with providing the administrative, financial, legal, compliance, accounting and recordkeeping services to the portfolios, including the preparation of all tax returns, periodic reports to shareholders and regulatory reports, among other services. These expenses are allocated to each share class based on its relative net assets at the time the expense was incurred. These accounting and legal services fees incurred for the six months ended February 29, 2020 amounted to an annual rate of 0.02% of the portfolios' average daily net assets.
Distribution and service plans. The portfolios have a distribution agreement with the Distributor. The portfolios have adopted distribution and service plans for certain classes as detailed below pursuant to Rule 12b-1 under the 1940 Act, to pay the Distributor for services provided as the distributor of shares of the portfolios. In addition, under a service plan for certain classes as detailed below, the portfolios pay for certain other services. The portfolios may pay up to the following contractual rates of distribution and service fees under these arrangements, expressed as an annual percentage of average daily net assets for each class of the portfolios' shares:
| Class | Rule 12b-1 Fee | Service fee |
| Class R1 | 0.50% | 0.25% |
| Class R2 | 0.25% | 0.25% |
| Class R4 | 0.25% | 0.10% |
| Class 1 | 0.05% | — |
The portfolios' Distributor has contractually agreed to waive 0.10% of Rule12b-1 fees for Class R4 shares. The current waiver agreement expires on December 31, 2020, unless renewed by mutual agreement of the portfolios and the Distributor based upon a determination that this is appropriate under the circumstances at the time. This contractual waiver amounted to the following for Class R4 shares for the six months ended February 29, 2020:
| Portfolio | Class R4 |
| Multi-Index 2060 Preservation Portfolio | $59 |
| Multi-Index 2055 Preservation Portfolio | 23 |
| Multi-Index 2050 Preservation Portfolio | 409 |
| Multi-Index 2045 Preservation Portfolio | 24 |
| Multi-Index 2040 Preservation Portfolio | 72 |
| Portfolio | Class R4 |
| Multi-Index 2035 Preservation Portfolio | $31 |
| Multi-Index 2030 Preservation Portfolio | 653 |
| Multi-Index 2025 Preservation Portfolio | 35 |
| Multi-Index 2020 Preservation Portfolio | 64 |
| Multi-Index Income Preservation Portfolio | 217 |
Transfer agent fees. The John Hancock group of funds has a complex-wide transfer agent agreement with John Hancock Signature Services, Inc. (Signature Services), an affiliate of the Advisor. The transfer agent fees paid to Signature Services are determined based on the cost to Signature Services (Signature Services Cost) of providing recordkeeping services. It also includes out-of-pocket expenses, including payments made to third-parties for recordkeeping services provided to their clients who invest in one or more John Hancock funds. In addition, Signature Services Cost may be reduced by certain fees that Signature Services receives in connection with retirement and small accounts. Signature Services Cost is calculated monthly and allocated, as applicable, to five categories of share classes: Retail Share and Institutional Share Classes of Non-Municipal Bond Funds, Class R6 Shares, Retirement Share Classes and Municipal Bond Share Classes. Within each of these categories, the applicable costs are allocated to the affected John Hancock affiliated funds and/or classes, based on the relative average daily net assets.
Class level expenses. Class level expenses for the six months ended February 29, 2020 were as follows:
| Portfolio | Class | Distribution and service fees | Transfer agent fees |
| Multi-Index 2060 Preservation Portfolio | Class R1 | $251 | $6 |
| | Class R2 | 370 | 11 |
| | Class R4 | 148 | 8 |
| | Class R6 | — | 314 |
| | Class 1 | 25,344 | — |
| | Total | $26,113 | $339 |
| Multi-Index 2055 Preservation Portfolio | Class R1 | $111 | $3 |
| | Class R2 | 429 | 13 |
| | Class R4 | 58 | 3 |
| | Class R6 | — | 111 |
| | Class 1 | 70,251 | — |
| | Total | $70,849 | $130 |
| Multi-Index 2050 Preservation Portfolio | Class R1 | $1,715 | $30 |
| | Class R2 | 2,010 | 53 |
| | Class R4 | 1,390 | 54 |
| | Class R6 | — | 5,001 |
| | Class 1 | 138,951 | — |
| | Total | $144,066 | $5,138 |
| | SEMIANNUAL REPORT | JOHN HANCOCK MULTI-INDEX PRESERVATION PORTFOLIOS | 49 |
| Portfolio | Class | Distribution and service fees | Transfer agent fees |
| Multi-Index 2045 Preservation Portfolio | Class R1 | $1,479 | $27 |
| | Class R2 | 1,350 | 36 |
| | Class R4 | 60 | 3 |
| | Class R6 | — | 4,677 |
| | Class 1 | 178,447 | — |
| | Total | $181,336 | $4,743 |
| Multi-Index 2040 Preservation Portfolio | Class R1 | $999 | $19 |
| | Class R2 | 914 | 24 |
| | Class R4 | 223 | 9 |
| | Class R6 | — | 5,490 |
| | Class 1 | 219,648 | — |
| | Total | $221,784 | $5,542 |
| Multi-Index 2035 Preservation Portfolio | Class R1 | $2,109 | $44 |
| | Class R2 | 3,200 | 85 |
| | Class R4 | 82 | 3 |
| | Class R6 | — | 6,031 |
| | Class 1 | 279,183 | — |
| | Total | $284,574 | $6,163 |
| Multi-Index 2030 Preservation Portfolio | Class R1 | $2,779 | $52 |
| | Class R2 | 1,722 | 46 |
| | Class R4 | 2,254 | 86 |
| | Class R6 | — | 6,538 |
| | Class 1 | 317,174 | — |
| | Total | $323,929 | $6,722 |
| Multi-Index 2025 Preservation Portfolio | Class R1 | $1,168 | $23 |
| | Class R2 | 3,834 | 101 |
| | Class R4 | 97 | 4 |
| | Class R6 | — | 4,991 |
| | Class 1 | 290,381 | — |
| | Total | $295,480 | $5,119 |
| Multi-Index 2020 Preservation Portfolio | Class R1 | $762 | $13 |
| | Class R2 | 2,936 | 77 |
| | Class R4 | 200 | 9 |
| | Class R6 | — | 2,691 |
| | Class 1 | 140,156 | — |
| | Total | $144,054 | $2,790 |
| Multi-Index Income Preservation Portfolio | Class R1 | $605 | $12 |
| | Class R2 | 1,669 | 44 |
| | Class R4 | 712 | 29 |
| | Class R6 | — | 1,452 |
| | Class 1 | 79,192 | — |
| | Total | $82,178 | $1,537 |
Trustee expenses. The portfolios compensate each Trustee who is not an employee of the Advisor or its affiliates. The costs of paying Trustee compensation and expenses are allocated to each portfolio based on their net assets relative to other funds within the John Hancock group of funds complex.
Note 5—Portfolio share transactions
Transactions in portfolios' shares for the six months ended February 29, 2020 and for the year ended August 31, 2019 were as follows:
| Multi-Index 2060 Preservation Portfolio | Six Months Ended 2-29-20 | Year Ended 8-31-19 |
| | Shares | Amount | Shares | Amount |
| Class R1 shares | | | | |
| Sold | 3,634 | $43,671 | 3,110 | $36,128 |
| Distributions reinvested | 316 | 3,769 | — | — |
| Repurchased | (22) | (272) | (1,448) | (17,004) |
| 50 | JOHN HANCOCK MULTI-INDEX PRESERVATION PORTFOLIOS | SEMIANNUAL REPORT | |
| Multi-Index 2060 Preservation Portfolio (continued) | Six Months Ended 2-29-20 | Year Ended 8-31-19 |
| | Shares | Amount | Shares | Amount |
| Net increase | 3,928 | $47,168 | 1,662 | $19,124 |
| Class R2 shares | | | | |
| Sold | 1,973 | $23,827 | 12,446 | $148,048 |
| Distributions reinvested | 765 | 9,129 | 564 | 5,831 |
| Repurchased | (44) | (550) | (4,451) | (52,707) |
| Net increase | 2,694 | $32,406 | 8,559 | $101,172 |
| Class R4 shares | | | | |
| Sold | 1,401 | $17,167 | 1,119 | $13,143 |
| Distributions reinvested | 458 | 5,459 | 309 | 3,196 |
| Repurchased | (107) | (1,283) | (62) | (737) |
| Net increase | 1,752 | $21,343 | 1,366 | $15,602 |
| Class R6 shares | | | | |
| Sold | 295,496 | $3,593,065 | 299,819 | $3,494,897 |
| Distributions reinvested | 33,035 | 394,107 | 9,618 | 99,454 |
| Repurchased | (79,893) | (950,186) | (106,187) | (1,213,812) |
| Net increase | 248,638 | $3,036,986 | 203,250 | $2,380,539 |
| Class 1 shares | | | | |
| Sold | 1,475,139 | $17,853,031 | 3,047,506 | $35,597,171 |
| Distributions reinvested | 651,565 | 7,773,171 | 457,740 | 4,728,450 |
| Repurchased | (294,848) | (3,569,290) | (451,792) | (5,159,715) |
| Net increase | 1,831,856 | $22,056,912 | 3,053,454 | $35,165,906 |
| Total net increase | 2,088,868 | $25,194,815 | 3,268,291 | $37,682,343 |
| Multi-Index 2055 Preservation Portfolio | Six Months Ended 2-29-201 | Year Ended 8-31-191 |
| | Shares | Amount | Shares | Amount |
| Class R2 shares | | | | |
| Sold | 3,262 | $36,155 | 5,800 | $62,936 |
| Distributions reinvested | 1,338 | 14,425 | 843 | 8,061 |
| Repurchased | — | — | (193) | (2,113) |
| Net increase | 4,600 | $50,580 | 6,450 | $68,884 |
| Class R4 shares | | | | |
| Sold | 203 | $2,340 | 42 | $455 |
| Distributions reinvested | 23 | 246 | — | — |
| Net increase | 226 | $2,586 | 42 | $455 |
| Class R6 shares | | | | |
| Sold | 110,417 | $1,220,866 | 88,583 | $951,263 |
| Distributions reinvested | 16,142 | 173,850 | 4,246 | 40,594 |
| Repurchased | (35,629) | (393,492) | (10,754) | (117,146) |
| Net increase | 90,930 | $1,001,224 | 82,075 | $874,711 |
| Class 1 shares | | | | |
| Sold | 1,302,047 | $14,435,835 | 3,202,580 | $34,774,292 |
| Distributions reinvested | 2,562,621 | 27,599,428 | 2,732,274 | 26,093,220 |
| Repurchased | (1,440,790) | (15,959,150) | (2,035,797) | (22,149,092) |
| Net increase | 2,423,878 | $26,076,113 | 3,899,057 | $38,718,420 |
| Total net increase | 2,519,634 | $27,130,503 | 3,987,624 | $39,662,470 |
| | |
| 1 | There were no share transactions for Class R1 for the six months ended February 29, 2020 and year ended August 31, 2019. |
| | SEMIANNUAL REPORT | JOHN HANCOCK MULTI-INDEX PRESERVATION PORTFOLIOS | 51 |
| Multi-Index 2050 Preservation Portfolio | Six Months Ended 2-29-20 | Year Ended 8-31-19 |
| | Shares | Amount | Shares | Amount |
| Class R1 shares | | | | |
| Sold | 11,643 | $143,480 | 19,456 | $239,093 |
| Distributions reinvested | 2,774 | 33,400 | 2,294 | 24,597 |
| Repurchased | (1,851) | (22,954) | (14,352) | (178,016) |
| Net increase | 12,566 | $153,926 | 7,398 | $85,674 |
| Class R2 shares | | | | |
| Sold | 10,225 | $124,967 | 48,556 | $588,051 |
| Distributions reinvested | 5,605 | 67,372 | 6,002 | 64,223 |
| Repurchased | (9,941) | (125,933) | (61,870) | (752,739) |
| Net increase (decrease) | 5,889 | $66,406 | (7,312) | $(100,465) |
| Class R4 shares | | | | |
| Sold | 69,795 | $903,416 | 28,951 | $345,864 |
| Distributions reinvested | 10,067 | 121,210 | 28 | 305 |
| Repurchased | (8,022) | (99,931) | (6) | (75) |
| Net increase | 71,840 | $924,695 | 28,973 | $346,094 |
| Class R6 shares | | | | |
| Sold | 2,301,568 | $28,487,142 | 3,743,422 | $45,144,155 |
| Distributions reinvested | 668,372 | 8,007,101 | 393,443 | 4,194,100 |
| Repurchased | (916,066) | (11,314,021) | (959,958) | (11,661,179) |
| Net increase | 2,053,874 | $25,180,222 | 3,176,907 | $37,677,076 |
| Class 1 shares | | | | |
| Sold | 1,127,289 | $14,029,613 | 2,748,461 | $33,552,020 |
| Distributions reinvested | 4,681,862 | 56,088,706 | 6,008,900 | 64,114,967 |
| Repurchased | (3,084,970) | (38,290,842) | (6,301,861) | (76,358,017) |
| Net increase | 2,724,181 | $31,827,477 | 2,455,500 | $21,308,970 |
| Total net increase | 4,868,350 | $58,152,726 | 5,661,466 | $59,317,349 |
| Multi-Index 2045 Preservation Portfolio | Six Months Ended 2-29-20 | Year Ended 8-31-19 |
| | Shares | Amount | Shares | Amount |
| Class R1 shares | | | | |
| Sold | 3,137 | $43,520 | 9,002 | $121,436 |
| Distributions reinvested | 2,285 | 30,923 | 2,785 | 33,616 |
| Repurchased | (605) | (8,416) | (16,717) | (226,159) |
| Net increase (decrease) | 4,817 | $66,027 | (4,930) | $(71,107) |
| Class R2 shares | | | | |
| Sold | 8,992 | $124,718 | 21,399 | $290,771 |
| Distributions reinvested | 3,773 | 51,010 | 4,103 | 49,484 |
| Repurchased | (1,560) | (21,775) | (60,388) | (857,473) |
| Net increase (decrease) | 11,205 | $153,953 | (34,886) | $(517,218) |
| Class R4 shares | | | | |
| Sold | 440 | $6,358 | 127 | $1,746 |
| Distributions reinvested | 53 | 719 | — | — |
| Repurchased | — | — | (9) | (120) |
| Net increase | 493 | $7,077 | 118 | $1,626 |
| Class R6 shares | | | | |
| Sold | 1,909,756 | $26,591,367 | 2,822,164 | $38,572,513 |
| Distributions reinvested | 557,030 | 7,508,762 | 360,400 | 4,332,011 |
| Repurchased | (676,946) | (9,399,849) | (900,748) | (12,367,280) |
| 52 | JOHN HANCOCK MULTI-INDEX PRESERVATION PORTFOLIOS | SEMIANNUAL REPORT | |
| Multi-Index 2045 Preservation Portfolio (continued) | Six Months Ended 2-29-20 | Year Ended 8-31-19 |
| | Shares | Amount | Shares | Amount |
| Net increase | 1,789,840 | $24,700,280 | 2,281,816 | $30,537,244 |
| Class 1 shares | | | | |
| Sold | 1,037,975 | $14,422,069 | 2,540,426 | $34,838,775 |
| Distributions reinvested | 5,332,786 | 71,885,959 | 6,905,298 | 83,001,677 |
| Repurchased | (4,045,139) | (56,734,901) | (7,205,411) | (99,188,956) |
| Net increase | 2,325,622 | $29,573,127 | 2,240,313 | $18,651,496 |
| Total net increase | 4,131,977 | $54,500,464 | 4,482,431 | $48,602,041 |
| Multi-Index 2040 Preservation Portfolio | Six Months Ended 2-29-20 | Year Ended 8-31-19 |
| | Shares | Amount | Shares | Amount |
| Class R1 shares | | | | |
| Sold | 2,800 | $38,226 | 9,411 | $126,473 |
| Distributions reinvested | 1,026 | 13,724 | 1,533 | 18,384 |
| Repurchased | (745) | (10,155) | (7,926) | (106,478) |
| Net increase | 3,081 | $41,795 | 3,018 | $38,379 |
| Class R2 shares | | | | |
| Sold | 3,860 | $53,103 | 17,183 | $231,124 |
| Distributions reinvested | 2,041 | 27,289 | 3,576 | 42,802 |
| Repurchased | (2,777) | (38,934) | (32,093) | (431,798) |
| Net increase (decrease) | 3,124 | $41,458 | (11,334) | $(157,872) |
| Class R4 shares | | | | |
| Sold | 6,768 | $97,120 | 4,368 | $58,309 |
| Distributions reinvested | 1,004 | 13,476 | 29 | 348 |
| Repurchased | (373) | (5,310) | (686) | (9,317) |
| Net increase | 7,399 | $105,286 | 3,711 | $49,340 |
| Class R6 shares | | | | |
| Sold | 1,984,502 | $27,281,923 | 3,525,674 | $47,396,317 |
| Distributions reinvested | 639,959 | 8,511,460 | 429,618 | 5,121,049 |
| Repurchased | (826,760) | (11,344,144) | (1,044,643) | (14,166,903) |
| Net increase | 1,797,701 | $24,449,239 | 2,910,649 | $38,350,463 |
| Class 1 shares | | | | |
| Sold | 1,114,490 | $15,436,357 | 2,577,821 | $35,463,258 |
| Distributions reinvested | 6,451,654 | 86,000,544 | 8,758,356 | 104,487,193 |
| Repurchased | (5,034,725) | (69,985,669) | (9,391,111) | (128,161,158) |
| Net increase | 2,531,419 | $31,451,232 | 1,945,066 | $11,789,293 |
| Total net increase | 4,342,724 | $56,089,010 | 4,851,110 | $50,069,603 |
| Multi-Index 2035 Preservation Portfolio | Six Months Ended 2-29-20 | Year Ended 8-31-19 |
| | Shares | Amount | Shares | Amount |
| Class R1 shares | | | | |
| Sold | 2,443 | $33,141 | 7,509 | $99,656 |
| Distributions reinvested | 3,768 | 49,960 | 10,451 | 124,573 |
| Repurchased | (1,871) | (25,393) | (63,613) | (806,642) |
| Net increase (decrease) | 4,340 | $57,708 | (45,653) | $(582,413) |
| Class R2 shares | | | | |
| Sold | 5,998 | $81,068 | 40,385 | $539,969 |
| Distributions reinvested | 7,174 | 94,769 | 8,668 | 103,068 |
| Repurchased | (5,723) | (79,039) | (67,261) | (922,660) |
| | SEMIANNUAL REPORT | JOHN HANCOCK MULTI-INDEX PRESERVATION PORTFOLIOS | 53 |
| Multi-Index 2035 Preservation Portfolio (continued) | Six Months Ended 2-29-20 | Year Ended 8-31-19 |
| | Shares | Amount | Shares | Amount |
| Net increase (decrease) | 7,449 | $96,798 | (18,208) | $(279,623) |
| Class R4 shares | | | | |
| Sold | 1,208 | $16,878 | 688 | $9,196 |
| Distributions reinvested | 158 | 2,091 | — | — |
| Net increase | 1,366 | $18,969 | 688 | $9,196 |
| Class R6 shares | | | | |
| Sold | 2,177,630 | $29,583,749 | 3,763,397 | $50,118,375 |
| Distributions reinvested | 657,108 | 8,660,679 | 491,002 | 5,823,282 |
| Repurchased | (982,593) | (13,282,668) | (1,186,877) | (15,827,515) |
| Net increase | 1,852,145 | $24,961,760 | 3,067,522 | $40,114,142 |
| Class 1 shares | | | | |
| Sold | 1,190,871 | $16,328,848 | 3,261,897 | $43,483,195 |
| Distributions reinvested | 7,675,045 | 101,080,336 | 10,647,487 | 126,172,725 |
| Repurchased | (6,686,001) | (91,048,540) | (12,067,282) | (162,832,982) |
| Net increase | 2,179,915 | $26,360,644 | 1,842,102 | $6,822,938 |
| Total net increase | 4,045,215 | $51,495,879 | 4,846,451 | $46,084,240 |
| Multi-Index 2030 Preservation Portfolio | Six Months Ended 2-29-20 | Year Ended 8-31-19 |
| | Shares | Amount | Shares | Amount |
| Class R1 shares | | | | |
| Sold | 6,798 | $89,884 | 31,840 | $410,870 |
| Distributions reinvested | 2,930 | 37,950 | 3,812 | 44,947 |
| Repurchased | (25,113) | (333,331) | (61,412) | (749,711) |
| Net decrease | (15,385) | $(205,497) | (25,760) | $(293,894) |
| Class R2 shares | | | | |
| Sold | 5,522 | $73,115 | 36,824 | $471,509 |
| Distributions reinvested | 2,787 | 35,983 | 5,518 | 64,839 |
| Repurchased | (6,671) | (90,621) | (67,318) | (885,980) |
| Net increase (decrease) | 1,638 | $18,477 | (24,976) | $(349,632) |
| Class R4 shares | | | | |
| Sold | 61,107 | $840,457 | 64,235 | $827,420 |
| Distributions reinvested | 9,902 | 128,526 | — | — |
| Repurchased | (4,431) | (59,989) | — | — |
| Net increase | 66,578 | $908,994 | 64,235 | $827,420 |
| Class R6 shares | | | | |
| Sold | 2,280,292 | $30,217,841 | 4,462,309 | $57,461,999 |
| Distributions reinvested | 625,789 | 8,060,166 | 418,652 | 4,906,584 |
| Repurchased | (925,840) | (12,261,288) | (1,235,860) | (16,112,810) |
| Net increase | 1,980,241 | $26,016,719 | 3,645,101 | $46,255,773 |
| Class 1 shares | | | | |
| Sold | 1,603,310 | $21,282,512 | 3,462,788 | $45,190,001 |
| Distributions reinvested | 7,674,444 | 98,923,584 | 11,299,520 | 132,543,363 |
| Repurchased | (8,746,081) | (116,302,521) | (14,543,945) | (190,623,273) |
| Net increase (decrease) | 531,673 | $3,903,575 | 218,363 | $(12,889,909) |
| Total net increase | 2,564,745 | $30,642,268 | 3,876,963 | $33,549,758 |
| 54 | JOHN HANCOCK MULTI-INDEX PRESERVATION PORTFOLIOS | SEMIANNUAL REPORT | |
| Multi-Index 2025 Preservation Portfolio | Six Months Ended 2-29-20 | Year Ended 8-31-19 |
| | Shares | Amount | Shares | Amount |
| Class R1 shares | | | | |
| Sold | 1,463 | $18,153 | 6,132 | $75,288 |
| Distributions reinvested | 760 | 9,342 | 1,098 | 12,534 |
| Repurchased | (1,222) | (15,221) | (9,135) | (113,292) |
| Net increase (decrease) | 1,001 | $12,274 | (1,905) | $(25,470) |
| Class R2 shares | | | | |
| Sold | 7,691 | $97,041 | 19,333 | $237,270 |
| Distributions reinvested | 7,847 | 96,366 | 9,101 | 103,845 |
| Repurchased | (1,963) | (25,183) | (23,814) | (299,822) |
| Net increase | 13,575 | $168,224 | 4,620 | $41,293 |
| Class R4 shares | | | | |
| Sold | 1,304 | $16,223 | 577 | $7,168 |
| Distributions reinvested | 123 | 1,514 | 93 | 1,063 |
| Repurchased | (8) | (97) | (31) | (387) |
| Net increase | 1,419 | $17,640 | 639 | $7,844 |
| Class R6 shares | | | | |
| Sold | 1,957,631 | $24,665,775 | 3,822,441 | $47,032,557 |
| Distributions reinvested | 439,729 | 5,377,884 | 312,305 | 3,550,905 |
| Repurchased | (1,214,707) | (15,293,054) | (1,274,172) | (15,773,419) |
| Net increase | 1,182,653 | $14,750,605 | 2,860,574 | $34,810,043 |
| Class 1 shares | | | | |
| Sold | 1,201,746 | $15,078,168 | 2,072,072 | $25,570,099 |
| Distributions reinvested | 6,467,480 | 79,097,274 | 9,344,988 | 106,252,510 |
| Repurchased | (9,256,460) | (117,005,471) | (17,258,590) | (214,109,445) |
| Net decrease | (1,587,234) | $(22,830,029) | (5,841,530) | $(82,286,836) |
| Total net decrease | (388,586) | $(7,881,286) | (2,977,602) | $(47,453,126) |
| Multi-Index 2020 Preservation Portfolio | Six Months Ended 2-29-20 | Year Ended 8-31-19 |
| | Shares | Amount | Shares | Amount |
| Class R1 shares | | | | |
| Sold | 1,019 | $11,850 | 2,291 | $26,018 |
| Distributions reinvested | 761 | 8,673 | 929 | 9,975 |
| Repurchased | (172) | (2,004) | (2,624) | (30,005) |
| Net increase | 1,608 | $18,519 | 596 | $5,988 |
| Class R2 shares | | | | |
| Sold | 4,709 | $54,342 | 14,602 | $163,909 |
| Distributions reinvested | 3,522 | 40,084 | 4,401 | 47,219 |
| Repurchased | (434) | (5,040) | (20,093) | (228,320) |
| Net increase (decrease) | 7,797 | $89,386 | (1,090) | $(17,192) |
| Class R4 shares | | | | |
| Sold | 1,438 | $17,031 | 6,648 | $75,098 |
| Distributions reinvested | 370 | 4,205 | — | — |
| Repurchased | (224) | (2,625) | (385) | (4,461) |
| Net increase | 1,584 | $18,611 | 6,263 | $70,637 |
| Class R6 shares | | | | |
| Sold | 1,099,302 | $12,777,684 | 2,296,812 | $25,897,714 |
| Distributions reinvested | 183,336 | 2,077,199 | 151,818 | 1,621,417 |
| Repurchased | (738,585) | (8,567,238) | (999,623) | (11,312,141) |
| | SEMIANNUAL REPORT | JOHN HANCOCK MULTI-INDEX PRESERVATION PORTFOLIOS | 55 |
| Multi-Index 2020 Preservation Portfolio (continued) | Six Months Ended 2-29-20 | Year Ended 8-31-19 |
| | Shares | Amount | Shares | Amount |
| Net increase | 544,053 | $6,287,645 | 1,449,007 | $16,206,990 |
| Class 1 shares | | | | |
| Sold | 570,500 | $6,624,411 | 1,644,961 | $18,650,648 |
| Distributions reinvested | 2,396,462 | 27,127,950 | 3,920,044 | 41,826,866 |
| Repurchased | (6,815,717) | (79,370,453) | (14,636,881) | (165,890,122) |
| Net decrease | (3,848,755) | $(45,618,092) | (9,071,876) | $(105,412,608) |
| Total net decrease | (3,293,713) | $(39,203,931) | (7,617,100) | $(89,146,185) |
| Multi-Index Income Preservation Portfolio | Six Months Ended 2-29-20 | Year Ended 8-31-19 |
| | Shares | Amount | Shares | Amount |
| Class R1 shares | | | | |
| Sold | 975 | $11,084 | 1,534 | $16,938 |
| Distributions reinvested | 243 | 2,725 | 188 | 2,001 |
| Repurchased | (1,139) | (12,803) | (531) | (5,875) |
| Net increase | 79 | $1,006 | 1,191 | $13,064 |
| Class R2 shares | | | | |
| Sold | 2,471 | $28,028 | 19,188 | $212,194 |
| Distributions reinvested | 1,586 | 17,750 | 1,280 | 13,599 |
| Repurchased | (14,726) | (167,265) | (3,882) | (42,982) |
| Net increase (decrease) | (10,669) | $(121,487) | 16,586 | $182,811 |
| Class R4 shares | | | | |
| Sold | 39,902 | $459,714 | 14,840 | $164,471 |
| Distributions reinvested | 1,946 | 21,742 | 5 | 58 |
| Repurchased | (1,509) | (17,260) | (904) | (10,318) |
| Net increase | 40,339 | $464,196 | 13,941 | $154,211 |
| Class R6 shares | | | | |
| Sold | 600,672 | $6,836,641 | 1,206,912 | $13,229,364 |
| Distributions reinvested | 76,312 | 850,117 | 38,076 | 402,849 |
| Repurchased | (270,978) | (3,072,779) | (441,681) | (4,902,584) |
| Net increase | 406,006 | $4,613,979 | 803,307 | $8,729,629 |
| Class 1 shares | | | | |
| Sold | 651,348 | $7,391,423 | 1,553,675 | $16,989,137 |
| Distributions reinvested | 1,054,440 | 11,757,001 | 1,244,143 | 13,175,471 |
| Repurchased | (4,626,893) | (52,769,590) | (8,620,537) | (95,066,668) |
| Net decrease | (2,921,105) | $(33,621,166) | (5,822,719) | $(64,902,060) |
| Total net decrease | (2,485,350) | $(28,663,472) | (4,987,694) | $(55,822,345) |
Affiliates of the Trust owned shares of the following classes of the portfolios on February 29, 2020. Such concentration of shareholders’ capital could have a material effect on the portfolios if such shareholders redeem from the portfolios.
| Portfolio | Class | % by Class |
| Multi-Index 2060 Preservation Portfolio | R1 | 42% |
| Multi-Index 2060 Preservation Portfolio | R2 | 25% |
| Multi-Index 2060 Preservation Portfolio | R4 | 37% |
| Multi-Index 2060 Preservation Portfolio | 1 | 100% |
| Multi-Index 2055 Preservation Portfolio | R1 | 100% |
| Multi-Index 2055 Preservation Portfolio | R2 | 20% |
| Multi-Index 2055 Preservation Portfolio | R4 | 94% |
| Multi-Index 2055 Preservation Portfolio | 1 | 100% |
| Multi-Index 2050 Preservation Portfolio | 1 | 100% |
| Multi-Index 2045 Preservation Portfolio | R4 | 84% |
| 56 | JOHN HANCOCK MULTI-INDEX PRESERVATION PORTFOLIOS | SEMIANNUAL REPORT | |
| Portfolio | Class | % by Class |
| Multi-Index 2045 Preservation Portfolio | 1 | 100% |
| Multi-Index 2040 Preservation Portfolio | R4 | 22% |
| Multi-Index 2040 Preservation Portfolio | 1 | 100% |
| Multi-Index 2035 Preservation Portfolio | R4 | 61% |
| Multi-Index 2035 Preservation Portfolio | 1 | 100% |
| Multi-Index 2030 Preservation Portfolio | 1 | 100% |
| Multi-Index 2025 Preservation Portfolio | R4 | 56% |
| Multi-Index 2025 Preservation Portfolio | 1 | 100% |
| Multi-Index 2020 Preservation Portfolio | R4 | 34% |
| Multi-Index 2020 Preservation Portfolio | 1 | 100% |
| Multi-Index Income Preservation Portfolio | R1 | 27% |
| Multi-Index Income Preservation Portfolio | R4 | 7% |
| Multi-Index Income Preservation Portfolio | 1 | 100% |
Note 6—Purchase and sale of securities
Purchases and sales of securities, other than short-term investments, amounted to the following for the six months ended February 29, 2020:
| | Purchases | | Sales | |
| Portfolio | U.S. Government | Other issuers | U.S. Government | Other issuers |
| Multi-Index 2060 Preservation Portfolio | $7,729,879 | $34,921,731 | — | $21,615,157 |
| Multi-Index 2055 Preservation Portfolio | 19,694,546 | 55,205,882 | — | 64,838,458 |
| Multi-Index 2050 Preservation Portfolio | 44,214,111 | 118,996,793 | — | 145,530,659 |
| Multi-Index 2045 Preservation Portfolio | 54,282,979 | 141,180,978 | — | 192,672,997 |
| Multi-Index 2040 Preservation Portfolio | 66,278,840 | 182,800,711 | — | 252,746,947 |
| Multi-Index 2035 Preservation Portfolio | 83,078,468 | 250,833,505 | — | 342,637,356 |
| Multi-Index 2030 Preservation Portfolio | 93,906,621 | 385,852,713 | — | 499,180,861 |
| Multi-Index 2025 Preservation Portfolio | 118,376,595 | 275,399,062 | — | 430,400,414 |
| Multi-Index 2020 Preservation Portfolio | 70,655,262 | 169,212,203 | — | 285,738,476 |
| Multi-Index Income Preservation Portfolio | 39,696,211 | 128,526,217 | — | 197,956,775 |
Note 7—Investment in affiliated underlying funds
The portfolios invest primarily in affiliated underlying funds that are managed by the Advisor and its affiliates. The portfolios do not invest in the affiliated underlying funds for the purpose of exercising management or control; however, the portfolios' investment may represent a significant portion of each underlying funds’ net assets. At February 29, 2020, the following portfolios held 5% or more of the net assets of the underlying funds shown below:
| Portfolio | Affiliated Class NAV | Percentage of
underlying fund
net assets |
| Multi-Index 2050 Preservation Portfolio | John Hancock Funds II Strategic Equity Allocation Fund | 6.1% |
| Multi-Index 2045 Preservation Portfolio | John Hancock Funds II Strategic Equity Allocation Fund | 7.4% |
| Multi-Index 2040 Preservation Portfolio | John Hancock Funds II Strategic Equity Allocation Fund | 8.5% |
| Multi-Index 2035 Preservation Portfolio | John Hancock Funds II Strategic Equity Allocation Fund | 9.5% |
| Multi-Index 2030 Preservation Portfolio | John Hancock Funds II Strategic Equity Allocation Fund | 7.8% |
Information regarding the portfolios' fiscal year to date purchases and sales of the affiliated underlying funds as well as income and capital gains earned by the portfolios, if any, is as follows:
| | | | | | | | Dividends and distributions |
| Affiliate | Ending
share
amount | Beginning
value | Cost of
purchases | Proceeds
from shares
sold | Realized
gain
(loss) | Change in
unrealized
appreciation
(depreciation) | Income
distributions
received | Capital gain
distributions
received | Ending
value |
| Multi-Index 2060 Preservation Portfolio |
| John Hancock Collateral Trust* | — | $1,564,153 | $8,495,685 | $(10,059,740) | $(82) | $(16) | $3,805 | — | — |
| Strategic Equity Allocation | 7,017,623 | 65,933,633 | 14,953,476 | (2,074,154) | (357,825) | (1,963,041) | 1,643,536 | $815,320 | $76,492,089 |
| | | | | | $(357,907) | $(1,963,057) | $1,647,341 | $815,320 | $76,492,089 |
| Multi-Index 2055 Preservation Portfolio |
| John Hancock Collateral Trust* | — | $4,876,405 | $55,865,725 | $(60,741,859) | $(276) | $5 | $19,942 | — | — |
| | SEMIANNUAL REPORT | JOHN HANCOCK MULTI-INDEX PRESERVATION PORTFOLIOS | 57 |
| | | | | | | | Dividends and distributions |
| Affiliate | Ending
share
amount | Beginning
value | Cost of
purchases | Proceeds
from shares
sold | Realized
gain
(loss) | Change in
unrealized
appreciation
(depreciation) | Income
distributions
received | Capital gain
distributions
received | Ending
value |
| Strategic Equity Allocation | 17,100,897 | $188,685,869 | $11,954,086 | $(10,359,140) | $(1,272,046) | $(2,608,996) | $4,319,952 | $2,143,028 | $186,399,773 |
| | | | | | $(1,272,322) | $(2,608,991) | $4,339,894 | $2,143,028 | $186,399,773 |
| Multi-Index 2050 Preservation Portfolio |
| John Hancock Collateral Trust* | — | $10,168,844 | $33,321,262 | $(43,490,845) | $2,772 | $(2,033) | $33,137 | — | — |
| Strategic Equity Allocation | 38,376,788 | 427,067,495 | 25,398,162 | (25,456,332) | (2,225,557) | (6,476,774) | 9,622,532 | $4,773,515 | $418,306,994 |
| | | | | | $(2,222,785) | $(6,478,807) | $9,655,669 | $4,773,515 | $418,306,994 |
| Multi-Index 2045 Preservation Portfolio |
| John Hancock Collateral Trust* | 574,759 | $14,028,524 | $43,542,360 | $(51,818,188) | $(952) | $964 | $45,328 | — | $5,752,708 |
| Strategic Equity Allocation | 46,358,012 | 527,386,367 | 25,758,420 | (37,872,904) | (3,239,234) | (6,730,322) | 11,681,136 | $5,794,740 | 505,302,327 |
| | | | | | $(3,240,186) | $(6,729,358) | $11,726,464 | $5,794,740 | $511,055,035 |
| Multi-Index 2040 Preservation Portfolio |
| John Hancock Collateral Trust* | 73,876 | $29,898,994 | $146,990,217 | $(176,151,266) | $3,859 | $(2,382) | $81,194 | — | $739,422 |
| Strategic Equity Allocation | 53,301,705 | 610,750,351 | 30,416,921 | (49,164,196) | (3,964,775) | (7,049,714) | 13,452,248 | $6,673,348 | 580,988,587 |
| | | | | | $(3,960,916) | $(7,052,096) | $13,533,442 | $6,673,348 | $581,728,009 |
| Multi-Index 2035 Preservation Portfolio |
| John Hancock Collateral Trust* | 803,044 | $42,789,437 | $181,816,282 | $(216,572,866) | $7,978 | $(3,244) | $98,268 | — | $8,037,587 |
| Strategic Equity Allocation | 59,343,790 | 688,995,663 | 36,698,530 | (67,370,869) | (3,023,448) | (8,452,566) | 15,108,780 | $7,495,115 | 646,847,310 |
| | | | | | $(3,015,470) | $(8,455,810) | $15,207,048 | $7,495,115 | $654,884,897 |
| Multi-Index 2030 Preservation Portfolio |
| John Hancock Collateral Trust* | 1,068,782 | $52,492,246 | $409,301,028 | $(451,094,049) | $1,352 | $(3,248) | $120,519 | — | $10,697,329 |
| Strategic Equity Allocation | 49,031,904 | 605,980,861 | 34,323,244 | (99,548,992) | 2,684,199 | (8,991,554) | 12,966,560 | $6,432,409 | 534,447,758 |
| | | | | | $2,685,551 | $(8,994,802) | $13,087,079 | $6,432,409 | $545,145,087 |
| Multi-Index 2025 Preservation Portfolio |
| John Hancock Collateral Trust* | — | $22,884,044 | $315,357,980 | $(338,233,890) | $(5,271) | $(2,863) | $101,452 | — | — |
| Strategic Equity Allocation | 27,610,783 | 347,769,533 | 24,911,811 | (68,757,761) | 7,546,149 | (10,512,192) | 7,237,151 | $3,590,182 | $300,957,540 |
| | | | | | $7,540,878 | $(10,515,055) | $7,338,603 | $3,590,182 | $300,957,540 |
| Multi-Index 2020 Preservation Portfolio |
| John Hancock Collateral Trust* | 3,262,395 | $11,481,974 | $343,395,927 | $(322,227,097) | $368 | $1,814 | $54,781 | — | $32,652,986 |
| Strategic Equity Allocation | 2,955,684 | 68,771,980 | 7,142,893 | (46,099,902) | 6,956,180 | (4,554,191) | 1,348,449 | $668,934 | 32,216,960 |
| | | | | | $6,956,548 | $(4,552,377) | $1,403,230 | $668,934 | $64,869,946 |
| Multi-Index Income Preservation Portfolio |
| John Hancock Collateral Trust* | 2,391,880 | $5,305,173 | $137,330,570 | $(118,698,963) | $2,011 | $1,300 | $25,777 | — | $23,940,091 |
| 58 | JOHN HANCOCK MULTI-INDEX PRESERVATION PORTFOLIOS | SEMIANNUAL REPORT | |
| | | | | | | | Dividends and distributions |
| Affiliate | Ending
share
amount | Beginning
value | Cost of
purchases | Proceeds
from shares
sold | Realized
gain
(loss) | Change in
unrealized
appreciation
(depreciation) | Income
distributions
received | Capital gain
distributions
received | Ending
value |
| Strategic Equity Allocation | 1,644,214 | $16,598,596 | $6,323,068 | $(4,488,802) | $401,648 | $(912,573) | $324,008 | $160,733 | $17,921,937 |
| | | | | | $403,659 | $(911,273) | $349,785 | $160,733 | $41,862,028 |
| * | Refer to the Securities lending note within Note 2 for details regarding this investment. |
Note 8—Subsequent events
A widespread health crisis such as a global pandemic could cause substantial market volatility, exchange trading suspensions and closures, impact the ability to complete redemptions, and affect fund performance. For example, the novel coronavirus disease (COVID-19) has resulted in significant disruptions to global business activity. The impact of a health crisis and other epidemics and pandemics that may arise in the future, could affect the global economy in ways that cannot necessarily be foreseen at the present time. A health crisis may exacerbate other pre-existing political, social and economic risks. Any such impact could adversely affect the funds' performance, resulting in losses to your investment.
| | SEMIANNUAL REPORT | JOHN HANCOCK MULTI-INDEX PRESERVATION PORTFOLIOS | 59 |
| | |
Trustees
Hassell H. McClellan,Chairperson
Steven R. Pruchansky,Vice Chairperson
Andrew G. Arnott†
Charles L. Bardelis*
James R. Boyle
Peter S. Burgess*
William H. Cunningham
Grace K. Fey
Marianne Harrison†
Deborah C. Jackson
James M. Oates*
Gregory A. Russo
Officers
Andrew G. Arnott
President
Francis V. Knox, Jr.
Chief Compliance Officer
Charles A. Rizzo
Chief Financial Officer
Salvatore Schiavone
Treasurer
Christopher (Kit) Sechler
Secretary and Chief Legal Officer
| Investment advisor
John Hancock Investment Management LLC
Subadvisor
Manulife Investment Management (US) LLC
Portfolio Managers
Robert E. Sykes, CFA
Nathan W. Thooft, CFA
Principal distributor
John Hancock Investment Management Distributors LLC
Custodian
State Street Bank and Trust Company
Transfer agent
John Hancock Signature Services, Inc.
Legal counsel
K&L Gates LLP
|
* Member of the Audit Committee
† Non-Independent Trustee
The portfolios' proxy voting policies and procedures, as well as the portfolio proxy voting record for the most recent twelve-month period ended June 30, are available free of charge on the Securities and Exchange Commission (SEC) website at sec.gov or on our website.
All of the portfolios' holdings as of the end of the third month of every fiscal quarter are filed with the SEC on Form N-PORT within 60 days of the end of the fiscal quarter. The portfolios' Form N-PORT filings are available on our website and the SEC's website, sec.gov.
We make this information on your portfolio, as well asmonthly portfolio holdings, and other portfolio details available on our website at jhinvestments.com or by calling 800-225-5291.
| | | | |
| | You can also contact us: |
| | 800-225-5291
jhinvestments.com | Regular mail:
John Hancock Signature Services, Inc.
P.O. Box 55913
Boston, MA 02205-5913
| Express mail:
John Hancock Signature Services, Inc.
2000 Crown Colony Drive
Suite 55913
Quincy, MA 02169-0953
|
SEMIANNUAL REPORT | JOHN HANCOCK MULTI-INDEX PRESERVATION PORTFOLIOS 60
John Hancock family of funds
| | | |
DOMESTIC EQUITY FUNDS
Blue Chip Growth
Classic Value
Disciplined Value
Disciplined Value Mid Cap
Equity Income
Financial Industries
Fundamental All Cap Core
Fundamental Large Cap Core
New Opportunities
Regional Bank
Small Cap Core
Small Cap Growth
Small Cap Value
U.S. Global Leaders Growth
U.S. Quality Growth
GLOBAL AND INTERNATIONAL EQUITY FUNDS
Disciplined Value International
Emerging Markets
Emerging Markets Equity
Fundamental Global Franchise
Global Equity
Global Shareholder Yield
Global Thematic Opportunities
International Dynamic Growth
International Growth
International Small Company
| | INCOME FUNDS
Bond
California Tax-Free Income
Emerging Markets Debt
Floating Rate Income
Government Income
High Yield
High Yield Municipal Bond
Income
Investment Grade Bond
Money Market
Short Duration Bond
Short Duration Credit Opportunities
Strategic Income Opportunities
Tax-Free Bond
ALTERNATIVE AND SPECIALTY FUNDS
Absolute Return Currency
Alternative Asset Allocation
Alternative Risk Premia
Diversified Macro
Infrastructure
Multi-Asset Absolute Return
Seaport Long/Short
|
A fund's investment objectives, risks, charges, and expenses should be considered carefully before investing. The prospectus contains this and other important information about the fund. To obtain a prospectus, contact your financial professional, call John Hancock Investment Management at 800-225-5291, or visit our website at jhinvestments.com. Please read the prospectus carefully before investing or sending money.
| | | |
ASSET ALLOCATION
Balanced
Income Allocation
Multi-Index Lifetime Portfolios
Multi-Index Preservation Portfolios
Multimanager Lifestyle Portfolios
Multimanager Lifetime Portfolios
Retirement Income 2040
EXCHANGE-TRADED FUNDS
John Hancock Multifactor Consumer Discretionary ETF
John Hancock Multifactor Consumer Staples ETF
John Hancock Multifactor Developed International ETF
John Hancock Multifactor Emerging Markets ETF
John Hancock Multifactor Energy ETF
John Hancock Multifactor Financials ETF
John Hancock Multifactor Healthcare ETF
John Hancock Multifactor Industrials ETF
John Hancock Multifactor Large Cap ETF
John Hancock Multifactor Materials ETF
John Hancock Multifactor Media and
Communications ETF
John Hancock Multifactor Mid Cap ETF
John Hancock Multifactor Small Cap ETF
John Hancock Multifactor Technology ETF
John Hancock Multifactor Utilities ETF
| | ENVIRONMENTAL, SOCIAL, AND
GOVERNANCE FUNDS
ESG All Cap Core
ESG Core Bond
ESG International Equity
ESG Large Cap Core
CLOSED-END FUNDS
Financial Opportunities
Hedged Equity & Income
Income Securities Trust
Investors Trust
Preferred Income
Preferred Income II
Preferred Income III
Premium Dividend
Tax-Advantaged Dividend Income
Tax-Advantaged Global Shareholder Yield
|
John Hancock Multifactor ETF shares are bought and sold at market price (not NAV), and are not individually redeemed from the fund. Brokerage commissions will reduce returns.
John Hancock ETFs are distributed by Foreside Fund Services, LLC, and are subadvised by Dimensional Fund Advisors LP. Foreside is not affiliated with John Hancock Investment Management Distributors LLC or Dimensional Fund Advisors LP.
Dimensional Fund Advisors LP receives compensation from John Hancock in connection with licensing rights to the John Hancock Dimensional indexes. Dimensional Fund Advisors LP does not sponsor, endorse, or sell, and makes no representation as to the advisability of investing in, John Hancock Multifactor ETFs.
John Hancock Investment Management
A trusted brand
John Hancock Investment Management is a premier asset manager representing one of America's most
trusted brands, with a heritage of financial stewardship dating back to 1862. Helping our shareholders
pursue their financial goals is at the core of everything we do. It's why we support the role of professional
financial advice and operate with the highest standards of conduct and integrity.
A better way to invest
We serve investors globally through a unique multimanager approach: We search the world to find
proven portfolio teams with specialized expertise for every strategy we offer, then we apply robust
investment oversight to ensure they continue to meet our uncompromising standards and serve the
best interests of our shareholders.
Results for investors
Our unique approach to asset management enables us to provide a diverse set of investments backed
by some of the world's best managers, along with strong risk-adjusted returns across asset classes.
John Hancock Investment Management Distributors LLC n Member FINRA, SIPC
200 Berkeley Street n Boston, MA 02116-5010 n 800-225-5291 n jhinvestments.com
This report is for the information of the shareholders of John Hancock Multi-Index Preservation Portfolios. It is not authorized for distribution to prospective investors unless preceded or accompanied by a prospectus.
John Hancock
Multimanager Lifetime Portfolios
Semiannual report 2/29/2020
Beginning on January 1, 2021, as permitted by regulations adopted by the Securities and Exchange Commission, paper copies of the fund's shareholder reports like this one will no longer be sent by mail, unless you specifically request paper copies of the reports from the fund or from your financial intermediary. Instead, the reports will be made available on a website, and you will be notified by mail each time a report is posted and provided with a website link to access the report.
If you already elected to receive shareholder reports electronically, you will not be affected by this change, and you do not need to take any action. You may elect to receive shareholder reports and other communications electronically by calling John Hancock Investment Management at 800-225-5291 (Class A shares) or 888-972-8696 (Class I, Class R1, Class R2, Class R3, Class R4, Class R5, and Class R6 shares) or by contacting your financial intermediary.
You may elect to receive all reports in paper, free of charge, at any time. You can inform John Hancock Investment Management or your financial intermediary that you wish to continue receiving paper copies of your shareholder reports by following the instructions listed above. Your election to receive reports in paper will apply to all funds held with John Hancock Investment Management or your financial intermediary.
A message to shareholders
Dear shareholder,
Global financial markets were on pace to deliver strong returns during the 6 months ended February 29, 2020, until heightened fears over the coronavirus (COVID-19) sent the markets skidding during the last week of the period. Prior to the turbulence, investors benefited from a combination of low inflation, accommodative central bank policy, healthy fundamentals, and corporate buybacks of stock. Investors in non-U.S. equities also saw strong gains, fueled in part by similarly supportive monetary policy and some signs of strength in developing markets. In an environment of low inflation and declining interest rates, bonds were also faring well.
However, the COVID-19 pandemic and plummeting oil prices put an end to all that good news. Shortly after period end, the U.S. Federal Reserve lowered interest rates and lawmakers embarked on a plan to launch major fiscal stimulus to support the economy.
After the longest bull market in U.S. history, we're now in bear market territory. Indeed, the spread of COVID-19, trade disputes, rising unemployment, and other geopolitical tensions may continue to create uncertainty among businesses and investors. Your financial professional can helpposition your portfolio so that it's sufficiently diversified to seek to meet your long-term objectives and to withstand the inevitable bouts of market volatility along the way.
On behalf of everyone at John Hancock Investment Management, I'd like to take this opportunity to welcome new shareholders and thank existing shareholders for the continued trust you've placed in us.
Sincerely,
Andrew G. Arnott
President and CEO,
John Hancock Investment Management
Head of Wealth and Asset Management,
United States and Europe
This commentary reflects the CEO's views as of this report's period end and are subject to change at any time. Diversification does not guarantee investment returns and does not eliminate risk of loss. All investments entail risks, including the possible loss of principal. For more up-to-date information, you can visit our website at jhinvestments.com.
.
John Hancock
Multimanager Lifetime Portfolios
Table of contents
| | | |
| 2 | | Multimanager Lifetime Portfolios' strategy at a glance |
| 3 | | Portfolio summary |
| 4 | | Multimanager 2060 Lifetime Portfolio |
| 5 | | Multimanager 2055 Lifetime Portfolio |
| 6 | | Multimanager 2050 Lifetime Portfolio |
| 7 | | Multimanager 2045 Lifetime Portfolio |
| 8 | | Multimanager 2040 Lifetime Portfolio |
| 9 | | Multimanager 2035 Lifetime Portfolio |
| 10 | | Multimanager 2030 Lifetime Portfolio |
| 11 | | Multimanager 2025 Lifetime Portfolio |
| 12 | | Multimanager 2020 Lifetime Portfolio |
| 13 | | Multimanager 2015 Lifetime Portfolio |
| 14 | | Multimanager 2010 Lifetime Portfolio |
| 15 | | Your expenses |
| 21 | | Portfolios' investments |
| 32 | | Financial statements |
| 45 | | Financial highlights |
| 67 | | Notes to financial statements |
| 105 | | More information |
SEMIANNUAL REPORT | JOHN HANCOCK MULTIMANAGER LIFETIME PORTFOLIOS 1
Multimanager Lifetime Portfolios' strategy at a glance
A SIMPLE, STRATEGIC PATH TO HELP YOU REACH YOUR RETIREMENT GOALS
Multimanager Lifetime Portfolios make diversification easy because the asset mix of each portfolio automatically changes over time.
| • | Portfolios with dates further off initially invest more aggressively in stock funds. |
| • | As a portfolio approaches its target date,1 the allocation will gradually migrate to more conservative fixed-income funds. |
| • | Once the target date is reached, the allocation will continue to become increasingly conservative until it reaches the end of its glide path, investing primarily in fixed-income funds. |
JOHN HANCOCK MULTIMANAGER LIFETIME PORTFOLIOS—AUTOMATICALLY ADJUST OVER TIME2
The chart below illustrates how the asset allocation mix of John Hancock Multimanager Lifetime Portfolios adjusts over time.
The principal value of each portfolio is not guaranteed and you could lose money at any time, including at or after the target date.
1 Based on an estimated retirement date.
2 Allocations may vary as a result of market activity or cash allocations held during unusual market or economic conditions.
SEMIANNUAL REPORT | JOHN HANCOCK MULTIMANAGER LIFETIME PORTFOLIOS 2
MULTIMANAGER 2060-2010 LIFETIME PORTFOLIOS' CLASS A SHARE RETURNS (%)
For the six months ended 2/29/2020
MARKET INDEX TOTAL RETURNS
For the six month period ended 2/29/20
| | | |
| U.S. Stocks | S&P 500 Index | 1.92% |
| Russell Midcap Index | -1.11% |
| Russell 2000 Index | -0.52% |
| FTSE NAREIT All Equity REIT Index | -3.95% |
| International Stocks | MSCI EAFE Index | -0.91% |
| MSCI Emerging Markets Index | 2.93% |
| MSCI EAFE Small Cap Index | 0.42% |
| Fixed Income | Bloomberg Barclays U.S. Aggregate Bond Index | 3.39% |
| ICE Bank of America U.S. High Yield Master II Index | 1.31% |
| JP Morgan Global Government Bonds Unhedged Index | 1.11% |
SEMIANNUAL REPORT | JOHN HANCOCK MULTIMANAGER LIFETIME PORTFOLIOS 3
Multimanager 2060 Lifetime Portfolio
GROWTH OF $10,000
This chart shows what happened to a hypothetical $10,000 investment in John Hancock Multimanager 2060 Lifetime Portfolio for the share classes and periods indicated, assuming all distributions were reinvested. For comparison, we've shown the same investment in two blended indexes and three separate indexes.
Index 1is the S&P Target Date 2060+ Index, an unmanaged index comprised of a set of indices aligned with specific target date years.
Index 2 is the Bloomberg Barclays U.S. Aggregate Bond Index, an unmanaged index of dollar-denominated and nonconvertible investment-grade debt issues.
Index 3 is the John Hancock 2060 Lifetime Index, which is based on the fund's asset allocation glide path and will reflect a more conservative allocation over time. The index is a customized blended index comprising some or all of the following component indices (ordered alphabetically): Bloomberg Barclays U.S. Aggregate Bond Index, Bloomberg Barclays U.S. Corporate Bond 1-5 Year Index, Bloomberg Barclays U.S. Treasury TIPS 1-5 Year Index, ICE BofA Long U.S. Treasury Principal STRIPS Index, ICE BofA U.S. High Yield Index, JP Morgan Emerging Markets Bond Index Global, MSCI Emerging Markets Index, MSCI World Energy Index, MSCI World ex-USA Index, MSCI World Metals & Mining Index, Russell 2500 Index, S&P 500 Index, S&P Global ex-U.S. REIT Index, S&P Global Infrastructure Index, S&P U.S. REIT Index, and S&P/LSTA Leveraged Loan Index.
Index 4 is the S&P 500 Index, an unmanaged index that includes 500 widely traded common stocks.
Index 5 is 66.50% Russell 3000 Index, 28.50% MSCI ACWI ex-USA Index, 4.00% Bloomberg Barclays U.S. Aggregate Bond Index, and 1.00% ICE BofA U.S. High Yield Master II Index.
Prior to January 1, 2020, the fund's primary benchmark was the S&P 500 Index. Effective January 1, 2020, the fund's primary benchmark index is the S&P Target Date 2060+ Index. The S&P Target Date 2060+ Index better reflects the universe of investment opportunities based on the fund's current investment strategy.
It is not possible to invest directly in an index. Index figures do not reflect expenses or sales charges, which would result in lower returns.
ASSET ALLOCATION (%)
| | | |
| Affiliated investment companies | % of Total |
| Equity | 87.0 |
| | Large Blend | 32.5 |
| | U.S. Large Cap | 26.4 |
| | International Equity | 9.4 |
| | U.S. Mid Cap | 8.9 |
| | Emerging-Market Equity | 6.6 |
| | U.S. Small Cap | 1.9 |
| | Sector Equity | 1.3 |
| Fixed income | 2.6 |
| | Intermediate Bond | 0.8 |
| | Multi-Sector Bond | 0.6 |
| | Emerging-Market Debt | 0.6 |
| | High Yield Bond | 0.6 |
| Alternative and specialty | 3.7 |
| | Sector Equity | 2.4 |
| | Absolute Return | 1.3 |
| Unaffiliated investment companies | 4.0 |
| | Equity | 4.0 |
| U.S. Government | 2.5 |
| Short-term investments and other | 0.2 |
As a percentage of net assets.
PERFORMANCE CHART
Total returns with maximum sales charge for the period ended 2-29-20 (%)
| | | | | | | | | | | | | | | |
| | Class A | Class I1 | Class R11 | Class R21 | Class R31 | Class R41 | Class R51 | Class R61 | Class 11 | Index 1 | Index 2 | Index 3 | Index 4 | Index 5 |
| Inception | 3-30-16 | 3-30-16 | 3-30-16 | 3-30-16 | 3-30-16 | 3-30-16 | 3-30-16 | 3-30-16 | 3-30-16 | 3-30-16 | 3-30-16 | 3-30-16 | 3-30-16 | 3-30-16 |
| Average annual total returns | | |
| 1-year | -1.92 | 3.51 | 3.03 | 3.25 | 2.94 | 3.46 | 3.56 | 3.62 | 3.57 | 3.25 | 11.68 | 6.51 | 8.19 | 4.95 |
| Since inception | 6.79 | 8.55 | 8.10 | 8.31 | 8.08 | 8.47 | 8.61 | 8.66 | 8.59 | 8.59 | 4.00 | 10.39 | 11.94 | 9.89 |
| Cumulative returns | | |
| 6-months | -3.80 | 1.51 | 1.21 | 1.34 | 1.20 | 1.38 | 1.56 | 1.53 | 1.48 | 0.58 | 3.39 | 2.51 | 1.92 | 1.44 |
| Since inception | 29.36 | 37.94 | 35.71 | 36.74 | 35.59 | 37.53 | 38.26 | 38.51 | 38.13 | 38.12 | 16.61 | 47.36 | 55.59 | 44.72 |
Performance figures assume all distributions have been reinvested. Figures reflect maximum sales charge on Class A shares of 5%. Sales charges are not applicable to Class I, Class R1, Class R2, Class R3, Class R4, Class R5, Class R6, and Class 1 shares.
The expense ratios of the portfolio, both net (including any fee waivers and/or expense limitations) and gross (excluding any fee waivers and/or expense limitations), are set forth according to the most recent publicly available prospectuses for the portfolio and may differ from those disclosed in the Financial highlights tables in this report. Net expenses reflect contractual expense limitations in effect until December 31, 2020 and are subject to change. Had the contractual fee waivers and expense limitations not been in place, gross expenses would apply. The following expense ratios include the expenses of the underlying funds in which the portfolio invests. The expense ratios are as follows:
| | | | | | | | | | |
| | Class A | Class I | Class R1 | Class R2 | Class R3 | Class R4 | Class R5 | Class R6 | Class 1 |
| Gross (%) | 1.63 | 1.33 | 1.97 | 1.72 | 1.87 | 1.57 | 1.27 | 1.22 | 1.26 |
| Net (%) | 1.00 | 0.70 | 1.34 | 1.09 | 1.24 | 0.84 | 0.64 | 0.58 | 0.63 |
Please refer to the most recent prospectus and annual or semiannual report for more information on expenses and any expense limitation arrangements for each class.
The returns reflect past results and should not be considered indicative of future performance. The return and principal value of an investment will fluctuate so that shares, when redeemed, may be worth more or less than their original cost. Due to market volatility and other factors, the portfolio's current performance may be higher or lower than the performance shown. For current to the most recent month-end performance data, please call 800-225-5291 or visit the portfolio's website at jhinvestments.com.
The performance information does not reflect the deduction of taxes that a shareholder would pay on portfolio distributions or the redemption of portfolio shares. The portfolio's performance results reflect any applicable fee waivers or expense reductions, without which the expenses would increase and results would have been less favorable.
| 1 | For certain types of investors, as described in the portfolio's prospectuses. |
SEMIANNUAL REPORT | JOHN HANCOCK MULTIMANAGER LIFETIME PORTFOLIOS 4
Multimanager 2055 Lifetime Portfolio
GROWTH OF $10,000
This chart shows what happened to a hypothetical $10,000 investment in John Hancock Multimanager 2055 Lifetime Portfolio for the share classes and periods indicated, assuming all distributions were reinvested. For comparison, we've shown the same investment in two blended indexes and three separate indexes.
Index 1is the S&P Target Date 2055 Index, an unmanaged index comprised of a set of indices aligned with specific target date years.
Index 2 is the Bloomberg Barclays U.S. Aggregate Bond Index, an unmanaged index of dollar-denominated and nonconvertible investment-grade debt issues.
Index 3 is the John Hancock 2055 Lifetime Index, which is based on the fund's asset allocation glide path and will reflect a more conservative allocation over time. The index is a customized blended index comprising some or all of the following component indices (ordered alphabetically): Bloomberg Barclays U.S. Aggregate Bond Index, Bloomberg Barclays U.S. Corporate Bond 1-5 Year Index, Bloomberg Barclays U.S. Treasury TIPS 1-5 Year Index, ICE BofA Long U.S. Treasury Principal STRIPS Index, ICE BofA U.S. High Yield Index, JP Morgan Emerging Markets Bond Index Global, MSCI Emerging Markets Index, MSCI World Energy Index, MSCI World ex-USA Index, MSCI World Metals & Mining Index, Russell 2500 Index, S&P 500 Index, S&P Global ex-U.S. REIT Index, S&P Global Infrastructure Index, S&P U.S. REIT Index, and S&P/LSTA Leveraged Loan Index.
Index 4 is the S&P 500 Index, an unmanaged index that includes 500 widely traded common stocks.
Index 5 is 66.50% Russell 3000 Index, 28.50% MSCI ACWI ex-USA Index, 4.00% Bloomberg Barclays U.S. Aggregate Bond Index, and 1.00% ICE BofA U.S. High Yield Master II Index.
Prior to January 1, 2020, the fund's primary benchmark was the S&P 500 Index. Effective January 1, 2020, the fund's primary benchmark index is the S&P Target Date 2055 Index. The S&P Target Date 2055 Index better reflects the universe of investment opportunities based on the fund's current investment strategy.
It is not possible to invest directly in an index. Index figures do not reflect expenses or sales charges, which would result in lower returns.
ASSET ALLOCATION (%)
| | | |
| Affiliated investment companies | % of Total |
| Equity | 87.0 |
| | Large Blend | 32.6 |
| | U.S. Large Cap | 26.5 |
| | International Equity | 9.3 |
| | U.S. Mid Cap | 8.9 |
| | Emerging-Market Equity | 6.5 |
| | U.S. Small Cap | 1.9 |
| | Sector Equity | 1.3 |
| Fixed income | 2.5 |
| | Intermediate Bond | 0.8 |
| | Multi-Sector Bond | 0.6 |
| | Emerging-Market Debt | 0.6 |
| | High Yield Bond | 0.5 |
| Alternative and specialty | 3.7 |
| | Sector Equity | 2.4 |
| | Absolute Return | 1.3 |
| Unaffiliated investment companies | 4.0 |
| | Equity | 4.0 |
| U.S. Government | 2.6 |
| Short-term investments and other | 0.2 |
As a percentage of net assets.
PERFORMANCE CHART
Total returns with maximum sales charge for the period ended 2-29-20 (%)
| | | | | | | | | | | | | | | |
| | Class A | Class I1,2 | Class R12 | Class R22 | Class R32 | Class R42 | Class R52 | Class R62 | Class 12 | Index 1 | Index 2 | Index 3 | Index 4 | Index 5 |
| Inception | 3-26-14 | 3-26-14 | 3-26-14 | 3-26-14 | 3-26-14 | 3-26-14 | 3-26-14 | 3-26-14 | 3-26-14 | 3-26-14 | 3-26-14 | 3-26-14 | 3-26-14 | 3-26-14 |
| Average annual total returns | | |
| 1-year | -1.91 | 3.56 | 3.08 | 3.08 | 2.94 | 3.51 | 3.60 | 3.66 | 3.61 | 3.17 | 11.68 | 6.51 | 8.19 | 4.95 |
| 5-year | 4.25 | 5.67 | 5.24 | 5.35 | 5.16 | 5.60 | 5.73 | 5.78 | 5.73 | 5.86 | 3.58 | 7.03 | 9.23 | 6.67 |
| Since inception | 4.98 | 6.14 | 5.78 | 5.93 | 5.72 | 6.17 | 6.31 | 6.36 | 6.31 | 6.43 | 3.92 | 7.88 | 10.29 | 7.37 |
| Cumulative returns | | |
| 6-months | -3.72 | 1.46 | 1.27 | 1.18 | 1.13 | 1.41 | 1.51 | 1.47 | 1.51 | 0.54 | 3.39 | 2.51 | 1.92 | 1.44 |
| 5-year | 23.13 | 31.72 | 29.09 | 29.79 | 28.59 | 31.34 | 32.14 | 32.45 | 32.12 | 32.93 | 19.21 | 40.45 | 55.49 | 38.11 |
| Since inception | 33.45 | 42.41 | 39.57 | 40.71 | 39.13 | 42.66 | 43.75 | 44.14 | 43.73 | 44.72 | 25.62 | 56.85 | 78.79 | 52.43 |
Performance figures assume all distributions have been reinvested. Figures reflect maximum sales charge on Class A shares of 5%. Sales charges are not applicable to Class I, Class R1, Class R2, Class R3, Class R4, Class R5, Class R6, and Class 1 shares.
The expense ratios of the portfolio, both net (including any fee waivers and/or expense limitations) and gross (excluding any fee waivers and/or expense limitations), are set forth according to the most recent publicly available prospectuses for the portfolio and may differ from those disclosed in the Financial highlights tables in this report. Net expenses reflect contractual expense limitations in effect until December 31, 2020 and are subject to change. Had the contractual fee waivers and expense limitations not been in place, gross expenses would apply. The following expense ratios include the expenses of the underlying funds in which the portfolio invests. The expense ratios are as follows:
| | | | | | | | | | |
| | Class A | Class I | Class R1 | Class R2 | Class R3 | Class R4 | Class R5 | Class R6 | Class 1 |
| Gross (%) | 1.42 | 1.12 | 1.76 | 1.51 | 1.66 | 1.36 | 1.06 | 1.01 | 1.05 |
| Net (%) | 1.01 | 0.71 | 1.35 | 1.10 | 1.25 | 0.85 | 0.65 | 0.59 | 0.64 |
Please refer to the most recent prospectus and annual or semiannual report for more information on expenses and any expense limitation arrangements for each class.
The returns reflect past results and should not be considered indicative of future performance. The return and principal value of an investment will fluctuate so that shares, when redeemed, may be worth more or less than their original cost. Due to market volatility and other factors, the portfolio's current performance may be higher or lower than the performance shown. For current to the most recent month-end performance data, please call 800-225-5291 or visit the portfolio's website at jhinvestments.com.
The performance information does not reflect the deduction of taxes that a shareholder would pay on portfolio distributions or the redemption of portfolio shares. The portfolio's performance results reflect any applicable fee waivers or expense reductions, without which the expenses would increase and results would have been less favorable.
| 1 | Class I shares were first offered on 3-27-15. Returns prior to this date are those of Class R1 shares that have not been adjusted for class-specific expenses; otherwise, returns would vary. |
| 2 | For certain types of investors, as described in the portfolio's prospectuses. |
SEMIANNUAL REPORT | JOHN HANCOCK MULTIMANAGER LIFETIME PORTFOLIOS 5
Multimanager 2050 Lifetime Portfolio
GROWTH OF $10,000
This chart shows what happened to a hypothetical $10,000 investment in John Hancock Multimanager 2050 Lifetime Portfolio for the share classes and periods indicated, assuming all distributions were reinvested. For comparison, we've shown the same investment in two blended indexes and three separate indexes.
Index 1is the S&P Target Date 2050 Index, an unmanaged index comprised of a set of indices aligned with specific target date years.
Index 2 is the Bloomberg Barclays U.S. Aggregate Bond Index, an unmanaged index of dollar-denominated and nonconvertible investment-grade debt issues.
Index 3 is the John Hancock 2050 Lifetime Index, which is based on the fund's asset allocation glide path and will reflect a more conservative allocation over time. The index is a customized blended index comprising some or all of the following component indices (ordered alphabetically): Bloomberg Barclays U.S. Aggregate Bond Index, Bloomberg Barclays U.S. Corporate Bond 1-5 Year Index, Bloomberg Barclays U.S. Treasury TIPS 1-5 Year Index, ICE BofA Long U.S. Treasury Principal STRIPS Index, ICE BofA U.S. High Yield Index, JP Morgan Emerging Markets Bond Index Global, MSCI Emerging Markets Index, MSCI World Energy Index, MSCI World ex-USA Index, MSCI World Metals & Mining Index, Russell 2500 Index, S&P 500 Index, S&P Global ex-U.S. REIT Index, S&P Global Infrastructure Index, S&P U.S. REIT Index, and S&P/LSTA Leveraged Loan Index.
Index 4 is the S&P 500 Index, an unmanaged index that includes 500 widely traded common stocks.
Index 5 is 66.50% Russell 3000 Index, 28.50% MSCI ACWI ex-USA Index, 4.00% Bloomberg Barclays U.S. Aggregate Bond Index, and 1.00% ICE BofA U.S. High Yield Master II Index.
Prior to January 1, 2020, the fund's primary benchmark was the S&P 500 Index. Effective January 1, 2020, the fund's primary benchmark index is the S&P Target Date 2050 Index. The S&P Target Date 2050 Index better reflects the universe of investment opportunities based on the fund's current investment strategy.
It is not possible to invest directly in an index. Index figures do not reflect expenses or sales charges, which would result in lower returns.
ASSET ALLOCATION (%)
| | | |
| Affiliated investment companies | % of Total |
| Equity | 87.1 |
| | Large Blend | 32.6 |
| | U.S. Large Cap | 26.4 |
| | International Equity | 9.3 |
| | U.S. Mid Cap | 9.0 |
| | Emerging-Market Equity | 6.6 |
| | U.S. Small Cap | 1.9 |
| | Sector Equity | 1.3 |
| Fixed income | 2.4 |
| | Intermediate Bond | 0.8 |
| | Multi-Sector Bond | 0.6 |
| | Emerging-Market Debt | 0.5 |
| | High Yield Bond | 0.5 |
| Alternative and specialty | 3.8 |
| | Sector Equity | 2.5 |
| | Absolute Return | 1.3 |
| Unaffiliated investment companies | 4.0 |
| | Equity | 4.0 |
| U.S. Government | 2.6 |
| Short-term investments and other | 0.1 |
As a percentage of net assets.
PERFORMANCE CHART
Total returns with maximum sales charge for the period ended 2-29-20 (%)
| | | | | | | | | | | | | | | |
| | Class A1 | Class I1,2 | Class R11,2 | Class R21,2 | Class R31,2 | Class R41,2 | Class R51,2 | Class R61,2 | Class 12 | Index 1 | Index 2 | Index 3 | Index 4 | Index 5 |
| Inception | 4-29-11 | 4-29-11 | 4-29-11 | 4-29-11 | 4-29-11 | 4-29-11 | 4-29-11 | 4-29-11 | 4-29-11 | 4-29-11 | 4-29-11 | 4-29-11 | 4-29-11 | 4-29-11 |
| Average annual total returns | | |
| 1-year | -2.02 | 3.41 | 2.82 | 3.16 | 2.92 | 3.28 | 3.58 | 3.63 | 3.59 | 3.24 | 11.68 | 6.51 | 8.19 | 4.95 |
| 5-year | 4.24 | 5.65 | 5.00 | 5.25 | 5.11 | 5.51 | 5.73 | 5.77 | 5.73 | 5.81 | 3.58 | 7.03 | 9.23 | 6.67 |
| Since inception | 5.99 | 6.96 | 6.34 | 6.58 | 6.45 | 6.81 | 7.01 | 7.06 | 7.00 | 7.33 | 3.75 | 8.58 | 11.48 | 8.22 |
| Cumulative returns | | |
| 6-months | -3.79 | 1.38 | 1.14 | 1.30 | 1.15 | 1.34 | 1.54 | 1.50 | 1.54 | 0.58 | 3.39 | 2.51 | 1.92 | 1.44 |
| 5-year | 23.08 | 31.63 | 27.61 | 29.15 | 28.31 | 30.74 | 32.11 | 32.40 | 32.10 | 32.63 | 19.21 | 40.45 | 55.49 | 38.11 |
| Since inception | 67.26 | 81.25 | 72.12 | 75.58 | 73.70 | 79.02 | 82.05 | 82.71 | 81.90 | 86.81 | 38.48 | 107.04 | 161.33 | 101.02 |
Performance figures assume all distributions have been reinvested. Figures reflect maximum sales charge on Class A shares of 5%. Sales charges are not applicable to Class I, Class R1, Class R2, Class R3, Class R4, Class R5, Class R6, and Class 1 shares.
The expense ratios of the portfolio, both net (including any fee waivers and/or expense limitations) and gross (excluding any fee waivers and/or expense limitations), are set forth according to the most recent publicly available prospectuses for the portfolio and may differ from those disclosed in the Financial highlights tables in this report. Net expenses reflect contractual expense limitations in effect until December 31, 2020 and are subject to change. Had the contractual fee waivers and expense limitations not been in place, gross expenses would apply. The following expense ratios include the expenses of the underlying funds in which the portfolio invests. The expense ratios are as follows:
| | | | | | | | | | |
| | Class A | Class I | Class R1 | Class R2 | Class R3 | Class R4 | Class R5 | Class R6 | Class 1 |
| Gross (%) | 1.37 | 1.07 | 1.71 | 1.46 | 1.61 | 1.31 | 1.01 | 0.96 | 1.00 |
| Net (%) | 1.02 | 0.72 | 1.36 | 1.11 | 1.26 | 0.86 | 0.66 | 0.60 | 0.65 |
Please refer to the most recent prospectus and annual or semiannual report for more information on expenses and any expense limitation arrangements for each class.
The returns reflect past results and should not be considered indicative of future performance. The return and principal value of an investment will fluctuate so that shares, when redeemed, may be worth more or less than their original cost. Due to market volatility and other factors, the portfolio's current performance may be higher or lower than the performance shown. For current to the most recent month-end performance data, please call 800-225-5291 or visit the portfolio's website at jhinvestments.com.
The performance information does not reflect the deduction of taxes that a shareholder would pay on portfolio distributions or the redemption of portfolio shares. The portfolio's performance results reflect any applicable fee waivers or expense reductions, without which the expenses would increase and results would have been less favorable.
| 1 | Class A, Class R1, Class R2, Class R3, Class R4, Class R5, and Class R6 shares were first offered on 3-1-12; Class I shares were first offered on 3-27-15. Returns prior to these dates are those of Class 1 shares that have not been adjusted for class-specific expenses; otherwise, returns would vary. |
| 2 | For certain types of investors, as described in the portfolio's prospectuses. |
SEMIANNUAL REPORT | JOHN HANCOCK MULTIMANAGER LIFETIME PORTFOLIOS 6
Multimanager 2045 Lifetime Portfolio
GROWTH OF $10,000
This chart shows what happened to a hypothetical $10,000 investment in John Hancock Multimanager 2045 Lifetime Portfolio for the share classes and periods indicated, assuming all distributions were reinvested. For comparison, we've shown the same investment in two blended indexes and three separate indexes.
Index 1is the S&P Target Date 2045 Index, an unmanaged index comprised of a set of indices aligned with specific target date years.
Index 2 is the Bloomberg Barclays U.S. Aggregate Bond Index, an unmanaged index of dollar-denominated and nonconvertible investment-grade debt issues.
Index 3is the John Hancock 2045 Lifetime Index, which is based on the fund's asset allocation glide path and will reflect a more conservative allocation over time. The index is a customized blended index comprising some or all of the following component indices (ordered alphabetically): Bloomberg Barclays U.S. Aggregate Bond Index, Bloomberg Barclays U.S. Corporate Bond 1-5 Year Index, Bloomberg Barclays U.S. Treasury TIPS 1-5 Year Index, ICE BofA Long U.S. Treasury Principal STRIPS Index, ICE BofA U.S. High Yield Index, JP Morgan Emerging Markets Bond Index Global, MSCI Emerging Markets Index, MSCI World Energy Index, MSCI World ex-USA Index, MSCI World Metals & Mining Index, Russell 2500 Index, S&P 500 Index, S&P Global ex-U.S. REIT Index, S&P Global Infrastructure Index, S&P U.S. REIT Index, and S&P/LSTA Leveraged Loan Index.
Index 4is the S&P 500 Index, an unmanaged index that includes 500 widely traded common stocks.
Index 5is 66.50% Russell 3000 Index, 28.50% MSCI ACWI ex-USA Index, 4.00% Bloomberg Barclays U.S. Aggregate Bond Index, and 1.00% ICE BofA U.S. High Yield Master II Index.
Prior to January 1, 2020, the fund's primary benchmark was the S&P 500 Index. Effective January 1, 2020, the fund's primary benchmark index is the S&P Target Date 2045 Index. The S&P Target Date 2045 Index better reflects the universe of investment opportunities based on the fund's current investment strategy.
It is not possible to invest directly in an index. Index figures do not reflect expenses or sales charges, which would result in lower returns.
ASSET ALLOCATION (%)
| | | |
| Affiliated investment companies | % of Total |
| Equity | 87.0 |
| | Large Blend | 32.8 |
| | U.S. Large Cap | 26.2 |
| | International Equity | 9.3 |
| | U.S. Mid Cap | 9.0 |
| | Emerging-Market Equity | 6.5 |
| | U.S. Small Cap | 1.9 |
| | Sector Equity | 1.3 |
| Fixed income | 2.4 |
| | Intermediate Bond | 0.9 |
| | Multi-Sector Bond | 0.5 |
| | Emerging-Market Debt | 0.5 |
| | High Yield Bond | 0.5 |
| Alternative and specialty | 3.8 |
| | Sector Equity | 2.5 |
| | Absolute Return | 1.3 |
| Unaffiliated investment companies | 4.0 |
| | Equity | 4.0 |
| U.S. Government | 2.6 |
| Short-term investments and other | 0.2 |
As a percentage of net assets.
PERFORMANCE CHART
Total returns with maximum sales charge for the period ended 2-29-20 (%)
| | | | | | | | | | | | | | | |
| | Class A | Class I1,2 | Class R11 | Class R21,2 | Class R31 | Class R41 | Class R51 | Class R61,2 | Class 11 | Index 1 | Index 2 | Index 3 | Index 4 | Index 5 |
| Start date | 2-28-10 | 2-28-10 | 2-28-10 | 2-28-10 | 2-28-10 | 2-28-10 | 2-28-10 | 2-28-10 | 2-28-10 | 2-28-10 | 2-28-10 | 2-28-10 | 2-28-10 | 2-28-10 |
| Average annual total returns | | |
| 1-year | -1.93 | 3.39 | 2.81 | 3.10 | 2.88 | 3.35 | 3.63 | 3.60 | 3.55 | 3.43 | 11.68 | 6.51 | 8.19 | 4.95 |
| 5-year | 4.28 | 5.64 | 5.00 | 5.25 | 5.10 | 5.50 | 5.73 | 5.79 | 5.73 | 5.73 | 3.58 | 7.03 | 9.23 | 6.67 |
| 10-year | 7.75 | 8.33 | 8.00 | 8.22 | 8.11 | 8.50 | 8.76 | 8.69 | 8.74 | 8.84 | 3.93 | 10.25 | 12.65 | 9.81 |
| Cumulative returns | | |
| 6-months | -3.76 | 1.47 | 1.08 | 1.18 | 1.15 | 1.33 | 1.52 | 1.48 | 1.44 | 0.63 | 3.39 | 2.51 | 1.92 | 1.44 |
| 5-year | 23.31 | 31.56 | 27.60 | 29.16 | 28.25 | 30.72 | 32.14 | 32.47 | 32.11 | 32.11 | 19.21 | 40.45 | 55.49 | 38.11 |
| 10-year | 111.00 | 122.65 | 115.94 | 120.27 | 118.07 | 126.05 | 131.52 | 130.04 | 131.06 | 133.37 | 47.07 | 165.35 | 229.18 | 154.93 |
Performance figures assume all distributions have been reinvested. Figures reflect maximum sales charge on Class A shares of 5%. Sales charges are not applicable to Class I, Class R1, Class R2, Class R3, Class R4, Class R5, Class R6, and Class 1 shares.
The expense ratios of the portfolio, both net (including any fee waivers and/or expense limitations) and gross (excluding any fee waivers and/or expense limitations), are set forth according to the most recent publicly available prospectuses for the portfolio and may differ from those disclosed in the Financial highlights tables in this report. Net expenses reflect contractual expense limitations in effect until December 31, 2020 and are subject to change. Had the contractual fee waivers and expense limitations not been in place, gross expenses would apply. The following expense ratios include the expenses of the underlying funds in which the portfolio invests. The expense ratios are as follows:
| | | | | | | | | | |
| | Class A | Class I | Class R1 | Class R2 | Class R3 | Class R4 | Class R5 | Class R6 | Class 1 |
| Gross (%) | 1.34 | 1.04 | 1.68 | 1.43 | 1.58 | 1.28 | 0.98 | 0.93 | 0.97 |
| Net (%) | 1.00 | 0.70 | 1.34 | 1.09 | 1.24 | 0.84 | 0.64 | 0.58 | 0.63 |
Please refer to the most recent prospectus and annual or semiannual report for more information on expenses and any expense limitation arrangements for each class.
The returns reflect past results and should not be considered indicative of future performance. The return and principal value of an investment will fluctuate so that shares, when redeemed, may be worth more or less than their original cost. Due to market volatility and other factors, the portfolio's current performance may be higher or lower than the performance shown. For current to the most recent month-end performance data, please call 800-225-5291 or visit the portfolio's website at jhinvestments.com.
The performance information does not reflect the deduction of taxes that a shareholder would pay on portfolio distributions or the redemption of portfolio shares. The portfolio's performance results reflect any applicable fee waivers or expense reductions, without which the expenses would increase and results would have been less favorable.
| 1 | For certain types of investors as described in the portfolio's prospectuses. |
| 2 | Class I shares were first offered on 3-27-15. Class R2 and Class R6 shares were first offered on 3-1-12 and 9-1-11, respectively. Returns prior to these dates are those of Class R1 shares that have not been adjusted for class-specific expenses; otherwise, returns would vary. |
SEMIANNUAL REPORT | JOHN HANCOCK MULTIMANAGER LIFETIME PORTFOLIOS 7
Multimanager 2040 Lifetime Portfolio
GROWTH OF $10,000
This chart shows what happened to a hypothetical $10,000 investment in John Hancock Multimanager 2040 Lifetime Portfolio for the share classes and periods indicated, assuming all distributions were reinvested. For comparison, we've shown the same investment in two blended indexes and three separate indexes.
Index 1 is the S&P Target Date 2040 Index, an unmanaged index comprised of a set of indices aligned with specific target date years.
Index 2is the Bloomberg Barclays U.S. Aggregate Bond Index, an unmanaged index of dollar-denominated and nonconvertible investment-grade debt issues.
Index 3is the John Hancock 2040 Lifetime Index, which is based on the fund's asset allocation glide path and will reflect a more conservative allocation over time. The index is a customized blended index comprising some or all of the following component indices (ordered alphabetically): Bloomberg Barclays U.S. Aggregate Bond Index, Bloomberg Barclays U.S. Corporate Bond 1-5 Year Index, Bloomberg Barclays U.S. Treasury TIPS 1-5 Year Index, ICE BofA Long U.S. Treasury Principal STRIPS Index, ICE BofA U.S. High Yield Index, JP Morgan Emerging Markets Bond Index Global, MSCI Emerging Markets Index, MSCI World Energy Index, MSCI World ex-USA Index, MSCI World Metals & Mining Index, Russell 2500 Index, S&P 500 Index, S&P Global ex-U.S. REIT Index, S&P Global Infrastructure Index, S&P U.S. REIT Index, and S&P/LSTA Leveraged Loan Index.
Index 4is the S&P 500 Index, an unmanaged index that includes 500 widely traded common stocks.
Index 5is 64.40% Russell 3000 Index, 27.60% MSCI ACWI ex-USA Index, 6.40% Bloomberg Barclays U.S. Aggregate Bond Index, and 1.60% ICE BofA U.S. High Yield Master II Index.
Prior to January 1, 2020, the fund's primary benchmark was the S&P 500 Index. Effective January 1, 2020, the fund's primary benchmark index is the S&P Target Date 2040 Index. The S&P Target Date 2040 Index better reflects the universe of investment opportunities based on the fund's current investment strategy.
It is not possible to invest directly in an index. Index figures do not reflect expenses or sales charges, which would result in lower returns.
ASSET ALLOCATION (%)
| | | |
| Affiliated investment companies | % of Total |
| Equity | 82.0 |
| | Large Blend | 31.4 |
| | U.S. Large Cap | 23.7 |
| | International Equity | 9.7 |
| | U.S. Mid Cap | 8.2 |
| | Emerging-Market Equity | 6.0 |
| | U.S. Small Cap | 1.7 |
| | Sector Equity | 1.3 |
| Fixed income | 4.8 |
| | Intermediate Bond | 2.3 |
| | Multi-Sector Bond | 0.9 |
| | Emerging-Market Debt | 0.9 |
| | High Yield Bond | 0.7 |
| Alternative and specialty | 4.6 |
| | Sector Equity | 3.2 |
| | Absolute Return | 1.4 |
| Unaffiliated investment companies | 4.3 |
| | Equity | 4.3 |
| U.S. Government | 4.1 |
| Short-term investments and other | 0.2 |
As a percentage of net assets.
PERFORMANCE CHART
Total returns with maximum sales charge for the period ended 2-29-20 (%)
| | | | | | | | | | | | | | | |
| | Class A | Class I1,2 | Class R11 | Class R21,2 | Class R31 | Class R41 | Class R51 | Class R61,2 | Class 11 | Index 1 | Index 2 | Index 3 | Index 4 | Index 5 |
| Start date | 2-28-10 | 2-28-10 | 2-28-10 | 2-28-10 | 2-28-10 | 2-28-10 | 2-28-10 | 2-28-10 | 2-28-10 | 2-28-10 | 2-28-10 | 2-28-10 | 2-28-10 | 2-28-10 |
| Average annual total returns | | |
| 1-year | -1.57 | 3.86 | 3.28 | 3.51 | 3.38 | 3.84 | 4.01 | 3.98 | 4.03 | 3.70 | 11.68 | 6.98 | 8.19 | 5.19 |
| 5-year | 4.32 | 5.72 | 5.07 | 5.32 | 5.17 | 5.58 | 5.78 | 5.83 | 5.80 | 5.65 | 3.58 | 7.12 | 9.23 | 6.72 |
| 10-year | 7.78 | 8.38 | 8.04 | 8.26 | 8.15 | 8.54 | 8.79 | 8.72 | 8.77 | 8.68 | 3.93 | 10.30 | 12.65 | 9.83 |
| Cumulative returns | | |
| 6-months | -3.45 | 1.78 | 1.47 | 1.61 | 1.47 | 1.75 | 1.83 | 1.80 | 1.85 | 0.75 | 3.39 | 2.65 | 1.92 | 1.58 |
| 5-year | 23.53 | 32.05 | 28.06 | 29.58 | 28.64 | 31.18 | 32.45 | 32.76 | 32.54 | 31.64 | 19.21 | 41.07 | 55.49 | 38.43 |
| 10-year | 111.44 | 123.51 | 116.77 | 121.05 | 118.92 | 127.02 | 132.15 | 130.64 | 131.89 | 129.87 | 47.07 | 166.52 | 229.18 | 155.50 |
Performance figures assume all distributions have been reinvested. Figures reflect maximum sales charge on Class A shares of 5%. Sales charges are not applicable to Class I, Class R1, Class R2, Class R3, Class R4, Class R5, Class R6, and Class 1 shares.
The expense ratios of the portfolio, both net (including any fee waivers and/or expense limitations) and gross (excluding any fee waivers and/or expense limitations), are set forth according to the most recent publicly available prospectuses for the portfolio and may differ from those disclosed in the Financial highlights tables in this report. Net expenses reflect contractual expense limitations in effect until December 31, 2020 and are subject to change. Had the contractual fee waivers and expense limitations not been in place, gross expenses would apply. The following expense ratios include the expenses of the underlying funds in which the portfolio invests. The expense ratios are as follows:
| | | | | | | | | | |
| | Class A | Class I | Class R1 | Class R2 | Class R3 | Class R4 | Class R5 | Class R6 | Class 1 |
| Gross (%) | 1.34 | 1.04 | 1.68 | 1.43 | 1.58 | 1.28 | 0.98 | 0.93 | 0.97 |
| Net (%) | 1.00 | 0.70 | 1.34 | 1.09 | 1.24 | 0.84 | 0.64 | 0.58 | 0.63 |
Please refer to the most recent prospectus and annual or semiannual report for more information on expenses and any expense limitation arrangements for each class.
The returns reflect past results and should not be considered indicative of future performance. The return and principal value of an investment will fluctuate so that shares, when redeemed, may be worth more or less than their original cost. Due to market volatility and other factors, the portfolio's current performance may be higher or lower than the performance shown. For current to the most recent month-end performance data, please call 800-225-5291 or visit the portfolio's website at jhinvestments.com.
The performance information does not reflect the deduction of taxes that a shareholder would pay on portfolio distributions or the redemption of portfolio shares. The portfolio's performance results reflect any applicable fee waivers or expense reductions, without which the expenses would increase and results would have been less favorable.
| 1 | For certain types of investors as described in the portfolio's prospectuses. |
| 2 | Class I shares were first offered on 3-27-15. Class R2 and Class R6 shares were first offered on 3-1-12 and 9-1-11, respectively. Returns prior to these dates are those of Class R1 shares that have not been adjusted for class-specific expenses; otherwise, returns would vary. |
SEMIANNUAL REPORT | JOHN HANCOCK MULTIMANAGER LIFETIME PORTFOLIOS 8
Multimanager 2035 Lifetime Portfolio
GROWTH OF $10,000
This chart shows what happened to a hypothetical $10,000 investment in John Hancock Multimanager 2035 Lifetime Portfolio for the share classes and periods indicated, assuming all distributions were reinvested. For comparison, we've shown the same investment in two blended indexes and three separate indexes.
Index 1is the S&P Target Date 2035 Index, an unmanaged index comprised of a set of indices aligned with specific target date years.
Index 2is the Bloomberg Barclays U.S. Aggregate Bond Index, an unmanaged index of dollar-denominated and nonconvertible investment-grade debt issues.
Index 3is the John Hancock 2035 Lifetime Index, which is based on the fund's asset allocation glide path and will reflect a more conservative allocation over time. The index is a customized blended index comprising some or all of the following component indices (ordered alphabetically): Bloomberg Barclays U.S. Aggregate Bond Index, Bloomberg Barclays U.S. Corporate Bond 1-5 Year Index, Bloomberg Barclays U.S. Treasury TIPS 1-5 Year Index, ICE BofA Long U.S. Treasury Principal STRIPS Index, ICE BofA U.S. High Yield Index, JP Morgan Emerging Markets Bond Index Global, MSCI Emerging Markets Index, MSCI World Energy Index, MSCI World ex-USA Index, MSCI World Metals & Mining Index, Russell 2500 Index, S&P 500 Index, S&P Global ex-U.S. REIT Index, S&P Global Infrastructure Index, S&P U.S. REIT Index, and S&P/LSTA Leveraged Loan Index.
Index 4is the S&P 500 Index, an unmanaged index that includes 500 widely traded common stocks.
Index 5is 59.50% Russell 3000 Index, 25.50% MSCI ACWI ex-USA Index, 12.00% Bloomberg Barclays U.S. Aggregate Bond Index, and 3.00% ICE BofA U.S. High Yield Master II Index.
Prior to January 1, 2020, the fund's primary benchmark was the S&P 500 Index. Effective January 1, 2020, the fund's primary benchmark index is the S&P Target Date 2035 Index. The S&P Target Date 2035 Index better reflects the universe of investment opportunities based on the fund's current investment strategy.
It is not possible to invest directly in an index. Index figures do not reflect expenses or sales charges, which would result in lower returns.
ASSET ALLOCATION (%)
| | | |
| Affiliated investment companies | % of Total |
| Equity | 73.9 |
| | Large Blend | 28.5 |
| | U.S. Large Cap | 21.9 |
| | International Equity | 9.2 |
| | U.S. Mid Cap | 6.9 |
| | Emerging-Market Equity | 5.1 |
| | U.S. Small Cap | 1.3 |
| | Sector Equity | 1.0 |
| Fixed income | 11.3 |
| | Intermediate Bond | 5.8 |
| | Multi-Sector Bond | 2.5 |
| | Emerging-Market Debt | 1.6 |
| | High Yield Bond | 1.4 |
| Alternative and specialty | 5.4 |
| | Sector Equity | 3.8 |
| | Absolute Return | 1.6 |
| Unaffiliated investment companies | 3.9 |
| | Equity | 3.9 |
| U.S. Government | 5.4 |
| Short-term investments and other | 0.1 |
As a percentage of net assets.
PERFORMANCE CHART
Total returns with maximum sales charge for the period ended 2-29-20 (%)
| | | | | | | | | | | | | | | |
| | Class A | Class I1,2 | Class R11 | Class R21,2 | Class R31 | Class R41 | Class R51 | Class R61,2 | Class 11 | Index 1 | Index 2 | Index 3 | Index 4 | Index 5 |
| Start date | 2-28-10 | 2-28-10 | 2-28-10 | 2-28-10 | 2-28-10 | 2-28-10 | 2-28-10 | 2-28-10 | 2-28-10 | 2-28-10 | 2-28-10 | 2-28-10 | 2-28-10 | 2-28-10 |
| Average annual total returns | | |
| 1-year | -0.99 | 4.53 | 3.81 | 4.21 | 3.89 | 4.37 | 4.55 | 4.71 | 4.66 | 4.15 | 11.68 | 7.94 | 8.19 | 5.66 |
| 5-year | 4.21 | 5.60 | 4.94 | 5.21 | 5.04 | 5.45 | 5.66 | 5.74 | 5.68 | 5.52 | 3.58 | 6.99 | 9.23 | 6.59 |
| 10-year | 7.69 | 8.29 | 7.95 | 8.17 | 8.04 | 8.46 | 8.69 | 8.63 | 8.69 | 8.44 | 3.93 | 10.20 | 12.65 | 9.73 |
| Cumulative returns | | |
| 6-months | -3.24 | 2.05 | 1.70 | 1.92 | 1.79 | 1.99 | 2.07 | 2.13 | 2.09 | 0.93 | 3.39 | 2.72 | 1.92 | 1.73 |
| 5-year | 22.90 | 31.33 | 27.24 | 28.90 | 27.85 | 30.41 | 31.67 | 32.20 | 31.85 | 30.85 | 19.21 | 40.20 | 55.49 | 37.60 |
| 10-year | 109.71 | 121.80 | 114.89 | 119.33 | 116.64 | 125.35 | 130.08 | 128.89 | 130.16 | 124.89 | 47.07 | 164.07 | 229.18 | 153.05 |
Performance figures assume all distributions have been reinvested. Figures reflect maximum sales charge on Class A shares of 5%. Sales charges are not applicable to Class I, Class R1, Class R2, Class R3, Class R4, Class R5, Class R6, and Class 1 shares.
The expense ratios of the portfolio, both net (including any fee waivers and/or expense limitations) and gross (excluding any fee waivers and/or expense limitations), are set forth according to the most recent publicly available prospectuses for the portfolio and may differ from those disclosed in the Financial highlights tables in this report. Net expenses reflect contractual expense limitations in effect until December 31, 2020 and are subject to change. Had the contractual fee waivers and expense limitations not been in place, gross expenses would apply. The following expense ratios include the expenses of the underlying funds in which the portfolio invests. The expense ratios are as follows:
| | | | | | | | | | |
| | Class A | Class I | Class R1 | Class R2 | Class R3 | Class R4 | Class R5 | Class R6 | Class 1 |
| Gross (%) | 1.34 | 1.04 | 1.68 | 1.43 | 1.58 | 1.28 | 0.98 | 0.93 | 0.97 |
| Net (%) | 1.01 | 0.71 | 1.35 | 1.10 | 1.25 | 0.85 | 0.65 | 0.59 | 0.64 |
Please refer to the most recent prospectus and annual or semiannual report for more information on expenses and any expense limitation arrangements for each class.
The returns reflect past results and should not be considered indicative of future performance. The return and principal value of an investment will fluctuate so that shares, when redeemed, may be worth more or less than their original cost. Due to market volatility and other factors, the portfolio's current performance may be higher or lower than the performance shown. For current to the most recent month-end performance data, please call 800-225-5291 or visit the portfolio's website at jhinvestments.com.
The performance information does not reflect the deduction of taxes that a shareholder would pay on portfolio distributions or the redemption of portfolio shares. The portfolio's performance results reflect any applicable fee waivers or expense reductions, without which the expenses would increase and results would have been less favorable.
| 1 | For certain types of investors as described in the portfolio's prospectuses. |
| 2 | Class I shares were first offered on 3-27-15. Class R2 and Class R6 shares were first offered on 3-1-12 and 9-1-11, respectively. Returns prior to these dates are those of Class R1 shares that have not been adjusted for class-specific expenses; otherwise, returns would vary. |
SEMIANNUAL REPORT | JOHN HANCOCK MULTIMANAGER LIFETIME PORTFOLIOS 9
Multimanager 2030 Lifetime Portfolio
GROWTH OF $10,000
This chart shows what happened to a hypothetical $10,000 investment in John Hancock Multimanager 2030 Lifetime Portfolio for the share classes and periods indicated, assuming all distributions were reinvested. For comparison, we've shown the same investment in two blended indexes and three separate indexes.
Index 1is the S&P Target Date 2030 Index, an unmanaged index comprised of a set of indices aligned with specific target date years.
Index 2is the Bloomberg Barclays U.S. Aggregate Bond Index, an unmanaged index of dollar-denominated and nonconvertible investment-grade debt issues.
Index 3is the John Hancock 2030 Lifetime Index, which is based on the fund's asset allocation glide path and will reflect a more conservative allocation over time. The index is a customized blended index comprising some or all of the following component indices (ordered alphabetically): Bloomberg Barclays U.S. Aggregate Bond Index, Bloomberg Barclays U.S. Corporate Bond 1-5 Year Index, Bloomberg Barclays U.S. Treasury TIPS 1-5 Year Index, ICE BofA Long U.S. Treasury Principal STRIPS Index, ICE BofA U.S. High Yield Index, JP Morgan Emerging Markets Bond Index Global, MSCI Emerging Markets Index, MSCI World Energy Index, MSCI World ex-USA Index, MSCI World Metals & Mining Index, Russell 2500 Index, S&P 500 Index, S&P Global ex-U.S. REIT Index, S&P Global Infrastructure Index, S&P U.S. REIT Index, and S&P/LSTA Leveraged Loan Index.
Index 4is the S&P 500 Index, an unmanaged index that includes 500 widely traded common stocks.
Index 5is 51.80% Russell 3000 Index, 22.20% MSCI ACWI ex-USA Index, 20.80% Bloomberg Barclays U.S. Aggregate Bond Index, and 5.20% ICE BofA U.S. High Yield Master II Index.
Prior to January 1, 2020, the fund's primary benchmark was the S&P 500 Index. Effective January 1, 2020, the fund's primary benchmark index is the S&P Target Date 2030 Index. The S&P Target Date 2030 Index better reflects the universe of investment opportunities based on the fund's current investment strategy.
It is not possible to invest directly in an index. Index figures do not reflect expenses or sales charges, which would result in lower returns.
ASSET ALLOCATION (%)
| | | |
| Affiliated investment companies | % of Total |
| Equity | 64.4 |
| | Large Blend | 25.3 |
| | U.S. Large Cap | 18.1 |
| | International Equity | 9.4 |
| | U.S. Mid Cap | 5.6 |
| | Emerging-Market Equity | 4.0 |
| | U.S. Small Cap | 1.0 |
| | Sector Equity | 1.0 |
| Fixed income | 19.0 |
| | Intermediate Bond | 9.5 |
| | Multi-Sector Bond | 4.7 |
| | Emerging-Market Debt | 2.6 |
| | High Yield Bond | 2.2 |
| Alternative and specialty | 6.5 |
| | Sector Equity | 4.8 |
| | Absolute Return | 1.7 |
| Unaffiliated investment companies | 3.3 |
| | Equity | 3.3 |
| U.S. Government | 6.6 |
| Short-term investments and other | 0.2 |
As a percentage of net assets.
PERFORMANCE CHART
Total returns with maximum sales charge for the period ended 2-29-20 (%)
| | | | | | | | | | | | | | | |
| | Class A | Class I1,2 | Class R11 | Class R21,2 | Class R31 | Class R41 | Class R51 | Class R61,2 | Class 11 | Index 1 | Index 2 | Index 3 | Index 4 | Index 5 |
| Start date | 2-28-10 | 2-28-10 | 2-28-10 | 2-28-10 | 2-28-10 | 2-28-10 | 2-28-10 | 2-28-10 | 2-28-10 | 2-28-10 | 2-28-10 | 2-28-10 | 2-28-10 | 2-28-10 |
| Average annual total returns | | |
| 1-year | -0.41 | 5.18 | 4.59 | 4.83 | 4.67 | 5.17 | 5.26 | 5.32 | 5.37 | 4.83 | 11.68 | 8.95 | 8.19 | 6.46 |
| 5-year | 4.10 | 5.49 | 4.84 | 5.10 | 4.93 | 5.37 | 5.54 | 5.62 | 5.56 | 5.34 | 3.58 | 6.80 | 9.23 | 6.45 |
| 10-year | 7.46 | 8.05 | 7.72 | 7.93 | 7.81 | 8.22 | 8.45 | 8.40 | 8.45 | 8.10 | 3.93 | 9.90 | 12.65 | 9.43 |
| Cumulative returns | | |
| 6-months | -2.99 | 2.30 | 2.01 | 2.15 | 2.00 | 2.29 | 2.28 | 2.34 | 2.29 | 1.19 | 3.39 | 2.80 | 1.92 | 2.10 |
| 5-year | 22.24 | 30.61 | 26.64 | 28.23 | 27.18 | 29.87 | 30.97 | 31.43 | 31.07 | 29.72 | 19.21 | 38.97 | 55.49 | 36.68 |
| 10-year | 105.32 | 116.90 | 110.31 | 114.54 | 112.19 | 120.30 | 125.08 | 123.99 | 124.99 | 117.99 | 47.07 | 157.09 | 229.18 | 146.20 |
Performance figures assume all distributions have been reinvested. Figures reflect maximum sales charge on Class A shares of 5%. Sales charges are not applicable to Class I, Class R1, Class R2, Class R3, Class R4, Class R5, Class R6, and Class 1 shares.
The expense ratios of the portfolio, both net (including any fee waivers and/or expense limitations) and gross (excluding any fee waivers and/or expense limitations), are set forth according to the most recent publicly available prospectuses for the portfolio and may differ from those disclosed in the Financial highlights tables in this report. Net expenses reflect contractual expense limitations in effect until December 31, 2020 and are subject to change. Had the contractual fee waivers and expense limitations not been in place, gross expenses would apply. The following expense ratios include the expenses of the underlying funds in which the portfolio invests. The expense ratios are as follows:
| | | | | | | | | | |
| | Class A | Class I | Class R1 | Class R2 | Class R3 | Class R4 | Class R5 | Class R6 | Class 1 |
| Gross (%) | 1.32 | 1.02 | 1.66 | 1.41 | 1.56 | 1.26 | 0.96 | 0.91 | 0.95 |
| Net (%) | 0.99 | 0.69 | 1.33 | 1.08 | 1.23 | 0.83 | 0.63 | 0.57 | 0.62 |
Please refer to the most recent prospectus and annual or semiannual report for more information on expenses and any expense limitation arrangements for each class.
The returns reflect past results and should not be considered indicative of future performance. The return and principal value of an investment will fluctuate so that shares, when redeemed, may be worth more or less than their original cost. Due to market volatility and other factors, the portfolio's current performance may be higher or lower than the performance shown. For current to the most recent month-end performance data, please call 800-225-5291 or visit the portfolio's website at jhinvestments.com.
The performance information does not reflect the deduction of taxes that a shareholder would pay on portfolio distributions or the redemption of portfolio shares. The portfolio's performance results reflect any applicable fee waivers or expense reductions, without which the expenses would increase and results would have been less favorable.
| 1 | For certain types of investors as described in the portfolio's prospectuses. |
| 2 | Class I shares were first offered on 3-27-15. Class R2 and Class R6 shares were first offered on 3-1-12 and 9-1-11, respectively. Returns prior to these dates are those of Class R1 shares that have not been adjusted for class-specific expenses; otherwise, returns would vary. |
SEMIANNUAL REPORT | JOHN HANCOCK MULTIMANAGER LIFETIME PORTFOLIOS 10
Multimanager 2025 Lifetime Portfolio
GROWTH OF $10,000
This chart shows what happened to a hypothetical $10,000 investment in John Hancock Multimanager 2025 Lifetime Portfolio for the share classes and periods indicated, assuming all distributions were reinvested. For comparison, we've shown the same investment in two blended indexes and three separate indexes.
Index 1is the S&P Target Date 2025 Index, an unmanaged index comprised of a set of indices aligned with specific target date years.
Index 2is the Bloomberg Barclays U.S. Aggregate Bond Index, an unmanaged index of dollar-denominated and nonconvertible investment-grade debt issues.
Index 3is the John Hancock 2025 Lifetime Index, which is based on the fund's asset allocation glide path and will reflect a more conservative allocation over time. The index is a customized blended index comprising some or all of the following component indices (ordered alphabetically): Bloomberg Barclays U.S. Aggregate Bond Index, Bloomberg Barclays U.S. Corporate Bond 1-5 Year Index, Bloomberg Barclays U.S. Treasury TIPS 1-5 Year Index, ICE BofA Long U.S. Treasury Principal STRIPS Index, ICE BofA U.S. High Yield Index, JP Morgan Emerging Markets Bond Index Global, MSCI Emerging Markets Index, MSCI World Energy Index, MSCI World ex-USA Index, MSCI World Metals & Mining Index, Russell 2500 Index, S&P 500 Index, S&P Global ex-U.S. REIT Index, S&P Global Infrastructure Index, S&P U.S. REIT Index, and S&P/LSTA Leveraged Loan Index.
Index 4is the S&P 500 Index, an unmanaged index that includes 500 widely traded common stocks.
Index 5is 43.40% Russell 3000 Index, 18.60% MSCI ACWI ex-USA Index, 30.40% Bloomberg Barclays U.S. Aggregate Bond Index, and 7.60% ICE BofA U.S. High Yield Master II Index.
Prior to January 1, 2020, the fund's primary benchmark was the S&P 500 Index. Effective January 1, 2020, the fund's primary benchmark index is the S&P Target Date 2025 Index. The S&P Target Date 2025 Index better reflects the universe of investment opportunities based on the fund's current investment strategy.
It is not possible to invest directly in an index. Index figures do not reflect expenses or sales charges, which would result in lower returns.
ASSET ALLOCATION (%)
| | | |
| Affiliated investment companies | % of Total |
| Equity | 53.7 |
| | Large Blend | 21.6 |
| | U.S. Large Cap | 13.9 |
| | International Equity | 9.6 |
| | U.S. Mid Cap | 4.3 |
| | Emerging-Market Equity | 2.8 |
| | Sector Equity | 0.8 |
| | U.S. Small Cap | 0.7 |
| Fixed income | 27.9 |
| | Intermediate Bond | 11.8 |
| | Multi-Sector Bond | 7.7 |
| | Emerging-Market Debt | 3.2 |
| | High Yield Bond | 2.8 |
| | Short-Term Bond | 1.5 |
| | Bank Loan | 0.9 |
| Alternative and specialty | 7.4 |
| | Sector Equity | 5.6 |
| | Absolute Return | 1.8 |
| Unaffiliated investment companies | 2.9 |
| | Equity | 2.9 |
| U.S. Government | 8.0 |
| Short-term investments and other | 0.1 |
As a percentage of net assets.
PERFORMANCE CHART
Total returns with maximum sales charge for the period ended 2-29-20 (%)
| | | | | | | | | | | | | | | |
| | Class A | Class I1,2 | Class R11 | Class R21,2 | Class R31 | Class R41 | Class R51 | Class R61,2 | Class 11 | Index 1 | Index 2 | Index 3 | Index 4 | Index 5 |
| Start date | 2-28-10 | 2-28-10 | 2-28-10 | 2-28-10 | 2-28-10 | 2-28-10 | 2-28-10 | 2-28-10 | 2-28-10 | 2-28-10 | 2-28-10 | 2-28-10 | 2-28-10 | 2-28-10 |
| Average annual total returns | | |
| 1-year | 0.19 | 5.76 | 5.06 | 5.32 | 5.15 | 5.52 | 5.85 | 5.80 | 5.74 | 5.49 | 11.68 | 9.34 | 8.19 | 7.22 |
| 5-year | 3.86 | 5.25 | 4.59 | 4.86 | 4.69 | 5.12 | 5.31 | 5.39 | 5.31 | 5.13 | 3.58 | 6.42 | 9.23 | 6.18 |
| 10-year | 7.07 | 7.67 | 7.33 | 7.54 | 7.41 | 7.82 | 8.05 | 7.99 | 8.04 | 7.70 | 3.93 | 9.48 | 12.65 | 8.96 |
| Cumulative returns | | |
| 6-months | -3.00 | 2.21 | 1.92 | 2.07 | 2.00 | 2.17 | 2.28 | 2.24 | 2.28 | 1.43 | 3.39 | 2.71 | 1.92 | 2.33 |
| 5-year | 20.87 | 29.18 | 25.17 | 26.78 | 25.77 | 28.34 | 29.50 | 29.99 | 29.51 | 28.43 | 19.21 | 36.52 | 55.49 | 34.97 |
| 10-year | 97.94 | 109.30 | 102.79 | 106.91 | 104.30 | 112.29 | 116.99 | 115.76 | 116.78 | 110.06 | 47.07 | 147.31 | 229.18 | 135.94 |
Performance figures assume all distributions have been reinvested. Figures reflect maximum sales charge on Class A shares of 5%. Sales charges are not applicable to Class I, Class R1, Class R2, Class R3, Class R4, Class R5, Class R6, and Class 1 shares.
The expense ratios of the portfolio, both net (including any fee waivers and/or expense limitations) and gross (excluding any fee waivers and/or expense limitations), are set forth according to the most recent publicly available prospectuses for the portfolio and may differ from those disclosed in the Financial highlights tables in this report. Net expenses reflect contractual expense limitations in effect until December 31, 2020 and are subject to change. Had the contractual fee waivers and expense limitations not been in place, gross expenses would apply. The following expense ratios include the expenses of the underlying funds in which the portfolio invests. The expense ratios are as follows:
| | | | | | | | | | |
| | Class A | Class I | Class R1 | Class R2 | Class R3 | Class R4 | Class R5 | Class R6 | Class 1 |
| Gross (%) | 1.32 | 1.02 | 1.66 | 1.41 | 1.56 | 1.26 | 0.96 | 0.91 | 0.95 |
| Net (%) | 0.98 | 0.68 | 1.32 | 1.07 | 1.22 | 0.82 | 0.62 | 0.56 | 0.61 |
Please refer to the most recent prospectus and annual or semiannual report for more information on expenses and any expense limitation arrangements for each class.
The returns reflect past results and should not be considered indicative of future performance. The return and principal value of an investment will fluctuate so that shares, when redeemed, may be worth more or less than their original cost. Due to market volatility and other factors, the portfolio's current performance may be higher or lower than the performance shown. For current to the most recent month-end performance data, please call 800-225-5291 or visit the portfolio's website at jhinvestments.com.
The performance information does not reflect the deduction of taxes that a shareholder would pay on portfolio distributions or the redemption of portfolio shares. The portfolio's performance results reflect any applicable fee waivers or expense reductions, without which the expenses would increase and results would have been less favorable.
| 1 | For certain types of investors as described in the portfolio's prospectuses. |
| 2 | Class I shares were first offered on 3-27-15. Class R2 and Class R6 shares were first offered on 3-1-12 and 9-1-11, respectively. Returns prior to these dates are those of Class R1 shares that have not been adjusted for class-specific expenses; otherwise, returns would vary. |
SEMIANNUAL REPORT | JOHN HANCOCK MULTIMANAGER LIFETIME PORTFOLIOS 11
Multimanager 2020 Lifetime Portfolio
GROWTH OF $10,000
This chart shows what happened to a hypothetical $10,000 investment in John Hancock Multimanager 2020 Lifetime Portfolio for the share classes and periods indicated, assuming all distributions were reinvested. For comparison, we've shown the same investment in two blended indexes and three separate indexes.
Index 1is the S&P Target Date 2020 Index, an unmanaged index comprised of a set of indices aligned with specific target date years.
Index 2is the Bloomberg Barclays U.S. Aggregate Bond Index, an unmanaged index of dollar-denominated and nonconvertible investment-grade debt issues.
Index 3is the John Hancock 2020 Lifetime Index, which is based on the fund's asset allocation glide path and will reflect a more conservative allocation over time. The index is a customized blended index comprising some or all of the following component indices (ordered alphabetically): Bloomberg Barclays U.S. Aggregate Bond Index, Bloomberg Barclays U.S. Corporate Bond 1-5 Year Index, Bloomberg Barclays U.S. Treasury TIPS 1-5 Year Index, ICE BofA Long U.S. Treasury Principal STRIPS Index, ICE BofA U.S. High Yield Index, JP Morgan Emerging Markets Bond Index Global, MSCI Emerging Markets Index, MSCI World Energy Index, MSCI World ex-USA Index, MSCI World Metals & Mining Index, Russell 2500 Index, S&P 500 Index, S&P Global ex-U.S. REIT Index, S&P Global Infrastructure Index, S&P U.S. REIT Index, and S&P/LSTA Leveraged Loan Index.
Index 4is the S&P 500 Index, an unmanaged index that includes 500 widely traded common stocks.
Index 5is 36.40% Russell 3000 Index, 15.60% MSCI ACWI ex-USA Index, 38.40% Bloomberg Barclays U.S. Aggregate Bond Index, and 9.60% ICE BofA U.S. High Yield Master II Index.
Prior to January 1, 2020, the fund's primary benchmark was the S&P 500 Index. Effective January 1, 2020, the fund's primary benchmark index is the S&P Target Date 2020 Index. The S&P Target Date 2020 Index better reflects the universe of investment opportunities based on the fund's current investment strategy.
It is not possible to invest directly in an index. Index figures do not reflect expenses or sales charges, which would result in lower returns.
ASSET ALLOCATION (%)
| | | |
| Affiliated investment companies | % of Total |
| Equity | 41.4 |
| | Large Blend | 17.5 |
| | U.S. Large Cap | 8.8 |
| | International Equity | 8.8 |
| | U.S. Mid Cap | 3.1 |
| | Emerging-Market Equity | 1.7 |
| | U.S. Small Cap | 0.8 |
| | Sector Equity | 0.7 |
| Fixed income | 39.5 |
| | Intermediate Bond | 18.6 |
| | Multi-Sector Bond | 8.6 |
| | Emerging-Market Debt | 4.1 |
| | High Yield Bond | 3.5 |
| | Short-Term Bond | 3.1 |
| | Bank Loan | 1.6 |
| Alternative and specialty | 8.5 |
| | Sector Equity | 6.5 |
| | Absolute Return | 2.0 |
| Unaffiliated investment companies | 2.1 |
| | Equity | 2.1 |
| U.S. Government | 8.3 |
| Short-term investments and other | 0.2 |
As a percentage of net assets.
PERFORMANCE CHART
Total returns with maximum sales charge for the period ended 2-29-20 (%)
| | | | | | | | | | | | | | | |
| | Class A | Class I1,2 | Class R11 | Class R21,2 | Class R31 | Class R41 | Class R51 | Class R61,2 | Class 11 | Index 1 | Index 2 | Index 3 | Index 4 | Index 5 |
| Start date | 2-28-10 | 2-28-10 | 2-28-10 | 2-28-10 | 2-28-10 | 2-28-10 | 2-28-10 | 2-28-10 | 2-28-10 | 2-28-10 | 2-28-10 | 2-28-10 | 2-28-10 | 2-28-10 |
| Average annual total returns | | |
| 1-year | 0.72 | 6.42 | 5.81 | 5.95 | 5.79 | 6.21 | 6.39 | 6.46 | 6.51 | 6.06 | 11.68 | 9.21 | 8.19 | 7.80 |
| 5-year | 3.58 | 5.00 | 4.33 | 4.56 | 4.40 | 4.81 | 5.03 | 5.08 | 5.03 | 4.86 | 3.58 | 5.88 | 9.23 | 5.83 |
| 10-year | 6.53 | 7.12 | 6.78 | 6.99 | 6.87 | 7.27 | 7.51 | 7.44 | 7.50 | 7.24 | 3.93 | 8.85 | 12.65 | 8.34 |
| Cumulative returns | | |
| 6-months | -2.86 | 2.44 | 2.15 | 2.29 | 2.14 | 2.32 | 2.41 | 2.47 | 2.41 | 1.65 | 3.39 | 2.55 | 1.92 | 2.43 |
| 5-year | 19.25 | 27.61 | 23.59 | 25.00 | 24.03 | 26.48 | 27.79 | 28.09 | 27.83 | 26.79 | 19.21 | 33.04 | 55.49 | 32.76 |
| 10-year | 88.19 | 99.01 | 92.75 | 96.56 | 94.35 | 101.76 | 106.30 | 105.04 | 106.16 | 101.08 | 47.07 | 133.42 | 229.18 | 122.73 |
Performance figures assume all distributions have been reinvested. Figures reflect maximum sales charge on Class A shares of 5%. Sales charges are not applicable to Class I, Class R1, Class R2, Class R3, Class R4, Class R5, Class R6, and Class 1 shares.
The expense ratios of the portfolio, both net (including any fee waivers and/or expense limitations) and gross (excluding any fee waivers and/or expense limitations), are set forth according to the most recent publicly available prospectuses for the portfolio and may differ from those disclosed in the Financial highlights tables in this report. Net expenses reflect contractual expense limitations in effect until December 31, 2020 and are subject to change. Had the contractual fee waivers and expense limitations not been in place, gross expenses would apply. The following expense ratios include the expenses of the underlying funds in which the portfolio invests. The expense ratios are as follows:
| | | | | | | | | | |
| | Class A | Class I | Class R1 | Class R2 | Class R3 | Class R4 | Class R5 | Class R6 | Class 1 |
| Gross (%) | 1.32 | 1.02 | 1.66 | 1.41 | 1.56 | 1.26 | 0.96 | 0.91 | 0.95 |
| Net (%) | 0.96 | 0.66 | 1.30 | 1.05 | 1.20 | 0.80 | 0.60 | 0.54 | 0.59 |
Please refer to the most recent prospectus and annual or semiannual report for more information on expenses and any expense limitation arrangements for each class.
The returns reflect past results and should not be considered indicative of future performance. The return and principal value of an investment will fluctuate so that shares, when redeemed, may be worth more or less than their original cost. Due to market volatility and other factors, the portfolio's current performance may be higher or lower than the performance shown. For current to the most recent month-end performance data, please call 800-225-5291 or visit the portfolio's website at jhinvestments.com.
The performance information does not reflect the deduction of taxes that a shareholder would pay on portfolio distributions or the redemption of portfolio shares. The portfolio's performance results reflect any applicable fee waivers or expense reductions, without which the expenses would increase and results would have been less favorable.
| 1 | For certain types of investors as described in the portfolio's prospectuses. |
| 2 | Class I shares were first offered on 3-27-15. Class R2 and Class R6 shares were first offered on 3-1-12 and 9-1-11, respectively. Returns prior to these dates are those of Class R1 shares that have not been adjusted for class-specific expenses; otherwise, returns would vary. |
SEMIANNUAL REPORT | JOHN HANCOCK MULTIMANAGER LIFETIME PORTFOLIOS 12
Multimanager 2015 Lifetime Portfolio
GROWTH OF $10,000
This chart shows what happened to a hypothetical $10,000 investment in John Hancock Multimanager 2015 Lifetime Portfolio for the share classes and periods indicated, assuming all distributions were reinvested. For comparison, we've shown the same investment in two blended indexes and three separate indexes.
Index 1 is the S&P Target Date 2015 Index, an unmanaged index comprised of a set of indices aligned with specific target date years.
Index 2is the Bloomberg Barclays U.S. Aggregate Bond Index, an unmanaged index of dollar-denominated and nonconvertible investment-grade debt issues.
Index 3is the John Hancock 2015 Lifetime Index, which is based on the fund's asset allocation glide path and will reflect a more conservative allocation over time. The index is a customized blended index comprising some or all of the following component indices (ordered alphabetically): Bloomberg Barclays U.S. Aggregate Bond Index, Bloomberg Barclays U.S. Corporate Bond 1-5 Year Index, Bloomberg Barclays U.S. Treasury TIPS 1-5 Year Index, ICE BofA Long U.S. Treasury Principal STRIPS Index, ICE BofA U.S. High Yield Index, JP Morgan Emerging Markets Bond Index Global, MSCI Emerging Markets Index, MSCI World Energy Index, MSCI World ex-USA Index, MSCI World Metals & Mining Index, Russell 2500 Index, S&P 500 Index, S&P Global ex-U.S. REIT Index, S&P Global Infrastructure Index, S&P U.S. REIT Index, and S&P/LSTA Leveraged Loan Index.
Index 4is the S&P 500 Index, an unmanaged index that includes 500 widely traded common stocks.
Index 5is 30.60% Russell 3000 Index, 13.10% MSCI ACWI ex-USA Index, 45.00% Bloomberg Barclays U.S. Aggregate Bond Index, and 11.30% ICE Bank of America Merrill Lynch U.S. High Yield Master II Index.
Prior to January 1, 2020, the fund's primary benchmark was the Bloomberg Barclays U.S. Aggregate Bond Index. Effective January 1, 2020, the fund's primary benchmark index is the S&P Target Date 2015 Index. The S&P Target Date 2015 Index better reflects the universe of investment opportunities based on the fund's current investment strategy.
It is not possible to invest directly in an index. Index figures do not reflect expenses or sales charges, which would result in lower returns.
ASSET ALLOCATION (%)
| | | |
| Affiliated investment companies | % of Total |
| Equity | 34.8 |
| | Large Blend | 14.5 |
| | International Equity | 8.5 |
| | U.S. Large Cap | 8.1 |
| | U.S. Mid Cap | 2.2 |
| | Emerging-Market Equity | 1.0 |
| | U.S. Small Cap | 0.5 |
| Fixed income | 47.3 |
| | Intermediate Bond | 22.3 |
| | Multi-Sector Bond | 9.5 |
| | Short-Term Bond | 4.7 |
| | Emerging-Market Debt | 4.5 |
| | High Yield Bond | 3.9 |
| | Bank Loan | 2.4 |
| Alternative and specialty | 7.6 |
| | Sector Equity | 5.4 |
| | Absolute Return | 2.2 |
| Unaffiliated investment companies | 1.8 |
| | Equity | 1.8 |
| U.S. Government | 8.4 |
| Short-term investments and other | 0.1 |
As a percentage of net assets.
PERFORMANCE CHART
Total returns with maximum sales charge for the period ended 2-29-20 (%)
| | | | | | | | | | | | | | | |
| | Class A | Class I1,2 | Class R11 | Class R21,2 | Class R31 | Class R41 | Class R51 | Class R61,2 | Class 11 | Index 1 | Index 2 | Index 3 | Index 4 | Index 5 |
| Start date | 2-28-10 | 2-28-10 | 2-28-10 | 2-28-10 | 2-28-10 | 2-28-10 | 2-28-10 | 2-28-10 | 2-28-10 | 2-28-10 | 2-28-10 | 2-28-10 | 2-28-10 | 2-28-10 |
| Average annual total returns | | |
| 1-year | 0.99 | 6.61 | 5.97 | 6.27 | 6.09 | 6.48 | 6.68 | 6.74 | 6.69 | 6.33 | 11.68 | 8.72 | 8.19 | 8.26 |
| 5-year | 3.26 | 4.62 | 3.96 | 4.21 | 4.07 | 4.47 | 4.69 | 4.73 | 4.70 | 4.58 | 3.58 | 5.25 | 9.23 | 5.50 |
| 10-year | 5.97 | 6.56 | 6.23 | 6.44 | 6.32 | 6.73 | 6.96 | 6.91 | 6.95 | 6.66 | 3.93 | 7.93 | 12.65 | 7.74 |
| Cumulative returns | | |
| 6-months | -3.01 | 2.17 | 1.89 | 2.05 | 2.00 | 2.14 | 2.24 | 2.30 | 2.25 | 1.75 | 3.39 | 2.29 | 1.92 | 2.51 |
| 5-year | 17.39 | 25.36 | 21.44 | 22.90 | 22.07 | 24.45 | 25.78 | 25.97 | 25.80 | 25.08 | 19.21 | 29.15 | 55.49 | 30.72 |
| 10-year | 78.62 | 88.86 | 82.94 | 86.71 | 84.63 | 91.78 | 96.00 | 94.98 | 95.86 | 90.60 | 47.07 | 114.56 | 229.18 | 110.77 |
Performance figures assume all distributions have been reinvested. Figures reflect maximum sales charge on Class A shares of 5%. Sales charges are not applicable to Class I, Class R1, Class R2, Class R3, Class R4, Class R5, Class R6, and Class 1 shares.
The expense ratios of the portfolio, both net (including any fee waivers and/or expense limitations) and gross (excluding any fee waivers and/or expense limitations), are set forth according to the most recent publicly available prospectuses for the portfolio and may differ from those disclosed in the Financial highlights tables in this report. Net expenses reflect contractual expense limitations in effect until December 31, 2020 and are subject to change. Had the contractual fee waivers and expense limitations not been in place, gross expenses would apply. The following expense ratios include the expenses of the underlying funds in which the portfolio invests. The expense ratios are as follows:
| | | | | | | | | | |
| | Class A | Class I | Class R1 | Class R2 | Class R3 | Class R4 | Class R5 | Class R6 | Class 1 |
| Gross (%) | 1.37 | 1.07 | 1.71 | 1.46 | 1.61 | 1.31 | 1.01 | 0.96 | 1.00 |
| Net (%) | 0.94 | 0.64 | 1.28 | 1.03 | 1.18 | 0.78 | 0.58 | 0.52 | 0.57 |
Please refer to the most recent prospectus and annual or semiannual report for more information on expenses and any expense limitation arrangements for each class.
The returns reflect past results and should not be considered indicative of future performance. The return and principal value of an investment will fluctuate so that shares, when redeemed, may be worth more or less than their original cost. Due to market volatility and other factors, the portfolio's current performance may be higher or lower than the performance shown. For current to the most recent month-end performance data, please call 800-225-5291 or visit the portfolio's website at jhinvestments.com.
The performance information does not reflect the deduction of taxes that a shareholder would pay on portfolio distributions or the redemption of portfolio shares. The portfolio's performance results reflect any applicable fee waivers or expense reductions, without which the expenses would increase and results would have been less favorable.
| 1 | For certain types of investors as described in the portfolio's prospectuses. |
| 2 | Class I shares were first offered on 3-27-15. Class R2 and Class R6 shares were first offered on 3-1-12 and 9-1-11, respectively. Returns prior to these dates are those of Class R1 shares that have not been adjusted for class-specific expenses; otherwise, returns would vary. |
SEMIANNUAL REPORT | JOHN HANCOCK MULTIMANAGER LIFETIME PORTFOLIOS 13
Multimanager 2010 Lifetime Portfolio
GROWTH OF $10,000
This chart shows what happened to a hypothetical $10,000 investment in John Hancock Multimanager 2010 Lifetime Portfolio for the share classes and periods indicated, assuming all distributions were reinvested. For comparison, we've shown the same investment in two blended indexes and three separate indexes.
Index 1is the S&P Target Date 2010 Index, an unmanaged index comprised of a set of indices aligned with specific target date years.
Index 2is the Bloomberg Barclays U.S. Aggregate Bond Index, an unmanaged index of dollar-denominated and nonconvertible investment-grade debt issues.
Index 3is the John Hancock 2010 Lifetime Index, which is based on the fund's asset allocation glide path and will reflect a more conservative allocation over time. The index is a customized blended index comprising some or all of the following component indices (ordered alphabetically): Bloomberg Barclays U.S. Aggregate Bond Index, Bloomberg Barclays U.S. Corporate Bond 1-5 Year Index, Bloomberg Barclays U.S. Treasury TIPS 1-5 Year Index, ICE BofA Long U.S. Treasury Principal STRIPS Index, ICE BofA U.S. High Yield Index, JP Morgan Emerging Markets Bond Index Global, MSCI Emerging Markets Index, MSCI World Energy Index, MSCI World ex-USA Index, MSCI World Metals & Mining Index, Russell 2500 Index, S&P 500 Index, S&P Global ex-U.S. REIT Index, S&P Global Infrastructure Index, S&P U.S. REIT Index, and S&P/LSTA Leveraged Loan Index.
Index 4is the S&P 500 Index, an unmanaged index that includes 500 widely traded common stocks.
Index 5is 26.25% Russell 3000 Index, 11.25% MSCI ACWI ex-USA Index, 50.00% Bloomberg Barclays U.S. Aggregate Bond Index, and 12.50% ICE BofA U.S. High Yield Master II Index.
Prior to January 1, 2020, the fund's primary benchmark was the Bloomberg Barclays U.S. Aggregate Bond Index. Effective January 1, 2020, the fund's primary benchmark index is the S&P Target Date 2010 Index. The S&P Target Date 2010 Index better reflects the universe of investment opportunities based on the fund's current investment strategy.
It is not possible to invest directly in an index. Index figures do not reflect expenses or sales charges, which would result in lower returns.
ASSET ALLOCATION (%)
| | | |
| Affiliated investment companies | % of Total |
| Equity | 28.7 |
| | Large Blend | 12.3 |
| | U.S. Large Cap | 8.3 |
| | International Equity | 6.1 |
| | U.S. Mid Cap | 1.3 |
| | Emerging-Market Equity | 0.4 |
| | U.S. Small Cap | 0.3 |
| Fixed income | 53.6 |
| | Intermediate Bond | 24.9 |
| | Multi-Sector Bond | 10.3 |
| | Short-Term Bond | 6.4 |
| | Emerging-Market Debt | 4.8 |
| | High Yield Bond | 4.1 |
| | Bank Loan | 3.1 |
| Alternative and specialty | 7.9 |
| | Absolute Return | 5.4 |
| | Sector Equity | 2.5 |
| Unaffiliated investment companies | 1.5 |
| | Equity | 1.5 |
| U.S. Government | 8.2 |
| Short-term investments and other | 0.1 |
As a percentage of net assets.
PERFORMANCE CHART
Total returns with maximum sales charge for the period ended 2-29-20 (%)
| | | | | | | | | | | | | | | |
| | Class A | Class I1,2 | Class R11 | Class R21,2 | Class R31 | Class R41 | Class R51 | Class R61,2 | Class 11 | Index 1 | Index 2 | Index 3 | Index 4 | Index 5 |
| Start date | 2-28-10 | 2-28-10 | 2-28-10 | 2-28-10 | 2-28-10 | 2-28-10 | 2-28-10 | 2-28-10 | 2-28-10 | 2-28-10 | 2-28-10 | 2-28-10 | 2-28-10 | 2-28-10 |
| Average annual total returns | | |
| 1-year | 1.15 | 6.82 | 6.33 | 6.44 | 6.31 | 6.70 | 6.90 | 6.95 | 6.90 | 6.76 | 11.68 | 8.27 | 8.19 | 8.62 |
| 5-year | 3.05 | 4.42 | 3.86 | 4.02 | 3.87 | 4.30 | 4.49 | 4.54 | 4.49 | 4.27 | 3.58 | 4.89 | 9.23 | 5.32 |
| 10-year | 5.55 | 6.13 | 5.84 | 6.00 | 5.90 | 6.30 | 6.54 | 6.46 | 6.52 | 6.00 | 3.93 | 7.13 | 12.65 | 7.26 |
| Cumulative returns | | |
| 6-months | -3.08 | 2.12 | 1.99 | 1.99 | 1.97 | 2.12 | 2.20 | 2.13 | 2.20 | 1.92 | 3.39 | 2.16 | 1.92 | 2.60 |
| 5-year | 16.19 | 24.16 | 20.82 | 21.76 | 20.90 | 23.45 | 24.57 | 24.88 | 24.56 | 23.27 | 19.21 | 26.97 | 55.49 | 29.59 |
| 10-year | 71.62 | 81.24 | 76.37 | 79.16 | 77.32 | 84.23 | 88.47 | 87.05 | 88.03 | 79.09 | 47.07 | 99.10 | 229.18 | 101.60 |
Performance figures assume all distributions have been reinvested. Figures reflect maximum sales charge on Class A shares of 5%. Sales charges are not applicable to Class I, Class R1, Class R2, Class R3, Class R4, Class R5, Class R6, and Class 1 shares.
The expense ratios of the portfolio, both net (including any fee waivers and/or expense limitations) and gross (excluding any fee waivers and/or expense limitations), are set forth according to the most recent publicly available prospectuses for the portfolio and may differ from those disclosed in the Financial highlights tables in this report. Net expenses reflect contractual expense limitations in effect until December 31, 2020 and are subject to change. Had the contractual fee waivers and expense limitations not been in place, gross expenses would apply. The following expense ratios include the expenses of the underlying funds in which the portfolio invests. The expense ratios are as follows:
| | | | | | | | | | |
| | Class A | Class I | Class R1 | Class R2 | Class R3 | Class R4 | Class R5 | Class R6 | Class 1 |
| Gross (%) | 1.40 | 1.10 | 1.74 | 1.49 | 1.64 | 1.34 | 1.04 | 0.99 | 1.03 |
| Net (%) | 0.92 | 0.62 | 1.26 | 1.01 | 1.16 | 0.76 | 0.56 | 0.50 | 0.55 |
Please refer to the most recent prospectus and annual or semiannual report for more information on expenses and any expense limitation arrangements for each class.
The returns reflect past results and should not be considered indicative of future performance. The return and principal value of an investment will fluctuate so that shares, when redeemed, may be worth more or less than their original cost. Due to market volatility and other factors, the portfolio's current performance may be higher or lower than the performance shown. For current to the most recent month-end performance data, please call 800-225-5291 or visit the portfolio's website at jhinvestments.com.
The performance information does not reflect the deduction of taxes that a shareholder would pay on portfolio distributions or the redemption of portfolio shares. The portfolio's performance results reflect any applicable fee waivers or expense reductions, without which the expenses would increase and results would have been less favorable.
| 1 | For certain types of investors as described in the portfolio's prospectuses. |
| 2 | Class I shares were first offered on 3-27-15. Class R2 and Class R6 shares were first offered on 3-1-12 and 9-1-11, respectively. Returns prior to these dates are those of Class R1 shares that have not been adjusted for class-specific expenses; otherwise, returns would vary. |
SEMIANNUAL REPORT | JOHN HANCOCK MULTIMANAGER LIFETIME PORTFOLIOS 14
As a shareholder of a John Hancock Funds II Multimanager Lifetime Portfolio, you incur two types of costs: (1) transaction costs, including sales charges (loads) on certain purchases or redemptions, and (2) ongoing costs, including management fees, distribution and service (Rule 12b-1) fees, and other portfolio expenses. In addition to the operating expenses which each portfolio bears directly, each portfolio indirectly bears a pro rata share of the operating expenses of the underlying funds in which each portfolio invests. Because underlying funds have varied operating expenses and transaction costs, and a portfolio may own different proportions of the underlying funds at different times, the amount of expenses incurred indirectly by the portfolio will vary. Had these indirect expenses been reflected in the following analysis, total expenses would have been higher than the amounts shown.
These examples are intended to help you understand your ongoing costs (in dollars) of investing in a portfolio so you can compare these costs with the ongoing costs of investing in other mutual funds. The examples are based on an investment of $1,000 at the beginning of the period and held for the entire period (September 1, 2019 through February 29, 2020).
Actual expenses:
The first line of each share class in the following table provides information about actual account values and actual expenses. You may use the information in this line, together with the amount you invested, to estimate the expenses that you paid over the period. Simply divide your account value by $1,000 (for example, an $8,600 account value divided by $1,000 = 8.6), then multiply the result by the number in the first line under the heading entitled “Expenses paid during period ended” to estimate the expenses you paid on your account during this period.
Hypothetical example for comparison purposes:
The second line of each share class in the following table provides information about hypothetical account values and hypothetical expenses based on the actual expense ratio for the share class and an assumed annualized rate of return of 5% per year before expenses, which is not the actual return of the share class. The hypothetical account values and expenses may not be used to estimate the actual ending account balance or expenses you paid for the period. You may use this information to compare the ongoing costs of investing in a portfolio and other funds. To do so, compare this 5% hypothetical example with the 5% hypothetical examples that appear in the shareholder reports of the other funds. Please remember that these hypothetical account values and expenses may not be used to estimate the actual ending account balance or expenses you paid for the period.
Please note that the expenses shown in the table are meant to highlight your ongoing costs only and do not reflect any transactional costs. Therefore, the second line of each share class in the table is useful in comparing ongoing costs only, and will not help you determine the relative total costs of owning different funds. In addition, if these transactional costs were included, your costs would have been higher. See the portfolios’ prospectuses for details regarding transaction costs.
SHAREHOLDER EXPENSE EXAMPLE CHART
| | | Account
value on
9-1-2019 | Ending
value on
2-29-2020 | Expenses
paid during
period ended
2-29-20201 | Annualized
expense
ratio2 |
| Multimanager 2060 Lifetime Portfolio |
| Class A | Actual expenses/actual returns | $1,000.00 | $1,013.00 | $2.10 | 0.42% |
| | Hypothetical example | 1,000.00 | 1,022.80 | 2.11 | 0.42% |
| Class I | Actual expenses/actual returns | 1,000.00 | 1,015.10 | 0.60 | 0.12% |
| | Hypothetical example | 1,000.00 | 1,024.30 | 0.60 | 0.12% |
| Class R1 | Actual expenses/actual returns | 1,000.00 | 1,012.10 | 2.55 | 0.51% |
| | Hypothetical example | 1,000.00 | 1,022.30 | 2.56 | 0.51% |
| Class R2 | Actual expenses/actual returns | 1,000.00 | 1,013.40 | 1.90 | 0.38% |
| | Hypothetical example | 1,000.00 | 1,023.00 | 1.91 | 0.38% |
| Class R3 | Actual expenses/actual returns | 1,000.00 | 1,012.00 | 3.10 | 0.62% |
| | Hypothetical example | 1,000.00 | 1,021.80 | 3.12 | 0.62% |
| Class R4 | Actual expenses/actual returns | 1,000.00 | 1,013.80 | 0.80 | 0.16% |
| | Hypothetical example | 1,000.00 | 1,024.10 | 0.81 | 0.16% |
| Class R5 | Actual expenses/actual returns | 1,000.00 | 1,015.60 | 0.30 | 0.06% |
| | Hypothetical example | 1,000.00 | 1,024.60 | 0.30 | 0.06% |
| Class R6 | Actual expenses/actual returns | 1,000.00 | 1,015.30 | 0.00 | 0.00% |
| | Hypothetical example | 1,000.00 | 1,024.90 | 0.00 | 0.00% |
| Class 1 | Actual expenses/actual returns | 1,000.00 | 1,014.80 | 0.25 | 0.05% |
| | Hypothetical example | 1,000.00 | 1,024.60 | 0.25 | 0.05% |
| | SEMIANNUAL REPORT | JOHN HANCOCK MULTIMANAGER LIFETIME PORTFOLIOS | 15 |
SHAREHOLDER EXPENSE EXAMPLE CHART (continued)
| | | Account
value on
9-1-2019 | Ending
value on
2-29-2020 | Expenses
paid during
period ended
2-29-20201 | Annualized
expense
ratio2 |
| Multimanager 2055 Lifetime Portfolio |
| Class A | Actual expenses/actual returns | $1,000.00 | $1,013.50 | $2.10 | 0.42% |
| | Hypothetical example | 1,000.00 | 1,022.80 | 2.11 | 0.42% |
| Class I | Actual expenses/actual returns | 1,000.00 | 1,014.60 | 0.60 | 0.12% |
| | Hypothetical example | 1,000.00 | 1,024.30 | 0.60 | 0.12% |
| Class R1 | Actual expenses/actual returns | 1,000.00 | 1,012.70 | 2.55 | 0.51% |
| | Hypothetical example | 1,000.00 | 1,022.30 | 2.56 | 0.51% |
| Class R2 | Actual expenses/actual returns | 1,000.00 | 1,011.80 | 2.50 | 0.50% |
| | Hypothetical example | 1,000.00 | 1,022.40 | 2.51 | 0.50% |
| Class R3 | Actual expenses/actual returns | 1,000.00 | 1,011.30 | 3.30 | 0.66% |
| | Hypothetical example | 1,000.00 | 1,021.60 | 3.32 | 0.66% |
| Class R4 | Actual expenses/actual returns | 1,000.00 | 1,014.10 | 0.80 | 0.16% |
| | Hypothetical example | 1,000.00 | 1,024.10 | 0.81 | 0.16% |
| Class R5 | Actual expenses/actual returns | 1,000.00 | 1,015.10 | 0.30 | 0.06% |
| | Hypothetical example | 1,000.00 | 1,024.60 | 0.30 | 0.06% |
| Class R6 | Actual expenses/actual returns | 1,000.00 | 1,014.70 | 0.00 | 0.00% |
| | Hypothetical example | 1,000.00 | 1,024.90 | 0.00 | 0.00% |
| Class 1 | Actual expenses/actual returns | 1,000.00 | 1,015.10 | 0.25 | 0.05% |
| | Hypothetical example | 1,000.00 | 1,024.60 | 0.25 | 0.05% |
| Multimanager 2050 Lifetime Portfolio |
| Class A | Actual expenses/actual returns | $1,000.00 | $1,012.80 | $2.10 | 0.42% |
| | Hypothetical example | 1,000.00 | 1,022.80 | 2.11 | 0.42% |
| Class I | Actual expenses/actual returns | 1,000.00 | 1,013.80 | 0.60 | 0.12% |
| | Hypothetical example | 1,000.00 | 1,024.30 | 0.60 | 0.12% |
| Class R1 | Actual expenses/actual returns | 1,000.00 | 1,011.40 | 3.80 | 0.76% |
| | Hypothetical example | 1,000.00 | 1,021.10 | 3.82 | 0.76% |
| Class R2 | Actual expenses/actual returns | 1,000.00 | 1,013.00 | 2.45 | 0.49% |
| | Hypothetical example | 1,000.00 | 1,022.40 | 2.46 | 0.49% |
| Class R3 | Actual expenses/actual returns | 1,000.00 | 1,011.50 | 3.25 | 0.65% |
| | Hypothetical example | 1,000.00 | 1,021.60 | 3.27 | 0.65% |
| Class R4 | Actual expenses/actual returns | 1,000.00 | 1,013.40 | 1.30 | 0.26% |
| | Hypothetical example | 1,000.00 | 1,023.60 | 1.31 | 0.26% |
| Class R5 | Actual expenses/actual returns | 1,000.00 | 1,015.40 | 0.30 | 0.06% |
| | Hypothetical example | 1,000.00 | 1,024.60 | 0.30 | 0.06% |
| Class R6 | Actual expenses/actual returns | 1,000.00 | 1,015.00 | 0.00 | 0.00% |
| | Hypothetical example | 1,000.00 | 1,024.90 | 0.00 | 0.00% |
| Class 1 | Actual expenses/actual returns | 1,000.00 | 1,015.40 | 0.25 | 0.05% |
| | Hypothetical example | 1,000.00 | 1,024.60 | 0.25 | 0.05% |
| 16 | JOHN HANCOCK MULTIMANAGER LIFETIME PORTFOLIOS | SEMIANNUAL REPORT | |
SHAREHOLDER EXPENSE EXAMPLE CHART (continued)
| | | Account
value on
9-1-2019 | Ending
value on
2-29-2020 | Expenses
paid during
period ended
2-29-20201 | Annualized
expense
ratio2 |
| Multimanager 2045 Lifetime Portfolio |
| Class A | Actual expenses/actual returns | $1,000.00 | $1,012.80 | $2.10 | 0.42% |
| | Hypothetical example | 1,000.00 | 1,022.80 | 2.11 | 0.42% |
| Class I | Actual expenses/actual returns | 1,000.00 | 1,014.70 | 0.60 | 0.12% |
| | Hypothetical example | 1,000.00 | 1,024.30 | 0.60 | 0.12% |
| Class R1 | Actual expenses/actual returns | 1,000.00 | 1,010.80 | 3.65 | 0.73% |
| | Hypothetical example | 1,000.00 | 1,021.20 | 3.67 | 0.73% |
| Class R2 | Actual expenses/actual returns | 1,000.00 | 1,011.80 | 2.55 | 0.51% |
| | Hypothetical example | 1,000.00 | 1,022.30 | 2.56 | 0.51% |
| Class R3 | Actual expenses/actual returns | 1,000.00 | 1,011.50 | 3.25 | 0.65% |
| | Hypothetical example | 1,000.00 | 1,021.60 | 3.27 | 0.65% |
| Class R4 | Actual expenses/actual returns | 1,000.00 | 1,013.30 | 1.30 | 0.26% |
| | Hypothetical example | 1,000.00 | 1,023.60 | 1.31 | 0.26% |
| Class R5 | Actual expenses/actual returns | 1,000.00 | 1,015.20 | 0.30 | 0.06% |
| | Hypothetical example | 1,000.00 | 1,024.60 | 0.30 | 0.06% |
| Class R6 | Actual expenses/actual returns | 1,000.00 | 1,014.80 | 0.00 | 0.00% |
| | Hypothetical example | 1,000.00 | 1,024.90 | 0.00 | 0.00% |
| Class 1 | Actual expenses/actual returns | 1,000.00 | 1,014.40 | 0.25 | 0.05% |
| | Hypothetical example | 1,000.00 | 1,024.60 | 0.25 | 0.05% |
| Multimanager 2040 Lifetime Portfolio |
| Class A | Actual expenses/actual returns | $1,000.00 | $1,015.90 | $2.11 | 0.42% |
| | Hypothetical example | 1,000.00 | 1,022.80 | 2.11 | 0.42% |
| Class I | Actual expenses/actual returns | 1,000.00 | 1,017.80 | 0.60 | 0.12% |
| | Hypothetical example | 1,000.00 | 1,024.30 | 0.60 | 0.12% |
| Class R1 | Actual expenses/actual returns | 1,000.00 | 1,014.70 | 3.76 | 0.75% |
| | Hypothetical example | 1,000.00 | 1,021.10 | 3.77 | 0.75% |
| Class R2 | Actual expenses/actual returns | 1,000.00 | 1,016.10 | 2.46 | 0.49% |
| | Hypothetical example | 1,000.00 | 1,022.40 | 2.46 | 0.49% |
| Class R3 | Actual expenses/actual returns | 1,000.00 | 1,014.70 | 3.26 | 0.65% |
| | Hypothetical example | 1,000.00 | 1,021.60 | 3.27 | 0.65% |
| Class R4 | Actual expenses/actual returns | 1,000.00 | 1,017.50 | 1.30 | 0.26% |
| | Hypothetical example | 1,000.00 | 1,023.60 | 1.31 | 0.26% |
| Class R5 | Actual expenses/actual returns | 1,000.00 | 1,018.30 | 0.30 | 0.06% |
| | Hypothetical example | 1,000.00 | 1,024.60 | 0.30 | 0.06% |
| Class R6 | Actual expenses/actual returns | 1,000.00 | 1,018.00 | 0.00 | 0.00% |
| | Hypothetical example | 1,000.00 | 1,024.90 | 0.00 | 0.00% |
| Class 1 | Actual expenses/actual returns | 1,000.00 | 1,018.50 | 0.25 | 0.05% |
| | Hypothetical example | 1,000.00 | 1,024.60 | 0.25 | 0.05% |
| | SEMIANNUAL REPORT | JOHN HANCOCK MULTIMANAGER LIFETIME PORTFOLIOS | 17 |
SHAREHOLDER EXPENSE EXAMPLE CHART (continued)
| | | Account
value on
9-1-2019 | Ending
value on
2-29-2020 | Expenses
paid during
period ended
2-29-20201 | Annualized
expense
ratio2 |
| Multimanager 2035 Lifetime Portfolio |
| Class A | Actual expenses/actual returns | $1,000.00 | $1,018.20 | $2.11 | 0.42% |
| | Hypothetical example | 1,000.00 | 1,022.80 | 2.11 | 0.42% |
| Class I | Actual expenses/actual returns | 1,000.00 | 1,020.50 | 0.60 | 0.12% |
| | Hypothetical example | 1,000.00 | 1,024.30 | 0.60 | 0.12% |
| Class R1 | Actual expenses/actual returns | 1,000.00 | 1,017.00 | 3.81 | 0.76% |
| | Hypothetical example | 1,000.00 | 1,021.10 | 3.82 | 0.76% |
| Class R2 | Actual expenses/actual returns | 1,000.00 | 1,019.20 | 2.56 | 0.51% |
| | Hypothetical example | 1,000.00 | 1,022.30 | 2.56 | 0.51% |
| Class R3 | Actual expenses/actual returns | 1,000.00 | 1,017.90 | 3.31 | 0.66% |
| | Hypothetical example | 1,000.00 | 1,021.60 | 3.32 | 0.66% |
| Class R4 | Actual expenses/actual returns | 1,000.00 | 1,019.90 | 1.31 | 0.26% |
| | Hypothetical example | 1,000.00 | 1,023.60 | 1.31 | 0.26% |
| Class R5 | Actual expenses/actual returns | 1,000.00 | 1,020.70 | 0.30 | 0.06% |
| | Hypothetical example | 1,000.00 | 1,024.60 | 0.30 | 0.06% |
| Class R6 | Actual expenses/actual returns | 1,000.00 | 1,021.30 | 0.00 | 0.00% |
| | Hypothetical example | 1,000.00 | 1,024.90 | 0.00 | 0.00% |
| Class 1 | Actual expenses/actual returns | 1,000.00 | 1,020.90 | 0.25 | 0.05% |
| | Hypothetical example | 1,000.00 | 1,024.60 | 0.25 | 0.05% |
| Multimanager 2030 Lifetime Portfolio |
| Class A | Actual expenses/actual returns | $1,000.00 | $1,021.10 | $2.11 | 0.42% |
| | Hypothetical example | 1,000.00 | 1,022.80 | 2.11 | 0.42% |
| Class I | Actual expenses/actual returns | 1,000.00 | 1,023.00 | 0.60 | 0.12% |
| | Hypothetical example | 1,000.00 | 1,024.30 | 0.60 | 0.12% |
| Class R1 | Actual expenses/actual returns | 1,000.00 | 1,020.10 | 3.72 | 0.74% |
| | Hypothetical example | 1,000.00 | 1,021.20 | 3.72 | 0.74% |
| Class R2 | Actual expenses/actual returns | 1,000.00 | 1,021.50 | 2.46 | 0.49% |
| | Hypothetical example | 1,000.00 | 1,022.40 | 2.46 | 0.49% |
| Class R3 | Actual expenses/actual returns | 1,000.00 | 1,020.00 | 3.26 | 0.65% |
| | Hypothetical example | 1,000.00 | 1,021.60 | 3.27 | 0.65% |
| Class R4 | Actual expenses/actual returns | 1,000.00 | 1,022.90 | 1.26 | 0.25% |
| | Hypothetical example | 1,000.00 | 1,023.60 | 1.26 | 0.25% |
| Class R5 | Actual expenses/actual returns | 1,000.00 | 1,022.80 | 0.30 | 0.06% |
| | Hypothetical example | 1,000.00 | 1,024.60 | 0.30 | 0.06% |
| Class R6 | Actual expenses/actual returns | 1,000.00 | 1,023.40 | 0.00 | 0.00% |
| | Hypothetical example | 1,000.00 | 1,024.90 | 0.00 | 0.00% |
| Class 1 | Actual expenses/actual returns | 1,000.00 | 1,022.90 | 0.25 | 0.05% |
| | Hypothetical example | 1,000.00 | 1,024.60 | 0.25 | 0.05% |
| 18 | JOHN HANCOCK MULTIMANAGER LIFETIME PORTFOLIOS | SEMIANNUAL REPORT | |
SHAREHOLDER EXPENSE EXAMPLE CHART (continued)
| | | Account
value on
9-1-2019 | Ending
value on
2-29-2020 | Expenses
paid during
period ended
2-29-20201 | Annualized
expense
ratio2 |
| Multimanager 2025 Lifetime Portfolio |
| Class A | Actual expenses/actual returns | $1,000.00 | $1,021.10 | $2.11 | 0.42% |
| | Hypothetical example | 1,000.00 | 1,022.80 | 2.11 | 0.42% |
| Class I | Actual expenses/actual returns | 1,000.00 | 1,022.10 | 0.60 | 0.12% |
| | Hypothetical example | 1,000.00 | 1,024.30 | 0.60 | 0.12% |
| Class R1 | Actual expenses/actual returns | 1,000.00 | 1,019.20 | 3.72 | 0.74% |
| | Hypothetical example | 1,000.00 | 1,021.20 | 3.72 | 0.74% |
| Class R2 | Actual expenses/actual returns | 1,000.00 | 1,020.70 | 2.46 | 0.49% |
| | Hypothetical example | 1,000.00 | 1,022.40 | 2.46 | 0.49% |
| Class R3 | Actual expenses/actual returns | 1,000.00 | 1,020.00 | 3.31 | 0.66% |
| | Hypothetical example | 1,000.00 | 1,021.60 | 3.32 | 0.66% |
| Class R4 | Actual expenses/actual returns | 1,000.00 | 1,021.70 | 1.31 | 0.26% |
| | Hypothetical example | 1,000.00 | 1,023.60 | 1.31 | 0.26% |
| Class R5 | Actual expenses/actual returns | 1,000.00 | 1,022.80 | 0.30 | 0.06% |
| | Hypothetical example | 1,000.00 | 1,024.60 | 0.30 | 0.06% |
| Class R6 | Actual expenses/actual returns | 1,000.00 | 1,022.40 | 0.00 | 0.00% |
| | Hypothetical example | 1,000.00 | 1,024.90 | 0.00 | 0.00% |
| Class 1 | Actual expenses/actual returns | 1,000.00 | 1,022.80 | 0.25 | 0.05% |
| | Hypothetical example | 1,000.00 | 1,024.60 | 0.25 | 0.05% |
| Multimanager 2020 Lifetime Portfolio |
| Class A | Actual expenses/actual returns | $1,000.00 | $1,022.50 | $2.11 | 0.42% |
| | Hypothetical example | 1,000.00 | 1,022.80 | 2.11 | 0.42% |
| Class I | Actual expenses/actual returns | 1,000.00 | 1,024.40 | 0.60 | 0.12% |
| | Hypothetical example | 1,000.00 | 1,024.30 | 0.60 | 0.12% |
| Class R1 | Actual expenses/actual returns | 1,000.00 | 1,021.50 | 3.77 | 0.75% |
| | Hypothetical example | 1,000.00 | 1,021.10 | 3.77 | 0.75% |
| Class R2 | Actual expenses/actual returns | 1,000.00 | 1,022.90 | 2.51 | 0.50% |
| | Hypothetical example | 1,000.00 | 1,022.40 | 2.51 | 0.50% |
| Class R3 | Actual expenses/actual returns | 1,000.00 | 1,021.40 | 3.32 | 0.66% |
| | Hypothetical example | 1,000.00 | 1,021.60 | 3.32 | 0.66% |
| Class R4 | Actual expenses/actual returns | 1,000.00 | 1,023.20 | 1.26 | 0.25% |
| | Hypothetical example | 1,000.00 | 1,023.60 | 1.26 | 0.25% |
| Class R5 | Actual expenses/actual returns | 1,000.00 | 1,024.10 | 0.30 | 0.06% |
| | Hypothetical example | 1,000.00 | 1,024.60 | 0.30 | 0.06% |
| Class R6 | Actual expenses/actual returns | 1,000.00 | 1,024.70 | 0.00 | 0.00% |
| | Hypothetical example | 1,000.00 | 1,024.90 | 0.00 | 0.00% |
| Class 1 | Actual expenses/actual returns | 1,000.00 | 1,024.10 | 0.25 | 0.05% |
| | Hypothetical example | 1,000.00 | 1,024.60 | 0.25 | 0.05% |
| | SEMIANNUAL REPORT | JOHN HANCOCK MULTIMANAGER LIFETIME PORTFOLIOS | 19 |
SHAREHOLDER EXPENSE EXAMPLE CHART (continued)
| | | Account
value on
9-1-2019 | Ending
value on
2-29-2020 | Expenses
paid during
period ended
2-29-20201 | Annualized
expense
ratio2 |
| Multimanager 2015 Lifetime Portfolio |
| Class A | Actual expenses/actual returns | $1,000.00 | $1,020.90 | $2.11 | 0.42% |
| | Hypothetical example | 1,000.00 | 1,022.80 | 2.11 | 0.42% |
| Class I | Actual expenses/actual returns | 1,000.00 | 1,021.70 | 0.60 | 0.12% |
| | Hypothetical example | 1,000.00 | 1,024.30 | 0.60 | 0.12% |
| Class R1 | Actual expenses/actual returns | 1,000.00 | 1,018.90 | 3.81 | 0.76% |
| | Hypothetical example | 1,000.00 | 1,021.10 | 3.82 | 0.76% |
| Class R2 | Actual expenses/actual returns | 1,000.00 | 1,020.50 | 2.51 | 0.50% |
| | Hypothetical example | 1,000.00 | 1,022.40 | 2.51 | 0.50% |
| Class R3 | Actual expenses/actual returns | 1,000.00 | 1,020.00 | 3.26 | 0.65% |
| | Hypothetical example | 1,000.00 | 1,021.60 | 3.27 | 0.65% |
| Class R4 | Actual expenses/actual returns | 1,000.00 | 1,021.40 | 1.36 | 0.27% |
| | Hypothetical example | 1,000.00 | 1,023.50 | 1.36 | 0.27% |
| Class R5 | Actual expenses/actual returns | 1,000.00 | 1,022.40 | 0.30 | 0.06% |
| | Hypothetical example | 1,000.00 | 1,024.60 | 0.30 | 0.06% |
| Class R6 | Actual expenses/actual returns | 1,000.00 | 1,023.00 | 0.00 | 0.00% |
| | Hypothetical example | 1,000.00 | 1,024.90 | 0.00 | 0.00% |
| Class 1 | Actual expenses/actual returns | 1,000.00 | 1,022.50 | 0.25 | 0.05% |
| | Hypothetical example | 1,000.00 | 1,024.60 | 0.25 | 0.05% |
| Multimanager 2010 Lifetime Portfolio |
| Class A | Actual expenses/actual returns | $1,000.00 | $1,020.60 | $2.11 | 0.42% |
| | Hypothetical example | 1,000.00 | 1,022.80 | 2.11 | 0.42% |
| Class I | Actual expenses/actual returns | 1,000.00 | 1,021.20 | 0.60 | 0.12% |
| | Hypothetical example | 1,000.00 | 1,024.30 | 0.60 | 0.12% |
| Class R1 | Actual expenses/actual returns | 1,000.00 | 1,019.90 | 3.16 | 0.63% |
| | Hypothetical example | 1,000.00 | 1,021.70 | 3.17 | 0.63% |
| Class R2 | Actual expenses/actual returns | 1,000.00 | 1,019.90 | 2.46 | 0.49% |
| | Hypothetical example | 1,000.00 | 1,022.40 | 2.46 | 0.49% |
| Class R3 | Actual expenses/actual returns | 1,000.00 | 1,019.70 | 3.26 | 0.65% |
| | Hypothetical example | 1,000.00 | 1,021.60 | 3.27 | 0.65% |
| Class R4 | Actual expenses/actual returns | 1,000.00 | 1,021.20 | 1.31 | 0.26% |
| | Hypothetical example | 1,000.00 | 1,023.60 | 1.31 | 0.26% |
| Class R5 | Actual expenses/actual returns | 1,000.00 | 1,022.00 | 0.30 | 0.06% |
| | Hypothetical example | 1,000.00 | 1,024.60 | 0.30 | 0.06% |
| Class R6 | Actual expenses/actual returns | 1,000.00 | 1,021.30 | 0.00 | 0.00% |
| | Hypothetical example | 1,000.00 | 1,024.90 | 0.00 | 0.00% |
| Class 1 | Actual expenses/actual returns | 1,000.00 | 1,022.00 | 0.25 | 0.05% |
| | Hypothetical example | 1,000.00 | 1,024.60 | 0.25 | 0.05% |
| 1 | Expenses are equal to the annualized expense ratio, multiplied by the average account value over the period, multiplied by 182/366 (to reflect the one-half year period). |
| 2 | Ratios do not include expenses indirectly incurred by the underlying funds and can vary based on the mix of underlying funds held by the portfolios. |
| 20 | JOHN HANCOCK MULTIMANAGER LIFETIME PORTFOLIOS | SEMIANNUAL REPORT | |
| Subadvisors of Affiliated Underlying Funds |
| Allianz Global Investors U.S. LLC | (Allianz) |
| Axiom International Investors LLC | (Axiom) |
| BCSF Advisors, LP (Bain Capital Credit) | (Bain Capital) |
| Boston Partners Global Investors, Inc. | (Boston Partners) |
| Deutsche Investment Management Americas, Inc. | (Deutsche) |
| Dimensional Fund Advisors LP | (DFA) |
| Epoch Investment Partners, Inc. | (Epoch) |
| First Quadrant, L.P. | (First Quadrant) |
| Jennison Associates LLC | (Jennison) |
| Manulife Investment Management (North America) Limited | (MIM NA) |
| Manulife Investment Management (US) LLC | (MIM US) |
| Redwood Investment Management, LLC | (Redwood) |
| Stone Harbor Investment Partners LP | (Stone Harbor) |
| T. Rowe Price Associates, Inc. | (T. Rowe Price) |
| Unigestion (UK) Limited | (Unigestion) |
| Wellington Management Company LLP | (Wellington) |
| Wells Capital Management, Incorporated | (Wells Capital) |
MULTIMANAGER 2060 LIFETIME PORTFOLIO
As of 2-29-20 (unaudited)
| | Shares or
Principal
Amount | Value |
| AFFILIATED INVESTMENT COMPANIES (A) - 93.3% | |
| Equity - 87.0% | | |
| Blue Chip Growth, Class NAV, JHF II (T. Rowe Price) | 150,378 | $6,335,422 |
| Capital Appreciation, Class NAV, JHF II (Jennison) | 253,552 | 3,937,669 |
| Capital Appreciation Value, Class NAV, JHF II (T. Rowe Price) | 283,994 | 3,064,296 |
| Disciplined Value, Class NAV, JHF III (Boston Partners) | 227,486 | 4,097,016 |
| Disciplined Value International, Class NAV, JHIT (Boston Partners) | 312,223 | 3,437,573 |
| Emerging Markets Equity, Class NAV, JHIT (MIM US) (B) | 623,041 | 6,641,616 |
| Equity Income, Class NAV, JHF II (T. Rowe Price) | 365,428 | 6,018,591 |
| Financial Industries, Class NAV, JHIT II (MIM US) (B) | 77,131 | 1,312,767 |
| Fundamental Large Cap Core, Class NAV, JHIT (MIM US) (B) | 65,448 | 3,085,890 |
| International Dynamic Growth, Class NAV, JHIT (Axiom) | 63,409 | 673,404 |
| International Growth, Class NAV, JHF III (Wellington) | 105,702 | 2,949,092 |
| International Small Company, Class NAV, JHF II (DFA) | 244,759 | 2,371,716 |
| Mid Cap Stock, Class NAV, JHF II (Wellington) | 225,534 | 4,578,335 |
| Mid Value, Class NAV, JHF II (T. Rowe Price) | 315,622 | 4,374,522 |
| Small Cap Growth, Class NAV, JHF II (Redwood) (C) | 61,846 | 987,060 |
| Small Cap Value, Class NAV, JHF II (Wellington) | 52,008 | 933,545 |
| Strategic Equity Allocation, Class NAV, JHF II (MIM US) (B) | 2,991,554 | 32,608,045 |
| Fixed income - 2.6% | | |
| Bond, Class NAV, JHSB (MIM US) (B) | 25,347 | 419,740 |
| Core Bond, Class NAV, JHF II (Wells Capital) | 30,597 | 415,195 |
| Emerging Markets Debt, Class NAV, JHF II (MIM US) (B) | 59,912 | 570,963 |
| High Yield, Class NAV, JHBT (MIM US) (B) | 168,721 | 566,901 |
| Strategic Income Opportunities, Class NAV, JHF II (MIM US) (B) | 53,770 | 574,260 |
| Alternative and specialty - 3.7% | | |
| Absolute Return Currency, Class NAV, JHF II (First Quadrant) | 71,070 | 658,815 |
| Alternative Risk Premia, Class NAV, JHIT (Unigestion) | 65,927 | 631,585 |
| Health Sciences, Class NAV, JHF II (T. Rowe Price) | 262,247 | 1,219,450 |
| Science & Technology, Class NAV, JHF II (T. Rowe Price/Allianz) | 322,525 | 1,235,269 |
|
TOTAL AFFILIATED INVESTMENT COMPANIES (Cost
$99,160,176) | $93,698,737 |
| UNAFFILIATED INVESTMENT COMPANIES - 4.0% | |
| Equity - 4.0% | | |
| Fidelity 500 Index Fund | 3,716 | 381,885 |
| SEE NOTES TO FINANCIAL STATEMENTS | SEMIANNUAL REPORT | JOHN HANCOCK MULTIMANAGER LIFETIME PORTFOLIOS | 21 |
MULTIMANAGER 2060 LIFETIME PORTFOLIO (continued)
| | Shares or
Principal
Amount | Value |
| Equity - (continued) | | |
| Fidelity Emerging Markets Index Fund | 190,569 | $1,898,069 |
| Fidelity International Index Fund | 29,276 | 1,132,097 |
| Fidelity Small Cap Index Fund | 33,064 | 616,309 |
|
TOTAL UNAFFILIATED INVESTMENT COMPANIES (Cost
$4,357,608) | $4,028,360 |
| COMMON STOCKS - 0.0% | |
| Energy - 0.0% | | |
| Sakari Resources, Ltd. (C)(D)(E) | 4,248 | 1,678 |
|
TOTAL COMMON STOCKS (Cost
$1,807) | $1,678 |
| U.S. GOVERNMENT AND AGENCY OBLIGATIONS - 2.5% | |
| U.S. Government - 2.5% | | |
| U.S. Treasury STRIPS, PO, 1.687%, 11/15/2048 | 1,045,700 | 642,358 |
| U.S. Treasury STRIPS, PO, 1.704%, 02/15/2047 | 1,011,600 | 637,185 |
| U.S. Treasury STRIPS, PO, 1.712%, 05/15/2047 | 1,017,800 | 637,022 |
| U.S. Treasury STRIPS, PO, 1.716%, 08/15/2046 | 1,007,600 | 638,078 |
|
TOTAL U.S. GOVERNMENT AND AGENCY OBLIGATIONS (Cost
$2,233,976) | $2,554,643 |
| SHORT-TERM INVESTMENTS - 0.1% | |
| Short-term funds - 0.1% | | |
| State Street Institutional U.S. Government Money Market Fund, Premier Class, 1.5386% (F) | 128,400 | 128,400 |
|
| TOTAL SHORT-TERM INVESTMENTS (Cost $128,400) | $128,400 |
| Total investments (Cost $105,881,967) - 99.9% | $100,411,818 |
| Other assets and liabilities, net - 0.1% | 79,440 |
| TOTAL NET ASSETS - 100.0% | $100,491,258 |
MULTIMANAGER 2055 LIFETIME PORTFOLIO
As of 2-29-20 (unaudited)
| | Shares or
Principal
Amount | Value |
| AFFILIATED INVESTMENT COMPANIES (A) - 93.2% | |
| Equity - 87.0% | | |
| Blue Chip Growth, Class NAV, JHF II (T. Rowe Price) | 331,880 | $13,982,111 |
| Capital Appreciation, Class NAV, JHF II (Jennison) | 556,741 | 8,646,188 |
| Capital Appreciation Value, Class NAV, JHF II (T. Rowe Price) | 635,250 | 6,854,343 |
| Disciplined Value, Class NAV, JHF III (Boston Partners) | 498,243 | 8,973,364 |
| Disciplined Value International, Class NAV, JHIT (Boston Partners) | 678,908 | 7,474,777 |
| Emerging Markets Equity, Class NAV, JHIT (MIM US) (B) | 1,350,451 | 14,395,810 |
| Equity Income, Class NAV, JHF II (T. Rowe Price) | 800,366 | 13,182,034 |
| Financial Industries, Class NAV, JHIT II (MIM US) (B) | 168,933 | 2,875,247 |
| Fundamental Large Cap Core, Class NAV, JHIT (MIM US) (B) | 143,346 | 6,758,776 |
MULTIMANAGER 2055 LIFETIME PORTFOLIO (continued)
| | Shares or
Principal
Amount | Value |
| Equity - (continued) | | |
| International Dynamic Growth, Class NAV, JHIT (Axiom) | 137,914 | $1,464,651 |
| International Growth, Class NAV, JHF III (Wellington) | 229,111 | 6,392,205 |
| International Small Company, Class NAV, JHF II (DFA) | 535,440 | 5,188,415 |
| Mid Cap Stock, Class NAV, JHF II (Wellington) | 499,347 | 10,136,735 |
| Mid Value, Class NAV, JHF II (T. Rowe Price) | 689,402 | 9,555,115 |
| Small Cap Growth, Class NAV, JHF II (Redwood) (C) | 137,333 | 2,191,830 |
| Small Cap Value, Class NAV, JHF II (Wellington) | 113,909 | 2,044,668 |
| Strategic Equity Allocation, Class NAV, JHF II (MIM US) (B) | 6,552,159 | 71,418,536 |
| Fixed income - 2.5% | | |
| Bond, Class NAV, JHSB (MIM US) (B) | 54,655 | 905,091 |
| Core Bond, Class NAV, JHF II (Wells Capital) | 65,935 | 894,734 |
| Emerging Markets Debt, Class NAV, JHF II (MIM US) (B) | 126,113 | 1,201,852 |
| High Yield, Class NAV, JHBT (MIM US) (B) | 355,149 | 1,193,302 |
| Strategic Income Opportunities, Class NAV, JHF II (MIM US) (B) | 113,182 | 1,208,789 |
| Alternative and specialty - 3.7% | | |
| Absolute Return Currency, Class NAV, JHF II (First Quadrant) | 159,487 | 1,478,443 |
| Alternative Risk Premia, Class NAV, JHIT (Unigestion) | 142,488 | 1,365,036 |
| Health Sciences, Class NAV, JHF II (T. Rowe Price) | 572,096 | 2,660,245 |
| Science & Technology, Class NAV, JHF II (T. Rowe Price/Allianz) | 716,185 | 2,742,990 |
|
TOTAL AFFILIATED INVESTMENT COMPANIES (Cost
$215,193,776) | $205,185,287 |
| UNAFFILIATED INVESTMENT COMPANIES - 4.0% | |
| Equity - 4.0% | | |
| Fidelity 500 Index Fund | 8,140 | 836,418 |
| Fidelity Emerging Markets Index Fund | 412,827 | 4,111,757 |
| Fidelity International Index Fund | 63,440 | 2,453,235 |
| Fidelity Small Cap Index Fund | 72,417 | 1,349,853 |
|
TOTAL UNAFFILIATED INVESTMENT COMPANIES (Cost
$9,477,280) | $8,751,263 |
| COMMON STOCKS - 0.0% | |
| Energy - 0.0% | | |
| Sakari Resources, Ltd. (C)(D)(E) | 12,063 | 4,763 |
|
TOTAL COMMON STOCKS (Cost
$5,131) | $4,763 |
| U.S. GOVERNMENT AND AGENCY OBLIGATIONS - 2.6% | |
| U.S. Government - 2.6% | | |
| U.S. Treasury STRIPS, PO, 1.687%, 11/15/2048 | 2,347,700 | 1,442,157 |
| U.S. Treasury STRIPS, PO, 1.704%, 02/15/2047 | 2,269,400 | 1,429,446 |
| U.S. Treasury STRIPS, PO, 1.712%, 05/15/2047 | 2,284,700 | 1,429,950 |
| U.S. Treasury STRIPS, PO, 1.716%, 08/15/2046 | 2,260,200 | 1,431,305 |
| 22 | JOHN HANCOCK MULTIMANAGER LIFETIME PORTFOLIOS | SEMIANNUAL REPORT | SEE NOTES TO FINANCIAL STATEMENTS |
MULTIMANAGER 2055 LIFETIME PORTFOLIO (continued)
| | Shares or
Principal
Amount | Value |
|
TOTAL U.S. GOVERNMENT AND AGENCY OBLIGATIONS (Cost
$5,011,523) | $5,732,858 |
| SHORT-TERM INVESTMENTS - 0.2% | |
| Short-term funds - 0.2% | | |
| State Street Institutional U.S. Government Money Market Fund, Premier Class, 1.5386% (F) | 289,567 | $289,567 |
|
| TOTAL SHORT-TERM INVESTMENTS (Cost $289,567) | $289,567 |
| Total investments (Cost $229,977,277) - 100.0% | $219,963,738 |
| Other assets and liabilities, net - 0.0% | 84,667 |
| TOTAL NET ASSETS - 100.0% | $220,048,405 |
MULTIMANAGER 2050 LIFETIME PORTFOLIO
As of 2-29-20 (unaudited)
| | Shares or
Principal
Amount | Value |
| AFFILIATED INVESTMENT COMPANIES (A) - 93.3% | |
| Equity - 87.1% | | |
| Blue Chip Growth, Class NAV, JHF II (T. Rowe Price) | 616,692 | $25,981,230 |
| Capital Appreciation, Class NAV, JHF II (Jennison) | 1,037,410 | 16,110,973 |
| Capital Appreciation Value, Class NAV, JHF II (T. Rowe Price) | 1,176,015 | 12,689,207 |
| Disciplined Value, Class NAV, JHF III (Boston Partners) | 906,280 | 16,322,109 |
| Disciplined Value International, Class NAV, JHIT (Boston Partners) | 1,259,840 | 13,870,841 |
| Emerging Markets Equity, Class NAV, JHIT (MIM US) (B) | 2,505,245 | 26,705,916 |
| Equity Income, Class NAV, JHF II (T. Rowe Price) | 1,452,534 | 23,923,240 |
| Financial Industries, Class NAV, JHIT II (MIM US) (B) | 309,117 | 5,261,174 |
| Fundamental Large Cap Core, Class NAV, JHIT (MIM US) (B) | 262,447 | 12,374,378 |
| International Dynamic Growth, Class NAV, JHIT (Axiom) | 256,640 | 2,725,512 |
| International Growth, Class NAV, JHF III (Wellington) | 426,067 | 11,887,269 |
| International Small Company, Class NAV, JHF II (DFA) | 985,428 | 9,548,793 |
| Mid Cap Stock, Class NAV, JHF II (Wellington) | 924,006 | 18,757,318 |
| Mid Value, Class NAV, JHF II (T. Rowe Price) | 1,274,841 | 17,669,298 |
| Small Cap Growth, Class NAV, JHF II (Redwood) (C) | 253,382 | 4,043,979 |
| Small Cap Value, Class NAV, JHF II (Wellington) | 207,110 | 3,717,628 |
| Strategic Equity Allocation, Class NAV, JHF II (MIM US) (B) | 12,186,111 | 132,828,608 |
| Fixed income - 2.4% | | |
| Bond, Class NAV, JHSB (MIM US) (B) | 97,618 | 1,616,547 |
| Core Bond, Class NAV, JHF II (Wells Capital) | 115,743 | 1,570,634 |
MULTIMANAGER 2050 LIFETIME PORTFOLIO (continued)
| | Shares or
Principal
Amount | Value |
| Fixed income - (continued) | | |
| Emerging Markets Debt, Class NAV, JHF II (MIM US) (B) | 230,836 | $2,199,870 |
| High Yield, Class NAV, JHBT (MIM US) (B) | 657,038 | 2,207,646 |
| Strategic Income Opportunities, Class NAV, JHF II (MIM US) (B) | 208,976 | 2,231,861 |
| Alternative and specialty - 3.8% | | |
| Absolute Return Currency, Class NAV, JHF II (First Quadrant) | 297,349 | 2,756,424 |
| Alternative Risk Premia, Class NAV, JHIT (Unigestion) | 266,646 | 2,554,472 |
| Health Sciences, Class NAV, JHF II (T. Rowe Price) | 1,067,309 | 4,962,987 |
| Science & Technology, Class NAV, JHF II (T. Rowe Price/Allianz) | 1,334,242 | 5,110,145 |
|
TOTAL AFFILIATED INVESTMENT COMPANIES (Cost
$385,770,607) | $379,628,059 |
| UNAFFILIATED INVESTMENT COMPANIES - 4.0% | |
| Equity - 4.0% | | |
| Fidelity 500 Index Fund | 15,004 | 1,541,836 |
| Fidelity Emerging Markets Index Fund | 769,506 | 7,664,277 |
| Fidelity International Index Fund | 117,883 | 4,558,533 |
| Fidelity Small Cap Index Fund | 131,877 | 2,458,189 |
|
TOTAL UNAFFILIATED INVESTMENT COMPANIES (Cost
$17,575,331) | $16,222,835 |
| COMMON STOCKS - 0.0% | |
| Energy - 0.0% | | |
| Sakari Resources, Ltd. (C)(D)(E) | 24,454 | 9,656 |
|
TOTAL COMMON STOCKS (Cost
$10,402) | $9,656 |
| U.S. GOVERNMENT AND AGENCY OBLIGATIONS - 2.6% | |
| U.S. Government - 2.6% | | |
| U.S. Treasury STRIPS, PO, 1.687%, 11/15/2048 | 4,373,200 | 2,686,392 |
| U.S. Treasury STRIPS, PO, 1.704%, 02/15/2047 | 4,229,400 | 2,664,007 |
| U.S. Treasury STRIPS, PO, 1.712%, 05/15/2047 | 4,257,200 | 2,664,500 |
| U.S. Treasury STRIPS, PO, 1.716%, 08/15/2046 | 4,211,800 | 2,667,185 |
|
TOTAL U.S. GOVERNMENT AND AGENCY OBLIGATIONS (Cost
$9,335,580) | $10,682,084 |
| SHORT-TERM INVESTMENTS - 0.1% | |
| Short-term funds - 0.1% | | |
| State Street Institutional U.S. Government Money Market Fund, Premier Class, 1.5386% (F) | 500,220 | 500,220 |
|
| TOTAL SHORT-TERM INVESTMENTS (Cost $500,220) | $500,220 |
| Total investments (Cost $413,192,140) - 100.0% | $407,042,854 |
| Other assets and liabilities, net - 0.0% | 100,127 |
| TOTAL NET ASSETS - 100.0% | $407,142,981 |
| SEE NOTES TO FINANCIAL STATEMENTS | SEMIANNUAL REPORT | JOHN HANCOCK MULTIMANAGER LIFETIME PORTFOLIOS | 23 |
MULTIMANAGER 2045 LIFETIME PORTFOLIO
As of 2-29-20 (unaudited)
| | Shares or
Principal
Amount | Value |
| AFFILIATED INVESTMENT COMPANIES (A) - 93.2% | |
| Equity - 87.0% | | |
| Blue Chip Growth, Class NAV, JHF II (T. Rowe Price) | 1,089,887 | $45,916,958 |
| Capital Appreciation, Class NAV, JHF II (Jennison) | 1,822,285 | 28,300,088 |
| Capital Appreciation Value, Class NAV, JHF II (T. Rowe Price) | 2,087,094 | 22,519,748 |
| Disciplined Value, Class NAV, JHF III (Boston Partners) | 1,565,395 | 28,192,765 |
| Disciplined Value International, Class NAV, JHIT (Boston Partners) | 2,204,484 | 24,271,373 |
| Emerging Markets Equity, Class NAV, JHIT (MIM US) (B) | 4,360,822 | 46,486,366 |
| Equity Income, Class NAV, JHF II (T. Rowe Price) | 2,508,887 | 41,321,363 |
| Financial Industries, Class NAV, JHIT II (MIM US) (B) | 548,595 | 9,337,093 |
| Fundamental Large Cap Core, Class NAV, JHIT (MIM US) (B) | 454,565 | 21,432,716 |
| International Dynamic Growth, Class NAV, JHIT (Axiom) | 455,187 | 4,834,081 |
| International Growth, Class NAV, JHF III (Wellington) | 754,301 | 21,044,991 |
| International Small Company, Class NAV, JHF II (DFA) | 1,722,537 | 16,691,384 |
| Mid Cap Stock, Class NAV, JHF II (Wellington) | 1,633,858 | 33,167,313 |
| Mid Value, Class NAV, JHF II (T. Rowe Price) | 2,261,676 | 31,346,830 |
| Small Cap Growth, Class NAV, JHF II (Redwood) (C) | 449,252 | 7,170,065 |
| Small Cap Value, Class NAV, JHF II (Wellington) | 355,399 | 6,379,420 |
| Strategic Equity Allocation, Class NAV, JHF II (MIM US) (B) | 21,583,320 | 235,258,191 |
| Fixed income - 2.4% | | |
| Bond, Class NAV, JHSB (MIM US) (B) | 163,597 | 2,709,171 |
| Core Bond, Class NAV, JHF II (Wells Capital) | 196,484 | 2,666,289 |
| Emerging Markets Debt, Class NAV, JHF II (MIM US) (B) | 401,750 | 3,828,675 |
| High Yield, Class NAV, JHBT (MIM US) (B) | 1,139,487 | 3,828,675 |
| Strategic Income Opportunities, Class NAV, JHF II (MIM US) (B) | 358,562 | 3,829,441 |
| Alternative and specialty - 3.8% | | |
| Absolute Return Currency, Class NAV, JHF II (First Quadrant) | 527,114 | 4,886,344 |
| Alternative Risk Premia, Class NAV, JHIT (Unigestion) | 469,145 | 4,494,410 |
| Health Sciences, Class NAV, JHF II (T. Rowe Price) | 1,893,422 | 8,804,413 |
| Science & Technology, Class NAV, JHF II (T. Rowe Price/Allianz) | 2,343,454 | 8,975,430 |
|
TOTAL AFFILIATED INVESTMENT COMPANIES (Cost
$617,898,265) | $667,693,593 |
| UNAFFILIATED INVESTMENT COMPANIES - 4.0% | |
| Equity - 4.0% | | |
| Fidelity 500 Index Fund | 26,566 | 2,729,959 |
MULTIMANAGER 2045 LIFETIME PORTFOLIO (continued)
| | Shares or
Principal
Amount | Value |
| Equity - (continued) | | |
| Fidelity Emerging Markets Index Fund | 1,337,179 | $13,318,308 |
| Fidelity International Index Fund | 208,363 | 8,057,396 |
| Fidelity Small Cap Index Fund | 231,634 | 4,317,654 |
|
TOTAL UNAFFILIATED INVESTMENT COMPANIES (Cost
$30,809,020) | $28,423,317 |
| COMMON STOCKS - 0.0% | |
| Energy - 0.0% | | |
| Sakari Resources, Ltd. (C)(D)(E) | 45,339 | 17,903 |
|
TOTAL COMMON STOCKS (Cost
$19,285) | $17,903 |
| U.S. GOVERNMENT AND AGENCY OBLIGATIONS - 2.6% | |
| U.S. Government - 2.6% | | |
| U.S. Treasury STRIPS, PO, 1.687%, 11/15/2048 | 7,759,500 | 4,766,546 |
| U.S. Treasury STRIPS, PO, 1.704%, 02/15/2047 | 7,506,200 | 4,727,993 |
| U.S. Treasury STRIPS, PO, 1.712%, 05/15/2047 | 7,555,200 | 4,728,656 |
| U.S. Treasury STRIPS, PO, 1.716%, 08/15/2046 | 7,474,300 | 4,733,212 |
|
TOTAL U.S. GOVERNMENT AND AGENCY OBLIGATIONS (Cost
$16,564,020) | $18,956,407 |
| SHORT-TERM INVESTMENTS - 0.2% | |
| Short-term funds - 0.2% | | |
| State Street Institutional U.S. Government Money Market Fund, Premier Class, 1.5386% (F) | 1,205,831 | 1,205,831 |
|
| TOTAL SHORT-TERM INVESTMENTS (Cost $1,205,831) | $1,205,831 |
| Total investments (Cost $666,496,421) - 100.0% | $716,297,051 |
| Other assets and liabilities, net - 0.0% | 126,252 |
| TOTAL NET ASSETS - 100.0% | $716,423,303 |
MULTIMANAGER 2040 LIFETIME PORTFOLIO
As of 2-29-20 (unaudited)
| | Shares or
Principal
Amount | Value |
| AFFILIATED INVESTMENT COMPANIES (A) - 91.4% | |
| Equity - 82.0% | | |
| Blue Chip Growth, Class NAV, JHF II (T. Rowe Price) | 1,143,817 | $48,189,015 |
| Capital Appreciation, Class NAV, JHF II (Jennison) | 1,868,604 | 29,019,416 |
| Capital Appreciation Value, Class NAV, JHF II (T. Rowe Price) | 1,516,795 | 16,366,221 |
| Disciplined Value, Class NAV, JHF III (Boston Partners) | 1,601,537 | 28,843,686 |
| Disciplined Value International, Class NAV, JHIT (Boston Partners) | 2,278,509 | 25,086,389 |
| Emerging Markets Equity, Class NAV, JHIT (MIM US) (B) | 4,513,432 | 48,113,183 |
| Equity Income, Class NAV, JHF II (T. Rowe Price) | 2,678,314 | 44,111,832 |
| Financial Industries, Class NAV, JHIT II (MIM US) (B) | 609,151 | 10,367,748 |
| Fundamental Global Franchise, Class NAV, JHF II (MIM US) (B) | 199,581 | 2,103,582 |
| 24 | JOHN HANCOCK MULTIMANAGER LIFETIME PORTFOLIOS | SEMIANNUAL REPORT | SEE NOTES TO FINANCIAL STATEMENTS |
MULTIMANAGER 2040 LIFETIME PORTFOLIO (continued)
| | Shares or
Principal
Amount | Value |
| Equity - (continued) | | |
| Fundamental Large Cap Core, Class NAV, JHIT (MIM US) (B) | 500,863 | $23,615,669 |
| Global Equity, Class NAV, JHF II (MIM US) (B) | 324,032 | 3,603,241 |
| Global Shareholder Yield, Class NAV, JHF III (Epoch) | 209,237 | 2,167,691 |
| International Dynamic Growth, Class NAV, JHIT (Axiom) | 344,618 | 3,659,848 |
| International Growth, Class NAV, JHF III (Wellington) | 820,783 | 22,899,844 |
| International Small Company, Class NAV, JHF II (DFA) | 1,891,177 | 18,325,507 |
| Mid Cap Stock, Class NAV, JHF II (Wellington) | 1,652,234 | 33,540,360 |
| Mid Value, Class NAV, JHF II (T. Rowe Price) | 2,300,148 | 31,880,055 |
| Small Cap Growth, Class NAV, JHF II (Redwood) (C) | 434,300 | 6,931,425 |
| Small Cap Value, Class NAV, JHF II (Wellington) | 357,880 | 6,423,949 |
| Strategic Equity Allocation, Class NAV, JHF II (MIM US) (B) | 23,089,601 | 251,676,653 |
| Fixed income - 4.8% | | |
| Bond, Class NAV, JHSB (MIM US) (B) | 677,462 | 11,218,768 |
| Core Bond, Class NAV, JHF II (Wells Capital) | 534,005 | 7,246,450 |
| Emerging Markets Debt, Class NAV, JHF II (MIM US) (B) | 757,881 | 7,222,605 |
| High Yield, Class NAV, JHBT (MIM US) (B) | 1,627,944 | 5,469,890 |
| Strategic Income Opportunities, Class NAV, JHF II (MIM US) (B) | 672,332 | 7,180,506 |
| Alternative and specialty - 4.6% | | |
| Absolute Return Currency, Class NAV, JHF II (First Quadrant) | 594,106 | 5,507,362 |
| Alternative Risk Premia, Class NAV, JHIT (Unigestion) | 546,172 | 5,232,328 |
| Diversified Real Assets, Class NAV, JHIT (Deutsche/MIM NA/Wellington) (B) | 755,496 | 6,429,269 |
| Health Sciences, Class NAV, JHF II (T. Rowe Price) | 2,088,969 | 9,713,706 |
| Science & Technology, Class NAV, JHF II (T. Rowe Price/Allianz) | 2,599,924 | 9,957,708 |
|
TOTAL AFFILIATED INVESTMENT COMPANIES (Cost
$677,752,496) | $732,103,906 |
| UNAFFILIATED INVESTMENT COMPANIES - 4.3% | |
| Equity - 4.3% | | |
| Fidelity 500 Index Fund | 47,832 | 4,915,210 |
| Fidelity Emerging Markets Index Fund | 1,173,176 | 11,684,830 |
| Fidelity International Index Fund | 330,944 | 12,797,600 |
| Fidelity Small Cap Index Fund | 249,992 | 4,659,860 |
|
TOTAL UNAFFILIATED INVESTMENT COMPANIES (Cost
$37,062,625) | $34,057,500 |
| COMMON STOCKS - 0.0% | |
| Energy - 0.0% | | |
| Sakari Resources, Ltd. (C)(D)(E) | 49,809 | 19,668 |
|
TOTAL COMMON STOCKS (Cost
$21,187) | $19,668 |
MULTIMANAGER 2040 LIFETIME PORTFOLIO (continued)
| | Shares or
Principal
Amount | Value |
|
| U.S. GOVERNMENT AND AGENCY OBLIGATIONS - 4.1% | |
| U.S. Government - 4.1% | | |
| U.S. Treasury STRIPS, PO, 1.687%, 11/15/2048 | 13,549,700 | $8,323,380 |
| U.S. Treasury STRIPS, PO, 1.704%, 02/15/2047 | 13,105,600 | 8,254,934 |
| U.S. Treasury STRIPS, PO, 1.712%, 05/15/2047 | 13,193,100 | 8,257,310 |
| U.S. Treasury STRIPS, PO, 1.716%, 08/15/2046 | 13,053,200 | 8,266,134 |
|
TOTAL U.S. GOVERNMENT AND AGENCY OBLIGATIONS (Cost
$28,925,654) | $33,101,758 |
| SHORT-TERM INVESTMENTS - 0.2% | |
| Short-term funds - 0.2% | | |
| State Street Institutional U.S. Government Money Market Fund, Premier Class, 1.5386% (F) | 1,204,510 | 1,204,510 |
|
| TOTAL SHORT-TERM INVESTMENTS (Cost $1,204,510) | $1,204,510 |
| Total investments (Cost $744,966,472) - 100.0% | $800,487,342 |
| Other assets and liabilities, net - 0.0% | 133,869 |
| TOTAL NET ASSETS - 100.0% | $800,621,211 |
MULTIMANAGER 2035 LIFETIME PORTFOLIO
As of 2-29-20 (unaudited)
| | Shares or
Principal
Amount | Value |
| AFFILIATED INVESTMENT COMPANIES (A) - 90.6% | |
| Equity - 73.9% | | |
| Blue Chip Growth, Class NAV, JHF II (T. Rowe Price) | 1,296,155 | $54,607,029 |
| Capital Appreciation, Class NAV, JHF II (Jennison) | 2,086,651 | 32,405,692 |
| Capital Appreciation Value, Class NAV, JHF II (T. Rowe Price) | 1,893,330 | 20,429,031 |
| Disciplined Value, Class NAV, JHF III (Boston Partners) | 1,722,662 | 31,025,151 |
| Disciplined Value International, Class NAV, JHIT (Boston Partners) | 2,508,597 | 27,619,651 |
| Emerging Markets Equity, Class NAV, JHIT (MIM US) (B) | 4,723,608 | 50,353,666 |
| Equity Income, Class NAV, JHF II (T. Rowe Price) | 3,150,169 | 51,883,287 |
| Financial Industries, Class NAV, JHIT II (MIM US) (B) | 603,144 | 10,265,518 |
| Fundamental Global Franchise, Class NAV, JHF II (MIM US) (B) | 394,030 | 4,153,075 |
| Fundamental Large Cap Core, Class NAV, JHIT (MIM US) (B) | 582,735 | 27,475,962 |
| Global Equity, Class NAV, JHF II (MIM US) (B) | 533,381 | 5,931,197 |
| Global Shareholder Yield, Class NAV, JHF III (Epoch) | 344,399 | 3,567,977 |
| International Dynamic Growth, Class NAV, JHIT (Axiom) | 271,433 | 2,882,615 |
| International Growth, Class NAV, JHF III (Wellington) | 943,924 | 26,335,491 |
| International Small Company, Class NAV, JHF II (DFA) | 2,198,928 | 21,307,617 |
| Mid Cap Stock, Class NAV, JHF II (Wellington) | 1,725,667 | 35,031,037 |
| SEE NOTES TO FINANCIAL STATEMENTS | SEMIANNUAL REPORT | JOHN HANCOCK MULTIMANAGER LIFETIME PORTFOLIOS | 25 |
MULTIMANAGER 2035 LIFETIME PORTFOLIO (continued)
| | Shares or
Principal
Amount | Value |
| Equity - (continued) | | |
| Mid Value, Class NAV, JHF II (T. Rowe Price) | 2,401,014 | $33,278,050 |
| Small Cap Growth, Class NAV, JHF II (Redwood) (C) | 430,832 | 6,876,072 |
| Small Cap Value, Class NAV, JHF II (Wellington) | 352,451 | 6,326,487 |
| Strategic Equity Allocation, Class NAV, JHF II (MIM US) (B) | 26,103,294 | 284,525,904 |
| Fixed income - 11.3% | | |
| Bond, Class NAV, JHSB (MIM US) (B) | 1,863,714 | 30,863,101 |
| Core Bond, Class NAV, JHF II (Wells Capital) | 1,941,343 | 26,344,023 |
| Emerging Markets Debt, Class NAV, JHF II (MIM US) (B) | 1,720,527 | 16,396,622 |
| High Yield, Class NAV, JHBT (MIM US) (B) | 3,137,151 | 10,540,828 |
| Short Duration Credit Opportunities, Class NAV, JHF II (Stone Harbor) | 671,556 | 6,399,932 |
| Strategic Income Opportunities, Class NAV, JHF II (MIM US) (B) | 1,745,277 | 18,639,563 |
| U.S. High Yield Bond, Class NAV, JHF II (Wells Capital) | 309,260 | 3,392,577 |
| Alternative and specialty - 5.4% | | |
| Absolute Return Currency, Class NAV, JHF II (First Quadrant) | 856,953 | 7,943,950 |
| Alternative Risk Premia, Class NAV, JHIT (Unigestion) | 785,975 | 7,529,637 |
| Diversified Real Assets, Class NAV, JHIT (Deutsche/MIM NA/Wellington) (B) | 2,222,346 | 18,912,166 |
| Health Sciences, Class NAV, JHF II (T. Rowe Price) | 2,068,360 | 9,617,875 |
| Science & Technology, Class NAV, JHF II (T. Rowe Price/Allianz) | 2,524,795 | 9,669,967 |
|
TOTAL AFFILIATED INVESTMENT COMPANIES (Cost
$834,731,335) | $902,530,750 |
| UNAFFILIATED INVESTMENT COMPANIES - 3.9% | |
| Equity - 3.9% | | |
| Fidelity 500 Index Fund | 37,624 | 3,866,215 |
| Fidelity Emerging Markets Index Fund | 977,161 | 9,732,525 |
| Fidelity International Index Fund | 509,550 | 19,704,306 |
| Fidelity Small Cap Index Fund | 287,741 | 5,363,484 |
|
TOTAL UNAFFILIATED INVESTMENT COMPANIES (Cost
$42,181,014) | $38,666,530 |
| COMMON STOCKS - 0.0% | |
| Energy - 0.0% | | |
| Sakari Resources, Ltd. (C)(D)(E) | 52,909 | 20,892 |
|
TOTAL COMMON STOCKS (Cost
$22,505) | $20,892 |
| U.S. GOVERNMENT AND AGENCY OBLIGATIONS - 5.4% | |
| U.S. Government - 5.4% | | |
| U.S. Treasury STRIPS, PO, 1.687%, 11/15/2048 | 21,988,800 | 13,507,394 |
| U.S. Treasury STRIPS, PO, 1.704%, 02/15/2047 | 21,267,800 | 13,396,127 |
| U.S. Treasury STRIPS, PO, 1.712%, 05/15/2047 | 21,410,300 | 13,400,299 |
| U.S. Treasury STRIPS, PO, 1.716%, 08/15/2046 | 21,180,800 | 13,413,058 |
|
TOTAL U.S. GOVERNMENT AND AGENCY OBLIGATIONS (Cost
$46,940,294) | $53,716,878 |
MULTIMANAGER 2035 LIFETIME PORTFOLIO (continued)
| | Shares or
Principal
Amount | Value |
|
| SHORT-TERM INVESTMENTS - 0.1% | |
| Short-term funds - 0.1% | | |
| State Street Institutional U.S. Government Money Market Fund, Premier Class, 1.5386% (F) | 1,360,725 | $1,360,725 |
|
| TOTAL SHORT-TERM INVESTMENTS (Cost $1,360,725) | $1,360,725 |
| Total investments (Cost $925,235,873) - 100.0% | $996,295,775 |
| Other assets and liabilities, net - 0.0% | 139,730 |
| TOTAL NET ASSETS - 100.0% | $996,435,505 |
MULTIMANAGER 2030 LIFETIME PORTFOLIO
As of 2-29-20 (unaudited)
| | Shares or
Principal
Amount | Value |
| AFFILIATED INVESTMENT COMPANIES (A) - 89.9% | |
| Equity - 64.4% | | |
| Blue Chip Growth, Class NAV, JHF II (T. Rowe Price) | 1,192,350 | $50,233,695 |
| Capital Appreciation, Class NAV, JHF II (Jennison) | 1,805,645 | 28,041,671 |
| Capital Appreciation Value, Class NAV, JHF II (T. Rowe Price) | 3,056,920 | 32,984,168 |
| Disciplined Value, Class NAV, JHF III (Boston Partners) | 1,514,742 | 27,280,498 |
| Disciplined Value International, Class NAV, JHIT (Boston Partners) | 2,519,866 | 27,743,723 |
| Emerging Markets Equity, Class NAV, JHIT (MIM US) (B) | 4,360,845 | 46,486,605 |
| Equity Income, Class NAV, JHF II (T. Rowe Price) | 2,892,995 | 47,647,631 |
| Financial Industries, Class NAV, JHIT II (MIM US) (B) | 662,419 | 11,274,367 |
| Fundamental Global Franchise, Class NAV, JHF II (MIM US) (B) | 1,022,137 | 10,773,327 |
| Fundamental Large Cap Core, Class NAV, JHIT (MIM US) (B) | 559,415 | 26,376,440 |
| Global Equity, Class NAV, JHF II (MIM US) (B) | 1,154,590 | 12,839,039 |
| Global Shareholder Yield, Class NAV, JHF III (Epoch) | 692,911 | 7,178,556 |
| International Dynamic Growth, Class NAV, JHIT (Axiom) | 367,720 | 3,905,183 |
| International Growth, Class NAV, JHF III (Wellington) | 914,357 | 25,510,567 |
| International Small Company, Class NAV, JHF II (DFA) | 2,343,746 | 22,710,898 |
| Mid Cap Stock, Class NAV, JHF II (Wellington) | 1,647,923 | 33,452,839 |
| Mid Value, Class NAV, JHF II (T. Rowe Price) | 2,296,636 | 31,831,370 |
| Small Cap Growth, Class NAV, JHF II (Redwood) (C) | 386,525 | 6,168,935 |
| Small Cap Value, Class NAV, JHF II (Wellington) | 318,556 | 5,718,072 |
| Strategic Equity Allocation, Class NAV, JHF II (MIM US) (B) | 27,293,767 | 297,502,063 |
| 26 | JOHN HANCOCK MULTIMANAGER LIFETIME PORTFOLIOS | SEMIANNUAL REPORT | SEE NOTES TO FINANCIAL STATEMENTS |
MULTIMANAGER 2030 LIFETIME PORTFOLIO (continued)
| | Shares or
Principal
Amount | Value |
| Fixed income - 19.0% | | |
| Bond, Class NAV, JHSB (MIM US) (B) | 3,307,383 | $54,770,258 |
| Core Bond, Class NAV, JHF II (Wells Capital) | 4,098,923 | 55,622,385 |
| Emerging Markets Debt, Class NAV, JHF II (MIM US) (B) | 3,239,499 | 30,872,434 |
| High Yield, Class NAV, JHBT (MIM US) (B) | 5,924,722 | 19,907,066 |
| Short Duration Credit Opportunities, Class NAV, JHF II (Stone Harbor) | 1,464,689 | 13,958,483 |
| Strategic Income Opportunities, Class NAV, JHF II (MIM US) (B) | 3,820,660 | 40,804,645 |
| U.S. High Yield Bond, Class NAV, JHF II (Wells Capital) | 590,411 | 6,476,808 |
| Alternative and specialty - 6.5% | | |
| Absolute Return Currency, Class NAV, JHF II (First Quadrant) | 1,117,016 | 10,354,743 |
| Alternative Risk Premia, Class NAV, JHIT (Unigestion) | 1,036,945 | 9,933,934 |
| Diversified Real Assets, Class NAV, JHIT (Deutsche/MIM NA/Wellington) (B) | 4,110,714 | 34,982,174 |
| Health Sciences, Class NAV, JHF II (T. Rowe Price) | 2,259,618 | 10,507,222 |
| Science & Technology, Class NAV, JHF II (T. Rowe Price/Allianz) | 2,793,790 | 10,700,215 |
|
TOTAL AFFILIATED INVESTMENT COMPANIES (Cost
$973,662,997) | $1,054,550,014 |
| UNAFFILIATED INVESTMENT COMPANIES - 3.3% | |
| Equity - 3.3% | | |
| Fidelity Emerging Markets Index Fund | 816,598 | 8,133,320 |
| Fidelity International Index Fund | 662,046 | 25,601,315 |
| Fidelity Small Cap Index Fund | 296,139 | 5,520,025 |
|
TOTAL UNAFFILIATED INVESTMENT COMPANIES (Cost
$42,795,510) | $39,254,660 |
| COMMON STOCKS - 0.0% | |
| Energy - 0.0% | | |
| Sakari Resources, Ltd. (C)(D)(E) | 59,458 | 23,478 |
|
TOTAL COMMON STOCKS (Cost
$25,291) | $23,478 |
| U.S. GOVERNMENT AND AGENCY OBLIGATIONS - 6.6% | |
| U.S. Government - 6.6% | | |
| U.S. Treasury STRIPS, PO, 1.687%, 11/15/2048 | 31,913,800 | 19,604,175 |
| U.S. Treasury STRIPS, PO, 1.704%, 02/15/2047 | 30,867,100 | 19,442,518 |
| U.S. Treasury STRIPS, PO, 1.712%, 05/15/2047 | 31,072,500 | 19,447,686 |
| U.S. Treasury STRIPS, PO, 1.716%, 08/15/2046 | 30,740,400 | 19,466,817 |
|
TOTAL U.S. GOVERNMENT AND AGENCY OBLIGATIONS (Cost
$68,133,684) | $77,961,196 |
| SHORT-TERM INVESTMENTS - 0.2% | |
| Short-term funds - 0.2% | | |
| State Street Institutional U.S. Government Money Market Fund, Premier Class, 1.5386% (F) | 1,728,453 | 1,728,453 |
MULTIMANAGER 2030 LIFETIME PORTFOLIO (continued)
| | Shares or
Principal
Amount | Value |
|
| TOTAL SHORT-TERM INVESTMENTS (Cost $1,728,453) | $1,728,453 |
| Total investments (Cost $1,086,345,935) - 100.0% | $1,173,517,801 |
| Other assets and liabilities, net - 0.0% | 148,582 |
| TOTAL NET ASSETS - 100.0% | $1,173,666,383 |
MULTIMANAGER 2025 LIFETIME PORTFOLIO
As of 2-29-20 (unaudited)
| | Shares or
Principal
Amount | Value |
| AFFILIATED INVESTMENT COMPANIES (A) - 89.0% | |
| Equity - 53.7% | | |
| Blue Chip Growth, Class NAV, JHF II (T. Rowe Price) | 782,089 | $32,949,399 |
| Capital Appreciation, Class NAV, JHF II (Jennison) | 1,113,650 | 17,294,984 |
| Capital Appreciation Value, Class NAV, JHF II (T. Rowe Price) | 4,094,317 | 44,177,684 |
| Disciplined Value, Class NAV, JHF III (Boston Partners) | 946,953 | 17,054,616 |
| Disciplined Value International, Class NAV, JHIT (Boston Partners) | 2,207,660 | 24,306,335 |
| Emerging Markets Equity, Class NAV, JHIT (MIM US) (B) | 3,010,224 | 32,088,992 |
| Equity Income, Class NAV, JHF II (T. Rowe Price) | 1,945,784 | 32,047,065 |
| Financial Industries, Class NAV, JHIT II (MIM US) (B) | 536,336 | 9,128,432 |
| Fundamental Global Franchise, Class NAV, JHF II (MIM US) (B) | 1,642,034 | 17,307,043 |
| Fundamental Large Cap Core, Class NAV, JHIT (MIM US) (B) | 399,763 | 18,848,803 |
| Global Equity, Class NAV, JHF II (MIM US) (B) | 1,549,296 | 17,228,170 |
| Global Shareholder Yield, Class NAV, JHF III (Epoch) | 747,546 | 7,744,577 |
| International Dynamic Growth, Class NAV, JHIT (Axiom) | 357,779 | 3,799,613 |
| International Growth, Class NAV, JHF III (Wellington) | 785,279 | 21,909,289 |
| International Small Company, Class NAV, JHF II (DFA) | 2,020,179 | 19,575,533 |
| Mid Cap Stock, Class NAV, JHF II (Wellington) | 1,249,762 | 25,370,165 |
| Mid Value, Class NAV, JHF II (T. Rowe Price) | 1,775,976 | 24,615,034 |
| Small Cap Growth, Class NAV, JHF II (Redwood) (C) | 269,670 | 4,303,927 |
| Small Cap Value, Class NAV, JHF II (Wellington) | 226,221 | 4,060,667 |
| Strategic Equity Allocation, Class NAV, JHF II (MIM US) (B) | 23,170,249 | 252,555,712 |
| Fixed income - 27.9% | | |
| Bond, Class NAV, JHSB (MIM US) (B) | 4,587,810 | 75,974,138 |
| Core Bond, Class NAV, JHF II (Wells Capital) | 4,591,011 | 62,300,021 |
| Emerging Markets Debt, Class NAV, JHF II (MIM US) (B) | 3,948,185 | 37,626,216 |
| Floating Rate Income, Class NAV, JHF II (Bain Capital) | 1,278,146 | 10,404,106 |
| SEE NOTES TO FINANCIAL STATEMENTS | SEMIANNUAL REPORT | JOHN HANCOCK MULTIMANAGER LIFETIME PORTFOLIOS | 27 |
MULTIMANAGER 2025 LIFETIME PORTFOLIO (continued)
| | Shares or
Principal
Amount | Value |
| Fixed income - (continued) | | |
| High Yield, Class NAV, JHBT (MIM US) (B) | 7,293,628 | $24,506,589 |
| Short Duration Bond, Class NAV, JHBT (MIM US) (B) | 1,693,275 | 17,017,414 |
| Short Duration Credit Opportunities, Class NAV, JHF II (Stone Harbor) | 2,409,721 | 22,964,643 |
| Strategic Income Opportunities, Class NAV, JHF II (MIM US) (B) | 6,260,744 | 66,864,747 |
| U.S. High Yield Bond, Class NAV, JHF II (Wells Capital) | 712,731 | 7,818,661 |
| Alternative and specialty - 7.4% | | |
| Absolute Return Currency, Class NAV, JHF II (First Quadrant) | 1,143,899 | 10,603,941 |
| Alternative Risk Premia, Class NAV, JHIT (Unigestion) | 1,072,040 | 10,270,143 |
| Diversified Real Assets, Class NAV, JHIT (Deutsche/MIM NA/Wellington) (B) | 5,578,610 | 47,473,973 |
| Health Sciences, Class NAV, JHF II (T. Rowe Price) | 1,847,792 | 8,592,231 |
| Science & Technology, Class NAV, JHF II (T. Rowe Price/Allianz) | 2,262,609 | 8,665,794 |
|
TOTAL AFFILIATED INVESTMENT COMPANIES (Cost
$962,843,009) | $1,037,448,657 |
| UNAFFILIATED INVESTMENT COMPANIES - 2.9% | |
| Equity - 2.9% | | |
| Fidelity Emerging Markets Index Fund | 692,337 | 6,895,673 |
| Fidelity International Index Fund | 555,094 | 21,465,489 |
| Fidelity Small Cap Index Fund | 253,195 | 4,719,555 |
|
TOTAL UNAFFILIATED INVESTMENT COMPANIES (Cost
$36,129,004) | $33,080,717 |
| COMMON STOCKS - 0.0% | |
| Energy - 0.0% | | |
| Sakari Resources, Ltd. (C)(D)(E) | 43,019 | 16,986 |
|
TOTAL COMMON STOCKS (Cost
$18,298) | $16,986 |
| U.S. GOVERNMENT AND AGENCY OBLIGATIONS - 8.0% | |
| U.S. Government - 8.0% | | |
| U.S. Treasury Inflation Protected Security, 0.125%, 01/15/2023 | 6,700,911 | 6,779,888 |
| U.S. Treasury Inflation Protected Security, 0.125%, 07/15/2024 | 5,168,536 | 5,296,193 |
| U.S. Treasury Inflation Protected Security, 0.625%, 07/15/2021 | 2,959,275 | 3,000,917 |
| U.S. Treasury STRIPS, PO, 1.687%, 11/15/2048 | 31,934,700 | 19,617,014 |
| U.S. Treasury STRIPS, PO, 1.704%, 02/15/2047 | 30,886,800 | 19,454,926 |
| U.S. Treasury STRIPS, PO, 1.712%, 05/15/2047 | 31,093,700 | 19,460,955 |
| U.S. Treasury STRIPS, PO, 1.716%, 08/15/2046 | 30,759,100 | 19,478,659 |
|
TOTAL U.S. GOVERNMENT AND AGENCY OBLIGATIONS (Cost
$83,119,347) | $93,088,552 |
| SHORT-TERM INVESTMENTS - 0.1% | |
| Short-term funds - 0.1% | | |
| State Street Institutional U.S. Government Money Market Fund, Premier Class, 1.5386% (F) | 1,703,783 | 1,703,783 |
MULTIMANAGER 2025 LIFETIME PORTFOLIO (continued)
| | Shares or
Principal
Amount | Value |
|
| TOTAL SHORT-TERM INVESTMENTS (Cost $1,703,783) | $1,703,783 |
| Total investments (Cost $1,083,813,441) - 100.0% | $1,165,338,695 |
| Other assets and liabilities, net - 0.0% | 128,065 |
| TOTAL NET ASSETS - 100.0% | $1,165,466,760 |
MULTIMANAGER 2020 LIFETIME PORTFOLIO
As of 2-29-20 (unaudited)
| | Shares or
Principal
Amount | Value |
| AFFILIATED INVESTMENT COMPANIES (A) - 89.4% | |
| Equity - 41.4% | | |
| Blue Chip Growth, Class NAV, JHF II (T. Rowe Price) | 189,127 | $7,967,902 |
| Capital Appreciation, Class NAV, JHF II (Jennison) | 156,930 | 2,437,116 |
| Capital Appreciation Value, Class NAV, JHF II (T. Rowe Price) | 3,417,217 | 36,871,771 |
| Disciplined Value, Class NAV, JHF III (Boston Partners) | 58,493 | 1,053,460 |
| Disciplined Value International, Class NAV, JHIT (Boston Partners) | 989,014 | 10,889,049 |
| Emerging Markets Equity, Class NAV, JHIT (MIM US) (B) | 1,221,014 | 13,016,005 |
| Equity Income, Class NAV, JHF II (T. Rowe Price) | 540,972 | 8,909,801 |
| Financial Industries, Class NAV, JHIT II (MIM US) (B) | 317,027 | 5,395,794 |
| Fundamental Global Franchise, Class NAV, JHF II (MIM US) (B) | 1,271,642 | 13,403,112 |
| Fundamental Large Cap Core, Class NAV, JHIT (MIM US) (B) | 187,824 | 8,855,904 |
| Global Equity, Class NAV, JHF II (MIM US) (B) | 1,213,143 | 13,490,149 |
| Global Shareholder Yield, Class NAV, JHF III (Epoch) | 641,850 | 6,649,570 |
| International Dynamic Growth, Class NAV, JHIT (Axiom) | 418,559 | 4,445,101 |
| International Growth, Class NAV, JHF III (Wellington) | 253,652 | 7,076,888 |
| International Small Company, Class NAV, JHF II (DFA) | 1,028,383 | 9,965,029 |
| Mid Cap Stock, Class NAV, JHF II (Wellington) | 583,057 | 11,836,056 |
| Mid Value, Class NAV, JHF II (T. Rowe Price) | 823,417 | 11,412,558 |
| Small Cap Growth, Class NAV, JHF II (Redwood) (C) | 189,605 | 3,026,093 |
| Small Cap Value, Class NAV, JHF II (Wellington) | 160,144 | 2,874,579 |
| Strategic Equity Allocation, Class NAV, JHF II (MIM US) (B) | 11,939,865 | 130,144,528 |
| Fixed income - 39.5% | | |
| Bond, Class NAV, JHSB (MIM US) (B) | 4,452,582 | 73,734,758 |
| Core Bond, Class NAV, JHF II (Wells Capital) | 4,778,205 | 64,840,236 |
| Emerging Markets Debt, Class NAV, JHF II (MIM US) (B) | 3,237,300 | 30,851,474 |
| Floating Rate Income, Class NAV, JHF II (Bain Capital) | 1,489,455 | 12,124,161 |
| 28 | JOHN HANCOCK MULTIMANAGER LIFETIME PORTFOLIOS | SEMIANNUAL REPORT | SEE NOTES TO FINANCIAL STATEMENTS |
MULTIMANAGER 2020 LIFETIME PORTFOLIO (continued)
| | Shares or
Principal
Amount | Value |
| Fixed income - (continued) | | |
| High Yield, Class NAV, JHBT (MIM US) (B) | 5,993,761 | $20,139,039 |
| Short Duration Bond, Class NAV, JHBT (MIM US) (B) | 2,292,213 | 23,036,737 |
| Short Duration Credit Opportunities, Class NAV, JHF II (Stone Harbor) | 1,731,982 | 16,505,789 |
| Strategic Income Opportunities, Class NAV, JHF II (MIM US) (B) | 4,465,019 | 47,686,407 |
| U.S. High Yield Bond, Class NAV, JHF II (Wells Capital) | 580,767 | 6,371,013 |
| Alternative and specialty - 8.5% | | |
| Absolute Return Currency, Class NAV, JHF II (First Quadrant) | 813,979 | 7,545,588 |
| Alternative Risk Premia, Class NAV, JHIT (Unigestion) | 771,573 | 7,391,667 |
| Diversified Real Assets, Class NAV, JHIT (Deutsche/MIM NA/Wellington) (B) | 4,533,737 | 38,582,100 |
| Health Sciences, Class NAV, JHF II (T. Rowe Price) | 1,096,519 | 5,098,814 |
| Science & Technology, Class NAV, JHF II (T. Rowe Price/Allianz) | 1,344,988 | 5,151,305 |
|
TOTAL AFFILIATED INVESTMENT COMPANIES (Cost
$625,939,465) | $668,779,553 |
| UNAFFILIATED INVESTMENT COMPANIES - 2.1% | |
| Equity - 2.1% | | |
| Fidelity Emerging Markets Index Fund | 259,772 | 2,587,327 |
| Fidelity International Index Fund | 346,190 | 13,387,166 |
|
TOTAL UNAFFILIATED INVESTMENT COMPANIES (Cost
$17,596,491) | $15,974,493 |
| COMMON STOCKS - 0.0% | |
| Energy - 0.0% | | |
| Sakari Resources, Ltd. (C)(D)(E) | 19,966 | 7,884 |
|
TOTAL COMMON STOCKS (Cost
$8,493) | $7,884 |
| U.S. GOVERNMENT AND AGENCY OBLIGATIONS - 8.3% | |
| U.S. Government - 8.3% | | |
| U.S. Treasury Inflation Protected Security, 0.125%, 01/15/2023 | 9,120,845 | 9,228,344 |
| U.S. Treasury Inflation Protected Security, 0.125%, 07/15/2024 | 7,034,387 | 7,208,128 |
| U.S. Treasury Inflation Protected Security, 0.625%, 07/15/2021 | 4,028,213 | 4,084,896 |
| U.S. Treasury STRIPS, PO, 1.687%, 11/15/2048 | 17,056,400 | 10,477,494 |
| U.S. Treasury STRIPS, PO, 1.704%, 02/15/2047 | 16,495,800 | 10,390,347 |
| U.S. Treasury STRIPS, PO, 1.712%, 05/15/2047 | 16,605,500 | 10,393,066 |
| U.S. Treasury STRIPS, PO, 1.716%, 08/15/2046 | 16,428,100 | 10,403,339 |
|
TOTAL U.S. GOVERNMENT AND AGENCY OBLIGATIONS (Cost
$56,738,980) | $62,185,614 |
| SHORT-TERM INVESTMENTS - 0.2% | |
| Short-term funds - 0.2% | | |
| State Street Institutional U.S. Government Money Market Fund, Premier Class, 1.5386% (F) | 1,258,855 | 1,258,855 |
MULTIMANAGER 2020 LIFETIME PORTFOLIO (continued)
| | Shares or
Principal
Amount | Value |
|
| TOTAL SHORT-TERM INVESTMENTS (Cost $1,258,855) | $1,258,855 |
| Total investments (Cost $701,542,284) - 100.0% | $748,206,399 |
| Other assets and liabilities, net - 0.0% | 69,524 |
| TOTAL NET ASSETS - 100.0% | $748,275,923 |
MULTIMANAGER 2015 LIFETIME PORTFOLIO
As of 2-29-20 (unaudited)
| | Shares or
Principal
Amount | Value |
| AFFILIATED INVESTMENT COMPANIES (A) - 89.7% | |
| Equity - 34.8% | | |
| Blue Chip Growth, Class NAV, JHF II (T. Rowe Price) | 52,239 | $2,200,830 |
| Capital Appreciation, Class NAV, JHF II (Jennison) | 45,608 | 708,286 |
| Capital Appreciation Value, Class NAV, JHF II (T. Rowe Price) | 1,256,722 | 13,560,032 |
| Disciplined Value International, Class NAV, JHIT (Boston Partners) | 315,455 | 3,473,162 |
| Emerging Markets Equity, Class NAV, JHIT (MIM US) (B) | 250,816 | 2,673,701 |
| Equity Income, Class NAV, JHF II (T. Rowe Price) | 174,264 | 2,870,122 |
| Fundamental Global Franchise, Class NAV, JHF II (MIM US) (B) | 475,065 | 5,007,182 |
| Fundamental Large Cap Core, Class NAV, JHIT (MIM US) (B) | 53,732 | 2,533,450 |
| Global Equity, Class NAV, JHF II (MIM US) (B) | 444,929 | 4,947,605 |
| Global Shareholder Yield, Class NAV, JHF III (Epoch) | 284,034 | 2,942,596 |
| International Dynamic Growth, Class NAV, JHIT (Axiom) | 115,284 | 1,224,315 |
| International Growth, Class NAV, JHF III (Wellington) | 87,324 | 2,436,338 |
| International Small Company, Class NAV, JHF II (DFA) | 316,177 | 3,063,754 |
| Mid Cap Stock, Class NAV, JHF II (Wellington) | 147,124 | 2,986,627 |
| Mid Value, Class NAV, JHF II (T. Rowe Price) | 209,196 | 2,899,458 |
| Small Cap Growth, Class NAV, JHF II (Redwood) (C) | 45,270 | 722,505 |
| Small Cap Value, Class NAV, JHF II (Wellington) | 38,397 | 689,225 |
| Strategic Equity Allocation, Class NAV, JHF II (MIM US) (B) | 3,630,198 | 39,569,154 |
| Fixed income - 47.3% | | |
| Bond, Class NAV, JHSB (MIM US) (B) | 1,946,197 | 32,229,026 |
| Core Bond, Class NAV, JHF II (Wells Capital) | 2,083,754 | 28,276,547 |
| Emerging Markets Debt, Class NAV, JHF II (MIM US) (B) | 1,289,587 | 12,289,771 |
| Floating Rate Income, Class NAV, JHF II (Bain Capital) | 785,771 | 6,396,179 |
| High Yield, Class NAV, JHBT (MIM US) (B) | 2,383,304 | 8,007,901 |
| Short Duration Bond, Class NAV, JHBT (MIM US) (B) | 1,276,694 | 12,830,773 |
| SEE NOTES TO FINANCIAL STATEMENTS | SEMIANNUAL REPORT | JOHN HANCOCK MULTIMANAGER LIFETIME PORTFOLIOS | 29 |
MULTIMANAGER 2015 LIFETIME PORTFOLIO (continued)
| | Shares or
Principal
Amount | Value |
| Fixed income - (continued) | | |
| Short Duration Credit Opportunities, Class NAV, JHF II (Stone Harbor) | 695,371 | $6,626,886 |
| Strategic Income Opportunities, Class NAV, JHF II (MIM US) (B) | 1,795,482 | 19,175,752 |
| U.S. High Yield Bond, Class NAV, JHF II (Wells Capital) | 232,630 | 2,551,947 |
| Alternative and specialty - 7.6% | | |
| Absolute Return Currency, Class NAV, JHF II (First Quadrant) | 330,709 | 3,065,672 |
| Alternative Risk Premia, Class NAV, JHIT (Unigestion) | 312,867 | 2,997,267 |
| Diversified Real Assets, Class NAV, JHIT (Deutsche/MIM NA/Wellington) (B) | 1,699,597 | 14,463,572 |
|
TOTAL AFFILIATED INVESTMENT COMPANIES (Cost
$228,298,805) | $243,419,635 |
| UNAFFILIATED INVESTMENT COMPANIES - 1.8% | |
| Equity - 1.8% | | |
| Fidelity Emerging Markets Index Fund | 93,449 | 930,753 |
| Fidelity International Index Fund | 101,194 | 3,913,165 |
|
TOTAL UNAFFILIATED INVESTMENT COMPANIES (Cost
$5,318,892) | $4,843,918 |
| COMMON STOCKS - 0.0% | |
| Energy - 0.0% | | |
| Sakari Resources, Ltd. (C)(D)(E) | 5,942 | 2,346 |
|
TOTAL COMMON STOCKS (Cost
$2,528) | $2,346 |
| U.S. GOVERNMENT AND AGENCY OBLIGATIONS - 8.4% | |
| U.S. Government - 8.4% | | |
| U.S. Treasury Inflation Protected Security, 0.125%, 01/15/2023 | 5,052,514 | 5,112,064 |
| U.S. Treasury Inflation Protected Security, 0.125%, 07/15/2024 | 3,896,641 | 3,992,883 |
| U.S. Treasury Inflation Protected Security, 0.625%, 07/15/2021 | 2,230,915 | 2,262,308 |
| U.S. Treasury STRIPS, PO, 1.687%, 11/15/2048 | 4,638,000 | 2,849,055 |
| U.S. Treasury STRIPS, PO, 1.704%, 02/15/2047 | 4,485,700 | 2,825,445 |
| U.S. Treasury STRIPS, PO, 1.712%, 05/15/2047 | 4,515,000 | 2,825,852 |
| U.S. Treasury STRIPS, PO, 1.716%, 08/15/2046 | 4,466,300 | 2,828,351 |
|
TOTAL U.S. GOVERNMENT AND AGENCY OBLIGATIONS (Cost
$21,163,856) | $22,695,958 |
| SHORT-TERM INVESTMENTS - 0.1% | |
| Short-term funds - 0.1% | | |
| State Street Institutional U.S. Government Money Market Fund, Premier Class, 1.5386% (F) | 374,168 | 374,168 |
|
| TOTAL SHORT-TERM INVESTMENTS (Cost $374,168) | $374,168 |
| Total investments (Cost $255,158,249) - 100.0% | $271,336,025 |
| Other assets and liabilities, net - 0.0% | 62,500 |
| TOTAL NET ASSETS - 100.0% | $271,398,525 |
MULTIMANAGER 2010 LIFETIME PORTFOLIO
As of 2-29-20 (unaudited)
| | Shares or
Principal
Amount | Value |
| AFFILIATED INVESTMENT COMPANIES (A) - 90.2% | |
| Equity - 28.7% | | |
| Blue Chip Growth, Class NAV, JHF II (T. Rowe Price) | 12,510 | $527,058 |
| Capital Appreciation Value, Class NAV, JHF II (T. Rowe Price) | 797,532 | 8,605,371 |
| Disciplined Value International, Class NAV, JHIT (Boston Partners) | 196,003 | 2,157,998 |
| Emerging Markets Equity, Class NAV, JHIT (MIM US) (B) | 58,304 | 621,517 |
| Equity Income, Class NAV, JHF II (T. Rowe Price) | 31,001 | 510,584 |
| Fundamental Global Franchise, Class NAV, JHF II (MIM US) (B) | 259,122 | 2,731,144 |
| Fundamental Large Cap Core, Class NAV, JHIT (MIM US) (B) | 23,945 | 1,128,997 |
| Global Equity, Class NAV, JHF II (MIM US) (B) | 308,157 | 3,426,706 |
| Global Shareholder Yield, Class NAV, JHF III (Epoch) | 227,446 | 2,356,345 |
| International Dynamic Growth, Class NAV, JHIT (Axiom) | 35,692 | 379,046 |
| International Growth, Class NAV, JHF III (Wellington) | 67,581 | 1,885,517 |
| International Small Company, Class NAV, JHF II (DFA) | 178,403 | 1,728,724 |
| Mid Cap Stock, Class NAV, JHF II (Wellington) | 59,014 | 1,197,987 |
| Mid Value, Class NAV, JHF II (T. Rowe Price) | 82,501 | 1,143,468 |
| Small Cap Growth, Class NAV, JHF II (Redwood) (C) | 15,325 | 244,584 |
| Small Cap Value, Class NAV, JHF II (Wellington) | 13,004 | 233,421 |
| Strategic Equity Allocation, Class NAV, JHF II (MIM US) (B) | 2,008,524 | 21,892,911 |
| Fixed income - 53.6% | | |
| Bond, Class NAV, JHSB (MIM US) (B) | 1,407,583 | 23,309,582 |
| Core Bond, Class NAV, JHF II (Wells Capital) | 1,542,999 | 20,938,491 |
| Emerging Markets Debt, Class NAV, JHF II (MIM US) (B) | 881,579 | 8,401,453 |
| Floating Rate Income, Class NAV, JHF II (Bain Capital) | 665,694 | 5,418,750 |
| High Yield, Class NAV, JHBT (MIM US) (B) | 1,624,456 | 5,458,171 |
| Short Duration Bond, Class NAV, JHBT (MIM US) (B) | 1,124,009 | 11,296,293 |
| Short Duration Credit Opportunities, Class NAV, JHF II (Stone Harbor) | 492,486 | 4,693,396 |
| Strategic Income Opportunities, Class NAV, JHF II (MIM US) (B) | 1,270,292 | 13,566,716 |
| U.S. High Yield Bond, Class NAV, JHF II (Wells Capital) | 158,506 | 1,738,814 |
| Alternative and specialty - 7.9% | | |
| Absolute Return Currency, Class NAV, JHF II (First Quadrant) | 241,661 | 2,240,197 |
| Alternative Risk Premia, Class NAV, JHIT (Unigestion) | 226,709 | 2,171,868 |
| Diversified Real Assets, Class NAV, JHIT (Deutsche/MIM NA/Wellington) (B) | 1,112,044 | 9,463,491 |
| 30 | JOHN HANCOCK MULTIMANAGER LIFETIME PORTFOLIOS | SEMIANNUAL REPORT | SEE NOTES TO FINANCIAL STATEMENTS |
MULTIMANAGER 2010 LIFETIME PORTFOLIO (continued)
| | Shares or
Principal
Amount | Value |
|
TOTAL AFFILIATED INVESTMENT COMPANIES (Cost
$152,068,538) | $159,468,600 |
| UNAFFILIATED INVESTMENT COMPANIES - 1.5% | |
| Equity - 1.5% | | |
| Fidelity Emerging Markets Index Fund | 60,689 | $604,459 |
| Fidelity International Index Fund | 50,698 | 1,960,497 |
|
TOTAL UNAFFILIATED INVESTMENT COMPANIES (Cost
$2,743,912) | $2,564,956 |
| COMMON STOCKS - 0.0% | |
| Energy - 0.0% | | |
| Sakari Resources, Ltd. (C)(D)(E) | 2,849 | 1,125 |
|
TOTAL COMMON STOCKS (Cost
$1,212) | $1,125 |
| U.S. GOVERNMENT AND AGENCY OBLIGATIONS - 8.2% | |
| U.S. Government - 8.2% | | |
| U.S. Treasury Inflation Protected Security, 0.125%, 01/15/2023 | 4,305,692 | 4,356,440 |
| U.S. Treasury Inflation Protected Security, 0.125%, 07/15/2024 | 3,320,868 | 3,402,890 |
| U.S. Treasury Inflation Protected Security, 0.625%, 07/15/2021 | 1,901,740 | 1,928,500 |
| U.S. Treasury STRIPS, PO, 1.687%, 11/15/2048 | 1,957,500 | 1,202,463 |
| U.S. Treasury STRIPS, PO, 1.704%, 02/15/2047 | 1,893,900 | 1,192,927 |
| U.S. Treasury STRIPS, PO, 1.712%, 05/15/2047 | 1,905,800 | 1,192,804 |
| U.S. Treasury STRIPS, PO, 1.716%, 08/15/2046 | 1,886,500 | 1,194,654 |
|
TOTAL U.S. GOVERNMENT AND AGENCY OBLIGATIONS (Cost
$13,780,139) | $14,470,678 |
| SHORT-TERM INVESTMENTS - 0.1% | |
| Short-term funds - 0.1% | | |
| State Street Institutional U.S. Government Money Market Fund, Premier Class, 1.5386% (F) | 227,081 | 227,081 |
|
| TOTAL SHORT-TERM INVESTMENTS (Cost $227,081) | $227,081 |
| Total investments (Cost $168,820,882) - 100.0% | $176,732,440 |
| Other assets and liabilities, net - 0.0% | 57,948 |
| TOTAL NET ASSETS - 100.0% | $176,790,388 |
Percentages are based upon net assets.
Security Abbreviations and Legend
| JHBT | John Hancock Bond Trust |
| JHF II | John Hancock Funds II |
| JHF III | John Hancock Funds III |
| JHIT | John Hancock Investment Trust |
| JHIT II | John Hancock Investment Trust II |
| JHSB | John Hancock Sovereign Bond Fund |
| PO | Principal-Only Security - (Principal Tranche of Stripped Security). Rate shown is the annualized yield on date of purchase. |
| STRIPS | Separate Trading of Registered Interest and Principal Securities |
| (A) | The underlying funds' subadvisor is shown parenthetically. |
| (B) | The subadvisor is an affiliate of the advisor. |
| (C) | Non-income producing. |
| (D) | Restricted security as to resale, excluding 144A securities. |
| (E) | Security is valued using significant unobservable inputs and is classified as Level 3 in the fair value hierarchy. Refer to Note 2 to the financial statements. |
| (F) | The rate shown is the annualized seven-day yield as of 2-29-20. |
| SEE NOTES TO FINANCIAL STATEMENTS | SEMIANNUAL REPORT | JOHN HANCOCK MULTIMANAGER LIFETIME PORTFOLIOS | 31 |
STATEMENTS OF ASSETS AND LIABILITIES 2-29-20 (unaudited)
| | Multimanager 2060 Lifetime Portfolio | Multimanager 2055 Lifetime Portfolio | Multimanager 2050 Lifetime Portfolio | Multimanager 2045 Lifetime Portfolio |
| Assets | | | | |
| Unaffiliated investments, at value | $6,713,081 | $14,778,451 | $27,414,795 | $48,603,458 |
| Affiliated investments, at value | 93,698,737 | 205,185,287 | 379,628,059 | 667,693,593 |
| Total investments, at value | 100,411,818 | 219,963,738 | 407,042,854 | 716,297,051 |
| Dividends and interest receivable | 13,203 | 33,422 | 66,326 | 130,076 |
| Receivable for fund shares sold | 283,586 | 808,615 | 435,151 | 398,950 |
| Receivable for investments sold | — | — | — | 600,135 |
| Receivable from affiliates | 2,553 | 4,026 | 6,150 | 11,056 |
| Other assets | 88,675 | 89,378 | 92,490 | 82,659 |
| Total assets | 100,799,835 | 220,899,179 | 407,642,971 | 717,519,927 |
| Liabilities | | | | |
| Payable for investments purchased | 213,277 | 799,199 | 192,253 | 49,243 |
| Payable for fund shares repurchased | 70,424 | 20,778 | 266,249 | 985,880 |
| Payable to affiliates | | | | |
| Accounting and legal services fees | 2,743 | 5,972 | 11,006 | 19,457 |
| Transfer agent fees | 358 | 1,756 | 6,179 | 11,462 |
| Distribution and service fees | 73 | 304 | 1,612 | 2,142 |
| Trustees' fees | 19 | 248 | 634 | 1,317 |
| Other liabilities and accrued expenses | 21,683 | 22,517 | 22,057 | 27,123 |
| Total liabilities | 308,577 | 850,774 | 499,990 | 1,096,624 |
| Net assets | $100,491,258 | $220,048,405 | $407,142,981 | $716,423,303 |
| Net assets consist of | | | | |
| Paid-in capital | $105,601,382 | $230,042,491 | $410,777,114 | $648,490,935 |
| Total distributable earnings (loss) | (5,110,124) | (9,994,086) | (3,634,133) | 67,932,368 |
| Net assets | $100,491,258 | $220,048,405 | $407,142,981 | $716,423,303 |
| Unaffiliated investments, at cost | $6,721,791 | $14,783,501 | $27,421,533 | $48,598,156 |
| Affiliated investments, at cost | 99,160,176 | 215,193,776 | 385,770,607 | 617,898,265 |
| Total investments, at cost | 105,881,967 | 229,977,277 | 413,192,140 | 666,496,421 |
| Net asset value per share | | | | |
| The portfolios have an unlimited number of shares authorized with no par value. Net asset value is calculated by dividing the net assets of each class of shares by the number of outstanding shares in the class. | | | | |
| Class A1 | | | | |
| Net assets | $3,291,653 | $16,949,863 | $59,857,307 | $111,028,072 |
| Shares outstanding | 290,286 | 1,674,043 | 5,534,899 | 11,448,193 |
| Net asset value and redemption price per share | $11.34 | $10.13 | $10.81 | $9.70 |
| Class I | | | | |
| Net assets | $44,670 | $56,305 | $57,643 | $212,965 |
| Shares outstanding | 3,934 | 5,555 | 5,327 | 21,837 |
| Net asset value, offering price and redemption price per share | $11.362 | $10.14 | $10.82 | $9.75 |
| Class R1 | | | | |
| Net assets | $60,220 | $127,469 | $1,594,548 | $1,798,908 |
| Shares outstanding | 5,309 | 12,596 | 147,689 | 185,987 |
| Net asset value, offering price and redemption price per share | $11.34 | $10.12 | $10.80 | $9.67 |
| Class R2 | | | | |
| Net assets | $106,313 | $675,802 | $1,141,462 | $2,537,141 |
| Shares outstanding | 9,375 | 66,754 | 105,541 | 260,393 |
| Net asset value, offering price and redemption price per share | $11.34 | $10.12 | $10.82 | $9.74 |
| Class R3 | | | | |
| Net assets | $205,719 | $149,171 | $1,116,604 | $1,089,143 |
| Shares outstanding | 18,136 | 14,754 | 103,393 | 112,459 |
| Net asset value, offering price and redemption price per share | $11.34 | $10.11 | $10.80 | $9.68 |
| Class R4 | | | | |
| Net assets | $60,207 | $41,351 | $876,390 | $136,074 |
| Shares outstanding | 5,308 | 4,082 | 81,047 | 13,996 |
| Net asset value, offering price and redemption price per share | $11.34 | $10.13 | $10.81 | $9.72 |
| Class R5 | | | | |
| Net assets | $160,267 | $142,393 | $42,566 | $1,601,226 |
| Shares outstanding | 14,126 | 14,043 | 3,932 | 163,784 |
| Net asset value, offering price and redemption price per share | $11.35 | $10.14 | $10.83 | $9.78 |
| Class R6 | | | | |
| Net assets | $2,342,316 | $7,430,148 | $18,167,860 | $30,716,237 |
| Shares outstanding | 206,247 | 732,805 | 1,677,654 | 3,149,578 |
| Net asset value, offering price and redemption price per share | $11.36 | $10.14 | $10.83 | $9.75 |
| 32 | JOHN HANCOCK MULTIMANAGER LIFETIME PORTFOLIOS | SEMIANNUAL REPORT | SEE NOTES TO FINANCIAL STATEMENTS |
STATEMENTS OF ASSETS AND LIABILITIES 2-29-20 (unaudited)
Continued
| | Multimanager 2060 Lifetime Portfolio | Multimanager 2055 Lifetime Portfolio | Multimanager 2050 Lifetime Portfolio | Multimanager 2045 Lifetime Portfolio |
| Class 1 | | | | |
| Net assets | $94,219,893 | $194,475,903 | $324,288,601 | $567,303,537 |
| Shares outstanding | 8,299,385 | 19,184,066 | 29,982,734 | 58,107,494 |
| Net asset value, offering price and redemption price per share | $11.35 | $10.14 | $10.82 | $9.76 |
| Maximum offering price per share | | | | |
| Class A (net asset value per share ÷ 95%)3 | $11.94 | $10.66 | $11.38 | $10.21 |
| 1 | Redemption price per share is equal to net asset value less any applicable contingent deferred sales charge. |
| 2 | Net asset value, offering price and redemption price per share of $11.36 is calculated using Net assets of $44,670.06 and Shares outstanding of 3,933.875. |
| 3 | On single retail sales of less than $50,000. On sales of $50,000 or more and on group sales the offering price is reduced. |
| SEE NOTES TO FINANCIAL STATEMENTS | SEMIANNUAL REPORT | JOHN HANCOCK MULTIMANAGER LIFETIME PORTFOLIOS | 33 |
STATEMENTS OF ASSETS AND LIABILITIES 2-29-20 (unaudited)
Continued
| | Multimanager 2040 Lifetime Portfolio | Multimanager 2035 Lifetime Portfolio | Multimanager 2030 Lifetime Portfolio | Multimanager 2025 Lifetime Portfolio |
| Assets | | | | |
| Unaffiliated investments, at value | $68,383,436 | $93,765,025 | $118,967,787 | $127,890,038 |
| Affiliated investments, at value | 732,103,906 | 902,530,750 | 1,054,550,014 | 1,037,448,657 |
| Total investments, at value | 800,487,342 | 996,295,775 | 1,173,517,801 | 1,165,338,695 |
| Dividends and interest receivable | 192,732 | 363,910 | 611,074 | 867,114 |
| Receivable for fund shares sold | 381,379 | 142,412 | 225,689 | 236,301 |
| Receivable for investments sold | 2,762,439 | 5,779,279 | 8,109,852 | 7,108,167 |
| Receivable from affiliates | 12,444 | 14,206 | 17,086 | 16,731 |
| Other assets | 82,578 | 85,863 | 87,752 | 89,098 |
| Total assets | 803,918,914 | 1,002,681,445 | 1,182,569,254 | 1,173,656,106 |
| Liabilities | | | | |
| Payable for investments purchased | 2,803,820 | 3,902,854 | 5,763,459 | 6,602,071 |
| Payable for fund shares repurchased | 427,638 | 2,265,247 | 3,053,667 | 1,501,012 |
| Payable to affiliates | | | | |
| Accounting and legal services fees | 21,670 | 26,762 | 31,031 | 30,713 |
| Transfer agent fees | 14,073 | 16,192 | 19,635 | 18,926 |
| Distribution and service fees | 1,632 | 4,076 | 2,616 | 3,491 |
| Trustees' fees | 1,463 | 1,845 | 2,257 | 2,357 |
| Other liabilities and accrued expenses | 27,407 | 28,964 | 30,206 | 30,776 |
| Total liabilities | 3,297,703 | 6,245,940 | 8,902,871 | 8,189,346 |
| Net assets | $800,621,211 | $996,435,505 | $1,173,666,383 | $1,165,466,760 |
| Net assets consist of | | | | |
| Paid-in capital | $725,963,933 | $903,951,340 | $1,065,160,042 | $1,064,928,582 |
| Total distributable earnings (loss) | 74,657,278 | 92,484,165 | 108,506,341 | 100,538,178 |
| Net assets | $800,621,211 | $996,435,505 | $1,173,666,383 | $1,165,466,760 |
| Unaffiliated investments, at cost | $67,213,976 | $90,504,538 | $112,682,938 | $120,970,432 |
| Affiliated investments, at cost | 677,752,496 | 834,731,335 | 973,662,997 | 962,843,009 |
| Total investments, at cost | 744,966,472 | 925,235,873 | 1,086,345,935 | 1,083,813,441 |
| Net asset value per share | | | | |
| The portfolios have an unlimited number of shares authorized with no par value. Net asset value is calculated by dividing the net assets of each class of shares by the number of outstanding shares in the class. | | | | |
| Class A1 | | | | |
| Net assets | $138,122,361 | $158,858,240 | $194,154,069 | $188,536,725 |
| Shares outstanding | 13,850,466 | 15,911,560 | 19,712,584 | 19,384,456 |
| Net asset value and redemption price per share | $9.97 | $9.98 | $9.85 | $9.73 |
| Class I | | | | |
| Net assets | $263,848 | $15,285 | $978,036 | $1,637,057 |
| Shares outstanding | 26,299 | 1,525 | 99,685 | 169,144 |
| Net asset value, offering price and redemption price per share | $10.03 | $10.032 | $9.81 | $9.68 |
| Class R1 | | | | |
| Net assets | $2,853,081 | $4,571,680 | $3,777,464 | $3,785,585 |
| Shares outstanding | 286,806 | 459,284 | 385,924 | 391,787 |
| Net asset value, offering price and redemption price per share | $9.95 | $9.95 | $9.79 | $9.66 |
| Class R2 | | | | |
| Net assets | $986,870 | $2,626,217 | $2,911,909 | $5,631,870 |
| Shares outstanding | 98,584 | 261,693 | 297,827 | 583,105 |
| Net asset value, offering price and redemption price per share | $10.01 | $10.04 | $9.78 | $9.66 |
| Class R3 | | | | |
| Net assets | $1,323,609 | $2,035,027 | $1,485,223 | $2,702,693 |
| Shares outstanding | 133,259 | 204,070 | 151,563 | 279,572 |
| Net asset value, offering price and redemption price per share | $9.93 | $9.97 | $9.80 | $9.67 |
| Class R4 | | | | |
| Net assets | $245,257 | $99,049 | $519,980 | $724,734 |
| Shares outstanding | 24,583 | 9,877 | 53,085 | 74,793 |
| Net asset value, offering price and redemption price per share | $9.98 | $10.03 | $9.80 | $9.69 |
| Class R5 | | | | |
| Net assets | $236,703 | $424,865 | $804,115 | $1,330,246 |
| Shares outstanding | 23,576 | 42,298 | 82,071 | 137,607 |
| Net asset value, offering price and redemption price per share | $10.04 | $10.04 | $9.80 | $9.67 |
| Class R6 | | | | |
| Net assets | $32,718,861 | $40,598,213 | $49,126,072 | $45,093,925 |
| Shares outstanding | 3,267,176 | 4,045,384 | 5,013,832 | 4,668,426 |
| Net asset value, offering price and redemption price per share | $10.01 | $10.04 | $9.80 | $9.66 |
| 34 | JOHN HANCOCK MULTIMANAGER LIFETIME PORTFOLIOS | SEMIANNUAL REPORT | SEE NOTES TO FINANCIAL STATEMENTS |
STATEMENTS OF ASSETS AND LIABILITIES 2-29-20 (unaudited)
Continued
| | Multimanager 2040 Lifetime Portfolio | Multimanager 2035 Lifetime Portfolio | Multimanager 2030 Lifetime Portfolio | Multimanager 2025 Lifetime Portfolio |
| Class 1 | | | | |
| Net assets | $623,870,621 | $787,206,929 | $919,909,515 | $916,023,925 |
| Shares outstanding | 62,218,852 | 78,351,151 | 93,795,737 | 94,717,017 |
| Net asset value, offering price and redemption price per share | $10.03 | $10.05 | $9.81 | $9.67 |
| Maximum offering price per share | | | | |
| Class A (net asset value per share ÷ 95%)3 | $10.49 | $10.51 | $10.37 | $10.24 |
| 1 | Redemption price per share is equal to net asset value less any applicable contingent deferred sales charge. |
| 2 | Net asset value, offering price and redemption price per share of $10.03 is calculated using Net assets of $15,285.30 and Shares outstanding of 1,524.512. |
| 3 | On single retail sales of less than $50,000. On sales of $50,000 or more and on group sales the offering price is reduced. |
| SEE NOTES TO FINANCIAL STATEMENTS | SEMIANNUAL REPORT | JOHN HANCOCK MULTIMANAGER LIFETIME PORTFOLIOS | 35 |
STATEMENTS OF ASSETS AND LIABILITIES 2-29-20 (unaudited)
Continued
| | Multimanager 2020 Lifetime Portfolio | Multimanager 2015 Lifetime Portfolio | Multimanager 2010 Lifetime Portfolio |
| Assets | | | |
| Unaffiliated investments, at value | $79,426,846 | $27,916,390 | $17,263,840 |
| Affiliated investments, at value | 668,779,553 | 243,419,635 | 159,468,600 |
| Total investments, at value | 748,206,399 | 271,336,025 | 176,732,440 |
| Dividends and interest receivable | 730,967 | 311,047 | 221,712 |
| Receivable for fund shares sold | 147,912 | 322,669 | 299,085 |
| Receivable for investments sold | 6,946,843 | 2,700,246 | 1,025,463 |
| Receivable from affiliates | 11,954 | 5,374 | 4,020 |
| Other assets | 83,925 | 80,102 | 75,333 |
| Total assets | 756,128,000 | 274,755,463 | 178,358,053 |
| Liabilities | | | |
| Payable for investments purchased | 4,274,846 | 1,711,736 | 975,597 |
| Payable for fund shares repurchased | 3,507,154 | 1,603,009 | 559,525 |
| Payable to affiliates | | | |
| Accounting and legal services fees | 19,525 | 7,103 | 4,542 |
| Transfer agent fees | 17,550 | 9,097 | 4,346 |
| Distribution and service fees | 2,852 | 1,075 | 219 |
| Trustees' fees | 1,644 | 564 | 316 |
| Other liabilities and accrued expenses | 28,506 | 24,354 | 23,120 |
| Total liabilities | 7,852,077 | 3,356,938 | 1,567,665 |
| Net assets | $748,275,923 | $271,398,525 | $176,790,388 |
| Net assets consist of | | | |
| Paid-in capital | $682,282,326 | $248,754,238 | $164,762,680 |
| Total distributable earnings (loss) | 65,993,597 | 22,644,287 | 12,027,708 |
| Net assets | $748,275,923 | $271,398,525 | $176,790,388 |
| Unaffiliated investments, at cost | $75,602,819 | $26,859,444 | $16,752,344 |
| Affiliated investments, at cost | 625,939,465 | 228,298,805 | 152,068,538 |
| Total investments, at cost | 701,542,284 | 255,158,249 | 168,820,882 |
| Net asset value per share | | | |
| The portfolios have an unlimited number of shares authorized with no par value. Net asset value is calculated by dividing the net assets of each class of shares by the number of outstanding shares in the class. | | | |
| Class A1 | | | |
| Net assets | $178,782,810 | $92,025,083 | $43,923,890 |
| Shares outstanding | 19,342,078 | 10,801,943 | 5,230,088 |
| Net asset value and redemption price per share | $9.24 | $8.52 | $8.40 |
| Class I | | | |
| Net assets | $84,130 | $771,887 | $237,451 |
| Shares outstanding | 9,101 | 90,690 | 28,297 |
| Net asset value, offering price and redemption price per share | $9.24 | $8.51 | $8.39 |
| Class R1 | | | |
| Net assets | $4,316,211 | $1,543,601 | $301,424 |
| Shares outstanding | 468,881 | 181,799 | 36,030 |
| Net asset value, offering price and redemption price per share | $9.21 | $8.49 | $8.37 |
| Class R2 | | | |
| Net assets | $988,535 | $37,603 | $462,295 |
| Shares outstanding | 107,455 | 4,441 | 55,106 |
| Net asset value, offering price and redemption price per share | $9.20 | $8.47 | $8.39 |
| Class R3 | | | |
| Net assets | $1,642,871 | $1,069,727 | $118,866 |
| Shares outstanding | 178,341 | 126,007 | 14,206 |
| Net asset value, offering price and redemption price per share | $9.21 | $8.49 | $8.37 |
| Class R4 | | | |
| Net assets | $217,473 | $11,155 | $47,433 |
| Shares outstanding | 23,653 | 1,315 | 5,656 |
| Net asset value, offering price and redemption price per share | $9.19 | $8.48 | $8.39 |
| Class R5 | | | |
| Net assets | $3,254,314 | $288,995 | $23,261 |
| Shares outstanding | 352,875 | 34,009 | 2,773 |
| Net asset value, offering price and redemption price per share | $9.22 | $8.50 | $8.39 |
| Class R6 | | | |
| Net assets | $29,428,132 | $11,122,755 | $7,767,232 |
| Shares outstanding | 3,197,096 | 1,307,961 | 925,353 |
| Net asset value, offering price and redemption price per share | $9.20 | $8.50 | $8.39 |
| Class 1 | | | |
| Net assets | $529,561,447 | $164,527,719 | $123,908,536 |
| Shares outstanding | 57,431,746 | 19,350,718 | 14,765,631 |
| Net asset value, offering price and redemption price per share | $9.22 | $8.50 | $8.39 |
| 36 | JOHN HANCOCK MULTIMANAGER LIFETIME PORTFOLIOS | SEMIANNUAL REPORT | SEE NOTES TO FINANCIAL STATEMENTS |
STATEMENTS OF ASSETS AND LIABILITIES 2-29-20 (unaudited)
Continued
| | Multimanager 2020 Lifetime Portfolio | Multimanager 2015 Lifetime Portfolio | Multimanager 2010 Lifetime Portfolio |
| Maximum offering price per share | | | |
| Class A (net asset value per share ÷ 95%)2 | $9.73 | $8.97 | $8.84 |
| 1 | Redemption price per share is equal to net asset value less any applicable contingent deferred sales charge. |
| 2 | On single retail sales of less than $50,000. On sales of $50,000 or more and on group sales the offering price is reduced. |
| SEE NOTES TO FINANCIAL STATEMENTS | SEMIANNUAL REPORT | JOHN HANCOCK MULTIMANAGER LIFETIME PORTFOLIOS | 37 |
STATEMENTS OF OPERATIONSFor the six months ended 2-29-20 (unaudited)
| | Multimanager 2060 Lifetime Portfolio | Multimanager 2055 Lifetime Portfolio | Multimanager 2050 Lifetime Portfolio | Multimanager 2045 Lifetime Portfolio |
| Investment income | | | | |
| Income distributions received from affiliated investments | $1,540,739 | $3,546,681 | $6,755,098 | $12,022,617 |
| Dividends | 43,499 | 100,048 | 189,949 | 338,252 |
| Interest | 9,367 | 21,491 | 40,596 | 74,900 |
| Less foreign taxes withheld | (540) | (1,534) | (3,110) | — |
| Other income received from advisor | 65,633 | 140,097 | 245,650 | 513,271 |
| Total investment income | 1,658,698 | 3,806,783 | 7,228,183 | 12,949,040 |
| Expenses | | | | |
| Investment management fees | 70,064 | 161,923 | 309,234 | 552,962 |
| Distribution and service fees | 27,951 | 76,310 | 189,757 | 338,977 |
| Accounting and legal services fees | 8,744 | 20,226 | 38,534 | 68,837 |
| Transfer agent fees | 1,881 | 10,417 | 38,404 | 72,117 |
| Trustees' fees | 826 | 1,989 | 3,818 | 6,936 |
| Custodian fees | 27,151 | 27,151 | 27,151 | 27,151 |
| State registration fees | 50,459 | 50,819 | 46,311 | 46,870 |
| Printing and postage | 9,280 | 9,786 | 10,962 | 12,756 |
| Professional fees | 21,423 | 22,735 | 22,628 | 27,908 |
| Other | 7,720 | 8,158 | 8,890 | 10,426 |
| Total expenses | 225,499 | 389,514 | 695,689 | 1,164,940 |
| Less expense reductions | (195,826) | (303,252) | (469,113) | (755,918) |
| Net expenses | 29,673 | 86,262 | 226,576 | 409,022 |
| Net investment income | 1,629,025 | 3,720,521 | 7,001,607 | 12,540,018 |
| Realized and unrealized gain (loss) | | | | |
| Net realized gain (loss) on | | | | |
| Unaffiliated investments | 7,885 | 22,771 | 48,777 | 92,310 |
| Affiliated investments | (449,697) | (400,323) | 1,257,530 | 12,375,862 |
| Capital gain distributions received from unaffiliated investments | 15,168 | 34,999 | 66,975 | 119,298 |
| Capital gain distributions received from affiliated investments | 2,416,766 | 5,535,003 | 10,495,415 | 18,667,179 |
| | 1,990,122 | 5,192,450 | 11,868,697 | 31,254,649 |
| Change in net unrealized appreciation (depreciation) of | | | | |
| Unaffiliated investments | 33,896 | 114,733 | 240,694 | 470,823 |
| Affiliated investments | (3,093,770) | (6,373,470) | (13,011,319) | (32,198,744) |
| | (3,059,874) | (6,258,737) | (12,770,625) | (31,727,921) |
| Net realized and unrealized loss | (1,069,752) | (1,066,287) | (901,928) | (473,272) |
| Increase in net assets from operations | $559,273 | $2,654,234 | $6,099,679 | $12,066,746 |
| 38 | JOHN HANCOCK MULTIMANAGER LIFETIME PORTFOLIOS | SEMIANNUAL REPORT | SEE NOTES TO FINANCIAL STATEMENTS |
STATEMENTS OF OPERATIONSFor the six months ended 2-29-20 (unaudited)
Continued
| | Multimanager 2040 Lifetime Portfolio | Multimanager 2035 Lifetime Portfolio | Multimanager 2030 Lifetime Portfolio | Multimanager 2025 Lifetime Portfolio |
| Investment income | | | | |
| Income distributions received from affiliated investments | $13,282,556 | $16,361,992 | $18,876,424 | $18,979,096 |
| Dividends | 371,014 | 470,146 | 614,942 | 725,761 |
| Interest | 118,961 | 183,580 | 314,674 | 328,299 |
| Other income received from advisor | 557,812 | 562,142 | 678,436 | 585,253 |
| Total investment income | 14,330,343 | 17,577,860 | 20,484,476 | 20,618,409 |
| Expenses | | | | |
| Investment management fees | 627,854 | 802,958 | 987,094 | 1,049,509 |
| Distribution and service fees | 392,375 | 476,392 | 560,151 | 562,361 |
| Accounting and legal services fees | 76,398 | 94,074 | 110,079 | 110,448 |
| Transfer agent fees | 88,035 | 100,435 | 123,103 | 120,489 |
| Trustees' fees | 7,651 | 9,431 | 11,197 | 11,255 |
| Custodian fees | 27,151 | 27,151 | 27,151 | 27,151 |
| State registration fees | 47,171 | 47,027 | 47,640 | 46,649 |
| Printing and postage | 12,877 | 13,657 | 14,403 | 14,533 |
| Professional fees | 28,654 | 30,539 | 32,359 | 32,725 |
| Other | 10,707 | 11,519 | 12,319 | 12,379 |
| Total expenses | 1,318,873 | 1,613,183 | 1,925,496 | 1,987,499 |
| Less expense reductions | (840,608) | (1,038,662) | (1,245,228) | (1,307,631) |
| Net expenses | 478,265 | 574,521 | 680,268 | 679,868 |
| Net investment income | 13,852,078 | 17,003,339 | 19,804,208 | 19,938,541 |
| Realized and unrealized gain (loss) | | | | |
| Net realized gain (loss) on | | | | |
| Unaffiliated investments | 150,007 | 466,582 | 945,467 | 1,600,454 |
| Affiliated investments | 12,348,359 | 15,028,941 | 12,443,157 | 13,340,037 |
| Capital gain distributions received from unaffiliated investments | 151,061 | 280,334 | 441,489 | 646,750 |
| Capital gain distributions received from affiliated investments | 20,513,506 | 23,843,026 | 26,134,980 | 23,254,456 |
| | 33,162,933 | 39,618,883 | 39,965,093 | 38,841,697 |
| Change in net unrealized appreciation (depreciation) of | | | | |
| Unaffiliated investments | 1,536,618 | 3,266,083 | 5,657,888 | 5,446,963 |
| Affiliated investments | (32,812,097) | (38,439,963) | (37,974,222) | (35,880,542) |
| | (31,275,479) | (35,173,880) | (32,316,334) | (30,433,579) |
| Net realized and unrealized gain | 1,887,454 | 4,445,003 | 7,648,759 | 8,408,118 |
| Increase in net assets from operations | $15,739,532 | $21,448,342 | $27,452,967 | $28,346,659 |
| SEE NOTES TO FINANCIAL STATEMENTS | SEMIANNUAL REPORT | JOHN HANCOCK MULTIMANAGER LIFETIME PORTFOLIOS | 39 |
STATEMENTS OF OPERATIONSFor the six months ended 2-29-20 (unaudited)
Continued
| | Multimanager 2020 Lifetime Portfolio | Multimanager 2015 Lifetime Portfolio | Multimanager 2010 Lifetime Portfolio |
| Investment income | | | |
| Income distributions received from affiliated investments | $12,389,839 | $4,568,240 | $2,881,856 |
| Dividends | 559,000 | 230,160 | 179,972 |
| Interest | 190,387 | 64,751 | 39,527 |
| Less foreign taxes withheld | (4,510) | (1,449) | (682) |
| Other income received from advisor | 385,667 | 140,505 | 86,291 |
| Total investment income | 13,520,383 | 5,002,207 | 3,186,964 |
| Expenses | | | |
| Investment management fees | 739,661 | 281,574 | 185,922 |
| Distribution and service fees | 436,136 | 198,242 | 103,304 |
| Accounting and legal services fees | 71,606 | 26,319 | 16,611 |
| Transfer agent fees | 111,635 | 58,885 | 28,832 |
| Trustees' fees | 7,513 | 2,745 | 1,767 |
| Custodian fees | 27,151 | 27,151 | 27,151 |
| State registration fees | 48,356 | 47,366 | 45,476 |
| Printing and postage | 13,208 | 11,064 | 10,141 |
| Professional fees | 29,012 | 23,982 | 22,810 |
| Other | 10,835 | 8,585 | 8,152 |
| Total expenses | 1,495,113 | 685,913 | 450,166 |
| Less expense reductions | (949,328) | (429,560) | (318,573) |
| Net expenses | 545,785 | 256,353 | 131,593 |
| Net investment income | 12,974,598 | 4,745,854 | 3,055,371 |
| Realized and unrealized gain (loss) | | | |
| Net realized gain (loss) on | | | |
| Unaffiliated investments | 1,599,529 | 653,658 | 466,755 |
| Affiliated investments | 17,180,040 | 7,259,211 | 4,918,537 |
| Capital gain distributions received from unaffiliated investments | 515,413 | 214,647 | 151,129 |
| Capital gain distributions received from affiliated investments | 13,238,785 | 4,248,956 | 2,361,895 |
| | 32,533,767 | 12,376,472 | 7,898,316 |
| Change in net unrealized appreciation (depreciation) of | | | |
| Unaffiliated investments | 2,350,368 | 396,882 | 21,384 |
| Affiliated investments | (27,615,848) | (10,532,082) | (6,860,844) |
| | (25,265,480) | (10,135,200) | (6,839,460) |
| Net realized and unrealized gain | 7,268,287 | 2,241,272 | 1,058,856 |
| Increase in net assets from operations | $20,242,885 | $6,987,126 | $4,114,227 |
| 40 | JOHN HANCOCK MULTIMANAGER LIFETIME PORTFOLIOS | SEMIANNUAL REPORT | SEE NOTES TO FINANCIAL STATEMENTS |
STATEMENTS OF CHANGES IN NET ASSETS
| | Multimanager 2060 Lifetime Portfolio | Multimanager 2055 Lifetime Portfolio | Multimanager 2050 Lifetime Portfolio |
| | Six months ended
2-29-20
(unaudited) | Year ended
8-31-19
| Six months ended
2-29-20
(unaudited) | Year ended
8-31-19
| Six months ended
2-29-20
(unaudited) | Year ended
8-31-19
|
| Increase (decrease) in net assets | | | | | | |
| From operations | | | | | | |
| Net investment income | $1,629,025 | $1,032,602 | $3,720,521 | $3,042,499 | $7,001,607 | $6,271,244 |
| Net realized gain | 1,990,122 | 3,414,926 | 5,192,450 | 13,475,127 | 11,868,697 | 32,136,494 |
| Change in net unrealized appreciation (depreciation) | (3,059,874) | (4,288,636) | (6,258,737) | (17,977,455) | (12,770,625) | (42,226,671) |
| Increase (decrease) in net assets resulting from operations | 559,273 | 158,892 | 2,654,234 | (1,459,829) | 6,099,679 | (3,818,933) |
| Distributions to shareholders | | | | | | |
| From earnings | | | | | | |
| Class A | (170,539) | (93,940) | (1,332,858) | (1,032,978) | (5,337,840) | (5,180,316) |
| Class I | (3,116) | (3,079) | (5,130) | (5,065) | (5,740) | (15,936) |
| Class R1 | (2,914) | (2,911) | (3,729) | (4,281) | (127,662) | (137,418) |
| Class R2 | (6,621) | (4,554) | (53,863) | (38,445) | (97,715) | (96,998) |
| Class R3 | (11,620) | (2,910) | (11,204) | (23,132) | (94,678) | (120,299) |
| Class R4 | (4,003) | (3,422) | (3,871) | (4,500) | (84,086) | (80,472) |
| Class R5 | (13,186) | (8,273) | (10,728) | (8,133) | (3,709) | (6,775) |
| Class R6 | (127,470) | (112,831) | (584,071) | (440,864) | (1,593,319) | (1,673,850) |
| Class 1 | (5,913,640) | (3,704,710) | (16,757,049) | (15,574,577) | (31,049,227) | (33,374,846) |
| Total distributions | (6,253,109) | (3,936,630) | (18,762,503) | (17,131,975) | (38,393,976) | (40,686,910) |
| Portfolio share transactions | | | | | | |
| From portfolio share transactions | 22,144,487 | 32,966,334 | 29,604,047 | 38,886,086 | 35,583,742 | 41,822,596 |
| Total increase (decrease) | 16,450,651 | 29,188,596 | 13,495,778 | 20,294,282 | 3,289,445 | (2,683,247) |
| Net assets | | | | | | |
| Beginning of period | 84,040,607 | 54,852,011 | 206,552,627 | 186,258,345 | 403,853,536 | 406,536,783 |
| End of period | $100,491,258 | $84,040,607 | $220,048,405 | $206,552,627 | $407,142,981 | $403,853,536 |
| SEE NOTES TO FINANCIAL STATEMENTS | SEMIANNUAL REPORT | JOHN HANCOCK MULTIMANAGER LIFETIME PORTFOLIOS | 41 |
STATEMENTS OF CHANGES IN NET ASSETS
Continued
| | Multimanager 2045 Lifetime Portfolio | Multimanager 2040 Lifetime Portfolio | Multimanager 2035 Lifetime Portfolio |
| | Six months ended
2-29-20
(unaudited) | Year ended
8-31-19
| Six months ended
2-29-20
(unaudited) | Year ended
8-31-19
| Six months ended
2-29-20
(unaudited) | Year ended
8-31-19
|
| Increase (decrease) in net assets | | | | | | |
| From operations | | | | | | |
| Net investment income | $12,540,018 | $12,128,918 | $13,852,078 | $13,772,520 | $17,003,339 | $18,665,331 |
| Net realized gain | 31,254,649 | 80,874,163 | 33,162,933 | 83,607,136 | 39,618,883 | 99,984,238 |
| Change in net unrealized appreciation (depreciation) | (31,727,921) | (102,661,419) | (31,275,479) | (105,794,559) | (35,173,880) | (123,116,568) |
| Increase (decrease) in net assets resulting from operations | 12,066,746 | (9,658,338) | 15,739,532 | (8,414,903) | 21,448,342 | (4,466,999) |
| Distributions to shareholders | | | | | | |
| From earnings | | | | | | |
| Class A | (12,655,529) | (11,588,938) | (14,605,840) | (13,451,438) | (16,778,695) | (15,261,093) |
| Class I | (21,948) | (8,952) | (45,642) | (12,330) | (366) | (12,021) |
| Class R1 | (169,669) | (206,880) | (249,715) | (252,679) | (405,558) | (591,449) |
| Class R2 | (285,527) | (251,564) | (110,333) | (79,059) | (279,500) | (194,892) |
| Class R3 | (121,869) | (124,712) | (137,448) | (295,533) | (231,188) | (200,711) |
| Class R4 | (15,224) | (17,277) | (26,526) | (23,691) | (10,334) | (35,318) |
| Class R5 | (181,085) | (259,384) | (23,647) | (40,835) | (35,148) | (36,222) |
| Class R6 | (3,449,052) | (3,245,626) | (3,330,112) | (3,539,663) | (3,621,249) | (3,596,028) |
| Class 1 | (68,433,681) | (70,191,203) | (71,311,067) | (75,246,373) | (88,355,228) | (91,587,792) |
| Total distributions | (85,333,584) | (85,894,536) | (89,840,330) | (92,941,601) | (109,717,266) | (111,515,526) |
| Portfolio share transactions | | | | | | |
| From portfolio share transactions | 49,101,197 | 36,949,715 | 56,701,696 | 47,336,637 | 73,924,770 | 28,874,148 |
| Total decrease | (24,165,641) | (58,603,159) | (17,399,102) | (54,019,867) | (14,344,154) | (87,108,377) |
| Net assets | | | | | | |
| Beginning of period | 740,588,944 | 799,192,103 | 818,020,313 | 872,040,180 | 1,010,779,659 | 1,097,888,036 |
| End of period | $716,423,303 | $740,588,944 | $800,621,211 | $818,020,313 | $996,435,505 | $1,010,779,659 |
| 42 | JOHN HANCOCK MULTIMANAGER LIFETIME PORTFOLIOS | SEMIANNUAL REPORT | SEE NOTES TO FINANCIAL STATEMENTS |
STATEMENTS OF CHANGES IN NET ASSETS
Continued
| | Multimanager 2030 Lifetime Portfolio | Multimanager 2025 Lifetime Portfolio | Multimanager 2020 Lifetime Portfolio |
| | Six months ended
2-29-20
(unaudited) | Year ended
8-31-19
| Six months ended
2-29-20
(unaudited) | Year ended
8-31-19
| Six months ended
2-29-20
(unaudited) | Year ended
8-31-19
|
| Increase (decrease) in net assets | | | | | | |
| From operations | | | | | | |
| Net investment income | $19,804,208 | $24,970,131 | $19,938,541 | $29,484,117 | $12,974,598 | $22,208,434 |
| Net realized gain | 39,965,093 | 107,800,733 | 38,841,697 | 93,764,688 | 32,533,767 | 57,909,361 |
| Change in net unrealized appreciation (depreciation) | (32,316,334) | (123,100,281) | (30,433,579) | (99,855,400) | (25,265,480) | (55,904,520) |
| Increase in net assets resulting from operations | 27,452,967 | 9,670,583 | 28,346,659 | 23,393,405 | 20,242,885 | 24,213,275 |
| Distributions to shareholders | | | | | | |
| From earnings | | | | | | |
| Class A | (18,805,996) | (18,040,944) | (17,135,527) | (16,558,687) | (15,829,355) | (15,099,709) |
| Class I | (85,151) | (74,773) | (120,334) | (10,924) | (17,153) | (30,390) |
| Class R1 | (358,350) | (366,303) | (319,540) | (390,154) | (404,333) | (394,662) |
| Class R2 | (284,703) | (140,571) | (406,017) | (243,728) | (85,891) | (128,558) |
| Class R3 | (176,447) | (193,993) | (242,056) | (252,246) | (154,111) | (172,438) |
| Class R4 | (51,636) | (53,322) | (66,576) | (73,321) | (19,449) | (19,353) |
| Class R5 | (108,251) | (116,364) | (134,005) | (133,730) | (359,787) | (393,841) |
| Class R6 | (4,265,813) | (4,342,951) | (3,696,766) | (4,243,076) | (2,698,725) | (2,805,848) |
| Class 1 | (95,973,396) | (103,718,952) | (90,814,254) | (105,918,621) | (52,177,245) | (63,603,874) |
| Total distributions | (120,109,743) | (127,048,173) | (112,935,075) | (127,824,487) | (71,746,049) | (82,648,673) |
| Portfolio share transactions | | | | | | |
| From portfolio share transactions | 67,524,992 | 16,399,104 | 32,873,488 | (26,141,907) | (2,339,273) | (75,745,244) |
| Total decrease | (25,131,784) | (100,978,486) | (51,714,928) | (130,572,989) | (53,842,437) | (134,180,642) |
| Net assets | | | | | | |
| Beginning of period | 1,198,798,167 | 1,299,776,653 | 1,217,181,688 | 1,347,754,677 | 802,118,360 | 936,299,002 |
| End of period | $1,173,666,383 | $1,198,798,167 | $1,165,466,760 | $1,217,181,688 | $748,275,923 | $802,118,360 |
| SEE NOTES TO FINANCIAL STATEMENTS | SEMIANNUAL REPORT | JOHN HANCOCK MULTIMANAGER LIFETIME PORTFOLIOS | 43 |
STATEMENTS OF CHANGES IN NET ASSETS
Continued
| | Multimanager 2015 Lifetime Portfolio | Multimanager 2010 Lifetime Portfolio |
| | Six months ended
2-29-20
(unaudited) | Year ended
8-31-19
| Six months ended
2-29-20
(unaudited) | Year ended
8-31-19
|
| Increase (decrease) in net assets | | | | |
| From operations | | | | |
| Net investment income | $4,745,854 | $9,072,064 | $3,055,371 | $5,828,615 |
| Net realized gain | 12,376,472 | 19,816,674 | 7,898,316 | 9,434,410 |
| Change in net unrealized appreciation (depreciation) | (10,135,200) | (17,449,162) | (6,839,460) | (6,348,560) |
| Increase in net assets resulting from operations | 6,987,126 | 11,439,576 | 4,114,227 | 8,914,465 |
| Distributions to shareholders | | | | |
| From earnings | | | | |
| Class A | (8,090,538) | (8,454,544) | (3,312,277) | (3,533,345) |
| Class I | (71,735) | (56,242) | (18,005) | (12,726) |
| Class R1 | (125,093) | (133,475) | (21,802) | (35,868) |
| Class R2 | (3,089) | (4,328) | (32,958) | (36,407) |
| Class R3 | (204,721) | (231,894) | (8,912) | (10,462) |
| Class R4 | (997) | (6,316) | (3,470) | (6,296) |
| Class R5 | (31,071) | (47,658) | (2,643) | (3,539) |
| Class R6 | (1,070,547) | (1,210,562) | (595,231) | (868,970) |
| Class 1 | (15,799,022) | (21,831,006) | (9,603,188) | (11,897,784) |
| Total distributions | (25,396,813) | (31,976,025) | (13,598,486) | (16,405,397) |
| Portfolio share transactions | | | | |
| From portfolio share transactions | (10,668,939) | (44,122,951) | (2,770,998) | (16,171,958) |
| Total decrease | (29,078,626) | (64,659,400) | (12,255,257) | (23,662,890) |
| Net assets | | | | |
| Beginning of period | 300,477,151 | 365,136,551 | 189,045,645 | 212,708,535 |
| End of period | $271,398,525 | $300,477,151 | $176,790,388 | $189,045,645 |
| 44 | JOHN HANCOCK MULTIMANAGER LIFETIME PORTFOLIOS | SEMIANNUAL REPORT | SEE NOTES TO FINANCIAL STATEMENTS |
Multimanager 2060 Lifetime Portfolio
| Per share operating performance for a share outstanding throughout each period | | Ratios and supplemental data | |
| | | | Income (loss) from investment operations | | | | Less distributions | | | | Ratios to average net assets | | | |
| Period ended | Net asset
value,
beginning
of period ($) | | Net
investment
income
(loss) ($)1, 2 | Net realized and
unrealized
gain (loss)
on investments ($) | | Total from
investment
operations ($) | | From net
investment
income ($) | From net
realized
gain ($) | Total
distributions ($) | Net asset
value,
end of
period ($) | Total
return
(%)3, 4 | Expenses
before
reductions
(%)5 | Expenses
including
reductions
(%)5 | Net
investment
income
(loss) (%)2 | Net
assets,
end of
period
(in thousands) | Portfolio
turnover
(%) |
| Class A | |
| 02-29-20206 | 11.88 | | 0.197 | 0.02 | | 0.21 | | (0.18) | (0.57) | (0.75) | 11.34 | 1.308 | 0.839 | 0.429 | 3.087, 9 | 3,292 | 24 |
| 08-31-2019 | 12.91 | | 0.147 | (0.41) | | (0.27) | | (0.16) | (0.60) | (0.76) | 11.88 | (1.30) | 0.88 | 0.41 | 1.227 | 2,136 | 27 |
| 08-31-2018 | 12.12 | | 0.137 | 1.19 | | 1.32 | | (0.15) | (0.38) | (0.53) | 12.91 | 11.08 | 1.09 | 0.41 | 1.067 | 1,497 | 21 |
| 08-31-2017 | 10.61 | | 0.087 | 1.56 | | 1.64 | | (0.12) | (0.01) | (0.13) | 12.12 | 15.59 | 2.63 | 0.42 | 0.717 | 640 | 24 |
| 08-31-201610 | 10.00 | | (0.01)7 | 0.62 | | 0.61 | | — | — | — | 10.61 | 6.108 | 23.249 | 0.439 | (0.12)7, 9 | 118 | 10 |
| Class I | |
| 02-29-20206 | 11.91 | | 0.217 | 0.03 | | 0.24 | | (0.22) | (0.57) | (0.79) | 11.36 | 1.518 | 0.539 | 0.129 | 3.367, 9 | 45 | 24 |
| 08-31-2019 | 12.95 | | 0.207 | (0.45) | | (0.25) | | (0.19) | (0.60) | (0.79) | 11.91 | (1.06) | 0.59 | 0.13 | 1.667 | 47 | 27 |
| 08-31-2018 | 12.15 | | 0.157 | 1.22 | | 1.37 | | (0.19) | (0.38) | (0.57) | 12.95 | 11.45 | 0.79 | 0.11 | 1.207 | 51 | 21 |
| 08-31-2017 | 10.62 | | 0.187 | 1.50 | | 1.68 | | (0.14) | (0.01) | (0.15) | 12.15 | 16.04 | 2.32 | 0.11 | 1.577 | 121 | 24 |
| 08-31-201610 | 10.00 | | 0.017 | 0.61 | | 0.62 | | — | — | — | 10.62 | 6.208 | 22.939 | 0.119 | 0.207, 9 | 106 | 10 |
| Class R1 | |
| 02-29-20206 | 11.88 | | 0.177 | 0.03 | | 0.20 | | (0.17) | (0.57) | (0.74) | 11.34 | 1.218 | 0.929 | 0.519 | 2.797, 9 | 60 | 24 |
| 08-31-2019 | 12.90 | | 0.157 | (0.43) | | (0.28) | | (0.14) | (0.60) | (0.74) | 11.88 | (1.34) | 0.98 | 0.51 | 1.287 | 47 | 27 |
| 08-31-2018 | 12.12 | | 0.107 | 1.20 | | 1.30 | | (0.14) | (0.38) | (0.52) | 12.90 | 10.89 | 1.19 | 0.51 | 0.807 | 51 | 21 |
| 08-31-2017 | 10.60 | | 0.137 | 1.51 | | 1.64 | | (0.11) | (0.01) | (0.12) | 12.12 | 15.63 | 2.73 | 0.51 | 1.177 | 121 | 24 |
| 08-31-201610 | 10.00 | | (0.01)7 | 0.61 | | 0.60 | | — | — | — | 10.60 | 6.008 | 23.339 | 0.529 | (0.21)7, 9 | 106 | 10 |
| Class R2 | |
| 02-29-20206 | 11.88 | | 0.197 | 0.03 | | 0.22 | | (0.19) | (0.57) | (0.76) | 11.34 | 1.348 | 0.789 | 0.389 | 3.117, 9 | 106 | 24 |
| 08-31-2019 | 12.92 | | 0.167 | (0.43) | | (0.27) | | (0.17) | (0.60) | (0.77) | 11.88 | (1.27) | 0.83 | 0.36 | 1.317 | 95 | 27 |
| 08-31-2018 | 12.14 | | 0.137 | 1.20 | | 1.33 | | (0.17) | (0.38) | (0.55) | 12.92 | 11.13 | 0.98 | 0.30 | 1.037 | 73 | 21 |
| 08-31-2017 | 10.61 | | 0.167 | 1.51 | | 1.67 | | (0.13) | (0.01) | (0.14) | 12.14 | 15.92 | 2.49 | 0.27 | 1.387 | 129 | 24 |
| 08-31-201610 | 10.00 | | —7, 11 | 0.61 | | 0.61 | | — | — | — | 10.61 | 6.108 | 23.089 | 0.279 | 0.047, 9 | 106 | 10 |
| Class R3 | |
| 02-29-20206 | 11.87 | | 0.187 | 0.02 | | 0.20 | | (0.16) | (0.57) | (0.73) | 11.34 | 1.208 | 1.029 | 0.629 | 2.907, 9 | 206 | 24 |
| 08-31-2019 | 12.90 | | 0.077 | (0.36) | | (0.29) | | (0.14) | (0.60) | (0.74) | 11.87 | (1.42) | 1.04 | 0.58 | 0.607 | 153 | 27 |
| 08-31-2018 | 12.12 | | 0.107 | 1.20 | | 1.30 | | (0.14) | (0.38) | (0.52) | 12.90 | 10.89 | 1.19 | 0.51 | 0.807 | 51 | 21 |
| 08-31-2017 | 10.60 | | 0.137 | 1.51 | | 1.64 | | (0.11) | (0.01) | (0.12) | 12.12 | 15.63 | 2.73 | 0.51 | 1.177 | 121 | 24 |
| 08-31-201610 | 10.00 | | (0.01)7 | 0.61 | | 0.60 | | — | — | — | 10.60 | 6.008 | 23.339 | 0.529 | (0.21)7, 9 | 106 | 10 |
| Class R4 | |
| 02-29-20206 | 11.90 | | 0.217 | 0.02 | | 0.23 | | (0.22) | (0.57) | (0.79) | 11.34 | 1.388 | 0.679 | 0.169 | 3.387, 9 | 60 | 24 |
| 08-31-2019 | 12.93 | | 0.197 | (0.43) | | (0.24) | | (0.19) | (0.60) | (0.79) | 11.90 | (1.00) | 0.73 | 0.16 | 1.597 | 55 | 27 |
| 08-31-2018 | 12.14 | | 0.157 | 1.20 | | 1.35 | | (0.18) | (0.38) | (0.56) | 12.93 | 11.33 | 0.94 | 0.16 | 1.197 | 56 | 21 |
| 08-31-2017 | 10.62 | | 0.177 | 1.50 | | 1.67 | | (0.14) | (0.01) | (0.15) | 12.14 | 15.90 | 2.48 | 0.17 | 1.517 | 125 | 24 |
| 08-31-201610 | 10.00 | | 0.017 | 0.61 | | 0.62 | | — | — | — | 10.62 | 6.208 | 23.089 | 0.179 | 0.147, 9 | 106 | 10 |
| Class R5 | |
| 02-29-20206 | 11.90 | | 0.227 | 0.03 | | 0.25 | | (0.23) | (0.57) | (0.80) | 11.35 | 1.568 | 0.479 | 0.069 | 3.567, 9 | 160 | 24 |
| 08-31-2019 | 12.94 | | 0.177 | (0.41) | | (0.24) | | (0.20) | (0.60) | (0.80) | 11.90 | (0.96) | 0.53 | 0.06 | 1.447 | 168 | 27 |
| 08-31-2018 | 12.16 | | 0.167 | 1.20 | | 1.36 | | (0.20) | (0.38) | (0.58) | 12.94 | 11.37 | 0.72 | 0.04 | 1.287 | 118 | 21 |
| 08-31-2017 | 10.62 | | 0.187 | 1.52 | | 1.70 | | (0.15) | (0.01) | (0.16) | 12.16 | 16.22 | 2.24 | 0.02 | 1.597 | 168 | 24 |
| 08-31-201610 | 10.00 | | 0.017 | 0.61 | | 0.62 | | — | — | — | 10.62 | 6.208 | 22.839 | 0.029 | 0.297, 9 | 106 | 10 |
| Class R6 | |
| 02-29-20206 | 11.92 | | 0.217 | 0.04 | | 0.25 | | (0.24) | (0.57) | (0.81) | 11.36 | 1.538 | 0.429 | —9 | 3.427, 9 | 2,342 | 24 |
| 08-31-2019 | 12.95 | | 0.227 | (0.45) | | (0.23) | | (0.20) | (0.60) | (0.80) | 11.92 | (0.86) | 0.48 | — | 1.847 | 1,611 | 27 |
| 08-31-2018 | 12.16 | | 0.147 | 1.23 | | 1.37 | | (0.20) | (0.38) | (0.58) | 12.95 | 11.47 | 0.69 | — | 1.107 | 1,402 | 21 |
| 08-31-2017 | 10.62 | | 0.187 | 1.52 | | 1.70 | | (0.15) | (0.01) | (0.16) | 12.16 | 16.24 | 2.23 | — | 1.587 | 142 | 24 |
| 08-31-201610 | 10.00 | | 0.017 | 0.61 | | 0.62 | | — | — | — | 10.62 | 6.208 | 22.839 | —9 | 0.317, 9 | 106 | 10 |
| SEE NOTES TO FINANCIAL STATEMENTS | SEMIANNUAL REPORT | JOHN HANCOCK MULTIMANAGER LIFETIME PORTFOLIOS | 45 |
| Financial highlights continued |
Multimanager 2060 Lifetime Portfolio (continued)
| Per share operating performance for a share outstanding throughout each period | | Ratios and supplemental data | |
| | | | Income (loss) from investment operations | | | | Less distributions | | | | Ratios to average net assets | | | |
| Period ended | Net asset
value,
beginning
of period ($) | | Net
investment
income
(loss) ($)1, 2 | Net realized and
unrealized
gain (loss)
on investments ($) | | Total from
investment
operations ($) | | From net
investment
income ($) | From net
realized
gain ($) | Total
distributions ($) | Net asset
value,
end of
period ($) | Total
return
(%)3, 4 | Expenses
before
reductions
(%)5 | Expenses
including
reductions
(%)5 | Net
investment
income
(loss) (%)2 | Net
assets,
end of
period
(in thousands) | Portfolio
turnover
(%) |
| Class 1 | |
| 02-29-20206 | 11.91 | | 0.217 | 0.03 | | 0.24 | | (0.23) | (0.57) | (0.80) | 11.35 | 1.488 | 0.469 | 0.059 | 3.387, 9 | 94,220 | 24 |
| 08-31-2019 | 12.94 | | 0.187 | (0.41) | | (0.23) | | (0.20) | (0.60) | (0.80) | 11.91 | (0.92) | 0.52 | 0.05 | 1.557 | 79,730 | 27 |
| 08-31-2018 | 12.15 | | 0.187 | 1.19 | | 1.37 | | (0.20) | (0.38) | (0.58) | 12.94 | 11.43 | 0.73 | 0.05 | 1.407 | 51,555 | 21 |
| 08-31-2017 | 10.62 | | 0.117 | 1.58 | | 1.69 | | (0.15) | (0.01) | (0.16) | 12.15 | 16.10 | 2.26 | 0.05 | 0.987 | 23,938 | 24 |
| 08-31-201610 | 10.00 | | —7, 11 | 0.62 | | 0.62 | | — | — | — | 10.62 | 6.208 | 22.869 | 0.059 | 0.207, 9 | 1,794 | 10 |
| 1 Based on average daily shares outstanding. |
| 2 Net investment income is affected by the timing and frequency of the declaration of dividends by the underlying funds in which the portfolio invests. Accordingly, a significant portion of income is recorded in December. |
| 3 Total returns would have been lower had certain expenses not been reduced during the applicable periods. |
| 4 Does not reflect the effect of sales charges, if any. |
| 5 Ratios do not include expenses indirectly incurred from underlying funds and can vary based on the mix of underlying funds held by the portfolio. |
| 6 Six months ended 2-29-20. Unaudited. |
| 7 Net investment income (loss) per share and net investment income (loss) ratio reflect other income received from the Advisor for reimbursement of indirect net expenses associated with the portfolio's investments in underlying investment companies of $0.01, $0.02, $0.02, $0.02 and $0.002 per share and 0.07%, 0.17%, 0.20%, 0.18% and 0.07%, for the periods ended 2-29-20, 8-31-19, 8-31-18, 8-31-17 and 8-31-16, respectively. |
| 8 Not annualized. |
| 9 Annualized. |
| 10 Period from 3-30-16 (commencement of operations) to 8-31-16. |
| 11 Less than $0.005 per share. |
| 46 | JOHN HANCOCK MULTIMANAGER LIFETIME PORTFOLIOS | SEMIANNUAL REPORT | SEE NOTES TO FINANCIAL STATEMENTS |
Multimanager 2055 Lifetime Portfolio
| Per share operating performance for a share outstanding throughout each period | | Ratios and supplemental data | |
| | | | Income (loss) from investment operations | | | | Less distributions | | | | Ratios to average net assets | | | |
| Period ended | Net asset
value,
beginning
of period ($) | | Net
investment
income
(loss) ($)1, 2 | Net realized and
unrealized
gain (loss)
on investments ($) | | Total from
investment
operations ($) | | From net
investment
income ($) | From net
realized
gain ($) | Total
distributions ($) | Net asset
value,
end of
period ($) | Total
return
(%)3, 4 | Expenses
before
reductions
(%)5 | Expenses
including
reductions
(%)5 | Net
investment
income
(loss) (%)2 | Net
assets,
end of
period
(in thousands) | Portfolio
turnover
(%) |
| Class A | |
| 02-29-20206 | 10.83 | | 0.177 | 0.05 | | 0.22 | | (0.17) | (0.75) | (0.92) | 10.13 | 1.358 | 0.699 | 0.429 | 3.027, 9 | 16,950 | 24 |
| 08-31-2019 | 12.19 | | 0.147 | (0.45) | | (0.31) | | (0.16) | (0.89) | (1.05) | 10.83 | (1.30) | 0.68 | 0.41 | 1.257 | 13,755 | 29 |
| 08-31-2018 | 11.59 | | 0.147 | 1.12 | | 1.26 | | (0.16) | (0.50) | (0.66) | 12.19 | 11.09 | 0.67 | 0.41 | 1.217 | 11,328 | 14 |
| 08-31-2017 | 10.46 | | 0.107 | 1.48 | | 1.58 | | (0.13) | (0.32) | (0.45) | 11.59 | 15.73 | 0.71 | 0.42 | 0.967 | 7,046 | 33 |
| 08-31-2016 | 10.00 | | 0.077 | 0.64 | | 0.71 | | (0.10) | (0.15) | (0.25) | 10.46 | 7.23 | 0.83 | 0.43 | 0.897 | 2,217 | 7 |
| 08-31-2015 | 10.64 | | 0.077 | (0.51) | | (0.44) | | (0.10) | (0.10) | (0.20) | 10.00 | (4.23) | 3.73 | 0.44 | 0.667 | 554 | 18 |
| Class I | |
| 02-29-20206 | 10.86 | | 0.197 | 0.05 | | 0.24 | | (0.21) | (0.75) | (0.96) | 10.14 | 1.468 | 0.399 | 0.129 | 3.367, 9 | 56 | 24 |
| 08-31-2019 | 12.22 | | 0.187 | (0.45) | | (0.27) | | (0.20) | (0.89) | (1.09) | 10.86 | (1.01) | 0.39 | 0.13 | 1.627 | 57 | 29 |
| 08-31-2018 | 11.62 | | 0.157 | 1.14 | | 1.29 | | (0.19) | (0.50) | (0.69) | 12.22 | 11.47 | 0.37 | 0.11 | 1.247 | 54 | 14 |
| 08-31-2017 | 10.49 | | 0.187 | 1.44 | | 1.62 | | (0.17) | (0.32) | (0.49) | 11.62 | 16.05 | 0.40 | 0.11 | 1.627 | 111 | 33 |
| 08-31-2016 | 10.03 | | 0.167 | 0.59 | | 0.75 | | (0.14) | (0.15) | (0.29) | 10.49 | 7.56 | 0.51 | 0.11 | 1.567 | 100 | 7 |
| 08-31-201510 | 10.51 | | 0.017 | (0.49) | | (0.48) | | — | — | — | 10.03 | (4.57)8 | 0.859 | 0.119 | 0.237, 9 | 95 | 1811 |
| Class R1 | |
| 02-29-20206 | 10.82 | | 0.127 | 0.09 | | 0.21 | | (0.16) | (0.75) | (0.91) | 10.12 | 1.278 | 0.789 | 0.519 | 2.247, 9 | 127 | 24 |
| 08-31-2019 | 12.18 | | 0.147 | (0.45) | | (0.31) | | (0.16) | (0.89) | (1.05) | 10.82 | (1.37) | 0.78 | 0.51 | 1.307 | 44 | 29 |
| 08-31-2018 | 11.59 | | 0.107 | 1.13 | | 1.23 | | (0.14) | (0.50) | (0.64) | 12.18 | 10.89 | 0.77 | 0.51 | 0.827 | 50 | 14 |
| 08-31-2017 | 10.45 | | 0.137 | 1.45 | | 1.58 | | (0.12) | (0.32) | (0.44) | 11.59 | 15.73 | 0.81 | 0.51 | 1.227 | 116 | 33 |
| 08-31-2016 | 10.00 | | 0.127 | 0.58 | | 0.70 | | (0.10) | (0.15) | (0.25) | 10.45 | 7.05 | 0.92 | 0.52 | 1.157 | 105 | 7 |
| 08-31-2015 | 10.63 | | 0.107 | (0.55) | | (0.45) | | (0.08) | (0.10) | (0.18) | 10.00 | (4.32) | 7.59 | 0.59 | 0.947 | 100 | 18 |
| Class R2 | |
| 02-29-20206 | 10.83 | | 0.167 | 0.04 | | 0.20 | | (0.16) | (0.75) | (0.91) | 10.12 | 1.188 | 0.779 | 0.509 | 2.927, 9 | 676 | 24 |
| 08-31-2019 | 12.19 | | 0.117 | (0.42) | | (0.31) | | (0.16) | (0.89) | (1.05) | 10.83 | (1.35) | 0.78 | 0.51 | 1.057 | 602 | 29 |
| 08-31-2018 | 11.61 | | 0.057 | 1.20 | | 1.25 | | (0.17) | (0.50) | (0.67) | 12.19 | 10.98 | 0.72 | 0.46 | 0.417 | 436 | 14 |
| 08-31-2017 | 10.47 | | 0.157 | 1.45 | | 1.60 | | (0.14) | (0.32) | (0.46) | 11.61 | 15.94 | 0.62 | 0.33 | 1.357 | 166 | 33 |
| 08-31-2016 | 10.02 | | 0.177 | 0.55 | | 0.72 | | (0.12) | (0.15) | (0.27) | 10.47 | 7.31 | 0.72 | 0.32 | 1.557 | 118 | 7 |
| 08-31-2015 | 10.64 | | 0.127 | (0.54) | | (0.42) | | (0.10) | (0.10) | (0.20) | 10.02 | (4.04) | 7.08 | 0.34 | 1.157 | 107 | 18 |
| Class R3 | |
| 02-29-20206 | 10.81 | | 0.167 | 0.03 | | 0.19 | | (0.14) | (0.75) | (0.89) | 10.11 | 1.138 | 0.939 | 0.669 | 2.857, 9 | 149 | 24 |
| 08-31-2019 | 12.17 | | 0.307 | (0.63) | | (0.33) | | (0.14) | (0.89) | (1.03) | 10.81 | (1.49) | 0.93 | 0.67 | 2.657 | 107 | 29 |
| 08-31-2018 | 11.58 | | 0.097 | 1.14 | | 1.23 | | (0.14) | (0.50) | (0.64) | 12.17 | 10.85 | 0.87 | 0.61 | 0.807 | 212 | 14 |
| 08-31-2017 | 10.45 | | 0.127 | 1.45 | | 1.57 | | (0.12) | (0.32) | (0.44) | 11.58 | 15.61 | 0.84 | 0.55 | 1.067 | 187 | 33 |
| 08-31-2016 | 10.00 | | 0.107 | 0.60 | | 0.70 | | (0.10) | (0.15) | (0.25) | 10.45 | 7.05 | 0.95 | 0.55 | 1.037 | 120 | 7 |
| 08-31-2015 | 10.64 | | 0.097 | (0.54) | | (0.45) | | (0.09) | (0.10) | (0.19) | 10.00 | (4.34) | 7.15 | 0.56 | 0.897 | 124 | 18 |
| Class R4 | |
| 02-29-20206 | 10.85 | | 0.197 | 0.04 | | 0.23 | | (0.20) | (0.75) | (0.95) | 10.13 | 1.418 | 0.539 | 0.169 | 3.337, 9 | 41 | 24 |
| 08-31-2019 | 12.22 | | 0.187 | (0.46) | | (0.28) | | (0.20) | (0.89) | (1.09) | 10.85 | (1.04) | 0.53 | 0.16 | 1.657 | 44 | 29 |
| 08-31-2018 | 11.62 | | 0.147 | 1.14 | | 1.28 | | (0.18) | (0.50) | (0.68) | 12.22 | 11.32 | 0.52 | 0.16 | 1.187 | 51 | 14 |
| 08-31-2017 | 10.48 | | 0.177 | 1.45 | | 1.62 | | (0.16) | (0.32) | (0.48) | 11.62 | 16.10 | 0.56 | 0.17 | 1.577 | 117 | 33 |
| 08-31-2016 | 10.03 | | 0.157 | 0.58 | | 0.73 | | (0.13) | (0.15) | (0.28) | 10.48 | 7.42 | 0.67 | 0.17 | 1.517 | 105 | 7 |
| 08-31-2015 | 10.65 | | 0.147 | (0.54) | | (0.40) | | (0.12) | (0.10) | (0.22) | 10.03 | (3.86) | 7.30 | 0.19 | 1.347 | 100 | 18 |
| Class R5 | |
| 02-29-20206 | 10.86 | | 0.197 | 0.05 | | 0.24 | | (0.21) | (0.75) | (0.96) | 10.14 | 1.518 | 0.339 | 0.069 | 3.357, 9 | 142 | 24 |
| 08-31-2019 | 12.23 | | 0.187 | (0.46) | | (0.28) | | (0.20) | (0.89) | (1.09) | 10.86 | (0.97) | 0.33 | 0.06 | 1.617 | 97 | 29 |
| 08-31-2018 | 11.64 | | 0.177 | 1.12 | | 1.29 | | (0.20) | (0.50) | (0.70) | 12.23 | 11.35 | 0.31 | 0.05 | 1.437 | 223 | 14 |
| 08-31-2017 | 10.50 | | 0.177 | 1.47 | | 1.64 | | (0.18) | (0.32) | (0.50) | 11.64 | 16.24 | 0.32 | 0.03 | 1.577 | 157 | 33 |
| 08-31-2016 | 10.04 | | 0.167 | 0.59 | | 0.75 | | (0.14) | (0.15) | (0.29) | 10.50 | 7.62 | 0.42 | 0.02 | 1.637 | 118 | 7 |
| 08-31-2015 | 10.66 | | 0.167 | (0.55) | | (0.39) | | (0.13) | (0.10) | (0.23) | 10.04 | (3.71) | 7.09 | 0.03 | 1.517 | 101 | 18 |
| Class R6 | |
| 02-29-20206 | 10.87 | | 0.197 | 0.05 | | 0.24 | | (0.22) | (0.75) | (0.97) | 10.14 | 1.478 | 0.289 | —9 | 3.467, 9 | 7,430 | 24 |
| 08-31-2019 | 12.23 | | 0.187 | (0.44) | | (0.26) | | (0.21) | (0.89) | (1.10) | 10.87 | (0.80) | 0.28 | — | 1.657 | 5,437 | 29 |
| 08-31-2018 | 11.63 | | 0.137 | 1.17 | | 1.30 | | (0.20) | (0.50) | (0.70) | 12.23 | 11.48 | 0.27 | — | 1.077 | 3,277 | 14 |
| 08-31-2017 | 10.49 | | 0.177 | 1.47 | | 1.64 | | (0.18) | (0.32) | (0.50) | 11.63 | 16.28 | 0.31 | — | 1.587 | 463 | 33 |
| 08-31-2016 | 10.04 | | 0.127 | 0.63 | | 0.75 | | (0.15) | (0.15) | (0.30) | 10.49 | 7.58 | 0.42 | — | 1.457 | 362 | 7 |
| 08-31-2015 | 10.67 | | 0.137 | (0.52) | | (0.39) | | (0.14) | (0.10) | (0.24) | 10.04 | (3.76) | 6.34 | — | 1.287 | 177 | 18 |
| SEE NOTES TO FINANCIAL STATEMENTS | SEMIANNUAL REPORT | JOHN HANCOCK MULTIMANAGER LIFETIME PORTFOLIOS | 47 |
| Financial highlights continued |
Multimanager 2055 Lifetime Portfolio (continued)
| Per share operating performance for a share outstanding throughout each period | | Ratios and supplemental data | |
| | | | Income (loss) from investment operations | | | | Less distributions | | | | Ratios to average net assets | | | |
| Period ended | Net asset
value,
beginning
of period ($) | | Net
investment
income
(loss) ($)1, 2 | Net realized and
unrealized
gain (loss)
on investments ($) | | Total from
investment
operations ($) | | From net
investment
income ($) | From net
realized
gain ($) | Total
distributions ($) | Net asset
value,
end of
period ($) | Total
return
(%)3, 4 | Expenses
before
reductions
(%)5 | Expenses
including
reductions
(%)5 | Net
investment
income
(loss) (%)2 | Net
assets,
end of
period
(in thousands) | Portfolio
turnover
(%) |
| Class 1 | |
| 02-29-20206 | 10.86 | | 0.197 | 0.04 | | 0.23 | | (0.20) | (0.75) | (0.95) | 10.14 | 1.518 | 0.329 | 0.059 | 3.357, 9 | 194,476 | 24 |
| 08-31-2019 | 12.23 | | 0.187 | (0.45) | | (0.27) | | (0.21) | (0.89) | (1.10) | 10.86 | (0.94) | 0.31 | 0.05 | 1.637 | 186,409 | 29 |
| 08-31-2018 | 11.63 | | 0.197 | 1.11 | | 1.30 | | (0.20) | (0.50) | (0.70) | 12.23 | 11.42 | 0.31 | 0.05 | 1.577 | 170,628 | 14 |
| 08-31-2017 | 10.49 | | 0.187 | 1.45 | | 1.63 | | (0.17) | (0.32) | (0.49) | 11.63 | 16.22 | 0.34 | 0.05 | 1.617 | 135,851 | 33 |
| 08-31-2016 | 10.03 | | 0.127 | 0.63 | | 0.75 | | (0.14) | (0.15) | (0.29) | 10.49 | 7.63 | 0.45 | 0.05 | 1.397 | 101,710 | 7 |
| 08-31-2015 | 10.66 | | 0.117 | (0.51) | | (0.40) | | (0.13) | (0.10) | (0.23) | 10.03 | (3.80) | 0.95 | 0.05 | 1.027 | 44,994 | 18 |
| 1 Based on average daily shares outstanding. |
| 2 Net investment income is affected by the timing and frequency of the declaration of dividends by the underlying funds in which the portfolio invests. Accordingly, a significant portion of income is recorded in December. |
| 3 Total returns would have been lower had certain expenses not been reduced during the applicable periods. |
| 4 Does not reflect the effect of sales charges, if any. |
| 5 Ratios do not include expenses indirectly incurred from underlying funds and can vary based on the mix of underlying funds held by the portfolio. |
| 6 Six months ended 2-29-20. Unaudited. |
| 7 Net investment income (loss) per share and net investment income (loss) ratio reflect other income received from the Advisor for reimbursement of indirect net expenses associated with the portfolio's investments in underlying investment companies of $0.01, $0.02, $0.02, $0.02, $0.01 and $0.01 per share and 0.06%, 0.16%, 0.19%, 0.19%, 0.12% and 0.09%, for the periods ended 2-29-20, 8-31-19, 8-31-18, 8-31-17, 8-31-16 and 8-31-15, respectively. |
| 8 Not annualized. |
| 9 Annualized. |
| 10 The inception date for Class I shares is 3-27-15. |
| 11 Portfolio turnover is shown for the period from 9-1-14 to 8-31-15. |
| 48 | JOHN HANCOCK MULTIMANAGER LIFETIME PORTFOLIOS | SEMIANNUAL REPORT | SEE NOTES TO FINANCIAL STATEMENTS |
Multimanager 2050 Lifetime Portfolio
| Per share operating performance for a share outstanding throughout each period | | Ratios and supplemental data | |
| | | | Income (loss) from investment operations | | | | Less distributions | | | | Ratios to average net assets | | | |
| Period ended | Net asset
value,
beginning
of period ($) | | Net
investment
income
(loss) ($)1, 2 | Net realized and
unrealized
gain (loss)
on investments ($) | | Total from
investment
operations ($) | | From net
investment
income ($) | From net
realized
gain ($) | Total
distributions ($) | Net asset
value,
end of
period ($) | Total
return
(%)3, 4 | Expenses
before
reductions
(%)5 | Expenses
including
reductions
(%)5 | Net
investment
income
(loss) (%)2 | Net
assets,
end of
period
(in thousands) | Portfolio
turnover
(%) |
| Class A | |
| 02-29-20206 | 11.65 | | 0.187 | 0.05 | | 0.23 | | (0.18) | (0.89) | (1.07) | 10.81 | 1.288 | 0.649 | 0.429 | 2.997, 9 | 59,857 | 24 |
| 08-31-2019 | 13.29 | | 0.157 | (0.51) | | (0.36) | | (0.16) | (1.12) | (1.28) | 11.65 | (1.33) | 0.62 | 0.41 | 1.287 | 54,552 | 31 |
| 08-31-2018 | 12.73 | | 0.167 | 1.20 | | 1.36 | | (0.17) | (0.63) | (0.80) | 13.29 | 11.00 | 0.59 | 0.41 | 1.227 | 53,484 | 18 |
| 08-31-2017 | 11.65 | | 0.147 | 1.62 | | 1.76 | | (0.16) | (0.52) | (0.68) | 12.73 | 15.87 | 0.59 | 0.42 | 1.187 | 42,799 | 38 |
| 08-31-2016 | 11.42 | | 0.117 | 0.68 | | 0.79 | | (0.13) | (0.43) | (0.56) | 11.65 | 7.16 | 0.59 | 0.43 | 1.107 | 24,261 | 11 |
| 08-31-2015 | 12.44 | | 0.127 | (0.62) | | (0.50) | | (0.11) | (0.41) | (0.52) | 11.42 | (4.21) | 0.61 | 0.45 | 0.957 | 14,346 | 11 |
| Class I | |
| 02-29-20206 | 11.68 | | 0.207 | 0.05 | | 0.25 | | (0.22) | (0.89) | (1.11) | 10.82 | 1.388 | 0.349 | 0.129 | 3.377, 9 | 58 | 24 |
| 08-31-2019 | 13.32 | | 0.277 | (0.59) | | (0.32) | | (0.20) | (1.12) | (1.32) | 11.68 | (0.96) | 0.33 | 0.13 | 2.337 | 56 | 31 |
| 08-31-2018 | 12.75 | | 0.187 | 1.23 | | 1.41 | | (0.21) | (0.63) | (0.84) | 13.32 | 11.29 | 0.29 | 0.11 | 1.347 | 61 | 18 |
| 08-31-2017 | 11.68 | | 0.197 | 1.59 | | 1.78 | | (0.19) | (0.52) | (0.71) | 12.75 | 16.19 | 0.28 | 0.11 | 1.597 | 116 | 38 |
| 08-31-2016 | 11.44 | | 0.187 | 0.66 | | 0.84 | | (0.17) | (0.43) | (0.60) | 11.68 | 7.58 | 0.28 | 0.11 | 1.557 | 97 | 11 |
| 08-31-201510 | 11.99 | | 0.017 | (0.56) | | (0.55) | | — | — | — | 11.44 | (4.59)8 | 0.289 | 0.109 | 0.227, 9 | 95 | 1111 |
| Class R1 | |
| 02-29-20206 | 11.62 | | 0.157 | 0.06 | | 0.21 | | (0.14) | (0.89) | (1.03) | 10.80 | 1.148 | 0.989 | 0.769 | 2.607, 9 | 1,595 | 24 |
| 08-31-2019 | 13.25 | | 0.117 | (0.50) | | (0.39) | | (0.12) | (1.12) | (1.24) | 11.62 | (1.62) | 0.97 | 0.76 | 0.957 | 1,387 | 31 |
| 08-31-2018 | 12.70 | | 0.117 | 1.20 | | 1.31 | | (0.13) | (0.63) | (0.76) | 13.25 | 10.58 | 0.94 | 0.76 | 0.867 | 1,380 | 18 |
| 08-31-2017 | 11.63 | | 0.107 | 1.61 | | 1.71 | | (0.12) | (0.52) | (0.64) | 12.70 | 15.47 | 0.95 | 0.75 | 0.817 | 1,060 | 38 |
| 08-31-2016 | 11.40 | | 0.097 | 0.67 | | 0.76 | | (0.10) | (0.43) | (0.53) | 11.63 | 6.88 | 0.87 | 0.71 | 0.777 | 696 | 11 |
| 08-31-2015 | 12.43 | | 0.057 | (0.59) | | (0.54) | | (0.08) | (0.41) | (0.49) | 11.40 | (4.54) | 1.56 | 0.72 | 0.447 | 638 | 11 |
| Class R2 | |
| 02-29-20206 | 11.65 | | 0.167 | 0.08 | | 0.24 | | (0.18) | (0.89) | (1.07) | 10.82 | 1.308 | 0.719 | 0.499 | 2.607, 9 | 1,141 | 24 |
| 08-31-2019 | 13.29 | | 0.127 | (0.49) | | (0.37) | | (0.15) | (1.12) | (1.27) | 11.65 | (1.44) | 0.71 | 0.50 | 1.057 | 1,264 | 31 |
| 08-31-2018 | 12.73 | | 0.147 | 1.21 | | 1.35 | | (0.16) | (0.63) | (0.79) | 13.29 | 10.92 | 0.71 | 0.53 | 1.077 | 996 | 18 |
| 08-31-2017 | 11.65 | | 0.127 | 1.63 | | 1.75 | | (0.15) | (0.52) | (0.67) | 12.73 | 15.79 | 0.67 | 0.50 | 1.007 | 840 | 38 |
| 08-31-2016 | 11.42 | | 0.107 | 0.68 | | 0.78 | | (0.12) | (0.43) | (0.55) | 11.65 | 7.08 | 0.63 | 0.47 | 0.987 | 498 | 11 |
| 08-31-2015 | 12.44 | | 0.137 | (0.63) | | (0.50) | | (0.11) | (0.41) | (0.52) | 11.42 | (4.21) | 1.60 | 0.50 | 1.067 | 265 | 11 |
| Class R3 | |
| 02-29-20206 | 11.63 | | 0.167 | 0.06 | | 0.22 | | (0.16) | (0.89) | (1.05) | 10.80 | 1.158 | 0.879 | 0.659 | 2.757, 9 | 1,117 | 24 |
| 08-31-2019 | 13.27 | | 0.157 | (0.53) | | (0.38) | | (0.14) | (1.12) | (1.26) | 11.63 | (1.54) | 0.87 | 0.66 | 1.277 | 1,011 | 31 |
| 08-31-2018 | 12.70 | | 0.147 | 1.20 | | 1.34 | | (0.14) | (0.63) | (0.77) | 13.27 | 10.85 | 0.82 | 0.63 | 1.087 | 1,184 | 18 |
| 08-31-2017 | 11.64 | | 0.127 | 1.60 | | 1.72 | | (0.14) | (0.52) | (0.66) | 12.70 | 15.53 | 0.86 | 0.65 | 1.007 | 819 | 38 |
| 08-31-2016 | 11.41 | | 0.097 | 0.69 | | 0.78 | | (0.12) | (0.43) | (0.55) | 11.64 | 7.03 | 0.74 | 0.57 | 0.927 | 573 | 11 |
| 08-31-2015 | 12.43 | | 0.107 | (0.62) | | (0.52) | | (0.09) | (0.41) | (0.50) | 11.41 | (4.36) | 2.62 | 0.58 | 0.807 | 158 | 11 |
| Class R4 | |
| 02-29-20206 | 11.66 | | 0.207 | 0.04 | | 0.24 | | (0.20) | (0.89) | (1.09) | 10.81 | 1.348 | 0.589 | 0.269 | 3.307, 9 | 876 | 24 |
| 08-31-2019 | 13.30 | | 0.187 | (0.52) | | (0.34) | | (0.18) | (1.12) | (1.30) | 11.66 | (1.13) | 0.57 | 0.26 | 1.507 | 776 | 31 |
| 08-31-2018 | 12.74 | | 0.187 | 1.21 | | 1.39 | | (0.20) | (0.63) | (0.83) | 13.30 | 11.17 | 0.54 | 0.26 | 1.397 | 665 | 18 |
| 08-31-2017 | 11.67 | | 0.187 | 1.59 | | 1.77 | | (0.18) | (0.52) | (0.70) | 12.74 | 15.98 | 0.51 | 0.24 | 1.527 | 467 | 38 |
| 08-31-2016 | 11.44 | | 0.167 | 0.66 | | 0.82 | | (0.16) | (0.43) | (0.59) | 11.67 | 7.41 | 0.50 | 0.23 | 1.407 | 424 | 11 |
| 08-31-2015 | 12.46 | | 0.097 | (0.56) | | (0.47) | | (0.14) | (0.41) | (0.55) | 11.44 | (3.97) | 2.22 | 0.22 | 0.767 | 319 | 11 |
| Class R5 | |
| 02-29-20206 | 11.68 | | 0.207 | 0.07 | | 0.27 | | (0.23) | (0.89) | (1.12) | 10.83 | 1.548 | 0.289 | 0.069 | 3.397, 9 | 43 | 24 |
| 08-31-2019 | 13.34 | | 0.237 | (0.56) | | (0.33) | | (0.21) | (1.12) | (1.33) | 11.68 | (1.05) | 0.28 | 0.07 | 1.847 | 34 | 31 |
| 08-31-2018 | 12.77 | | 0.157 | 1.27 | | 1.42 | | (0.22) | (0.63) | (0.85) | 13.34 | 11.44 | 0.22 | 0.04 | 1.167 | 277 | 18 |
| 08-31-2017 | 11.69 | | 0.207 | 1.60 | | 1.80 | | (0.20) | (0.52) | (0.72) | 12.77 | 16.29 | 0.20 | 0.03 | 1.687 | 185 | 38 |
| 08-31-2016 | 11.45 | | 0.167 | 0.69 | | 0.85 | | (0.18) | (0.43) | (0.61) | 11.69 | 7.65 | 0.18 | 0.02 | 1.567 | 166 | 11 |
| 08-31-2015 | 12.48 | | 0.197 | (0.65) | | (0.46) | | (0.16) | (0.41) | (0.57) | 11.45 | (3.85) | 3.52 | 0.01 | 1.557 | 122 | 11 |
| Class R6 | |
| 02-29-20206 | 11.69 | | 0.207 | 0.06 | | 0.26 | | (0.23) | (0.89) | (1.12) | 10.83 | 1.508 | 0.239 | —9 | 3.427, 9 | 18,168 | 24 |
| 08-31-2019 | 13.34 | | 0.187 | (0.49) | | (0.31) | | (0.22) | (1.12) | (1.34) | 11.69 | (0.90) | 0.22 | — | 1.527 | 15,426 | 31 |
| 08-31-2018 | 12.77 | | 0.187 | 1.25 | | 1.43 | | (0.23) | (0.63) | (0.86) | 13.34 | 11.48 | 0.19 | — | 1.407 | 8,508 | 18 |
| 08-31-2017 | 11.69 | | 0.197 | 1.62 | | 1.81 | | (0.21) | (0.52) | (0.73) | 12.77 | 16.31 | 0.18 | — | 1.577 | 3,528 | 38 |
| 08-31-2016 | 11.46 | | 0.167 | 0.68 | | 0.84 | | (0.18) | (0.43) | (0.61) | 11.69 | 7.62 | 0.18 | — | 1.537 | 3,185 | 11 |
| 08-31-2015 | 12.48 | | 0.167 | (0.60) | | (0.44) | | (0.17) | (0.41) | (0.58) | 11.46 | (3.72) | 0.41 | — | 1.367 | 2,085 | 11 |
| SEE NOTES TO FINANCIAL STATEMENTS | SEMIANNUAL REPORT | JOHN HANCOCK MULTIMANAGER LIFETIME PORTFOLIOS | 49 |
| Financial highlights continued |
Multimanager 2050 Lifetime Portfolio (continued)
| Per share operating performance for a share outstanding throughout each period | | Ratios and supplemental data | |
| | | | Income (loss) from investment operations | | | | Less distributions | | | | Ratios to average net assets | | | |
| Period ended | Net asset
value,
beginning
of period ($) | | Net
investment
income
(loss) ($)1, 2 | Net realized and
unrealized
gain (loss)
on investments ($) | | Total from
investment
operations ($) | | From net
investment
income ($) | From net
realized
gain ($) | Total
distributions ($) | Net asset
value,
end of
period ($) | Total
return
(%)3, 4 | Expenses
before
reductions
(%)5 | Expenses
including
reductions
(%)5 | Net
investment
income
(loss) (%)2 | Net
assets,
end of
period
(in thousands) | Portfolio
turnover
(%) |
| Class 1 | |
| 02-29-20206 | 11.67 | | 0.207 | 0.07 | | 0.27 | | (0.23) | (0.89) | (1.12) | 10.82 | 1.548 | 0.279 | 0.059 | 3.347, 9 | 324,289 | 24 |
| 08-31-2019 | 13.32 | | 0.207 | (0.52) | | (0.32) | | (0.21) | (1.12) | (1.33) | 11.67 | (0.97) | 0.26 | 0.05 | 1.667 | 329,347 | 31 |
| 08-31-2018 | 12.75 | | 0.217 | 1.21 | | 1.42 | | (0.22) | (0.63) | (0.85) | 13.32 | 11.44 | 0.23 | 0.05 | 1.607 | 339,982 | 18 |
| 08-31-2017 | 11.68 | | 0.207 | 1.59 | | 1.79 | | (0.20) | (0.52) | (0.72) | 12.75 | 16.18 | 0.22 | 0.05 | 1.687 | 318,895 | 38 |
| 08-31-2016 | 11.44 | | 0.177 | 0.67 | | 0.84 | | (0.17) | (0.43) | (0.60) | 11.68 | 7.67 | 0.22 | 0.05 | 1.547 | 305,789 | 11 |
| 08-31-2015 | 12.47 | | 0.177 | (0.63) | | (0.46) | | (0.16) | (0.41) | (0.57) | 11.44 | (3.86) | 0.19 | 0.05 | 1.427 | 258,387 | 11 |
| 1 Based on average daily shares outstanding. |
| 2 Net investment income is affected by the timing and frequency of the declaration of dividends by the underlying funds in which the portfolio invests. Accordingly, a significant portion of income is recorded in December. |
| 3 Total returns would have been lower had certain expenses not been reduced during the applicable periods. |
| 4 Does not reflect the effect of sales charges, if any. |
| 5 Ratios do not include expenses indirectly incurred from underlying funds and can vary based on the mix of underlying funds held by the portfolio. |
| 6 Six months ended 2-29-20. Unaudited. |
| 7 Net investment income (loss) per share and net investment income (loss) ratio reflect other income received from the Advisor for reimbursement of indirect net expenses associated with the portfolio's investments in underlying investment companies of $0.01, $0.02, $0.02, $0.02, $0.01 and $0.01 per share and 0.06%, 0.15%, 0.18%, 0.19%, 0.11% and 0.08%, for the periods ended 2-29-20, 8-31-19, 8-31-18, 8-31-17, 8-31-16 and 8-31-15, respectively. |
| 8 Not annualized. |
| 9 Annualized. |
| 10 The inception date for Class I shares is 3-27-15. |
| 11 Portfolio turnover is shown for the period from 9-1-14 to 8-31-15. |
| 50 | JOHN HANCOCK MULTIMANAGER LIFETIME PORTFOLIOS | SEMIANNUAL REPORT | SEE NOTES TO FINANCIAL STATEMENTS |
Multimanager 2045 Lifetime Portfolio
| Per share operating performance for a share outstanding throughout each period | | Ratios and supplemental data | |
| | | | Income (loss) from investment operations | | | | Less distributions | | | | Ratios to average net assets | | | |
| Period ended | Net asset
value,
beginning
of period ($) | | Net
investment
income
(loss) ($)1, 2 | Net realized and
unrealized
gain (loss)
on investments ($) | | Total from
investment
operations ($) | | From net
investment
income ($) | From net
realized
gain ($) | Total
distributions ($) | Net asset
value,
end of
period ($) | Total
return
(%)3, 4 | Expenses
before
reductions
(%)5 | Expenses
including
reductions
(%)5 | Net
investment
income
(loss) (%)2 | Net
assets,
end of
period
(in thousands) | Portfolio
turnover
(%) |
| Class A | |
| 02-29-20206 | 10.71 | | 0.167 | 0.08 | | 0.24 | | (0.17) | (1.08) | (1.25) | 9.70 | 1.288 | 0.629 | 0.429 | 3.017, 9 | 111,028 | 25 |
| 08-31-2019 | 12.40 | | 0.147 | (0.49) | | (0.35) | | (0.16) | (1.18) | (1.34) | 10.71 | (1.29) | 0.60 | 0.41 | 1.327 | 104,554 | 33 |
| 08-31-2018 | 12.17 | | 0.157 | 1.16 | | 1.31 | | (0.16) | (0.92) | (1.08) | 12.40 | 11.12 | 0.56 | 0.41 | 1.267 | 108,685 | 19 |
| 08-31-2017 | 11.24 | | 0.147 | 1.54 | | 1.68 | | (0.15) | (0.60) | (0.75) | 12.17 | 15.83 | 0.56 | 0.42 | 1.247 | 98,637 | 30 |
| 08-31-2016 | 11.14 | | 0.127 | 0.65 | | 0.77 | | (0.13) | (0.54) | (0.67) | 11.24 | 7.18 | 0.55 | 0.43 | 1.157 | 70,954 | 15 |
| 08-31-2015 | 12.27 | | 0.137 | (0.63) | | (0.50) | | (0.11) | (0.52) | (0.63) | 11.14 | (4.28) | 0.54 | 0.44 | 1.067 | 52,732 | 12 |
| Class I | |
| 02-29-20206 | 10.77 | | 0.177 | 0.09 | | 0.26 | | (0.20) | (1.08) | (1.28) | 9.75 | 1.478 | 0.329 | 0.129 | 3.117, 9 | 213 | 25 |
| 08-31-2019 | 12.48 | | 0.147 | (0.48) | | (0.34) | | (0.19) | (1.18) | (1.37) | 10.77 | (1.12) | 0.31 | 0.12 | 1.337 | 199 | 33 |
| 08-31-2018 | 12.25 | | 0.157 | 1.20 | | 1.35 | | (0.20) | (0.92) | (1.12) | 12.48 | 11.37 | 0.27 | 0.11 | 1.187 | 81 | 19 |
| 08-31-2017 | 11.31 | | 0.197 | 1.54 | | 1.73 | | (0.19) | (0.60) | (0.79) | 12.25 | 16.20 | 0.25 | 0.11 | 1.677 | 118 | 30 |
| 08-31-2016 | 11.20 | | 0.187 | 0.64 | | 0.82 | | (0.17) | (0.54) | (0.71) | 11.31 | 7.58 | 0.24 | 0.11 | 1.577 | 96 | 15 |
| 08-31-201510 | 11.74 | | 0.017 | (0.55) | | (0.54) | | — | — | — | 11.20 | (4.60)8 | 0.229 | 0.119 | 0.227, 9 | 95 | 1211 |
| Class R1 | |
| 02-29-20206 | 10.67 | | 0.137 | 0.08 | | 0.21 | | (0.13) | (1.08) | (1.21) | 9.67 | 1.088 | 0.939 | 0.739 | 2.487, 9 | 1,799 | 25 |
| 08-31-2019 | 12.35 | | 0.117 | (0.49) | | (0.38) | | (0.12) | (1.18) | (1.30) | 10.67 | (1.60) | 0.92 | 0.73 | 1.037 | 1,713 | 33 |
| 08-31-2018 | 12.13 | | 0.117 | 1.15 | | 1.26 | | (0.12) | (0.92) | (1.04) | 12.35 | 10.71 | 0.89 | 0.73 | 0.917 | 2,033 | 19 |
| 08-31-2017 | 11.20 | | 0.147 | 1.51 | | 1.65 | | (0.12) | (0.60) | (0.72) | 12.13 | 15.51 | 0.90 | 0.75 | 1.197 | 1,820 | 30 |
| 08-31-2016 | 11.10 | | 0.127 | 0.61 | | 0.73 | | (0.09) | (0.54) | (0.63) | 11.20 | 6.84 | 0.91 | 0.75 | 1.047 | 1,955 | 15 |
| 08-31-2015 | 12.23 | | 0.077 | (0.60) | | (0.53) | | (0.08) | (0.52) | (0.60) | 11.10 | (4.54) | 1.01 | 0.75 | 0.597 | 2,083 | 12 |
| Class R2 | |
| 02-29-20206 | 10.75 | | 0.157 | 0.08 | | 0.23 | | (0.16) | (1.08) | (1.24) | 9.74 | 1.188 | 0.719 | 0.519 | 2.787, 9 | 2,537 | 25 |
| 08-31-2019 | 12.43 | | 0.137 | (0.49) | | (0.36) | | (0.14) | (1.18) | (1.32) | 10.75 | (1.36) | 0.69 | 0.51 | 1.237 | 2,592 | 33 |
| 08-31-2018 | 12.21 | | 0.127 | 1.17 | | 1.29 | | (0.15) | (0.92) | (1.07) | 12.43 | 10.90 | 0.67 | 0.51 | 0.957 | 2,404 | 19 |
| 08-31-2017 | 11.27 | | 0.117 | 1.58 | | 1.69 | | (0.15) | (0.60) | (0.75) | 12.21 | 15.80 | 0.65 | 0.50 | 0.957 | 1,653 | 30 |
| 08-31-2016 | 11.16 | | 0.107 | 0.67 | | 0.77 | | (0.12) | (0.54) | (0.66) | 11.27 | 7.18 | 0.64 | 0.50 | 0.957 | 822 | 15 |
| 08-31-2015 | 12.30 | | 0.117 | (0.62) | | (0.51) | | (0.11) | (0.52) | (0.63) | 11.16 | (4.36) | 1.36 | 0.50 | 0.947 | 464 | 12 |
| Class R3 | |
| 02-29-20206 | 10.68 | | 0.157 | 0.07 | | 0.22 | | (0.14) | (1.08) | (1.22) | 9.68 | 1.158 | 0.859 | 0.659 | 2.827, 9 | 1,089 | 25 |
| 08-31-2019 | 12.36 | | 0.147 | (0.51) | | (0.37) | | (0.13) | (1.18) | (1.31) | 10.68 | (1.54) | 0.84 | 0.65 | 1.287 | 986 | 33 |
| 08-31-2018 | 12.14 | | 0.137 | 1.15 | | 1.28 | | (0.14) | (0.92) | (1.06) | 12.36 | 10.81 | 0.82 | 0.66 | 1.057 | 1,217 | 19 |
| 08-31-2017 | 11.22 | | 0.147 | 1.51 | | 1.65 | | (0.13) | (0.60) | (0.73) | 12.14 | 15.50 | 0.80 | 0.65 | 1.247 | 1,209 | 30 |
| 08-31-2016 | 11.11 | | 0.197 | 0.56 | | 0.75 | | (0.10) | (0.54) | (0.64) | 11.22 | 7.04 | 0.79 | 0.65 | 1.557 | 1,362 | 15 |
| 08-31-2015 | 12.25 | | 0.107 | (0.63) | | (0.53) | | (0.09) | (0.52) | (0.61) | 11.11 | (4.51) | 0.90 | 0.65 | 0.817 | 2,070 | 12 |
| Class R4 | |
| 02-29-20206 | 10.74 | | 0.167 | 0.08 | | 0.24 | | (0.18) | (1.08) | (1.26) | 9.72 | 1.338 | 0.569 | 0.269 | 2.867, 9 | 136 | 25 |
| 08-31-2019 | 12.43 | | 0.157 | (0.48) | | (0.33) | | (0.18) | (1.18) | (1.36) | 10.74 | (1.13) | 0.54 | 0.26 | 1.387 | 174 | 33 |
| 08-31-2018 | 12.20 | | 0.227 | 1.11 | | 1.33 | | (0.18) | (0.92) | (1.10) | 12.43 | 11.23 | 0.52 | 0.26 | 1.797 | 263 | 19 |
| 08-31-2017 | 11.27 | | 0.157 | 1.55 | | 1.70 | | (0.17) | (0.60) | (0.77) | 12.20 | 16.00 | 0.50 | 0.25 | 1.337 | 489 | 30 |
| 08-31-2016 | 11.16 | | 0.187 | 0.62 | | 0.80 | | (0.15) | (0.54) | (0.69) | 11.27 | 7.46 | 0.48 | 0.25 | 1.587 | 559 | 15 |
| 08-31-2015 | 12.30 | | 0.177 | (0.65) | | (0.48) | | (0.14) | (0.52) | (0.66) | 11.16 | (4.12) | 0.73 | 0.25 | 1.397 | 629 | 12 |
| Class R5 | |
| 02-29-20206 | 10.80 | | 0.187 | 0.09 | | 0.27 | | (0.21) | (1.08) | (1.29) | 9.78 | 1.528 | 0.269 | 0.069 | 3.367, 9 | 1,601 | 25 |
| 08-31-2019 | 12.50 | | 0.227 | (0.54) | | (0.32) | | (0.20) | (1.18) | (1.38) | 10.80 | (0.99) | 0.25 | 0.06 | 1.987 | 1,484 | 33 |
| 08-31-2018 | 12.27 | | 0.197 | 1.17 | | 1.36 | | (0.21) | (0.92) | (1.13) | 12.50 | 11.42 | 0.21 | 0.06 | 1.537 | 2,729 | 19 |
| 08-31-2017 | 11.32 | | 0.207 | 1.55 | | 1.75 | | (0.20) | (0.60) | (0.80) | 12.27 | 16.35 | 0.21 | 0.05 | 1.707 | 1,408 | 30 |
| 08-31-2016 | 11.22 | | 0.167 | 0.65 | | 0.81 | | (0.17) | (0.54) | (0.71) | 11.32 | 7.56 | 0.19 | 0.05 | 1.517 | 1,917 | 15 |
| 08-31-2015 | 12.36 | | 0.177 | (0.63) | | (0.46) | | (0.16) | (0.52) | (0.68) | 11.22 | (3.90) | 0.40 | 0.05 | 1.427 | 1,638 | 12 |
| Class R6 | |
| 02-29-20206 | 10.78 | | 0.197 | 0.07 | | 0.26 | | (0.21) | (1.08) | (1.29) | 9.75 | 1.488 | 0.219 | —9 | 3.427, 9 | 30,716 | 25 |
| 08-31-2019 | 12.48 | | 0.187 | (0.49) | | (0.31) | | (0.21) | (1.18) | (1.39) | 10.78 | (0.89) | 0.20 | — | 1.707 | 29,020 | 33 |
| 08-31-2018 | 12.25 | | 0.187 | 1.18 | | 1.36 | | (0.21) | (0.92) | (1.13) | 12.48 | 11.48 | 0.16 | — | 1.447 | 12,631 | 19 |
| 08-31-2017 | 11.31 | | 0.167 | 1.58 | | 1.74 | | (0.20) | (0.60) | (0.80) | 12.25 | 16.34 | 0.15 | — | 1.407 | 4,941 | 30 |
| 08-31-2016 | 11.20 | | 0.137 | 0.70 | | 0.83 | | (0.18) | (0.54) | (0.72) | 11.31 | 7.72 | 0.14 | — | 1.507 | 3,314 | 15 |
| 08-31-2015 | 12.35 | | 0.167 | (0.62) | | (0.46) | | (0.17) | (0.52) | (0.69) | 11.20 | (3.94) | 0.39 | — | 1.367 | 1,781 | 12 |
| SEE NOTES TO FINANCIAL STATEMENTS | SEMIANNUAL REPORT | JOHN HANCOCK MULTIMANAGER LIFETIME PORTFOLIOS | 51 |
| Financial highlights continued |
Multimanager 2045 Lifetime Portfolio (continued)
| Per share operating performance for a share outstanding throughout each period | | Ratios and supplemental data | |
| | | | Income (loss) from investment operations | | | | Less distributions | | | | Ratios to average net assets | | | |
| Period ended | Net asset
value,
beginning
of period ($) | | Net
investment
income
(loss) ($)1, 2 | Net realized and
unrealized
gain (loss)
on investments ($) | | Total from
investment
operations ($) | | From net
investment
income ($) | From net
realized
gain ($) | Total
distributions ($) | Net asset
value,
end of
period ($) | Total
return
(%)3, 4 | Expenses
before
reductions
(%)5 | Expenses
including
reductions
(%)5 | Net
investment
income
(loss) (%)2 | Net
assets,
end of
period
(in thousands) | Portfolio
turnover
(%) |
| Class 1 | |
| 02-29-20206 | 10.79 | | 0.187 | 0.08 | | 0.26 | | (0.21) | (1.08) | (1.29) | 9.76 | 1.448 | 0.259 | 0.059 | 3.357, 9 | 567,304 | 25 |
| 08-31-2019 | 12.49 | | 0.197 | (0.51) | | (0.32) | | (0.20) | (1.18) | (1.38) | 10.79 | (0.95) | 0.23 | 0.05 | 1.697 | 599,868 | 33 |
| 08-31-2018 | 12.25 | | 0.207 | 1.17 | | 1.37 | | (0.21) | (0.92) | (1.13) | 12.49 | 11.52 | 0.20 | 0.05 | 1.637 | 669,149 | 19 |
| 08-31-2017 | 11.31 | | 0.207 | 1.54 | | 1.74 | | (0.20) | (0.60) | (0.80) | 12.25 | 16.27 | 0.19 | 0.05 | 1.707 | 669,937 | 30 |
| 08-31-2016 | 11.21 | | 0.187 | 0.63 | | 0.81 | | (0.17) | (0.54) | (0.71) | 11.31 | 7.56 | 0.17 | 0.05 | 1.597 | 712,160 | 15 |
| 08-31-2015 | 12.35 | | 0.187 | (0.64) | | (0.46) | | (0.16) | (0.52) | (0.68) | 11.21 | (3.90) | 0.15 | 0.05 | 1.497 | 705,106 | 12 |
| 1 Based on average daily shares outstanding. |
| 2 Net investment income is affected by the timing and frequency of the declaration of dividends by the underlying funds in which the portfolio invests. Accordingly, a significant portion of income is recorded in December. |
| 3 Total returns would have been lower had certain expenses not been reduced during the applicable periods. |
| 4 Does not reflect the effect of sales charges, if any. |
| 5 Ratios do not include expenses indirectly incurred from underlying funds and can vary based on the mix of underlying funds held by the portfolio. |
| 6 Six months ended 2-29-20. Unaudited. |
| 7 Net investment income (loss) per share and net investment income (loss) ratio reflect other income received from the Advisor for reimbursement of indirect net expenses associated with the portfolio's investments in underlying investment companies of $0.01, $0.02, $0.02, $0.02, $0.01 and $0.01 per share and 0.07%, 0.16%, 0.19%, 0.19%, 0.12% and 0.09%, for the periods ended 2-29-20, 8-31-19, 8-31-18, 8-31-17, 8-31-16 and 8-31-15, respectively. |
| 8 Not annualized. |
| 9 Annualized. |
| 10 The inception date for Class I shares is 3-27-15. |
| 11 Portfolio turnover is shown for the period from 9-1-14 to 8-31-15. |
| 52 | JOHN HANCOCK MULTIMANAGER LIFETIME PORTFOLIOS | SEMIANNUAL REPORT | SEE NOTES TO FINANCIAL STATEMENTS |
Multimanager 2040 Lifetime Portfolio
| Per share operating performance for a share outstanding throughout each period | | Ratios and supplemental data | |
| | | | Income (loss) from investment operations | | | | Less distributions | | | | Ratios to average net assets | | | |
| Period ended | Net asset
value,
beginning
of period ($) | | Net
investment
income
(loss) ($)1, 2 | Net realized and
unrealized
gain (loss)
on investments ($) | | Total from
investment
operations ($) | | From net
investment
income ($) | From net
realized
gain ($) | Total
distributions ($) | Net asset
value,
end of
period ($) | Total
return
(%)3, 4 | Expenses
before
reductions
(%)5 | Expenses
including
reductions
(%)5 | Net
investment
income
(loss) (%)2 | Net
assets,
end of
period
(in thousands) | Portfolio
turnover
(%) |
| Class A | |
| 02-29-20206 | 10.91 | | 0.177 | 0.09 | | 0.26 | | (0.17) | (1.03) | (1.20) | 9.97 | 1.598 | 0.629 | 0.429 | 2.997, 9 | 138,122 | 25 |
| 08-31-2019 | 12.56 | | 0.157 | (0.47) | | (0.32) | | (0.17) | (1.16) | (1.33) | 10.91 | (1.09) | 0.60 | 0.41 | 1.357 | 127,736 | 33 |
| 08-31-2018 | 12.29 | | 0.167 | 1.13 | | 1.29 | | (0.17) | (0.85) | (1.02) | 12.56 | 10.83 | 0.56 | 0.41 | 1.267 | 127,662 | 19 |
| 08-31-2017 | 11.35 | | 0.147 | 1.56 | | 1.70 | | (0.16) | (0.60) | (0.76) | 12.29 | 15.81 | 0.56 | 0.42 | 1.247 | 108,511 | 32 |
| 08-31-2016 | 11.24 | | 0.127 | 0.66 | | 0.78 | | (0.13) | (0.54) | (0.67) | 11.35 | 7.20 | 0.55 | 0.43 | 1.147 | 77,804 | 14 |
| 08-31-2015 | 12.36 | | 0.137 | (0.63) | | (0.50) | | (0.11) | (0.51) | (0.62) | 11.24 | (4.27) | 0.54 | 0.44 | 1.057 | 55,527 | 12 |
| Class I | |
| 02-29-20206 | 10.98 | | 0.237 | 0.06 | | 0.29 | | (0.21) | (1.03) | (1.24) | 10.03 | 1.788 | 0.329 | 0.129 | 4.067, 9 | 264 | 25 |
| 08-31-2019 | 12.64 | | 0.147 | (0.44) | | (0.30) | | (0.20) | (1.16) | (1.36) | 10.98 | (0.85) | 0.30 | 0.12 | 1.277 | 325 | 33 |
| 08-31-2018 | 12.36 | | 0.277 | 1.07 | | 1.34 | | (0.21) | (0.85) | (1.06) | 12.64 | 11.16 | 0.26 | 0.11 | 2.157 | 122 | 19 |
| 08-31-2017 | 11.41 | | 0.197 | 1.55 | | 1.74 | | (0.19) | (0.60) | (0.79) | 12.36 | 16.18 | 0.25 | 0.11 | 1.667 | 104 | 32 |
| 08-31-2016 | 11.30 | | 0.187 | 0.63 | | 0.81 | | (0.16) | (0.54) | (0.70) | 11.41 | 7.51 | 0.24 | 0.11 | 1.577 | 96 | 14 |
| 08-31-201510 | 11.84 | | 0.017 | (0.55) | | (0.54) | | — | — | — | 11.30 | (4.56)8 | 0.229 | 0.109 | 0.227, 9 | 95 | 1211 |
| Class R1 | |
| 02-29-20206 | 10.87 | | 0.147 | 0.11 | | 0.25 | | (0.14) | (1.03) | (1.17) | 9.95 | 1.478 | 0.959 | 0.759 | 2.597, 9 | 2,853 | 25 |
| 08-31-2019 | 12.51 | | 0.117 | (0.46) | | (0.35) | | (0.13) | (1.16) | (1.29) | 10.87 | (1.42) | 0.93 | 0.75 | 0.997 | 2,519 | 33 |
| 08-31-2018 | 12.24 | | 0.117 | 1.14 | | 1.25 | | (0.13) | (0.85) | (0.98) | 12.51 | 10.50 | 0.90 | 0.75 | 0.867 | 2,497 | 19 |
| 08-31-2017 | 11.31 | | 0.117 | 1.54 | | 1.65 | | (0.12) | (0.60) | (0.72) | 12.24 | 15.39 | 0.90 | 0.75 | 0.927 | 2,758 | 32 |
| 08-31-2016 | 11.20 | | 0.107 | 0.64 | | 0.74 | | (0.09) | (0.54) | (0.63) | 11.31 | 6.86 | 0.89 | 0.75 | 0.897 | 2,479 | 14 |
| 08-31-2015 | 12.33 | | 0.097 | (0.63) | | (0.54) | | (0.08) | (0.51) | (0.59) | 11.20 | (4.60) | 1.00 | 0.75 | 0.757 | 2,308 | 12 |
| Class R2 | |
| 02-29-20206 | 10.94 | | 0.177 | 0.10 | | 0.27 | | (0.17) | (1.03) | (1.20) | 10.01 | 1.618 | 0.699 | 0.499 | 2.997, 9 | 987 | 25 |
| 08-31-2019 | 12.58 | | 0.117 | (0.44) | | (0.33) | | (0.15) | (1.16) | (1.31) | 10.94 | (1.18) | 0.69 | 0.51 | 1.047 | 987 | 33 |
| 08-31-2018 | 12.31 | | 0.227 | 1.06 | | 1.28 | | (0.16) | (0.85) | (1.01) | 12.58 | 10.71 | 0.67 | 0.52 | 1.777 | 651 | 19 |
| 08-31-2017 | 11.37 | | 0.147 | 1.55 | | 1.69 | | (0.15) | (0.60) | (0.75) | 12.31 | 15.69 | 0.64 | 0.50 | 1.237 | 1,288 | 32 |
| 08-31-2016 | 11.26 | | 0.147 | 0.63 | | 0.77 | | (0.12) | (0.54) | (0.66) | 11.37 | 7.10 | 0.65 | 0.50 | 1.327 | 851 | 14 |
| 08-31-2015 | 12.38 | | 0.137 | (0.63) | | (0.50) | | (0.11) | (0.51) | (0.62) | 11.26 | (4.26) | 0.88 | 0.50 | 1.097 | 501 | 12 |
| Class R3 | |
| 02-29-20206 | 10.86 | | 0.167 | 0.09 | | 0.25 | | (0.15) | (1.03) | (1.18) | 9.93 | 1.478 | 0.849 | 0.659 | 2.817, 9 | 1,324 | 25 |
| 08-31-2019 | 12.50 | | 0.207 | (0.54) | | (0.34) | | (0.14) | (1.16) | (1.30) | 10.86 | (1.30) | 0.84 | 0.66 | 1.797 | 1,174 | 33 |
| 08-31-2018 | 12.24 | | 0.127 | 1.13 | | 1.25 | | (0.14) | (0.85) | (0.99) | 12.50 | 10.53 | 0.81 | 0.65 | 0.987 | 2,600 | 19 |
| 08-31-2017 | 11.30 | | 0.147 | 1.53 | | 1.67 | | (0.13) | (0.60) | (0.73) | 12.24 | 15.61 | 0.80 | 0.65 | 1.257 | 1,874 | 32 |
| 08-31-2016 | 11.19 | | 0.167 | 0.59 | | 0.75 | | (0.10) | (0.54) | (0.64) | 11.30 | 6.98 | 0.79 | 0.65 | 1.307 | 2,142 | 14 |
| 08-31-2015 | 12.32 | | 0.107 | (0.63) | | (0.53) | | (0.09) | (0.51) | (0.60) | 11.19 | (4.51) | 0.87 | 0.65 | 0.867 | 2,763 | 12 |
| Class R4 | |
| 02-29-20206 | 10.92 | | 0.187 | 0.10 | | 0.28 | | (0.19) | (1.03) | (1.22) | 9.98 | 1.758 | 0.569 | 0.269 | 3.217, 9 | 245 | 25 |
| 08-31-2019 | 12.57 | | 0.177 | (0.48) | | (0.31) | | (0.18) | (1.16) | (1.34) | 10.92 | (0.94) | 0.54 | 0.26 | 1.517 | 224 | 33 |
| 08-31-2018 | 12.30 | | 0.227 | 1.09 | | 1.31 | | (0.19) | (0.85) | (1.04) | 12.57 | 10.97 | 0.50 | 0.24 | 1.727 | 252 | 19 |
| 08-31-2017 | 11.36 | | 0.187 | 1.54 | | 1.72 | | (0.18) | (0.60) | (0.78) | 12.30 | 16.00 | 0.50 | 0.25 | 1.547 | 345 | 32 |
| 08-31-2016 | 11.25 | | 0.147 | 0.66 | | 0.80 | | (0.15) | (0.54) | (0.69) | 11.36 | 7.39 | 0.49 | 0.25 | 1.297 | 1,098 | 14 |
| 08-31-2015 | 12.38 | | 0.217 | (0.69) | | (0.48) | | (0.14) | (0.51) | (0.65) | 11.25 | (4.10) | 0.73 | 0.25 | 1.737 | 888 | 12 |
| Class R5 | |
| 02-29-20206 | 10.99 | | 0.197 | 0.10 | | 0.29 | | (0.21) | (1.03) | (1.24) | 10.04 | 1.838 | 0.269 | 0.069 | 3.377, 9 | 237 | 25 |
| 08-31-2019 | 12.65 | | 0.237 | (0.52) | | (0.29) | | (0.21) | (1.16) | (1.37) | 10.99 | (0.78) | 0.25 | 0.06 | 1.997 | 192 | 33 |
| 08-31-2018 | 12.37 | | 0.217 | 1.14 | | 1.35 | | (0.22) | (0.85) | (1.07) | 12.65 | 11.22 | 0.21 | 0.06 | 1.657 | 830 | 19 |
| 08-31-2017 | 11.42 | | 0.207 | 1.55 | | 1.75 | | (0.20) | (0.60) | (0.80) | 12.37 | 16.25 | 0.20 | 0.05 | 1.727 | 818 | 32 |
| 08-31-2016 | 11.31 | | 0.257 | 0.57 | | 0.82 | | (0.17) | (0.54) | (0.71) | 11.42 | 7.58 | 0.19 | 0.05 | 2.007 | 1,425 | 14 |
| 08-31-2015 | 12.44 | | 0.187 | (0.64) | | (0.46) | | (0.16) | (0.51) | (0.67) | 11.31 | (3.89) | 0.29 | 0.05 | 1.487 | 2,411 | 12 |
| Class R6 | |
| 02-29-20206 | 10.97 | | 0.197 | 0.10 | | 0.29 | | (0.22) | (1.03) | (1.25) | 10.01 | 1.808 | 0.219 | —9 | 3.427, 9 | 32,719 | 25 |
| 08-31-2019 | 12.63 | | 0.207 | (0.49) | | (0.29) | | (0.21) | (1.16) | (1.37) | 10.97 | (0.71) | 0.19 | — | 1.857 | 28,782 | 33 |
| 08-31-2018 | 12.35 | | 0.187 | 1.17 | | 1.35 | | (0.22) | (0.85) | (1.07) | 12.63 | 11.29 | 0.16 | — | 1.437 | 14,476 | 19 |
| 08-31-2017 | 11.41 | | 0.187 | 1.57 | | 1.75 | | (0.21) | (0.60) | (0.81) | 12.35 | 16.24 | 0.15 | — | 1.537 | 4,053 | 32 |
| 08-31-2016 | 11.29 | | 0.167 | 0.68 | | 0.84 | | (0.18) | (0.54) | (0.72) | 11.41 | 7.74 | 0.14 | — | 1.647 | 3,376 | 14 |
| 08-31-2015 | 12.42 | | 0.157 | (0.60) | | (0.45) | | (0.17) | (0.51) | (0.68) | 11.29 | (3.85) | 0.41 | — | 1.297 | 1,762 | 12 |
| SEE NOTES TO FINANCIAL STATEMENTS | SEMIANNUAL REPORT | JOHN HANCOCK MULTIMANAGER LIFETIME PORTFOLIOS | 53 |
| Financial highlights continued |
Multimanager 2040 Lifetime Portfolio (continued)
| Per share operating performance for a share outstanding throughout each period | | Ratios and supplemental data | |
| | | | Income (loss) from investment operations | | | | Less distributions | | | | Ratios to average net assets | | | |
| Period ended | Net asset
value,
beginning
of period ($) | | Net
investment
income
(loss) ($)1, 2 | Net realized and
unrealized
gain (loss)
on investments ($) | | Total from
investment
operations ($) | | From net
investment
income ($) | From net
realized
gain ($) | Total
distributions ($) | Net asset
value,
end of
period ($) | Total
return
(%)3, 4 | Expenses
before
reductions
(%)5 | Expenses
including
reductions
(%)5 | Net
investment
income
(loss) (%)2 | Net
assets,
end of
period
(in thousands) | Portfolio
turnover
(%) |
| Class 1 | |
| 02-29-20206 | 10.98 | | 0.197 | 0.11 | | 0.30 | | (0.22) | (1.03) | (1.25) | 10.03 | 1.858 | 0.259 | 0.059 | 3.347, 9 | 623,871 | 25 |
| 08-31-2019 | 12.64 | | 0.197 | (0.48) | | (0.29) | | (0.21) | (1.16) | (1.37) | 10.98 | (0.77) | 0.23 | 0.05 | 1.747 | 656,081 | 33 |
| 08-31-2018 | 12.36 | | 0.217 | 1.14 | | 1.35 | | (0.22) | (0.85) | (1.07) | 12.64 | 11.23 | 0.20 | 0.05 | 1.657 | 722,948 | 19 |
| 08-31-2017 | 11.41 | | 0.207 | 1.55 | | 1.75 | | (0.20) | (0.60) | (0.80) | 12.36 | 16.26 | 0.19 | 0.05 | 1.707 | 722,764 | 32 |
| 08-31-2016 | 11.30 | | 0.187 | 0.64 | | 0.82 | | (0.17) | (0.54) | (0.71) | 11.41 | 7.59 | 0.17 | 0.05 | 1.587 | 753,738 | 14 |
| 08-31-2015 | 12.43 | | 0.187 | (0.64) | | (0.46) | | (0.16) | (0.51) | (0.67) | 11.30 | (3.89) | 0.15 | 0.05 | 1.497 | 737,363 | 12 |
| 1 Based on average daily shares outstanding. |
| 2 Net investment income is affected by the timing and frequency of the declaration of dividends by the underlying funds in which the portfolio invests. Accordingly, a significant portion of income is recorded in December. |
| 3 Total returns would have been lower had certain expenses not been reduced during the applicable periods. |
| 4 Does not reflect the effect of sales charges, if any. |
| 5 Ratios do not include expenses indirectly incurred from underlying funds and can vary based on the mix of underlying funds held by the portfolio. |
| 6 Six months ended 2-29-20. Unaudited. |
| 7 Net investment income (loss) per share and net investment income (loss) ratio reflect other income received from the Advisor for reimbursement of indirect net expenses associated with the portfolio's investments in underlying investment companies of $0.01, $0.02, $0.02, $0.02, $0.01 and $0.01 per share and 0.07%, 0.16% 0.19%, 0.19%, 0.12% and 0.09%, for the periods ended 2-29-20, 8-31-19, 8-31-18, 8-31-17, 8-31-16 and 8-31-15, respectively. |
| 8 Not annualized. |
| 9 Annualized. |
| 10 The inception date for Class I shares is 3-27-15. |
| 11 Portfolio turnover is shown for the period from 9-1-14 to 8-31-15. |
| 54 | JOHN HANCOCK MULTIMANAGER LIFETIME PORTFOLIOS | SEMIANNUAL REPORT | SEE NOTES TO FINANCIAL STATEMENTS |
Multimanager 2035 Lifetime Portfolio
| Per share operating performance for a share outstanding throughout each period | | Ratios and supplemental data | |
| | | | Income (loss) from investment operations | | | | Less distributions | | | | Ratios to average net assets | | | |
| Period ended | Net asset
value,
beginning
of period ($) | | Net
investment
income
(loss) ($)1, 2 | Net realized and
unrealized
gain (loss)
on investments ($) | | Total from
investment
operations ($) | | From net
investment
income ($) | From net
realized
gain ($) | Total
distributions ($) | Net asset
value,
end of
period ($) | Total
return
(%)3, 4 | Expenses
before
reductions
(%)5 | Expenses
including
reductions
(%)5 | Net
investment
income
(loss) (%)2 | Net
assets,
end of
period
(in thousands) | Portfolio
turnover
(%) |
| Class A | |
| 02-29-20206 | 10.89 | | 0.177 | 0.11 | | 0.28 | | (0.19) | (1.00) | (1.19) | 9.98 | 1.828 | 0.629 | 0.429 | 3.007, 9 | 158,858 | 25 |
| 08-31-2019 | 12.38 | | 0.177 | (0.40) | | (0.23) | | (0.18) | (1.08) | (1.26) | 10.89 | (0.46) | 0.59 | 0.41 | 1.517 | 146,789 | 34 |
| 08-31-2018 | 12.28 | | 0.177 | 1.02 | | 1.19 | | (0.18) | (0.91) | (1.09) | 12.38 | 10.05 | 0.56 | 0.41 | 1.387 | 152,404 | 19 |
| 08-31-2017 | 11.40 | | 0.167 | 1.46 | | 1.62 | | (0.16) | (0.58) | (0.74) | 12.28 | 15.05 | 0.55 | 0.42 | 1.387 | 125,348 | 35 |
| 08-31-2016 | 11.31 | | 0.137 | 0.64 | | 0.77 | | (0.13) | (0.55) | (0.68) | 11.40 | 7.12 | 0.54 | 0.43 | 1.237 | 89,978 | 18 |
| 08-31-2015 | 12.42 | | 0.137 | (0.64) | | (0.51) | | (0.11) | (0.49) | (0.60) | 11.31 | (4.23) | 0.54 | 0.44 | 1.087 | 66,902 | 12 |
| Class I | |
| 02-29-20206 | 10.96 | | 0.127 | 0.19 | | 0.31 | | (0.24) | (1.00) | (1.24) | 10.03 | 2.058 | 0.329 | 0.129 | 2.117, 9 | 15 | 25 |
| 08-31-2019 | 12.46 | | 0.287 | (0.48) | | (0.20) | | (0.22) | (1.08) | (1.30) | 10.96 | (0.18) | 0.31 | 0.13 | 2.387 | 2 | 34 |
| 08-31-2018 | 12.36 | | 0.217 | 1.02 | | 1.23 | | (0.22) | (0.91) | (1.13) | 12.46 | 10.30 | 0.26 | 0.11 | 1.727 | 347 | 19 |
| 08-31-2017 | 11.47 | | 0.197 | 1.48 | | 1.67 | | (0.20) | (0.58) | (0.78) | 12.36 | 15.41 | 0.24 | 0.11 | 1.627 | 273 | 35 |
| 08-31-2016 | 11.38 | | 0.197 | 0.62 | | 0.81 | | (0.17) | (0.55) | (0.72) | 11.47 | 7.43 | 0.23 | 0.11 | 1.647 | 96 | 18 |
| 08-31-201510 | 11.92 | | 0.017 | (0.55) | | (0.54) | | — | — | — | 11.38 | (4.53)8 | 0.229 | 0.109 | 0.277, 9 | 95 | 1211 |
| Class R1 | |
| 02-29-20206 | 10.84 | | 0.147 | 0.12 | | 0.26 | | (0.15) | (1.00) | (1.15) | 9.95 | 1.708 | 0.969 | 0.769 | 2.487, 9 | 4,572 | 25 |
| 08-31-2019 | 12.33 | | 0.147 | (0.41) | | (0.27) | | (0.14) | (1.08) | (1.22) | 10.84 | (0.81) | 0.92 | 0.74 | 1.257 | 4,171 | 34 |
| 08-31-2018 | 12.24 | | 0.147 | 1.00 | | 1.14 | | (0.14) | (0.91) | (1.05) | 12.33 | 9.63 | 0.88 | 0.73 | 1.107 | 6,470 | 19 |
| 08-31-2017 | 11.36 | | 0.127 | 1.47 | | 1.59 | | (0.13) | (0.58) | (0.71) | 12.24 | 14.72 | 0.88 | 0.75 | 1.007 | 5,658 | 35 |
| 08-31-2016 | 11.27 | | 0.127 | 0.62 | | 0.74 | | (0.10) | (0.55) | (0.65) | 11.36 | 6.78 | 0.88 | 0.75 | 1.037 | 4,233 | 18 |
| 08-31-2015 | 12.39 | | 0.097 | (0.64) | | (0.55) | | (0.08) | (0.49) | (0.57) | 11.27 | (4.57) | 0.94 | 0.75 | 0.737 | 4,451 | 12 |
| Class R2 | |
| 02-29-20206 | 10.93 | | 0.177 | 0.12 | | 0.29 | | (0.18) | (1.00) | (1.18) | 10.04 | 1.928 | 0.719 | 0.519 | 3.107, 9 | 2,626 | 25 |
| 08-31-2019 | 12.42 | | 0.167 | (0.40) | | (0.24) | | (0.17) | (1.08) | (1.25) | 10.93 | (0.57) | 0.69 | 0.51 | 1.427 | 2,021 | 34 |
| 08-31-2018 | 12.32 | | 0.147 | 1.04 | | 1.18 | | (0.17) | (0.91) | (1.08) | 12.42 | 9.91 | 0.66 | 0.51 | 1.177 | 2,064 | 19 |
| 08-31-2017 | 11.44 | | 0.127 | 1.50 | | 1.62 | | (0.16) | (0.58) | (0.74) | 12.32 | 14.91 | 0.64 | 0.50 | 1.027 | 1,577 | 35 |
| 08-31-2016 | 11.34 | | 0.147 | 0.64 | | 0.78 | | (0.13) | (0.55) | (0.68) | 11.44 | 7.11 | 0.63 | 0.50 | 1.237 | 639 | 18 |
| 08-31-2015 | 12.46 | | 0.117 | (0.63) | | (0.52) | | (0.11) | (0.49) | (0.60) | 11.34 | (4.30) | 1.32 | 0.50 | 0.917 | 486 | 12 |
| Class R3 | |
| 02-29-20206 | 10.86 | | 0.167 | 0.11 | | 0.27 | | (0.16) | (1.00) | (1.16) | 9.97 | 1.798 | 0.869 | 0.669 | 2.927, 9 | 2,035 | 25 |
| 08-31-2019 | 12.35 | | 0.127 | (0.38) | | (0.26) | | (0.15) | (1.08) | (1.23) | 10.86 | (0.76) | 0.84 | 0.66 | 1.137 | 1,752 | 34 |
| 08-31-2018 | 12.26 | | 0.157 | 1.00 | | 1.15 | | (0.15) | (0.91) | (1.06) | 12.35 | 9.72 | 0.81 | 0.66 | 1.237 | 2,069 | 19 |
| 08-31-2017 | 11.38 | | 0.157 | 1.45 | | 1.60 | | (0.14) | (0.58) | (0.72) | 12.26 | 14.81 | 0.80 | 0.65 | 1.267 | 2,157 | 35 |
| 08-31-2016 | 11.29 | | 0.137 | 0.62 | | 0.75 | | (0.11) | (0.55) | (0.66) | 11.38 | 6.88 | 0.77 | 0.65 | 1.167 | 2,144 | 18 |
| 08-31-2015 | 12.41 | | 0.127 | (0.65) | | (0.53) | | (0.10) | (0.49) | (0.59) | 11.29 | (4.47) | 0.88 | 0.65 | 1.017 | 2,009 | 12 |
| Class R4 | |
| 02-29-20206 | 10.94 | | 0.187 | 0.12 | | 0.30 | | (0.21) | (1.00) | (1.21) | 10.03 | 1.998 | 0.569 | 0.269 | 3.177, 9 | 99 | 25 |
| 08-31-2019 | 12.44 | | 0.177 | (0.39) | | (0.22) | | (0.20) | (1.08) | (1.28) | 10.94 | (0.37) | 0.54 | 0.26 | 1.497 | 87 | 34 |
| 08-31-2018 | 12.34 | | 0.197 | 1.02 | | 1.21 | | (0.20) | (0.91) | (1.11) | 12.44 | 10.17 | 0.50 | 0.25 | 1.537 | 627 | 19 |
| 08-31-2017 | 11.46 | | 0.207 | 1.44 | | 1.64 | | (0.18) | (0.58) | (0.76) | 12.34 | 15.18 | 0.50 | 0.25 | 1.687 | 509 | 35 |
| 08-31-2016 | 11.36 | | 0.187 | 0.63 | | 0.81 | | (0.16) | (0.55) | (0.71) | 11.46 | 7.38 | 0.47 | 0.25 | 1.557 | 736 | 18 |
| 08-31-2015 | 12.48 | | 0.167 | (0.65) | | (0.49) | | (0.14) | (0.49) | (0.63) | 11.36 | (4.06) | 0.65 | 0.25 | 1.357 | 758 | 12 |
| Class R5 | |
| 02-29-20206 | 10.96 | | 0.187 | 0.13 | | 0.31 | | (0.23) | (1.00) | (1.23) | 10.04 | 2.078 | 0.269 | 0.069 | 3.207, 9 | 425 | 25 |
| 08-31-2019 | 12.46 | | 0.217 | (0.41) | | (0.20) | | (0.22) | (1.08) | (1.30) | 10.96 | (0.13) | 0.24 | 0.06 | 1.797 | 289 | 34 |
| 08-31-2018 | 12.36 | | 0.217 | 1.02 | | 1.23 | | (0.22) | (0.91) | (1.13) | 12.46 | 10.36 | 0.21 | 0.06 | 1.717 | 1,008 | 19 |
| 08-31-2017 | 11.48 | | 0.227 | 1.45 | | 1.67 | | (0.21) | (0.58) | (0.79) | 12.36 | 15.39 | 0.20 | 0.05 | 1.847 | 796 | 35 |
| 08-31-2016 | 11.38 | | 0.187 | 0.65 | | 0.83 | | (0.18) | (0.55) | (0.73) | 11.48 | 7.60 | 0.18 | 0.05 | 1.537 | 1,153 | 18 |
| 08-31-2015 | 12.50 | | 0.187 | (0.64) | | (0.46) | | (0.17) | (0.49) | (0.66) | 11.38 | (3.86) | 0.38 | 0.05 | 1.507 | 1,358 | 12 |
| Class R6 | |
| 02-29-20206 | 10.96 | | 0.197 | 0.12 | | 0.31 | | (0.23) | (1.00) | (1.23) | 10.04 | 2.138 | 0.219 | —9 | 3.357, 9 | 40,598 | 25 |
| 08-31-2019 | 12.46 | | 0.207 | (0.39) | | (0.19) | | (0.23) | (1.08) | (1.31) | 10.96 | (0.05) | 0.19 | — | 1.887 | 31,906 | 34 |
| 08-31-2018 | 12.35 | | 0.207 | 1.05 | | 1.25 | | (0.23) | (0.91) | (1.14) | 12.46 | 10.51 | 0.16 | — | 1.617 | 17,412 | 19 |
| 08-31-2017 | 11.47 | | 0.207 | 1.47 | | 1.67 | | (0.21) | (0.58) | (0.79) | 12.35 | 15.46 | 0.15 | — | 1.737 | 6,317 | 35 |
| 08-31-2016 | 11.38 | | 0.107 | 0.73 | | 0.83 | | (0.19) | (0.55) | (0.74) | 11.47 | 7.56 | 0.13 | — | 1.397 | 4,037 | 18 |
| 08-31-2015 | 12.50 | | 0.207 | (0.66) | | (0.46) | | (0.17) | (0.49) | (0.66) | 11.38 | (3.81) | 0.51 | — | 1.637 | 924 | 12 |
| SEE NOTES TO FINANCIAL STATEMENTS | SEMIANNUAL REPORT | JOHN HANCOCK MULTIMANAGER LIFETIME PORTFOLIOS | 55 |
| Financial highlights continued |
Multimanager 2035 Lifetime Portfolio (continued)
| Per share operating performance for a share outstanding throughout each period | | Ratios and supplemental data | |
| | | | Income (loss) from investment operations | | | | Less distributions | | | | Ratios to average net assets | | | |
| Period ended | Net asset
value,
beginning
of period ($) | | Net
investment
income
(loss) ($)1, 2 | Net realized and
unrealized
gain (loss)
on investments ($) | | Total from
investment
operations ($) | | From net
investment
income ($) | From net
realized
gain ($) | Total
distributions ($) | Net asset
value,
end of
period ($) | Total
return
(%)3, 4 | Expenses
before
reductions
(%)5 | Expenses
including
reductions
(%)5 | Net
investment
income
(loss) (%)2 | Net
assets,
end of
period
(in thousands) | Portfolio
turnover
(%) |
| Class 1 | |
| 02-29-20206 | 10.97 | | 0.187 | 0.13 | | 0.31 | | (0.23) | (1.00) | (1.23) | 10.05 | 2.098 | 0.259 | 0.059 | 3.327, 9 | 787,207 | 25 |
| 08-31-2019 | 12.47 | | 0.217 | (0.41) | | (0.20) | | (0.22) | (1.08) | (1.30) | 10.97 | (0.10) | 0.23 | 0.05 | 1.897 | 823,762 | 34 |
| 08-31-2018 | 12.36 | | 0.227 | 1.02 | | 1.24 | | (0.22) | (0.91) | (1.13) | 12.47 | 10.45 | 0.20 | 0.05 | 1.787 | 915,487 | 19 |
| 08-31-2017 | 11.47 | | 0.217 | 1.47 | | 1.68 | | (0.21) | (0.58) | (0.79) | 12.36 | 15.49 | 0.18 | 0.05 | 1.827 | 917,775 | 35 |
| 08-31-2016 | 11.38 | | 0.197 | 0.63 | | 0.82 | | (0.18) | (0.55) | (0.73) | 11.47 | 7.50 | 0.17 | 0.05 | 1.657 | 962,950 | 18 |
| 08-31-2015 | 12.50 | | 0.197 | (0.65) | | (0.46) | | (0.17) | (0.49) | (0.66) | 11.38 | (3.86) | 0.15 | 0.05 | 1.547 | 959,123 | 12 |
| 1 Based on average daily shares outstanding. |
| 2 Net investment income is affected by the timing and frequency of the declaration of dividends by the underlying funds in which the portfolio invests. Accordingly, a significant portion of income is recorded in December. |
| 3 Total returns would have been lower had certain expenses not been reduced during the applicable periods. |
| 4 Does not reflect the effect of sales charges, if any. |
| 5 Ratios do not include expenses indirectly incurred from underlying funds and can vary based on the mix of underlying funds held by the portfolio. |
| 6 Six months ended 2-29-20. Unaudited. |
| 7 Net investment income (loss) per share and net investment income (loss) ratio reflect other income received from the Advisor for reimbursement of indirect net expenses associated with the portfolio's investments in underlying investment companies of $0.01, $0.02, $0.02, $0.02, $0.01 and $0.01 per share and 0.05%, 0.15%, 0.19%, 0.19%, 0.12% and 0.10%, for the periods ended 2-29-20, 8-31-19, 8-31-18, 8-31-17, 8-31-16 and 8-31-15, respectively. |
| 8 Not annualized. |
| 9 Annualized. |
| 10 The inception date for Class I shares is 3-27-15. |
| 11 Portfolio turnover is shown for the period from 9-1-14 to 8-31-15. |
| 56 | JOHN HANCOCK MULTIMANAGER LIFETIME PORTFOLIOS | SEMIANNUAL REPORT | SEE NOTES TO FINANCIAL STATEMENTS |
Multimanager 2030 Lifetime Portfolio
| Per share operating performance for a share outstanding throughout each period | | Ratios and supplemental data | |
| | | | Income (loss) from investment operations | | | | Less distributions | | | | Ratios to average net assets | | | |
| Period ended | Net asset
value,
beginning
of period ($) | | Net
investment
income
(loss) ($)1, 2 | Net realized and
unrealized
gain (loss)
on investments ($) | | Total from
investment
operations ($) | | From net
investment
income ($) | From net
realized
gain ($) | Total
distributions ($) | Net asset
value,
end of
period ($) | Total
return
(%)3, 4 | Expenses
before
reductions
(%)5 | Expenses
including
reductions
(%)5 | Net
investment
income
(loss) (%)2 | Net
assets,
end of
period
(in thousands) | Portfolio
turnover
(%) |
| Class A | |
| 02-29-20206 | 10.64 | | 0.167 | 0.12 | | 0.28 | | (0.19) | (0.88) | (1.07) | 9.85 | 2.118 | 0.639 | 0.429 | 2.977, 9 | 194,154 | 23 |
| 08-31-2019 | 11.87 | | 0.197 | (0.26) | | (0.07) | | (0.21) | (0.95) | (1.16) | 10.64 | 0.69 | 0.60 | 0.41 | 1.747 | 182,499 | 40 |
| 08-31-2018 | 11.91 | | 0.197 | 0.83 | | 1.02 | | (0.20) | (0.86) | (1.06) | 11.87 | 8.79 | 0.56 | 0.41 | 1.607 | 185,975 | 20 |
| 08-31-2017 | 11.17 | | 0.187 | 1.28 | | 1.46 | | (0.18) | (0.54) | (0.72) | 11.91 | 13.84 | 0.55 | 0.42 | 1.557 | 160,943 | 36 |
| 08-31-2016 | 11.10 | | 0.157 | 0.59 | | 0.74 | | (0.16) | (0.51) | (0.67) | 11.17 | 6.99 | 0.54 | 0.43 | 1.467 | 116,337 | 18 |
| 08-31-2015 | 12.19 | | 0.157 | (0.62) | | (0.47) | | (0.13) | (0.49) | (0.62) | 11.10 | (3.98) | 0.53 | 0.44 | 1.317 | 85,386 | 14 |
| Class I | |
| 02-29-20206 | 10.61 | | 0.187 | 0.13 | | 0.31 | | (0.23) | (0.88) | (1.11) | 9.81 | 2.308 | 0.339 | 0.129 | 3.367, 9 | 978 | 23 |
| 08-31-2019 | 11.85 | | 0.217 | (0.26) | | (0.05) | | (0.24) | (0.95) | (1.19) | 10.61 | 0.96 | 0.31 | 0.13 | 2.017 | 891 | 40 |
| 08-31-2018 | 11.90 | | 0.207 | 0.84 | | 1.04 | | (0.23) | (0.86) | (1.09) | 11.85 | 9.01 | 0.26 | 0.11 | 1.707 | 755 | 20 |
| 08-31-2017 | 11.16 | | 0.217 | 1.28 | | 1.49 | | (0.21) | (0.54) | (0.75) | 11.90 | 14.22 | 0.24 | 0.11 | 1.897 | 324 | 36 |
| 08-31-2016 | 11.08 | | 0.117 | 0.68 | | 0.79 | | (0.20) | (0.51) | (0.71) | 11.16 | 7.43 | 0.23 | 0.11 | 1.537 | 288 | 18 |
| 08-31-201510 | 11.58 | | 0.037 | (0.53) | | (0.50) | | — | — | — | 11.08 | (4.32)8 | 0.219 | 0.109 | 0.507, 9 | 96 | 1411 |
| Class R1 | |
| 02-29-20206 | 10.56 | | 0.137 | 0.14 | | 0.27 | | (0.16) | (0.88) | (1.04) | 9.79 | 2.018 | 0.959 | 0.749 | 2.537, 9 | 3,777 | 23 |
| 08-31-2019 | 11.79 | | 0.157 | (0.26) | | (0.11) | | (0.17) | (0.95) | (1.12) | 10.56 | 0.32 | 0.93 | 0.74 | 1.417 | 3,671 | 40 |
| 08-31-2018 | 11.84 | | 0.157 | 0.82 | | 0.97 | | (0.16) | (0.86) | (1.02) | 11.79 | 8.39 | 0.89 | 0.73 | 1.277 | 4,372 | 20 |
| 08-31-2017 | 11.11 | | 0.137 | 1.28 | | 1.41 | | (0.14) | (0.54) | (0.68) | 11.84 | 13.44 | 0.90 | 0.75 | 1.207 | 4,348 | 36 |
| 08-31-2016 | 11.04 | | 0.107 | 0.61 | | 0.71 | | (0.13) | (0.51) | (0.64) | 11.11 | 6.65 | 0.86 | 0.75 | 1.027 | 4,118 | 18 |
| 08-31-2015 | 12.13 | | 0.137 | (0.63) | | (0.50) | | (0.10) | (0.49) | (0.59) | 11.04 | (4.24) | 0.95 | 0.75 | 1.097 | 2,915 | 14 |
| Class R2 | |
| 02-29-20206 | 10.56 | | 0.167 | 0.13 | | 0.29 | | (0.19) | (0.88) | (1.07) | 9.78 | 2.158 | 0.699 | 0.499 | 2.987, 9 | 2,912 | 23 |
| 08-31-2019 | 11.79 | | 0.197 | (0.27) | | (0.08) | | (0.20) | (0.95) | (1.15) | 10.56 | 0.58 | 0.68 | 0.50 | 1.827 | 2,744 | 40 |
| 08-31-2018 | 11.84 | | 0.187 | 0.82 | | 1.00 | | (0.19) | (0.86) | (1.05) | 11.79 | 8.66 | 0.66 | 0.51 | 1.527 | 2,347 | 20 |
| 08-31-2017 | 11.11 | | 0.167 | 1.28 | | 1.44 | | (0.17) | (0.54) | (0.71) | 11.84 | 13.74 | 0.63 | 0.50 | 1.447 | 3,254 | 36 |
| 08-31-2016 | 11.04 | | 0.107 | 0.64 | | 0.74 | | (0.16) | (0.51) | (0.67) | 11.11 | 6.93 | 0.63 | 0.50 | 1.147 | 1,988 | 18 |
| 08-31-2015 | 12.14 | | 0.157 | (0.63) | | (0.48) | | (0.13) | (0.49) | (0.62) | 11.04 | (4.08) | 0.95 | 0.50 | 1.297 | 845 | 14 |
| Class R3 | |
| 02-29-20206 | 10.58 | | 0.167 | 0.11 | | 0.27 | | (0.17) | (0.88) | (1.05) | 9.80 | 2.008 | 0.859 | 0.659 | 3.007, 9 | 1,485 | 23 |
| 08-31-2019 | 11.80 | | 0.207 | (0.29) | | (0.09) | | (0.18) | (0.95) | (1.13) | 10.58 | 0.48 | 0.84 | 0.65 | 1.867 | 1,301 | 40 |
| 08-31-2018 | 11.86 | | 0.167 | 0.81 | | 0.97 | | (0.17) | (0.86) | (1.03) | 11.80 | 8.39 | 0.81 | 0.66 | 1.387 | 1,628 | 20 |
| 08-31-2017 | 11.12 | | 0.157 | 1.29 | | 1.44 | | (0.16) | (0.54) | (0.70) | 11.86 | 13.65 | 0.79 | 0.65 | 1.357 | 2,879 | 36 |
| 08-31-2016 | 11.05 | | 0.177 | 0.55 | | 0.72 | | (0.14) | (0.51) | (0.65) | 11.12 | 6.76 | 0.78 | 0.65 | 1.477 | 1,822 | 18 |
| 08-31-2015 | 12.15 | | 0.147 | (0.63) | | (0.49) | | (0.12) | (0.49) | (0.61) | 11.05 | (4.22) | 0.86 | 0.65 | 1.207 | 2,210 | 14 |
| Class R4 | |
| 02-29-20206 | 10.59 | | 0.177 | 0.13 | | 0.30 | | (0.21) | (0.88) | (1.09) | 9.80 | 2.298 | 0.559 | 0.259 | 3.217, 9 | 520 | 23 |
| 08-31-2019 | 11.82 | | 0.227 | (0.28) | | (0.06) | | (0.22) | (0.95) | (1.17) | 10.59 | 0.86 | 0.54 | 0.26 | 2.077 | 451 | 40 |
| 08-31-2018 | 11.87 | | 0.227 | 0.80 | | 1.02 | | (0.21) | (0.86) | (1.07) | 11.82 | 8.88 | 0.51 | 0.25 | 1.857 | 509 | 20 |
| 08-31-2017 | 11.14 | | 0.207 | 1.27 | | 1.47 | | (0.20) | (0.54) | (0.74) | 11.87 | 13.99 | 0.50 | 0.25 | 1.817 | 820 | 36 |
| 08-31-2016 | 11.07 | | 0.197 | 0.57 | | 0.76 | | (0.18) | (0.51) | (0.69) | 11.14 | 7.20 | 0.48 | 0.25 | 1.727 | 995 | 18 |
| 08-31-2015 | 12.16 | | 0.207 | (0.64) | | (0.44) | | (0.16) | (0.49) | (0.65) | 11.07 | (3.75) | 0.71 | 0.25 | 1.717 | 949 | 14 |
| Class R5 | |
| 02-29-20206 | 10.61 | | 0.187 | 0.12 | | 0.30 | | (0.23) | (0.88) | (1.11) | 9.80 | 2.288 | 0.279 | 0.069 | 3.387, 9 | 804 | 23 |
| 08-31-2019 | 11.85 | | 0.227 | (0.26) | | (0.04) | | (0.25) | (0.95) | (1.20) | 10.61 | 1.03 | 0.25 | 0.06 | 2.087 | 947 | 40 |
| 08-31-2018 | 11.89 | | 0.227 | 0.84 | | 1.06 | | (0.24) | (0.86) | (1.10) | 11.85 | 9.19 | 0.21 | 0.06 | 1.907 | 1,902 | 20 |
| 08-31-2017 | 11.16 | | 0.237 | 1.26 | | 1.49 | | (0.22) | (0.54) | (0.76) | 11.89 | 14.20 | 0.19 | 0.05 | 2.067 | 1,305 | 36 |
| 08-31-2016 | 11.09 | | 0.257 | 0.54 | | 0.79 | | (0.21) | (0.51) | (0.72) | 11.16 | 7.41 | 0.18 | 0.05 | 2.217 | 1,775 | 18 |
| 08-31-2015 | 12.19 | | 0.207 | (0.62) | | (0.42) | | (0.19) | (0.49) | (0.68) | 11.09 | (3.63) | 0.28 | 0.05 | 1.747 | 2,356 | 14 |
| Class R6 | |
| 02-29-20206 | 10.61 | | 0.187 | 0.13 | | 0.31 | | (0.24) | (0.88) | (1.12) | 9.80 | 2.348 | 0.229 | —9 | 3.437, 9 | 49,126 | 23 |
| 08-31-2019 | 11.85 | | 0.227 | (0.25) | | (0.03) | | (0.26) | (0.95) | (1.21) | 10.61 | 1.10 | 0.20 | — | 2.087 | 38,634 | 40 |
| 08-31-2018 | 11.89 | | 0.217 | 0.85 | | 1.06 | | (0.24) | (0.86) | (1.10) | 11.85 | 9.24 | 0.16 | — | 1.797 | 21,191 | 20 |
| 08-31-2017 | 11.16 | | 0.207 | 1.30 | | 1.50 | | (0.23) | (0.54) | (0.77) | 11.89 | 14.26 | 0.14 | — | 1.767 | 7,367 | 36 |
| 08-31-2016 | 11.09 | | 0.167 | 0.63 | | 0.79 | | (0.21) | (0.51) | (0.72) | 11.16 | 7.47 | 0.13 | — | 1.817 | 4,806 | 18 |
| 08-31-2015 | 12.19 | | 0.227 | (0.64) | | (0.42) | | (0.19) | (0.49) | (0.68) | 11.09 | (3.58) | 0.31 | — | 1.877 | 2,028 | 14 |
| SEE NOTES TO FINANCIAL STATEMENTS | SEMIANNUAL REPORT | JOHN HANCOCK MULTIMANAGER LIFETIME PORTFOLIOS | 57 |
| Financial highlights continued |
Multimanager 2030 Lifetime Portfolio (continued)
| Per share operating performance for a share outstanding throughout each period | | Ratios and supplemental data | |
| | | | Income (loss) from investment operations | | | | Less distributions | | | | Ratios to average net assets | | | |
| Period ended | Net asset
value,
beginning
of period ($) | | Net
investment
income
(loss) ($)1, 2 | Net realized and
unrealized
gain (loss)
on investments ($) | | Total from
investment
operations ($) | | From net
investment
income ($) | From net
realized
gain ($) | Total
distributions ($) | Net asset
value,
end of
period ($) | Total
return
(%)3, 4 | Expenses
before
reductions
(%)5 | Expenses
including
reductions
(%)5 | Net
investment
income
(loss) (%)2 | Net
assets,
end of
period
(in thousands) | Portfolio
turnover
(%) |
| Class 1 | |
| 02-29-20206 | 10.62 | | 0.187 | 0.12 | | 0.30 | | (0.23) | (0.88) | (1.11) | 9.81 | 2.298 | 0.259 | 0.059 | 3.317, 9 | 919,910 | 23 |
| 08-31-2019 | 11.85 | | 0.237 | (0.26) | | (0.03) | | (0.25) | (0.95) | (1.20) | 10.62 | 1.12 | 0.23 | 0.05 | 2.127 | 967,661 | 40 |
| 08-31-2018 | 11.90 | | 0.237 | 0.82 | | 1.05 | | (0.24) | (0.86) | (1.10) | 11.85 | 9.09 | 0.20 | 0.05 | 1.987 | 1,081,097 | 20 |
| 08-31-2017 | 11.16 | | 0.227 | 1.28 | | 1.50 | | (0.22) | (0.54) | (0.76) | 11.90 | 14.29 | 0.18 | 0.05 | 1.997 | 1,098,168 | 36 |
| 08-31-2016 | 11.09 | | 0.217 | 0.58 | | 0.79 | | (0.21) | (0.51) | (0.72) | 11.16 | 7.41 | 0.16 | 0.05 | 1.897 | 1,158,836 | 18 |
| 08-31-2015 | 12.19 | | 0.207 | (0.62) | | (0.42) | | (0.19) | (0.49) | (0.68) | 11.09 | (3.63) | 0.15 | 0.05 | 1.737 | 1,144,249 | 14 |
| 1 Based on average daily shares outstanding. |
| 2 Net investment income is affected by the timing and frequency of the declaration of dividends by the underlying funds in which the portfolio invests. Accordingly, a significant portion of income is recorded in December. |
| 3 Total returns would have been lower had certain expenses not been reduced during the applicable periods. |
| 4 Does not reflect the effect of sales charges, if any. |
| 5 Ratios do not include expenses indirectly incurred from underlying funds and can vary based on the mix of underlying funds held by the portfolio. |
| 6 Six months ended 2-29-20. Unaudited. |
| 7 Net investment income (loss) per share and net investment income (loss) ratio reflect other income received from the Advisor for reimbursement of indirect net expenses associated with the portfolio's investments in underlying investment companies of $0.01, $0.02, $0.02, $0.02, $0.01, and $0.01 per share and 0.06%, 0.16%, 0.20%, 0.20%, 0.13% and 0.10% for the periods ended 2-29-20, 8-31-19, 8-31-18, 8-31-17, 8-31-16 and 8-31-15, respectively. |
| 8 Not annualized. |
| 9 Annualized. |
| 10 The inception date for Class I shares is 3-27-15. |
| 11 Portfolio turnover is shown for the period from 9-1-14 to 8-31-15. |
| 58 | JOHN HANCOCK MULTIMANAGER LIFETIME PORTFOLIOS | SEMIANNUAL REPORT | SEE NOTES TO FINANCIAL STATEMENTS |
Multimanager 2025 Lifetime Portfolio
| Per share operating performance for a share outstanding throughout each period | | Ratios and supplemental data | |
| | | | Income (loss) from investment operations | | | | Less distributions | | | | Ratios to average net assets | | | |
| Period ended | Net asset
value,
beginning
of period ($) | | Net
investment
income
(loss) ($)1, 2 | Net realized and
unrealized
gain (loss)
on investments ($) | | Total from
investment
operations ($) | | From net
investment
income ($) | From net
realized
gain ($) | Total
distributions ($) | Net asset
value,
end of
period ($) | Total
return
(%)3, 4 | Expenses
before
reductions
(%)5 | Expenses
including
reductions
(%)5 | Net
investment
income
(loss) (%)2 | Net
assets,
end of
period
(in thousands) | Portfolio
turnover
(%) |
| Class A | |
| 02-29-20206 | 10.44 | | 0.167 | 0.10 | | 0.26 | | (0.21) | (0.76) | (0.97) | 9.73 | 2.118 | 0.649 | 0.429 | 2.967, 9 | 188,537 | 25 |
| 08-31-2019 | 11.46 | | 0.217 | (0.14) | | 0.07 | | (0.23) | (0.86) | (1.09) | 10.44 | 1.80 | 0.60 | 0.41 | 2.017 | 180,550 | 39 |
| 08-31-2018 | 11.62 | | 0.217 | 0.63 | | 0.84 | | (0.22) | (0.78) | (1.00) | 11.46 | 7.40 | 0.56 | 0.41 | 1.837 | 176,446 | 21 |
| 08-31-2017 | 11.07 | | 0.207 | 1.08 | | 1.28 | | (0.21) | (0.52) | (0.73) | 11.62 | 12.22 | 0.55 | 0.42 | 1.787 | 157,054 | 37 |
| 08-31-2016 | 11.01 | | 0.197 | 0.54 | | 0.73 | | (0.20) | (0.47) | (0.67) | 11.07 | 6.91 | 0.54 | 0.43 | 1.767 | 110,938 | 21 |
| 08-31-2015 | 12.04 | | 0.187 | (0.59) | | (0.41) | | (0.16) | (0.46) | (0.62) | 11.01 | (3.59) | 0.53 | 0.44 | 1.597 | 88,278 | 15 |
| Class I | |
| 02-29-20206 | 10.41 | | 0.167 | 0.12 | | 0.28 | | (0.25) | (0.76) | (1.01) | 9.68 | 2.218 | 0.349 | 0.129 | 3.107, 9 | 1,637 | 25 |
| 08-31-2019 | 11.43 | | 0.157 | (0.05) | | 0.10 | | (0.26) | (0.86) | (1.12) | 10.41 | 2.17 | 0.31 | 0.12 | 1.557 | 1,502 | 39 |
| 08-31-2018 | 11.59 | | 0.247 | 0.63 | | 0.87 | | (0.25) | (0.78) | (1.03) | 11.43 | 7.73 | 0.27 | 0.11 | 2.097 | 81 | 21 |
| 08-31-2017 | 11.04 | | 0.237 | 1.08 | | 1.31 | | (0.24) | (0.52) | (0.76) | 11.59 | 12.61 | 0.24 | 0.11 | 2.057 | 165 | 37 |
| 08-31-2016 | 10.98 | | 0.247 | 0.52 | | 0.76 | | (0.23) | (0.47) | (0.70) | 11.04 | 7.26 | 0.22 | 0.11 | 2.167 | 97 | 21 |
| 08-31-201510 | 11.42 | | 0.047 | (0.48) | | (0.44) | | — | — | — | 10.98 | (3.85)8 | 0.219 | 0.109 | 0.837, 9 | 96 | 1511 |
| Class R1 | |
| 02-29-20206 | 10.36 | | 0.137 | 0.11 | | 0.24 | | (0.18) | (0.76) | (0.94) | 9.66 | 1.928 | 0.959 | 0.749 | 2.557, 9 | 3,786 | 25 |
| 08-31-2019 | 11.38 | | 0.187 | (0.14) | | 0.04 | | (0.20) | (0.86) | (1.06) | 10.36 | 1.48 | 0.91 | 0.72 | 1.717 | 4,103 | 39 |
| 08-31-2018 | 11.55 | | 0.187 | 0.61 | | 0.79 | | (0.18) | (0.78) | (0.96) | 11.38 | 7.01 | 0.87 | 0.72 | 1.567 | 4,530 | 21 |
| 08-31-2017 | 11.01 | | 0.167 | 1.07 | | 1.23 | | (0.17) | (0.52) | (0.69) | 11.55 | 11.82 | 0.86 | 0.73 | 1.497 | 4,199 | 37 |
| 08-31-2016 | 10.94 | | 0.207 | 0.50 | | 0.70 | | (0.16) | (0.47) | (0.63) | 11.01 | 6.67 | 0.88 | 0.75 | 1.667 | 3,999 | 21 |
| 08-31-2015 | 11.98 | | 0.147 | (0.59) | | (0.45) | | (0.13) | (0.46) | (0.59) | 10.94 | (3.94) | 0.92 | 0.75 | 1.197 | 5,346 | 15 |
| Class R2 | |
| 02-29-20206 | 10.37 | | 0.157 | 0.11 | | 0.26 | | (0.21) | (0.76) | (0.97) | 9.66 | 2.078 | 0.709 | 0.499 | 2.887, 9 | 5,632 | 25 |
| 08-31-2019 | 11.39 | | 0.187 | (0.12) | | 0.06 | | (0.22) | (0.86) | (1.08) | 10.37 | 1.71 | 0.69 | 0.50 | 1.807 | 4,273 | 39 |
| 08-31-2018 | 11.56 | | 0.207 | 0.62 | | 0.82 | | (0.21) | (0.78) | (0.99) | 11.39 | 7.26 | 0.66 | 0.50 | 1.757 | 2,723 | 21 |
| 08-31-2017 | 11.01 | | 0.167 | 1.11 | | 1.27 | | (0.20) | (0.52) | (0.72) | 11.56 | 12.20 | 0.64 | 0.50 | 1.497 | 2,593 | 37 |
| 08-31-2016 | 10.95 | | 0.157 | 0.57 | | 0.72 | | (0.19) | (0.47) | (0.66) | 11.01 | 6.85 | 0.60 | 0.49 | 1.517 | 1,324 | 21 |
| 08-31-2015 | 11.99 | | 0.187 | (0.60) | | (0.42) | | (0.16) | (0.46) | (0.62) | 10.95 | (3.70) | 1.02 | 0.50 | 1.567 | 770 | 15 |
| Class R3 | |
| 02-29-20206 | 10.37 | | 0.147 | 0.11 | | 0.25 | | (0.19) | (0.76) | (0.95) | 9.67 | 2.008 | 0.879 | 0.669 | 2.777, 9 | 2,703 | 25 |
| 08-31-2019 | 11.39 | | 0.187 | (0.14) | | 0.04 | | (0.20) | (0.86) | (1.06) | 10.37 | 1.53 | 0.85 | 0.66 | 1.767 | 2,561 | 39 |
| 08-31-2018 | 11.56 | | 0.187 | 0.62 | | 0.80 | | (0.19) | (0.78) | (0.97) | 11.39 | 7.09 | 0.81 | 0.65 | 1.607 | 2,674 | 21 |
| 08-31-2017 | 11.02 | | 0.197 | 1.05 | | 1.24 | | (0.18) | (0.52) | (0.70) | 11.56 | 11.92 | 0.80 | 0.65 | 1.737 | 3,537 | 37 |
| 08-31-2016 | 10.95 | | 0.187 | 0.53 | | 0.71 | | (0.17) | (0.47) | (0.64) | 11.02 | 6.78 | 0.77 | 0.65 | 1.677 | 4,464 | 21 |
| 08-31-2015 | 12.00 | | 0.187 | (0.63) | | (0.45) | | (0.14) | (0.46) | (0.60) | 10.95 | (3.92) | 0.83 | 0.65 | 1.527 | 3,676 | 15 |
| Class R4 | |
| 02-29-20206 | 10.41 | | 0.167 | 0.11 | | 0.27 | | (0.23) | (0.76) | (0.99) | 9.69 | 2.178 | 0.589 | 0.269 | 3.097, 9 | 725 | 25 |
| 08-31-2019 | 11.44 | | 0.237 | (0.15) | | 0.08 | | (0.25) | (0.86) | (1.11) | 10.41 | 1.91 | 0.55 | 0.26 | 2.227 | 736 | 39 |
| 08-31-2018 | 11.60 | | 0.227 | 0.64 | | 0.86 | | (0.24) | (0.78) | (1.02) | 11.44 | 7.56 | 0.52 | 0.26 | 1.967 | 759 | 21 |
| 08-31-2017 | 11.05 | | 0.227 | 1.08 | | 1.30 | | (0.23) | (0.52) | (0.75) | 11.60 | 12.45 | 0.49 | 0.25 | 1.997 | 785 | 37 |
| 08-31-2016 | 10.99 | | 0.227 | 0.53 | | 0.75 | | (0.22) | (0.47) | (0.69) | 11.05 | 7.11 | 0.47 | 0.25 | 2.007 | 418 | 21 |
| 08-31-2015 | 12.03 | | 0.227 | (0.61) | | (0.39) | | (0.19) | (0.46) | (0.65) | 10.99 | (3.43) | 0.67 | 0.25 | 1.917 | 397 | 15 |
| Class R5 | |
| 02-29-20206 | 10.40 | | 0.187 | 0.10 | | 0.28 | | (0.25) | (0.76) | (1.01) | 9.67 | 2.288 | 0.289 | 0.069 | 3.397, 9 | 1,330 | 25 |
| 08-31-2019 | 11.43 | | 0.257 | (0.15) | | 0.10 | | (0.27) | (0.86) | (1.13) | 10.40 | 2.14 | 0.25 | 0.07 | 2.377 | 1,342 | 39 |
| 08-31-2018 | 11.60 | | 0.237 | 0.64 | | 0.87 | | (0.26) | (0.78) | (1.04) | 11.43 | 7.71 | 0.21 | 0.05 | 2.067 | 1,635 | 21 |
| 08-31-2017 | 11.05 | | 0.277 | 1.05 | | 1.32 | | (0.25) | (0.52) | (0.77) | 11.60 | 12.68 | 0.19 | 0.05 | 2.477 | 1,182 | 37 |
| 08-31-2016 | 10.99 | | 0.237 | 0.54 | | 0.77 | | (0.24) | (0.47) | (0.71) | 11.05 | 7.34 | 0.18 | 0.05 | 2.067 | 1,926 | 21 |
| 08-31-2015 | 12.03 | | 0.237 | (0.60) | | (0.37) | | (0.21) | (0.46) | (0.67) | 10.99 | (3.24) | 0.31 | 0.05 | 1.967 | 2,114 | 15 |
| Class R6 | |
| 02-29-20206 | 10.40 | | 0.187 | 0.10 | | 0.28 | | (0.26) | (0.76) | (1.02) | 9.66 | 2.248 | 0.239 | —9 | 3.397, 9 | 45,094 | 25 |
| 08-31-2019 | 11.42 | | 0.257 | (0.13) | | 0.12 | | (0.28) | (0.86) | (1.14) | 10.40 | 2.31 | 0.20 | — | 2.447 | 38,659 | 39 |
| 08-31-2018 | 11.59 | | 0.247 | 0.64 | | 0.88 | | (0.27) | (0.78) | (1.05) | 11.42 | 7.77 | 0.17 | — | 2.147 | 22,698 | 21 |
| 08-31-2017 | 11.04 | | 0.217 | 1.11 | | 1.32 | | (0.25) | (0.52) | (0.77) | 11.59 | 12.75 | 0.14 | — | 1.887 | 8,987 | 37 |
| 08-31-2016 | 10.98 | | 0.207 | 0.57 | | 0.77 | | (0.24) | (0.47) | (0.71) | 11.04 | 7.40 | 0.13 | — | 2.047 | 3,830 | 21 |
| 08-31-2015 | 12.02 | | 0.257 | (0.61) | | (0.36) | | (0.22) | (0.46) | (0.68) | 10.98 | (3.20) | 0.50 | — | 2.137 | 1,007 | 15 |
| SEE NOTES TO FINANCIAL STATEMENTS | SEMIANNUAL REPORT | JOHN HANCOCK MULTIMANAGER LIFETIME PORTFOLIOS | 59 |
| Financial highlights continued |
Multimanager 2025 Lifetime Portfolio (continued)
| Per share operating performance for a share outstanding throughout each period | | Ratios and supplemental data | |
| | | | Income (loss) from investment operations | | | | Less distributions | | | | Ratios to average net assets | | | |
| Period ended | Net asset
value,
beginning
of period ($) | | Net
investment
income
(loss) ($)1, 2 | Net realized and
unrealized
gain (loss)
on investments ($) | | Total from
investment
operations ($) | | From net
investment
income ($) | From net
realized
gain ($) | Total
distributions ($) | Net asset
value,
end of
period ($) | Total
return
(%)3, 4 | Expenses
before
reductions
(%)5 | Expenses
including
reductions
(%)5 | Net
investment
income
(loss) (%)2 | Net
assets,
end of
period
(in thousands) | Portfolio
turnover
(%) |
| Class 1 | |
| 02-29-20206 | 10.40 | | 0.177 | 0.11 | | 0.28 | | (0.25) | (0.76) | (1.01) | 9.67 | 2.288 | 0.269 | 0.059 | 3.337, 9 | 916,024 | 25 |
| 08-31-2019 | 11.43 | | 0.257 | (0.15) | | 0.10 | | (0.27) | (0.86) | (1.13) | 10.40 | 2.15 | 0.24 | 0.05 | 2.427 | 983,455 | 39 |
| 08-31-2018 | 11.60 | | 0.257 | 0.62 | | 0.87 | | (0.26) | (0.78) | (1.04) | 11.43 | 7.71 | 0.20 | 0.05 | 2.217 | 1,136,209 | 21 |
| 08-31-2017 | 11.05 | | 0.257 | 1.07 | | 1.32 | | (0.25) | (0.52) | (0.77) | 11.60 | 12.68 | 0.18 | 0.05 | 2.227 | 1,176,137 | 37 |
| 08-31-2016 | 10.99 | | 0.247 | 0.53 | | 0.77 | | (0.24) | (0.47) | (0.71) | 11.05 | 7.34 | 0.16 | 0.05 | 2.207 | 1,278,028 | 21 |
| 08-31-2015 | 12.03 | | 0.237 | (0.60) | | (0.37) | | (0.21) | (0.46) | (0.67) | 10.99 | (3.24) | 0.15 | 0.05 | 2.027 | 1,308,200 | 15 |
| 1 Based on average daily shares outstanding. |
| 2 Net investment income is affected by the timing and frequency of the declaration of dividends by the underlying funds in which the portfolio invests. Accordingly, a significant portion of income is recorded in December. |
| 3 Total returns would have been lower had certain expenses not been reduced during the applicable periods. |
| 4 Does not reflect the effect of sales charges, if any. |
| 5 Ratios do not include expenses indirectly incurred from underlying funds and can vary based on the mix of underlying funds held by the portfolio. |
| 6 Six months ended 2-29-20. Unaudited. |
| 7 Net investment income (loss) per share and net investment income (loss) ratio reflect other income received from the Advisor for reimbursement of indirect net expenses associated with the portfolio's investments in underlying investment companies of $0.01, $0.02, $0.02, $0.02, $0.01, and $0.01 per share and 0.05%, 0.15%, 0.19%, 0.20%, 0.13% and 0.10%, for the periods ended 2-29-20, 8-31-19, 8-31-18, 8-31-17, 8-31-16 and 8-31-15, respectively. |
| 8 Not annualized. |
| 9 Annualized. |
| 10 The inception date for Class I shares is 3-27-15. |
| 11 Portfolio turnover is shown for the period from 9-1-14 to 8-31-15. |
| 60 | JOHN HANCOCK MULTIMANAGER LIFETIME PORTFOLIOS | SEMIANNUAL REPORT | SEE NOTES TO FINANCIAL STATEMENTS |
Multimanager 2020 Lifetime Portfolio
| Per share operating performance for a share outstanding throughout each period | | Ratios and supplemental data | |
| | | | Income (loss) from investment operations | | | | Less distributions | | | | Ratios to average net assets | | | |
| Period ended | Net asset
value,
beginning
of period ($) | | Net
investment
income
(loss) ($)1, 2 | Net realized and
unrealized
gain (loss)
on investments ($) | | Total from
investment
operations ($) | | From net
investment
income ($) | From net
realized
gain ($) | Total
distributions ($) | Net asset
value,
end of
period ($) | Total
return
(%)3, 4 | Expenses
before
reductions
(%)5 | Expenses
including
reductions
(%)5 | Net
investment
income
(loss) (%)2 | Net
assets,
end of
period
(in thousands) | Portfolio
turnover
(%) |
| Class A | |
| 02-29-20206 | 9.89 | | 0.157 | 0.10 | | 0.25 | | (0.23) | (0.67) | (0.90) | 9.24 | 2.258 | 0.669 | 0.429 | 3.017, 9 | 178,783 | 27 |
| 08-31-2019 | 10.66 | | 0.227 | (0.03) | | 0.19 | | (0.24) | (0.72) | (0.96) | 9.89 | 2.89 | 0.62 | 0.41 | 2.277 | 171,370 | 40 |
| 08-31-2018 | 10.93 | | 0.227 | 0.41 | | 0.63 | | (0.23) | (0.67) | (0.90) | 10.66 | 5.92 | 0.57 | 0.41 | 2.027 | 171,973 | 19 |
| 08-31-2017 | 10.64 | | 0.227 | 0.82 | | 1.04 | | (0.23) | (0.52) | (0.75) | 10.93 | 10.42 | 0.55 | 0.42 | 2.057 | 144,135 | 35 |
| 08-31-2016 | 10.69 | | 0.217 | 0.47 | | 0.68 | | (0.23) | (0.50) | (0.73) | 10.64 | 6.72 | 0.54 | 0.43 | 2.077 | 112,709 | 20 |
| 08-31-2015 | 11.69 | | 0.227 | (0.60) | | (0.38) | | (0.19) | (0.43) | (0.62) | 10.69 | (3.38) | 0.54 | 0.44 | 1.967 | 85,398 | 18 |
| Class I | |
| 02-29-20206 | 9.90 | | 0.187 | 0.09 | | 0.27 | | (0.26) | (0.67) | (0.93) | 9.24 | 2.448 | 0.369 | 0.129 | 3.607, 9 | 84 | 27 |
| 08-31-2019 | 10.67 | | 0.267 | (0.04) | | 0.22 | | (0.27) | (0.72) | (0.99) | 9.90 | 3.23 | 0.33 | 0.13 | 2.637 | 230 | 40 |
| 08-31-2018 | 10.94 | | 0.237 | 0.43 | | 0.66 | | (0.26) | (0.67) | (0.93) | 10.67 | 6.23 | 0.28 | 0.11 | 2.217 | 705 | 19 |
| 08-31-2017 | 10.65 | | 0.247 | 0.83 | | 1.07 | | (0.26) | (0.52) | (0.78) | 10.94 | 10.76 | 0.24 | 0.11 | 2.317 | 155 | 35 |
| 08-31-2016 | 10.69 | | 0.267 | 0.46 | | 0.72 | | (0.26) | (0.50) | (0.76) | 10.65 | 7.16 | 0.23 | 0.11 | 2.477 | 99 | 20 |
| 08-31-201510 | 11.07 | | 0.067 | (0.44) | | (0.38) | | — | — | — | 10.69 | (3.43)8 | 0.229 | 0.109 | 1.177, 9 | 97 | 1811 |
| Class R1 | |
| 02-29-20206 | 9.84 | | 0.137 | 0.11 | | 0.24 | | (0.20) | (0.67) | (0.87) | 9.21 | 2.158 | 0.999 | 0.759 | 2.687, 9 | 4,316 | 27 |
| 08-31-2019 | 10.60 | | 0.197 | (0.02) | | 0.17 | | (0.21) | (0.72) | (0.93) | 9.84 | 2.62 | 0.95 | 0.75 | 1.937 | 4,724 | 40 |
| 08-31-2018 | 10.88 | | 0.187 | 0.40 | | 0.58 | | (0.19) | (0.67) | (0.86) | 10.60 | 5.49 | 0.91 | 0.74 | 1.717 | 4,465 | 19 |
| 08-31-2017 | 10.59 | | 0.177 | 0.83 | | 1.00 | | (0.19) | (0.52) | (0.71) | 10.88 | 10.09 | 0.90 | 0.75 | 1.577 | 4,253 | 35 |
| 08-31-2016 | 10.64 | | 0.197 | 0.45 | | 0.64 | | (0.19) | (0.50) | (0.69) | 10.59 | 6.38 | 0.88 | 0.75 | 1.797 | 3,091 | 20 |
| 08-31-2015 | 11.64 | | 0.197 | (0.59) | | (0.40) | | (0.17) | (0.43) | (0.60) | 10.64 | (3.65) | 0.93 | 0.74 | 1.667 | 3,098 | 18 |
| Class R2 | |
| 02-29-20206 | 9.84 | | 0.147 | 0.12 | | 0.26 | | (0.23) | (0.67) | (0.90) | 9.20 | 2.298 | 0.749 | 0.509 | 2.947, 9 | 989 | 27 |
| 08-31-2019 | 10.61 | | 0.227 | (0.04) | | 0.18 | | (0.23) | (0.72) | (0.95) | 9.84 | 2.77 | 0.71 | 0.51 | 2.237 | 1,098 | 40 |
| 08-31-2018 | 10.89 | | 0.207 | 0.41 | | 0.61 | | (0.22) | (0.67) | (0.89) | 10.61 | 5.74 | 0.67 | 0.51 | 1.867 | 1,440 | 19 |
| 08-31-2017 | 10.60 | | 0.217 | 0.82 | | 1.03 | | (0.22) | (0.52) | (0.74) | 10.89 | 10.37 | 0.65 | 0.50 | 2.027 | 1,778 | 35 |
| 08-31-2016 | 10.65 | | 0.187 | 0.49 | | 0.67 | | (0.22) | (0.50) | (0.72) | 10.60 | 6.66 | 0.62 | 0.50 | 1.847 | 1,370 | 20 |
| 08-31-2015 | 11.65 | | 0.217 | (0.59) | | (0.38) | | (0.19) | (0.43) | (0.62) | 10.65 | (3.40) | 0.91 | 0.49 | 1.877 | 1,105 | 18 |
| Class R3 | |
| 02-29-20206 | 9.85 | | 0.137 | 0.11 | | 0.24 | | (0.21) | (0.67) | (0.88) | 9.21 | 2.148 | 0.909 | 0.669 | 2.697, 9 | 1,643 | 27 |
| 08-31-2019 | 10.61 | | 0.197 | (0.01) | | 0.18 | | (0.22) | (0.72) | (0.94) | 9.85 | 2.70 | 0.86 | 0.66 | 1.977 | 1,967 | 40 |
| 08-31-2018 | 10.89 | | 0.207 | 0.39 | | 0.59 | | (0.20) | (0.67) | (0.87) | 10.61 | 5.59 | 0.82 | 0.65 | 1.847 | 1,566 | 19 |
| 08-31-2017 | 10.61 | | 0.227 | 0.78 | | 1.00 | | (0.20) | (0.52) | (0.72) | 10.89 | 10.09 | 0.80 | 0.65 | 2.107 | 2,259 | 35 |
| 08-31-2016 | 10.65 | | 0.227 | 0.44 | | 0.66 | | (0.20) | (0.50) | (0.70) | 10.61 | 6.59 | 0.78 | 0.65 | 1.997 | 3,009 | 20 |
| 08-31-2015 | 11.66 | | 0.207 | (0.60) | | (0.40) | | (0.18) | (0.43) | (0.61) | 10.65 | (3.63) | 0.83 | 0.65 | 1.817 | 3,419 | 18 |
| Class R4 | |
| 02-29-20206 | 9.85 | | 0.157 | 0.11 | | 0.26 | | (0.25) | (0.67) | (0.92) | 9.19 | 2.328 | 0.599 | 0.259 | 3.147, 9 | 217 | 27 |
| 08-31-2019 | 10.62 | | 0.237 | (0.02) | | 0.21 | | (0.26) | (0.72) | (0.98) | 9.85 | 3.07 | 0.56 | 0.26 | 2.397 | 239 | 40 |
| 08-31-2018 | 10.89 | | 0.277 | 0.37 | | 0.64 | | (0.24) | (0.67) | (0.91) | 10.62 | 6.11 | 0.52 | 0.25 | 2.517 | 211 | 19 |
| 08-31-2017 | 10.61 | | 0.257 | 0.80 | | 1.05 | | (0.25) | (0.52) | (0.77) | 10.89 | 10.55 | 0.50 | 0.25 | 2.357 | 513 | 35 |
| 08-31-2016 | 10.66 | | 0.277 | 0.43 | | 0.70 | | (0.25) | (0.50) | (0.75) | 10.61 | 6.94 | 0.48 | 0.25 | 2.527 | 870 | 20 |
| 08-31-2015 | 11.66 | | 0.277 | (0.62) | | (0.35) | | (0.22) | (0.43) | (0.65) | 10.66 | (3.15) | 0.72 | 0.25 | 2.417 | 1,064 | 18 |
| Class R5 | |
| 02-29-20206 | 9.89 | | 0.177 | 0.10 | | 0.27 | | (0.27) | (0.67) | (0.94) | 9.22 | 2.418 | 0.309 | 0.069 | 3.487, 9 | 3,254 | 27 |
| 08-31-2019 | 10.66 | | 0.277 | (0.04) | | 0.23 | | (0.28) | (0.72) | (1.00) | 9.89 | 3.29 | 0.27 | 0.06 | 2.717 | 3,778 | 40 |
| 08-31-2018 | 10.93 | | 0.257 | 0.42 | | 0.67 | | (0.27) | (0.67) | (0.94) | 10.66 | 6.29 | 0.22 | 0.06 | 2.377 | 5,384 | 19 |
| 08-31-2017 | 10.64 | | 0.257 | 0.83 | | 1.08 | | (0.27) | (0.52) | (0.79) | 10.93 | 10.84 | 0.20 | 0.05 | 2.407 | 4,687 | 35 |
| 08-31-2016 | 10.69 | | 0.277 | 0.45 | | 0.72 | | (0.27) | (0.50) | (0.77) | 10.64 | 7.14 | 0.18 | 0.05 | 2.607 | 4,130 | 20 |
| 08-31-2015 | 11.70 | | 0.267 | (0.59) | | (0.33) | | (0.25) | (0.43) | (0.68) | 10.69 | (3.03) | 0.23 | 0.05 | 2.357 | 4,494 | 18 |
| Class R6 | |
| 02-29-20206 | 9.87 | | 0.177 | 0.11 | | 0.28 | | (0.28) | (0.67) | (0.95) | 9.20 | 2.478 | 0.259 | —9 | 3.497, 9 | 29,428 | 27 |
| 08-31-2019 | 10.65 | | 0.267 | (0.03) | | 0.23 | | (0.29) | (0.72) | (1.01) | 9.87 | 3.28 | 0.21 | — | 2.677 | 28,384 | 40 |
| 08-31-2018 | 10.92 | | 0.257 | 0.42 | | 0.67 | | (0.27) | (0.67) | (0.94) | 10.65 | 6.36 | 0.17 | — | 2.327 | 16,997 | 19 |
| 08-31-2017 | 10.63 | | 0.247 | 0.84 | | 1.08 | | (0.27) | (0.52) | (0.79) | 10.92 | 10.92 | 0.15 | — | 2.317 | 10,285 | 35 |
| 08-31-2016 | 10.69 | | 0.257 | 0.47 | | 0.72 | | (0.28) | (0.50) | (0.78) | 10.63 | 7.11 | 0.13 | — | 2.707 | 3,713 | 20 |
| 08-31-2015 | 11.69 | | 0.287 | (0.60) | | (0.32) | | (0.25) | (0.43) | (0.68) | 10.69 | (2.90) | 0.32 | — | 2.527 | 2,285 | 18 |
| SEE NOTES TO FINANCIAL STATEMENTS | SEMIANNUAL REPORT | JOHN HANCOCK MULTIMANAGER LIFETIME PORTFOLIOS | 61 |
| Financial highlights continued |
Multimanager 2020 Lifetime Portfolio (continued)
| Per share operating performance for a share outstanding throughout each period | | Ratios and supplemental data | |
| | | | Income (loss) from investment operations | | | | Less distributions | | | | Ratios to average net assets | | | |
| Period ended | Net asset
value,
beginning
of period ($) | | Net
investment
income
(loss) ($)1, 2 | Net realized and
unrealized
gain (loss)
on investments ($) | | Total from
investment
operations ($) | | From net
investment
income ($) | From net
realized
gain ($) | Total
distributions ($) | Net asset
value,
end of
period ($) | Total
return
(%)3, 4 | Expenses
before
reductions
(%)5 | Expenses
including
reductions
(%)5 | Net
investment
income
(loss) (%)2 | Net
assets,
end of
period
(in thousands) | Portfolio
turnover
(%) |
| Class 1 | |
| 02-29-20206 | 9.89 | | 0.177 | 0.10 | | 0.27 | | (0.27) | (0.67) | (0.94) | 9.22 | 2.418 | 0.299 | 0.059 | 3.367, 9 | 529,561 | 27 |
| 08-31-2019 | 10.66 | | 0.277 | (0.04) | | 0.23 | | (0.28) | (0.72) | (1.00) | 9.89 | 3.32 | 0.25 | 0.05 | 2.697 | 590,329 | 40 |
| 08-31-2018 | 10.93 | | 0.267 | 0.41 | | 0.67 | | (0.27) | (0.67) | (0.94) | 10.66 | 6.29 | 0.21 | 0.05 | 2.447 | 733,558 | 19 |
| 08-31-2017 | 10.64 | | 0.267 | 0.82 | | 1.08 | | (0.27) | (0.52) | (0.79) | 10.93 | 10.84 | 0.18 | 0.05 | 2.507 | 821,058 | 35 |
| 08-31-2016 | 10.69 | | 0.277 | 0.45 | | 0.72 | | (0.27) | (0.50) | (0.77) | 10.64 | 7.14 | 0.17 | 0.05 | 2.527 | 955,449 | 20 |
| 08-31-2015 | 11.70 | | 0.277 | (0.60) | | (0.33) | | (0.25) | (0.43) | (0.68) | 10.69 | (3.03) | 0.15 | 0.05 | 2.397 | 1,032,205 | 18 |
| 1 Based on average daily shares outstanding. |
| 2 Net investment income is affected by the timing and frequency of the declaration of dividends by the underlying funds in which the portfolio invests. Accordingly, a significant portion of income is recorded in December. |
| 3 Total returns would have been lower had certain expenses not been reduced during the applicable periods. |
| 4 Does not reflect the effect of sales charges, if any. |
| 5 Ratios do not include expenses indirectly incurred from underlying funds and can vary based on the mix of underlying funds held by the portfolio. |
| 6 Six months ended 2-29-20. Unaudited. |
| 7 Net investment income (loss) per share and net investment income (loss) ratio reflect other income received from the Advisor for reimbursement of indirect net expenses associated with the portfolio's investments in underlying investment companies of $0.01, $0.02, $0.02, $0.02, $0.02 and $0.01 per share and 0.05%, 0.15%, 0.20%, 0.21%, 0.14% and 0.12% for periods ended 2-29-20, 8-31-19, 8-31-18, 8-31-17, 8-31-16 and 8-31-15, respectively. |
| 8 Not annualized. |
| 9 Annualized. |
| 10 The inception date for Class I shares is 3-27-15. |
| 11 Portfolio turnover is shown for the period from 9-1-14 to 8-31-15. |
| 62 | JOHN HANCOCK MULTIMANAGER LIFETIME PORTFOLIOS | SEMIANNUAL REPORT | SEE NOTES TO FINANCIAL STATEMENTS |
Multimanager 2015 Lifetime Portfolio
| Per share operating performance for a share outstanding throughout each period | | Ratios and supplemental data | |
| | | | Income (loss) from investment operations | | | | Less distributions | | | | Ratios to average net assets | | | |
| Period ended | Net asset
value,
beginning
of period ($) | | Net
investment
income
(loss) ($)1, 2 | Net realized and
unrealized
gain (loss)
on investments ($) | | Total from
investment
operations ($) | | From net
investment
income ($) | From net
realized
gain ($) | Total
distributions ($) | Net asset
value,
end of
period ($) | Total
return
(%)3, 4 | Expenses
before
reductions
(%)5 | Expenses
including
reductions
(%)5 | Net
investment
income
(loss) (%)2 | Net
assets,
end of
period
(in thousands) | Portfolio
turnover
(%) |
| Class A | |
| 02-29-20206 | 9.12 | | 0.147 | 0.07 | | 0.21 | | (0.23) | (0.58) | (0.81) | 8.52 | 2.098 | 0.729 | 0.429 | 3.047, 9 | 92,025 | 30 |
| 08-31-2019 | 9.75 | | 0.237 | 0.04 | | 0.27 | | (0.26) | (0.64) | (0.90) | 9.12 | 3.85 | 0.66 | 0.41 | 2.537 | 91,688 | 41 |
| 08-31-2018 | 10.13 | | 0.227 | 0.23 | | 0.45 | | (0.24) | (0.59) | (0.83) | 9.75 | 4.54 | 0.60 | 0.41 | 2.227 | 98,847 | 17 |
| 08-31-2017 | 10.02 | | 0.227 | 0.60 | | 0.82 | | (0.24) | (0.47) | (0.71) | 10.13 | 8.81 | 0.58 | 0.42 | 2.267 | 90,426 | 38 |
| 08-31-2016 | 10.25 | | 0.227 | 0.41 | | 0.63 | | (0.25) | (0.61) | (0.86) | 10.02 | 6.63 | 0.56 | 0.43 | 2.327 | 73,985 | 19 |
| 08-31-2015 | 11.35 | | 0.247 | (0.58) | | (0.34) | | (0.23) | (0.53) | (0.76) | 10.25 | (3.13) | 0.55 | 0.44 | 2.267 | 62,597 | 16 |
| Class I | |
| 02-29-20206 | 9.13 | | 0.157 | 0.07 | | 0.22 | | (0.26) | (0.58) | (0.84) | 8.51 | 2.178 | 0.429 | 0.129 | 3.387, 9 | 772 | 30 |
| 08-31-2019 | 9.76 | | 0.257 | 0.05 | | 0.30 | | (0.29) | (0.64) | (0.93) | 9.13 | 4.21 | 0.37 | 0.13 | 2.827 | 670 | 41 |
| 08-31-2018 | 10.14 | | 0.247 | 0.24 | | 0.48 | | (0.27) | (0.59) | (0.86) | 9.76 | 4.85 | 0.31 | 0.11 | 2.497 | 610 | 17 |
| 08-31-2017 | 10.02 | | 0.227 | 0.65 | | 0.87 | | (0.28) | (0.47) | (0.75) | 10.14 | 9.27 | 0.27 | 0.11 | 2.277 | 369 | 38 |
| 08-31-2016 | 10.25 | | 0.277 | 0.39 | | 0.66 | | (0.28) | (0.61) | (0.89) | 10.02 | 6.98 | 0.25 | 0.11 | 2.747 | 95 | 19 |
| 08-31-201510 | 10.58 | | 0.067 | (0.39) | | (0.33) | | — | — | — | 10.25 | (3.12)8 | 0.239 | 0.109 | 1.407, 9 | 97 | 1611 |
| Class R1 | |
| 02-29-20206 | 9.08 | | 0.127 | 0.07 | | 0.19 | | (0.20) | (0.58) | (0.78) | 8.49 | 1.898 | 1.069 | 0.769 | 2.687, 9 | 1,544 | 30 |
| 08-31-2019 | 9.70 | | 0.207 | 0.05 | | 0.25 | | (0.23) | (0.64) | (0.87) | 9.08 | 3.57 | 1.00 | 0.76 | 2.177 | 1,471 | 41 |
| 08-31-2018 | 10.09 | | 0.197 | 0.22 | | 0.41 | | (0.21) | (0.59) | (0.80) | 9.70 | 4.10 | 0.94 | 0.74 | 1.927 | 1,487 | 17 |
| 08-31-2017 | 9.98 | | 0.197 | 0.60 | | 0.79 | | (0.21) | (0.47) | (0.68) | 10.09 | 8.48 | 0.93 | 0.75 | 1.987 | 1,867 | 38 |
| 08-31-2016 | 10.21 | | 0.207 | 0.40 | | 0.60 | | (0.22) | (0.61) | (0.83) | 9.98 | 6.29 | 0.90 | 0.75 | 2.057 | 2,200 | 19 |
| 08-31-2015 | 11.32 | | 0.197 | (0.57) | | (0.38) | | (0.20) | (0.53) | (0.73) | 10.21 | (3.48) | 1.07 | 0.75 | 1.827 | 2,238 | 16 |
| Class R2 | |
| 02-29-20206 | 9.07 | | 0.137 | 0.08 | | 0.21 | | (0.23) | (0.58) | (0.81) | 8.47 | 2.058 | 0.809 | 0.509 | 2.997, 9 | 38 | 30 |
| 08-31-2019 | 9.69 | | 0.237 | 0.04 | | 0.27 | | (0.25) | (0.64) | (0.89) | 9.07 | 3.87 | 0.73 | 0.49 | 2.537 | 33 | 41 |
| 08-31-2018 | 10.09 | | 0.177 | 0.25 | | 0.42 | | (0.23) | (0.59) | (0.82) | 9.69 | 4.16 | 0.71 | 0.51 | 1.717 | 47 | 17 |
| 08-31-2017 | 9.98 | | 0.197 | 0.63 | | 0.82 | | (0.24) | (0.47) | (0.71) | 10.09 | 8.88 | 0.66 | 0.50 | 1.947 | 584 | 38 |
| 08-31-2016 | 10.22 | | 0.237 | 0.39 | | 0.62 | | (0.25) | (0.61) | (0.86) | 9.98 | 6.54 | 0.65 | 0.50 | 2.177 | 158 | 19 |
| 08-31-2015 | 11.33 | | 0.257 | (0.60) | | (0.35) | | (0.23) | (0.53) | (0.76) | 10.22 | (3.23) | 1.81 | 0.50 | 2.337 | 143 | 16 |
| Class R3 | |
| 02-29-20206 | 9.08 | | 0.137 | 0.07 | | 0.20 | | (0.21) | (0.58) | (0.79) | 8.49 | 2.008 | 0.949 | 0.659 | 2.887, 9 | 1,070 | 30 |
| 08-31-2019 | 9.71 | | 0.227 | 0.03 | | 0.25 | | (0.24) | (0.64) | (0.88) | 9.08 | 3.59 | 0.90 | 0.66 | 2.437 | 2,108 | 41 |
| 08-31-2018 | 10.10 | | 0.197 | 0.23 | | 0.42 | | (0.22) | (0.59) | (0.81) | 9.71 | 4.20 | 0.86 | 0.66 | 1.937 | 2,556 | 17 |
| 08-31-2017 | 9.98 | | 0.237 | 0.58 | | 0.81 | | (0.22) | (0.47) | (0.69) | 10.10 | 8.70 | 0.82 | 0.65 | 2.317 | 3,126 | 38 |
| 08-31-2016 | 10.21 | | 0.237 | 0.38 | | 0.61 | | (0.23) | (0.61) | (0.84) | 9.98 | 6.40 | 0.80 | 0.65 | 2.257 | 5,620 | 19 |
| 08-31-2015 | 11.32 | | 0.227 | (0.59) | | (0.37) | | (0.21) | (0.53) | (0.74) | 10.21 | (3.38) | 0.82 | 0.65 | 2.047 | 6,405 | 16 |
| Class R4 | |
| 02-29-20206 | 9.09 | | 0.147 | 0.08 | | 0.22 | | (0.25) | (0.58) | (0.83) | 8.48 | 2.148 | 0.659 | 0.279 | 3.217, 9 | 11 | 30 |
| 08-31-2019 | 9.72 | | 0.257 | 0.04 | | 0.29 | | (0.28) | (0.64) | (0.92) | 9.09 | 4.06 | 0.61 | 0.26 | 2.747 | 11 | 41 |
| 08-31-2018 | 10.11 | | 0.247 | 0.22 | | 0.46 | | (0.26) | (0.59) | (0.85) | 9.72 | 4.62 | 0.56 | 0.26 | 2.457 | 65 | 17 |
| 08-31-2017 | 10.00 | | 0.257 | 0.59 | | 0.84 | | (0.26) | (0.47) | (0.73) | 10.11 | 9.04 | 0.52 | 0.25 | 2.547 | 95 | 38 |
| 08-31-2016 | 10.23 | | 0.267 | 0.39 | | 0.65 | | (0.27) | (0.61) | (0.88) | 10.00 | 6.85 | 0.49 | 0.25 | 2.637 | 109 | 19 |
| 08-31-2015 | 11.34 | | 0.267 | (0.58) | | (0.32) | | (0.26) | (0.53) | (0.79) | 10.23 | (2.98) | 1.51 | 0.25 | 2.437 | 182 | 16 |
| Class R5 | |
| 02-29-20206 | 9.12 | | 0.167 | 0.07 | | 0.23 | | (0.27) | (0.58) | (0.85) | 8.50 | 2.248 | 0.369 | 0.069 | 3.517, 9 | 289 | 30 |
| 08-31-2019 | 9.75 | | 0.287 | 0.03 | | 0.31 | | (0.30) | (0.64) | (0.94) | 9.12 | 4.27 | 0.31 | 0.07 | 2.977 | 323 | 41 |
| 08-31-2018 | 10.14 | | 0.267 | 0.22 | | 0.48 | | (0.28) | (0.59) | (0.87) | 9.75 | 4.81 | 0.26 | 0.06 | 2.667 | 1,206 | 17 |
| 08-31-2017 | 10.02 | | 0.267 | 0.61 | | 0.87 | | (0.28) | (0.47) | (0.75) | 10.14 | 9.34 | 0.22 | 0.05 | 2.617 | 1,292 | 38 |
| 08-31-2016 | 10.26 | | 0.307 | 0.36 | | 0.66 | | (0.29) | (0.61) | (0.90) | 10.02 | 6.96 | 0.20 | 0.05 | 2.787 | 1,442 | 19 |
| 08-31-2015 | 11.37 | | 0.287 | (0.58) | | (0.30) | | (0.28) | (0.53) | (0.81) | 10.26 | (2.77) | 0.36 | 0.05 | 2.627 | 1,767 | 16 |
| Class R6 | |
| 02-29-20206 | 9.12 | | 0.167 | 0.07 | | 0.23 | | (0.27) | (0.58) | (0.85) | 8.50 | 2.308 | 0.319 | —9 | 3.507, 9 | 11,123 | 30 |
| 08-31-2019 | 9.76 | | 0.267 | 0.04 | | 0.30 | | (0.30) | (0.64) | (0.94) | 9.12 | 4.23 | 0.26 | — | 2.937 | 11,764 | 41 |
| 08-31-2018 | 10.14 | | 0.247 | 0.25 | | 0.49 | | (0.28) | (0.59) | (0.87) | 9.76 | 4.96 | 0.21 | — | 2.497 | 7,076 | 17 |
| 08-31-2017 | 10.03 | | 0.237 | 0.64 | | 0.87 | | (0.29) | (0.47) | (0.76) | 10.14 | 9.29 | 0.17 | — | 2.397 | 3,109 | 38 |
| 08-31-2016 | 10.26 | | 0.267 | 0.41 | | 0.67 | | (0.29) | (0.61) | (0.90) | 10.03 | 7.11 | 0.15 | — | 3.107 | 830 | 19 |
| 08-31-2015 | 11.37 | | 0.317 | (0.60) | | (0.29) | | (0.29) | (0.53) | (0.82) | 10.26 | (2.72) | 0.89 | — | 2.887 | 394 | 16 |
| SEE NOTES TO FINANCIAL STATEMENTS | SEMIANNUAL REPORT | JOHN HANCOCK MULTIMANAGER LIFETIME PORTFOLIOS | 63 |
| Financial highlights continued |
Multimanager 2015 Lifetime Portfolio (continued)
| Per share operating performance for a share outstanding throughout each period | | Ratios and supplemental data | |
| | | | Income (loss) from investment operations | | | | Less distributions | | | | Ratios to average net assets | | | |
| Period ended | Net asset
value,
beginning
of period ($) | | Net
investment
income
(loss) ($)1, 2 | Net realized and
unrealized
gain (loss)
on investments ($) | | Total from
investment
operations ($) | | From net
investment
income ($) | From net
realized
gain ($) | Total
distributions ($) | Net asset
value,
end of
period ($) | Total
return
(%)3, 4 | Expenses
before
reductions
(%)5 | Expenses
including
reductions
(%)5 | Net
investment
income
(loss) (%)2 | Net
assets,
end of
period
(in thousands) | Portfolio
turnover
(%) |
| Class 1 | |
| 02-29-20206 | 9.12 | | 0.157 | 0.08 | | 0.23 | | (0.27) | (0.58) | (0.85) | 8.50 | 2.258 | 0.349 | 0.059 | 3.377, 9 | 164,528 | 30 |
| 08-31-2019 | 9.75 | | 0.277 | 0.04 | | 0.31 | | (0.30) | (0.64) | (0.94) | 9.12 | 4.28 | 0.30 | 0.05 | 2.987 | 192,409 | 41 |
| 08-31-2018 | 10.14 | | 0.267 | 0.22 | | 0.48 | | (0.28) | (0.59) | (0.87) | 9.75 | 4.81 | 0.24 | 0.05 | 2.627 | 253,242 | 17 |
| 08-31-2017 | 10.02 | | 0.277 | 0.60 | | 0.87 | | (0.28) | (0.47) | (0.75) | 10.14 | 9.34 | 0.21 | 0.05 | 2.707 | 324,331 | 38 |
| 08-31-2016 | 10.26 | | 0.297 | 0.37 | | 0.66 | | (0.29) | (0.61) | (0.90) | 10.02 | 6.96 | 0.18 | 0.05 | 2.797 | 410,447 | 19 |
| 08-31-2015 | 11.37 | | 0.297 | (0.59) | | (0.30) | | (0.28) | (0.53) | (0.81) | 10.26 | (2.77) | 0.16 | 0.05 | 2.697 | 486,633 | 16 |
| 1 Based on average daily shares outstanding. |
| 2 Net investment income is affected by the timing and frequency of the declaration of dividends by the underlying funds in which the portfolio invests. Accordingly, a significant portion of income is recorded in December. |
| 3 Total returns would have been lower had certain expenses not been reduced during the applicable periods. |
| 4 Does not reflect the effect of sales charges, if any. |
| 5 Ratios do not include expenses indirectly incurred from underlying funds and can vary based on the mix of underlying funds held by the portfolio. |
| 6 Six months ended 2-29-20. Unaudited. |
| 7 Net investment income (loss) per share and net investment income (loss) ratio reflect other income received from the Advisor for reimbursement of indirect net expenses associated with the portfolio's investments in underlying investment companies of $0.00, $0.02, $0.02, $0.02, $0.02 and $0.01 per share and 0.05%, 0.16%, 0.21%, 0.22%, 0.15% and 0.12% for the periods ended 2-29-20, 8-31-19, 8-31-18, 8-31-17, 8-31-16 and 8-31-15, respectively. |
| 8 Not annualized. |
| 9 Annualized. |
| 10 The inception date for Class I shares is 3-27-15. |
| 11 Portfolio turnover is shown for the period from 9-1-14 to 8-31-15. |
| 64 | JOHN HANCOCK MULTIMANAGER LIFETIME PORTFOLIOS | SEMIANNUAL REPORT | SEE NOTES TO FINANCIAL STATEMENTS |
Multimanager 2010 Lifetime Portfolio
| Per share operating performance for a share outstanding throughout each period | | Ratios and supplemental data | |
| | | | Income (loss) from investment operations | | | | Less distributions | | | | Ratios to average net assets | | | |
| Period ended | Net asset
value,
beginning
of period ($) | | Net
investment
income
(loss) ($)1, 2 | Net realized and
unrealized
gain (loss)
on investments ($) | | Total from
investment
operations ($) | | From net
investment
income ($) | From net
realized
gain ($) | Total
distributions ($) | Net asset
value,
end of
period ($) | Total
return
(%)3, 4 | Expenses
before
reductions
(%)5 | Expenses
including
reductions
(%)5 | Net
investment
income
(loss) (%)2 | Net
assets,
end of
period
(in thousands) | Portfolio
turnover
(%) |
| Class A | |
| 02-29-20206 | 8.86 | | 0.147 | 0.06 | | 0.20 | | (0.24) | (0.42) | (0.66) | 8.40 | 2.068 | 0.779 | 0.429 | 3.087, 9 | 43,924 | 34 |
| 08-31-2019 | 9.25 | | 0.237 | 0.11 | | 0.34 | | (0.26) | (0.47) | (0.73) | 8.86 | 4.50 | 0.70 | 0.41 | 2.687 | 45,444 | 48 |
| 08-31-2018 | 9.54 | | 0.227 | 0.12 | | 0.34 | | (0.23) | (0.40) | (0.63) | 9.25 | 3.65 | 0.64 | 0.41 | 2.367 | 46,288 | 20 |
| 08-31-2017 | 9.49 | | 0.227 | 0.46 | | 0.68 | | (0.24) | (0.39) | (0.63) | 9.54 | 7.71 | 0.61 | 0.42 | 2.387 | 47,800 | 39 |
| 08-31-2016 | 9.59 | | 0.247 | 0.36 | | 0.60 | | (0.26) | (0.44) | (0.70) | 9.49 | 6.63 | 0.59 | 0.43 | 2.557 | 42,691 | 20 |
| 08-31-2015 | 10.57 | | 0.257 | (0.55) | | (0.30) | | (0.25) | (0.43) | (0.68) | 9.59 | (2.97) | 0.57 | 0.44 | 2.507 | 41,187 | 16 |
| Class I | |
| 02-29-20206 | 8.87 | | 0.157 | 0.05 | | 0.20 | | (0.26) | (0.42) | (0.68) | 8.39 | 2.128 | 0.479 | 0.129 | 3.357, 9 | 237 | 34 |
| 08-31-2019 | 9.25 | | 0.277 | 0.11 | | 0.38 | | (0.29) | (0.47) | (0.76) | 8.87 | 4.98 | 0.42 | 0.13 | 3.037 | 133 | 48 |
| 08-31-2018 | 9.55 | | 0.247 | 0.12 | | 0.36 | | (0.26) | (0.40) | (0.66) | 9.25 | 3.84 | 0.35 | 0.11 | 2.577 | 158 | 20 |
| 08-31-2017 | 9.49 | | 0.237 | 0.49 | | 0.72 | | (0.27) | (0.39) | (0.66) | 9.55 | 8.17 | 0.30 | 0.11 | 2.517 | 202 | 39 |
| 08-31-2016 | 9.60 | | 0.277 | 0.35 | | 0.62 | | (0.29) | (0.44) | (0.73) | 9.49 | 6.87 | 0.27 | 0.11 | 2.917 | 96 | 20 |
| 08-31-201510 | 9.88 | | 0.077 | (0.35) | | (0.28) | | — | — | — | 9.60 | (2.83)8 | 0.269 | 0.119 | 1.617, 9 | 97 | 1611 |
| Class R1 | |
| 02-29-20206 | 8.82 | | 0.137 | 0.06 | | 0.19 | | (0.22) | (0.42) | (0.64) | 8.37 | 1.998 | 0.979 | 0.639 | 2.887, 9 | 301 | 34 |
| 08-31-2019 | 9.20 | | 0.247 | 0.09 | | 0.33 | | (0.24) | (0.47) | (0.71) | 8.82 | 4.37 | 0.94 | 0.65 | 2.747 | 300 | 48 |
| 08-31-2018 | 9.50 | | 0.197 | 0.12 | | 0.31 | | (0.21) | (0.40) | (0.61) | 9.20 | 3.25 | 0.89 | 0.65 | 2.097 | 528 | 20 |
| 08-31-2017 | 9.44 | | 0.187 | 0.49 | | 0.67 | | (0.22) | (0.39) | (0.61) | 9.50 | 7.53 | 0.89 | 0.70 | 1.937 | 653 | 39 |
| 08-31-2016 | 9.55 | | 0.217 | 0.35 | | 0.56 | | (0.23) | (0.44) | (0.67) | 9.44 | 6.20 | 0.88 | 0.71 | 2.267 | 486 | 20 |
| 08-31-2015 | 10.53 | | 0.227 | (0.55) | | (0.33) | | (0.22) | (0.43) | (0.65) | 9.55 | (3.24) | 1.39 | 0.75 | 2.177 | 531 | 16 |
| Class R2 | |
| 02-29-20206 | 8.85 | | 0.137 | 0.06 | | 0.19 | | (0.23) | (0.42) | (0.65) | 8.39 | 1.998 | 0.849 | 0.499 | 3.017, 9 | 462 | 34 |
| 08-31-2019 | 9.23 | | 0.227 | 0.12 | | 0.34 | | (0.25) | (0.47) | (0.72) | 8.85 | 4.51 | 0.80 | 0.51 | 2.577 | 491 | 48 |
| 08-31-2018 | 9.53 | | 0.217 | 0.11 | | 0.32 | | (0.22) | (0.40) | (0.62) | 9.23 | 3.45 | 0.75 | 0.51 | 2.217 | 452 | 20 |
| 08-31-2017 | 9.47 | | 0.167 | 0.53 | | 0.69 | | (0.24) | (0.39) | (0.63) | 9.53 | 7.75 | 0.67 | 0.48 | 1.717 | 522 | 39 |
| 08-31-2016 | 9.59 | | 0.597 | (0.02) | | 0.57 | | (0.25) | (0.44) | (0.69) | 9.47 | 6.33 | 0.71 | 0.50 | 4.187 | 70 | 20 |
| 08-31-2015 | 10.57 | | 0.257 | (0.55) | | (0.30) | | (0.25) | (0.43) | (0.68) | 9.59 | (2.97) | 1.22 | 0.50 | 2.497 | 561 | 16 |
| Class R3 | |
| 02-29-20206 | 8.82 | | 0.137 | 0.06 | | 0.19 | | (0.22) | (0.42) | (0.64) | 8.37 | 1.978 | 1.009 | 0.659 | 2.897, 9 | 119 | 34 |
| 08-31-2019 | 9.21 | | 0.227 | 0.09 | | 0.31 | | (0.23) | (0.47) | (0.70) | 8.82 | 4.23 | 0.95 | 0.66 | 2.567 | 120 | 48 |
| 08-31-2018 | 9.51 | | 0.197 | 0.12 | | 0.31 | | (0.21) | (0.40) | (0.61) | 9.21 | 3.30 | 0.90 | 0.66 | 2.037 | 151 | 20 |
| 08-31-2017 | 9.45 | | 0.227 | 0.45 | | 0.67 | | (0.22) | (0.39) | (0.61) | 9.51 | 7.60 | 0.85 | 0.65 | 2.367 | 254 | 39 |
| 08-31-2016 | 9.56 | | 0.327 | 0.25 | | 0.57 | | (0.24) | (0.44) | (0.68) | 9.45 | 6.30 | 0.83 | 0.65 | 3.017 | 598 | 20 |
| 08-31-2015 | 10.55 | | 0.237 | (0.56) | | (0.33) | | (0.23) | (0.43) | (0.66) | 9.56 | (3.23) | 1.01 | 0.65 | 2.277 | 1,183 | 16 |
| Class R4 | |
| 02-29-20206 | 8.86 | | 0.147 | 0.06 | | 0.20 | | (0.25) | (0.42) | (0.67) | 8.39 | 2.128 | 0.719 | 0.269 | 3.177, 9 | 47 | 34 |
| 08-31-2019 | 9.24 | | 0.247 | 0.12 | | 0.36 | | (0.27) | (0.47) | (0.74) | 8.86 | 4.79 | 0.65 | 0.26 | 2.787 | 89 | 48 |
| 08-31-2018 | 9.54 | | 0.257 | 0.10 | | 0.35 | | (0.25) | (0.40) | (0.65) | 9.24 | 3.70 | 0.57 | 0.23 | 2.677 | 73 | 20 |
| 08-31-2017 | 9.48 | | 0.257 | 0.46 | | 0.71 | | (0.26) | (0.39) | (0.65) | 9.54 | 8.03 | 0.56 | 0.25 | 2.717 | 247 | 39 |
| 08-31-2016 | 9.59 | | 0.247 | 0.37 | | 0.61 | | (0.28) | (0.44) | (0.72) | 9.48 | 6.73 | 0.53 | 0.25 | 2.657 | 980 | 20 |
| 08-31-2015 | 10.58 | | 0.257 | (0.54) | | (0.29) | | (0.27) | (0.43) | (0.70) | 9.59 | (2.82) | 0.85 | 0.24 | 2.477 | 879 | 16 |
| Class R5 | |
| 02-29-20206 | 8.87 | | 0.167 | 0.05 | | 0.21 | | (0.27) | (0.42) | (0.69) | 8.39 | 2.208 | 0.419 | 0.069 | 3.637, 9 | 23 | 34 |
| 08-31-2019 | 9.25 | | 0.287 | 0.10 | | 0.38 | | (0.29) | (0.47) | (0.76) | 8.87 | 5.03 | 0.35 | 0.06 | 3.217 | 34 | 48 |
| 08-31-2018 | 9.55 | | 0.317 | 0.06 | | 0.37 | | (0.27) | (0.40) | (0.67) | 9.25 | 3.90 | 0.30 | 0.05 | 3.207 | 43 | 20 |
| 08-31-2017 | 9.50 | | 0.257 | 0.47 | | 0.72 | | (0.28) | (0.39) | (0.67) | 9.55 | 8.13 | 0.25 | 0.05 | 2.747 | 364 | 39 |
| 08-31-2016 | 9.61 | | 0.307 | 0.33 | | 0.63 | | (0.30) | (0.44) | (0.74) | 9.50 | 6.95 | 0.23 | 0.05 | 3.077 | 266 | 20 |
| 08-31-2015 | 10.59 | | 0.307 | (0.56) | | (0.26) | | (0.29) | (0.43) | (0.72) | 9.61 | (2.52) | 1.20 | 0.04 | 2.957 | 233 | 16 |
| Class R6 | |
| 02-29-20206 | 8.88 | | 0.157 | 0.05 | | 0.20 | | (0.27) | (0.42) | (0.69) | 8.39 | 2.138 | 0.369 | —9 | 3.497, 9 | 7,767 | 34 |
| 08-31-2019 | 9.26 | | 0.267 | 0.13 | | 0.39 | | (0.30) | (0.47) | (0.77) | 8.88 | 5.09 | 0.30 | — | 2.977 | 8,356 | 48 |
| 08-31-2018 | 9.56 | | 0.257 | 0.12 | | 0.37 | | (0.27) | (0.40) | (0.67) | 9.26 | 3.95 | 0.25 | — | 2.697 | 3,754 | 20 |
| 08-31-2017 | 9.50 | | 0.227 | 0.51 | | 0.73 | | (0.28) | (0.39) | (0.67) | 9.56 | 8.29 | 0.20 | — | 2.407 | 2,044 | 39 |
| 08-31-2016 | 9.61 | | 0.627 | 0.01 | | 0.63 | | (0.30) | (0.44) | (0.74) | 9.50 | 7.01 | 0.18 | — | 4.337 | 67 | 20 |
| 08-31-2015 | 10.60 | | 0.317 | (0.57) | | (0.26) | | (0.30) | (0.43) | (0.73) | 9.61 | (2.56) | 1.04 | — | 3.067 | 171 | 16 |
| SEE NOTES TO FINANCIAL STATEMENTS | SEMIANNUAL REPORT | JOHN HANCOCK MULTIMANAGER LIFETIME PORTFOLIOS | 65 |
| Financial highlights continued |
Multimanager 2010 Lifetime Portfolio (continued)
| Per share operating performance for a share outstanding throughout each period | | Ratios and supplemental data | |
| | | | Income (loss) from investment operations | | | | Less distributions | | | | Ratios to average net assets | | | |
| Period ended | Net asset
value,
beginning
of period ($) | | Net
investment
income
(loss) ($)1, 2 | Net realized and
unrealized
gain (loss)
on investments ($) | | Total from
investment
operations ($) | | From net
investment
income ($) | From net
realized
gain ($) | Total
distributions ($) | Net asset
value,
end of
period ($) | Total
return
(%)3, 4 | Expenses
before
reductions
(%)5 | Expenses
including
reductions
(%)5 | Net
investment
income
(loss) (%)2 | Net
assets,
end of
period
(in thousands) | Portfolio
turnover
(%) |
| Class 1 | |
| 02-29-20206 | 8.87 | | 0.157 | 0.06 | | 0.21 | | (0.27) | (0.42) | (0.69) | 8.39 | 2.208 | 0.409 | 0.059 | 3.417, 9 | 123,909 | 34 |
| 08-31-2019 | 9.26 | | 0.277 | 0.10 | | 0.37 | | (0.29) | (0.47) | (0.76) | 8.87 | 4.92 | 0.34 | 0.05 | 3.077 | 134,078 | 48 |
| 08-31-2018 | 9.56 | | 0.257 | 0.12 | | 0.37 | | (0.27) | (0.40) | (0.67) | 9.26 | 3.90 | 0.29 | 0.05 | 2.727 | 161,261 | 20 |
| 08-31-2017 | 9.50 | | 0.267 | 0.47 | | 0.73 | | (0.28) | (0.39) | (0.67) | 9.56 | 8.24 | 0.24 | 0.05 | 2.837 | 193,321 | 39 |
| 08-31-2016 | 9.61 | | 0.297 | 0.34 | | 0.63 | | (0.30) | (0.44) | (0.74) | 9.50 | 6.95 | 0.21 | 0.05 | 2.967 | 233,197 | 20 |
| 08-31-2015 | 10.60 | | 0.307 | (0.57) | | (0.27) | | (0.29) | (0.43) | (0.72) | 9.61 | (2.61) | 0.17 | 0.05 | 2.967 | 268,891 | 16 |
| 1 Based on average daily shares outstanding. |
| 2 Net investment income is affected by the timing and frequency of the declaration of dividends by the underlying funds in which the portfolio invests. Accordingly, a significant portion of income is recorded in December. |
| 3 Total returns would have been lower had certain expenses not been reduced during the applicable periods. |
| 4 Does not reflect the effect of sales charges, if any. |
| 5 Ratios do not include expenses indirectly incurred from underlying funds and can vary based on the mix of underlying funds held by the portfolio. |
| 6 Six months ended 2-29-20. Unaudited. |
| 7 Net investment income (loss) per share and net investment income (loss) ratio reflect other income received from the Advisor for reimbursement of indirect net expenses associated with the portfolio's investments in underlying investment companies of $0.00, $0.02, $0.02, $0.02, $0.02 and $0.01 per share and 0.05%, 0.17%, 0.23%, 0.24%, 0.17% and 0.14% for the periods ended 2-29-20, 8-31-19, 8-31-18, 8-31-17, 8-31-16 and 8-31-15, respectively. |
| 8 Not annualized. |
| 9 Annualized. |
| 10 The inception date for Class I shares is 3-27-15. |
| 11 Portfolio turnover is shown for the period from 9-1-14 to 8-31-15. |
| 66 | JOHN HANCOCK MULTIMANAGER LIFETIME PORTFOLIOS | SEMIANNUAL REPORT | SEE NOTES TO FINANCIAL STATEMENTS |
| Notes to financial statements (unaudited) | |
Note 1—Organization
John Hancock Funds II (the Trust) is an open-end management investment company organized as a Massachusetts business trust. The Trust is registered under the Investment Company Act of 1940, as amended (the 1940 Act). It is a series company with multiple investment series (collectively, Multimanager Lifetime Portfolios, or the portfolios and individually, the portfolio), eleven of which are presented in this report. The portfolios operate as “funds of funds” that may invest in affiliated underlying funds of the Trust, other funds in John Hancock group of funds complex, non-John Hancock funds and certain other permitted investments.
The portfolios may offer multiple classes of shares. The shares currently offered by the portfolios are detailed in the Statements of assets and liabilities. Class A shares are offered to all investors. Class I shares are offered to institutions and certain investors. Class R1, Class R2, Class R3, Class R4 and Class R5 shares are available only to certain retirement and 529 plans. Class R6 shares are only available to certain retirement plans, institutions and other investors. Class 1 shares are offered only to certain affiliates of Manulife Financial Corporation (MFC). Shareholders of each class have exclusive voting rights to matters that affect that class. The distribution and service fees, if any, and transfer agent fees for each class may differ.
The investment objective of each portfolio is to seek high total return through the portfolio’s target retirement date, with a greater focus on income beyond the target date. Total return, commonly understood as the combination of income and capital appreciation, includes interest, capital gains, dividends, and distributions realized over a given period of time.
The accounting policies of the underlying funds in which the portfolios invest are outlined in the underlying funds’ shareholder reports, which include the underlying funds’ financial statements. These are available on the Securities and Exchange Commission (SEC) website at sec.gov. John Hancock underlying funds' shareholder reports are also available without charge by calling 800-225-5291 or visiting jhinvestments.com. The underlying funds are not covered by this report.
Note 2—Significant accounting policies
The financial statements have been prepared in conformity with accounting principles generally accepted in the United States of America (US GAAP), which require management to make certain estimates and assumptions as of the date of the financial statements. Actual results could differ from those estimates and those differences could be significant. The portfolios qualify as investment companies under Topic 946 of Accounting Standards Codification of US GAAP.
Events or transactions occurring after the end of the fiscal period through the date that the financial statements were issued have been evaluated in the preparation of the financial statements. The following summarizes the significant accounting policies of the portfolios:
Security valuation. Investments are stated at value as of the scheduled close of regular trading on the New York Stock Exchange (NYSE), normally at 4:00 P.M., Eastern Time. In case of emergency or other disruption resulting in the NYSE not opening for trading or the NYSE closing at a time other than the regularly scheduled close, the net asset value (NAV) may be determined as of the regularly scheduled close of the NYSE pursuant to the portfolios' Valuation Policies and Procedures.
In order to value the securities, the portfolios use the following valuation techniques: Investments in affiliated underlying funds and other open-end mutual funds are valued at their respective NAVs each business day. Debt obligations are valued based on the evaluated prices provided by an independent pricing vendor. Independent pricing vendors utilize matrix pricing, which takes into account factors such as institutional-size trading in similar groups of securities, yield, quality, coupon rate, maturity, type of issue, trading characteristics and other market data, as well as broker supplied prices.
Other portfolio securities and assets, for which reliable market quotations are not readily available, are valued at fair value as determined in good faith by the portfolios' Pricing Committee following procedures established by the Board of Trustees. The frequency with which these fair valuation procedures are used cannot be predicted and fair value of securities may differ significantly from the value that would have been used had a ready market for such securities existed.
The portfolios use a three-tier hierarchy to prioritize the pricing assumptions, referred to as inputs, used in valuation techniques to measure fair value. Level 1 includes securities valued using quoted prices in active markets for identical securities, including registered investment companies. Level 2 includes securities valued using other significant observable inputs. Observable inputs may include quoted prices for similar securities, interest rates, prepayment speeds and credit risk. Prices for securities valued using these inputs are received from independent pricing vendors and brokers and are based on an evaluation of the inputs described. Level 3 includes securities valued using significant unobservable inputs when market prices are not readily available or reliable, including the portfolios' own assumptions in determining the fair value of investments. Factors used in determining value may include market or issuer specific events or trends, changes in interest rates and credit quality. The inputs or methodology used for valuing securities are not necessarily an indication of the risks associated with investing in those securities. Changes in valuation techniques and related inputs may result in transfers into or out of an assigned level within the disclosure hierarchy.
The following is a summary of the values by input classification of the portfolios' investments as of February 29, 2020, by major security category or type:
| | Total
value at
2-29-20 | Level 1
quoted price | Level 2
significant
observable
inputs | Level 3
significant
unobservable
inputs |
| Multimanager 2060 Lifetime Portfolio | | | | |
| Investments in securities: | | | | |
| Assets | | | | |
| | SEMIANNUAL REPORT | JOHN HANCOCK MULTIMANAGER LIFETIME PORTFOLIOS | 67 |
| | Total
value at
2-29-20 | Level 1
quoted price | Level 2
significant
observable
inputs | Level 3
significant
unobservable
inputs |
| Multimanager 2060 Lifetime Portfolio (continued) | | | | |
| Affiliated investment companies | $93,698,737 | $93,698,737 | — | — |
| Unaffiliated investment companies | 4,028,360 | 4,028,360 | — | — |
| Common stocks | 1,678 | — | — | $1,678 |
| U.S. Government and Agency obligations | 2,554,643 | — | $2,554,643 | — |
| Short-term investments | 128,400 | 128,400 | — | — |
| Total investments in securities | $100,411,818 | $97,855,497 | $2,554,643 | $1,678 |
| |
| Multimanager 2055 Lifetime Portfolio | | | | |
| Investments in securities: | | | | |
| Assets | | | | |
| Affiliated investment companies | $205,185,287 | $205,185,287 | — | — |
| Unaffiliated investment companies | 8,751,263 | 8,751,263 | — | — |
| Common stocks | 4,763 | — | — | $4,763 |
| U.S. Government and Agency obligations | 5,732,858 | — | $5,732,858 | — |
| Short-term investments | 289,567 | 289,567 | — | — |
| Total investments in securities | $219,963,738 | $214,226,117 | $5,732,858 | $4,763 |
| |
| Multimanager 2050 Lifetime Portfolio | | | | |
| Investments in securities: | | | | |
| Assets | | | | |
| Affiliated investment companies | $379,628,059 | $379,628,059 | — | — |
| Unaffiliated investment companies | 16,222,835 | 16,222,835 | — | — |
| Common stocks | 9,656 | — | — | $9,656 |
| U.S. Government and Agency obligations | 10,682,084 | — | $10,682,084 | — |
| Short-term investments | 500,220 | 500,220 | — | — |
| Total investments in securities | $407,042,854 | $396,351,114 | $10,682,084 | $9,656 |
| |
| Multimanager 2045 Lifetime Portfolio | | | | |
| Investments in securities: | | | | |
| Assets | | | | |
| Affiliated investment companies | $667,693,593 | $667,693,593 | — | — |
| Unaffiliated investment companies | 28,423,317 | 28,423,317 | — | — |
| Common stocks | 17,903 | — | — | $17,903 |
| U.S. Government and Agency obligations | 18,956,407 | — | $18,956,407 | — |
| Short-term investments | 1,205,831 | 1,205,831 | — | — |
| Total investments in securities | $716,297,051 | $697,322,741 | $18,956,407 | $17,903 |
| |
| Multimanager 2040 Lifetime Portfolio | | | | |
| Investments in securities: | | | | |
| Assets | | | | |
| Affiliated investment companies | $732,103,906 | $732,103,906 | — | — |
| Unaffiliated investment companies | 34,057,500 | 34,057,500 | — | — |
| Common stocks | 19,668 | — | — | $19,668 |
| U.S. Government and Agency obligations | 33,101,758 | — | $33,101,758 | — |
| Short-term investments | 1,204,510 | 1,204,510 | — | — |
| Total investments in securities | $800,487,342 | $767,365,916 | $33,101,758 | $19,668 |
| |
| Multimanager 2035 Lifetime Portfolio | | | | |
| Investments in securities: | | | | |
| Assets | | | | |
| 68 | JOHN HANCOCK MULTIMANAGER LIFETIME PORTFOLIOS | SEMIANNUAL REPORT | |
| | Total
value at
2-29-20 | Level 1
quoted price | Level 2
significant
observable
inputs | Level 3
significant
unobservable
inputs |
| Multimanager 2035 Lifetime Portfolio (continued) | | | | |
| Affiliated investment companies | $902,530,750 | $902,530,750 | — | — |
| Unaffiliated investment companies | 38,666,530 | 38,666,530 | — | — |
| Common stocks | 20,892 | — | — | $20,892 |
| U.S. Government and Agency obligations | 53,716,878 | — | $53,716,878 | — |
| Short-term investments | 1,360,725 | 1,360,725 | — | — |
| Total investments in securities | $996,295,775 | $942,558,005 | $53,716,878 | $20,892 |
| |
| Multimanager 2030 Lifetime Portfolio | | | | |
| Investments in securities: | | | | |
| Assets | | | | |
| Affiliated investment companies | $1,054,550,014 | $1,054,550,014 | — | — |
| Unaffiliated investment companies | 39,254,660 | 39,254,660 | — | — |
| Common stocks | 23,478 | — | — | $23,478 |
| U.S. Government and Agency obligations | 77,961,196 | — | $77,961,196 | — |
| Short-term investments | 1,728,453 | 1,728,453 | — | — |
| Total investments in securities | $1,173,517,801 | $1,095,533,127 | $77,961,196 | $23,478 |
| |
| Multimanager 2025 Lifetime Portfolio | | | | |
| Investments in securities: | | | | |
| Assets | | | | |
| Affiliated investment companies | $1,037,448,657 | $1,037,448,657 | — | — |
| Unaffiliated investment companies | 33,080,717 | 33,080,717 | — | — |
| Common stocks | 16,986 | — | — | $16,986 |
| U.S. Government and Agency obligations | 93,088,552 | — | $93,088,552 | — |
| Short-term investments | 1,703,783 | 1,703,783 | — | — |
| Total investments in securities | $1,165,338,695 | $1,072,233,157 | $93,088,552 | $16,986 |
| |
| Multimanager 2020 Lifetime Portfolio | | | | |
| Investments in securities: | | | | |
| Assets | | | | |
| Affiliated investment companies | $668,779,553 | $668,779,553 | — | — |
| Unaffiliated investment companies | 15,974,493 | 15,974,493 | — | — |
| Common stocks | 7,884 | — | — | $7,884 |
| U.S. Government and Agency obligations | 62,185,614 | — | $62,185,614 | — |
| Short-term investments | 1,258,855 | 1,258,855 | — | — |
| Total investments in securities | $748,206,399 | $686,012,901 | $62,185,614 | $7,884 |
| |
| Multimanager 2015 Lifetime Portfolio | | | | |
| Investments in securities: | | | | |
| Assets | | | | |
| Affiliated investment companies | $243,419,635 | $243,419,635 | — | — |
| Unaffiliated investment companies | 4,843,918 | 4,843,918 | — | — |
| Common stocks | 2,346 | — | — | $2,346 |
| U.S. Government and Agency obligations | 22,695,958 | — | $22,695,958 | — |
| Short-term investments | 374,168 | 374,168 | — | — |
| Total investments in securities | $271,336,025 | $248,637,721 | $22,695,958 | $2,346 |
| |
| Multimanager 2010 Lifetime Portfolio | | | | |
| Investments in securities: | | | | |
| Assets | | | | |
| | SEMIANNUAL REPORT | JOHN HANCOCK MULTIMANAGER LIFETIME PORTFOLIOS | 69 |
| | Total
value at
2-29-20 | Level 1
quoted price | Level 2
significant
observable
inputs | Level 3
significant
unobservable
inputs |
| Multimanager 2010 Lifetime Portfolio (continued) | | | | |
| Affiliated investment companies | $159,468,600 | $159,468,600 | — | — |
| Unaffiliated investment companies | 2,564,956 | 2,564,956 | — | — |
| Common stocks | 1,125 | — | — | $1,125 |
| U.S. Government and Agency obligations | 14,470,678 | — | $14,470,678 | — |
| Short-term investments | 227,081 | 227,081 | — | — |
| Total investments in securities | $176,732,440 | $162,260,637 | $14,470,678 | $1,125 |
Security transactions and related investment income. Investment security transactions are accounted for on a trade date plus one basis for daily NAV calculations. However, for financial reporting purposes, investment transactions are reported on trade date. Interest income is accrued as earned. Interest income includes coupon interest and amortization/accretion of premiums/discounts on debt securities. Debt obligations may be placed in a non-accrual status and related interest income may be reduced by stopping current accruals and writing off interest receivable when the collection of all or a portion of interest has become doubtful. Income and capital gain distributions from underlying funds are recorded on ex-date. Dividend income is recorded on the ex-date, except for dividends of certain foreign securities where the dividend may not be known until after the ex-date. In those cases, dividend income, net of withholding taxes, is recorded when the portfolio becomes aware of the dividends. Non-cash dividends, if any, are recorded at the fair market value of the securities received. Gains and losses on securities sold are determined on the basis of identified cost and may include proceeds from litigation.
Inflation-indexed bonds. Inflation-indexed bonds are securities that generally have a lower coupon interest rate fixed at issuance but whose principal value is periodically adjusted based on a rate of inflation, such as the Consumer Price Index. Over the life of an inflation-indexed bond, interest is paid on the inflation adjusted principal value as described above. Increases in the principal amount of these securities are recorded as interest income. Decreases in the principal amount of these securities may reduce interest income to the extent of income previously recorded. If these decreases are in excess of income previously recorded, an adjustment to the cost of the security is made.
Stripped securities.Stripped securities are financial instruments structured to separate principal and interest cash flows so that one class receives principal payments from the underlying assets (PO or principal only), while the other class receives the interest cash flows (IO or interest only). Both PO and IO investments represent an interest in the cash flows of an underlying stripped security. If the underlying assets experience greater than anticipated prepayments of principal, the portfolio may fail to fully recover its initial investment in an IO security. The market value of these securities can be extremely volatile in response to changes in interest rates or prepayments on the underlying securities. In addition, these securities also have the risk that the portfolio may not receive all or part of its principal or interest payments because the borrower or issuer has defaulted on its obligation.
Overdraft. The portfolios may have the ability to borrow from banks for temporary or emergency purposes, including meeting redemption requests that otherwise might require the untimely sale of securities. Pursuant to the portfolios' custodian agreement, the custodian may loan money to the portfolios to make properly authorized payments. The portfolios are obligated to repay the custodian for any overdraft, including any related costs or expenses. The custodian may have a lien, security interest or security entitlement in any portfolio property that is not otherwise segregated or pledged, to the extent of any overdraft, and to the maximum extent permitted by law. Overdrafts at period end, if any, are presented under the caption Due to custodian in the Statements of assets and liabilities.
Line of credit. The portfolios and other affiliated funds have entered into a syndicated line of credit agreement with Citibank, N.A. as the administrative agent that enables them to participate in a $750 million unsecured committed line of credit. Excluding commitments designated for a certain fund and subject to the needs of all other affiliated funds, a portfolio can borrow up to an aggregate commitment amount of $500 million, subject to asset coverage and other limitations as specified in the agreement. A commitment fee payable at the end of each calendar quarter, based on the average daily unused portion of each line of credit, is charged to each participating portfolio based on a combination of fixed and asset based allocations and is reflected in Other expenses on the Statements of operations. For the six months ended February 29, 2020, the portfolios had no borrowings under the line of credit.
Commitment fees for the six months ended February 29, 2020 were as follows:
| Portfolio | Commitment fee |
| Multimanager 2060 Lifetime Portfolio | $1,117 |
| Multimanager 2055 Lifetime Portfolio | 1,263 |
| Multimanager 2050 Lifetime Portfolio | 1,502 |
| Multimanager 2045 Lifetime Portfolio | 1,904 |
| Multimanager 2040 Lifetime Portfolio | 2,002 |
| Multimanager 2035 Lifetime Portfolio | 2,233 |
| Multimanager 2030 Lifetime Portfolio | 2,466 |
| Multimanager 2025 Lifetime Portfolio | 2,497 |
| Multimanager 2020 Lifetime Portfolio | 2,020 |
| Multimanager 2015 Lifetime Portfolio | 1,389 |
| Multimanager 2010 Lifetime Portfolio | 1,258 |
| 70 | JOHN HANCOCK MULTIMANAGER LIFETIME PORTFOLIOS | SEMIANNUAL REPORT | |
Expenses. Within the John Hancock group of funds complex, expenses that are directly attributable to an individual portfolio are allocated to such portfolio. Expenses that are not readily attributable to a specific portfolio are allocated among all portfolios in an equitable manner, taking into consideration, among other things, the nature and type of expense and the portfolio’s relative net assets. Expense estimates are accrued in the period to which they relate and adjustments are made when actual amounts are known.
Class allocations. Income, common expenses and realized and unrealized gains (losses) are determined at the portfolio level and allocated daily to each class of shares based on the net assets of the class. Class-specific expenses, such as distribution and service fees, if any, and transfer agent fees, for all classes, are charged daily at the class level based on the net assets of each class and the specific expense rates applicable to each class.
Federal income taxes. Each portfolio intends to continue to qualify as a regulated investment company by complying with the applicable provisions of the Internal Revenue Code and will not be subject to federal income tax on taxable income that is distributed to shareholders. Therefore, no federal income tax provision is required.
As of August 31, 2019, the portfolios had no uncertain tax positions that would require financial statement recognition, derecognition or disclosure. The portfolios' federal tax returns are subject to examination by the Internal Revenue Service for a period of three years.
For federal income tax purposes, the costs of investments owned on February 29, 2020, including short-term investments, were as follows:
| Portfolio | Aggregate
cost | Unrealized
appreciation | Unrealized
(depreciation) | Net unrealized
appreciation/
(depreciation) |
| Multimanager 2060 Lifetime Portfolio | $107,418,530 | $595,891 | $(7,602,603) | $(7,006,712) |
| Multimanager 2055 Lifetime Portfolio | 234,909,927 | 2,718,806 | (17,664,995) | (14,946,189) |
| Multimanager 2050 Lifetime Portfolio | 422,152,447 | 7,574,218 | (22,683,811) | (15,109,593) |
| Multimanager 2045 Lifetime Portfolio | 677,223,616 | 47,999,948 | (8,926,513) | 39,073,435 |
| Multimanager 2040 Lifetime Portfolio | 756,670,725 | 54,328,179 | (10,511,562) | 43,816,617 |
| Multimanager 2035 Lifetime Portfolio | 940,620,309 | 68,137,467 | (12,462,001) | 55,675,466 |
| Multimanager 2030 Lifetime Portfolio | 1,100,619,612 | 86,394,332 | (13,496,143) | 72,898,189 |
| Multimanager 2025 Lifetime Portfolio | 1,099,725,477 | 80,046,656 | (14,433,438) | 65,613,218 |
| Multimanager 2020 Lifetime Portfolio | 712,110,405 | 45,138,115 | (9,042,121) | 36,095,994 |
| Multimanager 2015 Lifetime Portfolio | 259,590,241 | 14,960,469 | (3,214,685) | 11,745,784 |
| Multimanager 2010 Lifetime Portfolio | 171,808,250 | 6,884,074 | (1,959,884) | 4,924,190 |
Distribution of income and gains. Distributions to shareholders from net investment income and net realized gains, if any, are recorded on the ex-date. The portfolios generally declare and pay dividends and capital gain distributions, if any, annually.
Distributions paid by the portfolios with respect to each class of shares are calculated in the same manner, at the same time and in the same amount, except for the effect of class level expenses that may be applied differently to each class.
Such distributions, on a tax basis, are determined in conformity with income tax regulations, which may differ from US GAAP. Distributions in excess of tax basis earnings and profits, if any, are reported in the portfolios' financial statements as a return of capital. The final determination of tax characteristics of the portfolio's distribution will occur at the end of the year and will subsequently be reported to shareholders. Short-term gains from underlying funds are treated as ordinary income for tax purposes.
Capital accounts within the financial statements are adjusted for permanent book-tax differences. These adjustments have no impact on net assets or the results of operations. Temporary book-tax differences, if any, will reverse in a subsequent period. Book-tax differences are primarily attributable to wash sale loss deferrals.
Note 3—Guarantees and indemnifications
Under the Trust's organizational documents, its Officers and Trustees are indemnified against certain liabilities arising out of the performance of their duties to the Trust, including the portfolios. Additionally, in the normal course of business, the Trust enters into contracts with service providers that contain general indemnification clauses. The Trust's maximum exposure under these arrangements is unknown, as this would involve future claims that may be made against the Trust that have not yet occurred. The risk of material loss from such claims is considered remote.
Note 4—Fees and transactions with affiliates
John Hancock Investment Management LLC (the Advisor) serves as investment advisor for the portfolios. John Hancock Investment Management Distributors LLC (the Distributor), an affiliate of the Advisor, serves as principal underwriter of the portfolios. The Advisor and the Distributor are indirect, wholly owned subsidiaries of MFC.
Management fee. The portfolios have an investment management agreement with the Advisor under which the portfolios pay a daily management fee to the Advisor as detailed below. The Advisor has a subadvisory agreement with Manulife Investment Management (US) LLC, an indirect, wholly owned subsidiary of MFC and an affiliate of the Advisor. The portfolios are not responsible for payment of the subadvisory fees.
| | SEMIANNUAL REPORT | JOHN HANCOCK MULTIMANAGER LIFETIME PORTFOLIOS | 71 |
The management fee has two components: (1) a fee on assets invested in a fund of the Trust or John Hancock Funds III (JHF III) (Assets in a fund of the Trust or JHF III); and (2) a fee on assets invested in investments other than a fund of the Trust or JHF III (Other assets). Aggregate net assets include the net assets of the portfolios, similar portfolios of John Hancock Variable Insurance Trust (JHVIT), and similar portfolios of the Trust. JHVIT funds are advised by an affiliate of the Advisor, John Hancock Variable Trust Advisers LLC and are distributed by an affiliate of the Advisor, John Hancock Distributors, LLC.
Management fees are determined in accordance with the following schedule:
| | First $7.5 billion of aggregate net assets | Excess over $7.5 billion of aggregate net assets |
| Assets in a fund of the Trust or JHF III | 0.060% | 0.050% |
| Other assets | 0.510% | 0.500% |
Expense reimbursements. The Advisor has contractually agreed to reduce its management fees or if, necessary make payment to the portfolio in an amount by which certain expenses including underlying fund expenses (acquired fund fees), exceed the amount indicated below of the respective portfolio’s average net assets. This expense limitation agreement expires on December 31, 2020, unless renewed by mutual agreement of the portfolios and the Advisor based upon a determination that this is appropriate under the circumstances at that time.
| Portfolio | Expense
limitation as a
percentage of
average net
assets |
| Multimanager 2060 Lifetime Portfolio | 0.58% |
| Multimanager 2055 Lifetime Portfolio | 0.59% |
| Multimanager 2050 Lifetime Portfolio | 0.60% |
| Multimanager 2045 Lifetime Portfolio | 0.58% |
| Multimanager 2040 Lifetime Portfolio | 0.58% |
| Multimanager 2035 Lifetime Portfolio | 0.59% |
| Portfolio | Expense
limitation as a
percentage of
average net
assets |
| Multimanager 2030 Lifetime Portfolio | 0.57% |
| Multimanager 2025 Lifetime Portfolio | 0.56% |
| Multimanager 2020 Lifetime Portfolio | 0.54% |
| Multimanager 2015 Lifetime Portfolio | 0.52% |
| Multimanager 2010 Lifetime Portfolio | 0.50% |
Payments under this arrangement are intended to reimburse the portfolios for a portion of the indirect net expenses associated with the portfolios’ investments in underlying funds. Amounts received in excess of portfolio level operating expenses are included as Other income received from advisor in the Statements of operations.
The Advisor has contractually agreed to waive and/or reimburse all class-specific expenses for Class R6 shares of each portfolio to the extent they exceed 0.00% of average net assets attributable to Class R6 shares. The current expense limitation agreement expires on December 31, 2020, unless renewed by mutual agreement of the portfolios and the Advisor based upon a determination that this is appropriate under the circumstances at that time.
Additionally, the Advisor has voluntarily agreed to waive its management fee for each portfolio so that the aggregate management fee retained by the Advisor with respect to both the portfolio and its underlying investments (after payment of subadvisory fees) does not exceed 0.51% of the portfolio’s first $7.5 billion of average daily net assets and 0.50% of the portfolio’s average daily net assets in excess of $7.5 billion. The Advisor may terminate this voluntary waiver at any time upon notice to the Trust.
For the six months ended February 29, 2020, the expense reductions under these agreements amounted to the following and are reflected as a reduction of total expenses in the Statements of operations:
| | Expense reimbursement by class |
| Portfolio | Class A | Class I | Class R1 | Class R2 | Class R3 | Class R4 | Class R5 | Class R6 | Class 1 | Total |
| Multimanager 2060 Lifetime Portfolio | $5,575 | $98 | $103 | $215 | $387 | $121 | $366 | $4,123 | $184,808 | $195,796 |
| Multimanager 2055 Lifetime Portfolio | 21,826 | 81 | 83 | 908 | 185 | 61 | 165 | 9,612 | 270,308 | 303,229 |
| Multimanager 2050 Lifetime Portfolio | 66,019 | 68 | 1,682 | 1,361 | 1,210 | 986 | 44 | 20,158 | 377,136 | 468,664 |
| Multimanager 2045 Lifetime Portfolio | 112,298 | 207 | 1,671 | 2,706 | 1,087 | 151 | 1,587 | 32,094 | 604,040 | 755,841 |
| Multimanager 2040 Lifetime Portfolio | 138,423 | 337 | 2,631 | 1,037 | 1,302 | 243 | 217 | 32,722 | 663,574 | 840,486 |
| Multimanager 2035 Lifetime Portfolio | 158,625 | 7 | 4,231 | 2,502 | 2,130 | 97 | 346 | 36,739 | 833,937 | 1,038,614 |
| Multimanager 2030 Lifetime Portfolio | 198,389 | 879 | 3,842 | 2,926 | 1,710 | 520 | 1,070 | 45,450 | 990,189 | 1,244,975 |
| Multimanager 2025 Lifetime Portfolio | 202,336 | 1,508 | 4,054 | 4,931 | 2,862 | 789 | 1,471 | 45,357 | 1,043,955 | 1,307,263 |
| Multimanager 2020 Lifetime Portfolio | 212,787 | 198 | 5,618 | 1,219 | 2,200 | 262 | 4,420 | 36,009 | 686,505 | 949,218 |
| Multimanager 2015 Lifetime Portfolio | 138,087 | 1,150 | 2,239 | 52 | 3,367 | 16 | 479 | 17,980 | 266,185 | 429,555 |
| Multimanager 2010 Lifetime Portfolio | 79,377 | 378 | 531 | 799 | 213 | 92 | 55 | 14,101 | 223,000 | 318,546 |
Expenses waived or reimbursed in the current fiscal period are not subject to recapture in future fiscal periods.
The investment management fees, including the impact of the waivers and reimbursements as described above, incurred for the six months ended February 29, 2020, were equivalent to a net annual effective rate of the portfolios' average daily net assets as follows:
| Portfolio | Net Annual Effective Rate |
| Multimanager 2060 Lifetime Portfolio | 0.00% |
| Portfolio | Net Annual Effective Rate |
| Multimanager 2055 Lifetime Portfolio | 0.00% |
| 72 | JOHN HANCOCK MULTIMANAGER LIFETIME PORTFOLIOS | SEMIANNUAL REPORT | |
| Portfolio | Net Annual Effective Rate |
| Multimanager 2050 Lifetime Portfolio | 0.00% |
| Multimanager 2045 Lifetime Portfolio | 0.00% |
| Multimanager 2040 Lifetime Portfolio | 0.00% |
| Multimanager 2035 Lifetime Portfolio | 0.00% |
| Multimanager 2030 Lifetime Portfolio | 0.00% |
| Portfolio | Net Annual Effective Rate |
| Multimanager 2025 Lifetime Portfolio | 0.00% |
| Multimanager 2020 Lifetime Portfolio | 0.00% |
| Multimanager 2015 Lifetime Portfolio | 0.00% |
| Multimanager 2010 Lifetime Portfolio | 0.00% |
Accounting and legal services. Pursuant to a service agreement, the portfolios reimburse the Advisor for all expenses associated with providing the administrative, financial, legal, compliance, accounting and recordkeeping services to the portfolios, including the preparation of all tax returns, periodic reports to shareholders and regulatory reports, among other services. These expenses are allocated to each share class based on its relative net assets at the time the expense was incurred. These accounting and legal services fees incurred for the six months ended February 29, 2020 amounted to an annual rate of 0.02% of the portfolios' average daily net assets.
Distribution and service plans. The portfolios have a distribution agreement with the Distributor. The portfolios have adopted distribution and service plans for certain classes as detailed below pursuant to Rule 12b-1 under the 1940 Act, to pay the Distributor for services provided as the distributor of shares of the portfolios. In addition, under a service plan for certain classes as detailed below, the portfolios pay for certain other services. The portfolios may pay up to the following contractual rates of distribution and service fees under these arrangements, expressed as an annual percentage of average daily net assets for each class of the portfolios' shares:
| Class | Rule 12b-1 Fee | Service fee |
| Class A | 0.30% | — |
| Class R1 | 0.50% | 0.25% |
| Class R2 | 0.25% | 0.25% |
| Class R3 | 0.50% | 0.15% |
| Class R4 | 0.25% | 0.10% |
| Class R5 | — | 0.05% |
| Class 1 | 0.05% | — |
The portfolios' Distributor has contractually agreed to waive 0.10% of Rule12b-1 fees for Class R4 shares. The current waiver agreement expires on December 31, 2020, unless renewed by mutual agreement of the portfolios and the Distributor based upon a determination that this is appropriate under the circumstances at the time. This contractual waiver amounted to the following for Class R4 shares for the six months ended February 29, 2020:
| Portfolio | Class R4 |
| Multimanager 2060 Lifetime Portfolio | $30 |
| Multimanager 2055 Lifetime Portfolio | 23 |
| Multimanager 2050 Lifetime Portfolio | 449 |
| Multimanager 2045 Lifetime Portfolio | 77 |
| Multimanager 2040 Lifetime Portfolio | 122 |
| Multimanager 2035 Lifetime Portfolio | 48 |
| Portfolio | Class R4 |
| Multimanager 2030 Lifetime Portfolio | $253 |
| Multimanager 2025 Lifetime Portfolio | 368 |
| Multimanager 2020 Lifetime Portfolio | 110 |
| Multimanager 2015 Lifetime Portfolio | 5 |
| Multimanager 2010 Lifetime Portfolio | 27 |
Sales charges. Class A shares are assessed up-front sales charges of up to 5.00% of net asset value for such shares. The following table summarizes the net up-front sales charges received by the Distributor during the six months ended February 29, 2020:
| | Multimanager 2060 Lifetime Portfolio | Multimanager 2055 Lifetime Portfolio | Multimanager 2050 Lifetime Portfolio | Multimanager 2045 Lifetime Portfolio | Multimanager 2040 Lifetime Portfolio | Multimanager 2035 Lifetime Portfolio | Multimanager 2030 Lifetime Portfolio | Multimanager 2025 Lifetime Portfolio | Multimanager 2020 Lifetime Portfolio | Multimanager 2015 Lifetime Portfolio | Multimanager 2010 Lifetime Portfolio |
| Total sales charges | $2,227 | $2,058 | $12,690 | $13,840 | $3,692 | $11,522 | $13,493 | $8,503 | $4,695 | $2,252 | $746 |
| Retained for printing prospectus, advertising and sales literature | 357 | 328 | 1,937 | 1,970 | 262 | 1,773 | 1,826 | 1,211 | 663 | 301 | 91 |
| Sales commission to unrelated broker-dealers | 1,870 | 1,730 | 10,753 | 11,870 | 3,430 | 9,749 | 11,667 | 7,292 | 4,032 | 1,951 | 655 |
Class A shares may be subject to contingent deferred sales charges (CDSCs). Certain Class A shares that are acquired through purchases of $1 million or more and are redeemed within one year of purchase are subject to a 1.00% sales charge. CDSCs are applied to the lesser of the current market value at the time of redemption or the original purchase cost of the shares being redeemed. Proceeds from CDSCs are used to compensate the Distributor for providing distribution-related services in connection with the sale of these shares. During the six months ended February 29, 2020, CDSCs received by the Distributor for Class A shares were as follows:
| Portfolio | Class A |
| Multimanager 2050 Lifetime Portfolio | $ 92 |
| Multimanager 2035 Lifetime Portfolio | 28 |
| Multimanager 2030 Lifetime Portfolio | 20 |
| | SEMIANNUAL REPORT | JOHN HANCOCK MULTIMANAGER LIFETIME PORTFOLIOS | 73 |
| Portfolio | Class A |
| Multimanager 2025 Lifetime Portfolio | $5 |
Transfer agent fees. The John Hancock group of funds has a complex-wide transfer agent agreement with John Hancock Signature Services, Inc. (Signature Services), an affiliate of the Advisor. The transfer agent fees paid to Signature Services are determined based on the cost to Signature Services (Signature Services Cost) of providing recordkeeping services. It also includes out-of-pocket expenses, including payments made to third-parties for recordkeeping services provided to their clients who invest in one or more John Hancock funds. In addition, Signature Services Cost may be reduced by certain fees that Signature Services receives in connection with retirement and small accounts. Signature Services Cost is calculated monthly and allocated, as applicable, to five categories of share classes: Retail Share and Institutional Share Classes of Non-Municipal Bond Funds, Class R6 Shares, Retirement Share Classes and Municipal Bond Share Classes. Within each of these categories, the applicable costs are allocated to the affected John Hancock affiliated funds and/or classes, based on the relative average daily net assets.
Class level expenses. Class level expenses for the six months ended February 29, 2020 were as follows:
| Portfolio | Class | Distribution and service fees | Transfer agent fees |
| Multimanager 2060 Lifetime Portfolio | Class A | $4,115 | $1,683 |
| | Class I | — | 30 |
| | Class R1 | 127 | 3 |
| | Class R2 | 194 | 7 |
| | Class R3 | 578 | 13 |
| | Class R4 | 75 | 4 |
| | Class R5 | 45 | 12 |
| | Class R6 | — | 129 |
| | Class 1 | 22,817 | — |
| | Total | $27,951 | $1,881 |
| Multimanager 2055 Lifetime Portfolio | Class A | $24,099 | $9,870 |
| | Class I | — | 37 |
| | Class R1 | 147 | 4 |
| | Class R2 | 1,636 | 44 |
| | Class R3 | 440 | 9 |
| | Class R4 | 57 | 3 |
| | Class R5 | 30 | 8 |
| | Class R6 | — | 442 |
| | Class 1 | 49,901 | — |
| | Total | $76,310 | $10,417 |
| Multimanager 2050 Lifetime Portfolio | Class A | $90,064 | $36,913 |
| | Class I | — | 38 |
| | Class R1 | 5,705 | 100 |
| | Class R2 | 2,998 | 82 |
| | Class R3 | 3,532 | 73 |
| | Class R4 | 1,551 | 59 |
| | Class R5 | 9 | 3 |
| | Class R6 | — | 1,136 |
| | Class 1 | 85,898 | — |
| | Total | $189,757 | $38,404 |
| Multimanager 2045 Lifetime Portfolio | Class A | $169,588 | $69,519 |
| | Class I | — | 128 |
| | Class R1 | 6,037 | 110 |
| | Class R2 | 6,755 | 179 |
| | Class R3 | 3,496 | 72 |
| | Class R4 | 264 | 10 |
| | Class R5 | 387 | 105 |
| | Class R6 | — | 1,994 |
| | Class 1 | 152,450 | — |
| | Total | $338,977 | $72,117 |
| 74 | JOHN HANCOCK MULTIMANAGER LIFETIME PORTFOLIOS | SEMIANNUAL REPORT | |
| Portfolio | Class | Distribution and service fees | Transfer agent fees |
| Multimanager 2040 Lifetime Portfolio | Class A | $208,473 | $85,443 |
| | Class I | — | 210 |
| | Class R1 | 9,649 | 173 |
| | Class R2 | 2,486 | 69 |
| | Class R3 | 4,129 | 86 |
| | Class R4 | 427 | 16 |
| | Class R5 | 54 | 14 |
| | Class R6 | — | 2,024 |
| | Class 1 | 167,157 | — |
| | Total | $392,375 | $88,035 |
| Multimanager 2035 Lifetime Portfolio | Class A | $237,998 | $97,563 |
| | Class I | — | 3 |
| | Class R1 | 15,734 | 278 |
| | Class R2 | 6,199 | 164 |
| | Class R3 | 6,915 | 140 |
| | Class R4 | 169 | 7 |
| | Class R5 | 86 | 22 |
| | Class R6 | — | 2,258 |
| | Class 1 | 209,291 | — |
| | Total | $476,392 | $100,435 |
| Multimanager 2030 Lifetime Portfolio | Class A | $290,744 | $119,194 |
| | Class I | — | 530 |
| | Class R1 | 13,678 | 246 |
| | Class R2 | 6,752 | 188 |
| | Class R3 | 5,303 | 110 |
| | Class R4 | 848 | 33 |
| | Class R5 | 262 | 69 |
| | Class R6 | — | 2,733 |
| | Class 1 | 242,564 | — |
| | Total | $560,151 | $123,103 |
| Multimanager 2025 Lifetime Portfolio | Class A | $283,250 | $116,144 |
| | Class I | — | 867 |
| | Class R1 | 13,727 | 249 |
| | Class R2 | 10,785 | 299 |
| | Class R3 | 8,644 | 176 |
| | Class R4 | 1,289 | 49 |
| | Class R5 | 344 | 91 |
| | Class R6 | — | 2,614 |
| | Class 1 | 244,322 | — |
| | Total | $562,361 | $120,489 |
| Multimanager 2020 Lifetime Portfolio | Class A | $265,550 | $108,898 |
| | Class I | — | 105 |
| | Class R1 | 17,310 | 309 |
| | Class R2 | 2,504 | 67 |
| | Class R3 | 5,955 | 121 |
| | Class R4 | 373 | 15 |
| | Class R5 | 926 | 245 |
| | Class R6 | — | 1,875 |
| | Class 1 | 143,518 | — |
| | Total | $436,136 | $111,635 |
| | SEMIANNUAL REPORT | JOHN HANCOCK MULTIMANAGER LIFETIME PORTFOLIOS | 75 |
| Portfolio | Class | Distribution and service fees | Transfer agent fees |
| Multimanager 2015 Lifetime Portfolio | Class A | $139,874 | $57,365 |
| | Class I | — | 476 |
| | Class R1 | 5,664 | 99 |
| | Class R2 | 87 | 2 |
| | Class R3 | 7,279 | 151 |
| | Class R4 | 19 | 1 |
| | Class R5 | 81 | 22 |
| | Class R6 | — | 769 |
| | Class 1 | 45,238 | — |
| | Total | $198,242 | $58,885 |
| Multimanager 2010 Lifetime Portfolio | Class A | $68,556 | $28,121 |
| | Class I | — | 132 |
| | Class R1 | 937 | 20 |
| | Class R2 | 1,106 | 30 |
| | Class R3 | 394 | 8 |
| | Class R4 | 93 | 4 |
| | Class R5 | 8 | 2 |
| | Class R6 | — | 515 |
| | Class 1 | 32,210 | — |
| | Total | $103,304 | $28,832 |
Trustee expenses. The portfolios compensate each Trustee who is not an employee of the Advisor or its affiliates. The costs of paying Trustee compensation and expenses are allocated to each portfolio based on their net assets relative to other funds within the John Hancock group of funds complex.
Note 5—Portfolio share transactions
Transactions in portfolios' shares for the six months ended February 29, 2020 and for the year ended August 31, 2019 were as follows:
| Multimanager 2060 Lifetime Portfolio | Six Months Ended 2-29-20 | Year Ended 8-31-19 |
| | Shares | Amount | Shares | Amount |
| Class A shares | | | | |
| Sold | 188,767 | $2,323,456 | 119,100 | $1,406,304 |
| Distributions reinvested | 13,812 | 170,164 | 8,997 | 93,564 |
| Repurchased | (92,115) | (1,124,069) | (64,247) | (768,735) |
| Net increase | 110,464 | $1,369,551 | 63,850 | $731,133 |
| Class I shares | | | | |
| Sold | 28 | $349 | — | — |
| Distributions reinvested | 2 | 22 | — | — |
| Net increase | 30 | $371 | — | — |
| Class R1 shares | | | | |
| Sold | 1,615 | $19,612 | — | — |
| Repurchased | (225) | (2,834) | — | — |
| Net increase | 1,390 | $16,778 | — | — |
| Class R2 shares | | | | |
| Sold | 1,108 | $13,666 | 2,222 | $26,367 |
| Distributions reinvested | 297 | 3,653 | 150 | 1,557 |
| Repurchased | (38) | (479) | — | — |
| Net increase | 1,367 | $16,840 | 2,372 | $27,924 |
| Class R3 shares | | | | |
| Sold | 6,285 | $77,645 | 9,050 | $105,788 |
| Distributions reinvested | 710 | 8,752 | — | — |
| Repurchased | (1,762) | (22,365) | (66) | (787) |
| Net increase | 5,233 | $64,032 | 8,984 | $105,001 |
| 76 | JOHN HANCOCK MULTIMANAGER LIFETIME PORTFOLIOS | SEMIANNUAL REPORT | |
| Multimanager 2060 Lifetime Portfolio (continued) | Six Months Ended 2-29-20 | Year Ended 8-31-19 |
| | Shares | Amount | Shares | Amount |
| Class R4 shares | | | | |
| Sold | 621 | $7,946 | 361 | $4,195 |
| Distributions reinvested | 75 | 929 | 33 | 341 |
| Repurchased | (5) | (64) | (80) | (973) |
| Net increase | 691 | $8,811 | 314 | $3,563 |
| Class R5 shares | | | | |
| Sold | 4,007 | $50,647 | 9,057 | $106,321 |
| Distributions reinvested | 1,070 | 13,186 | 795 | 8,273 |
| Repurchased | (5,072) | (63,294) | (4,825) | (58,114) |
| Net increase | 5 | $539 | 5,027 | $56,480 |
| Class R6 shares | | | | |
| Sold | 83,893 | $1,044,264 | 123,304 | $1,468,395 |
| Distributions reinvested | 10,335 | 127,425 | 10,839 | 112,831 |
| Repurchased | (23,127) | (283,040) | (107,253) | (1,293,315) |
| Net increase | 71,101 | $888,649 | 26,890 | $287,911 |
| Class 1 shares | | | | |
| Sold | 1,548,916 | $19,132,260 | 2,927,687 | $34,726,479 |
| Distributions reinvested | 479,614 | 5,913,640 | 355,880 | 3,704,710 |
| Repurchased | (423,169) | (5,266,984) | (572,236) | (6,676,867) |
| Net increase | 1,605,361 | $19,778,916 | 2,711,331 | $31,754,322 |
| Total net increase | 1,795,642 | $22,144,487 | 2,818,768 | $32,966,334 |
| Multimanager 2055 Lifetime Portfolio | Six Months Ended 2-29-20 | Year Ended 8-31-19 |
| | Shares | Amount | Shares | Amount |
| Class A shares | | | | |
| Sold | 583,343 | $6,513,840 | 514,863 | $5,609,469 |
| Distributions reinvested | 121,085 | 1,331,932 | 108,112 | 1,025,985 |
| Repurchased | (300,194) | (3,344,125) | (282,478) | (3,082,289) |
| Net increase | 404,234 | $4,501,647 | 340,497 | $3,553,165 |
| Class I shares | | | | |
| Sold | 217 | $2,434 | 723 | $7,919 |
| Distributions reinvested | 113 | 1,239 | 66 | 622 |
| Repurchased | (10) | (120) | (11) | (120) |
| Net increase | 320 | $3,553 | 778 | $8,421 |
| Class R1 shares | | | | |
| Sold | 8,509 | $92,106 | — | — |
| Repurchased | (9) | (97) | — | — |
| Net increase | 8,500 | $92,009 | — | — |
| Class R2 shares | | | | |
| Sold | 7,002 | $78,212 | 20,049 | $214,974 |
| Distributions reinvested | 4,897 | 53,863 | 4,051 | 38,445 |
| Repurchased | (765) | (8,780) | (4,227) | (47,001) |
| Net increase | 11,134 | $123,295 | 19,873 | $206,418 |
| Class R3 shares | | | | |
| Sold | 5,395 | $60,278 | 13,825 | $150,428 |
| Distributions reinvested | 1,019 | 11,204 | 2,440 | 23,131 |
| Repurchased | (1,540) | (17,492) | (23,829) | (242,869) |
| Net increase (decrease) | 4,874 | $53,990 | (7,564) | $(69,310) |
| | SEMIANNUAL REPORT | JOHN HANCOCK MULTIMANAGER LIFETIME PORTFOLIOS | 77 |
| Multimanager 2055 Lifetime Portfolio (continued) | Six Months Ended 2-29-20 | Year Ended 8-31-19 |
| | Shares | Amount | Shares | Amount |
| Class R4 shares | | | | |
| Distributions reinvested | — | — | 7 | $69 |
| Repurchased | — | — | (71) | (772) |
| Net decrease | — | — | (64) | $(703) |
| Class R5 shares | | | | |
| Sold | 5,146 | $57,989 | 9,333 | $105,485 |
| Distributions reinvested | 974 | 10,728 | 857 | 8,133 |
| Repurchased | (1,038) | (11,619) | (19,423) | (230,648) |
| Net increase (decrease) | 5,082 | $57,098 | (9,233) | $(117,030) |
| Class R6 shares | | | | |
| Sold | 240,788 | $2,678,431 | 385,855 | $4,259,178 |
| Distributions reinvested | 52,497 | 577,988 | 46,456 | 440,864 |
| Repurchased | (60,883) | (679,323) | (199,782) | (2,200,630) |
| Net increase | 232,402 | $2,577,096 | 232,529 | $2,499,412 |
| Class 1 shares | | | | |
| Sold | 1,712,573 | $19,035,730 | 3,316,586 | $36,122,116 |
| Distributions reinvested | 1,521,984 | 16,757,049 | 1,641,157 | 15,574,577 |
| Repurchased | (1,213,859) | (13,597,420) | (1,747,642) | (18,890,980) |
| Net increase | 2,020,698 | $22,195,359 | 3,210,101 | $32,805,713 |
| Total net increase | 2,687,244 | $29,604,047 | 3,786,917 | $38,886,086 |
| Multimanager 2050 Lifetime Portfolio | Six Months Ended 2-29-20 | Year Ended 8-31-19 |
| | Shares | Amount | Shares | Amount |
| Class A shares | | | | |
| Sold | 954,375 | $11,494,790 | 1,025,122 | $12,041,248 |
| Distributions reinvested | 454,042 | 5,334,995 | 507,296 | 5,179,489 |
| Repurchased | (554,463) | (6,621,141) | (875,496) | (10,345,828) |
| Net increase | 853,954 | $10,208,644 | 656,922 | $6,874,909 |
| Class I shares | | | | |
| Sold | 396 | $4,742 | 8,632 | $105,738 |
| Distributions reinvested | 137 | 1,615 | 113 | 1,151 |
| Repurchased | — | — | (8,495) | (100,081) |
| Net increase | 533 | $6,357 | 250 | $6,808 |
| Class R1 shares | | | | |
| Sold | 42,291 | $494,245 | 38,648 | $457,041 |
| Distributions reinvested | 7,094 | 83,281 | 8,539 | 87,097 |
| Repurchased | (21,026) | (251,221) | (32,008) | (370,123) |
| Net increase | 28,359 | $326,305 | 15,179 | $174,015 |
| Class R2 shares | | | | |
| Sold | 13,082 | $155,717 | 58,672 | $682,998 |
| Distributions reinvested | 8,305 | 97,669 | 9,011 | 91,997 |
| Repurchased | (24,329) | (298,691) | (34,172) | (406,030) |
| Net increase (decrease) | (2,942) | $(45,305) | 33,511 | $368,965 |
| Class R3 shares | | | | |
| Sold | 10,888 | $130,073 | 55,665 | $658,219 |
| Distributions reinvested | 8,065 | 94,678 | 11,794 | 120,299 |
| Repurchased | (2,495) | (29,683) | (69,753) | (785,212) |
| Net increase (decrease) | 16,458 | $195,068 | (2,294) | $(6,694) |
| 78 | JOHN HANCOCK MULTIMANAGER LIFETIME PORTFOLIOS | SEMIANNUAL REPORT | |
| Multimanager 2050 Lifetime Portfolio (continued) | Six Months Ended 2-29-20 | Year Ended 8-31-19 |
| | Shares | Amount | Shares | Amount |
| Class R4 shares | | | | |
| Sold | 14,208 | $172,693 | 18,147 | $221,014 |
| Distributions reinvested | 7,156 | 84,086 | 7,889 | 80,472 |
| Repurchased | (6,894) | (81,872) | (9,477) | (110,656) |
| Net increase | 14,470 | $174,907 | 16,559 | $190,830 |
| Class R5 shares | | | | |
| Sold | 719 | $8,635 | 2,406 | $29,773 |
| Distributions reinvested | 315 | 3,709 | 664 | 6,775 |
| Repurchased | (16) | (190) | (20,945) | (270,621) |
| Net increase (decrease) | 1,018 | $12,154 | (17,875) | $(234,073) |
| Class R6 shares | | | | |
| Sold | 400,649 | $4,805,378 | 991,554 | $11,835,007 |
| Distributions reinvested | 134,377 | 1,580,269 | 163,942 | 1,673,850 |
| Repurchased | (176,929) | (2,114,499) | (473,700) | (5,559,250) |
| Net increase | 358,097 | $4,271,148 | 681,796 | $7,949,607 |
| Class 1 shares | | | | |
| Sold | 1,540,876 | $18,369,845 | 3,179,153 | $37,441,695 |
| Distributions reinvested | 2,642,487 | 31,049,227 | 3,272,044 | 33,374,846 |
| Repurchased | (2,411,690) | (28,984,608) | (3,759,690) | (44,318,312) |
| Net increase | 1,771,673 | $20,434,464 | 2,691,507 | $26,498,229 |
| Total net increase | 3,041,620 | $35,583,742 | 4,075,555 | $41,822,596 |
| Multimanager 2045 Lifetime Portfolio | Six Months Ended 2-29-20 | Year Ended 8-31-19 |
| | Shares | Amount | Shares | Amount |
| Class A shares | | | | |
| Sold | 1,417,665 | $15,438,927 | 1,429,107 | $15,433,890 |
| Distributions reinvested | 1,170,669 | 12,338,856 | 1,201,654 | 11,271,334 |
| Repurchased | (906,325) | (9,781,340) | (1,631,155) | (17,774,281) |
| Net increase | 1,682,009 | $17,996,443 | 999,606 | $8,930,943 |
| Class I shares | | | | |
| Sold | 3,589 | $38,339 | 20,098 | $216,750 |
| Distributions reinvested | 1,605 | 16,995 | 386 | 3,636 |
| Repurchased | (1,809) | (20,452) | (8,553) | (91,466) |
| Net increase | 3,385 | $34,882 | 11,931 | $128,920 |
| Class R1 shares | | | | |
| Sold | 42,188 | $444,789 | 41,937 | $443,727 |
| Distributions reinvested | 12,814 | 134,808 | 14,204 | 132,949 |
| Repurchased | (29,650) | (326,427) | (60,160) | (651,721) |
| Net increase (decrease) | 25,352 | $253,170 | (4,019) | $(75,045) |
| Class R2 shares | | | | |
| Sold | 23,599 | $254,960 | 53,421 | $577,891 |
| Distributions reinvested | 26,788 | 283,683 | 26,181 | 246,622 |
| Repurchased | (31,211) | (342,110) | (31,812) | (339,005) |
| Net increase | 19,176 | $196,533 | 47,790 | $485,508 |
| Class R3 shares | | | | |
| Sold | 15,492 | $169,783 | 50,852 | $549,153 |
| Distributions reinvested | 11,573 | 121,869 | 13,308 | 124,698 |
| Repurchased | (6,876) | (73,160) | (70,386) | (737,081) |
| | SEMIANNUAL REPORT | JOHN HANCOCK MULTIMANAGER LIFETIME PORTFOLIOS | 79 |
| Multimanager 2045 Lifetime Portfolio (continued) | Six Months Ended 2-29-20 | Year Ended 8-31-19 |
| | Shares | Amount | Shares | Amount |
| Net increase (decrease) | 20,189 | $218,492 | (6,226) | $(63,230) |
| Class R4 shares | | | | |
| Sold | 1,258 | $13,776 | 2,417 | $26,462 |
| Distributions reinvested | 1,442 | 15,224 | 1,840 | 17,277 |
| Repurchased | (4,878) | (54,409) | (9,239) | (113,457) |
| Net decrease | (2,178) | $(25,409) | (4,982) | $(69,718) |
| Class R5 shares | | | | |
| Sold | 10,760 | $115,021 | 18,543 | $203,958 |
| Distributions reinvested | 17,051 | 181,085 | 27,477 | 259,384 |
| Repurchased | (1,396) | (14,606) | (126,922) | (1,401,850) |
| Net increase (decrease) | 26,415 | $281,500 | (80,902) | $(938,508) |
| Class R6 shares | | | | |
| Sold | 528,829 | $5,777,927 | 1,983,355 | $22,259,492 |
| Distributions reinvested | 317,877 | 3,366,323 | 342,744 | 3,225,224 |
| Repurchased | (389,367) | (4,236,151) | (645,883) | (6,928,590) |
| Net increase | 457,339 | $4,908,099 | 1,680,216 | $18,556,126 |
| Class 1 shares | | | | |
| Sold | 1,631,496 | $17,997,595 | 3,482,381 | $37,826,735 |
| Distributions reinvested | 6,456,008 | 68,433,681 | 7,451,295 | 70,191,203 |
| Repurchased | (5,587,223) | (61,193,789) | (8,912,202) | (98,023,219) |
| Net increase | 2,500,281 | $25,237,487 | 2,021,474 | $9,994,719 |
| Total net increase | 4,731,968 | $49,101,197 | 4,664,888 | $36,949,715 |
| Multimanager 2040 Lifetime Portfolio | Six Months Ended 2-29-20 | Year Ended 8-31-19 |
| | Shares | Amount | Shares | Amount |
| Class A shares | | | | |
| Sold | 1,727,867 | $19,152,811 | 1,806,797 | $19,827,018 |
| Distributions reinvested | 1,332,640 | 14,365,855 | 1,382,181 | 13,213,650 |
| Repurchased | (921,201) | (10,269,655) | (1,641,885) | (18,128,445) |
| Net increase | 2,139,306 | $23,249,011 | 1,547,093 | $14,912,223 |
| Class I shares | | | | |
| Sold | 16,256 | $186,127 | 23,197 | $257,018 |
| Distributions reinvested | 4,210 | 45,642 | 740 | 7,114 |
| Repurchased | (23,799) | (263,744) | (3,979) | (46,327) |
| Net increase (decrease) | (3,333) | $(31,975) | 19,958 | $217,805 |
| Class R1 shares | | | | |
| Sold | 72,431 | $778,570 | 46,841 | $511,590 |
| Distributions reinvested | 20,153 | 216,844 | 21,844 | 208,613 |
| Repurchased | (37,582) | (425,522) | (36,529) | (409,571) |
| Net increase | 55,002 | $569,892 | 32,156 | $310,632 |
| Class R2 shares | | | | |
| Sold | 11,895 | $133,079 | 65,296 | $718,670 |
| Distributions reinvested | 10,114 | 109,429 | 7,850 | 75,361 |
| Repurchased | (13,616) | (150,791) | (34,714) | (381,389) |
| Net increase | 8,393 | $91,717 | 38,432 | $412,642 |
| 80 | JOHN HANCOCK MULTIMANAGER LIFETIME PORTFOLIOS | SEMIANNUAL REPORT | |
| Multimanager 2040 Lifetime Portfolio (continued) | Six Months Ended 2-29-20 | Year Ended 8-31-19 |
| | Shares | Amount | Shares | Amount |
| Class R3 shares | | | | |
| Sold | 15,069 | $167,835 | 66,230 | $737,741 |
| Distributions reinvested | 12,798 | 137,448 | 31,011 | 295,533 |
| Repurchased | (2,743) | (30,098) | (197,154) | (2,039,039) |
| Net increase (decrease) | 25,124 | $275,185 | (99,913) | $(1,005,765) |
| Class R4 shares | | | | |
| Sold | 2,938 | $33,304 | 4,226 | $47,923 |
| Distributions reinvested | 2,461 | 26,526 | 2,478 | 23,691 |
| Repurchased | (1,329) | (14,690) | (6,273) | (74,378) |
| Net increase (decrease) | 4,070 | $45,140 | 431 | $(2,764) |
| Class R5 shares | | | | |
| Sold | 3,992 | $43,805 | 8,283 | $93,498 |
| Distributions reinvested | 2,179 | 23,647 | 4,249 | 40,835 |
| Repurchased | (46) | (504) | (60,683) | (724,102) |
| Net increase (decrease) | 6,125 | $66,948 | (48,151) | $(589,769) |
| Class R6 shares | | | | |
| Sold | 685,343 | $7,658,510 | 2,082,066 | $23,931,378 |
| Distributions reinvested | 306,736 | 3,318,881 | 369,047 | 3,539,158 |
| Repurchased | (349,126) | (3,877,697) | (973,255) | (10,736,789) |
| Net increase | 642,953 | $7,099,694 | 1,477,858 | $16,733,747 |
| Class 1 shares | | | | |
| Sold | 1,716,818 | $19,385,380 | 3,887,757 | $43,218,075 |
| Distributions reinvested | 6,584,586 | 71,311,067 | 7,838,164 | 75,246,373 |
| Repurchased | (5,839,866) | (65,360,363) | (9,179,619) | (102,116,562) |
| Net increase | 2,461,538 | $25,336,084 | 2,546,302 | $16,347,886 |
| Total net increase | 5,339,178 | $56,701,696 | 5,514,166 | $47,336,637 |
| Multimanager 2035 Lifetime Portfolio | Six Months Ended 2-29-20 | Year Ended 8-31-19 |
| | Shares | Amount | Shares | Amount |
| Class A shares | | | | |
| Sold | 1,942,145 | $21,556,081 | 1,769,215 | $19,180,810 |
| Distributions reinvested | 1,540,333 | 16,466,157 | 1,562,748 | 14,955,498 |
| Repurchased | (1,055,098) | (11,566,964) | (2,162,634) | (23,723,907) |
| Net increase | 2,427,380 | $26,455,274 | 1,169,329 | $10,412,401 |
| Class I shares | | | | |
| Sold | 2,369 | $25,736 | 16,992 | $194,439 |
| Distributions reinvested | 34 | 366 | 1,250 | 12,021 |
| Repurchased | (1,101) | (11,075) | (45,856) | (520,388) |
| Net increase (decrease) | 1,302 | $15,027 | (27,614) | $(313,928) |
| Class R1 shares | | | | |
| Sold | 87,024 | $930,233 | 73,263 | $780,962 |
| Distributions reinvested | 35,459 | 377,993 | 48,305 | 461,312 |
| Repurchased | (47,966) | (536,120) | (261,666) | (2,836,360) |
| Net increase (decrease) | 74,517 | $772,106 | (140,098) | $(1,594,086) |
| Class R2 shares | | | | |
| Sold | 58,900 | $671,187 | 47,561 | $515,376 |
| Distributions reinvested | 25,896 | 278,387 | 18,699 | 179,888 |
| Repurchased | (8,015) | (87,724) | (47,530) | (515,094) |
| | SEMIANNUAL REPORT | JOHN HANCOCK MULTIMANAGER LIFETIME PORTFOLIOS | 81 |
| Multimanager 2035 Lifetime Portfolio (continued) | Six Months Ended 2-29-20 | Year Ended 8-31-19 |
| | Shares | Amount | Shares | Amount |
| Net increase | 76,781 | $861,850 | 18,730 | $180,170 |
| Class R3 shares | | | | |
| Sold | 44,687 | $499,391 | 119,529 | $1,312,693 |
| Distributions reinvested | 21,647 | 231,188 | 20,973 | 200,711 |
| Repurchased | (23,586) | (258,902) | (146,717) | (1,615,057) |
| Net increase (decrease) | 42,748 | $471,677 | (6,215) | $(101,653) |
| Class R4 shares | | | | |
| Sold | 1,034 | $11,531 | 7,956 | $87,800 |
| Distributions reinvested | 963 | 10,334 | 3,675 | 35,318 |
| Repurchased | (36) | (399) | (54,147) | (613,141) |
| Net increase (decrease) | 1,961 | $21,466 | (42,516) | $(490,023) |
| Class R5 shares | | | | |
| Sold | 12,963 | $142,201 | 24,741 | $281,583 |
| Distributions reinvested | 3,270 | 35,148 | 3,765 | 36,222 |
| Repurchased | (299) | (3,241) | (82,990) | (984,207) |
| Net increase (decrease) | 15,934 | $174,108 | (54,484) | $(666,402) |
| Class R6 shares | | | | |
| Sold | 1,050,899 | $11,567,332 | 1,972,339 | $22,237,720 |
| Distributions reinvested | 333,656 | 3,583,461 | 372,700 | 3,581,647 |
| Repurchased | (250,879) | (2,782,691) | (831,002) | (9,055,914) |
| Net increase | 1,133,676 | $12,368,102 | 1,514,037 | $16,763,453 |
| Class 1 shares | | | | |
| Sold | 1,575,745 | $17,682,361 | 3,983,056 | $44,006,290 |
| Distributions reinvested | 8,219,091 | 88,355,228 | 9,520,561 | 91,587,792 |
| Repurchased | (6,558,504) | (73,252,429) | (11,832,267) | (130,909,866) |
| Net increase | 3,236,332 | $32,785,160 | 1,671,350 | $4,684,216 |
| Total net increase | 7,010,631 | $73,924,770 | 4,102,519 | $28,874,148 |
| Multimanager 2030 Lifetime Portfolio | Six Months Ended 2-29-20 | Year Ended 8-31-19 |
| | Shares | Amount | Shares | Amount |
| Class A shares | | | | |
| Sold | 2,211,593 | $23,761,570 | 2,615,001 | $28,004,741 |
| Distributions reinvested | 1,776,727 | 18,531,262 | 1,890,425 | 17,751,093 |
| Repurchased | (1,430,817) | (15,306,022) | (3,022,482) | (32,440,071) |
| Net increase | 2,557,503 | $26,986,810 | 1,482,944 | $13,315,763 |
| Class I shares | | | | |
| Sold | 27,385 | $292,565 | 15,873 | $173,066 |
| Distributions reinvested | 7,880 | 81,872 | 7,641 | 71,447 |
| Repurchased | (19,561) | (210,525) | (3,236) | (33,809) |
| Net increase | 15,704 | $163,912 | 20,278 | $210,704 |
| Class R1 shares | | | | |
| Sold | 87,684 | $934,181 | 63,198 | $664,639 |
| Distributions reinvested | 33,738 | 349,863 | 35,527 | 332,180 |
| Repurchased | (82,976) | (880,044) | (122,153) | (1,319,219) |
| Net increase (decrease) | 38,446 | $404,000 | (23,428) | $(322,400) |
| 82 | JOHN HANCOCK MULTIMANAGER LIFETIME PORTFOLIOS | SEMIANNUAL REPORT | |
| Multimanager 2030 Lifetime Portfolio (continued) | Six Months Ended 2-29-20 | Year Ended 8-31-19 |
| | Shares | Amount | Shares | Amount |
| Class R2 shares | | | | |
| Sold | 34,791 | $380,611 | 171,264 | $1,788,362 |
| Distributions reinvested | 26,991 | 279,629 | 13,601 | 126,894 |
| Repurchased | (23,720) | (256,665) | (124,200) | (1,298,886) |
| Net increase | 38,062 | $403,575 | 60,665 | $616,370 |
| Class R3 shares | | | | |
| Sold | 59,714 | $641,618 | 110,438 | $1,169,400 |
| Distributions reinvested | 16,999 | 176,447 | 20,726 | 193,993 |
| Repurchased | (48,126) | (505,607) | (146,130) | (1,484,230) |
| Net increase (decrease) | 28,587 | $312,458 | (14,966) | $(120,837) |
| Class R4 shares | | | | |
| Sold | 6,045 | $65,937 | 11,161 | $121,791 |
| Distributions reinvested | 4,979 | 51,636 | 5,709 | 53,322 |
| Repurchased | (553) | (5,935) | (17,315) | (179,011) |
| Net increase (decrease) | 10,471 | $111,638 | (445) | $(3,898) |
| Class R5 shares | | | | |
| Sold | 17,494 | $187,205 | 62,776 | $712,391 |
| Distributions reinvested | 10,439 | 108,251 | 12,459 | 116,364 |
| Repurchased | (35,138) | (363,417) | (146,548) | (1,670,158) |
| Net decrease | (7,205) | $(67,961) | (71,313) | $(841,403) |
| Class R6 shares | | | | |
| Sold | 1,403,427 | $15,028,699 | 2,901,649 | $31,424,175 |
| Distributions reinvested | 401,860 | 4,167,293 | 455,313 | 4,252,626 |
| Repurchased | (433,340) | (4,652,471) | (1,504,028) | (15,922,070) |
| Net increase | 1,371,947 | $14,543,521 | 1,852,934 | $19,754,731 |
| Class 1 shares | | | | |
| Sold | 2,324,311 | $24,883,674 | 4,598,729 | $48,779,073 |
| Distributions reinvested | 9,245,992 | 95,973,396 | 11,092,936 | 103,718,952 |
| Repurchased | (8,932,433) | (96,190,031) | (15,757,140) | (168,707,951) |
| Net increase (decrease) | 2,637,870 | $24,667,039 | (65,475) | $(16,209,926) |
| Total net increase | 6,691,385 | $67,524,992 | 3,241,194 | $16,399,104 |
| Multimanager 2025 Lifetime Portfolio | Six Months Ended 2-29-20 | Year Ended 8-31-19 |
| | Shares | Amount | Shares | Amount |
| Class A shares | | | | |
| Sold | 2,358,997 | $24,910,411 | 3,020,587 | $31,383,368 |
| Distributions reinvested | 1,654,392 | 16,858,255 | 1,751,415 | 16,235,616 |
| Repurchased | (1,923,706) | (20,189,127) | (2,875,295) | (30,020,545) |
| Net increase | 2,089,683 | $21,579,539 | 1,896,707 | $17,598,439 |
| Class I shares | | | | |
| Sold | 51,185 | $519,546 | 159,718 | $1,656,930 |
| Distributions reinvested | 11,785 | 119,504 | 1,095 | 10,098 |
| Repurchased | (38,130) | (408,854) | (23,570) | (246,495) |
| Net increase | 24,840 | $230,196 | 137,243 | $1,420,533 |
| Class R1 shares | | | | |
| Sold | 64,304 | $661,688 | 68,484 | $693,707 |
| Distributions reinvested | 22,559 | 228,525 | 26,093 | 240,576 |
| Repurchased | (91,047) | (961,467) | (96,580) | (1,013,284) |
| | SEMIANNUAL REPORT | JOHN HANCOCK MULTIMANAGER LIFETIME PORTFOLIOS | 83 |
| Multimanager 2025 Lifetime Portfolio (continued) | Six Months Ended 2-29-20 | Year Ended 8-31-19 |
| | Shares | Amount | Shares | Amount |
| Net decrease | (4,184) | $(71,254) | (2,003) | $(79,001) |
| Class R2 shares | | | | |
| Sold | 141,637 | $1,466,062 | 224,473 | $2,271,098 |
| Distributions reinvested | 40,115 | 405,967 | 25,850 | 238,077 |
| Repurchased | (10,729) | (110,463) | (77,315) | (781,153) |
| Net increase | 171,023 | $1,761,566 | 173,008 | $1,728,022 |
| Class R3 shares | | | | |
| Sold | 38,426 | $400,228 | 73,907 | $792,768 |
| Distributions reinvested | 23,895 | 242,056 | 27,358 | 252,246 |
| Repurchased | (29,651) | (303,325) | (89,128) | (934,363) |
| Net increase | 32,670 | $338,959 | 12,137 | $110,651 |
| Class R4 shares | | | | |
| Sold | 3,169 | $33,420 | 7,222 | $75,481 |
| Distributions reinvested | 6,559 | 66,576 | 7,944 | 73,321 |
| Repurchased | (5,626) | (59,874) | (10,837) | (109,819) |
| Net increase | 4,102 | $40,122 | 4,329 | $38,983 |
| Class R5 shares | | | | |
| Sold | 15,638 | $159,737 | 22,093 | $225,556 |
| Distributions reinvested | 13,242 | 134,005 | 14,495 | 133,499 |
| Repurchased | (20,359) | (208,437) | (50,584) | (544,354) |
| Net increase (decrease) | 8,521 | $85,305 | (13,996) | $(185,299) |
| Class R6 shares | | | | |
| Sold | 1,203,801 | $12,474,419 | 2,848,133 | $30,290,558 |
| Distributions reinvested | 336,424 | 3,401,244 | 458,890 | 4,221,787 |
| Repurchased | (590,630) | (6,183,573) | (1,574,933) | (16,238,672) |
| Net increase | 949,595 | $9,692,090 | 1,732,090 | $18,273,673 |
| Class 1 shares | | | | |
| Sold | 1,767,291 | $18,562,476 | 4,431,492 | $46,056,467 |
| Distributions reinvested | 8,964,882 | 90,814,254 | 11,500,393 | 105,918,621 |
| Repurchased | (10,548,468) | (110,159,765) | (20,792,748) | (217,022,996) |
| Net increase (decrease) | 183,705 | $(783,035) | (4,860,863) | $(65,047,908) |
| Total net increase (decrease) | 3,459,955 | $32,873,488 | (921,348) | $(26,141,907) |
| Multimanager 2020 Lifetime Portfolio | Six Months Ended 2-29-20 | Year Ended 8-31-19 |
| | Shares | Amount | Shares | Amount |
| Class A shares | | | | |
| Sold | 2,599,131 | $25,717,470 | 3,239,366 | $31,712,655 |
| Distributions reinvested | 1,645,149 | 15,744,080 | 1,698,458 | 14,997,382 |
| Repurchased | (2,228,729) | (21,935,126) | (3,747,115) | (36,990,388) |
| Net increase | 2,015,551 | $19,526,424 | 1,190,709 | $9,719,649 |
| Class I shares | | | | |
| Sold | 4,846 | $48,597 | 18,706 | $183,390 |
| Distributions reinvested | 1,794 | 17,153 | 2,197 | 19,402 |
| Repurchased | (20,727) | (202,892) | (63,793) | (644,543) |
| Net decrease | (14,087) | $(137,142) | (42,890) | $(441,751) |
| 84 | JOHN HANCOCK MULTIMANAGER LIFETIME PORTFOLIOS | SEMIANNUAL REPORT | |
| Multimanager 2020 Lifetime Portfolio (continued) | Six Months Ended 2-29-20 | Year Ended 8-31-19 |
| | Shares | Amount | Shares | Amount |
| Class R1 shares | | | | |
| Sold | 41,076 | $397,527 | 32,723 | $318,972 |
| Distributions reinvested | 42,251 | 402,652 | 43,687 | 384,887 |
| Repurchased | (94,567) | (923,016) | (17,347) | (171,952) |
| Net increase (decrease) | (11,240) | $(122,837) | 59,063 | $531,907 |
| Class R2 shares | | | | |
| Sold | 6,851 | $67,660 | 27,199 | $262,639 |
| Distributions reinvested | 9,015 | 85,819 | 11,698 | 102,945 |
| Repurchased | (19,972) | (200,598) | (63,083) | (615,969) |
| Net decrease | (4,106) | $(47,119) | (24,186) | $(250,385) |
| Class R3 shares | | | | |
| Sold | 10,979 | $108,977 | 73,519 | $727,321 |
| Distributions reinvested | 16,154 | 154,111 | 19,573 | 172,438 |
| Repurchased | (48,477) | (481,343) | (40,894) | (392,550) |
| Net increase (decrease) | (21,344) | $(218,255) | 52,198 | $507,209 |
| Class R4 shares | | | | |
| Sold | 7,414 | $74,469 | 4,729 | $46,653 |
| Distributions reinvested | 2,045 | 19,449 | 2,202 | 19,353 |
| Repurchased | (10,046) | (100,102) | (2,559) | (26,430) |
| Net increase (decrease) | (587) | $(6,184) | 4,372 | $39,576 |
| Class R5 shares | | | | |
| Sold | 15,113 | $145,339 | 51,409 | $504,361 |
| Distributions reinvested | 37,714 | 359,787 | 44,704 | 393,841 |
| Repurchased | (82,003) | (787,797) | (219,148) | (2,220,061) |
| Net decrease | (29,176) | $(282,671) | (123,035) | $(1,321,859) |
| Class R6 shares | | | | |
| Sold | 772,929 | $7,559,396 | 1,992,456 | $19,867,978 |
| Distributions reinvested | 282,261 | 2,687,124 | 319,043 | 2,804,387 |
| Repurchased | (733,259) | (7,170,785) | (1,032,715) | (10,034,107) |
| Net increase | 321,931 | $3,075,735 | 1,278,784 | $12,638,258 |
| Class 1 shares | | | | |
| Sold | 743,664 | $7,474,424 | 2,198,505 | $21,530,403 |
| Distributions reinvested | 5,469,313 | 52,177,245 | 7,219,509 | 63,603,874 |
| Repurchased | (8,496,311) | (83,778,893) | (18,529,482) | (182,302,125) |
| Net decrease | (2,283,334) | $(24,127,224) | (9,111,468) | $(97,167,848) |
| Total net decrease | (26,392) | $(2,339,273) | (6,716,453) | $(75,745,244) |
| Multimanager 2015 Lifetime Portfolio | Six Months Ended 2-29-20 | Year Ended 8-31-19 |
| | Shares | Amount | Shares | Amount |
| Class A shares | | | | |
| Sold | 1,223,946 | $11,047,870 | 1,149,368 | $10,281,930 |
| Distributions reinvested | 920,667 | 8,065,040 | 1,028,968 | 8,427,245 |
| Repurchased | (1,395,379) | (12,532,940) | (2,267,312) | (20,617,008) |
| Net increase (decrease) | 749,234 | $6,579,970 | (88,976) | $(1,907,833) |
| Class I shares | | | | |
| Sold | 15,443 | $140,376 | 10,675 | $98,001 |
| Distributions reinvested | 8,208 | 71,735 | 6,876 | 56,243 |
| Repurchased | (6,429) | (58,529) | (6,587) | (58,137) |
| | SEMIANNUAL REPORT | JOHN HANCOCK MULTIMANAGER LIFETIME PORTFOLIOS | 85 |
| Multimanager 2015 Lifetime Portfolio (continued) | Six Months Ended 2-29-20 | Year Ended 8-31-19 |
| | Shares | Amount | Shares | Amount |
| Net increase | 17,222 | $153,582 | 10,964 | $96,107 |
| Class R1 shares | | | | |
| Sold | 11,588 | $102,858 | 15,986 | $143,068 |
| Distributions reinvested | 13,369 | 116,715 | 15,288 | 124,902 |
| Repurchased | (5,171) | (48,453) | (22,516) | (202,834) |
| Net increase | 19,786 | $171,120 | 8,758 | $65,136 |
| Class R2 shares | | | | |
| Sold | 763 | $6,782 | 1,588 | $14,126 |
| Distributions reinvested | 336 | 2,926 | 398 | 3,248 |
| Repurchased | (332) | (2,976) | (3,166) | (27,972) |
| Net increase (decrease) | 767 | $6,732 | (1,180) | $(10,598) |
| Class R3 shares | | | | |
| Sold | 32,620 | $295,863 | 42,099 | $364,805 |
| Distributions reinvested | 23,450 | 204,721 | 28,384 | 231,894 |
| Repurchased | (162,210) | (1,438,898) | (101,661) | (876,915) |
| Net decrease | (106,140) | $(938,314) | (31,178) | $(280,216) |
| Class R4 shares | | | | |
| Sold | — | — | 463 | $4,112 |
| Distributions reinvested | 115 | $997 | 775 | 6,316 |
| Repurchased | (9) | (77) | (6,765) | (60,976) |
| Net increase (decrease) | 106 | $920 | (5,527) | $(50,548) |
| Class R5 shares | | | | |
| Sold | 1,714 | $15,750 | 5,834 | $53,868 |
| Distributions reinvested | 3,559 | 31,071 | 5,833 | 47,658 |
| Repurchased | (6,650) | (58,540) | (99,987) | (946,478) |
| Net decrease | (1,377) | $(11,719) | (88,320) | $(844,952) |
| Class R6 shares | | | | |
| Sold | 319,675 | $2,918,285 | 918,078 | $8,516,733 |
| Distributions reinvested | 122,629 | 1,070,547 | 148,171 | 1,210,562 |
| Repurchased | (423,612) | (3,858,326) | (502,253) | (4,530,693) |
| Net increase | 18,692 | $130,506 | 563,996 | $5,196,602 |
| Class 1 shares | | | | |
| Sold | 690,539 | $6,341,645 | 1,124,719 | $10,097,774 |
| Distributions reinvested | 1,809,739 | 15,799,022 | 2,672,094 | 21,831,006 |
| Repurchased | (4,245,684) | (38,902,403) | (8,670,582) | (78,315,429) |
| Net decrease | (1,745,406) | $(16,761,736) | (4,873,769) | $(46,386,649) |
| Total net decrease | (1,047,116) | $(10,668,939) | (4,505,232) | $(44,122,951) |
| Multimanager 2010 Lifetime Portfolio | Six Months Ended 2-29-20 | Year Ended 8-31-19 |
| | Shares | Amount | Shares | Amount |
| Class A shares | | | | |
| Sold | 153,575 | $1,370,299 | 388,312 | $3,389,443 |
| Distributions reinvested | 384,261 | 3,300,798 | 441,213 | 3,525,290 |
| Repurchased | (435,888) | (3,826,334) | (707,024) | (6,174,815) |
| Net increase | 101,948 | $844,763 | 122,501 | $739,918 |
| 86 | JOHN HANCOCK MULTIMANAGER LIFETIME PORTFOLIOS | SEMIANNUAL REPORT | |
| Multimanager 2010 Lifetime Portfolio (continued) | Six Months Ended 2-29-20 | Year Ended 8-31-19 |
| | Shares | Amount | Shares | Amount |
| Class I shares | | | | |
| Sold | 31,215 | $276,932 | 8,790 | $76,207 |
| Distributions reinvested | 1,499 | 12,858 | 1,597 | 12,726 |
| Repurchased | (19,440) | (171,440) | (12,440) | (107,429) |
| Net increase (decrease) | 13,274 | $118,350 | (2,053) | $(18,496) |
| Class R1 shares | | | | |
| Sold | 1,677 | $14,602 | 3,680 | $30,724 |
| Distributions reinvested | 2,463 | 21,082 | 2,771 | 22,055 |
| Repurchased | (2,082) | (18,184) | (29,832) | (254,160) |
| Net increase (decrease) | 2,058 | $17,500 | (23,381) | $(201,381) |
| Class R2 shares | | | | |
| Sold | 2,663 | $23,666 | 7,350 | $63,687 |
| Distributions reinvested | 3,841 | 32,958 | 4,562 | 36,407 |
| Repurchased | (6,908) | (61,288) | (5,370) | (45,651) |
| Net increase (decrease) | (404) | $(4,664) | 6,542 | $54,443 |
| Class R3 shares | | | | |
| Sold | 547 | $4,820 | 1,776 | $15,512 |
| Distributions reinvested | 1,041 | 8,912 | 1,313 | 10,462 |
| Repurchased | (1,030) | (8,849) | (5,886) | (50,542) |
| Net increase (decrease) | 558 | $4,883 | (2,797) | $(24,568) |
| Class R4 shares | | | | |
| Sold | 842 | $7,561 | 1,651 | $14,483 |
| Distributions reinvested | 405 | 3,470 | 789 | 6,296 |
| Repurchased | (5,658) | (50,387) | (246) | (2,154) |
| Net increase (decrease) | (4,411) | $(39,356) | 2,194 | $18,625 |
| Class R5 shares | | | | |
| Sold | — | — | 2 | $20 |
| Distributions reinvested | 308 | $2,643 | 445 | 3,539 |
| Repurchased | (1,368) | (11,802) | (1,269) | (10,394) |
| Net decrease | (1,060) | $(9,159) | (822) | $(6,835) |
| Class R6 shares | | | | |
| Sold | 72,388 | $642,491 | 898,042 | $7,891,490 |
| Distributions reinvested | 67,655 | 580,481 | 108,893 | 868,970 |
| Repurchased | (156,149) | (1,389,816) | (470,705) | (3,976,595) |
| Net increase (decrease) | (16,106) | $(166,844) | 536,230 | $4,783,865 |
| Class 1 shares | | | | |
| Sold | 1,115,897 | $9,888,780 | 1,927,334 | $16,950,798 |
| Distributions reinvested | 1,119,253 | 9,603,188 | 1,490,950 | 11,897,784 |
| Repurchased | (2,584,389) | (23,028,439) | (5,718,708) | (50,366,111) |
| Net decrease | (349,239) | $(3,536,471) | (2,300,424) | $(21,517,529) |
| Total net decrease | (253,382) | $(2,770,998) | (1,662,010) | $(16,171,958) |
Affiliates of the Trust owned shares of the following classes of the portfolios on February 29, 2020. Such concentration of shareholders’ capital could have a material effect on the portfolios if such shareholders redeem from the portfolios.
| Portfolio | Class | % by Class |
| Multimanager 2060 Lifetime Portfolio | I | 99% |
| Multimanager 2060 Lifetime Portfolio | R1 | 74% |
| Multimanager 2060 Lifetime Portfolio | R2 | 42% |
| Multimanager 2060 Lifetime Portfolio | R3 | 22% |
| | SEMIANNUAL REPORT | JOHN HANCOCK MULTIMANAGER LIFETIME PORTFOLIOS | 87 |
| Portfolio | Class | % by Class |
| Multimanager 2060 Lifetime Portfolio | R4 | 74% |
| Multimanager 2060 Lifetime Portfolio | 1 | 100% |
| Multimanager 2055 Lifetime Portfolio | I | 73% |
| Multimanager 2055 Lifetime Portfolio | R1 | 33% |
| Multimanager 2055 Lifetime Portfolio | R4 | 100% |
| Multimanager 2055 Lifetime Portfolio | 1 | 100% |
| Multimanager 2050 Lifetime Portfolio | I | 70% |
| Multimanager 2050 Lifetime Portfolio | 1 | 100% |
| Multimanager 2045 Lifetime Portfolio | I | 18% |
| Multimanager 2045 Lifetime Portfolio | R6 | 2% |
| Multimanager 2045 Lifetime Portfolio | 1 | 100% |
| Multimanager 2040 Lifetime Portfolio | 1 | 100% |
| Multimanager 2035 Lifetime Portfolio | 1 | 100% |
| Multimanager 2030 Lifetime Portfolio | 1 | 100% |
| Multimanager 2025 Lifetime Portfolio | 1 | 100% |
| Multimanager 2020 Lifetime Portfolio | R6 | 11% |
| Multimanager 2020 Lifetime Portfolio | 1 | 100% |
| Multimanager 2015 Lifetime Portfolio | 1 | 100% |
| Multimanager 2010 Lifetime Portfolio | 1 | 100% |
Note 6—Purchase and sale of securities
Purchases and sales of securities, other than short-term investments, amounted to the following for the six months ended February 29, 2020:
| | Purchases | Sales |
| Portfolio | U.S. Government | Other issuers | U.S. Government | Other issuers |
| Multimanager 2060 Lifetime Portfolio | $2,349,979 | $41,019,950 | $197,691 | $22,823,525 |
| Multimanager 2055 Lifetime Portfolio | 5,302,223 | 68,829,658 | 494,835 | 52,460,731 |
| Multimanager 2050 Lifetime Portfolio | 9,907,459 | 109,029,251 | 972,373 | ��� 101,083,176 |
| Multimanager 2045 Lifetime Portfolio | 17,614,432 | 172,999,435 | 1,783,872 | 189,898,237 |
| Multimanager 2040 Lifetime Portfolio | 30,867,826 | 186,599,131 | 3,292,334 | 207,140,349 |
| Multimanager 2035 Lifetime Portfolio | 50,158,349 | 223,043,500 | 5,452,061 | 252,741,600 |
| Multimanager 2030 Lifetime Portfolio | 74,163,079 | 216,602,190 | 10,154,423 | 266,700,730 |
| Multimanager 2025 Lifetime Portfolio | 90,631,567 | 216,019,799 | 12,580,321 | 307,898,371 |
| Multimanager 2020 Lifetime Portfolio | 61,848,876 | 146,947,867 | 8,508,579 | 232,460,618 |
| Multimanager 2015 Lifetime Portfolio | 23,252,706 | 63,554,573 | 3,458,519 | 104,053,623 |
| Multimanager 2010 Lifetime Portfolio | 16,053,476 | 45,024,864 | 3,266,315 | 64,088,762 |
Note 7—Investment in affiliated underlying funds
The portfolios invest primarily in affiliated underlying funds that are managed by the Advisor and its affiliates. The portfolios do not invest in the affiliated underlying funds for the purpose of exercising management or control; however, the portfolios' investment may represent a significant portion of each underlying funds’ net assets. At February 29, 2020, the following portfolios held 5% or more of the net assets of the underlying funds shown below:
| Portfolio | Affiliated Class NAV | Percentage of
underlying fund
net assets |
| Multimanager 2035 Lifetime Portfolio | JHF Alternative Risk Premia Fund | 5.2% |
| Multimanager 2030 Lifetime Portfolio | JHF Alternative Risk Premia Fund | 6.8% |
| Multimanager 2025 Lifetime Portfolio | JHF Short Duration Bond Fund | 10.6% |
| Multimanager 2025 Lifetime Portfolio | JHF Alternative Risk Premia Fund | 7.0% |
| Multimanager 2025 Lifetime Portfolio | JHF Diversified Real Assets Fund | 5.6% |
| Multimanager 2020 Lifetime Portfolio | JHF Short Duration Bond Fund | 14.4% |
| Multimanager 2020 Lifetime Portfolio | JHF Alternative Risk Premia Fund | 5.1% |
| Multimanager 2015 Lifetime Portfolio | JHF Short Duration Bond Fund | 8.0% |
| Multimanager 2010 Lifetime Portfolio | JHF Short Duration Bond Fund | 7.1% |
Information regarding the portfolios' fiscal year to date purchases and sales of the affiliated underlying funds as well as income and capital gains earned by the portfolios, if any, is as follows:
| 88 | JOHN HANCOCK MULTIMANAGER LIFETIME PORTFOLIOS | SEMIANNUAL REPORT | |
| | | | | | | | Dividends and distributions |
| Affiliate | Ending
share
amount | Beginning
value | Cost of
purchases | Proceeds
from shares
sold | Realized
gain
(loss) | Change in
unrealized
appreciation
(depreciation) | Income
distributions
received | Capital gain
distributions
received | Ending
value |
| Multimanager 2060 Lifetime Portfolio |
| Absolute Return Currency | 71,070 | $385,703 | $256,511 | — | — | $16,601 | $11,640 | — | $658,815 |
| Alternative Risk Premia | 65,927 | — | 662,205 | $(3,316) | $(10) | (27,294) | 229 | — | 631,585 |
| Asia Pacific Total Return Bond | — | 94,900 | 43,273 | (138,714) | 3,516 | (2,975) | 4,291 | — | — |
| Blue Chip Growth | 150,378 | 3,483,901 | 3,257,956 | (296,292) | (4,655) | (105,488) | — | $59,716 | 6,335,422 |
| Bond | 25,347 | 644,172 | 362,087 | (590,714) | 36,699 | (32,504) | 11,566 | 4,634 | 419,740 |
| Capital Appreciation | 253,552 | 2,114,972 | 2,218,060 | (270,110) | (40,263) | (84,990) | 327 | 245,697 | 3,937,669 |
| Capital Appreciation Value | 283,994 | 3,823,998 | 1,068,500 | (1,553,420) | (35,611) | (239,171) | 69,828 | 374,708 | 3,064,296 |
| Core Bond | 30,597 | 698,217 | 391,908 | (674,475) | 10,335 | (10,790) | 11,181 | 6,599 | 415,195 |
| Disciplined Value | 227,486 | 2,158,360 | 2,569,237 | (130,230) | (10,933) | (489,418) | 36,766 | 106,490 | 4,097,016 |
| Disciplined Value International | 312,223 | 1,992,667 | 1,839,069 | (126,629) | (6,875) | (260,659) | 60,126 | — | 3,437,573 |
| Diversified Real Assets | — | 2,860,760 | 691,695 | (3,599,100) | (19,121) | 65,766 | 93,087 | 52,336 | — |
| Emerging Markets Debt | 59,912 | 394,671 | 329,543 | (162,143) | (1,250) | 10,142 | 7,991 | — | 570,963 |
| Emerging Markets Equity | 623,041 | 4,791,393 | 2,259,494 | (475,424) | (50,373) | 116,526 | 134,047 | — | 6,641,616 |
| Equity Income | 365,428 | 3,143,377 | 3,807,276 | (173,369) | (14,945) | (743,748) | 57,429 | 207,766 | 6,018,591 |
| Financial Industries | 77,131 | 947,111 | 589,816 | (100,966) | (7,962) | (115,232) | 22,216 | 85,476 | 1,312,767 |
| Floating Rate Income | — | 240,106 | 79,827 | (321,580) | 324 | 1,323 | 5,859 | — | — |
| Fundamental Global Franchise | — | 888,932 | 271,023 | (1,137,976) | (21,686) | (293) | 8,533 | 57,999 | — |
| Fundamental Large Cap Core | 65,448 | 1,738,662 | 1,612,942 | (121,334) | (8,936) | (135,444) | 16,616 | — | 3,085,890 |
| Global Equity | — | 1,582,023 | 315,456 | (2,034,590) | 166,333 | (29,222) | 35,835 | 8,887 | — |
| Global Shareholder Yield | — | 637,021 | 494,525 | (1,179,533) | 31,284 | 16,703 | 11,868 | 18,394 | — |
| Health Sciences | 262,247 | 1,026,611 | 313,346 | (146,887) | (4,558) | 30,938 | — | 45,334 | 1,219,450 |
| High Yield | 168,721 | 165,475 | 442,061 | (27,002) | (60) | (13,573) | 7,374 | — | 566,901 |
| International Dynamic Growth | 63,409 | 601,906 | 290,202 | (269,360) | 25,185 | 25,471 | 2,431 | — | 673,404 |
| International Growth | 105,702 | 1,920,839 | 1,206,868 | (115,388) | (1,293) | (61,934) | 18,382 | — | 2,949,092 |
| International Growth Stock | — | 111,742 | — | (113,414) | 15,960 | (14,288) | — | — | — |
| International Small Cap | — | 193,401 | — | (199,697) | 17,882 | (11,586) | — | — | — |
| International Small Company | 244,759 | 2,385,303 | 889,560 | (814,313) | (61,219) | (27,615) | 64,629 | 64,189 | 2,371,716 |
| Mid Cap Stock | 225,534 | 3,440,172 | 2,175,419 | (621,922) | (37,171) | (378,163) | — | 482,215 | 4,578,335 |
| Mid Value | 315,622 | 3,722,105 | 1,086,508 | (262,595) | (32,728) | (138,768) | 70,313 | 48,810 | 4,374,522 |
| | SEMIANNUAL REPORT | JOHN HANCOCK MULTIMANAGER LIFETIME PORTFOLIOS | 89 |
| | | | | | | | Dividends and distributions |
| Affiliate | Ending
share
amount | Beginning
value | Cost of
purchases | Proceeds
from shares
sold | Realized
gain
(loss) | Change in
unrealized
appreciation
(depreciation) | Income
distributions
received | Capital gain
distributions
received | Ending
value |
| Real Return Bond | — | $22,184 | — | $(21,873) | $1,417 | $(1,728) | — | — | — |
| Science & Technology | 322,525 | 1,092,803 | $341,452 | (195,004) | (74,909) | 70,927 | — | $111,202 | $1,235,269 |
| Short Duration Credit Opportunities | — | 195,539 | 88,649 | (286,535) | 4,703 | (2,356) | $3,391 | — | — |
| Small Cap Growth | 61,846 | 1,813,138 | 496,549 | (1,347,234) | 20,373 | 4,234 | — | — | 987,060 |
| Small Cap Value | 52,008 | 1,849,228 | 484,392 | (1,381,342) | 23,244 | (41,977) | 19,276 | 66,349 | 933,545 |
| Spectrum Income | — | 10,310 | 10 | (10,302) | 599 | (617) | 10 | — | — |
| Strategic Equity Allocation | 2,991,554 | 30,090,221 | 6,316,296 | (2,937,474) | (393,712) | (467,286) | 745,785 | 369,965 | 32,608,045 |
| Strategic Income Opportunities | 53,770 | 561,178 | 464,421 | (454,289) | 13,028 | (10,078) | 7,760 | — | 574,260 |
| U.S. High Yield Bond | — | 57,814 | 26,329 | (84,283) | 1,120 | (980) | 1,953 | — | — |
| Value Equity | — | 114,850 | — | (117,197) | 6,571 | (4,224) | — | — | — |
| | | | | | $(449,697) | $(3,093,770) | $1,540,739 | $2,416,766 | $93,698,737 |
| Multimanager 2055 Lifetime Portfolio |
| Absolute Return Currency | 159,487 | $1,431,912 | $101,896 | $(75,076) | $(6,773) | $26,484 | $40,957 | — | $1,478,443 |
| Alternative Risk Premia | 142,488 | — | 1,432,791 | (8,201) | (25) | (59,529) | 522 | — | 1,365,036 |
| Asia Pacific Total Return Bond | — | 229,739 | 77,822 | (308,658) | 12,488 | (11,391) | 9,954 | — | — |
| Blue Chip Growth | 331,880 | 8,499,105 | 6,244,085 | (538,237) | (3,595) | (219,247) | — | $136,840 | 13,982,111 |
| Bond | 54,655 | 1,559,445 | 650,252 | (1,312,229) | 84,615 | (76,992) | 26,202 | 10,762 | 905,091 |
| Capital Appreciation | 556,741 | 5,147,478 | 4,477,143 | (715,234) | (103,614) | (159,585) | 752 | 564,922 | 8,646,188 |
| Capital Appreciation Value | 635,250 | 9,312,788 | 1,984,338 | (3,833,173) | (54,197) | (555,413) | 158,868 | 852,506 | 6,854,343 |
| Core Bond | 65,935 | 1,690,279 | 735,739 | (1,527,019) | 33,189 | (37,454) | 26,312 | 15,444 | 894,734 |
| Disciplined Value | 498,243 | 5,276,730 | 5,035,173 | (274,191) | (18,585) | (1,045,763) | 84,612 | 245,070 | 8,973,364 |
| Disciplined Value International | 678,908 | 4,837,575 | 3,429,151 | (244,212) | (7,081) | (540,656) | 138,396 | — | 7,474,777 |
| Diversified Real Assets | — | 7,002,489 | 1,127,899 | (8,254,100) | (71,618) | 195,330 | 214,226 | 120,444 | — |
| Emerging Markets Debt | 126,113 | 1,116,872 | 327,309 | (265,821) | (3,759) | 27,251 | 19,256 | — | 1,201,852 |
| Emerging Markets Equity | 1,350,451 | 11,671,703 | 3,651,245 | (1,172,248) | (103,223) | 348,333 | 307,505 | — | 14,395,810 |
| Equity Income | 800,366 | 7,675,249 | 7,546,480 | (424,716) | (34,961) | (1,580,018) | 133,781 | 474,821 | 13,182,034 |
| Financial Industries | 168,933 | 2,510,655 | 856,194 | (255,487) | (16,766) | (219,349) | 51,085 | 196,545 | 2,875,247 |
| Floating Rate Income | — | 597,267 | 144,498 | (745,343) | 4,972 | (1,394) | 13,605 | — | — |
| Fundamental Global Franchise | — | 2,163,250 | 442,940 | (2,558,680) | (64,623) | 17,113 | 19,460 | 132,275 | — |
| 90 | JOHN HANCOCK MULTIMANAGER LIFETIME PORTFOLIOS | SEMIANNUAL REPORT | |
| | | | | | | | Dividends and distributions |
| Affiliate | Ending
share
amount | Beginning
value | Cost of
purchases | Proceeds
from shares
sold | Realized
gain
(loss) | Change in
unrealized
appreciation
(depreciation) | Income
distributions
received | Capital gain
distributions
received | Ending
value |
| Fundamental Large Cap Core | 143,346 | $4,247,228 | $3,051,693 | $(273,773) | $(11,933) | $(254,439) | $38,249 | — | $6,758,776 |
| Global Equity | — | 3,859,927 | 410,022 | (4,597,258) | 533,639 | (206,330) | 81,654 | $20,249 | — |
| Global Shareholder Yield | — | 1,981,338 | 535,564 | (2,659,279) | 167,088 | (24,711) | 30,946 | 42,411 | — |
| Health Sciences | 572,096 | 2,494,622 | 358,068 | (263,680) | (6,289) | 77,524 | — | 103,937 | 2,660,245 |
| High Yield | 355,149 | 400,591 | 871,406 | (50,284) | 166 | (28,577) | 16,501 | — | 1,193,302 |
| International Dynamic Growth | 137,914 | 1,455,663 | 524,538 | (639,556) | 64,775 | 59,231 | 5,602 | — | 1,464,651 |
| International Growth | 229,111 | 4,686,737 | 2,087,975 | (275,340) | 4,610 | (111,777) | 42,290 | — | 6,392,205 |
| International Growth Stock | — | 300,886 | — | (305,386) | 48,885 | (44,385) | — | — | — |
| International Small Cap | — | 549,162 | — | (567,041) | 61,391 | (43,512) | — | — | — |
| International Small Company | 535,440 | 5,757,996 | 1,435,245 | (1,858,040) | (65,166) | (81,620) | 146,994 | 145,994 | 5,188,415 |
| Mid Cap Stock | 499,347 | 8,366,278 | 3,798,307 | (1,072,290) | 14,880 | (970,440) | — | 1,107,876 | 10,136,735 |
| Mid Value | 689,402 | 9,095,165 | 1,386,425 | (612,273) | (64,865) | (249,337) | 161,064 | 111,807 | 9,555,115 |
| Real Return Bond | — | 59,001 | — | (58,170) | 3,750 | (4,581) | — | — | — |
| Science & Technology | 716,185 | 2,667,185 | 524,186 | (440,821) | (146,183) | 138,623 | — | 255,878 | 2,742,990 |
| Short Duration Credit Opportunities | — | 473,369 | 153,445 | (632,112) | 12,210 | (6,912) | 7,773 | — | — |
| Small Cap Growth | 137,333 | 4,401,735 | 721,530 | (2,981,056) | 60,894 | (11,273) | — | — | 2,191,830 |
| Small Cap Value | 113,909 | 4,519,512 | 711,728 | (3,181,951) | 118,748 | (123,369) | 44,161 | 152,009 | 2,044,668 |
| Spectrum Income | — | 26,764 | 25 | (26,742) | 1,537 | (1,584) | 25 | — | — |
| Strategic Equity Allocation | 6,552,159 | 73,288,942 | 6,792,340 | (7,210,608) | (904,403) | (547,735) | 1,703,792 | 845,213 | 71,418,536 |
| Strategic Income Opportunities | 113,182 | 1,358,527 | 837,779 | (994,833) | 33,254 | (25,938) | 17,569 | — | 1,208,789 |
| U.S. High Yield Bond | — | 139,958 | 45,356 | (185,583) | 5,033 | (4,764) | 4,568 | — | — |
| Value Equity | — | 290,185 | — | (296,113) | 21,212 | (15,284) | — | — | — |
| | | | | | $(400,323) | $(6,373,470) | $3,546,681 | $5,535,003 | $205,185,287 |
| Multimanager 2050 Lifetime Portfolio |
| Absolute Return Currency | 297,349 | $3,043,440 | $138,774 | $(461,665) | $(19,996) | $55,871 | $77,963 | — | $2,756,424 |
| Alternative Risk Premia | 266,646 | — | 2,665,993 | — | — | (111,521) | 963 | — | 2,554,472 |
| Asia Pacific Total Return Bond | — | 438,871 | 122,541 | (563,794) | 25,017 | (22,635) | 18,515 | — | — |
| Blue Chip Growth | 616,692 | 16,518,709 | 11,289,562 | (1,448,792) | 10,003 | (388,252) | — | $259,623 | 25,981,230 |
| Bond | 97,618 | 2,980,398 | 1,010,830 | (2,387,644) | 154,397 | (141,434) | 49,430 | 19,994 | 1,616,547 |
| Capital Appreciation | 1,037,410 | 10,003,839 | 8,165,439 | (1,572,113) | (234,759) | (251,433) | 1,428 | 1,072,331 | 16,110,973 |
| | SEMIANNUAL REPORT | JOHN HANCOCK MULTIMANAGER LIFETIME PORTFOLIOS | 91 |
| | | | | | | | Dividends and distributions |
| Affiliate | Ending
share
amount | Beginning
value | Cost of
purchases | Proceeds
from shares
sold | Realized
gain
(loss) | Change in
unrealized
appreciation
(depreciation) | Income
distributions
received | Capital gain
distributions
received | Ending
value |
| Capital Appreciation Value | 1,176,015 | $18,142,181 | $3,154,839 | $(7,473,500) | $(16,488) | $(1,117,825) | $301,622 | $1,618,546 | $12,689,207 |
| Core Bond | 115,743 | 3,178,811 | 1,103,031 | (2,701,871) | 70,662 | (79,999) | 48,744 | 27,964 | 1,570,634 |
| Disciplined Value | 906,280 | 10,256,393 | 8,528,636 | (491,185) | (24,282) | (1,947,453) | 161,077 | 466,543 | 16,322,109 |
| Disciplined Value International | 1,259,840 | 9,434,465 | 6,070,573 | (637,306) | (5,331) | (991,560) | 264,304 | — | 13,870,841 |
| Diversified Real Assets | — | 13,610,264 | 1,662,509 | (15,520,021) | (105,956) | 353,204 | 408,960 | 229,929 | — |
| Emerging Markets Debt | 230,836 | 2,320,701 | 315,461 | (482,768) | (3,943) | 50,419 | 38,716 | — | 2,199,870 |
| Emerging Markets Equity | 2,505,245 | 22,653,339 | 6,006,557 | (2,479,494) | (140,994) | 666,508 | 579,362 | — | 26,705,916 |
| Equity Income | 1,452,534 | 14,885,654 | 12,880,547 | (860,598) | (55,598) | (2,926,765) | 255,795 | 899,603 | 23,923,240 |
| Financial Industries | 309,117 | 5,662,843 | 552,555 | (588,239) | (30,758) | (335,227) | 97,365 | 374,605 | 5,261,174 |
| Floating Rate Income | — | 1,152,916 | 196,321 | (1,355,708) | 6,031 | 440 | 25,867 | — | — |
| Fundamental Global Franchise | — | 4,220,882 | 642,285 | (4,775,339) | 39,302 | (127,130) | 36,851 | 250,489 | — |
| Fundamental Large Cap Core | 262,447 | 8,269,950 | 5,168,591 | (599,357) | 7,875 | (472,681) | 73,209 | — | 12,374,378 |
| Global Equity | — | 7,516,486 | 478,859 | (8,626,149) | 1,236,834 | (606,030) | 155,514 | 38,566 | — |
| Global Shareholder Yield | — | 4,258,224 | 403,886 | (4,963,432) | 520,535 | (219,213) | 62,378 | 80,905 | — |
| Health Sciences | 1,067,309 | 4,853,549 | 607,454 | (642,433) | (23,527) | 167,944 | — | 196,895 | 4,962,987 |
| High Yield | 657,038 | 815,674 | 1,575,725 | (132,053) | 1,644 | (53,344) | 32,229 | — | 2,207,646 |
| International Dynamic Growth | 256,640 | 2,832,920 | 908,071 | (1,256,313) | 131,493 | 109,341 | 10,659 | — | 2,725,512 |
| International Growth | 426,067 | 9,127,074 | 3,490,579 | (550,260) | 39,503 | (219,627) | 80,660 | — | 11,887,269 |
| International Growth Stock | — | 597,173 | — | (606,085) | 127,552 | (118,640) | — | — | — |
| International Small Cap | — | 1,113,285 | — | (1,149,530) | 129,406 | (93,161) | — | — | — |
| International Small Company | 985,428 | 11,183,238 | 2,271,725 | (3,671,218) | 186,801 | (421,753) | 279,354 | 277,453 | 9,548,793 |
| Mid Cap Stock | 924,006 | 16,235,282 | 5,889,126 | (1,554,076) | 75,505 | (1,888,519) | — | 2,082,662 | 18,757,318 |
| Mid Value | 1,274,841 | 17,625,643 | 1,661,395 | (1,070,821) | (94,118) | (452,801) | 305,206 | 211,868 | 17,669,298 |
| Real Return Bond | — | 114,763 | — | (113,149) | 7,319 | (8,933) | — | — | — |
| Science & Technology | 1,334,242 | 5,184,580 | 911,574 | (971,772) | (299,715) | 285,478 | — | 487,175 | 5,110,145 |
| Short Duration Credit Opportunities | — | 901,047 | 245,411 | (1,156,434) | 27,871 | (17,895) | 14,661 | — | — |
| Small Cap Growth | 253,382 | 8,559,792 | 1,032,125 | (5,636,175) | 188,424 | (100,187) | — | — | 4,043,979 |
| Small Cap Value | 207,110 | 8,755,656 | 890,601 | (5,954,030) | 353,158 | (327,757) | 83,885 | 288,744 | 3,717,628 |
| Spectrum Income | — | 52,445 | 48 | (52,401) | 2,972 | (3,064) | 49 | — | — |
| Strategic Equity Allocation | 12,186,111 | 142,946,617 | 6,411,445 | (14,217,803) | (1,152,530) | (1,159,121) | 3,248,530 | 1,611,520 | 132,828,608 |
| 92 | JOHN HANCOCK MULTIMANAGER LIFETIME PORTFOLIOS | SEMIANNUAL REPORT | |
| | | | | | | | Dividends and distributions |
| Affiliate | Ending
share
amount | Beginning
value | Cost of
purchases | Proceeds
from shares
sold | Realized
gain
(loss) | Change in
unrealized
appreciation
(depreciation) | Income
distributions
received | Capital gain
distributions
received | Ending
value |
| Strategic Income Opportunities | 208,976 | $2,597,935 | $1,503,457 | $(1,883,803) | $66,771 | $(52,499) | $33,155 | — | $2,231,861 |
| U.S. High Yield Bond | — | 267,027 | 73,926 | (341,481) | 11,943 | (11,415) | 8,647 | — | — |
| Value Equity | — | 578,628 | — | (590,485) | 44,507 | (32,650) | — | — | — |
| | | | | | $1,257,530 | $(13,011,319) | $6,755,098 | $10,495,415 | $379,628,059 |
| Multimanager 2045 Lifetime Portfolio |
| Absolute Return Currency | 527,114 | $5,780,834 | $232,925 | $(1,191,738) | $33,945 | $30,378 | $138,616 | — | $4,886,344 |
| Alternative Risk Premia | 469,145 | — | 4,690,964 | — | — | (196,554) | 1,712 | — | 4,494,410 |
| Asia Pacific Total Return Bond | — | 797,618 | 189,146 | (990,483) | 44,034 | (40,315) | 33,213 | — | — |
| Blue Chip Growth | 1,089,887 | 30,301,979 | 19,020,637 | (2,785,669) | 26,552 | (646,541) | — | $461,380 | 45,916,958 |
| Bond | 163,597 | 5,397,964 | 1,408,708 | (4,119,399) | 189,364 | (167,466) | 87,368 | 35,695 | 2,709,171 |
| Capital Appreciation | 1,822,285 | 18,407,654 | 13,831,771 | (3,131,357) | 9,822 | (817,802) | 2,538 | 1,905,579 | 28,300,088 |
| Capital Appreciation Value | 2,087,094 | 33,279,239 | 4,314,588 | (13,057,953) | 680,044 | (2,696,170) | 536,688 | 2,879,944 | 22,519,748 |
| Core Bond | 196,484 | 5,852,694 | 1,625,883 | (4,793,795) | 141,096 | (159,589) | 88,555 | 50,640 | 2,666,289 |
| Disciplined Value | 1,565,395 | 18,742,175 | 13,908,190 | (1,019,604) | 37,519 | (3,475,515) | 286,499 | 829,815 | 28,192,765 |
| Disciplined Value International | 2,204,484 | 17,194,225 | 9,996,370 | (1,207,664) | (73,969) | (1,637,589) | 469,584 | — | 24,271,373 |
| Diversified Real Assets | — | 24,944,563 | 2,167,715 | (27,566,495) | (220,994) | 675,211 | 727,227 | 408,867 | — |
| Emerging Markets Debt | 401,750 | 4,352,940 | 330,781 | (935,953) | (4,536) | 85,443 | 71,016 | — | 3,828,675 |
| Emerging Markets Equity | 4,360,822 | 41,459,397 | 8,855,439 | (4,866,177) | (180,319) | 1,218,026 | 1,032,976 | — | 46,486,366 |
| Equity Income | 2,508,887 | 27,195,317 | 20,884,584 | (1,571,847) | 38,587 | (5,225,278) | 459,224 | 1,600,805 | 41,321,363 |
| Financial Industries | 548,595 | 10,505,065 | 840,751 | (1,398,307) | 136,116 | (746,532) | 173,443 | 667,307 | 9,337,093 |
| Floating Rate Income | — | 2,069,307 | 340,154 | (2,421,161) | 115,516 | (103,816) | 45,974 | — | — |
| Fundamental Global Franchise | — | 7,734,910 | 784,002 | (8,362,507) | 933,467 | (1,089,872) | 65,588 | 445,825 | — |
| Fundamental Large Cap Core | 454,565 | 15,104,367 | 8,418,327 | (1,310,903) | 56,826 | (835,901) | 129,984 | — | 21,432,716 |
| Global Equity | — | 13,768,233 | 501,057 | (15,400,049) | 2,683,976 | (1,553,217) | 276,480 | 68,564 | — |
| Global Shareholder Yield | — | 8,128,771 | 384,354 | (9,074,169) | 1,797,891 | (1,236,847) | 114,861 | 143,985 | — |
| Health Sciences | 1,893,422 | 8,859,341 | 838,584 | (1,156,417) | (34,586) | 297,491 | — | 348,718 | 8,804,413 |
| High Yield | 1,139,487 | 1,386,981 | 2,784,718 | (249,946) | (3,971) | (89,107) | 54,926 | — | 3,828,675 |
| International Dynamic Growth | 455,187 | 5,187,526 | 1,429,453 | (2,212,559) | 237,374 | 192,287 | 18,969 | — | 4,834,081 |
| International Growth | 754,301 | 16,719,153 | 5,506,649 | (869,855) | 33,413 | (344,369) | 143,511 | — | 21,044,991 |
| International Growth Stock | — | 1,098,852 | — | (1,115,257) | 316,218 | (299,813) | — | — | — |
| | SEMIANNUAL REPORT | JOHN HANCOCK MULTIMANAGER LIFETIME PORTFOLIOS | 93 |
| | | | | | | | Dividends and distributions |
| Affiliate | Ending
share
amount | Beginning
value | Cost of
purchases | Proceeds
from shares
sold | Realized
gain
(loss) | Change in
unrealized
appreciation
(depreciation) | Income
distributions
received | Capital gain
distributions
received | Ending
value |
| International Small Cap | — | $2,066,220 | — | $(2,133,480) | $1,126,914 | $(1,059,654) | — | — | — |
| International Small Company | 1,722,537 | 20,403,753 | $3,383,604 | (6,735,724) | 204,607 | (564,856) | $496,773 | $493,394 | $16,691,384 |
| Mid Cap Stock | 1,633,858 | 29,822,221 | 9,540,882 | (2,988,410) | 41,307 | (3,248,687) | — | 3,706,501 | 33,167,313 |
| Mid Value | 2,261,676 | 32,297,237 | 2,207,785 | (2,209,497) | (177,308) | (771,387) | 543,825 | 377,513 | 31,346,830 |
| Real Return Bond | — | 210,749 | — | (207,784) | 13,813 | (16,778) | — | — | — |
| Science & Technology | 2,343,454 | 9,473,338 | 1,330,889 | (1,819,234) | (461,492) | 451,929 | — | 865,211 | 8,975,430 |
| Short Duration Credit Opportunities | — | 1,638,081 | 356,344 | (2,012,258) | 59,815 | (41,982) | 25,981 | — | — |
| Small Cap Growth | 449,252 | 15,625,202 | 1,484,630 | (10,096,598) | 259,658 | (102,827) | — | — | 7,170,065 |
| Small Cap Value | 355,399 | 16,053,895 | 1,095,911 | (10,855,631) | 443,984 | (358,739) | 149,107 | 513,247 | 6,379,420 |
| Spectrum Income | — | 95,601 | 89 | (95,521) | 7,826 | (7,995) | 89 | — | — |
| Strategic Equity Allocation | 21,583,320 | 261,825,577 | 9,335,009 | (32,104,150) | 3,571,701 | (7,369,946) | 5,773,679 | 2,864,189 | 235,258,191 |
| Strategic Income Opportunities | 358,562 | 4,705,141 | 2,426,509 | (3,326,822) | 96,998 | (72,385) | 58,699 | — | 3,829,441 |
| U.S. High Yield Bond | — | 484,435 | 107,701 | (592,981) | 25,596 | (24,751) | 15,512 | — | — |
| Value Equity | — | 1,061,800 | — | (1,083,629) | 169,058 | (147,229) | — | — | — |
| | | | | | $12,375,862 | $(32,198,744) | $12,022,617 | $18,667,179 | $667,693,593 |
| Multimanager 2040 Lifetime Portfolio |
| Absolute Return Currency | 594,106 | $6,437,200 | $321,844 | $(1,324,163) | $5,893 | $66,588 | $162,971 | — | $5,507,362 |
| Alternative Risk Premia | 546,172 | — | 5,552,060 | (88,122) | (2,904) | (228,706) | 2,049 | — | 5,232,328 |
| Asia Pacific Total Return Bond | — | 1,301,551 | 318,523 | (1,626,506) | 69,120 | (62,688) | 54,837 | — | — |
| Blue Chip Growth | 1,143,817 | 33,786,276 | 17,866,631 | (3,038,584) | 10,679 | (435,987) | — | $515,853 | 48,189,015 |
| Bond | 677,462 | 9,407,161 | 3,856,991 | (2,198,745) | 15,592 | 137,769 | 177,349 | 63,071 | 11,218,768 |
| Capital Appreciation | 1,868,604 | 20,295,234 | 12,619,067 | (3,149,798) | (48) | (745,039) | 2,807 | 2,107,249 | 29,019,416 |
| Capital Appreciation Value | 1,516,795 | 36,993,075 | 5,130,214 | (24,017,158) | 1,580,337 | (3,320,247) | 601,129 | 3,225,743 | 16,366,221 |
| Core Bond | 534,005 | 7,943,669 | 3,009,407 | (3,778,387) | 72,448 | (687) | 112,526 | 59,189 | 7,246,450 |
| Disciplined Value | 1,601,537 | 20,830,247 | 12,628,518 | (1,226,427) | 45,532 | (3,434,184) | 318,925 | 923,732 | 28,843,686 |
| Disciplined Value International | 2,278,509 | 16,531,265 | 11,584,195 | (1,173,821) | (77,918) | (1,777,332) | 450,334 | — | 25,086,389 |
| Diversified Real Assets | 755,496 | 27,288,978 | 2,556,526 | (22,933,074) | (410,234) | (72,927) | 798,104 | 448,716 | 6,429,269 |
| Emerging Markets Debt | 757,881 | 6,635,693 | 1,975,530 | (1,491,882) | (30,918) | 134,182 | 109,304 | — | 7,222,605 |
| Emerging Markets Equity | 4,513,432 | 44,906,682 | 7,119,155 | (5,234,100) | (187,051) | 1,508,497 | 1,134,596 | — | 48,113,183 |
| Equity Income | 2,678,314 | 30,922,476 | 20,563,119 | (2,008,016) | 46,941 | (5,412,688) | 521,439 | 1,817,012 | 44,111,832 |
| 94 | JOHN HANCOCK MULTIMANAGER LIFETIME PORTFOLIOS | SEMIANNUAL REPORT | |
| | | | | | | | Dividends and distributions |
| Affiliate | Ending
share
amount | Beginning
value | Cost of
purchases | Proceeds
from shares
sold | Realized
gain
(loss) | Change in
unrealized
appreciation
(depreciation) | Income
distributions
received | Capital gain
distributions
received | Ending
value |
| Financial Industries | 609,151 | $11,788,795 | $1,021,257 | $(1,788,566) | $186,480 | $(840,218) | $192,627 | $741,115 | $10,367,748 |
| Floating Rate Income | — | 3,346,404 | 486,625 | (3,850,677) | 128,138 | (110,490) | 69,261 | — | — |
| Fundamental Global Franchise | 199,581 | 8,860,548 | 1,047,281 | (7,385,716) | 601,729 | (1,020,260) | 75,648 | 514,201 | 2,103,582 |
| Fundamental Large Cap Core | 500,863 | 16,850,916 | 8,909,955 | (1,364,744) | 62,610 | (843,068) | 144,994 | — | 23,615,669 |
| Global Equity | 324,032 | 15,034,540 | 546,713 | (12,791,804) | 2,012,078 | (1,198,286) | 302,906 | 75,118 | 3,603,241 |
| Global Shareholder Yield | 209,237 | 8,925,549 | 290,254 | (7,393,354) | 1,366,041 | (1,020,799) | 125,870 | 157,479 | 2,167,691 |
| Health Sciences | 2,088,969 | 9,521,917 | 1,207,419 | (1,293,173) | (24,652) | 302,195 | — | 377,690 | 9,713,706 |
| High Yield | 1,627,944 | 2,300,453 | 3,854,841 | (553,123) | (10,624) | (121,657) | 87,483 | — | 5,469,890 |
| International Dynamic Growth | 344,618 | 5,698,880 | 1,690,888 | (4,373,004) | 514,672 | 128,412 | 20,969 | — | 3,659,848 |
| International Growth | 820,783 | 18,346,373 | 5,931,720 | (1,069,218) | 27,286 | (336,317) | 158,479 | — | 22,899,844 |
| International Growth Stock | — | 1,209,525 | — | (1,227,534) | 348,086 | (330,077) | — | — | — |
| International Small Cap | — | 2,267,560 | — | (2,341,384) | 1,226,627 | (1,152,803) | — | — | — |
| International Small Company | 1,891,177 | 21,958,567 | 3,751,841 | (6,960,542) | 187,042 | (611,401) | 535,738 | 532,094 | 18,325,507 |
| Mid Cap Stock | 1,652,234 | 31,912,090 | 7,666,212 | (2,756,390) | 61,672 | (3,343,224) | — | 3,986,022 | 33,540,360 |
| Mid Value | 2,300,148 | 35,471,473 | 1,949,325 | (4,812,751) | (296,715) | (431,277) | 598,448 | 415,431 | 31,880,055 |
| Real Return Bond | — | 273,259 | — | (269,414) | 17,858 | (21,703) | — | — | — |
| Science & Technology | 2,599,924 | 10,030,685 | 1,397,042 | (1,420,578) | (380,401) | 330,960 | — | 918,854 | 9,957,708 |
| Short Duration Credit Opportunities | — | 2,613,186 | 589,874 | (3,232,776) | 83,320 | (53,604) | 40,013 | — | — |
| Small Cap Growth | 434,300 | 16,656,882 | 1,622,546 | (11,586,180) | 349,406 | (111,229) | — | — | 6,931,425 |
| Small Cap Value | 357,880 | 17,533,839 | 1,460,530 | (12,784,013) | 548,836 | (335,243) | 163,415 | 562,496 | 6,423,949 |
| Spectrum Income | — | 276,079 | 255 | (275,849) | 21,759 | (22,244) | 255 | — | — |
| Strategic Equity Allocation | 23,089,601 | 279,952,732 | 10,356,053 | (34,727,196) | 3,933,813 | (7,838,749) | 6,193,476 | 3,072,441 | 251,676,653 |
| Strategic Income Opportunities | 672,332 | 7,584,251 | 2,411,804 | (2,848,555) | 30,434 | 2,572 | 101,148 | — | 7,180,506 |
| U.S. High Yield Bond | — | 789,002 | 182,215 | (972,543) | 31,780 | (30,454) | 25,456 | — | — |
| Value Equity | — | 1,164,393 | — | (1,188,324) | 183,615 | (159,684) | — | — | — |
| | | | | | $12,348,359 | $(32,812,097) | $13,282,556 | $20,513,506 | $732,103,906 |
| Multimanager 2035 Lifetime Portfolio |
| Absolute Return Currency | 856,953 | $9,843,376 | $485,787 | $(2,494,964) | $3,833 | $105,918 | $233,984 | — | $7,943,950 |
| Alternative Risk Premia | 785,975 | — | 7,969,625 | (107,057) | (3,851) | (329,080) | 2,898 | — | 7,529,637 |
| Asia Pacific Total Return Bond | — | 3,734,897 | 490,745 | (4,243,009) | 202,396 | (185,029) | 151,912 | — | — |
| | SEMIANNUAL REPORT | JOHN HANCOCK MULTIMANAGER LIFETIME PORTFOLIOS | 95 |
| | | | | | | | Dividends and distributions |
| Affiliate | Ending
share
amount | Beginning
value | Cost of
purchases | Proceeds
from shares
sold | Realized
gain
(loss) | Change in
unrealized
appreciation
(depreciation) | Income
distributions
received | Capital gain
distributions
received | Ending
value |
| Blue Chip Growth | 1,296,155 | $38,171,656 | $20,234,276 | $(3,302,034) | $31,867 | $(528,736) | — | $582,926 | $54,607,029 |
| Bond | 1,863,714 | 25,869,332 | 8,726,862 | (4,132,846) | 33,779 | 365,974 | $482,416 | 174,530 | 30,863,101 |
| Capital Appreciation | 2,086,651 | 22,710,142 | 13,833,413 | (3,330,176) | 75,656 | (883,343) | 3,139 | 2,356,746 | 32,405,692 |
| Capital Appreciation Value | 1,893,330 | 45,307,972 | 5,166,974 | (27,878,291) | 2,066,441 | (4,234,065) | 741,228 | 3,977,530 | 20,429,031 |
| Core Bond | 1,941,343 | 23,681,609 | 8,527,029 | (6,183,054) | 66,272 | 252,167 | 352,155 | 202,775 | 26,344,023 |
| Disciplined Value | 1,722,662 | 22,419,751 | 13,543,463 | (1,369,817) | 53,507 | (3,621,753) | 341,922 | 990,343 | 31,025,151 |
| Disciplined Value International | 2,508,597 | 16,574,508 | 14,359,391 | (1,169,424) | (73,259) | (2,071,565) | 453,738 | — | 27,619,651 |
| Diversified Real Assets | 2,222,346 | 31,624,214 | 2,898,500 | (13,331,785) | (224,524) | (2,054,239) | 923,800 | 519,386 | 18,912,166 |
| Emerging Markets Debt | 1,720,527 | 17,006,971 | 2,197,194 | (3,108,762) | (115,317) | 416,536 | 280,629 | — | 16,396,622 |
| Emerging Markets Equity | 4,723,608 | 49,895,532 | 5,297,449 | (6,707,815) | (180,577) | 2,049,077 | 1,239,157 | — | 50,353,666 |
| Equity Income | 3,150,169 | 36,460,987 | 23,851,119 | (2,186,808) | 59,143 | (6,301,154) | 610,916 | 2,128,495 | 51,883,287 |
| Financial Industries | 603,144 | 14,000,619 | 1,162,055 | (4,382,227) | 640,583 | (1,155,512) | 225,822 | 868,832 | 10,265,518 |
| Floating Rate Income | — | 7,502,313 | 730,998 | (8,272,587) | 101,346 | (62,070) | 167,611 | — | — |
| Fundamental Global Franchise | 394,030 | 12,633,977 | 1,195,211 | (8,959,740) | 635,860 | (1,352,233) | 107,164 | 728,427 | 4,153,075 |
| Fundamental Large Cap Core | 582,735 | 19,448,057 | 10,544,097 | (1,612,189) | 79,375 | (983,378) | 166,840 | — | 27,475,962 |
| Global Equity | 533,381 | 17,760,015 | 606,922 | (13,201,082) | 2,041,261 | (1,275,919) | 356,779 | 88,478 | 5,931,197 |
| Global Shareholder Yield | 344,399 | 10,659,449 | 411,985 | (7,791,541) | 1,433,410 | (1,145,326) | 149,539 | 186,130 | 3,567,977 |
| Health Sciences | 2,068,360 | 10,188,888 | 857,490 | (1,778,366) | (27,817) | 377,680 | — | 402,712 | 9,617,875 |
| High Yield | 3,137,151 | 6,700,148 | 4,729,563 | (676,092) | (15,924) | (196,867) | 220,682 | — | 10,540,828 |
| International Dynamic Growth | 271,433 | 6,473,579 | 1,555,751 | (5,984,200) | 764,418 | 73,067 | 23,436 | — | 2,882,615 |
| International Growth | 943,924 | 20,671,339 | 6,992,382 | (946,608) | 31,784 | (413,406) | 179,354 | — | 26,335,491 |
| International Growth Stock | — | 1,208,445 | — | (1,226,520) | 348,124 | (330,049) | — | — | — |
| International Small Cap | — | 2,408,672 | — | (2,487,089) | 1,316,910 | (1,238,493) | — | — | — |
| International Small Company | 2,198,928 | 24,144,053 | 4,105,171 | (6,345,246) | 103,859 | (700,220) | 585,657 | 581,674 | 21,307,617 |
| Mid Cap Stock | 1,725,667 | 36,205,936 | 7,113,154 | (4,818,481) | 178,960 | (3,648,532) | — | 4,522,179 | 35,031,037 |
| Mid Value | 2,401,014 | 40,096,867 | 2,141,871 | (8,451,453) | (434,118) | (75,117) | 673,580 | 467,587 | 33,278,050 |
| Real Return Bond | — | 694,750 | — | (684,994) | 45,159 | (54,915) | — | — | — |
| Science & Technology | 2,524,795 | 10,660,461 | 1,381,211 | (2,389,486) | (589,781) | 607,562 | — | 971,765 | 9,669,967 |
| Short Duration Credit Opportunities | 671,556 | 7,258,904 | 989,955 | (1,859,922) | 13,897 | (2,902) | 131,134 | — | 6,399,932 |
| Small Cap Growth | 430,832 | 18,232,961 | 1,575,951 | (13,268,125) | 435,967 | (100,682) | — | — | 6,876,072 |
| 96 | JOHN HANCOCK MULTIMANAGER LIFETIME PORTFOLIOS | SEMIANNUAL REPORT | |
| | | | | | | | Dividends and distributions |
| Affiliate | Ending
share
amount | Beginning
value | Cost of
purchases | Proceeds
from shares
sold | Realized
gain
(loss) | Change in
unrealized
appreciation
(depreciation) | Income
distributions
received | Capital gain
distributions
received | Ending
value |
| Small Cap Value | 352,451 | $18,633,547 | $1,489,004 | $(14,114,256) | $602,387 | $(284,195) | $173,197 | $596,165 | $6,326,487 |
| Spectrum Income | — | 1,785,655 | 1,654 | (1,784,169) | 141,101 | (144,241) | 1,654 | — | — |
| Strategic Equity Allocation | 26,103,294 | 317,427,724 | 14,070,755 | (42,807,200) | 4,933,542 | (9,098,917) | 7,047,992 | 3,496,346 | 284,525,904 |
| Strategic Income Opportunities | 1,745,277 | 20,694,677 | 3,361,540 | (5,497,747) | 60,451 | 20,642 | 263,830 | — | 18,639,563 |
| U.S. High Yield Bond | 309,260 | 2,242,909 | 1,458,792 | (240,112) | (4,765) | (64,247) | 69,827 | — | 3,392,577 |
| Value Equity | — | 1,223,966 | — | (1,249,151) | 197,586 | (172,401) | — | — | — |
| | | | | | $15,028,941 | $(38,439,963) | $16,361,992 | $23,843,026 | $902,530,750 |
| Multimanager 2030 Lifetime Portfolio |
| Absolute Return Currency | 1,117,016 | $14,025,625 | $646,107 | $(4,465,047) | $28,055 | $120,003 | $306,897 | — | $10,354,743 |
| Alternative Risk Premia | 1,036,945 | — | 10,483,981 | (112,133) | (4,021) | (433,893) | 3,827 | — | 9,933,934 |
| Asia Pacific Total Return Bond | — | 6,354,668 | 613,272 | (6,998,884) | 342,759 | (311,815) | 250,410 | — | — |
| Blue Chip Growth | 1,192,350 | 40,349,510 | 13,206,438 | (3,372,340) | 27,625 | 22,462 | — | $604,577 | 50,233,695 |
| Bond | 3,307,383 | 47,679,766 | 12,231,808 | (5,818,486) | 52,249 | 624,921 | 865,307 | 311,366 | 54,770,258 |
| Capital Appreciation | 1,805,645 | 23,623,154 | 8,325,785 | (3,450,463) | 81,259 | (538,064) | 3,212 | 2,411,184 | 28,041,671 |
| Capital Appreciation Value | 3,056,920 | 55,512,917 | 5,676,669 | (25,106,174) | 1,737,718 | (4,836,962) | 891,516 | 4,784,000 | 32,984,168 |
| Core Bond | 4,098,923 | 48,623,911 | 12,663,663 | (6,287,539) | 71,053 | 551,297 | 748,390 | 446,753 | 55,622,385 |
| Disciplined Value | 1,514,742 | 26,629,515 | 5,771,690 | (2,265,461) | 83,546 | (2,938,792) | 399,670 | 1,157,603 | 27,280,498 |
| Disciplined Value International | 2,519,866 | 18,943,463 | 12,397,517 | (1,624,651) | (103,808) | (1,868,798) | 511,097 | — | 27,743,723 |
| Diversified Real Assets | 4,110,714 | 34,537,951 | 7,394,940 | (2,290,693) | (103,580) | (4,556,444) | 990,211 | 556,724 | 34,982,174 |
| Emerging Markets Debt | 3,239,499 | 29,558,492 | 3,689,472 | (2,941,240) | (113,041) | 678,751 | 500,115 | — | 30,872,434 |
| Emerging Markets Equity | 4,360,845 | 47,627,320 | 3,607,764 | (6,570,890) | (139,862) | 1,962,273 | 1,176,492 | — | 46,486,605 |
| Equity Income | 2,892,995 | 41,821,258 | 14,623,836 | (3,370,435) | 85,015 | (5,512,043) | 693,381 | 2,407,080 | 47,647,631 |
| Financial Industries | 662,419 | 15,293,328 | 1,327,675 | (4,792,481) | 700,376 | (1,254,531) | 242,659 | 933,611 | 11,274,367 |
| Floating Rate Income | — | 14,083,843 | 1,103,752 | (15,256,507) | 161,284 | (92,372) | 312,505 | — | — |
| Fundamental Global Franchise | 1,022,137 | 17,920,499 | 1,666,222 | (7,259,980) | 65,771 | (1,619,185) | 149,166 | 1,013,926 | 10,773,327 |
| Fundamental Large Cap Core | 559,415 | 22,381,614 | 6,575,218 | (2,209,176) | 109,682 | (480,898) | 189,385 | — | 26,376,440 |
| Global Equity | 1,154,590 | 21,235,815 | 898,248 | (9,520,255) | 1,250,036 | (1,024,805) | 418,290 | 103,732 | 12,839,039 |
| Global Shareholder Yield | 692,911 | 11,916,146 | 465,088 | (5,125,621) | 854,270 | (931,327) | 164,763 | 204,034 | 7,178,556 |
| Health Sciences | 2,259,618 | 10,115,444 | 1,781,227 | (1,663,557) | (45,592) | 319,700 | — | 394,487 | 10,507,222 |
| High Yield | 5,924,722 | 12,330,389 | 9,097,040 | (1,115,931) | (25,264) | (379,168) | 402,033 | — | 19,907,066 |
| | SEMIANNUAL REPORT | JOHN HANCOCK MULTIMANAGER LIFETIME PORTFOLIOS | 97 |
| | | | | | | | Dividends and distributions |
| Affiliate | Ending
share
amount | Beginning
value | Cost of
purchases | Proceeds
from shares
sold | Realized
gain
(loss) | Change in
unrealized
appreciation
(depreciation) | Income
distributions
received | Capital gain
distributions
received | Ending
value |
| International Dynamic Growth | 367,720 | $6,699,151 | $1,904,857 | $(5,496,140) | $669,412 | $127,903 | $24,737 | — | $3,905,183 |
| International Growth | 914,357 | 21,658,945 | 5,256,846 | (1,176,632) | 50,766 | (279,358) | 185,448 | — | 25,510,567 |
| International Growth Stock | — | 1,531,441 | — | (1,554,288) | 441,686 | (418,839) | — | — | — |
| International Small Cap | — | 2,735,868 | — | (2,824,734) | 1,525,531 | (1,436,665) | — | — | — |
| International Small Company | 2,343,746 | 24,168,449 | 4,667,078 | (5,352,264) | 53,663 | (826,028) | 582,084 | $578,125 | 22,710,898 |
| Mid Cap Stock | 1,647,923 | 37,699,108 | 6,897,737 | (7,766,391) | 354,704 | (3,732,319) | — | 4,628,129 | 33,452,839 |
| Mid Value | 2,296,636 | 43,860,641 | 2,402,762 | (14,361,709) | (543,371) | 473,047 | 728,015 | 505,374 | 31,831,370 |
| Real Return Bond | — | 1,538,461 | — | (1,516,888) | 99,714 | (121,287) | — | — | — |
| Science & Technology | 2,793,790 | 11,418,488 | 1,366,849 | (2,067,239) | (522,740) | 504,857 | — | 1,021,264 | 10,700,215 |
| Short Duration Credit Opportunities | 1,464,689 | 14,479,302 | 1,602,630 | (2,129,954) | 5,192 | 1,313 | 261,213 | — | 13,958,483 |
| Small Cap Growth | 386,525 | 17,796,603 | 1,192,990 | (13,165,728) | 537,082 | (192,012) | — | — | 6,168,935 |
| Small Cap Value | 318,556 | 18,234,686 | 1,544,202 | (14,456,412) | 719,951 | (324,355) | 167,251 | 575,698 | 5,718,072 |
| Spectrum Income | — | 3,220,561 | 2,963 | (3,217,882) | 249,568 | (255,210) | 2,963 | — | — |
| Strategic Equity Allocation | 27,293,767 | 323,450,437 | 16,517,591 | (37,146,615) | 3,436,057 | (8,755,407) | 7,049,943 | 3,497,313 | 297,502,063 |
| Strategic Income Opportunities | 3,820,660 | 41,639,670 | 5,284,071 | (6,229,823) | 29,007 | 81,720 | 528,474 | — | 40,804,645 |
| U.S. High Yield Bond | 590,411 | 4,155,214 | 2,834,268 | (381,764) | (12,401) | (118,509) | 126,970 | — | 6,476,808 |
| Value Equity | — | 1,479,751 | — | (1,510,174) | 233,806 | (203,383) | — | — | — |
| | | | | | $12,443,157 | $(37,974,222) | $18,876,424 | $26,134,980 | $1,054,550,014 |
| Multimanager 2025 Lifetime Portfolio |
| Absolute Return Currency | 1,143,899 | $15,754,396 | $571,790 | $(5,866,532) | $(16,977) | $161,264 | $322,256 | — | $10,603,941 |
| Alternative Risk Premia | 1,072,040 | — | 10,923,424 | (199,277) | (5,128) | (448,876) | 4,008 | — | 10,270,143 |
| Asia Pacific Total Return Bond | — | 9,041,085 | 727,546 | (9,812,577) | 446,429 | (402,483) | 353,646 | — | — |
| Blue Chip Growth | 782,089 | 32,580,728 | 4,932,452 | (5,281,767) | 13,573 | 704,413 | — | $482,665 | 32,949,399 |
| Bond | 4,587,810 | 79,994,676 | 15,250,195 | (20,153,470) | 254,344 | 628,393 | 1,399,990 | 519,803 | 75,974,138 |
| Capital Appreciation | 1,113,650 | 19,330,475 | 2,724,033 | (4,802,325) | 341,714 | (298,913) | 2,590 | 1,944,177 | 17,294,984 |
| Capital Appreciation Value | 4,094,317 | 54,673,616 | 5,766,631 | (12,487,703) | 833,704 | (4,608,564) | 884,950 | 4,748,765 | 44,177,684 |
| Core Bond | 4,591,011 | 68,759,395 | 10,811,502 | (17,754,032) | 296,830 | 186,326 | 1,041,769 | 614,857 | 62,300,021 |
| Disciplined Value | 946,953 | 22,612,462 | 1,803,579 | (5,811,175) | 279,713 | (1,829,963) | 336,640 | 975,044 | 17,054,616 |
| Disciplined Value International | 2,207,660 | 15,106,686 | 12,728,479 | (1,677,730) | (96,399) | (1,754,701) | 411,803 | — | 24,306,335 |
| Diversified Real Assets | 5,578,610 | 30,534,142 | 26,400,669 | (2,840,605) | (4,933) | (6,615,300) | 870,778 | 489,576 | 47,473,973 |
| 98 | JOHN HANCOCK MULTIMANAGER LIFETIME PORTFOLIOS | SEMIANNUAL REPORT | |
| | | | | | | | Dividends and distributions |
| Affiliate | Ending
share
amount | Beginning
value | Cost of
purchases | Proceeds
from shares
sold | Realized
gain
(loss) | Change in
unrealized
appreciation
(depreciation) | Income
distributions
received | Capital gain
distributions
received | Ending
value |
| Emerging Markets Debt | 3,948,185 | $41,672,951 | $2,042,694 | $(6,983,553) | $(195,317) | $1,089,441 | $706,678 | — | $37,626,216 |
| Emerging Markets Equity | 3,010,224 | 34,217,509 | 2,096,983 | (5,629,615) | (102,983) | 1,507,098 | 837,187 | — | 32,088,992 |
| Equity Income | 1,945,784 | 34,924,911 | 4,756,995 | (4,210,231) | 105,568 | (3,530,178) | 571,723 | $1,976,452 | 32,047,065 |
| Financial Industries | 536,336 | 13,670,019 | 1,268,211 | (5,446,044) | 903,193 | (1,266,947) | 214,520 | 825,347 | 9,128,432 |
| Floating Rate Income | 1,278,146 | 23,237,280 | 1,526,743 | (14,219,463) | (278,655) | 138,201 | 531,734 | — | 10,404,106 |
| Fundamental Global Franchise | 1,642,034 | 21,075,693 | 1,817,076 | (3,247,209) | 34,889 | (2,373,406) | 174,049 | 1,183,064 | 17,307,043 |
| Fundamental Large Cap Core | 399,763 | 16,686,194 | 4,399,047 | (2,039,527) | 108,929 | (305,840) | 139,809 | — | 18,848,803 |
| Global Equity | 1,549,296 | 21,046,421 | 926,840 | (4,442,582) | 484,240 | (786,749) | 410,433 | 101,784 | 17,228,170 |
| Global Shareholder Yield | 747,546 | 9,492,599 | 428,183 | (1,866,471) | 289,095 | (598,829) | 130,462 | 161,150 | 7,744,577 |
| Health Sciences | 1,847,792 | 8,505,415 | 1,214,479 | (1,359,867) | (30,338) | 262,542 | — | 325,516 | 8,592,231 |
| High Yield | 7,293,628 | 19,737,044 | 6,713,686 | (1,519,516) | (27,515) | (397,110) | 600,261 | — | 24,506,589 |
| International Dynamic Growth | 357,779 | 5,112,807 | 1,490,171 | (3,314,350) | 370,204 | 140,781 | 18,604 | — | 3,799,613 |
| International Growth | 785,279 | 16,370,252 | 7,239,370 | (1,288,745) | 62,457 | (474,045) | 141,455 | — | 21,909,289 |
| International Growth Stock | — | 1,007,438 | — | (1,022,568) | 290,827 | (275,697) | — | — | — |
| International Small Cap | — | 1,989,643 | — | (2,054,178) | 1,129,140 | (1,064,605) | — | — | — |
| International Small Company | 2,020,179 | 18,022,473 | 4,875,589 | (2,406,502) | 19,054 | (935,081) | 426,660 | 423,758 | 19,575,533 |
| Mid Cap Stock | 1,249,762 | 30,629,094 | 6,092,611 | (8,755,165) | 600,134 | (3,196,509) | — | 3,719,499 | 25,370,165 |
| Mid Value | 1,775,976 | 34,089,445 | 1,572,412 | (10,979,942) | (330,268) | 263,387 | 556,579 | 386,366 | 24,615,034 |
| Real Return Bond | — | 2,386,930 | — | (2,353,472) | 155,561 | (189,019) | — | — | — |
| Science & Technology | 2,262,609 | 9,642,617 | 1,376,951 | (2,359,741) | (595,818) | 601,785 | — | 848,059 | 8,665,794 |
| Short Duration Bond | 1,693,275 | — | 18,049,904 | (1,103,222) | 2,276 | 68,456 | — | — | 17,017,414 |
| Short Duration Credit Opportunities | 2,409,721 | 24,942,157 | 2,139,822 | (4,138,973) | (21,893) | 43,530 | 443,858 | — | 22,964,643 |
| Small Cap Growth | 269,670 | 14,103,818 | 892,091 | (11,011,049) | 478,033 | (158,966) | — | — | 4,303,927 |
| Small Cap Value | 226,221 | 14,307,810 | 1,038,117 | (11,665,323) | 625,821 | (245,758) | 128,955 | 443,879 | 4,060,667 |
| Spectrum Income | — | 6,561,156 | 6,060 | (6,555,820) | 685,029 | (696,425) | 6,060 | — | — |
| Strategic Equity Allocation | 23,170,249 | 289,563,836 | 14,526,866 | (48,462,257) | 6,042,590 | (9,115,323) | 6,218,183 | 3,084,695 | 252,555,712 |
| Strategic Income Opportunities | 6,260,744 | 70,961,924 | 7,582,431 | (11,896,685) | 21,810 | 195,267 | 892,586 | — | 66,864,747 |
| U.S. High Yield Bond | 712,731 | 6,594,492 | 1,897,550 | (518,600) | (16,808) | (137,973) | 200,870 | — | 7,818,661 |
| Value Equity | — | 1,150,733 | — | (1,174,479) | 187,912 | (164,166) | — | — | — |
| | | | | | $13,340,037 | $(35,880,542) | $18,979,096 | $23,254,456 | $1,037,448,657 |
| | SEMIANNUAL REPORT | JOHN HANCOCK MULTIMANAGER LIFETIME PORTFOLIOS | 99 |
| | | | | | | | Dividends and distributions |
| Affiliate | Ending
share
amount | Beginning
value | Cost of
purchases | Proceeds
from shares
sold | Realized
gain
(loss) | Change in
unrealized
appreciation
(depreciation) | Income
distributions
received | Capital gain
distributions
received | Ending
value |
| Multimanager 2020 Lifetime Portfolio |
| Absolute Return Currency | 813,979 | $13,665,261 | $349,628 | $(6,579,608) | $(15,038) | $125,345 | $233,544 | — | $7,545,588 |
| Alternative Risk Premia | 771,573 | — | 7,797,916 | (79,862) | (2,572) | (323,815) | 2,890 | — | 7,391,667 |
| Asia Pacific Total Return Bond | — | 9,279,445 | 765,252 | (10,091,150) | 272,317 | (225,864) | 359,608 | — | — |
| Blue Chip Growth | 189,127 | 16,031,980 | 604,042 | (9,690,711) | 2,600,329 | (1,577,738) | — | $231,951 | 7,967,902 |
| Bond | 4,452,582 | 68,763,384 | 11,965,296 | (7,874,140) | 90,067 | 790,151 | 1,228,239 | 444,503 | 73,734,758 |
| Capital Appreciation | 156,930 | 9,796,142 | 1,129,078 | (8,938,521) | 3,861,005 | (3,410,588) | 1,281 | 961,880 | 2,437,116 |
| Capital Appreciation Value | 3,417,217 | 38,171,341 | 6,033,273 | (4,346,385) | 334,693 | (3,321,151) | 619,442 | 3,324,009 | 36,871,771 |
| Core Bond | 4,778,205 | 62,602,997 | 8,962,988 | (7,337,348) | 91,047 | 520,552 | 952,504 | 564,268 | 64,840,236 |
| Disciplined Value | 58,493 | 11,409,741 | 694,406 | (11,362,700) | 2,241,472 | (1,929,459) | 165,783 | 480,173 | 1,053,460 |
| Disciplined Value International | 989,014 | 14,495,747 | 1,344,788 | (4,735,177) | (203,363) | (12,946) | 385,241 | — | 10,889,049 |
| Diversified Real Assets | 4,533,737 | 17,755,649 | 28,111,948 | (1,781,179) | (3,040) | (5,501,278) | 492,719 | 277,020 | 38,582,100 |
| Emerging Markets Debt | 3,237,300 | 34,936,198 | 848,630 | (5,676,913) | �� (187,313) | 930,872 | 587,626 | — | 30,851,474 |
| Emerging Markets Equity | 1,221,014 | 15,012,605 | 1,203,425 | (3,915,313) | 39,836 | 675,452 | 358,832 | — | 13,016,005 |
| Equity Income | 540,972 | 18,120,690 | 2,137,894 | (10,685,568) | 1,016,594 | (1,679,809) | 292,386 | 1,003,925 | 8,909,801 |
| Financial Industries | 317,027 | 6,052,323 | 630,713 | (965,369) | 158,003 | (479,876) | 94,513 | 363,632 | 5,395,794 |
| Floating Rate Income | 1,489,455 | 19,738,308 | 1,151,704 | (8,567,735) | (169,235) | (28,881) | 469,085 | — | 12,124,161 |
| Fundamental Global Franchise | 1,271,642 | 14,019,823 | 2,150,493 | (1,016,388) | 19,859 | (1,770,675) | 113,077 | 768,617 | 13,403,112 |
| Fundamental Large Cap Core | 187,824 | 10,516,076 | 478,159 | (2,414,202) | 191,705 | 84,166 | 85,836 | — | 8,855,904 |
| Global Equity | 1,213,143 | 14,185,018 | 1,570,745 | (1,840,623) | 157,988 | (582,979) | 270,790 | 67,154 | 13,490,149 |
| Global Shareholder Yield | 641,850 | 6,986,542 | 789,990 | (779,445) | 113,967 | (461,484) | 94,851 | 115,974 | 6,649,570 |
| Health Sciences | 1,096,519 | 4,561,084 | 1,495,245 | (1,043,110) | (17,575) | 103,170 | — | 170,727 | 5,098,814 |
| High Yield | 5,993,761 | 15,913,667 | 5,851,414 | (1,272,765) | (13,871) | (339,406) | 485,086 | — | 20,139,039 |
| International Dynamic Growth | 418,559 | 2,498,878 | 2,344,794 | (380,717) | 19,381 | (37,235) | 8,711 | — | 4,445,101 |
| International Growth | 253,652 | 7,963,208 | 444,193 | (1,453,216) | 243,553 | (120,850) | 66,935 | — | 7,076,888 |
| International Growth Stock | — | 454,488 | — | (461,312) | 131,529 | (124,705) | — | — | — |
| International Small Cap | — | 937,266 | — | (967,661) | 549,296 | (518,901) | — | — | — |
| International Small Company | 1,028,383 | 8,930,072 | 2,760,100 | (1,230,302) | 24,964 | (519,805) | 206,028 | 204,627 | 9,965,029 |
| Mid Cap Stock | 583,057 | 15,590,124 | 2,739,915 | (5,260,878) | 756,731 | (1,989,836) | — | 1,847,484 | 11,836,056 |
| Mid Value | 823,417 | 17,380,132 | 681,813 | (6,738,793) | 37,995 | 51,411 | 277,130 | 192,378 | 11,412,558 |
| 100 | JOHN HANCOCK MULTIMANAGER LIFETIME PORTFOLIOS | SEMIANNUAL REPORT | |
| | | | | | | | Dividends and distributions |
| Affiliate | Ending
share
amount | Beginning
value | Cost of
purchases | Proceeds
from shares
sold | Realized
gain
(loss) | Change in
unrealized
appreciation
(depreciation) | Income
distributions
received | Capital gain
distributions
received | Ending
value |
| Real Return Bond | — | $2,009,605 | — | $(1,981,614) | $132,229 | $(160,220) | — | — | — |
| Science & Technology | 1,344,988 | 4,720,550 | $1,531,263 | (1,052,289) | (258,919) | 210,700 | — | $405,459 | $5,151,305 |
| Short Duration Bond | 2,292,213 | 7,749,623 | 16,774,576 | (1,591,795) | 2,665 | 101,668 | $92,215 | — | 23,036,737 |
| Short Duration Credit Opportunities | 1,731,982 | 19,553,815 | 1,385,172 | (4,464,168) | (39,810) | 70,780 | 341,442 | — | 16,505,789 |
| Small Cap Growth | 189,605 | 7,478,221 | 340,867 | (4,867,688) | 128,797 | (54,104) | — | — | 3,026,093 |
| Small Cap Value | 160,144 | 7,681,168 | 468,628 | (5,368,273) | 301,415 | (208,359) | 67,611 | 232,725 | 2,874,579 |
| Spectrum Income | — | 5,763,058 | 5,334 | (5,758,466) | 792,753 | (802,679) | 5,334 | — | — |
| Strategic Equity Allocation | 11,939,865 | 151,524,648 | 8,177,361 | (28,139,933) | 3,595,961 | (5,013,509) | 3,189,588 | 1,582,279 | 130,144,528 |
| Strategic Income Opportunities | 4,465,019 | 55,272,107 | 5,159,367 | (12,959,957) | 88,712 | 126,178 | 680,853 | — | 47,686,407 |
| U.S. High Yield Bond | 580,767 | 5,308,432 | 1,630,424 | (441,510) | (4,089) | (122,244) | 160,659 | — | 6,371,013 |
| Value Equity | — | 585,032 | — | (597,137) | 100,002 | (87,897) | — | — | — |
| | | | | | $17,180,040 | $(27,615,848) | $12,389,839 | $13,238,785 | $668,779,553 |
| Multimanager 2015 Lifetime Portfolio |
| Absolute Return Currency | 330,709 | $5,441,348 | $122,645 | $(2,542,583) | $42,861 | $1,401 | $95,497 | — | $3,065,672 |
| Alternative Risk Premia | 312,867 | — | 3,245,713 | (116,337) | (1,076) | (131,033) | 1,180 | — | 2,997,267 |
| Asia Pacific Total Return Bond | — | 4,782,290 | 430,129 | (5,238,662) | 190,962 | (164,719) | 177,888 | — | — |
| Blue Chip Growth | 52,239 | 4,992,154 | 323,453 | (3,443,173) | 716,864 | (388,468) | — | $69,093 | 2,200,830 |
| Bond | 1,946,197 | 33,276,371 | 4,994,607 | (6,397,176) | 67,512 | 287,712 | 571,797 | 205,015 | 32,229,026 |
| Capital Appreciation | 45,608 | 2,775,467 | 363,333 | (2,556,141) | 990,750 | (865,123) | 348 | 260,968 | 708,286 |
| Capital Appreciation Value | 1,256,722 | 14,608,354 | 2,506,292 | (2,473,505) | 129,212 | (1,210,321) | 228,457 | 1,225,932 | 13,560,032 |
| Core Bond | 2,083,754 | 30,376,659 | 3,649,701 | (5,962,715) | 76,843 | 136,059 | 452,828 | 262,846 | 28,276,547 |
| Disciplined Value | — | 3,148,157 | 324,079 | (3,605,346) | 941,782 | (808,672) | 44,143 | 127,857 | — |
| Disciplined Value International | 315,455 | 3,625,990 | 646,271 | (651,715) | (37,774) | (109,610) | 96,438 | — | 3,473,162 |
| Diversified Real Assets | 1,699,597 | 5,966,467 | 12,053,996 | (1,486,330) | (19,212) | (2,051,349) | 160,311 | 90,132 | 14,463,572 |
| Emerging Markets Debt | 1,289,587 | 14,992,204 | 491,803 | (3,529,424) | (77,410) | 412,598 | 252,672 | — | 12,289,771 |
| Emerging Markets Equity | 250,816 | 3,763,895 | 370,554 | (1,679,519) | 100,114 | 118,657 | 86,502 | — | 2,673,701 |
| Equity Income | 174,264 | 5,431,999 | 841,331 | (3,184,207) | 256,281 | (475,282) | 84,493 | 287,010 | 2,870,122 |
| Financial Industries | — | 1,156,846 | 83,785 | (1,306,596) | 167,819 | (101,854) | 17,285 | 66,501 | — |
| Floating Rate Income | 785,771 | 8,712,495 | 426,792 | (2,628,316) | (10,534) | (104,258) | 212,598 | — | 6,396,179 |
| | SEMIANNUAL REPORT | JOHN HANCOCK MULTIMANAGER LIFETIME PORTFOLIOS | 101 |
| | | | | | | | Dividends and distributions |
| Affiliate | Ending
share
amount | Beginning
value | Cost of
purchases | Proceeds
from shares
sold | Realized
gain
(loss) | Change in
unrealized
appreciation
(depreciation) | Income
distributions
received | Capital gain
distributions
received | Ending
value |
| Fundamental Global Franchise | 475,065 | $5,453,937 | $1,073,876 | $(872,384) | $13,789 | $(662,036) | $42,448 | $288,532 | $5,007,182 |
| Fundamental Large Cap Core | 53,732 | 2,381,859 | 786,874 | (621,893) | 24,971 | (38,361) | 18,758 | — | 2,533,450 |
| Global Equity | 444,929 | 5,431,822 | 819,834 | (1,164,640) | 101,703 | (241,114) | 99,175 | 24,594 | 4,947,605 |
| Global Shareholder Yield | 284,034 | 3,138,485 | 374,750 | (421,978) | 61,240 | (209,901) | 42,629 | 51,752 | 2,942,596 |
| Health Sciences | — | 738,626 | 74,388 | (895,147) | 87,650 | (5,517) | — | 26,537 | — |
| High Yield | 2,383,304 | 6,727,834 | 2,328,189 | (911,231) | (3,226) | (133,665) | 199,158 | — | 8,007,901 |
| International Dynamic Growth | 115,284 | 727,310 | 688,353 | (194,661) | 6,330 | (3,017) | 2,555 | — | 1,224,315 |
| International Growth | 87,324 | 2,324,250 | 550,080 | (438,798) | 20,118 | (19,312) | 19,431 | — | 2,436,338 |
| International Growth Stock | — | 142,102 | — | (144,229) | 41,242 | (39,115) | — | — | — |
| International Small Cap | — | 271,126 | — | (279,953) | 69,768 | (60,941) | — | — | — |
| International Small Company | 316,177 | 2,767,411 | 1,052,553 | (606,358) | 13,924 | (163,776) | 61,148 | 60,732 | 3,063,754 |
| Mid Cap Stock | 147,124 | 4,611,016 | 977,774 | (2,287,552) | 627,696 | (942,307) | — | 525,820 | 2,986,627 |
| Mid Value | 209,196 | 5,290,543 | 498,811 | (2,980,719) | 240,413 | (149,590) | 80,943 | 56,189 | 2,899,458 |
| Real Return Bond | — | 880,541 | — | (868,153) | 58,287 | (70,675) | — | — | — |
| Science & Technology | — | 892,133 | 124,071 | (1,070,343) | 63,878 | (9,739) | — | 73,452 | — |
| Short Duration Bond | 1,276,694 | 3,661,196 | 10,124,338 | (1,011,254) | 763 | 55,730 | 43,081 | — | 12,830,773 |
| Short Duration Credit Opportunities | 695,371 | 7,993,827 | 634,191 | (2,011,830) | (21,314) | 32,012 | 136,994 | — | 6,626,886 |
| Small Cap Growth | 45,270 | 2,021,683 | 193,163 | (1,520,402) | 33,410 | (5,349) | — | — | 722,505 |
| Small Cap Value | 38,397 | 2,063,873 | 241,768 | (1,656,515) | 108,295 | (68,196) | 17,369 | 59,787 | 689,225 |
| Spectrum Income | — | 2,300,022 | 2,132 | (2,298,097) | 446,274 | (450,331) | 2,133 | — | — |
| Strategic Equity Allocation | 3,630,198 | 48,773,515 | 4,566,020 | (13,571,865) | 1,548,824 | (1,747,340) | 980,104 | 486,207 | 39,569,154 |
| Strategic Income Opportunities | 1,795,482 | 22,593,840 | 2,169,464 | (5,669,143) | 146,150 | (64,559) | 273,460 | — | 19,175,752 |
| U.S. High Yield Bond | 232,630 | 2,246,687 | 647,582 | (292,222) | 4,643 | (54,743) | 66,417 | — | 2,551,947 |
| Value Equity | — | 165,854 | — | (169,265) | 29,389 | (25,978) | — | — | — |
| | | | | | $7,259,211 | $(10,532,082) | $4,568,240 | $4,248,956 | $243,419,635 |
| Multimanager 2010 Lifetime Portfolio |
| Absolute Return Currency | 241,661 | $3,933,171 | $106,442 | $(1,833,047) | $3,354 | $30,277 | $67,603 | — | $2,240,197 |
| Alternative Risk Premia | 226,709 | — | 2,280,955 | (14,134) | (49) | (94,904) | 834 | — | 2,171,868 |
| Asia Pacific Total Return Bond | — | 3,262,195 | 290,892 | (3,570,915) | 123,918 | (106,090) | 121,003 | — | — |
| Blue Chip Growth | 12,510 | 2,400,038 | 233,367 | (2,312,140) | 845,740 | (639,947) | — | $33,885 | 527,058 |
| 102 | JOHN HANCOCK MULTIMANAGER LIFETIME PORTFOLIOS | SEMIANNUAL REPORT | |
| | | | | | | | Dividends and distributions |
| Affiliate | Ending
share
amount | Beginning
value | Cost of
purchases | Proceeds
from shares
sold | Realized
gain
(loss) | Change in
unrealized
appreciation
(depreciation) | Income
distributions
received | Capital gain
distributions
received | Ending
value |
| Bond | 1,407,583 | $24,045,679 | $3,313,961 | $(4,300,017) | $41,613 | $208,346 | $407,867 | $146,832 | $23,309,582 |
| Capital Appreciation | — | 1,285,128 | 217,157 | (1,583,636) | 698,455 | (617,104) | 164 | 123,244 | — |
| Capital Appreciation Value | 797,532 | 8,507,665 | 2,098,763 | (1,326,550) | 99,958 | (774,465) | 135,333 | 726,216 | 8,605,371 |
| Core Bond | 1,542,999 | 22,304,841 | 2,469,631 | (3,990,922) | 49,184 | 105,757 | 329,938 | 192,184 | 20,938,491 |
| Disciplined Value | — | 2,134,725 | 271,761 | (2,498,328) | 519,270 | (427,428) | 30,158 | 87,351 | — |
| Disciplined Value International | 196,003 | 1,181,693 | 1,380,096 | (230,744) | (13,286) | (159,761) | 32,786 | — | 2,157,998 |
| Diversified Real Assets | 1,112,044 | 3,432,188 | 8,120,127 | (748,062) | (4,875) | (1,335,887) | 92,734 | 52,138 | 9,463,491 |
| Emerging Markets Debt | 881,579 | 9,877,256 | 302,236 | (1,976,668) | (68,497) | 267,126 | 163,490 | — | 8,401,453 |
| Emerging Markets Equity | 58,304 | 1,703,689 | 220,872 | (1,462,951) | 147,828 | 12,079 | 39,528 | — | 621,517 |
| Equity Income | 31,001 | 3,738,795 | 563,742 | (3,849,926) | 496,033 | (438,060) | 58,467 | 199,505 | 510,584 |
| Floating Rate Income | 665,694 | 5,731,522 | 643,704 | (855,711) | (4,814) | (95,951) | 152,395 | — | 5,418,750 |
| Fundamental Global Franchise | 259,122 | 2,731,443 | 759,928 | (413,751) | 244 | (346,720) | 21,415 | 145,566 | 2,731,144 |
| Fundamental Large Cap Core | 23,945 | 1,663,460 | 188,596 | (802,339) | 68,785 | 10,495 | 13,217 | — | 1,128,997 |
| Global Equity | 308,157 | 3,438,438 | 822,755 | (716,936) | 53,243 | (170,794) | 63,755 | 15,811 | 3,426,706 |
| Global Shareholder Yield | 227,446 | 2,325,859 | 471,183 | (312,187) | 47,535 | (176,045) | 31,378 | 38,191 | 2,356,345 |
| High Yield | 1,624,456 | 4,407,985 | 1,628,250 | (483,001) | (912) | (94,151) | 130,607 | — | 5,458,171 |
| International Dynamic Growth | 35,692 | 377,365 | 179,400 | (207,810) | 16,042 | 14,049 | 1,390 | — | 379,046 |
| International Growth | 67,581 | 1,204,287 | 1,009,400 | (277,706) | 7,755 | (58,219) | 10,565 | — | 1,885,517 |
| International Growth Stock | — | 73,650 | — | (74,753) | 21,472 | (20,369) | — | — | — |
| International Small Cap | — | 130,717 | — | (134,970) | 30,941 | (26,688) | — | — | — |
| International Small Company | 178,403 | 1,287,031 | 838,099 | (290,546) | 6,144 | (112,004) | 28,683 | 28,487 | 1,728,724 |
| Mid Cap Stock | 59,014 | 2,158,464 | 545,269 | (1,372,792) | 293,322 | (426,276) | — | 248,484 | 1,197,987 |
| Mid Value | 82,501 | 2,743,592 | 363,026 | (2,051,580) | 154,932 | (66,502) | 42,580 | 29,558 | 1,143,468 |
| Real Return Bond | — | 616,380 | — | (607,773) | 41,948 | (50,555) | — | — | — |
| Short Duration Bond | 1,124,009 | 3,234,540 | 8,613,355 | (600,241) | 72 | 48,567 | 37,843 | — | 11,296,293 |
| Short Duration Credit Opportunities | 492,486 | 5,352,312 | 393,938 | (1,057,781) | (15,816) | 20,743 | 91,938 | — | 4,693,396 |
| Small Cap Growth | 15,325 | 649,735 | 83,206 | (496,203) | 18,216 | (10,370) | — | — | 244,584 |
| Small Cap Value | 13,004 | 904,068 | 140,266 | (841,213) | 52,857 | (22,557) | 7,754 | 26,690 | 233,421 |
| Spectrum Income | — | 1,495,051 | 1,381 | (1,493,807) | 288,712 | (291,337) | 1,381 | — | — |
| Strategic Equity Allocation | 2,008,524 | 26,425,595 | 2,965,538 | (7,367,402) | 792,045 | (922,865) | 539,743 | 267,753 | 21,892,911 |
| | SEMIANNUAL REPORT | JOHN HANCOCK MULTIMANAGER LIFETIME PORTFOLIOS | 103 |
| | | | | | | | Dividends and distributions |
| Affiliate | Ending
share
amount | Beginning
value | Cost of
purchases | Proceeds
from shares
sold | Realized
gain
(loss) | Change in
unrealized
appreciation
(depreciation) | Income
distributions
received | Capital gain
distributions
received | Ending
value |
| Strategic Income Opportunities | 1,270,292 | $15,207,552 | $1,417,206 | $(3,104,379) | $86,732 | $(40,395) | $184,082 | — | $13,566,716 |
| U.S. High Yield Bond | 158,506 | 1,469,995 | 459,480 | (156,745) | 4,793 | (38,709) | 43,225 | — | 1,738,814 |
| Value Equity | — | 74,170 | — | (75,683) | 15,643 | (14,130) | — | — | — |
| | | | | | $4,918,537 | $(6,860,844) | $2,881,856 | $2,361,895 | $159,468,600 |
Note 8—Subsequent events
A widespread health crisis such as a global pandemic could cause substantial market volatility, exchange trading suspensions and closures, impact the ability to complete redemptions, and affect fund performance. For example, the novel coronavirus disease (COVID-19) has resulted in significant disruptions to global business activity. The impact of a health crisis and other epidemics and pandemics that may arise in the future, could affect the global economy in ways that cannot necessarily be foreseen at the present time. A health crisis may exacerbate other pre-existing political, social and economic risks. Any such impact could adversely affect the funds' performance, resulting in losses to your investment.
| 104 | JOHN HANCOCK MULTIMANAGER LIFETIME PORTFOLIOS | SEMIANNUAL REPORT | |
| | |
Trustees
Hassell H. McClellan,Chairperson
Steven R. Pruchansky,Vice Chairperson
Andrew G. Arnott†
Charles L. Bardelis*
James R. Boyle
Peter S. Burgess*
William H. Cunningham
Grace K. Fey
Marianne Harrison†
Deborah C. Jackson
James M. Oates*
Gregory A. Russo
Officers
Andrew G. Arnott
President
Francis V. Knox, Jr.
Chief Compliance Officer
Charles A. Rizzo
Chief Financial Officer
Salvatore Schiavone
Treasurer
Christopher (Kit) Sechler
Secretary and Chief Legal Officer
| Investment advisor
John Hancock Investment Management LLC
Subadvisor
Manulife Investment Management (US) LLC
Portfolio Managers
Robert E. Sykes, CFA
Nathan W. Thooft, CFA
Principal distributor
John Hancock Investment Management Distributors LLC
Custodian
State Street Bank and Trust Company
Transfer agent
John Hancock Signature Services, Inc.
Legal counsel
K&L Gates LLP
|
* Member of the Audit Committee
† Non-Independent Trustee
The portfolios' proxy voting policies and procedures, as well as the portfolio proxy voting record for the most recent twelve-month period ended June 30, are available free of charge on the Securities and Exchange Commission (SEC) website at sec.gov or on our website.
All of the portfolios' holdings as of the end of the third month of every fiscal quarter are filed with the SEC on Form N-PORT within 60 days of the end of the fiscal quarter. The portfolios' Form N-PORT filings are available on our website and the SEC's website, sec.gov.
We make this information on your portfolio, as well asmonthly portfolio holdings, and other portfolio details available on our website at jhinvestments.com or by calling 800-225-5291.
| | | | |
| | You can also contact us: |
| | 800-225-5291
jhinvestments.com | Regular mail:
John Hancock Signature Services, Inc.
P.O. Box 55913
Boston, MA 02205-5913
| Express mail:
John Hancock Signature Services, Inc.
2000 Crown Colony Drive
Suite 55913
Quincy, MA 02169-0953
|
SEMIANNUAL REPORT | JOHN HANCOCK MULTIMANAGER LIFETIME PORTFOLIOS 105
John Hancock family of funds
| | | |
DOMESTIC EQUITY FUNDS
Blue Chip Growth
Classic Value
Disciplined Value
Disciplined Value Mid Cap
Equity Income
Financial Industries
Fundamental All Cap Core
Fundamental Large Cap Core
New Opportunities
Regional Bank
Small Cap Core
Small Cap Growth
Small Cap Value
U.S. Global Leaders Growth
U.S. Quality Growth
GLOBAL AND INTERNATIONAL EQUITY FUNDS
Disciplined Value International
Emerging Markets
Emerging Markets Equity
Fundamental Global Franchise
Global Equity
Global Shareholder Yield
Global Thematic Opportunities
International Dynamic Growth
International Growth
International Small Company
| | INCOME FUNDS
Bond
California Tax-Free Income
Emerging Markets Debt
Floating Rate Income
Government Income
High Yield
High Yield Municipal Bond
Income
Investment Grade Bond
Money Market
Short Duration Bond
Short Duration Credit Opportunities
Strategic Income Opportunities
Tax-Free Bond
ALTERNATIVE AND SPECIALTY FUNDS
Absolute Return Currency
Alternative Asset Allocation
Alternative Risk Premia
Diversified Macro
Infrastructure
Multi-Asset Absolute Return
Seaport Long/Short
|
A fund's investment objectives, risks, charges, and expenses should be considered carefully before investing. The prospectus contains this and other important information about the fund. To obtain a prospectus, contact your financial professional, call John Hancock Investment Management at 800-225-5291, or visit our website at jhinvestments.com. Please read the prospectus carefully before investing or sending money.
| | | |
ASSET ALLOCATION
Balanced
Income Allocation
Multi-Index Lifetime Portfolios
Multi-Index Preservation Portfolios
Multimanager Lifestyle Portfolios
Multimanager Lifetime Portfolios
Retirement Income 2040
EXCHANGE-TRADED FUNDS
John Hancock Multifactor Consumer Discretionary ETF
John Hancock Multifactor Consumer Staples ETF
John Hancock Multifactor Developed International ETF
John Hancock Multifactor Emerging Markets ETF
John Hancock Multifactor Energy ETF
John Hancock Multifactor Financials ETF
John Hancock Multifactor Healthcare ETF
John Hancock Multifactor Industrials ETF
John Hancock Multifactor Large Cap ETF
John Hancock Multifactor Materials ETF
John Hancock Multifactor Media and
Communications ETF
John Hancock Multifactor Mid Cap ETF
John Hancock Multifactor Small Cap ETF
John Hancock Multifactor Technology ETF
John Hancock Multifactor Utilities ETF
| | ENVIRONMENTAL, SOCIAL, AND
GOVERNANCE FUNDS
ESG All Cap Core
ESG Core Bond
ESG International Equity
ESG Large Cap Core
CLOSED-END FUNDS
Financial Opportunities
Hedged Equity & Income
Income Securities Trust
Investors Trust
Preferred Income
Preferred Income II
Preferred Income III
Premium Dividend
Tax-Advantaged Dividend Income
Tax-Advantaged Global Shareholder Yield
|
John Hancock Multifactor ETF shares are bought and sold at market price (not NAV), and are not individually redeemed from the fund. Brokerage commissions will reduce returns.
John Hancock ETFs are distributed by Foreside Fund Services, LLC, and are subadvised by Dimensional Fund Advisors LP. Foreside is not affiliated with John Hancock Investment Management Distributors LLC or Dimensional Fund Advisors LP.
Dimensional Fund Advisors LP receives compensation from John Hancock in connection with licensing rights to the John Hancock Dimensional indexes. Dimensional Fund Advisors LP does not sponsor, endorse, or sell, and makes no representation as to the advisability of investing in, John Hancock Multifactor ETFs.
John Hancock Investment Management
A trusted brand
John Hancock Investment Management is a premier asset manager representing one of America's most
trusted brands, with a heritage of financial stewardship dating back to 1862. Helping our shareholders
pursue their financial goals is at the core of everything we do. It's why we support the role of professional
financial advice and operate with the highest standards of conduct and integrity.
A better way to invest
We serve investors globally through a unique multimanager approach: We search the world to find
proven portfolio teams with specialized expertise for every strategy we offer, then we apply robust
investment oversight to ensure they continue to meet our uncompromising standards and serve the
best interests of our shareholders.
Results for investors
Our unique approach to asset management enables us to provide a diverse set of investments backed
by some of the world's best managers, along with strong risk-adjusted returns across asset classes.
John Hancock Investment Management Distributors LLC n Member FINRA, SIPC
200 Berkeley Street n Boston, MA 02116-5010 n 800-225-5291 n jhinvestments.com
This report is for the information of the shareholders of John Hancock Multimanager Lifetime Portfolios. It is not authorized for distribution to prospective investors unless preceded or accompanied by a prospectus.
ITEM 2. CODE OF ETHICS.
ITEM 3. AUDIT COMMITTEE FINANCIAL EXPERT.
Not Applicable
ITEM 4. PRINCIPAL ACCOUNTANT FEES AND SERVICES.
ITEM 5. AUDIT COMMITTEE OF LISTED REGISTRANTS
Not Applicable.
ITEM 6. SCHEDULE OF INVESTMENTS.
ITEM 7. DISCLOSURE OF PROXY VOTING POLICIES AND PROCEDURES FOR CLOSED-END MANAGEMENT INVESTMENT COMPANIES.
Not Applicable.
ITEM 8. PORTFOLIO MANAGERS OF CLOSED-END MANAGEMENT INVESTMENT COMPANIES.
Not Applicable.
ITEM 9. PURCHASE OF EQUITY SECURITIES BY CLOSED-END MANAGEMENT INVESTMENT COMPANIES AND AFFILIATED PURCHASERS.
Not Applicable.
ITEM 10. SUBMISSION OF MATTERS TO VOTE OF SECURITY HOLDERS.
Not Applicable.
ITEM 11. CONTROLS AND PROCEDURES.
| (a) | EVALUATION OF DISCLOSURE CONTROLS AND PROCEDURES. The Registrant maintains disclosure controls and procedures that are designed to ensure that information required to be disclosed in this Form N-CSR is recorded, processed, summarized and reported within the periods specified in the rules and forms of the Securities and Exchange Commission. Such disclosure controls and procedures include controls and procedures designed to ensure that such information is accumulated and communicated to the Registrant's management, including its principal executive officer and principal financial officer, as appropriate, to allow timely decisions regarding required disclosure. |
Within 90 days prior to the filing date of this Form N-CSR, the Registrant had carried out an evaluation, under the supervision and with the participation of the Registrant's management, including the Registrant's principal executive officer and the Registrant's principal financial officer, of the effectiveness of the design and operation of the Registrant's disclosure controls and procedures relating to information required to be disclosed on Form N-CSR. Based on such evaluation, the Registrant's principal executive officer and principal financial officer concluded that the Registrant's disclosure controls and procedures are operating effectively to ensure that:
(i) information required to be disclosed in this Form N-CSR is recorded, processed, summarized and reported within the periods specified in the rules and forms of the Securities and Exchange Commission, and
(ii) information is accumulated and communicated to the Registrant’s management, including its principal executive officer and principal financial officer, as appropriate, to allow timely decisions regarding required disclosure.
(b) CHANGE IN REGISTRANT’S INTERNAL CONTROL: Not Applicable.
ITEM 12. DISCLOSURE OF SECURITIES LENDING ACTIVITIES FOR CLOSED-END MANAGEMENT INVESTMENT COMPANIES.
Not applicable.
ITEM 13. EXHIBITS.
(a)(1) Separate certifications for the registrant's principal executive officer and principal financial officer, as required by Section 302 of the Sarbanes-Oxley Act of 2002 and Rule 30a-2(a) under the Investment Company Act of 1940, are attached.
(b)(1) Separate certifications for the registrant's principal executive officer and principal financial officer, as required by 18 U.S.C. Section 1350, as adopted pursuant to Section 906 of the Sarbanes-Oxley Act of 2002, and Rule 30a-2(b) under the Investment Company Act of 1940, are attached. The certifications furnished pursuant to this paragraph are not deemed to be "filed" for purposes of Section 18 of the Securities Exchange Act of 1934, or otherwise subject to the liability of that section. Such certifications are not deemed to be incorporated by reference into any filing under the Securities Act of 1933 or the Securities Exchange Act of 1934, except to the extent that the Registrant specifically incorporates them by reference.
(c)(1) Submission of Matters to a Vote of Security Holders is attached. See attached “John Hancock Funds – Nominating and Governance Committee Charter”.
SIGNATURES
Pursuant to the requirements of the Securities Exchange Act of 1934 and the Investment Company Act of 1940, the registrant has duly caused this report to be signed on its behalf by the undersigned, thereunto duly authorized.
JOHN HANCOCK FUNDS II
/s/ Andrew Arnott
_______________________________
Andrew Arnott
President
Date: April 7, 2020
Pursuant to the requirements of the Securities Exchange Act of 1934 and the Investment Company Act of 1940, this report has been signed below by the following persons on behalf of the registrant and in the capacities and on the dates indicated.
/s/ Andrew Arnott
_______________________________
Andrew Arnott
President
Date: April 7, 2020
/s/ Charles A. Rizzo
_________________________________
Charles A. Rizzo
Chief Financial Officer
Date: April 7, 2020