UNITED STATES
SECURITIES AND EXCHANGE COMMISSION
Washington, D.C. 20549
FORM N-CSR
CERTIFIED SHAREHOLDER REPORT OF REGISTERED MANAGEMENT INVESTMENT COMPANIES
Investment Company Act file number 811-21779
JOHN HANCOCK FUNDS II
---------------------------------------------------------
(Exact name of registrant as specified in charter)
200 Berkeley Street, BOSTON, MA 02116
-------------------------------------------------------------
(Address of principal executive offices) (Zip code)
SALVATORE SCHIAVONE, 197 Clarendon Street, BOSTON, MA 02116
------------------------------------------------------------------------------------------
(Name and address of agent for service)
Registrant's telephone number, including area code: (617) 663-4497
--------------
Date of fiscal year end: 12/31 |
| |
| Date of reporting period: 6/30/19 |
ITEM 1. REPORTS TO STOCKHOLDERS.
The Registrant prepared two semiannual reports to shareholders for the period ended June 30, 2019. The report applies to the 5 Multimanager Lifestyle Portfolios and the Retirement Income Fund 2040 report.
John Hancock
Multimanager Lifestyle Portfolios
Semiannual report 6/30/19

Beginning on January 1, 2021, as permitted by regulations adopted by the Securities and Exchange Commission, paper copies of the Fund's shareholder reports like this one will no longer be sent by mail, unless you specifically request paper copies of the reports from the Fund or from your financial intermediary. Instead, the reports will be made available on a website, and you will be notified by mail each time a report is posted and provided with a website link to access the report.
If you already elected to receive shareholder reports electronically, you will not be affected by this change, and you do not need to take any action. You may elect to receive shareholder reports and other communications electronically by calling John Hancock Investment Management at 800-225-5291 (Class A, Class B and Class C shares) or 888-972-8696 (Class I, Class R1, Class R2, Class R3, Class R4, Class R5, Class R6, Class 1 and Class 5 shares) or by contacting your financial intermediary.
You may elect to receive all reports in paper, free of charge, at any time. You can inform John Hancock Investment Management or your financial intermediary that you wish to continue receiving paper copies of your shareholder reports by following the instructions listed above. Your election to receive reports in paper will apply to all funds held with John Hancock Investment Management or your financial intermediary.
A message to shareholders
Dear shareholder,
An increasingly favorable outlook for U.S. Federal Reserve (Fed) policy drove positive returns across the financial markets for the six months ended June 30, 2019. The combination of slowing growth and low inflation prompted the Fed to adopt a more dovish tone in its communications. The world equity markets rallied in response, as the improving rate outlook led investors to look past the more immediate concerns of weak economic data and the ongoing trade dispute between the United States and China.Market volatility did increase after period end, however, as a result of the trade dispute.
The bond market also benefited from the prospect of interest-rate cuts, causing the yield on the 10-year U.S. Treasury note to fall to its lowest level since late 2016. Credit-sensitive market segmentswere further aided by improving investor sentiment, leading to gains for both investment-grade corporate issues and high-yield bonds.
As always, your best resource in unpredictable markets is your financial advisor, who can help position your portfolio so that it's sufficiently diversified to meet your long-term objectives and to withstand the inevitable turbulence along the way.
On behalf of everyone at John Hancock Investment Management, I'd like to take this opportunity to welcome new shareholders and thank existing shareholders for the continued trust you've placed in us.
Sincerely,
Andrew G. Arnott
President and CEO,
John Hancock Investment Management
Head of Wealth and Asset Management,
United States and Europe
This commentary reflects the CEO's views as of this report's period end and are subject to change at any time. Diversification does not guarantee investment returns and does not eliminate risk of loss. All investments entail risks, including the possible loss of principal. For more up-to-date information, you can visit our website at jhinvestments.com.
John Hancock
Multimanager Lifestyle Portfolios
Table of contents
| | | |
| 2 | | Multimanager Lifestyle Portfolios at a glance |
| 5 | | Multimanager Lifestyle Aggressive Portfolio |
| 6 | | Multimanager Lifestyle Growth Portfolio |
| 7 | | Multimanager Lifestyle Balanced Portfolio |
| 8 | | Multimanager Lifestyle Moderate Portfolio |
| 9 | | Multimanager Lifestyle Conservative Portfolio |
| 10 | | Your expenses |
| 14 | | Portfolios' investments |
| 20 | | Financial statements |
| 25 | | Financial highlights |
| 35 | | Notes to financial statements |
| 56 | | Continuation of investment advisory and subadvisory agreements |
| 62 | | More information |
SEMIANNUAL REPORT | JOHN HANCOCK MULTIMANAGER LIFESTYLE PORTFOLIOS 1
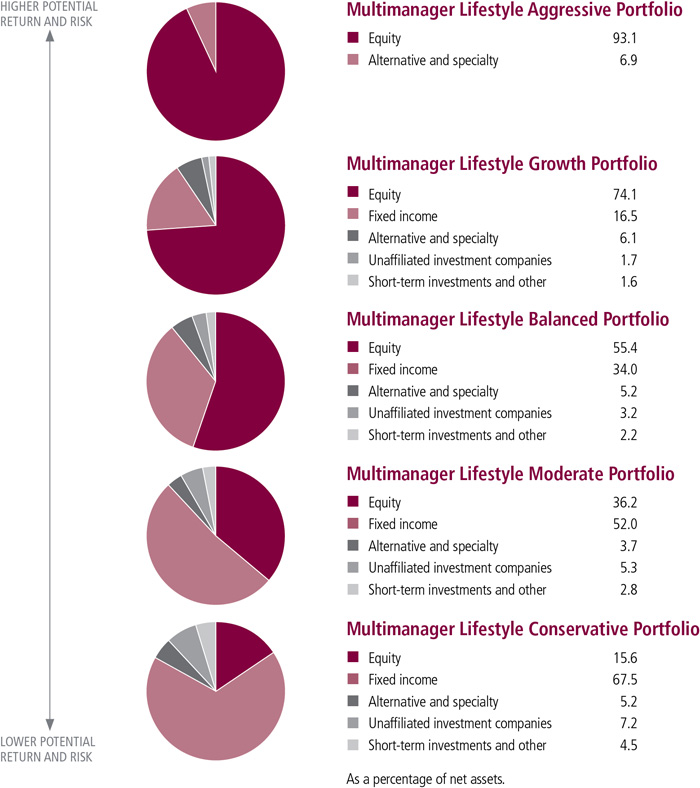
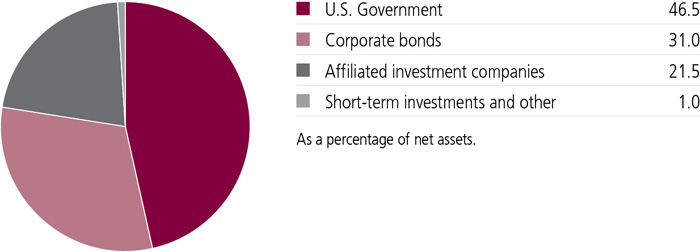
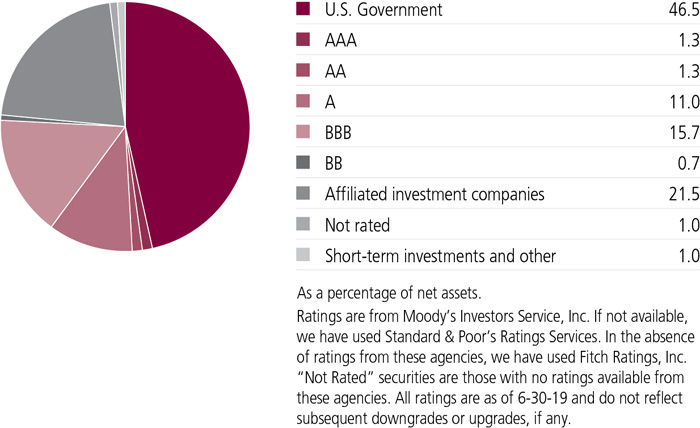
Multimanager Lifestyle Portfolios at a glance
PORTFOLIO ALLOCATION AS OF 6/30/19 (%)
SEMIANNUAL REPORT | JOHN HANCOCK MULTIMANAGER LIFESTYLE PORTFOLIOS 2
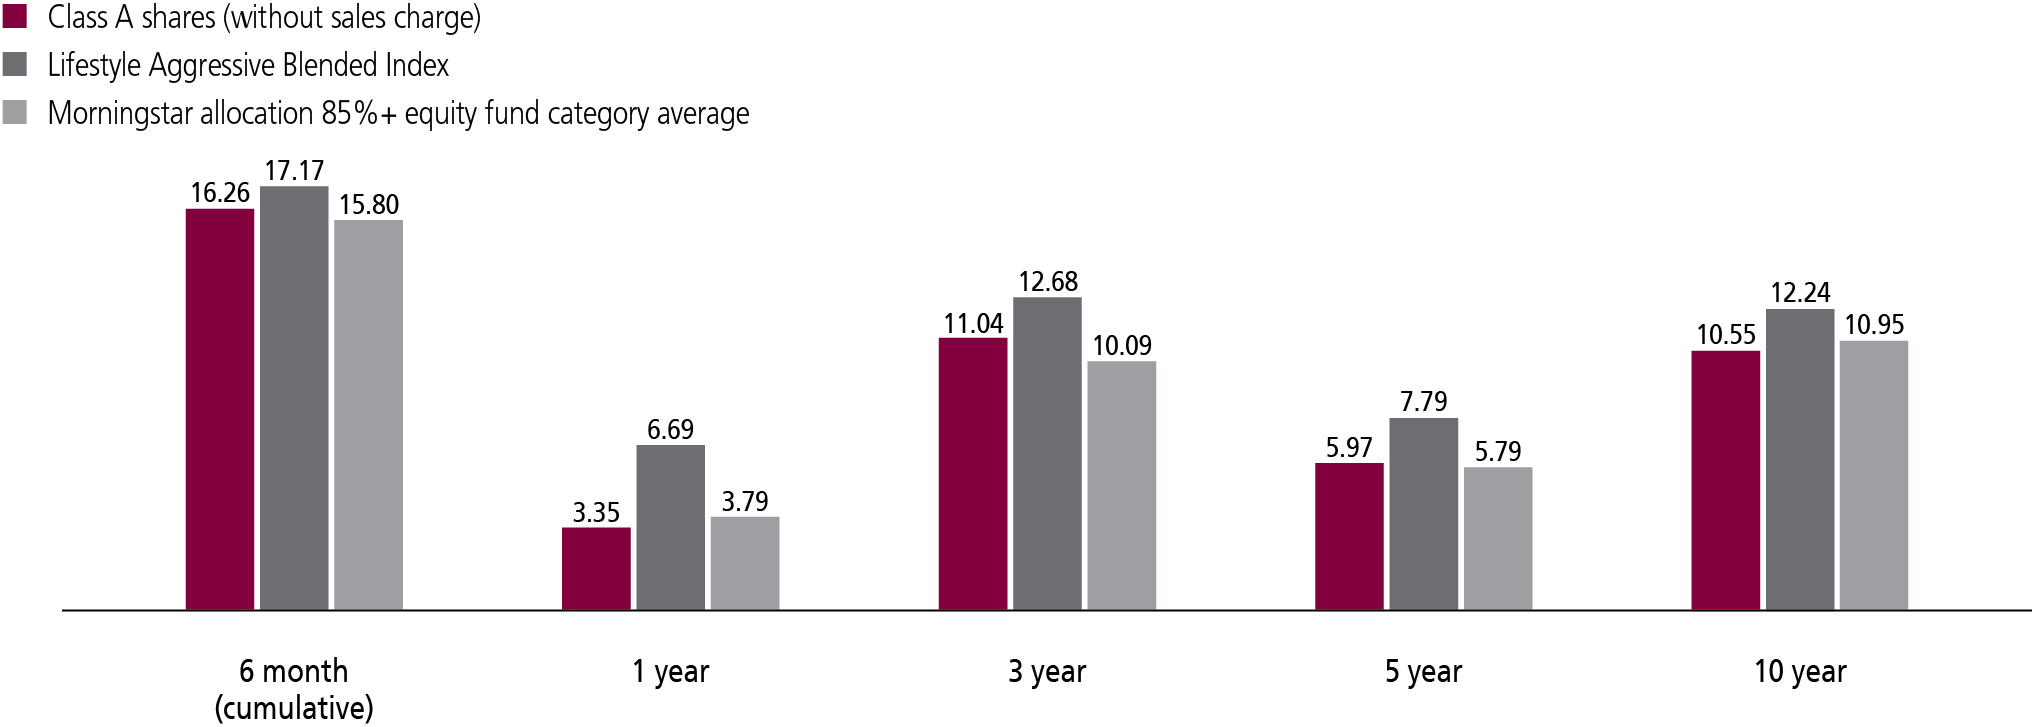
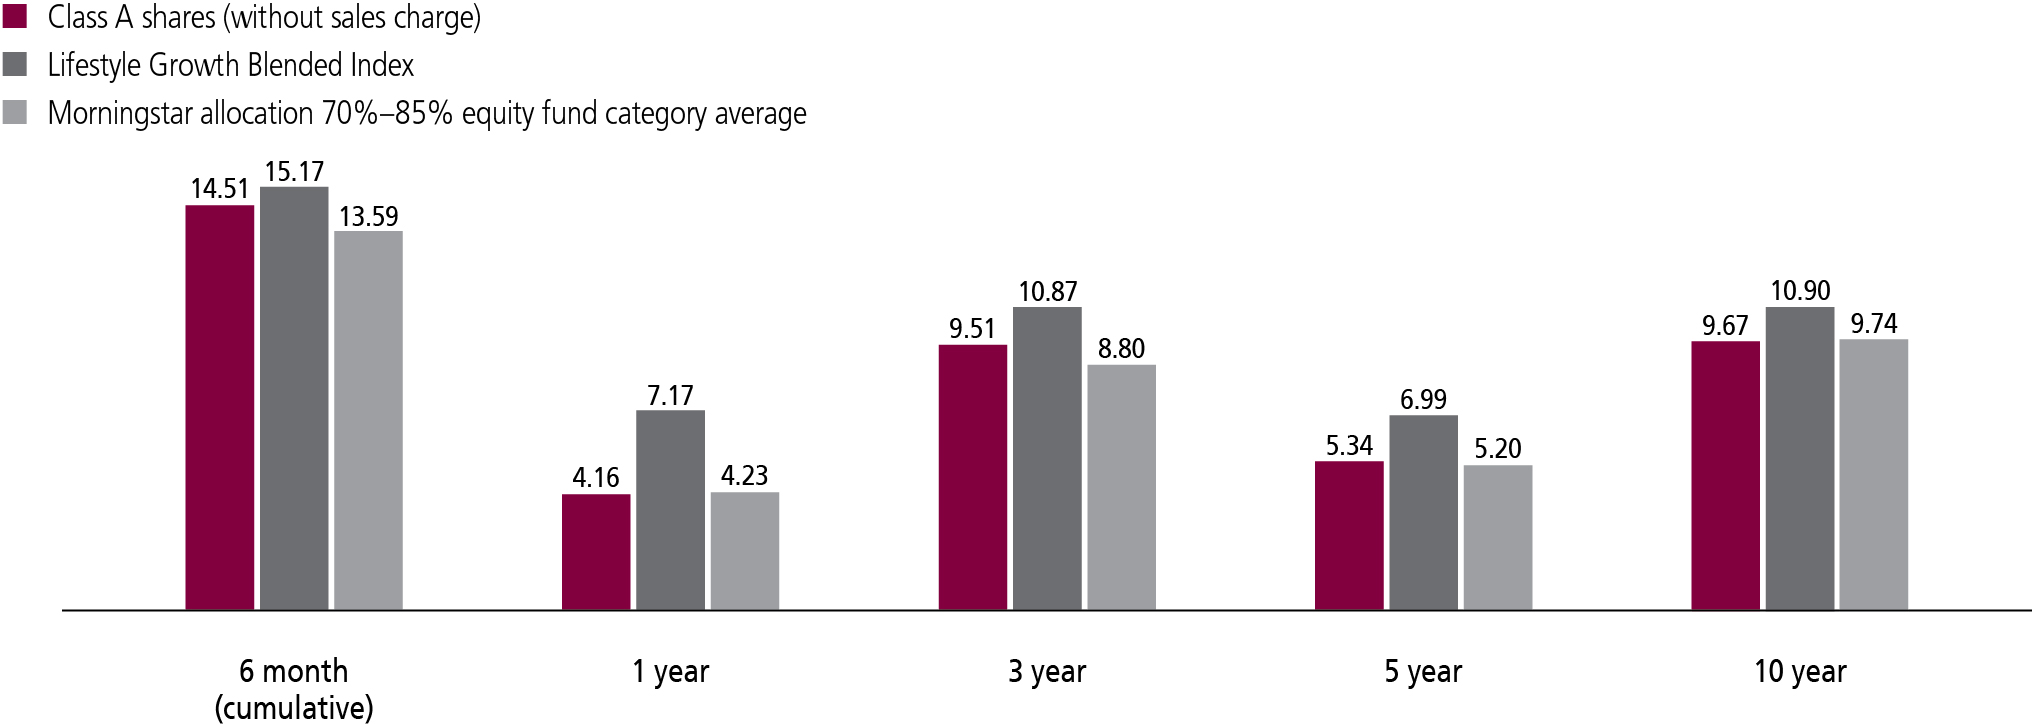
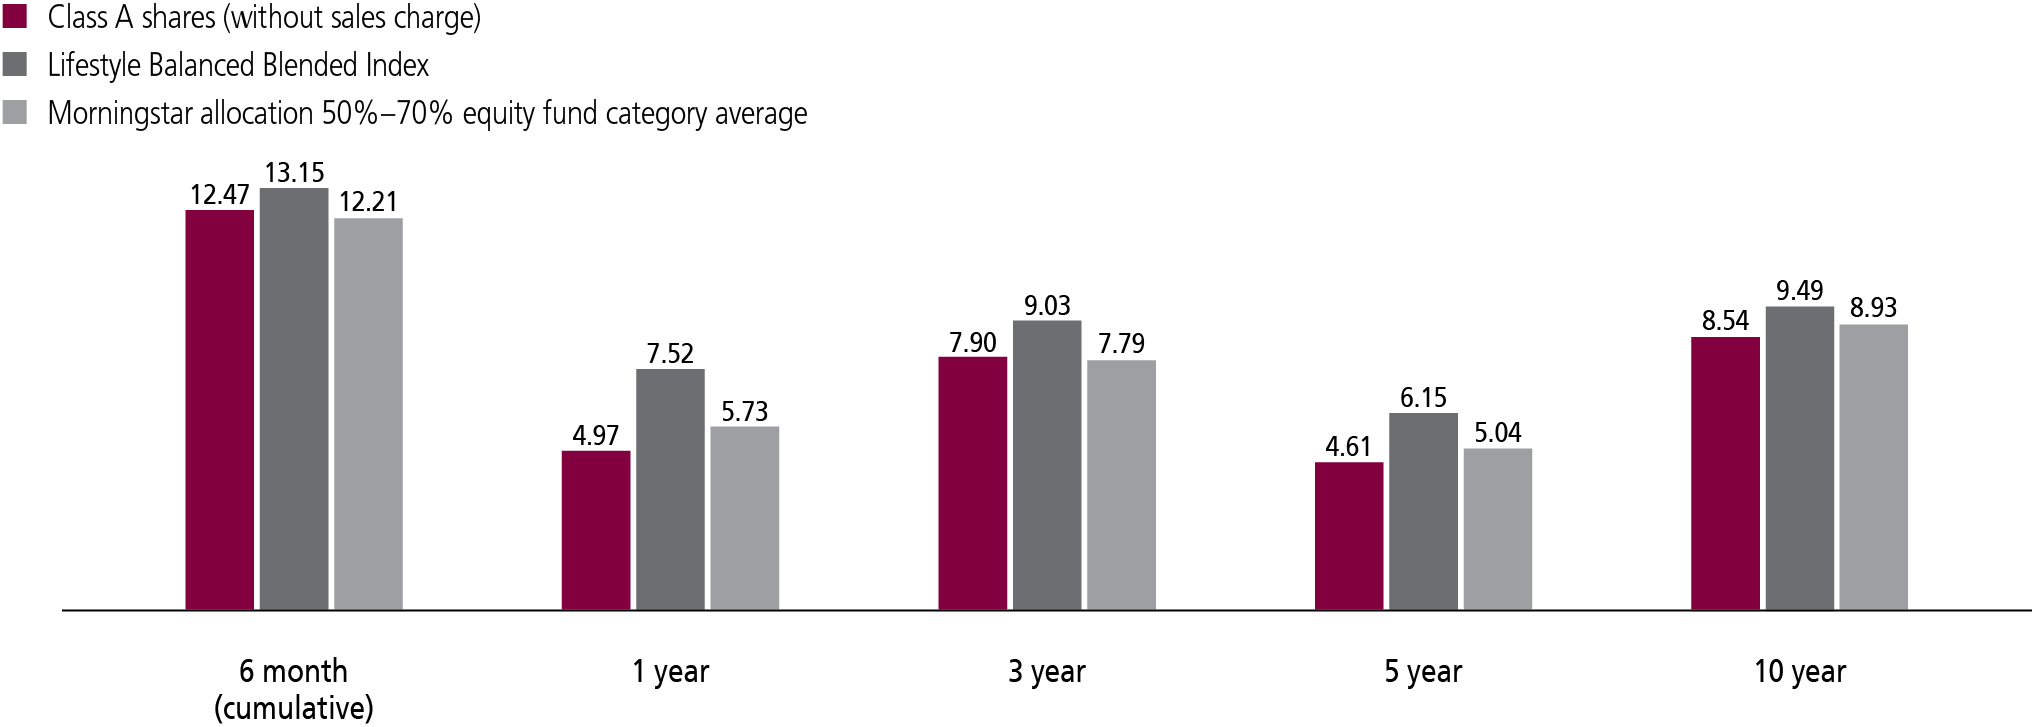
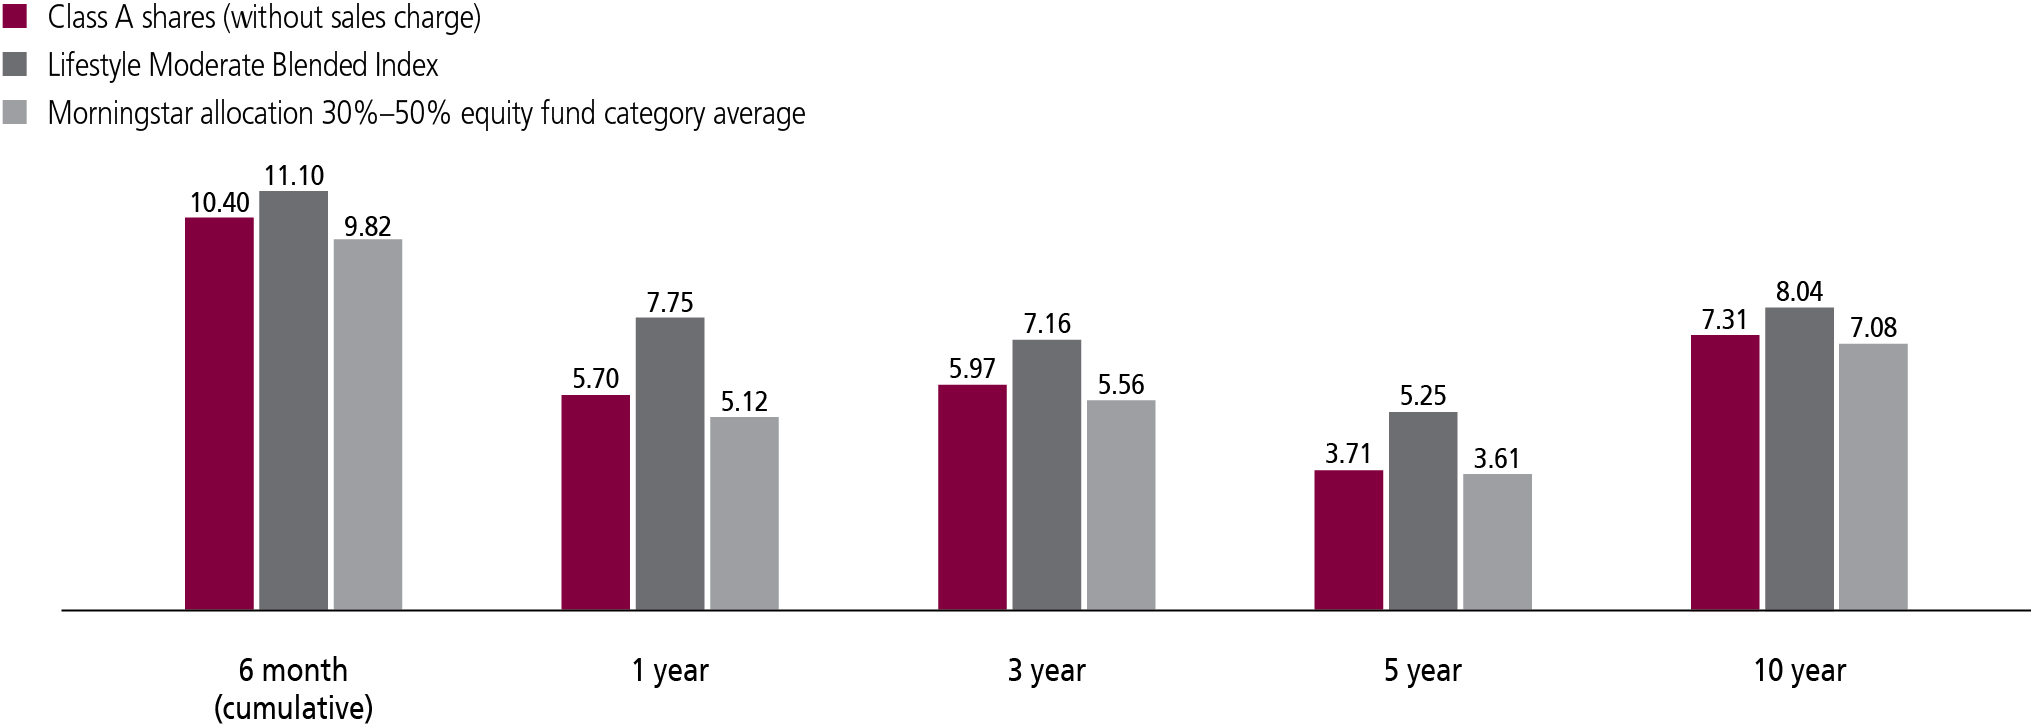
AVERAGE ANNUAL TOTAL RETURNS AS OF 6/30/19(%)
Multimanager Lifestyle Aggressive Portfolio
Multimanager Lifestyle Growth Portfolio
Multimanager Lifestyle Balanced Portfolio
SEMIANNUAL REPORT | JOHN HANCOCK MULTIMANAGER LIFESTYLE PORTFOLIOS 3
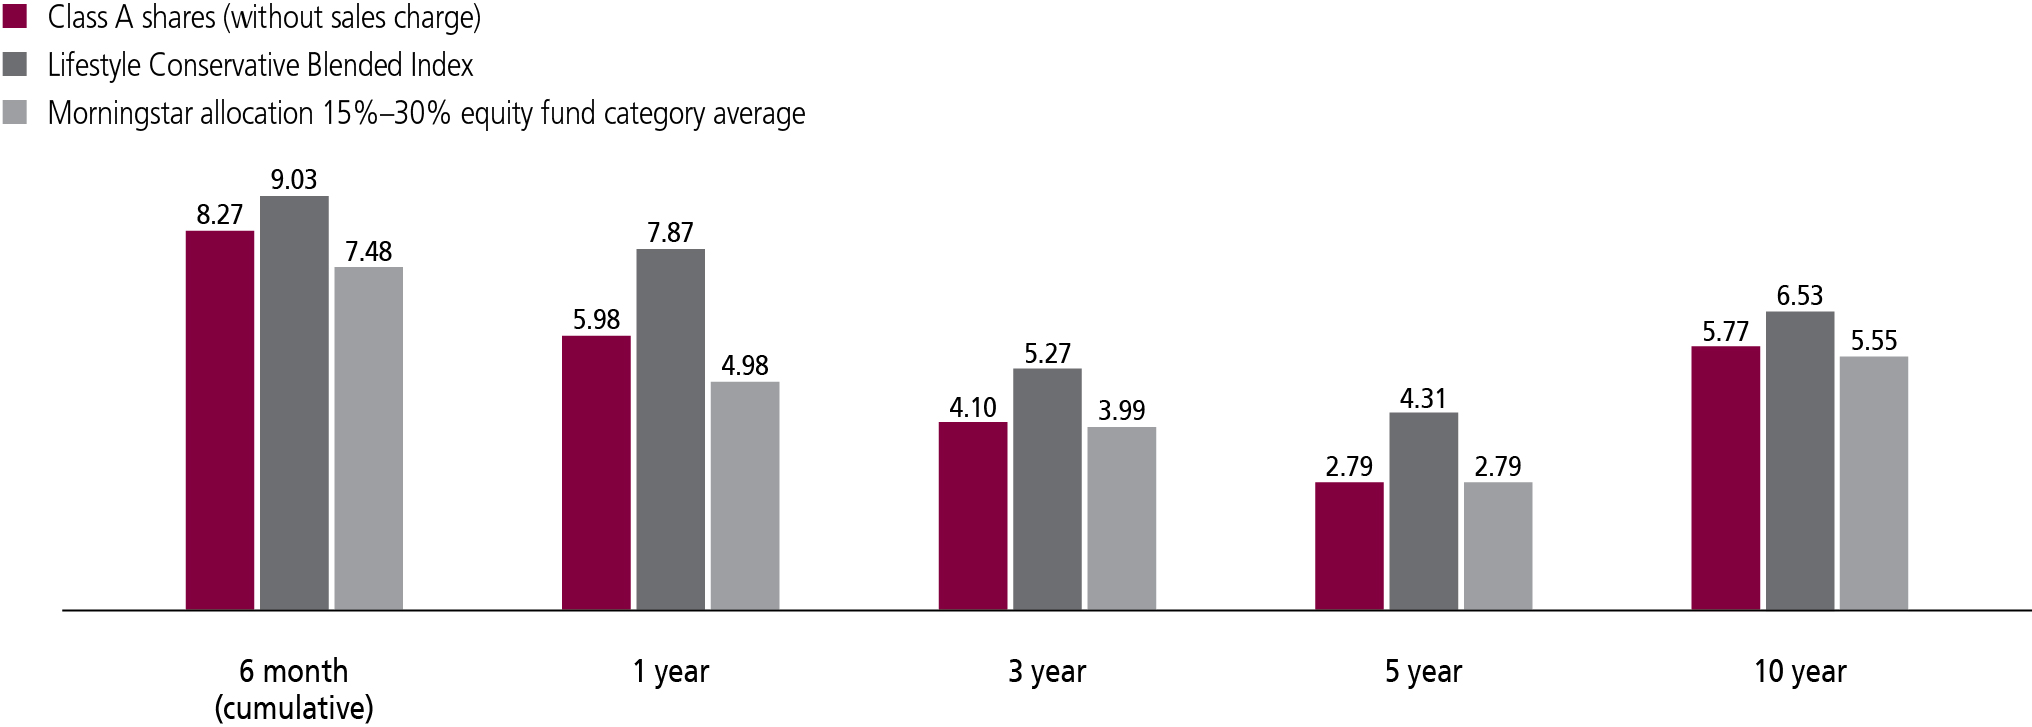
AVERAGE ANNUAL TOTAL RETURNS AS OF 6/30/19(%)
Multimanager Lifestyle Moderate Portfolio
Multimanager Lifestyle Conservative Portfolio
Lifestyle Aggressive Blended Index is composed of 70% Russell 3000 Index and 30% MSCI All Country World ex-USA Index.
Lifestyle Growth Blended Index is composed of 56% Russell 3000 Index, 24% MSCI All Country World ex-USA Index, 16% Bloomberg Barclays U.S. Aggregate Bond Index, and 4% ICE Bank of America Merrill Lynch U.S. High Yield Master II Index.
Lifestyle Balanced Blended Index is composed of 42% Russell 3000 Index, 18% MSCI All Country World ex-USA Index, 32% Bloomberg Barclays U.S. Aggregate Bond Index, and 8% ICE Bank of America Merrill Lynch U.S. High Yield Master II Index.
Lifestyle Moderate Blended Index is composed of 28% Russell 3000 Index, 12% MSCI All Country World ex-USA Index, 48% Bloomberg Barclays U.S. Aggregate Bond Index, and 12% ICE Bank of America Merrill Lynch U.S. High Yield Master II Index.
Lifestyle Conservative Blended Index is composed of 14% Russell 3000 Index, 6% MSCI All Country World ex-USA Index, 64% Bloomberg Barclays U.S. Aggregate Bond Index, and 16% ICE Bank of America Merrill Lynch U.S. High Yield Master II Index.
It is not possible to invest directly in an index. Index figures do not reflect expenses or sales charges, which would result in lower returns.
Figures from Morningstar, Inc. include reinvested distributions and do not take into account sales charges. Actual load-adjusted performance is lower.
The past performance shown here reflects reinvested distributions and the beneficial effect of any expense reductions, and does not guarantee future results. Returns for periods shorter than one year are cumulative, and results for other share classes will vary. Shares will fluctuate in value and, when redeemed, may be worth more or less than their original cost. Current month-end performance may be lower or higher than the performance cited, and can be found at jhinvestments.com or by calling 800-225-5291. For further information on the portfolios' objectives, risks, and strategy, see the portfolios' prospectuses.
SEMIANNUAL REPORT | JOHN HANCOCK MULTIMANAGER LIFESTYLE PORTFOLIOS 4
Multimanager Lifestyle Aggressive Portfolio
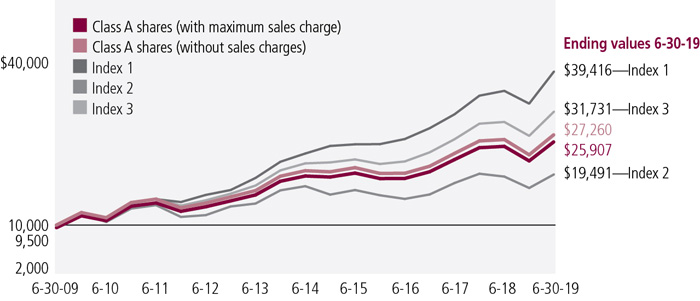
GROWTH OF $10,000
This chart shows what happened to a hypothetical $10,000 investment in John Hancock Multimanager Lifestyle Aggressive Portfolio for the share classes and periods indicated, assuming all distributions were reinvested. For comparison, we've shown the same investment in a blended index and two separate indexes.
Index 1is the S&P 500, an unmanaged index that includes 500 widely traded common stocks.
Index 2is the MSCI EAFE (Europe, Australasia, Far East) Index, a free-float-adjusted market capitalization index that is designed to measure developed market equity performance.
Index 3 is 70% Russell 3000 Index and 30% MSCI All Country World ex-USA Index.
It is not possible to invest directly in an index. Index figures do not reflect expenses or sales charges, which would result in lower returns.
ASSET ALLOCATION (%)
| | | |
| Affiliated investment companies | 100.0 |
| Equity | 93.1 |
| | U.S. Large Cap | 30.6 |
| | International Equity | 27.8 |
| | U.S. Mid Cap | 10.1 |
| | Emerging-Market Equity | 10.0 |
| | Large Blend | 7.2 |
| | U.S. Small Cap | 6.0 |
| | Sector Equity | 1.4 |
| Alternative and specialty | 6.9 |
| | Sector Equity | 5.9 |
| | Absolute Return | 0.6 |
| | Long/Short Equity | 0.4 |
As a percentage of net assets.
PERFORMANCE CHART
Total returns with maximum sales charge for the period ended 6-30-19 (%)
| | | | | | | | | | | | | | | |
| | Class A | Class B | Class C | Class I1,2 | Class R11 | Class R21,2 | Class R31 | Class R41 | Class R51 | Class R61,2 | Class 11 | Index 1 | Index 2 | Index 3 |
| Average annual total returns |
| 1 year | -1.83 | -1.95 | 1.64 | 3.67 | 2.93 | 3.20 | 3.06 | 3.49 | 3.73 | 3.73 | 3.69 | 10.42 | 1.08 | 6.69 |
| 5 year | 4.89 | 4.91 | 5.21 | 6.11 | 5.57 | 5.84 | 5.65 | 6.09 | 6.32 | 6.41 | 6.34 | 10.71 | 2.25 | 7.79 |
| 10 year | 9.99 | 9.88 | 9.76 | 10.23 | 10.11 | 10.25 | 10.21 | 10.61 | 10.90 | 10.75 | 11.00 | 14.70 | 6.90 | 12.24 |
| Cumulative returns |
| 6 months | 10.44 | 10.83 | 14.82 | 16.49 | 16.08 | 16.14 | 16.08 | 16.35 | 16.48 | 16.49 | 16.44 | 18.54 | 14.03 | 17.17 |
| 5 year | 26.96 | 27.06 | 28.89 | 34.52 | 31.11 | 32.84 | 31.66 | 34.38 | 35.84 | 36.44 | 36.00 | 66.33 | 11.75 | 45.50 |
| 10 year | 159.07 | 156.60 | 153.68 | 164.75 | 162.00 | 165.33 | 164.35 | 174.20 | 181.35 | 177.51 | 183.96 | 294.16 | 94.91 | 217.31 |
Performance figures assume all distributions have been reinvested. Returns with maximum sales charge reflect a sales charge on Class A shares of 5%, and the applicable contingent deferred sales charge (CDSC) on Class B and Class C shares. The Class B shares' CDSC declines annually between years 1-6 according to the following schedule: 5%, 4%, 3%, 3%, 2%, 1%. No sales charges will be assessed after the sixth year. Class C shares held for less than one year are subject to a 1% CDSC. Sales charges are not applicable to Class I, Class R1, Class R2, Class R3, Class R4, Class R5, Class R6, and Class 1 shares.
Performance of the classes will vary based on the difference in sales charges paid by shareholders investing in the different classes and the fee structure of those classes.
The expense ratios of the portfolio, both net (including any fee waivers and/or expense limitations) and gross (excluding any fee waivers and/or expense limitations), are set forth according to the most recent publicly available prospectuses for the portfolio and may differ from those disclosed in the Financial highlights tables in this report. Net expenses reflect contractual expense limitations in effect until April 30, 2020 and are subject to change. Had the contractual fee waivers and expense limitations not been in place, gross expenses would apply. The following expense ratios include expenses of the affiliated underlying funds in which the portfolio invests. The expense ratios are as follows:
| | | | | | | | | | | | |
| | Class A | Class B | Class C | Class I | Class R1 | Class R2 | Class R3 | Class R4 | Class R5 | Class R6 | Class 1 |
| Gross (%) | 1.39 | 2.09 | 2.09 | 1.09 | 1.74 | 1.49 | 1.64 | 1.34 | 1.04 | 0.99 | 1.02 |
| Net (%) | 1.38 | 2.09 | 2.09 | 1.08 | 1.74 | 1.49 | 1.64 | 1.24 | 1.04 | 0.99 | 1.02 |
Please refer to the most recent prospectus and annual or semiannual report for more information on expenses and any expense limitation arrangements for each class.
The returns reflect past results and should not be considered indicative of future performance. The return and principal value of an investment will fluctuate so that shares, when redeemed, may be worth more or less than their original cost. Due to market volatility, the portfolio's current performance may be higher or lower than the performance shown. For performance data current to the most recent month end, please call 800-225-5291 or visit the portfolio's website at jhinvestments.com.
This performance information does not reflect the deduction of taxes that a shareholder may pay on portfolio distributions or the redemption of portfolio shares. The portfolio's performance results reflect any applicable fee waivers or expense reductions, without which the expenses would increase and results would have been less favorable.
| 1 | For certain types of investors as described in the portfolio's prospectuses. |
| 2 | Class I shares were first offered on 5-1-15; Class R2 shares were first offered on 3-1-12; Class R6 shares were first offered on 9-1-11. Returns prior to these dates are those of Class C shares that have not been adjusted for class-specific expenses; otherwise, returns would vary. |
SEMIANNUAL REPORT | JOHN HANCOCK MULTIMANAGER LIFESTYLE PORTFOLIOS 5
Multimanager Lifestyle Growth Portfolio
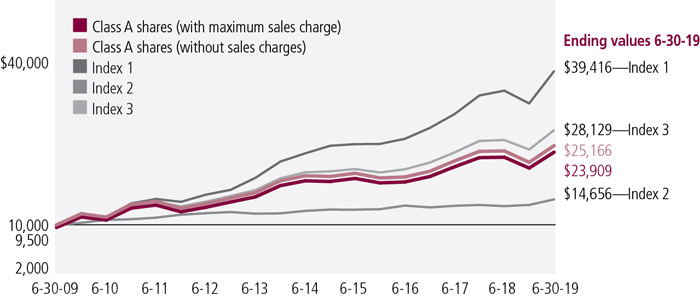
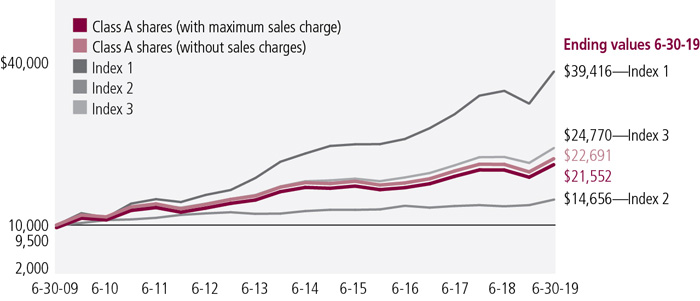
GROWTH OF $10,000
This chart shows what happened to a hypothetical $10,000 investment in John Hancock Multimanager Lifestyle Growth Portfolio for the share classes and periods indicated, assuming all distributions were reinvested. For comparison, we've shown the same investment in a blended index and two separate indexes.
Index 1is the S&P 500, an unmanaged index that includes 500 widely traded common stocks.
Index 2is the Bloomberg Barclays U.S. Aggregate Bond Index, an unmanaged index of dollar-denominated and non-convertible investment-grade debt issues.
Index 3 is 56% Russell 3000 Index, 24% MSCI All Country World ex-USA Index, 16% Bloomberg Barclays U.S. Aggregate Bond Index, and 4% ICE Bank of America Merrill Lynch U.S. High Yield Master II Index.
It is not possible to invest directly in an index. Index figures do not reflect expenses or sales charges, which would result in lower returns.
ASSET ALLOCATION (%)
| | | |
| Affiliated investment companies | 96.7 |
| Equity | 74.1 |
| | U.S. Large Cap | 24.6 |
| | International Equity | 23.7 |
| | U.S. Mid Cap | 8.3 |
| | Emerging-Market Equity | 6.3 |
| | Large Blend | 5.6 |
| | U.S. Small Cap | 4.3 |
| | Sector Equity | 1.3 |
| Fixed income | 16.5 |
| | Intermediate Bond | 6.9 |
| | Multi-Sector Bond | 4.4 |
| | Emerging-Market Debt | 2.2 |
| | High Yield Bond | 1.3 |
| | Bank Loan | 1.0 |
| | Global Bond | 0.6 |
| | Inflation-Protected Bond | 0.1 |
| Alternative and specialty | 6.1 |
| | Sector Equity | 4.8 |
| | Absolute Return | 1.1 |
| | Long/Short Equity | 0.2 |
| Unaffiliated investment companies | 1.7 |
| | Fixed income | 1.7 |
| Short-term investments and other | 1.6 |
As a percentage of net assets.
PERFORMANCE CHART
Total returns with maximum sales charge for the period ended 6-30-19 (%)
| | | | | | | | | | | | | | | | |
| | Class A | Class B | Class C | Class I1,2 | Class R11 | Class R21,2 | Class R31 | Class R41 | Class R51 | Class R61,2 | Class 11 | Class 51 | Index 1 | Index 2 | Index 3 |
| Average annual total returns |
| 1 year | -1.03 | -1.29 | 2.45 | 4.49 | 3.81 | 4.02 | 3.91 | 4.28 | 4.51 | 4.53 | 4.49 | 4.55 | 10.42 | 7.87 | 7.17 |
| 5 year | 4.27 | 4.29 | 4.59 | 5.47 | 4.96 | 5.21 | 5.07 | 5.48 | 5.69 | 5.76 | 5.71 | 5.76 | 10.71 | 2.95 | 6.99 |
| 10 year | 9.11 | 9.02 | 8.89 | 9.35 | 9.28 | 9.37 | 9.39 | 9.78 | 10.05 | 9.86 | 10.10 | 10.16 | 14.70 | 3.90 | 10.90 |
| Cumulative returns |
| 6 months | 8.76 | 9.08 | 13.10 | 14.60 | 14.29 | 14.39 | 14.31 | 14.53 | 14.66 | 14.68 | 14.59 | 14.70 | 18.54 | 6.11 | 15.17 |
| 5 year | 23.24 | 23.38 | 25.14 | 30.53 | 27.41 | 28.92 | 28.03 | 30.57 | 31.86 | 32.33 | 32.03 | 32.33 | 66.33 | 15.64 | 40.21 |
| 10 year | 139.09 | 137.20 | 134.34 | 144.45 | 142.91 | 144.90 | 145.25 | 154.35 | 160.50 | 156.12 | 161.83 | 163.19 | 294.16 | 46.56 | 181.29 |
Performance figures assume all distributions have been reinvested. Returns with maximum sales charge reflect a sales charge on Class A shares of 5%, and the applicable contingent deferred sales charge (CDSC) on Class B and Class C shares. The Class B shares' CDSC declines annually between years 1-6 according to the following schedule: 5%, 4%, 3%, 3%, 2%, 1%. No sales charges will be assessed after the sixth year. Class C shares held for less than one year are subject to a 1% CDSC. Sales charges are not applicable to Class I, Class R1, Class R2, Class R3, Class R4, Class R5, Class R6, Class 1, and Class 5 shares.
Performance of the classes will vary based on the difference in sales charges paid by shareholders investing in the different classes and the fee structure of those classes.
The expense ratios of the portfolio, both net (including any fee waivers and/or expense limitations) and gross (excluding any fee waivers and/or expense limitations), are set forth according to the most recent publicly available prospectuses for the portfolio and may differ from those disclosed in the Financial highlights tables in this report. Net expenses reflect contractual expense limitations in effect until April 30, 2020 and are subject to change. Had the contractual fee waivers and expense limitations not been in place, gross expenses would apply. The following expense ratios include expenses of the affiliated underlying funds in which the portfolio invests. The expense ratios are as follows:
| | | | | | | | | | | | | |
| | Class A | Class B | Class C | Class I | Class R1 | Class R2 | Class R3 | Class R4 | Class R5 | Class R6 | Class 1 | Class 5 |
| Gross (%) | 1.35 | 2.05 | 2.05 | 1.05 | 1.69 | 1.44 | 1.59 | 1.29 | 0.99 | 0.94 | 0.98 | 0.93 |
| Net (%) | 1.34 | 2.05 | 2.05 | 1.04 | 1.69 | 1.44 | 1.59 | 1.19 | 0.99 | 0.94 | 0.98 | 0.93 |
Please refer to the most recent prospectus and annual or semiannual report for more information on expenses and any expense limitation arrangements for each class.
The returns reflect past results and should not be considered indicative of future performance. The return and principal value of an investment will fluctuate so that shares, when redeemed, may be worth more or less than their original cost. Due to market volatility, the portfolio's current performance may be higher or lower than the performance shown. For performance data current to the most recent month end, please call 800-225-5291 or visit the portfolio's website at jhinvestments.com.
This performance information does not reflect the deduction of taxes that a shareholder may pay on portfolio distributions or the redemption of portfolio shares. The portfolio's performance results reflect any applicable fee waivers or expense reductions, without which the expenses would increase and results would have been less favorable.
| 1 | For certain types of investors as described in the portfolio's prospectuses. |
| 2 | Class I shares were first offered on 5-1-15; Class R2 shares were first offered on 3-1-12; Class R6 shares were first offered on 9-1-11. Returns prior to these dates are those of Class C shares that have not been adjusted for class-specific expenses; otherwise, returns would vary. |
SEMIANNUAL REPORT | JOHN HANCOCK MULTIMANAGER LIFESTYLE PORTFOLIOS 6
Multimanager Lifestyle Balanced Portfolio
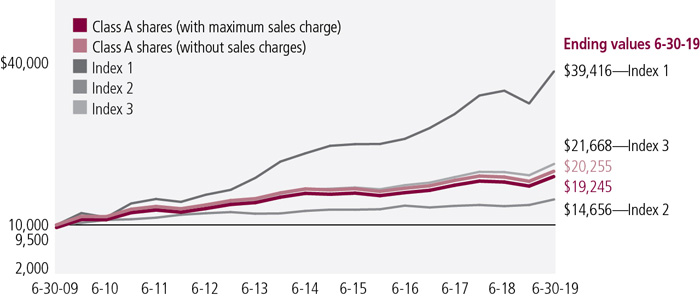
GROWTH OF $10,000
This chart shows what happened to a hypothetical $10,000 investment in John Hancock Multimanager Lifestyle Balanced Portfolio for the share classes and periods indicated, assuming all distributions were reinvested. For comparison, we've shown the same investment in a blended index and two separate indexes.
Index 1is the S&P 500, an unmanaged index that includes 500 widely traded common stocks.
Index 2is the Bloomberg Barclays U.S. Aggregate Bond Index, an unmanaged index of dollar-denominated and non-convertible investment-grade debt issues.
Index 3 is 42% Russell 3000 Index, 18% MSCI All Country World ex-USA Index, 32% Bloomberg Barclays U.S. Aggregate Bond Index, and 8% ICE Bank of America Merrill Lynch U.S. High Yield Master II Index.
It is not possible to invest directly in an index. Index figures do not reflect expenses or sales charges, which would result in lower returns.
ASSET ALLOCATION (%)
| | | |
| Affiliated investment companies | 94.6 |
| Equity | 55.4 |
| | U.S. Large Cap | 19.5 |
| | International Equity | 17.2 |
| | U.S. Mid Cap | 5.5 |
| | Large Blend | 5.1 |
| | Emerging-Market Equity | 3.9 |
| | U.S. Small Cap | 3.1 |
| | Sector Equity | 1.1 |
| Fixed income | 34.0 |
| | Intermediate Bond | 14.3 |
| | Multi-Sector Bond | 10.2 |
| | Emerging-Market Debt | 3.5 |
| | High Yield Bond | 2.6 |
| | Bank Loan | 2.3 |
| | Global Bond | 0.9 |
| | Inflation-Protected Bond | 0.2 |
| Alternative and specialty | 5.2 |
| | Sector Equity | 3.7 |
| | Absolute Return | 1.3 |
| | Long/Short Equity | 0.2 |
| Unaffiliated investment companies | 3.2 |
| | Equity | 0.1 |
| | Fixed income | 3.1 |
| Short-term investments and other | 2.2 |
As a percentage of net assets.
PERFORMANCE CHART
Total returns with maximum sales charge for the period ended 6-30-19 (%)
| | | | | | | | | | | | | | | | |
| | Class A | Class B | Class C | Class I1,2 | Class R11 | Class R21,2 | Class R31 | Class R41 | Class R51 | Class R61,2 | Class 11 | Class 51 | Index 1 | Index 2 | Index 3 |
| Average annual total returns |
| 1 year | -0.27 | -0.56 | 3.28 | 5.32 | 4.63 | 4.90 | 4.74 | 5.14 | 5.34 | 5.42 | 5.39 | 5.44 | 10.42 | 7.87 | 7.52 |
| 5 year | 3.54 | 3.56 | 3.86 | 4.74 | 4.24 | 4.49 | 4.35 | 4.76 | 4.97 | 5.03 | 5.00 | 5.05 | 10.71 | 2.95 | 6.15 |
| 10 year | 7.98 | 7.90 | 7.76 | 8.22 | 8.14 | 8.24 | 8.26 | 8.68 | 8.91 | 8.72 | 8.97 | 9.03 | 14.70 | 3.90 | 9.49 |
| Cumulative returns |
| 6 months | 6.83 | 7.19 | 11.09 | 12.72 | 12.34 | 12.41 | 12.38 | 12.58 | 12.67 | 12.69 | 12.76 | 12.78 | 18.54 | 6.11 | 13.15 |
| 5 year | 18.98 | 19.10 | 20.87 | 26.07 | 23.06 | 24.59 | 23.75 | 26.20 | 27.47 | 27.84 | 27.64 | 27.95 | 66.33 | 15.64 | 34.75 |
| 10 year | 115.52 | 113.87 | 111.21 | 120.31 | 118.72 | 120.76 | 121.19 | 129.84 | 134.81 | 130.68 | 135.99 | 137.31 | 294.16 | 46.56 | 147.70 |
Performance figures assume all distributions have been reinvested. Returns with maximum sales charge reflect a sales charge on Class A shares of 5%, and the applicable contingent deferred sales charge (CDSC) on Class B and Class C shares. The Class B shares' CDSC declines annually between years 1-6 according to the following schedule: 5%, 4%, 3%, 3%, 2%, 1%. No sales charges will be assessed after the sixth year. Class C shares held for less than one year are subject to a 1% CDSC. Sales charges are not applicable to Class I, Class R1, Class R2, Class R3, Class R4, Class R5, Class R6, Class 1, and Class 5 shares.
Performance of the classes will vary based on the difference in sales charges paid by shareholders investing in the different classes and the fee structure of those classes.
The expense ratios of the portfolio, both net (including any fee waivers and/or expense limitations) and gross (excluding any fee waivers and/or expense limitations), are set forth according to the most recent publicly available prospectuses for the portfolio and may differ from those disclosed in the Financial highlights tables in this report. Net expenses reflect contractual expense limitations in effect until April 30, 2020 and are subject to change. Had the contractual fee waivers and expense limitations not been in place, gross expenses would apply. The following expense ratios include expenses of the affiliated underlying funds in which the portfolio invests. The expense ratios are as follows:
| | | | | | | | | | | | | |
| | Class A | Class B | Class C | Class I | Class R1 | Class R2 | Class R3 | Class R4 | Class R5 | Class R6 | Class 1 | Class 5 |
| Gross (%) | 1.32 | 2.02 | 2.02 | 1.02 | 1.67 | 1.42 | 1.57 | 1.27 | 0.97 | 0.92 | 0.96 | 0.91 |
| Net (%) | 1.31 | 2.02 | 2.02 | 1.01 | 1.67 | 1.42 | 1.57 | 1.17 | 0.97 | 0.92 | 0.96 | 0.91 |
Please refer to the most recent prospectus and annual or semiannual report for more information on expenses and any expense limitation arrangements for each class.
The returns reflect past results and should not be considered indicative of future performance. The return and principal value of an investment will fluctuate so that shares, when redeemed, may be worth more or less than their original cost. Due to market volatility, the portfolio's current performance may be higher or lower than the performance shown. For performance data current to the most recent month end, please call 800-225-5291 or visit the portfolio's website at jhinvestments.com.
This performance information does not reflect the deduction of taxes that a shareholder may pay on portfolio distributions or the redemption of portfolio shares. The portfolio's performance results reflect any applicable fee waivers or expense reductions, without which the expenses would increase and results would have been less favorable.
| 1 | For certain types of investors as described in the portfolio's prospectuses. |
| 2 | Class I shares were first offered on 5-1-15; Class R2 shares were first offered on 3-1-12; Class R6 shares were first offered on 9-1-11. Returns prior to these dates are those of Class C shares that have not been adjusted for class-specific expenses; otherwise, returns would vary. |
SEMIANNUAL REPORT | JOHN HANCOCK MULTIMANAGER LIFESTYLE PORTFOLIOS 7
Multimanager Lifestyle Moderate Portfolio
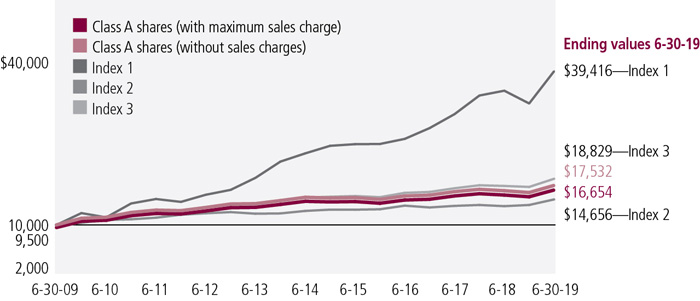
GROWTH OF $10,000
This chart shows what happened to a hypothetical $10,000 investment in John Hancock Multimanager Lifestyle Moderate Portfolio for the share classes and periods indicated, assuming all distributions were reinvested. For comparison, we've shown the same investment in a blended index and two separate indexes.
Index 1is the S&P 500, an unmanaged index that includes 500 widely traded common stocks.
Index 2is the Bloomberg Barclays U.S. Aggregate Bond Index, an unmanaged index of dollar-denominated and non-convertible investment-grade debt issues.
Index 3 is 28% Russell 3000 Index, 12% MSCI All Country World ex-USA Index, 48% Bloomberg Barclays U.S. Aggregate Bond Index, and 12% ICE Bank of America Merrill Lynch U.S. High Yield Master II Index.
It is not possible to invest directly in an index. Index figures do not reflect expenses or sales charges, which would result in lower returns.
ASSET ALLOCATION (%)
| | | |
| Affiliated investment companies | 91.9 |
| Equity | 36.2 |
| | U.S. Large Cap | 14.1 |
| | International Equity | 12.2 |
| | Large Blend | 3.4 |
| | U.S. Mid Cap | 3.2 |
| | Emerging-Market Equity | 1.9 |
| | U.S. Small Cap | 1.4 |
| Fixed income | 52.0 |
| | Intermediate Bond | 26.0 |
| | Multi-Sector Bond | 12.4 |
| | Emerging-Market Debt | 4.7 |
| | High Yield Bond | 3.4 |
| | Bank Loan | 3.3 |
| | Global Bond | 1.9 |
| | Inflation-Protected Bond | 0.3 |
| Alternative and specialty | 3.7 |
| | Sector Equity | 1.8 |
| | Absolute Return | 1.1 |
| | Thematic Equity | 0.5 |
| | Long/Short Equity | 0.3 |
| Unaffiliated investment companies | 5.3 |
| | Equity | 0.5 |
| | Fixed income | 4.8 |
| Short-term investments and other | 2.8 |
As a percentage of net assets.
PERFORMANCE CHART
Total returns with maximum sales charge for the period ended 6-30-19 (%)
| | | | | | | | | | | | | | | | |
| | Class A | Class B | Class C | Class I1,2 | Class R11 | Class R21,2 | Class R31 | Class R41 | Class R51 | Class R61,2 | Class 11 | Class 51 | Index 1 | Index 2 | Index 3 |
| Average annual total returns |
| 1 year | 0.39 | 0.02 | 3.97 | 6.04 | 5.36 | 5.61 | 5.54 | 5.81 | 6.08 | 6.14 | 6.09 | 6.16 | 10.42 | 7.87 | 7.75 |
| 5 year | 2.66 | 2.65 | 2.99 | 3.86 | 3.34 | 3.60 | 3.46 | 3.85 | 4.06 | 4.14 | 4.10 | 4.14 | 10.71 | 2.95 | 5.25 |
| 10 year | 6.77 | 6.68 | 6.56 | 7.01 | 6.88 | 7.04 | 7.01 | 7.38 | 7.65 | 7.51 | 7.74 | 7.80 | 14.70 | 3.90 | 8.04 |
| Cumulative returns |
| 6 months | 4.84 | 5.03 | 9.10 | 10.69 | 10.24 | 10.48 | 10.38 | 10.53 | 10.62 | 10.75 | 10.72 | 10.67 | 18.54 | 6.11 | 11.10 |
| 5 year | 14.02 | 13.98 | 15.87 | 20.86 | 17.83 | 19.34 | 18.54 | 20.77 | 22.04 | 22.48 | 22.25 | 22.50 | 66.33 | 15.64 | 29.17 |
| 10 year | 92.45 | 90.91 | 88.86 | 96.97 | 94.54 | 97.43 | 96.82 | 103.87 | 108.96 | 106.34 | 110.78 | 111.86 | 294.16 | 46.56 | 116.68 |
Performance figures assume all distributions have been reinvested. Returns with maximum sales charge reflect a sales charge on Class A shares of 5%, and the applicable contingent deferred sales charge (CDSC) on Class B and Class C shares. The Class B shares' CDSC declines annually between years 1-6 according to the following schedule: 5%, 4%, 3%, 3%, 2%, 1%. No sales charges will be assessed after the sixth year. Class C shares held for less than one year are subject to a 1% CDSC. Sales charges are not applicable to Class I, Class R1, Class R2, Class R3, Class R4, Class R5, Class R6, Class 1, and Class 5 shares.
Performance of the classes will vary based on the difference in sales charges paid by shareholders investing in the different classes and the fee structure of those classes.
The expense ratios of the portfolio, both net (including any fee waivers and/or expense limitations) and gross (excluding any fee waivers and/or expense limitations), are set forth according to the most recent publicly available prospectuses for the portfolio and may differ from those disclosed in the Financial highlights tables in this report. Net expenses reflect contractual expense limitations in effect until April 30, 2020 and are subject to change. Had the contractual fee waivers and expense limitations not been in place, gross expenses would apply. The following expense ratios include expenses of the affiliated underlying funds in which the portfolio invests. The expense ratios are as follows:
| | | | | | | | | | | | | |
| | Class A | Class B | Class C | Class I | Class R1 | Class R2 | Class R3 | Class R4 | Class R5 | Class R6 | Class 1 | Class 5 |
| Gross (%) | 1.31 | 2.01 | 2.01 | 1.01 | 1.66 | 1.41 | 1.56 | 1.26 | 0.96 | 0.91 | 0.94 | 0.89 |
| Net (%) | 1.30 | 20.1 | 2.01 | 1.00 | 1.66 | 1.41 | 1.56 | 1.16 | 0.96 | 0.91 | 0.94 | 0.89 |
Please refer to the most recent prospectus and annual or semiannual report for more information on expenses and any expense limitation arrangements for each class.
The returns reflect past results and should not be considered indicative of future performance. The return and principal value of an investment will fluctuate so that shares, when redeemed, may be worth more or less than their original cost. Due to market volatility, the portfolio's current performance may be higher or lower than the performance shown. For performance data current to the most recent month end, please call 800-225-5291 or visit the portfolio's website at jhinvestments.com.
This performance information does not reflect the deduction of taxes that a shareholder may pay on portfolio distributions or the redemption of portfolio shares. The portfolio's performance results reflect any applicable fee waivers or expense reductions, without which the expenses would increase and results would have been less favorable.
| 1 | For certain types of investors as described in the portfolio's prospectuses. |
| 2 | Class I shares were first offered on 5-1-15; Class R2 shares were first offered on 3-1-12; Class R6 shares were first offered on 9-1-11. Returns prior to these dates are those of Class C shares that have not been adjusted for class-specific expenses; otherwise, returns would vary. |
SEMIANNUAL REPORT | JOHN HANCOCK MULTIMANAGER LIFESTYLE PORTFOLIOS 8
Multimanager Lifestyle Conservative Portfolio
GROWTH OF $10,000
This chart shows what happened to a hypothetical $10,000 investment in John Hancock Multimanager Lifestyle Conservative Portfolio for the share classes and periods indicated, assuming all distributions were reinvested. For comparison, we've shown the same investment in a blended index and two separate indexes.
Index 1 is the S&P 500, an unmanaged index that includes 500 widely traded common stocks.
Index 2is the Bloomberg Barclays U.S. Aggregate Bond Index, an unmanaged index of dollar-denominated and non-convertible investment-grade debt issues.
Index 3is 14% Russell 3000 Index, 6% MSCI All Country World ex-USA Index, 64% Bloomberg Barclays U.S. Aggregate Bond Index, and 16% ICE Bank of America Merrill Lynch U.S. High Yield Master II Index.
It is not possible to invest directly in an index. Index figures do not reflect expenses or sales charges, which would result in lower returns.
ASSET ALLOCATION (%)
| | | |
| Affiliated investment companies | 88.3 |
| Equity | 15.6 |
| | International Equity | 6.6 |
| | U.S. Large Cap | 5.1 |
| | U.S. Mid Cap | 1.3 |
| | Large Blend | 1.3 |
| | U.S. Small Cap | 0.7 |
| | Emerging-Market Equity | 0.6 |
| Fixed income | 67.5 |
| | Intermediate Bond | 37.2 |
| | Multi-Sector Bond | 14.6 |
| | Emerging-Market Debt | 5.6 |
| | Bank Loan | 4.2 |
| | High Yield Bond | 3.5 |
| | Global Bond | 2.0 |
| | Inflation-Protected Bond | 0.4 |
| Alternative and specialty | 5.2 |
| | Thematic Equity | 1.7 |
| | Sector Equity | 1.7 |
| | Absolute Return | 1.6 |
| | Long/Short Equity | 0.2 |
| Unaffiliated investment companies | 7.2 |
| | Equity | 0.4 |
| | Fixed income | 6.8 |
| Short-term investments and other | 4.5 |
As a percentage of net assets.
PERFORMANCE CHART
Total returns with maximum sales charge for the period ended 6-30-19 (%)
| | | | | | | | | | | | | | | |
| | Class A | Class B | Class C | Class I1,2 | Class R11 | Class R21,2 | Class R31 | Class R41 | Class R51 | Class R61,2 | Class 11 | Index 1 | Index 2 | Index 3 |
| Average annual total returns |
| 1 year | 0.69 | 0.16 | 4.24 | 6.23 | 5.55 | 5.81 | 5.72 | 6.15 | 6.28 | 6.33 | 6.37 | 10.42 | 7.87 | 7.87 |
| 5 year | 1.74 | 1.69 | 2.05 | 2.90 | 2.39 | 2.66 | 2.54 | 2.90 | 3.10 | 3.18 | 3.15 | 10.71 | 2.95 | 4.31 |
| 10 year | 5.23 | 5.15 | 5.03 | 5.46 | 5.32 | 5.50 | 5.48 | 5.81 | 6.09 | 5.95 | 6.19 | 14.70 | 3.90 | 6.53 |
| Cumulative returns |
| 6 months | 2.83 | 2.81 | 6.90 | 8.36 | 8.01 | 8.23 | 8.11 | 8.36 | 8.38 | 8.41 | 8.48 | 18.54 | 6.11 | 9.03 |
| 5 year | 9.02 | 8.75 | 10.68 | 15.39 | 12.54 | 14.04 | 13.35 | 15.37 | 16.51 | 16.94 | 16.77 | 66.33 | 15.64 | 23.50 |
| 10 year | 66.54 | 65.22 | 63.28 | 70.23 | 67.96 | 70.86 | 70.45 | 75.91 | 80.64 | 78.26 | 82.31 | 294.16 | 46.56 | 88.29 |
Performance figures assume all distributions have been reinvested. Returns with maximum sales charge reflect a sales charge on Class A shares of 5%, and the applicable contingent deferred sales charge (CDSC) on Class B and Class C shares. The Class B shares' CDSC declines annually between years 1-6 according to the following schedule: 5%, 4%, 3%, 3%, 2%, 1%. No sales charges will be assessed after the sixth year. Class C shares held for less than one year are subject to a 1% CDSC. Sales charges are not applicable to Class I, Class R1, Class R2, Class R3, Class R4, Class R5, Class R6, and Class 1 shares.
Performance of the classes will vary based on the difference in sales charges paid by shareholders investing in the different classes and the fee structure of those classes.
The expense ratios of the portfolio, both net (including any fee waivers and/or expense limitations) and gross (excluding any fee waivers and/or expense limitations), are set forth according to the most recent publicly available prospectuses for the portfolio and may differ from those disclosed in the Financial highlights tables in this report. Net expenses reflect contractual expense limitations in effect until April 30, 2020 and are subject to change. Had the contractual fee waivers and expense limitations not been in place, gross expenses would apply. The following expense ratios include expenses of the affiliated underlying funds in which the portfolio invests. The expense ratios are as follows:
| | | | | | | | | | | | |
| | Class A | Class B | Class C | Class I | Class R1 | Class R2 | Class R3 | Class R4 | Class R5 | Class R6 | Class 1 |
| Gross (%) | 1.30 | 2.00 | 2.00 | 1.00 | 1.65 | 1.40 | 1.55 | 1.25 | 0.95 | 0.90 | 0.94 |
| Net (%) | 1.29 | 2.00 | 2.00 | 0.99 | 1.65 | 1.40 | 1.55 | 1.15 | 0.95 | 0.90 | 0.94 |
Please refer to the most recent prospectus and annual or semiannual report for more information on expenses and any expense limitation arrangements for each class.
The returns reflect past results and should not be considered indicative of future performance. The return and principal value of an investment will fluctuate so that shares, when redeemed, may be worth more or less than their original cost. Due to market volatility, the portfolio's current performance may be higher or lower than the performance shown. For performance data current to the most recent month end, please call 800-225-5291 or visit the portfolio's website at jhinvestments.com.
This performance information does not reflect the deduction of taxes that a shareholder may pay on portfolio distributions or the redemption of portfolio shares. The portfolio's performance results reflect any applicable fee waivers or expense reductions, without which the expenses would increase and results would have been less favorable.
| 1 | For certain types of investors as described in the portfolio's prospectuses. |
| 2 | Class I shares were first offered on 5-1-15; Class R2 shares were first offered on 3-1-12; Class R6 shares were first offered on 9-1-11. Returns prior to these dates are those of Class C shares that have not been adjusted for class-specific expenses; otherwise, returns would vary. |
SEMIANNUAL REPORT | JOHN HANCOCK MULTIMANAGER LIFESTYLE PORTFOLIOS 9
As a shareholder of a John Hancock Funds II Multimanager Lifestyle Portfolio, you incur two types of costs: (1) transaction costs, including sales charges (loads) on certain purchases or redemptions, and (2) ongoing costs, including management fees, distribution and service (Rule 12b-1) fees, and other portfolio expenses. In addition to the operating expenses which each portfolio bears directly, each portfolio indirectly bears a pro rata share of the operating expenses of the underlying funds in which each portfolio invests. Because underlying funds have varied operating expenses and transaction costs, and a portfolio may own different proportions of the underlying funds at different times, the amount of expenses incurred indirectly by the portfolio will vary. Had these indirect expenses been reflected in the following analysis, total expenses would have been higher than the amounts shown.
These examples are intended to help you understand your ongoing costs (in dollars) of investing in a portfolio so you can compare these costs with the ongoing costs of investing in other mutual funds. The examples are based on an investment of $1,000 at the beginning of the period and held for the entire period (January 1, 2019 through June 30, 2019).
Actual expenses:
The first line of each share class in the following table provides information about actual account values and actual expenses. You may use the information in this line, together with the amount you invested, to estimate the expenses that you paid over the period. Simply divide your account value by $1,000 (for example, an $8,600 account value divided by $1,000 = 8.6), then multiply the result by the number in the first line under the heading entitled “Expenses paid during period ended” to estimate the expenses you paid on your account during this period.
Hypothetical example for comparison purposes:
The second line of each share class in the following table provides information about hypothetical account values and hypothetical expenses based on the actual expense ratio for the share class and an assumed annualized rate of return of 5% per year before expenses, which is not the actual return of the share class. The hypothetical account values and expenses may not be used to estimate the actual ending account balance or expenses you paid for the period. You may use this information to compare the ongoing costs of investing in a portfolio and other funds. To do so, compare this 5% hypothetical example with the 5% hypothetical examples that appear in the shareholder reports of the other funds. Please remember that these hypothetical account values and expenses may not be used to estimate the actual ending account balance or expenses you paid for the period.
Please note that the expenses shown in the table are meant to highlight your ongoing costs only and do not reflect any transactional costs. Therefore, the second line of each share class in the table is useful in comparing ongoing costs only, and will not help you determine the relative total costs of owning different funds. In addition, if these transactional costs were included, your costs would have been higher. See the portfolios’ prospectuses for details regarding transaction costs.
| 10 | JOHN HANCOCK MULTIMANAGER LIFESTYLE PORTFOLIOS | SEMIANNUAL REPORT | |
SHAREHOLDER EXPENSE EXAMPLE CHART
| | | Account
value on
1-1-2019 | Ending
value on
6-30-2019 | Expenses
paid during
period ended
6-30-20191 | Annualized
expense
ratio2 |
| Multimanager Lifestyle Aggressive Portfolio |
| Class A | Actual expenses/actual returns | $1,000.00 | $1,162.60 | $2.63 | 0.49% |
| | Hypothetical example | 1,000.00 | 1,022.40 | 2.46 | 0.49% |
| Class B | Actual expenses/actual returns | 1,000.00 | 1,158.30 | 6.37 | 1.19% |
| | Hypothetical example | 1,000.00 | 1,018.90 | 5.96 | 1.19% |
| Class C | Actual expenses/actual returns | 1,000.00 | 1,158.20 | 6.37 | 1.19% |
| | Hypothetical example | 1,000.00 | 1,018.90 | 5.96 | 1.19% |
| Class I | Actual expenses/actual returns | 1,000.00 | 1,164.90 | 1.02 | 0.19% |
| | Hypothetical example | 1,000.00 | 1,023.90 | 0.95 | 0.19% |
| Class R1 | Actual expenses/actual returns | 1,000.00 | 1,160.80 | 4.39 | 0.82% |
| | Hypothetical example | 1,000.00 | 1,020.70 | 4.11 | 0.82% |
| Class R2 | Actual expenses/actual returns | 1,000.00 | 1,161.40 | 3.05 | 0.57% |
| | Hypothetical example | 1,000.00 | 1,022.00 | 2.86 | 0.57% |
| Class R3 | Actual expenses/actual returns | 1,000.00 | 1,160.80 | 3.96 | 0.74% |
| | Hypothetical example | 1,000.00 | 1,021.10 | 3.71 | 0.74% |
| Class R4 | Actual expenses/actual returns | 1,000.00 | 1,163.50 | 1.82 | 0.34% |
| | Hypothetical example | 1,000.00 | 1,023.10 | 1.71 | 0.34% |
| Class R5 | Actual expenses/actual returns | 1,000.00 | 1,164.80 | 0.70 | 0.13% |
| | Hypothetical example | 1,000.00 | 1,024.10 | 0.65 | 0.13% |
| Class R6 | Actual expenses/actual returns | 1,000.00 | 1,164.90 | 0.48 | 0.09% |
| | Hypothetical example | 1,000.00 | 1,024.30 | 0.45 | 0.09% |
| Class 1 | Actual expenses/actual returns | 1,000.00 | 1,164.40 | 0.70 | 0.13% |
| | Hypothetical example | 1,000.00 | 1,024.10 | 0.65 | 0.13% |
| Multimanager Lifestyle Growth Portfolio |
| Class A | Actual expenses/actual returns | $1,000.00 | $1,145.10 | $2.66 | 0.50% |
| | Hypothetical example | 1,000.00 | 1,022.30 | 2.51 | 0.50% |
| Class B | Actual expenses/actual returns | 1,000.00 | 1,140.80 | 6.42 | 1.21% |
| | Hypothetical example | 1,000.00 | 1,018.80 | 6.06 | 1.21% |
| Class C | Actual expenses/actual returns | 1,000.00 | 1,141.00 | 6.42 | 1.21% |
| | Hypothetical example | 1,000.00 | 1,018.80 | 6.06 | 1.21% |
| Class I | Actual expenses/actual returns | 1,000.00 | 1,146.00 | 1.06 | 0.20% |
| | Hypothetical example | 1,000.00 | 1,023.80 | 1.00 | 0.20% |
| Class R1 | Actual expenses/actual returns | 1,000.00 | 1,142.90 | 4.41 | 0.83% |
| | Hypothetical example | 1,000.00 | 1,020.70 | 4.16 | 0.83% |
| Class R2 | Actual expenses/actual returns | 1,000.00 | 1,143.90 | 3.19 | 0.60% |
| | Hypothetical example | 1,000.00 | 1,021.80 | 3.01 | 0.60% |
| Class R3 | Actual expenses/actual returns | 1,000.00 | 1,143.10 | 3.93 | 0.74% |
| | Hypothetical example | 1,000.00 | 1,021.10 | 3.71 | 0.74% |
| Class R4 | Actual expenses/actual returns | 1,000.00 | 1,145.30 | 1.76 | 0.33% |
| | Hypothetical example | 1,000.00 | 1,023.20 | 1.66 | 0.33% |
| Class R5 | Actual expenses/actual returns | 1,000.00 | 1,146.60 | 0.80 | 0.15% |
| | Hypothetical example | 1,000.00 | 1,024.10 | 0.75 | 0.15% |
| Class R6 | Actual expenses/actual returns | 1,000.00 | 1,146.80 | 0.53 | 0.10% |
| | Hypothetical example | 1,000.00 | 1,024.30 | 0.50 | 0.10% |
| Class 1 | Actual expenses/actual returns | 1,000.00 | 1,145.90 | 0.74 | 0.14% |
| | Hypothetical example | 1,000.00 | 1,024.10 | 0.70 | 0.14% |
| Class 5 | Actual expenses/actual returns | 1,000.00 | 1,147.00 | 0.48 | 0.09% |
| | Hypothetical example | 1,000.00 | 1,024.30 | 0.45 | 0.09% |
| | SEMIANNUAL REPORT | JOHN HANCOCK MULTIMANAGER LIFESTYLE PORTFOLIOS | 11 |
SHAREHOLDER EXPENSE EXAMPLE CHART (continued)
| | | Account
value on
1-1-2019 | Ending
value on
6-30-2019 | Expenses
paid during
period ended
6-30-20191 | Annualized
expense
ratio2 |
| Multimanager Lifestyle Balanced Portfolio |
| Class A | Actual expenses/actual returns | $1,000.00 | $1,124.70 | $2.74 | 0.52% |
| | Hypothetical example | 1,000.00 | 1,022.20 | 2.61 | 0.52% |
| Class B | Actual expenses/actual returns | 1,000.00 | 1,121.90 | 6.42 | 1.22% |
| | Hypothetical example | 1,000.00 | 1,018.70 | 6.11 | 1.22% |
| Class C | Actual expenses/actual returns | 1,000.00 | 1,120.90 | 6.42 | 1.22% |
| | Hypothetical example | 1,000.00 | 1,018.70 | 6.11 | 1.22% |
| Class I | Actual expenses/actual returns | 1,000.00 | 1,127.20 | 1.16 | 0.22% |
| | Hypothetical example | 1,000.00 | 1,023.70 | 1.10 | 0.22% |
| Class R1 | Actual expenses/actual returns | 1,000.00 | 1,123.40 | 4.42 | 0.84% |
| | Hypothetical example | 1,000.00 | 1,020.60 | 4.21 | 0.84% |
| Class R2 | Actual expenses/actual returns | 1,000.00 | 1,124.10 | 3.27 | 0.62% |
| | Hypothetical example | 1,000.00 | 1,021.70 | 3.11 | 0.62% |
| Class R3 | Actual expenses/actual returns | 1,000.00 | 1,123.80 | 3.95 | 0.75% |
| | Hypothetical example | 1,000.00 | 1,021.10 | 3.76 | 0.75% |
| Class R4 | Actual expenses/actual returns | 1,000.00 | 1,125.80 | 1.84 | 0.35% |
| | Hypothetical example | 1,000.00 | 1,023.10 | 1.76 | 0.35% |
| Class R5 | Actual expenses/actual returns | 1,000.00 | 1,126.70 | 0.84 | 0.16% |
| | Hypothetical example | 1,000.00 | 1,024.00 | 0.80 | 0.16% |
| Class R6 | Actual expenses/actual returns | 1,000.00 | 1,126.90 | 0.63 | 0.12% |
| | Hypothetical example | 1,000.00 | 1,024.20 | 0.60 | 0.12% |
| Class 1 | Actual expenses/actual returns | 1,000.00 | 1,127.60 | 0.84 | 0.16% |
| | Hypothetical example | 1,000.00 | 1,024.00 | 0.80 | 0.16% |
| Class 5 | Actual expenses/actual returns | 1,000.00 | 1,127.80 | 0.58 | 0.11% |
| | Hypothetical example | 1,000.00 | 1,024.20 | 0.55 | 0.11% |
| Multimanager Lifestyle Moderate Portfolio |
| Class A | Actual expenses/actual returns | $1,000.00 | $1,104.00 | $2.82 | 0.54% |
| | Hypothetical example | 1,000.00 | 1,022.10 | 2.71 | 0.54% |
| Class B | Actual expenses/actual returns | 1,000.00 | 1,100.30 | 6.46 | 1.24% |
| | Hypothetical example | 1,000.00 | 1,018.60 | 6.21 | 1.24% |
| Class C | Actual expenses/actual returns | 1,000.00 | 1,101.00 | 6.46 | 1.24% |
| | Hypothetical example | 1,000.00 | 1,018.60 | 6.21 | 1.24% |
| Class I | Actual expenses/actual returns | 1,000.00 | 1,106.90 | 1.25 | 0.24% |
| | Hypothetical example | 1,000.00 | 1,023.60 | 1.20 | 0.24% |
| Class R1 | Actual expenses/actual returns | 1,000.00 | 1,102.40 | 4.48 | 0.86% |
| | Hypothetical example | 1,000.00 | 1,020.50 | 4.31 | 0.86% |
| Class R2 | Actual expenses/actual returns | 1,000.00 | 1,104.80 | 3.24 | 0.62% |
| | Hypothetical example | 1,000.00 | 1,021.70 | 3.11 | 0.62% |
| Class R3 | Actual expenses/actual returns | 1,000.00 | 1,103.80 | 3.91 | 0.75% |
| | Hypothetical example | 1,000.00 | 1,021.10 | 3.76 | 0.75% |
| Class R4 | Actual expenses/actual returns | 1,000.00 | 1,105.30 | 2.04 | 0.39% |
| | Hypothetical example | 1,000.00 | 1,022.90 | 1.96 | 0.39% |
| Class R5 | Actual expenses/actual returns | 1,000.00 | 1,106.20 | 0.99 | 0.19% |
| | Hypothetical example | 1,000.00 | 1,023.90 | 0.95 | 0.19% |
| Class R6 | Actual expenses/actual returns | 1,000.00 | 1,107.50 | 0.73 | 0.14% |
| | Hypothetical example | 1,000.00 | 1,024.10 | 0.70 | 0.14% |
| Class 1 | Actual expenses/actual returns | 1,000.00 | 1,107.20 | 0.94 | 0.18% |
| | Hypothetical example | 1,000.00 | 1,023.90 | 0.90 | 0.18% |
| Class 5 | Actual expenses/actual returns | 1,000.00 | 1,106.70 | 0.68 | 0.13% |
| | Hypothetical example | 1,000.00 | 1,024.10 | 0.65 | 0.13% |
| 12 | JOHN HANCOCK MULTIMANAGER LIFESTYLE PORTFOLIOS | SEMIANNUAL REPORT | |
SHAREHOLDER EXPENSE EXAMPLE CHART (continued)
| | | Account
value on
1-1-2019 | Ending
value on
6-30-2019 | Expenses
paid during
period ended
6-30-20191 | Annualized
expense
ratio2 |
| Multimanager Lifestyle Conservative Portfolio |
| Class A | Actual expenses/actual returns | $1,000.00 | $1,082.70 | $2.89 | 0.56% |
| | Hypothetical example | 1,000.00 | 1,022.00 | 2.81 | 0.56% |
| Class B | Actual expenses/actual returns | 1,000.00 | 1,078.10 | 6.49 | 1.26% |
| | Hypothetical example | 1,000.00 | 1,018.50 | 6.31 | 1.26% |
| Class C | Actual expenses/actual returns | 1,000.00 | 1,079.00 | 6.50 | 1.26% |
| | Hypothetical example | 1,000.00 | 1,018.50 | 6.31 | 1.26% |
| Class I | Actual expenses/actual returns | 1,000.00 | 1,083.60 | 1.34 | 0.26% |
| | Hypothetical example | 1,000.00 | 1,023.50 | 1.30 | 0.26% |
| Class R1 | Actual expenses/actual returns | 1,000.00 | 1,080.10 | 4.69 | 0.91% |
| | Hypothetical example | 1,000.00 | 1,020.30 | 4.56 | 0.91% |
| Class R2 | Actual expenses/actual returns | 1,000.00 | 1,082.30 | 3.36 | 0.65% |
| | Hypothetical example | 1,000.00 | 1,021.60 | 3.26 | 0.65% |
| Class R3 | Actual expenses/actual returns | 1,000.00 | 1,081.10 | 3.87 | 0.75% |
| | Hypothetical example | 1,000.00 | 1,021.10 | 3.76 | 0.75% |
| Class R4 | Actual expenses/actual returns | 1,000.00 | 1,083.60 | 2.12 | 0.41% |
| | Hypothetical example | 1,000.00 | 1,022.80 | 2.06 | 0.41% |
| Class R5 | Actual expenses/actual returns | 1,000.00 | 1,083.80 | 1.09 | 0.21% |
| | Hypothetical example | 1,000.00 | 1,023.80 | 1.05 | 0.21% |
| Class R6 | Actual expenses/actual returns | 1,000.00 | 1,084.10 | 0.83 | 0.16% |
| | Hypothetical example | 1,000.00 | 1,024.00 | 0.80 | 0.16% |
| Class 1 | Actual expenses/actual returns | 1,000.00 | 1,084.80 | 1.03 | 0.20% |
| | Hypothetical example | 1,000.00 | 1,023.80 | 1.00 | 0.20% |
| | |
| 1 | Expenses are equal to the annualized expense ratio, multiplied by the average account value over the period, multiplied by 181/365 (to reflect the one-half year period). |
| 2 | Ratios do not include expenses indirectly incurred by the underlying funds and can vary based on the mix of underlying funds held by the portfolios. |
| | SEMIANNUAL REPORT | JOHN HANCOCK MULTIMANAGER LIFESTYLE PORTFOLIOS | 13 |
| Subadvisors of Affiliated Underlying Funds |
| Allianz Global Investors U.S. LLC | (Allianz) |
| Axiom International Investors LLC | (Axiom) |
| Barrow, Hanley, Mewhinney & Strauss, LLC | (Barrow Hanley) |
| BCSF Advisors, LP (Bain Capital Credit) | (Bain Capital) |
| Boston Partners Global Investors, Inc. | (Boston Partners) |
| Deutsche Investment Management Americas, Inc. | (Deutsche) |
| Dimensional Fund Advisors LP | (DFA) |
| Epoch Investment Partners, Inc. | (Epoch) |
| First Quadrant, L.P. | (First Quadrant) |
| Franklin Templeton Investments Corp. | (Franklin Templeton) |
| Invesco Advisers, Inc. | (Invesco) |
| Jennison Associates LLC | (Jennison) |
| Manulife Investment Management (North America) Limited | (MIM NA) |
| Manulife Investment Management (US) LLC | (MIM US) |
| Pacific Investment Management Company LLC | (PIMCO) |
| Pictet Asset Management SA | (Pictet) |
| Redwood Investments, LLC | (Redwood) |
| Stone Harbor Investment Partners LP | (Stone Harbor) |
| T. Rowe Price Associates, Inc. | (T. Rowe Price) |
| Wellington Management Company, LLP | (Wellington) |
| Wells Capital Management, Incorporated | (Wells Capital) |
MULTIMANAGER LIFESTYLE AGGRESSIVE PORTFOLIO
As of 6-30-19 (unaudited)
| | Shares or
Principal
Amount | Value |
| AFFILIATED INVESTMENT COMPANIES (A) - 100.0% |
| Equity - 93.1% |
| Blue Chip Growth, Class NAV, JHF II (T. Rowe Price) | 5,723,297 | $236,658,330 |
| Capital Appreciation, Class NAV, JHF II (Jennison) | 8,851,797 | 140,478,013 |
| Capital Appreciation Value, Class NAV, JHF II (T. Rowe Price) | 13,152,076 | 154,142,326 |
| Disciplined Value, Class NAV, JHF III (Boston Partners) | 6,999,196 | 141,313,774 |
| Disciplined Value International, Class NAV, JHIT (Boston Partners) | 17,075,073 | 205,242,374 |
| Emerging Markets Equity, Class NAV, JHIT (MIM US) (B) | 26,538,377 | 283,960,632 |
| Equity Income, Class NAV, JHF II (T. Rowe Price) | 12,703,755 | 236,289,849 |
| Financial Industries, Class NAV, JHIT II (MIM US) (B) | 2,890,060 | 53,812,909 |
| Fundamental Global Franchise, Class NAV, JHF II (MIM US) (B) | 2,469,486 | 29,584,440 |
| Fundamental Large Cap Core, Class NAV, JHIT (MIM US) (B) | 4,753,690 | 226,846,086 |
| Global Equity, Class NAV, JHF II (MIM US) (B) | 5,377,839 | 62,866,934 |
| Global Shareholder Yield, Class NAV, JHF III (Epoch) | 3,570,770 | 39,564,127 |
| Global Thematic Opportunities, Class NAV, JHIT (Pictet) (C) | 7,142,166 | 83,206,236 |
| International Dynamic Growth, Class NAV, JHIT (Axiom) (C) | 4,597,795 | 47,357,292 |
| International Growth, Class NAV, JHF III (Wellington) | 5,381,535 | 150,629,174 |
| International Growth Stock, Class NAV, JHF II (Invesco) | 601,699 | 8,357,604 |
| International Small Cap, Class NAV, JHF II (Franklin Templeton) | 589,385 | 10,349,608 |
| International Small Company, Class NAV, JHF II (DFA) | 10,467,028 | 109,694,449 |
| International Strategic Equity Allocation, Class NAV, JHF II (MIM US) (B) | 31,095,426 | 293,229,871 |
| Mid Cap Stock, Class NAV, JHF II (Wellington) | 7,697,042 | 175,723,475 |
| Mid Value, Class NAV, JHF II (T. Rowe Price) | 12,888,663 | 192,298,857 |
| Multifactor Emerging Markets ETF, JHETF (DFA) | 3,568,132 | 91,411,974 |
| Multifactor Mid Cap ETF, JHETF (DFA) | 332,796 | 12,147,054 |
| Multifactor Small Cap ETF, JHETF (DFA) | 465,634 | 12,280,491 |
| Small Cap Core, Class NAV, JHIT (MIM US) (B) | 5,521,840 | 64,715,962 |
| Small Cap Growth, Class NAV, JHF II (Redwood) | 3,980,923 | 68,750,539 |
| Small Cap Stock, Class NAV, JHF II (Wellington) | 444,328 | 4,101,143 |
| Small Cap Value, Class NAV, JHF II (Wellington) | 3,636,239 | 73,961,099 |
| U.S. Strategic Equity Allocation, Class NAV, JHF II (MIM US) (B) | 27,043,279 | 269,621,488 |
| Value Equity, Class NAV, JHIT (Barrow Hanley) | 742,155 | 8,631,260 |
| 14 | JOHN HANCOCK MULTIMANAGER LIFESTYLE PORTFOLIOS | SEMIANNUAL REPORT | SEE NOTES TO FINANCIAL STATEMENTS |
MULTIMANAGER LIFESTYLE AGGRESSIVE PORTFOLIO (continued)
| | Shares or
Principal
Amount | Value |
| Alternative and specialty - 6.9% |
| Absolute Return Currency, Class NAV, JHF II (First Quadrant) | 2,412,693 | $22,027,886 |
| Diversified Real Assets, Class NAV, JHIT (Deutsche/MIM NA/Wellington) (B) | 12,368,798 | 124,306,419 |
| Health Sciences, Class NAV, JHF II (T. Rowe Price) | 10,398,336 | 49,184,131 |
| Science & Technology, Class NAV, JHF II (T. Rowe Price/Allianz) | 12,519,457 | 48,074,714 |
| Seaport Long/Short, Class NAV, JHIT (Wellington) | 1,292,404 | 14,862,643 |
|
| TOTAL AFFILIATED INVESTMENT COMPANIES (Cost $3,183,616,781) | $3,745,683,163 |
| SHORT-TERM INVESTMENTS - 0.0% |
| Money market funds - 0.0% |
| State Street Institutional U.S. Government Money Market Fund, Premier Class, 2.3057% (D) | 4,326 | 4,326 |
| TOTAL SHORT-TERM INVESTMENTS (Cost $4,326) | $4,326 |
Total Investments (Multimanager Lifestyle Aggressive Portfolio)
(Cost $3,183,621,107) - 100.0% | $3,745,687,489 |
| Other assets and liabilities, net - 0.0% | 6,660 |
| TOTAL NET ASSETS - 100.0% | | $3,745,694,149 |
MULTIMANAGER LIFESTYLE GROWTH PORTFOLIO
As of 6-30-19 (unaudited)
| | Shares or
Principal
Amount | Value |
| AFFILIATED INVESTMENT COMPANIES (A) - 96.7% |
| Equity - 74.1% |
| Blue Chip Growth, Class NAV, JHF II (T. Rowe Price) | 13,832,105 | $571,957,531 |
| Capital Appreciation, Class NAV, JHF II (Jennison) | 21,623,964 | 343,172,311 |
| Capital Appreciation Value, Class NAV, JHF II (T. Rowe Price) | 40,432,094 | 473,864,143 |
| Disciplined Value, Class NAV, JHF III (Boston Partners) | 17,407,760 | 351,462,670 |
| Disciplined Value International, Class NAV, JHIT (Boston Partners) | 40,271,570 | 484,064,266 |
| Emerging Markets Equity, Class NAV, JHIT (MIM US) (B) | 44,735,153 | 478,666,142 |
| Equity Income, Class NAV, JHF II (T. Rowe Price) | 30,155,603 | 560,894,213 |
| Financial Industries, Class NAV, JHIT II (MIM US) (B) | 7,932,052 | 147,694,810 |
| Fundamental Global Franchise, Class NAV, JHF II (MIM US) (B) | 9,842,346 | 117,911,303 |
| Fundamental Large Cap Core, Class NAV, JHIT (MIM US) (B) | 8,550,440 | 408,026,987 |
| Global Equity, Class NAV, JHF II (MIM US) (B) | 16,443,434 | 192,223,741 |
MULTIMANAGER LIFESTYLE GROWTH PORTFOLIO (continued)
| | Shares or
Principal
Amount | Value |
| Equity - (continued) |
| Global Shareholder Yield, Class NAV, JHF III (Epoch) | 13,020,027 | $144,261,896 |
| Global Thematic Opportunities, Class NAV, JHIT (Pictet) (C) | 16,030,849 | 186,759,392 |
| International Dynamic Growth, Class NAV, JHIT (Axiom) (C) | 10,786,159 | 111,097,441 |
| International Growth, Class NAV, JHF III (Wellington) | 12,624,559 | 353,361,394 |
| International Growth Stock, Class NAV, JHF II (Invesco) | 1,410,683 | 19,594,392 |
| International Small Cap, Class NAV, JHF II (Franklin Templeton) | 1,350,180 | 23,709,167 |
| International Small Company, Class NAV, JHF II (DFA) | 23,016,721 | 241,215,240 |
| International Strategic Equity Allocation, Class NAV, JHF II (MIM US) (B) | 79,112,726 | 746,033,002 |
| Mid Cap Stock, Class NAV, JHF II (Wellington) | 19,172,784 | 437,714,650 |
| Mid Value, Class NAV, JHF II (T. Rowe Price) | 31,445,140 | 469,161,489 |
| Multifactor Emerging Markets ETF, JHETF (DFA) | 8,482,819 | 217,321,340 |
| Multifactor Mid Cap ETF, JHETF (DFA) | 410,476 | 14,982,374 |
| Multifactor Small Cap ETF, JHETF (DFA) | 1,271,422 | 33,532,102 |
| Small Cap Core, Class NAV, JHIT (MIM US) (B) | 12,651,453 | 148,275,028 |
| Small Cap Growth, Class NAV, JHF II (Redwood) | 7,900,591 | 136,443,200 |
| Small Cap Stock, Class NAV, JHF II (Wellington) | 883,845 | 8,157,890 |
| Small Cap Value, Class NAV, JHF II (Wellington) | 7,326,832 | 149,027,767 |
| U.S. Strategic Equity Allocation, Class NAV, JHF II (MIM US) (B) | 61,743,634 | 615,584,030 |
| Value Equity, Class NAV, JHIT (Barrow Hanley) | 1,803,463 | 20,974,278 |
| Fixed income - 16.5% |
| Asia Pacific Total Return Bond, Class NAV, JHF II (MIM US) (B) | 6,867,688 | 67,990,107 |
| Bond, Class NAV, JHSB (MIM US) (B) | 25,888,917 | 415,258,222 |
| Core Bond, Class NAV, JHF II (Wells Capital) | 26,039,257 | 341,635,048 |
| Emerging Markets Debt, Class NAV, JHF II (MIM US) (B) | 25,782,536 | 244,676,264 |
| Floating Rate Income, Class NAV, JHF II (Bain Capital) | 13,776,770 | 114,484,958 |
| High Yield, Class NAV, JHBT (MIM US) (B) | 32,158,729 | 109,982,854 |
| Real Return Bond, Class NAV, JHF II (PIMCO) | 1,034,733 | 11,485,532 |
| Short Duration Credit Opportunities, Class NAV, JHF II (Stone Harbor) | 12,687,887 | 121,423,075 |
| Spectrum Income, Class NAV, JHF II (T. Rowe Price) | 3,033,039 | 32,392,858 |
| Strategic Income Opportunities, Class NAV, JHF II (MIM US) (B) | 31,613,331 | 333,204,504 |
| U.S. High Yield Bond, Class NAV, JHF II (Wells Capital) | 3,287,081 | 36,486,598 |
| Alternative and specialty - 6.1% |
| Absolute Return Currency, Class NAV, JHF II (First Quadrant) | 13,859,438 | 126,536,666 |
| SEE NOTES TO FINANCIAL STATEMENTS | SEMIANNUAL REPORT | JOHN HANCOCK MULTIMANAGER LIFESTYLE PORTFOLIOS | 15 |
MULTIMANAGER LIFESTYLE GROWTH PORTFOLIO (continued)
| | Shares or
Principal
Amount | Value |
| Alternative and specialty - (continued) |
| Diversified Real Assets, Class NAV, JHIT (Deutsche/MIM NA/Wellington) (B) | 31,386,471 | $315,434,032 |
| Health Sciences, Class NAV, JHF II (T. Rowe Price) | 21,142,315 | 100,003,151 |
| Science & Technology, Class NAV, JHF II (T. Rowe Price/Allianz) | 27,451,122 | 105,412,307 |
| Seaport Long/Short, Class NAV, JHIT (Wellington) | 2,262,534 | 26,019,144 |
|
| TOTAL AFFILIATED INVESTMENT COMPANIES (Cost $9,323,638,377) | $10,709,569,509 |
| UNAFFILIATED INVESTMENT COMPANIES - 1.7% |
| Fixed income - 1.7% |
|
| Fidelity Inflation Protected Bond Index Fund | 18,023,347 | 181,134,637 |
|
| TOTAL UNAFFILIATED INVESTMENT COMPANIES (Cost $175,249,460) | $181,134,637 |
| SHORT-TERM INVESTMENTS - 1.6% |
| U.S. Government - 1.6% |
| U.S. Treasury Bill, 2.100%, 09/26/2019 * | 8,838,000 | 8,793,735 |
| U.S. Treasury Bill, 2.160%, 09/12/2019 * | 32,318,000 | 32,182,656 |
| U.S. Treasury Bill, 2.310%, 08/29/2019 * | 19,853,000 | 19,784,754 |
| U.S. Treasury Bill, 2.335%, 08/08/2019 * | 33,469,000 | 33,396,930 |
| U.S. Treasury Bill, 2.366%, 07/18/2019 * | 21,303,000 | 21,282,629 |
| U.S. Treasury Bill, 2.372%, 08/08/2019 * | 56,851,000 | 56,728,581 |
| U.S. Treasury Bill, 2.388%, 07/18/2019 * | 9,210,000 | 9,201,193 |
| Money market funds - 0.0% |
| State Street Institutional U.S. Government Money Market Fund, Premier Class, 2.3057% (D) | 16,635 | 16,635 |
| TOTAL SHORT-TERM INVESTMENTS (Cost $181,338,078) | $181,387,113 |
Total Investments (Multimanager Lifestyle Growth Portfolio)
(Cost $9,680,225,915) - 100.0% | $11,072,091,259 |
| Other assets and liabilities, net - 0.0% | (992,728) |
| TOTAL NET ASSETS - 100.0% | | $11,071,098,531 |
MULTIMANAGER LIFESTYLE BALANCED PORTFOLIO
As of 6-30-19 (unaudited)
| | Shares or
Principal
Amount | Value |
| AFFILIATED INVESTMENT COMPANIES (A) - 94.6% |
| Equity - 55.4% |
| Blue Chip Growth, Class NAV, JHF II (T. Rowe Price) | 10,075,089 | $416,604,933 |
| Capital Appreciation, Class NAV, JHF II (Jennison) | 15,608,389 | 247,705,140 |
| Capital Appreciation Value, Class NAV, JHF II (T. Rowe Price) | 40,823,788 | 478,454,793 |
| Disciplined Value, Class NAV, JHF III (Boston Partners) | 12,640,205 | 255,205,732 |
MULTIMANAGER LIFESTYLE BALANCED PORTFOLIO (continued)
| | Shares or
Principal
Amount | Value |
| Equity - (continued) |
| Disciplined Value International, Class NAV, JHIT (Boston Partners) | 27,939,084 | $335,827,784 |
| Emerging Markets Equity, Class NAV, JHIT (MIM US) (B) | 27,272,992 | 291,821,015 |
| Equity Income, Class NAV, JHF II (T. Rowe Price) | 22,204,786 | 413,009,021 |
| Financial Industries, Class NAV, JHIT II (MIM US) (B) | 6,527,404 | 121,540,264 |
| Fundamental Global Franchise, Class NAV, JHF II (MIM US) (B) | 11,816,003 | 141,555,712 |
| Fundamental Large Cap Core, Class NAV, JHIT (MIM US) (B) | 6,491,936 | 309,795,193 |
| Global Equity, Class NAV, JHF II (MIM US) (B) | 15,629,677 | 182,710,927 |
| Global Shareholder Yield, Class NAV, JHF III (Epoch) | 12,586,372 | 139,457,003 |
| Global Thematic Opportunities, Class NAV, JHIT (Pictet) (C) | 8,776,486 | 102,246,063 |
| International Dynamic Growth, Class NAV, JHIT (Axiom) (C) | 7,513,206 | 77,386,020 |
| International Growth, Class NAV, JHF III (Wellington) | 8,793,994 | 246,143,881 |
| International Growth Stock, Class NAV, JHF II (Invesco) | 983,318 | 13,658,283 |
| International Small Cap, Class NAV, JHF II (Franklin Templeton) | 826,312 | 14,510,042 |
| International Small Company, Class NAV, JHF II (DFA) | 13,165,648 | 137,975,986 |
| International Strategic Equity Allocation, Class NAV, JHF II (MIM US) (B) | 51,399,770 | 484,699,828 |
| Mid Cap Stock, Class NAV, JHF II (Wellington) | 12,370,927 | 282,428,253 |
| Mid Value, Class NAV, JHF II (T. Rowe Price) | 20,489,342 | 305,700,984 |
| Multifactor Emerging Markets ETF, JHETF (DFA) | 5,472,844 | 140,208,790 |
| Multifactor Mid Cap ETF, JHETF (DFA) | 227,871 | 8,317,292 |
| Multifactor Small Cap ETF, JHETF (DFA) | 727,994 | 19,199,895 |
| Small Cap Core, Class NAV, JHIT (MIM US) (B) | 7,909,035 | 92,693,889 |
| Small Cap Growth, Class NAV, JHF II (Redwood) | 6,022,858 | 104,014,760 |
| Small Cap Stock, Class NAV, JHF II (Wellington) | 677,785 | 6,255,952 |
| Small Cap Value, Class NAV, JHF II (Wellington) | 5,636,080 | 114,637,869 |
| U.S. Strategic Equity Allocation, Class NAV, JHF II (MIM US) (B) | 56,398,524 | 562,293,288 |
| Value Equity, Class NAV, JHIT (Barrow Hanley) | 1,280,482 | 14,892,005 |
| Fixed income - 34.0% |
| Asia Pacific Total Return Bond, Class NAV, JHF II (MIM US) (B) | 9,602,262 | 95,062,393 |
| Bond, Class NAV, JHSB (MIM US) (B) | 53,968,585 | 865,656,111 |
| Core Bond, Class NAV, JHF II (Wells Capital) | 53,850,397 | 706,517,210 |
| Emerging Markets Debt, Class NAV, JHF II (MIM US) (B) | 40,457,690 | 383,943,479 |
| Floating Rate Income, Class NAV, JHF II (Bain Capital) | 30,348,631 | 252,197,126 |
| 16 | JOHN HANCOCK MULTIMANAGER LIFESTYLE PORTFOLIOS | SEMIANNUAL REPORT | SEE NOTES TO FINANCIAL STATEMENTS |
MULTIMANAGER LIFESTYLE BALANCED PORTFOLIO (continued)
| | Shares or
Principal
Amount | Value |
| Fixed income - (continued) |
| High Yield, Class NAV, JHBT (MIM US) (B) | 61,705,586 | $211,033,104 |
| Real Return Bond, Class NAV, JHF II (PIMCO) | 2,151,738 | 23,884,289 |
| Short Duration Credit Opportunities, Class NAV, JHF II (Stone Harbor) | 29,109,381 | 278,576,780 |
| Spectrum Income, Class NAV, JHF II (T. Rowe Price) | 6,673,110 | 71,268,819 |
| Strategic Income Opportunities, Class NAV, JHF II (MIM US) (B) | 72,652,570 | 765,758,085 |
| U.S. High Yield Bond, Class NAV, JHF II (Wells Capital) | 6,309,536 | 70,035,846 |
| Alternative and specialty - 5.2% |
| Absolute Return Currency, Class NAV, JHF II (First Quadrant) | 15,351,200 | 140,156,458 |
| Diversified Real Assets, Class NAV, JHIT (Deutsche/MIM NA/Wellington) (B) | 25,642,381 | 257,705,929 |
| Health Sciences, Class NAV, JHF II (T. Rowe Price) | 15,135,015 | 71,588,620 |
| Science & Technology, Class NAV, JHF II (T. Rowe Price/Allianz) | 18,605,908 | 71,446,687 |
| Seaport Long/Short, Class NAV, JHIT (Wellington) | 2,309,846 | 26,563,232 |
|
| TOTAL AFFILIATED INVESTMENT COMPANIES (Cost $9,229,206,894) | $10,352,344,765 |
| UNAFFILIATED INVESTMENT COMPANIES - 3.2% |
| Equity - 0.1% |
| Fidelity International Index Fund | 79,699 | 3,297,167 |
| Fixed income - 3.1% |
|
| Fidelity Inflation Protected Bond Index Fund | 33,820,791 | 339,898,949 |
|
| TOTAL UNAFFILIATED INVESTMENT COMPANIES (Cost $332,015,967) | $343,196,116 |
| SHORT-TERM INVESTMENTS - 2.2% |
| U.S. Government - 2.2% |
| U.S. Treasury Bill, 2.100%, 09/26/2019 * | 6,866,000 | 6,831,611 |
| U.S. Treasury Bill, 2.160%, 09/12/2019 * | 68,902,000 | 68,613,447 |
| U.S. Treasury Bill, 2.310%, 08/29/2019 * | 76,271,000 | 76,008,813 |
| U.S. Treasury Bill, 2.335%, 08/08/2019 * | 1,528,000 | 1,524,709 |
| U.S. Treasury Bill, 2.366%, 07/18/2019 * | 10,784,000 | 10,773,688 |
| U.S. Treasury Bill, 2.372%, 08/08/2019 * | 74,645,000 | 74,484,265 |
| U.S. Treasury Bill, 2.388%, 07/18/2019 * | 6,907,000 | 6,900,395 |
| Money market funds - 0.0% |
| State Street Institutional U.S. Government Money Market Fund, Premier Class, 2.3057% (D) | 20,682 | 20,682 |
| TOTAL SHORT-TERM INVESTMENTS (Cost $245,087,838) | $245,157,610 |
Total Investments (Multimanager Lifestyle Balanced Portfolio)
(Cost $9,806,310,699) - 100.0% | $10,940,698,491 |
| Other assets and liabilities, net - 0.0% | (1,546,362) |
| TOTAL NET ASSETS - 100.0% | | $10,939,152,129 |
MULTIMANAGER LIFESTYLE MODERATE PORTFOLIO
As of 6-30-19 (unaudited)
| | Shares or
Principal
Amount | Value |
| AFFILIATED INVESTMENT COMPANIES (A) - 91.9% |
| Equity - 36.2% |
| Blue Chip Growth, Class NAV, JHF II (T. Rowe Price) | 1,748,076 | $72,282,950 |
| Capital Appreciation, Class NAV, JHF II (Jennison) | 2,845,892 | 45,164,303 |
| Capital Appreciation Value, Class NAV, JHF II (T. Rowe Price) | 11,698,641 | 137,108,073 |
| Disciplined Value, Class NAV, JHF III (Boston Partners) | 2,282,474 | 46,083,156 |
| Disciplined Value International, Class NAV, JHIT (Boston Partners) | 4,765,623 | 57,282,793 |
| Emerging Markets Equity, Class NAV, JHIT (MIM US) (B) | 2,773,324 | 29,674,568 |
| Equity Income, Class NAV, JHF II (T. Rowe Price) | 4,281,616 | 79,638,060 |
| Fundamental Global Franchise, Class NAV, JHF II (MIM US) (B) | 3,255,852 | 39,005,102 |
| Fundamental Large Cap Core, Class NAV, JHIT (MIM US) (B) | 1,431,136 | 68,293,833 |
| Global Equity, Class NAV, JHF II (MIM US) (B) | 4,765,516 | 55,708,881 |
| Global Shareholder Yield, Class NAV, JHF III (Epoch) | 3,776,063 | 41,838,779 |
| International Dynamic Growth, Class NAV, JHIT (Axiom) (C) | 1,276,370 | 13,146,611 |
| International Growth, Class NAV, JHF III (Wellington) | 1,493,982 | 41,816,566 |
| International Growth Stock, Class NAV, JHF II (Invesco) | 166,999 | 2,319,617 |
| International Small Cap, Class NAV, JHF II (Franklin Templeton) | 138,535 | 2,432,682 |
| International Small Company, Class NAV, JHF II (DFA) | 2,340,545 | 24,528,916 |
| International Strategic Equity Allocation, Class NAV, JHF II (MIM US) (B) | 11,604,595 | 109,431,334 |
| Mid Cap Stock, Class NAV, JHF II (Wellington) | 2,196,451 | 50,144,969 |
| Mid Value, Class NAV, JHF II (T. Rowe Price) | 3,466,073 | 51,713,809 |
| Multifactor Emerging Markets ETF, JHETF (DFA) | 1,252,101 | 32,077,576 |
| Small Cap Growth, Class NAV, JHF II (Redwood) | 1,038,689 | 17,938,158 |
| Small Cap Stock, Class NAV, JHF II (Wellington) | 136,830 | 1,262,938 |
| Small Cap Value, Class NAV, JHF II (Wellington) | 1,231,374 | 25,046,149 |
| U.S. Strategic Equity Allocation, Class NAV, JHF II (MIM US) (B) | 10,727,488 | 106,953,055 |
| Value Equity, Class NAV, JHIT (Barrow Hanley) | 186,627 | 2,170,476 |
| Fixed income - 52.0% |
| Asia Pacific Total Return Bond, Class NAV, JHF II (MIM US) (B) | 5,984,321 | 59,244,779 |
| Bond, Class NAV, JHSB (MIM US) (B) | 25,894,351 | 415,345,398 |
| Core Bond, Class NAV, JHF II (Wells Capital) | 31,659,832 | 415,376,995 |
| Emerging Markets Debt, Class NAV, JHF II (MIM US) (B) | 15,836,922 | 150,292,389 |
| SEE NOTES TO FINANCIAL STATEMENTS | SEMIANNUAL REPORT | JOHN HANCOCK MULTIMANAGER LIFESTYLE PORTFOLIOS | 17 |
MULTIMANAGER LIFESTYLE MODERATE PORTFOLIO (continued)
| | Shares or
Principal
Amount | Value |
| Fixed income - (continued) |
| Floating Rate Income, Class NAV, JHF II (Bain Capital) | 12,658,842 | $105,194,975 |
| High Yield, Class NAV, JHBT (MIM US) (B) | 23,559,327 | 80,572,900 |
| Real Return Bond, Class NAV, JHF II (PIMCO) | 883,149 | 9,802,949 |
| Short Duration Credit Opportunities, Class NAV, JHF II (Stone Harbor) | 10,284,778 | 98,425,326 |
| Spectrum Income, Class NAV, JHF II (T. Rowe Price) | 2,347,010 | 25,066,071 |
| Strategic Income Opportunities, Class NAV, JHF II (MIM US) (B) | 25,630,618 | 270,146,713 |
| U.S. High Yield Bond, Class NAV, JHF II (Wells Capital) | 2,418,597 | 26,846,422 |
| Alternative and specialty - 3.7% |
| Absolute Return Currency, Class NAV, JHF II (First Quadrant) | 3,922,915 | 35,816,216 |
| Diversified Real Assets, Class NAV, JHIT (Deutsche/MIM NA/Wellington) (B) | 5,872,176 | 59,015,366 |
| Infrastructure, Class NAV, JHIT (Wellington) (E) | 1,219,321 | 15,778,011 |
| Seaport Long/Short, Class NAV, JHIT (Wellington) | 745,015 | 8,567,668 |
|
| TOTAL AFFILIATED INVESTMENT COMPANIES (Cost $2,697,305,242) | $2,928,555,532 |
| UNAFFILIATED INVESTMENT COMPANIES - 5.3% |
| Equity - 0.5% |
| Fidelity International Index Fund | 391,814 | 16,209,360 |
| Fixed income - 4.8% |
|
| Fidelity Inflation Protected Bond Index Fund | 15,186,824 | 152,627,582 |
|
| TOTAL UNAFFILIATED INVESTMENT COMPANIES (Cost $163,234,344) | $168,836,942 |
| SHORT-TERM INVESTMENTS - 2.8% |
| U.S. Government - 2.8% |
| U.S. Treasury Bill, 2.160%, 09/12/2019 * | 37,138,000 | 36,982,471 |
| U.S. Treasury Bill, 2.310%, 08/29/2019 * | 17,988,000 | 17,926,165 |
| U.S. Treasury Bill, 2.335%, 08/08/2019 * | 473,000 | 471,981 |
| U.S. Treasury Bill, 2.366%, 07/18/2019 * | 3,162,000 | 3,158,977 |
| U.S. Treasury Bill, 2.372%, 08/08/2019 * | 30,286,000 | 30,220,784 |
| Money market funds - 0.0% |
| State Street Institutional U.S. Government Money Market Fund, Premier Class, 2.3057% (D) | 7,497 | 7,497 |
| TOTAL SHORT-TERM INVESTMENTS (Cost $88,743,221) | $88,767,875 |
Total Investments (Multimanager Lifestyle Moderate Portfolio)
(Cost $2,949,282,807) - 100.0% | $3,186,160,349 |
| Other assets and liabilities, net - 0.0% | (556,045) |
| TOTAL NET ASSETS - 100.0% | | $3,185,604,304 |
MULTIMANAGER LIFESTYLE CONSERVATIVE PORTFOLIO
As of 6-30-19 (unaudited)
| | Shares or
Principal
Amount | Value |
| AFFILIATED INVESTMENT COMPANIES (A) - 88.3% |
| Equity - 15.6% |
| Blue Chip Growth, Class NAV, JHF II (T. Rowe Price) | 237,399 | $9,816,433 |
| Capital Appreciation, Class NAV, JHF II (Jennison) | 428,589 | 6,801,706 |
| Capital Appreciation Value, Class NAV, JHF II (T. Rowe Price) | 5,859,236 | 68,670,244 |
| Disciplined Value, Class NAV, JHF III (Boston Partners) | 487,676 | 9,846,185 |
| Disciplined Value International, Class NAV, JHIT (Boston Partners) | 1,513,478 | 18,192,010 |
| Emerging Markets Equity, Class NAV, JHIT (MIM US) (B) | 899,312 | 9,622,641 |
| Equity Income, Class NAV, JHF II (T. Rowe Price) | 826,923 | 15,380,766 |
| Fundamental Global Franchise, Class NAV, JHF II (MIM US) (B) | 1,615,074 | 19,348,588 |
| Fundamental Large Cap Core, Class NAV, JHIT (MIM US) (B) | 209,446 | 9,994,749 |
| Global Equity, Class NAV, JHF II (MIM US) (B) | 2,254,327 | 26,353,086 |
| Global Shareholder Yield, Class NAV, JHF III (Epoch) | 1,687,143 | 18,693,546 |
| International Dynamic Growth, Class NAV, JHIT (Axiom) (C) | 405,674 | 4,178,439 |
| International Growth, Class NAV, JHF III (Wellington) | 476,197 | 13,328,763 |
| International Growth Stock, Class NAV, JHF II (Invesco) | 53,254 | 739,694 |
| International Strategic Equity Allocation, Class NAV, JHF II (MIM US) (B) | 5,875,472 | 55,405,699 |
| Mid Cap Stock, Class NAV, JHF II (Wellington) | 642,168 | 14,660,688 |
| Mid Value, Class NAV, JHF II (T. Rowe Price) | 1,173,277 | 17,505,299 |
| Multifactor Emerging Markets ETF, JHETF (DFA) | 191,354 | 4,902,298 |
| Small Cap Growth, Class NAV, JHF II (Redwood) | 309,596 | 5,346,727 |
| Small Cap Stock, Class NAV, JHF II (Wellington) | 87,811 | 810,497 |
| Small Cap Value, Class NAV, JHF II (Wellington) | 479,897 | 9,761,107 |
| U.S. Strategic Equity Allocation, Class NAV, JHF II (MIM US) (B) | 3,191,237 | 31,816,630 |
| Value Equity, Class NAV, JHIT (Barrow Hanley) | 34,766 | 404,334 |
| Fixed income - 67.5% |
| Asia Pacific Total Return Bond, Class NAV, JHF II (MIM US) (B) | 4,777,913 | 47,301,338 |
| Bond, Class NAV, JHSB (MIM US) (B) | 27,726,001 | 444,725,053 |
| Core Bond, Class NAV, JHF II (Wells Capital) | 33,896,163 | 444,717,653 |
| Emerging Markets Debt, Class NAV, JHF II (MIM US) (B) | 14,060,371 | 133,432,918 |
| Floating Rate Income, Class NAV, JHF II (Bain Capital) | 12,038,139 | 100,036,938 |
| High Yield, Class NAV, JHBT (MIM US) (B) | 18,152,926 | 62,083,008 |
| Real Return Bond, Class NAV, JHF II (PIMCO) | 950,257 | 10,547,854 |
| 18 | JOHN HANCOCK MULTIMANAGER LIFESTYLE PORTFOLIOS | SEMIANNUAL REPORT | SEE NOTES TO FINANCIAL STATEMENTS |
MULTIMANAGER LIFESTYLE CONSERVATIVE PORTFOLIO (continued)
| | Shares or
Principal
Amount | Value |
| Fixed income - (continued) |
| Short Duration Credit Opportunities, Class NAV, JHF II (Stone Harbor) | 9,131,580 | $87,389,223 |
| Spectrum Income, Class NAV, JHF II (T. Rowe Price) | 1,992,220 | 21,276,906 |
| Strategic Income Opportunities, Class NAV, JHF II (MIM US) (B) | 22,841,254 | 240,746,821 |
| U.S. High Yield Bond, Class NAV, JHF II (Wells Capital) | 1,863,367 | 20,683,375 |
| Alternative and specialty - 5.2% |
| Absolute Return Currency, Class NAV, JHF II (First Quadrant) | 4,262,400 | 38,915,713 |
| Diversified Real Assets, Class NAV, JHIT (Deutsche/MIM NA/Wellington) (B) | 3,965,839 | 39,856,687 |
| Infrastructure, Class NAV, JHIT (Wellington) (E) | 3,151,460 | 40,779,893 |
| Seaport Long/Short, Class NAV, JHIT (Wellington) | 330,913 | 3,805,500 |
|
| TOTAL AFFILIATED INVESTMENT COMPANIES (Cost $2,007,276,140) | $2,107,879,009 |
| UNAFFILIATED INVESTMENT COMPANIES - 7.2% |
| Equity - 0.4% |
| Fidelity International Index Fund | 222,227 | 9,193,520 |
| Fixed income - 6.8% |
|
| Fidelity Inflation Protected Bond Index Fund | 16,309,938 | 163,914,880 |
|
| TOTAL UNAFFILIATED INVESTMENT COMPANIES (Cost $167,423,851) | $173,108,400 |
| SHORT-TERM INVESTMENTS - 4.5% |
| U.S. Government - 4.5% |
| U.S. Treasury Bill, 2.100%, 09/26/2019 * | 1,294,000 | 1,287,519 |
| U.S. Treasury Bill, 2.160%, 09/12/2019 * | 53,446,000 | 53,222,175 |
| U.S. Treasury Bill, 2.310%, 08/29/2019 * | 14,164,000 | 14,115,310 |
| U.S. Treasury Bill, 2.335%, 08/08/2019 * | 654,000 | 652,592 |
| U.S. Treasury Bill, 2.366%, 07/18/2019 * | 1,427,000 | 1,425,635 |
| U.S. Treasury Bill, 2.372%, 08/08/2019 * | 36,810,000 | 36,730,736 |
| Money market funds - 0.0% |
| State Street Institutional U.S. Government Money Market Fund, Premier Class, 2.3057% (D) | 8,559 | 8,559 |
| TOTAL SHORT-TERM INVESTMENTS (Cost $107,413,925) | $107,442,526 |
Total Investments (Multimanager Lifestyle Conservative Portfolio)
(Cost $2,282,113,916) - 100.0% | $2,388,429,935 |
| Other assets and liabilities, net - 0.0% | (521,788) |
| TOTAL NET ASSETS - 100.0% | | $2,387,908,147 |
Percentages are based upon net assets.
Security Abbreviations and Legend
| JHF II | John Hancock Funds II |
| JHF III | John Hancock Funds III |
| JHIT | John Hancock Investment Trust |
| JHIT II | John Hancock Investment Trust II |
MULTIMANAGER LIFESTYLE CONSERVATIVE PORTFOLIO (continued)
| JHETF | John Hancock Exchange-Traded Fund Trust |
| JHSB | John Hancock Sovereign Bond Fund |
| JHBT | John Hancock Bond Trust |
| (A) | The underlying funds' subadvisor is shown parenthetically. |
| (B) | The subadvisor is an affiliate of the advisor. |
| (C) | Non-income producing. |
| (D) | The rate shown is the annualized seven-day yield as of 6-30-19. |
| (E) | Formerly known as Enduring Assets Fund. |
| * | Yield represents either the annualized yield at the date of purchase, the stated coupon rate or, for floating rate securities, the rate at period end. |
| SEE NOTES TO FINANCIAL STATEMENTS | SEMIANNUAL REPORT | JOHN HANCOCK MULTIMANAGER LIFESTYLE PORTFOLIOS | 19 |
STATEMENTS OF ASSETS AND LIABILITIES 6-30-19 (unaudited)
| | Multimanager Lifestyle Aggressive Portfolio | Multimanager Lifestyle Growth Portfolio | Multimanager Lifestyle Balanced Portfolio | Multimanager Lifestyle Moderate Portfolio | Multimanager Lifestyle Conservative Portfolio |
| Assets | | | | | |
| Unaffiliated investments, at value | $4,326 | $362,521,750 | $588,353,726 | $257,604,817 | $280,550,926 |
| Affiliated investments, at value | 3,745,683,163 | 10,709,569,509 | 10,352,344,765 | 2,928,555,532 | 2,107,879,009 |
| Total investments, at value | 3,745,687,489 | 11,072,091,259 | 10,940,698,491 | 3,186,160,349 | 2,388,429,935 |
| Dividends and interest receivable | 333,677 | 4,969,519 | 8,798,668 | 3,478,869 | 3,218,869 |
| Receivable for fund shares sold | 390,713 | 744,555 | 1,274,139 | 962,081 | 824,099 |
| Receivable for investments sold | 9,203,791 | 23,397,163 | 20,340,314 | 6,801,414 | 738,640 |
| Receivable from affiliates | 506 | 1,678 | 1,766 | 647 | 559 |
| Other assets | 72,529 | 150,577 | 214,118 | 117,955 | 107,887 |
| Total assets | 3,755,688,705 | 11,101,354,751 | 10,971,327,496 | 3,197,521,315 | 2,393,319,989 |
| Liabilities | | | | | |
| Distributions payable | — | — | 90,265 | 111,015 | 193,693 |
| Payable for investments purchased | — | 4,523,567 | 9,130,228 | 3,739,221 | 3,542,941 |
| Payable for fund shares repurchased | 9,533,665 | 24,399,819 | 21,628,011 | 7,625,215 | 1,322,438 |
| Payable to affiliates | | | | | |
| Accounting and legal services fees | 322,896 | 957,919 | 948,043 | 277,801 | 207,639 |
| Transfer agent fees | 57,936 | 202,936 | 217,168 | 82,030 | 71,271 |
| Distribution and service fees | 6,999 | 13,687 | 14,949 | 4,919 | 4,651 |
| Trustees' fees | 1,962 | 6,121 | 6,107 | 1,879 | 1,434 |
| Other liabilities and accrued expenses | 71,098 | 152,171 | 140,596 | 74,931 | 67,775 |
| Total liabilities | 9,994,556 | 30,256,220 | 32,175,367 | 11,917,011 | 5,411,842 |
| Net assets | $3,745,694,149 | $11,071,098,531 | $10,939,152,129 | $3,185,604,304 | $2,387,908,147 |
| Net assets consist of | | | | | |
| Paid-in capital | $2,825,324,007 | $8,823,318,607 | $9,279,910,822 | $2,868,685,999 | $2,283,959,484 |
| Total distributable earnings (loss) | 920,370,142 | 2,247,779,924 | 1,659,241,307 | 316,918,305 | 103,948,663 |
| Net assets | $3,745,694,149 | $11,071,098,531 | $10,939,152,129 | $3,185,604,304 | $2,387,908,147 |
| Unaffiliated investments, at cost | $4,326 | $356,587,538 | $577,103,805 | $251,977,565 | $274,837,776 |
| Affiliated investments, at cost | 3,183,616,781 | 9,323,638,377 | 9,229,206,894 | 2,697,305,242 | 2,007,276,140 |
| Total investments, at cost | 3,183,621,107 | 9,680,225,915 | 9,806,310,699 | 2,949,282,807 | 2,282,113,916 |
| Net asset value per share | | | | | |
| The portfolios have an unlimited number of shares authorized with no par value. Net asset value is calculated by dividing the net assets of each class of shares by the number of outstanding shares in the class. | | | | | |
| Class A1 | | | | | |
| Net assets | $496,514,807 | $1,647,025,887 | $1,724,845,354 | $633,794,635 | $543,824,736 |
| Shares outstanding | 32,611,785 | 108,749,683 | 117,878,243 | 47,074,040 | 41,877,635 |
| Net asset value and redemption price per share | $15.23 | $15.15 | $14.63 | $13.46 | $12.99 |
| Class B1 | | | | | |
| Net assets | $4,697,592 | $19,767,749 | $22,431,127 | $8,905,979 | $7,645,177 |
| Shares outstanding | 308,671 | 1,304,692 | 1,534,588 | 662,104 | 588,396 |
| Net asset value, offering price and redemption price per share | $15.22 | $15.15 | $14.62 | $13.45 | $12.99 |
| Class C1 | | | | | |
| Net assets | $93,206,136 | $415,253,857 | $463,370,324 | $195,197,750 | $171,775,514 |
| Shares outstanding | 6,118,502 | 27,445,516 | 31,665,747 | 14,495,597 | 13,225,085 |
| Net asset value, offering price and redemption price per share | $15.23 | $15.13 | $14.63 | $13.47 | $12.99 |
| Class I | | | | | |
| Net assets | $11,191,510 | $34,414,281 | $42,327,464 | $13,121,720 | $14,013,743 |
| Shares outstanding | 736,896 | 2,283,853 | 2,911,434 | 978,759 | 1,081,019 |
| Net asset value, offering price and redemption price per share | $15.19 | $15.07 | $14.54 | $13.41 | $12.96 |
| Class R1 | | | | | |
| Net assets | $4,936,633 | $13,292,607 | $9,737,055 | $3,955,533 | $5,296,375 |
| Shares outstanding | 324,084 | 874,393 | 668,921 | 294,274 | 408,204 |
| Net asset value, offering price and redemption price per share | $15.23 | $15.20 | $14.56 | $13.44 | $12.97 |
| Class R2 | | | | | |
| Net assets | $4,918,446 | $10,731,434 | $10,153,556 | $2,474,742 | $2,501,692 |
| Shares outstanding | 325,454 | 714,307 | 698,286 | 184,540 | 192,890 |
| Net asset value, offering price and redemption price per share | $15.11 | $15.02 | $14.54 | $13.41 | $12.97 |
| Class R3 | | | | | |
| Net assets | $8,626,305 | $11,964,246 | $18,325,067 | $5,786,093 | $3,657,737 |
| Shares outstanding | 568,898 | 792,262 | 1,256,005 | 430,645 | 282,405 |
| Net asset value, offering price and redemption price per share | $15.16 | $15.10 | $14.59 | $13.44 | $12.95 |
| Class R4 | | | | | |
| Net assets | $4,664,196 | $5,494,671 | $8,539,528 | $3,179,368 | $2,934,881 |
| Shares outstanding | 307,730 | 363,119 | 584,870 | 237,187 | 226,514 |
| Net asset value, offering price and redemption price per share | $15.16 | $15.13 | $14.60 | $13.40 | $12.96 |
| 20 | JOHN HANCOCK MULTIMANAGER LIFESTYLE PORTFOLIOS | SEMIANNUAL REPORT | SEE NOTES TO FINANCIAL STATEMENTS |
STATEMENTS OF ASSETS AND LIABILITIES 6-30-19 (unaudited)
Continued
| | Multimanager Lifestyle Aggressive Portfolio | Multimanager Lifestyle Growth Portfolio | Multimanager Lifestyle Balanced Portfolio | Multimanager Lifestyle Moderate Portfolio | Multimanager Lifestyle Conservative Portfolio |
| Class R5 | | | | | |
| Net assets | $1,910,693 | $8,488,758 | $13,248,749 | $5,888,690 | $3,177,027 |
| Shares outstanding | 125,716 | 559,552 | 906,015 | 438,789 | 245,083 |
| Net asset value, offering price and redemption price per share | $15.20 | $15.17 | $14.62 | $13.42 | $12.96 |
| Class R6 | | | | | |
| Net assets | $44,465,245 | $115,817,658 | $121,570,311 | $34,249,661 | $23,714,043 |
| Shares outstanding | 2,927,626 | 7,678,303 | 8,365,612 | 2,556,518 | 1,830,542 |
| Net asset value, offering price and redemption price per share | $15.19 | $15.08 | $14.53 | $13.40 | $12.95 |
| Class 1 | | | | | |
| Net assets | $3,070,562,586 | $8,465,574,723 | $8,345,101,238 | $2,219,510,345 | $1,609,367,222 |
| Shares outstanding | 202,521,789 | 561,209,524 | 574,409,102 | 165,405,983 | 124,206,508 |
| Net asset value, offering price and redemption price per share | $15.16 | $15.08 | $14.53 | $13.42 | $12.96 |
| Class 5 | | | | | |
| Net assets | — | $323,272,660 | $159,502,356 | $59,539,788 | — |
| Shares outstanding | — | 21,460,891 | 10,973,470 | 4,442,831 | — |
| Net asset value, offering price and redemption price per share | — | $15.06 | $14.54 | $13.40 | — |
| Maximum offering price per share | | | | | |
| Class A (net asset value per share ÷ 95%)2 | $16.03 | $15.95 | $15.40 | $14.17 | $13.67 |
| 1 | Redemption price per share is equal to net asset value less any applicable contingent deferred sales charge. |
| 2 | On single retail sales of less than $50,000. On sales of $50,000 or more and on group sales the offering price is reduced. |
| SEE NOTES TO FINANCIAL STATEMENTS | SEMIANNUAL REPORT | JOHN HANCOCK MULTIMANAGER LIFESTYLE PORTFOLIOS | 21 |
STATEMENTS OF OPERATIONSFor the six months ended 6-30-19 (unaudited)
| | Multimanager Lifestyle Aggressive Portfolio | Multimanager Lifestyle Growth Portfolio | Multimanager Lifestyle Balanced Portfolio | Multimanager Lifestyle Moderate Portfolio | Multimanager Lifestyle Conservative Portfolio |
| Investment income | | | | | |
| Income distributions received from affiliated investments | $3,661,369 | $40,569,567 | $70,764,283 | $28,331,299 | $26,048,878 |
| Interest | 14,770 | 1,589,054 | 2,572,154 | 922,274 | 1,038,020 |
| Dividends | — | 205,744 | 393,994 | 212,416 | 208,274 |
| Total investment income | 3,676,139 | 42,364,365 | 73,730,431 | 29,465,989 | 27,295,172 |
| Expenses | | | | | |
| Investment management fees | 3,208,708 | 8,997,922 | 8,919,728 | 2,619,921 | 2,108,274 |
| Distribution and service fees | 2,034,331 | 6,850,242 | 7,237,273 | 2,574,542 | 2,162,372 |
| Accounting and legal services fees | 355,399 | 1,051,112 | 1,036,814 | 303,133 | 225,587 |
| Transfer agent fees | 341,581 | 1,204,018 | 1,289,975 | 485,628 | 422,695 |
| Trustees' fees | 36,686 | 109,510 | 109,055 | 32,322 | 24,265 |
| Custodian fees | 16,439 | 16,960 | 16,951 | 16,946 | 16,433 |
| State registration fees | 78,277 | 84,817 | 86,980 | 81,934 | 77,804 |
| Printing and postage | 34,008 | 94,621 | 83,504 | 37,621 | 32,810 |
| Professional fees | 44,892 | 97,440 | 96,513 | 41,692 | 35,386 |
| Other | 21,180 | 50,021 | 50,303 | 19,822 | 16,329 |
| Total expenses | 6,171,501 | 18,556,663 | 18,927,096 | 6,213,561 | 5,121,955 |
| Less expense reductions | (2,340,289) | (5,570,027) | (4,789,516) | (1,179,676) | (805,798) |
| Net expenses | 3,831,212 | 12,986,636 | 14,137,580 | 5,033,885 | 4,316,157 |
| Net investment income (loss) | (155,073) | 29,377,729 | 59,592,851 | 24,432,104 | 22,979,015 |
| Realized and unrealized gain (loss) | | | | | |
| Net realized gain (loss) on | | | | | |
| Unaffiliated investments and foreign currency transactions | 141,189 | 322,075 | 207,161 | 17,850 | 356 |
| Affiliated investments | 121,220,106 | 286,368,220 | 199,114,316 | 17,938,590 | (368,497) |
| | 121,361,295 | 286,690,295 | 199,321,477 | 17,956,440 | (368,141) |
| Change in net unrealized appreciation (depreciation) of | | | | | |
| Unaffiliated investments and translation of assets and liabilities in foreign currencies | — | 5,953,902 | 11,293,933 | 5,643,692 | 5,727,057 |
| Affiliated investments | 429,001,700 | 1,150,751,258 | 1,008,867,674 | 269,557,973 | 161,527,692 |
| | 429,001,700 | 1,156,705,160 | 1,020,161,607 | 275,201,665 | 167,254,749 |
| Net realized and unrealized gain | 550,362,995 | 1,443,395,455 | 1,219,483,084 | 293,158,105 | 166,886,608 |
| Increase (decrease) in net assets from operations | $550,207,922 | $1,472,773,184 | $1,279,075,935 | $317,590,209 | $189,865,623 |
| 22 | JOHN HANCOCK MULTIMANAGER LIFESTYLE PORTFOLIOS | SEMIANNUAL REPORT | SEE NOTES TO FINANCIAL STATEMENTS |
STATEMENTS OF CHANGES IN NET ASSETS
| | Multimanager Lifestyle Aggressive Portfolio | Multimanager Lifestyle Growth Portfolio | Multimanager Lifestyle Balanced Portfolio |
| | Six months ended
6-30-19
(unaudited) | Year ended
12-31-18
| Six months ended
6-30-19
(unaudited) | Year ended
12-31-18
| Six months ended
6-30-19
(unaudited) | Year ended
12-31-18
|
| Increase (decrease) in net assets | | | | | | |
| From operations | | | | | | |
| Net investment income (loss) | $(155,073) | $38,976,527 | $29,377,729 | $174,147,836 | $59,592,851 | $234,118,177 |
| Net realized gain | 121,361,295 | 441,599,862 | 286,690,295 | 1,125,995,956 | 199,321,477 | 840,858,408 |
| Change in net unrealized appreciation (depreciation) | 429,001,700 | (858,679,480) | 1,156,705,160 | (2,251,917,031) | 1,020,161,607 | (1,810,722,398) |
| Increase (decrease) in net assets resulting from operations | 550,207,922 | (378,103,091) | 1,472,773,184 | (951,773,239) | 1,279,075,935 | (735,745,813) |
| From net investment income and net realized gain | | | | | | |
| Class A | — | (51,109,195) | — | (154,331,632) | (6,858,980) | (135,841,404) |
| Class B | — | (632,408) | — | (2,514,337) | (14,096) | (2,159,589) |
| Class C | — | (9,984,618) | — | (39,639,362) | (288,530) | (37,300,776) |
| Class I | — | (1,074,039) | — | (3,432,022) | (233,018) | (3,642,958) |
| Class R1 | — | (538,925) | — | (1,363,477) | (26,365) | (1,025,976) |
| Class R2 | — | (615,824) | — | (1,250,503) | (37,433) | (1,118,486) |
| Class R3 | — | (875,456) | — | (1,102,923) | (51,492) | (1,287,203) |
| Class R4 | — | (500,565) | — | (515,626) | (40,553) | (631,099) |
| Class R5 | — | (358,437) | — | (882,566) | (74,928) | (1,173,544) |
| Class R6 | — | (3,872,638) | — | (9,159,506) | (656,163) | (7,268,376) |
| Class 1 | — | (341,594,813) | — | (852,825,679) | (48,210,224) | (713,637,053) |
| Class 5 | — | — | — | (30,388,934) | (944,109) | (12,816,870) |
| Total distributions | — | (411,156,918) | — | (1,097,406,567) | (57,435,891) | (917,903,334) |
| Portfolio share transactions | | | | | | |
| From portfolio share transactions | (222,619,287) | (73,238,755) | (730,539,268) | (521,635,491) | (652,395,408) | (742,423,310) |
| Total increase (decrease) | 327,588,635 | (862,498,764) | 742,233,916 | (2,570,815,297) | 569,244,636 | (2,396,072,457) |
| Net assets | | | | | | |
| Beginning of period | 3,418,105,514 | 4,280,604,278 | 10,328,864,615 | 12,899,679,912 | 10,369,907,493 | 12,765,979,950 |
| End of period | $3,745,694,149 | $3,418,105,514 | $11,071,098,531 | $10,328,864,615 | $10,939,152,129 | $10,369,907,493 |
| SEE NOTES TO FINANCIAL STATEMENTS | SEMIANNUAL REPORT | JOHN HANCOCK MULTIMANAGER LIFESTYLE PORTFOLIOS | 23 |
STATEMENTS OF CHANGES IN NET ASSETS
Continued
| | Multimanager Lifestyle Moderate Portfolio | Multimanager Lifestyle Conservative Portfolio |
| | Six months ended
6-30-19
(unaudited) | Year ended
12-31-18
| Six months ended
6-30-19
(unaudited) | Year ended
12-31-18
|
| Increase (decrease) in net assets | | | | |
| From operations | | | | |
| Net investment income | $24,432,104 | $83,315,294 | $22,979,015 | $67,974,796 |
| Net realized gain (loss) | 17,956,440 | 165,950,322 | (368,141) | 49,367,464 |
| Change in net unrealized appreciation (depreciation) | 275,201,665 | (417,709,977) | 167,254,749 | (206,978,404) |
| Increase (decrease) in net assets resulting from operations | 317,590,209 | (168,444,361) | 189,865,623 | (89,636,144) |
| From net investment income and net realized gain | | | | |
| Class A | (3,999,493) | (39,590,857) | (4,581,744) | (20,860,532) |
| Class B | (28,357) | (708,969) | (40,730) | (334,764) |
| Class C | (581,481) | (11,978,202) | (875,969) | (5,947,405) |
| Class I | (107,715) | (1,007,565) | (140,805) | (622,608) |
| Class R1 | (24,613) | (316,963) | (38,913) | (237,034) |
| Class R2 | (14,660) | (227,077) | (20,535) | (112,100) |
| Class R3 | (29,616) | (335,571) | (27,086) | (132,417) |
| Class R4 | (22,744) | (204,665) | (27,237) | (87,989) |
| Class R5 | (49,106) | (456,067) | (33,426) | (180,532) |
| Class R6 | (272,897) | (1,672,764) | (232,672) | (836,279) |
| Class 1 | (18,121,374) | (152,722,250) | (16,442,608) | (69,386,676) |
| Class 5 | (492,234) | (3,762,358) | — | — |
| Total distributions | (23,744,290) | (212,983,308) | (22,461,725) | (98,738,336) |
| Portfolio share transactions | | | | |
| From portfolio share transactions | (200,203,887) | (328,205,952) | (123,542,746) | (340,224,242) |
| Total increase (decrease) | 93,642,032 | (709,633,621) | 43,861,152 | (528,598,722) |
| Net assets | | | | |
| Beginning of period | 3,091,962,272 | 3,801,595,893 | 2,344,046,995 | 2,872,645,717 |
| End of period | $3,185,604,304 | $3,091,962,272 | $2,387,908,147 | $2,344,046,995 |
| 24 | JOHN HANCOCK MULTIMANAGER LIFESTYLE PORTFOLIOS | SEMIANNUAL REPORT | SEE NOTES TO FINANCIAL STATEMENTS |
Multimanager Lifestyle Aggressive Portfolio
| Per share operating performance for a share outstanding throughout each period | | Ratios and supplemental data | |
| | | | Income (loss) from investment operations | | | | Less distributions | | | | Ratios to average net assets | | | |
| Period ended | Net asset
value,
beginning
of period ($) | | Net
investment
income
(loss) ($)1, 2 | Net realized and
unrealized
gain (loss)
on investments ($) | | Total from
investment
operations ($) | | From net
investment
income ($) | From net
realized
gain ($)3 | Total
distributions ($) | Net asset
value,
end of
period ($) | Total
return
(%)4, 5 | Expenses
before
reductions
(%)6 | Expenses
including
reductions
(%)6 | Net
investment
income
(loss) (%)2 | Net
assets,
end of
period
(in millions) | Portfolio
turnover
(%) |
| Multimanager Lifestyle Aggressive Portfolio | |
| Class A | |
| 06-30-20197 | 13.10 | | (0.02) | 2.15 | | 2.13 | | — | — | — | 15.23 | 16.268 | 0.629 | 0.499 | (0.29)9 | 497 | 21 |
| 12-31-2018 | 16.52 | | 0.12 | (1.82) | | (1.70) | | (0.12) | (1.60) | (1.72) | 13.10 | (10.19) | 0.56 | 0.48 | 0.72 | 439 | 22 |
| 12-31-2017 | 14.72 | | 0.13 | 3.23 | | 3.36 | | (0.13) | (1.43) | (1.56) | 16.52 | 22.79 | 0.55 | 0.48 | 0.79 | 499 | 23 |
| 12-31-2016 | 14.87 | | 0.12 | 0.91 | | 1.03 | | (0.12) | (1.06) | (1.18) | 14.72 | 6.92 | 0.53 | 0.47 | 0.78 | 419 | 31 |
| 12-31-2015 | 16.29 | | 0.11 | (0.34) | | (0.23) | | (0.10) | (1.09) | (1.19) | 14.87 | (1.54) | 0.52 | 0.47 | 0.64 | 411 | 15 |
| 12-31-2014 | 15.94 | | 0.10 | 0.60 | | 0.70 | | (0.09) | (0.26) | (0.35) | 16.29 | 4.39 | 0.53 | 0.47 | 0.59 | 393 | 18 |
| Class B | |
| 06-30-20197 | 13.14 | | (0.07) | 2.15 | | 2.08 | | — | — | — | 15.22 | 15.838 | 1.329 | 1.199 | (1.01)9 | 5 | 21 |
| 12-31-2018 | 16.55 | | (0.03) | (1.78) | | (1.81) | | —10 | (1.60) | (1.60) | 13.14 | (10.82) | 1.26 | 1.18 | (0.17) | 6 | 22 |
| 12-31-2017 | 14.75 | | (0.02) | 3.26 | | 3.24 | | (0.01) | (1.43) | (1.44) | 16.55 | 21.97 | 1.25 | 1.18 | (0.10) | 10 | 23 |
| 12-31-2016 | 14.90 | | (0.01) | 0.93 | | 0.92 | | (0.01) | (1.06) | (1.07) | 14.75 | 6.15 | 1.23 | 1.19 | (0.08) | 12 | 31 |
| 12-31-2015 | 16.33 | | (0.04) | (0.32) | | (0.36) | | — | (1.07) | (1.07) | 14.90 | (2.31) | 1.24 | 1.21 | (0.26) | 16 | 15 |
| 12-31-2014 | 15.98 | | (0.06) | 0.63 | | 0.57 | | — | (0.22) | (0.22) | 16.33 | 3.58 | 1.28 | 1.26 | (0.36) | 22 | 18 |
| Class C | |
| 06-30-20197 | 13.15 | | (0.07) | 2.15 | | 2.08 | | — | — | — | 15.23 | 15.828 | 1.329 | 1.199 | (1.00)9 | 93 | 21 |
| 12-31-2018 | 16.57 | | (0.02) | (1.80) | | (1.82) | | —10 | (1.60) | (1.60) | 13.15 | (10.87) | 1.26 | 1.18 | (0.14) | 91 | 22 |
| 12-31-2017 | 14.76 | | —10 | 3.25 | | 3.25 | | (0.01) | (1.43) | (1.44) | 16.57 | 22.03 | 1.25 | 1.18 | (0.03) | 148 | 23 |
| 12-31-2016 | 14.92 | | —10 | 0.91 | | 0.91 | | (0.01) | (1.06) | (1.07) | 14.76 | 6.07 | 1.23 | 1.19 | 0.01 | 155 | 31 |
| 12-31-2015 | 16.33 | | (0.02) | (0.32) | | (0.34) | | — | (1.07) | (1.07) | 14.92 | (2.19) | 1.22 | 1.19 | (0.11) | 167 | 15 |
| 12-31-2014 | 15.99 | | (0.03) | 0.60 | | 0.57 | | — | (0.23) | (0.23) | 16.33 | 3.56 | 1.23 | 1.21 | (0.19) | 169 | 18 |
| Class I | |
| 06-30-20197 | 13.04 | | —10 | 2.15 | | 2.15 | | — | — | — | 15.19 | 16.498 | 0.339 | 0.199 | 0.029 | 11 | 21 |
| 12-31-2018 | 16.47 | | 0.15 | (1.81) | | (1.66) | | (0.17) | (1.60) | (1.77) | 13.04 | (9.98) | 0.28 | 0.18 | 0.91 | 10 | 22 |
| 12-31-2017 | 14.67 | | 0.22 | 3.19 | | 3.41 | | (0.18) | (1.43) | (1.61) | 16.47 | 23.20 | 0.24 | 0.17 | 1.33 | 10 | 23 |
| 12-31-2016 | 14.83 | | 0.19 | 0.87 | | 1.06 | | (0.16) | (1.06) | (1.22) | 14.67 | 7.18 | 0.22 | 0.17 | 1.25 | 4 | 31 |
| 12-31-201511 | 17.07 | | 0.28 | (1.28) | | (1.00) | | (0.15) | (1.09) | (1.24) | 14.83 | (5.98)8 | 0.209 | 0.179 | 2.569 | 3 | 1512 |
| Class R1 | |
| 06-30-20197 | 13.12 | | (0.04) | 2.15 | | 2.11 | | — | — | — | 15.23 | 16.088 | 0.959 | 0.829 | (0.62)9 | 5 | 21 |
| 12-31-2018 | 16.55 | | 0.04 | (1.81) | | (1.77) | | (0.06) | (1.60) | (1.66) | 13.12 | (10.58) | 0.92 | 0.83 | 0.25 | 5 | 22 |
| 12-31-2017 | 14.74 | | 0.05 | 3.26 | | 3.31 | | (0.07) | (1.43) | (1.50) | 16.55 | 22.44 | 0.89 | 0.82 | 0.33 | 6 | 23 |
| 12-31-2016 | 14.90 | | 0.05 | 0.91 | | 0.96 | | (0.06) | (1.06) | (1.12) | 14.74 | 6.48 | 0.88 | 0.84 | 0.35 | 6 | 31 |
| 12-31-2015 | 16.32 | | 0.02 | (0.31) | | (0.29) | | (0.04) | (1.09) | (1.13) | 14.90 | (1.89) | 0.89 | 0.86 | 0.12 | 7 | 15 |
| 12-31-2014 | 15.98 | | (0.03) | 0.64 | | 0.61 | | (0.01) | (0.26) | (0.27) | 16.32 | 3.82 | 1.02 | 1.00 | (0.18) | 8 | 18 |
| Class R2 | |
| 06-30-20197 | 13.00 | | (0.03) | 2.14 | | 2.11 | | — | — | — | 15.11 | 16.148 | 0.709 | 0.579 | (0.37)9 | 5 | 21 |
| 12-31-2018 | 16.42 | | 0.08 | (1.79) | | (1.71) | | (0.11) | (1.60) | (1.71) | 13.00 | (10.28) | 0.68 | 0.59 | 0.49 | 4 | 22 |
| 12-31-2017 | 14.64 | | 0.07 | 3.25 | | 3.32 | | (0.11) | (1.43) | (1.54) | 16.42 | 22.67 | 0.64 | 0.57 | 0.41 | 6 | 23 |
| 12-31-2016 | 14.80 | | 0.10 | 0.90 | | 1.00 | | (0.10) | (1.06) | (1.16) | 14.64 | 6.78 | 0.62 | 0.58 | 0.67 | 7 | 31 |
| 12-31-2015 | 16.22 | | 0.07 | (0.32) | | (0.25) | | (0.08) | (1.09) | (1.17) | 14.80 | (1.65) | 0.65 | 0.60 | 0.44 | 5 | 15 |
| 12-31-2014 | 15.88 | | 0.14 | 0.53 | | 0.67 | | (0.07) | (0.26) | (0.33) | 16.22 | 4.19 | 1.01 | 0.62 | 0.85 | 5 | 18 |
| Class R3 | |
| 06-30-20197 | 13.06 | | (0.04) | 2.14 | | 2.10 | | — | — | — | 15.16 | 16.088 | 0.869 | 0.749 | (0.54)9 | 9 | 21 |
| 12-31-2018 | 16.48 | | 0.07 | (1.81) | | (1.74) | | (0.08) | (1.60) | (1.68) | 13.06 | (10.46) | 0.81 | 0.72 | 0.44 | 8 | 22 |
| 12-31-2017 | 14.68 | | 0.23 | 3.09 | | 3.32 | | (0.09) | (1.43) | (1.52) | 16.48 | 22.58 | 0.80 | 0.73 | 1.38 | 10 | 23 |
| 12-31-2016 | 14.84 | | 0.07 | 0.91 | | 0.98 | | (0.08) | (1.06) | (1.14) | 14.68 | 6.59 | 0.77 | 0.73 | 0.45 | 5 | 31 |
| 12-31-2015 | 16.27 | | 0.06 | (0.35) | | (0.29) | | (0.05) | (1.09) | (1.14) | 14.84 | (1.86) | 0.81 | 0.78 | 0.34 | 6 | 15 |
| 12-31-2014 | 15.92 | | (0.01) | 0.64 | | 0.63 | | (0.02) | (0.26) | (0.28) | 16.27 | 3.94 | 0.94 | 0.92 | (0.06) | 7 | 18 |
| Class R4 | |
| 06-30-20197 | 13.03 | | (0.01) | 2.14 | | 2.13 | | — | — | — | 15.16 | 16.358 | 0.579 | 0.349 | (0.14)9 | 5 | 21 |
| 12-31-2018 | 16.45 | | 0.11 | (1.78) | | (1.67) | | (0.15) | (1.60) | (1.75) | 13.03 | (10.08) | 0.52 | 0.33 | 0.69 | 4 | 22 |
| 12-31-2017 | 14.66 | | 0.16 | 3.21 | | 3.37 | | (0.15) | (1.43) | (1.58) | 16.45 | 22.98 | 0.50 | 0.33 | 1.00 | 8 | 23 |
| 12-31-2016 | 14.81 | | 0.11 | 0.94 | | 1.05 | | (0.14) | (1.06) | (1.20) | 14.66 | 7.10 | 0.47 | 0.33 | 0.76 | 7 | 31 |
| 12-31-2015 | 16.24 | | 0.10 | (0.32) | | (0.22) | | (0.12) | (1.09) | (1.21) | 14.81 | (1.46) | 0.51 | 0.38 | 0.60 | 6 | 15 |
| 12-31-2014 | 15.90 | | 0.09 | 0.59 | | 0.68 | | (0.08) | (0.26) | (0.34) | 16.24 | 4.25 | 0.68 | 0.56 | 0.53 | 7 | 18 |
| SEE NOTES TO FINANCIAL STATEMENTS | SEMIANNUAL REPORT | JOHN HANCOCK MULTIMANAGER LIFESTYLE AGGRESSIVE PORTFOLIO | 25 |
| Financial highlights continued |
Multimanager Lifestyle Aggressive Portfolio (continued)
| Per share operating performance for a share outstanding throughout each period | | Ratios and supplemental data | |
| | | | Income (loss) from investment operations | | | | Less distributions | | | | Ratios to average net assets | | | |
| Period ended | Net asset
value,
beginning
of period ($) | | Net
investment
income
(loss) ($)1, 2 | Net realized and
unrealized
gain (loss)
on investments ($) | | Total from
investment
operations ($) | | From net
investment
income ($) | From net
realized
gain ($)3 | Total
distributions ($) | Net asset
value,
end of
period ($) | Total
return
(%)4, 5 | Expenses
before
reductions
(%)6 | Expenses
including
reductions
(%)6 | Net
investment
income
(loss) (%)2 | Net
assets,
end of
period
(in millions) | Portfolio
turnover
(%) |
| Class R5 | |
| 06-30-20197 | 13.05 | | —10 | 2.15 | | 2.15 | | — | — | — | 15.20 | 16.488 | 0.269 | 0.139 | 0.059 | 2 | 21 |
| 12-31-2018 | 16.48 | | 0.11 | (1.76) | | (1.65) | | (0.18) | (1.60) | (1.78) | 13.05 | (9.91) | 0.22 | 0.13 | 0.66 | 3 | 22 |
| 12-31-2017 | 14.68 | | 0.17 | 3.24 | | 3.41 | | (0.18) | (1.43) | (1.61) | 16.48 | 23.25 | 0.20 | 0.13 | 1.04 | 7 | 23 |
| 12-31-2016 | 14.83 | | 0.15 | 0.93 | | 1.08 | | (0.17) | (1.06) | (1.23) | 14.68 | 7.30 | 0.17 | 0.13 | 1.01 | 7 | 31 |
| 12-31-2015 | 16.26 | | 0.13 | (0.31) | | (0.18) | | (0.16) | (1.09) | (1.25) | 14.83 | (1.25) | 0.19 | 0.16 | 0.81 | 8 | 15 |
| 12-31-2014 | 15.92 | | 0.12 | 0.61 | | 0.73 | | (0.13) | (0.26) | (0.39) | 16.26 | 4.56 | 0.28 | 0.26 | 0.75 | 12 | 18 |
| Class R6 | |
| 06-30-20197 | 13.04 | | 0.01 | 2.14 | | 2.15 | | — | — | — | 15.19 | 16.498 | 0.229 | 0.099 | 0.139 | 44 | 21 |
| 12-31-2018 | 16.47 | | 0.22 | (1.86) | | (1.64) | | (0.19) | (1.60) | (1.79) | 13.04 | (9.87) | 0.17 | 0.08 | 1.31 | 33 | 22 |
| 12-31-2017 | 14.67 | | 0.25 | 3.17 | | 3.42 | | (0.19) | (1.43) | (1.62) | 16.47 | 23.32 | 0.15 | 0.08 | 1.51 | 29 | 23 |
| 12-31-2016 | 14.82 | | 0.16 | 0.93 | | 1.09 | | (0.18) | (1.06) | (1.24) | 14.67 | 7.38 | 0.12 | 0.06 | 1.10 | 18 | 31 |
| 12-31-2015 | 16.23 | | 0.18 | (0.33) | | (0.15) | | (0.17) | (1.09) | (1.26) | 14.82 | (1.07) | 0.13 | 0.06 | 1.12 | 21 | 15 |
| 12-31-2014 | 15.89 | | 0.20 | 0.56 | | 0.76 | | (0.16) | (0.26) | (0.42) | 16.23 | 4.76 | 0.26 | 0.06 | 1.24 | 15 | 18 |
| Class 1 | |
| 06-30-20197 | 13.02 | | 0.01 | 2.13 | | 2.14 | | — | — | — | 15.16 | 16.448 | 0.269 | 0.139 | 0.079 | 3,071 | 21 |
| 12-31-2018 | 16.45 | | 0.17 | (1.82) | | (1.65) | | (0.18) | (1.60) | (1.78) | 13.02 | (9.92) | 0.20 | 0.12 | 1.03 | 2,815 | 22 |
| 12-31-2017 | 14.65 | | 0.18 | 3.24 | | 3.42 | | (0.19) | (1.43) | (1.62) | 16.45 | 23.31 | 0.19 | 0.12 | 1.08 | 3,548 | 23 |
| 12-31-2016 | 14.81 | | 0.16 | 0.91 | | 1.07 | | (0.17) | (1.06) | (1.23) | 14.65 | 7.26 | 0.16 | 0.11 | 1.10 | 3,360 | 31 |
| 12-31-2015 | 16.22 | | 0.16 | (0.32) | | (0.16) | | (0.16) | (1.09) | (1.25) | 14.81 | (1.12) | 0.14 | 0.11 | 0.94 | 3,560 | 15 |
| 12-31-2014 | 15.88 | | 0.14 | 0.61 | | 0.75 | | (0.15) | (0.26) | (0.41) | 16.22 | 4.71 | 0.13 | 0.11 | 0.88 | 3,937 | 18 |
| 1 Based on average daily shares outstanding. |
| 2 Net investment income is affected by the timing and frequency of the declaration of dividends by the underlying funds in which the portfolio invests. |
| 3 Capital gain distributions may vary between classes due to expense differences applied to ordinary income distributions from underlying funds. |
| 4 Total returns would have been lower had certain expenses not been reduced during the applicable periods. |
| 5 Does not reflect the effect of sales charges, if any. |
| 6 Ratios do not include expense indirectly incurred from underlying funds and can vary based on the mix of underlying funds held by the portfolio. |
| 7 Six months ended 6-30-19. Unaudited. |
| 8 Not annualized. |
| 9 Annualized. |
| 10 Less than $0.005 per share. |
| 11 The inception date for Class I shares is 5-1-15. |
| 12 Portfolio turnover is shown for the period from 1-1-15 to 12-31-15. |
| 26 | JOHN HANCOCK MULTIMANAGER LIFESTYLE AGGRESSIVE PORTFOLIO | SEMIANNUAL REPORT | SEE NOTES TO FINANCIAL STATEMENTS |
Multimanager Lifestyle Growth Portfolio
| Per share operating performance for a share outstanding throughout each period | | Ratios and supplemental data | |
| | | | Income (loss) from investment operations | | | | Less distributions | | | | Ratios to average net assets | | | |
| Period ended | Net asset
value,
beginning
of period ($) | | Net
investment
income
(loss) ($)1, 2 | Net realized and
unrealized
gain (loss)
on investments ($) | | Total from
investment
operations ($) | | From net
investment
income ($) | From net
realized
gain ($)3 | Total
distributions ($) | Net asset
value,
end of
period ($) | Total
return
(%)4, 5 | Expenses
before
reductions
(%)6 | Expenses
including
reductions
(%)6 | Net
investment
income
(loss) (%)2 | Net
assets,
end of
period
(in millions) | Portfolio
turnover
(%) |
| Multimanager Lifestyle Growth Portfolio | |
| Class A | |
| 06-30-20197 | 13.23 | | 0.02 | 1.90 | | 1.92 | | — | — | — | 15.15 | 14.518 | 0.619 | 0.509 | 0.289 | 1,647 | 20 |
| 12-31-2018 | 16.16 | | 0.20 | (1.62) | | (1.42) | | (0.20) | (1.31) | (1.51) | 13.23 | (8.70) | 0.55 | 0.48 | 1.22 | 1,502 | 20 |
| 12-31-2017 | 14.77 | | 0.19 | 2.59 | | 2.78 | | (0.20) | (1.19) | (1.39) | 16.16 | 18.84 | 0.54 | 0.48 | 1.17 | 1,719 | 24 |
| 12-31-2016 | 14.89 | | 0.18 | 0.82 | | 1.00 | | (0.20) | (0.92) | (1.12) | 14.77 | 6.69 | 0.52 | 0.47 | 1.19 | 1,587 | 28 |
| 12-31-2015 | 16.35 | | 0.19 | (0.41) | | (0.22) | | (0.19) | (1.05) | (1.24) | 14.89 | (1.45) | 0.51 | 0.47 | 1.17 | 1,611 | 15 |
| 12-31-2014 | 16.09 | | 0.19 | 0.54 | | 0.73 | | (0.18) | (0.29) | (0.47) | 16.35 | 4.48 | 0.52 | 0.47 | 1.14 | 1,535 | 16 |
| Class B | |
| 06-30-20197 | 13.28 | | (0.03) | 1.90 | | 1.87 | | — | — | — | 15.15 | 14.088 | 1.319 | 1.219 | (0.46)9 | 20 | 20 |
| 12-31-2018 | 16.20 | | 0.05 | (1.57) | | (1.52) | | (0.09) | (1.31) | (1.40) | 13.28 | (9.33) | 1.25 | 1.18 | 0.31 | 26 | 20 |
| 12-31-2017 | 14.82 | | 0.05 | 2.61 | | 2.66 | | (0.09) | (1.19) | (1.28) | 16.20 | 17.94 | 1.24 | 1.18 | 0.31 | 46 | 24 |
| 12-31-2016 | 14.94 | | 0.06 | 0.82 | | 0.88 | | (0.08) | (0.92) | (1.00) | 14.82 | 5.92 | 1.22 | 1.19 | 0.37 | 57 | 28 |
| 12-31-2015 | 16.39 | | 0.05 | (0.38) | | (0.33) | | (0.07) | (1.05) | (1.12) | 14.94 | (2.09) | 1.22 | 1.19 | 0.30 | 76 | 15 |
| 12-31-2014 | 16.14 | | 0.04 | 0.56 | | 0.60 | | (0.06) | (0.29) | (0.35) | 16.39 | 3.65 | 1.23 | 1.21 | 0.23 | 100 | 16 |
| Class C | |
| 06-30-20197 | 13.27 | | (0.03) | 1.89 | | 1.86 | | — | — | — | 15.13 | 14.108 | 1.319 | 1.219 | (0.43)9 | 415 | 20 |
| 12-31-2018 | 16.18 | | 0.06 | (1.57) | | (1.51) | | (0.09) | (1.31) | (1.40) | 13.27 | (9.34) | 1.25 | 1.18 | 0.38 | 414 | 20 |
| 12-31-2017 | 14.80 | | 0.06 | 2.60 | | 2.66 | | (0.09) | (1.19) | (1.28) | 16.18 | 17.97 | 1.24 | 1.18 | 0.40 | 629 | 24 |
| 12-31-2016 | 14.92 | | 0.07 | 0.81 | | 0.88 | | (0.08) | (0.92) | (1.00) | 14.80 | 5.93 | 1.22 | 1.19 | 0.45 | 670 | 28 |
| 12-31-2015 | 16.37 | | 0.07 | (0.40) | | (0.33) | | (0.07) | (1.05) | (1.12) | 14.92 | (2.09) | 1.21 | 1.19 | 0.42 | 730 | 15 |
| 12-31-2014 | 16.12 | | 0.06 | 0.54 | | 0.60 | | (0.06) | (0.29) | (0.35) | 16.37 | 3.66 | 1.22 | 1.20 | 0.38 | 739 | 16 |
| Class I | |
| 06-30-20197 | 13.15 | | 0.04 | 1.88 | | 1.92 | | — | — | — | 15.07 | 14.608 | 0.329 | 0.209 | 0.589 | 34 | 20 |
| 12-31-2018 | 16.07 | | 0.24 | (1.60) | | (1.36) | | (0.25) | (1.31) | (1.56) | 13.15 | (8.37) | 0.26 | 0.18 | 1.47 | 32 | 20 |
| 12-31-2017 | 14.69 | | 0.29 | 2.53 | | 2.82 | | (0.25) | (1.19) | (1.44) | 16.07 | 19.20 | 0.23 | 0.17 | 1.78 | 38 | 24 |
| 12-31-2016 | 14.82 | | 0.34 | 0.69 | | 1.03 | | (0.24) | (0.92) | (1.16) | 14.69 | 6.97 | 0.21 | 0.17 | 2.27 | 16 | 28 |
| 12-31-201510 | 16.97 | | 0.23 | (1.09) | | (0.86) | | (0.24) | (1.05) | (1.29) | 14.82 | (5.17)8 | 0.209 | 0.179 | 2.119 | 6 | 1511 |
| Class R1 | |
| 06-30-20197 | 13.30 | | —12 | 1.90 | | 1.90 | | — | — | — | 15.20 | 14.298 | 0.939 | 0.839 | (0.06)9 | 13 | 20 |
| 12-31-2018 | 16.23 | | 0.13 | (1.60) | | (1.47) | | (0.15) | (1.31) | (1.46) | 13.30 | (9.00) | 0.89 | 0.82 | 0.79 | 14 | 20 |
| 12-31-2017 | 14.83 | | 0.13 | 2.61 | | 2.74 | | (0.15) | (1.19) | (1.34) | 16.23 | 18.45 | 0.87 | 0.82 | 0.79 | 18 | 24 |
| 12-31-2016 | 14.96 | | 0.13 | 0.80 | | 0.93 | | (0.14) | (0.92) | (1.06) | 14.83 | 6.24 | 0.85 | 0.81 | 0.83 | 18 | 28 |
| 12-31-2015 | 16.41 | | 0.13 | (0.40) | | (0.27) | | (0.13) | (1.05) | (1.18) | 14.96 | (1.73) | 0.86 | 0.83 | 0.76 | 20 | 15 |
| 12-31-2014 | 16.15 | | 0.10 | 0.56 | | 0.66 | | (0.11) | (0.29) | (0.40) | 16.41 | 4.04 | 0.89 | 0.87 | 0.62 | 22 | 16 |
| Class R2 | |
| 06-30-20197 | 13.13 | | 0.01 | 1.88 | | 1.89 | | — | — | — | 15.02 | 14.398 | 0.709 | 0.609 | 0.179 | 11 | 20 |
| 12-31-2018 | 16.05 | | 0.17 | (1.59) | | (1.42) | | (0.19) | (1.31) | (1.50) | 13.13 | (8.78) | 0.64 | 0.57 | 1.06 | 11 | 20 |
| 12-31-2017 | 14.68 | | 0.14 | 2.61 | | 2.75 | | (0.19) | (1.19) | (1.38) | 16.05 | 18.71 | 0.64 | 0.58 | 0.86 | 13 | 24 |
| 12-31-2016 | 14.81 | | 0.17 | 0.80 | | 0.97 | | (0.18) | (0.92) | (1.10) | 14.68 | 6.56 | 0.61 | 0.58 | 1.14 | 18 | 28 |
| 12-31-2015 | 16.27 | | 0.18 | (0.42) | | (0.24) | | (0.17) | (1.05) | (1.22) | 14.81 | (1.55) | 0.62 | 0.59 | 1.09 | 15 | 15 |
| 12-31-2014 | 16.02 | | 0.18 | 0.51 | | 0.69 | | (0.15) | (0.29) | (0.44) | 16.27 | 4.29 | 0.73 | 0.62 | 1.07 | 12 | 16 |
| Class R3 | |
| 06-30-20197 | 13.21 | | — | 1.89 | | 1.89 | | — | — | — | 15.10 | 14.318 | 0.849 | 0.749 | 0.049 | 12 | 20 |
| 12-31-2018 | 16.13 | | 0.15 | (1.59) | | (1.44) | | (0.17) | (1.31) | (1.48) | 13.21 | (8.87) | 0.76 | 0.68 | 0.95 | 11 | 20 |
| 12-31-2017 | 14.75 | | 0.17 | 2.57 | | 2.74 | | (0.17) | (1.19) | (1.36) | 16.13 | 18.54 | 0.78 | 0.73 | 1.05 | 14 | 24 |
| 12-31-2016 | 14.87 | | 0.14 | 0.82 | | 0.96 | | (0.16) | (0.92) | (1.08) | 14.75 | 6.44 | 0.74 | 0.71 | 0.91 | 14 | 28 |
| 12-31-2015 | 16.33 | | 0.12 | (0.38) | | (0.26) | | (0.15) | (1.05) | (1.20) | 14.87 | (1.70) | 0.77 | 0.74 | 0.71 | 18 | 15 |
| 12-31-2014 | 16.08 | | 0.11 | 0.55 | | 0.66 | | (0.12) | (0.29) | (0.41) | 16.33 | 4.09 | 0.82 | 0.80 | 0.69 | 23 | 16 |
| Class R4 | |
| 06-30-20197 | 13.21 | | 0.03 | 1.89 | | 1.92 | | — | — | — | 15.13 | 14.538 | 0.539 | 0.339 | 0.479 | 5 | 20 |
| 12-31-2018 | 16.14 | | 0.16 | (1.55) | | (1.39) | | (0.23) | (1.31) | (1.54) | 13.21 | (8.56) | 0.50 | 0.33 | 1.00 | 5 | 20 |
| 12-31-2017 | 14.75 | | 0.19 | 2.62 | | 2.81 | | (0.23) | (1.19) | (1.42) | 16.14 | 19.03 | 0.48 | 0.32 | 1.19 | 11 | 24 |
| 12-31-2016 | 14.87 | | 0.18 | 0.84 | | 1.02 | | (0.22) | (0.92) | (1.14) | 14.75 | 6.85 | 0.46 | 0.33 | 1.18 | 15 | 28 |
| 12-31-2015 | 16.33 | | 0.18 | (0.38) | | (0.20) | | (0.21) | (1.05) | (1.26) | 14.87 | (1.30) | 0.47 | 0.34 | 1.10 | 19 | 15 |
| 12-31-2014 | 16.08 | | 0.21 | 0.52 | | 0.73 | | (0.19) | (0.29) | (0.48) | 16.33 | 4.49 | 0.51 | 0.39 | 1.26 | 29 | 16 |
| SEE NOTES TO FINANCIAL STATEMENTS | SEMIANNUAL REPORT | JOHN HANCOCK MULTIMANAGER LIFESTYLE GROWTH PORTFOLIO | 27 |
| Financial highlights continued |
Multimanager Lifestyle Growth Portfolio (continued)
| Per share operating performance for a share outstanding throughout each period | | Ratios and supplemental data | |
| | | | Income (loss) from investment operations | | | | Less distributions | | | | Ratios to average net assets | | | |
| Period ended | Net asset
value,
beginning
of period ($) | | Net
investment
income
(loss) ($)1, 2 | Net realized and
unrealized
gain (loss)
on investments ($) | | Total from
investment
operations ($) | | From net
investment
income ($) | From net
realized
gain ($)3 | Total
distributions ($) | Net asset
value,
end of
period ($) | Total
return
(%)4, 5 | Expenses
before
reductions
(%)6 | Expenses
including
reductions
(%)6 | Net
investment
income
(loss) (%)2 | Net
assets,
end of
period
(in millions) | Portfolio
turnover
(%) |
| Class R5 | |
| 06-30-20197 | 13.23 | | 0.05 | 1.89 | | 1.94 | | — | — | — | 15.17 | 14.668 | 0.259 | 0.159 | 0.639 | 8 | 20 |
| 12-31-2018 | 16.16 | | 0.18 | (1.54) | | (1.36) | | (0.26) | (1.31) | (1.57) | 13.23 | (8.35) | 0.21 | 0.14 | 1.12 | 8 | 20 |
| 12-31-2017 | 14.77 | | 0.24 | 2.60 | | 2.84 | | (0.26) | (1.19) | (1.45) | 16.16 | 19.22 | 0.18 | 0.13 | 1.46 | 22 | 24 |
| 12-31-2016 | 14.89 | | 0.21 | 0.84 | | 1.05 | | (0.25) | (0.92) | (1.17) | 14.77 | 7.05 | 0.16 | 0.13 | 1.40 | 21 | 28 |
| 12-31-2015 | 16.35 | | 0.22 | (0.38) | | (0.16) | | (0.25) | (1.05) | (1.30) | 14.89 | (1.10) | 0.16 | 0.14 | 1.34 | 28 | 15 |
| 12-31-2014 | 16.10 | | 0.22 | 0.55 | | 0.77 | | (0.23) | (0.29) | (0.52) | 16.35 | 4.71 | 0.19 | 0.17 | 1.34 | 38 | 16 |
| Class R6 | |
| 06-30-20197 | 13.15 | | 0.05 | 1.88 | | 1.93 | | — | — | — | 15.08 | 14.688 | 0.219 | 0.109 | 0.709 | 116 | 20 |
| 12-31-2018 | 16.08 | | 0.28 | (1.63) | | (1.35) | | (0.27) | (1.31) | (1.58) | 13.15 | (8.34) | 0.15 | 0.08 | 1.75 | 88 | 20 |
| 12-31-2017 | 14.70 | | 0.33 | 2.51 | | 2.84 | | (0.27) | (1.19) | (1.46) | 16.08 | 19.30 | 0.14 | 0.08 | 2.00 | 78 | 24 |
| 12-31-2016 | 14.82 | | 0.23 | 0.83 | | 1.06 | | (0.26) | (0.92) | (1.18) | 14.70 | 7.16 | 0.11 | 0.06 | 1.56 | 41 | 28 |
| 12-31-2015 | 16.28 | | 0.27 | (0.42) | | (0.15) | | (0.26) | (1.05) | (1.31) | 14.82 | (1.04) | 0.11 | 0.06 | 1.63 | 47 | 15 |
| 12-31-2014 | 16.03 | | 0.30 | 0.49 | | 0.79 | | (0.25) | (0.29) | (0.54) | 16.28 | 4.86 | 0.17 | 0.06 | 1.81 | 37 | 16 |
| Class 1 | |
| 06-30-20197 | 13.16 | | 0.05 | 1.87 | | 1.92 | | — | — | — | 15.08 | 14.598 | 0.249 | 0.149 | 0.649 | 8,466 | 20 |
| 12-31-2018 | 16.08 | | 0.25 | (1.60) | | (1.35) | | (0.26) | (1.31) | (1.57) | 13.16 | (8.31) | 0.19 | 0.12 | 1.53 | 7,935 | 20 |
| 12-31-2017 | 14.70 | | 0.24 | 2.59 | | 2.83 | | (0.26) | (1.19) | (1.45) | 16.08 | 19.26 | 0.17 | 0.12 | 1.50 | 9,997 | 24 |
| 12-31-2016 | 14.83 | | 0.23 | 0.81 | | 1.04 | | (0.25) | (0.92) | (1.17) | 14.70 | 7.03 | 0.15 | 0.11 | 1.55 | 9,850 | 28 |
| 12-31-2015 | 16.28 | | 0.24 | (0.39) | | (0.15) | | (0.25) | (1.05) | (1.30) | 14.83 | (1.02) | 0.13 | 0.11 | 1.46 | 10,420 | 15 |
| 12-31-2014 | 16.03 | | 0.23 | 0.55 | | 0.78 | | (0.24) | (0.29) | (0.53) | 16.28 | 4.80 | 0.13 | 0.11 | 1.41 | 11,576 | 16 |
| Class 5 | |
| 06-30-20197 | 13.13 | | 0.05 | 1.88 | | 1.93 | | — | — | — | 15.06 | 14.708 | 0.199 | 0.099 | 0.699 | 323 | 20 |
| 12-31-2018 | 16.06 | | 0.26 | (1.61) | | (1.35) | | (0.27) | (1.31) | (1.58) | 13.13 | (8.34) | 0.14 | 0.07 | 1.63 | 284 | 20 |
| 12-31-2017 | 14.68 | | 0.26 | 2.58 | | 2.84 | | (0.27) | (1.19) | (1.46) | 16.06 | 19.34 | 0.12 | 0.07 | 1.63 | 314 | 24 |
| 12-31-2016 | 14.81 | | 0.25 | 0.80 | | 1.05 | | (0.26) | (0.92) | (1.18) | 14.68 | 7.09 | 0.10 | 0.06 | 1.65 | 259 | 28 |
| 12-31-2015 | 16.26 | | 0.26 | (0.40) | | (0.14) | | (0.26) | (1.05) | (1.31) | 14.81 | (0.98) | 0.08 | 0.06 | 1.57 | 243 | 15 |
| 12-31-2014 | 16.01 | | 0.25 | 0.54 | | 0.79 | | (0.25) | (0.29) | (0.54) | 16.26 | 4.86 | 0.08 | 0.06 | 1.53 | 233 | 16 |
| 1 Based on average daily shares outstanding. |
| 2 Net investment income is affected by the timing and frequency of the declaration of dividends by the underlying funds in which the portfolio invests. |
| 3 Capital gain distributions may vary between classes due to expense differences applied to ordinary income distributions from underlying funds. |
| 4 Total returns would have been lower had certain expenses not been reduced during the applicable periods. |
| 5 Does not reflect the effect of sales charges, if any. |
| 6 Ratios do not include expense indirectly incurred from underlying funds and can vary based on the mix of underlying funds held by the portfolio. |
| 7 Six months ended 6-30-19. Unaudited. |
| 8 Not annualized. |
| 9 Annualized. |
| 10 The inception date for Class I shares is 5-1-15. |
| 11 Portfolio turnover is shown for the period from 1-1-15 to 12-31-15. |
| 12 Less than $0.005 per share. |
| 28 | JOHN HANCOCK MULTIMANAGER LIFESTYLE GROWTH PORTFOLIO | SEMIANNUAL REPORT | SEE NOTES TO FINANCIAL STATEMENTS |
Multimanager Lifestyle Balanced Portfolio
| Per share operating performance for a share outstanding throughout each period | | Ratios and supplemental data | |
| | | | Income (loss) from investment operations | | | | Less distributions | | | | Ratios to average net assets | | | |
| Period ended | Net asset
value,
beginning
of period ($) | | Net
investment
income
(loss) ($)1, 2 | Net realized and
unrealized
gain (loss)
on investments ($) | | Total from
investment
operations ($) | | From net
investment
income ($) | From net
realized
gain ($)3 | Total
distributions ($) | Net asset
value,
end of
period ($) | Total
return
(%)4, 5 | Expenses
before
reductions
(%)6 | Expenses
including
reductions
(%)6 | Net
investment
income
(loss) (%)2 | Net
assets,
end of
period
(in millions) | Portfolio
turnover
(%) |
| Multimanager Lifestyle Balanced Portfolio | |
| Class A | |
| 06-30-20197 | 13.06 | | 0.06 | 1.57 | | 1.63 | | (0.06) | — | (0.06) | 14.63 | 12.478 | 0.619 | 0.529 | 0.869 | 1,725 | 24 |
| 12-31-2018 | 15.29 | | 0.26 | (1.30) | | (1.04) | | (0.27) | (0.92) | (1.19) | 13.06 | (6.79) | 0.56 | 0.49 | 1.74 | 1,604 | 18 |
| 12-31-2017 | 14.32 | | 0.24 | 1.88 | | 2.12 | | (0.25) | (0.90) | (1.15) | 15.29 | 14.79 | 0.54 | 0.48 | 1.57 | 1,841 | 27 |
| 12-31-2016 | 14.31 | | 0.24 | 0.72 | | 0.96 | | (0.25) | (0.70) | (0.95) | 14.32 | 6.73 | 0.52 | 0.47 | 1.64 | 1,782 | 23 |
| 12-31-2015 | 15.55 | | 0.27 | (0.50) | | (0.23) | | (0.26) | (0.75) | (1.01) | 14.31 | (1.54) | 0.51 | 0.47 | 1.69 | 1,843 | 13 |
| 12-31-2014 | 15.36 | | 0.28 | 0.34 | | 0.62 | | (0.27) | (0.16) | (0.43) | 15.55 | 4.00 | 0.52 | 0.47 | 1.77 | 1,786 | 15 |
| Class B | |
| 06-30-20197 | 13.05 | | 0.01 | 1.57 | | 1.58 | | (0.01) | — | (0.01) | 14.62 | 12.198 | 1.319 | 1.229 | 0.129 | 22 | 24 |
| 12-31-2018 | 15.28 | | 0.13 | (1.27) | | (1.14) | | (0.17) | (0.92) | (1.09) | 13.05 | (7.50) | 1.26 | 1.19 | 0.87 | 28 | 18 |
| 12-31-2017 | 14.32 | | 0.12 | 1.88 | | 2.00 | | (0.14) | (0.90) | (1.04) | 15.28 | 13.93 | 1.24 | 1.19 | 0.75 | 47 | 27 |
| 12-31-2016 | 14.31 | | 0.12 | 0.74 | | 0.86 | | (0.15) | (0.70) | (0.85) | 14.32 | 5.99 | 1.22 | 1.19 | 0.83 | 59 | 23 |
| 12-31-2015 | 15.54 | | 0.13 | (0.46) | | (0.33) | | (0.15) | (0.75) | (0.90) | 14.31 | (2.20) | 1.22 | 1.19 | 0.85 | 78 | 13 |
| 12-31-2014 | 15.35 | | 0.13 | 0.37 | | 0.50 | | (0.15) | (0.16) | (0.31) | 15.54 | 3.21 | 1.24 | 1.22 | 0.85 | 98 | 15 |
| Class C | |
| 06-30-20197 | 13.06 | | 0.01 | 1.57 | | 1.58 | | (0.01) | — | (0.01) | 14.63 | 12.098 | 1.319 | 1.229 | 0.149 | 463 | 24 |
| 12-31-2018 | 15.30 | | 0.14 | (1.29) | | (1.15) | | (0.17) | (0.92) | (1.09) | 13.06 | (7.48) | 1.26 | 1.19 | 0.92 | 479 | 18 |
| 12-31-2017 | 14.33 | | 0.13 | 1.88 | | 2.01 | | (0.14) | (0.90) | (1.04) | 15.30 | 13.99 | 1.24 | 1.19 | 0.81 | 718 | 27 |
| 12-31-2016 | 14.32 | | 0.13 | 0.73 | | 0.86 | | (0.15) | (0.70) | (0.85) | 14.33 | 5.99 | 1.22 | 1.19 | 0.90 | 792 | 23 |
| 12-31-2015 | 15.55 | | 0.15 | (0.48) | | (0.33) | | (0.15) | (0.75) | (0.90) | 14.32 | (2.19) | 1.21 | 1.19 | 0.95 | 876 | 13 |
| 12-31-2014 | 15.37 | | 0.16 | 0.33 | | 0.49 | | (0.15) | (0.16) | (0.31) | 15.55 | 3.18 | 1.22 | 1.20 | 1.00 | 892 | 15 |
| Class I | |
| 06-30-20197 | 12.97 | | 0.08 | 1.57 | | 1.65 | | (0.08) | — | (0.08) | 14.54 | 12.728 | 0.329 | 0.229 | 1.169 | 42 | 24 |
| 12-31-2018 | 15.20 | | 0.31 | (1.30) | | (0.99) | | (0.32) | (0.92) | (1.24) | 12.97 | (6.55) | 0.27 | 0.19 | 2.05 | 40 | 18 |
| 12-31-2017 | 14.24 | | 0.35 | 1.80 | | 2.15 | | (0.29) | (0.90) | (1.19) | 15.20 | 15.15 | 0.23 | 0.18 | 2.25 | 45 | 27 |
| 12-31-2016 | 14.24 | | 0.35 | 0.65 | | 1.00 | | (0.30) | (0.70) | (1.00) | 14.24 | 7.01 | 0.21 | 0.17 | 2.42 | 17 | 23 |
| 12-31-201510 | 16.00 | | 0.34 | (1.08) | | (0.74) | | (0.27) | (0.75) | (1.02) | 14.24 | (4.70)8 | 0.209 | 0.179 | 3.269 | 6 | 1311 |
| Class R1 | |
| 06-30-20197 | 12.99 | | 0.04 | 1.56 | | 1.60 | | (0.03) | — | (0.03) | 14.56 | 12.348 | 0.939 | 0.849 | 0.529 | 10 | 24 |
| 12-31-2018 | 15.22 | | 0.20 | (1.29) | | (1.09) | | (0.22) | (0.92) | (1.14) | 12.99 | (7.15) | 0.91 | 0.84 | 1.31 | 13 | 18 |
| 12-31-2017 | 14.26 | | 0.19 | 1.86 | | 2.05 | | (0.19) | (0.90) | (1.09) | 15.22 | 14.39 | 0.88 | 0.83 | 1.21 | 17 | 27 |
| 12-31-2016 | 14.25 | | 0.19 | 0.72 | | 0.91 | | (0.20) | (0.70) | (0.90) | 14.26 | 6.39 | 0.86 | 0.83 | 1.28 | 16 | 23 |
| 12-31-2015 | 15.48 | | 0.20 | (0.48) | | (0.28) | | (0.20) | (0.75) | (0.95) | 14.25 | (1.86) | 0.86 | 0.84 | 1.27 | 17 | 13 |
| 12-31-2014 | 15.30 | | 0.19 | 0.35 | | 0.54 | | (0.20) | (0.16) | (0.36) | 15.48 | 3.52 | 0.92 | 0.91 | 1.22 | 20 | 15 |
| Class R2 | |
| 06-30-20197 | 12.98 | | 0.05 | 1.56 | | 1.61 | | (0.05) | — | (0.05) | 14.54 | 12.418 | 0.719 | 0.629 | 0.729 | 10 | 24 |
| 12-31-2018 | 15.20 | | 0.25 | (1.29) | | (1.04) | | (0.26) | (0.92) | (1.18) | 12.98 | (6.85) | 0.66 | 0.59 | 1.62 | 12 | 18 |
| 12-31-2017 | 14.25 | | 0.22 | 1.86 | | 2.08 | | (0.23) | (0.90) | (1.13) | 15.20 | 14.61 | 0.64 | 0.58 | 1.45 | 14 | 27 |
| 12-31-2016 | 14.24 | | 0.23 | 0.72 | | 0.95 | | (0.24) | (0.70) | (0.94) | 14.25 | 6.66 | 0.61 | 0.58 | 1.57 | 16 | 23 |
| 12-31-2015 | 15.48 | | 0.25 | (0.50) | | (0.25) | | (0.24) | (0.75) | (0.99) | 14.24 | (1.66) | 0.63 | 0.59 | 1.58 | 14 | 13 |
| 12-31-2014 | 15.29 | | 0.29 | 0.30 | | 0.59 | | (0.24) | (0.16) | (0.40) | 15.48 | 3.87 | 0.79 | 0.62 | 1.86 | 10 | 15 |
| Class R3 | |
| 06-30-20197 | 13.02 | | 0.04 | 1.57 | | 1.61 | | (0.04) | — | (0.04) | 14.59 | 12.388 | 0.849 | 0.759 | 0.639 | 18 | 24 |
| 12-31-2018 | 15.25 | | 0.23 | (1.30) | | (1.07) | | (0.24) | (0.92) | (1.16) | 13.02 | (7.03) | 0.78 | 0.72 | 1.52 | 16 | 18 |
| 12-31-2017 | 14.29 | | 0.20 | 1.87 | | 2.07 | | (0.21) | (0.90) | (1.11) | 15.25 | 14.47 | 0.78 | 0.73 | 1.31 | 18 | 27 |
| 12-31-2016 | 14.28 | | 0.20 | 0.72 | | 0.92 | | (0.21) | (0.70) | (0.91) | 14.29 | 6.48 | 0.75 | 0.72 | 1.38 | 22 | 23 |
| 12-31-2015 | 15.51 | | 0.20 | (0.46) | | (0.26) | | (0.22) | (0.75) | (0.97) | 14.28 | (1.75) | 0.76 | 0.74 | 1.30 | 24 | 13 |
| 12-31-2014 | 15.33 | | 0.20 | 0.36 | | 0.56 | | (0.22) | (0.16) | (0.38) | 15.51 | 3.64 | 0.80 | 0.78 | 1.27 | 30 | 15 |
| Class R4 | |
| 06-30-20197 | 13.03 | | 0.07 | 1.57 | | 1.64 | | (0.07) | — | (0.07) | 14.60 | 12.588 | 0.549 | 0.359 | 1.059 | 9 | 24 |
| 12-31-2018 | 15.26 | | 0.27 | (1.29) | | (1.02) | | (0.29) | (0.92) | (1.21) | 13.03 | (6.66) | 0.51 | 0.35 | 1.79 | 7 | 18 |
| 12-31-2017 | 14.29 | | 0.23 | 1.91 | | 2.14 | | (0.27) | (0.90) | (1.17) | 15.26 | 14.99 | 0.48 | 0.33 | 1.49 | 13 | 27 |
| 12-31-2016 | 14.28 | | 0.24 | 0.74 | | 0.98 | | (0.27) | (0.70) | (0.97) | 14.29 | 6.90 | 0.46 | 0.33 | 1.68 | 21 | 23 |
| 12-31-2015 | 15.52 | | 0.25 | (0.46) | | (0.21) | | (0.28) | (0.75) | (1.03) | 14.28 | (1.42) | 0.47 | 0.34 | 1.57 | 24 | 13 |
| 12-31-2014 | 15.33 | | 0.28 | 0.35 | | 0.63 | | (0.28) | (0.16) | (0.44) | 15.52 | 4.12 | 0.49 | 0.37 | 1.78 | 40 | 15 |
| SEE NOTES TO FINANCIAL STATEMENTS | SEMIANNUAL REPORT | JOHN HANCOCK MULTIMANAGER LIFESTYLE BALANCED PORTFOLIO | 29 |
| Financial highlights continued |
Multimanager Lifestyle Balanced Portfolio (continued)
| Per share operating performance for a share outstanding throughout each period | | Ratios and supplemental data | |
| | | | Income (loss) from investment operations | | | | Less distributions | | | | Ratios to average net assets | | | |
| Period ended | Net asset
value,
beginning
of period ($) | | Net
investment
income
(loss) ($)1, 2 | Net realized and
unrealized
gain (loss)
on investments ($) | | Total from
investment
operations ($) | | From net
investment
income ($) | From net
realized
gain ($)3 | Total
distributions ($) | Net asset
value,
end of
period ($) | Total
return
(%)4, 5 | Expenses
before
reductions
(%)6 | Expenses
including
reductions
(%)6 | Net
investment
income
(loss) (%)2 | Net
assets,
end of
period
(in millions) | Portfolio
turnover
(%) |
| Class R5 | |
| 06-30-20197 | 13.05 | | 0.08 | 1.57 | | 1.65 | | (0.08) | — | (0.08) | 14.62 | 12.678 | 0.259 | 0.169 | 1.219 | 13 | 24 |
| 12-31-2018 | 15.28 | | 0.30 | (1.29) | | (0.99) | | (0.32) | (0.92) | (1.24) | 13.05 | (6.47) | 0.21 | 0.14 | 1.98 | 13 | 18 |
| 12-31-2017 | 14.31 | | 0.30 | 1.87 | | 2.17 | | (0.30) | (0.90) | (1.20) | 15.28 | 15.19 | 0.19 | 0.14 | 1.95 | 19 | 27 |
| 12-31-2016 | 14.30 | | 0.27 | 0.74 | | 1.01 | | (0.30) | (0.70) | (1.00) | 14.31 | 7.10 | 0.16 | 0.13 | 1.86 | 17 | 23 |
| 12-31-2015 | 15.53 | | 0.30 | (0.47) | | (0.17) | | (0.31) | (0.75) | (1.06) | 14.30 | (1.16) | 0.16 | 0.14 | 1.88 | 29 | 13 |
| 12-31-2014 | 15.35 | | 0.31 | 0.34 | | 0.65 | | (0.31) | (0.16) | (0.47) | 15.53 | 4.25 | 0.19 | 0.17 | 1.96 | 41 | 15 |
| Class R6 | |
| 06-30-20197 | 12.97 | | 0.09 | 1.56 | | 1.65 | | (0.09) | — | (0.09) | 14.53 | 12.698 | 0.219 | 0.129 | 1.309 | 122 | 24 |
| 12-31-2018 | 15.20 | | 0.35 | (1.33) | | (0.98) | | (0.33) | (0.92) | (1.25) | 12.97 | (6.45) | 0.16 | 0.09 | 2.29 | 84 | 18 |
| 12-31-2017 | 14.24 | | 0.35 | 1.82 | | 2.17 | | (0.31) | (0.90) | (1.21) | 15.20 | 15.27 | 0.14 | 0.08 | 2.29 | 73 | 27 |
| 12-31-2016 | 14.24 | | 0.28 | 0.73 | | 1.01 | | (0.31) | (0.70) | (1.01) | 14.24 | 7.13 | 0.11 | 0.06 | 1.92 | 44 | 23 |
| 12-31-2015 | 15.47 | | 0.35 | (0.51) | | (0.16) | | (0.32) | (0.75) | (1.07) | 14.24 | (1.08) | 0.11 | 0.06 | 2.27 | 66 | 13 |
| 12-31-2014 | 15.29 | | 0.36 | 0.31 | | 0.67 | | (0.33) | (0.16) | (0.49) | 15.47 | 4.38 | 0.16 | 0.06 | 2.29 | 39 | 15 |
| Class 1 | |
| 06-30-20197 | 12.96 | | 0.08 | 1.57 | | 1.65 | | (0.08) | — | (0.08) | 14.53 | 12.768 | 0.249 | 0.169 | 1.229 | 8,345 | 24 |
| 12-31-2018 | 15.19 | | 0.31 | (1.29) | | (0.98) | | (0.33) | (0.92) | (1.25) | 12.96 | (6.50) | 0.20 | 0.13 | 2.07 | 7,931 | 18 |
| 12-31-2017 | 14.24 | | 0.29 | 1.86 | | 2.15 | | (0.30) | (0.90) | (1.20) | 15.19 | 15.14 | 0.17 | 0.12 | 1.90 | 9,797 | 27 |
| 12-31-2016 | 14.23 | | 0.29 | 0.72 | | 1.01 | | (0.30) | (0.70) | (1.00) | 14.24 | 7.16 | 0.14 | 0.11 | 2.00 | 10,041 | 23 |
| 12-31-2015 | 15.46 | | 0.31 | (0.47) | | (0.16) | | (0.32) | (0.75) | (1.07) | 14.23 | (1.13) | 0.13 | 0.11 | 1.99 | 10,678 | 13 |
| 12-31-2014 | 15.28 | | 0.32 | 0.34 | | 0.66 | | (0.32) | (0.16) | (0.48) | 15.46 | 4.33 | 0.13 | 0.11 | 2.02 | 12,041 | 15 |
| Class 5 | |
| 06-30-20197 | 12.97 | | 0.09 | 1.57 | | 1.66 | | (0.09) | — | (0.09) | 14.54 | 12.788 | 0.199 | 0.119 | 1.279 | 160 | 24 |
| 12-31-2018 | 15.20 | | 0.32 | (1.30) | | (0.98) | | (0.33) | (0.92) | (1.25) | 12.97 | (6.44) | 0.15 | 0.08 | 2.14 | 143 | 18 |
| 12-31-2017 | 14.24 | | 0.31 | 1.86 | | 2.17 | | (0.31) | (0.90) | (1.21) | 15.20 | 15.27 | 0.12 | 0.07 | 2.00 | 165 | 27 |
| 12-31-2016 | 14.24 | | 0.30 | 0.71 | | 1.01 | | (0.31) | (0.70) | (1.01) | 14.24 | 7.13 | 0.09 | 0.06 | 2.10 | 150 | 23 |
| 12-31-2015 | 15.47 | | 0.33 | (0.49) | | (0.16) | | (0.32) | (0.75) | (1.07) | 14.24 | (1.07) | 0.08 | 0.06 | 2.09 | 141 | 13 |
| 12-31-2014 | 15.29 | | 0.34 | 0.33 | | 0.67 | | (0.33) | (0.16) | (0.49) | 15.47 | 4.38 | 0.08 | 0.06 | 2.14 | 139 | 15 |
| 1 Based on average daily shares outstanding. |
| 2 Net investment income is affected by the timing and frequency of the declaration of dividends by the underlying funds in which the portfolio invests. |
| 3 Capital gain distributions may vary between classes due to expense differences applied to ordinary income distributions from underlying funds. |
| 4 Total returns would have been lower had certain expenses not been reduced during the applicable periods. |
| 5 Does not reflect the effect of sales charges, if any. |
| 6 Ratios do not include expense indirectly incurred from underlying funds and can vary based on the mix of underlying funds held by the portfolio. |
| 7 Six months ended 6-30-19. Unaudited. |
| 8 Not annualized. |
| 9 Annualized. |
| 10 The inception date for Class I shares is 5-1-15. |
| 11 Portfolio turnover is shown for the period from 1-1-15 to 12-31-15. |
| 30 | JOHN HANCOCK MULTIMANAGER LIFESTYLE BALANCED PORTFOLIO | SEMIANNUAL REPORT | SEE NOTES TO FINANCIAL STATEMENTS |
Multimanager Lifestyle Moderate Portfolio
| Per share operating performance for a share outstanding throughout each period | | Ratios and supplemental data | |
| | | | Income (loss) from investment operations | | | | Less distributions | | | | Ratios to average net assets | | | |
| Period ended | Net asset
value,
beginning
of period ($) | | Net
investment
income
(loss) ($)1, 2 | Net realized and
unrealized
gain (loss)
on investments ($) | | Total from
investment
operations ($) | | From net
investment
income ($) | From net
realized
gain ($)3 | Total
distributions ($) | Net asset
value,
end of
period ($) | Total
return
(%)4, 5 | Expenses
before
reductions
(%)6 | Expenses
including
reductions
(%)6 | Net
investment
income
(loss) (%)2 | Net
assets,
end of
period
(in millions) | Portfolio
turnover
(%) |
| Multimanager Lifestyle Moderate Portfolio | |
| Class A | |
| 06-30-20197 | 12.27 | | 0.09 | 1.18 | | 1.27 | | (0.08) | — | (0.08) | 13.46 | 10.408 | 0.619 | 0.549 | 1.349 | 634 | 26 |
| 12-31-2018 | 13.83 | | 0.30 | (1.01) | | (0.71) | | (0.31) | (0.54) | (0.85) | 12.27 | (5.19) | 0.56 | 0.50 | 2.19 | 601 | 14 |
| 12-31-2017 | 13.30 | | 0.27 | 1.14 | | 1.41 | | (0.27) | (0.61) | (0.88) | 13.83 | 10.64 | 0.55 | 0.49 | 1.90 | 693 | 28 |
| 12-31-2016 | 13.13 | | 0.28 | 0.57 | | 0.85 | | (0.29) | (0.39) | (0.68) | 13.30 | 6.52 | 0.51 | 0.48 | 2.06 | 680 | 25 |
| 12-31-2015 | 14.11 | | 0.31 | (0.54) | | (0.23) | | (0.31) | (0.44) | (0.75) | 13.13 | (1.67) | 0.51 | 0.47 | 2.21 | 680 | 11 |
| 12-31-2014 | 14.29 | | 0.35 | 0.17 | | 0.52 | | (0.33) | (0.37) | (0.70) | 14.11 | 3.63 | 0.52 | 0.47 | 2.36 | 662 | 14 |
| Class B | |
| 06-30-20197 | 12.26 | | 0.04 | 1.19 | | 1.23 | | (0.04) | — | (0.04) | 13.45 | 10.038 | 1.319 | 1.249 | 0.579 | 9 | 26 |
| 12-31-2018 | 13.82 | | 0.18 | (0.99) | | (0.81) | | (0.21) | (0.54) | (0.75) | 12.26 | (5.87) | 1.26 | 1.20 | 1.32 | 12 | 14 |
| 12-31-2017 | 13.28 | | 0.15 | 1.17 | | 1.32 | | (0.17) | (0.61) | (0.78) | 13.82 | 9.96 | 1.25 | 1.20 | 1.08 | 20 | 28 |
| 12-31-2016 | 13.13 | | 0.17 | 0.56 | | 0.73 | | (0.19) | (0.39) | (0.58) | 13.28 | 5.61 | 1.21 | 1.19 | 1.27 | 25 | 25 |
| 12-31-2015 | 14.10 | | 0.19 | (0.51) | | (0.32) | | (0.21) | (0.44) | (0.65) | 13.13 | (2.33) | 1.22 | 1.20 | 1.36 | 30 | 11 |
| 12-31-2014 | 14.28 | | 0.21 | 0.20 | | 0.41 | | (0.22) | (0.37) | (0.59) | 14.10 | 2.84 | 1.25 | 1.24 | 1.43 | 39 | 14 |
| Class C | |
| 06-30-20197 | 12.27 | | 0.04 | 1.20 | | 1.24 | | (0.04) | — | (0.04) | 13.47 | 10.108 | 1.319 | 1.249 | 0.629 | 195 | 26 |
| 12-31-2018 | 13.83 | | 0.19 | (1.00) | | (0.81) | | (0.21) | (0.54) | (0.75) | 12.27 | (5.86) | 1.26 | 1.20 | 1.36 | 202 | 14 |
| 12-31-2017 | 13.30 | | 0.16 | 1.15 | | 1.31 | | (0.17) | (0.61) | (0.78) | 13.83 | 9.87 | 1.25 | 1.20 | 1.12 | 299 | 28 |
| 12-31-2016 | 13.14 | | 0.17 | 0.57 | | 0.74 | | (0.19) | (0.39) | (0.58) | 13.30 | 5.69 | 1.21 | 1.19 | 1.30 | 354 | 25 |
| 12-31-2015 | 14.11 | | 0.21 | (0.53) | | (0.32) | | (0.21) | (0.44) | (0.65) | 13.14 | (2.32) | 1.21 | 1.19 | 1.46 | 392 | 11 |
| 12-31-2014 | 14.30 | | 0.23 | 0.17 | | 0.40 | | (0.22) | (0.37) | (0.59) | 14.11 | 2.79 | 1.22 | 1.21 | 1.59 | 411 | 14 |
| Class I | |
| 06-30-20197 | 12.22 | | 0.10 | 1.19 | | 1.29 | | (0.10) | — | (0.10) | 13.41 | 10.698 | 0.329 | 0.249 | 1.629 | 13 | 26 |
| 12-31-2018 | 13.78 | | 0.37 | (1.04) | | (0.67) | | (0.35) | (0.54) | (0.89) | 12.22 | (5.00) | 0.28 | 0.20 | 2.70 | 15 | 14 |
| 12-31-2017 | 13.25 | | 0.35 | 1.10 | | 1.45 | | (0.31) | (0.61) | (0.92) | 13.78 | 11.01 | 0.24 | 0.19 | 2.54 | 14 | 28 |
| 12-31-2016 | 13.09 | | 0.37 | 0.51 | | 0.88 | | (0.33) | (0.39) | (0.72) | 13.25 | 6.78 | 0.20 | 0.18 | 2.77 | 5 | 25 |
| 12-31-201510 | 14.42 | | 0.33 | (0.92) | | (0.59) | | (0.30) | (0.44) | (0.74) | 13.09 | (4.13)8 | 0.199 | 0.179 | 3.559 | 2 | 1111 |
| Class R1 | |
| 06-30-20197 | 12.25 | | 0.07 | 1.18 | | 1.25 | | (0.06) | — | (0.06) | 13.44 | 10.248 | 0.939 | 0.869 | 1.019 | 4 | 26 |
| 12-31-2018 | 13.81 | | 0.25 | (1.01) | | (0.76) | | (0.26) | (0.54) | (0.80) | 12.25 | (5.52) | 0.89 | 0.82 | 1.85 | 5 | 14 |
| 12-31-2017 | 13.27 | | 0.21 | 1.16 | | 1.37 | | (0.22) | (0.61) | (0.83) | 13.81 | 10.38 | 0.87 | 0.83 | 1.52 | 6 | 28 |
| 12-31-2016 | 13.12 | | 0.22 | 0.57 | | 0.79 | | (0.25) | (0.39) | (0.64) | 13.27 | 6.03 | 0.84 | 0.82 | 1.67 | 7 | 25 |
| 12-31-2015 | 14.09 | | 0.25 | (0.53) | | (0.28) | | (0.25) | (0.44) | (0.69) | 13.12 | (1.99) | 0.87 | 0.85 | 1.77 | 8 | 11 |
| 12-31-2014 | 14.28 | | 0.24 | 0.20 | | 0.44 | | (0.26) | (0.37) | (0.63) | 14.09 | 3.07 | 1.01 | 1.00 | 1.65 | 8 | 14 |
| Class R2 | |
| 06-30-20197 | 12.22 | | 0.08 | 1.19 | | 1.27 | | (0.08) | — | (0.08) | 13.41 | 10.488 | 0.699 | 0.629 | 1.229 | 2 | 26 |
| 12-31-2018 | 13.78 | | 0.26 | (0.99) | | (0.73) | | (0.29) | (0.54) | (0.83) | 12.22 | (5.39) | 0.67 | 0.61 | 1.91 | 3 | 14 |
| 12-31-2017 | 13.25 | | 0.22 | 1.18 | | 1.40 | | (0.26) | (0.61) | (0.87) | 13.78 | 10.57 | 0.64 | 0.59 | 1.60 | 4 | 28 |
| 12-31-2016 | 13.09 | | 0.26 | 0.57 | | 0.83 | | (0.28) | (0.39) | (0.67) | 13.25 | 6.35 | 0.60 | 0.58 | 1.98 | 7 | 25 |
| 12-31-2015 | 14.06 | | 0.30 | (0.54) | | (0.24) | | (0.29) | (0.44) | (0.73) | 13.09 | (1.72) | 0.64 | 0.60 | 2.12 | 6 | 11 |
| 12-31-2014 | 14.25 | | 0.36 | 0.13 | | 0.49 | | (0.31) | (0.37) | (0.68) | 14.06 | 3.41 | 1.02 | 0.62 | 2.50 | 4 | 14 |
| Class R3 | |
| 06-30-20197 | 12.24 | | 0.07 | 1.20 | | 1.27 | | (0.07) | — | (0.07) | 13.44 | 10.388 | 0.829 | 0.759 | 1.139 | 6 | 26 |
| 12-31-2018 | 13.80 | | 0.27 | (1.02) | | (0.75) | | (0.27) | (0.54) | (0.81) | 12.24 | (5.43) | 0.79 | 0.72 | 1.95 | 5 | 14 |
| 12-31-2017 | 13.27 | | 0.24 | 1.14 | | 1.38 | | (0.24) | (0.61) | (0.85) | 13.80 | 10.39 | 0.78 | 0.74 | 1.70 | 7 | 28 |
| 12-31-2016 | 13.11 | | 0.24 | 0.57 | | 0.81 | | (0.26) | (0.39) | (0.65) | 13.27 | 6.18 | 0.74 | 0.72 | 1.78 | 8 | 25 |
| 12-31-2015 | 14.08 | | 0.26 | (0.52) | | (0.26) | | (0.27) | (0.44) | (0.71) | 13.11 | (1.89) | 0.78 | 0.76 | 1.82 | 8 | 11 |
| 12-31-2014 | 14.27 | | 0.27 | 0.19 | | 0.46 | | (0.28) | (0.37) | (0.65) | 14.08 | 3.16 | 0.89 | 0.87 | 1.82 | 10 | 14 |
| Class R4 | |
| 06-30-20197 | 12.21 | | 0.10 | 1.18 | | 1.28 | | (0.09) | — | (0.09) | 13.40 | 10.538 | 0.569 | 0.399 | 1.509 | 3 | 26 |
| 12-31-2018 | 13.78 | | 0.29 | (0.99) | | (0.70) | | (0.33) | (0.54) | (0.87) | 12.21 | (5.14) | 0.52 | 0.36 | 2.11 | 3 | 14 |
| 12-31-2017 | 13.24 | | 0.25 | 1.19 | | 1.44 | | (0.29) | (0.61) | (0.90) | 13.78 | 10.93 | 0.49 | 0.34 | 1.78 | 5 | 28 |
| 12-31-2016 | 13.09 | | 0.28 | 0.57 | | 0.85 | | (0.31) | (0.39) | (0.70) | 13.24 | 6.53 | 0.45 | 0.34 | 2.07 | 8 | 25 |
| 12-31-2015 | 14.06 | | 0.30 | (0.51) | | (0.21) | | (0.32) | (0.44) | (0.76) | 13.09 | (1.50) | 0.48 | 0.36 | 2.15 | 10 | 11 |
| 12-31-2014 | 14.25 | | 0.34 | 0.18 | | 0.52 | | (0.34) | (0.37) | (0.71) | 14.06 | 3.60 | 0.57 | 0.45 | 2.36 | 14 | 14 |
| SEE NOTES TO FINANCIAL STATEMENTS | SEMIANNUAL REPORT | JOHN HANCOCK MULTIMANAGER LIFESTYLE MODERATE PORTFOLIO | 31 |
| Financial highlights continued |
Multimanager Lifestyle Moderate Portfolio (continued)
| Per share operating performance for a share outstanding throughout each period | | Ratios and supplemental data | |
| | | | Income (loss) from investment operations | | | | Less distributions | | | | Ratios to average net assets | | | |
| Period ended | Net asset
value,
beginning
of period ($) | | Net
investment
income
(loss) ($)1, 2 | Net realized and
unrealized
gain (loss)
on investments ($) | | Total from
investment
operations ($) | | From net
investment
income ($) | From net
realized
gain ($)3 | Total
distributions ($) | Net asset
value,
end of
period ($) | Total
return
(%)4, 5 | Expenses
before
reductions
(%)6 | Expenses
including
reductions
(%)6 | Net
investment
income
(loss) (%)2 | Net
assets,
end of
period
(in millions) | Portfolio
turnover
(%) |
| Class R5 | |
| 06-30-20197 | 12.23 | | 0.11 | 1.19 | | 1.30 | | (0.11) | — | (0.11) | 13.42 | 10.628 | 0.269 | 0.199 | 1.689 | 6 | 26 |
| 12-31-2018 | 13.79 | | 0.32 | (0.99) | | (0.67) | | (0.35) | (0.54) | (0.89) | 12.23 | (4.87) | 0.21 | 0.15 | 2.37 | 6 | 14 |
| 12-31-2017 | 13.26 | | 0.32 | 1.14 | | 1.46 | | (0.32) | (0.61) | (0.93) | 13.79 | 11.05 | 0.19 | 0.14 | 2.26 | 10 | 28 |
| 12-31-2016 | 13.10 | | 0.31 | 0.58 | | 0.89 | | (0.34) | (0.39) | (0.73) | 13.26 | 6.82 | 0.15 | 0.13 | 2.31 | 9 | 25 |
| 12-31-2015 | 14.07 | | 0.35 | (0.53) | | (0.18) | | (0.35) | (0.44) | (0.79) | 13.10 | (1.29) | 0.18 | 0.16 | 2.47 | 11 | 11 |
| 12-31-2014 | 14.26 | | 0.36 | 0.18 | | 0.54 | | (0.36) | (0.37) | (0.73) | 14.07 | 3.78 | 0.27 | 0.26 | 2.45 | 12 | 14 |
| Class R6 | |
| 06-30-20197 | 12.21 | | 0.11 | 1.19 | | 1.30 | | (0.11) | — | (0.11) | 13.40 | 10.758 | 0.219 | 0.149 | 1.779 | 34 | 26 |
| 12-31-2018 | 13.77 | | 0.36 | (1.02) | | (0.66) | | (0.36) | (0.54) | (0.90) | 12.21 | (4.91) | 0.17 | 0.10 | 2.64 | 24 | 14 |
| 12-31-2017 | 13.24 | | 0.31 | 1.16 | | 1.47 | | (0.33) | (0.61) | (0.94) | 13.77 | 11.14 | 0.15 | 0.09 | 2.20 | 25 | 28 |
| 12-31-2016 | 13.08 | | 0.32 | 0.57 | | 0.89 | | (0.34) | (0.39) | (0.73) | 13.24 | 6.90 | 0.10 | 0.07 | 2.41 | 29 | 25 |
| 12-31-2015 | 14.05 | | 0.38 | (0.54) | | (0.16) | | (0.37) | (0.44) | (0.81) | 13.08 | (1.20) | 0.11 | 0.06 | 2.74 | 30 | 11 |
| 12-31-2014 | 14.24 | | 0.42 | 0.15 | | 0.57 | | (0.39) | (0.37) | (0.76) | 14.05 | 3.99 | 0.21 | 0.06 | 2.90 | 20 | 14 |
| Class 1 | |
| 06-30-20197 | 12.23 | | 0.11 | 1.19 | | 1.30 | | (0.11) | — | (0.11) | 13.42 | 10.728 | 0.259 | 0.189 | 1.699 | 2,220 | 26 |
| 12-31-2018 | 13.79 | | 0.34 | (1.01) | | (0.67) | | (0.35) | (0.54) | (0.89) | 12.23 | (4.94) | 0.20 | 0.14 | 2.51 | 2,162 | 14 |
| 12-31-2017 | 13.26 | | 0.31 | 1.15 | | 1.46 | | (0.32) | (0.61) | (0.93) | 13.79 | 11.07 | 0.18 | 0.13 | 2.23 | 2,657 | 28 |
| 12-31-2016 | 13.10 | | 0.32 | 0.57 | | 0.89 | | (0.34) | (0.39) | (0.73) | 13.26 | 6.84 | 0.14 | 0.12 | 2.40 | 2,821 | 25 |
| 12-31-2015 | 14.07 | | 0.35 | (0.52) | | (0.17) | | (0.36) | (0.44) | (0.80) | 13.10 | (1.25) | 0.13 | 0.11 | 2.50 | 3,005 | 11 |
| 12-31-2014 | 14.26 | | 0.38 | 0.18 | | 0.56 | | (0.38) | (0.37) | (0.75) | 14.07 | 3.93 | 0.12 | 0.11 | 2.62 | 3,455 | 14 |
| Class 5 | |
| 06-30-20197 | 12.21 | | 0.11 | 1.19 | | 1.30 | | (0.11) | — | (0.11) | 13.40 | 10.678 | 0.209 | 0.139 | 1.759 | 60 | 26 |
| 12-31-2018 | 13.77 | | 0.35 | (1.01) | | (0.66) | | (0.36) | (0.54) | (0.90) | 12.21 | (4.82) | 0.15 | 0.09 | 2.60 | 53 | 14 |
| 12-31-2017 | 13.24 | | 0.33 | 1.14 | | 1.47 | | (0.33) | (0.61) | (0.94) | 13.77 | 11.14 | 0.13 | 0.08 | 2.33 | 62 | 28 |
| 12-31-2016 | 13.08 | | 0.34 | 0.55 | | 0.89 | | (0.34) | (0.39) | (0.73) | 13.24 | 6.90 | 0.09 | 0.07 | 2.50 | 57 | 25 |
| 12-31-2015 | 14.06 | | 0.37 | (0.54) | | (0.17) | | (0.37) | (0.44) | (0.81) | 13.08 | (1.27) | 0.08 | 0.06 | 2.61 | 52 | 11 |
| 12-31-2014 | 14.24 | | 0.40 | 0.18 | | 0.58 | | (0.39) | (0.37) | (0.76) | 14.06 | 4.06 | 0.07 | 0.06 | 2.72 | 52 | 14 |
| 1 Based on average daily shares outstanding. |
| 2 Net investment income is affected by the timing and frequency of the declaration of dividends by the underlying funds in which the portfolio invests. |
| 3 Capital gain distributions may vary between classes due to expense differences applied to ordinary income distributions from underlying funds. |
| 4 Total returns would have been lower had certain expenses not been reduced during the applicable periods. |
| 5 Does not reflect the effect of sales charges, if any. |
| 6 Ratios do not include expense indirectly incurred from underlying funds and can vary based on the mix of underlying funds held by the portfolio. |
| 7 Six months ended 6-30-19. Unaudited. |
| 8 Not annualized. |
| 9 Annualized. |
| 10 The inception date for Class I shares is 5-1-15. |
| 11 Portfolio turnover is shown for the period from 1-1-15 to 12-31-15. |
| 32 | JOHN HANCOCK MULTIMANAGER LIFESTYLE MODERATE PORTFOLIO | SEMIANNUAL REPORT | SEE NOTES TO FINANCIAL STATEMENTS |
Multimanager Lifestyle Conservative Portfolio
| Per share operating performance for a share outstanding throughout each period | | Ratios and supplemental data | |
| | | | Income (loss) from investment operations | | | | Less distributions | | | | Ratios to average net assets | | | |
| Period ended | Net asset
value,
beginning
of period ($) | | Net
investment
income
(loss) ($)1, 2 | Net realized and
unrealized
gain (loss)
on investments ($) | | Total from
investment
operations ($) | | From net
investment
income ($) | From net
realized
gain ($)3 | Total
distributions ($) | Net asset
value,
end of
period ($) | Total
return
(%)4, 5 | Expenses
before
reductions
(%)6 | Expenses
including
reductions
(%)6 | Net
investment
income
(loss) (%)2 | Net
assets,
end of
period
(in millions) | Portfolio
turnover
(%) |
| Multimanager Lifestyle Conservative Portfolio | |
| Class A | |
| 06-30-20197 | 12.10 | | 0.11 | 0.89 | | 1.00 | | (0.11) | — | (0.11) | 12.99 | 8.278 | 0.639 | 0.569 | 1.769 | 544 | 34 |
| 12-31-2018 | 13.06 | | 0.31 | (0.79) | | (0.48) | | (0.32) | (0.16) | (0.48) | 12.10 | (3.67) | 0.57 | 0.51 | 2.44 | 526 | 11 |
| 12-31-2017 | 12.60 | | 0.27 | 0.62 | | 0.89 | | (0.27) | (0.16) | (0.43) | 13.06 | 7.11 | 0.55 | 0.50 | 2.05 | 611 | 26 |
| 12-31-2016 | 12.42 | | 0.29 | 0.38 | | 0.67 | | (0.28) | (0.21) | (0.49) | 12.60 | 5.40 | 0.51 | 0.48 | 2.26 | 607 | 23 |
| 12-31-2015 | 13.30 | | 0.33 | (0.56) | | (0.23) | | (0.33) | (0.32) | (0.65) | 12.42 | (1.74) | 0.51 | 0.47 | 2.47 | 576 | 10 |
| 12-31-2014 | 13.68 | | 0.37 | 0.10 | | 0.47 | | (0.37) | (0.48) | (0.85) | 13.30 | 3.44 | 0.53 | 0.47 | 2.67 | 600 | 22 |
| Class B | |
| 06-30-20197 | 12.11 | | 0.06 | 0.89 | | 0.95 | | (0.07) | — | (0.07) | 12.99 | 7.818 | 1.339 | 1.269 | 1.009 | 8 | 34 |
| 12-31-2018 | 13.07 | | 0.20 | (0.77) | | (0.57) | | (0.23) | (0.16) | (0.39) | 12.11 | (4.35) | 1.27 | 1.21 | 1.57 | 10 | 11 |
| 12-31-2017 | 12.61 | | 0.16 | 0.64 | | 0.80 | | (0.18) | (0.16) | (0.34) | 13.07 | 6.35 | 1.25 | 1.21 | 1.24 | 17 | 26 |
| 12-31-2016 | 12.43 | | 0.18 | 0.40 | | 0.58 | | (0.19) | (0.21) | (0.40) | 12.61 | 4.66 | 1.21 | 1.19 | 1.42 | 23 | 23 |
| 12-31-2015 | 13.30 | | 0.22 | (0.54) | | (0.32) | | (0.23) | (0.32) | (0.55) | 12.43 | (2.39) | 1.22 | 1.20 | 1.64 | 30 | 10 |
| 12-31-2014 | 13.68 | | 0.24 | 0.12 | | 0.36 | | (0.26) | (0.48) | (0.74) | 13.30 | 2.65 | 1.25 | 1.24 | 1.75 | 39 | 22 |
| Class C | |
| 06-30-20197 | 12.10 | | 0.07 | 0.89 | | 0.96 | | (0.07) | — | (0.07) | 12.99 | 7.908 | 1.339 | 1.269 | 1.049 | 172 | 34 |
| 12-31-2018 | 13.06 | | 0.21 | (0.78) | | (0.57) | | (0.23) | (0.16) | (0.39) | 12.10 | (4.35) | 1.27 | 1.21 | 1.64 | 180 | 11 |
| 12-31-2017 | 12.61 | | 0.17 | 0.62 | | 0.79 | | (0.18) | (0.16) | (0.34) | 13.06 | 6.27 | 1.25 | 1.21 | 1.28 | 261 | 26 |
| 12-31-2016 | 12.42 | | 0.19 | 0.40 | | 0.59 | | (0.19) | (0.21) | (0.40) | 12.61 | 4.74 | 1.21 | 1.19 | 1.48 | 310 | 23 |
| 12-31-2015 | 13.30 | | 0.23 | (0.56) | | (0.33) | | (0.23) | (0.32) | (0.55) | 12.42 | (2.47) | 1.21 | 1.19 | 1.73 | 349 | 10 |
| 12-31-2014 | 13.68 | | 0.27 | 0.09 | | 0.36 | | (0.26) | (0.48) | (0.74) | 13.30 | 2.66 | 1.23 | 1.21 | 1.91 | 378 | 22 |
| Class I | |
| 06-30-20197 | 12.08 | | 0.13 | 0.88 | | 1.01 | | (0.13) | — | (0.13) | 12.96 | 8.368 | 0.349 | 0.269 | 2.049 | 14 | 34 |
| 12-31-2018 | 13.04 | | 0.37 | (0.81) | | (0.44) | | (0.36) | (0.16) | (0.52) | 12.08 | (3.39) | 0.28 | 0.21 | 2.89 | 15 | 11 |
| 12-31-2017 | 12.58 | | 0.32 | 0.61 | | 0.93 | | (0.31) | (0.16) | (0.47) | 13.04 | 7.44 | 0.24 | 0.20 | 2.42 | 15 | 26 |
| 12-31-2016 | 12.40 | | 0.39 | 0.32 | | 0.71 | | (0.32) | (0.21) | (0.53) | 12.58 | 5.73 | 0.20 | 0.18 | 3.04 | 11 | 23 |
| 12-31-201510 | 13.49 | | 0.34 | (0.80) | | (0.46) | | (0.31) | (0.32) | (0.63) | 12.40 | (3.40)8 | 0.199 | 0.179 | 3.849 | 4 | 1011 |
| Class R1 | |
| 06-30-20197 | 12.09 | | 0.09 | 0.88 | | 0.97 | | (0.09) | — | (0.09) | 12.97 | 8.018 | 0.989 | 0.919 | 1.389 | 5 | 34 |
| 12-31-2018 | 13.05 | | 0.28 | (0.80) | | (0.52) | | (0.28) | (0.16) | (0.44) | 12.09 | (4.01) | 0.92 | 0.86 | 2.18 | 7 | 11 |
| 12-31-2017 | 12.59 | | 0.21 | 0.64 | | 0.85 | | (0.23) | (0.16) | (0.39) | 13.05 | 6.74 | 0.89 | 0.85 | 1.62 | 6 | 26 |
| 12-31-2016 | 12.41 | | 0.24 | 0.39 | | 0.63 | | (0.24) | (0.21) | (0.45) | 12.59 | 5.04 | 0.86 | 0.84 | 1.90 | 9 | 23 |
| 12-31-2015 | 13.29 | | 0.26 | (0.54) | | (0.28) | | (0.28) | (0.32) | (0.60) | 12.41 | (2.11) | 0.87 | 0.86 | 1.95 | 8 | 10 |
| 12-31-2014 | 13.68 | | 0.30 | 0.09 | | 0.39 | | (0.30) | (0.48) | (0.78) | 13.29 | 2.86 | 1.00 | 0.99 | 2.14 | 10 | 22 |
| Class R2 | |
| 06-30-20197 | 12.08 | | 0.10 | 0.89 | | 0.99 | | (0.10) | — | (0.10) | 12.97 | 8.238 | 0.729 | 0.659 | 1.649 | 3 | 34 |
| 12-31-2018 | 13.04 | | 0.30 | (0.79) | | (0.49) | | (0.31) | (0.16) | (0.47) | 12.08 | (3.77) | 0.68 | 0.63 | 2.37 | 3 | 11 |
| 12-31-2017 | 12.59 | | 0.23 | 0.64 | | 0.87 | | (0.26) | (0.16) | (0.42) | 13.04 | 6.91 | 0.63 | 0.58 | 1.73 | 2 | 26 |
| 12-31-2016 | 12.40 | | 0.25 | 0.42 | | 0.67 | | (0.27) | (0.21) | (0.48) | 12.59 | 5.39 | 0.60 | 0.58 | 1.95 | 4 | 23 |
| 12-31-2015 | 13.28 | | 0.31 | (0.55) | | (0.24) | | (0.32) | (0.32) | (0.64) | 12.40 | (1.86) | 0.65 | 0.61 | 2.31 | 5 | 10 |
| 12-31-2014 | 13.67 | | 0.46 | (0.02) | | 0.44 | | (0.35) | (0.48) | (0.83) | 13.28 | 3.21 | 1.13 | 0.62 | 3.30 | 5 | 22 |
| Class R3 | |
| 06-30-20197 | 12.07 | | 0.10 | 0.88 | | 0.98 | | (0.10) | — | (0.10) | 12.95 | 8.118 | 0.829 | 0.759 | 1.579 | 4 | 34 |
| 12-31-2018 | 13.03 | | 0.28 | (0.78) | | (0.50) | | (0.30) | (0.16) | (0.46) | 12.07 | (3.86) | 0.75 | 0.69 | 2.21 | 3 | 11 |
| 12-31-2017 | 12.57 | | 0.23 | 0.64 | | 0.87 | | (0.25) | (0.16) | (0.41) | 13.03 | 6.91 | 0.73 | 0.69 | 1.79 | 5 | 26 |
| 12-31-2016 | 12.39 | | 0.25 | 0.40 | | 0.65 | | (0.26) | (0.21) | (0.47) | 12.57 | 5.19 | 0.69 | 0.68 | 1.94 | 6 | 23 |
| 12-31-2015 | 13.26 | | 0.27 | (0.52) | | (0.25) | | (0.30) | (0.32) | (0.62) | 12.39 | (1.94) | 0.76 | 0.75 | 2.04 | 8 | 10 |
| 12-31-2014 | 13.65 | | 0.31 | 0.10 | | 0.41 | | (0.32) | (0.48) | (0.80) | 13.26 | 3.01 | 0.88 | 0.86 | 2.21 | 11 | 22 |
| Class R4 | |
| 06-30-20197 | 12.07 | | 0.12 | 0.89 | | 1.01 | | (0.12) | — | (0.12) | 12.96 | 8.368 | 0.579 | 0.419 | 2.019 | 3 | 34 |
| 12-31-2018 | 13.03 | | 0.32 | (0.78) | | (0.46) | | (0.34) | (0.16) | (0.50) | 12.07 | (3.54) | 0.52 | 0.36 | 2.46 | 2 | 11 |
| 12-31-2017 | 12.58 | | 0.27 | 0.63 | | 0.90 | | (0.29) | (0.16) | (0.45) | 13.03 | 7.20 | 0.49 | 0.35 | 2.09 | 4 | 26 |
| 12-31-2016 | 12.40 | | 0.30 | 0.39 | | 0.69 | | (0.30) | (0.21) | (0.51) | 12.58 | 5.56 | 0.45 | 0.34 | 2.35 | 6 | 23 |
| 12-31-2015 | 13.27 | | 0.31 | (0.51) | | (0.20) | | (0.35) | (0.32) | (0.67) | 12.40 | (1.56) | 0.50 | 0.38 | 2.37 | 6 | 10 |
| 12-31-2014 | 13.66 | | 0.36 | 0.10 | | 0.46 | | (0.37) | (0.48) | (0.85) | 13.27 | 3.36 | 0.63 | 0.51 | 2.62 | 9 | 22 |
| SEE NOTES TO FINANCIAL STATEMENTS | SEMIANNUAL REPORT | JOHN HANCOCK MULTIMANAGER LIFESTYLE CONSERVATIVE PORTFOLIO | 33 |
| Financial highlights continued |
Multimanager Lifestyle Conservative Portfolio (continued)
| Per share operating performance for a share outstanding throughout each period | | Ratios and supplemental data | |
| | | | Income (loss) from investment operations | | | | Less distributions | | | | Ratios to average net assets | | | |
| Period ended | Net asset
value,
beginning
of period ($) | | Net
investment
income
(loss) ($)1, 2 | Net realized and
unrealized
gain (loss)
on investments ($) | | Total from
investment
operations ($) | | From net
investment
income ($) | From net
realized
gain ($)3 | Total
distributions ($) | Net asset
value,
end of
period ($) | Total
return
(%)4, 5 | Expenses
before
reductions
(%)6 | Expenses
including
reductions
(%)6 | Net
investment
income
(loss) (%)2 | Net
assets,
end of
period
(in millions) | Portfolio
turnover
(%) |
| Class R5 | |
| 06-30-20197 | 12.08 | | 0.13 | 0.88 | | 1.01 | | (0.13) | — | (0.13) | 12.96 | 8.388 | 0.289 | 0.219 | 2.069 | 3 | 34 |
| 12-31-2018 | 13.04 | | 0.36 | (0.79) | | (0.43) | | (0.37) | (0.16) | (0.53) | 12.08 | (3.34) | 0.22 | 0.16 | 2.80 | 4 | 11 |
| 12-31-2017 | 12.58 | | 0.30 | 0.64 | | 0.94 | | (0.32) | (0.16) | (0.48) | 13.04 | 7.49 | 0.20 | 0.16 | 2.33 | 5 | 26 |
| 12-31-2016 | 12.40 | | 0.32 | 0.40 | | 0.72 | | (0.33) | (0.21) | (0.54) | 12.58 | 5.77 | 0.15 | 0.13 | 2.53 | 7 | 23 |
| 12-31-2015 | 13.28 | | 0.36 | (0.54) | | (0.18) | | (0.38) | (0.32) | (0.70) | 12.40 | (1.41) | 0.18 | 0.16 | 2.70 | 8 | 10 |
| 12-31-2014 | 13.67 | | 0.38 | 0.12 | | 0.50 | | (0.41) | (0.48) | (0.89) | 13.28 | 3.64 | 0.26 | 0.24 | 2.75 | 13 | 22 |
| Class R6 | |
| 06-30-20197 | 12.07 | | 0.14 | 0.87 | | 1.01 | | (0.13) | — | (0.13) | 12.95 | 8.418 | 0.239 | 0.169 | 2.199 | 24 | 34 |
| 12-31-2018 | 13.03 | | 0.40 | (0.83) | | (0.43) | | (0.37) | (0.16) | (0.53) | 12.07 | (3.30) | 0.17 | 0.11 | 3.13 | 21 | 11 |
| 12-31-2017 | 12.57 | | 0.33 | 0.62 | | 0.95 | | (0.33) | (0.16) | (0.49) | 13.03 | 7.56 | 0.15 | 0.10 | 2.53 | 16 | 26 |
| 12-31-2016 | 12.39 | | 0.34 | 0.39 | | 0.73 | | (0.34) | (0.21) | (0.55) | 12.57 | 5.85 | 0.10 | 0.07 | 2.68 | 14 | 23 |
| 12-31-2015 | 13.27 | | 0.39 | (0.56) | | (0.17) | | (0.39) | (0.32) | (0.71) | 12.39 | (1.34) | 0.13 | 0.06 | 2.95 | 13 | 10 |
| 12-31-2014 | 13.65 | | 0.47 | 0.06 | | 0.53 | | (0.43) | (0.48) | (0.91) | 13.27 | 3.87 | 0.42 | 0.06 | 3.41 | 8 | 22 |
| Class 1 | |
| 06-30-20197 | 12.07 | | 0.13 | 0.89 | | 1.02 | | (0.13) | — | (0.13) | 12.96 | 8.488 | 0.279 | 0.209 | 2.129 | 1,609 | 34 |
| 12-31-2018 | 13.03 | | 0.36 | (0.79) | | (0.43) | | (0.37) | (0.16) | (0.53) | 12.07 | (3.33) | 0.21 | 0.15 | 2.78 | 1,573 | 11 |
| 12-31-2017 | 12.58 | | 0.31 | 0.62 | | 0.93 | | (0.32) | (0.16) | (0.48) | 13.03 | 7.43 | 0.18 | 0.14 | 2.37 | 1,931 | 26 |
| 12-31-2016 | 12.39 | | 0.33 | 0.40 | | 0.73 | | (0.33) | (0.21) | (0.54) | 12.58 | 5.88 | 0.13 | 0.12 | 2.59 | 2,149 | 23 |
| 12-31-2015 | 13.27 | | 0.37 | (0.55) | | (0.18) | | (0.38) | (0.32) | (0.70) | 12.39 | (1.39) | 0.13 | 0.11 | 2.79 | 2,241 | 10 |
| 12-31-2014 | 13.66 | | 0.41 | 0.10 | | 0.51 | | (0.42) | (0.48) | (0.90) | 13.27 | 3.74 | 0.13 | 0.11 | 2.94 | 2,584 | 22 |
| 1 Based on average daily shares outstanding. |
| 2 Net investment income is affected by the timing and frequency of the declaration of dividends by the underlying funds in which the portfolio invests. |
| 3 Capital gain distributions may vary between classes due to expense differences applied to ordinary income distributions from underlying funds. |
| 4 Total returns would have been lower had certain expenses not been reduced during the applicable periods. |
| 5 Does not reflect the effect of sales charges, if any. |
| 6 Ratios do not include expense indirectly incurred from underlying funds and can vary based on the mix of underlying funds held by the portfolio. |
| 7 Six months ended 6-30-19. Unaudited. |
| 8 Not annualized. |
| 9 Annualized. |
| 10 The inception date for Class I shares is 5-1-15. |
| 11 Portfolio turnover is shown for the period from 1-1-15 to 12-31-15. |
| 34 | JOHN HANCOCK MULTIMANAGER LIFESTYLE CONSERVATIVE PORTFOLIO | SEMIANNUAL REPORT | SEE NOTES TO FINANCIAL STATEMENTS |
Notes to financial statements (unaudited)
Note 1 — Organization
John Hancock Funds II (the Trust) is an open-end management investment company organized as a Massachusetts business trust and registered under the Investment Company Act of 1940, as amended (the 1940 Act). It is a series company with multipleinvestment series (the funds), five ofwhich (collectively, Multimanager Lifestyle Portfolios, or the portfolios, and individually the portfolio) of which are presented in this report. The Portfolios operate as "funds of funds", investing in affiliated underlying funds of the Trust, other funds in the John Hancock funds complex, non-John Hancock funds and certain other permitted investments.
The portfolios may offer multiple classes of shares. The shares currently outstandingare detailed in the Statements of assets and liabilities. Class A and Class C are offered to allinvestors. Class B shares are closed to new investors, subject to exceptions described in the portfolios' prospectus. Class I shares are offeredto institutions and certaininvestors. Class R1, Class R2, Class R3, Class R4 and Class R5 shares are available only to certain retirement plans. Class R6 shares are only available to certain retirement plans, institutions and other investors. Class 1 sharesare offered only to certain affiliates of Manulife Financial Corporation (MFC).Class 5 shares areavailable only to the John Hancock Freedom 529 plans.Class B sharesconvert to Class A shares eight years after purchase. Class C shares convert to Class A shares ten years after purchase (certain exclusions may apply).Shareholders of each class have exclusive voting rights to matters that affect that class.The distribution and service fees, if any, and transfer agent feesfor each class may differ.
The investment objectives of the portfolios are as follows:
Multimanager Lifestyle Aggressive Portfolio
To seek long-term growth of capital. Current income is not a consideration.
Multimanager Lifestyle Growth Portfolio
To seek long-term growth of capital. Current income is also a consideration.
Multimanager Lifestyle Balanced Portfolio
To seek a balance between a high level of current income and growth of capital, with a greater emphasis on growth of capital.
Multimanager Lifestyle Moderate Portfolio
To seek a balance between a high level of current income and growth of capital, with a greater emphasis on income.
Multimanager Lifestyle Conservative Portfolio
To seek a high level of current income with some consideration given to growth of capital.
The accounting policies of the John Hancock underlying funds in which the portfolios invest are outlined in the underlying funds' shareholder reports, which include the underlying funds' financial statements, available without charge by calling 800-344-1029 or visiting jhinvestments.com, or on the Securities and Exchange Commission (SEC) website at sec.gov. The underlying funds are not covered by this report.
Note 2 — Significant accounting policies
The financial statements have been prepared in conformity with accounting principles generally accepted in the United States of America (US GAAP), which require management to make certain estimates and assumptions as of the date of the financial statements. Actual results could differ from those estimates and those differences could be significant. The portfolios qualify as investment companies under Topic 946 of Accounting Standards Codification of US GAAP.
Events or transactions occurring after the end of the fiscal period through the date that the financial statements were issued have been evaluated in the preparation of the financial statements. The following summarizes the significant accounting policies of the portfolios:
Security valuation. Investments are stated at value as of the scheduled close of regular trading on the New York Stock Exchange (NYSE), normally at 4:00 p.m., Eastern Time. In case of emergency or other disruption resulting in the NYSE not opening for trading or the NYSE closing at a time other than the regularly scheduled close, the net asset value (NAV) may be determined as of the regularly scheduled close of the NYSE pursuant to the portfolio's Valuation Policies and Procedures.
In order to value the securities, the portfolios use the following valuation techniques: Investments by the portfolios in underlying affiliated funds and/or other open-end management investment companies are valued at their respective NAVs each business day. Debt obligations are typically valued based on the evaluated prices provided by an independent pricing vendor. Independent pricing vendors utilize matrix pricing which takes into account factors such as institutional-size trading in similar groups of securities, yield, quality, coupon rate, maturity, type of issue, trading characteristics and other market data, as well as broker supplied prices.
Other portfolio securities and assets, for which reliable market quotations are not readily available, are valued at fair value as determined in good faith by the portfolios' Pricing Committee following procedures established by the Board of Trustees. The frequency with which these fair valuation procedures are used cannot be predicted and fair value of securities may differ significantly from the value that would have been used had a ready market for such securities existed.
The portfolios use a three-tier hierarchy to prioritize the pricing assumptions, referred to as inputs, used in valuation techniques to measure fair value. Level 1 includes securities valued using quoted prices in active markets for identical securities, including registered investment companies. Level 2 includes securities valued using other significant observable inputs. Observable inputs may include quoted prices for similar securities, interest rates, prepayment speeds and credit risk. Prices for securities valued using these inputs are received from independent pricing vendors and brokers and are based on an evaluation of the inputs described. Level 3 includes securities valued using significant unobservable inputs when market prices are not readily available or reliable, including the portfolio's own assumptions in determining the fair value of investments. Factors used in determining value may include market or issuer specific events or trends, changes in interest rates and credit quality. The inputs or methodology used for valuing securities are not necessarily an indication of the risks associated with investing in those securities. Changes in valuation techniques and related inputs may result in transfers into or out of an assigned level within the disclosure hierarchy.
SEMIANNUAL REPORT | JOHN HANCOCK MULTIMANAGER LIFESTYLE PORTFOLIOS 35
As of June 30, 2019, all investments held in the Multimanager Lifestyle Aggressive Portfolio, the Multimanager Lifestyle Growth Portfolio, Multimanager Lifestyle Balanced Portfolio, Multimanager Lifestyle Moderate Portfolio, and Multimanager Lifestyle Conservative Portfolio are categorized as Level 1, with the exception of U.S. Government securities which are categorized as Level 2, under the hierarchy described above.
Security transactions and related investment income. Investment security transactions are accounted for on a trade date plus one basis for daily NAV calculations. However, for financial reporting purposes, investment transactions are reported on trade date. Interest income is accrued as earned. Gains and losses on securities sold are determined on the basis of identified cost and may include proceeds from litigation. Income and capital gain distributions from underlying funds are recorded on ex-date.
Line of credit. The portfolios may have the ability to borrow from banks for temporary or emergency purposes, including meeting redemption requests that otherwise might require the untimely sale of securities. Pursuant to the portfolios' custodian agreement, the custodian may loan money to the portfolios to make properly authorized payments. The portfolios are obligated to repay the custodian for any overdraft, including any related costs or expenses. The custodian may have a lien, security interest or security entitlement in any portfolio property that is not otherwise segregated or pledged, to the extent of any overdraft, and to the maximum extent permitted by law.
The portfolios and other affiliated funds have entered into a syndicated line of credit agreement with Citibank, N.A. as the administrative agent that enables them to participate in a $750 million unsecured committed line of credit. Excluding commitments designated for a certain fund and subject to the needs of all other affiliated funds, the portfolios can borrow up to an aggregate commitment amount of $500 million, subject to asset coverage and other limitations as specified in the agreement. A commitment fee payable at the end of each calendar quarter, based on the average daily unused portion of the line of credit, is charged to each participating portfolio based on a combination of fixed and asset based allocations and is reflected in Other expenses on the Statements of operations. For the six months ended June 30, 2019, the portfolios had no borrowings under the line of credit.
Commitment fees for the six months ended June 30, 2019 were as follows:
| | |
| Portfolio | Commitment fee |
| Multimanager Lifestyle Aggressive Portfolio | $6,900 |
| Multimanager Lifestyle Growth Portfolio | 18,494 |
| Multimanager Lifestyle Balanced Portfolio | 18,385 |
| Multimanager Lifestyle Moderate Portfolio | 6,121 |
| Multimanager Lifestyle Conservative Portfolio | 4,848 |
Expenses. Within the John Hancock group of funds complex, expenses that are directly attributable to an individual fund are allocated to such fund. Expenses that are not readily attributable to a specific fund are allocated among all funds in an equitable manner, taking into consideration, among other things, the nature and type of expense and the fund's relative net assets. Expense estimates are accrued in the period to which they relate and adjustments are made when actual amounts are known.
Class allocations. Income, common expenses and realized and unrealized gains (losses) are determined at the fund level and allocated daily to each class of shares based on the net assets of the class. Class-specific expenses, such as distribution and service fees, if any, and transfer agent fees, for all classes, are charged daily at the class level based on the net assets of each class and the specific expense rates applicable to each class.
Federal income taxes. Each portfolio intends to continue to qualify as a regulated investment company by complying with the applicable provisions of the Internal Revenue Code and will not be subject to federal income tax on taxable income that is distributed to shareholders. Therefore, no federal income tax provision is required.
As of December 31, 2018, the portfolios had no uncertain tax positions that would require financial statement recognition, derecognition or disclosure. Each portfolio's federal tax returns are subject to examination by the Internal Revenue Service for a period of three years.
For federal income tax purposes, the costs of investments owned on June 30, 2019, including short-term investments, were as follows:
| | | | | | | | | | | | | | | |
| | Portfolio | | | Aggregate cost | | | Unrealized
appreciation | | | Unrealized
(depreciation) | | | Net unrealized
appreciation/
(depreciation) | |
| | Multimanager Lifestyle Aggressive Portfolio | | | $3,246,805,493 | | | $513,501,489 | | | ($14,619,493 | ) | | $498,881,996 | |
| | Multimanager Lifestyle Growth Portfolio | | | 9,876,433,814 | | | 1,235,860,053 | | | (40,202,608 | ) | | 1,195,657,445 | |
| | Multimanager Lifestyle Balanced Portfolio | | | 10,033,583,530 | | | 938,078,615 | | | (30,963,654 | ) | | 907,114,961 | |
| | Multimanager Lifestyle Moderate Portfolio | | | 2,992,982,107 | | | 200,756,919 | | | (7,578,677 | ) | | 193,178,242 | |
| | Multimanager Lifestyle Conservative Portfolio | | | 2,318,610,539 | | | 75,251,960 | | | (5,432,564 | ) | | 69,819,396 | |
Distribution of income and gains. Distributions to shareholders from net investment income and net realized gains, if any, are recorded on the ex-date. The Multimanager Lifestyle Aggressive Portfolio and Multimanager Lifestyle Growth Portfolio generally declare and pay dividends and capital gain distributions, if any, at least annually. The Multimanager Lifestyle Balanced Portfolio, Multimanager Lifestyle Moderate Portfolio and Multimanager Lifestyle Conservative Portfolio generally declare and pay dividends quarterly and capital gain distributions, if any, at least annually.
Distributions paid by the portfolios with respect to each class of shares are calculated in the same manner, at the same time and in the same amount, except for the effect of class level expenses that may be applied differently to each class.
SEMIANNUAL REPORT | JOHN HANCOCK MULTIMANAGER LIFESTYLE PORTFOLIOS 36
Such distributions, on a tax basis, are determined in conformity with income tax regulations, which may differ from US GAAP. Distributions in excess of tax basis earnings and profits, if any, are reported in the portfolios' financial statements as a return of capital. The final determination of tax characteristics of the portfolio's distribution will occur at the end of the year and will subsequently be reported to shareholders. Short-term gains from underlying funds are treated as ordinary income for tax purposes.
Capital accounts within the financial statements are adjusted for permanent book-tax differences. These adjustments have no impact on net assets or the results of operations. Temporary book-tax differences, if any, will reverse in a subsequent period. Book-tax differences are primarily attributable to wash sale loss deferrals.
Note 3 — Guarantees and indemnifications
Under the Trust's organizational documents, its Officers and Trustees are indemnified against certain liabilities arising out of the performance of their duties to the Trust, including the portfolios. Additionally, in the normal course of business, the Trust enters into contracts with service providers that contain general indemnification clauses. The Trust's maximum exposure under these arrangements is unknown, as this would involve future claims that may be made against the Trust that have not yet occurred. The risk of material loss from such claims is considered remote.
Note 4 — Fees and transactions with affiliates
John Hancock Investment Management LLC (the Advisor) serves as investment advisor for the portfolios. John Hancock Investment Management Distributors LLC (the Distributor), an affiliate of the Advisor, serves as principal underwriter of the portfolios. The Advisor and the Distributor are indirect, wholly owned subsidiaries of MFC. Prior to June 28, 2019, the Advisor was known as John Hancock Advisers, LLC and the Distributor was known as John Hancock Funds, LLC.
Management fee. The portfolios have an investment management agreement with the Advisor under which the portfolios pay a daily management fee to the Advisor, equivalent on an annual basis, as detailed below. Aggregate net assets include the net assets of the portfolios and the net assets of similar funds of John Hancock Variable Insurance Trust (JHVIT) and net assets of similar funds of the Trust. The Advisor has a subadvisory agreement with Manulife Investment Management (US) LLC, which is an indirectly owned subsidiary of MFC and an affiliate of the Advisor. Prior to May 7, 2019, Manulife Investment Management (US) LLC was known as John Hancock Asset Management a division of Manulife Asset Management (US) LLC. The portfolios are not responsible for payment of the subadvisory fees.
Under the advisory agreement, the portfolios pay a daily management fee to the Advisor as outlined below:
| | | |
| | First $7.5 billion of aggregate net assets | Excess over $7.5 billion of aggregate net assets |
| Affiliated fund assets | 0.05% | 0.04% |
| Other assets | 0.50% | 0.49% |
The advisory fee has two components: (a) a fee on assets invested in affiliated funds (Affiliated fund assets) and (b) a fee on assets not invested in affiliated funds (Other assets). Affiliated funds are any funds of the Trust, JHVIT (excluding 500 Index Trust, Total Bond Market Trust and International Equity Index Trust) and John Hancock Funds III.
The Advisor has contractually agreed to waive and/or reimburse all class-specific expenses for Class A and Class I shares of the portfolios to the extent they exceed 0.41% and 0.11%, respectively, of average net assets on an annualized basis attributable to the class (the class expense waiver). The class expense waiver expires on April 30, 2020, unless renewed by mutual agreement of the portfolios and the Advisor based upon a determination that this is appropriate under the circumstances at that time.
The Advisor has contractually agreed to reduce its management fee and/or make payment to each portfolio in an amount equal to the amount by which "Other expenses" of a portfolio exceed 0.05% of the average annual net assets (on an annualized basis) of the portfolio. "Other expenses" means all of the expenses of a portfolio, excluding certain expenses such as management fees, taxes, brokerage commissions, interest expense, litigation and indemnification expenses and other extraordinary expenses not incurred in the ordinary course of the portfolio's business, class-specific expenses, underlying fund expenses (acquired fund fees), and short dividend expense. The current expense limitation agreement expires on April 30, 2020, unless renewed by mutual agreement of a portfolio and the Advisor based upon a determination that this is appropriate under the circumstances at that time.
Additionally, the Advisor voluntarily agreed to waive its advisory fee for each portfolio so that the aggregate advisory fee retained by the Advisor with respect to both the portfolio and its underlying investments (after payment of subadvisory fees) does not exceed 0.50% of the portfolio's first $7.5 billion of average net assets and 0.49% of the portfolio's average net assets in excess of $7.5 billion. This voluntary waiver may be amended or terminated at any time by the Advisor upon notice to the Trust.
For the six months ended June 30, 2019, the expense reductions related to these agreements amounted to the following and are reflected as a reduction of the total expenses in the Statements of operations:
| | | | | | | | | | | | | | | | | | | | | | | | | | | | | | | | | | | | | | | | | | |
| | | | | Expense Reimbursement by Class | |
| | | | | Class A | | | Class B | | | Class C | | | Class I | | | Class R1 | | | Class R2 | | | Class R3 | | | Class R4 | | | Class R5 | | | Class R6 | | | Class 1 | | | Class 5 | | | Total | |
| | Multimanager Lifestyle
Aggressive Portfolio | | | $314,908 | | | $3,379 | | | $59,276 | | | $7,159 | | | $3,346 | | | $3,029 | | | $5,378 | | | $2,884 | | | $1,642 | | | $23,854 | | | $1,913,166 | | | — | | | $2,338,021 | |
| | Multimanager Lifestyle
Growth Portfolio | | | 851,187 | | | 11,814 | | | 215,039 | | | 19,137 | | | 7,357 | | | 5,510 | | | 5,872 | | | 2,590 | | | 4,444 | | | 49,550 | | | 4,238,304 | | | $156,695 | | | 5,567,499 | |
| | Multimanager Lifestyle
Balanced Portfolio | | | 782,268 | | | 11,115 | | | 210,182 | | | 21,472 | | | 5,086 | | | 4,958 | | | 7,548 | | | 3,446 | | | 5,886 | | | 42,707 | | | 3,623,533 | | | 67,461 | | | 4,785,662 | |
SEMIANNUAL REPORT | JOHN HANCOCK MULTIMANAGER LIFESTYLE PORTFOLIOS 37
| | | | | | | | | | | | | | | | | | | | | | | | | | | | | | | | | | | | | | | | | | |
| | | | | Expense Reimbursement by Class | |
| | | | | Class A | | | Class B | | | Class C | | | Class I | | | Class R1 | | | Class R2 | | | Class R3 | | | Class R4 | | | Class R5 | | | Class R6 | | | Class 1 | | | Class 5 | | | Total | |
| | Multimanager Lifestyle
Moderate Portfolio | | | $241,762 | | | $3,976 | | | $73,462 | | | $5,953 | | | $1,838 | | | $953 | | | $2,014 | | | $1,136 | | | $2,286 | | | $11,132 | | | $812,574 | | | $21,057 | | | $1,178,143 | |
| | Multimanager Lifestyle
Conservative Portfolio | | | 191,617 | | | 2,925 | | | 58,945 | | | 5,776 | | | 1,967 | | | 883 | | | 1,174 | | | 893 | | | 1,188 | | | 7,141 | | | 531,989 | | | — | | | 804,498 | |
Expenses waived or reimbursed in the current fiscal period are not subject to recapture in future fiscal periods.
The investment management fees, including the impact of the waivers and reimbursements as described above, incurred for the six months ended June 30, 2019 were equivalent to a net annual effective rate of the portfolios' average daily net assets as follows:
| | | | | |
| Portfolio | Annual effective rate | | Portfolio | Annual effective rate |
| Multimanager Lifestyle Aggressive Portfolio | 0.05% | | Multimanager Lifestyle Moderate Portfolio | 0.09% |
| Multimanager Lifestyle Growth Portfolio | 0.06% | | Multimanager Lifestyle Conservative Portfolio | 0.11% |
| Multimanager Lifestyle Balanced Portfolio | 0.08% | |
Accounting and legal services. Pursuant to a service agreement, the portfolios reimburse the Advisor for all expenses associated with providing the administrative, financial, legal, compliance, accounting and recordkeeping services to the portfolios, including the preparation of all tax returns, periodic reports to shareholders and regulatory reports, among other services. These expenses are allocated to each share class based on its relative net assets at the time the expense was incurred. These accounting and legal services fees incurred for the six months ended June 30, 2019 amounted to an annual rate of 0.02% of each portfolio's average daily net assets.
Distribution and service plans. The portfolios have a distribution agreement with the Distributor. The portfolios have adopted distribution and service plans with respect to Class A, Class B, Class C, Class R1, Class R2, Class R3, Class R4 and Class 1 shares pursuant to Rule 12b-1 under the 1940 Act, to pay the Distributor for services provided as the distributor of shares of the portfolios. In addition, under a service plan for Class R1, Class R2, Class R3, Class R4 and Class R5 shares, the portfolios pay for certain other services. The portfolios may pay up to the following contractual rates of distribution and service fees under these arrangements, expressed as an annual percentage of average daily net assets for each class of the portfolios' shares:
| | | | | | | |
| Class | Rule 12b-1 fee | Service fee | | Class | Rule 12b-1 fee | Service fee |
| Class A | 0.30% | — | | Class R3 | 0.50% | 0.15% |
| Class B | 1.00% | — | | Class R4 | 0.25% | 0.10% |
| Class C | 1.00% | — | | Class R5 | — | 0.05% |
| Class R1 | 0.50% | 0.25% | | Class 1 | 0.05% | — |
| Class R2 | 0.25% | 0.25% | | | |
The portfolios' Distributor has contractually agreed to waive 0.10% of Rule12b-1 fees for Class R4 shares. The current waiver agreement expires on April 30, 2020, unless renewed by mutual agreement of the portfolios and the Distributor based upon a determination that this is appropriate under the circumstances at the time. This contractual waiver amounted to the following for the six months ended June 30, 2019:
| | |
| Portfolio | Class R4 |
| Multimanager Lifestyle Aggressive Portfolio | $2,268 |
| Multimanager Lifestyle Growth Portfolio | 2,528 |
| Multimanager Lifestyle Balanced Portfolio | 3,854 |
| Multimanager Lifestyle Moderate Portfolio | 1,533 |
| Multimanager Lifestyle Conservative Portfolio | 1,300 |
Sales charges. Class A shares are assessed up-front sales charges of up to 5.00% of the net asset value of such shares. The following summarizes the net up-front sales charges received by the Distributor during the six months ended June 30, 2019:
| | | | | | |
| | Multimanager
Lifestyle
Aggressive
Portfolio | Multimanager
Lifestyle
Growth
Portfolio | Multimanager
Lifestyle
Balanced
Portfolio | Multimanager
Lifestyle
Moderate
Portfolio | Multimanager
Lifestyle
Conservative
Portfolio |
| Net sales charges | $167,474 | $582,110 | $428,791 | $178,873 | $101,790 |
| Retained for printing prospectus, advertising and sales literature | 26,932 | 94,976 | 71,003 | 29,713 | 16,748 |
| Sales commission to unrelated broker-dealers | 140,542 | 487,134 | 357,788 | 149,160 | 85,042 |
Class A, Class B and Class C shares may be subject to contingent deferred sales charges (CDSCs). Certain Class A shares that are acquired through purchases of $1 million or more and are redeemed within one year of purchase are subject to a 1.00% sales charge. Class B shares that are redeemed within six years of purchase are subject to CDSCs, at declining rates, beginning at 5.00%. Class C shares that are redeemed within one year of purchase are subject to a 1.00% CDSC. CDSCs are applied to the lesser of the current market value at the time of redemption or the original purchase cost of the shares being redeemed. Proceeds from CDSCs are used to compensate the Distributor for providing distribution-related services in connection with the sale of these shares. During the six months ended June 30, 2019, CDSCs received by the Distributor were as follows:
SEMIANNUAL REPORT | JOHN HANCOCK MULTIMANAGER LIFESTYLE PORTFOLIOS 38
| | | | |
| Portfolio | Class A | Class B | Class C |
| Multimanager Lifestyle Aggressive Portfolio | $837 | $98 | $4,186 |
| Multimanager Lifestyle Growth Portfolio | 651 | 568 | 11,441 |
| Multimanager Lifestyle Balanced Portfolio | 470 | 159 | 10,591 |
| Multimanager Lifestyle Moderate Portfolio | 408 | 148 | 3,738 |
| Multimanager Lifestyle Conservative Portfolio | 1,100 | 129 | 4,397 |
Transfer agent fees. The John Hancock group of funds has a complex-wide transfer agent agreement with John Hancock Signature Services, Inc. (Signature Services), an affiliate of the Advisor. The transfer agent fees paid to Signature Services are determined based on the cost to Signature Services (Signature Services Cost) of providing recordkeeping services. It also includes out-of-pocket expenses, including payments made to third-parties for recordkeeping services provided to their clients who invest in one or more John Hancock funds. In addition, Signature Services Cost may be reduced by certain fees that Signature Services receives in connection with retirement and small accounts. Signature Services Cost is calculated monthly and allocated, as applicable, to five categories of share classes: Retail Share and Institutional Share Classes of Non-Municipal Bond Funds, Class R6 Shares, Retirement Share Classes and Municipal Bond Share Classes. Within each of these categories, the applicable costs are allocated to the affected John Hancock affiliated funds and/or classes, based on the relative average daily net assets.
Class level expenses. Class level expenses for the six months ended June 30, 2019 were:
| | | | | | | | | | | | |
| | | | | Class | | | Distribution and service fees | | | Transfer agent fees | |
| | Multimanager Lifestyle Aggressive Portfolio | | | Class A | | | $717,675 | | | $274,288 | |
| | | | | Class B | | | 27,002 | | | 3,084 | |
| | | | | Class C | | | 469,105 | | | 53,724 | |
| | | | | Class I | | | — | | | 6,291 | |
| | | | | Class R1 | | | 19,169 | | | 350 | |
| | | | | Class R2 | | | 11,454 | | | 318 | |
| | | | | Class R3 | | | 27,281 | | | 562 | |
| | | | | Class R4 | | | 7,885 | | | 302 | |
| | | | | Class R5 | | | 485 | | | 179 | |
| | | | | Class R6 | | | — | | | 2,483 | |
| | | | | Class 1 | | | 754,275 | | | — | |
| | | | | Total | | | $2,034,331 | | | $341,581 | |
| | Multimanager Lifestyle Growth Portfolio | | | Class A | | | $2,400,339 | | | $917,293 | |
| | | | | Class B | | | 117,860 | | | 13,457 | |
| | | | | Class C | | | 2,121,172 | | | 242,931 | |
| | | | | Class I | | | — | | | 20,515 | |
| | | | | Class R1 | | | 52,624 | | | 967 | |
| | | | | Class R2 | | | 26,835 | | | 731 | |
| | | | | Class R3 | | | 36,573 | | | 769 | |
| | | | | Class R4 | | | 8,128 | | | 336 | |
| | | | | Class R5 | | | 2,051 | | | 583 | |
| | | | | Class R6 | | | — | | | 6,436 | |
| | | | | Class 1 | | | 2,084,660 | | | — | |
| | | | | Total | | | $6,850,242 | | | $1,204,018 | |
| | Multimanager Lifestyle Balanced Portfolio | | | Class A | | | $2,525,602 | | | $965,202 | |
| | | | | Class B | | | 127,254 | | | 14,546 | |
| | | | | Class C | | | 2,390,557 | | | 273,711 | |
| | | | | Class I | | | — | | | 26,076 | |
| | | | | Class R1 | | | 41,840 | | | 776 | |
| | | | | Class R2 | | | 28,312 | | | 765 | |
| | | | | Class R3 | | | 54,174 | | | 1,131 | |
| | | | | Class R4 | | | 12,810 | | | 509 | |
| | | | | Class R5 | | | 2,790 | | | 891 | |
| | | | | Class R6 | | | — | | | 6,368 | |
| | | | | Class 1 | | | 2,053,934 | | | — | |
| | | | | Total | | | $7,237,273 | | | $1,289,975 | |
| | Multimanager Lifestyle Moderate Portfolio | | | Class A | | | $924,127 | | | $353,191 | |
| | | | | Class B | | | 54,395 | | | 6,217 | |
| | | | | Class C | | | 997,857 | | | 114,286 | |
| | | | | Class I | | | — | | | 8,467 | |
SEMIANNUAL REPORT | JOHN HANCOCK MULTIMANAGER LIFESTYLE PORTFOLIOS 39
| | | | | | | | | | | | |
| | | | | Class | | | Distribution and service fees | | | Transfer agent fees | |
| | | | | Class R1 | | | $17,925 | | | $333 | |
| | | | | Class R2 | | | 6,230 | | | 175 | |
| | | | | Class R3 | | | 16,539 | | | 363 | |
| | | | | Class R4 | | | 5,313 | | | 204 | |
| | | | | Class R5 | | | 1,483 | | | 414 | |
| | | | | Class R6 | | | — | | | 1,978 | |
| | | | | Class 1 | | | 550,673 | | | — | |
| | | | | Total | | | $2,574,542 | | | $485,628 | |
| | Multimanager Lifestyle Conservative Portfolio | | | Class A | | | $799,170 | | | $305,437 | |
| | | | | Class B | | | 43,980 | | | 5,027 | |
| | | | | Class C | | | 879,456 | | | 100,730 | |
| | | | | Class I | | | — | | | 8,875 | |
| | | | | Class R1 | | | 22,093 | | | 396 | |
| | | | | Class R2 | | | 6,488 | | | 176 | |
| | | | | Class R3 | | | 10,311 | | | 233 | |
| | | | | Class R4 | | | 4,493 | | | 170 | |
| | | | | Class R5 | | | 925 | | | 241 | |
| | | | | Class R6 | | | — | | | 1,410 | |
| | | | | Class 1 | | | 395,456 | | | — | |
| | | | | Total | | | $2,162,372 | | | $422,695 | |
Trustee expenses.The portfolios compensate each Trustee who is not an employee of the Advisor or its affiliates. The costs of paying Trustee compensation and expenses are allocated to theportfolios based on their net assets relative to other funds within the John Hancock group of funds complex.
Note 5 — Portfolio share transactions
Transactions in portfolios shares for the six months ended June 30, 2019 and for the year ended December 31, 2018 were as follows:
Multimanager Lifestyle Aggressive Portfolio
| | | | | | | | | | | | | | | | | | | | | | | | | | | |
| | | | | | | | | |
| | | | | | | | Six months ended 6-30-19 | | | | | | | | | | | | Year ended 12-31-18 | |
| | | | | Shares | | | Amount | | | | | | | | | Shares | | | Amount | |
| | Class A shares | | | | | | | | | | | | | | | | | | | |
| | Sold | | | 1,698,427 | | | $24,698,047 | | | | | | | | | 5,005,281 | | | $83,659,913 | |
| | Distributions reinvested | | | 370 | | | 4,808 | | | | | | | | | 3,904,693 | | | 50,686,417 | |
| | Repurchased | | | (2,638,680 | ) | | (38,403,268 | ) | | | | | | | | (5,560,419 | ) | | (92,372,129 | ) |
| | Net increase (decrease) | | | (939,883 | ) | | $(13,700,413 | ) | | | | | | | | 3,349,555 | | | $41,974,201 | |
| | Class B shares | | | | | | | | | | | | | | | | | | | |
| | Sold | | | 1,349 | | | $20,327 | | | | | | | | | 10,382 | | | $175,089 | |
| | Distributions reinvested | | | — | | | — | | | | | | | | | 48,418 | | | 630,402 | |
| | Repurchased | | | (132,615 | ) | | (1,943,202 | ) | | | | | | | | (228,756 | ) | | (3,799,387 | ) |
| | Net decrease | | | (131,266 | ) | | $(1,922,875 | ) | | | | | | | | (169,956 | ) | | $(2,993,896 | ) |
| | Class C shares | | | | | | | | | | | | | | | | | | | |
| | Sold | | | 290,665 | | | $4,243,546 | | | | | | | | | 717,591 | | | $11,848,750 | |
| | Distributions reinvested | | | 147 | | | 1,916 | | | | | | | | | 759,435 | | | 9,896,129 | |
| | Repurchased | | | (1,101,209 | ) | | (16,035,931 | ) | | | | | | | | (3,478,977 | ) | | (58,068,070 | ) |
| | Net decrease | | | (810,397 | ) | | $(11,790,469 | ) | | | | | | | | (2,001,951 | ) | | $(36,323,191 | ) |
| | Class I shares | | | | | | | | | | | | | | | | | | | |
| | Sold | | | 175,168 | | | $2,558,176 | | | | | | | | | 570,790 | | | $9,214,508 | |
| | Distributions reinvested | | | — | | | — | | | | | | | | | 79,387 | | | 1,026,476 | |
| | Repurchased | | | (173,533 | ) | | (2,501,559 | ) | | | | | | | | (497,115 | ) | | (8,177,374 | ) |
| | Net increase | | | 1,635 | | | $56,617 | | | | | | | | | 153,062 | | | $2,063,610 | |
| | Class R1 shares | | | | | | | | | | | | | | | | | | | |
| | Sold | | | 32,055 | | | $469,744 | | | | | | | | | 73,828 | | | $1,217,205 | |
| | Distributions reinvested | | | — | | | — | | | | | | | | | 37,751 | | | 491,147 | |
| | Repurchased | | | (74,266 | ) | | (1,106,426 | ) | | | | | | | | (128,503 | ) | | (2,154,883 | ) |
| | Net decrease | | | (42,211 | ) | | $(636,682 | ) | | | | | | | | (16,924 | ) | | $(446,531 | ) |
SEMIANNUAL REPORT | JOHN HANCOCK MULTIMANAGER LIFESTYLE PORTFOLIOS 40
| | | | | | | | | | | | | | | | | | | | | | | | | | | |
| | | | | | | | | |
| | | | | | | | Six months ended 6-30-19 | | | | | | | | | | | | Year ended 12-31-18 | |
| | | | | Shares | | | Amount | | | | | | | | | Shares | | | Amount | |
| | Class R2 shares | | | | | | | | | | | | | | | | | | | |
| | Sold | | | 26,430 | | | $384,666 | | | | | | | | | 166,240 | | | $2,726,387 | |
| | Distributions reinvested | | | — | | | — | | | | | | | | | 27,353 | | | 352,575 | |
| | Repurchased | | | (33,848 | ) | | (488,085 | ) | | | | | | | | (211,238 | ) | | (3,194,555 | ) |
| | Net decrease | | | (7,418 | ) | | $(103,419 | ) | | | | | | | | (17,645 | ) | | $(115,593 | ) |
| | Class R3 shares | | | | | | | | | | | | | | | | | | | |
| | Sold | | | 68,138 | | | $995,176 | | | | | | | | | 133,061 | | | $2,177,510 | |
| | Distributions reinvested | | | — | | | — | | | | | | | | | 67,655 | | | 875,456 | |
| | Repurchased | | | (89,232 | ) | | (1,317,362 | ) | | | | | | | | (218,430 | ) | | (3,658,034 | ) |
| | Net decrease | | | (21,094 | ) | | $(322,186 | ) | | | | | | | | (17,714 | ) | | $(605,068 | ) |
| | Class R4 shares | | | | | | | | | | | | | | | | | | | |
| | Sold | | | 39,971 | | | $578,499 | | | | | | | | | 78,559 | | | $1,299,557 | |
| | Distributions reinvested | | | — | | | — | | | | | | | | | 38,773 | | | 500,565 | |
| | Repurchased | | | (57,858 | ) | | (836,903 | ) | | | | | | | | (284,387 | ) | | (4,667,981 | ) |
| | Net decrease | | | (17,887 | ) | | $(258,404 | ) | | | | | | | | (167,055 | ) | | $(2,867,859 | ) |
| | Class R5 shares | | | | | | | | | | | | | | | | | | | |
| | Sold | | | 13,421 | | | $193,488 | | | | | | | | | 52,409 | | | $878,960 | |
| | Distributions reinvested | | | — | | | — | | | | | | | | | 27,721 | | | 358,437 | |
| | Repurchased | | | (108,949 | ) | | (1,615,499 | ) | | | | | | | | (256,726 | ) | | (4,280,254 | ) |
| | Net decrease | | | (95,528 | ) | | $(1,422,011 | ) | | | | | | | | (176,596 | ) | | $(3,042,857 | ) |
| | Class R6 shares | | | | | | | | | | | | | | | | | | | |
| | Sold | | | 914,739 | | | $13,340,776 | | | | | | | | | 920,501 | | | $14,770,819 | |
| | Distributions reinvested | | | — | | | — | | | | | | | | | 291,936 | | | 3,771,807 | |
| | Repurchased | | | (549,273 | ) | | (7,971,656 | ) | | | | | | | | (406,865 | ) | | (6,730,289 | ) |
| | Net increase | | | 365,466 | | | $5,369,120 | | | | | | | | | 805,572 | | | $11,812,337 | |
| | Class 1 shares | | | | | | | | | | | | | | | | | | | |
| | Sold | | | 865,017 | | | $12,656,052 | | | | | | | | | 1,841,987 | | | $30,676,603 | |
| | Distributions reinvested | | | — | | | — | | | | | | | | | 26,480,218 | | | 341,594,813 | |
| | Repurchased | | | (14,569,336 | ) | | (210,544,617 | ) | | | | | | | | (27,857,276 | ) | | (454,965,324 | ) |
| | Net increase (decrease) | | | (13,704,319 | ) | | $(197,888,565 | ) | | | | | | | | 464,929 | | | $(82,693,908 | ) |
| | Total net increase (decrease) | | | (15,402,902 | ) | | $(222,619,287 | ) | | | | | | | | 2,205,277 | | | $(73,238,755 | ) |
Multimanager Lifestyle Growth Portfolio
| | | | | | | | | | | | | | | | | | | | | | | | | | | |
| | | | | | | | | |
| | | | | | | | Six months ended 6-30-19 | | | | | | | | | | | | Year ended 12-31-18 | |
| | | | | Shares | | | Amount | | | | | | | | | Shares | | | Amount | |
| | Class A shares | | | | | | | | | | | | | | | | | | | |
| | Sold | | | 4,625,082 | | | $67,410,823 | | | | | | | | | 13,566,335 | | | $220,103,002 | |
| | Distributions reinvested | | | 779 | | | 10,235 | | | | | | | | | 11,607,763 | | | 152,413,451 | |
| | Repurchased | | | (9,353,253 | ) | | (135,907,899 | ) | | | | | | | | (18,062,602 | ) | | (291,689,515 | ) |
| | Net increase (decrease) | | | (4,727,392 | ) | | $(68,486,841 | ) | | | | | | | | 7,111,496 | | | $80,826,938 | |
| | Class B shares | | | | | | | | | | | | | | | | | | | |
| | Sold | | | 550 | | | $8,183 | | | | | | | | | 19,695 | | | $315,222 | |
| | Distributions reinvested | | | — | | | — | | | | | | | | | 187,596 | | | 2,472,517 | |
| | Repurchased | | | (674,777 | ) | | (9,811,915 | ) | | | | | | | | (1,043,432 | ) | | (16,885,582 | ) |
| | Net decrease | | | (674,227 | ) | | $(9,803,732 | ) | | | | | | | | (836,141 | ) | | $(14,097,843 | ) |
| | Class C shares | | | | | | | | | | | | | | | | | | | |
| | Sold | | | 856,210 | | | $12,463,195 | | | | | | | | | 2,275,360 | | | $36,586,796 | |
| | Distributions reinvested | | | 265 | | | 3,488 | | | | | | | | | 2,970,660 | | | 39,095,976 | |
| | Repurchased | | | (4,611,551 | ) | | (67,228,807 | ) | | | | | | | | (12,928,614 | ) | | (209,879,914 | ) |
| | Net decrease | | | (3,755,076 | ) | | $(54,762,124 | ) | | | | | | | | (7,682,594 | ) | | $(134,197,142 | ) |
SEMIANNUAL REPORT | JOHN HANCOCK MULTIMANAGER LIFESTYLE PORTFOLIOS 41
| | | | | | | | | | | | | | | | | | | | | | | | | | | |
| | | | | | | | | |
| | | | | | | | Six months ended 6-30-19 | | | | | | | | | | | | Year ended 12-31-18 | |
| | | | | Shares | | | Amount | | | | | | | | | Shares | | | Amount | |
| | Class I shares | | | | | | | | | | | | | | | | | | | |
| | Sold | | | 433,348 | | | $6,266,632 | | | | | | | | | 1,115,018 | | | $17,758,634 | |
| | Distributions reinvested | | | — | | | — | | | | | | | | | 249,740 | | | 3,256,616 | |
| | Repurchased | | | (576,337 | ) | | (8,257,041 | ) | | | | | | | | (1,284,318 | ) | | (20,402,249 | ) |
| | Net increase (decrease) | | | (142,989 | ) | | $(1,990,409 | ) | | | | | | | | 80,440 | | | $613,001 | |
| | Class R1 shares | | | | | | | | | | | | | | | | | | | |
| | Sold | | | 35,024 | | | $507,125 | | | | | | | | | 129,466 | | | $2,069,105 | |
| | Distributions reinvested | | | — | | | — | | | | | | | | | 91,156 | | | 1,203,262 | |
| | Repurchased | | | (201,115 | ) | | (2,987,586 | ) | | | | | | | | (319,273 | ) | | (5,216,319 | ) |
| | Net decrease | | | (166,091 | ) | | $(2,480,461 | ) | | | | | | | | (98,651 | ) | | $(1,943,952 | ) |
| | Class R2 shares | | | | | | | | | | | | | | | | | | | |
| | Sold | | | 65,054 | | | $941,547 | | | | | | | | | 281,209 | | | $4,522,766 | |
| | Distributions reinvested | | | — | | | — | | | | | | | | | 70,987 | | | 924,958 | |
| | Repurchased | | | (179,013 | ) | | (2,567,094 | ) | | | | | | | | (359,891 | ) | | (5,478,252 | ) |
| | Net decrease | | | (113,959 | ) | | $(1,625,547 | ) | | | | | | | | (7,695 | ) | | $(30,528 | ) |
| | Class R3 shares | | | | | | | | | | | | | | | | | | | |
| | Sold | | | 63,341 | | | $920,991 | | | | | | | | | 126,727 | | | $2,040,419 | |
| | Distributions reinvested | | | — | | | — | | | | | | | | | 84,093 | | | 1,102,454 | |
| | Repurchased | | | (104,223 | ) | | (1,494,661 | ) | | | | | | | | (254,887 | ) | | (4,169,864 | ) |
| | Net decrease | | | (40,882 | ) | | $(573,670 | ) | | | | | | | | (44,067 | ) | | $(1,026,991 | ) |
| | Class R4 shares | | | | | | | | | | | | | | | | | | | |
| | Sold | | | 58,615 | | | $853,597 | | | | | | | | | 75,771 | | | $1,198,403 | |
| | Distributions reinvested | | | — | | | — | | | | | | | | | 39,331 | | | 515,626 | |
| | Repurchased | | | (70,587 | ) | | (980,568 | ) | | | | | | | | (450,216 | ) | | (7,332,997 | ) |
| | Net decrease | | | (11,972 | ) | | $(126,971 | ) | | | | | | | | (335,114 | ) | | $(5,618,968 | ) |
| | Class R5 shares | | | | | | | | | | | | | | | | | | | |
| | Sold | | | 35,825 | | | $521,180 | | | | | | | | | 171,555 | | | $2,782,085 | |
| | Distributions reinvested | | | — | | | — | | | | | | | | | 67,218 | | | 882,566 | |
| | Repurchased | | | (109,242 | ) | | (1,597,124 | ) | | | | | | | | (944,511 | ) | | (15,440,417 | ) |
| | Net decrease | | | (73,417 | ) | | $(1,075,944 | ) | | | | | | | | (705,738 | ) | | $(11,775,766 | ) |
| | Class R6 shares | | | | | | | | | | | | | | | | | | | |
| | Sold | | | 2,080,141 | | | $30,346,542 | | | | | | | | | 2,325,779 | | | $36,633,747 | |
| | Distributions reinvested | | | — | | | — | | | | | | | | | 679,726 | | | 8,870,428 | |
| | Repurchased | | | (1,083,846 | ) | | (15,666,324 | ) | | | | | | | | (1,158,540 | ) | | (18,596,103 | ) |
| | Net increase | | | 996,295 | | | $14,680,218 | | | | | | | | | 1,846,965 | | | $26,908,072 | |
| | Class 1 shares | | | | | | | | | | | | | | | | | | | |
| | Sold | | | 509,157 | | | $7,486,422 | | | | | | | | | 1,752,847 | | | $27,929,570 | |
| | Distributions reinvested | | | — | | | — | | | | | | | | | 65,350,627 | | | 852,825,679 | |
| | Repurchased | | | (42,438,188 | ) | | (609,884,603 | ) | | | | | | | | (85,588,507 | ) | | (1,367,698,732 | ) |
| | Net decrease | | | (41,929,031 | ) | | $(602,398,181 | ) | | | | | | | | (18,485,033 | ) | | $(486,943,483 | ) |
| | Class 5 shares | | | | | | | | | | | | | | | | | | | |
| | Sold | | | 372,463 | | | $5,387,816 | | | | | | | | | 743,672 | | | $12,003,031 | |
| | Distributions reinvested | | | — | | | — | | | | | | | | | 2,332,228 | | | 30,388,934 | |
| | Repurchased | | | (506,778 | ) | | (7,283,422 | ) | | | | | | | | (1,036,831 | ) | | (16,740,794 | ) |
| | Net increase (decrease) | | | (134,315 | ) | | $(1,895,606 | ) | | | | | | | | 2,039,069 | | | $25,651,171 | |
| | Total net decrease | | | (50,773,056 | ) | | $(730,539,268 | ) | | | | | | | | (17,117,063 | ) | | $(521,635,491 | ) |
SEMIANNUAL REPORT | JOHN HANCOCK MULTIMANAGER LIFESTYLE PORTFOLIOS 42
Multimanager Lifestyle Balanced Portfolio
| | | | | | | | | | | | | | | | | | | | | | | | | | | |
| | | | | | | | | |
| | | | | | | | Six months ended 6-30-19 | | | | | | | | | | | | Year ended 12-31-18 | |
| | | | | Shares | | | Amount | | | | | | | | | Shares | | | Amount | |
| | Class A shares | | | | | | | | | | | | | | | | | | | |
| | Sold | | | 5,461,219 | | | $77,262,010 | | | | | | | | | 14,916,689 | | | $227,148,507 | |
| | Distributions reinvested | | | 470,363 | | | 6,800,540 | | | | | | | | | 10,214,207 | | | 134,332,387 | |
| | Repurchased | | | (10,908,155 | ) | | (154,128,012 | ) | | | | | | | | (22,678,041 | ) | | (344,436,680 | ) |
| | Net increase (decrease) | | | (4,976,573 | ) | | $(70,065,462 | ) | | | | | | | | 2,452,855 | | | $17,044,214 | |
| | Class B shares | | | | | | | | | | | | | | | | | | | |
| | Sold | | | 744 | | | $10,815 | | | | | | | | | 17,654 | | | $264,354 | |
| | Distributions reinvested | | | 947 | | | 13,804 | | | | | | | | | 162,440 | | | 2,114,489 | |
| | Repurchased | | | (589,834 | ) | | (8,305,286 | ) | | | | | | | | (1,107,214 | ) | | (16,856,261 | ) |
| | Net decrease | | | (588,143 | ) | | $(8,280,667 | ) | | | | | | | | (927,120 | ) | | $(14,477,418 | ) |
| | Class C shares | | | | | | | | | | | | | | | | | | | |
| | Sold | | | 668,074 | | | $9,410,095 | | | | | | | | | 2,239,461 | | | $33,986,628 | |
| | Distributions reinvested | | | 19,559 | | | 285,453 | | | | | | | | | 2,840,001 | | | 36,990,090 | |
| | Repurchased | | | (5,694,529 | ) | | (80,422,920 | ) | | | | | | | | (15,332,800 | ) | | (233,032,868 | ) |
| | Net decrease | | | (5,006,896 | ) | | $(70,727,372 | ) | | | | | | | | (10,253,338 | ) | | $(162,056,150 | ) |
| | Class I shares | | | | | | | | | | | | | | | | | | | |
| | Sold | | | 705,899 | | | $9,914,132 | | | | | | | | | 1,565,698 | | | $23,681,102 | |
| | Distributions reinvested | | | 15,015 | | | 215,634 | | | | | | | | | 255,564 | | | 3,353,342 | |
| | Repurchased | | | (915,929 | ) | | (12,872,298 | ) | | | | | | | | (1,674,302 | ) | | (25,074,865 | ) |
| | Net increase (decrease) | | | (195,015 | ) | | $(2,742,532 | ) | | | | | | | | 146,960 | | | $1,959,579 | |
| | Class R1 shares | | | | | | | | | | | | | | | | | | | |
| | Sold | | | 60,538 | | | $856,264 | | | | | | | | | 174,728 | | | $2,617,260 | |
| | Distributions reinvested | | | 1,686 | | | 24,294 | | | | | | | | | 63,351 | | | 824,941 | |
| | Repurchased | | | (362,480 | ) | | (5,102,853 | ) | | | | | | | | (375,631 | ) | | (5,698,203 | ) |
| | Net decrease | | | (300,256 | ) | | $(4,222,295 | ) | | | | | | | | (137,552 | ) | | $(2,256,002 | ) |
| | Class R2 shares | | | | | | | | | | | | | | | | | | | |
| | Sold | | | 29,486 | | | $411,648 | | | | | | | | | 266,193 | | | $4,019,398 | |
| | Distributions reinvested | | | 1,439 | | | 20,678 | | | | | | | | | 47,859 | | | 624,769 | |
| | Repurchased | | | (266,752 | ) | | (3,731,294 | ) | | | | | | | | (328,250 | ) | | (4,773,719 | ) |
| | Net decrease | | | (235,827 | ) | | $(3,298,968 | ) | | | | | | | | (14,198 | ) | | $(129,552 | ) |
| | Class R3 shares | | | | | | | | | | | | | | | | | | | |
| | Sold | | | 195,487 | | | $2,756,764 | | | | | | | | | 254,807 | | | $3,852,643 | |
| | Distributions reinvested | | | 3,567 | | | 51,484 | | | | | | | | | 98,479 | | | 1,286,478 | |
| | Repurchased | | | (149,425 | ) | | (2,079,152 | ) | | | | | | | | (308,321 | ) | | (4,682,395 | ) |
| | Net increase | | | 49,629 | | | $729,096 | | | | | | | | | 44,965 | | | $456,726 | |
| | Class R4 shares | | | | | | | | | | | | | | | | | | | |
| | Sold | | | 194,797 | | | $2,744,433 | | | | | | | | | 122,788 | | | $1,861,415 | |
| | Distributions reinvested | | | 2,812 | | | 40,553 | | | | | | | | | 47,701 | | | 631,165 | |
| | Repurchased | | | (148,847 | ) | | (2,062,700 | ) | | | | | | | | (508,472 | ) | | (7,563,106 | ) |
| | Net increase (decrease) | | | 48,762 | | | $722,286 | | | | | | | | | (337,983 | ) | | $(5,070,526 | ) |
| | Class R5 shares | | | | | | | | | | | | | | | | | | | |
| | Sold | | | 133,805 | | | $1,889,505 | | | | | | | | | 251,771 | | | $3,840,483 | |
| | Distributions reinvested | | | 5,186 | | | 74,928 | | | | | | | | | 88,687 | | | 1,173,544 | |
| | Repurchased | | | (238,281 | ) | | (3,358,498 | ) | | | | | | | | (579,922 | ) | | (8,916,645 | ) |
| | Net decrease | | | (99,290 | ) | | $(1,394,065 | ) | | | | | | | | (239,464 | ) | | $(3,902,618 | ) |
| | Class R6 shares | | | | | | | | | | | | | | | | | | | |
| | Sold | | | 2,886,701 | | | $40,717,752 | | | | | | | | | 2,295,750 | | | $34,264,888 | |
| | Distributions reinvested | | | 42,107 | | | 605,377 | | | | | | | | | 545,484 | | | 7,144,134 | |
| | Repurchased | | | (1,069,655 | ) | | (14,979,386 | ) | | | | | | | | (1,115,839 | ) | | (16,819,588 | ) |
| | Net increase | | | 1,859,153 | | | $26,343,743 | | | | | | | | | 1,725,395 | | | $24,589,434 | |
SEMIANNUAL REPORT | JOHN HANCOCK MULTIMANAGER LIFESTYLE PORTFOLIOS 43
| | | | | | | | | | | | | | | | | | | | | | | | | | | |
| | | | | | | | | |
| | | | | | | | Six months ended 6-30-19 | | | | | | | | | | | | Year ended 12-31-18 | |
| | | | | Shares | | | Amount | | | | | | | | | Shares | | | Amount | |
| | Class 1 shares | | | | | | | | | | | | | | | | | | | |
| | Sold | | | 1,640,999 | | | $23,388,651 | | | | | | | | | 2,059,788 | | | $31,096,621 | |
| | Distributions reinvested | | | 3,359,362 | | | 48,210,224 | | | | | | | | | 54,369,764 | | | 713,637,053 | |
| | Repurchased | | | (42,366,389 | ) | | (590,537,774 | ) | | | | | | | | (89,576,646 | ) | | (1,344,211,841 | ) |
| | Net decrease | | | (37,366,028 | ) | | $(518,938,899 | ) | | | | | | | | (33,147,094 | ) | | $(599,478,167 | ) |
| | Class 5 shares | | | | | | | | | | | | | | | | | | | |
| | Sold | | | 273,918 | | | $3,876,944 | | | | | | | | | 396,893 | | | $6,031,942 | |
| | Distributions reinvested | | | 65,730 | | | 944,109 | | | | | | | | | 976,090 | | | 12,816,870 | |
| | Repurchased | | | (381,775 | ) | | (5,341,326 | ) | | | | | | | | (1,184,612 | ) | | (17,951,642 | ) |
| | Net increase (decrease) | | | (42,127 | ) | | $(520,273 | ) | | | | | | | | 188,371 | | | $897,170 | |
| | Total net decrease | | | (46,852,611 | ) | | $(652,395,408 | ) | | | | | | | | (40,498,203 | ) | | $(742,423,310 | ) |
Multimanager Lifestyle Moderate Portfolio
| | | | | | | | | | | | | | | | | | | | | | | | | | | |
| | | | | | | | | |
| | | | | | | | Six months ended 6-30-19 | | | | | | | | | | | | Year ended 12-31-18 | |
| | | | | Shares | | | Amount | | | | | | | | | Shares | | | Amount | |
| | Class A shares | | | | | | | | | | | | | | | | | | | |
| | Sold | | | 2,614,173 | | | $34,165,328 | | | | | | | | | 6,261,722 | | | $85,509,436 | |
| | Distributions reinvested | | | 293,187 | | | 3,905,553 | | | | | | | | | 3,075,587 | | | 38,273,933 | |
| | Repurchased | | | (4,824,463 | ) | | (62,712,073 | ) | | | | | | | | (10,414,177 | ) | | (141,999,306 | ) |
| | Net decrease | | | (1,917,103 | ) | | $(24,641,192 | ) | | | | | | | | (1,076,868 | ) | | $(18,215,937 | ) |
| | Class B shares | | | | | | | | | | | | | | | | | | | |
| | Sold | | | 13,465 | | | $172,592 | | | | | | | | | 22,428 | | | $301,685 | |
| | Distributions reinvested | | | 2,021 | | | 26,929 | | | | | | | | | 53,916 | | | 665,535 | |
| | Repurchased | | | (331,494 | ) | | (4,330,877 | ) | | | | | | | | (524,639 | ) | | (7,173,568 | ) |
| | Net decrease | | | (316,008 | ) | | $(4,131,356 | ) | | | | | | | | (448,295 | ) | | $(6,206,348 | ) |
| | Class C shares | | | | | | | | | | | | | | | | | | | |
| | Sold | | | 494,954 | | | $6,432,864 | | | | | | | | | 1,164,939 | | | $15,837,574 | |
| | Distributions reinvested | | | 42,115 | | | 562,613 | | | | | | | | | 938,816 | | | 11,594,296 | |
| | Repurchased | | | (2,507,814 | ) | | (32,665,781 | ) | | | | | | | | (7,278,118 | ) | | (99,116,861 | ) |
| | Net decrease | | | (1,970,745 | ) | | $(25,670,304 | ) | | | | | | | | (5,174,363 | ) | | $(71,684,991 | ) |
| | Class I shares | | | | | | | | | | | | | | | | | | | |
| | Sold | | | 274,458 | | | $3,571,907 | | | | | | | | | 816,947 | | | $11,078,145 | |
| | Distributions reinvested | | | 7,552 | | | 100,113 | | | | | | | | | 75,161 | | | 931,102 | |
| | Repurchased | | | (531,023 | ) | | (6,868,812 | ) | | | | | | | | (673,446 | ) | | (9,109,164 | ) |
| | Net increase (decrease) | | | (249,013 | ) | | $(3,196,792 | ) | | | | | | | | 218,662 | | | $2,900,083 | |
| | Class R1 shares | | | | | | | | | | | | | | | | | | | |
| | Sold | | | 36,768 | | | $483,164 | | | | | | | | | 65,884 | | | $892,201 | |
| | Distributions reinvested | | | 1,478 | | | 19,677 | | | | | | | | | 19,991 | | | 247,514 | |
| | Repurchased | | | (157,493 | ) | | (2,082,828 | ) | | | | | | | | (120,839 | ) | | (1,644,507 | ) |
| | Net decrease | | | (119,247 | ) | | $(1,579,987 | ) | | | | | | | | (34,964 | ) | | $(504,792 | ) |
| | Class R2 shares | | | | | | | | | | | | | | | | | | | |
| | Sold | | | 15,785 | | | $204,785 | | | | | | | | | 92,857 | | | $1,256,203 | |
| | Distributions reinvested | | | 732 | | | 9,709 | | | | | | | | | 10,795 | | | 134,354 | |
| | Repurchased | | | (59,256 | ) | | (765,174 | ) | | | | | | | | (201,008 | ) | | (2,632,744 | ) |
| | Net decrease | | | (42,739 | ) | | $(550,680 | ) | | | | | | | | (97,356 | ) | | $(1,242,187 | ) |
| | Class R3 shares | | | | | | | | | | | | | | | | | | | |
| | Sold | | | 38,216 | | | $498,224 | | | | | | | | | 83,707 | | | $1,145,416 | |
| | Distributions reinvested | | | 2,225 | | | 29,616 | | | | | | | | | 27,108 | | | 335,570 | |
| | Repurchased | | | (37,953 | ) | | (489,211 | ) | | | | | | | | (155,986 | ) | | (2,114,727 | ) |
| | Net increase (decrease) | | | 2,488 | | | $38,629 | | | | | | | | | (45,171 | ) | | $(633,741 | ) |
SEMIANNUAL REPORT | JOHN HANCOCK MULTIMANAGER LIFESTYLE PORTFOLIOS 44
| | | | | | | | | | | | | | | | | | | | | | | | | | | |
| | | | | | | | | |
| | | | | | | | Six months ended 6-30-19 | | | | | | | | | | | | Year ended 12-31-18 | |
| | | | | Shares | | | Amount | | | | | | | | | Shares | | | Amount | |
| | Class R4 shares | | | | | | | | | | | | | | | | | | | |
| | Sold | | | 79,622 | | | $1,031,423 | | | | | | | | | 54,317 | | | $737,203 | |
| | Distributions reinvested | | | 1,715 | | | 22,744 | | | | | | | | | 16,409 | | | 204,666 | |
| | Repurchased | | | (76,602 | ) | | (995,786 | ) | | | | | | | | (202,403 | ) | | (2,749,415 | ) |
| | Net increase (decrease) | | | 4,735 | | | $58,381 | | | | | | | | | (131,677 | ) | | $(1,807,546 | ) |
| | Class R5 shares | | | | | | | | | | | | | | | | | | | |
| | Sold | | | 56,442 | | | $736,579 | | | | | | | | | 97,465 | | | $1,329,128 | |
| | Distributions reinvested | | | 3,701 | | | 49,106 | | | | | | | | | 36,501 | | | 456,067 | |
| | Repurchased | | | (135,150 | ) | | (1,760,093 | ) | | | | | | | | (312,330 | ) | | (4,255,019 | ) |
| | Net decrease | | | (75,007 | ) | | $(974,408 | ) | | | | | | | | (178,364 | ) | | $(2,469,824 | ) |
| | Class R6 shares | | | | | | | | | | | | | | | | | | | |
| | Sold | | | 1,239,191 | | | $16,121,839 | | | | | | | | | 781,496 | | | $10,501,113 | |
| | Distributions reinvested | | | 16,445 | | | 218,094 | | | | | | | | | 132,094 | | | 1,641,835 | |
| | Repurchased | | | (694,099 | ) | | (9,077,443 | ) | | | | | | | | (715,152 | ) | | (9,652,740 | ) |
| | Net increase | | | 561,537 | | | $7,262,490 | | | | | | | | | 198,438 | | | $2,490,208 | |
| | Class 1 shares | | | | | | | | | | | | | | | | | | | |
| | Sold | | | 1,246,791 | | | $16,389,832 | | | | | | | | | 3,339,747 | | | $45,301,495 | |
| | Distributions reinvested | | | 1,365,211 | | | 18,121,374 | | | | | | | | | 12,261,352 | | | 152,722,250 | |
| | Repurchased | | | (14,036,133 | ) | | (182,166,850 | ) | | | | | | | | (31,493,653 | ) | | (426,711,802 | ) |
| | Net decrease | | | (11,424,131 | ) | | $(147,655,644 | ) | | | | | | | | (15,892,554 | ) | | $(228,688,057 | ) |
| | Class 5 shares | | | | | | | | | | | | | | | | | | | |
| | Sold | | | 244,041 | | | $3,156,736 | | | | | | | | | 224,234 | | | $3,040,370 | |
| | Distributions reinvested | | | 37,133 | | | 492,234 | | | | | | | | | 302,638 | | | 3,762,358 | |
| | Repurchased | | | (217,483 | ) | | (2,811,994 | ) | | | | | | | | (655,534 | ) | | (8,945,548 | ) |
| | Net increase (decrease) | | | 63,691 | | | $836,976 | | | | | | | | | (128,662 | ) | | $(2,142,820 | ) |
| | Total net decrease | | | (15,481,542 | ) | | $(200,203,887 | ) | | | | | | | | (22,791,174 | ) | | $(328,205,952 | ) |
Multimanager Lifestyle Conservative Portfolio
| | | | | | | | | | | | | | | | | | | | | | | | | | | |
| | | | | | | | | |
| | | | | | | | Six months ended 6-30-19 | | | | | | | | | | | | Year ended 12-31-18 | |
| | | | | Shares | | | Amount | | | | | | | | | Shares | | | Amount | |
| | Class A shares | | | | | | | | | | | | | | | | | | | |
| | Sold | | | 2,107,108 | | | $26,594,144 | | | | | | | | | 6,269,097 | | | $80,252,643 | |
| | Distributions reinvested | | | 343,808 | | | 4,425,691 | | | | | | | | | 1,634,854 | | | 20,144,015 | |
| | Repurchased | | | (4,055,492 | ) | | (51,181,451 | ) | | | | | | | | (11,217,371 | ) | | (143,732,492 | ) |
| | Net decrease | | | (1,604,576 | ) | | $(20,161,616 | ) | | | | | | | | (3,313,420 | ) | | $(43,335,834 | ) |
| | Class B shares | | | | | | | | | | | | | | | | | | | |
| | Sold | | | 9,675 | | | $122,289 | | | | | | | | | 28,331 | | | $362,681 | |
| | Distributions reinvested | | | 2,941 | | | 37,877 | | | | | | | | | 24,772 | | | 304,179 | |
| | Repurchased | | | (240,151 | ) | | (3,036,423 | ) | | | | | | | | (522,407 | ) | | (6,700,403 | ) |
| | Net decrease | | | (227,535 | ) | | $(2,876,257 | ) | | | | | | | | (469,304 | ) | | $(6,033,543 | ) |
| | Class C shares | | | | | | | | | | | | | | | | | | | |
| | Sold | | | 344,485 | | | $4,363,500 | | | | | | | | | 998,289 | | | $12,759,779 | |
| | Distributions reinvested | | | 57,764 | | | 744,325 | | | | | | | | | 413,425 | | | 5,071,680 | |
| | Repurchased | | | (2,050,746 | ) | | (25,953,504 | ) | | | | | | | | (6,515,151 | ) | | (83,437,151 | ) |
| | Net decrease | | | (1,648,497 | ) | | $(20,845,679 | ) | | | | | | | | (5,103,437 | ) | | $(65,605,692 | ) |
| | Class I shares | | | | | | | | | | | | | | | | | | | |
| | Sold | | | 178,850 | | | $2,257,637 | | | | | | | | | 832,943 | | | $10,624,093 | |
| | Distributions reinvested | | | 9,764 | | | 125,342 | | | | | | | | | 45,809 | | | 563,609 | |
| | Repurchased | | | (372,363 | ) | | (4,686,759 | ) | | | | | | | | (750,944 | ) | | (9,615,472 | ) |
| | Net increase (decrease) | | | (183,749 | ) | | $(2,303,780 | ) | | | | | | | | 127,808 | | | $1,572,230 | |
SEMIANNUAL REPORT | JOHN HANCOCK MULTIMANAGER LIFESTYLE PORTFOLIOS 45
| | | | | | | | | | | | | | | | | | | | | | | | | | | |
| | | | | | | | | |
| | | | | | | | Six months ended 6-30-19 | | | | | | | | | | | | Year ended 12-31-18 | |
| | | | | Shares | | | Amount | | | | | | | | | Shares | | | Amount | |
| | Class R1 shares | | | | | | | | | | | | | | | | | | | |
| | Sold | | | 46,011 | | | $583,208 | | | | | | | | | 178,120 | | | $2,277,230 | |
| | Distributions reinvested | | | 2,814 | | | 36,183 | | | | | | | | | 17,444 | | | 214,090 | |
| | Repurchased | | | (198,071 | ) | | (2,489,653 | ) | | | | | | | | (130,251 | ) | | (1,669,429 | ) |
| | Net increase (decrease) | | | (149,246 | ) | | $(1,870,262 | ) | | | | | | | | 65,313 | | | $821,891 | |
| | Class R2 shares | | | | | | | | | | | | | | | | | | | |
| | Sold | | | 9,290 | | | $116,351 | | | | | | | | | 143,907 | | | $1,872,181 | |
| | Distributions reinvested | | | 1,376 | | | 17,678 | | | | | | | | | 7,317 | | | 90,042 | |
| | Repurchased | | | (37,153 | ) | | (469,737 | ) | | | | | | | | (89,017 | ) | | (1,125,381 | ) |
| | Net increase (decrease) | | | (26,487 | ) | | $(335,708 | ) | | | | | | | | 62,207 | | | $836,842 | |
| | Class R3 shares | | | | | | | | | | | | | | | | | | | |
| | Sold | | | 29,944 | | | $377,476 | | | | | | | | | 45,374 | | | $579,872 | |
| | Distributions reinvested | | | 2,110 | | | 27,086 | | | | | | | | | 10,785 | | | 132,417 | |
| | Repurchased | | | (32,711 | ) | | (411,044 | ) | | | | | | | | (120,162 | ) | | (1,537,459 | ) |
| | Net decrease | | | (657 | ) | | $(6,482 | ) | | | | | | | | (64,003 | ) | | $(825,170 | ) |
| | Class R4 shares | | | | | | | | | | | | | | | | | | | |
| | Sold | | | 85,889 | | | $1,079,822 | | | | | | | | | 21,515 | | | $276,373 | |
| | Distributions reinvested | | | 2,121 | | | 27,237 | | | | | | | | | 7,126 | | | 87,988 | |
| | Repurchased | | | (20,917 | ) | | (265,580 | ) | | | | | | | | (194,103 | ) | | (2,497,408 | ) |
| | Net increase (decrease) | | | 67,093 | | | $841,479 | | | | | | | | | (165,462 | ) | | $(2,133,047 | ) |
| | Class R5 shares | | | | | | | | | | | | | | | | | | | |
| | Sold | | | 15,799 | | | $199,973 | | | | | | | | | 83,855 | | | $1,075,980 | |
| | Distributions reinvested | | | 2,604 | | | 33,420 | | | | | | | | | 14,648 | | | 180,533 | |
| | Repurchased | | | (113,564 | ) | | (1,433,362 | ) | | | | | | | | (122,754 | ) | | (1,578,445 | ) |
| | Net decrease | | | (95,161 | ) | | $(1,199,969 | ) | | | | | | | | (24,251 | ) | | $(321,932 | ) |
| | Class R6 shares | | | | | | | | | | | | | | | | | | | |
| | Sold | | | 385,320 | | | $4,897,654 | | | | | | | | | 961,369 | | | $12,314,648 | |
| | Distributions reinvested | | | 17,532 | | | 225,014 | | | | | | | | | 68,089 | | | 835,773 | |
| | Repurchased | | | (313,852 | ) | | (3,936,571 | ) | | | | | | | | (500,567 | ) | | (6,391,514 | ) |
| | Net increase | | | 89,000 | | | $1,186,097 | | | | | | | | | 528,891 | | | $6,758,907 | |
| | Class 1 shares | | | | | | | | | | | | | | | | | | | |
| | Sold | | | 1,888,023 | | | $23,876,446 | | | | | | | | | 2,819,392 | | | $35,885,441 | |
| | Distributions reinvested | | | 1,280,773 | | | 16,442,607 | | | | | | | | | 5,631,660 | | | 69,386,676 | |
| | Repurchased | | | (9,256,836 | ) | | (116,289,622 | ) | | | | | | | | (26,366,755 | ) | | (337,231,011 | ) |
| | Net decrease | | | (6,088,040 | ) | | $(75,970,569 | ) | | | | | | | | (17,915,703 | ) | | $(231,958,894 | ) |
| | Total net decrease | | | (9,867,855 | ) | | $(123,542,746 | ) | | | | | | | | (26,271,361 | ) | | $(340,224,242 | ) |
Affiliates of the portfolios owned 2% of Class R6 shares in Multimanager Lifestyle Conservative Portfolio,1% of Class R6 shares in Multimanager Lifestyle Aggressive Portfolio and Multimanager Lifestyle Balanced and 100% of Class 1 shares in each of the portfolios on June 30, 2019. Such concentration of shareholders' capital could have a material effect on the portfolio if such shareholders redeem from the portfolio.
Note 6 — Purchase and sale of securities
The following summarizes the purchases and sales of the underlying funds of the portfolios for the six months ended June 30, 2019:
| | | |
| Portfolio | Purchases | Sales |
| Multimanager Lifestyle Aggressive Portfolio | $772,985,688 | $995,341,683 |
| Multimanager Lifestyle Growth Portfolio | 2,203,919,966 | 2,985,507,802 |
| Multimanager Lifestyle Balanced Portfolio | 2,514,401,492 | 3,222,164,735 |
| Multimanager Lifestyle Moderate Portfolio | 819,612,089 | 1,043,265,715 |
| Multimanager Lifestyle Conservative Portfolio | 775,672,730 | 943,702,911 |
Note 7 — Investment in affiliated underlying funds
The portfolios invest primarily in affiliated underlying funds that are managed by the Advisor and its affiliates. The portfolios do not invest in the affiliated underlying funds for the purpose of exercising management or control; however, a portfolio's investment may represent a significant portion of each underlying fund's net assets. At June 30, 2019, the following portfolios held 5% or more of the net assets of the underlying funds shown below:
SEMIANNUAL REPORT | JOHN HANCOCK MULTIMANAGER LIFESTYLE PORTFOLIOS 46
| | | | | | | | | |
| | Portfolio | | | Affiliated Class NAV | | | Percentage of
underlying fund
net assets | |
| | Multimanager Lifestyle Aggressive Portfolio | |
| | | | | JHF Global Thematic Opportunities Fund | | | 22.3% | |
| | | | | JHF II International Strategic Equity Allocation Fund | | | 17.4% | |
| | | | | JHF II Health Sciences Fund | | | 17.3% | |
| | | | | JHF II U.S. Strategic Equity Allocation Fund | | | 17.0% | |
| | | | | JHF II Science & Technology Fund | | | 16.4% | |
| | | | | JHF International Dynamic Growth Fun | | | 16.2% | |
| | | | | JHF II Small Cap Stock Fund | | | 15.9% | |
| | | | | JHF II Mid Value Fund | | | 15.0% | |
| | | | | JHF II International Small Company Fund | | | 14.0% | |
| | | | | JHF II International Growth Stock Fund | | | 13.8% | |
| | | | | JHF Emerging Markets Equity Fund | | | 13.6% | |
| | | | | JHF Value Equity Fund | | | 13.3% | |
| | | | | JHF II Equity-Income Fund | | | 13.2% | |
| | | | | JHF Diversified Real Assets Fund | | | 12.4% | |
| | | | | JHF II Small Cap Growth Fund | | | 12.3% | |
| | | | | JHF II Small Cap Value Fund | | | 11.8% | |
| | | | | JHF Disciplined Value International Fund | | | 11.6% | |
| | | | | Multifactor Emerging Markets ETF | | | 11.3% | |
| | | | | JHF II Mid Cap Stock Fund | | | 10.7% | |
| | | | | JHF Small Cap Core Fund | | | 9.8% | |
| | | | | JHF II Capital Appreciation Value | | | 9.3% | |
| | | | | JHF II Global Equity Fund | | | 8.6% | |
| | | | | JHF II International Small Cap Fund | | | 8.1% | |
| | | | | JHF II Capital Appreciation Fund | | | 7.8% | |
| | | | | JHF Financial Industries Fund | | | 7.3% | |
| | | | | JHF II Fundamental Global Franchise Fund | | | 6.0% | |
| | | | | JHF II Blue Chip Growth Fund | | | 5.9% | |
| | Multimanager Lifestyle Growth Portfolio | |
| | | | | JHF Global Thematic Opportunities Fund | | | 50.1% | |
| | | | | JHF II International Strategic Equity Allocation Fund | | | 44.2% | |
| | | | | JHF II U.S. Strategic Equity Allocation Fund | | | 38.8% | |
| | | | | JHF International Dynamic Growth Fund | | | 38.0% | |
| | | | | JHF II Mid Value Fund | | | 36.5% | |
| | | | | JHF II Science & Technology Fund | | | 36.0% | |
| | | | | JHF II Health Sciences Fund | | | 35.3% | |
| | | | | JHF II International Growth Stock Fund | | | 32.4% | |
| | | | | JHF Value Equity Fund | | | 32.3% | |
| | | | | JHF II Small Cap Stock Fund | | | 31.6% | |
| | | | | JHF Diversified Real Assets Fund | | | 31.5% | |
| | | | | JHF II Equity-Income Fund | | | 31.2% | |
| | | | | JHF II International Small Company Fund | | | 30.8% | |
| | | | | JHF II Capital Appreciation Value | | | 28.7% | |
| | | | | JHF Disciplined Value International Fund | | | 27.4% | |
| | | | | Multifactor Emerging Markets ETF | | | 26.9% | |
| | | | | JHF II Mid Cap Stock Fund | | | 26.7% | |
| | | | | JHF II Global Equity Fund | | | 26.3% | |
| | | | | JHF II Small Cap Growth Fund | | | 24.4% | |
| | | | | JHF II Fundamental Global Franchise Fund | | | 24.0% | |
| | | | | JHF II Small Cap Value Fund | | | 23.8% | |
| | | | | JHF Emerging Markets Equity Fund | | | 22.9% | |
| | | | | JHF Small Cap Core Fund | | | 22.5% | |
| | | | | JHF II Emerging Markets Debt Fund | | | 22.3% | |
| | | | | JHF II Asia Pacific Total Return Bond Fund | | | 21.9% | |
SEMIANNUAL REPORT | JOHN HANCOCK MULTIMANAGER LIFESTYLE PORTFOLIOS 47
| | | | | | | | | |
| | Portfolio | | | Affiliated Class NAV | | | Percentage of
underlying fund
net assets | |
| | | | | JHF Financial Industries Fund | | | 20.0% | |
| | | | | JHF II Capital Appreciation Fund | | | 19.1% | |
| | | | | JHF II Spectrum Income Fund | | | 18.7% | |
| | | | | JHF II International Small Cap Fund | | | 18.5% | |
| | | | | JHF II U.S. High Yield Bond Fund | | | 14.4% | |
| | | | | JHF II Blue Chip Growth Fund | | | 14.3% | |
| | | | | JHF II Short Duration Credit Opportunities Fund | | | 13.6% | |
| | | | | JHF II Core Bond Fund | | | 11.8% | |
| | | | | JHF II Floating Rate Income Fund | | | 11.4% | |
| | | | | JHF II Absolute Return Currency Fund | | | 11.2% | |
| | | | | JHF High Yield Fund | | | 10.6% | |
| | | | | JHF II Real Return Bond Fund | | | 8.5% | |
| | | | | JHF Fundamental Large Cap Core Fund | | | 8.1% | |
| | | | | Multifactor Small Cap Fund ETF | | | 7.8% | |
| | | | | JHF III Global Shareholder Yield Fund | | | 7.1% | |
| | | | | JHF II Strategic Income Opportunities Fund | | | 6.0% | |
| | Multimanager Lifestyle Balanced Portfolio | |
| | | | | JHF II Spectrum Income Fund | | | 39.2% | |
| | | | | JHF II U.S. Strategic Equity Allocation Fund | | | 38.6% | |
| | | | | JHF II Emerging Markets Debt Fund | | | 36.9% | |
| | | | | JHF II Short Duration Credit Opportunities Fund | | | 35.6% | |
| | | | | JHF II Asia Pacific Total Return Bond Fund | | | 35.2% | |
| | | | | JHF II Capital Appreciation Value | | | 34.4% | |
| | | | | JHF II Fundamental Global Franchise Fund | | | 33.4% | |
| | | | | JHF II International Strategic Equity Allocation Fund | | | 31.3% | |
| | | | | JHF II U.S. High Yield Bond Fund | | | 30.5% | |
| | | | | JHF Global Thematic Opportunities Fund | | | 29.7% | |
| | | | | JHF International Dynamic Growth Fund | | | 29.0% | |
| | | | | JHF Diversified Real Assets Fund | | | 27.7% | |
| | | | | JHF II Health Sciences Fund | | | 27.2% | |
| | | | | JHF II Floating Rate Income Fund | | | 26.4% | |
| | | | | JHF II Global Equity Fund | | | 26.2% | |
| | | | | JHF II Science & Technology Fund | | | 25.9% | |
| | | | | JHF II Core Bond Fund | | | 25.5% | |
| | | | | JHF II Small Cap Stock Fund | | | 25.3% | |
| | | | | JHF II Mid Value Fund | | | 25.1% | |
| | | | | JHF II Equity-Income Fund | | | 25.0% | |
| | | | | JHF Value Equity Fund | | | 24.5% | |
| | | | | JHF II International Growth Stock Fund | | | 24.5% | |
| | | | | JHF High Yield Fund | | | 23.5% | |
| | | | | JHF Disciplined Value International Fund | | | 23.1% | |
| | | | | JHF II Small Cap Growth Fund | | | 20.6% | |
| | | | | JHF II Small Cap Value Fund | | | 20.3% | |
| | | | | JHF II International Small Company Fund | | | 20.0% | |
| | | | | JHF II Real Return Bond Fund | | | 19.8% | |
| | | | | Multifactor Emerging Markets ETF | | | 18.1% | |
| | | | | JHF II Mid Cap Stock Fund | | | 18.1% | |
| | | | | JHF Financial Industries Fund | | | 17.1% | |
| | | | | JHF Small Cap Core Fund | | | 16.8% | |
| | | | | JHF Emerging Markets Equity Fund | | | 16.5% | |
| | | | | JHF II Capital Appreciation Fund | | | 16.3% | |
| | | | | JHF II Strategic Income Opportunities Fund | | | 14.5% | |
| | | | | JHF II Absolute Return Currency Fund | | | 13.7% | |
| | | | | JHF II International Small Cap Fund | | | 13.0% | |
SEMIANNUAL REPORT | JOHN HANCOCK MULTIMANAGER LIFESTYLE PORTFOLIOS 48
| | | | | | | | | |
| | Portfolio | | | Affiliated Class NAV | | | Percentage of
underlying fund
net assets | |
| | | | | JHF II Blue Chip Growth Fund | | | 13.0% | |
| | | | | JHF III Global Shareholder Yield Fund | | | 12.8% | |
| | | | | JHF Fundamental Large Cap Core Fund | | | 12.8% | |
| | | | | JHF Bond Fund | | | 5.3% | |
| | Multimanager Lifestyle Moderate Portfolio | |
| | | | | JHF II Asia Pacific Total Return Bond Fund | | | 19.1% | |
| | | | | JHF II Spectrum Income Fund | | | 14.5% | |
| | | | | JHF II Core Bond Fund | | | 14.3% | |
| | | | | JHF II Emerging Markets Debt Fund | | | 13.7% | |
| | | | | JHF II Short Duration Credit Opportunities Fund | | | 11.0% | |
| | | | | JHF II U.S. High Yield Bond Fund | | | 10.6% | |
| | | | | JHF II Floating Rate Income Fund | | | 10.5% | |
| | | | | JHF II Capital Appreciation Value | | | 8.3% | |
| | | | | JHF II Fundamental Global Franchise Fund | | | 7.9% | |
| | | | | JHF High Yield Fund | | | 7.8% | |
| | | | | JHF II Global Equity Fund | | | 7.6% | |
| | | | | JHF II Real Return Bond Fund | | | 7.2% | |
| | | | | JHF II U.S. Strategic Equity Allocation Fund | | | 6.7% | |
| | | | | JHF II International Strategic Equity Allocation Fund | | | 6.5% | |
| | | | | JHF Diversified Real Assets Fund | | | 5.9% | |
| | | | | JHF Infrastructure Fund | | | 5.1% | |
| | Multimanager Lifestyle Conservative Portfolio | |
| | | | | JHF II Core Bond Fund | | | 15.3% | |
| | | | | JHF II Asia Pacific Total Return Bond Fund | | | 15.2% | |
| | | | | JHF Infrastructure Fund | | | 13.3% | |
| | | | | JHF II Spectrum Income Fund | | | 12.3% | |
| | | | | JHF II Emerging Markets Debt Fund | | | 12.2% | |
| | | | | JHF II Floating Rate Income Fund | | | 10.0% | |
| | | | | JHF II Short Duration Credit Opportunities Fund | | | 9.8% | |
| | | | | JHF II U.S. High Yield Bond Fund | | | 8.1% | |
| | | | | JHF II Real Return Bond Fund | | | 7.8% | |
| | | | | JHF High Yield Fund | | | 6.0% | |
Information regarding each portfolio's purchases and sales of the affiliated underlying funds as well as income and capital gains earned, if any, during the period is as follows:
| | | | | | | | | | | | | | | | | | | | | | | | | | | | | | |
| | | | | | | | | | | | | | | | | Dividends and distributions | | | | | | | | | | |
| | Portfolio | | | Beginning
share
amount | | | Shares
purchased | | | Shares
sold | | | Ending
share
amount | | | Income
distributions
received | | | Capital gain
distributions
received | | | Realized
gain (loss)* | | | Change in
unrealized
appreciation
(depreciation) | | | Ending
value | |
| | Multimanager Lifestyle Aggressive Portfolio | |
| | Absolute Return Currency | | | 2,443,805 | | | — | | | (31,112 | ) | | 2,412,693 | | | — | | | — | | | $2,297 | | | ($292,628 | ) | | $22,027,886 | |
| | Blue Chip Growth | | | 6,290,949 | | | 387,149 | | | (954,801 | ) | | 5,723,297 | | | — | | | — | | | (3,525,621 | ) | | 46,787,291 | | | 236,658,330 | |
| | Capital Appreciation | | | 9,834,142 | | | 542,169 | | | (1,524,514 | ) | | 8,851,797 | | | — | | | — | | | (2,765,159 | ) | | 28,964,748 | | | 140,478,013 | |
| | Capital Appreciation Value | | | 14,137,720 | | | 115,239 | | | (1,100,883 | ) | | 13,152,076 | | | — | | | — | | | 279,671 | | | 23,551,462 | | | 154,142,326 | |
| | Disciplined Value | | | 7,584,242 | | | 96,096 | | | (681,142 | ) | | 6,999,196 | | | — | | | — | | | 373,706 | | | 16,378,841 | | | 141,313,774 | |
| | Disciplined Value International | | | 8,006,002 | | | 9,562,544 | | | (493,473 | ) | | 17,075,073 | | | — | | | — | | | (804,385 | ) | | 7,796,609 | | | 205,242,374 | |
| | Diversified Real Assets | | | 13,007,555 | | | 171,658 | | | (810,415 | ) | | 12,368,798 | | | — | | | — | | | (810,753 | ) | | 17,532,730 | | | 124,306,419 | |
| | Emerging Markets | | | 15,056,809 | | | — | | | (15,056,809 | ) | | — | | | — | | | — | | | 54,544,440 | | | (44,423,486 | ) | | — | |
| | Emerging Markets Equity | | | 15,737,620 | | | 10,983,239 | | | (182,482 | ) | | 26,538,377 | | | — | | | — | | | (231,752 | ) | | 24,454,619 | | | 283,960,632 | |
| | Equity Income | | | 10,845,980 | | | 2,046,792 | | | (189,017 | ) | | 12,703,755 | | | $2,165,710 | | | — | | | 39,052 | | | 26,295,239 | | | 236,289,849 | |
| | Financial Industries | | | 3,603,404 | | | — | | | (713,344 | ) | | 2,890,060 | | | — | | | — | | | 1,748,584 | | | 8,383,714 | | | 53,812,909 | |
SEMIANNUAL REPORT | JOHN HANCOCK MULTIMANAGER LIFESTYLE PORTFOLIOS 49
| | | | | | | | | | | | | | | | | | | | | | | | | | | | | | |
| | | | | | | | | | | | | | | | | Dividends and distributions | | | | | | | | | | |
| | Portfolio | | | Beginning
share
amount | | | Shares
purchased | | | Shares
sold | | | Ending
share
amount | | | Income
distributions
received | | | Capital gain
distributions
received | | | Realized
gain (loss)* | | | Change in
unrealized
appreciation
(depreciation) | | | Ending
value | |
| | Fundamental Global Franchise | | | 2,843,648 | | | 9,538 | | | (383,700 | ) | | 2,469,486 | | | — | | | — | | | $455,567 | | | $5,666,684 | | | $29,584,440 | |
| | Fundamental Large Cap Core | | | 3,976,340 | | | 1,175,242 | | | (397,892 | ) | | 4,753,690 | | | — | | | — | | | (1,242,020 | ) | | 36,827,033 | | | 226,846,086 | |
| | Global Equity | | | 5,896,826 | | | 27,994 | | | (546,981 | ) | | 5,377,839 | | | — | | | — | | | 148,391 | | | 10,936,424 | | | 62,866,934 | |
| | Global Focused Strategies | | | 3,292,526 | | | — | | | (3,292,526 | ) | | — | | | — | | | — | | | (836,363 | ) | | 2,473,132 | | | — | |
| | Global Shareholder Yield | | | 3,602,773 | | | 69,303 | | | (101,306 | ) | | 3,570,770 | | | $769,514 | | | — | | | 16,055 | | | 3,539,459 | | | 39,564,127 | |
| | Global Thematic Opportunities | | | 1,068,000 | | | 6,503,193 | | | (429,027 | ) | | 7,142,166 | | | — | | | — | | | 116,390 | | | 9,657,773 | | | 83,206,236 | |
| | Greater China Opportunities | | | 455,796 | | | — | | | (455,796 | ) | | — | | | — | | | — | | | (43,427 | ) | | 1,027,868 | | | — | |
| | Health Sciences | | | 10,870,928 | | | 347,155 | | | (819,747 | ) | | 10,398,336 | | | — | | | — | | | (298,840 | ) | | 7,781,163 | | | 49,184,131 | |
| | International Dynamic Growth | | | — | | | 4,770,043 | | | (172,248 | ) | | 4,597,795 | | | — | | | — | | | (34,744 | ) | | 1,309,961 | | | 47,357,292 | |
| | International Growth | | | 5,997,334 | | | 8,127 | | | (623,926 | ) | | 5,381,535 | | | — | | | — | | | 488,619 | | | 24,605,851 | | | 150,629,174 | |
| | International Growth Stock | | | 5,820,605 | | | — | | | (5,218,906 | ) | | 601,699 | | | — | | | — | | | 14,612,328 | | | (3,955,521 | ) | | 8,357,604 | |
| | International Small Cap | | | 4,346,164 | | | — | | | (3,756,779 | ) | | 589,385 | | | — | | | — | | | 16,554,891 | | | (9,063,713 | ) | | 10,349,608 | |
| | International Small Company | | | 7,342,885 | | | 3,568,469 | | | (444,326 | ) | | 10,467,028 | | | — | | | — | | | (229,715 | ) | | 8,843,368 | | | 109,694,449 | |
| | International Strategic Equity Allocation | | | 32,200,543 | | | 110,457 | | | (1,215,574 | ) | | 31,095,426 | | | — | | | — | | | (1,084,139 | ) | | 36,772,690 | | | 293,229,871 | |
| | International Value | | | 8,202,370 | | | — | | | (8,202,370 | ) | | — | | | — | | | — | | | 25,369,509 | | | (15,330,305 | ) | | — | |
| | Mid Cap Stock | | | 9,256,360 | | | — | | | (1,559,318 | ) | | 7,697,042 | | | — | | | — | | | 4,132,780 | | | 43,311,819 | | | 175,723,475 | |
| | Mid Value | | | 14,255,846 | | | 26,317 | | | (1,393,500 | ) | | 12,888,663 | | | — | | | — | | | (2,435,247 | ) | | 24,782,741 | | | 192,298,857 | |
| | Multifactor Emerging Markets ETF | | | — | | | 3,568,132 | | | — | | | 3,568,132 | | | 596,948 | | | — | | | — | | | 2,316,795 | | | 91,411,974 | |
| | Multifactor Mid Cap ETF | | | — | | | 332,796 | | | — | | | 332,796 | | | 54,063 | | | — | | | — | | | 506,231 | | | 12,147,054 | |
| | Multifactor Small Cap ETF | | | — | | | 465,634 | | | — | | | 465,634 | | | 56,281 | | | — | | | — | | | 75,204 | | | 12,280,491 | |
| | New Opportunities | | | 1,500,442 | | | — | | | (1,500,442 | ) | | — | | | — | | | — | | | 8,522,813 | | | (3,462,836 | ) | | — | |
| | Science & Technology | | | 11,052,297 | | | 3,040,462 | | | (1,573,302 | ) | | 12,519,457 | | | — | | | — | | | (4,599,893 | ) | | 12,850,257 | | | 48,074,714 | |
| | Seaport Long/Short | | | 1,318,884 | | | 54,549 | | | (81,029 | ) | | 1,292,404 | | | — | | | — | | | 42,645 | | | 1,311,869 | | | 14,862,643 | |
| | Small Cap Core | | | 3,129,305 | | | 2,913,746 | | | (521,211 | ) | | 5,521,840 | | | — | | | — | | | (993,410 | ) | | 8,129,561 | | | 64,715,962 | |
| | Small Cap Growth | | | 2,164,107 | | | 2,054,591 | | | (237,775 | ) | | 3,980,923 | | | — | | | — | | | (415,009 | ) | | 7,766,841 | | | 68,750,539 | |
| | Small Cap Stock | | | 4,228,400 | | | — | | | (3,784,072 | ) | | 444,328 | | | — | | | — | | | 6,189,202 | | | 709,937 | | | 4,101,143 | |
| | Small Cap Value | | | 2,451,279 | | | 1,659,067 | | | (474,107 | ) | | 3,636,239 | | | — | | | — | | | (312,306 | ) | | 7,785,379 | | | 73,961,099 | |
| | Small Company Value | | | 1,215,772 | | | — | | | (1,215,772 | ) | | — | | | — | | | — | | | 6,398,560 | | | (2,699,708 | ) | | — | |
| | Technical Opportunities | | | 7,998,614 | | | 7,009 | | | (8,005,623 | ) | | — | | | 18,853 | | | — | | | (5,215,602 | ) | | 8,321,666 | | | — | |
| | U.S. Strategic Equity Allocation | | | 24,419,231 | | | 4,161,111 | | | (1,537,063 | ) | | 27,043,279 | | | — | | | — | | | (917,175 | ) | | 38,405,587 | | | 269,621,488 | |
| | Value Equity | | | 7,743,112 | | | — | | | (7,000,957 | ) | | 742,155 | | | — | | | — | | | 7,980,166 | | | 2,369,351 | | | 8,631,260 | |
| | | | | | | | | | | | | | | | | $3,661,369 | | | — | | | $121,220,106 | | | $429,001,700 | | | $3,745,683,163 | |
| | Multimanager Lifestyle Growth Portfolio | |
| | Absolute Return Currency | | | 14,067,176 | | | — | | | (207,738 | ) | | 13,859,438 | | | — | | | — | | | ($25,707 | ) | | ($1,642,359 | ) | | $126,536,666 | |
| | Asia Pacific Total Return Bond | | | 6,435,125 | | | 694,697 | | | (262,134 | ) | | 6,867,688 | | | — | | | — | | | (116,596 | ) | | 3,960,151 | | | 67,990,107 | |
| | Blue Chip Growth | | | 15,122,735 | | | 550,157 | | | (1,840,787 | ) | | 13,832,105 | | | — | | | — | | | (7,649,765 | ) | | 111,299,235 | | | 571,957,531 | |
| | Bond | | | 18,594,562 | | | 8,770,724 | | | (1,476,369 | ) | | 25,888,917 | | | $6,719,714 | | | — | | | (320,788 | ) | | 20,014,714 | | | 415,258,222 | |
| | Capital Appreciation | | | 24,494,129 | | | 1,054,464 | | | (3,924,629 | ) | | 21,623,964 | | | — | | | — | | | (9,311,882 | ) | | 74,244,840 | | | 343,172,311 | |
| | Capital Appreciation Value | | | 44,281,376 | | | 176,991 | | | (4,026,273 | ) | | 40,432,094 | | | — | | | — | | | 3,974,863 | | | 70,153,143 | | | 473,864,143 | |
| | Core Bond | | | 7,409,415 | | | 19,940,844 | | | (1,311,002 | ) | | 26,039,257 | | | 3,225,621 | | | — | | | (166,947 | ) | | 12,480,543 | | | 341,635,048 | |
| | Disciplined Value | | | 18,738,660 | | | 157,209 | | | (1,488,109 | ) | | 17,407,760 | | | — | | | — | | | 873,805 | | | 40,833,981 | | | 351,462,670 | |
SEMIANNUAL REPORT | JOHN HANCOCK MULTIMANAGER LIFESTYLE PORTFOLIOS 50
| | | | | | | | | | | | | | | | | | | | | | | | | | | | | | |
| | | | | | | | | | | | | | | | | Dividends and distributions | | | | | | | | | | |
| | Portfolio | | | Beginning
share
amount | | | Shares
purchased | | | Shares
sold | | | Ending
share
amount | | | Income
distributions
received | | | Capital gain
distributions
received | | | Realized
gain (loss)* | | | Change in
unrealized
appreciation
(depreciation) | | | Ending
value | |
| | Disciplined Value International | | | 21,935,822 | | | 19,161,117 | | | (825,369 | ) | | 40,271,570 | | | — | | | — | | | ($1,442,515 | ) | | $20,711,668 | | | $484,064,266 | |
| | Diversified Real Assets | | | 33,439,407 | | | 301,125 | | | (2,354,061 | ) | | 31,386,471 | | | — | | | — | | | (2,216,317 | ) | | 45,243,697 | | | 315,434,032 | |
| | Emerging Markets | | | 28,984,249 | | | — | | | (28,984,249 | ) | | — | | | — | | | — | | | 149,827,729 | | | (130,401,974 | ) | | — | |
| | Emerging Markets Debt | | | 24,073,433 | | | 1,709,103 | | | — | | | 25,782,536 | | | $5,683,449 | | | — | | | — | | | 18,466,270 | | | 244,676,264 | |
| | Emerging Markets Equity | | | 30,904,861 | | | 13,830,292 | | | — | | | 44,735,153 | | | — | | | — | | | — | | | 45,261,106 | | | 478,666,142 | |
| | Equity Income | | | 26,641,038 | | | 4,830,988 | | | (1,316,423 | ) | | 30,155,603 | | | 5,203,265 | | | — | | | 1,154,206 | | | 63,385,175 | | | 560,894,213 | |
| | Financial Industries | | | 9,294,021 | | | — | | | (1,361,969 | ) | | 7,932,052 | | | — | | | — | | | 3,306,540 | | | 23,220,112 | | | 147,694,810 | |
| | Floating Rate Income | | | 16,307,103 | | | 381,446 | | | (2,911,779 | ) | | 13,776,770 | | | 3,117,990 | | | — | | | (249,286 | ) | | 4,534,440 | | | 114,484,958 | |
| | Fundamental Global Franchise | | | 10,113,777 | | | — | | | (271,431 | ) | | 9,842,346 | | | — | | | — | | | 225,973 | | | 22,278,279 | | | 117,911,303 | |
| | Fundamental Large Cap Core | | | 8,504,934 | | | 1,275,684 | | | (1,230,178 | ) | | 8,550,440 | | | — | | | — | | | (2,771,365 | ) | | 75,790,737 | | | 408,026,987 | |
| | Global Absolute Return Strategies | | | 3,100,012 | | | — | | | (3,100,012 | ) | | — | | | — | | | — | | | 1,279,711 | | | — | | | — | |
| | Global Bond | | | 2,414,053 | | | — | | | (2,414,053 | ) | | — | | | — | | | — | | | 4,816,706 | | | (4,266,443 | ) | | — | |
| | Global Equity | | | 18,429,444 | | | — | | | (1,986,010 | ) | | 16,443,434 | | | — | | | — | | | 483,128 | | | 33,828,299 | | | 192,223,741 | |
| | Global Shareholder Yield | | | 13,392,352 | | | 253,042 | | | (625,367 | ) | | 13,020,027 | | | 2,809,669 | | | — | | | 415,869 | | | 12,831,407 | | | 144,261,896 | |
| | Global Short Duration Credit | | | 5,884,576 | | | 328,138 | | | (6,212,714 | ) | | — | | | 585,449 | | | — | | | (2,681,120 | ) | | 4,560,768 | | | — | |
| | Global Thematic Opportunities | | | 2,605,000 | | | 14,591,620 | | | (1,165,771 | ) | | 16,030,849 | | | — | | | — | | | 322,820 | | | 23,064,917 | | | 186,759,392 | |
| | Health Sciences | | | 22,681,424 | | | 1,184,946 | | | (2,724,055 | ) | | 21,142,315 | | | — | | | — | | | (1,206,211 | ) | | 16,800,039 | | | 100,003,151 | |
| | High Yield (JHAM) | | | 14,431,890 | | | 19,736,983 | | | (2,010,144 | ) | | 32,158,729 | | | 2,389,317 | | | — | | | (977,743 | ) | | 4,760,628 | | | 109,982,854 | |
| | High Yield (WAMCO) | | | 3,196,234 | | | 19,065 | | | (3,215,299 | ) | | — | | | 148,326 | | | — | | | 6,724,381 | | | (5,070,319 | ) | | — | |
| | International Dynamic Growth | | | — | | | 11,057,059 | | | (270,900 | ) | | 10,786,159 | | | — | | | — | | | 26,615 | | | 3,089,001 | | | 111,097,441 | |
| | International Growth | | | 14,070,800 | | | — | | | (1,446,241 | ) | | 12,624,559 | | | — | | | — | | | 1,517,490 | | | 57,601,057 | | | 353,361,394 | |
| | International Growth Stock | | | 15,882,919 | | | — | | | (14,472,236 | ) | | 1,410,683 | | | — | | | — | | | 34,320,344 | | | (7,925,086 | ) | | 19,594,392 | |
| | International Small Cap | | | 10,245,044 | | | — | | | (8,894,864 | ) | | 1,350,180 | | | — | | | — | | | 24,681,214 | | | (6,526,547 | ) | | 23,709,167 | |
| | International Small Company | | | 16,939,826 | | | 6,795,229 | | | (718,334 | ) | | 23,016,721 | | | — | | | — | | | (503,946 | ) | | 20,261,315 | | | 241,215,240 | |
| | International Strategic Equity Allocation | | | 84,176,717 | | | — | | | (5,063,991 | ) | | 79,112,726 | | | — | | | — | | | (5,009,070 | ) | | 97,164,398 | | | 746,033,002 | |
| | International Value | | | 19,157,665 | | | — | | | (19,157,665 | ) | | — | | | — | | | — | | | 56,384,511 | | | (33,037,031 | ) | | — | |
| | Mid Cap Stock | | | 21,849,716 | | | — | | | (2,676,932 | ) | | 19,172,784 | | | — | | | — | | | 8,910,419 | | | 105,654,360 | | | 437,714,650 | |
| | Mid Value | | | 34,027,854 | | | 10,744 | | | (2,593,458 | ) | | 31,445,140 | | | — | | | — | | | (4,306,166 | ) | | 58,283,949 | | | 469,161,489 | |
| | Multifactor Emerging Markets ETF | | | — | | | 8,482,819 | | | — | | | 8,482,819 | | | 1,419,176 | | | — | | | — | | | 5,313,720 | | | 217,321,340 | |
| | Multifactor Mid Cap ETF | | | — | | | 410,476 | | | — | | | 410,476 | | | 66,682 | | | — | | | — | | | 596,682 | | | 14,982,374 | |
| | Multifactor Small Cap ETF | | | — | | | 1,271,422 | | | — | | | 1,271,422 | | | 153,677 | | | — | | | — | | | (89,583 | ) | | 33,532,102 | |
| | New Opportunities | | | 3,441,169 | | | — | | | (3,441,169 | ) | | — | | | — | | | — | | | 11,798,912 | | | (144,821 | ) | | — | |
| | Real Return Bond | | | 16,867,209 | | | 1,223,967 | | | (17,056,443 | ) | | 1,034,733 | | | — | | | — | | | (2,722,818 | ) | | 8,415,606 | | | 11,485,532 | |
| | Science & Technology | | | 25,196,189 | | | 5,630,682 | | | (3,375,749 | ) | | 27,451,122 | | | — | | | — | | | (11,353,766 | ) | | 30,173,542 | | | 105,412,307 | |
| | Seaport Long/Short | | | 2,323,037 | | | 10,756 | | | (71,259 | ) | | 2,262,534 | | | — | | | — | | | 65,277 | | | 2,301,974 | | | 26,019,144 | |
| | Short Duration Credit Opportunities | | | 11,649,542 | | | 2,066,718 | | | (1,028,373 | ) | | 12,687,887 | | | 2,405,918 | | | — | | | (626,592 | ) | | 5,438,353 | | | 121,423,075 | |
| | Short Term Government Income | | | 2,794,809 | | | 10,616 | | | (2,805,425 | ) | | — | | | 98,728 | | | — | | | (267,553 | ) | | 342,696 | | | — | |
| | Small Cap Core | | | 7,161,568 | | | 6,711,854 | | | (1,221,969 | ) | | 12,651,453 | | | — | | | — | | | (2,011,122 | ) | | 18,547,953 | | | 148,275,028 | |
| | Small Cap Growth | | | 4,402,783 | | | 4,160,821 | | | (663,013 | ) | | 7,900,591 | | | — | | | — | | | (1,195,347 | ) | | 15,907,455 | | | 136,443,200 | |
| | Small Cap Stock | | | 8,471,097 | | | — | | | (7,587,252 | ) | | 883,845 | | | — | | | — | | | 9,424,641 | | | 4,348,943 | | | 8,157,890 | |
| | Small Cap Value | | | 5,042,758 | | | 3,154,774 | | | (870,700 | ) | | 7,326,832 | | | — | | | — | | | (987,902 | ) | | 15,927,620 | | | 149,027,767 | |
SEMIANNUAL REPORT | JOHN HANCOCK MULTIMANAGER LIFESTYLE PORTFOLIOS 51
| | | | | | | | | | | | | | | | | | | | | | | | | | | | | | |
| | | | | | | | | | | | | | | | | Dividends and distributions | | | | | | | | | | |
| | Portfolio | | | Beginning
share
amount | | | Shares
purchased | | | Shares
sold | | | Ending
share
amount | | | Income
distributions
received | | | Capital gain
distributions
received | | | Realized
gain (loss)* | | | Change in
unrealized
appreciation
(depreciation) | | | Ending
value | |
| | Small Company Value | | | 2,526,673 | | | — | | | (2,526,673 | ) | | — | | | — | | | — | | | $11,916,074 | | | ($4,185,091 | ) | | — | |
| | Spectrum Income | | | 12,684,217 | | | 66,673 | | | (9,717,851 | ) | | 3,033,039 | | | $689,538 | | | — | | | 2,846,255 | | | 1,568,392 | | | $32,392,858 | |
| | Strategic Income Opportunities | | | 23,131,736 | | | 10,697,717 | | | (2,216,122 | ) | | 31,613,331 | | | 4,930,816 | | | — | | | (744,795 | ) | | 17,504,054 | | | 333,204,504 | |
| | Technical Opportunities | | | 19,517,940 | | | — | | | (19,517,940 | ) | | — | | | 45,780 | | | — | | | (12,979,709 | ) | | 20,562,080 | | | — | |
| | Total Return | | | 15,896,586 | | | — | | | (15,896,586 | ) | | — | | | — | | | — | | | 3,112,668 | | | 1,127,003 | | | — | |
| | U.S. High Yield Bond | | | 3,241,196 | | | 231,847 | | | (185,962 | ) | | 3,287,081 | | | 876,452 | | | — | | | 37,159 | | | 2,047,087 | | | 36,486,598 | |
| | U.S. Strategic Equity Allocation | | | 66,551,064 | | | — | | | (4,807,430 | ) | | 61,743,634 | | | — | | | — | | | (2,868,781 | ) | | 101,645,889 | | | 615,584,030 | |
| | Value Equity | | | 18,879,303 | | | — | | | (17,075,840 | ) | | 1,803,463 | | | — | | | — | | | 22,634,719 | | | 2,493,234 | | | 20,974,278 | |
| | | | | | | | | | | | | | | | | $40,569,567 | | | — | | | $286,368,220 | | | $1,150,751,258 | | | $10,709,569,509 | |
| | Multimanager Lifestyle Balanced Portfolio | |
| | Absolute Return Currency | | | 15,427,559 | | | — | | | (76,359 | ) | | 15,351,200 | | | — | | | — | | | ($7,646 | ) | | ($1,834,498 | ) | | $140,156,458 | |
| | Asia Pacific Total Return Bond | | | 10,908,033 | | | 692,933 | | | (1,998,704 | ) | | 9,602,262 | | | — | | | — | | | (642,287 | ) | | 6,734,671 | | | 95,062,393 | |
| | Blue Chip Growth | | | 11,137,303 | | | 203,685 | | | (1,265,899 | ) | | 10,075,089 | | | — | | | — | | | (5,678,147 | ) | | 81,666,288 | | | 416,604,933 | |
| | Bond | | | 42,187,390 | | | 15,338,954 | | | (3,557,759 | ) | | 53,968,585 | | | $14,471,624 | | | — | | | (680,373 | ) | | 42,751,548 | | | 865,656,111 | |
| | Capital Appreciation | | | 18,152,001 | | | 371,765 | | | (2,915,377 | ) | | 15,608,389 | | | — | | | — | | | (7,567,279 | ) | | 55,442,042 | | | 247,705,140 | |
| | Capital Appreciation Value | | | 45,332,704 | | | — | | | (4,508,916 | ) | | 40,823,788 | | | — | | | — | | | 4,762,523 | | | 70,864,548 | | | 478,454,793 | |
| | Core Bond | | | 17,142,849 | | | 39,762,740 | | | (3,055,192 | ) | | 53,850,397 | | | 6,809,322 | | | — | | | (250,677 | ) | | 26,069,793 | | | 706,517,210 | |
| | Disciplined Value | | | 13,731,032 | | | 94,208 | | | (1,185,035 | ) | | 12,640,205 | | | — | | | — | | | 464,135 | | | 29,802,692 | | | 255,205,732 | |
| | Disciplined Value International | | | 14,433,348 | | | 14,152,014 | | | (646,278 | ) | | 27,939,084 | | | — | | | — | | | (1,021,468 | ) | | 13,845,642 | | | 335,827,784 | |
| | Diversified Real Assets | | | 27,876,873 | | | 492,394 | | | (2,726,886 | ) | | 25,642,381 | | | — | | | — | | | (2,442,765 | ) | | 38,220,508 | | | 257,705,929 | |
| | Emerging Markets | | | 18,043,457 | | | — | | | (18,043,457 | ) | | — | | | — | | | — | | | 91,339,424 | | | (79,252,903 | ) | | — | |
| | Emerging Markets Debt | | | 37,324,178 | | | 3,133,512 | | | — | | | 40,457,690 | | | 8,909,514 | | | — | | | — | | | 28,887,295 | | | 383,943,479 | |
| | Emerging Markets Equity | | | 19,747,457 | | | 7,525,535 | | | — | | | 27,272,992 | | | — | | | — | | | — | | | 28,485,342 | | | 291,821,015 | |
| | Equity Income | | | 19,439,789 | | | 4,300,909 | | | (1,535,912 | ) | | 22,204,786 | | | 3,778,310 | | | — | | | 1,056,380 | | | 45,715,290 | | | 413,009,021 | |
| | Financial Industries | | | 7,622,193 | | | — | | | (1,094,789 | ) | | 6,527,404 | | | — | | | — | | | 2,699,809 | | | 19,117,601 | | | 121,540,264 | |
| | Floating Rate Income | | | 34,814,445 | | | 1,065,656 | | | (5,531,470 | ) | | 30,348,631 | | | 6,817,644 | | | — | | | (3,039,391 | ) | | 12,329,432 | | | 252,197,126 | |
| | Fundamental Global Franchise | | | 11,816,003 | | | — | | | — | | | 11,816,003 | | | — | | | — | | | — | | | 26,586,006 | | | 141,555,712 | |
| | Fundamental Large Cap Core | | | 6,319,054 | | | 1,118,040 | | | (945,158 | ) | | 6,491,936 | | | — | | | — | | | (2,582,945 | ) | | 56,733,702 | | | 309,795,193 | |
| | Global Absolute Return Strategies | | | 3,147,811 | | | — | | | (3,147,811 | ) | | — | | | — | | | — | | | 1,154,446 | | | — | | | — | |
| | Global Bond | | | 4,092,293 | | | — | | | (4,092,293 | ) | | — | | | — | | | — | | | 7,693,224 | | | (6,751,306 | ) | | — | |
| | Global Equity | | | 17,717,033 | | | 23,623 | | | (2,110,979 | ) | | 15,629,677 | | | — | | | — | | | 559,277 | | | 32,350,087 | | | 182,710,927 | |
| | Global Shareholder Yield | | | 13,098,267 | | | 245,064 | | | (756,959 | ) | | 12,586,372 | | | 2,721,092 | | | — | | | 627,102 | | | 12,361,671 | | | 139,457,003 | |
| | Global Short Duration Credit | | | 11,555,477 | | | 617,561 | | | (12,173,038 | ) | | — | | | 1,162,061 | | | — | | | (7,697,936 | ) | | 11,431,260 | | | — | |
| | Global Thematic Opportunities | | | 1,327,000 | | | 8,187,801 | | | (738,315 | ) | | 8,776,486 | | | — | | | — | | | 292,656 | | | 11,908,104 | | | 102,246,063 | |
| | Health Sciences | | | 16,576,439 | | | 420,796 | | | (1,862,220 | ) | | 15,135,015 | | | — | | | — | | | (763,893 | ) | | 12,001,840 | | | 71,588,620 | |
| | High Yield (JHAM) | | | 28,332,527 | | | 36,852,786 | | | (3,479,727 | ) | | 61,705,586 | | | 4,589,999 | | | — | | | (1,640,721 | ) | | 9,050,105 | | | 211,033,104 | |
| | High Yield (WAMCO) | | | 6,271,708 | | | 37,436 | | | (6,309,144 | ) | | — | | | 291,250 | | | — | | | 13,205,561 | | | (9,927,965 | ) | | — | |
| | International Dynamic Growth | | | — | | | 7,677,267 | | | (164,061 | ) | | 7,513,206 | | | — | | | — | | | 20,844 | | | 2,165,266 | | | 77,386,020 | |
| | International Growth | | | 9,950,480 | | | 58,533 | | | (1,215,019 | ) | | 8,793,994 | | | — | | | — | | | 1,193,084 | | | 40,486,366 | | | 246,143,881 | |
| | International Growth Stock | | | 10,647,215 | | | — | | | (9,663,897 | ) | | 983,318 | | | — | | | — | | | 27,431,483 | | | (9,507,646 | ) | | 13,658,283 | |
| | International Small Cap | | | 6,342,572 | | | — | | | (5,516,260 | ) | | 826,312 | | | — | | | — | | | 11,309,114 | | | (462,974 | ) | | 14,510,042 | |
SEMIANNUAL REPORT | JOHN HANCOCK MULTIMANAGER LIFESTYLE PORTFOLIOS 52
| | | | | | | | | | | | | | | | | | | | | | | | | | | | | | |
| | | | | | | | | | | | | | | | | Dividends and distributions | | | | | | | | | | |
| | Portfolio | | | Beginning
share
amount | | | Shares
purchased | | | Shares
sold | | | Ending
share
amount | | | Income
distributions
received | | | Capital gain
distributions
received | | | Realized
gain (loss)* | | | Change in
unrealized
appreciation
(depreciation) | | | Ending
value | |
| | International Small Company | | | 10,704,763 | | | 2,814,230 | | | (353,345 | ) | | 13,165,648 | | | — | | | — | | | ($222,402 | ) | | $12,568,395 | | | $137,975,986 | |
| | International Strategic Equity Allocation | | | 55,467,045 | | | 264,894 | | | (4,332,169 | ) | | 51,399,770 | | | — | | | — | | | (4,081,857 | ) | | 64,730,172 | | | 484,699,828 | |
| | International Value | | | 13,723,245 | | | — | | | (13,723,245 | ) | | — | | | — | | | — | | | 47,357,127 | | | (30,491,632 | ) | | — | |
| | Mid Cap Stock | | | 14,356,271 | | | 707,504 | | | (2,692,848 | ) | | 12,370,927 | | | — | | | — | | | 3,362,474 | | | 67,991,754 | | | 282,428,253 | |
| | Mid Value | | | 22,143,487 | | | 637,916 | | | (2,292,061 | ) | | 20,489,342 | | | — | | | — | | | (3,558,525 | ) | | 38,563,386 | | | 305,700,984 | |
| | Multifactor Emerging Markets ETF | | | — | | | 5,472,844 | | | — | | | 5,472,844 | | | $915,607 | | | — | | | — | | | 3,409,524 | | | 140,208,790 | |
| | Multifactor Mid Cap ETF | | | — | | | 227,871 | | | — | | �� | 227,871 | | | 37,018 | | | — | | | — | | | 320,484 | | | 8,317,292 | |
| | Multifactor Small Cap ETF | | | — | | | 727,994 | | | — | | | 727,994 | | | 87,993 | | | — | | | — | | | (58,066 | ) | | 19,199,895 | |
| | New Opportunities | | | 2,037,042 | | | — | | | (2,037,042 | ) | | — | | | — | | | — | | | 9,206,589 | | | (2,359,563 | ) | | — | |
| | Real Return Bond | | | 35,088,585 | | | 2,420,969 | | | (35,357,816 | ) | | 2,151,738 | | | — | | | — | | | (6,478,769 | ) | | 18,392,315 | | | 23,884,289 | |
| | Science & Technology | | | 17,014,670 | | | 4,444,625 | | | (2,853,387 | ) | | 18,605,908 | | | — | | | — | | | (4,199,047 | ) | | 16,866,838 | | | 71,446,687 | |
| | Seaport Long/Short | | | 2,398,641 | | | 15,131 | | | (103,926 | ) | | 2,309,846 | | | — | | | — | | | 111,769 | | | 2,337,457 | | | 26,563,232 | |
| | Short Duration Credit Opportunities | | | 29,205,476 | | | 2,038,891 | | | (2,134,986 | ) | | 29,109,381 | | | 5,642,225 | | | — | | | (1,295,968 | ) | | 13,001,091 | | | 278,576,780 | |
| | Short Term Government Income | | | 3,825,523 | | | 9,165 | | | (3,834,688 | ) | | — | | | 85,234 | | | — | | | (347,237 | ) | | 471,601 | | | — | |
| | Small Cap Core | | | 4,262,776 | | | 4,302,344 | | | (656,085 | ) | | 7,909,035 | | | — | | | — | | | (983,214 | ) | | 10,879,606 | | | 92,693,889 | |
| | Small Cap Growth | | | 3,407,806 | | | 3,125,387 | | | (510,335 | ) | | 6,022,858 | | | — | | | — | | | (588,491 | ) | | 12,039,721 | | | 104,014,760 | |
| | Small Cap Stock | | | 6,735,763 | | | 3,636 | | | (6,061,614 | ) | | 677,785 | | | — | | | — | | | 8,585,418 | | | 2,190,901 | | | 6,255,952 | |
| | Small Cap Value | | | 3,876,382 | | | 2,649,658 | | | (889,960 | ) | | 5,636,080 | | | — | | | — | | | (439,452 | ) | | 12,147,822 | | | 114,637,869 | |
| | Small Company Value | | | 2,021,078 | | | — | | | (2,021,078 | ) | | — | | | — | | | — | | | 12,628,291 | | | (6,501,451 | ) | | — | |
| | Spectrum Income | | | 28,272,680 | | | 148,495 | | | (21,748,065 | ) | | 6,673,110 | | | 1,535,651 | | | — | | | 7,193,192 | | | 2,685,449 | | | 71,268,819 | |
| | Strategic Income Opportunities | | | 51,557,069 | | | 24,771,829 | | | (3,676,328 | ) | | 72,652,570 | | | 11,198,016 | | | — | | | (1,989,388 | ) | | 40,101,015 | | | 765,758,085 | |
| | Technical Opportunities | | | 9,945,541 | | | — | | | (9,945,541 | ) | | — | | | 23,012 | | | — | | | (5,991,978 | ) | | 9,848,582 | | | — | |
| | Total Return | | | 37,395,321 | | | — | | | (37,395,321 | ) | | — | | | — | | | — | | | (314,665 | ) | | 10,407,256 | | | — | |
| | U.S. High Yield Bond | | | 6,361,438 | | | 374,969 | | | (426,871 | ) | | 6,309,536 | | | 1,688,711 | | | — | | | 81,110 | | | 4,051,435 | | | 70,035,846 | |
| | U.S. Strategic Equity Allocation | | | 62,571,476 | | | 247,393 | | | (6,420,345 | ) | | 56,398,524 | | | — | | | — | | | (4,855,484 | ) | | 96,404,600 | | | 562,293,288 | |
| | Value Equity | | | 13,424,831 | | | — | | | (12,144,349 | ) | | 1,280,482 | | | — | | | — | | | 16,141,289 | | | 1,599,175 | | | 14,892,005 | |
| | | | | | | | | | | | | | | | | $70,764,283 | | | — | | | $199,114,316 | | | $1,008,867,674 | | | $10,352,344,765 | |
| | Multimanager Lifestyle Moderate Portfolio | |
| | Absolute Return Currency | | | 6,273,317 | | | — | | | (2,350,402 | ) | | 3,922,915 | | | — | | | — | | | ($164,188 | ) | | ($248,377 | ) | | $35,816,216 | |
| | Asia Pacific Total Return Bond | | | 5,954,347 | | | 292,615 | | | (262,641 | ) | | 5,984,321 | | | — | | | — | | | (81,190 | ) | | 3,569,985 | | | 59,244,779 | |
| | Blue Chip Growth | | | 1,389,801 | | | 508,250 | | | (149,975 | ) | | 1,748,076 | | | — | | | — | | | (750,404 | ) | | 10,925,751 | | | 72,282,950 | |
| | Bond | | | 16,993,549 | | | 10,301,600 | | | (1,400,798 | ) | | 25,894,351 | | | $6,499,918 | | | — | | | (223,082 | ) | | 19,367,344 | | | 415,345,398 | |
| | Capital Appreciation | | | 3,390,900 | | | — | | | (545,008 | ) | | 2,845,892 | | | — | | | — | | | (2,185,986 | ) | | 11,049,620 | | | 45,164,303 | |
| | Capital Appreciation Value | | | 13,469,950 | | | 21,750 | | | (1,793,059 | ) | | 11,698,641 | | | — | | | — | | | 1,126,488 | | | 21,040,476 | | | 137,108,073 | |
| | Core Bond | | | 19,640,764 | | | 14,380,428 | | | (2,361,360 | ) | | 31,659,832 | | | 4,115,611 | | | — | | | 136,912 | | | 16,966,550 | | | 415,376,995 | |
| | Disciplined Value | | | 2,046,898 | | | 399,700 | | | (164,124 | ) | | 2,282,474 | | | — | | | — | | | (24,821 | ) | | 4,701,372 | | | 46,083,156 | |
| | Disciplined Value International | | | 3,109,710 | | | 1,803,847 | | | (147,934 | ) | | 4,765,623 | | | — | | | — | | | (259,798 | ) | | 3,036,847 | | | 57,282,793 | |
| | Diversified Real Assets | | | 6,507,933 | | | 143,373 | | | (779,130 | ) | | 5,872,176 | | | — | | | — | | | (383,240 | ) | | 8,689,642 | | | 59,015,366 | |
| | Emerging Markets | | | 2,336,678 | | | — | | | (2,336,678 | ) | | — | | | — | | | — | | | 3,387,043 | | | (1,858,929 | ) | | — | |
| | Emerging Markets Debt | | | 14,515,086 | | | 1,321,836 | | | — | | | 15,836,922 | | | 3,487,069 | | | — | | | — | | | 11,298,987 | | | 150,292,389 | |
| | Emerging Markets Equity | | | 2,576,498 | | | 196,826 | | | — | | | 2,773,324 | | | — | | | — | | | — | | | 3,551,276 | | | 29,674,568 | |
| | Equity Income | | | 2,906,089 | | | 1,546,671 | | | (171,144 | ) | | 4,281,616 | | | 664,809 | | | — | | | (128,636 | ) | | 7,380,492 | | | 79,638,060 | |
| | Floating Rate Income | | | 14,781,644 | | | 354,425 | | | (2,477,227 | ) | | 12,658,842 | | | 2,847,813 | | | — | | | (2,142,670 | ) | | 6,067,134 | | | 105,194,975 | |
SEMIANNUAL REPORT | JOHN HANCOCK MULTIMANAGER LIFESTYLE PORTFOLIOS 53
| | | | | | | | | | | | | | | | | | | | | | | | | | | | | | |
| | | | | | | | | | | | | | | | | Dividends and distributions | | | | | | | | | | |
| | Portfolio | | | Beginning
share
amount | | | Shares
purchased | | | Shares
sold | | | Ending
share
amount | | | Income
distributions
received | | | Capital gain
distributions
received | | | Realized
gain (loss)* | | | Change in
unrealized
appreciation
(depreciation) | | | Ending
value | |
| | Fundamental Global Franchise | | | 3,864,464 | | | 4,207 | | | (612,819 | ) | | 3,255,852 | | | — | | | — | | | ($454,337 | ) | | $8,797,041 | | | $39,005,102 | |
| | Fundamental Large Cap Core | | | 2,348,190 | | | 1,012 | | | (918,066 | ) | | 1,431,136 | | | — | | | — | | | (1,796,720 | ) | | 20,279,563 | | | 68,293,833 | |
| | Global Absolute Return Strategies | | | 1,420,910 | | | — | | | (1,420,910 | ) | | — | | | — | | | — | | | 530,973 | | | (5,735 | ) | | — | |
| | Global Bond | | | 3,475,234 | | | — | | | (3,475,234 | ) | | — | | | — | | | — | | | 5,801,029 | | | (4,992,706 | ) | | — | |
| | Global Equity | | | 5,509,325 | | | 27,227 | | | (771,036 | ) | | 4,765,516 | | | — | | | — | | | 202,736 | | | 9,983,253 | | | 55,708,881 | |
| | Global Shareholder Yield | | | 3,949,817 | | | 73,645 | | | (247,399 | ) | | 3,776,063 | | | $817,726 | | | — | | | 276,260 | | | 3,662,876 | | | 41,838,779 | |
| | Global Short Duration Credit | | | 4,458,785 | | | 135,465 | | | (4,594,250 | ) | | — | | | 443,710 | | | — | | | (1,619,116 | ) | | 3,051,046 | | | — | |
| | High Yield (JHAM) | | | 11,146,926 | | | 13,707,315 | | | (1,294,914 | ) | | 23,559,327 | | | 1,767,106 | | | — | | | (600,974 | ) | | 3,489,723 | | | 80,572,900 | |
| | High Yield (WAMCO) | | | 2,457,258 | | | 14,722 | | | (2,471,980 | ) | | — | | | 114,538 | | | — | | | 2,803,893 | | | (1,520,027 | ) | | — | |
| | Infrastructure | | | 1,347,862 | | | 13,016 | | | (141,557 | ) | | 1,219,321 | | | 138,584 | | | — | | | 263,469 | | | 1,782,899 | | | 15,778,011 | |
| | International Dynamic Growth | | | — | | | 1,313,963 | | | (37,593 | ) | | 1,276,370 | | | — | | | — | | | 3,042 | | | 371,465 | | | 13,146,611 | |
| | International Growth | | | 1,713,632 | | | 17,366 | | | (237,016 | ) | | 1,493,982 | | | — | | | — | | | 389,653 | | | 6,762,536 | | | 41,816,566 | |
| | International Growth Stock | | | 2,094,242 | | | — | | | (1,927,243 | ) | | 166,999 | | | — | | | — | | | 5,842,105 | | | (2,234,001 | ) | | 2,319,617 | |
| | International Small Cap | | | 1,070,864 | | | — | | | (932,329 | ) | | 138,535 | | | — | | | — | | | 1,099,706 | | | 757,085 | | | 2,432,682 | |
| | International Small Company | | | 1,814,583 | | | 591,538 | | | (65,576 | ) | | 2,340,545 | | | — | | | — | | | (26,418 | ) | | 2,167,859 | | | 24,528,916 | |
| | International Strategic Equity Allocation | | | 12,835,369 | | | 162,245 | | | (1,393,019 | ) | | 11,604,595 | | | — | | | — | | | (1,126,183 | ) | | 15,040,031 | | | 109,431,334 | |
| | International Value | | | 2,119,554 | | | — | | | (2,119,554 | ) | | — | | | — | | | — | | | 10,759,900 | | | (8,202,385 | ) | | — | |
| | Mid Cap Stock | | | 2,628,020 | | | 123,456 | | | (555,025 | ) | | 2,196,451 | | | — | | | — | | | 1,117,229 | | | 11,866,130 | | | 50,144,969 | |
| | Mid Value | | | 3,819,300 | | | 268,152 | | | (621,379 | ) | | 3,466,073 | | | — | | | — | | | 264,742 | | | 5,815,009 | | | 51,713,809 | |
| | Multifactor Emerging Markets ETF | | | — | | | 1,252,101 | | | — | | | 1,252,101 | | | 209,477 | | | — | | | — | | | 650,828 | | | 32,077,576 | |
| | Real Return Bond | | | 14,582,460 | | | 689,493 | | | (14,388,804 | ) | | 883,149 | | | — | | | — | | | (2,362,771 | ) | | 7,251,469 | | | 9,802,949 | |
| | Seaport Long/Short | | | 795,487 | | | — | | | (50,472 | ) | | 745,015 | | | — | | | — | | | 52,391 | | | 751,488 | | | 8,567,668 | |
| | Short Duration Credit Opportunities | | | 10,689,738 | | | 376,752 | | | (781,712 | ) | | 10,284,778 | | | 2,013,417 | | | — | | | (462,000 | ) | | 4,689,230 | | | 98,425,326 | |
| | Short Term Government Income | | | 1,270,672 | | | 4,433 | | | (1,275,105 | ) | | — | | | 41,230 | | | — | | | (121,482 | ) | | 156,611 | | | — | |
| | Small Cap Growth | | | 707,687 | | | 462,388 | | | (131,386 | ) | | 1,038,689 | | | — | | | — | | | (113,088 | ) | | 2,346,113 | | | 17,938,158 | |
| | Small Cap Stock | | | 1,380,706 | | | 1,786 | | | (1,245,662 | ) | | 136,830 | | | — | | | — | | | 1,114,041 | | | 1,092,294 | | | 1,262,938 | |
| | Small Cap Value | | | 1,460,901 | | | 30,558 | | | (260,085 | ) | | 1,231,374 | | | — | | | — | | | (268,043 | ) | | 4,174,864 | | | 25,046,149 | |
| | Spectrum Income | | | 10,155,607 | | | 53,099 | | | (7,861,696 | ) | | 2,347,010 | | | 549,135 | | | — | | | 2,588,320 | | | 949,012 | | | 25,066,071 | |
| | Strategic Income Opportunities | | | 18,518,974 | | | 8,269,942 | | | (1,158,298 | ) | | 25,630,618 | | | 3,969,698 | | | — | | | (525,464 | ) | | 14,106,768 | | | 270,146,713 | |
| | Total Return | | | 18,914,881 | | | — | | | (18,914,881 | ) | | — | | | — | | | — | | | (3,136,288 | ) | | 8,206,007 | | | — | |
| | U.S. High Yield Bond | | | 2,499,498 | | | 89,413 | | | (170,314 | ) | | 2,418,597 | | | 651,458 | | | — | | | (4,057 | ) | | 1,622,372 | | | 26,846,422 | |
| | U.S. Strategic Equity Allocation | | | 12,216,361 | | | 96,608 | | | (1,585,481 | ) | | 10,727,488 | | | — | | | — | | | (1,890,942 | ) | | 19,607,019 | | | 106,953,055 | |
| | Value Equity | | | 1,957,494 | | | — | | | (1,770,867 | ) | | 186,627 | | | — | | | — | | | 1,030,556 | | | 1,544,066 | | | 2,170,476 | |
| | | | | | | | | | | | | | | | | $28,331,299 | | | — | | | $17,938,590 | | | $269,557,973 | | | $2,928,555,532 | |
| | Multimanager Lifestyle Conservative Portfolio | |
| | Absolute Return Currency | | | 7,391,133 | | | — | | | (3,128,733 | ) | | 4,262,400 | | | — | | | — | | | ($205,960 | ) | | ($215,442 | ) | | $38,915,713 | |
| | Asia Pacific Total Return Bond | | | 4,778,425 | | | 126,851 | | | (127,363 | ) | | 4,777,913 | | | — | | | — | | | (44,579 | ) | | 2,818,618 | | | 47,301,338 | |
| | Blue Chip Growth | | | 137,392 | | | 120,044 | | | (20,037 | ) | | 237,399 | | | — | | | — | | | 8,925 | | | 1,065,236 | | | 9,816,433 | |
| | Bond | | | 16,521,333 | | | 12,821,478 | | | (1,616,810 | ) | | 27,726,001 | | | $6,697,500 | | | — | | | (294,994 | ) | | 20,196,275 | | | 444,725,053 | |
| | Capital Appreciation | | | 611,751 | | | 13,306 | | | (196,468 | ) | | 428,589 | | | — | | | — | | | (698,457 | ) | | 2,214,915 | | | 6,801,706 | |
| | Capital Appreciation Value | | | 6,749,352 | | | 20,838 | | | (910,954 | ) | | 5,859,236 | | | — | | | — | | | 319,868 | | | 10,691,707 | | | 68,670,244 | |
| | Core Bond | | | 18,675,724 | | | 16,680,580 | | | (1,460,141 | ) | | 33,896,163 | | | 4,365,730 | | | — | | | 44,517 | | | 17,682,047 | | | 444,717,653 | |
SEMIANNUAL REPORT | JOHN HANCOCK MULTIMANAGER LIFESTYLE PORTFOLIOS 54
| | | | | | | | | | | | | | | | | | | | | | | | | | | | | | |
| | | | | | | | | | | | | | | | | Dividends and distributions | | | | | | | | | | |
| | Portfolio | | | Beginning
share
amount | | | Shares
purchased | | | Shares
sold | | | Ending
share
amount | | | Income
distributions
received | | | Capital gain
distributions
received | | | Realized
gain (loss)* | | | Change in
unrealized
appreciation
(depreciation) | | | Ending
value | |
| | Disciplined Value | | | 386,233 | | | 135,862 | | | (34,419 | ) | | 487,676 | | | — | | | — | | | ($33,614 | ) | | $929,178 | | | $9,846,185 | |
| | Disciplined Value International | | | 971,878 | | | 608,346 | | | (66,746 | ) | | 1,513,478 | | | — | | | — | | | (110,504 | ) | | 981,131 | | | 18,192,010 | |
| | Diversified Real Assets | | | 4,452,575 | | | 176,443 | | | (663,179 | ) | | 3,965,839 | | | — | | | — | | | (194,453 | ) | | 5,840,346 | | | 39,856,687 | |
| | Emerging Markets | | | 823,200 | | | — | | | (823,200 | ) | | — | | | — | | | — | | | 1,181,534 | | | (643,188 | ) | | — | |
| | Emerging Markets Debt | | | 12,128,833 | | | 1,931,538 | | | — | | | 14,060,371 | | | $3,070,143 | | | — | | | — | | | 9,837,781 | | | 133,432,918 | |
| | Emerging Markets Equity | | | 899,312 | | | — | | | — | | | 899,312 | | | — | | | — | | | — | | | 1,223,065 | | | 9,622,641 | |
| | Equity Income | | | 547,452 | | | 338,751 | | | (59,280 | ) | | 826,923 | | | 139,247 | | | — | | | (43,308 | ) | | 1,460,966 | | | 15,380,766 | |
| | Floating Rate Income | | | 14,540,253 | | | 341,977 | | | (2,844,091 | ) | | 12,038,139 | | | 2,704,275 | | | — | | | (2,678,143 | ) | | 6,500,643 | | | 100,036,938 | |
| | Fundamental Global Franchise | | | 1,932,672 | | | 8,792 | | | (326,390 | ) | | 1,615,074 | | | — | | | — | | | (145,992 | ) | | 4,294,992 | | | 19,348,588 | |
| | Fundamental Large Cap Core | | | 636,201 | | | 589 | | | (427,344 | ) | | 209,446 | | | — | | | — | | | (911,813 | ) | | 5,387,321 | | | 9,994,749 | |
| | Global Absolute Return Strategies | | | 1,565,997 | | | — | | | (1,565,997 | ) | | — | | | — | | | — | | | 586,197 | | | (13,690 | ) | | — | |
| | Global Bond | | | 4,057,551 | | | — | | | (4,057,551 | ) | | — | | | — | | | — | | | 6,838,826 | | | (5,901,046 | ) | | — | |
| | Global Equity | | | 2,629,614 | | | 21,381 | | | (396,668 | ) | | 2,254,327 | | | — | | | — | | | 83,541 | | | 4,715,413 | | | 26,353,086 | |
| | Global Shareholder Yield | | | 1,741,225 | | | 32,725 | | | (86,807 | ) | | 1,687,143 | | | 363,376 | | | — | | | 122,415 | | | 1,621,313 | | | 18,693,546 | |
| | Global Short Duration Credit | | | 3,390,169 | | | 57,228 | | | (3,447,397 | ) | | — | | | 333,006 | | | — | | | (1,738,792 | ) | | 2,818,582 | | | — | |
| | High Yield (JHAM) | | | 7,305,214 | | | 11,868,620 | | | (1,020,908 | ) | | 18,152,926 | | | 1,290,085 | | | — | | | (70,366 | ) | | 2,078,980 | | | 62,083,008 | |
| | High Yield (WAMCO) | | | 1,600,588 | | | 9,515 | | | (1,610,103 | ) | | — | | | 74,027 | | | — | | | 2,707,413 | | | (1,870,644 | ) | | — | |
| | Infrastructure | | | 3,541,745 | | | 48,273 | | | (438,558 | ) | | 3,151,460 | | | 357,940 | | | — | | | 811,096 | | | 4,546,295 | | | 40,779,893 | |
| | International Dynamic Growth | | | — | | | 415,422 | | | (9,748 | ) | | 405,674 | | | — | | | — | | | 1,627 | | | 117,939 | | | 4,178,439 | |
| | International Growth | | | 549,365 | | | 7,632 | | | (80,800 | ) | | 476,197 | | | — | | | — | | | 55,403 | | | 2,220,687 | | | 13,328,763 | |
| | International Growth Stock | | | 741,006 | | | — | | | (687,752 | ) | | 53,254 | | | — | | | — | | | 2,030,377 | | | (811,343 | ) | | 739,694 | |
| | International Strategic Equity Allocation | | | 6,510,339 | | | 79,149 | | | (714,016 | ) | | 5,875,472 | | | — | | | — | | | (703,579 | ) | | 7,745,191 | | | 55,405,699 | |
| | International Value | | | 774,461 | | | — | | | (774,461 | ) | | — | | | — | | | — | | | 3,977,728 | | | (3,051,910 | ) | | — | |
| | Mid Cap Stock | | | 819,709 | | | 44,128 | | | (221,669 | ) | | 642,168 | | | — | | | — | | | 463,984 | | | 3,483,841 | | | 14,660,688 | |
| | Mid Value | | | 1,275,775 | | | 48,386 | | | (150,884 | ) | | 1,173,277 | | | — | | | — | | | (148,714 | ) | | 2,155,449 | | | 17,505,299 | |
| | Multifactor Emerging Markets ETF | | | — | | | 191,354 | | | — | | | 191,354 | | | 32,014 | | | — | | | — | | | 124,695 | | | 4,902,298 | |
| | Real Return Bond | | | 15,955,894 | | | 400,871 | | | (15,406,508 | ) | | 950,257 | | | — | | | — | | | (4,568,530 | ) | | 9,841,393 | | | 10,547,854 | |
| | Seaport Long/Short | | | 357,443 | | | 701 | | | (27,231 | ) | | 330,913 | | | — | | | — | | | 18,609 | | | 337,952 | | | 3,805,500 | |
| | Short Duration Credit Opportunities | | | 10,776,516 | | | 196,926 | | | (1,841,862 | ) | | 9,131,580 | | | 1,835,989 | | | — | | | (1,121,819 | ) | | 5,153,378 | | | 87,389,223 | |
| | Short Term Government Income | | | 11,335,360 | | | 36,345 | | | (11,371,705 | ) | | — | | | 338,009 | | | — | | | (5,335,994 | ) | | 5,657,651 | | | — | |
| | Small Cap Growth | | | — | | | 340,283 | | | (30,687 | ) | | 309,596 | | | — | | | — | | | 10,715 | | | 235,973 | | | 5,346,727 | |
| | Small Cap Stock | | | 889,628 | | | 3,154 | | | (804,971 | ) | | 87,811 | | | — | | | — | | | 992,582 | | | 422,894 | | | 810,497 | |
| | Small Cap Value | | | 543,800 | | | 31,024 | | | (94,927 | ) | | 479,897 | | | — | | | — | | | (169,795 | ) | | 1,613,764 | | | 9,761,107 | |
| | Spectrum Income | | | 8,786,758 | | | 45,476 | | | (6,840,014 | ) | | 1,992,220 | | | 470,264 | | | — | | | 2,320,976 | | | 720,239 | | | 21,276,906 | |
| | Strategic Income Opportunities | | | 16,023,319 | | | 8,073,401 | | | (1,255,466 | ) | | 22,841,254 | | | 3,492,639 | | | — | | | (360,816 | ) | | 12,301,455 | | | 240,746,821 | |
| | Total Return | | | 18,097,995 | | | — | | | (18,097,995 | ) | | — | | | — | | | — | | | (3,007,888 | ) | | 7,852,484 | | | — | |
| | U.S. High Yield Bond | | | 1,635,665 | | | 273,066 | | | (45,364 | ) | | 1,863,367 | | | 484,634 | | | — | | | 8,157 | | | 1,053,939 | | | 20,683,375 | |
| | U.S. Strategic Equity Allocation | | | 3,678,464 | | | 42,122 | | | (529,349 | ) | | 3,191,237 | | | — | | | — | | | (543,576 | ) | | 5,809,420 | | | 31,816,630 | |
| | Value Equity | | | 357,471 | | | — | | | (322,705 | ) | | 34,766 | | | — | | | — | | | 178,699 | | | 281,807 | | | 404,334 | |
| | | | | | | | | | | | | | | | | $26,048,878 | | | — | | | ($368,497 | ) | | $161,527,692 | | | $2,107,879,009 | |
| | *Realized gain (loss) on investments in affiliated funds or the Statements of operations includes litigation proceeds which are not reflected in the above table. | |
SEMIANNUAL REPORT | JOHN HANCOCK MULTIMANAGER LIFESTYLE PORTFOLIOS 55
CONTINUATION OF INVESTMENT ADVISORY AND SUBADVISORY AGREEMENTS
Evaluation of Advisory and Subadvisory Agreements by the Board of Trustees
This section describes the evaluation by the Board of Trustees (the Board) of John Hancock Funds II (the Trust) of the Advisory Agreement (the Advisory Agreement) and each Subadvisory Agreement (collectively, the Subadvisory Agreements) with respect to each of the portfolios of the Trust included in this report (the Funds). The Advisory and Subadvisory Agreements are collectively referred to as the Agreements. Prior to the June 23-26, 2019 in-person meeting at which the Agreements were approved, the Board also discussed and considered information regarding the proposed continuation of the Agreements at an in-person meeting held on May 28-30, 2019.
Approval of Advisory and Subadvisory Agreements
At in-person meetings held on June 23-26, 2019, the Board, including the Trustees who are not parties to any Agreement or considered to be interested persons of the Trust under the Investment Company Act of 1940, as amended (the 1940 Act) (the Independent Trustees), reapproved for an annual period, the continuation of the Advisory Agreement between the Trust and the Advisor and the applicable Subadvisory Agreements between the Advisor and the sub-advisers (each, a Subadvisor and collectively, the Subadvisors) with respect to each of the Funds in this report.
In considering the Advisory Agreement and the Subadvisory Agreements with respect to each Fund, the Board received in advance of the meetings a variety of materials relating to each Fund, the Advisor and each Subadvisor, including comparative performance, fee and expense information for peer groups of similar mutual funds prepared by an independent third-party provider of mutual fund data; performance information for the Funds' benchmark indices; and, with respect to each Subadvisor, comparative performance information for comparably managed accounts, as applicable; and other information provided by the Advisor and the Subadvisors regarding the nature, extent and quality of services provided by the Advisor and the Subadvisors under their respective Agreements, as well as information regarding the Advisor's revenues and costs of providing services to the Funds and any compensation paid to affiliates of the Advisor. At the meetings at which the renewal of the Advisory Agreement and Subadvisory Agreements are considered, particular focus is given to information concerning Fund performance, comparability of fees and total expenses, and profitability. However, the Board noted that the evaluation process with respect to the Advisor and the Subadvisors is an ongoing one. In this regard, the Board also took into account discussions with management and information provided to the Board (including its various committees) at prior meetings with respect to the services provided by the Advisor and the Subadvisors to the Funds, including quarterly performance reports prepared by management containing reviews of investment results, and periodic presentations from the Subadvisors with respect to the Funds they manage. The information received and considered by the Board both in conjunction with the May and June meetings and throughout the year was both written and oral. The Board noted the affiliation of the Subadvisors with the Advisor, noting any potential conflicts of interest. The Board also considered the nature, quality, and extent of the non-advisory services, if any, to be provided to the Funds by the Advisor's affiliates, including distribution services. The Board considered the Advisory Agreement and the Subadvisory Agreements separately in the course of its review. In doing so, the Board noted the respective roles of the Advisor and the Subadvisors in providing services to the Funds. In addition, although the Board approved the renewal of the Agreements for all of the Funds at the June meeting, the Board considered each Fund separately.
Throughout the process, the Board asked questions of and requested additional information from management. The Board is assisted by counsel for the Trust and the Independent Trustees are also separately assisted by independent legal counsel throughout the process. The Independent Trustees also received a memorandum from their independent counsel discussing the legal standards for their consideration of the proposed continuation of the Agreements and discussed the proposed continuation of the Agreements in private sessions with their independent legal counsel at which no representatives of management were present.
Approval of Advisory Agreement
In approving the Advisory Agreement with respect to each Fund, the Board, including the Independent Trustees, considered a variety of factors, including those discussed below. The Board also considered other factors (including conditions and trends prevailing generally in the economy, the securities markets and the industry) and did not treat any single factor as determinative, and each Trustee may have attributed different weights to different factors. The Board's conclusions may be based in part on its consideration of the advisory and subadvisory arrangements in prior years and on the Board's ongoing regular review of Fund performance and operations throughout the year.
Nature, Extent and Quality of Services. Among the information received by the Board from the Advisor relating to the nature, extent and quality of services provided to the Funds, the Board reviewed information provided by the Advisor relating to its operations and personnel, descriptions of its organizational and management structure, and information regarding the Advisor's compliance and regulatory history, including its Form ADV. The Board also noted that on a regular basis it receives and reviews information from the Trust's Chief Compliance Officer (CCO) regarding the Funds' compliance policies and procedures established pursuant to Rule 38a-1 under the 1940 Act. The Board observed that the scope of services provided by the Advisor, and of the undertakings required of the Advisor in connection with those services, including maintaining and monitoring its own and the Fund's compliance programs, risk management programs, liquidity management programs and cybersecurity programs, had expanded over time as a result of regulatory, market and other developments. The Board considered that the Advisor is responsible for the management of the day-to-day operations of the Funds, including but not limited to, general supervision of and coordination of the services provided by the Subadvisors, and is also responsible for monitoring and reviewing the activities of the Subadvisors and other third-party service providers. The Board also considered the significant risks assumed by the Advisor in connection with the services provided to the Funds including entrepreneurial risk in sponsoring new Funds and ongoing risks including investment, operational, enterprise, litigation, regulatory and compliance risks with respect to all Funds.
In considering the nature, extent and quality of the services provided by the Advisor, the Trustees also took into account their knowledge of the Advisor's management and the quality of the performance of the Advisor's duties, through Board meetings, discussions and reports during the preceding year and through each Trustee's experience as a Trustee of the Trust and of the other trusts in the complex.
SEMIANNUAL REPORT | JOHN HANCOCK MULTIMANAGER LIFESTYLE PORTFOLIOS 56
In the course of their deliberations regarding the Advisory Agreement, the Board considered, among other things:
| | | |
| | (a) | the skills and competency with which the Advisor has in the past managed the Trust's affairs and its subadvisory relationships, the Advisor's oversight and monitoring of the Subadvisors' investment performance and compliance programs, such as the Subadvisors' compliance with fund policies and objectives, review of brokerage matters including with respect to trade allocation and best execution, and the Advisor's timeliness in responding to performance issues; |
| | (b) | the background, qualifications and skills of the Advisor's personnel; |
| | (c) | the Advisor's compliance policies and procedures and its responsiveness to regulatory changes and mutual fund industry developments; |
| | (d) | the Advisor's administrative capabilities, including its ability to supervise the other service providers for the Funds, as well as the Advisor's oversight of any securities lending activity, its monitoring of class action litigation and collection of class action settlements on behalf of the Funds, and bringing loss recovery actions on behalf of the Funds; |
| | (e) | the financial condition of the Advisor and whether it has the financial wherewithal to provide a high level and quality of services to the Funds; |
| | (f) | the Advisor's initiatives intended to improve various aspects of the Trust's operations and investor experience with the Funds; and |
| | (g) | the Advisor's reputation and experience in serving as an investment adviser to the Trust and the benefit to shareholders of investing in funds that are part of a family of funds offering a variety of investments. |
The Board concluded that the Advisor may reasonably be expected to continue to provide a high quality of services under the Advisory Agreement with respect to the Funds.
Investment Performance. In considering each Fund's performance, the Board noted that it reviews at its regularly scheduled meetings information about the Funds' performance results. In connection with the consideration of the Advisory Agreement, the Board:
| | | |
| | (a) | reviewed information prepared by management regarding the Funds' performance; |
| | (b) | considered the comparative performance of each Fund's respective benchmark; |
| | (c) | considered the performance of comparable funds, if any, as included in the report prepared by an independent third-party provider of mutual fund data; and |
| | (d) | took into account the Advisor's analysis of each Fund's performance and its plans and recommendations regarding the Trust's subadvisory arrangements generally and with respect to particular Funds. |
The Board noted that while it found the data provided by the independent third-party generally useful it recognized its limitations, including in particular that the data may vary depending on the end date selected and that the results of the performance comparisons may vary depending on the selection of the peer group. The Board noted that each Fund generally outperformed the historical performance of comparable funds and underperformed the Fund's respective benchmark, with certain exceptions noted in Appendix A. In such cases, the Board considered steps the Advisor had taken to address performance and concluded that such performance is being monitored and reasonably addressed.
Fees and Expenses. The Board reviewed comparative information prepared by an independent third-party provider of mutual fund data including, among other data, each Fund's contractual and net management fees (and subadvisory fees, to the extent available) and total expenses as compared to similarly situated investment companies deemed to be comparable to the Fund in light of the nature, extent and quality of the management and subadvisory services provided by the Advisor and the Subadvisors. The Board considered each Fund's ranking within a smaller group of peer funds chosen by the independent third-party provider, as well as the Fund's ranking within broader groups of funds. In comparing each Fund's contractual and net management fees to that of comparable funds, the Board noted that such fee includes both advisory and administrative costs.
The Board took into account management's discussion with respect to the overall management fee, the fees of each Subadvisor, including the amount of the advisory fee retained by the Advisor after payment of the subadvisory fees, in each case in light of the services rendered for those amounts and the risks undertaken by the Advisor. The Board also noted that, in addition, the Advisor is currently waiving fees and/or reimbursing expenses with respect to certain of the Funds. The Board also noted that the Advisor pays the subadvisory fees of the Funds. In addition, the Board noted that the Advisor continued advisory and subadvisory fee reductions in the past year with respect to several Funds. The Board also took into account that management had agreed to implement an overall fee waiver across the complex, which is discussed further below. The Board also noted management's discussion of the Funds' expenses, as well as certain actions taken over the past several years to reduce the Funds' operating expenses. The Board reviewed information provided by the Advisor concerning investment advisory fees charged to other clients (including other funds in the complex) having similar investment mandates, if any. The Board considered any differences between the Advisor's and Subadvisor's services to a Fund and the services they provide to other such comparable clients or funds. The Board concluded that the advisory fee paid with respect to each of the Funds is reasonable in light of the nature, extent and quality of the services provided the Funds under the Advisory Agreement.
In addition, the Trustees reviewed the advisory fee to be paid to the Advisor for each Fund and concluded that the advisory fee to be paid to the Advisor with respect to each Fund is based on services provided that are in addition to, rather than duplicative of, the services provided pursuant to the advisory agreements for the underlying portfolios of the Fund and that the additional services are necessary because of the differences between the investment policies, strategies and techniques of a Fund and those of its underlying portfolios.
SEMIANNUAL REPORT | JOHN HANCOCK MULTIMANAGER LIFESTYLE PORTFOLIOS 57
Profitability/Fall Out Benefits. In considering the costs of the services to be provided and the profits to be realized by the Advisor and its affiliates (including the Subadvisors that are affiliated with the Advisor) from the Advisor's relationship with the Trust, the Board:
| | | |
| | (a) | reviewed financial information of the Advisor; |
| | (b) | reviewed and considered (i) information presented by the Advisor regarding the net profitability to the Advisor and its affiliates, of each Fund; |
| | (c) | received and reviewed profitability information with respect to the John Hancock fund complex as a whole and with respect to each Fund; |
| | (d) | received information with respect to the Advisor's allocation methodologies used in preparing the profitability data and considered that the Advisor hired an independent third-party consultant to provide an analysis of the Advisor's allocation methodologies; |
| | (e) | considered that the John Hancock insurance companies that are affiliates of the Advisor, as shareholders of the Trust directly or through their separate accounts, receive certain tax credits or deductions relating to foreign taxes paid and dividends received by certain Funds of the Trust and noted that these tax benefits, which are not available to participants in qualified retirement plans under applicable income tax law, are reflected in the profitability analysis reviewed by the Board; |
| | (f) | considered that the Advisor also provides administrative services to the Funds on a cost basis pursuant to an administrative services agreement; |
| | (g) | noted that the Funds' Subadvisors are affiliates of the Advisor; |
| | (h) | noted that affiliates of the Advisor provide transfer agency services and distribution services to the Funds, and that the Trust's distributor also receives Rule 12b-1 payments to support distribution of the products; |
| | (i) | noted that the Advisor also derives reputational and other indirect benefits from providing advisory services to the Funds; |
| | (j) | noted that the subadvisory fees for the Funds are paid by the Advisor; |
| | (k) | with respect to each Fund, the Board noted that the advisory fee is in addition to the fees received by the Advisor and its affiliates with regard to the underlying portfolios in which the Funds may invest; |
| | (l) | considered the Advisor's ongoing costs and expenditures necessary to improve services, meet new regulatory and compliance requirements, and adapt to other challenges impacting the mutual fund industry; and |
| | (m) | considered that the Advisor should be entitled to earn a reasonable level of profits in exchange for the level of services it provides to each Fund and the risks that it assumes as Advisor, including entrepreneurial, operational, reputational, litigation and regulatory risk. |
Based upon its review, the Board concluded that the level of profitability, if any, of the Advisor and its affiliates (including the Subadvisors, which are affiliated with the Advisor), from their relationship with each Fund was reasonable and not excessive.
Economies of Scale. In considering the extent to which economies of scale would be realized as a Fund grows and whether fee levels reflect these economies of scale for the benefit of Fund shareholders, the Board:
| | | |
| | (a) | considered that with respect to the John Hancock underlying portfolios in which the Funds invest, the Advisor has agreed to waive a portion of its management fee for such fund and for each of the other John Hancock funds in the complex (except as discussed below) (the Participating Portfolios) or otherwise reimburse the expenses of the Participating Portfolios (the Reimbursement). This waiver is based on upon the aggregate net assets of all the Participating Portfolios. The Board also noted that the Advisor had implemented additional breakpoints to the complex-wide fee waiver in recent years. (The Funds that are not Participating Portfolios as of the date of this annual report are each Fund and each other of the funds of funds of the Trust and John Hancock Variable Insurance Trust and John Hancock Collateral Trust. These funds of funds also benefit from such overall management fee waiver through their investment in underlying portfolios that include certain of the Participating Portfolios, which are subject to the Reimbursement. |
| | (b) | reviewed the Trust's advisory fee structure and concluded that (i) the Funds' fee structures contain breakpoints at the advisory fee level and (ii) although economies of scale cannot be measured with precision, these arrangements permit shareholders of the Funds to benefit from economies of scale if those Funds grow. The Board also took into account management's discussion of the Funds' advisory fee structure; and |
| | (c) | the Board also considered the effect of the Funds' growth in size on their performance and fees. The Board also noted that if the Funds' assets increase over time, the Funds may realize other economies of scale. |
Approval of Subadvisory Agreements
In making its determination with respect to approval of the Subadvisory Agreements, the Board reviewed:
| | | |
| | (1) | information relating to each Subadvisor's business, including current subadvisory services to the Trust (and other funds in the John Hancock family of funds); |
| | (2) | the historical and current performance of each Fund and comparative performance information relating to the Fund's benchmark and comparable funds; and |
| | (3) | the subadvisory fee for each Fund and comparative fee information, where available, prepared by an independent third-party provider of mutual fund data. |
SEMIANNUAL REPORT | JOHN HANCOCK MULTIMANAGER LIFESTYLE PORTFOLIOS 58
Nature, Extent and Quality of Services. With respect to the services provided by each of the Subadvisors with respect to each Fund, the Board received information provided to the Board by each Subadvisor, including each Subadvisor's Form ADV, as well as took into account information presented throughout the past year. The Board considered each Subadvisor's current level of staffing and its overall resources, as well as received information relating to a Subadvisor's compensation program. The Board reviewed each Subadvisor's history and investment experience, as well as information regarding the qualifications, background and responsibilities of the Subadvisor's investment and compliance personnel who provide services to the Funds. The Board also considered, among other things, the Subadvisor's compliance program and any disciplinary history. The Board also considered the Subadvisor's risk assessment and monitoring process. The Board reviewed each Subadvisor's regulatory history, including whether it was currently involved in any regulatory actions or investigations as well as material litigation, and any settlements and amelioratory actions undertaken, as appropriate. The Board noted that the Advisor conducts regular, periodic reviews of each Subadvisor and its operations, including regarding investment processes and organizational and staffing matters. The Board also noted that the CCO and his staff conduct regular, periodic compliance reviews with each of the Subadvisors and present reports to the Independent Trustees regarding the same, which includes evaluating the regulatory compliance systems of the Subadvisors and procedures reasonably designed by them to assure compliance with the federal securities laws. The Board also took into account the financial condition of each Subadvisor.
The Board considered each Subadvisor's investment process and philosophy. The Board took into account that each Subadvisor's responsibilities include the development and maintenance of an investment program for the applicable Fund which is consistent with the Fund's investment objectives, the selection of investment securities and underlying funds and the placement of orders for the purchase and sale of such securities and underlying funds, as well as the implementation of compliance controls related to performance of these services. The Board also received information with respect to each Subadvisor's brokerage policies and practices, including with respect to best execution and soft dollars.
Subadvisor Compensation. In considering the cost of services to be provided by each Subadvisor and the profitability to that Subadvisor of its relationship with the Fund, the Board noted that the fees under the Subadvisory Agreements are paid by the Advisor and not the Funds.
In addition, the Board considered other potential indirect benefits that the Subadvisors and their affiliates may receive from the Subadvisor's relationship with the Fund, such as the opportunity to provide advisory services to additional portfolios of the Trusts and reputational benefits.
Subadvisory Fees. The Board considered that the Fund pays an advisory fee to the Advisor and that, in turn, the Advisor pays a subadvisory fee to each Subadvisor. As noted above, the Board also considered, if available, each Fund's sub-advisory fees as compared to similarly situated investment companies deemed to be comparable to the Fund as included in the report prepared by the independent third party provider of mutual fund data. The Board also took into account the sub-advisory fees paid by the Advisor to fees charged by each Fund's Subadvisor to manage other sub-advised portfolios and portfolios not subject to regulation under the 1940 Act, as applicable.
Subadvisor Performance. As noted above, the Board considered each Fund's performance as compared to the Fund's respective peer group and benchmark and noted that the Board reviews information about the Fund's performance results at its regularly scheduled meetings. The Board noted the Advisor's expertise and resources in monitoring the performance, investment style, and risk-adjusted performance of each Subadvisor. The Board was mindful of the Advisor's focus on each Subadvisor's performance. The Board also noted each Subadvisor's long-term performance record for similar accounts, as applicable.
The Board's decision to approve the Subadvisory Agreement with respect to each Fund was based on a number of determinations, including the following:
| | | |
| | (1) | Each Subadvisor has extensive experience and demonstrated skills as a manager; |
| | (2) | Although not without variation, the performance of each Fund managed by a Subadvisor generally has been in line with or outperformed the historical performance of comparable funds and underperformed the Fund's respective benchmarks, with the exceptions noted in Appendix A (with respect to such exceptions, the Board considered the steps the Subadvisor had taken to address performance and concluded that performance is being monitored and reasonably addressed); |
| | (3) | The subadvisory fees are reasonable in relation to the level and quality of services being provided under the Subadvisory Agreement; and |
| | (4) | Subadvisory fees are paid by the Adviser and not the Funds and the advisory fees for each Fund contains breakpoints that permit shareholders to benefit from economies of scale if those Funds grow. |
In addition, in the case of each Fund, the Trustees reviewed the subadvisory fee to be paid to the Subadvisor for the Fund and concluded that the subadvisory fee to be paid to the Subadvisor with respect to each Fund is based on services provided that are in addition to, rather than duplicative of, the services provided pursuant to the advisory agreements and subadvisory agreements for the underlying portfolios of the Fund and that the additional services are necessary because of the differences between the investment policies, strategies and techniques of a Fund and those of its underlying portfolios.
Additional information relating to each Fund's fees and expenses and performance that the Board considered in approving the Advisory Agreement and Subadvisory Agreement for a particular Fund is set forth in Appendix A.
* * *
Based on their evaluation of all factors that they deemed to be material, including those factors described above, the Board, including the Independent Trustees, concluded that renewal of the Advisory Agreement and each of the Subadvisory Agreements with respect to each Fund would be in the best interest of each of the respective Funds and its shareholders. Accordingly, the Board, and the Independent Trustees voting separately, approved the Advisory Agreement and Subadvisory Agreement with respect to each Fund for an additional one-year period.
SEMIANNUAL REPORT | JOHN HANCOCK MULTIMANAGER LIFESTYLE PORTFOLIOS 59
APPENDIX A
| | | | | | | | | | | | |
| | Portfolio (subadviser) | | | Performance as of
12.31.2018 | | | Fees and expenses | | | 2019 comments | |
| | Multimanager Lifestyle Aggressive Portfolio
(Manulife Investment Management (US))
| | | Benchmark Index - The Fund underperformed the benchmark index for the one-, three-, five- and ten-year periods.
Broadridge Category - The Fund underperformed the average for the one-year period and outperformed the average for the three-, five- and ten-year periods.
| | | Limited comparative subadviser fee data was provided due to the limited number of Broadridge peer funds.
Net management fees for this Fund are lower than the peer group median.
Net total expenses for this Fund are lower than the peer group median.
| | | The Board took into account management's discussion of the factors that contributed to the Fund's performance for the one-, three-, five- and ten-year periods relative to the benchmark index and for the one-year period relative to the peer group average.
The Board noted the Fund's favorable performance relative to the peer group average for the three-, five-and ten-year periods.
The Board noted the Fund's net management fees and net total expenses are lower than the peer group median.
| |
| | Multimanager Lifestyle Balanced Portfolio
(Manulife Investment Management (US))
| | | Benchmark Index - The Fund underperformed the benchmark index for the one-, three-, five- and ten-year periods.
Broadridge Category - The Fund underperformed the average for the one- and five-year periods and outperformed the average for the three- and ten-year periods.
| | | Limited comparative subadviser fee data was provided due to the limited number of Broadridge peer funds.
Net management fees for this Fund are lower than the peer group median.
Net total expenses for this Fund are lower than the peer group median.
| | | The Board took into account management's discussion of the factors that contributed to the Fund's performance for the one-, three-, five- and ten-year periods relative to the benchmark index and for the one- and five-year periods relative to the peer group average.
The Board noted the Fund's favorable performance relative to the peer group average for the three- and ten-year periods.
The Board noted that the Fund outperformed its Morningstar peer group for the year-to-date period ended April 30, 2019.
The Board noted the Fund's net management fees and net total expenses are lower than the peer group median.
| |
| | Multimanager Lifestyle Conservative Portfolio
(Manulife Investment Management (US))
| | | Benchmark Index - The Fund underperformed the benchmark index for the one-, three-, five- and ten-year periods.
Broadridge Category - The Fund underperformed the average for the one-, three- and five-year periods and outperformed the average for the ten-year period.
| | | Limited comparative subadviser fee data was provided due to the limited number of Broadridge peer funds.
Net management fees for this Fund are lower than the peer group median.
Net total expenses for this Fund are lower than the peer group median.
| | | The Board took into account management's discussion of the factors that contributed to the Fund's performance for the one-, three-, five- and ten-year periods relative to the benchmark index and for the one-, three- and five-year periods relative to the peer group average.
The Board noted the Fund's favorable performance relative to the peer group average for the ten-year period.
The Board noted that the Fund outperformed its Morningstar peer group for the year-to-date period ended April 30, 2019.
The Board noted the Fund's net management fees and net total expenses are lower than the peer group median.
| |
SEMIANNUAL REPORT | JOHN HANCOCK MULTIMANAGER LIFESTYLE PORTFOLIOS 60
| | | | | | | | | | | | |
| | Portfolio (subadviser) | | | Performance as of
12.31.2018 | | | Fees and expenses | | | 2019 comments | |
| | Multimanager Lifestyle Growth Portfolio
(Manulife Investment Management (US))
| | | Benchmark Index - The Fund underperformed the benchmark index for the one-, three-, five- and ten-year periods.
Broadridge Category - The Fund underperformed the average for the one-year period and outperformed the average for the three-, five- and ten-year periods.
| | | Limited comparative subadviser fee data was provided due to the limited number of Broadridge peer funds.
Net management fees for this Fund are lower than the peer group median.
Net total expenses for this Fund are lower than the peer group median.
| | | The Board took into account management's discussion of the factors that contributed to the Fund's performance for the one-, three-, five- and ten-year periods relative to the benchmark index and for the one-year period relative to the peer group average.
The Board noted the Fund's favorable performance relative to the peer group average for the three-, five- and ten-year periods.
The Board noted that the Fund outperformed its Morningstar peer group for the year-to-date period ended April 30, 2019.
The Board noted the Fund's net management fees and net total expenses are lower than the peer group median.
| |
| | Multimanager Lifestyle Moderate Portfolio
(Manulife Investment Management (US))
| | | Benchmark Index - The Fund underperformed the benchmark index for the one-, three- and five- year periods and outperformed the benchmark index for the ten-year period.
Broadridge Category - The Fund outperformed the average for the one-, three-, five- and ten-year periods.
| | | Limited comparative subadviser fee data was provided due to the limited number of Broadridge peer funds.
Net management fees for this Fund are lower than the peer group median.
Net total expenses for this Fund are lower than the peer group median.
| | | The Board took into account management's discussion of the factors that contributed to the Fund's performance for the one-, three- and five-year periods relative to the benchmark index.
The Board noted the Fund's favorable performance relative to the benchmark index for the ten-year period and to the peer group average for the one-, three-, five- and ten-year periods.
The Board noted the Fund's net management fees and net total expenses are lower than the peer group median.
| |
SEMIANNUAL REPORT | JOHN HANCOCK MULTIMANAGER LIFESTYLE PORTFOLIOS 61
| | |
Trustees
Hassell H. McClellan,Chairperson
Steven R. Pruchansky,Vice Chairperson
Andrew G. Arnott†
Charles L. Bardelis*
James R. Boyle
Peter S. Burgess*
William H. Cunningham
Grace K. Fey
Marianne Harrison†
Theron S. Hoffman*
Deborah C. Jackson
James M. Oates
Gregory A. Russo
Officers
Andrew G. Arnott
President
Francis V. Knox, Jr.
Chief Compliance Officer
Charles A. Rizzo
Chief Financial Officer
Salvatore Schiavone
Treasurer
Christopher (Kit) Sechler**
Secretary and Chief Legal Officer
| Investment advisor
John Hancock Investment Management LLC
Subadvisor
Manulife Investment Management (US) LLC
Portfolio Managers
Robert E. Sykes, CFA
Nathan W. Thooft, CFA
Principal distributor
John Hancock Investment Management Distributors LLC
Custodian
State Street Bank and Trust Company
Transfer agent
John Hancock Signature Services, Inc.
Legal counsel
K&L Gates LLP
|
* Member of the Audit Committee
† Non-Independent Trustee
** Effective 9-13-18
The fund's proxy voting policies and procedures, as well as the fund proxy voting record for the most recent twelve-month period ended June 30, are available free of charge on the Securities and Exchange Commission (SEC) website at sec.gov or on our website.
All of the fund's holdings as of the end of the third month of every fiscal quarter are filed with the SEC on Form N-PORT within 60 days of the end of the fiscal quarter. The fund's Form N-PORT filings are available on our website and the SEC's website, sec.gov.
We make this information on your fund, as well asmonthly portfolio holdings, and other fund details available on our website at jhinvestments.com or by calling 800-225-5291.
| | | | |
| | You can also contact us: |
| | 800-225-5291
jhinvestments.com | Regular mail:
John Hancock Signature Services, Inc.
P.O. Box 55913
Boston, MA 02205-5913
| Express mail:
John Hancock Signature Services, Inc.
2000 Crown Colony Drive
Suite 55913
Quincy, MA 02169-0953
|
SEMIANNUAL REPORT | JOHN HANCOCK MULTIMANAGER LIFESTYLE PORTFOLIOS 62
John Hancock family of funds
| | | |
DOMESTIC EQUITY FUNDS
Blue Chip Growth
Classic Value
Disciplined Value
Disciplined Value Mid Cap
Equity Income
Financial Industries
Fundamental All Cap Core
Fundamental Large Cap Core
New Opportunities
Regional Bank
Small Cap Core
Small Cap Growth
Small Cap Value
U.S. Global Leaders Growth
U.S. Quality Growth
Value Equity
GLOBAL AND INTERNATIONAL EQUITY FUNDS
Disciplined Value International
Emerging Markets
Emerging Markets Equity
Fundamental Global Franchise
Global Equity
Global Shareholder Yield
Global Thematic Opportunities
International Dynamic Growth
International Growth
International Small Company
| | INCOME FUNDS
Bond
California Tax-Free Income
Emerging Markets Debt
Floating Rate Income
Government Income
High Yield
High Yield Municipal Bond
Income
Investment Grade Bond
Money Market
Short Duration Bond
Short Duration Credit Opportunities
Spectrum Income
Strategic Income Opportunities
Tax-Free Bond
ALTERNATIVE AND SPECIALTY FUNDS
Absolute Return Currency
Alternative Asset Allocation
Disciplined Alternative Yield
Diversified Macro
Global Absolute Return Strategies
Infrastructure
Seaport Long/Short
|
A fund's investment objectives, risks, charges, and expenses should be considered carefully before investing. The prospectus contains this and other important information about the fund. To obtain a prospectus, contact your financial professional, call John Hancock Investment Management at 800-225-5291, or visit our website at jhinvestments.com. Please read the prospectus carefully before investing or sending money.
| | | |
ASSET ALLOCATION
Balanced
Income Allocation
Multi-Index Lifetime Portfolios
Multi-Index Preservation Portfolios
Multimanager Lifestyle Portfolios
Multimanager Lifetime Portfolios
Retirement Income 2040
EXCHANGE-TRADED FUNDS
John Hancock Multifactor Consumer Discretionary ETF
John Hancock Multifactor Consumer Staples ETF
John Hancock Multifactor Developed International ETF
John Hancock Multifactor Emerging Markets ETF
John Hancock Multifactor Energy ETF
John Hancock Multifactor Financials ETF
John Hancock Multifactor Healthcare ETF
John Hancock Multifactor Industrials ETF
John Hancock Multifactor Large Cap ETF
John Hancock Multifactor Materials ETF
John Hancock Multifactor Media and
Communications ETF
John Hancock Multifactor Mid Cap ETF
John Hancock Multifactor Small Cap ETF
John Hancock Multifactor Technology ETF
John Hancock Multifactor Utilities ETF
| | ENVIRONMENTAL, SOCIAL, AND
GOVERNANCE FUNDS
ESG All Cap Core
ESG Core Bond
ESG International Equity
ESG Large Cap Core
CLOSED-END FUNDS
Financial Opportunities
Hedged Equity & Income
Income Securities Trust
Investors Trust
Preferred Income
Preferred Income II
Preferred Income III
Premium Dividend
Tax-Advantaged Dividend Income
Tax-Advantaged Global Shareholder Yield
|
John Hancock Multifactor ETF shares are bought and sold at market price (not NAV), and are not individually redeemed from the fund. Brokerage commissions will reduce returns.
John Hancock ETFs are distributed by Foreside Fund Services, LLC, and are subadvised by Dimensional Fund Advisors LP. Foreside is not affiliated with John Hancock Investment Management Distributors, LLC or Dimensional Fund Advisors LP.
Dimensional Fund Advisors LP receives compensation from John Hancock in connection with licensing rights to the John Hancock Dimensional indexes. Dimensional Fund Advisors LP does not sponsor, endorse, or sell, and makes no representation as to the advisability of investing in, John Hancock Multifactor ETFs.
John Hancock Investment Management
A trusted brand
John Hancock Investment Management is a premier asset manager representing one of America's most
trusted brands, with a heritage of financial stewardship dating back to 1862. Helping our shareholders
pursue their financial goals is at the core of everything we do. It's why we support the role of professional
financial advice and operate with the highest standards of conduct and integrity.
A better way to invest
We serve investors globally through a unique multimanager approach: We search the world to find
proven portfolio teams with specialized expertise for every strategy we offer, then we apply robust
investment oversight to ensure they continue to meet our uncompromising standards and serve the
best interests of our shareholders.
Results for investors
Our unique approach to asset management enables us to provide a diverse set of investments backed
by some of the world's best managers, along with strong risk-adjusted returns across asset classes.
John Hancock Investment Management, LLC n 200 Berkeley Street n Boston, MA 02116 n 800-225-6020 n jhinvestments.com/etf
This report is for the information of the shareholders of John Hancock Multimanager Lifestyle Portfolios. It is not authorized for distribution to prospective investors unless preceded or accompanied by a prospectus.
John Hancock
Retirement Income 2040 Fund
Semiannual report 6/30/19
Beginning on January 1, 2021, as permitted by regulations adopted by the Securities and Exchange Commission, paper copies of the Fund's shareholder reports like this one will no longer be sent by mail, unless you specifically request paper copies of the reports from the Fund or from your financial intermediary. Instead, the reports will be made available on a website, and you will be notified by mail each time a report is posted and provided with a website link to access the report.
If you already elected to receive shareholder reports electronically, you will not be affected by this change, and you do not need to take any action. You may elect to receive shareholder reports and other communications electronically by calling John Hancock Investment Management at 888-972-8696 (Class R6 shares) or by contacting your financial intermediary.
You may elect to receive all reports in paper, free of charge, at any time. You can inform John Hancock Investment Management or your financial intermediary that you wish to continue receiving paper copies of your shareholder reports by following the instructions listed above. Your election to receive reports in paper will apply to all funds held with John Hancock Investment Management or your financial intermediary.

A message to shareholders
Dear shareholder,
An increasingly favorable outlook for U.S. Federal Reserve (Fed) policy drove positive returns across the financial markets for the six months ended June 30, 2019. The combination of slowing growth and low inflation prompted the Fed to adopt a more dovish tone in its communications. The world equity markets rallied in response, as the improving rate outlook led investors to look past the more immediate concerns of weak economic data and the ongoing trade dispute between the United States and China.Market volatility did increase after period end, however, as a result of the trade dispute.
The bond market also benefited from the prospect of interest-rate cuts, causing the yield on the 10-year U.S. Treasury note to fall to its lowest level since late 2016. Credit-sensitive market segmentswere further aided by improving investor sentiment, leading to gains for both investment-grade corporate issues and high-yield bonds.
As always, your best resource in unpredictable markets is your financial advisor, who can help position your portfolio so that it's sufficiently diversified to meet your long-term objectives and to withstand the inevitable turbulence along the way.
On behalf of everyone at John Hancock Investment Management, I'd like to take this opportunity to welcome new shareholders and thank existing shareholders for the continued trust you've placed in us.
Sincerely,
Andrew G. Arnott
President and CEO,
John Hancock Investment Management
Head of Wealth and Asset Management,
United States and Europe
This commentary reflects the CEO's views as of this report's period end and are subject to change at any time. Diversification does not guarantee investment returns and does not eliminate risk of loss. All investments entail risks, including the possible loss of principal. For more up-to-date information, you can visit our website at jhinvestments.com.
John Hancock
Retirement Income 2040 Fund
Table of contents
| | | |
| 2 | | Your fund at a glance |
| 3 | | Portfolio Summary |
| 4 | | A look at performance |
| 6 | | Your expenses |
| 8 | | Fund's investments |
| 14 | | Financial statements |
| 17 | | Financial highlights |
| 18 | | Notes to financial statements |
| 23 | | Continuation of investment advisory and subadvisory agreements |
| 29 | | More information |
SEMIANNUAL REPORT | JOHN HANCOCK RETIREMENT INCOME 2040 FUND 1
INVESTMENT OBJECTIVE
The fund seeks to maintain and maximize regular cash distributions through December 2040 and to grow such distributions over time.
TOTAL RETURNS AS OF 6/30/19 (%)
The Bloomberg Barclays U.S. Aggregate Bond Index is an unmanaged index of dollar-denominated and non-convertible investment-grade debt issues.
It is not possible to invest directly in an index. Index figures do not reflect expenses or sales charges, which would result in lower returns.
Figures from Morningstar, Inc. include reinvested distributions and do not take into account sales charges. Actual load-adjusted performance is lower. Since inception returns for the Morningstar fund category average are not available.
The past performance shown here reflects reinvested distributions and the beneficial effect of any expense reductions, and does not guarantee future results. Returns for periods shorter than one year are cumulative. Performance of the other share classes will vary based on the difference in the fees and expenses of those classes. Shares will fluctuate in value and, when redeemed, may be worth more or less than their original cost. Current month-end performance may be lower or higher than the performance cited, and can be found at jhinvestments.com or by calling 800-225-5291. For further information on the fund's objectives, risks, and strategy, see the fund's prospectus.
SEMIANNUAL REPORT | JOHN HANCOCK RETIREMENT INCOME 2040 FUND 2
PORTFOLIO COMPOSITION AS OF 6/30/19 (%)
QUALITY COMPOSITION AS OF 6/30/19 (%)
A note about risks
The fund is subject to various risks as described in the fund's prospectus. For more information, please refer to the "Principal risks" section of the prospectus.
SEMIANNUAL REPORT | JOHN HANCOCK RETIREMENT INCOME 2040 FUND 3
TOTAL RETURNS FOR THE PERIOD ENDED JUNE 30, 2019
| | | | | | | |
| Average annual total returns (%) | | Cumulative total returns (%) |
| | 1-year | Since
inception1 | | | 6-month | Since
inception1 |
| Class R62 | 9.02 | 5.38 | | | 10.68 | 10.97 |
| Index† | 7.87 | 3.74 | | | 6.11 | 7.56 |
Performance figures assume all distributions have been reinvested. Sales charges are not applicable to Class R6 shares.
The expense ratios of the fund, both net (including any fee waivers and/or expense limitations) and gross (excluding any fee waivers and/or expense limitations), are set forth according to the most recent publicly available prospectus for the fund and may differ from those disclosed in the Financial highlights tables in this report. Net expenses reflect contractual expense limitations in effect until April 30, 2020 and are subject to change. Had the contractual fee waivers and expense limitations not been in place, gross expenses would apply. The expense ratios are as follows:
| | |
| | Class R6 | | | |
| Gross (%) | 1.68 | | | |
| Net (%) | 0.52 | | | |
Please refer to the most recent prospectus and annual or semiannual report for more information on expenses and any expense limitation arrangements for each class.
The returns reflect past results and should not be considered indicative of future performance. The return and principal value of an investment will fluctuate so that shares, when redeemed, may be worth more or less than their original cost. Due to market volatility and other factors, the fund's current performance may be higher or lower than the performance shown. For current to the most recent month-end performance data, please call 800-225-5291 or visit the fund's website at jhinvestments.com.
The performance table above and the chart on the next page do not reflect the deduction of taxes that a shareholder would pay on fund distributions or the redemption of fund shares. The fund's performance results reflect any applicable fee waivers or expense reductions, without which the expenses would increase and results would have been less favorable.
| † | Index is the Bloomberg Barclays U.S. Aggregate Bond Index. |
See the following page for footnotes.
SEMIANNUAL REPORT | JOHN HANCOCK RETIREMENT INCOME 2040 FUND 4
This chart shows what happened to a hypothetical $10,000 investment in John Hancock Retirement Income 2040 Fund for the share class and period indicated, assuming all distributions were reinvested. For comparison, we've shown the same investment in the Bloomberg Barclays U.S. Aggregate Bond Index.
The Bloomberg Barclays U.S. Aggregate Bond Index is an unmanaged index of dollar-denominated and non-convertible investment-grade debt issues.
It is not possible to invest directly in an index. Index figures do not reflect expenses or sales charges, which would result in lower returns.
Footnotes related to performance pages
| 1 | From 7-6-17. |
| 2 | For certain types of investors as described in the fund's prospectus. |
SEMIANNUAL REPORT | JOHN HANCOCK RETIREMENT INCOME 2040 FUND 5
These examples are intended to help you understand your ongoing operating expenses of investing in the fund so you can compare these costs with the ongoing costs of investing in other mutual funds.
Understanding fund expenses
As a shareholder of the fund, you incur two types of costs:
■Transaction costs,which include sales charges (loads) on purchases or redemptions (if applicable), minimum account fee charge, etc.
■Ongoing operating expenses, including management fees, distribution and service fees (if applicable), and other fund expenses.
We are presenting only your ongoing operating expenses here.
Actual expenses/actual returns
The first line of each share class in the table on the following page is intended to provide information about the fund’s actual ongoing operating expenses, and is based on the fund’s actual return. It assumes an account value of $1,000.00 on January 1, 2019, with the same investment held until June 30, 2019.
Together with the value of your account, you may use this information to estimate the operating expenses that you paid over the period. Simply divide your account value at June 30, 2019, by $1,000.00, then multiply it by the “expenses paid” for your share class from the table. For example, for an account value of $8,600.00, the operating expenses should be calculated as follows:
Hypothetical example for comparison purposes
The second line of each share class in the table on the following page allows you to compare the fund’s ongoing operating expenses with those of any other fund. It provides an example of the fund’s hypothetical account values and hypothetical expenses based on each class’s actual expense ratio and an assumed 5% annualized return before expenses (which is not the class’s actual return). It assumes an account value of $1,000.00 on January 1, 2019, with the same investment held until June 30, 2019. Look in any other fund shareholder report to find its hypothetical example and you will be able to compare these expenses. Please remember that these hypothetical account values and expenses may not be used to estimate the actual ending account balance or expenses you paid for the period.
| 6 | JOHN HANCOCK RETIREMENT INCOME 2040 FUND | SEMIANNUAL REPORT | |
Remember, these examples do not include any transaction costs, therefore, these examples will not help you to determine the relative total costs of owning different funds. If transaction costs were included, your expenses would have been higher. See the prospectuses for details regarding transaction costs.
SHAREHOLDER EXPENSE EXAMPLE CHART
| | | Account
value on
1-1-2019 | Ending
value on
6-30-2019 | Expenses
paid during
period ended
6-30-20191 | Annualized
expense
ratio2 |
| Class R6 | Actual expenses/actual returns | $1,000.00 | $1,106.80 | $1.99 | 0.38% |
| | Hypothetical example | 1,000.00 | 1,022.90 | 1.91 | 0.38% |
| 1 | Expenses are equal to the annualized expense ratio, multiplied by the average account value over the period, multiplied by 181/365 (to reflect the one-half year period). |
| 2 | Ratios do not include fees and expenses indirectly incurred by the underlying funds and can vary based on mixed of underlying funds held by the fund. |
| | SEMIANNUAL REPORT | JOHN HANCOCK RETIREMENT INCOME 2040 FUND | 7 |
AS OF 6-30-19 (unaudited)
| | Rate (%) | Maturity date | | Par value^ | Value |
| U.S. Government and Agency obligations 46.5% | | | | $13,282,429 |
| (Cost $12,458,064) | | | | | |
| U.S. Government 46.5% | | | | 13,282,429 |
| U.S. Treasury | | | | | |
| Bond | 3.500 | 02-15-39 | | 470,000 | 557,776 |
| Bond | 3.875 | 08-15-40 | | 415,000 | 517,875 |
| Bond | 4.250 | 05-15-39 | | 330,000 | 431,320 |
| Bond | 4.250 | 11-15-40 | | 330,000 | 432,609 |
| Bond | 4.375 | 02-15-38 | | 415,000 | 548,140 |
| Bond | 4.375 | 11-15-39 | | 325,000 | 431,729 |
| Bond | 4.500 | 02-15-36 | | 810,000 | 1,067,903 |
| Bond | 4.500 | 05-15-38 | | 405,000 | 543,633 |
| Bond | 4.625 | 02-15-40 | | 430,000 | 589,873 |
| Bond | 4.750 | 02-15-37 | | 375,000 | 513,091 |
| Bond | 5.000 | 05-15-37 | | 475,000 | 669,193 |
| Bond | 5.250 | 02-15-29 | | 335,000 | 430,056 |
| Bond | 5.375 | 02-15-31 | | 690,000 | 926,163 |
| Bond | 5.500 | 08-15-28 | | 275,000 | 355,663 |
| Bond | 6.000 | 02-15-26 | | 40,000 | 50,256 |
| Bond | 6.125 | 08-15-29 | | 290,000 | 398,965 |
| Bond | 6.250 | 05-15-30 | | 775,000 | 1,092,840 |
| Bond | 6.500 | 11-15-26 | | 115,000 | 151,238 |
| Bond | 6.625 | 02-15-27 | | 260,000 | 346,531 |
| Bond | 6.750 | 08-15-26 | | 70,000 | 92,621 |
| Bond | 7.625 | 11-15-22 | | 5,000 | 5,959 |
| Bond | 8.125 | 08-15-21 | | 345,000 | 390,093 |
| Note | 1.500 | 11-30-19 | | 385,000 | 384,007 |
| Note | 1.750 | 12-31-20 | | 440,000 | 439,347 |
| Note | 2.000 | 02-15-25 | | 320,000 | 323,100 |
| Note | 2.250 | 03-31-20 | | 65,000 | 65,107 |
| Note | 2.250 | 12-31-23 | | 605,000 | 617,785 |
| Note | 2.250 | 03-31-26 | | 45,000 | 46,081 |
| Note | 2.250 | 11-15-27 | | 135,000 | 138,127 |
| Note | 2.375 | 03-15-21 | | 75,000 | 75,712 |
| Note | 2.500 | 05-15-24 | | 10,000 | 10,338 |
| Note | 2.750 | 09-30-20 | | 50,000 | 50,520 |
| Note | 2.750 | 02-15-24 | | 370,000 | 386,188 |
| Note | 2.750 | 02-15-28 | | 125,000 | 132,837 |
|
| Note | 2.875 | 05-15-28 | | 65,000 | 69,753 |
| 8 | JOHN HANCOCK RETIREMENT INCOME 2040 FUND | SEMIANNUAL REPORT | SEE NOTES TO FINANCIAL STATEMENTS |
| | Rate (%) | Maturity date | | Par value^ | Value |
|
| Corporate bonds 31.0% | | | $8,876,604 |
| (Cost $8,571,729) | | | | | |
| Communication services 4.6% | | | 1,326,085 |
| Diversified telecommunication services 2.6% | | | |
| AT&T, Inc. | 3.875 | 01-15-26 | | 85,000 | 88,846 |
| AT&T, Inc. | 4.500 | 05-15-35 | | 90,000 | 94,237 |
| AT&T, Inc. | 5.350 | 09-01-40 | | 50,000 | 56,385 |
| Deutsche Telekom International Finance BV | 9.250 | 06-01-32 | | 50,000 | 76,642 |
| Verizon Communications, Inc. | 4.329 | 09-21-28 | | 102,000 | 112,795 |
| Verizon Communications, Inc. | 4.400 | 11-01-34 | | 80,000 | 88,626 |
| Verizon Communications, Inc. | 4.500 | 08-10-33 | | 111,923 | 129,464 |
| Verizon Communications, Inc. | 5.250 | 03-16-37 | | 75,000 | 89,633 |
| Media 1.8% | | | |
| CBS Corp. | 5.500 | 05-15-33 | | 105,000 | 121,553 |
| Charter Communications Operating LLC | 5.375 | 04-01-38 | | 75,000 | 80,248 |
| Comcast Corp. | 3.999 | 11-01-49 | | 17,000 | 17,893 |
| Comcast Corp. | 4.049 | 11-01-52 | | 43,000 | 45,598 |
| Comcast Corp. | 4.250 | 01-15-33 | | 75,000 | 83,977 |
| Comcast Corp. | 6.500 | 11-15-35 | | 55,000 | 74,481 |
| Comcast Corp. | 7.050 | 03-15-33 | | 75,000 | 105,016 |
| Wireless telecommunication services 0.2% | | | |
| Vodafone Group PLC | 6.150 | 02-27-37 | | 50,000 | 60,691 |
| Consumer discretionary 1.8% | | | 517,921 |
| Automobiles 0.4% | | | |
| Ford Motor Company | 7.450 | 07-16-31 | | 60,000 | 70,924 |
| General Motors Company | 6.600 | 04-01-36 | | 55,000 | 60,885 |
| Hotels, restaurants and leisure 0.3% | | | |
| McDonald's Corp. | 6.300 | 03-01-38 | | 60,000 | 78,080 |
| Internet and direct marketing retail 0.5% | | | |
| Amazon.com, Inc. | 4.800 | 12-05-34 | | 50,000 | 61,320 |
| eBay, Inc. | 3.450 | 08-01-24 | | 70,000 | 72,025 |
| Multiline retail 0.4% | | | |
| Target Corp. | 6.350 | 11-01-32 | | 90,000 | 121,656 |
| Specialty retail 0.2% | | | |
| The Home Depot, Inc. | 5.875 | 12-16-36 | | 40,000 | 53,031 |
| Consumer staples 1.2% | | | 332,252 |
| Beverages 0.5% | | | |
| Anheuser-Busch InBev Worldwide, Inc. | 4.700 | 02-01-36 | | 85,000 | 93,472 |
| Anheuser-Busch InBev Worldwide, Inc. | 8.200 | 01-15-39 | | 35,000 | 52,727 |
| Food products 0.7% | | | |
| Kraft Heinz Foods Company | 6.875 | 01-26-39 | | 55,000 | 66,408 |
| SEE NOTES TO FINANCIAL STATEMENTS | SEMIANNUAL REPORT | JOHN HANCOCK RETIREMENT INCOME 2040 FUND | 9 |
| | Rate (%) | Maturity date | | Par value^ | Value |
| Consumer staples (continued) | | | |
| Food products (continued) | | | |
| Tyson Foods, Inc. | 4.875 | 08-15-34 | | 105,000 | $119,645 |
| Energy 4.8% | | | 1,385,018 |
| Energy equipment and services 0.2% | | | |
| Halliburton Company | 4.850 | 11-15-35 | | 60,000 | 63,935 |
| Oil, gas and consumable fuels 4.6% | | | |
| Anadarko Petroleum Corp. | 6.200 | 03-15-40 | | 45,000 | 54,315 |
| Anadarko Petroleum Corp. | 6.450 | 09-15-36 | | 45,000 | 55,281 |
| BP Capital Markets America, Inc. | 3.937 | 09-21-28 | | 60,000 | 65,321 |
| Canadian Natural Resources, Ltd. | 6.250 | 03-15-38 | | 45,000 | 55,516 |
| Canadian Natural Resources, Ltd. | 6.450 | 06-30-33 | | 55,000 | 66,995 |
| ConocoPhillips | 5.900 | 10-15-32 | | 80,000 | 104,247 |
| Energy Transfer Partners LP | 6.050 | 06-01-41 | | 50,000 | 55,933 |
| Energy Transfer Partners LP | 7.500 | 07-01-38 | | 45,000 | 57,176 |
| EOG Resources, Inc. | 3.900 | 04-01-35 | | 85,000 | 89,257 |
| Exxon Mobil Corp. | 3.043 | 03-01-26 | | 55,000 | 56,947 |
| Kinder Morgan Energy Partners LP | 5.800 | 03-15-35 | | 75,000 | 86,462 |
| Kinder Morgan Energy Partners LP | 6.500 | 09-01-39 | | 45,000 | 55,339 |
| Marathon Oil Corp. | 2.800 | 11-01-22 | | 60,000 | 60,254 |
| Shell International Finance BV | 4.125 | 05-11-35 | | 110,000 | 122,179 |
| Suncor Energy, Inc. | 5.950 | 05-15-35 | | 50,000 | 62,201 |
| Sunoco Logistics Partners Operations LP | 3.900 | 07-15-26 | | 60,000 | 61,238 |
| TransCanada PipeLines, Ltd. | 4.625 | 03-01-34 | | 85,000 | 94,295 |
| Valero Energy Corp. | 6.625 | 06-15-37 | | 45,000 | 56,877 |
| Valero Energy Corp. | 7.500 | 04-15-32 | | 45,000 | 61,250 |
| Financials 5.2% | | | 1,487,472 |
| Banks 3.0% | | | |
| Bank of Montreal (3.803% to 12-15-27, then 5 Year U.S. Swap Rate + 1.432%) | 3.803 | 12-15-32 | | 110,000 | 111,552 |
| Citigroup, Inc. | 6.000 | 10-31-33 | | 85,000 | 104,480 |
| Citigroup, Inc. | 6.625 | 06-15-32 | | 80,000 | 103,310 |
| Fifth Third Bancorp | 8.250 | 03-01-38 | | 55,000 | 81,278 |
| HSBC Holdings PLC | 7.625 | 05-17-32 | | 75,000 | 104,106 |
| JPMorgan Chase & Co. | 6.400 | 05-15-38 | | 60,000 | 82,717 |
| U.S. Bancorp | 2.950 | 07-15-22 | | 70,000 | 71,394 |
| Wells Fargo & Company | 3.500 | 03-08-22 | | 80,000 | 82,286 |
| Wells Fargo & Company | 5.375 | 02-07-35 | | 100,000 | 123,289 |
| Capital markets 0.7% | | | |
| Morgan Stanley | 3.125 | 07-27-26 | | 100,000 | 101,860 |
| Morgan Stanley | 7.250 | 04-01-32 | | 70,000 | 98,560 |
| Insurance 1.5% | | | |
| American International Group, Inc. | 3.875 | 01-15-35 | | 95,000 | 94,601 |
| 10 | JOHN HANCOCK RETIREMENT INCOME 2040 FUND | SEMIANNUAL REPORT | SEE NOTES TO FINANCIAL STATEMENTS |
| | Rate (%) | Maturity date | | Par value^ | Value |
| Financials (continued) | | | |
| Insurance (continued) | | | |
| MetLife, Inc. | 6.500 | 12-15-32 | | 50,000 | $68,123 |
| Prudential Financial, Inc. | 3.905 | 12-07-47 | | 63,000 | 65,734 |
| The Progressive Corp. | 2.450 | 01-15-27 | | 110,000 | 108,826 |
| The Travelers Companies, Inc. | 6.750 | 06-20-36 | | 60,000 | 85,356 |
| Health care 2.8% | | | 812,968 |
| Biotechnology 0.5% | | | |
| AbbVie, Inc. | 4.500 | 05-14-35 | | 85,000 | 87,328 |
| GlaxoSmithKline Capital, Inc. | 5.375 | 04-15-34 | | 45,000 | 56,848 |
| Health care providers and services 1.2% | | | |
| CVS Health Corp. | 4.750 | 12-01-22 | | 100,000 | 106,158 |
| CVS Health Corp. | 4.780 | 03-25-38 | | 100,000 | 104,227 |
| CVS Health Corp. | 4.875 | 07-20-35 | | 65,000 | 67,994 |
| UnitedHealth Group, Inc. | 4.625 | 07-15-35 | | 60,000 | 68,970 |
| Pharmaceuticals 1.1% | | | |
| Allergan Funding SCS | 4.550 | 03-15-35 | | 90,000 | 90,801 |
| Johnson & Johnson | 4.375 | 12-05-33 | | 85,000 | 99,787 |
| Pfizer, Inc. | 3.400 | 05-15-24 | | 55,000 | 58,011 |
| Wyeth LLC | 5.950 | 04-01-37 | | 55,000 | 72,844 |
| Industrials 3.1% | | | 881,415 |
| Aerospace and defense 0.8% | | | |
| Lockheed Martin Corp. | 4.500 | 05-15-36 | | 60,000 | 68,843 |
| The Boeing Company | 6.125 | 02-15-33 | | 75,000 | 98,799 |
| United Technologies Corp. | 4.450 | 11-16-38 | | 50,000 | 56,052 |
| Air freight and logistics 0.2% | | | |
| FedEx Corp. | 4.900 | 01-15-34 | | 50,000 | 58,138 |
| Industrial conglomerates 1.1% | | | |
| General Electric Company | 5.875 | 01-14-38 | | 75,000 | 84,925 |
| General Electric Company | 6.750 | 03-15-32 | | 70,000 | 86,378 |
| General Electric Company | 6.875 | 01-10-39 | | 50,000 | 62,879 |
| Georgia-Pacific LLC | 8.875 | 05-15-31 | | 50,000 | 77,167 |
| Road and rail 0.2% | | | |
| CSX Corp. | 6.000 | 10-01-36 | | 45,000 | 56,686 |
| Trading companies and distributors 0.8% | | | |
| AerCap Ireland Capital DAC | 3.950 | 02-01-22 | | 65,000 | 66,856 |
| AerCap Ireland Capital DAC | 5.000 | 10-01-21 | | 70,000 | 73,396 |
| International Lease Finance Corp. | 8.625 | 01-15-22 | | 80,000 | 91,296 |
| Information technology 2.3% | | | 660,787 |
| IT services 0.4% | | | |
| IBM Corp. | 5.875 | 11-29-32 | | 95,000 | 121,305 |
| SEE NOTES TO FINANCIAL STATEMENTS | SEMIANNUAL REPORT | JOHN HANCOCK RETIREMENT INCOME 2040 FUND | 11 |
| | Rate (%) | Maturity date | | Par value^ | Value |
| Information technology (continued) | | | |
| Software 1.5% | | | |
| Microsoft Corp. | 3.500 | 02-12-35 | | 65,000 | $69,183 |
| Microsoft Corp. | 4.100 | 02-06-37 | | 60,000 | 68,427 |
| Microsoft Corp. | 4.200 | 11-03-35 | | 55,000 | 63,017 |
| Oracle Corp. | 3.900 | 05-15-35 | | 50,000 | 54,086 |
| Oracle Corp. | 4.300 | 07-08-34 | | 110,000 | 125,220 |
| Oracle Corp. | 6.125 | 07-08-39 | | 40,000 | 54,784 |
| Technology hardware, storage and peripherals 0.4% | | | |
| Dell International LLC (A) | 6.020 | 06-15-26 | | 95,000 | 104,765 |
| Materials 1.5% | | | 435,427 |
| Chemicals 0.7% | | | |
| LyondellBasell Industries NV | 5.750 | 04-15-24 | | 95,000 | 106,784 |
| Praxair, Inc. | 3.200 | 01-30-26 | | 95,000 | 99,172 |
| Containers and packaging 0.2% | | | |
| International Paper Company | 7.300 | 11-15-39 | | 50,000 | 65,090 |
| Metals and mining 0.6% | | | |
| Rio Tinto Alcan, Inc. | 5.750 | 06-01-35 | | 50,000 | 62,355 |
| Rio Tinto Finance USA, Ltd. | 3.750 | 06-15-25 | | 95,000 | 102,026 |
| Real estate 0.5% | | | 129,017 |
| Equity real estate investment trusts 0.5% | | | |
| Crown Castle International Corp. | 4.300 | 02-15-29 | | 120,000 | 129,017 |
| Utilities 3.2% | | | 908,242 |
| Electric utilities 2.5% | | | |
| Duke Energy Carolinas LLC | 6.050 | 04-15-38 | | 60,000 | 80,179 |
| Duke Energy Carolinas LLC | 6.450 | 10-15-32 | | 75,000 | 99,505 |
| Florida Power & Light Company | 5.950 | 02-01-38 | | 60,000 | 80,987 |
| MidAmerican Energy Company | 5.750 | 11-01-35 | | 70,000 | 88,121 |
| Oncor Electric Delivery Company LLC | 5.250 | 09-30-40 | | 45,000 | 56,258 |
| PacifiCorp | 5.250 | 06-15-35 | | 55,000 | 65,525 |
| Virginia Electric & Power Company | 6.350 | 11-30-37 | | 85,000 | 113,861 |
| Xcel Energy, Inc. | 6.500 | 07-01-36 | | 95,000 | 124,579 |
| Multi-utilities 0.7% | | | |
| Dominion Energy, Inc. | 6.300 | 03-15-33 | | 75,000 | 96,348 |
| DTE Energy Company | 6.375 | 04-15-33 | | 80,000 | 102,879 |
|
| | | | | Shares | Value |
| Affiliated investment companies 21.5% | | | | | $6,132,360 |
| (Cost $6,646,056) | | | | | |
| Equity 21.5% | | | | | 6,132,360 |
| Strategic Equity Allocation, Class NAV, JHF II (MIM US) (B) | | | | 536,984 | 6,132,360 |
|
| 12 | JOHN HANCOCK RETIREMENT INCOME 2040 FUND | SEMIANNUAL REPORT | SEE NOTES TO FINANCIAL STATEMENTS |
| | | Yield (%) | | Shares | Value |
| Short-term investments 0.2% | | | | | $66,029 |
| (Cost $66,029) | | | | | |
| Money market funds 0.2% | | | | | 66,029 |
| State Street Institutional U.S. Government Money Market Fund, Premier Class | 2.3057(C) | | 66,029 | 66,029 |
|
| Total investments (Cost $27,741,878) 99.2% | | | $28,357,422 |
| Other assets and liabilities, net 0.8% | | | | 221,265 |
| Total net assets 100.0% | | | | | $28,578,687 |
| The percentage shown for each investment category is the total value of the category as a percentage of the net assets of the fund. |
| ^All par values are denominated in U.S. dollars unless otherwise indicated. |
| Security Abbreviations and Legend |
| JHF II | John Hancock Funds II |
| MIM US | Manulife Investment Management (US) LLC |
| (A) | These securities are exempt from registration under Rule 144A of the Securities Act of 1933. Such securities may be resold, normally to qualified institutional buyers, in transactions exempt from registration. |
| (B) | The subadvisor is an affiliate of the advisor. |
| (C) | The rate shown is the annualized seven-day yield as of 6-30-19. |
At 6-30-19, the aggregate cost of investments for federal income tax purposes was $28,256,486. Net unrealized appreciation aggregated to $100,936, of which $747,555 related to gross unrealized appreciation and $646,619 related to gross unrealized depreciation.
| SEE NOTES TO FINANCIAL STATEMENTS | SEMIANNUAL REPORT | JOHN HANCOCK RETIREMENT INCOME 2040 FUND | 13 |
STATEMENT OF ASSETS AND LIABILITIES 6-30-19 (unaudited)
| Assets | |
| Unaffiliated investments, at value (Cost $21,095,822) | $22,225,062 |
| Affiliated investments, at value (Cost $6,646,056) | 6,132,360 |
| Total investments, at value (Cost $27,741,878) | 28,357,422 |
| Interest receivable | 242,389 |
| Receivable for investments sold | 250,388 |
| Receivable from affiliates | 2,174 |
| Other assets | 11,590 |
| Total assets | 28,863,963 |
| Liabilities | |
| Distributions payable | 250,760 |
| Payable for fund shares repurchased | 99 |
| Payable to affiliates | |
| Accounting and legal services fees | 2,384 |
| Transfer agent fees | 285 |
| Trustees' fees | 14 |
| Other liabilities and accrued expenses | 31,734 |
| Total liabilities | 285,276 |
| Net assets | $28,578,687 |
| Net assets consist of | |
| Paid-in capital | $28,429,269 |
| Total distributable earnings (loss) | 149,418 |
| Net assets | $28,578,687 |
| |
| Net asset value per share | |
| Based on net asset value and shares outstanding - the fund has an unlimited number of shares authorized with no par value | |
| Class R6 ($28,578,687 ÷ 573,377 shares) | $49.84 |
| 14 | JOHN HANCOCK Retirement Income 2040 Fund | SEMIANNUAL REPORT | SEE NOTES TO FINANCIAL STATEMENTS |
STATEMENT OF OPERATIONS For the six months ended 6-30-19 (unaudited)
| Investment income | |
| Interest | $332,237 |
| Expenses | |
| Investment management fees | 54,197 |
| Accounting and legal services fees | 2,550 |
| Transfer agent fees | 1,805 |
| Trustees' fees | 429 |
| Custodian fees | 13,888 |
| State registration fees | 12,845 |
| Printing and postage | 10,849 |
| Professional fees | 12,541 |
| Other | 3,767 |
| Total expenses | 112,871 |
| Less expense reductions | (61,385) |
| Net expenses | 51,486 |
| Net investment income | 280,751 |
| Realized and unrealized gain (loss) | |
| Net realized gain (loss) on | |
| Unaffiliated investments | (49,158) |
| Affiliated investments | (283,811) |
| | (332,969) |
| Change in net unrealized appreciation (depreciation) of | |
| Unaffiliated investments | 1,637,732 |
| Affiliated investments | 1,210,209 |
| �� | 2,847,941 |
| Net realized and unrealized gain | 2,514,972 |
| Increase in net assets from operations | $2,795,723 |
| | |
| SEE NOTES TO FINANCIAL STATEMENTS | SEMIANNUAL REPORT | JOHN HANCOCK Retirement Income 2040 Fund | 15 |
STATEMENTS OF CHANGES IN NET ASSETS
| | Six months ended
6-30-19
(unaudited) | Year ended
12-31-18 |
| Increase (decrease) in net assets | | |
| From operations | | |
| Net investment income | $280,751 | $613,065 |
| Net realized gain (loss) | (332,969) | 539,344 |
| Change in net unrealized appreciation (depreciation) | 2,847,941 | (2,162,560) |
| Increase (decrease) in net assets resulting from operations | 2,795,723 | (1,010,151) |
| Distributions to shareholders | | |
| From net investment income and net realized gain | | |
| Class R6 | (581,585) | (1,629,550) |
| Total distributions | (581,585) | (1,629,550) |
| From fund share transactions | 177,965 | 4,212,841 |
| Total increase | 2,392,103 | 1,573,140 |
| Net assets | | |
| Beginning of period | 26,186,584 | 24,613,444 |
| End of period | $28,578,687 | $26,186,584 |
| 16 | JOHN HANCOCK Retirement Income 2040 Fund | SEMIANNUAL REPORT | SEE NOTES TO FINANCIAL STATEMENTS |
| CLASS R6 SHARES Period ended | 6-30-191 | 12-31-18 | 12-31-172 |
| Per share operating performance | | | |
| Net asset value, beginning of period | $45.97 | $51.19 | $50.00 |
| Net investment income3,4 | 0.49 | 1.24 | 0.69 |
| Net realized and unrealized gain (loss) on investments | 4.40 | (3.31) | 1.56 |
| Total from investment operations | 4.89 | (2.07) | 2.25 |
| Less distributions | | | |
| From net investment income | (1.02) | (1.76) | (0.98) |
| From net realized gain | — | (1.39) | (0.08) |
| Total distributions | (1.02) | (3.15) | (1.06) |
| Net asset value, end of period | $49.84 | $45.97 | $51.19 |
| Total return (%)5 | 10.686 | (4.08) | 4.536 |
| Ratios and supplemental data | | | |
| Net assets, end of period (in millions) | $29 | $26 | $25 |
| Ratios (as a percentage of average net assets): | | | |
| Expenses before reductions7 | 0.838 | 1.54 | 0.889 |
| Expenses including reductions7 | 0.388 | 0.36 | 0.349 |
| Net investment income4 | 2.078 | 2.53 | 2.299 |
| Portfolio turnover (%) | 10 | 25 | 17 |
| 1 | Six months ended 6-30-19. Unaudited. |
| 2 | Period from 7-6-17 (commencement of operations) to 12-31-17. |
| 3 | Based on average daily shares outstanding. |
| 4 | Net investment income is affected by the timing and frequency of the declaration of dividends by the underlying funds in which the fund invests. |
| 5 | Total returns would have been lower had certain expenses not been reduced during the applicable periods. |
| 6 | Not annualized. |
| 7 | Ratios do not include fees and expenses indirectly incurred by the underlying funds and can vary based on mixed of underlying funds held by the fund. |
| 8 | Annualized. |
| 9 | Annualized. Certain income and expenses are presented unannualized. |
| SEE NOTES TO FINANCIAL STATEMENTS | SEMIANNUAL REPORT | JOHN HANCOCK Retirement Income 2040 Fund | 17 |
| Notes to financial statements (unaudited) | |
Note 1—Organization
John Hancock Retirement Income 2040 Fund (the fund) is a series of John Hancock Funds II (the Trust), an open-end management investment company organized as a Massachusetts business trust and registered under the Investment Company Act of 1940, as amended (the 1940 Act). The investment objective of the fund is to maintain and maximize regular cash distributions through December 2040 and to grow such distributions over time.
The fund operates in part as a fund of funds and may invest in other funds for which the fund’s investment advisor or an affiliate serves as investment advisor, as well as funds advised by an entity that is not affiliated with the fund’s investment advisor (collectively, “Underlying Funds”). Class R6 shares are only available to certain retirement plans, institutions and other investors.
The accounting policies of the John Hancock underlying funds in which the fund invests are outlined in the underlying funds’ shareholder reports, which include the underlying funds’ financial statements, available without charge by calling 800-344-1029 or visiting jhinvestments.com, or on the Securities and Exchange Commission (SEC) website at sec.gov. The underlying funds are not covered by this report.
Note 2—Significant accounting policies
The financial statements have been prepared in conformity with accounting principles generally accepted in the United States of America (US GAAP), which require management to make certain estimates and assumptions as of the date of the financial statements. Actual results could differ from those estimates and those differences could be significant. The fund qualifies as an investment company under Topic 946 of Accounting Standards Codification of US GAAP.
Events or transactions occurring after the end of the fiscal period through the date that the financial statements were issued have been evaluated in the preparation of the financial statements. The following summarizes the significant accounting policies of the fund:
Security valuation. Investments are stated at value as of the scheduled close of regular trading on the New York Stock Exchange (NYSE), normally at 4:00 P.M., Eastern Time. In case of emergency or other disruption resulting in the NYSE not opening for trading or the NYSE closing at a time other than the regularly scheduled close, the net asset value (NAV) may be determined as of the regularly scheduled close of the NYSE pursuant to the fund's Valuation Policies and Procedures.
In order to value the securities, the fund uses the following valuation techniques: Debt obligations are typically valued based on the evaluated prices provided by an independent pricing vendor. Independent pricing vendors utilize matrix pricing which takes into account factors such as institutional-size trading in similar groups of securities, yield, quality, coupon rate, maturity, type of issue, trading characteristics and other market data, as well as broker supplied prices. Investments by the fund in affiliated underlying funds and other open-end management investment companies are valued at their respective NAVs each business day.
Other portfolio securities and assets, for which reliable market quotations are not readily available, are valued at fair value as determined in good faith by the fund's Pricing Committee following procedures established by the Board of Trustees. The frequency with which these fair valuation procedures are used cannot be predicted and fair value of securities may differ significantly from the value that would have been used had a ready market for such securities existed.
| 18 | JOHN HANCOCK Retirement Income 2040 Fund | SEMIANNUAL REPORT | |
The fund uses a three-tier hierarchy to prioritize the pricing assumptions, referred to as inputs, used in valuation techniques to measure fair value. Level 1 includes securities valued using quoted prices in active markets for identical securities, including registered investment companies. Level 2 includes securities valued using other significant observable inputs. Observable inputs may include quoted prices for similar securities, interest rates, prepayment speeds and credit risk. Prices for securities valued using these inputs are received from independent pricing vendors and brokers and are based on an evaluation of the inputs described. Level 3 includes securities valued using significant unobservable inputs when market prices are not readily available or reliable, including the fund's own assumptions in determining the fair value of investments. Factors used in determining value may include market or issuer specific events or trends, changes in interest rates and credit quality. The inputs or methodology used for valuing securities are not necessarily an indication of the risks associated with investing in those securities. Changes in valuation techniques and related inputs may result in transfers into or out of an assigned level within the disclosure hierarchy.
| | Total
value at
6-30-19 | Level 1
quoted
price | Level 2
significant
observable
inputs | Level 3
significant
unobservable
inputs |
| Investments in securities: | | | | |
| Assets | | | | |
| U.S. Government and Agency obligations | $13,282,429 | — | $13,282,429 | — |
| Corporate bonds | 8,876,604 | — | 8,876,604 | — |
| Affiliated investment companies | 6,132,360 | $6,132,360 | — | — |
| Short-term investments | 66,029 | 66,029 | — | — |
| Total investments in securities | $28,357,422 | $6,198,389 | $22,159,033 | — |
Security transactions and related investment income. Investment security transactions are accounted for on a trade date plus one basis for daily NAV calculations. However, for financial reporting purposes, investment transactions are reported on trade date. Interest income is accrued as earned. Interest income includes coupon interest and amortization/accretion of premiums/discounts on debt securities. Debt obligations may be placed in a non-accrual status and related interest income may be reduced by stopping current accruals and writing off interest receivable when the collection of all or a portion of interest has become doubtful. Gains and losses on securities sold are determined on the basis of identified cost and may include proceeds from litigation.
Line of credit. The fund may have the ability to borrow from banks for temporary or emergency purposes, including meeting redemption requests that otherwise might require the untimely sale of securities. Pursuant to the fund's custodian agreement, the custodian may loan money to the fund to make properly authorized payments. The fund is obligated to repay the custodian for any overdraft, including any related costs or expenses. The custodian may have a lien, security interest or security entitlement in any fund property that is not otherwise segregated or pledged, to the extent of any overdraft, and to the maximum extent permitted by law.
The fund and other affiliated funds, have entered into a syndicated line of credit agreement with Citibank, N.A. as the administrative agent that enables them to participate in a $750 million unsecured committed line of credit. Excluding commitments designated for a certain fund and subject to the needs of all other affiliated funds, the fund can borrow up to an aggregate commitment amount of $500 million, subject to asset coverage and other limitations as specified in the agreement. A commitment fee payable at the end of each calendar quarter, based on the average daily unused portion of the line of credit, is charged to each participating fund based on a
| | SEMIANNUAL REPORT | JOHN HANCOCK Retirement Income 2040 Fund | 19 |
combination of fixed and asset based allocations and is reflected in Other expenses on the Statement of operations. For the six months ended June 30, 2019, the fund had no borrowings under the line of credit. Commitment fees for the six months ended June 30, 2019 were $1,068.
Expenses. Within the John Hancock group of funds complex, expenses that are directly attributable to an individual fund are allocated to such fund. Expenses that are not readily attributable to a specific fund are allocated among all funds in an equitable manner, taking into consideration, among other things, the nature and type of expense and the fund’s relative net assets. Expense estimates are accrued in the period to which they relate and adjustments are made when actual amounts are known.
Change in Accounting Principle. Effective January 1, 2019, the fund is subject to Accounting Standards Update (ASU) 2017-08, Premium Amortization on Purchased Callable Debt Securities, which shortens the premium amortization period for purchased non contingently callable debt securities. Adoption of the ASU had no material impact to the fund.
Federal income taxes. The fund intends to continue to qualify as a regulated investment company by complying with the applicable provisions of the Internal Revenue Code and will not be subject to federal income tax on taxable income that is distributed to shareholders. Therefore, no federal income tax provision is required.
As of December 31, 2018, the fund had no uncertain tax positions that would require financial statement recognition, derecognition or disclosure. The fund's federal tax returns are subject to examination by the Internal Revenue Service for a period of three years.
Distribution of income and gains. Distributions to shareholders from net investment income and net realized gains, if any, are recorded on the ex-date. The fund generally declares dividends daily and pays them quarterly. Capital gain distributions, if any, are typically distributed annually.
Such distributions, on a tax basis, are determined in conformity with income tax regulations, which may differ from US GAAP. Distributions in excess of tax basis earnings and profits, if any, are reported in the fund’s financial statements as a return of capital. The final determination of tax characteristics of the fund’s distribution will occur at the end of the year and will subsequently be reported to shareholders. Short-term gains from underlying funds are treated as ordinary income for tax purposes.
Capital accounts within the financial statements are adjusted for permanent book-tax differences. These adjustments have no impact on net assets or the results of operations. Temporary book-tax differences, if any, will reverse in a subsequent period. Book-tax differences are primarily attributable to characterization of distributions, amortization and accretion on debt securities, and wash sale loss deferrals.
Note 3—Guarantees and indemnifications
Under the Trust's organizational documents, its Officers and Trustees are indemnified against certain liabilities arising out of the performance of their duties to the Trust, including the fund. Additionally, in the normal course of business, the fund enters into contracts with service providers that contain general indemnification clauses. The fund's maximum exposure under these arrangements is unknown, as this would involve future claims that may be made against the fund that have not yet occurred. The risk of material loss from such claims is considered remote.
| 20 | JOHN HANCOCK Retirement Income 2040 Fund | SEMIANNUAL REPORT | |
Note 4—Fees and transactions with affiliates
John Hancock Investment Management LLC (the Advisor) serves as investment advisor for the fund. John Hancock Investment Management Distributors LLC (the Distributor), an affiliate of the Advisor, serves as principal underwriter of the fund. The Advisor and the Distributor are indirect, wholly owned subsidiaries of Manulife Financial Corporation (MFC). Prior to June 28, 2019, the Advisor was known as John Hancock Advisers, LLC and the Distributor was known as John Hancock Funds, LLC.
Management fee. The fund has an investment management agreement with the Advisor under which the fund pays a daily management fee to the Advisor equivalent on an annual basis of 0.40% on the average daily net assets of the fund. The Advisor has a subadvisory agreement with Manulife Investment Management (North America) Limited, an indirectly owned subsidiary of MFC and an affiliate of the Advisor. Prior to May 7, 2019, Manulife Investment Management (North America) Limited was known as John Hancock Asset Management a division of Manulife Asset Management (North America) Limited. The fund is not responsible for payment of the subadvisory fees.
To the extent that expenses of Class R6 shares exceed 0.38% of average net assets attributable to the class (“expense limitation”), the Advisor has contractually agreed to reduce its management fee or, if necessary,make payment to the class in an amount equal to the amount by which expenses of the share class exceed the expense limitation. For purposes of this agreement, “expenses of Class R6 shares” means all expenses of the class (including fund expenses attributable to the class), excluding taxes; portfolio brokerage commissions; interest expense; litigation and indemnification expenses and other extraordinary expenses not incurred in the ordinary course of the fund’s business; acquired fund fees (underlying fund fees); borrowing costs; prime brokerage fees; and short dividend expense. The expense limitation expires on April 30, 2020, unless renewed by mutual agreement of the fund and the advisor based upon a determination that this is appropriate under the circumstances at that time.
The expense reductions described above amounted to $61,385 for the six months ended June 30, 2019.
Expenses waived or reimbursed in the current fiscal period are not subject to recapture in future fiscal periods.
The investment management fees, including the impact of the waivers and reimbursements as described above, incurred for the six months ended June 30, 2019 were equivalent to a net annual effective rate of 0.00% of the fund's average daily net assets.
Accounting and legal services. Pursuant to a service agreement, the fund reimburses the Advisor for all expenses associated with providing the administrative, financial, legal, compliance, accounting and recordkeeping services to the fund, including the preparation of all tax returns, periodic reports to shareholders and regulatory reports, among other services. These accounting and legal services fees incurred for the six months ended June 30, 2019 amounted to an annual rate of 0.02% of the fund's average daily net assets.
Transfer agent fees. The John Hancock group of funds has a complex-wide transfer agent agreement with John Hancock Signature Services, Inc. (Signature Services), an affiliate of the Advisor. The transfer agent fees paid to Signature Services are determined based on the cost to Signature Services (Signature Services Cost) of providing recordkeeping services. It also includes out-of-pocket expenses, including payments made to third-parties for recordkeeping services provided to their clients who invest in one or more John Hancock funds. In addition, Signature Services Cost may be reduced by certain fees that Signature Services receives in connection with retirement and small accounts. Signature Services Cost is calculated monthly and allocated, as applicable, to five categories of share classes: Retail Share and Institutional Share Classes of Non-Municipal Bond Funds, Class R6
| | SEMIANNUAL REPORT | JOHN HANCOCK Retirement Income 2040 Fund | 21 |
Shares, Retirement Share Classes and Municipal Bond Share Classes. Within each of these categories, the applicable costs are allocated to the affected John Hancock affiliated funds and/or classes, based on the relative average daily net assets.
Trustee expenses. The fund compensates each Trustee who is not an employee of the Advisor or its affiliates. The costs of paying Trustee compensation and expenses are allocated to the fund based on its net assets relative to other funds within the John Hancock group of funds complex.
Note 5—Fund share transactions
Transactions in fund shares for the six months ended June 30, 2019 and for the year ended December 31, 2018 were as follows:
| | Six Months Ended 6-30-19 | Year Ended 12-31-18 |
| | Shares | Amount | Shares | Amount |
| Class R6 shares | | | | |
| Sold | 3,314 | $158,787 | 75,639 | $3,611,038 |
| Distributions reinvested | 1,632 | 80,065 | 14,368 | 655,686 |
| Repurchased | (1,266) | (60,887) | (1,140) | (53,883) |
| Net increase | 3,680 | $177,965 | 88,867 | $4,212,841 |
| Total net increase | 3,680 | $177,965 | 88,867 | $4,212,841 |
Affiliates of the fund owned 100% of shares of Class R6 on June 30, 2019. Such concentration of shareholders’ capital could have a material effect on the fund if such shareholders redeem from the fund.
Note 6—Purchase and sale of securities
Purchases and sales of securities, other than short-term investments and U.S. Treasury obligations, amounted to $918,295 and $1,552,163, respectively, for the six months ended June 30, 2019. Purchases and sales of U.S. Treasury obligations aggregated $1,749,468 and $1,125,716, respectively, for the six months ended June 30, 2019.
Note 7—Investment in affiliated underlying funds
The fund invests in an affiliated underlying fund that is managed by the Advisor and its affiliates. The fund does not invest in the affiliated underlying fund for the purpose of exercising management or control; however, the fund’s investment may represent a significant portion of the underlying fund’s net assets. At June 30, 2019, the fund did not hold 5% or more of the net assets of the underlying fund.
Information regarding the fund’s fiscal year to date purchases and sales of the affiliated underlying funds as well as income and capital gains earned by the fund from its investments in affiliated underlying funds is as follows:
| | | | | | Dividends and distributions |
| Affiliate | Beginning
share
amount | Shares
purchased | Shares
sold | Ending
share
amount | Income
distributions
received | Capital gain
distributions
received | Realized
gain
(loss) | Change in
unrealized
appreciation
(depreciation) | Ending
value |
| Strategic Equity Allocation | 625,811 | 16,801 | (105,628) | 536,984 | — | — | $(283,811) | $1,210,209 | $6,132,360 |
| 22 | JOHN HANCOCK Retirement Income 2040 Fund | SEMIANNUAL REPORT | |
Continuation of Investment Advisory and Subadvisory Agreements
Evaluation of Advisory and Subadvisory Agreements by the Board of Trustees
This section describes the evaluation by the Board of Trustees (the Board) of John Hancock Funds II (the Trust) of the Advisory Agreement (the Advisory Agreement) with John Hancock Investment Management LLC (the Advisor, formerly known as "John Hancock Advisors, LLC") and the Subadvisory Agreement (the Subadvisory Agreement) with Manulife Investment Management (North America) Limited (the Subadvisor, formerly known as "John Hancock Asset Management a division of Manulife Asset Management (North America) Limited") for John Hancock Retirement Income 2040 (the fund). The Advisory Agreement and Subadvisory Agreement are collectively referred to as the Agreements. Prior to the June 23-26, 2019 in-person meeting at which the Agreements were approved, the Board also discussed and considered information regarding the proposed continuation of the Agreements at an in-person meeting held on May 28-30, 2019.
Approval of Advisory and Subadvisory Agreements
At in-person meetings held on June 23-26, 2019, the Board, including the Trustees who are not parties to any Agreement or considered to be interested persons of the Trust under the Investment Company Act of 1940, as amended (the 1940 Act) (the Independent Trustees), reapproved for an annual period the continuation of the Advisory Agreement between the Trust and the Advisor and the Subadvisory Agreement between the Advisor and the Subadvisor with respect to the fund.
In considering the Advisory Agreement and the Subadvisory Agreement, the Board received in advance of the meetings a variety of materials relating to the fund, the Advisor and the Subadvisor, including comparative performance, fee and expense information for a peer group of similar funds prepared by an independent third-party provider of fund data, performance information for an applicable benchmark index; and, with respect to the Subadvisor, comparative performance information for comparably managed accounts, as applicable, and other information provided by the Advisor and the Subadvisor regarding the nature, extent and quality of services provided by the Advisor and the Subadvisor under their respective Agreements, as well as information regarding the Advisor's revenues and costs of providing services to the fund and any compensation paid to affiliates of the Advisor. At the meetings at which the renewal of the Advisory Agreement and Subadvisory Agreement are considered, particular focus is given to information concerning fund performance, comparability of fees and total expenses, and profitability. However, the Board noted that the evaluation process with respect to the Advisor and the Subadvisor is an ongoing one. In this regard, the Board also took into account discussions with management and information provided to the Board (including its various committees) at prior meetings with respect to the services provided by the Advisor and the Subadvisor to the fund, including quarterly performance reports prepared by management containing reviews of investment results and prior presentations from the Subadvisor with respect to the fund. The information received and considered by the Board in connection with the May and June meetings and throughout the year was both written and oral. The Board noted the affiliation of the Subadvisor with the Advisor, noting any potential conflicts of interest. The Board also considered the nature, quality, and extent of non-advisory services, if any, to be provided to the fund by the Advisor's affiliates, including distribution services. The Board considered the Advisory Agreement and the Subadvisory Agreement separately in the course of its review. In doing so, the Board noted the respective roles of the Advisor and Subadvisor in providing services to the fund.
Throughout the process, the Board asked questions of and requested additional information from management. The Board is assisted by counsel for the Trust and the Independent Trustees are also separately assisted by independent legal counsel throughout the process. The Independent Trustees also received a memorandum from their independent legal counsel discussing the legal standards for their consideration of the proposed continuation of the Agreements
SEMIANNUAL REPORT | JOHN HANCOCK RETIREMENT INCOME 2040 FUND 23
and discussed the proposed continuation of the Agreements in private sessions with their independent legal counsel at which no representatives of management were present.
Approval of Advisory Agreement
In approving the Advisory Agreement with respect to the fund, the Board, including the Independent Trustees, considered a variety of factors, including those discussed below. The Board also considered other factors (including conditions and trends prevailing generally in the economy, the securities markets, and the industry) and did not treat any single factor as determinative, and each Trustee may have attributed different weights to different factors. The Board's conclusions may be based in part on its consideration of the advisory and subadvisory arrangements in prior years and on the Board's ongoing regular review of fund performance and operations throughout the year.
Nature, extent, and quality of services. Among the information received by the Board from the Advisor relating to the nature, extent, and quality of services provided to the fund, the Board reviewed information provided by the Advisor relating to its operations and personnel, descriptions of its organizational and management structure, and information regarding the Advisor's compliance and regulatory history, including its Form ADV. The Board also noted that on a regular basis it receives and reviews information from the Trust's Chief Compliance Officer (CCO) regarding the fund's compliance policies and procedures established pursuant to Rule 38a-1 under the 1940 Act. The Board observed that the scope of services provided by the Advisor, and of the undertakings required of the Advisor in connection with those services, including maintaining and monitoring its own and the fund's compliance programs, risk management programs, liquidity management programs and cybersecurity programs, had expanded over time as a result of regulatory, market and other developments. The Board considered that the Advisor is responsible for the management of the day-to-day operations of the fund, including, but not limited to, general supervision of and coordination of the services provided by the Subadvisor, and is also responsible for monitoring and reviewing the activities of the Subadvisor and third-party service providers. The Board also considered the significant risks assumed by the Advisor in connection with the services provided to the fund including entrepreneurial risk in sponsoring new funds and ongoing risks including investment, operational, enterprise, litigation, regulatory and compliance risk with respect to all funds.
In considering the nature, extent, and quality of the services provided by the Advisor, the Trustees also took into account their knowledge of the Advisor's management and the quality of the performance of the Advisor's duties, through Board meetings, discussions and reports during the preceding year and through each Trustee's experience as a Trustee of the Trust and of the other trusts in the John Hancock group of funds complex (the John Hancock Fund Complex).
In the course of their deliberations regarding the Advisory Agreement, the Board considered, among other things:
| | | | | | | | | |
| | | | | (a) | | | the skills and competency with which the Advisor has in the past managed the Trust's affairs and its subadvisory relationship, the Advisor's oversight and monitoring of the Subadvisor's investment performance and compliance programs, such as the Subadvisor's compliance with fund policies and objectives, review of brokerage matters, including with respect to trade allocation and best execution and the Advisor's timeliness in responding to performance issues; | |
| | | | | (b) | | | the background, qualifications and skills of the Advisor's personnel; | |
| | | | | (c) | | | the Advisor's compliance policies and procedures and its responsiveness to regulatory changes and fund industry developments; | |
SEMIANNUAL REPORT | JOHN HANCOCK RETIREMENT INCOME 2040 FUND 24
| | | | | | | | | |
| | | | | (d) | | | the Advisor's administrative capabilities, including its ability to supervise the other service providers for the fund, as well as the Advisor's oversight of any securities lending activity, its monitoring of class action litigation and collection of class action settlements on behalf of the fund, and bringing loss recovery actions on behalf of the fund; | |
| | | | | (e) | | | the financial condition of the Advisor and whether it has the financial wherewithal to provide a high level and quality of services to the fund; | |
| | | | | (f) | | | the Advisor's initiatives intended to improve various aspects of the Trust's operations and investor experience with the fund; and | |
| | | | | (g) | | | the Advisor's reputation and experience in serving as an investment advisor to the Trust and the benefit to shareholders of investing in funds that are part of a family of funds offering a variety of investments. | |
The Board concluded that the Advisor may reasonably be expected to continue to provide a high quality of services under the Advisory Agreement with respect to the fund.
Investment performance.In considering the fund's performance, the Board noted that it reviews at its regularly scheduled meetings information about the fund's performance results. In connection with the consideration of the Advisory Agreement, the Board:
| | | |
| | (a) | reviewed information prepared by management regarding the fund's performance;
|
| | (b) | considered the comparative performance of an applicable benchmark index;
|
| | (c) | considered the performance of comparable funds, if any, as included in the report prepared by an independent third-party provider of fund data; and
|
| | (d) | took into account the Advisor's analysis of the fund's performance and its plans and recommendations regarding the Trust's subadvisory arrangements generally.
|
The Board noted that while it found the data provided by the independent third-party generally useful it recognized its limitations, including in particular that the data may vary depending on the end date selected and the results of the performance comparisons may vary depending on the selection of the peer group. The Board noted that the fund underperformed its benchmark index and peer group average for the one-year period ended December 31, 2018. The Board took into account management's discussion of the fund's performance. The Board also took into account management's discussion of the factors that contributed to the fund's recent underperformance, including the relatively recent inception period of the fund. The Board concluded that the fund's performance is being monitored and reasonably addressed, where appropriate.
Fees and expenses. The Board reviewed comparative information prepared by an independent third-party provider of fund data, including, among other data, the fund's contractual and net management fees (and subadvisory fees, to the extent available) and total expenses as compared to similarly situated investment companies deemed to be comparable to the fund in light of the nature, extent and quality of the management and advisory and subadvisory services provided by the Advisor and the Subadvisor. The Board considered the fund's ranking within a smaller group of peer funds chosen by the independent third-party provider, as well as the fund's ranking within a broader group of funds. In comparing the fund's contractual and net management fees to those of comparable funds, the Board noted that such fees include both advisory and administrative costs. The Board noted that net management fees and net total expenses for the fund are lower than the peer group median.
The Board took into account management's discussion with respect to the overall management fee and the fees of the Subadvisor, including the amount of the advisory fee retained by the Advisor after payment of the subadvisory fee, in each case in light of the services rendered for those amounts and the risks undertaken by the Advisor. The Board also
SEMIANNUAL REPORT | JOHN HANCOCK RETIREMENT INCOME 2040 FUND 25
noted that the Advisor pays the subadvisory fee. In addition, the Board took into account that management had agreed to implement an overall fee waiver across the complex, including the fund, which is discussed further below. The Board also noted actions taken over the past several years to reduce the fund's operating expenses. The Board also noted that, in addition, the Advisor is currently waiving fees and/or reimbursing expenses with respect to the fund. The Board reviewed information provided by the Advisor concerning the investment advisory fee charged by the Advisor or one of its advisory affiliates to other clients (including other funds in the John Hancock Fund Complex) having similar investment mandates, if any. The Board considered any differences between the Advisor's and Subadvisor's services to the fund and the services they provide to other comparable clients or funds. The Board concluded that the advisory fee paid with respect to the fund is reasonable in light of the nature, extent and quality of the services provided to the fund under the Advisory Agreement.
Profitability/Fall out benefits. In considering the costs of the services to be provided and the profits to be realized by the Advisor and its affiliates (including the Subadvisor) from the Advisor's relationship with the Trust, the Board:
| | | |
| | (a) | reviewed financial information of the Advisor; |
| | (b) | reviewed and considered information presented by the Advisor regarding the net profitability to the Advisor and its affiliates with respect to the fund; |
| | (c) | received and reviewed profitability information with respect to the John Hancock Fund Complex as a whole and with respect to the fund; |
| | (d) | received information with respect to the Advisor's allocation methodologies used in preparing the profitability data and considered that the Advisor hired an independent third-party consultant to provide an analysis of the Advisor's allocation methodologies; |
| | (e) | considered that the John Hancock insurance companies that are affiliates of the Advisor, as shareholders of the Trust directly or through their separate accounts, receive certain tax credits or deductions relating to foreign taxes paid and dividends received by certain funds of the Trust and noted that these tax benefits, which are not available to participants in qualified retirement plans under applicable income tax law, are reflected in the profitability information reviewed by the Board; |
| | (f) | considered that the Advisor also provides administrative services to the fund on a cost basis pursuant to an administrative services agreement; |
| | (g) | noted that affiliates of the Advisor provide transfer agency services and distribution services to the fund, and that the fund's distributor also receives Rule 12b-1 payments to support distribution of the fund; |
| | (h) | noted that the fund's Subadvisor is an affiliate of the Advisor; |
| | (i) | noted that the Advisor also derives reputational and other indirect benefits from providing advisory services to the fund; |
| | (j) | noted that the subadvisory fee for the fund is paid by the Advisor; |
| | (k) | considered the Advisor's ongoing costs and expenditures necessary to improve services, meet new regulatory and compliance requirements, and adapt to other challenges impacting the fund industry; and |
| | (l) | considered that the Advisor should be entitled to earn a reasonable level of profits in exchange for the level of services it provides to the fund and the risks that it assumes as Advisor, including entrepreneurial, operational, reputational, litigation and regulatory risk. |
Based upon its review, the Board concluded that the level of profitability, if any, of the Advisor and its affiliates (including the Subadvisor) from their relationship with the fund was reasonable and not excessive.
SEMIANNUAL REPORT | JOHN HANCOCK RETIREMENT INCOME 2040 FUND 26
Economies of scale. In considering the extent to which economies of scale would be realized as the fund grows and whether fee levels reflect these economies of scale for the benefit of fund shareholders, the Board:
| | | |
| | (a) | considered that with respect to the John Hancock underlying portfolios in which the Fund invests, the Advisor has agreed to waive a portion of its management fee for such fund and for each of the other John Hancock funds in the complex (except as discussed below) (the Participating Portfolios) or otherwise reimburse the expenses of the Participating Portfolios (the Reimbursement). This waiver is based on upon the aggregate net assets of all the Participating Portfolios. The Board also noted that the Advisor had implemented additional breakpoints to the complex-wide fee waiver in recent years. (The funds that are not Participating Portfolios as of the date of this annual report are the Fund and the funds of funds of the Trust and John Hancock Variable Insurance Trust and John Hancock Collateral Trust. These funds of funds also benefit from such overall management fee waiver through their investment in underlying portfolios that include certain of the Participating Portfolios, which are subject to the Reimbursement; |
| | (b) | also took into account management's discussion of the fund's advisory fee structure; and |
| | (c) | the Board also considered the effect of the fund's growth in size on its performance and fees. The Board also noted that if the fund's assets increase over time, the fund may realize other economies of scale. |
Approval of Subadvisory Agreement
In making its determination with respect to approval of the Subadvisory Agreement, the Board reviewed:
| | | |
| | (1) | information relating to the Subadvisor's business, including current subadvisory services to the Trust (and other funds in the John Hancock Fund Complex); |
| | (2) | the historical and current performance of the fund and comparative performance information relating to an applicable benchmark index and comparable funds; and |
| | (3) | the subadvisory fee for the fund, including any breakpoints, and to the extent available, comparable fee information prepared by an independent third party provider of fund data. |
Nature, extent, and quality of services. With respect to the services provided by the Subadvisor, the Board received information provided to the Board by the Subadvisor, including the Subadvisor's Form ADV, as well as took into account information presented throughout the past year. The Board considered the Subadvisor's current level of staffing and its overall resources, as well as received information relating to the Subadvisor's compensation program. The Board reviewed the Subadvisor's history and investment experience, as well as information regarding the qualifications, background, and responsibilities of the Subadvisor's investment and compliance personnel who provide services to the fund. The Board also considered, among other things, the Subadvisor's compliance program and any disciplinary history. The Board also considered the Subadvisor's risk assessment and monitoring process. The Board reviewed the Subadvisor's regulatory history, including whether it was involved in any regulatory actions or investigations as well as material litigation, and any settlements and amelioratory actions undertaken, as appropriate. The Board noted that the Advisor conducts regular, periodic reviews of the Subadvisor and its operations, including regarding investment processes and organizational and staffing matters. The Board also noted that the Trust's CCO and his staff conduct regular, periodic compliance reviews with the Subadvisor and present reports to the Independent Trustees regarding the same, which includes evaluating the regulatory compliance systems of the Subadvisor and procedures reasonably designed to assure compliance with the federal securities laws. The Board also took into account the financial condition of the Subadvisor.
SEMIANNUAL REPORT | JOHN HANCOCK RETIREMENT INCOME 2040 FUND 27
The Board considered the Subadvisor's investment process and philosophy. The Board took into account that the Subadvisor's responsibilities include the development and maintenance of an investment program for the fund that is consistent with the fund's investment objective, the selection of investment securities and the placement of orders for the purchase and sale of such securities, as well as the implementation of compliance controls related to performance of these services. The Board also received information with respect to the Subadvisor's brokerage policies and practices, including with respect to best execution and soft dollars.
Subadvisor compensation. In considering the cost of services to be provided by the Subadvisor and the profitability to the Subadvisor of its relationship with the fund, the Board noted that the fees under the Subadvisory Agreement are paid by the Advisor and not the fund. The Board also received information and took into account any other potential conflicts of interest the Advisor might have in connection with the Subadvisory Agreement.
In addition, the Board considered other potential indirect benefits that the Subadvisor and its affiliates may receive from the Subadvisor's relationship with the fund, such as the opportunity to provide advisory services to additional funds in the John Hancock Fund Complex and reputational benefits.
Subadvisory fees. The Board considered that the fund pays an advisory fee to the Advisor and that, in turn, the Advisor pays a subadvisory fee to the Subadvisor. As noted above, the Board also considered the fund's subadvisory fees as compared to similarly situated investment companies deemed to be comparable to the fund as included in the report prepared by the independent third party provider of fund data, to the extent available. The Board noted that the limited size of the Lipper peer group was not sufficient for comparative purposes. The Board also took into account the subadvisory fees paid by the Advisor to the Subadvisor with respect to the fund and compared them to fees charged by the Subadvisor to manage other subadvised portfolios and portfolios not subject to regulation under the 1940 Act, as applicable.
Subadvisor performance. As noted above, the Board considered the fund's performance as compared to the fund's peer group and the benchmark index and noted that the Board reviews information about the fund's performance results at its regularly scheduled meetings. The Board noted the Advisor's expertise and resources in monitoring the performance, investment style and risk-adjusted performance of the Subadvisor. The Board was mindful of the Advisor's focus on the Subadvisor's performance. The Board also noted the Subadvisor's long-term performance record for similar accounts, as applicable.
The Board's decision to approve the Subadvisory Agreement was based on a number of determinations, including the following:
| | | |
| | (1) | the Subadvisor has extensive experience and demonstrated skills as a manager; |
| | (2) | the performance of the fund is being monitored and reasonably addressed, where appropriate; |
| | (3) | the subadvisory fee is reasonable in relation to the level and quality of services being provided under the Subadvisory Agreement; and |
| | (4) | noted that the subadvisory fees are paid by the Advisor not the fund. |
| * * * |
Based on the Board's evaluation of all factors that the Board deemed to be material, including those factors described above, the Board, including the Independent Trustees, concluded that renewal of the Advisory Agreement and the Subadvisory Agreement would be in the best interest of the fund and its shareholders. Accordingly, the Board, and the Independent Trustees voting separately, approved the Advisory Agreement and Subadvisory Agreement for an additional one-year period.
SEMIANNUAL REPORT | JOHN HANCOCK RETIREMENT INCOME 2040 FUND 28
| | |
Trustees
Hassell H. McClellan,Chairperson
Steven R. Pruchansky,Vice Chairperson
Andrew G. Arnott†
Charles L. Bardelis*
James R. Boyle
Peter S. Burgess*
William H. Cunningham
Grace K. Fey
Marianne Harrison†
Theron S. Hoffman*
Deborah C. Jackson
James M. Oates
Gregory A. Russo
Officers
Andrew G. Arnott
President
Francis V. Knox, Jr.
Chief Compliance Officer
Charles A. Rizzo
Chief Financial Officer
Salvatore Schiavone
Treasurer
Christopher (Kit) Sechler**
Secretary and Chief Legal Officer
| Investment advisor
John Hancock Investment Management LLC
Subadvisor
Manulife Investment Management (North America) Limited
Portfolio Managers
Sonia Chatigny, MSc, CFA
Jean-Francois Giroux, MSc, FRM, CFA
Serge Lapierre, BSc, FCIA, FSA
Nadia Live, MScA, CFA
Nicholas Scipio Del Campo, BSc, MSc, CFA
Claude Turcot, MSc, ACIA, ASA, CFA
Principal distributor
John Hancock Investment Management Distributors LLC
Custodian
State Street Bank and Trust Company
Transfer agent
John Hancock Signature Services, Inc.
Legal counsel
K&L Gates LLP
|
* Member of the Audit Committee
† Non-Independent Trustee
** Effective 9-13-18
The fund's proxy voting policies and procedures, as well as the fund proxy voting record for the most recent twelve-month period ended June 30, are available free of charge on the Securities and Exchange Commission (SEC) website at sec.gov or on our website.
All of the fund's holdings as of the end of the third month of every fiscal quarter are filed with the SEC on Form N-PORT within 60 days of the end of the fiscal quarter. The fund's Form N-PORT filings are available on our website and the SEC's website, sec.gov.
We make this information on your fund, as well asmonthly portfolio holdings, and other fund details available on our website at jhinvestments.com or by calling 800-225-5291.
| | | | |
| | You can also contact us: |
| | 800-225-5291
jhinvestments.com | Regular mail:
John Hancock Signature Services, Inc.
P.O. Box 55913
Boston, MA 02205-5913
| Express mail:
John Hancock Signature Services, Inc.
2000 Crown Colony Drive
Suite 55913
Quincy, MA 02169-0953
|
SEMIANNUAL REPORT | JOHN HANCOCK RETIREMENT INCOME 2040 FUND 29
John Hancock family of funds
| | | |
DOMESTIC EQUITY FUNDS
Blue Chip Growth
Classic Value
Disciplined Value
Disciplined Value Mid Cap
Equity Income
Financial Industries
Fundamental All Cap Core
Fundamental Large Cap Core
New Opportunities
Regional Bank
Small Cap Core
Small Cap Growth
Small Cap Value
U.S. Global Leaders Growth
U.S. Quality Growth
Value Equity
GLOBAL AND INTERNATIONAL EQUITY FUNDS
Disciplined Value International
Emerging Markets
Emerging Markets Equity
Fundamental Global Franchise
Global Equity
Global Shareholder Yield
Global Thematic Opportunities
International Dynamic Growth
International Growth
International Small Company
| | INCOME FUNDS
Bond
California Tax-Free Income
Emerging Markets Debt
Floating Rate Income
Government Income
High Yield
High Yield Municipal Bond
Income
Investment Grade Bond
Money Market
Short Duration Bond
Short Duration Credit Opportunities
Spectrum Income
Strategic Income Opportunities
Tax-Free Bond
ALTERNATIVE AND SPECIALTY FUNDS
Absolute Return Currency
Alternative Asset Allocation
Disciplined Alternative Yield
Diversified Macro
Global Absolute Return Strategies
Infrastructure
Seaport Long/Short
|
A fund's investment objectives, risks, charges, and expenses should be considered carefully before investing. The prospectus contains this and other important information about the fund. To obtain a prospectus, contact your financial professional, call John Hancock Investment Management at 800-225-5291, or visit our website at jhinvestments.com. Please read the prospectus carefully before investing or sending money.
| | | |
ASSET ALLOCATION
Balanced
Income Allocation
Multi-Index Lifetime Portfolios
Multi-Index Preservation Portfolios
Multimanager Lifestyle Portfolios
Multimanager Lifetime Portfolios
Retirement Income 2040
EXCHANGE-TRADED FUNDS
John Hancock Multifactor Consumer Discretionary ETF
John Hancock Multifactor Consumer Staples ETF
John Hancock Multifactor Developed International ETF
John Hancock Multifactor Emerging Markets ETF
John Hancock Multifactor Energy ETF
John Hancock Multifactor Financials ETF
John Hancock Multifactor Healthcare ETF
John Hancock Multifactor Industrials ETF
John Hancock Multifactor Large Cap ETF
John Hancock Multifactor Materials ETF
John Hancock Multifactor Media and
Communications ETF
John Hancock Multifactor Mid Cap ETF
John Hancock Multifactor Small Cap ETF
John Hancock Multifactor Technology ETF
John Hancock Multifactor Utilities ETF
| | ENVIRONMENTAL, SOCIAL, AND
GOVERNANCE FUNDS
ESG All Cap Core
ESG Core Bond
ESG International Equity
ESG Large Cap Core
CLOSED-END FUNDS
Financial Opportunities
Hedged Equity & Income
Income Securities Trust
Investors Trust
Preferred Income
Preferred Income II
Preferred Income III
Premium Dividend
Tax-Advantaged Dividend Income
Tax-Advantaged Global Shareholder Yield
|
John Hancock Multifactor ETF shares are bought and sold at market price (not NAV), and are not individually redeemed
from the fund. Brokerage commissions will reduce returns.
John Hancock ETFs are distributed by Foreside Fund Services, LLC, and are subadvised by Dimensional Fund Advisors LP.
Foreside is not affiliated with John Hancock Investment Management Distributors, LLC or Dimensional Fund Advisors LP.
Dimensional Fund Advisors LP receives compensation from John Hancock in connection with licensing rights to the
John Hancock Dimensional indexes. Dimensional Fund Advisors LP does not sponsor, endorse, or sell, and makes no
representation as to the advisability of investing in, John Hancock Multifactor ETFs.
John Hancock Investment Management
A trusted brand
John Hancock Investment Management is a premier asset manager
representing one of America's most trusted brands, with a heritage of
financial stewardship dating back to 1862. Helping our shareholders
pursue their financial goals is at the core of everything we do. It's why
we support the role of professional financial advice and operate with
the highest standards of conduct and integrity.
A better way to invest
We serve investors globally through a unique multimanager approach:
We search the world to find proven portfolio teams with specialized
expertise for every strategy we offer, then we apply robust investment
oversight to ensure they continue to meet our uncompromising
standards and serve the best interests of our shareholders.
Results for investors
Our unique approach to asset management enables us to provide
a diverse set of investments backed by some of the world's best
managers, along with strong risk-adjusted returns across asset classes.
John Hancock Investment Management Distributors, LLC n Member FINRA, SIPC
200 Berkeley Street n Boston, MA 02116-5010 n 800-225-5291 n jhinvestments.com
This report is for the information of the shareholders of John Hancock Retirement Income 2040 Fund. It is not authorized for distribution to prospective investors unless preceded or accompanied by a prospectus.
ITEM 2. CODE OF ETHICS.
(a) Not Applicable
(b) Not Applicable
(c) Not Applicable
(d) Not Applicable
(e) Not Applicable
(f) Not Applicable
ITEM 3. AUDIT COMMITTEE FINANCIAL EXPERT.
Not Applicable
ITEM 4. PRINCIPAL ACCOUNTANT FEES AND SERVICES.
(a) Not Applicable
(b) Not Applicable
(c) Not Applicable
(d) Not Applicable
(e) Not Applicable
(f) Not Applicable
(g) Not Applicable
(h) Not Applicable
ITEM 5. AUDIT COMMITTEE OF LISTED REGISTRANTS
Not Applicable.
ITEM 6. SCHEDULE OF INVESTMENTS.
(a) Included with Item 1.
(b) Not Applicable
ITEM 7. DISCLOSURE OF PROXY VOTING POLICIES AND PROCEDURES FOR CLOSED-END MANAGEMENT INVESTMENT COMPANIES.
Not Applicable.
ITEM 8. PORTFOLIO MANAGERS OF CLOSED-END MANAGEMENT INVESTMENT COMPANIES.
Not Applicable.
ITEM 9. PURCHASE OF EQUITY SECURITIES BY CLOSED-END MANAGEMENT INVESTMENT COMPANIES AND AFFILIATED PURCHASERS.
Not Applicable.
ITEM 10. SUBMISSION OF MATTERS TO VOTE OF SECURITY HOLDERS.
Not Applicable.
ITEM 11. CONTROLS AND PROCEDURES.
(a) Based upon their evaluation of the registrant's disclosure controls and procedures as conducted within 90 days of the filing date of this Form N-CSR, the registrant's principal executive officer and principal financial officer have concluded that those disclosure controls and procedures provide reasonable assurance that the material information required to be disclosed by the registrant on this report is recorded, processed, summarized and reported within the time periods specified in the Securities and Exchange Commission's rules and forms.
(b) There were no changes in the registrant's internal control over financial reporting that occurred during the period covered by this report that have materially affected, or are reasonably likely to materially affect, the registrant's internal control over financial reporting.
ITEM 12. DISCLOSURE OF SECURITIES LENDING ACTIVITIES FOR CLOSED-END MANAGEMENT INVESTMENT COMPANIES.: Not applicable.
ITEM 13. EXHIBITS.
(a)(1) Not applicable
(a)(2)(i) CERTIFICATION OF PRINCIPAL EXECUTIVE OFFICER.
(a)(2)(ii) CERTIFICATION OF PRINCIPAL FINANCIAL OFFICER.
(b) CERTIFICATION PURSUANT TO Rule 30a-2(b) OF THE INVESTMENT COMPANY ACT OF 1940
(c)(1) Submission of Matters to a Vote of Security Holders is attached. See attached “John Hancock Funds – Nominating and Governance Committee Charter”.
SIGNATURES
Pursuant to the requirements of the Securities Exchange Act of 1934 and the Investment Company Act of 1940, the registrant has duly caused this report to be signed on its behalf by the undersigned, thereunto duly authorized.
| JOHN HANCOCK FUNDS II |
| |
| |
| /s/ Andrew Arnott |
| Andrew Arnott |
| President |
| Date: August 21, 2019 |
Pursuant to the requirements of the Securities Exchange Act of 1934 and the Investment Company Act of 1940, this report has been signed below by the following persons on behalf of the registrant and in the capacities and on the dates indicated.
| |
| /s/ Andrew Arnott |
| Andrew Arnott |
| President |
| Date: August 21, 2019 |
| |
| |
| |
| /s/ Charles A. Rizzo |
| Charles A. Rizzo |
| Chief Financial Officer |
| Date: August 21, 2019 |