Exhibit 99.1
FASF
May 12, 2006
Consolidated Financial Results
for Fiscal 2005
(Year Ended March 31, 2006)
Listed company name: DAIICHI SANKYO COMPANY, LIMITED
Stock code number: 4568
Listed exchanges: Tokyo, Osaka, and Nagoya
Head office: Tokyo, Japan
URL: http://www.daiichisankyo.co.jp
Representative: Mr. Takashi Shoda, President and Representative Director
Contact: Mr. Toshio Takahashi, Corporate Officer, General Manager of Corporate Communications Department
Telephone: +81-3-6225-1126
Meeting of the Board of Directors: May 12, 2006
U.S. accounting standards: Not applicable
1. Consolidated Financial Results for Fiscal 2005
(1) Consolidated Financial Results
(Figures less than ¥1 million, except per share amounts, have been omitted)
| Net sales | Operating income | Ordinary income | ||||||||||
| Millions of yen | Percent change | Millions of yen | Percent change | Millions of yen | Percent change | |||||||
Fiscal 2005 | 925,918 | — | 154,728 | — | 159,714 | — | ||||||
Fiscal 2004 | — | — | — | — | — | — | ||||||
| Net income | Basic net income per share | Diluted net income per share | Return on equity | Ordinary income as a percentage of total assets | Ordinary income as a percentage of net sales | |||||||||
| Millions of yen | Percent change | Yen | Yen | % | % | % | ||||||||
Fiscal 2005 | 87,692 | — | 119.49 | 119.47 | 7.3 | 10.3 | 17.2 | |||||||
Fiscal 2004 | — | — | — | — | — | — | — | |||||||
Notes:
| 1. | Equity in earnings (losses) of subsidiaries and affiliates accounted for by the equity method: |
Fiscal 2005: | (¥349million) | |||||
Fiscal 2004: | None |
| 2. | Weighted average number of common shares issued and outstanding during the fiscal year (consolidated): |
Fiscal 2005: | 730,938,068 shares | |||||
Fiscal 2004: | — |
3. Changes in accounting policies: | No |
| 4. | Percentages for net sales, operating income, ordinary income and net income represent a change from the corresponding results in the previous fiscal year. |
(2) Consolidated Financial Position
(Figures less than ¥1 million, except per share amounts, have been omitted)
| Total assets | Shareholders’ equity | Shareholders’ equity ratio | Shareholders’ equity per share | |||||
| Millions of yen | Millions of yen | % | Yen | |||||
Fiscal 2005 | 1,596,126 | 1,237,529 | 77.5 | 1,696.97 | ||||
Fiscal 2004 | — | — | — | — |
Note: Total number of common shares issued and outstanding at the end of the fiscal year (consolidated):
Fiscal 2005: | 729,052,296 shares | |||||||
Fiscal 2004: | — |
(3) Consolidated Cash Flows
(Figures less than ¥1 million, except per share amounts, have been omitted)
| Net cash flows from operating activities | Net cash flows from investing activities | Net cash flows from financing activities | Cash and cash equivalents at the end of year | |||||||
| Millions of yen | Millions of yen | Millions of yen | Millions of yen | |||||||
Fiscal 2005 | 132,759 | (39,258 | ) | (50,106 | ) | 400,967 | ||||
Fiscal 2004 | — | — | — | — |
(4) Scope of Consolidation and Application of Equity Method:
Number of consolidated subsidiaries: | 57 | |||||||||||||||
Number of non-consolidated subsidiaries accounted for by the equity method: | 0 | |||||||||||||||
Number of affiliates accounted for by the equity method: | 5 |
(5) Changes in Scope of Consolidation and Application of Equity Method:
Consolidated subsidiaries: | ||||||||||||||||||||||||||||
(Increase) | 2 | |||||||||||||||||||||||||||
(Decrease) | 15 | |||||||||||||||||||||||||||
Companies accounted for by the equity method: | ||||||||||||||||||||||||||||
(Increase) | 3 | |||||||||||||||||||||||||||
(Decrease) | 0 |
2. Forecast of Consolidated Results for Fiscal Year 2006(April 1, 2006—March 31, 2007)
| Net sales | Ordinary income | Net income | ||||
| Millions of yen | Millions of yen | Millions of yen | ||||
Interim 6-month period | 470,000 | 60,000 | 38,000 | |||
Full fiscal year | 865,000 | 115,000 | 47,000 |
Reference: Forecasted annual net income per share (basic): ¥64.47
| * | Note: The forecast figures shown above are based on information that was available at the time of preparation and may contain certain uncertainties. Actual performance and other factors may differ from these forecasts due to changes in circumstances and other developments. For more information concerning these forecasts can be found in the attached Supplementary Information on page 15 and 16. |
1. State of the Group
DAIICHI SANKYO COMPANY, LIMITED (“DAIICHI SANKYO” or the “Company”) is a joint holding company established on September 28, 2005 through the joint stock transfer implemented by Sankyo Company, Limited (“Sankyo”) and Daiichi Pharmaceutical Co., Ltd. (“Daiichi”)
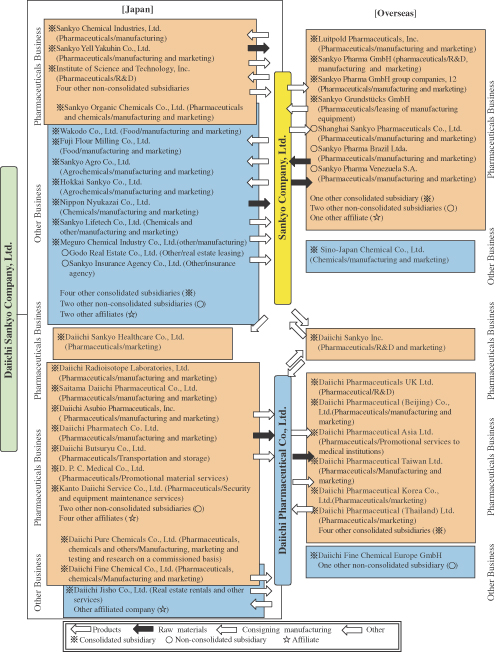
The DAIICHI SANKYO Group (the “Group”) consists of the Company, its two wholly owned direct subsidiaries (Sankyo and Daiichi) and their 71 subsidiaries and 8 affiliates, for a total of 82 companies. The Group’s principal business is the manufacture and sale of pharmaceuticals, its main product line, as well as food, agrochemicals and chemicals. The following chart illustrates the organization of the DAIICHI SANKYO Group:
Consolidated Subsidiaries
Name | Location | Capital (Million of yen) | Principal business | % of voting rights held (indirect holdings) | Relationship | |||||
Consolidated subsidiaries | ||||||||||
Sankyo Co., Ltd. | Chuo-ku, Tokyo | 68,793 | Pharmaceuticals | 100.0 | Management contract Concurrent directors | |||||
Daiichi Pharmaceutical Co., Ltd. | Chuo-ku, Tokyo | 45,246 | Pharmaceuticals | 100.0 | Management contract Concurrent directors | |||||
Daiichi Asubio Pharma Co., Ltd. | Minato-ku, Tokyo | 11,000 | Pharmaceuticals | 100.0 [100.0] | Concurrent directors | |||||
Daiichi Fine Chemical Co., Ltd. | Takaoka-shi, Toyama | 2,276 | Pharmaceuticals Other | 100.0 [100.0] | ||||||
Daiichi Radioisotope Laboratories, Ltd. | Chuo-ku, Tokyo | 1,400 | Pharmaceuticals | 100.0 [100.0] | ||||||
Daiichi Pure Chemicals Co., Ltd. | Chuo-ku, Tokyo | 1,275 | Pharmaceuticals Other | 100.0 [100.0] | Concurrent directors | |||||
Saitama Daiichi Pharmaceutical Co., Ltd. | Kasukabe-shi, Saitama | 1,005 | Pharmaceuticals | 100.0 [100.0] | ||||||
Sankyo Organic Chemicals Co., Ltd. | Takatsu-ku, Kawasaki-shi, Kanagawa | 300 | Pharmaceuticals Other | 93.4 [93.4] | Concurrent directors | |||||
Daiichi Pharmatech Co., Ltd. | Chuo-ku, Tokyo | 100 | Pharmaceuticals | 100.0 [100.0] | ||||||
Sankyo Yell Yakuhin Co., Ltd. | Chiyoda-ku, Tokyo | 96 | Pharmaceuticals | 100.0 [100.0] | ||||||
Sankyo Chemical Industries, Ltd. | Chuo-ku, Tokyo | 65 | Pharmaceuticals | 100.0 [100.0] | ||||||
Daiichi Butsuryu Co., Ltd. | Sumida-ku, Tokyo | 50 | Pharmaceuticals | 100.0 [100.0] | ||||||
Daiichi Medical Co., Ltd. | Chuo-ku, Tokyo | 50 | Pharmaceuticals | 100.0 [100.0] | ||||||
Institute of Science and Technology, Inc. | Shinagawa-ku, Tokyo | 20 | Pharmaceuticals | 100.0 [100.0] | Concurrent directors | |||||
Kanto Daiichi Service Co., Ltd. | Edogawa-ku, Tokyo | 10 | Pharmaceuticals | 100.0 [100.0] | ||||||
Daiichi Sankyo Healthcare Co., Ltd. | Chuo-ku, Tokyo | 10 | Pharmaceuticals | 100.0 [100.0] | ||||||
Wakodo Co., Ltd. | Chiyoda-ku, Tokyo | 2,918 | Other | 61.2 [61.2] | Concurrent directors | |||||
Wako Food Industry Co., Ltd. | Nagano-shi, Nagano | 25 | Other | 100.0 [100.0] | ||||||
Wako Logistics Co., Ltd. | Chofu-shi, Tokyo | 21 | Other | 100.0 [100.0] | ||||||
Nihon Shoni Iji Shuppansha Co., Ltd. | Shinjuku-ku, Tokyo | 20 | Other | 100.0 [100.0] | ||||||
Fuji Flour Milling Co., Ltd. | Shimizu-ku, Shizuoka-shi, Shizuoka | 500 | Other | 66.4 [66.4] | ||||||
Sankyo Agro Co., Ltd. | Bunkyo-ku, Tokyo | 350 | Other | 100.0 [100.0] | ||||||
Utsunomiya Chemical Industry Co., Ltd. | Utsunomiya-shi, Tochigi | 20 | Other | 100.0 [100.0] | Concurrent directors | |||||
Hokkai Sankyo Co., Ltd. | Kitahiroshima-shi, Hokkaido | 331 | Other | 80.0 [80.0] | Concurrent directors | |||||
Nippon Nyukazai Co., Ltd. | Chuo-ku, Tokyo | 300 | Other | 100.0 [100.0] | Concurrent directors | |||||
Sankyo Lifetech Co., Ltd. | Bunkyo-ku, Tokyo | 300 | Other | 100.0 [100.0] | ||||||
Daiichi Jisho Co., Ltd. | Chuo-ku, Tokyo | 100 | Other | 100.0 [100.0] | ||||||
Meguro Chemical Industry Co., Ltd. | Meguro-ku, Tokyo | 40 | Other | 100.0 [100.0] | Concurrent directors | |||||
Daiichi Sankyo Inc. | New Jersey, U.S. | 24.9 million U.S. dollars | Pharmaceuticals | 100.0 [100.0] | ||||||
Luitpold Pharmaceuticals, Inc. | New York, U.S. | 200 thousand U.S. dollars | Pharmaceuticals | 100.0 [100.0] | ||||||
Daiichi Asubio Pharmaceuticals, Inc. | New Jersey, U.S. | 1 U.S. dollar | Pharmaceuticals | 100.0 [100.0] | ||||||
Daiichi Asubio Holdings, Inc. | Delaware, U.S. | 6,272 thousand U.S. dollars | Pharmaceuticals | 100.0 [100.0] | ||||||
Daiichi Asubio Medical Research Laboratories LLC | Massachusetts, U.S. | 3 million U.S. dollars | Pharmaceuticals | 100.0 [100.0] | ||||||
Sankyo Pharma GmbH | Munich, Germany | 16 million euros | Pharmaceuticals | 100.0 [100.0] | ||||||
Sankyo Pharma UK Ltd. | Amersham, UK | 19.5 million pounds | Pharmaceuticals | 100.0 [100.0] | ||||||
Sankyo Pharma Espana S.A. | Madrid, Spain | 120 thousand euros | Pharmaceuticals | 100.0 [100.0] | ||||||
Sankyo Pharma Italia S.p.A. | Rome, Italy | 120 thousand euros | Pharmaceuticals | 100.0 [100.0] | ||||||
Sankyo Pharma Portugal Lda. | Porto Salvo, Portugal | 349 thousand euros | Pharmaceuticals | 100.0 [100.0] | ||||||
Sankyo Pharmazeutika Austria GmbH | Vienna, Austria | 18 thousand euros | Pharmaceuticals | 100.0 [100.0] | ||||||
Sankyo Pharma (Schweiz) AG | Thalwil, Switzerland | 3 million Swiss Francs | Pharmaceuticals | 100.0 [100.0] | ||||||
Sankyo Pharma Nederland B.V. | Zwanenburg, the Netherlands | 18 thousand euros | Pharmaceuticals | 100.0 [100.0] | ||||||
N.V. Sankyo Pharma Belgium S.A. | Louvain-La- Nueve, Belgium | 62 thousand euros | Pharmaceuticals | 100.0 [100.0] | ||||||
Oy Sankyo Pharma Finland Ab | Helsinki, Finland | 25 thousand euros | Pharmaceuticals | 100.0 [100.0] | ||||||
Sankyo Manufacturing France S.a.r.l. | Altkirch, France | 457 thousand euros | Pharmaceuticals | 100.0 [100.0] | ||||||
Dignos-Chemie GmbH | Munich, Germany | 40 thousand euros | Pharmaceuticals | 100.0 [100.0] | ||||||
Sankyo Pharma France S.A.S. | Rueil Malmaison, France | 2,182 thousand euros | Pharmaceuticals | 100.0 [100.0] | ||||||
Sankyo Grundstücks GmbH | Munich, Germany | 5.1 million euros | Pharmaceuticals | 100.0 [100.0] | ||||||
Sankyo Grundstücks GmbH & Co. Object Munich KG | Munich, Germany | 38.2 million euros | Pharmaceuticals | 94.0 [94.0] | ||||||
Daiichi Pharmaceuticals UK Ltd. | London, UK | 400 thousand pounds | Pharmaceuticals | 100.0 [100.0] | ||||||
Laboratoires Daiichi Sanofi–Aventis | Paris, France | 154 thousand euros | Pharmaceuticals | 51.0 [51.0] | Concurrent directors | |||||
Daiichi Fine Chemical Europe GmbH | Dusseldorf, Germany | 511 thousand euros | Other | 100.0 [100.0] | ||||||
Daiichi Pharmaceutical (Beijing) Co., Ltd. | Beijing, China | 63,800 thousand U.S. dollars | Pharmaceuticals | 100.0 [100.0] | Concurrent directors | |||||
Daiichi Pharmaceutical Asia Ltd. | Hong Kong, China | 3,000 thousand HK dollars | Pharmaceuticals | 100.0 [100.0] | ||||||
Daiichi Pharmaceutical Taiwan Ltd. | Taipei, Taiwan | 80 million NT dollars | Pharmaceuticals | 100.0 [100.0] | ||||||
Daiichi Pharmaceutical Korea Co., Ltd. | Seoul, Korea | 3,000 million W | Pharmaceuticals | 70.0 [70.0] | Concurrent directors | |||||
Daiichi Pharmaceutical (Thailand) Ltd | Bangkok, Thailand | 10,000 thousand baht | Pharmaceuticals | 100.0 [100.0] | ||||||
Sino-Japan Chemical Co., Ltd. | Taipei, Taiwan | 144 million NT dollars | Other | 52.0 [52.0] | Concurrent directors | |||||
Affiliated companies accounted for by the equity method | ||||||||||
Sanofi-Pasteur-Daiichi Vaccines Co., Ltd. | Edogawa-ku, Tokyo | 310 | Pharmaceuticals | 50.0 [50.0] | Concurrent directors | |||||
Laboratoires Daiichi Sanofi–Synthelabo | Shinjuku-ku, Tokyo | 100 | Pharmaceuticals | 49.0 [49.0] | Concurrent directors | |||||
Tokyo Iyaku Shiki Co., Ltd. | Shimada-shi, Shizuoka | 163 | Pharmaceuticals | 30.9 [30.9] | ||||||
Nishimura Shiki Co., Ltd. | Takatsuki-shi, Osaka | 30 | Pharmaceuticals | 30.9 [30.9] | ||||||
Hitachi Pharma Evolutions, Ltd. | Shinagawa-ku, Tokyo | 250 | Other | 49.0 [49.0] | ||||||
(Notes)
| 1. | The information under the principal business operations column indicates the name of operating segment used in the segments information, to which the respective entity belong. |
| 2. | Of the consolidated subsidiaries and affiliates listed above, Sankyo Company, Limited, Daiichi Pharmaceutical Co., Ltd., Daiichi Asubio Pharma Co., Ltd. and Daiichi Pharmaceutical (Beijing) Co., Ltd. are qualified as a “significant subsidiary” as defined in the regulations under the Securities and Exchange Law of Japan. |
| 3. | Of the consolidated subsidiaries and affiliates listed above, Sankyo Company, Limited, Daiichi Pharmaceutical Co., Ltd., Wakodo Co., Ltd. and Fuji Flour Milling Co., Ltd. file a separate securities report to the Ministry of Finance in Japan. |
| 4. | Figures in parentheses under the percentage of voting rights held column refer to the percentage of ownership held indirectly through other subsidiaries. |
| 5. | Daiichi Sankyo Healthcare Co., Ltd., a new consolidated subsidiary, was established in December 2005, for the purpose of integrating the healthcare business of Sankyo Company, Limited. and Daiichi Pharmaceutical Co., Ltd. On April 1, 2006, Sankyo and Daiichi each divested their respective healthcare (OTC drug) operations into Daiichi Sankyo Healthcare Co., Ltd. |
| 6. | Sankyo Grundstücks GmbH & Co. Object Munich KG, a 94% owned partnership newly established by Sankyo Grundstücks GmbH is included in the scope of consolidation from the year ended March 31, 2006. |
| 7. | Daiichi Suntory Pharma Co., Ltd. changed its name to Daiichi Asubio Pharma Co., Ltd. on October 1, 2005. |
| 8. | Daiichi Pharmaceutical (Beijing) Co., Ltd. took over Daiichi Pharmaceutical (China) Co., Ltd. by merger on January 10, 2006. |
| 9. | On March 31, 2006, Sankyo Pharma Inc., a U.S. subsidiary of Sankyo Company, Limited, took over by merger three U.S. subsidiaries of Daiichi Pharmaceutical Co., Ltd. (Daiichi Pharma Holdings, Inc., Daiichi Pharmaceutical Corporation and Daiichi Medical Research, Inc.), and changed its name to DAIICHI SANKYO, INC. |
| 10. | F.P. Processing Co., Ltd., which was a consolidated subsidiary of the Company, has been excluded from the scope of consolidation in the year ended March 31, 2006 due to the disposition of the Company’s entire share holdings in this company in January 2006. |
| 11. | Fuji Flour Milling Co., Ltd., a consolidated subsidiary, was merged with Nitto Flour Milling Co., Ltd. on April 1, 2006. The merged entity changed its name to Nitto-Fuji Flour Milling Co., Ltd. The percentage of the Company’s voting interests in Nitto-Fuji Flour Milling Co., Ltd. was diluted so that it is no longer an affiliate of the Company from that date. |
| 12. | The Company sold its entire equity interests in Oy Sankyo Pharma Finland Ab in January 2006. |
| 13. | Sanofi-Synthelabo Daiichi Pharmaceutical Co., Ltd. changed its name to Sanofi-Aventis Daiichi Pharmaceutical Co., Ltd. on April 1, 2006. |
2. Management Policies
1. Principal Management Policies
The Company is a joint holding company established on September 28, 2005 through the joint stock transfer implemented by Sankyo Company, Limited and Daiichi Pharmaceutical Co., Ltd. The Company and all the other companies in the DAIICHI SANKYO Group (the “Group”) are currently focused on solving various business issues, for the complete integration which is scheduled in April 2007.
The vision of the Group is to become a Japan-based “global pharma-innovator” that meets the medical needs of people worldwide by continuously developing innovative pharmaceuticals and related services. As a leading company in Japan’s pharmaceutical industry, DAIICHI SANKYO aims to develop a continuous stream of innovative drugs, and to expand its operations, built upon a global business bases, in the world’s major countries, and thereby to become a global player with its strong competitiveness in certain therapeutic areas.
In pursuit of this vision, the Company is determined to create three corporate values: economic value for shareholders through strong growth generated by innovative products; social value for the society by fulfilling a contributory role as a good corporate citizen; and human value by enhancing human development of the employees through proactive support for skill improvement.
2. Shareholder Profit Distribution Policies
The Company has prioritized the distribution of profits generated by the DAIICHI SANKYO Group businesses among the key management issues. The profit distribution is determined, while focusing on a level of return that is commensurate with underlying business performance and capital efficiency, based on comprehensive consideration of other factors, such as the need to build up retained earnings to fund future business development for growth strategies.
The Company has set a medium-term goal of achieving a dividend-on-equity (DOE) ratio of 5% (i.e. payout of total dividends equal to 5% of shareholders’ equity) by the fiscal year ending March 2010. Going forward, the Company plans to increase the level of dividends steadily toward this goal. The Company also plans to buy back, in a strategic manner, its own shares.
Undistributed earnings will be primarily used for investments in Daiichi Sankyo’s future growth strategies including the strengthening of R&D, corporate collaboration, and overseas business development.
3. Number of Shares of Common Stock per Unit
To increase the liquidity of its shares and expand its shareholder base, the Company has set the size of its share trading unit at 100 shares.
4. Business Performance Targets
The DAIICHI SANKYO Group aims to greatly enhance its earning power through the synergies created by the business integration, and a steady sales growth from its existing mainstay products and contribution by new products, while maintaining R&D spending at a level required to pursue the “global pharma-innovator” status. The performance goals for the fiscal year ending March 31, 2010 have been set to at net sales of ¥932.0 billion and operating income of ¥255.0 billion.
5. Medium- to Long-Term Management Strategies and Challenges
For the DAIICHI SANKYO Group, the ongoing integration process is an opportunity to make it prepared to take its first step as a Japan-based “global pharma-innovator.” The Company is actively tackling the issues discussed below as part of this process.
| (1) | Realization of Complete Integration |
In line with the integration schedule, the first step toward the complete business integration was the establishment of the Company as a joint holding company through the stock transfer. Operational integration has since progressed in several areas. The integration of sales and marketing functions in the U.S., development functions in both Europe and the U.S., and the healthcare businesses was completed on schedule by April 2006. The two remaining goals to complete by the end of March 2007 are: the establishment of an independent operation outside the DAIICHI SANKYO Group by all the non-pharmaceutical businesses; and the complete integration of the pharmaceutical businesses of Sankyo Company, Limited and Daiichi Pharmaceutical Co., Ltd. through merger with the holding company, DAIICHI SANKYO.
The DAIICHI SANKYO Group is focusing its collective efforts on the realization of complete integration with an aim of realizing the highest level of operational efficiency in the industry. Various business integration committees have been formed to guide this process, including the installation of common support teams, such as one for the integration of the HR systems. By the time the merger has been completed, the Company expects the integration process will have delivered substantial benefits, ranging from improved use of personnel, streamlined cost structures and other operational synergies to stronger management and business development functions as well as more effective HR training and development.
| (2) | Concentration on the Pharmaceutical Business |
To promote superior earnings and consistent growth, the DAIICHI SANKYO Group plans to concentrate on the pharmaceutical business consisting of prescription drug and healthcare product operations. The plan is to complete the establishment of an independent operation outside the DAIICHI SANKYO Group by the non-pharmaceutical businesses before the end of March 2007.
Fuji Flour Milling Co., Ltd. already concluded a merger agreement with Nitto Flour Milling Co., Ltd. in September 2005 and became independent of the Group when the merger came into effect in April 2006. Wakodo Co., Ltd. also will become independent of the Group in May 2006 as the Group is to sell its equity interests in Wakodo through a TOB by Asahi Breweries, Ltd.
| (3) | Enhancement in Innovative Drug Discovery |
In order to achieve its goal of developing innovative new drugs to fulfill unsatisfied medical needs, the Company is working to build an R&D operation with specific management objectives. The principal objectives include (1) a global R&D organization of an appropriate scale; (2) sufficient scale to support innovative researches in the key therapeutic areas; (3) retention and development of researchers for in-house discovery of key drug candidates; and (4) effective and efficient controls on development projects coupled with timely decision-making.
The integration of the R&D management functions of Sankyo and Daiichi is one of the top management priorities within the overall integration process. Upon successful completion of the integration of the development organizations in Europe and the United States in April 2006, the Company has already started a global drug development process, a year ahead of the original schedule. Back in October 2005, the Company established the Global Executive Meeting of Research and Development (GEMRAD) as the deliberative body to facilitate the R&D-related decision making. GEMRAD has designated cardiovascular, glucose metabolic, infectious and cancer diseases as the strategic therapeutic areas for the DAIICHI SANKYO Group. The selection of drug development candidates within these areas has also been completed. Based on a priority evaluation on each candidate, GEMRAD has selected five pipeline drugs as the top-priority development projects for the DAIICHI SANKYO Group: prasugrel (CS-747), an antiplatelet agent; DU-176b, a factor-Xa inhibitor; CS-8663, a combination drug containing the antihypertensives olmesartan and amlodipine; DJ-927, a taxane derivative (oral anticancer); and DZ-697b, an antiplatelet agent. A development project team has been set up to manage R&D activities for each of these key pipeline drug candidates.
| (4) | Enhancement of Earnings Bases in Japan and Overseas |
The integration of the domestic prescription drug businesses will result in a combined sales force of over 2,500 medical representatives (MRs), which will afford the DAIICHI SANKYO Group superior marketing power in terms of both quality and quantity. The integration will also facilitate further strengthening of relationships with medical wholesalers operating on a national scale, thereby enabling the implementation of a distribution strategy that make most use of economies of scale. Beginning in April 2007, the Company plans to concentrate its marketing power on promoting sales of the leading products, thereby increasing sales and creating a stronger base of sales operations within the domestic market. Collaborative activities have already commenced forOlmetec® (November 2005) andCravit® (April 2006) to accelerate the realization of merger benefits.
In overseas markets, the Company plans to take full advantage of larger economies of scale created by the integration and thereby achieve substantial increases in product value by conducting both development and marketing in-house for certain high-priority projects, particularly in the United States. To this end, management recognizes a critical need in the expansion of overseas development and marketing bases in the United States and other markets. The Company plans to focus on such expansion through various means which include the selective acquisition of external resources based on an alliance- and M&A-centered strategy.
The Company established DAIICHI SANKYO, INC. by integrating the U.S.-based operations of Sankyo and Daiichi, in April 2006 and has been expanding the U.S. operations.
In the healthcare drug operations, the Company established Daiichi Sankyo Healthcare Co., Ltd., by integrating the healthcare businesses of Sankyo and Daiichi, and started its operations in April 2006.
Going forward, the Company plans to strengthen its earnings base by constructing a low-cost operational structure and by expanding sales of exiting brands as well as new products, through its focus on integrated capabilities in R&D, sales and marketing.
In addition, in April 2006, the Company acquired all the shares of Zepharma Inc., the healthcare business of Astellas Pharma Inc. The plan is to integrate the operations of Zepharma with those of Daiichi Sankyo Healthcare in April 2007, which will strengthen its earnings base by further expanding the scale of operations and by boosting brand asset values.
6. Litigation
| (1) | In the United States, numerous lawsuits seeking damages and other compensation were brought against Warner-Lambert Company and other pharmaceutical companies by certain patients who took the diabetes drug Rezulin, which had been sold until March 2000 using a compound whose generic name is troglitazone supplied by the Sankyo Company, Limited, a wholly-owned subsidiary of the Company. A U.S. subsidiary of the Company, Sankyo Pharma Inc. (currently, DAIICHI SANKYO, INC.), is named as a defendant in a small portion of these cases, and it is defending these cases in cooperation with Warner-Lambert. In these cases, the compensation demanded from all defendants includes claims for both compensatory and punitive damages. In connection with the costs and damages to be borne by the Sankyo Company, Limited and its subsidiaries, there is a provision in the license agreement with Warner-Lambert indemnifying the Sankyo Company, Limited and its subsidiaries. |
| (2) | Daiichi Pharmaceutical Co., Ltd., a subsidiary of the Company, has settled with most of the civil claims in the United States, following the earlier antitrust judgment against Daiichi related to its sales of bulk vitamins. In Europe, Daiichi was in the process of an appeal with the European Court of First Instance to reduce the fine initially imposed by the European Commission. |
In March 2006, the court ruled a reduction in the amount of the fine to §1,800 million and the Company accepted the ruling. As a result, the Company, which had already expensed a part of the fine as an extraordinary loss in the fiscal year ended March 31, 2002, charged the balance in the extraordinary losses in the fiscal year ended March 31, 2006.
| (3) | With its local U.S. licensee as co-plaintiff, Daiichi Pharmaceutical Co., Ltd., a subsidiary of the Company, filed a patent infringement lawsuit in a U.S. district court against the Mylan Group, who had filed an application for a generic version of levofloxacin (one of the Company’s leading products). The U.S. district court ruled in favor of Daiichi in December 2004, which was then appealed by the Mylan Group. In December 2005, the appellate court affirmed the decision by the U.S. district court. |
Going forward, the DAIICHI SANKYO Group will continue to rigorously defend its intellectual property rights.
7. Matters Relating to the Parent Company, etc.
Not applicable.
3. Results of Operations and Financial Position
The Company was established on September 28, 2005, as a joint holding company through the share transfer. Accordingly, as the current fiscal year is the Company’s first year of operation, year-by-year performance comparisons are not presented.
Performance figures for the fiscal year include the two subsidiaries’ consolidated results from April 1, 2005 through March 31, 2006, as well as the Company’s non-consolidated results from September 28, 2005 through March 31, 2006.
1. Result of Operations
| (1) | Overview of the fiscal year |
While, the global pharmaceutical market continues to realize a certain level of growth, led by the U.S. market, the global market is characterized by such trends as the progressive globalization and the increasing strictness of new drug development standards as well as the intense competition centered on global mega pharmaceutical companies in the areas of both R&D and marketing activities. In the Japanese market, measures to contain healthcare costs advanced further as national university hospitals were reorganized into independent medical corporations and an increasing number of medical institutions have been adopting a new comprehensive in-hospital treatment evaluation system. In addition, the competition among increasingly prominent foreign-owned pharmaceutical companies and other major companies has intensified, which resulted in our business environment being intensively harsh.
The DAIICHI SANKYO Group focused its marketing efforts on expanding markets for its products by promoting the proper use of drugs through the provision of accurate information related to the efficacy and safety of its products. As a result, the Company posted consolidated net sales of ¥925.9 billion in its first inaugural fiscal year. The Company’s top-selling products in Japan included the antihypertensive agentsOlmetec® andCalblock®, the broad-spectrum oral antibacterial agentCravit®, andArtist®, a treatment for high blood pressure, angina, and chronic cardiac insufficiency. In overseas markets, leading contributors to the net sales included bulk exports of the synthetic antibacterial levofloxacin and the antihypertensive agent olmesartan (sold asBenicar® in North America and asOlmetec® in Europe).
In terms of profitability, the Company invested in improving quality and technology levels while promoting cost-reduction measures. As a result, the total cost of sales amounted to ¥290.7 billion (cost-of-sales ratio: 31.4%); selling, general and administrative expenses totaled ¥480.4 billion, of which research and development expenses accounted for ¥158.7 billion. Operating income was ¥154.7 billion and ordinary income was ¥159.7 billion.
The Company took an charge of ¥9.8 billion related to the business integration and also posted an impairment loss of ¥5.2 billion for idle property, plant and equipment in the extraordinary losses. Net income for the year ended March 31, 2006 amounted to ¥87.6 billion.
| (2) | Segment Information |
(Operating Segments) Net sales of each operating segment include only sales to outside customers.
| 1) | Pharmaceuticals |
Net sales in the pharmaceuticals segment totaled ¥784.6 billion, and operating income amounted to ¥148.1 billion.
Uncertainty plagued the business environment in the Japanese prescription drug market with an ongoing impact of government initiatives to reduce healthcare spending, including more affirmative measures to promote the use of generic medicines, and a downward revision in the National Health Insurance (NHI) drug reimbursement tariff implemented in April 2006 by an average of 6.7%.
Under these harsh market conditions, sales of prescription drugs in the Japanese market totaled ¥431.4 billion. Although sales of the antihyperlipidemic agentMevalotin® declined, several leading products recorded higher sales, including the broad-spectrum oral antibacterial agentCravit® and the antihypertensive agentOlmetec®. Sales revenue was also increased by a receipt of the milestone payments related to the approval on manufacturing and marketing ofPlavix®.
Sales of prescription drugs in overseas markets totaled ¥289.5 billion. Sales of bulk pravastatin, an antihyperlipidemic agent, declined due to its patent expiration in Europe and fierce competition in the United States. Sales of the antihypertensive agent olmesartan (marketed asBenicar® in North America and asOlmetec® in Europe) increased significantly, and bulk exports of the synthetic antibacterial levofloxacin also generated a steady growth. In addition, favorable currency translation arising from yen depreciation contributed to the higher sales amount.
Sales of healthcare drugs amounted to ¥27.9 billion. Depressed market conditions in Japan and the entry of rival products resulted in lower sales of leading products such as the hair growth agentsKaroyan Gush® andCystina C®, a vitamin complex. The decrease was offset by brisk sales ofLamisil AT®, the switch-OTC formulation of a prescription drug for treating athlete’s foot.
| 2) | Other |
Sales in the other segment totaled ¥141.2 billion, and operating income amounted to ¥6.1 billion.
The DAIICHI SANKYO Group plans to focus its resources on the pharmaceutical business. To this end, the Company plans to spin off the non-pharmaceutical businesses as independent enterprises, and thereby to realize greater operational efficiency.
| (3) | Dividends |
As initially projected, the Company will pay a year-end dividend of ¥25 per share.
As a result, together with the share transfer payment of ¥25 per share paid in lien of interim dividends on December 12, 2005, the dividend payout ratio (consolidated) will be 40.5 % and the dividends on equity ratio (consolidated) will be 2.9 %.
| (4) | R&D Activities |
R&D spending by the DAIICHI SANKYO Group, which was mostly incurred in the pharmaceutical segment, totaled ¥158.7 billion (17.1% of net sales).
The R&D activities of the DAIICHI SANKYO Group are directed at realizing the Company’s vision of being a “global pharma-innovator.” The Group focused its R&D investments in the strategic therapeutic areas with the aim of bringing a continuous stream of world-class innovative drugs to the market, while also trying to shorten the lead time to launch a new product.
As part of the ongoing integration process, the Company first moved to integrate the R&D decision-making bodies of Sankyo and Daiichi. By unifying R&D management into an integrated structure, the Company aims to accelerate those high-priority development projects that are positioned to become the driving force for future business growth.
In terms of the development status of key projects, on the Sankyo side a regulatory approval was obtained in January 2006 forLoxonin® poultice (generic name: loxoprofen sodium), a percutaneous absorption-type analgesic and anti-inflammatory preparation, and the launch of the product is planned for May 2006 in Japan. In addition, on the Daiichi side, a regulatory approval was obtained in January 2006 forUrief® (generic name: silodosin), an agent for treating dysuria that was jointly developed with Kissei Pharmaceutical Co., Ltd., and forPlavix® (generic name: clopidogrel sulfate), an antiplatelet agent. Both products were launched also in May 2006. Based on an agreement reached in September 2005 to transfer the marketing rights to the Sanofi-Aventis Group, Daiichi transferred the approval forPlavix® to their Japanese subsidiary Sanofi-Aventis K.K. in March 2006. The Company plans to continue collaborating with Sanofi-Aventis K.K. on the manufacture and promotion ofPlavix® in Japan.
In January 2006, Sankyo concluded an agreement with U.S.-based KAI Pharmaceuticals, Inc. for KAI-9803 (internal code: CS-9803), a treatment for myocardial infarction and cerebral infarction currently in Phase I/II clinical trials in the United States, in which the Company gained exclusive worldwide development, manufacturing and distribution rights for that drug. The joint development of the drug with KAI Pharmaceuticals is expected to continues.
Based on its ongoing reviews of the R&D projects, the DAIICHI SANKYO Group terminated its involvement in the development of two drug candidates, CS-505, a treatment for arteriosclerotic disorders developed in-house due to its failure to demonstrate sufficient clinical efficacy in Phase II trials in the United States; andFidarestat®,a diabetic neuropathy agent being jointly developed with Sanwa Kagaku Kenkyusho Co., Ltd. in order to concentrate its R&D resources on more strategic candiates.
The results of a large-scale clinical trial “MEGA Study” featuring a Sankyo drug, pravastatin (brand name: Mevalotin®), were presented in November 2005 at the annual American Heart Association (AHA) Scientific Sessions. This trial was a special study initiated in 1993 as a contract research project sponsored by the Ministry of Health, Labor and Welfare (the Ministry of Health and Welfare at the time) targeting approximately 8,000 mild to moderate hyperlipidemia patients with no past history of coronary heart disease. It represents the first large-scale randomized, comparative study in Japan to test the drug’s efficacy in primary prevention against cardiovascular disease over an average observation period of more than five years. The results of the study clearly underlined the significant potential clinical benefits of antihyperlipidemic therapy in Japan. Going forward, the Company plans to communicate this information accurately and appropriately to the healthcare professionals communities.
2. Financial Position
Statement of Cash Flows
Cash and cash equivalents increased by ¥46.8 billion during the year ended March 31, 2006, to ¥400.9 billion. Contributing factors are summarized as follows:
Cash Flows from Operating Activities
Net cash provided by operating activities amounted to ¥132.7 billion. The amount mainly consisted of ¥136.8 billion in income before income taxes and minority interests, ¥41.1 billion in depreciation expense, and ¥53 billion in payments of income taxes.
Cash Flows from Investing Activities
Net cash used in investing activities totaled ¥39.2 billion. The Company used ¥48.5 billion for the capital expenditures in property, plant and equipment and intangible assets, and ¥10.2 billion for the acquisition of investments in subsidiaries.
Cash Flows from Financing Activities
Cash used in financing activities amounted to ¥50.1 billion. A total of ¥16.6 billion was used to purchase treasury stock, ¥17.3 billion was paid as cash dividends, and ¥17.1 billion was paid as stock transfer payments.
| <Principal Financial Indicators> | ||
| Fiscal 2005 | ||
Shareholders’ equity ratio (%) | 77.5 | |
Market capitalization ratio (%) | 122.6 | |
Interest-bearing debt ratio (years) | 0.1 | |
Interest coverage ratio (times) | 593.9 | |
Shareholders’ equity ratio: total shareholders’ equity/total assets | ||
Market capitalization ratio: total market capitalization/total assets | ||
Interest-bearing debt ratio: interest-bearing debt/operating cash flows | ||
Interest coverage ratio: operating cash flows/interest paid | ||
(Notes)
| 1. | All indicators are calculated on a consolidated basis. |
| 2. | Total market capitalization = closing stock price on the balance sheet date times the number of outstanding common shares at the balance sheet date (net of treasury shares) |
| 3. | Interest-bearing debt includes all consolidated balance sheet liabilities which are subject to an interest payment. |
| 4. | Operating cash flows equal to the amount of cash flows from operating activities in the consolidated statement of cash flows less the amounts of “interest paid” and “income taxes paid.” Interest paid equals to the “interest paid” included in the consolidated statement of cash flows. |
3 Forecast of Consolidated Results for Fiscal 2006 (April 1, 2006 – March 31, 2007)
| (Billions of yen) | ||||||||||||
| Net sales | Operating income | Ordinary income | Net income | |||||||||
Fiscal 2006 | 865 | 108 | 115 | 47 | ||||||||
Fiscal 2005 | 925 | 154 | 159 | 87 | ||||||||
Change (%) | (6.6 | ) | (30.2 | ) | (28.0 | ) | (46.4 | ) | ||||
The DAIICHI SANKYO Group expects the business environment in the year ending March 31, 2007 to remain challenging in Japan and in overseas markets. The Company plans to leverage its combined marketing forces to boost market presence and thereby strengthen the earnings base. At the same time, the Company will continue to focus on realizing increased efficiency.
On the sales front, the Company faces a particularly tough challenge due to a number of factors that will significantly depress revenues, including the effect of NHI price cuts in Japan; the expiration of the U.S. patent on pravastatin; and the planned reorganization of the DAIICHI SANKYO Group’s non-pharmaceutical businesses. On the other hand, the Company will be able to reinforce sales and promotional efforts in prescription drug market in Japan by utilizing its superior sales force for core mainstay products such as the antihypertensiveOlmetec®, the antihyperlipidemic agentMevalotin® and the broad-spectrum oral antibacterial agentCravit®. Another key sales goal in Japan is a smooth market introduction forUrief®, an agent for relieving symptoms of dysuria associated with prostatic hypertrophy (launched in May 2006).
In overseas prescription drug markets, the two major sales-related objectives are the prioritized allocation of resources to expand sales of the antihypertensive agent olmesartan (marketed asBenicar® in North America and asOlmetec® in Europe) and a continued focus on building cooperative relationships with alliance partners to maximize sales of the bulk agents pravastatin (an antihyperlipidemic agent) and levofloxacin (a synthetic antibacterial), as well as other major products. In the healthcare drug business, by having divested and integrated the healthcare operations of Sankyo and Daiichi into one entity and having also acquired Zepharma Inc., the main focus will be on expanding and strengthening the business base. Taking into account all the above factors, the DAIICHI SANKYO Group projects a 6.6% decline in overall sales to ¥865.0 billion.
On the profit side, the Company plans to invest consistently in critical R&D areas, as well as investing in sales bases outside of Japan. The Company also expects business integration costs to be incurred to achieve the complete integration in April 2007. A variety of efforts are now underway across the entire DAIICHI SANKYO Group to maintain profitability and build operational efficiency by restructuring the infrastructures and business processes, and by reducing cost and containing expenses. The company will continue to work on making group companies in non-pharmaceutical business become completely independent companies outside of the Group by March 2007. For the year ending March 31, 2007, the DAIICHI SANKYO Group projects a 30.2% decline in operating income to ¥108.0 billion and a 28.0% decrease in ordinary income to ¥115.0 billion, and a 46.4% decrease in net income to ¥47 billion.
Earnings at overseas subsidiaries are calculated using the foreign exchange rates of ¥115 = U.S.$1.00 and ¥135 = € 1.00.
Regarding dividend payment in fiscal 2006, although the Company forecasts its earnings to decline, it plans to pay cash dividend of 60 yen per share, up 10 yen compared to the current fiscal year, based on its policy to increase a level of cash dividends at a stable rate to the mid-term targeted ratio of 5% on a cash dividend on shareholders’ equity (DOE).
4. Business Risks
The following section provides an overview of the principal risks that could affect the business results and financial condition of the DAIICHI SANKYO Group. Any forward-looking statements or projections contained in this overview represent the best judgment of DAIICHI SANKYO Group management as of the end of the last fiscal year (March 31, 2006).
| (1) | Research and Development Risk |
Research and development of new drug candidates is an extremely costly process that requires many years to complete successfully, during which time there is a continual risk that R&D activities on a particular compound may be terminated due to failure to demonstrate expected clinical efficacy. In addition, any changes in the terms of agreements with other third-parties governing R&D-related alliances, or the cancellation thereof, can also materially affect the outcomes of R&D programs.
| (2) | Manufacturing and Procurement Risk |
The DAIICHI SANKYO Group manufactures some of its products at its own production facilities using original technology, but is also dependent on specific suppliers for the supply of some finished products, raw materials and production intermediates. Any delay, suspension or termination of such manufacturing or supply activities for any reason could have a material impact on the Company’s business results and financial position. Manufacture of pharmaceuticals in Japan is subject to strict regulation as stipulated in the Pharmaceutical Affairs Law. Any quality assurance problem that necessitated a product recall could have a material adverse impact on the Company’s business results and financial position.
| (3) | Sales-related Risk |
Any decline in sales due to the emergence of unanticipated side effects of a drug, or due to the entry of generic products into a sector following the expiration of a patent, and the introduction of a rival product within the same therapeutic area, could have a material impact on the Company’s business results and financial position. Any changes in the terms of sales or technology transfer agreements, or the expiration or cancellation thereof, could have a material impact on the Company’s business results and financial position.
| (4) | Legal and Regulatory Risk |
Prescription drugs in Japan are subject to a variety of laws, regulations and ordinances. Trends in regulatory measures relating to the medical treatment systems and the national health insurance, most notably the NHI price revisions that occur every two years, could have a material impact on the Company’s business results and financial position. Similarly, sales of prescription drugs in overseas markets are also subject to a variety of legal and regulatory constraints.
| (5) | Intellectual Property Risk |
The business activities of the DAIICHI SANKYO Group could be subject to restraint or dispute in an event of the infringement of the patents or other intellectual property rights of other parties. Conversely, infringement of the intellectual property rights of the DAIICHI SANKYO Group by other parties could lead to a legal action by the Company to protect such rights. In either case, the resulting outcome could have a material impact on the Company’s business results and financial position.
| (6) | Environmental Risk |
Certain of the chemicals used in pharmaceutical research and manufacturing processes include substances with the potential to exert a negative impact on human health and natural ecosystems. All DAIICHI SANKYO Group facilities operate on a self-regulated basis according to the internal standards designed to prevent the occurrence of any air or water pollution caused by plant emissions. The DAIICHI SANKYO Group also takes a proactive stance on environmental protection, for instance by employing substitute chemicals wherever possible to reduce a potential environmental impact of chemical substances used. Notwithstanding those efforts, there could be a material impact on the Company’s business results and financial position, were the emissions of a DAIICHI SANKYO Group facility determined to have resulted in a serious environmental problem.
| (7) | Litigation-related Risk |
Besides potential antitrust issues, the DAIICHI SANKYO Group could also face litigation of various forms concerning its business activities, such as lawsuits related to drug side effects, product liability or labor disputes. Such developments could have a material impact on the Company’s business results and financial position.
| (8) | Currency Fluctuation Risk |
Fluctuations in foreign currency exchange rates could be a financially adverse effect on the Company. The DAIICHI SANKYO Group conducts business, including production, sales, import and export activities, on a global basis, and foreign exchange movements could therefore have a material impact on the Company’s business results and financial position.
| (9) | Other Risks |
Other risks besides those noted above that could have a material impact on the Company’s business results and financial position include the suspension of its business activities due to an earthquake or other large-scale natural disaster; the interruption of the Company’s computer systems due to a network-mediated virus or other causes; changes in stock prices and interest rates; and collection issues on accounts and loans receivable due to default by a customer or a country specific problem at the customer.
4. Consolidated Financial Statements
(1) Consolidated Balance Sheets
(Millions of yen)
See | As of March 31, 2006 | |||||||||
| Amount | % | |||||||||
ASSETS | ||||||||||
I Current assets: | ||||||||||
1. Cash and time deposits | 223,979 | |||||||||
2. Trade notes and accounts receivable | 240,173 | |||||||||
3. Marketable securities | 274,510 | |||||||||
4. Mortgage-backed securities | 16,500 | |||||||||
5. Inventories | 121,694 | |||||||||
6. Deferred tax assets | 40,911 | |||||||||
7. Other current assets | 41,313 | |||||||||
Allowance for doubtful accounts | (599 | ) | ||||||||
Total current assets | 958,483 | 60.1 | ||||||||
II Non-current assets: | ||||||||||
1. Property, plant and equipment: | *1 | |||||||||
(1) Buildings and structures | *3 | 164,047 | ||||||||
(2) Machinery, equipment and vehicles | *3 | 47,888 | ||||||||
(3) Land | *3 | 48,892 | ||||||||
(4) Construction in progress | 10,010 | |||||||||
(5) Other | *3 | 18,874 | 289,712 | 18.1 | ||||||
Total property, plant and equipment, net | ||||||||||
2. Intangible assets: | ||||||||||
Goodwill, net | 9,788 | |||||||||
Other intangible assets, net | 26,378 | 36,166 | 2.3 | |||||||
3. Investments and other assets: | ||||||||||
(1) Investment securities | *2, 3 | 256,338 | ||||||||
(2) Long-term loans | 6,154 | |||||||||
(3) Prepaid pension costs | 17,307 | |||||||||
(4) Deferred tax assets | 7,403 | |||||||||
(5) Other assets | *2 | 25,090 | ||||||||
Allowance for doubtful accounts | (529 | ) | 311,763 | 19.5 | ||||||
Total non-current assets | 637,643 | 39.9 | ||||||||
Total assets | 1,596,126 | 100.0 | ||||||||
(Millions of yen)
| See Note | As of March 31, 2006 | |||||||
| Amount | % | |||||||
LIABILITIES | ||||||||
I Current liabilities: | ||||||||
1. Trade notes and accounts payable | 65,596 | |||||||
2. Short-term bank loans | *3 | 13,547 | ||||||
3. Income taxes payable | 26,169 | |||||||
4. Deferred tax liabilities | 31 | |||||||
5. Allowance for sales returns | 657 | |||||||
6. Allowance for sales rebates | 2,204 | |||||||
7. Allowance for contingent losses | 3,379 | |||||||
8. Other current liabilities | 125,246 | |||||||
Total current liabilities | 236,833 | 14.9 | ||||||
II Non-current liabilities: | ||||||||
1. Long-term debt | *3 | 3,374 | ||||||
2. Deferred tax liabilities | 23,926 | |||||||
3. Accrued retirement and severance benefits | 68,321 | |||||||
4. Accrued directors’ retirement and severance benefits | 3,140 | |||||||
5. Accrued soil remediation costs | 2,850 | |||||||
6. Other non-current liabilities | 8,540 | |||||||
Total non-current liabilities | 110,154 | 6.9 | ||||||
Total liabilities | 346,987 | 21.8 | ||||||
MINORITY INTERESTS | ||||||||
Minority interests | 11,609 | 0.7 | ||||||
SHAREHOLDERS’ EQUITY | ||||||||
I Common stock | *7 | 50,000 | 3.1 | |||||
II Additional paid-in-capital | 179,858 | 11.3 | ||||||
III Retained earnings | 936,513 | 58.7 | ||||||
IV Net unrealized gain on investment securities | 80,254 | 5.0 | ||||||
V Foreign currency translation adjustments | 735 | 0.0 | ||||||
VI Treasury stock at cost | *8 | (9,832 | ) | (0.6 | ) | |||
Total shareholders’ equity | 1,237,529 | 77.5 | ||||||
Total liabilities, minority interests and shareholders’ equity | 1,596,126 | 100.0 | ||||||
(2) Consolidated Statement of Income
(Millions of yen)
See | Fiscal 2005 (Year Ended March 31, 2006) | |||||||
| Amount | % | |||||||
I Net sales | 925,918 | 100.0 | ||||||
II Cost of sales | *1 | 290,735 | 31.4 | |||||
Gross profit | 635,182 | 68.6 | ||||||
III Selling, general and administrative expenses: | ||||||||
1. Advertising and promotional expenses | 74,690 | |||||||
2. Salaries and bonuses | 98,570 | |||||||
3. Retirement and severance costs | 4,899 | |||||||
4. Research and development expenses | *1 | 158,716 | ||||||
5. Other | 143,577 | 480,454 | 51.9 | |||||
Operating income | 154,728 | 16.7 | ||||||
IV Non-operating income: | ||||||||
1. Interest income | 3,326 | |||||||
2. Dividend income | 1,995 | |||||||
3. Rent income | 1,148 | |||||||
5. Other income | 4,480 | 10,951 | 1.2 | |||||
V Non-operating expenses: | ||||||||
1. Interest expense | 313 | |||||||
2. Loss on disposal and write-down of inventories | 1,587 | |||||||
3. Charitable contributions | 1,099 | |||||||
4. Amortization of start-up costs | 361 | |||||||
5. Equity in net losses of affiliated companies | 349 | |||||||
6. Other expenses | 2,253 | 5,964 | 0.7 | |||||
Ordinary income | 159,714 | 17.2 | ||||||
(Millions of yen)
See | Fiscal 2005 (Year Ended March 31, 2006) | ||||||||
| Amount | % | ||||||||
VI Extraordinary gains: | |||||||||
1. Gain on sale of property, plant and equipment | *2 | 4,897 | |||||||
2. Gain on sale of investments in affiliates | 1,179 | ||||||||
3. Gain on sale of investment securities | 649 | ||||||||
4. Gain from the return of the substitutional portion of the employees’ pension fund to the government | 163 | 6,890 | 0.8 | ||||||
VII Extraordinary losses | |||||||||
1. Loss on disposal of property, plant and equipment | *3 | 5,550 | |||||||
2. Loss on business integration | *4 | 9,893 | |||||||
3. Loss on impairment of property, plant and equipment | *5 | 5,253 | |||||||
4. Provision for contingent losses | *6 | 3,379 | |||||||
5. Provision for soil remediation costs | 2,850 | ||||||||
6. Restructuring charge | *7 | 1,153 | |||||||
7. Loss on settlement of vitamin-related anti-trust litigations | *8 | 1,125 | |||||||
8. Loss on valuation of investment securities | 346 | ||||||||
9. Supplemental retirement benefit cost | 160 | 29,712 | 3.2 | ||||||
Net income before income taxes and minority interests | 136,892 | 14.8 | |||||||
Income tax expense – current | 54,207 | ||||||||
Income tax benefit – deferred | (5,011 | ) | 49,196 | 5.3 | |||||
Minority interests in net income of subsidiaries | 3 | 0.0 | |||||||
Net income | 87,692 | 9.5 | |||||||
(3) Consolidated Statement of Retained Earnings
(Millions of yen)
See | Fiscal 2005 (Year Ended March 31, 2006) | |||||
| Amount | ||||||
ADDITIONAL PAID-IN CAPITAL | ||||||
I Additional paid-in capital, beginning of year | 180,027 | |||||
II Decrease in additional paid-in capital: | ||||||
Loss on reissuance of treasury stock | 169 | 169 | ||||
III Additional paid-in capital, end of year | 179,858 | |||||
RETAINED EARNINGS | ||||||
I Retained earnings, beginning of year | 956,658 | |||||
II Increase in retained earnings: | 87,692 | 87,692 | ||||
Net income | ||||||
III Decrease in retained earnings: | ||||||
1. Cash dividends | 17,311 | |||||
2. Share transfer payment | 17,167 | |||||
3. Bonuses to directors | 405 | |||||
4. Retirement of treasury stock | 72,419 | |||||
5. Loss on reissuance of treasury stock | 298 | |||||
6. Decrease due to changes in scope of consolidation | 235 | 107,837 | ||||
IV Retained earnings, end of year | 936,513 | |||||
| (4) | Consolidated Statement of Cash Flows |
(Millions of yen)
Fiscal 2005 (Year Ended March 31, 2006) | |||||||||||||
| See Note | Amount | ||||||||||||
I Cash flows from operating activities: | |||||||||||||
Income before income taxes and minority interests | 136,892 | ||||||||||||
Depreciation | 41,128 | ||||||||||||
Loss on impairment of property, plant and equipment | 5,253 | ||||||||||||
Amortization of goodwill | 1,424 | ||||||||||||
Decrease in allowance for doubtful accounts | (27 | ) | |||||||||||
Decrease in accrued retirement and severance benefits | (3,314 | ) | |||||||||||
Increase in prepaid pension costs | (1,813 | ) | |||||||||||
Interest and dividend income | (5,322 | ) | |||||||||||
Interest expense | 313 | ||||||||||||
Loss on sale of property, plant and equipment | 653 | ||||||||||||
Loss on penalty and settlement | 1,125 | ||||||||||||
Equity in net losses of affiliated companies | 349 | ||||||||||||
Decrease in trade notes and accounts receivable | 11,651 | ||||||||||||
Decrease in inventories | 8,251 | ||||||||||||
Decrease in trade notes and accounts payable | (6,990 | ) | |||||||||||
Other, net | (7,661 | ) | |||||||||||
Subtotal | 181,914 | ||||||||||||
Interest and dividends received | 5,285 | ||||||||||||
Interest paid | (313 | ) | |||||||||||
Penalty & legal settlement paid | (1,125 | ) | |||||||||||
Income taxes paid | (53,001 | ) | |||||||||||
Net cash provided by operating activities | 132,759 | ||||||||||||
II Cash flows from investing activities: | |||||||||||||
Purchases of time deposits | (5,140 | ) | |||||||||||
Proceeds from maturities in time deposits | 4,409 | ||||||||||||
Purchases of marketable securities | (86,578 | ) | |||||||||||
Proceeds from sale of marketable Securities | 119,972 | ||||||||||||
Acquisitions of property, plant and equipment | (41,798 | ) | |||||||||||
Proceeds from sale of property, plant and equipment | 5,471 | ||||||||||||
Acquisitions of intangible assets | (6,788 | ) | |||||||||||
Acquisitions of investment securities | (38,975 | ) | |||||||||||
Proceeds from sale of Investment securities | 16,095 | ||||||||||||
Acquisitions of investments in subsidiaries resulting in changes in percentage of equity holding | (10,268 | ) | |||||||||||
Proceeds from sale of investments in consolidated subsidiary resulting in changes in scope of consolidation | *2 | 642 | |||||||||||
Payment for loans receivable | (2,451 | ) | |||||||||||
Proceeds from collection of loans receivable | 1,837 | ||||||||||||
Other, net | 4,313 | ||||||||||||
Net cash used in investing activities | (39,258 | ) | |||||||||||
(Millions of yen)
Fiscal 2005 (Year Ended March 31, 2006) | |||||||||||||
| See Note | Amount | ||||||||||||
III Cash flows from financing activities | |||||||||||||
Net decrease in short-term bank loans | (2,286 | ) | |||||||||||
Proceeds from long-term debt | 1,110 | ||||||||||||
Repayments of long-term debt | (1,204 | ) | |||||||||||
Purchases of treasury stock | (16,610 | ) | |||||||||||
Proceeds from sale of treasury stock | 2,919 | ||||||||||||
Dividends paid | (17,326 | ) | |||||||||||
Stock transfer payments | (17,167 | ) | |||||||||||
Other, net | 460 | ||||||||||||
Net cash used in financing activities | (50,106 | ) | |||||||||||
IV Effect of exchange rate changes on cash and cash equivalents | 3,793 | ||||||||||||
V Net increase in cash and cash equivalents | 47,188 | ||||||||||||
VI Cash and cash equivalents, beginning of year | 354,102 | ||||||||||||
VII Decrease in cash and cash equivalents due to changes in scope of consolidation | (322 | ) | |||||||||||
VIII Cash and cash equivalents, end of year | *1 | 400,967 | |||||||||||
Basis of Presentation and Summary of Significant Accounting Policies for the Preparation of the Consolidated Financial Statements
Item | Fiscal 2005 (Year ended March 31, 2006) | |||
| 1. Scope of consolidation | (1) Consolidated subsidiaries: 57
Principal consolidated subsidiaries:
In Japan
Sankyo Co., Ltd., Daiichi Pharmaceutical Co., Ltd., Daiichi Asubio Pharma. Co., Ltd., Daiichi Fine Chemical Co., Ltd., Daiichi Radioisotope Laboratories, Ltd., Daiichi Pure Chemicals Co., Ltd., Daiichi Pharmatech Co., Ltd., Wakodo Co., Ltd., Sankyo Agro Co., Ltd., Nippon Nyukazai Co., Ltd., Sankyo Lifetech Co., Ltd.
Overseas
Daiichi Sankyo, Inc. Luitpold Pharmaceuticals, Inc. Sankyo Pharma GmbH | |||
| Nippon Daiya Valve Co., Ltd., Kyushu Sankyo Co., Ltd. and Sankyo Foods Co., Ltd., which were consolidated subsidiaries of Sankyo Co. Ltd. were excluded from the scope of consolidation because of the sale of their shares and other reasons. | ||||
In addition, Daiichi Pharmaceutical Co. Ltd. sold off a part of its investments in two subsidiaries, Tokyo Iyaku Shiki Co., Ltd. and Nishimura Shiki Co. Consequently, the Company has excluded the two companies from consolidation and now accounts for them under the equity method. Daiichi Fine Chemicals Inc. completed its liquidation procedures and is no longer consolidated. | ||||
| Dismed AG, previously a consolidated subsidiary of Sankyo Co., Ltd., merged with another consolidated subsidiary, as did the following four former consolidated subsidiaries of Daiichi Pharmaceutical Co., Ltd.: Kansai Daiichi Service Co., Ltd.; Daiichi Technos Co., Ltd.; Daiichi Suntory Biomedical Research Ltd.; and Daiichi Pharmaceutical (China) Co., Ltd. On March 31, 2006, Sankyo Pharma, Inc., a consolidated subsidiary of Sankyo Co., Ltd., and Daiichi Pharma Holdings, Inc., Daiichi Pharmaceutical Corporation, and Daiichi Medical Research, Inc., the latter three former consolidated subsidiaries of Daiichi Pharmaceutical Co., Ltd., merged to form Daiichi Sankyo, Inc. | ||||
| The Company also began consolidating Daiichi Sankyo Healthcare Co., Ltd., Sankyo Grundstücks GmbH & Co. and Object München AG, which was established during the year. | ||||
(2) Non-consolidated subsidiaries (including Sankyo Insurance Agency Co., Ltd., Godo Real Estate Co. Ltd. and Shanghai Sankyo Pharmaceuticals Co., Ltd.) are small and are not material when measured by the amounts of total assets, net sales, net income (based on the Company’s ownership percentage), retained earnings (based on the Company’s ownership percentage), and other indicators. They have therefore been excluded from the scope of consolidation.
| ||||
| 2. Application of the Equity Method | (1) Affiliated companies accounted for under the equity method: 5
Name of principal company: Sanofi Pasteur Daiichi Vaccine Co., Ltd | |||
| (2) Net income (based on the Company’s equity percentage), retained earnings (based on the Company’s equity percentage), and other indicators of those non-consolidated subsidiaries (including Sankyo Insurance Agency Co., Ltd., Godo Real Estate Co. Ltd. and Shanghai Sankyo Pharmaceuticals Co., Ltd.) and affiliated companies (including Tokyo Yakugyo Kaikan Co., Ltd.) that have not been accounted for under the equity method are not material or significant to the Company as a whole. Therefore, these companies have not been accounted for under the equity method, but are rather reported in the Company’s investment account under the cost method. | ||||
Item | Fiscal 2005 (Year ended March 31, 2006) | |||
| 3. Fiscal Year-End of Consolidated Subsidiaries | The fiscal year-end of certain consolidated subsidiaries is December 31. In preparing the consolidated financial statements, the Company uses the financial statements of these companies as of their fiscal year-end. For major intervening transactions that occurred between the fiscal year-end of those companies and March 31, appropriate adjustments have been made in the consolidated financial statements. | |||
Name of subsidiaries that have fiscal year-end on December 31: Luitpoid Pharmaceuticals, Inc., Daiichi Asubio Pharmaceuticals, Inc., Sankyo Pharma GmbH and its 12 subsidiaries as well as Daiichi Pharmaceutical (Beijing) Co., Ltd. and 5 other subsidiaries. | ||||
Following its merger with Daiichi Pharma Holdings, Inc. et al, Sankyo Pharma, Inc. changed its fiscal-year end to March 31. However, for the current fiscal year, the Company consolidated Sankyo Pharma’s financial statements as of December 31, 2005.
| ||||
| 4. Accounting for Business Combination | (1) The Company was established through a joint transfer of shares by Sankyo and Daiichi (the wholly owned subsidiaries) and became the parent company of the wholly owned subsidiaries. The Company accounted for this business combination under the pooling of interests method in accordance with “Accounting for Business Combinations in the Establishment of Parent-Subsidiary Relationship Using the Exchange of Shares and the Transfer of Shares (Research Report No. 6 of the Accounting Systems Committee of the Japanese Institute of Certified Public Accountants).
(2) As a result of the comprehensive review of the wholly owned subsidiaries’ business operations, financial conditions, and management performance, the Company has determined that the pooling of interests accounting is appropriate for this business combination, since the wholly owned subsidiaries continue jointly to share the risks and rewards of the Daiichi Sankyo group. | |||
Item | Fiscal 2005 (Year ended March 31, 2006) | |
| 5. Summary of Significant Accounting Policies | ||
| (a) Methods of Valuation of Significant Assets | (1) Marketable and Investment Securities
Held-to-maturity securities:
Mainly the amortized cost method (straight-line amortization)
Available-for-sale securities:
Securities with determinable market value;
Mainly stated at market value based on the quoted market prices at the end of the fiscal year. Unrealized holding gains and losses are reported in a component of shareholders’ equity, with the cost of securities sold being calculated by the moving-average method.
Securities without determinable market value;
Mainly stated at cost based on the moving-average method
(2) Derivatives
Market value method | |
(3) Inventories
Mainly stated at the lower of cost, by the average method, or market | ||
| (b) Depreciation and Amortization of Significant Depreciable Assets | (1) Property, Plant and Equipment
The Company and its domestic consolidated subsidiaries account for depreciation of property, plant and equipment by the declining-balance method, except for the buildings (excluding fixtures) acquired on or after April 1, 1998, which are accounted for by the straight-line method.
Overseas consolidated subsidiaries account for depreciation of property, plant and equipment mainly by the straight-line method. | |
The principal useful lives are as follows:
Buildings and structures: 15-50 years
Machinery, equipment and vehicles: 4-7 years | ||
(2) Intangible Assets
Intangible assets are being amortized by the straight-line method. Software for internal use is amortized over the estimated useful lives of a five-year period. | ||
| (c) Method of Amortization of Deferred Charges | (1) Start-up Costs
Start-up costs are expensed as incurred. | |
Item | Fiscal 2005 (Year ended March 31, 2006) | |
| (d) Methods of Accounting for Significant Allowances | (1) Allowance for Doubtful Accounts
The Company covers the risk of credit losses from potential customer defaults by providing for this allowance. For normal accounts, the allowance is computed on the basis of the historical default rates. For specific over-due accounts, the allowance is based on individual account-by-account estimates of the amounts that may not be recoverable.
(2) Allowance for Sales Returns
To prepare for losses on potential returns of products after the end of the fiscal year, the Company’s certain subsidiaries provide for an amount equal to the sum of gross profits and inventory losses on such returned products, based on its estimate of possible sales returns.
For the current fiscal year, the provision for this allowance of ¥268 million is included in cost of sales.
(3) Allowance for Sales Rebates
To prepare for future sales rebates, the Company’s certain subsidiaries provide for this allowance calculated by multiplying an estimated sales rebate percentage for the fiscal year by the amounts of accounts receivable from and inventories held by wholesalers at the end of the fiscal year.
(4) Accrued Retirement and Severance Benefits
To prepare for future payments of employee retirement severance benefit, the Company’s domestic consolidated subsidiaries provide for an amount incurred by the fiscal year-end based on estimated projected benefit obligations and plan assets at the end of the fiscal year.
Certain overseas consolidated subsidiaries provide for such accruals in accordance with accounting principles generally accepted in the countries of their domicile.
Prior service cost is amortized under the straight-line method over a period of 5 to 10 years, which is equal to or less than the estimated average remaining years of service of the eligible employees at the time such prior year service cost was incurred.
Actuarial gains and losses are amortized under the straight-line method, beginning in the fiscal year following the year in which the gain or loss was initially measured, over a period of 5 to 10 years, which is equal to or less than the average remaining years of service of the eligible employees at the time such actuarial gain or loss occurred, except for Sankyo which recognizes actuarial gains or losses immediately as they occur.
(Supplemental Information)
Accompanying the enactment of the Defined Benefit Pension Plan Law, Daiichi, a consolidated subsidiary, received an approval of exemption from the Minister of Health, Labour and Welfare, on January 1, 2005, from the obligations for pension payment liabilities related to past employee service with respect to the substitutional portion of its Employees’ Pension Fund, and on May 31, 2005, a payment was made to transfer the plan assets related to the substitutional portion to the government based on the minimum liability.
For the current fiscal year, as a result of this return of the plan assets, the Company recognized an extraordinary gain of ¥163 million.
(5) Accrued Directors’ Retirement and Severance Benefits
To prepare for payments of directors’ retirement and severance benefits, the Company’s domestic consolidated subsidiaries provide for an amount equal to the total benefits that would have become payable at the end of the fiscal year, in accordance with the internal policies, had all directors resigned voluntarily.
Certain of the Company’s overseas consolidated subsidiaries record a provision for an amount incurred by the end of the fiscal year.
(6) Allowance for Contingent Losses
To prepare for possible future contingent losses, the Company provides an accrual for an amount of reasonably possible losses, by examining individual risks on a case by case basis. |
Item | Fiscal 2005 (Year ended March 31, 2006) | |
(7) Accrued soil remediation costs
Based on a survey completed on certain land for the scope of soil remediation, Sankyo, a consolidated subsidiary, has recognized a provision for soil remediation at an estimated amount of cleanup costs that Sankyo will reasonably incur for the fiscal year ending March 31, 2007 and thereafter. | ||
| (e) Translation of Assets and Liabilities Denominated in Foreign Currencies into Yen | Receivables and payables denominated in foreign currencies are converted into yen amounts at the rates of exchange in effect at the balance sheet date, with resulting translation gains or losses recognized currently in earnings. The assets and liabilities of overseas consolidated subsidiaries are converted into yen amounts at the rates of exchange in effect at their balance sheet dates, while income and expenses are converted into yen amounts at the average exchange rates in effect over the respective periods, with resulting translation gains and losses recorded in a component of shareholders’ equity under translation adjustments or in the minority interests section of the balance sheet. | |
| (f) Accounting for Significant Lease Transactions | Financing leases are accounted for using the same accounting method applied to operating leases, with the exception of those financing leases in which the legal title of the underlying property is transferred from the lessor to the lessee. | |
| (g) Significant Hedge Accounting Methods | (1) Hedge Accounting Methods
The Company employs the deferred hedge method of accounting. Foreign exchange forward contracts that meet certain criteria are accounted as a hedge of underlying assets and liabilities. Interest rate swaps that meet certain hedge criteria and whose notional amounts, interest payments and maturities match with those of the hedged borrowings are accounted for by the special short-cut method, as if the interest rates of the interest rate swaps had been originally applied to the underlying borrowings.
(2) Hedging Instruments and Hedged Items
Hedging instruments: Foreign exchange forward contracts, and interest rate swaps
Hedged items: Accounts payable and receivable and forecasted transactions denominated in foreign currencies, and loans
(3) Hedge Policy
Certain consolidated subsidiaries hedge foreign exchange rate fluctuation risks relating to imports and exports and interest rate risks related to variable rate borrowings. The Company and its consolidated subsidiaries do not enter into speculative derivative transactions.
(4) Methods of Assessing Hedge Effectiveness
The hedge effectiveness of foreign exchange forward contracts as a hedge has not been assessed, as the principal terms of the hedging instruments are the same as those of the hedged items. The effectiveness of interest rate swaps accounted for by the special short-cut method has also not been assessed, as permitted under the standard. | |
| (h) Accounting for Consumption Tax | The tax-exclusion (net of tax) method is used to account for the national and local consumption taxes. | |
| 5. Valuation Method for Assets and Liabilities of Subsidiaries Acquired in Business Combination | All assets and liabilities of an acquired business that becomes a consolidated subsidiary are valued on a full fair value basis without taking into account minority interests’ share in such assets and liabilities. | |
| 6. Amortization of Goodwill | Goodwill is being amortized mainly over a period of five years. However, if the amount is immaterial, it is written off currently in earnings. | |
| 7. Appropriation of Retained Earnings | The consolidated statement of retained earnings reflects the appropriation of retained earnings approved during the fiscal year. | |
| 8. Cash and Cash Equivalent in the Consolidated Statement of Cash Flows | Cash and cash equivalents in the consolidated statement of cash flows consist of: cash on hand, deposits which can be withdrawn upon demand, and highly liquid short-term investments that are easily convertible into cash with little risk of fluctuation in value, and that mature within three months of their dates of acquisition. | |
Notes to Consolidated Financial Statements
(Notes to Consolidated Balance Sheet)
As of March 31, 2006
* 1. Accumulated depreciation on property, plant and equipment totaled ¥543,118 million.
* 2. The balances related to non-consolidated subsidiaries and affiliated companies were as follows:
Investment securities (stock) | ¥ | 2,106 million | |
Other assets (other investments in capital) | ¥ | 7,213 million |
* 3. Pledged assets and secured liabilities
Assets pledged as collateral and secured liabilities were as follows:
Pledged assets | (Millions of yen) | ||||
Buildings and structures | 2,285 | (1,840 | ) | ||
Machinery, equipment and vehicles | 2,321 | (2,321 | ) | ||
Land | 900 | (757 | ) | ||
Other | 60 | (60 | ) | ||
Investment securities | 766 | (— | ) | ||
Total | 6,333 | (4,979 | ) | ||
Secured liabilities | (Millions of yen) | ||||
Short-term bank loans | 415 | (88 | ) | ||
Long-term debt | 1,367 | (700 | ) | ||
Total | 1,782 | (788 | ) | ||
Figures in parentheses indicate factory foundation mortgaged assets and related obligations, and are also included in the figures of the left.
| 4. | Contingent liabilities |
Certain debt and other obligations of non-consolidated companies and employees owed to financial institutions are guaranteed by the Company. A breakdown of these obligations was as follows:
| (Millions of yen) | ||
Guarantees provided on employees housing loans, etc | 2,195 | |
Sanofi-Pasteur-Daiichi Vaccines Co., Ltd. | 350 | |
Saudi Arabian-Japanese Pharmaceutical Co., Ltd. | 322 | |
One other company | 52 | |
Total | 2,920 |
| 5. | The discounted trade notes receivable totaled ¥93 million. |
| 6. | Commitment line contracts |
Certain consolidated subsidiaries maintain committed lines of credit with 17 financial institutions in order to allow an efficient procurement of working capital. The balance of unused credit lines under these contracts at the end of the fiscal year was as follows:
| (Millions of yen) | ||
Total commitments | 63,000 | |
Commitments used | — | |
Commitments unused | 63,000 |
* 7. The total number of common shares of the Company issued at the year-end was 735,011,343 shares.
* 8. Consolidated subsidiaries owned 5,959,047 shares of the Company’s common shares at the year-end.
(Notes to Consolidated Statement of Income)
Fiscal 2005
(Year ended March 31, 2006)
* 1. Research and development expenses included in selling, general and administrative expenses and manufacturing overhead expenses totaled ¥158,716 million.
* 2. Breakdown of gain on sale of property, plant and equipment
| (Millions of yen) | ||
Buildings and structures | 1 | |
Machinery, equipment and vehicles | 33 | |
Land | 4,860 | |
Other | 2 |
* 3. Breakdown of loss on disposal of property, plant and equipment
| (Millions of yen) | ||
Buildings and structures | 1,773 | |
Machinery, equipment and vehicles | 422 | |
Land | 44 | |
Other | 514 | |
Other intangible assets | 1,308 |
In addition, expenses for disposal of property, plant and equipment totaled ¥1,487 million.
* 4. Loss on business integration
The loss represents one-time costs associated with integration of the pharmaceutical operations of the Sankyo Group and the Daiichi Group. The amount consisted of the following:
Expenses associated with the integration of overseas operations | ¥ | 7,086 million | |
Expenses associated with the integration of healthcare business | ¥ | 968 million | |
Other research and consulting expenses | ¥ | 1,838 million |
* 5. Loss on impairment of property, plant and equipment
The Daiichi Sankyo Group (the Company and consolidated subsidiaries) classifies its assets held and used for its business operations into asset groups on the basis of operating segments in the management reporting in consideration of similarities of products or operating activities, consistency within the Group, and future maintenance sustainability. On the other hand, leased assets and idle assets that are not directly used for its business operations are grouped on a properly by properly basis.
For the current fiscal year, the Daiichi Sankyo Group recorded an impairment loss on the following asset groups:
Location | Function | Asset Type | Status | |||
| Iwaki, Fukushima | Onahama Plant (manufacturing facilities of pharmaceuticals) | Buildings and structures Machinery, equipment and vehicles | Idle | |||
| Shiraishi-ku, Sapporo | Former Sapporo Distribution Center facility | Land | Idle | |||
| Shimotoga-gun, Tochigi | Former Tochigi Research Center facility | Buildings, land, etc. | Idle | |||
| Tsuchiura, Ibaraki | Company housing, etc. | Land | Idle | |||
| Sanbu-gun, Chiba | Chiba plant site | Land | Idle | |||
Because the above asset groups are idle and have uncertain prospects for future utilization, their book values have been written down to a recoverable amount, and such reductions in the mount of ¥5,253 million were recorded as a loss on impairment in the extraordinary losses.
The impairment loss consisted of ¥2,442 million associated with buildings and structures, ¥1,888 million associated with machinery, equipment and vehicles, ¥901 million associated with land and ¥20 million associated with other assets.
The recoverable amount of an assets group is an estimated net realizable value, which was obtained based on third-party appraisal or the valuation amount for real estate tax purpose, with reasonable adjustments.
* 6. Provision for contingent losses
The amount represents an estimated amount of penalty arising out of the product purchase commitments that contain a minimum purchase provision.
* 7. Restructuring charge
To concentrate on the pharmaceutical business, the Company has been carrying out a reorganization of its peripheral businesses. As part of this reorganization, the Company sold certain investments in affiliated companies. Restructuring charge includes a loss on such sales of investments and expenses paid to external advisers.
* 8. Loss on settlement of vitamin-related anti-trust litigations
The amount represents fines resulting from an unsuccessful appeal against the EC ruling that the Company participated in a vitamin cartel.
(Notes to Consolidated Statements of Cash Flows)
Fiscal 2005
(Year ended March 31, 2006)
| 1. | Reconciliation of cash and cash equivalents at the end of the fiscal year with the balance sheet accounts |
| (Millions of yen) | |||
Cash and time deposits | 223,979 | ||
Less time deposits with maturities extending over three months | (2,901 | ) | |
Add short-term investments with maturities within three months | 179,890 | ||
Cash and cash equivalents | 400,967 |
* 2. Breakdown of assets and liabilities of consolidated subsidiaries that are no longer consolidated due to sale of stock
The following table presents are the breakdown of the assets and liabilities of Nippon Daiya Valve Co., Ltd. and F.P. Processing Co., Ltd. which are no longer consolidated due to sale of their stock, and a reconciliation of the sale price of the stock and the proceeds from the sale:
| (Millions of yen) | |||
Current assets | 4,452 | ||
Non-current assets | 939 | ||
Current liabilities | (3,526 | ) | |
Non-current liabilities | (561 | ) | |
Gain from sale of stock in affiliate | 27 | ||
Loss on sale of investments in subsidiaries | (330 | ) | |
Gross proceeds from sale of investment of investments in subsidiaries | 1,001 | ||
Cash and cash equivalents of subsidiaries disposed | (358 | ) | |
Proceeds from sale of investment in subsidiaries | 642 |
(1) Lease Transactions
Pro-forma information on financing leases has not been presented herein because the Company discloses such information through EDINET (Electronic Disclosure for Investors’ NETwork).
(2) Marketable and Investment Securities
1. Held-to-Maturity Securities with Determinable Market Value
(Millions of yen)
| Carrying amount | Market value | Difference | |||||
Securities with market values greater than their carrying amounts: | |||||||
(1) Government and local bonds | 999 | 1,000 | 0 | ||||
(2) Corporate bonds | 22,808 | 22,866 | 58 | ||||
(3) Other | — | — | — | ||||
Sub-total | 23,808 | 23,866 | 58 | ||||
Securities with market values at or less than their carrying amounts: | |||||||
(1) Government and local bonds | 42,397 | 42,311 | (86 | ) | |||
(2) Corporate bonds | 83,695 | 82,639 | (1,055 | ) | |||
(3) Other | — | — | — | ||||
Sub-total | 126,093 | 124,951 | (1,141 | ) | |||
Total | 149,901 | 148,817 | (1,083 | ) | |||
2. Available-for-Sale Securities with Determinable Market Value
(Millions of yen)
| Acquisition cost | Carrying amount | Difference | |||||
Securities with carrying amounts greater than their acquisition costs: | |||||||
(1) Stock | 38,949 | 172,059 | 133,109 | ||||
(2) Bonds | |||||||
a) Government and local bonds | — | — | — | ||||
b) Corporate bonds | 1,120 | 1,226 | 106 | ||||
c) Other | — | — | — | ||||
(3) Other | 2,155 | 3,276 | 1,121 | ||||
Sub-total | 42,224 | 176,562 | 134,337 | ||||
Securities whose carrying amounts at or less than their acquisition costs: | |||||||
(1) Stock | 64 | 59 | (4 | ) | |||
(2) Bonds | |||||||
a) Government and local bonds | — | — | — | ||||
b) Corporate bonds | — | — | — | ||||
c) Other | 17,096 | 17,096 | — | ||||
(3) Other | 210 | 204 | (6 | ) | |||
Sub-total | 17,371 | 17,360 | (10 | ) | |||
Total | 59,595 | 193,922 | 134,327 | ||||
| Note: | During the fiscal year, an impairment loss of ¥301 million has been recorded on available-for-sale securities with determinable market value. When the market value of securities has dropped by 30% or more from the acquisition costs, the securities are classified as having ‘fallen significantly.’ When the securities’ market decline is 50% or more, the securities are written-down to their market value. When the market value of securities has dropped by 30% or more but less than 50%, likelihood of recovery is estimated on the basis of market value trends and the financial conditions of the issuing companies. Write-downs are recognized in all of such securities other than those for which there is a prospect for recovery. |
3. Available-for-Sale Securities Sold During the Year
(Millions of yen)
Amount sold | Total gain on sale | Total loss on sale | ||
4,593 | 752 | 206 | ||
4. Breakdown of Securities without Determinable Market Value
(Millions of yen)
| Carrying amount | ||
(1) Held-to-maturity securities | ||
a) Certificates of deposit | 12,000 | |
b) Commercial papers | 84,981 | |
c) Other | 10 | |
(2) Available-for-sale securities | ||
a) Money management funds, etc. | 65,811 | |
b) Unlisted stock | 11,847 | |
c) Preferred securities | 6,000 | |
d) Other | 4,267 |
5. Scheduled Maturities of Available-for-Sale with Maturity and Held-to-Maturity Securities
(Millions of yen)
| Within one year | Between one and five years | Between five and ten years | Over ten years | |||||
(1) Bonds | ||||||||
a) Government and local bonds | 40,403 | 2,993 | — | — | ||||
b) Corporate bonds | 54,206 | 41,281 | 11,016 | — | ||||
c) Other | 96,991 | — | — | — | ||||
(2) Other securities | — | 1,226 | — | — | ||||
Total | 191,602 | 45,501 | 11,016 | — | ||||
(3) Derivative Transactions
The fair value information of derivative instruments has not been presented herein because the Company discloses such information through EDINET (Electronic Disclosure for Investors’ NETwork).
(4) Retirement and Severance Benefits
1. Summary of Retirement and Severance Benefit Arrangements
Sankyo Company, Limited and its domestic consolidated subsidiaries have unfunded lump-sum retirement and severance benefit plans and qualified pension benefit plans as their primary defined benefit arrangement. In addition, certain of the domestic consolidated subsidiaries participate in a multi-employer employees’ pension fund plan. Daiichi Pharmaceutical Co., Ltd. and its domestic subsidiaries have adopted the group-wide retirement benefit arrangement comprising of a defined benefit corporate pension plan and a defined contribution pension plan. Certain overseas consolidated subsidiaries provide a defined benefit plan or a defined contribution plan.
Additional retirement benefits which are not subject to the actuarial valuation in accordance with the accounting standards for the retirement and severance benefits may be paid to employees upon retirement.
2. Retirement and Severance Benefit Obligation
(Millions of yen)
| As of March 31, 2006 | |||
(1) Projected benefit obligations (Note 1) | (148,160 | ) | |
(2) Plan assets at fair value (Note 2) | 97,909 | ||
(3) Over-funded projected benefit obligations in excess of plan assets (1)+(2) | (50,251 | ) | |
(4) Unrecognized actuarial losses | 2,064 | ||
(5) Unrecognized prior service costs | (2,827 | ) | |
(6) Net pension liabilities recognized in the consolidated balance sheet (3)+(4)+(5) | (51,014 | ) | |
(7) Prepaid pension assets | 17,307 | ||
Accrued retirement and severance benefits (6)-(8) | (68,321 | ) | |
(Notes)
| 1. | Certain consolidated subsidiaries use the simplified vested-benefit method in calculating their retirement and severance benefit obligations. |
| 2. | In addition, the plan assets in the multi-employer welfare pension fund, estimated based on the Company’s contribution ratio since the amount attributable to the Company’s contributions cannot be calculated reasonably, totaled 8,891 million yen. This amount has not been included in the plan assets presented above. |
3. Employees’ Retirement and Severance Benefit Costs
(Millions of yen)
| Fiscal 2005 (Year ended March 31, 2006) | |||
(1) Service cost for benefits earned (Notes 1, and 2) | 8,715 | ||
(2) Interest cost | 3,272 | ||
(3) Expected return on plan assets | (2,338 | ) | |
(4) Amortization of actuarial gain or loss | (1,437 | ) | |
(5) Amortization of prior service costs | (870 | ) | |
(6) Additional retirement benefits | 1,620 | ||
(7) Net periodic retirement and severance costs (1)+(2)+(3)+(4)+(5)+(6) | 8,961 | ||
(8) Gain from return of the substitutional portion of the Employees’ Pension Fund to the government | (163 | ) | |
(9) Others (Note 3) | 884 | ||
Total retirement and severance costs (7)+(8)+(9) | 9,681 | ||
(Notes)
| 1. | Costs of retirement and severance benefits of those consolidated subsidiaries which have adopted the simplified vested-benefit method are included in service cost for benefits earned. |
| 2. | The amount is net of employees’ contributions to the multi-employer employees’ pension fund. |
| 3. | The amount consists of contributions to the defined contribution pension plan and prepayments of retirement benefit to certain employees based on the retirement benefit prepayment arrangement. |
4. Principal Assumptions Used in the Calculation of Retirement and Severance Benefit Obligations
(Millions of yen)
Fiscal 2005 (Year ended March 31, 2006) | ||
Method of inter-period attribution of estimated retirement benefit costs | Straight line method | |
Discount rate | Mainly 2.5% | |
Expected rate of return on plan assets | 2.5 - 3.0% | |
Amortization period of prior service costs | 5 - 10 years (amortized under the straight-line method over a period not exceeding the average remaining years of service of the eligible employees at the time such prior service cost was incurred) | |
Amortization period of actuarial gain or loss | 5-10 years (amortized beginning in the fiscal year following the year in which such actuarial gain or loss was first measured under the straight-line method over a period not exceeding the average remaining years of services of the eligible employees at the time such actuarial gain or loss occurred)
Sankyo Company, Limited recognizes actuarial gains or losses immediately as they occur. | |
(5) Deferred Income Taxes
Fiscal 2005
(As of March 31, 2006)
| 1. | Principal components of deferred tax assets and deferred tax liabilities |
| (Millions of yen | ) | ||
Deferred tax assets | |||
Accrued retirement and severance benefits | 25,879 | ||
Prepaid consigned research and co-development expenses | 21,546 | ||
Depreciation | 16,914 | ||
Net operating loss carry forwards for income tax purposes | 15,840 | ||
Accrued bonuses | 10,330 | ||
Unrealized profit on inventories and loss on valuation of inventories | 8,009 | ||
Unrealized holding gains on property, plant and equipment | 6,106 | ||
Impairment losses | 4,402 | ||
Accrued enterprise tax | 2,181 | ||
Other | 20,679 | ||
| 131,891 | |||
Valuation allowance | (32,484 | ) | |
Total deferred tax assets | 99,407 | ||
Deferred tax liabilities: | |||
Unrealized holding gain on available-for-sale securities | (55,030 | ) | |
Reserve for reduction in bases of property, plant and equipment for income tax purposes | (9,604 | ) | |
Prepaid pension costs | (6,948 | ) | |
Other | (3,468 | ) | |
Total deferred tax liabilities | (75,052 | ) | |
Net deferred tax assets | 24,355 | ||
Note: Net deferred tax assets are included in the following balance sheet captions:
(Millions of yen)
Current assets – deferred tax assets | 40,911 | ||
Non-current assets – deferred tax assets | 7,403 | ||
Current liabilities – deferred tax liabilities | (31 | ) | |
Non-current liabilities – deferred tax liabilities | (23,926 | ) |
| 2. | Reconciliation of the difference between the statutory tax rate and the effective tax rate |
(percent)
Statutory tax rate | 40.5 | ||
(Adjustments) | |||
Non-deductible permanent differences including entertainment and other items | 5.2 | ||
Deductible permanent differences including dividend received deductions and other items | (1.0 | ) | |
Decrease in valuation allowance | (3.1 | ) | |
Tax credit for research and development expenses | (6.2 | ) | |
Other | 0.5 | ||
Effective tax rate | 35.9 | ||
(6) Segment Information
| a. | Information by Operating Segment |
(Millions of yen)
Fiscal 2005 (Year ended March 31, 2006) | Pharmaceuticals | Other | Total | Eliminations & corporate | Consolidated | ||||||
I Net sales and operating income | |||||||||||
Net sales | |||||||||||
(1) Outside customers | 784,666 | 141,251 | 925,918 | — | 925,918 | ||||||
(2) Inter-segment sales and transfers | 790 | 4,024 | 4,814 | (4,814 | ) | — | |||||
Total | 785,457 | 145,275 | 930,733 | (4,814 | ) | 925,918 | |||||
Operating expenses | 637,342 | �� | 139,129 | 776,472 | (5,282 | ) | 771,190 | ||||
Operating income | 148,114 | 6,146 | 154,260 | 467 | 154,728 | ||||||
II Assets, depreciation and capital expenditures | |||||||||||
Assets | 1,429,425 | 169,659 | 1,599,084 | (2,957 | ) | 1,596,126 | |||||
Depreciation | 35,795 | 5,333 | 41,128 | — | 41,128 | ||||||
Impairment loss | 5,253 | — | 5,253 | — | 5,253 | ||||||
Capital expenditures | 28,967 | 6,408 | 35,375 | — | 35,375 |
(Notes)
| 1. | Method of classifying operating segments: Classification into ‘Pharmaceuticals’ and ‘Other’ is based on consideration of product type, market characteristics and other factors. |
| 2. | Principal products in each operating segment |
Pharmaceuticals: | Prescription drugs and medicine, and healthcare products | |||
Other: | Food products, agrochemicals, chemicals, and other | |||
b. Information by Geographic Segment
(Millions of yen)
Fiscal 2005 (Year ended March 31, 2006) | Japan | North America | Other | Total | Eliminations & corporate | Consolidated | |||||||
I Net sales and operating income | |||||||||||||
Net sales | |||||||||||||
(1) Outside customers | 752,793 | 116,061 | 57,063 | 925,918 | — | 925,918 | |||||||
(2) Inter-segment sales and transfers | 21,553 | 18,212 | 5,805 | 45,572 | (45,572 | ) | — | ||||||
| 774,347 | 134,274 | 62,869 | 971,490 | (45,572 | ) | 925,918 | |||||||
Operating expenses | 644,098 | 108,816 | 62,690 | 815,605 | (44,414 | ) | 771,190 | ||||||
Operating income | 130,249 | 25,457 | 178 | 155,885 | (1,157 | ) | 154,728 | ||||||
II Assets | 1,452,287 | 132,455 | 59,040 | 1,643,783 | (47,656 | ) | 1,596,126 | ||||||
(Notes)
| 1. | Method of classifying geographic segments |
| Geographic segments are classified on the basis of geographic proximity. |
| 2. | Countries and regions included in each segment other than Japan |
| North America: the United States |
| Other: Germany, the United Kingdom, France, Spain, Italy, Taiwan and others |
c. Overseas Sales
(Millions of yen)
Fiscal 2005 (Year ended March 31, 2006) | Americas | Europe | Other Areas | Total | ||||
I Overseas net sales | 182,614 | 98,440 | 26,210 | 307,265 | ||||
II Consolidated net sales | 925,918 | |||||||
III Percentage of overseas net sales to consolidated net sales (%) | 19.7 | 10.6 | 2.9 | 33.2 |
(Notes)
| 1. | Method of classifying countries and regions |
Countries and regions are classified on the basis of geographic proximity.
| 2. | Countries and regions included in each area |
North America: the United States and Canada
Europe: Germany, the United Kingdom, Spain, Italy, Ireland, France, Switzerland and others
Other areas: Asia, the Middle East, Latin America and others
| 3. | Overseas net sales are sales of the Company and its consolidated subsidiaries which were transacted in countries or regions outside of Japan. |
(7) Transactions with Related Parties
There were no transactions during the fiscal year.
Per Share Information
Fiscal 2005 (Year ended March 31, 2006) | ||
Net assets per share | ¥1,696.97 | |
Net income per share (basic) | ¥119.49 | |
Net income per share (diluted) | ¥119.47 |
(Note) Calculations of basic and diluted net income per share were based on the following numerators and denominators:
Fiscal 2005 (Year ended March 31, 2006) | ||
Net income per share (basic): | ||
Net income (millions of yen) | 87,692 | |
Amount not available for common shareholders (millions of yen) | 350 | |
(Including directors��� bonuses paid from net income of) (millions of yen) | [350] | |
Net income available for dividends on common shares (millions of yen) | 87,342 | |
Weighted-average number of common shares outstanding during the year (1,000 shares) | 730,938 | |
Net income per share (diluted): | ||
Adjustments to net income (millions of yen) | — | |
Additional dilutive common shares (1,000 shares) | 136 | |
Including dilutive effect of stock options of (1,000 shares) | [136] | |
| Descriptions of potentially dilutive common shares that were not included in the computation of diluted net income per share because of their anti-dilutive effect | Two share subscription right plans (related to 1,001 thousand shares) issued by Daiichi and one share purchase option plan (related to 3,760 units of options) issued by Sankyo. All outstanding stock options have been cancelled prior to the fiscal year-end. |
Subsequent Events
Fiscal 2005
(Year ended March 31, 2006)
(Acquisition of a subsidiary through purchase of shares)
The Company and Astellas Pharma Inc. agreed that the Company would acquire all of the outstanding shares of Zepharma Inc., a subsidiary of Astellas Pharma Inc. A written agreement was entered into on March 31, 2006, and the transaction was closed on April 13, 2006.
| (1) | Purpose of acquisition |
To strengthen the healthcare business in the area of non-prescription drugs
| (2) | Name of company selling the shares |
Astellas Pharma Inc.
| (3) | Name of the company acquired; nature of business; and its size |
| Name: | Zepharma Inc. | |
| Nature of business: | Development and sale of drugs, non-prescription drugs, cosmetics, foods, etc. | |
| Capital: | ¥300 million | |
| Sales: | ¥22.4 billion (pro-forma amount for the year ended March 31, 2005) | |
| (4) | Date of acquisition |
April 13, 2006
| (5) | Number of shares purchased; cost of acquisition; and percentage of ownership held upon acquisition |
| Number of shares purchased: | 6,000 shares | |
| Cost of acquisition: | ¥35.5 billion | |
| Percentage of ownership held upon acquisition: | 100% | |
| (6) | Source of financing |
The full amount was paid out of on-hand cash
Fiscal 2005
(Year ended March 31, 2006)
(Sale of a subsidiary)
At its Board of Directors’ Meeting held on April 24, 2006, Sankyo Co., Ltd., a wholly owned subsidiary of the Company, approved to apply for a sale of the shares of its subsidiary, Wakodo Co., Ltd., in response to a tender offer to be made by Asahi Breweries, Ltd. for Wakodo shares.
| (1) | Reasons for sale |
To concentrate management resources on the pharmaceutical business, the Company has been reassessing its involvement in non-pharmaceutical businesses. In the course of this reassessment, a tender offer to purchase Wakodo Co. Ltd.’s shares was proposed by Asahi Breweries, Ltd., who has valued highly of both the nature of Wakodo’s business and the growth prospects of that business. The Company has concluded to accept the tender offer taking into consideration Asahi Breweries’ management’s pursuit of customer satisfaction and quality, its technologies and know-how, and its variety of sales channels that would contribute to the future development of Wakodo’s business, as well as the price and other terms of the tender offer.
| (2) | Name of buyer |
Asahi Breweries, Ltd.
| (3) | Date of sale |
April 25, 2006 Date of public notice of the tender offer
May 15, 2006 Last day of the tender offer period
May 19, 2006 Commencement date of settlement
| (4) | Name of subsidiary; nature of business; and nature of transactions with the Company |
Name: Wakodo Co., Ltd.
Nature of business: Manufacture and sale of powdered baby milk; baby foods; vending machine foods; household food items; commercial-use milk powder; pharmaceuticals; non-prescription drugs; cosmetics; sanitary goods; and general merchandise
Transactions with the Company: None
| (5) | Number of shares to be sold; sale price; gain or loss on sale and ownership percentage upon disposition |
Number of shares to be sold: 3,533,000
Sale price: ¥27.9 billion
Ownership percentage upon disposition: 0%
5. Production, Orders and Sales
| (1) | Production |
Production by operating segment for the fiscal year is summarized as follows:
Operating segment | Amount (Millions of yen) | Changes (%) | ||
Pharmaceuticals | 633,177 | — | ||
Other | 102,782 | — | ||
| 735,960 | — |
(Notes)
| 1. | Production amounts are based on net selling prices and are after elimination of inter-segment sales. |
| 2. | The above amounts are stated exclusive of consumption tax. |
(2) Orders
The Daiichi Sankyo Group performs production according to its own production plans, which are primarily based on its sales forecast. Order-based production is carried out at certain subsidiaries; however, the amount of order back-log is not presented herein as such amounts were insignificant.
(3) Net Sales
Net sales by operating segment for the fiscal year were as follows:
Operating segment | Amount (Millions of yen) | Changes (%) | ||
Pharmaceuticals | 784,666 | — | ||
Other | 141,251 | — | ||
| 925,918 | — |
(Notes)
| 1. | Net sales amounts are after elimination of inter-segment sales. |
| 2. | Net sales to major customers and their percentage of total net sales were as follows: |
Customers | Fiscal 2005 | |||
| (Millions of yen) | % | |||
Alfresa Corporation | 105,010 | 11.3 | ||
| 3. | The above amounts are stated exclusive of consumption tax. |
FASF
May 12, 2006
Non-consolidated Financial Results
for the Fiscal Year 2005
(Year Ended March 31, 2006)
Listed company name: DAIICHI SANKYO COMPANY, LIMITED
Stock code number: 4568
Listed exchanges: Tokyo, Osaka, and Nagoya
Head office: Tokyo, Japan
Homepage: http://www.daiichisankyo.co.jp
Representative: Mr. Takashi Syoda, President and CEO
Contact: Mr. Toshio Takahashi, Corporate Officer, General Manager of Corporate Communication Department
TEL: +81-3-6225-1126
Meeting of the Board of Directors: May 12, 2006
Interim dividends: Yes
Scheduled date of dividend payments: From June 30, 2006
Annual meeting of the shareholders: June 29, 2006
Adoption of the unit share system: Yes (One unit equals 100 shares)
1. Financial Results for the Interim Period of Fiscal 2005
(1) Non-Consolidated Financial Results
(Figures less than ¥1 million, except per share amounts, have been omitted)
| Operating revenue | Operating income | Ordinary income | ||||||||||
| Millions of yen | Percent change | Millions of yen | Percent change | Millions of yen | Percent change | |||||||
Fiscal 2005 | 76,656 | — | 73,948 | — | 73,591 | — | ||||||
Fiscal 2004 | — | — | — | — | — | — | ||||||
| Net income | Basic net income per share | Diluted net income per share | Return on equity | Ordinary income as a percentage of | Ordinary income as a percentage of net sales | |||||||||
| Millions of yen | Percent change | Yen | Yen | % | % | % | ||||||||
Fiscal 2005 | 73,545 | — | 100.06 | — | 6.3 | 6.2 | 96.0 | |||||||
Fiscal 2004 | — | — | — | — | — | — | — | |||||||
Notes:
| 1. | Weighted-average number of common shares issued and outstanding during the fiscal year: |
Fiscal 2005: | 734,991,327 shares | |
Fiscal 2004: | — shares |
| 2. | Changes in accounting policies: No |
| 3. | Percentages for operating revenue, operating income, ordinary income and net income represent a change from the corresponding results in the previous fiscal year. |
(2) Dividends
| (yen) | ||||||||||||
| Dividends per share for the year | Total dividend payments (millions of yen) | Dividend payout ratio (%) | Dividends as a percentage of Shareholders’ equity (%) | |||||||||
| Interim | Year-end | |||||||||||
Fiscal 2005 | 25.00 | — | 25.00 | 18,374 | 25.0 | 1.5 | ||||||
Fiscal 2004 | — | — | — | — | — | — | ||||||
Note: In lieu of an interim dividend, the Company made a share transfer payment of ¥25 per common share to the shareholders of record in the final shareholders registries, as of September 27, 2005, of Sankyo Company, Limited and Daiichi Pharmaceutical Co., Ltd.
(3) Non-Consolidated Financial Position
(Figures less than ¥1 million, except per share amounts, have been omitted)
| Total assets | Shareholders’ equity | Shareholders’ equity ratio | Shareholders’ equity per share | |||||
| Millions of yen | Millions of yen | % | Yen | |||||
Fiscal 2005 | 1,209,278 | 1,206,810 | 99.8 | 1,641.98 | ||||
Fiscal 2004 | — | — | — | — |
Notes 1. Total number of common shares issued at the end of the fiscal year
Fiscal 2005: | 735,011,343 shares | |||
Fiscal 2004: | — shares |
2. Number of common shares in treasury stock at the end of the fiscal year
Fiscal 2005: | 37,608 shares | |||
Fiscal 2004: | — shares |
2. Forecasts of Non-Consolidated Results Fiscal Year 2006(April 1, 2006—March 31, 2007)
| Operating revenue | Ordinary income | Net income | Cash dividends per share | |||||||||
| Interim | Year-end | |||||||||||
| Millions of yen | Millions of yen | Millions of yen | Yen | Yen | Yen | |||||||
Interim 6-month period | 3,000 | 100 | 100 | 30.00 | — | — | ||||||
Full-fiscal year | 6,300 | 300 | 200 | — | 30.00 | 60.00 | ||||||
Reference: Forecasted annual net income per share (basic) : ¥0.27
* Note: The forecast figures shown above are based on information that was available at the time of preparation and may contain some uncertainties. Actual performance and other factors may differ from these forecasts due to changes in circumstances and other developments. For more information concerning these forecasts can be found in the attached Supplementary Information on page 15 and 16.
6. Non-Consolidated Financial Statements
(1) Non-Consolidated Balance Sheets
(Millions of yen)
| As of March 31, 2006 | ||||||||
| See Note | Amount | % | ||||||
ASSETS | ||||||||
I Current assets: | ||||||||
1. Cash and time deposits | 41,900 | |||||||
2. Deferred tax assets | 172 | |||||||
3. Other receivables | 1,380 | |||||||
4. Income tax refunds receivable | 14,541 | |||||||
5. Other current assets | 193 | |||||||
Total current assets | 58,187 | 4.8 | ||||||
II �� Non-current assets | ||||||||
1. Property and equipment | ||||||||
(1) Buildings | 32 | |||||||
Less accumulated depreciation | 4 | 27 | ||||||
(2) Furniture, tools and fixtures | 12 | |||||||
Less accumulated depreciation | 1 | 11 | ||||||
Total property and equipment, net | 39 | 0.0 | ||||||
2. Intangible assets, net: | ||||||||
(1) Trade marks | 296 | |||||||
(2) Other | 0 | |||||||
Total intangible assets, net | 296 | 0.0 | ||||||
3. Investments and other assets: | ||||||||
(1) Investments in affiliated companies | 1,150,654 | |||||||
(2) Deferred tax assets | 16 | |||||||
(3) Other assets | 83 | |||||||
Total investments and other assets | 1,150,755 | 95.2 | ||||||
Total non-current assets | 1,151,090 | 95.2 | ||||||
Total assets | 1,209,278 | 100.0 | ||||||
(Millions of yen)
| As of March 31, 2006 | ||||||||||
| See Note | Amount | % | ||||||||
LIABILITIES | ||||||||||
I Current liabilities: | ||||||||||
1. Accounts payable | 2,110 | |||||||||
2. Accrued expenses | 165 | |||||||||
3. Income tax payable | 138 | |||||||||
4. Consumption taxes payable | 45 | |||||||||
5. Advance receipts | 8 | |||||||||
Total current liabilities | 2,467 | 0.2 | ||||||||
Total liabilities | 2,467 | 0.2 | ||||||||
SHAREHOLDERS’ EQUITY | ||||||||||
I Common stock | *1 | 50,000 | 4.1 | |||||||
II Additional paid-in-capital: | ||||||||||
1. Capital surplus | 1,083,349 | |||||||||
2. Other capital surplus | ||||||||||
(1) Gain on reissuance of treasury stock | 0 | |||||||||
Total additional paid-in-capital | 1,083,350 | 89.6 | ||||||||
III Retained earnings: | ||||||||||
1. Unappropriated retained earnings | 73,545 | |||||||||
Total retained earnings | 73,545 | 6.1 | ||||||||
IV Treasury stock at cost | *2 | (84 | ) | (0.0 | ) | |||||
Total shareholders’ equity | 1,206,810 | 99.8 | ||||||||
Total liabilities and shareholders’ equity | 1,209,278 | 100.0 | ||||||||
(2) Non-Consolidated Statement of Income
(Millions of yen)
| See Note | Fiscal 2005 (Year Ended March 31, 2006) | ||||||||
| Amount | % | ||||||||
I Operating revenue | |||||||||
1. Dividend income | *1 | 73,501 | |||||||
2. Management fee income | 3,155 | 76,656 | 100.0 | ||||||
II Operating expenses: | |||||||||
1. Directors’ compensation, salaries and bonuses: | 528 | ||||||||
2. Retirement and severance costs | 30 | ||||||||
3. Welfare benefit expenses | 57 | ||||||||
4. Depreciation expense | 22 | ||||||||
5. Outsourcing service fees | 440 | ||||||||
6. Corporate advertising expenses | 869 | ||||||||
7. Other | 758 | 2,707 | 3.5 | ||||||
Operating income | 73,948 | 96.5 | |||||||
III Non-operating income | |||||||||
1. Interest income | 2 | ||||||||
2. Other income | 2 | 4 | 0.0 | ||||||
IV Non-operating expenses | |||||||||
1. Start-up costs | 361 | ||||||||
2. Other expenses | 0 | 361 | 0.5 | ||||||
Ordinary income | 73,591 | 96.0 | |||||||
V Extraordinary gains | — | ||||||||
VI Extraordinary losses | — | ||||||||
Net income before income taxes | 73,591 | 96.0 | |||||||
Income tax expense — current | 235 | ||||||||
Income tax expense — deferred | (189 | ) | 45 | 0.1 | |||||
Net income | 73,545 | 95.9 | |||||||
Unappropriated retained earnings, end of year | 73,545 | ||||||||
(3) Proposal for Appropriations of Retained Earnings
| See Note | Fiscal 2005 (Year Ended March 31, 2006) | |||||
| Approval date at the general meeting of shareholders: June 29, 2006 | ||||||
| Amount | ||||||
I Unappropriated retained earnings | 73,545 | |||||
II Appropriations: | ||||||
Dividends | 18,374 | 18,374 | ||||
III Unappropriated retained earnings carried forward to the next fiscal year | 55,170 | |||||
Significant Accounting Principles and Policies for the Preparation of the Non-Consolidated Financial Statements
Item | Fiscal 2005 (Year Ended March 31, 2006) | |
1. Methods of Valuation of Investment Securities | Investments in subsidiaries: Accounted for by the moving-average cost method | |
2. Depreciation and Amortization of Significant Depreciable Assets | (1) Property and Equipment
Depreciation is calculated based on the declining-balance method.
(2) Intangible Assets
Amortization is calculated based on the straight-line method. | |
3. Method for Amortization of Deferred Charges | Start-up Costs
Start-up costs are expensed as incurred. | |
4. Accounting for Significant Lease Transactions | Finance lease transactions are accounted for using the same method applied to operating lease transactions, with the exception for those finance leases in which the legal title of the underlying property is transferred from the lessor to the lessee. | |
5. Accounting for Consumption Tax | The tax-exclusion (net of tax) method is used to account for the national and local consumption taxes. | |
Notes to Non-Consolidated Financial Statements
(Notes to Non-Consolidated Balance Sheet)
As of March 31, 2006
*1. Authorized number of common shares | 2,800,000,000 shares | |||
Number of common shares issued | 735,011,343 shares |
| The Articles of Incorporation provides that in the event of the retirement of shares, the number of shares the Company is authorized to issue shall be reduced by the number of shares retired. | ||||
*2. Treasury stock | ||||
| Treasury stock owned by the Company at the end of the fiscal year was 37,608 shares of common stock. | ||||
(Notes to Non-Consolidated Statement of Income)
Fiscal 2005
(Year Ended March 31, 2006)
| *1. Transactions with affiliated companies | ||
| The Company’s principal transactions with its affiliates were as follows. |
| Dividend income | ¥ | 73,501 million |
| (1) | Lease Transactions |
Pro-forma information on financing leases has not been presented herein because the Company discloses such information through EDINET.
| (2) | Marketable and Investment Securities |
None of the stock of subsidiaries and affiliates has a quoted market price.
| (3) | Deferred Income Taxes |
Fiscal 2005
(Year ended March 31, 2006)
| 1. | Breakdown of deferred tax assets and deferred tax liabilities |
(Millions of yen)
Deferred tax assets: | ||
Accrued expenses | 61 | |
Accrued bonuses | 56 | |
Accrued enterprise tax | 42 | |
Depreciation | 16 | |
Other | 11 | |
Total deferred tax assets | 189 | |
Net deferred tax assets | 189 | |
| 2. | Reconciliation of the difference between the statutory tax rate and the effective tax rate (percent) |
Statutory tax rate | 40.7 | ||
(Adjustments) | |||
Deductible permanent differences including dividend received deductions and other items | (40.6 | ) | |
Other | 0.0 | ||
Effective tax rate | 0.1 | ||
(Per Share Information)
Fiscal 2005 (Year Ended March 31, 2006) | ||
Net assets per share | ¥1,641.98 | |
Net income per share | ¥100.06 |
(Notes)
| 1. | No information on diluted net income per share is presented because the Company has no potentially dilutive shares. |
| 2. | Calculation of net income per share was based on the following numerators and denominators. |
Fiscal 2005 (Year Ended March 31, 2006) | ||
Net income per share (basic) | ||
Net income (millions of yen) | 73,545 | |
Net income not available for dividends on common shares (millions of yen) | — | |
Net income available for payment of dividends on common shares (millions of yen) | 73,545 | |
Weighted - average number of common shares outstanding during the year (1,000 shares) | 734,991 |
Subsequent Events
Fiscal 2005
(Year ended March 31, 2006)
(Acquisition of a subsidiary through purchase of shares)
The Company and Astellas Pharma Inc. agreed that the Company would acquire all of the outstanding shares of Zepharma Inc., a subsidiary of Astellas Pharma Inc. A written agreement was entered into on March 31, 2006, and the transaction was closed on April 13, 2006.
| (1) | Purpose of acquisition |
To strengthen the healthcare business in the area of non – prescription drugs
| (2) | Name of company selling the shares |
Astellas Pharma Inc.
| (3) | Name of the company acquired; nature of business; and its size |
Name: Zepharma Inc.
Nature of business: Development and sale of drugs, non-prescription drugs, cosmetics and foods, etc.
Capital: ¥300 million
Sales: ¥22.4 billion (pro-forma amount for the year ended March 31, 2005)
| (4) | Date of acquisition |
April 13, 2006
| (5) | Number of shares purchased; cost of acquisition; and percentage of ownership held upon acquisition purchase |
Number of shares purchased: 6,000
Cost of acquisition: ¥35.5 billion
Percentage of ownership held upon acquisition: 100%
| (6) | Source of financing |
The full amount was paid out of on-hand cash
7. Proposed Changes in the Membership of the Board of Directors
(as of June 29, 2006)
1. Changes in Representative Directors
(Representative Director Scheduled to Retire)
None
2. Changes in Directors
(Candidates for Election to the Board of Directors)
Executive Director Yukio Sugimura (currently Executive Vice-President and Representative Director of Sankyo Co., Ltd.)
(Directors Scheduled to Retire)
Executive Director Hideho Kawamura (scheduled to be elected Advisor of Sankyo Co., Ltd.)
3. Changes in Corporate Auditors
None
4. Candidates for Election to Substitute Corporate Auditors
Substitute auditor Sumio Moriwaki (attorney)
5. Changes in Executive Officers
None