Exhibit 99.2
FASF
May 12, 2006
Consolidated Financial Results for Fiscal 2005
(Year Ended March 31, 2006)
Sankyo Company, Limited
Listed company: DAIICHI SANKYO COMPANY, LIMITED
Stock code number: 4568
Listed exchanges: Tokyo, Osaka, and Nagoya
Head office: Tokyo, Japan
Homepage: http://www.sankyo.co.jp/
Contact: Toshio Takahashi, Executive Officer and General Manager, Corporate Communications Department
Phone: (03) 6225-1126
Meeting of Board of Directors: May 12, 2006
Parent company name: DAIICHI SANKYO COMPANY, LIMITED (stock code: 4568)
Parent company shareholding in the Company: 100.0%
U.S. accounting standards: Not applicable
Consolidated Financial Results for Fiscal 2005
| (1) | Consolidated Financial Results |
(Figures less than ¥1 million, except per share amounts, have been omitted)
| Net sales | Operating income | Ordinary income | |||||||||||||
| Millions of yen | Percent change | Millions of yen | Percent change | Millions of yen | Percent change | ||||||||||
Fiscal 2005 | 579,949 | (1.3 | ) | 78,335 | (7.8 | ) | 82,164 | (0.4 | ) | ||||||
Fiscal 2004 | 587,830 | (1.4 | ) | 84,925 | (11.1 | ) | 82,506 | (12.2 | ) | ||||||
| Net income | Basic net income per share | Diluted net income per share | Return on equity | Ordinary income as a percentage of total assets | Ordinary income as a percentage of net sales | |||||||||
| Millions of yen | Percent change | Yen | Yen | % | % | % | ||||||||
Fiscal 2005 | 50,627 | 4.9 | 118.57 | 118.56 | 7.1 | 8.5 | 14.2 | |||||||
Fiscal 2004 | 48,282 | 11.2 | 111.78 | 111.74 | 6.9 | 8.7 | 14.0 | |||||||
Notes:
| 1. | Equity in earnings of subsidiaries and affiliates accounted for by the equity method: |
Fiscal 2005: | 19 million yen | |||||
Fiscal 2004: | None |
| 2. | Weighted-average number of common shares issued and outstanding during the fiscal year (consolidated): |
Fiscal 2005: | 425,007,394 shares | |||||
Fiscal 2004: | 429,527,836 shares |
| 3. | Changes in accounting policies: Yes |
| 4. | Percentages for net sales, operating income, ordinary income and net income represent a change from the corresponding results in the previous fiscal year. |
| (2) | Consolidated Financial Position |
(Figures less than ¥1 million, except per share amounts, have been omitted)
| Total assets | Shareholders’ equity | Shareholders’ equity ratio | Shareholders’ equity per share | |||||
| Millions of yen | Millions of yen | % | Yen | |||||
Fiscal 2005 | 964,389 | 713,715 | 74.0 | 1,687.71 | ||||
Fiscal 2004 | 976,230 | 716,587 | 73.4 | 1,667.76 |
| Note: | Total number of common share issued and outstanding at the end of the fiscal year (consolidated): |
Fiscal 2005: | 422,753,456 shares | |||||
Fiscal 2004: | 429,508,509 shares |
| (3) | Consolidated Cash Flows |
(Figures less than ¥1 million, except per share amounts, have been omitted)
| Net cash flows from operating activities | Net cash flows from investing activities | Net cash flows from financing activities | Cash and cash end of year | |||||||
| Millions of yen | Millions of yen | Millions of yen | Millions of yen | |||||||
Fiscal 2005 | 79,806 | (20,295 | ) | (70,359 | ) | 254,708 | ||||
Fiscal 2004 | 96,703 | (16,265 | ) | (12,716 | ) | 262,530 |
| (4) | Scope of Consolidation and Application of Equity Method: |
Number of consolidated subsidiaries: | 34 | |||
Number of non-consolidated subsidiaries accounted for by the equity method: | 0 | |||
Number of affiliates accounted for by the equity method: | 1 |
| (5) | Changes in Scope of Consolidation and Application of Equity Method: |
Consolidated subsidiaries: | (Increase) | 2 | ||||
| (Decrease) | 5 | |||||
Companies accounted for by the equity method: | (Increase) | 1 | ||||
| (Decrease) | 0 | |||||
1. State of the Group
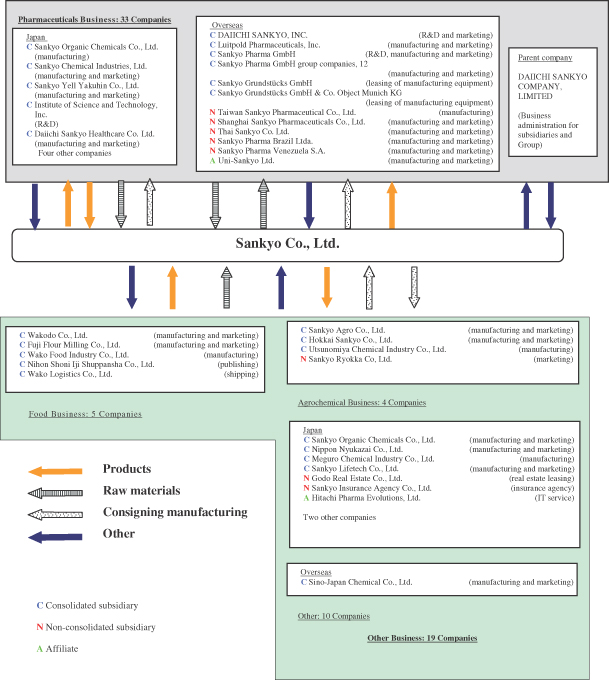
On September 28, 2005, Sankyo Company, Limited together with Daiichi Pharmaceutical Co., Ltd. jointly implemented a share transfer and thereby created the DAIICHI SANKYO GROUP comprising two wholly owned subsidiaries and their group companies. The Sankyo Group consists of Sankyo Company, Limited (the “Company”), its 47 subsidiaries, and its 3 affiliates, for a total of 51 companies. The Group’s operating activities consist mainly of the manufacture and sale of pharmaceuticals, food products, agrochemicals, veterinary drugs and chemical products.
The following chart illustrates the organization of the Sankyo Group:
Parent Company
Name | Location | Capital/ Investment | Principal Business Operations | Percentage of Voting Rights Held | Nature of Relationship | |||||||||||||
| Concurrent Directors, etc. | Financial Support | Operating Transactions | Facilities Leased | Other | ||||||||||||||
| (Million yen) | (%) | |||||||||||||||||
DAIICHI SANKYO COMPANY, LIMITED | Chuo-ku, Tokyo | 50,000 | Business administration of subsidiaries and group companies, and related operations | 100.0 | Yes | — | — | Sankyo leases offices | Receipt of services related to business administration | |||||||||
(Notes)
1. DAIICHI SANKYO file a separate securities report (‘yukashoken todokedesho’ or ‘yukashoken hokokusho’) to the Ministry of Finance in Japan.
2. DAIICHI SANKYO is a joint holding company established through stock transfer on September 28, 2005.
Consolidated Subsidiaries
| ||||||||||||||||||
Name | Location | Capital/ Investment | Principal Business Operations | Percentage of Voting Rights Held | Nature of Relationship | |||||||||||||
| Concurrent Directors, etc. | Financial Support | Operating Transactions | Facilities Leased | Other | ||||||||||||||
| (Million yen) | (%) | (Million yen) | ||||||||||||||||
| Wakodo Co., Ltd. | Chiyoda-ku, Tokyo | 2,918 | Food | 61.2 (0.7) | Yes | Wakodo Co., Ltd. | Chiyoda-ku, Tokyo | 2,918 | Food | |||||||||
| Fuji Flour Milling Co., Ltd. | Shimizu-ku, Shizuoka-shi | 500 | Food | 66.4 (0.2) | Yes | — | Sankyo purchases raw materials | Research facilities and warehouses | — | |||||||||
| Sankyo Organic Chemicals Co., Ltd. | Takatsu-ku, Kawasaki-shi | 300 | Pharmaceuticals and other | 93.4 | Yes | — | Sankyo purchases raw materials and consigns manufacturing | Manufacturing facilities | — | |||||||||
| Nippon Nyukazai Co., Ltd. | Chuo-ku, Tokyo | 300 | Other | 100.0 | Yes | Loan guarantees | Sankyo purchases raw materials | Land | — | |||||||||
| Sankyo Chemical Industries, Ltd. | Chuo-ku, Tokyo | 65 | Pharmaceuticals | 100.0 | No | Facility- related Loans and working capital | Sankyo purchases raw materials and consigns manufacturing | — | — | |||||||||
| Hokkai Sankyo Co., Ltd. | Kitahiroshima-shi | 331 | Agrochemicals | 80.0 | Yes | — | — | — | — | |||||||||
| Meguro Chemical Industry Co., Ltd. | Meguro-ku, Tokyo | 40 | Other | 100.0 | Yes | — | Sankyo purchases materials and consigns manufacturing | Manufacturing facilities | — | |||||||||
| Utsunomiya Chemical Industry Co., Ltd. | Utsunomiya-shi | 20 | Agrochemicals | 100.0 (100.0) | Yes | Facility- related loans | — | — | — | |||||||||
| Institute of Science and Technology, Inc. | Shinagawa-ku, Tokyo | 20 | Pharmaceuticals | 100.0 | Yes | — | Sankyo consigns pharmaceutical testing | Offices | — | |||||||||
| Sankyo Yell Yakuhin Co., Ltd. | Chiyoda-ku, Tokyo | 96 | Pharmaceuticals | 100.0 | Yes | Facility- related loans and working capital | Sankyo sells raw materials Sankyo purchases products | — | — | |||||||||
| Nihon Shoni Iji Shuppansha Co., Ltd. | Shinjuku-ku, Tokyo | 20 | Food | 100.0 (100.0) | No | — | — | — | — | |||||||||
| Wako Logistics Co., Ltd. | Chofu-shi | 21 | Food | 100.0 (100.0) | No | — | — | — | — | |||||||||
| Wako Food Industry Co., Ltd. | Nagano-shi | 25 | Food | 100.0 (100.0) | Yes | — | — | — | — | |||||||||
| Sankyo Agro Co., Ltd. | Bunkyo-ku, Tokyo | 350 | Agrochemicals | 100.0 | Yes | — | Sankyo conducts R&D for the company | Land, buildings and offices | — | |||||||||
| Sankyo Lifetech Co., Ltd. | Bunkyo-ku, Tokyo | 300 | Other | 100.0 | Yes | — | Sankyo conducts R&D and manufacturing for the company | Offices | — | |||||||||
Daiichi Sankyo Healthcare Co., Ltd. | Chuo-ku, Tokyo | 10 | Pharmaceuticals | 50.0 | Yes | — | — | Offices | — | |||||||||
| Sino-Japan Chemical Co., Ltd. | Taipei, Taiwan | 144 million NT$ | Other | 52.0 (3.4) | Yes | — | — | — | — | |||||||||
| DAIICHI SANKYO, INC. | New Jersey, U.S. | 24.9 million U.S. dollars | Pharmaceuticals | 80.8 | Yes | Trade payables related to co-promotion, and office and car lease guarantees | Sankyo sells products and consigns pharmaceutical R&D | — | Sankyo provides pharmaceutical technologies | |||||||||
| Luitpold Pharmaceuticals Inc. | Shirley, U.S. | 0.2 million U.S. dollars | Pharmaceuticals | 100.0 (100.0) | Yes | — | — | — | — | |||||||||
| Sankyo Grundstücks GmbH | Munich, Germany | 5.1 million euros | Pharmaceuticals | 100.0 | No | — | — | — | — | |||||||||
| Sankyo Grundstücks GmbH & Co. Object Munich KG | Munich, Germany | 38.2 million euros | Pharmaceuticals | 94.0 (94.0) | No | — | — | — | — | |||||||||
| Sankyo Pharma GmbH | Munich, Germany | 16.0 million euros | Pharmaceuticals | 100.0 | No | — | Sankyo sells raw materials and consigns manufacturing and pharmaceutical R&D | — | Sankyo provides pharmaceutical technologies | |||||||||
| Sankyo Pharma UK Ltd. | Amersham, UK | 19.5 million pounds | Pharmaceuticals | 100.0 (100.0) | No | — | — | — | — | |||||||||
| Sankyo Pharma Espana S.A. | Madrid, Spain | 120 thousand euros | Pharmaceuticals | 100.0 (100.0) | No | — | — | — | — | |||||||||
| Sankyo Pharma Italia S.p.A. | Rome, Italy | 120 thousand euros | Pharmaceuticals | 100.0 (100.0) | No | — | — | — | — | |||||||||
| Sankyo Pharma Portugal Lda. | Porto Salvo, Portugal | 349 thousand euros | Pharmaceuticals | 100.0 (100.0) | No | — | — | — | — | |||||||||
| Sankyo Pharmazeutika Austria GmbH | Vienna, Austria | 18 thousand euros | Pharmaceuticals | 100.0 (100.0) | No | — | — | — | — | |||||||||
| Sankyo Pharma (Schweiz) AG | Thalwil, Switzerland | 3 million Swiss Francs | Pharmaceuticals | 100.0 (100.0) | No | — | — | — | — | |||||||||
| Sankyo Pharma Nederland B.V. | Zwanenburg, the Netherlands | 18 thousand euros | Pharmaceuticals | 100.0 (100.0) | No | — | — | — | — | |||||||||
| N.V. Sankyo Pharma Belgium S.A. | Louvain-La-Nueve, Belgium | 62 thousand euros | Pharmaceuticals | 100.0 (100.0) | No | — | — | — | — | |||||||||
| O. Y. Sankyo Pharma Finland Ab | Helsinki, Finland | 25 thousand euros | Pharmaceuticals | 100.0 (100.0) | No | — | — | — | — | |||||||||
| Sankyo Manufacturing France S.a.r.l. | Altkirch, France | 457 thousand euros | Pharmaceuticals | 100.0 (100.0) | No | — | — | — | — | |||||||||
| Dignos-Chemie GmbH | Munich, Germany | 40 thousand euros | Pharmaceuticals | 100.0 (100.0) | No | — | — | — | — | |||||||||
| Sankyo Pharma France S.A.S. | Rueil Malmaison, France | 2,182 thousand euros | Pharmaceuticals | 100.0 (100.0) | No | — | — | — | — | |||||||||
(Notes)
| 1. | The information in the ‘Principal Operating Activities’ column represents the name of operating segment defined in the operating segment information section. |
| 2. | The following two subsidiaries file a separate securities report (‘yukashoken todokedesho’ or ‘yukashoken hokokusyo’) to the Ministry of Finance in Japan: Wakodo Co., Ltd. and Fuji Flour Milling Co., Ltd., whose common shares are publicly traded on the Tokyo and Nagoya Stock Exchanges, respectively. |
| 3. | Figures in parentheses in the ‘Percentage of Voting Rights Held’ column represent the percentage of voting shares held indirectly, and are also included in the respective total percentages. |
| 4. | Daiichi Sankyo Healthcare Co., Ltd., which was established in December 2005 as a vehicle for the integration of the OTC drug operations of the Company and Daiichi Pharmaceutical Co., Ltd., is included in the scope of consolidation from the year ended March 31, 2006. |
| 5. | Sankyo Grundstücks GmbH & Co. Object Munich KG, a 94% owned partnership newly established by Sankyo Grundstücks GmbH is included in the scope of consolidation from the year ended March 31, 2006. |
| 6. | Nippon Daiya Valve Co., Ltd., which was a consolidated subsidiary of the Company until the year ended March 31, 2005, has been excluded from the scope of consolidation in the year ended March 31, 2006 due to the disposition of the Company’s entire share holdings in this company in April 2005. |
| 7. | Kyushu Sankyo Co., Ltd., which was a consolidated subsidiary of the Company until the year ended March 31, 2005, has been excluded from the scope of consolidation in the year ended March 31, 2006 due to its integration with two other consolidated subsidiaries, Sankyo Agro Co., Ltd. and Utsunomiya Chemical Industry Co., Ltd., in April, 2005. |
| 8. | Sankyo Foods Co., Ltd., which was a consolidated subsidiary of the Company until the year ended March 31, 2005, has been excluded from the scope of consolidation in the year ended March 31, 2006 due to the sale of its business in July 2005. |
| 9. | Dismed AG, which had been a consolidated subsidiary of the Company until the year ended March 31, 2005, merged with Sankyo Pharma (Schweiz) AG, a consolidated subsidiary, in June 2005. |
| 10. | F.P. Processing Co., Ltd., which was a consolidated subsidiary of the Company until the year ended March 31, 2005, has been excluded from the scope of consolidation in the year ended March 31, 2006 due to the disposition of the Company’s entire share holdings in this company in January 2006. |
| 11. | Sankyo Pharma Inc., a consolidated subsidiary of the Company, absorbed Daiichi Pharma Holdings, Inc., Daiichi Pharmaceutical Corp. and Daiichi Medical Research Inc., which are U.S.-based subsidiaries of Daiichi Pharmaceutical Co., Ltd., by merger on March 31, 2006. The name of the merged entity was changed to DAIICHI SANKYO, INC. |
| 12. | The Company sold its entire ownership of O.Y. Sankyo Pharma Finland Ab in January 2006. |
| 13. | Fuji Flour Milling Co., Ltd., a consolidated subsidiary, were merged with Nitto Flour Milling Co., Ltd. on April 1, 2006. The name of the merged entity was changed to Nitto Fuji Flour Milling Co., Ltd. The percentage of the Company’s voting interests in Nitto-Fuji Flour Milling was diluted so that it is no longer an affiliate of the Company from that date. |
| 14. | Net sales (excluding inter-group sales among consolidated subsidiaries) at DAIICHI SANKYO, INC. accounted for more than 10% of consolidated net sales. |
Information on earnings, etc:
(1) Net sales | ¥ | 69,555 million | |
(2) Ordinary income | ¥ | 8,435 million | |
(3) Net income | ¥ | 10,699 million | |
(4) Shareholders’ Equity | ¥ | 38,462 million | |
(5) Total assets | ¥ | 63,890 million |
Affiliate Accounted for by the Equity Method
Name | Location | Capital/ Investment | Principal Business Operations | Percentage of Voting Rights Held | Nature of Relationship | |||||||||||||
| Mutual Directors | Financial Support | Operating Transactions | Facilities Leased | Other | ||||||||||||||
| (Million yen) | (%) | |||||||||||||||||
| Hitachi Pharma Evolutions, Ltd. | Shinagawa-ku, Tokyo | 250 | IT | 49.0 | Yes | — | — | Offices | — | |||||||||
Hitachi Pharma Evolutions, Ltd. was established though joint investment by the Company, Hitachi, Ltd. and Hitachi Systems & Services, Ltd.
2. Management Policies
On September 28, 2005, Sankyo Company, Limited and Daiichi Pharmaceutical Co., Ltd. jointly established a holding company, DAIICHI SANKYO COMPANY, LIMITED, through the joint stock transfer. For information regarding the principal management policies and corporate strategies of the DAIICHI SANKYO Group, please refer to DAIICHI SANKYO’s report on the consolidated results (“Kessan Tanshin”) for the fiscal year.
III. Results of Operations and Financial Position
I. Results of Operations
1. Overview of the fiscal year
(Millions of yen)
| Net sales | Operating income | Recurring income | Net income | ||||||||
March 31, 2006 | 579,949 | 78,335 | 82,164 | 50,627 | |||||||
March 31, 2005 | 587,830 | 84,925 | 82,506 | 48,282 | |||||||
Change (%) | (1.3 | ) | (7.8 | ) | (0.4 | ) | 4.9 |
(1) Overview of Performance
Business conditions remained harsh in the year ended March 31, 2006, particularly in the developed country markets in Japan, the United States and Europe, as the governments tried to contain healthcare costs while the R&D related expenses continued to rise. Competition among the U.S. and European pharmaceutical “global mega” firms continued to intensify at the global level.
Facing such challenging conditions, the Company reached an agreement with Daiichi Pharmaceutical Co., Ltd. to fully integrate both companies’ pharmaceutical operations by April 2007 with the aim of creating a new ��global pharma-innovator” with global-level R&D capabilities. The first step in the integration process was the establishment on September 28, 2005 of DAIICHI SANKYO COMPANY, LIMITED as a joint holding company.
In the year ended March 31, 2006, the Sankyo Group posted consolidated net sales of ¥579,949 million (a decline by 1.3% compared with the previous year), operating income of ¥78,335 million (a decrease by 7.8%), ordinary income of ¥82,164 million (a decrease by 0.4%) and net income of ¥50,627 million (an increase by 4.9%). Robust growth in sales in Japan, Europe and the United States of the strategic global product olmesartan, an antihypertensive agent (sold in the United States as Benicar® and in Europe and Japan as Olmetec®), helped to offset a number of factors that depressed net sales, including lower sales of the flagship antihyperlipidemic agent Mevalotin®; the termination of the co-promotion agreements for Espo® (renal anemia), Gran® (leukopenia) and Alesion® (allergic disorders); and the exclusion of certain non-pharmaceutical subsidiaries from the scope of consolidation. As a result, net sales declined only slightly.
Operating income decreased by 7.8% due to a rise in R&D expenditures and other factors. However, ordinary income was kept at virtually the same level as in the previous year owing to an improved non-operating income and expenses.
At the net income level, a lower tax rate at U.S.-based subsidiaries resulted in substantially higher after-tax income, despite the fact that net extraordinary losses increased due to a reduction in gain on sale of property, plant and equipment compared to the previous year and other factors, resulting in a 4.9% increase in net income compared with the previous year.
(2) Segment Information
Operating Segments
(Millions of yen)
| Net Sales | Operating Income | |||||||||||||||||||
| Fiscal 2005 | Fiscal 2004 | Change | Change (%) | Fiscal 2005 | Fiscal 2004 | Change | Change (%) | |||||||||||||
Pharmaceutical | 454,451 | 455,633 | (1,181 | ) | (0.3 | ) | 72,226 | 77,495 | (5,269 | ) | (6.8 | ) | ||||||||
Other | 127,331 | 134,843 | (7,512 | ) | (5.6 | ) | 5,672 | 6,587 | (914 | ) | (13.9 | ) | ||||||||
1) Pharmaceuticals
Net sales in the pharmaceuticals segment totaled ¥454,451 million, a decline of 0.3% compared with the previous year. Operating income fell by 6.8% to ¥72,226 million.
With respect to prescription drugs, sales of antihypertensive agent olmesartan, (sold in the United States as Benicar® and in Europe and Japan as Olmetec®), demonstrated a strong growth in Japan and overseas markets. In contrast, sales of the mainstay product Mevalotin®, an antihyperlipidemic agent, declined due to fiercer competition in Japan and the United States from rival products, and due to its patent expiration in some European countries. The termination of the co-marketing agreements for Espo® (renal anemia), Gran® (leukopenia) and Alesion® (allergic disorders) also depressed sales. Overall sales were at a level with the previous year sales.
Operating income fell, reflecting a rise in R&D expenditures and other factors.
2) Other Businesses
Net sales in this segment totaled ¥127,331 million, a decline of 5.6% compared with the previous year. Operating income fell by 13.9% to ¥5,672 million.
As part of initiatives to focus on the pharmaceutical business, the Sankyo Group sold its interests and transferred businesses of three of the non-pharmaceutical subsidiaries (Nippon Daiya Valve Co., Ltd., Sankyo Foods Co., Ltd. and F.P. Processing Co., Ltd.), all of which became excluded from the scope of consolidation. As a result, net sales and operating income both declined compared with the previous year.
Geographic segments
(Millions of yen)
| Net Sales | Operating Income | |||||||||||||||||||||
| Fiscal 2005 | Fiscal 2004 | Change | Change (%) | Fiscal 2005 | Fiscal 2004 | Change | Change (%) | |||||||||||||||
Japan | 443,906 | 473,867 | (29,961 | ) | (6.3 | ) | 54,914 | 73,313 | (18,399 | ) | (25.1 | ) | ||||||||||
North America | 109,389 | 80,327 | 29,061 | 36.2 | 24,836 | 13,143 | 11,693 | 89.0 | ||||||||||||||
Other | 53,474 | 52,645 | 828 | 1.6 | (424 | ) | (1,310 | ) | 886 | — | ||||||||||||
Net sales in Japan totaled ¥443,906 million, a decline of 6.3% compared with the previous year. Operating income declined by 25.1% to ¥54,914 million.
Although Olmetec® posted a steady growth in sales, sales of Mevalotin® fell amid intense competition. The transfer of the distribution rights for Espo®, Gran® and Alesion®, along with the exclusion of certain non-pharmaceutical subsidiaries from the scope of consolidation also had a negative effect on net sales.
Operating income declined sharply compared with the previous year, reflecting higher R&D expenditures as well as the decrease in sales.
2) North America
Net sales rose by 36.2% compared with the previous year, to ¥109,389 million, and operating income jumped by 89.0%, to ¥24,836 million.
Soaring sales of the antihypertensive agent Benicar® and its diuretic combination Benicar® HCT and a growth in sales of the antihyperlipidemic agent, WelChol®, at DAIICHI SANKYO, INC. (formerly Sankyo Pharma Inc.), coupled with a strong performance of the antianemia agent, Venofer®, at Luitpold Pharmaceuticals Inc., brought the significant increase in net sales in North America.
Operating income increased substantially compared with the previous year due to higher sales.
3) Other
Net sales were up by 1.6%, to ¥53,474 million, and operating loss was reduced from ¥1,310 million in the previous fiscal year, to ¥424 million in the current year.
In Europe, the Sankyo Pharma GmbH Group contributed a growth in sales of Olmetec®.
2. R&D Activities
R&D expenses, which were mostly incurred in the pharmaceuticals business, totaled ¥97,265 million in the year ended March 31, 2006 (16.8% of net sales).
The Sankyo Group focuses its R&D resources on cardiovascular disorders and five other major therapeutic areas with the aim of bringing a continuous stream of world-class innovative drugs to the market. In line with the integration process with Daiichi Pharmaceutical Co., Ltd., the Company integrated management of R&D management activities and has identified high-priority R&D projects to ensure the efficient distribution of resources. Sankyo’s R&D projects that have been given a high-priority designation include CS-747 [Phase III (U.S. and Europe); Phase I (Japan)], a treatment for ischemic disease being jointly developed with the Eli Lilly Company, and CS-8663 [Phase III (U.S. and Europe)], a combination drug of antihypertensive agents olmesartan and amlodipine.
The results of a large-scale clinical trial (“MEGA Study”) featuring the antihyperlipidemic agent Mevalotin® were presented in November 2005 at the annual American Heart Association (AHA) Scientific Sessions. This trial was a special study initiated in 1993 as a contract research project sponsored by the Japanese Ministry of Health, Labor and Welfare (the Ministry of Health and Welfare at the time) targeting approximately 8,000 mild to moderate hyperlipidemia patients with no past history of coronary heart disease. It represented the first large-scale randomized, comparative study in Japan to test the drug’s efficacy in primary prevention against cardiovascular disease over an average observation period of more than five years. Mevalotin® demonstrated high efficacy in the trial. The results also underlined the clear clinical value of antihyperlipidemic therapy in Japan.
In other R&D-related development areas, during the year ended March 31, 2006, Sankyo concluded a licensing and development agreement with U.S.-based KAI Pharmaceuticals, Inc. for KAI-9803, a treatment for myocardial and cerebral infarction to further reinforce Sankyo’s R&D efforts in the cardiovascular field.
II. Financial Position
1. Overview of the fiscal year
Consolidated Cash Flows
(Millions of yen)
| 2006 | 2005 | Change | |||||||
Net cash provided by (used in) operating activities | 79,806 | 96,703 | (16,896 | ) | |||||
Net cash provided by (used in) investing activities | (20,295 | ) | (16,265 | ) | (4,029 | ) | |||
Net cash provided by (used in) financing activities | (70,359 | ) | (12,716 | ) | (57,643 | ) | |||
Effect of exchange rate changes on cash and cash equivalents | 3,342 | (123 | ) | 3,466 | |||||
Net increase (decrease) in cash and cash equivalents | (7,506 | ) | 67,596 | (75,103 | ) | ||||
Cash and cash equivalents at the end of period | 254,708 | 262,530 | (7,821 | ) |
Cash and cash equivalents at the end of the fiscal year declined by ¥7,821 million from the end of the previous fiscal year, to ¥254,708 million. Contributing factors are summarized as follows:
Cash Flows from Operating Activities
Net cash provided by operating activities decreased by ¥16,896 million from the previous fiscal year, to ¥79,806 million. This is mainly a result of a ¥7,220 million decline in income before income taxes and minority interests and a ¥7,183 million increase in corporate tax payments.
Cash Flows from Investing Activities
Net cash used in investing activities increased by ¥4,029 million from the previous fiscal year, to ¥20,295 million, largely as a result of a ¥9,285 million decrease in proceeds from sale of property, plant and equipment due to an absence of the sale of land for the site of Sankyo’s former Tanashi Plant posted in the previous fiscal year.
Cash Flows from Financing Activities
Net cash used in financing activities increased by ¥57,643 million compared with the prior year, to ¥70,359 million. This increase principally reflected higher cash outflows compared with the previous year due to purchases of treasury stock (an increase of ¥16,413 million) and dividends paid to shareholders (an increase of ¥39,068 million), reflecting a higher year-end dividend plus an interim dividend paid to the holding company).
Trends in key cash flow indicators are summarized as follows:
| As of March 2003 | As of March 2004 | As of March 2005 | As of March 2006 | |||||
Shareholders’ equity ratio (%) | 71.9 | 73.6 | 73.4 | 74.0 | ||||
Debt redemption period (year) | 0.4 | 0.3 | 0.2 | 0.3 | ||||
Interest coverage ratio (times) | 157.5 | 212.4 | 269.8 | 255.2 |
Shareholders’ equity ratio: Shareholders’ equity / total assets
Debt redemption period: Interest-bearing debt / operating cash flows
Interest coverage ratio: Operating cash flows / interest paid
| * | All figures in the above table were calculated on a consolidated basis. |
| * | Interest-bearing debt represents all liabilities subject to the payment of interest included in the consolidated balance sheets. |
| * | Operating cash flows represent net cash provided by operating activities in the consolidated statements of cash flows. In addition, interest paid equals to “interest paid” in the consolidated statement of cash flows. |
IV. Consolidated Financial Statements
1. Consolidated Balance Sheets
(Millions of yen)
| As of March 31, 2005 | As of March 31, 2006 | Change | |||||||||||||
See Note | Amount | % | Amount | % | % | ||||||||||
ASSETS | |||||||||||||||
Current assets | |||||||||||||||
Cash and time deposits | 175,960 | 162,976 | (12,983 | ) | |||||||||||
Trade notes and accounts receivable | 162,442 | 149,870 | (12,572 | ) | |||||||||||
Marketable securities | 146,632 | 158,625 | 11,993 | ||||||||||||
Parent company stock | — | 8,912 | 8,912 | ||||||||||||
Inventories | 89,979 | 84,071 | (5,907 | ) | |||||||||||
Deferred tax assets | 21,832 | 22,874 | 1,041 | ||||||||||||
Other current assets | 9,704 | 11,471 | 1,767 | ||||||||||||
Allowance for doubtful accounts | (483 | ) | (564 | ) | (80 | ) | |||||||||
Total current assets | 606,067 | 62.1 | 598,238 | 62.0 | (7,829 | ) | |||||||||
Non-current assets | |||||||||||||||
Property, plant and equipment | *1 | ||||||||||||||
Buildings and structures | *3 | 111,966 | 108,690 | (3,275 | ) | ||||||||||
Machinery, equipment and vehicles | *3 | 31,831 | 28,259 | (3,572 | ) | ||||||||||
Land | *3 | 30,655 | 32,265 | 1,609 | |||||||||||
Construction in progress | 10,005 | 4,076 | (5,929 | ) | |||||||||||
Other non-current assets | *3 | 11,980 | 12,789 | 809 | |||||||||||
Total property, plant and equipment, net | 196,439 | 20.1 | 186,080 | 19.3 | (10,358 | ) | |||||||||
Intangible assets | |||||||||||||||
Goodwill, net | 845 | 547 | (298 | ) | |||||||||||
Other, net | 24,181 | 19,589 | (4,592 | ) | |||||||||||
Total intangible assets, net | 25,026 | 2.6 | 20,136 | 2.1 | (4,890 | ) | |||||||||
Investments and other assets | |||||||||||||||
Investment securities | *2, 3 | 114,480 | 133,471 | 18,991 | |||||||||||
Long-term loans | 5,876 | 5,273 | (603 | ) | |||||||||||
Deferred tax assets | 14,967 | 4,016 | (10,951 | ) | |||||||||||
Prepaid pension costs | — | 2,950 | 2,950 | ||||||||||||
Other assets | *2 | 13,702 | 14,450 | 748 | |||||||||||
Allowance for doubtful accounts | (329 | ) | (228 | ) | 101 | ||||||||||
Total investments and other assets | 148,696 | 15.2 | 159,934 | 16.6 | 11,237 | ||||||||||
Total non-current assets | 370,163 | 37.9 | 366,150 | 38.0 | (4,012 | ) | |||||||||
Total assets | 976,230 | 100.0 | 964,389 | 100.0 | (11,841 | ) | |||||||||
(Millions of yen)
| As of March 31, 2005 | As of March 31, 2006 | Change | |||||||||||||
| See Note | Amount | % | Amount | % | % | ||||||||||
LIABILITIES | |||||||||||||||
Current liabilities | |||||||||||||||
Trade notes and accounts payable | 54,435 | 47,997 | (6,437 | ) | |||||||||||
Short-term bank loans | *3 | 16,699 | 13,546 | (3,153 | ) | ||||||||||
Income taxes payable | 16,904 | 2,621 | (14,283 | ) | |||||||||||
Deferred tax liabilities | 689 | 31 | (658 | ) | |||||||||||
Accrued bonuses | 13,481 | — | (13,481 | ) | |||||||||||
Allowance for sales returns | 476 | 412 | (64 | ) | |||||||||||
Allowance for sales rebates | 1,022 | 894 | (127 | ) | |||||||||||
Allowance for contingent losses | — | 3,379 | 3,379 | ||||||||||||
Other current liabilities | 70,002 | 78,591 | 8,589 | ||||||||||||
Total current liabilities | 173,712 | 17.8 | 147,475 | 15.3 | (26,236 | ) | |||||||||
Non-current liabilities | |||||||||||||||
Long-term debt | *3 | 3,373 | 3,369 | (3 | ) | ||||||||||
Deferred tax liabilities | 441 | 2,306 | 1,864 | ||||||||||||
Accrued retirement and severance benefits | 66,843 | 63,389 | (3,454 | ) | |||||||||||
Accrued directors’ retirement and severance benefits | 1,830 | 1,619 | (211 | ) | |||||||||||
Accrued soil remediation costs | — | 2,850 | 2,850 | ||||||||||||
Other non-current liabilities | 4,006 | 5,792 | 1,786 | ||||||||||||
Total non-current liabilities | 76,495 | 7.8 | 79,326 | 8.2 | 2,831 | ||||||||||
Total liabilities | 250,208 | 25.6 | 226,802 | 23.5 | (23,405 | ) | |||||||||
MINORITY INTERESTS | |||||||||||||||
Minority interests | 9,434 | 1.0 | 23,870 | 2.5 | 14,435 | ||||||||||
SHAREHOLDERS’ EQUITY | |||||||||||||||
Common stock | *7 | 68,793 | 7.0 | 68,793 | 7.1 | — | |||||||||
Additional paid-in capital | 66,862 | 6.8 | 66,862 | 6.9 | — | ||||||||||
Retained earnings | 580,514 | 59.5 | 529,144 | 54.9 | (51,370 | ) | |||||||||
Net unrealized gain on investment securities | 27,857 | 2.9 | 47,933 | 5.0 | 20,076 | ||||||||||
Foreign currency translation adjustments | (7,026 | ) | (0.7 | ) | 982 | 0.1 | 8,008 | ||||||||
Treasury stock at cost | *8 | (20,412 | ) | (2.1 | ) | — | — | 20,412 | |||||||
Total shareholders’ equity | 716,587 | 73.4 | 713,715 | 74.0 | (2,872 | ) | |||||||||
Total liabilities, minority interests and shareholders’ equity | 976,230 | 100.0 | 964,389 | 100.0 | (11,841 | ) | |||||||||
2. Consolidated Statements of Income
(Millions of yen)
Fiscal 2004 (Year ended March 31, 2005) | Fiscal 2005 (Year ended March 31, 2006) | Changes from fiscal 2004 | |||||||||||
| See Note | Amount | % | Amount | % | Amount | ||||||||
Net sales | 587,830 | 100.0 | 579,949 | 100.0 | (7,880 | ) | |||||||
Cost of sales | *1 | 213,874 | 36.4 | 198,328 | 34.2 | (15,545 | ) | ||||||
Gross profit | 373,956 | 63.6 | 381,621 | 65.8 | 7,664 | ||||||||
Reversal of provision for sales returns | — | — | 64 | 0.0 | |||||||||
Provision for sales returns | 15 | 0.0 | — | — | |||||||||
Adjusted gross profit | 373,940 | 63.6 | 381,685 | 65.8 | 7,745 | ||||||||
Selling, general and administrative expenses | 289,015 | 49.2 | 303,350 | 52.3 | 14,335 | ||||||||
Advertising and promotional expenses | 51,738 | 58,515 | |||||||||||
Salaries and bonuses | 46,401 | 56,486 | |||||||||||
Provision for accrued bonuses | 8,282 | — | |||||||||||
Retirement and severance benefits | 3,976 | 1,715 | |||||||||||
Provision for allowance for directors’ retirement and severance benefits | 248 | 430 | |||||||||||
Provision of allowance for doubtful accounts | — | 111 | |||||||||||
Research and development expense | *1 | 86,551 | 97,265 | ||||||||||
Amortization of goodwill | 389 | 400 | |||||||||||
Other | 91,427 | 88,423 | |||||||||||
Operating income | 84,925 | 14.4 | 78,335 | 13.5 | (6,590 | ) | |||||||
Non-operating income | 6,425 | 1.1 | 8,490 | 1.4 | 2,064 | ||||||||
Interest income | 1,178 | 2,488 | |||||||||||
Dividend income | 2,126 | 1,257 | |||||||||||
Amortization of goodwill | 11 | 3 | |||||||||||
Equity in earnings of affiliated companies | — | 19 | |||||||||||
Rent income | 889 | 1,053 | |||||||||||
Other | 2,219 | 3,667 | |||||||||||
Non-operating expenses | 8,844 | 1.5 | 4,660 | 0.8 | (4,183 | ) | |||||||
Interest expense | 358 | 312 | |||||||||||
Loss on disposal of inventories | 3,983 | 1,314 | |||||||||||
Charitable contributions | 737 | 1,099 | |||||||||||
Other | 3,765 | 1,934 | |||||||||||
Ordinary income | 82,506 | 14.0 | 82,164 | 14.1 | (342 | ) | |||||||
(Millions of yen)
Fiscal 2004 (Year ended March 31, 2005) | Fiscal 2005 (Year ended March 31, 2006) | Changes from fiscal 2004 | |||||||||||||
| See Note | Amount | % | Amount | % | Amount | ||||||||||
Extraordinary income | 15,775 | 2.7 | 6,521 | 1.1 | (9,254 | ) | |||||||||
Gain on sale of property, plant and equipment | *2 | 12,179 | 4,897 | ||||||||||||
Gain on sale of investments in affiliates | 544 | 1,179 | |||||||||||||
Gain on sale of investment securities | 983 | 444 | |||||||||||||
Reversal of allowance for doubtful accounts | 2,026 | — | |||||||||||||
Reversal of accrued directors’ retirement and severance benefits | 41 | — | |||||||||||||
Extraordinary losses | 20,603 | 3.5 | 18,227 | 3.1 | (2,375 | ) | |||||||||
Loss on disposal of property, plant and equipment | *3 | 2,333 | 4,706 | ||||||||||||
Loss on impairment of property, plant and equipment | *4 | 15,865 | 3,913 | ||||||||||||
Provision for contingent losses | — | 3,379 | |||||||||||||
Provision for soil remediation costs | — | 2,850 | |||||||||||||
Loss related to business integration | *5 | — | 2,231 | ||||||||||||
Loss on disposal of investments in affiliates | — | 374 | |||||||||||||
Restructuring charge | *6 | — | 345 | ||||||||||||
Loss on deemed sale of investments in affiliates | — | 333 | |||||||||||||
Supplemental retirement benefits | 662 | 47 | |||||||||||||
Loss on valuation of investment securities | 4 | 44 | |||||||||||||
Loss on sale of investment securities | 5 | — | |||||||||||||
Loss on valuation of investments in affiliates | 1,483 | — | |||||||||||||
Loss on valuation of other investments in capital | 249 | — | |||||||||||||
Income before income taxes and minority interests | 77,678 | 13.2 | 70,457 | 12.1 | (7,220 | ) | |||||||||
Income tax expense - current | 33,224 | 22,075 | |||||||||||||
Income tax benefit - deferred | (4,550 | ) | 4.9 | (2,710 | ) | 3.3 | (9,309 | ) | |||||||
Minority interests in net income of subsidiaries | 722 | 0.1 | 465 | 0.1 | (256 | ) | |||||||||
Net income | 48,282 | 8.2 | 50,627 | 8.7 | 2,345 | ||||||||||
3. Consolidated Statements of Capital Surplus and Retained Earnings
(Millions of yen)
Fiscal 2004 (Year ended March 31, 2005) | Fiscal 2005 (Year ended March 31, 2006) | Changes from fiscal 2004 | |||||||||||
| See Note | Amount | Amount | Amount | ||||||||||
ADDITIONAL PAID-IN CAPITAL | |||||||||||||
Additional paid-in capital, beginning of year | 66,862 | 66,862 | — | ||||||||||
Increase in additional paid-in capital | — | — | — | ||||||||||
Decrease in additional paid-in capital | — | — | — | ||||||||||
Additional paid-in capital, end of year | 66,862 | 66,862 | — | ||||||||||
RETAINED EARNINGS | |||||||||||||
Retained earnings, beginning of year | 546,422 | 580,514 | 34,091 | ||||||||||
Increase in retained earnings: | |||||||||||||
Net income | 48,282 | 50,627 | |||||||||||
Increase due to merger with a non-consolidated subsidiary | 117 | 48,399 | — | 50,627 | 2,227 | ||||||||
Decrease in retained earnings: | |||||||||||||
Cash dividends | 13,959 | 53,013 | |||||||||||
Bonuses; | |||||||||||||
Bonuses to directors | 326 | 240 | |||||||||||
Bonuses to corporate auditors | 21 | 20 | |||||||||||
Retirement of treasury stock | — | 35,736 | |||||||||||
Loss on reissuance of treasury stock | — | 229 | |||||||||||
Decrease in retained earnings due to dilution of ownership in consolidated subsidiaries | — | 12,522 | |||||||||||
Decrease due to changes in scope of consolidation | — | 14,308 | 235 | 101,997 | 87,689 | ||||||||
Retained earnings, end of year | 580,514 | 529,144 | (51,370 | ) | |||||||||
4. Consolidated Statements of Cash Flows
(Millions of yen)
Fiscal 2004 (Year ended March 31, 2005) | Fiscal 2005 (Year ended March 31, 2006) | Changes from fiscal 2004 | |||||||||
| See Note | Amount | Amount | Amount | ||||||||
Cash flows from operating activities: | |||||||||||
Income before income taxes and minority interests | 77,678 | 70,457 | (7,220 | ) | |||||||
Depreciation | 28,811 | 27,100 | (1,710 | ) | |||||||
Loss on impairment of property, plant and equipment | 15,865 | 3,913 | (11,951 | ) | |||||||
Gain on sale of marketable and investment securities | (1,064 | ) | (395 | ) | 668 | ||||||
Loss on valuation of marketable and investment securities | 1,736 | (232 | ) | (1,968 | ) | ||||||
Amortization of goodwill | 378 | 397 | 19 | ||||||||
Increase (decrease) in allowance for doubtful accounts | (2,021 | ) | 14 | 2,036 | |||||||
Increase (decrease) in accrued retirement and severance benefits | (3,498 | ) | (2,986 | ) | 511 | ||||||
Increase (decrease) in accrued bonuses | 224 | (13,391 | ) | (13,615 | ) | ||||||
Interest and dividend income | (3,304 | ) | (3,745 | ) | (440 | ) | |||||
Interest expense | 358 | 312 | (45 | ) | |||||||
Gain on sale of property, plant and equipment | (10,731 | ) | (190 | ) | 10,540 | ||||||
Decrease in trade notes and accounts receivable | 8,147 | 13,657 | 5,510 | ||||||||
Decrease in inventories | 122 | 5,259 | 5,136 | ||||||||
Increase (decrease) increase in trade notes and accounts payable | 3,473 | (7,369 | ) | (10,843 | ) | ||||||
Other, net | 6,329 | 19,747 | 13,418 | ||||||||
Subtotal | 122,504 | 112,550 | (9,954 | ) | |||||||
Interest and dividends received | 3,407 | 3,603 | 195 | ||||||||
Interest paid | (358 | ) | (312 | ) | 45 | ||||||
Income taxes paid | (28,851 | ) | (36,034 | ) | (7,183 | ) | |||||
Net cash provided by operating activities | 96,703 | 79,806 | (16,896 | ) | |||||||
Cash flows from investing activities: | |||||||||||
Purchases of time deposits | (7,889 | ) | (1,786 | ) | 6,103 | ||||||
Proceeds from maturities of time deposits | 10,842 | 2,363 | (8,478 | ) | |||||||
Purchases of marketable securities | (62,969 | ) | (59,538 | ) | 3,431 | ||||||
Proceeds from sale of marketable securities | 77,786 | 78,943 | 1,157 | ||||||||
Acquisitions of property, plant and equipment | (27,282 | ) | (28,166 | ) | (883 | ) | |||||
Proceeds from sale of property, plant and equipment | 14,696 | 5,411 | (9,285 | ) | |||||||
Acquisitions of intangible assets | (2,439 | ) | (4,513 | ) | (2,073 | ) | |||||
Proceeds from disposal of intangible assets | — | 625 | 625 | ||||||||
Acquisitions of investment securities | (21,704 | ) | (18,712 | ) | 2,991 | ||||||
Proceeds from sale of investment securities | 1,561 | 2,959 | 1,397 | ||||||||
Proceeds from sale of investments in subsidiaries resulting in changes in scope of consolidation | *2 | 527 | 642 | 114 | |||||||
Payments for loans receivable | (904 | ) | (1,951 | ) | (1,046 | ) | |||||
Proceeds from collection of loans receivable | 1,342 | 1,812 | 470 | ||||||||
Other, net | 169 | 1,615 | 1,446 | ||||||||
Net cash used in investing activities | (16,265 | ) | (20,295 | ) | (4,029 | ) | |||||
(Millions of yen)
Fiscal 2004 (Year ended March 31, 2005) | Fiscal 2005 (Year ended March 31, 2006) | Changes from fiscal 2004 | |||||||||
| See Note | Amount | Amount | Amount | ||||||||
Cash flows from financing activities: | |||||||||||
Net (decrease) increase in short-term bank loans | 2,365 | (2,286 | ) | (4,652 | ) | ||||||
Proceeds from long-term debt | 470 | 1,110 | 640 | ||||||||
Repayments of long-term debt | (1,282 | ) | (1,186 | ) | 95 | ||||||
Proceeds from share issued to minority shareholders | — | 876 | 876 | ||||||||
Purchases of treasury stock | (76 | ) | (16,490 | ) | (16,413 | ) | |||||
Proceeds from sale of treasury stock | — | 936 | 936 | ||||||||
Dividends paid to shareholders | (13,960 | ) | (53,028 | ) | (39,068 | ) | |||||
Dividends paid to minority shareholders | (109 | ) | (194 | ) | (84 | ) | |||||
Other, net | (123 | ) | (97 | ) | 25 | ||||||
Net cash used in financing activities | (12,716 | ) | (70,359 | ) | (57,643 | ) | |||||
Effect of exchange rate changes on cash and cash equivalents | (123 | ) | 3,342 | 3,466 | |||||||
Net (decrease) increase in cash and cash equivalents | 67,596 | (7,506 | ) | (75,103 | ) | ||||||
Cash and cash equivalents, beginning of year | 194,789 | 262,530 | 67,740 | ||||||||
Decrease in cash and cash equivalents due to changes in scope of consolidation | — | (314 | ) | (314 | ) | ||||||
Increase in cash and cash equivalents due to merger with a non-consolidated subsidiary | 144 | — | (144 | ) | |||||||
Cash and cash equivalents, end of year | 262,530 | 254,708 | (7,821 | ) | |||||||
Basis of Presentation and Summary of Accounting Principles and Policies for the Preparation of the Consolidated Financial Statements
1. Scope of Consolidation
Consolidated subsidiaries: 34
The names of the consolidated subsidiaries are included in ‘1. State of the Group.’
The Company added Daiichi Sankyo Healthcare Co. Ltd., Sankyo Grundstücks GmbH & Co. and Object München KG to its scope of consolidation during the fiscal year.
Nippon Daiya Valve Co., Ltd., Sankyo Foods Co., Ltd., Kyushu Sankyo Co., Ltd., F.P. Processing Co., Ltd. and Dismed AG, which were previously consolidated subsidiaries of the Company, have been excluded from the scope of consolidation in the current fiscal year.
Reasons for adding these companies to and removing from the scope of consolidation are stated in ‘1. State of the Group.’
The Company’s shares of total assets, net sales and net income in its non-consolidated subsidiaries have an immaterial impact on its overall consolidated financial statements, as does its share of retained earnings in these companies. Accordingly, they were not included in the scope of consolidation.
The Company’s primary non-consolidated subsidiaries are Sankyo Insurance Agency Co., Ltd., Godo Real Estate Co., Ltd. and Shanghai Sankyo Pharmaceuticals Co., Ltd.
2. Application of the Equity Method
| (1) | The Company does not use the equity method for any of its non-consolidated subsidiaries. |
| (2) | The Company applies the equity method to one affiliate, Hitachi Pharma Evolutions, Ltd., which was newly established during the fiscal year. Each has an inmaterial impact on consolidated net income and retained earnings, and in the aggregate they are not material to the overall consolidated financial statements. The Company’s principal non-consolidated subsidiaries are Sankyo Insurance Agency Co., Ltd., Godo Real Estate Co., Ltd. and Shanghai Sankyo Pharmaceuticals Co., Ltd. The Company’s principal affiliate that is not accounted for by the equity method is Tokyo Pharmaceutical Industry Kaikan Co., Ltd. |
3. Fiscal Year End of Consolidated Subsidiaries
The fiscal year-end of 18 of the Company’s overseas consolidated subsidiaries is December 31. The financial statements of those subsidiaries as of their year-end are used in the preparation of the consolidated financial statements. However, appropriate adjustments have been made in the consolidation financial statements for major intervening transactions that took place between the fiscal year-end of those companies and March 31.
4. Summary of Significant Accounting Policies
| (1) | Methods of Valuation of Significant Assets |
Marketable and Investment Securities:
Held-to-maturity securities:
Mainly the amortized cost method (straight-line amortization)
Available-for-sale securities:
Securities with determinable market value;
Mainly stated at market value based on the quoted market prices at the end of the fiscal year. Unrealized holding gains and losses are reported in a component of shareholders’ equity, with the cost of securities sold calculated by the moving average method.
Securities without determinable market value:
Mainly stated at cost based on the moving average method
Derivatives:
Market value method
Inventories:
Mainly stated at the lower of cost, by average method, or market
| (2) | Depreciation and Amortization of Significant Depreciable Assets |
Property, Plant and Equipment:
The Company and its domestic consolidated subsidiaries account for property, plant and equipment by the declining balance method, except for the buildings (excluding fixtures) acquired on or after April 1, 1998, which are accounted for by the straight-line method. Overseas consolidated subsidiaries account for property, plant and equipment mainly by the straight-line method. The principal useful lives are as follows:
Buildings and structures: 2~60 years
Machinery, equipment and vehicles: 2~17 years
Intangible Assets:
Intangible assets are being amortized by the straight-line method. Software for internal use is amortized over the estimated useful lives of a five-year period.
| (3) | Methods of Accounting for Significant Allowances |
Allowance for Doubtful Accounts
The Company and its consolidated subsidiaries cover the risk of credit losses from potential customer defaults by providing for this allowance on the basis of the historical default rates for regular accounts, and individual evaluation of collectible amount for specific overdue accounts that are considered unlikely to be repaid in full.
Allowance for Sales Returns
The Company and certain of its domestic subsidiaries provide for losses on estimated future returns of products and merchandise based on historical past return experience. The amount recognized is the sum of estimated gross profit on sales and losses on disposal of returned inventories.
Allowance for Sales Rebates
To prepare for future sales rebates, the Company records this allowance calculated by multiplying an estimated sales rebate percentage for the fiscal year by the amounts of accounts receivable from and inventories held by wholesalers’ at the end of the fiscal year.
Retirement and Severance Benefits
To prepare for retirement and severance benefits, the Company and its domestic consolidated subsidiaries provide for an amount based on projected benefit obligation and plan assets at the end of the fiscal year. In addition, provisions have been made for six of the Company’s overseas consolidated subsidiaries in accordance with accounting principles generally accepted in the countries of their domicile.
Prior service cost is amortized by the straight-line method over a period of five years, which is less than the estimated average remaining years of service of the eligible employees at the time such prior service cost was recognized.
The Company itself recognizes actuarial gain and losses immediately as they occur. The domestic consolidated subsidiaries amortize actuarial gain and loss by the straight-line method beginning in the fiscal year following the year in which the gain or loss was initially measured over a period of five years, which is less than the average remaining years of service of the eligible employees at the time such actuarial gain or loss occured.
Directors’ Retirement and Severance Benefits
To prepare for directors’ retirement and severance benefits, the Company and its domestic consolidated subsidiaries provide for an amount that would have become payable at the end of the fiscal year in accordance with the internal policies, had all directors resigned voluntarily. Two overseas consolidated subsidiaries provide for an amount incurred by the end of the fiscal year.
Allowance for Contingent Losses
To prepare for possible future contingent losses, the Company provides an accrual for an amount of reasonably possible losses, by examining individual risks on a case by case basis.
Accrued for soil remediation costs
To provide for potential soil remediation costs, the Company has recognized a provision for losses on soil remediation based on estimated costs of the cleanup.
| (4) | Translation of Significant Assets and Liabilities Denominated in Foreign Currencies into Yen |
Receivables and payables denominated in foreign currencies are converted into yen amounts at the rates of exchange in effect at the end of the fiscal year, with resulting translation gains or losses recognized currently in earnings. The assets and liabilities of overseas consolidated subsidiaries are converted into yen amounts at the rates of exchange in effect at their balance sheet dates, while income and expenses are converted into yen amounts at the average exchange rates in effect over the respective periods, with resulting translation gains and losses recorded in a component of shareholders’ equity under translation adjustments and in the minority interests section of the balance sheets.
| (5) | Accounting for Significant Lease Transactions |
The same accounting method applied to operating leases is used for financing leases, except for those in which the legal title of the underlying property is transferred from the lessor to the lessee.
| (6) | Significant Hedge Accounting Methods |
Hedge Accounting Methods
The deferral hedge method of accounting has been adopted. Foreign exchange forward contracts that meet certain hedge criteria are accounted for as a hedge of underlying assets and liabilities. Interest rate swaps that meet certain hedge criteria are accounted for by the special short-cut method, in accordance with the accounting standard, as if the interest rates of the interest rate swaps were originally applied to the underlying borrowings.
Hedging Instruments and Hedged Items
Hedging instruments: Foreign forward exchange contracts and interest rate swaps
Hedged Items: Accounts payable and receivable and forecasted transactions denominated in foreign currencies and loans
Hedge Policy
The Company hedges hedge foreign exchange rate fluctuation risks relating to imports and exports and interest rate risks relating to variable rate borrowings. The Company and its consolidated subsidiaries do not enter into speculative derivative transactions.
Methods of Assessing Effectiveness of Hedge
The hedge effectiveness of foreign exchange forward contracts as a hedge has not been assessed, as the principal provisions of the transactions are the same. The effectiveness of interest rate swaps accounted for by the special short-cut method has also not been assessed, as permitted under the standard.
| (7) | Other Significant Accounting Policies |
Accounting for Consumption Tax
The tax-exclusion (net of tax) method is applied to account for national and local consumption taxes.
5. Valuation Method for Assets and Liabilities of Subsidiaries Acquired in Business Combination
All assets and liabilities of an acquired business that becomes a consolidated subsidiary are valued on a full fair value basis without taking into account minority interests’ share in such assets and liabilities.
6. Amortization of Goodwill
Goodwill is being amortized mainly over a period of five years. However, if the amount is inmaterial, it is written off currently in earnings.
7. Appropriations of Retained Earnings
The consolidated statements of retained earnings reflect the appropriation of retained earnings approved during the respective fiscal year.
8. Cash and Cash Equivalents in the Consolidated Statements of Cash Flows
Cash and cash equivalents in the consolidated statements of cash flows consist of: cash in hand, deposits which can be withdrawn upon demand, and highly liquid short-term investments that are easily convertible into cash, have little risk of fluctuation in value, and that mature within three months of their dates of acquisition.
Changes in Significant Accounting Principles and Policies for the Preparation of the Consolidated Financial Statements
(Valuation Method of Inventories)
Previously, inventories of the Company and its domestic consolidated subsidiaries were principally stated at cost determined by the average method; however, effective in the current year, inventories are principally stated at the lower of average cost or market.
This change was made to appropriately reflect the valuation of inventories, the effect of market price changes caused by the severe operating environment in the pharmaceutical industry.
This change resulted in a ¥299 million decrease in ordinary income and income before income taxes for the current fiscal year compared to the amounts that would have been reported had the previous method been applied consistently.
The effects of the above change to the operating segments information are described in the “6. Segment Information” section.
(Accounting for Allowance for Sales Returns)
Previously, the Company and certain domestic consolidated subsidiaries recorded this provision based on the maximum amounts deductible for income tax purpose in accordance with the Corporate Tax Law in Japan; however, effective in the current fiscal year, the provision is recorded in an amount equal to the sum of gross profits and inventory losses on estimated returned products, mainly based on its historical experience of sales returns.
This change was made to appropriately reflect to the reported earnings the effect of the fact that most of the returned products are disposed of and are not reused or resold to customers.
As a result, operating income, ordinary income, and income before income taxes for current fiscal year decreased by ¥19 million as compared to the amounts that would have been reported had the previous method been applied consistently.
The effects of the above change to the operating segments are described in the “6. Segment Information” section.
Supplemental Information
(Accounting for Accrued Bonuses)
Previously, the Company and consolidated subsidiaries accrued an estimated amount of bonuses payable for the fiscal year in “accrued bonuses”; however, effective in the current fiscal year, accrued bonuses are included in “accrued expenses” as the amount of bonuses applicable to the fiscal year has become determinable. As a result of this change, bonuses of ¥14,044 million, which were attributable to the current fiscal year, have been recorded in “accrued expenses.”
(Accounting for Allowance for Contingent Losses)
During the current fiscal year, the Company recognized an allowance for contingent loss in the amount of ¥3,379 million for potential penalties arising out of its product purchase commitments with a minimum purchase provision, for which the payment of penalties has become probable and the amount of such penalties can be reasonably estimated.
In the interim period of the current fiscal year, the company provided an allowance for an amount of possible losses due to devaluation of excess inventories. However, at this fiscal year-end the Company has changed its accounting standard along with a revision of product purchase agreements.
(Accounting for Soil-Remediation Costs)
The Company has recognized an accrual for soil-remediation costs of ¥2,850 million, which was an estimated amount of the cleanup costs that the Company would reasonably incur, based on a survey completed on certain land for the scope of soil remediation.
Notes to Consolidated Financial Statements
Notes to Consolidated Balance Sheets
As of March 31, 2005
| *1. | Accumulated depreciation on property, plant and equipment totaled ¥322,172 million. |
| *2. | The balance related to non-consolidated subsidiaries and affiliated companies were as follows: |
| (Millions of yen) | ||
Investment securities (stock) | 1,801 | |
Other assets (other investments in capital) | 6,598 |
| *3. | Pledged assets and secured liabilities |
Assets pledged as collateral and secured liabilities were as follows:
Pledged assets | (Millions of yen) | ||||
Buildings and structures | 1,912 | (1,562 | ) | ||
Machinery, equipment and vehicles | 2,087 | (2,087 | ) | ||
Land | 277 | (56 | ) | ||
Other | 33 | (33 | ) | ||
Investment securities | 415 | (— | ) | ||
Total | 4,727 | (3,740 | ) | ||
Secured liabilities | (Millions of yen) | ||||
Short-term bank loans | 3,314 | (2,931 | ) | ||
Long-term debt | 622 | (289 | ) | ||
Total | 3,936 | (3,221 | ) | ||
Figures in parentheses indicate factory foundation mortgaged assets and related secured obligations, and are also included in the figures on the left.
As of March 31, 2006
| *1. | Accumulated depreciation on property, plant and equipment totaled ¥325,891 million. |
| *2. | The balance related to non-consolidated subsidiaries and affiliated companies were as follows: |
| (Millions of yen) | ||
Investment securities (stock) | 1,597 | |
Other assets (other investments in capital) | 6,598 |
| *3. | Pledged assets and secured liabilities |
Assets pledged as collateral and secured liabilities were as follows:
Pledged assets | (Millions of yen) | ||||
Buildings and structures | 1,893 | (1,448 | ) | ||
Machinery, equipment and vehicles | 2,075 | (2,075 | ) | ||
Land | 176 | (32 | ) | ||
Other | 38 | (38 | ) | ||
Investment securities | 766 | (— | ) | ||
Total | 4,949 | (3,595 | ) | ||
Secured liabilities | (Millions of yen) | ||||
Short-term bank loans | 415 | (88 | ) | ||
Long-term debt | 1,367 | (700 | ) | ||
Total | 1,782 | (788 | ) | ||
Figures in parentheses indicate factory foundation mortgaged assets and related secured obligations, and are also included in the figures on the left.
As of March 31, 2005
| 4. | Contingencies |
(1) Certain debt and other obligations of non-consolidated companies and employees owed to financial institutions are guaranteed by the Company. A breakdown of these obligations was as follows:
| (Millions of yen) | ||
Saudi Arabian-Japanese Pharmaceutical Co., Ltd. | 366 | |
One other company and employees | 129 | |
Total | 496 |
(2) For purchase contracts with a minimum volume purchase commitment, the Company is exposed to a risk of valuation loss due to excess inventory.
| 5. | The discounted trade notes receivable totaled ¥561 million. |
| 6. | Overdraft contracts and commitment line contracts. |
The Company and its consolidated subsidiaries maintain overdraft contracts and commitment line contracts with 16 financial institutions and 15 financial institutions, respectively, in order to allow an efficient procurement of working capital. The balance of unused credit lines under these contracts at the fiscal year-end was as follows:
| (Millions of yen) | ||
Overdraft limit and commitments totals | 82,679 | |
Overdrafts and commitments used | 10,035 | |
Overdrafts and commitments unused | 72,643 |
| *7. | Total number of common shares of the Company issued at the year-end was 439,498,765 shares. |
| *8. | Treasury stock owned by the Company at the year-end was 9,990,256 shares of common stock. |
As of March 31, 2006
| 4. | Contingencies |
(1) Certain debt and other obligations of non-consolidated companies and employees owed to financial institutions are guaranteed by the Company. A breakdown of these obligations was as follows:
| (Millions of yen) | ||
Saudi Arabian-Japanese Pharmaceutical Co., Ltd. | 322 | |
One other company and employees | 49 | |
Total | 372 |
(2)
| 5. | The discounted trade notes receivable totaled ¥65 million. |
| 6. | Overdraft contracts and commitment line contracts. |
The Company and its consolidated subsidiaries maintain overdraft contracts and commitment line contracts with 15 financial institutions and 15 financial institutions, respectively, in order to allow an efficient procurement of working capital. The balance of unused credit lines under these contracts at the fiscal year-end was as follows:
| (Millions of yen) | ||
Overdraft limit and commitments totals | 81,429 | |
Overdrafts and commitments used | 7,675 | |
Overdrafts and commitments unused | 73,753 |
| *7. | Total number of common shares of the Company issued at the year-end was 422,753,456 shares. |
| *8. |
Notes to Consolidated Statements of Income
Fiscal 2004
(Year ended March 31, 2005)
| *1. | Research and development expenses included under selling, general and administrative expenses and manufacturing overhead expenses totaled ¥86,551million. |
| *2. | Breakdown of gain on sale of property, plant and equipment: |
| (Millions of yen) | ||
Buildings and structures | 31 | |
Machinery, equipment and vehicles | 14 | |
Land | 12,133 | |
Other | 0 |
| *3. | Breakdown of loss on disposal of property, plant and equipment |
| (Millions of yen) | ||
Buildings and structures | 455 | |
Machinery, equipment and vehicles | 332 | |
Land | 567 | |
Other | 133 | |
Other intangible assets | 300 |
In addition, expenses for disposal of property, plant and equipment totaled ¥545 million.
Fiscal 2005
(Year ended March 31, 2006)
| *1. | Research and development expenses included under selling, general and administrative expenses and manufacturing overhead expenses totaled ¥97,265 million. |
| *2. | Breakdown of gain on sale of property, plant and equipment: |
| (Millions of yen) | ||
Buildings and structures | 1 | |
Machinery, equipment and vehicles | 33 | |
Land | 4,860 | |
Other | 2 |
| *3. | Breakdown of loss on disposal of property, plant and equipment |
| (Millions of yen) | ||
Buildings and structures | 1,635 | |
Machinery, equipment and vehicles | 234 | |
Land | 44 | |
Other | 255 | |
Other intangible assets | 1,307 |
In addition, expenses for disposal of property, plant and equipment totaled ¥1,228 million.
Year ended March 31, 2005
| *4. | Loss on impairment of property, plant and equipment |
The Company and its consolidated subsidiaries (the Sankyo Group) classify their assets held and used for the business operations into asset groups, on the basis of operating segments about which separate financial information is regularly identified for management reporting purpose (e.g., product groups), whereas the Sankyo Group classifies lease assets and idle assets which are not directly used for its business operations on a property by property basis.
For the fiscal year, the Sankyo Group recorded impairment losses in the amount of ¥15,865 million on the following asset groups:
| (1) | Assets held and used for its business operations |
With respect to a distribution right of certain imported products (¥13,059 million) in the pharmaceutical segment, the Company recognized a full impairment loss in extraordinary losses because the Company expects negative cash flows from the imported products due to a decrease in profitability resulting from their sluggish sales.
(2) Lease assets and idle assets
Location | Function | Asset Type | Status | |||
| Iwaki, Fukushima | Onahama Plant (manufacturing facilities of pharmaceuti-cals) | Buildings and structures Machinery, equipment and vehicles | Idle | |||
| Yasu, Shiga | Former Yasugawa Plant (manufacturing facilities of agrochemicals) | Buildings | Idle | |||
| Shizuoka, etc., Shizuoka | Company dormitory land | Land | Idle | |||
Since the asset groups shown in the table above were idle and their expected use was uncertain in the foreseeable future, the Sankyo Group reduced their book values to a recoverable amount and recorded such reductions of ¥2,806 million as a loss on impairment in the extraordinary losses. These impairment losses consisted of the losses on buildings and structures of ¥2,159 million, on machinery, equipment and vehicles of ¥525 million, on land of ¥112 million, and on other assets of ¥9 million.
The Sankyo Group measures the recoverable amount of an asset group by its net realizable value. The Sankyo Group calculates the net realizable value of land based on the valuation amount for real estate tax purpose, with reasonable adjustments. With respect to buildings and machinery, equipment and vehicles, their net realizable values were estimated at five percent of their acquisition costs.
| *5. | __________ |
| *6. | __________ |
Year ended March 31, 2006
| *4. | Loss on impairment of property, plant and equipment |
The Company and its consolidated subsidiaries (the Sankyo Group) classify their assets held and used for the business operations into asset groups, on the basis of operating segments about which separate financial information is regularly identified for management reporting purpose (e.g., product groups), whereas the Sankyo Group classifies lease assets and idle assets which are not directly used for its business operations on a property by property basis.
For the fiscal year, the Sankyo Group recorded impairment losses on the following asset groups:
Location | Function | Asset Type | Status | |||
| Iwaki, Fukushima | Onahama Plant (manufacturing facilities of pharmaceuti-cals) | Buildings and structures Machinery, equipment and vehicles | Idle | |||
| Tsuchiura, Ibaraki | Company housing etc. | Land | Idle | |||
There was no indication of impairment for the assets that are held and used for operations of the Sankyo Group’s business. However, since the asset groups shown in the table above were idle and their expected use was uncertain in the foreseeable future, the Sankyo Group reduced their book values a to a recoverable amount and recorded such reductions of ¥3,913 million as a loss on impairment in the extraordinary losses. These impairment losses consisted of the losses on buildings and structures of ¥2,004 million, on machinery, equipment and vehicles of ¥1,881 million, on land of ¥11 million, and on other assets of ¥16 million.
The Sankyo Group measures the recoverable amount of an asset group by its net realizable value. The Sankyo Group calculates the net realizable value of land based on the valuation amount for real estate tax purpose, with reasonable adjustments. With respect to buildings, and machinery, equipment and vehicles, their net realizable values were estimated at five percent of their acquisition costs.
| *5. | Loss on business integration |
The loss represents one-time costs associated with the integration of the business operations of the Sankyo Group and the Daiichi Pharmaceutical Group within the Daiichi Sankyo Group.
| *6. | Restructuring charge |
The amount represents one-time costs associated with the restructuring of non-pharmaceutical businesses within the Sankyo Group.
Notes the Consolidated Statements of Cash Flows
Year ended March 31, 2005
| 1. | Reconciliation of cash and cash equivalents at the end of the fiscal year to the balance sheet accounts. |
| (Millions of yen) | |||
Cash and time deposits | 175,960 | ||
Marketable securities | 146,632 | ||
Less time deposits with maturities extending over three months | (2,484 | ) | |
Less stock and securities with maturities extending over three months | (57,577 | ) | |
Cash and cash equivalents | 262,530 |
| *2. | Breakdown of assets and liabilities of consolidated subsidiaries that are no longer consolidated due to sale of stock |
The following table presents a breakdown of the assets and liabilities of Sankyo Trading Co., Ltd, which is no longer consolidated due to sale of its stock, and a reconciliation of the sales price of the stock and the proceeds from the sale:
| (Millions of yen) | |||
Current assets | 466 | ||
Non-current assets | 2,532 | ||
Current liabilities | (1,237 | ) | |
Non-current liabilities | (1,196 | ) | |
Other | (7 | ) | |
Gain on sale of investments in subsidiary | 86 | ||
Gross proceeds from sale of investments in subsidiary | 644 | ||
Cash and cash equivalents of subsidiary disposed | (116 | ) | |
Proceeds from sale of investments in subsidiary | 527 |
Year ended March 31, 2006
| 1. | Reconciliation of cash and cash equivalents at the end of the fiscal year to the balance sheet accounts. |
| (Millions of yen) | |||
Cash and time deposits | 162,976 | ||
Marketable securities | 158,625 | ||
Less time deposits with maturities extending over three months | (1,905 | ) | |
Less stock and securities with maturities extending over three months | (64,987 | ) | |
Cash and cash equivalents | 254,708 |
| *2. | Breakdown of assets and liabilities of consolidated subsidiaries that are no longer consolidated due to sale of stock |
The following table presents are the breakdown of the assets and liabilities of Nippon Daiya Valve Co., Ltd. and F.P. Processing Co., Ltd. which are no longer consolidated due to sale of their stock, and a reconciliation of the sale price of the stock and the proceeds from the sale:
| (Millions of yen) | |||
Current assets | 4,452 | ||
Non-current assets | 939 | ||
Current liabilities | (3,526 | ) | |
Non-current liabilities | (561 | ) | |
Gain on sale of investments in subsidiaries | 27 | ||
Loss on sale of investments in subsidiaries | (330 | ) | |
Gross proceeds from sale of investment of investments in subsidiaries | 1,001 | ||
Cash and cash equivalents of subsidiaries disposed | (358 | ) | |
Proceeds from sale of investment in subsidiaries | 642 |
Lease Transactions
Pro-forma information on financing leases has not been presented herein because the Company discloses such information through EDINET (Electronic Disclosure for Investors’ NETwork).
Marketable and Investment Securities
Fiscal 2004 (as of March 31, 2005)
| 1. | Trading Securities |
No applicable.
| 2. | Held-to-Maturity Securities with Determinable Market Value |
(Millions of yen)
| Carrying amount | Market value | Difference | |||||
Securities with market values greater than their carrying amounts | |||||||
(1) Government and local bonds | 1,002 | 1,002 | 0 | ||||
(2) Corporate bonds | 39,237 | 39,382 | 144 | ||||
(3) Other | — | — | — | ||||
Total | 40,239 | 40,384 | 145 | ||||
Securities with market values were less than their carrying amounts | |||||||
(1) Government and local bonds | 28,088 | 28,088 | — | ||||
(2) Corporate bonds | 14,987 | 14,974 | (13 | ) | |||
(3) Other | — | — | — | ||||
Total | 43,076 | 43,063 | (13 | ) | |||
Total | 83,316 | 83,448 | 132 | ||||
3. Available-for-sale Securities with Determinable Market Value | |||||||
| (Millions of yen | ) | ||||||
| Carrying amount | Market value | Difference | |||||
Securities with carrying amounts greater than their acquisition costs: | |||||||
(1) Stocks | 20,545 | 67,899 | 47,353 | ||||
(2) Bonds | |||||||
a) Government and local bonds | — | — | — | ||||
b) Corporate bonds | — | — | — | ||||
c) Other | — | — | — | ||||
(3) Other | 220 | 229 | 8 | ||||
Total | 20,766 | 68,128 | 47,362 | ||||
Securities with carrying amounts at or less than their acquisition costs: | |||||||
(1) Stocks | 7 | 7 | (0 | ) | |||
(2) Bonds | |||||||
a) Government and local bonds | — | — | — | ||||
b) Corporate bonds | — | — | — | ||||
c) Other | — | — | — | ||||
(3) Other | 2 | 2 | (0 | ) | |||
Total | 9 | 9 | (0 | ) | |||
Total | 20,776 | 68,137 | 47,361 | ||||
(Notes)
When the market value of securities has dropped by 30% or more from the acquisition costs, the securities are classified as having ‘fallen significantly. When the securities’ market decline is 50% or more, the securities are written-down to their market value. When the market value of securities has dropped by 30% or more but less than 50%, likelihood of recovery is estimated on the basis of market value trends and the financial conditions of the issuing companies. Write-downs are recognized for all of such securities other than those for which there is a prospect for recovery.
| 4. | Available-for-Sale securities Sold During the Year |
(Millions of yen)
| Amount sold | Total gain on sale | Total loss on sale | ||
| 1,184 | 983 | 5 |
| 5. | Breakdown of Securities without Determinable Market Value |
(Millions of yen)
| Carrying amount | ||
(1) Held-to-Maturity securities | ||
a) Commercial papers | 29,998 | |
b) Other | 10 | |
(2) Available-for-sale securities | ||
a) Unlisted stock | 14,416 | |
b) Money management funds, etc. | 60,848 | |
c) Other | 2,583 |
��
| 6. | Scheduled Maturities of Available-for-Sale Securities with Maturity and Held-to-Maturity Securities |
(Millions of yen)
| Within one year | Between one and five years | Between five and ten years | Over ten years | |||||
(1) Bonds | ||||||||
a) Government and local bonds | 29,077 | 13 | — | — | ||||
b) Corporate bonds | 26,707 | 27,517 | — | — | ||||
c) Other | — | 10 | — | — | ||||
(2) Other | ||||||||
Commercial papers | 29,998 | — | — | — | ||||
Total | 85,783 | 27,540 | — | — | ||||
Fiscal 2005 (as of March 31, 2006)
| 1. | Traded Securities |
No applicable items.
| 2. | Held-to-Maturity Securities with Determinable Market Value |
(Millions of yen)
| Carrying amount | Market value | Difference | |||||
Securities with market values greater than their carrying amounts | |||||||
(1) Government and local bonds | — | — | — | ||||
(2) Corporate bonds | 11,203 | 11,222 | 18 | ||||
(3) Other | — | — | — | ||||
Total | 11,203 | 11,222 | 18 | ||||
Securities with market values were less than their carrying amounts | |||||||
(1) Government and local bonds | 39,403 | 39,403 | — | ||||
(2) Corporate bonds | 35,619 | 35,403 | (215 | ) | |||
(3) Other | — | — | — | ||||
Total | 75,022 | 74,807 | (215 | ) | |||
Total | 86,226 | 86,029 | (197 | ) | |||
3. Available-for-sale Securities with Determinable Market Value | |||||||
| (Millions of yen | ) | ||||||
| Carrying amount | Market value | Difference | |||||
Securities with carrying amounts greater than their acquisition costs: | |||||||
(1) Stocks | 21,461 | 101,432 | 79,970 | ||||
(2) Bonds | |||||||
a) Government and local bonds | — | — | — | ||||
b) Corporate bonds | — | — | — | ||||
c) Other | — | — | — | ||||
(3) Other | 7 | 21 | 14 | ||||
Total | 21,469 | 101,454 | 79,984 | ||||
Securities with carrying amounts at or less than their acquisition costs: | |||||||
(1) Stocks | 0 | 0 | — | ||||
(2) Bonds | |||||||
a) Government and local bonds | — | — | — | ||||
b) Corporate bonds | — | — | — | ||||
c) Other | 17,096 | 17,096 | — | ||||
(3) Other | 210 | 204 | (6 | ) | |||
Total | 17,308 | 17,302 | (6 | ) | |||
Total | 38,777 | 118,756 | 79,978 | ||||
(Notes)
When the market value of the securities has dropped by 30% or more from the acquisition costs, the securities are classified as having ‘fallen significantly. When the securities’ market decline is 50% or more, the securities are written-down to their market value. When the market value of securities has dropped by 30% or more but less than 50%, likelihood of recovery is estimated on the basis of market value trends and the financial conditions of the issuing companies. Write-downs are recognized in all cases other than those for which there is a prospect for recovery.
| 4. | Other Securities Sold During the Year Ended March 31, 2006 |
(Millions of yen)
Amount sold | Total gain on sale | Total loss on sale | ||
| 563 | 282 | 0 |
| 5. | Breakdown of Securities without Determinable Market Value |
(Millions of yen)
| Carrying amount | ||
(1) Held-to-Maturity securities | ||
a) Commercial papers | 29,994 | |
b) Other | 10 | |
(2) Available-for-sale securities | ||
a) Unlisted stocks | 13,610 | |
b) Money management funds, etc. | 46,546 | |
c) Other | 4,267 |
| 6. | Scheduled Maturities of Available-for-Sale Securities with Maturity and Held-to-Maturity Securities |
(Millions of yen)
| Within one year | Between one and five years | Between five and ten years | Over ten years | |||||
(1) Bonds | ||||||||
a) Government and local bonds | 39,403 | — | — | — | ||||
b) Corporate bonds | 25,574 | 21,248 | — | — | ||||
c) Other | 10 | — | — | — | ||||
(2) Other | ||||||||
Commercial paper | 29,994 | — | — | — | ||||
Total | 94,981 | 21,248 | — | — | ||||
Derivative Transactions
The fair value information of derivative instruments has not been presented because the Company discloses such information through EDINET (Electronic Disclosure for Investors’ NETwork).
Retirement and Severance Benefits
1. Summary of the Company’s Retirement Benefits Arrangements
The Company has an unfounded lump-sum retirement and severance plan and a qualified pension benefit plan as its defined benefit arrangement.
The Company’s domestic consolidated subsidiaries have unfunded lump-sum retirement and severance plans and certain domestic consolidated subsidiaries have qualified pension benefit plans. Certain other domestic consolidated subsidiaries participate in a multi-employer employees’ pension fund-plan. Certain overseas consolidated subsidiaries provide adopt a defined benefit plan or a defined contribution plan.
Additional retirement benefits which are not subject to the actuarial valuation in accordance with the accounting standards for retirement and severance benefits may be are occasionally paid to employees upon retirement.
2. Retirement and Severance Benefits Obligation
(Millions of yen)
Fiscal 2004 (As of March 31, 2005) | Fiscal 2005 (As of March 31, 2006) | |||||
(1) Projected benefit obligations (Note 1) | (84,085 | ) | 83,945 | |||
(2) Plan assets at fair value (Note 2) | 22,429 | 27,682 | ||||
(3) Projected benefit obligations in excess of plan assets | (61,656 | ) | (56,263 | ) | ||
(4) Unrecognized actuarial losses | 73 | (91 | ) | |||
(5) Unrecognized prior service costs | (5,260 | ) | (4,083 | ) | ||
(6) Prepaid pension costs | — | (2,950 | ) | |||
(7) Accrued retirement and severance benefits (3)+(4)+(5)+(6) | (66,843 | ) | (63,389 | ) | ||
(Notes)
| 1. | Certain consolidated subsidiaries use the simplified vested-benefit method in calculating their retirement and severance benefit obligations. |
| 2. | In addition, the plan assets in the multi-employer employees’ pension fund, estimated based on the Company’s contribution ration since the amount of attributable to the Company’s contributions cannot be calculated reasonably, totaled ¥7,923 million as of March 2005 and ¥8,891 million as of March 2006 . This amount has not been included in the plan assets presented above. |
| 3. | Employees’ Retirement and Severance Benefit Costs |
(Millions of yen)
Fiscal 2004 (As of March 31, 2005) | Fiscal 2005 (As of March 31, 2006) | |||||
(1) Service cost for benefits earned (Notes 1, 2) | 6,596 | 5,599 | ||||
(2) Interest cost | 1,844 | 1,723 | ||||
(3) Expected return on plan assets | (392 | ) | (443 | ) | ||
(4) Amortization of unrecognized actuarial gain or loss | (426 | ) | (2,773 | ) | ||
(5) Amortization of unrecognized prior service costs | (603 | ) | (1,176 | ) | ||
(6) Additional retirement benefits (Note 3) | 693 | 128 | ||||
Net periodic costs retirement and severance costs | 7,712 | 3,058 | ||||
(Notes)
| 1. | Costs of retirement and severance benefits of those consolidated subsidiaries which have adopted the simplified vested-benefit method are included in service cost for benefits earned. |
| 2. | The amount is net of employees’ contributions to the multi-employer employees’ pension fund . |
| 3. | Of this amount, ¥662 million for the year ended March 31, 2005 and ¥47 million for the year ended March 31, 2006 are included in extraordinary losses. |
4. Principal Assumptions Used in the Calculation of Retirement and Severance Benefits Obligations
Fiscal 2004 (As of March 31, 2005) | Fiscal 2005 (As of March 31, 2006) | |||
(1) Method of inter-period attribution of estimated benefit costs | Straight-line method | Straight-line method | ||
(2) Discount rate | 2.5% | 2.5% | ||
(3) Expected rate of return on plan assets | 2.5% | 2.5% | ||
(4) Period of amortization of unrecognized prior service costs | Five years | Five years | ||
(5) Period of amortization of unrecognized actuarial gain or loss | Between one and five years | Between one and five years |
Deferred Income Taxes
Year ended March 31, 2005
| 1) | Principal Components of Deferred Tax Assets and Liabilities |
| (Millions of yen) | |||
Deferred tax assets: | |||
Accrued retirement and severance benefits | 24,001 | ||
Prepaid consigned research and co development expenses | 14,775 | ||
Net operating loss carry forwards for income tax purposes | 14,012 | ||
Impairment losses | 6,445 | ||
Accrued bonuses | 4,898 | ||
Loss on valuation of inventories | 3,350 | ||
Excess amortization on internal-use software | 3,005 | ||
Depreciation | 2,476 | ||
Unrealized profit on inventories | 2,158 | ||
Loss on valuation of investment securities | 1,932 | ||
Milestone payment received for co promotion agreement | 1,263 | ||
Accrued enterprise tax | 1,161 | ||
Other | 8,557 | ||
Subtotal | 88,040 | ||
Valuation allowance | (24,271 | ) | |
Total deferred tax assets | 63,769 | ||
Deferred tax liabilities: | |||
Unrealized holding gain on available-for-sale securities | (19,264 | ) | |
Reserve for reduction in bases of property, plant and equipment for income tax purposes | (5,954 | ) | |
Reserve for accelerated depreciation for income tax purposes | (1,881 | ) | |
Other | (999 | ) | |
Total deferred tax liabilities | (28,100 | ) | |
Net deferred tax assets | 35,668 | ||
Note: Net deferred tax assets are included in the following balance sheet captions:
| (Millions of yen) | |||
Current assets – deferred tax assets | 21,832 | ||
Non-current assets – deferred tax assets | 14,967 | ||
Current liabilities – deferred tax liabilities | (689 | ) | |
Non-current liabilities – deferred tax liabilities | (441 | ) |
Year ended March 31, 2006
| 1) | Principal Components of Deferred Tax Assets and Liabilities |
| (Millions of yen) | |||
Deferred tax assets: | |||
Accrued retirement and severance benefits | 24,112 | ||
Prepaid consigned research and co development expenses | 14,441 | ||
Net operating loss carry forwards for income tax purposes | 11,944 | ||
Unrealized holding gains on property, plant and equipment | 6,106 | ||
Accrued bonuses | 5,814 | ||
Impairment losses | 3,860 | ||
Excess amortization on internal-use software | 2,995 | ||
Loss on valuation of inventories | 2,965 | ||
Depreciation | 2,573 | ||
Unrealized profit on inventories | 2,314 | ||
Allowance for contingent losses | 1,371 | ||
Accrued soil remediation costs | 1,156 | ||
Other | 10,933 | ||
Subtotal | 90,589 | ||
Valuation allowance | (21,415 | ) | |
Total deferred tax assets | 69,174 | ||
Deferred tax liabilities: | |||
Unrealized holding gain on available-for-sale securities | (33,005 | ) | |
Reserve for reduction in bases of property, plant and equipment for income tax purposes | (7,031 | ) | |
Reserve for accelerated depreciation for income tax purposes | (1,950 | ) | |
Prepaid pension costs | (1,129 | ) | |
Other | (1,506 | ) | |
Total deferred tax liabilities | (44,622 | ) | |
Net deferred tax assets | 24,552 | ||
Note: Net deferred tax assets are included in the following balance sheet captions:
| (Millions of yen) | |||
Current assets – deferred tax assets | 22,874 | ||
Non-current assets – deferred tax assets | 4,016 | ||
Current liabilities – deferred tax liabilities | (31 | ) | |
Non-current liabilities – deferred tax liabilities | (2,306 | ) |
Year ended March 31, 2005
| (2) | Reconciliation of the difference between the statutory tax rate and the effective tax rate |
| (Percent) | |||
Statutory tax rate | 40.6 | ||
(Adjustments) | |||
Non-deductible permanent differences including entertainment expenses and other items | 5.3 | ||
Valuation allowance | 3.3 | ||
IT investment tax credit | (0.4 | ) | |
Deductible permanent differences including dividend received deductions and other items | (1.0 | ) | |
R&D expense tax credit | (6.1 | ) | |
Effect of overseas subsidiaries’ tax rates | (6.6 | ) | |
Other | 1.8 | ||
Effective tax rate | 36.9 | ||
Year ended March 31, 2006
| (2) | Reconciliation of the difference between the statutory tax rate and the effective tax rate |
| (Percent) | |||
Statutory tax rate | 40.6 | ||
(Adjustments) | |||
Non-deductible permanent differences including entertainment expenses and other items | 7.0 | ||
Deductible permanent differences including dividend received deductions and other items | (1.1 | ) | |
R&D expense tax credit | (5.1 | ) | |
Decrease in valuation allowance | (12.1 | ) | |
Other | (1.8 | ) | |
Effective tax rate | 27.5 | ||
Segment Information
| (1) | Information by Operating Segment |
Fiscal 2004
(Millions of yen)
March 31: | Pharmaceuticals | Other | Total | Eliminations & corporate | Consolidated | ||||||
I. Net sales and operating income | |||||||||||
Net sales | |||||||||||
(1) Outside customers | 454,710 | 133,120 | 587,830 | — | 587,830 | ||||||
(2) Inter-segment sales and transfers | 922 | 1,723 | 2,646 | (2,646 | ) | — | |||||
Total | 455,633 | 134,843 | 590,476 | (2,646 | ) | 587,830 | |||||
Operating expenses | 378,137 | 128,256 | 506,393 | (3,488 | ) | 502,904 | |||||
Operating income | 77,495 | 6,587 | 84,083 | 842 | 84,925 | ||||||
II. Assets, depreciation and capital expenditures | |||||||||||
Assets | 512,239 | 146,942 | 659,181 | 317,049 | 976,230 | ||||||
Depreciation | 25,633 | 3,177 | 28,811 | — | 28,811 | ||||||
Impairment loss | 15,853 | 11 | 15,865 | — | 15,865 | ||||||
Capital expenditures | 25,276 | 8,517 | 33,794 | — | 33,794 |
(Notes)
| 1. | Method of classifying operating segments |
Classification into ‘Pharmaceuticals’ and ‘Other’ is based on consideration of product type, market characteristics and other factors.
| 2. | Principal products in each operating segment |
Operating segments | Principal products | |||
| Pharmaceuticals | Prescription drugs, healthcare products | |||
| Other | Food | Food products and additives | ||
Agrochemicals | Insecticides, herbicides and fungicides | |||
Other | Chemical products, veterinary drugs and bulbs | |||
| 3. | Of the assets as of March 31, 2005, corporate assets included under the category of “Eliminations & corporate” amounted to ¥318,220 million. The amount consisted mainly of temporary excess working capital (such as cash, time deposits and marketable securities) and long-term investment assets (investment securities) held at the parent company. |
| 4. | Depreciation includes the depreciation of property, plant and equipment, as well as the amortization of intangible assets and long-term prepaid assets. |
| 5. | Capital expenditures include additions to property, plant and equipment, intangible assets and long-term prepaid assets. |
| 6. | As noted in “Changes in Significant Accounting Principles and Policies for the Preparation of the Consolidated Financial Statements,” the Sankyo Group has adopted the accounting standards for impairment of fixed assets for effective this fiscal year. |
| 7. | As noted in “Supplemental Information,” in accordance with the guidance in “Practical Treatment Concerning the income Statement Presentation of the Pro Forma Standard Taxation Portion of Enterprise Tax, enterprise taxes levied in proportion to the value-added and the capital were recognized as selling, general and administrative expenses in the amount of ¥814 million and ¥157 million for the Pharmaceuticals Segment and the Other Segment, respectively, effective in this fiscal year. |
Fiscal 2005
(Millions of yen)
March 31: | Pharmaceuticals | Other | Total | Eliminations & corporate | Consolidated | ||||||
I. Net sales and operating income | |||||||||||
Net sales | |||||||||||
(1) Outside customers | 453,856 | 126,092 | 579,949 | — | 579,949 | ||||||
(2) Inter-segment sales and transfers | 594 | 1,238 | 1,833 | (1,833 | ) | — | |||||
Total | 454,451 | 127,331 | 581,783 | (1,833 | ) | 579,949 | |||||
Operating expenses | 382,225 | 121,658 | 503,883 | (2,269 | ) | 501,614 | |||||
Operating income | 72,226 | 5,672 | 77,899 | 435 | 78,335 | ||||||
II. Assets, depreciation and capital expenditures | |||||||||||
Assets | 507,790 | 140,704 | 648,494 | 315,894 | 964,389 | ||||||
Depreciation | 23,186 | 3,914 | 27,100 | — | 27,100 | ||||||
Impairment loss | 3,913 | — | 3,913 | — | 3,913 | ||||||
Capital expenditures | 17,576 | 4,113 | 21,689 | — | 21,689 |
(Notes)
| 1. | Method of classifying operating segments |
Classifications into ‘Pharmaceuticals’ and ‘Other’ is based on a consideration of product type, market characteristics and other factors.
| 2. | Principal products in each operating segment |
Operating segments | Principal products | |||
| Pharmaceuticals | Prescription drugs, healthcare products | |||
| Other | Food | Food products and additives | ||
Agrochemicals | Insecticides, herbicides and fungicides | |||
Other | Chemical products and veterinary drugs | |||
| 3. | Of the assets as of March 31, 2006, corporate assets included under the category of “Eliminations & corporate” amounted to ¥316,751 million. The amount consisted mainly of temporary excess working capital (such as cash, time deposits and marketable securities) and long-term investment assets (investment securities) held at the parent company. |
| 4. | Depreciation includes the depreciation of property, plant and equipment, as well as the amortization of intangible assets and long-term prepaid assets |
| 5. | Capital expenditures include additions to tangible fixed assets, intangible fixed assets and long-term prepaid expenses |
| 6. | Changes in accounting principles and policies |
(1) As noted in “Changes in Significant Accounting Principles and Policies for the Preparation of the Consolidated Financial Statements,” the Company changed its method of valuing inventories during the fiscal year to the lower of average cost or market method .This resulted in a reduction of ¥295 million and ¥4 million in year-end inventories for the Pharmaceutical Segment and Other Segment, respectively.
(2) As also noted in “Changes in Significant Accounting Principles and Policies for the Preparation of the Consolidated Financial Statements,” the Company changed its accounting for allowance for sales returns to a method that recognizes an amount equal to the sum of gross profits on sales and inventory losses on estimated returned products, mainly based on its historical experience of sales returns. As a result of this change, it recognized ¥19 million less in operating income for the Pharmaceutical Segment. There was no impact on segment income for the Other Segment.
| (2) | Information by Geographic Segment |
Fiscal 2004
(Millions of yen)
| Japan | North America | Other | Total | Eliminations & corporate | Consolidated | |||||||||
Net sales and operating income | ||||||||||||||
I. Net sales | ||||||||||||||
(1) Outside customers | 461,748 | 76,902 | 49,178 | 587,830 | — | 587,830 | ||||||||
(2) Inter-segment sales and transfers | 12,119 | 3,424 | 3,466 | 19,010 | (19,010 | ) | — | |||||||
Total | 473,867 | 80,327 | 52,645 | 606,841 | (19,010 | ) | 587,830 | |||||||
Operating expenses | 400,554 | 67,184 | 53,956 | 521,694 | (18,789 | ) | 502,904 | |||||||
Operating income (loss) | 73,313 | 13,143 | (1,310 | ) | 85,146 | (220 | ) | 84,925 | ||||||
II. Assets | 543,343 | 76,651 | 46,004 | 665,998 | 310,232 | 976,230 | ||||||||
(Notes)
| 1. | Method of classifying geographic segments |
Geographic segments are classified on the basis of geographic proximity.
| 2. | Countries and regions included in each segment other than Japan |
North America: the United States
Other: Germany, the United Kingdom, France, Spain, Italy, Taiwan and other
| 3. | Of the assets as of March 31, 2005, corporate assets included under the category of “Eliminations & corporate” amounted to ¥318,220 million. The amounts consisted mainly of temporary excess working capital (such as cash, time deposits and marketable securities) and long-term investment assets (investment securities) held at the parent company. |
| 4. | As noted in “Changes in Significant Accounting Principles and Policies for the Preparation of the Consolidated Financial Statements,” the Sankyo Group has adopted the accounting standards for impairment of fixed assets for effective this period. |
| 5. | As noted in “Supplemental Information,” in accordance with the guidance in “Practical Treatment Concerning the Income Statement Presentation of the Pro Forma Standard Taxation Portion of Enterprise Tax,” enterprise taxes levied in proportion to the value-added and the capital were recognized as selling, general and administrative expenses’ in the amount of ¥971 million for the Japan segment, effective in this fiscal year. This change had no effect on the segment income in the North America and Other segments. |
Fiscal 2005
(Millions of yen)
| Japan | North America | Other | Total | Eliminations & corporate | Consolidated | |||||||||
Net sales and operating income | ||||||||||||||
I. Net sales | ||||||||||||||
(1) External sales | 426,215 | 104,608 | 49,125 | 579,949 | — | 579,949 | ||||||||
(2) Inter-segment sales and transfers | 17,691 | 4,781 | 4,348 | 26,820 | (26,820 | ) | —�� | |||||||
Total | 443,906 | 109,389 | 53,474 | 606,770 | (26,820 | ) | 579,949 | |||||||
Operating expenses | 388,992 | 84,552 | 53,898 | 527,443 | (25,828 | ) | 501,614 | |||||||
Operating income (loss) | 54,914 | 24,836 | (424 | ) | 79,327 | (992 | ) | 78,335 | ||||||
II. Assets | 494,428 | 122,408 | 47,802 | 664,638 | 299,750 | 964,389 | ||||||||
(Notes)
| 1. | Method of classifying geographic segments |
Geographic segments are classified on the basis of geographic proximity.
| 2. | Countries and regions included in segments other than Japan |
North America: the United States
Other: Germany, the United Kingdom, France, Spain, Italy, Taiwan and other
| 3. | Of the assets as of March 31, 2006, corporate assets included under the category of “Eliminations & corporate” amounted to ¥316,751 million. The amounts consisted mainly of temporary excess working capital (such as cash, time deposits and marketable securities) and long-term investment assets (investment securities) held at the parent company. |
| 4. | Change in accounting methods |
| (1) | As noted in “Changes in Significant Accounting Principles and Policies for the Preparation of the Consolidated Financial Statements,” the Company changed its method of valuing inventories during the fiscal year to the lower of average cost or market method. This resulted in a reduction of ¥299 million in year-end inventories for the Japan segment. This change had no impact on segment income for the North America and Other Segments. |
| (2) | As also noted in “Changes in Significant Accounting Principles and Policies for the Preparation of the Consolidated Financial Statements,” the Company changed its accounting for allowance for sales returns to a method that recognizes an amount equal to the sum of gross profits on sales and inventory losses on estimated returned products, mainly based on its historical experience of sales returns. As a result of this change, it recognized ¥19 million less in operating income for the Japan Segment. There was no impact on segment income for the North America and Other Segments. |
| (3) | Overseas Sales |
Year ended March 31, 2005
(Millions of yen)
| North America | Europe | Other areas | Total | |||||
Overseas net sales | 114,949 | 85,372 | 15,324 | 215,645 | ||||
Consolidated net sales | 587,830 | |||||||
Percentage of overseas net sales to consolidated net sales (%) | 19.6 | 14.5 | 2.6 | 36.7 | ||||
(Notes)
| 1. | Method of classifying countries and regions |
Countries and regions are classified on the basis of geographic proximity.
| 2. | Countries and regions included in each area |
North America: the United States and Canada
Europe: Germany, the United Kingdom, Spain, Italy, Ireland, France, Switzerland and others
Other areas: Asia, the Middle East, Latin America and others
| 3. | Overseas net sales are sales of the Company and its consolidated subsidiaries which are transacted in countries or regions outside of Japan. |
Year ended March 31, 2006
(Millions of yen)
| North America | Europe | Other areas | Total | |||||
Overseas net sales | 134,895 | 82,291 | 15,538 | 232,724 | ||||
Consolidated net sales | 579,949 | |||||||
Percentage of overseas net sales to consolidated net sales (%) | 23.2 | 14.2 | 2.7 | 40.1 | ||||
(Notes)
| 1. | Method of classifying countries and regions |
Same as the previous year
| 2. | Countries and regions included in each area |
Same as the previous year
| 3. | Overseas net sales are sales of the Company and its consolidated subsidiaries which are transacted in countries or regions outside of Japan. |
Transactions with Related Parties
Not applicable.
(Subsequent Events)
Fiscal 2004
–
Fiscal 2005
(Sale of a subsidiary)
At its Board of Directors Meeting held on April 24, 2006, the Company approved to apply for a sale of the shares of its subsidiary, Wakodo Co., Ltd., in response to a tender offer to be made by Asahi Breweries, Ltd. for Wakodo shares.
| (1) | Reasons for sale |
To concentrate management resources on the pharmaceutical business, the Company has been reassessing its involvement in non-pharmaceutical businesses. In the course of this reassessment, a tender offer to purchase Wakodo Co. Ltd.’s shares was proposed by Asahi Breweries, Ltd. who has valued highly of both the nature of Wakodo’s business and the growth prospects of that business. The Company has concluded to accept the tender offer taking into consideration Asahi’s management pursuit of customer satisfaction and quality, its technologies and know-how, and its variety of sales channels that would contribute to the future development of Wakodo’s business, as well as the price and other terms of the tender offer.
| (2) | Name of buyer |
Asahi Breweries, Ltd.
| (3) | Date of sale |
| April 25, 2006 | Date of public notice of the tender offer | |
| May 15, 2006 | Last day of the tender offer period | |
| May 19, 2006 | Commencement date of settlement | |
| (4) | Name of subsidiary; nature of business; and nature of transactions with the Company |
Name: Wakodo Co., Ltd.
Nature of business: | Manufacture and sale of powdered baby milk; baby foods; vending machine foods; household food items; commercial-use milk powder; pharmaceuticals; non-prescription drugs; cosmetics; sanitary goods; and general merchandise |
Transactions with the Company: None
| (5) | Number of shares to be sold; sale price; gain or loss on sale and ownership interest upon disposition |
Number of shares to be sold: 3,533,000
Sale price: ¥27.9 billion
Ownership interest upon disposition: 0%
Fiscal 2004
(Signing of an agreement to integrate businesses by establishing a joint holding company with Daiichi Pharmaceutical Co., Ltd. (“Daiichi”))
The Company signed an agreement to integrate its businesses with Daiichi through the resolution by the Board of Directors on May 13, 2005. The joint holding company, DAIICHI SANKYO COMPANY, LIMITED, will be established on September 28, 2005 through the approval at the 151st ordinary general shareholders’ meeting to be held on June 29, 2005.
| 1. | Objectives of the integration |
In response to unsatisfied needs from patients and health care professionals, the Company and Daiichi (together, “Both Companies”) will integrate their businesses with an objective to pursue a Japan-based “global pharma-innovator,” who provides innovative products and services continuously and demonstrates a unique competitiveness in the international pharmaceutical market.
| 2. | Business integration process |
| (1) | A joint holding company will be established in the form of a fully-fledged parent company through stock transfer from Both Companies on September 28, 2005. As a result of the joint stock transfer, common stocks of Both Companies traded on the stock exchanges will be delisted and the new holding company will apply for listing. |
| (2) | The pharmaceutical businesses of both Companies will be integrated into the joint holding company by April 2007. |
| 3. | Profile of the joint holding company |
Company name: | Daiichi Sankyo Company, Limited | |
Headquarters : | 3-5-1 Nihonbashi-honcho, Chuo-ku, Tokyo, Japan | |
Common stock : | 50 billion yen | |
Fiscal 2005
–
V. Production, Orders and Sales
1. Production
Production by operating segment for the fiscal year is summarized as follows:
Operating segment | Production (Millions of yen) | Changes (%) | ||
Pharmaceuticals | 347,995 | 101.7 | ||
Other | 91,124 | 97.9 | ||
Total | 439,120 | 100.9 |
(Notes:)
| 1. | Production amounts are based on net selling prices and after elimination of inter-segment sales. |
| 2. | The above amounts are stated exclusive of consumption tax. |
2. Orders
The Sankyo Group performs production according to its own production plans, which are primarily based on its sales forecast. Order-based production is carried out at certain subsidiaries; however, the amount of order back-log is not included herein as such amounts were insignificant.
3. Net Sales
Net sales by operating segment for the fiscal year were as follows:
Operating segment | Production (Millions of yen) | Changes (%) | ||
Pharmaceuticals | 453,856 | 99.8 | ||
Other | 126,092 | 94.7 | ||
Total | 579,949 | 98.7 |
(Notes)
| 1. | Net sales amounts represent net sales to external customers. |
| 2. | Net sales to major customers and their percentage of total net sales were as follows: |
Customers | Fiscal 2004 | Fiscal 2005 | ||||||
| (Millions of yen) | % | (Millions of yen) | % | |||||
Bristol-Myers Squibb Company | 72,074 | 12.3 | 61,509 | 10.6 | ||||
Alfresa Corporation | 64,985 | 11.1 | 59,220 | 10.2 | ||||
| 3. | The above amounts are stated exclusive of consumption tax. |
FASF
May 12, 2006
Non-Consolidated Financial Results for Fiscal 2005
(Year Ended March 31, 2006)
Sankyo Company, Limited
Listed company: DAIICHI SANKYO COMPANY, LIMITED
Stock code number: 4568
Listed exchanges: Tokyo, Osaka, and Nagoya
Head office: Tokyo, Japan
Homepage: http://www.sankyo.co.jp/
Contact: Toshio Takahashi, Executive Officer and General Manager, Corporate Communications Department
Phone: (03) 6225-1126
Meeting of the Board of Directors: May 12, 2006
Interim dividends: Yes
Adoption of unit share system: Yes (One unit equals 100 shares)
Non-Consolidated Financial Results for Fiscal 2005
(1) Non-Consolidated Financial Results
(Figures less than ¥1 million, except per share amounts, have been omitted)
| Net sales | Operating income | Ordinary income | |||||||||||||
| Millions of yen | Percent change | Millions of yen | Percent change | Millions of yen | Percent change | ||||||||||
Fiscal 2005 | 318,127 | (6.5 | ) | 46,344 | (28.1 | ) | 48,955 | (23.7 | ) | ||||||
Fiscal 2004 | 340,091 | (9.7 | ) | 64,441 | (30.6 | ) | 64,124 | (31.7 | ) | ||||||
| Net income | Basic net income per share | Diluted net income per share | Return on equity | Ordinary income as a percentage of total assets | Ordinary income as a percentage of net sales | ||||||||||
| Millions of yen | Percent change | Yen | Yen | % | % | % | |||||||||
Fiscal 2005 | 23,145 | (38.4 | ) | 54.26 | 54.26 | 3.2 | 5.8 | 15.4 | |||||||
Fiscal 2004 | 37,548 | (33.2 | ) | 87.23 | 87.19 | 5.2 | 7.5 | 18.9 | |||||||
Notes:
| 1. | Weighted-average number of common shares issued and outstanding during the fiscal year: |
Fiscal 2005: | 425,007,394 shares | |
Fiscal 2004: | 429,527,836 shares |
| 2. | Changes in accounting policies: Yes |
| 3. | Percentages for net sales, operating income, ordinary income and net income represent a change from the corresponding results in the previous fiscal years. |
(2) Dividends
Beginning in the interim period of fiscal 2005, dividends are paid to the Company’s parent company Daiichi Sankyo Company, Limited.
(3) Non-Consolidated Financial Position
(Figures less than ¥1 million, except per share amounts, have been omitted)
| Total assets | Shareholders’ equity | Shareholders’ equity ratio | Shareholders’ equity per share | |||||
| Millions of yen | Millions of yen | % | Yen | |||||
Fiscal 2005 | 821,595 | 702,194 | 85.5 | 1,660.81 | ||||
Fiscal 2004 | 869,575 | 727,993 | 83.7 | 1,694.75 |
Notes:
| 1. | Total number of common shares issued at the end of the fiscal year: |
Fiscal 2005: | 422,753,456 shares | |
Fiscal 2004: | 429,508,509 shares |
| 2. | Number of common shares in treasury stock at the end of the fiscal year: |
Fiscal 2005: | — shares | |
Fiscal 2004: | 9,990,256 shares |
VI. Non-Consolidated Financial Statements
1. Non-Consolidated Balance Sheets
(Millions of yen)
See Note | 2005 | 2006 | Change | ||||||||||||
March 31: | Amount | % | Amount | % | Amount | ||||||||||
ASSETS | |||||||||||||||
Current assets | |||||||||||||||
Cash and time deposits | 133,346 | 108,784 | |||||||||||||
Trade notes receivable | 2,813 | 1,481 | |||||||||||||
Account receivables - trade | *5 | 101,292 | 87,253 | ||||||||||||
Marketable securities | 98,697 | 92,381 | |||||||||||||
Parent company stock | — | 8,912 | |||||||||||||
Merchandises | 8,580 | 9,194 | |||||||||||||
Products | 10,727 | 7,913 | |||||||||||||
Semifinished products | 22,120 | 18,241 | |||||||||||||
Raw materials | 8,201 | 10,522 | |||||||||||||
Work in progress | 3,726 | 2,822 | |||||||||||||
Prepaid expense | 341 | 304 | |||||||||||||
Deferred tax asset | 18,158 | 18,391 | |||||||||||||
Account receivables - others | 2,360 | 3,674 | |||||||||||||
Other current assets | 1,372 | 2,456 | |||||||||||||
Allowance for doubtful accounts | (34 | ) | (410 | ) | |||||||||||
Total current assets | 411,705 | 47.3 | 371,923 | 45.3 | (39,782 | ) | |||||||||
Non-current assets | |||||||||||||||
Property, plant and equipment | |||||||||||||||
Buildings | 161,128 | 160,776 | |||||||||||||
Less Accumulated Depreciation | 75,815 | 79,149 | |||||||||||||
Buildings, net | 85,312 | 81,626 | |||||||||||||
Structures | 19,842 | 20,114 | |||||||||||||
Less Accumulated Depreciation | 12,834 | 13,304 | |||||||||||||
Structures, net | 7,007 | 6,810 | |||||||||||||
Machinery and equipment | 133,544 | 132,351 | |||||||||||||
Less Accumulated Depreciation | 115,651 | 118,025 | |||||||||||||
Machinery and equipment, net | 17,893 | 14,326 | |||||||||||||
Motor vehicles and transport equipment | 400 | 396 | |||||||||||||
Less Accumulated Depreciation | 359 | 362 | |||||||||||||
Motor vehicles and transport equipment, net | 41 | 33 | |||||||||||||
Tools, equipment and fixtures | 42,492 | 44,552 | |||||||||||||
Less Accumulated Depreciation | 34,677 | 35,672 | |||||||||||||
Tools, equipment and fixtures, net | 7,814 | 8,879 | |||||||||||||
Land | 21,177 | 23,316 | |||||||||||||
Construction in progress | 7,518 | 3,009 | |||||||||||||
Total property, plant and equipment, net | 146,765 | 16.9 | 138,003 | 16.8 | (8,762 | ) | |||||||||
(Millions of yen)
See Note | 2005 | 2006 | Change | ||||||||||||
March 31 | Amount | % | Amount | % | Amount | ||||||||||
Intangible assets, net | |||||||||||||||
Patent rights | 84 | 144 | |||||||||||||
Land-use rights | 24 | 17 | |||||||||||||
Trade marks | 228 | 199 | |||||||||||||
Software | 6,850 | 4,656 | |||||||||||||
Distribution rights | 3,163 | 477 | |||||||||||||
Other intangible assets | 79 | 76 | |||||||||||||
Total intangible assets, net | 10,430 | 1.2 | 5,571 | 0.7 | (4,858 | ) | |||||||||
Investments and other assets | |||||||||||||||
Investment securities | 109,720 | 128,085 | |||||||||||||
Investments in affiliated companies | 116,744 | 115,611 | |||||||||||||
Other investments in capital | 923 | 748 | |||||||||||||
Other investments in affiliated companies | 47,751 | 47,751 | |||||||||||||
Long-term loans | 7 | — | |||||||||||||
Long term loans to employees | 3,127 | 3,101 | |||||||||||||
Long-term loans to affiliated companies | 7,182 | 5,128 | |||||||||||||
Long-term prepaid expense | 263 | 314 | |||||||||||||
Prepaid pension costs | — | 2,740 | |||||||||||||
Deferred tax assets | 12,485 | — | |||||||||||||
Insurance reserve fund | 167 | 170 | |||||||||||||
Guarantee money and deposits | 2,540 | 2,615 | |||||||||||||
Allowance for doubtful accounts | (240 | ) | (172 | ) | |||||||||||
Total investments and other assets | 300,673 | 34.6 | 306,096 | 37.2 | 5,423 | ||||||||||
Total non-current assets | 457,869 | 52.7 | 449,672 | 54.7 | (8,197 | ) | |||||||||
Total assets | 869,575 | 100.0 | 821,595 | 100.0 | (47,980 | ) | |||||||||
(Millions of yen)
| 2005 | 2006 | Change | |||||||||||
March 31: | See Note | Amount | % | Amount | % | Amount | |||||||
LIABILITIES | |||||||||||||
Current liabilities | |||||||||||||
Accounts payable | *5 | 25,891 | 19,753 | ||||||||||
Amounts payable-other | 30,976 | 21,134 | |||||||||||
Accrued expenses | 2,460 | 13,991 | |||||||||||
Income taxes payable | 14,802 | 241 | |||||||||||
Consumption tax payable | 1,037 | 1,311 | |||||||||||
Advance received | 740 | 483 | |||||||||||
Accrued bonuses | 7,908 | — | |||||||||||
Allowance for sales returns | 362 | 273 | |||||||||||
Allowance for sales rebates | 1,022 | 894 | |||||||||||
Allowance for contingent losses | — | 3,379 | |||||||||||
Other current liabilities | 2,074 | 338 | |||||||||||
Total current liabilities | 87,276 | 10.0 | 61,801 | 7.5 | (25,474 | ) | |||||||
Non-current liabilities | |||||||||||||
Accrued retirement and severance benefits | 53,573 | 51,743 | |||||||||||
Accrued directors’ retirement and severance benefits | 732 | 489 | |||||||||||
Accrued soil remediation costs | — | 2,850 | |||||||||||
Deferred tax liabilities | — | 1,523 | |||||||||||
Other non-current liabilities | — | 992 | |||||||||||
Total non-current liabilities | 54,305 | 6.3 | 57,598 | 7.0 | 3,292 | ||||||||
Total liabilities | 141,581 | 16.3 | 119,400 | 14.5 | (22,181 | ) | |||||||
(Millions of yen)
| 2005 | 2006 | Change | |||||||||||||
March 31: | See Note | Amount | % | Amount | % | Amount | |||||||||
SHAREHOLDERS’ EQUITY | |||||||||||||||
Common stock | *1 | 68,793 | 7.9 | 68,793 | 8.4 | — | |||||||||
Additional paid-in capital: | |||||||||||||||
Capital surplus | 66,856 | 66,856 | |||||||||||||
Total additional paid-in capital | 66,856 | 7.7 | 66,856 | 8.1 | — | ||||||||||
Retained earnings | |||||||||||||||
Legally appropriate retained earnings | 13,214 | 13,214 | |||||||||||||
Voluntary retained earnings reserve: | |||||||||||||||
Reserve for special depreciation | 2,536 | 2,742 | |||||||||||||
Reserve for reduction in cost basis of fixed assets | 2,281 | 7,648 | |||||||||||||
Special reserve | 485,600 | 485,600 | |||||||||||||
Unappropriated retained earnings | 81,947 | 10,457 | |||||||||||||
Total retained earnings | 585,580 | 67.3 | 519,664 | 63.3 | (65,916 | ) | |||||||||
Net unrealized gain on investment securities | 27,176 | 3.1 | 46,880 | 5.7 | 19,704 | ||||||||||
Treasury stock at cost | *2 | (20,412 | ) | (2.3 | ) | — | — | 20,412 | |||||||
Total shareholders’ equity | 727,993 | 83.7 | 702,194 | 85.5 | (25,798 | ) | |||||||||
Total liabilities and shareholders’ equity | 869,575 | 100.0 | 821,595 | 100.0 | (47,980 | ) | |||||||||
2. Non-Consolidated Statements of Income
(Millions of yen)
| 2005 | 2006 | Change | |||||||||||
For the year ended March 31: | See Note | Amount | % | Amount | % | Amount | |||||||
Net sales | 340,091 | 100.0 | 318,127 | 100.0 | (21,963 | ) | |||||||
Sales of merchandise | 258,595 | 263,255 | |||||||||||
Sales of product | 81,495 | 54,872 | |||||||||||
Cost of sales | *2 | 113,632 | 98,812 | ||||||||||
Merchandise and products beginning of year | 21,929 | 19,307 | |||||||||||
Production cost | 45,545 | 46,233 | |||||||||||
Merchandise purchases | 46,157 | 33,271 | |||||||||||
Merchandise and products end of year | 19,307 | 17,107 | |||||||||||
| 94,324 | 27.7 | 81,704 | 25.7 | (12,620 | ) | ||||||||
Gross profit | 245,766 | 72.3 | 236,422 | 74.3 | (9,343 | ) | |||||||
Reversal of provision for sales returns | — | — | 89 | 0.0 | 89 | ||||||||
Provision for sales returns | 22 | 0.0 | — | — | (22 | ) | |||||||
Adjusted gross profit | 245,744 | 72.3 | 236,511 | 74.3 | (9,232 | ) | |||||||
Selling, general and administrative expenses | 181,303 | 53.4 | 190,167 | 59.7 | 8,863 | ||||||||
Promotional expenses | 13,676 | 14,107 | |||||||||||
Advertising expenses | 12,708 | 11,691 | |||||||||||
Salaries and bonuses | 23,577 | 28,354 | |||||||||||
Provision for accrued bonuses | 4,378 | — | |||||||||||
Retirement and severance benefits | 2,255 | 188 | |||||||||||
Provision for accrued directors’ retirement and severance benefits | 51 | 90 | |||||||||||
Depreciation | 7,203 | 5,338 | |||||||||||
Travel and transportation expenses | 4,249 | 4,499 | |||||||||||
Research and development expense | *1, 2 | 75,052 | 85,911 | ||||||||||
Other | 38,150 | 39,984 | |||||||||||
Operating income | 64,441 | 18.9 | 46,344 | 14.6 | (18,096 | ) | |||||||
(Millions of yen)
| 2005 | 2006 | Change | |||||||||||
For the year ended March 31: | See Note | Amount | % | Amount | % | Amount | |||||||
Non-operating income | 6,555 | 2.0 | 5,614 | 1.7 | (941 | ) | |||||||
Interest income | 173 | 157 | |||||||||||
Interest income on marketable securities | 272 | 229 | |||||||||||
Dividend income | *5 | 3,364 | 1,648 | ||||||||||
Rent income | *5 | 1,533 | 1,518 | ||||||||||
Other | 1,211 | 2,060 | |||||||||||
Non-operating expenses | 6,871 | 2.0 | 3,002 | 0.9 | (3,868 | ) | |||||||
Loss on disposal of inventories | 3,610 | 739 | |||||||||||
Charitable contributions | 728 | 1,087 | |||||||||||
Other | 2,532 | 1.176 | |||||||||||
Ordinary income | 64,124 | 18.9 | 48,955 | 15.4 | (15,168 | ) | |||||||
Extraordinary income | 16,872 | 5.0 | 3,407 | 1.0 | (13,464 | ) | |||||||
Gain on sale of property, plant and equipment | *3 | 12,046 | 1,826 | ||||||||||
Reversal of allowance for doubtful accounts | 2,040 | — | |||||||||||
Gain on sale of investments in affiliates | 1,788 | 1,404 | |||||||||||
Gain on sale of investment securities | 957 | 176 | |||||||||||
Reversal of accrued directors’ retirement and severance benefits | 40 | — | |||||||||||
Extraordinary losses | 19,899 | 5.9 | 15,955 | 5.0 | (3,943 | ) | |||||||
Loss on disposal of property, plant and equipment | *4 | 1,933 | 3,856 | ||||||||||
Loss on impairment of property, plant and equipment | *6 | 15,879 | 3,913 | ||||||||||
Provision for contingent losses | — | 3,379 | |||||||||||
Provision for soil remediation costs | — | 2,850 | |||||||||||
Loss on business integration | *7 | — | 1,551 | ||||||||||
Restructuring charge | *8 | — | 274 | ||||||||||
Loss on sale of investments in affiliates | — | 44 | |||||||||||
Supplemental retirement benefits | 348 | 43 | |||||||||||
Loss on valuation of investment securities | — | 41 | |||||||||||
Loss on valuation of investments in affiliates | 1,483 | — | |||||||||||
Loss on valuation of other investments in capital | 249 | — | |||||||||||
Loss on sale of investment securities | 5 | — | |||||||||||
Income before income taxes | 61,098 | 18.0 | 36,407 | 11.4 | (24,690 | ) | |||||||
(Millions of yen)
| 2005 | 2006 | Change | ||||||||||||
For the year ended March 31: | See Note | Amount | % | Amount | % | Amount | ||||||||
Income tax expense-current | 29,130 | 12,937 | ||||||||||||
Income tax expense (benefit)-deferred | (5,580 | ) | 324 | |||||||||||
| 23,549 | 7.0 | 13,262 | 4.1 | (10,287 | ) | |||||||||
Net income | 37,548 | 11.0 | 23,145 | 7.3 | (14,403 | ) | ||||||||
Unapproriated retained earnings brought-forward from the previous fiscal year | 50,841 | 65,553 | 14,712 | |||||||||||
Loss on sale of treasury stock | — | 229 | 229 | |||||||||||
Retirement of treasury stock | — | 35,736 | 35,736 | |||||||||||
Interim dividends | 6,442 | 42,275 | 35,832 | |||||||||||
Unappropriated retained earnings, end of year | 81,947 | 10,457 | (71,489 | ) | ||||||||||
3. Proposal for Appropriation of Retained Earnings
(Millions of yen)
| 2005 | 2006 | Change | |||||||||||
March 31: | See Note | Amount | Amount | Amount | |||||||||
Unappropriated retained earnings, end of year | 81,947 | 10,457 | (71,489 | ) | |||||||||
Reversal of voluntary retained earnings reserve: | |||||||||||||
Reserve for special depreciation | 625 | 828 | |||||||||||
Reserve for reduction in cost basis of fixed assets | 80 | 430 | |||||||||||
Special reserve | — | 705 | 60,000 | 61,258 | 60,552 | ||||||||
Retained earnings available for appropriation | 82,653 | 71,716 | (10,936 | ) | |||||||||
Appropriations | |||||||||||||
Cash dividends | 10,737 | — | |||||||||||
Bonuses paid to : | |||||||||||||
Directors | 72 | 72 | |||||||||||
Corporate Auditors | 10 | 10 | |||||||||||
Voluntary retained earning reserve | |||||||||||||
Reserve for special depreciation | 831 | 935 | |||||||||||
Reserve for reduction in cost basis of fixed assets | 5,448 | 17,099 | 786 | 1,804 | (15,295 | ) | |||||||
Unappropriated retained earnings, carried forward to the next fiscal year | 65,553 | 69,911 | 4,358 | ||||||||||
Summary of Significant Accounting Principles and Policies for the Preparation of Non-Consolidated Financial Statements
| Item | Fiscal 2004 | Fiscal 2005 | ||||
| 1. | Methods of Valuation of Significant Assets | (1) Investment securities
- Held-to-maturity securities: Stated at amortized costs (straight-line method)
- Investments in subsidiaries and affiliated companies:
Accounted for by the moving-average cost method
Available-for-sale securities:
With quoted market value; Stated at quoted market value at the balance sheet dates (Unrealized holding gains or losses are reported as a component of shareholders’ equity. Realized gains or losses are computed using the moving-average cost method.)
- With no readily available market value; Accounted for by thee moving-average cost method | (1) Investment securities
- Held-to-maturity securities:
Same as for the previous year
- Stocks of subsidiaries and affiliated companies:
Same as for the previous year
Available-for-sale securities:
- With quoted market value;
Same as for the previous year
- With no readily available market value;
Same as for the previous year | |||
(2) Inventories
Accounted for at the lower of cost or market, with cost being determined under the average cost method.
| (2) Inventories
Same as for the previous year | |||||
| 2. | Depreciation and Amortization of Significant Depreciable Assets | (1) Property, Plant and Equipment:
Depreciation is computed using the declining-balance method; except for the buildings (excluding fixtures) acquired on or after April 1, 1998 which are depreciated using the straight line method.
The ranges of useful lives of principal assets are as follows:
Buildings: 2 to 50 years Machinery and equipment: 2 to 17 years | (1) Property, Plant and Equipment:
Same as for the previous year | |||
(2) Intangible Assets:
Amortization is computed using the straight-line method. Software for internal use is amortized over the estimated useful lives of a five year period.
| (2) Intangible Assets:
Same as for the previous year | |||||
| 3. | Method of Accounting for Significant Allowances: | (1) Allowance for Doubtful Accounts
The Company covers the risk of credit losses from potential customer defaults by providing this allowance. The allowance is estimated on the basis of historical default rates for normal accounts and individual account-by-account evaluation for specific over-due accounts. | (1) Allowance for Doubtful Accounts
Same as for the previous year | |||
(2) Accrued bonuses
To prepare for bonus payments, the Company accrues an amount based on a portion of the estimated total amount of bonus attributable to the fiscal year. | (2) Allowance for bonuses
Not applicable | |||||
(3) Allowance for sales returns
The Company provides for loss on sales returns of products and merchandise based on the maximum amount deductible for tax purpose in accordance with the Corporate Tax Law in Japan. | (3) Allowance for sales returns
The Company provides for loss on sales returns of products and merchandise based on its historical experience of sales returns. The Company recognizes an amount equal to the sum of gross profits on sales and inventory losses on estimated returned products. | |||||
Item | 2005 | 2006 | ||
(4) Allowance for sales rebates
To prepare for future sales rebates, the Company records an allowance in an amount calculated by multiplying the sales rebate rate for the fiscal year by wholesalers’ inventory amounts or accounts receivable balances at the end of the fiscal year. | (4) Allowance for sales rebates
Same as for the previous year | |||
(5) Accrued retirement and severance benefits
To prepare for future payments of retirement and severance benefits, the Company provides for an allowance based on estimated projected benefit obligations and plan assets at the end of the fiscal year.
Prior service cost is amortized under the straight-line method over a period of 5 years, which is equal to or less than the estimated average remaining years of service of the eligible employees at the time such prior service cost was recognized.
Actuarial gains and losses are recognized immediately in the fiscal year in which such gain or loss was recognized. | (5) Allowance for retirement and severance benefits
Same as for the previous year | |||
(6) Accrued directors’ retirement and severance benefits
To prepare for future payments of directors’ retirement and severance benefits, the Company provides for an amount that would have become payable at the end of the fiscal year in accordance with internal regulations, had all directors resigned voluntarily. | (6) Allowance for directors’ retirement and severance benefits
Same as for the previous year | |||
(7) Allowance for contingent losses
-Not applicable | (7) Allowance for contingent losses
To prepare for possible future contingent losses, the Company provides an accrual for an amount of reasonably possible losses by examining individual risk on a case by case basis. | |||
(8) Allowance for soil remediation measures
-Not applicable | (8) Accrued soil remediation costs
To provide for potential soil remediation costs, the Company has recognized a provision for losses on soil remediation based on estimated costs of the cleanup. | |||
| Item | 2005 | 2006 | ||||
| 4. | Translation of Assets and Liabilities Denominated in Foreign Currencies into Yen | Receivables and payables denominated in foreign currencies are converted into yen amounts at the rates of exchange in effect at the end of the fiscal year, with resulting translation gains or losses recognized currently in earnings.
| Same as for the previous year | |||
| 5. | Accounting for Significant Lease Transactions | The same accounting method applied to operating leases is used for financial leases, except for those in which the legal title of the underlying property is transferred from the lessor to the lessee.
| Same as for the previous year | |||
| 6. | Other Significant Accounting Policies | Accounting for Consumption Tax The tax-exclusion (net of tax) method is applied to account for national and local consumption taxes. | Same as for the previous year | |||
Changes in Significant Accounting Principles and Policies for the Preparation of the Non-Consolidated Financial Statements
2005
–
–
(Accounting for Impairment of Property, Plant and Equipment)
Effective in the fiscal year, the Company adopted the new accounting standard for impairment of property, plant and equipment (“Opinion Concerning Establishment of Accounting Standard for Impairment of Fixed Assets” issued by the Business Accounting Deliberation Council on August 9, 2002) and its implementation guidance (the Financial Accounting Standard Implementation Guidance No. 6 issued by the Accounting Standards Board of Japan on October 31, 2003). The new accounting standard was allowed to be adopted beginning in the fiscal year ended March 31, 2004.
As a result of this adoption, income before income taxes decreased by ¥15,879 million.
An accumulated impairment loss is recorded as direct reduction in the book value of respective assets in accordance with the revised regulations for financial statement presentation.
2006
(Valuation Method of Inventories)
Previously, inventories of the Company were principally stated at cost determined by the average method; however, effective in the fiscal year, inventories are principally stated at the lower of average cost or market.
This change was made to appropriately reflect, in the valuation of inventories, the effect of market price changes caused by the severe operating environment in the pharmaceutical industry.
This change resulted in a ¥294 million decrease in ordinary income and income before income taxes for the fiscal year compared to the amounts that would have been reported had the previous method been applied consistently.
(Accounting for Allowance for Sales Returns)
Previously, the Company recorded this provision based on the maximum amount deductible for income tax purpose in accordance with the Corporate Tax Law in Japan; however, effective in the fiscal year, the provision is principally recorded in an amount equal to the sum of gross profits and inventory losses on estimated returned products, mainly based on its historical experience of sales returns.
This change was made to appropriately reflect to the reported earning the effect of the fact that most of the returned products are disposed of and are not reused or resold to customers.
As a result, operating income, ordinary income, and income before income taxes for the fiscal year decreased by ¥19 million as compared to the amounts that would have been reported had the previous method been applied consistently.
–
Supplemental Information
Fiscal 2004
–
–
(The Pro Forma Standard Taxation System)
In accordance with the guidance in Implementation Guidance Report No.12, “Practical Treatment Concerning the Income Statement Presentation of the Pro Forma Standard Tax Portion of Enterprise Tax” on February 13, 2004 by Accounting Standards Board of Japan, the Company recorded ¥809 million levied in proportion to the value-added and the capital as selling, general and administrative expenses in the fiscal year.
Fiscal 2005
(Accounting for Accrued Bonuses)
Previously, the Company accrued an estimated amount of bonuses payable for the fiscal year in “accrued bonuses”; however, effective in the fiscal year, accrued bonuses are recorded in “accrued expense” as the amount of bonuses applicable to the fiscal year has become determinable. As a result of this change, bonuses of ¥7,837 million, which were attributable to the fiscal year, have been recorded in “accrued expense.”
(Accounting for Allowance for Contingent Losses)
During the current fiscal year, the Company recognized an allowance for contingent loss in the amount of ¥3,379 million for potential penalties arising out of its product purchase commitments with a minimum purchase provision, for which the payment of penalties has become probable and the amount of such penalties can be reasonably estimated.
In the interim period of the current fiscal year, the company provided an allowance for an amount of possible losses due to devaluation of excess inventories. However, at this fiscal year-end the Company has changed its accounting standard along with a revision of product purchase agreements.
(Accounting for Soil Remediation Costs)
The Company has recognized an accrual for soil-remediation costs of ¥2,850 million, which was an estimated amount of the cleanup costs that the Company would reasonably incur, based on a survey completed on certain land for the scope of soil remediation.
–
Notes to Non-Consolidated Financial Statements
(Notes to Non-Consolidated Balance Sheets)
2005
| *1. | Authorized number of shares 1,168,099,000 common shares |
Number of shares issued 439,498,765 common shares
The Company’s Articles of Incorporation provides that when the shares are retired, the number of authorized shares shall be reduced.
| *2. | Treasury stock |
The number of shares in treasury stock owned by the Company at the end of the fiscal year was 9,990,256 shares of common stock.
| 3. | Contingencies |
(1) Certain debt and other obligations of 3 affiliated companies and employees owed to financial institutions are guaranteed by the Company. A breakdown of these obligations was as follows:
| (Millions of yen) | ||
Sankyo Pharma Inc. | 4,738 | |
Nippon Nyukazai Co., Ltd. | 1,500 | |
Saudi Arabian-Japanese Pharmaceutical Co., Ltd. | 366 | |
Employees | 101 | |
Total | 6,707 |
(2) For purchase contracts with a minimum volume purchase commitment, the Company is exposed to a risk of valuation loss due to excess inventory.
| 4. | Overdraft contracts and commitment line contracts |
The Company and its consolidated subsidiaries maintain overdraft contracts and commitment line contracts with 2 financial institutions and 15 financial institutions, respectively, in order to allow an efficient procurement of working capital. The balance of unused credit lines under these contracts at the fiscal year-end was as follows:
| (Millions of yen) | ||
Overdraft limit and commitments totals | 60,000 | |
Overdrafts and commitments used | — | |
Overdrafts and commitments unused | 60,000 |
| *5. | Assets and liabilities related to affiliated companies were as follows: |
Accounts receivable | 1,701 | |
Accounts payable | 3,727 |
| 6. | Limitations on Dividends |
The restricted net assets of the Company, attributable to the mark-to-market adjustment to the assets specified in Article 124-3 of the Commercial Code of Japan, was ¥27,176 million.
2006
| *1. | Authorized number of shares 1,151,353,691 common shares |
Number of shares issued 422,753,456 common shares
The Company’s Articles of Incorporation provides that when the shares are retired, the number of authorized shares shall be reduced.
Total number of shares authorized in the Company’s Articles of Incorporation is 1,168,099,000 common shares, however the Company has retired 16,745,309 common shares of its treasury stock by September 26, 2005.
| *2. |
| 3. | Contingencies |
(1) Certain debt and other obligations of 3 affiliated companies and employees owed to financial institutions are guaranteed by the Company. A breakdown of these obligations was as follows:
| (Millions of yen) | ||
DAIICHI SANKYO, INC. | 7,059 | |
Nippon Nyukazai Co., Ltd. | 1,300 | |
Saudi Arabian-Japanese Pharmaceutical Co., Ltd. | 322 | |
Employees | 4 | |
Total | 8,687 |
(Note) Sankyo Pharma Inc. absorbed Daiichi Pharma Holdings, Inc., Daiichi Pharmaceutical Corp. and Daiichi Medical Research Inc., which are U.S.-based subsidiaries of Daiichi Pharmaceutical Co., Ltd., by merger on March 31, 2006. The name of the merged entity was changed to DAIICHI SANKYO, INC.
(2)
| 4. | Overdraft contracts and commitment line contracts |
The Company and its consolidated subsidiaries maintain overdraft contracts and commitment line contracts with 2 financial institutions and 15 financial institutions, respectively, in order to allow an efficient procurement of working capital. The balance of unused credit lines under these contracts at the fiscal year-end was as follows:
| (Millions of yen) | ||
Overdraft limit and commitments totals | 60,000 | |
Overdrafts and commitments used | — | |
Overdrafts and commitments unused | 60,000 |
| *5. | Assets and liabilities related to affiliated companies were as follows: |
Accounts receivable | 3,087 | |
Accounts payable | 3,034 |
| 6. | Limitations on Dividends |
The restricted net assets of the Company, attributable to the mark-to-market adjustment to the assets specified in Article 124-3 of the old Commercial Code of Japan, was ¥46,880 million.
Notes to Non-Consolidated Statements of Income
2005
| *1. | Research and development expenses included the following: |
| (Millions of yen) | ||
Provision for accrued bonuses | 2,436 | |
Salaries and bonuses | 12,648 | |
Retirement and severance benefits | 1,187 | |
Depreciation | 6,361 |
| *2. | Research and development expenses included in selling, general and administrative expenses was ¥75,052 million. |
| *3. | Breakdown of gain on sale of property, plant and equipment |
| (Millions of yen) | ||
Buildings | 5 | |
Machinery, equipment and vehicles | 4 | |
Tools, equipment and fixtures | 0 | |
Land | 12,035 | |
Total | 12,046 | |
| *4. | Breakdown of loss on disposal of property, plant and equipment |
| (Millions of yen) | ||||
| Loss on disposal | Loss on sale | |||
Buildings | 335 | 36 | ||
Structures | 50 | 0 | ||
Machinery and equipment | 146 | 5 | ||
Motor vehicle and transport equipment | 3 | — | ||
Tools and fixtures | 78 | — | ||
Land | — | 567 | ||
Other | 300 | — | ||
In addition, expenses for disposal of property, plant and equipment totaled ¥410 million.
2006
| *1. | Research and development expenses included the following |
| (Millions of yen) | ||
Salaries and bonuses | 14,646 | |
Retirement and severance benefits | 166 | |
Depreciation | 7,285 |
| *2. | Research and development expenses included in selling, general and administrative expenses was ¥85,911 million. |
| *3. | Breakdown of gain on sale of property, plant and equipment |
| (Millions of yen) | ||
Buildings | 1 | |
Machinery, equipment and vehicles | 0 | |
Land | 1,824 | |
Total | 1,826 | |
| *4. | Breakdown of loss on disposal of property, plant and equipment |
(Millions of yen)
| Loss on disposal | Loss on sale | |||
Buildings | 1,263 | 167 | ||
Structures | 31 | 0 | ||
Machinery and equipment | 64 | 56 | ||
Motor vehicle and transport equipment | 0 | 0 | ||
Tools and fixtures | 182 | 6 | ||
Land | — | 38 | ||
Other | 1,307 | — |
In addition, expenses for disposal of property, plant and equipment totaled ¥738 million.
2005
| *5. | Transactions with affiliated companies |
The Company’s principal transactions with its affiliates were as follows.
| (Millions of yen) | ||
Dividend income | 1,902 | |
Rental income | 866 |
| *6. | Loss on impairment of property, plant and equipment |
The Company classifies its assets held and used for its business operations into asset groups, on the basis of operating segments, about which separate financial information is regularly identified for management reporting purpose (e.g., product group), whereas the Company classifies lease assets and idle assets which are not directly used for its business operations on a property by property basis.
For the fiscal year, the Company recorded impairment losses in the amount of ¥15,879 million on the following asset groups.
| (1) | Assets held and used for its business operations |
With respect to a distribution right of an imported product (¥13,059 million) in the pharmaceutical segment, the Company recognized a full impairment loss in extraordinary losses because the Company expects negative cash flows from the imported product due to a decrease in profitability resulting from their sluggish sales.
| (2) | Lease assets and idle assets |
Location & Function | Asset type | Status | ||
Iwaki, Fukushima Onahama Plant (manufacturing facilities of pharmaceuticals) | Buildings Machinery and equipment | Idle | ||
Yasu, Shiga Former Yasu-gawa Plant (manufacturing facilities of agrochemicals) | Buildings | Idle | ||
Shizuoka, etc., Shizuoka Company dormitory land | Land | Idle | ||
Since the asset groups shown in the table above were idle and their expected use was uncertain in the foreseeable future, the Company reduced its book values to a recoverable amount and recorded such reductions of ¥2,820 million as a loss on impairment in the extraordinary losses. These impairment losses consisted of the losses on buildings of ¥2,094 million, on structures of ¥70 million, on machinery and equipment of ¥525 million, on tools, equipment and fixtures of ¥9 million, and on land of ¥120 million.
The Company measures the recoverable amount of an asset group by net realizable value. The Company calculates the net realizable value of land based on the valuation amount for real estate tax purpose, with reasonable adjustments. With respect to buildings, structures, machinery and equipment, motor vehicles and transport equipment, and tools, equipment and fixtures, their net realizable values were estimated at five percent of their
2006
| *5. | Transactions with affiliated companies |
The Company’s principal transactions with its affiliates were as follows.
| (Millions of yen) | ||
Dividend income | 556 | |
Rental income | 820 |
| *6. | Loss on impairment of property, plant and equipment |
The Company classifies its assets held and used for its business operations into asset groups, on the basis of operating segments, about which separate financial information is regularly identified for management reporting purpose (e.g., product group), whereas the Company classifies lease assets and idle assets which are not directly used for its business operations on a property by property basis.
For the fiscal year, the Company recorded impairment losses on the following asset groups.
Location & Function | Asset type | Status | ||
Iwaki, Fukushima Onahama Plant (manufacturing facilities of pharmaceuticals) | Buildings Machinery and equipment | Idle | ||
Tsuchiura, Ibaraki Company housing etc. | Land | Idle | ||
There was no indication of impairment for the assets that are held and used for operations of the Company’s business. However, since the asset groups shown in the table above were idle and their expected use was uncertain in the foreseeable future, the Company reduced their book values to a recoverable amount and recorded such reductions of ¥3,913 million as a loss on impairment in the extraordinary losses. These impairment losses consisted of the losses on buildings of ¥1,877 million, on structures of ¥127 million, on machinery and equipment of ¥1,881 million, on tools and fixtures of ¥16 million and on land of ¥11 million. The Company measures the recoverable amount of an asset group by its net realizable value. The Company calculates the net realizable value of land based on the valuation amount for real estate tax purpose, with reasonable adjustments. With respect to buildings, structures, machinery and equipment, motor vehicles and transport equipment, and tools, equipment and fixtures, their net realizable values were estimated at five percent of their acquisition costs.
2005
| *7. |
| *8. |
2006
| *7. | Loss on business integration |
The loss represents one-time costs associated with the integration of the business operations of the Sankyo Group and the Daiichi Pharmaceutical Group within the Daiichi Sankyo Group.
| *8. | Restructuring charge |
The amount represents one-time costs associated with the restructuring of non-pharmaceutical businesses within the Sankyo Group.
Marketable and Investment Securities
Investments in Subsidiaries and Affiliated Companies with Determinable Market Value
(Millions of yen)
| 2005 | 2006 | |||||||||||
| Carrying amount | Market value | Difference | Carrying amount | Market value | Difference | |||||||
Investment in subsidiaries | 4,512 | 13,075 | 8,563 | 4,512 | 17,987 | 13,474 | ||||||
investment in affiliated companies | — | — | — | — | — | — | ||||||
Total | 4,512 | 13,075 | 8,563 | 4,512 | 17,987 | 13,474 | ||||||
Deferred Income Taxes
Principal Components of Deferred Tax Assets and Liabilities
2005
| 1) | Breakdown of deferred tax assets and deferred tax liabilities |
| (Millions of yen) | |||
Deferred tax assets: | |||
Accrued retirement and severance benefits | 20,540 | ||
Prepaid consigned research and co-development expenses | 13,892 | ||
Impairment loss | 6,440 | ||
Loss on valuation of inventories | 3,133 | ||
Accrued employees’ bonuses | 3,013 | ||
Excess amortization on internal-use software | 2,853 | ||
Accrued enterprise tax | 999 | ||
Other | 7,689 | ||
Subtotal | 58,561 | ||
Valuation allowances | (2,191 | ) | |
Total deferred tax assets | 56,370 | ||
Deferred tax liabilities: | |||
Unrealized holding gain on available-for sale securities | (18,632 | ) | |
Reserve for reduction in basis of property, plant and equipment for income tax purposes | (5,221 | ) | |
Reserve for accelerated depreciation | (1,872 | ) | |
Total deferred tax liabilities | (25,725 | ) | |
Net deferred tax assets | 30,644 | ||
2006
| 1) | Breakdown of deferred tax assets and deferred tax liabilities |
| (Millions of yen) | |||
Deferred tax assets: | |||
Accrued retirement and severance benefits | 21,008 | ||
Prepaid consigned research and co-development expenses | 14,307 | ||
Impairment loss | 3,860 | ||
Accrued bonuses | 3,031 | ||
Excess amortization on internal-use software | 2,875 | ||
Loss on valuation of inventories | 2,857 | ||
Allowance for contingent losses | 1,371 | ||
Accrued soil remediation costs | 1,156 | ||
Other | 7,503 | ||
Subtotal | 57,972 | ||
Valuation allowances | (637 | ) | |
Total deferred tax assets | 57,334 | ||
Deferred tax liabilities: | |||
Unrealized holding gain on available-for-sale securities | (32,011 | ) | |
Reserve for reduction in bases of property, plant and equipment for income tax purposes | (5,465 | ) | |
Reserve for accelerated depreciation | (1,944 | ) | |
Prepaid pension costs | (1,044 | ) | |
Total deferred tax liabilities | (40,466 | ) | |
Net deferred tax assets | 16,868 | ||
2005
| (2) | Reconciliation of the difference between the statutory tax rate and the Company’s effective tax rate |
| (Percent) | |||
Statutory tax rate | 40.6 | ||
(Adjustments) | |||
Non-deductible permanent differences including entertainment expenses and other items | 5.7 | ||
Per capita inhabitant tax | 0.2 | ||
IT investment tax credit | (0.1 | ) | |
Deductible permanent differences including dividend received deductions and other items | (2.1 | ) | |
R&D expenses tax credit | (7.2 | ) | |
Others | 1.4 | ||
Effective tax rate | 38.5 | ||
2006
| (2) | Reconciliation of the difference between the statutory tax rate and the Company’s effective tax rate |
| (Percent) | |||
Statutory tax rate | 40.6 | ||
(Adjustments) | |||
Non-deductible permanent differences including entertainment expenses and other items | 10.9 | ||
Per capita inhabitant | 0.3 | ||
IT investment tax credit | (0.2 | ) | |
Refund of corporate income taxes for the previous fiscal years | (0.7 | ) | |
Deductible permanent differences including dividend received deductions and other items | (2.6 | ) | |
Decrease in valuation allowances | (4.3 | ) | |
R&D expenses tax credit | (5.7 | ) | |
Others | (1.9 | ) | |
Effective tax rate | 36.4 | ||
(Subsequent Events)
2005
—
2006
(Sale of a subsidiary)
At its Board of Directors Meeting held on April 24, 2006, the Company approved to apply for a sale of the shares of its subsidiary, Wakodo Co., Ltd., in response to a tender offer to be made by Asahi Breweries, Ltd. for Wakodo shares.
| (1) | Reasons for sale |
To concentrate management resources on the pharmaceutical business, the Company has been reassessing its involvement in non-pharmaceutical businesses. In the course of this reassessment, a tender offer to purchase Wakodo Co. Ltd.’s shares was proposed by Asahi Breweries, Ltd. who has valued highly of both the nature of Wakodo’s business and the growth prospects of that business. The Company has concluded to accept the tender offer taking into consideration Asahi’s management pursuit of customer satisfaction and quality, its technologies and know-how, and its varity of sales channels that would contribute to the future development of Wakodo’s business as well as the price and other terms of the tender offer.
| (2) | Name of buyer |
Asahi Breweries, Ltd.
| (3) | Date of sale |
April 25, 2006 Date of public notice of the tender offer
May 15, 2006 Last day of the tender offer period
May 19, 2006 Commencement date of settlement
| (4) | Name of subsidiary; nature of business; and nature of transactions with the Company |
Name: Wakodo Co., Ltd.
Nature of business: Manufacture and sale of powdered baby milk; baby foods; vending machine foods; household food items; commercial-use milk powder; pharmaceuticals; non-prescription drugs; cosmetics; sanitary goods; and general merchandise
Transactions with the Company: None
| (5) | Number of shares to be sold; sale price; gain or loss on sale and ownership interest upon disposition |
Number of shares to be sold: 3,533,000
Sale price: ¥27.9 billion
Ownership interest upon disposition: 0%
2005
(Signing of an agreement to integrate businesses by establishing a joint holding company with Daiichi Pharmaceutical Co., Ltd. (“Daiichi”))
The Company signed an agreement to integrate its businesses with Daiichi through the resolution by the Board of Directors on May 13, 2005. The joint holding company, DAIICHI SANKYO COMPANY, LIMITED, will be established on September 28, 2005 through the approval at the 151st ordinary general shareholders’ meeting to be held on June 29, 2005.
| 1. | Objectives of the integration |
In response to unsatisfied needs from patients and health care professionals, the Company and Daiichi (together, “Both Companies”) will integrate their businesses with an objective to pursue a Japan-based “global pharma-innovator,” who provides innovative products and services continuously and demonstrates a unique competitiveness in the international pharmaceutical market.
| 2. | Business integration process |
| (1) | A joint holding company will be established in the form of a fully-fledged parent company through stock transfer from Both Companies on September 28, 2005. As a result of the joint stock transfer, common stocks of Both Companies traded on the stock exchanges will be delisted and the new holding company will apply for listing. |
| (2) | The pharmaceutical businesses of both Companies will be integrated into the joint holding company by April 2007. |
| 3. | Profile of the joint holding company |
Company name : Daiichi Sankyo Company, Limited
Headquarters : 3-5-1 Nihonbashi-honcho, Chuo-ku, Tokyo, Japan
Common stock : 50 billion yen
2006
—
(Other)
Year ended March 31, 2005
–
Year ended March 31, 2006
The Company separated its healthcare business as of April 1, 2006 and transferred said business to DAIICHI SANKYO HEALTHCARE CO., LTD., a company jointly established with Daiichi Pharmaceutical Co., Ltd. on December 16, 2005. Concurrently, Daiichi Pharmaceutical Co., Ltd. transferred its healthcare business to DAIICHI SANKYO HEALTHCARE CO., LTD.
The Company’s shareholding ratio after the business separation is 66.7%.
| 1. | The Company’s assets and liabilities to be transferred |
| (Millions of yen) | ||
Current assets | 9,193 | |
Non-current assets | 443 | |
Total assets | 9,637 | |
Current liabilities | 1,717 | |
Total liabilities | 1,717 | |
Net assets | 7,920 |
| 2. | Net sales for the fiscal year ended March 31, 2006 |
Sankyo Company, Ltd. Healthcare Business
| (Millions of yen) | ||
Net sales | 20,383 |
VII. Proposed Changes in Membership of the Board of Directors
(as of June 27, 2006)
1. Changes in Representative Directors
(Representative Director Scheduled to Retire)
| Executive Vice-President and Representative Director | Hideho Kawamura | |
| (scheduled to be elected Advisor of Sankyo Co., Ltd.) |
2. Changes in Directors
(Directors Scheduled to Retire)
| Executive Vice-President and Representative Director | Hideho Kawamura | |
| (scheduled to be elected Advisor of Sankyo Co., Ltd.) |
3. Changes in Corporate Auditors
| None |
4. Changes in Executive Officers
| None |