Exhibit 99.3
FASF
May 12, 2006
Consolidated Financial Results for Fiscal 2005
(Year Ended March 31, 2006)
Daiichi Pharmaceutical Co., Ltd.
Listed company name: DAIICHI SANKYO COMPANY, LIMITED
Stock code number: 4568
Listed exchanges: Tokyo, Osaka, and Nagoya
Head office: Tokyo, Japan
Contact: Mr. Toshio Takahashi, Corporate Officer, General Manager of Corporate Communications Department
Telephone: +81-3-6225-1126
Meeting of the Board of Directors: May 12, 2006
Parent company name: DAIICHI SANKYO COMPANY, LIMITED (stock code 4568)
Parent company shareholding in the Company: 100%
U.S. accounting standards: Not applicable
Consolidated Financial Results for Fiscal 2005
(1) Consolidated Financial Results
(Figures less than ¥1 million, except per share amounts, have been omitted)
| Net sales | Operating income | Ordinary income | ||||||||||
| Millions of yen | Percent change | Millions of yen | Percent change | Millions of yen | Percent change | |||||||
Fiscal 2005 | 346,447 | 5.5 | 76,087 | 35.7 | 77,929 | 36.0 | ||||||
Fiscal 2004 | 328,534 | 1.8 | 56,063 | 21.6 | 57,320 | 22.7 | ||||||
| Net income | Basic net income per share | Diluted net income per share | Return on equity | Ordinary income as a percentage of total assets | Ordinary income as a percentage of net sales | |||||||||
| Millions of yen | Percent change | Yen | Yen | % | % | % | ||||||||
Fiscal 2005 | 37,409 | 0.6 | 138.59 | 138.55 | 8.0 | 13.6 | 22.5 | |||||||
Fiscal 2004 | 37,175 | 39.4 | 137.95 | 137.90 | 8.5 | 10.7 | 17.4 | |||||||
Notes:
| 1. | Equity in earnings (losses) of affiliated companies accounted for using the equity method: |
Fiscal 2005: | (¥369 million) | |
Fiscal 2004: | (¥399 million) |
| 2. | Weighted-average number of common shares issued and outstanding during the fiscal year (consolidated): |
Fiscal 2005: | 269,078,712 shares | |
Fiscal 2004: | 268,481,535 shares |
| 3. | Changes in accounting policies: Yes |
| 4. | Percentages for net sales, operating income, ordinary income and net income represent a change from the corresponding results in the previous fiscal years. |
(2) Consolidated Financial Position
(Figures less than ¥1 million, except per share amounts, have been omitted)
| Total assets | Shareholders�� equity | Shareholders’ equity ratio | Shareholders’ equity per share | |||||
| Millions of yen | Millions of yen | % | Yen | |||||
Fiscal 2005 | 597,701 | 481,181 | 80.5 | 1,785.55 | ||||
Fiscal 2004 | 546,555 | 448,563 | 82.1 | 1,670.71 |
Note: Total number of common shares issued and outstanding at the end of the fiscal year (consolidated):
Fiscal 2005: | 269,420,093 shares | |||
Fiscal 2004: | 268,404,023 shares |
(3) Consolidated Cash Flows
(Figures less than ¥1 million, except per share amounts, have been omitted)
| Net cash flows from operating activities | Net cash flows from investing activities | Net cash flows from financing activities | Cash and cash equivalents at the end | |||||||
| Millions of yen | Millions of yen | Millions of yen | Millions of yen | |||||||
Fiscal 2005 | 66,998 | (18,528 | ) | (36,127 | ) | 98,823 | ||||
Fiscal 2004 | 35,571 | (21,989 | ) | (12,369 | ) | 91,571 |
(4) Scope of Consolidation and Application of Equity Method
Number of consolidated subsidiaries: | 21 | |||
Number of non-consolidated subsidiaries accounted for by the equity method: | 0 | |||
Number of affiliates accounted for by the equity method: | 6 |
(5) Changes in Scope of Consolidation and Application of Equity Method
Consolidated subsidiaries | ||||
(Increase) | 0 | |||
(Decrease) | 10 | |||
Equity method affiliates | ||||
(Increase) | 4 | |||
(Decrease) | 0 |
1. State of the Group
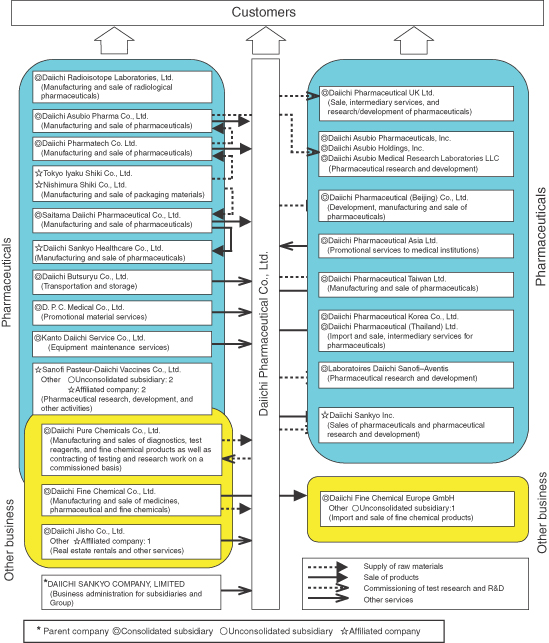
On September 28, 2005, Daiichi Pharmaceutical Co., Ltd. and Sankyo Company, Limited jointly implemented a share transfer and thereby created a joint holding company—DAIICHI SANKYO COMPANY, LIMITED—under which both companies become wholly owned subsidiaries. Within this organizational structure, the Daiichi Group comprises Daiichi Pharmaceutical Co., Ltd. (the Company), its 24 subsidiaries (including 21 consolidated subsidiaries and 3 unconsolidated subsidiaries) and 7 affiliated companies, for a total of 32 companies. The lines of business of Daiichi Group companies, the positioning of principal companies within the Group, and the operating and geographic segments to which each company belongs are shown below.
Operating Segments | Lines of Business | Principal Group Companies | ||||
| Pharmaceuticals | Prescription drugs Diagnostic and radiopharmaceuticals OTC drugs Veterinary and livestock feed products | Japan | Daiichi Pharmaceutical Co.,Ltd. Daiichi Pure Chemicals Co., Ltd. Daiichi Radioisotope Laboratories, Ltd. Daiichi Fine Chemical Co., Ltd. Saitama Daiichi Pharmaceutical Co., Ltd. Daiichi Asubio Pharma Co., Ltd. Daiichi Pharmatech Co., Ltd. Tokyo Iyaku Shiki Co., Ltd. Nishimura Shiki Co., Ltd. Daiichi Butsuryu Co., Ltd. D. P. C. Medical Co., Ltd. Kanto Daiichi Service Co., Ltd. Daiichi Sankyo Healthcare Co., Ltd.
Unconsolidated subsidiaries: 2; affiliated companies: 2
Total 17 companies | |||
| Overseas | Daiichi Pharmaceutical UK Ltd. Daiichi Pharmaceutical (Beijing) Co., Ltd. Daiichi Pharmaceutical Asia Ltd. Daiichi Pharmaceutical Taiwan Ltd. Daiichi Pharmaceutical Korea Co., Ltd. Daiichi Pharmaceutical (Thailand) Ltd. Laboratoires Daiichi Sanofi–Aventis Daiichi Asubio Pharmaceuticals, Inc. Daiichi Asubio Holdings, Inc. Daiichi Asubio Medical Research Laboratories LLC Daiichi Sankyo Inc.
Total 11 companies | |||||
| Other Business | Fine chemical business Safety research business Other business | Japan | Daiichi Pure Chemicals Co., Ltd. Daiichi Fine Chemical Co., Ltd. Daiichi Jisho Co., Ltd.
Other affiliated company: 1
Total 4 companies | |||
| Overseas | Daiichi Fine Chemical Europe GmbH
Unconsolidated subsidiary: 1
Total 2 companies | |||||
| Pure holding company (parent company) | Japan | DAIICHI SANKYO COMPANY, LIMITED | ||||
| In Japan | Overseas |
As of March 31, 2006; Millions of yen
Name | Location | Capital or investment | Principal business operations | Percentage of voting rights held (%) | Details of Relationship | ||||||||||||
| Concurrently serving directors, etc. | Financial support | Operating transactions | Facilities leased | ||||||||||||||
| Parent Company | |||||||||||||||||
DAIICHI SANKYO COMPANY, LIMITED (Note 2) | Chuo-ku, Tokyo | 50,000 | Holding company | 100 | 5 | — | The Company contracted management service | — | |||||||||
| Consolidated Subsidiaries | |||||||||||||||||
| Daiichi Pure Chemicals Co., Ltd. | Chuo-ku, Tokyo | 1,275 | Pharmaceuticals Other | 100 | 1 | Facility- related loans and working capital | The Company purchases a portion of bulk pharmaceutical materials and diagnostics products, and also commissions testing and trials. | — | |||||||||
Daiichi Radioisotope Laboratories, Ltd. (Note 3) | Chuo-ku, Tokyo | 1,400 | Pharmaceuticals | 100 (17 | ) | 1 | — | — | — | ||||||||
| Daiichi Fine Chemical Co., Ltd. | Takaoka-shi, Toyama | 2,276 | Pharmaceuticals Other | 100 | 1 | Facility- related loans and working capital | The Company purchases bulk pharmaceutical materials. | — | |||||||||
| Saitama Daiichi Pharmaceutical Co., Ltd. | Kasukabe-shi, Saitama | 1,005 | Pharmaceuticals | 100 | 2 | — | The Company purchases pharmaceutical products. | — | |||||||||
Daiichi Asubio Pharma Co., Ltd. (Notes 4 and 5) | Minato-ku, Tokyo | 11,000 | Pharmaceuticals | 100 | 6 | Working capital | The Company purchases pharmaceutical products. | — | |||||||||
Daiichi Pharmatech Co., Ltd. (Note 6) | Chuo-ku, Tokyo | 100 | Pharmaceuticals | 100 | — | Working capital | The Company purchases pharmaceutical products. | Manufacturing facilities and land | |||||||||
| Daiichi Jisho Co., Ltd. | Chuo-ku, Tokyo | 100 | Other | 100 | 1 | — | The Company commissions building administration, etc. | Business-use office space | |||||||||
| Daiichi Butsuryu Co., Ltd. | Sumida-ku, Tokyo | 50 | Pharmaceuticals | 100 | 1 | — | The Company commissions transport and storage of the Company’s products. | Business-use office space | |||||||||
| D. P. C. Medical Co., Ltd. | Chuo-ku, Tokyo | 50 | Pharmaceuticals | 100 | 1 | — | The Company purchases marketing and promotion materials. | — | |||||||||
| Kanto Daiichi Service Co., Ltd. | Edogawa-ku, Tokyo | 10 | Pharmaceuticals | 100 | — | — | The Company commissions equipment maintenance, etc. | Business-use office space | |||||||||
| Daiichi Pharmaceuticals UK Ltd. | London, UK | 400 thousand pounds | Pharmaceuticals | 100 | — | — | The Company commissions R&D | — | |||||||||
Daiichi Pharmaceutical (Beijing) Co., Ltd. (Notes 4 and 7) | Beijing, China | 63,800 thousand U.S. dollars | Pharmaceuticals | 100 | 1 | Facility- related loans | The Company sells bulk pharmaceutical materials | — | |||||||||
| Daiichi Pharmaceutical Asia Ltd. | Hong Kong, China | 3,000 thousand HK dollars | Pharmaceuticals | 100 | — | — | The Company commissions academic marketing promotion activities. | — | |||||||||
| Daiichi Pharmaceutical Taiwan Ltd. | Taipei, Taiwan | 80,000 thousand NT dollars | Pharmaceuticals | 100 | 1 | — | The Company sells bulk pharmaceutical materials | — | |||||||||
Name | Location | Capital or investment | Principal business operations | Percentage of voting rights held (%) | Details of Relationship | ||||||||||||
| Concurrently serving directors, etc. | Financial support | Operating transactions | Facilities leased | ||||||||||||||
| Daiichi Pharmaceutical Korea Co., Ltd. | Seoul, Korea | 3,000 million W | Pharmaceuticals | 70 | 1 | — | The Company commissions marketing of the Company’s products. | — | |||||||||
| Daiichi Pharmaceutical (Thailand) Ltd. | Bangkok, Thailand | 10,000 thousand baht | Pharmaceuticals | 100 | — | — | The Company commissions marketing of the Company’s products. | — | |||||||||
Laboratoires Daiichi Sanofi–Aventis (Note 8) | Paris, France | 154 thousand euros | Pharmaceuticals | 51 | 3 | — | The Company commissions R&D. | — | |||||||||
Daiichi Fine Chemical Europe GmbH (Note 3) | Dusseldorf, Germany | 511 thousand euros | Other | 100 (100 | ) | — | — | The Company commissions marketing of the Company’s products. | — | ||||||||
Daiichi Asubio Pharma- ceuticals, Inc. (Note 3) | New Jersey, U.S. | 1 U.S. dollar | Pharmaceuticals | 100 (100 | ) | 1 | — | — | — | ||||||||
Daiichi Asubio Holdings, Inc. (Notes 3 and 9) | Delaware, U.S. | 6,000 thousand U.S. dollars | Pharmaceuticals | 100 (100 | ) | 1 | — | — | — | ||||||||
Daiichi Asubio Medical Research Laboratories LLC (Notes 3 and 9) | Massachusetts, U.S. | 6,272 thousand U.S. dollars | Pharmaceuticals | 100 (100 | ) | 1 | — | — | — | ||||||||
Affiliated Companies Accounted for by the Equity Method | |||||||||||||||||
Sanofi-Pasteur-Daiichi Vaccines Co., Ltd. (Note 10) | Edogawa-ku, Tokyo | 310 | Pharmaceuticals | 50 | 3 | Working capital | The Company commissions R&D. | Business- use office space | |||||||||
Laboratoires Daiichi Sanofi–Synthelabo (Note 11) | Shinjuku-ku, Tokyo | 100 | Pharmaceuticals | 49 | 2 | Working capital | The Company commissions R&D. | — | |||||||||
Tokyo Iyaku Shiki Co., Ltd. (Note 12) | Shimada-shi, Shizuoka | 163 | Pharmaceuticals | 31 | — | — | — | ||||||||||
Nishimura Shiki Co., Ltd. (Note 12) | Takatsuki-shi, Osaka | 30 | Pharmaceuticals | 31 | — | — | — | ||||||||||
Daiichi Sankyo Healthcare Co., Ltd. (Note 13) | Chuo-ku, Tokyo | 10 | Pharmaceuticals | 50 | 1 | — | Research- use office space | ||||||||||
Daiichi Sankyo Inc. (Note 14) | New Jersey, U.S. | 24.985 thousand U.S. dollars | Pharmaceuticals | 19 | — | — | The Company commissions marketing of the Company’s products, and R&D. | — | |||||||||
Notes
| 1. | The “Principal business operations” column contains the name of the operating segment to which the business operations are classified. |
| 2. | This company files a separate securities report to the Ministry of Finance in Japan. |
| 3. | Figures in parentheses within the “Percentage voting rights held” column represent a percentage of indirect ownership held by the Company. Indirect ownership and voting rights in Daiichi Radioisotope Laboratories, Ltd., are owned by Daiichi Pure Chemicals Co., Ltd. Indirect ownership and voting rights in Daiichi Fine Chemical Europe GmbH is owned by Daiichi Fine Chemical Co., Ltd. Indirect ownership and voting rights in Daiichi Asubio Pharmaceuticals, Inc., Daiichi Asubio Holdings, Inc., and Daiichi Asubio Medical Research Laboratories, LLC, are all owned by Daiichi Asubio Pharma Co., Ltd. |
| 4. | These companies are qualified as significant subsidiary as defined in the regulations under the Securities Exchange Law of Japan. |
| 5. | Daiichi Suntory Pharma Co., Ltd. merged with Daiichi Suntory Biomedical Research Ltd. as of April 1, 2005. In addition, on September 15, 2005, the Company purchased from Suntory Ltd. all of the remaining shares in Daiichi Suntory Pharma Co., Ltd., and thereby increased its voting interests in Daiichi Suntory Pharma Co., Ltd. to 100%. Further, as of October 1, 2005, the corporate name of Daiichi Suntory Pharma Co., Ltd. was changed to Daiichi Asubio Pharma Co., Ltd. |
| 6. | On April 1, 2005, Daiichi Pharmatech Co., Ltd. took over the operations of the three factories—Osaka Factory, Shizuoka Factory, and Akita Factory—that had been spun-off from the Company. At the same time, Daiichi Pharmatech Co., Ltd. merged with two of the Company’s subsidiaries—Kansai Daiichi Service Co., Ltd. and Daiichi Technos Co., Ltd. |
| 7. | Daiichi Pharmaceutical (Beijing) Co., Ltd. took over Daiichi Pharmaceutical (China) Co., Ltd. by merger on January 10, 2006. |
| 8. | Laboratoires Daiichi Sanofi-Synthelabo changed its name to Laboratoires Daiichi Sanofi-Aventis on June 24, 2005. |
| 9. | Daiichi Asubio Holdings, Inc. and Daiichi Asubio Medical Research Laboratories, LLC decided to cease their operations in May 2005. |
| 10. | Aventis Pasteur-Daiichi Vaccines Co., Ltd. changed its name to Sanofi-Pasteur-Daiichi Vaccines Co., Ltd. on July 29, 2005. |
| 11. | Laboratoires Daiichi Sanofi–Synthelabo changed its name to Laboratoires Daiichi Sanofi–Aventis on April 1, 2006. |
| 12. | The Company sold a portion of its shares in Tokyo Iyaku Shiki Co., Ltd. and Nishimura Shiki Co., Ltd. and reduced its voting interests in each of those companies to 31%. As a result, at the end of the fiscal year, these two companies are accounted as affiliated companies. |
| 13. | On April 1, 2006, the Company divested its healthcare operations, which became part of Daiichi Sankyo Healthcare Co., Ltd. The Company holds 33.33% of its voting rights as a result of this divesture. |
| 14. | On March 31, 2006, Sankyo Pharma Inc., a subsidiary of Sankyo Company, Limited, merged with three subsidiaries of the Company (Daiichi Pharma Holdings, Inc., Daiichi Pharmaceutical Corporation and Daiichi Medical Research, Inc.), with Sankyo Pharma Inc. as the surviving entity. This company then changed its name to DAIICHI SANKYO, INC. |
| 15. | Because the percentage of consolidated net sales accounted for by an individual consolidated subsidiary (excluding inter-company transactions among the consolidated companies) was less than 10%, selected financial information of the subsidiaries has been omitted herein. |
2. Management Policies
On September 28, 2005, the Company and Sankyo Company, Limited jointly implemented a joint stock transfer and thereby established a holding company—DAIICHI SANKYO COMPANY, LIMITED—under which both companies have become wholly owned subsidiaries. For information on the Daiichi Sankyo Group’s principal management policies and corporate strategies, please refer to the DAIICHI SANKYO COMPANY’s report on the Consolidated Financial Results (“Kessan Tanshin”) for the fiscal year.
3. Results of Operations and Financial Position
I. Results of Operations
1. Overview of the fiscal year
(Millions of yen)
| Net sales | Operating income | Ordinary income | Net income | |||||
Fiscal 2004 | 328,534 | 56,063 | 57,320 | 37,175 | ||||
Fiscal 2005 | 346,447 | 76,087 | 77,929 | 37,409 | ||||
Change (%) | 5.5 | 35.7 | 36.0 | 0.6 |
(1) Overview of Performance
Competition continues to intensify in the pharmaceutical markets worldwide, particularly among “global-mega” pharmaceutical companies in the areas of both new drug-related R&D and marketing activities. In Japan, the reorganization of national university hospitals and other national hospitals into independent medical corporations is one of several factors promoting changes in the medical industry environment. With an increasing number of medical institutions adopting a new comprehensive hospital treatment evaluation system, conditions are becoming harsher as pressures grow to contain healthcare costs.
Facing such harsh conditions, the Daiichi Group focused its marketing efforts on expanding markets for its products by promoting the proper use of drugs through the provision of information related to the efficacy and safety of its products. Higher revenue from domestic sales of prescription drugs, an increase in bulk levofloxacin exports, and a receipt of milestone payments related to the approval on manufacturing and marketing of Plavix contributed to an increase in net sales. Net sales totaled ¥346,447 million, an increase of 5.5% compared with the previous year. Regarding profitability, increased expenses related to the expansion of global R&D programs and the business integration with Sankyo Company, Limited were offset by higher revenues plus cost-of-sales reductions following the start of operations at Daiichi Pharmatech Co., Ltd. Operating income and ordinary income both increased significantly compared with the previous year. Operating income rose significantly by 35.7% to ¥76,087 million, while ordinary income increased by 36.0% to ¥77,929 million. As a result, net income was kept higher than the prior year level even after an extraordinary loss arising from the integration with Sankyo Company, Limited, rising by 0.6% to ¥37,409 million. The amounts of net sales, operating income, ordinary income and net income all marked the new record highs.
The percentage of consolidated net sales derived from overseas operations was 21.5%.
(2) Segment Information
Operating segment
(Millions of yen)
Operating segment | Net sales | Operating income | ||||||||||||||
| Fiscal 2004 | Fiscal 2005 | Increase (Decrease) | Fiscal 2004 | Fiscal 2005 | Increase (Decrease) | |||||||||||
Pharmaceuticals | 311,844 | 331,135 | 19,290 | 64,096 | 86,319 | 22,223 | ||||||||||
Other | 16,689 | 15,312 | (1,377 | ) | (78 | ) | 446 | 525 | ||||||||
Subtotal | 328,534 | 346,447 | 17,913 | 64,017 | 86,766 | 22,748 | ||||||||||
Eliminations | — | — | — | (7,953 | ) | (10,678 | ) | (2,724 | ) | |||||||
Consolidated | 328,534 | 346,447 | 17,913 | 56,063 | 76,087 | 20,024 | ||||||||||
Note: Net sales are the amounts of sales to external customers.
Pharmaceuticals
<Prescription Drugs>
Harsh conditions prevailed for original drug manufacturers in the Japanese prescription drug market amid the ongoing impact of measures intended to reduce healthcare spending, including a move to promote the use of generic pharmaceuticals. Business conditions became particularly tougher toward the fiscal year-end, with the revisions to tariffs for medical treatment reimbursement and National Health Insurance (NHI) drug prices approaching in April 2006. Leading products Cravit, a mainstay broad-spectrum oral antibacterial agent, and Omnipaque, a nonionic contrast medium, both recorded sales significantly above the previous year level. Other products that contributed to sales growth included Artist, a long-acting beta-blocker for treating high blood pressure, angina, and chronic cardiac insufficiency; Mobic, a nonsteroidal anti-inflammatory agent; HANP, an agent for treating acute cardiac insufficiency; Zyrtec, a long-acting selective H1 receptor antagonist and anti-allergy agent; and Topotecin, an anticancer agent. Total domestic prescription drug sales increased by 7.8% to ¥221,866 million.
Overseas prescription drug sales were positively affected by such factors as increased bulk shipments of the antibacterial agent, levofloxacin, to the United States and Europe; sales growth generated by Evoxac, an agent for treating the symptoms of dry mouth in patients with Sjögren’s syndrome, and FLOXIN Otic, an antibacterial quinolone solution for treating ear infections; and an additional contribution due to favorable currency translation arising from yen depreciation. Overseas net sales of prescription drugs increased by 11.8% compared with the previous year to ¥68,534 million.
<Diagnostics and Radiopharmaceuticals>
Although measures aimed at containing medical costs and intensifying competition have kept the market conditions challenging, the Company recorded increased domestic sales and exports of diagnostics products. However, a decrease in sales of radiopharmaceuticals products caused total net sales of diagnostics and radiopharmaceutical products to decline by 1.9% from the previous year to ¥32,293 million.
<OTC Drugs>
Sales of two main OTC drug products—the hair-growth accelerator Karoyan Gush and the vitamin C product Cystina C—declined, due to such factors as the launch of new competing products by the competitors. Accordingly, OTC drug sales dropped by 26.3% from the previous year to ¥7,516 million.
<Other Businesses>
Although the profitability of its fine chemical operations was improved, a decrease in vitamin product sales primarily in North America and Europe and other factors caused net sales of fine chemical products to fall by 12.8% from the previous year to ¥11,308 million. Total net sales in the other businesses segment, including fine chemicals, declined by 8.3% from the previous year, to ¥15,312 million.
R&D Activities
Daiichi’s R&D programs aim to generate a stream of innovative drug development candidates by targeting the discovery of new drug target molecules and the acquisition of innovative new drug “seeds.” Preclinical research on DC-159a, a new quinolone drug candidate for treating a broad range of infections, has now been completed, and preparations are underway for the drug to enter Phase I clinical trials.
Daiichi has a number of alliances with external research institutions, including a collaborative research program with the UCSF Cancer Research Institute and Rigel Pharmaceuticals, Inc. (both based in the U.S.) to identify potential drug treatments that act on molecular targets in the cancer field and a joint genomic drug discovery program with Japan-based Kazusa DNA Research. Results obtained from these programs are facilitating new drug discovery. Another genomic drug discovery program conducted jointly with Japan-based Celestar Lexico-Sciences, Inc. has accomplished its research goals. With a view to a new drug discovery, this program is now focusing on verifying the potential clinical significance for treating disease of the protein interactions discovered. Separately, in March 2005, the Company and MediBIC ALLIANCE jointly established a drug development venture capital fund to facilitate the collection of promising technologies as well as the realization of collaborative researches.
Moreover, in September 2005, the Company reached an agreement with GE Healthcare (the healthcare division of U.S.-based General Electric Company) regarding R&D collaboration related to new imaging agents, and is engaged in R&D projects aimed at meeting potential therapeutic needs of patients in the Japanese market.
On the drug development front, global development work is currently underway with DU-176b, an oral factor-Xa inhibitor; DZ-697b, a novel antiplatelet agent; DX-619, a new quinolone compound for treating drug-resistant infections; DJ-927, a taxane derivative anti-cancer chemotherapeutic agent; and DW-908e, an anti-allergy agent.
In Japan, Kissei Pharmaceutical Co., Ltd. received regulatory approval in January 2006 to manufacture and distribute Urief (silodosin), an agent for treating dysuria jointly developed with the Company (the launch is planned for May 2006). Clinical trials with this drug are also currently underway in China. Based on an agreement reached in September 2005 to transfer all the marketing rights to the Sanofi-Aventis Group, Daiichi transferred the approval for Plavix (clopidogrel sulfate), an antiplatelet agent, to their Japansese subsidiary Sanofi-Aventis K.K. in March 2006. The Company and Sanofi-Aventis K.K. plan to continue collaborating on the production and promotion of Plavix in Japan. In addition, the Daiichi Group has applications pending in Japan for Sonazoid, an ultrasonic contrast medium, and for ActHIB, the first Haemophilus influenzae type b conjugate vaccine for pediatric use in Japan (the NDA is sponsored by Aventis Pasteur-Daiichi Vaccines Co., Ltd.) Elsewhere, in April 2006, Daiichi received regulatory approval with a partial change for the additional indication of hepatitis C-induced liver cirrhosis for Feron, a natural interferon-beta agent jointly developed with Toray Industries, Inc. of Japan.
Following the inclusion in the NHI reimbursement listing on April 1, 2006 of the Synchromed® EL pump and InDura® catheter medical devices required for continuous administration of the drug into the intrathecal cavity, the Company commenced sales in Japan of Gabalon Intrathecal Injection (baclofen), an anti-spasticity agent, for which the Company previously received manufacturing and marketing approval in April 2005, in combination with these delivery devices. Gabalon Intrathecal has been designated an orphan drug an agent for rare diseases. The Company also submitted an application to expand the efficacy to include pediatric applications in May 2005.
Other noteworthy products under development pipelines include DU-6859a (sitafloxacin), a quinolone antibacterial agent discovered and developed in-house, and HGF DNA plasmid, an agent for treating peripheral arterial disease and ischemic heart disease, for which exclusive marketing rights in Japan, the United States, and Europe have been obtained from AnGes MG, Inc.
In addition, Daiichi Asubio Pharma Co., Ltd. is proceeding with domestic clinical trials of SUN Y7017 (memantine hydrochloride), an agent for treating Alzheimer’s disease, and SUN 11031 (ghrelin), an agent for treating anorexia nervosa.
Regarding OTC products, the Company has conducted clinical testing of an orally administered tranexamic acid preparation designed to reduce skin wrinkles and confirmed the preparation’s efficacy based on objective evaluations.
Manufacturing and Technologies
In April 2005, Daiichi Pharmatech Co., Ltd. began full-scale operations, took over the operations of the three of the Company’s domestic manufacturing facilities and merged with Kansai Daiichi Service Co., Ltd. and Daiichi Technos Co., Ltd. with goals of improving quality and technology levels and achieving further cost reductions. The cost reductions achieved to date by such moves have exceeded initial expectations.
As part of its strategy of maintaining distribution quality while reducing the costs, the Company completed the closing of the Sapporo Distribution Center in July 2005 and transfer of that facility’s functions to the Tokyo Distribution Center. In January 2006, the Company also transferred distribution functions of Shizuoka Distribution Center to Osaka Distribution Center.
In order to realize considerable reduction in cost of sales, the Daiichi Group has been working to shift to a new levofloxacin manufacturing method involving a new synthesis technology. Having completed transition of levofloxacin exported to the United States during the previous fiscal year, the Daiichi Group is pursuing its effort to complete the transition with respect to levofloxacin exported to Europe during the year.
In October 2005, Daiichi Asubio Pharma Co., Ltd. completed the construction of a bio bulk manufacturing facility at its Chiyoda Pharma Factory that is designed to meet growing demands of HANP injectable 1000 as well as other newly developed products.
Group-wide Initiatives
Regarding structural reforms, the Daiichi Group has moved forward with an effort to create a slim and strong group business structure. This effort has resulted in the consolidation of Group drug discovery functions, the transfer of veterinary and livestock feed products business to a company outside the Group, the establishment of Daiichi Pharmatech Co., Ltd. to handle manufacturing functions, the closing and consolidation of distribution centers, and other achievements. In preparation for the integration of operations with Sankyo Company, Limited in April 2007, the Daiichi Group will continue to implement such other measures, with the objective of establishing the best and competitively strong Group structure.
Regarding moves to introduce and upgrade the information systems, the Company has been proceeding with the introduction of enterprise resource planning (ERP) systems at major domestic Group companies. The Company is currently working on an implementation of the supply-chain management systems, and the manufacturing administration function of the systems at Daiichi Radioisotope Laboratories, Ltd., began its full-scale operations in May 2005.
Litigation
The Company has now settled with most of the civil claims in the U. S., following the earlier antitrust judgment against the Company related to its sales of bulk vitamins. In Europe, the Company was in the process of an appeal with the European Court of First Instance to reduce the fine initially imposed by the European Commission. The Company has since accepted the verdict of the court, whose ruling issued in March 2006 resulted in the fine being reduced to €18 million. As a part of the fine had been expensed as an extraordinary loss in the year ended March 31, 2002, and the balance was charged in the extraordinary losses in the year ended March 31, 2006.
In the U. S., with its local licensee as co-plaintiff, Daiichi filed a patent infringement lawsuit in a U.S. district court against the Mylan Group, who had filed an application for a generic version of levofloxacin (one of the Company’s leading products). The U.S. district court ruled in favor of the Company in December 2004, which was then appealed by the Mylan Group. In December 2005, the appellate court affirmed the decision by the U.S. district court. Going forward, the Daiichi Group will continue to rigorously defend its intellectual property rights.
II. Financial Position
1. Overview of the fiscal year
<Assets, Liabilities and Shareholders’ Equity>
Total assets amounted to ¥597.7 billion at the end of the fiscal year, an increase of ¥51.1 billion compared with the previous year-end. Within current assets, marketable securities increased by ¥8.3 billion. Within non-current assets, investment securities increased by ¥33.8 billion, reflecting appreciation in market values. Total liabilities increased by ¥19.7 billion, due largely to higher income taxes payable. Within shareholders’ equity, although retained earnings declined by ¥24.9 billion due to factors such as dividend payments and treasury stock cancellations, net unrealized gains on investment securities increased by ¥17.7 billion. Total shareholders’ equity increased by ¥32.6 billion compared with the previous year-end.
<Consolidated Cash Flows>
(Millions of yen)
Accounting Items | Fiscal 2004 | Fiscal 2005 | Change | ||||||
Net cash flows from operating activities | 35,571 | 66,998 | 31,427 | ||||||
Net cash flows from investing activities | (21,989 | ) | (18,528 | ) | 3,460 | ||||
Net cash flows from financing activities | (12,369 | ) | (36,127 | ) | (23,758 | ) | |||
Effect of exchange rate changes on cash and cash equivalents | 12 | 451 | 438 | ||||||
Net increase (decrease) in cash and cash equivalents | 1,225 | 12,794 | 11,569 | ||||||
Cash and cash equivalents at end of period | 91,571 | 98,823 | 7,251 |
Net cash provided by operating activities amounted to ¥66,998 million, an increase of ¥31,427 million compared with the previous year. Besides higher net income before taxes and minority interests, the increase reflected an increase in net cash inflows of ¥30.3 billion due to a decrease in accrued retirement and severance benefits and an increase in prepaid pension costs, which were associated with changes in the Company’s pension benefit arrangements.
Net cash used in investing activities totaled ¥18,528 million, a decrease of ¥3,460 million from the previous year. This change reflected such cash payments as one for the acquisition of minority shares which was partially funded by the redemption of bonds with maturities exceeding three months.
Net cash used in financing activities amounted to ¥36,127 million, an increase in net cash outflows compared with the previous year of ¥23,758 million. Besides an increase in the year-end dividends paid to shareholders, the increase reflected the payment of an interim dividend totaling ¥31.2 billion as the first dividend from the Daiichi Group to its holding company.
After factoring in the effect of excluding certain U.S. subsidiaries from the scope of consolidation, total cash and cash equivalents at March 31, 2006 amounted to ¥98,823 million, an increase of ¥7,251 million compared with the previous year-end.
<Principal Financial Indicators>
| Fiscal 2003 | Fiscal 2004 | Fiscal 2005 | ||||
Shareholders’ equity ratio (%) | 80.9 | 82.1 | 80.5 | |||
Debt redemption period (years) | 0.0 | 0.0 | 0.0 | |||
Interest coverage ratio (times) | 48,280.4 | 51,372.9 | 138,405.3 |
Notes
| 1. | Shareholders’ equity ratio = total shareholders’ equity/total assets |
| 2. | Interest-bearing debt ratio = interest-bearing debt/operating cash flows |
| 3. | Interest coverage ratio = operating cash flows /interest paid |
| • | All indicators in the above table were calculated based on a consolidated basis. |
| • | Interest-bearing debt includes all consolidated balance sheets liabilities which are subject to an interest payment. |
| • | Operating cash flows equal to the amount of cash flows from operating activities in the consolidated statements of cash flows less the amounts of “interest paid” and “income taxes paid”. |
| • | Interest paid equals to the “interest paid” included in the consolidated statements of cash flows. |
4. Consolidated Financial Statements
(1) Consolidated Balance Sheets
(Millions of yen)
| See Note | As of March 31, 2005 | As of March 31, 2006 | Change | ||||||||||||||||
| Amount | % | Amount | % | Amount | |||||||||||||||
ASSETS | |||||||||||||||||||
I. Current assets: | |||||||||||||||||||
1. Cash and time deposits | 16,395 | 13,566 | |||||||||||||||||
2. Trade notes and accounts receivable | 88,168 | 89,892 | |||||||||||||||||
3. Marketable securities | 107,514 | 115,884 | |||||||||||||||||
4. Parent company stock | — | 6,986 | |||||||||||||||||
5. Mortgage-backed securities | 20,000 | 16,500 | |||||||||||||||||
6. Inventories | 40,486 | 36,690 | |||||||||||||||||
7. Deferred tax assets | 13,826 | 15,287 | |||||||||||||||||
8. Other current assets | 13,496 | 15,998 | |||||||||||||||||
Allowance for doubtful accounts | (50 | ) | (35 | ) | |||||||||||||||
Total current assets | 299,836 | 54.86 | 310,772 | 51.99 | 10,935 | ||||||||||||||
II. Non-current assets: | |||||||||||||||||||
1. Property, plant and equipment: | |||||||||||||||||||
(1) Buildings and structures | *1 | 141,983 | 144,457 | ||||||||||||||||
Less accumulated depreciation | 86,013 | 55,969 | 89,128 | 55,328 | |||||||||||||||
(2) Machinery, equipment and vehicles | *1 | 112,430 | 114,615 | ||||||||||||||||
Less accumulated depreciation | 92,724 | 19,705 | 94,986 | 19,629 | |||||||||||||||
(3) Land | *1 | 17,526 | 16,627 | ||||||||||||||||
(4) Construction in progress | 6,029 | 5,934 | |||||||||||||||||
(5) Other | *1 | 38,264 | 38,150 | ||||||||||||||||
Less accumulated depreciation | 31,892 | 6,372 | 32,107 | 6,042 | |||||||||||||||
Total property, plant and equipment, net | 105,602 | 19.32 | 103,562 | 17.33 | (2,040 | ) | |||||||||||||
2. Intangible assets: | |||||||||||||||||||
(1) Goodwill, net | — | 9,241 | |||||||||||||||||
(2) Other intangible assets, net | 6,796 | 6,280 | |||||||||||||||||
Total intangible assets, net | 6,796 | 1.24 | 15,521 | 2.60 | 8,725 | ||||||||||||||
(Millions of yen)
| See Note | As of March 31, 2005 | As of March 31, 2006 | Change | ||||||||||||||||
| Amount | % | Amount | % | Amount | |||||||||||||||
3. Investments and other assets: | |||||||||||||||||||
(1) Investment securities | *2 | 105,461 | 139,309 | ||||||||||||||||
(2) Long-term loans | 763 | 880 | |||||||||||||||||
(3) Prepaid pension costs | 15,493 | 14,356 | |||||||||||||||||
(4) Deferred tax assets | 3,167 | 3,370 | |||||||||||||||||
(5) Other assets | *2 | 9,756 | 10,229 | ||||||||||||||||
Allowance for doubtful accounts | (323 | ) | (301 | ) | |||||||||||||||
Total investments and other assets | 134,319 | 24.58 | 167,845 | 28.08 | 33,525 | ||||||||||||||
Total non-current assets | 246,718 | 45.14 | 286,929 | 48.01 | 40,210 | ||||||||||||||
Total assets | 546,555 | 100.00 | 597,701 | 100.00 | 51,145 | ||||||||||||||
LIABILITIES | |||||||||||||||||||
I. Current liabilities: | |||||||||||||||||||
1. Trade notes and accounts payable | 17,182 | 17,599 | |||||||||||||||||
2. Short-term bank loans | *1 | 18 | 0 | ||||||||||||||||
3. Income taxes payable | 8,401 | 23,410 | |||||||||||||||||
4. Allowance for sales returns | 448 | 245 | |||||||||||||||||
5. Allowance for sales rebates | 1,421 | 1,309 | |||||||||||||||||
6. Other current liabilities | 46,867 | 42,741 | |||||||||||||||||
Total current liabilities | 74,339 | 13.60 | 85,305 | 14.27 | 10,966 | ||||||||||||||
II. Non-current liabilities: | |||||||||||||||||||
1. Long-term debt | *1 | 5 | 4 | ||||||||||||||||
2. Deferred tax liabilities | 9,791 | 21,620 | |||||||||||||||||
3. Accrued retirement and severance benefits | 4,754 | 4,932 | |||||||||||||||||
4. Accrued directors’ retirement and severance benefits | 2,200 | 1,520 | |||||||||||||||||
5. Other non-current liabilities | 5,318 | 2,748 | |||||||||||||||||
Total non-current liabilities | 22,070 | 4.04 | 30,827 | 5.16 | 8,757 | ||||||||||||||
Total liabilities | 96,409 | 17.64 | 116,133 | 19.43 | 19,723 | ||||||||||||||
MINORITY INTERESTS | |||||||||||||||||||
Minority Interests | 1,582 | 0.29 | 385 | 0.06 | (1,196 | ) | |||||||||||||
(Millions of yen)
| See Note | As of March 31, 2005 | As of March 31, 2006 | Change | |||||||||||||||||
| Amount | % | Amount | % | Amount | ||||||||||||||||
SHAREHOLDERS’ EQUITY | ||||||||||||||||||||
I. Common stock | *4 | 45,246 | 8.28 | 45,246 | 7.57 | |||||||||||||||
II. Additional paid-in-capital | 49,130 | 8.99 | 48,961 | 8.19 | ||||||||||||||||
III. Retained earnings | 376,144 | 68.82 | 351,242 | 58.77 | ||||||||||||||||
IV. Net unrealized gain on investment securities | 18,215 | 3.33 | 35,977 | 6.02 | ||||||||||||||||
V. Foreign currency translation adjustments | (1,305 | ) | (0.24 | ) | (246 | ) | (0.04 | ) | ||||||||||||
VI. Treasury stock at cost | *5 | (38,867 | ) | (7.11 | ) | — | — | |||||||||||||
Total shareholders’ equity | 448,563 | 82.07 | 481,181 | 80.51 | 32,618 | |||||||||||||||
Total liabilities, minority interests and shareholders’ equity | 546,555 | 100.00 | 597,701 | 100.00 | 51,145 | |||||||||||||||
(2) Consolidated Statements of Income
(Millions of yen)
| See Note | Fiscal 2004 (For the year ended March 31, 2005) | Fiscal 2005 (For the year ended March 31, 2006) | Change | ||||||||||||||
| Amount | % | Amount | % | Amount | |||||||||||||
I. Net sales | 328,534 | 100.00 | 346,447 | 100.00 | 17,913 | ||||||||||||
II. Cost of sales | *1 | 100,834 | 30.69 | 92,190 | 26.61 | (8,643 | ) | ||||||||||
Gross profit | 227,699 | 69.31 | 254,257 | 73.39 | 26,557 | ||||||||||||
III. Selling, general and administrative expenses: | |||||||||||||||||
1. Salaries and bonuses | 38,076 | 38,895 | |||||||||||||||
2. Retirement and severance costs | 3,429 | 3,153 | |||||||||||||||
3. Research and development expenses | *1 | 57,416 | 61,647 | ||||||||||||||
4. Other | 72,713 | 171,636 | 52.24 | 74,473 | 178,169 | 51.43 | 6,532 | ||||||||||
Operating income | 56,063 | 17.07 | 76,087 | 21.96 | 20,024 | ||||||||||||
IV. Non-operating income: | |||||||||||||||||
1. Interest income | 738 | 836 | |||||||||||||||
2. Dividend income | 735 | 1,011 | |||||||||||||||
3. Foreign exchange gains | 297 | 521 | |||||||||||||||
4. Other income | 1,023 | 2,795 | 0.85 | 507 | 2,876 | 0.83 | 80 | ||||||||||
V. Non-operating expenses: | |||||||||||||||||
1. Interest expense | 1 | 0 | |||||||||||||||
2. Loss on disposal and write-down of inventories | 626 | 273 | |||||||||||||||
3. Equity in net losses of affiliated companies | 399 | 369 | |||||||||||||||
4. Other expenses | 510 | 1,538 | 0.47 | 391 | 1,034 | 0.30 | (504 | ) | |||||||||
Ordinary income | 57,320 | 17.45 | 77,929 | 22.49 | 20,609 | ||||||||||||
VI. Extraordinary gains: | |||||||||||||||||
1. Gain on sale of investment securities | 283 | 204 | |||||||||||||||
2. Gain on sale of land | 384 | — | |||||||||||||||
3. Gain from the return of the substitutional portion of the employees’ pension fund to the government | 11,747 | 163 | |||||||||||||||
4. Gain from the transfer to the defined contribution pension plan | 3,769 | — | |||||||||||||||
5. Gain on sale of the veterinary and livestock feed product business | *2 | 800 | 16,983 | 5.17 | — | 368 | 0.11 | (16,615 | ) | ||||||||
(Millions of yen)
| See Note | Fiscal 2004 (For the year ended March 31, 2005) | Fiscal 2005 (For the year ended March 31, 2006) | Change | ||||||||||||||||||
| Amount | % | Amount | % | Amount | |||||||||||||||||
VII. Extraordinary losses: | |||||||||||||||||||||
1. Loss on business integration | *3 | — | 7,661 | ||||||||||||||||||
2. Loss on settlement of vitamin-related anti-trust litigations | *4 | 111 | 1,125 | ||||||||||||||||||
3. Loss on valuation of investment securities | 32 | 301 | |||||||||||||||||||
4. Supplemental retirement benefits | — | 113 | |||||||||||||||||||
5. Loss on sale of investments in affiliated Company | — | 99 | |||||||||||||||||||
6. Restructuring charge | *5 | 7,316 | — | ||||||||||||||||||
7. Loss on settlement of employee pension fund plan | *6 | 381 | — | ||||||||||||||||||
8. Loss on impairment of property, plant and equipment | *7 | — | 1,339 | ||||||||||||||||||
9. Loss on disposal of property, plant and equipment | *8 | 1,792 | 9,633 | 2.93 | 843 | 11,485 | 3.32 | 1,851 | |||||||||||||
Net income before income taxes and minority interests | 64,670 | 19.69 | 66,813 | 19.28 | 2,142 | ||||||||||||||||
Income tax expense-current | 17,357 | 31,897 | |||||||||||||||||||
Income tax expense (benefit)-deferred | 11,486 | 28,843 | 8.78 | (2,028 | ) | 29,868 | 8.61 | 1,024 | |||||||||||||
Minority interests in net losses of subsidiaries | (1,348 | ) | (0.41 | ) | (463 | ) | (0.13 | ) | 884 | ||||||||||||
Net income | 37,175 | 11.32 | 37,409 | 10.80 | 223 | ||||||||||||||||
(3) Consolidated Statements of Retained Earnings
(Millions of yen)
| See Note | Fiscal 2004 (For the year ended March 31, 2005) | Fiscal 2005 (For the year ended March 31, 2006) | Change | ||||||||||
| Amount | Amount | Amount | |||||||||||
ADDITIONAL PAID-IN CAPITAL | |||||||||||||
I. Additional paid-in capital, beginning of year | 48,961 | 49,130 | 169 | ||||||||||
II. Increase in additional paid-in capital: | |||||||||||||
Gain on reissuance of treasury stock | 169 | 169 | — | — | (169 | ) | |||||||
III. Decrease additional paid-in capital: | |||||||||||||
Loss on reissuance of treasury stock | — | — | 169 | 169 | 169 | ||||||||
IV. Additional paid-in capital, end of year | 49,130 | 48,961 | (169 | ) | |||||||||
RETAINED EARNINGS | |||||||||||||
I. Retained earnings, beginning of year | 347,973 | 376,144 | 28,170 | ||||||||||
II. Increase in retained earnings: | |||||||||||||
1. Net income | 37,175 | 37,409 | |||||||||||
2. Increase in retained earnings due to dilution of ownership in consolidated subsidiaries | — | 37,175 | 12,522 | 49,931 | 12,755 | ||||||||
III. Decrease in retained earnings: | |||||||||||||
1. Cash dividends | 8,071 | 37,935 | |||||||||||
2. Bonuses to directors | 160 | 144 | |||||||||||
3. Changes in scope of investments accounted for under the equity method | 772 | — | |||||||||||
4. Retirement of treasury stocks | — | 36,683 | |||||||||||
5. Loss on reissuance of treasury stock | — | 9,004 | 69 | 74,833 | 65,828 | ||||||||
IV. Retained earnings, end of period | 376,144 | 351,242 | (24,901 | ) | |||||||||
(4) Consolidated Statements of Cash Flows
(Millions of yen)
| See Note | Fiscal 2004 (For the year ended | Fiscal 2005 (For the year ended | Change | ||||||||
| Amount | Amount | Amount | |||||||||
I. Cash flows from operating activities: | |||||||||||
Income before income taxes and minority interests | 64,670 | 66,813 | 2,142 | ||||||||
Depreciation | 15,946 | 14,133 | (1,813 | ) | |||||||
Loss on impairment of property, plant and equipment | — | 1,339 | 1,339 | ||||||||
Amortization of goodwill | 3 | 1,026 | 1,023 | ||||||||
Decrease in accrued retirement and severance benefits | (14,807 | ) | (328 | ) | 14,479 | ||||||
Decrease (increase) in prepaid pension costs | (15,493 | ) | 1,136 | 16,630 | |||||||
Decrease in allowance for doubtful accounts | (139 | ) | (41 | ) | 97 | ||||||
Interest and dividend income | (1,474 | ) | (1,847 | ) | (373 | ) | |||||
Interest expense | 1 | 0 | (0 | ) | |||||||
Loss on disposal of investment securities | 34 | 303 | 269 | ||||||||
Loss on disposal of property, plant and equipment | 1,792 | 843 | (948 | ) | |||||||
Increase in trade notes and accounts receivable | (6,793 | ) | (2,389 | ) | 4,403 | ||||||
Increase (decrease) in inventories | (1,290 | ) | 2,750 | 4,041 | |||||||
Increase in trade notes and accounts payable | 3,011 | 378 | (2,633 | ) | |||||||
Increase in accrued expenses and other liabilities | 1,457 | 1,825 | 367 | ||||||||
Other, net | 6,453 | (2,966 | ) | (9,419 | ) | ||||||
Subtotal | 53,373 | 82,979 | 29,605 | ||||||||
Interest and dividends received | 1,501 | 1,953 | 452 | ||||||||
Interest paid | (1 | ) | (0 | ) | 0 | ||||||
Fines, penalties and settlements paid | (89 | ) | (1,125 | ) | (1,035 | ) | |||||
Income taxes paid | (19,212 | ) | (16,807 | ) | 2,405 | ||||||
Net cash provided by operating activity | 35,571 | 66,998 | 31,427 | ||||||||
(Millions of yen)
| See Note | Fiscal 2004 (For the year ended | Fiscal 2005 (For the year ended | Change | ||||||||
| Amount | Amount | Amount | |||||||||
II. Cash flows from investing activities: | |||||||||||
Purchases of time deposits | (7,800 | ) | (3,353 | ) | 4,447 | ||||||
Proceeds from maturities of time deposits | 8,267 | 2,045 | (6,221 | ) | |||||||
Purchases of marketable securities | (26,601 | ) | (27,040 | ) | (438 | ) | |||||
Proceeds from sale of marketable securities | 25,210 | 41,028 | 15,818 | ||||||||
Proceeds from sale of mortgage-backed securities | — | 3,500 | 3,500 | ||||||||
Acquisitions of property, plant and equipment | (10,753 | ) | (13,589 | ) | (2,835 | ) | |||||
Acquisitions of intangible assets | (2,546 | ) | (1,961 | ) | 585 | ||||||
Acquisitions of investment securities | (24,443 | ) | (20,267 | ) | 4,176 | ||||||
Proceeds from sale of investment securities | 22,181 | 13,136 | (9,045 | ) | |||||||
Acquisition of minority interests in subsidiary | — | (10,268 | ) | (10,268 | ) | ||||||
Acquisition of other investments | (1,434 | ) | (507 | ) | 926 | ||||||
Other, net | (4,065 | ) | (1,249 | ) | 2,815 | ||||||
Net cash used in investing activity | (21,989 | ) | (18,528 | ) | 3,460 | ||||||
III. Cash flows from financing activities: | |||||||||||
Repayment of long-term debt | (18 | ) | (18 | ) | 0 | ||||||
Dividends paid | (8,071 | ) | (37,935 | ) | (29,864 | ) | |||||
Purchases of treasury stock | (4,263 | ) | (24 | ) | 4,239 | ||||||
Proceeds from reissuance of treasury stock upon exercise of stock options | — | 1,970 | 1,970 | ||||||||
Other, net | (15 | ) | (119 | ) | (104 | ) | |||||
Net cash used in financing activity | (12,369 | ) | (36,127 | ) | (23,758 | ) | |||||
IV. Effect of exchange rate changes on cash and cash equivalents | 12 | 451 | 438 | ||||||||
V. Net increase (decrease) in cash and cash equivalents | 1,225 | 12,794 | 11,569 | ||||||||
VI. Cash and cash equivalents, beginning of period | 90,346 | 91,571 | 1,225 | ||||||||
VII. Decrease in cash and cash equivalents due to changes in scope of consolidation | — | (5,543 | ) | (5,543 | ) | ||||||
VIII. Cash and cash equivalents, end of period | * | 91,571 | 98,823 | 7,251 | |||||||
Basis of Presentation and Summary of Significant Accounting Policies for the Preparation of the Consolidated Financial Statements
Fiscal 2004
(For the year ended March 31, 2005)
| 1. | Scope of consolidation |
| (1) | Consolidated subsidiaries: 31 |
Principal consolidated subsidiaries:
In Japan
Daiichi Pure Chemicals Co., Ltd.
Daiichi Radioisotope Laboratories, Ltd.
Daiichi Fine Chemical Co., Ltd.
Saitama Daiichi Pharmaceutical Co., Ltd.
Daiichi Suntory Pharma Co., Ltd.
Overseas
Daiichi Pharmaceutical Corporation
Daiichi Medical Research, Inc.
Daiichi Pharmaceutical (Beijing) Co., Ltd.
Daiichi Pharmaceutical (China) Co., Ltd.
During the fiscal year, three newly-established subsidiaries have been added to the scope of consolidation: Daiichi Pharmaceutical Corporation, Daiichi Medical Research, Inc., and Daiichi Pharmatech, Co., Ltd. Also, during the fiscal year, the corporate name of former Daiichi Pharmaceutical Corporation was changed to Daiichi Pharmaceutical Holdings, Inc
| (2) | Non-consolidated subsidiaries: 3 |
During the fiscal year, the Company excluded one newly established subsidiary from the scope of consolidation, and thereby increased the number of non-consolidated subsidiaries to three. Non-consolidated subsidiaries are small in size and are not material when measured by the amounts of assets, sales, net income (based on the Company’s ownership percentage), retained earnings (based on the Company’s ownership percentage), and other indicators. They have therefore been excluded from the scope of consolidation.
| 2. | Application of the Equity Method |
| (1) | Affiliated companies accounted for under the equity method: 2 |
Names of principal companies:
Aventis Pasteur Daiichi Vaccine Co., Ltd., plus one other company.
Since the significance of these affiliates to the consolidated financial statements has increased, they have been included in the scope of companies accounted for under the equity method beginning in the fiscal year.
(2) For the fiscal year, net income (based on the Company’s equity percentage), retained earnings (based on the Company’s equity percentage) and other indicators of the Company’s three non-consolidated subsidiaries and three of its 20%-50% owned affiliated companies are not material or significant to the Company as a whole. Therefore, these companies have not been accounted for under the equity method, but are reported in the Company’s investment accounts under the cost method.
Fiscal 2005
(For the year ended March 31, 2006)
| 1. | Scope of consolidation |
| (1) | Consolidated subsidiaries: 21 |
Principal consolidated subsidiaries:
In Japan
Daiichi Pure Chemicals Co., Ltd.
Daiichi Radioisotope Laboratories, Ltd.
Daiichi Fine Chemical Co., Ltd.
Saitama Daiichi Pharmaceutical Co., Ltd.
Daiichi Asubio Pharma Co., Ltd.
Daiichi Pharmatech Co., Ltd.
Overseas
Daiichi Pharmaceutical (Beijing) Co., Ltd.
During the fiscal year, the Company excluded the following companies from the scope of consolidation due to their merger with other companies within the group: Kansai Daiichi Service Co., Ltd. and Daiichi Technos Co., Ltd. (merged into Daiichi Pharmatech Co., Ltd.); Daiichi Suntory Biomedical Research Ltd. (merged into Daiichi Suntory Pharma Co., Ltd.); and Daiichi Pharmaceutical (China) Co., Ltd. (merged into Daiichi Pharmaceutical (Beijing) Co., Ltd.) Also during the year, Daiichi Suntory Pharma Co., Ltd. changed its name to Daiichi Asubio Pharma Co., Ltd.
In addition, the Company sold a part of its ownership interests in Tokyo Iyaku Shiki Co., Ltd. and Nishimura Shiki Co., Ltd. Consequently, it began accounting for both companies under the equity method in the second half of the fiscal year.
The Company also completed the liquidation of Daiichi Fine Chemicals, Inc., and eliminated it from the scope of consolidation.
Also during the year, Daiichi Pharma Holdings, Inc., Daiichi Pharmaceutical Corporation and Daiichi Medical Research, Inc. became subsidiaries of Sankyo Pharma, Inc. Although the Company has begun accounting for the companies using the equity method, it continued to consolidate their income statements during the fiscal year. Finally, during the fiscal year, Sankyo Pharma Inc. changed its name to Daiichi Sankyo Inc.
| (2) | Non-consolidated subsidiaries: 3 |
Non-consolidated subsidiaries are small in size and are not material when measured by the amounts of assets, sales, net income (based on the Company’s ownership percentage), retained earnings (based on the Company’s ownership percentage), and other indicators. They have, therefore, been excluded from the scope of consolidation.
| 2. | Application of the Equity Method |
| (1) | Affiliated companies accounted for under the equity method: 6 |
Names of principal companies:
In Japan
Daiichi Sankyo Healthcare Co., Ltd.
Sanofi Pasteur Daiichi Vaccine Co., Ltd.
Tokyo Iyaku Shiki Co., Ltd.
Nishimura Shiki Co., Ltd. plus one other company
During the interim period, the corporate name of Aventis Pasteur Daiichi Vaccine Co., Ltd. was changed to Sanofi Pasteur Daiichi Vaccine Co., Ltd.
Overseas
Daiichi Sankyo, Inc.
During the fiscal year, the corporate name of Aventis Pasteur Daiichi Vaccine Co., Ltd. was changed to Sanofi Pasteur Daiichi Vaccine Co., Ltd. Daiichi Sankyo Healthcare Co., Ltd., which was established during the year, has been added to the equity-method affiliates.
| (2) | Same as for the previous year. |
Fiscal 2004
(For the year ended March 31, 2005)
| (3) | The equity method of accounting is applied on the basis of the affiliated companies’ fiscal years. One affiliated company has a fiscal year-end date that is different from the Company’s fiscal year-end. |
| 3 | Fiscal Year-end of Consolidated Subsidiaries |
The fiscal year-end of the following consolidated subsidiaries is December 31: Daiichi Pharmaceutical (China) Co., Ltd.; Daiichi Pharmaceutical (Beijing) Co., Ltd.; Daiichi Asubio Pharmaceuticals, Inc.; Daiichi Asubio Holdings, Inc.; Daiichi Asubio Medical Research Laboratories LLC.
In preparing the consolidated financial statements, the Company uses the financial statements of these companies as of their fiscal year-end. For major intervening transactions that occurred between the fiscal year-end of these companies and March 31, appropriate adjustments have been made in the consolidated financial statements.
| 4 | Summary of Significant Accounting Policies |
| (1) | Methods of Valuation of Significant Assets |
| (a) | Marketable and Investment Securities |
Held-to-maturity securities: The Company reports held-to-maturity securities at an amortized cost using the straight-line amortization.
Available-for-sale securities:
Securities with quoted market prices:
The fair value method based on the quoted market prices at the end of the fiscal year (Unrealized holding gains/losses are reported in a component of stockholder’s equity, with costs of securities sold being calculated using the moving average method.)
Securities with no readily available market value:
Stated at cost based mainly on the moving- average method
| (b) | Inventories |
Inventories are mainly stated at the lower of cost or market, with cost being determined by the average cost method.
| (2) | Depreciation and Amortization of Significant Depreciable Assets |
| (a) | Property, plant and equipment: |
The Company and its domestic consolidated subsidiaries account for depreciation of property, plant and equipment based on the declining-balance method. Certain overseas consolidated subsidiaries account for depreciation of property, plant and equipment under the straight-line method. The ranges of useful lives are as follows:
Buildings and structures: 38 to 50 years
Machinery, equipment and vehicles: 4 to 7 years
Fiscal 2005
(For the year ended March 31, 2006)
| (3) | Same as for the previous year |
| 3. | Fiscal Year-end of Consolidated Subsidiaries |
The fiscal year-end of the following consolidated subsidiaries is December 31: Daiichi Pharmaceutical (Beijing) Co., Ltd.; Daiichi Asubio Pharmaceuticals, Inc.; Daiichi Asubio Holdings, Inc.; Daiichi Asubio Medical Research Laboratories LLC.
In preparing the consolidated financial statements, the Company uses the financial statements of these companies as of their fiscal year-end. For major intervening transactions that occurred between the fiscal year-end of these companies and March 31, appropriate adjustments have been made in the consolidated financial statements.
| 4. | Summary of Significant Accounting Policies |
| (1) | Methods of Valuation of Significant Assets |
| (a) | Marketable and Investment Securities |
Held-to-maturity securities: Same as for the previous year
Available-for-sale securities:
Securities with quoted market value:
Same as for the previous year
Securities with no readily available market value:
Same as for the previous year
| (b) | Inventories |
Same as for the previous year
| (2) | Depreciation and Amortization of Significant Depreciable Assets |
| (a) | Property, plant and equipment: |
The Company and its domestic consolidated subsidiaries account for depreciation of property, plant and equipment based on the declining-balance method, except for buildings (excluding fixtures) purchased on and after April 1, 1998, which are depreciated using the straight-line method. Certain overseas consolidated subsidiaries account for depreciation of property, plant and equipment under the straight-line method. The ranges of useful lives are as follows:
Buildings and structures: 38 to 50 years
Machinery, equipment and vehicles: 4 to 7 years
Fiscal 2004
(For the year ended March 31, 2005)
| (b) | Intangible Assets and Long-term Prepaid Expenses: |
The Company accounts for amortization under the straight-line method
| (3) | Methods of Accounting for Significant Allowances |
| (a) | Allowance for Doubtful Accounts |
The Company covers the risk of credit losses from potential customer defaults by providing this allowance. For normal accounts, the allowance is computed on the basis of the historical default rates. For specific over-due accounts, the allowance is based on individual account-by-account estimates of the amounts that may not be recoverable.
| (b) | Allowance for Sales Returns |
To prepare for losses on potential returns of products after the fiscal year-end, the Company provides for an amount equal to the sum of gross profits and inventory losses on such returned products, based on its estimates of possible sales returns.
For the fiscal year, the Company’s reversal of sales return provision in the amount of ¥43 million was deducted from cost of sales.
Fiscal 2005
(For the year ended March 31, 2006)
(Changes in Accounting Policies)
Buildings (excluding fixtures) purchased on and after April 1, 1998, had been depreciated using the declining-balance method, however, beginning in the fiscal year, the Company depreciates such buildings using the straight-line method.
This decision to change the method of depreciation was made for the following reasons after a review of its depreciation policies: Since the benefit from capital spending on facilities is considered not being influenced by their level of utilization, but is realized constantly in each period, the new method better reflects the underlying performance of the Company in the statements of income, based on the Company’s capital investments going forward.
In connection with the agreement to integrate its operations with those of Sankyo Company, Limited on May 13, 2005, and the establishment of a joint holding company, DAIICHI SANKYO COMPANY, LIMITED on September 28, 2005, the Company has recognized a need to conform its accounting policies to those of the new corporate group.
As a result of this accounting change, depreciation expense for the fiscal year was decreased by ¥216 million. Accordingly, operating income, ordinary income and net income before income taxes and minority interests all increased by ¥216 million as compared to the amounts that would have been reported had the previous method of accounting been consistently applied.
The effect of this change on segment information is presented in the Segment Information section.
| (b) | Intangible Assets and Long-term Prepaid Expenses: |
Same as for the previous year
| (3) | Methods of Accounting for Significant Allowances |
| (a) | Allowance for Doubtful Accounts |
Same as for the previous year
| (b) | Allowance for Sales Returns |
To prepare for losses on potential returns of products after fiscal year-end, the Company provides for an amount equal to the sum of gross profits and inventory losses on such returned products, based on its estimates of possible sales returns.
For the fiscal year, the Company’s reversal of sales return provision in the amount of ¥203 million was deducted from cost of sales
Fiscal 2004
(For the year ended March 31, 2005)
| (c) | Allowance for Sales Rebates |
To prepare for future sales rebates, the Company provides for this allowance calculated by multiplying an estimated sales rebate percentage for the fiscal year by the amounts of accounts receivable from and inventories held by wholesalers at the fiscal year-end.
| (d) | Accrued Retirement and Severance Costs |
To prepare for future payments of employee retirement and severance benefits, the Company provides for an accrual based on estimated projected benefit obligations and plan assets at the end of the fiscal year.
Prior service cost is amortized under the straight-line method over a period of 10 years, which is equal to or less than the estimated average remaining years of service of the eligible employees at the time such prior service cost was incurred.
Actuarial gain and loss are amortized based on the straight-line method, beginning in the fiscal year following the year in which the gain or loss was initially measured, over a period of 10 years, which is equal to or less than the average remaining years of service of the eligible employees at the time such actuarial gain or loss occurred
(Supplementary Information)
Accompanying the enactment of the Defined Benefit Pension Law, the Company received an approval of exemption from the Minister of Health, Labour and Welfare, on January 1, 2005, from the obligation for pension payment liabilities related to past employee service with respect to the substitutional portion of its Employees’ Pension Fund.For the fiscal year, as a result, the Company recognized an extraordinary gain of ¥11,747 million from the return of the substitutional portion of the employees’ pension fund to the government.
In addition, accompanying the enactment of the Defined Contribution Pension Plans Law, the Company and certain of its domestic consolidated subsidiaries restructured a portion of their lump-sum retirement benefit plans to a defined contribution pension plan. This transaction was accounted for under the provisions of “Accounting for Transitions between Retirement Benefit Plans” (Corporate Accounting Guidelines No. 1).This change in retirement benefit arrangement resulted in an extraordinary gain of ¥3,769 million for the fiscal year.
| (e) | Accrued Directors’ Retirement and Severance Costs |
To prepare for payments of directors’ retirement and severance benefits, the Company and its domestic consolidated subsidiaries provide for an amount equal to the total benefits that would have become payable at the end of the fiscal year, in accordance with the internal policies, had all directors resigned voluntarily.
Fiscal 2005
(For the year ended March 31, 2006)
| (c) | Allowance for Sales Rebates |
Same as for the previous year
| (d) | Accrued Retirement and Severance Costs |
To prepare for future payments of employee retirement and severance benefits, the Company provides for an accrual based on estimated projected benefit obligations and plan assets at the end of the fiscal year.
Prior service cost is amortized under the straight-line method over a period of 10 years, which is equal to or less than the estimated average remaining years of service of the eligible employees at the time such prior service cost was incurred.
Actuarial gain and loss are amortized based on the straight-line method, beginning in the fiscal year following the year in which the gain or loss was initially measured, over a period of 10 years, which is equal to or less than the average remaining years of service of the eligible employees at the time such actuarial gain or loss occurred
(Supplementary Information)
Accompanying the enactment of the Defined Benefit Pension Law, the Company received an approval of exemption from the Minister of Health, Labour and Welfare on January 1, 2005, from the obligation for pension payment liabilities related to past employee service with respect to the substitutional portion of its Employees’ Pension Fund, and on May 31, 2005, a payment was made to transfer the plan assets related to the substitutional portion to the government based on the minimum liability.For the fiscal year, as a result, the Company recognized an extraordinary gain of ¥163 million from the return of the substitutional portion of the employees’ pension fund to the government.
| (e) | Accrued Directors’ Retirement and Severance Costs |
Same as for the previous year
Fiscal 2004
(For the year ended March 31, 2005)
| (4) | Translation of Significant Assets and Liabilities Denominated in Foreign Currencies into Yen |
Receivables and payables denominated in foreign currencies are translated into yen amounts at the exchange rates prevailing at the end of the fiscal year, with resulting translation gains or losses recognized currently in earnings. The assets and liabilities of overseas consolidated subsidiaries are translated into yen amounts at the exchange rates prevailing at their balance sheet dates, while income and expenses are translated into yen amounts at the average exchange rates prevailing over the respective periods, with resulting translation gains or losses recorded in a separate component of shareholders’ equity under foreign currency translation adjustments or in the minority interests section of the balance sheets.
| (5) | Accounting for Significant Lease Transactions |
Finance lease transactions are accounted for using the same method applied to operating lease transactions, with the exception for those finance leases in which the legal title of the underlying property is transferred from the lessor to the lessee.
| (6) | Significant Hedge Accounting Method |
| (a) | Hedge Accounting Method |
The Company employs the deferred hedge method of accounting. Foreign exchange forward contracts that meet certain hedge criteria are accounted for as a hedge of underlying assets and liabilities
| (b) | Hedging Instruments and Hedged Items |
Hedging Instruments: Foreign exchange forward contracts and other
Hedged Items: Assets denominated in foreign currencies
| (c) | Hedge Policy |
The Company hedges foreign exchange rate fluctuation risks in accordance with its internal policies.
| (d) | Method for Assessing Hedge Effectiveness |
Based on its internal policies, the Company evaluates the effectiveness of hedges by examining the correlations between its hedging instruments and hedged items as a result of fluctuations of foreign currency exchange rates and confirms the effectiveness of its hedge relationship.
| (7) | Accounting for Consumption Tax |
The tax-exclusion (net of tax) method is used to account for the national and local consumption taxes.
| 5. | Valuation Method for Assets and Liabilities of Subsidiaries Acquired in Business Combinations |
All assets and liabilities of an acquired business that becomes a consolidated subsidiary are valued on a full fair value basis without taking into account minority interests’ share in such assets and liabilities.
| 6. | Amortization of Goodwill |
Goodwill recorded in the consolidated financial statements is generally amortized on a straight-line basis over a period of five years.
| 7. | Appropriations of Retained Earnings |
The consolidated statements of retained earnings are prepared based on the appropriations of retained earnings approved during the fiscal year.
| 8. | Definition of Cash and Cash Equivalents in the Consolidated Statements of Cash Flows |
Cash and cash equivalents in the consolidated statements of cash flows consists of the following: cash in hand, deposits that can be withdrawn upon demand, and highly liquid short-term investments that are readily convertible to cash with little risk of fluctuation in value, and that mature within three months from the dates of acquisition.
Fiscal 2005
(For the year ended March 31, 2006)
| (4) | Translation of Significant Assets and Liabilities Denominated in Foreign Currencies into Yen |
Same as for the previous year
| (5) | Accounting for Significant Lease Transactions |
Same as for the previous year
| (6) | Significant Hedge Accounting Method |
| (a) | Hedge Accounting Method |
Same as for the previous year
| (b) | Hedging Instruments and Hedged Items |
Same as for the previous year
| (c) | Hedge Policy |
Same as for the previous year
| (d) | Method for Assessing Hedge Effectiveness |
Same as for the previous year
| (7) | Accounting for Consumption Tax |
Same as for the previous year
| 5. | Valuation Method for Assets and Liabilities of subsidiaries Acquired in Business Combinations |
Same as for the previous year
| 6. | Amortization of Goodwill |
Same as for the previous year
| 7. | Appropriations of Retained Earnings |
Same as for the previous year
| 8. | Definition of Cash and Cash Equivalents in the Consolidated Statements of Cash Flows |
Same as for the previous year
Changes in Significant Accounting Principles and Policies for the Preparation of the Consolidated Financial Statements
Fiscal 2004
(For the year ended March 31, 2005)
—
Fiscal 2005
(For the year ended March 31, 2006)
(Accounting for Impairment of Property, Plant and Equipment)
Effective in the current fiscal year, the Company adopted the new accounting standard as required for impairment of property, plant and equipment (“Opinion Concerning Establishment of Accounting Standard for Impairment of Fixed Asset” issued by the Business Accounting Deliberation Council on August 9, 2002) and its implementation guidance (the Financial Accounting Standard Implementation Guidance No. 6 issued by the Accounting Standards Board of Japan on October 31, 2003). As a result of this adoption, income before income taxes and minority interests was decreased by ¥1,339 million.
An accumulated impairment loss is recorded as direct reduction in the book value of respective assets in accordance with the revised regulations for consolidated financial statement presentation.
Notes to Consolidated Financial Statements
(Notes to Consolidated Balance Sheets)
As of March 31, 2005
 1. Pledged assets and secured liabilities
Assets pledged as collateral and secured liabilities were as follows:
| (Millions of yen) | |||||
Pledged assets: | |||||
Buildings and structures | 426 | (426 | ) | ||
Machinery, equipment and vehicles | 264 | (264 | ) | ||
Land | 724 | (724 | ) | ||
Other | 26 | (26 | ) | ||
Total | 1,441 | (1,441 | ) | ||
Secured liabilities: | |||||
Short-term bank loans | 17 | (17 | ) | ||
Figures in parentheses indicate factory foundation mortgaged assets and related secured borrowings that are included in the figures on the left.
2. The balances related to non-consolidated subsidiaries and affiliated companies were as follows:
| (Millions of yen) | ||
Investment securities | 87 | |
Other assets (other investment in capital) | 600 |
| 3. | Contingent Liabilities |
| (1) | The Company guarantees the following debt and other obligations owed to financial institutions. |
| (Millions of yen) | ||
Guarantees provided on | ||
Employees housing loans, etc | 2,737 | |
Aventis Pasteur-Daiichi Vaccines Co., Ltd. | 350 |
| (2) | The trade notes receivable discounted 78 |
4. The Company’s common stock issued at the end of the fiscal year was 286,453,235 shares.
5. Treasury stock owned by the Company at the end of the fiscal year was 18,049,212 shares of common stock.
| 6. | Commitment Line Contracts |
To facilitate the efficient raising of working capital, the Company maintains committed lines of credit with four financial institutions. The unused balance of credit lines under these commitments at the fiscal year-end was as follows:
| (Millions of yen) | ||
Total amount of committed credit lines | 30,000 | |
Less amount borrowed against credit lines | — | |
Credit lines unused | 30,000 |
As of March 31, 2006
1. Pledged assets and secured liabilities
Assets pledged as collateral and secured liabilities were as follows:
| (Millions of yen) | |||||
Pledged assets: | |||||
Buildings and structures | 391 | (391 | ) | ||
Machinery, equipment and vehicles | 245 | (245 | ) | ||
Land | 724 | (724 | ) | ||
Other | 22 | (22 | ) | ||
Total | 1,384 | (1,384 | ) | ||
Secured liabilities:
The Company had no outstanding secured liabilities as of the end of the fiscal year.
Figures in parentheses indicate factory foundation mortgaged assets and related secured borrowings that are included in the figures on the left.
2. The balances related to non-consolidated subsidiaries and affiliated companies were as follows:
| (Millions of yen) | ||
Investment securities | 16,858 | |
Other assets (other investment in capital) | 615 |
| 3. | Contingent Liabilities |
| (1) | The Company guarantees the following debt and other obligations owed to financial institutions. |
| (Millions of yen) | ||
Guarantees provided on Employees housing loans, etc | 2,190 | |
Sanofi- Pasteur-Daiichi Vaccines Co., Ltd. | 350 | |
Other | 8 |
| (2) | The trade notes receivable discounted 28 |
4. The Company’s common stock issued at the end of the fiscal year was 269,420,093 shares
5.
| 6. | Committed Line Contracts |
To facilitate the efficient raising of working capital, the Company maintains committed lines of credit with four financial institutions. The unused balance of credit lines under these commitments at the fiscal year-end was as follows:
| (Millions of yen) | ||
Total amount of committed credit lines | 30,000 | |
Less amount borrowed against credit lines | — | |
Credit lines unused | 30,000 |
(Notes to Consolidated Statements of Income)
Fiscal 2004
(For the year ended March 31, 2005)
1. Research and development expenses included in selling, general and administrative expenses and manufacturing overhead costs were ¥58,605 million.
2. A gain on sale of the veterinary and livestock feed product business was recognized as a result of sale of the domestic distribution rights and other intangibles related to its veterinary and livestock feed product business to a third-party.
3.
4. Loss on settlement of vitamin-related anti-trust litigations
The loss on settlement of vitamin-related anti-trust litigations was related to a settlement of a part of the civil anti-trust class-action damage claims in connection with the Company’s vitamin transactions.
5. A restructuring charge was recorded for the one-time termination benefits provided to certain employees who were involuntarily transferred from the Company to a newly established wholly-owned subsidiary, Daiichi Pharmatech Co., Ltd.
6. The loss on settlement of an employee pension fund represented a one-time payment made by a consolidated subsidiary to settle its participation in a multi-employer Employee Pension Fund plan.
7.
Fiscal 2005
(For the year ended March 31, 2006)
1. Research and development expenses included in selling, general and administrative expenses and manufacturing overhead costs were ¥61,647 million.
2. ��
3. Losses on business integration
The loss represents one-time costs associated with the integration of business operations of the Daiichi and the Sankyo groups. The breakdown of this expense is as follows.
| (Millions of yen) | ||
Expenses associated with the integration of overseas operations | 6,406 | |
Expenses associated with the integration of the healthcare business | 448 | |
Other research and consulting expenses | 807 |
4. Loss on settlement of vitamin-related anti-trust litigations
The amount represents a penalty resulting from an unsuccessful appeal against the EC ruling that the Company participated in a vitamin cartel
5.
6.
7. Loss on impairment of property, plant and equipment
The Daiichi Group (the Company and its consolidated subsidiaries) classifies the operating assets held and used into asset groups on the basis of operating segments in the management reporting in consideration of similarities of products or business activities, the uniformity within the Group, and future maintenance sustainability. On the other hand, idle assets that are not directly used for its business operations are grouped on a property by properly basis.
For the fiscal year, the Group recorded an impairment loss on the following asset groups:
Location | Function | Asset type | Status | |||
| Shiroishi-ku, Sapporo | Former Sapporo Distribution Center site | Land | Idle | |||
Shimotsuke-shi, Tochigi | Former Tochigi Research Center facility | Building land, etc. | Idle | |||
Sanmu-shi, Chiba | Chiba plant site | Land | Idle | |||
Because the above asset groups are idle and have uncertain prospects for future utilization, their book values have been written down to a recoverable amount and such reductions in the amount of ¥1,339 million were recorded as a loss on impairment in the extraordinary losses.
The impairment loss consisted of ¥420 million associated with buildings, ¥17 million associated with other structures, ¥7 million associated with machinery and equipment, ¥4 million associated with tools, furniture and fixtures, and ¥890 million associated with land.
A recoverable amount of an asset group is estimated from its net realizable value, which is obtained based mainly on third-party appraisal by real estate appraisals.
Fiscal 2004
(For the year ended March 31, 2005)
8. The breakdown of losses on sale of property, plant and equipment was as follows:
| (Millions of yen) | ||
Buildings and structures | 884 | |
Machinery, equipment and vehicles | 267 | |
Other | 639 |
Fiscal 2005
(For the year ended March 31, 2006)
8. The breakdown of losses on sale of property, plant and equipment was as follows:
| (Millions of yen) | ||
Buildings and structures | 259 | |
Machinery, equipment and vehicles | 252 | |
Other | 331 |
(Notes to Consolidated Statements of Cash Flows)
Fiscal 2004
(For the year ended March 31, 2005)
Reconciliation of cash and cash equivalents at the fiscal year-end with the balance sheet accounts:
| (As of March 31, 2005) | |||
| (Millions of yen) | |||
Cash and time deposits | 16,395 | ||
Less time deposits with maturities extending over three months | (579 | ) | |
Add short-term investments with maturities within three months | 75,755 | ||
Cash and cash equivalents | 91,571 | ||
Fiscal 2005
(For the year ended March 31, 2006)
Reconciliation of cash and cash equivalents at the fiscal year-end with the balance sheet accounts:
| (As of March 31, 2006) | |||
| (Millions of yen) | |||
Cash and time deposits | 13,566 | ||
Less time deposits with maturities extending over three months | (996 | ) | |
Add short-term investments with maturities within three months | 86,252 | ||
Cash and cash equivalents | 98,823 | ||
| (1) | Lease transactions: |
Pro-forma information on financing leases has not been presented herein because the Company discloses such information through EDINET
| (2) | Marketable and Investment Securities |
| 1. Held-to-Maturity Securities with Determinable Market Value | (Millions of yen | ) |
Type of securities | Fiscal 2004 (As of March 31, 2005) | Fiscal 2005 (As of March 31, 2006) | ||||||||||||
March 31; | Carrying Amount | Market value | Difference | Carrying Amount | Market value | Difference | ||||||||
Securities with market values greater than balance sheet carrying amounts | ||||||||||||||
(1) National and local government bonds | — | — | — | 999 | 1,000 | 0 | ||||||||
(2) Corporate bonds | 29,332 | 29,492 | 160 | 11,604 | 11,644 | 40 | ||||||||
(3) Other securities | — | — | — | — | — | — | ||||||||
Total | 29,332 | 29,492 | 160 | 12,604 | 12,644 | 40 | ||||||||
Securities with market values at or less than balance sheet carrying amounts | ||||||||||||||
(1) National and local government bonds | — | — | — | 2,993 | 2,907 | (86 | ) | |||||||
(2) Corporate bonds | 39,409 | 39,022 | (387 | ) | 48,076 | 47,236 | (839 | ) | ||||||
(3) Other securities | — | — | — | — | — | — | ||||||||
Total | 39,409 | 39,022 | (387 | ) | 51,070 | 50,144 | (925 | ) | ||||||
Total | 68,742 | 68,514 | (227 | ) | 63,674 | 62,788 | (885 | ) | ||||||
| 2. Available-for-Sale Securities with Determinable Fair Value | (Millions of yen | ) |
Type of securities | Fiscal 2004 (As of March 31, 2005) | Fiscal 2005 (As of March 31, 2006) | ||||||||||||
March 31; | Acquisition cost | Carrying amount | Difference | Acquisition cost | Carrying amount | Difference | ||||||||
Securities with balance sheet carrying values greater than acquisition cost | ||||||||||||||
(1) Equity securities | 26,285 | 56,955 | 30,669 | 27,235 | 86,525 | 59,290 | ||||||||
(2) Debt securities. | — | — | — | — | — | — | ||||||||
a. National and local government bonds | ||||||||||||||
b. Corporate bonds | 1,120 | 1,176 | 56 | 1,120 | 1,226 | 106 | ||||||||
c. Other securities | — | — | — | — | — | — | ||||||||
(3) Other | 2,412 | 2,859 | 446 | 2,147 | 3,254 | 1,106 | ||||||||
Total | 29,818 | 60,990 | 31,172 | 30,502 | 91,006 | 60,504 | ||||||||
Securities with balance sheet carrying values at or less than acquisition cost | ||||||||||||||
(1) Equity securities | 606 | 496 | (109 | ) | 63 | 58 | (4 | ) | ||||||
(2) Debt securities. | — | — | — | — | — | — | ||||||||
a. National and local government bonds | ||||||||||||||
b. Corporate bonds | — | — | — | — | — | — | ||||||||
c. Other securities | — | — | — | — | — | — | ||||||||
(3) Other | 3,260 | 2,840 | (419 | ) | — | — | — | |||||||
Total | 3,866 | 3,337 | (529 | ) | 63 | 58 | (4 | ) | ||||||
Total | 33,685 | 64,328 | 30,643 | 30,565 | 91,065 | 60,500 | ||||||||
| Notes: | During the fiscal year, the Company recorded a loss on valuation of available-for-sale securities in the amount of ¥301 million. Impairment losses for marketable and investment securities are classified and computed as follows: |
| (1) | An impairment loss is generally recognized on securities whose market value has declined 50% or more compared to the acquisition cost as of the beginning of the fiscal year. Exceptions are allowed only when there is a justifiable reason. |
| (2) | For securities whose market value has declined more than 30% but less than 50% compared to the acquisition cost as of the beginning of fiscal year, after consideration of future prospects for recovery in market value of individual securities, an impairment loss is recognized on those securities that are considered not likely to recover in value. |
| (3) | An impairment loss is not generally recognized on those securities whose market value has declined less than 30% compared to the acquisition cost as of the beginning of the fiscal year. |
| 3. Available-for-Sale Securities Sold during the Year | (Millions of yen | ) |
Fiscal 2004 (For the year ended March 31, 2005) | Fiscal 2005 (For the year ended March 31, 2006) | |||||||||
| Amount sold | Total gain on sale | Total loss on sale | Amount sold | Total gain on sale | Total loss on sale | |||||
| 1,935 | 283 | 27 | 4,029 | 469 | 206 | |||||
| 4. Breakdown of Securities without Determinable Market Value | (Millions of yen | ) |
March 31 | Fiscal 2004 | Fiscal 2005 | ||
| Carrying value | Carrying value | |||
(1) Held-to-maturity securities | ||||
Certificates of deposit | 20,000 | 12,000 | ||
Commercial papers | 47,492 | 54,987 | ||
(2) Available-for-sale securities | ||||
MMF, FFF and medium-term government bond funds | 8,263 | 19,264 | ||
Preferred equity securities | 1,000 | 1,000 | ||
Unlisted stock | 2,061 | 2,329 | ||
Preferred securities | 1,000 | 1,000 |
| 5. Scheduled Maturities of Available-for-Sale Securities with Maturity and Held-to-Maturity Securities | (Millions of yen | ) |
Type of securities | Fiscal 2004 (As of March 31, 2005) | Fiscal 2005 (As of March 31, 2006) | ||||||||||||||
March 31 | Within one year | Between one and five years | Between five and ten years | Over ten years | Within one year | Between one and five years | Between five and ten years | Over ten years | ||||||||
1. Debt securities | ||||||||||||||||
(1) National and local government bonds | — | — | — | — | 999 | 2,993 | — | — | ||||||||
(2) Corporate bonds | 31,758 | 22,983 | 14,000 | — | 28,632 | 20,032 | 11,016 | — | ||||||||
(3) Other | 67,492 | — | — | — | 66,987 | — | — | — | ||||||||
2. Other securities | — | 2,359 | — | — | — | 1,226 | — | — | ||||||||
Total | 99,250 | 25,342 | 14,000 | — | 96,620 | 24,253 | 11,016 | — | ||||||||
(3) Derivative transactions
The fair value information on derivative instruments has not been presented herein because such information is disclosed via EDINET
(4) Retirement and Severance Benefit
| 1. | Summary of the Company’s Retirement Benefits Arrangements |
Previously, the Company had maintained: an Employees’ Pension Fund plan and a lump-sum retirement benefit plan, both of which were a defined benefit arrangements. The Company received an approval of exemption from the Minister of Health, Labour and Welfare on January 1, 2005, from the obligation for pension payment liabilities related to past employee service with respect to the substitutional portion of its Employees’ Pension Fund, and on May 31, 2005, a payment was made to transfer the plan assets related to the substitutional portion to the government based on the minimum liability. In addition, domestic consolidated subsidiaries had previously maintained various defined benefit retirement arrangements including Tax Qualified Pension plans (adopted by 10 consolidated subsidiaries) and lump-sum retirement benefit plans.
Daiichi Pharmaceuticals Co., Ltd. and certain domestic group companies (10 consolidated subsidiaries), upon obtaining an approval of exemption from the obligation related to past employee service with respect to the substitutional portion of the Daiichi Pharmaceutical Employees’ Pension Fund, beginning on January 1, 2005, unified their retirement benefit arrangements. With an exception of certain lump-sum retirement benefit plans, the Company’s various retirement benefit arrangements have been transformed into a single group arrangement comprising a Defined Benefit Corporate Pension plan and a Defined Contribution Pension plan.
Also, under certain circumstances, when employees retire or otherwise leave the Company, additional retirement benefits may be paid.
Please note that certain of the Group’s overseas consolidated subsidiaries also maintain defined benefit pension plans.
| 2. | Components of Retirement Benefit Obligations |
(Millions of yen)
Fiscal 2004 (As of March 31, 2005) | Fiscal 2005 (As of March 31, 2006) | |||||
a) Projected benefit obligations | (83,244 | ) | (64,215 | ) | ||
b) Fair value of pension plan assets | 83,197 | 70,227 | ||||
c) (Under)/over-funded projected benefit obligations (a + b) | (47 | ) | 6,011 | |||
d) Unamortized transition obligations | — | — | ||||
e) Unrecognized actuarial loss | 9,222 | 2,156 | ||||
f) Unrecognized prior service cost | 1,563 | 1,256 | ||||
g) Net pension assets recognized in the consolidated balance sheets | 10,739 | 9,423 | ||||
h) Prepaid pension costs | 15,493 | 14,356 | ||||
i) Accrued retirement and severance costs | (4,754 | ) | (4,932 | ) | ||
(Notes)
| 1. | The above figures include the substitutional portion of the Employees’ Pension Fund. |
| 2. | Certain of the Company’s subsidiaries use the simplified vested-benefit method in computing retirement and severance obligations. |
| 3. | The effects of the transfer of a portion of the lump-sum retirement benefit plans to a defined contribution pension plan in 2005 were as follows: |
Decrease in projected benefit obligations | 11,779 | ||
Unrecognized actuarial loss | (1,334 | ) | |
Unrecognized prior service benefit | 3,852 | ||
Decrease in accrued retirement and severance costs | 14,297 | ||
The amount of plan assets to be transferred to the defined contribution pension plan totaled ¥10,528 million. The transfer is scheduled to take place over the next four-year period. The amount of the plan assets not yet transferred was ¥6,744 million at the end of fiscal 2004, which was included in Other Payables (other current assets) and Long-term Payables (other non-current liabilities) in the accompanying consolidated balance sheets.
3. Employees’ Retirement and Severance Costs
(Millions of yen)
Fiscal 2004 (For the year | Fiscal 2005 (For the year | |||||
a) Service costs-benefits earned during the year | 3,605 | 3,115 | ||||
b) Interest cost | 2,381 | 1,548 | ||||
c) Expected return on plan assets | (1,993 | ) | (1,895 | ) | ||
d) Amortization of actuarial loss | 2,073 | 1,335 | ||||
e) Amortization of prior service costs | (267 | ) | 305 | |||
f) Net periodic retirement and severance costs | 5,799 | 4,411 | ||||
g) Gain from the return of the substitutional portion of the Employees’ Pension Fund to the government | (11,747 | ) | (163 | ) | ||
h) Losses on business integration | — | 1,378 | ||||
i) Additional retirement benefits | — | 113 | ||||
j) Loss on settlement of Employees’ Pension Fund plan | 381 | — | ||||
k) Gain from the transfer to the defined contribution pension plan | (3,769 | ) | — | |||
l) Restructuring charge | 7,316 | — | ||||
m) Other | 204 | 884 | ||||
Total retirement and severance costs | (1,814 | ) | 6,623 | |||
(Notes)
| 1. | Service cost is net of employee Contributions to be the Employees’ Pension Fund. |
| 2. | Retirement and severance costs of consolidated subsidiaries that are computed under the simplified vested-benefit method are included in “ Service costs-benefits earned during the year.” |
| 3. | The Restructuring charge was related to the payments of additional one-time termination benefits to the employees who were transferred to Daichi Pharmatech Co., Ltd., which was established through a split-off of three domestic manufacturing plants of the Company. |
| 4. | Other represents the Company’s contributions to the defined contribution pension plan and prepayments of retirement benefits to certain employees under the retirement benefit prepayment arrangement. |
4. Principal Assumptions Used in the Calculation of Retirement and Severance Benefit Obligations
Fiscal 2004 (As of March 31, 2005) | Fiscal 2005 (As of March 31, 2006) | |||
a) Method for inter-period attribution of estimated retirement costs | Straight-line method | Same as for the previous year | ||
b) Discount rate | Mainly 2.5% | Same as for the previous year | ||
c) Expected return on plan assets | Mainly 3.0% | Same as for the previous year | ||
d) Amortization period of prior service costs | Mainly 10 years (amortized under the straight-line method over a period not exceeding the average remaining years of service of the eligible employees at the time such prior service cost was incurred) | Same as for the previous year | ||
e) Amortization period of actuarial gain and loss | Mainly 10 years (amortized beginning in the fiscal year following the year in which the actuarial gain or loss was first measured under the straight-line method over a period not exceeding the average remaining years of services of the eligible employees at the time such actuarial gain or loss occurred) | Same as for the previous year | ||
(5) Deferred income taxes
| 1. | Principal Components of Deferred Tax Assets and Liabilities |
(Millions of yen)
Fiscal 2004 (As of March 31, 2005) | Fiscal 2005 (As of March 31, 2006) | |||||
Deferred tax assets: | ||||||
Depreciation | 11,163 | 11,329 | ||||
Prepaid consigned research and co-development expenses, etc. | 5,435 | 7,104 | ||||
Accrued expenses | 4,544 | 4,458 | ||||
Net operating loss carry forwards for income Tax purposes | — | 3,895 | ||||
Accrued enterprise tax | 707 | 1,994 | ||||
Accrued retirement and severance costs | 1,553 | 1,767 | ||||
Payables to the defined contribution pension plan | 2,626 | 1,455 | ||||
Inventories (unrealized profit and valuation losses) | 1,290 | 1,431 | ||||
Impairment losses on investment securities | 776 | 385 | ||||
Other | 7,635 | 7,207 | ||||
Subtotal | 35,731 | 41,030 | ||||
Valuation allowance | (6,637 | ) | (11,068 | ) | ||
Total deferred tax assets | 29,094 | 29,961 | ||||
Deferred tax liabilities: | ||||||
Unrealized holding gain on available-for-sale securities | (12,419 | ) | (24,520 | ) | ||
Prepaid pension costs | (6,866 | ) | (5,819 | ) | ||
Reserve for reduction in bases of fixed assets for income tax purposes | (2,588 | ) | (2,573 | ) | ||
Reserve for accelerated depreciation | (17 | ) | (11 | ) | ||
Total deferred tax liabilities | (21,892 | ) | (32,924 | ) | ||
Net deferred tax assets (liabilities) | 7,202 | (2,963 | ) | |||
(Note) Net deferred tax assets are included under the following balance sheet captions
Fiscal 2004 (As of March 31, 2005) | Fiscal 2005 (As of March 31, 2006) | |||||
Current assets-deferred tax assets | 13,826 | 15,287 | ||||
Non-current assets-deferred tax assets | 3,167 | 3,370 | ||||
Current liabilities-deferred tax liabilities | — | — | ||||
Non-current liabilities-deferred tax liabilities | (9,791 | ) | (21,620 | ) |
| 2. | Reconciliation of the difference between the statutory tax rate and the Company’s effective tax rate |
Fiscal 2004 (As of March 31, 2005) | Fiscal 2005 (As of March 31, 2006) | |||||
| (percent) | (percent) | |||||
Statutory tax rate | 40.5 | 40.5 | ||||
(Adjustments) | ||||||
Non-deductible permanent differences including entertainment and other expenses | 3.2 | 3.3 | ||||
Deductible permanent differences including dividend received deductions and other items | (0.5 | ) | (1.0 | ) | ||
Per capita inhabitants’ taxes | 0.2 | 0.3 | ||||
Tax credit for research and development expenses | (4.2 | ) | (7.4 | ) | ||
Increase in valuation allowance | — | 6.4 | ||||
Other | 5.4 | 2.6 | ||||
Effective tax rate | 44.6 | 44.7 | ||||
(6) Segment Information
a. Information by Operating Segment
Information by operating segment on a consolidated basis for the most recent two fiscal years was as follows:
(Millions of yen)
Fiscal 2004 (For the year ended March 31, 2005) | ||||||||||||
| Pharmaceuticals | Other | Total | Eliminations and corporate | Consolidated | ||||||||
I. Net sales and operating income | ||||||||||||
Net sales | ||||||||||||
(1) Outside customers | 311,844 | 16,689 | 328,534 | — | 328,534 | |||||||
(2) Inter-segment | 73 | 2,783 | 2,857 | (2,857 | ) | — | ||||||
Total sales | 311,917 | 19,473 | 331,391 | (2,857 | ) | 328,534 | ||||||
Operating expenses | 247,821 | 19,552 | 267,373 | 5,096 | 272,470 | |||||||
Operating income | 64,096 | (78 | ) | 64,017 | (7,953 | ) | 56,063 | |||||
II. Assets, depreciation, and capital expenditures | ||||||||||||
Assets | 288,257 | 28,768 | 317,026 | 229,529 | 546,555 | |||||||
Depreciation | 14,342 | 1,518 | 15,861 | 85 | 15,946 | |||||||
Capital expenditures | 12,937 | 1,747 | 14,684 | 113 | 14,798 | |||||||
Notes:
| 1. | Method of classifying operating segments |
The operating segments of the Company and its consolidated subsidiaries are the pharmaceutical segment, which is the principal business of the Company, and the other segment, which is businesses other than the pharmaceutical business.
| 2. | Principal products in each operating segment |
| Business segment | Principal products | |
| Pharmaceutical business | Pharmaceutical products, diagnostic and radiopharmaceutical products, over-the-counter drugs, and veterinary and livestock feed products | |
| Other | ||
Fine chemicals | Bulk vitamins, chemical products, industrial chemicals and other | |
Safety testing and research | Contract research and development | |
Other | Real estate rental and other |
| 3. | Included in operating expenses under elimination and corporate was ¥7,919 million that could not be allocated to the operating segments. These expenses consisted mainly of the expenses of the administrative departments of the parent company. |
| 4. | Included in assets under elimination and corporate was ¥231,328 million in corporate assets. These assets were comprised mainly of temporary excess working capital funds under management of the parent company (cash, time deposit, short-term investments and other), long-term investments (investment securities) and assets used by the administrative departments of the parent company. |
Fiscal 2005
(Millions of yen)
Fiscal 2005 (For the year ended March 31, 2006) | |||||||||||
| Pharmaceuticals | Other | Total | Eliminations and corporate | Consolidated | |||||||
I. Net sales and operating income | |||||||||||
Net sales | |||||||||||
(1) Outside customers | 331,135 | 15,312 | 346,447 | — | 346,447 | ||||||
(2) Inter-segment | 195 | 2,592 | 2,788 | (2,788 | ) | — | |||||
Total | 331,331 | 17,905 | 349,236 | (2,788 | ) | 346,447 | |||||
Operating expenses | 245,011 | 17,458 | 262,470 | 7,889 | 270,359 | ||||||
Operating income | 86,319 | 446 | 86,766 | (10,678 | ) | 76,087 | |||||
II. Assets, depreciation, and capital expenditures | |||||||||||
Assets | 310,948 | 28,978 | 339,926 | 257,774 | 597,701 | ||||||
Depreciation | 12,616 | 1,435 | 14,052 | 80 | 14,133 | ||||||
Loss on impairment of property, plant and equipment | 1,339 | — | 1,339 | — | 1,339 | ||||||
Capital expenditures | 11,215 | 2,300 | 13,515 | 15 | 13,531 | ||||||
Notes:
| 1. | Method of classifying operating segments |
The operating segment of the Company and its consolidated subsidiaries are the pharmaceutical segment, which is the principal business of the Company, and the other, segment which is businesses other than the pharmaceutical business.
| 2. | Principal products by business segment |
| Business segment | Principal products | |
| Pharmaceutical business | Pharmaceutical products, diagnostic and radiopharmaceutical products and over-the-counter drugs | |
| Other | ||
Fine chemicals | Bulk vitamins, chemical products, industrial chemicals and other | |
Safety testing and research | Contract research and development | |
| Other | Real estate rental and other |
| 3. | Included in operating expenses under elimination and corporate was ¥10,709 million that could not be allocated to business segments. These expenses consisted mainly of the expenses of the administrative departments of the parent company. |
| 4. | Included in assets under elimination and corporate was ¥259,843 million in corporate assets. These assets were comprised mainly of excess working capital funds under management of the parent company (cash, short-term investments and other), long-term investments (investment securities) and assets used by the administrative departments of the parent company. |
| 5. | Changes in Accounting Principles and Policies |
Changes in Depreciation Method
As noted in “Changes in Significant Accounting Principals and Policies for the Preparation of the Consolidated Financial Statements”, the Company changed its method of depreciation during the year from the declining balance to the straight line for Buildings (excluding fixtures) purchased on and after April 1, 1998. As a result of this change, as compared to the amounts that would have been reported, had the previous depreciation method been applied consistently, operating expense for the fiscal year was decreased by ¥206 million for the pharmaceutical business segment and by ¥10 million for the other segment, and accordingly operating income for the two segments was increased by the same amount.
| b. | Information by Geographic Segment |
Information by geographic segment has been omitted because more than 90% of total segment sales and segment assets were attributable to Japan.
c. Overseas Net Sales
Information about overseas net sales for the two most recent fiscal years was as follows:
(Millions of yen)
Fiscal 2004
(For the year ended March 31, 2005)
| Americas | Europe | Asia and other | Total | |||||
I. Overseas net sales | 46,608 | 13,392 | 8,588 | 68,589 | ||||
II. Consolidated net sales | 328,534 | |||||||
III. Percentage of overseas net sales (%) | 14.2 | 4.1 | 2.6 | 20.9 | ||||
(Millions of yen)
Fiscal 2005
(For the year ended March 31, 2006)
| Americas | Europe | Asia and other | Total | |||||
I. Overseas net sales | 48,975 | 16,148 | 9,416 | 74,540 | ||||
II. Consolidated net sales | 346,447 | |||||||
III. Percentage of overseas net sales (%) | 14.1 | 4.7 | 2.7 | 21.5 | ||||
Notes:
| 1. | Geographic areas are classified on the basis of geographic proximity. |
| 2. | Principal countries for each geographic area include the following: |
(1) Americas: | United States | |||
(2) Europe: | Germany, France, Italy | |||
(3) Asia and other: | China, Taiwan, Korea |
| 3. | Overseas net sales are defined as net sales of the Company and its consolidated subsidiaries transacted in countries or regions outside of Japan. |
(Transactions with related parties)
None applicable
Per Share Information
Fiscal 2004 (For the year ended March 31, 2005) | Fiscal 2005 (For the year ended March 31, 2006) | |||||||
| Net assets per share | ¥ | 1,670.71 | Net assets per share | ¥ | 1,785.55 | |||
| Net income per share (basic) | ¥ | 137.95 | Net income per share (basic) | ¥ | 138.59 | |||
| Net income per share (diluted) | ¥ | 137.90 | Net income per share (diluted) | ¥ | 138.55 | |||
Note: Calculations of basic and diluted net income per share were based on the following numerators and denominators:
(Millions of yen)
Fiscal 2004 (For the year ended March 31, 2005) | Fiscal 2005 (For the year ended March 31, 2005) | |||
| Net income per share (basic): | ||||
| Net income | 37,175 | 37,409 | ||
| Amount not available for common shareholders | 137 | 118 | ||
| (Including directors’ bonuses paid from net income of) | (137) | (118) | ||
| Net income available for dividends on common shares | 37,037 | 37,291 | ||
| Weighted-average number of common shares outstanding during the period (1,000 shares) | 268,481 | 269,078 | ||
| Net income per share (diluted): | ||||
| Additional dilutive common shares (1,000 shares) | 111 | 70 | ||
| (Including dilutive effect of stock options of) (1,000 shares) | (111) | (70) | ||
| Descriptions of potentially dilutive common shares that were not included in the computation of diluted net income per share because of their anti-dilutive effect | Two share subscription right plans (related to 1,001 thousand shares) and one share purchase option plan (related to 4,090 units of options) | Two share subscription right plans (related to 1,001 thousand shares) All outstanding stock options were cancelled before the end of the fiscal year. |
(Subsequent Events)
Fiscal 2004
| • | Details on the integration of the Company’s operations with Sankyo Co., Ltd. though the formation of a joint holding company are provided on EDINET. |
| • | Details on the termination of stock option agreements are also available on EDINET. |
Fiscal 2005
None applicable
5. Production, Orders and Sales
(1) Production
Production performance by operating segment for the fiscal year is summarized as follows:
(Millions of yen)
Operating segment | Fiscal 2005 (For the year ended March 31, 2006) | |||
| Amount | Changes from the previous year (%) | |||
Pharmaceutical business | 285,181 | 4.8 | ||
Other | 11,658 | 1.2 | ||
Total | 296,840 | 4.6 | ||
Notes:
| 1. | Production amounts are stated based on selling prices, exclusive of consumption tax. |
| 2. | The above amounts are stated exclusive of consumption tax. |
(2) Procurement
Procurement performance by operating segment for the fiscal year was as follows:
(Millions of yen)
Operating segment | Fiscal 2005 (For the year ended March 31, 2006) | ||||
| Amount | Changes from the previous year (%) | ||||
Pharmaceutical business | 37,070 | 15.8 | |||
Other | 1,285 | (44.7 | ) | ||
Total | 38,356 | 11.7 | |||
Notes:
| 1. | Procurement amounts are stated based on selling prices, exclusive of consumption tax. |
| 2. | The above amounts are stated exclusive of consumption tax. |
(3) Orders
The Company manufactures products according to its production plans based not on advance customer orders but on forecasted product demand.
(4) Sales
Sales performance by operating segment for the fiscal year was as follows:
(Millions of yen)
Operating segment | Fiscal 2005 (For the year ended March 31, 2006) | ||||
| Amount | Changes from the previous period (%) | ||||
Pharmaceutical business | 331,135 | 6.2 | |||
Other | 15,312 | (8.3 | ) | ||
Total | 346,447 | 5.5 | |||
Notes:
| 1. | Inter-segment sales have been eliminated. |
| 2. | The above amounts are stated exclusive of consumption tax |
| 3. | During the fiscal year, net sales to major customers and their percentage of total net sales were as follows: |
(Millions of yen)
Customers | Fiscal 2004 (For the year ended | Fiscal 2005 (For the year ended | ||||||
| Amount | Percentage of total | Amount | Percentage of total | |||||
Alfresa Corporation | 43,039 | 13.1 | 45,789 | 13.2 | ||||
Mediceo Paltac Holdings Co., Ltd. | 40,177 | 12.2 | 43,707 | 12.6 | ||||
Suzuken Co., Ltd. | 35,420 | 10.8 | 37,043 | 10.7 | ||||
(Notes)
| 1. | Mediceo Paltac Holdings Co., Ltd. was formed through the integration of Mediceo Holdings (formerly Kuraya Sanseido, Inc., which became Mediceo Holdings on October 1, 2004) and Paltac Corporation on October 1, 2005. |
| 2. | Alfresa Corporation is the former Fukujin Co., Ltd., which took control of certain operations of Azwell Inc. and Taishodo Co., Ltd. through a reorganization by corporate separation on October 1, 2004. Fukujin Co., Ltd. then changed its name to Alfresa Corporation on October 1, 2004. |
| 3. | The figures for the year ended March 31, 2005 are pro forma amounts that have been restated to allow for year-by-year comparisons following the foregoing reorganizations. |
FASF
November 7, 2005
Non-Consolidated Financial Results
For the Fiscal 2005
(Year Ended March 31, 2006)
Daiichi Pharmaceutical Co., Ltd.
Listed company name: DAIICHI SANKYO COMPANY, LIMITED
Stock code number: 4568
Listed Exchanges: Tokyo, Osaka, and Nagoya
Head office: Tokyo, Japan
Contact: Mr. Toshio Takahashi, Corporate Officer, General Manager of Corporate Communications Department
Telephone: +81-3-6225-1126
Meeting of the Board of Directors: May 12, 2006
Interim dividends: Yes
Adoption of the unit share system: Yes (One unit equals 100 shares)
Non-Consolidated Financial Results for the Interim Period of Fiscal 2005
(1) Non-Consolidated Financial Results
(Figures less than ¥1 million, except per share amounts, have been omitted)
| Net sales | Operating income | Ordinary income | ||||||||||
| Millions of yen | Percent change | Millions of yen | Percent change | Millions of yen | Percent change | |||||||
Fiscal 2005 | 278,193 | 7.0 | 71,174 | 30.7 | 74,160 | 31.7 | ||||||
Fiscal 2004 | 259,912 | 2.5 | 54,440 | 20.0 | 56,322 | 21.1 | ||||||
| Net income | Basic net income per share | Diluted net income per share | Return on equity | Ordinary income as a percentage of total assets | Ordinary income as a percentage of net sales | ||||||||||
| Millions of yen | Percent change | Yen | Yen | % | % | % | |||||||||
Fiscal 2005 | 31,199 | 61.6 | 115,65 | 115.62 | 7.4 | 13.9 | 26.7 | ||||||||
Fiscal 2004 | 19,303 | (31.0 | ) | 71.53 | 71.50 | 4.7 | 11.3 | 21.7 | |||||||
Notes
| 1. | Weighted-average number of common shares issued and outstanding during the fiscal year |
Fiscal 2005: | 269,078,712 shares | |
Fiscal 2004: | 268,481,535 shares |
| 2. | Changes in accounting policies: Yes |
| 3. | Percentages for net sales, operating income, ordinary income and net income indicate a change from the corresponding results in the previous fiscal years. |
(2) Dividends
Beginning in the interim period of fiscal 2005, dividends are paid to the Company’s wholly owing parent company Daiichi Sankyo Company, Limited.
(3) Non-Consolidated Financial Position
(Figures less than ¥1 million, except per share amounts, have been omitted.)
| Total assets | Shareholders’ equity | Shareholders’ equity ratio | Shareholders’ equity per share | |||||
| Millions of yen | Millions of yen | % | Yen | |||||
Fiscal 2005 | 556,677 | 427,796 | 76.8 | 1,587.54 | ||||
Fiscal 2004 | 508,932 | 415,020 | 81.5 | 1,545.88 |
Notes 1. Total number of common shares issued at the end of the fiscal year
Fiscal 2005: | 269,420,093 shares | |||
Fiscal 2004: | 268,404,023 shares |
| 2. | Number of common shares in treasury stock at the end of the fiscal year |
Fiscal 2005: | — | |||
Fiscal 2004: | 18,049,212 shares |
6. Non-Consolidated Financial Statements
| (1) | Non-Consolidated Balance Sheets |
(Millions of yen)
See Note | As of March 31, 2005 | As of March 31, 2006 | Change | |||||||||||||
Amount | % | Amount | % | Amount | ||||||||||||
ASSETS | ||||||||||||||||
I. Current assets: | ||||||||||||||||
1. Cash and time deposits | 6,455 | 7,707 | ||||||||||||||
2. Trade notes receivable | 6,771 | 4,563 | ||||||||||||||
3. Accounts receivable | *4 | 63,046 | 68,823 | |||||||||||||
4. Marketable securities | 107,514 | 115,884 | ||||||||||||||
5. Parent company stock | — | 6,986 | ||||||||||||||
6. Mortgage-backed securities | 20,000 | 16,500 | ||||||||||||||
7. Merchandises | 5,911 | 18,677 | ||||||||||||||
8. Products | 13,360 | 302 | ||||||||||||||
9. Semi-finished products | 4,816 | — | ||||||||||||||
10. Raw materials | 6,222 | 1,989 | ||||||||||||||
11. Work in process | 1,249 | — | ||||||||||||||
12. Prepaid expenses | 187 | 194 | ||||||||||||||
13. Deferred tax assets | 10,850 | 12,182 | ||||||||||||||
14. Short-term loans to affiliated companies | 9,715 | 431 | ||||||||||||||
15. Other receivables | 4,277 | 12,637 | ||||||||||||||
16. Other current assets | 8,806 | 6,113 | ||||||||||||||
Total current assets | 269,185 | 52.89 | 272,993 | 49.04 | 3,807 | |||||||||||
(Millions of yen)
See Note | As of March 31, 2005 | As of March 31, 2006 | Change | ||||||||||||||
| Amount | % | Amount | % | Amount | |||||||||||||
II. Non-current assets: | |||||||||||||||||
1. Property, plant and equipment: | *1 | ||||||||||||||||
(1) Buildings | 86,374 | 63,030 | |||||||||||||||
Less accumulated depreciation | 52,523 | 33,851 | 38,792 | 24,237 | |||||||||||||
(2) Structures | 8,624 | 5,618 | |||||||||||||||
Less accumulated depreciation | 6,118 | 2,505 | 4,237 | 1,381 | |||||||||||||
(3) Machinery and equipment | 65,274 | 25,043 | |||||||||||||||
Less accumulated depreciation | 55,150 | 10,124 | 21,217 | 3,826 | |||||||||||||
(4) Vehicles and transportation equipment | 496 | 91 | |||||||||||||||
Less accumulated depreciation | 449 | 46 | 73 | 18 | |||||||||||||
(5) Furniture, tools and fixtures | 24,285 | 21,152 | |||||||||||||||
Less accumulated depreciation | 21,195 | 3,090 | 18,445 | 2,706 | |||||||||||||
(6) Land | 7,241 | 6,847 | |||||||||||||||
(7) Construction in progress | 1,273 | 177 | |||||||||||||||
Total property, plant and equipment, net | 58,133 | 11.42 | 39,195 | 7.04 | (18,937 | ) | |||||||||||
2. Intangible assets, net | |||||||||||||||||
(1) Sales and distribution rights | 2,921 | 3,028 | |||||||||||||||
(2) Patents | 2,975 | 2,598 | |||||||||||||||
(3) Real estate lease rights | 1 | 1 | |||||||||||||||
(4) Trademarks | 66 | 56 | |||||||||||||||
(5) Software | 1,873 | 2,441 | |||||||||||||||
(6) Other intangible assets | 75 | 67 | |||||||||||||||
Total intangible assets, net | 7,915 | 1.56 | 8,194 | 1.47 | 279 | ||||||||||||
(Millions of yen)
See Note | As of March 31, 2005 | As of March 31, 2006 | Change | |||||||||||||||
| Amount | % | Amount | % | Amount | ||||||||||||||
3. Investments and other assets: | ||||||||||||||||||
(1) Investment securities | 104,045 | 121,281 | ||||||||||||||||
(2) Stock of affiliated companies | 52,748 | 111,663 | ||||||||||||||||
(3) Advances to affiliated companies | 8,685 | 8,653 | ||||||||||||||||
(4) Long-term loans to employees | 4 | 2 | ||||||||||||||||
(5) Long-term loans to affiliated companies | 5,651 | 6,806 | ||||||||||||||||
(6) Prepaid pension cost | 15,385 | 14,266 | ||||||||||||||||
(7) Other assets | 6,524 | 7,330 | ||||||||||||||||
(8) Allowance for doubtful accounts | (676 | ) | (1,356 | ) | ||||||||||||||
(9) Allowance reserve for investment losses | (18,671 | ) | (32,353 | ) | ||||||||||||||
Total investments and other assets | 173,698 | 34.13 | 236,293 | 42.45 | 62,595 | |||||||||||||
Total non-current assets | 239,747 | 47.11 | 283,683 | 50.96 | 43,936 | |||||||||||||
Total assets | 508,932 | 100.00 | 556,677 | 100.00 | 47,744 | |||||||||||||
(Millions of yen)
See Note | As of March 31, 2004 | As of March 31, 2005 | Change | ||||||||||||||||
| Amount | % | Amount | % | Amount | |||||||||||||||
LIABILITIES | |||||||||||||||||||
I. Current liabilities: | |||||||||||||||||||
1. Accounts payable | *4 | 16,163 | 24,704 | ||||||||||||||||
2. Other payables | 10,660 | 8,694 | |||||||||||||||||
3. Accrued expenses | 19,445 | 16,647 | |||||||||||||||||
4. Income tax payable | 7,023 | 20,518 | |||||||||||||||||
5. Consumption taxes payable | 502 | 881 | |||||||||||||||||
6. Advance receipts | 1,546 | 1,228 | |||||||||||||||||
7. Advances received from affiliated companies | *5 | 22,774 | 31,462 | ||||||||||||||||
8. Allowance for sales returns | 448 | 245 | |||||||||||||||||
9. Allowance for sales rebates | 1,421 | 1,309 | |||||||||||||||||
10. Other | — | 36 | |||||||||||||||||
Total current liabilities | 79,985 | 15.72 | 105,727 | 18.99 | 25,742 | ||||||||||||||
II. Non-current liabilities: | |||||||||||||||||||
1. Long-term payables | 3,467 | 1,375 | |||||||||||||||||
2. Deferred tax liabilities | 9,035 | 20,638 | |||||||||||||||||
3. Accrued retirement and severance benefits | 213 | 220 | |||||||||||||||||
4. Accrued directors’ retirement and severance costs | 1,208 | 918 | |||||||||||||||||
Total non-current liabilities | 13,926 | 2.74 | 23,153 | 4.16 | 9,227 | ||||||||||||||
Total liabilities | 93,912 | 18.46 | 128,881 | 23.15 | 34,969 | ||||||||||||||
SHAREHOLDERS’ EQUITY | |||||||||||||||||||
I. Common stock | *1 | 45,246 | 8.89 | 45,246 | 8.13 | — | |||||||||||||
II. Additional paid-in-capital: | |||||||||||||||||||
1. Capital surplus | 48,961 | 48,961 | |||||||||||||||||
2. Other capital surplus | |||||||||||||||||||
(1) Gain on reissuance of treasury stock | 169 | — | |||||||||||||||||
Total additional paid-in-capital | 49,130 | 9.65 | 48,961 | 8.79 | (169 | ) | |||||||||||||
III. Retained earnings: | |||||||||||||||||||
1. Legally appropriated retained earnings | 7,599 | 7,599 | |||||||||||||||||
2. Voluntary retained earnings reserve: | |||||||||||||||||||
(1) Reserve for reduction in cost basis of fixed assets | 2,591 | 2,639 | |||||||||||||||||
(2) Special reserve | 306,762 | 266,762 | |||||||||||||||||
3. Unappropriated retained earnings | 24,442 | 20,805 | |||||||||||||||||
Unappropriated retained earnings | 341,395 | 67.08 | 297,807 | 53.50 | (43,588 | ) | |||||||||||||
IV. Net unrealized gain on investment securities | 18,115 | 3.56 | 35,780 | 6.43 | 17,665 | ||||||||||||||
V. Treasury stock at cost | *2 | (38,867 | ) | (7.64 | ) | — | — | 38,867 | |||||||||||
Total shareholders’ equity | 415,020 | 81.54 | 427,796 | 76.85 | 12,775 | ||||||||||||||
Total liabilities and shareholders’ equity | 508,932 | 100.00 | 556,677 | 100.00 | 47,744 | ||||||||||||||
(2) Non-Consolidated Statements of Income
(Millions of yen)
See Note | Fiscal 2004 (For the year ended March 31, 2005) | Fiscal 2005 (For the year ended March 31, 2006) | Change | ||||||||||||||
| Amount | % | Amount | % | Amount | |||||||||||||
I. Net sales: | |||||||||||||||||
1. Sales of products | 175,635 | 1,520 | |||||||||||||||
2. Sales of merchandise | 62,981 | 247,963 | |||||||||||||||
3. Royalty income | 21,296 | 259,912 | 100.00 | 28,709 | 278,193 | 100.00 | 18,280 | ||||||||||
II. Cost of sales: | *1 *2 *3 | ||||||||||||||||
1. Product and merchandise inventories, beginning of year | 16,014 | 18,950 | |||||||||||||||
2. Merchandises purchased during the year | 38,519 | 78,799 | |||||||||||||||
3. Costs of products manufactured during the year | 48,130 | 592 | |||||||||||||||
Subtotal | 102,663 | 98,342 | |||||||||||||||
4. Less amount transferred to other accounts | 1,343 | 921 | |||||||||||||||
5. Less product and merchandise inventories, end of year | 19,272 | 18,979 | |||||||||||||||
Total cost of sales | 20,615 | 82,047 | 31.57 | 19,901 | 78,441 | 28.20 | (3,605 | ) | |||||||||
Gross profit on sales | 177,865 | 68.43 | 199,751 | 71.80 | 21,886 | ||||||||||||
Reversal of provision for sales returns | 491 | 0.19 | 448 | 0.17 | (43 | ) | |||||||||||
Provision for sales returns | 448 | 0.17 | 245 | 0.09 | (203 | ) | |||||||||||
Adjusted gross profit | 177,908 | 68.45 | 199,955 | 71.88 | 22,047 | ||||||||||||
III. Selling, general and administrative expenses: | *3 | ||||||||||||||||
1. Shipping and storage expenses | 1,401 | 1,197 | |||||||||||||||
2. Advertising expenses | 3,686 | 2,613 | |||||||||||||||
3. Sales promotion expenses | 10,229 | 11,676 | |||||||||||||||
4. Royalty expense | 791 | 823 | |||||||||||||||
5. Salaries and bonuses | 25,395 | 26,305 | |||||||||||||||
6. Employee retirement and severance costs | 3,043 | 2,759 | |||||||||||||||
7. Welfare expenses | 3,831 | 3,820 | |||||||||||||||
8. Depreciation expense | 3,035 | 2,493 | |||||||||||||||
9. Rent expenses | 6,298 | 5,935 | |||||||||||||||
10. Travel and transportation expenses | 3,991 | 4,014 | |||||||||||||||
11. Research and development expenses | *1 | 42,698 | 46,736 | ||||||||||||||
12. Other | 19,063 | 123,467 | 47.50 | 20,404 | 128,781 | 46.30 | 5,313 | ||||||||||
Operating income | 54,440 | 20.95 | 71,174 | 25.58 | 16,733 | ||||||||||||
See Note | Fiscal 2004 (For the year ended March 31, 2005) | Fiscal 2005 (For the year ended March 31, 2006) | Change | ||||||||||||||
| Amount | % | Amount | % | Amount | |||||||||||||
IV. Non-operating income | |||||||||||||||||
1. Interest income | 287 | 376 | |||||||||||||||
2. Interest income from investment securities | 505 | 458 | |||||||||||||||
3. Dividend income | 1,230 | 1,527 | |||||||||||||||
4. Rental income | *4 | 187 | 1,448 | ||||||||||||||
5. Foreign exchange gains | 357 | 280 | |||||||||||||||
6. Other income | 359 | 2,928 | 1.12 | 204 | 4,297 | 1.55 | 1,368 | ||||||||||
V. Non-operating expenses | |||||||||||||||||
1. Loss on disposal and write-down of inventories | *2 | 384 | 223 | ||||||||||||||
2. Expenses on rental assets | — | 797 | |||||||||||||||
3. Provision of allowance for doubtful accounts | 297 | 96 | |||||||||||||||
4. Other expense | 363 | 1,046 | 0.40 | 193 | 1,310 | 0.47 | 264 | ||||||||||
Ordinary income | 56,322 | 21.67 | 74,160 | 26.66 | 17,838 | ||||||||||||
VI. Extraordinary gains: | 683 | ||||||||||||||||
1. Gain on sale of investments in affiliates | — | 163 | |||||||||||||||
2. Gain from the return of the substitutional portion of the employees’ pension fund to the government | 11,747 | 17 | |||||||||||||||
3. Gain on sale of Investment securities | 20 | — | |||||||||||||||
4. Gain from the transfer to the defined contribution pension plan | 3,073 | — | |||||||||||||||
5. Gain on sale of the veterinary and livestock feed products business | *5 | 679 | 15,520 | 5.97 | — | 864 | 0.31 | (14,655 | ) | ||||||||
VII. Extraordinary losses: | |||||||||||||||||
1. Provision for allowance for investment losses | 18,671 | 13,682 | |||||||||||||||
2. Loss on business integration | *6 | — | 1,255 | ||||||||||||||
3. Loss on settlement of vitamin- related anti-trust litigations | *7 | 111 | 1,125 | ||||||||||||||
4. Provision of allowance for doubtful receivables of affiliates | — | 582 | |||||||||||||||
5. Loss on valuation on investments in affiliates | — | 48 | |||||||||||||||
6. Restructuring charge | *8 | 7,042 | — | ||||||||||||||
7. Loss on valuation of investment securities | 28 | — | |||||||||||||||
8. Loss on impairment of property, plant and equipment | *9 | — | 842 | ||||||||||||||
9. Loss on disposal of property, plant and equipment | *10 | 1,124 | 26,978 | 10.38 | 195 | 17,732 | 6.38 | (9,245 | ) | ||||||||
Net income before income taxes | 44,865 | 17.26 | 57,292 | 20.59 | 12,427 | ||||||||||||
See Note | Fiscal 2004 (For the year ended March 31, 2005) | Fiscal 2005 (For the year ended March 31, 2006) | Change | |||||||||||||||
| Amount | % | Amount | % | Amount | ||||||||||||||
Income tax expense-current | 15,400 | 28,110 | ||||||||||||||||
Income tax expense (benefit)-deferred | 10,161 | 25,561 | 9.83 | (2,016 | ) | 26,093 | 9.37 | 531 | ||||||||||
Net income | 19,303 | 7.43 | 31,199 | 11.22 | 11,895 | |||||||||||||
Unappropriated retained earnings, brought-forward from the previous fiscal year | 9,165 | 57,584 | 48,419 | |||||||||||||||
Loss on re-issuance of treasury stock | — | 69 | 69 | |||||||||||||||
Retirement of treasury stock | — | 36,683 | 36,683 | |||||||||||||||
Less interim dividends | 4,026 | 31,225 | 27,199 | |||||||||||||||
Unappropriated retained earnings, end of year | 24,442 | 20,805 | (3,636 | ) | ||||||||||||||
(3) Proposal for Appropriations of Retained Earnings
(Millions of yen)
Fiscal 2004 (Approved at the general meeting of shareholders held on June 29, 2005) | Fiscal 2005 (Proposed for approval at the general meeting of shareholders to be held on June 29, 2006) | Change | |||||||||
I. Unappropriated retained earnings, end of year | 24,442 | 20,805 | (3,636 | ) | |||||||
II. Reversal of voluntary retained earnings reserve | |||||||||||
1. Reserve for reduction in cost basis of fixed assets | — | 7 | |||||||||
2. Special reserve | 40,000 | 40,000 | 30,000 | 30,007 | (9,993 | ) | |||||
Total retained earnings available for appropriation | 64,442 | 50,813 | (13,628 | ) | |||||||
III. Appropriations | |||||||||||
1. Dividends | 6,710 | — | |||||||||
2. Directors’ bonuses | 100 | 80 | |||||||||
(Including corporate auditors’ bonuses of) | (—) | (—) | |||||||||
3. Voluntary retained earnings reserve | |||||||||||
(1) Reserve for reduction in cost basis of fixed assets | 48 | — | |||||||||
(2) Special reserve | — | 6,858 | — | 80 | (6,778 | ) | |||||
VI. Unappropriated retained earnings, carried-forward to the next fiscal year | 57,584 | 50,733 | (6,850 | ) | |||||||
Summary of Significant Accounting Principles for the Preparation of the Non-Consolidated Financial Statements
Fiscal 2004
(For the year ended March 31, 2005)
| 1. | Methods of Valuation of Investment Securities |
Held-to-maturity securities:
Stated at amortized costs (straight-line method)
Investments in subsidiaries and affiliated companies:
Accounted for at moving-average costs
Available-for-sale securities:
With quoted market value: Stated at quoted market value at the balance sheet dates (Unrealized holding gains or losses are reported as a component of shareholders’ equity. Realized gains or losses are computed using the moving-average cost method.)
With no readily available market value: Accounted for at moving-average costs
| 2. | Method of Valuation of Inventories |
Accounted for at the lower of cost or market, with cost being determined under the average cost method.
| 3. | Depreciation and Amortization of Depreciable Assets |
Property, Plant and Equipment:
Depreciation is computed using the declining-balance method.
The ranges of useful lives of principal assets are as follows:
Buildings: 38 to 50 years
Machinery and equipment: 4 to 7 years
Intangible Assets:
Amortization is computed using the straight-line method. Software that is expected to generate future revenues or to contribute to a future cost reduction is amortized over estimated number of years it will be used internally.
| 4. | Translation of Significant Assets and Liabilities Denominated in Foreign Currency to Yen |
Foreign currency denominated assets and liabilities are translated into yen amounts at the exchange rates prevailing on the balance sheet dates. The resulting translation gains and losses are recognized currently in earnings. The foreign currency denominated assets that are hedged by specific foreign currency forward contracts are converted into yen based on the relevant contract rates.
Fiscal 2005
(For the year ended March 31, 2006)
| 1. | Methods of Valuation of Investment Securities |
Held-to-maturity securities:
Same as for the previous year
Stock of subsidiaries and affiliated companies:
Same as for the previous year
Available-for-sale securities:
Same as for the previous year
| 2. | Method of Valuation of Inventories |
Same as for the previous year
| 3. | Depreciation and Amortization of Depreciable Assets |
Property, Plant and Equipment:
Depreciation is computed using the declining-balance method, except for the buildings (excluding fixtures) purchased on and after April 1, 1998, which are depreciated using the straight-line method. The ranges of useful lives of principal assets are as follows:
Buildings: 38 to 50 years
Machinery and equipment: 4 to 7 years
(Changes in accounting policies)
Buildings (excluding fixtures) purchased on and after April 1, 1998 had been depreciated using the declining-balance method, however, beginning in the fiscal year, the Company depreciates such buildings using the straight-line method.
This decision to change the method of depreciation was made for the following reasons after a review of its depreciation policies: Since the benefit from capital spending on facilities is considered not being influenced by their level of utilization, but is realized constantly in each period, the new method better reflects the underlying performance of the Company in the statements of income, based on the Company’s capital investments going forward.
In connection with the agreement to integrate its operations with those of Sankyo Company, Limited on May 13, 2005, and the establishment of a joint holding company, DAIICHI SANKYO COMPANY, LIMITED on September 28, 2005, the Company has recognized a need to conform its accounting policies to those of the new corporate group.
As a result of this accounting change, depreciation expense for the fiscal year was decreased by ¥121 million. Accordingly, operating income, ordinary income and income before income taxes all increased by ¥121 million as compared to the amounts that would have been reported had the previous method of accounting been consistently applied.
Intangible Assets:
Same as for the previous year
| 4. | Translation of Significant Assets and Liabilities Denominated in Foreign Currency to Yen |
Same as for the previous year
Fiscal 2004
(For the year ended March 31, 2005)
| 5. | Methods of Determining Significant Allowances: |
| (1) | Allowance for Doubtful Accounts |
The Company covers the risk of credit losses from potential customer defaults by providing this allowance. The allowance is estimated on the basis of historical default rates for normal accounts and individual account-by-account evaluation for specific over-due accounts.
| (2) | Allowance for Investment Losses |
To cover a decline in value of the investments in affiliated companies, the Company provides for an allowance based on the financial condition and future prospects for recovery of the affiliated companies.
| (3) | Allowance for Sales Returns |
To prepare for losses from potential returns of products after the fiscal year-end, the Company provides for an amount equal to the sum of gross profit and inventory losses on such returned products, based on its estimate of possible sales returns.
| (4) | Allowance for Sales Rebates |
To prepare for future sales rebates, the Company provides for this allowance in an amount calculated by multiplying in an estimated sales rebate percentage for the fiscal year by the amounts of accounts receivable from and inventories held by wholesalers’ at the end of the fiscal year.
| (5) | Accrued Retirement and Severance Costs |
To prepare for future payments of retirement and severance benefits, the Company provides for an accrual based on estimated projected benefit obligations and plan assets at the end of the fiscal year.
Prior service cost is amortized under the straight-line method over a period of 10 years, which is equal to or less than the estimated average remaining years of service of the eligible employees at the time such prior service cost was incurred.
Actuarial gains and losses are amortized based on the straight-line method, beginning in the fiscal year following the year in which the gain or loss was initially measured, over a period of 10 years, which is equal to or less than the average remaining years of service of the eligible employees at the time such actuarial gain or loss occurred.
(Supplemental Information)
Accompanying the enactment of the Defined Benefit Pension Law, the Company received an approval of exemption from the Minister of Health, Labor and Welfare, on January 1, 2005, from the obligation for pension payment liabilities related to past employee service with respect to the substitutional portion of its Employees “Pension Fund.
For the fiscal year, as a result, the Company recognized an extraordinary gain of ¥11,747 million from the return of the substitutional portion of the employees’ pension fund to the government.
In addition, accompanying the enactment of the Defined Contribution Pension Plan Laws, the Company and certain of its domestic consolidated subsidiaries transferred a portion of their lump-sum retirement benefit plans to a defined contribution plan, which was accounted for under the provisions of “Accounting Principles for Transitions among Retirement Benefit Plans” (Corporate Accounting Guidelines No. 1).
This change in retirement benefit arrangement resulted in an extraordinary gain of ¥3,073 million for the fiscal year.
| (6) | Accrued Directors’ Retirement and Severance Costs |
To prepare for payments of directors’ retirement and severance benefits, the Company provides for an amount equal to the total benefits that would have become payable at the end of the fiscal year, in accordance with the internal policies, had all directors resigned voluntarily.
| 6. | Accounting for Significant Lease Transactions |
Finance lease transactions are accounted for using the same method applied to operating lease transactions, with the exception for those finance leases in which the legal title of the underlying property is transferred from the lessor to the lessee.
Fiscal 2005
(For the year ended March 31, 2006)
| 5. | Methods of Determining Significant Allowances: |
| (1) | Allowance for Doubtful Accounts |
Same as for the previous year
| (2) | Allowance for Investment Losses |
Same as for the previous year
| (3) | Allowance for Sales Returns |
Same as for the previous year
| (4) | Allowance for Sales Rebates |
Same as for the previous year
| (5) | Accrued Retirement and Severance Costs |
To prepare for future payments of retirement and severance benefits, the Company provides for an accrual based on estimated projected benefit obligations and plan assets at the end of the fiscal year.
Prior service cost is amortized under the straight-line method over a period of 10 years, which is equal to or less than the estimated average remaining years of service of the eligible employees at the time such prior service cost was incurred.
Actuarial gains and losses are amortized based on the straight-line method, beginning in the fiscal year following the year in which such gain or loss was initially measured, over a period of 10 years, which is equal to or less than the average remaining years of service of the eligible employees at the time such actuarial gain or loss occurred.
(Supplemental Information)
Accompanying the enactment of the Defined Benefit Pension Law, the Company received an approval of exemption from the Minister of Health, Labour and Welfare on January 1, 2005, from the obligation for pension payment liabilities related to past employee service with respect to the substitutional portion of its Employees’ Pension Fund, and on May 31, 2005, a payment was made to transfer the plan assets related to the substitutional portion to the government based on the minimum liability.
For the fiscal year, as a result of this return of plan assets, the Company recognized an extraordinary gain of ¥163 million.
| (6) | Accrued Directors’ Retirement and Severance Costs |
Same as for the previous year
| 6. | Accounting for Significant Lease Transactions |
Same as for the previous year
Fiscal 2004
(For the year ended March 31, 2005)
| 7. | Significant Hedge Accounting Method |
| (1) | Hedge Accounting Method |
The Company employs the deferred hedge method of accounting. Foreign exchange forward contracts that meet certain hedge criteria are accounted for as a hedge of underlying assets and liabilities.
| (2) | Hedging Instruments and Hedged Items |
Hedging Instruments: Foreign exchange forward contracts and other Hedged
Items: Assets denominated in foreign currencies.
| (3) | Hedge Policy |
The Company hedges foreign exchange rate fluctuation risks in accordance with its internal policies.
| (4) | Method of Assessing Hedge Effectiveness |
Based on its internal policies, the Company evaluates the effectiveness of hedges by examining the correlations between its hedging instruments and hedged items as a result of fluctuations in foreign currency exchange rates and confirms the effectiveness of its hedge relationship.
| 8. | Other Significant Accounting Policies |
Accounting for Consumption Tax
The tax-exclusion (net of tax) method is used to account for the national and local consumption taxes.
Fiscal 2005
(For the year ended March 31, 2006)
| 7. | Significant Hedge Accounting Method |
| (1) | Hedge Accounting Method |
Same as for the previous year
| (2) | Hedging Instruments and Hedged Items |
Same as for the previous year
| (3) | Hedge Policy |
Same as for the previous year
| (4) | Method of Assessing Hedge Effectiveness |
Same as for the previous year
| 8. | Other Significant Accounting Policies |
Accounting for Consumption Tax
Same as for the previous year
Changes in Significant Principles and Policies for the Preparation of the Non-Consolidated Financial Statements
Fiscal 2005
Fiscal 2004
(For the year ended March 31, 2005)
–
Fiscal 2005
(For the year ended March 31, 2006)
(Accounting for Impairment of Property, Plant and Equipment)
Effective in the current fiscal year, the Company adopted the new accounting standard as required for impairment of property, plant and equipment (“Opinion Concerning Establishment of Accounting Standard for Impairment of Fixed Assets” issued by the Business Accounting Deliberation Council on August 9, 2002) and its implementation guidance (the Financial Accounting Standard Implementation Guidance No. 6 issued by the Accounting Standards Board of Japan on October 31, 2003). As a result of this adoption, income before income taxes was decreased by ¥842 million.
An accumulated impairment loss is recorded as direct reduction in the book value of respective assets in accordance with the revised regulations for financial statement presentation.
Notes to Non-Consolidated Financial Statements
(Notes to Non-Consolidated Balance Sheets)
As of March 31, 2005
*1. Authorized number of shares | 789,000,000 common shares | |
Number of shares issued | 286,453,235 common shares |
| *2. | Treasury stock |
The number of share in treasury stock owned by the Company at the end of the fiscal year was 18,049,212 shares of common stock.
| 3. | Contingent Liabilities |
| (1) | The Company guarantees certain debt and other obligations owed to financial institutions |
| (Millions of yen) | ||
Guarantees provided for employees’ (housing loans, etc) | 2,540 | |
Aventis Pasteur-Daiichi Vaccines Co., Ltd. | 350 |
| (2) | Trade export notes receivable discounted 78 |
| *4. | Assets and liabilities related to affiliated to companies were as follows: |
| (Millions of yen) | ||
Accounts receivable | 831 | |
Accounts payable | 5,402 |
| *5. | The Company holds the excess working capital of its subsidiaries |
| 6. | Commitment Line Contracts |
To facilitate the efficient raising of working capital, the Company maintains committed lines of credit with four financial institutions. The unused balance of credit lines under these commitments at the fiscal year-end was as follows:
| (Millions of yen) | ||
Total amount of committed credit lines | 30,000 | |
Less amount borrowed against credit lines | — | |
Credit lines unused | 30,000 |
| 7. | Limitations on Dividends |
The restricted net assets of the Company, attributable the mark-to-market adjustment to the assets specified in Article 124-3 of the Commercial Code of Japan, was ¥18,115 million.
As of March 31, 2006
*1. Authorized number of shares | 771,966,858 common shares |
Under its Articles of Incorporation, the Company is authorized to issue 789,000,000 common shares. However on September 26, 2005, 17,033,142 common shares were retired.
Number of shares issued | 269,420,093 common shares |
*2.–
| 3. | Contingent Liabilities |
(1) The Company guarantees certain debt and other obligations owed to financial institutions
| (Millions of yen) | ||
Guarantees provided for employees’ (housing loans, etc) | 2,038 | |
Sanofi- Pasteur-Daiichi Vaccines Co., Ltd. | 350 |
| (2) | Trade export notes receivable discounted 28 |
| *4. | Assets and liabilities related to affiliated companies were as follows: |
| (Millions of yen) | ||
Accounts receivable | 891 | |
Accounts payable | 14,074 |
| *5. | Same as for the previous year |
| 6. | Commitment Line Contract |
To facilitate the efficient raising of working capital, the Company maintains committed lines of credit with four financial institutions. The unused balance of credit lines under these commitments at the fiscal year-end was as follows:
| (Millions of yen) | ||
Total amount of committed credit lines | 30,000 | |
Less amount borrowed against credit lines | — | |
Credit lines unused | 30,000 |
| 7. | Limitations on Dividends |
The restricted net assets of the Company, attributable to the mark-to-market adjustment to the assets specified in Article 124-3 of the old Commercial Code of Japan, was ¥35,780 million.
(Notes to Non-Consolidated Statement of Income)
Fiscal 2004
(For the year ended March 31, 2005)
| *1. | Research and development expenses included under selling, general and administrative expenses and manufacturing overhead costs |
| (Millions of yen) | ||
| 43,886 |
*2.
| (1) | Losses from application of the lower of cost or market method to inventories were accounted for at their net amount in non-operating expenses (loss on disposal and write-down of inventories) under the periodic reserve method. |
| (Millions of yen) | |||
Reversal of valuation losses | 414 | ||
Provision for evaluation losses | 277 | ||
Net difference | (137 | ) |
| (2) | The amount transferred to other accounts included expense items such as sales promotion and valuation losses. |
| *3. | The amount of procurement from affiliated companies included in cost of sale and selling, general and administrative expenses |
| (Millions of yen) | ||
| 33,083 |
| *4. | Of allowance for doubtful accounts recognized during the year, the amount relating to affiliates was as follows. |
| (Millions of yen) | ||
| 297 |
| *5. | A gain on sale of the veterinary and livestock feed product business was recognized as a result of sale of the domestic distribution rights and other intangibles related to its veterinary and livestock feed product business to a third-party. |
| *6. |
| *7. | Loss on settlement of vitamin-related anti-trust litigations |
The loss on settlement of vitamin-related anti-trust litigations was related to a settlement of a part of the civil anti-trust class-action damage claims in connection with the Company’s vitamin transactions.
| *8. | A restructuring charge was recorded for the one-time termination benefits provided to certain employees who were involuntarily transferred from the Company to a newly established wholly- owned subsidiary, Daiichi Pharmatech Co., Ltd. |
| *9. |
Fiscal 2005
(For the year ended March 31, 2006)
| *1. | Research and development expenses included under selling, general and administrative expenses and manufacturing overhead costs |
| (Millions of yen) | ||
| 46,736 |
*2.
| (1) | Losses from application of the lower of cost or market method to inventories were accounted for at their net amount in non-operating expenses (loss on disposal and write-down of inventories) under the periodic reserve method. During the fiscal year, the Company allocated to Daiichi Pharmatec Co., Ltd. a portion of the reversal, in the amount of ¥23 million, of the valuation losses that the Company had recognized in the previous fiscal year. |
| (Millions of yen) | |||
Reversal of valuation losses | 253 | ||
Provision for evaluation losses | 207 | ||
Net difference | (46 | ) |
| (2) | Same as for the previous year |
| *3. | The amount of procurement from affiliated companies included in cost of sale and selling, general and administrative expenses |
| (Millions of yen) | ||
| 120,557 |
| *4. | Of rental income recognized during the year, the amount relating to affiliates was as follows. |
| (Millions of yen) | ||
| 1,448 |
| *5. |
| *6. | Losses from business integration |
The loss represents one-time costs associated with the integration of business operations of the Company and Sankyo Company, Limited. The breakdown of this expense is as follows
| (Millions of yen) | ||
Expenses associated with the integration of the healthcare business | 448 | |
Other research and consulting expenses | 807 |
| *7. | Loss on settlement of vitamin-related anti-trust litigations |
The amount represents a penalty resulting from an unsuccessful appeal against the EC ruling that the Company participated in a vitamin cartel.
| *8. |
| *9. | The Company classifies the operating assets held and used into asset groups on the basis of operating segments in the management reporting in consideration of similarities of products or business activities, the uniformity with group management, and future maintenance sustainability. On the other hand, idle assets that are not directly used for its business operations are grouped on a property by properly basis. For the fiscal year, the Company recorded an impairment loss on the following asset groups: |
(Idle Assets)
Location | Function | Asset type | Status | |||
Shiroish-ku, Sapporo | Former Sapporo Distribution Center site | Land | Idle | |||
Shimotsuke-shi, Tochigi | Former Tochigi Research Center facility | Building, land, etc. | Idle | |||
Because the above asset groups are idle and have uncertain prospects for future utilization, their book values have been written down to a recoverable amount and such reductions in the amount of ¥842 million were recorded as a loss on impairment in the extraordinary losses.
The impairment loss consisted of ¥420 million associated with buildings, ¥17 million associated with other structures, ¥5 million associated with machinery and equipment, ¥4 million associated with tools and instruments, and ¥394 million associated with land.
Fiscal 2004
(For the year ended March 31, 2005)
| *10. | The breakdown of losses on sales of fixed assets was as follows: |
| (Millions of yen) | ||
Buildings | 382 | |
Machinery, and equipment | 132 | |
Furniture, tools and fixtures | 610 |
Fiscal 2004
(For the year ended March 31, 2005)
A recoverable amount of an asset group is estimated from its net realizable value, which is obtained based on third party appraisals.
| *10. | The breakdown of losses on sales of fixed assets was as follows: |
| (Millions of yen) | ||
Buildings | 97 | |
Machinery, and equipment | 62 | |
Furniture, tools and fixtures | 35 |
(1) Marketable and Investment Securities
None of the stock of subsidiaries and affiliated companies has a quoted market price.
(2) Deferred Income Taxes
| 1. | Principal Components of Deferred Tax Assets and Liabilities |
(Millions of yen)
Fiscal 2004 (As of 2005) | Fiscal 2005 (As of 2006) | |||||
Deferred tax assets: | ||||||
Allowance for investment losses on affiliated companies | 7,567 | 13,112 | ||||
Depreciation | 9,567 | 9,323 | ||||
Prepaid consigned research and co-development expenses, etc. | 3,468 | 4,389 | ||||
Accrued expenses | 3,183 | 2,996 | ||||
Accrued enterprise tax payable | 578 | 1,762 | ||||
Payables to the defined contribution pension plan | 2,127 | 1,131 | ||||
Impairment losses on investment securities | 1,005 | 848 | ||||
Accrued retirement and severance costs | 86 | 89 | ||||
Other | 3,706 | 4,778 | ||||
Subtotal | 31,291 | 38,433 | ||||
Valuation allowance | (8,510 | ) | (14,927 | ) | ||
Total deferred tax assets | 22,781 | 23,505 | ||||
Deferred tax liabilities: | ||||||
Unrealized holding gain on available-for-sale securities | (12,345 | ) | (24,386 | ) | ||
Prepaid pension costs | (6,822 | ) | (5,782 | ) | ||
Reserve for reduction in basis of fixed assets for tax purposes | (1,798 | ) | (1,793 | ) | ||
Total deferred tax liabilities | (20,967 | ) | (31,961 | ) | ||
Net deferred tax assets (liabilities) | 1,814 | (8,456 | ) | |||
2. Reconciliation of the difference between the statutory tax rate and the Company’s effective tax rate |
| |||||
Fiscal 2004 (As of 2005) | Fiscal 2005 (As of 2006) | |||||
| (percent) | (percent) | |||||
Statutory tax rate | 40.5 | 40.5 | ||||
(Adjustments) | ||||||
Non-deductible permanent differences including entertainment and other expenses | 3.8 | 3.2 | ||||
Deductible permanent differences including dividend received deductions and other items | (0.7 | ) | (1.1 | ) | ||
Per capita inhabitants’ taxes | 0.2 | 0.2 | ||||
Tax credit for research and development expenses | (5.5 | ) | (7.8 | ) | ||
Increase in valuation allowance | 19.0 | 10.9 | ||||
Other | (0.3 | ) | (0.2 | ) | ||
Effective tax rate | 57.0 | 45.7 | ||||
Per Share Information
Fiscal 2004 (For the year ended March 31, 2005) | Fiscal 2005 (For the year ended March 31, 2006) | |||||||
Net assets per share | ¥ | 1,545.88 | Net assets per share | ¥ | 1,587.54 | |||
Net income per share (basic) | ¥ | 71.53 | Net income per share (basic) | ¥ | 115.65 | |||
Net income per share (diluted) | ¥ | 71.50 | Net income per share (diluted) | ¥ | 115.62 | |||
Note: Calculations of basic and diluted net income per share were based on the following numerators and denominators:
(Millions of yen)
Fiscal Year 2004: (For the year ended March 31, 2005) | Fiscal Year 2005: (For the year ended March 31, 2006) | |||
| Net income per share (basic): | ||||
| Net income | 19,303 | 31,199 | ||
| Amount not available for common shareholders | 100 | 80 | ||
| (Including directors’ bonuses paid from net income of) | (100) | (80) | ||
| Net income available for dividends on common shares | 19,203 | 31,119 | ||
| Weighted-average number of common shares outstanding during the year (1,000 shares) | 268,481 | 269,078 | ||
| Net income per share (diluted): | ||||
| Additional dilutive common shares (1,000 shares) | 111 | 70 | ||
| (Including dilutive effect of stock options of) (1,000 shares) | (111) | (70) | ||
| Descriptions of potentially dilutive common shares that were not included in the computation of diluted net income per share because of their anti-dilutive effect. | Two share subscription right plans (related to 1,001 thousand shares) and one share purchase option plan (related to 4,090 units of options). | Two share subscription right plans (related to 1,001 thousand shares) All outstanding stock options were cancelled before the end of the fiscal year. |
(Subsequent Events)
Fiscal 2004
| • | Details on the integration of the Company’s operations with Sankyo Co., Ltd. though the formation of a joint holding company are provided on EDINET. |
| • | Details on the termination of stock option agreements are also available on EDINET. |
Fiscal 2005
None applicable
| 5. | Proposed Changes in Membership of the Board of Directors and Corporate Officers |
(as of June 28, 2006)
| 1. | Changes in Representative Directors* |
| (1) | Candidates scheduled for election to Representative Director |
Representative Director and Senior Managing Director | Tadao Suzuki | |
| (Currently, Senior Managing Director) | ||
Representative Director and Senior Managing Director | Tsutomu Une | |
| (Currently, Managing Director) | ||
| (2) | Directors Scheduled to Retire |
Kenichi Mizutani (Currently, Representative Director and Senior Managing Director)
Scheduled to be elected advisor of Daiichi Pharmaceutical Co., Ltd.
| 2. | Promotions of Directors |
| Managing Director | Hiroshi Sugiyama (Currently, Board Director, General Manager of Clinical Development Department 1) | |
| Managing Director | Toru Kuroda (Currently, Board Director, General Manager of Corporate Planning Department) | |
| Managing Director | Akira Nagano (Currently, Board of Director, Post-Marketing Surveillance/Quality Assurance) | |
| 3. | Changes of Corporate Officers |
(Candidates scheduled for election to Corporate Officers)
Corporate Officer | Masayuki Okamura (Currently, General Manager of Osaka Branch) | |
Corporate Officer | Tatsuro Miyagawa (Currently, General Manager of Corporate Communications Department) | |
Corporate Officer | Seiichi Yokoyama (Currently, Board Director of Daiichi Asubio Pharma Co., Ltd.) | |
(Corporate Officer scheduled to retire)
Corporate Officer | Yuichi Kanou (Currently, Board Director and Executive Vice President of Daiichi Sankyo Healthcare Co., Ltd.) | |
| Scheduled to be re-elected Board Director and Executive Vice President of Daiichi Sankyo Healthcare Co., Ltd. | ||