UNITED STATES
SECURITIES AND EXCHANGE COMMISSION
Washington, D.C. 20549
FORM N-CSR
CERTIFIED SHAREHOLDER REPORT OF REGISTERED
MANAGEMENT INVESTMENT COMPANIES
Investment Company Act file number: 811-21825
AARP FUNDS
(Exact name of registrant as specified in charter)
650 F. Street, N.W.
Washington, DC 20004
(Address of principal executive offices) (Zip code)
| | |
| (Name and Address of Agent for Service) | | Copy to: |
| |
Richard Hisey AARP Financial Incorporated Two Highwood Drive, Suite 202 Tewksbury, MA 01876 | | Gary O. Cohen, Esq. Jorden Burt LLP 1025 Thomas Jefferson Street, NW Suite 400 East Washington, DC 20007-5208 |
Registrant’s telephone number, including area code: (202) 434-3650
Date of fiscal year end: June 30
Date of reporting period: June 30, 2008
| Item 1. | Report to Shareholders |

Letter to Shareholders
Market Commentary
Annual Report
June 30, 2008
AARP Aggressive Fund
AARP Moderate Fund
AARP Conservative Fund
AARP Income Fund
AARP Money Market Fund
A LETTER TO SHAREHOLDERS
| | |

Richard M. Hisey President, AARP Funds | | Dear Fellow Shareholder, Over the past year, an impressive array of macroeconomic difficulties has challenged economies – both developed and emerging – and depressed financial markets. Rising oil and commodity prices, falling home values and a weakening job market have pressured stock prices, while credit and inflation concerns have limited bond market returns. Smart strategies for volatile times While it is never easy to watch an account decline in value, remember that any new funds added during market downturns have |
greater purchasing power – your money simply buys more shares at lower prices. This is the same strategy that savvy shoppers employ when items go on sale prompting them to stock up. However, sales do not go on forever and some shoppers, who wait for even lower prices, may miss out on good bargains. Similarly, if you are unnerved by the current downturn or are sitting on the sidelines, rather than continuing to make regular investments according to an overall plan1, you may forfeit the opportunity to “buy low” – to invest in funds when they may be bargain priced.
One way of judging how cheap or expensive stocks are is to examine their price-to-earnings ratio or P/E ratio. The P/E ratio is a measurement tool that compares a companies’ stock price to its earnings. A lower P/E ratio is generally better. Without getting overly complicated, the price to earnings ratio of the Standard and Poor’s 500 Index was 17.64 as of June 30, 2008. This ratio is below the 5-, 10-, and 20-year historical averages, which range between 20 and 26. Put simply, on a relative basis, stock prices are cheaper than they have been in the recent past.
Can prices get even cheaper? Possibly. The truth is not even knowledgeable, experienced professionals know what will happen next. However, history shows that downturns are natural, normal and – yes, even healthy, because they can help bring exuberant markets back into balance. Investors who understand this often find it easier to stay focused on their goals and to continue to invest regardless of the environment – a rewarding strategy because the long-term direction of both stocks and bonds has been upward, despite recessions and bear markets. To sell a losing investment is to ensure a loss. In addition, you risk missing out on any substantial gains when markets recover and they have often done so in the past, with big moves over a short period of time.
So if you’re tempted to get out of the investment markets during volatile times, consider what you may miss. One of the basic principles of investing is to invest for the long term. Over time, riding out the high and lows of the market has proven to be a more effective financial strategy.
NOT PART OF THE ANNUAL REPORT
The benefits of diversification
While the bond market has delivered gains over the past year, stocks have experienced a bear-market decline of approximately 20%. As a result, investors with diversified portfolios, such as those represented by AARP lifestyle funds, have had a built-in cushion against stock market volatility. These funds have held up better than funds that invest in the stock market only.
Diversification2 is just one of the benefits of investing in AARP Funds. In addition, they offer low fees, the benefits of indexing, automatic rebalancing3 and simple choices. If you have questions about your funds, call a Financial Advisor at AARP Financial. Our advisors are salaried professionals who are focused on your needs – they do not work on commission. They can provide guidance, answer your questions and help you make informed decisions about your investments especially in this challenging environment. You can discuss your financial needs with one of these capable and experienced professionals by calling 1-800-958-6457 any time between 8:00 a.m. and 6:00 p.m. Eastern Time, Monday through Friday.
Thank you for investing in AARP Funds. We will continue to work hard to earn your confidence and to help you keep your long-term financial goals on target.
Sincerely,

Richard M. Hisey
President, AARP Funds
This Shareholder Report must be preceded or accompanied by the AARP Funds prospectus for individuals who are not current AARP Funds shareholders. An investor should consider the investment objectives, risks, charges and expenses of AARP Funds carefully before investing. To get an additional prospectus containing this and other information, please call 1-800-958-6457. Read the prospectus carefully before you invest.
While AARP has licensed the use of its name to AARP Funds and endorses the services provided by AARP Financial Inc., AARP does not offer financial products or services itself, and it cannot recommend that you or any specific individual should purchase any particular product or service. AARP Financial Inc. is a registered investment adviser and a subsidiary of AARP.
Financial Advisors are registered as representatives of ALPS Distributors, Inc., a registered broker-dealer, and as investment adviser representatives of AARP Financial Inc, a registered investment adviser. AARP Financial Inc. offers investment advisory services and is not affiliated with ALPS Distributors, Inc
AARP Funds are advised by AARP Financial Inc. and distributed by ALPS Distributors, Inc.
1 | An Automatic Investment Plan does not assure a profit and does not protect against a loss in a declining market. |
2 | Diversification can help you reduce overall risk although it does not eliminate the risk of investment loss. |
3 | The sale of an investment for the purpose of rebalancing may be subject to taxes. |
NOT PART OF THE ANNUAL REPORT
Market Commentary June 30, 2008
Equity markets extended their losses in the second quarter of 2008, as fresh worries about the banking sector – precipitated by problems at government-sponsored residential mortgage enterprises, Freddie Mac and Fannie Mae – as well as rising food and energy prices, weighed heavily on investor sentiment. Despite a rebound in the months of April and May, hopes for a recovery were dashed as June proved to be a challenging month for global equity markets. It was the third consecutive quarter of negative performance for the S&P 500 Index, which has lost 11.96% for the year through June 30. The Morgan Stanley Capital International (“MSCI”) U.S. Investable Market 2500 Index recorded a 1.52% loss for the quarter, bringing its six month return to -10.82%.
Other than energy and materials, all major sectors lost value during the first half of the year, with the financial sector down almost 30%. International equities, as measured by the MSCI EAFE (Europe, Australasia, and Far East) Index, recorded a 2.25% loss for the quarter, bringing the six month total to -10.96%. With the exception of Canada – which is enjoying the fruits of the recent energy boom – all major developed market indices lost value in first half of 2008, as the run up in energy prices exacts a heavy toll in virtually all economies. However, despite the problems at Fannie and Freddie and the substantial write-offs undertaken in the banking and finance sectors in general, bonds, as measured by the Lehman Brothers Aggregate Bond Index, have fared well. While the index is only marginally positive – up 1.13% year-to-date – bonds generally provided welcome relief to investors who have experienced double-digit losses in equities during this time.
While many indices have fallen into what is considered bear market territory, not all the news on the economy is bad. First, corporate balance sheets remain strong, with large cash positions and low inventory levels. Second, the overall trade balance has recovered in response to a weaker dollar. In fact, U.S. exports, aided by sustained weakness in the U.S. dollar, have helped many American multinationals withstand a slowing U.S. economy better than smaller companies with primarily domestic markets. In the second quarter, Coca Cola noted that, while domestic beverage sales have softened, international revenue received a boost from the weak dollar. And, surprisingly, a weak dollar, coupled with high
NOT PART OF THE ANNUAL REPORT
energy prices, have been a boon for a few U.S. firms. Honeywell, which derives a signification portion of its revenue overseas, has said that higher energy prices have actually helped with sales of temperature control equipment as customers seek energy savings. Although non-farm payrolls have fallen during 2008, the decline is substantially below that of 2001-2002. Finally, while some economists predicted that the U.S. economy would shrink in the first quarter, the final GDP results showed the economy growing by a percentage point.
While debates continue as to whether or not the U.S. economy is in, or will head into, recession; whether the recent run-up in oil and other commodity prices is a boom or a bubble; and whether or not there will be additional fallout from the credit crunch, there is no question that world economy faces an uphill battle. The recent convergence of events serves as a reminder of why it is important to focus on long term performance. Maintaining a well-diversified mix of investments with a long term viewpoint is one of the best ways to ride out unnerving and, sometimes extreme, short-term market trends.
The views, forecasts and supporting information contained in this Market Commentary are as of June 30, 2008 and are subject to change.
Sources: SSgA Funds Management, Inc., MSCI Barra, Lehman Brothers, Inc., IMF
NOT PART OF THE ANNUAL REPORT
AARP FUNDS
…
Annual Report
June 30, 2008
…
KEEPING YOU INFORMED
This shareholder report for the AARP Funds represents our commitment to providing communications that are clear, concise and informative. One of our highest priorities at AARP Funds is to help you make sense of investment information that is often complex. We hope you find it helpful in evaluating your investment with us.
EXPERTISE AND GUIDANCE WHEN YOU NEED IT
AARP Financial’s Financial Advisors are ready to help you determine if you are on track financially for retirement and to answer specific questions about AARP Funds. They work on salary, not commission, and are there to help you focus on your goals, take decisive action and feel comfortable with your decisions. Financial Advisors are FINRA registered representatives through ALPS Distributors, Inc., and are employed by AARP Financial.
| | | | |
| | AARP FUNDS 2008 ANNUAL REPORT | | 1 |
Table of Contents
This Shareholder Report must be preceded or accompanied by the AARP Funds prospectus for individuals who are not current AARP Funds shareholders. An investor should consider the investment objectives, risks, charges and expenses of AARP Funds carefully before investing. To get an additional prospectus containing this and other information, please call 1-800-958-6457. Read the prospectus carefully before you invest.
While AARP has licensed the use of its name to AARP Funds and endorses the services provided by AARP Financial Inc., AARP cannot recommend that you or any specific individual should purchase shares of a particular fund. AARP is not a registered investment adviser or broker/dealer.
AARP Funds are distributed by ALPS Distributors, Inc.
AARP Financial Inc. is not affiliated with ALPS Distributors, Inc.
| | | | |
| 2 | | AARP FUNDS 2008 ANNUAL REPORT | | AARP Funds Overview |
AARP Funds Overview
The AARP Funds (excluding the AARP Money Market Fund) are “funds of funds” because they invest substantially all of their assets in the underlying AARP Portfolios (the “AARP Portfolios”), each of which is a separately registered investment company.
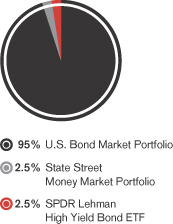
The AARP Funds (excluding the AARP Money Market Fund) invest in one or more of the AARP Portfolios, but in different amounts. In addition to its investment in the U.S. Bond Market Portfolio, the AARP Income Fund also invests a portion of its assets in the SPDR Lehman High Yield Bond ETF and the State Street Money Market Portfolio (the “State Street Portfolio”), a series of a separately registered investment company called the State Street Master Funds.
The AARP Money Market Fund is a feeder fund, buying shares of the master fund, the State Street Portfolio. This is called a “master-feeder” structure because it allows different feeder funds to pool their assets in an underlying master fund to seek economies of scale.
| | | | | | | | | | |
| | | | | | |
| | | AARP
Aggressive Fund | | AARP
Moderate Fund | | AARP
Conservative Fund | | AARP
Income Fund | | AARP Money
Market Fund |
| Investment Objective | | Seeks growth of capital and some current income | | Seeks a balance of growth of capital and current income | | Seeks primarily current income, with some growth of capital | | Seeks current income and long- term preservation of capital | | Seeks current income, liquidity, preservation of capital, and a stable $1.00 per
share price |
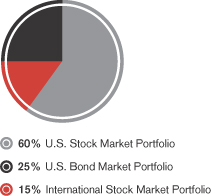
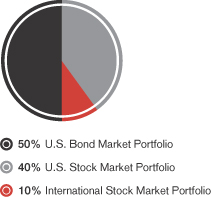
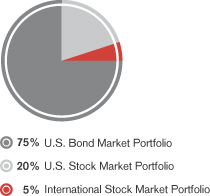
U.S. Stock
Market Portfolio | | 60% | | 40% | | 20% | | – | | – |
U.S. Bond
Market Portfolio | | 25% | | 50% | | 75% | | 95% | | – |
International Stock
Market Portfolio | | 15% | | 10% | | 5% | | – | | – |
State Street
Portfolio | | – | | – | | – | | 2.5% | | 100% |
| SPDR Lehman High Yield Bond ETF | | – | | – | | – | | 2.5% | | – |
Source: AARP Funds
AARP Portfolios Top 10 Holdings as a percentage of net assets at June 30, 2008
| | | | | | | | | | | | | | | | | | |
| U.S. Stock Market Portfolio | | | | | | U.S. Bond Market Portfolio | | | | | | International Stock Market Portfolio |
| | | | | | | | | |
Exxon Mobil Corp. | | 3.3% | | | | | | FHLMC, 5.500%, 3/1/36 | | 1.8% | | | | | | BP PLC | | 1.7% |
General Electric Co. | | 1.9% | | | | | | U.S. Treasury Notes,
4.625%, 2/15/17 | | 1.5% | | | | | | Total SA | | 1.4% |
Microsoft Corp. | | 1.6% | | | | | | U.S. Treasury Notes,
3.125%, 5/15/18 | | 1.4% | | | | | | HSBC Holdings PLC | | 1.4% |
Chevron Corp. | | 1.4% | | | | | | U.S. Treasury Notes,
2.625%, 5/31/10 | | 1.3% | | | | | | Nestle SA | | 1.4% |
AT&T, Inc. | | 1.4% | | | | | | U.S. Treasury Notes,
4.250%, 11/1/15 | | 1.1% | | | | | | Vodafone Group PLC | | 1.2% |
Procter & Gamble Co. | | 1.3% | | | | | | FHLMC, 5.000%, 3/1/36 | | 1.0% | | | | | | Royal Dutch Shell PLC | | 1.1% |
Johnson & Johnson | | 1.3% | | | | | | FNMA, 5.500%, 4/1/35 | | 1.0% | | | | | | BHP Billiton Ltd. | | 1.1% |
International Business Machines Corp. | | 1.1% | | | | | | FNMA, 7.000%, 8/1/37 | | 0.9% | | | | | | Toyota Motor Corp. | | 1.0% |
Apple Computer, Inc. | | 1.0% | | | | | | FNMA, 4.750%, 12/15/10 | | 0.9% | | | | | | Novartis AG | | 1.0% |
ConocoPhillips | | 1.0% | | | | | | U.S. Treasury Notes,
4.000%, 4/15/10 | | 0.9% | | | | | | E.ON AG | | 1.0% |
Total | | 15.3% | | | | | | Total | | 11.8% | | | | | | Total | | 12.3% |
| | | | |
| How the Funds Performed | | AARP FUNDS 2008 ANNUAL REPORT | | 3 |
How the Funds Performed as of June 30, 2008
| | | | | | | | | | | | | | | |
| | | | | | | | |
| | | | | | | | | 1 year | | | | Average annual since
inception | | | |
| | | | | AARP Aggressive Fund | | | | -7.49% | | | | 4.43% | 1 | | |
| | | | | Aggressive Composite Index | | | | -7.28% | | | | 4.94% | 1 | | |
| | | | | MSCI U.S. Investable Market 2500 Index®2 | | | | -12.30% | | | | 3.58% | 1 | | |
| | | | | AARP Moderate Fund | | | | -2.79% | | | | 4.53% | 1 | | |
| | | | | Moderate Composite Index | | | | -2.56% | | | | 5.04% | 1 | | |
| | | | | MSCI U.S. Investable Market 2500 Index®2 | | | | -12.30% | | | | 3.58% | 1 | | |
| | | | | Lehman Brothers Aggregate Bond Index®2 | | | | 7.12% | | | | 4.96% | 1 | | |
| | | | | AARP Conservative Fund | | | | 2.04% | | | | 4.60% | 1 | | |
| | | | | Conservative Composite Index | | | | 2.24% | | | | 5.04% | 1 | | |
| | | | | Lehman Brothers Aggregate Bond Index®2 | | | | 7.12% | | | | 4.96% | 1 | | |
| | | | | AARP Income Fund | | | | 6.83% | | | | 4.89% | 3 | | |
| | | | | Income Composite Index | | | | 6.93% | | | | 5.25% | 3 | | |
| | | | | Lehman Brothers Aggregate Bond Index®2 | | | | 7.12% | | | | 5.30% | 3 | | |
| | | | | Citigroup 3-Month Treasury Bill Index | | | | 3.33% | | | | 4.07% | 3 | | |
| | | | | AARP Money Market Fund | | | | 4.09% | | | | 4.59% | 4 | | |
| | | | | Citigroup 3-Month Treasury Bill Index | | | | 3.33% | | | | 4.19% | 4 | | |
| | | | | AARP Money Market Fund 7-Day Annualized Yield | | | | 2.30% | | | | | | | |
| | |
| | | 1 For the period from January 1, 2006 (commencement of operations) to June 30, 2008. 2 The MSCI U.S. Investable Market 2500 Index and the Lehman Brothers Aggregate Bond Index serve as broad measures of the U.S equity and taxable bond markets, respectively. Since the Funds invest in differing combinations of these and other markets, Composite Indexes have been constucted utilizing the proportionate weightings of the indexes for each market. These Composite Indexes provide a particularly useful benchmark to measure the performance of the Funds. For more detailed information regarding the Composite Indexes, please see A Word about Benchmarks that follows. 3 For the period from September 29, 2006 (commencement of operations) to June 30, 2008. 4 For the period from July 1, 2006 (commencement of operations) to June 30, 2008. Sources: MSCI Barra, Lehman Brothers Inc., Citigroup, AARP Financial Inc. Total returns for periods less than one year are not annualized. |
Total annual fund operating fees and expense are 1.33% for the Aggressive Fund, 0.92% for the Moderate Fund, 1.59% for the Conservative Fund, 4.64% for the Income Fund and 0.83% for the Money Market Fund. Net annual fund operating fees and expenses for the funds (after contractual waivers and/or reimbursements) are 0.30% for the Money Market Fund and 0.50% for the others through November 1, 2008 and November 1, 2009, respectively.
Performance data quoted represents past performance which is no guarantee of future results. Investment return and principal value will fluctuate so that an investor’s shares, when redeemed, may be worth more or less than their original cost. Mutual fund performance changes over time and current performance may be lower or higher than what is stated. Returns shown do not reflect the deduction of taxes that a shareholder may pay on fund distributions or the redemption of fund shares. Mutual funds are not obligations of or guaranteed by any bank and are not federally insured. The performance of the Funds assumes the reinvestment of all dividends and distributions. The indexes above have been adjusted to reflect reinvestment of dividends on securities in the indexes. The adviser is waiving a portion of its advisory fee and other operating expenses. Had the fees not been waived or reimbursed, returns would have been lower. It is not possible to invest directly in an Index.
For the most recent month-end performance and after-tax returns, visit www.aarpfunds.com or call 1-800-958-6457.
An investment in the AARP Money Market Fund is not insured or guaranteed by the Federal Deposit Insurance Corporation or any other government agency. Although the Fund seeks to preserve the value of your investment at $1.00 per share, it is possible to lose money by investing in the Fund.
| | | | |
| 4 | | AARP FUNDS 2008 ANNUAL REPORT | | A Word about Benchmarks |
A Word about Benchmarks
A useful tool to measure the performance of AARP Funds.
When evaluating how your investment performed, it’s helpful to compare it to an appropriate benchmark. You can think of the benchmark as a handy yardstick for measuring how well the fund did in meeting its investment objectives. For example, the AARP Income Fund tries to produce comparable returns of the Lehman Brothers Aggregate Bond Index.
The AARP Aggressive Fund, AARP Moderate Fund and AARP Conservative Fund are indexed and try to produce the returns of a mixture of three indexes. For these Funds, a particularly useful benchmark is one that combines the three indexes in similar amounts to the target investments of the Funds. When you combine different indexes into one benchmark, it’s called a “composite index”.
We also believe it is useful for you to consider the returns of the overall bond and stock markets when you assess the performance of the AARP Funds. This allows you to see how diversification works in practice. Sometimes the bond and stock markets move in opposite directions, or when the stock market goes down, the bond market doesn’t go quite as far down.
There is one caveat though. Please remember that a benchmark of indexes has a built-in performance advantage over an actual mutual fund. An index is merely a list of securities in a stock or bond market so the returns of indexes do not reflect the real world costs of managing a mutual fund. It is difficult to match the returns of an index because of this difference.

Indexes vs. index funds
Indexes, as opposed to index funds, are a group or list of securities representing a market or part of a market. The returns of the index do not reflect the costs of actually investing in the index and do not include fees, brokerage commissions or other expenses of investing. While you can invest in an index fund – it’s a real investment, you cannot invest directly in an index – it’s just a list.
| | | | |
| A Word about Benchmarks | | AARP FUNDS 2008 ANNUAL REPORT | | 5 |
Following is a table that shows the make up of the index weightings for each AARP Fund:
| | | | | | | | | | | | | | |
| | | | | | | | |
| | | | | AARP
Aggressive Fund | | AARP
Moderate Fund | | AARP
Conservative
Fund | | AARP
Income Fund | | AARP Money
Market Fund | | |
| | | | | Aggressive
Composite
Index | | Moderate
Composite
Index | | Conservative
Composite
Index | | Income
Composite
Index | | | | |
| | | MSCI U.S. Investable
Market 2500 Index® | | 60% | | 40% | | 20% | | – | | – | | |
| | | Lehman Brothers
Aggregate Bond Index® | | 25% | | 50% | | 75% | | 95% | | – | | |
| | | MSCI EAFE Index® | | 15% | | 10% | | 5% | | – | | – | | |
| | | Citigroup 3-Month
Treasury Bill Index | | – | | – | | – | | 5% | | 100% | | |
Source: AARP Funds
A description of each index
• | | MSCI U.S. Investable Market 2500 Index®* – The index includes about 2,500 securities listed on the New York and American Stock Exchanges and the Nasdaq over-the-counter market. The stocks include companies of all types and sizes, which represent the investable universe of companies in the U.S. Equity market. |
• | | Lehman Brothers Aggregate Bond Index® – The index includes a large variety of U.S. and foreign bonds traded in U.S. markets that are investment grade and taxable, covering three major types of bonds: government and corporate bonds, mortgage-backed securities and asset-backed securities. |
• | | MSCI EAFE Index®* – The index includes about 1,000 securities that are listed on the stock exchanges of 21 developed countries, excluding the United States and Canada. |
| • | | Citigroup 3-Month Treasury Bill Index – The index is comprised of equal dollar amounts of 3-Month Treasury Bills purchased at the beginning of each of the prior three consecutive months. As each bill matures, all proceeds are reinvested in a new 3-month bill. |
| * | Please note that although the AARP Funds seek to track these MSCI indexes, MSCI does not sponsor, endorse, or promote the AARP Funds. For a more detailed description of our relationship with MSCI please see the statement of additional information for the AARP Funds. |
| | | | |
| 6 | | AARP FUNDS 2008 ANNUAL REPORT | | AARP Aggressive Fund Overview |
AARP Aggressive Fund Overview
| | | | | | |
| | | |
Portfolio of investments June 30, 2008 | | | | | | |
Mutual funds: 100.4% | | | | | | |
| | | Shares | | Value | |
| | | | | | | |
| U.S. Stock Market Portfolio1 – 60.2% | | 1,485,869 | | $ | 15,081,568 | |
| | |
| U.S. Bond Market Portfolio1 – 25.1% | | 629,658 | | | 6,283,987 | |
| | |
| International Stock Market Portfolio1 – 15.1% | | 340,288 | | | 3,770,392 | |
| | |
| Total investments: 100.4% (Identified cost $26,623,002) | | | | | 25,135,947 | |
| | | | | | | |
| Other assets and liabilities, net: (0.4)% | | | | | (91,453 | ) |
| | | | | | | |
| Total net assets: 100.0% | | | | $ | 25,044,494 | |
1 Affiliated issuer. See Notes to Financial Statements. | | | | | | |
| | |
| |
Performance as of June 30, 2008 |
| | |
Growth of $10,000 This graph illustrates the
hypothetical investment of
$10,000 in the AARP
Aggressive Fund from
January 1, 2006
(commencement of
operations) through June 30,
2008, compared to the
Aggressive Composite Index
and the MSCI U.S. Investable
Market 2500 Index.2 | | 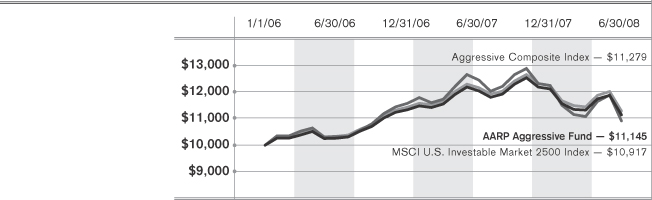 |
| | |
| | | This hypothetical example does not represent the returns of any particular investment. |
| | | | | | | | |
| | | | | |
| Performance summary | | Average Annual Returns as of June 30, 2008 | | 1-Year | | Since
inception | | |
| | | AARP Aggressive Fund | | (7.49)% | | 4.43%1 | | |
| | | Aggressive Composite Index2 | | (7.28)% | | 4.94%1 | | |
| | | MSCI U.S. Investable Market 2500 Index®2 | | (12.30)% | | 3.58%1 | | |
| | | | | |
| | |
| |
Performance data quoted represents past performance which is no guarantee of future results. Investment return and principal value will
fluctuate so that an investor’s shares, when redeemed, may be worth more or less than their original cost. Mutual fund performance changes
over time and current performance may be lower or higher than what is stated. Returns shown do not reflect the deduction of taxes that a
shareholder may pay on fund distributions or the redemption of fund shares. Mutual funds are not obligations of or guaranteed by any bank
and are not federally insured. The performance of the Funds assumes the reinvestment of all dividends and distributions. The indexes above
have been adjusted to reflect reinvestment of dividends on securities in the indexes. The adviser is waiving a portion of its advisory fee and
other operating expenses. Had the fees not been waived or reimbursed, returns would have been lower. It is not possible to invest directly in
an Index. For the most recent month-end performance and after-tax returns, visit www.aarpfunds.com or call 1-800-958-6457. 1 For the period from January 1, 2006 (commencement of operations) to June 30, 2008.
2 The MSCI U.S. Investable Market 2500 Index serves as a broad measure of the U.S. equity market. Since the Fund invests in differing
combinations of this and other markets, the Aggressive Composite Index has been constructed utilizing the proportionate weightings of the
indexes for each market. This Composite Index provides a particularly useful benchmark to measure the performance of the Fund. For more
detailed information regarding the Composite Indexes and the Underlying Indexes, please see “A Word about Benchmarks” on page 4. |
| | | | |
| AARP Aggressive Fund Overview | | AARP FUNDS 2008 ANNUAL REPORT | | 7 |
Portfolio construction
AARP Aggressive Fund
Performance commentary
The AARP Aggressive Fund seeks growth of capital and some current income. To achieve this objective, the Fund targets an asset allocation of 60% in U.S. equity, 15% in international equity, and 25% in bonds. For the year ended June 30, 2008, the AARP Aggressive Fund returned -7.49%, as compared to the Aggressive Composite Index return of -7.28% and the MSCI U.S. Investable Market 2500 Index return of -12.30%. The Fund’s performance includes the operating expenses, whereas index returns are unmanaged and do not include expenses of any kind. The Fund tracked its benchmark closely during the period and continues to benefit from its diversification to its underlying asset classes.
During the twelve month period ended June 30, 2008, stock returns have been negative; however, bond returns have been positive. In fact, strong bond returns enhanced the Fund’s performance during the period as the U.S. Bond Market Portfolio returned 7.20%. In contrast, weak equity performance, both in the U.S. and internationally, detracted from performance as the U.S. Stock Market Portfolio returned -12.35% and the International Stock Market Portfolio returned -10.62%, for the year ending June 30, 2008.
The twelve month period ended June 30, 2008 proved to be a volatile period for global financial markets and investors. The period did not start that way, as July 2007 recorded all-time highs in many major indices including the S&P 500 Index. However, a perfect storm of macroeconomic challenges, led off by problems in the U.S. sub-prime mortgage sector, erased those gains and subsequently produced double digit market losses in the months to come. Problems in the sub-prime mortgage market quickly spread to other credit sectors including the high yield corporate bond sector and resulted in massive asset write downs at several large financial institutions. In 2007, several mortgage-related hedge funds had collapsed; by February of 2008, a prominent investment bank had collapsed. During this time, the Federal Reserve Bank (“the Fed”) reduced key rates a number of times and took additional steps to mitigate the credit crunch and jump start economic growth. In addition, the U.S. Government launched a $160 billion fiscal stimulus package in the first half of 2008. While the package could very well have helped the U.S. economy avoid negative Gross Domestic Product growth in the 2nd Quarter of 2008, its long-term impact for the economy is questionable since the package consists of one-time tax rebates.
We believe that high market volatility is likely to persist and the risks to global growth are skewed to the downside, reflecting uncertainty about the effects of financial market turbulence, increasing inflation, and the resilience of the U.S. labor market. On the positive side, a persistently weak U.S. dollar has increased the competitiveness of U.S. produced goods sold overseas and has cushioned a slowdown in domestic consumer spending. At the same time, fear of a recession in the U.S. will continue to be a challenge for investors in the second half of 2008.
Sources: SSgA FM, Bloomberg, Factset
| | | | |
| 8 | | AARP FUNDS 2008 ANNUAL REPORT | | AARP Moderate Fund Overview |
AARP Moderate Fund Overview
| | | | | | |
| | | |
Portfolio of investments June 30, 2008 | | | | | | |
Mutual funds: 100.2% | | | | | | |
| | | Shares | | Value | |
| | | | | | | |
| U.S. Bond Market Portfolio1 – 50.1% | | 2,125,572 | | $ | 21,213,208 | |
| | |
| U.S. Stock Market Portfolio1 – 40.1% | | 1,671,977 | | | 16,970,566 | |
| | |
| International Stock Market Portfolio1 – 10.0% | | 382,910 | | | 4,242,641 | |
| | |
| Total investments: 100.2% (Identified cost $43,955,106) | | | | | 42,426,415 | |
| | | | | | | |
| Other assets and liabilities, net: (0.2)% | | | | | (102,859 | ) |
| | | | | | | |
| Total net assets: 100.0% | | | | $ | 42,323,556 | |
1 Affiliated issuer. See Notes to Financial Statements. | | | | | | |
| | |
| |
Performance as of June 30, 2008 |
| | |
Growth of $10,000 This graph illustrates the
hypothetical investment of
$10,000 in the AARP
Moderate Fund from
January 1, 2006
(commencement of
operations) through June 30,
2008, compared to the
Moderate Composite Index,
the MSCI U.S. Investable
Market 2500 Index, and the
Lehman Brothers Aggregate
Bond Index.2 | | 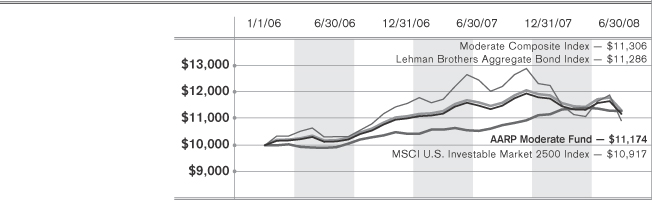 |
| | |
| | | This hypothetical example does not represent the returns of any particular investment. |
| | | | | | | | | | |
| | | | | | | |
| Performance summary | | Average Annual Returns as of June 30, 2008 | | 1-Year | | Since
inception | | | | |
| | | AARP Moderate Fund | | (2.79)% | | 4.53%1 | | | | |
| | | Moderate Composite Index2 | | (2.56)% | | 5.04%1 | | | | |
| | | MSCI U.S. Investable Market 2500 Index®2 | | (12.30)% | | 3.58%1 | | | | |
| | | Lehman Brothers Aggregate Bond Index®2 | | 7.12% | | 4.96%1 | | | | |
| | | | | | | |
| | | | |
| |
Performance data quoted represents past performance which is no guarantee of future results. Investment return and principal value will
fluctuate so that an investor’s shares, when redeemed, may be worth more or less than their original cost. Mutual fund performance changes
over time and current performance may be lower or higher than what is stated. Returns shown do not reflect the deduction of taxes that a
shareholder may pay on fund distributions or the redemption of fund shares. Mutual funds are not obligations of or guaranteed by any bank
and are not federally insured. The performance of the Funds assumes the reinvestment of all dividends and distributions. The indexes above
have been adjusted to reflect reinvestment of dividends on securities in the indexes. The adviser is waiving a portion of its advisory fee and other
operating expenses. Had the fees not been waived or reimbursed, returns would have been lower. It is not possible to invest directly in an Index. For the most recent month-end performance and after-tax returns, visit www.aarpfunds.com or call 1-800-958-6457. 1 For the period from January 1, 2006 (commencement of operations) to June 30, 2008.
2 The MSCI U.S. Investable Market 2500 Index and the Lehman Brothers Aggregate Bond Index serve as broad measures of the U.S.
equity and taxable bond market. Since the Fund invests in differing combinations of this and other markets, the Moderate Composite Index
has been constructed utilizing the proportionate weightings of the indexes for each market. This Composite Index provides a particularly
useful benchmark to measure the performance of the Fund. For more detailed information regarding the Composite Indexes and the
Underlying Indexes, please see “A Word about Benchmarks” on page 4. |
| | | | |
| AARP Moderate Fund Overview | | AARP FUNDS 2008 ANNUAL REPORT | | 9 |
Portfolio construction
Tracking difference
The difference between the performance of the Fund and its comparative index.
AARP Moderate Fund
Performance commentary
The AARP Moderate Fund seeks a balance of growth of capital and current income. To achieve this objective, the Fund targets an asset allocation of 50% in bonds, 40% in U.S. equity and 10% in international equity. For the year ended June 30, 2008, the AARP Moderate Fund returned -2.79%, as compared to the Moderate Composite Index return of -2.56%, 7.12% for the Lehman Brothers Aggregate Bond Index and -12.30% for the MSCI U.S. Investable Market 2500 Index. The Fund’s performance includes the operating expenses, whereas index returns are unmanaged and do not include expenses of any kind. The Fund tracked its benchmark closely during the period and continues to benefit from its diversification to its underlying asset classes.
During the twelve month period ended June 30, 2008, stock and bond performance was mixed. The Fund’s performance during the period was helped by its investment in the U.S. Bond Market Portfolio, which returned 7.20%. However, global equity investments declined in value and hurt performance as the U.S. Stock Market Portfolio returned -12.35% and the International Stock Market Portfolio returned -10.62%, for the year ending June 30, 2008.
The twelve month period ended June 30, 2008 was marked by increased volatility in global financial markets, precipitated in part by problems in the U.S. sub-prime credit market. Despite achieving a record closing high on July 19, 2007, the S&P 500 Index, and equity markets in general, experienced a sharp reversal in August as credit problems worsened and forced many institutions to sell equities to cover losses in certain bond sectors. The Federal Reserve Bank (“the Fed”) took swift and creative action to provide liquidity to the market. Not only did the Fed reduce key rates several times, but it also encouraged investment banks to borrow from it at its discount window.
A combination of rising oil and commodity prices, falling home prices and a weakening labor market resulted in a sharp decline in global equity prices in early 2008. Equity market investors grew increasingly concerned—with good reason—that the consumer and consumer related spending would be hurt by these factors. Consumer spending drives almost two-thirds of U.S. Gross Domestic Product. Once again, taking note of the situation and the potential negative implications, the Fed continued to ease monetary policy. As an additional measure, the U.S. Government launched a substantial fiscal stimulus package in the form of one-time tax rebates.
We believe that increased volatility in the markets is likely to persist and the risks to global economic growth remain high, reflecting uncertainty about the effects of financial market turmoil, increasing inflation and the resilience of the U.S. labor market. Accordingly, investors’ fear of a recession in the U.S. will continue to be a headwind in the second half of 2008.
Sources: SSgA FM, Bloomberg, Factset
| | | | |
| 10 | | AARP FUNDS 2008 ANNUAL REPORT | | AARP Conservative Fund Overview |
AARP Conservative Fund Overview
| | | | | | |
| | | |
Portfolio of investments June 30, 2008 | | | | | | |
Mutual funds: 100.4% | | | | | | |
| | | Shares | | Value | |
| | | | | | | |
| U.S. Bond Market Portfolio1 – 75.3% | | 1,363,005 | | $ | 13,602,788 | |
| | |
| U.S. Stock Market Portfolio1 – 20.1% | | 357,380 | | | 3,627,410 | |
| | |
| International Stock Market Portfolio1 – 5.0% | | 81,846 | | | 906,852 | |
| | |
| Total investments: 100.4% (Identified cost $18,414,765) | | | | | 18,137,050 | |
| | | | | | | |
| Other assets and liabilities, net: (0.4)% | | | | | (72,291 | ) |
| | | | | | | |
| Total net assets: 100.0% | | | | $ | 18,064,759 | |
1 Affiliated issuer. See Notes to Financial Statements. | | | | | | |
| | |
| |
Performance as of June 30, 2008 |
| | |
Growth of $10,000 This graph illustrates the
hypothetical investment of
$10,000 in the AARP
Conservative Fund from
January 1, 2006
(commencement of
operations) through June 30,
2008, compared to the
Conservative Composite
Index and the Lehman
Brothers Aggregate Bond
Index.2 | | 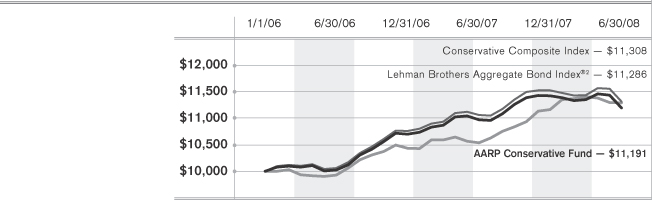 |
| | |
| | | This hypothetical example does not represent the returns of any particular investment. |
| | | | | | | | |
| | | | | |
| Performance summary | | Average Annual Returns as of June 30, 2008 | | 1-Year | | Since
inception | | |
| | | AARP Conservative Fund | | 2.04% | | 4.60%1 | | |
| | | Conservative Composite Index2 | | 2.24% | | 5.04%1 | | |
| | | Lehman Brothers Aggregate Bond Index®2 | | 7.12% | | 4.96%1 | | |
| | | | | |
| | |
| |
Performance data quoted represents past performance which is no guarantee of future results. Investment return and principal value will
fluctuate so that an investor’s shares, when redeemed, may be worth more or less than their original cost. Mutual fund performance changes
over time and current performance may be lower or higher than what is stated. Returns shown do not reflect the deduction of taxes that a
shareholder may pay on fund distributions or the redemption of fund shares. Mutual funds are not obligations of or guaranteed by any bank and
are not federally insured. The performance of the Funds assumes the reinvestment of all dividends and distributions. The indexes above have
been adjusted to reflect reinvestment of dividends on securities in the indexes. The adviser is waiving a portion of its advisory fee and other
operating expenses. Had the fees not been waived or reimbursed, returns would have been lower. It is not possible to invest directly in an Index. For the most recent month-end performance and after-tax returns, visit www.aarpfunds.com or call 1-800-958-6457. 1 For the period from January 1, 2006 (commencement of operations) to June 30, 2008.
2 The Lehman Brothers Aggregate Bond Index serves as a broad measure of the U.S. taxable bond market. Since the Fund invests in
differing combinations of this and other markets, the Conservative Composite Index has been constructed utilizing the proportionate
weightings of the indexes for each market. This Composite Index provides a particularly useful benchmark to measure the performance of
the Fund. For more detailed information regarding the Composite Indexes and the Underlying Indexes, please see “A Word about
Benchmarks” on page 4. Sources: Lehman Brothers, Inc., AARP Financial Inc. |
| | | | |
| AARP Conservative Fund Overview | | AARP FUNDS 2008 ANNUAL REPORT | | 11 |
Portfolio construction
AARP Conservative Fund
Performance commentary
The AARP Conservative Fund seeks primarily current income, with some growth of capital. To achieve this objective, the Fund targets an asset allocation of 75% in bonds, 20% in U.S. equity and 5% in international equity. For the year ended June 30, 2008, the AARP Conservative Fund returned 2.04%, as compared to the Conservative Composite Index return of 2.24%, and 7.12% for the Lehman Brothers Aggregate Bond Index. The Fund’s performance includes the operating expenses, whereas index returns are unmanaged and do not include expenses of any kind. The Fund tracked its benchmark closely during the period and continues to benefit from its diversification to its underlying asset classes.
During the twelve month period ended June 30, 2008, bonds performed considerably better than stocks. The Fund’s substantial allocation to U.S. investment-grade bonds helped to protect it from the downturn in the equity markets and problems that occurred in other sectors of the credit markets—most notably the sub-prime mortgage sector. The Fund’s performance was boosted by its investment in the U.S. Bond Market Portfolio which returned 7.20%. In contrast, the Fund’s 25% allocation to equities—both U.S. and developed international equities—detracted from performance as the U.S. Stock Market Portfolio returned -12.35% and the International Stock Market Portfolio returned -10.62%, for the year ending June 30, 2008.
Despite closing at record highs during July 2007, the S&P 500 Index, the Dow Jones Industrial Average and many other global indices lost ground during the twelve month period ended June 30, 2008. A slowdown and subsequent downturn in real estate markets throughout the U.S. translated into problems for the sub-prime mortgage market. These problems spread rapidly to other credit markets including the asset-backed commercial paper sector and the high-yield bond sector. This prompted investors to seek less risky alternatives such as U.S. Treasuries; the result of that demand pushed Treasury prices up and their yields down. Rising oil and commodity prices and their inflationary effects on consumer goods caused Treasury Inflation-Protected Securities (“TIPS”) to perform particularly well during this time.
During the previous twelve months, the Federal Reserve Bank (“the Fed”) took a number of steps to address the credit crunch and rejuvenate economic growth. In early 2008, and for the first time since the Great Depression, the Fed opened its discount window to help troubled investment banks. At the same time, the U.S. Government weighed in with a $160 billion fiscal stimulus package to help U.S. households cope with a depressed housing market, tightened lending standards and increased costs for food and fuel. As the second quarter of 2008 was coming to a close, both the U.S. Treasury and the Fed worked on plans to support mortgage giants Freddie Mac and Fannie Mae in order to prevent further problems and a potentially systemic collapse in the global financial markets.
We believe that volatility in the markets is likely to continue, at least in the near term. Although the Fed has worked diligently to contain the problems in the credit markets, it is unclear whether or not there will be additional flare-ups in the credit markets and subsequent asset write downs in the months to come. Much of the uncertainty centers on the U.S. consumer—already tapped from rising energy prices, falling home values and a weakening job market—and consumer spending. A weaker consumer could cause a further slowdown in the economy which could increase the likelihood of mortgage defaults and losses, and tempers expectations for global growth.
Sources: SSgA FM, Bloomberg, Factset
| | | | |
| 12 | | AARP FUNDS 2008 ANNUAL REPORT | | AARP Income Fund Overview |
AARP Income Fund Overview
| | | | | | |
| | | |
Portfolio of investments June 30, 2008 | | | | | | |
Mutual funds: 100.8% | | | | | | |
| | | Shares | | Value | |
| | | | | | | |
| U.S. Bond Market Portfolio1 – 95.7% | | 618,644 | | $ | 6,174,069 | |
| | |
| State Street Money Market Portfolio2 – 2.7% | | 173,789 | | | 173,789 | |
| | |
| SPDR Lehman High Yield Bond ETF2 – 2.4% | | 3,575 | | | 157,229 | |
| | |
| Total investments: 100.8% (Identified cost $6,576,981) | | | | | 6,505,087 | |
| | | | | | | |
| Other assets and liabilities, net: (0.8)% | | | | | (54,720 | ) |
| | | | | | | |
| Total net assets: 100.0% | | | | $ | 6,450,367 | |
1 Affiliated issuer. 2 Investment in non-controlled affiliate. See Notes to Financial Statements. | | | | | | |
| | |
| |
Performance as of June 30, 2008 |
| | |
Growth of $10,000 This graph illustrates the
hypothetical investment of
$10,000 in the AARP Income
Fund from September 29,
2006 (commencement of
operations) through June 30,
2008, compared to the
Income Composite Index, the
Lehman Brothers Aggregate
Bond Index, and the
Citigroup 3-Month Treasury
Bill Index.2 | | 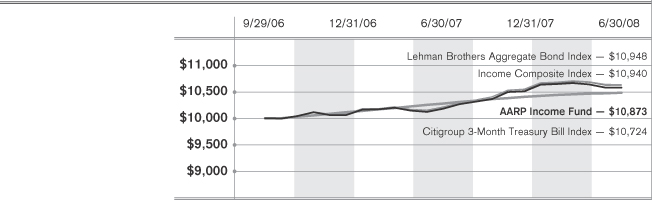 |
| | |
| | | This hypothetical example does not represent the returns of any particular investment. |
| | | | | | | | |
| | | | | |
| Performance summary | | Average Annual Returns as of June 30, 2008 | | 1-Year | | Since
inception | | |
| | | AARP Income Fund | | 6.83% | | 4.89%1 | | |
| | | Income Composite Index2 | | 6.93% | | 5.25%1 | | |
| | | Lehman Brothers Aggregate Bond Index®2 | | 7.12% | | 5.30%1 | | |
| | | Citigroup 3-Month Treasury Bill Index | | 3.33% | | 4.07%1 | | |
| | | | | |
| | | | | | |
| |
Performance data quoted represents past performance which is no guarantee of future results. Investment return and principal value will
fluctuate so that an investor’s shares, when redeemed, may be worth more or less than their original cost. Mutual fund performance changes
over time and current performance may be lower or higher than what is stated. Returns shown do not reflect the deduction of taxes that a
shareholder may pay on fund distributions or the redemption of fund shares. Mutual funds are not obligations of or guaranteed by any bank
and are not federally insured. The performance of the Funds assumes the reinvestment of all dividends and distributions. The indexes above
have been adjusted to reflect reinvestment of dividends on securities in the indexes. The adviser is waiving a portion of its advisory fee and other
operating expenses. Had the fees not been waived or reimbursed, returns would have been lower. It is not possible to invest directly in an Index. For the most recent month-end performance and after-tax returns, visit www.aarpfunds.com or call 1-800-958-6457. 1 For the period from September 29, 2006 (commencement of operations) to June 30, 2008.
2 The Lehman Brothers Aggregate Bond Index serves as a broad measure of the U.S. taxable bond market. Since the Fund invests in differing
combinations of this and other markets, the Income Composite Index has been constructed utilizing the proportionate weightings of the indexes
for each market. This Composite Index provides a particularly useful benchmark to measure the performance of the Fund. For more detailed
information regarding the Composite Indexes and the Underlying Indexes, please see “A Word about Benchmarks” on page 4. |
| | | | |
| AARP Income Fund Overview | | AARP FUNDS 2008 ANNUAL REPORT | | 13 |
Portfolio construction
AARP Income Fund
Performance commentary
The AARP Income Fund seeks current income and long-term preservation of capital. To achieve this objective, the Fund targeted an asset allocation of 95% in long-term bonds and 5% in short-term securities for most of the reporting period. However, this asset allocation was slightly changed in late May 2008 by investing 2.5% of assets in high yield bonds and reducing investments in short-term securities to 2.5%. For the year ended June 30, 2008, the AARP Income Fund returned 6.83%, as compared to the Income Composite Index return of 6.93%, 3.33% for the Citigroup 3-Month Treasury Bill Index, and 7.12% for the Lehman Brothers Aggregate Bond Index. The Fund’s performance includes the operating expenses, whereas index returns are unmanaged and do not include expenses of any kind. The Fund tracked its benchmark closely during the period and benefits from its allocations to fixed income and short-term securities.
The Fund’s investments in bonds and short-term securities helped to protect investors from the downturn in the equity markets. Its investment in the U.S. Bond Market Portfolio returned 7.20%, while the State Street Money Market Portfolio returned 3.94% in the period.
The economy’s prospects took a distinct turn for the worse in the summer of 2007. Inventories of new and existing homes for sale rose to their highest levels since the housing market correction of the early 1990s, pushing new home construction to its lowest level in more than a decade. Crude oil prices continued to move higher, flirting with the $100 a barrel mark in late November 2007 and eventually breaching the $140 a barrel mark by the end of June 2008.
Holding U.S. government bonds was generally profitable as steady deterioration in mortgage bonds and leveraged loans convinced the Federal Reserve Bank of the economic risks associated with the credit market turmoil. The Federal Reserve Bank acted with discount-rate cuts in both August and September and a half percentage cut in the Fed funds target at the September 18, 2007 meeting of the Federal Open Market Committee. In the third quarter of 2007, two-year and three year maturities saw yield declines upward of 0.85%, while ten-year yields retreated by roughly half as much.
During the twelve month period ending June 30, 2008 monetary easing and fiscal stimulus were brought to bear on the U.S. economy to address a multitude of economic challenges. The Fed funds target was lowered from 5.25% to 2% and the U.S. Government introduced a $160 billion stimulus package in the form of tax credit to consumers. Increased capital markets volatilities especially in equities forced many investors to seek the safety of U.S. Government bonds.
However, by the end of June, the dual pressure on food and fuel expenses exacerbated inflations concerns and drove headline Consumer Price Index (“CPI”) to 5% from a year ago. The Federal Reserve Bank, understandably, is worried that an increase in the CPI could lead to further inflationary pressures, leading to changes in wage bargaining and business pricing behavior that will eventually push up actual inflation. The Federal Reserve Bank, however, is currently restricted to using hawkish rhetoric to contain such expectations, because of the fragility of financial markets and the economy preclude tightening at this time.
Sources: Bloomberg, SSgA FM, FactSet
| | | | |
| 14 | | AARP FUNDS 2008 ANNUAL REPORT | | AARP Money Market Fund Overview |
AARP Money Market Fund Overview
| | | |
| | |
Portfolio of investments June 30, 2008 | | | |
Mutual funds: 99.2% | | | |
| | | Value |
| | | | |
| Investment in State Street Money Market Portfolio1 – 99.2% | | $ | 76,451,920 |
| |
| Total investments: 99.2% (Identified cost $76,451,920) | | | 76,451,920 |
| | | | |
| Other assets and liabilities, net: 0.8% | | | 623,693 |
| | | | |
| Total net assets: 100.0% | | $ | 77,075,613 |
1 The financial statements of the State Street Money Market Portfolio, including its investment portfolio, are included elsewhere within this report and should be read in conjunction with the AARP Money Market Fund’s financial statements. AARP Money Market Fund invests only in State Street Money Market Portfolio. At June 30, 2008, AARP Money Market Fund owned 0.89% of the State Street Money Market Portfolio. See Notes to Financial Statements. |
Portfolio construction*
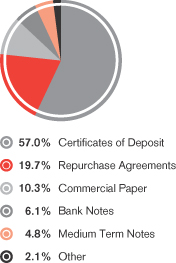
| | |
| Maturities ladder as of June 30, 2008 | | |
| |
| 0-3 Days | | 26.0% |
| |
| |
| 4-90 Days | | 65.3% |
| |
| |
| 90+ Days | | 8.7% |
| |
| |
| Total | | 100.0% |
| |
| |
| Average Maturity | | 40 Days |
| | | | |
| |
| Performance summary | | |
| Average Annual Returns as of June 30, 2008 |
| |
| | | 1-Year | | Since
inception |
| |
| | |
| AARP Money Market Fund | | 4.09% | | 4.59%1 |
| |
| | |
| Citigroup 3-Month Treasury Bill Index | | 3.33% | | 4.19%1 |
| |
| | |
| AARP Money Market Fund 7-Day Yield | | 2.30% | | |
| |
*Portfolio construction represents the composition of the underlying holdings in the State Street Money Market Portfolio, whose financial statements are included elsewhere in this report.
Performance data quoted represents past performance which is no guarantee of future results. Investment return and principal value will fluctuate so that an investor’s shares, when redeemed, may be worth more or less than their original cost. Mutual fund performance changes over time and current performance may be lower or higher than what is stated. Returns shown do not reflect the deduction of taxes that a shareholder may pay on fund distributions or the redemption of fund shares. Mutual funds are not obligations of or guaranteed by any bank and are not federally insured. The performance of the Funds assumes the reinvestment of all dividends and distributions. The indexes above have been adjusted to reflect reinvestment of dividends on securities in the indexes. The adviser is waiving a portion of its advisory fee and other operating expenses. Had the fees not been waived or reimbursed, returns would have been lower. It is not possible to invest directly in an Index.
For the most recent month-end performance and after-tax returns, visit www.aarpfunds.com or call 1-800-958-6457.
An investment in the AARP Money Market Fund is not insured or guaranteed by the Federal Deposit Insurance Corporation or any other government agency. Although the Fund seeks to preserve the value of your investment at $1.00 per share, it is possible to lose money by investing in the Fund.
1 | For the period from July 1, 2006 (commencement of operations) to June 30, 2008. |
Sources: Citigroup, AARP Financial Inc.
| | | | |
| Understanding Your Expenses | | AARP FUNDS 2008 ANNUAL REPORT | | 15 |
Understanding Your Expenses (unaudited)
As a shareholder of a Fund, you incur ongoing costs, including investment advisory fees, distribution (12b-1) fees, shareholder services fees, and other expenses of running a fund. It’s important to understand exactly how much you pay to purchase and own a fund and to compare the costs of owning different funds because these costs reduce your returns.
The example in the table on the next page is intended to help you to understand your ongoing costs in dollars of investing in an AARP Fund and to compare these costs with the ongoing costs of investing in other mutual funds. It is based on an investment of $1,000 invested at the beginning of the period and held for the entire period from January 1, 2008 to June 30, 2008.
Actual expenses
The first line for each Fund in the table on the next page, labeled “Actual”, provides information about actual account values and actual expenses. You may use this information, together with the amount you invested, to estimate the expenses that you incurred over the period. Simply divide your account value by $1,000 (for example, an $8,600 account value divided by $1,000 = 8.6), then multiply the result by the number in the line labeled “Actual” under the heading entitled “Expenses paid during period” to estimate the expenses attributable to your investment during this period.
Hypothetical example for comparison purposes
The second line for each fund in the table, labeled “Hypothetical”, helps you compare the costs of an AARP Fund to other funds using a 5% return as required by the Securities and Exchange Commission for all mutual funds. It provides information about hypothetical account values and hypothetical expenses based on a Fund’s actual expense ratio and an assumed rate of return of 5% per year before expenses, which is not a Fund’s actual return. You should not use the hypothetical account values and expenses to estimate the actual ending account balance or your expenses for the period. Rather, these figures help you to compare the ongoing costs of investing in an AARP Fund with other funds. To do so, compare this 5% hypothetical example with the 5% hypothetical examples that appear in the shareholder reports of the other funds.
Please note that the expenses shown in the table are meant to highlight your ongoing costs only and do not reflect any transaction costs, such as redemption fees which are charged by some mutual funds. Therefore, the line labeled “Hypothetical” is useful in comparing ongoing costs only, and will not help you determine the relative total costs of owning different funds. If these transaction costs were included, your costs would have been higher.
| | | | |
| 16 | | AARP FUNDS 2008 ANNUAL REPORT | | Understanding Your Expenses |
In addition to the fees and expenses which the Fund bears directly, the Fund indirectly bears a pro rata share of the fees and expenses of the underlying portfolios in which the Fund invests. Because the underlying portfolios have varied expenses and fee levels and the Fund may own different proportions of the underlying funds at different times, the amount of fees and expenses incurred indirectly by the Fund may vary in the future. However, AARP Financial has agreed contractually to waive fees and reimburse expenses to keep the net total operating expenses of the AARP Funds, including the indirect fees and expenses of the underlying portfolios, at 0.50% of average daily net assets through at least November 1, 2008. In addition, effective March 1, 2007, AARP Financial has agreed contractually to waive fees and reimburse expenses to keep the net total operating expenses of the AARP Money Market Fund, including its pro-rata allocation of expenses from the State Street Portfolio, at 0.30% of average daily net assets through at least November 1, 2009.
| | | | | | | | | | | | | | | | |
| | | | | | | |
| | | Beginning
account value
1/1/08 | | Ending
account value
6/30/08 | | Expenses paid
during period2 | | Annualized
expense ratio2 | | Effective
expenses paid during
period3 | | Effective
annualized
expense
ratio3 |
| |
| |
| AARP Aggressive Fund | | | | | | | | | | | | | | | | |
Actual | | $ | 1,000 | | $ | 920.40 | | $ | 1.15 | | 0.24% | | $ | 2.39 | | 0.50% |
Hypothetical1 | | $ | 1,000 | | $ | 1,023.67 | | $ | 1.21 | | | | $ | 2.51 | | |
| |
| |
| AARP Moderate Fund | | | | | | | | | | | | | | | | |
Actual | | $ | 1,000 | | $ | 951.00 | | $ | 1.16 | | 0.24% | | $ | 2.43 | | 0.50% |
Hypothetical1 | | $ | 1,000 | | $ | 1,023.67 | | $ | 1.21 | | | | $ | 2.51 | | |
| |
| |
| AARP Conservative Fund | | | | | | | | | | | | | | | | |
Actual | | $ | 1,000 | | $ | 980.00 | | $ | 1.23 | | 0.25% | | $ | 2.46 | | 0.50% |
Hypothetical1 | | $ | 1,000 | | $ | 1,023.62 | | $ | 1.26 | | | | $ | 2.51 | | |
| |
| |
| AARP Income Fund | | | | | | | | | | | | | | | | |
Actual | | $ | 1,000 | | $ | 1,010.00 | | $ | 1.30 | | 0.26% | | $ | 2.50 | | 0.50% |
Hypothetical1 | | $ | 1,000 | | $ | 1,023.57 | | $ | 1.31 | | | | $ | 2.51 | | |
| |
| |
| AARP Money Market Fund | | | | | | | | | | | | | | | | |
Actual | | $ | 1,000 | | $ | 1,015.60 | | $ | 1.50 | | 0.30% | | $ | 1.50 | | 0.30% |
Hypothetical1 | | $ | 1,000 | | $ | 1,023.37 | | $ | 1.51 | | | | $ | 1.51 | | |
| |
| |
| |
1 The Hypothetical example assumes a 5% return before expenses. 2 Expenses reflect the Fund’s annualized net expense ratios multiplied by the average account value over the period, multiplied by 182/366 (to reflect the one-half year period). The fees and expenses of the underlying portfolios are not included in these amounts. 3 Effective expenses reflect the sum of the expenses borne directly by the Fund plus the Fund’s pro-rata share of the weighted average expense ratio of the underlying portfolios in which it invests. The effective annualized expense ratio combines the Fund’s annualized net expense ratio and the annualized weighted average expense ratios of the underlying portfolios. The annualized weighted average expense ratio includes the annualized expense ratio for each underlying portfolio weighted for the Fund’s relative average investment during the same period. |
| | | | |
| How to Read Financial Statements | | AARP FUNDS 2008 ANNUAL REPORT | | 17 |
How to Read Financial Statements
Mutual funds are companies that pool money from many investors and invest that money in stocks, bonds and other securities and assets. Mutual fund financial statements show investors where a fund’s money came from, where it went, where it is and what it is worth as of the close of the fund’s most recent fiscal period. The portfolio of investments shows where the money is as of the close of the fund’s most recent fiscal period. The holdings of each AARP Fund as of June 30, 2008 are shown in the individual Fund Overview sections of this annual report. In addition, this section of the annual report contains four additional financial statements:
1. Statements of assets and liabilities.
These statements are the Funds’ balance sheets as of the close of the period (June 30, 2008). They show the value and the cost of what each Fund owned, how much it owed to others and the resulting difference or “net assets”.
| • | | Assets are the stocks, bonds, cash, and other financial instruments that a fund owns and has purchased with monies investors pay when they purchase shares. |
| • | | Liabilities are the amounts of money that a fund owes. Liabilities include payments due for the purchase of financial investments as well as bills that a fund incurs for services that are needed to run a fund, such as legal services and printing. |
| • | | Net assets = total assets – total liabilities. Net assets represent what is left of assets after liabilities are subtracted. This leftover amount belongs to the investors, or shareholders, of the fund. |
2. Statements of operations
These statements provide a summary of the investment income, such as dividends, that a fund has earned as well as gains and losses from its investment activities for the period ended June 30, 2008. Realized gains or losses reflect the difference between purchase price and selling price for transactions that took place during the period. Unrealized gains and losses reflect the difference between purchase price and the value of positions that are still held as of the end of the period. The statements also include specific details of fund expenses.
3. Statements of changes in net assets
These statements describe the changes in net assets during the current and prior period, which result from operations, any distributions of earnings to investors, and any shareholder transactions.
4. Financial highlights
The financial highlights table is intended to help you understand a fund’s financial performance for a share outstanding for the current period and each of the applicable prior periods.
The Notes to Financial Statements provide additional information to help you better understand the financial statements. They include a description of the most important accounting policies used in portraying the company’s financial condition and results, including how a fund records and values its investments, tax information, as well as additional detail on shareholder and investment transactions.
| | | | |
| 18 | | AARP FUNDS 2008 ANNUAL REPORT | | Financial Statements |
Financial Statements
| | | | | | | | | | | | | | | | | | | |
|
Statements of assets and liabilities June 30, 2008 |
| | | AARP
Aggressive
Fund | | | AARP
Moderate
Fund | | | AARP
Conservative
Fund | | | AARP
Income
Fund | | | AARP
Money Market
Fund |
| | | | | | | | | | | | | | | | | | | |
| Assets: | | | | | | | | | | | | | | | | | | | |
| Investments in affiliated issuers, at value (identified cost of $26,623,002, $43,955,106, $18,414,765 and $6,403,192, respectively) | | $ | 25,135,947 | | | $ | 42,426,415 | | | $ | 18,137,050 | | | $ | 6,331,298 | | | $ | – |
| Investments in State Street Money Market Portfolio, at value (identified cost of $173,789 and $76,451,920, respectively) | | | – | | | | – | | | | – | | | | 173,789 | | | | 76,451,920 |
| Receivable from adviser | | | 2,406 | | | | 3,809 | | | | – | | | | 2,103 | | | | 20,817 |
| Receivable for investments sold | | | 393,353 | | | | 1,258,146 | | | | 164,754 | | | | 17,784 | | | | – |
| Receivable for fund shares sold | | | 32,841 | | | | 80,975 | | | | 99,783 | | | | 6,268 | | | | 822,004 |
| Total assets | | $ | 25,564,547 | | | $ | 43,769,345 | | | $ | 18,401,587 | | | $ | 6,531,242 | | | $ | 77,294,741 |
| | | | | | | | | | | | | | | | | | | |
| Liabilities: | | | | | | | | | | | | | | | | | | | |
| Payable for investments purchased | | | 285,401 | | | | 586,736 | | | | 257,592 | | | | – | | | | – |
| Payable for fund shares redeemed | | | 140,793 | | | | 752,385 | | | | 6,945 | | | | 26,273 | | | | 131,670 |
| Income distribution payable | | | 18,825 | | | | 33,998 | | | | 14,940 | | | | 3,282 | | | | 3,030 |
| Payable to adviser | | | – | | | | – | | | | 589 | | | | – | | | | – |
| Accrued portfolio acct. fees (Note 6) | | | 1,604 | | | | 1,607 | | | | 1,602 | | | | 1,588 | | | | 1,485 |
| Accrued administration fees (Note 6) | | | 785 | | | | 1,260 | | | | 513 | | | | 178 | | | | 2,202 |
| Accrued transfer agent fees (Note 6) | | | 22,747 | | | | 17,410 | | | | 6,168 | | | | 2,928 | | | | 22,104 |
| Accrued distribution services fee | | | 4,476 | | | | 7,187 | | | | 2,928 | | | | 1,017 | | | | 12,564 |
| Accrued audit fees | | | 15,345 | | | | 15,345 | | | | 15,345 | | | | 15,345 | | | | 15,345 |
| Accrued registration fees | | | 963 | | | | 747 | | | | 1,092 | | | | 150 | | | | 538 |
| Accrued printing and postage expenses | | | 10,253 | | | | 10,253 | | | | 10,253 | | | | 11,253 | | | | 11,329 |
| Accrued legal fees | | | 10,557 | | | | 10,557 | | | | 10,557 | | | | 10,557 | | | | 10,557 |
| Accrued miscellaneous expense | | | 8,304 | | | | 8,304 | | | | 8,304 | | | | 8,304 | | | | 8,304 |
| Total liabilities | | $ | 520,053 | | | $ | 1,445,789 | | | $ | 336,828 | | | $ | 80,875 | | | $ | 219,128 |
| | | | | | | | | | | | | | | | | | | |
| Net assets | | $ | 25,044,494 | | | $ | 42,323,556 | | | $ | 18,064,759 | | | $ | 6,450,367 | | | $ | 77,075,613 |
| Net assets consist of: | | | | | | | | | | | | | | | | | | | |
| Paid-in capital | | $ | 26,586,972 | | | $ | 43,805,867 | | | $ | 18,321,184 | | | $ | 6,514,540 | | | $ | 77,073,714 |
| Net unrealized appreciation (depreciation) of investments | | | (1,487,055 | ) | | | (1,528,691 | ) | | | (277,715 | ) | | | (71,894 | ) | | | – |
| Accumulated net realized gain (loss) on investments | | | (55,460 | ) | | | 46,337 | | | | 21,283 | | | | 7,718 | | | | 1,899 |
| Undistributed net investment income | | | 37 | | | | 43 | | | | 7 | | | | 3 | | | | – |
| Net assets | | $ | 25,044,494 | | | $ | 42,323,556 | | | $ | 18,064,759 | | | $ | 6,450,367 | | | $ | 77,075,613 |
| | | | | | | | | | | | | | | | | | | |
| Shares of beneficial interest outstanding | | | 2,395,250 | | | | 4,101,189 | | | | 1,784,257 | | | | 644,013 | | | | 77,073,714 |
| Net asset value per share | | $ | 10.46 | | | $ | 10.32 | | | $ | 10.12 | | | $ | 10.02 | | | $ | 1.00 |
|
| See Notes to Financial Statements. |
| | | | |
| Financial Statements | | AARP FUNDS 2008 ANNUAL REPORT | | 19 |
Financial Statements (continued)
| | | | | | | | | | | | | | | | | | | | |
|
Statements of operations Year ended June 30, 2008 | |
| | | AARP
Aggressive
Fund | | | AARP
Moderate
Fund | | | AARP
Conservative
Fund | | | AARP
Income
Fund | | | AARP
Money Market
Fund | |
| | | | | | | | | | | | | | | | | | | | |
| Investment income: | | | | | | | | | | | | | | | | | | | | |
| Dividends from affiliated issuers | | $ | 691,340 | | | $ | 1,360,035 | | | $ | 604,298 | | | $ | 183,006 | | | $ | – | |
| Interest allocated from State Street Money Market Portfolio | | | – | | | | – | | | | – | | | | 7,429 | | | | 2,584,003 | |
| Total investment income | | $ | 691,340 | | | $ | 1,360,035 | | | $ | 604,298 | | | $ | 190,435 | | | $ | 2,584,003 | |
| | | | | | | | | | | | | | | | | | | | |
| Expenses: | | | | | | | | | | | | | | | | | | | | |
| Expenses allocated from State Street Money Market Portfolio | | | – | | | | – | | | | – | | | | 185 | | | | 63,703 | |
| Investment adviser fee (Note 6) | | | 2,550 | | | | 3,942 | | | | 1,442 | | | | 383 | | | | – | |
| Administration fees (Note 6) | | | 8,926 | | | | 13,796 | | | | 5,046 | | | | 1,340 | | | | 22,260 | |
| Registration fees | | | 18,868 | | | | 22,233 | | | | 19,551 | | | | 23,004 | | | | 26,671 | |
| Transfer and dividend disbursing agent fees and expenses (Note 6) | | | 118,617 | | | | 103,895 | | | | 37,599 | | | | 12,834 | | | | 138,540 | |
| Trustees’ fees | | | 20,000 | | | | 20,000 | | | | 20,000 | | | | 20,000 | | | | 20,000 | |
| Audit fees | | | 18,786 | | | | 18,786 | | | | 18,786 | | | | 18,035 | | | | 18,035 | |
| Legal fees | | | 49,655 | | | | 49,655 | | | | 49,655 | | | | 49,655 | | | | 49,655 | |
| Portfolio accounting fees (Note 6) | | | 18,929 | | | | 19,067 | | | | 18,874 | | | | 17,390 | | | | 17,132 | |
| Distribution service fees | | | 51,007 | | | | 78,833 | | | | 28,835 | | | | 7,659 | | | | 127,200 | |
| Printing and postage expenses | | | 17,174 | | | | 17,174 | | | | 17,174 | | | | 17,174 | | | | 17,174 | |
| Insurance expense | | | 5,344 | | | | 8,508 | | | | 3,218 | | | | 974 | | | | 18,305 | |
| Miscellaneous | | | 9,094 | | | | 9,094 | | | | 9,094 | | | | 9,094 | | | | 9,094 | |
| Total expenses | | $ | 338,950 | | | $ | 364,983 | | | $ | 229,274 | | | $ | 177,727 | | | $ | 527,769 | |
| | | | | | | | | | | | | | | | | | | | |
| Waivers and reimbursements (Note 6): | | | | | | | | | | | | | | | | | | | | |
| Reduction of expenses by investment adviser | | | (277,206 | ) | | | (268,545 | ) | | | (193,699 | ) | | | (167,727 | ) | | | (336,980 | ) |
| Net expenses | | | 61,744 | | | | 96,438 | | | | 35,575 | | | | 10,000 | | | | 190,789 | |
| Net investment income | | | 629,596 | | | | 1,263,597 | | | | 568,723 | | | | 180,435 | | | | 2,393,214 | |
| | | | | | | | | | | | | | | | | | | | |
| Realized and unrealized gain (loss) on investments: | | | | | | | | | | | | | | | | | |
| Net realized gain (loss) on affiliated investments | | | (116,239 | ) | | | 81,734 | | | | 57,346 | | | | 11,408 | | | | – | |
| Net realized gain allocated from State Street Money Market Portfolio | | | – | | | | – | | | | – | | | | – | | | | 1,903 | |
| Capital gain distributions from affiliated investments | | | 239,142 | | | | 239,992 | | | | 41,459 | | | | – | | | | – | |
| Net change in unrealized appreciation (depreciation) of investments | | | (2,861,553 | ) | | | (2,907,787 | ) | | | (505,064 | ) | | | (35,643 | ) | | | – | |
| Net realized and unrealized gain (loss) on investments | | | (2,738,650 | ) | | | (2,586,061 | ) | | | (406,259 | ) | | | (24,235 | ) | | | 1,903 | |
| Change in net assets resulting from operations | | $ | (2,109,054 | ) | | $ | (1,322,464 | ) | | $ | 162,464 | | | $ | 156,200 | | | $ | 2,395,117 | |
|
| See Notes to Financial Statements. | |
| | | | |
| 20 | | AARP FUNDS 2008 ANNUAL REPORT | | Financial Statements |
Financial Statements (continued)
| | | | | | | | | | | | | | | | | | |
| | | |
Statements of changes in net assets | | | | | | | | | | | |
| | | AARP Aggressive Fund | | | AARP Moderate Fund | | | |
| | | | | |
| | | Year
ended
6/30/08 | | | Year
ended
6/30/07 | | | Year
ended
6/30/08 | | | Year
ended
6/30/07 | | | |
| Increase (decrease) in net assets | | | | | | | | | | | | | | | | | | |
| Operations: | | | | | | | | | | | | | | | | | | |
| Net investment income | | $ | 629,596 | | | $ | 311,276 | | | $ | 1,263,597 | | | $ | 706,669 | | | |
| Net realized gain (loss) on investments | | | 122,903 | | | | 64,523 | | | | 321,726 | | | | 174,252 | | | |
| Net change in unrealized appreciation (depreciation) of investments | | | (2,861,553 | ) | | | 1,463,167 | | | | (2,907,787 | ) | | | 1,590,280 | | | |
| Change in net assets resulting from operations | | | (2,109,054 | ) | | | 1,838,966 | | | | (1,322,464 | ) | | | 2,471,201 | | | |
| | | | | | | | | | | | | | | | | | |
| Distributions to shareholders: | | | | | | | | | | | | | | | | | | |
| From net investment income | | | (687,591 | ) | | | (326,680 | ) | | | (1,322,333 | ) | | | (726,251 | ) | | |
| From net realized gains on investments | | | (161,853 | ) | | | (485 | ) | | | (362,860 | ) | | | (448 | ) | | |
| Change in net assets resulting from distributions to shareholders | | | (849,444 | ) | | | (327,165 | ) | | | (1,685,193 | ) | | | (726,699 | ) | | |
| | | | | | | | | | | | | | | | | | |
| Share transactions: | | | | | | | | | | | | | | | | | | |
| Proceeds from sales of shares | | | 14,172,454 | | | | 14,326,319 | | | | 21,178,734 | | | | 20,156,884 | | | |
| Net asset value of shares issued on reinvestment of dividends | | | 800,783 | | | | 306,759 | | | | 1,603,205 | | | | 690,077 | | | |
| Cost of shares redeemed | | | (7,192,023 | ) | | | (2,376,776 | ) | | | (9,376,196 | ) | | | (3,798,646 | ) | | |
| Change in net assets resulting from share transactions | | | 7,781,214 | | | | 12,256,302 | | | | 13,405,743 | | | | 17,048,315 | | | |
| Change in net assets | | | 4,822,716 | | | | 13,768,103 | | | | 10,398,086 | | | | 18,792,817 | | | |
| | | | | | | | | | | | | | | | | | |
| Net assets: | | | | | | | | | | | | | | | | | | |
| Beginning of year | | $ | 20,221,778 | | | $ | 6,453,675 | | | $ | 31,925,470 | | | $ | 13,132,653 | | | |
| End of year | | $ | 25,044,494 | | | $ | 20,221,778 | | | $ | 42,323,556 | | | $ | 31,925,470 | | | |
| Undistributed net investment income included in net assets at end of period | | $ | 37 | | | $ | 60 | | | $ | 43 | | | $ | 586 | | | |
1 | For the period from September 29, 2006 (commencement of operations) through June 30, 2007. |
See Notes to Financial Statements.
| | | | |
| Financial Statements | | AARP FUNDS 2008 ANNUAL REPORT | | 21 |
| | | | | | | | | | | | | | | | | | | | | | | | |
| | | | | | |
| | | | | | | | | | | | | | | | | | | | | | | | |
| | | AARP Conservative Fund | | | AARP Income Fund | | | AARP Money Market Fund | |
| | | | | | |
| | | Year
ended
6/30/08 | | | Year
ended
6/30/07 | | | Year
ended
6/30/08 | | | Period
ended
6/30/071 | | | Year
ended
6/30/08 | | | Year
ended
6/30/07 | |
| | | | | | | | | | | | | | | | | | | | | | | | |
| | | | | | | | | | | | | | | | | | | | | | | | |
| | $ | 568,723 | | | $ | 342,687 | | | $ | 180,435 | | | $ | 38,730 | | | $ | 2,393,214 | | | $ | 257,459 | |
| | | | | | |
| | | 98,805 | | | | 34,092 | | | | 11,408 | | | | (3,660 | ) | | | 1,903 | | | | (4 | ) |
| | | | | | |
| | | | (505,064 | ) | | | 332,822 | | | | (35,643 | ) | | | (36,251 | ) | | | – | | | | – | |
| | | | | | |
| | | | 162,464 | | | | 709,601 | | | | 156,200 | | | | (1,181 | ) | | | 2,395,117 | | | | 257,455 | |
| | | | | | | | | | | | | | | | | | | | | | | | |
| | | | | | | | | | | | | | | | | | | | | | | | |
| | | (580,384 | ) | | | (346,605 | ) | | | (180,518 | ) | | | (38,730 | ) | | | (2,393,214 | ) | | | (257,459 | ) |
| | | | | | |
| | | | (93,875 | ) | | | (849 | ) | | | (33 | ) | | | – | | | | – | | | | – | |
| | | | | | |
| | | | (674,259 | ) | | | (347,454 | ) | | | (180,551 | ) | | | (38,730 | ) | | | (2,393,214 | ) | | | (257,459 | ) |
| | | | | | | | | | | | | | | | | | | | | | | | |
| | | | | | | | | | | | | | | | | | | | | | | | |
| | | 9,143,231 | | | | 6,121,245 | | | | 6,152,675 | | | | 2,568,586 | | | | 93,159,127 | | | | 38,408,002 | |
| | | | | | |
| | | 615,194 | | | | 313,936 | | | | 149,210 | | | | 29,841 | | | | 2,310,555 | | | | 246,685 | |
| | | | (2,803,399 | ) | | | (1,756,336 | ) | | | (2,164,932 | ) | | | (220,751 | ) | | | (54,137,641 | ) | | | (2,913,014 | ) |
| | | | | | |
| | | | 6,955,026 | | | | 4,678,845 | | | | 4,136,953 | | | | 2,377,676 | | | | 41,332,041 | | | | 35,741,673 | |
| | | | 6,443,231 | | | | 5,040,992 | | | | 4,112,602 | | | | 2,337,765 | | | | 41,333,944 | | | | 35,741,669 | |
| | | | | | | | | | | | | | | | | | | | | | | | |
| | | | | | | | | | | | | | | | | | | | | | | | |
| | | $ | 11,621,528 | | | $ | 6,580,536 | | | $ | 2,337,765 | | | $ | – | | | $ | 35,741,669 | | | $ | – | |
| | | $ | 18,064,759 | | | $ | 11,621,528 | | | $ | 6,450,367 | | | $ | 2,337,765 | | | $ | 77,075,613 | | | $ | 35,741,669 | |
| | | | | | |
| | | $ | 7 | | | $ | 1,615 | | | $ | 3 | | | $ | 89 | | | $ | – | | | $ | – | |
| | | | |
| 22 | | AARP FUNDS 2008 ANNUAL REPORT | | Financial Statements |
Financial Statements (continued)
| | | | | | | | | | | | | | |
| | | |
Financial highlights | | | | | | | | | | |
| | | |
| (For a share outstanding throughout the period) | | | | | | | | | | |
| | | AARP Aggressive Fund | | | |
| | | | |
| | | Year
ended
6/30/08 | | | Year
ended
6/30/07 | | | Period
ended
6/30/061 | | | |
| | | | | | | | | | | | | | |
| Net asset value, beginning of period | | $ | 11.68 | | | $ | 10.17 | | | $ | 10.00 | | | |
| | | | | | | | | | | | | | |
| Income from investment operations: | | | | | | | | | | | | | | |
| Net investment income | | | 0.29 | | | | 0.24 | | | | 0.09 | | | |
Net realized and unrealized gain (loss) on affiliated investments | | | (1.15 | ) | | | 1.52 | | | | 0.17 | | | |
| Total from investment operations | | | (0.86 | ) | | | 1.76 | | | | 0.26 | | | |
| | | | | | | | | | | | | | |
| Less distributions: | | | | | | | | | | | | | | |
| From net investment income | | | (0.29 | ) | | | (0.25 | ) | | | (0.09 | ) | | |
| From net realized gains on investments | | | (0.07 | ) | | | (0.00 | )2 | | | – | | | |
| Total distributions | | | (0.36 | ) | | | (0.25 | ) | | | (0.09 | ) | | |
| Net asset value, end of period | | $ | 10.46 | | | $ | 11.68 | | | $ | 10.17 | | | |
| Total return3 | | | (7.49 | )% | | | 17.41 | % | | | 2.60 | % | | |
| | | | | | | | | | | | | | |
| Ratios to average net assets: | | | | | | | | | | | | | | |
| Net expenses | | | 0.24 | %4 | | | 0.24 | %4 | | | 0.24 | %4,5 | | |
| Net investment income | | | 2.47 | % | | | 2.55 | % | | | 3.36 | %5 | | |
| Expense waiver/reimbursement6 | | | (1.09 | )% | | | (2.00 | )% | | | (11.22 | )%5 | | |
| | | | | | | | | | | | | | |
| Supplemental data: | | | | | | | | | | | | | | |
| Net assets, at end of period (000 omitted) | | $ | 25,044 | | | $ | 20,222 | | | $ | 6,454 | | | |
| Portfolio Turnover | | | 22 | % | | | 12 | % | | | 7 | % | | |
1 | For the period from January 1, 2006 (commencement of operations) to June 30, 2006. |
2 | Represents less than $0.01. |
3 | Total returns for periods of less than one year are not annualized. |
4 | In addition to the fees and expenses which the Funds bear directly, the Funds indirectly bear a pro-rata share of the fees and expenses of the underlying portfolios in which the Funds invest. The net expense ratio shown does not include these indirect expenses. If included, the net expense ratio for each fund would be 0.50%. | |
5 | Computed on an annualized basis. |
6 | This expense decrease is reflected in both the net expense and net investment income ratios shown above. |
See Notes to Financial Statements.
| | | | |
| Financial Statements | | AARP FUNDS 2008 ANNUAL REPORT | | 23 |
| | | | | | | | | | | | |
| |
| | | | |
| |
| | | | |
| | | AARP Moderate Fund | |
| | | |
| | | Year
ended
6/30/08 | | | Year
ended
6/30/07 | | | Period
ended
6/30/061 | |
| | | | | | | | | | | | |
| | $ | 11.06 | | | $ | 10.04 | | | $ | 10.00 | |
| | | | | | | | | | | | |
| | | | | | | | | | | | |
| | | 0.34 | | | | 0.31 | | | | 0.10 | |
| | | |
| | | | (0.64 | ) | | | 1.02 | | | | 0.04 | |
| | | | (0.30 | ) | | | 1.33 | | | | 0.14 | |
| | | | | | | | | | | | |
| | | | | | | | | | | | |
| | | (0.34 | ) | | | (0.31 | ) | | | (0.10 | ) |
| | | | (0.10 | ) | | | (0.00 | )2 | | | – | |
| | | | (0.44 | ) | | | (0.31 | ) | | | (0.10 | ) |
| | | $ | 10.32 | | | $ | 11.06 | | | $ | 10.04 | |
| | | | (2.79 | )% | | | 13.32 | % | | | 1.44 | % |
| | | | | | | | | | | | |
| | | | | | | | | | | | |
| | | | 0.24 | %4 | | | 0.24 | %4 | | | 0.24 | %4,5 |
| | | | 3.21 | % | | | 3.27 | % | | | 4.58 | %5 |
| | | | (0.68 | )% | | | (1.11 | )% | | | (6.82 | )%5 |
| | | | | | | | | | | | |
| | | | | | | | | | | | |
| | | $ | 42,324 | | | $ | 31,925 | | | $ | 13,133 | |
| | | | 24 | % | | | 13 | % | | | 5 | % |
| | | | |
| 24 | | AARP FUNDS 2008 ANNUAL REPORT | | Financial Statements |
Financial Statements (continued)
| | | | | | | | | | | | |
| | |
Financial highlights | | | | | | | | |
| | |
| (For a share outstanding throughout the period) | | | | | | | | |
| | | AARP Conservative Fund | |
| | | |
| | | Year
ended
6/30/08 | | | Year
ended
6/30/07 | | | Period
ended
6/30/061 | |
| | | | | | | | | | | | |
| Net asset value, beginning of period | | $ | 10.38 | | | $ | 9.86 | | | $ | 10.00 | |
| | | | | | | | | | | | |
| Income from investment operations: | | | | | | | | | | | | |
| Net investment income | | | 0.40 | | | | 0.39 | | | | 0.16 | |
Net realized and unrealized gain
(loss) on affiliated investments | | | (0.19 | ) | | | 0.53 | | | | (0.14 | ) |
| Total from investment operations | | | 0.21 | | | | 0.92 | | | | 0.02 | |
| | | | | | | | | | | | |
| Less distributions: | | | | | | | | | | | | |
| From net investment income | | | (0.40 | ) | | | (0.40 | ) | | | (0.16 | ) |
| From net realized gain on investments | | | (0.07 | ) | | | (0.00 | )2 | | | – | |
| Total distributions | | | (0.47 | ) | | | (0.40 | ) | | | (0.16 | ) |
| Net asset value, end of period | | $ | 10.12 | | | $ | 10.38 | | | $ | 9.86 | |
| Total return3 | | | 2.04 | % | | | 9.40 | % | | | 0.24 | % |
| | | | | | | | | | | | |
| Ratios to average net assets: | | | | | | | | | | | | |
| Net expenses | | | 0.25 | %4 | | | 0.25 | %4 | | | 0.24 | %4,5 |
| Net investment income | | | 3.94 | % | | | 4.01 | % | | | 5.31 | %5 |
| Expense waiver/reimbursement6 | | | (1.34 | )% | | | (2.16 | )% | | | (11.00 | )%5 |
| | | | | | | | | | | | |
| Supplemental data: | | | | | | | | | | | | |
| Net assets, at end of period (000 omitted) | | $ | 18,065 | | | $ | 11,622 | | | $ | 6,581 | |
| Portfolio Turnover | | | 19 | % | | | 17 | % | | | 7 | % |
1 | For the period from January 1, 2006 (commencement of operations) to June 30, 2006. |
2 | Represents less than $0.01. |
3 | Total returns for periods of less than one year are not annualized. |
4 | In addition to the fees and expenses which the Funds bear directly, the Funds indirectly bear a pro-rata share of the fees and expenses of the underlying portfolios in which the Funds invest. The net expense ratio shown does not include these indirect expenses. If included, the net expense ratio for each fund would be 0.50%. |
5 | Computed on an annualized basis. |
6 | This expense decrease is reflected in both the net expense and net investment income ratios shown above. |
See Notes to Financial Statements.
| | | | |
| Financial Statements | | AARP FUNDS 2008 ANNUAL REPORT | | 25 |
Financial Statements (continued)
| | | | | | | | | | | | | | | | |
| | |
Financial highlights | | | | | | | | |
| | |
| (For a share outstanding throughout the period) | | | | | | | | | |
| | | AARP Income Fund | | | AARP Money Market Fund | |
| | | | |
| | | Year
ended
6/30/081 | | | Period
ended
6/30/071,2 | | | Year
ended
6/30/08 | | | Year
ended
6/30/071 | |
| | | | | | | | | | | | | | | | |
| Net asset value, beginning of period | | $ | 9.82 | | | $ | 10.00 | | | $ | 1.00 | | | $ | 1.00 | |
| | | | | | | | | | | | | | | | |
| Income from investment operations: | | | | | | | | | | | | | | | | |
| Net investment income | | | 0.46 | | | | 0.36 | | | | 0.04 | | | | 0.05 | |
Net realized and unrealized gain
(loss) on affiliated investments | | | 0.20 | | | | (0.18 | ) | | | – | | | | – | |
| Total from investment operations | | | 0.66 | | | | 0.18 | | | | 0.04 | | | | 0.05 | |
| | | | | | | | | | | | | | | | |
| Less distributions: | | | | | | | | | | | | | | | | |
| From net investment income | | | (0.46 | ) | | | (0.36 | ) | | | (0.04 | ) | | | (0.05 | ) |
| From net realized gains on investments | | | (0.00 | )3 | | | – | | | | – | | | | – | |
| Total distributions | | | (0.46 | ) | | | (0.36 | ) | | | (0.04 | ) | | | (0.05 | ) |
| Net asset value, end of period | | $ | 10.02 | | | $ | 9.82 | | | $ | 1.00 | | | $ | 1.00 | |
| Total return4 | | | 6.83 | % | | | 1.78 | % | | | 4.09 | % | | | 5.11 | % |
| | | | | | | | | | | | | | | | |
| Ratios to average net assets: | | | | | | | | | | | | | | | | |
| Net expenses | | | 0.26 | %5 | | | 0.25 | %5,6 | | | 0.30 | %5,7 | | | 0.33 | %5,7 |
| Net investment income | | | 4.71 | % | | | 5.36 | %6 | | | 3.77 | % | | | 5.06 | % |
| Expense waiver/reimbursement8 | | | (4.38 | )% | | | (21.21 | )%6 | | | (0.53 | )% | | | (3.91 | )% |
| | | | | | | | | | | | | | | | |
| Supplemental data: | | | | | | | | | | | | | | | | |
| Net assets, at end of period (000 omitted) | | $ | 6,450 | | | $ | 2,338 | | | $ | 77,076 | | | $ | 35,742 | |
| Portfolio Turnover | | | 52 | % | | | 30 | % | | | – | | | | – | |
1 | The per share amounts and percentages include the Fund’s proportionate share of income, expenses and net realized and unrealized gains or losses of the State Street Money Market Portfolio. |
2 | For the period from September 29, 2006 (commencement of operations) to June 30, 2007. |
3 | Represents less than $0.01. |
4 | Total returns for periods of less than one year are not annualized. |
5 | In addition to the fees and expenses which the Funds bear directly, the Funds indirectly bear a pro-rata share of the fees and expenses of the underlying portfolios in which the Funds invest. The net expense ratio shown does not include these indirect expenses. If included, the net expense ratio for each fund would be 0.50%. |
6 | Computed on an annualized basis. |
7 | Effective March 1, 2007, AARP Financial has agreed contractually to waive fees and reimburse expenses to keep the net total operating expenses of the AARP Money Market Fund, including its pro-rata allocation of expenses from the State Street Portfolio, at 0.30% of average daily net assets through November 1, 2009. |
8 | This expense decrease is reflected in both the net expense and net investment income ratios shown above. |
See Notes to Financial Statements.
| | | | |
| 26 | | AARP FUNDS 2008 ANNUAL REPORT | | Notes to Financial Statements |
Notes to Financial Statements
1. Business and Organization
AARP Aggressive Fund, AARP Moderate Fund, AARP Conservative Fund, AARP Income Fund and AARP Money Market Fund (each a “Fund” and collectively the “Funds”) are each a series of AARP Funds (the “Trust”). The Trust is organized as a Delaware statutory trust and is registered under the Investment Company Act of 1940, as amended (the “Act”), as an open-end management investment company. The inception dates of the Funds were as follows: December 22, 2005 (AARP Aggressive Fund, AARP Moderate Fund and AARP Conservative Fund), June 30, 2006 (AARP Money Market Fund) and September 29, 2006 (AARP Income Fund); the Funds began operations, including recording income and expenses (“commencement of operations”) on January 1, 2006 (Aggressive, Moderate and Conservative), July 1, 2006 (Money Market Fund) and September 29, 2006 (Income Fund).
The Funds, except for the AARP Money Market Fund are “funds of funds” because they invest substantially all of their assets in the underlying series of “AARP Portfolios”, each a separately registered investment company. Each Fund, with the exception of the AARP Income Fund and the AARP Money Market Fund invests in all three of the AARP Portfolios, but in different amounts. The AARP Income Fund invests the vast majority of its assets in one of the AARP Portfolios, the U.S. Bond Market Portfolio. In addition, the AARP Income Fund also invests a portion of its assets in the State Street Money Market Portfolio (the “State Street Portfolio”), a series of a separately registered investment company called the State Street Master Funds, and the SPDR Lehman High Yield Bond ETF. The AARP Money Market Fund is a feeder fund that invests substantially all of its assets in the State Street Portfolio, the master fund. The investment objective and policies of the State Street Portfolio are substantially similar to those of the AARP Money Market Fund. The value of the AARP Money Market Fund’s investment in the State Street Portfolio reflects the AARP Money Market Fund’s proportionate interest in the net assets of the State Street Portfolio (0.89% at June 30, 2008). The performance of the AARP Money Market Fund is directly affected by the performance of the State Street Portfolio. The financial statements of the State Street Portfolio are included elsewhere in this report and should be read in conjunction with the AARP Money Market Fund’s financial statements.
The investment objective of the AARP Aggressive Fund is to seek growth of capital and some current income. The investment objective of the AARP Moderate Fund is to seek a balance of growth of capital and current income. The investment objective of the AARP Conservative Fund is to primarily seek current income with some growth of capital. The investment objective of the AARP Income Fund is to seek current income and preservation of capital over the long-term.
The investment objective of the AARP Money Market Fund is to seek to maximize current income while providing liquidity, preservation of capital, and a stable $1.00 per share price.
| | | | |
| Notes to Financial Statements | | AARP FUNDS 2008 ANNUAL REPORT | | 27 |
2. Significant accounting policies
The financial statements have been prepared in accordance with United States generally accepted accounting principles (“GAAP”), which require management to make estimates and assumptions that affect that amounts reported herein. Actual results could differ from those estimates. The following is a summary of significant accounting policies consistently followed by the Funds in the preparation of their financial statements.
INVESTMENT VALUATION
Because the Funds, except for AARP Money Market Fund, invest in one or more of the AARP Portfolios, they value their investments in the AARP Portfolios daily at the closing net asset value of the AARP Portfolios.
Securities of the AARP Portfolios are valued as of the close of trading on the New York Stock Exchange (generally 4:00 p.m. Eastern time) on the valuation date. An independent pricing service generally provides these prices. Stock holdings are valued at the latest quoted sales price or official closing price taken from the primary market in which the stock trades. If a security does not trade during the day, it is valued at the average of the latest quotes for buying and selling the security, the bid and asked prices. Bond holdings are generally valued as reported by an independent pricing service at what is called an “evaluated average price,” which considers such factors as comparable bond prices, yields, maturities and ratings.
Short-term investments with a maturity at issuance or a remaining maturity at the time of purchase of 60 days or less are generally valued at amortized cost, which approximates market value. Foreign securities quoted in foreign currencies are translated into U.S. dollars based upon exchange rates prevailing at the close of trading and as provided by an independent source.
Securities for which market quotations are not readily available, or whose values have been materially affected by events occurring before a Fund’s pricing time but after the close of the securities’ primary markets (e.g. foreign securities), are valued by methods deemed by the Board of Trustees of AARP Portfolios to represent fair value.
The AARP Money Market Fund and the AARP Income Fund record their investments in the State Street Portfolio at market value. The valuation policies of the State Street Portfolio are discussed in Note 2 of the State Street Portfolio’s Notes to Financial Statements, which are included elsewhere within this report.
The Funds adopted Financial Accounting Standards Board Statement of Financial Accounting Standards No. 157, Fair Value Measurements (“FAS157”), effective for financial statements issued for fiscal years beginning after November 15, 2007 and interim periods
| | | | |
| 28 | | AARP FUNDS 2008 ANNUAL REPORT | | Notes to Financial Statements |
Notes to Financial Statements (continued)
within those fiscal years. In accordance with FAS 157, fair value is defined as the price that the Funds would receive upon selling an investment in a timely transaction to an independent buyer in the principal or most advantageous market of the investment. FAS 157 established a three-tier hierarchy for measuring fair value and enhancing disclosure. The AARP Conservative, Moderate, Aggressive and Income Funds are Registered Investment Companies (“RIC”) as well as fund of funds, which invest all of their investable assets in other RICs, (AARP U.S. Stock Portfolio, AARP U.S. Bond Market Portfolio, AARP International Stock Market Portfolio, State Street Money Market Portfolio and the SPDR Lehman High Yield Bond ETF). In regards to FAS 157 treatment, investments in other RICs are widely considered to be treated as Level 1 securities due to the availability of a daily valued and quoted price for those underlying Portfolios. However, in the case of the underlying U.S. Stock Portfolio, U.S. Bond Market Portfolio, International Stock Market Portfolio, State Street Money Market Portfolio and the SPDR Lehman High Yield Bond ETF, certain of those securities fall into Level 2 or Level 3 FAS 157 pricing hierarchy due to specific valuation circumstances, particularly matrix pricing of bond holdings, amortized cost valuation method used for evaluating short term money market instruments or certain foreign securities that could be fair valued at any particular point in time. The Level 2 and 3 securities held as of June 30, 2008 will be separately identified in the Portfolio of Investments for the U.S. Stock Portfolio, U.S. Bond Market Portfolio, International Stock Market Portfolio and State Street Money Market Portfolio, respectively. The three tier hierarchy of inputs is summarized in the three broad Levels listed below.
| | • | | Level 1 – quoted prices in active markets for identical investments |
| | • | | Level 2 – other significant observable inputs (including quoted prices for similar investments, interest rates, prepayment speeds, credit risk, etc.) |
| | • | | Level 3 – significant unobservable inputs (including the Fund’s own assumptions in determining the fair value of investments) |
The following is a summary of the inputs used as of June 30, 2008 in valuing the Funds’ investments carried at value:
AARP Aggressive Fund
| | | |
| Valuation inputs | | Investments in securities |
| | | |
| |
Level 1 – Quoted Prices | | $ | 25,135,947 |
Level 2 – Other Significant Observable Inputs | | | – |
Level 3 – Significant Unobservable Inputs | | | – |
Total | | $ | 25,135,947 |
| | | | |
| Notes to Financial Statements | | AARP FUNDS 2008 ANNUAL REPORT | | 29 |
AARP Moderate Fund
| | | |
| Valuation inputs | | Investments in securities |
| | | |
| |
Level 1 – Quoted Prices | | $ | 42,426,415 |
Level 2 – Other Significant Observable Inputs | | | – |
Level 3 – Significant Unobservable Inputs | | | – |
Total | | $ | 42,426,415 |
AARP Conservative Fund
| | | |
| Valuation inputs | | Investments in securities |
| | | |
| |
Level 1 – Quoted Prices | | $ | 18,137,050 |
Level 2 – Other Significant Observable Inputs | | | – |
Level 3 – Significant Unobservable Inputs | | | – |
Total | | $ | 18,137,050 |
AARP Income Fund
| | | |
| Valuation inputs | | Investments in securities |
| | | |
| |
Level 1 – Quoted Prices | | $ | 6,505,087 |
Level 2 – Other Significant Observable Inputs | | | – |
Level 3 – Significant Unobservable Inputs | | | – |
Total | | $ | 6,505,087 |
The AARP Money Market Fund is a Registered Investment Company (“RIC”) as well as a feeder into the State Street Money Market Master Portfolio. The AARP Money Market Fund invests all of its investable assets by purchasing shares directly into the State Street Money Market Portfolio, which is also a RIC. In regards to FAS 157 treatment, investments in other RICs are widely considered to be treated as Level 1 securities due to the availability of a daily valued and quoted price for that underlying Portfolio. However, in the case of the State Street Money Market Portfolio, certain of those securities fall into Level 2 or Level 3 FAS 157 pricing hierarchy due to specific valuation circumstances, particularly amortized cost valuation method used for evaluating short term money market instruments. The Level 2 and Level 3 securities held at a reporting period end will be separately identified in the Portfolio of Investments for the State Street Money Market Master Portfolio. The three-tier hierarchy of inputs is summarized in the three broad Levels listed below.
| | • | | Level 1 – quoted prices in active markets for identical investments |
| | • | | Level 2 – other significant observable inputs (including quoted prices for similar investments, interest rates, prepayment speeds, credit risk, etc.) |
| | | | |
| 30 | | AARP FUNDS 2008 ANNUAL REPORT | | Notes to Financial Statements |
Notes to Financial Statements (continued)
| | • | | Level 3 – significant unobservable inputs (including the Fund’s own assumptions in determining the fair value of investments) |
The following is a summary of the inputs used as of June 30, 2008 in valuing the Fund’s investments carried at value:
| | | |
| Valuation inputs | | Investments in securities |
| | | |
| |
Level 1 – Quoted Prices | | $ | 76,451,920 |
Level 2 – Other Significant Observable Inputs | | | – |
Level 3 – Significant Unobservable Inputs | | | – |
Total | | $ | 76,451,920 |
FEDERAL TAXES
The Funds intend to comply with the provisions of the Internal Revenue Code applicable to regulated investment companies. The Funds plan to distribute substantially all of their investment company taxable income, including any net realized gain on investments not offset by capital loss carryforwards, if any, to shareholders. For these reasons, no federal income or excise tax provision is required.
At July 1, 2007, the Funds adopted FIN 48, there was no impact to the Funds financial statements. As of June 30, 2008, tax years 2006 through 2008 remain subject to examination by the Funds’ major tax jurisdictions, which include the United States of America and the state of Delaware.
In July, 2006, Financial Accounting Standards Board Interpretation No. 48, Accounting for Uncertainty in Income Taxes – an interpretation of FASB Statement 109 (“FIN 48”), was issued and is effective for years beginning after December 15, 2006. FIN 48 determines a threshold for financial statement recognition, measurement and disclosure of a tax position taken (or expected to be taken) on a tax return. Upon adoption there was no impact.
SECURITIES TRANSACTIONS, DIVIDEND AND INTEREST INCOME AND EXPENSES
Securities transactions are recorded on a trade date basis, the date a Fund agrees to purchase or sell a security. Interest income, if any, is recorded daily on an accrual basis. Dividend income is recorded on the ex-dividend date, or for certain foreign securities, when the information becomes available to the funds. Realized gains and losses from securities transactions are recorded on the basis of identified cost. Expenses are accrued daily. Many expenses are directly attributable to one Fund and therefore are charged accordingly. Expenses that are not directly attributable to one or more Funds are allocated among applicable Funds on an equitable and consistent basis considering such things as the nature and type of expenses and the relative net assets of the Funds.
In addition to the accounting policies noted above, the AARP Income Fund and the AARP Money Market Fund also have a pro-rata
| | | | |
| Notes to Financial Statements | | AARP FUNDS 2008 ANNUAL REPORT | | 31 |
share in the net investment income and gains or losses of the State Street Portfolio. Net investment income for the Funds consists of each Fund’s pro-rata share of the net investment income of the State Street Portfolio, less all expenses of each Fund. Realized gains and losses from security transactions consist of each Fund’s pro-rata share of the realized gains and losses of the State Street Portfolio.
INDEMNIFICATIONS
The Funds’ organizational documents provide current and former trustees and officers with a limited indemnification against liabilities arising in connection with the performance of their duties to the Funds. In the normal course of business, the Funds may also enter into contracts that provide general indemnifications. The Funds’ maximum exposure under these arrangements is unknown as this would be dependent on future claims that may be made against the Funds. The risk of material loss from such claims is considered remote.
DISTRIBUTIONS TO SHAREHOLDERS
Distributions to shareholders from net investment income and net realized gains, if any, are recorded on the ex-dividend date. Such distributions are determined in conformity with income tax regulations, which may differ from generally accepted accounting principles. Capital gain distributions, if any, are generally declared and paid annually. Income distributions, if any, are generally declared and paid quarterly for the AARP Conservative Fund, semiannually for the AARP Moderate Fund and the AARP Aggressive Fund, and monthly for the AARP Income Fund. Income distributions are generally declared daily and paid monthly for the AARP Money Market Fund.
INVESTMENTS IN UNDERLYING PORTFOLIOS
In addition to the fees and expenses which the Funds bear directly, the Funds indirectly bear a pro-rata share of the fees and expenses of the AARP Portfolios in which the Funds invest as well as the fees and expenses of the State Street Portfolio, as applicable. AARP Financial has agreed contractually to waive fees and reimburse expenses to keep the net total operating expenses of the AARP Funds, including the indirect fees and expenses of the underlying portfolio’s at 0.50% of average daily net assets through at least November 1, 2008. In addition, effective March 1, 2008, AARP Financial has agreed contractually to waive fees and reimburse expenses to keep the net total operating expense of the AARP Money Market Fund, including its pro-rata allocation of expense from the State Street Portfolio, at 0.30% of average daily net assets through at least November 1, 2009.
| | | | |
| 32 | | AARP FUNDS 2008 ANNUAL REPORT | | Notes to Financial Statements |
Notes to Financial Statements (continued)
NEW ACCOUNTING PRONOUNCEMENTS
On March 19, 2008, the FASB issued Statement of Financial Accounting Standards No. 161 (“SFAS No. 161”), “Disclosure about Derivative Instruments and Hedging Activities.” This new accounting statement requires enhanced disclosures about an entity’s derivative and hedging activities. Entities are required to provide enhanced disclosures about (a) how and why an entity invests in derivatives, (b) how derivatives are accounted for under Statement 133, and (c) how derivatives affect an entity’s financial position, financial performance and cash flows. SFAS No. 161 also requires enhanced disclosures regarding credit-risk-related contingent features of derivative instruments. SFAS No. 161 is effective for financial statements issued for fiscal years and interim periods beginning after November 15, 2008. As of June 30, 2008, management of the Funds and AARP Portfolios is currently assessing the impact of the expanded financial statement disclosures that will result from adopting SFAS No. 161.
3. Capital share transactions
The Funds have authorized an unlimited number of $0.001 par value shares. Transactions in shares were as follows:
| | | | | | | | | | |
| | | | | | | | | | | |
| | | | | |
| | | | | Year ended
June 30, 2008 | | | | | Year ended
June 30, 2007 | |
| | |
AARP Aggressive Fund | | | | | | | | | | |
Shares sold | | | | 1,239,475 | | | | | 1,280,627 | |
Dividends and/or distributions reinvested | | | | 72,065 | | | | | 26,786 | |
Shares redeemed | | | | (647,413 | ) | | | | (210,836 | ) |
| | | | | | | | | | | |
Net increase | | | | 664,127 | | | | | 1,096,577 | |
| | |
AARP Moderate Fund | | | | | | | | | | |
Shares sold | | | | 1,930,180 | | | | | 1,864,210 | |
Dividends and/or distributions reinvested | | | | 149,303 | | | | | 63,146 | |
Shares redeemed | | | | (865,937 | ) | | | | (348,211 | ) |
| | | | | | | | | | | |
Net increase | | | | 1,213,546 | | | | | 1,579,145 | |
| | |
AARP Conservative Fund | | | | | | | | | | |
Shares sold | | | | 873,721 | | | | | 591,217 | |
Dividends and/or distributions reinvested | | | | 59,325 | | | | | 30,414 | |
Shares redeemed | | | | (268,145 | ) | | | | (169,642 | ) |
| | | | | | | | | | | |
Net increase | | | | 664,901 | | | | | 451,989 | |
| | |
AARP Income Fund | | | | | | | | | | |
Shares sold | | | | 605,451 | | | | | 257,241 | 1 |
Dividends and/or distributions reinvested | | | | 14,788 | | | | | 3,007 | 1 |
Shares redeemed | | | | (214,272 | ) | | | | (22,202 | )1 |
| | | | | | | | | | | |
Net increase | | | | 405,967 | | | | | 238,046 | 1 |
| | |
AARP Money Market Fund | | | | | | | | | | |
Shares sold | | | | 93,159,127 | | | | | 38,408,008 | |
Dividends and/or distributions reinvested | | | | 2,310,555 | | | | | 246,679 | |
Shares redeemed | | | | (54,137,641 | ) | | | | (2,913,014 | ) |
| | | | | | | | | | | |
Net increase | | | | 41,332,041 | | | | | 35,741,673 | |
| |
1 For the period from September 29, 2006 (commencement of operations) through June 30, 2007. | |
| | | | |
| Notes to Financial Statements | | AARP FUNDS 2008 ANNUAL REPORT | | 33 |
4. Investment transactions
The aggregate cost of purchases and proceeds from sales of securities, other than short-term obligations, for the year ended June 30, 2008 were as follows:
| | | | | | |
| Fund name | | Purchases | | Sales |
| | | | | | |
| | |
AARP Aggressive Fund | | $ | 13,449,619 | | $ | 5,589,862 |
AARP Moderate Fund | | | 22,689,321 | | | 9,399,603 |
AARP Conservative Fund | | | 9,666,537 | | | 2,742,798 |
AARP Income Fund | | | 6,032,148 | | | 1,924,271 |
5. Federal income tax information
Net investment income (loss) and net realized gain (loss) may differ for financial statement and tax purposes. The character of dividends and distributions made during the fiscal year from net investment income or net realized gains may differ from their ultimate characterization for federal income tax purposes. These differences are attributable to the differing treatments for the deferral of losses on wash sales. Additionally, short-term capital gains are considered ordinary income for income tax purposes. The tax character of distributions paid during the fiscal years ended June 30, 2008 and June 30, 2007, was as follows:
| | | | | | | | | | | | | | | | | | |
| | | | | | | | | | | | | | | | | | | |
| | | Distributions paid from: |
| |
| |
| | | 2008 | | 2007 |
| |
| |
| Fund name | | Ordinary
income | | Long-term
capital gains | | Total | | Ordinary
income | | Long-term
capital gains | | Total |
| |
| |
AARP Aggressive Fund | | $ | 694,973 | | $ | 154,471 | | $ | 849,444 | | $ | 327,165 | | $ | – | | $ | 327,165 |
AARP Moderate Fund | | | 1,322,513 | | | 362,680 | | | 1,685,193 | | | 726,699 | | | – | | | 726,699 |
AARP Conservative Fund | | | 592,103 | | | 82,156 | | | 674,259 | | | 347,454 | | | – | | | 347,454 |
AARP Income Fund | | | 180,551 | | | – | | | 180,551 | | | 38,730 | | | – | | | 38,730 |
AARP Money Market Fund | | | 2,393,214 | | | – | | | 2,393,214 | | | 257,459 | | | – | | | 257,459 |
The timing and character of income and capital gain distributions are determined in accordance with income tax regulations, which may differ from Generally Accepted Accounting Principles. Reclassifications are made to the Fund’s capital accounts for permanent tax differences to reflect income and gains available for distribution under income tax regulations. During the fiscal year ended June 30, 2008, permanent book and tax basis differences resulting primarily from differing treatments for distributions received from the AARP Portfolios were identified and reclassified among the components of the Fund’s net assets as follows:
| | | | | | |
| | | | | | | |
| Fund name | | Undistributed
net investment
income (loss) | | Accumulated
net realized
gains (loss) |
| |
| |
| | | | | | | |
AARP Aggressive Fund | | $ | 57,972 | | $ | (57,972) |
AARP Moderate Fund | | | 58,193 | | | (58,193) |
AARP Conservative Fund | | | 10,053 | | | (10,053) |
AARP Income Fund | | | (3) | | | 3 |
AARP Money Market Fund | | | – | | | – |
Net investment income (loss), net realized gains (losses), and net assets were not affected by this reclassification.
| | | | |
| 34 | | AARP FUNDS 2008 ANNUAL REPORT | | Notes to Financial Statements |
Notes to Financial Statements (continued)
The table below shows distribution requirements the Funds must satisfy under the income tax regulations. In addition the table shows losses the Funds may be able to offset against income and gains realized in future years as well as unrealized appreciation or depreciation of securities and other investments for federal income tax purposes. Under current tax law, certain capital and net foreign currency losses realized after October 31 within the taxable year may be deferred and treated as occurring on the first day of the following year.
| | | | | | | | | | | | |
| | | | | | | | | | | | | |
| Fund name | | Undistributed
net investment
income | | Undistributed
long-term
gain | | Accumulated
loss
carryforward | | Post October
losses
deferred |
| |
| |
| | | | | | | | | | | | | |
AARP Aggressive Fund | | $ | 37 | | $ | 206,928 | | $ | – | | $ | – |
AARP Moderate Fund | | | 43 | | | 267,885 | | | – | | | – |
AARP Conservative Fund | | | 7 | | | 57,915 | | | – | | | – |
AARP Income Fund | | | 3 | | | 18,724 | | | – | | | – |
AARP Money Market Fund | | | 1,899 | | | – | | | – | | | – |
The aggregate cost of securities and other investments and the composition of unrealized appreciation and depreciation of securities and other investments for federal income tax purposes as of June 30, 2008 are noted below. The primary difference between book and tax appreciation or depreciation of securities and other investments, if applicable, is attributable to the tax deferral of losses or tax realization of financial statement unrealized gain or loss.
| | | | | | | | | | | | |
| | | | | | | | | | | | | |
| Fund name | | Federal tax
cost of securities | | Gross unrealized
appreciation | | Gross unrealized
depreciation | | Net
unrealized
appreciation
(depreciation) |
| |
| |
| | | | | | | | | | | | | |
AARP Aggressive Fund | | $ | 26,885,389 | | $ | 34,702 | | $ | (1,784,144) | | $ | (1,749,442) |
AARP Moderate Fund | | | 44,176,654 | | | 78,410 | | | (1,828,649) | | | (1,750,239) |
AARP Conservative Fund | | | 18,451,397 | | | 23,871 | | | (338,218) | | | (314,347) |
AARP Income Fund | | | 6,587,987 | | | – | | | (82,900) | | | (82,900) |
AARP Money Market Fund | | | 76,451,920 | | | – | | | – | | | – |
6. Fees and other transactions with affiliates
ADVISER AND SUB-ADVISER FEES
The Trust has an investment advisory agreement with AARP Financial, which delegates to AARP Financial the responsibility to manage the investment activities of the Funds, including the overall investment program of the Funds. AARP Financial is also responsible for overseeing the Funds’ (other than the Money Market Fund’s) sub-adviser, SSgA Funds Management, Inc. (“SSgA FM”), which rebalances the applicable Funds under the direction of AARP Financial and manages the day-to-day investments of the AARP Portfolios’ assets. Each Fund (other than the Money Market Fund) pays to AARP Financial an annual fee of 0.01% of its average daily net assets. AARP Financial pays SSgA FM for its subadvisory services out of these fees. For the period from July 1, 2006 through at least November 1, 2008, AARP Financial has contractually agreed to waive its fees and/or reimburse expenses to keep the total annual operating expenses of the Funds and the AARP Portfolios and, as appropriate, the State Street Portfolio at 0.50% of average daily net assets. Effective February 6, 2007, AARP Financial has voluntarily agreed to waive its fees and/or reimburse expenses to keep the total annual operating expenses of the AARP Money Market Fund, including its pro-rata allocation of expenses from the State Street Portfolio, at 0.30% of average daily net assets. The Fund’s Board of Trustees
| | | | |
| Notes to Financial Statements | | AARP FUNDS 2008 ANNUAL REPORT | | 35 |
approved an amendment, proposed by AARP Financial, to amend the existing contractual agreements to make this voluntary fee waiver/expense reimbursement a contractual obligation of AARP Financial effective March 1, 2007 through at least November 1, 2008. The expense reimbursement amount payable by AARP Financial will be dependent on the actual expenses of the Funds and the Portfolios.
Under the Money Market Fund’s investment advisory agreement, no fee is payable to AARP Financial at any time the Fund is invested in a master-feeder structure, such as the State Street Portfolio. The State Street Portfolio has retained SSgA FM as the investment adviser to the Portfolio. For its services, SSgA FM receives a fee at the rate of 0.10% of the portfolio’s average daily net assets, which is paid from the assets of the Fund.
For the year ended June 30, 2008, AARP Financial contractually waived/reimbursed the following fees for the AARP Funds:
| | | | | | |
| Fund name | | Adviser
fee waiver | | Reimbursement of other
operating expenses |
| | | | | | |
| | |
AARP Aggressive Fund | | $ | 2,550 | | $ | 274,656 |
AARP Moderate Fund | | | 3,942 | | | 264,603 |
AARP Conservative Fund | | | 1,442 | | | 192,257 |
AARP Income Fund | | | 383 | | | 167,344 |
AARP Money Market Fund | | | – | | | 336,980 |
| | | | | | $ | 1,235,840 |
ADMINISTRATION FEES
As the Funds’ administrator, AARP Financial provides the Funds with general administrative services associated with the day-to-day operations of the Funds and monitors and coordinates the activities of the other service providers to the Funds. For its administrative services, AARP Financial receives an annual fee of 0.035% of each Fund’s average daily net assets.
The Administration agreement between AARP Financial and the Funds can be terminated on sixty (60) days prior written notice.
SUB-ADMINISTRATION, TRANSFER AGENCY AND CUSTODIAN FEES
State Street Bank and Trust Company (“State Street”) acts as the subadministrator, transfer agent, custodian and fund accounting agent for the Funds. State Street is a subsidiary of State Street Corporation and an affiliate of SSgA FM. Under the terms of the sub-administration agreement, AARP Financial pays to State Street an annual fee at the rate of 0.0175% of the first $6 billion of the Funds’ average daily net assets and then a decreasing rate for average daily net assets above that level.
The Sub-Administration agreement between State Street and AARP Financial can be terminated by either party on sixty (60) days prior written notice. Under the terms of the transfer agency agreement, each
| | | | |
| 36 | | AARP FUNDS 2008 ANNUAL REPORT | | Notes to Financial Statements |
Notes to Financial Statements (continued)
Fund pays to State Street an annual fee at the rate of 0.135% of the first $5 billion of the Funds’ average daily net assets and then a decreasing rate for average daily net assets above that level, plus out-of-pocket expenses. State Street has in turn delegated the provision of transfer agency services to its affiliate, Boston Financial Data Services, Inc. Under the terms of the custody agreement, each Fund pays to State Street an annual fee of $15,000, plus out-of-pocket expenses.
TRUSTEE COMPENSATION
The Trust is supervised by a Board of Trustees, (the “Board”). The Board represents the interests of the Funds and their shareholders. The Board meets periodically throughout the year to oversee the Funds’ activities. The Board consists of four “Independent Trustees.” The compensation of the Independent Trustees consists of an annual retainer. The Trust’s officers do not receive compensation from the Funds for their services. Compensation paid by the Funds to the Independent Trustees is included in the Funds’ Statements of Operations.
INVESTMENTS IN THE FUNDS
AARP Services, Inc., the parent company of AARP Financial, Inc. (“AARP Financial”), the investment adviser to the Funds, has made investments in the AARP Aggressive Fund, the AARP Moderate Fund and the AARP Conservative Fund, with values at June 30, 2008 of $37,892, $36,874 and $36,929, respectively. AARP Financial has made an investment in the AARP Income Fund, with a value at June 30, 2008 of $81,550. Further, AARP is the parent company of AARP Services, Inc. There were no purchases or sales by AARP Services, Inc., during July 1, 2007 to June 30, 2008.
In addition, to receive an investment return, AARP Financial, in the normal course of business, has made investments in the AARP Money Market Fund, with a value at June 30, 2008 of $27.8 million.
In January 2008, to receive an investment return, AARP Financial, in the normal course of business, made an additional investment in the AARP Money Market Fund of $30 million. Further, AARP, the parent company to AARP Services, Inc., in the normal course of business, made investments in the AARP Money Market Fund of $15 million. During the twelve months ended June 30, 2008, AARP made purchases of $15,000,000 and had redeemed $10,000,000 in the AARP Money Market Fund.
If AARP Financial or AARP decide in the future to withdraw all or a portion of these investments, Management of the Funds believes there would be no material impact on the operations or returns of the Money Market Fund.
| | | | |
| Report of Independent Registered Public Accounting Firm | | AARP FUNDS 2008 ANNUAL REPORT | | 37 |
Report of Independent Registered Public Accounting Firm
The Board of Trustees and Shareholders AARP Funds:
We have audited the accompanying statements of assets and liabilities of AARP Conservative Fund, AARP Moderate Fund, AARP Aggressive Fund, AARP Income Fund, and AARP Money Market Fund, each a series of the AARP Funds, including the portfolio of investments, as of June 30, 2008, and the related statements of operations for the year then ended, the statements of changes in net assets for each of the years or periods in the two-year period then ended, and the financial highlights for each of the years or periods in the three-year period then ended. These financial statements and financial highlights are the responsibility of management. Our responsibility is to express an opinion on these financial statements and financial highlights based on our audits.
We conducted our audits in accordance with the standards of the Public Company Accounting Oversight Board (United States). Those standards require that we plan and perform the audit to obtain reasonable assurance about whether the financial statements and financial highlights are free of material misstatement. An audit includes examining, on a test basis, evidence supporting the amounts and disclosures in the financial statements. Our procedures included confirmation of securities owned as of June 30, 2008, by correspondence with the transfer agent of the underlying portfolios, or by other appropriate auditing procedures. An audit also includes assessing the accounting principles used and significant estimates made by management, as well as evaluating the overall financial statement presentation. We believe that our audits provide a reasonable basis for our opinion.
In our opinion, the financial statements and financial highlights referred to above present fairly, in all material respects, the financial position of AARP Conservative Fund, AARP Moderate Fund, AARP Aggressive Fund, AARP Income Fund, and AARP Money Market Fund as of June 30, 2008, and the results of their operations for the year then ended, the changes in their net assets for each of the years or periods in the two-year period then ended, and the financial highlights for each of the years or periods in the three-year period then ended, in conformity with U.S. generally accepted accounting principles.

Boston, Massachusetts
August 20, 2008
| | | | |
| 38 | | AARP FUNDS 2008 ANNUAL REPORT | | AARP Funds—Supplemental Information |
AARP Funds –
Supplemental Information
2008 U.S. Tax Distribution Information to Shareholders
Corporate Dividends Received Deduction. For the year ended June 30, 2008, a percentage of dividends distributed by the Funds listed below qualifies for the dividends received deduction for corporate shareholders. These percentages are as follows:
| | | |
| Fund | | Qualifying percentages | |
| |
AARP Aggressive Fund | | 41.94 | % |
| |
AARP Moderate Fund | | 22.76 | |
| |
AARP Conservative Fund | | 9.35 | |
| |
AARP Income Fund | | – | |
| |
AARP Money Market Fund | | – | |
Qualified Dividend Income. The amount of dividends distributed by the Funds during the fiscal year ended June 30, 2008, are considered qualified dividend income, and are eligible for reduced tax rates. These lower rates range from 5% to 15% depending on an individual’s tax bracket. These amounts and corresponding percentage of dividends paid are as follows:
| | | | | |
| Fund | | Percentage of
dividends paid | | Amounts |
| | |
AARP Aggressive Fund | | 55.95% | | $ | 388,813 |
| | |
AARP Moderate Fund | | 30.59 | | | 404,502 |
| | |
AARP Conservative Fund | | 12.68 | | | 75,088 |
| | |
AARP Income Fund | | – | | | – |
| | |
AARP Money Market Fund | | – | | | – |
Proxy voting policies, procedures and record
Both a description of the policies and procedures that AARP Financial uses to determine how to vote proxies on behalf of the Funds and the AARP Portfolios relating to portfolios securities and information regarding how AARP Financial voted proxies related to portfolio securities during the most recent fiscal year ended June 30 is available on our web site at www.aarpfunds.com and, without charge, upon request, by calling us at 1-800-958-6457. Such information for the AARP Funds is also available on the Securities and Exchange Commission’s (“SEC”) website at www.sec.gov.
| | | | |
| AARP Funds—Supplemental Information | | AARP FUNDS 2008 ANNUAL REPORT | | 39 |
Shareholder statements and reports
When we send financial reports, prospectuses and other regulatory materials to shareholders, we attempt to reduce the volume of mail you receive by sending one copy of these documents to two or more account holders who share the same address. However, if you wish to receive individual copies of materials, please contact us at 1-800-958-6457. Once we have received your instructions, we will begin sending individual copies for each account within 30 days. These materials are also available on our website at www.aarpfunds.com.
Statement regarding availability of quarterly fund schedule
The Funds and the AARP Portfolios file complete schedules of investments with the SEC for the quarters ended September 30 and March 31 of each fiscal year on Form N-Q which are available on the Funds’ website, www.aarpfunds.com and the SEC’s website at www.sec.gov. Additionally, the Funds’ and the AARP Portfolios’ Forms N-Q may be reviewed and copied at the SEC’s Public Reference Room in Washington D.C. For information on the Public Reference Room, call 1-800-SEC-0330.
| | | | |
| 40 | | AARP FUNDS 2008 ANNUAL REPORT | | About the Funds’ Board of Trustees and Officers |
About the Funds’ Board of Trustees and Officers (unaudited)
The Board of Trustees (“Board”) of the AARP Funds oversee the operation and management the Funds.
The Board is comprised of one interested trustee and four trustees who are independent, meaning that they are not “interested persons” of AARP Funds for purposes of the Investment Company Act. Put simply, this means that they do not have material affiliations with AARP Funds, AARP Financial or SSgA FM apart from the personal investments they may have made in AARP Funds as private individuals.
Our independent board members bring distinguished backgrounds in business, academia and public service to their task of working with AARP Funds officers to establish policies and oversee the activities of the Funds.
The table below shows information for each trustee and executive officer of AARP Funds. The mailing address of the trustees and officers is AARP Funds, 650 F Street, N.W., Washington, DC 20004, Attn: Fund Secretary.
Independent trustees
| | |
| |
PETER C. CLAPMAN c/o AARP Financial, Inc. 650 F Street, N.W. Washington, DC 20004 Age: 72 Chairman of the Board and
Trustee since 2005 | | Consultant, governance advisory services (July 2005–present) Head of U.S. operations, Governance for Owners (governance services and
consulting) (June 2005–present) Executive Director, Pace Law School (director education) (April 2005–September 2006) Member, NASDAQ Listing Council (2005–present) Senior Vice President and Chief Counsel, TIAA-CREF (financial services, pension and investment products) (1972–July 2005). Other trusteeships held: Director, iPass, Inc. (February 2007–present) Director, National Association of Corporate Trustees (non-profit private director education) (January 2005–present) |
| |
RICHARD M. REILLY c/o AARP Financial, Inc., 650 F Street, N.W., Washington, DC 20004 Age: 70 Trustee since 2006 | | Self-Employed Consultant (November 2002–present) Senior Vice President, Allmerica Financial Corp. (financial services holding company) (November 2001–November 2002) President, Allmerica Financial Services (investments/insurance)
(1995–November 2001). Other trusteeships held: Trustee, International Foundation for Retiement Education (InFRE)
(September 2006–present) Trustee, Allmerica Investment Trust (investment company) (1990–November 2002) Trustee, Allmerica Securities Trust (1990–November 2002) |
| |
| | | | |
| About the Funds’ Board of Trustees and Officers | | AARP FUNDS 2008 ANNUAL REPORT | | 41 |
| | |
| |
ELLEN B. SAFIR, CFA c/o AARP Financial, Inc., 650 F Street, N.W., Washington, DC 20004 Age: 64 Trustee since 2006 | | Chief Executive Officer, New Century Advisors, LLC
(registered investment adviser) (2002–present) President, CFA Society of Washington, DC (July 2007–present) Member, Investment Committee, United States Holocaust Memorial Museum
(June 1997–present); Managing Director, Fixed Income and Currencies, Howard Hughes Medical Institute (medical research) (1986–2002). |
| |
LYNN E. TURNER c/o AARP Financial, Inc., 650 F Street, N.W., Washington, DC 20004 Age: 56 Trustee since 2005 | | Self-Employed Consultant (June 2007–present) Managing Director of Research, Glass Lewis & Co. LLC
(financial and proxy research) (July 2003–June 2007) Managing Director/Senior Advisor, Kroll, Inc.
(forensic accounting) (July 2003–present) Professor, Colorado State University (August 2001–June 2003) Chief Accountant, Securities and Exchange Commission (July 1998–August 2001). Other trusteeships held: Director, Guidance Software, Inc. (April 2007–February 2008) Trustee, Colorado Public Employees Retirement Association (COPERA)
(August 2007–present) |
| |
| |
| Officers | | |
| |
RICHARD M. HISEY, CFA Two Highwood Drive, 2nd Floor Tewksbury MA 01876 Age: 49 President, Treasurer and
Chief Financial Officer | | President, AARP Financial (May 2008–present); Chief Investment Officer, AARP Financial (April 2006–present); Executive Vice President and Chief Investment Officer, Cole Management, Incorporated (venture capital firm) (2005–2006); Senior Vice President, MFS Investment Management and Treasurer and Chief Financial Officer, MFS Group of Mutual Funds (2002–2005); Senior Vice President, The Bank of New York (2000–2002). |
| |
SUSAN KIRKPATRICK Two Highwood Drive 2nd Floor Tewksbury, MA 01876 Age: 42 Chief Compliance Officer | | Chief Compliance Officer, AARP Financial (November 2007–present); Director of Compliance, AARP Financial (December 2005–November 2007); Chief Compliance Officer, Grail Partners (investment banking)
(March 2005–December 2005); Director, Devonshire Financial Group (consulting) (September 2004–December 2005); NewRiver, Inc. (electronic delivery of compliance documents) (July 1999–September 2004) |
| |
MARC DUFFY 650 F Street, N.W. Washington, DC 20004 Age: 50 Secretary | | Associate General Counsel, AARP Financial (August 2006–present); Assistant General Counsel, E*TRADE Financial Corporation
(January 2004–August 2006); Assistant General Counsel, Legg Mason Wood Walker, Incorporated
(September 1999–January 2004). |
| |
| | | | |
| 42 | | AARP FUNDS 2008 ANNUAL REPORT | | About the Funds’ Board of Trustees and Officers |
About the Funds’ Board of Trustees and Officers (continued)
| | |
| |
JEFFREY J. GABOURY Two Highwood Drive, 2nd Floor Tewksbury MA 01876 Age: 39 Assistant Treasurer | | Assistant Treasurer, AARP Financial (April 2008–Present); Deputy Treasurer, Lord, Abbett & Co. LLC (June 2006–April 2008); Treasurer and Chief Financial Officer of the New York Life Investment Management Group of Mutual Funds (December 2004–December 2005); Director of Compliance, Investors Bank & Trust Company (August 1996–November 2004) |
| |
JULIE TEDESCO State Street Bank and Trust Company 4 Copley Place 5th Floor Boston, MA 02116 Age: 50 Assistant Secretary | | Senior Vice President and Senior Managing Counsel, State Street Bank and Trust Company (2000–present). |
| |
THERESA DEWAR State Street Bank and Trust Company The John Hancock Tower 14th Floor Boston, MA 02116 Age: 53 Assistant Treasurer | | Senior Vice President, Fund Administration, State Street Bank and Trust Company (1997–present). |
| |
Additional information about AARP Funds’ trustees is provided in the Statement of Additional Information and is available without charge, upon request, by calling 1-800-958-6457.
| | | | |
| | STATE STREET MONEY MARKET PORTFOLIO | | 43 |
State Street
Money Market Portfolio
Semi-Annual Report
June 30, 2008 (unaudited)
The December 31, 2007 Annual Report for the State Street Money Market Portfolio is included the December 31, 2007 AARP Funds Semi-Annual Report, which is available on our website at www.aarpfunds.com and, without charge, upon request, by calling us at 1-800-958-6457.
Table of Contents
| | | | |
| 44 | | STATE STREET MONEY MARKET PORTFOLIO | | Expense Example |
Expense Example
As a shareholder of the State Street Money Market Portfolio (the “Portfolio”), you incur ongoing costs, which include costs for portfolio management and administrative services, among others. This example is intended to help you understand your ongoing costs (in dollars) of investing in the Portfolio and to compare these costs with the ongoing costs of investing in other mutual funds.
The example is based on an investment of $1,000 made at the beginning of the period shown and held for the entire period from January 1, 2008 to June 30, 2008.
The table below illustrates your Portfolio’s costs in two ways:
| • | | Based on actual fund return. This section helps you to estimate the actual expenses that you paid over the period. The “Ending Account Value” shown is derived from the Portfolio’s actual return, and the third column shows the dollar amount that would have been paid by an investor who started with $1,000 in the Portfolio. You may use the information here, together with the amount you invested, to estimate the expenses that you paid over the period. |
| | | To do so, simply divide your account value by $1,000 (for example, an $8,600 account value divided by $1,000 = 8.6), then multiply the result by the number given for the Portfolio under the heading “Expenses Paid During Period”. |
| • | | Based on hypothetical 5% return. This section is intended to help you compare your Portfolio’s costs with those of other mutual funds. It assumes that the Portfolio had a yearly return of 5% before expenses, but that the expense ratio is unchanged. In this case- because the return used is not the Portfolio’s actual return- the results do not apply to your investment. The example is useful in making comparisons because the Securities and Exchange Commission requires all mutual funds to calculate expenses based on a 5% return. You can assess your Portfolio’s costs by comparing this hypothetical example with the hypothetical examples that appear in shareholder reports of other funds. |
| * | The calculations are based on expenses incurred in the most recent fiscal period of the Portfolio. The Portfolio’s annualized average weighted expense ratio as of June 30, 2008 was 0.100%. The dollar amounts shown as “Expenses Paid” are equal to the annualized average weighted expense ratio multiplied by the average account value over the period, multiplied by the number of days in the most recent six-month period, then divided by the number of days in the most recent 12-month period. |
| | | | | | | | | | | | |
Six Months Ended
June 30, 2008 | | | | Beginning
Account Value January 1, 2008 | | | | Ending Account Value June 30, 2008 | | | | Expenses
Paid During
Period* |
Based on Actual
Portfolio Return | | | | $1,000.00 | | | | $1,016.60 | | | | $0.50 |
| |
| Based on Hypothetical (5% return before expenses) | | | | $1,000.00 | | | | $1,024.37 | | | | $0.50 |
| | | | |
| Portfolio Statistics | | STATE STREET MONEY MARKET PORTFOLIO | | 45 |
Portfolio Statistics (unaudited)
| | | |
| Portfolio Composition* | | June 30, 2008 | |
| Yankee Certificates of Deposit | | 45.4 | % |
| Repurchase Agreements | | 19.7 | |
| Commercial Paper | | 10.3 | |
| Euro Certificates of Deposit | | 9.6 | |
| Bank Notes | | 6.1 | |
| Medium Term Notes | | 4.8 | |
| Certificates of Deposit | | 2.0 | |
| Master Note | | 1.2 | |
| Promissory Notes | | 0.6 | |
| Other assets less liabilities | | 0.3 | |
| Total | | 100.0 | % |
| |
| Maturity Ladder | | June 30, 2008 | |
| 0-3 Days | | 26.0 | % |
| 4-90 Days | | 65.3 | |
| 90+ Days | | 8.7 | |
| Total | | 100.0 | % |
| |
| Average Maturity | | 40 Days | |
| * | As a percentage of net assets as of the date indicated. The Portfolio’s composition will vary over time. |
| | | | |
| 46 | | STATE STREET MONEY MARKET PORTFOLIO | | Portfolio of Investments |
Portfolio of Investments June 30, 2008 (unaudited)
| | | | | | | | |
| Name of Issuer and Title of Issue | | Interest
Rate | | Maturity
Date | | Principal
Amount | | Amortized
Cost† |
| COMMERCIAL PAPER – 10.3% | | | | | | | | |
| Bank Domestic – 4.7% | | | | | | | | |
| Bank of America Corp. | | 2.615% | | 10/02/2008 | | $100,000,000 | | $99,324,458 |
| JPMorgan Chase & Co. | | 2.500% | | 08/12/2008 | | 300,000,000 | | 299,125,000 |
| | | | | | | | |
| | | | | | | | 398,449,458 |
| | | | | | | | |
| Bank Foreign – 1.6% | | | | | | | | |
| CBA (Deleware) Finance, Inc. | | 2.730% | | 07/03/2008 | | 37,488,000 | | 37,482,314 |
| CBA (Deleware) Finance, Inc. | | 2.730% | | 07/07/2008 | | 100,000,000 | | 99,954,500 |
| | | | | | | | |
| | | | | | | | 137,436,814 |
| | | | | | | | |
| Finance Captive Consumer – 4.0% | | | | | | | | |
| General Electric Capital Corp. | | 2.830% | | 12/18/2008 | | 350,000,000 | | 345,322,639 |
| | | | | | | | |
| TOTAL COMMERCIAL PAPER | | | | | | | | 881,208,911 |
| | | | | | | | |
| CERTIFICATES OF DEPOSIT – 2.0% | | | | | | | | |
| Bank Domestic – 2.0% | | | | | | | | |
| Citibank | | 2.980% | | 07/23/2008 | | 175,000,000 | | 175,000,000 |
| | | | | | | | |
| TOTAL CERTIFICATES OF DEPOSIT | | | | | | | | 175,000,000 |
| | | | | | | | |
| YANKEE CERTIFICATES OF DEPOSIT – 45.4% | | | | | | | | |
| Bank Foreign – 45.4% | | | | | | | | |
| ABN AMRO Bank | | 2.640% | | 08/15/2008 | | 250,000,000 | | 250,001,552 |
| Australia New Zeland Cayman | | 2.700% | | 07/17/2008 | | 120,000,000 | | 120,000,000 |
| Banco Santander | | 2.750% | | 07/17/2008 | | 100,000,000 | | 100,000,000 |
| Banco Santander | | 2.770% | | 08/12/2008 | | 250,000,000 | | 250,000,000 |
| Bank of Nova Scotia | | 2.550% | | 07/15/2008 | | 150,000,000 | | 150,000,000 |
| Bank of Nova Scotia | | 2.710% | | 07/03/2008 | | 200,000,000 | | 200,000,000 |
| Barclays Bank PLC(a) | | 2.805% | | 07/14/2008 | | 125,000,000 | | 125,000,000 |
| Barclays Bank PLC | | 3.150% | | 07/30/2008 | | 100,000,000 | | 100,000,000 |
| BNP Paribas | | 2.710% | | 09/12/2008 | | 300,000,000 | | 300,000,000 |
| BNP Paribas | | 2.710% | | 10/27/2008 | | 100,000,000 | | 100,000,000 |
| Calyon NY | | 2.920% | | 07/07/2008 | | 100,000,000 | | 99,999,959 |
| Dexia Credit Local NY | | 2.755% | | 07/14/2008 | | 250,000,000 | | 250,000,448 |
| Fortis Bank New York | | 2.700% | | 09/12/2008 | | 150,000,000 | | 150,000,000 |
| Lloyds Bank | | 2.610% | | 08/19/2008 | | 100,000,000 | | 100,001,352 |
| Rabobank Nederland | | 2.630% | | 08/18/2008 | | 350,000,000 | | 350,000,000 |
| Royal Bank of Scotland | | 2.690% | | 09/22/2008 | | 300,000,000 | | 300,003,427 |
| Societe Generale NY | | 2.750% | | 10/22/2008 | | 200,000,000 | | 200,000,000 |
| Societe Generale NY | | 2.850% | | 09/10/2008 | | 100,000,000 | | 100,000,000 |
| Svenska Handelsbanken AB | | 2.705% | | 07/17/2008 | | 100,000,000 | | 100,000,221 |
| Toronto Dominion Bank | | 2.740% | | 09/23/2008 | | 200,000,000 | | 200,000,000 |
| UBS AG Stamford CT | | 2.810% | | 07/11/2008 | | 100,000,000 | | 100,000,000 |
| UBS AG Stamford CT | | 2.940% | | 07/03/2008 | | 250,000,000 | | 250,000,034 |
| | | | | | | | |
| TOTAL YANKEE CERTIFICATES OF DEPOSIT | | | | | | | | 3,895,006,993 |
| | | | | | | | |
| | | | |
| Portfolio of Investments | | STATE STREET MONEY MARKET PORTFOLIO | | 47 |
Portfolio of Investments June 30, 2008 (unaudited) (continued)
| | | | | | | | |
| Name of Issuer and Title of Issue | | Interest
Rate | | Maturity
Date | | Principal
Amount | | Amortized
Cost† |
| | | | | | | | |
| EURO CERTIFICATES OF DEPOSIT – 9.6% | | | | | | | | |
| Bank Foreign – 9.6% | | | | | | | | |
| Australia New Zeland Cayman | | 2.750% | | 09/16/2008 | | $200,000,000 | | $200,000,000 |
| Credit Agricole SA | | 2.710% | | 09/02/2008 | | 250,000,000 | | 250,000,000 |
| ING Bank Amsterdam | | 2.800% | | 07/14/2008 | | 75,000,000 | | 75,000,000 |
| ING Bank Amsterdam | | 2.900% | | 07/07/2008 | | 300,000,000 | | 300,000,000 |
| | | | | | | | |
| TOTAL EURO CERTIFICATES OF DEPOSIT | | | | | | | | 825,000,000 |
| | | | | | | | |
| BANK NOTES – 6.1% | | | | | | | | |
| Bank Domestic – 3.5% | | | | | | | | |
| Bank of America(b) | | 2.750% | | 09/15/2008 | | 300,000,000 | | 300,000,000 |
| | | | | | | | |
| | | | | | | | 300,000,000 |
| | | | | | | | |
| Bank Foreign – 2.6% | | | | | | | | |
| BNP Paribas(a)(b) | | 2.719% | | 08/19/2008 | | 25,000,000 | | 25,000,000 |
| Lloyds TSB Group PLC(a)(b) | | 2.440% | | 07/07/2008 | | 100,000,000 | | 100,000,000 |
| Svenska Handelsbanken(a)(b) | | 2.471% | | 07/21/2008 | | 100,000,000 | | 100,000,000 |
| | | | | | | | |
| | | | | | | | 225,000,000 |
| | | | | | | | |
| TOTAL BANK NOTES | | | | | | | | 525,000,000 |
| | | | | | | | |
| MASTER NOTE – 1.2% | | | | | | | | |
| Goldman Sachs Group, Inc.(a)(c) | | 3.182% | | 07/21/2008 | | 100,000,000 | | 100,000,000 |
| | | | | | | | |
| TOTAL MASTER NOTE | | | | | | | | 100,000,000 |
| | | | | | | | |
| MEDIUM TERM NOTES – 4.8% | | | | | | | | |
| Bank Domestic – 2.0% | | | | | | | | |
| American Express Credit Corp.(a) | | 2.492% | | 07/21/2008 | | 20,000,000 | | 20,000,000 |
| JPMorgan Chase & Co.(a) | | 2.449% | | 07/02/2008 | | 50,000,000 | | 50,000,000 |
| Procter & Gamble International Funding SCA(a) | | 2.789% | | 08/19/2008 | | 24,000,000 | | 24,000,000 |
| Wells Fargo Company(a) | | 2.631% | | 07/18/2008 | | 50,000,000 | | 50,000,000 |
| Wells Fargo Company(a) | | 2.631% | | 07/18/2008 | | 30,000,000 | | 30,000,000 |
| | | | | | | | |
| | | | | | | | 174,000,000 |
| | | | | | | | |
| Bank Foreign – 2.8% | | | | | | | | |
| Alliance & Leicester PLC(a)(b) | | 2.493% | | 07/31/2008 | | 35,000,000 | | 35,000,000 |
| Bank of Scotland PLC(a)(b) | | 2.448% | | 07/09/2008 | | 25,000,000 | | 25,000,000 |
| Caja de Ahorros y Monte de Piedad de Madrid(a)(b) | | 2.968% | | 07/21/2008 | | 30,000,000 | | 30,000,000 |
| National Australia Bank Ltd.(a)(b) | | 2.448% | | 07/07/2008 | | 20,000,000 | | 20,000,000 |
| UniCredito Italiano Bank Ireland PLC(a)(b) | | 2.501% | | 07/15/2008 | | 15,000,000 | | 15,000,000 |
| Westpac Banking Corp.(a)(b) | | 2.440% | | 07/07/2008 | | 100,000,000 | | 100,000,000 |
| Westpac Banking Corp.(a)(b) | | 2.471% | | 07/16/2008 | | 15,000,000 | | 15,000,000 |
| | | | | | | | |
| | | | | | | | 240,000,000 |
| | | | | | | | |
| TOTAL MEDIUM TERM NOTES | | | | | | | | 414,000,000 |
| | | | | | | | |
| PROMISSORY NOTE – 0.6% | | | | | | | | |
| Goldman Sachs Group, Inc.(a)(c) | | 4.100% | | 07/15/2008 | | 50,000,000 | | 50,000,000 |
| | | | | | | | |
| TOTAL PROMISSORY NOTE | | | | | | | | 50,000,000 |
| | | | | | | | |
| | | | |
| 48 | | STATE STREET MONEY MARKET PORTFOLIO | | Portfolio of Investments |
Portfolio of Investments June 30, 2008 (unaudited) (continued)
| | | | | | | | |
| Name of Issuer and Title of Issue | | Interest
Rate | | Maturity
Date | | Principal
Amount | | Amortized
Cost† |
| REPURCHASE AGREEMENTS – 19.7% | | | | | | | | |
| Bank of America Tri Party Repo, dated 06/30/08 (collateralized by Federal Home Loan Mortgage Corporation, 0.000% due 12/05/08 valued at $16,039,958); proceeds $15,726,005 | | 2.300% | | 07/01/2008 | | $15,725,000 | | $15,725,000 |
| | | | | | | | |
| | | | |
| Bank of America Tri Party Repo, dated 06/30/08 (collateralized by Federal National Mortgage Associations, 5.500% due 06/01/33 valued at $408,000,000); proceeds $400,027,778 | | 2.500% | | 07/01/2008 | | 400,000,000 | | 400,000,000 |
| | | | | | | | |
| | | | |
| Credit Suisse First Boston Tri Party Repo, dated 06/30/08 (collateralized by Corporate Notes, 5.250% - 8.812% due 05/15/09 - 05/23/37 valued at $78,520,429); proceeds $75,005,521 | | 2.650% | | 07/01/2008 | | 75,000,000 | | 75,000,000 |
| | | | | | | | |
| | | | |
| JP Morgan Chase Tri Party Repo, dated 06/30/08 (collateralized by Government National Mortgage Association, 4.500% - 6.000% due 07/20/31 - 11/20/35, Federal National Mortgage Association, 2.983% - 7.000% due 07/01/16 - 05/01/38, and Federal Home Loan Mortgage Corporation 3.021% - 22.120% due 11/01/10 - 04/01/38 valued at $408,000,000); proceeds $400,030,000 | | 2.700% | | 07/01/2008 | | 400,000,000 | | 400,000,000 |
| | | | | | | | |
| | | | |
| Salomon Brothers Tri Party Repo, dated 06/30/08 (collateralized by Federal National Mortgage Association, 6.000% due 11/01/36 - 10/01/37 valued at $408,003,280); proceeds $400,030,000 | | 2.700% | | 07/01/2008 | | 400,000,000 | | 400,000,000 |
| | | | | | | | |
| | | | |
| UBS Warburg Tri Party Repo, dated 06/30/08 (collateralized by Federal National Mortgage Association, 3.500% - 12.500% due 07/01/08 - 06/01/48 valued at $408,004,734); proceeds $400,030,556 | | 2.750% | | 07/01/2008 | | 400,000,000 | | 400,000,000 |
| | | | | | | | |
| | | | | | | | |
| | | | | | | | |
| TOTAL REPURCHASE AGREEMENTS | | | | | | | | 1,690,725,000 |
| | | | | | | | |
| | | | | | | | |
| TOTAL INVESTMENTS(d) – 99.7% | | | | | | | | 8,555,940,904 |
| OTHER ASSETS IN EXCESS OF LIABILITIES – 0.3% | | | | | | | | 26,863,984 |
| | | | | | | | |
| NET ASSETS – 100.0% | | | | | | | | $8,582,804,888 |
| | | | | | | | |
(a) | | Floating Rate Note – Interest rate shown is rate in effect at June 30, 2008 with next reset date. |
(b) | | Security subject to restrictions on resale under federal securities laws, which may only be resold upon registration under the Securities Act of 1933, as amended (“1933 Act”) or in transactions exempt from registration, including sales to qualified institutional buyers pursuant to Rule 144A of the 1933 Act. The Portfolio does not have the right to demand that this security be registered. |
(c) | | Security subject to restrictions on resale that has been deemed by the Adviser to be illiquid. The Portfolio may not invest more than 10% of its net assets in illiquid securities. At June 30, 2008, this security represents 1.7% of net assets. |
(d) | | Also represents the cost for federal tax purposes. |
| † | | See Note 2 to the Notes to Financial Statements. |
See Notes to Financial Statements
| | | | |
| Financial Statements | | STATE STREET MONEY MARKET PORTFOLIO | | 49 |
Statement of Assets and Liabilities June 30, 2008 (unaudited)
| | | | | |
| Assets | | | | | |
| Investments in unaffiliated issuers, at amortized cost (Note 2) | | $ | | | 6,865,215,904 |
| Repurchase agreements (cost $1,690,725,000) (Note 2) | | | | | 1,690,725,000 |
| | | | | |
| | | | | 8,555,940,904 |
| Cash | | | | | 288 |
| Receivables: | | | | | |
| Interest receivable | | | | | 27,087,888 |
| Receivable from adviser (Note 3) | | | | | 162,265 |
| Miscellaneous assets | | | | | 512,367 |
| Prepaid expenses | | | | | 21,052 |
| | | | | |
| Total assets | | | | | 8,583,724,764 |
| Liabilities | | | | | |
| Payables: | | | | | |
| Management fee (Note 3) | | | | | 731,948 |
| Administration, custody and transfer agent fees (Note 3) | | | | | 150,737 |
| Professional fees | | | | | 24,331 |
| Trustees’ fees (Note 4) | | | | | 95 |
| Accrued expenses and other liabilities | | | | | 12,765 |
| | | | | |
| Total Liabilities | | | | | 919,876 |
| | | | | |
| Net Assets | | $ | | | 8,582,804,888 |
| | | | | |
Statement of Operations For the Six Months Ended June 30, 2008 (unaudited)
| | | | | | |
| Investment Income | | | | | | |
| Interest | | $ | | | 136,803,834 | |
| | | | | | |
| Expenses | | | | | | |
| Management fees (Note 3) | | | | | 4,079,283 | |
| Administration, custody and transfer agent fees (Note 3) | | | | | 831,046 | |
| Professional fees | | | | | 31,042 | |
| Trustees’ fees (Note 4) | | | | | 29,091 | |
| Other expenses | | | | | 78 | |
| | | | | 21,868 | |
| | | | | | |
| Total Expenses | | | | | 4,992,408 | |
| Less: Fee waivers/reimbursements by investment adviser (Note 3) | | | | | (913,126 | ) |
| | | | | | |
| Total Net Expenses | | | | | 4,079,282 | |
| | | | | | |
| Net Investment Income | | $ | | | 132,724,552 | |
| | | | | | |
| Realized and Unrealized Gain (Loss) | | | | | | |
| Net realized loss on investments | | | | | | |
| Change in net unrealized appreciation (depreciation) in value of Investment Securities | | | | | | |
| Net gain (loss) on investments | | | | | 235,064 | |
| | | | | | |
| Net Increase in Net Assets Resulting from Operations | | $ | | | 132,959,616 | |
| | | | | | |
See Notes to Financial Statements.
| | | | |
| 50 | | STATE STREET MONEY MARKET PORTFOLIO | | Financial Statements |
Statement of Changes in Net Assets
| | | | | | | | | | | | |
| | | For the Six Months
Ended June 30, 2008
(Unaudited) | | | For the Year Ended
December 31, 2007 | |
| Increase in Net Assets From: | | | | | | | | | | | | |
| Operations | | | | | | | | | | | | |
| Net investment income | | $ | | | 132,724,552 | | | $ | | | 294,455,764 | |
| Net realized gain (loss) on investments | | | | | 235,064 | | | | | | (6,953 | ) |
| | | | | | | | | | | | |
| Net increase in net assets resulting from operations | | | | | 132,959,616 | | | | | | 294,448,811 | |
| | | | | | | | | | | | |
| Capital Transactions | | | | | | | | | | | | |
| Proceeds from contributions | | | | | 11,362,497,990 | | | | | | 14,082,546,440 | |
| Fair value of withdrawals | | | | | (9,830,915,746 | ) | | | | | (13,655,849,339 | ) |
| | | | | | | | | | | | |
| Net increase in net assets from capital transactions | | | | | 1,531,582,244 | | | | | | 426,697,101 | |
| | | | | | | | | | | | |
| Total Net Increase in Net Assets | | | | | 1,664,541,860 | | | | | | 721,145,912 | |
| Net Assets | | | | | | | | | | | | |
| Beginning of period | | | | | 6,918,263,028 | | | | | | 6,197,117,116 | |
| | | | | | | | | | | | |
| End of period | | $ | | | 8,582,804,888 | | | $ | | | 6,918,263,028 | |
| | | | | | | | | | | | |
Financial Highlights The following table includes selected supplemental data and ratios to average net assets:
| | | | | | | | | | | | | | | |
| | | Six Months
Ended 6/30/2008
(Unaudited) | | Year Ended
12/31/2007 | | Year Ended
12/31/2006 | | Year Ended
12/31/2005 | | Period Ended
12/31/2004* |
| Supplemental Data and Ratios: | | | | | | | | | | | | | | | |
| Net assets, end of period (in thousands) | | $ | 8,582,805 | | $ | 6,918,263 | | $ | 6,197,117 | | $ | 1,639,871 | | $ | 381,716 |
| Ratios to average net assets: | | | | | | | | | | | | | | | |
| Gross operating expenses | | | 0.12%** | | | 0.12% | | | 0.13% | | | 0.14% | | | 0.18%** |
| Net operating expenses | | | 0.10%** | | | 0.10% | | | 0.10% | | | 0.10% | | | 0.10%** |
| Net investment income | | | 3.26%** | | | 5.14% | | | 5.08% | | | 3.33% | | | 1.71%** |
| Total return(a) | | | 1.66% | | | 5.30% | | | 5.09% | | | 3.31% | | | 0.68% |
| * | The Portfolio commenced operations on August 12, 2004. |
(a) | Results represent past performance and are not indicative of future results. Total return for periods of less than one year are not annualized. |
See Notes to Financial Statements.
| | | | |
| Notes to Financial Statements | | STATE STREET MONEY MARKET PORTFOLIO | | 51 |
Notes to Financial Statements
1. Organization
The State Street Master Funds (the “Trust”) is registered under the Investment Company Act of 1940, as amended (the “1940 Act”), as an open-end management investment company, and was organized as a business trust under the laws of The Commonwealth of Massachusetts on July 27, 1999. The Trust comprises eleven investment portfolios: the State Street Equity 500 Index Portfolio, the State Street Equity 400 Index Portfolio, the State Street Equity 2000 Index Portfolio, the State Street Aggregate Bond Index Portfolio, the State Street Money Market Portfolio, the State Street Tax Free Money Market Portfolio, the State Street Limited Duration Bond Portfolio, the State Street Short-Term Tax Exempt Bond Portfolio (formerly the State Street Tax Free Limited Duration Bond Portfolio), the State Street Treasury Money Market Portfolio, the State Street Treasury Plus Money Market Portfolio and the State Street U.S. Government Money Market Portfolio. Information presented in these financial statements pertains only to the State Street Money Market Portfolio (the “Portfolio”). At June 30, 2008, only the Portfolio, the State Street Equity 500 Index Portfolio, the State Street Tax Free Money Market Portfolio, the State Street Short-Term Tax Exempt Bond Portfolio (formerly the State Street Tax Free Limited Duration Bond Portfolio), the State Street Treasury Money Market Portfolio, the State Street Treasury Plus Money Market Portfolio and the State Street U.S. Government Money Market Portfolio were in operation. The Portfolio commenced operations on August 12, 2004. The Portfolio is authorized to issue an unlimited number of non-transferable beneficial interests.
The Portfolio’s investment objective is to maximize current income to the extent consistent with the preservation of capital and liquidity by investing in dollar denominated securities.
2. Significant Accounting Policies
The following is a summary of the significant accounting policies consistently followed by the Portfolio in the preparation of its financial statements.
SECURITY VALUATION
As permitted under Rule 2a-7 of the 1940 Act and certain conditions therein, securities of the Portfolio are valued initially at cost and thereafter assume a constant amortization to maturity of any discount or premium.
The Portfolio adopted Financial Accounting Standards Board Statement of Financial Accounting Standards No. 157, Fair Value Measurements (“FAS 157”), effective for financial statements issued for fiscal years beginning after November 15, 2007 and interim periods within those fiscal years. In accordance with FAS 157, fair value is defined as the price that the portfolio would receive upon selling an
| | | | |
| 52 | | STATE STREET MONEY MARKET PORTFOLIO | | Notes to Financial Statements |
investment in a timely transaction to an independent buyer in the principal or most advantageous market of the investment. Various inputs are used in determining the value of the Fund’s investments. FAS 157 established a three tier hierarchy of inputs to establish a classification of fair value measurements and disclosure. The three tier hierarchy of inputs is summarized below:
| | • | | Level 1 – quoted prices in active markets for identical securities |
| | • | | Level 2 – other significant observable inputs (including quoted prices for similar securities, interest rates, prepayment speeds, credit risk, etc.) |
| | • | | Level 3 – significant unobservable inputs (including the Fund’s own assumptions in determining the fair value of investments) |
The inputs or methodology used for valuing securities are not an indication of the risk associated with investing in those securities. The following is a summary of the inputs used, as of June 30, 2008, in valuing the Fund’s assets carried at fair value:
| | |
| Valuation inputs | | Investments in securities |
| |
| Level 1 – Quoted Prices | | $— |
| Level 2 – Other Significant Observable Inputs | | $8,555,940,904 |
| Level 3 – Significant Unobservable Inputs | | — |
| Total | | $8,555,940,904 |
SECURITIES TRANSACTIONS, INVESTMENT INCOME AND EXPENSES
Securities transactions are recorded on a trade date basis for financial statement purposes. Interest income is recorded daily on the accrual basis and includes amortization of premium and accretion of discount on investments. Realized gains and losses from securities transactions are recorded on the basis of identified cost. Expenses are accrued daily.
All of the net investment income and realized gains and losses from the security transactions of the Portfolio are allocated pro rata among the partners in the Portfolio based on each partner’s daily ownership percentage.
FEDERAL INCOME TAXES
The Portfolio is not required to pay federal income taxes on its net investment income and net capital gains because it is treated as a partnership for federal income tax purposes. All interest, gains and losses of the Portfolio are deemed to have been “passed through” to the Portfolio’s partners in proportion to their holdings in the Portfolio, regardless of whether such items have been distributed by the Portfolio. Each partner is responsible for tax liability based on its distributive share; therefore, no provision has been made for federal income taxes.
The Portfolio adopted the provisions of Financial Accounting Standards Board Interpretation No. 48 (FIN 48), “Accounting for
| | | | |
| Notes to Financial Statements | | STATE STREET MONEY MARKET PORTFOLIO | | 53 |
Uncertainty in Income Taxes”, on June 29, 2007. As of and during the six months ended June 30, 2008, the Portfolio did not have a liability for any unrecognized tax expenses. The Portfolio recognizes interest and penalties, if any, related to tax liabilities as income tax expense in the Statement of Operations. As of June 30, 2008, tax years 2004 through 2007 remain subject to examination by the portfolio’s major tax jurisdictions, which include the United States of America and the Commonwealth of Massachusetts.
At June 30, 2008, the cost of investments for federal income tax purposes was the same as the cost for financial reporting purposes.
REPURCHASE AGREEMENTS
A repurchase agreement customarily obligates the seller at the time it sells securities to the Portfolio to repurchase the securities at a mutually agreed upon price and time which, in the case of the Portfolio’s transactions, is within seven days. The total amount received by the Portfolio on repurchase is calculated to exceed the price paid by the Portfolio, reflecting an agreed-upon market rate of interest for the period of time to the settlement date, and is not necessarily related to the interest rate on the underlying securities. The underlying securities are ordinarily United States Government securities, but may consist of other securities in which the Portfolio is permitted to invest. Repurchase agreements are fully collateralized at all times. The use of repurchase agreements involves certain risks. For example, if the seller of securities under a repurchase agreement defaults on its obligation to repurchase the underlying securities (as a result of its bankruptcy or otherwise) the Portfolio will seek to dispose of such securities; this action could involve costs or delays. In addition, the proceeds of any such disposition may be less than the amount the Portfolio is owed under the repurchase agreement. The Portfolio may enter into repurchase agreements maturing within seven days with domestic dealers, banks and other financial institutions deemed to be creditworthy by SSgA Funds Management, Inc. (“SSgA FM” or the “Adviser”), a subsidiary of State Street Corporation and an affiliate of State Street Bank and Trust Company (“State Street”).
EXPENSE ALLOCATION
Certain expenses are applicable to multiple Portfolios. Expenses directly attributable to a Portfolio are charged to that Portfolio. Expenses of the Trust that are not directly attributed to a Portfolio are allocated among the Portfolios, on the basis of relative net assets, except where a more appropriate allocation of expenses to each of the Portfolios can otherwise be made fairly.
USE OF ESTIMATES
The Portfolio’s financial statements are prepared in accordance with U.S. generally accepted accounting principles that require the use of management estimates. Actual results could differ from those estimates.
| | | | |
| 54 | | STATE STREET MONEY MARKET PORTFOLIO | | Notes to Financial Statements |
3. Related Party Fees
The Portfolio has entered into an investment advisory agreement with SSgA FM. The Adviser directs the investments of the Portfolio in accordance with its investment objective, policies, and limitations. In compensation for the Adviser’s services as investment adviser, the Portfolio pays the Adviser an annual fee of 0.10% of the Portfolio’s average daily net assets. The Adviser has contractually agreed to cap the total operating expenses of the Portfolio at 0.10% of the Portfolio’s average daily net assets until November 1, 2008. For the six months ended June 30, 2008, SSgA FM reimbursed the Portfolio $913,126 under this agreement.
State Street is the administrator, custodian and transfer agent for the Portfolio. In compensation for State Street’s services as administrator, custodian and transfer agent beginning February 1, 2007, the Trust pays State Street an annual fee, which is accrued daily and payable monthly at the applicable fee rate described below, of the following annual percentages of the Trust’s average aggregate daily net assets during the month as follows:
| | |
| Asset Levels | | Annual percentage of average
aggregate daily net assets |
| |
| First $400 Million | | 0.03% |
| Thereafter | | 0.02 |
| Minimum annual fee per trust: | | $150,000 |
4. Trustees’ Fees
The Trust pays each trustee who is not an officer or employee of SSgA FM or State Street $2,500 for each meeting of the Board of Trustees and an additional $500 for each telephonic meeting attended. The Trust also pays each trustee an annual retainer of $30,000. Each trustee is reimbursed for out-of-pocket and travel expenses.
5. Indemnifications
The Trust’s organizational documents provide that its officers and trustees are indemnified against certain liabilities arising out of the performance of their duties to the Trust. In addition, both in some of its principal service contracts and in the normal course of its business, the Trust enters into contracts that provide indemnifications to other parties for certain types of losses or liabilities. The Trust’s maximum exposure under these arrangements in unknown as this could involve future claims against the Trust. Management does not expect any significant claims.
| | | | |
| General Information | | STATE STREET MONEY MARKET PORTFOLIO | | 55 |
General Information (unaudited)
Proxy Voting Policies and Procedures and Record
The Trust has adopted proxy voting procedures relating to portfolio securities held by the Portfolio. A description of the policies and procedures is available (i) without charge, upon request, by calling (877) 521-4083 or (ii) on the website of the Securities and Exchange Commission (the “SEC”) at www.sec.gov. Information on how the Portfolio voted proxies relating to portfolio securities during the most recent 12-month period ending June 30 is available by August 31 (i) without charge, upon request, by calling (877) 521-4083 or (ii) on the SEC’s website at www.sec.gov.
Quarterly Portfolio Schedule
The Trust files its complete schedule of portfolio holdings with the SEC for the first and third quarters of its fiscal year (as of March and September of each year) on Form N-Q. The Trust’s Forms N-Q are available on the SEC’s website at www.sec.gov. The Trust’s Forms N-Q may be reviewed and copied at the SEC’s Public Reference Room in Washington, D.C. and information on the operation of the Public Reference Room may be obtained by calling 1-800-SEC-0330. The most recent Form N-Q is available without charge, upon request, by calling (877) 521-4083.
| | | | |
| 56 | | STATE STREET MONEY MARKET PORTFOLIO | | Trustees and Executive Officers |
Trustees
Michael F. Holland
William L. Boyan
Rina K. Spence
Douglas T. Williams
James E. Ross
Investment Adviser
SSgA Funds Management, Inc.
State Street Financial Center
One Lincoln Street
Boston, MA 02111
Administrator, Custodian and Transfer Agent
State Street Bank and Trust Company
State Street Financial Center
One Lincoln Street
Boston, MA 02111
Independent Registered Public Accounting Firm
Ernst & Young LLP
200 Clarendon Street
Boston, MA 02116
Legal Counsel
Ropes & Gray LLP
One International Place
Boston, MA 02110
This report is for shareholder information. This is not a prospectus intended for use in the purchase or sale of shares of beneficial interest.
State Street Money Market Portfolio
State Street Bank and Trust Company
P.O. Box 5049
Boston, MA 02206
| | | | |
| How to Contact Us | | AARP FUNDS 2008 ANNUAL REPORT | | 57 |
How to Contact Us
Telephone
Call 1-800-958-6457 weekdays from 8:00 am to 6:00 pm Eastern time, to speak directly with a courteous, knowledgeable representative. The following prompt choices are available when you dial the number above:
| • | | Financial Center investment counselors are available to answer investment questions relating to the AARP Funds. |
| • | | Shareholder Services representatives can handle any account-related questions or transactions. |
| • | | Automated Response System is available 24 hours a day, seven days a week to handle a wide range of account functions (as shown below). |
Financial Center investment counselors
| • | | Speak with specially trained representatives to help you identify your goals, determine if you’re on track financially for retirement and decide if an AARP Fund is right for you. |
Shareholder Services representatives or our 24-hour Automated Response System
| • | | Receive general account information and service from our Shareholder Services representatives |
| • | | Initiate an electronic transfer to buy or sell shares |
| • | | Order duplicate statements |
| • | | Check your account balance or share prices |
| • | | Change your address of record (not available via the Automated Response System) |
Mail
AARP Funds
P.O. Box 8035
Boston, MA 02266-8035
Overnight delivery
AARP Funds
c/o BFDS
30 Dan Road
Canton, MA 02021
| • | | Request to buy, sell or exchange shares in writing |
| • | | Change the name on your account |
| • | | Add a seasonal mailing address |
| • | | Add banking information to your account |
| • | | Add or change an Automatic Investment Program |
| • | | Add or change payroll deduction |
Website
www.aarpfunds.com
| • | | Get a prospectus or fund report |
| • | | Buy, sell or exchange shares |
| • | | View your account balance and share price |
| • | | Change your mailing address |
| • | | Order duplicate statements or copies of your tax forms |
| • | | Get forms to accomplish a variety of tasks |
AARP Funds
P.O. Box 8035
Boston, MA 02266-8035
1-800-958-6457
www.aarpfunds.com
©2008 AARP Funds
| | |

| | ARP000628 02/29/2009 ARP-AR-001-0808 |
| (a) | AARP Funds (the “Registrant”) has adopted a Code of Ethics that applies to the Registrant’s principal executive officer and senior financial officers, including the principal financial officer, controller or principal accounting officer, or persons performing similar functions, regardless of whether these persons are employed by the Registrant or a third party. |
| (b) | No disclosures are required by this Item 2(b). |
| (c) | There have been no amendments to the Registrant’s Code of Ethics during the reporting period for Form N-CSR. |
| (d) | There have been no waivers granted by the Registrant to individuals covered by the Registrant’s Code of Ethics during the reporting period for Form N-CSR. |
| (f) | A copy of the Registrant’s Code of Ethics is attached as an exhibit to this Form N-CSR. |
| Item 3. | Audit Committee Financial Expert |
| | | | |
| (a) | | (1) | | The Board of Trustees of the Registrant has determined that the Registrant has one member serving on the Registrant’s Audit Committee that possesses the attributes identified in Instruction 2(b) of Item 3 to Form N-CSR to qualify as “audit committee financial expert.” |
| | |
| | (2) | | For the reporting period, the name of the audit committee financial expert was Lynn Turner. Mr. Turner was deemed to be “independent” as that term is defined in Item 3(a)(2) of Form N-CSR. |
| Item 4. | Principal Accountant Fees and Services |
| (a) | Audit Fees – The aggregate fees billed for professional services rendered by the independent registered public accounting firm for the audit of the Registrant’s annual financial statements or services normally provided in connection with statutory and regulatory filings or engagements for the last two fiscal years ended June 30, 2008 and June 30, 2007 were $97,312.50 and $145,000, respectively. |
| (b) | Audit-Related Fees – The Registrant was not billed any fees by the independent registered public accounting firm for the fiscal years ended June 30, 2008 and June 30, 2007 for assurance and related services rendered by the independent registered public accounting firm to the Registrant that are reasonably related to the performance of the audit of the Registrant’s financial statements and are not reported under paragraph (a) of this Item 4. |
During the fiscal years ended June 30, 2008 and June 30, 2007, no fees for assurance and related services that relate directly to the operations and financial reporting of the Registrant were billed by the independent registered public accounting firm to the Registrant’s investment adviser or any other entity controlling, controlled by, or under common control with the investment adviser that provides ongoing services to the Registrant.
| (c) | Tax Fees – During the fiscal years ended June 30, 2008 and June 30, 2007, no fees for tax compliance, tax advice, tax planning and tax return preparation were billed by the independent registered public accounting firm to the Registrant. |
During the fiscal years ended June 30, 2008 and June 30, 2007, no fees for tax compliance, tax advice or tax planning services that relate directly to the operations and financial reporting of the Registrant were billed by the independent registered public accounting firm to the Registrant’s investment adviser or any other entity controlling, controlled by, or under common control with the investment adviser that provides ongoing services to the Registrant.
During the fiscal years ended June 30, 2008 and June 30, 2007, the Registrant was billed $24,875 and $25,000, respectively by another accounting firm for tax compliance, tax advice, tax planning and tax return preparation.
During the fiscal years ended June 30, 2008 and June 30, 2007, no fees for tax compliance, tax advice or tax planning services that relate directly to the operations and financial reporting of the Registrant were billed by another accounting firm to the Registrant’s investment adviser or any other entity controlling, controlled by, or under common control with the investment adviser that provides ongoing services to the Registrant.
| (d) | All Other Fees – During the fiscal years ended June 30, 2008 and June 30, 2007, there were no fees billed for products and services provided by the independent registered public accounting firm to the Registrant, other than the services reported in paragraph (a) – (c) of this Item 4. |
During the fiscal years ended June 30, 2008 and June 30, 2007, no fees for other services that relate directly to the operations and financial reporting of the Registrant were billed by the independent registered public accounting firm to the Registrant’s investment adviser or any other entity controlling, controlled by, or under common control with the investment adviser that provides ongoing services to the Registrant.
| (e)(1) | Pre-Approval Policies and Procedures |
It is the general policy of the Audit Committee not to approve non-audit services. In considering whether to approve non-audit services, the Audit Committee will consider the following:
| | (a) | whether the service is being performed principally for the Audit Committee; |
| | (b) | the effects of the service, if any, on audit effectiveness or on the quality and timeliness of the Funds financial reporting process; |
| | (c) | whether the service would be performed by specialists (e.g., technology specialists) who ordinarily also provide recurring audit support; |
| | (d) | whether the service would be performed by audit personnel and, if so, whether it will enhance their knowledge of the Funds business and operations; |
| | (e) | whether the role of those performing the service would be inconsistent with the Auditor’s role (e.g., a role where neutrality, impartiality and auditor skepticism are likely to be subverted); |
| | (f) | whether the audit firm’s personnel would be assuming a management role or creating a mutuality of interest with management; |
| | (g) | whether the auditors, in effect, would be auditing their own numbers; |
| | (h) | whether the project must be started and completed very quickly and therefore is not a longer term relationship; |
| | (i) | whether the audit firm has unique service expertise in the service that cannot be obtained from another service provider; and |
| | (j) | the size of the fee(s) for the non-audit service(s). |
| (e)(2) | Percentage of Services. |
One hundred percent of the services described in each of paragraphs (b) through (d) of this Item were approved by the registrant’s Audit Committee pursuant to paragraph (c)(7)(i)(C) of Rule 2-01 of Regulation S-X.
| (f) | No disclosures are required by this Item 4(f). |
| (g) | The independent registered public accounting firm did not bill the Registrant for any other non-audit services for the fiscal years ended June 30, 2008 and June 30, 2007 for the Registrant other than as disclosed above. |
| (h) | No disclosures are required by this Item 4(h). |
| Item 5. | Audit Committee of Listed Registrants |
Not applicable.
| Item 6. | Schedule of Investments |
Schedule of Investments is included as a part of the report to shareholders filed under Item 1 of this Form N-CSR.
| Item 7. | Disclosure of Proxy Voting Policies and Procedures for Closed-End Management Investment Companies |
Not applicable.
| Item 8. | Portfolio Managers of Closed-End Investment Companies |
Not applicable.
| Item 9. | Purchases of Equity Securities by Closed-End Management Investment Company and Affiliated Purchasers |
Not applicable.
| Item 10. | Submission of Matters to a Vote of Security Holders |
The Board of Trustees has adopted procedures by which shareholders may recommend nominees to the Board. There have been no amendments to such procedures during the reporting period for Form N-CSR.
| Item 11. | Controls and Procedures |
| (a) | The Registrant’s principal executive and principal financial officers have concluded that the Registrant’s disclosure controls and procedures (as defined in Rule 30a-3(c) under the Investment Company Act of 1940, as amended (the “1940 Act”) (17 CFR 270.30a-3(c)) are effective, as of a date within 90 days of the filing date of this Form N-CSR based on their evaluation of these controls and procedures required by Rule 30a-3(b) under the 1940 Act (17 CFR 270.30a-3(b)) and Rules 13a-15(b) or 15d-15(b) under the Securities Exchange Act of 1934 (17 CFR 240.13a-15(b) or 240.15d-15(b)). |
| (b) | There were no changes in the Registrant’s internal control over financial reporting (as defined in Rule 30a-3(d) under the 1940 Act (17 CFR 270.30a-3(d)) that occurred during the second fiscal quarter of the period covered by this report that has materially affected, or is reasonably likely to materially affect, the Registrant’s internal control over financial reporting. |
| (a)(1) | Code of Ethics is attached hereto. |
| (a)(2) | The certifications required by Rule 30a-2(a) of the 1940 Act are attached hereto. (Ex-99.CERT) |
| (b) | The certifications required by Rule 30a-2(b) of the 1940 Act and Section 906 of the Sarbanes-Oxley Act of 2002 are attached hereto.(Ex-99.906CERT) |
SIGNATURES
Pursuant to the requirements of the Securities Exchange Act of 1934 and the Investment Company Act of 1940, the registrant has duly caused this report to be signed on its behalf by the undersigned, thereunto duly authorized.
| | |
| AARP FUNDS |
| |
| By: | | /s/ Richard M. Hisey |
| | Richard M. Hisey |
| | President (principal executive officer) of AARP Funds |
| |
| Date: | | August 19, 2008 |
Pursuant to the requirements of the Securities Exchange Act of 1934 and the Investment Company Act of 1940, this report has been signed below by the following persons on behalf of the registrant and in the capacities and on the dates indicated.
| | |
| By: | | /s/ Richard M. Hisey |
| | Richard M. Hisey |
| | President (principal executive officer) of AARP Funds |
| |
| Date: | | August 19, 2008 |
| | |
| By: | | /s/ Richard M. Hisey |
| | Richard M. Hisey |
| | Treasurer (principal financial officer) of AARP Funds |
| |
| Date: | | August 19, 2008 |