UNITED STATES
SECURITIES AND EXCHANGE COMMISSION
Washington, D.C. 20549
FORM N-CSR
CERTIFIED SHAREHOLDER REPORT OF REGISTERED
MANAGEMENT INVESTMENT COMPANIES
Investment Company Act file number: 811-21825
AARP FUNDS
(Exact name of registrant as specified in charter)
650 F Street, NW
Washington, DC 20004-1604
(Address of principal executive offices)(Zip code)
| | |
| (Name and Address of Agent for Service) | | Copy to: |
| |
Richard Hisey AARP Financial Incorporated Two Highwood Drive, Suite 202 Tewksbury, MA 01876 | | Gary O. Cohen, Esq. Jorden Burt LLP 1025 Thomas Jefferson Street, NW Suite 400 East Washington, DC 20007-5208 |
Registrant’s telephone number, including area code: (202) 434-3650
Date of fiscal year end: June 30
Date of reporting period: June 30, 2009
| Item 1. | Report to Shareholders |

Letter to Shareholders
Market Commentary
Annual Report
June 30, 2009
AARP Aggressive Fund (AAGSX)
AARP Moderate Fund (AAMDX)
AARP Conservative Fund (AACNX)
AARP Income Fund (AANCX)
AARP Money Market Fund (AARXX)
| | |
A LETTER TO SHAREHOLDERS |

Richard M. Hisey President, AARP Funds | | Dear Fellow Shareholders, The past 12 months have been a virtual roller coaster of market volatility as investors were faced with a global financial crisis and the deepest recession since the Great Depression. Although the economy finally seems to be bottoming out, the recovery is expected to be more muted than in the past. This is due to a number of factors including a significant shift in the behavior and attitude of the consumer, and baby boomers in particular. After suffering through a housing downturn and seeing their retirement savings diminished by the bear market, there are signs that American consumers are focused on renewing their personal balance sheets, saving more and spending less. While this strengthening |
behavior is certainly praiseworthy, it could have a dampening effect on the recovery since consumer spending has generally accounted for 70% of economic activity in the U.S.
“TOUGH-LOVE” ECONOMY
We are in what I would call a “tough-love” economy and therefore, as investors, we need to keep in mind that the recovery may come slowly and that growth in the U.S. may be more subdued than in the past and we should not expect a quick or sharp bounce-back. U.S. consumers, saddled with significant amounts of personal debt, can no longer spend as conspicuously as they once did. Some people are going to have to work longer just to make up for lost retirement savings, while others may have to go without some of the luxuries to which they have grown accustomed.
As in most recoveries, we expect various industry sectors such as the auto or banking industries to improve at different rates with banking rebounding strongly, while automotive companies are returning at a slower pace. There are typically leading indicators that tell us where the economy is going and these suggest that it is bottoming out. For example, leading indicators such as the stock market have already regained some of their losses, rising 40% off their March 2009 lows. However, lagging indicators such as the unemployment rate are still expected to worsen in the near future before it gets better. In terms of housing prices, some areas of the country are starting to improve while other areas are still suffering. Although it seems like the worst is over, there is no clear understanding of how strong the recovery will be or how long it will take. Because of this uncertainty and because different sectors will recover at their own pace, we still see a rough road ahead. We consider the trend among Americans to become more circumspect and shoring up their balance sheets by paying off debt and rebuilding their retirement savings to be very positive.
WHAT OUR FINANCIAL ADVISORS ARE HEARING
Our Financial Advisors are hearing from people every day who are having trouble managing their debt, dealing with unemployment or seeking a second opinion regarding their investments. In the past year and a half, they have handled over 150,000 calls, mostly from people looking for a trusted source that offers education, advice and guidance. Many are seeking investments such as the AARP Funds, which, as we’ve stressed in the past, are designed to help simplify investment decisions, while delivering a low-cost, diversified* index-based portfolio and provides access to our experienced Financial Advisors.
NOT PART OF THE ANNUAL REPORT
INCREASED EXPOSURE TO EMERGING MARKETS
As discussed more fully in the annual report to shareholders, a primary driver of our funds’ performance over the past six months has been an increased allocation to international equities and specifically emerging markets. The AARP Aggressive Fund, the AARP Moderate Fund, and the AARP Conservative Fund continue to receive 5 Star Morningstar Ratings™ for the three years ending June 30, 2009 and overall. “Five Stars” is the highest rating a fund can receive and means that the fund ranked in the top 10% of its respective category.
The AARP Aggressive Fund was rated 85th out of 1740 Large Blend Category Funds for the three year period ending 06/30/09 and overall. The AARP Moderate Fund was rated 56th out of 960 Moderate Allocation Category Funds for the three year period ending 06/30/09 and overall. The AARP Conservative Fund was rated 10th out of 485 Conservative Allocation Category Funds for the three year period ending 06/30/09 and overall. Morningstar Ratings are based on risk adjusted performance.
Many economists believe that over the long term many emerging markets may experience stronger growth than more developed economies. While emerging markets have been more volatile than markets in developed countries, company valuations have been attractive and the countries represented may weather the current economic challenges better than more developed countries, according to many strategists. We share this view and this was a key ingredient in our thinking when we decided to shift the asset allocation benchmarks on all three AARP Financial lifestyle funds on January 1, 2009 to broaden the funds’ international exposure to include not only developed markets, but also emerging markets. These changes were part of our overall strategy for staying focused on investing for the longer term.
OUR MISSION
It is our mission to provide access to straightforward financial products and to serve as a resource when it comes to investment questions or concerns. We applaud people for taking responsibility for their financial security and urge anyone who has any questions about their personal investments as well as other financially related questions to call our Financial Advisors. These are experienced salaried professionals who do not work on commission and who are available between 8 a.m. and 6 p.m. Eastern Time, Monday through Friday by calling 1-800-958-6457. Thank you for investing in AARP Funds and for remaining invested through this challenging period. We promise to continue working hard to maintain your trust and your confidence.
Sincerely,

Richard M. Hisey
President, AARP Funds
* Diversification reduces risk but does not eliminate it.
When investing in bonds, you are subject, but not limited to, the same interest rate, inflation, and credit risk associated with the underlying bonds owned by the Fund. The Income Fund's prospectus allows for investment in non-investment grade securities. All investments involve some risk, including the AARP Funds. Each of the three funds, Conservative, Moderate, and Aggressive, invest in a mix of domestic and international stocks and U.S. bonds.
NOT PART OF THE ANNUAL REPORT
In addition to the normal risks associated with investing, emerging market investments do involve risk of capital loss from unfavorable fluctuation in currency values, from differences in generally accepted accounting principles, from economic or political instability in other nations or increased volatility and lower trading volume.
This Shareholder Report must be preceded or accompanied by the AARP Funds prospectus for individuals who are not current AARP Funds shareholders. An investor should consider the investment objectives, risks, charges and expenses of AARP Funds carefully before investing. To get an additional prospectus containing this and other information, please call 1-800-958-6457. Read the prospectus carefully before you invest.
While AARP has licensed the use of its name to AARP Funds and endorses the services provided by AARP Financial Inc., AARP does not offer financial products or services itself, and it cannot recommend that you or any specific individual should purchase any particular product or service. AARP Financial Inc. is an investment adviser and a subsidiary of AARP.
The AARP Financial, Inc, Financial Advisors are registered as representatives of ALPS Distributors, Inc., a registered broker-dealer, and as investment adviser representatives of AARP Financial Inc an investment adviser. AARP Financial Inc. offers investment advisory services and is not affiliated with ALPS Distributors, Inc
AARP Funds are advised by AARP Financial Inc. and distributed by ALPS Distributors, Inc.
Past performance cannot guarantee future results. The Overall Morningstar Rating is derived from a weighted average of the fund’s performance figures for three year Morningstar rating metrics. For each fund with at least a three-year history, Morningstar calculates a Morningstar Rating™ based on a Morningstar Risk-Adjusted Return measure that accounts for variation in a fund’s monthly performance (including the effects of sales charges, loads and redemption fees), placing more emphasis on downward variations and rewarding consistent performance. (Each share class is counted as a fraction of one fund within this scale and rated separately, which may cause slight variations in the distribution percentages.) The top 10% of the funds in an investment category receive 5 stars, the next 22.5% receive 4 stars, the next 35% receive 3 stars, the next 22.5% receive 2 stars, and the bottom 10% receive 1 star.
2009 Morningstar, Inc. All Rights Reserved. The information contained herein: (1) is proprietary to Morningstar and/or its content providers; (2) may not be copied or distributed; and (3) is not warranted to be accurate, complete or timely. Neither Morningstar nor its content providers are responsible for any damages or losses arising from any use of this information.
NOT PART OF THE ANNUAL REPORT
Market Commentary June 30, 2009
The last time that many major market indexes reported a quarter of positive performance was in the third quarter of 2007. After six consecutive quarters of negative performance – a peak to trough decline of 58% from October 2007 to March 2009 – the S&P 500 Index returned 16% in the second quarter of 2009. Despite these gains, the S&P 500 Index closed the quarter at a level of 919, 42% below its October 2007 peak of 1576 (post real estate bubble) and 41% below its prior peak in March 2000 (post dot.com bubble). Broader market indices gained as well with the Morgan Stanley Capital International (“MSCI”) U.S. Investable Market 2500 Index recording a 17% gain for the quarter.
International market indexes produced even larger gains and were led by emerging markets. The MSCI Emerging Markets Index returned 35% during this time. The MSCI ACWI ex U.S. Index, a combination of developed and emerging markets, returned 28% for the quarter. In fact, every country index in the MSCI ACWI ex U.S. Index posted gains in the second quarter with India and China advancing 60% and 36%, respectively. At the same time, the sharp declines that preceded the second quarter continue to weigh heavily on investor returns and many country indexes are deeply in negative territory when viewed from a longer term perspective.
U.S. investment grade bonds, as measured by the Barclays Capital Aggregate Bond Index, increased by nearly 2% in the second quarter as corporate bonds rallied in expectation of improving economic conditions and higher corporate profits. The positive outlook also benefited the high yield bond segment as yields fell and prices continued to rise (recall the inverse relationship between bond yields and bond prices). High yield bonds, as measured by the Barclays Capital High Yield Very Liquid Index, returned 26% during the second quarter of 2009. Despite being in a recession since December 2007, some upbeat macroeconomic data have been released that may suggest that the worst part of the recession may be over. Existing home sales recorded their third monthly increase in June as homebuyers capitalized on a robust supply of homes combined with historically low mortgage rates. Also during this time, U.S. single-family home prices rose in May from April, the first monthly increase in nearly three years. Interest rates remain low and have assisted in relieving some of the pressure on debt strapped consumers and homeowners. Also, the U.S. savings rate hit a 15-year high of 6.9% as households continue to add to their cash reserves.
NOT PART OF THE ANNUAL REPORT
Despite the improved outlook, many challenges remain. Consumer sentiment remains low and has put strain on retail sales. The U.S. unemployment rate stands at 9.5%, although in some states such as California, Nevada and Michigan the rate is substantially higher. When the number of underemployed workers is included (underutilization of labor) the rate increases to about 16.5%, placing the number of involuntarily idle workers at about 25 million. Given these factors and their impact on GDP in the U.S. (consumer spending drives nearly 70% of the U.S. economy), future growth prospects and an economic rebound appear tepid.
Performance data quoted represents past performance which is no guarantee of future results. The indexes above have been adjusted to reflect reinvestment of dividends on securities in the indexes and do not reflect the expenses of managing a fund. It is not possible to invest directly in an Index.
The views, forecasts and supporting information contained in this Market Commentary are as of June 30, 2009 and are subject to change. This Market Commentary must be preceded or accompanied by the AARP Funds prospectus for individuals who are not current AARP Funds shareholders. An investor should consider the investment objectives, risks, charges and expenses of AARP Funds carefully before investing. To get an additional prospectus containing this and other information, please call 1-800-958-6457. Read the prospectus carefully before you invest.
While AARP has licensed the use of its name to AARP Funds and endorses the services provided by AARP Financial Inc., AARP does not offer financial products or services itself, and it cannot recommend that you or any specific individual should purchase any particular product or service. AARP Financial Inc. is a registered investment adviser and a subsidiary of AARP.
Financial Advisors are FINRA registered representatives through ALPS Distributors, Inc., a registered broker/dealer, and employed by AARP Financial Inc. AARP Funds are advised by AARP Financial Inc. and distributed by ALPS Distributors, Inc.
AARP Financial Inc. is not affiliated with ALPS Distributors, Inc.
MSCI U.S. Investable Market 2500 Index – The index includes 2500 securities listed on the New York and American Exchanges and the NASDAQ over-the-counter market. The stocks include companies of all types and sizes, which represent the investable universe of companies in the U.S. Equity market.
NOT PART OF THE ANNUAL REPORT
MSCI ACWI Index ex US Index – The index is a free float adjusted market capitalization weighted index that is designed to measure the equity market performance of developed and emerging markets.
MSCI Emerging Markets Index – The index is a free float-adjusted market capitalization index that is designed to measure equity market performance of global emerging markets
Barclays High Yield Very Liquid Index – The index includes publicly issued U.S. dollar denominated, non-investment grade, fixed-rate, taxable corporate bonds that have a remaining maturity of at least one year. The High Yield Index includes only corporate sectors.
Barclays U.S. Capital Aggregate Bond Index – The index includes a large variety of U.S. and foreign bonds traded in U.S. markets that are investment grade and taxable, covering three major types of bonds: government and corporate bonds, mortgage-backed securities and asset backed securities.
While you can invest in an index fund – it’s a real investment, you cannot invest in an index – it’s just a list.
Sources: SSgA Funds Management, Inc., MSCI Barra, The Portfolio Advisory Group
NOT PART OF THE ANNUAL REPORT
AARP FUNDS
…
Annual Report
June 30, 2009
…
KEEPING YOU INFORMED
This shareholder report for the AARP Funds represents our commitment to providing communications that are clear, concise and informative. One of our highest priorities at AARP Funds is to help you make sense of investment information that is often complex. We hope you find it helpful in evaluating your investment with us.
EXPERTISE AND GUIDANCE
WHEN YOU NEED IT
AARP Financial’s Financial Advisors are ready to help you determine if you are on track financially for retirement and to answer specific questions about AARP Funds. They work on salary, not commission, and are there to help you focus on your goals, take decisive action and feel comfortable with your decisions. Financial Advisors are FINRA registered representatives through ALPS Distributors, Inc., and are employed by AARP Financial.
| | | | |
| | AARP FUNDS 2009 ANNUAL REPORT | | 1 |
Table of Contents
This Shareholder Report must be preceded or accompanied by the AARP Funds prospectus for individuals who are not current AARP Funds shareholders. An investor should consider the investment objectives, risks, charges and expenses of AARP Funds carefully before investing. To get an additional prospectus containing this and other information, please call 1-800-958-6457. Read the prospectus carefully before you invest.
While AARP has licensed the use of its name to AARP Funds and endorses the services provided by AARP Financial Inc., AARP cannot recommend that you or any specific individual should purchase shares of a particular fund. AARP is not a registered investment adviser or broker/dealer.
AARP Funds are distributed by ALPS Distributors, Inc.
AARP Financial Inc. is not affiliated with ALPS Distributors, Inc.
| | | | |
| 2 | | AARP FUNDS 2009 ANNUAL REPORT | | AARP Funds Overview |
AARP Funds Overview
Each of the AARP Funds (except for the AARP Money Market Fund) are “fund-of-funds” because they invest substantially all of their assets in two or more of the underlying AARP Portfolios (the “AARP Portfolios”), which are separate registered investment company.
In the fund of funds structure, each fund (except for the AARP Money Market Fund) invests its assets in a mix of asset classes. The AARP Income Fund, in addition to its investment in the U.S. Bond Market Portfolio, also invests a portion of its assets in the State Street Money Market Portfolio (the “State Street Portfolio”), a series of a separate registered investment company called the State Street Master Funds, and the SPDR Barclays Capital High Yield Bond exchange traded fund.
The AARP Money Market Fund is a feeder fund, buying shares of the master fund to the State Street Portfolio. This is called a “master-feeder” structure because it allows different feeder funds to pool their assets in an underlying master fund to seek economies of scale.
Effective January 1, 2009, the allocations of each AARP Fund among the underlying portfolios are as follows:
| | | | | | | | | | |
| | | | | | |
| | | AARP
Aggressive Fund | | AARP
Moderate Fund | | AARP
Conservative Fund | | AARP
Income Fund | | AARP Money
Market Fund |
| Investment Objective | | Seeks growth of capital and some current income | | Seeks a balance of growth of capital and current income | | Seeks primarily current income, with some growth of capital | | Seeks current income and preservation of capital over the long term | | Seeks to maximize current income, while providing for liquidity, the preservation of capital, and a stable $1.00 per
share price |
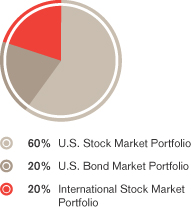
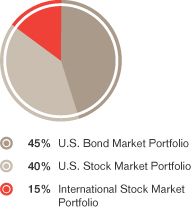
U.S. Stock
Market Portfolio | | 60% | | 40% | | 22.5% | | – | | – |
U.S. Bond
Market Portfolio | | 20% | | 45% | | 70% | | 95% | | – |
International Stock
Market Portfolio | | 20% | | 15% | | 7.5% | | – | | – |
State Street
Portfolio | | – | | – | | – | | 2.5% | | 100% |
| SPDR Barclays Capital High Yield Bond ETF | | – | | – | | – | | 2.5% | | – |
Source: AARP Funds
On January 1, 2009, the allocations of the Conservative, Moderate and Aggressive Funds among the underlying Portfolios were changed to increase the Funds’ exposure to equities by 5 percentage points.
| | | | |
| AARP Funds Overview | | AARP FUNDS 2009 ANNUAL REPORT | | 3 |
AARP Portfolios Top 10 Holdings as a percentage of net assets at June 30, 2009
| | | | | | | | | | | | | | | | | | |
| U.S. Stock Market Portfolio | | | | | | U.S. Bond Market Portfolio | | | | | | International Stock Market Portfolio |
| | | | | | | | | |
Exxon Mobil Corp. | | 3.4% | | | | | | U.S. Treasury Notes, 0.875%, 3/31/11 | | 0.9% | | | | | | BP PLC | | 1.2% |
Microsoft Corp. | | 1.9% | | | | | | U.S. Treasury Notes, 4.500%, 4/30/12 | | 0.9% | | | | | | HSBC Holdings PLC | | 1.2% |
Johnson & Johnson | | 1.6% | | | | | | U.S. Treasury Notes, 4.875%, 8/15/16 | | 0.9% | | | | | | Nestle SA | | 1.2% |
Procter & Gamble Co. | | 1.5% | | | | | | FHLMC, 5.000%, 2/1/37 | | 0.9% | | | | | | Total SA | | 1.0% |
AT&T, Inc. | | 1.4% | | | | | | U.S. Treasury Notes, 4.625%, 12/31/11 | | 0.8% | | | | | | Toyota Motor Corp | | 0.9% |
International Business Machines Corp. | | 1.4% | | | | | | U.S. Treasury Notes, 4.250%, 11/15/17 | | 0.8% | | | | | | Vodafone Group PLC | | 0.9% |
Chevron Corp. | | 1.3% | | | | | | U.S. Treasury Notes, 3.375%, 7/13/13 | | 0.8% | | | | | | Banco Santander Central Hispano SA | | 0.8% |
JPMorgan Chase & Co. | | 1.3% | | | | | | FNMA, 7.000%, 8/1/37 | | 0.8% | | | | | | Telefonica SA | | 0.8% |
Apple Computer, Inc. | | 1.3% | | | | | | U.S. Treasury Notes, 1.500%, 10/31/10 | | 0.8% | | | | | | Roche Holdings AG | | 0.8% |
General Electric Co. | | 1.2% | | | | | | FNMA, 1.750%, 3/23/11 | | 0.8% | | | | | | BHP Billiton Ltd | | 0.8% |
Total | | 16.3% | | | | | | Total | | 8.4% | | | | | | Total | | 9.6% |
| | | | |
| 4 | | AARP FUNDS 2009 ANNUAL REPORT | | How the Funds Performed |
How the Funds Performed as of June 30, 2009
| | | | | | | | | | | | | | | | | |
| | | | | | | | | |
| | | | | | | 1 year | | | | 3 years | | | | Average
annual since
inception4 | | | |
| | | AARP Aggressive Fund | | | | -18.81% | | | | -4.10% | | | | -2.82% | | | |
| | | Aggressive Composite Index5 | | | | -18.02% | | | | -3.09% | | | | -1.90% | | | |
| | | MSCI U.S. Investable Market 2500 Index®1 | | | | -26.28% | | | | -7.98% | | | | -6.02% | | | |
| | | AARP Moderate Fund | | | | -10.48% | | | | -0.46% | | | | 0.01% | | | |
| | | Moderate Composite Index5 | | | | -9.60% | | | | 0.45% | | | | 0.84% | | | |
| | | MSCI U.S. Investable Market 2500 Index®1 | | | | -26.28% | | | | -7.98% | | | | -6.02% | | | |
| | | Barclays Capital Aggregate Bond Index®1 | | | | 6.05% | | | | 6.43% | | | | 5.27% | | | |
| | | AARP Conservative Fund | | | | -2.19% | | | | 2.98% | | | | 2.62% | | | |
| | | Conservative Composite Index5 | | | | -1.60% | | | | 3.60% | | | | 3.21% | | | |
| | | Barclays Capital Aggregate Bond Index®1 | | | | 6.05% | | | | 6.43% | | | | 5.27% | | | |
| | | AARP Income Fund | | | | 5.38% | | | | – | | | | 5.07% | 2 | | |
| | | Income Composite Index | | | | 5.79% | | | | – | | | | 5.49% | 2 | | |
| | | Barclays Capital Aggregate Bond Index®1 | | | | 6.05% | | | | – | | | | 5.57% | 2 | | |
| | | J.P. Morgan 1-Month LIBOR | | | | 1.63% | | | | – | | | | 3.88% | 2 | | |
| | | AARP Money Market Fund | | | | 1.34% | | | | 3.50% | | | | 3.50% | 3 | | |
| | | J.P. Morgan 1-Month LIBOR | | | | 1.63% | | | | 3.86% | | | | 3.86% | 3 | | |
| | | AARP Money Market Fund 7-Day Effective Yield | | | | 0.27% | | | | | | | | | | | |
| |
1 The MSCI U.S. Investable Market 2500 Index and the Barclays Capital Aggregate Bond Index serve as broad measures of the U.S equity and taxable bond markets, respectively. Since the Funds invest in differing combinations of these and other markets, Composite Indexes have been constructed utilizing the proportionate weightings of the indexes for each market. These Composite Indexes provide a particularly useful benchmark to measure the performance of the Funds. For more detailed information regarding the Composite Indexes, please see A Word about Benchmarks that follows. 2 For the period from September 29, 2006 (commencement of operations) to June 30, 2009. 3 For the period from July 1, 2006 (commencement of operations) to June 30, 2009. 4 The inception date for the Aggressive, Moderate and Conservative Funds was December 31, 2005. 5 The weightings of these composite indexes were changed to reflect the January 1, 2009 weighting changes for the Conservative, Moderate and Aggressive Funds. The composite performance reflects the new weightings calculations from January 1, 2009 to June 30, 2009. Sources: MSCI Barra, Barclays Capital Inc., J.P. Morgan, AARP Financial Inc. Total returns for period less than one year are not annualized. |
Total annual fund operating fees and expenses are 1.59% for the Aggressive Fund, 1.18% for the Moderate Fund, 1.84% for the Conservative Fund, 4.88% for the Income Fund and 0.83% for the Money Market Fund. Net annual fund operating fees and expenses for the funds (after contractual waivers and/or reimbursements) are 0.30% for the Money Market Fund and 0.50% for the others through November 1, 2009. Total annual operating fees and expenses as of June 30, 2009 can be found on pages 32, 33, 34, 35 and 36 of this report.
Performance data quoted represents past performance which is no guarantee of future results. Investment return and principal value will fluctuate so that an investor’s shares, when redeemed, may be worth more or less than their original cost. Mutual fund performance changes over time and current performance may be lower or higher than what is stated. Returns shown do not reflect the deduction of taxes that a shareholder may pay on fund distributions or the redemption of fund shares. Mutual funds are not obligations of or guaranteed by any bank and are not federally insured. The performance of the Funds assumes the reinvestment of all dividends and distributions. The indexes above have been adjusted to reflect reinvestment of dividends on securities in the indexes. The returns of the Funds are net of expenses. Indexes do not have expenses. The adviser is waiving a portion of its advisory fee and other operating expenses. Had the fees not been waived or reimbursed, returns would have been lower. It is not possible to invest directly in an Index.
For the most recent month-end performance and after-tax returns, visit www.aarpfinancial.com or call 1-800-958-6457.
An investment in the AARP Money Market Fund is not insured or guaranteed by the Federal Deposit Insurance Corporation or any other government agency. Although the Fund seeks to preserve the value of your investment at $1.00 per share, it is possible to lose money by investing in the Fund.
| | | | |
| A Word about Benchmarks | | AARP FUNDS 2009 ANNUAL REPORT | | 5 |
A Word about Benchmarks
A useful tool to measure the performance of AARP Funds.
When evaluating how your investment performed, it’s helpful to compare it to an appropriate benchmark. You can think of the benchmark as a handy yardstick for measuring how well the fund did in meeting its investment objectives. For example, the AARP Income Fund tries to produce returns comparable to the Barclays Capital Aggregate Bond Index.
The AARP Aggressive Fund, AARP Moderate Fund and AARP Conservative Fund are indexed and try to produce the returns of a mixture of three indexes. For these Funds, a particularly useful benchmark is one that combines the three indexes in similar amounts to the target investments of the Funds. When you combine different indexes into one benchmark, it’s called a “composite index”.
We also believe it is useful for you to consider the returns of the overall bond and stock markets when you assess the performance of the AARP Funds. This allows you to see how diversification works in practice. Sometimes the bond and stock markets move in opposite directions, or when the stock market goes down, the bond market doesn’t go quite as far down.
There is one caveat though. Please remember that a benchmark of indexes has a built-in performance advantage over an actual mutual fund. An index is merely a list of securities in a stock or bond market, so the returns of indexes do not reflect the real world costs of managing a mutual fund. It is difficult to match the returns of an index because of this difference.
The mix underlying the composite index for the Aggressive, Moderate and Conservative Funds was changed to reflect the January 1, 2009 revised allocations of these funds among the underlying portfolios. Historical composite indexes performance from January 1, 2009 was recalculated to reflect the revised allocations.

Indexes vs. index funds
Indexes, as opposed to index funds, are a group or list of securities representing a market or part of a market. The returns of the index do not reflect the costs of actually investing in the index and do not include fees, brokerage commissions or other expenses of investing. While you can invest in an index fund – it’s a real investment, you cannot invest directly in an index – it’s just a list.
| | | | |
| 6 | | AARP FUNDS 2009 ANNUAL REPORT | | A Word about Benchmarks |
Following is a table that shows the make up of the index weightings for each AARP Fund:
| | | | | | | | | | | | | | |
| | | | | | | | |
| | | | | AARP
Aggressive Fund1 | | AARP
Moderate Fund1 | | AARP
Conservative
Fund2 | | AARP
Income Fund2 | | AARP Money
Market Fund | | |
| | | | | Aggressive Composite Index | | Moderate Composite Index | | Conservative Composite Index | | Income Composite Index | | | | |
| | | Barclays Capital
Aggregate Bond Index® | | 20% | | 45% | | 70% | | 95% | | – | | |
| | | MSCI U.S. Investable
Market 2500 Index®* | | 60% | | 40% | | 22.5% | | – | | – | | |
| | | MSCI ACWI ex US
Index® 2,* | | 20% | | 15% | | 7.5% | | – | | – | | |
| | | JP Morgan 1 Month
LIBOR | | – | | – | | – | | 2.5% | | 100% | | |
| | | Barclays Capital High
Yield Very Liquid Index | | – | | – | | – | | 2.5% | | – | | |
Source: AARP Funds
A description of each index
| • | | MSCI U.S. Investable Market 2500 Index® * – The index includes about 2,500 securities listed on the New York and American Stock Exchanges and the Nasdaq over-the-counter market. The stocks include companies of all types and sizes, which represent the investable universe of companies in the U.S. Equity market. |
| • | | MSCI ACWI ex US Index®* – The index is a free float adjusted market capitalization weighted index that is designed to measure the equity market performance of developed and emerging markets. As of November 2008, the MSCI ACWI ex US index® consisted of 46 county indices comprised of 22 developed and 24 emerging market country indices. |
| • | | Barclays Capital Aggregate Bond Index® – The index includes a large variety of U.S. and foreign bonds traded in U.S. markets that are investment grade and taxable, covering three major types of bonds: government and corporate bonds, mortgage-backed securities and asset-backed securities. |
| • | | Barclays Capital High Yield Very Liquid Index – This index measures the performance of publicly issued U.S. dollar denominated high yield corporate bonds with above average liquidity. The index includes only corporate sectors like Industrial, Utility, and Financial Institutions. |
| • | | MSCI EAFE Index®* – The index includes about 1,000 securities that are listed on the stock exchanges of 21 developed countries, excluding the United States and Canada. |
| 1 | Effective January 1, 2009, the AARP Conservative, Moderate and Aggressive Fund increased their allocation percentages to equities by 5 percentage points. See page 2 for new allocation amounts. |
| 2 | Effective January 1, 2009 the underlying International Portfolio changed its index to the MSCI All Country World Index, excluding U.S. Index (MSCI ACWI ex US index) |
| * | Please note that although the AARP Funds seek to track these MSCI indexes, MSCI does not sponsor, endorse, or promote the AARP Funds. For a more detailed description of our relationship with MSCI please see the statement of additional information for the AARP Funds. |
| | | | |
| AARP Aggressive Fund Overview | | AARP FUNDS 2009 ANNUAL REPORT | | 7 |
AARP Aggressive Fund Overview
| | | | | | |
| | | |
Portfolio of investments June 30, 2009 | | | | | | |
Mutual funds: 100.3% | | | | | | |
| | | Shares | | Value | |
| | | | | | | |
| U.S. Stock Market Portfolio1 – 60.2% | | 1,924,458 | | $ | 13,990,809 | |
| | |
| U.S. Bond Market Portfolio1 – 20.1% | | 462,749 | | | 4,683,019 | |
| | |
| International Stock Market Portfolio1 – 20.0% | | 608,080 | | | 4,657,894 | |
| | |
| Total investments: 100.3% (Identified cost $27,948,374) | | | 23,331,722 | |
| | | | | | | |
| Other assets and liabilities, net: (0.3)% | | | | | (61,976 | ) |
| | | | | | | |
| Total net assets: 100.0% | | | | $ | 23,269,746 | |
1 Affiliated issuer. See Notes to Financial Statements. | | | | | | |
| | | | | | | | | | | | | | | | |
| |
Affiliated companies The fund invests substantially all of its assets in the Portfolios, which are considered affiliated companies. As defined by the Investment Act of 1940 (“the Act”), an affiliated company is one in which the fund owns 5% or more of the outstanding voting securities, or of a company which is under common ownership or control. | |
| | | | | | |
| Affiliate | | Purchase Cost | | Sales Cost | | Investment Income | | Value 6/30/08 | | Value 6/30/09 | |
| | |
| U.S. Bond Market Portfolio | | $ | 2,575,131 | | $ | 4,195,007 | | $ | 215,128 | | $ | 6,283,987 | | $ | 4,683,019 | |
| | |
| U.S. Stock Market Portfolio | | | 5,163,209 | | | 2,236,271 | | | 270,018 | | | 15,081,568 | | | 13,990,809 | |
| | |
| International Stock Market Portfolio | | | 3,006,434 | | | 1,072,106 | | | 118,537 | | | 3,770,392 | | | 4,657,894 | |
| | |
TOTAL | | | | | | | | $ | 603,683 | | $ | 25,135,947 | | $ | 23,331,722 | |
| | |
| |
Amounts reflected on the accompanying financial statements include the following amounts related to affiliated companies: | |
| Investment in securities, at cost | | | | | $ | 27,948,374 | |
| | |
| Income distributions from underlying AARP Portfolios | | | | | $ | 603,683 | |
| | |
| Realized gain (loss) on sales of underlying AARP Portfolios | | | | | $ | (1,916,018 | ) |
| | |
| Capital gain distributions from underlying AARP Portfolios | | | | | $ | 50,463 | |
| | | | |
| 8 | | AARP FUNDS 2009 ANNUAL REPORT | | AARP Aggressive Fund Overview |
| | | | | | |
| | | |
| | | Performance as of June 30, 2009 | | |
| | | | |
| | | Growth of $10,000 This graph illustrates the
hypothetical investment of
$10,000 in the AARP
Aggressive Fund from
December 30, 2005 (inception
date) through June 30, 2009,
compared to the Aggressive
Composite Index and the
MSCI U.S. Investable
Market 2500 Index.2 | | 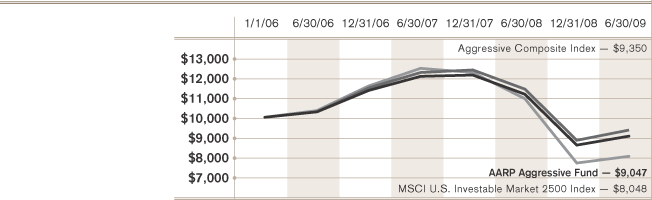 | | |
| | | | |
| | | | | This hypothetical example does not represent the returns of any particular investment. | | |
| | | | | | | | | | | | | |
| | | | | | | | |
| | | Performance summary | | Average annual returns as of June 30, 2009 |
| | | | | | | | |
| | | | | | | 1-Year | | 3-Years | | Since
inception | | | |
| | | | | AARP Aggressive Fund1 | | -18.81% | | -4.10% | | -2.82% | | | |
| | | | | Aggressive Composite Index2 | | -18.02% | | -3.09% | | -1.90% | | | |
| | | | | MSCI U.S. Investable Market 2500 Index®2 | | -26.28% | | -7.98% | | -6.02% | | | |
| | | | | | | | |
| | |
| |
Performance data quoted represents past performance which is no guarantee of future results. Investment return and principal value will
fluctuate so that an investor’s shares, when redeemed, may be worth more or less than their original cost. Mutual fund performance changes
over time and current performance may be lower or higher than what is stated. Returns shown do not reflect the deduction of taxes that a
shareholder may pay on fund distributions or the redemption of fund shares. Mutual funds are not obligations of or guaranteed by any bank
and are not federally insured. The performance of the Fund assumes the reinvestment of all dividends and distributions. The index above has
been adjusted to reflect reinvestment of dividends on securities in the index. The returns of the Funds are net of expenses. Indexes do not have
expenses. The adviser is waiving a portion of its advisory fee and other operating expenses. Had the fees not been waived or reimbursed,
returns would have been lower. It is not possible to invest directly in an Index. For the most recent month-end performance and after-tax returns, visit www.aarpfinancial.com or call 1-800-958-6457. 1 Inception date December 30, 2005.
2 The MSCI U.S. Investable Market 2500 Index serves as a broad measure of the U.S. equity market. Since the Fund invests in differing
combinations of this and other markets, the Aggressive Composite Index has been constructed utilizing the proportionate weightings of the
indexes for each market. This Composite Index provides a particularly useful benchmark to measure the performance of the Fund. For more
detailed information regarding the Composite Indexes and the Underlying Indexes, please see “A Word about Benchmarks” on page 5. |
| | | | |
| AARP Aggressive Fund Overview | | AARP FUNDS 2009 ANNUAL REPORT | | 9 |
Portfolio construction
AARP Aggressive Fund
Investment commentary – June 30, 2009
The AARP Aggressive Fund seeks growth of capital and some current income. To achieve this objective, the Fund targets an asset allocation of 60% in U.S. stocks, 20% in international stocks, and 20% in bonds. For the year ended June 30, 2009, the AARP Aggressive Fund returned -18.81%, as compared to the Aggressive Composite Index return of -18.02% and the MSCI U.S. Investable Market 2500 Index return of -26.28%. The Fund’s performance includes operating expenses, whereas index performance is unmanaged and does not include any expenses. The Fund tracked its benchmark closely during the period and continues to benefit from its diversification to its underlying asset classes.
During this time, equity returns were negative while bond returns were positive. The decline in equity prices was largely driven by a sharp decline in sales and profits as the economic slowdown impacted both large and small companies. In fact, earnings for companies in the S&P 500 index declined for six straight quarters, and many economists expect this trend to continue in the near term. Exposure to bonds helped offset weak equity performance; however, with most of the Fund allocated to stocks, both U.S. and international, the benefit from allocating 20% of the Fund to bonds was limited. The U.S. Stock Market Portfolio returned -26.49% and the International Stock Market Portfolio returned -28.75% during the period.
The twelve month period ending June 30, 2009 started on a promising note with oil prices retreating from historical highs reached in July 2008. This helped ease inflation fears, but more serious problems emerged as the global financial markets entered a period of severe stress in the third quarter of 2008. In a span of ten days in September, a number of major U.S. financial giants including Fannie Mae, Freddie Mac, and AIG fell. The collapse of Lehman Brothers triggered global market declines that not only produced massive losses for investors – a $4 trillion decrease total market capitalization of the U.S. stock market since October 2007 – but also jeopardized economies worldwide.
The U.S. Federal Reserve deployed a range of policy tools, in addition to the U.S. government’s $787 billion stimulus package, to fight the twin problems of economic weakness and financial market distress. The Federal Reserve Bank (“the Fed”) reduced key rates to minimal levels. In addition, the Fed announced plans to purchase more than one trillion dollars worth of agency mortgage-backed securities and long dated U.S. Treasury securities in order to put downward pressure on longer term interest rates. The Fed and U.S. Treasury also introduced a number of new programs to enhance market liquidity and inject capital into the banking system.
After six consecutive quarters of declines, stock markets rallied in the second quarter of 2009. Financial and technology stocks led the rebound. Improving growth prospects also brought a significant rise in yields to government bond markets including the U.S. Treasury issues. We believe that proactive and aggressive fiscal and monetary stimulus, combined with an effective financial stability plan, will allow positive growth to resume in the U.S. by the fourth quarter of 2009.
| | | | |
| 10 | | AARP FUNDS 2009 ANNUAL REPORT | | AARP Aggressive Fund Overview |
Sources: SSgA Performance Group, Bloomberg, Factset
The MSCI US Investable Market 2500 IndexSM is a trademark of Morgan Stanley Capital International.
The views expressed in this material are the views of SSgA through the period ended June 30, 2009 and are subject to change based on market and other conditions. The information provided does not constitute investment advice and it should not be relied on as such. All material has been obtained from sources believed to be reliable, but its accuracy is not guaranteed. This document contains certain statements that may be deemed forward-looking statements. Please note that any such statements are not guarantees of any future performance and actual results or developments may differ materially from those projected.
| | | | |
| AARP Moderate Fund Overview | | AARP FUNDS 2009 ANNUAL REPORT | | 11 |
AARP Moderate Fund Overview
| | | | | | |
| | | |
Portfolio of investments June 30, 2009 | | | | | | |
Mutual funds: 100.2% | | | | | | |
| | | Shares | | Value | |
| | | | | | | |
| U.S. Bond Market Portfolio1 – 45.1% | | 1,737,431 | | $ | 17,582,800 | |
| | |
| U.S. Stock Market Portfolio1 – 40.1% | | 2,146,262 | | | 15,603,327 | |
| | |
| International Stock Market Portfolio1 – 15.0% | | 762,967 | | | 5,844,330 | |
| | |
| Total investments: 100.2% (Identified cost $42,695,400) | | | 39,030,457 | |
| | | | | | | |
| Other assets and liabilities, net: (0.2)% | | | | | (79,909 | ) |
| | | | | | | |
| Total net assets: 100.0% | | | | $ | 38,950,548 | |
1 Affiliated issuer. See Notes to Financial Statements. | | | | | | |
| | | | | | | | | | | | | | | | |
| |
Affiliated companies The fund invests substantially all of its assets in the Portfolios, which are considered affiliated companies. As defined by the Investment Act of 1940 (“the Act”), an affiliated company is one in which the fund owns 5% or more of the outstanding voting securities, or of a company which is under common ownership or control. | |
| | | | | | |
| Affiliate | | Purchase Cost | | Sales Cost | | Investment Income | | Value 6/30/08 | | Value 6/30/09 | |
| | |
| U.S. Bond Market Portfolio | | $ | 6,818,398 | | $ | 10,577,075 | | $ | 803,114 | | $ | 21,213,208 | | $ | 17,582,800 | |
| | |
| U.S. Stock Market Portfolio | | | 7,003,278 | | | 3,570,343 | | | 321,750 | | | 16,970,566 | | | 15,603,327 | |
| | |
| International Stock Market Portfolio | | | 4,688,021 | | | 1,888,321 | | | 149,556 | | | 4,242,641 | | | 5,844,330 | |
| | |
TOTAL | | | | | | | | $ | 1,274,420 | | $ | 42,426,415 | | $ | 39,030,457 | |
| | |
| |
Amounts reflected on the accompanying financial statements include the following amounts related to affiliated companies: | |
| Investment in securities, at cost | | | | | $ | 42,695,400 | |
| | |
| Income distributions from underlying AARP Portfolios | | | | | $ | 1,274,420 | |
| | |
| Realized gain (loss) on sales of underlying AARP Portfolios | | | | | $ | (3,733,664 | ) |
| | |
| Capital gain distributions from underlying AARP Portfolios | | | | | $ | 74,106 | |
| | | | |
| 12 | | AARP FUNDS 2009 ANNUAL REPORT | | AARP Moderate Fund Overview |
| | | | | | |
| | | |
| | | Performance as of June 30, 2009 | | |
| | | | |
| | | Growth of $10,000 This graph illustrates the
hypothetical investment of
$10,000 in the AARP
Moderate Fund from
December 30, 2005 (inception
date) through June 30, 2009,
compared to the Moderate
Composite Index, the MSCI
U.S. Investable Market 2500
Index, and the Barclays
Capital Aggregate Bond
Index.2 | | 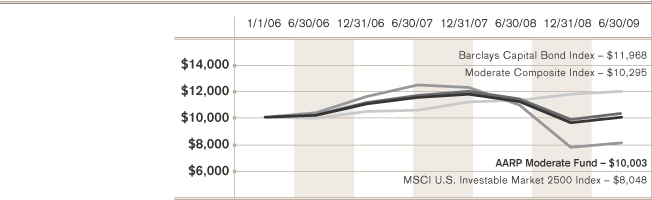 | | |
| | | | |
| | | | | This hypothetical example does not represent the returns of any particular investment. | | |
| | | | | | | | | | | | | |
| | | | | | | | |
| | | Performance summary | | Average annual returns as of June 30, 2009 | | | |
| | | | | | | | |
| | | | | | | 1-Year | | 3-Years | | Since
inception | | | |
| | | | | AARP Moderate Fund1 | | -10.48% | | -0.46% | | 0.01% | | | |
| | | | | Moderate Composite Index2 | | -9.60% | | 0.45% | | 0.84% | | | |
| | | | | MSCI U.S. Investable Market 2500 Index®2 | | -26.28% | | -7.98% | | -6.02% | | | |
| | | | | Barclays Capital Aggregate Bond Index®2 | | 6.05% | | 6.43% | | 5.27% | | | |
| | | | | | | | |
| | |
| |
Performance data quoted represents past performance which is no guarantee of future results. Investment return and principal value will
fluctuate so that an investor’s shares, when redeemed, may be worth more or less than their original cost. Mutual fund performance changes
over time and current performance may be lower or higher than what is stated. Returns shown do not reflect the deduction of taxes that a
shareholder may pay on fund distributions or the redemption of fund shares. Mutual funds are not obligations of or guaranteed by any bank
and are not federally insured. The performance of the Fund assumes the reinvestment of all dividends and distributions. The indexes above
have been adjusted to reflect reinvestment of dividends on securities in the indexes. The returns of the Funds are net of expenses. Indexes do
not have expenses. The adviser is waiving a portion of its advisory fee and other operating expenses. Had the fees not been waived or
reimbursed, returns would have been lower. It is not possible to invest directly in an Index. For the most recent month-end performance and after-tax returns, visit www.aarpfinancial.com or call 1-800-958-6457. 1 Inception date December 30, 2005.
2 The MSCI U.S. Investable Market 2500 Index and the Barclays Capital Aggregate Bond Index serve as broad measures of the U.S. equity
and taxable bond market. Since the Fund invests in differing combinations of this and other markets, the Moderate Composite Index has
been constructed utilizing the proportionate weightings of the indexes for each market. This Composite Index provides a particularly useful
benchmark to measure the performance of the Fund. For more detailed information regarding the Composite Indexes and the Underlying
Indexes, please see “A Word about Benchmarks” on page 5. |
| | | | |
| AARP Moderate Fund Overview | | AARP FUNDS 2009 ANNUAL REPORT | | 13 |
Portfolio construction
AARP Moderate Fund
Investment commentary – June 30, 2009
The AARP Moderate Fund seeks a balance of growth of capital and current income. To achieve this objective, the Fund targets an asset allocation of 45% in bonds, 40% in U.S. stocks, and 15% in international stocks. For the year ended June 30, 2009, the AARP Moderate Fund returned -10.48%, as compared to the Moderate Composite Index return of -9.60%, -26.28% for the MSCI U.S. Investable Market 2500 IndexSM and +6.05% for the Barclays Capital Aggregate Bond Index. The Fund’s performance includes operating expenses, whereas index performance is unmanaged and does not include any expenses. The Fund tracked its benchmark closely during the period and continues to benefit from its diversification to its underlying asset classes.
For the period, stock returns were negative while bond returns were positive. A healthy allocation to bonds helped the Fund offset the underperformance of stocks. The U.S. Bond Market portfolio returned +6.12%, while the U.S. Stock Market Portfolio returned -26.49% and the International Stock Market Portfolio returned -28.75% during the period.
The twelve month period ending June 30, 2009 started on a promising note as oil prices fell from historical levels reached in July 2008. This helped ease inflation fears, but more serious problems emerged as the global financial markets entered a period of severe stress and volatility in the third quarter of 2008. In a span of ten days in September, a number of major U.S. financial giants fell. The collapse of Lehman Brothers triggered global market declines that not only produced massive losses for investors – a $4 trillion decrease off total market capitalization of the U.S. stock market since October 2007 – but also jeopardized economies worldwide.
In addition to the U.S. government’s $787 billion stimulus package, the U.S. Federal Reserve deployed a range of policy tools to combat the simultaneous problems of economic weakness and financial market distress. The Federal Reserve Bank (“the Fed”) reduced key rates to minimal levels. In addition, the Fed announced plans to purchase more than one trillion dollars worth of agency mortgage backed securities and long dated U.S. Treasury securities in order to put downward pressure on longer term interest rates. The Fed and U.S. Treasury also introduced a number of new programs to enhance market liquidity and inject capital into the banking system.
Stock markets advanced in the second quarter of 2009, the first positive quarterly performance since the third quarter of 2007. Financial and technology stocks led the rebound. U.S. investment grade bonds, as measured by the Barclays Capital Aggregate Bond Index, increased by nearly 2% in the second quarter as corporate bonds rallied in expectation of improving economic conditions and higher corporate
| | | | |
| 14 | | AARP FUNDS 2009 ANNUAL REPORT | | AARP Moderate Fund Overview |
profits. We believe that proactive and aggressive fiscal and monetary stimulus, combined with an effective financial stability plan, will allow positive growth to resume in the U.S. by the fourth quarter of 2009.
Sources: SSgA Performance Group, Bloomberg, Factset
The MSCI US Investable Market 2500 IndexSM is a trademark of Morgan Stanley Capital International.
The US Barclays Capital Aggregate Bond Index is a trademark of Barclays Capital, Inc.
The views expressed in this material are the views of SSgA through the period ended June 30, 2009 and are subject to change based on market and other conditions. The information provided does not constitute investment advice and it should not be relied on as such. All material has been obtained from sources believed to be reliable, but its accuracy is not guaranteed. This document contains certain statements that may be deemed forward-looking statements. Please note that any such statements are not guarantees of any future performance and actual results or developments may differ materially from those projected.
| | | | |
| AARP Conservative Fund Overview | | AARP FUNDS 2009 ANNUAL REPORT | | 15 |
AARP Conservative Fund Overview
| | | | | | |
| | | |
Portfolio of investments June 30, 2009 | | | | | | |
Mutual funds: 100.3% | | | | | | |
| | | Shares | | Value | |
| | | | | | | |
| U.S. Bond Market Portfolio1 – 70.3% | | 1,306,890 | | $ | 13,225,726 | |
| | |
| U.S. Stock Market Portfolio1 – 22.5% | | 583,843 | | | 4,244,540 | |
| | |
| International Stock Market Portfolio1 – 7.5% | | 184,240 | | | 1,411,278 | |
| | |
| Total investments: 100.3% (Identified cost $18,909,732) | | | 18,881,544 | |
| | | | | | | |
| Other assets and liabilities, net: (0.3)% | | | | | (56,007 | ) |
| | | | | | | |
| Total net assets: 100.0% | | | | $ | 18,825,537 | |
1 Affiliated issuer. See Notes to Financial Statements. | |
| | | | | | | | | | | | | | | | |
| |
Affiliated companies The fund invests substantially all of its assets in the Portfolios, which are considered affiliated companies. As defined by the Investment Act of 1940 (“the Act”), an affiliated company is one in which the fund owns 5% or more of the outstanding voting securities, or of a company which is under common ownership or control. | |
| | | | | | |
| Affiliate | | Purchase Cost | | Sales Cost | | Investment Income | | Value 6/30/08 | | Value 6/30/09 | |
| | |
| U.S. Bond Market Portfolio | | $ | 5,390,389 | | $ | 5,885,452 | | $ | 550,229 | | $ | 13,602,788 | | $ | 13,225,726 | |
| | |
| U.S. Stock Market Portfolio | | | 3,155,764 | | | 1,567,203 | | | 80,218 | | | 3,627,410 | | | 4,244,540 | |
| | |
| International Stock Market Portfolio | | | 1,428,077 | | | 703,385 | | | 35,243 | | | 906,852 | | | 1,411,278 | |
| | |
TOTAL | | | | | | | | $ | 665,690 | | $ | 18,137,050 | | $ | 18,881,544 | |
| | |
| |
Amounts reflected on the accompanying financial statements include the following amounts related to affiliated companies: | |
| Investment in securities, at cost | | | | | $ | 18,909,732 | |
| | |
| Income distributions from underlying AARP Portfolios | | | | | $ | 665,690 | |
| | |
| Realized gain (loss) on sales of underlying AARP Portfolios | | | | | $ | (1,323,222 | ) |
| | |
| Capital gain distributions from underlying AARP Portfolios | | | | | $ | 24,232 | |
| | | | |
| 16 | | AARP FUNDS 2009 ANNUAL REPORT | | AARP Conservative Fund Overview |
| | | | | | |
| | | |
| | | Performance as of June 30, 2009 | | |
| | | | |
| | | Growth of $10,000 This graph illustrates the
hypothetical investment of
$10,000 in the AARP
Conservative Fund from
December 30, 2005
(inception date) through
June 30, 2009, compared to
the Conservative Composite
Index and the Barclays Capital
Aggregate Bond Index.2 | | 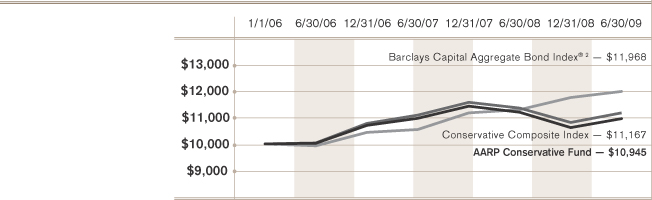 | | |
| | | | |
| | | | | This hypothetical example does not represent the returns of any particular investment. | | |
| | | | | | | | | | | | |
| | | | | | | |
| | | Performance summary | | Average annual returns as of June 30, 2009 | | |
| | | | | | | |
| | | | | | | 1-Year | | 3-Years | | Since
inception | | |
| | | | | AARP Conservative Fund1 | | -2.19% | | 2.98% | | 2.62% | | |
| | | | | Conservative Composite Index2 | | -1.60% | | 3.60% | | 3.21% | | |
| | | | | MSCI U.S. Investable Market 2500 Index®2 | | -26.28% | | -7.98% | | -6.02% | | |
| | | | | Barclays Capital Aggregate Bond Index®2 | | 6.05% | | 6.43% | | 5.27% | | |
| | | | | | | |
| | |
| |
Performance data quoted represents past performance which is no guarantee of future results. Investment return and principal value will
fluctuate so that an investor’s shares, when redeemed, may be worth more or less than their original cost. Mutual fund performance changes
over time and current performance may be lower or higher than what is stated. Returns shown do not reflect the deduction of taxes that a
shareholder may pay on fund distributions or the redemption of fund shares. Mutual funds are not obligations of or guaranteed by any bank
and are not federally insured. The performance of the Fund assumes the reinvestment of all dividends and distributions. The index above has
been adjusted to reflect reinvestment of dividends on securities in the index. The returns of the Funds are net of expenses. Indexes do not have
expenses. The adviser is waiving a portion of its advisory fee and other operating expenses. Had the fees not been waived or reimbursed,
returns would have been lower. It is not possible to invest directly in an Index. For the most recent month-end performance and after-tax returns, visit www. aarpfinancial.com or call 1-800-958-6457. 1 Inception date December 30, 2005.
2 The Barclays Capital Aggregate Bond Index serves as abroad measure of the U.S. taxable bond market. Since the Fund invests in differing
combinations of this and other markets, the Conservative Composite Index has been constructed utilizing the proportionate weightings of the
indexes for each market. This Composite Index provides a particularly useful benchmark to measure the performance of the Fund. For more
detailed information regarding the Composite Indexes and the Underlying Indexes, please see “A Word about Benchmarks” on page 5.
• MSCI U.S. Investable Market 2500 Index®* – The index includes about 2,500 securities listed on
the New York and American Stock Exchanges and the Nasdaq over-the-counter market. The stocks
include companies of all types and sizes, which represent the investable universe of companies in the
U.S. Equity market. Sources: Barclays Capital, Inc., AARP Financial Inc. |
| | | | |
| AARP Conservative Fund Overview | | AARP FUNDS 2009 ANNUAL REPORT | | 17 |
Portfolio construction
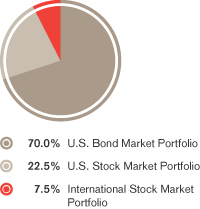
AARP Conservative Fund
Investment commentary – June 30, 2009
The AARP Conservative Fund seeks primarily current income, with some growth of capital. To achieve this objective, the Fund targets an asset allocation of 70% in bonds, 22.5% in U.S. stocks, and 7.5% in international stocks. For the year ended June 30, 2009, the AARP Conservative Fund returned -2.19%, as compared to the Conservative Composite Index return of -1.60%, +6.05% for the Barclays Capital Aggregate Bond Index and -26.28% for the MSCI U.S. Investable Market 2500 IndexSM. The Fund’s performance includes operating expenses, whereas index performance is unmanaged and does not include any expenses. The Fund tracked its benchmark closely during the period and continues to benefit from its diversification to its underlying asset classes.
The Fund’s large allocation to bonds helped protect the Fund from the sharp decline in stock prices. The U.S. Bond Market Portfolio returned +6.12%. In contrast, stock investments, both U.S. and international, detracted from performance as the U.S. Stock Market Portfolio returned -26.49% and the International Stock Market Portfolio returned -28.75% during the period.
The twelve month period ending June 30, 2009 started on a promising note as oil prices fell from historical levels reached in July 2008. Inflation fears eased, but more serious problems emerged as the global financial markets entered a period of severe stress and volatility in the third quarter of 2008. In a span of ten days in September, a number of major U.S. financial giants fell. The collapse of Lehman Brothers triggered global market declines that not only produced massive losses for investors – $4 trillion lopped off total market capitalization of the U.S. stock market since October 2007 – but also jeopardized economies worldwide. During this time credit markets also froze as banks were reluctant to lend cash. This pushed interest rates up and bond prices down.
The U.S. Federal Reserve deployed a range of policy tools, in addition to the U.S. government’s $787 billion stimulus package, to counteract the twin problems of economic weakness and financial market distress. The Federal Reserve Bank (“the Fed”) reduced key rates to minimal levels. In addition, the Fed announced plans to purchase more than one trillion dollars worth of agency mortgage-backed securities and long dated U.S. Treasury securities in order to put downward pressure on longer term interest rates. The Fed and U.S. Treasury also introduced a number of new programs to enhance market liquidity and inject capital into the banking system.
U.S. investment grade bonds, as measured by the Barclays Capital Aggregate Bond Index, increased by nearly 2% in the second quarter of 2009 as corporate bonds rallied in expectation of improving economic conditions and improved corporate profits. Stocks also performed well,
| | | | |
| 18 | | AARP FUNDS 2009 ANNUAL REPORT | | AARP Conservative Fund Overview |
with financial and technology stocks leading a strong rally during this time. We believe that proactive and aggressive fiscal and monetary stimulus, combined with an effective financial stability plan, will allow positive growth to resume in the U.S. by the fourth quarter of 2009.
Sources: SSgA Performance Group, Bloomberg, Factset
The MSCI US Investable Market 2500 IndexSM is a trademark of Morgan Stanley Capital International.
The US Barclays Capital Aggregate Bond Index is a trademark of Barclays Capital, Inc.
The views expressed in this material are the views of SSgA through the period ended June 30, 2009 and are subject to change based on market and other conditions. The information provided does not constitute investment advice and it should not be relied on as such. All material has been obtained from sources believed to be reliable, but its accuracy is not guaranteed. This document contains certain statements that may be deemed forward-looking statements. Please note that any such statements are not guarantees of any future performance and actual results or developments may differ materially from those projected.
| | | | |
| AARP Income Fund Overview | | AARP FUNDS 2009 ANNUAL REPORT | | 19 |
AARP Income Fund Overview
| | | | | | |
| | | |
Portfolio of investments June 30, 2009 | | | | | | |
Mutual funds: 100.4% | | | | | | |
| | | Shares | | Value | |
| | | | | | | |
| U.S. Bond Market Portfolio1 – 95.3% | | 1,268,908 | | $ | 12,841,346 | |
| | |
| State Street Money Market Portfolio2 – 2.6% | | 349,692 | | | 349,692 | |
| | |
| SPDR Barclays Capital High Yield Bond ETF2 – 2.5% | | 9,804 | | | 345,003 | |
| | |
| Total investments: 100.4% (Identified cost $13,375,896) | | | 13,536,041 | |
| | | | | | | |
| Other assets and liabilities, net: (0.4)% | | | | | (54,521 | ) |
| | | | | | | |
| Total net assets: 100.0% | | | | $ | 13,481,520 | |
1 Affiliated issuer. 2 Investment in non-controlled affiliate. See Notes to Financial Statements. | | | | | | |
| | | | | | | | | | | | | | | | |
| |
Affiliated companies The fund invests substantially all of its assets in the underlying portfolios, and is considered an affiliated company. As defined by the Investment Act of 1940 (“the Act”), an affiliated company is one in which the fund owns 5% or more of the outstanding voting securities, or of a company which is under common ownership or control. | |
| | | | | | |
| Affiliate | | Purchase Cost | | Sales Cost | | Investment Income | | Value 6/30/08 | | Value 6/30/09 | |
| | |
| U.S. Bond Market Portfolio | | $ | 8,810,318 | | $ | 2,331,750 | | $ | 462,440 | | $ | 6,174,069 | | $ | 12,841,346 | |
| | |
| |
Amounts reflected on the accompanying financial statements include the following amounts related to affiliated companies: | |
| Investment in securities, at cost | | | | | $ | 12,684,607 | |
| | |
| Income distributions from underlying AARP Portfolios | | | | | $ | 462,440 | |
| | |
| Realized gain (loss) on sales of underlying AARP Portfolios | | | | | $ | (57,453 | ) |
| | |
| Capital gain distributions from underlying AARP Portfolios | | | | | $ | 10,043 | |
| | | | |
| 20 | | AARP FUNDS 2009 ANNUAL REPORT | | AARP Income Fund Overview |
| | | | | | |
| | | |
| | | Performance as of June 30, 2009 | | |
| | | | |
| | | Growth of $10,000 This graph illustrates the
hypothetical investment of
$10,000 in the AARP Income
Fund from September 29,
2006 (inception date) through
June 30, 2009, compared to
the Income Composite Index,
the Barclays Capital
Aggregate Bond Index, and
the J.P. Morgan 1-Month
LIBOR.2 | | 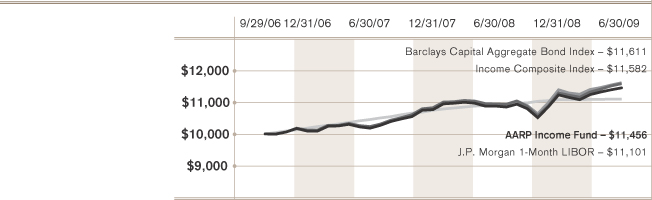 | | |
| | | | |
| | | | | This hypothetical example does not represent the returns of any particular investment. | | |
| | | | | | | | | | | | |
| | | | | | | | | |
| | | Performance summary | | Average annual returns as of June 30, 2009 |
| | | | | | | | | |
| | | | | | | 1-Year | | Since
inception | | | | |
| | | | | AARP Income Fund1 | | 5.38% | | 5.07% | | | | |
| | | | | Income Composite Index2 | | 5.79% | | 5.49% | | | | |
| | | | | Barclays Capital Aggregate Bond Index®2 | | 6.05% | | 5.57% | | | | |
| | | | | J.P. Morgan 1-Month LIBOR | | 1.63% | | 3.88% | | | | |
| | | | | | | | | |
| | |
| |
Performance data quoted represents past performance which is no guarantee of future results. Investment return and principal value will
fluctuate so that an investor’s shares, when redeemed, may be worth more or less than their original cost. Mutual fund performance changes
over time and current performance may be lower or higher than what is stated. Returns shown do not reflect the deduction of taxes that a
shareholder may pay on fund distributions or the redemption of fund shares. Mutual funds are not obligations of or guaranteed by any bank
and are not federally insured. The performance of the Fund assumes the reinvestment of all dividends and distributions. The indexes above
have been adjusted to reflect reinvestment of dividends on securities in the indexes. The returns of the Funds are net of expenses. Indexes do
not have expenses. The adviser is waiving a portion of its advisory fee and other operating expenses. Had the fees not been waived or
reimbursed, returns would have been lower. It is not possible to invest directly in an Index. For the most recent month-end performance and after-tax returns, visit www.aarpfinancial.com or call 1-800-958-6457. 1 Inception date September 29, 2006.
2 The Barclays Capital Aggregate Bond Index serves as abroad measure of the U.S. taxable bond market. Since the Fund invests in differing
combinations of this and other markets, the Income Composite Index has been constructed utilizing the proportionate weightings of the
indexes for each market. This Composite Index provides a particularly useful benchmark to measure the performance of the Fund. For more
detailed information regarding the Composite Indexes and the Underlying Indexes, please see “A Word about Benchmarks” on page 5. |
| | | | |
| AARP Income Fund Overview | | AARP FUNDS 2009 ANNUAL REPORT | | 21 |
Portfolio construction
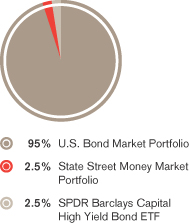
AARP Income Fund
Investment commentary – June 30, 2009
The AARP Income Fund seeks current income and long-term preservation of capital. To achieve this objective, the Fund targets an asset allocation of 95% in long-term bonds, 2.50% in short-term securities and 2.50% in high yield bonds. For the year ended June 30, 2009, the AARP Income Fund returned +5.38%, as compared to the Income Composite Index return of +5.79% and +6.05% for the Barclays Capital Aggregate Bond Index. The Fund’s performance includes operating expenses, where as index performance is unmanaged and does not include any expenses. The Fund tracked its benchmark closely during the period.
Despite severe problems in the credit markets, investment grade bonds, as measured by the Barclays Capital Aggregate Bond Index, remained a pillar of stability. The Fund’s investment in the U.S. Bond Market Portfolio returned +6.12% while the State Street Money Market Portfolio returned +1.21% in the period. Investment return from exposure to high yield bonds detracted from portfolio performance in the period.
The twelve month period ending June 30, 2009 started on a promising note as oil prices fell from historical levels reached in July 2008. Inflation fears eased, but more serious problems emerged as the global financial markets entered a period of severe stress and volatility in the third quarter of 2008. In a span of ten days in September, a number of major U.S. financial giants fell. The collapse of Lehman Brothers triggered global market declines that not only produced massive losses for investors – $4 trillion lopped off total market capitalization of the U.S. stock market since October 2007 – but also jeopardized economies worldwide. During this time credit markets also froze as banks were reluctant to lend cash. This pushed interest rates up and bond prices down.
The U.S. Federal Reserve deployed a range of policy tools, in addition to the U.S. government’s $787 billion stimulus package, to counteract the twin problems of economic weakness and financial market distress. The Federal Reserve Bank (“the Fed”) reduced key rates to minimal levels. In addition, the Fed announced plans to purchase more than one trillion dollars worth of agency mortgage backed securities and long dated U.S. Treasury securities in order to put downward pressure on longer term interest rates. The Fed and U.S. Treasury also introduced a number of new programs to enhance market liquidity and inject capital into the banking system.
U.S. investment grade bonds, as measured by the Barclays Capital Aggregate Bond Index, increased by nearly 2% in the second quarter of 2009 as corporate bonds rallied in expectation of improving economic conditions and improved corporate profits. The positive outlook also
| | | | |
| 22 | | AARP FUNDS 2009 ANNUAL REPORT | | AARP Income Fund Overview |
benefited the high yield segment as yields declined and prices increased. High yield bonds, as measured by the Barclays Capital High Yield Very Liquid Index, returned 26% during the second quarter of 2009. We believe that proactive and aggressive fiscal and monetary stimulus, combined with an effective financial stability plan, will allow positive growth to resume in the U.S. by the fourth quarter of 2009.
Sources: Bloomberg, SSgA Performance Group, FactSet
The US Barclays Capital Aggregate Bond Index is a trademark of Barclays Capital, Inc.
The views expressed in this material are the views of SSgA through the period ended June 30, 2009 and are subject to change based on market and other conditions. The information provided does not constitute investment advice and it should not be relied on as such. All material has been obtained from sources believed to be reliable, but its accuracy is not guaranteed. This document contains certain statements that may be deemed forward-looking statements. Please note that any such statements are not guarantees of any future performance and actual results or developments may differ materially from those projected.
| | | | |
| AARP Money Market Fund Overview | | AARP FUNDS 2009 ANNUAL REPORT | | 23 |
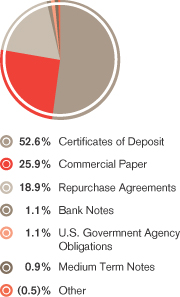
AARP Money Market Fund Overview
Portfolio construction*
| | | | |
| |
Portfolio of investments June 30, 2009 | | | | |
Mutual funds: 100.5% | | | | |
| | | Value | |
| | | | |
| Investment in State Street Money Market Portfolio1 – 100.5% | | $ | 52,139,535 | |
| | |
| Total investments: 100.5% (Identified cost $52,139,535) | | | 52,139,535 | |
| | | | |
| Other assets and liabilities, net: (0.5)% | | | (236,329 | ) |
| | | | |
| Total net assets: 100.0% | | $ | 51,903,206 | |
1 The financial statements of the State Street Money Market Portfolio, including its investment portfolio, are included elsewhere within this report and should be read in conjunction with the AARP Money Market Fund’s financial statements. AARP Money Market Fund invests only in State Street Money Market Portfolio. At June 30, 2009, AARP Money Market Fund owned 0.54% of the State Street Money Market Portfolio. See Notes to Financial Statements. | |
Performance summary
Maturity ladder
| | | | | | | | | | | | |
| | | |
| | | Average annual returns as of June 30, 2009 | | | | |
| | | | | | |
| | | | | 1-Year | | 3-Years | | Since
inception | | | | |
| | AARP Money Market Fund | | 1.34% | | 3.50% | | 3.50%1 | | | | |
| | J.P. Morgan 1-Month LIBOR | | 1.63% | | 3.86% | | 3.86%1 | | | | |
| | AARP Money Market Fund 7-Day Yield | | 0.27% | | | | | | | | |
| | | Maturities as of June 30, 2009 | | | | |
| | | | | | |
| | 0-3 Days | | | | | | 20.0% | | | | |
| | 4-90 Days | | | | | | 53.0% | | | | |
| | 90+ Days | | | | | | 27.5% | | | | |
| | Total | | | | | | 100.5% | | | | |
| | Average Maturity | | | | | | | | | | |
| | | | | | |
| | |
|
*Portfolio construction represents the composition of the underlying holdings in the State Street Money Market Portfolio, whose financial
statements are included elsewhere in this report. As a percentage of net assets as of the date indicated. The Portfolio’s composition will vary
over time. Performance data quoted represents past performance which is no guarantee of future results. Investment return and principal value will
fluctuate so that an investor’s shares, when redeemed, may be worth more or less than their original cost. Mutual fund performance changes
over time and current performance may be lower or higher than what is stated. Returns shown do not reflect the deduction of taxes that a
shareholder may pay on fund distributions or the redemption of fund shares. Mutual funds are not obligations of or guaranteed by any bank
and are not federally insured. The performance of the Funds assumes the reinvestment of all dividends and distributions. The indexes above
have been adjusted to reflect reinvestment of dividends on securities in the indexes. The returns of the Funds are net of expenses. Indexes do
not have expenses. The adviser is waiving a portion of its advisory fee and other operating expenses. Had the fees not been waived or
reimbursed, returns would have been lower. It is not possible to invest directly in an Index. For the most recent month-end performance and after-tax returns, visit www.aarpfinancial.com or call 1-800-958-6457. An investment in the AARP Money Market Fund is not insured or guaranteed by the Federal Deposit Insurance Corporation or any other
government agency. Although the Fund seeks to preserve the value of your investment at $1.00 per share, it is possible to lose money by
investing in the Fund. 1 For the period from July 1, 2006 (commencement of operations) to June 30, 2009. Sources: J.P Morgan, AARP Financial Inc. |
| | | | |
| 24 | | AARP FUNDS 2009 ANNUAL REPORT | | Understanding Your Expenses |
Understanding Your Expenses (unaudited)
As a shareholder of a Fund, you incur ongoing costs, including investment advisory fees, distribution (12b-1) fees, shareholder services fees, and other expenses of running a fund. It’s important to understand exactly how much you pay to purchase and own a fund and to compare the costs of owning different funds because these costs reduce your returns.
The example in the table on page 27 is intended to help you to understand your ongoing costs in dollars of investing in an AARP Fund and to compare these costs with the ongoing costs of investing in other mutual funds. It is based on an investment of $1,000 invested at the beginning of the period and held for the entire period from January 1, 2009 to June 30, 2009.
Actual Expenses
The first line for each fund in the table on the next page, labeled “Actual,” provides information about actual account values and actual expenses. You may use this information, together with the amount you invested, to estimate the expenses that you incurred over the period. Simply divide your account value by $1,000 (for example, an $8,600 account value divided by $1,000 = 8.6), then multiply the result by the number in the line labeled “Actual” under the heading entitled “Expenses paid during period” to estimate the expenses attributable to your investment during this period.
Hypothetical Example For Comparison Purposes
The second line for each fund in the table, labeled “Hypothetical”, helps you compare the costs of an AARP Fund to other funds using a 5% return as required by the Securities and Exchange Commission for all mutual funds. It provides information about hypothetical account values and hypothetical expenses based on an AARP Fund’s actual expense ratio and an assumed rate of return of 5% per year before expenses, which is not an AARP Fund’s actual return. You should not use the hypothetical account values and expenses to estimate the actual ending account balance or your expenses for the period. Rather, these figures help you to compare the ongoing costs of investing in an AARP Fund with other funds. To do so, compare this 5% hypothetical example with the 5% hypothetical examples that appear in the shareholder reports of the other funds.
Please note that the expenses shown in the table are meant to highlight your ongoing costs only and do not reflect any transaction costs. Therefore, the line labeled “Hypothetical” is useful in comparing ongoing costs only, and will not help you determine the relative total costs of owning different funds.
In addition to the fees and expenses which the AARP Fund bears directly, the AARP Fund indirectly bears a pro rata share of the fees and expenses of the underlying portfolios in which the AARP Fund invests.
| | | | |
| Understanding Your Expenses | | AARP FUNDS 2009 ANNUAL REPORT | | 25 |
Because the underlying portfolios have varied expenses and fee levels and the AARP Fund may own different proportions of the underlying portfolios at different times, the amount of fees and expenses incurred indirectly by the AARP Fund may vary in the future. However AARP Financial has agreed contractually to waive fees and reimburse expenses to keep the net total operating expenses of the AARP Funds, including the indirect fees and expenses of the underlying portfolios, at 0.50% of average daily net assets through at least November 1, 2009 (0.30% with respect to the AARP Money Market Fund).
| | | | |
| 26 | | AARP FUNDS 2009 ANNUAL REPORT | | Understanding Your Expenses |
| | | | | | | | | | | | | | | | |
| | | | | | | |
| | | Beginning
account value
1/1/09 | | Ending
account value
6/30/09 | | Expenses paid
during period2 | | Annualized
expense ratio2 | | Effective
expenses paid during
period3 | | Effective
annualized
expense
ratio3 |
| |
| |
| AARP Aggressive Fund | | | | | | | | | | | | | | | | |
Actual | | $ | 1,000 | | $ | 1,051.40 | | $ | 1.22 | | 0.24% | | $ | 2.54 | | 0.50% |
Hypothetical1 | | $ | 1,000 | | $ | 1,023.60 | | $ | 1.20 | | | | $ | 2.51 | | |
| |
| |
| AARP Moderate Fund | | | | | | | | | | | | | | | | |
Actual | | $ | 1,000 | | $ | 1,043.20 | | $ | 1.22 | | 0.24% | | $ | 2.53 | | 0.50% |
Hypothetical1 | | $ | 1,000 | | $ | 1,023.60 | | $ | 1.20 | | | | $ | 2.51 | | |
| |
| |
| AARP Conservative Fund | | | | | | | | | | | | | | | | |
Actual | | $ | 1,000 | | $ | 1,031.80 | | $ | 1.26 | | 0.25% | | $ | 2.52 | | 0.50% |
Hypothetical1 | | $ | 1,000 | | $ | 1,023.55 | | $ | 1.25 | | | | $ | 2.51 | | |
| |
| |
| AARP Income Fund | | | | | | | | | | | | | | | | |
Actual | | $ | 1,000 | | $ | 1,019.80 | | $ | 1.30 | | 0.26% | | $ | 2.50 | | 0.50% |
Hypothetical1 | | $ | 1,000 | | $ | 1,023.51 | | $ | 1.30 | | | | $ | 2.51 | | |
| |
| |
| AARP Money Market Fund | | | | | | | | | | | | | | | | |
Actual | | $ | 1,000 | | $ | 1,002.80 | | $ | 1.49 | | 0.30% | | $ | 1.49 | | 0.30% |
Hypothetical1 | | $ | 1,000 | | $ | 1,023.31 | | $ | 1.51 | | | | $ | 1.51 | | |
| |
| |
| |
1 The Hypothetical example assumes a 5% return before expenses. 2 Expenses reflect the Fund’s annualized net expense ratios multiplied by the average account value over the period, multiplied by 181/365 (to reflect the one-half year period). The fees and expenses of the underlying portfolios are not included in these amounts. 3 Effective expenses reflect the sum of the expenses borne directly by the Fund plus the Fund’s pro-rata share of the weighted average expense ratio of the underlying portfolios in which it invests. The effective annualized expense ratio combines the Fund’s annualized net expense ratio (after applying contractual waivers and/or reimbursements) and the annualized weighted average expense ratios of the underlying portfolios. The annualized weighted average expense ratio includes the annualized expense ratio for each underlying portfolio weighted for the Fund’s relative average investment during the same period. |
| | | | |
| How to Read Financial Statements | | AARP FUNDS 2009 ANNUAL REPORT | | 27 |
How to Read Financial Statements
Mutual funds are companies that pool money from many investors and invest that money in stocks, bonds and other securities and assets. Mutual fund financial statements show investors where a fund’s money came from, where it went, where it is and what it is worth as of the close of the fund’s most recent fiscal period. The portfolio of investments shows where the money is as of the close of the fund’s most recent fiscal period. The holdings of each AARP Fund as of June 30, 2009 are shown in the individual Fund Overview sections of this annual report. In addition, this section of the annual report contains four additional financial statements:
1. Statements of assets and liabilities.
These statements are the Funds’ balance sheets as of the close of the period (June 30, 2009). They show the value and the cost of what each Fund owned, how much it owed to others and the resulting difference or “net assets”.
| • | | Assets are the stocks, bonds, cash, and other financial instruments that a fund owns and has purchased with monies investors pay when they purchase shares. |
| • | | Liabilities are the amounts of money that a fund owes. Liabilities include payments due for the purchase of financial investments as well as bills that a fund incurs for services that are needed to run a fund, such as legal services and printing. |
| • | | Net assets = total assets – total liabilities. Net assets represent what is left of assets after liabilities are subtracted. This leftover amount belongs to the investors, or shareholders, of the fund. |
2. Statements of operations
These statements provide a summary of the investment income, such as dividends, that a Fund has earned as well as gains and losses from its investment activities for the period ended June 30, 2009. Realized gains or losses reflect the difference between purchase price and selling price for transactions that took place during the period. Unrealized gains and losses reflect the difference between purchase price and the value of investments that are still held as of the end of the period. The statements also include specific details of fund expenses.
3. Statements of changes in net assets
These statements describe the changes in net assets during the current and prior period, which result from operations, any distributions of earnings to investors, and any shareholder transactions.
4. Financial highlights
The financial highlights table is intended to help you understand a fund’s financial performance for a share outstanding for the current period and each of the applicable prior periods.
The Notes to Financial Statements provide additional information to help you better understand the financial statements. They include a description of the most important accounting policies used in portraying the company’s financial condition and results, including how a fund records and values its investments, tax information, as well as additional detail on shareholder and investment transactions.
| | | | |
| 28 | | AARP FUNDS 2009 ANNUAL REPORT | | Financial Statements |
Financial Statements
| | | | | | | | | | | | | | | | | | | | |
| |
Statements of assets and liabilities June 30, 2009 | | | | | |
|
| |
| | | AARP
Aggressive
Fund | | | AARP
Moderate
Fund | | | AARP
Conservative
Fund | | | AARP
Income
Fund | | | AARP
Money Market
Fund | |
| | | | | | | | | | | | | | | | | | | | |
| Assets: | | | | | | | | | | | | | | | | | | | | |
| Investments in affiliated issuers, at value (identified cost of $27,948,374, $42,695,400, $18,909,732 and $12,684,607, respectively) | | $ | 23,331,722 | | | $ | 39,030,457 | | | $ | 18,881,544 | | | $ | 12,841,346 | | | $ | – | |
Investments in unaffiliated issuer
(identified cost of $341,597) | | | – | | | | – | | | | – | | | | 345,003 | | | | – | |
| Investments in State Street Money Market Portfolio, at value (identified cost of $349,692 and $52,139,535, respectively) | | | – | | | | – | | | | – | | | | 349,692 | | | | 52,139,535 | |
| Receivable from adviser | | | 20,350 | | | | 19,171 | | | | 12,700 | | | | 12,849 | | | | 29,972 | |
| Receivable for investments sold | | | – | | | | – | | | | – | | | | 5,000 | | | | – | |
| Receivable for fund shares sold | | | 3,305 | | | | 31,000 | | | | 33,796 | | | | 6,285 | | | | 8,623 | |
| Total assets | | $ | 23,355,377 | | | $ | 39,080,628 | | | $ | 18,928,040 | | | $ | 13,560,175 | | | $ | 52,178,130 | |
| | | | | | | | | | | | | | | | | | | | |
| Liabilities: | | | | | | | | | | | | | | | | | | | | |
| Payable for investments purchased | | | 3,305 | | | | 28,000 | | | | 20,313 | | | | – | | | | – | |
| Payable for fund shares redeemed | | | – | | | | 3,000 | | | | 13,483 | | | | 17,000 | | | | 206,252 | |
| Income distribution payable | | | 16,077 | | | | 31,630 | | | | 11,569 | | | | 3,550 | | | | 359 | |
| Payable for Trustees’ fees | | | 5,000 | | | | 5,000 | | | | 5,000 | | | | 5,000 | | | | 5,000 | |
| Accrued portfolio acct. fees (Note 6) | | | 2,872 | | | | 2,893 | | | | 2,869 | | | | 1,334 | | | | 1,298 | |
| Accrued administration fees (Note 6) | | | 669 | | | | 1,114 | | | | 531 | | | | 380 | | | | 1,504 | |
| Accrued transfer agent fees (Note 6) | | | 13,291 | | | | 11,522 | | | | 5,216 | | | | 3,594 | | | | 13,879 | |
| Accrued distribution services fee | | | 3,813 | | | | 6,352 | | | | 3,031 | | | | 2,169 | | | | 8,573 | |
| Accrued audit fees | | | 18,122 | | | | 18,122 | | | | 18,122 | | | | 19,122 | | | | 21,122 | |
| Accrued registration fees | | | 2,067 | | | | 2,032 | | | | 1,954 | | | | 6,091 | | | | 2,999 | |
| Accrued printing and postage expenses | | | 9,435 | | | | 9,435 | | | | 9,435 | | | | 9,435 | | | | 9,435 | |
| Accrued legal fees | | | 3,138 | | | | 3,138 | | | | 3,138 | | | | 3,138 | | | | 3,138 | |
| Accrued miscellaneous expense | | | 7,842 | | | | 7,842 | | | | 7,842 | | | | 7,842 | | | | 1,365 | |
| Total liabilities | | $ | 85,631 | | | $ | 130,080 | | | $ | 102,503 | | | $ | 78,655 | | | $ | 274,924 | |
| | | | | | | | | | | | | | | | | | | | |
| Net assets | | $ | 23,269,746 | | | $ | 38,950,548 | | | $ | 18,825,537 | | | $ | 13,481,520 | | | $ | 51,903,206 | |
| Net assets consist of: | | | | | | | | | | | | | | | | | | | | |
| Paid-in capital | | $ | 30,015,621 | | | $ | 46,501,370 | | | $ | 20,192,641 | | | $ | 13,384,716 | | | $ | 51,901,566 | |
| Net unrealized appreciation (depreciation) of investments | | | (4,616,652 | ) | | | (3,664,943 | ) | | | (28,188 | ) | | | 160,145 | | | | – | |
| Accumulated net realized gain (loss) on investments | | | (2,129,223 | ) | | | (3,885,900 | ) | | | (1,338,903 | ) | | | (63,347 | ) | | | (259 | ) |
| | | | | |
| Undistributed (distributions in excess of) net investment income | | | – | | | | 21 | | | | (13 | ) | | | 6 | | | | 1,899 | |
| Net assets | | $ | 23,269,746 | | | $ | 38,950,548 | | | $ | 18,825,537 | | | $ | 13,481,520 | | | $ | 51,903,206 | |
| | | | | | | | | | | | | | | | | | | | |
| Shares of beneficial interest outstanding | | | 2,846,316 | | | | 4,388,440 | | | | 1,980,342 | | | | 1,335,801 | | | | 51,901,566 | |
| Net asset value per share | | $ | 8.18 | | | $ | 8.88 | | | $ | 9.51 | | | $ | 10.09 | | | $ | 1.00 | |
|
| See Notes to Financial Statements. | |
| | | | |
| Financial Statements | | AARP FUNDS 2009 ANNUAL REPORT | | 29 |
Financial Statements (continued)
| | | | | | | | | | | | | | | | | | | | |
|
Statements of operations Year ended June 30, 2009 | |
| | | AARP
Aggressive Fund | | | AARP
Moderate
Fund | | | AARP
Conservative
Fund | | | AARP Income Fund | | | AARP Money Market
Fund | |
| | | | | | | | | | | | | | | | | | | | |
| Investment income: | | | | | | | | | | | | | | | | | | | | |
| Dividends from affiliated issuers | | $ | 603,683 | | | $ | 1,274,420 | | | $ | 665,690 | | | $ | 462,440 | | | $ | – | |
| Dividends from an unaffiliated issuer | | | – | | | | – | | | | – | | | | 36,377 | | | | – | |
| Interest allocated from State Street Money Market Portfolio | | | – | | | | – | | | | – | | | | 4,136 | | | | 1,129,066 | |
| Total investment income | | $ | 603,683 | | | $ | 1,274,420 | | | $ | 665,690 | | | $ | 502,953 | | | $ | 1,129,066 | |
| | | | | | | | | | | | | | | | | | | | |
| Expenses: | | | | | | | | | | | | | | | | | | | | |
| Expenses allocated from State Street Money Market Portfolio | | | – | | | | – | | | | – | | | | 293 | | | | 68,322 | |
| Investment adviser fee (Note 6) | | | 2,070 | | | | 3,716 | | | | 1,686 | | | | 1,068 | | | | — | |
| Administration fees (Note 6) | | | 7,243 | | | | 13,005 | | | | 5,901 | | | | 3,736 | | | | 23,224 | |
| Registration fees | | | 18,085 | | | | 18,562 | | | | 18,071 | | | | 19,305 | | | | 27,472 | |
| Transfer and dividend disbursing agent fees and expenses (Note 6) | | | 106,934 | | | | 105,146 | | | | 47,029 | | | | 30,242 | | | | 141,173 | |
| Trustees’ fees | | | 20,000 | | | | 20,000 | | | | 20,000 | | | | 20,000 | | | | 20,000 | |
| Audit fees | | | 19,593 | | | | 19,593 | | | | 19,593 | | | | 20,593 | | | | 22,593 | |
| Legal fees | | | 38,426 | | | | 38,426 | | | | 38,426 | | | | 38,426 | | | | 38,426 | |
| Portfolio accounting fees (Note 6) | | | 18,323 | | | | 18,794 | | | | 18,149 | | | | 16,311 | | | | 16,340 | |
| Distribution service fees | | | 41,392 | | | | 74,316 | | | | 33,717 | | | | 21,349 | | | | 132,707 | |
| Printing and postage expenses | | | 19,847 | | | | 19,847 | | | | 19,847 | | | | 18,847 | | | | 18,770 | |
| Insurance expense | | | 4,500 | | | | 8,475 | | | | 4,126 | | | | 3,410 | | | | 18,011 | |
| Miscellaneous | | | 11,016 | | | | 11,016 | | | | 11,016 | | | | 11,016 | | | | 34,980 | |
| Total expenses | | $ | 307,429 | | | $ | 350,896 | | | $ | 237,561 | | | $ | 204,596 | | | $ | 562,018 | |
| | | | | | | | | | | | | | | | | | | | |
| Waivers and reimbursements (Note 6): | | | | | | | | | | | | | | | | | | | | |
| Reduction of expenses by investment adviser | | | (257,542 | ) | | | (260,358 | ) | | | (196,013 | ) | | | (176,615 | ) | | | (362,955 | ) |
| Net expenses | | | 49,887 | | | | 90,538 | | | | 41,548 | | | | 27,981 | | | | 199,063 | |
| Net investment income | | | 553,796 | | | | 1,183,882 | | | | 624,142 | | | | 474,972 | | | | 930,003 | |
| | | | | | | | | | | | | | | | | | | | |
| Realized and unrealized gain (loss) on investments: | | | | | | | | | | | | | | | | | |
| Net realized loss on affiliated investments | | | (1,916,018 | ) | | | (3,733,664 | ) | | | (1,323,222 | ) | | | (57,453 | ) | | | – | |
| Net realized gain (loss) allocated from State Street Money Market Portfolio | | | – | | | | – | | | | – | | | | 4 | | | | (259 | ) |
| Capital gain distributions from affiliated investments | | | 50,463 | | | | 74,106 | | | | 24,232 | | | | 10,043 | | | | – | |
| Net change in unrealized appreciation (depreciation) of investments | | | (3,129,597 | ) | | | (2,136,252 | ) | | | 249,527 | | | | 232,039 | | | | – | |
| Net realized and unrealized gain (loss) on investments | | | (4,995,152 | ) | | | (5,795,810 | ) | | | (1,049,463 | ) | | | 184,633 | | | | (259 | ) |
| Change in net assets resulting from operations | | $ | (4,441,356 | ) | | $ | (4,611,928 | ) | | $ | (425,321 | ) | | $ | 659,605 | | | $ | 929,744 | |
| | | | | |
| See Notes to Financial Statements. | | | | | | | | | | | | | | | | | | | | |
| | | | |
| 30 | | AARP FUNDS 2009 ANNUAL REPORT | | Financial Statements |
Financial Statements (continued)
| | | | | | | | | | | | | | | | | | |
| | | |
Statements of changes in net assets | | | | | | | | | | | |
| | | AARP Aggressive Fund | | | AARP Moderate Fund | | | |
| | | | | |
| | | Year
ended
6/30/09 | | | Year
ended
6/30/08 | | | Year
ended
6/30/09 | | | Year
ended
6/30/08 | | | |
| Increase (decrease) in net assets | | | | | | | | | | | | | | | | | | |
| Operations: | | | | | | | | | | | | | | | | | | |
| Net investment income | | $ | 553,796 | | | $ | 629,596 | | | $ | 1,183,882 | | | $ | 1,263,597 | | | |
Net realized gain (loss)
on investments | | | (1,865,555 | ) | | | 122,903 | | | | (3,659,558 | ) | | | 321,726 | | | |
| Net change in unrealized appreciation (depreciation) of investments | | | (3,129,597 | ) | | | (2,861,553 | ) | | | (2,136,252 | ) | | | (2,907,787 | ) | | |
Change in net assets resulting
from operations | | | (4,441,356 | ) | | | (2,109,054 | ) | | | (4,611,928 | ) | | | (1,322,464 | ) | | |
| | | | | | | | | | | | | | | | | | |
| Distributions to shareholders: | | | | | | | | | | | | | | | | | | |
| From net investment income | | | (555,111 | ) | | | (687,591 | ) | | | (1,188,697 | ) | | | (1,322,333 | ) | | |
| From net realized gains on investments | | | (206,931 | ) | | | (161,853 | ) | | | (267,888 | ) | | | (362,860 | ) | | |
| Change in net assets resulting from distributions to shareholders | | | (762,042 | ) | | | (849,444 | ) | | | (1,456,585 | ) | | | (1,685,193 | ) | | |
| | | | | | | | | | | | | | | | | | |
| Share transactions: | | | | | | | | | | | | | | | | | | |
| Proceeds from sales of shares | | | 7,802,845 | | | | 14,172,454 | | | | 10,582,167 | | | | 21,178,734 | | | |
| Net asset value of shares issued on reinvestment of dividends | | | 718,295 | | | | 800,783 | | | | 1,371,216 | | | | 1,603,205 | | | |
| Cost of shares redeemed | | | (5,092,490 | ) | | | (7,192,023 | ) | | | (9,257,878 | ) | | | (9,376,196 | ) | | |
| Change in net assets resulting from share transactions | | | 3,428,650 | | | | 7,781,214 | | | | 2,695,505 | | | | 13,405,743 | | | |
| Change in net assets | | | (1,774,748 | ) | | | 4,822,716 | | | | (3,373,008 | ) | | | 10,398,086 | | | |
| | | | | | | | | | | | | | | | | | |
| Net assets: | | | | | | | | | | | | | | | | | | |
| Beginning of year | | $ | 25,044,494 | | | $ | 20,221,778 | | | $ | 42,323,556 | | | $ | 31,925,470 | | | |
| End of year | | $ | 23,269,746 | | | $ | 25,044,494 | | | $ | 38,950,548 | | | $ | 42,323,556 | | | |
| Undistributed (distributions in excess of) net investment income included in net assets at end of period | | $ | — | | | $ | 37 | | | $ | 21 | | | $ | 43 | | | |
See Notes to Financial Statements.
| | | | |
| Financial Statements | | AARP FUNDS 2009 ANNUAL REPORT | | 31 |
| | | | | | | | | | | | | | | | | | | | | | | | |
| | | |
| | | AARP Conservative Fund | | | AARP Income Fund | | | AARP Money Market Fund | |
| | | | | | |
| | | Year
ended
6/30/09 | | | Year
ended
6/30/08 | | | Year
ended
6/30/09 | | | Year
ended
6/30/08 | | | Year
ended
6/30/09 | | | Year
ended
6/30/08 | |
| | | | | | | | | | | | | | | | | | | | | | | | |
| | | | | | | | | | | | | | | | | | | | | | | | |
| | $ | 624,142 | | | $ | 568,723 | | | $ | 474,972 | | | $ | 180,435 | | | $ | 930,003 | | | $ | 2,393,214 | |
| | | | | | |
| | | (1,298,990 | ) | | | 98,805 | | | | (47,406 | ) | | | 11,408 | | | | (259 | ) | | | 1,903 | |
| | | | | | |
| | | | 249,527 | | | | (505,064 | ) | | | 232,039 | | | | (35,643 | ) | | | — | | | | — | |
| | | | | | |
| | | | (425,321 | ) | | | 162,464 | | | | 659,605 | | | | 156,200 | | | | 929,744 | | | | 2,395,117 | |
| | | | | | | | | | | | | | | | | | | | | | | | |
| | | | | | | | | | | | | | | | | | | | | | | | |
| | | (627,428 | ) | | | (580,384 | ) | | | (477,921 | ) | | | (180,518 | ) | | | (930,003 | ) | | | (2,393,214 | ) |
| | | | | | |
| | | | (57,930 | ) | | | (93,875 | ) | | | (20,707 | ) | | | (33 | ) | | | — | | | | — | |
| | | | | | |
| | | | (685,358 | ) | | | (674,259 | ) | | | (498,628 | ) | | | (180,551 | ) | | | (930,003 | ) | | | (2,393,214 | ) |
| | | | | | | | | | | | | | | | | | | | | | | | |
| | | | | | | | | | | | | | | | | | | | | | | | |
| | | 7,771,650 | | | | 9,143,231 | | | | 9,865,153 | | | | 6,152,675 | | | | 30,835,385 | | | | 93,159,127 | |
| | | | | | |
| | | 628,940 | | | | 615,194 | | | | 454,391 | | | | 149,210 | | | | 906,951 | | | | 2,310,555 | |
| | | | (6,529,133 | ) | | | (2,803,399 | ) | | | (3,449,368 | ) | | | (2,164,932 | ) | | | (56,914,484 | ) | | | (54,137,641 | ) |
| | | | | | |
| | | | 1,871,457 | | | | 6,955,026 | | | | 6,870,176 | | | | 4,136,953 | | | | (25,172,148 | ) | | | 41,332,041 | |
| | | | 760,778 | | | | 6,443,231 | | | | 7,031,153 | | | | 4,112,602 | | | | (25,172,407 | ) | | | 41,333,944 | |
| | | | | | | | | | | | | | | | | | | | | | | | |
| | | | | | | | | | | | | | | | | | | | | | | | |
| | | $ | 18,064,759 | | | $ | 11,621,528 | | | $ | 6,450,367 | | | $ | 2,337,765 | | | $ | 77,075,613 | | | $ | 35,741,669 | |
| | | $ | 18,825,537 | | | $ | 18,064,759 | | | $ | 13,481,520 | | | $ | 6,450,367 | | | $ | 51,903,206 | | | $ | 77,075,613 | |
| | | | | | |
| | | $ | (13 | ) | | $ | 7 | | | $ | 6 | | | $ | 3 | | | $ | 1,899 | | | $ | — | |
| | | | |
| 32 | | AARP FUNDS 2009 ANNUAL REPORT | | Financial Statements |
Financial Statements (continued)
| | | | | | | | | | | | | | | | |
| | | | |
Financial highlights | | | | | | | | | | | | | | | | |
| | | | |
| (For a share outstanding throughout the period) | | | | | | | | | | | | | | | | |
| | | AARP Aggressive Fund | |
| | | | |
| | | Year ended
6/30/09 | | | Year
ended
6/30/08 | | | Year
ended
6/30/07 | | | Period
ended
6/30/061 | |
| Net asset value, beginning of period | | $ | 10.46 | | | $ | 11.68 | | | $ | 10.17 | | | $ | 10.00 | |
| | | | | | | | | | | | | | | | |
| Income from investment operations: | | | | | | | | | | | | | | | | |
| Net investment income | | | 0.21 | | | | 0.29 | | | | 0.24 | | | | 0.09 | |
Net realized and unrealized gain (loss) on affiliated investments | | | (2.19 | ) | | | (1.15 | ) | | | 1.52 | | | | 0.17 | |
| Total from investment operations | | | (1.98 | ) | | | (0.86 | ) | | | 1.76 | | | | 0.26 | |
| | | | | | | | | | | | | | | | |
| Less distributions: | | | | | | | | | | | | | | | | |
| From net investment income | | | (0.21 | ) | | | (0.29 | ) | | | (0.25 | ) | | | (0.09 | ) |
| From net realized gains on investments | | | (0.09 | ) | | | (0.07 | ) | | | (0.00 | )2 | | | – | |
| Total distributions | | | (0.30 | ) | | | (0.36 | ) | | | (0.25 | ) | | | (0.09 | ) |
| Net asset value, end of period | | $ | 8.18 | | | $ | 10.46 | | | $ | 11.68 | | | $ | 10.17 | |
| Total return3 | | | (18.81 | )% | | | (7.49 | )% | | | 17.41 | % | | | 2.60 | % |
| | | | | | | | | | | | | | | | |
| Ratios to average net assets: | | | | | | | | | | | | | | | | |
| Net expenses4 | | | 0.24 | % | | | 0.24 | % | | | 0.24 | % | | | 0.24 | %5 |
| Net investment income | | | 2.68 | % | | | 2.47 | % | | | 2.55 | % | | | 3.36 | %5 |
| Expense waiver/reimbursement6 | | | (1.24 | )% | | | (1.09 | )% | | | (2.00 | )% | | | (11.22 | )%5 |
| | | | | | | | | | | | | | | | |
| Supplemental data: | | | | | | | | | | | | | | | | |
| Net assets, end of period (000 omitted) | | $ | 23,270 | | | $ | 25,044 | | | $ | 20,222 | | | $ | 6,454 | |
| Portfolio turnover | | | 36 | % | | | 22 | % | | | 12 | % | | | 7 | % |
| 1 | For the period from December 30, 2005 (commencement of operations) to June 30, 2006. |
| 2 | Represents less than $0.01. |
| 3 | Total returns for periods of less than one year are not annualized. |
| 4 | In addition to the fees and expenses that the fund bears directly, the fund indirectly bears a pro-rata share of the fees and expenses of the underlying portfolios in which the fund invest. The net expense ratio shown does not include these indirect expenses. If included, the net expense ratio for each Fund would be 0.50%. |
| 5 | Computed on an annualized basis. |
| 6 | This expense decrease is reflected in both the net expense and net investment income (loss) ratios shown above. |
See Notes to Financial Statements.
| | | | |
| Financial Statements | | AARP FUNDS 2009 ANNUAL REPORT | | 33 |
Financial Statements (continued)
| | | | | | | | | | | | | | | | |
| | | | |
Financial highlights | | | | | | | | | | | | | | | | |
| | | |
| (For a share outstanding throughout the period) | | | | | | | | | | | | | |
| | | AARP Moderate Fund | |
| | | | |
| | | Year
ended
6/30/09 | | | Year
ended
6/30/08 | | | Year
ended
6/30/07 | | | Period
ended
6/30/061 | |
| Net asset value, beginning of period | | $ | 10.32 | | | $ | 11.06 | | | $ | 10.04 | | | $ | 10.00 | |
| | | | | | | | | | | | | | | | |
| Income from investment operations: | | | | | | | | | | | | | | | | |
| Net investment income | | | 0.28 | | | | 0.34 | | | | 0.31 | | | | 0.10 | |
| Net realized and unrealized gain (loss) on affiliated investments | | | (1.37 | ) | | | (0.64 | ) | | | 1.02 | | | | 0.04 | |
| Total from investment operations | | | (1.09 | ) | | | (0.30 | ) | | | 1.33 | | | | 0.14 | |
| | | | | | | | | | | | | | | | |
| Less distributions: | | | | | | | | | | | | | | | | |
| From net investment income | | | (0.28 | ) | | | (0.34 | ) | | | (0.31 | ) | | | (0.10 | ) |
| From net realized gains on investments | | | (0.07 | ) | | | (0.10 | ) | | | (0.00 | )2 | | | – | |
| Total distributions | | | (0.35 | ) | | | (0.44 | ) | | | (0.31 | ) | | | (0.10 | ) |
| Net asset value, end of period | | $ | 8.88 | | | $ | 10.32 | | | $ | 11.06 | | | $ | 10.04 | |
| Total return3 | | | (10.48 | )% | | | (2.79 | )% | | | 13.32 | % | | | 1.44 | % |
| | | | | | | | | | | | | | | | |
| Ratios to average net assets: | | | | | | | | | | | | | | | | |
| Net expenses4 | | | 0.24 | % | | | 0.24 | % | | | 0.24 | % | | | 0.24 | %5 |
| Net investment income | | | 3.20 | % | | | 3.21 | % | | | 3.27 | % | | | 4.58 | %5 |
| Expense waiver/reimbursement6 | | | (0.70 | )% | | | (0.68 | )% | | | (1.11 | )% | | | (6.82 | )%5 |
| | | | | | | | | | | | | | | | |
| Supplemental data: | | | | | | | | | | | | | | | | |
| Net assets, end of period (000 omitted) | | $ | 38,951 | | | $ | 42,324 | | | $ | 31,925 | | | $ | 13,133 | |
| Portfolio turnover | | | 43 | % | | | 24 | % | | | 13 | % | | | 5 | % |
| 1 | For the period from December 30, 2005 (commencement of operations) to June 30, 2006. |
| 2 | Represents less than $0.01. |
| 3 | Total returns for periods of less than one year are not annualized. |
| 4 | In addition to the fees and expenses that the fund bears directly, the fund indirectly bears a pro-rata share of the fees and expenses of the underlying portfolios in which the fund invest. The net expense ratio shown does not include these indirect expenses. If included, the net expense ratio for each Fund would be 0.50%. |
| 5 | Computed on an annualized basis. |
| 6 | This expense decrease is reflected in both the net expense and net investment income (loss) ratios shown above. |
See Notes to Financial Statements.
| | | | |
| 34 | | AARP FUNDS 2009 ANNUAL REPORT | | Financial Statements |
Financial Statements (continued)
| | | | | | | | | | | | | | | | | | |
| | |
Financial highlights | | | | | | |
| | |
| (For a share outstanding throughout the period) | | | | | | | |
| | | AARP Conservative Fund | | | |
| | | | | |
| | | Year
ended
6/30/09 | | | Year
ended
6/30/08 | | | Year
ended
6/30/07 | | | Period
ended
6/30/061 | | | |
| Net asset value, beginning of period | | $ | 10.12 | | | $ | 10.38 | | | $ | 9.86 | | | $ | 10.00 | | | |
| | | | | | | | | | | | | | | | | | |
| Income from investment operations: | | | | | | | | | | | | | | | | | | |
| Net investment income | | | 0.34 | | | | 0.40 | | | | 0.39 | | | | 0.16 | | | |
Net realized and unrealized gain
(loss) on affiliated investments | | | (0.58 | ) | | | (0.19 | ) | | | 0.53 | | | | (0.14 | ) | | |
| Total from investment operations | | | (0.24 | ) | | | 0.21 | | | | 0.92 | | | | 0.02 | | | |
| | | | | | | | | | | | | | | | | | |
| Less distributions: | | | | | | | | | | | | | | | | | | |
| From net investment income | | | (0.34 | ) | | | (0.40 | ) | | | (0.40 | ) | | | (0.16 | ) | | |
| From net realized gains on investments | | | (0.03 | ) | | | (0.07 | ) | | | (0.00 | )2 | | | – | | | |
| Total distributions | | | (0.37 | ) | | | (0.47 | ) | | | (0.40 | ) | | | (0.16 | ) | | |
| Net asset value, end of period | | $ | 9.51 | | | $ | 10.12 | | | $ | 10.38 | | | $ | 9.86 | | | |
| Total return3 | | | (2.19 | )% | | | 2.04 | % | | | 9.40 | % | | | 0.24 | % | | |
| | | | | | | | | | | | | | | | | | |
| Ratios to average net assets: | | | | | | | | | | | | | | | | | | |
| Net expenses4 | | | 0.25 | % | | | 0.25 | % | | | 0.25 | % | | | 0.24 | %5 | | |
| Net investment income | | | 3.72 | % | | | 3.94 | % | | | 4.01 | % | | | 5.31 | %5 | | |
| Expense waiver/reimbursement6 | | | (1.16 | )% | | | (1.34 | )% | | | (2.16 | )% | | | (11.00 | )%5 | | |
| | | | | | | | | | | | | | | | | | |
| Supplemental data: | | | | | | | | | | | | | | | | | | |
| Net assets, end of period (000 omitted) | | $ | 18,826 | | | $ | 18,065 | | | $ | 11,622 | | | $ | 6,581 | | | |
| Portfolio turnover | | | 48 | % | | | 19 | % | | | 17 | % | | | 7 | % | | |
| 1 | For the period from December 30, 2005 (commencement of operations) to June 30, 2006. |
| 2 | Represents less than $0.01. |
| 3 | Total returns for periods of less than one year are not annualized. |
| 4 | In addition to the fees and expenses that the fund bears directly, the fund indirectly bears a pro-rata share of the fees and expenses of the underlying portfolios in which the fund invest. The net expense ratio shown does not include these indirect expenses. If included, the net expense ratio for each Fund would be 0.50%. |
| 5 | Computed on an annualized basis. |
| 6 | This expense decrease is reflected in both the net expense and net investment income (loss) ratios shown above. |
See Notes to Financial Statements.
| | | | |
| Financial Statements | | AARP FUNDS 2009 ANNUAL REPORT | | 35 |
Financial Statements (continued)
| | | | | | | | | | | | | | |
| | | | |
Financial highlights | | | | | | | | | | | | | | |
| | | |
| (For a share outstanding throughout the period) | | | | | | | | | | | |
| | | AARP Income Fund | | | |
| | | | |
| | | Year
ended
6/30/091 | | | Year
ended
6/30/081 | | | Period
ended
6/30/071,2 | | | |
| Net asset value, beginning of period | | $ | 10.02 | | | $ | 9.82 | | | $ | 10.00 | | | |
| | | | | | | | | | | | | | |
| Income from investment operations: | | | |
| Net investment income | | | 0.44 | | | | 0.46 | | | | 0.36 | | | |
Net realized and unrealized gain
(loss) on affiliated investments | | | 0.09 | | | | 0.20 | | | | (0.18 | ) | | |
| Total from investment operations | | | 0.53 | | | | 0.66 | | | | 0.18 | | | |
| | | | | | | | | | | | | | |
| Less distributions: | | | | | | | | | | | | | | |
| From net investment income | | | (0.44 | ) | | | (0.46 | ) | | | (0.36 | ) | | |
| From net realized gains on investments | | | (0.02 | ) | | | (0.00 | )3 | | | – | | | |
| Total distributions | | | (0.46 | ) | | | (0.46 | ) | | | (0.36 | ) | | |
| Net asset value, end of period | | $ | 10.09 | | | $ | 10.02 | | | $ | 9.82 | | | |
| Total return4 | | | 5.38 | % | | | 6.83 | % | | | 1.78 | % | | |
| | | | | | | | | | | | | | |
| Ratios to average net assets: | | | | | | | | | | | | | | |
| Net expenses5 | | | 0.26 | % | | | 0.26 | % | | | 0.25 | %6 | | |
| Net investment income | | | 4.48 | % | | | 4.71 | % | | | 5.36 | %6 | | |
| Expense waiver/reimbursement7 | | | (1.65 | )% | | | (4.38 | )% | | | (21.21 | )%6 | | |
| | | | | | | | | | | | | | |
| Supplemental data: | | | | | | | | | | | | | | |
| Net assets, end of period (000 omitted) | | $ | 13,482 | | | $ | 6,450 | | | $ | 2,338 | | | |
| Portfolio turnover | | | 23 | % | | | 52 | % | | | 30 | % | | |
| 1 | The per share amounts and percentages include the Fund’s proportionate share of income, expenses and net realized and unrealized gains or losses of the State Street Money Market Portfolio. |
| 2 | For the period from September 29, 2006 (commencement of operations) to June 30, 2007. |
| 3 | Represents less than $0.01. |
| 4 | Total returns for periods of less than one year are not annualized. |
| 5 | In addition to the fees and expenses that the fund bears directly, the fund indirectly bears a pro-rata share of the fees and expenses of the underlying portfolios in which the fund invest. The net expense ratio shown does not include these indirect expenses. If included, the net expense ratio for each Fund would be 0.50%. |
| 6 | Computed on an annualized basis. |
| 7 | This expense decrease is reflected in both the net expense and net investment income (loss) ratios shown above. |
See Notes to Financial Statements.
| | | | |
| 36 | | AARP FUNDS 2009 ANNUAL REPORT | | Financial Statements |
Financial Statements (continued)
| | | | | | | | | | | | | | |
| | | | |
Financial highlights | | | | | | | | | | | | | | |
| | | |
| (For a share outstanding throughout the period) | | | | | | | | | | | |
| | | AARP Money Market Fund | | | |
| | | | |
| | | Year
ended
6/30/091 | | | Year
ended
6/30/081 | | | Period
ended
6/30/071 | | | |
| Net asset value, beginning of period | | $ | 1.00 | | | $ | 1.00 | | | $ | 1.00 | | | |
| | | | | | | | | | | | | | |
| Income from investment operations: | | | |
| Net investment income | | | 0.01 | | | | 0.04 | | | | 0.05 | | | |
Net realized and unrealized gain
(loss) on affiliated investments | | | – | | | | – | | | | – | | | |
| Total from investment operations | | | 0.01 | | | | 0.04 | | | | 0.05 | | | |
| | | | | | | | | | | | | | |
| Less distributions: | | | | | | | | | | | | | | |
| From net investment income | | | (0.01 | ) | | | (0.04 | ) | | | (0.05 | ) | | |
| From net realized gains on investments | | | – | | | | – | | | | – | | | |
| Total distributions | | | (0.01 | ) | | | (0.04 | ) | | | (0.05 | ) | | |
| Net asset value, end of period | | $ | 1.00 | | | $ | 1.00 | | | $ | 1.00 | | | |
| Total return2 | | | 1.34 | % | | | 4.09 | % | | | 5.11 | % | | |
| | | | | | | | | | | | | | |
| Ratios to average net assets: | | | | | | | | | | | | | | |
| Net expenses3 | | | 0.30 | % | | | 0.30 | % | | | 0.33 | % | | |
| Net investment income | | | 1.40 | % | | | 3.77 | % | | | 5.06 | % | | |
| Expense waiver/reimbursement4 | | | (0.55 | )% | | | (0.53 | )% | | | (3.91 | )% | | |
| | | | | | | | | | | | | | |
| Supplemental data: | | | | | | | | | | | | | | |
| Net assets, end of period (000 omitted) | | $ | 51,903 | | | $ | 77,076 | | | $ | 35,742 | | | |
| 1 | The per share amounts and percentages include the Fund’s proportionate share of income, expenses and net realized and unrealized gains or losses of the State Street Money Market Portfolio. |
| 2 | Total returns for periods of less than one year are not annualized. |
| 3 | Effective March 1, 2007, AARP Financial has agreed contractually to waive fees and reimburse expenses to keep the net total operating expenses of the AARP Money Market Fund, including its pro-rata allocation of expenses from the State Street Portfolio, at 0.30% of average daily net assets through November 1, 2009. |
| 4 | This expense decrease is reflected in both the net expense and net investment income (loss) ratios shown above. |
See Notes to Financial Statements.
| | | | |
| Notes to Financial Statements | | AARP FUNDS 2009 ANNUAL REPORT | | 37 |
Notes to Financial Statements
1. Business and Organization
AARP Aggressive Fund, AARP Moderate Fund, AARP Conservative Fund, AARP Income Fund, and AARP Money Market Fund (each a “Fund” and collectively the “Funds”) are each a series of AARP Funds (the “Trust”). The Trust is organized as a Delaware statutory trust and is registered under the Investment Company Act of 1940, as amended (the “Act”), as an open-end management investment company. The inception dates of the Funds were as follows: December 30, 2005 (AARP Aggressive Fund, AARP Moderate Fund and AARP Conservative Fund), June 30, 2006 (AARP Money Market Fund) and September 29, 2006 (AARP Income Fund).
The Funds, except for the AARP Money Market Fund are “fund of funds” because they invest substantially all of their assets in the underlying series of AARP Portfolios, each a separate registered investment company. Each Fund, with the exception of the AARP Income Fund and the AARP Money Market Fund invests in all three of the AARP Portfolios, but in different amounts. The AARP Income Fund invests the vast majority of its assets in one of the AARP Portfolios, the U.S. Bond Market Portfolio. In addition, the AARP Income Fund also invests a portion of its assets in the State Street Money Market Portfolio (the “State Street Portfolio”), a series of a separate registered investment company called State Street Master Funds, and the SPDR Barclays Capital High Yield Bond ETF. The AARP Money Market Fund is a feeder fund that invests substantially all of its assets in the State Street Portfolio, the master fund. The investment objective and policies of the State Street Portfolio are substantially similar to those of the AARP Money Market Fund. The value of the AARP Money Market Fund’s investment in the State Street Portfolio reflects the AARP Money Market Fund’s proportionate interest in the net assets of the State Street Portfolio (0.54% at June 30, 2009). The performance of the AARP Money Market Fund is directly affected by the performance of the State Street Portfolio. The financial statements of the State Street Portfolio are included elsewhere in this report and should be read in conjunction with the AARP Money Market Fund’s financial statements.
The investment objective of the AARP Aggressive Fund is to seek growth of capital and some current income. The investment objective of the AARP Moderate Fund is to seek a balance of growth of capital and current income. The investment objective of the AARP Conservative Fund is to seek current income with some growth of capital. The investment objective of the AARP Income Fund is to seek current income and preservation of capital over the long-term.
| | | | |
| 38 | | AARP FUNDS 2009 ANNUAL REPORT | | Notes to Financial Statements |
Notes to Financial Statements (continued)
The investment objective of the AARP Money Market Fund is to seek to maximize current income while providing for liquidity, the preservation of capital, and a stable $1.00 per share price.
2. Significant accounting policies
The financial statements have been prepared in accordance with United States generally accepted accounting principles (“GAAP”), which require management to make estimates and assumptions that affect that amounts reported herein. Actual results could differ from those estimates. The following is a summary of significant accounting policies consistently followed by the Funds in the preparation of their financial statements.
INVESTMENT VALUATION
The Funds, except for AARP Money Market Fund, invest in one or more of the AARP Portfolios, accordingly, they value their investments in the AARP Portfolios daily at the closing net asset value of the AARP Portfolios.
Securities of the AARP Portfolios are valued as of the close of trading on the New York Stock Exchange (generally 4:00 p.m. Eastern time) on the valuation date. An independent pricing service generally provides these prices. Stock holdings are valued at the latest quoted sales price or official closing price taken from the primary market in which the stock trades. If a security does not trade during the day, it is valued at the average of the latest quotes for buying and selling the security, the bid and asked prices. Bond holdings are generally valued as reported by an independent pricing service at what is called an “evaluated average price,” which considers such factors as comparable bond prices, yields, maturities and ratings.
Short-term investments with a maturity at issuance or a remaining maturity at the time of purchase of 60 days or less are generally valued at amortized cost, which approximates market value. Foreign securities quoted in foreign currencies are translated into U.S. dollars based upon exchange rates prevailing at the close of trading and as provided by an independent source.
Securities for which market quotations are not readily available, or whose values have been materially affected by events occurring before a Fund’s pricing time but after the close of the securities’ primary markets (e.g. foreign securities), are valued by methods deemed by the Board of Trustees of AARP Portfolios to represent fair value.
The AARP Money Market Fund and the AARP Income Fund record their investments in the State Street Portfolio at market value. The valuation policies of the State Street Portfolio are discussed in Note 2 of the State Street Portfolio’s Notes to Financial Statements, which are included elsewhere within this report.
| | | | |
| Notes to Financial Statements | | AARP FUNDS 2009 ANNUAL REPORT | | 39 |
The Funds adopted Financial Accounting Standards Board Statement of Financial Accounting Standards No. 157, Fair Value Measurements (“FAS 157”), effective for financial statements issued for fiscal years beginning after November 15, 2007 and interim periods within those fiscal years. In accordance with FAS 157, fair value is defined as the price that the Funds would receive upon selling an investment in a timely transaction to an independent buyer in the principal or most advantageous market of the investment. FAS 157 established a three-tier hierarchy for measuring fair value and enhancing disclosure. The Conservative Fund, Moderate Fund, Aggressive Fund and Income Fund are Registered Investment Companies (“RIC”) as well as fund of funds, which invest all of their investable assets in other RICs, (U.S. Stock Market Portfolio, U.S. Bond Market Portfolio, International Stock Market Portfolio, State Street Money Market Portfolio, and the SPDR Barclays Capital High Yield Bond ETF). The AARP Money Market Fund is a RIC as well as a feeder into the State Street Money Market Portfolio. In regards to FAS 157 treatment, investments in other RICs are widely considered to be treated as Level 1 securities due to the availability of a daily valued and quoted price for those underlying portfolios. However, in the case of the underlying U.S. Stock Market Portfolio, U.S. Bond Market Portfolio, International Stock Market Portfolio, State Street Money Market Portfolio and the SPDR Barclays Capital High Yield Bond ETF, certain of the securities held by the underlying portfolios fall into Level 2 or Level 3 FAS 157 pricing hierarchy due to specific valuation circumstances, particularly matrix pricing of bond holdings, amortized cost valuation method used for evaluating short term money market instruments or certain foreign securities that could be fair valued at any particular point in time. In the Portfolio of Investments for the U.S. Stock Market Portfolio, U.S. Bond Market Portfolio, International Stock Market Portfolio and State Street Money Market Portfolio, the Level 2 and 3 securities held as of June 30, 2009 will be separately identified.
The three tier hierarchy of inputs is summarized in the three broad Levels listed below.
| • | | Level 1 – quoted prices in active markets for identical investments |
| • | | Level 2 – other significant observable inputs (including quoted prices for similar investments, interest rates, prepayment speeds, credit risk, etc.) |
| • | | Level 3 – significant unobservable inputs (including the fund’s own assumptions in determining the fair value of investments) |
| | | | |
| 40 | | AARP FUNDS 2009 ANNUAL REPORT | | Notes to Financial Statements |
Notes to Financial Statements (continued)
The following is a summary of the inputs used as of June 30, 2009 in valuing the Funds’ investments carried at value:
AARP Aggressive Fund
| | | |
| Valuation Inputs | | Investment
in Securities |
| |
| Level 1 – Quoted Prices and Investments in Mutual Funds | | $ | 23,331,722 |
Level 2 – Other Significant Observable Inputs | | | – |
Level 3 – Significant Unobservable Inputs | | | – |
Total | | $ | 23,331,722 |
AARP Moderate Fund
| | | |
| Valuation Inputs | | Investment
in Securities |
| |
Level 1 – Quoted Prices and Investments in Mutual Funds | | $ | 39,030,457 |
Level 2 – Other Significant Observable Inputs | | | – |
Level 3 – Significant Unobservable Inputs | | | – |
Total | | $ | 39,030,457 |
AARP Conservative Fund
| | | |
| Valuation Inputs | | Investment
in Securities |
| |
Level 1 – Quoted Prices and Investments in Mutual Funds | | $ | 18,881,544 |
Level 2 – Other Significant Observable Inputs | | | – |
Level 3 – Significant Unobservable Inputs | | | – |
Total | | $ | 18,881,544 |
AARP Income Fund
| | | |
| Valuation Inputs | | Investment
in Securities |
| |
Level 1 – Quoted Prices and Investments in Mutual Funds | | $ | 13,536,041 |
Level 2 – Other Significant Observable Inputs | | | – |
Level 3 – Significant Unobservable Inputs | | | – |
Total | | $ | 13,536,041 |
AARP Money Market Fund
| | | |
| Valuation Inputs | | Investment
in Securities |
| |
Level 1 – Quoted Prices and Investments in Mutual Funds | | $ | 52,139,535 |
Level 2 – Other Significant Observable Inputs | | | – |
Level 3 – Significant Unobservable Inputs | | | – |
Total | | $ | 52,139,535 |
| | | | |
| Notes to Financial Statements | | AARP FUNDS 2009 ANNUAL REPORT | | 41 |
FEDERAL TAXES
The Funds intend to comply with the provisions of the Internal Revenue Code applicable to regulated investment companies. The Funds plan to distribute substantially all of their investment company taxable income, including any net realized gain on investments not offset by capital loss carryforwards, if any, to shareholders. For these reasons, no federal income or excise tax provision is required.
Management has analyzed the Funds’ tax position taken on federal income tax returns for all open years and has concluded that as of June 30, 2009 no provision for income taxes would be required in the Funds’ financial statements. As of June 30, 2009, tax years 2006 through 2009 remain subject to examination by the Funds’ major tax jurisdictions, which include the United States of America and the state of Delaware.
SECURITIES TRANSACTIONS, DIVIDEND AND INTEREST INCOME AND EXPENSES
Securities transactions are recorded on a trade date basis, the date a Fund agrees to purchase or sell a security. Interest income, if any, is recorded daily on an accrual basis. Dividend income is recorded on the ex-dividend date. Realized gains and losses from securities transactions are recorded on the basis of identified cost. Expenses are accrued daily. Many expenses are directly attributable to one Fund and therefore are charged accordingly. Expenses that are not directly attributable to one or more Funds are allocated among applicable Funds on an equitable and consistent basis considering such things as the nature and type of expenses and the relative net assets of the Funds.
In addition to the accounting policies noted above, the AARP Income Fund and the AARP Money Market Fund also have a pro-rata share in the net investment income and gains or losses of the State Street Portfolio. Net investment income for these Funds consists of each Fund’s pro-rata share of the net investment income of the State Street Portfolio, less all expenses of each Fund. Realized gains and losses from security transactions consist of each Fund’s pro-rata share of the realized gains and losses of the State Street Portfolio.
INDEMNIFICATIONS
The Funds’ organizational documents provide current and former trustees and officers with a limited indemnification against liabilities arising in connection with the performance of their duties to the Funds. In the normal course of business, the Funds may also enter into contracts that provide general indemnifications. The Funds’ maximum exposure under these arrangements is unknown as this would be dependent on future claims that may be made against the Funds. The risk of material loss from such claims is considered remote.
| | | | |
| 42 | | AARP FUNDS 2009 ANNUAL REPORT | | Notes to Financial Statements |
Notes to Financial Statements (continued)
DISTRIBUTIONS TO SHAREHOLDERS
Distributions to shareholders from net investment income and net realized gains, if any, are recorded on the ex-dividend date. Such distributions are determined in conformity with income tax regulations, which may differ from generally accepted accounting principles. Capital gain distributions, if any, are generally declared and paid annually. Income distributions, if any, are generally declared and paid quarterly for the AARP Conservative Fund, semiannually for the AARP Moderate Fund and the AARP Aggressive Fund, and monthly for the AARP Income Fund. Income distributions are generally declared daily and paid monthly for the AARP Money Market Fund.
INVESTMENTS IN UNDERLYING PORTFOLIOS
In addition to the fees and expenses which the Funds bear directly, the Funds indirectly bear a pro-rata share of the fees and expenses of the AARP Portfolios in which the Funds invest as well as the fees and expenses of the State Street Portfolio, as applicable. AARP Financial has agreed contractually to waive fees and reimburse expenses to keep the net total operating expenses of the AARP Funds, including the indirect fees and expenses of the underlying portfolio’s at 0.50% of average daily net assets (at 0.30% with respect to the AARP Money Market Portfolio) through at least November 1, 2009.
SUBSEQUENT EVENTS
The Funds have evaluated the need for disclosures and/or adjustments resulting from subsequent events through August 31, 2009, the date the financial statements were available to be issued. This evaluation did not uncover in any subsequent events that necessitated disclosures and/or adjustments.
| | | | |
| Notes to Financial Statements | | AARP FUNDS 2009 ANNUAL REPORT | | 43 |
3. Capital share transactions
The Funds have authorized an unlimited number of $0.001 par value shares. Transactions in shares were as follows:
| | | | | | | | |
| | | | | | | | | |
| | | | | |
| | | | | Year ended
June 30, 2009 | | | | Year ended
June 30, 2008 |
| |
AARP Aggressive Fund | | | | | | | | |
Shares sold | | | | 955,861 | | | | 1,239,475 |
Dividends and/or distributions reinvested | | | | 90,250 | | | | 72,065 |
Shares redeemed | | | | (595,045) | | | | (647,413) |
| | | | | | | | | |
Net increase | | | | 451,066 | | | | 664,127 |
| |
AARP Moderate Fund | | | | | | | | |
Shares sold | | | | 1,175,210 | | | | 1,930,180 |
Dividends and/or distributions reinvested | | | | 157,338 | | | | 149,303 |
Shares redeemed | | | | (1,045,297) | | | | (865,937) |
| | | | | | | | | |
Net increase | | | | 287,251 | | | | 1,213,546 |
| |
AARP Conservative Fund | | | | | | | | |
Shares sold | | | | 823,960 | | | | 873,721 |
Dividends and/or distributions reinvested | | | | 67,023 | | | | 59,325 |
Shares redeemed | | | | (694,898) | | | | (268,145) |
| | | | | | | | | |
Net increase | | | | 196,085 | | | | 664,901 |
| |
AARP Income Fund | | | | | | | | |
Shares sold | | | | 993,007 | | | | 605,451 |
Dividends and/or distributions reinvested | | | | 45,629 | | | | 14,788 |
Shares redeemed | | | | (346,848) | | | | (214,272) |
| | | | | | | | | |
Net increase | | | | 691,788 | | | | 405,967 |
| |
AARP Money Market Fund | | | | | | | | |
Shares sold | | | | 30,835,385 | | | | 93,159,127 |
Dividends and/or distributions reinvested | | | | 906,951 | | | | 2,310,555 |
Shares redeemed | | | | (56,914,484) | | | | (54,137,641) |
| | | | | | | | | |
Net increase/decrease | | | | (25,172,148) | | | | 41,332,041 |
| | | | | | | | | |
4. Investment transactions
The aggregate cost of purchases and proceeds from sales of securities, other than short-term obligations, for the year ended June 30, 2009 were as follows:
| | | | | | |
| Fund name | | Purchases | | Sales |
| | |
AARP Aggressive Fund | | $ | 10,744,773 | | $ | 7,503,384 |
AARP Moderate Fund | | | 18,509,697 | | | 16,035,739 |
AARP Conservative Fund | | | 9,974,229 | | | 8,156,040 |
AARP Income Fund | | | 9,076,555 | | | 2,396,092 |
5. Federal income tax information
Net investment income (loss) and net realized gain (loss) may differ for financial statement and tax purposes. The character of dividends and distributions made during the fiscal year from net investment income or
| | | | |
| 44 | | AARP FUNDS 2009 ANNUAL REPORT | | Notes to Financial Statements |
Notes to Financial Statements (continued)
net realized gains may differ from their ultimate characterization for federal income tax purposes. These differences are attributable to the differing treatments for the deferral of losses on wash sales. Additionally, short-term capital gains are considered ordinary income for income tax purposes. The tax character of distributions paid during the fiscal years ended June 30, 2009 and June 30, 2008, was as follows:
| | | | | | | | | | | | | | | | | | |
| | | | | | | | | | | | | | | | | | | |
| | | Distributions paid from: |
| |
| |
| | | 2009 | | 2008 |
| |
| Fund Name | | Ordinary
Income | | Long-Term
Capital
Gains | | Total | | Ordinary
Income | | Long-Term
Capital
Gains | | Total |
| |
| |
AARP Aggressive Fund | | $ | 555,114 | | $ | 206,928 | | $ | 762,042 | | $ | 694,973 | | $ | 154,471 | | $ | 849,444 |
AARP Moderate Fund | | | 1,188,700 | | | 267,885 | | | 1,456,585 | | | 1,322,513 | | | 362,680 | | | 1,685,193 |
AARP Conservative Fund | | | 627,443 | | | 57,915 | | | 685,358 | | | 592,103 | | | 82,156 | | | 674,259 |
AARP Income Fund | | | 477,924 | | | 20,704 | | | 498,628 | | | 180,551 | | | – | | | 180,551 |
AARP Money Market Fund | | | 930,003 | | | – | | | 930,003 | | | 2,393,214 | | | – | | | 2,393,214 |
Reclassifications have been made to the Funds’ components of net assets to reflect income and gains available for distribution under income tax regulations. The primary permanent differences causing such reclassifications are due to distributions received from the AARP Portfolios. During the fiscal year ended June 30, 2009, the following amounts were reclassified:
| | | | | | | | | |
| | | | | | | | | | |
| Fund name | | Undistributed
net investment
income (loss) | | Accumulated
net realized
gains (loss) | | Paid in
Capital |
| |
| |
| | | | | | | | | | |
AARP Aggressive Fund | | $ | 1,278 | | $ | (1,277) | | $ | (1) |
AARP Moderate Fund | | | 4,793 | | | (4,791) | | | (2) |
AARP Conservative Fund | | | 3,266 | | | (3,266) | | | – |
AARP Income Fund | | | 2,952 | | | (2,952) | | | – |
AARP Money Market Fund | | | 1,899 | | | (1,899) | | | – |
Net investment income (loss), net realized gains (losses), and net assets were not affected by this reclassification.
The table below shows distribution requirements the Funds must satisfy under the income tax regulations. In addition the table shows losses the Funds may be able to offset against income and gains realized in future years as well as unrealized appreciation or depreciation of securities and other investments for federal income tax purposes. Under current tax law, certain capital and net foreign currency losses realized after October 31 within the taxable year may be deferred and treated as occurring on the first day of the following year.
| | | | |
| Notes to Financial Statements | | AARP FUNDS 2009 ANNUAL REPORT | | 45 |
| | | | | | | | | | | | |
| | | | | | | | | | | | | |
| Fund Name | | Undistributed net investment income | | Undistributed long-term
gain | | Accumulated loss
carryforward | | Post October losses
deferred |
| |
| |
AARP Aggressive Fund | | $ | – | | $ | – | | $ | (41,478) | | $ | – |
AARP Moderate Fund | | | 21 | | | – | | | (84,326) | | | (266,835) |
AARP Conservative Fund | | | (13) | | | – | | | (27,947) | | | (81,623) |
AARP Income Fund | | | 6 | | | – | | | – | | | (9,938) |
AARP Money Market Fund | | | 1,899 | | | – | | | (259) | | | – |
Capital Loss Carryforwards by fund:
| | | |
| | | Expiration
Year 2017 |
| |
AARP Aggressive Fund | | $ | 41,478 |
AARP Moderate Fund | | | 84,326 |
AARP Conservative Fund | | | 27,947 |
AARP Income Fund | | | – |
AARP Money Market Fund | | | 259 |
The aggregate cost of securities and other investments and the composition of unrealized appreciation and depreciation of securities and other investments for federal income tax purposes as of June 30, 2009 are noted below. The primary difference between book and tax appreciation or depreciation of securities and other investments, if applicable, is attributable to the tax deferral of losses or tax realization of financial statement unrealized gain or loss.
| | | | | | | | | | | | |
| | | | | | | | | | | | | |
| Fund name | | Federal tax
cost of securities | | Gross unrealized
appreciation | | Gross unrealized
depreciation | | Net unrealized
appreciation
(depreciation) |
| |
| |
AARP Aggressive Fund | | $ | 30,036,119 | | $ | 67,215 | | $ | (6,771,612) | | $ | (6,704,397) |
AARP Moderate Fund | | | 46,230,139 | | | 306,009 | | | (7,505,691) | | | (7,199,682) |
AARP Conservative Fund | | | 20,139,065 | | | 335,686 | | | (1,593,207) | | | (1,257,521) |
AARP Income Fund | | | 13,429,305 | | | 106,736 | | | – | | | 106,736 |
AARP Money Market Fund | | | 52,139,535 | | | – | | | – | | | – |
6. Fees and other transactions with affiliates
ADVISER AND SUB-ADVISER FEES
The Trust has an investment advisory agreement with AARP Financial, which delegates to AARP Financial the responsibility to manage the investment activities of the Funds, including the overall investment program of the Funds. AARP Financial is also responsible for overseeing the Funds’ (other than the Money Market Fund’s) sub-adviser, SSgA Funds Management, Inc. (“SSgA FM”), which rebalances the applicable Funds under the direction of AARP Financial and manages the day-to-day investments of the AARP Portfolios’ assets. Each Fund (other than the Money Market Fund) pays to AARP Financial an annual fee of 0.01% of its average daily net assets. AARP Financial pays SSgA FM for its subadvisory services out of these fees. Through at least November 1, 2009, AARP Financial has contractually agreed to waive its fees and/or reimburse
| | | | |
| 46 | | AARP FUNDS 2009 ANNUAL REPORT | | Notes to Financial Statements |
Notes to Financial Statements (continued)
expenses to keep the total annual operating expenses of the Funds, including the consideration of the Funds’ pro-rata or allocated share of expenses of the AARP Portfolios and, as appropriate, State Street Portfolio at 0.50% of average daily net assets (at 0.30% with respect to the AARP Money Market Fund). The expense reimbursement amount payable by AARP Financial will be dependent on the actual expenses of the Funds and the Portfolios.
Under the Money Market Fund’s investment advisory agreement, no fee is payable to AARP Financial at any time the Fund is invested in a master-feeder structure, such as the State Street Portfolio. The State Street Portfolio has retained SSgA FM as the investment adviser to the Portfolio. For its services, SSgA FM receives a fee at the rate of 0.10% of the portfolio’s average daily net assets, which is paid from the assets of the Fund.
For the year ended June 30, 2009, AARP Financial contractually waived/reimbursed the following fees for the AARP Funds:
| | | | | | |
| Fund name | | Adviser
fee waiver | | Reimbursement of other
operating expenses |
| | | | | | |
| | |
AARP Aggressive Fund | | $ | 2,070 | | $ | 255,472 |
AARP Moderate Fund | | | 3,716 | | | 256,642 |
AARP Conservative Fund | | | 1,686 | | | 194,327 |
AARP Income Fund | | | 1,068 | | | 175,547 |
AARP Money Market Fund | | | – | | | 362,955 |
ADMINISTRATION FEES
As the Funds’ administrator, AARP Financial provides the Funds with general administrative services associated with the day-to-day operations of the Funds and monitors and coordinates the activities of the other service providers to the Funds. For its administrative services, AARP Financial receives an annual fee of 0.035% of each Fund’s average daily net assets.
The Administration agreement between AARP Financial and the Funds can be terminated on sixty (60) days prior written notice.
SUB-ADMINISTRATION, TRANSFER AGENCY AND CUSTODIAN FEES
State Street Bank and Trust Company (“State Street”) acts as the subadministrator, transfer agent, custodian and fund accounting agent for the Funds. State Street is a subsidiary of State Street Corporation and an affiliate of SSgA FM. Under the terms of the sub-administration agreement, AARP Financial pays to State Street an annual fee at the rate of 0.0175% of the first $6 billion of the Funds’ average daily net assets and then a decreasing rate for average daily net assets above that level. The Sub-Administration agreement between State Street and AARP Financial can be terminated by either party on sixty (60) days prior written notice. Under the terms of the transfer agency agreement, each
| | | | |
| Notes to Financial Statements | | AARP FUNDS 2009 ANNUAL REPORT | | 47 |
Fund pays to State Street an annual fee at the rate of 0.135% of the first $5 billion of the Funds’ average daily net assets and then a decreasing rate for average daily net assets above that level, plus out-of-pocket expenses. State Street has in turn delegated the provision of transfer agency services to its affiliate, Boston Financial Data Services, Inc. Under the terms of the custody agreement, each Fund pays to State Street an annual fee of $15,000, plus out-of-pocket expenses.
TRUSTEE COMPENSATION
The Trust is supervised by a Board of Trustees, (the “Board”). The Board represents the interests of the Funds and their shareholders. The Board meets periodically throughout the year to oversee the Funds’ activities. The Board consists of four “Independent Trustees” and one trustee who is affiliated with the Investment Adviser to the Funds (“Interested Trustee”). The Interested Trustee and Officers of the Trust do not receive any compensation from the Funds for their service on the Board. The compensation of the Independent Trustees consists of an annual retainer. Compensation paid by the Funds to the Independent Trustees is included in the Funds’ Statements of Operations. The aggregate compensation paid to the Trustees by the Trust was $100,000 for the reporting period.
INVESTMENTS IN THE FUNDS
AARP, the indirect parent company of AARP Financial, Inc. (“AARP Financial”), the investment adviser to the Funds, has made investments in the AARP Aggressive Fund, the AARP Moderate Fund and the AARP Conservative Fund, with values at June 30, 2009 of $30,764, $33,011 and $36,122, respectively. AARP Financial has made an investment in the AARP Income Fund, with a value at June 30, 2009 of $85,937. There were no purchases or sales in these Funds by AARP during July 1, 2008 to June 30, 2009.
In addition, to receive an investment return and to manage their working capital, AARP and AARP Financial, in the normal course of business, has made investments in the AARP Money Market Fund, with a value at June 30, 2009 of $23.5 million.
If AARP Financial or AARP decide in the future to withdraw all or a portion of these investments, Management of the Funds believes there would be no material impact on the operations or returns of the Money Market Fund.
| | | | |
| 48 | | AARP FUNDS 2009 ANNUAL REPORT | | Report of Independent Registered Public Accounting Firm |
Report of Independent Registered
Public Accounting Firm
The Board of Trustees and Shareholders of AARP Funds:
We have audited the accompanying statements of assets and liabilities of AARP Aggressive Fund, AARP Moderate Fund, AARP Conservative Fund, AARP Income Fund, and AARP Money Market Fund, each a series of AARP Funds, including the portfolio of investments, as of June 30, 2009, and the related statements of operations for the year then ended, the statements of changes in net assets for each of the years in the two-year period then ended, and the financial highlights for each of the years or periods in the four-year period then ended. These financial statements and financial highlights are the responsibility of management. Our responsibility is to express an opinion on these financial statements and financial highlights based on our audits.
We conducted our audits in accordance with the standards of the Public Company Accounting Oversight Board (United States). Those standards require that we plan and perform the audit to obtain reasonable assurance about whether the financial statements and financial highlights are free of material misstatement. An audit includes examining, on a test basis, evidence supporting the amounts and disclosures in the financial statements. Our procedures included confirmation of securities owned as of June 30, 2009, by correspondence with the transfer agent of the underlying portfolios, or by other appropriate auditing procedures. An audit also includes assessing the accounting principles used and significant estimates made by management, as well as evaluating the overall financial statement presentation. We believe that our audits provide a reasonable basis for our opinion.
In our opinion, the financial statements and financial highlights referred to above present fairly, in all material respects, the financial position of AARP Aggressive Fund, AARP Moderate Fund, AARP Conservative Fund, AARP Income Fund, and AARP Money Market Fund as of June 30, 2009, the results of their operations for the year then ended, the changes in their net assets for each of the years in the two-year period then ended, and the financial highlights for each of the years or periods in the four-year period then ended, in conformity with U.S. generally accepted accounting principles.

Boston, Massachusetts
August 25, 2009
| | | | |
| AARP Funds—Supplemental Information | | AARP FUNDS 2009 ANNUAL REPORT | | 49 |
AARP Funds –
Supplemental Information
2009 U.S. Tax Distribution Information to Shareholders
Corporate Dividends Received Deduction. For the year ended June 30, 2009, a percentage of dividends distributed by the Funds listed below qualifies for the dividends received deduction for corporate shareholders. These percentages are as follows:
| | |
| Fund | | Qualifying Percentages |
| |
AARP Aggressive Fund | | 48.56% |
AARP Moderate Fund | | 27.00% |
AARP Conservative Fund | | 88.06% |
AARP Income Fund | | – |
AARP Money Market Fund | | – |
Qualified Dividend Income. The amount of dividends distributed by the Funds during the fiscal year ended June 30, 2009, are considered qualified dividend income, and are eligible for reduced tax rates. These lower rates range from 5% to 15% depending on an individual’s tax bracket. These amounts and corresponding percentage of dividends paid are as follows:
| | | | | |
| Fund | | Percentage of
Dividends Paid | | Amounts |
| | |
AARP Aggressive Fund | | 70.00% | | $ | 388,556 |
AARP Moderate Fund | | 39.65% | | | 471,306 |
AARP Conservative Fund | | 100.00% | | | 633,728 |
AARP Income Fund | | – | | | – |
AARP Money Market Fund | | – | | | – |
Proxy voting policies, procedures and record
Both a description of the policies and procedures that AARP Financial uses to determine how to vote proxies on behalf of the Funds and the AARP Portfolios relating to portfolios securities and information regarding how AARP Financial voted proxies related to portfolio securities during the most recent fiscal year ended June 30 is available on our web site at www.aarpfinancial.com and, without charge, upon request, by calling us at 1-800-958-6457. Such information for the AARP Funds is also available on the Securities and Exchange Commission’s (“SEC”) website at www.sec.gov.
| | | | |
| 50 | | AARP FUNDS 2009 ANNUAL REPORT | | AARP Funds—Supplemental Information |
Shareholder statements and reports
When we send financial reports, prospectuses and other regulatory materials to shareholders, we attempt to reduce the volume of mail you receive by sending one copy of these documents to two or more account holders who share the same address. However, if you wish to receive individual copies of materials, please contact us at 1-800-958-6457. Once we have received your instructions, we will begin sending individual copies for each account within 30 days. These materials are also available on our website at www.aarpfinancial.com.
Statement regarding availability of quarterly fund schedule
The Funds and the AARP Portfolios file complete schedules of investments with the SEC for the quarters ended September 30 and March 31 of each fiscal year on Form N-Q which are available on the Funds’ website, www.aarpfunds.com and the SEC’s website at www.sec.gov. Additionally, the Funds’ and the AARP Portfolios’ Forms N-Q may be reviewed and copied at the SEC’s Public Reference Room in Washington DC. For information on the Public Reference Room, call 1-800-SEC-0330.
| | | | |
| About the Funds’ Board of Trustees and Officers | | AARP FUNDS 2009 ANNUAL REPORT | | 51 |
About the Funds’ Board of Trustees and Officers (unaudited)
The Board of Trustees (“Board”) of the AARP Funds oversee the operation and management the Funds.
The Board is comprised of one interested trustee and four trustees who are independent, meaning that they are not “interested persons” of AARP Funds for purposes of the Investment Company Act. Put simply, this means that they do not have material affiliations with AARP Funds, AARP Financial or SSgA FM apart from the personal investments they may have made in AARP Funds as private individuals.
Our independent board members bring distinguished backgrounds in business, academia and public service to their task of working with AARP Funds officers to establish policies and oversee the activities of the Funds.
The table below includes information about the trustees and officers of the Trust, including their:
| • | | principal occupations during the past five years; and |
| • | | other directorships of publicly traded companies or funds. |
Shareholders may communicate with the Board and officers by sending written correspondence to AARP Funds c/o the Funds’ Secretary, 650 F Street NW, Washington, D.C. 20004.
Trustees and Officers
| | | | | | | | |
| |
| Name, Address and Age | | Position(s)
with the
Trust and
Term of
Office(1) | | Principal Occupation(s)
During Past 5 Years | | Number of
Funds and
Portfolios
in Fund
Complex(2)
Overseen
by Trustee | | Other
Directorships
Held by
Trustee |
| |
Independent Trustees | | | | | | | | |
| |
PETER C. CLAPMAN c/o AARP Financial Incorporated 650 F Street, N.W., Washington, DC 20004 Age: 73 | | Chairman of the Board and Trustee since 2005 | | Consultant, governance advisory services (July 2005–present); Director, National Association of Corporate Directors (non-profit private director education) (January 2005–present); Head of U.S. operations, Governance for Owners (governance services and consulting) (June 2005–present); Member, NASDAQ Listing Council (2005–present); Senior Vice President and Chief Counsel, TIAA-CREF (financial services, pension and investment products) (1972–July 2005). | | 8 | | Director, iPass, Inc. (February 2007–present). |
| |
| | | | |
| 52 | | AARP FUNDS 2009 ANNUAL REPORT | | About the Funds’ Board of Trustees and Officers |
About the Funds’ Board of Trustees
and Officers (continued)
| | | | | | | | |
| |
| Name, Address and Age | | Position(s)
with the
Trust and
Term of
Office(1) | | Principal Occupation(s)
During Past 5 Years | | Number of
Funds and
Portfolios
in Fund
Complex(2)
Overseen
by Trustee | | Other
Directorships
Held by
Trustee |
| |
RICHARD M. REILLY c/o AARP Financial Incorporated 650 F Street, N.W., Washington, DC 20004 Age: 71 | | Trustee since 2006 | | Self-Employed Consultant (November 2002–present); Trustee, International Foundation for Retirement Education (InFRE) (September 2006–present); Senior Vice President, Allmerica Financial Corp. (financial services holding company) (November 2001–November 2002); President, Allmerica Financial Services (investments/insurance) (1995–November 2001). | | 8 | | None. |
| |
ELLEN B. SAFIR, CFA c/o AARP Financial Incorporated 650 F Street, N.W., Washington, DC 20004 Age: 64 | | Trustee since 2006 | | Chief Executive Officer, New Century Advisors, LLC (registered investment adviser) (2002 – present); President, CFA Society of Washington, DC (July 2007–June 2008); Member, Investment Committee, United States Holocaust Memorial Museum (June 1997–present); Managing Director, Fixed Income and Currencies, Howard Hughes Medical Institute (medical research) (1986–2002). | | 8 | | None. |
| |
LYNN E. TURNER c/o AARP Financial Incorporated 650 F Street, N.W., Washington, DC 20004 Age: 57 | | Trustee since 2005 | | Trustee, Colorado Public Employees Retirement Association (COPERA) (August 2007–present); Managing Director/Senior Advisor, LECG (forensic accounting) (May 2009–present); Managing Director/Senior Advisor, Kroll Inc. (forensic accounting) (July 200–March 2009); Managing Director of Research, Glass Lewis & Co. LLC (financial and proxy research) (July 2003–June 2007); Professor, Colorado State University (August 2001–June 2003); Chief Accountant, Securities and Exchange Commission (July 1998–August 2001). | | 8 | | Director, Guidance Software, Inc. (April 2007–February 2008); Director, Sun Microsystems, Inc. (November 2003–October 2006). |
| |
| Interested Trustee | | | | | | | | |
| |
ROBERT R. HAGANS, JR.(3) c/o AARP Financial Incorporated 650 F Street, N.W., Washington, DC 20004 Age: 54 | | Trustee since 2008 | | Chief Financial Officer, AARP (2001–present); Director, AARP Financial Inc. (2007–2008); Director, Boys and Girls Club of America (2008–present). | | 8 | | Treasurer and Director, Industrial Bank, NA (2000–present) |
| |
| (1) | Each trustee may serve until his/her death, resignation, removal, retirement or declaration of incompetence by a court of appropriate jurisdiction. |
| (2) | The “Fund Complex” consists of the five AARP Funds discussed in this report, and the three series of the AARP Portfolios, which are not offered to the public for investment. |
| (3) | Mr. Hagans is considered an interested trustee due to his position as Chief Financial Officer of AARP. |
| | | | |
| About the Funds’ Board of Trustees and Officers | | AARP FUNDS 2009 ANNUAL REPORT | | 53 |
| | | | |
| |
| | |
| Name, Address and Age | | Position(s)
with the
Trust and
Term of
Office(1) | | Principal Occupation(s) During Past 5 Years |
| |
| Officers | | | | |
| |
RICHARD M. HISEY, CFA AARP Financial Incorporated Two Highwood Drive, 2nd Floor, Tewksbury MA 01876 Age: 50 | | President | | President, AARP Financial Inc. (May 2008–present); Chief Investment Officer, AARP Financial Inc. (April 2006–present); Executive Vice President and Chief Investment Officer, Cole Management, Incorporated (venture capital firm) (2005–2006); Senior Vice President, MFS Investment Management and Treasurer and Chief Financial Officer, MFS Group of Mutual Funds (2002–2005); Senior Vice President, The Bank of New York (2000–2002). |
| |
JEFFREY J. GABOURY AARP Financial Incorporated Two Highwood Drive, 2nd Floor, Tewksbury MA 01876 Age: 40 | | Treasurer | | Assistant Treasurer, AARP Financial Inc. (May 2008–November 2008); Deputy Treasurer, Lord, Abbett & Co. LLC (June 2006–April 2008); Treasurer and Chief Financial Officer of the New York Life Investment Management Group of Mutual Funds (December 2004–December 2005); Director of Compliance, Investors Bank & Trust Company (August 1996–November 2004). |
| |
SUSAN KIRKPATRICK AARP Financial Incorporated Two Highwood Drive, 2nd Floor, Tewksbury, MA 01876 Age: 43 | | Chief Compliance Officer | | Chief Compliance Officer, AARP Financial Inc. (November 2007–present); Director of Compliance, AARP Financial Inc. (December 2005–November 2007); Chief Compliance Officer, Grail Partners (investment banking) (March 2005–December 2005); Director, Devonshire Financial Group (consulting) (September 2004–December 2005); NewRiver, Inc. (electronic delivery of compliance documents) (July 1999–September 2004). |
| |
MARC DUFFY AARP Financial Incorporated 650 F Street, N.W., Washington, DC 20004 Age: 51 | | Secretary | | Associate General Counsel, AARP Financial Inc. (August 2006–present); Assistant General Counsel, E*TRADE Financial Corporation (January 2004–August 2006); Assistant General Counsel, Legg Mason Wood Walker, Incorporated (September 1999–January 2004). |
| |
JULIE TEDESCO State Street Bank and Trust Company 4 Copley Place, 5th Floor, Boston, MA 02116 Age: 51 | | Assistant Secretary | | Senior Vice President and Senior Managing Counsel, State Street Bank and Trust Company (2000–present). |
| |
| (1) | Each officer serves at the pleasure of the Board until the next annual election of officers or until his or her successor is chosen and qualified, or in each case until his or her death, resignation or removal from office, in accordance with the By-Laws of the Trust. |
Additional information about AARP Funds’ trustees is provided in the Statement of Additional Information and is available without charge, upon request, by calling 1-800-958-6457.
| | | | |
| 54 | | STATE STREET MONEY MARKET PORTFOLIO | | |
State Street
Money Market Portfolio
Semi-Annual Report
June 30, 2009 (unaudited)
| | | | |
| Expense Example | | STATE STREET MONEY MARKET PORTFOLIO | | 55 |
Expense Example
As a shareholder of the State Street Money Market Portfolio (the “Portfolio”), you incur ongoing costs, which include costs for portfolio management and administrative services, among others. This example is intended to help you understand your ongoing costs (in dollars) of investing in the Portfolio and to compare these costs with the ongoing costs of investing in other mutual funds.
The example is based on an investment of $1,000 made at the beginning of the period shown and held for the entire period from January 1, 2009 to June 30, 2009.
The table below illustrates your Portfolio’s costs in two ways:
| • | | Based on actual fund return. This section helps you to estimate the actual expenses that you paid over the period. The “Ending Account Value” shown is derived from the Portfolio’s actual return, and the third column shows the dollar amount that would have been paid by an investor who started with $1,000 in the Portfolio. You may use the information here, together with the amount you invested, to estimate the expenses that you paid over the period. |
| | | To do so, simply divide your account value by $1,000 (for example, an $8,600 account value divided by $1,000 = 8.6), then multiply the result by the number given for the Portfolio under the heading “Expenses Paid During Period.” |
| • | | Based on hypothetical 5% return. This section is intended to help you compare your Portfolio’s costs with those of other mutual funds. It assumes that the Portfolio had a yearly return of 5% before expenses, but that the expense ratio is unchanged. In this case – because the return used is not the Portfolio’s actual return – the results do not apply to your investment. The example is useful in making comparisons because the Securities and Exchange Commission requires all mutual funds to calculate expenses based on a 5% return. You can assess your Portfolio’s costs by comparing this hypothetical example with the hypothetical examples that appear in shareholder reports of other funds. |
| | | | | | | | | | | | |
Six Months Ended
June 30, 2009 | | | | Beginning
Account Value
January 1, 2009 | | | | Ending
Account Value
June 30, 2009 | | | | Expenses
Paid During
Period* |
Based on Actual
Portfolio Return | | | | $1,000.00 | | | | $1,003.80 | | | | $0.55 |
| |
Based on Hypothetical
(5% return before expenses) | | | | $1,000.00 | | | | $1,024.25 | | | | $0.55 |
| * | The calculations are based on expenses incurred in the most recent six month period of the Portfolio. The annualized average weighted expense ratio as of June 30, 2009 was 0.11%. The dollar amounts shown as “Expenses Paid” are equal to the annualized average weighted expense ratio multiplied by the average account value over the period, multiplied by the number of days in the most recent six month period, then divided by the number of days in the most recent 12 month period. |
| | | | |
| 56 | | STATE STREET MONEY MARKET PORTFOLIO | | Portfolio Statistics |
Portfolio Statistics (unaudited)
| | | |
| Portfolio Composition* | | June 30, 2009 | |
| Yankee Certificates of Deposit | | 38.8 | % |
| Commercial Paper | | 25.9 | |
| Repurchase Agreements | | 18.9 | |
| Eurodollar Certificates of Deposit | | 10.2 | |
| Certificates of Deposit | | 3.6 | |
| Bank Notes | | 1.1 | |
| U.S. Government Agency Obligations | | 1.1 | |
| Medium Term Notes | | 0.9 | |
| Liabilities in Excess of Assets | | (0.5 | ) |
| Total | | 100.0 | % |
| |
| Maturity Ladder* | | June 30, 2009 | |
| 0-3 Days | | 20.0 | % |
| 4-90 Days | | 53.0 | |
| 90+ Days | | 27.5 | |
| Total | | 100.5 | % |
| |
| Average days to maturity | | 55 | |
| * | As a percentage of net assets as of the date indicated. The Portfolio’s composition will vary over time. |
| | | | |
| Portfolio of Investments | | STATE STREET MONEY MARKET PORTFOLIO | | 57 |
Portfolio of Investments June 30, 2009 (unaudited)
| | | | | | | | |
| Name of Issuer and Title of Issue | | Interest
Rate | | Maturity
Date | | Principal
Amount | | Amortized
Cost |
| | | | | | | | |
| COMMERCIAL PAPER – 25.9% | | | | | | | | |
Asset Backed Commercial Paper Credit
Arbitrage – 3.4% | | | | | | | | |
| Aspen Funding Corp.(a) | | 0.380% | | 09/22/2009 | | $75,000,000 | | $74,934,292 |
| Solitaire Funding LLC(a) | | 0.500% | | 07/20/2009 | | 100,000,000 | | 99,973,611 |
| Solitaire Funding LLC(a) | | 0.550% | | 09/14/2009 | | 150,000,000 | | 149,828,125 |
| | | | | | | | |
| | | | | | | | 324,736,028 |
| | | | | | | | |
| Asset Backed Commercial Paper Receivables and Securities – 5.2% | | | | | | | | |
| Alpine Securitization Corp.(a) | | 0.370% | | 09/08/2009 | | 150,000,000 | | 149,893,625 |
| Gemini Securitization Corp. LLC(a) | | 0.600% | | 07/06/2009 | | 100,000,000 | | 99,991,667 |
| Gemini Securitization Corp. LLC(a) | | 0.370% | | 09/22/2009 | | 50,000,000 | | 49,957,347 |
| Gemini Securitization Corp. LLC(a) | | 0.370% | | 09/23/2009 | | 100,000,000 | | 99,913,667 |
| Nieuw Amsterdam Receivables Corp.(a) | | 0.440% | | 09/23/2009 | | 100,000,000 | | 99,897,333 |
| | | | | | | | |
| | | | | | | | 499,653,639 |
| | | | | | | | |
| Bank Domestic – 2.1% | | | | | | | | |
| JPMorgan Chase Funding, Inc.(a) | | 0.320% | | 09/01/2009 | | 200,000,000 | | 199,889,778 |
| | | | | | | | |
| Bank Foreign – 11.6% | | | | | | | | |
| Banco Bilbao Vizcaya Argentaria/London(a) | | 0.630% | | 12/16/2009 | | 150,000,000 | | 149,559,000 |
| Banco Bilbao Vizcaya Argentaria/London(a) | | 1.005% | | 11/16/2009 | | 50,000,000 | | 49,808,333 |
| CBA Delaware Finance, Inc. | | 0.500% | | 12/14/2009 | | 70,000,000 | | 69,838,611 |
| DnB NOR Bank ASA(a) | | 0.640% | | 12/03/2009 | | 200,000,000 | | 199,448,889 |
| Societe Generale North America, Inc. | | 0.800% | | 07/08/2009 | | 200,000,000 | | 199,968,889 |
| Societe Generale North America, Inc. | | 0.840% | | 11/06/2009 | | 50,000,000 | | 49,850,666 |
| Westpac Banking Corp.(a) | | 0.530% | | 07/10/2009 | | 150,000,000 | | 149,980,125 |
| Westpac Banking Corp.(a) | | 0.540% | | 07/10/2009 | | 200,000,000 | | 199,973,000 |
| Westpac Banking Corp.(a) | | 0.650% | | 11/13/2009 | | 45,000,000 | | 44,890,313 |
| | | | | | | | |
| | | | | | | | 1,113,317,826 |
| | | | | | | | |
| Finance Non-Captive Diversified – 3.6% | | | | | | | | |
| General Electric Capital Corp. | | 0.320% | | 07/22/2009 | | 100,000,000 | | 99,981,333 |
| General Electric Co. | | 0.350% | | 09/22/2009 | | 120,000,000 | | 119,903,167 |
| General Electric Co. | | 0.350% | | 09/24/2009 | | 120,000,000 | | 119,900,833 |
| | | | | | | | |
| | | | | | | | 339,785,333 |
| | | | | | | | |
| TOTAL COMMERCIAL PAPER | | | | | | | | 2,477,382,604 |
| | | | | | | | |
| CERTIFICATES OF DEPOSIT – 3.6% | | | | | | | | |
| Bank Domestic – 3.6% | | | | | | | | |
| Bank of America NA/Charlotte NC(b) | | 0.850% | | 07/10/2009 | | 70,000,000 | | 70,000,000 |
| Bank of America NA/Charlotte NC(b) | | 0.530% | | 10/09/2009 | | 150,000,000 | | 150,000,000 |
| Bank of America NA/Charlotte NC(b) | | 0.660% | | 12/01/2009 | | 125,000,000 | | 125,000,000 |
| | | | | | | | |
| TOTAL CERTIFICATES OF DEPOSIT | | | | | | | | 345,000,000 |
| | | | | | | | |
| | | | |
| 58 | | STATE STREET MONEY MARKET PORTFOLIO | | Portfolio of Investments |
Portfolio of Investments June 30, 2009 (unaudited) (continued)
| | | | | | | | |
| Name of Issuer and Title of Issue | | Interest
Rate | | Maturity
Date | | Principal
Amount | | Amortized
Cost |
| | | | | | | | |
| EURO CERTIFICATES OF DEPOSIT – 10.2% | | | | | | | | |
| Bank Foreign – 10.2% | | | | | | | | |
| Credit Agricole SA | | 0.900% | | 07/01/2009 | | $100,000,000 | | $100,000,000 |
| ING Bank NV | | 1.110% | | 07/14/2009 | | 175,000,000 | | 175,000,000 |
| ING Bank NV | | 0.730% | | 11/09/2009 | | 150,000,000 | | 150,000,000 |
| ING Bank NV | | 0.830% | | 11/24/2009 | | 150,000,000 | | 150,000,000 |
| National Australia Bank Ltd. | | 0.903% | | 11/09/2009 | | 200,000,000 | | 200,001,811 |
| National Australia Bank Ltd. | | 0.510% | | 12/29/2009 | | 200,000,000 | | 200,005,015 |
| | | | | | | | |
| TOTAL EURO CERTIFICATES OF DEPOSIT | | | | | | | | 975,006,826 |
| | | | | | | | |
| YANKEE CERTIFICATES OF DEPOSIT – 38.8% | | | | | | | | |
| Bank Foreign – 38.8% | | | | | | | | |
| Banco Bilbao Vizcaya Argentaria | | 0.875% | | 07/09/2009 | | 200,000,000 | | 200,000,222 |
| Bank of Nova Scotia/Houston | | 0.590% | | 07/06/2009 | | 400,000,000 | | 400,000,000 |
| Bank of Nova Scotia/Houston | | 0.520% | | 12/23/2009 | | 75,000,000 | | 75,000,000 |
| Barclays Bank PLC NY | | 1.150% | | 07/08/2009 | | 200,000,000 | | 200,000,000 |
| Barclays Bank PLC NY | | 1.620% | | 07/13/2009 | | 50,000,000 | | 50,000,000 |
| Barclays Bank PLC NY | | 1.305% | | 08/24/2009 | | 75,000,000 | | 75,000,000 |
| BNP Paribas NY | | 0.900% | | 07/14/2009 | | 100,000,000 | | 100,000,000 |
| BNP Paribas NY | | 0.870% | | 11/02/2009 | | 150,000,000 | | 150,000,000 |
| Calyon NY | | 0.920% | | 07/09/2009 | | 100,000,000 | | 100,000,000 |
| Calyon NY | | 0.650% | | 11/19/2009 | | 225,000,000 | | 225,000,000 |
| Deutsche Bank AG NY | | 0.620% | | 07/20/2009 | | 100,000,000 | | 100,000,000 |
| Lloyds TSB Bank PLC NY | | 0.840% | | 08/13/2009 | | 100,000,000 | | 100,000,000 |
| Lloyds TSB Bank PLC NY | | 0.835% | | 10/05/2009 | | 300,000,000 | | 300,000,000 |
| Lloyds TSB Bank PLC NY | | 0.920% | | 11/30/2009 | | 100,000,000 | | 100,000,000 |
| Rabobank Nederland NV/NY | | 0.700% | | 07/07/2009 | | 150,000,000 | | 150,000,000 |
| Rabobank Nederland NV/NY | | 0.700% | | 11/12/2009 | | 75,000,000 | | 75,000,000 |
| Royal Bank of Scotland/NY | | 1.220% | | 07/23/2009 | | 200,000,000 | | 200,000,000 |
| Royal Bank of Scotland/NY | | 1.040% | | 08/04/2009 | | 200,000,000 | | 200,000,000 |
| Royal Bank of Scotland/NY | | 0.850% | | 10/23/2009 | | 75,000,000 | | 75,000,000 |
| Societe Generale NY | | 0.940% | | 08/20/2009 | | 200,000,000 | | 200,000,000 |
| Svenska Handelsbanken/NY | | 0.700% | | 07/09/2009 | | 100,000,000 | | 100,000,000 |
| Svenska Handelsbanken/NY | | 0.600% | | 09/15/2009 | | 100,000,000 | | 100,000,000 |
| Svenska Handelsbanken/NY | | 0.420% | | 11/02/2009 | | 50,000,000 | | 50,000,000 |
| Toronto-Dominion Bank/NY | | 0.500% | | 12/18/2009 | | 45,000,000 | | 45,000,000 |
| Toronto-Dominion Bank/NY | | 0.500% | | 07/14/2009 | | 200,000,000 | | 200,000,000 |
| Toronto-Dominion Bank/NY | | 0.500% | | 07/15/2009 | | 150,000,000 | | 150,000,000 |
| | | | | | | | |
| TOTAL YANKEE CERTIFICATES OF DEPOSIT | | | | | | | | 3,720,000,222 |
| | | | | | | | |
| | | | |
| Portfolio of Investments | | STATE STREET MONEY MARKET PORTFOLIO | | 59 |
Portfolio of Investments June 30, 2009 (unaudited) (continued)
| | | | | | | | |
| Name of Issuer and Title of Issue | | Interest
Rate | | Maturity
Date | | Principal
Amount | | Amortized
Cost |
| | | | | | | | |
| BANK NOTES – 1.1% | | | | | | | | |
| Bank Domestic – 1.1% | | | | | | | | |
| Bank of America NA/Charlotte NC(b) | | 0.861% | | 08/25/2009 | | $100,000,000 | | $100,000,000 |
| | | | | | | | |
| TOTAL BANK NOTES | | | | | | | | 100,000,000 |
| | | | | | | | |
| MEDIUM TERM NOTES – 0.9% | | | | | | | | |
| Consumer Non-Cyclical – 0.9% | | | | | | | | |
| Procter & Gamble Co.(b) | | 0.663% | | 09/09/2009 | | 69,000,000 | | 69,002,870 |
| Procter & Gamble International Funding SCA(b) | | 0.996% | | 08/07/2009 | | 20,000,000 | | 20,000,000 |
| | | | | | | | |
| TOTAL MEDIUM TERM NOTES | | | | | | | | 89,002,870 |
| | | | | | | | |
| U.S. GOVERNMENT AGENCY OBLIGATIONS – 1.1% | | | | | | | | |
| Sovereign – 1.1% | | | | | | | | |
| Federal National Mortgage Association(b) | | 1.029% | | 07/13/2009 | | 100,000,000 | | 100,000,000 |
| | | | | | | | |
| TOTAL U.S. GOVERNMENT AGENCY OBLIGATIONS | | | | | | | | 100,000,000 |
| | | | | | | | |
| REPURCHASE AGREEMENTS – 18.9% | | | | | | | | |
| Agreement with Bank of America and The Bank of New York, dated 06/30/09 (collateralized by a Federal National Mortgage Association, 5.500% - 6.000% due 02/01/23 - 06/01/39 valued at $319,427,281); proceeds $313,164,696 | | 0.080% | | 07/01/2009 | | 313,164,000 | | 313,164,000 |
| | | | | | | | |
| | | | |
| Agreement with Barclays Capital, Inc. and The Bank of New York, dated 06/30/09 (collateralized by Government National Mortgage Association, 4.500% - 6.000% due 11/20/37 - 04/15/39 valued at $306,000,001); proceeds $300,000,667 | | 0.080% | | 07/01/2009 | | 300,000,000 | | 300,000,000 |
| | | | | | | | |
| | | | |
| Agreement with Citigroup and The Bank of New York, dated 06/30/09 (collateralized by a U.S. Treasury Notes, 3.125% - 5.000% due 08/15/11 - 04/30/13 and U.S. Treasury Bonds, 6.750% due 08/15/26 valued at $306,000,057); proceeds $300,000,083 | | 0.010% | | 07/01/2009 | | 300,000,000 | | 300,000,000 |
| | | | | | | | |
| | | | |
| Agreement with Deutsche Bank and The Bank of New York, dated 06/30/09 (collateralized by a Federal Home Loan Mortgage Corporation, 0.694% - 6.500% due 01/15/31 - 03/15/37 and Federal National Mortgage Association, 0.000% - 135.375% due 03/25/18 - 07/25/39 valued at $306,000,000); proceeds $300,000,750 | | 0.090% | | 07/01/2009 | | 300,000,000 | | 300,000,000 |
| | | | | | | | |
| | | | |
| 60 | | STATE STREET MONEY MARKET PORTFOLIO | | Portfolio of Investments |
Portfolio of Investments June 30, 2009 (unaudited)
| | | | | | | | | |
| Name of Issuer and Title of Issue | | Interest
Rate | | Maturity
Date | | Principal
Amount | | Amortized
Cost | |
| | | | |
Agreement with Goldman Sachs and The Bank of New York, dated 06/30/09 (collateralized by Federal Home Loan Mortgage Corporation, 4.000% due 06/01/24 and Federal National Mortgage Association,
4.500% - 6.500% due 12/01/31 - 12/01/37 valued at $306,000,001); proceeds $300,000,417 | | 0.050% | | 07/01/2009 | | $300,000,000 | | $300,000,000 | |
| | | | | | | | | |
| Agreement with UBS Warburg and J P Morgan Chase & Co., dated 06/30/09 (collateralized by Federal National Mortgage Association, 3.500% - 7.000% due 12/01/11 - 09/01/47 valued at $306,002,180); proceeds $300,000,833 | | 0.100% | | 07/01/2009 | | 300,000,000 | | 300,000,000 | |
| | | | | | | | | |
| | | | | | | | | |
| | | | | | | | | |
| TOTAL REPURCHASE AGREEMENTS | | | | | | | | 1,813,164,000 | |
| | | | | | | | | |
| | | | | | | | | |
| TOTAL INVESTMENTS(c) † – 100.5% | | | | | | | | 9,619,556,522 | |
| LIABILITIES IN EXCESS OF ASSETS – (0.5)% | | | | | | | | (43,601,700 | ) |
| | | | | | | | | |
| NET ASSETS – 100.0% | | | | | | | | $9,575,954,822 | |
| | | | | | | | | |
| (a) | | Security subject to restrictions on resale under federal securities laws, which may only be resold upon registration under the Securities Act of 1933, as amended (“1933 Act”) or in transactions exempt from registration, including sales to qualified institutional buyers pursuant to Rule 144A of the 1933 Act. The Portfolio does not have the right to demand that this security be registered. |
| (b) | | Variable Rate Security – Interest rate is in effect as of June 30, 2009. |
| (c) | | Unless otherwise indicated, the values of the securities of the Portfolio are determined based on Level 2 inputs established by FAS 157 (Note 2). |
| † | | See Note 2 of the Notes to Financial Statements. |
See Notes to Financial Statements.
| | | | |
| Financial Statements | | STATE STREET MONEY MARKET PORTFOLIO | | 61 |
Statement of Assets and Liabilities June 30, 2009 (unaudited)
| | | | | |
| Assets | | | | | |
| Investments in unaffiliated issuers, at amortized cost (Note 2) | | $ | | | 7,806,392,522 |
| Repurchase Agreements, at amortized cost (Note 2) | | | | | 1,813,164,000 |
| | | | | |
| Total investments | | | | | 9,619,556,522 |
| Cash | | | | | 985 |
| Interest receivable | | | | | 7,355,662 |
| Prepaid expense | | | | | 28,917 |
| | | | | |
| Total assets | | | | | 9,626,942,086 |
| Liabilities | | | | | |
| Investment securities purchased | | | | | 50,000,000 |
| Management fee (Note 3) | | | | | 795,187 |
| Administration and custody fees (Note 3) | | | | | 161,193 |
| Professional fees | | | | | 22,956 |
| Trustee’s fees (Note 4) | | | | | 348 |
| Accrued expenses and other liabilities | | | | | 7,580 |
| | | | | |
| Total liabilities | | | | | 50,987,264 |
| | | | | |
| Net Assets | | $ | | | 9,575,954,822 |
| | | | | |
Statement of Operations Six Months Ended June 30, 2009 (unaudited)
| | | | | | |
| Investment Income | | | | | | |
| Interest | | $ | | | 35,993,168 | |
| | | | | | |
| Expenses | | | | | | |
| Management fees (Note 3) | | | | | 4,218,030 | |
| Administration and custody fees (Note 3) | | | | | 856,091 | |
| Professional fees | | | | | 22,972 | |
| Trustee’s fees (Note 4) | | | | | 25,101 | |
| Printing fees | | | | | 1,539 | |
| Other expenses | | | | | 26,058 | |
| | | | | | |
| Total Expenses | | | | | 5,149,791 | |
| Less: Fee waivers/reimbursements by Investment Adviser (Note 3) | | | | | (589,262 | ) |
| | | | | | |
| Total Net Expenses | | | | | 4,560,529 | |
| | | | | | |
| Net Investment Income | | $ | | | 31,432,639 | |
| | | | | | |
| Realized Gain | | | | | | |
| Net realized gain on investments | | $ | | | 34,655 | |
| | | | | | |
| Net Increase in Net Assets Resulting from Operations | | $ | | | 31,467,294 | |
| | | | | | |
See Notes to Financial Statements.
| | | | |
| 62 | | STATE STREET MONEY MARKET PORTFOLIO | | Financial Statements |
Statements of Changes in Net Assets
| | | | | | | | | | | | |
| | | Six Months
Ended June 30, 2009
(Unaudited) | | | Year Ended
December 31, 2008 | |
| Increase in Net Assets From: | | | | | | | | | | | | |
| Operations | | | | | | | | | | | | |
| Net investment income | | $ | | | 31,432,639 | | | $ | | | 226,704,311 | |
| Net realized gain on investments | | | | | 34,655 | | | | | | 126,859 | |
| | | | | | | | | | | | |
| Net increase in net assets from operations | | | | | 31,467,294 | | | | | | 226,831,170 | |
| | | | | | | | | | | | |
| Capital Transactions | | | | | | | | | | | | |
| Proceeds from contributions | | | | | 10,790,013,674 | | | | | | 23,607,267,075 | |
| Fair value of withdrawals | | | | | (9,851,431,285 | ) | | | | | (22,146,456,134 | ) |
| | | | | | | | | | | | |
| Net increase in net assets from capital transactions | | | | | 938,582,389 | | | | | | 1,460,810,941 | |
| | | | | | | | | | | | |
| Net Increase in Net Assets | | | | | 970,049,683 | | | | | | 1,687,642,111 | |
| Net Assets | | | | | | | | | | | | |
| Beginning of period | | | | | 8,605,905,139 | | | | | | 6,918,263,028 | |
| | | | | | | | | | | | |
| End of period | | $ | | | 9,575,954,822 | | | $ | | | 8,605,905,139 | |
| | | | | | | | | | | | |
Financial Highlights
| | | | | | | | | | | |
| | | | | Ratios to Average Net Assets | | Net Assets End of Period (000s omitted) |
| Period Ended December 31, | | Total
Return(a) | | Gross
Operating
Expenses | | Net
Operating
Expenses | | Net
Investment
Income | |
| 2009* | | 0.38% | | 0.12%** | | 0.11%** | | 0.75%** | | $ | 9,575,955 |
| 2008 | | 2.75% | | 0.12%
| | 0.10% | | 2.79% | | $ | 8,605,905 |
| 2007 | | 5.30% | | 0.12% | | 0.10% | | 5.14% | | $ | 6,918,263 |
| 2006 | | 5.09% | | 0.13% | | 0.10% | | 5.08% | | $ | 6,197,117 |
| 2005 | | 3.31% | | 0.14% | | 0.10% | | 3.33% | | $ | 1,639,871 |
| 2004(b) | | 0.68% | | 0.18%** | | 0.10%** | | 1.71%** | | $ | 381,716 |
| (a) | Results represent past performance and are not indicative of future results. Total return for periods of less than one year are not annualized. |
| (b) | The Portfolio commenced operations on August 12, 2004. |
| * | For the six months ended June 30, 2009 (Unaudited). |
See Notes to Financial Statements.
| | | | |
| Notes to Financial Statements | | STATE STREET MONEY MARKET PORTFOLIO | | 63 |
Notes to Financial Statements
1. Organization
The State Street Master Funds (the “Trust”) is registered under the Investment Company Act of 1940, as amended (the “1940 Act”), as an open-end management investment company, and was organized as a business trust under the laws of The Commonwealth of Massachusetts on July 27, 1999. The Trust comprises eleven investment portfolios: the State Street Equity 500 Index Portfolio, the State Street Equity 400 Index Portfolio, the State Street Equity 2000 Index Portfolio, the State Street Aggregate Bond Index Portfolio, the State Street Money Market Portfolio, the State Street Tax Free Money Market Portfolio, the State Street Limited Duration Bond Portfolio, the State Street Short-Term Tax Exempt Bond Portfolio, the State Street U.S. Government Money Market Portfolio, the State Street Treasury Money Market Portfolio and the State Street Treasury Plus Money Market Portfolio. At June 30, 2009, only the State Street Equity 500 Index Portfolio, the State Street Money Market Portfolio, the State Street Tax Free Money Market Portfolio, the State Street Short-Term Tax Free Bond Portfolio, the State Street U.S. Government Money Market Portfolio, the State Street Treasury Money Market Portfolio and the State Street Treasury Plus Money Market Portfolio were in operation. Information presented in these financial statements pertains only to the State Street Money Market Portfolio (the “Portfolio”). The Portfolio commenced operations on August 12, 2004. The Portfolio is authorized to issue an unlimited number of non-transferable beneficial interests.
The Portfolio’s investment objective is to seek to maximize current income, to the extent consistent with the preservation of capital and liquidity by investing in dollar denominated securities.
2. Significant Accounting Policies
The following is a summary of the significant accounting policies consistently followed by the Portfolio in the preparation of its financial statements.
SECURITY VALUATION
As permitted under Rule 2a-7 of the 1940 Act and certain conditions therein, securities of the Portfolio are valued initially at cost and thereafter assume a constant amortization to maturity of any discount or premium.
The Portfolio adopted Financial Accounting Standards Board (“FASB”) Statement of Financial Accounting Standards No. 157, Fair Value Measurements (“FAS 157”), effective for financial statements issued for fiscal years beginning after November 15, 2007 and interim periods within those fiscal years. In accordance with FAS 157, fair value is defined as the price that the portfolio would receive upon selling an investment in a timely transaction to an independent buyer in the principal or most advantageous market of the investment. Various inputs
| | | | |
| 64 | | STATE STREET MONEY MARKET PORTFOLIO | | Notes to Financial Statements |
are used in determining the value of the Portfolio’s investments. FAS 157 established a three tier hierarchy of inputs to establish a classification of fair value measurements and disclosure. The three tier hierarchy of inputs is summarized below:
| • | | Level 1 – quoted prices in active markets for identical securities |
| • | | Level 2 – other significant observable inputs (including quoted prices for similar securities, interest rates, prepayment speeds, credit risk, etc.) |
| • | | Level 3 – significant unobservable inputs (including the Portfolio’s own assumptions in determining the fair value of investments) |
The inputs or methodology used for valuing securities are not an indication of the risk associated with investing in those securities.
The following is a summary of the inputs used, as of June 30, 2009, in valuing the Portfolios’ assets carried at fair value:
State Street Money Market Portfolio:
| | | |
| Valuation Inputs | | Investments
in Securities |
| |
Level 1 – Quoted Prices | | $ | – |
Level 2 – Other Significant Observable Inputs | | | 9,619,556,522 |
Level 3 – Significant Unobservable Inputs | | | – |
Total | | $ | 9,619,556,522 |
In April 2009, the FASB issued FASB Staff Position No. 157-4, “Determining Fair Value When the Volume and Level of Activity for the Asset or Liability Have Significantly Decreased and Identifying Transactions That Are Not Orderly” (“FSP 157-4”). FSP 157-4 provides additional guidance for estimating fair value in accordance with FAS 157 when the volume and level of activity for the asset or liability have significantly decreased as well as guidance on identifying circumstances that indicate a transaction is not orderly. The type of inputs used to value each security is identified in the Portfolio of Investments, which also includes a breakdown of the Portfolio’s investments by category.
On March 19, 2008, FASB released Statement of Financial Accounting Standards No. 161, “Disclosures about Derivative Instruments and Hedging Activities” (“FAS 161”). FAS 161 requires qualitative disclosures about objectives and strategies for using derivatives, quantitative disclosures about fair value amounts of gains and losses on derivative instruments, and disclosures about credit-risk related contingent features in derivative agreements. The application of FAS 161 is required for fiscal years beginning after November 15, 2008
| | | | |
| Notes to Financial Statements | | STATE STREET MONEY MARKET PORTFOLIO | | 65 |
and interim periods within those fiscal years. Management has evaluated the implication of FAS 161 and there is no impact on the Portfolio’s Financial Statements.
In September 2008, FASB issued a FASB Staff Position No. 133-1 and FIN 45-4 “Disclosures about Credit Derivatives and Certain Guarantees: An Amendment of FASB Statement No. 133 and FASB Interpretation No. 45; and Clarification of the Effective Date of FASB Statement No. 161” (“FSP 133”). FSP 133 requires enhanced transparency of the effect of credit derivatives and guarantees on an issuer’s financial position, financial performance and cash flows. FSP 133 is effective for fiscal years ending after November 15, 2007. FSP 133 applies to certain credit derivatives, hybrid instruments that have embedded credit derivatives (for example, credit-linked notes), and certain guarantees and it requires additional disclosures regarding credit derivatives with sold protection. Management has evaluated the implication of FSP 133 and there is no impact to the Portfolio.
SECURITIES TRANSACTIONS, INVESTMENT INCOME AND EXPENSES
Securities transactions are recorded on a trade date basis for financial statement purposes. Interest income is recorded daily on the accrual basis and includes amortization of premium and accretion of discount on investments. Realized gains and losses from securities transactions are recorded on the basis of identified cost. Expenses are accrued daily.
All of the net investment income and realized gains and losses from the security transactions of the Portfolio are allocated pro rata among the partners in the Portfolio based on each partner’s daily ownership percentage.
FEDERAL INCOME TAXES
The Portfolio is not required to pay federal income taxes on its net investment income and net capital gains because it is treated as a partnership for federal income tax purposes. All interest, gains and losses of the Portfolio are deemed to have been “passed through” to the Portfolio’s partners in proportion to their holdings in the Portfolio, regardless of whether such items have been distributed by the Portfolio. Each partner is responsible for tax liability based on its distributive share; therefore, no provision has been made for federal income taxes.
The Portfolio has reviewed the tax positions for open years as of December 31, 2008, and determined it did not have a liability for any unrecognized tax expenses. The Portfolio recognizes interest and penalties, if any, related to tax liabilities as income tax expense in the Statement of Operations. As of June 30, 2009, tax years 2005 through 2008 remain subject to examination by the Portfolio’s major tax jurisdictions, which include the United States of America and the Commonwealth of Massachusetts.
| | | | |
| 66 | | STATE STREET MONEY MARKET PORTFOLIO | | Notes to Financial Statements |
At June 30, 2009, the cost of investments for federal income tax purposes was the same as the cost for financial reporting purposes.
REPURCHASE AGREEMENTS
A repurchase agreement customarily obligates the seller at the time it sells securities to a Portfolio to repurchase the securities at a mutually agreed upon price and time which, in the case of the Portfolio’s transactions, is generally within seven days. The total amount received by a Portfolio on repurchase is calculated to exceed the price paid by the Portfolio, reflecting an agreed-upon market rate of interest for the period of time to the settlement date, and is not necessarily related to the interest rate on the underlying securities. The underlying securities are ordinarily United States Government securities, but may consist of other securities in which a Portfolio is permitted to invest. Repurchase agreements are fully collateralized at all times. The use of repurchase agreements involves certain risks. For example, if the seller of securities under a repurchase agreement defaults on its obligation to repurchase the underlying securities (as a result of its bankruptcy or otherwise) the Portfolio will seek to dispose of such securities; this action could involve costs or delays. In addition, the proceeds of any such disposition may be less than the amount the Portfolio is owed under the repurchase agreement. A Portfolio may enter into repurchase agreements maturing within seven days with domestic dealers, banks and other financial institutions deemed to be creditworthy by SSgA Funds Management, Inc. (“SSgA FM” or the “Adviser”), a subsidiary of State Street Corporation and an affiliate of State Street Bank and Trust Company (“State Street”).
EXPENSE ALLOCATION
Certain expenses are applicable to multiple Portfolios. Expenses directly attributable to a Portfolio are charged to that Portfolio. Expenses of the Trust that are not directly attributed to a Portfolio are allocated among the Portfolios, on the basis of relative net assets, except where a more appropriate allocation of expenses to each of the Portfolios can otherwise be made fairly.
USE OF ESTIMATES
The Portfolio’s financial statements are prepared in accordance with U.S. generally accepted accounting principles, which require the use of management estimates. Actual results could differ from those estimates.
3. Related Party Fees
The Portfolio has entered into investment advisory agreements with the Adviser. The Adviser directs the investments of the Portfolio in accordance with its investment objectives, policies, and limitations. In compensation for the Adviser’s services as investment adviser, the
| | | | |
| Notes to Financial Statements | | STATE STREET MONEY MARKET PORTFOLIO | | 67 |
Portfolio pays the Adviser an annual fee of 0.10% of the Portfolio’s average daily net assets. The Adviser contractually agreed to cap the total operating expenses of the Portfolio at 0.10% of the Portfolio’s average daily net assets through April 30, 2009. For the period ended June 30, 2009, SSgA FM reimbursed the Portfolio $589,262 under this agreement.
State Street is the administrator, custodian and transfer agent for the Portfolio. In compensation for State Street’s services as administrator, custodian and transfer agent beginning February 1, 2007, the Trust pays State Street an annual fee, which is accrued daily at and payable monthly at the applicable fee rate described below, of the following annual percentages of the Trust’s average aggregate daily net assets during the month as follows:
| | |
| Asset Levels | | Annual percentage of
average aggregate daily net assets |
| |
| First $400 Million | | 0.03% |
| Thereafter | | 0.02 |
| Minimum annual fee for the trust: | | $150,000 |
Effective August 1, 2009, the annual fees paid by the Trust to State Street for its services as administrator, custodian, and transfer agent for the Portfolios were revised as follows:
| | |
| Asset Levels | | Annual percentage of
average aggregate daily net assets |
| |
| First $400 million | | 0.03% |
| Next $15 billion | | 0.02% |
| Thereafter | | 0.01% |
| Minimum annual fee for the trust: | | $150,000 |
4. Trustees’ Fees
The Trust pays each trustee who is not an officer or employee of SSgA FM or State Street $2,500 for each meeting of the Board of Trustees and an additional $500 for each telephonic meeting attended. The Trust also pays each trustee an annual retainer of $30,000. Each trustee is reimbursed for out-of-pocket and travel expenses.
5. Indemnifications
The Trust’s organizational documents provide that its officers and trustees are indemnified against certain liabilities arising out of the performance of their duties to the Trust. In addition, both in some of its principal service contracts and in the normal course of its business, the Trust enters into contracts that provide indemnifications to other parties for certain types of losses or liabilities. The Trust’s maximum
| | | | |
| 68 | | STATE STREET MONEY MARKET PORTFOLIO | | Notes to Financial Statements |
exposure under these arrangements in unknown as this could involve future claims against the Trust. Management does not expect any significant claims.
6. Subsequent Events
In accordance with the provisions set forth in FASB Statement of Financial Accounting Standards No. 165 “Subsequent Events,” adopted by the Portfolio as of June 30, 2009, management has evaluated the possibility of subsequent events existing in the Portfolio’s financial statements through August 20, 2009. Management has determined that there are no material events that would require disclosure in the Portfolio’s financial statements through this date.
| | | | |
| General Information | | STATE STREET MONEY MARKET PORTFOLIO | | 69 |
General Information June 30, 2009 (unaudited)
Proxy Voting Policies and Procedures and Record
The Trust has adopted proxy voting procedures relating to portfolio securities held by the Portfolios. A description of the policies and procedures is available (i) without charge, upon request, by calling (877) 521-4083 or (ii) on the website of the Securities Exchange Commission (the “SEC”) at www.sec.gov. Information on how the Portfolios voted proxies relating to portfolio securities during the most recent 12-month period ending June 30 is available by August 31 (i) without charge, upon request, by calling (877) 521-4083 or (ii) on the SEC’s website at www.sec.gov.
Quarterly Portfolio Schedule
The Trust files its complete schedule of portfolio holdings with the SEC for the first and third quarters of its fiscal year (as of March and September of each year) on Form N-Q. The Trust’s Forms N-Q are available on the SEC’s website at www.sec.gov. The Trust’s Forms N-Q may be reviewed and copied at the SEC’s Public Reference Room in Washington, D.C. and information on the operation of the Public Reference Room may be obtained by calling 1-800-SEC-0330. The most recent Form N-Q is available without charge, upon request, by calling (877) 521-4083.
Trustees and Executive Officers (unaudited)
Trustees
Michael F. Holland
William L. Boyan
Rina K. Spence
Douglas T. Williams
James E. Ross
Investment Adviser
SSgA Funds Management, Inc.
State Street Financial Center
One Lincoln Street
Boston, MA 02111
Custodian
State Street Bank and Trust Company
State Street Financial Center
One Lincoln Street
Boston, MA 02111
Administrator
State Street Bank and Trust Company
801 Pennsylvania Avenue
Kansas City, MO 64105
Independent Registered Public Accounting Firm
Ernst & Young LLP
200 Clarendon Street
Boston, MA 02116
Legal Counsel
Ropes & Gray LLP
One International Place
Boston, MA 02110
This report is for shareholder information. This is not a prospectus intended for use in the purchase or sale of shares of beneficial interest.
State Street Master Funds
State Street Bank and Trust Company
P.O. Box 5049
Boston, MA 02206
| | | | |
| 70 | | STATE STREET MONEY MARKET PORTFOLIO | | Trustees and Executive Officers |
| | | | |
| How to Contact Us | | AARP FUNDS 2009 ANNUAL REPORT | | 71 |
How to Contact Us
Telephone
Call 1-800-958-6457 weekdays from 8:00 am to 6:00 pm Eastern time, to speak directly with a courteous, knowledgeable representative. The following prompt choices are available when you dial the number above:
| • | | Financial Center Financial Advisors are available to answer investment questions relating to the AARP Funds. |
| • | | Shareholder Services representatives can handle any account-related questions or transactions. |
| • | | Automated Response System is available 24 hours a day, seven days a week to handle a wide range of account functions (as shown below). |
Financial Center Financial Advisors
| • | | Speak with specially trained representatives to help you identify your goals, determine if you’re on track financially for retirement and decide if an AARP Fund is right for you. |
Shareholder Services representatives or our 24-hour Automated Response System
| • | | Receive general account information and service from our Shareholder Services representatives |
| • | | Initiate an electronic transfer to buy or sell shares |
| • | | Order duplicate statements |
| • | | Check your account balance or share prices |
| • | | Change your address of record (not available via the Automated Response System) |
Mail
AARP Funds
P.O. Box 8035
Boston, MA 02266-8035
Overnight delivery
AARP Funds
c/o BFDS
30 Dan Road
Canton, MA 02021
| • | | Request to buy, sell or exchange shares in writing |
| • | | Change the name on your account |
| • | | Add a seasonal mailing address |
| • | | Add banking information to your account |
| • | | Add or change an Automatic Investment Program |
| • | | Add or change payroll deduction |
Website
www.aarpfinancial.com
| • | | Get a prospectus or fund report |
| • | | Buy, sell or exchange shares |
| • | | View your account balance and share price |
| • | | Change your mailing address |
| • | | Order duplicate statements or copies of your tax forms |
| • | | Get forms to accomplish a variety of tasks |
AARP Funds
P.O. Box 8035
Boston, MA 02266-8035
1-800-958-6457
www.aarpfinancial.com
©2009 AARP Funds
| | |

| | ARP000789 02/28/10 ARP-AR-001-0809 |
Item 2. Code of Ethics
| (a) | AARP Funds (the “Registrant”) has adopted a Code of Ethics that applies to the Registrant’s principal executive officer and senior financial officer, including the principal financial officer, controller or principal accounting officer, or persons performing similar functions, regardless of whether these persons are employed by the Registrant or a third party. |
| (b) | No disclosures are required by this Item 2(b). |
| (c) | There have been no amendments to the Registrant’s Code of Ethics during the reporting period for this Form N-CSR. |
| (d) | There have been no waivers granted by the Registrant to individuals covered by the Registrant’s Code of Ethics during the reporting period for this Form N-CSR. |
| (f) | A copy of the Registrant’s Code of Ethics is attached as an exhibit to this Form N-CSR. |
Item 3. Audit Committee Financial Expert
| (a) (1) | The Board of Trustees of the Registrant has determined that the Registrant has a member serving on the Registrant’s Audit Committee that possesses the attributes identified in Instruction 2(b) of Item 3 to Form N-CSR to qualify as “audit committee financial expert.” |
| | (2) | For the reporting period, the name of the audit committee financial expert was Lynn Turner. Mr. Turner was deemed to be “independent” as that term is defined in Form N-CSR. |
Item 4. Principal Accountant Fees and Services
| (a) | Audit Fees – The aggregate fees billed for professional services rendered by the independent registered public accounting firm for the audit of the Registrant’s annual financial statements or services normally provided in connection with statutory and regulatory filings or engagements for the last two fiscal years ended June 30, 2009 and June 30, 2008 were $100,562.50 and $97,312.50, respectively. |
| (b) | Audit-Related Fees – The Registrant was not billed any fees by the independent registered public accounting firm for the fiscal years ended June 30, 2009 and June 30, 2008 for assurance and related services rendered by the independent registered public accounting firm to the Registrant that are reasonably related to the performance of the audit of the Registrant’s financial statements and are not reported under paragraph (a) of this Item 4. |
During the fiscal years ended June 30, 2009 and June 30, 2008, no fees for assurance and related services that relate directly to the operations and financial reporting of the Registrant were billed by the independent registered public accounting firm to the Registrant’s investment adviser or any other entity controlling, controlled by, or under common control with the investment adviser that provides ongoing services to the Registrant.
| (c) | Tax Fees – During the fiscal years ended June 30, 2009 and June 30, 2008, no fees for tax compliance, tax advice, tax planning and tax return preparation were billed by the independent registered public accounting firm to the Registrant. |
During the fiscal years ended June 30, 2009 and June 30, 2008, no fees for tax compliance, tax advice or tax planning services that relate directly to the operations and financial reporting of the Registrant were billed by the independent registered public accounting firm to the Registrant’s investment adviser or any other entity controlling, controlled by, or under common control with the investment adviser that provides ongoing services to the Registrant.
During the fiscal years ended June 30, 2009 and June 30, 2008, the Registrant was billed $28,350 and $24,875, respectively by another accounting firm for tax compliance, tax advice, tax planning and tax return preparation.
During the fiscal years ended June 30, 2009 and June 30, 2008, no fees for tax compliance, tax advice or tax planning services that relate directly to the operations and financial reporting of the Registrant were billed by another accounting firm to the Registrant’s investment adviser or any other entity controlling, controlled by, or under common control with the investment adviser that provides ongoing services to the Registrant.
| (d) | All Other Fees – During the fiscal years ended June 30, 2009 and June 30, 2008, there were no fees billed for products and services provided by the independent registered public accounting firm to the Registrant, other than the services reported in paragraph (a) – (c) of this Item 4. |
During the fiscal years ended June 30, 2009 and June 30, 2008, no fees for other services that relate directly to the operations and financial reporting of the Registrant were billed by the independent registered public accounting firm to the Registrant’s investment adviser or any other entity controlling, controlled by, or under common control with the investment adviser that provides ongoing services to the Registrant.
(e)(1) Pre-Approval Policies and Procedures
It is the general policy of the Audit Committee not to approve non-audit services. In considering whether to approve non-audit services, the Audit Committee will consider the following:
| | (a) | whether the service is being performed principally for the Audit Committee; |
| | (b) | the effects of the service, if any, on audit effectiveness or on the quality and timeliness of the Funds financial reporting process; |
| | (c) | whether the service would be performed by specialists (e.g., technology specialists) who ordinarily also provide recurring audit support; |
| | (d) | whether the service would be performed by audit personnel and, if so, whether it will enhance their knowledge of the Funds business and operations; |
| | (e) | whether the role of those performing the service would be inconsistent with the Auditor’s role (e.g., a role where neutrality, impartiality and auditor skepticism are likely to be subverted); |
| | (f) | whether the audit firm’s personnel would be assuming a management role or creating a mutuality of interest with management; |
| | (g) | whether the auditors, in effect, would be auditing their own numbers; |
| | (h) | whether the project must be started and completed very quickly and therefore is not a longer term relationship; |
| | (i) | whether the audit firm has unique service expertise in the service that cannot be obtained from another service provider; and |
| | (j) | the size of the fee(s) for the non-audit service(s). |
(e)(2) Percentage of Services.
None of the services described in each of paragraphs (b) through (d) of this Item were approved by the Registrant’s Audit Committee pursuant to paragraph (c)(7)(i)(C) of Rule 2-01 of Regulation S-X.
| (f) | No disclosures are required by this Item 4(f). |
| (g) | During the fiscal years ended June 30, 2009 and June 30, 2008, the aggregate non-audit fees billed by the Registrant’s independent registered public accounting firm for services rendered to the Registrant, the Registrant’s investment adviser and any entity controlling, controlled by, or under common control with the investment adviser that provides ongoing services to the Registrant were $0 and $0, respectively. |
| (h) | No disclosures are required by this Item 4(h). |
Item 5. Audit Committee of Listed Registrants
Not applicable.
Item 6. Schedule of Investments
Schedule of Investments is included as a part of the report to shareholders filed under Item 1 of this Form N-CSR.
Item 7. Disclosure of Proxy Voting Policies and Procedures for Closed-End Management Investment Companies
Not applicable.
Item 8. Portfolio Managers of Closed-End Management Investment Companies
Not applicable.
Item 9. Purchases of Equity Securities by Closed-End Management Investment Company and Affiliated Purchasers
Not applicable.
Item 10. Submission of Matters to a Vote of Security Holders
The Board of Trustees has adopted procedures by which shareholders may recommend nominees to the Board. During the reporting period for this Form N-CSR, the following material changes were made to these procedures: for nominating shareholders, eliminate the minimum ownership and holding period requirements; and eliminate certain restrictions on affiliations between a nominee and nominating shareholder.
Item 11. Controls and Procedures
| (a) | The Registrant’s principal executive and principal financial officers have concluded that the Registrant’s disclosure controls and procedures (as defined in Rule 30a-3(c) under the Investment Company Act of 1940, as amended (the “1940 Act”) are effective, as of a date within 90 days of the filing date of this Form N-CSR based on their evaluation of these controls and procedures required by Rule 30a-3(b) under the 1940 Act and Rules 13a-15(b) or 15d-15(b) under the Securities Exchange Act of 1934. |
| (b) | There were no changes in the Registrant’s internal control over financial reporting (as defined in Rule 30a-3(d) under the 1940 Act) that occurred during the second fiscal quarter of the period covered by this report that has materially affected, or is reasonably likely to materially affect, the Registrant’s internal control over financial reporting. |
Item 12. Exhibits
| (a)(1) | Code of Ethics referred to in Item 2 is attached hereto. |
| (a)(2) | The certifications required by Rule 30a-2(a) of the 1940 Act and Section 302 of the Sarbanes-Oxley Act of 2002 (“Sarbanes-Oxley Act”) are attached hereto. (Ex-99.CERT) |
| (b) | The certifications required by Rule 30a-2(b) of the 1940 Act and Section 906 of the Sarbanes-Oxley Act are attached hereto. (Ex-99.906CERT) |
SIGNATURES
Pursuant to the requirements of the Securities Exchange Act of 1934 and the Investment Company Act of 1940, the registrant has duly caused this report to be signed on its behalf by the undersigned, thereunto duly authorized.
| | |
| AARP FUNDS |
| |
| By: | | /s/ Richard M. Hisey |
| | Richard M. Hisey |
President (principal executive officer) of AARP Funds
Date: August 25, 2009
Pursuant to the requirements of the Securities Exchange Act of 1934 and the Investment Company Act of 1940, this report has been signed below by the following persons on behalf of the registrant and in the capacities and on the dates indicated.
| | |
| |
| By: | | /s/ Richard M. Hisey |
| | Richard M. Hisey |
President (principal executive officer) of AARP Funds
Date: August 25, 2009
| | |
| |
| By: | | /s/ Jeffrey J. Gaboury |
| | Jeffrey J. Gaboury |
Treasurer (principal financial officer) of AARP Funds
Date: August 25, 2009