Table of Contents
UNITED STATES SECURITIES AND EXCHANGE COMMISSION
Washington, D.C. 20549
FORM 10-Q
| þ | QUARTERLY REPORT PURSUANT TO SECTION 13 OR 15(d) OF THE SECURITIES EXCHANGE ACT OF 1934 |
For the quarterly period ended June 30, 2007
OR
| o | TRANSITION REPORT PURSUANT TO SECTION 13 OR 15(d) OF THE SECURITIES EXCHANGE ACT OF 1934 |
For the transition period from to
Commission File No. 1-32913
VeraSun Energy Corporation
(Exact name of registrant as specified in its charter)
| South Dakota | 20-3430241 | |
| (State or other jurisdiction of | (IRS Employer | |
| incorporation or organization) | Identification Number) | |
| 100 22nd Avenue | ||
| Brookings, SD | 57006 | |
| (Address of principal executive offices) | (Zip Code) |
605-696-7200
(Registrant’s telephone number, including area code)
NONE
(Former name, former address and former fiscal year, if changed since last report)
(Registrant’s telephone number, including area code)
NONE
(Former name, former address and former fiscal year, if changed since last report)
Indicate by check mark whether the registrant (1) has filed all reports required to be filed by Section 13 or 15(d) of the Securities Exchange Act of 1934 during the preceding 12 months (or for such shorter period that the registrant was required to file such reports), and (2) has been subject to such filing requirements for the past 90 days.
Yesþ Noo
Indicate by check mark whether the registrant is a large accelerated filer, an accelerated filer, or a non-accelerated filer. See definition of “accelerated filer and large accelerated filer” in Rule 12b-2 of the Exchange Act. (Check one):
Large accelerated filero Accelerated filero Non-accelerated filerþ
Indicate by check mark whether the registrant is a shell company (as defined in Rule 12b-2 of the Exchange Act).
Yeso Noþ
The number of shares of Common Stock outstanding on July 27, 2007 was 78,288,737.
VERASUN ENERGY CORPORATION
JUNE 30, 2007
INDEX TO FORM 10-Q
JUNE 30, 2007
INDEX TO FORM 10-Q
| PAGE NO. | ||||||||
| 1 | ||||||||
| 2 | ||||||||
| 3 | ||||||||
| 4 | ||||||||
| 11 | ||||||||
| 21 | ||||||||
| 23 | ||||||||
| 23 | ||||||||
| 33 | ||||||||
| 33 | ||||||||
| 34 | ||||||||
| 35 | ||||||||
| 36 | ||||||||
| 302 Certification of Chief Executive Officer | ||||||||
| 302 Certification of Chief Financial Officer | ||||||||
| 906 Certification of Chief Executive Officer | ||||||||
| 906 Certification of Chief Financial Officer | ||||||||
i
Table of Contents
PART I. FINANCIAL INFORMATION
ITEM 1. FINANCIAL STATEMENTS
VERASUN ENERGY CORPORATION
CONDENSED CONSOLIDATED BALANCE SHEETS
(dollars in thousands, except per share data)
| June 30, 2007 | December 31, 2006 | |||||||
| (unaudited) | ||||||||
Assets | ||||||||
| Current Assets | ||||||||
| Cash and cash equivalents | $ | 414,428 | $ | 318,049 | ||||
| Receivables | 43,813 | 62,549 | ||||||
| Inventories | 76,969 | 39,049 | ||||||
| Prepaid expenses | 7,422 | 4,187 | ||||||
| Derivative financial instruments | 16,765 | 12,382 | ||||||
Total current assets | 559,397 | 436,216 | ||||||
| Restricted cash held in escrow | — | 44,267 | ||||||
| Designated cash and cash equivalents | 249,516 | — | ||||||
| Debt issuance costs, net | 16,458 | 5,685 | ||||||
| Goodwill | 6,129 | 6,129 | ||||||
| Other long-term assets | 722 | 480 | ||||||
| 272,825 | 56,561 | |||||||
| Property and equipment, net | 493,277 | 301,720 | ||||||
| $ | 1,325,499 | $ | 794,497 | |||||
Liabilities and Shareholders’ Equity | ||||||||
| Current Liabilities | ||||||||
| Current portion of deferred revenues | $ | 95 | $ | 96 | ||||
| Accounts payable | 64,334 | 36,391 | ||||||
| Accrued expenses | 8,984 | 2,961 | ||||||
| Derivative financial instruments | 21,924 | 11,331 | ||||||
| Deferred income taxes | 2,091 | 1,370 | ||||||
Total current liabilities | 97,428 | 52,149 | ||||||
| Long-term debt | 656,776 | 208,905 | ||||||
| Deferred revenues, less current portion | 1,567 | 1,613 | ||||||
| Deferred income taxes | 30,294 | 25,399 | ||||||
| 688,637 | 235,917 | |||||||
| Commitments and Contingencies | ||||||||
| Shareholders’ Equity | ||||||||
| Common stock, $0.01 par value; authorized 250,000,000 shares; 77,994,433 and 75,463,640 shares issued and outstanding as of June 30, 2007 and December 31, 2006, respectively | 780 | 755 | ||||||
| Additional paid-in capital | 434,848 | 417,049 | ||||||
| Retained earnings | 104,412 | 89,589 | ||||||
| Accumulated other comprehensive loss | (606 | ) | (962 | ) | ||||
| 539,434 | 506,431 | |||||||
| Total Liabilities and Shareholders’ Equity | $ | 1,325,499 | $ | 794,497 | ||||
See accompanying notes to condensed consolidated financial statements.
1
Table of Contents
VERASUN ENERGY CORPORATION
CONDENSED CONSOLIDATED STATEMENTS OF OPERATIONS
(dollars in thousands, except per share data)
(Unaudited)
| Three Months Ended June 30, | Six Months Ended June 30, | |||||||||||||||
| 2007 | 2006 | 2007 | 2006 | |||||||||||||
| Revenues: | ||||||||||||||||
| Net sales | $ | 168,768 | $ | 152,308 | $ | 312,629 | $ | 262,189 | ||||||||
| Other revenues, incentive income | 788 | 1,244 | 1,437 | 2,219 | ||||||||||||
Total revenues | 169,556 | 153,552 | 314,066 | 264,408 | ||||||||||||
| Cost of goods sold | 137,071 | 90,616 | 272,337 | 172,126 | ||||||||||||
Gross profit | 32,485 | 62,936 | 41,729 | 92,282 | ||||||||||||
| Selling, general and administrative expenses | 8,397 | 22,412 | 19,931 | 26,182 | ||||||||||||
Operating income | 24,088 | 40,524 | 21,798 | 66,100 | ||||||||||||
| Other income (expense): | ||||||||||||||||
| Interest expense, including change in fair value of convertible put warrant in 2006 | (6,179 | ) | (13,766 | ) | (7,931 | ) | (30,062 | ) | ||||||||
| Interest income | 5,362 | 2,302 | 8,907 | 3,970 | ||||||||||||
| Other income | 30 | 19 | 32 | 21 | ||||||||||||
| (787 | ) | (11,445 | ) | 1,008 | (26,071 | ) | ||||||||||
Income before income taxes | 23,301 | 29,079 | 22,806 | 40,029 | ||||||||||||
| Income tax provision | 8,165 | 9,526 | 7,982 | 17,741 | ||||||||||||
Net income | $ | 15,136 | $ | 19,553 | $ | 14,824 | $ | 22,288 | ||||||||
| Per Share data: | ||||||||||||||||
| Income per common share — Basic | $ | 0.20 | $ | 0.30 | $ | 0.19 | $ | 0.35 | ||||||||
| Basic weighted average number of common shares | 76,998,341 | 64,828,596 | 76,357,188 | 63,627,172 | ||||||||||||
| Income per common share — diluted | $ | 0.19 | $ | 0.29 | $ | 0.18 | $ | 0.33 | ||||||||
| Diluted weighted average number of common and common equivalent shares | 80,918,850 | 68,484,396 | 80,697,289 | 67,028,128 | ||||||||||||
See accompanying notes to condensed consolidated financial statements.
2
Table of Contents
VERASUN ENERGY CORPORATION
CONDENSED CONSOLIDATED STATEMENTS OF CASH FLOWS
(dollars in thousands, except per share data)
(Unaudited)
| Six Months Ended June 30, | ||||||||
| 2007 | 2006 | |||||||
| Cash Flows from Operating Activities | ||||||||
| Net income | $ | 14,824 | $ | 22,288 | ||||
| Adjustments to reconcile net income to net cash provided by operating activities provided by operating activities: | ||||||||
| Excess tax benefits from share-based payment arrangements | (6,865 | ) | — | |||||
| Change in derivative financial instruments | 6,756 | (3,331 | ) | |||||
| Depreciation | 6,080 | 4,746 | ||||||
| Deferred income taxes | 5,425 | 10,485 | ||||||
| Stock-based compensation expense | 2,679 | 19,709 | ||||||
| Amortization of debt issuance costs and debt discount | 730 | 649 | ||||||
| Accretion of deferred revenue | (48 | ) | (47 | ) | ||||
| (Gain) loss on disposal of equipment | (83 | ) | 10 | |||||
| Change in fair value of convertible put warrant | — | 19,670 | ||||||
| Changes in current assets and liabilities: | ||||||||
| (Increase) decrease in: | ||||||||
| Receivables | 18,697 | (16,548 | ) | |||||
| Inventories | (37,920 | ) | 2,392 | |||||
| Prepaid expenses | (3,235 | ) | 1,109 | |||||
| Increase (decrease) in: | ||||||||
| Accounts payable | 11,059 | (8,099 | ) | |||||
| Accrued expenses | 6,023 | 2,364 | ||||||
Net cash provided by operating activities | 24,122 | 55,397 | ||||||
| Cash Flows from Investing Activities | ||||||||
| Investment in designated cash and cash equivalents | (249,516 | ) | — | |||||
| Purchases of property and equipment | (129,551 | ) | (6,117 | ) | ||||
| Payment of deposits | (202 | ) | — | |||||
| Proceeds from sale of equipment | 6 | 838 | ||||||
Net cash used in investing activities | (379,263 | ) | (5,279 | ) | ||||
| Cash Flows from Financing Activities | ||||||||
| Proceeds from long-term debt | 447,750 | — | ||||||
| Debt issuance costs paid | (11,375 | ) | (1,044 | ) | ||||
| Proceeds from the issuance of 2,530,793 and 12,731,446 shares of common stock, respectively | 8,285 | 234,155 | ||||||
| Excess tax benefits from share-based payment arrangements | 6,865 | — | ||||||
| Costs of raising capital | (5 | ) | — | |||||
Net cash provided by financing activities | 451,520 | 233,111 | ||||||
Net increase in cash and cash equivalents | 96,379 | 283,229 | ||||||
| Cash and Cash Equivalents | ||||||||
| Beginning | 318,049 | 29,714 | ||||||
| Ending | $ | 414,428 | $ | 312,943 | ||||
See accompanying notes to condensed consolidated financial statements.
3
Table of Contents
VERASUN ENERGY CORPORATION
NOTES TO CONDENSED CONSOLIDATED FINANCIAL STATEMENTS (Unaudited)
(dollars in thousands, except per share data)
Note 1. Unaudited Interim Condensed Consolidated Financial Statements
The accompanying condensed consolidated balance sheet as of December 31, 2006 has been derived from audited consolidated financial statements. The unaudited interim condensed consolidated financial statements of VeraSun Energy Corporation and its subsidiaries reflect all adjustments consisting only of normal recurring adjustments that are, in the opinion of our management, necessary for a fair presentation of their consolidated financial position and results of operations and cash flows. The results for the three and six months ended June 30, 2007 are not necessarily indicative of the results that may be expected for a full fiscal year. Certain information and note disclosures normally included in annual consolidated financial statements prepared in accordance with accounting principles generally accepted in the United States of America have been condensed or omitted pursuant to the rules and regulations of the Securities and Exchange Commission, although the Company believes that the disclosures made are adequate to make the information not misleading. These condensed consolidated financial statements should be read in conjunction with the audited consolidated financial statements and notes thereto included in our annual report for the year ended December 31, 2006 filed on Form 10-K with the Securities and Exchange Commission. VeraSun Energy Corporation and its subsidiaries are collectively referred to as “VeraSun,” the “Company,” “we,” “us” and “our”.
Nature of Business
VeraSun is one of the largest ethanol producers in the United States based on production capacity, according to the Renewable Fuels Association (“RFA”). We focus primarily on the production and sale of ethanol and its co-products.
Principles of Consolidation
The accompanying condensed consolidated financial statements include the accounts of VeraSun Energy Corporation and its subsidiaries. All intercompany balances and transactions have been eliminated in consolidation.
Reclassifications
The accompanying condensed consolidated financial statements contain certain reclassifications to conform to the presentation used in the current period.
Revenue Recognition
We recognize revenue when all of the following criteria are satisfied: persuasive evidence of an arrangement exists; risk of loss and title transfer to the customer; the price is fixed and determinable; and collectibility is reasonably assured. Sales and related costs of goods sold are included in income upon delivery to our customers at terminals or other locations. Generally, there are no formal customer acceptance requirements or further obligations relating to our products. If such requirements or obligations exist, we recognize the related revenues when the requirements are completed and the obligations are fulfilled. Shipping and handling charges to customers are included in revenue.
We receive incentives to produce ethanol from state and federal entities. In accordance with the terms of these arrangements, incentive income is recognized when we produce ethanol or blend ethanol with gasoline to produce E85.
Use of Estimates
The preparation of financial statements in conformity with U.S. generally accepted accounting principles (“GAAP”) requires management to make estimates and assumptions that affect (i) the reported amounts of assets and liabilities, (ii) the disclosure of contingent assets and liabilities at the date of the financial statements, and (iii) the reported amounts of revenues and expenses during the reporting period.
We use estimates and assumptions in accounting for the following significant matters, among others:
| • | Allowances for doubtful accounts |
4
Table of Contents
VERASUN ENERGY CORPORATION
NOTES TO CONDENSED CONSOLIDATED FINANCIAL STATEMENTS (Unaudited) (Continued)
(dollars in thousands, except per share data)
| • | Inventory valuation and allowances | ||
| • | Fair value of derivative instruments and related hedged items | ||
| • | Useful lives of property, equipment and intangible assets | ||
| • | Asset retirement obligations | ||
| • | Long-lived and intangible asset impairments | ||
| • | Contingencies | ||
| • | Fair value of options and restricted stock granted under our stock-based compensation plans | ||
| • | Tax related items |
Actual results may differ from previously estimated amounts, and such differences may be material to our consolidated financial statements. We periodically review estimates and assumptions, and the effects of revisions are reflected in the period in which the revision is made. The revisions to estimates or assumptions during the periods presented in the accompanying condensed consolidated financial statements were not considered to be significant.
Designated Cash and Cash Equivalents
In connection with our sale of $450 million of senior notes in April, 2007 (see Note 8) we stated our intent to use an aggregate of $280 million of the proceeds to finance the costs of construction and startup of our proposed ethanol production facility near Reynolds, Indiana and the costs to purchase and install corn oil extraction equipment at our ethanol production facilities. The $249,516 of designated cash represents the balance of those proceeds after deduction of cash spent to date on those two projects. That balance is not subject to any escrow arrangement, and our plans with respect to those projects and the designation of such cash may change in future periods.
Recent Events
On April 1, 2007, we began marketing and selling our ethanol to customers directly. In connection with this activity, we have established our own marketing, transportation and storage infrastructure. We lease 900 tanker railcars and have contracted with storage depots near our customers and at our strategic locations to ensure efficient delivery of our ethanol. We have also hired a marketing and sales force, as well as logistical and other operational personnel to staff our distribution activities. The termination of our relationship with Aventine Renewable Energy Holdings, Inc. (“Aventine”), which previously provided marketing and sales services, changed our customer base. For the six months ended June 30, 2007, we had two customers that each exceeded 10% of total sales and on a combined basis represented 49.5% of total sales. For the three months ended June 30, 2007, we had four customers that each exceeded 10% of total sales and on a combined basis represented 59.4% of total sales.
Our Charles City, Iowa facility began start up operations as of the end of first quarter 2007. The facility is now operating at full capacity. Costs incurred during its start-up period were expensed as incurred.
On July 22, 2007, we entered into an agreement to acquire a company with three ethanol production facilities and two development sites. See Note 9 below.
5
Table of Contents
VERASUN ENERGY CORPORATION
NOTES TO CONDENSED CONSOLIDATED FINANCIAL STATEMENTS (Unaudited) (Continued)
(dollars in thousands, except per share data)
Note 2. Inventories
A summary of inventories is as follows:
| June 30 | December 31, | |||||||
| 2007 | 2006 | |||||||
| (unaudited) | ||||||||
| Ethanol | $ | 37,415 | $ | 3,339 | ||||
| Corn | 23,201 | 24,492 | ||||||
| Supplies | 9,700 | 7,084 | ||||||
| Work in process | 3,445 | 2,489 | ||||||
| Chemicals | 2,312 | 1,214 | ||||||
| Distillers grains | 896 | 431 | ||||||
| $ | 76,969 | $ | 39,049 | |||||
6
Table of Contents
VERASUN ENERGY CORPORATION
NOTES TO CONDENSED CONSOLIDATED FINANCIAL STATEMENTS (Unaudited) (Continued)
(dollars in thousands, except per share data)
Note 3. Earnings Per Common Share
Basic earnings per common share (“EPS”) is computed by dividing net income available to common shareholders by the weighted average number of common shares outstanding for the period. Diluted EPS reflects the potential dilution that would occur, using the treasury stock method, if securities or other obligations to issue common stock were exercised or converted into common stock or resulted in the issuance of common stock that shared in the Company’s earnings, unless the effect is antidilutive.
A reconciliation of net income and common stock share amounts used in the calculation of basic and diluted EPS for the three months ended June 30, 2007 and 2006 follows:
| Weighted | ||||||||||||
| Average | ||||||||||||
| Net | Shares | Per Share | ||||||||||
| Income | Outstanding | Amount | ||||||||||
| 2007: | ||||||||||||
| Basic EPS | $ | 15,136 | 76,998,341 | $ | 0.20 | |||||||
| Effects of dilutive securities: | ||||||||||||
| Stock options, restricted stock and warrants — antidilutive | — | 3,920,509 | (0.01 | ) | ||||||||
| Diluted EPS | $ | 15,136 | 80,918,850 | $ | 0.19 | |||||||
| 2006: | ||||||||||||
| Basic EPS | $ | 19,553 | 64,828,596 | $ | 0.30 | |||||||
| Effects of dilutive securities: | ||||||||||||
| Exercise of stock options, restricted stock and warrants | — | 3,655,800 | (0.01 | ) | ||||||||
| Diluted EPS | $ | 19,553 | 68,484,396 | $ | 0.29 | |||||||
A reconciliation of net income and common stock share amounts used in the calculation of basic and diluted EPS for the six months ended June 30, 2007 and 2006 follows:
| Weighted | ||||||||||||
| Average | ||||||||||||
| Net | Shares | Per Share | ||||||||||
| Income | Outstanding | Amount | ||||||||||
| 2007: | ||||||||||||
| Basic EPS | $ | 14,824 | 76,357,188 | $ | 0.19 | |||||||
| Effects of dilutive securities: | ||||||||||||
| Stock options, restricted stock and warrants — antidilutive | — | 4,340,101 | (0.01 | ) | ||||||||
| Diluted EPS | $ | 14,824 | 80,697,289 | $ | 0.18 | |||||||
| 2006: | ||||||||||||
| Basic EPS | $ | 22,288 | 63,627,172 | $ | 0.35 | |||||||
| Effects of dilutive securities: | ||||||||||||
| Exercise of stock options, restricted stock and warrants | — | 3,400,956 | (0.02 | ) | ||||||||
| Diluted EPS | $ | 22,288 | 67,028,128 | $ | 0.33 | |||||||
Performance-based stock option awards for 620,041 shares at a weighted average exercise prices of $2.08 per share in the three months ended June 30, 2006 were not included in the computation of diluted EPS since the accounting “grant date” had not yet occurred.
7
Table of Contents
VERASUN ENERGY CORPORATION
NOTES TO CONDENSED CONSOLIDATED FINANCIAL STATEMENTS (Unaudited) (Continued)
(dollars in thousands, except per share data)
NOTES TO CONDENSED CONSOLIDATED FINANCIAL STATEMENTS (Unaudited) (Continued)
(dollars in thousands, except per share data)
Note 4. Comprehensive Income
The components of comprehensive income, net of income tax, are as follows:
| Three Months Ended June 30, | Six Months Ended June 30, | |||||||||||||||
| 2007 | 2006 | 2007 | 2006 | |||||||||||||
| Net income | $ | 15,136 | $ | 19,553 | $ | 14,824 | $ | 22,288 | ||||||||
| Unrealized gain (loss) from hedging activities | (606 | ) | (2,188 | ) | 356 | (2,797 | ) | |||||||||
| Comprehensive income | $ | 14,530 | $ | 17,365 | $ | 15,180 | $ | 19,491 | ||||||||
Note 5. Business Segment Information
Statement of Financial Accounting Standards (“SFAS”) No. 131,“Disclosure about Segments of an Enterprise and Related Information”(“SFAS 131”), establishes standards for reporting information about operating segments in annual financial statements and requires selected information about operating segments in financial reports issued to shareholders. It also establishes standards for related disclosures about products and services, geographic areas and major customers. Operating segments are defined as components of an enterprise for which separate financial information is available that is evaluated regularly by the chief operating decision maker or decision making group in deciding how to allocate resources and in assessing performance.
In connection with the termination of our marketing arrangement with Aventine on March 31, 2007, we re-evaluated our operating segments based on the application of SFAS 131 and have identified one reportable business segment, the manufacture and marketing of fuel-grade ethanol and the co-products of the ethanol production process as all of our operating segments meet the requirements of aggregation. Our chief operating decision maker reviews financial information presented on a consolidated basis, accompanied by disaggregated information about revenue and certain expenses for purposes of assessing financial performance and making operating decisions. Accordingly, we consider ourselves to be operating in a single industry segment. Previously, we had two reportable segments, ethanol production and other.
8
Table of Contents
VERASUN ENERGY CORPORATION
NOTES TO CONDENSED CONSOLIDATED FINANCIAL STATEMENTS (Unaudited) (Continued)
(dollars in thousands, except per share data)
NOTES TO CONDENSED CONSOLIDATED FINANCIAL STATEMENTS (Unaudited) (Continued)
(dollars in thousands, except per share data)
Note 6. Material Commitments
In September 2006, we entered into an agreement for construction of three ethanol production facilities. We began construction of two of these facilities, Hartley, Iowa and Welcome, Minnesota in the fourth quarter of 2006 and broke ground for a third facility, Reynolds, Indiana, in April 2007. We had acquired the rights to land for the Reynolds facility from an affiliate of American Milling, LP. In connection with acquiring the land rights, we issued 150,000 shares of our common stock in March 2007 and an additional 150,000 shares in June 2007 when required air permits were obtained.
We are party to contracts with consultants, independent contractors and other service providers in which we have agreed to indemnify such parties against certain liabilities. Based on historical experience and our assessment of the likelihood that such parties will make claims against us, we believe these indemnification obligations are not material. As of the date of this report, we are not aware of any claims against us.
We believe we are in compliance with applicable environmental laws and regulations and that our environmental controls are adequate to address existing regulatory requirements.
Note 7. Income Tax
Recently issued accounting standards:We adopted the provisions of Financial Accounting Standards Board Interpretation 48,Accounting for Uncertainty in Income Taxes, on January 1, 2007. Previously, we had accounted for tax contingencies in accordance with SFAS No 5,Accounting for Contingencies. As required by Interpretation 48, which clarifies SFAS No 109,Accounting for Income Taxes, we recognize the financial statement benefit of a tax position only after determining that the relevant tax authority would more likely than not sustain the position following an audit. For tax positions meeting this standard, the amount recognized in the financial statements is the largest benefit that has a greater than 50 percent likelihood of being realized upon ultimate settlement with the relevant tax authority. At the adoption date, we applied Interpretation 48 to all tax positions for which the statute of limitations remained open. We recognized no material adjustment in the liability for unrecognized income tax benefits as a result of implementing Interpretation 48.
The amount of unrecognized tax benefits as of January 1, 2007 was zero. There have been no material changes in unrecognized tax benefits since January 1, 2007.
We are subject to income taxes in the U.S. federal jurisdiction and various states jurisdictions. Tax regulations within each jurisdiction are subject to the interpretation of the related tax laws and regulations and require significant judgment to apply. With few exceptions, we are no longer subject to the U.S. federal, state or local income tax examinations by tax authorities for the years before 2003.
We are currently under examination by the Internal Revenue Service for tax year 2004 and the short tax year through September 30, 2005. We expect these examinations to be concluded and settled in the next 12 months. We have — not recorded any material adjustment in the liability for unrecognized income tax benefits related to this audit.
We recognize interest accrued related to unrecognized tax benefits in interest expense and penalties in operating expenses for all periods presented. We did not accrue any amounts for the payment of interest and penalties at January 1, 2007. Subsequent changes to accrued interest and penalties are not applicable.
9
Table of Contents
Note 8. Long-Term Debt
VERASUN ENERGY CORPORATION
NOTES TO CONDENSED CONSOLIDATED FINANCIAL STATEMENTS (Unaudited) (Continued)
(dollars in thousands, except per share data)
NOTES TO CONDENSED CONSOLIDATED FINANCIAL STATEMENTS (Unaudited) (Continued)
(dollars in thousands, except per share data)
The following table summarizes our long-term debt at the dates indicated:
| As of June 30, 2007 | As of December 31, 2006 | |||||||
| (unaudited) | ||||||||
| Existing credit facility | $ | — | $ | — | ||||
| 9 7/8% senior secured notes due 2012 | 210,000 | 210,000 | ||||||
| 9 3/8% senior notes due 2017 | 450,000 | — | ||||||
| Aggregate principal amount | 660,000 | 210,000 | ||||||
| Unamortized discount | (3,224 | ) | (1,095 | ) | ||||
| Total | $ | 656,776 | $ | 208,905 | ||||
In April 2007, we issued $450 million aggregate principal amount of Senior Notes due 2017 at 99.5%. The notes bear interest at a fixed rate of 9.375% and are recorded net of unamortized debt discount of $2.3 million. The notes mature in full on June 1, 2017. They may be redeemed at any time prior to June 1, 2012 by paying a make-whole premium and may be redeemed at any time after June 1, 2012 at specified redemption prices. Interest is paid on a semi-annual basis on June 1 and December 1 of each year beginning on December 1, 2007. The proceeds have been or are being used: to finance costs of construction and startup of the production facility near Reynolds, Indiana; to finance costs to purchase and install corn oil extraction equipment at certain facilities; to pay estimated offering fees and expenses ; and for general corporate purposes.
The indenture governing the 2017 Notes contains restrictive covenants which, among other things, limit our ability (subject to exceptions) (a) to make restricted payments (which limits redemption of capital stock, voluntary debt repayments, and investments); (b) incur additional debt; (c) engage in transactions with shareholders and affiliates; (d) pay dividends and other payments restrictions affecting subsidiaries; (e) incur liens on assets; (f) sell assets; and (g) engage in unrelated businesses.
Under the registration rights agreement that was executed in connection with this debt offering, we agree to: (a) cause the exchange offer to be completed within 365 days after the notes are issued and (b) file a shelf registration statement within 365 days after the notes are issued for the resale of the notes if we cannot effect an exchange offer and in some other circumstances. If we have not effected the exchange offer for the Notes or caused a shelf registration statement with respect to resale of the notes to be declared effective on or prior to such date that is 365 days after the closing date, the annual interest rate will increase by 0.25% per annum and by an additional 0.25% for each subsequent 90-day period, up to a maximum of 1.0% per annum, until all registration defaults have been cured.
Note 9. Subsequent Event
On July 22, 2007, we entered into a Unit Purchase Agreement (“the Unit Purchase Agreement”) with ASAlliances Biofuels, LLC (“ASAlliances”). The Unit Purchase Agreement provides for our purchase by the Company of all of the equity interests in ASA OpCo Holdings, LLC from ASAlliances for an aggregate purchase price of $725 million, comprised of the issuance of 13,801,384 shares of our common stock (valued at $200 million), the payment of $250 million of cash and $275 million in project financing. ASA OpCo Holdings, LLC owns companies with three biorefineries with an expected production capacity of 330 MMGY and two developmental sites. We also agreed to register, within 180 days of the acquisition date, the shares to be issued in the transaction . The parties have made customary representations, warranties and covenants in the Unit Purchase Agreement. The sale and purchase is subject to clearance under the Hart-Scott-Radino Antitrust Improvements Act as well as other customary closing conditions.
10
Table of Contents
ITEM 2. MANAGEMENT’S DISCUSSION AND ANALYSIS OF FINANCIAL CONDITION AND RESULTS OF OPERATIONS
FORWARD LOOKING STATEMENTS
The following information should be read in conjunction with the condensed consolidated financial statements and notes thereto included in Part I, Item 1 of this quarterly report and the audited consolidated financial statements and notes thereto contained in the Company’s annual report on Form 10-K filed with the Securities and Exchange Commission on March 29, 2007. VeraSun Energy Corporation and its subsidiaries are collectively referred to as the “Company,” “we,” “us” and “our”.
This management’s discussion and analysis of financial condition and results of operations (“MD&A”) contains forward-looking statements which are subject to risks and uncertainties. Many factors could cause actual results to differ materially from those projected in forward-looking statements, including the risks described in Part II, Item 1A of this quarterly report. These forward-looking statements include any statements related to our expectations regarding future performance or conditions, including construction of new facilities, the production volumes of those facilities, anticipated costs to construct new facilities, completion of pending or future acquisitions, development of alternative technologies, future marketing arrangements and the adequacy of anticipated sources of cash to fund our future capital requirements. Our actual results may differ materially from those discussed in the forward-looking statements. Words such as “believes,” “anticipates,” “expects,” “intends,” “plans” and similar expressions are intended to identify forward-looking statements, but are not the exclusive means of identifying such statements. We do not undertake any duty to update forward-looking statements after the date they are made or to conform them to actual results or to changes in circumstances or expectations.
Business Overview
VeraSun is one of the largest ethanol producers in the United States based on production capacity, according to the Renewable Fuels Association (“RFA”). We focus primarily on the production and sale of ethanol and its co-products. This focus has enabled us to significantly grow our ethanol production capacity and to work with automakers, fuel distributors, trade associations and consumers to increase the demand for ethanol. As an industry leader, we play an active role in developments within the renewable fuels industry.
Ethanol is a type of alcohol produced in the U.S. principally from corn. Ethanol is primarily used as a blend component in the U.S. gasoline fuel market, which approximated 142 billion gallons in 2006 according to the Energy Information Administration (“EIA”). Refiners and marketers have historically blended ethanol with gasoline to increase octane and reduce tailpipe emissions. The ethanol industry has grown significantly over the last few years, expanding production capacity at a compounded annual growth rate of approximately 22% from 2000 to 2006. We believe the ethanol market will continue to grow as a result of ethanol’s cleaner burning characteristics, a shortage of domestic petroleum refining capacity, geopolitical concerns, and federally mandated renewable fuel usage. We also believe that E85, a fuel blend composed primarily of 85% ethanol, may become increasingly important as an alternative to unleaded gasoline.
We own and operate three of the largest ethanol production facilities in the U.S., with a combined ethanol production capacity of 340 million gallons per year, or “MMGY.” As of July 27, 2007, our ethanol production capacity represented approximately 5.3% of the total ethanol production capacity in the U.S., according to the RFA. Upon completion of our facilities under construction and the closing of our pending acquisition of ASA OpCo Holdings, LLC, we expect to have 560 MMGY of production capacity by the end of 2007 and one billion gallons per year of capacity by the end of 2008. See Note 9 of Notes to Condensed Consolidated Financial Statements in Part I of this quarterly report.
Our facilities are designed to operate on a continuous basis and use current dry-milling technology, a production process that results in increased ethanol yield and reduced capital costs compared to wet-milling facilities. In addition to producing ethanol, we produce and sell wet and dry distillers grains as ethanol co-products, which serve to partially offset our corn costs. In 2006, we produced approximately 226.3 million gallons of fuel ethanol and 492,000 tons of distillers grains.
Our facility in Aurora, South Dakota commenced operations in December 2003 and our facility in Fort Dodge, Iowa commenced operations in October 2005. We commenced startup operations at our facility in Charles City, Iowa as of the end of the first quarter of 2007. Construction of our facilities in Hartley, Iowa, and Welcome, Minnesota commenced in late 2006, and we expect those facilities to begin production by the end of the first quarter of 2008. We also broke ground for a facility in Reynolds, Indiana in April 2007 and expect to begin operations there by the end of 2008.
11
Table of Contents
We re-evaluated our operating segments based on the application of SFAS 131 and have identified one reportable business segment, the manufacture and marketing of fuel-grade ethanol and the co-products of the ethanol production process as all of our operating segments meet the requirements of aggregation. Previously, we had two reportable segments, ethanol production and other.
Executive Summary
Highlights for the six months ended June 30, 2007 are as follows:
| • | Total revenues increased 18.8%, or $49.7 million compared to the 2006 comparable period. | ||
| • | Cash flows provided by operating activities were $24.1 million. | ||
| • | Net income was $14.8 million compared to net income of $22.3 million for the 2006 period. | ||
| • | Ethanol shipped was 123.6 million gallons, an increase of 12.0 million gallons or 10.7%, from the 2006 period. | ||
| • | Production volume was 140.9 million gallons, up 30.2 million gallons or 27.3% compared to the 2006 period. | ||
| • | Earnings per diluted share was $0.18 for the six month period ended June 30, 2007 compared to $0.33 for the comparable 2006 period. |
Components of Revenues and Expenses
Total revenues.Our primary source of revenue is the sale of ethanol produced at our Aurora, Fort Dodge and Charles City facilities. Our principal sources of revenue are:
| • | the sale of ethanol; | ||
| • | the sale of distillers grains, which are co-products of the ethanol production process; and | ||
| • | the sale of ethanol blended VE85tm fuel. |
The selling prices for our ethanol are largely determined by the market demand for ethanol, which, in turn, is influenced by the industry factors described elsewhere in this report.
Cost of goods sold and gross profit.Our gross profit is derived from our total revenues less our cost of goods sold. Our cost of goods sold is mainly affected by the cost of corn, natural gas and transportation. Corn is our most significant raw material cost. The price of corn is influenced by weather conditions and other factors affecting crop yields, farmer planting decisions and general economic, market and regulatory factors. These factors include government policies and subsidies with respect to agriculture and international trade, and global and local demand and supply. The spot price of corn tends to rise during the spring planting season and tends to decrease during the fall harvest. We purchase natural gas to power steam generation in our ethanol production process and to dry our distillers grains. Natural gas represents our second largest cost. Cost of goods sold also includes net gain or loss from derivatives relating to corn and natural gas. Transportation expense represents the third major component of our cost of goods sold. Transportation expense includes freight and shipping of our ethanol and co-products, as well as costs incurred in storing ethanol at destination terminals.
12
Table of Contents
Selling, general and administrative expenses.Selling, general and administrative expenses consist of salaries and benefits paid to our administrative employees including stock-based compensation, taxes, expenses relating to third-party services, insurance, travel, marketing and other expenses. Other expenses include education and training, marketing, travel, corporate donations and other miscellaneous overhead costs. We expect selling, general and administrative expenses to increase significantly in connection with our expansion plans, which will require us to hire more personnel at our additional facilities.
Other income (expense).Other income (expense) includes the interest on our long-term debt and notes payable, the change in fair value of a put warrant (in the 2006 periods), debt extinguishment costs and the amortization of the related fees to execute required financing agreements. We expect interest expense, net of interest capitalized as part of new plant construction, to increase significantly as a result of our issuance of additional debt in the second quarter of 2007.
Results of Operations
The following table sets forth, for the periods presented, revenues, expenses and net income, as well as the percentage relationship to total revenues of specified items in our condensed consolidated statement of operations:
| Three Months Ended June 30, | Six Months Ended June 30, | |||||||||||||||||||||||||||||||
| 2007 | 2006 | 2007 | 2006 | |||||||||||||||||||||||||||||
| (unaudited) | ||||||||||||||||||||||||||||||||
| (dollars in thousands) | (dollars in thousands) | |||||||||||||||||||||||||||||||
| Total revenues | $ | 169,556 | 100.0 | % | $ | 153,552 | 100.0 | % | $ | 314,066 | 100.0 | % | $ | 264,408 | 100.0 | % | ||||||||||||||||
| Cost of goods sold | 137,071 | 80.8 | 90,616 | 59.0 | 272,337 | 86.7 | 172,126 | 65.1 | ||||||||||||||||||||||||
| Gross profit | 32,485 | 19.2 | 62,936 | 41.0 | 41,729 | 13.3 | 92,282 | 34.9 | ||||||||||||||||||||||||
| Selling, general and administrative expenses | 8,397 | 5.0 | 22,412 | 14.6 | 19,931 | 6.3 | 26,182 | 9.9 | ||||||||||||||||||||||||
| Operating income | 24,088 | 14.2 | 40,524 | 26.4 | 21,798 | 7.0 | 66,100 | 25.0 | ||||||||||||||||||||||||
| Other income (expense), net | (787 | ) | (0.5 | ) | (11,445 | ) | (7.5 | ) | 1,008 | 0.3 | (26,071 | ) | (9.9 | ) | ||||||||||||||||||
| Income before income taxes | 23,301 | 13.7 | 29,079 | 18.9 | 22,806 | 7.3 | 40,029 | 15.1 | ||||||||||||||||||||||||
| Income tax expense | 8,165 | 4.8 | 9,526 | 6.2 | 7,982 | 2.5 | 17,741 | 6.7 | ||||||||||||||||||||||||
| Net income | $ | 15,136 | 8.9 | % | $ | 19,553 | 12.7 | % | $ | 14,824 | 4.8 | % | $ | 22,288 | 8.4 | % | ||||||||||||||||
The following table sets forth other key data for the periods presented (in thousands, except per unit data):
| Three Months Ended June 30, | Six Months Ended June 30, | |||||||||||||||
| 2007 | 2006 | 2007 | 2006 | |||||||||||||
Operating data: | ||||||||||||||||
| Ethanol sold (gallons) (1) | 63,368 | 57,104 | 123,579 | 111,585 | ||||||||||||
| Average gross price of ethanol sold (dollars per gallon) | $ | 2.21 | $ | 2.39 | $ | 2.15 | $ | 2.09 | ||||||||
| Average corn cost per bushel | 3.62 | 2.17 | 3.77 | 2.02 | ||||||||||||
| Average natural gas cost per MMBTU | 7.59 | 7.75 | 7.85 | 8.69 | ||||||||||||
| Average dry distillers grains gross price per ton | 96 | 83 | 93 | 84 | ||||||||||||
Other financial data: | ||||||||||||||||
| EBITDA (2) | $ | 33,027 | $ | 45,227 | $ | 36,817 | $ | 74,837 | ||||||||
| Net cash flows provided by operating activities | 4,357 | 37,996 | 24,122 | 55,397 | ||||||||||||
| (1) | Excludes ethanol sold in VE85™ sales. | |
| (2) | EBITDA is defined as earnings before interest expense, income tax expense, depreciation and amortization. Amortization of debt issuance costs and debt discount are included in interest expense. |
13
Table of Contents
Non-GAAP Financial Measures
We believe that earnings before income taxes, depreciation and amortization, or EBITDA, is useful to investors and management in evaluating our operating performance in relation to other companies in our industry because the calculation of EBITDA generally eliminates the effects of financings and income taxes, which items may vary for different companies for reasons unrelated to overall operating performance. EBITDA is a non-GAAP financial measure and has limitations as an analytical tool, and you should not consider it in isolation or as a substitute for net income or any other measure of performance under GAAP, or to cash flows from operating, investing or financing activities as a measure of liquidity. Some of the limitations of EBITDA are:
| • | EBITDA does not reflect our cash used for capital expenditures; | ||
| • | Although depreciation and amortization are non-cash charges, the assets being depreciated or amortized often will have to be replaced and EBITDA does not reflect the cash requirements for replacements; | ||
| • | EBITDA does not reflect changes in, or cash requirements for, our working capital requirements; | ||
| • | EBITDA does not reflect the cash necessary to make payments of interest or principal on our indebtedness; and | ||
| • | EBITDA includes non-recurring payments to us which are reflected in other income. |
We compensate for these limitations by relying on our GAAP results, as well as on our EBITDA.
The following table reconciles our EBITDA to net income for the periods presented (dollars in thousands):
| Three Months Ended June 30, | Six Months Ended June 30, | |||||||||||||||
| 2007 | 2006 | 2007 | 2006 | |||||||||||||
| Net income | $ | 15,136 | $ | 19,553 | $ | 14,824 | $ | 22,288 | ||||||||
| Depreciation | 3,547 | 2,382 | 6,080 | 4,746 | ||||||||||||
| Interest expense | 6,179 | 13,766 | 7,931 | 30,062 | ||||||||||||
| Income tax expense | 8,165 | 9,526 | 7,982 | 17,741 | ||||||||||||
| EBITDA | $ | 33,027 | $ | 45,227 | $ | 36,817 | $ | 74,837 | ||||||||
Three Months Ended June 30, 2007 Compared to Three Months Ended June 30, 2006
Total revenues.Total revenues, which includes revenue from the sale of ethanol, distillers grains and VE85™, increased by $16.0 million, or 10.4%, to $169.6 million for the three months ended June 30, 2007 from $153.5 million for the three months ended June 30, 2006. The increase in total revenues was primarily the result of an 11.0% increase in ethanol volume sold partially offset by a decrease in average ethanol prices of $0.18 per gallon, or 7.6%, compared to the three months ended June 30, 2006. Ethanol production increased by 24.7 million gallons, or 43.6%, as a result of the added capacity from bringing the Charles City, Iowa facility on-line in April 2007.
Net sales from ethanol increased $6.3 million, or 4.6%, to $142.3 million for the three months ended June 30, 2007 from $136.0 million for the three months ended June 30, 2006. The impact of increased volume, primarily from the additional Charles City capacity, was $15.0 million partially offset by an $8.7 million reduction due to lower prices. The average price of ethanol sold was $2.21 per gallon for the three months ended June 30, 2007 compared to $2.39 per gallon for the three months ended June 30, 2006.
The net loss from derivatives included in net sales was $1.0 million and $1.9 million for the three months ended June 30, 2007 and 2006, respectively.
Net sales from co-products increased $8.5 million, or 60.3%, to $22.5 million for the three months ended June 30, 2007 from $14.0 million for the three months ended June 30, 2006. The impact of increased volume from the additional Charles City capacity was $5.7 million and the impact of higher prices was $2.8 million.
Net sales of VE85TM , our branded E85 product, increased $1.7 million to $4.0 million for the three months ended June 30, 2007 from $2.3 million for the three months ended June 30, 2006, primarily due to an increase in the number of retail outlets selling our product.
14
Table of Contents
Cost of goods sold and gross profit.Gross profit decreased $30.5 million to $32.5 million for the three months ended June 30, 2007 from $62.9 million for the three months ended June 30, 2006. The decrease in gross profit was primarily due to higher corn costs, partially offset by an increase in ethanol volume produced in the 2007 period compared to the 2006 period. Results for the full year 2007 are also expected to be adversely affected by these relatively higher corn costs.
Corn costs increased $38.7 million to $81.7 million for the three months ended June 30, 2007 from $43.0 million for the three months ended June 30, 2006. Corn costs represented 59.6% of our cost of goods sold before taking into account our co-product sales and 43.2% of our cost of goods sold after taking into account co-product sales for the three months ended June 30, 2007, compared to 47.7% of our cost of goods sold before taking into account our co-product sales and 32.1% of our cost of goods sold after taking into account co-product sales for the three months ended June 30, 2006.
The increase in total corn costs in the 2007 period was primarily driven by an increase in cash corn prices compared to the 2006 period. In addition, our 2007 corn costs included mark-to-market gain of $5.4 million for derivatives relating to future deliveries of corn. We had recorded a mark-to-market loss of $2.7 million in the 2006 period, resulting in an $8.1 million decrease in corn costs between the periods as a result of these mark-to-market adjustments.
The net gain from derivatives included in cost of goods sold was $4.9 million for the three months ended June 30, 2007 compared to a net loss of $3.0 million for the three months ended June 30, 2006. The increase was primarily due to the mark-to-market adjustment described above. We mark all exchange traded corn futures contracts to market through costs of goods sold.
Natural gas costs increased $0.9 million to $14.4 million for the three months ended June 30, 2007 from $13.5 million for the three months ended June 30, 2006, and accounted for 10.5% of our cost of goods sold for the three months ended June 30, 2007 compared to 15.0% of our cost of goods sold for the three months ended June 30, 2006. The increase in natural gas costs was attributable to an increase in our production compared to the same period in 2006, partially offset by a decrease in natural gas prices per million British Thermal Units, or MMBTU in the 2007 period.
Transportation expense increased $0.2 million to $14.1 million for the three months ended June 30, 2007 from $13.9 million for the three months ended June 30, 2006, primarily due to the termination of our marketing agreement with Aventine, additional volume of ethanol and co-products shipped, and increased rail rates in the 2007 period. Transportation expense accounted for 10.3% of our cost of goods sold for the three months ended June 30, 2007 compared to 15.4% of our cost of goods sold for the three months ended June 30, 2006.
Labor and manufacturing overhead costs increased $1.5 million to $10.2 million for the three months ended June 30, 2007 from $8.7 million for the three months ended June 30, 2006. The increase was primarily due to additional production at our Charles City, Iowa facility.
Selling, general and administrative expenses.Selling, general and administrative expenses decreased $14.0 million to $8.4 million for the three months ended June 30, 2007 from $22.4 million for the three months ended June 30, 2006. The decrease was primarily the result of a charge to stock compensation expense of $16.3 million in the 2006 period in connection with our initial public offering, or IPO, partially offset by increased management and administrative costs in the 2007 period to support our growth and public company status.
Other income (expense).Interest expense decreased $7.6 million to $6.2 million for the three months ended June 30, 2007, compared to $13.8 million for the three months ended June 30, 2006. Interest expense in the 2006 period included a charge of $8.7 million relating to a warrant that was fully exercised in connection with our IPO.
Interest income increased $3.1 million to $5.4 million for the three months ended June 30, 2007, compared to $2.3 million for the three months ended June 30, 2006. The increase was primarily attributable to the interest on funds received from our IPO and issuance of additional debt.
Income taxes.The income tax expense was $8.2 million for the three months ended June 30, 2007, versus income tax expense of $9.5 million for the three months ended June 30, 2006. The effective tax rate for the three months ended June 30, 2007 was 35.0%, compared to 32.8% for the three months ended June 30, 2006. The increase in effective tax rate was due to an increase in non-deductible stock compensation in 2007.
15
Table of Contents
Six Months Ended June 30, 2007 Compared to Six Months Ended June 30, 2006
Total revenues.Total revenues, which includes revenue from the sale of ethanol, distillers grains and VE85™, increased by $49.7 million, or 18.8%, to $314.1 million for the six months ended June 30, 2007 from $264.4 million for the six months ended June 30, 2006. The increase in total revenues was primarily the result of a 10.7% increase in ethanol volume sold and an increase in average ethanol prices of $0.07 per gallon, or 3.3%, compared to the six months ended June 30, 2006. Ethanol production increased by 30.2 million gallons, or 27.3%, as a result of the added capacity from bringing the Charles City, Iowa facility on-line in April 2007.
Net sales from ethanol increased $36.1 million, or 15.6%, to $267.8 million for the six months ended June 30, 2007 from $231.7 million for the six months ended June 30, 2006. The impact of increased volume, primarily from the additional Charles City capacity was $25.0 million and the impact from higher prices was $11.1 million. The average price of ethanol sold was $2.15 per gallon for the six months ended June 30, 2007 compared to $2.09 per gallon for the six months ended June 30, 2006.
The net loss from derivatives included in net sales was $1.0 million for the six months ended June 30, 2007 compared to a net loss of $1.4 million for the six months ended June 30, 2006.
Net sales from co-products increased $11.4 million, or 41.4%, to $39.0 million for the six months ended June 30, 2007 from $27.6 million for the six months ended June 30, 2006. Co-product sales increased $7.4 million primarily as a result of the additional production volume from the Charles City Facility and $4.0 million due to an increase in the average price per ton in the 2007 period.
Net sales of VE85TM, our branded E85 product, increased $2.9 million to $5.9 million for the six months ended June 30, 2007 from $2.9 million for the six months ended June 30, 2007, primarily due to an increase in the number of retail outlets selling our product.
Cost of goods sold and gross profit.Gross profit decreased $50.5 million to $41.7 million for the six months ended June 30, 2007 from $92.3 million for the six months ended June 30, 2006. The decrease in gross profit was primarily due to higher corn costs, partially offset by an increase in ethanol volume sold in the 2007 period compared to the 2006 period. Results for the full year 2007 are also expected to be adversely affected by these relatively higher corn costs.
Corn costs increased $86.8 million to $165.4 million for the six months ended June 30, 2007 from $78.7 million for the six months ended June 30, 2006. Corn costs represented 60.7% of our cost of goods sold before taking into account our co-product sales and 52.5% of our cost of goods sold after taking into account co-product sales for the six months ended June 30, 2007, compared to 45.9% of our cost of goods sold before taking into account our co-product sales and 29.8% of our cost of goods sold after taking into account co-product sales for the six months ended June 30, 2006.
The increase in total corn costs in the 2007 period was primarily driven by an increase in cash corn prices compared to the prior period. In addition, our 2007 corn costs included mark-to-market gains of $0.1 million for derivatives relating to future deliveries of corn. We had a mark-to-market gain of $2.6 million in the 2006 period, resulting in a $2.5 million increase in corn costs between the periods as a result of these mark-to-market adjustments.
The net loss from derivatives included in cost of goods sold was $8.1 million for the six months ended June 30, 2007 compared to a net loss of $2.6 million for the six months ended June 30, 2006. The increase was primarily due to the mark-to-market adjustment described above. We mark all exchange traded corn futures contracts to market through costs of goods sold.
Natural gas costs decreased $0.7 million to $28.9 million for the six months ended June 30, 2007 from $29.5 million for the six months ended June 30, 2006, and accounted for 10.6% of our cost of goods sold for the six months ended June 30, 2007 compared to 17.2% of our cost of goods sold for the six months ended June 30, 2006. The decrease in natural gas costs was attributable to a decrease in natural gas prices per MMBTU ($7.85 in 2007 and $8.69 in 2006), partially offset by higher production, primarily from the additional Charles City capacity.
Transportation expense increased $4.4 million to $30.4 million for the six months ended June 30, 2007 from $26.0 million for the six months ended June 30, 2006, primarily due to additional volume of ethanol and co-products shipped, and increased rail rates for the 2007 period. Transportation expense accounted for 11.2% of our cost of goods sold for the six months ended June 30, 2007 compared to 15.1% of our cost of goods sold for the six months ended June 30, 2006.
16
Table of Contents
Labor and manufacturing overhead costs increased $3.7 million to $19.0 million for the six months ended June 30, 2007 from $15.4 million for the six months ended June 30, 2006. The increase was primarily due to the Charles City Facility being operational in the 2007 period as well additional staffing needed to achieve higher production rates from our operating facilities.
Selling, general and administrative expenses.Selling, general and administrative expenses decreased $6.3 million to $19.9 million for the six months ended June 30, 2007 from $26.2 million for the six months ended June 30, 2006. The decrease was primarily the result of a charge to stock compensation expense in the 2006 period of $16.3 million in connection with our IPO, partially offset by increased management and administrative costs in the 2007 period to support our growth and public company status.
Other income (expense).Interest expense decreased $22.1 million to $7.9 million for the six months ended June 30, 2007 compared to $30.1 million for the six months ended June 30, 2006. Interest expense in the 2006 period included a charge of $19.7 million relating to a warrant that was fully exercised in connection with our IPO.
Interest income increased $4.9 million to $8.9 million for the six months ended June 30, 2007 compared to $4.0 million for the six months ended June 30, 2006. The increase was primarily attributable to the interest on funds received from our IPO and issuance of additional debt.
Income taxes.The income tax expense was $8.0 million and $17.7 million for the six months ended June 30, 2007 and 2006, respectively. The effective tax rate for the six months ended June 30, 2007 was 35.0% compared to 44.3% for the six months ended June 30, 2006. The effective tax rate was higher in 2006 due to nondeductible expense associated with the increase in the estimated fair value of the put warrant and the accelerated vesting of incentive stock option and restricted stock awards in connection with our IPO.
Liquidity and Capital Resources
Our principal sources of liquidity consist of the issuance of common stock, cash and cash equivalents on hand, cash provided by operations and available borrowings under our credit agreement. We have also issued long-term debt as a source of funds, including $210.0 million aggregate principal amount of senior secured notes in December 2005 and $450.0 million aggregate principal amount of senior notes in May 2007. In addition to funding operations, our principal uses of cash have been, and are expected to be, the construction of new facilities, capital expenditures and debt service requirements. We also plan to use $250 million of cash in connection with the acquisition of three ethanol production facilities. See Note 9 of Notes to Condensed Consolidated Financial Statements in Part I of this quarterly report.
The following table summarizes our sources and uses of cash and cash equivalents from our unaudited condensed consolidated statements of cash flows for the periods presented (in thousands):
| Six Months Ended June 30, | ||||||||
| 2007 | 2006 | |||||||
| Net cash provided by operating activities | $ | 24,122 | $ | 55,397 | ||||
| Net cash used in investing activities | (379,263 | ) | (5,279 | ) | ||||
| Net cash provided by financing activities | 451,520 | 233,111 | ||||||
| Net increase in cash and cash equivalents | $ | 96,379 | $ | 283,229 | ||||
We believe that net cash provided by operating activities is useful to investors and management as a measure of the ability of our business to generate cash which can be used to meet business needs and obligations or to re-invest for future growth.
Cash provided by operating activities was $24.1 million for the six months ended June 30, 2007 compared to $55.4 million provided by operating activities for the six months ended June 30, 2006. At June 30, 2007, we had total unrestricted cash and cash equivalents of $663.9 million, which includes $249.5 million of designated cash and cash equivalents, compared to $312.9 million at June 30, 2006.
17
Table of Contents
Cash used in investing activities was $379.3 million for the six months ended June 30, 2007 compared to cash used of $5.3 million for the six months ended June 30, 2006. The increase primarily resulted from our $249.5 million investment in designated cash for future purchases of property, plant and equipment. In addition, to construction expenditures and the acquisitions of other fixed assets in the 2007 period. In addition, $44.3 million was spent from escrowed cash for the construction of our Charles City facility.
Cash provided by financing activities for the six months ended June 30, 2007 was $451.5 million compared to $233.1 million provided by financing activities for the six months ended June 30, 2006. The 2006 period included debt issuance costs and estimated net proceeds from our IPO.
As of June 30, 2007, we had total debt of $656.8 million, net of $3.2 million of unaccreted debt discount. In addition, we had $5.4 million of letters of credit issued but not drawn under our $30.0 million credit agreement, leaving $24.6 million of borrowing capacity at June 30, 2007.
Our financial position and liquidity are, and will be, influenced by a variety of factors, including:
| • | our ability to generate cash flows from operations; | ||
| • | the level of our outstanding indebtedness and the interest we are obligated to pay on this indebtedness; and | ||
| • | our capital expenditure requirements, which consist primarily of plant construction and the purchase of equipment. |
We intend to fund our principal liquidity and capital resource requirements through cash and cash equivalents, cash provided by operations and borrowings under our credit agreement.
In addition to the construction of our Hartley, Welcome and Reynolds facilities, we may also consider additional opportunities for growing our production capacity, including the development of additional sites and the expansion of one or more of our existing facilities. Acquisitions or further expansion of our operations could cause our indebtedness, and our ratio of debt to equity, to increase. See Note 9 of Notes of Condensed Consolidated Financial Statements in Part I of this quarterly report. Our ability to access these sources of capital is restricted by the indenture governing our senior secured and senior unsecured notes and the terms of our credit agreement.
We expect to make capital expenditures of between $200 million and $250 million for the remainder of 2007. For all of 2007 we expect to spend between $350 million and $400 million for the construction of our previously announced ethanol production facilities, the purchase and installation of corn oil extraction equipment, facility maintenance, terminal infrastructure, cellulosic ethanol projects, operational improvements and further development of possible ethanol facility sites. These estimates do not include amounts expected to be used for construction expenditures at the facilities expected to be acquired from ASAlliances Biofuels LLC. See Note 9 of Notes to Condensed Consolidated Financial Statements in Part I of this quarterly report. During the six months ended June 30, 2007, we spent $129.6 million for the purchase of property and equipment, in addition to $44.3 million spent from escrowed cash for the construction of our Charles City facility.
We have no off-balance sheet arrangements.
Critical Accounting Estimates
Our MD&A is based on our condensed consolidated financial statements, which have been prepared in accordance with GAAP. The preparation of financial statements requires the use of estimates and assumptions about matters that are inherently uncertain and that affect the carrying value of our assets and liabilities. We consider an accounting estimate to be critical if:
| • | the accounting estimate requires us to make assumptions about matters that were highly uncertain at the time the accounting estimate was made; and | ||
| • | changes in the estimate that are reasonably likely to occur from period to period, or use of different estimates that we reasonably could have used in the current period, would have a material impact on our financial condition or results of operations. |
18
Table of Contents
Management has discussed the development and selection of critical accounting estimates with the Audit Committee of our Board of Directors and the Audit Committee has reviewed our MD&A.
Revenue recognition.Revenue from the production of ethanol and its co-products is recorded when title transfers to customers. Shipping and handling charges to customers are included in revenues. In accordance with our prior marketing agreement with Aventine, sales through March 31, 2007 were recorded when products were shipped from our production facilities, net of commissions retained by Aventine at the time payment was remitted. As of April 1, 2007, we commenced direct sales of our ethanol to customers. Our sales of ethanol are now generally recognized upon delivery to our customers at terminals or other locations, rather than upon shipment from our plants.
Derivative instruments and hedging activities.Derivatives are recognized on the balance sheet at their fair value. On the date the derivative contract is entered, we may designate the derivative as a hedge of a forecasted transaction or for the variability of cash flows to be received or paid related to a recognized asset or liability, which we refer to as a “cash flow” hedge. Changes in the fair value of derivatives that are highly effective as, and that are designated and qualify as, a cash flow hedge are recorded in other comprehensive income, net of tax effect, until earnings are affected by the variability of cash flows (e.g.,when periodic settlements on a variable rate asset or liability are recorded in earnings). Effectiveness is measured on a quarterly basis using the cumulative dollar offset method.
To reduce price risk caused by market fluctuations, we generally follow a policy of using exchange traded futures contracts to reduce our net position of merchandisable agricultural commodity inventories and forward cash purchase and sales contracts and use exchange traded futures contracts to reduce price risk under fixed price ethanol sales. Forward contracts, in which delivery of the related commodity has occurred, are valued at market price with changes in market price recorded in cost of goods sold. Unrealized gains and losses on forward contracts, in which delivery has not occurred, are deemed “normal purchases and normal sales” under SFAS No. 133, as amended, unless designated otherwise, and therefore are not marked to market in our financial statements. Forward contracts designated otherwise are marked to market.
When hedge accounting is discontinued because it is probable that a forecasted transaction will not occur, the derivative will continue to be carried on the balance sheet at its fair value, and gains and losses that were accumulated in other comprehensive income will be recognized immediately in earnings. In all other situations in which hedge accounting is discontinued, the derivative will be carried at its fair value on the balance sheet, with subsequent changes in its fair value recognized in current-period income.
Stock-based compensation.Effective January 1, 2006, we adopted SFAS No. 123R, utilizing the modified prospective application method. SFAS No. 123R requires all share-based payments to employees, including grants of employee stock options, to be recognized in the statement of operations based on their fair values.
We use the Black-Scholes single option pricing model to determine the fair value for employee stock options, which can be affected by our stock price and several subjective assumptions, including:
| • | expected stock price volatility — since we only recently became a publicly-traded company, we base a portion of this estimate on that of a comparable publicly-traded company; | ||
| • | expected forfeiture rate — we base this estimate on historic forfeiture rates, which may not be indicative of actual future forfeiture rates; and | ||
| • | expected term — we base this estimate on the mid-point between the average vesting period and expiration date, which may not equal the actual option term. |
If the estimates we use to calculate the fair value for employee stock options differ from actual results, we may be exposed to gains or losses that could be material.
Property and equipment:Property and equipment are stated at cost. Depreciation is computed by the straight-line method over the estimated useful lives set forth below. Changes in circumstances such as technological advances or changes to our business model could result in actual useful lives differing from these estimates.
19
Table of Contents
| Years | ||||
| Land improvements | 10-39 | |||
| Buildings and improvements | 7-40 | |||
| Machinery and equipment | ||||
• Railroad equipment (side track, locomotive and other) | 20-39 | |||
• Facility equipment (large tanks, fermenters and other equipment) | 20-39 | |||
• Other | 5-7 | |||
| Office furniture and equipment | 3-10 | |||
Maintenance, repairs and minor replacements are charged to operations while major replacements and improvements are capitalized.
Construction in progress will be depreciated upon the commencement of operations of the property.
Goodwill:The test for goodwill impairment is a two-step process and is performed on at least an annual basis. The first step is a comparison of the fair value of the reporting unit with its carrying amount, including goodwill. If this step reflects impairment, then the loss would be measured in the second step as the excess of recorded goodwill over its implied fair value. Implied fair value is the excess of fair value of the reporting unit over the fair value of all identified assets and liabilities. The test for impairment of unamortized indefinite life intangible assets is performed on at least an annual basis. We deem unamortized other intangible assets to be impaired if the carrying amount of an asset exceeds its fair value. We test the recoverability of all other long-lived assets whenever events or circumstances indicate that the carrying value may not be recoverable. If these other assets were determined to be impaired, the loss is measured as the amount by which the carrying value of the asset exceeds its fair value. In assessing the recoverability of our long-lived assets, management relies on a number of assumptions including operating results and business strategy. Changes in these factors or changes in the economic environment in which we operate may result in future impairment charges.
20
Table of Contents
ITEM 3. QUANTITATIVE AND QUALITATIVE DISCLOSURES ABOUT MARKET RISK
The following section discusses significant changes in market risks since our latest fiscal year end. You should read this discussion in conjunction with the disclosures made in our Annual Report on Form 10-K for the year ended December 31, 2006 and described in Part II, Item 1A of this quarterly report.
In addition to risks inherent in our operations, as a commodity-based business we are subject to a variety of market factors, including the price relationship between ethanol and corn as shown in the following graph:
Ethanol and Corn Price Comparison
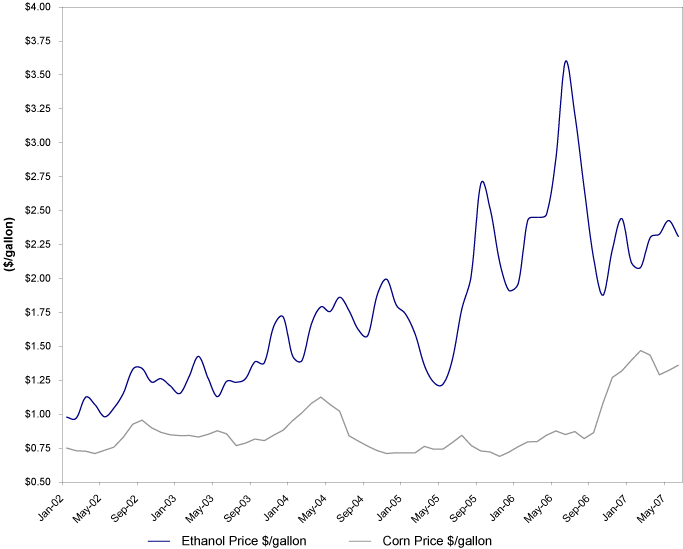
| (1) | Ethanol prices are based on the monthly average of the daily closing price of U.S. average ethanol rack prices quoted by Bloomberg, L.P. The corn prices are based on the monthly average of the daily closing prices of the nearby corn futures quoted by the Chicago Board of Trade (“CBOT”) and assume a conversion rate of 2.8 gallons of ethanol produced per bushel of corn. The comparison between the ethanol and corn prices presented does not reflect the costs of producing ethanol other than the cost of corn and should not be used as a measure of future results. This comparison also does not reflect the revenues received from the sale of distillers grains. |
We consider market risk to be the potential loss arising from adverse changes in market rates and prices. We are subject to significant market risk with respect to the price of ethanol, our principal product, and the price and availability of corn, the principal commodity used in our ethanol production process. In general, ethanol prices are influenced by the supply and demand for gasoline, the availability of substitutes and the effect of laws and regulations. Higher corn costs result in lower profit margins and, therefore, represent unfavorable market conditions. Traditionally, we have not been able to pass along increased corn costs to our ethanol customers. The availability and price of corn are subject to wide fluctuations due to unpredictable factors such as weather conditions during the corn growing season, carry-over from the previous crop year and current crop year yield, governmental policies with respect to agriculture and international supply and demand. Corn costs represented approximately 59.6% of our total cost of goods sold for the six months ended June 30, 2007 compared to 45.9% for the six months ended June 30, 2006. Over the ten-year period from 1997 through 2006, corn prices (based on the CBOT daily futures data) have ranged from a low of $1.75 per bushel on August 11, 2000 to a high of $3.90 per bushel on December 29, 2006 with prices averaging $2.32 per bushel during this period. At July 27, 2007, the CBOT price per bushel of corn for September delivery was $3.21.
21
Table of Contents
Corn prices increased significantly in the fourth quarter of 2006 and have remained in 2007 at substantially higher levels than in 2006. In the first six months of 2007, CBOT corn prices have ranged from a low of $3.44 per bushel to a high of $4.27 per bushel, with prices averaging $3.87 per bushel, compared to CBOT corn prices in the first six months of 2006 that ranged from a low of $2.03 per bushel to a high of $2.63 per bushel, with prices averaging $2.31 per bushel. These higher corn prices contributed to adverse comparisons in the three-month and six-month period ended June 30, 2007 to the same 2006 period in our cost of goods sold, gross profit, operating income, net income and EBITDA, and we anticipate these higher corn prices will continue to adversely affect such year-over-year comparisons through 2007.
We are also subject to market risk with respect to our supply of natural gas that is consumed in the ethanol production process and has been historically subject to volatile market conditions. Natural gas prices and availability are affected by weather conditions and overall economic conditions. Natural gas costs represented 10.4% of our cost of goods sold for the six months ended June 30, 2007 compared to 17.2% for the six months ended June 30, 2006. The price fluctuation in natural gas prices over the seven-year period from December 31, 1999 through December 31, 2006, based on the New York Mercantile Exchange, or NYMEX, daily futures data, has ranged from a low of $1.83 per MMBTU on September 26, 2001 to a high of $15.38 per MMBTU on December 23, 2005, averaging $5.63 per MMBTU during this period. At July 27, 2007, the NYMEX price of natural gas for August delivery was $6.11 per MMBTU.
We have prepared a sensitivity analysis to estimate our exposure to market risk with respect to our corn and natural gas requirements, ethanol contracts and the related exchange-traded contracts for 2006. Market risk related to these factors is estimated as the potential change in pre-tax income, resulting from a hypothetical 10% adverse change in the fair value of our corn and natural gas requirements and ethanol contracts (based on average prices for 2006) net of the corn and natural gas forward and futures contracts used to hedge our market risk with respect to our corn and natural gas requirements. The results of this analysis, which may differ from actual results, are as follows:
| Annual | Change in | |||||||||||||
| Volume | Hypothetical Adverse | Annual | ||||||||||||
| Requirements | Units | Change in Price | Pre-Tax Income | |||||||||||
| (In millions) | (In millions) | |||||||||||||
| Ethanol | 224.5 | gallons | 10 | % | $ | (48.9 | ) | |||||||
| Corn | 80.4 | bushels | 10 | (17.4 | ) | |||||||||
| Natural gas | 6.9 | MMBTU | 10 | (5.8 | ) | |||||||||
As of June 30, 2007, we had contracted forward on a fixed price basis the following quantities of corn and natural gas, which represent the indicated percentages of our estimated requirements for these inputs for the next twelve months:
| Three Months Ended | Three Months Ended | Three Months Ended | Three Months Ended | Twelve Months Ended | ||||||||||||||||
| September 30, | December 31, | March 31, | June 30, | June 30, | ||||||||||||||||
| 2006 | 2007 | 2008 | 2008 | 2008 | ||||||||||||||||
| Corn (thousands of bushels) (1) | — | — | — | — | — | |||||||||||||||
| Percentage of estimated requirements | — | — | — | — | — | |||||||||||||||
| Natural Gas (MMBTU) | 360,000 | 180,000 | — | — | 540,000 | |||||||||||||||
| Percentage of estimated requirements | 13 | % | 7 | % | — | — | 1.6 | % | ||||||||||||
| (1) | Represents our net corn position, which includes exchange-traded futures and forward purchase contracts. Changes in the value of these contracts are recognized as income or loss in the period in which the change occurs. |
The extent to which we enter into these arrangements vary substantially from time to time based on a number of factors, including supply and demand factors affecting the needs of customers or suppliers to purchase ethanol or sell us raw materials on a fixed basis, our views as to future market trends, seasonable factors and the costs of futures contracts. For example, we would expect to purchase forward a smaller percentage of our corn requirements for the fall months when prices tend to be lower.
22
Table of Contents
ITEM 4. CONTROLS AND PROCEDURES
Evaluation of Disclosure Controls and Procedures.
We carried out an evaluation at June 30, 2007, under the supervision of our management, including our chief executive officer and our chief financial officer, of the effectiveness of the design and operation of our disclosure controls and procedures pursuant to Rule 13a-15(b) under the Securities Exchange Act of 1934 (the “Exchange Act”). Based on those evaluations, our chief executive officer and chief financial officer have concluded that, as of the end of the period covered by this quarterly report, our disclosure controls and procedures were effective in ensuring that information required to be disclosed in our Exchange Act reports is (1) recorded, processed, summarized and reported in a timely manner, and (2) accumulated and communicated to our management, including our chief executive officer and chief financial officer, as appropriate to allow timely decisions regarding required disclosure.
Our management is working with our Audit Committee to identify and implement corrective actions where required to improve our internal controls, including the enhancement of our reporting systems and procedures. Specifically, we have enhanced our process relating to determining the fair value of derivative financial instruments. We have also hired an outside service provider to assist us with income tax provisions. Changes made in these areas were determined with the involvement of our Audit Committee, our general counsel, our Chief Financial Officer and our Chief Executive Officer. We believe these actions have remediated our weaknesses relating to accounting for derivative financial instruments and income taxes. Our efforts to remediate the remaining weaknesses are focused on hiring additional accounting personnel with specific expertise to address our financial reporting requirements. In addition to our recruiting efforts, we expect that work currently underway related to our Sarbanes Oxley Section 404 compliance project will also support our remediation efforts.
Changes in Internal Control over Financial Reporting
Except as noted above, there have been no changes in our internal control over financial reporting that occurred during the period covered by this quarterly report that have materially affected, or are reasonably likely to materially affect, our internal control over financial reporting.
PART II. OTHER INFORMATION
ITEM 1A. RISK FACTORS
Our results of operations, financial position and business outlook are highly dependent on commodity prices, which are subject to significant volatility and uncertainty, and the availability of supplies, so our results could fluctuate substantially.
Our results are substantially dependent on commodity prices, especially prices for corn, natural gas, ethanol and unleaded gasoline. As a result of the volatility of the prices for these items, our results may fluctuate substantially and we may experience periods of declining prices for our products and increasing costs for our raw materials, which could result in operating losses. Although we may attempt to offset a portion of the effects of fluctuations in prices by entering into forward contracts to supply ethanol or purchase corn, natural gas or other items or by engaging in transactions involving exchange-traded futures contracts, the amount and duration of these hedging and other risk mitigation activities may vary substantially over time and these activities also involve substantial risks. See “We engage in hedging transactions and other risk mitigation strategies that could harm our results.”
Our business is highly sensitive to corn prices and we generally cannot pass on increases in corn prices to our customers.
The principal raw material we use to produce ethanol and co-products, including dry and wet distillers grains, is corn. As a result, changes in the price of corn can significantly affect our business. In general, rising corn prices produce lower profit margins. Because ethanol competes with non-corn-based fuels, we generally are unable to pass along increased corn costs to our customers. At certain levels, corn prices may make ethanol uneconomical to use in fuel markets. Corn costs constituted approximately 60.2% of our total cost of goods sold for the six months ended June 30, 2007, compared to 45.9% for the six months ended June 30, 2006. Over the ten-year period from 1997 through 2006, corn prices (based on the Chicago Board of Trade (the “CBOT”) daily futures data) have ranged from a low of $1.75 per bushel on August 11, 2000 to a high of $3.90 per bushel on December 29, 2006, with prices averaging $2.32 per bushel during this period. At July 27, 2007, the CBOT price per bushel of corn for September delivery was $3.21.
23
Table of Contents
The industry has experienced significantly higher corn prices commencing in the fourth quarter of 2006, which have remained in 2007 at substantially higher levels than in 2006. In the six months of 2007, CBOT corn prices have ranged from a low of $3.44 per bushel to a high of $4.27 per bushel, with prices averaging $3.87 per bushel. These higher corn prices contributed to adverse comparisons in the three-month and six-month period ended June 30, 2007 to the same 2006 periods in our cost of goods sold, gross profit, operating income, net income and EBITDA, and we anticipate these higher corn prices will continue to adversely affect such year-over-year comparisons through 2007.
The price of corn is influenced by weather conditions and other factors affecting crop yields, farmer planting decisions and general economic, market and regulatory factors. These factors include government policies and subsidies with respect to agriculture and international trade, and global and local demand and supply. The significance and relative effect of these factors on the price of corn is difficult to predict. Any event that tends to negatively affect the supply of corn, such as adverse weather or crop disease, could increase corn prices and potentially harm our business. We may also have difficulty, from time to time, in physically sourcing corn on economical terms due to supply shortages. Such a shortage could require us to suspend operations until corn is available at economical terms, which would have a material adverse effect on our business, results of operations and financial position. In addition, the price we pay for corn at a facility could increase if an additional ethanol production facility is built in the same general vicinity.
The spread between ethanol and corn prices can vary significantly and we do not expect the spread to return to recent high levels.
Our gross margin depends principally on the spread between ethanol and corn prices. During the five-year period from 2002 through 2006, ethanol prices (based on average U.S. ethanol rack prices from Bloomberg (“Bloomberg”)) have ranged from a low of $0.94 per gallon to a high of $3.98 per gallon, averaging $1.70 per gallon during this period. For the year ended December 31, 2006, ethanol prices averaged $2.53 per gallon, reaching a high of $3.98 per gallon and a low of $1.72 per gallon (based on the daily closing prices from Bloomberg). In early 2006, the spread between ethanol and corn prices was at historically high levels, driven in large part by oil companies removing a competitive product, MTBE, from the fuel stream and replacing it with ethanol in a relatively short time period. However, this spread has fluctuated widely. Fluctuations are likely to continue to occur. Any reduction in the spread between ethanol and corn prices, whether as a result of an increase in corn prices or natural gas prices or a reduction in ethanol prices, would adversely affect our results of operations and financial position.
The market for natural gas is subject to conditions that create uncertainty in the price and availability of the natural gas that we use in our manufacturing process.
We rely upon third parties for our supply of natural gas, which is consumed in the manufacture of ethanol. The prices for and availability of natural gas are subject to volatile market conditions. These market conditions often are affected by factors beyond our control such as higher prices resulting from colder than average weather conditions and overall economic conditions. Significant disruptions in the supply of natural gas could impair our ability to manufacture ethanol for our customers. Furthermore, increases in natural gas prices or changes in our natural gas costs relative to natural gas costs paid by competitors may adversely affect our results of operations and financial position. Natural gas costs represented approximately 10.5% of our cost of goods sold for the six months ended June 30, 2007, compared to 17.2% for the six months ended June 30, 2006. The price fluctuations in natural gas prices over the seven-year period from December 31, 1999 through December 31, 2006, based on the New York Mercantile Exchange, or NYMEX, daily futures data, has ranged from a low of $1.83 per MMBTU on September 26, 2001 to a high of $15.38 per MMBTU on December 13, 2005, averaging $5.63 per MMBTU during this period. At July 27, 2007, the NYMEX price of natural gas for August delivery was $6.11 per MMBTU.
Fluctuations in the selling price and production cost of gasoline may reduce our profit margins.
Ethanol is marketed both as a fuel additive to reduce vehicle emissions from gasoline and as an octane enhancer to improve the octane rating of gasoline with which it is blended. As a result, ethanol prices are influenced by the supply and demand for gasoline and our results of operations and financial position may be materially adversely affected if gasoline demand or prices decrease.
Historically, the price of a gallon of gasoline has been lower than the cost to produce a gallon of ethanol. In addition, some of our sales contracts provide for pricing on an indexed basis, so that the price we receive for products sold under these arrangements is adjusted as gasoline prices change.
We may not realize the expected benefits from the ethanol facilities acquired from ASAlliances Biofuels, LLC in the time frame anticipated or at all.
24
Table of Contents
The acquisition of the three ethanol facilities from ASAlliances Biofuels, LLC is not final, and may not be consummated if any of the conditions to such acquisition are not satisfied. If such acquisition is completed, its expected benefits will depend, in part, on the timely construction and operation of the acquired ethanol facilities, which involve the following risks, among others:
| • | Failure of contractors to meet construction milestones; and | ||
| • | Our inability to achieve the expected production schedules of the acquired ethanol facilities. |
The expected benefits of the transaction also depend on the timely and efficient integration of the operations and personnel of the acquired ethanol facilities. The risks involved in this integration include, among others:
| • | Disruption of our ongoing business and distraction of management; | ||
| • | Loss of key employees of the acquired ethanol facilities; and | ||
| • | Loss of, or disputes with, existing service providers and suppliers of the acquired ethanol facilities. |
We may also encounter unforeseen obstacles or costs in the timely construction and operation of the acquired ethanol facilities and the integration of such ethanol facilities. The presence of one or more material liabilities of the acquired ethanol facilities that are unknown to us at the time of acquisition may have a material adverse effect on our business.
If the acquisition is completed, we will be dependent on Cargill, Incorporated and its subsidiaries for various services at the acquired ethanol facilities, including corn procurement, the marketing and sale of ethanol and distillers grains produced at the facilities and risk management. As a result, our results of operations and financial position may be adversely affected if Cargill does not perform these services in an effective manner.
Our business is subject to seasonal fluctuations.
Our operating results are influenced by seasonal fluctuations in the price of our primary operating inputs, corn and natural gas, and the price of our primary product, ethanol. The spot price of corn tends to rise during the spring planting season in May and June and tends to decrease during the fall harvest in October and November. The price for natural gas, however, tends to move opposite that of corn and tends to be lower in the spring and summer and higher in the fall and winter. In addition, our ethanol prices are substantially correlated with the price of unleaded gasoline especially in connection with any indexed, gas-plus sales contracts we may have. The price of unleaded gasoline tends to rise during each of the summer and winter. Given our limited history and the growth of our industry, we do not know yet how these seasonal fluctuations will affect our results over time.
We engage in hedging transactions and other risk mitigation strategies that could harm our results of operations.
In an attempt to partially offset the effects of volatility of ethanol prices and corn and natural gas costs, we enter into contracts to supply a portion of our ethanol production or purchase a portion of our corn or natural gas requirements on a forward basis and also engage in other hedging transactions involving exchange-traded futures contracts for corn, natural gas and unleaded gasoline from time to time. The price of unleaded gasoline also affects the price we receive for our ethanol under indexed contracts. The financial statement impact of these activities is dependent upon, among other things, the prices involved and our ability to sell sufficient products to use all of the corn and natural gas for which we have futures contracts. Hedging arrangements also expose us to the risk of financial loss in situations where the other party to the hedging contract defaults on its contract or, in the case of exchange-traded contracts, where there is a change in the expected differential between the underlying price in the hedging agreement and the actual prices paid or received by us. Hedging activities can themselves result in losses when a position is purchased in a declining market or a position is sold in a rising market. A hedge position is often settled in the same time frame as the physical commodity is either purchased (corn and natural gas) or sold (ethanol). Hedging losses may be offset by a decreased cash price for corn and natural gas and an increased cash price for ethanol. We also vary the amount of hedging or other risk mitigation strategies we undertake, and we may choose not to engage in hedging transactions at all. As a result, our results of operations and financial position may be adversely affected by increases in the price of corn or natural gas or decreases in the price of ethanol or unleaded gasoline.
We may not achieve anticipated operating results and our financial position may be adversely affected if we do not successfully develop our corn oil extraction business.
Our anticipated operating results and financial position may depend in part on our ability to develop and operate our planned corn oil extraction facilities successfully. We plan to extract corn oil from distillers grains, a co-product of the ethanol production process, and to sell the oil or convert it into biodiesel. We have contracted with Crown Iron Works Company for the purchase of corn oil extraction equipment.
25
Table of Contents
Large scale extraction of corn oil from distillers grains, as we contemplate, is unproven, and we may not achieve planned operating results. Our operating results and financial position will be affected by events or conditions associated with the development, operation and cost of the planned corn oil extraction equipment, including:
| • | the outcome of negotiations with government agencies, vendors, customers or others, including, for example, our ability to negotiate favorable contracts with customers, or the development of reliable markets; | ||
| • | changes in development and operating conditions and costs, including costs of services, equipment and construction; | ||
| • | unforeseen technological difficulties, including problems that may delay start-up or interrupt production or that may lead to unexpected downtime, or construction delays; | ||
| • | corn prices and other market conditions, including competition from other producers of corn oil; | ||
| • | government regulation; and | ||
| • | development of transportation, storage and distribution infrastructure supporting the facilities and the biodiesel industry generally. |
We are subject to and will become subject to additional financial reporting and other requirements for which our accounting, internal audit and other management systems and resources may not be adequately prepared. In addition, if we fail to remediate certain material weaknesses in our internal controls over financial reporting, we may not be able to report our financial results accurately, which could cause investors to lose confidence in our financial reporting.
We are subject to and will become subject to additional reporting and other obligations under the Securities Exchange Act of 1934, as amended, including the requirements of Section 404 of the Sarbanes-Oxley Act of 2002 no later than December 31, 2007. Section 404 requires annual management assessment of the effectiveness of our internal controls over financial reporting and a report by our independent auditors addressing these assessments. These reporting and other obligations will increasingly place significant demands on our management, administrative, operational, internal audit, tax and accounting resources. We are implementing additional financial and management controls, reporting systems and procedures and an internal audit function and are hiring additional accounting, internal audit and finance staff. If we are unable to accomplish these objectives in a timely and effective fashion, our ability to comply with our financial reporting requirements and other rules that apply to reporting companies could be impaired. In connection with the audit of our financial statements for the fiscal year ended December 31, 2006, we identified several material weaknesses in our internal controls over financial reporting relating to inadequate monitoring of accounting recognition matters and significant accounting estimates, including derivative financial instruments and income taxes, and deficiencies in our financial closing process. We are remediating these weaknesses, but we cannot assure you that we will have no future deficiencies or weaknesses in our internal controls over financial reporting.
We are substantially dependent on three facilities, and any operational disruption could result in a reduction of our sales volumes and could cause us to incur substantial losses.
Most of our revenues are and will continue to be derived from the sale of ethanol and the related co-products that we produce at our facilities. Our operations may be subject to significant interruption if any of our facilities experiences a major accident or is damaged by severe weather or other natural disasters. In addition, our operations may be subject to labor disruptions and unscheduled downtime, or other operational hazards inherent in our industry, such as equipment failures, fires, explosions, abnormal pressures, blowouts, pipeline ruptures, transportation accidents and natural disasters. Some of these operational hazards may cause personal injury or loss of life, severe damage to or destruction of property and equipment or environmental damage, and may result in suspension of operations and the imposition of civil or criminal penalties. Our insurance may not be adequate to fully cover the potential operational hazards described above and we may not be able to renew this insurance on commercially reasonable terms or at all.
We may not be able to implement our expansion strategy as planned or at all.
We plan to grow our business by investing in new or existing facilities and to pursue other business opportunities, such as marketing VE85tm and other ethanol-blended fuel. We believe that there is increasing competition for suitable facility sites. We may not find suitable additional sites for construction of new facilities or other suitable expansion opportunities.
26
Table of Contents
We may need additional financing to implement our expansion strategy and we may not have access to the funding required for the expansion of our business or such funding may not be available to us on acceptable terms. We may finance the expansion of our business with additional indebtedness or by issuing additional equity securities. We could face financial risks associated with incurring additional indebtedness, such as reducing our liquidity and access to financial markets and increasing the amount of cash flow required to service such indebtedness.
We must also obtain numerous regulatory approvals and permits in order to construct and operate additional or expanded facilities, including our Hartley, Welcome and Reynolds facilities. These requirements may not be satisfied in a timely manner or at all. In addition, as described below under “We may be adversely affected by environmental, health and safety laws, regulations and liabilities,” federal and state governmental requirements may substantially increase our costs, which could have a material adverse effect on our results of operations and financial position. Our expansion plans may also result in other unanticipated adverse consequences, such as the diversion of management’s attention from our existing operations.
Our construction costs may also increase to levels that would make a new facility too expensive to complete or unprofitable to operate. Our construction contracts with respect to the construction of our Hartley, Welcome and Reynolds facilities do not limit our exposure to higher costs. Contractors, engineering firms, construction firms and equipment suppliers also receive requests and orders from other ethanol companies and, therefore, we may not be able to secure their services or products on a timely basis or on acceptable financial terms. We may suffer significant delays or cost overruns as a result of a variety of factors, such as shortages of workers or materials, transportation constraints, adverse weather, unforeseen difficulties or labor issues, any of which could prevent us from commencing operations as expected at our facilities.
Additionally, any expansion of our existing facilities or any installation of corn oil extraction system at one of our existing facilities would be sufficiently novel and complex that we may not be able to complete either successfully or without incurring significant cost overruns and construction delays. We have only limited experience with facility expansion and we have never installed large-scale, corn oil extraction systems at our facilities.
Accordingly, we may not be able to implement our expansion strategy as planned or at all. We may not find additional appropriate sites for new facilities and we may not be able to finance, construct, develop or operate these new or expanded facilities successfully.
Potential future acquisitions could be difficult to find and integrate, divert the attention of key personnel, disrupt our business, and adversely affect our financial results.
As part of our business strategy, we may consider acquisitions of building sites, production facilities, storage or distribution facilities and selected infrastructure. We may not find suitable acquisition opportunities.
Acquisitions involve numerous risks, any of which could harm our business, including:
| • | difficulties in integrating the operations, technologies, products, existing contracts, accounting processes and personnel of the target and realizing the anticipated synergies of the combined businesses; | ||
| • | difficulties in building an ethanol plant on a site we purchase, including obtaining zoning and other required permits; | ||
| • | risks relating to environmental hazards on sites we purchase; | ||
| • | risks relating to acquiring or developing the infrastructure needed for facilities or sites we may acquire, including access to rail networks; | ||
| • | difficulties in supporting and transitioning customers, if any, of the target company or assets; | ||
| • | diversion of financial and management resources from existing operations; | ||
| • | the price we pay or other resources that we devote may exceed the value we realize, or the value we could have realized if we had allocated the purchase price or other resources to another opportunity; | ||
| • | risks of entering new markets or areas in which we have limited or no experience or are outside our core competencies; |
27
Table of Contents
| • | potential loss of key employees, customers and strategic alliances from either our current business or the business of the target; | ||
| • | assumption of unanticipated problems or latent liabilities, such as problems with the quality of the products of the target; and | ||
| • | inability to generate sufficient revenue to offset acquisition costs and development costs. |
Acquisitions also frequently result in the recording of goodwill and other intangible assets which are subject to potential impairments, periodic amortization, or both that could harm our financial results. As a result, if we fail to properly evaluate acquisitions or investments, we may not achieve the anticipated benefits of any such acquisitions, and we may incur costs in excess of what we anticipate. The failure to successfully evaluate and execute acquisitions or investments or otherwise adequately address these risks could materially harm our business and financial results.
Growth in the sale and distribution of ethanol is dependent on the changes to and expansion of related infrastructure which may not occur on a timely basis, if at all, and our operations could be adversely affected by infrastructure disruptions.
Substantial development of infrastructure will be required by persons and entities outside of our control for our operations, and the ethanol industry generally, to grow. Areas requiring expansion include, but are not limited to:
| • | rail capacity; | ||
| • | storage facilities for ethanol; | ||
| • | truck fleets capable of transporting ethanol within localized markets; | ||
| • | refining and blending facilities to handle ethanol; | ||
| • | service stations equipped to handle ethanol fuels; and | ||
| • | the fleet of Flexible Fuel Vehicles, or FFVs, capable of using E85 fuel. |
Substantial investments required for these infrastructure changes and expansions may not be made or they may not be made on a timely basis. Any delay or failure in making the changes to or expansion of infrastructure could hurt the demand or prices for our products, impede our delivery of products, impose additional costs on us or otherwise have a material adverse effect on our results of operations or financial position. Our business is dependent on the continuing availability of infrastructure and any infrastructure disruptions could have a material adverse effect on our business.
We have a limited operating history and our business may not be as successful as we envision.
We began our business in 2001 and commenced commercial operations at our Aurora facility in December 2003, at our Fort Dodge facility in October 2005 and at our Charles City facility in April 2007. Accordingly, we have a limited operating history from which you can evaluate our business and prospects. In addition, our prospects must be considered in light of the risks and uncertainties encountered by a company with limited operating history in rapidly evolving markets, such as the ethanol market, where supply and demand may change significantly in a short amount of time.
Some of these risks relate to our potential inability to:
| • | effectively manage our business and operations; | ||
| • | successfully execute our plan to sell our ethanol directly to customers; | ||
| • | recruit and retain key personnel; | ||
| • | successfully maintain a low-cost structure as we expand the scale of our business; |
28
Table of Contents
| • | manage rapid growth in personnel and operations; | ||
| • | develop new products that complement our existing business; and | ||
| • | successfully address the other risks described throughout this report. |
If we cannot successfully address these risks, our business and our results of operations and financial position would suffer.
New plants under construction or decreases in the demand for ethanol may result in excess production capacity in our industry.
According to the RFA, domestic ethanol production capacity will have increased from 1.8 BGY as of January 2001 to an estimated 8.0 BGY at December 31, 2007. The RFA estimates that, as of July 27, 2007, approximately 6.4 BGY of additional production capacity is under construction. The ethanol industry in the U.S. now consists of more than 120 production facilities. Excess capacity in the ethanol industry would have an adverse effect on our results of operations, cash flows and financial position. In a manufacturing industry with excess capacity, producers have an incentive to manufacture additional products for so long as the price exceeds the marginal cost of production (i.e., the cost of producing only the next unit, without regard for interest, overhead or fixed costs). This incentive can result in the reduction of the market price of ethanol to a level that is inadequate to generate sufficient cash flow to cover costs.
Excess capacity may also result from decreases in the demand for ethanol, which could result from a number of factors, including, but not limited to, regulatory developments and reduced U.S. gasoline consumption. Reduced gasoline consumption could occur as a result of increased prices for gasoline or crude oil, which could cause businesses and consumers to reduce driving or acquire vehicles with more favorable gasoline mileage. There is some evidence that this has occurred in the recent past as U.S. gasoline prices have increased.
We may not be able to compete effectively in our industry.
In the U.S., we compete with other corn processors, ethanol producers and refiners, including Archer Daniels Midland Company, US BioEnergy Corporation, Hawkeye Renewables, LLC, Aventine Renewable Energy Holdings, Inc., and Cargill, Inc. As of July 31, 2007, the top five producers accounted for approximately 33.1% of the ethanol production capacity in the U.S. according to the RFA. A number of our competitors are divisions of substantially larger enterprises and have substantially greater financial resources than we do. Smaller competitors also pose a threat. Farmer-owned cooperatives and independent firms consisting of groups of individual farmers and investors have been able to compete successfully in the ethanol industry. These smaller competitors operate smaller facilities that do not affect the local price of corn grown in the proximity of the facility as much as larger facilities like ours do. In addition, many of these smaller competitors are farmer owned and often require their farmer-owners to commit to selling them a certain amount of corn as a requirement of ownership. A significant portion of production capacity in our industry consists of smaller-sized facilities. Most new ethanol plants under development across the country are individually owned. In addition, institutional investors and high net worth individuals could heavily invest in ethanol production facilities and oversupply the demand for ethanol, resulting in lower ethanol price levels that might adversely affect our results of operations and financial position.
In addition to domestic competition, we also face increasing competition from international suppliers. Currently there is a $0.54 per gallon tariff on foreign produced ethanol which is scheduled to expire January 1, 2009. If this tariff is not renewed, we would face increased competition from international suppliers. Ethanol imports equivalent up to 7% of total domestic production in any given year from various countries were exempted from this tariff under the Caribbean Basin Initiative to spur economic development in Central America and the Caribbean. Currently, international suppliers produce ethanol primarily from sugar cane and have cost structures that may be substantially lower than ours.
Any increase in domestic or foreign competition could cause us to reduce our prices and take other steps to compete effectively, which could adversely affect our results of operations and financial position.
Our operating results may suffer if our direct marketing and sales efforts cannot achieve results comparable to those achieved by marketing through Aventine.
On March 31, 2007 we terminated our agreements with Aventine regarding the marketing and sale of our ethanol and on April 1, 2007, we commenced direct sales of our ethanol to customers. In connection with this activity, we have established our own marketing, transportation and storage infrastructure. We lease 900 tanker railcars and have contracted with storage depots near our customers and at our strategic locations to ensure efficient delivery of our finished ethanol product. We have also hired a marketing and sales force, as well as logistical and other operational personnel to staff our distribution activities. The marketing, sales, distribution, transportation, storage or administrative efforts we have implemented may not achieve results comparable to those achieved by marketing through Aventine. Any failure to successfully execute these efforts would have a material adverse effect on our results of operations and financial position. Our financial results in 2007 also may be adversely affected by our need to establish inventory in storage locations to facilitate this transition.
29
Table of Contents
Operations at our Charles City facility and our additional planned facilities are subject to various uncertainties, which may cause them to not achieve results comparable to our Aurora and Fort Dodge facilities.
Test operations began at our Fort Dodge facility in September 2005. During this time, a failure occurred in a key piece of equipment. This failure, which has been remedied by installation of replacement equipment from a new supplier, delayed our start up process. In October 2005, we recommenced our start up activities at the plant and are now operating at full capacity. As a new plant, our Charles City facility is subject, and our additional planned facilities will be subject, to various uncertainties as to their ability to produce ethanol and co-products as planned, including the potential for additional failures of key equipment. Due to these uncertainties, the results of our Charles City facility or our additional planned facilities may not be comparable to those of our Aurora or Fort Dodge facilities.
The U.S. ethanol industry is highly dependent upon federal and state legislation and regulation and any changes in legislation or regulation could materially and adversely affect our results of operations and financial position.
The elimination or significant reduction in the blenders’ credit could have a material adverse effect on our results of operations and financial position. The cost of production of ethanol is made significantly more competitive with regular gasoline by federal tax incentives. Before January 1, 2005, the federal excise tax incentive program allowed gasoline distributors who blended ethanol with gasoline to receive a federal excise tax rate reduction for each blended gallon they sold. If the fuel was blended with 10% ethanol, the refiner/marketer paid $0.052 per gallon less tax, which equated to an incentive of $0.52 per gallon of ethanol. The $0.52 per gallon incentive for ethanol was reduced to $0.51 per gallon in 2005 and is scheduled to expire in 2010. The blenders’ credits may not be renewed in 2010 or may be renewed on different terms. In addition, the blenders’ credits, as well as other federal and state programs benefiting ethanol (such as tariffs), generally are subject to U.S. government obligations under international trade agreements, including those under the World Trade Organization Agreement on Subsidies and Countervailing Measures, and might be the subject of challenges thereunder, in whole or in part. The elimination or significant reduction in the blenders’ credit or other programs benefiting ethanol may have a material adverse effect on our results of operations and financial position.
Ethanol can be imported into the U.S. duty-free from some countries, which may undermine the ethanol industry in the U.S. Imported ethanol is generally subject to a $0.54 per gallon tariff that was designed to offset the $0.51 per gallon ethanol incentive available under the federal excise tax incentive program for refineries that blend ethanol in their fuel. A special exemption from the tariff exists for ethanol imported from 24 countries in Central America and the Caribbean Islands, which is limited to a total of 7% of U.S. production per year. Imports from the exempted countries may increase as a result of new plants under development. Since production costs for ethanol in these countries are estimated to be significantly less than what they are in the U.S., the duty-free import of ethanol through the countries exempted from the tariff may negatively affect the demand for domestic ethanol and the price at which we sell our ethanol. Although the $0.54 per gallon tariff has been extended through December 31, 2008, bills were previously introduced in both the U.S. House of Representatives and U.S. Senate to repeal the tariff. We do not know the extent to which the volume of imports would increase or the effect on U.S. prices for ethanol if the tariff is not renewed beyond its current expiration. Any changes in the tariff or exemption from the tariff could have a material adverse effect on our results of operations and financial position. In addition, the North America Free Trade Agreement, or NAFTA, which entered into force on January 1, 1994, allows Canada and Mexico to export ethanol to the United States duty-free or at a reduced rate. Canada is exempt from duty under the current NAFTA guidelines, while Mexico’s duty rate is $0.10 per gallon.
The effect of the RFS in the recent Energy Policy Act is uncertain. The Acts eliminated the mandated use of oxygenates and established minimum nationwide levels of renewable fuels (ethanol, biodiesel or any other liquid fuel produced from biomass or biogas) to be included in gasoline. The elimination of the oxygenate requirement for reformulated gasoline may result in a decline in ethanol consumption, which in turn could have a material adverse effect on our results of operations and financial condition. The legislation also included provisions for trading of credits for use of renewable fuels and authorized potential reductions in the RFS minimum by action of a governmental administrator. As the rules for implementation of the RFS and the energy bill are still under development, the impact of legislation is still uncertain.
30
Table of Contents
The legislation did not include MTBE liability protection sought by refiners, which resulted in accelerated removal of MTBE and increased demand for ethanol. However, refineries may use other possible replacement additives, such as iso-octane, iso-octene or alkylate. Accordingly, the demand for ethanol could decrease. In addition, the mandated minimum level of use of renewable fuels in the RFS is significantly below projected ethanol production levels. Excess production capacity in our industry would negatively affect our results of operations, financial position and cash flows. See “New plants under construction or decreases in the demand for ethanol may result in excess production capacity in our industry.”
Waivers of the RFS minimum levels of renewable fuels included in gasoline could have a material adverse affect on our results of operations. Under the Energy Policy Act, the U.S. Department of Energy, in consultation with the Secretary of Agriculture and the Secretary of Energy, may waive the renewable fuels mandate with respect to one or more states if the Administrator of the U.S. Environmental Protection Agency, or U.S. “EPA”, determines that implementing the requirements would severely harm the economy or the environment of a state, a region or the U.S., or that there is inadequate supply to meet the requirement. Any waiver of the RFS with respect to one or more states would adversely offset demand for ethanol and could have a material adverse effect on our results of operations and financial condition.
We may be adversely affected by environmental, health and safety laws, regulations and liabilities.
We are subject to various federal, state and local environmental laws and regulations, including those relating to the discharge of materials into the air, water and ground, the generation, storage, handling, use, transportation and disposal of hazardous materials, and the health and safety of our employees. In addition, some of these laws and regulations require our facilities to operate under permits that are subject to renewal or modification. These laws, regulations and permits can often require expensive pollution control equipment or operational changes to limit actual or potential impacts to the environment. A violation of these laws and regulations or permit conditions can result in substantial fines, natural resource damages, criminal sanctions, permit revocations and/or facility shutdowns. In addition, we have made, and expect to make, significant capital expenditures on an ongoing basis to comply with increasingly stringent environmental laws, regulations and permits.
We may be liable for the investigation and cleanup of environmental contamination at each of the properties that we own or operate and at off-site locations where we arrange for the disposal of hazardous substances. If these substances have been or are disposed of or released at sites that undergo investigation and/or remediation by regulatory agencies, we may be responsible under the Comprehensive Environmental Response, Compensation and Liability Act of 1980, or CERCLA, or other environmental laws for all or part of the costs of investigation and/or remediation, and for damages to natural resources. We may also be subject to related claims by private parties alleging property damage and personal injury due to exposure to hazardous or other materials at or from those properties. Some of these matters may require us to expend significant amounts for investigation, cleanup or other costs.
In addition, new laws, new interpretations of existing laws, increased governmental enforcement of environmental laws or other developments could require us to make additional significant expenditures. Continued government and public emphasis on environmental issues can be expected to result in increased future investments for environmental controls at our production facilities. Present and future environmental laws and regulations (and interpretations thereof) applicable to our operations, more vigorous enforcement policies and discovery of currently unknown conditions may require substantial expenditures that could have a material adverse effect on our results of operations and financial position.
The hazards and risks associated with producing and transporting our products (such as fires, natural disasters, explosions, and abnormal pressures and blowouts) may also result in personal injury claims or damage to property and third parties. As protection against operating hazards, we maintain insurance coverage against some, but not all, potential losses. However, we could sustain losses for uninsurable or uninsured risks, or in amounts in excess of existing insurance coverage. Events that result in significant personal injury or damage to our property or third parties or other losses that are not fully covered by insurance could have a material adverse effect on our results of operations and financial position.
We are dependent upon our officers for management and direction, and the loss of any of these persons could adversely affect our operations and results.
We are dependent upon our officers for implementation of our proposed expansion strategy and execution of our business plan. The loss of any of our officers could have a material adverse effect upon our results of operations and financial position. We do not have employment agreements with our officers or other key personnel. In addition, we do not maintain “key person” life insurance for any of our officers. The loss of any of our officers could delay or prevent the achievement of our business objectives.
Our competitive position, financial position and results of operations may be adversely affected by technological advances and our efforts to anticipate and employ such technological advances may prove unsuccessful.
31
Table of Contents
The development and implementation of new technologies may result in a significant reduction in the costs of ethanol production. For instance, any technological advances in the efficiency or cost to produce ethanol from inexpensive, cellulosic sources such as wheat, oat or barley straw could have an adverse effect on our business, because our facilities are designed to produce ethanol from corn, which is, by comparison, a raw material with other high value uses. We do not predict when new technologies may become available, the rate of acceptance of new technologies by our competitors or the costs associated with new technologies. In addition, advances in the development of alternatives to ethanol could significantly reduce demand for or eliminate the need for ethanol.
We plan to invest over time on projects and companies engaged in research, development and commercialization of processes for conversion of cellulosic material to ethanol. These investments will be early- and mid-stage and highly speculative. The use of cost-effective and efficient cellulosic material in the production of ethanol is unproven. There is no assurance when, if ever, commercially viable technology will be developed. Nor can there be any assurance that we can identify suitable investment opportunities, that such development will be the product of any investment we make in this technology and that we will not lose our investments in whole or in part, or that if developed by others it will be available to producers such as us on commercially reasonable terms.
Any advances in technology which require significant unanticipated capital expenditures to remain competitive or which reduce demand or prices for ethanol would have a material adverse effect on our results of operations and financial position.
Insiders control a significant portion of our common stock and their interests may differ from those of other shareholders.
As of July 27, 2007, our executive officers and directors as a group beneficially own approximately 46.8% of our outstanding common stock, including Donald L. Endres, our Chief Executive Officer, who beneficially owns approximately 41.9% of our outstanding common stock. The interests of these shareholders may not always coincide with our interests as a company or the interests of other shareholders. The sale or prospect of sale of a substantial number of the shares could have an adverse effect on the market price of our common stock.
Our debt level could negatively impact our financial condition, results of operations and business prospects.
As of June 30, 2007, our total debt was $656.8 million (net of unaccreted discount of $3.2 million). As of June 30, 2007, we had borrowing capacity of $24.6 million under our $30.0 million credit agreement. Letters of credit totaling $5.4 million have been issued and undrawn under the credit agreement. Under agreements governing our debt, we may be able to incur a significant amount of additional debt from time to time, including drawing under our credit agreement. If we do so, the risks related to our high level of debt could increase. Specifically, our high level of debt could have important consequences to our shareholders, including the following:
| • | requiring us to dedicate a substantial portion of our cash flow from operations to required payments on debt, thereby reducing the availability of cash flow for working capital, capital expenditures and other general business activities; | ||
| • | limiting our ability to obtain additional financing in the future for working capital, capital expenditures, acquisitions and general corporate and other activities; | ||
| • | limiting our flexibility in planning for, or reacting to, changes in our business and the industry in which we operate; | ||
| • | increasing our vulnerability to both general and industry-specific adverse economic conditions; and | ||
| • | placing us at a competitive disadvantage against less leveraged competitors. |
Borrowings under our credit agreement bear interest at variable rates and expose us to interest rate risk. If interest rates increase, our debt service obligations on the variable rate indebtedness would increase even though the amount borrowed remained the same, and our net income and cash available for servicing our indebtedness would decrease.
Our common stock price has been volatile and you may lose all or part of your investment.
The market price of our common stock has fluctuated significantly since our IPO. Future fluctuations could be based on various factors in addition to those otherwise described in this report, including:
| • | our operating performance and the performance of our competitors; |
32
Table of Contents
| • | the public’s reaction to our press releases, our other public announcements and our filings with the SEC; | ||
| • | changes in earnings estimates or recommendations by research analysts who follow us or other companies in our industry; | ||
| • | variations in general economic conditions; | ||
| • | the registration rights granted by us with respect to shares of our common stock that will be issued in connection with our acquisition of three ethanol facilities from ASAlliances Biofuels, LLC; | ||
| • | the number of shares that are publicly traded; | ||
| • | actions of our existing shareholders, including sales of common stock by our directors and executive officers; | ||
| • | the arrival or departure of key personnel; and | ||
| • | other developments affecting us, our industry or our competitors. |
In addition, in recent years the stock market has experienced significant price and volume fluctuations. These fluctuations may be unrelated to the operating performance of particular companies. These broad market fluctuations may cause declines in the market price of our common stock. The price of our common stock could fluctuate based upon factors that have little or nothing to do with our company or its performance, and those fluctuations could materially reduce our common stock price.
ITEM 2. UNREGISTERED SALES OF EQUITY SECURITIES AND USE OF PROCEEDS
In connection with acquiring the land rights for the site for our Reynolds, Indiana facility, we issued to an affiliate of American Milling 150,000 share of our common stock in March 2007 and an additional 150,000 shares in June 2007 when required permits were obtained. These issuances were made pursuant to the site acquisition agreement we have with American Milling. We relied on the private offering exemption under Section 4(2) of the Securities Act of 1933 to complete this transaction.
On June 13, 2006, our Registration Statement on Form S-1 (Registration No. 333-132861) became effective. We completed our IPO on June 19, 2006. As of June 30, 2007, we had applied the net proceeds we received from our IPO as follows (dollars in millions):
| Construction of facilities | $ | 132.6 | ||
| Purchase of real estate | 24.5 | |||
| Temporary investments | 75.9 |
None of the foregoing payments were to our directors or officers, or their associates, or to our affiliates or persons owning ten percent or more of our common stock.
ITEM 4. SUBMISSION OF MATTERS TO A VOTE OF SECURITY HOLDERS
We held our annual meeting of shareholders on May 16, 2007. At the meeting, the shareholders elected the following three Class I directors for three-year terms: Donald L. Endres, 63,304,886 votes for and 155,868 votes withheld;D. Duane Gilliam, 63,312,193 votes for and 148,561 votes withheld; and Paul A. Schock, 63,329,621 votes for and 131,133 votes withheld. The Class II directors, T. Jack Huggins III and Steven T. Kirby, and the Class III director Bruce A. Jamerson, continue to serve on our Board of Directors. Mark L. First, formerly a Class III director, submitted his resignation as a director, effective August 1, 2007.
At the annual meeting, the shareholders also ratified the selection of McGladrey & Pullen, LLP as our independent auditors for 2007 by a vote of 63,255,313 for, 98,813 against and 106,628 abstentions. There were no broker non-votes.
33
Table of Contents
ITEM 5. OTHER INFORMATION
Under Item 1.01 of a Current Report on Form 8-K filed July 25, 2007, the Company reported that it entered into a Unit Purchase Agreement with ASA OpCo Holdings, LLC, ASAlliances Biofuels, LLC and the Securityholders named therein, dated July 22, 2007. The Unit Purchase Agreement provides for the purchase by the Company of a company owning three biorefineries and the rights to two development sites for an aggregate purchase price of $725 million, comprised of the issuance of 13,801,384 shares of our common stock (valued at $200 million), the payment of $250 million of cash and $275 million in project financing. We also agree to register with the Securities and Exchange Commission, within 180 days after the date of the acquisition, the shares to be issued in the transaction. The parties have made customary representations, warranties and covenants in the Unit Purchase Agreement. The sale and purchase is subject to clearance under the Hart-Scott-Rodino Antitrust Improvements Act as well as other customary closing conditions.
Mark L. First, formerly a Class III director of the Company, submitted his resignation as a director effective as of August 1, 2007.
34
Table of Contents
ITEM 6. EXHIBITS
| 2.1 | Unit Purchase Agreement among VeraSun Energy Corporation, ASA OpCo Holdings, LLC, ASAlliances Biofuels, LLC and the Securityholders named therein (incorporated by reference to Exhibit 2.1 to Form 8-K dated July 25, 2007) | |
| 3.1 | Articles of Incorporation, as amended, of VeraSun Energy Corporation.* | |
| 3.2 | Bylaws, as amended, of VeraSun Energy Corporation.* | |
| 4.1 | Indenture, dated as of December 21, 2005, between VeraSun Energy Corporation, as Issuer, VeraSun Aurora Corporation, VeraSun Fort Dodge, LLC, VeraSun Charles City, LLC and VeraSun Marketing, LLC, as Subsidiary Guarantors, and Wells Fargo, N.A., as Trustee.* | |
| 4.2 | Registration Rights Agreement, dated as of December 21, 2005, by and among VeraSun Energy Corporation, VeraSun Aurora Corporation, VeraSun Fort Dodge, LLC, VeraSun Charles City, LLC, VeraSun Marketing LLC, Lehman Brothers Inc. and Morgan Stanly & Co. Incorporated.* | |
| 4.3 | Revolving Credit Agreement, dated as of December 21, 2005, among VeraSun Energy Corporation, First National Bank of Omaha, VeraSun Aurora Corporation, VeraSun Fort Dodge, LLC and VeraSun Charles City, LLC.* | |
| 4.4 | First Supplemental Indenture, dated May 4, 2006, between VeraSun Energy Corporation, as Issuer, VeraSun Aurora Corporation, VeraSun Fort Dodge, LLC, VeraSun Charles City, LLC, VeraSun Marketing, LLC and VeraSun Welcome, LLC, as Subsidiary Guarantors, and Wells Fargo, N.A., as Trustee.* | |
| 4.5 | Second Supplemental Indenture, dated August 21, 2006, between VeraSun Energy Corporation, as Issuer, VeraSun Aurora Corporation, VeraSun Fort Dodge, LLC, VeraSun Charles City, LLC, VeraSun Hartley, LLC, VeraSun Marketing, LLC, and VeraSun Welcome, LLC, as Subsidiary Guarantors, and Wells Fargo, N.A., as Trustee. (Incorporated by reference to Exhibit 10.1 to VeraSun Energy Corporation’s quarterly report on form 10-Q for the period ending September 30, 2006.) | |
| 4.6 | Third Supplemental Indenture, dated February 9, 2007, between VeraSun Energy Corporation, as Issuer, VeraSun Aurora Corporation, VeraSun Fort Dodge, LLC, VeraSun Charles City, LLC, VeraSun Hartley, LLC, VeraSun Marketing, LLC, VeraSun Welcome, LLC, VeraSun Granite City, LLC, and VeraSun Reynolds, LLC, as Subsidiary Guarantors, and Wells Fargo, N.A., as Trustee. (Incorporated by reference to Exhibit 10.1 to VeraSun Energy Corporation’s annual report on form 10-K for the period ending December 30, 2006.) | |
| 31.1 | Certification of Chief Executive Officer pursuant to Section 302 of the Sarbanes-Oxley Act of 2002. | |
| 31.2 | Certification of Chief Financial Officer pursuant to Section 302 of the Sarbanes-Oxley Act of 2002. | |
| 32.1 | Certification of Chief Executive Officer pursuant to Section 906 of the Sarbanes-Oxley Act of 2002. | |
| 32.2 | Certification of Chief Financial Officer pursuant to Section 906 of the Sarbanes-Oxley Act of 2002. |
| * | Incorporated by reference to VeraSun Energy Corporation’s Registration Statement on Form S-1, as amended (file number 333-132861). |
35
Table of Contents
SIGNATURE
Pursuant to the requirements of the Securities Exchange Act of 1934, the registrant has duly caused this quarterly report to be signed on its behalf by the undersigned, thereunto duly authorized.
| VeraSun Energy Corporation | ||||
| Date: August 1, 2007 | By: | /s/ Donald L. Endres | ||
| Donald L. Endres | ||||
| Chief Executive Officer | ||||
| | ||||
| By: | /s/ Danny C. Herron | |||
| Danny C. Herron | ||||
| Chief Financial Officer | ||||
36