Table of Contents
UNITED STATES SECURITIES AND EXCHANGE COMMISSION
Washington, D.C. 20549
FORM 10-Q
| x | QUARTERLY REPORT PURSUANT TO SECTION 13 OR 15(d) OF THE SECURITIES EXCHANGE ACT OF 1934 |
For the quarterly period ended June 30, 2008
OR
| ¨ | TRANSITION REPORT PURSUANT TO SECTION 13 OR 15(d) OF THE SECURITIES EXCHANGE ACT OF 1934 |
For the transition period from to
Commission File No. 1-32913
VeraSun Energy Corporation
(Exact name of registrant as specified in its charter)
| South Dakota | 20-3430241 | |
(State or other jurisdiction of incorporation or organization) | (IRS Employer Identification Number) |
100 22nd Avenue Brookings, SD | 57006 | |
| (Address of principal executive offices) | (Zip Code) |
605-696-7200
(Registrant’s telephone number, including area code)
NONE
(Former name, former address and former fiscal year, if changed since last report)
Indicate by check mark whether the registrant (1) has filed all reports required to be filed by Section 13 or 15(d) of the Securities Exchange Act of 1934 during the preceding 12 months (or for such shorter period that the registrant was required to file such reports), and (2) has been subject to such filing requirements for the past 90 days. Yes x No ¨
Indicate by check mark whether the registrant is a large accelerated filer, an accelerated filer, or a non-accelerated filer, or a smaller reporting company. See definition of “large accelerated filer”, “accelerated filer”, and “smaller reporting company” in Rule 12b-2 of the Exchange Act.
Large accelerated filer ¨ Accelerated filer x Non-accelerated filer ¨ Smaller reporting company ¨
Indicate by check mark whether the registrant is a shell company (as defined in Rule 12b-2 of the Exchange Act). Yes ¨ No x
The number of shares of Common Stock outstanding on August 1, 2008 was 157,145,552.
Table of Contents
JUNE 30, 2008
INDEX TO FORM 10-Q
2
Table of Contents
| ITEM 1. | FINANCIAL STATEMENTS |
CONDENSED CONSOLIDATED BALANCE SHEETS
| June 30, 2008 (unaudited) | December 31, 2007 | |||||
| (dollars in thousands, except per share data) | ||||||
Assets | ||||||
Current Assets | ||||||
Cash and cash equivalents | $ | 28,441 | $ | 110,942 | ||
Restricted cash | 14,777 | — | ||||
Short-term investments | — | 43,175 | ||||
Trade receivables, less allowance for doubtful accounts of $419 and $95 in 2008 and 2007, respectively | 166,998 | 51,294 | ||||
Inventories | 210,657 | 107,912 | ||||
Prepaid expenses and other assets | 107,776 | 63,597 | ||||
Derivative financial instruments | 64,233 | 12,627 | ||||
Deferred income taxes | 848 | — | ||||
Total current assets | 593,730 | 389,547 | ||||
Goodwill | 266,779 | 169,629 | ||||
Other intangible assets | 66,344 | 21,668 | ||||
Other long-term assets | 27,233 | 15,572 | ||||
Debt issuance costs, net | 18,077 | 15,478 | ||||
| 378,433 | 222,347 | |||||
Property and equipment, net | 2,480,822 | 1,251,612 | ||||
| $ | 3,452,985 | $ | 1,863,506 | |||
Liabilities and Shareholders’ Equity | ||||||
Current Liabilities | ||||||
Current maturities of long-term debt | $ 51,124 | $ | 16,774 | |||
Accounts payable | 176,831 | 120,814 | ||||
Accrued expenses and other liabilities | 42,191 | 11,138 | ||||
Derivative financial instruments | 41,707 | 11,299 | ||||
Deferred income taxes | — | 1,869 | ||||
Total current liabilities | 311,853 | 161,894 | ||||
Long-term debt, less current maturities | 1,396,718 | 888,696 | ||||
Deferred income taxes | 157,594 | 51,564 | ||||
Other long-term liabilities | 47,049 | 5,621 | ||||
Total long-term liabilities | 1,601,361 | 945,881 | ||||
Minority interest in consolidated subsidiary | 3,908 | — | ||||
Commitments and Contingencies | ||||||
Shareholders’ Equity | ||||||
Preferred stock, $0.01 par value; authorized 25,000,000 shares; none issued or outstanding | — | — | ||||
Common stock, $0.01 par value; authorized 350,000,000 and 250,000,000 shares at June 30, 2008, and December 31, 2007, respectively; 157,145,552 and 92,948,664 shares issued and outstanding as of June 30, 2008 and December 31, 2007, respectively | 1,571 | 929 | ||||
Additional paid-in capital | 1,386,633 | 638,606 | ||||
Retained earnings | 147,659 | 116,196 | ||||
| 1,535,863 | 755,731 | |||||
| $ | 3,452,985 | $ | 1,863,506 | |||
See Notes to Condensed Consolidated Financial Statements.
3
Table of Contents
CONDENSED CONSOLIDATED STATEMENTS OF OPERATIONS
(Unaudited)
| Three Months Ended June 30, | Six Months Ended June 30, | |||||||||||||||
| 2008 | 2007 | 2008 | 2007 | |||||||||||||
| (dollars in thousands, except per share data) | ||||||||||||||||
Net sales | $ | 1,015,168 | $ | 169,556 | $ | 1,531,642 | $ | 314,066 | ||||||||
Cost of goods sold | 943,214 | 137,071 | 1,424,570 | 272,337 | ||||||||||||
Gross profit | 71,954 | 32,485 | 107,072 | 41,729 | ||||||||||||
Startup expenses | 4,591 | 218 | 6,702 | 1,584 | ||||||||||||
Restructuring charge | 2,004 | — | 2,004 | — | ||||||||||||
Selling, general and administrative expenses | 16,317 | 8,179 | 27,682 | 18,347 | ||||||||||||
Total selling, general and administrative expenses: | 22,912 | 8,397 | 36,388 | 19,931 | ||||||||||||
Operating income | 49,042 | 24,088 | 70,684 | 21,798 | ||||||||||||
Other income (expense): | ||||||||||||||||
Interest expense | (15,501 | ) | (6,179 | ) | (26,314 | ) | (7,931 | ) | ||||||||
Interest income | 607 | 5,362 | 1,548 | 8,907 | ||||||||||||
Other income | 240 | 30 | 714 | 32 | ||||||||||||
| (14,654 | ) | (787 | ) | (24,052 | ) | 1,008 | ||||||||||
Income before income taxes and minority interest | 34,388 | 23,301 | 46,632 | 22,806 | ||||||||||||
Income tax provision | 10,504 | 8,165 | 15,175 | 7,982 | ||||||||||||
Income before minority interest | 23,884 | 15,136 | 31,457 | 14,824 | ||||||||||||
Minority interest in net loss of subsidiary, net of income taxes | 6 | — | 6 | — | ||||||||||||
Net income | $ | 23,890 | $ | 15,136 | $ | 31,463 | $ | 14,824 | ||||||||
Per share data: | ||||||||||||||||
Income per common share—basic | $ | 0.15 | $ | 0.20 | $ | 0.25 | $ | 0.19 | ||||||||
Basic weighted average number of common shares | 156,962,647 | 76,998,341 | 124,836,224 | 76,357,188 | ||||||||||||
Income per common share—diluted | $ | 0.15 | $ | 0.19 | $ | 0.25 | $ | 0.18 | ||||||||
Diluted weighted average number of common and common equivalent shares | 159,520,353 | 80,918,850 | 127,349,906 | 80,697,289 | ||||||||||||
See Notes to Condensed Consolidated Financial Statements.
4
Table of Contents
CONDENSED CONSOLIDATED STATEMENTS OF CASH FLOWS
(Unaudited)
| Six Months Ended June 30, | ||||||||
| 2008 | 2007 | |||||||
| (dollars in thousands) | ||||||||
Cash Flows from Operating Activities | ||||||||
Net income | $ | 31,463 | $ | 14,824 | ||||
Adjustments to reconcile net income to net cash provided by (used in) operating activities: | ||||||||
Depreciation | 30,687 | 6,080 | ||||||
Change in derivative financial instruments | (16,996 | ) | 6,756 | |||||
Accretion of contracts and long-term debt fair valued during purchase accounting | (6,374 | ) | — | |||||
Deferred income taxes | 5,094 | 5,425 | ||||||
Stock-based compensation expense | 4,451 | 2,679 | ||||||
Amortization | 1,829 | — | ||||||
Amortization of debt issuance cost and debt discount | 1,261 | 730 | ||||||
Gain on disposal of equipment | (262 | ) | (83 | ) | ||||
Accretion of deferred revenue | (147 | ) | (48 | ) | ||||
Minority interest in net loss of subsidiary | (6 | ) | — | |||||
Excess tax benefits from share-based payment arrangements | — | (6,865 | ) | |||||
Changes in current assets and liabilities, net of effects of business acquisition | ||||||||
Trade receivables | (60,406 | ) | 18,697 | |||||
Inventories | (32,080 | ) | (37,920 | ) | ||||
Prepaid expenses and other assets | (32,447 | ) | (3,235 | ) | ||||
Accounts payable | 54,210 | 11,059 | ||||||
Accrued expenses and other liabilities | (18,989 | ) | 6,023 | |||||
Net cash (used in) provided by operating activities | (38,712 | ) | 24,122 | |||||
Cash Flows from Investing Activities | ||||||||
Purchases of property and equipment | (188,857 | ) | (129,551 | ) | ||||
US BioEnergy acquisition, net of transaction costs | 45,106 | — | ||||||
Proceeds from the sale of short-term investments | 43,175 | — | ||||||
Change in restricted cash | (14,777 | ) | — | |||||
Payments for other long-term assets and liabilities | (2,040 | ) | (202 | ) | ||||
Proceeds from sales of property and equipment | 1,300 | 6 | ||||||
Purchase of short-term investments | — | (249,516 | ) | |||||
Net cash used in investing activities | (116,093 | ) | (379,263 | ) | ||||
Cash Flows from Financing Activities | ||||||||
Proceeds from long-term debt | 97,092 | 447,750 | ||||||
Principal payments on long-term debt | (19,696 | ) | — | |||||
Debt issuance costs paid | (3,655 | ) | (11,375 | ) | ||||
Cost of registering equity securities | (1,063 | ) | (5 | ) | ||||
Net effect of the exercise of stock options | (374 | ) | 8,285 | |||||
Excess tax benefits from share-based payment arrangements | — | 6,865 | ||||||
Net cash provided by financing activities | 72,304 | 451,520 | ||||||
Net (decrease) increase in cash and cash equivalents | (82,501 | ) | 96,379 | |||||
Cash and Cash Equivalents | ||||||||
Beginning of period | 110,942 | 318,049 | ||||||
End of period | $ | 28,441 | $ | 414,428 | ||||
See Notes to Condensed Consolidated Financial Statements.
5
Table of Contents
NOTES TO CONDENSED CONSOLIDATED FINANCIAL STATEMENTS (Unaudited)
(dollars in thousands, except per share data)
Note 1. Nature of Business and Basis of Presentation
The accompanying condensed consolidated balance sheet as of December 31, 2007, has been derived from audited consolidated financial statements. The unaudited interim condensed consolidated financial statements of VeraSun Energy Corporation and its subsidiaries reflect all adjustments consisting only of normal recurring adjustments that are, in the opinion of our management, necessary for a fair presentation of their consolidated financial position, results of operations and cash flows. The results for the six months ended June 30, 2008, are not necessarily indicative of the results that may be expected for a full fiscal year. Certain information and note disclosures normally included in annual consolidated financial statements prepared in accordance with accounting principles generally accepted in the United States of America (“GAAP”) have been condensed or omitted pursuant to the rules and regulations of the Securities and Exchange Commission (“SEC”), although the Company believes that the disclosures made are adequate to make the information not misleading. These condensed consolidated financial statements should be read in conjunction with the Company’s audited consolidated financial statements and notes thereto included in its annual report for the year ended December 31, 2007, filed on Form 10-K with the SEC. VeraSun Energy Corporation, its subsidiaries and joint venture Big River Resources Grinnell, LLC (“Grinnell”) are collectively referred to as “VeraSun,” the “Company,” “we,” “us” and “our”.
Nature of Business
VeraSun is one of the largest ethanol producers in the United States based on production capacity, according to the Renewable Fuels Association (“RFA”). We focus primarily on the production and sale of ethanol and its co-products.
Principles of Consolidation
The accompanying condensed consolidated financial statements include the accounts of VeraSun Energy Corporation, its subsidiaries, and Grinnell. All intercompany balances and transactions have been eliminated on consolidation. See note 2 for acquisition in the second quarter of 2008.
Reclassifications
The accompanying consolidated financial statements contain certain reclassifications to conform to the presentation used in the current period. The reclassification had no impact on shareholders’ equity, working capital, gross profit or net income.
Revenue Recognition
Revenue from the production of ethanol and distillers grains is recorded when title transfers to customers. Shipping and handling charges to customers are included in revenues. In accordance with our prior marketing agreement with Aventine Renewable Energy, Inc (“Aventine”), sales through March 31, 2007, were recorded when products were shipped from our production facilities, net of commissions retained by Aventine. As of April 1, 2007, we commenced direct sales of our ethanol to customers. Our sales of ethanol are now generally recognized upon shipment from our plants, except for sales from Aurora, South Dakota, and Fort Dodge and Charles City, Iowa, where sales are recognized upon delivery to our customers, at terminals or other locations.
We receive incentives to produce ethanol from state and federal entities. In accordance with the terms of these arrangements, incentive income is recognized when we produce ethanol or blend ethanol with gasoline to produce E85. For the three and six months ending June 30, 2008, incentive revenue was $4,208 and $5,354 respectively, compared to $788 and $1,437 for the three and six months ended June 30, 2007, respectively.
6
Table of Contents
VERASUN ENERGY CORPORATION
NOTES TO CONDENSED CONSOLIDATED FINANCIAL STATEMENTS (Unaudited)
(dollars in thousands, except per share data)
Net sales from four customers represented approximately 23%, 16%, 11%, and 10% of the Company’s net sales for the six months ended June 30, 2008. At June 30, 2008, accounts receivable balance from these customers accounted for 61% of total trade receivable.
Use of Estimates
The preparation of financial statements in conformity with GAAP requires management to make estimates and assumptions that affect (i) the reported amounts of assets and liabilities, (ii) the disclosure of contingent assets and liabilities at the date of the financial statements, and (iii) the reported amounts of revenues and expenses during the reporting period.
We use estimates and assumptions in accounting for the following significant matters, among others:
| • | Allowances for doubtful accounts |
| • | Valuation of acquired assets |
| • | Inventory valuation and allowances |
| • | Fair value of derivative financial instruments and related hedged items |
| • | Useful lives of property and equipment and intangible assets |
| • | Asset retirement obligations |
| • | Goodwill and other Long-lived asset impairments. |
| • | Contingencies |
| • | Fair value of options and restricted stock granted under our stock-based compensation plans |
| • | Tax related items |
Actual results may differ from previously estimated amounts, and such differences may be material to our condensed consolidated financial statements. We periodically review estimates and assumptions, and the effects of revisions are reflected in the period in which the revision is made. The revisions to estimates or assumptions during the periods presented in the accompanying condensed consolidated financial statements were not considered to be significant.
Recently Issued Accounting Pronouncements:
In September 2006, the Financial Accounting Standards Board (FASB) issued Statement of Financial Accounting Standards (SFAS) No. 157, “Fair Value Measurements” (SFAS No. 157) which provides a single definition of fair value, together with a framework for measuring it, and requires additional disclosure about the use of fair value to measure assets and liabilities. SFAS No. 157 also emphasizes that fair value is a market-based measurement, and sets out a fair value hierarchy with the highest priority being quoted prices in active markets. Fair value measurements are disclosed by level within that hierarchy. SFAS No. 157 is effective for financial statements issued for fiscal years beginning after November 15, 2007.
In February 2008, the FASB issued “Effective Date of FASB Statement No. 157” FASB Staff Position (FSP) No. 157-2 (FSP No. 157-2). FSP No. 157-2 delays the effective date of SFAS No. 157 until fiscal years beginning after November 15, 2008, for fair value measurements of non-financial assets and non-financial liabilities, except for items that are recognized or disclosed at fair value in an entity’s financial statements on a recurring basis (at least annually).
7
Table of Contents
VERASUN ENERGY CORPORATION
NOTES TO CONDENSED CONSOLIDATED FINANCIAL STATEMENTS (Unaudited)
(dollars in thousands, except per share data)
As of January 1, 2008, the Company adopted SFAS No. 157 for all assets and liabilities measured at fair value except for non-financial assets and non-financial liabilities measured at fair value on a non-recurring basis, as permitted by FSP No. 157-2. The adoption did not have a material impact on the Company’s consolidated financial statements. For additional discussion and SFAS No. 157 required disclosures see Note 6 to these condensed consolidated financial statements.
In February 2007, the FASB issued “The Fair Value Option for Financial Assets and Financial Liabilities — Including an Amendment of FASB Statement No. 115” (SFAS No. 159), which provides companies with an option to measure, at specified election dates, many financial instruments and certain other items at fair value that are not currently measured at fair value. A company that adopts SFAS No. 159 will report unrealized gains and losses on items, for which the fair value option has been elected, in earnings at each subsequent reporting date. This statement also establishes presentation and disclosure requirements designed to facilitate comparisons between entities that choose different measurement attributes for similar types of assets and liabilities. This statement is effective for fiscal years beginning after November 15, 2007. Effective January 1, 2008, the Company adopted SFAS No. 159 but did not elect fair value as an alternative.
In December 2007, the FASB issued SFAS No. 141 (revised 2007), “Business Combinations.” This statement significantly changes the financial accounting and reporting of business combination transactions. The provisions of this statement are to be applied prospectively to business combination transactions in the first annual reporting period beginning on or after December 15, 2008. The Company is currently assessing the impact of the adoption this will have on our consolidated financial statements.
In December 2007, the FASB issued SFAS No. 160, “Non-controlling Interests in Consolidated Financial Statements”, (SFAS No. 160), which amends Accounting Research Bulletin No. 51. SFAS No. 160 improves the relevance, comparability, and transparency of financial information provided to investors by requiring all entities to report non-controlling (minority) interests in subsidiaries as equity in the consolidated financial statements. This statement is effective for fiscal years beginning after December 15, 2008, and early adoption is not permitted. The provisions of this standard must be applied retrospectively upon adoption. The Company has assessed SFAS No. 160 and has determined that the impact of the adoption of this statement will result in minority interest being reported as a component of shareholders’ equity, but separate from the parent’s equity.
In March 2008, the FASB issued SFAS No. 161, “Disclosures about Derivative Instruments and Hedging Activities.” The new standard is intended to improve financial reporting about derivative instruments and hedging activities by requiring enhanced disclosures to enable investors to better understand their effects on an entity’s financial position, financial performance, and cash flows. It is effective for financial statements issued for fiscal years and interim periods beginning after November 15, 2008, with early application encouraged. We do not expect the adoption of SFAS No. 161 to have a material impact on our consolidated financial statements. However, we are still in the process of evaluating the impact of adopting SFAS No. 161.
In April 2008, the FASB released FSP No. 142-3, “Determination of the Useful Life of Intangible Assets.” The FSP requires entities to disclose information for recognized intangible assets that enable users of financial statements to understand the extent to which expected future cash flows associated with intangible assets are affected by the entity’s intent or ability to renew or extend the arrangement associated with the intangible asset. The FSP also amends the factors an entity should consider in developing the renewal or extension assumptions used in determining the useful life of recognized intangible assets under SFAS No. 142, “Goodwill and Other Intangible Assets.” The FSP will be applied prospectively only to intangible assets acquired after the FSP’s effective date, but the disclosure requirements will be applied prospectively to all intangible assets as of the FSP’s effective date. The FSP is effective for fiscal years beginning after December 15, 2008 and early adoption is not permitted. The Company is currently assessing the impact the adoption of the FSP will have on its consolidated financial statements.
8
Table of Contents
VERASUN ENERGY CORPORATION
NOTES TO CONDENSED CONSOLIDATED FINANCIAL STATEMENTS (Unaudited)
(dollars in thousands, except per share data)
Note 2. Business Combinations
US BioEnergy Corporation Merger
On April 1, 2008, the Company acquired 100% of the outstanding common stock of US BioEnergy Corporation (“US BioEnergy”) for an aggregate purchase price of $756,898, consisting of the value of the common stock issued, stock option awards under which approximately 1.8 million shares of common stock are issuable upon the future exercise of the stock options and transaction costs. Under the merger agreement, 0.81 shares of the Company’s common stock were issued for each outstanding share of US BioEnergy common stock. The existing VeraSun shares remained outstanding and represent approximately 60 percent of the shares outstanding after the merger. A breakdown of the aggregated purchase price is as follows:
Number of shares of US BioEnergy common stock outstanding at the closing date of the merger (in thousands) | 79,986 | ||||||
Exchange ratio | 0.81 | ||||||
Shares of VeraSun issued (in thousands) | 64,789 | ||||||
Multiplied by VeraSun’s weighted average stock price for the period two business days before and three business days after the November 29, 2007 announcement of acquisition | $ | 11.36 | $ | 736,001 | |||
Fair value of VeraSun’s stock options issued in exchange for US BioEnergy’s stock options outstanding as of the closing date of the merger | 14,664 | ||||||
Other, including VeraSun’s transaction (registering and issuing) costs | 7,296 | ||||||
Less: Cost of registering equity securities | (1,063 | ) | |||||
Purchase price | $ | 756,898 | |||||
The fair value of VeraSun’s options issued in exchange for US BioEnergy’s stock options was determined using the Black-Scholes option pricing model with the following assumptions: dividend yield of 0.0%; expected volatility of 65%; risk-free rate of 3.0%; and an expected life of 6.9 years.
The merger is an opportunity for two leading companies in the renewable fuels industry to capitalize on synergies and provide value for shareholders. It also underscores the commitment of each company to execute on its growth strategy to become a large-scale, low-cost ethanol producer. The merger is expected to create a unique and stronger business platform by improving access to capital and allowing the combined company to leverage technology and operating experience across its entire plant fleet.
The excess of purchase price over the estimated fair value of identifiable net assets acquired has been classified as goodwill. The major factors that contribute to goodwill include the expected future profitability of US BioEnergy, the market position of US BioEnergy, its existing facilities and plants under construction given their geographic locations, and its successful track record of plant start-ups and completions.
The US BioEnergy acquisition increased the Company’s production capacity by 420 million gallons per year (MMGY). These facilities include Albert City, Iowa with a capacity of 110 MMGY; Woodbury, Michigan with a capacity of 50 MMGY; Central City and Ord, Nebraska with capacities of 100 MMGY and 50 MMGY respectively; and Marion, South Dakota with a capacity of 110 MMGY. Plants under construction acquired include facilities near Hankinson, North Dakota; Dyersville, Iowa and Janesville, Minnesota. Each of these plants are expected to have a capacity of 110 MMGY. The Hankinson, North Dakota facility, which was completed in June of 2008 with a capacity of 110 MMGY, became operational on July 21, 2008. US BioEnergy’s primary products are ethanol and distillers grains, which it derives from corn. All ethanol produced by US BioEnergy is sold to Provista Renewable Fuels Marketing, LLC (“Provista”), an ethanol marketing company owned by CHS, Inc, except ethanol produced at the Marion, South Dakota facility, which is sold to Archer Daniels Midland. Effective August 31, 2008, the Company intends to terminate its marketing agreement with Provista.
9
Table of Contents
VERASUN ENERGY CORPORATION
NOTES TO CONDENSED CONSOLIDATED FINANCIAL STATEMENTS (Unaudited)
(dollars in thousands, except per share data)
The acquired assets of the US BioEnergy acquisition have been included in the condensed consolidated balance sheet as of June 30, 2008, and the operations of US BioEnergy are included in the Company’s condensed consolidated statement of operations beginning April 1, 2008.
In accordance with Statement of Financial Accounting Standards No. 141, “Business Combinations,” the Company recorded this acquisition using the purchase method of accounting. The purchase price has been allocated to tangible and identifiable intangible assets acquired and liabilities assumed based on their respective fair values as of April 1, 2008. The excess purchase price over the fair value of tangible and intangible assets acquired and liabilities assumed was recorded as goodwill, of which approximately $21,000 will be deductible for tax purposes. We are in the process of finalizing the allocation of the purchase price to the individual assets acquired and liabilities assumed. The preliminary allocation of the purchase price included in the current period condensed consolidated balance sheet is based on the estimates of management. We will continue to evaluate the purchase price allocation, including the fair value of property, plant, and equipment, value of identifiable intangibles (see Note 3), which is primarily customer relationships and favorable corn procurement agreements, fair value of various ethanol, distiller, and rail car contracts and the fair value of long-term debt. We expect to revise the purchase price allocation as better information becomes available. The following sets forth the allocation of the purchase consideration:
Cash | $ | 51,339 | |
Other current assets | 142,917 | ||
Property, plant and equipment | 1,069,350 | ||
Intangible assets | 55,694 | ||
Goodwill | 101,773 | ||
Other non-current assets | 6,571 | ||
Total assets acquired | 1,427,644 | ||
Current liabilities, excluding current maturities on long-term debt | 85,055 | ||
Long-term debt | 460,979 | ||
Deferred tax liability | 101,411 | ||
Other long-term liabilities | 19,387 | ||
Minority interest in consolidated subsidiary | 3,914 | ||
Total liabilities assumed | 670,746 | ||
Net assets acquired | $ | 756,898 | |
ASA Holdings Acquisition
On August 17, 2007, we closed on a transaction with ASAlliances Biofuels, LLC (“ASAlliances”). Under a Unit Purchase Agreement, we purchased all of the equity interests in ASA OpCo Holdings, LLC (“ASA Holdings”) from ASAlliances for an aggregate purchase price of $683,997. Of this amount, we issued 13,801,384 shares of our common stock valued at $194,323, and paid $250,000 of cash to the seller at closing, and $6,310 for transaction fees and expenses. The balance of the purchase price consisted of $233,364 of indebtedness owed by ASA Holdings and its subsidiaries, ASA Albion, LLC, ASA Bloomingburg, LLC and ASA Linden, LLC, which remained outstanding after the closing under a Credit Agreement, dated February 6, 2006 among ASA Holdings, ASA Albion, LLC, ASA Bloomingburg, LLC and ASA Linden, LLC, as borrowers, and WestLB AG, New York branch, as administrative agent for the lenders and the lenders named therein (“Senior Credit Facility”). We also agreed to register under applicable securities laws, within 180 days of the acquisition date, the shares issued in the transaction. ASA Holdings owns companies with three bio-refineries and developmental rights to two sites. This transaction is referred to in this document as the “ASA Acquisition”.
10
Table of Contents
VERASUN ENERGY CORPORATION
NOTES TO CONDENSED CONSOLIDATED FINANCIAL STATEMENTS (Unaudited)
(dollars in thousands, except per share data)
The 13,801,384 shares of common stock issued in connection with the ASA Acquisition were valued at $194,323 based on the weighted average of the Company’s stock price two days before and two days after July 22, 2007, the date of the acquisition agreement and announcement of the transaction. The preliminary determination of goodwill acquired in the ASA acquisition was $163,500. In June 2008, a purchase price reduction of $4,623 was determined due to a delay in the start-up of the Bloomingburg, Ohio facility. This adjustment was converted into a 648,000 reduction in the shares issued. This adjustment was recognized as a reduction in goodwill and shareholders’ equity as of June 30, 2008.
Pro Forma Results
The following table provides unaudited pro forma consolidated results of operations for the three and six months ended June 30, 2008 and 2007, as though the ASA and US BioEnergy acquisitions had occurred as of the beginning of the respective fiscal years. The pro forma results include certain purchase accounting adjustments with respect to the acquired tangible and intangible assets. However, pro forma results do not include any anticipated costs savings or other effects of the planned integration. Accordingly, such amounts are not necessarily indicative of the results if the acquisition had occurred on the dates indicated or that may result in the future.
| Three Months Ended June 30, | Six Months Ended June 30, | |||||||||||
| 2008 | 2007 | 2008 | 2007 | |||||||||
Pro forma results: | ||||||||||||
Net sales | $ | 1,015,168 | $ | 339,676 | $ | 1,740,527 | $ | 640,862 | ||||
Net income | 23,890 | 21,466 | 34,957 | 27,333 | ||||||||
Basic net income per share | 0.15 | 0.14 | 0.22 | 0.18 | ||||||||
Diluted net income per share | 0.15 | 0.13 | 0.22 | 0.17 | ||||||||
Note 3. Goodwill and Other Identifiable Intangible Assets
Changes to goodwill for the six months ended June 30, 2008 were as follows:
| Total | ||||
Balance as of December 31, 2007 | $ | 169,629 | ||
US BioEnergy acquisition (see note 2) | 101,773 | |||
ASA purchase price adjustment (see note 2) | (4,623 | ) | ||
Balance as of June 30, 2008 | $ | 266,779 | ||
In accordance with Statement of Financial Accounting Standards No. 142, “Goodwill and Other Intangible Assets” (“SFAS 142”), and Statement of Financial Accounting Standards No. 144, “Accounting for the Impairment or Disposal of Long-Lived Assets” (“SFAS 144”), as of April 1, 2008 (the day of the Company’s merger with US BioEnergy), the Company performed an interim impairment test of its goodwill, identifiable intangible assets and all its long-lived assets due to events and changes in circumstances that indicated an impairment might have occurred. The major factor deemed by management to have constituted an impairment triggering event was the sustained decrease in the Company stock price relative to the book value of the Company coupled with a significant issuance of common stock, pursuant to a merger with US BioEnergy.
For purposes of testing goodwill, the Company estimated the fair value of the enterprise utilizing several fair value measurement techniques, including two market estimates and one income estimate, and using relevant data available through and as of April 1, 2008. Under the market approaches, the fair value of the enterprise was
11
Table of Contents
VERASUN ENERGY CORPORATION
NOTES TO CONDENSED CONSOLIDATED FINANCIAL STATEMENTS (Unaudited)
(dollars in thousands, except per share data)
estimated based upon the fair value of invested capital for VeraSun, as well as a separate comparison to revenue and earnings before interest, taxes, deprecation, and amortization, “EBITDA,” multiples for similar publicly traded companies in the renewable energy industry. The fair value estimates using both market approaches included a control premium similar to those observed for historical renewable energy company market transactions. Under the income approach, the fair value of the enterprise was estimated based upon the present value of estimated future cash flows for VeraSun. The income approach is dependent on a number of critical management assumptions including estimates of ethanol and distiller sales price, corn and natural gas cost, appropriate discount rates and other relevant assumptions.
Taking into consideration a weight of the two market estimates and the income estimate the indicated fair value of the enterprise was more than its carrying value, and therefore, the Company was not required to perform step two of the SFAS 142 goodwill impairment testing methodology. The Company also concluded that no impairment to its identifiable intangible assets and all its long-lived assets has occurred as of the interim test date.
Due to extreme corn and crude oil price volatility, tight credit markets, the volatility of the Company’s stock price and the resulting decline in its market capitalization and the uncertain economic environment, as well as other uncertainties, the Company can provide no assurance that a material impairment charge to goodwill, intangible assets and all long lived assets will not occur in a future period. The Company will continue to monitor circumstances and events in future periods to determine whether additional interim asset impairment testing is warranted.
Other intangible assets as of June 30, 2008 and December 31, 2007 are as follows:
| June 30, 2008 | December 31, 2007 | |||||||||||
| Gross Carrying Value | Accumulated Amortization | Gross Carrying Value | Accumulated Amortization | |||||||||
Favorable corn procurement agreements | $ | 41,794 | $ | 9,190 | $ | — | — | |||||
Vendor supply arrangements | 20,370 | 682 | 20,370 | $ | 228 | |||||||
Customer relationships | 13,900 | 933 | — | — | ||||||||
Non-compete agreements | 1,740 | 655 | 1,740 | 214 | ||||||||
Total | $ | 77,804 | $ | 11,460 | $ | 22,110 | $ | 442 | ||||
All other intangible assets are amortizable and the weighted-average amortization periods related to these amortizable intangible assets are as follows:
| (In years) | Weighted-average Amortization Period | |
Favorable corn procurement agreements | 3 | |
Vendor supply arrangements | 20 | |
Customer relationships | 4 | |
Non-compete agreements | 2 |
The weighted-average amortization period for all amortizable intangibles on a combined basis is 16 years.
The aggregate amortization expense for the three and six months ended June 30, 2008, was $10,627 and $11,018, respectively. There was no intangible amortization expense both for the three and six months ended June 30, 2007, respectively, as amortizable intangible assets were acquired subsequent to June 30, 2007. Based on current levels of amortizable intangible assets, estimated annual amortization expense is expected to be $22,461 in 2008, $16,979 in 2009, $6,556 in 2010, $3,984 in 2011, $1,694 in 2012 and $1,019 in 2013.
12
Table of Contents
VERASUN ENERGY CORPORATION
NOTES TO CONDENSED CONSOLIDATED FINANCIAL STATEMENTS (Unaudited)
(dollars in thousands, except per share data)
Note 4: Restructuring Activities
In conjunction with the US BioEnergy acquisition, the Company is combining corporate headquarters in Sioux Falls, South Dakota, and is recording a restructuring charge related to severance payments to existing VeraSun employees and relocation of headquarters to Sioux Falls.
Restructuring costs for the first six months of 2008 were as follows:
| Balance at December 31, 2007 | Six months ended June 30, 2008 | Cumulative Drawdowns | Balance at June 30, 2008 | ||||||||||||||||||
| Charges | Reversals | Totals | Cash Payments | Non-cash Charges | |||||||||||||||||
Personnel and severance costs: | $ | — | $ | 2,004 | $ | — | $ | 2,004 | $ | 1,985 | $ | — | $ | 19 | |||||||
Lease and other contractual commitments: | — | — | — | — | — | — | — | ||||||||||||||
Other: | — | — | — | — | — | — | — | ||||||||||||||
Total | $ | — | $ | 2,004 | $ | — | $ | 2,004 | $ | 1,985 | $ | — | $ | 19 | |||||||
All restructuring charges and cash payments for the three and six months ended June 30, 2008 consisted of personnel and severance costs. At year-end 2007, VeraSun expected to reduce headcount by 16 employees. As of June 30, 2008 the Company has reduced headcount by 14 employees as part of its restructuring actions. The majority of the restructuring accrual will be utilized in 2008.
There were no costs associated with restructuring activities for the three and six month periods ended June 30, 2007.
Note 5. Inventories
Corn, chemicals, supplies and work in process inventories are stated at the lower of cost or market on the first-in, first-out method. Ethanol and distillers grains are stated at the lower of average cost or market.
A summary of inventories as of June 30, 2008 and December 31, 2007 is as follows:
| June 30, 2008 | December 31, 2007 | |||||
Ethanol | $ | 81,799 | $ | 56,199 | ||
Corn | 80,611 | 27,637 | ||||
Work in process | 19,774 | 7,859 | ||||
Supplies | 16,035 | 11,341 | ||||
Chemicals | 8,376 | 2,743 | ||||
Distillers grains | 4,062 | 2,133 | ||||
| $ | 210,657 | $ | 107,912 | |||
Note 6. Fair Value Disclosure
Effective January 1, 2008, the Company adopted the provisions of SFAS No. 157 for assets and liabilities recognized at fair value on a recurring basis. SFAS No. 157 establishes a framework for measuring fair value and requires enhanced disclosures about assets and liabilities carried at fair value.
13
Table of Contents
VERASUN ENERGY CORPORATION
NOTES TO CONDENSED CONSOLIDATED FINANCIAL STATEMENTS (Unaudited)
(dollars in thousands, except per share data)
As defined in SFAS No. 157, fair value is the price that would be received to sell an asset or paid to transfer a liability in the principal or most advantageous market for the asset or liability in an orderly transaction between market participants at the measurement date. SFAS No. 157 establishes a fair value hierarchy, which prioritizes the inputs used in measuring fair value into three broad levels as follows:
Level 1 – Quoted prices are available in active markets for identical assets or liabilities as of the reported date. The types of assets and liabilities included in Level 1 are highly liquid and actively traded instruments with quoted prices, such as equities listed by the New York Stock Exchange and commodity derivative contracts listed on the Chicago Board of Trade.
Level 2 – Pricing inputs are other than quoted prices in active markets, but are either directly or indirectly observable as of the reported date. The types of assets and liabilities included in Level 2 are typically either comparable to actively traded securities or contracts, or priced with models using highly observable inputs, such as commodity options priced using observable forward prices.
Level 3 – Significant inputs to pricing have little or no observability as of the reporting date. The types of assets and liabilities included in Level 3 are those with inputs requiring significant management judgment or estimation, such as the complex and subjective models and forecasts used to determine the fair value of financial transmission rights.
The following table presents the fair value hierarchy for those assets and liabilities measured at fair value on a recurring basis as of June 30, 2008. As required by SFAS No. 157, financial assets and liabilities are classified in their entirety based on the lowest level of input that is significant to the fair value measurement. The Company’s assessment of the significance of a particular input to the fair value measurement requires judgment and may affect the valuation of fair value assets and liabilities and their placement within the fair value hierarchy levels.
| Fair value as of June 30, 2008 | ||||||||||
| Level 1 | Level 2 | Level 3 | Total | |||||||
Assets: | ||||||||||
Derivatives (current) | $ | 14,671 | 49,562 | — | $ | 64,233 | ||||
Derivatives (long-term) * | — | 6,205 | — | 6,205 | ||||||
Total | $ | 14,671 | 55,767 | — | $ | 70,438 | ||||
Liabilities: | ||||||||||
Derivatives (current) | $ | 37,742 | 3,965 | — | $ | 41,707 | ||||
Derivatives (long-term) * | 5,234 | — | — | 5,234 | ||||||
Total | $ | 42,976 | 3,965 | — | $ | 46,941 | ||||
| * | Long-term derivatives assets and liabilities are included in other long-term assets and other long-term liabilities, respectively, based on their contractual maturities. |
The Company enters into various commodity derivative instruments, including forward contracts, futures, options, swaps and other over-the-counter agreements. The fair value of the Company’s commodity derivatives is determined using unadjusted quoted prices for identical instruments on the applicable exchange in which VeraSun transacts. When quoted prices for identical instruments are not available, VeraSun uses forward price curves derived from market price quotations. Market price quotations are obtained from independent energy brokers, exchanges, direct communication with market participants and actual transactions executed by VeraSun. This methodology also applies to those derivative contract commitments which were made by US BioEnergy prior to the April 1 2008 merger with VeraSun. Market price quotations for certain inputs are generally readily obtainable for the applicable term of VeraSun’s outstanding commodity derivative instruments and, therefore, VeraSun’s forward price curves for those locations and periods reflect observable market quotes.
14
Table of Contents
VERASUN ENERGY CORPORATION
NOTES TO CONDENSED CONSOLIDATED FINANCIAL STATEMENTS (Unaudited)
(dollars in thousands, except per share data)
Note 7. Long-Term Debt and Credit Facility
The following table summarizes the Company’s long-term debt:
| June 30, 2008 | December 31, 2007 | |||||||
9 3/8% senior notes due 2017 (“2017 Notes”) (a) | $ | 450,000 | $ | 450,000 | ||||
Senior credit facility (b) | 266,750 | 240,946 | ||||||
9 7/8% senior secured notes due 2012 (“2012 Notes”) (a) | 210,000 | 210,000 | ||||||
AgStar construction loans (d) | 201,146 | — | ||||||
AgStar senior secured term loans (d) | 173,408 | — | ||||||
Marion construction loans (e) | 90,000 | — | ||||||
AgStar revolving term loans (d) | 54,763 | — | ||||||
UBS credit facility due 2011 (c) | 40,500 | — | ||||||
Revolving loans (d) (e) | 12,742 | — | ||||||
Tax increment revenue note (g) | 5,000 | 5,000 | ||||||
Community redevelopment revenue bonds (f) | 3,203 | — | ||||||
Other | 3,524 | 2,546 | ||||||
Total | 1,511,036 | 908,492 | ||||||
Less unamortized discount | (2,818 | ) | (3,022 | ) | ||||
Less: unamortized discount associated with US BioEnergy acquisition (h) | (60,376 | ) | — | |||||
Less current maturities of long-term debt | (51,124 | ) | (16,774 | ) | ||||
Long-term debt | $ | 1,396,718 | $ | 888,696 | ||||
The schedule of principal payments for long-term debt as of June 30, 2008 is estimated to be as follows:
| Q3-Q4 2008 | $ | 31,442 | |
2009 | 46,824 | ||
2010 | 56,850 | ||
2011 | 127,514 | ||
2012 | 400,977 | ||
2013 | 143,013 | ||
Thereafter | 704,416 | ||
Total | $ | 1,511,036 | |
(a) Senior Notes
In May 2007, the Company issued $450,000 aggregate principal amount of unsecured Senior Notes due 2017 (the “2017 Notes”) at 99.5% of face value. The 2017 Notes bear interest at a fixed rate of 9.375% per annum and are recorded net of unamortized debt discount of $2,300. The 2017 Notes mature on June 1, 2017. They may be redeemed at any time prior to June 1, 2012 by paying a make-whole premium and may be redeemed at any time after June 1, 2012 at specified redemption prices. Interest on the 2017 Notes is paid on a semi-annual basis on June 1 and December 1 of each year beginning on December 1, 2007.
The Senior Secured Notes due 2012 (the “2012 Notes”) bear interest at 9.875% per annum, payable semi-annually on June 15 and December 15 of each year, and mature on December 15, 2012. They may be redeemed at any time at specified redemption prices. The 2012 Notes and the 2017 Notes are guaranteed by the Company’s
15
Table of Contents
VERASUN ENERGY CORPORATION
NOTES TO CONDENSED CONSOLIDATED FINANCIAL STATEMENTS (Unaudited)
(dollars in thousands, except per share data)
existing subsidiaries, other than ASA Holdings and its subsidiaries and US BioEnergy and its subsidiaries, and any future restricted subsidiaries that guaranty any of the Company’s or any subsidiary guarantor’s other indebtedness. The 2012 Notes are secured on a first priority basis by liens on substantially all of VeraSun Energy Corporation’s assets and the assets of the subsidiary guarantors other than accounts receivable, inventory and commodities accounts, and the cash proceeds therefrom.
The indentures governing the 2012 Notes and the 2017 Notes contain restrictive covenants which, among other things, limit the Company’s ability (subject to exceptions) to (a) make restricted payments (which limits redemption of capital stock, voluntary debt repayments, and investments); (b) incur additional debt; (c) engage in transactions with shareholders and affiliates; (d) pay dividends and other payments restrictions affecting subsidiaries; (e) incur liens on assets; (f) sell assets; and (g) engage in unrelated businesses.
Under the registration rights agreement that was executed in connection with the offering of the 2017 Notes, the Company agreed to: (a) cause an exchange offer of registered notes to be completed by May 15, 2008 and (b) file a shelf registration statement for the resale of the notes by May 15, 2008 if the Company cannot effect an exchange offer and in some other circumstances. If the Company did not effect the exchange offer for the 2017 Notes or caus a shelf registration statement with respect to resale of the notes to be declared effective by May 15, 2008, the annual interest rate would increase by 0.25% per annum and by an additional 0.25% for each subsequent 90-day period, up to a maximum of 1% per annum, until all registration defaults have been cured. The Company complied with this registration obligation by filing a shelf registration statement on April 18, 2008.
(b) Senior Credit Facility
In connection with the ASA Acquisition, the Senior Credit Facility, as amended, remained in effect and provides for aggregate borrowings of up to $275,000 in two tranches: Tranche A for up to $175,000 and Tranche B for up to $100,000. Borrowings under the Senior Credit Facility must be used for the development, engineering, construction and operation of the Company’s Linden, Albion and Bloomingburg plants.
At December 31, 2007, the Company had borrowed $153,567 and $87,379 under the Senior Credit Facility in the form of Tranche A and Tranche B construction loans, respectively. On March 15, 2008, the Company converted the two tranches into term notes in the amounts of $175,000 and $100,000 respectively. Amounts borrowed and repaid under the Senior Credit Facility may not be re-borrowed. The Company paid quarterly commitment fees of 0.5% per annum on the average daily unused amount of the construction loan commitments under the Senior Credit Facility. The Company also pays agent fees of $125 per year.
Tranche A loans bear interest, at the Company’s option, at the administrative agent’s base rate (which is the higher of the federal funds effective rate and the administrative agent’s prime rate) plus 1.5% per annum or a Eurodollar rate based on LIBOR plus 2.5% per annum. Tranche B loans bear interest, at the Company’s option, at the administrative agent base rate plus 3.5% per annum or LIBOR plus 4.5% per annum. The interest rate as of June 30, 2008 was 5.1% and 7.1% for Tranche A loans and Tranche B loans, respectively. The interest rate as of December 31, 2007 was 7.7% and 10.1% for Tranche A loans and Tranche B loans, respectively.
The obligations under the Senior Credit Facility are secured by the assets of ASA Holdings and its subsidiaries and a pledge made by VeraSun Energy Corporation of all of the equity interests in ASA Holdings.
The Tranche A term loan is payable in equal quarterly installments of principal of $2,625, and the Tranche B term loan is payable in equal quarterly installments of principal of $1,500, plus accrued interest in accordance with the terms of the Senior Credit Facility, and mature on June 30, 2014.
16
Table of Contents
VERASUN ENERGY CORPORATION
NOTES TO CONDENSED CONSOLIDATED FINANCIAL STATEMENTS (Unaudited)
(dollars in thousands, except per share data)
The Senior Credit Facility requires the Company to prepay the term loans each quarter based on a percentage of excess cash flows as defined in the Senior Credit Facility, generated from the Linden, Albion and Bloomingburg plants. The Company did not make any prepayment on the Senior Credit Facility for the three and six months ended June 30, 2008.
The Senior Credit Facility contains various covenants that, among other restrictions, limit ASA Holdings’ ability and the ability of its subsidiaries to make distributions and pay dividends; incur indebtedness and swap and hedge obligations; grant or assume liens; make certain investments; change the nature of their business; issue equity interests not pledged to the lenders; and sell, transfer, assign or convey assets, or engage in certain mergers or acquisitions. The Company was in compliance with all covenants as of June 30, 2008.
As part of the covenant requirements when the construction loans were converted to term notes, the Company is required to restrict a certain amount of cash representing principal and interest payments on the outstanding Senior Credit Facility. Restricted cash as of June 30, 2008 includes $9,500 related to this requirement.
(c) UBS Credit Facility
On May 30, 2008, the Company entered into a Credit Agreement (the “Credit Facility”) with UBS Securities LLC, UBS AG, Stamford Branch, and UBS Loan Finance LLC. The Credit Agreement provides up to $125,000 of revolving credit subject to a borrowing base. The borrowing base is a formula based on eligible inventory and receivables, minus certain reserves. All obligations under the Credit Facility are secured by the VeraSun’s inventory and accounts receivable. Advances under the Credit Facility may be used for general corporate purposes, including capital expenditures. Subject to collateral availability, the Credit Facility also permits the Company to advance funds to VeraSun Reynolds, LLC and, in an initial amount not to exceed $40,000, to other subsidiaries of the Company. At June 30, 2008, the Company’s borrowing base was $92,745, and the Company had borrowed $40,500 under the Credit Facility. The average interest rate on the credit facility as of June 30, 2008, was 6.5%.
The Company is in the process of transferring certain letters of credit to the Credit Facility. As of June 30, 2008, UBS required the Company to restrict a certain amount of cash until all the letters of credit were transferred. Restricted cash as of June 30, 2008 includes $1,525 related to this requirement.
(d) AgStar Credit Facilities
On April 1, 2008, the Company assumed various credit facilities with AgStar as an administrative agent and as a lender, and a group of other lenders as part of the US BioEnergy acquisition. As of June 30, 2008, $435,059 was outstanding with AgStar, which was comprised of the following:
| • | $201,146 of construction loans bearing interest of 3.15% above the one-month LIBOR, interest payable quarterly; |
| • | $88,265 of senior secured term loans bearing interest of 2.90% above the one-month LIBOR, with monthly principal and interest payments through February 2012 and September 2012; |
| • | $85,143 of senior secured term loans bearing interest of 3.25% above the one-month LIBOR, with monthly principal and interest payments through November 2011 and March 2012; and |
| • | $54,763 of revolving term loans bearing interest ranging from 2.90% to 3.25% above the one-month LIBOR, interest payable monthly, due on various dates ranging through November 2011 to September 2012. |
17
Table of Contents
VERASUN ENERGY CORPORATION
NOTES TO CONDENSED CONSOLIDATED FINANCIAL STATEMENTS (Unaudited)
(dollars in thousands, except per share data)
In addition, the Company had availability of $30,000 under seasonal revolving loans, bearing interest of 4.00% above the one-month LIBOR, interest payable monthly with outstanding principal balance due May 2009, that are available for working capital needs of which $5,742 were outstanding as of June 30, 2008, and $3,500 was used for letters of credit.
All of the AgStar senior secured term loans contain incentive based pricing that is based on levels of equity, which will reduce the interest rate ranging from 150 to 300 basis points above the one-month LIBOR rate. These agreements, each of which is associated with a particular ethanol plant, require quarterly payments of up to $5,000 annually based on excess cash flow calculations reducing the principal balance.
The Company has various construction retainage and payables relating to the construction of the Janesville, Hankinson and Dyersville facilities. We intend to finance the construction payables with availability under our AgStar credit facility. As of June 30, 2008, we had $17,077 in construction payables that are classified within other long-term liabilities on these condensed consolidated balance sheets. As of June 30, 2008, there was approximately $89,354 of construction funding available under the AgStar credit facility.
(e) Marion Construction loans
US Bio Marion, LLC (“US Bio Marion”), which became a subsidiary of the Company as a result of the US BioEnergy acquisition, at the time of the acquisition had outstanding construction loans from Dougherty Funding LLC (“Dougherty”) relating to the Marion, South Dakota facility (“Marion”). As of April 1, 2008, there was $79,800 of outstanding Marion construction loan borrowings bearing interest of 4.00% above the three-month LIBOR, interest payable monthly with outstanding principal balance due May 2009. On June 1, 2008 the outstanding Marion constructions loans were converted into a term note in the amount of $90,000 requiring monthly amortized payments of principal and interest sufficient to amortize the remaining unpaid principal balance to a maturity date of March 31, 2013. The term loan is secured by substantially all of the assets of US Bio Marion. As of June 30, 2008, outstanding borrowings under the Marion term note were $90,000.
Restricted cash as of June 30, 2008 includes $3,752 of cash proceeds received from the conversion of the Marion construction loan to a term note. The lender will release escrow funds upon the submission of construction in process payments. The Company expects to obtain the cash proceeds to be released from escrow by the end of fiscal 2008.
US Bio Marion also has a seasonal revolving line of credit with First Bank & Trust, a South Dakota bank, to fund operating requirements. Amounts available and outstanding under the seasonal revolving loans as of June 30, 2008, were $7,000, bearing interest at 4.00% above the one-month LIBOR. The revolving line of credit is secured by US Bio Marion’s inventory and accounts receivable and expires on May 28, 2009.
US Bio Marion also has a $5,500 letters of credit agreement with First Bank & Trust to be issued on behalf of Marion to satisfy the requirements of certain utility service providers to secure US Bio Marion’s contractual obligation to them under certain agreements with these utility service providers. As of June 30, 2008, US Bio Marion had outstanding letters of credit with First Bank & Trust of $5,500.
(f) Community Redevelopment Revenue Bonds
As part of the US BioEnergy acquisition, the Company assumed Community Redevelopment Revenue Bonds, issued by the Community Redevelopment Authority (“Authority”) of the City of Central City, Nebraska. The redevelopment contract requires semi-annual interest and principal payments through 2018. The bonds bear interest at fixed rates ranging from 6.25% to 7.25%. Real estate taxes paid by Central City and allocated to the
18
Table of Contents
VERASUN ENERGY CORPORATION
NOTES TO CONDENSED CONSOLIDATED FINANCIAL STATEMENTS (Unaudited)
(dollars in thousands, except per share data)
Authority will be used by the Authority to pay principal and interest of the bonds. Although such real estate taxes are expected to be sufficient to repay the bonds, Central City is obligated to pay any deficiency when due. The agreement is secured by a mortgage on Central City’s real property which is subordinate to the term notes payable to bank and the revolving term note. As of June 30, 2008, the principal balance on the outstanding bonds was $3,203.
(g) Tax increment revenue note
As part of the ASA Acquisition, the Company assumed a tax increment revenue note (“Note”) due to the city of Albion, Nebraska with a principal amount of $5,000.
Interest on the Note accrues at an initial rate of 8.5% per annum, which shall be adjusted on December 1, 2009, December 1, 2012, and December 1, 2015, to a rate equal to the lower of (1) the Three-Year United States Treasury Constant Maturity Index plus 425 basis points or (2) 10%. Interest is payable annually beginning on February 1, 2008.
The Note is subject to redemption in whole or in part prior to maturity at the option of the Company, on or after February 1, 2009, at a redemption price in varying amounts of up to 103% of the principal amount being redeemed, together with accrued interest.
Principal and interest on the Note are payable out of property taxes expected to be assessed on the Albion facility with minimum principal payments beginning on February 1, 2009 and each year thereafter until maturity on February 1, 2022.
(h) Unamortized discount
On April 1, 2008, the Company assumed contractual current and long-term debt maturities of $525,147 as part of the US BioEnergy acquisition. FASB Statement No. 141 requires note payable, long-term debt and other claims payable to be recognized at present values of amounts to be paid, determined at appropriate current discount rates. The fair value of the assumed US BioEnergy debt on the date of acquisition was $460,979. The difference between the fair value and the contractual balance as of the date of acquisition was $64,168. The unamortized balance is reflected in the table above as “Unamortized discount associated with US BioEnergy acquisition,” and is being amortized over the effective interest rate method as interest expense over the life of the outstanding contractual obligations assumed ranging from 2011 to 2013. For the three months ended June 30, 2008, the amortized debt discount was $3,792. The expected amortization for the remaining six months of fiscal 2008 is $7,600; and annual amortization for the fiscal years 2009 through 2013 is $14,600, $14,200, $13,500, $7,000 and $3,500.
Restricted Net Assets
Certain debt financing arrangements of the Company’s subsidiaries limit the subsidiaries’ ability to pay dividends or make distributions to their parent companies. The Company’s condensed consolidated balance sheet includes approximately $1,047,000 and $442,000 of net assets of the subsidiaries at June 30, 2008 and December 31, 2007, respectively, which, subject to limitations under the applicable financing arrangements, would generally be available to fund operations and investments at a particular subsidiary, but would not be available to the Company and its other subsidiaries for general corporate purposes.
Note 8. Contingencies
We are party to contracts with consultants, independent contractors and other service providers in which we have agreed to indemnify such parties against certain liabilities. Based on historical experience and our assessment of the likelihood that such parties will make claims against us, we believe these indemnification obligations are not material. As of the date of this report, we are not aware of any claims against us related to these indemnification obligations.
19
Table of Contents
VERASUN ENERGY CORPORATION
NOTES TO CONDENSED CONSOLIDATED FINANCIAL STATEMENTS (Unaudited)
(dollars in thousands, except per share data)
We believe we are in compliance with applicable environmental laws and regulations and that our environmental controls are adequate to address existing regulatory requirements.
The Company is a party to various lawsuits, claims, investigations and administrative proceedings that arise in connection with its business, none of which are material.
Note 9: Income Taxes
VeraSun Energy Corporation and its subsidiaries join in the filing of a U.S. federal consolidated income tax return. The U.S. federal statute of limitations remains open for our 2004 and subsequent tax years. U.S. state jurisdictions have statutes of limitations generally ranging from 3 to 5 years. Our tax returns are currently under examination in federal jurisdictions.
We had unrecognized tax benefits of $8,219 and $1,352 at June 30, 2008, and December 31, 2007, respectively. The substantial increase is primarily due to unrecognized tax benefits of US BioEnergy recorded prior to its acquisition by VeraSun. The amounts of unrecognized tax benefits, if recognized, would be immaterial at June 30, 2008, and December 31, 2007, respectively.
We recognize interest and penalties related to these unrecognized tax benefits in the income tax provision which were immaterial during the three and six month periods ended June 30, 2008. Additionally, we had approximately $71 and $44 accrued at June 30, 2008, and December 31, 2007, respectively, for interest associated with unrecognized tax benefits. We expect that the amount of unrecognized tax benefits may change during the next twelve months; however, we do not expect the change to have a material impact on our results of operations or our financial position.
The effective income tax rate on income before income taxes and minority interest was 30.5% and 32.5% for the three and six months ended June 30, 2008, respectively, compared to 35.0% and 35.0% for the three and six months ended June 30, 2007, respectively. The decrease to tax rate is primarily caused by the recognition of state tax credits that are more likely than not to be utilized in the future.
Note 10. Comprehensive Income
The components of comprehensive income, net of income tax, are as follows:
| Three Months Ended June 30, | Six Months Ended June 30, | ||||||||||||
| 2008 | 2007 | 2008 | 2007 | ||||||||||
Net income | $ | 23,890 | $ | 15,136 | $ | 31,463 | $ | 14,824 | |||||
Unrealized (loss) gain from hedging activities | — | (606 | ) | — | 356 | ||||||||
Comprehensive income | $ | 23,890 | $ | 14,530 | $ | 31,463 | $ | 15,180 | |||||
Note 11. Income Per Common Share
Basic income per common share is computed by dividing net income available to common shareholders by the weighted average number of common shares outstanding for the period. Diluted income per common share reflects the potential dilution that would occur, using the treasury stock method, if securities or other obligations to issue common stock were exercised or converted into common stock or resulted in the issuance of common stock that shared in the Company’s earnings.
20
Table of Contents
VERASUN ENERGY CORPORATION
NOTES TO CONDENSED CONSOLIDATED FINANCIAL STATEMENTS (Unaudited)
(dollars in thousands, except per share data)
A reconciliation of net income and common stock share amounts used in the calculation of basic and diluted income per common share is as follows for the three and six months ended June 30, 2008 and 2007:
| Three months ended June 30, | Six months ended June 30, | |||||||||||||||||
| Net Income | Weighted Average Shares Outstanding | Per Share Amount | Net Income | Weighted Average Shares Outstanding | Per Share Amount | |||||||||||||
2008: | ||||||||||||||||||
Income per common share - basic | $ | 23,890 | 156,962,647 | $ | 0.15 | $ | 31,463 | 124,836,224 | $ | 0.25 | ||||||||
Effects of dilutive securities: | ||||||||||||||||||
Stock options and warrants | 2,557,706 | (0.00 | ) | 2,513,682 | (0.00 | ) | ||||||||||||
Income per common share - diluted | $ | 23,890 | 159,520,353 | $ | 0.15 | $ | 31,463 | 127,349,906 | $ | 0.25 | ||||||||
2007: | ||||||||||||||||||
Income per common share - basic | $ | 15,136 | 76,998,341 | $ | 0.20 | $ | 14,824 | 76,357,188 | $ | 0.19 | ||||||||
Effects of dilutive securities: | ||||||||||||||||||
Stock options and warrants | 3,920,509 | (0.01 | ) | 4,340,101 | (0.01 | ) | ||||||||||||
Income per common share - diluted | $ | 15,136 | 80,918,850 | $ | 0.19 | $ | 14,824 | 80,697,289 | $ | 0.18 | ||||||||
Note 12. Stock–Based Compensation and Equity Based Awards
In January 2008, the Company granted restricted stock awards and stock options at a ratio of 50% restricted stock and 50% stock options based on the Black-Scholes valuation at the time of grant to certain employees pursuant to the revised long-term incentive plan approved by the Compensation Committee of the Board of Directors in December 2007. The stock options vest evenly over three years, and the restricted stock cliff vests on the third anniversary date of the grant. In addition, Outside Directors (directors who are neither officers nor employees) were granted equity compensation using the same ratio of restricted stock and stock options as the employee’s long-term incentive plan, subject to a one year vesting period. In May 2008, an additional grant was made to four new members of the Board of Directors that were added subsequent to the completion of the merger with US BioEnergy (see Note 2). These grants will fully vest at the same one year anniversary date as those awarded in January 2008.
Upon completion of the merger with US BioEnergy, the Company issued grants of restricted stock and stock options with similar terms and conditions as outstanding US BioEnergy awards at the time of the merger, which were replaced. Compensation expense recognized in the periods after the merger include expense for those awards granted, but not yet vested as of the merger date. A separate Stock Incentive Plan, the “USBE Plan” was authorized and 2.5 million shares were reserved by the Board of Directors for the issuance of shares related to the acquired grants. No future grants will be made for issuance under the USBE Plan. Grants issued under the USBE Plan include 328,185 shares of restricted stock and 1,787,066 stock options. Future expense recognized is based on the estimated fair value of unvested awards using the Black-Scholes pricing model. Unvested USBE Plan awards that will be expensed by the Company in future periods include 204,055 shares of restricted stock awards and 63,785 stock options.
As of June 30, 2008, there was $17,490 of total unrecognized compensation expense related to nonvested options and restricted stock granted under all plans that is expected to be recognized as a charge to earnings over a weighted-average period of 2.71 years.
21
Table of Contents
VERASUN ENERGY CORPORATION
NOTES TO CONDENSED CONSOLIDATED FINANCIAL STATEMENTS (Unaudited)
(dollars in thousands, except per share data)
Note 13. Business Segment Information
Operating segments are defined as components of an enterprise for which separate financial information is available that is evaluated regularly by the chief operating decision maker or decision making group in deciding how to allocate resources and in assessing performance. The Company has identified one reportable business segment, the manufacture and marketing of fuel-grade ethanol and distillers grains. The Company’s chief operating decision maker reviews financial information presented on a consolidated basis for purposes of assessing financial performance and making operating decisions. The chief operating decision maker also receives disaggregated information about certain operating expenses. Accordingly, the Company considers itself to be operating in a single industry segment.
Note 14. Guarantors / Non-Guarantors Condensed Consolidating Financial Statements
In accordance with the indentures governing the Company’s senior secured notes and senior unsecured notes, certain wholly-owned subsidiaries of the Company have fully and unconditionally guaranteed the notes on a joint and several basis. The following tables present condensed consolidating financial information for VeraSun Energy Corporation (“VEC”), the issuer of the notes, subsidiaries that are guarantors of the notes and subsidiaries that are non-guarantors of the notes. VeraSun Aurora Corporation, VeraSun Fort Dodge, LLC, VeraSun Charles City, LLC, VeraSun Marketing, LLC, VeraSun Hartley, LLC, VeraSun Welcome, LLC, VeraSun Biodiesel, LLC, VeraSun Granite City, LLC, VeraSun Reynolds, LLC, VeraSun Litchfield, LLC and VeraSun Tilton, LLC, each a wholly-owned subsidiary of VEC, are combined as guarantors.
22
Table of Contents
VERASUN ENERGY CORPORATION
NOTES TO CONDENSED CONSOLIDATED FINANCIAL STATEMENTS (Unaudited)
(dollars in thousands, except per share data)
CONDENSED CONSOLIDATING BALANCE SHEET
June 30, 2008
ASSETS
| Issuer | Guarantors | Non-Guarantors | Eliminations and Consolidations | Consolidated | ||||||||||||
Current Assets | ||||||||||||||||
Cash and cash equivalents | $ | 2,034 | $ | — | $ | 28,689 | $ | (2,282 | ) | $ | 28,441 | |||||
Restricted cash | 1,525 | — | 13,252 | — | 14,777 | |||||||||||
Trade receivables | — | 65,682 | 104,213 | (2,897 | ) | 166,998 | ||||||||||
Inventories | — | 109,799 | 93,121 | 7,737 | 210,657 | |||||||||||
Prepaid expenses and other assets | — | 125,594 | 24,988 | (42,806 | ) | 107,776 | ||||||||||
Derivative financial instruments | — | 39,850 | 24,383 | — | 64,233 | |||||||||||
Deferred income taxes | — | — | 2,814 | (1,966 | ) | 848 | ||||||||||
Total current assets | 3,559 | 340,925 | 291,460 | (42,214 | ) | 593,730 | ||||||||||
Other Assets | ||||||||||||||||
Goodwill | 6,106 | — | 260,673 | — | 266,779 | |||||||||||
Other intangible assets | — | — | 66,344 | — | 66,344 | |||||||||||
Other long-term assets | 2,610 | 16,247 | 8,376 | — | 27,233 | |||||||||||
Debt issuance costs, net | 18,077 | — | — | — | 18,077 | |||||||||||
Deferred income taxes | 22,813 | — | — | (22,813 | ) | — | ||||||||||
Investment in subsidiaries | 1,450,392 | — | 1,837 | (1,452,229 | ) | — | ||||||||||
| 1,499,998 | 16,247 | 337,230 | (1,475,042 | ) | 378,433 | |||||||||||
Property and equipment, net | 13,928 | 825,360 | 1,635,631 | 5,903 | 2,480,822 | |||||||||||
| $ | 1,517,485 | $ | 1,182,532 | $ | 2,264,321 | $ | (1,511,353 | ) | $ | 3,452,985 | ||||||
23
Table of Contents
VERASUN ENERGY CORPORATION
NOTES TO CONDENSED CONSOLIDATED FINANCIAL STATEMENTS (Unaudited)
(dollars in thousands, except per share data)
CONDENSED CONSOLIDATING BALANCE SHEET—(Continued)
June 30, 2008
LIABILITIES AND SHAREHOLDERS’ AND MEMBERS’ EQUITY
| Issuer | Guarantors | Non-Guarantors | Eliminations and Consolidations | Consolidated | |||||||||||||
Current Liabilities | |||||||||||||||||
Outstanding checks in excess of bank balance | $ | — | $ | 11,078 | $ | — | $ | (11,078 | ) | $ | — | ||||||
Current maturities of long-term debt | — | — | 51,124 | — | 51,124 | ||||||||||||
Accounts payable | 18,707 | 133,265 | 61,111 | (36,252 | ) | 176,831 | |||||||||||
Accrued expenses and other liabilities | 5,379 | 6,394 | 30,418 | — | 42,191 | ||||||||||||
Derivative financial instruments | — | 36,055 | 5,652 | — | 41,707 | ||||||||||||
Deferred income taxes | 538 | 1,428 | — | (1,966 | ) | — | |||||||||||
Total current liabilities | 24,624 | 188,220 | 148,305 | (49,296 | ) | 311,853 | |||||||||||
Long-Term Liabilities | |||||||||||||||||
Long-term debt, less current maturities | 697,682 | — | 699,036 | — | 1,396,718 | ||||||||||||
Deferred income taxes | — | 70,112 | 110,295 | (22,813 | ) | 157,594 | |||||||||||
Other long-term liabilities | 1,444 | 6,706 | 38,899 | — | 47,049 | ||||||||||||
| 699,126 | 76,818 | 848,230 | (22,813 | ) | 1,601,361 | ||||||||||||
Minority interest in consolidated subsidiary | — | — | 3,908 | — | 3,908 | ||||||||||||
Intercompany (receivable) payable | (737,328 | ) | 676,141 | 61,187 | — | — | |||||||||||
Shareholders’ and Members’ Equity | 1,531,063 | 241,353 | 1,202,691 | (1,439,244 | ) | 1,535,863 | |||||||||||
| $ | 1,517,485 | $ | 1,182,532 | $ | 2,264,321 | $ | (1,511,353 | ) | $ | 3,452,985 | |||||||
24
Table of Contents
VERASUN ENERGY CORPORATION
NOTES TO CONDENSED CONSOLIDATED FINANCIAL STATEMENTS (Unaudited)
(dollars in thousands, except per share data)
CONDENSED CONSOLIDATING STATEMENT OF OPERATIONS
For the Three Months Ended June 30, 2008
| Issuer | Guarantors | Non-Guarantors | Eliminations and Consolidations | Consolidated | ||||||||||||||||
Net sales | $ | 3,930 | $ | 494,386 | $ | 523,222 | $ | (6,370 | ) | $ | 1,015,168 | |||||||||
Cost of goods sold | 81 | 464,070 | 485,433 | (6,370 | ) | 943,214 | ||||||||||||||
Gross profit | 3,849 | 30,316 | 37,789 | — | 71,954 | |||||||||||||||
Startup expenses | — | 2,651 | 1,940 | — | 4,591 | |||||||||||||||
Restructuring charge | 2,004 | — | — | — | 2,004 | |||||||||||||||
Selling, general and administrative expenses | 11,662 | 948 | 3,707 | — | 16,317 | |||||||||||||||
Operating income (loss) | (9,817 | ) | 26,717 | 32,142 | — | 49,042 | ||||||||||||||
Other income (expense): | ||||||||||||||||||||
Interest expense | (17,391 | ) | (7,143 | ) | (10,782 | ) | 19,815 | (15,501 | ) | |||||||||||
Interest income | 16,215 | 753 | 297 | (16,658 | ) | 607 | ||||||||||||||
Equity in earnings of subsidiaries | 28,928 | — | — | (28,928 | ) | — | ||||||||||||||
Other income | 2,485 | 21 | (2,266 | ) | — | 240 | ||||||||||||||
| 30,237 | (6,369 | ) | (12,751 | ) | (25,771 | ) | (14,654 | ) | ||||||||||||
Income before income taxes and minority interest | 20,420 | 20,348 | 19,391 | (25,771 | ) | 34,388 | ||||||||||||||
Income tax provision (benefit) | (3,470 | ) | 7,269 | 6,705 | — | 10,504 | ||||||||||||||
Income before minority interest | 23,890 | 13,079 | 12,686 | (25,771 | ) | 23,884 | ||||||||||||||
Minority interest in net loss of subsidiary, net of income taxes | — | — | 6 | — | 6 | |||||||||||||||
Net income | $ | 23,890 | $ | 13,079 | $ | 12,692 | $ | (25,771 | ) | $ | 23,890 | |||||||||
25
Table of Contents
VERASUN ENERGY CORPORATION
NOTES TO CONDENSED CONSOLIDATED FINANCIAL STATEMENTS (Unaudited)
(dollars in thousands, except per share data)
CONDENSED CONSOLIDATING STATEMENT OF OPERATIONS
For the Six Months Ended June 30, 2008
| Issuer | Guarantors | Non-Guarantors | Eliminations and Consolidations | Consolidated | ||||||||||||||||
Net sales | $ | 7,757 | $ | 874,669 | $ | 655,586 | $ | (6,370 | ) | $ | 1,531,642 | |||||||||
Cost of goods sold | 120 | 814,018 | 616,802 | (6,370 | ) | 1,424,570 | ||||||||||||||
Gross profit | 7,637 | 60,651 | 38,784 | — | 107,072 | |||||||||||||||
Startup expenses | — | 3,777 | 2,925 | — | 6,702 | |||||||||||||||
Restructuring charge | 2,004 | — | — | — | 2,004 | |||||||||||||||
Selling, general and administrative expenses | 21,010 | 2,293 | 4,379 | — | 27,682 | |||||||||||||||
Operating income (loss) | (15,377 | ) | 54,581 | 31,480 | — | 70,684 | ||||||||||||||
Other income (expense): | ||||||||||||||||||||
Interest expense | (34,578 | ) | (14,140 | ) | (14,172 | ) | 36,576 | (26,314 | ) | |||||||||||
Interest income | 31,956 | 1,603 | 308 | (32,319 | ) | 1,548 | ||||||||||||||
Equity in earnings of subsidiaries | 40,731 | — | — | (40,731 | ) | — | ||||||||||||||
Other income | 2,674 | 306 | (2,266 | ) | — | 714 | ||||||||||||||
| 40,783 | (12,231 | ) | (16,130 | ) | (36,474 | ) | (24,052 | ) | ||||||||||||
Income before income taxes and minority interest | 25,406 | 42,350 | 15,350 | (36,474 | ) | 46,632 | ||||||||||||||
Income tax provision (benefit) | (6,057 | ) | 16,032 | 5,200 | — | 15,175 | ||||||||||||||
Income before minority interest | 31,463 | 26,318 | 10,150 | (36,474 | ) | 31,457 | ||||||||||||||
Minority interest in net loss of subsidiary, net of income taxes | — | — | 6 | — | 6 | |||||||||||||||
Net income | $ | 31,463 | $ | 26,318 | $ | 10,156 | $ | (36,474 | ) | $ | 31,463 | |||||||||
26
Table of Contents
VERASUN ENERGY CORPORATION
NOTES TO CONDENSED CONSOLIDATED FINANCIAL STATEMENTS (Unaudited)
(dollars in thousands, except per share data)
CONDENSED CONSOLIDATING STATEMENT OF CASH FLOWS
For the Six months Ended June 30, 2008
| Issuer | Guarantors | Non-Guarantors | Eliminations and Consolidations | Consolidated | ||||||||||||||||
Net cash provided by (used in) operating activities | $ | (171,748 | ) | $ | 116,269 | $ | 12,518 | $ | 4,249 | $ | (38,712 | ) | ||||||||
Cash Flows from Investing Activities | ||||||||||||||||||||
Purchases of property and equipment | 3,512 | (129,482 | ) | (58,638 | ) | (4,249 | ) | (188,857 | ) | |||||||||||
US BioEnergy acquisition, net of transaction costs | (6,233 | ) | — | 51,339 | — | 45,106 | ||||||||||||||
Proceeds from the sale of short-term investments | 43,175 | — | — | — | 43,175 | |||||||||||||||
Change in restricted cash | (1,525 | ) | — | (13,252 | ) | — | (14,777 | ) | ||||||||||||
Payments for other long-term assets and liabilities | 1,232 | (266 | ) | (3,006 | ) | — | (2,040 | ) | ||||||||||||
Proceeds from sales of equipment | — | 1,300 | — | — | 1,300 | |||||||||||||||
Net cash (used in) provided by investing activities | 40,161 | (128,448 | ) | (23,557 | ) | (4,249 | ) | (116,093 | ) | |||||||||||
Cash Flows from Financing Activities | ||||||||||||||||||||
Proceeds from long-term debt | 40,500 | — | 56,592 | — | 97,092 | |||||||||||||||
Principal payments on long-term debt | — | — | (19,696 | ) | — | (19,696 | ) | |||||||||||||
Debt issuance cost paid | (3,655 | ) | — | — | — | (3,655 | ) | |||||||||||||
Cost of registering equity securities | (1,063 | ) | — | — | — | (1,063 | ) | |||||||||||||
Net effect of the exercise of stock options | (374 | ) | (374 | ) | ||||||||||||||||
Outstanding checks in excess of bank balance | 2,282 | (2,282 | ) | — | ||||||||||||||||
Net cash provided by (used in) financing activities | 35,408 | 2,282 | 36,896 | (2,282 | ) | 72,304 | ||||||||||||||
Net (decrease) increase in cash and cash equivalents | (96,179 | ) | (9,897 | ) | 25,857 | (2,282 | ) | (82,501 | ) | |||||||||||
Cash and cash equivalents, beginning of period | 98,213 | 9,897 | 2,832 | — | 110,942 | |||||||||||||||
Cash and cash equivalents, end of period | $ | 2,034 | $ | — | $ | 28,689 | $ | (2,282 | ) | $ | 28,441 | |||||||||
27
Table of Contents
VERASUN ENERGY CORPORATION
NOTES TO CONDENSED CONSOLIDATED FINANCIAL STATEMENTS (Unaudited)
(dollars in thousands, except per share data)
CONDENSED CONSOLIDATING BALANCE SHEET
December 31, 2007
ASSETS
| Issuer | Guarantors | Non-Guarantors | Eliminations and Consolidations | Consolidated | ||||||||||||
Current Assets | ||||||||||||||||
Cash and cash equivalents | $ | 98,213 | $ | 9,897 | $ | 2,832 | $ | — | $ | 110,942 | ||||||
Short-term investments | 43,175 | — | — | — | 43,175 | |||||||||||
Trade receivables | — | 32,063 | 19,231 | — | 51,294 | |||||||||||
Inventories | — | 92,542 | 15,370 | — | 107,912 | |||||||||||
Prepaid expenses and other assets | 12,867 | 43,824 | 6,906 | — | 63,597 | |||||||||||
Derivative financial instruments | — | 12,627 | — | — | 12,627 | |||||||||||
Total current assets | 154,255 | 190,953 | 44,339 | — | 389,547 | |||||||||||
Other Assets | ||||||||||||||||
Goodwill | 6,129 | — | 163,500 | — | 169,629 | |||||||||||
Other intangible assets | — | — | 21,668 | — | 21,668 | |||||||||||
Other long-term assets | 3,793 | 9,776 | 2,003 | — | 15,572 | |||||||||||
Debt issuance costs, net | 15,478 | — | — | — | 15,478 | |||||||||||
Investment in subsidiaries | 664,543 | — | — | (664,543 | ) | — | ||||||||||
| 689,943 | 9,776 | 187,171 | (664,543 | ) | 222,347 | |||||||||||
Property and equipment, net | 18,216 | 705,276 | 526,420 | 1,700 | 1,251,612 | |||||||||||
| $ | 862,414 | $ | 906,005 | $ | 757,930 | $ | (662,843 | ) | $ | 1,863,506 | ||||||
28
Table of Contents
VERASUN ENERGY CORPORATION
NOTES TO CONDENSED CONSOLIDATED FINANCIAL STATEMENTS (Unaudited)
(dollars in thousands, except per share data)
CONDENSED CONSOLIDATING BALANCE SHEET—(Continued)
December 31, 2007
LIABILITIES AND SHAREHOLDERS’ AND MEMBERS’ EQUITY
| Issuer | Guarantors | Non-Guarantors | Eliminations and Consolidations | Consolidated | |||||||||||||
Current Liabilities | |||||||||||||||||
Current maturities of long-term debt | $ | — | $ | — | $ | 16,774 | $ | — | $ | 16,774 | |||||||
Accounts payable | 5,111 | 77,860 | 37,843 | — | 120,814 | ||||||||||||
Accrued expenses | 4,449 | 4,948 | 1,741 | — | 11,138 | ||||||||||||
Derivative financial instruments | — | 11,299 | — | — | 11,299 | ||||||||||||
Deferred income taxes | 63 | 1,429 | 377 | — | 1,869 | ||||||||||||
Total current liabilities | 9,623 | 95,536 | 56,735 | — | 161,894 | ||||||||||||
Long-Term Liabilities | |||||||||||||||||
Long-term debt, less current maturities | 656,978 | — | 231,718 | — | 888,696 | ||||||||||||
Deferred income taxes | (6,199 | ) | 54,079 | 3,684 | — | 51,564 | |||||||||||
Other long term liabilities | 1,395 | 1,519 | 2,707 | — | 5,621 | ||||||||||||
| 652,174 | 55,598 | 238,109 | — | 945,881 | |||||||||||||
Intercompany (receivable) payable | (553,414 | ) | 533,062 | 20,352 | — | — | |||||||||||
Shareholders’ and Members’ Equity | 754,031 | 221,809 | 442,734 | (662,843 | ) | 755,731 | |||||||||||
| $ | 862,414 | $ | 906,005 | $ | 757,930 | $ | (662,843 | ) | $ | 1,863,506 | |||||||
29
Table of Contents
VERASUN ENERGY CORPORATION
NOTES TO CONDENSED CONSOLIDATED FINANCIAL STATEMENTS (Unaudited)
(dollars in thousands, except per share data)
CONDENSED CONSOLIDATING STATEMENT OF OPERATIONS
For the Three Months Ended June 30, 2007
| Issuer | Guarantors | Non-Guarantors | Eliminations and Consolidations | Consolidated | |||||||||||||||
Net sales | $ | 1,526 | $ | 168,030 | $ | — | $ | — | $ | 169,556 | |||||||||
Cost of goods sold | 10 | 137,061 | — | — | 137,071 | ||||||||||||||
Gross profit | 1,516 | 30,969 | — | — | 32,485 | ||||||||||||||
Startup expenses | — | 218 | — | — | 218 | ||||||||||||||
Restructuring charge | — | — | — | — | — | ||||||||||||||
Selling, general and administrative expenses | 6,537 | 1,642 | — | — | 8,179 | ||||||||||||||
Operating income (loss) | (5,021 | ) | 29,109 | — | — | 24,088 | |||||||||||||
Other income (expense): | |||||||||||||||||||
Interest expense | (11,656 | ) | (2,442 | ) | — | 7,919 | (6,179 | ) | |||||||||||
Interest income | 12,451 | 830 | — | (7,919 | ) | 5,362 | |||||||||||||
Other income | — | 30 | — | — | 30 | ||||||||||||||
Equity in earnings of subsidiaries | 15,799 | — | — | (15,799 | ) | — | |||||||||||||
| 16,594 | (1,582 | ) | — | (15,799 | ) | (787 | ) | ||||||||||||
Income before income taxes | 11,573 | 27,527 | — | (15,799 | ) | 23,301 | |||||||||||||
Income tax expense (benefit) | (3,563 | ) | 11,728 | — | — | 8,165 | |||||||||||||
Net income | $ | 15,136 | $ | 15,799 | $ | — | $ | (15,799 | ) | $ | 15,136 | ||||||||
CONDENSED CONSOLIDATING STATEMENT OF OPERATIONS
For the Six Months Ended June 30, 2007
| Issuer | Guarantors | Non-Guarantors | Eliminations and Consolidations | Consolidated | |||||||||||||||
Net sales | $ | 2,412 | $ | 311,654 | $ | — | $ | — | $ | 314,066 | |||||||||
Cost of goods sold | 20 | 272,317 | — | — | 272,337 | ||||||||||||||
Gross profit | 2,392 | 39,337 | — | — | 41,729 | ||||||||||||||
Startup expenses | — | 1,584 | — | — | 1,584 | ||||||||||||||
Restructuring charge | — | — | — | — | — | ||||||||||||||
Selling, general and administrative expenses | 15,389 | 2,958 | — | — | 18,347 | ||||||||||||||
Operating income (loss) | (12,997 | ) | 34,795 | — | — | 21,798 | |||||||||||||
Other income (expense): | |||||||||||||||||||
Interest expense | (17,494 | ) | (3,778 | ) | — | 13,341 | (7,931 | ) | |||||||||||
Interest income | 21,050 | 1,198 | — | (13,341 | ) | 8,907 | |||||||||||||
Other income | 1 | 31 | — | — | 32 | ||||||||||||||
Equity in earnings of subsidiaries | 18,791 | — | — | (18,791 | ) | — | |||||||||||||
| 22,348 | (2,549 | ) | — | (18,791 | ) | 1,008 | |||||||||||||
Income before income taxes | 9,351 | 32,246 | — | (18,791 | ) | 22,806 | |||||||||||||
Income tax expense (benefit) | (5,473 | ) | 13,455 | — | — | 7,982 | |||||||||||||
Net income | $ | 14,824 | $ | 18,791 | $ | — | $ | (18,791 | ) | $ | 14,824 | ||||||||
30
Table of Contents
VERASUN ENERGY CORPORATION
NOTES TO CONDENSED CONSOLIDATED FINANCIAL STATEMENTS (Unaudited)
(dollars in thousands, except per share data)
CONDENSED CONSOLIDATING STATEMENT OF CASH FLOWS
For the Six months Ended June 30, 2007
| Issuer | Guarantors | Non Guarantors | Eliminations and Consolidations | Consolidated | |||||||||||||||
Net cash provided by (used in) operating activities | $ | (122,012 | ) | $ | 36,356 | $ | — | $ | 109,778 | $ | 24,122 | ||||||||
Cash Flows from Investing Activities | |||||||||||||||||||
Proceeds of short-term investments | (249,516 | ) | — | — | — | (249,516 | ) | ||||||||||||
Purchases of property and equipment with restricted cash held in escrow | 44,267 | (44,267 | ) | — | — | — | |||||||||||||
Purchases of property and equipment | (1,065 | ) | (128,486 | ) | — | — | (129,551 | ) | |||||||||||
Payment of deposits | (50 | ) | (152 | ) | — | — | (202 | ) | |||||||||||
Proceeds from sale of property and equipment | 5 | 1 | — | — | 6 | ||||||||||||||
Net cash (used in) investing activities | (206,359 | ) | (172,904 | ) | — | — | (379,263 | ) | |||||||||||
Cash Flows from Financing Activities | |||||||||||||||||||
Proceeds from long-term debt | 447,750 | — | — | — | 447,750 | ||||||||||||||
Principal payments on long-term debt | — | 109,778 | — | (109,778 | ) | — | |||||||||||||
Net effect of the exercise of stock options | 8,285 | — | — | — | 8,285 | ||||||||||||||
Excess tax benefits from share-based payment arrangements | 6,865 | — | — | — | 6,865 | ||||||||||||||
Debt issuance cost paid | (11,375 | ) | — | — | — | (11,375 | ) | ||||||||||||
Costs of raising capital | (5 | ) | — | — | — | (5 | ) | ||||||||||||
Outstanding checks in excess of bank balance | — | 26,768 | — | (26,768 | ) | — | |||||||||||||
Net cash provided by (used in) financing activities | 451,520 | 136,546 | — | (136,546 | ) | 451,520 | |||||||||||||
Net increase (decrease) in cash and cash equivalents | 123,149 | (2 | ) | — | (26,768 | ) | 96,379 | ||||||||||||
Cash and cash equivalents, beginning of period | 324,146 | 2 | — | (6,099 | ) | 318,049 | |||||||||||||
Cash and cash equivalents, end of period | $ | 447,295 | $ | — | $ | — | $ | (32,867 | ) | $ | 414,428 | ||||||||
31
Table of Contents
| ITEM 2. | MANAGEMENT’S DISCUSSION AND ANALYSIS OF FINANCIAL CONDITION AND RESULTS OF OPERATIONS |
FORWARD LOOKING STATEMENTS
We make certain forward-looking statements in this Quarterly Report on Form 10-Q and in the documents that are incorporated herein by reference. These forward-looking statements relate to our outlook or expectations for earnings, revenues, expenses, asset quality or other future financial or business performance, strategies or expectations, or the impact of legal, regulatory or supervisory matters on our business, results of operations or financial condition. Specifically, forward-looking statements may include statements preceded by, followed by or that contain the words “estimate,” “plan,” “project,” “forecast,” “intend,” “expect,” “anticipate,” “believe,” “seek,” “target” or similar expressions.
These statements reflect our management’s judgment based on currently available information and involve a number of risks and uncertainties that could cause actual results to differ materially from those in the forward-looking statements.
Future performance cannot be assured. Actual results may differ materially from those in the forward-looking statements. Some factors that could cause our actual results to differ include:
| • | our ability to achieve the expected benefits from our recent acquisition of US BioEnergy Corporation (“US BioEnergy”); |
| • | the volatility and uncertainty of corn, natural gas, ethanol, unleaded gasoline and other commodities prices; |
| • | the results of our hedging transactions and other risk mitigation strategies; |
| • | operational disruptions at our facilities; |
| • | the effects of vigorous competition and excess capacity in the industries in which we operate; |
| • | the costs and business risks associated with developing new products and entering new markets; |
| • | the development of infrastructure related to the sale and distribution of ethanol; |
| • | the effects of other mergers and consolidations in the biofuels industry and unexpected announcements or developments from others in the biofuels industry; |
| • | the uncertainties related to our acquisitions of US BioEnergy, ASA OpCo Holdings, LLC and other businesses; |
| • | the impact of new, emerging and competing technologies on our business; |
| • | the possibility of one or more of the markets in which we compete being impacted by political, legal and regulatory changes or other external factors over which we have no control; |
| • | changes in or elimination of governmental laws, tariffs, trade or other controls or enforcement practices; |
| • | the impact of a potential Renewable Fuel Standards waiver; |
| • | our reliance on key management personnel; |
| • | limitations and restrictions contained in the instruments and agreements governing our indebtedness; |
| • | our ability to raise additional capital and secure additional financing; |
| • | the volatility of the market price of our stock; |
| • | risk of potential goodwill and other intangible impairment; |
| • | our ability to implement additional financial and management controls, reporting systems and procedures and comply with Section 404 of the Sarbanes-Oxley Act, as amended; and |
| • | other risks referenced from time to time in our filings with the SEC and those factors listed in this Form 10Q under Part II, Item 1A, “Risks Factors” and in Item 1A – Risk Factors of Part I of our Annual Report on Form 10-K for the year ended December 31, 2007. |
32
Table of Contents
You are cautioned not to place undue reliance on any forward-looking statements, which speak only as of the date of this Form 10Q, or in the case of a document incorporated by reference, as of the date of that document. Except as required by law, we undertake no obligation to publicly update or release any revisions to these forward-looking statements to reflect any events or circumstances after the date of this Form 10-Q or to reflect the occurrence of unanticipated events.
Business Overview
VeraSun is one of the largest ethanol producers in the United States based on production capacity, according to the Renewable Fuels Association (“RFA”). We focus primarily on the production and sale of ethanol and distillers grains. This focus has enabled us to significantly grow our ethanol production capacity and to work with automakers, fuel distributors, trade associations and consumers to increase the demand for ethanol. As an industry leader, we play an active role in developments within the renewable fuels industry.
Ethanol is a type of alcohol produced in the U.S. principally from corn. Ethanol is primarily used as a blend component in the U.S. gasoline fuel market, which approximated 142 billion gallons in 2007 according to the Energy Information Administration (“EIA”). Refiners and marketers have historically blended ethanol with gasoline to increase octane and reduce tailpipe emissions. The ethanol industry has grown significantly over the last few years, expanding production capacity at a compounded annual growth rate of approximately 22% from 2000 to 2007. We believe the ethanol market will continue to grow as a result of ethanol’s cleaner burning characteristics, a shortage of domestic petroleum refining capacity, geopolitical concerns, and federally mandated renewable fuel usage. We also believe that E85, a fuel blend composed of 85% ethanol, may become increasingly important as an alternative to unleaded gasoline.
We completed the acquisition of US BioEnergy on April 1, 2008. The acquisition was accounted for using the purchase method of accounting. Accordingly, US BioEnergy’s results of operations are included in our consolidated operating results beginning in the second quarter of 2008.
As of July 31, 2008, we own and operate twelve ethanol production facilities in the U.S., with a combined nameplate capacity of approximately 1.2 billion gallons per year. As of July 31, 2008, our ethanol production capacity represented approximately 12.7% of the total ethanol production capacity in the U.S., according to the RFA. We have designated a “nameplate” production capacity for each of our ethanol production facilities. Generally, we determine the nameplate capacity of a facility upon completing construction of the facility, upon completing an expansion of the facility or the acquisition of the facility. The nameplate capacity for each facility represents our estimate of the production capacity of that facility at the time, based on the capacity specified in the applicable design-build agreement or other construction agreement for the plant, our experience operating the plant or similar plants, environmental or other regulatory constraints and other applicable factors. The nameplate capacity of our facilities may not be comparable to the capacity our competitors report as nameplate capacity for their facilities.
Our facilities are designed to operate on a continuous basis and use current dry-milling technology, a production process that results in increased ethanol yield and reduced capital costs compared to wet-milling facilities. In addition to producing ethanol, we produce and sell wet and dry distillers grains. In 2007, we produced approximately 353.1 million gallons of fuel ethanol and 1.2 million tons of distillers grains.
We have four additional ethanol production facilities completed or under construction with a combined annual production capacity of 440 million gallons per year, or “MMGY.” These facilities are located in: Hartley, Iowa and Welcome, Minnesota which the Company has delayed start-up; Dyersville, Iowa, which is expected to begin production during the third quarter of 2008; and Janesville, Minnesota which is expected to begin production during the fourth quarter of 2008. Upon completion of these facilities, we will have production capacity of approximately 1.6 billion gallons per year. We also broke ground on a facility in Reynolds, Indiana in April 2007. However, in October 2007, we suspended construction of the Reynolds facility due to market conditions. We expect to resume construction at Reynolds as more favorable market conditions return.
33
Table of Contents
Executive Summary
We completed our acquisition of US BioEnergy on April 1, 2008. The addition of US BioEnergy’s production facilities increased our production capacity 420 MMGY, or 62.7%, to approximately 1.1 billion gallons per year. These facilities include Albert City, Iowa with a capacity of 110 MMGY; Woodbury, Michigan with a capacity of 50 MMGY; Central City and Ord, Nebraska with capacities of 100 MMGY and 50 MMGY respectively; and Marion, SD with a capacity of 110 MMGY. Plants under construction acquired as a result of the US BioEnergy acquisition include facilities, each with an expected capacity of 110 MMGY, near Hankinson, North Dakota, Dyersville, Iowa and Janesville, Minnesota. The Hankinson, North Dakota facility became operational on July 21, 2008.
We completed our acquisition of ASA OpCo Holdings, LLC on August 17, 2007. This acquisition added three 110 MMGY production facilities (in Linden, Indiana; Albion, Nebraska; and Bloomingburg, Ohio) to our production capacity. The facilities in Linden, Indiana and Albion Nebraska became operational in August and October of 2007 respectively. The Bloomingburg, Ohio facility became operational in March of 2008.
Highlights for the six months ended June 30, 2008, are as follows:
| • | Total revenues increased 388% or $1.2 billion compared to the 2007 comparable period. |
| • | Net income was $31.5 million for the 2008 period, compared to net income of $14.8 million for the 2007 comparable period. |
| • | Ethanol gallons sold were 521.6 million gallons, an increase of 398.0 million gallons or 322% higher than the 2007 period. |
| • | Production volume was 398.3 million gallons, up 257.4 million gallons or 183% compared to the 2007 period. |
| • | Income per fully diluted common share was $0.25 for the 2008 period compared to $0.18 per share for the 2007 period. |
Components of Revenues and Expenses
Total revenues.Our primary source of revenue during the second quarter of 2008 was the sale of products produced at our facilities located at Aurora and Marion, South Dakota; Fort Dodge, Charles City, and Albert City, Iowa; Linden, Indiana; Albion, Central City, and Ord, Nebraska; Bloomingburg, Ohio; and Woodbury, Michigan. In addition, we also market ethanol purchased from other producers. Our principal sources of revenue are:
| • | the sale of ethanol; |
| • | the sale of distillers grains; |
• | the sale of ethanol blended VE85® fuel; and |
| • | the sale of corn. |
The selling prices for our products are largely determined by the market demand for ethanol which, in turn, is influenced by the industry factors described elsewhere in this report.
Cost of goods sold and gross profit.Our gross profit is derived from our total revenues less our cost of goods sold. Our cost of goods sold is mainly affected by the cost of corn, natural gas and transportation and the purchase price of ethanol from other producers. Corn is our most significant raw material production cost (excluding the cost of ethanol purchases). The price of corn is influenced by weather conditions and other factors affecting crop yields, farmer planting decisions and general economic, market and regulatory factors. These factors include government policies and subsidies with respect to agriculture and international trade, and global and local demand and supply. The spot price of corn tends to rise during the spring planting season and tends to decrease during the fall harvest. We purchase natural gas to power steam generation in our ethanol production
34
Table of Contents
process and to dry our distillers grains. Natural gas represents our second largest production cost (excluding the cost of ethanol purchases). Cost of goods sold also includes the net gain or loss from derivatives relating to corn and natural gas, and the cost of ethanol that we purchase for resale. Transportation expense represents the third major component of our cost of goods sold (excluding the cost of ethanol purchases). Transportation expense includes rail car leases, freight and shipping of our ethanol and distillers grains, as well as costs incurred in storing ethanol at destination terminals.
Startup expenses. Costs associated with the operation of a facility prior to the production and sale of ethanol are expensed as incurred. During the second quarter of 2008, we incurred startup expenses relating to the Welcome and Janesville, Minnesota; Hankinson, North Dakota; and Dyersville and Hartley, Iowa facilities. During the second quarter of 2007 we incurred startup expenses relating to our facilities near Hartley, Iowa; Welcome, Minnesota; and Reynolds, Indiana.
Restructuring expenses. Restructuring expenses consist of personnel and severance costs for VeraSun employee terminations of duplicate positions in conjunction with the US BioEnergy acquisition and costs related to relocating the Company’s headquarters to Sioux Falls, South Dakota.
Selling, general and administrative expenses.Selling, general and administrative expenses consist of salaries and benefits paid to our administrative employees including stock-based compensation, taxes, expenses relating to third-party services, insurance, travel, marketing, severance and other expenses. Other expenses include education and training, marketing, travel, corporate donations and other miscellaneous overhead costs.
Other income (expense).Other income (expense) includes the interest on our long-term debt and the amortization of the related fees to execute required financing agreements.
Results of Operations
The following table sets forth, for the periods presented, revenues, expenses and net income, as well as the percentage relationship to total revenues of specified items in our condensed consolidated statement of operations:
| Three Months Ended June 30, | Six Months Ended June 30, | ||||||||||||||||||||||||||
| 2008 | 2007 | 2008 | 2007 | ||||||||||||||||||||||||
| (unaudited) | (unaudited) | ||||||||||||||||||||||||||
| (dollars in thousands) | (dollars in thousands) | ||||||||||||||||||||||||||
Total revenue | $ | 1,015,168 | 100.0 | % | $ | 169,556 | 100.0 | % | $ | 1,531,642 | 100.0 | % | $ | 314,066 | 100.0 | % | |||||||||||
Cost of goods sold | 943,214 | 92.9 | 137,071 | 80.8 | 1,424,570 | 93.0 | 272,337 | 86.7 | |||||||||||||||||||
Gross profit | 71,954 | 7.1 | 32,485 | 19.2 | 107,072 | 7.0 | 41,729 | 13.3 | |||||||||||||||||||
Startup expenses | 4,591 | 0.5 | 218 | 0.1 | 6,702 | 0.4 | 1,584 | 0.5 | |||||||||||||||||||
Restructuring charge | 2,004 | 0.2 | — | 0.0 | 2,004 | 0.1 | — | 0.0 | |||||||||||||||||||
Selling, general and administrative expenses | 16,317 | 1.6 | 8,179 | 4.9 | 27,682 | 1.9 | 18,347 | 5.9 | |||||||||||||||||||
Operating income | 49,042 | 4.8 | 24,088 | 14.2 | 70,684 | 4.6 | 21,798 | 6.9 | |||||||||||||||||||
Other income (expense), net | (14,654 | ) | (1.4 | ) | (787 | ) | (0.5 | ) | (24,052 | ) | (1.6 | ) | 1,008 | 0.3 | |||||||||||||
Income before income taxes and minority interest | 34,388 | 3.4 | 23,301 | 13.7 | 46,632 | 3.0 | 22,806 | 7.2 | |||||||||||||||||||
Income tax provision | 10,504 | 1.0 | 8,165 | 4.8 | 15,175 | 1.0 | 7,982 | 2.5 | |||||||||||||||||||
Minority interest | 6 | 0.0 | — | 0.0 | 6 | 0.0 | — | 0.0 | |||||||||||||||||||
Net income | $ | 23,890 | 2.4 | % | $ | 15,136 | 8.9 | % | $ | 31,463 | 2.0 | % | $ | 14,824 | 4.7 | % | |||||||||||
35
Table of Contents
The following table sets forth other key data for the periods presented (dollars in thousands, except per unit data):
| Three Months Ended June 30, | Six Months Ended June 30, | |||||||||||||
| 2008 | 2007 | 2008 | 2007 | |||||||||||
| (unaudited) | (unaudited) | |||||||||||||
Other financial data: | ||||||||||||||
Net cash flows (used in) provided by operating activities | $ | (35,391 | ) | $ | 4,357 | $ | (38,712 | ) | $ | 24,122 | ||||
Other non-GAAP financial performance data: | ||||||||||||||
EBITDA (1) | $ | 73,122 | $ | 33,027 | $ | 105,468 | $ | 36,817 | ||||||
Operating data: | ||||||||||||||
Ethanol sold—produced (gallons, in thousands) (2) | 246,556 | 63,368 | 388,756 | 123,579 | ||||||||||
Ethanol sold—purchase/resale (gallons, in thousands) | 83,353 | — | 132,807 | — | ||||||||||
Total ethanol sold | 329,909 | 63,368 | 521,563 | 123,579 | ||||||||||
Distillers grains sold (tons, in thousands) | 829.8 | 235.2 | 1,376.3 | 419.8 | ||||||||||
Average gross price of ethanol sold per gallon | $ | 2.59 | $ | 2.21 | $ | 2.49 | $ | 2.15 | ||||||
Average corn cost per bushel | 5.37 | 3.62 | 5.14 | 3.77 | ||||||||||
Average natural gas cost per MMBTU | 10.81 | 7.59 | 10.48 | 7.85 | ||||||||||
Average dry distillers grains gross price per ton | 144.07 | 95.72 | 131.01 | 92.79 | ||||||||||
| (1) | EBITDA is defined as earnings before interest expense, income tax expense, depreciation and amortization. Amortization of debt issuance costs and debt discount are included in interest expense. |
(2) | Excludes ethanol sold in VE85® sales. |
Non-GAAP Financial Measures
We believe that earnings before interest expense, income tax provision (benefit), depreciation and amortization, or EBITDA, is useful to investors and management in evaluating our operating performance in relation to other companies in our industry because the calculation of EBITDA generally eliminates the effects of financings and income taxes, which items may vary for different companies for reasons unrelated to overall operating performance. EBITDA is a non-GAAP financial measure and has limitations as an analytical tool, and should not be considered in isolation or as a substitute for net income or any other measure of performance under GAAP, or to cash flows from operating, investing or financing activities as a measure of liquidity. Some of the limitations of EBITDA are:
| • | EBITDA does not reflect our cash used for capital expenditures; |
| • | Although depreciation and amortization are non-cash charges, the assets being depreciated or amortized often will have to be replaced and EBITDA does not reflect the cash requirements for replacements; |
| • | EBITDA does not reflect changes in, or cash requirements for, our working capital requirements; |
| • | EBITDA does not reflect the cash necessary to make payments of interest or principal on our indebtedness; and |
| • | EBITDA includes non-recurring payments to us which are reflected in other income. |
We compensate for these limitations by relying on our GAAP results, as well as on our EBITDA.
36
Table of Contents
The following table reconciles our EBITDA to net income for the periods presented (dollars in thousands):
| Three Months Ended June 30, | Six Months Ended June 30, | |||||||||||
| 2008 | 2007 | 2008 | 2007 | |||||||||
| (unaudited) | (unaudited) | (unaudited) | (unaudited) | |||||||||
Net income | $ | 23,890 | $ | 15,136 | $ | 31,463 | $ | 14,824 | ||||
Depreciation and amortization | 23,227 | 3,547 | 32,516 | 6,080 | ||||||||
Interest expense | 15,501 | 6,179 | 26,314 | 7,931 | ||||||||
Income tax provision | 10,504 | 8,165 | 15,175 | 7,982 | ||||||||
EBITDA | $ | 73,122 | $ | 33,027 | $ | 105,468 | $ | 36,817 | ||||
Three Months Ended June 30, 2008 Compared to Three Months Ended June 30, 2007
Total revenues, which include revenues from the sale of ethanol, distillers grains, VE85®, and corn increased by $845.6 million, or 498.7%, to $1,015.2 million for the three months ended June 30, 2008, compared to $169.6 million for the three months ended June 30, 2007. The increase in total revenues was primarily the result of a 420.6% increase in ethanol volume sold and an increase in average ethanol prices of $0.38 per gallon, or 17.1%, compared to 2007. For the three months ended June 30, 2008, the Company sold 329.9 million gallons of ethanol, which includes 83.4 million gallons of ethanol that were purchased from others and resold to our customers. Ethanol production increased by 175.0 million gallons, or 214.8%, to 256.5 million gallons compared with the three months ended June 30, 2007, as a result of the added capacity from Linden, Indiana facility in August 2007, the Albion, Nebraska facility in October 2007, the Bloomingburg, Ohio facility in March 2008 and the US BioEnergy acquisition on April 1, 2008.
Net sales from ethanol increased $710.4 million, or 499.4%, to $852.7 million for the three months ended June 30, 2008 compared with $142.3 million for the three months ended June 30, 2007. Of the increase, $588.2 million was driven by additional volumes of ethanol sold. The increased volume resulted from additional production at the Linden, Albion, and Bloomingburg facilities, which came on line since June 30, 2007, output from the US BioEnergy facilities acquired April 1, 2008, and ethanol that was purchased and resold to our customers. Higher ethanol prices contributed $122.2 million of the increased revenue. The average price of ethanol sold was $2.59 per gallon for the three months ended June 30, 2008, compared to $2.21 per gallon for the three months ended June 30, 2007.
Net sales from distillers grains increased $97.0 million, or 431.0%, to $119.5 million for the three months ended June 30, 2008 compared with $22.5 million for the three months ended June 30, 2007. The impact of increased volume was $56.9 million and the impact of higher prices of $48.35 per ton contributed $40.1 million of the increased revenues.
Net sales of VE85®, our branded E85 product, increased $8.2 million, or 206.5%, to $12.2 million for the three months ended June 30, 2008 compared with $4.0 million for the three months ended June 30, 2007, primarily due to an increase in the number of retail outlets selling VE85® resulting in a $6.3 million increase and the impact of higher prices contributing to an additional increase of $1.9 million.
Net sales from the sale of corn was $26.5 million. During the quarter, due to delayed startup at Hartley, Iowa; Welcome, Minnesota; and Hankinson, North Dakota, we sold a portion of our corn inventory.
Excluding the sale of corn inventory, sales for the quarter would have been $988.7 million, an increase of $819.1 million or 483.1% over the same period in 2007.
Cost of goods sold and gross profit. Corn costs increased $413.7 million, or 506.5%, to $495.4 million for the three months ended June 30, 2008 compared with $81.7 million for the three months ended June 30, 2007. If the corn sales of $26.5 million are netted with corn costs, the total corn costs for the quarter would have been $469.0 million, an increase of $387.3 million or 474.1% over the same period in 2007.
37
Table of Contents
Corn costs (net of corn sales) were $5.37 per bushel or $1.90 per manufactured gallon sold for the three months ending June 30, 2008, compared with $3.62 per bushel or $1.29 per manufactured gallon sold for the same period in 2007.
The increase in total corn costs (net of corn sales) for the three months ended June 30, 2008 was driven by $236.2 million of increased corn purchases resulting from additional production from the Linden, Albion, and Bloomingburg facilities, which came on line since June 30, 2007, and the US BioEnergy facilities acquired April 1, 2008, and $151.1 million of the increased corn costs resulted from higher corn prices per bushel.
A net gain of $25.6 million from derivatives was included in cost of goods sold for the three months ended June 30, 2008 compared to a net gain of $4.9 million for the three months ended June 30, 2007. The increase was due to mark-to-market adjustments related to our corn hedges.
Natural gas costs increased $60.2 million, or 417.0%, to $74.6 million for the three months ended June 30, 2008 from $14.4 million for the three months ended June 30, 2007. The increase in natural gas costs for the three months ended June 30, 2008 was primarily attributable to an increase in our production compared to the three months ended June 30, 2007, which accounted for $33.8 million and an increase in natural gas prices per million British Thermal Units, or MMBTU, in 2008, which accounted for $26.4 million. On a cost per gallon basis, natural gas accounted for $0.30 and $0.23 of cost per manufactured gallon sold for the three months ended June 30, 2008 and June 30, 2007, respectively.
Transportation expense increased $46.4 million, or 329.5%, to $60.5 million for the three months ended June 30, 2008 from $14.1 million for the three months ended June 30, 2007, due to additional volume of ethanol and distillers grain shipped and increased rail rates for 2008. On a cost per gallon basis, transportation expense accounted for $0.25 of cost per manufactured gallon sold for the three months ended June 30, 2008 and $0.22 of cost per manufactured gallon sold for the three months ended June 30, 2007.
Labor and manufacturing overhead costs increased $34.9 million, or 343.1%, to $45.1 million for the three months ended June 30, 2008 from $10.2 million for the three months ended June 30, 2007. The increase was primarily due to the addition of production at our Linden, Albion, Bloomingburg and US BioEnergy facilities. On a cost per gallon basis, labor and manufacturing overhead costs accounted for $0.19 of cost per manufactured gallon sold for the three months ended June 30, 2008, compared to $0.16 per manufactured gallon sold for the three months ended June 30, 2007. The increase in cost per gallon was primarily driven by higher depreciation, which went from $0.04 per manufactured gallon for the three months ended June 30, 2007, to $0.09 per manufactured gallon for the three months ended June 30, 2008.
Other inputs, which includes chemicals, water, electricity and denaturant, increased $29.8 million, or 285.2%, to $40.3 million for the three months ended June 30, 2008 from $10.5 million for the three months ended June 30, 2007. The increase is primarily due to the increased volume from the addition of the Linden, Albion, Bloomingburg, and US BioEnergy facilities. On a cost per gallon basis, other inputs accounted for $0.16 of cost per manufactured gallon sold for the three months ended June 30, 2008 and $0.17 of cost per manufactured gallon sold for the three months ended June 30, 2007.
Ethanol purchased for resale cost $215.1 million for the three months ended June 30, 2008. During the quarter, we purchased and resold 83.4 million gallons at an average cost of $2.58 per gallon.
Gross profit increased $39.5 million, or 121.5%, to $72.0 million for the three months ended June 30, 2008 from $32.5 million for the three months ended June 30, 2007. The increase in gross profit was primarily due to additional ethanol volumes sold and increased ethanol prices, partially offset by an increase in corn costs in the 2008 period compared to the 2007 period. In addition, we recognized gross profit of $8.2 million related to the sale of corn inventory for the three months ended June 30, 2008.
Startup expenses.Startup expenses increased $4.4 million to $4.6 million for the three months ended June 30, 2008 from $0.2 million for the three months ended June 30, 2007. The increase was due to the increase in the number of plants under construction or in development. In 2008, the Welcome and Janesville, Minnesota; Hankinson, North Dakota; and Dyersville and Hartley, Iowa facilities were all in startup mode and in the second quarter of 2007, the Hartley, Iowa; Welcome, Minnesota; and Reynolds, Indiana facilities were in startup mode in the second quarter.
38
Table of Contents
Restructuring charge. Restructuring charge relate to personnel and severance costs of duplicate VeraSun employees that were terminated in conjunction with the US BioEnergy acquisition. For the three months ended June 30, 2008, $2.0 million of restructuring charges were incurred.
Selling, general and administrative expenses. Selling, general and administrative expenses increased $8.1 million, or 99.5%, to $16.3 million for the three months ended June 30, 2008 from $8.2 million for the three months ended June 30, 2007. The increase was primarily the result of increased management and administrative costs in the 2008 period to support our growth strategy and the acquisition of US BioEnergy. Selling, general and administrative expenses were $0.05 per total gallon sold in the three months ended June 30, 2008 and $0.13 per total gallon sold in the three months ended June 30, 2007.
Other income (expense). Interest expense increased $9.3 million, or 150.9% to $15.5 million for the three months ended June 30, 2008, compared to $6.2 million for the three months ended June 30, 2007. The increase is primarily due to debt assumed in the ASA OpCo Holdings and US BioEnergy acquisitions and the recognition of interest expense on debt for which the interest cost was previously being capitalized on facilities that were under construction in prior periods. Interest cost capitalized for the three months ended June 30, 2008 was $16.7 million compared to $4.7 million for the three months ended June 30, 2007. Interest expense is expected to increase in the future as additional plants currently under construction begin operations.
Interest income decreased $4.8 million, or 88.7%, to $0.6 million for the three months ended June 30, 2008, compared to $5.4 million for the three months ended June 30, 2007. The decrease was primarily attributable to a decrease in the funds available to be invested in interest bearing securities.
Other income includes rental income associated with land held for developmental sites and other miscellaneous items.
Income taxes. The income tax provision was $10.5 million for the three months ended June 30, 2008 compared to $8.2 million for the three months ended June 30, 2007. The effective tax rate for the three months ended June 30, 2008 was 30.5% compared to 35.0% for the three months ended June 30, 2007. The decrease to the effective tax rate is primarily caused by the recognition of state tax credits that are more likely than not to be utilized in the future.
Tax audit.The Internal Revenue Service (IRS) has proposed certain adjustments to our 2004 and 2005 federal income tax returns, as well as to the pre-acquisition US BioEnergy 2005 and 2006 federal income tax returns. We have accepted the IRS proposed adjustments changing the depreciable life of our plant production assets from 5 years to 7 years. These adjustments have been incorporated into the June 30, 2008 financial statements and include a $0.4 million interest charge. We are contesting other proposed adjustments and have not recognized any effect of the contested adjustments or any associated interest or penalties. We may not prevail on these positions and, if so, we could incur incremental income tax and interest expense in future periods. We do not anticipate any material changes to the Company’s financial position or results of operations as a result of the audits.
Six Months Ended June 30, 2008 Compared to Six Months Ended June 30, 2007
Total revenues, which include revenues from the sale of ethanol, distillers grains, VE85® and corn, increased by $1,217.5 million, or 387.7%, to $1,531.6 million for the six months ended June 30, 2008, compared to $314.1 million for the six months ended June 30, 2007. The increase in total revenues was primarily the result of a 322.0% increase in ethanol volume sold and an increase in average ethanol prices of $0.34 per gallon, or 15.7%, compared to 2007. For the six months ended June 30, 2008, the Company sold 521.6 million gallons of ethanol, which includes 132.8 million gallons of ethanol that were purchased from others and resold to our customers. Ethanol production increased by 257.4 million gallons, or 182.7%, to 398.3 million gallons compared with the six months ended June 30, 2007, as a result of the added capacity from the Charles City, Iowa facility in April 2007, the Linden, Indiana facility in August 2007, the Albion, Nebraska facility in October 2007, the Bloomingburg, Ohio facility in March 2008 and the US BioEnergy acquisition completed on April 1, 2008.
39
Table of Contents
Net sales from ethanol increased $1,032.0 million, or 385.5%, to $1,299.8 million for the six months ended June 30, 2008 compared with $267.8 million for the six months ended June 30, 2007. Of the increase, $857.5 million was driven by additional volumes of ethanol sold. The increased volume resulted from production at the Charles City, Iowa; Linden, Indiana; Albion, Nebraska; and Bloomingburg, Ohio facilities, which came on line since June 30, 2007, output from the US BioEnergy facilities acquired April 1, 2008, and ethanol that was purchased and resold to our customers. Higher ethanol prices contributed $174.6 million of the increased revenue. The average price of ethanol sold was $2.49 per gallon for the six months ended June 30, 2008, compared to $2.15 per gallon for the six months ended June 30, 2007.
Net sales from distillers grains increased $141.3 million, or 362.9%, to $180.3 million for the six months ended June 30, 2008 compared with $39.0 million for the six months ended June 30, 2007. The impact of increased volume was $88.8 million and the impact of higher prices of $38.22 per ton contributed $52.5 million of the increased revenues.
Net sales of VE85®, our branded E85 product, increased $13.7 million, or 232.2%, to $19.6 million for the six months ended June 30, 2008 compared with $5.9 million for the six months ended June 30, 2007, primarily due to an increase in the number of retail outlets selling VE85® resulting in a $10.0 million increase and the impact of higher prices contributing to an additional increase of $3.7 million.
Net sales from the sale of corn was $26.5 million. During the six months ended June 30, 2008, due to delayed startup at Hartley, Iowa; Welcome, Minnesota; and Hankinson, North Dakota, we sold a portion of our corn inventory.
Excluding the sale of corn inventory, sales for the quarter would have been $1,505.2 million, an increase of $1,191.1 million or 379.2% over the same period in 2007.
Cost of goods sold and gross profit. Corn costs increased $568.4 million, or 343.7%, to $734.0 million for the six months ended June 30, 2008 compared with $165.4 million for the six months ended June 30, 2007. If the corn sales of $26.5 million are netted with corn costs, the total corn costs for the quarter would have been $707.4 million, an increase of $542.0 million or 327.7% over the same period in 2007.
Corn costs (net of corn sales) were $1.82 per manufactured gallon sold for the six months ending June 30, 2008, compared with $1.34 per manufactured gallon sold for the same period in 2007.
The increase in total corn costs (net of corn sales) for the six months ended June 30, 2008 was driven by $355.0 million of increased corn purchases resulting from additional production from the Charles City, Linden, Albion and Bloomingburg facilities, which came on line since June 30, 2007, and the US BioEnergy facilities acquired April 1, 2008, and $187.1 million of the increased corn costs resulted from higher corn prices per bushel.
A net gain of $30.0 million from derivatives was included in cost of goods sold for the six months ended June 30, 2008 compared to a net loss of $8.1 million for the six months ended June 30, 2007. The increase was due to mark-to-market adjustments related to our corn hedges.
Natural gas costs increased $80.7 million, or 279.4%, to $109.6 million for the six months ended June 30, 2008 from $28.9 million for the six months ended June 30, 2007. The increase in natural gas costs for the six months ended June 30, 2008 was primarily attributable to an increase in our production compared to the six months ended June 30, 2007, which accounted for $48.9 million and an increase in natural gas prices per million British Thermal Units, or MMBTU, in 2008, which accounted for $31.8 million. On a cost per gallon basis, natural gas accounted for $0.28 of cost per manufactured gallon sold for the six months ended June 30, 2008 and $0.23 of cost per manufactured gallon sold for the six months ended June 30, 2007.
40
Table of Contents
Transportation expense increased $70.4 million, or 231.4%, to $100.8 million for the six months ended June 30, 2008 from $30.4 million for the six months ended June 30, 2007, due to additional volume of ethanol and distillers grain shipped and increased rail rates for 2008. On a cost per gallon basis, transportation expense accounted for $0.26 of cost per manufactured gallon sold for the six months ended June 30, 2008 and $0.25 of cost per manufactured gallon sold for the six months ended June 30, 2007.
Labor and manufacturing overhead costs increased $46.6 million, or 244.8%, to $65.6 million for the six months ended June 30, 2008 from $19.0 million for the six months ended June 30, 2007. The increase was due to the addition of production at our Charles City, Linden, Albion, Bloomingburg and US BioEnergy facilities and partially offset with lower overhead costs. On a cost per gallon basis, labor and manufacturing overhead costs accounted for $0.17 of cost per manufactured gallon sold for the six months ended June 30, 2008, compared to $0.15 per manufactured gallon sold for the six months ended June 30, 2007. The increase in cost per gallon was primarily driven by higher depreciation, which went from $0.04 per manufactured gallon for the six months ended June 30, 2007, to $0.08 per manufactured gallon for the six months ended June 30, 2008.
Other inputs, which includes chemicals, electricity and denaturant, increased $40.5 million, or 201.9%, to $60.5 million for the six months ended June 30, 2008 from $20.0 million for the six months ended June 30, 2007. The increase is primarily due to the increased volume from the addition of the Charles City, Linden, Albion, Bloomingburg, and US BioEnergy facilities, offset partially with lower costs. On a cost per gallon basis, other inputs accounted for $0.16 of cost per manufactured gallon sold for the six months ended June 30, 2008 and June 30, 2007.
Ethanol purchased for resale cost $334.1 million for the six months ended June 30, 2008. During the quarter, we purchased and resold 132.8 million gallons at an average cost of $2.52 per gallon. No ethanol was purchased for resale in the first six months of 2007.
Gross profit increased $65.4 million, or 156.6%, to $107.1 million for the six months ended June 30, 2008 from $41.7 million for the six months ended June 30, 2007. The increase in gross profit was primarily due to additional ethanol volumes sold and increased ethanol prices, partially offset by an increase in corn costs in the 2008 period compared to the 2007 period. In addition, we recognized gross profit of $8.2 million related to the sale of corn inventory for the three months ended June 30, 2008.
Startup expenses.Startup expenses increased $5.1 million, or 323.1%, to $6.7 million for the six months ended June 30, 2008 from $1.6 million for the six months ended June 30, 2007. The increase was due to the increase in the number of plants under construction or in development. In 2008, the Welcome and Janesville, Minnesota; Hankinson, North Dakota; and Dyersville and Hartley, Iowa facilities were all in startup mode. In the first six months of 2007 no facilities were in startup mode.
Restructuring charge. Restructuring charge relate to personnel and severance costs of duplicate VeraSun employees that were terminated in conjunction with the US BioEnergy merger. For the six months ended June 30, 2008, $2.0 million of restructuring charges were incurred.
Selling, general and administrative expenses. Selling, general and administrative expenses increased $9.4 million, or 50.9%, to $27.7 million for the six months ended June 30, 2008 from $18.3 million for the six months ended June 30, 2007. The increase was primarily the result of increased management and administrative costs in the 2008 period to support our growth strategy. Selling, general and administrative expenses were $0.05 per total gallons sold in the six months ended June 30, 2008, compared to $0.15 per total gallons sold in the six months ended June 30, 2007.
Other income (expense). Interest expense increased $18.4 million, or 232.9%, to $26.3 million for the six months ended June 30, 2008, compared to $7.9 million for the six months ended June 30, 2007. The increase is primarily due to debt assumed in the acquisitions of ASA OpCo Holdings and US BioEnergy and the recognition of interest expense on debt for which the interest cost was previously being capitalized on facilities that were under construction in prior periods. Interest cost capitalized for the six months ended June 30, 2008 was $26.9 million compared to $8.3 million for the six months ended June 30, 2007. Interest expense is expected to increase in the future as additional plants currently under construction begin operations.
41
Table of Contents
Interest income decreased $7.4 million, or 82.6%, to $1.5 million for the six months ended June 30, 2008, compared to $8.9 million for the six months ended June 30, 2007. The decrease was primarily attributable to a decrease in the funds available to be invested in interest bearing securities.
Other income includes rental income associated with land held for developmental sites and other miscellaneous items.
Income taxes. The income tax provision was $15.2 million for the six months ended June 30, 2008 compared to $8.0 million for the six months ended June 30, 2007. The effective tax rate for the six months ended June 30, 2008 was 32.5% compared to 35.0% for the six months ended June 30, 2007. The decrease to the effective tax rate is primarily caused by the recognition of state tax credits that are more likely than not to be utilized in the future.
Tax audit. The Internal Revenue Service (IRS) has proposed certain adjustments to our 2004 and 2005 federal income tax returns, as well as to the pre-acquisition US BioEnergy 2005 and 2006 federal income tax returns. We have accepted the IRS proposed adjustments changing the depreciable life of our plant production assets from 5 years to 7 years. These adjustments have been incorporated into the June 30, 2008 financial statements and include a $0.4 million interest charge. We are contesting other proposed adjustments and have not recognized any effect of the contested adjustments or any associated interest or penalties. We may not prevail on these positions and, if so, we could incur incremental income tax and interest expense in future periods. We do not anticipate any material changes to the Company’s financial position or results of operations as a result of the audits.
Liquidity and Capital Resources
Our principal sources of liquidity consist of cash provided by operations, cash and cash equivalents on hand, short-term investments, and available borrowings under our credit agreements. In addition to funding operations, our principal uses of cash have been, and are expected to be, the construction of new facilities, capital expenditures, acquisitions and debt service requirements.
The following table summarizes our sources and uses of cash and cash equivalents for the periods presented (in thousands):
| Six Months Ended June 30, | ||||||||
| 2008 | 2007 | |||||||
| (unaudited) | ||||||||
Net cash (used in) provided by operating activities | $ | (38,712 | ) | $ | 24,122 | |||
Net cash used in investing activities | (116,093 | ) | (379,263 | ) | ||||
Net cash provided by financing activities | 72,304 | 451,520 | ||||||
Net (decrease) increase in cash and cash equivalents | $ | (82,501 | ) | $ | 96,379 | |||
As of June 30, 2008, we had cash and cash equivalents of $28.4 million compared to $414.4 million at June 30, 2007. We also had $14.7 million of cash that is restricted under the terms of credit agreements. In addition, our credit agreements limit our ability to utilize cash generated at certain subsidiaries to fund the operations of other non-borrower subsidiaries.
Cash used in operating activities was $38.7 million for the six months ended June 30, 2008, compared to $24.1 million of cash provided by operating activities for the six months ended June 30, 2007. Our working capital increased $89.7 million during the six months ended June 30, 2008, primarily due to the increase in cost of ethanol and corn, additional ethanol gallons and corn bushels held in inventory, and increase in trade receivables. The increase to working capital was partially offset by the results from operations.
42
Table of Contents
Cash used in investing activities was $116.1 million for the six months ended June, 2008 compared to cash used of $379.3 million in the six months ended June 30, 2007. The decrease was primarily the result of fewer facilities under construction in the current period.
Cash provided by financing activities for the six months ended June 30, 2008 was $72.3 million, compared to $451.5 million for the six months ended June 30, 2007. The decrease was primarily due to less proceeds from long-term debt in the current period.
Our financial position and liquidity are, and will be, influenced by a variety of factors, including:
| • | our ability to generate cash flows from operations, which depends substantially on the market prices of commodities that we purchase and sell; |
| • | our decision to start or idle facilities based on market conditions and working capital requirements: |
| • | the level of our outstanding indebtedness and the interest we are obligated to pay on this indebtedness; and |
| • | our capital expenditure requirements, which consist primarily of plant construction and the purchase of equipment. |
We intend to fund our principal liquidity and capital resource requirements through cash and cash equivalents, cash provided by operations and borrowings under our credit agreements.
In addition to the final construction of our Hartley and Dyersville, Iowa; and Janesville and Welcome, Minnesota; facilities and oil extraction units at our Aurora, South Dakota facility, we may also consider additional opportunities for growing our production capacity, including acquisitions, development of additional sites and expansion of one or more of our existing facilities.
Acquisitions or further expansion of our operations could cause our indebtedness and our ratio of debt to equity to increase. The indentures governing our 2012 Notes and 2017 Notes and the terms of our credit agreements limit our ability to incur additional debt and could restrict our ability to make acquisitions and expand our facilities.
In 2008, we expect to make capital expenditures between $50 and $75 million in the third quarter, and between $25 million and $50 million in the fourth quarter for the construction of our previously announced ethanol production facilities, the purchase and installation of corn oil extraction equipment, facility maintenance, terminal infrastructure, cellulosic ethanol projects, operational improvements and further development of possible ethanol facility sites. We intend to fund these capital expenditures through cash flows from operations, cash and cash equivalents, short-term investments and funds available under the credit facility. As of June 30, 2008, there was approximately $89.3 million of construction funding available under the project financing facilities in place.
Based on current market conditions, we believe that our existing sources of capital will be sufficient to fund anticipated working capital requirements, capital expenditures and cash required for other activities for at least the next 12 months. However, cash flows from future operations and the amount and timing of our future financing needs are inherently uncertain. Future cash flow will depend on our future operating results and our capital expenditures. These items, especially our future operating results, will depend on numerous factors beyond our control, including future movements in the market price of commodities we purchase and sell (in particular, corn and ethanol) and the other factors set forth in Item 1A—Risk Factors of Part I of our Annual Report on Form 10-K for the year ended December 31, 2007 and of Our Quarterly Report on From 10-Q for the quarter ended March 31, 2008. In light of these circumstances, we have from time to time explored, and expect to continue to explore, opportunities to raise additional capital and reduce our outstanding indebtedness through various financing arrangements and transactions that may involve the issuance of additional equity or debt securities. There can be no assurance, however, that any such financing arrangements and transactions will be available to us on acceptable terms or at all. In addition, our indentures and credit agreements limit our ability to incur indebtedness. Should our existing and any new sources of capital be insufficient to meet our cash needs, our business, financial condition and results of operations could be materially adversely affected.
43
Table of Contents
Off-Balance Sheet Arrangements
The company had no off-balance sheet arrangements as of June 30, 2008.
Contractual Obligations
The following summarizes the Company’s contractual obligations as of June 30, 2008. Our contractual obligations increased significantly compared to the contractual obligations as of December 31, 2007 due to the completion of the US BioEnergy acquisition on April 1, 2008.
| Types of Obligations | ||||||||||||||||||
| (in thousands) | Long-term debt obligations (1) | Operating lease obligations | Purchase obligations (2) | Other purchase obligations (3) | Construction obligations (4) | Total contractual obligations | ||||||||||||
Remaining 2008 | $ | 81,800 | $ | 29,996 | $ | 461,102 | $ | 25,563 | $ | 104,348 | $ | 702,809 | ||||||
Year ended 2009 | 152,881 | 77,637 | 134,955 | 73,188 | 70,181 | 508,842 | ||||||||||||
Year ended 2010 | 165,457 | 76,086 | 19,734 | 29,667 | 290,944 | |||||||||||||
Year ended 2011 | 230,649 | 74,694 | 89 | 29,694 | 335,126 | |||||||||||||
Year ended 2012 | 493,916 | 61,646 | 29,644 | 585,206 | ||||||||||||||
Year ended 2013 | 208,728 | 39,333 | 29,260 | 277,321 | ||||||||||||||
Thereafter | 920,010 | 68,676 | 144,762 | 1,133,448 | ||||||||||||||
Total | $ | 2,253,441 | $ | 428,068 | $ | 615,880 | $ | 361,778 | $ | 174,529 | $ | 3,833,696 | ||||||
| (1) | Amounts represent principal and interest payments due on the senior secured notes, credit facilities, construction loans, capital leases, etc. and unused commitment fees under our credit agreement. |
| (2) | Purchase obligations include corn contracts and a multi-year corn purchase agreement under which we expect to take delivery. To quantify the purchase obligation under certain of our corn contracts and our multi-year corn purchase agreement, we have used our June 30, 2008 published bid prices for corn. |
| (3) | Other purchase obligations include estimated payments for electricity and water supply agreements, natural gas purchase contracts and purchase orders for operations. |
| (4) | Includes amounts due under our master-design build agreements and open purchase orders related to construction obligations, expected to be converted to long-term loans. |
| ITEM 3. | QUANTITATIVE AND QUALITATIVE DISCLOSURES ABOUT MARKET RISK |
The following section discusses significant changes in market risks since our latest fiscal year end. You should read this discussion in conjunction with the disclosures made in our Annual Report on Form 10-K for the year ended December 31, 2007, and risks described in Part II, Item IA of this quarterly report.
Market risk is the potential economic loss that may result from adverse changes in the fair value of financial instruments. VeraSun is exposed to market risk from changes in both commodity prices and interest rates. VeraSun monitors its exposure to commodity risks and attempts to manage these risks by hedging commodity contracts. VeraSun does not use derivative instruments for speculative or trading purposes. VeraSun’s broad-based business activities help to reduce the impact that volatility in any particular area or related areas may have on its operating earnings as a whole. VeraSun’s management takes an active role in the risk management process and has developed policies and procedures that require specific administrative and business functions to assist in the identification, assessment and control of various risks.
44
Table of Contents
In addition to risks inherent in our operations, as a commodity-based business we are subject to a variety of market factors, including the price relationship between ethanol and corn as shown in the following graph:
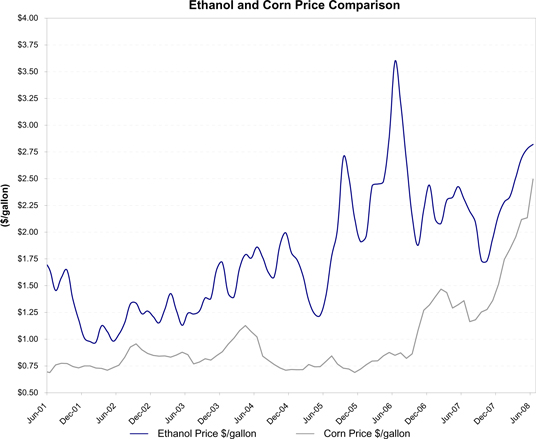
| (1) | Ethanol prices are based on the monthly average of the daily closing price of U.S. average ethanol rack prices quoted by Bloomberg, L.P. (“Bloomberg”). The corn prices are based on the monthly average of the daily closing prices of the nearby corn futures quoted by the Chicago Board of Trade (“CBOT”) and assume a conversion rate of 2.8 gallons of ethanol produced per bushel of corn. The comparison between the ethanol and corn prices presented does not reflect the costs of producing ethanol other than the cost of corn, and should not be used as a measure of future results. This comparison also does not reflect the revenues that are received from the sale of distillers grains. |
We consider market risk to be the potential loss arising from adverse changes in market rates and prices. We are subject to significant market risk with respect to the price of ethanol, our principal product, and the price and availability of corn, the principal commodity used in our ethanol production process. In general, ethanol prices are influenced by the supply and demand for gasoline, the availability of substitutes and the effect of laws and
45
Table of Contents
regulations. Higher corn costs result in lower profit margins and, therefore, represent unfavorable market conditions. Historically, we have not been able to pass along increased corn costs to our ethanol customers. The availability and price of corn are subject to wide fluctuations due to unpredictable factors such as weather conditions during the corn growing season, carry-over from the previous crop year and current crop year yield, governmental policies with respect to agriculture and international supply and demand. Corn costs represented approximately 67.6% of our total cost of goods sold related to manufactured ethanol gallons for the six months ended June 30, 2008 compared to 59.6% for the six months ended June 30, 2007. Over the ten-year period from 1998 through 2007, corn prices (based on the CBOT daily futures data) have ranged from a low of $1.75 per bushel on August 11, 2000 to a high of $4.55 per bushel on December 31, 2007 with prices averaging $2.42 per bushel during this period. At August 1, 2008, the CBOT price per bushel of corn for September delivery was $5.65 per bushel.
We are also subject to market risk with respect to our supply of natural gas that is consumed in the ethanol production process and has been historically subject to volatile market conditions. Natural gas prices and availability are affected by weather conditions and overall economic conditions. Natural gas costs represented 10.6% of our total cost of goods sold related to manufactured ethanol gallons for the six months ended June 30, 2008, compared to 10.4% for the six months ended June 30, 2007. The price fluctuation in natural gas prices over the seven-year period from 2000 through 2007, based on the New York Mercantile Exchange, or NYMEX, daily futures data, has ranged from a low of $1.83 per MMBTU on September 26, 2001, to a high of $15.38 per MMBTU on December 23, 2005, averaging $6.03 per MMBTU during this period. At August 1, 2008, the NYMEX price of natural gas for September delivery was $9.39 per MMBTU.
We have prepared a sensitivity analysis to estimate our exposure to market risk with respect to our corn and natural gas requirements, ethanol contracts and the related exchange-traded contracts for 2007. Market risk related to these factors is estimated as the potential change in pre-tax income, resulting from a hypothetical 10% adverse change in the fair value of our corn and natural gas requirements and ethanol contracts (based on average prices for 2007) net of the corn and natural gas forward and futures contracts used to hedge our market risk with respect to our corn and natural gas requirements. The results of this analysis are set forth in the following table. Actual results may differ from these amounts due to various factors, including significant increases in the Company’s production capacity during 2008.
| Volume Requirements | Units | Hypothetical Adverse Change in Price | Change in Annual Pre-Tax Income | ||||||||
| (In millions) | (In millions) | ||||||||||
Ethanol | 353.1 | gallons | 10 | % | $ | (70.8 | ) | ||||
Corn | 126.1 | bushels | 10 | (45.4 | ) | ||||||
Natural gas | 10.7 | MMBTU | 10 | (7.7 | ) | ||||||
As of June 30, 2008, we had contracted forward on a fixed price basis the following quantities of corn and natural gas, which represent the indicated percentages of our estimated requirements for these inputs for the next twelve months:
| Three months ending September 30, 2008 | Three months ending December 31, 2008 | Three months ending March 31, 2009 | Three months ending June 30, 2009 | Twelve months ending June 30, 2009 | |||||||||||
Corn (thousands of bushels) | 23,592 | 2,199 | 296 | 108 | 26,194 | ||||||||||
Percentage of estimated requirements | 23.3 | % | 1.9 | % | 0.3 | % | 0.1 | % | 5.9 | % | |||||
Natural Gas (MMBTU) | — | 180 | — | — | 180 | ||||||||||
Percentage of estimated requirements | 0 | % | 2 | % | 0 | % | 0 | % | 0 | % |
46
Table of Contents
The extent to which we enter into these arrangements varies substantially from time to time based on a number of factors, including supply and demand factors affecting the needs of customers or suppliers to purchase ethanol or sell us raw materials on a fixed basis, our views as to future market trends, seasonal factors and the costs of futures contracts.
Credit Risk Management: Credit risk is the possibility of loss from a customer’s failure to make payments according to contract terms. Prior to granting credit, each customer is evaluated, taking into consideration the borrower’s financial condition, collateral, debt-servicing capacity, past payment experience, credit bureau information, and other financial and qualitative factors that may affect the borrower’s ability to repay. Specific credit reviews and standard industry credit scoring models are used in performing this evaluation. Loans that have been granted are typically monitored through an asset-quality-review process that closely monitors past due accounts and initiates collection actions when appropriate
Counterparty Risk Management: VeraSun is exposed to credit losses in the event of non-performance by the counterparties to its commodity contracts. VeraSun does not obtain collateral or other security to support financial instruments subject to credit risk, but monitors the credit standing of the counterparties. VeraSun does not anticipate non-performance by its counterparties.
As a result of the above market, credit and economic risks, net income and revenues in any particular period may not be representative of full-year results and may vary significantly from year to year and from quarter to quarter.
Interest Rate Risk Management: The Company’s earnings are affected by changes in interest rates due to the impact those changes have on its interest expense from variable long-term debt obligations. If interest rates were to increase by 100 basis points for a full year, based on the Company’s variable long-term debt obligations at June 30, 2008, the Company’s interest expenditure would increase by approximately $8.3 million.
| ITEM 4. | CONTROLS AND PROCEDURES |
Evaluation of Disclosure Controls and Procedures
The Company maintains disclosure controls and procedures that are designed to ensure that information required to be disclosed in the reports that the Company files or submits under the Securities Exchange Act of 1934 (the “Exchange Act”) is recorded, processed, summarized and reported within the time periods specified in the SEC’s rules and forms, and that such information is accumulated and communicated to the Company’s management, including its Chief Executive Officer and Chief Financial Officer, as appropriate, to allow timely decisions regarding required financial disclosure.
As of the end of the period covered by this report, the Company carried out an evaluation, under the supervision of management, including the Chief Executive Officer and the Chief Financial Officer, of the effectiveness of the design and operation of the Company’s disclosure controls and procedures pursuant to Exchange Act Rule 13a-15. Based upon such evaluation as of June 30, 2008, the Chief Executive Officer and the Chief Financial Officer concluded that the Company’s disclosure controls and procedures were effective at the reasonable assurance level to ensure that information required to be disclosed in this Quarterly Report on Form 10-Q was recorded, processed, summarized and reported within the time period required by the Securities and Exchange Commission’s rules and forms and accumulated and communicated to management, including the Company’s Chief Executive Officer and Chief Financial Officer, to allow timely decisions regarding required disclosure.
During the second quarter, the Company substantially completed the integration of US BioEnergy’s accounting processes into the legacy systems, policies and procedures of VeraSun.
In connection with the evaluation described above, the Company’s management, including the Chief Executive Officer and the Chief Financial Officer, identified no other change in the Company’s internal control over financial reporting that occurred during the Company’s fiscal quarter ended June 30, 2008 that has materially affected, or is reasonably likely to materially affect, the Company’s internal control over financial reporting.
47
Table of Contents
| ITEM 1A. | RISK FACTORS |
Our business is subject to a number of risks and uncertainties. In addition to other information contained in this Quarterly Report, readers are directed to the “Risk Factors” section of our Annual Report on Form 10-K for the year ended December 31, 2007 and our Quarterly Report on Form 10-Q for the quarter ended March 31, 2008. These factors could affect our future business, results of operations, cash flows or financial position, and could cause future results to differ materially from those expressed in any of the forward-looking statements contained in this Quarterly Report on Form 10-Q. Additional risks and uncertainties not currently known to us or that we currently deem to be immaterial may also materially and adversely affect our business, financial condition and results of operations.
| ITEM 4. | SUBMISSION OF MATTERS TO A VOTE OF SECURITY HOLDERS |
VeraSun held its 2008 Annual Meeting of Shareholders on June 11, 2008. The shareholders (i) elected one Class I director for a two-year term, three Class II directors for three-year terms, and three Class III directors for one-year terms; (ii) approved an amendment to our Articles of Incorporation to increase the number of shares of Common Stock we are authorized to issue from 250,000,000 shares to 350,000,000 shares; (iii) approved an amendment to our Articles of Incorporation to increase the amount of indebtedness we are permitted to incur from $1 billion to $5 billion; and (iv) ratified the Audit Committee’s selection of McGladrey & Pullen, LLP as the company’s independent auditor for 2008. There were 128,742,129 outstanding shares eligible to vote.
The persons elected to the Company’s Board of Directors, the number of votes cast for, withheld and abstentions with respect to each of these persons, and their terms, are set forth below:
Director | Class | For | Withheld | Abstentions | Term | |||||
Gordon W. Ommen* | I | 123,231,641 | 2,817,968 | 2,692,520 | Two Years | |||||
James E. Dauwalter | II | 124,655,589 | 1,281,009 | 2,805,531 | Three Years | |||||
T. Jack Huggins III | II | 124,586,318 | 1,352,872 | 2,802,939 | Three Years | |||||
Steven T. Kirby | II | 124,435,586 | 1,616,959 | 2,689,584 | Three Years | |||||
Jay D. Debertin | III | 123,526,235 | 2,395,961 | 2,819,933 | One Year | |||||
D. Duane Gilliam | III | 124,559,805 | 1,343,436 | 2,838,888 | One Year | |||||
Mark A. Ruelle* | III | 124,644,913 | 1,284,837 | 2,812,379 | One Year |
| * | These directors have subsequently resigned. |
48
Table of Contents
The proposal to amend our Articles of Incorporation to increase the number of shares of Common Stock we are authorized to issue from 250,000,000 shares to 350,000,000 shares received the following votes at the 2008 Annual Meeting of Shareholders:
Votes for approval | 124,088,701 | |
Votes against | 2,501,782 | |
Abstentions | 2,151,646 |
There were no broker non-votes for this item.
The proposal to amend our Articles of Incorporation to increase the amount of indebtedness we are permitted to incur from $1 billion to $5 billion received the following votes at the 2008 Annual Meeting of Shareholders:
Votes for approval | 98,365,041 | |
Votes against | 888,608 | |
Abstentions | 3,165,698 | |
Broker Non-vote | 26,322,782 |
The proposal to ratify the Audit Committee’s selection of McGladrey & Pullen, LLP as the Company’s independent auditor for 2008 received the following votes at the 2008 Annual Meeting of Shareholders:
Votes for approval | 128,159,375 | |
Votes against | 200,847 | |
Abstentions | 381,907 |
There were no broker non-votes for this item.
| ITEM 6. | EXHIBITS |
Exhibit | Description | |
| 3.1 | Articles of Incorporation, as amended, of VeraSun Energy Corporation. | |
| 3.2 | Bylaws, as amended, of VeraSun Energy Corporation (incorporated by reference to Exhibit 3.1 to VeraSun’s Form 8-K, filed with the SEC on April 1, 2008). | |
| 10.1 | Master Loan Agreement, dated November 15, 2005, between US Bio Albert City, LLC and AgStar Financial Services, PCA, as amended by Amendment No. 1, dated July 31, 2006, and as supplemented by the First Supplement, dated November 15, 2005, as amended, and the Second Supplement, dated November 15, 2005 (incorporated by reference to Exhibit 10.7 to Amendment No. 2 to US BioEnergy Corporation’s Registration Statement on Form S-1, filed with the SEC on September 26, 2006, File No. 333-136279) | |
| 10.2 | Amendment No. 1 to Second Supplement to the Master Loan Agreement (Revolving Loan), dated as of October 19, 2007, by and between US Bio Albert City, LLC and AgStar Financial Services, PCA (incorporated by reference to Exhibit 10.11 to US BioEnergy Corporation’s Quarterly Report on Form 10-Q, filed with the SEC on November 13, 2007, File No. 001-33203) | |
| 10.3 | Amendment No. 1 to the Amended and Restated Master Loan Agreement, dated as of October 19, 2007, by and between US Bio Albert City, LLC and AgStar Financial Services, PCA (incorporated by reference to Exhibit 10.10 to US BioEnergy Corporation’s Quarterly Report on Form 10-Q, filed with the SEC on November 13, 2007, File No. 001-33203) | |
49
Table of Contents
Exhibit | Description | |
| 10.4 | Amendment No. 2 to the Amended and Restated Master Loan Agreement, dated November 1, 2007, by and between US Bio Albert City, LLC and AgStar Financial Services, PCA (incorporated by reference to Exhibit 10.9 to US BioEnergy Corporation’s Quarterly Report on Form 10-Q, filed with the SEC on November 13, 2007, File No. 001-33203) | |
| 10.5 | Amendment No. 1 to the Third Supplement to the Master Loan Agreement (Term Loan), dated as of October 19, 2007, by and between US Bio Albert City, LLC and AgStar Financial Services, PCA (incorporated by reference to Exhibit 10.12 to US BioEnergy Corporation’s Quarterly Report on Form 10-Q, filed with the SEC on November 13, 2007, File No. 001-33203) | |
| 10.6 | Amendment No. 1 to the Fourth Supplement to the Master Loan Agreement (Term Revolving Loan), dated as of October 19, 2007, by and between US Bio Albert City, LLC and AgStar Financial Services, PCA (incorporated by reference to Exhibit 10.14 to US BioEnergy Corporation’s Quarterly Report on Form 10-Q, filed with the SEC on November 13, 2007, File No. 001-33203) | |
| 10.7 | Master Loan Agreement, dated November 15, 2005, between Superior Corn Products, LLC and AgStar Financial Services, PCA, as amended by Amendment No. 1, dated July 31, 2006, and as supplemented by the First Supplement, dated November 15, 2005, as amended, and the Second Supplement, dated November 15, 2005 (incorporated by reference to Exhibit 10.9 to Amendment No. 2 to US BioEnergy Corporation’s Registration Statement on Form S-1, filed with the SEC on September 26, 2006, File No. 333-136279) | |
| 10.8 | Continuing Guaranty, dated November 15, 2005, between US BioEnergy Corporation and AgStar Financial Services, PCA (incorporated by reference to Exhibit 10.10 to Amendment No. 2 to US BioEnergy Corporation’s Registration Statement on Form S-1, filed with the SEC on September 26, 2006, File No. 333-136279) | |
| 10.9 | Amendment No. 2 to the Master Loan Agreement, dated October 19, 2007, by and between US Bio Woodbury, LLC and AgStar Financial Services, PCA (incorporated by reference to Exhibit 10.18 to US BioEnergy Corporation’s Quarterly Report on Form 10-Q, filed with the SEC on November 13, 2007, File No. 001-33203) | |
| 10.10 | Amendment No. 2 to the Amended and Restated Second Supplement to the Master Loan Agreement (Revolving Loan), dated November 1, 2007, by and between US Bio Woodbury, LLC and AgStar Financial Services, PCA (incorporated by reference to Exhibit 10.16 to US BioEnergy Corporation’s Quarterly Report on Form 10-Q, filed with the SEC on November 13, 2007, File No. 001-33203) | |
| 10.11 | Amendment No. 1 to the Amended and Restated Second Supplement to the Master Loan Agreement (Revolving Loan), dated October 19, 2007, by and between US Bio Woodbury, LLC and AgStar Financial Services, PCA (incorporated by reference to Exhibit 10.19 to US BioEnergy Corporation’s Quarterly Report on Form 10-Q, filed with the SEC on November 13, 2007, File No. 001-33203) | |
| 10.12 | Amendment No. 1 to the Third Supplement to the Master Loan Agreement (Term Loan), dated October 19, 2007, by and between US Bio Woodbury, LLC and AgStar Financial Services, PCA (incorporated by reference to Exhibit 10.20 to US BioEnergy Corporation’s Quarterly Report on Form 10-Q, filed with the SEC on November 13, 2007, File No. 001-33203) | |
| 10.13 | Amendment No. 1 to the Fourth Supplement to the Master Loan Agreement (Term Revolving Loan), dated October 19, 2007, by and between US Bio Woodbury, LLC and AgStar Financial Services, PCA (incorporated by reference to Exhibit 10.2 to US BioEnergy Corporation’s Quarterly Report on Form 10-Q, filed with the SEC on November 13, 2007, File No. 001-33203) | |
| 10.14 | 2005 Stock Incentive Plan (incorporated by reference to Exhibit 10.13 to Amendment No. 2 to US BioEnergy Corporation’s Registration Statement on Form S-1, filed with the SEC on September 26, 2006, File No. 333-136279)* | |
50
Table of Contents
Exhibit | Description | |
| 10.15 | 2006 Stock Incentive Plan (incorporated by reference to Exhibit 4.7 to US BioEnergy Corporation’s Registration Statement on Form S-8, filed with the SEC on December 15, 2006, File No. 333-139367)* | |
| 10.16 | Form of Incentive Stock Option Agreement under the US BioEnergy Corporation 2005 Stock Incentive Plan (incorporated by reference to Exhibit 10.27 to Amendment No. 2 to US BioEnergy Corporation’s Registration Statement on Form S-1, filed with the SEC on September 26, 2006, File No. 333-136279)* | |
| 10.17 | Stock Option Agreement, dated November 17, 2005, between US BioEnergy Corporation and Global Ethanol, Inc. (incorporated by reference to Exhibit 10.29 to Amendment No. 3 to US BioEnergy Corporation’s Registration Statement on Form S-1, filed with the SEC on October 27, 2006, File No. 333-136279)* | |
| 10.18 | Stock Option Agreement, dated November 17, 2005, between US BioEnergy Corporation and Capitaline Advisors, LLC (incorporated by reference to Exhibit 10.30 to Amendment No. 3 to US BioEnergy Corporation’s Registration Statement on Form S-1, filed with the SEC on October 27, 2006, File No. 333-136279)* | |
| 10.19 | Form of Incentive Stock Option Agreement under the US BioEnergy Corporation 2006 Stock Incentive Plan (incorporated by reference to Exhibit 10.30 to Amendment No. 8 to US BioEnergy Corporation’s Registration Statement on Form S-1, filed with the SEC on December 11, 2006, File No. 333-136279)* | |
| 10.20 | Form of Non-Qualified Stock Option Agreement under the US BioEnergy Corporation 2006 Stock Incentive Plan (incorporated by reference to Exhibit 10.31 to Amendment No. 8 to US BioEnergy Corporation’s Registration Statement on Form S-1, filed with the SEC on December 11, 2006, File No. 333-136279)* | |
| 10.21 | Form of Restricted Stock Award Agreement under the US BioEnergy Corporation 2006 Stock Incentive Plan (incorporated by reference to Exhibit 10.32 to Amendment No. 8 to US BioEnergy Corporation’s Registration Statement on Form S-1, filed with the SEC on December 11, 2006, File No. 333-136279)* | |
| 10.22 | Operating Agreement of Big River Resources Grinnell, LLC, dated February 1, 2007, between Big River Resources, LLC and US BioEnergy Corporation (incorporated by reference to Exhibit 10.1 to US BioEnergy’s Current Report on Form 8-K, filed with the SEC on February 7, 2007, File No. 001-33203) | |
| 10.23 | Credit Agreement, dated February 7, 2007, among US Bio Platte Valley, LLC, AgStar Financial Services, PCA, and the commercial, banking or financial institutions whose signatures appear on the signature pages thereto (incorporated by reference to Exhibit 10.1 to US BioEnergy’s Current Report on Form 8-K, filed with the SEC on February 13, 2007, File No. 001-33203) | |
| 10.24 | Amendment No. 1 to the Credit Agreement, dated October 19, 2007, by and between US Bio Platte Valley, LLC and AgStar Financial Services, PCA (incorporated by reference to Exhibit 10.7 to US BioEnergy Corporation’s Quarterly Report on Form 10-Q, filed with the SEC on November 13, 2007, File No. 001-33203) | |
| 10.25 | Credit Agreement, dated February 7, 2007, among US Bio Ord, LLC, AgStar Financial Services, PCA, and the commercial, banking or financial institutions whose signatures appear on the signature pages thereto (incorporated by reference to Exhibit 10.2 to US BioEnergy’s Current Report on Form 8-K, filed with the SEC on February 13, 2007, File No. 001-33203) | |
| 10.26 | Amendment No. 1 to the Credit Agreement, dated October 19, 2007, by and between US Bio Ord, LLC and AgStar Financial Services, PCA (incorporated by reference to Exhibit 10.3 to US BioEnergy Corporation’s Quarterly Report on Form 10-Q, filed with the SEC on November 13, 2007, File No. 001-33203) | |
51
Table of Contents
Exhibit | Description | |
| 10.27 | Credit Agreement, dated February 7, 2007, among US Bio Dyersville, LLC, AgStar Financial Services, PCA, and the commercial, banking or financial institutions whose signatures appear on the signature pages thereto (incorporated by reference to Exhibit 10.3 to US BioEnergy’s Current Report on Form 8-K, filed with the SEC on February 13, 2007, File No. 001-33203) | |
| 10.28 | Amendment No. 1 to the Credit Agreement, dated October 19, 2007, by and between US Bio Dyersville, LLC and AgStar Financial Services, PCA, as amended by Amendment No. 2 to the Credit Agreement, dated November 1, 2007 (incorporated by reference to Exhibits 10.6 and 10.8 to US BioEnergy Corporation’s Quarterly Report on Form 10-Q, filed with the SEC on November 13, 2007, File No. 001-33203) | |
| 10.29 | Credit Agreement, dated February 7, 2007, among US Bio Hankinson, LLC, AgStar Financial Services, PCA, and the commercial, banking or financial institutions whose signatures appear on the signature pages thereto (incorporated by reference to Exhibit 10.4 to US BioEnergy’s Current Report on Form 8-K, filed with the SEC on February 13, 2007, File No. 001-33203) | |
| 10.30 | Amendment No. 1 to the Credit Agreement, dated October 19, 2007, by and between US Bio Hankinson, LLC and AgStar Financial Services, PCA (incorporated by reference to Exhibit 10.4 to US BioEnergy Corporation’s Quarterly Report on Form 10-Q, filed with the SEC on November 13, 2007, File No. 001-33203) | |
| 10.31 | Credit Agreement, dated February 7, 2007, among US Bio Janesville, LLC, AgStar Financial Services, PCA, and the commercial, banking or financial institutions whose signatures appear on the signature pages thereto (incorporated by reference to Exhibit 10.5 to US BioEnergy’s Current Report on Form 8-K, filed with the SEC on February 13, 2007, File No. 001-33203) | |
| 10.32 | Amendment No. 1 to the Credit Agreement, dated October 19, 2007, by and between US Bio Janesville, LLC and AgStar Financial Services, PCA (incorporated by reference to Exhibit 10.5 to US BioEnergy Corporation’s Quarterly Report on Form 10-Q, filed with the SEC on November 13, 2007, File No. 001-33203) | |
| 10.33 | Lease Agreement, dated July 10, 2007, between CHS Inc. and US Bio Energy Corporation (incorporated by reference to Exhibit 10.1 to US BioEnergy’s Current Report on Form 8-K, filed with the SEC on July 11, 2007, File No. 001-33203) | |
| 10.34 | Change in Control Agreement dated as of September 28, 2007 between US BioEnergy Corporation and Gordon W. Ommen (incorporated by reference to Exhibit 10.24 to US BioEnergy Corporation’s Quarterly Report on Form 10-Q, filed with the SEC on November 13, 2007, File No. 001-33203)* | |
| 10.35 | Change in Control Agreement, dated September 28, 2007, between US BioEnergy Corporation and each of Richard Atkinson, Gregory S. Schlicht, Chad Hatch and Kim Regenhard (incorporated by reference to Exhibit 10.24 to US BioEnergy Corporation’s Quarterly Report on Form 10-Q, filed with the SEC on November 13, 2007, File No. 001-33203)* | |
| 10.36 | Loan and Security Agreement, dated June 22, 2006, between Millennium Ethanol, LLC and Dougherty Funding, LLC (incorporated by reference to Exhibit 10.1 to Millennium Ethanol, LLC’s Amendment No. 1 to Registration Statement on Form 10 filed with the SEC on June 18, 2007, File No. 000-52608) | |
| 10.37 | Revolving Credit Agreement, dated as of May 30, 2008, among VeraSun Energy Corporation, UBS Securities LLC, UBS AG, Stamford Branch, UBS Loan Finance LLC, VeraSun Fort Dodge, LLC, VeraSun Hartley, LLC, VeraSun Welcome, LLC, VeraSun Charles City, LLC, VeraSun Aurora Corporation, and VeraSun Marketing, LLC (incorporated by reference to Exhibit 10.1 to VeraSun’s Form 8-K, filed with the SEC on June 4, 2008). | |
| 10.38 | VeraSun Energy Corporation Senior Management Retention Plan (incorporated by reference to Exhibit 10.1 to VeraSun’s Form 8-K, filed with the SEC on May 14, 2008). | |
| 31.1 | Certification of Chief Executive Officer pursuant to Section 302 of the Sarbanes-Oxley Act of 2002. | |
| 31.2 | Certification of Chief Financial Officer pursuant to Section 302 of the Sarbanes-Oxley Act of 2002. | |
| 32.1 | Certification of Chief Executive Officer pursuant to Section 906 of the Sarbanes-Oxley Act of 2002. | |
| 32.2 | Certification of Chief Financial Officer pursuant to Section 906 of the Sarbanes-Oxley Act of 2002. | |
52
Table of Contents
Pursuant to the requirements of the Securities Exchange Act of 1934, the registrant has duly caused this report to be signed on its behalf by the undersigned thereunto duly authorized.
Date: August 11, 2008.
| VERASUN ENERGY CORPORATION | ||
| By: | /s/ Danny C. Herron | |
| Danny C. Herron | ||
| President and Chief Financial Officer | ||
| (authorized officer and chief financial officer) | ||
| By: | /s/ Bryan Meier | |
| Bryan Meier | ||
| Vice President Finance and Chief Accounting Officer | ||
| (principal accounting officer) | ||
Exhibit | ||
| 3.1 | Articles of Incorporation, as amended, of VeraSun Energy Corporation. | |
| 31.1 | Certification of Chief Executive Officer pursuant to Section 302 of the Sarbanes-Oxley Act of 2002. | |
| 31.2 | Certification of Chief Financial Officer pursuant to Section 302 of the Sarbanes-Oxley Act of 2002. | |
| 32.1 | Certification of Chief Executive Officer pursuant to Section 906 of the Sarbanes-Oxley Act of 2002. | |
| 32.2 | Certification of Chief Financial Officer pursuant to Section 906 of the Sarbanes-Oxley Act of 2002. | |
53