Table of Contents
UNITED STATES
SECURITIES AND EXCHANGE COMMISSION
Washington, D.C. 20549
FORM 10-Q
| x | QUARTERLY REPORT PURSUANT TO SECTION 13 OR 15(d) OF THE SECURITIES EXCHANGE ACT OF 1934 |
For the quarterly period ended September 30, 2008
OR
| ¨ | TRANSITION REPORT PURSUANT TO SECTION 13 OR 15(d) OF THE SECURITIES EXCHANGE ACT OF 1934 |
For the transition period from to
Commission File No. 1-32913
VeraSun Energy Corporation
(Exact name of registrant as specified in its charter)
| South Dakota | 20-3430241 | |
| (State or other jurisdiction of | (IRS Employer | |
| incorporation or organization) | Identification Number) |
| 110 N. Minnesota Ave, Suite 300 | ||
| Sioux Falls, SD | 57104 | |
| (Address of principal executive offices) | (Zip Code) |
605-978-7000
(Registrant’s telephone number, including area code)
NONE
(Former name, former address and former fiscal year, if changed since last report)
Indicate by check mark whether the registrant (1) has filed all reports required to be filed by Section 13 or 15(d) of the Securities Exchange Act of 1934 during the preceding 12 months (or for such shorter period that the registrant was required to file such reports), and (2) has been subject to such filing requirements for the past 90 days. Yes x No ¨
Indicate by check mark whether the registrant is a large accelerated filer, an accelerated filer, or a non-accelerated filer, or a smaller reporting company. See the definitions of “large accelerated filer”, “accelerated filer” and “smaller reporting company” in Rule 12b-2 of the Exchange Act.
| Large accelerated filer | ¨ | Accelerated filer | x | |||
| Non-accelerated filer | ¨ | Smaller reporting company | ¨ | |||
Indicate by check mark whether the registrant is a shell company (as defined in Rule 12b-2 of the Exchange Act). Yes ¨ No x
The number of shares of Common Stock outstanding on October 29, 2008 was 158,568,110.
Table of Contents
SEPTEMBER 30, 2008
INDEX TO FORM 10-Q
| PAGE NO. | ||
Item 1 —Financial Statements | ||
| 3 | ||
| 4 | ||
| 5 | ||
| 6 | ||
Item 2 —Management’s Discussion and Analysis of Financial Condition and Results of Operations | 42 | |
Item 3 —Quantitative and Qualitative Disclosures About Market Risk | 60 | |
Item 4 —Controls and Procedures | 63 | |
Item 1 —Legal Proceedings | 63 | |
Item 1A —Risk Factors | 63 | |
Item 2 —Unregistered Sales of Equity Securities and Use of Proceeds | 77 | |
Item 5 —Other Information | 77 | |
Item 6 —Exhibits | 77 | |
| 79 | ||
2
Table of Contents
| ITEM 1. | FINANCIAL STATEMENTS |
CONDENSED CONSOLIDATED BALANCE SHEETS
| September 30, 2008 | |||||||
| (unaudited) | December 31, 2007 | ||||||
| (dollars in thousands, except per share data) | |||||||
Assets | |||||||
Current Assets | |||||||
Cash and cash equivalents | $ | 9,326 | $ | 110,942 | |||
Restricted cash | 14,828 | — | |||||
Short-term investments | — | 43,175 | |||||
Trade receivables, less allowance for doubtful accounts of $419 and $95 in 2008 and 2007, respectively | 147,469 | 51,294 | |||||
Inventories | 183,107 | 107,912 | |||||
Prepaid expenses and other assets | 61,704 | 63,597 | |||||
Derivative financial instruments | 1,294 | 12,627 | |||||
Deferred income taxes | 3,787 | — | |||||
Total current assets | 421,515 | 389,547 | |||||
Goodwill | — | 169,629 | |||||
Other intangible assets | 33,803 | 21,668 | |||||
Other long-term assets | 13,623 | 15,572 | |||||
Debt issuance costs, net | 17,784 | 15,478 | |||||
| 65,210 | 222,347 | ||||||
Property and equipment, net | 2,426,136 | 1,251,612 | |||||
| $ | 2,912,861 | $ | 1,863,506 | ||||
Liabilities and Shareholders’ Equity | |||||||
Current Liabilities | |||||||
Current maturities of long-term debt | $ | 1,524,958 | $ | 16,774 | |||
Accounts payable | 173,547 | 120,814 | |||||
Accrued expenses and other liabilities | 85,289 | 11,138 | |||||
Derivative financial instruments | 14,512 | 11,299 | |||||
Deferred income taxes | — | 1,869 | |||||
Total current liabilities | 1,798,306 | 161,894 | |||||
Long-term debt, less current maturities | 10,931 | 888,696 | |||||
Deferred income taxes | 4,896 | 51,564 | |||||
Other long-term liabilities | 27,204 | 5,621 | |||||
Total long-term liabilities | 43,031 | 945,881 | |||||
Commitments and Contingencies | |||||||
Minority interest in consolidated subsidiary | 900 | — | |||||
Shareholders’ Equity | |||||||
Preferred stock, $0.01 par value; authorized 25,000,000 shares; none issued or outstanding | — | — | |||||
Common stock, $0.01 par value; authorized 350,000,000 and 250,000,000 shares at September 30, 2008, and December 31, 2007, respectively; 158,568,427 and 92,948,664 shares issued and outstanding as of September 30, 2008 and December 31, 2007, respectively | 1,586 | 929 | |||||
Additional paid-in capital | 1,397,485 | 638,606 | |||||
Retained (deficit) earnings | (328,447 | ) | 116,196 | ||||
| 1,070,624 | 755,731 | ||||||
| $ | 2,912,861 | $ | 1,863,506 | ||||
See Notes to Condensed Consolidated Financial Statements.
3
Table of Contents
CONDENSED CONSOLIDATED STATEMENTS OF OPERATIONS
(Unaudited)
| Three Months Ended September 30, | Nine Months Ended September 30, | |||||||||||||||
| 2008 | 2007 | 2008 | 2007 | |||||||||||||
| (dollars in thousands, except per share data) | ||||||||||||||||
Net sales | $ | 1,084,467 | $ | 221,868 | $ | 2,616,110 | $ | 535,934 | ||||||||
Cost of goods sold | (1,262,380 | ) | (198,474 | ) | (2,686,949 | ) | (470,811 | ) | ||||||||
Lower of cost or market adjustment | (40,107 | ) | — | (40,107 | ) | — | ||||||||||
Gross profit (loss) | (218,020 | ) | 23,394 | (110,946 | ) | 65,123 | ||||||||||
Startup expenses | 2,719 | 1,675 | 9,421 | 3,257 | ||||||||||||
Restructuring charge | 110 | — | 2,114 | — | ||||||||||||
Selling, general and administrative expenses | 21,280 | 9,862 | 48,961 | 28,211 | ||||||||||||
Goodwill impairment | 263,332 | — | 263,332 | — | ||||||||||||
Long-lived asset impairment | 121,218 | — | 121,218 | — | ||||||||||||
Total operating expenses | 408,659 | 11,537 | 445,046 | 31,468 | ||||||||||||
Operating income (loss) | (626,679 | ) | 11,857 | (555,992 | ) | 33,655 | ||||||||||
Other income (expense): | ||||||||||||||||
Interest expense | (28,692 | ) | (12,016 | ) | (55,006 | ) | (19,947 | ) | ||||||||
Interest income | 73 | 5,523 | 1,621 | 14,430 | ||||||||||||
Gain on extinguishment of debt | 3,743 | — | 3,743 | — | ||||||||||||
Other income | 576 | 4 | 1,290 | 36 | ||||||||||||
| (24,300 | ) | (6,489 | ) | (48,352 | ) | (5,481 | ) | |||||||||
Income (loss) before income taxes and minority interest | (650,979 | ) | 5,368 | (604,344 | ) | 28,174 | ||||||||||
Income tax provision (benefit) | (174,851 | ) | (2,425 | ) | (159,676 | ) | 5,557 | |||||||||
Income (loss) before minority interest | (476,128 | ) | 7,793 | (444,668 | ) | 22,617 | ||||||||||
Minority interest in net loss of subsidiary, net of income taxes | 19 | — | 25 | — | ||||||||||||
Net income (loss) | $ | (476,109 | ) | $ | 7,793 | $ | (444,643 | ) | $ | 22,617 | ||||||
Per share data: | ||||||||||||||||
Income (loss) per common share - basic | $ | (3.03 | ) | $ | 0.09 | $ | (3.28 | ) | $ | 0.29 | ||||||
Basic weighted average number of common shares | 157,135,926 | 85,177,689 | 135,660,386 | 79,329,665 | ||||||||||||
Income (loss) per common share - diluted | $ | (3.03 | ) | $ | 0.09 | $ | (3.28 | ) | $ | 0.27 | ||||||
Diluted weighted average number of common and common equivalent shares | 157,135,926 | 88,157,051 | 135,660,386 | 83,472,558 | ||||||||||||
See Notes to Condensed Consolidated Financial Statements.
4
Table of Contents
CONDENSED CONSOLIDATED STATEMENTS OF CASH FLOWS
(Unaudited)
| Nine Months Ended September 30, | ||||||||
| 2008 | 2007 | |||||||
| (dollars in thousands) | ||||||||
Cash Flows from Operating Activities | ||||||||
Net income (loss) | $ | (444,643 | ) | $ | 22,617 | |||
Adjustments to reconcile net income (loss) to net cash provided by (used in) operating activities: | ||||||||
Goodwill impairment | 263,332 | — | ||||||
Deferred income taxes | (150,460 | ) | 11,017 | |||||
Long-lived asset impairment | 121,218 | — | ||||||
Depreciation | 53,381 | 11,120 | ||||||
Lower of cost or market adjustment | 40,107 | |||||||
Change in derivative financial instruments | 21,100 | 3,198 | ||||||
Stock-based compensation expense | 6,311 | 4,356 | ||||||
Accretion of contracts and long-term debt fair valued during purchase accounting | (4,518 | ) | — | |||||
Gain on extinguishment of debt | (3,743 | ) | — | |||||
Amortization of other intangible assets | 3,273 | — | ||||||
Amortization of debt issuance cost and debt discount | 2,253 | 1,357 | ||||||
Gain on disposal of equipment | (370 | ) | (82 | ) | ||||
Accretion of deferred revenue | (147 | ) | (71 | ) | ||||
Minority interest in net loss of subsidiary | (25 | ) | — | |||||
Excess tax benefits from share-based payment arrangements | — | (8,424 | ) | |||||
Changes in current assets and liabilities, net of effects of business aquisition | ||||||||
Trade receivables | (38,794 | ) | (2,928 | ) | ||||
Inventories | (17,397 | ) | (29,193 | ) | ||||
Prepaid expenses and other assets | 13,405 | (3,335 | ) | |||||
Accounts payable | 52,486 | 39,476 | ||||||
Accrued expenses and other liabilities | 4,669 | 24,538 | ||||||
Net cash (used in) provided by operating activities | (78,562 | ) | 73,646 | |||||
Cash Flows from Investing Activities | ||||||||
Purchases of property and equipment | (264,991 | ) | (303,241 | ) | ||||
Acquisitions, net of transaction costs | 44,359 | (242,775 | ) | |||||
Proceeds from the sale of short-term investments | 43,175 | — | ||||||
Change in restricted cash | (14,828 | ) | — | |||||
Proceeds from sales of property and equipment | 1,300 | 6 | ||||||
Payments for other long-term assets and liabilities | (382 | ) | (6,496 | ) | ||||
Net cash used in investing activities | (191,367 | ) | (552,506 | ) | ||||
Cash Flows from Financing Activities | ||||||||
Proceeds from long-term debt | 195,445 | 471,367 | ||||||
Principal payments on long-term debt | (21,004 | ) | — | |||||
Debt issuance costs paid | (3,779 | ) | (11,539 | ) | ||||
Cost of registering equity securities | (2,127 | ) | (5 | ) | ||||
Net effect of the exercise of stock options | (222 | ) | — | |||||
Excess tax benefits from share-based payment arrangements | — | 8,424 | ||||||
Net proceeds from the issuance of 2,934,747 shares of common stock | — | 12,784 | ||||||
Net cash provided by financing activities | 168,313 | 481,031 | ||||||
Net (decrease) increase in cash and cash equivalents | (101,616 | ) | 2,171 | |||||
Cash and Cash Equivalents | ||||||||
Beginning of period | 110,942 | 318,049 | ||||||
End of period | $ | 9,326 | $ | 320,220 | ||||
See Notes to Condensed Consolidated Financial Statements.
5
Table of Contents
NOTES TO CONDENSED CONSOLIDATED FINANCIAL STATEMENTS (unaudited)
(dollars in thousands, except for per share data)
Note 1. Nature of Business and Basis of Presentation
Nature of Business
VeraSun Energy Corporation, a South Dakota corporation, together with its subsidiaries, is one of the largest ethanol producers in the United States based on production capacity, according to Renewable Fuels Association (“RFA”) data. VeraSun focuses primarily on the production and sale of ethanol and its co-products.
Basis of Presentation and Going Concern Considerations
The accompanying condensed consolidated balance sheet as of December 31, 2007 has been derived from audited consolidated financial statements. The unaudited condensed consolidated financial statements present the accounts of VeraSun Energy Corporation, a South Dakota corporation, and its wholly-owned subsidiaries, including, since April 1, 2008 (see Note 2), US BioEnergy Corporation (“US BioEnergy”), and US BioEnergy’s joint venture Big River Resources Grinnell, LLC (“Grinnell”). Except as the context requires or as stated otherwise, “VeraSun,” the “Company,” “we,” “us” and “our” refer to VeraSun Energy Corporation, its subsidiaries and Grinnell, collectively. The unaudited interim condensed consolidated financial statements of VeraSun reflect all recurring and non-recurring adjustments that are, in the opinion of our management, necessary for a fair presentation of VeraSun’s consolidated financial position, results of operations and cash flows. Refer to Note 3 “Goodwill and Other Identifiable Intangible Assets,” Note 4 “Impairment of Long-Lived Assets” and Note 6 “Inventories” for information on non-recurring adjustments. The results for the nine months ended September 30, 2008 are not necessarily indicative of the results that may be expected for a full fiscal year. Certain information and note disclosures normally included in annual consolidated financial statements prepared in accordance with accounting principles generally accepted in the United States of America (“GAAP”) have been condensed or omitted pursuant to the rules and regulations of the Securities and Exchange Commission (“SEC”), although the Company believes that the disclosures made are adequate to make the information not misleading. These condensed consolidated financial statements should be read in conjunction with the Company’s audited consolidated financial statements and notes thereto included in its annual report for the year ended December 31, 2007 filed on Form 10-K with the SEC.
During the third quarter of 2008, the Company suffered a significant loss from operations as a result of various factors including dramatic changes in corn costs and falling ethanol prices. Subsequent to September 30, 2008, we continue to suffer operating losses primarily due to the relative prices of ethanol and corn. Such losses,combined with worsening capital market conditions and a tightening of trade credit, resulted in severe constraints on the Company’s liquidity position. Faced with these constraints, on October 31, 2008, VeraSun Energy Corporation and 24 of its subsidiaries, which include all of VeraSun Energy Corporation’s material subsidiaries, filed voluntary petitions for relief (collectively, the “Bankruptcy Filing”) under Chapter 11 (“Chapter 11”) of the United States Bankruptcy Code (the “Bankruptcy Code”) with the United States Bankruptcy Court for the District of Delaware (the “Bankruptcy Court”). VeraSun intends to continue to operate its business as debtor-in-possession under the jurisdiction of the Bankruptcy Court and in accordance with the applicable provisions of the Bankruptcy Code and orders of the Bankruptcy Court. See Note 15 “Subsequent Events,” for details regarding the Bankruptcy Filing and the Chapter 11 cases. The accompanying unaudited condensed consolidated financial statements have been prepared assuming we will continue as a going concern, which assumes continuity of operations and realization of assets and satisfaction of liabilities in the ordinary course of business. Our ability to continue as a going concern is dependent upon, among other things, (i) our ability to secure adequate debtor-in-possession financing; (ii) our ability to comply with the terms and conditions of any debtor-in-possession financing and any cash collateral order entered by the Bankruptcy Court in connection with the Chapter 11 cases; (iii) our ability to maintain adequate cash on hand; (iv) our ability to generate cash from operations; (v) our ability to obtain confirmation of and to consummate a plan of reorganization under the Bankruptcy Code; (vi) the cost, duration and outcome of the reorganization process; and (vii) our ability to achieve profitability. Uncertainty as to the outcome of these factors raises substantial doubt about the Company’s ability to continue as a going concern. We are currently evaluating various courses of action to address the operational and liquidity issues the Company is facing and are in the process of attempting to secure debtor-in-possession financing, as described in Note 15, and formulating plans for improving operations. There can be no assurance that any of these efforts will be successful. The accompanying consolidated financial statements do not include any adjustments that might result should we be unable to continue as a going concern.
American Institute of Certified Public Accountants Statement of Position 90-7, “Financial Reporting by Entities in Reorganization under the Bankruptcy Code” (SOP 90-7), which is applicable to companies in Chapter 11, generally does not change the manner in which financial statements are prepared. However, it does require that the financial statements for periods subsequent to the filing of the Chapter 11 petition distinguish transactions and events that are directly associated with the reorganization from the ongoing operations of the business. Revenues, expenses (including professional fees), realized gains and losses, and provisions for losses that can be directly associated with the reorganization and restructuring of the business must be reported separately as
6
Table of Contents
VERASUN ENERGY CORPORATION
NOTES TO CONDENSED CONSOLIDATED FINANCIAL STATEMENTS (unaudited)
(dollars in thousands, except for per share data)
reorganization items in the consolidated statements of operations beginning in the quarter ending December 31, 2008. The consolidated balance sheet must distinguish pre-petition liabilities subject to compromise from both those pre-petition liabilities that are not subject to compromise and from post-petition liabilities. Liabilities that may be affected by the plan must be reported at the amounts expected to be allowed, even if they may be settled for lesser amounts. In addition, cash provided by reorganization items must be disclosed separately in the condensed consolidated statement of cash flows. VeraSun adopted SOP 90-7 effective on October 31, 2008 and will segregate those items as outlined above for all reporting periods subsequent to such date.
Principles of Consolidation
The accompanying condensed consolidated financial statements include the accounts of VeraSun Energy Corporation and its subsidiaries. All intercompany balances and transactions have been eliminated on consolidation. See Note 2 for disclosures related to acquisitions in the second quarter of 2008 and the third quarter of 2007.
Reclassifications
The accompanying consolidated financial statements contain certain reclassifications to conform to the presentation used in the current period. The reclassification had no impact on shareholders’ equity, working capital, gross profit or net income.
Revenue Recognition
Revenue from the production of ethanol and distillers grains is recorded when title transfers to customers. Shipping and handling charges to customers are included in revenues. In accordance with our marketing agreements with Provista Renewable Fuels Marketing, LLC (“Provista”) that terminated in August 2008, certain sales from April 1, 2008 through August 31, 2008 were recorded when products were shipped from our production facilities, net of commissions retained by Provista. Our sales of ethanol, with the exception of sales from our plants in Bloomingburg, Ohio; Linden, Indiana; Marion, South Dakota; and Albion, Nebraska, which are recognized upon shipment from these plants, net of commissions retained by Cargill, Inc. and Archer-Daniels-Midland Co. under marketing agreements, are now recognized upon delivery to our customers at terminals or other locations.
We receive incentives to produce ethanol from state and federal entities. In accordance with the terms of these arrangements, incentive income is recognized when we produce ethanol or blend ethanol with gasoline to produce E85. For the three and nine months ending September 30, 2008, incentive revenue was $1,663 and $7,017 respectively, compared to $1,134 and $2,571 for the three and nine months ended September 30, 2007, respectively.
Net sales to three customers represented approximately 22%, 15%, and 12% of the Company’s net sales for the nine months ended September 30, 2008. At September 30, 2008, accounts receivable balance from these customers accounted for 43% of total trade receivable.
Derivatives and Hedging Activities
Derivatives are recognized on the balance sheet at their fair value and are included in the accompanying balance sheets as “Derivative financial instruments”. On the date the derivative contract is entered into, the Company may designate the derivative as a hedge of a forecasted transaction or of the variability of cash flows to be received or paid related to a recognized asset or liability (“cash flow” hedge). Changes in the fair value of a derivative that is highly effective and that is designated and qualifies as a cash flow hedge are recorded in other comprehensive income, net of tax effect, until earnings are affected by the variability of cash flows (e.g., when periodic settlements on a variable rate asset or liability are recorded in earnings). Changes in the fair value of undesignated derivative instruments are reported in current period earnings.
Prior to September 1, 2008, in connection with the execution of forward purchase contracts, the Company normally elected to create a hedging relationship by selling an exchange traded futures contract as an offsetting position. In this situation, the forward purchase contract was designated to be valued at market price until delivery was made against the contract. During the third quarter of 2008, the Company chose to exit a majority of offsetting futures contracts due to unacceptable margin exposure. The corresponding forward purchase contracts are continuing to be marked to market until their settlement. The Company has elected not to establish hedging relationships for forward purchase contracts executed during the third quarter of 2008 subsequent to August 31, 2008. Since the Company has elected the normal purchase normal sale exception, forward purchase contracts not hedged are not subject to accounting requirements under SFAS 133—Accounting for Derivative Instruments and Hedging Activities and, accordingly, are not marked to market. In circumstances where we estimate that our cash contract value cannot be recovered through the sale of ethanol, we record a loss on the contract classified as “Lower of cost or market adjustment” in the accompanying condensed consolidated statements of operations and the resulting liability classified as accrued expenses in the accompanying condensed consolidated balance sheet. Losses are calculated using a lower of cost or market approach, similar to inventory.
7
Table of Contents
VERASUN ENERGY CORPORATION
NOTES TO CONDENSED CONSOLIDATED FINANCIAL STATEMENTS (unaudited)
(dollars in thousands, except for per share data)
The Company continues to formally document all relationships between hedging instruments and hedged items, as well as its risk-management objectives and strategy for undertaking various hedged transactions. This process includes linking all derivatives that are designated as cash flow hedges to specific assets and liabilities on the balance sheet or to specific firm commitments or forecasted transactions. The Company also formally assesses, both at the hedge’s inception and on an ongoing basis, whether the derivatives that are used in hedging transactions are highly effective in offsetting changes in cash flows of hedged items.
When hedge accounting is discontinued because it is probable that a forecasted transaction will not occur, the derivative will continue to be carried on the balance sheet at its fair value, and gains and losses that were accumulated in other comprehensive income will be recognized immediately in earnings. In all other situations in which hedge accounting is discontinued, the derivative will be carried at its fair value on the balance sheet, with subsequent changes in its fair value recognized in current-period income. The Company’s derivative positions related to corn are undesignated instruments where changes in the fair value of these economic hedges are included in cost of goods sold in the income statements. Income statement effects of unleaded gasoline futures contracts and natural gas futures contracts are included in net sales and cost of goods sold, respectively.
The Company recorded corn related derivatives losses of $118,584 and $114,316 during the three months and nine months ended September 30, 2008, respectively, compared to gains of $13,724 and $5,674 for the three months ended and nine months ended September 30, 2007, respectively. The losses are attributable to unrealized mark-to-market open positions of forward purchase and futures contracts, realized hedging losses on exiting futures contracts, and settled forward purchase contracts. Unrealized mark-to-market losses accounted for $42,254 and $12,275 of this derivative loss for the three months and nine months ended September 30, 2008, respectively, compared to no gain or loss and $72 for the three months and nine months ended September 30, 2007. Losses due to realized positions account for $76,330 and $102,041 for the three months and nine months ended September 30, 2008, respectively, compared to a net gain of $13,724 and $5,602 for the three months and nine months ended September 30, 2007, respectively. These losses are included in Cost of goods sold.
Use of Estimates
The preparation of financial statements in conformity with GAAP requires management to make estimates and assumptions that affect (i) the reported amounts of assets and liabilities, (ii) the disclosure of contingent assets and liabilities at the date of the financial statements, and (iii) the reported amounts of revenues and expenses during the reporting period.
We use estimates and assumptions in accounting for the following significant matters, among others:
| • | Allowances for doubtful accounts |
| • | Inventory valuation and allowances |
| • | Valuation of acquired assets and liabilities |
| • | Fair value of derivative financial instruments and related hedged items |
| • | Accrued losses on forward purchase and sales contracts |
| • | Useful lives of property and equipment and intangible assets |
| • | Asset retirement obligations |
| • | Goodwill and other long-lived asset impairments |
| • | Accounting for assets to be sold and related purchase order obligations |
| • | Contingencies |
| • | Fair value of options and restricted stock granted under our stock-based compensation plans |
8
Table of Contents
VERASUN ENERGY CORPORATION
NOTES TO CONDENSED CONSOLIDATED FINANCIAL STATEMENTS (unaudited)
(dollars in thousands, except for per share data)
| • | Tax related items |
Actual results may differ from previously estimated amounts, and such differences may be material to our condensed consolidated financial statements. We periodically review estimates and assumptions, and the effects of revisions are reflected in the period in which the revision is made. The revisions to estimates or assumptions during the periods presented in the accompanying condensed consolidated financial statements were not considered to be significant.
Recently Issued Accounting Pronouncements:
In February 2008, the FASB issued “Effective Date of FASB Statement No. 157” FASB Staff Position (FSP) No. 157-2 (FSP No. 157-2). FSP No. 157-2 delays the effective date of SFAS No. 157 until fiscal years beginning after November 15, 2008, for fair value measurements of non-financial assets and non-financial liabilities, except for items that are recognized or disclosed at fair value in an entity’s financial statements on a recurring basis (at least annually).
As of January 1, 2008, the Company adopted SFAS No. 157 for all assets and liabilities measured at fair value except for non-financial assets and non-financial liabilities measured at fair value on a non-recurring basis, as permitted by FSP No. 157-2. The adoption did not have a material impact on the Company’s consolidated financial statements. For additional discussion and SFAS No. 157 required disclosures see Note 7 to these condensed consolidated financial statements.
In February 2007, the FASB issued “The Fair Value Option for Financial Assets and Financial Liabilities — Including an Amendment of FASB Statement No. 115” (SFAS No. 159), which provides companies with an option to measure, at specified election dates, many financial instruments and certain other items at fair value that are not currently measured at fair value. A company that adopts SFAS No. 159 will report unrealized gains and losses on items for which the fair value option has been elected in earnings at each subsequent reporting date. This statement also establishes presentation and disclosure requirements designed to facilitate comparisons between entities that choose different measurement attributes for similar types of assets and liabilities. This statement is effective for fiscal years beginning after November 15, 2007. Effective January 1, 2008, the Company adopted SFAS No. 159 but did not elect fair value as an alternative.
In December 2007, the FASB issued SFAS No. 141 (revised 2007), “Business Combinations.” This statement significantly changes the financial accounting and reporting of business combination transactions. The provisions of this statement are to be applied prospectively to business combination transactions in the first annual reporting period beginning on or after December 15, 2008. The Company is currently assessing the impact of the adoption this will have on our consolidated financial statements.
In December 2007, the FASB issued SFAS No. 160, “Noncontrolling Interests in Consolidated Financial Statements”, (SFAS No. 160), which amends Accounting Research Bulletin No. 51. SFAS No. 160 improves the relevance, comparability, and transparency of financial information provided to investors by requiring all entities to report noncontrolling (minority) interests in subsidiaries as equity in the consolidated financial statements. This statement is effective for fiscal years beginning after December 15, 2008, and early adoption is not permitted. The provisions of this standard must be applied retrospectively upon adoption. The Company has assessed SFAS No. 160 and has determined that the impact of the adoption of this statement will result in minority interest being reported as a component of shareholders’ equity, but separate from VeraSun Energy Corporation’s equity.
In March 2008, the FASB issued SFAS No. 161, “Disclosures about Derivative Instruments and Hedging Activities” (“SFAS No. 161”). The new standard is intended to improve financial reporting about derivative instruments and hedging activities by requiring enhanced disclosures to enable investors to better understand their effects on an entity’s financial position, financial performance, and cash flows. It is effective for financial statements issued for fiscal years and interim periods beginning after November 15, 2008, with early application encouraged. We do not expect the adoption of SFAS No. 161 to have a material impact on our consolidated financial statements. However, we are still in the process of evaluating the impact of adopting SFAS No. 161.
In April 2008, the FASB released FSP No. 142-3, “Determination of the Useful Life of Intangible Assets. “ This FSP requires entities to disclose information for recognized intangible assets that enable users of financial statements to understand the extent to which expected future cash flows associated with intangible assets are affected by the entity’s intent or ability to renew or extend the arrangement associated with the intangible asset. This FSP also amends the factors an entity should consider in developing the renewal or extension assumptions used in determining the useful life of recognized intangible assets under SFAS No. 142, “Goodwill and Other Intangible Assets.” This FSP will be applied prospectively only to intangible assets acquired after the FSP’s effective date, but the disclosure requirements will be applied prospectively to all intangible assets as of the FSP’s effective date. This FSP is effective for fiscal years beginning after December 15, 2008 and early adoption is not permitted. The Company is currently assessing the impact the adoption of the FSP will have on its consolidated financial statements.
9
Table of Contents
VERASUN ENERGY CORPORATION
NOTES TO CONDENSED CONSOLIDATED FINANCIAL STATEMENTS (unaudited)
(dollars in thousands, except for per share data)
In September 2008, the FASB issued FSP No. 133-1 and FIN 45-4, “Disclosures about Credit Derivatives and Certain Guarantees: An Amendment of FASB Statement No. 133 and FASB Interpretation No. 45; and Clarification of the Effective Date of FASB Statement No. 161.” This FSP is intended to improve disclosures about credit derivatives by requiring more information about the potential adverse effects of changes in credit risk on the financial position, financial performance, and cash flows of the sellers of credit derivatives. This FSP amends FASB Statement No. 133, Accounting for Derivative Instruments and Hedging Activities, to require disclosures by sellers of credit derivatives, including credit derivatives embedded in hybrid instruments. This FSP also amends FASB Interpretation (FIN) No. 45, Guarantor’s Accounting and Disclosure Requirements for Guarantees, Including Indirect Guarantees of Indebtedness to Others, to require an additional disclosure about the current status of the payment/performance risk of a guarantee. The provisions of the FSP that amend Statement 133 and FIN 45 are effective for reporting periods (annual or interim) ending after November 15, 2008. Finally, this FSP clarifies the effective date in SFAS No. 161. The disclosures required by SFAS No. 161 should be provided for any reporting period (annual or quarterly interim) beginning after November 15, 2008. This clarification of the effective date of SFAS No. 161 is effective upon issuance of the FSP. The Company is currently assessing the impact the adoption of the FSP will have on its consolidated financial statements.
Note 2. Business Combinations
US BioEnergy Acquisition
On April 1, 2008, the Company acquired 100% of the outstanding common stock of US BioEnergy for an aggregate purchase price of $757,645, consisting of the value of the common stock issued, stock option awards under which approximately 1.8 million shares of common stock are issuable upon the future exercise of the stock options and transaction costs. Under the merger agreement, 0.81 shares of the Company’s common stock were issued for each outstanding share of US BioEnergy common stock. This transaction is referred to in this document as the “US BioEnergy Acquisition.” The existing VeraSun shares remained outstanding and represented approximately 60 percent of the shares outstanding after the acquisition. A breakdown of the aggregated purchase price is as follows:
Number of shares of US BioEnergy common stock outstanding at the closing date of the merger (in thousands) | 79,986 | ||||||
Exchange ratio | 0.81 | ||||||
Shares of VeraSun issued (in thousands) | 64,789 | ||||||
| Multiplied by VeraSun’s weighted average stock price for the period two business days before and three business days after the November 29, 2007 announcement of acquisition | $ | 11.36 | $ | 736,001 | |||
| Fair value of VeraSun’s stock options issued in exchange for US BioEnergy’s stock options outstanding as of the closing date of the merger | 14,664 | ||||||
Other, including VeraSun’s transaction (registering and issuing) costs | 8,397 | ||||||
Less: Cost of registering equity securities | (1,417 | ) | |||||
Purchase price | $ | 757,645 | |||||
The fair value of VeraSun’s options issued in exchange for US BioEnergy’s stock options was determined using the Black-Scholes option pricing model with the following assumptions: dividend yield of 0.0%; expected volatility of 65%; risk-free rate of 3.0%; and an expected life of 6.9 years.
The acquisition was an opportunity for two leading companies in the renewable fuels industry to capitalize on synergies and provide value for shareholders. It also underscored the commitment of each company to execute on its growth strategy to become a large-scale, low-cost ethanol producer. The merger was expected to create a unique and stronger business platform by improving access to capital and allowing the combined company to leverage technology and operating experience across its entire plant fleet.
The excess of purchase price over the estimated fair value of identifiable net assets acquired was classified as goodwill. The major factors that contributed to goodwill included the expected future profitability of US BioEnergy, the market position of US BioEnergy, its existing facilities and plants under construction given their geographic locations, and its successful track record of plant start-ups and completions. Refer to Note 3 for the Company’s goodwill impairment evaluation performed as of the end of the third quarter of fiscal year 2008.
10
Table of Contents
VERASUN ENERGY CORPORATION
NOTES TO CONDENSED CONSOLIDATED FINANCIAL STATEMENTS (unaudited)
(dollars in thousands, except for per share data)
Through the US BioEnergy Acquisition, the Company acquired five operating ethanol production facilities: Albert City, Iowa, with a capacity of 110 MMGY; Woodbury, Michigan, with a capacity of 50 MMGY; Central City and Ord, Nebraska, with capacities of 100 MMGY and 50 MMGY, respectively; and Marion, South Dakota, with a capacity of 110 MMGY. The Hankinson, North Dakota facility, with a capacity of 110 MMGY, was completed in June of 2008 and became operational on July 21, 2008. The Dyersville, Iowa facility, with a capacity of 110 MMGY, became operational on September 5, 2008. The start-up of the Janesville, Minnesota facility, which is expected to have a capacity of 110 MMGY, has been delayed indefinitely because the financing necessary to continue construction and start-up activities, which we had anticipated would be available under existing project financing and credit lines, has not been forthcoming due to the Bankruptcy Filing (see Note 15). US BioEnergy’s primary products are ethanol and distillers grains, which it derives from corn. At the acquisition date, all ethanol produced by US BioEnergy was sold to Provista, an ethanol marketing company owned by CHS, Inc, except ethanol produced at the Marion, South Dakota facility, which is sold to Archer-Daniels–Midland Co. Effective August 31, 2008, the Company terminated its marketing agreement with Provista.
The acquired assets of the US BioEnergy Acquisition have been included in the condensed consolidated balance sheet as of September 30, 2008, and the operations of US BioEnergy are included in the Company’s condensed consolidated statement of operations beginning April 1, 2008.
In accordance with Statement of Financial Accounting Standards No. 141, “Business Combinations,” the Company recorded this acquisition using the purchase method of accounting. The purchase price has been allocated to tangible and identifiable intangible assets acquired and liabilities assumed based on their respective fair values as of April 1, 2008. The excess purchase price over the fair value of tangible and intangible assets acquired and liabilities assumed was recorded as goodwill, of which approximately $21,000 was considered deductible for tax purposes. Adjustments have been made to the preliminary allocation as reported as of June 30, 2008, primarily relating to the finalizing the fair value of property, plant, and equipment, fair value of identifiable intangibles, fair value of various ethanol, distiller, and rail car contracts, tax incentive credits, and transaction cost. The adjustments had an impact of decreasing goodwill by $3,447, increasing other non-current assets by $1,328, decreasing property, plant, and equipment by $520, decreasing other long-term liabilities, deferred tax liability, and minority interest in consolidated subsidiary by $300, $97, and $2,989, respectively. The following sets forth the allocation of the purchase consideration:
Cash | $ | 51,339 | |
Other current assets | 142,917 | ||
Property, plant and equipment | 1,068,830 | ||
Intangible assets | 55,694 | ||
Goodwill | 98,326 | ||
Other non-current assets | 7,899 | ||
Total assets acquired | 1,425,005 | ||
Current liabilities, excluding current maturities on long-term debt | 85,055 | ||
Long-term debt | 460,979 | ||
Deferred tax liability | 101,314 | ||
Other long-term liabilities | 19,087 | ||
Minority interest in consolidated subsidiary | 925 | ||
Total liabilities assumed | 667,360 | ||
Net assets acquired | $ | 757,645 | |
ASA Acquisition
On August 17, 2007, we closed on a transaction with ASAlliances Biofuels, LLC (“ASAlliances”). Under a Unit Purchase Agreement, we purchased all of the equity interests in ASA OpCo Holdings, LLC (“ASA Holdings”) from ASAlliances for an aggregate purchase price of $683,997. Of this amount, we issued 13,801,384 shares of our common stock valued at $194,323, and paid $250,000 of cash to the seller at closing, and $6,310 for transaction fees and expenses. The balance of the purchase price consisted of $233,364 of indebtedness owed by ASA Holdings and its subsidiaries, ASA Albion, LLC, ASA Bloomingburg, LLC and ASA Linden, LLC, which remained outstanding after the closing under a Credit Agreement, dated February 6, 2006 among ASA Holdings, ASA Albion, LLC, ASA Bloomingburg, LLC and ASA Linden, LLC, as borrowers, and WestLB AG, New York branch, as administrative agent for the lenders and the lenders named therein (“Senior Credit Facility”). We also agreed to register under
11
Table of Contents
VERASUN ENERGY CORPORATION
NOTES TO CONDENSED CONSOLIDATED FINANCIAL STATEMENTS (unaudited)
(dollars in thousands, except for per share data)
applicable securities laws, within 180 days of the acquisition date, the shares issued in the transaction. ASA Holdings owns companies with three bio-refineries and developmental rights to two sites. This transaction is referred to in this document as the “ASA Acquisition”.
The 13,801,384 shares of common stock issued in connection with the ASA Acquisition were valued at $194,323 based on the weighted average of the Company’s stock price two days before and two days after July 22, 2007, the date of the acquisition agreement and announcement of the transaction. The preliminary determination of goodwill acquired in the ASA Acquisition was $163,500. In June 2008, a purchase price reduction of $4,623 was determined due to a delay in the start-up of the Bloomingburg, Ohio facility. This adjustment was converted into a 648,000 reduction in the shares issued. This adjustment was recognized as a reduction in goodwill and shareholders’ equity as of June 30, 2008. Refer to Note 3 for the Company’s goodwill impairment evaluation performed during the third quarter of fiscal year 2008.
Pro Forma Results
The following table provides unaudited pro forma consolidated results of operations for the three and nine months ended September 30, 2008 and 2007, as though the ASA Acquisition and the US BioEnergy Acquisition had occurred as of the beginning of the respective fiscal years. The pro forma results include certain purchase accounting adjustments with respect to the acquired tangible and intangible assets. However, pro forma results do not include any anticipated costs savings or other effects of the planned integration. Accordingly, such amounts are not necessarily indicative of the results if the acquisition had occurred on the dates indicated or that may result in the future.
| Three Months Ended September 30, | Nine Months Ended September 30, | |||||||||||||
| 2008 | 2007 | 2008 | 2007 | |||||||||||
Pro forma results: | ||||||||||||||
Net sales | $ | 1,084,467 | $ | 384,111 | $ | 2,824,994 | $ | 1,024,973 | ||||||
Net income (loss) | (476,109 | ) | 10,325 | (441,152 | ) | 36,613 | ||||||||
Basic net income (loss) per share | (3.03 | ) | 0.06 | (2.81 | ) | 0.22 | ||||||||
Diluted net income (loss) per share | (3.03 | ) | 0.06 | (2.81 | ) | 0.22 | ||||||||
Note 3. Goodwill and Other Identifiable Intangible Assets
Goodwill
Changes to goodwill for the nine months ended September 30, 2008 were as follows:
| Total | ||||
Balance as of December 31, 2007 | $ | 169,629 | ||
US BioEnergy acquisition (see note 2) | 98,326 | |||
ASA purchase price adjustment (see note 2) | (4,623 | ) | ||
Impairment charge | (263,332 | ) | ||
Balance as of September 30, 2008 | $ | — | ||
In accordance with Statement of Financial Accounting Standards No. 142, “Goodwill and Other Intangible Assets” (“SFAS 142”), the Company performs an annual impairment evaluation as of October 1st or performs an interim evaluation if triggering events have occurred. In accordance with Statement of Financial Accounting Standards No. 144, “Accounting for the Impairment or Disposal of Long-Lived Assets” (“SFAS 144”), the Company performs an impairment evaluation of long-lived assets if triggering events occur.
During the second quarter of fiscal 2008, the Company performed an interim impairment evaluation of its goodwill, other identifiable intangible assets and all its long-lived assets due to triggering events as in the sustained decrease in the Company’s stock price relative to the book value of the Company coupled with a significant issuance of common stock, pursuant to a merger with US
12
Table of Contents
VERASUN ENERGY CORPORATION
NOTES TO CONDENSED CONSOLIDATED FINANCIAL STATEMENTS (unaudited)
(dollars in thousands, except for per share data)
BioEnergy. No impairment was recorded during this impairment test as the fair value of the enterprise value was more than its carrying value. The Company also concluded that no impairment to its identifiable intangible assets and all its long-lived assets had occurred on the April 1st test date.
As of the end of the third quarter of fiscal 2008, the Company performed another interim impairment evaluation of its goodwill, other identifiable intangible assets and all its long-lived assets due to factors deemed by management to have constituted an impairment triggering event during the third quarter. The triggering event was the further sustained decrease in the Company stock price relative to the book value of the Company and declining gross margins leading to the substantial net loss incurred during the quarter.
For purposes of testing goodwill, the Company estimated the fair value of the enterprise utilizing several fair value measurement techniques, including two market estimates and one income estimate, and using relevant data available through and as of September 30, 2008. Under the market approaches, the fair value of the enterprise was estimated based upon the fair value of invested capital for VeraSun, as well as a separate comparison to revenue and earnings before interest, taxes, depreciation, and amortization (“EBITDA”) multiples for similar publicly traded companies in the renewable energy industry. Under the income approach, the fair value of the enterprise was estimated based upon the present value of estimated future cash flows for VeraSun. The income approach is dependent on a number of critical management assumptions including estimates of ethanol and distiller sales price, corn and natural gas cost, appropriate discount rates and other relevant assumptions. The Company considered the approaches described above and determined the income statement approach provided the best estimate of our enterprise fair value. The enterprise fair value was less than the entity’s carrying value, and, therefore, the Company was required to perform step two of the SFAS 142 goodwill impairment testing methodology.
In step two of the impairment test, the Company determined the implied fair value of goodwill by allocating the fair value of the reporting unit determined in step one to all the assets and liabilities of the Company, including any recognized and unrecognized intangible assets, as if the reporting unit had been acquired in a business combination and the fair value of the reporting unit was the price paid to acquire the reporting unit. The Company’s step two analysis resulted in no implied fair value of goodwill, and, therefore, the Company recognized an impairment charge of $263,332 for the three and nine months ended September 30, 2008, representing a write-off of the entire amount of the Company’s previously recorded goodwill.
As a result of the impairment testing described above and in Note 4, the Company’s goodwill and certain long-lived assets were recorded at fair value. In accordance with FASB Staff Position No. 157-2, Effective Date of FASB Statement No. 157, the Company has not applied SFAS 157 to the determination of the fair value of these assets. However, the provisions of SFAS 157 were applied to the determination of the fair value of financial assets and financial liabilities that were part of the SFAS 142 step two goodwill fair value determination.
Other intangible assets
Other intangible assets as of September 30, 2008 and December 31, 2007 are as follows:
| September 30, 2008 | December 31, 2007 | ||||||||||||||||||||
| Gross Carrying Value | Accumulated Amortization | Impairment | Net Carrying Value | Gross Carrying Value | Accumulated Amortization | Net Carrying Value | |||||||||||||||
Favorable corn procurement agreements | $ | 41,794 | $ | 17,179 | $ | 22,278 | $ | 2,337 | — | — | — | ||||||||||
Vendor supply arrangements | 20,370 | 937 | — | 19,433 | $ | 20,370 | $ | 228 | $ | 20,142 | |||||||||||
Customer relationships | 13,900 | 1,867 | — | 12,033 | — | — | — | ||||||||||||||
Non-compete agreements | 1,740 | 911 | 829 | — | 1,740 | 214 | 1,526 | ||||||||||||||
Total | $ | 77,804 | $ | 20,894 | $ | 23,107 | $ | 33,803 | $ | 22,110 | $ | 442 | $ | 21,668 | |||||||
The Company completed an impairment evaluation of these other intangible assets as of September 30, 2008 due to triggering events described in the preceding paragraphs. The Company determined that the fair value of the favorable corn procurement agreements and non-compete agreements was less than their carrying value. The fair value of the favorable corn procurement agreements was determined based upon a lower of cost or market analysis of the corn contracts acquired and marked to fair value as part of the US BioEnergy Acquisition on April 1, 2008. Implied fair value of the non-compete agreements was determined based on the Company’s decision not to enforce these non-compete agreements.
Based on the lower of cost or market analysis, the Company recorded an impairment charges on favorable corn procurement contracts of $22,278 for the three months ended September 30, 2008. The total impairment charge was recorded in the statement of operations as “Long-lived asset impairment”. The impairment of other identifiable intangible assets was determined as of the September 30, 2008 test date in accordance with SFAS No. 144. See Note 4 for information regarding impairment of the Company’s long-lived assets.
13
Table of Contents
VERASUN ENERGY CORPORATION
NOTES TO CONDENSED CONSOLIDATED FINANCIAL STATEMENTS (unaudited)
(dollars in thousands, except for per share data)
All other intangible assets are amortizable and the weighted-average amortization periods related to these amortizable intangible assets are as follows:
| (In years) | Weighted-average Amortization Period | |
Favorable corn procurement agreements | 3 | |
Vendor supply arrangements | 20 | |
Customer relationships | 4 |
The weighted-average amortization period for all amortizable intangibles on a combined basis is 16 years.
The Company’s aggregate amortization expense was $9,434 and $20,452 for the three and nine months ended September 30, 2008 and $112 for the three and nine month periods ended September 30, 2007, respectively. Based on current levels of amortizable intangible assets, estimated annual amortization expense is expected to be $1,188 in the fourth quarter of 2008, $6,800 in 2009, $5,040 in 2010, $3,984 in 2011, $1,694 in 2012 and $1,019 in 2013.
Note 4. Impairment of Long-Lived Assets
Long-lived asset impairment charges for the three and nine months ended September 30, 2008 were as follows:
| Total | |||
Impairment of property, plant, and equipment | $ | 92,961 | |
Impairment of investment in economic development bonds | 5,150 | ||
Impairment of favorable corn procurement agreements (see Note 3) | 22,278 | ||
Impairment of non-compete agreements (see Note 3) | 829 | ||
| $ | 121,218 | ||
As of the end of the third quarter of fiscal 2008, the Company performed an impairment test of its long-lived assets due to the triggering events mentioned in Note 3.
We evaluated the recoverability of property, plant and equipment in accordance with SFAS No. 144. For purposes of testing impairment of its long-lived assets at September 30, 2008, the Company determined whether the carrying amount of its long-lived assets was recoverable by comparing the carrying amount to the sum of the undiscounted cash flows expected to result from the use and eventual disposition of the assets. If the carrying value of the assets exceeded the expected cash flows, the Company estimated the fair value of these assets to determine whether an impairment existed. The estimated undiscounted cash flows were dependent on a number of critical management assumptions, including estimates of future capacity, crush margin, corn, natural gas and other inputs, operating costs and other relevant assumptions. If estimates of fair value were required, fair value was estimated using the market approach. Asset appraisals and recent transactions for similar assets were considered by the Company in its market value determination less any transaction or disposal cost the Company might occur.
Based on the recoverability analysis on certain properties, the Company recorded an impairment charge of $92,961 for the three months ended September 30, 2008 to reflect the write-down of such assets to fair market value and an estimated amount to settle open purchase orders. The Company also recorded an impairment charge of $5,150 relating to the value of economic development bonds in connection with the Reynolds, Indiana facility. The total impairment charge was recorded in the statement of operations as “Long-lived asset impairment”.
See the disclosure under the heading “Other intangible assets” in Note 3 for information regarding long-lived asset impairment charges relating to favorable corn procurement agreements and non-compete agreements.
14
Table of Contents
VERASUN ENERGY CORPORATION
NOTES TO CONDENSED CONSOLIDATED FINANCIAL STATEMENTS (unaudited)
(dollars in thousands, except for per share data)
Due to corn and crude oil price volatility, tight credit markets, the volatility of the Company’s stock price and the resulting decline in its market capitalization and the uncertain economic environment, as well as other uncertainties, the Company can provide no assurance that a material impairment charge to remaining intangible assets and all long lived assets will not occur in a future period. The Company will continue to monitor circumstances and events in future periods to determine whether additional interim long-lived asset impairment testing is warranted.
Note 5. Restructuring Activities
In conjunction with the US BioEnergy Acquisition, the Company has combined corporate headquarters in Sioux Falls, South Dakota, and has recorded a restructuring charge related to severance payments to existing VeraSun employees.
Restructuring costs for the first nine months of 2008 were as follows:
| Balance at | Nine months ended September 30, 2008 | Cumulative Drawdowns | Balance at | ||||||||||||||||||
| December 31, | Cash | Non-cash | September 30, | ||||||||||||||||||
| 2007 | Charges | Reversals | Totals | Payments | Charges | 2008 | |||||||||||||||
Personnel and severance costs: | $ | — | $ | 2,114 | $ | — | $ | 2,114 | $ | 2,114 | $ | — | $ | — | |||||||
Total | $ | — | $ | 2,114 | $ | — | $ | 2,114 | $ | 2,114 | $ | — | $ | — | |||||||
All restructuring charges and cash payments for the three and nine months ended September 30, 2008 consisted of personnel and severance costs. At year-end 2007, VeraSun expected to reduce headcount by 16 employees. As of September 30, 2008 the Company had reduced headcount by 17 employees as part of its restructuring actions.
There were no costs associated with restructuring activities for the three and nine month periods ended September 30, 2007.
Note 6. Inventories
Corn, chemicals, supplies and work in process inventories are stated at the lower of cost or market on the first-in, first-out method. Ethanol and distillers grains are stated at the lower of average cost or market.
A summary of inventories as of September 30, 2008 and December 31, 2007 is as follows:
| September 30, | December 31, | |||||
| 2008 | 2007 | |||||
Ethanol | $ | 108,237 | $ | 56,199 | ||
Corn | 22,572 | 27,637 | ||||
Work in process | 21,643 | 7,859 | ||||
Supplies | 16,149 | 11,341 | ||||
Chemicals | 7,948 | 2,743 | ||||
Distillers grains | 6,558 | 2,133 | ||||
| $ | 183,107 | $ | 107,912 | |||
Lower of cost or market adjustment for the three and nine months ended September 30, 2008 was as follows:
| Total | |||
Loss on forward corn contracts and purchase commitments | $ | 27,240 | |
Lower of cost or market adjustment for inventory on hand | 12,867 | ||
| $ | 40,107 | ||
15
Table of Contents
VERASUN ENERGY CORPORATION
NOTES TO CONDENSED CONSOLIDATED FINANCIAL STATEMENTS (unaudited)
(dollars in thousands, except for per share data)
The Company had entered into forward corn purchase contracts and multi-year corn purchase agreements under which it is required to take delivery at the contract price. Currently, some of these contract prices are above current market prices for corn. Given the declining ethanol price, upon taking delivery under these contracts, the Company would incur a loss. Accordingly, the Company recorded a loss on these purchase commitments aggregating to $27,240 for both three months and nine months ended September 30, 2008. The loss was recorded in “Lower of cost or market adjustments” on the condensed consolidated statement of operations. The amount of the loss was determined by applying a methodology similar to that used in the impairment evaluation with respect to inventory. Given the uncertainty of future ethanol prices, this loss may or may not be recovered, and further losses on the outstanding purchase commitments could be recorded in future periods.
During the three and nine month periods ended September 30, 2008, we recorded an inventory valuation impairment of $12,867 attributable primarily to decreases in market prices of corn and ethanol. The inventory valuation impairment was recorded in ”Lower of cost or market adjustment” on the condensed consolidated statement of operations.
Note 7. Fair Value Disclosure
Effective January 1, 2008, the Company adopted the provisions of SFAS No. 157 for assets and liabilities recognized at fair value on a recurring basis. SFAS No. 157 establishes a framework for measuring fair value and requires enhanced disclosures about assets and liabilities carried at fair value.
As defined in SFAS No. 157, fair value is the price that would be received to sell an asset or paid to transfer a liability in the principal or most advantageous market for the asset or liability in an orderly transaction between market participants at the measurement date. SFAS No. 157 establishes a fair value hierarchy, which prioritizes the inputs used in measuring fair value into three broad levels as follows:
Level 1 – Quoted prices are available in active markets for identical assets or liabilities as of the reported date. The types of assets and liabilities included in Level 1 are highly liquid and actively traded instruments with quoted prices, such as equities listed by the New York Stock Exchange and commodity derivative contracts listed on the Chicago Board of Trade.
Level 2 – Pricing inputs are other than quoted prices in active markets, but are either directly or indirectly observable as of the reported date. The types of assets and liabilities included in Level 2 are typically either comparable to actively traded securities or contracts, or priced with models using highly observable inputs, such as commodity options priced using observable forward prices.
Level 3 – Significant inputs to pricing have little or no observability as of the reporting date. The types of assets and liabilities included in Level 3 are those with inputs requiring significant management judgment or estimation, such as the complex and subjective models and forecasts used to determine the fair value of financial transmission rights.
The following table presents the fair value hierarchy for those assets and liabilities measured at fair value on a recurring basis as of September 30, 2008. As required by SFAS No. 157, financial assets and liabilities are classified in their entirety based on the lowest level of input that is significant to the fair value measurement. The Company’s assessment of the significance of a particular input to the fair value measurement requires judgment and may affect the valuation of fair value assets and liabilities and their placement within the fair value hierarchy levels.
| Significant other | Significant | |||||||||||
| Total Carrying | Quoted prices in | observable | unobservable | |||||||||
| Value at | active markets | inputs | inputs | |||||||||
| September 30, 2008 | (Level 1) | (Level 2) | (Level 3) | |||||||||
Assets | ||||||||||||
Derivative financial instruments assets* | $ | 2,994 | $ | 2,364 | $ | 630 | $ | — | ||||
Liabilities | ||||||||||||
Derivative financials instrument liabilities* | $ | 17,593 | $ | — | $ | 17,593 | $ | — | ||||
| * | Derivative financial instruments assets and liabilities with the same counter party have been shown net in the accompanying balance sheet and long-term derivative financial instruments liabilities of $1,381 is included in other long-term liabilities. |
16
Table of Contents
VERASUN ENERGY CORPORATION
NOTES TO CONDENSED CONSOLIDATED FINANCIAL STATEMENTS (unaudited)
(dollars in thousands, except for per share data)
The Company enters into various commodity derivative instruments, including forward contracts, futures, options, swaps and other over-the-counter agreements. The fair value of the Company’s commodity derivatives is determined using unadjusted quoted prices for identical instruments on the applicable exchange in which VeraSun transacts. When quoted prices for identical instruments are not available, VeraSun uses forward price curves derived from market price quotations. Market price quotations are obtained from independent energy brokers, exchanges, direct communication with market participants and actual transactions executed by VeraSun. This methodology also applies to those derivative contract commitments which were made by US BioEnergy prior to the April 1, 2008 acquisition by VeraSun. Market price quotations for certain inputs are generally readily obtainable for the applicable term of VeraSun’s outstanding commodity derivative instruments and, therefore, VeraSun’s forward price curves for those locations and periods reflect observable market quotes.
Note 8. Long-Term Debt and Credit Facility
The Bankruptcy Filing, on October 31, 2008, resulted in an event of default under substantially all of VeraSun’s pre-petition long-term debt, summarized in the table below, with the exception of the tax increment revenue note, community redevelopment revenue bonds, and other debt consisting of capital leases and economic development loans. In light of the Bankruptcy Filing, the affected long-term debt obligations are reflected on the unaudited condensed consolidated balance sheet as of September 30, 2008 under current maturities of long-term debt, and no further borrowings are available under the related credit facilities. Under section 362 of the Bankruptcy Code, however, the acceleration provisions applicable to those debt obligations are generally unenforceable, and any remedies that may exist related to the events of default described above are stayed. For details on the impact of the Bankruptcy Filing and a discussion of the Company’s debtor-in-possession financing, see Note 15 “Subsequent Events”.
The following table summarizes the Company’s pre-petition long-term debt:
| September 30, | December 31, | |||||||
| 2008 | 2007 | |||||||
9 3/8% senior notes due 2017 (a) | $ | 437,000 | $ | 450,000 | ||||
Senior credit facility (b) | 266,750 | 240,946 | ||||||
AgStar construction loans (d) | 237,785 | — | ||||||
9 7/8% senior secured notes due 2012 (a) | 210,000 | 210,000 | ||||||
AgStar senior secured term loans (d) | 166,587 | — | ||||||
UBS credit facility due 2011 (c) | 108,795 | — | ||||||
Marion credit facility (e) | 88,394 | — | ||||||
AgStar revolving term loans (d) | 54,763 | — | ||||||
Revolving loans (d) (e) | 13,442 | — | ||||||
Tax increment revenue note (g) | 5,000 | 5,000 | ||||||
Community redevelopment revenue bonds (f) | 3,203 | — | ||||||
Other | 3,415 | 2,546 | ||||||
Total | 1,595,134 | 908,492 | ||||||
Less unamortized discount | (2,661 | ) | (3,022 | ) | ||||
Less unamortized discount associated with US BioEnergy Acquisition (h) | (56,584 | ) | — | |||||
Less current maturities of long-term debt | (1,524,958 | ) | (16,774 | ) | ||||
Long-term debt | $ | 10,931 | $ | 888,696 | ||||
At September 30, 2008, the Company was in the process of addressing certain conditions that could have, with the passage of time or receipt of notice, resulted in events of default under certain of the Company’s credit facilities. The Company’s Chapter 11 Bankruptcy filing on October 31, 2008 stayed the possible impact of such conditions.
17
Table of Contents
VERASUN ENERGY CORPORATION
NOTES TO CONDENSED CONSOLIDATED FINANCIAL STATEMENTS (unaudited)
(dollars in thousands, except for per share data)
(a) Senior Notes
In May 2007, the Company issued $450,000 aggregate principal amount of unsecured Senior Notes due 2017 (the “2017 Notes”) at 99.5% of face value. The 2017 Notes bear interest at a fixed rate of 9.375% per annum and are recorded net of unamortized debt discount of $2,300. The 2017 Notes mature on June 1, 2017. They may be redeemed at any time prior to June 1, 2012 by paying a make-whole premium and may be redeemed at any time after June 1, 2012 at specified redemption prices. Interest on the 2017 Notes is paid on a semi-annual basis on June 1 and December 1 of each year beginning on December 1, 2007. Total remaining principal balance as of September 30, 2008 was $437,000.
In August 2008, the Company extinguished $13,000 of principal and $282 of accrued interest outstanding on the 2017 Notes in exchange for 1,428,299 shares of the Company’s common stock. In connection with the extinguishment, the Company recorded a gain on extinguishment of debt in the amount of $3,743 for the three month ended September 30, 2008. The gain was computed by deducting the market price of the stock issued, as of the date issued, from the carrying value of the debt extinguished. Such amount included the write-off of unamortized debt issuance cost, unamortized debt discount, and transaction cost totalling $440.
The Senior Secured Notes due 2012 (the “2012 Notes”), principal amount of $210,000, bear interest at 9.875% per annum, payable semi-annually on June 15 and December 15 of each year, and mature on December 15, 2012. They may be redeemed at any time at specified redemption prices. The 2012 Notes and the 2017 Notes are guaranteed by the Company’s existing subsidiaries, other than ASA Holdings and its subsidiaries and US BioEnergy and its subsidiaries, and any future restricted subsidiaries that guaranty any of the Company’s or any subsidiary guarantor’s other indebtedness. The 2012 Notes are secured on a first priority basis by liens on substantially all of VeraSun Energy Corporation’s assets and the assets of the subsidiary guarantors other than accounts receivable, inventory and commodities accounts, and the cash proceeds therefrom.
The indentures governing the 2012 Notes and the 2017 Notes contain restrictive covenants which, among other things, limit the Company’s ability (subject to exceptions) to (a) make restricted payments (which limits redemption of capital stock, voluntary debt repayments, and investments); (b) incur additional debt; (c) engage in transactions with shareholders and affiliates; (d) pay dividends and other payments restrictions affecting subsidiaries; (e) incur liens on assets; (f) sell assets; and (g) engage in unrelated businesses.
(b) Senior Credit Facility
In connection with the ASA Acquisition, the Senior Credit Facility, as amended, remained in effect and provides for aggregate borrowings of up to $275,000 in two tranches: Tranche A for up to $175,000 and Tranche B for up to $100,000. Borrowings under the Senior Credit Facility must be used for the development, engineering, construction and operation of the Company’s Linden, Albion and Bloomingburg plants.
At December 31, 2007, the Company had borrowed $153,567 and $87,379 under the Senior Credit Facility in the form of Tranche A and Tranche B construction loans, respectively. On March 15, 2008, the Company converted the two tranches into term notes in the amounts of $175,000 and $100,000 respectively. Amounts borrowed and repaid under the Senior Credit Facility may not be re-borrowed. The Company paid quarterly commitment fees of 0.5% per annum on the average daily unused amount of the construction loan commitments under the Senior Credit Facility. The Company also pays agent fees of $125 per year.
Tranche A loans bear interest, at the Company’s option, at the administrative agent’s base rate (which is the higher of the federal funds effective rate and the administrative agent’s prime rate) plus 1.5% per annum or a Eurodollar rate based on LIBOR plus 2.5% per annum. Tranche B loans bear interest, at the Company’s option, at the administrative agent base rate plus 3.5% per annum or a Eurodollar rate based on LIBOR plus 4.5% per annum. The interest rate as of September 30, 2008 was 6.2% and 8.2% for Tranche A loans and Tranche B loans, respectively. The interest rate as of December 31, 2007 was 7.7% and 10.1% for Tranche A loans and Tranche B loans, respectively.
The obligations under the Senior Credit Facility are secured by the assets of ASA Holdings and its subsidiaries and a pledge made by VeraSun Energy Corporation of all of the equity interests in ASA Holdings.
The Tranche A term loan is payable in equal quarterly installments of principal of $2,625, and the Tranche B term loan is payable in equal quarterly installments of principal of $1,500, plus accrued interest in accordance with the terms of the Senior Credit Facility, with the balance in each case payable at maturity on June 30, 2014.
The Senior Credit Facility requires the Company to prepay the term loans each quarter. Among other such prepayment requirements, the Company must prepay a percentage of excess cash flows, if any, generated from the Linden, Albion and Bloomingburg plants. The Company did not make any prepayment on the Senior Credit Facility for the three and nine months ended September 30, 2008.
18
Table of Contents
VERASUN ENERGY CORPORATION
NOTES TO CONDENSED CONSOLIDATED FINANCIAL STATEMENTS (unaudited)
(dollars in thousands, except for per share data)
The Senior Credit Facility contains various covenants that, among other restrictions, limit ASA Holdings’ ability and the ability of its subsidiaries to make distributions and pay dividends; incur indebtedness and swap and hedge obligations; grant or assume liens; make certain investments; change the nature of their business; issue equity interests not pledged to the lenders; and sell, transfer, assign or convey assets, or engage in certain mergers or acquisitions.
As part of the covenant requirements when the construction loans were converted to term notes, the Company is required to restrict a certain amount of cash representing principal and interest payments on the outstanding Senior Credit Facility. Restricted cash as of September 30, 2008 includes $9,500 related to this requirement.
(c) UBS Credit Facility
On May 30, 2008, the Company entered into a Credit Agreement (the “Credit Facility”) with UBS Securities LLC, UBS AG, Stamford Branch, and UBS Loan Finance LLC. The Credit Agreement provides up to $125,000 of revolving credit subject to a borrowing base. The borrowing base is a formula based on eligible inventory and receivables, minus certain reserves. All obligations under the Credit Facility are secured by the VeraSun’s inventory and accounts receivable. Advances under the Credit Facility may be used for general corporate purposes, including permitted acquisitions. Subject to collateral availability, the Credit Facility also permits the Company to advance funds to VeraSun Reynolds, LLC and, in an initial amount not to exceed $40,000, to other subsidiaries of the Company. At September 30, 2008, the Company’s borrowing base was $140,854, and the Company had borrowed $108,795 under the Credit Facility at an average interest rate of 6.5%.
The Company is in the process of transferring certain letters of credit to the Credit Facility. As of September 30, 2008, UBS required the Company to restrict a certain amount of cash until all the letters of credit were transferred. Restricted cash as of September 30, 2008 includes $1,525 related to this requirement.
(d) AgStar Credit Facilities
On April 1, 2008, the Company assumed various credit facilities with AgStar as an administrative agent and as a lender, and a group of other lenders as part of the US BioEnergy Acquisition. As of September 30, 2008, $459,135 was outstanding with AgStar, which was comprised of the following:
| • | $237,785 of construction loans bearing interest of 3.15% above the one-month LIBOR, interest payable quarterly; |
| • | $83,136 of senior secured term loans bearing interest of 2.90% above the one-month LIBOR, with monthly principal and interest payments through February 2012 and September 2012; |
| • | $83,451 of senior secured term loans bearing interest of 3.25% above the one-month LIBOR, with monthly principal and interest payments through November 2011 and March 2012; and |
| • | $54,763 of revolving term loans bearing interest ranging from 2.90% to 3.25% above the one-month LIBOR, interest payable monthly, due on various dates ranging through November 2011 to September 2012. |
In addition, the Company had availability of $16,525 under seasonal revolving loans, bearing interest of 3.1% above the one-month LIBOR, interest payable monthly with outstanding principal balance due May 2009, that are available for working capital needs of which $6,442 were outstanding as of September 30, 2008, and $3,475 was used for letters of credit.
All of the AgStar senior secured term loans contain incentive based pricing that is based on levels of equity, which will reduce the interest rate ranging from 150 to 300 basis points above the one-month LIBOR rate. These agreements, each of which is associated with a particular ethanol plant, require quarterly payments of up to $5,000 annually based on excess cash flow calculations reducing the principal balance.
The Company has various construction retainage and payables relating to the construction of the Hankinson, Janesville and Dyersville facilities. As of September 30, 2008, there was approximately $57,715 of construction funding available under the AgStar credit facility, of which $11,496 was used for outstanding letters of credit. In light of the Bankruptcy Filing, no further borrowings are available under this credit facility.
19
Table of Contents
VERASUN ENERGY CORPORATION
NOTES TO CONDENSED CONSOLIDATED FINANCIAL STATEMENTS (unaudited)
(dollars in thousands, except for per share data)
(e) Marion Credit Facilities
US Bio Marion, LLC (“US Bio Marion”), which became a subsidiary of the Company as a result of the US BioEnergy Acquisition, at the time of the acquisition had outstanding construction loan from Dougherty Funding LLC (“Dougherty”) relating to the Marion, South Dakota facility (“Marion”). As of April 1, 2008, there was $79,800 of outstanding Marion construction loan borrowings bearing interest of 4.00% above the three-month LIBOR, interest payable monthly with outstanding principal balance due May 2009. On June 1, 2008 the outstanding Marion constructions loans were converted into a term note in the amount of $90,000 requiring monthly amortized payments of principal and interest sufficient to amortize the remaining unpaid principal balance to a maturity date of March 31, 2013. The term loan is secured by substantially all of the assets of US Bio Marion. As of September 30, 2008, outstanding borrowings under the Marion term note were $88,394.
Restricted cash as of September 30, 2008 includes $3,803 of cash proceeds received from the conversion of the Marion construction loan to a term note.
US Bio Marion also has a seasonal revolving line of credit with First Bank & Trust, a South Dakota bank, to fund operating requirements. Amounts available and outstanding under the seasonal revolving loans as of September 30, 2008, were $7,000, bearing interest at 6.8%. The revolving line of credit is secured by US Bio Marion’s inventory and accounts receivable and expires on May 28, 2009.
US Bio Marion also has a $7,300 letters of credit agreement with First Bank & Trust to be issued on behalf of Marion to satisfy the requirements of certain utility service providers to secure US Bio Marion’s contractual obligation to them under certain agreements with these utility service providers. As of September 30, 2008, US Bio Marion had outstanding letters of credit with First Bank & Trust of $7,300.
(f) Community Redevelopment Revenue Bonds
As part of the US BioEnergy Acquisition, the Company assumed a guarantee of Community Redevelopment Revenue Bonds issued by the Community Redevelopment Authority (the “Authority”) of the City of Central City, Nebraska and obligations under a redevelopment contract with the Authority. The bonds bear interest at fixed rates ranging from 6.25% to 7.25% and require semi-annual interest and principal payments through 2018. Real estate taxes paid by Central City and allocated to the Authority will be used by the Authority to pay principal and interest of the bonds. Although such real estate taxes are expected to be sufficient to repay the bonds, Central City is obligated to pay any deficiency when due. The contract and the guarantee are secured by a mortgage on Central City’s real property which is subordinate to the notes payable to AgStar in connection with the AgStar credit facility for Central City. As of September 30, 2008, the principal balance on the outstanding bonds was $3,203.
(g) Tax increment revenue note
As part of the ASA Acquisition, the Company assumed a guarantee of a tax increment revenue note (the “Note”) issued by the city of Albion, Nebraska with a principal amount of $5,000 and obligations under a redevelopment contract with the city of Albion.
Interest on the Note accrues at an initial rate of 8.5% per annum, which shall be adjusted on December 1, 2009, December 1, 2012, and December 1, 2015, to a rate equal to the lower of (1) the Three-Year United States Treasury Constant Maturity Index plus 425 basis points or (2) 10%. Interest is payable annually beginning on February 1, 2008.
The Note is subject to redemption in whole or in part prior to maturity at the option of the Company, on or after February 1, 2009, at a redemption price in varying amounts of up to 103% of the principal amount being redeemed, together with accrued interest.
Beginning on February 1, 2009 and each year thereafter until maturity on February 1, 2022, real estate taxes paid by ASA Albion and allocated to the city of Albion will be used by the city of Albion to make principal and interest payments on the Note. Although such real estate taxes are expected to be sufficient to repay the Note, ASA Albion is obligated to pay any deficiency when due.
20
Table of Contents
VERASUN ENERGY CORPORATION
NOTES TO CONDENSED CONSOLIDATED FINANCIAL STATEMENTS (unaudited)
(dollars in thousands, except for per share data)
(h) Unamortized discount
On April 1, 2008, the Company assumed contractual current and long-term debt maturities of $525,147 as part of the US BioEnergy Acquisition. FASB Statement No. 141 requires note payable, long-term debt and other claims payable to be recognized at present values of amounts to be paid, determined at appropriate current discount rates. The present value of the assumed US BioEnergy debt on the date of acquisition was $460,979. The difference between the present value and the contractual balance as of the date of acquisition was $64,168. The unamortized balance is reflected in the table above as “Unamortized discount associated with US BioEnergy Acquisition,” and is being amortized over the effective interest rate method as interest expense over the life of the outstanding contractual obligations assumed ranging from 2011 to 2013. For the three and nine months ended September 30, 2008, the amortized debt discount was $3,792 and $7,584, respectively. The expected amortization for the remaining three months of fiscal 2008 is $3,794, and annual amortization for the fiscal years 2009 through 2013 is $14,590, $14,200, $13,500, $7,000 and $3,500.
Restricted Net Assets
Certain debt financing arrangements of the Company’s subsidiaries limit the subsidiaries’ ability to pay dividends or make distributions to their parent companies. The Company’s condensed consolidated balance sheet includes approximately $845,000 and $442,000 of net assets of the subsidiaries at September 30, 2008 and December 31, 2007, respectively, which, subject to limitations under the applicable financing arrangements, would generally be available to fund operations and investments at a particular subsidiary, but would not be available to the Company and its other subsidiaries for general corporate purposes.
Note 9. Contingencies
We are party to contracts with consultants, independent contractors and other service providers in which we have agreed to indemnify such parties against certain liabilities. Based on historical experience and our assessment of the likelihood that such parties will make claims against us, we believe these indemnification obligations are not material. As of the date of this report, we are not aware of any claims against us related to these indemnification obligations.
We believe we are in compliance with applicable environmental laws and regulations and that our environmental controls are adequate to address existing regulatory requirements.
The Company is a party to various lawsuits, claims, investigations and administrative proceedings that arise in connection with its business, none of which are material.
As of September 30, 2008, the Company had open purchase orders which aggregated to approximately $46,000 for the construction of previously suspended facilities. The Company has recorded their estimated cost of settlement as part of the impairment charge on long-lived assets discussed in Note 4. Actual settlement costs may differ materially from the estimate made by the Company.
Note 10. Income Taxes
VeraSun Energy Corporation and its subsidiaries join in the filing of a U.S. federal consolidated income tax return. The U.S. federal statute of limitations remains open for our 2004 and subsequent tax years. Tax returns for 2004 and 2005 are currently under examination in federal jurisdictions. The federal tax returns for US BioEnergy are under examination for tax periods ending prior to US BioEnergy’s Acquisition by VeraSun, which include it’s 2005, 2006, and 2007 tax years. U.S. state jurisdictions have statutes of limitations generally ranging from 3 to 5 years.
We had unrecognized tax benefits of $48,162 and $1,352 at September 30, 2008, and December 31, 2007, respectively. The increase is due to unrecognized tax benefits associated with the timing of various temporary differences. The amounts of unrecognized tax benefits, if recognized, would have an immaterial impact on our effective tax rate at September 30, 2008, and December 31, 2007, respectively.
We recognize interest and penalties related to these unrecognized tax benefits in the income tax provision which were immaterial during the three and nine month periods ended September 30, 2008. Additionally, we had approximately $125 and $44 accrued at September 30, 2008, and December 31, 2007, respectively, for interest associated with unrecognized tax benefits. We expect that the amount of unrecognized tax benefits may change during the next twelve months; however, we do not expect the change to have a material impact on our results of operations or our financial position.
21
Table of Contents
VERASUN ENERGY CORPORATION
NOTES TO CONDENSED CONSOLIDATED FINANCIAL STATEMENTS (unaudited)
(dollars in thousands, except for per share data)
The Company’s expected effective tax (benefit) rate as of September 30, 2008 and 2007 differs from the U.S. federal income tax rate as follows:
| Nine Months Ended September 30, | ||||||
| 2008 | 2007 | |||||
Expected federal tax (benefit) rate | (35.0 | )% | 35.0 | % | ||
State taxes | (2.4 | ) | 1.4 | |||
State tax credits earned | (1.6 | ) | — | |||
Tax-exempt interest | — | (19.2 | ) | |||
Impairment of non-deductible goodwill | 5.0 | — | ||||
Valuation allowance | 7.9 | — | ||||
Other | (0.3 | ) | 2.5 | |||
Effective tax (benefit) rate | (26.4 | )% | 19.7 | % | ||
As of September 30, 2008, estimated deferred tax assets are approximately $311,000 prior to a valuation allowance of $62,000. Deferred tax assets are primarily related to net operating loss carryforwards, tax-deductible goodwill, stock based compensation and lower of cost or market impairment charges taken. The company has deferred tax liabilities of approximately $250,000 which are primarily related to property and equipment.
The estimated federal net operating loss carryforward at September 30, 2008 is approximately $504,000. The Company’s ability to deduct net operating loss carryforwards could be significantly limited if the Company were to undergo an ownership change for purposes of section 382 of the Internal Revenue Code.
In establishing the realizability of deferred tax assets, we consider whether it is more likely than not that some portion or all of the deferred tax assets will not be realized. The ultimate realization of deferred tax assets is dependent upon the generation of future taxable income during the periods in which those temporary differences become deductible. In making this assessment we consider the scheduled reversal of deferred taxes, projected future taxable income, and tax planning strategies. Significant weight is given to evidence that can be objectively verified. The significant losses combined with uncertain economic and market conditions, aided the Company’s determination that it is not more likely than not that we will realize the benefits of net deferred tax assets related to the federal and state net operating losses and credits. As such, the company recorded a valuation allowance of approximately $48,000 against its deferred tax assets during the three and nine month period ended September 30, 2008. As of September 30, 2008, the valuation allowance was $62,000, including the $9,500 balance as of December 31, 2007 and approximately $4,500 related to the US BioEnergy Acquisition.
Note 11. Comprehensive Income (Loss)
The components of comprehensive income (loss), net of income tax, are as follows:
| Three Months Ended September 30, | Nine Months Ended September 30, | |||||||||||||
| 2008 | 2007 | 2008 | 2007 | |||||||||||
Net income (loss) | $ | (476,109 | ) | $ | 7,793 | $ | (444,643 | ) | $ | 22,617 | ||||
Unrealized gain from hedging activities | — | 506 | — | 862 | ||||||||||
Comprehensive income (loss) | $ | (476,109 | ) | $ | 8,299 | $ | (444,643 | ) | $ | 23,479 | ||||
Note 12. Income (Loss) Per Common Share
Basic income (loss) per common share is computed by dividing net income (loss) available to common shareholders by the weighted average number of common shares outstanding for the period. Diluted income (loss) per common share reflects the potential dilution that would occur, using the treasury stock method, if securities or other obligations to issue common stock were exercised or converted into common stock or resulted in the issuance of common stock that shared in the Company’s earnings.
22
Table of Contents
VERASUN ENERGY CORPORATION
NOTES TO CONDENSED CONSOLIDATED FINANCIAL STATEMENTS (unaudited)
(dollars in thousands, except for per share data)
A reconciliation of net income (loss) and common stock share amounts used in the calculation of basic and diluted income (loss) per common share is as follows for the three and nine months ended September 30, 2008 and 2007:
| Three months ended September 30, | Nine months ended September 30, | |||||||||||||||||||
| Net Income (Loss) | Weighted Average Shares Outstanding | Per Share Amount | Net Income (Loss) | Weighted Average Shares Outstanding | Per Share Amount | |||||||||||||||
2008: | ||||||||||||||||||||
Loss per common share - basic | $ | (476,109 | ) | 157,135,926 | $ | (3.03 | ) | $ | (444,643 | ) | 135,660,386 | $ | (3.28 | ) | ||||||
Effects of dilutive securities: | ||||||||||||||||||||
Stock options and warrants | — | — | — | — | ||||||||||||||||
Loss per common share - diluted | $ | (476,109 | ) | 157,135,926 | $ | (3.03 | ) | $ | (444,643 | ) | 135,660,386 | $ | (3.28 | ) | ||||||
2007: | ||||||||||||||||||||
Income per common share - basic | $ | 7,793 | 85,177,689 | $ | 0.09 | $ | 22,617 | 79,329,665 | $ | 0.29 | ||||||||||
Effects of dilutive securities: | ||||||||||||||||||||
Stock options and warrants | 2,979,362 | — | 4,142,893 | (0.02 | ) | |||||||||||||||
Income per common share - diluted | $ | 7,793 | 88,157,051 | $ | 0.09 | $ | 22,617 | 83,472,558 | $ | 0.27 | ||||||||||
Stock options, restricted stock and warrants for 2,347,326 and 2,458,230 shares for the three and nine months ended September 30, 2008, were not included in the calculation of diluted EPS as their effects would be antidilutive.
Note 13. Stock-Based Compensation and Equity Based Awards
In January 2008, the Company granted restricted stock awards and stock options at a ratio of 50% restricted stock and 50% stock options based on the Black-Scholes valuation at the time of grant to certain employees pursuant to the revised long-term incentive plan approved by the Compensation Committee of the Board of Directors in December 2007. The stock options vest evenly over three years, and the restricted stock cliff vests on the third anniversary date of the grant. In addition, Outside Directors (directors who are neither officers nor employees) were granted equity compensation using the same ratio of restricted stock and stock options as the employee’s long-term incentive plan, subject to a one year vesting period. In May 2008, an additional grant was made to four new members of the Board of Directors that were added subsequent to the completion of the merger with US BioEnergy (see Note 2). These grants will fully vest at the same one year anniversary date as those awarded in January 2008.
Upon completion of the US BioEnergy Acquisition, the Company issued grants of restricted stock and stock options with terms and conditions similar to those of the outstanding US BioEnergy awards at the time of the merger that were replaced by those grants. Compensation expense recognized in the periods after the acquisition includes expense for those awards granted, but not yet vested, as of the acquisition date. A separate Stock Incentive Plan, the “USBE Plan” was authorized and 2.5 million shares were reserved by the Board of Directors for the issuance of shares related to those acquisition-related grants. No future grants will be made for issuance under the USBE Plan. Grants issued under the USBE Plan include 328,185 shares of restricted stock and 1,787,066 stock options. Future expense recognized is based on the estimated fair value of unvested awards using the Black-Scholes pricing model. Unvested USBE Plan awards that will be expensed by the Company in future periods include 204,055 shares of restricted stock awards and 63,785 stock options.
As of September 30, 2008, there was $15,543 of total unrecognized compensation expense related to non-vested options and restricted stock granted under all plans that is expected to be recognized as a charge to earnings over a weighted-average period of 2.44 years.
23
Table of Contents
VERASUN ENERGY CORPORATION
NOTES TO CONDENSED CONSOLIDATED FINANCIAL STATEMENTS (unaudited)
(dollars in thousands, except for per share data)
Note 14. Business Segment Information
Operating segments are defined as components of an enterprise for which separate financial information is available that is evaluated regularly by the chief operating decision maker or decision making group in deciding how to allocate resources and in assessing performance. The Company has identified one reportable business segment, the manufacture and marketing of fuel-grade ethanol and distillers grains. The Company’s chief operating decision maker reviews financial information presented on a consolidated basis for purposes of assessing financial performance and making operating decisions. The chief operating decision maker also receives disaggregated information about certain operating expenses. Accordingly, the Company considers itself to be operating in a single industry segment.
Note 15. Subsequent Events
Chapter 11 Bankruptcy Filing
The Company suffered significant losses in the third quarter of 2008 from a dramatic increase in its corn costs, reflecting in part costs attributable to its corn procurement and hedging arrangements, and historically unfavorable margins. Beginning in the third quarter of 2008 these losses, combined with worsening capital market conditions and a tightening of trade credit, resulted in severe constraints on the Company’s liquidity position. Faced with these constraints, on October 31, 2008 (the “Petition Date”), VeraSun Energy Corporation and 24 of its subsidiaries, which include all of VeraSun Energy Corporation’s material subsidiaries, filed voluntary petitions for relief under Chapter 11 of the Bankruptcy Code with the United States Bankruptcy Court for the District of Delaware. VeraSun’s Chapter 11 cases are being jointly administered by the Bankruptcy Court as Case No. 08-12606 (BLS) (collectively, the “Bankruptcy Cases”). The petitions were filed in order to enable VeraSun to pursue reorganization efforts under Chapter 11 of the Bankruptcy Code. VeraSun intends to continue to operate its business as debtor-in-possession under the jurisdiction of the Bankruptcy Court and in accordance with the applicable provisions of the Bankruptcy Code and orders of the Bankruptcy Court. In general, as debtors-in-possession, VeraSun Energy Corporation and its subsidiaries that are part of the Bankruptcy Filing (collectively, the “Debtors”) are authorized under Chapter 11 to continue to operate as an ongoing business, but may not engage in transactions outside of the ordinary course of business without the prior approval of the Bankruptcy Court. The Debtors comprise, in addition to VeraSun Energy Corporation, ASA Albion, LLC, ASA Bloomingburg, LLC, ASA Linden, LLC, and ASA OpCo Holdings, LLC, each a Delaware limited liability company; US Bio Marion, LLC, a South Dakota limited liability company; VeraSun Janesville, LLC, a Minnesota limited liability company; US BioEnergy Corporation, a South Dakota corporation; VeraSun Albert City, LLC, an Iowa limited liability company, VeraSun Central City, LLC and VeraSun Ord, LLC, each a Nebraska limited liability company, VeraSun Dyersville, LLC, a Delaware limited liability company, VeraSun Hankinson, LLC, a North Dakota limited liability company, and VeraSun Woodbury, LLC, a Michigan limited liability company (the “AgStar Debtors”); and VeraSun Aurora Corporation, a South Dakota corporation, and VeraSun Charles City, LLC, VeraSun Fort Dodge, LLC, VeraSun Hartley, LLC, VeraSun Marketing, LLC, VeraSun Welcome, LLC, VeraSun Granite City, LLC, VeraSun Reynolds, LLC, VeraSun Biodiesel, LLC, VeraSun Litchfield, LLC and VeraSun Tilton, LLC, each a Delaware limited liability company (the “Other VSE Debtors”).
No assurance can be provided as to what values, if any, will be ascribed in the Debtors’ bankruptcy proceedings to the Debtors’ pre-petition liabilities, common stock and other securities. Accordingly, caution should be exercised with respect to existing and future investments in any of these liabilities or securities.
At hearings held on November 3, 2008 and November 4, 2008, the Bankruptcy Court granted VeraSun’s first day motions for various relief designed to stabilize the Company’s operations and business relationships with vendors, lenders, employees and others and entered orders granting authority to VeraSun to, among other things: (a) pay pre-petition and post-petition employee wages, salaries, benefits and other employee obligations; (b) pay vendors and other providers in the ordinary course for goods and services received from and after the Petition Date and (c) pay suppliers delivering goods on or after October 11, 2008. In addition, the Bankruptcy Court entered an order prohibiting utility companies from altering or discontinuing service on account of pre-petition invoices.
Shortly after the Bankruptcy Filing, VeraSun began notifying all known or potential creditors of the Bankruptcy Filing. The Bankruptcy Filing triggered defaults on substantially all debt of the Company (see Note 8). Subject to certain exceptions under the Bankruptcy Code, the Bankruptcy Filing then automatically enjoined, or stayed, the continuation of any judicial or administrative proceedings or other actions against VeraSun or its property to recover on, collect or secure a claim arising prior to the Petition Date. Thus, for example, creditor actions to obtain possession of property from VeraSun, or to create, perfect or enforce any lien against the property of VeraSun, or to collect on or otherwise exercise rights or remedies with respect to a pre-petition claim are enjoined unless and until the Bankruptcy Court lifts the automatic stay.
24
Table of Contents
VERASUN ENERGY CORPORATION
NOTES TO CONDENSED CONSOLIDATED FINANCIAL STATEMENTS (unaudited)
(dollars in thousands, except for per share data)
In order to successfully exit Chapter 11 bankruptcy, VeraSun will need to propose, and obtain confirmation by the Bankruptcy Court of, a plan of reorganization that satisfies the requirements of the Bankruptcy Code. A plan of reorganization would, among other things, resolve the Debtors’ pre-petition obligations, set forth the revised capital structure of the newly reorganized entity and provide for corporate governance subsequent to exit from bankruptcy. VeraSun has the exclusive right for 120 days after the Petition Date to file a plan of reorganization and 60 additional days to obtain necessary acceptances. Such periods may be extended by the Bankruptcy Court for cause to up to 18 months and 20 months, respectively, after the Petition Date. If VeraSun’s exclusivity period lapses, any party in interest may file a plan of reorganization for VeraSun. In addition to the need for Bankruptcy Court confirmation and satisfaction of Bankruptcy Code requirements, a plan of reorganization must be accepted as described below by holders of impaired claims and equity interests in order to become effective. A VeraSun Chapter 11 plan of reorganization will have been accepted by holders of claims against and equity interests in VeraSun if (i) at least one-half in number and two-thirds in dollar amount of claims actually voting in each impaired class of claims have voted to accept the plan and (ii) at least two-thirds in amount of equity interests actually voting in each impaired class of equity interests has voted to accept the plan. Under circumstances specified in the so-called “cramdown” provisions of section 1129(b) of the Bankruptcy Code, the Bankruptcy Court may confirm a plan even if such plan has not been accepted by all impaired classes of claims and equity interests. A class of claims or equity interests that does not receive or retain any property under the plan on account of such claims or interests is deemed to have voted to reject the plan. The precise requirements and evidentiary showing for confirming a plan notwithstanding its rejection by one or more impaired classes of claims or equity interests depends upon a number of factors, including the status and seniority of the claims or equity interests in the rejecting class – i.e., secured claims or unsecured claims, subordinated or senior claims, preferred or common stock.
Under section 365 of the Bankruptcy Code, VeraSun may assume, assume and assign, or reject executory contracts and unexpired leases, including real property, railcars and equipment leases, subject to the approval of the Bankruptcy Court and certain other conditions. Rejection constitutes a court-authorized breach of the lease or contract in question and, subject to certain exceptions, relieves VeraSun of its future obligations under such lease or contract but creates a deemed pre-petition claim for damages caused by such breach or rejection. Parties whose contracts or leases are rejected may file claims against VeraSun for damages. Generally, the assumption of an executory contract or unexpired lease requires VeraSun to cure all prior defaults under such executory contract or unexpired lease, including all pre-petition arrearages, and to provide adequate assurance of future performance. In this regard, the Company expects that liabilities subject to compromise and resolution in the Bankruptcy Cases will arise in the future as a result of damage claims created by VeraSun’s rejection of various executory contracts and unexpired leases. Conversely, the Company would expect that the assumption of certain executory contracts and unexpired leases may convert liabilities shown in future financial statements as subject to compromise to post-petition liabilities. Due to the uncertain nature of many of the potential claims, the Company is unable to project the magnitude of such claims with any degree of certainty.
The Bankruptcy Court will establish a deadline for the filing of proofs of claim under the Bankruptcy Code, requiring VeraSun’s creditors to submit claims for liabilities not paid and for damages incurred. There may be differences between the amounts at which any such liabilities are recorded in the Company’s financial statements and the amount claimed by VeraSun’s creditors. Significant litigation may be required to resolve any such disputes or discrepancies.
Although VeraSun expects to file a reorganization plan that provides for emergence from Chapter 11 bankruptcy some time in the future, there can be no assurance that a reorganization plan will be proposed by VeraSun or confirmed by the Bankruptcy Court, or that any such plan will be consummated.
The Company has incurred and will continue to incur significant costs associated with the reorganization. The amount of these costs, which are being expensed as incurred, are expected to significantly affect the Company’s results of operations.
As of the Petition Date, VeraSun had approximately $15,234 in cash and cash equivalents. On November 3, 2008, VeraSun obtained agreements from certain lenders, subject to specified conditions, for debtor-in-possession (“DIP”) financing of up to $215,000, as described below, to provide liquidity during the reorganization process. The ability of the Company to continue as a going concern is dependent upon, among other things, (i) the Company’s ability to secure adequate DIP financing; (ii) the Company’s ability to comply with the terms and conditions of any DIP financing and any cash collateral order entered by the Bankruptcy Court in connection with the Bankruptcy Cases; (iii) the ability of the Company to maintain adequate cash on hand; (iv) the ability of the Company to generate cash from operations; (v) the ability of the Company to obtain confirmation of and to consummate a plan of reorganization under the Bankruptcy Code; (vi) the cost, duration and outcome of the reorganization process; and (vii) the Company’s ability to achieve profitability. Uncertainty as to the outcome of these factors raises substantial doubt about the Company’s ability to continue as a going concern. We are currently evaluating various courses of action to address the operational and liquidity issues the Company is facing and are in the process of attempting to secure DIP financing, as described below, and formulating plans for improving operations. There can be no assurance that any of these efforts will be successful. The accompanying unaudited condensed consolidated financial statements do not include any adjustments that might result should the Company be unable to continue as a going concern. Preparing the accompanying unaudited condensed consolidated financial statements on a going concern basis contemplates the realization of assets and the discharge of liabilities in the normal course of business for the foreseeable future.
25
Table of Contents
VERASUN ENERGY CORPORATION
NOTES TO CONDENSED CONSOLIDATED FINANCIAL STATEMENTS (unaudited)
(dollars in thousands, except for per share data)
As a result of the Bankruptcy Filing, realization of assets and liquidation of liabilities are subject to uncertainty. While operating as a debtor-in-possession under the protection of Chapter 11, and subject to Bankruptcy Court approval or otherwise as permitted in the normal course of business, VeraSun may sell or otherwise dispose of assets and liquidate or settle liabilities for amounts other than those reflected in the condensed consolidated financial statements. Further, a plan of reorganization could materially change the amounts and classifications reported in our consolidated financial statements. Our historical consolidated financial statements do not give effect to any adjustments to the carrying value of assets or amounts of liabilities that might be necessary as a consequence of confirmation of a plan of reorganization.
The potential adverse publicity associated with the Bankruptcy Filing and the resulting uncertainty regarding the Company’s future prospects may hinder the Company’s ongoing business activities and its ability to operate, fund and execute its business plan by impairing relations with existing and potential customers; negatively impacting the ability of the Company to attract, retain and compensate key executives and employees and to retain employees generally; limiting the Company’s ability to obtain trade credit; and impairing present and future relationships with vendors and service providers.
Under the priority scheme established by the Bankruptcy Code, unless creditors agree otherwise, post-petition liabilities and pre-petition liabilities must be satisfied in full before shareholders of VeraSun are entitled to receive any distribution or retain any property under a plan of reorganization. The ultimate recovery, if any, to creditors and shareholders of VeraSun will not be determined until confirmation and consummation of a plan of reorganization. No assurance can be given as to what values, if any, will be ascribed in the Bankruptcy Cases to each of these constituencies or what types or amounts of distributions, if any, they would receive. Accordingly, the Company urges that appropriate caution be exercised with respect to existing and future investments in any of the Company’s liabilities.
Notice and Sell-Down Procedures for Trading in Claims and Equity Securities
On November 6, 2008, the Bankruptcy Court entered an interim order (the “Interim Order”) granting the motion of the Debtors to (a) require beneficial owners of substantial amounts of VeraSun Energy Corporation’s common stock to provide notice of their holdings and restrict, in specified circumstances and subject to specified terms and conditions, acquisitions or dispositions of VeraSun Energy Corporation’s common stock by Substantial Shareholders (as defined below) (the “Common Stock Notice and Transfer Requirements”) and (b) require, in specified circumstances and subject to specified terms and conditions, substantial holders of claims against the Debtors to sell down an amount of claims necessary to permit the Debtors to preserve the availability of the benefit of their accrued net operating losses and other tax attributes under Section 382 of the Internal Revenue Code of 1986, as amended (the “Code”), and implement the Debtors’ plan of reorganization (the “Claims Sell-Down Requirements”). The Bankruptcy Court also scheduled a hearing to consider approval of the final order to be held on December 2, 2008.
Under the Common Stock Notice and Transfer Requirements, all “Substantial Shareholders” must provide the Debtors, the Debtors’ counsel and the Bankruptcy Court advance notice of their intent to buy or sell VeraSun Energy Corporation common stock (including options to acquire common stock, as further specified in the Interim Order) prior to effectuating any such purchase or sale. A “Substantial Shareholder” under the Interim Order is a person or entity that beneficially owns or, as a result of a transaction, would beneficially own, at least 7,464,414 shares (including options to acquire shares, as further specified in the Interim Order) of VeraSun Energy Corporation’s common stock, representing approximately 4.75% of all issued and outstanding shares of VeraSun Energy Corporation’s common stock. The Common Stock Notice and Transfer Requirements were requested by the Debtors to identify and, where necessary, restrict potential trades of VeraSun Energy Corporation’s common stock that could negatively impact the Debtors’ ability to preserve maximum availability of their accrued net operating losses and other tax attributes under Section 382 of the Code. Pursuant to the Interim Order, the Debtors have 30 calendar days after notification of a transfer by a Substantial Shareholder to file any objections with the Bankruptcy Court and serve notice on such Substantial Shareholder. If the Debtors file any objections, the transfer would not become effective unless approved by a final and non-appealable order of the Bankruptcy Court. In addition, a person or entity that is or becomes a Substantial Shareholder must file with the Bankruptcy Court, and provide the Debtors and their counsel with, notification of such status on or before the later of (a) 20 days after the effective date of the notice of entry of the Interim Order or (b) ten days after becoming a Substantial Shareholder.
Under the Claims Sell-Down Requirements, any holder of claims against the Debtors that would entitle such holder to more than 4.75% of the common stock and any other securities of the reorganized Debtors under a confirmed plan of reorganization utilizing the tax benefits under Section 382 of the Code may be required to sell those claims to the extent necessary to the implementation of that plan of reorganization.
26
Table of Contents
VERASUN ENERGY CORPORATION
NOTES TO CONDENSED CONSOLIDATED FINANCIAL STATEMENTS (unaudited)
(dollars in thousands, except for per share data)
Debtor-In-Possession Financing
On November 3, 2008, VeraSun Energy Corporation and each of the Other VSE Debtors (collectively, the “VSE Obligors”) executed a commitment letter (the “Bondholder Commitment Letter”) pursuant to which certain holders (“VSE Lenders”) of the Company’s 9 7/8% Senior Secured Notes due 2012 (the “Senior Secured Notes”) have agreed to provide debtor-in-possession financing to the VSE Obligors, as borrowers, to be guaranteed by each of the other VSE Obligors. On November 3, 2008, the Bankruptcy Court entered an interim order (the “Interim Order”) approving the debtor-in-possession financing pursuant to a term sheet (the “VSE Term Sheet”) under the Bondholder Commitment Letter. The VSE Term Sheet provides for debtor-in-possession financing composed of triple-draw term loans (the “VSE Loans”) in an aggregate principal amount of not less than $160,650 and up to $190,000, subject to the fulfillment by the VSE Obligors of specified conditions precedent. Pursuant to the terms of the VSE Term Sheet, the VSE Lenders made available an initial $15,000 of the VSE Loans to the Company on an interim basis on November 3, 2008 (the “Interim Facility”). Trilogy Portfolio Company, LLC, Trilogy Special Situations Master Fund, Ltd., Mariner LDC, AIG Global Investment Corp., AIG SunAmerica Asset Management Corp., Wayzata Opportunities Fund II, L.P. and Wayzata Opportunities Fund Offshore II, L.P. comprise the VSE Lenders.
The VSE Loans require regular cash interest payments at a rate of 16.5% per annum. Fees payable by the Company to the VSE Lenders will be incurred upon each VSE Loan funding date in the amount of 2.00% multiplied by the principal amount of the VSE Loans made on such funding date. In addition, upon repayment at maturity the Company is obligated to pay a fee equal to 2.00% of the principal amount of the VSE Loans, which fee increases to 5.00% if the VSE Loans are repaid by the Company prior to the maturity date, in each case as set forth in the Term Sheet.
The VSE Loans mature on the earliest to occur of (i) November 3, 2009, (ii) 32 days after the entry by the Bankruptcy Court of the Interim Order approving the VSE Loans if the final order approving the VSE Loans has not been entered before the expiration of these 32 days, (iii) the confirmation by the Bankruptcy Court of a plan of reorganization of the VSE Obligors in the Cases and (iv) the acceleration of the VSE Loans or the termination of the VSE Lenders’ commitments in accordance with the final loan documentation.
The commitment of the VSE Lenders to provide VSE Loans is subject to a number of conditions, including completion of final loan documentation satisfactory in form and substance to the VSE Lenders and the administrative agent for the VSE Lenders, and final approval by the Bankruptcy Court. Failure of the Company to execute and deliver satisfactory final loan documentation on or prior to a specified date (initially November 17, 2008, subsequently changed by the parties to November 21, 2008) will constitute an event of default and will result in the VSE Loans becoming immediately due and payable. Subject to the conditions set forth therein, the VSE Term Sheet provides for $10,000 of the VSE Loans (in addition to the $15,000 available under the Interim Facility) to be made available by the VSE Lenders upon the execution and delivery of such final loan documentation, and the remaining VSE Loans to be made available by the VSE Lenders upon receipt of final approval by the Bankruptcy Court. There can be no assurance that the Company will be able to obtain financing (other than under the Interim Facility) or retain the financing under the Interim Facility on the terms proposed in the Bondholder Commitment Letter (including the VSE Term Sheet) or at all.
The VSE Loans may be used for working capital and general corporate purposes of the VSE Obligors and for bankruptcy-related costs and expenses (subject to certain limitations) of the VSE Obligors, in each case subject to a budget acceptable to the VSE Lenders. In addition, from and after final approval by the Bankruptcy Court, not less than $84,150 of the VSE Loans will be used to discharge $84,150 aggregate principal amount of Senior Secured Notes held by the VSE Lenders.
Subject to a $1,000 professional fee carve-out, the VSE Loans will be secured by a first priority, priming security interest on the property, plant and equipment of the VSE Obligors and a junior security interest on the accounts receivable and inventory of the VSE Obligors (junior to the security interests of the lenders under the Company’s $125,000 revolving credit facility with UBS Securities LLC, UBS AG, Stamford Branch, and UBS Loan Finance LLC).
The VSE Loans will be subject to provisions regarding mandatory prepayments upon certain events, affirmative and negative covenants, financial covenants and budgeting requirements to be determined, events of default, and other customary terms and conditions.
On November 3, 2008, each of the AgStar Debtors, together with US BioEnergy Corporation, as guarantor, executed a term sheet (each an “AgStar Term Sheet”) with AgStar Financial Services, PCA (“AgStar”), which is one of the lenders under the AgStar Debtors’ respective separate pre-petition credit facilities entered into in each case with a group of lenders, including AgStar, for each of which facilities AgStar is the administrative agent.
27
Table of Contents
VERASUN ENERGY CORPORATION
NOTES TO CONDENSED CONSOLIDATED FINANCIAL STATEMENTS (unaudited)
(dollars in thousands, except for per share data)
On November 3, 2008, the Bankruptcy Court entered several interim orders (the “AgStar Interim Orders”) approving the respective AgStar Term Sheets. Each of the AgStar Term Sheets has substantially the same terms as the other AgStar Term Sheets and provides for a revolving debtor-in-possession credit facility (each, an “AgStar Facility”) consisting of an interim facility and an aggregate post-petition facility in the principal amounts shown in the following table, subject to the fulfillment by the applicable AgStar Debtor of specified conditions precedent:
| Interim aggregate amount of the applicable facility | Total aggregate amount of the applicable post- petition facility | |||||
VeraSun Albert City, LLC | $ | 3,000 | $ | 5,000 | ||
VeraSun Central City, LLC | 3,000 | 5,000 | ||||
VeraSun Ord, LLC | 1,500 | 2,500 | ||||
VeraSun Dyersville, LLC | 3,000 | 5,000 | ||||
VeraSun Hankinson, LLC | 3,000 | 5,000 | ||||
VeraSun Woodbury, LLC | 1,500 | 2,500 | ||||
| $ | 15,000 | $ | 25,000 | |||
Pursuant to the terms of the AgStar Term Sheets and the AgStar Interim Orders, each of the AgStar Debtors borrowed the amount of its respective interim facility as shown in the above table on November 3, 2008.
The interest rate on borrowings under each AgStar Facility, as specified in each of the AgStar Term Sheets, is the LIBOR Rate plus 7.0% per annum, which may be increased to the lesser of the maximum nonusurious interest rate and a default rate of 2.0% in addition to the LIBOR Rate plus 7.0% per annum.
The AgStar Debtors paid fees to the lenders under the AgStar Facilities on November 3, 2008 in the amount of 1.5% of the aggregate committed amount of the post-petition facilities.
Under the terms of the applicable AgStar Term Sheet, the maturity date of the (i) interim facility occurs on the earlier of the entry of the final order of the Bankruptcy Court approving the final loan documentation (the “AgStar Final Order”) or December 10, 2008 and (ii) post-petition facility occurs on November 3, 2009 or on such earlier date as provided in the AgStar Interim Order, the AgStar Final Order or the final loan documents.
Financing under each AgStar Term Sheet is subject to a number of conditions, including final loan documentation and receipt of the AgStar Final Order, each in a form acceptable to AgStar. Failure of the AgStar Debtors to receive the AgStar Final Order by December 10, 2008 will constitute an event of default and will result in the AgStar Loans becoming immediately due and payable. There can be no assurance that the AgStar Debtors will be able to obtain post-petition facility financing, or retain the interim facility financing, on the terms provided in the AgStar Term Sheets or at all.
Each AgStar Facility is guaranteed by US BioEnergy Corporation. Advances under each AgStar Facility are subject to a borrowing base based on eligible accounts receivable and eligible inventory of the applicable AgStar Debtor. Each AgStar Facility may be used for working capital needs of the applicable AgStar Debtor, in each case subject to a budget.
Each AgStar Facility will be secured by a lien on all of the assets of the applicable AgStar Debtor. The AgStar Facilities will be subject to provisions regarding affirmative and negative covenants, events of default, and other customary terms and conditions.
As of November 14, 2008, the outstanding principal amount of borrowings under the VSE Loans and the AgStar Facilities was approximately $30,000.
In addition to the Interim Order and the AgStar Interim Orders, the Bankruptcy Court entered interim orders authorizing the Company to use the cash collateral of its creditors to fund specified operations and pay specified expenses of the Bankruptcy Cases. These interim cash collateral orders include authorization of the use of cash collateral of the lenders under the Company’s pre-petition $125 million revolving credit facility with UBS Securities LLC, UBS AG, Stamford Branch, and UBS Loan Finance LLC (the “Pre-Petition Revolving Credit Facility Lenders”). There can be no assurance that the Company will be able to continue to have access to the cash collateral of the Pre-Petition Revolving Credit Facility Lenders or other secured creditors.
28
Table of Contents
VERASUN ENERGY CORPORATION
NOTES TO CONDENSED CONSOLIDATED FINANCIAL STATEMENTS (unaudited)
(dollars in thousands, except for per share data)
Note 16. Guarantors / Non-Guarantors Condensed Consolidating Financial Statements
In accordance with the indentures governing the Company’s senior secured notes and senior unsecured notes, certain wholly-owned subsidiaries of the Company have fully and unconditionally guaranteed the notes on a joint and several basis. The following tables present condensed consolidating financial information for VeraSun Energy Corporation (“VEC”), the issuer of the notes, subsidiaries that are guarantors of the notes and subsidiaries that are non-guarantors of the notes. VeraSun Aurora Corporation, VeraSun Fort Dodge, LLC, VeraSun Charles City, LLC, VeraSun Marketing, LLC, VeraSun Hartley, LLC, VeraSun Welcome, LLC, VeraSun Biodiesel, LLC, VeraSun Granite City, LLC, VeraSun Reynolds, LLC, VeraSun Litchfield, LLC and VeraSun Tilton, LLC, each a wholly-owned subsidiary of VEC, are combined as guarantors.
Certain debt financing arrangements of the Company’s non-guarantor subsidiaries limit the non-guarantor subsidiaries’ ability to pay dividends or make distributions to VeraSun Energy Corporation. The Company’s unaudited condensed consolidated balance sheet includes approximately $845,000 of net assets of the non-guarantor subsidiaries at September 30, 2008, which, subject to limitations under the applicable financing arrangements, would generally be available to fund operations and investments at a particular non-guarantor subsidiary, but would not be available to VeraSun Energy Corporation for general corporate purposes.
29
Table of Contents
VERASUN ENERGY CORPORATION
NOTES TO CONDENSED CONSOLIDATED FINANCIAL STATEMENTS (unaudited)
(dollars in thousands, except for per share data)
CONDENSED CONSOLIDATING BALANCE SHEET
September 30, 2008
ASSETS
| Issuer | Guarantors | Non-Guarantors | Eliminations and Consolidations | Consolidated | |||||||||||||
Current Assets | |||||||||||||||||
Cash and cash equivalents | $ | 3,352 | $ | 6,607 | $ | — | $ | (633 | ) | $ | 9,326 | ||||||
Restricted cash | 1,525 | — | 13,303 | — | 14,828 | ||||||||||||
Trade receivables | — | 98,871 | 48,598 | — | 147,469 | ||||||||||||
Inventories | — | 106,574 | 71,225 | 5,308 | 183,107 | ||||||||||||
Prepaid expenses and other assets | — | 246,191 | 49,854 | (234,341 | ) | 61,704 | |||||||||||
Derivative financial instruments | — | 426 | 868 | — | 1,294 | ||||||||||||
Deferred income taxes | 3,727 | — | 1,488 | (1,428 | ) | 3,787 | |||||||||||
Total current assets | 8,604 | 458,669 | 185,336 | (231,094 | ) | 421,515 | |||||||||||
Other Assets | |||||||||||||||||
Goodwill | — | — | — | — | — | ||||||||||||
Other intangible assets | — | — | 33,803 | — | 33,803 | ||||||||||||
Other long-term assets | 2,882 | 4,216 | 6,525 | — | 13,623 | ||||||||||||
Debt issuance costs, net | 17,784 | — | — | — | 17,784 | ||||||||||||
Deferred income taxes | — | — | 42,401 | (42,401 | ) | — | |||||||||||
Investment in subsidiaries | 1,411,722 | — | — | (1,411,722 | ) | — | |||||||||||
| 1,432,388 | 4,216 | 82,729 | (1,454,123 | ) | 65,210 | ||||||||||||
Property and equipment, net | 9,034 | 754,247 | 1,653,384 | 9,471 | 2,426,136 | ||||||||||||
| $ | 1,450,026 | $ | 1,217,132 | $ | 1,921,449 | $ | (1,675,746 | ) | $ | 2,912,861 | |||||||
| LIABILITIES AND SHAREHOLDERS’ AND MEMBERS’ EQUITY | |||||||||||||||||
| Issuer | Guarantors | Non-Guarantors | Eliminations and Consolidations | Consolidated | |||||||||||||
Current Liabilities | |||||||||||||||||
Outstanding checks in excess of bank balance | $ | — | $ | — | $ | 633 | $ | (633 | ) | $ | — | ||||||
Current maturities of long-term debt | 753,134 | — | 771,824 | — | 1,524,958 | ||||||||||||
Accounts payable | 28,700 | 285,812 | 92,723 | (233,688 | ) | 173,547 | |||||||||||
Accrued expenses and other liabilities | 10,475 | 24,750 | 50,064 | — | 85,289 | ||||||||||||
Derivative financial instruments | — | 8,701 | 5,811 | — | 14,512 | ||||||||||||
Deferred income taxes | — | 1,428 | — | (1,428 | ) | — | |||||||||||
Total current liabilities | 792,309 | 320,691 | 921,055 | (235,749 | ) | 1,798,306 | |||||||||||
Long-Term Liabilities | |||||||||||||||||
Long-term debt, less current maturities | — | — | 10,931 | — | 10,931 | ||||||||||||
Deferred income taxes | 37,295 | 10,002 | — | (42,401 | ) | 4,896 | |||||||||||
Other long-term liabilities | 481 | 5,094 | 21,629 | — | 27,204 | ||||||||||||
| 37,776 | 15,096 | 32,560 | (42,401 | ) | 43,031 | ||||||||||||
Minority interest in consolidated subsidiary | — | — | 900 | — | 900 | ||||||||||||
Intercompany (receivable) payable | (791,027 | ) | 700,039 | 90,988 | — | — | |||||||||||
Shareholders’ and Members’ Equity | 1,410,968 | 181,306 | 875,946 | (1,397,596 | ) | 1,070,624 | |||||||||||
| $ | 1,450,026 | $ | 1,217,132 | $ | 1,921,449 | $ | (1,675,746 | ) | $ | 2,912,861 | |||||||
30
Table of Contents
VERASUN ENERGY CORPORATION
NOTES TO CONDENSED CONSOLIDATED FINANCIAL STATEMENTS (unaudited)
(dollars in thousands, except for per share data)
CONDENSED CONSOLIDATING STATEMENT OF OPERATIONS
For the Three Months Ended September 30, 2008
| Issuer | Guarantors | Non-Guarantors | Eliminations and Consolidations | Consolidated | ||||||||||||||||
Net sales | $ | 3,995 | $ | 594,834 | $ | 564,539 | $ | (78,901 | ) | $ | 1,084,467 | |||||||||
Cost of goods sold | (42 | ) | (677,167 | ) | (664,072 | ) | 78,901 | (1,262,380 | ) | |||||||||||
Lower of cost or market adjustment | — | (6,768 | ) | (33,339 | ) | — | (40,107 | ) | ||||||||||||
Gross profit (loss) | 3,953 | (89,101 | ) | (132,872 | ) | — | (218,020 | ) | ||||||||||||
Startup expenses | — | 1,763 | 956 | — | 2,719 | |||||||||||||||
Restructuring charge | 110 | — | — | — | 110 | |||||||||||||||
Selling, general and administrative expenses | 17,373 | 1,773 | 2,134 | — | 21,280 | |||||||||||||||
Goodwill impairment | 6,091 | — | 257,241 | — | 263,332 | |||||||||||||||
Long-lived asset impairment | 5,431 | 92,680 | 23,107 | — | 121,218 | |||||||||||||||
Operating loss | (25,052 | ) | (185,317 | ) | (416,310 | ) | — | (626,679 | ) | |||||||||||
Other income (expense): | ||||||||||||||||||||
Interest expense | (17,120 | ) | (17,076 | ) | (16,028 | ) | 21,532 | (28,692 | ) | |||||||||||
Interest income | 17,384 | 502 | 128 | (17,941 | ) | 73 | ||||||||||||||
Gain on extinguishment of debt | 3,743 | — | — | — | 3,743 | |||||||||||||||
Equity in earnings of subsidiaries | (378,378 | ) | — | — | 378,378 | — | ||||||||||||||
Other income | (5,431 | ) | 482 | 5,525 | — | 576 | ||||||||||||||
| (379,802 | ) | (16,092 | ) | (10,375 | ) | 381,969 | (24,300 | ) | ||||||||||||
Loss before income taxes and minority interest | (404,854 | ) | (201,409 | ) | (426,685 | ) | 381,969 | (650,979 | ) | |||||||||||
Income tax provision (benefit) | 71,255 | (138,176 | ) | (107,930 | ) | — | (174,851 | ) | ||||||||||||
Loss before minority interest | (476,109 | ) | (63,233 | ) | (318,755 | ) | 381,969 | (476,128 | ) | |||||||||||
Minority interest in net loss of subsidiary, net of income taxes | — | — | 19 | — | 19 | |||||||||||||||
Net loss | $ | (476,109 | ) | $ | (63,233 | ) | $ | (318,736 | ) | $ | 381,969 | $ | (476,109 | ) | ||||||
31
Table of Contents
VERASUN ENERGY CORPORATION
NOTES TO CONDENSED CONSOLIDATED FINANCIAL STATEMENTS (unaudited)
(dollars in thousands, except for per share data)
CONDENSED CONSOLIDATING STATEMENT OF OPERATIONS
For the Nine Months Ended September 30, 2008
| Issuer | Guarantors | Non-Guarantors | Eliminations and Consolidations | Consolidated | ||||||||||||||||
Net sales | $ | 11,754 | $ | 1,469,503 | $ | 1,220,125 | $ | (85,272 | ) | $ | 2,616,110 | |||||||||
Cost of goods sold | (162 | ) | (1,491,185 | ) | (1,280,874 | ) | 85,272 | (2,686,949 | ) | |||||||||||
Lower of cost or market adjustment | — | (6,768 | ) | (33,339 | ) | (40,107 | ) | |||||||||||||
Gross profit (loss) | 11,592 | (28,450 | ) | (94,088 | ) | — | (110,946 | ) | ||||||||||||
Startup expenses | — | 5,540 | 3,881 | — | 9,421 | |||||||||||||||
Restructuring charge | 2,114 | — | — | — | 2,114 | |||||||||||||||
Selling, general and administrative expenses | 38,382 | 4,066 | 6,513 | — | 48,961 | |||||||||||||||
Goodwill impairment | 6,091 | — | 257,241 | — | 263,332 | |||||||||||||||
Long-lived asset impairment | 5,431 | 92,680 | 23,107 | — | 121,218 | |||||||||||||||
Operating loss | (40,426 | ) | (130,736 | ) | (384,830 | ) | — | (555,992 | ) | |||||||||||
Other income (expense): | ||||||||||||||||||||
Interest expense | (51,697 | ) | (31,217 | ) | (30,200 | ) | 58,108 | (55,006 | ) | |||||||||||
Interest income | 49,339 | 2,105 | 436 | (50,259 | ) | 1,621 | ||||||||||||||
Gain on extinguishment of debt | 3,743 | — | — | — | 3,743 | |||||||||||||||
Equity in earnings of subsidiaries | (337,648 | ) | — | — | 337,648 | — | ||||||||||||||
Other income | (2,756 | ) | 788 | 3,258 | — | 1,290 | ||||||||||||||
| (339,019 | ) | (28,324 | ) | (26,506 | ) | 345,497 | (48,352 | ) | ||||||||||||
Loss before income taxes and minority interest | (379,445 | ) | (159,060 | ) | (411,336 | ) | 345,497 | (604,344 | ) | |||||||||||
Income tax provision (benefit) | 65,198 | (122,144 | ) | (102,730 | ) | — | (159,676 | ) | ||||||||||||
Loss before minority interest | (444,643 | ) | (36,916 | ) | (308,606 | ) | 345,497 | (444,668 | ) | |||||||||||
Minority interest in net loss of subsidiary, net of income taxes | — | — | 25 | — | 25 | |||||||||||||||
Net loss | $ | (444,643 | ) | $ | (36,916 | ) | $ | (308,581 | ) | $ | 345,497 | $ | (444,643 | ) | ||||||
32
Table of Contents
VERASUN ENERGY CORPORATION
NOTES TO CONDENSED CONSOLIDATED FINANCIAL STATEMENTS (unaudited)
(dollars in thousands, except for per share data)
CONDENSED CONSOLIDATING STATEMENT OF CASH FLOWS
For the Nine Months Ended September 30, 2008
| Issuer | Guarantors | Non-Guarantors | Eliminations and Consolidations | Consolidated | ||||||||||||||||
Net cash (used in) provided by operating activities | $ | (236,066 | ) | $ | 153,866 | $ | (4,211 | ) | $ | 7,849 | $ | (78,562 | ) | |||||||
Cash Flows from Investing Activities | ||||||||||||||||||||
Purchases of property and equipment | 3,946 | (158,422 | ) | (102,666 | ) | (7,849 | ) | (264,991 | ) | |||||||||||
US BioEnergy acquisition, net of transaction costs | (6,980 | ) | — | 51,339 | — | 44,359 | ||||||||||||||
Proceeds from the sale of short-term investments | 43,175 | — | — | — | 43,175 | |||||||||||||||
Change in restricted cash | (1,525 | ) | — | (13,303 | ) | — | (14,828 | ) | ||||||||||||
Proceeds from sales of equipment | — | 1,300 | — | — | 1,300 | |||||||||||||||
Payments for other long-term assets and liabilities | (24 | ) | (34 | ) | (324 | ) | — | (382 | ) | |||||||||||
Net cash (used in) provided by investing activities | 38,592 | (157,156 | ) | (64,954 | ) | (7,849 | ) | (191,367 | ) | |||||||||||
Cash Flows from Financing Activities | ||||||||||||||||||||
Proceeds from long-term debt | 108,741 | — | 86,704 | — | 195,445 | |||||||||||||||
Principal payments on long-term debt | — | — | (21,004 | ) | — | (21,004 | ) | |||||||||||||
Debt issuance cost paid | (3,779 | ) | — | — | — | (3,779 | ) | |||||||||||||
Cost of registering equity securities | (2,127 | ) | — | — | — | (2,127 | ) | |||||||||||||
Net effect of the exercise of stock options | (222 | ) | — | — | — | (222 | ) | |||||||||||||
Outstanding checks in excess of bank balance | — | — | 633 | (633 | ) | — | ||||||||||||||
Net cash provided by (used in ) financing activities | 102,613 | — | 66,333 | (633 | ) | 168,313 | ||||||||||||||
Net (decrease) increase in cash and cash equivalents | (94,861 | ) | (3,290 | ) | (2,832 | ) | (633 | ) | (101,616 | ) | ||||||||||
Cash and cash equivalents, beginning of period | 98,213 | 9,897 | 2,832 | — | 110,942 | |||||||||||||||
Cash and cash equivalents, end of period | $ | 3,352 | $ | 6,607 | $ | — | $ | (633 | ) | $ | 9,326 | |||||||||
33
Table of Contents
VERASUN ENERGY CORPORATION
NOTES TO CONDENSED CONSOLIDATED FINANCIAL STATEMENTS (unaudited)
(dollars in thousands, except for per share data)
CONDENSED CONSOLIDATING BALANCE SHEET
DECEMBER 31, 2007
ASSETS
| Issuer | Guarantors | Non-Guarantors | Eliminations and Consolidations | Consolidated | ||||||||||||
Current Assets | ||||||||||||||||
Cash and cash equivalents | $ | 98,213 | $ | 9,897 | $ | 2,832 | — | $ | 110,942 | |||||||
Short-term investments | 43,175 | — | — | — | 43,175 | |||||||||||
Trade receivables | — | 32,063 | 19,231 | — | 51,294 | |||||||||||
Inventories | — | 92,542 | 15,370 | — | 107,912 | |||||||||||
Prepaid expenses and other assets | 12,867 | 43,824 | 6,906 | — | 63,597 | |||||||||||
Derivative financial instruments | — | 12,627 | — | — | 12,627 | |||||||||||
Total current assets | 154,255 | 190,953 | 44,339 | — | 389,547 | |||||||||||
Other Assets | ||||||||||||||||
Goodwill | 6,129 | — | 163,500 | — | 169,629 | |||||||||||
Other intangible assets | — | — | 21,668 | — | 21,668 | |||||||||||
Other long-term assets | 3,793 | 9,776 | 2,003 | — | 15,572 | |||||||||||
Debt issuance costs, net | 15,478 | — | — | — | 15,478 | |||||||||||
Investment in subsidiaries | 664,543 | — | — | (664,543 | ) | — | ||||||||||
| 689,943 | 9,776 | 187,171 | (664,543 | ) | 222,347 | |||||||||||
Property and equipment, net | 18,216 | 705,276 | 526,420 | 1,700 | 1,251,612 | |||||||||||
| $ | 862,414 | $ | 906,005 | $ | 757,930 | $ | (662,843 | ) | $ | 1,863,506 | ||||||
LIABILITIES AND SHAREHOLDERS’ AND MEMBERS’ EQUITY
| Issuer | Guarantors | Non-Guarantors | Eliminations and Consolidations | Consolidated | |||||||||||||
Current Liabilities | |||||||||||||||||
Current maturities of long-term debt | $ | — | $ | — | $ | 16,774 | $ | — | $ | 16,774 | |||||||
Accounts payable | 5,111 | 77,860 | 37,843 | — | 120,814 | ||||||||||||
Accrued expenses | 4,449 | 4,948 | 1,741 | — | 11,138 | ||||||||||||
Derivative financial instruments | — | 11,299 | — | — | 11,299 | ||||||||||||
Deferred income taxes | 63 | 1,429 | 377 | — | 1,869 | ||||||||||||
Total current liabilities | 9,623 | 95,536 | 56,735 | — | 161,894 | ||||||||||||
Long-Term Liabilities | |||||||||||||||||
Long-term debt, less current maturities | 656,978 | — | 231,718 | — | 888,696 | ||||||||||||
Deferred income taxes | (6,199 | ) | 54,079 | 3,684 | — | 51,564 | |||||||||||
Other long term liabilities | 1,395 | 1,519 | 2,707 | — | 5,621 | ||||||||||||
| 652,174 | 55,598 | 238,109 | — | 945,881 | |||||||||||||
Intercompany (receivable) payable | (553,414 | ) | 533,062 | 20,352 | — | — | |||||||||||
Shareholders’ and Members’ Equity | 754,031 | 221,809 | 442,734 | (662,843 | ) | 755,731 | |||||||||||
| $ | 862,414 | $ | 906,005 | $ | 757,930 | $ | (662,843 | ) | $ | 1,863,506 | |||||||
34
Table of Contents
VERASUN ENERGY CORPORATION
NOTES TO CONDENSED CONSOLIDATED FINANCIAL STATEMENTS (unaudited)
(dollars in thousands, except for per share data)
| CONDENSED CONSOLIDATING STATEMENT OF OPERATIONS | ||||||||||||||||||||
| For the Three Months Ended September 30, 2007 | ||||||||||||||||||||
| Issuer | Guarantors | �� | Non-Guarantors | Eliminations and Consolidations | Consolidated | |||||||||||||||
Net sales | $ | 1,515 | $ | 197,378 | $ | 22,975 | $ | — | $ | 221,868 | ||||||||||
Cost of goods sold | 11 | 177,764 | 20,699 | — | 198,474 | |||||||||||||||
Gross profit | 1,504 | 19,614 | 2,276 | — | 23,394 | |||||||||||||||
Startup expenses | — | 367 | 1,308 | — | 1,675 | |||||||||||||||
Selling, general and administrative expenses | 7,685 | 1,901 | 276 | — | 9,862 | |||||||||||||||
Operating income (loss) | (6,181 | ) | 17,346 | 692 | — | 11,857 | ||||||||||||||
Other income (expense): | ||||||||||||||||||||
Interest expense | (17,579 | ) | (5,047 | ) | (385 | ) | 10,995 | (12,016 | ) | |||||||||||
Interest income | 15,281 | 1,237 | — | (10,995 | ) | 5,523 | ||||||||||||||
Other income | 2 | 2 | — | — | 4 | |||||||||||||||
Equity in earnings of subsidiaries | 10,082 | — | — | (10,082 | ) | — | ||||||||||||||
| 7,786 | (3,808 | ) | (385 | ) | (10,082 | ) | (6,489 | ) | ||||||||||||
Income before income taxes | 1,605 | 13,538 | 307 | (10,082 | ) | 5,368 | ||||||||||||||
Income tax expense (benefit) | (6,188 | ) | 3,763 | — | — | (2,425 | ) | |||||||||||||
Net income | $ | 7,793 | $ | 9,775 | $ | 307 | $ | (10,082 | ) | $ | 7,793 | |||||||||
35
Table of Contents
VERASUN ENERGY CORPORATION
NOTES TO CONDENSED CONSOLIDATED FINANCIAL STATEMENTS (unaudited)
(dollars in thousands, except for per share data)
CONDENSED CONSOLIDATING STATEMENT OF OPERATIONS
For the Nine Months Ended September 30, 2007
| Issuer | Guarantors | Non-Guarantors | Eliminations and Consolidations | Consolidated | ||||||||||||||||
Net sales | $ | 3,927 | $ | 509,032 | $ | 22,975 | $ | — | $ | 535,934 | ||||||||||
Cost of goods sold | 31 | 450,081 | 20,699 | — | 470,811 | |||||||||||||||
Gross profit | 3,896 | 58,951 | 2,276 | — | 65,123 | |||||||||||||||
Startup expenses | — | 1,949 | 1,308 | — | 3,257 | |||||||||||||||
Selling, general and administrative expenses | 23,074 | 4,861 | 276 | — | 28,211 | |||||||||||||||
Operating income (loss) | (19,178 | ) | 52,141 | 692 | — | 33,655 | ||||||||||||||
Other income (expense): | ||||||||||||||||||||
Interest expense | (35,073 | ) | (8,825 | ) | (385 | ) | 24,336 | (19,947 | ) | |||||||||||
Interest income | 36,331 | 2,435 | — | (24,336 | ) | 14,430 | ||||||||||||||
Other income | 2 | 34 | — | — | 36 | |||||||||||||||
Equity in earnings of subsidiaries | 28,874 | — | — | (28,874 | ) | — | ||||||||||||||
| 30,134 | (6,356 | ) | (385 | ) | (28,874 | ) | (5,481 | ) | ||||||||||||
Income before income taxes | 10,956 | 45,785 | 307 | (28,874 | ) | 28,174 | ||||||||||||||
Income tax expense (benefit) | (11,661 | ) | 17,218 | — | — | 5,557 | ||||||||||||||
Net income | $ | 22,617 | $ | 28,567 | $ | 307 | $ | (28,874 | ) | $ | 22,617 | |||||||||
36
Table of Contents
VERASUN ENERGY CORPORATION
NOTES TO CONDENSED CONSOLIDATED FINANCIAL STATEMENTS (unaudited)
(dollars in thousands, except for per share data)
CONDENSED CONSOLIDATING STATEMENT OF CASH FLOWS
For the Nine Months Ended September 30, 2007
| Issuer | Guarantors | Non-Guarantors | Eliminations | Consolidated | ||||||||||||||||
Net cash provided by (used in) operating activities | $ | (284,422 | ) | $ | 16,968 | $ | 21,194 | $ | 319,906 | $ | 73,646 | |||||||||
Cash Flows from Investing Activities | ||||||||||||||||||||
Purchases of property and equipment | 31,536 | (277,733 | ) | (57,044 | ) | — | (303,241 | ) | ||||||||||||
Payment for other long-term assets | (917 | ) | (5,355 | ) | (224 | ) | — | (6,496 | ) | |||||||||||
ASA Acquisition | (250,000 | ) | — | 7,225 | — | (242,775 | ) | |||||||||||||
Proceeds from sale of equipment | 5 | 1 | — | — | 6 | |||||||||||||||
Net cash used in investing activities | (219,376 | ) | (283,087 | ) | (50,043 | ) | — | (552,506 | ) | |||||||||||
Cash Flows from Financing Activities | ||||||||||||||||||||
Outstanding checks in excess of bank balance | — | 7,596 | — | (7,596 | ) | — | ||||||||||||||
Proceeds from long-term debt | 447,750 | — | 23,617 | — | 471,367 | |||||||||||||||
Principal payments on long-term debt | 45,746 | 258,521 | 15,639 | (319,906 | ) | — | ||||||||||||||
Proceeds from the issuance of common stock | 12,784 | — | — | — | 12,784 | |||||||||||||||
Excess tax benefits from share-based payment arrangements | 8,424 | — | — | — | 8,424 | |||||||||||||||
Costs of raising capital | (5 | ) | — | — | — | (5 | ) | |||||||||||||
Debt issuance costs paid | (11,430 | ) | — | (109 | ) | — | (11,539 | ) | ||||||||||||
Net cash provided by (used in) financing activities | 503,269 | 266,117 | 39,147 | (327,502 | ) | 481,031 | ||||||||||||||
Net increase (decrease) in cash and cash equivalents | (529 | ) | (2 | ) | 10,298 | (7,596 | ) | 2,171 | ||||||||||||
Cash and cash equivalents, beginning of period | 324,146 | 2 | — | (6,099 | ) | 318,049 | ||||||||||||||
Cash and cash equivalents, end of period | $ | 323,617 | $ | — | $ | 10,298 | $ | (13,695 | ) | $ | 320,220 | |||||||||
Under the universal shelf registration statement on Form S-3 (the “Registration Statement”) filed by VeraSun Energy Corporation on August 14, 2008, certain wholly-owned subsidiaries of VeraSun Energy Corporation may fully and unconditionally guarantee, on a joint and several basis, debt securities that may be offered from time to time by VeraSun Energy Corporation under the Registration Statement. The following tables present unaudited condensed consolidating financial information for (i) VeraSun Energy Corporation, (ii) all of the subsidiaries of VeraSun Energy Corporation that may guarantee debt securities offered under the Registration Statement and (iii) subsidiaries of VeraSun Energy Corporation that would not guarantee such debt securities, as of September 30, 2008, and for the three and/or nine months then ended. VeraSun Aurora Corporation, VeraSun Fort Dodge, LLC, VeraSun Charles City, LLC, VeraSun Marketing, LLC, VeraSun Hartley, LLC, VeraSun Welcome, LLC, VeraSun Biodiesel, LLC, VeraSun Granite City, LLC, VeraSun Reynolds, LLC, VeraSun Litchfield, LLC, VeraSun Tilton, LLC, and US BioEnergy Corporation, each a wholly-owned subsidiary of VeraSun Energy Corporation, are combined as guarantors.
Certain debt financing arrangements of VeraSun Energy Corporation’s non-guarantor subsidiaries limit the non-guarantor subsidiaries’ ability to pay dividends or make distributions to the guarantor companies. VeraSun Energy Corporation’s unaudited condensed consolidated balance sheet includes approximately $556,000 of net assets of the non-guarantor subsidiaries at September 30, 2008, which, subject to limitations under the applicable financing arrangements, would generally be available to fund operations and investments at a particular non-guarantor subsidiary, but would not be available to the guarantor subsidiaries for general corporate purposes.
37
Table of Contents
VERASUN ENERGY CORPORATION
NOTES TO CONDENSED CONSOLIDATED FINANCIAL STATEMENTS (unaudited)
(dollars in thousands, except for per share data)
CONDENSED CONSOLIDATING BALANCE SHEET
September 30, 2008
ASSETS
| Issuer | Guarantors | Non-Guarantors | Eliminations and Consolidations | Consolidated | ||||||||||||
Current Assets | ||||||||||||||||
Cash and cash equivalents | $ | 3,352 | $ | 6,600 | $ | — | $ | (626 | ) | $ | 9,326 | |||||
Restricted cash | 1,525 | — | 13,303 | — | 14,828 | |||||||||||
Trade receivables | — | 99,119 | 48,350 | — | 147,469 | |||||||||||
Inventories | — | 106,574 | 71,225 | 5,308 | 183,107 | |||||||||||
Prepaid expenses and other assets | — | 201,522 | 94,523 | (234,341 | ) | 61,704 | ||||||||||
Derivative financial instruments | — | 426 | 868 | — | 1,294 | |||||||||||
Deferred income taxes | 3,727 | 399 | — | (339 | ) | 3,787 | ||||||||||
Total current assets | 8,604 | 414,640 | 228,269 | (229,998 | ) | 421,515 | ||||||||||
Other Assets | ||||||||||||||||
Goodwill | — | — | — | — | — | |||||||||||
Other intangible assets | — | — | 33,803 | — | 33,803 | |||||||||||
Other long-term assets | 2,882 | 7,967 | 2,774 | — | 13,623 | |||||||||||
Debt issuance costs, net | 17,784 | — | — | — | 17,784 | |||||||||||
Deferred income taxes | — | 15,037 | 17,362 | (32,399 | ) | — | ||||||||||
Investment in subsidiaries | 1,411,722 | 614,938 | — | (2,026,660 | ) | — | ||||||||||
| 1,432,388 | 637,942 | 53,939 | (2,059,059 | ) | 65,210 | |||||||||||
Property and equipment, net | 9,034 | 758,675 | 1,648,956 | 9,471 | 2,426,136 | |||||||||||
| $ | 1,450,026 | $ | 1,811,257 | $ | 1,931,164 | $ | (2,279,586 | ) | $ | 2,912,861 | ||||||
LIABILITIES AND SHAREHOLDERS’ AND MEMBERS’ EQUITY
| Issuer | Guarantors | Non-Guarantors | Eliminations and Consolidations | Consolidated | |||||||||||||
Current Liabilities | |||||||||||||||||
Outstanding checks in excess of bank balance | $ | — | $ | — | $ | 626 | $ | (626 | ) | $ | — | ||||||
Current maturities of long-term debt | 753,134 | — | 771,824 | — | 1,524,958 | ||||||||||||
Accounts payable | 28,700 | 286,261 | 92,274 | (233,688 | ) | 173,547 | |||||||||||
Accrued expenses and other liabilities | 10,475 | 25,918 | 48,896 | — | 85,289 | ||||||||||||
Derivative financial instruments | — | 8,701 | 5,811 | — | 14,512 | ||||||||||||
Deferred income taxes | — | — | 339 | (339 | ) | — | |||||||||||
Total current liabilities | 792,309 | 320,880 | 919,770 | (234,653 | ) | 1,798,306 | |||||||||||
Long-Term Liabilities | |||||||||||||||||
Long-term debt, less current maturities | — | — | 10,931 | — | 10,931 | ||||||||||||
Deferred income taxes | 37,295 | — | — | (32,399 | ) | 4,896 | |||||||||||
Other long-term liabilities | 481 | 9,341 | 17,382 | — | 27,204 | ||||||||||||
| 37,776 | 9,341 | 28,313 | (32,399 | ) | 43,031 | ||||||||||||
Minority interest in consolidated subsidiary | — | — | 900 | — | 900 | ||||||||||||
Intercompany (receivable) payable | (791,027 | ) | 681,572 | 109,455 | — | — | |||||||||||
Shareholders’ and Members’ Equity | 1,410,968 | 799,464 | 872,726 | (2,012,534 | ) | 1,070,624 | |||||||||||
| $ | 1,450,026 | $ | 1,811,257 | $ | 1,931,164 | $ | (2,279,586 | ) | $ | 2,912,861 | |||||||
38
Table of Contents
VERASUN ENERGY CORPORATION
NOTES TO CONDENSED CONSOLIDATED FINANCIAL STATEMENTS (unaudited)
(dollars in thousands, except for per share data)
CONDENSED CONSOLIDATING STATEMENT OF OPERATIONS
For the Three Months Ended September 30, 2008
| Issuer | Guarantors | Non-Guarantors | Eliminations and Consolidations | Consolidated | ||||||||||||||||
Net sales | $ | 3,995 | $ | 594,933 | $ | 564,441 | $ | (78,902 | ) | $ | 1,084,467 | |||||||||
Cost of goods sold | (42 | ) | (677,163 | ) | (664,077 | ) | 78,902 | (1,262,380 | ) | |||||||||||
Lower of cost or market adjustment | — | (6,768 | ) | (33,339 | ) | — | (40,107 | ) | ||||||||||||
Gross profit (loss) | 3,953 | (88,998 | ) | (132,975 | ) | — | (218,020 | ) | ||||||||||||
Startup expenses | — | 1,763 | 956 | — | 2,719 | |||||||||||||||
Restructuring charge | 110 | — | — | — | 110 | |||||||||||||||
Selling, general and administrative expenses | 17,373 | 1,773 | 2,134 | — | 21,280 | |||||||||||||||
Goodwill impairment | 6,091 | 18,180 | 239,061 | — | 263,332 | |||||||||||||||
Long-lived asset impairment | 5,431 | 92,680 | 23,107 | — | 121,218 | |||||||||||||||
Operating loss | (25,052 | ) | (203,394 | ) | (398,233 | ) | — | (626,679 | ) | |||||||||||
Other income (expense): | ||||||||||||||||||||
Interest expense | (17,120 | ) | (17,077 | ) | (16,027 | ) | 21,532 | (28,692 | ) | |||||||||||
Interest income | 17,384 | 539 | 90 | (17,940 | ) | 73 | ||||||||||||||
Gain on extinguishment of debt | 3,743 | — | — | — | 3,743 | |||||||||||||||
Equity in earnings of subsidiaries | (378,378 | ) | (123,523 | ) | — | 501,901 | — | |||||||||||||
Other income | (5,431 | ) | 543 | 5,464 | — | 576 | ||||||||||||||
| (379,802 | ) | (139,518 | ) | (10,473 | ) | 505,493 | (24,300 | ) | ||||||||||||
Loss before income taxes and minority interest | (404,854 | ) | (342,912 | ) | (408,706 | ) | 505,493 | (650,979 | ) | |||||||||||
Income tax provision (benefit) | 71,255 | (129,976 | ) | (116,130 | ) | — | (174,851 | ) | ||||||||||||
Loss before minority interest | (476,109 | ) | (212,936 | ) | (292,576 | ) | 505,493 | (476,128 | ) | |||||||||||
Minority interest in net loss of subsidiary, net of income taxes | — | — | 19 | — | 19 | |||||||||||||||
Net loss | $ | (476,109 | ) | $ | (212,936 | ) | $ | (292,557 | ) | $ | 505,493 | $ | (476,109 | ) | ||||||
39
Table of Contents
VERASUN ENERGY CORPORATION
NOTES TO CONDENSED CONSOLIDATED FINANCIAL STATEMENTS (unaudited)
(dollars in thousands, except for per share data)
CONDENSED CONSOLIDATING STATEMENT OF OPERATIONS
For the Nine Months Ended September 30, 2008
| Issuer | Guarantors | Non-Guarantors | Eliminations and Consolidations | Consolidated | ||||||||||||||||
Net sales | $ | 11,754 | $ | 1,470,552 | $ | 1,219,076 | $ | (85,272 | ) | $ | 2,616,110 | |||||||||
Cost of goods sold | (162 | ) | (1,493,531 | ) | (1,278,528 | ) | 85,272 | (2,686,949 | ) | |||||||||||
Lower of cost or market adjustment | — | (6,768 | ) | (33,339 | ) | — | (40,107 | ) | ||||||||||||
Gross profit (loss) | 11,592 | (29,747 | ) | (92,791 | ) | — | (110,946 | ) | ||||||||||||
Startup expenses | — | 5,540 | 3,881 | — | 9,421 | |||||||||||||||
Restructuring charge | 2,114 | — | — | — | 2,114 | |||||||||||||||
Selling, general and administrative expenses | 38,382 | 4,066 | 6,513 | — | 48,961 | |||||||||||||||
Goodwill impairment | 6,091 | 18,180 | 239,061 | — | 263,332 | |||||||||||||||
Long-lived asset impairment | 5,431 | 92,680 | 23,107 | — | 121,218 | |||||||||||||||
Operating loss | (40,426 | ) | (150,213 | ) | (365,353 | ) | — | (555,992 | ) | |||||||||||
Other income (expense): | ||||||||||||||||||||
Interest expense | (51,697 | ) | (31,217 | ) | (30,200 | ) | 58,108 | (55,006 | ) | |||||||||||
Interest income | 49,339 | 2,233 | 308 | (50,259 | ) | 1,621 | ||||||||||||||
Gain on extinguishment of debt | 3,743 | — | — | — | 3,743 | |||||||||||||||
Equity in earnings of subsidiaries | (337,648 | ) | (111,419 | ) | — | 449,067 | — | |||||||||||||
Other income | (2,756 | ) | 878 | 3,168 | — | 1,290 | ||||||||||||||
| (339,019 | ) | (139,525 | ) | (26,724 | ) | 456,916 | (48,352 | ) | ||||||||||||
Loss before income taxes and minority interest | (379,445 | ) | (289,738 | ) | (392,077 | ) | 456,916 | (604,344 | ) | |||||||||||
Income tax provision (benefit) | 65,198 | (114,088 | ) | (110,786 | ) | — | (159,676 | ) | ||||||||||||
Loss before minority interest | (444,643 | ) | (175,650 | ) | (281,291 | ) | 456,916 | (444,668 | ) | |||||||||||
Minority interest in net loss of subsidiary, net of income taxes | — | — | 25 | — | 25 | |||||||||||||||
Net loss | $ | (444,643 | ) | $ | (175,650 | ) | $ | (281,266 | ) | $ | 456,916 | $ | (444,643 | ) | ||||||
40
Table of Contents
CONDENSED CONSOLIDATING STATEMENT OF CASH FLOWS
For the Nine Months Ended September 30, 2008
| Issuer | Guarantors | Non-Guarantors | Eliminations and Consolidations | Consolidated | ||||||||||||||||
Net cash (used in) provided by operating activities | $ | (236,066 | ) | $ | 137,191 | $ | 12,464 | $ | 7,849 | $ | (78,562 | ) | ||||||||
Cash Flows from Investing Activities | ||||||||||||||||||||
Purchases of property and equipment | 3,946 | (158,413 | ) | (102,675 | ) | (7,849 | ) | (264,991 | ) | |||||||||||
US BioEnergy acquisition, net of transaction costs | (6,980 | ) | 16,292 | 35,047 | — | 44,359 | ||||||||||||||
Proceeds from the sale of short-term investments | 43,175 | — | — | — | 43,175 | |||||||||||||||
Change in restricted cash | (1,525 | ) | — | (13,303 | ) | — | (14,828 | ) | ||||||||||||
Proceeds from sales of equipment | — | 1,300 | — | — | 1,300 | |||||||||||||||
Payments for other long-term assets and liabilities | (24 | ) | 333 | (691 | ) | — | (382 | ) | ||||||||||||
Net cash (used in) provided by investing activities | 38,592 | (140,488 | ) | (81,622 | ) | (7,849 | ) | (191,367 | ) | |||||||||||
Cash Flows from Financing Activities | ||||||||||||||||||||
Proceeds from long-term debt | 108,741 | — | 86,704 | — | 195,445 | |||||||||||||||
Principal payments on long-term debt | — | — | (21,004 | ) | — | (21,004 | ) | |||||||||||||
Debt issuance cost paid | (3,779 | ) | — | — | — | (3,779 | ) | |||||||||||||
Cost of registering equity securities | (2,127 | ) | — | — | — | (2,127 | ) | |||||||||||||
Net effect of the exercise of stock options | (222 | ) | — | — | — | (222 | ) | |||||||||||||
Outstanding checks in excess of bank balance | — | — | 626 | (626 | ) | — | ||||||||||||||
Net cash provided by (used in ) financing activities | 102,613 | — | 66,326 | (626 | ) | 168,313 | ||||||||||||||
Net (decrease) increase in cash and cash equivalents | (94,861 | ) | (3,297 | ) | (2,832 | ) | (626 | ) | (101,616 | ) | ||||||||||
Cash and cash equivalents, beginning of period | 98,213 | 9,897 | 2,832 | — | 110,942 | |||||||||||||||
Cash and cash equivalents, end of period | $ | 3,352 | $ | 6,600 | $ | — | $ | (626 | ) | $ | 9,326 | |||||||||
41
Table of Contents
| ITEM 2. | MANAGEMENT’S DISCUSSION AND ANALYSIS OF FINANCIAL CONDITION AND RESULTS OF OPERATIONS |
FORWARD-LOOKING STATEMENTS
We make certain forward-looking statements in this Quarterly Report on Form 10-Q. These forward-looking statements relate to our outlook or expectations for earnings, revenues, expenses, asset quality or other future financial or business performance, strategies or expectations, or the impact of legal, regulatory or supervisory matters on our business, results of operations or financial condition. Specifically, forward-looking statements may include statements preceded by, followed by or that contain the words “estimate,” “plan,” “project,” “forecast,” “intend,” “expect,” “anticipate,” “believe,” “seek,” “target” or similar expressions.
These statements reflect our management’s judgment based on currently available information and involve a number of risks and uncertainties that could cause actual results to differ materially from those in the forward-looking statements.
Future performance cannot be assured. Actual results may differ materially from those in the forward-looking statements. Some factors that could cause our actual results to differ include:
| • | our ability to continue as a going concern; |
| • | our ability to obtain additional debtor-in-possession (DIP) financing on an interim or final basis; |
| • | our ability to operate pursuant to the terms and conditions of any DIP financing and any cash collateral order entered by the Bankruptcy Court in connection with the Bankruptcy Cases; |
| • | our ability to obtain Court approval with respect to motions in the Chapter 11 proceedings prosecuted by us from time to time, including approval of motions relating to the priority of the lender’s security interest under any DIP financing; |
| • | our ability to develop, prosecute, confirm and consummate one or more plans of reorganization with respect to the Bankruptcy Cases; |
| • | risks associated with third parties seeking and obtaining court approval to terminate or shorten the exclusivity period that we have to propose and confirm one or more plans of reorganization, for the appointment of a Chapter 11 trustee or to convert the Bankruptcy Cases to cases under Chapter 7 of the Bankruptcy Code; |
| • | our ability to obtain and maintain normal terms with vendors and service providers; |
| • | our ability to maintain contracts that are critical to our operations; |
| • | the potential adverse impact of the Bankruptcy Cases on our liquidity or results of operations; |
| • | our ability to fund and execute our business plan; |
| • | our ability to attract, motivate and retain key executives and employees; |
| • | our ability to attract and retain customers; |
| • | the volatility and uncertainty of corn, natural gas, ethanol, unleaded gasoline and other commodities prices; |
| • | our ability to generate sufficient liquidity to fund our operations and capital expenditures; |
| • | the results of our hedging transactions and other risk mitigation strategies; |
| • | risk of potential further long-lived asset impairment; |
| • | operational disruptions at our facilities; |
| • | the effects of vigorous competition and excess capacity in the industry in which we operate; |
| • | the development of infrastructure related to the sale and distribution of ethanol; |
| • | the effects of other mergers and consolidations in the biofuels industry and unexpected announcements or developments from others in the biofuels industry; |
42
Table of Contents
| • | the uncertainties related to our acquisitions of US BioEnergy, ASA OpCo Holdings, LLC and other businesses, including our ability to achieve the expected benefits from these acquisitions; |
| • | the impact of new, emerging and competing technologies on our business; |
| • | the possibility of one or more of the markets in which we compete being impacted by political, legal and regulatory changes or other external factors over which we have no control; |
| • | changes in or elimination of governmental laws, tariffs, trade or other controls or enforcement practices; |
| • | the impact of any potential Renewable Fuel Standards waiver; |
| • | our ability to comply with various environmental, health and safety laws and regulations; |
| • | the success of the Company’s marketing and sales efforts; |
| • | our reliance on key management personnel; |
| • | our ability to secure additional financing; |
| • | deficiencies in our internal control over financial reporting constituting a material weakness to be remediated; and |
| • | other risks referenced from time to time in our filings with the SEC and those factors listed in this Form 10Q under Part II, Item 1A, “Risks Factors.” |
You are cautioned not to place undue reliance on any forward-looking statements, which speak only as of the date of this Form 10-Q, or in the case of a document incorporated by reference, as of the date of that document. Except as required by law, we undertake no obligation to publicly update or release any revisions to these forward-looking statements to reflect any events or circumstances after the date of this Form 10-Q or to reflect the occurrence of unanticipated events.
Business Overview
VeraSun is one of the largest ethanol producers in the United States based on production capacity, according to the Renewable Fuels Association (“RFA”). We focus primarily on the production and sale of ethanol and distillers grains. This focus has enabled us to significantly grow our ethanol production capacity and to work with automakers, fuel distributors, trade associations and consumers to increase the demand for ethanol. As an industry leader, we play an active role in developments within the renewable fuels industry.
Ethanol is a type of alcohol produced in the U.S. principally from corn. Ethanol is primarily used as a blend component in the U.S. gasoline fuel market, which approximated 142 billion gallons in 2007 according to the Energy Information Administration (“EIA”). Refiners and marketers have historically blended ethanol with gasoline to increase octane and reduce tailpipe emissions. The ethanol industry has grown significantly over the last few years, expanding production capacity at a compounded annual growth rate of approximately 22% from 2000 to 2007. We believe the ethanol market will continue to grow as a result of ethanol’s cleaner burning characteristics, a shortage of domestic petroleum refining capacity, geopolitical concerns, and federally mandated renewable fuel usage. We also believe that E85, a fuel blend composed of 85% ethanol, may become increasingly important as an alternative to unleaded gasoline.
We completed the acquisition of US BioEnergy on April 1, 2008. The acquisition was accounted for using the purchase method of accounting. Accordingly, US BioEnergy’s results of operations are included in our consolidated operating results beginning in the second quarter of 2008.
We own and operate 14 ethanol production facilities in the U.S., with a combined nameplate capacity of approximately 1.4 billion gallons per year. As of November 6, 2008, our ethanol production capacity represented approximately 13% of the total ethanol production capacity in the U.S., according to the RFA. We have designated a “nameplate” production capacity for each of our ethanol production facilities. Generally, we determine the nameplate capacity of a facility upon completing construction of the facility, upon completing an expansion of the facility or the acquisition of the facility. The nameplate capacity for each facility represents our estimate of the production capacity of that facility at the time, based on the capacity specified in the applicable design-build agreement or other construction agreement for the plant, our experience operating the plant or similar plants, environmental or other regulatory constraints and other applicable factors. The nameplate capacity of our facilities may not be comparable to the capacity our competitors report as nameplate capacity for their facilities.
43
Table of Contents
Our facilities are designed to operate on a continuous basis and use current dry-milling technology, a production process that results in increased ethanol yield and reduced capital costs compared to wet-milling facilities. In addition to producing ethanol, we produce and sell wet and dry distillers grains. For the nine months ended September 30, 2008, we produced approximately 692.7 million gallons of fuel ethanol and 2.2 million tons of distillers grains.
We have two additional ethanol production facilities completed or under construction in Welcome and Janesville, Minnesota, with a combined annual production capacity of 220 million gallons per year, or “MMGY.” The start-up of these facilities has been delayed indefinitely. We also broke ground on a facility in Reynolds, Indiana in April 2007. However, in October 2007, we suspended construction of the Reynolds facility.
Recent Events
We historically have employed short financial positions to hedge our physical purchases of corn. In July 2008, after corn prices had risen from approximately $6.00 per bushel at the end of May 2008 to almost $8.00 per bushel due to weather conditions in the Midwest and broader commodity market trends, we chose to exit our short financial positions in corn to mitigate what we considered to be unacceptable margin exposure in our futures positions. Upon termination of these short financial positions, we effectively priced our corresponding physical purchases of corn at the then-current market price, which proved to be significantly higher than subsequent market prices for corn. In addition, based on market forecasts that corn prices would continue to rise, we entered into a number of “accumulator” contracts relative to corn requirements for the third and fourth quarters that, in each case, allowed us to purchase a specified volume of corn at prices below then-prevailing market rates, but also required us to purchase that same volume of corn, in addition to the initial purchase, at one or more lower prices per bushel should market prices decline to or below those lower levels over the duration of the contract. Shortly thereafter, corn prices commenced a sharp decline from almost $8.00 per bushel to a low of under $5.00 per bushel in mid-August 2008. As a result, we were required under the accumulator contracts to purchase additional amounts of corn at prices that proved to be higher than prevailing market prices. As a result of these various hedge positions, we incurred derivative losses of $118,585 during the three months ended September 30, 2008, contributing to average corn costs $7.04 and $5.94 per bushel for the three and nine months ended September 30, 2008 compared to $3.32 and $3.58 for the same periods in 2007. During the third quarter of 2008 we exited all material hedging arrangements with respect to corn or any of our other key inputs or ethanol.
As of the end of the third quarter of fiscal 2008, the Company performed an interim impairment evaluation of its goodwill, other identifiable intangible assets and all its long-lived assets due to factors deemed by management to have constituted an impairment triggering event during the third quarter. The triggering event was a further sustained decrease in the trading price of VeraSun Energy Corporation common stock relative to the book value of the Company and declining crush margin leading to the substantial net loss incurred during the quarter. Based on the interim evaluation, the Company recorded a goodwill impairment of $263.3 million and a long lived asset impairment consisting of property, plant and equipment and other intangibles of $121.2 million.
The liquidity constraints described elsewhere in this report have adversely affected the availability of corn to the Company, causing some of the Company’s plants to operate significantly below capacity during October and November 2008, which could, among other things, result in a decline in the Company’s revenue during the fourth quarter of 2008.
Chapter 11 Bankruptcy
General
The Company suffered significant losses in the third quarter of 2008 from a dramatic increase in its corn costs, reflecting in part costs attributable to its corn procurement and hedging arrangements, and historically unfavorable margins. Beginning in the third quarter of 2008, these losses, combined with worsening capital market conditions and a tightening of trade credit resulted in severe constraints on the Company’s liquidity position. Faced with these constraints, on October 31, 2008 (the “Petition Date”), VeraSun Energy Corporation and 24 of its subsidiaries, which include all of VeraSun Energy Corporation’s material subsidiaries, filed voluntary petitions for relief under Chapter 11 of the Bankruptcy Code with the United States Bankruptcy Court for the District of Delaware, VeraSun’s Chapter 11 cases are being jointly administered by the Bankruptcy Court as Case No. 08-12606 (BLS) (collectively, the “Bankruptcy Cases”). The petitions were filed in order to enable VeraSun to pursue reorganization efforts under Chapter 11 of the Bankruptcy Code. VeraSun intends to continue to operate its business as debtor-in-possession under the jurisdiction of the Bankruptcy Court and in accordance with the applicable provisions of the Bankruptcy Code and orders of the Bankruptcy Court. In general, as debtors-in-possession, VeraSun Energy Corporation and its subsidiaries that are part of the Bankruptcy Filing (collectively, the “Debtors”) are authorized under Chapter 11 to continue to operate as an ongoing business, but may not engage in transactions outside of the ordinary course of business without the prior approval of the Bankruptcy Court. The Debtors comprise, in addition to VeraSun Energy Corporation, ASA Albion, LLC, ASA Bloomingburg, LLC, ASA Linden, LLC, and ASA OpCo Holdings, LLC, each a Delaware limited liability company; US Bio Marion, LLC, a South Dakota limited liability company; VeraSun Janesville, LLC, a Minnesota limited liability company; US BioEnergy Corporation, a South Dakota corporation; VeraSun Albert City, LLC, an Iowa limited liability company, VeraSun Central City, LLC and VeraSun Ord, LLC, each a Nebraska limited liability company, VeraSun Dyersville, LLC, a Delaware limited liability company, VeraSun Hankinson, LLC, a North Dakota limited liability company, and VeraSun Woodbury, LLC, a Michigan limited liability company (the “AgStar Debtors”); and VeraSun
44
Table of Contents
Aurora Corporation, a South Dakota corporation, and VeraSun Charles City, LLC, VeraSun Fort Dodge, LLC, VeraSun Hartley, LLC, VeraSun Marketing, LLC, VeraSun Welcome, LLC, VeraSun Granite City, LLC, VeraSun Reynolds, LLC, VeraSun Biodiesel, LLC, VeraSun Litchfield, LLC and VeraSun Tilton, LLC, each a Delaware limited liability company (the “Other VSE Debtors”).
As a result of the Bankruptcy Filing, the Debtors are periodically required to file various documents with, and provide certain information to, the Bankruptcy Court, including statements of financial affairs, schedules of assets and liabilities, monthly operating reports and other financial information. Such materials will be prepared according to requirements of federal bankruptcy law and may in some cases present information on an unconsolidated basis. While they would accurately provide then-current information required under federal bankruptcy law, such materials will contain information that may be unconsolidated and will generally be unaudited and prepared in a format different from that used in the Company’s consolidated financial statements filed under the securities laws. Accordingly, the Company believes that the substance and format of such materials do not allow meaningful comparison with its regular publicly-disclosed consolidated financial statements. Moreover, the materials filed with the Bankruptcy Court are not prepared for the purpose of providing a basis for an investment decision relating to VeraSun Energy Corporation’s or other Debtors’ stock or debt or for comparison with other financial information filed with the Securities and Exchange Commission.
Most of the Debtors’ filings with the Bankruptcy Court are available to the public at the offices of the Clerk of the Bankruptcy Court or the Bankruptcy Court’s web site (http://www.deb.uscourts.gov) or may be obtained through private document retrieval services. The Company undertakes no obligation to make any further public announcement with respect to the documents filed with the Bankruptcy Court or any matters referred to therein.
Additional information regarding the Bankruptcy Filing, including access to court documents and other general information about the Bankruptcy Cases, is available through the Company’s web site at http://www.verasun.com by following the link to “REORGANIZATION INFORMATION” or at http://www.kccllc.net/verasun. Information contained on, or that can be accessed through, such web sites or the Bankruptcy Court’s web site is not part of this report.
At hearings held on November 3, 2008 and November 4, 2008, the Bankruptcy Court granted VeraSun’s first day motions for various relief designed to stabilize the Company’s operations and business relationships with vendors, lenders, employees and others and entered orders granting authority to VeraSun to, among other things: (a) pay pre-petition and post-petition employee wages, salaries, benefits and other employee obligations; (b) pay vendors and other providers in the ordinary course for goods and services received from and after the Petition Date and; (c) pay suppliers delivering goods on or after October 11, 2008. In addition, the Bankruptcy Court entered an order prohibiting utility companies from altering or discontinuing service on account of pre-petition invoices.
Shortly after the Bankruptcy Filing, VeraSun began notifying all known or potential creditors of the Bankruptcy Filing. The Bankruptcy Filing triggered defaults on substantially all debt of the Company (see Note 8 to the unaudited condensed consolidated financial statements). Subject to certain exceptions under the Bankruptcy Code, the Bankruptcy Filing then automatically enjoined, or stayed, the continuation of any judicial or administrative proceedings or other actions against VeraSun or its property to recover on, collect or secure a claim arising prior to the Petition Date. Thus, for example, creditor actions to obtain possession of property from VeraSun, or to create, perfect or enforce any lien against the property of VeraSun, or to collect on or otherwise exercise rights or remedies with respect to a pre-petition claim are enjoined unless and until the Bankruptcy Court lifts the automatic stay.
In order to successfully exit Chapter 11 bankruptcy, VeraSun will need to propose, and obtain confirmation by the Bankruptcy Court of, a plan of reorganization that satisfies the requirements of the Bankruptcy Code. A plan of reorganization would, among other things, resolve the Debtors’ pre-petition obligations, set forth the revised capital structure of the newly reorganized entity and provide for corporate governance subsequent to exit from bankruptcy. VeraSun has the exclusive right for 120 days after the Petition Date to file a plan of reorganization and 60 additional days to obtain necessary acceptances. Such periods may be extended by the Bankruptcy Court for cause to up to 18 months and 20 months respectively, after the Petition Date. If VeraSun’s exclusivity period lapses, any party in interest may file a plan of reorganization for VeraSun. In addition to the need for Bankruptcy Court confirmation and satisfaction of Bankruptcy Code requirements, a plan of reorganization must be accepted as described below by holders of impaired claims and equity interests in order to become effective. A VeraSun Chapter 11 plan of reorganization will have been accepted by holders of claims against and equity interests in VeraSun if (i) at least one-half in number and two-thirds in dollar amount of claims actually voting in each impaired class of claims have voted to accept the plan and (ii) at least two-thirds in amount of equity interests actually voting in each impaired class of equity interests has voted to accept the plan. Under circumstances specified in the so-called “cramdown” provisions of section 1129(b) of the Bankruptcy Code, the Bankruptcy Court may confirm a plan even if such plan has not been accepted by all impaired classes of claims and equity interests. A class of claims or equity interests that does not receive or retain any property under the plan on account of such claims or interests is deemed to have voted to reject the plan. The precise requirements and evidentiary showing for confirming a plan notwithstanding its rejection by one or more impaired classes of claims or equity interests depends upon a number of factors, including the status and seniority of the claims or equity interests in the rejecting class - i.e., secured claims or unsecured claims, subordinated or senior claims, preferred or common stock.
45
Table of Contents
Under section 365 of the Bankruptcy Code, VeraSun may assume, assume and assign, or reject executory contracts and unexpired leases, including real property, railcars and equipment leases, subject to the approval of the Bankruptcy Court and certain other conditions. Rejection constitutes a court-authorized breach of the lease or contract in question and, subject to certain exceptions, relieves VeraSun of its future obligations under such lease or contract but creates a deemed pre-petition claim for damages caused by such breach or rejection. Parties whose contracts or leases are rejected may file claims against VeraSun for damages. Generally, the assumption of an executory contract or unexpired lease requires VeraSun to cure all prior defaults under such executory contract or unexpired lease, including all pre-petition arrearages, and to provide adequate assurance of future performance. In this regard, the Company expects that liabilities subject to compromise and resolution in the Bankruptcy Cases will arise in the future as a result of damage claims created by VeraSun’ s rejection of various executory contracts and unexpired leases. Conversely, the Company would expect that the assumption of certain executory contracts and unexpired leases may convert liabilities shown in future financial statements as subject to compromise to post-petition liabilities. Due to the uncertain nature of many of the potential claims, the Company is unable to project the magnitude of such claims with any degree of certainty.
The Bankruptcy Court will establish a deadline for the filing of proofs of claim under the Bankruptcy Code, requiring VeraSun’s creditors to submit claims for liabilities not paid and for damages incurred. There may be differences between the amounts at which any such liabilities are recorded in the Company’s financial statements and the amount claimed by VeraSun’s creditors. Significant litigation may be required to resolve any such disputes or discrepancies.
Although VeraSun expects to file a reorganization plan that provides for emergence from Chapter 11 bankruptcy some time in the future, there can be no assurance that a reorganization plan will be proposed by VeraSun or confirmed by the Bankruptcy Court, or that any such plan will be consummated.
The Company has incurred and will continue to incur significant costs associated with the reorganization. The amount of these costs, which are being expensed as incurred, are expected to significantly affect the Company’s results of operations.
As of the Petition Date, VeraSun had approximately $15.2 million in cash and cash equivalents. On November 3, 2008, VeraSun obtained agreements from certain lenders, subject to specified conditions, for debtor-in-possession (“DIP”) financing of up to $215.0 million, as described below, to provide liquidity during the reorganization process. The ability of the Company to continue as a going concern is dependent upon, among other things, (i) the Company’s ability to secure adequate DIP financing; (ii) the Company’s ability to comply with the terms and conditions of any DIP financing and any cash collateral order entered by the Bankruptcy Court in connection with the Bankruptcy Cases; (iii) the ability of the Company to maintain adequate cash on hand; (iv) the ability of the Company to generate cash from operations; (v) the ability of the Company to obtain confirmation of and to consummate a plan of reorganization under the Bankruptcy Code; (vi) the cost, duration and outcome of the reorganization process; and (vii) the Company’s ability to achieve profitability. Uncertainty as to the outcome of these factors raises substantial doubt about the Company’s ability to continue as a going concern. We are currently evaluating various courses of action to address the operational and liquidity issues the Company is facing and are in the process of attempting to secure DIP financing, as described below, and formulating plans for improving operations. There can be no assurance that any of these efforts will be successful. The accompanying unaudited condensed consolidated financial statements do not include any adjustments that might result should the Company be unable to continue as a going concern. Preparing the accompanying unaudited condensed consolidated financial statements on a going concern basis contemplates the realization of assets and the discharge of liabilities in the normal course of business for the foreseeable future.
As a result of the Bankruptcy Filing, realization of assets and liquidation of liabilities are subject to uncertainty. While operating as a debtor-in-possession under the protection of Chapter 11, and subject to Bankruptcy Court approval or otherwise as permitted in the normal course of business, VeraSun may sell or otherwise dispose of assets and liquidate or settle liabilities for amounts other than those reflected in the condensed consolidated financial statements. Further, a plan of reorganization could materially change the amounts and classifications reported in our consolidated financial statements. Our historical consolidated financial statements do not give effect to any adjustments to the carrying value of assets or amounts of liabilities that might be necessary as a consequence of confirmation of a plan of reorganization.
The potential adverse publicity associated with the Bankruptcy Filing and the resulting uncertainty regarding the Company’s future prospects may hinder the Company’s ongoing business activities and its ability to operate, fund and execute its business plan by impairing relations with existing and potential customers; negatively impacting the ability of the Company to attract, retain and compensate key executives and employees and to retain employees generally; limiting the Company’s ability to obtain trade credit; and impairing present and future relationships with vendors and service providers.
Under the priority scheme established by the Bankruptcy Code, unless creditors agree otherwise, post-petition liabilities and pre-petition liabilities must be satisfied in full before shareholders are entitled to receive any distribution or retain any property under a plan of reorganization. The ultimate recovery, if any, to creditors and/or common shareholders will not be determined until confirmation and consummation of a plan or plans of reorganization. No assurance can be given as to what values, if any, will be ascribed in the Bankruptcy Cases to each of these constituencies or what types or amounts of distributions, if any, they would receive. A plan of reorganization could result in holders of VeraSun Energy Corporation’s common stock (the “Common Stock”) receiving no
46
Table of Contents
distribution on account of their interests and cancellation of their existing stock. As discussed above, if the requirements of section 1129(b) of the Bankruptcy Code are met, a plan of reorganization can be confirmed notwithstanding its rejection by the Company’s equity security holders and notwithstanding the fact that such equity security holders do not receive or retain any property on account of their equity interests under the plan. In addition, the New York Stock Exchange notified the Company on November 3, 2008 that the Common Stock would be suspended immediately. As a result, trading in the Common Stock on the New York Stock Exchange has been suspended and application to the SEC to delist the Common Stock is pending. Our common stock is traded over the counter (“OTC”) with a new symbol “VSUNQ”.
The value of the Common Stock is highly speculative. The Company urges that appropriate caution be exercised with respect to existing and future investments in any of the Common Stock or any of the liabilities and/or other securities of the Company or other Debtors.
Notice and Sell-Down Procedures for Trading in Claims and Equity Securities
On November 6, 2008, the Bankruptcy Court entered an interim order (the “Interim Order”) granting the motion of the Debtors to (a) require beneficial owners of substantial amounts of VeraSun Energy Corporation’s common stock to provide notice of their holdings and restrict, in specified circumstances and subject to specified terms and conditions, acquisitions or dispositions of VeraSun Energy Corporation’s common stock by Substantial Shareholders (as defined below) (the “Common Stock Notice and Transfer Requirements”) and (b) require, in specified circumstances and subject to specified terms and conditions, substantial holders of claims against the Debtors to sell down an amount of claims necessary to permit the Debtors to preserve the availability of the benefit of their accrued net operating losses and other tax attributes under Section 382 of the Internal Revenue Code of 1986, as amended (the “Code”), and implement the Debtors’ plan of reorganization (the “Claims Sell-Down Requirements”). The Bankruptcy Court also scheduled a hearing to consider approval of the final order to be held on December 2, 2008.
Under the Common Stock Notice and Transfer Requirements, all “Substantial Shareholders” must provide the Debtors, the Debtors’ counsel and the Bankruptcy Court advance notice of their intent to buy or sell VeraSun Energy Corporation common stock (including options to acquire common stock, as further specified in the Interim Order) prior to effectuating any such purchase or sale. A “Substantial Shareholder” under the Interim Order is a person or entity that beneficially owns or, as a result of a transaction, would beneficially own, at least 7,464,414 shares (including options to acquire shares, as further specified in the Interim Order) of VeraSun Energy Corporation’s common stock, representing approximately 4.75% of all issued and outstanding shares of VeraSun Energy Corporation’s common stock. The Common Stock Notice and Transfer Requirements were requested by the Debtors to identify and, where necessary, restrict potential trades of VeraSun Energy Corporation’s common stock that could negatively impact the Debtors’ ability to preserve maximum availability of their accrued net operating losses and other tax attributes under Section 382 of the Code. Pursuant to the Interim Order, the Debtors have 30 calendar days after notification of a transfer by a Substantial Shareholder to file any objections with the Bankruptcy Court and serve notice on such Substantial Shareholder. If the Debtors file any objections, the transfer would not become effective unless approved by a final and non-appealable order of the Bankruptcy Court. In addition, a person or entity that is or becomes a Substantial Shareholder must file with the Bankruptcy Court, and provide the Debtors and their counsel with, notification of such status on or before the later of (a) 20 days after the effective date of the notice of entry of the Interim Order or (b) ten days after becoming a Substantial Shareholder.
Under the Claims Sell-Down Requirements, any holder of claims against the Debtors that would entitle such holder to more than 4.75% of the common stock and any other securities of the reorganized Debtors under a confirmed plan of reorganization utilizing the tax benefits under Section 382 of the Code may be required to sell those claims to the extent necessary to the implementation of that plan of reorganization.
Debtor-In-Possession Financing
On November 3, 2008, VeraSun Energy Corporation and each of the Other VSE Debtors (collectively, the “VSE Obligors”) executed a commitment letter (the “Bondholder Commitment Letter”) pursuant to which certain holders (“VSE Lenders”) of the Company’s 9 7/8% Senior Secured Notes due 2012 (the “Senior Secured Notes”) have agreed to provide debtor-in-possession financing to the VSE Obligors, as borrowers, to be guaranteed by each of the other VSE Obligors. On November 3, 2008, the Bankruptcy Court entered an interim order (the “Interim Order”) approving the debtor-in-possession financing pursuant to a term sheet (the “VSE Term Sheet”) under the Bondholder Commitment Letter. The VSE Term Sheet provides for debtor-in-possession financing composed of triple-draw term loans (the “VSE Loans”) in an aggregate principal amount of not less than $160.7 million and up to $190.0 million, subject to the fulfillment by the VSE Obligors of specified conditions precedent. Pursuant to the terms of the VSE Term Sheet, the VSE Lenders made available an initial $15.0 million of the VSE Loans to the Company on an interim basis on November 3, 2008 (the “Interim Facility”). Trilogy Portfolio Company, LLC, Trilogy Special Situations Master Fund, Ltd., Mariner LDC, AIG Global Investment Corp., AIG SunAmerica Asset Management Corp., Wayzata Opportunities Fund II, L.P. and Wayzata Opportunities Fund Offshore II, L.P. comprise the VSE Lenders.
47
Table of Contents
The VSE Loans require regular cash interest payments at a rate of 16.5% per annum. Fees payable by the Company to the VSE Lenders will be incurred upon each VSE Loan funding date in the amount of 2.00% multiplied by the principal amount of the VSE Loans made on such funding date. In addition, upon repayment at maturity the Company is obligated to pay a fee equal to 2.00% of the principal amount of the VSE Loans, which fee increases to 5.00% if the VSE Loans are repaid by the Company prior to the maturity date, in each case as set forth in the Term Sheet.
The VSE Loans mature on the earliest to occur of (i) November 3, 2009, (ii) 32 days after the entry by the Bankruptcy Court of the Interim Order approving the VSE Loans if the final order approving the VSE Loans has not been entered before the expiration of these 32 days, (iii) the confirmation by the Bankruptcy Court of a plan of reorganization of the VSE Obligors in the Cases and (iv) the acceleration of the VSE Loans or the termination of the VSE Lenders’ commitments in accordance with the final loan documentation.
The commitment of the VSE Lenders to provide VSE Loans is subject to a number of conditions, including completion of final loan documentation satisfactory in form and substance to the VSE Lenders and the administrative agent for the VSE Lenders, and final approval by the Bankruptcy Court. Failure of the Company to execute and deliver satisfactory final loan documentation on or prior to a specified date (initially November 17, 2008, subsequently changed by the parties to November 21, 2008) will constitute an event of default and will result in the VSE Loans becoming immediately due and payable. Subject to the conditions set forth therein, the VSE Term Sheet provides for $10.0 million of the VSE Loans (in addition to the $15.0 million available under the Interim Facility) to be made available by the VSE Lenders upon the execution and delivery of such final loan documentation, and the remaining VSE Loans to be made available by the VSE Lenders upon receipt of final approval by the Bankruptcy Court. There can be no assurance that the Company will be able to obtain financing (other than under the Interim Facility) or retain the financing under the Interim Facility on the terms proposed in the Bondholder Commitment Letter (including the VSE Term Sheet) or at all.
The VSE Loans may be used for working capital and general corporate purposes of the VSE Obligors and for bankruptcy-related costs and expenses (subject to certain limitations) of the VSE Obligors, in each case subject to a budget acceptable to the VSE Lenders. In addition, from and after final approval by the Bankruptcy Court, not less than $84.2 million of the VSE Loans will be used to discharge $84.2 million aggregate principal amount of Senior Secured Notes held by the VSE Lenders.
Subject to a $1.0 million professional fee carve-out, the VSE Loans will be secured by a first priority, priming security interest on the property, plant and equipment of the VSE Obligors and a junior security interest on the accounts receivable and inventory of the VSE Obligors (junior to the security interests of the lenders under the Company’s $125.0 million revolving credit facility with UBS Securities LLC, UBS AG, Stamford Branch, and UBS Loan Finance LLC).
The VSE Loans will be subject to provisions regarding mandatory prepayments upon certain events, affirmative and negative covenants, financial covenants and budgeting requirements to be determined, events of default, and other customary terms and conditions.
The foregoing description of the Bondholder Commitment Letter, including the VSE Term Sheet, does not purport to be complete and is qualified in its entirety by reference to the Bondholder Commitment Letter and the related waiver letter, copies of which are filed as Exhibit 10.7 and Exhibit 10.8, respectively, to this report.
On November 3, 2008, each of the AgStar Debtors, together with US BioEnergy Corporation, as guarantor, executed a term sheet (each an “AgStar Term Sheet”) with AgStar Financial Services, PCA (“AgStar”), which is one of the lenders under the AgStar Debtors’ respective separate pre-petition credit facilities entered into in each case with a group of lenders, including AgStar, for each of which facilities AgStar is the administrative agent.
On November 3, 2008, the Bankruptcy Court entered several interim orders (the “AgStar Interim Orders”) approving the respective AgStar Term Sheets. Each of the AgStar Term Sheets has substantially the same terms as the other AgStar Term Sheets and provides for a revolving debtor-in-possession credit facility (each, an “AgStar Facility”) consisting of an interim facility and an aggregate post-petition facility in the principal amounts shown in the following table, subject to the fulfillment by the applicable AgStar Debtor of specified conditions precedent:
48
Table of Contents
| Interim aggregate amount of the applicable facility | Total aggregate amount of the applicable post- petition facility | |||||
VeraSun Albert City, LLC | $ | 3,000,000 | $ | 5,000,000 | ||
VeraSun Central City, LLC | 3,000,000 | 5,000,000 | ||||
VeraSun Ord, LLC | 1,500,000 | 2,500,000 | ||||
VeraSun Dyersville, LLC | 3,000,000 | 5,000,000 | ||||
VeraSun Hankinson, LLC | 3,000,000 | 5,000,000 | ||||
VeraSun Woodbury, LLC | 1,500,000 | 2,500,000 | ||||
| $ | 15,000,000 | $ | 25,000,000 | |||
Pursuant to the terms of the AgStar Term Sheets and the AgStar Interim Orders, each of the AgStar Debtors borrowed the amount of its respective interim facility as shown in the above table on November 3, 2008.
The interest rate on borrowings under each AgStar Facility, as specified in each of the AgStar Term Sheets, is the LIBOR Rate plus 7.0% per annum, which may be increased to the lesser of the maximum nonusurious interest rate and a default rate of 2.0% in addition to the LIBOR Rate plus 7.0% per annum.
The AgStar Debtors paid fees to the lenders under the AgStar Facilities on November 3, 2008 in the amount of 1.5% of the aggregate committed amount of the post-petition facilities.
Under the terms of the applicable AgStar Term Sheet, the maturity date of the (i) interim facility occurs on the earlier of the entry of the final order of the Bankruptcy Court approving the final loan documentation (the “AgStar Final Order”) or December 10, 2008 and (ii) post-petition facility occurs on November 3, 2009 or on such earlier date as provided in the AgStar Interim Order, the AgStar Final Order or the final loan documents.
Financing under each AgStar Term Sheet is subject to a number of conditions, including final loan documentation and receipt of the AgStar Final Order, each in a form acceptable to AgStar. Failure of the AgStar Debtors to receive the AgStar Final Order by December 10, 2008 will constitute an event of default and will result in the AgStar Loans becoming immediately due and payable. There can be no assurance that the AgStar Debtors will be able to obtain post-petition facility financing, or retain the interim facility financing, on the terms provided in the AgStar Term Sheets or at all.
Each AgStar Facility is guaranteed by US BioEnergy Corporation. Advances under each AgStar Facility are subject to a borrowing base based on eligible accounts receivable and eligible inventory of the applicable AgStar Debtor. Each AgStar Facility may be used for working capital needs of the applicable AgStar Debtor, in each case subject to a budget.
Each AgStar Facility will be secured by a lien on all of the assets of the applicable AgStar Debtor. The AgStar Facilities will be subject to provisions regarding affirmative and negative covenants, events of default, and other customary terms and conditions.
The foregoing description of the AgStar Term Sheets does not purport to be complete and is qualified in its entirety by reference the AgStar Term Sheets, copies of which are filed as Exhibits 10.1 through 10.6 to this report.
As of November 14, 2008, the outstanding principal amount of borrowings under the VSE Loans and the AgStar Facilities was $30.0 million.
In addition to the Interim Order and the AgStar Interim Orders, the Bankruptcy Court entered interim orders authorizing the Company to use the cash collateral of its creditors to fund specified operations and pay specified expenses of the Bankruptcy Cases. These interim cash collateral orders include authorization of the use of cash collateral of the lenders under the Company’s pre-petition $125 million revolving credit facility with UBS Securities LLC, UBS AG, Stamford Branch, and UBS Loan Finance LLC (the “Pre-Petition Revolving Credit Facility Lenders”). There can be no assurance that the Company will be able to continue to have access to the cash collateral of the Pre-Petition Revolving Credit Facility Lenders or other secured creditors.
Executive Summary
Through the US BioEnergy Acquisition the Company acquired five operating ethanol production facilities: Albert City, Iowa, with a capacity of 110 MMGY; Woodbury, Michigan, with a capacity of 50 MMGY; Central City and Ord, Nebraska, with capacities of 100 MMGY and 50 MMGY, respectively; and Marion, South Dakota, with a capacity of 110 MMGY. The Hankinson, North Dakota facility, with a capacity of 110 MMGY, was completed in June of 2008 and became operational on July 21, 2008. The Dyersville, Iowa facility, with a capacity of 110 MMGY, became operational on September 5, 2008. The start-up of the Janesville, Minnesota facility, which is expected to have a capacity of 110 MMGY, has been delayed indefinitely because the financing necessary to continue construction and start-up activities, which we had anticipated would be available under existing project financing and credit lines, has not been forthcoming due to the Bankruptcy Filing.
49
Table of Contents
We completed our acquisition of ASA OpCo Holdings, LLC on August 17, 2007. This acquisition added three 110 MMGY production facilities (in Linden, Indiana; Albion, Nebraska; and Bloomingburg, Ohio) to our production capacity. The facilities in Linden, Indiana and Albion Nebraska became operational in August and October of 2007 respectively. The Bloomingburg, Ohio facility became operational in March of 2008.
Key results for the three months ended September 30, 2008, are as follows:
| • | Total revenues increased 388.8% or $862.6 million compared to the 2007 comparable period. |
| • | Loss on derivatives was $118.6 million for the 2008 period compared to a gain on derivatives of $13.7 million for the 2007 comparable period. |
| • | Lower of cost or market adjustment of $40.1 million was recognized. |
| • | Gross profit (loss) of $(218.0) million for the three month period, compared to gross profit of $23.4 million for the 2007 comparable period. |
| • | Impairment charges of $384.5 million were recorded, consisting of a $263.3 million goodwill write-off and $121.2 million related to long-lived asset impairment. |
| • | Net loss was $476.1 million for the three month period, compared to net income of $7.8 million for the 2007 comparable period. |
| • | Ethanol gallons sold were 347.0 million gallons, an increase of 251.9 million gallons or 264.7% higher than the 2007 period. |
| • | Production volume was 294.4 million gallons, up 195.0 million gallons or 196.2% compared to the 2007 period. |
| • | Loss per fully diluted common share was $3.03 for the 2008 period compared to income of $0.09 per share for the 2007 period. |
Key results for the nine months ended September 30, 2008, are as follows:
| • | Total revenues increased 388.1% or $2.1 billion compared to the 2007 comparable period. |
| • | Loss on derivatives was $114.3 million for the 2008 period compared to a gain on derivatives of $5.7 million for the 2007 comparable period. |
| • | Lower of cost or market adjustment of $40.1 million was recognized. |
| • | Gross profit (loss) of $(110.9) million for the nine month period, compared to gross profit of $65.1 million for the 2007 comparable period. |
| • | Impairment charges of $384.5 million were recorded, consisting of a $263.3 million goodwill write-off and $121.2 million related to long-lived asset impairment. |
| • | Net loss was $444.6 million for the nine month period, compared to net income of $22.6 million for the 2007 comparable period. |
| • | Ethanol gallons sold were 868.6 million gallons, an increase of 650.0 million gallons or 297.2% higher than the 2007 period. |
| • | Production volume was 692.7 million gallons, up 455.8 million gallons or 192.4% compared to the 2007 period. |
| • | Loss per fully diluted common share was $3.28 for the 2008 period compared to income of $0.27 per share for the 2007 period. |
Components of Revenues and Expenses
Total revenues.Our primary source of revenue during the third quarter of 2008 was the sale of products produced at our facilities located at Aurora and Marion, South Dakota; Fort Dodge, Charles City, Hartley, Dyersville, and Albert City, Iowa; Linden, Indiana; Albion, Central City, and Ord, Nebraska; Bloomingburg, Ohio; Hankinson, North Dakota; and Woodbury, Michigan. In addition, we also market ethanol purchased from other producers. Our principal sources of revenue are:
| • | the sale of ethanol; |
| • | the sale of distillers grains; |
• | the sale of ethanol blended VE85® fuel; and |
| • | the sale of corn. |
The selling prices for our products are largely determined by the market demand for ethanol which, in turn, is influenced by the industry factors described elsewhere in this report.
Cost of goods sold.Our gross profit is derived from our total revenues less our cost of goods sold and the lower of cost or market adjustment. Our cost of goods sold is mainly affected by the cost of corn, natural gas and transportation and the purchase price of ethanol from other producers. Corn is our most significant raw material production cost (excluding the cost of ethanol purchases). The price of corn is influenced by weather conditions and other factors affecting crop yields, farmer planting decisions and general economic, market and regulatory factors. These factors include government policies and subsidies with respect to agriculture and international trade, and global and local demand and supply. The spot price of corn tends to rise during the spring planting season and tends to decrease during the fall harvest. We purchase natural gas to power steam generation in our ethanol production process and to dry our distillers grains. Natural gas represents our second largest production cost (excluding the cost of ethanol purchases). Cost of goods sold also includes the net gain or loss from derivatives relating to corn and natural gas, and the cost of ethanol that we purchase for resale. Transportation expense represents the third major component of our cost of goods sold (excluding the cost of ethanol purchases). Transportation expense includes rail car leases, freight and shipping of our ethanol and distillers grains, as well as costs incurred in storing ethanol at destination terminals.
Lower of cost or market adjustment.Lower of cost or market adjustment include inventory valuation adjustments due to the market value of corn and ethanol inventories being less than cost and estimated loss on open forward purchase contracts.
50
Table of Contents
Startup expenses. Costs associated with the operation of a facility prior to the production and sale of ethanol are expensed as incurred. During the third quarter of 2008, we incurred startup expenses relating to the Welcome and Janesville, Minnesota and Dyersville and Hartley, Iowa facilities. During the second quarter of 2007 we incurred startup expenses relating to our facilities near Hartley, Iowa; Welcome, Minnesota; and Reynolds, Indiana.
Restructuring expenses. Restructuring expenses consist of personnel and severance costs for VeraSun employee terminations of duplicate positions in conjunction with the US BioEnergy Acquisition and costs related to relocating the Company’s headquarters to Sioux Falls, South Dakota.
Selling, general and administrative expenses.Selling, general and administrative expenses consist of salaries and benefits paid to our administrative employees including stock-based compensation, taxes, expenses relating to third-party services, insurance, travel, marketing, severance and other expenses. Other expenses include education and training, marketing, travel, corporate donations and other miscellaneous overhead costs.
Goodwill and long lived asset impairments.Impairment charges include the result of the Company’s carrying value of goodwill, other intangible assets, and long-lived asset exceeding the estimated fair values of the related assets.
Lower of cost or market adjustment.Lower of cost or market adjustment include inventory valuation adjustments due to the market value of corn and ethanol inventories being less than cost and estimated loss on open forward purchase contracts.
Other income (expense).Other income (expense) includes the interest on our long-term debt and the amortization of the related fees to execute required financing agreements.
Results of Operations
The following table sets forth, for the periods presented, revenues, expenses and net income, as well as the percentage relationship to total revenues of specified items in our condensed consolidated statement of operations:
| Three Months Ended September 30, | Nine Months Ended September 30, | |||||||||||||||||||||||||||
| 2008 | 2007 | 2008 | 2007 | |||||||||||||||||||||||||
| (unaudited) | (unaudited) | |||||||||||||||||||||||||||
| (dollars in thousands) | (dollars in thousands) | |||||||||||||||||||||||||||
Net sales | $ | 1,084,467 | 100 | % | $ | 221,868 | 100 | % | $ | 2,616,110 | 100 | % | $ | 535,934 | 100 | % | ||||||||||||
Cost of goods sold | (1,262,380 | ) | 116 | (198,474 | ) | 90 | (2,686,949 | ) | 103 | (470,811 | ) | 88 | ||||||||||||||||
Lower of cost or market adjustment | (40,107 | ) | 4 | — | — | (40,107 | ) | 2 | — | — | ||||||||||||||||||
Gross profit (loss) | (218,020 | ) | (16 | ) | 23,394 | 11 | (110,946 | ) | (3 | ) | 65,123 | 12 | ||||||||||||||||
Startup expenses | 2,719 | 0 | 1,675 | 1 | 9,421 | 0 | 3,257 | 1 | ||||||||||||||||||||
Restructuring charge | 110 | 0 | — | — | 2,114 | 0 | — | — | ||||||||||||||||||||
Selling, general and administrative expenses | 21,280 | 2 | 9,862 | 4 | 48,961 | 2 | 28,211 | 5 | ||||||||||||||||||||
Goodwill impairment | 263,332 | 24 | — | — | 263,332 | 10 | — | — | ||||||||||||||||||||
Long-lived asset impairment | 121,218 | 11 | — | — | 121,218 | 5 | — | — | ||||||||||||||||||||
Operating income (loss) | (626,679 | ) | (58 | ) | 11,857 | 5 | (555,992 | ) | (21 | ) | 33,655 | 6 | ||||||||||||||||
Other income (expense), net | (24,300 | ) | (2 | ) | (6,489 | ) | (3 | ) | (48,352 | ) | (2 | ) | (5,481 | ) | (1 | ) | ||||||||||||
Income (loss) before income taxes and minority interest | (650,979 | ) | (60 | ) | 5,368 | 2 | (604,344 | ) | (23 | ) | 28,174 | 5 | ||||||||||||||||
Income tax provision (benefit) | (174,851 | ) | (16 | ) | (2,425 | ) | (1 | ) | (159,676 | ) | (6 | ) | 5,557 | 1 | ||||||||||||||
Minority interest | 19 | 0 | — | — | 25 | 0 | — | — | ||||||||||||||||||||
Net income (loss) | $ | (476,109 | ) | (44 | )% | $ | 7,793 | 3 | % | $ | (444,643 | ) | (17 | )% | $ | 22,617 | 4 | % | ||||||||||
51
Table of Contents
The following table sets forth other key data for the periods presented (dollars in thousands, except per unit data):
| Three Months Ended September 30, | Nine Months Ended September 30, | |||||||||||||
| 2008 | 2007 | 2008 | 2007 | |||||||||||
| (unaudited) | (unaudited) | |||||||||||||
Other financial data: | ||||||||||||||
Net cash flows (used in) provided by operating activities | $ | (39,850 | ) | $ | 49,524 | $ | (78,562 | ) | $ | 73,646 | ||||
Operating data: | ||||||||||||||
Ethanol sold - produced (gallons, in thousands) (1) | 251,420 | 95,133 | 640,176 | 218,689 | ||||||||||
Ethanol sold - purchase/resale (gallons, in thousands) | 95,566 | — | 228,374 | — | ||||||||||
Total ethanol sold (gallons, in thousands) | 346,986 | 95,133 | 868,550 | 218,689 | ||||||||||
Distillers grains sold (tons, in thousands) | 816.7 | 303.1 | 2,193.0 | 730.5 | ||||||||||
Average gross price of ethanol sold per gallon | $ | 2.47 | $ | 1.96 | $ | 2.49 | $ | 2.07 | ||||||
Average corn cost per bushel | 7.04 | 3.32 | 5.94 | 3.58 | ||||||||||
Average natural gas cost per MMBTU | 8.33 | 6.17 | 9.75 | 6.59 | ||||||||||
Average dry distillers grains gross price per ton | 166.38 | 93.68 | 144.18 | 92.19 | ||||||||||
(1) | Excludes ethanol sold in VE85® sales. |
Three Months Ended September 30, 2008 Compared to Three Months Ended September 30, 2007
Total revenues, which include revenues from the sale of ethanol, distillers grains, VE85®, and corn increased by $862.6 million, or 388.8%, to $1,084.5 million for the three months ended September 30, 2008, compared to $221.9 million for the three months ended September 30, 2007. The increase in total revenues was primarily the result of a 264.7% increase in ethanol volume sold and an increase in average ethanol prices of $0.51 per gallon, or 26.5%, compared to 2007. For the three months ended September 30, 2008, the Company sold 347.0 million gallons of ethanol, which includes 95.6 million gallons of ethanol that were purchased from others and resold to our customers. Ethanol production increased by 195.0 million gallons, or 196.2%, to 294.4 million gallons compared with the three months ended September 30, 2007, as a result of the added capacity from, the Albion, Nebraska facility in October 2007, the Bloomingburg, Ohio facility in March 2008, Hankinson, North Dakota facility in July 2008, Hartley and Dyersville, Iowa facilities in August 2008 and September 2008, respectively, and the US BioEnergy facilities functional on the day of acquisition on April 1, 2008.
Net sales from ethanol increased $670.1 million, or 355.6%, to $858.6 million for the three months ended September 30, 2008 compared with $188.5 million for the three months ended September 30, 2007. Of the increase, $492.8 million was driven by additional volumes of ethanol sold. The increased volume resulted from additional production at the Albion, Bloomingburg, Hankinson, Hartley and Dyersville facilities, which came on line since September 30, 2007, output from the US BioEnergy facilities functional on the day of acquisition on April 1, 2008, and ethanol that was purchased and resold to our customers. Higher ethanol prices contributed $177.3 million of the increased revenue. The average price of ethanol sold was $2.47 per gallon for the three months ended September 30, 2008, compared to $1.96 per gallon for the three months ended September 30, 2007.
Net sales from distillers grains increased $107.5 million, or 378.6%, to $135.9 million for the three months ended September 30, 2008 compared with $28.4 million for the three months ended September 30, 2007. Increased volume and prices contributed $48.1 million and $59.4 million, respectively, to the increased revenues. The average price per ton of distillers grains increased by $72.70 per ton for the three months ended September 30, 2008 compared to the three months ended September 30, 2007.
Net sales of VE85®, our branded E85 product, increased $8.1 million, or 208.3%, to $12.0 million for the three months ended September 30, 2008 compared with $3.9 million for the three months ended September 30, 2007, primarily due to an increase in the number of retail outlets selling VE85® resulting in a $4.9 million increase and the impact of higher prices contributing to an additional increase of $3.2 million.
During the quarter, we sold excess corn inventory aggregating to $76.4 million. Excluding the sale of corn inventory, sales for the quarter would have been $1,008.1 million, an increase of $786.2 million or 354.4% over the same period in 2007.
52
Table of Contents
Cost of goods sold. Corn costs increased $644.0 million, or 559.3%, to $759.2 million for the three months ended September 30, 2008 compared with $115.2 million for the three months ended September 30, 2007. If the corn sales of $76.4 million are netted with corn costs, the total corn costs for the quarter would have been $682.8 million, an increase of $567.6 million or 492.3% over the same period in 2007.
Corn costs (net of corn sales) were $7.04 per bushel or $2.72 per manufactured gallon sold for the three months ending September 30, 2008, compared with $3.32 per bushel or $1.21 per manufactured gallon sold for the same period in 2007.
The increase in corn costs (net of corn sales) is attributable to three main factors: increased volume, increased corn prices, and losses due to corn-related derivatives. Increased volume contributed $210.6 million, reflecting increased corn purchases resulting from additional production from the Albion, Bloomingburg, Hankinson, Hartley and Dyersville facilities, which came on line since September 30, 2007, and the US BioEnergy facilities functional on the day of acquisition on April 1, 2008. Increased corn prices account for $224.7 million of the increased corn costs. Losses on corn related derivatives accounted for a $132.3 million increase in corn costs during the three months ended September 30, 2008 compared to the same period in 2007.
Corn related derivatives losses of $118.6 million during the three months ended September 30, 2008 compared to a gain of $13.7 for the three months ended September 30, 2007. The losses are attributable to unrealized mark-to-market open positions of forward purchase contracts executed prior to September 1, 2008 and realized hedging losses on exiting futures contracts due to unacceptable margin exposure and underlying settled forward purchase contracts. Mark-to-market losses accounted for $42.3 million of this derivative loss for the three months ended September 30, 2008 compared to no gain or loss for the three months ended September 30, 2007. Loss due to realized positions account for $76.3 million for the three months ended September 30, 2008, compared to a net gain of $13.7 million for the three months ended September 30, 2007, a net adverse change of $90.0 million.
Natural gas costs increased $53.0 million, or 286.5%, to $71.5 million for the three months ended September 30, 2008 from $18.5 million for the three months ended September 30, 2007. The increase in natural gas costs for the three months ended September 30, 2008 was primarily attributable to an increase in our production compared to the three months ended September 30, 2007, which accounted for $34.4 million and an increase in natural gas prices per million British Thermal Units, or MMBTU, in 2008, which accounted for $18.6 million. On a cost per gallon basis, natural gas accounted for $0.28 and $0.19 of cost per manufactured gallon sold for the three months ended September 30, 2008 and September 30, 2007, respectively. The increase in natural gas cost per manufactured gallon sold is mainly attributable to the increase in natural gas prices for the period.
Transportation expense increased $48.0 million, or 195.3%, to $72.6 million for the three months ended September 30, 2008 from $24.6 million for the three months ended September 30, 2007, due to additional volume of ethanol and distillers grain shipped and increased rail rates for 2008. On a cost per gallon basis, transportation expense accounted for $0.29 of cost per manufactured gallon sold for the three months ended September 30, 2008 and $0.26 of cost per manufactured gallon sold for the three months ended September 30, 2007.
Labor and manufacturing overhead costs increased $28.2 million, or 158.8%, to $46.0 million for the three months ended September 30, 2008 from $17.8 million for the three months ended September 30, 2007. The increase was primarily due to the addition of production at our Albion, Bloomingburg, Hankinson, Hartley, Dyersville and US BioEnergy facilities on line on the date of the US BioEnergy Acquisition. On a cost per gallon basis, labor and manufacturing overhead costs accounted for $0.19 of cost per manufactured gallon sold for the three months ended September 30, 2008, and September 30, 2007.
Depreciation as part of labor and manufacturing increased $0.04 per gallon, or 80.0%, to $0.09 for the three months ended September 30, 2008, compared to $0.05 for the three months ended September 30, 2007. The increase is primarily attributable to certain comparatively higher value plants added to the production fleet.
Labor and other manufacturing overhead costs without Depreciation decreased $0.04 per manufactured gallon, or 28.6%, to $0.10 for the nine months ended September 30, 2008, compared to $0.14 for the three months ended September 30, 2007. The decrease is primarily attributable to positive synergies achieved due to a stronger business platform achieved through the US BioEnergy Acquisition.
Other inputs, which include chemicals, water, electricity and denaturant, increased $33.5 million, or 208.0%, to $49.6 million for the three months ended September 30, 2008 from $16.1 million for the three months ended September 30, 2007. The increase is primarily due to the increased volume from the addition of the Albion, Bloomingburg, Hankinson, Hartley, Dyersville and US BioEnergy facilities. On a cost per gallon basis, other inputs accounted for $0.20 of cost per manufactured gallon sold for the three months ended September 30, 2008 and $0.17 of cost per manufactured gallon sold for the three months ended September 30, 2007.
Ethanol purchased for resale cost $250.2 million for the three months ended September 30, 2008. During the quarter, we purchased and resold 95.6 million gallons at an average cost of $2.62 per gallon.
Lower of cost or market adjustment. During the three months ended September 30, 2008, we had an inventory valuation adjustment of $12.9 million attributable to a departure from the cost basis of pricing our corn and ethanol inventories due to the recovery no longer as great as its cost. There was no such departure for the three months ended September 30, 2007. Also included in theLower of cost or market adjustmentis the estimated loss on open forward purchase contracts aggregating to $27.2 million. There was no such loss on open forward purchase contracts for the three months ended September 30, 2007. Given the uncertainty of future ethanol prices, this loss may or may not be recovered, and further losses on the outstanding purchase commitments could be recorded in future periods. coupled with the fact that ethanol prices have declined since September 30, 2008, and if this condition continues further losses will be recognized.
53
Table of Contents
Gross profit. Gross profit decreased $241.4 million, or 1,031.9%, to a loss of $218.0 million for the three months ended September 30, 2008 from $23.4 million profit for the three months ended September 30, 2007. The decrease in gross profit was primarily due to the increase in the average corn cost, mark to market and realized hedge losses, and lower of cost or market adjustmentpartially offset by the increased ethanol volumes sold, increased ethanol prices in the 2008 period compared to the 2007 period, and profit of $7.5 million related to the sale of corn inventory for the three months ended September 30, 2008. Subsequent to September 30, 2008, we continue to operate at a negative gross margin, primarily due to the relative prices of ethanol and corn, which is expected to result in continuing gross losses for the fourth quarter of 2008.
Startup expenses.Startup expenses increased $1.0 million to $2.7 million for the three months ended September 30, 2008 from $1.7 million for the three months ended September 30, 2007. The increase was due to the stage of development of plants under construction or in development in 2008. During 2008, the Welcome and Janesville, Minnesota and Dyersville and Hartley, Iowa facilities were all in startup mode and in the third quarter of 2007, the Hartley, Iowa; Welcome, Minnesota; Reynolds, Indiana; Albion Nebraska and Bloomingburg, Ohio facilities were in startup mode.
Restructuring charge. Restructuring charge relate to personnel and severance costs of duplicate VeraSun employees that were terminated in conjunction with the US BioEnergy Acquisition. For the three months ended September 30, 2008, $0.1 million of restructuring charges were incurred.
Selling, general and administrative expenses. Selling, general and administrative expenses increased $11.4 million, or 115.8% to $21.3 million for the three months ended September 30, 2008 from $9.9 million for the three months ended September 30, 2007. The increase was primarily the result of cost incurred on the unsuccessful equity offering and subsequent strategic alternatives initiative, as well as increased management and administrative costs in the 2008 period to support our growth strategy and the acquisition of US BioEnergy. Selling, general and administrative expenses were $0.06 per total gallon sold in the three months ended September 30, 2008 and $0.10 per total gallon sold in the three months ended September 30, 2007. The decrease in selling, general and administrative expenses per gallon sold is due to the synergies developed with the acquisition of US BioEnergy and gallons purchased for resale.
Goodwill impairment. In the third quarter of 2008, we completed a goodwill impairment evaluation in accordance with SFAS No. 142 to determine if the recorded goodwill was impaired. This evaluation indicated a significant impairment of goodwill, and accordingly we fully impaired the Company’s goodwill and recorded a charge of $263.3 million. No goodwill impairment charge was recorded for the three months ended September 30, 2007.
Long-lived asset impairment. Long-lived asset impairment charges relates to the impairment of property, plant and equipment, economic development bonds, favorable corn procurement agreements and non-compete agreements. These impairments were accounted for in accordance with SFAS No. 144. For the three months ended September 30, 2008, $121.2 million of long-lived asset impairments charges were incurred. No long-lived asset impairment charge was recorded for the three months ended September 30, 2007.
Other income (expense). Interest expense increased $16.7 million, or 138.8% to $28.7 million for the three months ended September 30, 2008, compared to $12.0 million for the three months ended September 30, 2007. The increase is primarily due to debt assumed in the ASA OpCo Holdings and US BioEnergy acquisitions and the recognition of interest expense on debt for which the interest cost was previously being capitalized on facilities that were under construction in prior periods.
Interest cost capitalized for the three months ended September 30, 2008 was $5.1 million compared to $5.7 million for the three months ended September 30, 2007.
Interest income decreased $5.4 million, or 98.7%, to $0.1 million for the three months ended September 30, 2008, compared to $5.5 million for the three months ended September 30, 2007. The decrease was primarily attributable to a decrease in the funds available to be invested in interest bearing securities.
Gain on extinguishment of debt reflects the Company extinguishment of $13.0 million of principal and $0.3 million of accrued interest outstanding on the 2017 Notes in exchange for 1,428,299 shares of the Company’s common stock. The Company recorded a gain on extinguishment of debt in the amount of $3.7 million for the three month ended September 30, 2008. No gain on extinguishment of debt was recorded for the three months ended September 30, 2007.
Other income includes rental income associated with land held for developmental sites and other miscellaneous items.
54
Table of Contents
Income taxes. The income tax benefit was $174.9 million for the three months ended September 30, 2008 compared to $2.4 million benefit for the three months ended September 30, 2007. The effective tax (benefit) rate for the three months ended September 30, 2008 was (26.9)% compared to (45.2)% for the three months ended September 30, 2007. For the three months ended September 30, 2008 the tax benefit rate was less than the U.S. federal income tax rate primarily due to the tax effect of the impairment of non-deductible goodwill in the amount of $30.0 million and the valuation allowance of $48.0 million established against deferred tax assets.
The Company has estimated its federal net operating loss carryforward at September 30, 2008 to be approximately $504.0 million. The Company’s ability to deduct net operating loss carryforwards could be significantly limited if the company were to undergo an ownership change for purposes of section 382 of the Code during or as a result of the Bankruptcy Cases.
The Internal Revenue Service (IRS) examination of the Company for tax year 2004 and the nine-month period ended September 30, 2005 is expected to be settled with a minimal time value adjustment. The IRS accepted the depreciable life of our plant production assets of five years as originally filed which formerly had been a contested issue.
The pre-acquisition US BioEnergy 2005 and 2006 federal income tax audit has been extended to include the 2007 return. We do not anticipate any material changes to the Company’s financial position or results of operations as a result of the US BioEnergy audit.
Nine Months Ended September 30, 2008 Compared to Nine Months Ended September 30, 2007
Total revenues, which include revenues from the sale of ethanol, distillers grains, VE85® and corn, increased by $2,080.2 million, or 388.1%, to $2,616.1 million for the nine months ended September 30, 2008, compared to $535.9 million for the nine months ended September 30, 2007. The increase in total revenues was primarily the result of a 297.2% increase in ethanol volume sold and an increase in average ethanol prices of $0.42 per gallon, or 20.1%, compared to 2007. For the nine months ended September 30, 2008, the Company sold 868.6 million gallons of ethanol, which includes 228.4 million gallons of ethanol that were purchased from others and resold to our customers. Ethanol production increased by 455.8 million gallons, or 192.4%, to 692.7 million gallons compared with the nine months ended September 30, 2007, as a result of the added capacity from the Albion, Nebraska facility in October 2007, the Bloomingburg, Ohio facility in March 2008, the Hankinson, North Dakota facility in July 2008, and the Hartley and Dyersville, Iowa facilities in August 2008 and September 2008, respectively, and the US BioEnergy facilities functional on the day of acquisition on April 1, 2008.
Net sales from ethanol increased $1,702.2 million, or 373.1%, to $2,158.4 million for the nine months ended September 30, 2008 compared with $456.2 million for the nine months ended September 30, 2007. Of the increase, $1,341.7 million was driven by additional volumes of ethanol sold. The increased volume resulted from additional production at the Albion, Bloomingburg, Hankinson, Hartley and Dyersville facilities, which came on line since September 30, 2007, output from the US BioEnergy facilities functional on the day of acquisition on April 1, 2008, and ethanol that was purchased and resold to our customers. Higher ethanol prices contributed $360.5 million of the increased revenue. The average price of ethanol sold was $2.49 per gallon for the nine months ended September 30, 2008, compared to $2.07 per gallon for the nine months ended September 30, 2007.
Net sales from distillers grains increased $248.9 million, or 369.5%, to $316.2 million for the nine months ended September 30, 2008 compared with $67.3 million for the nine months ended September 30, 2007. Increased volume and prices contributed $134.8 million and $114.0 million, respectively, to the increased revenues. The average price per ton of distillers grains increased by $51.99 per ton for the nine months ended September 30, 2008 compared to the nine months ended September 30, 2007.
Net sales of VE85®, our branded E85 product, increased $21.8 million, or 222.8%, to $31.6 million for the nine months ended September 30, 2008 compared with $9.8 million for the nine months ended September 30, 2007, primarily due to an increase in the number of retail outlets selling VE85® resulting in a $14.9 million increase and the impact of higher prices contributing to an additional increase of $6.9 million.
During the second and third quarters, we sold excess corn inventory aggregating to $102.8 million. Excluding the sale of corn inventory, sales for the quarter would have been $2,513.3 million, an increase of $1,977.4 million or 369.0% over the same period in 2007.
Cost of goods sold. Corn costs increased $1,215.8 million, or 432.7%, to $1,496.8 million for the nine months ended September 30, 2008, compared with $281.0 million for the nine months ended September 30, 2007. If the corn sales of $102.8 million are netted with corn costs, the total corn costs for the nine months ended would have been $1,394.0 million, an increase of $1,113.0 million or 369.1% over the same period in 2007.
55
Table of Contents
Corn costs (net of corn sales) were $5.94 per bushel or $2.18 per manufactured gallon sold for the nine months ending September 30, 2008, compared with $3.58 per bushel or $1.28 per manufactured gallon sold for the same period in 2007.
The increase in corn costs (net of corn sales) is attributable to three main factors: increased volume, increased corn prices, and losses due to corn-related derivatives. Increased volume contributed $551.1 million, reflecting increased corn purchases resulting from additional production from the Albion, Bloomingburg, Hankinson, Hartley and Dyersville facilities, which came on line since September 30, 2007, and the US BioEnergy facilities functional on the day of acquisition on April 1, 2008. Increased corn prices account for $441.9 million of the increased corn costs. Losses on corn related derivatives accounted for a $120.0 million increase in corn costs during the nine months ended September 30, 2008, compared to the same period in 2007.
Corn related derivatives losses of $114.3 million during the nine months ended September 30, 2008 compared to a gain of $5.7 for the nine months ended September 30, 2007. The losses are attributable to unrealized mark-to-market open positions of forward purchase contracts executed prior to September 1, 2008, and realized hedging losses on exiting futures contracts due to unacceptable margin exposure and settled forward purchase contracts. Mark-to-market losses accounted for $12.3 million of this derivative loss for the nine months ended September 30, 2008 compared to $0.1 million in gains for the nine months ended September 30, 2007. Losses due to realized positions account for $102.0 million for the nine months ended September 30, 2008 compared to a net gain of $5.6 million for the nine months ended September 30, 2007, a net change of $107.6 million.
Natural gas costs increased $133.3 million, or 280.2%, to $180.9 million for the nine months ended September 30, 2008 from $47.6 million for the nine months ended September 30, 2007. The increase in natural gas costs for the nine months ended September 30, 2008 was primarily attributable to an increase in our production compared to the nine months ended September 30, 2007, which accounted for $74.6 million and an increase in natural gas prices per million British Thermal Units, or MMBTU, in 2008, which accounted for $58.7 million. On a cost per gallon basis, natural gas accounted for $0.28 of cost per manufactured gallon sold for the nine months ended September 30, 2008 and $0.22 of cost per manufactured gallon sold for the nine months ended September 30, 2007. The increase in natural gas cost per manufactured gallon sold is mainly attributable to the increase in natural gas prices for the period.
Transportation expense increased $118.5 million, or 216.2%, to $173.3 million for the nine months ended September 30, 2008 from $54.8 million for the nine months ended September 30, 2007, due to additional volume of ethanol and distillers grain shipped and increased rail rates for 2008. On a cost per gallon basis, transportation expense accounted for $0.27 of cost per manufactured gallon sold for the nine months ended September 30, 2008 and $0.25 of cost per manufactured gallon sold for the nine months ended September 30, 2007.
Labor and manufacturing overhead costs increased $75.2 million, or 205.8%, to $111.7 million for the nine months ended September 30, 2008 from $36.5 million for the nine months ended September 30, 2007. The increase was primarily due to the addition of production at our Albion, Bloomingburg, Hankinson, Hartley, Dyersville and US BioEnergy facilities on line at the date of the US BioEnergy Acquisition. On a cost per gallon basis, labor and manufacturing overhead costs accounted for $0.17 of cost per manufactured gallon sold for the nine months ended September 30, 2008 and September 30, 2007.
Depreciation as part of labor and manufacturing overhead costs increased $0.03 per manufactured gallon, or 60.0%, to $0.08 for the nine months ended September 30, 2008, compared to $0.05 for the nine months ended September 30, 2007. The increase is primarily attributable to certain comparatively higher value plants added to the production fleet.
Labor and other manufacturing overhead costs without Depreciation decreased $0.03 per manufactured gallon, or 25.0%, to $0.09 for the nine months ended September 30, 2008, compared to $0.12 for the nine months ended September 30, 2007. The decrease is primarily attributable to positive synergies achieved due to a stronger business platform achieved through the US BioEnergy Acquisition.
Other inputs, which include chemicals, electricity and denaturant, increased $76.4 million, or 211.9%, to $112.4 million for the nine months ended September 30, 2008 from $36.0 million for the nine months ended September 30, 2007. The increase is primarily due to the increased volume from the addition of the Albion, Bloomingburg, Hankinson, Hartley, Dyersville and US BioEnergy facilities online on the date of the acquisition. On a cost per gallon basis, other inputs accounted for $0.18 and $0.16 of cost per manufactured gallon sold for the nine months ended September 30, 2008 and September 30, 2007 respectively.
Ethanol purchased for resale cost $578.7 million for the nine months ended September 30, 2008. During the first nine months of 2008 we purchased and resold 228.4 million gallons at an average cost of $2.53 per gallon. No ethanol was purchased for resale in the first nine months of 2007.
Lower of cost or market adjustment. During the nine months ended September 30, 2008, we had an inventory valuation adjustment of $12.9 million attributable to a departure from the cost basis of pricing our corn and ethanol inventories due to the recovery no longer as great as its cost. There was no such departure for the nine months ended September 30, 2007. Also included in theLower of cost or market adjustmentis the estimated loss on open forward purchase contracts aggregating to $27.2 million. There was no such loss on open forward purchase contracts for the nine months ended September 30, 2007. Given the uncertainty of future ethanol prices, this loss may or may not be recovered, and further losses on the outstanding purchase commitments could be recorded in future periods coupled with the fact that ethanol prices have declined since September 30, 2008, and if this condition continues further losses will be recognized.
Gross profit. Gross profit decreased $176.0 million, or 270.4%, to a loss of $110.9 million for the nine months ended September 30, 2008 from $65.1 million gain for the nine months ended September 30, 2007. The decrease in gross profit was primarily due to the increase in the average corn cost, mark to market and realized hedge losses, and lower of cost or market adjustmentoffset by the increased ethanol volumes sold, increased ethanol prices in the 2008 period compared to the 2007 period, and profit of $15.6 million related to the sale of corn inventory for the nine months ended September 30, 2008. Subsequent to September 30, 2008, we continue to operate at a negative gross margin, primarily due to the relative prices of ethanol and corn, which is expected to result in continuing gross losses for the fourth quarter of 2008.
56
Table of Contents
Startup expenses.Startup expenses increased $6.1 million, or 189.3%, to $9.4 million for the nine months ended September 30, 2008 from $3.3 million for the nine months ended September 30, 2007. The increase was due to the increase in the number of plants under construction or in development. During 2008, the Reynolds, Indiana; Welcome and Janesville, Minnesota; Hankinson, North Dakota; Bloomingburg, Ohio; and Dyersville and Hartley, Iowa facilities were all in startup mode and in the third quarter of 2007, the Hartley, Iowa; Welcome, Minnesota; Reynolds, Indiana; Albion Nebraska and Bloomingburg, Ohio facilities were in startup mode.
Restructuring charge. Restructuring charge relates to personnel and severance costs of duplicate VeraSun employees that were terminated in conjunction with the US BioEnergy merger. For the nine months ended September 30, 2008, $2.1 million of restructuring charges were incurred.
Selling, general and administrative expenses. Selling, general and administrative expenses increased $20.8 million, or 73.6%, to $49.0 million for the nine months ended September 30, 2008 from $28.2 million for the nine months ended September 30, 2007. The increase was primarily the result of increased management and administrative costs in the 2008 period to support our growth strategy. Selling, general and administrative expenses were $0.06 per total gallons sold in the nine months ended September 30, 2008, compared to $0.13 per total gallons sold in the nine months ended September 30, 2007. The decrease in selling, general and administrative expenses per gallon sold is due to the synergies developed with the acquisition of US BioEnergy and gallons purchased for resale.
Goodwill impairment. In the third quarter of 2008, we completed a goodwill impairment evaluation in accordance with SFAS No. 142 to determine if the recorded goodwill was impaired. This evaluation indicated a significant impairment of goodwill, and accordingly we fully impaired the Company’s goodwill and recorded a charge of $263.3 million. No goodwill impairment charge was recorded for the nine months ended September 30, 2007.
Long-lived asset impairment. Long-lived asset impairment charges relates to the impairment of property, plant and equipment, economic development bonds, favorable corn procurement agreements and non-compete agreements. These impairments were accounted for in accordance with SFAS No. 144. For the nine months ended September 30, 2008, $121.2 million of long-lived asset impairments charges were incurred. No long-lived asset impairment charge was recorded for the nine months ended September 30, 2007.
Other income (expense). Interest expense increased $35.1 million, or 175.8%, to $55.0 million for the nine months ended September 30, 2008, compared to $19.9 million for the nine months ended September 30, 2007. The increase is primarily due to debt assumed in the acquisitions of ASA OpCo Holdings and US BioEnergy and the recognition of interest expense on debt for which the interest cost was previously being capitalized on facilities that were under construction in prior periods.
Interest cost capitalized for the nine months ended September 30, 2008 was $32.0 million compared to $14.0 million for the nine months ended September 30, 2007.
Interest income decreased $12.8 million, or 88.8%, to $1.6 million for the nine months ended September 30, 2008, compared to $14.4 million for the nine months ended September 30, 2007. The decrease was primarily attributable to a decrease in the funds available to be invested in interest bearing securities.
Gain on extinguishment of debt reflects the Company extinguishment of $13.0 million of principal and $0.3 million of accrued interest outstanding on the 2017 Notes in exchange for 1,428,299 shares of the Company’s common stock. The Company recorded a gain on extinguishment of debt in the amount of $3.7 million for the nine month ended September 30, 2008. The gain was computed by deducting the market price of the stock issued as of the date issued, from the carrying values of the debt extinguished. Such amount included the write-off of unamortized debt issuance cost, unamortized debt discount, and transaction cost totaling $0.4 million. No gain on extinguishment of debt was recorded for the nine months ended September 30, 2007.
Other income includes rental income associated with land held for developmental sites and other miscellaneous items.
57
Table of Contents
Income taxes. The income tax benefit was $159.7 million for the nine months ended September 30, 2008 compared to $5.6 million provision for the nine months ended September 30, 2007. The effective tax (benefit) rate for the nine months ended September 30, 2008 was (26.4)% compared to 19.7% for the nine months ended September 30, 2007. For the nine months ended September 30, 2008, the tax benefit rate was less than the U.S. federal income tax rate primarily due to the tax effect of the impairment of non-deductible goodwill of $30.0 million and the valuation allowance of $48.0 million established against deferred tax assets.
The Company has estimated its federal net operating loss carryforward at September 30, 2008 to be approximately $504.0 million. The Company’s ability to deduct net operating loss carryforwards could be significantly limited if the company were to undergo an ownership change for purposes of section 382 of the Code during or as a result of the Bankruptcy Cases.
The Internal Revenue Service (IRS) examination of the Company for tax year 2004 and the nine-month period ended September 30, 2005 is expected to be settled with a minimal time value adjustment. The IRS accepted the depreciable life of our plant production assets of five years as originally filed which formerly had been a contested issue.
The pre-acquisition US BioEnergy 2005 and 2006 federal income tax audit has been extended to include the 2007 return. We do not anticipate any material changes to the Company’s financial position or results of operations as a result of the US BioEnergy audit.
Liquidity and Capital Resources
The following table summarizes our sources and uses of cash and cash equivalents for the periods presented (in thousands):
| Nine Months Ended September 30, | ||||||||
| 2008 | 2007 | |||||||
| (unaudited) | ||||||||
Net cash (used in) provided by operating activities | $ | (78,562 | ) | $ | 73,646 | |||
Net cash used in investing activities | (191,367 | ) | (552,506 | ) | ||||
Net cash provided by financing activities | 168,313 | 481,031 | ||||||
Net (decrease) increase in cash and cash equivalents | $ | (101,616 | ) | $ | 2,171 | |||
As of September 30, 2008, we had cash and cash equivalents of $9.3 million compared to $320.2 million at September 30, 2007. We also had $14.8 million of cash that is restricted under the terms of credit agreements, compared to none at September 30, 2007.
Cash used in operating activities was $78.6 million for the nine months ended September 30, 2008, compared to $73.6 million of cash provided by operating activities for the nine months ended September 30, 2007. Our working capital decreased $54.5 million during the nine months ended September 30, 2008, primarily due to the payment of accounts payables and recognition of lower of cost to market adjustment to inventory offset by an increase in trade receivable collections.
Cash used in investing activities was $191.4 million for the nine months ended September, 2008 compared to cash used of $552.5 million in the nine months ended September 30, 2007. The decrease was primarily the result of the cash paid for the ASA Acquisition in 2007 compared to the cash received from the US BioEnergy Acquisition in 2008, plus fewer facilities under construction during the current period.
Cash provided by financing activities for the nine months ended September 30, 2008 was $168.3 million, compared to $481.0 million for the nine months ended September 30, 2007. The decrease was primarily due to less proceeds from long-term debt in the current period.
As a result of the Bankruptcy Filing and the circumstances leading to the Bankruptcy Filing, described elsewhere in this report, we face uncertainty regarding the adequacy of our liquidity and capital resources and have limited access to financing. During the pendency of the Bankruptcy Cases, we expect that our primary sources of liquidity will be cash flows from operations and borrowings under such DIP financing as we may be able to obtain. In addition to the cash requirements necessary to fund ongoing operations, we have incurred significant professional fees and other costs in connection with the Bankruptcy Cases and expect that we will continue to incur significant professional fees and costs. The structure of our current interim and proposed DIP financing is such that borrowings under each of the various borrowing arrangements comprising the DIP financing are available only to particular operating subsidiaries or groups of operating subsidiaries and are not available to VeraSun Energy Corporation and its other subsidiaries for general corporate purposes. We cannot assure you that the amounts of cash available from operations, together with any DIP financing, will be sufficient to fund our operations, including operations during the period until such time as we are able to propose a plan of reorganization that will receive the requisite acceptance by creditors and be confirmed by the Bankruptcy Court. Our long-term liquidity requirements and the adequacy of our capital resources are difficult to predict at this time and ultimately cannot be determined until a plan of reorganization has been developed and is confirmed by the Bankruptcy Court.
On October 31, 2008, the date of the Bankruptcy Filing, we had approximately $15.2 million in cash and cash
58
Table of Contents
equivalents on hand. On November 3, 2008, we obtained agreements from certain lenders, subject to specified conditions, for DIP financing of up to $215.0 million to provide liquidity to the Other VSE Debtors and the AgStar Debtors during the reorganization process. Of that amount, approximately $15.0 million was made available immediately to fund the operations of the Other VSE Debtors, with an additional $10.0 million to be made available to the Other VSE Debtors upon execution and delivery of definitive loan documentation, during an interim period until the Bankruptcy Court issues an order approving the DIP financing on a final basis (the “Interim Period”). The Interim Period is currently expected to extend to December 2, 2008. Initial DIP financing of $15.0 million in the aggregate was made available immediately to the AgStar Debtors for the Interim Period. At the end of the Interim Period, subject to satisfaction of the terms and conditions of the DIP financing agreements, the balance of the proposed DIP financing will be sought to be approved by the Bankruptcy Court, comprising an additional $135.7 million to $165.0 million for the Other VSE Debtors (of which not less than $84.2 million will be used to discharge $84.2 million aggregate principal amount of Senior Secured Notes held by lenders under such DIP financing) and an additional $10.0 million for the AgStar Debtors. There can be no assurance, however, that the Other VSE Debtors or the AgStar Debtors will be able to satisfy the conditions necessary to retain the DIP financing received on November 3, 2008 or to secure the balance of the proposed DIP financing.
In addition to the DIP financing, under interim cash collateral orders entered by the Bankruptcy Court, the Debtors, including our operating subsidiaries other than the Other VSE Debtors and the AgStar Debtors, are authorized to use the cash collateral of their respective creditors to fund specified operations and pay specified expenses of the Bankruptcy Cases. The interim cash collateral orders include authorization for the applicable Debtors to use cash collateral of the Pre-Petition Revolving Credit Facility Lenders. There can be no assurance that we will be able to continue to have access to the cash collateral of the Pre-Petition Revolving Credit Facility Lenders or other secured creditors.
Funds available under interim DIP financing, together with cash generated from operations, are expected to be sufficient to fund operations of the Other VSE Debtors during the Interim Period until December 2, 2008. Funds available under interim DIP financing, together with cash generated from operations, are not expected to be sufficient to fund operations of AgStar Debtors during the Interim Period. We have requested that the lenders under the AgStar Debtors’ DIP financing provide additional funds during the Interim Period. In the event they or other lenders do not provide additional funds to the AgStar Debtors during the interim period, the production facilities of one or more of the AgStar Debtors may be required to operate at reduced levels or temporarily shut down. Cash available to our operating subsidiaries other than the Other VSE Debtors and the AgStar Debtors, including cash generated from operations, is not expected to be sufficient to fund operations at those operating subsidiaries, which account for approximately 31% of our production capacity, during the Interim Period. A number of our plants have been operating significantly below capacity during October 2008 and November 2008 due to continuing liquidity pressure as a result of restrictions on trade credit from our corn suppliers and transport providers.
We anticipate that funds available under any DIP financing will not be sufficient to fund the startup of production at our Welcome and Janesville, Minnesota facilities during 2008. We may maintain those facilities in a startup state or secure them to be idle for a longer term depending on availability of funds to take such actions.
We also anticipate that funds available under any DIP financing will not be sufficient to fund capital expenditures beyond those necessary to permit us to comply with our regulatory requirements. Consequently, we do not expect to continue in the near term construction of our Aurora, South Dakota oil extraction project, our Reynolds, Indiana ethanol production facility or any other production facilities at our existing expansion sites. We may seek to sell these and other assets.
Our ability to continue as a going concern is dependent upon, among other things, (i) our ability to secure adequate DIP financing; (ii) our ability to comply with the terms and conditions of any DIP financing and any cash collateral order entered by the Bankruptcy Court in connection with the Bankruptcy Cases; (iii) our ability to maintain adequate cash on hand; (iv) our ability to generate cash from operations; (v) our ability to obtain confirmation of and to consummate a plan of reorganization under the Bankruptcy Code; (vi) the cost, duration and outcome of the reorganization process; and (vii) our ability to achieve profitability. Uncertainty as to the outcome of these factors raises substantial doubt about our ability to continue as a going concern. We are currently evaluating various courses of action to address the operational and liquidity issues the Company is facing and are in the process of attempting to secure DIP financing and formulating plans for improving operations. There can be no assurance that any of these efforts will be successful.
Off-Balance Sheet Arrangements
The Company had no off-balance sheet arrangements as of September 30, 2008.
Contractual Obligations
The following table summarizes the Company’s contractual obligations as of September 30, 2008. Our contractual obligations increased significantly compared to the contractual obligations as of December 31, 2007 due to the completion of the US BioEnergy Acquisition on April 1, 2008.
59
Table of Contents
| Types of Obligations | ||||||||||||||||||
| (in thousands) | Long-term debt obligations (1) | Operating lease obligations | Purchase obligations (2) | Other purchase obligations (3) | Construction obligations (4) | Total contractual obligations | ||||||||||||
Remaining 2008 | $ | 363 | $ | 16,300 | $ | 246,218 | $ | 40,782 | $ | — | $ | 303,663 | ||||||
Year ended 2009 | 1,536 | 61,307 | 178,372 | 57,247 | — | 298,462 | ||||||||||||
Year ended 2010 | 1,522 | 51,759 | 23,063 | 19,029 | — | 95,373 | ||||||||||||
Year ended 2011 | 1,507 | 50,138 | 89 | 18,904 | — | 70,638 | ||||||||||||
Year ended 2012 | 1,402 | 43,464 | — | 18,796 | — | 63,662 | ||||||||||||
Year ended 2013 | 1,315 | 38,252 | — | 18,421 | — | 57,988 | ||||||||||||
Thereafter | 11,212 | 80,970 | — | 98,999 | — | 191,181 | ||||||||||||
Total | $ | 18,857 | $ | 342,170 | $ | 447,742 | $ | 272,178 | $ | — | $ | 1,080,967 | ||||||
The Company may assume, assume and assign or reject certain executory contracts and unexpired leases pursuant to the Bankruptcy Code. As a result, the Company anticipates that its lease obligations as currently detailed in the above table may change significantly in the future.
| (1) | As a result of the Bankruptcy Filing, the Company is not permitted to make any payments on certain pre-petition debt and, therefore, those amounts have been excluded from the table (see Note 8 to the accompanying condensed consolidated financial statements). Included in the table are principal and interest payments in the Company’s tax increment revenue note, community redevelopment revenue bonds, and other debt consisting of capital leases and economic development loans. |
| (2) | Purchase obligations include corn contracts and a multi-year corn purchase agreement under which we expect to take delivery. To quantify the purchase obligation under certain of our corn contracts and our multi-year corn purchase agreement, we have used our September 30, 2008 published bid prices for corn. |
| (3) | Other purchase obligations include estimated payments for electricity and water supply agreements, natural gas purchase contracts and open purchase orders. |
| (4) | Open purchase orders related to completion of the Reynolds facility aggregating to $70.2 million as of June 30, 2008 are not included herein because they are in the process of being cancelled in connection with the Company’s permanent suspension of the construction of the Reynolds facility (see Notes 4 and 9 to the accompanying condensed consolidated financial statements) and the Bankruptcy Filing (see Note 15 to the accompanying condensed consolidated financial statements). |
| ITEM 3. | QUANTITATIVE AND QUALITATIVE DISCLOSURES ABOUT MARKET RISK |
The following section discusses significant changes in market risks since our latest fiscal year end. You should read this discussion in conjunction with the disclosures made in our Annual Report on Form 10-K for the year ended December 31, 2007 and the risks described in Part II, Item IA of this quarterly report.
Market risk is the potential economic loss that may result from adverse changes in the fair value of financial instruments. VeraSun is exposed to market risk from changes in both commodity prices and interest rates. VeraSun monitors its exposure to commodity risks and has historically attempted to manage these risks by hedging commodity contracts. During the third quarter, VeraSun liquidated substantially all of its corn futures positions and became exposed to market risk on priced future corn purchase commitments. Subsequent to September 30, 2008, the Company liquidated all remaining corn futures positions. Presently, because of its limited liquidity, VeraSun attempts to manage its risks by relying on natural hedging imbedded in its business.
In addition to risks inherent in our operations, as a commodity-based business we are subject to a variety of market factors, including the price relationship between ethanol and corn as shown in the following graph:
60
Table of Contents
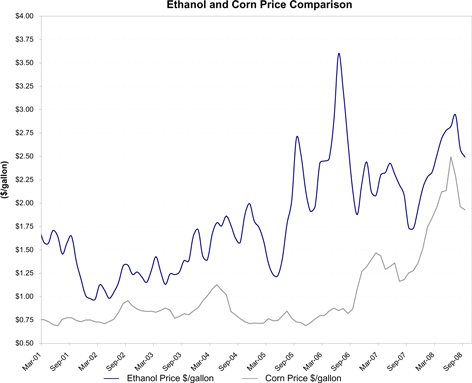
| (1) | Ethanol prices are based on the monthly average of the daily closing price of U.S. average ethanol rack prices quoted by Bloomberg, L.P. (“Bloomberg”). The corn prices are based on the monthly average of the daily closing prices of the nearby corn futures quoted by the Chicago Board of Trade (“CBOT”) and assume a conversion rate of 2.8 gallons of ethanol produced per bushel of corn. The comparison between the ethanol and corn prices presented does not reflect the costs of producing ethanol other than the cost of corn, and should not be used as a measure of future results. This comparison also does not reflect the revenues that are received from the sale of distillers grains. |
We consider market risk to be the potential loss arising from adverse changes in market rates and prices. We are subject to significant market risk with respect to the price of ethanol, our principal product, and the price and availability of corn, the principal commodity used in our ethanol production process. In general, ethanol prices are influenced by the supply and demand for gasoline, the availability of substitutes and the effect of laws and regulations. Higher corn costs result in lower profit margins and, therefore, represent unfavorable market conditions. Historically, we have not been able to pass along increased corn costs to our ethanol customers. The availability and price of corn are subject to wide fluctuations due to unpredictable factors such as weather conditions during the corn growing season, carry-over from the previous crop year and current crop year yield, governmental policies with respect to agriculture and international supply and demand. Corn costs represented approximately 55.7% of our total cost of goods sold related to manufactured ethanol gallons for the nine months ended September 30, 2008 compared to 59.7% for the nine months ended September 30, 2007. Over the ten-year period from 1998 through 2007, corn prices (based on the CBOT daily futures data) have ranged from a low of $1.75 per bushel on August 11, 2000 to a high of $4.56 per bushel on December 31, 2007 with prices averaging $2.42 per bushel during this period. At October 30, 2008, the CBOT price per bushel of corn for December delivery was $4.01 per bushel.
We are also subject to market risk with respect to our supply of natural gas that is consumed in the ethanol production process and has been historically subject to volatile market conditions. Natural gas prices and availability are affected by weather conditions and overall economic conditions. Natural gas costs represented 6.7% of our total cost of goods sold related to manufactured ethanol gallons for the nine months ended September 30, 2008, compared to 10.1% for the nine months ended September 30, 2007.
61
Table of Contents
The price fluctuation in natural gas prices over the five-year period from 2003 through 2007, based on the New York Mercantile Exchange, or NYMEX, daily futures data, has ranged from a low of $4.20 per MMBTU on September 27, 2006 to a high of $15.38 per MMBTU on December 13, 2005, averaging $6.96 per MMBTU during this period. At October 28, 2008, the NYMEX price of natural gas for December delivery was $6.18 per MMBTU.
We have prepared a sensitivity analysis to estimate our exposure to market risk with respect to our corn and natural gas requirements, ethanol contracts and the related exchange-traded contracts for 2007. Market risk related to these factors is estimated as the potential change in pre-tax income, resulting from a hypothetical 10% adverse change in the fair value of our corn and natural gas requirements and ethanol contracts (based on average prices for 2007) net of the corn and natural gas forward and futures contracts used to hedge our market risk with respect to our corn and natural gas requirements. The results of this analysis are set forth in the following table. Actual results may differ from these amounts due to various factors, including significant increases in the Company’s production capacity during 2008.
| Volume Requirements | Units | Hypothetical Adverse Change in Price | Change in Annual Pre-Tax Income | ||||||||
| (In millions) | (In millions) | ||||||||||
Ethanol | 353.1 | gallons | 10 | % | $ | (70.8 | ) | ||||
Corn | 126.1 | bushels | 10 | (45.4 | ) | ||||||
Natural gas | 10.7 | MMBTU | 10 | (7.7 | ) | ||||||
As of September 30, 2008, we had contracted forward on a fixed price basis the following quantities of corn and natural gas, which represent the indicated percentages of our estimated requirements for these inputs for the next twelve months:
| Three months ending December 31, 2008 | Three months ending March 31, 2009 | Three months ending June 30, 2009 | Three months ending September 30, 2009 | Twelve months ending September 30, 2009 | |||||||||||
Corn (thousands of bushels) | 51,768 | 18,458 | 4,455 | 5,480 | 80,161 | ||||||||||
Percentage of estimated requirements | 42.7 | % | 15.7 | % | 3.3 | % | 3.9 | % | 15.6 | % | |||||
Natural Gas (MMBTU) | 3,500 | — | — | — | 3,500 | ||||||||||
Percentage of estimated requirements | 35.7 | % | 0.0 | % | 0.0 | % | 0.0 | % | 8.3 | % |
The extent to which we enter into these arrangements varies substantially from time to time based on a number of factors, including supply and demand factors affecting the needs of customers or suppliers to purchase ethanol or sell us raw materials on a fixed basis, our views as to future market trends, seasonal factors and the costs of futures contracts.
Credit Risk Management: Credit risk is the possibility of loss from a customer’s failure to make payments according to contract terms. Prior to granting credit, each customer is evaluated, taking into consideration the borrower’s financial condition, collateral, debt-servicing capacity, past payment experience, credit bureau information, and other financial and qualitative factors that may affect the borrower’s ability to repay. Specific credit reviews and standard industry credit scoring models are used in performing this evaluation. Loans that have been granted are typically monitored through an asset-quality-review process that closely monitors past due accounts and initiates collection actions when appropriate
Counterparty Risk Management: VeraSun is exposed to credit losses in the event of non-performance by the counterparties to its commodity contracts. VeraSun does not obtain collateral or other security to support financial instruments subject to credit risk, but monitors the credit standing of the counterparties. VeraSun does not anticipate non-performance by its counterparties.
As a result of the above market, credit and economic risks, net income and revenues in any particular period may not be representative of full-year results and may vary significantly from year to year and from quarter to quarter.
Interest Rate Risk Management: The Company’s earnings are affected by changes in interest rates due to the impact those changes have on its interest expense from variable long-term debt obligations.
62
Table of Contents
| ITEM 4. | CONTROLS AND PROCEDURES |
In connection with the preparation of this Quarterly Report on Form 10-Q, we carried out an evaluation, under the supervision of our management, including our Chief Executive Officer and principal financial officer, of the effectiveness of the design and operation of our disclosure controls and procedures (as defined in Rule 13a-15(e) and Rule 15d-15(e) under the Exchange Act) as of the end of the period covered by this quarterly report. Based on such evaluation, our Chief Executive Officer and principal financial officer have concluded that, as of the end of such period, our disclosure controls and procedures were ineffective, because of the material weakness described below, in ensuring that information required to be disclosed by the Company in the reports that it files or submits under the Exchange Act is (1) recorded, processed, summarized and reported within the time periods specified in the SEC’s rules and forms and (2) accumulated and communicated to the Company’s management, including our Chief Executive Officer and principal financial officer, as appropriate to allow timely decisions regarding required disclosure. A “material weakness” is a deficiency, or a combination of deficiencies, in internal control over financial reporting that results in a reasonable possibility that a material misstatement of the financial statements will not be prevented or detected on a timely basis.
The material weakness referenced above relates to the analysis and review of complex and nonroutine transactions for accurate and timely disclosure. The Company has identified the following corrective actions necessary to address this material weakness:
| • | engage and involve outside contractors with technical accounting expertise, as needed, early in the process of evaluating complex, non-routine transactions to obtain additional guidance as to the application of generally accepted accounting principles to such transactions; |
| • | require the Company’s senior accounting personnel and principal accounting officer to review, approve and establish standards for documentation, and to document, or directly oversee documentation, of the accounting treatment for complex, non-routine transactions, including the analysis thereof and related conclusions reached; and |
| • | make the periodic sub-certification more robust for timely dissemination of complex, non-routine transactions, including the analysis thereof and related conclusions reached. |
During the fourth quarter of 2008, the Company began implementing, and intends to fully implement, the foregoing corrective actions. The Company believes that these corrective actions will mitigate the material weakness described above during the fourth quarter of 2008 and intends to develop procedures for the testing of the controls implemented through these corrective actions to determine if the material weakness has been remediated.
Except as described above, there has been no change in the Company’s internal control over financial reporting (as such term is defined in Rules 13a-15(f) and 15d-15(f) under the Exchange Act) that occurred in the fiscal quarter ended September 30, 2008 that has materially affected, or is reasonably likely to materially affect, the Company’s internal control over financial reporting.
| ITEM 1. | LEGAL PROCEEDINGS |
On October 31, 2008, the Company and 24 of its subsidiaries filed voluntary petitions for relief under Chapter 11 of the Bankruptcy Code with the United States Bankruptcy Court for the District of Delaware. The Bankruptcy Cases are being jointly administered by the Bankruptcy Court as Case Number 08-12606 (BLS). VeraSun intends to continue to operate its business as debtor-in-possession under the jurisdiction of the Bankruptcy Court and in accordance with the applicable provisions of the Bankruptcy Code and orders of the Bankruptcy Court. As a result of the filing, attempts to collect, secure, or enforce remedies with respect to pre-petition claims against VeraSun are subject to the automatic stay provisions of section 362 of the Bankruptcy Code. The Bankruptcy Cases are discussed in greater detail in Note 15 to the accompanying condensed consolidated financial statements.
| ITEM 1A. | RISK FACTORS |
The following risk factors update and supersede the risk factors included in Item 1A of our Annual Report on Form 10-K for the year ended December 31, 2007 and in Item 1A of Part II of our Quarterly Reports on Form 10-Q for the quarterly periods ended March 31 and June 30, 2008.
63
Table of Contents
The Company filed for reorganization under Chapter 11 on October 31, 2008 and is subject to the risks and uncertainties associated with the Bankruptcy Cases.
For the duration of the Bankruptcy Cases, our operations and our ability to execute our business strategy will be subject to the risks and uncertainties associated with bankruptcy. These risks include:
| • | our ability to continue as a going concern; |
| • | our ability to operate within the restrictions and the liquidity limitations of any DIP financing and any cash collateral order entered by the Bankruptcy Court in connection with the Bankruptcy Cases; |
| • | our ability to obtain Bankruptcy Court approval with respect to motions filed in the Bankruptcy Cases from time to time; |
| • | our ability to develop, prosecute, confirm and consummate a plan of reorganization with respect to the Chapter 11 proceedings; |
| • | the ability of third parties to seek and obtain court approval to terminate or shorten the exclusivity period for us to propose and confirm a plan of reorganization, to appoint a Chapter 11 trustee or to convert the Bankruptcy Cases to Chapter 7 cases; |
| • | our ability to obtain and maintain normal payment and other terms with customers, vendors and service providers; |
| • | our ability to maintain contracts that are critical to our operations; |
| • | our ability to attract, motivate and retain key employees; |
| • | our ability to attract and retain customers; and |
| • | our ability to fund and execute our business plan. |
We will also be subject to risks and uncertainties with respect to the actions and decisions of our creditors and other third parties who have interests in the Bankruptcy Cases that may be inconsistent with our plans.
These risks and uncertainties could affect our business and operations in various ways. For example, negative events or publicity associated with the Bankruptcy Cases could adversely affect our relationships with our vendors and employees, as well as with customers, which in turn could adversely affect our operations and financial condition. Also, pursuant to the Bankruptcy Code, we need Bankruptcy Court approval for transactions outside the ordinary course of business, which may limit our ability to respond timely to events or take advantage of opportunities. Because of the risks and uncertainties associated with the Bankruptcy Cases, we cannot predict or quantify the ultimate impact that events occurring during the Chapter 11 reorganization process will have on our business, financial condition and results of operations, and there is no certainty as to our ability to continue as a going concern.
As a result of the Bankruptcy Cases, realization of assets and liquidation of liabilities are subject to uncertainty. While operating under the protection of the Bankruptcy Code, and subject to Bankruptcy Court approval or otherwise as permitted in the normal course of business, we may sell or otherwise dispose of assets and liquidate or settle liabilities for amounts other than those reflected in our consolidated financial statements. Further, a plan of reorganization could materially change the amounts and classifications reported in our consolidated historical financial statements, which do not give effect to any adjustments to the carrying value of assets or amounts of liabilities that might be necessary as a consequence of confirmation of a plan of reorganization.
A long period of operating under Chapter 11 could harm our business.
A long period of operating under Chapter 11 could adversely affect our business and operations. So long as the Bankruptcy Cases continue, our senior management will be required to spend a significant amount of time and effort dealing with the Bankruptcy Cases instead of focusing exclusively on business operations. A prolonged period of operating under Chapter 11 will also make it more difficult to attract and retain management and other key personnel necessary to the success and growth of our business. In addition, the longer the Bankruptcy Cases continue, the more likely it is that our vendors will lose confidence in our ability to successfully reorganize our business, and they may seek to establish alternative arrangements for providing us with goods and services, including alternative payment arrangements, which in turn could have an adverse effect on our liquidity and/or results of operations. Our having sought bankruptcy protection may also adversely affect our ability to negotiate favorable terms from suppliers, landlords, contract or trading counterparties and others and to attract and retain customers and counterparties. The failure to obtain such favorable terms and to attract and retain customers and other contract or trading counterparties could adversely affect our financial performance.
64
Table of Contents
We may not be able to obtain confirmation of our Chapter 11 plan, and our emergence from Chapter 11 proceedings is not assured.
Our plan of reorganization has not yet been formulated or submitted to the Bankruptcy Court. In order to successfully emerge from Chapter 11 bankruptcy protection, we believe that we must develop, and obtain requisite court and creditor approval of, a viable Chapter 11 plan of reorganization. This process requires us to meet statutory requirements with respect to adequacy of disclosure with respect to a plan, soliciting and obtaining creditor acceptance of a plan, and fulfilling other statutory conditions for plan confirmation. We may not receive the requisite acceptances to confirm a plan. Even if the requisite acceptances of a plan are received, the Bankruptcy Court may not confirm it.
If a plan is not confirmed by the Bankruptcy Court, it is unclear whether we would be able to reorganize our business and what, if any, distributions holders of claims against us, including holders of our 9 7/8% senior secured notes due 2012 and other secured creditors, would ultimately receive with respect to their claims. If an alternative reorganization could not be agreed upon, it is possible that we would have to liquidate our assets, in which case it is likely that holders of claims would receive substantially less favorable treatment than they would receive if we were to emerge as a viable, reorganized entity. While we expect to emerge from Chapter 11 proceedings in the future, there can be no assurance as to whether we will successfully reorganize and emerge from Chapter 11 proceedings or, if we do successfully reorganize, as to when we would emerge from Chapter 11 proceedings.
We have substantial liquidity needs and may be required to seek additional financing.
Our principal sources of liquidity have historically consisted of cash provided by operations, cash and cash equivalents on hand and available borrowings under our credit agreements. Our liquidity position is significantly influenced by our operating results, which in turn are substantially dependent on commodity prices, especially prices for corn, ethanol, natural gas and unleaded gasoline. As a result, adverse commodity price movements adversely impact our liquidity. For the nine months ended September 30, 2008, operating activities used cash of $78.6 million, compared to $73.6 million of cash provided by operating activities for the same period in 2007. The net use of cash for the nine months ended September 30, 2008 was driven primarily by an increase in corn costs (net of corn sales) per manufactured gallon of ethanol, which more than tripled the increase in the average price of ethanol sold compared to the nine months ended September 30, 2007.
We face uncertainty regarding the adequacy of our liquidity and capital resources and have limited access to additional financing. In addition to the cash requirements necessary to fund ongoing operations, we have incurred significant professional fees and other costs in connection with the Bankruptcy Cases and expect that we will continue to incur significant professional fees and costs. The structure of our current interim and proposed DIP financing is such that borrowings under each of the various borrowing arrangements comprising the DIP financing are available only to particular operating subsidiaries or groups of operating subsidiaries and are not available to VeraSun Energy Corporation and its other subsidiaries for general corporate purposes. We cannot assure you that the amounts of cash available from operations, together with any DIP financing, will be sufficient to fund our operations, including operations during the period until such time as we are able to propose a plan of reorganization that will receive the requisite acceptance by creditors and be confirmed by the Bankruptcy Court.
Our liquidity and our ability to continue as a going concern, including our ability to meet our ongoing operational obligations, is dependent upon, among other things: (i) our ability to secure adequate DIP financing; (ii) our ability to comply with the terms and conditions of any DIP financing and any cash collateral order entered by the Bankruptcy Court in connection with the Bankruptcy Cases; (iii) our ability to maintain adequate cash on hand; (iv) our ability to generate cash from operations; (v) our ability to obtain confirmation of and to consummate a plan of reorganization under the Bankruptcy Code; (vi) the cost, duration and outcome of the reorganization process; and (vii) our ability to achieve profitability. Our ability to maintain adequate liquidity depends in part upon industry conditions and general economic, financial, competitive, regulatory and other factors beyond our control. Accordingly, there can be no assurance as to the success of our efforts. In the event that cash flows and any available borrowings under our interim and proposed DIP financing are not sufficient to meet our cash requirements, we may be required to seek additional financing. We can provide no assurance that additional financing would be available or, if available, offered to us on acceptable terms. Our access to additional financing is, and for the foreseeable future will likely continue to be, very limited. Our long-term liquidity requirements and the adequacy of our capital resources are difficult to predict at this time and ultimately cannot be determined until a plan of reorganization has been developed and is confirmed by the Bankruptcy Court.
We may be unable to secure additional financing.
On November 3, 2008, we obtained an aggregate of $30.0 million of interim DIP financing. While we have agreements from certain lenders for an aggregate of up to $215.0 million in DIP financing (including the $30.0 million received on November 3), those DIP financing agreements are subject to conditions, and there can be no assurance that we will be able to obtain DIP financing, other than the $30.0 million of interim DIP financing, on the proposed terms set
65
Table of Contents
forth in those DIP financing agreements or at all. Moreover, we have not obtained DIP financing commitments for several of our operating subsidiaries. In early November 2008, lack of financing led us to delay indefinitely the start-up of our Janesville, Minnesota, facility. If we are unable to secure sufficient DIP financing, we could be forced to discontinue some or all of our operations.
Our ability to arrange financing (including any extension or refinancing) and the cost of the financing are dependent upon numerous factors. Access to capital (including any extension or refinancing) for participants in the biofuels industry, including for us, has been significantly restricted for the last several months and may, as a result of the Bankruptcy Filing, be further restricted in the future. Other factors affecting our access to financing include:
| • | general economic and capital market conditions; |
| • | conditions in biofuels markets; |
| • | regulatory developments; |
| • | credit availability from banks or other lenders for us and our industry peers, as well as the economy in general; |
| • | investor confidence in the biofuels industry and in us; |
| • | the continued reliable operation of our ethanol production facilities; and |
| • | provisions of tax and securities laws that are conducive to raising capital. |
We have financed our existing ethanol production facilities using a variety of leveraged financing structures, consisting of senior secured and unsecured indebtedness, including construction financing, project financing, revolving credit facilities and term loans. Generally, our project financing obligations have been structured to be fully paid out of cash flow provided by the facility or facilities financed or leased. In the event of a default under a financing agreement that we do not cure, the lenders would generally have rights to the facility and any related assets. In the event of foreclosure after a default, we might not retain any interest in the facility. Market conditions and other factors may prevent similar financing for future facilities. It is possible that we may be unable to obtain the financing required to continue to operate our ethanol production facilities on terms satisfactory to us.
We may not have sufficient cash to service our indebtedness and other liquidity requirements.
Our ability to service any DIP financing indebtedness and successfully consummate a plan of reorganization will depend, in part, on our ability to generate cash. We cannot be certain that cash on hand together with cash from operations will by itself be sufficient to meet our cash and liquidity needs. If we are unable to generate enough cash to meet our liquidity needs, we could be forced to discontinue some or all of our operations.
66
Table of Contents
Our proposed DIP financing will impose significant operating and financial restrictions on us, compliance or non-compliance with which could have a material adverse effect on our liquidity and operations.
Restrictions imposed by the terms of our proposed DIP financing could adversely affect us by limiting our ability to plan for or react to market conditions or to meet our capital needs and could result in an event of default under the DIP financing. These restrictions will limit our ability, subject to certain exceptions, to, among other things:
| • | incur additional indebtedness and issue stock; |
| • | make prepayments on or purchase indebtedness in whole or in part; |
| • | pay dividends and other distributions with respect to our capital stock or repurchase our capital stock or make other restricted payments; |
| • | make investments; |
| • | enter into transactions with affiliates on other than arm’s-length terms; |
| • | create or incur liens to secure debt; |
| • | consolidate or merge with another entity, or allow one of our subsidiaries to do so; |
| • | lease, transfer or sell assets and use proceeds of permitted asset leases, transfers or sales; |
| • | incur dividend or other payment restrictions affecting subsidiaries; |
| • | make capital expenditures beyond specified limits; |
| • | engage in specified business activities; and |
| • | acquire facilities or other businesses. |
These limitations could have a material adverse effect on our liquidity and operations. If we fail to comply with the restrictions under any DIP financing and are unable to obtain a waiver or amendment or a default exists and is continuing under the DIP financing, the lenders could declare outstanding borrowings and other obligations under the DIP financing immediately due and payable. Our ability to comply with these restrictions may be affected by events beyond our control, and any material deviations from our forecasts could require us to seek waivers or amendments of covenants or alternative sources of financing or to reduce expenditures. We cannot assure you that such waivers, amendments or alternative financing could be obtained, or if obtained, would be on terms acceptable to us. If we are unable to comply with the terms of the DIP financing, or if we fail to generate sufficient cash flow from operations, or, if it became necessary, to obtain such waivers, amendments or alternative financing, it could adversely impact the timing of, and our ultimate ability to successfully implement, a plan of reorganization.
The prices of our debt and equity securities are volatile, and, in connection with our reorganization, holders of our securities may receive no payment or payment that is less than the face value or purchase price of such securities.
Prior to the Bankruptcy Filing, the market price for our common stock was volatile and, following our bankruptcy filing, the price of our common stock has generally been less than $0.08 per share. Prices for our debt securities are also volatile, and prices for such securities have generally been substantially below par following our bankruptcy filing. In addition, our common stock was suspended from the New York Stock Exchange pending delisting following the Bankruptcy Filing and currently trades over the counter. Accordingly, trading in the securities of the Company may be limited, and holders of such securities may not be able to resell their securities for their purchase price or at all. We can make no assurance that the price of our securities will not fluctuate substantially in the future.
It is possible that, in connection with our reorganization, all of the outstanding shares of common stock could be cancelled, and holders of our common stock may not be entitled to any payment in respect of their shares. In addition, new shares of our common stock may be issued. It is also possible that our obligations to holders of debt may be satisfied by payments to such holders that are less than both the par value of such securities and the price at which holders purchased such securities, or that shares of our common stock may be issued to certain of such holders in satisfaction of their claims. The value of any common stock so issued may be less than the par value or purchase price of such holders’ securities, and the price of any such common shares may be volatile.
Accordingly, trading in our securities during the pendency of the Bankruptcy Cases is highly speculative and poses substantial risks to purchasers of such securities, as holders may not be able to resell such securities or, in connection with our reorganization, may receive no payment, or a payment or other consideration that is less than the par value or the purchase price of such securities.
67
Table of Contents
We may be subject to claims that will not be discharged in the Bankruptcy Cases, which could have a material adverse effect on our results of operations and profitability.
The Bankruptcy Code provides that the confirmation of a plan of reorganization discharges a debtor from substantially all debts arising prior to confirmation and specified debts arising afterwards. With few exceptions, all claims that arose prior to the Petition Date and before confirmation of the plan of reorganization (i) would be subject to compromise and/or treatment under the plan of reorganization or (ii) would be discharged in accordance with the Bankruptcy Code and the terms of the plan of reorganization. Any claims not ultimately discharged by the Bankruptcy Court could have an adverse effect on our results of operations and profitability.
Bankruptcy laws may limit our secured creditors’ ability to realize value from their collateral.
Upon the commencement of a case for relief under Chapter 11, a secured creditor is prohibited from repossessing its security from a debtor in a Chapter 11 case, or from disposing of security repossessed from such debtor, without bankruptcy court approval. Moreover, the Bankruptcy Code generally permits the debtor to continue to retain and use collateral even though the debtor is in default under the applicable debt instruments, provided that the secured creditor is given “adequate protection.” The meaning of the term “adequate protection” may vary according to circumstance, but it is intended in general to protect the value of the secured creditor’s interest in the collateral and may include cash payments or the granting of additional security if and at such times as the Bankruptcy Court in its discretion determines that the value of the secured creditor’s interest in the collateral is declining during the pendency of the Chapter 11 proceedings. The Bankruptcy Court may determine that a secured creditor may not require compensation for a diminution in the value of its collateral if the value of the collateral exceeds the debt it secures.
In view of the lack of a precise definition of the term “adequate protection” and the broad discretionary power of the Bankruptcy Court, we cannot reliably predict:
| • | how long payments under our secured debt could be delayed as a result of the Chapter 11 proceedings; |
| • | whether or when secured creditors (or their applicable agents) could repossess or dispose of collateral; |
| • | the value of the collateral; or |
| • | whether or to what extent secured creditors would be compensated for any delay in payment or loss of value of the collateral through the requirement of “adequate protection.” |
Furthermore, if the Bankruptcy Court determines that the value of the collateral is not sufficient to repay all amounts due on applicable secured indebtedness, the holders of such indebtedness would hold a secured claim only to the extent of the value of their collateral and would otherwise hold unsecured claims with respect to any shortfall. The Bankruptcy Code generally permits the payment and accrual of post-petition interest, costs and attorneys’ fees to a secured creditor during a debtor’s Chapter 11 proceedings only to the extent the value of its collateral is determined by the Bankruptcy Court to exceed the aggregate outstanding principal amount of the obligations secured by the collateral.
Our financial results may be volatile and may not reflect historical trends.
While in bankruptcy, we expect our financial results to continue to be volatile as asset impairments, asset dispositions, restructuring activities, contract terminations and rejections, and claims assessments may significantly impact our consolidated financial statements. As a result, our historical financial performance is likely not indicative of our financial performance after the date of the Bankruptcy Filing. In addition, if we emerge from bankruptcy, the amounts reported in subsequent consolidated financial statements may materially change relative to historical consolidated financial statements, including as a result of revisions to our operating plans pursuant to a plan of reorganization. In addition, if we emerge from bankruptcy, we may be required to adopt fresh start accounting. If fresh start accounting is applicable, our assets and liabilities will be recorded at fair value as of the fresh start reporting date. The fair value of our assets and liabilities may differ materially from the recorded values of assets and liabilities on our consolidated balance sheets. In addition, if fresh start accounting is required, our financial results after the application of fresh start accounting may be different from historical trends. See Note 1 of the notes to the condensed consolidated financial statements in Item 1 of Part I of this report for further information on our accounting while in bankruptcy.
Conducting a successful Chapter 11 reorganization will depend significantly on our ability to retain and motivate management and key employees.
Our success depends significantly on the skills, experience and efforts of our personnel. We do not maintain “key person” life insurance for any of our officers. The loss of any of our officers, including our Chief Restructuring Officer, could have a material adverse effect upon our results of operations and our financial position and could delay or prevent the achievement of our business objectives. Our ability to develop and successfully consummate a plan of reorganization will be highly dependent upon the skills,
68
Table of Contents
experience and effort of our senior management, including our Chief Restructuring Officer, and other personnel. Our ability to attract, motivate and retain key employees is restricted, however, by provisions of the Bankruptcy Code, which limit or prevent our ability to implement a retention program or take other measures intended to motivate key employees to remain with the Company during the pendency of the Chapter 11 proceedings. In addition, we must obtain Bankruptcy Court approval of employment contracts and other employee compensation programs. The loss of the services of one or more members of our senior management or certain employees with critical skills, or a diminution in our ability to attract talented, committed individuals to fill vacant positions when needs arise, could have a material adverse effect on our ability to successfully reorganize and emerge from bankruptcy.
Transfers of our equity, or issuances of equity in connection with our restructuring, may impair our ability to utilize our federal income tax net operating loss carryforwards in the future.
Under federal income tax law, a corporation is generally permitted to deduct from taxable income in any year net operating losses carried forward from prior years. We had net operating loss carryforwards of approximately $504.0 million as of September 30, 2008. Our ability to deduct net operating loss carryforwards could be subject to a significant limitation if we were to undergo an “ownership change” for purposes of Section 382 of the Code during or as a result of the Bankruptcy Cases. During the pendency of the bankruptcy proceedings, the Bankruptcy Court has entered an interim order that places limitations on trading in our common stock, including options to acquire common stock, as further specified in the order. However, we can provide no assurances that these limitations will prevent an “ownership change” or that our ability to utilize our net operating loss carryforwards may not be significantly limited as a result of our reorganization.
Our results of operations, financial position and business are highly dependent on commodity prices, which are subject to significant volatility and uncertainty, and the availability of supplies, so our results could fluctuate substantially.
Our results are substantially dependent on commodity prices, especially prices for corn, natural gas, ethanol and unleaded gasoline. As a result of the volatility of the prices for these items, our results may fluctuate substantially and we may experience periods of declining prices for our products and increasing costs for our raw materials, which could result in operating losses. Although we may attempt to offset a portion of the effects of fluctuations in prices by entering into forward contracts to supply ethanol or purchase corn, natural gas or other items or by engaging in transactions involving exchange-traded futures contracts, the amount and duration of these hedging and other risk mitigation activities may vary substantially over time and these activities also involve substantial risks. See “We may engage in hedging transactions and other risk mitigation strategies that could harm our results of operations” in this Item 1A.
Our business is highly sensitive to corn prices and we generally cannot pass on increases in corn prices to our customers.
Corn is the principal raw material used to produce ethanol and dry and wet distillers grains. As a result, changes in the price of corn can significantly affect our business. Rising corn prices result in higher cost of ethanol and distillers grains. Because ethanol competes with non-corn-based fuels, we generally are unable to pass along increased corn costs to our customers. At certain levels, corn prices may make ethanol uneconomical to use in fuel markets. Corn costs constituted approximately 55.7% of our total cost of manufactured goods sold for the nine months ended September 30, 2008, compared to 59.7% for the nine months ended September 30, 2007. Over the ten-year period from 1998 through 2007, corn prices (based on the Chicago Board of Trade, or the CBOT, daily futures data) ranged from a low of $1.75 per bushel on August 11, 2000 to a high of $4.56 per bushel on December 31, 2007, with prices averaging $2.42 per bushel during this period.
The biofuels industry has experienced significantly higher corn prices commencing in the fourth quarter of 2006, which have since remained at substantially higher levels than in 2006. In the year ended December 31, 2007, CBOT corn prices ranged from a low of $3.10 per bushel to a high of $4.56 per bushel, with prices averaging $3.73 per bushel. For the first nine months of 2008, CBOT corn prices ranged from a low of $4.63 per bushel on January 2, 2008 to a high of $7.55 per bushel on June 27, 2008, with prices averaging $5.76 per bushel. These higher corn prices have had, and if they continue they will have, a material adverse effect on our business, results of operations and financial position.
The price of corn is influenced by weather conditions and other factors affecting crop yields, farmer planting decisions and general economic, market and regulatory factors. These factors include government policies and subsidies with respect to agriculture and international trade, and global and local demand and supply. The significance and relative effect of these factors on the price of corn is difficult to predict. Any event that tends to negatively affect the supply of corn, such as adverse weather or crop disease, could increase corn prices and potentially harm our business. For example, flooding in the Midwest region of the United States earlier this year caused a significant increase in corn prices. Increasing domestic ethanol capacity could boost the demand for corn and result in increased corn prices. In 2007, corn bought by ethanol plants represented approximately 18% of the total corn supply for that year according to results reported by the United States Department of Agriculture, or USDA, and this percentage is expected to increase as additional ethanol capacity comes on line, rising to more than 30% of the total corn supply by 2009/2010 according to the USDA. In addition, the price any of the companies pay for corn at a facility could increase if an additional ethanol production facility is built in the same general vicinity.
69
Table of Contents
We may also have difficulty, from time to time, in physically sourcing corn on economical terms due to supply shortages. Such a shortage could require us to suspend our operations until corn is available at economical terms, which would have a material adverse effect on our business, results of operations and financial position.
The spread between ethanol and corn prices can vary significantly, and a sustained narrow spread, or any further reduction in the spread, would adversely affect our results of operations and financial position.
Our gross margin depends principally on the spread between ethanol and corn prices. During the five-year period from 2003 through 2007, ethanol prices (based on average U.S. ethanol rack prices from Bloomberg) ranged from a low of $1.11 per gallon to a high of $3.98 per gallon, averaging $1.89 per gallon during this period. For the year ended December 31, 2007, ethanol prices averaged $2.12 per gallon, reaching a high of $2.50 per gallon and a low of $1.69 per gallon (based on the daily closing prices from Bloomberg), and for the nine months ended September 30, 2008, ethanol prices as reported by Bloomberg averaged $2.60 per gallon, reaching a high of $3.08 per gallon and a low of $2.17 per gallon. During the second quarter of 2006, the spread between ethanol and corn prices was at historically high levels, driven in large part by oil companies removing a competitive product, MTBE, from the fuel stream and replacing it with ethanol in a relatively short time period. However, this spread fluctuated widely and has been significantly narrower at times since early 2006. On June 17, 2008, for example, the closing prices reported by Bloomberg for ethanol and corn were $2.73 per gallon and $7.42 per bushel, respectively (corresponding to a spread of $0.08, assuming a yield of 2.8 gallons of ethanol per bushel of corn), compared to $3.98 per gallon and $2.40 per bushel, respectively (corresponding to a spread of $3.12, assuming a yield of 2.8 gallons of ethanol per bushel of corn), on July 5, 2006. Fluctuations are likely to continue to occur. A sustained narrow spread or any further reduction in the spread between ethanol and corn prices, whether as a result of sustained high or increased corn prices or sustained low or decreased ethanol prices, would adversely affect our results of operations and financial position. Further, ethanol prices have declined below our marginal cost of production, which could cause us to suspend production of ethanol at some or all of our plants or further delay plant start-ups.
We have recognized impairment charges of $384.5 million for the third quarter of 2008 and could recognize additional impairment charges in the future.
As of the end of the third quarter of fiscal 2008, the Company performed an interim impairment evaluation of its goodwill, other identifiable intangible assets and all its long-lived assets in light of the sustained decrease in the price of VeraSun Energy Corporation common stock relative to the book value of the Company, and declining gross crush margins leading to the substantial net loss incurred during the quarter and the Company’s intention to sell the long-lived assets associated with the Reynolds, Indiana, facility, where construction was previously suspended, and other land located in Litchfield, Granite City and Tilton, Illinois. Based on this evaluation, the Company recorded impairment charges of $384.5 million for the nine months ended September 30, 2008. Due to corn and crude oil price volatility, tight credit markets, the volatility of our stock price and the resulting decline in our market capitalization, the Bankruptcy Filing and the uncertain economic environment, as well as other uncertainties, we can provide no assurance that material impairment charges to intangible assets and long-lived assets will not occur in future periods.
The market for natural gas is subject to conditions that create uncertainty in the price and availability of the natural gas that is used in the ethanol manufacturing process.
We rely upon third parties for our supply of natural gas, which is consumed as fuel in the manufacture of ethanol. The prices for and availability of natural gas are subject to volatile market conditions. These market conditions often are affected by factors beyond our control, such as weather conditions (including hurricanes), overall economic conditions and foreign and domestic governmental regulation and relations. Significant disruptions in the supply of natural gas could impair our ability to manufacture ethanol for our customers. Furthermore, increases in natural gas prices or changes in our natural gas costs relative to natural gas costs paid by competitors may adversely affect our results of operations and financial position. Natural gas costs represented approximately 10.2% of our cost of goods sold for the year ended December 31, 2007, compared to 15.9% for the year ended December 31, 2006, and represented approximately 6.7% of our cost of manufactured goods sold for the nine months ended September 30, 2008, compared to 10.1% for the nine months ended September 30, 2007. The price fluctuations in natural gas prices over the five-year period from 2003 through 2007, based on the New York Mercantile Exchange, or NYMEX, daily futures data, ranged from a low of $4.20 per MMBTU on September 27, 2006 to a high of $15.38 per MMBTU on December 13, 2005, averaging $6.96 per MMBTU during this period. During the nine months ended September 30, 2008, NYMEX natural gas prices ranged from a low of $7.22 per MMBTU on September 29, 2008 to a high of $13.58 per MMBTU on July 3, 2008.
70
Table of Contents
Fluctuations in the selling price and production cost of gasoline may reduce our profit margins.
Ethanol is marketed both as an important fuel component to reduce vehicle emissions from gasoline and as an octane enhancer to improve the octane rating of gasoline with which it is blended. As a result, ethanol prices are influenced by the supply and demand for gasoline and our future results of operations and financial position may be materially adversely affected if gasoline demand or prices decrease.
Historically, the price of a gallon of gasoline has been lower than the cost to produce a gallon of ethanol. In addition, some of our sales contracts provide for pricing on an indexed basis, so that the price we receive for products sold under these arrangements is adjusted as gasoline prices change.
The price of distillers grains is affected by the price of other commodity products, such as soybeans, and decreases in the price of these commodities could decrease the price of distillers grains.
Distillers grains compete with other protein-based animal feed products. The price of distillers grains may decrease when the price of competing feed products decrease. The prices of competing animal feed products are based in part on the prices of the commodities from which they are derived. Downward pressure on commodity prices, such as soybeans, will generally cause the price of competing animal feed products to decline, resulting in downward pressure on the price of distillers grains. Because the price of distillers grains is not tied to production costs, decreases in the price of distillers grains will result in our generating less revenue and lower profit margins.
We may sell more ethanol than we produce and could be required to purchase ethanol at costs that exceed our selling prices.
In some instances our customers’ demand for ethanol is greater than the number of gallons we are able to produce. At times, we may satisfy our customers’ demand by committing to sell more gallons of ethanol than we produce and those volumes may be substantial. On those occasions, we purchase ethanol from other producers and marketers of ethanol for resale to our customers. Our sales commitments may provide for delivery in future periods. Depending on our expectations of market conditions, we may delay purchasing ethanol required to meet our sales commitments until delivery is required to our customers. We may be unable to secure sufficient quantities of ethanol to satisfy our sales commitments. In addition, the prices we pay for ethanol we purchase could exceed the price we obtain from our customers. Although we may take steps to mitigate quantity and pricing risks associated with ethanol we purchase and resell, there can be no assurance that we will do so or that any such steps will be effective. Our failure to manage such risks could result in operating losses and those losses could be substantial.
Our business is subject to seasonal fluctuations.
Our operating results are influenced by seasonal fluctuations in the price of our primary operating inputs, corn and natural gas, and the price of our primary product, ethanol. In recent years, the spot price of corn tended to rise during the spring planting season in May and June and tended to decrease during the fall harvest in October and November. The price of natural gas, however, tends to move opposite of corn and tends to be lower in the spring and summer and higher in the fall and winter. In addition, ethanol prices are substantially correlated with the price of unleaded gasoline. The price of unleaded gasoline tends to rise during the summer. Given our limited history and the growth of the industry, it is unclear how these seasonal fluctuations will affect our results over time.
We may engage in hedging transactions and other risk mitigation strategies that could harm our results of operations.
In an attempt to partially offset the effects of volatility of ethanol prices and corn and natural gas costs, we have in the past entered into, and may in the future enter into, contracts to supply a portion of our ethanol production or purchase a portion of our corn or natural gas requirements on a forward basis. We may also engage in other hedging transactions involving exchange-traded futures contracts for corn, natural gas and unleaded gasoline from time to time. The price of unleaded gasoline also affects the price received for ethanol under indexed contracts entered into by us. The financial statement impact of these activities is dependent upon, among other things, the prices involved and our ability to sell sufficient products to use all of the corn and natural gas for which we have futures contracts. Hedging arrangements also expose us to the risk of financial loss in situations where the other party to the hedging contract defaults on its contract or, in the case of exchange-traded contracts, where there is a change in the expected differential between the price of the commodity underlying the hedging agreement and the actual prices paid or received by us for the physical commodity bought or sold. Hedging activities can themselves result in losses when a position is purchased in a declining market or a position is sold in a rising market. A hedge position is often settled in the same time frame as the physical commodity is either purchased (corn and natural gas) or sold (ethanol). Hedging losses may be offset by a decreased cash price for corn and natural gas and an increased cash price for ethanol. We may also vary the amount of hedging or other risk mitigation strategies we undertake, and we may choose not to engage in hedging transactions at all. As a result, our results of operations and financial position may be adversely affected by increases in the price of corn or natural gas or decreases in the price of ethanol or unleaded gasoline. In the third quarter of 2008, for example, we recorded a loss on corn-related derivatives of $118.6 million.
71
Table of Contents
Growth in the sale and distribution of ethanol is dependent on the changes to and expansion of related infrastructure, which may not occur on a timely basis, if at all, and our operations could be adversely affected by infrastructure disruptions.
Substantial development of infrastructure will be required by persons and entities outside of our control for our operations, and the ethanol industry generally, to grow. Areas requiring expansion include, but are not limited to:
| • | additional rail capacity; |
| • | additional storage facilities for ethanol; |
| • | increases in truck fleets capable of transporting ethanol within localized markets; |
| • | expansion of refining and blending facilities to handle ethanol; |
| • | growth in service stations equipped to handle ethanol fuels; and |
| • | growth in the fleet of flexible fuel vehicles, or FFVs, capable of using E85 fuel. |
The expansion of the ethanol production industry has compounded the issues presented by the need to develop and expand ethanol-related infrastructure, as the lack of infrastructure prevents the use of ethanol in certain areas where there might otherwise be demand and results in excess ethanol supply in areas with more established ethanol infrastructure, depressing ethanol prices in those areas.
Substantial investments required for these infrastructure changes and expansions may not be made or they may not be made on a timely basis. Any delay or failure by us in making the changes to or expansion of infrastructure could hurt the demand or prices for products, impede delivery of products, impose additional costs or otherwise have a material adverse effect on our results of operations or financial position. Our business is dependent on the continuing availability of infrastructure and any infrastructure disruptions could have a material adverse effect on our business.
New plants under construction or decreases in the demand for ethanol may result in excess production capacity in the ethanol industry, which may cause the price of ethanol and/or distillers grains to decrease.
According to the RFA and company estimates, domestic ethanol production capacity has increased from 2.3 BGY as of January 2002 to approximately 10.0 BGY as of September 5, 2008, with additional production capacity of approximately 3.7 BGY under construction. The ethanol industry in the United States now consists of approximately 170 production facilities. Excess capacity in the ethanol industry would have an adverse effect on our results of operations, cash flows and financial position. In a manufacturing industry with excess capacity, producers have an incentive to manufacture additional products for so long as the price exceeds the marginal cost of production (i.e., the cost of producing only the next unit, without regard for interest, overhead or fixed costs). This incentive could result in the reduction of the market price of ethanol to a level that is inadequate to generate sufficient cash flow to cover costs.
Excess capacity may also result from decreases in the demand for ethanol, which could result from a number of factors, including, but not limited to, regulatory developments and reduced U.S. gasoline consumption. Reduced gasoline consumption could occur as a result of increased prices for gasoline or crude oil, which could cause businesses and consumers to reduce driving or acquire vehicles with more favorable gasoline mileage or acquire hybrid vehicles.
In addition, because ethanol production produces distillers grains as a co-product, increased ethanol production will also lead to increased supplies of distillers grains. An increase in the supply of distillers grains, without corresponding increases in demand, could lead to lower prices or an inability to sell our distillers grains production. A decline in the price of distillers grains or the distillers grains market generally could have a material adverse effect on our business, results of operations and financial condition.
We may not be able to compete effectively in our industry.
In the United States, there is competition with other corn processors, ethanol producers and refiners, including Archer Daniels Midland Company (“ADM”), POET, LLC, Hawkeye Renewables, LLC, Aventine Renewable Energy Holdings, Inc (“Aventine”), and Cargill Incorporated (“Cargill”). As of September 5, 2008, the top five producers accounted for approximately 42% of the ethanol production capacity in the United States according to the RFA and our estimates. A number of our competitors are divisions of substantially larger enterprises and have substantially greater financial resources than we do. Smaller competitors also pose a threat. Farmer-owned cooperatives and independent firms consisting of groups of individual farmers and investors have been able to compete successfully in the ethanol industry. These smaller competitors operate smaller facilities that do not affect the local price of corn grown in the proximity of the facility as much as larger facilities do. In addition, many of these smaller competitors are farmer-owned and often require their farmer-owners to commit to selling them a certain amount of corn as a requirement of ownership. Most new ethanol plants under development across the country are individually owned.
72
Table of Contents
In addition to domestic competition, we also face increasing competition from international suppliers. Currently, there is a $0.54 per gallon tariff on foreign produced ethanol which is scheduled to expire December 31, 2010. If this tariff is not renewed, competition from international suppliers would increase. Ethanol imports equivalent to up to 7% of total domestic production in any given year from various countries were exempted from this tariff under the Caribbean Basin Initiative to spur economic development in Central America and the Caribbean. Currently, international suppliers, such as Brazil, produce ethanol primarily from sugar cane and have cost structures that may be substantially lower than ours.
Any increase in domestic or foreign competition could cause us to reduce our prices and take other steps to compete effectively, which could adversely affect our results of operations and financial position.
Our competitive position, financial position and results of operations may be adversely affected by technological advances.
The development and implementation of new technologies may result in a significant reduction in the costs of ethanol production. For instance, any technological advances in the efficiency or cost to produce ethanol from inexpensive, cellulosic sources such as wheat, oat or barley straw could have an adverse effect on our business, because our facilities are designed to produce ethanol from corn, which is, by comparison, a raw material with other high value uses. We do not predict when new technologies may become available, the rate of acceptance of new technologies by competitors or the costs associated with new technologies. In addition, advances in the development of alternatives to ethanol could significantly reduce demand for or eliminate the need for ethanol.
Any advances in technology which require significant capital expenditures to remain competitive or which reduce demand or prices for ethanol would have a material adverse effect on our results of operations and financial position.
In addition, alternative fuels, additives and oxygenates are continually under development. Alternative fuel additives that can replace ethanol may be developed, which may decrease the demand for ethanol. It is also possible that technological advances in engine and exhaust system design and performance could reduce the use of oxygenates, which would lower the demand for ethanol, and our business, results of operations and financial condition may be materially adversely affected.
The U.S. ethanol industry is highly dependent upon federal and state legislation and regulation and any changes in legislation or regulation could materially and adversely affect our results of operations and financial position.
The elimination or significant reduction in the blenders’ credit could have a material adverse effect on our results of operations and financial position. The cost of production of ethanol is made significantly more competitive with regular gasoline by federal tax incentives. The federal excise tax incentive program currently allows gasoline distributors who blend ethanol with gasoline to receive a federal excise tax rate reduction for each blended gallon they sell. If the fuel is blended with 10% ethanol, the refiner/marketer pays $0.051 per gallon less tax, which equates to an incentive of $0.51 per gallon of ethanol. The $0.51 per gallon incentive for ethanol is scheduled to be reduced to $0.46 per gallon in 2009 and to expire in 2010. The blenders’ credits could be eliminated or reduced at any time through an act of Congress and may not be renewed in 2010 or may be renewed on different terms. In addition, the blenders’ credits, as well as other federal and state programs benefiting ethanol (such as tariffs), generally are subject to U.S. government obligations under international trade agreements, including those under the World Trade Organization Agreement on Subsidies and Countervailing Measures, and might be the subject of challenges thereunder, in whole or in part.
Ethanol can be imported into the United States duty-free from some countries, which may undermine the ethanol industry in the United States. Imported ethanol is generally subject to a $0.54 per gallon tariff that was designed to offset the $0.51 per gallon ethanol incentive that is available under the federal excise tax incentive program for refineries that blend ethanol in their fuel. A special exemption from the tariff exists for ethanol imported from 24 countries in Central America and the Caribbean Islands, which is limited to a total of 7% of U.S. production per year. Imports from the exempted countries may increase as a result of new plants under development. Since production costs for ethanol in these countries are estimated to be significantly less than production costs in the United States, the duty-free import of ethanol through the countries exempted from the tariff may negatively affect the demand for domestic ethanol and the price at which we sell ethanol. Although the $0.54 per gallon tariff has been extended through December 31, 2008, bills were previously introduced in both the U.S. House of Representatives and U.S. Senate to repeal the tariff. We do not know the extent to which the volume of imports would increase or the effect on U.S. prices for ethanol if the tariff is not renewed beyond its current expiration. Any changes in the tariff or exemption from the tariff could have a material adverse effect on our results of operations and our financial position. In addition, the North America Free Trade Agreement, or NAFTA, which entered into force on January 1, 1994, allows Canada and Mexico to export ethanol to the United States duty-free or at a reduced rate. Canada is exempt from duty under the current NAFTA guidelines, while Mexico’s duty rate is $0.10 per gallon.
73
Table of Contents
The effect of the renewable fuel standard (“RFS”) program in the Energy Independence and Security Act signed into law on December 19, 2007 (the “2007 Act”) is uncertain. The mandated minimum level of use of renewable fuels in the RFS under the 2007 Act increased to 9 billion gallons per year in 2008 (from 5.4 billion gallons under the RFS enacted in 2005), further increasing to 36 billion gallons per year in 2022. The 2007 Act also requires the increased use of “advanced” biofuels, which are alternative biofuels produced without using corn starch such as cellulosic ethanol and biomass-based diesel, with 21 billion gallons of the mandated 36 billion gallons of renewable fuel required to come from advanced biofuels by 2022. Required RFS volumes for both general and advanced renewable fuels in years to follow 2022 will be determined by a governmental administrator, in coordination with the U.S. Department of Energy and U.S. Department of Agriculture. Increased competition from other types of biofuels could have a material adverse effect on our results of operations and our financial position. See “Our competitive position, financial position and results of operations may be adversely affected by technological advances and our efforts to anticipate and employ such technological advances may prove unsuccessful” in this Item 1A.
The RFS program and the 2007 Act also include provisions allowing “credits” to be granted to fuel producers who blend in their fuel more than the required percentage of renewable fuels in a given year. These credits may be used in subsequent years to satisfy RFS production percentage and volume standards and may be traded to other parties. The accumulation of excess credits could further reduce the impact of the RFS mandate schedule and result in a lower ethanol price or could result in greater fluctuations in demand for ethanol from year to year, both of which could have a material adverse effect on our results of operations and our financial condition.
Waivers of the RFS minimum levels of renewable fuels included in gasoline could have a material adverse effect on our results of operations. Under the RFS as passed as part of the Energy Policy Act of 2005, the U.S. Environmental Protection Agency, or EPA, in consultation with the Secretary of Agriculture and the Secretary of Energy, may waive the renewable fuels mandate with respect to one or more states if the Administrator of the EPA determines upon the petition of one or more states that implementing the requirements would severely harm the economy or the environment of a state, a region or the United States, or that there is inadequate supply to meet the requirement. In addition, the 2007 Act allows any other person subject to the requirements of the RFS or the EPA Administrator to file a petition for such a waiver. Any waiver of the RFS with respect to one or more states could adversely offset demand for ethanol and could have a material adverse effect on our results of operations and our financial condition. In April 2008, Governor Perry (R-TX) submitted a waiver petition to significantly reduce the RFS. The waiver was based on the claim that the ethanol industry was adversely impacting consumer food prices and the livestock industry due to higher grain prices. The waiver request was supported by various senators, including Senator McCain (R-AZ). In August 2008, the EPA ruled that there was not sufficient evidence to grant the waiver and it was denied.
Various studies have criticized the efficiency of ethanol in general, and corn-based ethanol in particular, which could lead to the reduction or repeal of incentives and tariffs that promote the use and domestic production of ethanol or otherwise negatively impact public perception and acceptance of ethanol as an alternative fuel.
Although many trade groups, academics and governmental agencies have supported ethanol as a fuel additive that promotes a cleaner environment, others have criticized ethanol production as consuming considerably more energy and emitting more greenhouse gases than other biofuels and as potentially depleting water resources. Other studies have suggested that corn-based ethanol is less efficient than ethanol produced from switchgrass or wheat grain and that it negatively impacts consumers by causing higher prices for dairy, meat and other foodstuffs from livestock that consume corn. If these views gain acceptance, support for existing measures promoting the use and domestic production of corn-based ethanol could decline, leading to a reduction or repeal of these measures. These views could also negatively impact public perception of the ethanol industry and acceptance of ethanol as an alternative fuel.
We may be materially and adversely affected by environmental, health and safety laws, regulations and liabilities.
We are subject to various federal, state and local environmental laws and regulations, including those relating to the discharge of materials into the air, water and ground, the generation, storage, handling, use, transportation and disposal of hazardous materials, and the health and safety of employees. In addition, some of these laws and regulations require our facilities to operate under permits that are subject to renewal or modification. These laws, regulations and permits can often require expensive pollution control equipment or operational changes to limit actual or potential impacts to the environment. We have not been, and cannot assure you that we will be, at all times in complete compliance with these laws, regulations and permits. A violation of these laws and regulations or permit conditions can result in substantial fines, natural resource damages, criminal sanctions, permit revocations and/or facility shutdowns. In addition, we have made, and will continue to make, significant capital expenditures on an ongoing basis to comply with increasingly stringent environmental laws, regulations and permits.
We may be liable for the investigation and cleanup of environmental contamination at each of the properties we own, lease or operate and at off-site locations where we arrange for the disposal of hazardous substances. If these substances have been or are disposed of or released at sites that undergo investigation and/or remediation by regulatory agencies or private parties, we may be responsible under the Comprehensive Environmental Response, Compensation and Liability Act of 1980, or CERCLA, or other environmental laws for all or part of the costs of investigation and/or remediation, and for damages to natural resources. We may also
74
Table of Contents
be subject to related claims by private parties alleging property damage and personal injury due to exposure to hazardous or other materials at or from those properties. Some of these matters may require us to expend significant amounts for investigation, cleanup or other costs.
In addition, new laws or regulations, new interpretations of existing laws or regulations, increased governmental enforcement of environmental laws or regulations or other developments could require us to make additional significant expenditures or modify our operations. Continued government and public emphasis on environmental issues could result in increased future investments for environmental controls at our production facilities. Present and future environmental laws and regulations (and related interpretations) applicable to our operations, more vigorous enforcement policies and discovery of currently unknown conditions may require substantial capital and other expenditures that could have a material adverse effect on our results of operations and financial position. For example, our air emissions are subject to the federal Clean Air Act, the federal Clean Air Act Amendments of 1990 and similar state and local laws and associated regulations. The EPA has promulgated National Emissions Standards for Hazardous Air Pollutants (NESHAPs) under the federal Clean Air Act that could apply to plants that we own or operate if the emissions of hazardous air pollutants exceed certain thresholds. New or expanded plants would be required to comply with these standards upon startup if they exceed the hazardous air pollutant threshold. In addition to costs for achieving and maintaining compliance with these laws, more stringent standards may also limit our operating flexibility. Likewise, federal and state environmental authorities have recently been investigating alleged excess volatile organic compounds and other air emissions from certain U.S. ethanol plants.
The hazards and risks associated with producing and transporting our products (such as fires, natural disasters, explosions, and abnormal pressures and blowouts) may also result in personal injury claims or damage to property and third parties. As protection against operating hazards, we maintain insurance coverage against some, but not all, potential losses. However, losses could be sustained for uninsurable or uninsured risks, or in amounts in excess of existing insurance coverage. Events that result in significant personal injury or damage to our property or third parties or other losses that are not fully covered by insurance could have a material adverse effect on our results of operations and our financial position.
We are dependent on our production facilities, and any operational disruption may result in a reduction of sales volumes, which could cause substantial losses.
Our revenues are derived from the sale of ethanol and the related co-products produced at our facilities. A major accident or damage by severe weather or other natural disasters may cause significant interruptions at such facilities. In addition, our operations may be subject to labor disruptions and unscheduled downtime, or other operational hazards inherent in the ethanol industry, such as equipment failures, fires, explosions, abnormal pressures, blowouts, pipeline ruptures, transportation accidents and natural disasters. Some of these operational hazards may cause personal injury or loss of life, severe damage to or destruction of property and equipment or environmental damage, and may result in suspension of operations and the imposition of civil or criminal penalties. Our insurance may not be adequate to fully cover the potential operational hazards described above and such insurance may not be renewable on commercially reasonable terms or at all. Moreover, the operation of our plants is subject to various uncertainties, including uncertainties relating to the effectiveness of process improvements designed to achieve increased production capacities. As a result, our plants may not produce ethanol and distillers grains at the levels we expect, and our business, results of operations and financial condition may be materially adversely affected.
Disruptions to infrastructure, or in the supply of fuel, natural gas or water, could materially and adversely affect our business.
Our business depends on the continuing availability of rail, road, port, storage and distribution infrastructure. Any disruptions in this infrastructure network, whether caused by labor difficulties, earthquakes, storms, other natural disasters, human error or malfeasance or other reasons, could have a material adverse effect on our business. We rely upon third-parties to maintain the rail lines from their plants to the national rail network, and any failure on these third parties’ part to maintain the lines could impede the delivery of products, impose additional costs and could have a material adverse effect on our business, results of operations and financial condition.
We also depend on the continuing availability of raw materials, including fuel and natural gas. The production of ethanol, from the planting of corn to the distribution of ethanol to refiners, is highly energy-intensive. Significant amounts of fuel and natural gas are required for the growing, fertilizing and harvesting of corn, as well as for the fermentation, distillation and transportation of ethanol and the drying of distillers grains. A serious disruption in supplies of fuel or natural gas, including as a result of delivery curtailments to industrial customers due to extremely cold weather, or significant increases in the prices of fuel or natural gas, could significantly reduce the availability of raw materials at our plants, increase production costs and could have a material adverse effect on our business, results of operations and financial condition.
Our ethanol plants also require a significant and uninterrupted supply of water of suitable quality to operate. If there is an interruption in the supply of water for any reason, one or more plants may be required to halt production. If production is halted at one or more of these plants for an extended period of time, it could have a material adverse effect on our business, results of operations and financial condition.
75
Table of Contents
Our operating results may suffer if our direct and indirect marketing and sales efforts are not effective.
On March 31, 2007, we terminated our agreements with Aventine regarding the marketing and sale of our ethanol. We currently market and sell ethanol directly to customers, except for the ethanol produced at the facilities acquired in the ASA Acquisition and our Marion, South Dakota, facility. In connection with this activity, we have established our own marketing, transportation and storage infrastructure. We lease tanker railcars and have contracted with storage depots near our customers and at our strategic locations for efficient delivery of our finished ethanol product. We have also hired a marketing and sales force, as well as logistical and other operational personnel to staff our distribution activities. The marketing, sales, distribution, transportation, storage or administrative efforts we have implemented may not achieve results comparable to those achieved by marketing through Aventine. Any failure to successfully execute these efforts would have a material adverse effect on our results of operations and financial position. Our financial results also may be adversely affected by our need to establish inventory in storage locations to facilitate this transition.
Further, ethanol produced at certain of our facilities is or will be marketed by Cargill under agreements that remained in place after closing of the ASA Acquisition and by ADM under an agreement that remained in place after the US BioEnergy Acquisition. We also compete with Cargill and ADM for sales of ethanol and distillers grains. Our direct marketing and sales efforts may be less efficient as a result of the marketing relationships with Cargill and ADM.
Competition for qualified personnel in the ethanol industry is intense and we may not be able to hire and retain qualified personnel to operate our ethanol plants.
Our success depends, in part, on our ability to attract and retain competent personnel. For each of our plants, qualified managers, engineers, operations and other personnel must be hired, which can be challenging in a rural community. Competition for both managers and plant employees in the ethanol industry is intense, and we may not be able to attract and retain qualified personnel. If we are unable to hire and retain productive and competent personnel, the amount of ethanol we produce may decrease and we may not be able to efficiently operate our ethanol plants and execute our business strategy.
Operations at our recently-opened facilities and at any new facilities that we may bring into operation are subject to various uncertainties, which may cause them to not achieve results comparable to existing operational plants.
New plants and additional planned facilities will be subject to various uncertainties as to their ability to produce ethanol and co-products as planned, including the potential for failures of key equipment. Such a failure during test operations delayed the startup process at our Fort Dodge, Iowa, facility, which is now operating at full capacity, in the fall of 2005. Due to these uncertainties, the results of recently-opened facilities or additional new facilities may not be comparable to those of existing operational plants.
We do not own or control some of the assets we depend on to operate our business.
We depend on Cargill and its subsidiaries for various services at the ethanol production facilities we acquired in the ASA Acquisition, including corn procurement, the marketing and sale of ethanol and distillers grains produced at the facilities and risk management. As a result, our results of operations and financial position may be adversely affected if Cargill does not perform these services in an efficient manner.
We are subject to financial reporting and other requirements, for which our accounting, internal audit and other management systems and resources may not be adequately prepared. We have a material weakness in our internal control over financial reporting.
We are subject to reporting and other obligations under the Securities Exchange Act of 1934, as amended (the “Exchange Act”), including the requirements of Section 404 of the Sarbanes-Oxley Act of 2002, as amended. Section 404 requires annual management assessment of the effectiveness of a company’s internal controls over financial reporting and a report by its independent registered public accounting firm addressing the effectiveness of our internal controls over financial reporting. These reporting and other obligations place significant demands on our management, administrative, operational, internal audit and accounting resources. If we are unable to meet these demands in a timely and effective fashion, our ability to comply with our financial reporting requirements and other rules that apply to us could be impaired. Any failure to maintain effective internal controls could have a material adverse effect on our business, results of operations and financial condition.
During our review of our disclosure controls and procedures as of the end of the third quarter of 2008, our Chief Executive Officer and principal financial officer identified a material weakness pertaining to the analysis and review of complex and non-routine
76
Table of Contents
transactions for accurate and timely disclosure. This material weakness and any other material weaknesses that may arise could adversely affect our financial reporting process and our financial statements. Any failure to remediate this material weakness or any other material weaknesses that may arise or to implement new or improved controls, and any difficulties encountered in implementing new or improved controls, could cause us to fail to meet our reporting obligations under the Exchange Act. Inferior internal controls could also cause investors to lose confidence in our reported financial information.
If we are or become a United States real property holding corporation, non-U.S. holders may be subject to U.S. federal income tax (including withholding tax) in connection with the disposition of our shares, and U.S. holders selling our shares may be required to certify as to their status in order to avoid withholding.
Although we believe that we are not currently a “United States real property holding corporation” within the meaning of the Code and do not expect to become a United States real property holding corporation, no assurances can be made in this regard.
A non-U.S. holder of our common stock not otherwise subject to U.S. federal income tax on gain from the sale or other disposition of our common stock may nevertheless be subject to U.S. federal income tax with respect to such sale or other disposition if we are a United States real property holding corporation or have been a United States real property holding corporation at any time within the five-year period preceding the disposition (or the non-U.S. holder’s holding period if shorter). Generally, we will be a United States real property holding corporation if the fair market value of our U.S. real property interests equals or exceeds 50% of the sum of the fair market values of our worldwide real property interests and other assets used or held for use in a trade or business, all as determined under applicable U.S. Treasury regulations.
Certain non-U.S. holders of our common stock may be eligible for an exception to the forgoing general rule if our common stock is regularly traded on an established securities market during the calendar year in which the sale or disposition occurs and the non-U.S. holder holds no more than 5% of our outstanding common stock, directly or indirectly, during the five-year period preceding the disposition (or the non-U.S. holder’s holding period if shorter) (the “5% exception”). If we are a United States real property holding corporation during the relevant time period, and the 5% exception does not apply, the buyer or other transferee of our common stock will generally be required to withhold tax at the rate of 10% on the sales price, unless the transferor furnishes an affidavit certifying that it is not a foreign person in the manner and form specified in the applicable U.S. Treasury regulations.
| ITEM 2. | UNREGISTERED SALES OF EQUITY SECURITIES AND USE OF PROCEEDS |
On August 18, 2008, VeraSun Energy Corporation exchanged 507,246 shares of its common stock for $5.0 million aggregate principal amount of its 9 3/8% Senior Notes due 2017 (the “Notes”) and extinguishment of accrued interest thereon, and on August 25, 2008, VeraSun Energy Corporation exchanged 921,053 shares of its common stock for $8.0 million aggregate principal amount of the Notes and extinguishment of accrued interest thereon, in each case in negotiated transactions with institutional investors. The Notes acquired in exchange for the common stock were cancelled. The shares of common stock were issued exclusively to existing security holders of the Company pursuant to an exemption from registration under Section 3(a)(9) of the Securities Act of 1933, as amended. The Company did not receive any cash proceeds from the exchanges and did not pay, directly or indirectly, any commission or other remuneration, including underwriting discounts, to any broker, dealer, salesman or other person to solicit the exchanges of the Notes.
| ITEM 5. | OTHER INFORMATION |
The Company concluded on November 17, 2008 that the impairment charges described in Notes 3 and 4 in the notes to condensed consolidated financial statements contained in Item 1 of Part I of this report are required. The disclosure in Notes 3, 4 and 5 in the notes to condensed consolidated financial statements contained in Item 1 of Part I of this report is incorporated herein by reference.
On November 17, 2008, the VSE Lenders and the VSE Obligors agreed to, among other things, change from November 17, 2008 to November 21, 2008 the date after which, under the Bondholder Commitment Letter and the VSE Term Sheet, failure of the Company to have executed and delivered satisfactory final loan documentation will constitute an event of default and will result in the VSE Loans becoming immediately due and payable. The foregoing description of the parties’ agreement does not purport to be complete and is qualified in its entirety by reference to the waiver letter setting forth such agreement, a copy of which waiver letter is filed as Exhibit 10.8 to this report.
| ITEM 6. | EXHIBITS |
Exhibit | Description | |
| 10.1 | Debtor in Possession Financing Term Sheet, dated November 3, 2008, by and between AgStar Financial Services, PCA, VeraSun Hankinson, LLC, as debtor in possession, and US BioEnergy Corporation, as guarantor | |
| 10.2 | Debtor in Possession Financing Term Sheet, dated November 3, 2008, by and between AgStar Financial Services, PCA, VeraSun Ord, LLC, as debtor in possession, and US BioEnergy Corporation, as guarantor | |
| 10.3 | Debtor in Possession Financing Term Sheet, dated November 3, 2008, by and between AgStar Financial Services, PCA, VeraSun Woodbury, LLC, as debtor in possession, and US BioEnergy Corporation, as guarantor | |
| 10.4 | Debtor in Possession Financing Term Sheet, dated November 3, 2008, by and between AgStar Financial Services, PCA, VeraSun Central City, LLC, as debtor in possession, and US BioEnergy Corporation, as guarantor | |
77
Table of Contents
Exhibit | Description | |
| 10.5 | Debtor in Possession Financing Term Sheet, dated November 3, 2008, by and between AgStar Financial Services, PCA, VeraSun Albert City, LLC, as debtor in possession, and US BioEnergy Corporation, as guarantor | |
| 10.6 | Debtor in Possession Financing Term Sheet, dated November 3, 2008, by and between AgStar Financial Services, PCA, VeraSun Dyersville, LLC, as debtor in possession, and US BioEnergy Corporation, as guarantor | |
| 10.7 | DIP Facility Commitment Letter, dated November 3, 2008 (the “DIP Facility Commitment Letter”), by and between VeraSun Energy Corporation, as borrower, VeraSun Granite City, LLC, VeraSun Reynolds, LLC, VeraSun Biodiesel, LLC, VeraSun Litchfield, LLC, VeraSun Tilton, LLC, VeraSun Aurora Corporation, VeraSun Charles City, LLC, VeraSun Marketing, LLC, VeraSun Welcome, LLC, VeraSun Fort Dodge, LLC and VeraSun Hartley, LLC, as guarantors, and Trilogy Portfolio Company, LLC, Trilogy Special Situations Master Fund, Ltd., Mariner LDC, AIG Global Investment Corp., AIG SunAmerica Asset Management Corp., Wayzata Opportunities Fund II, L.P., Wayzata Opportunities Fund Offshore II, L.P., as lenders | |
| 10.8 | Waiver Letter, dated November 17, 2008, relating to the DIP Facility Commitment Letter | |
| 31.1 | Certification of Principal Executive Officer pursuant to Section 302 of the Sarbanes-Oxley Act of 2002 | |
| 31.2 | Certification of Principal Financial Officer pursuant to Section 302 of the Sarbanes-Oxley Act of 2002 | |
| 32.1 | Certification of Principal Executive Officer pursuant to Section 906 of the Sarbanes-Oxley Act of 2002 | |
| 32.2 | Certification of Principal Financial Officer pursuant to Section 906 of the Sarbanes-Oxley Act of 2002 | |
78
Table of Contents
Pursuant to the requirements of the Securities Exchange Act of 1934, the registrant has duly caused this report to be signed on its behalf by the undersigned thereunto duly authorized.
| VERASUN ENERGY CORPORATION | ||||||
| Date: November 19, 2008 | By: | /s/ Bryan Meier | ||||
| Bryan Meier | ||||||
Vice President, Finance and Chief Accounting Officer (authorized officer and principal financial and accounting officer) | ||||||
EXHIBIT INDEX
Exhibit | Description | |
| 10.1 | Debtor in Possession Financing Term Sheet, dated November 3, 2008, by and between AgStar Financial Services, PCA, VeraSun Hankinson, LLC, as debtor in possession, and US BioEnergy Corporation, as guarantor | |
| 10.2 | Debtor in Possession Financing Term Sheet, dated November 3, 2008, by and between AgStar Financial Services, PCA, VeraSun Ord, LLC, as debtor in possession, and US BioEnergy Corporation, as guarantor | |
| 10.3 | Debtor in Possession Financing Term Sheet, dated November 3, 2008, by and between AgStar Financial Services, PCA, VeraSun Woodbury, LLC, as debtor in possession, and US BioEnergy Corporation, as guarantor | |
| 10.4 | Debtor in Possession Financing Term Sheet, dated November 3, 2008, by and between AgStar Financial Services, PCA, VeraSun Central City, LLC, as debtor in possession, and US BioEnergy Corporation, as guarantor | |
| 10.5 | Debtor in Possession Financing Term Sheet, dated November 3, 2008, by and between AgStar Financial Services, PCA, VeraSun Albert City, LLC, as debtor in possession, and US BioEnergy Corporation, as guarantor | |
| 10.6 | Debtor in Possession Financing Term Sheet, dated November 3, 2008, by and between AgStar Financial Services, PCA, VeraSun Dyersville, LLC, as debtor in possession, and US BioEnergy Corporation, as guarantor | |
| 10.7 | DIP Facility Commitment Letter, dated November 3, 2008 (the “DIP Facility Commitment Letter”), by and between VeraSun Energy Corporation, as borrower, VeraSun Granite City, LLC, VeraSun Reynolds, LLC, VeraSun Biodiesel, LLC, VeraSun Litchfield, LLC, VeraSun Tilton, LLC, VeraSun Aurora Corporation, VeraSun Charles City, LLC, VeraSun Marketing, LLC, VeraSun Welcome, LLC, VeraSun Fort Dodge, LLC and VeraSun Hartley, LLC, as guarantors, and Trilogy Portfolio Company, LLC, Trilogy Special Situations Master Fund, Ltd., Mariner LDC, AIG Global Investment Corp., AIG SunAmerica Asset Management Corp., Wayzata Opportunities Fund II, L.P., Wayzata Opportunities Fund Offshore II, L.P., as lenders | |
| 10.8 | Waiver Letter, dated November 17, 2008, relating to the DIP Facility Commitment Letter | |
| 31.1 | Certification of Principal Executive Officer pursuant to Section 302 of the Sarbanes-Oxley Act of 2002 | |
| 31.2 | Certification of Principal Financial Officer pursuant to Section 302 of the Sarbanes-Oxley Act of 2002 | |
| 32.1 | Certification of Principal Executive Officer pursuant to Section 906 of the Sarbanes-Oxley Act of 2002 | |
| 32.2 | Certification of Principal Financial Officer pursuant to Section 906 of the Sarbanes-Oxley Act of 2002 | |
79