Table of Contents
UNITED STATES
SECURITIES AND EXCHANGE COMMISSION
Washington, D.C. 20549
FORM 10-Q
| x | QUARTERLY REPORT PURSUANT TO SECTION 13 OR 15(d) OF THE SECURITIES EXCHANGE ACT OF 1934 |
For the quarterly period ended March 31, 2008
OR
| ¨ | TRANSITION REPORT PURSUANT TO SECTION 13 OR 15(d) OF THE SECURITIES EXCHANGE ACT OF 1934 |
For the transition period from to
Commission File No. 1-32913
VeraSun Energy Corporation
(Exact name of registrant as specified in its charter)
| South Dakota | 20-3430241 | |
(State or other jurisdiction of incorporation or organization) | (IRS Employer Identification Number) |
100 22nd Avenue Brookings, SD | 57006 | |
| (Address of principal executive offices) | (Zip Code) |
605-696-7200
(Registrant’s telephone number, including area code)
NONE
(Former name, former address and former fiscal year, if changed since last report)
Indicate by check mark whether the registrant (1) has filed all reports required to be filed by Section 13 or 15(d) of the Securities Exchange Act of 1934 during the preceding 12 months (or for such shorter period that the registrant was required to file such reports), and (2) has been subject to such filing requirements for the past 90 days. Yes x No ¨
Indicate by check mark whether the registrant is a large accelerated filer, an accelerated filer, or a non-accelerated filer, or a smaller reporting company. See definition of “large accelerated filer”, “accelerated filer”, and “smaller reporting company” in Rule 12b-2 of the Exchange Act. (Check one):
Large accelerated filer ¨ Accelerated filer x Non-accelerated filer ¨ Smaller reporting company ¨
Indicate by check mark whether the registrant is a shell company (as defined in Rule 12b-2 of the Exchange Act). Yes ¨ No x
The number of shares of Common Stock outstanding on May 1, 2008 was 157,833,727.
Table of Contents
MARCH 31, 2008
INDEX TO FORM 10-Q
2
Table of Contents
| ITEM 1. | FINANCIAL STATEMENTS |
CONDENSED CONSOLIDATED BALANCE SHEETS
(dollars in thousands, except per share data)
| March 31, 2008 (unaudited) | December 31, 2007 | |||||
Assets | ||||||
Current Assets | ||||||
Cash and cash equivalents | $ | 73,489 | $ | 110,942 | ||
Short-term investments | 3,000 | 43,175 | ||||
Trade receivables, less allowance for doubtful accounts of $80 and $95 in 2008 and 2007, respectively | 66,866 | 51,294 | ||||
Inventories | 151,545 | 107,912 | ||||
Prepaid expenses and other current assets | 75,084 | 63,597 | ||||
Derivative financial instruments | 31,906 | 12,627 | ||||
Total current assets | 401,890 | 389,547 | ||||
Goodwill | 169,629 | 169,629 | ||||
Other intangible assets | 21,268 | 21,668 | ||||
Other long-term assets | 18,006 | 15,572 | ||||
Debt issuance costs, net | 14,953 | 15,478 | ||||
| 223,856 | 222,347 | |||||
Property and equipment, net | 1,309,959 | 1,251,612 | ||||
| $ | 1,935,705 | $ | 1,863,506 | |||
Liabilities and Shareholders’ Equity | ||||||
Current Liabilities | ||||||
Current maturities of long-term debt | $ | 16,774 | $ | 16,774 | ||
Current portion of deferred revenues | 95 | 95 | ||||
Accounts payable | 112,148 | 120,814 | ||||
Accrued expenses | 29,897 | 11,043 | ||||
Derivative financial instruments | 28,474 | 11,299 | ||||
Deferred income taxes | 1,869 | 1,869 | ||||
Total current liabilities | 189,257 | 161,894 | ||||
Long-term debt, less current maturities | 918,732 | 888,696 | ||||
Deferred income taxes | 56,248 | 51,564 | ||||
Other long-term liabilities | 4,754 | 4,102 | ||||
Deferred revenues, less current portion | 1,495 | 1,519 | ||||
| 981,229 | 945,881 | |||||
Commitments and Contingencies | ||||||
Shareholders’ Equity | ||||||
Preferred stock, $0.01 par value; authorized 25,000,000 shares; none issued or outstanding | — | — | ||||
Common stock, $0.01 par value; authorized 250,000,000 shares; 93,115,733 and 92,948,664 shares issued and outstanding as of March 31, 2008 and December 31, 2007, respectively | 931 | 929 | ||||
Additional paid-in capital | 640,519 | 638,606 | ||||
Retained earnings | 123,769 | 116,196 | ||||
| 765,219 | 755,731 | |||||
| $ | 1,935,705 | $ | 1,863,506 | |||
See Notes to Condensed Consolidated Financial Statements.
3
Table of Contents
CONDENSED CONSOLIDATED STATEMENTS OF OPERATIONS
(Unaudited)
| Three Months Ended March 31, | ||||||||
| 2008 | 2007 | |||||||
| (dollars in thousands, except per share data) | ||||||||
Revenues: | ||||||||
Net sales | $ | 515,328 | $ | 143,861 | ||||
Other revenues, incentive income | 1,146 | 649 | ||||||
Total revenues | 516,474 | 144,510 | ||||||
Cost of goods sold | 481,356 | 135,266 | ||||||
Gross profit | 35,118 | 9,244 | ||||||
Startup expenses | 2,111 | 1,365 | ||||||
Selling, general and administrative expenses | 11,365 | 10,169 | ||||||
Operating income (loss) | 21,642 | (2,290 | ) | |||||
Other income (expense): | ||||||||
Interest expense | (10,813 | ) | (1,752 | ) | ||||
Interest income | 941 | 3,545 | ||||||
Other income | 474 | 2 | ||||||
| (9,398 | ) | 1,795 | ||||||
Income (loss) before income taxes | 12,244 | (495 | ) | |||||
Income tax provision (benefit) | 4,671 | (183 | ) | |||||
Net income (loss) | $ | 7,573 | $ | (312 | ) | |||
Per Share data: | ||||||||
Income per common share - basic | $ | 0.08 | $ | — | ||||
Basic weighted average number of common shares | 92,646,695 | 75,708,911 | ||||||
Income per common share - diluted | $ | 0.08 | $ | — | ||||
Diluted weighted average number of common and common equivalent shares | 95,116,353 | 75,708,911 | ||||||
See Notes to Condensed Consolidated Financial Statements.
4
Table of Contents
CONDENSED CONSOLIDATED STATEMENTS OF CASH FLOWS
(Unaudited)
| Three Months Ended March 31, | ||||||||
| 2008 | 2007 | |||||||
| (dollars in thousands) | ||||||||
Cash Flows from Operating Activities | ||||||||
Net income (loss) | $ | 7,573 | $ | (312 | ) | |||
Adjustments to reconcile net income (loss) to net cash provided by (used in) operating activities: | ||||||||
Depreciation | 8,889 | 2,534 | ||||||
Deferred income taxes | 4,684 | 252 | ||||||
Change in derivative financial instruments | (3,272 | ) | 6,851 | |||||
Stock-based compensation expense | 1,869 | 1,469 | ||||||
Amortization | 1,027 | 285 | ||||||
(Gain) loss on disposal of equipment | (262 | ) | (82 | ) | ||||
Excess tax benefits from share-based payment arrangements | — | (2,908 | ) | |||||
Accretion of deferred revenue | (24 | ) | (24 | ) | ||||
Change in other long-term liabilities | 763 | — | ||||||
Changes in current assets and liabilities | ||||||||
Trade receivables | (15,572 | ) | 6,406 | |||||
Inventories | (43,633 | ) | (7,570 | ) | ||||
Prepaid expenses | (10,319 | ) | (1,030 | ) | ||||
Accounts payable | 26,102 | 6,698 | ||||||
Accrued expenses | 18,854 | 7,196 | ||||||
Net cash provided by (used in) operating activities | (3,321 | ) | 19,765 | |||||
Cash Flows from Investing Activities | ||||||||
Purchases of property and equipment | (103,179 | ) | (56,757 | ) | ||||
Proceeds from the sale of short-term investments | 40,175 | 142,360 | ||||||
Payments for other long-term assets | (2,434 | ) | (50 | ) | ||||
Proceeds from sales of property and equipment | 1,300 | 1 | ||||||
Purchase of short-term investments | — | (149,715 | ) | |||||
Net cash used in investing activities | (64,138 | ) | (64,161 | ) | ||||
Cash Flows from Financing Activities | ||||||||
Proceeds from long-term debt | 34,055 | — | ||||||
Net proceeds from the issuance of stock options and warrants | 72 | — | ||||||
Excess tax benefits from share-based payment arrangements | — | 2,908 | ||||||
Principal payments on long-term debt | (4,121 | ) | — | |||||
Net proceeds from the issuance of shares of common stock | — | 3,923 | ||||||
Debt issuance costs paid | — | (5 | ) | |||||
Net cash provided by financing activities | 30,006 | 6,826 | ||||||
Net decrease in cash and cash equivalents | (37,453 | ) | (37,570 | ) | ||||
Cash and Cash Equivalents | ||||||||
Beginning of period | 110,942 | 250,149 | ||||||
End of period | $ | 73,489 | $ | 212,579 | ||||
See Notes to Condensed Consolidated Financial Statements.
5
Table of Contents
NOTES TO CONDENSED CONSOLIDATED FINANCIAL STATEMENTS (Unaudited)
(dollars in thousands, except per share data)
Note 1. Unaudited Interim Condensed Consolidated Financial Statements
The accompanying condensed consolidated balance sheet as of December 31, 2007 has been derived from audited consolidated financial statements. The unaudited interim condensed consolidated financial statements of VeraSun Energy Corporation and its subsidiaries reflect all adjustments consisting only of normal recurring adjustments that are, in the opinion of our management, necessary for a fair presentation of their consolidated financial position, results of operations and cash flows. The results for the three months ended March 31, 2008 are not necessarily indicative of the results that may be expected for a full fiscal year. Certain information and note disclosures normally included in annual consolidated financial statements prepared in accordance with accounting principles generally accepted in the United States of America (“GAAP”) have been condensed or omitted pursuant to the rules and regulations of the Securities and Exchange Commission (“SEC”), although the Company believes that the disclosures made are adequate to make the information not misleading. These condensed consolidated financial statements should be read in conjunction with the Company’s audited consolidated financial statements and notes thereto included in its annual report for the year ended December 31, 2007 filed on Form 10-K with the SEC. VeraSun Energy Corporation and its subsidiaries are collectively referred to as “VeraSun,” the “Company,” “we,” “us” and “our”.
Nature of Business
VeraSun is one of the largest ethanol producers in the United States based on production capacity, according to the Renewable Fuels Association (“RFA”). We focus primarily on the production and sale of ethanol and distillers grains.
Principles of Consolidation
The accompanying condensed consolidated financial statements include the accounts of VeraSun Energy Corporation and its subsidiaries. All intercompany balances and transactions have been eliminated in consolidation.
Reclassifications
The accompanying 2007 condensed consolidated financial statements contain certain reclassifications to conform to the presentation used in the current period including $75.3 million in auction rate securities from cash equivalents to short-term investments as of March 31, 2007. The reclassifications had no impact on previously reported shareholders’ equity, working capital, gross profit or net income.
Revenue Recognition
Revenue from the production of ethanol and distillers grains is recorded when title transfers to customers. Shipping and handling charges to customers are included in revenues. In accordance with our prior marketing agreement with Aventine, sales through March 31, 2007 were recorded when products were shipped from our production facilities, net of commissions retained by Aventine at the time payment was remitted. As of April 1, 2007, we commenced direct sales of our ethanol to customers. Our sales of ethanol are now generally recognized upon delivery to our customers, at terminals or other locations, rather than upon shipment from our plants, except for sales to Cargill from our plants at Linden, Indiana, Albion, Nebraska, and Bloomingburg, Ohio where sales are recognized upon delivery to Cargill at the plants.
We receive incentives to produce ethanol from state and federal entities. In accordance with the terms of these arrangements, incentive income is recognized when we produce ethanol or blend ethanol with gasoline to produce E85.
Use of Estimates
The preparation of financial statements in conformity with GAAP requires management to make estimates and assumptions that affect (i) the reported amounts of assets and liabilities, (ii) the disclosure of contingent assets and liabilities at the date of the financial statements, and (iii) the reported amounts of revenues and expenses during the reporting period.
We use estimates and assumptions in accounting for the following significant matters, among others:
| • | Allowances for doubtful accounts |
| • | Valuation of acquired assets |
| • | Inventory valuation and allowances |
6
Table of Contents
VERASUN ENERGY CORPORATION
NOTES TO CONDENSED CONSOLIDATED FINANCIAL STATEMENTS (Unaudited)—Continued
(dollars in thousands, except per share data)
| • | Fair value of derivative instruments and related hedged items |
| • | Useful lives of property and equipment and intangible assets |
| • | Asset retirement obligations |
| • | Long-lived asset impairments, including goodwill |
| • | Contingencies |
| • | Fair value of options and restricted stock granted under our stock-based compensation plans |
| • | Tax related items |
Actual results may differ from previously estimated amounts, and such differences may be material to our condensed consolidated financial statements. We periodically review estimates and assumptions, and the effects of revisions are reflected in the period in which the revision is made. The revisions to estimates or assumptions during the periods presented in the accompanying condensed consolidated financial statements were not considered to be significant.
Recently Issued Accounting Pronouncements:
Statement of Financial Accounting Standards (SFAS) No. 157, “Fair Value Measurements” (SFAS No. 157)—In September 2006, the Financial Accounting Standards Board (FASB) issued SFAS No. 157, which provides a single definition of fair value, together with a framework for measuring it, and requires additional disclosure about the use of fair value to measure assets and liabilities. SFAS No. 157 also emphasizes that fair value is a market-based measurement, and sets out a fair value hierarchy with the highest priority being quoted prices in active markets. Fair value measurements are disclosed by level within that hierarchy. SFAS No. 157 is effective for financial statements issued for fiscal years beginning after November 15, 2007.
In February 2008, the FASB issued “Effective Date of FASB Statement No. 157” FASB Statement of Position (FSP) No. 157-2 (FSP No. 157-2)). FSP No. 157-2 delays the effective date of SFAS No. 157 until fiscal years beginning after November 15, 2008, for fair value measurements of non-financial assets and non-financial liabilities, except for items that are recognized or disclosed at fair value in an entity’s financial statements on a recurring basis (at least annually).
As of January 1, 2008, the Company adopted SFAS No. 157 for all assets and liabilities measured at fair value except for non-financial assets and non-financial liabilities measured at fair value on a non-recurring basis, as permitted by FSP No. 157-2. The adoption did not have a material impact on its consolidated financial statements. For additional discussion and SFAS No. 157 required disclosures see Note 7 to the consolidated financial statements.
“The Fair Value Option for Financial Assets and Financial Liabilities — Including an Amendment of FASB Statement No. 115” (SFAS No. 159) — In February 2007, the FASB issued SFAS No. 159, which provides companies with an option to measure, at specified election dates, many financial instruments and certain other items at fair value that are not currently measured at fair value. A company that adopts SFAS No. 159 will report unrealized gains and losses on items, for which the fair value option has been elected, in earnings at each subsequent reporting date. This statement also establishes presentation and disclosure requirements designed to facilitate comparisons between entities that choose different measurement attributes for similar types of assets and liabilities. This statement is effective for fiscal years beginning after November 15, 2007, effective January 1, 2008. The Company adopted SFAS No. 159 and but did not elect fair value as an alternative, as provided in the Statement.
The FASB issued SFAS No. 141 (revised 2007), “Business Combinations.” This statement significantly changes the financial accounting and reporting of business combination transactions. The provisions of this statement are to be applied prospectively to business combination transactions in the first annual reporting period beginning on or after December 15, 2008.
The FASB issued SFAS No. 160, “Noncontrolling Interests in Consolidated Financial Statements — an amendment of ARB No. 51.” SFAS No. 160 establishes accounting and reporting standards for noncontrolling interests in subsidiaries. This statement requires the reporting of all noncontrolling interests as a separate component of stockholders’ equity, the reporting of consolidated net income (loss) as the amount attributable to both the parent and the noncontrolling interests and the separate disclosure of net income (loss) attributable to the parent and to the noncontrolling interests. In addition, this statement provides accounting and reporting guidance related to changes in noncontrolling ownership interests. Other than the reporting requirements described above which require retrospective application, the provisions of SFAS No. 160 are to be applied prospectively in the first annual reporting period beginning on or after December 15, 2008. The Company currently does not have any noncontrolling interests in subsidiaries.
7
Table of Contents
VERASUN ENERGY CORPORATION
NOTES TO CONDENSED CONSOLIDATED FINANCIAL STATEMENTS (Unaudited)—Continued
(dollars in thousands, except per share data)
In March 2008, the FASB issued SFAS No. 161, “Disclosures about Derivative Instruments and Hedging Activities.” The new standard is intended to improve financial reporting about derivative instruments and hedging activities by requiring enhanced disclosures to enable investors to better understand their effects on an entity’s financial position, financial performance, and cash flows. It is effective for financial statements issued for fiscal years and interim periods beginning after November 15, 2008, with early application encouraged. We do not expect the adoption of SFAS No. 161 to have a material impact on our consolidated financial statements. However, we are still in the process of evaluating the impact of adopting SFAS No. 161.
Note 2. Inventories
A summary of inventories is as follows:
| March 31, 2008 | December 31, 2007 | |||||
Ethanol | $ | 82,941 | $ | 56,199 | ||
Corn | 40,770 | 27,637 | ||||
Supplies | 11,425 | 11,341 | ||||
Work in process | 9,997 | 7,859 | ||||
Chemicals | 3,264 | 2,743 | ||||
Distillers grains | 3,148 | 2,133 | ||||
| $ | 151,545 | $ | 107,912 | |||
Note 3. Income (Loss) Per Common Share
Basic income per common share is computed by dividing net income (loss) available to common shareholders by the weighted average number of common shares outstanding for the period. Diluted income (loss) per common share reflects the potential dilution that would occur, using the treasury stock method, if securities or other obligations to issue common stock were exercised or converted into common stock or resulted in the issuance of common stock that shared in the Company’s earnings.
A reconciliation of net income (loss) and common stock share amounts used in the calculation of basic and diluted income (loss) per common share is as follows for the three months ended March 31, 2008 and 2007:
| Net Income (loss) | Weighted Average Shares Outstanding | Per Share Amount | |||||||
2008: | |||||||||
Income per common share - basic | $ | 7,573 | 92,646,695 | $ | 0.08 | ||||
Effects of dilutive securities: | |||||||||
Stock options and warrants | — | 2,469,658 | — | ||||||
Income per common share - diluted | $ | 7,573 | 95,116,353 | $ | 0.08 | ||||
2007: | |||||||||
Loss per common share - basic | $ | (312 | ) | 75,708,911 | $ | — | |||
Effects of dilutive securities: | |||||||||
Stock options and warrants | — | — | — | ||||||
Loss per common share - diluted | $ | (312 | ) | 75,708,911 | $ | — | |||
Stock options, restricted stock and warrants for 6,667,888 shares for the three months ended March 31, 2007, were not included in the calculation of diluted EPS as their effects would be antidilutive.
8
Table of Contents
VERASUN ENERGY CORPORATION
NOTES TO CONDENSED CONSOLIDATED FINANCIAL STATEMENTS (Unaudited)—Continued
(dollars in thousands, except per share data)
Note 4. Long-Term Debt and Credit Facility
The following table summarizes the Company’s long-term debt:
| March 31, 2008 | December 31, 2007 | |||||||
9 3/8% senior notes due 2017 (“2017 Notes”) | $ | 450,000 | $ | 450,000 | ||||
Senior credit facility | 270,875 | 240,946 | ||||||
9 7/8% senior secured notes due 2012 (“2012 Notes”) | 210,000 | 210,000 | ||||||
Tax increment revenue note | 5,000 | 5,000 | ||||||
Capital lease obligation | 2,551 | 2,546 | ||||||
Total | 938,426 | 908,492 | ||||||
Less unamortized discount | (2,920 | ) | (3,022 | ) | ||||
Less current maturities of long-term debt | (16,774 | ) | (16,774 | ) | ||||
Long-term debt | $ | 918,732 | $ | 888,696 | ||||
Note 5. Comprehensive Income
The components of comprehensive income, net of income tax, are as follows:
| Three Months Ended March 31, | |||||||
| 2008 | 2007 | ||||||
Net income (loss) | $ | 7,573 | $ | (312 | ) | ||
Unrealized gain from hedging activities | — | 962 | |||||
Comprehensive income | $ | 7,573 | $ | 650 | |||
Note 6. Business Segment Information
Operating segments are defined as components of an enterprise for which separate financial information is available that is evaluated regularly by the chief operating decision maker or decision making group in deciding how to allocate resources and in assessing performance. In connection with the termination of the Company’s marketing arrangement with Aventine on March 31, 2007, the Company re-evaluated its operating segments based on the application of SFAS 131 and have identified one reportable business segment, the manufacture and marketing of fuel-grade ethanol and distillers grains. The Company’s chief operating decision maker reviews financial information presented on a consolidated basis for purposes of assessing financial performance and making operating decisions. The chief operating decision maker also receives disaggregated information about certain operating expenses. Accordingly, the Company considers itself to be operating in a single industry segment. Previously, the Company had two reportable segments, ethanol production and other.
Note 7. Fair Value Disclosure
Effective January 1, 2008, the Company adopted the provisions of SFAS No. 157 for assets and liabilities recognized at fair value on a recurring basis. SFAS No. 157 establishes a framework for measuring fair value and requires enhanced disclosures about assets and liabilities carried at fair value.
As defined in SFAS No. 157, fair value is the price that would be received to sell an asset or paid to transfer a liability in the principal or most advantageous market for the asset or liability in an orderly transaction between market participants at the measurement date. SFAS No. 157 establishes a fair value hierarchy, which prioritizes the inputs used in measuring fair value into three broad levels as follows:
Level 1 – Quoted prices are available in active markets for identical assets or liabilities as of the reported date. The types of assets and liabilities included in Level 1 are highly liquid and actively traded instruments with quoted prices, such as equities listed by the New York Stock Exchange and commodity derivative contracts listed on the Chicago Board of Trade.
9
Table of Contents
VERASUN ENERGY CORPORATION
NOTES TO CONDENSED CONSOLIDATED FINANCIAL STATEMENTS (Unaudited)—Continued
(dollars in thousands, except per share data)
Level 2 – Pricing inputs are other than quoted prices in active markets, but are either directly or indirectly observable as of the reported date. The types of assets and liabilities included in Level 2 are typically either comparable to actively traded securities or contracts, or priced with models using highly observable inputs, such as commodity options priced using observable forward prices.
Level 3 – Significant inputs to pricing have little or no observability as of the reporting date. The types of assets and liabilities included in Level 3 are those with inputs requiring significant management judgment or estimation, such as the complex and subjective models and forecasts used to determine the fair value of financial transmission rights.
The following table presents the fair value hierarchy for those assets and liabilities measured at fair value on a recurring basis as of March 31, 2008. As required by SFAS No. 157, financial assets and liabilities are classified in their entirety based on the lowest level of input that is significant to the fair value measurement. The Company’s assessment of the significance of a particular input to the fair value measurement requires judgment, and may affect the valuation of fair value assets and liabilities and their placement within the fair value hierarchy levels.
| At fair value as of March 31, 2008 | ||||||||||||
| Level 1 | Level 2 | Level 3 | Total | |||||||||
Assets: | ||||||||||||
Short-term investments | $ | — | $ | 3,000 | $ | — | $ | 3,000 | ||||
Derivative assets | 887 | 31,019 | — | 31,906 | ||||||||
Total | $ | 887 | $ | 34,019 | $ | — | $ | 34,906 | ||||
Liabilities | ||||||||||||
Derivative liabilities | $ | 28,474 | $ | — | $ | — | $ | 28,474 | ||||
Total | $ | 28,474 | $ | — | $ | — | $ | 28,474 | ||||
The Company’s short term investments are classified as available-for-sale and are stated at fair value. When available, the quoted market price or net asset value of an identical security in the principal market is used to record the fair value. In the absence of a quoted market price in a readily observable market, the fair value is determined using quoted market prices of securities with similar characteristics.
The Company enters into various commodity derivative instruments, including forward contracts, futures, options, swaps and other over-the-counter agreements. The fair value of the Company’s commodity derivatives is determined using unadjusted quoted prices for identical instruments on the applicable exchange in which VeraSun transacts. When quoted prices for identical instruments are not available, VeraSun uses forward price curves derived from market price quotations. Market price quotations are obtained from independent energy brokers, exchanges, direct communication with market participants and actual transactions executed by VeraSun. Market price quotations for certain inputs are generally readily obtainable for the applicable term of VeraSun’s outstanding commodity derivative instruments, and therefore, VeraSun’s forward price curves for those locations and periods reflect observable market quotes.
Note 8. Acquisition
On August 17, 2007, we closed on a transaction with ASAlliances. Under a Unit Purchase Agreement, we purchased all of the equity interests in ASA OpCo Holdings, LLC (“ASA Holdings”) from ASAlliances for an aggregate purchase price of $675,176. Of this amount, we issued 13,801,384 shares of our common stock valued at $194,323, and paid $250,000 of cash to the seller at closing. The balance of the purchase price consisted of $230,853 of indebtedness owed by ASA Holdings and its subsidiaries, ASA Albion, LLC, ASA Bloomingburg, LLC and ASA Linden, LLC, which remained outstanding after the closing under a Credit Agreement, dated February 6, 2006 among ASA Holdings, ASA Albion, LLC, ASA Bloomingburg, LLC and ASA Linden, LLC, as borrowers, and WestLB AG, New York branch, as administrative agent for the lenders and the lenders named therein (“Senior Credit Facility”). We also agreed to register under applicable securities laws, within 180 days of the acquisition date, the shares issued in the transaction. ASA Holdings owns companies with three biorefineries and developmental rights to two sites. This transaction is referred to in this document as the “ASA Acquisition”.
10
Table of Contents
VERASUN ENERGY CORPORATION
NOTES TO CONDENSED CONSOLIDATED FINANCIAL STATEMENTS (Unaudited)—Continued
(dollars in thousands, except per share data)
The three acquired facilities are each expected to operate at 110 million gallons per year and are located in Albion, Nebraska, Bloomingburg, Ohio, and Linden, Indiana. This transaction allowed the Company to expedite its expansion in the ethanol market as the plants were near completion. The Linden facility began operations in August 2007, the Albion facility began startup operations in October 2007, and the Bloomingburg facility began startup operations in March 2008.
The acquired assets of the ASA Acquisition have been included in the condensed consolidated balance sheet as of December 31, 2007 and March 31, 2008. The operations of ASA Holdings are included in the Company’s condensed consolidated statement of operations beginning August 17, 2007.
The 13,801,384 shares of common stock issued in connection with the ASA Acquisition were valued at $194,323 based on the weighted average of the Company’s stock price two days before and two days after July 22, 2007, the date of the acquisition agreement and announcement of the transaction.
The following table provides unaudited pro forma consolidated results of operations for the three months ended March 31, 2007, as though the ASA Acquisition had occurred as of January 1, 2007. The pro forma results include certain purchase accounting adjustments with respect to the acquired tangible and intangible assets. However, pro forma results do not include any anticipated costs savings or other effects of the planned integration of ASA Holdings. Accordingly, such amounts are not necessarily indicative of the results as if the acquisition had occurred on January 1, 2007 or that may result in the future.
| Three Months Ended March 31, 2007 | ||||
Net sales | $ | 143,861 | ||
Net loss | (3,285 | ) | ||
Diluted loss per common share | (0.04 | ) | ||
11
Table of Contents
VERASUN ENERGY CORPORATION
NOTES TO CONDENSED CONSOLIDATED FINANCIAL STATEMENTS (Unaudited)—Continued
(dollars in thousands, except per share data)
Note 9. Guarantors / Non-Guarantors Condensed Consolidating Financial Statements
In accordance with the indentures governing the Company’s senior secured notes and senior unsecured notes, certain wholly-owned subsidiaries of the Company have fully and unconditionally guaranteed the notes on a joint and several basis. The following tables present condensed consolidating financial information for VeraSun Energy Corporation (“VEC”), the issuer of the notes, subsidiaries that are guarantors of the notes and subsidiaries that are non-guarantors of the notes. VeraSun Aurora Corporation, VeraSun Fort Dodge, LLC, VeraSun Charles City, LLC, VeraSun Marketing, LLC, VeraSun Hartley, LLC, VeraSun Welcome, LLC, VeraSun Biodiesel, LLC, VeraSun Granite City, LLC, VeraSun Reynolds, LLC, VeraSun Litchfield, LLC and VeraSun Tilton, LLC, each a wholly-owned subsidiary of VEC, are combined as guarantors.
CONDENSED CONSOLIDATING BALANCE SHEET (Unaudited)
MARCH 31, 2008
ASSETS
| Issuer | Guarantors | Non-Guarantors | Eliminations and Consolidations | Consolidated | ||||||||||||||
Current Assets | ||||||||||||||||||
Cash and cash equivalents | $ | 65,193 | $ | (8,074 | ) | $ | 16,370 | $ | — | $ | 73,489 | |||||||
Short-term investments | 3,000 | — | — | — | 3,000 | |||||||||||||
Trade receivables | — | 46,468 | 23,110 | (2,712 | ) | 66,866 | ||||||||||||
Inventories | — | 134,444 | 17,676 | (575 | ) | 151,545 | ||||||||||||
Prepaid expenses and other current assets | 2,101 | 82,103 | 7,632 | (16,752 | ) | 75,084 | ||||||||||||
Derivative financial instruments | — | 26,751 | 5,155 | — | 31,906 | |||||||||||||
Total current assets | 70,294 | 281,692 | 69,943 | (20,039 | ) | 401,890 | ||||||||||||
Other Assets | ||||||||||||||||||
Goodwill | 6,129 | — | 163,500 | — | 169,629 | |||||||||||||
Intangible assets | — | — | 21,268 | — | 21,268 | |||||||||||||
Other long-term assets | 4,512 | 9,953 | 3,541 | — | 18,006 | |||||||||||||
Debt issuance costs, net | 14,953 | — | — | — | 14,953 | |||||||||||||
Investment in subsidiaries | 676,749 | — | (3,599 | ) | (673,150 | ) | — | |||||||||||
| 702,343 | 9,953 | 184,710 | (673,150 | ) | 223,856 | |||||||||||||
Property and equipment, net | 12,117 | 760,622 | 534,440 | 2,780 | 1,309,959 | |||||||||||||
Total assets | $ | 784,754 | $ | 1,052,267 | $ | 789,093 | $ | (690,409 | ) | $ | 1,935,705 | |||||||
LIABILITIES AND SHAREHOLDERS’ AND MEMBERS’ EQUITY
| Issuer | Guarantors | Non-Guarantors | Eliminations and Consolidations | Consolidated | |||||||||||||
Current Liabilities | |||||||||||||||||
Current maturities of long-term debt | $ | — | $ | — | $ | 16,774 | $ | — | $ | 16,774 | |||||||
Current portion of deferred revenues | — | 95 | — | — | 95 | ||||||||||||
Accounts payable | 4,719 | 101,615 | 25,278 | (19,464 | ) | 112,148 | |||||||||||
Accrued expenses | 6,830 | 18,984 | 4,083 | — | 29,897 | ||||||||||||
Derivative financial instruments | — | 28,163 | 311 | — | 28,474 | ||||||||||||
Deferred income taxes | 63 | 1,429 | 377 | — | 1,869 | ||||||||||||
Total current liabilities | 11,612 | 150,286 | 46,823 | (19,464 | ) | 189,257 | |||||||||||
Long-Term Liabilities | |||||||||||||||||
Long-term debt, less current maturities | 657,081 | — | 261,651 | — | 918,732 | ||||||||||||
Deferred revenue, less current portion | — | 1,495 | — | — | 1,495 | ||||||||||||
Deferred income taxes | (8,772 | ) | 62,842 | 2,178 | — | 56,248 | |||||||||||
Other long term liabilities | 1,408 | — | 3,346 | — | 4,754 | ||||||||||||
| 649,717 | 64,337 | 267,175 | — | 981,229 | |||||||||||||
Intercompany (receivable) payable | (639,588 | ) | 601,093 | 38,495 | — | — | |||||||||||
Shareholders’ and Members’ Equity | 763,013 | 236,551 | 436,600 | (670,945 | ) | 765,219 | |||||||||||
| $ | 784,754 | $ | 1,052,267 | $ | 789,093 | $ | (690,409 | ) | $ | 1,935,705 | |||||||
12
Table of Contents
VERASUN ENERGY CORPORATION
NOTES TO CONDENSED CONSOLIDATED FINANCIAL STATEMENTS (Unaudited)—Continued
(dollars in thousands, except per share data)
CONDENSED CONSOLIDATING STATEMENT OF OPERATIONS (Unaudited)
For the Three Months Ended March 31, 2008
| Issuer | Guarantors | Non-Guarantors | Eliminations and Consolidations | Consolidated | ||||||||||||||||
Total revenues | $ | 3,828 | $ | 380,284 | $ | 132,362 | $ | — | $ | 516,474 | ||||||||||
Total cost of goods sold | 39 | 349,949 | 131,368 | — | 481,356 | |||||||||||||||
Gross profit | 3,789 | 30,335 | 994 | — | 35,118 | |||||||||||||||
Startup expenses | — | 1,126 | 985 | — | 2,111 | |||||||||||||||
Selling, general and administrative expenses | 9,348 | 1,345 | 672 | — | 11,365 | |||||||||||||||
Operating income (loss) | (5,559 | ) | 27,864 | (663 | ) | — | 21,642 | |||||||||||||
Other income (expense): | ||||||||||||||||||||
Interest expense | (17,188 | ) | (6,997 | ) | (3,389 | ) | 16,761 | (10,813 | ) | |||||||||||
Interest income | 15,742 | 849 | 11 | (15,661 | ) | 941 | ||||||||||||||
Equity in earnings of subsidiaries | 11,803 | — | — | (11,803 | ) | — | ||||||||||||||
Other income | 189 | 285 | — | — | 474 | |||||||||||||||
| 10,546 | (5,863 | ) | (3,378 | ) | (10,703 | ) | (9,398 | ) | ||||||||||||
Income (loss) before income taxes | 4,987 | 22,001 | (4,041 | ) | (10,703 | ) | 12,244 | |||||||||||||
Income tax provision (benefit) | (2,586 | ) | 8,763 | (1,506 | ) | — | 4,671 | |||||||||||||
Net income (loss) | $ | 7,573 | $ | 13,238 | $ | (2,535 | ) | $ | (10,703 | ) | $ | 7,573 | ||||||||
CONDENSED CONSOLIDATING STATEMENT OF CASH FLOWS (Unaudited)
For the Three months Ended March 31, 2008
| Issuer | Guarantors | Non-Guarantors | Eliminations and Consolidations | Consolidated | ||||||||||||||||
Net cash provided by (used in) operating activities | $ | (78,060 | ) | $ | 63,664 | $ | 9,975 | $ | 1,100 | $ | (3,321 | ) | ||||||||
Cash Flows from Investing Activities | ||||||||||||||||||||
Purchases of property and equipment | 5,512 | (82,758 | ) | (24,833 | ) | (1,100 | ) | (103,179 | ) | |||||||||||
Proceeds from the sale of short-term investments | 40,175 | — | — | — | 40,175 | |||||||||||||||
Payments for other long-term assets | (719 | ) | (177 | ) | (1,538 | ) | — | (2,434 | ) | |||||||||||
Proceeds from sales of equipment | — | 1,300 | — | — | 1,300 | |||||||||||||||
Net cash used in investing activities | 44,968 | (81,635 | ) | (26,371 | ) | (1,100 | ) | (64,138 | ) | |||||||||||
Cash Flows from Financing Activities | ||||||||||||||||||||
Proceeds from long-term debt | — | — | 34,055 | — | 34,055 | |||||||||||||||
Proceeds from the issuance of stock options and warrants | 72 | — | — | — | 72 | |||||||||||||||
Principal payments on long-term debt | — | — | (4,121 | ) | — | (4,121 | ) | |||||||||||||
Net cash provided by financing activities | 72 | — | 29,934 | — | 30,006 | |||||||||||||||
Net increase (decrease) in cash and cash equivalents | (33,020 | ) | (17,971 | ) | 13,538 | — | (37,453 | ) | ||||||||||||
Cash and cash equivalents, beginning of period | 98,213 | 9,897 | 2,832 | — | 110,942 | |||||||||||||||
Cash and cash equivalents, end of period | $ | 65,193 | $ | (8,074 | ) | $ | 16,370 | $ | — | $ | 73,489 | |||||||||
13
Table of Contents
VERASUN ENERGY CORPORATION
NOTES TO CONDENSED CONSOLIDATED FINANCIAL STATEMENTS (Unaudited)—Continued
(dollars in thousands, except per share data)
CONDENSED CONSOLIDATING BALANCE SHEET
DECEMBER 31, 2007
ASSETS
| Issuer | Guarantors | Non-Guarantors | Eliminations and Consolidations | Consolidated | ||||||||||||
Current Assets | ||||||||||||||||
Cash and cash equivalents | $ | 98,213 | $ | 9,897 | $ | 2,832 | $ | — | $ | 110,942 | ||||||
Short-term investments | 43,175 | — | — | — | 43,175 | |||||||||||
Trade receivables | — | 32,063 | 19,231 | — | 51,294 | |||||||||||
Inventories | — | 92,542 | 15,370 | — | 107,912 | |||||||||||
Prepaid expenses and other current assets | 12,867 | 43,824 | 6,906 | — | 63,597 | |||||||||||
Derivative financial instruments | — | 12,627 | — | — | 12,627 | |||||||||||
Total current assets | 154,255 | 190,953 | 44,339 | — | 389,547 | |||||||||||
Other Assets | ||||||||||||||||
Goodwill | 6,129 | — | 163,500 | — | 169,629 | |||||||||||
Intangible assets | — | — | 21,668 | — | 21,668 | |||||||||||
Other long-term assets | 3,793 | 9,776 | 2,003 | — | 15,572 | |||||||||||
Debt issuance costs, net | 15,478 | — | — | — | 15,478 | |||||||||||
Investment in subsidiaries | 664,543 | — | — | (664,543 | ) | — | ||||||||||
| 689,943 | 9,776 | 187,171 | (664,543 | ) | 222,347 | |||||||||||
Property and equipment, net | 18,216 | 705,276 | 526,420 | 1,700 | 1,251,612 | |||||||||||
Total assets | $ | 862,414 | $ | 906,005 | $ | 757,930 | $ | (662,843 | ) | $ | 1,863,506 | |||||
LIABILITIES AND SHAREHOLDERS’ AND MEMBERS’ EQUITY
| Issuer | Guarantors | Non-Guarantors | Eliminations and Consolidations | Consolidated | |||||||||||||
Current Liabilities | |||||||||||||||||
Current maturities of long-term debt | $ | — | $ | — | $ | 16,774 | $ | — | $ | 16,774 | |||||||
Current portion of deferred revenues | — | 95 | — | — | 95 | ||||||||||||
Accounts payable | 5,111 | 77,860 | 37,843 | — | 120,814 | ||||||||||||
Accrued expenses | 4,449 | 4,853 | 1,741 | — | 11,043 | ||||||||||||
Derivative financial instruments | — | 11,299 | — | — | 11,299 | ||||||||||||
Deferred income taxes | 63 | 1,429 | 377 | — | 1,869 | ||||||||||||
Total current liabilities | 9,623 | 95,536 | 56,735 | — | 161,894 | ||||||||||||
Long-Term Liabilities | |||||||||||||||||
Long-term debt, less current maturities | 656,978 | — | 231,718 | — | 888,696 | ||||||||||||
Deferred income taxes | (6,199 | ) | 54,079 | 3,684 | — | 51,564 | |||||||||||
Other long term liabilities | 1,395 | — | 2,707 | — | 4,102 | ||||||||||||
Deferred revenue, less current portion | — | 1,519 | — | — | 1,519 | ||||||||||||
| 652,174 | 55,598 | 238,109 | — | 945,881 | |||||||||||||
Intercompany (receivable) payable | (553,414 | ) | 533,062 | 20,352 | — | — | |||||||||||
Shareholders’ and Members’ Equity | 754,031 | 221,809 | 442,734 | (662,843 | ) | 755,731 | |||||||||||
| $ | 862,414 | $ | 906,005 | $ | 757,930 | $ | (662,843 | ) | $ | 1,863,506 | |||||||
14
Table of Contents
VERASUN ENERGY CORPORATION
NOTES TO CONDENSED CONSOLIDATED FINANCIAL STATEMENTS (Unaudited)—Continued
(dollars in thousands, except per share data)
CONDENSED CONSOLIDATING STATEMENT OF OPERATIONS (Unaudited)
For the Three Months Ended March 31, 2007
| Issuer | Guarantors | Non-Guarantors | Eliminations and Consolidations | Consolidated | ||||||||||||||||
Revenues | $ | 886 | $ | 162,018 | $ | — | $ | (18,394 | ) | $ | 144,510 | |||||||||
Cost of goods sold | 10 | 152,817 | — | (17,561 | ) | 135,266 | ||||||||||||||
Gross profit | 876 | 9,201 | — | (833 | ) | 9,244 | ||||||||||||||
Startup expenses | — | 1,365 | — | — | 1,365 | |||||||||||||||
Selling, general and administrative expenses | 8,851 | 1,957 | 247 | (886 | ) | 10,169 | ||||||||||||||
Operating income (loss) | (7,975 | ) | 5,879 | (247 | ) | 53 | (2,290 | ) | ||||||||||||
Other income (expense): | ||||||||||||||||||||
Interest income | 8,598 | 369 | — | (5,422 | ) | 3,545 | ||||||||||||||
Interest expense | (5,837 | ) | (1,314 | ) | (23 | ) | 5,422 | (1,752 | ) | |||||||||||
Other income | — | 2 | — | — | 2 | |||||||||||||||
Equity in earnings of subsidiaries | 2,993 | — | — | (2,993 | ) | — | ||||||||||||||
| 5,754 | (943 | ) | (23 | ) | (2,993 | ) | 1,795 | |||||||||||||
Income (loss) before income taxes | (2,221 | ) | 4,936 | (270 | ) | (2,940 | ) | (495 | ) | |||||||||||
Income tax expense (benefit) | (1,909 | ) | 1,826 | (100 | ) | — | (183 | ) | ||||||||||||
Net income (loss) | $ | (312 | ) | $ | 3,110 | $ | (170 | ) | $ | (2,940 | ) | $ | (312 | ) | ||||||
15
Table of Contents
VERASUN ENERGY CORPORATION
NOTES TO CONDENSED CONSOLIDATED FINANCIAL STATEMENTS (Unaudited)—Continued
(dollars in thousands, except per share data)
CONDENSED CONSOLIDATING STATEMENT OF CASH FLOWS (Unaudited)
For the Three months Ended March 31, 2007
| Issuer | Guarantors | Non-Guarantors | Eliminations and Consolidations | Consolidated | ||||||||||||||||
Net cash provided by (used in) operating activities | $ | (42,973 | ) | $ | 198 | $ | 182 | $ | 62,358 | $ | 19,765 | |||||||||
Cash Flows from Investing Activities | ||||||||||||||||||||
Purchases of property and equipment | (485 | ) | (56,068 | ) | (204 | ) | — | (56,757 | ) | |||||||||||
Payment of deposits | (50 | ) | — | — | — | (50 | ) | |||||||||||||
Proceeds from sale of property and equipment | — | 1 | — | — | 1 | |||||||||||||||
Proceeds from the sale of short-term investments | 142,360 | — | — | — | 142,360 | |||||||||||||||
Purchase of short-term investments | (149,715 | ) | — | — | — | (149,715 | ) | |||||||||||||
Purchases of property and equipment with restricted cash held in escrow | 19,084 | (19,084 | ) | — | — | — | ||||||||||||||
Net cash provided by (used in) investing activities | 11,194 | (75,151 | ) | (204 | ) | — | (64,161 | ) | ||||||||||||
Cash Flows from Financing Activities | ||||||||||||||||||||
Excess tax benefits from share-based payment arrangements | 2,908 | — | — | — | 2,908 | |||||||||||||||
Proceeds from issuance of common stock | 3,923 | — | — | — | 3,923 | |||||||||||||||
Costs of raising capital | (5 | ) | — | — | — | (5 | ) | |||||||||||||
Principal payments on long-term debt | — | 62,358 | — | (62,358 | ) | — | ||||||||||||||
Outstanding checks in excess of bank balance | — | 12,595 | 20 | (12,615 | ) | — | ||||||||||||||
Net cash provided by financing activities | 6,826 | 74,953 | 20 | (74,973 | ) | 6,826 | ||||||||||||||
Net (decrease) in cash and cash equivalents | (24,953 | ) | — | (2 | ) | (12,615 | ) | (37,570 | ) | |||||||||||
Cash and cash equivalents, beginning of period | 256,246 | — | 2 | (6,099 | ) | 250,149 | ||||||||||||||
Cash and cash equivalents, end of period | $ | 231,293 | $ | — | $ | — | $ | (18,714 | ) | $ | 212,579 | |||||||||
16
Table of Contents
VERASUN ENERGY CORPORATION
NOTES TO CONDENSED CONSOLIDATED FINANCIAL STATEMENTS (Unaudited)—Continued
(dollars in thousands, except per share data)
Note 10. Material Commitments
We are party to contracts with consultants, independent contractors and other service providers in which we have agreed to indemnify such parties against certain liabilities. Based on historical experience and our assessment of the likelihood that such parties will make claims against us, we believe these indemnification obligations are not material. As of the date of this report, we are not aware of any claims against us.
We believe we are in compliance with applicable environmental laws and regulations and that our environmental controls are adequate to address existing regulatory requirements.
Note 12. Income Tax Matters
The Company is subject to income taxes in the U.S. federal jurisdiction and various states jurisdictions. Tax regulations within each jurisdiction are subject to the interpretation of the related tax laws and regulations and require significant judgement to apply. With few exceptions, the Company is no longer subject to the U.S. federal, state, or local income tax examinations by tax authorities for the years before 2004.
The Company is currently under examination by the Internal Revenue Service for tax year 2004 and the nine-month period ended September 30, 2005. The examination is expected to be completed by the end of 2008. As of March 31, 2008, the IRS has proposed certain adjustments to the Company’s 2004 and 2005 federal tax returns. Management is contesting those adjustments and has not recognized any effect of the proposed adjustments or any associated interest or penalties, based on its assessment of the position taken. The Company does not anticipate the adjustments would result in material changes to the Company’s financial position or results of operations.
Note 13. Subsequent Event
On April 1, 2008, the Company completed its acquisition of US BioEnergy Corporation (“US BioEnergy”). The Company issued approximately 64.8 million shares of common stock in the acquisition, representing approximately 40% of the common stock outstanding after the acquisition, and assumed stock option awards under which approximately 1.8 million shares of common stock are issuable upon the future exercise of the stock options.
As of April 1, 2008, US BioEnergy owned and operated five ethanol production facilities with total nameplate capacity of 420 MMGY and is constructing three additional ethanol production facilities with expected total nameplate capacity of 330 MMGY. US BioEnergy’s primary products are ethanol and distillers grains, which it derives from corn. All ethanol produced by US BioEnergy is sold to Provista Renewable Fuels Marketing, LLC (Provista), an ethanol marketing company owned by CHS, Inc, except ethanol produced at the Marion, South Dakota facility, which is sold to Archer Daniels Midland. The Company intends to terminate the marketing arrangement with Provista during the third quarter of 2008.
The merger was accounted for under the purchase method of accounting. The total purchase price was approximately $752,593; consisting of the value of the common stock and options issued and transaction costs. As of December 31, 2007, US BioEnergy had total assets of $1,168,845; total liabilities of $544,586 and stockholders’ equity of $624,259.
17
Table of Contents
| ITEM 2. | MANAGEMENT’S DISCUSSION AND ANALYSIS OF FINANCIAL CONDITION AND RESULTS OF OPERATIONS |
FORWARD LOOKING STATEMENTS
We make certain forward-looking statements in this Quarterly Report on Form 10-Q and in the documents that are incorporated herein by reference. These forward-looking statements relate to our outlook or expectations for earnings, revenues, expenses, asset quality or other future financial or business performance, strategies or expectations, or the impact of legal, regulatory or supervisory matters on our business, results of operations or financial condition. Specifically, forward-looking statements may include:
| • | statements preceded by, followed by or that include the words “estimate,” “plan,” “project,” “forecast,” “intend,” “expect,” “anticipate,” “believe,” “seek,” “target” or similar expressions. |
These statements reflect our management’s judgment based on currently available information and involve a number of risks and uncertainties that could cause actual results to differ materially from those in the forward-looking statements.
Future performance cannot be assured. Actual results may differ materially from those in the forward-looking statements. Some factors that could cause our actual results to differ include:
| • | our ability to achieve the expected benefits from our recent merger with US BioEnergy; |
18
Table of Contents
| • | the volatility and uncertainty of corn, natural gas, ethanol, unleaded gasoline and other commodities prices; |
| • | the results of our hedging transactions and other risk mitigation strategies; |
| • | operational disruptions at our facilities; |
| • | the effects of vigorous competition and excess capacity in the industries in which we operate; |
| • | the costs and business risks associated with developing new products and entering new markets; |
| • | our ability to locate and integrate potential future acquisitions; |
| • | our ability to develop a corn oil extraction business; |
| • | the development of infrastructure related to the sale and distribution of ethanol; |
| • | the effects of other mergers and consolidations in the biofuels industry and unexpected announcements or developments from others in the biofuels industry; |
| • | the uncertainties related to our acquisitions of US BioEnergy, ASA OpCo Holdings, LLC and other businesses; |
| • | the impact of new, emerging and competing technologies on our business; |
| • | the possibility of one or more of the markets in which we compete being impacted by political, legal and regulatory changes or other external factors over which we have no control; |
| • | changes in or elimination of governmental laws, tariffs, trade or other controls or enforcement practices; |
| • | our reliance on key management personnel; |
| • | limitations and restrictions contained in the instruments and agreements governing our indebtedness; |
| • | our ability to raise additional capital and secure additional financing; |
| • | the volatility of the market price of our stock; |
| • | our ability to implement additional financial and management controls, reporting systems and procedures and comply with Section 404 of the Sarbanes-Oxley Act, as amended; and |
| • | other risks referenced from time to time in our filings with the SEC and those factors listed in this Form 10-Q under Part II, Item 1A, “Risks Factors” beginning on page 28. |
You are cautioned not to place undue reliance on any forward-looking statements, which speak only as of the date of this Form 10-Q, or in the case of a document incorporated by reference, as of the date of that document. Except as required by law, we undertake no obligation to publicly update or release any revisions to these forward-looking statements to reflect any events or circumstances after the date of this Form 10-Q or to reflect the occurrence of unanticipated events.
Business Overview
VeraSun is one of the largest ethanol producers in the United States based on production capacity, according to the Renewable Fuels Association (“RFA”). We focus primarily on the production and sale of ethanol and distillers grains. This focus has enabled us to significantly grow our ethanol production capacity and to work with automakers, fuel distributors, trade associations and consumers to increase the demand for ethanol. As an industry leader, we play an active role in developments within the renewable fuels industry.
Ethanol is a type of alcohol produced in the U.S. principally from corn. Ethanol is primarily used as a blend component in the U.S. gasoline fuel market, which approximated 142 billion gallons in 2007 according to the Energy Information Administration (“EIA”). Refiners and marketers have historically blended ethanol with gasoline to increase octane and reduce tailpipe emissions. The ethanol industry has grown significantly over the last few years, expanding production capacity at a compounded annual growth rate of approximately 22% from 2000 to 2007. We believe the ethanol market will continue to grow as a result of ethanol’s cleaner burning
19
Table of Contents
characteristics, a shortage of domestic petroleum refining capacity, geopolitical concerns, and federally mandated renewable fuel usage. We also believe that E85, a fuel blend composed of 85% ethanol, may become increasingly important as an alternative to unleaded gasoline.
We completed the acquisition of US BioEnergy on April 1, 2008. The acquisition will be accounted for using the purchase method of accounting. Accordingly, US BioEnergy’s results of operations will be included in our consolidated operating results beginning in the second quarter of 2008.
As of April 1, 2008, we own and operate eleven ethanol production facilities in the U.S., with a combined nameplate capacity of approximately 1.1 billion gallons per year, or “BGY.” As of April 2, 2008, our ethanol production capacity represented approximately 13% of the total ethanol production capacity in the U.S., according to the RFA. We have designated a “nameplate” production capacity for each of our ethanol production facilities. Generally, we determine the nameplate capacity of a facility upon completing construction of the facility, upon completing an expansion of the facility or the acquisition of the facility. The nameplate capacity for each facility represents our estimate of the production capacity of that facility at the time, based on the capacity specified in the applicable design-build agreement or other construction agreement for the plant, our experience operating the plant or similar plants, environmental or other regulatory constraints and other applicable factors. The nameplate capacity of our facilities may not be comparable to the capacity our competitors report as nameplate capacity for their facilities.
Our facilities are designed to operate on a continuous basis and use current dry-milling technology, a production process that results in increased ethanol yield and reduced capital costs compared to wet-milling facilities. In addition to producing ethanol, we produce and sell wet and dry distillers grains. In 2007, we produced approximately 353.1 million gallons of fuel ethanol and 1.2 million tons of distillers grains.
We have five additional ethanol production facilities under construction with a combined annual production capacity of 550 million gallons per year, or “MMGY.” These facilities are located in: Hankinson, North Dakota, Hartley, Iowa and Welcome, Minnesota, which are expected to begin production during the second quarter of 2008; Dyersville, Iowa, which is expected to begin production during the third quarter of 2008; and Janesville, Minnesota which is expected to begin production during the fourth quarter of 2008. Upon completion of these facilities, we will have production capacity of approximately 1.6 BGY. We also broke ground on a facility in Reynolds, Indiana in April 2007. However, in October 2007 we suspended construction there due to market conditions. We expect to resume construction at Reynolds in 2008, depending on the return of more favorable market conditions.
Executive Summary
Highlights for the three months ended March 31, 2008, are as follows:
| • | Total revenues increased 257.4 % or $372.0 million compared to the 2007 comparable period. |
| • | Net income was $7.6 million for the 2008 period, compared to a net loss of $.3 million for the 2007 comparable period. |
| • | Ethanol gallons sold were 191.6 million gallons, an increase of 132.4 million gallons or 223.5% higher than the 2007 period. |
| • | Production volume was 141.9 million gallons, up 82.4 million gallons or 138.6% compared to the 2007 period. |
| • | Income per common share was $0.08 for the 2008 period compared to no income per share for the 2007 period. |
Components of Revenues and Expenses
Total revenues.Our primary source of revenue during the first quarter of 2008 was the sale of products produced at our Aurora, South Dakota; Fort Dodge, Iowa; Charles City, Iowa, Linden, Indiana; and Albion, Nebraska facilities in addition to ethanol purchased from other producers. Our principal sources of revenue are:
| • | the sale of ethanol; |
| • | the sale of distillers grains, and |
| • | the sale of ethanol blended VE85® fuel. |
The selling prices for our products are largely determined by the market demand for ethanol which, in turn, is influenced by the industry factors described elsewhere in this report.
Cost of goods sold and gross profit.Our gross profit is derived from our total revenues less our cost of goods sold. Our cost of goods sold is mainly affected by the cost of corn, natural gas, transportation and the purchase price of ethanol from other producers.
20
Table of Contents
Corn is our most significant raw material production cost (excluding the cost of ethanol purchases). The price of corn is influenced by weather conditions and other factors affecting crop yields, farmer planting decisions and general economic, market and regulatory factors. These factors include government policies and subsidies with respect to agriculture and international trade, and global and local demand and supply. The spot price of corn tends to rise during the spring planting season and tends to decrease during the fall harvest. Transportation expense represents the second major component of our cost of goods sold (excluding the cost of ethanol purchases). Transportation expense includes rail car leases, freight and shipping of our ethanol and distillers grains, as well as costs incurred in storing ethanol at destination terminals. We purchase natural gas to power steam generation in our ethanol production process and to dry our distillers grains. Natural gas represents our third largest production cost (excluding the cost of ethanol purchases). Cost of goods sold also includes net gain or loss from derivatives relating to corn and natural gas.
Startup expenses. Costs associated with the operation of a facility prior to the production and sale of ethanol are expensed as incurred. During the first quarter of 2008, we incurred startup expenses relating to the Bloomingburg, Ohio; Welcome, Minnesota; and Hartley, Iowa facilities. During the first quarter of 2007, we incurred startup expenses relating to the Charles City, Iowa facility.
Selling, general and administrative expenses.Selling, general and administrative expenses consist of salaries and benefits paid to our administrative employees including stock-based compensation, taxes, expenses relating to third-party services, insurance, travel, marketing and other expenses. Other expenses include education and training, marketing, travel, corporate donations and other miscellaneous overhead costs.
Other income (expense).Other income (expense) includes the interest on our long-term debt and the amortization of the related fees to execute required financing agreements.
Result of Operations
The following table sets forth, for the periods presented, revenues, expenses and net income (loss), as well as the percentage relationship to total revenues of specified items in our condensed consolidated statement of operations:
| Three Months Ended March 31, | ||||||||||||||
| 2008 | 2007 | |||||||||||||
| (unaudited) | ||||||||||||||
| (dollars in thousands) | ||||||||||||||
Total revenues | $ | 516,474 | 100.0 | % | $ | 144,510 | 100.0 | % | ||||||
Cost of goods sold | 481,356 | 93.2 | 135,266 | 93.6 | ||||||||||
Gross profit | 35,118 | 6.8 | 9,244 | 6.4 | ||||||||||
Start up expenses | 2,111 | 0.4 | 1,365 | 1.0 | ||||||||||
Selling, general and administrative expenses | 11,365 | 2.2 | 10,169 | 7.0 | ||||||||||
Operating income (loss) | 21,642 | 4.2 | (2,290 | ) | (1.6 | ) | ||||||||
Other income (expense), net | (9,398 | ) | (1.8 | ) | 1,795 | 1.2 | ||||||||
Income (loss) before income taxes | 12,244 | 2.4 | (495 | ) | (0.4 | ) | ||||||||
Income tax provision (benefit) | 4,671 | 0.9 | (183 | ) | (0.1 | ) | ||||||||
Net income (loss) | $ | 7,573 | 1.5 | % | $ | (312 | ) | (0.3 | )% | |||||
21
Table of Contents
The following table sets forth other key data for the periods presented (dollars in thousands, except per unit data):
| Three Months Ended March 31, | |||||||
| 2008 | 2007 | ||||||
| (unaudited) | |||||||
Other financial data: | |||||||
Net cash flows provided by (used in) operating activities | $ | (3,321 | ) | $ | 19,765 | ||
Other non-GAAP financial performance data: | |||||||
EBITDA (1) | $ | 32,345 | $ | 3,791 | |||
Operating data: | |||||||
Ethanol sold - produced (gallons) (2) | 142,189,494 | 59,249,075 | |||||
Ethanol sold - purchase/resale (gallons) | 49,454,595 | — | |||||
Distillers grains sold (tons) | 445.0 | 184.6 | |||||
Average gross price of ethanol sold per gallon | $ | 2.33 | $ | 2.13 | |||
Average corn cost per bushel | 4.73 | 4.05 | |||||
Average natural gas cost per MMBTU | 8.51 | 8.21 | |||||
Average dry distillers grains gross price per ton | 136.53 | 89.06 | |||||
| (1) | EBITDA is defined as earnings before interest expense, income tax expense, depreciation and amortization. Amortization of debt issuance costs and debt discount are included in interest expense. |
(2) | Excludes ethanol sold in VE85® sales. |
Non-GAAP Financial Measures
We believe that earnings before interest expense, income tax provision (benefit), depreciation and amortization, or EBITDA, is useful to investors and management in evaluating our operating performance in relation to other companies in our industry because the calculation of EBITDA generally eliminates the effects of financings and income taxes, which items may vary for different companies for reasons unrelated to overall operating performance. EBITDA is a non-GAAP financial measure and has limitations as an analytical tool, and should not be considered in isolation or as a substitute for net income or any other measure of performance under GAAP, or to cash flows from operating, investing or financing activities as a measure of liquidity. Some of the limitations of EBITDA are:
| • | EBITDA does not reflect our cash used for capital expenditures; |
| • | Although depreciation and amortization are non-cash charges, the assets being depreciated or amortized often will have to be replaced and EBITDA does not reflect the cash requirements for replacements; |
| • | EBITDA does not reflect changes in, or cash requirements for, our working capital requirements; |
| • | EBITDA does not reflect the cash necessary to make payments of interest or principal on our indebtedness; and |
| • | EBITDA includes non-recurring payments to us which are reflected in other income. |
We compensate for these limitations by relying on our GAAP results, as well as on our EBITDA.
The following table reconciles our EBITDA to net income (loss) for the periods presented (dollars in thousands):
| Three Months Ended March 31, | |||||||
| 2008 | 2007 | ||||||
| (unaudited) | (unaudited) | ||||||
Net income | $ | 7,573 | $ | (312 | ) | ||
Depreciation and amortization | 9,288 | 2,534 | |||||
Interest expense | 10,813 | 1,752 | |||||
Income tax provision | 4,671 | (183 | ) | ||||
EBITDA | $ | 32,345 | $ | 3,791 | |||
22
Table of Contents
Three Months Ended March 31, 2008 Compared to Three Months Ended March 31, 2007
Total revenues, which include revenues from the sale of ethanol, distillers grains and VE85®, increased by $372 million, or 257.4% to $516.5 million for the three months ended March 31, 2008, compared to $144.5 million for the three months ended March 31, 2007. The increase in total revenues was primarily the result of a 223.5% increase in ethanol volume sold and an increase in average ethanol prices of $0.20 per gallon, or 10.2%, compared to 2007. For the three months ended March 31, 2008, the company sold 191.7 million gallons of ethanol, which includes 49.5 million gallons of ethanol that were purchased from others and resold to our customers. Ethanol production increased by 82.4 million gallons, or 138.6%, to 142.2 million gallons compared with the three months ended March 31, 2007, as a result of the added capacity from the Charles City, Iowa facility in April 2007, the Linden, Indiana facility in August 2007, and the Albion, Nebraska facility in October 2007.
Net sales from ethanol increased $321.6 million, or 256.3%, to $447.1 million for the three months ended March 31, 2008 compared with $125.5 million for the three months ended March 31, 2007. Of the increase, $280.4 million was driven by additional volumes of ethanol sold. The increased volume resulted from additional production at Charles City, Linden, and Albion facilities, which came on line since March 31, 2007 and, ethanol that was purchased and resold to our customers. In addition, higher ethanol prices contributed $41.2 million of the increased revenue. The average price of ethanol sold was $2.33 per gallon for the three months ended March 31, 2008, compared to $2.13 per gallon for the three months ended March 31, 2007.
Net sales from distillers grains increased $44.4 million, or 269.6%, to $60.8 million for the three months ended March 31, 2008 compared with $16.4 million for the three months ended March 31, 2007. The impact of increased volume from the additional Charles City, Linden, and Albion capacity was $23.2 million and the impact of higher prices contributed $21.1 million of the increased revenues.
Net sales of VE85®, our branded E85 product, increased $5.5 million, or 285.3%, to $7.4 million for the three months ended March 31, 2008 compared with $1.9 million for the three months ended March 31, 2007, primarily due to an increase in the number of retail outlets selling VE85®.
Cost of goods sold and gross profit. Corn costs increased $154.0 million to $238.6 million for the three months ended March 31, 2008 compared with $84.6 million for the three months ended March 31, 2007. Corn costs were $1.68 per manufactured gallon sold for the three months ending March 31, 2008, compared with $1.43 per manufactured gallon sold for the same period in 2007.
The increase in total corn costs for the three months ended March 31, 2008 was driven by $100.3 million of increased corn purchases resulting from additional production from our Charles City, Linden, and Albion facilities and $50.2 million of the increased corn costs resulted from higher corn prices per bushel.
A net gain of $4.4 million from derivatives was included in cost of goods sold for the three months ended March 31, 2008 compared to a net loss of $5.3 million for the three months ended March 31, 2007. The increase was due to mark-to-market adjustments related to our corn hedges.
Transportation expense increased $23.6 million to $40.3 million for the three months ended March 31, 2008 from $16.7 million for the three months ended March 31, 2007, due to additional volume of ethanol and distillers grain shipped and increased rail rates for 2008. On a cost per gallon basis, transportation expense accounted for $0.28 of cost per manufactured gallon sold for the three months ended March 31, 2008 and March 31, 2007.
Natural gas costs increased $20.4 million to $35.0 million for the three months ended March 31, 2008 from $14.6 million for the three months ended March 31, 2007, The increase in natural gas costs for the three months ended March 31, 2008 was primarily attributable to an increase in our production compared to the three months ended March 31, 2007, and to a lesser extent, an increase in natural gas prices per million British Thermal Units, or MMBTU, in 2008. On a cost per gallon basis, natural gas accounted for $0.25 of cost per manufactured gallon sold for the three months ended March 31, 2008 and March 31, 2007.
23
Table of Contents
Labor and manufacturing overhead costs increased $11.7 million to $20.4 million for the three months ended March 31, 2008 from $8.7 million for the three months ended March 31, 2007. The increase was primarily due to additional production at our Charles City, Iowa, Linden, Indiana, and Albion, Nebraska facilities. On a cost per gallon basis, labor and manufacturing overhead costs accounted for $0.14 of cost per manufactured gallon sold for the three months ended March 31, 2008, compared to $0.15 per manufactured gallon sold for the three months ended March 31, 2007.
Other inputs, which includes chemicals, electricity and denaturant, increased $11.7 million to $20.1 million for the three months ended March 31, 2008 from $8.4 million for the three months ended March 31, 2007. The increase is primarily due to the increased volume from the additional Charles City, Linden, and Albion capacity that came on line in 2007. On a cost per gallon basis, other inputs accounted for $0.14 of cost per manufactured gallon sold for the three months ended March 31, 2008 and March 31, 2007.
Ethanol purchased for resale cost $118.9 million for the three months ended March 31, 2008. During the quarter, we purchased and resold 49.5 million gallons at an average cost of $2.41 per gallon.
Gross profit increased $25.9 million to $35.1 million for the three months ended March 31, 2008 from $9.2 million for the three months ended March 31, 2007. The increase in gross profit was primarily due to additional ethanol volumes sold and increased ethanol prices, partially offset by an increase in corn costs in the 2008 period compared to the 2007 period.
Startup expenses.Startup expenses increased $0.7 million to $2.1 million for the three months ended March 31, 2008 from $1.4 million for the three months ended March 31, 2007. The increase was due to the increase in the number of plants under construction or in development. In 2008, the Hartley, Iowa, Welcome, Minnesota, and the Bloomingburg, Ohio facilities were all in startup mode and in 2007 only the Charles City, Iowa facility was in startup mode.
Selling, general and administrative expenses. Selling, general and administrative expenses increased $1.2 million to $11.4 million for the three months ended March 31, 2008 from $10.2 million for the three months ended March 31, 2007. The increase was primarily the result of increased management and administrative costs in the 2008 period to support our growth strategy. Selling, general and administrative expenses were $0.06 per total gallons sold in the three months ended March 31, 2008, compared to $0.17 per total gallons sold in the three months ended March 31, 2007.
Other income (expense). Interest expense increased $9.0 million to $10.8 million for the three months ended March 31, 2008, compared to $1.8 million for the three months ended March 31, 2007. The increase is primarily due to the additional debt issued in 2007 and the recognition of interest expense on debt for which the interest cost was previously being capitalized on facilities that were under construction in prior periods. Interest cost capitalized for the three months ended March 31, 2008 was $10.3 million compared to $ 3.7 million for the three months ended March 31, 2007. Interest expense is expected to increase in the future as additional plants currently under construction begin operations.
Interest income decreased $2.6 million to $0.9 million for the three months ended March 31, 2008, compared to $3.5 million for the three months ended March 31, 2007. The decrease was primarily attributable to a decrease in the funds available to be invested in interest bearing securities.
Other income includes rental income associated with land held for developmental sites and other miscellaneous items.
Income taxes. The income tax provision was $4.7 million and income tax benefit was $0.2 million for the three months ended March 31, 2008 and 2007, respectively. The effective tax rate for 2008 was 38.1%, compared to 37.0% for the three months ended March 31, 2007.
The Internal Revenue Service has proposed certain adjustments to our 2004 and 2005 federal income tax returns. We are contesting those adjustments and have not recognized any effect of the proposed adjustments or any associated interest or penalties, based on our assessment of the positions taken in preparing our tax returns. We may not prevail on these positions and, if so, we could recognize incremental income tax expense in future periods. We have not quantified the magnitude of any such potential income tax expense.
Liquidity and Capital Resources
Our principal sources of liquidity consist of cash provided by operations, cash and cash equivalents on hand, short-term investments, available borrowings under our credit agreements, and the issuance of common stock. We have also issued long-term debt as a source of funds, including $210.0 million aggregate principal amount of senior secured notes in December 2005 and $450.0 million aggregate principal amount of senior notes in May 2007. In addition to funding operations, our principal uses of cash have been, and are expected to be, the construction of new facilities, capital expenditures, acquisitions and debt service requirements.
24
Table of Contents
The following table summarizes our sources and uses of cash and cash equivalents from our condensed consolidated statements of cash flows for the periods presented (in thousands):
| Three Months Ended March 31, | ||||||||
| 2008 | 2007 | |||||||
| (unaudited) | ||||||||
Net cash provided by (used in) operating activities | $ | (3,321 | ) | $ | 19,765 | |||
Net cash used in investing activities | (64,138 | ) | (64,161 | ) | ||||
Net cash provided by financing activities | 30,006 | 6,826 | ||||||
Net decrease in cash and cash equivalents | $ | (37,453 | ) | $ | (37,570 | ) | ||
Cash used in operating activities was $3.3 million for the three months ended March 31, 2008, compared to $19.8 million provided by operating activities for the three months ended March 31, 2007. Our inventory increased $43.6 million during the three months ended March 31, 2008, primarily due to the increase in cost of ethanol and corn and additional ethanol gallons and corn bushels held in inventory. As we add additional facilities, we expect that our total working capital requirements will increase. As March 31, 2008, we had total cash and cash equivalents of $73.5 million compared to $212.6 million at March 31, 2007.
As of March 31, 2008, we had a short-term investment of $3.0 million. The short-term investment consisted of a triple A rated auction rate security issued by an educational institution (Georgetown University).
Cash used in investing activities was $64.1 million for the three months ended March 31, 2008 compared to cash used of $64.2 million in the three months ended March 31, 2007. The increase primarily resulted from facility construction expenditures.
Cash provided by financing activities for the three months ended March 31, 2008 was $30.0 million, compared to $6.8 million for the three months ended March 31, 2007.
As of March 31, 2008, we had total debt of $935.5 million, net of $2.9 million of unaccreted debt discount. In addition, we had $13.0 million of letters of credit issued but not drawn under our $30.0 million credit agreement, leaving $17.0 million of borrowing capacity under that agreement at March 31, 2008. On May 5, 2008, we entered into a revolving credit facility commitment letter with UBS Investment Bank (“UBS”), under which UBS has committed to provide us with a secured revolving credit facility of up to $125 million. We expect to enter into the new credit facility no later than May 31, 2008. The entry into the new credit facility is subject to the completion of UBS’ due diligence, mutually agreeable loan documents and other customary conditions. The credit facility will have a 3-year term and will be secured by accounts receivable and inventory of certain wholly-owned subsidiaries. We intend to use proceeds derived from the credit facility for general corporate purposes. Our debt service requirements for the remainder of 2008 are expected to be approximately $104.6 million, consisting of $16.8 million in principal payment and $87.8 million in interest.
Our financial position and liquidity are, and will be, influenced by a variety of factors, including:
| • | our ability to generate cash flows from operations; |
| • | the level of our outstanding indebtedness and the interest we are obligated to pay on this indebtedness; and |
| • | our capital expenditure requirements, which consist primarily of plant construction and the purchase of equipment. |
We intend to fund our principal liquidity and capital resource requirements through cash and cash equivalents, cash provided by operations and borrowings under our credit agreement.
In addition to the construction of our planned Hartley, Iowa; Welcome, Minnesota; and Bloomingburg, Ohio; facilities and oil extraction units at our Aurora, South Dakota; Charles City, Iowa; and Fort Dodge, Iowa facilities, we may also consider additional opportunities for growing our production capacity, including acquisitions, development of additional sites and expansion of one or more of our existing facilities. Acquisitions or further expansion of our operations could cause our indebtedness, and our ratio of debt to equity, to increase. The indentures governing our 2012 Notes and 2017 Notes and the terms of our credit agreements limit our ability to incur additional debt and could restrict our ability to make acquisitions and expand our facilities.
In 2008, we expect to make capital expenditures of between $50 million and $75 million in the second quarter, and between $25 million and $50 million in each of the third and fourth quarters for the construction of our previously announced ethanol production facilities, the purchase and installation of corn oil extraction equipment, facility maintenance, terminal infrastructure, cellulosic ethanol projects, operational improvements and further development of possible ethanol facility sites. We intend to fund these capital expenditures through cash flows from operations, cash and cash equivalents, short-term investments and funds available under the credit facility.
25
Table of Contents
We have no off-balance sheet arrangements.
| ITEM 3. | QUANTITATIVE AND QUALITATIVE DISCLOSURES ABOUT MARKET RISK |
The following section discusses significant changes in market risks since our latest fiscal year end. You should read this discussion in conjunction with the disclosures made in our Annual Report on Form 10-K for the year ended December 31, 2007 and described in Part II, Item IA of this quarterly report.
In addition to risks inherent in our operations, as a commodity-based business we are subject to a variety of market factors, including the price relationship between ethanol and corn as shown in the following graph:
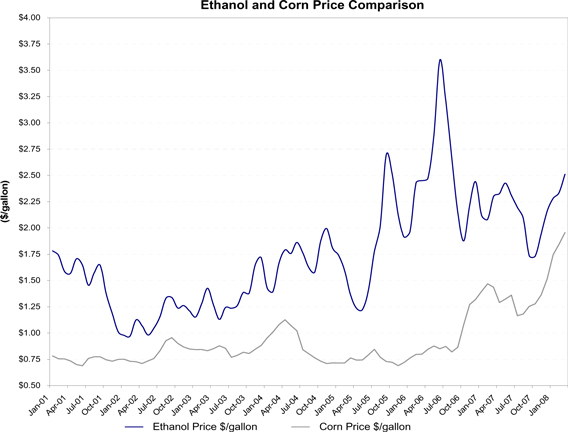
| (1) | Ethanol prices are based on the monthly average of the daily closing price of U.S. average ethanol rack prices quoted by Bloomberg, L.P. (“Bloomberg”). The corn prices are based on the monthly average of the daily closing prices of the nearby corn futures quoted by the Chicago Board of Trade (“CBOT”) and assume a conversion rate of 2.8 gallons of ethanol produced per bushel of corn. The comparison between the ethanol and corn prices presented does not reflect the costs of producing ethanol other than the cost of corn, and should not be used as a measure of future results. This comparison also does not reflect the revenues that are received from the sale of distillers grains. |
We consider market risk to be the potential loss arising from adverse changes in market rates and prices. We are subject to significant market risk with respect to the price of ethanol, our principal product, and the price and availability of corn, the principal commodity used in our ethanol production process. In general, ethanol prices are influenced by the supply and demand for gasoline, the availability of substitutes and the effect of laws and regulations. Higher corn costs result in lower profit margins and, therefore, represent unfavorable market conditions. Historically, we have not been able to pass along increased corn costs to our ethanol customers. The availability and price of corn are subject to wide fluctuations due to unpredictable factors such as weather conditions during the corn growing season, carry-over from the previous crop year and current crop year yield, governmental policies with respect to agriculture and international supply and demand. Corn costs represented approximately 65.9% of our total cost of goods sold related to manufactured ethanol gallons for the three months ended March 31, 2008 compared to 62.5% for the three months
26
Table of Contents
ended March 31, 2007. Over the ten-year period from 1998 through 2007, corn prices (based on the CBOT daily futures data) have ranged from a low of $1.75 per bushel on August 11, 2000 to a high of $4.55 per bushel on December 31, 2007 with prices averaging $2.42 per bushel during this period. At May 1, 2008, the CBOT price per bushel of corn for May delivery was $6.05.
We are also subject to market risk with respect to our supply of natural gas that is consumed in the ethanol production process and has been historically subject to volatile market conditions. Natural gas prices and availability are affected by weather conditions and overall economic conditions. Natural gas costs represented 9.7% of our total cost of goods sold related to manufactured ethanol gallons for the three months ended March 31, 2008 compared to 10.8% for the three months ended March 31, 2007. The price fluctuation in natural gas prices over the seven-year period from 2000 through 2007, based on the New York Mercantile Exchange, or NYMEX, daily futures data, has ranged from a low of $1.83 per MMBTU on September 26, 2001 to a high of $15.38 per MMBTU on December 23, 2005, averaging $6.03 per MMBTU during this period. At May 1, 2008, the NYMEX price of natural gas for June delivery was $10.51 per MMBTU.
We have prepared a sensitivity analysis to estimate our exposure to market risk with respect to our corn and natural gas requirements, ethanol contracts and the related exchange-traded contracts for 2007. Market risk related to these factors is estimated as the potential change in pre-tax income, resulting from a hypothetical 10% adverse change in the fair value of our corn and natural gas requirements and ethanol contracts (based on average prices for 2007) net of the corn and natural gas forward and futures contracts used to hedge our market risk with respect to our corn and natural gas requirements. The results of this analysis are set forth in the following table. Actual results may differ from these amounts due to various factors, including significant increases in the Company’s production capacity during 2008.
| Volume Requirements | Units | Hypothetical Adverse Change in Price | Change in Annual Pre-Tax Income | ||||||||
| (In millions) | (In millions) | ||||||||||
Ethanol | 353.1 | gallons | 10 | % | $ | (70.8 | ) | ||||
Corn | 126.1 | bushels | 10 | (45.4 | ) | ||||||
Natural gas | 10.7 | MMBTU | 10 | (7.7 | ) | ||||||
As of March 31, 2008, we had contracted forward on a fixed price basis the following quantities of corn and natural gas, which represent the indicated percentages of our estimated requirements for these inputs for the next twelve months:
| Three months ending June 30, 2008 | Three months ending September 30, 2008 | Three months ending December 31, 2008 | Three months ending March 31, 2009 | Twelve months ending June 30, 2009 | |||||||||||
Corn (thousands of bushels) | 9,162 | 225 | 1,861 | 291 | 11,539 | ||||||||||
Percentage of estimated requirements | 14.4 | % | 0.3 | % | 2.4 | % | 0.4 | % | 3.9 | % | |||||
Natural Gas (MMBTU) | — | — | — | — | — | ||||||||||
Percentage of estimated requirements | 0 | % | 0 | % | 0 | % | 0 | % | 0 | % |
The extent to which we enter into these arrangements varies substantially from time to time based on a number of factors, including supply and demand factors affecting the needs of customers or suppliers to purchase ethanol or sell us raw materials on a fixed basis, our views as to future market trends, seasonal factors and the costs of futures contracts.
27
Table of Contents
| ITEM 4. | CONTROLS AND PROCEDURES |
Evaluation of Disclosure Controls and Procedures
The Company maintains disclosure controls and procedures that are designed to ensure that information required to be disclosed in the reports that the Company files or submits under the Securities Exchange Act of 1934 (the “Exchange Act”) is recorded, processed, summarized and reported within the time periods specified in the SEC’s rules and forms, and that such information is accumulated and communicated to the Company’s management, including its Chief Executive Officer and Chief Financial Officer, as appropriate, to allow timely decisions regarding required financial disclosure.
As of the end of the period covered by this report, the Company carried out an evaluation, under the supervision of management, including the Chief Executive Officer and the Chief Financial Officer, of the effectiveness of the design and operation of the Company’s disclosure controls and procedures pursuant to Exchange Act Rule 13a-15. Based upon such evaluation as of March 31, 2008, the Chief Executive Officer and the Chief Financial Officer concluded that the Company’s disclosure controls and procedures were effective at the reasonable assurance level to ensure that information required to be disclosed in this Quarterly Report on Form 10-Q was recorded, processed, summarized and reported within the time period required by the Securities and Exchange Commission’s rules and forms and accumulated and communicated to management, including the Company’s Chief Executive Officer and Chief Financial Officer, to allow timely decisions regarding required disclosure.
Changes in Internal Control over Financial Reporting
There has been no change in the Company’s internal control over financial reporting (as defined in Rule 13a-15(f) under the Exchange Act) that occurred in the fiscal quarter ended March 31, 2008 that has materially affected, or is reasonably likely to materially affect, the Company’s internal control over financial reporting.
| ITEM 1A. | RISK FACTORS |
Our business is subject to a number of risks and uncertainties. In addition to other information contained in this Quarterly Report, readers are directed to the “Risk Factors” section of our Annual Report on Form 10-K for the year ended December 31, 2007 and the following factors for a description of material risks facing us. These factors could affect our future business, results of operations, cash flows or financial position, and could cause future results to differ materially from those expressed in any of the forward-looking statements contained in this Quarterly Report on Form 10-Q. Additional risks and uncertainties not currently known to us or that we currently deem to be immaterial may also materially and adversely affect our business, financial condition and results of operations.
We may sell more ethanol than we produce and could be required to purchase ethanol at costs that exceed our selling prices.
In some instances our customers’ demand for ethanol is greater than the number of gallons we are able to produce. At times, we may satisfy our customers’ demand by committing to sell more gallons of ethanol than we produce and those volumes may be substantial. On those occasions, we purchase ethanol from other producers and marketers of ethanol for resale to our customers. Our sales commitments may provide for delivery in future periods. Depending on our expectations of market conditions, we may delay purchasing ethanol required to meet our sales commitments until delivery is required to our customers. We may be unable to secure sufficient quantities of ethanol to satisfy our sales commitments. In addition, the prices we pay for ethanol we purchase could exceed the price we obtain from our customers. Although we may take steps to mitigate quantity and pricing risks associated with ethanol we purchase and resell, there can be no assurance that we will do so or that any such steps will be effective. Our failure to manage such risks could result in operating losses and those losses could be substantial.
28
Table of Contents
| ITEM 4. | SUBMISSION OF MATTERS TO A VOTE OF SECURITY HOLDERS |
On March 31, 2008, we held a special meeting of shareholders for the purpose of voting on the issuance shares of common stock pursuant to the merger (the “Merger”) with US BioEnergy, pursuant to the Agreement and Plan of Merger, dated as of November 29, 2007, by and among VeraSun, Host Acquisition Corporation (a direct, wholly-owned subsidiary of VeraSun) and US BioEnergy (the “Merger Agreement”), with the Merger becoming effective on April 1, 2008. Shareholders also voted on a proposal to adjourn the special meeting, if necessary, to solicit additional proxies if there were not sufficient shares to approve the issuance of shares of common stock pursuant to the Merger. On the proposal to issue shares of common stock pursuant to the Merger, 64,265,616 shares were voted in favor of the proposal, 91,753 shares were voted against the proposal, and 19,285 shares abstained from voting. On the proposal to adjourn the meeting, if necessary, to solicit additional proxies, 61,133,026 shares were voted in favor of the proposal, 3,224,771 shares were voted against the proposal, and 18,857 shares abstained from voting.
29
Table of Contents
| ITEM 6. | EXHIBITS |
| 2.1 | Unit Purchase Agreement among VeraSun Energy Corporation, ASA OpCo Holdings, LLC, ASAlliances Biofuels, LLC and the Security holders named therein (incorporated by reference to Exhibit 2.1 to VeraSun Energy Corporation’s current report on Form 8-K filed on July 25, 2007). | |
| 2.2 | Agreement and Plan of Merger, dated as of November 29, 2007, among VeraSun Energy Corporation, Host Acquisition Corporation and US BioEnergy Corporation (incorporated by reference to Exhibit 2.1 to VeraSun’s Current Report on Form 8-K, filed on December 5, 2007). | |
| 3.1 | Articles of Incorporation, as amended, of VeraSun Energy Corporation.* | |
| 3.2 | Bylaws, as amended, of VeraSun Energy Corporation (incorporated by reference to Exhibit 3.1 to VeraSun’s Form 8-K, filed with the SEC on April 1, 2008). | |
| 4.1 | Indenture, dated as of December 21, 2005, between VeraSun Energy Corporation, as Issuer, VeraSun Aurora Corporation, VeraSun Fort Dodge, LLC, VeraSun Charles City, LLC and VeraSun Marketing, LLC, as Subsidiary Guarantors, and Wells Fargo, N.A., as Trustee.* | |
| 4.2 | Registration Rights Agreement, dated as of December 21, 2005, by and among VeraSun Energy Corporation, VeraSun Aurora Corporation, VeraSun Fort Dodge, LLC, VeraSun Charles City, LLC, VeraSun Marketing LLC, Lehman Brothers Inc. and Morgan Stanly & Co. Incorporated.* | |
| 4.3 | Revolving Credit Agreement, dated as of December 21, 2005, among VeraSun Energy Corporation, First National Bank of Omaha, VeraSun Aurora Corporation, VeraSun Fort Dodge, LLC and VeraSun Charles City, LLC.* | |
| 4.4 | First Supplemental Indenture, dated May 4, 2006, between VeraSun Energy Corporation, as Issuer, VeraSun Aurora Corporation, VeraSun Fort Dodge, LLC, VeraSun Charles City, LLC, VeraSun Marketing, LLC and VeraSun Welcome, LLC, as Subsidiary Guarantors, and Wells Fargo, N.A., as Trustee.* | |
| 4.5 | Second Supplemental Indenture, dated August 21, 2006, between VeraSun Energy Corporation, as Issuer, VeraSun Aurora Corporation, VeraSun Fort Dodge, LLC, VeraSun Charles City, LLC, VeraSun Hartley, LLC, VeraSun Marketing, LLC, and VeraSun Welcome, LLC, as Subsidiary Guarantors, and Wells Fargo, N.A., as Trustee. (Incorporated by reference to Exhibit 10.1 to VeraSun Energy Corporation’s quarterly report on Form 10-Q for the period ended September 30, 2006.) | |
| 4.6 | Third Supplemental Indenture, dated February 9, 2007, between VeraSun Energy Corporation, as Issuer, VeraSun Aurora Corporation, VeraSun Fort Dodge, LLC, VeraSun Charles City, LLC, VeraSun Hartley, LLC, VeraSun Marketing, LLC, and VeraSun Welcome, LLC, as Subsidiary Guarantors, and Wells Fargo, N.A., as Trustee. (Incorporated by reference to VeraSun Energy Corporation’s Annual Report on Form 10-K for the period ended December 31, 2006.) | |
| 4.7 | Fourth Supplemental Indenture, dated May 17, 2007, between VeraSun Energy Corporation as Issuer, VeraSun Aurora Corporation, VeraSun Fort Dodge, LLC, VeraSun Charles City, LLC, VeraSun Hartley, LLC, VeraSun Marketing, LLC, VeraSun Welcome, LLC, VeraSun Granite City, LLC, VeraSun Reynolds, LLC, and VeraSun Biodiesel, LLC, as subsidiary Guarantors, and Wells Fargo, N.A., as Trustee (incorporated by reference to Exhibit 4.2 to VeraSun Energy Corporation’s current report on Form 8-K filed on May 17, 2007). | |
| 4.8 | Fifth Supplemental Indenture, dated December 31, 2007, between VeraSun Energy Corporation as Issuer, VeraSun Aurora Corporation, VeraSun Fort Dodge, LLC, VeraSun Charles City, LLC, VeraSun Hartley, LLC, VeraSun Marketing, LLC, VeraSun Welcome, LLC, VeraSun Granite City, LLC, VeraSun Reynolds, LLC, VeraSun Biodiesel, LLC, VeraSun Litchfield, LLC, and VeraSun Tilton, LLC, as subsidiary Guarantors, and Wells Fargo, N.A., as Trustee (incorporated by reference to Exhibit 4.7 to VeraSun Energy Corporation’s annual report on Form 10-K filed on March 12, 2008). | |
| 4.9 | Indenture, dated as of May 16, 2007, between VeraSun Energy Corporation as Issuer, VeraSun Aurora Corporation, VeraSun Fort Dodge, LLC, VeraSun Charles City, LLC, VeraSun Hartley, LLC, VeraSun Marketing, LLC, VeraSun Welcome, LLC, VeraSun Granite City, LLC, VeraSun Reynolds, LLC, and VeraSun Biodiesel, LLC, as subsidiary Guarantors, and Wells Fargo, N.A., as Trustee (incorporated by reference to Exhibit 4.1 to VeraSun Energy Corporation’s current report on Form 8-K filed on May 17, 2007). | |
| 4.10 | First Supplemental Indenture, dated December 31, 2007, between VeraSun Energy Corporation as Issuer, VeraSun Aurora Corporation, VeraSun Fort Dodge, LLC, VeraSun Charles City, LLC, VeraSun Hartley, LLC, VeraSun Marketing, LLC, VeraSun Welcome, LLC, VeraSun Granite City, LLC, VeraSun Reynolds, LLC, VeraSun Biodiesel, LLC, VeraSun Litchfield, LLC, and VeraSun Tilton, LLC, as subsidiary Guarantors, and Wells Fargo, N.A., as Trustee (incorporated by reference to Exhibit 4.9 to VeraSun Energy Corporation’s annual report on Form 10-K filed on March 12, 2008). | |
| 4.11 | Stock Transfer Restriction Agreement and Amendments to Site Acquisition Agreement, dated June 14, 2006, among the Company, American Milling, LP and the other parties named therein. (Incorporated by reference to Exhibit 10.4 to VeraSun Energy Corporation’s Current Report on Form 8-K dated June 14, 2006). | |
30
Table of Contents
| 4.12 | Registration Rights Agreement, dated as of May 16, 2007, between VeraSun Energy Corporation, VeraSun Aurora Corporation, VeraSun Fort Dodge, LLC, VeraSun Charles City, LLC, VeraSun Hartley, LLC, VeraSun Marketing, LLC, VeraSun Welcome, LLC, VeraSun Granite City, LLC, VeraSun Reynolds, LLC, VeraSun Biodiesel, LLC, Lehman Brothers Inc., Morgan Stanley & Co. Incorporated and UBS Securities LLC (incorporated by reference to Exhibit 4.3 to VeraSun Energy Corporation’s current report on Form 8-K filed on May 17, 2007). | |
| 4.13 | Registration Rights Agreement, dated as of August 17, 2007, among VeraSun Energy Corporation and the Holders of Registrable Securities named therein (incorporated by reference to Exhibit 4.9 to VeraSun Energy Corporation’s quarterly report on Form 10-Q filed on November 14, 2007). | |
| 10.1 | Fourth Omnibus Agreement (Seventh Amendment, Fourth Consent and Fourth Waiver), dated March 7, 2008, by and among ASA OpCo Holdings, LLC, ASA Albion, LLC, ASA Bloomingburg, LLC, ASA Linden, LLC, WestLB AG, New York Branch, as Administrative Agent, and the Lenders named therein (incorporated by reference to Exhibit 10.8 to VeraSun Energy Corporation’s annual report on Form 10-K filed on March 11, 2008). | |
| 31.1 | Certification of Chief Executive Officer pursuant to Section 302 of the Sarbanes-Oxley Act of 2002. | |
| 31.2 | Certification of Chief Financial Officer pursuant to Section 302 of the Sarbanes-Oxley Act of 2002. | |
| 32.1 | Certification of Chief Executive Officer pursuant to Section 906 of the Sarbanes-Oxley Act of 2002. | |
| 32.2 | Certification of Chief Financial Officer pursuant to Section 906 of the Sarbanes-Oxley Act of 2002. | |
| * | Incorporated by reference to VeraSun Energy Corporation’s Registration Statement on Form S-1, as amended (file number 333-132861). |
31
Table of Contents
Pursuant to the requirements of Section 13 or 15(d) of the Securities Exchange Act of 1934, the registrant has duly caused this report to be signed on its behalf by the undersigned, thereunto duly authorized, as of May 12, 2008.
| VERASUN ENERGY CORPORATION | ||
| By: | /s/ Danny C. Herron | |
| Danny C. Herron | ||
President and Chief Financial Officer (authorized officer and chief financial officer) | ||
| By: | /s/ Bryan Meier | |
| Bryan Meier | ||
Vice President Finance and Chief Accounting Officer (principal accounting officer) | ||
32