Washington, D.C. 20549
Michael G. Willis
ITEM 1. REPORTS TO STOCKHOLDERS.
The following is a copy of the report transmitted to shareholders pursuant to Rule 30e-1 under the Investment Company Act of 1940 (17 CFR 270.30e-1).
| | (Performance as of September 30, 2014) | | | | | Average Annual Since Inception 5/1/06 | |
| | Total Index System (INDEX) | 0.32% | 3.89% | 7.46% | 5.06% | 1.96% | |
| | Total Investment System (CASHX) | 0.18% | 5.46% | 8.31% | 6.03% | 3.22% | |
| | Global Dow (TR) | 2.57% | 12.04% | 16.26% | 8.30% | 5.67% | |
| The performance data quoted here represents past performance and past performance is not a guarantee of future results. Investment return and principal value will fluctuate, so that an investor’s shares, when redeemed, may be worth more or less than their original cost. Current performance may be lower or higher than the performance information quoted. To obtain performance information current to the most recent month-end, please call 1-888-5GIANT5. Total Annual Fund Operating Expenses of the Total Investment System and Total Index System as of the Funds’ most recent prospectus dated July 29, 2014 were 2.68% and 2.21%, respectively. Opinions expressed above are subject to change at any time, are not guaranteed and should not be considered investment advice.
Fund holdings and sector allocations are subject to change at any time and are not recommendations to buy or sell any security. Please refer to the schedule of investments for a complete list of Fund holdings.
Equity securities are more volatile and carry more risk than other forms of investing, including investment in high grade fixed income securities. Fixed income securities are subject to interest rate risk. Investments concentrated in one economic sector, such as, Energy, Raw materials and Real Estate, experience greater volatility than more broadly based investments. International investing is subject to greater volatility due to such factors as change in currency rates, foreign taxation, differences in auditing and other financial standards, and political and environmental instability.
The Global Dow Total Return is an unmanaged index of stocks. Unlike mutual funds, indexes are typically not subject to fees or expenses. It is not possible to invest directly in an index. The Global Dow (TR) is an equal-weighted stock index consisting of the stocks of 150 top companies from around the world as selected by Dow Jones editors and is designed to reflect the global stock market giving preferences to companies with a global reach.
The shareholder letter included is this report contains certain forward-looking statements about the factors that may affect the performance of the Funds in the future. These statements are based on Fund management’s predictions and expectations concerning certain future events and their expected impact on the Funds, such as performance of the economy as a whole and of specific industry sectors, changes in the levels of interest rates, the impact of developing world events, and other factors that may influence the future performance of the Funds. Management believes these forward-looking statements to be reasonable, although they are inherently uncertain and difficult to predict. Actual events may cause adjustments in portfolio management strategies from those currently expected to be employed.
A “basis point” is a unit that is equal to 1/100th of 1%. |
| | Giant 5 Total Investment System |
Schedule of Portfolio Investments | September 30, 2014 (Unaudited) |
| Security Description | | Shares | | | Fair Value | |
| INVESTMENT COMPANIES - 89.2% | |
| | | | | | | |
Fidelity Select Materials Portfolio | | | 29,621 | | | $ | 2,515,732 | |
| Invesco Equally-Weighted S&P 500 Fund, Class Y | | | 60,955 | | | | 2,909,379 | |
Third Avenue Real Estate Value Fund, Class I | | | 90,752 | | | | 2,823,309 | |
Vanguard Energy Fund, Admiral Shares | | | 20,603 | | | | 2,662,496 | |
| | | | | | | | | |
Total Investment Companies (Cost $8,944,882) | | | | | | | 10,910,916 | |
| Security Description | | Shares | | | Fair Value | |
| SHORT-TERM INVESTMENTS - 10.9% | |
| | | | | | | |
Fidelity Institutional Treasury Portfolio, Class I, 0.010%(a) | | | 1,326,348 | | | $ | 1,326,348 | |
| | | | | | | | | |
Total Short-Term Investments (Cost $1,326,348) | | | | | | | 1,326,348 | |
| | | | | | | | | |
Total Investments - 100.1% (Cost $10,271,230) | | | | | | | 12,237,264 | |
Liabilities in Excess of Other Assets - (0.1)% | | | | | | | (6,387 | ) |
NET ASSETS -100.0% | | | | | | $ | 12,230,877 | |
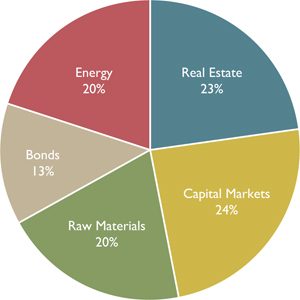
Giant 5 Total Investment System
Sector Breakdown
(Based on Total Investments) (Unaudited)
| (a) | Variable rate security; the rate shown represents the rate at September 30, 2014. |
See Notes to the Financial Statements.
| Giant 5 Total Investment System |
| STATEMENT OF ASSETS AND LIABILITIES | |
| September 30, 2014 (Unaudited) | | | |
| | | | |
| Assets: | | | |
Investment securities at fair value (cost $10,271,230) | | $ | 12,237,264 | |
Dividends receivable | | | 11 | |
Prepaid expenses | | | 26,181 | |
Total Assets | | | 12,263,456 | |
| | | | | |
| Liabilities: | | | | |
Payable to Adviser | | | 6,916 | |
Payable for 12b-1 fees | | | 1,755 | |
Payable to Trustees' | | | 72 | |
Other payables | | | 23,836 | |
Total Liabilities | | | 32,579 | |
| | | | | |
Net Assets | | $ | 12,230,877 | |
| | | | | |
| Net assets consist of: | | | | |
Paid-in-capital | | $ | 13,636,566 | |
Undistributed net investment loss | | | (115,753 | ) |
Accumulted undistributed net realized losses | | | (3,255,970 | ) |
Net unrealized appreciation on investments | | | 1,966,034 | |
| | | | | |
Net Assets | | $ | 12,230,877 | |
| | | | | |
| Capital Shares: | | | | |
| Investor Shares Outstanding (no par value, unlimited number of shares authorized) | | | 744,375 | |
| | | | | |
Net Asset Value, Offering Price and Redemption Price Per Share | | $ | 16.43 | |
| STATEMENT OF OPERATIONS | |
| For the period ended September 30, 2014 (Unaudited) | | | |
| | | | |
| Investment Income: | | | |
Dividends | | $ | 72,823 | |
Total Investment Income | | | 72,823 | |
| | | | | |
| Expenses: | | | | |
Investment advisory fees | | | 44,320 | |
Fund accounting and administration fees | | | 26,642 | |
Transfer Agency fees | | | 23,349 | |
12b-1 fees | | | 11,245 | |
Audit fees | | | 5,686 | |
Blue Sky fees | | | 5,402 | |
Custody fees | | | 4,560 | |
Insurance | | | 3,719 | |
CCO fees | | | 2,041 | |
Printing fees | | | 1,997 | |
Legal fees | | | 824 | |
Directors fees | | | 17 | |
Miscellaneous fees | | | 1,729 | |
Total Expenses | | | 131,531 | |
| | | | | |
Net Investment Loss | | | (58,708 | ) |
| | | | | |
| Net Realized and Unrealized Gains on Investments: | | | | |
Change in unrealized appreciation on investments | | | 118,320 | |
Net realized and unrealized gains on investments | | | 118,320 | |
| | | | | |
Change in net assets resulting from operations | | $ | 59,612 | |
See Notes to the Financial Statements.
| Giant 5 Total Investment System |
| | Period Ended September 30, 2014 (Unaudited) | | | Year Ended March 31, 2014 | |
| STATEMENTS OF CHANGES IN NET ASSETS | | | | | | |
| | | | | | | |
| Increase/(Decrease) in Net Assets from Operations | | | | | | |
| Net investment loss | | $ | (58,708 | ) | | $ | (131,469 | ) |
| Net realized gain from investment transactions | | | — | | | | 2,261,738 | |
| Long tem realized gain distribution from underlying funds | | | — | | | | 105,167 | |
| Change in unrealized appreciation/(depreciation) on investments | | | 118,320 | | | | (1,577,451 | ) |
| Change in net assets resulting from operations | | | 59,612 | | | | 657,985 | |
| | | | | | | | | |
| Capital Share Transactions | | | | | | | | |
| Proceeds from sale of shares | | | 11,056 | | | | 648,946 | |
| Cost of shares redeemed | | | (1,356,057 | ) | | | (2,370,336 | ) |
| Change in net assets resulting from capital share transactions | | | (1,345,001 | ) | | | (1,721,390 | ) |
| Net decrease in net assets | | | (1,285,389 | ) | | | (1,063,405 | ) |
| | | | | | | | | |
| Net Assets | | | | | | | | |
| Beginning of period | | | 13,516,266 | | | | 14,579,671 | |
| End of period | | $ | 12,230,877 | | | $ | 13,516,266 | |
| Accumulated undistributed net investment loss at end of period | | | (115,753 | ) | | | (57,045 | ) |
| | | | | | | | | |
| Share Information | | | | | | | | |
| Shares sold | | | 660 | | | | 41,621 | |
| Shares redeemed | | | (80,640 | ) | | | (152,395 | ) |
| Net change resulting from share transactions | | | (79,980 | ) | | | (110,774 | ) |
See Notes to the Financial Statements.
| Giant 5 Total Investment System |
| The table below sets forth financial data for a share outstanding in the Fund throughout each period presented: | | Period Ended September 30, 2014 (Unaudited) | | | Year Ended March 31, 2014 | | | Year Ended March 31, 2013 | | | Year Ended March 31, 2012 | | | Year Ended March 31, 2011 | | | Year Ended March 31, 2010 | |
| | | | | | | | | | | | | | | | | | | |
| Per share data | | | | | | | | | | | | | | | | | | |
Net Asset Value -
Beginning of Period | | $ | 16.40 | | | $ | 15.59 | | | $ | 14.75 | | | $ | 15.84 | | | $ | 13.28 | | | $ | 8.68 | |
| | | | | | | | | | | | | | | | | | | | | | | | | |
| Income/(loss) from Investment Operations: | | | | | | | | | | | | | | | | | | | | | | | | |
Net investment income/(loss) | | | (0.07 | ) | | | (0.16 | ) | | | (0.01 | ) | | | 0.05 | | | | — | (a) | | | 0.03 | |
| Net realized and unrealized gains/losses on investments | | | 0.10 | | | | 0.97 | | | | 0.90 | | | | (1.12 | ) | | | 2.60 | | | | 4.57 | (b) |
Total from investment operations | | | 0.03 | | | | 0.81 | | | | 0.89 | | | | (1.07 | ) | | | 2.60 | | | | 4.60 | |
| | | | | | | | | | | | | | | | | | | | | | | | | |
| Less Distributions Declared to Shareholders | | | | | | | | | | | | | | | | | | | | | | | | |
Net investment income | | | — | | | | — | | | | (0.05 | ) | | | (0.02 | ) | | | (0.04 | ) | | | — | |
Total distributions | | | — | | | | — | | | | (0.05 | ) | | | (0.02 | ) | | | (0.04 | ) | | | — | |
| | | | | | | | | | | | | | | | | | | | | | | | | |
Net Asset Value - End of Period | | $ | 16.43 | | | $ | 16.40 | | | $ | 15.59 | | | $ | 14.75 | | | $ | 15.84 | | | $ | 13.28 | |
| | | | | | | | | | | | | | | | | | | | | | | | | |
Total Return (c) | | | 0.18 | %(d) | | | 5.20 | % | | | 6.13 | % | | | (6.84 | )% | | | 19.59 | % | | | 53.00 | % |
| | | | | | | | | | | | | | | | | | | | | | | | | |
| Ratios (to average net assets) Supplemental Data: | | | | | | | | | | | | | | | | | | | | | | | | |
Net assets at end of period (000s) | | $ | 12,231 | | | $ | 13,516 | | | $ | 14,580 | | | $ | 16,384 | | | $ | 19,916 | | | $ | 18,816 | |
Ratio of expenses to
average net assets (e) | | | 1.99 | %(f) | | | 2.06 | % | | | 2.12 | % | | | 1.98 | % | | | 1.91 | % | | | 1.89 | % |
Net investment income/(loss)
to average net assets (g) | | | (0.89 | )%(f) | | | (0.94 | )% | | | (0.11 | )% | | | 0.28 | % | | | — | (h) | | | 0.24 | % |
Portfolio Turnover | | | 0 | %(d) | | | 115.08 | % | | | 2.02 | % | | | 15.21 | % | | | 7.23 | % | | | 8.84 | % |
| (b) | Realized and unrealized gains and losses per share in this caption are balancing amounts necessary to reconcile the change in net asset value per share in the period. It does not agree to the aggregrate gains and losses in the Statement of Operations due to flucuation in share transactions for the period. |
| (c) | Total return in the above table represents the rate of return that the investor would have earned or lost on an investment in the Fund assuming the reinvestment of dividends. |
| (e) | This ratio excludes the impact of expenses of the registered investment companies and exchange-traded funds in which the fund invests. |
| (g) | Recognition of the net investment income by the Fund is affected by th timing of the declaration of dividends by the underlying investment companies and exchange-traded funds is which the Fund invests. |
See Notes to the Financial Statements.
| | Giant 5 Total Index System |
Schedule of Portfolio Investments | September 30, 2014 (Unaudited) |
| Security Description | | Shares | | | Fair Value | |
| EXCHANGE TRADED FUNDS - 87.2% | |
| | | | | | | |
ETFS Physical Silver Shares* | | | 15,000 | | | $ | 251,700 | |
Guggenheim S&P 500 Equal Weight ETF | | | 28,000 | | | | 2,122,120 | |
Market Vectors Oil Service ETF | | | 10,000 | | | | 496,100 | |
| SPDR S&P Oil & Gas Exploration & Production ETF | | | 45,000 | | | | 3,097,350 | |
Vanguard Global ex-U.S. Real Estate ETF | | | 9,000 | | | | 490,050 | |
Vanguard Materials ETF | | | 26,000 | | | | 2,863,380 | |
Vanguard REIT ETF | | | 50,000 | | | | 3,592,500 | |
Vanguard S&P 500 ETF | | | 12,000 | | | | 2,167,080 | |
WisdomTree Commodity Country Equity Fund | | | 20,000 | | | | 579,802 | |
| | | | | | | | | |
Total Exchange Traded Funds (Cost $14,378,453) | | | | | | | 15,660,082 | |
| Security Description | | Shares | | | Fair Value | |
| SHORT-TERM INVESTMENTS - 12.9% | |
| | | | | | | |
Fidelity Institutional Treasury Portfolio, Class I, 0.010%(a) | | | 2,317,805 | | | $ | 2,317,805 | |
| | | | | | | | | |
Total Short-Term Investments (Cost $2,317,805) | | | | | | | 2,317,805 | |
| | | | | | | | | |
Total Investments - 100.1% (Cost $16,696,258) | | | | | | | 17,977,887 | |
Liabilities in Excess of Other Assets - (0.1)% | | | | | | | (17,364 | ) |
NET ASSETS -100.0% | | | | | | $ | 17,960,523 | |
Giant 5 Total Index System
Sector Breakdown
(Based on Total Investments) (Unaudited)
| (a) | Variable rate security; the rate shown represents the rate at September 30, 2014. |
See Notes to the Financial Statements.
| Giant 5 Total Index System |
| STATEMENT OF ASSETS AND LIABILITIES | |
| September 30, 2014 (Unaudited) | | | |
| | | | |
| Assets: | | | |
Investment securities at fair value (cost $16,696,258) | | $ | 17,977,887 | |
Dividends receivable | | | 18 | |
Prepaid expenses | | | 28,484 | |
Total Assets | | | 18,006,389 | |
| | | | | |
| Liabilities: | | | | |
Payable to Adviser | | | 10,219 | |
Payable for 12b-1 fees | | | 2,593 | |
Payable to Trustees' | | | 477 | |
Other payables | | | 32,577 | |
Total Liabilities | | | 45,866 | |
| | | | | |
Net Assets | | $ | 17,960,523 | |
| | | | | |
| Net assets consist of: | | | | |
Paid-in-capital | | $ | 19,450,147 | |
Undistributed net investment loss | | | (96,765 | ) |
Accumulted undistributed net realized losses | | | (2,674,488 | ) |
Net unrealized appreciation on investments | | | 1,281,629 | |
| | | | | |
Net Assets | | $ | 17,960,523 | |
| | | | | |
| Capital Shares: | | | | |
| Investor Shares Outstanding (no par value, unlimited number of shares authorized) | | | 1,159,816 | |
| | | | | |
Net Asset Value, Offering Price and Redemption Price Per Share | | $ | 15.49 | |
| STATEMENT OF OPERATIONS | |
| For the period ended September 30, 2014 (Unaudited) | | | |
| | | | |
| Investment Income: | | | |
Dividends | | $ | 144,357 | |
Total Investment Income | | | 144,357 | |
| | | | | |
| Expenses: | | | | |
Investment advisory fees | | | 64,512 | |
Fund accounting and administration fees | | | 38,786 | |
Transfer Agency fees | | | 30,047 | |
12b-1 fees | | | 16,369 | |
Custody fees | | | 7,247 | |
Audit fees | | | 5,686 | |
Insurance | | | 5,647 | |
Blue Sky fees | | | 5,406 | |
Printing fees | | | 4,987 | |
Legal fees | | | 4,562 | |
CCO fees | | | 2,972 | |
Directors fees | | | 424 | |
Miscellaneous fees | | | 2,145 | |
Total Expenses | | | 188,790 | |
| | | | | |
Net Investment Loss | | | (44,433 | ) |
| | | | | |
| Net Realized and Unrealized Gains on Investments: | | | | |
Change in unrealized appreciation on investments | | | 137,672 | |
Net realized and unrealized gains on investments | | | 137,672 | |
| | | | | |
Change in net assets resulting from operations | | $ | 93,239 | |
See Notes to the Financial Statements.
| Giant 5 Total Index System |
| | Period Ended September 30, 2014 (Unaudited) | | | Year Ended March 31, 2014 | |
| STATEMENTS OF CHANGES IN NET ASSETS | | | | | | |
| | | | | | | |
| Increase/(Decrease) in Net Assets from Operations | | | | | | |
| Net investment loss | | $ | (44,433 | ) | | $ | (160,422 | ) |
| Net realized gain from investment transactions | | | — | | | | 1,125,144 | |
| Change in unrealized appreciation/(depreciation) on investments | | | 137,672 | | | | (1,133,764 | ) |
| Change in net assets resulting from operations | | | 93,239 | | | | (169,042 | ) |
| | | | | | | | | |
| Capital Share Transactions | | | | | | | | |
| Proceeds from sale of shares | | | 116,675 | | | | 112,152 | |
| Cost of shares redeemed | | | (1,311,741 | ) | | | (2,642,422 | ) |
| Change in net assets resulting from capital share transactions | | | (1,195,066 | ) | | | (2,530,270 | ) |
| Net decrease in net assets | | | (1,101,827 | ) | | | (2,699,312 | ) |
| | | | | | | | | |
| Net Assets | | | | | | | | |
| Beginning of period | | | 19,062,350 | | | | 21,761,662 | |
| End of period | | $ | 17,960,523 | | | $ | 19,062,350 | |
| Accumulated undistributed net investment loss at end of period | | | (96,765 | ) | | | (52,332 | ) |
| | | | | | | | | |
| Share Information | | | | | | | | |
| Shares sold | | | 7,480 | | | | 7,545 | |
| Shares redeemed | | | (81,897 | ) | | | (177,180 | ) |
| Net change resulting from share transactions | | | (74,417 | ) | | | (169,635 | ) |
See Notes to the Financial Statements.
| Giant 5 Total Index System |
| The table below sets forth financial data for a share outstanding in the Fund throughout each period presented: | | Period Ended September 30, 2014 (Unaudited) | | | Year Ended March 31, 2014 | | | Year Ended March 31, 2013 | | | Year Ended March 31, 2012 | | | Year Ended March 31, 2011 | | | Year Ended March 31, 2010 | |
| | | | | | | | | | | | | | | | | | | |
| Per share data: | | | | | | | | | | | | | | | | | | |
Net Asset Value -
Beginning of Period | | $ | 15.44 | | | $ | 15.50 | | | $ | 14.63 | | | $ | 15.51 | | | $ | 13.08 | | | $ | 8.62 | |
| | | | | | | | | | | | | | | | | | | | | | | | | |
| Income/(loss) from Investment Operations: | | | | | | | | | | | | | | | | | | | | | | | | |
Net investment income/(loss) | | | (0.04 | ) | | | (0.13 | ) | | | (0.03 | ) | | | 0.02 | | | | 0.11 | | | | 0.07 | |
| Net realized and unrealized gains /losses on investments | | | 0.09 | | | | 0.07 | (a) | | | 0.90 | | | | (0.83 | ) | | | 2.43 | | | | 4.47 | |
Total from investment operations | | | 0.05 | | | | (0.06 | ) | | | 0.87 | | | | (0.81 | ) | | | 2.54 | | | | 4.54 | |
| | | | | | | | | | | | | | | | | | | | | | | | | |
| Less Distributions Declared to Shareholders: | | | | | | | | | | | | | | | | | | | | | | | | |
Net investment income | | | — | | | | — | | | | — | | | | (0.07 | ) | | | (0.11 | ) | | | (0.08 | ) |
Total distributions | | | — | | | | — | | | | — | | | | (0.07 | ) | | | (0.11 | ) | | | (0.08 | ) |
| | | | | | | | | | | | | | | | | | | | | | | | | |
Net Asset Value - End of Period | | $ | 15.49 | | | $ | 15.44 | | | $ | 15.50 | | | $ | 14.63 | | | $ | 15.51 | | | $ | 13.08 | |
| | | | | | | | | | | | | | | | | | | | | | | | | |
Total Return (b) | | | 0.32 | %(c) | | | (0.39 | )% | | | 5.95 | % | | | (5.16 | )% | | | 19.43 | % | | | 52.70 | % |
| | | | | | | | | | | | | | | | | | | | | | | | | |
| Ratio (to average net assets) Supplemental Data: | | | | | | | | | | | | | | | | | | | | | | | | |
Net assets at end of period (000s) | | $ | 17,961 | | | $ | 19,062 | | | $ | 21,762 | | | $ | 14,745 | | | $ | 16,767 | | | $ | 15,521 | |
Ratio of expenses to
average net assets (d) | | | 1.96 | %(e) | | | 1.97 | % | | | 2.11 | % | | | 2.03 | % | | | 1.97 | % | | | 1.94 | % |
Net investment income/(loss)
to average net assets (f) | | | (0.46 | )%(e) | | | (0.81 | )% | | | (0.27 | )% | | | 0.18 | % | | | 0.76 | % | | | 0.57 | % |
Portfolio Turnover | | | 0 | %(c) | | | 141.47 | % | | | 18.41 | % | | | 45.32 | % | | | 29.07 | % | | | 11.14 | % |
| (a) | Realized and unrealized gains and losses per share in this caption are balancing amounts necessary to reconcile the change in net asset value per share in the period. It does not agree to the aggregrate gains and losses in the Statement of Operations due to flucuation in share transactions for the period. |
| (b) | Total return in the above table represents the rate of return that the investor would have earned or lost on an investment in the Fund assuming the reinvestment of dividends. |
| (d) | This ratio excludes the impact of expenses of the registered investment companies and exchange-traded funds in which the fund invests. |
| (f) | Recognition of the net investment income by the Fund is affected by th timing of the declaration of dividends by the underlying investment companies and exchange-traded funds is which the Fund invests. |
See Notes to the Financial Statements.
| | Index Funds |
Notes to the Financial Statements | September 30, 2014 (Unaudited) |
Index Funds (the “Trust”) was organized as a trust under the laws of the State of Delaware on November 9, 2005 as Giant 5 Funds. The Trust is an open-end investment company registered under the Investment Company Act of 1940, as amended (the “1940 Act”). Effective after the close of business March 20, 2014, the name of the Trust was changed to Index Funds. The Trust is authorized to issue an unlimited number of shares, which are units of beneficial interest with no par value. The Trust currently offers shares of two series, each of which has different and distinct strategies and policies: the Giant 5 Total Investment System and the Giant 5 Total Index System (individually a “Fund,” collectively the “Funds”). Each of the Funds commenced operations on May 1, 2006.
The investment objective for each Fund is to seek total return. To pursue its investment objective, the Giant 5 Total Investment System will make investments primarily in other mutual funds that are not affiliated with the Fund. To pursue its investment objective, the Giant 5 Total Index System will primarily invest in unaffiliated index funds and exchange traded funds.
Each Fund is non-diversified, as that term is defined in the 1940 Act, and each Fund is a “fund of funds,” which means that generally each Fund invests in other mutual funds and exchange traded funds. The Trust has established two classes of shares: Investor Shares and Institutional Shares. While the Institutional Shares became effective during the year ended March 31, 2009, only Investor Shares have been offered and issued to date.
| 2. | Significant Accounting Policies |
The following is a summary of significant accounting policies followed by the Trust in the preparation of its financial statements. These policies are in conformity with accounting principles generally accepted in the United States of America (“U.S. GAAP”).
Security Valuation:
The value of assets in a Fund’s portfolio is determined on the basis of their fair value, or where market quotations are not readily available or are deemed unreliable due to a significant event or otherwise, determined in good faith in accordance with the procedures established by, and under the general supervision of, the Funds’ Board of Trustees (the “Board”). The Funds may invest in securities that are primarily listed on foreign exchanges that trade on weekends or other days when the Funds do not price their shares. The value of portfolio securities held by the Funds may change on days when shareholders will not be able to purchase or redeem shares.
Generally, each of the mutual funds, including money market funds, will be registered investment companies, therefore their net asset value per share (“NAV”) will be calculated as set forth in their prospectuses. As noted above, each Fund is a fund of funds, primarily invested in mutual funds and exchange traded funds that have their own internal fair pricing and valuation procedures. Due to this structure, the mutual funds’ policies will be used in the daily calculation of their NAV, which will, in turn, be used in calculating the Funds’ NAV. If for any reason, a mutual fund held by a Fund does not provide its NAV to the Fund in a timely fashion for the Funds’ NAV calculation, for valuation purposes, the last available NAV for the mutual fund will be adjusted by the percentage a predetermined benchmark rose or declined on that particular trading day. Investments in securities traded on a national securities exchange, including exchange traded funds and exchange traded notes, are valued at the last reported sale price on the exchange on which they are primarily traded. Securities traded in the over-the-counter market and listed securities for which no sale was reported on that date are generally valued at the last quoted bid price. Other short-term debt securities with remaining maturity of less than 60 days are valued at amortized cost, which approximates fair value.
A Fund will fair value price its securities when market quotations are not readily available. Generally, this would include securities for which trading has been halted, securities whose value has been materially affected by the occurrence of a significant event (as defined below), securities whose price has become stale (i.e., the market price has remained unchanged for five business days), and other securities where a market price is not available from either a national pricing service or a broker. In addition, the Pricing Committee will review exception priced securities (i.e., securities for which the fair value
| | Index Funds |
Notes to the Financial Statements | September 30, 2014 (Unaudited) |
is provided by a quote from a single broker rather than a national pricing service) on a quarterly basis. In these situations, the Pricing Committee will employ certain Board-approved methodologies to determine a fair value for the securities. Fair valuations will be reviewed by the Board on a quarterly basis. Fair value pricing should result in a more accurate determination of a Fund’s net asset value price, which should eliminate the potential for stale pricing arbitrage opportunities in a Fund. However, fair value pricing involves the risk that the values used by a Fund to price its investments may be different from those used by other investment companies and investors to price the same investments.
A “significant event” is one that occurred prior to a Fund’s valuation time, is not reflected in the most recent market price of a security, and materially affects the value of a security. Generally, such “significant events” relate to developments in foreign securities that occur after the close of trading in their respective markets. The Funds’ accounting agent may obtain fair value prices of foreign securities through utilization of a Fair Value Pricing Service previously approved by the Board where a movement in the U.S. equities market is sufficiently large to constitute a trigger established by the Pricing Committee.
U.S. GAAP establishes a hierarchy that prioritizes the various inputs used in determining the value of a Fund’s investments. The three broad levels of the hierarchy are described below:
| | • | Level 1 – quoted prices for active markets for identical securities. |
| | • | Level 2 – other significant observable inputs (including quoted prices for similar securities, interest rates, prepayment speeds, credit risk, etc.). |
| | • | Level 3 – significant unobservable inputs, including the Funds’ own assumptions in determining the fair value of investments. |
The inputs or methodology used for valuing securities are not necessarily an indication of the risk associated with investing in those securities. The following is a summary of the inputs used to value the Funds’ investments as of September 30, 2014.
Giant 5 Total Investment System
| | | | | Level 2 – Other Significant Observable Inputs | | | Level 3 – Significant Unobservable Inputs | | | | |
| | $ | 10,910,916 | | | $ | — | | | $ | — | | | $ | 10,910,916 | |
| | | 1,326,348 | | | | — | | | | — | | | | 1,326,348 | |
| | $ | 12,237,264 | | | $ | — | | | $ | — | | | $ | 12,237,264 | |
Giant 5 Total Index System
| | | | | Level 2 – Other Significant Observable Inputs | | | Level 3 – Significant Unobservable Inputs | | | | |
| | $ | 15,660,082 | | | $ | — | | | $ | — | | | $ | 15,660,082 | |
| | | 2,317,805 | | | | — | | | | — | | | | 2,317,805 | |
| | $ | 17,977,887 | | | $ | — | | | $ | — | | | $ | 17,977,887 | |
The Funds did not hold any Level 2 or 3 securities during the six months ended September 30, 2014.
With respect to the Funds, there were no transfers into and out of all levels during the current period presented. It is the Funds’ policy to recognize all transfers at the end of the reporting period.
| | Index Funds |
Notes to the Financial Statements | September 30, 2014 (Unaudited) |
Investment Transactions and Related Income:
Investment transactions are recorded on a trade date for financial reporting purposes. Dividend income is recorded on the ex-dividend date. Securities gains and losses are calculated based on highest cost, long-term holdings, and where not applicable, the first-in, first-out method. Interest income is recognized on the accrual basis and includes, where applicable, the amortization or accretion of premium or discount.
Expenses:
Expenses directly attributable to a Fund are charged directly to the Fund. Expenses relating to the Trust are allocated proportionately to each Fund within the Trust according to the relative net assets of each Fund or on another reasonable basis.
Distributions to Shareholders:
Dividends from net investment income, if any, are declared and distributed semi-annually for each Fund. Dividends from net realized gains, if any, are declared and distributed annually for each Fund.
The amounts of dividends from net investment income and of distributions from net realized gains, if any, are determined in accordance with federal income tax regulations and are recorded on the ex-dividend date. They may differ from U.S. GAAP. These “book/tax” differences are either considered temporary or permanent in nature. To the extent these differences are permanent in nature, such amounts are reclassified within the composition of net assets based on their federal tax-basis treatment; temporary differences do not require reclassification. As of March 31, 2014, permanent book to tax differences were as follows:
| | | | | Undistributed Net Investment Income | | | Accumulated Undistributed Net Realized Losses | |
Giant 5 Total Investment System | | $ | (91,390 | ) | | $ | 91,391 | | | $ | (1 | ) |
Giant 5 Total Index System | | | (162,281 | ) | | | 148,396 | | | | 13,885 | |
Federal Income Taxes:
Each Fund intends to qualify as a regulated investment company by complying with the provisions available to certain investment companies, as defined in Subchapter M of the Internal Revenue Code (the “Code”), and to make distributions from net investment income and from net realized capital gains sufficient to relieve it from all, or substantially all, federal income and excise taxes. Therefore, no federal or excise tax provision is recorded.
As of and during the year ended March 31, 2014, the Funds did not have a liability for any unrecognized tax benefits. The Funds recognize interest and penalties, if any, related to unrecognized tax benefits as income tax expense in the Statement of Operations. During the year, the Funds did not incur any interest or penalties. The Funds are subject to examination by U.S. federal tax authorities for all open tax years (2010-2013).
Use of Estimates:
The preparation of financial statements in conformity with U.S. GAAP requires management to make estimates and assumptions that affect the reported amounts of assets and liabilities, and the disclosure of contingent assets and liabilities at the date of the financial statements, and the reported amounts of increases and decreases in net assets from operations during the reporting period. Actual results could differ from those estimates.
| | Index Funds |
Notes to the Financial Statements | September 30, 2014 (Unaudited) |
Subsequent Events:
In preparing these financial statements, management has evaluated events and transactions for potential recognition or disclosure through the date these financial statements were issued.
| 3. | Related Party Transactions: |
Investment Adviser:
The Willis Group, Inc. (the “Adviser”) serves as the investment adviser to each Fund. Under the terms of the investment advisory agreement, the Adviser is entitled to receive fees computed daily and paid monthly at an annual rate of 0.67% of average net assets of each Fund. The Adviser makes the investment decisions for each of the Funds and continuously reviews, supervises and administers the investment program of each Fund, subject to the supervision of, and policies established by the Board. The amounts charged to the Funds for investment advisory services are reported within the Statement of Operations.
Certain trustees and officers of the Trust are also officers of the Adviser.
Distribution Plan:
Each Fund has adopted a Distribution Plan, pursuant to Rule 12b-1 under the 1940 Act (the “Distribution Plan”) with respect to its Investor Shares. Pursuant to the Distribution Plan, each Fund will pay 0.17% of its average daily net assets attributable to its Investor Shares. The Distribution Plan provides that the Funds pay the Distributor and other organizations for distributing shares, advertising and marketing and for providing certain services to shareholders of the Investor Shares. The 12b-1 expenses incurred by the Funds are reported within the Statement of Operations.
| 4. | Purchases and Sales of Securities: |
Purchases and sales of investment securities, excluding short-term securities for the period ended September 30, 2014, totaled:
| | Giant 5 Total Investment System | | | Giant 5 Total Index System | |
Purchases | | $ | 0 | | | $ | 0 | |
Sales | | | 0 | | | | 0 | |
There were no purchases or sales of U.S. government securities for the period.
| | Index Funds |
Notes to the Financial Statements | September 30, 2014 (Unaudited) |
| 5. | Federal Tax Information: |
At March 31, 2014, the cost, gross unrealized appreciation and gross unrealized depreciation on securities, for federal income tax purposes, were as follows:
| | Giant 5 Total Investment System | | | Giant 5 Total Index System | |
Tax Cost | | $ | 11,700,140 | | | $ | 17,959,339 | |
Tax Unrealized Appreciation | | | 1,847,714 | | | | 1,285,497 | |
Tax Unrealized (Depreciation) | | | — | | | | (140,484 | ) |
Net Unrealized Appreciation | | | 1,847,714 | | | | 1,145,013 | |
The tax character of distributions paid during the fiscal years ended March 31, 2014 and March 31, 2013 were as follows:
| | | Giant 5 Total Investment System | | | Giant 5 Total Index System | |
| | | | | | | | | | | | |
Distributions Paid from Ordinary Income | | $ | — | | | $ | 50,009 | | | $ | — | | | $ | 73,309 | |
Distributions Paid from Net Long Term Capital Gains | | | — | | | | — | | | | — | | | | — | |
Total Taxable Distributions | | | — | | | | 50,009 | | | | — | | | | 73,309 | |
Return of Capital Distributions | | | — | | | | — | | | | — | | | | — | |
Total Distributions Paid | | | — | | | | 50,009 | | | | — | | | | 73,309 | |
As of March 31, 2014, the components of accumulated (deficit) were as follows:
| | Giant 5 Total Investment System | | | Giant 5 Total Index System | |
Undistributed ordinary income | | $ | — | | | $ | — | |
Undistributed long-term capital gains | | | — | | | | — | |
Accumulated earnings | | | — | | | | — | |
Accumulated Capital and other Losses | | | (3,313,015 | ) | | | (2,727,876 | ) |
Unrealized Appreciation/(Depreciation) | | | 1,847,714 | | | | 1,145,013 | |
Total Accumulated (Deficit) | | $ | (1,465,301 | ) | | $ | (1,582,863 | ) |
The difference between book basis and tax-basis unrealized appreciation is attributable primarily to income/(loss) from grantor trusts, which is treated as an increase/(decrease) in cost basis of the grantor trust shares held.
| | Index Funds |
Notes to the Financial Statements | September 30, 2014 (Unaudited) |
At March 31, 2014, the Funds had capital loss carryforwards, which reduce the Funds’ taxable income arising from future net realized gains on investments, if any, to the extent permitted by the Code, and thus will reduce the amount of distributions to shareholders which would otherwise be necessary to relieve the Funds of any liability for federal tax. Pursuant to the Code, such capital loss carryforwards will expire as follows:
| | | Giant 5 Total Investment System | | | Giant 5 Total Index System | |
| | | | | | | | | | | | |
| Losses Expiring: | | | | | | | | | | | | |
2018 | | $ | 3,024,526 | | | $ | — | | | $ | 2,417,963 | | | $ | — | |
Losses Not Subject to Expiration | | | — | | | | — | | | | 3,177 | | | | — | |
| | | $ | 3,024,526 | | | $ | — | | | $ | 2,421,140 | | | $ | — | |
As of March 31, 2014, Giant 5 Total Investment System and Giant 5 Total Index System had $57,045 and $52,332, respectively of late year losses which are deferred until fiscal year 2015 for tax purposes. Net late year loss incurred after December 31, and within the taxable year are deemed to rise on the first day of the fund’s next taxable year.
As of March 31, 2014, Giant 5 Total Investment System and Giant 5 Total Index System had $231,444 and $253,348 respectively, of post-October losses which are deferred until fiscal year 2015 for tax purposes. Net capital loss incurred after October 31, and within the taxable year are deemed to rise on the first day of the fund’s next taxable year.
During the fiscal year ended March 31, 2014, Giant 5 Total Investment System and Giant 5 Total Index System utilized $2,594,361 and $ 1,388,665, respectively, of capital loss carryforwards.
The beneficial ownership, either directly or indirectly, of more than 25% of the voting securities creates a presumption of control of the Funds, under Section 2(a)(9) of the 1940 Act. As of September 30, 2014, TD Ameritrade Clearing, Inc., for the benefit of its customers, had ownership in the Giant 5 Total Investment System and the Giant 5 Total Index System in the amounts of 80.0% and 88.9%, respectively.
| | Index Funds |
| September 30, 2014 (Unaudited) |
As a shareholder of the Index Funds, you incur two types of costs: (1) transaction costs, including exchange fees; and (2) ongoing costs, including investment advisory fees, distribution (12b-1) fees, and other Fund expenses. The Examples below are intended to help you understand your ongoing costs (in dollars) of investing in the Funds and to compare these costs with the ongoing costs of investing in other mutual funds.
Each is based on an investment of $1,000 invested at the beginning of the period and held for the entire period from April 1, 2014 through September 30, 2014.
Actual Expenses
The table below provides information about actual account values and actual expenses. You may use the information below, together with the amount you invested, to estimate the expenses you paid over the period. Simply divide your account value by $1,000 (for example, an $8,600 account value divided by $1,000 = 8.6), then multiply the result by the number in the table under the heading entitled “Expenses Paid During Period” to estimate the expenses you paid on your account during the period.
| Beginning Account Value 4/1/14 | Ending Account Value 9/30/14 | Expenses paid during period 4/1/14-9/30/14(1) |
Giant 5 Total Investment System | | | |
Giant 5 Total Index System | | | |
Hypothetical Example for Comparison Purposes
The table below provides information about hypothetical account values and hypothetical expenses based on the Giant 5 Funds’ actual expense ratios and an assumed rate of return of 5% per year before expenses, which is not the Funds’ actual return. The hypothetical account values and expenses may not be used to estimate the actual ending account balance or expenses you paid for the period. However, you may use this information to compare this 5% hypothetical example with the 5% hypothetical examples that appear in the shareholder reports of the other funds.
Please note that the expenses shown in the table are meant to highlight your ongoing costs only and do not reflect any transactional costs, such as sales charges (loads) or exchange fees, if applicable. Therefore, the table is useful in comparing the ongoing costs only, and will not help you determine the relative total costs of owning different funds. In addition, if these transactional costs were included, your costs would have been higher.
| Beginning Account Value 4/1/14 | Ending Account Value 9/30/14 | Expenses paid during period 4/1/14-9/30/14(1) |
Giant 5 Total Investment System | | | |
Giant 5 Total Index System | | | |
| (1) | Expenses are equal to the average account value times the annualized expense ratio of the Giant 5 Total Investment System and the Giant 5 Total Index System of 1.99% and 1.96%, respectively, multiplied by the number of days in the period (183), divided by the number of days in the fiscal year (365). |
| | Index Funds |
| September 30, 2014 (Unaudited) |
Investment Adviser Contract Approval
The Investment Advisory Agreement with the Trust was formally considered for renewal by the independent members of the Board of Trustees (the “Trustees”) at its board meeting held on June 16, 2014. In conducting their review, the Trustees addressed a variety of factors including: a description of personnel and services provided to the Funds, investment advice and performance, brokerage practices and allocation of portfolio transactions, fees, other benefits and profitability, compliance program, and summary of key procedures regarding best execution, market timing, late trading, revenue sharing, selection of brokers soft dollars, trade allocations, trading of fund shares by insiders, affiliates and possible conflicts.
The Trustees reviewed materials furnished by the Adviser in connection with the review of the Advisory Agreement, including, among other items, the Adviser’s report and memorandum to the Board, its Form ADV and Code of Ethics, and the comparative data of the Funds’ advisory fees and total expenses against the averages and medians in the applicable peer categories.
In considering whether the Advisory Agreement should be approved, the Trustees, including the Independent Trustees, considered the following factors, with no single factor being all-important or determinative:
Investment Advisory Fee Rate. The Independent Trustees considered the information they received comparing the Funds’ contractual annual advisory fee and overall expenses against the averages and medians in the applicable peer categories. The Independent Trustees also noted the Adviser’s observation that although the Funds’ total expenses were higher than the averages and medians for their respective peer categories, each Fund is significantly smaller (in terms of net asset value) than the average fund in each category.
Nature, Extent and Quality of the Services under the Investment Advisory Agreement. The Independent Trustees reviewed and considered the Adviser’s investment advisory personnel (including the qualifications, background and responsibilities of the manager primarily responsible for the day-to-day portfolio management of the Funds), its history as an asset manager and its performance as manager of the Funds.
Performance. The Independent Trustees reviewed performance information for the Funds, including comparative information for the Funds’ rankings in their respective peer categories. The Independent Trustees also noted the observations set forth in the Adviser’s report and memorandum regarding the Funds’ relationship to their respective benchmark indices and Morningstar’s recent decision to change the Funds’ categorization.
Adviser’s Profitability. The Independent Trustees considered the overall fees, expenses and reimbursements payable to the Adviser, and certain financial information of the Adviser in connection with its relationship with the Funds.
Economies of Scale. The Independent Trustees considered whether economies of scale in the provision of services to the Funds were being passed along to the shareholders.
Incidental Benefits to the Adviser. The Independent Trustees reviewed and considered any other incidental benefits derived or to be derived by the Adviser from its relationship with the Funds, including, for example reputational benefits.
| | Index Funds |
| September 30, 2014 (Unaudited) |
After review of the materials provided and further discussion, the Independent Trustees concluded that:
| | • | the investment advisory fees to be received by the Adviser with respect to the Funds and the Funds’ total expense ratios, although generally higher than the applicable averages for each Fund’s peer universe, were within an acceptable range when considered against the services provided by the Adviser and in light of the average fund size within the peer universe; |
| | • | the nature, extent and quality of services to be rendered by the Adviser under the Advisory Agreement were adequate; |
| | • | the performance of each Fund was within an acceptable range of the performance of comparable funds; |
| | • | the profit anticipated to be realized by the Adviser in connection with the operation of the Funds is not unreasonable to the Funds; and |
| | • | there were no material economies of scale or other incidental benefits accruing to the Adviser in connection with its relationship with the Funds. |
| FACTS | WHAT DO INDEX FUNDS DO WITH YOUR PERSONAL INFORMATION? |
| | |
| Why? | Financial companies choose how they share your personal information. Federal law gives consumers the right to limit some but not all sharing. Federal law also requires us to tell you how we collect, share, and protect your personal information. Please read this notice carefully to understand what we do |
| | |
| What? | The types of personal information we collect and share depend on the product or service you have with us. This information can include: • Social Security number • account balances • account transactions • transaction history • wire transfer instructions • checking account information When you are no longer our customer, we continue to share your information as described in this notice. |
| | |
| How? | All financial companies need to share customers’ personal information to run their everyday business. In the section below, we list the reasons financial companies can share their customers’ personal information; the reasons Index Funds choose to share; and whether you can limit this sharing. |
| | | | |
| Reasons we can share your personal information | Do Index Funds share? | Can you limit this sharing? |
For our everyday business purposes – such as to process your transactions, maintain your account(s), respond to court orders and legal investigations, or to report to credit bureaus | Yes | No |
For our marketing purposes – to offer our products and services to you | No | We don’t share |
| For joint marketing with other financial companies | No | We don’t share |
For our affiliates’ everyday business purposes – information about your transactions and experiences | Yes | No |
For our affiliates’ everyday business purposes – information about your creditworthiness | No | We don’t share |
| For our affiliates to market to you | No | We don’t share |
| For nonaffiliates to market to you | No | We don’t share |
| | |
| Questions? | Call (888) 544-2685 or go to www.weareindex.com. |
| What we do |
| Who is providing this notice? | Funds advised by The Willis Group, Inc. A complete list is included below. |
| How do Index Funds protect my personal information? | To protect your personal information from unauthorized access and use, we use security measures that comply with federal law. These measures include computer safeguards and secured files and buildings. |
| How do Index Funds collect my personal information? | We collect your personal information, for example, when you § open an account § provide account information § give us your contact information § make a wire transfer § tell us where to send the money We also collect your information from others, such as credit bureaus, affiliates, or other companies. |
| Why can’t I limit all sharing? | Federal law gives you the right to limit only § sharing for affiliates’ everyday business purposes - information about your creditworthiness § affiliates from using your information to market to you § sharing for nonaffiliates to market to you State laws and individual companies may give you additional rights to limit sharing. |
| | |
| Definitions |
| Affiliates | Companies related by common ownership or control. They can be financial and nonfinancial companies. § Our affiliates include: The Willis Group, Inc. |
| Nonaffiliates | Companies not related by common ownership or control. They can be financial and nonfinancial companies. § Index Funds do not share with nonaffiliates so they can market to you. |
| Joint marketing | A formal agreement between nonaffiliated financial companies that together market financial products or services to you. § Index Funds do not jointly market. |
| List of Funds providing this notice |
Giant 5 Total Investment System Giant 5 Total Index System |
ITEM 2. CODE OF ETHICS.
Not applicable to semi-annual reports.
ITEM 3. AUDIT COMMITTEE FINANCIAL EXPERT.
Not applicable to semi-annual reports.
ITEM 4. PRINCIPAL ACCOUNTANT FEES AND SERVICES
Not applicable to semi-annual reports.
ITEM 5. AUDIT COMMITTEE OF LISTED REGISTRANTS.
Not applicable.
ITEM 6. SCHEDULE OF INVESTMENTS.
This information is included as part of the report to shareholders filed under Item 1 of this Form.
ITEM 7. DISCLOSURE OF PROXY VOTING POLICIES AND PROCEDURES FOR CLOSED-END MANAGEMENT INVESTMENT COMPANIES.
Not applicable.
ITEM 8. PORTFOLIO MANAGERS OF CLOSED-END MANAGEMENT INVESTMENT COMPANIES.
Not applicable.
ITEM 9. PURCHASES OF EQUITY SECURITIES BY CLOSED-END MANAGEMENT INVESTMENT COMPANIES AND AFFILIATED PURCHASERS.
Not applicable.
ITEM 10. SUBMISSION OF MATTERS TO A VOTE OF SECURITY HOLDERS.
Not applicable.
ITEM 11. CONTROLS AND PROCEDURES.
(a) Based on an evaluation of the disclosure controls and procedures (as defined in Rule 30a-3(c) under the Investment Company Act of 1940, as amended, the “Disclosure Controls”) as of a date within 90 days of the filing date (the “Filing Date”) of this Form N-CSR (the “Report”), the registrant's principal executive officer and principal financial officer have concluded that the Disclosure Controls are effectively designed to ensure that information that is required to be disclosed by the registrant in the Report is recorded, processed, summarized and reported within the time periods specified in the Securities and Exchange Commission’s rules and forms, including ensuring that information required to be disclosed in the Report is accumulated and communicated to the registrant’s management, including the registrant’s principal executive officer and principal financial officer, as appropriate to allow timely decisions regarding required disclosures.
(b) There were no changes in the registrant's internal control over financial reporting (as defined in Rule 30a-3(d) under the Investment Company Act of 1940) that occurred during the second fiscal quarter of the period covered by this report that have materially affected, or are reasonably likely to materially affect, the registrant's internal control over financial reporting.
ITEM 12. EXHIBITS.
Pursuant to the requirements of the Securities Exchange Act of 1934 and the Investment Company Act of 1940, the registrant has duly caused this report to be signed on its behalf by the undersigned, thereunto duly authorized.
Michael G. Willis
Pursuant to the requirements of the Securities Exchange Act of 1934 and the Investment Company Act of 1940, this report has been signed below by the following person on behalf of the registrant and in the capacities and on the dates indicated.
Michael G. Willis