UNITED STATES
SECURITIES AND EXCHANGE COMMISSION
Washington, D.C. 20549
FORM N-CSR
811-21836
(Investment Company Act file number)
Index Funds
(Exact name of registrant as specified in charter)
1155 Kelly Johnson Boulevard, Suite 111
Colorado Springs, Colorado 80920
(Address of principal executive offices) (Zip code)
(800) 788-5680
(Registrant's telephone number)
Michael G. Willis
1155 Kelly Johnson Boulevard, Suite 111
Colorado Springs, Colorado 80920
(Name and Address of Agent for Service)
Date of fiscal year end: March 31
Date of reporting period: April 1, 2017 – September 30, 2017
Item 1. Reports to Stockholders.
TABLE OF CONTENTS
| Shareholder Letter | 1 |
| Manager Commentary | 3 |
| Disclosure of Fund Expenses | 5 |
| Schedule of Investments | 6 |
| Statement of Assets and Liabilities | 12 |
| Statement of Operations | 13 |
| Statements of Changes in Net Assets | 14 |
| Financial Highlights | 15 |
| Notes to Financial Statements | 16 |
| Additional Information | 20 |
| Index Funds S&P 500 Equal Weight | Shareholder Letter |
September 30, 2017 (Unaudited)
Dear Shareholders,
The Fund’s underlying index, the S&P 500 Equal Weight Index, outperformed 98% of all large cap mutual fund managers over the past 10 years and outperformed 100% of all large cap mutual fund managers over the past 15 years*.
This striking fact is magnified when you consider that this performance was achieved by utilizing 500 leading US companies, not a narrowly focused technology index or the like. This index comprises a who’s who list of the most recognized companies in the world, making it a strong contender as a core holding for many portfolio managers and index models.
Since its inception in January of 2003, the S&P 500 Equal Weight Index* has outperformed the S&P 500 Index 10 out of the past 14 calendar years. That is notable, considering that the S&P 500 Index itself beats most large cap managers, most of the time. According to the year‐end 2016 SPIVA (S&P Indices Versus Active) report released by Standard & Poor’s, the S&P 500 Index outperformed 85% of all large‐cap fund managers over the past 10 years.
So, if it is so difficult to beat the S&P 500 Index, how has the S&P 500 Equal Weight Index been able to outperform it so consistently, while at the same time also beating 98% of all Large Cap Fund Managers over the past 10 years?
The answer, for us, is simple. We believe that the S&P 500 Equal Weight Index methodology corrects an inherent “buy‐high‐sell‐low” trading flaw buried within the market‐cap methodology that powers the S&P 500 Index and many other active manager strategies. To illustrate, an index fund seeking to track the S&P 500 Index must continuously adjust its portfolio to mirror the underlying index as the 500 stocks fluctuate in price. For example, if 250 index constituents move higher in price and 250 index constituents move lower in price, the market‐cap methodology requires the portfolio manager to purchase more of the 250 stocks that went higher in price and to sell a portion of the 250 stocks that fell in price. This effectively forces the manager to “buy high and sell low”.
In our view, the methodology behind the construction of the Equal Weight Index corrects the market‐cap “buy‐high‐sell‐low” trading methodology and replaces it with a “buy‐low‐sell‐high” trading methodology. How? Using the same 500 companies, the portfolio manager of the Equal Weight S&P 500 Index fund is required to rebalance the portfolio periodically. Using the example above, the equal weight methodology requires that the manager sell a portion of the 250 stocks that went higher in price and to purchase a portion of the 250 stocks that fell in price, until the 500 holdings are equal in value again. We believe this creates the very positive effect of forcing the manager to “buy low and sell high”, thus creating a simple solution to a traditionally complex problem. Here lies the “secret sauce”, in our opinion, and why we believe the alpha that has historically been achieved is sustainable over long periods of time.
The U.S. equity markets have posted solid returns during the first 3 quarters of 2017, with the S&P 500 Equal Weight Index achieving +11.94% and the S&P 500 Index achieving +14.24% returns.
During the 12‐months ending 09/30/2017, our INDEX FUNDS S&P 500 EQUAL WEIGHT Fund (ticker symbol INDEX) returned +16.10%, while the underlying index grew by +16.23%. During the same period, the S&P 500 Index strongly outperformed both, growing by +18.61% (see Fund Performance Chart on page 3).
The underperformance of our Fund relative to the S&P 500 Equal Weight Index is consistent with the expenses and trading costs of the Fund. The underperformance of our Fund relative to the market capitalization version of the S&P 500 Index normally occurs when the largest 50 companies within the S&P 500 Index materially outperform the other 450 stocks within the index. This is because the S&P 500 Market‐Cap Index overweight’s the top 50 companies within the index to over 50% of the index, whereas the Equal‐Weight methodology seeks to hold all 500 companies equal over time.
Looking forward, we see the $16 trillion‐dollar Mutual Fund Industry very much in transition, as low cost index modelling seeks to replace traditional, higher‐cost alternatives. Another positive development in the industry is the creation of what many are now calling “Clean Shares”. This is a no‐load mutual fund share class which contain no 12b‐1 fees, providing one uniform price across the board. We believe that Clean Shares will lead to higher transparency with fewer conflicts of interest, and could offer big savings for investors.
Semi-Annual Report | September 30, 2017 | 1 |
| Index Funds S&P 500 Equal Weight | Shareholder Letter |
September 30, 2017 (Unaudited)
The good news is that INDEX is already a “no‐load”, low cost index fund with no 12b‐1 fees and therefore stands to potentially benefit from these significant changes in the mutual fund industry. We believe that these are all exciting developments and that, depending on how things progress in the near future; low cost index funds may have a significant role to play in the reconfigured Wall Street.
Best Regards,
Michael G. Willis
President
INDEX FUNDS
The foregoing reflects the thoughts and opinions of Index Funds exclusively and is subject to change without notice. Cannot invest directly in an index. Subject to investment risks, including possible loss of principal amount invested.
| * | The S&P 500 Equal Weight Index is an equal weighted version of the S&P 500 Index. The index includes the same constituents as the capitalization weighted S&P 500, but each company in the S&P 500 Equal Weight Index is allocated a fixed weight - or 0.2% of the index total each quarterly rebalance. It is a broad-based securities market index. Such indices are generally not actively managed and are not subject to fees and expenses typically at associated with managed accounts or funds. You cannot invest directly in a broad-based securities index. |
S&P 500 Market Cap Index: The headline market cap indices, the S&P 500®, S&P MidCap 400®, and S&P SmallCap 600®, are widely recognized as leading indicators of U.S. equity market performance. The S&P 500 is the world's most-tracked index by AUM.
| Index Funds S&P 500 Equal Weight | Manager Commentary |
September 30, 2017 (Unaudited)
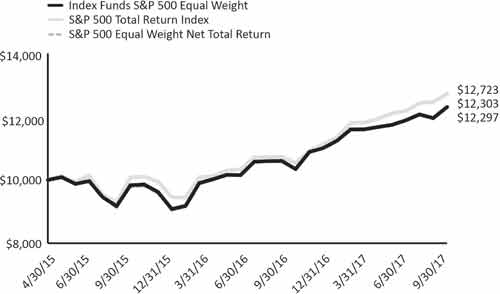
Growth of $10,000 Initial Investment (for the period ended September 30, 2017)
The graph shown above represents historical performance of a hypothetical investment of $10,000 in the Fund since inception. Past performance does not guarantee future results. All returns reflect reinvested dividends, but do not reflect the deduction of taxes that a shareholder would pay on Fund distributions or the redemption of Fund shares.
Performance (for the period ended September 30, 2017)
| | 1 Month | Quarter | 1 Year | Since Inception* |
| Index Funds S&P 500 Equal Weight | 2.92% | 3.54% | 16.10% | 8.95% |
| S&P 500 Total Return Index | 2.06% | 4.48% | 18.61% | 10.47% |
| S&P 500 Equal Weight Net Total Return | 2.92% | 3.60% | 16.23% | 8.92% |
The performance data quoted above represents past performance. Past performance is not a guarantee of future results. Investment return and value of the Fund shares will fluctuate so that an investor’s shares, when sold or redeemed, may be worth more or less than their original cost. Current performance data may be lower or higher than actual performance data quoted. Fund performance current to the most recent month-end is available by calling (844) 464-6339 or by visiting www.Index.world.
Returns of less than 1 year are cumulative.
Indices are not actively managed and do not reflect deduction for fees, expenses or taxes. An investor cannot invest directly in an index.
The returns shown above do not reflect the deduction of taxes a shareholder would pay on Fund distributions or redemption of Fund shares.
The total annual operating expenses and total annual operating expenses after fee waivers and/or reimbursement you may pay as an investor in the Fund (as reported in the July 28, 2017 Prospectus) are 6.83% and 0.25%, respectively. The Fund’s investment adviser has contractually agreed to limit expenses through July 31, 2018.
| * | The Fund’s inception date is April 30, 2015. |
The S&P 500® is widely regarded as the best single gauge of large-cap U.S. equities. There is over USD 7.8 trillion benchmarked to the index, with index assets comprising approximately USD 2.2 trillion of this total. The index includes 500 leading companies and captures approximately 80% coverage of available market capitalization.
| Semi-Annual Report | September 30, 2017 | 3 |
| Index Funds S&P 500 Equal Weight | Manager Commentary |
September 30, 2017 (Unaudited)
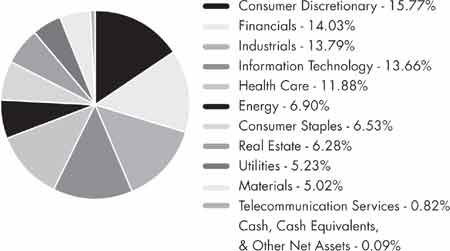
Sector Allocation (as a % of Net Assets)*
| * | Holdings are subject to change and may not reflect the current or future position of the portfolio. For Fund compliance purposes, the Fund's industry classifications refer to any one or more of the industry sub-classifications used by one or more widely recognized market indexes or ratings group indexes, and/or as defined by Fund management. This definition may not apply for purposes of this report, which may combine industry subclassifications for reporting ease. Industries are shown as a percentage of net assets. |
The S&P 500 Equal Weight Index (the “Index”) is a product of S&P Dow Jones Indices LLC (“SPDJI”), and has been licensed for use by The Index Group, Inc. S&P® is a registered trademark of S&P Global (“S&P”); Dow Jones® is a registered trademark of Dow Jones Trademark Holdings LLC (“Dow Jones”); Standard & Poor’s® and S&P® are trademarks of the Standard & Poor’s Financial Services LLC (“S&P”); and these trademarks have been licensed for use by SPDJI and sublicensed for certain purposes by The Index Group, Inc. The Index Funds S&P 500 Equal Weight is not sponsored, endorsed, sold or promoted by SPDJI, Dow Jones, S&P, any of their respective affiliates (collectively, “S&P Dow Jones Indices”). S&P Dow Jones Indices makes no representation or warranty, express or implied, to the owners of the Index Funds S&P 500 Equal Weight or any member of the public regarding the advisability of investing in securities generally or in Index Funds S&P 500 Equal Weight particularly or the ability of the S&P 500 Equal Weight Index to track general market performance. S&P Dow Jones Indices’ only relationship to The Index Group, Inc. with respect to the S&P 500 Equal Weight Index is the licensing of the Index and certain trademarks, service marks and/or trade names of S&P Dow Jones Indices and/or its licensors. The S&P 500 Equal Weight Index is determined, composed and calculated by S&P Dow Jones Indices without regard to The Index Group, Inc. or the Index Funds S&P 500 Equal Weight. S&P Dow Jones Indices have no obligation to take the needs of The Index Group, Inc. or the owners of the Index Funds S&P 500 Equal Weight into consideration in determining, composing or calculating the S&P 500 Equal Weight Index. S&P Dow Jones Indices are not responsible for and have not participated in the determination of the prices, and amount of the Index Funds S&P 500 Equal Weight or the timing of the issuance or sale of the Index Funds S&P 500 Equal Weight or in the determination or calculation of the equation by which the Index Funds S&P 500 Equal Weight is to be converted into cash, surrendered or redeemed, as the case may be. S&P Dow Jones Indices have no obligation or liability in connection with the administration, marketing or trading of the Index Funds S&P 500 Equal Weight. There is no assurance that investment products based on the S&P 500 Equal Weight Index will accurately track index performance or provide positive investment returns. S&P Dow Jones Indices LLC is not an investment advisor. Inclusion of a security within an index is not a recommendation by S&P Dow Jones Indices to buy, sell, or hold such security, nor is it considered to be investment advice.
S&P DOW JONES INDICES DOES NOT GUARANTEE THE ADEQUACY, ACCURACY, TIMELINESS AND/OR THE COMPLETENESS OF THE INDEX OR ANY DATA RELATED THERETO OR ANY COMMUNICATION, INCLUDING BUT NOT LIMITED TO, ORAL OR WRITTEN COMMUNICATION (INCLUDING ELECTRONIC COMMUNICATIONS) WITH RESPECT THERETO. S&P DOW JONES INDICES SHALL NOT BE SUBJECT TO ANY DAMAGES OR LIABILITY FOR ANY ERRORS, OMISSIONS, OR DELAYS THEREIN. S&P DOW JONES INDICES MAKE NO EXPRESS OR IMPLIED WARRANTIES, AND EXPRESSLY DISCLAIMS ALL WARRANTIES, OF MERCHANTABILITY OR FITNESS FOR A PARTICULAR PURPOSE OR USE (INCLUDING, WITHOUT LIMITATION, COMPLIANCE WITH SHARIAH LAW) OR AS TO RESULTS TO BE OBTAINED BY THE INDEX GROUP, INC., OWNERS OF THE INDEX FUNDS S&P 500 EQUAL WEIGHT, OR ANY OTHER PERSON OR ENTITY FROM THE USE OF THE INDEX OR WITH RESPECT TO ANY DATA RELATED THERETO. WITHOUT LIMITING ANY OF THE FOREGOING, IN NO EVENT WHATSOEVER SHALL S&P DOW JONES INDICES BE LIABLE FOR ANY INDIRECT, SPECIAL, INCIDENTAL, PUNITIVE, OR CONSEQUENTIAL DAMAGES INCLUDING BUT NOT LIMITED TO, LOSS OF PROFITS, TRADING LOSSES, LOST TIME OR GOODWILL, EVEN IF THEY HAVE BEEN ADVISED OF THE POSSIBLITY OF SUCH DAMAGES, WHETHER IN CONTRACT, TORT, STRICT LIABILITY, OR OTHERWISE. THERE ARE NO THIRD PARTY BENEFICIARIES OF ANY AGREEMENTS OR ARRANGEMENTS BETWEEN S&P DOW JONES INDICES AND THE INDEX GROUP, INC., OTHER THAN THE LICENSORS OF S&P DOW JONES INDICES.
| Index Funds S&P 500 Equal Weight | Disclosure of Fund Expenses |
September 30, 2017 (Unaudited)
As a shareholder of the Index Funds S&P 500 Equal Weight (the “Fund”), you will incur two types of costs: (1) transaction costs, including applicable redemption fees; and (2) ongoing costs, including management fees and other Fund expenses. The following examples are intended to help you understand your ongoing costs (in dollars) of investing in the Fund and to compare these costs with the ongoing costs of investing in other mutual funds. The examples are based on an investment of $1,000 invested on April 1, 2017 and held until September 30, 2017.
Actual Expenses. The first line of each table below provides information about actual account values and actual expenses. You may use the information in this line, together with the amount you invested, to estimate the expenses that you paid over the period. Simply divide your account value by $1,000 (for example, an $8,600 account value divided by $1,000 = 8.6), then multiply the result by the number in the first line under the heading “Expenses Paid During Period” to estimate the expenses you paid on your account during this period.
Hypothetical Example for Comparison Purposes. The second line of the table below provides information about hypothetical account values and hypothetical expenses based on the Fund’s actual expense ratio and an assumed rate of return of 5% per year before expenses, which is not the Fund’s actual return. The hypothetical account values and expenses may not be used to estimate the actual ending account balance or expenses you paid for the period. You may use this information to compare the ongoing costs of investing in the Fund and other mutual funds. To do so, compare this 5% hypothetical example with the 5% hypothetical examples that appear in the shareholder reports of the other funds. The expenses shown in the table are meant to highlight ongoing Fund costs only and do not reflect transaction fees, such as redemption fees or exchange fees. Therefore, the second line of each table below is useful in comparing ongoing costs only, and may not help you determine the relative total costs of owning different funds. In addition, if these transactional costs were included, your costs would have been higher.
| Index Funds S&P 500 Equal Weight | Beginning Account Value 4/1/2017 | Ending Account Value 09/30/17 | Expense Ratio(a) | Expenses Paid During Period 4/1/2017- 9/30/17(b) |
| Actual | $1,000.00 | $1,060.50 | 0.25% | $1.29 |
| Hypothetical (5% return before expenses) | $1,000.00 | $1,023.82 | 0.25% | $1.27 |
(a) | The Fund's expense ratios have been based on the Fund's most recent fiscal half-year expenses. |
(b) | Expenses are equal to the Fund's annualized net expense ratio multiplied by the average account value over the period, multiplied by the number of days in the most recent fiscal half-year (183), divided by 365. |
| Semi-Annual Report | September 30, 2017 | 5 |
| Index Funds S&P 500 Equal Weight | Schedule of Investments |
September 30, 2017 (Unaudited)
| | | Shares | | | Value | |
| COMMON STOCKS: 99.91% | | | | | | |
| Consumer Discretionary: 15.77% | | | | | | |
| Advance Auto Parts, Inc. | | | 435 | | | $ | 43,152 | |
Amazon.com, Inc.(a) | | | 42 | | | | 40,377 | |
AutoZone, Inc.(a) | | | 76 | | | | 45,228 | |
| Best Buy Co., Inc. | | | 739 | | | | 42,093 | |
| BorgWarner, Inc. | | | 887 | | | | 45,441 | |
CarMax, Inc.(a) | | | 599 | | | | 45,410 | |
| Carnival Corp. | | | 625 | | | | 40,356 | |
| CBS Corp., Class B Non‐Voting | | | 689 | | | | 39,962 | |
Charter Communications, Inc., Class A(a) | | | 104 | | | | 37,796 | |
Chipotle Mexican Grill, Inc.(a) | | | 137 | | | | 42,173 | |
| Coach, Inc. | | | 1,014 | | | | 40,844 | |
| Comcast Corp., Class A | | | 1,072 | | | | 41,251 | |
| Darden Restaurants, Inc. | | | 521 | | | | 41,044 | |
| Delphi Automotive PLC | | | 424 | | | | 41,722 | |
Discovery Communications, Inc., Class A(a) | | | 840 | | | | 17,884 | |
Discovery Communications, Inc., Class C(a) | | | 1,152 | | | | 23,340 | |
DISH Network Corp., Class A(a) | | | 751 | | | | 40,727 | |
| Dollar General Corp. | | | 543 | | | | 44,010 | |
Dollar Tree, Inc.(a) | | | 495 | | | | 42,976 | |
| DR Horton, Inc. | | | 1,131 | | | | 45,161 | |
| Expedia, Inc. | | | 289 | | | | 41,599 | |
| Foot Locker, Inc. | | | 1,147 | | | | 40,397 | |
| Ford Motor Co. | | | 3,608 | | | | 43,188 | |
| Gap, Inc. | | | 1,595 | | | | 47,100 | |
| Garmin, Ltd. | | | 785 | | | | 42,366 | |
| General Motors Co. | | | 1,107 | | | | 44,701 | |
| Genuine Parts Co. | | | 480 | | | | 45,912 | |
| Goodyear Tire & Rubber Co. | | | 1,351 | | | | 44,921 | |
| H&R Block, Inc. | | | 1,571 | | | | 41,600 | |
| Hanesbrands, Inc. | | | 1,632 | | | | 40,212 | |
| Harley‐Davidson, Inc. | | | 865 | | | | 41,702 | |
| Hasbro, Inc. | | | 435 | | | | 42,486 | |
| Hilton Worldwide Holdings, Inc. | | | 629 | | | | 43,684 | |
| Home Depot, Inc. | | | 257 | | | | 42,035 | |
| Interpublic Group of Cos., Inc. | | | 2,011 | | | | 41,809 | |
| Kohl's Corp. | | | 976 | | | | 44,554 | |
| L Brands, Inc. | | | 1,104 | | | | 45,937 | |
| Leggett & Platt, Inc. | | | 905 | | | | 43,196 | |
| Lennar Corp., Class A | | | 811 | | | | 42,821 | |
LKQ Corp.(a) | | | 1,178 | | | | 42,396 | |
| Lowe's Cos., Inc. | | | 521 | | | | 41,649 | |
| Macy's, Inc. | | | 1,923 | | | | 41,960 | |
| Marriott International, Inc., Class A | | | 396 | | | | 43,663 | |
| Mattel, Inc. | | | 2,683 | | | | 41,533 | |
| McDonald's Corp. | | | 256 | | | | 40,110 | |
| MGM Resorts International | | | 1,232 | | | | 40,151 | |
Michael Kors Holdings, Ltd.(a) | | | 972 | | | | 46,510 | |
Mohawk Industries, Inc.(a) | | | 159 | | | | 39,354 | |
Netflix, Inc.(a) | | | 232 | | | | 42,073 | |
| Newell Brands, Inc. | | | 930 | | | | 39,683 | |
| | | Shares | | | Value | |
| Consumer Discretionary (continued) | | | | | | |
| News Corp., Class A | | | 2,363 | | | $ | 31,333 | |
| News Corp., Class B | | | 742 | | | | 10,128 | |
| NIKE, Inc., Class B | | | 785 | | | | 40,702 | |
| Nordstrom, Inc. | | | 889 | | | | 41,916 | |
| Omnicom Group, Inc. | | | 563 | | | | 41,701 | |
O'Reilly Automotive, Inc.(a) | | | 206 | | | | 44,366 | |
Priceline Group, Inc.(a) | | | 22 | | | | 40,278 | |
| PulteGroup, Inc. | | | 1,591 | | | | 43,482 | |
| PVH Corp. | | | 321 | | | | 40,465 | |
| Ralph Lauren Corp. | | | 451 | | | | 39,819 | |
| Ross Stores, Inc. | | | 700 | | | | 45,199 | |
| Royal Caribbean Cruises, Ltd. | | | 350 | | | | 41,489 | |
| Scripps Networks Interactive, Inc., Class A | | | 480 | | | | 41,227 | |
| Signet Jewelers, Ltd. | | | 626 | | | | 41,660 | |
| Starbucks Corp. | | | 767 | | | | 41,196 | |
| Target Corp. | | | 715 | | | | 42,192 | |
| Tiffany & Co. | | | 439 | | | | 40,291 | |
| Time Warner, Inc. | | | 409 | | | | 41,902 | |
| TJX Cos., Inc. | | | 566 | | | | 41,731 | |
| Tractor Supply Co. | | | 679 | | | | 42,974 | |
TripAdvisor, Inc.(a) | | | 909 | | | | 36,842 | |
| Twenty‐First Century Fox, Inc., Class A | | | 1,091 | | | | 28,781 | |
| Twenty‐First Century Fox, Inc., Class B | | | 505 | | | | 13,024 | |
Ulta Beauty, Inc.(a) | | | 180 | | | | 40,691 | |
Under Armour, Inc., Class A(a) | | | 1,223 | | | | 20,155 | |
Under Armour, Inc., Class C(a) | | | 1,221 | | | | 18,339 | |
| VF Corp. | | | 656 | | | | 41,702 | |
| Viacom, Inc., Class B | | | 1,503 | | | | 41,844 | |
| Walt Disney Co. | | | 422 | | | | 41,597 | |
| Whirlpool Corp. | | | 238 | | | | 43,897 | |
| Wyndham Worldwide Corp. | | | 416 | | | | 43,851 | |
| Wynn Resorts, Ltd. | | | 283 | | | | 42,144 | |
| Yum! Brands, Inc. | | | 536 | | | | 39,455 | |
| | | | | | | | 3,326,622 | |
| | | | | | | | | |
| Consumer Staples: 6.53% | | | | | | | | |
| Altria Group, Inc. | | | 658 | | | | 41,730 | |
| Archer‐Daniels‐Midland Co. | | | 967 | | | | 41,107 | |
| Brown‐Forman Corp., Class B | | | 755 | | | | 40,996 | |
| Campbell Soup Co. | | | 856 | | | | 40,078 | |
| Church & Dwight Co., Inc. | | | 834 | | | | 40,407 | |
| Clorox Co. | | | 305 | | | | 40,233 | |
| Coca‐Cola Co. | | | 885 | | | | 39,834 | |
| Colgate‐Palmolive Co. | | | 571 | | | | 41,597 | |
| Conagra Brands, Inc. | | | 1,188 | | | | 40,083 | |
| Constellation Brands, Inc., Class A | | | 203 | | | | 40,488 | |
| Costco Wholesale Corp. | | | 260 | | | | 42,715 | |
| Coty, Inc., Class A | | | 2,489 | | | | 41,143 | |
| CVS Health Corp. | | | 514 | | | | 41,798 | |
| Dr. Pepper Snapple Group, Inc. | | | 447 | | | | 39,546 | |
| Estee Lauder Cos., Inc., Class A | | | 377 | | | | 40,656 | |
| General Mills, Inc. | | | 741 | | | | 38,354 | |
| Hershey Co. | | | 379 | | | | 41,375 | |
See Notes to Financial Statements.
| Index Funds S&P 500 Equal Weight | Schedule of Investments |
September 30, 2017 (Unaudited)
| | | Shares | | | Value | |
| Consumer Staples (continued) | | | | | | |
| Hormel Foods Corp. | | | 1,297 | | | $ | 41,686 | |
| JM Smucker Co. | | | 383 | | | | 40,188 | |
| Kellogg Co. | | | 599 | | | | 37,360 | |
| Kimberly‐Clark Corp. | | | 348 | | | | 40,953 | |
| Kraft Heinz Co. | | | 501 | | | | 38,853 | |
| Kroger Co. | | | 1,946 | | | | 39,037 | |
| McCormick & Co., Inc., Non‐Voting Shares | | | 420 | | | | 43,109 | |
| Molson Coors Brewing Co., Class B | | | 465 | | | | 37,963 | |
| Mondelez International, Inc., Class A | | | 1,009 | | | | 41,026 | |
Monster Beverage Corp.(a) | | | 728 | | | | 40,222 | |
| PepsiCo, Inc. | | | 357 | | | | 39,780 | |
| Philip Morris International, Inc. | | | 351 | | | | 38,965 | |
| Procter & Gamble Co. | | | 441 | | | | 40,122 | |
| Sysco Corp. | | | 775 | | | | 41,811 | |
| Tyson Foods, Inc., Class A | | | 627 | | | | 44,172 | |
| Walgreens Boots Alliance, Inc. | | | 503 | | | | 38,842 | |
| Wal‐Mart Stores, Inc. | | | 519 | | | | 40,555 | |
| | | | | | | | 1,376,784 | |
| | | | | | | | | |
| Energy: 6.90% | | | | | | | | |
| Anadarko Petroleum Corp. | | | 1,002 | | | | 48,948 | |
| Andeavor | | | 404 | | | | 41,673 | |
| Apache Corp. | | | 1,043 | | | | 47,769 | |
| Baker Hughes a GE Co. | | | 1,191 | | | | 43,614 | |
| Cabot Oil & Gas Corp. | | | 1,579 | | | | 42,238 | |
Chesapeake Energy Corp.(a) | | | 11,260 | | | | 48,418 | |
| Chevron Corp. | | | 370 | | | | 43,475 | |
| Cimarex Energy Co. | | | 412 | | | | 46,832 | |
Concho Resources, Inc.(a) | | | 366 | | | | 48,210 | |
| ConocoPhillips | | | 921 | | | | 46,096 | |
| Devon Energy Corp. | | | 1,302 | | | | 47,796 | |
| EOG Resources, Inc. | | | 472 | | | | 45,661 | |
| EQT Corp. | | | 675 | | | | 44,037 | |
| Exxon Mobil Corp. | | | 520 | | | | 42,630 | |
| Halliburton Co. | | | 1,018 | | | | 46,859 | |
| Helmerich & Payne, Inc. | | | 901 | | | | 46,951 | |
| Hess Corp. | | | 1,018 | | | | 47,734 | |
| Kinder Morgan, Inc. | | | 2,141 | | | | 41,064 | |
| Marathon Oil Corp. | | | 3,624 | | | | 49,142 | |
| Marathon Petroleum Corp. | | | 768 | | | | 43,070 | |
| National Oilwell Varco, Inc. | | | 1,291 | | | | 46,127 | |
Newfield Exploration Co.(a) | | | 1,653 | | | | 49,045 | |
| Noble Energy, Inc. | | | 1,665 | | | | 47,219 | |
| Occidental Petroleum Corp. | | | 680 | | | | 43,663 | |
| ONEOK, Inc. | | | 729 | | | | 40,394 | |
| Phillips 66 | | | 484 | | | | 44,339 | |
| Pioneer Natural Resources Co. | | | 319 | | | | 47,065 | |
| Range Resources Corp. | | | 2,472 | | | | 48,377 | |
| Schlumberger, Ltd. | | | 632 | | | | 44,088 | |
TechnipFMC PLC(a) | | | 1,607 | | | | 44,867 | |
| Valero Energy Corp. | | | 590 | | | | 45,389 | |
| | | Shares | | | Value | |
| Energy (continued) | | | | | | |
| Williams Cos., Inc. | | | 1,381 | | | $ | 41,444 | |
| | | | | | | | 1,454,234 | |
| | | | | | | | | |
| Financials: 14.03% | | | | | | | | |
| Affiliated Managers Group, Inc. | | | 237 | | | | 44,990 | |
| Aflac, Inc. | | | 505 | | | | 41,102 | |
| Allstate Corp. | | | 458 | | | | 42,095 | |
| American Express Co. | | | 486 | | | | 43,964 | |
| American International Group, Inc. | | | 685 | | | | 42,052 | |
| Ameriprise Financial, Inc. | | | 308 | | | | 45,741 | |
| Aon PLC | | | 287 | | | | 41,931 | |
| Arthur J Gallagher & Co. | | | 686 | | | | 42,223 | |
| Assurant, Inc. | | | 451 | | | | 43,080 | |
| Bank of America Corp. | | | 1,791 | | | | 45,384 | |
| Bank of New York Mellon Corp. | | | 813 | | | | 43,105 | |
| BB&T Corp. | | | 932 | | | | 43,748 | |
Berkshire Hathaway, Inc., Class B(a) | | | 234 | | | | 42,897 | |
| BlackRock, Inc. | | | 98 | | | | 43,815 | |
Brighthouse Financial, Inc.(a) | | | 752 | | | | 45,722 | |
| Capital One Financial Corp. | | | 524 | | | | 44,362 | |
| CBOE Holdings, Inc. | | | 391 | | | | 42,083 | |
| Charles Schwab Corp. | | | 1,059 | | | | 46,321 | |
| Chubb, Ltd. | | | 290 | | | | 41,340 | |
| Cincinnati Financial Corp. | | | 541 | | | | 41,424 | |
| Citigroup, Inc. | | | 620 | | | | 45,099 | |
| Citizens Financial Group, Inc. | | | 1,250 | | | | 47,337 | |
| CME Group, Inc. | | | 320 | | | | 43,418 | |
| Comerica, Inc. | | | 633 | | | | 48,273 | |
| Discover Financial Services | | | 710 | | | | 45,781 | |
E*Trade Financial Corp.(a) | | | 1,034 | | | | 45,093 | |
| Everest Re Group, Ltd. | | | 184 | | | | 42,024 | |
| Fifth Third Bancorp | | | 1,634 | | | | 45,719 | |
| Franklin Resources, Inc. | | | 999 | | | | 44,465 | |
| Goldman Sachs Group, Inc. | | | 188 | | | | 44,592 | |
| Hartford Financial Services Group, Inc. | | | 771 | | | | 42,737 | |
| Huntington Bancshares, Inc. | | | 3,327 | | | | 46,445 | |
| Intercontinental Exchange, Inc. | | | 627 | | | | 43,075 | |
| Invesco, Ltd. | | | 1,293 | | | | 45,307 | |
| JPMorgan Chase & Co. | | | 464 | | | | 44,317 | |
| KeyCorp | | | 2,466 | | | | 46,410 | |
| Leucadia National Corp. | | | 1,833 | | | | 46,283 | |
| Lincoln National Corp. | | | 623 | | | | 45,778 | |
| Loews Corp. | | | 891 | | | | 42,643 | |
| M&T Bank Corp. | | | 284 | | | | 45,735 | |
| Marsh & McLennan Cos., Inc. | | | 500 | | | | 41,905 | |
| MetLife, Inc. | | | 870 | | | | 45,196 | |
| Moody's Corp. | | | 302 | | | | 42,041 | |
| Morgan Stanley | | | 931 | | | | 44,846 | |
| NASDAQ, Inc. | | | 551 | | | | 42,741 | |
| Navient Corp. | | | 3,033 | | | | 45,556 | |
| Northern Trust Corp. | | | 464 | | | | 42,656 | |
| People's United Financial, Inc. | | | 2,522 | | | | 45,749 | |
| PNC Financial Services Group, Inc. | | | 338 | | | | 45,552 | |
| Principal Financial Group, Inc. | | | 675 | | | | 43,429 | |
See Notes to Financial Statements.
| Semi-Annual Report | September 30, 2017 | 7 |
| Index Funds S&P 500 Equal Weight | Schedule of Investments |
September 30, 2017 (Unaudited)
| | | Shares | | | Value | |
| Financials (continued) | | | | | | |
| Progressive Corp. | | | 902 | | | $ | 43,675 | |
| Prudential Financial, Inc. | | | 414 | | | | 44,016 | |
| Raymond James Financial, Inc. | | | 544 | | | | 45,876 | |
| Regions Financial Corp. | | | 3,092 | | | | 47,091 | |
| S&P Global, Inc. | | | 269 | | | | 42,047 | |
| State Street Corp. | | | 443 | | | | 42,324 | |
| SunTrust Banks, Inc. | | | 783 | | | | 46,800 | |
| Synchrony Financial | | | 1,436 | | | | 44,588 | |
| T Rowe Price Group, Inc. | | | 499 | | | | 45,234 | |
| Torchmark Corp. | | | 539 | | | | 43,169 | |
| Travelers Cos., Inc. | | | 343 | | | | 42,024 | |
| Unum Group | | | 870 | | | | 44,483 | |
| US Bancorp | | | 820 | | | | 43,944 | |
| Wells Fargo & Co. | | | 826 | | | | 45,554 | |
| Willis Towers Watson PLC | | | 270 | | | | 41,642 | |
| XL Group, Ltd. | | | 1,061 | | | | 41,856 | |
| Zions Bancorporation | | | 985 | | | | 46,472 | |
| | | | | | | | 2,958,376 | |
| | | | | | | | | |
| Health Care: 11.88% | | | | | | | | |
| Abbott Laboratories | | | 788 | | | | 42,048 | |
| AbbVie, Inc. | | | 480 | | | | 42,653 | |
| Aetna, Inc. | | | 252 | | | | 40,070 | |
| Agilent Technologies, Inc. | | | 631 | | | | 40,510 | |
Alexion Pharmaceuticals, Inc.(a) | | | 290 | | | | 40,684 | |
Align Technology, Inc.(a) | | | 226 | | | | 42,097 | |
| Allergan PLC | | | 175 | | | | 35,866 | |
| AmerisourceBergen Corp. | | | 497 | | | | 41,127 | |
| Amgen, Inc. | | | 227 | | | | 42,324 | |
| Anthem, Inc. | | | 212 | | | | 40,255 | |
| Baxter International, Inc. | | | 648 | | | | 40,662 | |
| Becton Dickinson and Co. | | | 202 | | | | 39,582 | |
Biogen, Inc.(a) | | | 126 | | | | 39,453 | |
Boston Scientific Corp.(a) | | | 1,424 | | | | 41,538 | |
| Bristol‐Myers Squibb Co. | | | 654 | | | | 41,686 | |
| Cardinal Health, Inc. | | | 600 | | | | 40,152 | |
Celgene Corp.(a) | | | 291 | | | | 42,434 | |
Centene Corp.(a) | | | 458 | | | | 44,321 | |
Cerner Corp.(a) | | | 592 | | | | 42,221 | |
| Cigna Corp. | | | 222 | | | | 41,501 | |
| Cooper Cos., Inc. | | | 163 | | | | 38,649 | |
| CR Bard, Inc. | | | 127 | | | | 40,703 | |
| Danaher Corp. | | | 473 | | | | 40,574 | |
DaVita, Inc.(a) | | | 702 | | | | 41,692 | |
| DENTSPLY SIRONA, Inc. | | | 701 | | | | 41,927 | |
Edwards Lifesciences Corp.(a) | | | 363 | | | | 39,679 | |
| Eli Lilly & Co. | | | 494 | | | | 42,257 | |
Envision Healthcare Corp.(a) | | | 832 | | | | 37,398 | |
Express Scripts Holding Co.(a) | | | 652 | | | | 41,285 | |
| Gilead Sciences, Inc. | | | 482 | | | | 39,052 | |
HCA Healthcare, Inc.(a) | | | 532 | | | | 42,342 | |
Henry Schein, Inc.(a) | | | 468 | | | | 38,371 | |
Hologic, Inc.(a) | | | 1,056 | | | | 38,745 | |
| Humana, Inc. | | | 160 | | | | 38,981 | |
| | Shares | | | Value | |
| Health Care (continued) | | | | | | |
IDEXX Laboratories, Inc.(a) | | | 260 | | | $ | 40,427 | |
Illumina, Inc.(a) | | | 195 | | | | 38,844 | |
Incyte Corp.(a) | | | 317 | | | | 37,007 | |
Intuitive Surgical, Inc.(a) | | | 39 | | | | 40,789 | |
| Johnson & Johnson | | | 312 | | | | 40,563 | |
Laboratory Corp. of America Holdings(a) | | | 260 | | | | 39,252 | |
| McKesson Corp. | | | 261 | | | | 40,092 | |
| Medtronic PLC | | | 499 | | | | 38,807 | |
| Merck & Co., Inc. | | | 638 | | | | 40,851 | |
Mettler‐Toledo International, Inc.(a) | | | 67 | | | | 41,953 | |
Mylan NV(a) | | | 1,277 | | | | 40,059 | |
| Patterson Cos., Inc. | | | 1,041 | | | | 40,235 | |
| PerkinElmer, Inc. | | | 606 | | | | 41,796 | |
| Perrigo Co. PLC | | | 495 | | | | 41,902 | |
| Pfizer, Inc. | | | 1,202 | | | | 42,911 | |
| Quest Diagnostics, Inc. | | | 381 | | | | 35,677 | |
Quintiles IMS Holdings, Inc.(a) | | | 422 | | | | 40,120 | |
Regeneron Pharmaceuticals, Inc.(a) | | | 87 | | | | 38,899 | |
| ResMed, Inc. | | | 513 | | | | 39,480 | |
| Stryker Corp. | | | 287 | | | | 40,760 | |
| Thermo Fisher Scientific, Inc. | | | 214 | | | | 40,489 | |
| UnitedHealth Group, Inc. | | | 208 | | | | 40,737 | |
| Universal Health Services, Inc., Class B | | | 371 | | | | 41,159 | |
Varian Medical Systems, Inc.(a) | | | 385 | | | | 38,523 | |
Vertex Pharmaceuticals, Inc.(a) | | | 258 | | | | 39,226 | |
Waters Corp.(a) | | | 220 | | | | 39,494 | |
| Zimmer Biomet Holdings, Inc. | | | 355 | | | | 41,567 | |
| Zoetis, Inc. | | | 634 | | | | 40,424 | |
| | | | | | | | 2,504,882 | |
| | | | | | | | | |
| Industrials: 13.79% | | | | | | | | |
| 3M Co. | | | 200 | | | | 41,980 | |
| Acuity Brands, Inc. | | | 228 | | | | 39,052 | |
| Alaska Air Group, Inc. | | | 552 | | | | 42,101 | |
| Allegion PLC | | | 507 | | | | 43,840 | |
| American Airlines Group, Inc. | | | 939 | | | | 44,593 | |
| AMETEK, Inc. | | | 640 | | | | 42,266 | |
| AO Smith Corp. | | | 725 | | | | 43,087 | |
| Arconic, Inc. | | | 1,679 | | | | 41,773 | |
| Boeing Co. | | | 172 | | | | 43,724 | |
| Caterpillar, Inc. | | | 349 | | | | 43,524 | |
| CH Robinson Worldwide, Inc. | | | 556 | | | | 42,312 | |
| Cintas Corp. | | | 306 | | | | 44,150 | |
| CSX Corp. | | | 801 | | | | 43,462 | |
| Cummins, Inc. | | | 252 | | | | 42,344 | |
| Deere & Co. | | | 350 | | | | 43,956 | |
| Delta Air Lines, Inc. | | | 864 | | | | 41,662 | |
| Dover Corp. | | | 470 | | | | 42,953 | |
| Eaton Corp. PLC | | | 568 | | | | 43,617 | |
| Emerson Electric Co. | | | 678 | | | | 42,605 | |
| Equifax, Inc. | | | 333 | | | | 35,295 | |
| Expeditors International of Washington, Inc. | | | 719 | | | | 43,039 | |
See Notes to Financial Statements.
| Index Funds S&P 500 Equal Weight | Schedule of Investments |
September 30, 2017 (Unaudited)
| | | Shares | | | Value | |
| Industrials (continued) | | | | | | |
| Fastenal Co. | | | 960 | | | $ | 43,757 | |
| FedEx Corp. | | | 194 | | | | 43,763 | |
| Flowserve Corp. | | | 1,038 | | | | 44,208 | |
| Fluor Corp. | | | 1,048 | | | | 44,121 | |
| Fortive Corp. | | | 617 | | | | 43,677 | |
| Fortune Brands Home & Security, Inc. | | | 636 | | | | 42,758 | |
| General Dynamics Corp. | | | 208 | | | | 42,761 | |
| General Electric Co. | | | 1,720 | | | | 41,590 | |
| Honeywell International, Inc. | | | 297 | | | | 42,097 | |
IHS Markit, Ltd.(a) | | | 863 | | | | 38,041 | |
| Illinois Tool Works, Inc. | | | 292 | | | | 43,204 | |
| Ingersoll‐Rand PLC | | | 469 | | | | 41,821 | |
| Jacobs Engineering Group, Inc. | | | 751 | | | | 43,761 | |
| JB Hunt Transport Services, Inc. | | | 402 | | | | 44,654 | |
| Johnson Controls International PLC | | | 1,047 | | | | 42,184 | |
| Kansas City Southern | | | 393 | | | | 42,711 | |
| L3 Technologies, Inc. | | | 225 | | | | 42,397 | |
| Lockheed Martin Corp. | | | 136 | | | | 42,199 | |
| Masco Corp. | | | 1,090 | | | | 42,521 | |
| Nielsen Holdings PLC | | | 1,065 | | | | 44,144 | |
| Norfolk Southern Corp. | | | 332 | | | | 43,904 | |
| Northrop Grumman Corp. | | | 153 | | | | 44,021 | |
| PACCAR, Inc. | | | 607 | | | | 43,910 | |
| Parker‐Hannifin Corp. | | | 254 | | | | 44,455 | |
| Pentair PLC | | | 661 | | | | 44,922 | |
Quanta Services, Inc.(a) | | | 1,134 | | | | 42,378 | |
| Raytheon Co. | | | 226 | | | | 42,167 | |
| Republic Services, Inc. | | | 626 | | | | 41,354 | |
| Robert Half International, Inc. | | | 901 | | | | 45,356 | |
| Rockwell Automation, Inc. | | | 250 | | | | 44,552 | |
| Rockwell Collins, Inc. | | | 312 | | | | 40,782 | |
| Roper Technologies, Inc. | | | 175 | | | | 42,595 | |
| Snap‐on, Inc. | | | 278 | | | | 41,425 | |
| Southwest Airlines Co. | | | 776 | | | | 43,440 | |
| Stanley Black & Decker, Inc. | | | 278 | | | | 41,970 | |
Stericycle, Inc.(a) | | | 583 | | | | 41,754 | |
| Textron, Inc. | | | 832 | | | | 44,828 | |
| TransDigm Group, Inc. | | | 161 | | | | 41,160 | |
| Union Pacific Corp. | | | 383 | | | | 44,416 | |
United Continental Holdings, Inc.(a) | | | 701 | | | | 42,677 | |
| United Parcel Service, Inc., Class B | | | 357 | | | | 42,872 | |
United Rentals, Inc.(a) | | | 323 | | | | 44,813 | |
| United Technologies Corp. | | | 374 | | | | 43,414 | |
Verisk Analytics, Inc.(a) | | | 497 | | | | 41,345 | |
| Waste Management, Inc. | | | 532 | | | | 41,640 | |
| WW Grainger, Inc. | | | 248 | | | | 44,578 | |
| Xylem, Inc. | | | 653 | | | | 40,897 | |
| | | | | | | | 2,909,329 | |
| | | | | | | | | |
| Information Technology: 13.66% | | | | | | | | |
| Accenture PLC, Class A | | | 306 | | | | 41,331 | |
| Activision Blizzard, Inc. | | | 631 | | | | 40,706 | |
Adobe Systems, Inc.(a) | | | 264 | | | | 39,384 | |
Advanced Micro Devices, Inc.(a) | | | 3,346 | | | | 42,661 | |
| | | Shares | | | Value | |
| Information Technology (continued) | | | | | | |
Akamai Technologies, Inc.(a) | | | 891 | | | $ | 43,410 | |
| Alliance Data Systems Corp. | | | 191 | | | | 42,316 | |
Alphabet, Inc., Class A(a) | | | 22 | | | | 21,422 | |
Alphabet, Inc., Class C(a) | | | 22 | | | | 21,100 | |
| Amphenol Corp., Class A | | | 509 | | | | 43,082 | |
| Analog Devices, Inc. | | | 509 | | | | 43,861 | |
ANSYS, Inc.(a) | | | 319 | | | | 39,151 | |
| Apple, Inc. | | | 258 | | | | 39,763 | |
| Applied Materials, Inc. | | | 924 | | | | 48,131 | |
Autodesk, Inc.(a) | | | 359 | | | | 40,301 | |
| Automatic Data Processing, Inc. | | | 378 | | | | 41,323 | |
| Broadcom, Ltd. | | | 168 | | | | 40,747 | |
| CA, Inc. | | | 1,236 | | | | 41,258 | |
Cadence Design Systems, Inc.(a) | | | 1,071 | | | | 42,272 | |
| Cisco Systems, Inc. | | | 1,302 | | | | 43,786 | |
Citrix Systems, Inc.(a) | | | 546 | | | | 41,944 | |
| Cognizant Technology Solutions Corp., Class A | | | 576 | | | | 41,783 | |
| Corning, Inc. | | | 1,436 | | | | 42,965 | |
| CSRA, Inc. | | | 1,273 | | | | 41,080 | |
| DXC Technology Co. | | | 487 | | | | 41,824 | |
eBay, Inc.(a) | | | 1,084 | | | | 41,691 | |
Electronic Arts, Inc.(a) | | | 347 | | | | 40,967 | |
F5 Networks, Inc.(a) | | | 355 | | | | 42,799 | |
Facebook, Inc., Class A(a) | | | 240 | | | | 41,009 | |
| Fidelity National Information Services, Inc. | | | 444 | | | | 41,465 | |
Fiserv, Inc.(a) | | | 335 | | | | 43,202 | |
| FLIR Systems, Inc. | | | 1,076 | | | | 41,867 | |
Gartner, Inc.(a) | | | 330 | | | | 41,055 | |
| Global Payments, Inc. | | | 431 | | | | 40,958 | |
| Harris Corp. | | | 335 | | | | 44,113 | |
| Hewlett Packard Enterprise Co. | | | 3,124 | | | | 45,954 | |
| HP, Inc. | | | 2,143 | | | | 42,774 | |
| Intel Corp. | | | 1,165 | | | | 44,363 | |
| International Business Machines Corp. | | | 287 | | | | 41,638 | |
| Intuit, Inc. | | | 289 | | | | 41,078 | |
| Juniper Networks, Inc. | | | 1,540 | | | | 42,858 | |
| KLA‐Tencor Corp. | | | 434 | | | | 46,004 | |
| Lam Research Corp. | | | 247 | | | | 45,705 | |
| MasterCard, Inc., Class A | | | 298 | | | | 42,078 | |
| Microchip Technology, Inc. | | | 474 | | | | 42,556 | |
Micron Technology, Inc.(a) | | | 1,263 | | | | 49,674 | |
| Microsoft Corp. | | | 554 | | | | 41,267 | |
| Motorola Solutions, Inc. | | | 482 | | | | 40,907 | |
| NetApp, Inc. | | | 1,061 | | | | 46,429 | |
| NVIDIA Corp. | | | 250 | | | | 44,692 | |
| Oracle Corp. | | | 795 | | | | 38,438 | |
| Paychex, Inc. | | | 720 | | | | 43,171 | |
PayPal Holdings, Inc.(a) | | | 670 | | | | 42,900 | |
Qorvo, Inc.(a) | | | 572 | | | | 40,429 | |
| QUALCOMM, Inc. | | | 825 | | | | 42,768 | |
Red Hat, Inc.(a) | | | 383 | | | | 42,459 | |
salesforce.com, Inc.(a) | | | 425 | | | | 39,703 | |
See Notes to Financial Statements.
| Semi-Annual Report | September 30, 2017 | 9 |
| Index Funds S&P 500 Equal Weight | Schedule of Investments |
September 30, 2017 (Unaudited)
| | | Shares | | | Value | |
| Information Technology (continued) | | | | | | |
| Seagate Technology PLC | | | 1,281 | | | $ | 42,491 | |
| Skyworks Solutions, Inc. | | | 392 | | | | 39,945 | |
| Symantec Corp. | | | 1,296 | | | | 42,522 | |
Synopsys, Inc.(a) | | | 515 | | | | 41,473 | |
| TE Connectivity, Ltd. | | | 519 | | | | 43,108 | |
| Texas Instruments, Inc. | | | 503 | | | | 45,089 | |
| Total System Services, Inc. | | | 591 | | | | 38,710 | |
VeriSign, Inc.(a) | | | 397 | | | | 42,237 | |
| Visa, Inc., Class A | | | 393 | | | | 41,359 | |
| Western Digital Corp. | | | 471 | | | | 40,694 | |
| Western Union Co. | | | 2,193 | | | | 42,106 | |
| Xerox Corp. | | | 1,299 | | | | 43,244 | |
| Xilinx, Inc. | | | 644 | | | | 45,615 | |
| | | | | | | | 2,881,165 | |
| | | | | | | | | |
| Materials: 5.02% | | | | | | | | |
| Air Products & Chemicals, Inc. | | | 282 | | | | 42,644 | |
| Albemarle Corp. | | | 347 | | | | 47,300 | |
| Avery Dennison Corp. | | | 439 | | | | 43,171 | |
| Ball Corp. | | | 1,018 | | | | 42,043 | |
| CF Industries Holdings, Inc. | | | 1,279 | | | | 44,970 | |
| DowDuPont, Inc. | | | 632 | | | | 43,753 | |
| Eastman Chemical Co. | | | 483 | | | | 43,707 | |
| Ecolab, Inc. | | | 312 | | | | 40,126 | |
| FMC Corp. | | | 470 | | | | 41,976 | |
Freeport‐McMoRan, Inc.(a) | | | 2,878 | | | | 40,407 | |
| International Flavors & Fragrances, Inc. | | | 288 | | | | 41,158 | |
| International Paper Co. | | | 749 | | | | 42,558 | |
| LyondellBasell Industries NV, Class A | | | 447 | | | | 44,275 | |
| Martin Marietta Materials, Inc. | | | 193 | | | | 39,802 | |
| Monsanto Co. | | | 350 | | | | 41,937 | |
| Mosaic Co. | | | 2,113 | | | | 45,620 | |
| Newmont Mining Corp. | | | 1,043 | | | | 39,123 | |
| Nucor Corp. | | | 752 | | | | 42,142 | |
| Packaging Corp. of America | | | 361 | | | | 41,400 | |
| PPG Industries, Inc. | | | 396 | | | | 43,029 | |
| Praxair, Inc. | | | 309 | | | | 43,180 | |
| Sealed Air Corp. | | | 953 | | | | 40,712 | |
| Sherwin‐Williams Co. | | | 119 | | | | 42,607 | |
| Vulcan Materials Co. | | | 338 | | | | 40,425 | |
| WestRock Co. | | | 726 | | | | 41,186 | |
| | | | | | | | 1,059,251 | |
| | | | | | | | | |
| Real Estate: 6.28% | | | | | | | | |
| Alexandria Real Estate Equities, Inc., REIT | | | 344 | | | | 40,926 | |
| American Tower Corp., REIT | | | 282 | | | | 38,544 | |
| Apartment Investment & Management Co., REIT, Class A | | | 882 | | | | 38,684 | |
| AvalonBay Communities, Inc., REIT | | | 220 | | | | 39,252 | |
| Boston Properties, Inc., REIT | | | 342 | | | | 42,025 | |
CBRE Group, Inc., Class A(a) | | | 1,131 | | | | 42,842 | |
| Crown Castle International Corp., REIT | | | 385 | | | | 38,492 | |
| | | Shares | | | Value | |
| Real Estate (continued) | | | | | | |
| Digital Realty Trust, Inc., REIT | | | 341 | | | $ | 40,351 | |
| Duke Realty Corp., REIT | | | 1,398 | | | | 40,290 | |
| Equinix, Inc., REIT | | | 89 | | | | 39,721 | |
| Equity Residential, REIT | | | 602 | | | | 39,690 | |
| Essex Property Trust, Inc., REIT | | | 154 | | | | 39,121 | |
| Extra Space Storage, Inc., REIT | | | 498 | | | | 39,800 | |
| Federal Realty Investment Trust, REIT | | | 317 | | | | 39,375 | |
| GGP, Inc., REIT | | | 1,926 | | | | 40,003 | |
| HCP, Inc., REIT | | | 1,356 | | | | 37,737 | |
| Host Hotels & Resorts, Inc., REIT | | | 2,258 | | | | 41,750 | |
| Iron Mountain, Inc., REIT | | | 1,024 | | | | 39,834 | |
| Kimco Realty Corp., REIT | | | 2,033 | | | | 39,745 | |
| Macerich Co., REIT | | | 756 | | | | 41,557 | |
| Mid‐America Apartment Communities, Inc., REIT | | | 380 | | | | 40,614 | |
| Prologis, Inc., REIT | | | 641 | | | | 40,678 | |
| Public Storage, REIT | | | 187 | | | | 40,016 | |
| Realty Income Corp., REIT | | | 690 | | | | 39,461 | |
| Regency Centers Corp., REIT | | | 639 | | | | 39,644 | |
SBA Communications Corp., REIT(a) | | | 274 | | | | 39,470 | |
| Simon Property Group, Inc., REIT | | | 257 | | | | 41,380 | |
| SL Green Realty Corp., REIT | | | 429 | | | | 43,466 | |
| UDR, Inc., REIT | | | 1,036 | | | | 39,399 | |
| Ventas, Inc., REIT | | | 591 | | | | 38,492 | |
| Vornado Realty Trust, REIT | | | 555 | | | | 42,668 | |
| Welltower, Inc., REIT | | | 549 | | | | 38,584 | |
| Weyerhaeuser Co., REIT | | | 1,220 | | | | 41,517 | |
| | | | | | | | 1,325,128 | |
| | | | | | | | | |
| Telecommunication Services: 0.82% | | | | | | | | |
| AT&T, Inc. | | | 1,151 | | | | 45,085 | |
| CenturyLink, Inc. | | | 2,211 | | | | 41,788 | |
Level 3 Communications, Inc.(a) | | | 776 | | | | 41,353 | |
| Verizon Communications, Inc. | | | 889 | | | | 43,996 | |
| | | | | | | | 172,222 | |
| | | | | | | | | |
| Utilities: 5.23% | | | | | | | | |
| AES Corp. | | | 3,656 | | | | 40,289 | |
| Alliant Energy Corp. | | | 949 | | | | 39,450 | |
| Ameren Corp. | | | 682 | | | | 39,447 | |
| American Electric Power Co., Inc. | | | 553 | | | | 38,843 | |
| American Water Works Co., Inc. | | | 500 | | | | 40,455 | |
| CenterPoint Energy, Inc. | | | 1,366 | | | | 39,901 | |
| CMS Energy Corp. | | | 842 | | | | 39,001 | |
| Consolidated Edison, Inc. | | | 479 | | | | 38,646 | |
| Dominion Energy, Inc. | | | 517 | | | | 39,773 | |
| DTE Energy Co. | | | 364 | | | | 39,079 | |
| Duke Energy Corp. | | | 467 | | | | 39,191 | |
| Edison International | | | 507 | | | | 39,125 | |
| Entergy Corp. | | | 513 | | | | 39,173 | |
| Eversource Energy | | | 646 | | | | 39,044 | |
| Exelon Corp. | | | 1,073 | | | | 40,420 | |
| FirstEnergy Corp. | | | 1,273 | | | | 39,246 | |
| NextEra Energy, Inc. | | | 276 | | | | 40,448 | |
See Notes to Financial Statements.
| Index Funds S&P 500 Equal Weight | Schedule of Investments |
September 30, 2017 (Unaudited)
| | | Shares | | | Value | |
| Utilities (continued) | | | | | | |
| NiSource, Inc. | | | 1,512 | | | $ | 38,692 | |
| NRG Energy, Inc. | | | 1,713 | | | | 43,836 | |
| PG&E Corp. | | | 580 | | | | 39,492 | |
| Pinnacle West Capital Corp. | | | 455 | | | | 38,475 | |
| PPL Corp. | | | 1,036 | | | | 39,316 | |
| Public Service Enterprise Group, Inc. | | | 882 | | | | 40,792 | |
| SCANA Corp. | | | 691 | | | | 33,507 | |
| Sempra Energy | | | 345 | | | | 39,375 | |
| Southern Co. | | | 816 | | | | 40,098 | |
| WEC Energy Group, Inc. | | | 615 | | | | 38,610 | |
| Xcel Energy, Inc. | | | 816 | | | | 38,613 | |
| | | | | | | | 1,102,337 | |
Total Common Stocks (Cost $19,387,869) | | | | | | | 21,070,330 | |
| | | | | | | | | |
| SHORT TERM INVESTMENTS: 0.32% | | | | | | | | |
Fidelity® Institutional Money Market Government Portfolio, Class I (0.91% 7‐day yield) | | | 66,540 | | | | 66,540 | |
| | | | | | | | | |
Total Short Term Investments (Cost $66,540) | | | | | | | 66,540 | |
| | | | | | | | | |
Total Investments: 100.23% (Cost $19,454,409) | | | | | | | 21,136,870 | |
| | | | | | | | | |
| Liabilities In Excess Of Other Assets: (0.23)% | | | | | | | (47,979 | ) |
| | | | | | | | | |
| Net Assets: 100.00% | | | | | | $ | 21,088,891 | |
| (a) | Non-income producing security. |
See Notes to Financial Statements.
| Semi-Annual Report | September 30, 2017 | 11 |
| Index Funds S&P 500 Equal Weight | Statement of Assets and Liabilities |
September 30, 2017 (Unaudited)
| ASSETS: | | | |
| Investments, at value | | $ | 21,136,870 | |
| Receivable for shares sold | | | 13,380 | |
| Receivable due from adviser | | | 56,159 | |
| Interest and dividends receivable | | | 23,085 | |
| Prepaid expenses and other assets | | | 26,328 | |
| Total Assets | | | 21,255,822 | |
| LIABILITIES: | | | | |
| Payable for investments purchased | | | 97,898 | |
| Payable for shares redeemed | | | 5,360 | |
| Payable to fund accounting and administration | | | 27,040 | |
| Payable for trustee fees and expenses | | | 120 | |
| Payable for transfer agency fees | | | 7,183 | |
| Payable for chief compliance officer fee | | | 3,479 | |
| Payable for professional fees | | | 17,086 | |
| Accrued expenses and other liabilities | | | 8,765 | |
| Total Liabilities | | | 166,931 | |
| NET ASSETS | | $ | 21,088,891 | |
| NET ASSETS CONSIST OF: | | | | |
| Paid‐in capital | | $ | 19,459,113 | |
| Accumulated undistributed net investment income | | | 203,934 | |
| Accumulated net realized loss on investments | | | (256,617 | ) |
| Net unrealized appreciation on investments | | | 1,682,461 | |
| NET ASSETS | | $ | 21,088,891 | |
| INVESTMENTS, AT COST | | $ | 19,454,409 | |
| PRICING OF SHARES | | | | |
| Net Asset Value, offering and redemption price per share | | $ | 28.92 | |
| Net Assets | | $ | 21,088,891 | |
| Shares of beneficial interest outstanding, without par value | | | 729,103 | |
See Notes to Financial Statements.
| Index Funds S&P 500 Equal Weight | Statement of Operations |
For the Six Months Ended September 30, 2017 (Unaudited)
| INVESTMENT INCOME: | | | |
| Dividends | | $ | 182,915 | |
| Interest | | | 491 | |
| Total Investment Income | | | 183,406 | |
| | | | | |
| EXPENSES: | | | | |
| Investment advisory fees (Note 3) | | | 22,131 | |
| Administration fees | | | 95,235 | |
| Custodian fees | | | 2,370 | |
| Audit and tax fees | | | 8,462 | |
| Legal fees | | | 18,381 | |
| Transfer agent fees | | | 22,317 | |
| Trustee fees and expenses | | | 89 | |
| Registration fees | | | 11,659 | |
| Printing fees | | | 3,540 | |
| Chief compliance officer fees | | | 10,333 | |
| Insurance expense | | | 9,383 | |
| Other | | | 3,868 | |
| Total expenses before waiver | | | 207,768 | |
| Less fees waived/reimbursed by investment adviser (Note 3) | | | (185,637 | ) |
| Total Net Expenses | | | 22,131 | |
| NET INVESTMENT INCOME: | | | 161,275 | |
| | | | | |
| REALIZED AND UNREALIZED GAIN/(LOSS) ON INVESTMENTS: | | | | |
| Net realized loss on investments | | | (190,781 | ) |
| Net change in unrealized appreciation on investments | | | 1,104,576 | |
| NET REALIZED AND UNREALIZED GAIN ON INVESTMENTS | | | 913,795 | |
| NET INCREASE IN NET ASSETS RESULTING FROM OPERATIONS | | $ | 1,075,070 | |
See Notes to Financial Statements.
| Semi-Annual Report | September 30, 2017 | 13 |
| Index Funds S&P 500 Equal Weight | Statement of Changes in Net Assets |
| | | For the Six Months Ended September 30, 2017 (Unaudited) | | | Year Ended March 31, 2017 | |
| OPERATIONS: | | | | | | |
| Net investment income | | $ | 161,275 | | | $ | 92,102 | |
| Net realized gain/(loss) on investments | | | (190,781 | ) | | | 27,690 | |
| Net change in unrealized appreciation on investments | | | 1,104,576 | | | | 761,477 | |
| Net increase in net assets resulting from operations | | | 1,075,070 | | | | 881,269 | |
| | | | | | | | | |
| DISTRIBUTIONS TO SHAREHOLDERS: | | | | | | | | |
| From net investment income | | | – | | | | (64,222 | ) |
| From net realized gains on investments | | | – | | | | (115,881 | ) |
| Net decrease in net assets from distributions | | | – | | | | (180,103 | ) |
| SHARE TRANSACTIONS: | | | | | | | | |
| Proceeds from sale of shares | | | 8,905,742 | | | | 10,695,494 | |
| Issued to shareholders in reinvestment of distributions | | | – | | | | 180,103 | |
| Cost of shares redeemed | | | (1,930,463 | ) | | | (1,615,021 | ) |
| Redemption fees | | | 541 | | | | 2,241 | |
| Net increase from share transactions | | | 6,975,820 | | | | 9,262,817 | |
| Net increase in net assets | | $ | 8,050,890 | | | $ | 9,963,983 | |
| NET ASSETS: | | | | | | | | |
| Beginning of period | | | 13,038,001 | | | | 3,074,018 | |
| End of period (including accumulated undistributed net investment income of 203,934 and 42,659) | | $ | 21,088,891 | | | $ | 13,038,001 | |
| | | | | | | | | |
| Other Information: | | | | | | | | |
| SHARE TRANSACTIONS: | | | | | | | | |
| Sold | | | 320,198 | | | | 405,525 | |
| Distributions reinvested | | | – | | | | 6,861 | |
| Redeemed | | | (69,231 | ) | | | (62,286 | ) |
| Net increase in shares outstanding | | | 250,967 | | | | 350,100 | |
See Notes to Financial Statements.
| Index Funds S&P 500 Equal Weight | Financial Highlights |
For a Share Outstanding Throughout the Periods Presented
| | | For the Six Months Ended September 30, 2017 (Unaudited) | | | For the Year Ended March 31, 2017 | | | For the Period May 1, 2015 (Commencement of Operations) to March 31, 2016 | |
| Net asset value, beginning of period | | $ | 27.27 | | | $ | 24.01 | | | $ | 25.00 | |
| | | | | | | | | | | | | |
| INCOME FROM INVESTMENT OPERATIONS: | | | | | | | | | | | | |
Net investment income(a) | | | 0.26 | | | | 0.43 | | | | 0.44 | |
| Net realized and unrealized gain/(loss) | | | 1.39 | | | | 3.66 | | | | (0.71 | ) |
| Total from investment operations | | | 1.65 | | | | 4.09 | | | | (0.27 | ) |
| | | | | | | | | | | | | |
| DISTRIBUTIONS: | | | | | | | | | | | | |
| From net investment income | | | – | | | | (0.30 | ) | | | (0.28 | ) |
| From net realized gains | | | – | | | | (0.54 | ) | | | (0.44 | ) |
| Total distributions | | | – | | | | (0.84 | ) | | | (0.72 | ) |
| | | | | | | | | | | | | |
| REDEMPTION FEES ADDED TO PAID‐IN CAPITAL (NOTE 2) | | | 0.00 | (b) | | | 0.01 | | | | – | |
| Net increase/(decrease) in net asset value | | | 1.65 | | | | 3.26 | | | | (0.99 | ) |
| Net asset value, end of period | | $ | 28.92 | | | $ | 27.27 | | | $ | 24.01 | |
| | | | | | | | | | | | | |
| TOTAL RETURN | | | 6.05 | %(c) | | | 17.19 | % | | | (1.00 | )%(c) |
| | | | | | | | | | | | | |
| SUPPLEMENTAL DATA: | | | | | | | | | | | | |
| Net assets, end of period (000s) | | $ | 21,089 | | | $ | 13,038 | | | $ | 3,074 | |
| | | | | | | | | | | | | |
| RATIOS TO AVERAGE NET ASSETS: | | | | | | | | | | | | |
| Ratio of expenses to average net assets excluding fee waivers and reimbursements | | | 2.35 | %(d) | | | 6.83 | % | | | 13.50 | %(d) |
| Ratio of expenses to average net assets including fee waivers and reimbursements | | | 0.25 | %(d) | | | 0.27 | % | | | 0.30 | %(d) |
| Ratio of net investment income ‐ to average net assets | | | 1.82 | %(d) | | | 1.66 | % | | | 2.02 | %(d) |
| | | | | | | | | | | | | |
| PORTFOLIO TURNOVER RATE | | | 21 | %(c) | | | 32 | % | | | 81 | %(c) |
(a) | Calculated using the average shares method. |
(b) | Less than $(0.005) per share. |
See Notes to Financial Statements.
| Semi-Annual Report | September 30, 2017 | 15 |
| Index Funds S&P 500 Equal Weight | Notes to Financial Statements |
| | September 30, 2017 (Unaudited) |
1. ORGANIZATION
The Index Funds S&P 500 Equal Weight (the “Fund”) is a separate series of Index Funds, an open-end management investment company that was organized as a trust under the laws of the State of Delaware on November 9, 2005 (the “Trust”). The Trust was previously known as “Giant 5 Funds”, and changed its name to “Index Funds” in February 2014. The Fund currently offers one class of shares: No Load Shares. The Fund is diversified, as that term is defined in the Investment Company Act of 1940, as amended (the “1940 Act”).
The Fund seeks to achieve its investment objective by investing in a portfolio of assets whose performance, before fees and expenses, is expected to match approximately the performance of the Standard & Poor’s 500 Equal Weight Index (the “Index”). The Fund expects that its portfolio will consist primarily of securities of issuers included in the Index. The Index is designed to measure the performance of approximately 500 U.S. issuers chosen for market size, liquidity and industry grouping, among other factors.
2. SIGNIFICANT ACCOUNTING POLICIES
The following is a summary of significant accounting policies consistently followed by the Fund. These policies are in conformity with accounting principles generally accepted in the United States of America (“GAAP”). The Fund is considered an investment company for financial reporting purposes under GAAP.
Use of Estimates — The preparation of financial statements in conformity with GAAP requires management to make estimates and assumptions that affect the amounts of assets and liabilities and disclosure of contingent assets and liabilities at the date of the financial statements and the reported amounts of increases and decreases in net assets from operations during the reporting period. Actual results could differ from those estimates.
Investment Transactions — Investment security transactions are accounted for on trade date. Gains and losses on securities sold are determined on a specific identification basis. Realized gains and losses from investment transactions are determined using the identified cost basis.
Investment Income — Dividend income is recorded on the ex-dividend date. Withholding taxes on foreign dividends have been provided for in accordance with the Fund’s understanding of the applicable country’s tax rules and rates. Interest income, which includes amortization of premium and accretion of discount, is recorded on the accrual basis.
Investment Valuation — The Fund’s portfolio securities are valued as of the close of trading of the New York Stock Exchange (“NYSE”) (normally 4:00 p.m., Eastern Time). Each security, excluding short-term investments, is valued at the last sale price reported by the principal security exchange on which the issue is traded. Money market funds, representing short-term investments, are valued at their daily net asset value. Securities that are traded on the Nasdaq Stock Market, Inc. are valued at the Nasdaq Official Closing Price or if no sale is reported, the mean between the bid and the ask. Securities which are traded over-the-counter are valued at the last sale price or, if no sale, at the mean between the bid and the ask. Securities for which quotations are not readily available are valued at fair value as determined by the investment adviser in accordance with procedures approved by the Board of Trustees (the “Board”). The fair value of a security is the amount which the Fund might reasonably expect to receive upon a current sale. The fair value of a security may differ from the last quoted price and the Fund may not be able to sell a security at the fair value. Market quotations may not be available, for example, if trading in particular securities was halted during the day and not resumed prior to the close of trading on the New York Stock Exchange. As of September 30, 2017, there were no securities that were internally fair valued.
Fair Value Measurements — A three-tier hierarchy has been established to classify fair value measurements for disclosure purposes. Inputs refer broadly to the assumptions that market participants would use in pricing the asset or liability, including assumptions about risk. Inputs may be observable or unobservable. Observable inputs are inputs that reflect the assumptions market participants would use in pricing the asset or liability that are developed based on market data obtained from sources independent of the reporting entity. Unobservable inputs are inputs that reflect the reporting entity’s own assumptions about the assumptions market participants would use in pricing the asset or liability that are developed based on the best information available. In accordance with the authoritative guidance on fair value measurements and disclosure under GAAP, the Fund discloses fair value of its investments in a hierarchy that prioritizes the inputs to valuation techniques used to measure the fair value.
Various inputs are used in determining the value of the Fund’s investments as of the reporting period end. These inputs are categorized in the following hierarchy under applicable financial accounting standards:
| Level 1 — | Unadjusted quoted prices in active markets for identical, unrestricted assets or liabilities that the Fund has the ability to access at the measurement date; |
| Index Funds S&P 500 Equal Weight | Notes to Financial Statements |
| | September 30, 2017 (Unaudited) |
| Level 2 — | Quoted prices which are not active, quoted prices for similar assets or liabilities in active markets or inputs other than quoted prices that are observable (either directly or indirectly) for substantially the full term of the asset or liability; and |
| Level 3 — | Significant unobservable prices or inputs (including the Fund’s own assumptions in determining the fair value of investments) where there is little or no market activity for the asset or liability at the measurement date. |
The availability of observable inputs can vary from security to security and is affected by a wide variety of factors, including, for example, the type of security, whether the security is new and not yet established in the marketplace, the liquidity of markets, and other characteristics particular to the security. To the extent that valuation is based on models or inputs that are less observable or unobservable in the market, the determination of fair value requires more judgment. Accordingly, the degree of judgment exercised in determining fair value is greatest for instruments categorized in Level 3.
An investment level within the fair value hierarchy is based on the lowest level input, individually or in the aggregate, that is significant to fair value measurement. The valuation techniques used by the Fund to measure fair value during the period ended September 30, 2017, maximized the use of observable inputs and minimized the use of unobservable inputs.
The inputs or methodologies used for valuing securities are not necessarily an indication of the risk or liquidity associated with investing in those securities. The following is a summary of the inputs used in valuing the Fund’s investments as of September 30, 2017:
| Investments in Securities at Value* | | Level 1 - Quoted Prices | | | Level 2 - Other Significant Observable Inputs | | | Level 3 - Significant Unobservable Inputs | | | Total | |
| Common Stocks | | $ | 21,070,330 | | | $ | – | | | $ | – | | | $ | 21,070,330 | |
| Short Term Investments | | | 66,540 | | | | – | | | | – | | | | 66,540 | |
| TOTAL | | $ | 21,136,870 | | | $ | – | | | $ | – | | | $ | 21,136,870 | |
| * | See Schedule of Investments for industry classification. |
It is the Fund’s policy to recognize transfers between levels at the end of the reporting period. There were no transfers between Levels 1 and 2 during the period ended September 30, 2017.
For the period ended September 30, 2017, the Fund did not have any unobservable inputs (Level 3) used in determining fair value.
Expenses
The Fund bears expenses incurred specifically for the Fund and general Trust expenses.
Distributions to Shareholders — Dividends from net investment income and distributions of net realized capital gains, if any, will be declared and paid at least annually. Income and capital gains distributions are determined in accordance with income tax regulations, which may differ from GAAP. Distributions to shareholders are recorded on the ex-dividend date.
Fees on Redemptions
The Fund charges a redemption fee of 0.25% on redemptions of the Fund’s shares occurring within 30 days following the issuance of such shares. The redemption fee is not a fee to finance sales or sales promotion expenses, but is paid to the Fund to defray the costs of liquidating an investor and discouraging short-term trading of the Fund’s shares. No redemption fee will be imposed on the redemption of shares representing dividends or capital gains distributions, or on amounts representing capital appreciation of shares.
Income Taxes — As of and during the period ended September 30, 2017, the Fund did not have a liability for any unrecognized tax benefits. The Fund files U.S. federal, state, and local tax returns as required. The Fund’s tax returns are subject to examination by the relevant tax authorities until expiration of the applicable statute of limitations which is generally three years after the filing of the tax return for federal purposes and four years for most state returns. Tax returns for open years have incorporated no uncertain tax positions that require a provision for income taxes. The Fund intends to continue to qualify each year as a “regulated investment company” under Subchapter M of the Internal Revenue Code of 1986, as amended. By so qualifying, the Fund will not be subject to Federal income taxes to the extent that it distributes substantially all of its taxable or tax-exempt income, if any, for its tax year ended March 31, 2018. In addition, by distributing in each calendar year substantially all of its net investment income, capital gains and certain other amounts, if any, the Fund will not be subject to a Federal excise tax. Therefore, no provision is made by the Fund for Federal income or excise taxes.
| Semi-Annual Report | September 30, 2017 | 17 |
| Index Funds S&P 500 Equal Weight | Notes to Financial Statements |
| | September 30, 2017 (Unaudited) |
3. ADVISORY FEES, ADMINISTRATION FEES AND OTHER AGREEMENTS
The Index Group, Inc., is the Investment Adviser for the Fund (the “Adviser”). The Adviser currently provides investment advisory services for individuals, trusts, estates and institutions. The Adviser commenced operations in 2004, and is registered as an investment adviser with the Securities and Exchange Commission. The Adviser is entitled to an investment advisory fee, computed daily and payable monthly, of 0.25% of the average daily net assets of the Fund.
The Adviser has agreed to waive and/or reimburse fees or expenses in order to limit Total Annual Fund Operating Expenses After Fee Waiver/Expense Reimbursement (excluding acquired fund fees and expenses, brokerage expenses, interest expenses, taxes and extraordinary expenses) to 0.25% of the Fund’s average daily net assets for No Load Shares. This agreement is in effect through July 31, 2018 and may not be terminated or modified prior to this date except with the approval of the Fund’s Board. Prior to December 23, 2016, the Adviser agreed to waive and/or reimburse fees or expenses in order to limit Total Annual Fund Operating Expenses After Fee Waiver/Expense Reimbursement (excluding acquired fund fees and expenses, brokerage expenses, interest expenses, taxes and extraordinary expenses) to 0.30% of the Fund’s average daily net assets for No Load Shares.
The Adviser may request a reimbursement from the Fund to recapture any reduced management fees or reimbursed Fund expenses within three years following the fee reduction or expense reimbursement, but only to the extent the Fund’s Total Annual Fund Operating Expenses, plus any requested reimbursement amount, are less than the above limit at the time of the request. Any such reimbursement is subject to review by the Board.
As of September 30, 2017 reimbursements that may potentially be made by the Fund to the Adviser total $873,443 and expire as follows:
| | |
| March 31, 2019 | | $ | 323,356 | |
| March 31, 2020 | | | 364,450 | |
| March 31, 2021 | | | 185,637 | |
| | | $ | 873,443 | |
Fund Accounting Fees and Expenses
ALPS Fund Services, Inc. (“ALPS” or the “Administrator”) provides administrative, fund accounting and other services to the Fund under the Administration, Bookkeeping and Pricing Services Agreement (the “Administration Agreement”) with the Trust. Under the Administration Agreement, ALPS is paid fees, accrued on a daily basis and paid on a monthly basis following the end of the month. Administrator fees paid by the Fund for the period ended September 30, 2017, are disclosed in the Statement of Operations.
The Administrator is also reimbursed by the Fund for certain out of pocket expenses.
Transfer Agent and Shareholder Services Agreement
ALPS serves as transfer, dividend paying and shareholder servicing agent for the Fund (the “Transfer Agent”) under a Transfer Agency and Services Agreement with the Trust. Transfer Agent fees paid by the Fund for the six months ended September 30, 2017, are disclosed in the Statement of Operations.
Compliance Services
ALPS provides Chief Compliance Officer services to the Fund. Additionally, ALPS provides services in monitoring and testing the policies and procedures of the Trust in conjunction with requirements under Rule 38a-1 under the 1940 Act. ALPS is compensated under the Chief Compliance Officer Services Agreement. Compliance services fees paid by the Fund for the six months ended September 30, 2017, are disclosed in the Statement of Operations.
Distributor
The Fund has entered into a Distribution Agreement with ALPS Distributors, Inc. (“the Distributor”) to provide distribution services to the Fund. The Distributor serves as underwriter/distributor of shares of the Fund. Distribution services fees paid by the Fund for the six months ended September 30, 2017, are disclosed in the Statement of Operations.
| Index Funds S&P 500 Equal Weight | Notes to Financial Statements |
| | September 30, 2017 (Unaudited) |
4. PURCHASES AND SALES OF INVESTMENT SECURITIES
The aggregate cost of purchases and proceeds from sales of investment securities, excluding short-term securities, are shown below for the six months ended September 30, 2017.
| Funds | | Cost of Investments Purchased | | | Proceeds from Investments Sold | |
| Index Funds S&P 500 Equal Weight | | $ | 10,710,578 | | | $ | 3,611,020 | |
5. TAX BASIS INFORMATION
Distributions are determined in accordance with federal income tax regulations, which differ from GAAP, and, therefore, may differ significantly in amount or character from net investment income and realized gains for financial reporting purposes. Financial reporting records are adjusted for permanent book/tax differences to reflect tax character but are not adjusted for temporary differences. The amounts and characteristics of tax basis distributions and composition of distributable earnings/(accumulated losses) are finalized at fiscal year-end.
The tax character of distributions paid during the year ended March 31, 2017, were as follows:
| | | | | | | |
| | | Ordinary Income | | Long-Term Capital Gain | |
| Index Funds S&P 500 Equal Weight | | $ | 160,229 | | | $ | 19,874 | |
As of September 30, 2017, net unrealized appreciation/(depreciation) of investments based on the federal tax cost were as follows:
| | | Gross Appreciation (excess of value over tax cost) | | | Gross Depreciation (excess of tax cost over value) | | | Net Unrealized Appreciation | | | Cost of Investments for Income Tax Purposes | |
| Index Funds S&P 500 Equal Weight | | $ | 2,039,350 | | | $ | (617,663 | ) | | $ | 1,421,687 | | | $ | 19,715,183 | |
The difference between book basis and tax basis is primarily attributable to wash sales.
6. BENEFICIAL OWNERSHIP
At September 30, 2017, a shareholder is the record owner of approximately 68% of the Fund’s shares.
7. COMMITMENTS AND CONTINGENCIES
Under the Trust’s organizational documents, its Officers and Trustees are indemnified against certain liabilities arising out of the performance of their duties to the Fund. In addition, in the normal course of business, the Trust entered into contracts with its service providers, on behalf of the Fund, and others that provide for general indemnifications. The Fund’s maximum exposure under these arrangements is unknown, as this would involve future claims that may be made against the Fund. The Fund expects the risk of loss to be remote.
| Semi-Annual Report | September 30, 2017 | 19 |
| Index Funds S&P 500 Equal Weight | Additional Information |
| | September 30, 2017 (Unaudited) |
1. PROXY VOTING POLICIES AND VOTING RECORD
A copy of the Trust’s Proxy Voting and Disclosure Policy and the Advisor’s Proxy Voting and Disclosure Policy are included as Appendix B to the Fund’s Statement of Additional Information and are available, (1) without charge, upon request, by calling (1-888-544-2685) and (2) on the SEC’s website at http://ww.sec.gov. Information regarding how the Fund voted proxies relating to portfolio securities during the most recent 12-month period ended June 30 will be available (1) without charge, upon request, by calling the Fund at the number above and (2) on the SEC’s website at http://www.sec.gov.
2. QUARTERLY PORTFOLIO HOLDINGS
The Fund files its complete schedule of portfolio holdings with the SEC for the first and third quarters of each fiscal year on Form N-Q. The Fund’s Forms N-Q are available on the SEC’s website at http://www.sec.gov. You may review and make copies at the SEC’s Public Reference Room in Washington, D.C. You may also obtain copies after paying a duplicating fee by writing the SEC’s Public Reference Section, Washington, D.C. 20549-0102 or by electronic request to publicinfo@sec.gov, or is available without charge, upon request, by calling the Funds at 1-888-544-2685. Information on the operation of the Public Reference Room may be obtained by calling the SEC at 1-800-SEC-0330, (1-800-732-0330).
Item 2. Code of Ethics.
Not applicable to this report.
Item 3. Audit Committee Financial Expert.
Not applicable to this report.
Item 4. Principal Accountant Fees and Services.
Not applicable to this report.
Item 5. Audit Committee of Listed Registrants.
Not applicable.
Item 6. Schedule of Investments.
Schedule of Investments is included as part of the Report to Stockholders filed under Item 1 of this form.
Item 7. Disclosure of Proxy Voting Policies and Procedures for Closed-End Management Investment Companies.
Not applicable.
Item 8. Portfolio Managers of Closed-End Management Investment Companies.
Not applicable.
Item 9. Purchases of Equity Securities by Closed-End Management Investment Companies.
Not applicable.
Item 10. Submission of Matters to Vote of Security Holders.
There have been no material changes to the procedures by which shareholders may recommend nominees to the registrant’s board of trustees.
Item 11. Controls and Procedures.
| (a) | The registrant’s principal executive officer and principal financial officer have concluded that the registrant’s disclosure controls and procedures (as defined in Rule 30a-3(c) under the Investment Company Act of 1940, as amended) are effective based on their evaluation of these controls and procedures as of a date within 90 days of the filing date of this document. |
| (b) | There was no change in the Registrant's internal control over financial reporting (as defined in Rule 30a-3(d) under the Investment Company Act of 1940, as amended) during the second fiscal quarter of the period covered by this report that has materially affected, or is reasonably likely to materially affect, the Registrant's internal control over financial reporting. |
Item 12. Exhibits.
| (a)(2) | The certifications required by Rule 30a-2(a) of the Investment Company Act of 1940, as amended, and Section 302 of the Sarbanes-Oxley Act of 2002 are attached hereto as Ex99.Cert. |
| (b) | The certifications by the registrant’s Principal Executive Officer and Principal Financial Officer, as required by Rule 30a-2(b) of the Investment Company Act of 1940, as amended, and Section 906 of the Sarbanes-Oxley Act of 2002 are attached hereto as Ex99.906Cert. |
SIGNATURES
Pursuant to the requirements of the Securities Exchange Act of 1934 and the Investment Company Act of 1940, the registrant has duly caused this report to be signed on its behalf by the undersigned, thereunto duly authorized.
| | Index Funds | |
| | | |
| | By: | /s/ Michael G. Willis | |
| | | Michael G. Willis, President | |
| | | (Principal Executive Officer) | |
| | Date: | December 6, 2017 | |
Pursuant to the requirements of the Securities Exchange Act of 1934 and the Investment Company Act of 1940, this report has been signed below by the following persons on behalf of the registrant and in the capacities and on the dates indicated.
| | By: | /s/ Michael G. Willis | |
| | | Michael G. Willis, President | |
| | | (Principal Executive Officer) | |
| | Date: | December 6, 2017 | |
| | By: | /s/ Michael G. Willis | |
| | | Michael G. Willis, President | |
| | | (Principal Financial Officer) | |
| | Date: | December 6, 2017 | |