UNITED STATES
SECURITIES AND EXCHANGE COMMISSION
Washington, D.C. 20549
FORM N-CSR
811-21836
(Investment Company Act file number)
Index Funds
(Exact name of registrant as specified in charter)
1155 Kelly Johnson Boulevard, Suite 111
Colorado Springs, Colorado 80920
Colorado Springs, Colorado 80920
(Address of principal executive offices) (Zip code)
(800) 788-5680
(Registrant's telephone number)
Michael G. Willis
1155 Kelly Johnson Boulevard, Suite 111
Colorado Springs, Colorado 80920
(Name and Address of Agent for Service)
Date of fiscal year end: March 31
Date of reporting period: April 1, 2015 – September 30, 2015
Item 1. Reports to Stockholders.
TABLE OF CONTENTS
| Manager Commentary | 1 |
| Disclosure of Fund Expenses | 3 |
| Schedule of Investments | 4 |
| Statement of Assets and Liabilities | 10 |
| Statement of Operations | 11 |
| Statement of Changes in Net Assets | 12 |
| Financial Highlights | 13 |
| Notes to Financial Statements | 14 |
| Additional Information | 18 |
| Approval of Advisory Agreement | 19 |

| Index Funds S&P 500 Equal Weight | Manager Commentary |
| September 30, 2015 (Unaudited) |
Growth of $10,000 Initial Investment (for the period ended September 30, 2015)
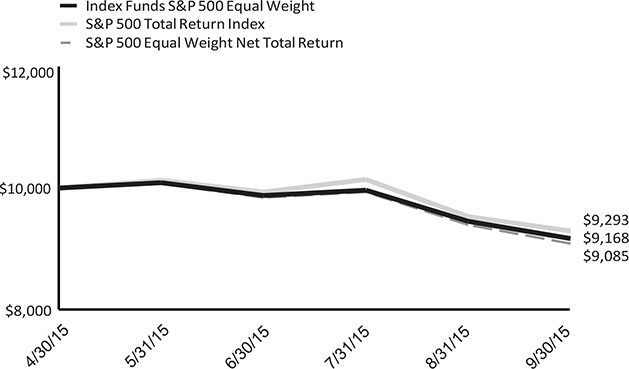
The graph shown above represents historical performance of a hypothetical investment of $10,000 in the Fund since inception. Past performance does not guarantee future results. All returns reflect reinvested dividends, but do not reflect the deduction of taxes that a shareholder would pay on Fund distributions or the redemption of Fund shares.
Performance (for the period ended September 30,2015)
| 1 Month | Quarter | Since Inception* | |
| Index Funds S&P 500 Equal Weight - NAV | -3.00% | -7.17% | -8.32% |
| S&P 500 Total Return Index | -2.47% | -6.44% | -7.07% |
| S&P 500 Equal Weight Net Total Return | -3.28% | -7.68% | -9.15% |
The performance data quoted above represents past performance. Past performance is not a guarantee of future results. Investment return and value of the Fund shares will fluctuate so that an investor's shares, when sold or redeemed, may be worth more or less than their original cost. Performance may be lower or higher than performance data quoted. Fund performance current to the most recent month-end is available by calling (844) 464-6339 or by visiting www.Index.World.
Returns of less than 1 year are cumulative.
Indices are not actively managed and do not reflect deduction for fees, expenses or taxes. An investor cannot invest directly in an index.
The returns shown above do not reflect the deduction of taxes a shareholder would pay on Fund distributions or redemption of Fund shares.
The total annual operating expenses and total annual operating expenses after fee waivers and/or reimbursement you may pay as an investor in the Fund (as reported in the April 17, 2015 Prospectus) are 0.96% and 0.30%, respectively. The Fund's investment adviser has contractually agreed to limit expenses through July 31, 2016.
| * | The Fund is new and has a limited operating history. The Fund's inception date is April 30, 2015. |
| Semi-Annual Report | September 30, 2015 | 1 |
| Index Funds S&P 500 Equal Weight | Manager Commentary |
| September 30, 2015 (Unaudited) |
Sector Allocation (as a % of Net Assets)*
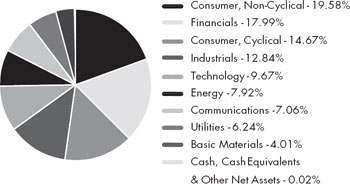
| * | Holdings are subject to change. Tables present indicative values only. For Fund compliance purposes, the Fund's industry classifications refer to any one or more of the industry sub-classifications used by one or more widely recognized market indexes or ratings group indexes, and/or as defined by Fund management. This definition may not apply for purposes of this report, which may combine industry subclassifications for reporting ease. Industries are shown as a percentage of net assets. |
| 2 | www.Index.World |
| Index Funds S&P 500 Equal Weight | Disclosure of Fund Expenses |
| September 30, 2015 (Unaudited) |
As a shareholder of the Index Funds S&P 500 Equal Weight (the "Fund"), you will incur two types of costs: (1) transaction costs, including applicable redemption fees; and (2) ongoing costs, including management fees and other Fund expenses. The following examples are intended to help you understand your ongoing costs (in dollars) of investing in the Fund and to compare these costs with the ongoing costs of investing in other mutual funds. The examples are based on an investment of $1,000 invested on May 1, 2015 and held until September 30, 2015.
Actual Expenses. The first line of each table below provides information about actual account values and actual expenses. You may use the information in this line, together with the amount you invested, to estimate the expenses that you paid over the period. Simply divide your account value by $1,000 (for example, an $8,600 account value divided by $1,000 = 8.6), then multiply the result by the number in the first line under the heading "Expenses Paid During Period" to estimate the expenses you paid on your account during this period.
Hypothetical Example for Comparison Purposes. The second line of the table below provides information about hypothetical account values and hypothetical expenses based on the Fund's actual expense ratio and an assumed rate of return of 5% per year before expenses, which is not the Fund's actual return. The hypothetical account values and expenses may not be used to estimate the actual ending account balance or expenses you paid for the period. You may use this information to compare the ongoing costs of investing in the Fund and other mutual funds. To do so, compare this 5% hypothetical example with the 5% hypothetical examples that appear in the shareholder reports of the other funds. The expenses shown in the table are meant to highlight ongoing Fund costs only and do not reflect transaction fees, such as redemption fees or exchange fees. Therefore, the second line of each table below is useful in comparing ongoing costs only, and may not help you determine the relative total costs of owning different funds. In addition, if these transactional costs were included, your costs would have been higher.
| Beginning | Ending | Expense Paid | ||||||||||||||
| Account Value | Account Value | Expense | During Period | |||||||||||||
| Index Funds S&P 500 Equal Weight | 05/01/15 | 09/30/15 | Ratio(a) | 05/01/15 - 9/30/15(b) | ||||||||||||
| Actual | $ | 1,000.00 | $ | 916.80 | 0.30 | % | $ | 1.20 | ||||||||
| Hypothetical (5% return before expenses) | $ | 1,000.00 | $ | 1,019.65 | 0.30 | % | $ | 1.27 | ||||||||
| (a) | The Fund's expense ratios have been based on the Fund's most recent fiscal half-year expenses. |
| (b) | Expenses are equal to the Fund's annualized net expense ratio multiplied by the average account value over the period, multiplied by the number of days in the most recent fiscal half-year (153), divided by 366. Note the actual expenses paid during the period are based on the Portfolio's inception date of May 1, 2015. |
| Semi-Annual Report | September 30, 2015 | 3 |
| Index Funds S&P 500 Equal Weight | Schedule of Investments |
September 30, 2015 (Unaudited)
| Shares | Value | |||||||
| COMMON STOCKS: 99.98% | ||||||||
| Basic Materials: 4.01% | ||||||||
| Air Products & Chemicals, Inc. | 45 | $ | 5,741 | |||||
| Airgas, Inc. | 64 | 5,717 | ||||||
| Alcoa, Inc. | 630 | 6,086 | ||||||
| CF Industries Holdings, Inc. | 109 | 4,894 | ||||||
| Dow Chemical Co. | 139 | 5,894 | ||||||
| Eastman Chemical Co. | 87 | 5,631 | ||||||
| Ecolab, Inc. | 55 | 6,035 | ||||||
| EI du Pont de Nemours & Co. | 125 | 6,025 | ||||||
| FMC Corp. | 146 | 4,951 | ||||||
| Freeport-McMoRan, Inc. | 533 | 5,165 | ||||||
| International Flavors & Fragrances, Inc. | 57 | 5,886 | ||||||
| International Paper Co. | 146 | 5,517 | ||||||
| LyondellBasell Industries NV, Class A | 73 | 6,085 | ||||||
| Monsanto Co. | 66 | 5,632 | ||||||
| Mosaic Co. | 155 | 4,822 | ||||||
| Newmont Mining Corp. | 374 | 6,010 | ||||||
| Nucor Corp. | 144 | 5,407 | ||||||
| PPG Industries, Inc. | 63 | 5,524 | ||||||
| Praxair, Inc. | 58 | 5,908 | ||||||
| Sherwin-Williams Co. | 24 | 5,347 | ||||||
| Sigma-Aldrich Corp. | 44 | 6,112 | ||||||
| 118,389 | ||||||||
| Communications: 7.06% | ||||||||
Amazon.com, Inc.(a) | 11 | 5,631 | ||||||
| AT&T, Inc. | 186 | 6,060 | ||||||
| Cablevision Systems Corp., Class A | 219 | 7,111 | ||||||
| CBS Corp., Class B Non-Voting | 138 | 5,506 | ||||||
| CenturyLink, Inc. | 231 | 5,803 | ||||||
| Cisco Systems, Inc. | 234 | 6,142 | ||||||
| Comcast Corp., Class A | 108 | 6,143 | ||||||
Discovery Communications, Inc., Class A(a) | 85 | 2,213 | ||||||
Discovery Communications, Inc., Class C(a) | 149 | 3,619 | ||||||
eBay, Inc.(a) | 231 | 5,646 | ||||||
| Expedia, Inc. | 52 | 6,119 | ||||||
F5 Networks, Inc.(a) | 51 | 5,906 | ||||||
Facebook, Inc., Class A(a) | 66 | 5,933 | ||||||
| Frontier Communications Corp. | 1,142 | 5,424 | ||||||
Google, Inc., Class A(a) | 5 | 3,192 | ||||||
Google, Inc., Class C(a) | 5 | 3,042 | ||||||
| Interpublic Group of Cos., Inc. | 309 | 5,911 | ||||||
| Juniper Networks, Inc. | 241 | 6,196 | ||||||
Level 3 Communications, Inc.(a) | 135 | 5,898 | ||||||
| Motorola Solutions, Inc. | 91 | 6,223 | ||||||
Netflix, Inc.(a) | 62 | 6,402 | ||||||
| News Corp., Class A | 466 | 5,881 | ||||||
| Nielsen Holdings PLC | 132 | 5,870 | ||||||
| Omnicom Group, Inc. | 90 | 5,931 | ||||||
Priceline Group, Inc.(a) | 5 | 6,184 | ||||||
| Shares | Value | |||||||
| Communications (continued) | ||||||||
| Scripps Networks Interactive, Inc., Class A | 114 | $ | 5,608 | |||||
| Symantec Corp. | 304 | 5,919 | ||||||
| TEGNA, Inc. | 262 | 5,866 | ||||||
| Time Warner Cable, Inc. | 32 | 5,740 | ||||||
| Time Warner, Inc. | 87 | 5,981 | ||||||
TripAdvisor, Inc.(a) | 91 | 5,735 | ||||||
| Twenty-First Century Fox, Inc., Class A | 230 | 6,205 | ||||||
VeriSign, Inc.(a) | 88 | 6,209 | ||||||
| Verizon Communications, Inc. | 133 | 5,787 | ||||||
| Viacom, Inc., Class B | 137 | 5,912 | ||||||
| Walt Disney Co. | 58 | 5,928 | ||||||
Yahoo! Inc.(a) | 193 | 5,580 | ||||||
| 208,456 | ||||||||
| Consumer, Cyclical: 14.67% | ||||||||
| Advance Auto Parts, Inc. | 35 | 6,634 | ||||||
| American Airlines Group, Inc. | 144 | 5,591 | ||||||
AutoNation, Inc.(a) | 104 | 6,051 | ||||||
AutoZone, Inc.(a) | 8 | 5,791 | ||||||
Bed Bath & Beyond, Inc.(a) | 99 | 5,645 | ||||||
| Best Buy Co., Inc. | 160 | 5,939 | ||||||
| BorgWarner, Inc. | 141 | 5,864 | ||||||
CarMax, Inc.(a) | 101 | 5,991 | ||||||
| Carnival Corp. | 118 | 5,865 | ||||||
Chipotle Mexican Grill, Inc.(a) | 8 | 5,762 | ||||||
| Coach, Inc. | 206 | 5,960 | ||||||
| Costco Wholesale Corp. | 43 | 6,216 | ||||||
| CVS Health Corp. | 60 | 5,789 | ||||||
| Darden Restaurants, Inc. | 87 | 5,963 | ||||||
| Delphi Automotive PLC | 80 | 6,083 | ||||||
| Delta Air Lines, Inc. | 130 | 5,833 | ||||||
| Dollar General Corp. | 86 | 6,230 | ||||||
Dollar Tree, Inc.(a) | 91 | 6,066 | ||||||
| DR Horton, Inc. | 194 | 5,696 | ||||||
| Fastenal Co. | 157 | 5,748 | ||||||
| Ford Motor Co. | 443 | 6,011 | ||||||
Fossil Group, Inc.(a) | 103 | 5,756 | ||||||
| GameStop Corp., Class A | 142 | 5,852 | ||||||
| Gap, Inc. | 188 | 5,358 | ||||||
| General Motors Co. | 202 | 6,064 | ||||||
| Genuine Parts Co. | 73 | 6,051 | ||||||
| Goodyear Tire & Rubber Co. | 205 | 6,013 | ||||||
| Hanesbrands, Inc. | 203 | 5,875 | ||||||
| Harley-Davidson, Inc. | 111 | 6,094 | ||||||
| Harman International Industries, Inc. | 62 | 5,951 | ||||||
| Hasbro, Inc. | 79 | 5,699 | ||||||
| Home Depot, Inc. | 53 | 6,121 | ||||||
| Johnson Controls, Inc. | 151 | 6,245 | ||||||
| Kohl's Corp. | 120 | 5,557 | ||||||
| L Brands, Inc. | 66 | 5,949 | ||||||
| Leggett & Platt, Inc. | 138 | 5,692 | ||||||
| Lennar Corp., Class A | 116 | 5,583 | ||||||
See Notes to Financial Statements.
| 4 | www.Index.World |
| Index Funds S&P 500 Equal Weight | Schedule of Investments |
September 30, 2015 (Unaudited)
| Shares | Value | |||||||
| Consumer, Cyclical (continued) | ||||||||
| Lowe's Cos., Inc. | 89 | $ | 6,134 | |||||
| Macy's, Inc. | 104 | 5,337 | ||||||
| Marriott International, Inc., Class A | 83 | 5,661 | ||||||
| Mattel, Inc. | 269 | 5,665 | ||||||
| McDonald's Corp. | 62 | 6,109 | ||||||
Michael Kors Holdings, Ltd.(a) | 138 | 5,829 | ||||||
Mohawk Industries, Inc.(a) | 29 | 5,272 | ||||||
| Newell Rubbermaid, Inc. | 143 | 5,679 | ||||||
| NIKE, Inc., Class B | 54 | 6,640 | ||||||
| Nordstrom, Inc. | 83 | 5,952 | ||||||
O'Reilly Automotive, Inc.(a) | 25 | 6,250 | ||||||
| PACCAR, Inc. | 106 | 5,530 | ||||||
| PulteGroup, Inc. | 290 | 5,472 | ||||||
| PVH Corp. | 53 | 5,403 | ||||||
| Ralph Lauren Corp. | 55 | 6,499 | ||||||
| Ross Stores, Inc. | 121 | 5,865 | ||||||
| Royal Caribbean Cruises, Ltd. | 65 | 5,791 | ||||||
| Signet Jewelers, Ltd. | 44 | 5,990 | ||||||
| Southwest Airlines Co. | 158 | 6,010 | ||||||
| Staples, Inc. | 438 | 5,138 | ||||||
| Starbucks Corp. | 108 | 6,139 | ||||||
| Starwood Hotels & Resorts Worldwide, Inc. | 82 | 5,451 | ||||||
| Target Corp. | 78 | 6,135 | ||||||
| Tiffany & Co. | 76 | 5,869 | ||||||
| TJX Cos., Inc. | 85 | 6,071 | ||||||
| Tractor Supply Co. | 69 | 5,818 | ||||||
Under Armour, Inc., Class A(a) | 63 | 6,097 | ||||||
United Continental Holdings, Inc.(a) | 107 | 5,676 | ||||||
Urban Outfitters, Inc.(a) | 201 | 5,905 | ||||||
| VF Corp. | 86 | 5,866 | ||||||
| Walgreens Boots Alliance, Inc. | 67 | 5,568 | ||||||
| Wal-Mart Stores, Inc. | 94 | 6,095 | ||||||
| Whirlpool Corp. | 37 | 5,449 | ||||||
| WW Grainger, Inc. | 27 | 5,805 | ||||||
| Wyndham Worldwide Corp. | 77 | 5,536 | ||||||
| Wynn Resorts, Ltd. | 90 | 4,781 | ||||||
| Yum! Brands, Inc. | 75 | 5,996 | ||||||
| 433,071 | ||||||||
| Consumer, Non-cyclical: 19.58% | ||||||||
| Abbott Laboratories | 140 | 5,631 | ||||||
| AbbVie, Inc. | 102 | 5,550 | ||||||
| ADT Corp. | 192 | 5,741 | ||||||
| Aetna, Inc. | 52 | 5,689 | ||||||
Alexion Pharmaceuticals, Inc.(a) | 35 | 5,474 | ||||||
Allergan PLC(a) | 21 | 5,708 | ||||||
| Altria Group, Inc. | 116 | 6,310 | ||||||
| AmerisourceBergen Corp. | 58 | 5,509 | ||||||
| Amgen, Inc. | 40 | 5,533 | ||||||
| Anthem, Inc. | 41 | 5,740 | ||||||
| Archer-Daniels-Midland Co. | 142 | 5,886 | ||||||
| Automatic Data Processing, Inc. | 78 | 6,268 | ||||||
| Shares | Value | |||||||
| Consumer, Non-cyclical (continued) | ||||||||
| Avery Dennison Corp. | 104 | $ | 5,883 | |||||
| Baxalta, Inc. | 170 | 5,357 | ||||||
| Baxter International, Inc. | 169 | 5,552 | ||||||
| Becton Dickinson and Co. | 45 | 5,970 | ||||||
Biogen, Inc.(a) | 19 | 5,544 | ||||||
Boston Scientific Corp.(a) | 360 | 5,908 | ||||||
| Bristol-Myers Squibb Co. | 103 | 6,098 | ||||||
| Brown-Forman Corp., Class B | 63 | 6,105 | ||||||
| Campbell Soup Co. | 123 | 6,234 | ||||||
| Cardinal Health, Inc. | 71 | 5,454 | ||||||
Celgene Corp.(a) | 49 | 5,300 | ||||||
| Cigna Corp. | 44 | 5,941 | ||||||
| Cintas Corp. | 71 | 6,088 | ||||||
| Clorox Co. | 55 | 6,354 | ||||||
| Coca-Cola Co. | 159 | 6,379 | ||||||
| Coca-Cola Enterprises, Inc. | 124 | 5,995 | ||||||
| Colgate-Palmolive Co. | 98 | 6,219 | ||||||
| ConAgra Foods, Inc. | 146 | 5,914 | ||||||
| Constellation Brands, Inc., Class A | 48 | 6,010 | ||||||
| CR Bard, Inc. | 32 | 5,962 | ||||||
| Danaher Corp. | 70 | 5,965 | ||||||
DaVita HealthCare Partners, Inc.(a) | 81 | 5,859 | ||||||
| DENTSPLY International, Inc. | 116 | 5,866 | ||||||
| Dr. Pepper Snapple Group, Inc. | 79 | 6,245 | ||||||
Edwards Lifesciences Corp.(a) | 44 | 6,255 | ||||||
| Eli Lilly & Co. | 74 | 6,193 | ||||||
Endo International PLC(a) | 81 | 5,612 | ||||||
| Equifax, Inc. | 62 | 6,025 | ||||||
| Estee Lauder Cos., Inc., Class A | 80 | 6,454 | ||||||
Express Scripts Holding Co.(a) | 72 | 5,829 | ||||||
| General Mills, Inc. | 108 | 6,062 | ||||||
| Gilead Sciences, Inc. | 55 | 5,400 | ||||||
| H&R Block, Inc. | 168 | 6,082 | ||||||
HCA Holdings, Inc.(a) | 72 | 5,570 | ||||||
Henry Schein, Inc.(a) | 45 | 5,972 | ||||||
| Hershey Co. | 67 | 6,156 | ||||||
| Hormel Foods Corp. | 98 | 6,204 | ||||||
| Humana, Inc. | 32 | 5,728 | ||||||
Intuitive Surgical, Inc.(a) | 12 | 5,515 | ||||||
| JM Smucker Co. | 52 | 5,933 | ||||||
| Johnson & Johnson | 65 | 6,068 | ||||||
| Kellogg Co. | 91 | 6,056 | ||||||
| Keurig Green Mountain, Inc. | 100 | 5,214 | ||||||
| Kimberly-Clark Corp. | 58 | 6,324 | ||||||
| Kraft Heinz Co. | 82 | 5,788 | ||||||
| Kroger Co. | 163 | 5,879 | ||||||
Laboratory Corp. of America Holdings(a) | 51 | 5,532 | ||||||
Mallinckrodt PLC(a) | 74 | 4,732 | ||||||
| MasterCard, Inc., Class A | 67 | 6,038 | ||||||
| McCormick & Co., Inc., Non-Voting Shares | 75 | 6,163 | ||||||
| McGraw Hill Financial, Inc. | 64 | 5,536 | ||||||
| McKesson Corp. | 31 | 5,736 | ||||||
See Notes to Financial Statements.
| Semi-Annual Report | September 30, 2015 | 5 |
| Index Funds S&P 500 Equal Weight | Schedule of Investments |
September 30, 2015 (Unaudited)
| Shares | Value | |||||||
| Consumer, Non-cyclical (continued) | ||||||||
| Mead Johnson Nutrition Co. | 80 | $ | 5,632 | |||||
| Medtronic PLC | 87 | 5,824 | ||||||
| Merck & Co., Inc. | 117 | 5,779 | ||||||
| Molson Coors Brewing Co., Class B | 88 | 7,306 | ||||||
| Mondelez International, Inc., Class A | 142 | 5,946 | ||||||
Monster Beverage Corp.(a) | 46 | 6,216 | ||||||
| Moody's Corp. | 60 | 5,892 | ||||||
Mylan NV(a) | 125 | 5,033 | ||||||
| Patterson Cos., Inc. | 133 | 5,752 | ||||||
PayPal Holdings, Inc.(a) | 181 | 5,618 | ||||||
| PepsiCo, Inc. | 66 | 6,224 | ||||||
| Perrigo Co. PLC | 34 | 5,347 | ||||||
| Pfizer, Inc. | 184 | 5,779 | ||||||
| Philip Morris International, Inc. | 76 | 6,029 | ||||||
| Procter & Gamble Co. | 89 | 6,403 | ||||||
Quanta Services, Inc.(a) | 249 | 6,028 | ||||||
| Quest Diagnostics, Inc. | 93 | 5,717 | ||||||
Regeneron Pharmaceuticals, Inc.(a) | 11 | 5,117 | ||||||
| Reynolds American, Inc. | 144 | 6,375 | ||||||
| Robert Half International, Inc. | 118 | 6,037 | ||||||
| St. Jude Medical, Inc. | 87 | 5,489 | ||||||
| Stryker Corp. | 61 | 5,740 | ||||||
| Sysco Corp. | 152 | 5,923 | ||||||
Tenet Healthcare Corp.(a) | 130 | 4,800 | ||||||
| Total System Services, Inc. | 130 | 5,906 | ||||||
| Tyson Foods, Inc., Class A | 140 | 6,034 | ||||||
United Rentals, Inc. (a) | 88 | 5,284 | ||||||
| UnitedHealth Group, Inc. | 51 | 5,917 | ||||||
| Universal Health Services, Inc., Class B | 46 | 5,741 | ||||||
Varian Medical Systems, Inc.(a) | 77 | 5,681 | ||||||
Vertex Pharmaceuticals, Inc.(a) | 45 | 4,686 | ||||||
| Western Union Co. | 332 | 6,096 | ||||||
| Whole Foods Market, Inc. | 188 | 5,950 | ||||||
| Zimmer Biomet Holdings, Inc. | 61 | 5,730 | ||||||
| Zoetis, Inc. | 135 | 5,559 | ||||||
| 577,887 | ||||||||
| Energy: 7.92% | ||||||||
| Anadarko Petroleum Corp. | 93 | 5,616 | ||||||
| Apache Corp. | 151 | 5,913 | ||||||
| Baker Hughes, Inc. | 114 | 5,933 | ||||||
| Cabot Oil & Gas Corp. | 263 | 5,749 | ||||||
Cameron International Corp.(a) | 94 | 5,764 | ||||||
| Chesapeake Energy Corp. | 803 | 5,886 | ||||||
| Chevron Corp. | 80 | 6,310 | ||||||
| Cimarex Energy Co. | 57 | 5,841 | ||||||
| Columbia Pipeline Group, Inc. | 259 | 4,737 | ||||||
| ConocoPhillips | 128 | 6,139 | ||||||
| CONSOL Energy, Inc. | 485 | 4,753 | ||||||
| Devon Energy Corp. | 156 | 5,786 | ||||||
| Diamond Offshore Drilling, Inc. | 276 | 4,775 | ||||||
| Ensco PLC, Class A | 393 | 5,534 | ||||||
| EOG Resources, Inc. | 79 | 5,751 | ||||||
| Shares | Value | |||||||
| Energy (continued) | ||||||||
| EQT Corp. | 84 | $ | 5,441 | |||||
| Exxon Mobil Corp. | 84 | 6,245 | ||||||
First Solar, Inc.(a) | 125 | 5,344 | ||||||
FMC Technologies, Inc.(a) | 187 | 5,797 | ||||||
| Halliburton Co. | 163 | 5,762 | ||||||
| Helmerich & Payne, Inc. | 123 | 5,813 | ||||||
| Hess Corp. | 116 | 5,807 | ||||||
| Kinder Morgan, Inc. | 202 | 5,591 | ||||||
| Marathon Oil Corp. | 403 | 6,206 | ||||||
| Marathon Petroleum Corp. | 127 | 5,884 | ||||||
| Murphy Oil Corp. | 227 | 5,493 | ||||||
| National Oilwell Varco, Inc. | 157 | 5,911 | ||||||
Newfield Exploration Co.(a) | 178 | 5,856 | ||||||
| Noble Energy, Inc. | 195 | 5,885 | ||||||
| Occidental Petroleum Corp. | 91 | 6,020 | ||||||
| ONEOK, Inc. | 173 | 5,571 | ||||||
| Phillips 66 | 75 | 5,763 | ||||||
| Pioneer Natural Resources Co. | 51 | 6,204 | ||||||
| Range Resources Corp. | 167 | 5,364 | ||||||
| Schlumberger, Ltd. | 82 | 5,656 | ||||||
Southwestern Energy Co.(a) | 394 | 5,000 | ||||||
| Spectra Energy Corp. | 223 | 5,858 | ||||||
| Tesoro Corp. | 64 | 6,223 | ||||||
| Transocean, Ltd. | 427 | 5,517 | ||||||
| Valero Energy Corp. | 97 | 5,830 | ||||||
| Williams Cos., Inc. | 141 | 5,196 | ||||||
| 233,724 | ||||||||
| Financials: 17.99% | ||||||||
| ACE, Ltd. | 60 | 6,204 | ||||||
Affiliated Managers Group, Inc.(a) | 35 | 5,985 | ||||||
| Aflac, Inc. | 105 | 6,104 | ||||||
Alliance Data Systems Corp.(a) | 24 | 6,216 | ||||||
| Allstate Corp. | 105 | 6,115 | ||||||
| American Express Co. | 80 | 5,930 | ||||||
| American International Group, Inc. | 104 | 5,909 | ||||||
| American Tower Corp., REIT | 68 | 5,983 | ||||||
| Ameriprise Financial, Inc. | 55 | 6,002 | ||||||
| Aon PLC | 67 | 5,937 | ||||||
| Apartment Investment & Management Co., REIT, Class A | 168 | 6,219 | ||||||
| Assurant, Inc. | 79 | 6,242 | ||||||
| AvalonBay Communities, Inc., REIT | 37 | 6,468 | ||||||
| Bank of America Corp. | 379 | 5,905 | ||||||
| Bank of New York Mellon Corp. | 154 | 6,029 | ||||||
| BB&T Corp. | 167 | 5,945 | ||||||
Berkshire Hathaway, Inc., Class B(a) | 46 | 5,998 | ||||||
| BlackRock, Inc. | 20 | 5,949 | ||||||
| Boston Properties, Inc., REIT | 53 | 6,275 | ||||||
| Capital One Financial Corp. | 80 | 5,802 | ||||||
CBRE Group, Inc., Class A(a) | 185 | 5,920 | ||||||
| Charles Schwab Corp. | 199 | 5,683 | ||||||
| Chubb Corp. | 50 | 6,132 | ||||||
See Notes to Financial Statements.
| 6 | www.Index.World |
| Index Funds S&P 500 Equal Weight | Schedule of Investments |
| September 30, 2015 (Unaudited) |
| Shares | Value | |||||||
| Financials (continued) | ||||||||
| Cincinnati Financial Corp. | 114 | $ | 6,133 | |||||
| Citigroup, Inc. | 119 | 5,904 | ||||||
| CME Group, Inc. | 64 | 5,935 | ||||||
| Comerica, Inc. | 145 | 5,960 | ||||||
| Crown Castle International Corp., REIT | 77 | 6,073 | ||||||
| Discover Financial Services | 116 | 6,031 | ||||||
E*Trade Financial Corp.(a) | 224 | 5,898 | ||||||
| Equinix, Inc., REIT | 21 | 5,741 | ||||||
| Equity Residential, REIT | 86 | 6,460 | ||||||
| Essex Property Trust, Inc., REIT | 28 | 6,256 | ||||||
| Fifth Third Bancorp | 307 | 5,805 | ||||||
| Franklin Resources, Inc. | 154 | 5,738 | ||||||
| General Growth Properties, Inc., REIT | 244 | 6,337 | ||||||
Genworth Financial, Inc., Class A(a) | 1,192 | 5,507 | ||||||
| Goldman Sachs Group, Inc. | 33 | 5,734 | ||||||
| Hartford Financial Services Group, Inc. | 132 | 6,043 | ||||||
| HCP, Inc., REIT | 168 | 6,258 | ||||||
| Host Hotels & Resorts, Inc., REIT | 343 | 5,423 | ||||||
| Hudson City Bancorp, Inc. | 632 | 6,427 | ||||||
| Huntington Bancshares, Inc. | 562 | 5,957 | ||||||
| Intercontinental Exchange, Inc. | 26 | 6,110 | ||||||
| Invesco, Ltd. | 185 | 5,778 | ||||||
| Iron Mountain, Inc., REIT | 214 | 6,638 | ||||||
| JPMorgan Chase & Co. | 97 | 5,914 | ||||||
| KeyCorp | 450 | 5,855 | ||||||
| Kimco Realty Corp., REIT | 264 | 6,450 | ||||||
| Legg Mason, Inc. | 143 | 5,950 | ||||||
| Leucadia National Corp. | 292 | 5,916 | ||||||
| Lincoln National Corp. | 122 | 5,790 | ||||||
| Loews Corp. | 167 | 6,035 | ||||||
| M&T Bank Corp. | 50 | 6,098 | ||||||
| Macerich Co., REIT | 82 | 6,299 | ||||||
| Marsh & McLennan Cos., Inc. | 112 | 5,849 | ||||||
| MetLife, Inc. | 125 | 5,894 | ||||||
| Morgan Stanley | 179 | 5,639 | ||||||
| NASDAQ OMX Group, Inc. | 117 | 6,240 | ||||||
| Navient Corp. | 488 | 5,485 | ||||||
| Northern Trust Corp. | 87 | 5,930 | ||||||
| People's United Financial, Inc. | 392 | 6,166 | ||||||
| Plum Creek Timber Co., Inc., REIT | 162 | 6,401 | ||||||
| PNC Financial Services Group, Inc. | 67 | 5,976 | ||||||
| Principal Financial Group, Inc. | 126 | 5,965 | ||||||
| Progressive Corp. | 201 | 6,159 | ||||||
| Prologis, Inc., REIT | 163 | 6,341 | ||||||
| Prudential Financial, Inc. | 77 | 5,868 | ||||||
| Public Storage, REIT | 30 | 6,349 | ||||||
| Realty Income Corp., REIT | 135 | 6,398 | ||||||
| Regions Financial Corp. | 639 | 5,757 | ||||||
| Simon Property Group, Inc., REIT | 34 | 6,246 | ||||||
| SL Green Realty Corp., REIT | 58 | 6,273 | ||||||
| State Street Corp. | 85 | 5,713 | ||||||
| SunTrust Banks, Inc. | 154 | 5,889 | ||||||
| T Rowe Price Group, Inc. | 86 | 5,977 | ||||||
| Shares | Value | |||||||
| Financials (continued) | ||||||||
| Torchmark Corp. | 105 | $ | 5,922 | |||||
| Travelers Cos., Inc. | 61 | 6,071 | ||||||
| Unum Group | 185 | 5,935 | ||||||
| US Bancorp | 148 | 6,069 | ||||||
| Ventas, Inc., REIT | 115 | 6,447 | ||||||
| Visa, Inc., Class A | 86 | 5,991 | ||||||
| Vornado Realty Trust, REIT | 68 | 6,149 | ||||||
| Wells Fargo & Co. | 115 | 5,905 | ||||||
| Welltower, Inc., REIT | 97 | 6,569 | ||||||
| Weyerhaeuser Co., REIT | 222 | 6,069 | ||||||
| XL Group PLC | 164 | 5,956 | ||||||
| Zions Bancorporation | 214 | 5,894 | ||||||
| 530,897 | ||||||||
| Industrials: 12.84% | ||||||||
| 3M Co. | 43 | 6,096 | ||||||
| Agilent Technologies, Inc. | 169 | 5,802 | ||||||
| Allegion PLC | 100 | 5,766 | ||||||
| AMETEK, Inc. | 114 | 5,965 | ||||||
| Amphenol Corp., Class A | 118 | 6,013 | ||||||
| Ball Corp. | 91 | 5,660 | ||||||
| Boeing Co. | 45 | 5,893 | ||||||
| Caterpillar, Inc. | 84 | 5,490 | ||||||
| CH Robinson Worldwide, Inc. | 88 | 5,965 | ||||||
| Corning, Inc. | 344 | 5,889 | ||||||
| CSX Corp. | 213 | 5,730 | ||||||
| Cummins, Inc. | 50 | 5,429 | ||||||
| Deere & Co. | 77 | 5,698 | ||||||
| Dover Corp. | 100 | 5,718 | ||||||
| Eaton Corp. PLC | 109 | 5,592 | ||||||
| Emerson Electric Co. | 132 | 5,830 | ||||||
| Expeditors International of Washington, Inc. | 124 | 5,834 | ||||||
| FedEx Corp. | 40 | 5,759 | ||||||
| FLIR Systems, Inc. | 214 | 5,990 | ||||||
| Flowserve Corp. | 142 | 5,842 | ||||||
| Fluor Corp. | 134 | 5,675 | ||||||
| Garmin, Ltd. | 169 | 6,064 | ||||||
| General Dynamics Corp. | 43 | 5,932 | ||||||
| General Electric Co. | 244 | 6,154 | ||||||
| Harris Corp. | 82 | 5,998 | ||||||
| Honeywell International, Inc. | 61 | 5,776 | ||||||
| Illinois Tool Works, Inc. | 73 | 6,009 | ||||||
| Ingersoll-Rand PLC | 110 | 5,585 | ||||||
Jacobs Engineering Group, Inc.(a) | 151 | 5,652 | ||||||
| JB Hunt Transport Services, Inc. | 79 | 5,641 | ||||||
| Joy Global, Inc. | 344 | 5,136 | ||||||
| Kansas City Southern | 66 | 5,998 | ||||||
| L-3 Communications Holdings, Inc. | 58 | 6,062 | ||||||
| Lockheed Martin Corp. | 29 | 6,012 | ||||||
| Martin Marietta Materials, Inc. | 35 | 5,318 | ||||||
| Masco Corp. | 224 | 5,640 | ||||||
| Norfolk Southern Corp. | 77 | 5,883 | ||||||
| See Notes to Financial Statements. |
| Semi-Annual Report | September 30, 2015 | 7 |
| Index Funds S&P 500 Equal Weight | Schedule of Investments |
| September 30, 2015 (Unaudited) |
| Shares | Value | |||||||
| Industrials (continued) | ||||||||
| Northrop Grumman Corp. | 36 | $ | 5,974 | |||||
Owens-Illinois, Inc.(a) | 303 | 6,278 | ||||||
| Parker-Hannifin Corp. | 57 | 5,546 | ||||||
| Pentair PLC | 112 | 5,716 | ||||||
| PerkinElmer, Inc. | 127 | 5,837 | ||||||
| Precision Castparts Corp. | 26 | 5,972 | ||||||
| Raytheon Co. | 57 | 6,228 | ||||||
| Republic Services, Inc. | 150 | 6,180 | ||||||
| Rockwell Automation, Inc. | 57 | 5,784 | ||||||
| Rockwell Collins, Inc. | 72 | 5,892 | ||||||
| Roper Technologies, Inc. | 38 | 5,955 | ||||||
| Ryder System, Inc. | 74 | 5,479 | ||||||
| Sealed Air Corp. | 119 | 5,579 | ||||||
| Snap-on, Inc. | 38 | 5,736 | ||||||
| Stanley Black & Decker, Inc. | 61 | 5,916 | ||||||
Stericycle, Inc.(a) | 43 | 5,990 | ||||||
| TE Connectivity, Ltd. | 100 | 5,989 | ||||||
| Textron, Inc. | 150 | 5,646 | ||||||
| Thermo Fisher Scientific, Inc. | 49 | 5,992 | ||||||
| Tyco International PLC | 169 | 5,655 | ||||||
| Union Pacific Corp. | 71 | 6,277 | ||||||
| United Parcel Service, Inc., Class B | 63 | 6,217 | ||||||
| United Technologies Corp. | 66 | 5,873 | ||||||
| Vulcan Materials Co. | 61 | 5,441 | ||||||
| Waste Management, Inc. | 122 | 6,077 | ||||||
Waters Corp.(a) | 49 | 5,792 | ||||||
| WestRock Co. | 103 | 5,298 | ||||||
| Xylem, Inc. | 187 | 6,143 | ||||||
| 378,958 | ||||||||
| Technology: 9.67% | ||||||||
| Accenture PLC, Class A | 62 | 6,092 | ||||||
| Activision Blizzard, Inc. | 208 | 6,425 | ||||||
Adobe Systems, Inc.(a) | 77 | 6,331 | ||||||
Akamai Technologies, Inc.(a) | 81 | 5,594 | ||||||
| Altera Corp. | 120 | 6,010 | ||||||
| Analog Devices, Inc. | 108 | 6,092 | ||||||
| Apple, Inc. | 53 | 5,846 | ||||||
| Applied Materials, Inc. | 392 | 5,758 | ||||||
Autodesk, Inc.(a) | 131 | 5,782 | ||||||
| Avago Technologies, Ltd. | 46 | 5,750 | ||||||
| Broadcom Corp., Class A | 114 | 5,863 | ||||||
| CA, Inc. | 219 | 5,979 | ||||||
Cerner Corp.(a) | 97 | 5,816 | ||||||
Citrix Systems, Inc.(a) | 86 | 5,958 | ||||||
Cognizant Technology Solutions Corp., Class A(a) | 97 | 6,073 | ||||||
| Computer Sciences Corp. | 98 | 6,015 | ||||||
| Dun & Bradstreet Corp. | 58 | 6,090 | ||||||
Electronic Arts, Inc.(a) | 88 | 5,962 | ||||||
| EMC Corp. | 247 | 5,968 | ||||||
| Fidelity National Information Services, Inc. | 87 | 5,836 | ||||||
| Shares | Value | |||||||
| Technology (continued) | ||||||||
Fiserv, Inc.(a) | 71 | $ | 6,149 | |||||
| Hewlett-Packard Co. | 224 | 5,737 | ||||||
| Intel Corp. | 206 | 6,209 | ||||||
| International Business Machines Corp. | 41 | 5,944 | ||||||
| Intuit, Inc. | 68 | 6,035 | ||||||
| KLA-Tencor Corp. | 119 | 5,950 | ||||||
| Lam Research Corp. | 85 | 5,553 | ||||||
| Linear Technology Corp. | 150 | 6,053 | ||||||
| Microchip Technology, Inc. | 138 | 5,946 | ||||||
Micron Technology, Inc.(a) | 362 | 5,423 | ||||||
| Microsoft Corp. | 140 | 6,196 | ||||||
| NetApp, Inc. | 192 | 5,683 | ||||||
| NVIDIA Corp. | 268 | 6,606 | ||||||
| Oracle Corp. | 160 | 5,779 | ||||||
| Paychex, Inc. | 133 | 6,335 | ||||||
| Pitney Bowes, Inc. | 297 | 5,895 | ||||||
Qorvo, Inc.(a) | 114 | 5,136 | ||||||
| QUALCOMM, Inc. | 111 | 5,964 | ||||||
Red Hat, Inc.(a) | 86 | 6,182 | ||||||
salesforce.com, Inc.(a) | 87 | 6,040 | ||||||
| SanDisk Corp. | 111 | 6,031 | ||||||
| Seagate Technology PLC | 124 | 5,555 | ||||||
| Skyworks Solutions, Inc. | 69 | 5,810 | ||||||
Teradata Corp.(a) | 205 | 5,937 | ||||||
| Texas Instruments, Inc. | 128 | 6,339 | ||||||
| Western Digital Corp. | 75 | 5,958 | ||||||
| Xerox Corp. | 583 | 5,673 | ||||||
| Xilinx, Inc. | 145 | 6,148 | ||||||
| 285,506 | ||||||||
| Utilities: 6.24% | ||||||||
| AES Corp. | 546 | 5,345 | ||||||
| AGL Resources, Inc. | 100 | 6,104 | ||||||
| Ameren Corp. | 157 | 6,636 | ||||||
| American Electric Power Co., Inc. | 113 | 6,425 | ||||||
| CenterPoint Energy, Inc. | 344 | 6,206 | ||||||
| CMS Energy Corp. | 186 | 6,570 | ||||||
| Consolidated Edison, Inc. | 97 | 6,484 | ||||||
| Dominion Resources, Inc. | 90 | 6,334 | ||||||
| DTE Energy Co. | 80 | 6,430 | ||||||
| Duke Energy Corp. | 89 | 6,403 | ||||||
| Edison International | 105 | 6,622 | ||||||
| Entergy Corp. | 97 | 6,315 | ||||||
| Eversource Energy | 132 | 6,682 | ||||||
| Exelon Corp. | 205 | 6,089 | ||||||
| FirstEnergy Corp. | 199 | 6,231 | ||||||
| NextEra Energy, Inc. | 63 | 6,146 | ||||||
| NiSource, Inc. | 366 | 6,789 | ||||||
| NRG Energy, Inc. | 329 | 4,886 | ||||||
| Pepco Holdings, Inc. | 264 | 6,394 | ||||||
| PG&E Corp. | 125 | 6,600 | ||||||
| Pinnacle West Capital Corp. | 102 | 6,542 | ||||||
| PPL Corp. | 205 | 6,742 | ||||||
| See Notes to Financial Statements. |
| 8 | www.Index.World |
| Index Funds S&P 500 Equal Weight | Schedule of Investments |
| September 30, 2015 (Unaudited) |
| Shares | Value | |||||||
| Utilities (continued) | ||||||||
| Public Service Enterprise Group, Inc. | 155 | $ | 6,535 | |||||
| SCANA Corp. | 118 | 6,639 | ||||||
| Sempra Energy | 67 | 6,480 | ||||||
| Southern Co. | 142 | 6,347 | ||||||
| TECO Energy, Inc. | 228 | 5,987 | ||||||
| WEC Energy Group, Inc. | 127 | 6,632 | ||||||
| Xcel Energy, Inc. | 183 | 6,480 | ||||||
| 184,075 | ||||||||
Total Common Stocks (Cost $3,297,610) | 2,950,963 | |||||||
| SHORT TERM INVESTMENTS: 0.22% | ||||||||
Fidelity® Institutional Money Market Government Portfolio, Class I (0.10% 7-day yield) | 6,505 | 6,505 | ||||||
Total Short Term Investments (Cost $6,505) | 6,505 | |||||||
Total Investments: 100.20% (Cost $3,304,115) | 2,957,468 | |||||||
| Liabilities In Excess Of Other Assets: (0.20)% | (5,825 | ) | ||||||
| Net Assets: 100.00% | $ | 2,951,643 | ||||||
| (a) | Non-income producing security. |
Investment Abbreviations:
Ltd. - Limited.
NV - Naamloze Vennootschap is the Dutch term for a public limited liability corporation.
PLC - Public limited company.
REIT - Real Estate Investment Trust.
| See Notes to Financial Statements. |
| Semi-Annual Report | September 30, 2015 | 9 |
| Index Funds S&P 500 Equal Weight | Statement of Assets and Liabilities |
September 30, 2015 (Unaudited)
Index Funds S&P 500 Equal Weight | ||||
| ASSETS: | ||||
| Investments, at value | $ | 2,957,468 | ||
| Cash | 72 | |||
| Receivable for investments sold | 139,568 | |||
| Interest and dividends receivable | 3,676 | |||
| Other assets | 61,934 | |||
| Total Assets | 3,162,718 | |||
| LIABILITIES: | ||||
| Payable for investments purchased | 148,56 | |||
| Payable to fund accounting and administration | 23,19 | |||
| Payable for trustee fees and expenses | 10 | |||
| Payable for transfer agency fees | 10,71 | |||
| Payable for chief compliance officer fee | 1,688 | |||
| Payable for professional fees | 20,29 | |||
| Accrued expenses and other liabilities | 6,607 | |||
| Total Liabilities | 211,07 | |||
| NET ASSETS | $ | 2,951,643 | ||
| NET ASSETS CONSIST OF: | ||||
| Paid-in capital | $ | 3,246,608 | ||
| Accumulated net investment income | 16,81 | |||
| Accumulated net realized gain on investments | 34,86 | |||
| Net unrealized depreciation on investments | (346,647 | ) | ||
| NET ASSETS | $ | 2,951,643 | ||
| INVESTMENTS, AT COST | $ | 3,304,115 | ||
| PRICING OF SHARES | ||||
| Net Asset Value, offering and redemption price per share | $ | 22.92 | ||
| Net Assets | $ | 2,951,643 | ||
| Shares of beneficial interest outstanding | 128,78 | |||
| See Notes to Financial Statements. |
| 10 | www.Index.World |
| Index Funds S&P 500 Equal Weight | Statement of Operations |
For the Period Ended September 30, 2015 (Unaudited)
Index Funds S&P 500 Equal Weight | ||||
| INVESTMENT INCOME: | ||||
| Dividends | $ | 19,683 | ||
| Foreign taxes withheld | (5 | ) | ||
| Total Investment Income | 19,678 | |||
| EXPENSES: | ||||
| Investment advisory fee (Note 3) | 2,384 | |||
| Administration fee | 67,070 | |||
| Custodian fee | 2,278 | |||
| Professional fees | 20,510 | |||
| Transfer agent fee | 23,251 | |||
| Trustee fees and expenses | 10 | |||
| Registration/filing fees | 13,504 | |||
| Reports to shareholder and printing fees | 2,961 | |||
| Chief compliance officer fee | 8,354 | |||
| Other | 7,225 | |||
| Total expenses before waiver | 147,547 | |||
| Less fees waived/reimbursed by investment adviser (Note 3) | (144,686 | ) | ||
| Total Net Expenses | 2,861 | |||
| NET INVESTMENT GAIN: | 16,817 | |||
| Net realized gain on investments | 34,865 | |||
| Net change in unrealized depreciation on investments | (346,647 | ) | ||
| NET REALIZED AND UNREALIZED LOSS ON INVESTMENTS NET | (311,782 | ) | ||
| DECREASE IN NET ASSETS RESULTING FROM OPERATIONS | $ | (294,965 | ) | |
| See Notes to Financial Statements. |
| Semi-Annual Report | September 30, 2015 | 11 |
| Index Funds S&P 500 Equal Weight | Statement of Changes in Net Assets |
For the Period May 1, 2015 (Commencement of Operations) to September 30, 2015 | ||||
| OPERATIONS: | ||||
| Net investment income | $ | 16,817 | ||
| Net realized gain on investments | 34,865 | |||
| Net change in unrealized depreciation on investments | (346,647 | ) | ||
| Net decrease in net assets resulting from operations | (294,965 | ) | ||
| SHARE TRANSACTIONS: | ||||
| Proceeds from sale of shares | 3,632,455 | |||
| Cost of shares redeemed | (385,847 | ) | ||
| Net increase from share transactions | 3,246,608 | |||
| Net increase in net assets | $ | 2,951,643 | ||
| NET ASSETS: | ||||
| Beginning of period | 0 | |||
| End of period (including accumulated net investment income of $16,817) | $ | 2,951,643 | ||
| Other Information: | ||||
| SHARE TRANSACTIONS: | ||||
| Sold | 144,708 | |||
| Redeemed | (15,922 | ) | ||
| Net increase in shares outstanding | 128,786 | |||
See Notes to Financial Statements.
| 12 | www.Index.World |
| Index Funds S&P 500 Equal Weight | Financial Highlights |
For a Share Outstanding Throughout the Period Presented
For the Period May 1, 2015 (Commencement of Operations) to September 30, 2015 | ||||
| Net asset value, beginning of period | $ | 25.00 | ||
| INCOME FROM INVESTMENT OPERATIONS: | ||||
Net investment income(a) | 0.18 | |||
| Net realized and unrealized loss | (2.26 | ) | ||
| Total from investment operations | (2.08 | ) | ||
| Net decrease in net asset value | (2.08 | ) | ||
| Net asset value, end of period | $ | 22.92 | ||
| TOTAL RETURN | (8.32 | )%(b) | ||
| SUPPLEMENTAL DATA: | ||||
| Net assets, end of period (000s) | $ | 2,952 | ||
| RATIOS TO AVERAGE NET ASSETS: | ||||
| Ratio of expenses to average net assets excluding fee waivers and reimbursements | 15.47 | %(c) | ||
| Ratio of expenses to average net assets including fee waivers and reimbursements | 0.30 | %(c) | ||
| Ratio of net investment income to average net assets | 1.76 | %(c) | ||
| PORTFOLIO TURNOVER RATE | 64 | %(b) | ||
(a) | Calculated using the average shares method. |
(b) | Not Annualized. |
(c) | Annualized. |
See Notes to Financial Statements.
Semi-Annual Report | September 30, 2015 | 13 |
| Index Funds S&P 500 Equal Weight | Notes to Financial Statements |
September 30, 2015 (Unaudited)
1. ORGANIZATION
The Index Funds S&P 500 Equal Weight (the "Fund") is a separate series of Index Funds, an open-end management investment company that was organized as a trust under the laws of the State of Delaware on November 9, 2005 (the "Trust"). The Trust was previously known as "Giant 5 Funds", and changed its name to "Index Funds" in February 2014. The Fund currently offers one class of shares: No Load Shares. The Fund is diversified, as that term is defined in the Investment Company Act of 1940, as amended (the "1940 Act").
The Fund seeks to achieve its investment objective by investing in a portfolio of assets whose performance, before fees and expenses, is expected to match approximately the performance of the Standard & Poor's 500 Equal Weight Index (the "Index"). The Fund expects that its portfolio will consist primarily of securities of issuers included in the Index. The Index is designed to measure the performance of approximately 500 U.S. issuers chosen for market size, liquidity and industry grouping, among other factors.
2. SIGNIFICANT ACCOUNTING POLICIES
The following is a summary of significant accounting policies consistently followed by the Fund. These policies are in conformity with U.S. generally accepted accounting principles ("GAAP"). The Fund is considered an investment company for financial reporting purposes under GAAP.
Use of Estimates — The preparation of financial statements in conformity with GAAP requires management to make estimates and assumptions that affect the amounts reported in financial statements. Actual results could differ from those estimates.
Investment Transactions — Investment security transactions are accounted for on trade date. Gains and losses on securities sold are determined on a specific identification basis.
Investment Income — Interest income is accrued and recorded on a daily basis including amortization of premiums, accretions of discounts and income earned from money market funds. Interest is not accrued on securities that are in default. Dividend income is recorded on the ex-dividend date. Withholding taxes on foreign dividends have been provided for in accordance with the Funds' understanding of the applicable country's tax rules and rates.
Investment Valuation — The Fund's portfolio securities are valued as of the close of trading of the New York Stock Exchange ("NYSE") (normally 4:00 p.m., Eastern Time). Each security, excluding short-term investments, is valued at the last sale price reported by the principal security exchange on which the issue is traded. Securities that are traded on the Nasdaq Stock Market, Inc. are valued at the Nasdaq Official Closing Price or if no sale is reported, the mean between the bid and the ask. Securities which are traded over-the-counter are valued at the last sale price or, if no sale, at the mean between the bid and the ask. Securities sold short which are listed on a national securities exchange or the Nasdaq Stock Market but which were not traded on the valuation date are valued at the mean between the bid and the ask. Unlisted equity securities for which market quotations are readily available are valued at the last sale price or, if no sale price, the mean between the bid and the ask. Options purchased or written by the Fund are valued at the mean of the highest bid and lowest ask price of all the exchanges on which the option trades. Securities for which quotations are not readily available are valued at fair value as determined by the investment adviser in accordance with procedures approved by the Board of Trustees. The fair value of a security is the amount which the Fund might reasonably expect to receive upon a current sale. The fair value of a security may differ from the last quoted price and the Fund may not be able to sell a security at the fair value. Market quotations may not be available, for example, if trading in particular securities was halted during the day and not resumed prior to the close of trading on the New York Stock Exchange. As of September 30, 2015 there were no securities that were internally fair valued. Variable rate demand notes are recorded at par value which approximates market value. For financial reporting purposes, investment transactions are recorded on the trade date.
Securities Transactions and Related Investment Income — Securities transactions are accounted for on trade date. Dividend income is recorded on the ex-dividend date. Realized gains and losses from investment transactions are determined using the identified cost basis. Interest income which includes amortization of premium and accretion of discount, is recorded on the accrual basis.
Fair Value Measurements — A three-tier hierarchy has been established to classify fair value measurements for disclosure purposes. Inputs refer broadly to the assumptions that market participants would use in pricing the asset or liability, including assumptions about risk. Inputs may be observable or unobservable. Observable inputs are inputs that reflect the assumptions market participants would use in pricing the asset or liability that are developed based on market data obtained from sources independent of the reporting entity. Unobservable inputs are inputs that reflect the reporting entity's own assumptions about the assumptions market participants would use in pricing the asset or liability that are developed based on the best information available. In accordance with the authoritative guidance on fair value measurements and disclosure under GAAP, the Fund discloses fair value of its investments in a hierarchy that prioritizes the inputs to valuation techniques used to measure the fair value.
| 14 | www.Index.World |
| Index Funds S&P 500 Equal Weight | Notes to Financial Statements |
September 30, 2015 (Unaudited)
Various inputs are used in determining the value of the Fund's investments as of the reporting period end. These inputs are categorized in the following hierarchy under applicable financial accounting standards:
| Level 1— | Unadjusted quoted prices in active markets for identical, unrestricted assets or liabilities that the Fund has the ability to access at the measurement date; | |
| Level 2— | Quoted prices which are not active, quoted prices for similar assets or liabilities in active markets or inputs other than quoted prices that are observable (either directly or indirectly) for substantially the full term of the asset or liability; and | |
| Level 3— | Significant unobservable prices or inputs (including the Fund's own assumptions in determining the fair value of investments) where there is little or no market activity for the asset or liability at the measurement date. |
The availability of observable inputs can vary from security to security and is affected by a wide variety of factors, including, for example, the type of security, whether the security is new and not yet established in the marketplace, the liquidity of markets, and other characteristics particular to the security. To the extent that valuation is based on models or inputs that are less observable or unobservable in the market, the determination of fair value requires more judgment. Accordingly, the degree of judgment exercised in determining fair value is greatest for instruments categorized in Level 3.
An investment level within the fair value hierarchy is based on the lowest level input, individually or in the aggregate, that is significant to fair value measurement. The valuation techniques used by the Fund to measure fair value during the period ended September 30, 2015 maximized the use of observable inputs and minimized the use of unobservable inputs.
The inputs or methodologies used for valuing securities are not necessarily an indication of the risk or liquidity associated with investing in those securities. The following is a summary of the inputs used in valuing the Fund's investments as of September 30, 2015:
| Investments in Securities at Value | Level 1 - Quoted Prices | Level 2 - Other Significant Observable Inputs | Level 3 - Significant Unobservable Inputs | Total | ||||||||||||
| Index Funds S&P 500 Equal Weight | ||||||||||||||||
| Common Stocks | $ | 2,950,963 | $ | – | $ | – | $ | 2,950,963 | ||||||||
| Short Term Investments | 6,505 | – | – | 6,505 | ||||||||||||
| TOTAL | $ | 2,957,468 | $ | – | $ | – | $ | 2,957,468 | ||||||||
| * | See Schedule of Investments for industry classification. |
It is the Fund's policy to recognize transfers between levels at the end of the reporting period. There were no transfers between Levels 1 and 2 during the period ended September 30, 2015.
For the period ended September 30, 2015, the Fund did not have any unobservable inputs (Level 3) used in determining fair value.
Income Taxes — As of and during the period ended September 30, 2015, the Fund did not have a liability for any unrecognized tax benefits. The Fund files U.S. federal, state, and local tax returns as required. The Fund's tax returns are subject to examination by the relevant tax authorities until expiration of the applicable statute of limitations which is generally three years after the filing of the tax return for federal purposes and four years for most state returns. Tax returns for open years have incorporated no uncertain tax positions that require a provision for income taxes. The Fund intends to continue to qualify each year as a "regulated investment company" under Subchapter M of the Internal Revenue Code of 1986, as amended. By so qualifying, the Fund will not be subject to Federal income taxes to the extent that it distributes substantially all of its taxable or tax- exempt income, if any, for its tax year ending September 30. In addition, by distributing in each calendar year substantially all of its net investment income, capital gains and certain other amounts, if any, the Fund will not be subject to a Federal excise tax. Therefore, no provision is made by the Fund for Federal income or excise taxes.
3. ADVISORY FEES, ADMINISTRATION FEES AND OTHER AGREEMENTS
The Index Group, Inc., is the Investment Adviser for the Fund (the "Adviser"). The Adviser currently provides investment advisory services for individuals, trusts, estates and institutions. The Adviser commenced operations in 2004, and is registered as an investment adviser with the Securities and Exchange Commission.
| Semi-Annual Report | September 30, 2015 | 15 |
| Index Funds S&P 500 Equal Weight | Notes to Financial Statements |
September 30, 2015 (Unaudited)
The Adviser has agreed to waive and/or reimburse fees or expenses in order to limit Total Annual Fund Operating Expenses After Fee Waiver/Expense Reimbursement (excluding acquired fund fees and expenses, brokerage expenses, interest expenses, taxes and extraordinary expenses) to 0.30% of the Fund's average daily net assets for No Load class Shares. This agreement is in effect through July 31, 2016. This agreement may not be terminated or modified prior to this date except with the approval of the Fund's Board of Trustees.
Fund Accounting Fees and Expenses
ALPS Fund Services, Inc. ("ALPS" or the "Administrator") provides administrative, fund accounting and other services to the Fund under the Administration, Bookkeeping and Pricing Services Agreement (the "Administration Agreement") with the Trust. Under the Agreement, ALPS is paid fees, accrued on a daily basis and paid on a monthly basis following the end of the month.
ALPS Fund Services, Inc. ("ALPS" or the "Administrator") provides administrative, fund accounting and other services to the Fund under the Administration, Bookkeeping and Pricing Services Agreement (the "Administration Agreement") with the Trust. Under the Agreement, ALPS is paid fees, accrued on a daily basis and paid on a monthly basis following the end of the month.
The Administrator is also reimbursed by the Fund for certain out of pocket expenses.
Transfer Agent and Shareholder Services Agreement
ALPS serves as transfer, dividend paying and shareholder servicing agent for the Fund (the "Transfer Agent") under a Transfer Agency and Services Agreement with the Trust.
ALPS serves as transfer, dividend paying and shareholder servicing agent for the Fund (the "Transfer Agent") under a Transfer Agency and Services Agreement with the Trust.
Compliance Services
ALPS provides Chief Compliance Officer services to the Fund. Additionally, ALPS provides services in monitoring and testing the policies and procedures of the Trust in conjunction with requirements under Rule 38a-1 under the 1940 Act. ALPS is compensated under the Chief Compliance Officer Services Agreement.
ALPS provides Chief Compliance Officer services to the Fund. Additionally, ALPS provides services in monitoring and testing the policies and procedures of the Trust in conjunction with requirements under Rule 38a-1 under the 1940 Act. ALPS is compensated under the Chief Compliance Officer Services Agreement.
Distributor
The Fund has entered into a Distribution Agreement with ALPS Distributors, Inc. ("the Distributor") to provide distribution services to the Fund. The Distributor serves as underwriter/distributor of shares of the Fund.
The Fund has entered into a Distribution Agreement with ALPS Distributors, Inc. ("the Distributor") to provide distribution services to the Fund. The Distributor serves as underwriter/distributor of shares of the Fund.
4. PURCHASES AND SALES OF INVESTMENT SECURITIES
The aggregate cost of purchases and proceeds from sales of investment securities, excluding short-term securities, are shown below for the period ended September 30, 2015.
| Funds | Cost of Investments Purchased | Proceeds from Investments Sold | ||||||
| Index Funds S&P 500 Equal Weight | $ | 4,841,843 | $ | 1,578,669 | ||||
5. TAX BASIS INFORMATION
Distributions are determined in accordance with federal income tax regulations, which differ from GAAP, and, therefore, may differ significantly in amount or character from net investment income and realized gains for financial reporting purposes. Financial reporting records are adjusted for permanent book/tax differences to reflect tax character but are not adjusted for temporary differences. The amounts and characteristics of tax basis distributions and composition of distributable earnings/(accumulated losses) are finalized at fiscal year-end.
As of September 30, 2015, net unrealized appreciation/(depreciation) of investments based on the federal tax cost were as follows:
Gross Appreciation (excess of value over tax cost) | Gross Depreciation (excess of tax cost over value) | Net Unrealized Depreciation | Cost of Investments for Income Tax Purposes | |||||||||||||
| Index Funds S&P 500 Equal Weight | $ | 13,499 | $ | (379,483 | ) | $ | (365,984 | ) | $ | 3,323,452 | ||||||
The difference between book basis and tax basis is primarily attributable to wash sales.
| 16 | www.Index.World |
| Index Funds S&P 500 Equal Weight | Notes to Financial Statements |
| September 30, 2015 (Unaudited) |
6. COMMITMENTS AND CONTINGENCIES |
Under the Trust's organizational documents, its Officers and Trustees are indemnified against certain liabilities arising out of the performance of their duties to the Fund. In addition, in the normal course of business, the Trust entered into contracts with its service providers, on behalf of the Fund, and others that provide for general indemnifications. The Fund's maximum exposure under these arrangements is unknown, as this would involve future claims that may be made against the Fund. The Fund expects the risk of loss to be remote.
7. RECENT ACCOUNTING PRONOUNCEMENT |
In May 2015, the Financial Accounting Standards Board ("FASB") issued Accounting Standards Update ("ASU") 2015-07, "Disclosures for Investments in Certain Entities that Calculate Net Asset Value Per Share (or its Equivalent)." This is an update to Accounting Standards Codification Topic 820, Fair Value Measurement. ASU 2015-07 removes the requirement to categorize within the fair value hierarchy investments for which fair value is measured at net asset value per share (or its equivalent) using the practical expedient.
ASU 2015-17 is effective for annual reporting periods beginning on or after December 15, 2015, and interim periods within those annual periods, with retrospective application for all periods presented. Early adoption is permitted.
Management of the fund is currently evaluating the impact ASU 2015-07 will have on the Fund's financial statements and disclosures.
| Semi-Annual Report | September 30, 2015 | 17 |
| Index Funds S&P 500 Equal Weight | Additional Information |
| September 30, 2015 (Unaudited) |
1. PROXY VOTING POLICIES AND VOTING RECORD |
A copy of the Trust's Proxy Voting and Disclosure Policy and the Advisor's Proxy Voting and Disclosure Policy are included as Appendix B to the Fund's Statement of Additional Information and are available, (1) without charge, upon request, by calling (1-888-544-2685) and (2) on the SEC's website at http://ww.sec.gov. Information regarding how the Fund voted proxies relating to portfolio securities during the most recent 12-month period ended June 30 will be available (1) without charge, upon request, by calling the Fund at the number above and (2) on the SEC's website at http://www.sec.gov.
2. QUARTERLY PORTFOLIO HOLDINGS |
The Fund files its complete schedule of portfolio holdings with the SEC for the first and third quarters of each fiscal year on Form N-Q. The Fund's Forms N-Q are available on the SEC's website at http://www.sec.gov. You may review and make copies at the SEC's Public Reference Room in Washington, D.C. You may also obtain copies after paying a duplicating fee by writing the SEC's Public Reference Section, Washington, D.C. 20549-0102 or by electronic request to publicinfo@sec.gov, or is available without charge, upon request, by calling the Funds at 1-888-544-2685. Information on the operation of the Public Reference Room may be obtained by calling the SEC at 1-800-SEC-0330, (1-800-732-0330).
| 18 | www.Index.World |
| Index Funds S&P 500 Equal Weight | Approval of Advisory Agreement |
| September 30, 2015 (Unaudited) |
At their regular meeting on June 16, 2014 (the "Meeting"), in considering whether to approve the Investment Advisory Agreement with respect to the Fund, the Independent Trustees considered the following factors, with no single factor being all-important or determinative:
Investment Advisory Fee Rate. The Independent Trustees considered the information they received comparing the Fund's contractual annual advisory fee and overall expenses against the average and median in the applicable Morningstar category. Mr. Willis stated that he expected the expected management fees for the Fund, to be competitive with similarly managed funds. He stated that he expected the Fund's expenses would be capped via a contractual expense waiver/reimbursement agreement with the adviser. Mr. Willis then reviewed the remaining components of the Funds' expenses.
Nature, Extent and Quality of the Services under the Investment Advisory Agreement. The Independent Trustees reviewed and considered the Adviser's investment advisory personnel (including the qualifications, background and responsibilities of the manager primarily responsible for the day-to-day portfolio management of the Fund), its history as an asset manager and its performance as manager of the Fund.
Performance. The Independent Trustees noted that it was not possible to consider performance for the new Fund since it did not have a track record and the Adviser did not have another product that employs the same strategies for comparison purposes.
Adviser's Profitability. The Independent Trustees considered the expected overall fees, expenses and reimbursements payable to the Adviser in connection with the Fund, and the historical revenues of the Adviser.
Economies of Scale. The Independent Trustees considered whether economies of scale in the provision of services to the Fund were being passed along to the shareholders.
Incidental Benefits to the Adviser. The Independent Trustees reviewed and considered any other incidental benefits derived or to be derived by the Adviser from its relationship with the Fund, including, for example reputational benefits.
After review of the materials provided and further discussion, the Independent Trustees concluded that:
| ● | the investment advisory fees to be received by the Adviser with respect to the Fund and the Fund's total expense ratios were within an acceptable range when considered against the services provided by the Adviser and in light of the fact that the Fund is new and taking into account its expected initial size within the peer universe; |
| ● | the nature, extent and quality of services to be rendered by the Adviser under the Investment Advisory Agreement were adequate, bearing in mind the lack of performance history for the new Fund and the limited availability of comparable information; and |
| ● | there were no material economies of scale or other incidental benefits accruing to the Adviser in connection with its relationship with the Fund. |
At the Meeting, the Independent Trustees requested supplemental information and Adviser provided materials in response. The Board determined that, given the totality of the information provided with respect to the Investment Advisory Agreement, the Board had received sufficient information. Based on the Trustees' deliberations and their evaluation of the information described above, the Trustees, including all of the Independent Trustees, concluded that the approval of the Investment Advisory Agreement is consistent with the best interests of the Fund and its shareholders.
| Semi-Annual Report | September 30, 2015 | 19 |
Item 2. Code of Ethics.
Not applicable to this report.
Item 3. Audit Committee Financial Expert.
Not applicable to this report.
Item 4. Principal Accountant Fees and Services.
Not applicable to this report.
Item 5. Audit Committee of Listed Registrants.
Not applicable.
Item 6. Schedule of Investments.
Schedule of Investments is included as part of the Report to Stockholders filed under Item 1 of this form.
Item 7. Disclosure of Proxy Voting Policies and Procedures for Closed-End Management Investment Companies.
Not applicable.
Item 8. Portfolio Managers of Closed-End Management Investment Companies.
Not applicable.
Item 9. Purchases of Equity Securities by Closed-End Management Investment Companies.
Not applicable.
Item 10. Submission of Matters to Vote of Security Holders.
There has been no material changes to the procedures by which shareholders may recommend nominees to the registrant’s board of trustees.
Item 11. Controls and Procedures.
(a) The registrant’s principal executive officer and principal financial officer have concluded that the registrant’s disclosure controls and procedures (as defined in Rule 30a-3(c) under the Investment Company Act of 1940, as amended) are effective based on their evaluation of these controls and procedures as of a date within 90 days of the filing date of this document.
(b) There was no change in the Registrant's internal control over financial reporting (as defined in Rule 30a-3(d) under the Investment Company Act of 1940, as amended) during the second fiscal quarter of the period covered by this report that has materially affected, or is reasonably likely to materially affect, the Registrant's internal control over financial reporting.
Item 12. Exhibits.
| (a)(1) | Not applicable. |
| (a)(2) | The certifications required by Rule 30a-2(a) of the Investment Company Act of 1940, as amended, and Section 302 of the Sarbanes-Oxley Act of 2002 are attached hereto as Ex99.Cert. |
| (a)(3) | Not applicable. |
| (b) | The certifications by the registrant’s Principal Executive Officer and Principal Financial Officer, as required by Rule 30a-2(b) of the Investment Company Act of 1940, as amended, and Section 906 of the Sarbanes-Oxley Act of 2002 are attached hereto as Ex99.906Cert. |
SIGNATURES
Pursuant to the requirements of the Securities Exchange Act of 1934 and the Investment Company Act of 1940, the registrant has duly caused this report to be signed on its behalf by the undersigned, thereunto duly authorized.
| Index Funds | |||
| By: | /s/ Michael G. Willis | ||
| Michael G. Willis, President | |||
| (Principal Executive Officer) | |||
| Date: | December 8, 2015 | ||
Pursuant to the requirements of the Securities Exchange Act of 1934 and the Investment Company Act of 1940, this report has been signed below by the following persons on behalf of the registrant and in the capacities and on the dates indicated.
| By: | /s/ Michael G. Willis | ||
| Michael G. Willis, President | |||
| (Principal Executive Officer) | |||
| Date: | December 8, 2015 |
| By: | /s/ Michael G. Willis | ||
| Michael G. Willis, President | |||
| (Principal Financial Officer) | |||
| Date: | December 8, 2015 |