UNITED STATES
SECURITIES AND EXCHANGE COMMISSION
Washington, D.C. 20549
FORM N-CSR
CERTIFIED SHAREHOLDER REPORT OF REGISTERED MANAGEMENT INVESTMENT COMPANIES
Investment Company Act file number 811-21852
Columbia Funds Series Trust II
(Exact name of registrant as specified in charter)
290 Congress Street
Boston, MA 02210
(Address of principal executive offices) (Zip code)
Daniel J. Beckman
c/o Columbia Management Investment Advisers, LLC
290 Congress Street
Boston, MA 02210
Ryan C. Larrenaga, Esq.
c/o Columbia Management Investment Advisers, LLC
290 Congress Street
Boston, MA 02210
(Name and address of agent for service)
Registrant's telephone number, including area code: (800) 345-6611
Date of fiscal year end: January 31
Date of reporting period: January 31, 2023
Form N-CSR is to be used by management investment companies to file reports with the Commission not later than 10 days after the transmission to stockholders of any report that is required to be transmitted to stockholders under Rule 30e-1 under the Investment Company Act of 1940 (17 CFR 270.30e-1). The Commission may use the information provided on Form N-CSR in its regulatory, disclosure review, inspection, and policymaking roles.
A registrant is required to disclose the information specified by Form N-CSR, and the Commission will make this information public. A registrant is not required to respond to the collection of information contained in Form N-CSR unless the Form displays a currently valid Office of Management and Budget ("OMB") control number. Please direct comments concerning the accuracy of the information collection burden estimate and any suggestions for reducing the burden to Secretary, Securities and Exchange Commission, 100 F Street, NE, Washington, DC 20549. The OMB has reviewed this collection of information under the clearance requirements of 44 U.S.C. § 3507.
Item 1. Reports to Stockholders.

January 31, 2023

| 3 | |
| 5 | |
| 7 | |
| 9 | |
| 11 | |
| 13 | |
| 15 | |
| 17 | |
| 34 | |
| 38 | |
| 40 | |
| 46 | |
| 66 | |
| 90 | |
| 91 | |
| 92 | |
| 98 |
Columbia Capital Allocation Conservative Portfolio (Unaudited)
| Average annual total returns (%) (for the period ended January 31, 2023) | |||||
| Inception | 1 Year | 5 Years | 10 Years | ||
| Class A | Excluding sales charges | 03/04/04 | -8.64 | 1.14 | 2.55 |
| Including sales charges | -12.95 | 0.16 | 2.06 | ||
| Advisor Class* | 06/13/13 | -8.36 | 1.41 | 2.79 | |
| Class C | Excluding sales charges | 03/04/04 | -9.39 | 0.38 | 1.78 |
| Including sales charges | -10.26 | 0.38 | 1.78 | ||
| Institutional Class | 09/27/10 | -8.50 | 1.39 | 2.80 | |
| Institutional 2 Class* | 06/13/13 | -8.44 | 1.41 | 2.83 | |
| Institutional 3 Class* | 06/13/13 | -8.41 | 1.46 | 2.88 | |
| Class R | 09/27/10 | -8.97 | 0.89 | 2.29 | |
| Blended Benchmark | -6.69 | 2.53 | 3.41 | ||
| Bloomberg U.S. Aggregate Bond Index | -8.36 | 0.86 | 1.43 | ||
| Russell 3000 Index | -8.24 | 9.12 | 12.28 | ||
| * | The returns shown for periods prior to the share class inception date (including returns for the Life of the Fund, if shown, which are since Fund inception) include the returns of the Fund’s oldest share class. Since the Fund launched more than one share class at its inception, Class A shares were used. These returns are adjusted to reflect any higher class-related operating expenses of the newer share classes, as applicable. Please visit columbiathreadneedleus.com/investor/investment-products/mutual-funds/appended-performance for more information. |
| Columbia Capital Allocation Portfolios | Annual Report 2023 | 3 |
Columbia Capital Allocation Conservative Portfolio (Unaudited)

| Portfolio breakdown (%) (at January 31, 2023) | |
| Equity Funds | 20.0 |
| Fixed Income Funds | 72.3 |
| Money Market Funds | 7.7 |
| Total | 100.0 |
| 4 | Columbia Capital Allocation Portfolios | Annual Report 2023 |
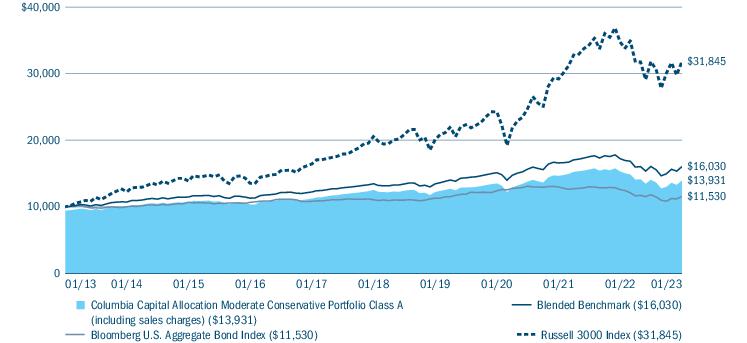
Columbia Capital Allocation Moderate Conservative Portfolio (Unaudited)
| Average annual total returns (%) (for the period ended January 31, 2023) | |||||
| Inception | 1 Year | 5 Years | 10 Years | ||
| Class A | Excluding sales charges | 10/15/96 | -8.89 | 2.14 | 3.98 |
| Including sales charges | -14.15 | 0.94 | 3.37 | ||
| Advisor Class | 11/08/12 | -8.76 | 2.38 | 4.24 | |
| Class C | Excluding sales charges | 10/15/96 | -9.58 | 1.39 | 3.21 |
| Including sales charges | -10.44 | 1.39 | 3.21 | ||
| Institutional Class | 10/15/96 | -8.72 | 2.39 | 4.24 | |
| Institutional 2 Class | 11/08/12 | -8.65 | 2.42 | 4.29 | |
| Institutional 3 Class* | 06/13/13 | -8.67 | 2.45 | 4.32 | |
| Class R | 01/23/06 | -9.11 | 1.89 | 3.72 | |
| Blended Benchmark | -6.85 | 3.56 | 4.83 | ||
| Bloomberg U.S. Aggregate Bond Index | -8.36 | 0.86 | 1.43 | ||
| Russell 3000 Index | -8.24 | 9.12 | 12.28 | ||
| * | The returns shown for periods prior to the share class inception date (including returns for the Life of the Fund, if shown, which are since Fund inception) include the returns of the Fund’s oldest share class. Since the Fund launched more than one share class at its inception, Class A shares were used. These returns are adjusted to reflect any higher class-related operating expenses of the newer share classes, as applicable. Please visit columbiathreadneedleus.com/investor/investment-products/mutual-funds/appended-performance for more information. |
| Columbia Capital Allocation Portfolios | Annual Report 2023 | 5 |
Columbia Capital Allocation Moderate Conservative Portfolio (Unaudited)
| Portfolio breakdown (%) (at January 31, 2023) | |
| Equity Funds | 35.4 |
| Fixed Income Funds | 62.7 |
| Money Market Funds | 1.9 |
| Total | 100.0 |
| 6 | Columbia Capital Allocation Portfolios | Annual Report 2023 |
Columbia Capital Allocation Moderate Portfolio (Unaudited)
| Average annual total returns (%) (for the period ended January 31, 2023) | |||||
| Inception | 1 Year | 5 Years | 10 Years | ||
| Class A | Excluding sales charges | 03/04/04 | -9.70 | 2.86 | 5.37 |
| Including sales charges | -14.88 | 1.65 | 4.75 | ||
| Advisor Class* | 06/13/13 | -9.54 | 3.09 | 5.62 | |
| Class C | Excluding sales charges | 03/04/04 | -10.42 | 2.08 | 4.59 |
| Including sales charges | -11.27 | 2.08 | 4.59 | ||
| Institutional Class | 09/27/10 | -9.48 | 3.12 | 5.65 | |
| Institutional 2 Class* | 06/13/13 | -9.46 | 3.12 | 5.66 | |
| Institutional 3 Class* | 06/13/13 | -9.39 | 3.18 | 5.73 | |
| Class R | 09/27/10 | -9.97 | 2.60 | 5.11 | |
| Blended Benchmark | -7.19 | 4.51 | 6.24 | ||
| Russell 3000 Index | -8.24 | 9.12 | 12.28 | ||
| Bloomberg U.S. Aggregate Bond Index | -8.36 | 0.86 | 1.43 | ||
| * | The returns shown for periods prior to the share class inception date (including returns for the Life of the Fund, if shown, which are since Fund inception) include the returns of the Fund’s oldest share class. Since the Fund launched more than one share class at its inception, Class A shares were used. These returns are adjusted to reflect any higher class-related operating expenses of the newer share classes, as applicable. Please visit columbiathreadneedleus.com/investor/investment-products/mutual-funds/appended-performance for more information. |
| Columbia Capital Allocation Portfolios | Annual Report 2023 | 7 |
Columbia Capital Allocation Moderate Portfolio (Unaudited)

| Portfolio breakdown (%) (at January 31, 2023) | |
| Equity Funds | 50.1 |
| Fixed Income Funds | 47.5 |
| Money Market Funds | 2.4 |
| Total | 100.0 |
| 8 | Columbia Capital Allocation Portfolios | Annual Report 2023 |
Columbia Capital Allocation Moderate Aggressive Portfolio (Unaudited)
| Average annual total returns (%) (for the period ended January 31, 2023) | |||||
| Inception | 1 Year | 5 Years | 10 Years | ||
| Class A | Excluding sales charges | 10/15/96 | -9.93 | 3.55 | 6.52 |
| Including sales charges | -15.12 | 2.33 | 5.90 | ||
| Advisor Class | 11/08/12 | -9.74 | 3.80 | 6.79 | |
| Class C | Excluding sales charges | 10/15/96 | -10.57 | 2.78 | 5.72 |
| Including sales charges | -11.42 | 2.78 | 5.72 | ||
| Institutional Class | 10/15/96 | -9.65 | 3.82 | 6.79 | |
| Institutional 2 Class | 11/08/12 | -9.65 | 3.85 | 6.86 | |
| Institutional 3 Class* | 06/13/13 | -9.58 | 3.91 | 6.90 | |
| Class R | 01/23/06 | -10.10 | 3.30 | 6.26 | |
| Class V | Excluding sales charges | 03/07/11 | -9.93 | 3.55 | 6.51 |
| Including sales charges | -15.12 | 2.33 | 5.89 | ||
| Blended Benchmark | -7.24 | 5.42 | 7.56 | ||
| Russell 3000 Index | -8.24 | 9.12 | 12.28 | ||
| Bloomberg U.S. Aggregate Bond Index | -8.36 | 0.86 | 1.43 | ||
| * | The returns shown for periods prior to the share class inception date (including returns for the Life of the Fund, if shown, which are since Fund inception) include the returns of the Fund’s oldest share class. Since the Fund launched more than one share class at its inception, Class A shares were used. These returns are adjusted to reflect any higher class-related operating expenses of the newer share classes, as applicable. Please visit columbiathreadneedleus.com/investor/investment-products/mutual-funds/appended-performance for more information. |
| Columbia Capital Allocation Portfolios | Annual Report 2023 | 9 |
Columbia Capital Allocation Moderate Aggressive Portfolio (Unaudited)

| Portfolio breakdown (%) (at January 31, 2023) | |
| Equity Funds | 65.1 |
| Fixed Income Funds | 32.6 |
| Money Market Funds | 2.3 |
| Total | 100.0 |
| 10 | Columbia Capital Allocation Portfolios | Annual Report 2023 |
Columbia Capital Allocation Aggressive Portfolio (Unaudited)
| Average annual total returns (%) (for the period ended January 31, 2023) | |||||
| Inception | 1 Year | 5 Years | 10 Years | ||
| Class A | Excluding sales charges | 03/04/04 | -10.14 | 4.16 | 7.64 |
| Including sales charges | -15.30 | 2.93 | 7.01 | ||
| Advisor Class* | 06/13/13 | -9.88 | 4.43 | 7.90 | |
| Class C | Excluding sales charges | 03/04/04 | -10.78 | 3.37 | 6.84 |
| Including sales charges | -11.61 | 3.37 | 6.84 | ||
| Institutional Class | 09/27/10 | -9.89 | 4.42 | 7.92 | |
| Institutional 2 Class* | 06/13/13 | -9.86 | 4.45 | 7.96 | |
| Institutional 3 Class* | 06/13/13 | -9.82 | 4.48 | 8.00 | |
| Class R | 09/27/10 | -10.36 | 3.88 | 7.37 | |
| Blended Benchmark | -7.29 | 6.19 | 8.75 | ||
| Russell 3000 Index | -8.24 | 9.12 | 12.28 | ||
| Bloomberg U.S. Aggregate Bond Index | -8.36 | 0.86 | 1.43 | ||
| * | The returns shown for periods prior to the share class inception date (including returns for the Life of the Fund, if shown, which are since Fund inception) include the returns of the Fund’s oldest share class. Since the Fund launched more than one share class at its inception, Class A shares were used. These returns are adjusted to reflect any higher class-related operating expenses of the newer share classes, as applicable. Please visit columbiathreadneedleus.com/investor/investment-products/mutual-funds/appended-performance for more information. |
| Columbia Capital Allocation Portfolios | Annual Report 2023 | 11 |
Columbia Capital Allocation Aggressive Portfolio (Unaudited)

| Portfolio breakdown (%) (at January 31, 2023) | |
| Equity Funds | 76.5 |
| Fixed Income Funds | 20.4 |
| Money Market Funds | 3.1 |
| Total | 100.0 |
| 12 | Columbia Capital Allocation Portfolios | Annual Report 2023 |
(Unaudited)
| • | Columbia Capital Allocation Conservative Portfolio Class A shares returned -8.64% excluding sales charges. The Fund underperformed its Blended Benchmark, which returned -6.69%. |
| • | Columbia Capital Allocation Moderate Conservative Portfolio Class A shares returned -8.89% excluding sales charges. The Fund underperformed its Blended Benchmark, which returned -6.85%. |
| • | Columbia Capital Allocation Moderate Portfolio Class A shares returned -9.70% excluding sales charges. The Fund underperformed its Blended Benchmark, which returned -7.19%. |
| • | Columbia Capital Allocation Moderate Aggressive Portfolio Class A shares returned -9.93% excluding sales charges. The Fund underperformed its Blended Benchmark, which returned -7.24%. |
| • | Columbia Capital Allocation Aggressive Portfolio Class A shares returned -10.14% excluding sales charges. The Fund underperformed its Blended Benchmark, which returned -7.29%. |
| • | Underlying fund manager performance overall detracted most from relative results across all five Funds during the annual period. |
| Columbia Capital Allocation Portfolios | Annual Report 2023 | 13 |
(Unaudited)
| ○ | Underlying fund manager performance within international equities generally and especially within emerging markets equities strategies hurt most within the equities asset class. |
| ○ | Underlying fund manager performance within U.S. large-cap value equities and within U.S. small-cap equities also dampened results. |
| ○ | On the fixed-income side, underlying fund manager performance within investment-grade bonds detracted most. |
| • | Asset allocation decisions as a whole also detracted from relative performance across all five Funds and were especially impactful in the three more aggressive Funds due to their use of leverage. |
| ○ | Having an underweighted allocation to investment-grade bonds hurt in all five Funds. |
| ○ | Positioning in emerging markets bonds notably detracted in the three more conservative Funds. |
| • | Style positioning overall detracted modestly from results in the most conservative Fund. |
| • | Style positioning decisions within the investment-grade bond sector weighed on results in the three more aggressive Funds. |
| • | Style positioning overall contributed positively to relative results in the two more aggressive Funds. |
| • | Style decisions in the investment-grade bond market segment added to performance in the two more conservative Funds. |
| • | In an annual period when U.S. large-cap value stocks handily outpaced large-cap U.S. growth stocks, the decision to overweight value-oriented funds over growth-oriented funds in all five Funds boosted relative results. |
| • | Having an overweighted allocation to international developed market equities, which outperformed both U.S. and emerging markets equities overall, proved prudent. |
| • | Similarly, the decision to overweight U.S. small-cap equities, which outperformed U.S. large-cap equities during the annual period, buoyed results in all five Funds. |
| • | High-yield bonds contributed positively to the Funds’ performance, as the decision to overweight the sector added value and underlying fund manager performance was also relatively strong. |
| • | An out-of-benchmark exposure to commodities in the three more aggressive Funds aided relative results, as the asset class was one of the few to generate positive absolute returns during the annual period. |
| 14 | Columbia Capital Allocation Portfolios | Annual Report 2023 |
(Unaudited)
| August 1, 2022 — January 31, 2023 | ||||||||||
| Account value at the beginning of the period ($) | Account value at the end of the period ($) | Expenses paid during the period ($) | Fund’s annualized expense ratio (%) | Effective expenses paid during the period ($) | Fund’s effective annualized expense ratio (%) | |||||
| Actual | Hypothetical | Actual | Hypothetical | Actual | Hypothetical | Actual | Actual | Hypothetical | Actual | |
| Columbia Capital Allocation Conservative Portfolio | ||||||||||
| Class A | 1,000.00 | 1,000.00 | 985.30 | 1,022.57 | 2.88 | 2.94 | 0.57 | 5.01 | 5.10 | 0.99 |
| Advisor Class | 1,000.00 | 1,000.00 | 986.50 | 1,023.85 | 1.62 | 1.65 | 0.32 | 3.75 | 3.82 | 0.74 |
| Class C | 1,000.00 | 1,000.00 | 981.40 | 1,018.80 | 6.61 | 6.74 | 1.31 | 8.73 | 8.90 | 1.73 |
| Institutional Class | 1,000.00 | 1,000.00 | 986.50 | 1,023.90 | 1.57 | 1.60 | 0.31 | 3.69 | 3.76 | 0.73 |
| Institutional 2 Class | 1,000.00 | 1,000.00 | 986.60 | 1,024.00 | 1.47 | 1.50 | 0.29 | 3.59 | 3.66 | 0.71 |
| Institutional 3 Class | 1,000.00 | 1,000.00 | 986.80 | 1,024.26 | 1.21 | 1.24 | 0.24 | 3.34 | 3.40 | 0.66 |
| Class R | 1,000.00 | 1,000.00 | 984.00 | 1,021.30 | 4.15 | 4.22 | 0.82 | 6.27 | 6.39 | 1.24 |
| Columbia Capital Allocation Portfolios | Annual Report 2023 | 15 |
(Unaudited)
| August 1, 2022 — January 31, 2023 | ||||||||||
| Account value at the beginning of the period ($) | Account value at the end of the period ($) | Expenses paid during the period ($) | Fund’s annualized expense ratio (%) | Effective expenses paid during the period ($) | Fund’s effective annualized expense ratio (%) | |||||
| Actual | Hypothetical | Actual | Hypothetical | Actual | Hypothetical | Actual | Actual | Hypothetical | Actual | |
| Columbia Capital Allocation Moderate Conservative Portfolio | ||||||||||
| Class A | 1,000.00 | 1,000.00 | 992.50 | 1,023.19 | 2.28 | 2.32 | 0.45 | 4.77 | 4.85 | 0.94 |
| Advisor Class | 1,000.00 | 1,000.00 | 992.70 | 1,024.46 | 1.02 | 1.03 | 0.20 | 3.50 | 3.56 | 0.69 |
| Class C | 1,000.00 | 1,000.00 | 988.50 | 1,019.36 | 6.08 | 6.17 | 1.20 | 8.56 | 8.70 | 1.69 |
| Institutional Class | 1,000.00 | 1,000.00 | 993.70 | 1,024.46 | 1.02 | 1.03 | 0.20 | 3.51 | 3.56 | 0.69 |
| Institutional 2 Class | 1,000.00 | 1,000.00 | 993.90 | 1,024.56 | 0.91 | 0.93 | 0.18 | 3.40 | 3.46 | 0.67 |
| Institutional 3 Class | 1,000.00 | 1,000.00 | 993.90 | 1,024.77 | 0.71 | 0.72 | 0.14 | 3.20 | 3.25 | 0.63 |
| Class R | 1,000.00 | 1,000.00 | 991.30 | 1,021.91 | 3.55 | 3.61 | 0.70 | 6.04 | 6.13 | 1.19 |
| Columbia Capital Allocation Moderate Portfolio | ||||||||||
| Class A | 1,000.00 | 1,000.00 | 996.10 | 1,023.44 | 2.03 | 2.06 | 0.40 | 4.88 | 4.95 | 0.96 |
| Advisor Class | 1,000.00 | 1,000.00 | 997.40 | 1,024.72 | 0.76 | 0.77 | 0.15 | 3.61 | 3.66 | 0.71 |
| Class C | 1,000.00 | 1,000.00 | 992.20 | 1,019.62 | 5.84 | 5.92 | 1.15 | 8.68 | 8.80 | 1.71 |
| Institutional Class | 1,000.00 | 1,000.00 | 997.40 | 1,024.72 | 0.76 | 0.77 | 0.15 | 3.61 | 3.66 | 0.71 |
| Institutional 2 Class | 1,000.00 | 1,000.00 | 997.40 | 1,024.82 | 0.66 | 0.67 | 0.13 | 3.51 | 3.56 | 0.69 |
| Institutional 3 Class | 1,000.00 | 1,000.00 | 997.70 | 1,025.07 | 0.41 | 0.41 | 0.08 | 3.26 | 3.30 | 0.64 |
| Class R | 1,000.00 | 1,000.00 | 994.80 | 1,022.17 | 3.30 | 3.35 | 0.65 | 6.15 | 6.23 | 1.21 |
| Columbia Capital Allocation Moderate Aggressive Portfolio | ||||||||||
| Class A | 1,000.00 | 1,000.00 | 1,001.30 | 1,023.39 | 2.09 | 2.11 | 0.41 | 5.10 | 5.16 | 1.00 |
| Advisor Class | 1,000.00 | 1,000.00 | 1,002.60 | 1,024.66 | 0.82 | 0.83 | 0.16 | 3.83 | 3.87 | 0.75 |
| Class C | 1,000.00 | 1,000.00 | 997.50 | 1,019.57 | 5.90 | 5.97 | 1.16 | 8.91 | 9.01 | 1.75 |
| Institutional Class | 1,000.00 | 1,000.00 | 1,002.60 | 1,024.66 | 0.82 | 0.83 | 0.16 | 3.83 | 3.87 | 0.75 |
| Institutional 2 Class | 1,000.00 | 1,000.00 | 1,002.80 | 1,024.87 | 0.61 | 0.62 | 0.12 | 3.62 | 3.66 | 0.71 |
| Institutional 3 Class | 1,000.00 | 1,000.00 | 1,003.20 | 1,025.12 | 0.36 | 0.36 | 0.07 | 3.37 | 3.41 | 0.66 |
| Class R | 1,000.00 | 1,000.00 | 1,000.00 | 1,022.12 | 3.36 | 3.40 | 0.66 | 6.37 | 6.44 | 1.25 |
| Class V | 1,000.00 | 1,000.00 | 1,001.30 | 1,023.39 | 2.09 | 2.11 | 0.41 | 5.10 | 5.16 | 1.00 |
| Columbia Capital Allocation Aggressive Portfolio | ||||||||||
| Class A | 1,000.00 | 1,000.00 | 1,008.80 | 1,023.39 | 2.10 | 2.11 | 0.41 | 5.27 | 5.31 | 1.03 |
| Advisor Class | 1,000.00 | 1,000.00 | 1,009.80 | 1,024.66 | 0.82 | 0.83 | 0.16 | 3.99 | 4.02 | 0.78 |
| Class C | 1,000.00 | 1,000.00 | 1,004.20 | 1,019.57 | 5.92 | 5.97 | 1.16 | 9.09 | 9.16 | 1.78 |
| Institutional Class | 1,000.00 | 1,000.00 | 1,010.40 | 1,024.66 | 0.82 | 0.83 | 0.16 | 4.00 | 4.02 | 0.78 |
| Institutional 2 Class | 1,000.00 | 1,000.00 | 1,010.10 | 1,024.82 | 0.67 | 0.67 | 0.13 | 3.84 | 3.87 | 0.75 |
| Institutional 3 Class | 1,000.00 | 1,000.00 | 1,010.60 | 1,025.07 | 0.41 | 0.41 | 0.08 | 3.59 | 3.61 | 0.70 |
| Class R | 1,000.00 | 1,000.00 | 1,007.30 | 1,022.12 | 3.38 | 3.40 | 0.66 | 6.55 | 6.59 | 1.28 |
| 16 | Columbia Capital Allocation Portfolios | Annual Report 2023 |
Columbia Capital Allocation Conservative Portfolio, January 31, 2023
| Equity Funds 20.0% | ||
| Shares | Value ($) | |
| International 4.6% | ||
| Columbia Overseas Core Fund, Institutional 3 Class(a),(b) | 885,397 | 8,623,769 |
| U.S. Large Cap 14.1% | ||
| Columbia Contrarian Core Fund, Institutional 3 Class(a) | 328,001 | 8,842,910 |
| Columbia Disciplined Core Fund, Institutional 3 Class(a) | 751,100 | 8,893,027 |
| Columbia Select Large Cap Equity Fund, Institutional 3 Class(a) | 556,806 | 8,864,346 |
| Total | 26,600,283 | |
| U.S. Small Cap 1.3% | ||
| Columbia Select Small Cap Value Fund, Institutional 3 Class(a) | 50,950 | 1,240,136 |
| Columbia Small Cap Growth Fund, Institutional 3 Class(a),(b) | 59,272 | 1,238,187 |
| Total | 2,478,323 | |
| Total Equity Funds (Cost $40,608,489) | 37,702,375 | |
| Fixed Income Funds 72.1% | ||
| Emerging Markets 1.4% | ||
| Columbia Emerging Markets Bond Fund, Institutional 3 Class(a) | 282,193 | 2,615,925 |
| Fixed Income Funds (continued) | ||
| Shares | Value ($) | |
| High Yield 5.6% | ||
| Columbia High Yield Bond Fund, Institutional 3 Class(a) | 1,011,289 | 10,638,764 |
| Investment Grade 65.1% | ||
| Columbia Bond Fund, Institutional 3 Class(a) | 1,256,227 | 37,737,062 |
| Columbia Corporate Income Fund, Institutional 3 Class(a) | 3,895,116 | 35,406,607 |
| Columbia Quality Income Fund, Institutional 3 Class(a) | 1,276,013 | 23,402,078 |
| Columbia U.S. Treasury Index Fund, Institutional 3 Class(a) | 2,568,064 | 26,271,294 |
| Total | 122,817,041 | |
| Total Fixed Income Funds (Cost $157,983,923) | 136,071,730 | |
| Money Market Funds 7.7% | ||
| Columbia Short-Term Cash Fund, 4.559%(a),(c) | 14,436,378 | 14,430,603 |
| Total Money Market Funds (Cost $14,432,669) | 14,430,603 | |
| Total Investments in Securities (Cost: $213,025,081) | 188,204,708 | |
| Other Assets & Liabilities, Net | 469,351 | |
| Net Assets | 188,674,059 | |
| Long futures contracts | ||||||
| Description | Number of contracts | Expiration date | Trading currency | Notional amount | Value/Unrealized appreciation ($) | Value/Unrealized depreciation ($) |
| MSCI EAFE Index | 7 | 03/2023 | USD | 741,650 | 47,494 | — |
| MSCI Emerging Markets Index | 19 | 03/2023 | USD | 992,370 | 70,840 | — |
| Russell 2000 Index E-mini | 11 | 03/2023 | USD | 1,066,670 | 70,229 | — |
| U.S. Treasury Ultra Bond | 13 | 03/2023 | USD | 1,842,750 | — | (30,072) |
| Total | 188,563 | (30,072) | ||||
| Short futures contracts | ||||||
| Description | Number of contracts | Expiration date | Trading currency | Notional amount | Value/Unrealized appreciation ($) | Value/Unrealized depreciation ($) |
| FTSE 100 Index | (5) | 03/2023 | GBP | (387,475) | — | (18,382) |
| S&P 500 Index E-mini | (2) | 03/2023 | USD | (409,000) | — | (985) |
| Total | — | (19,367) | ||||
| Columbia Capital Allocation Portfolios | Annual Report 2023 | 17 |
Columbia Capital Allocation Conservative Portfolio, January 31, 2023
| Cleared credit default swap contracts - buy protection | |||||||||||
| Reference entity | Counterparty | Maturity date | Pay fixed rate (%) | Payment frequency | Notional currency | Notional amount | Value ($) | Upfront payments ($) | Upfront receipts ($) | Unrealized appreciation ($) | Unrealized depreciation ($) |
| Markit CDX Emerging Markets Index, Series 38 | Morgan Stanley | 12/20/2027 | 1.000 | Quarterly | USD | 3,832,000 | (101,359) | — | — | — | (101,359) |
| Markit CDX North America High Yield Index, Series 39 | Morgan Stanley | 12/20/2027 | 5.000 | Quarterly | USD | 4,281,000 | (336,236) | — | — | — | (336,236) |
| Total | (437,595) | — | — | — | (437,595) | ||||||
| (a) | As defined in the Investment Company Act of 1940, as amended, an affiliated company is one in which the Fund owns 5% or more of the company’s outstanding voting securities, or a company which is under common ownership or control with the Fund. The value of the holdings and transactions in these affiliated companies during the year ended January 31, 2023 are as follows: |
| Affiliated issuers | Beginning of period($) | Purchases($) | Sales($) | Net change in unrealized appreciation (depreciation)($) | End of period($) | Capital gain distributions($) | Realized gain (loss)($) | Dividends — affiliated issuers ($) | End of period shares |
| Columbia Bond Fund, Institutional 3 Class | |||||||||
| 50,464,894 | 1,985,686 | (9,918,412) | (4,795,106) | 37,737,062 | — | (1,372,667) | 1,210,745 | 1,256,227 | |
| Columbia Contrarian Core Fund, Institutional 3 Class | |||||||||
| 12,170,826 | 1,230,473 | (2,494,267) | (2,064,122) | 8,842,910 | 748,409 | 158,175 | 53,006 | 328,001 | |
| Columbia Corporate Income Fund, Institutional 3 Class | |||||||||
| 38,695,353 | 9,282,830 | (9,079,892) | (3,491,684) | 35,406,607 | — | (956,011) | 1,118,975 | 3,895,116 | |
| Columbia Disciplined Core Fund, Institutional 3 Class | |||||||||
| 12,118,530 | 1,029,103 | (2,359,872) | (1,894,734) | 8,893,027 | 523,123 | 338,267 | 87,886 | 751,100 | |
| Columbia Emerging Markets Bond Fund, Institutional 3 Class | |||||||||
| 3,754,056 | 310,167 | (1,150,422) | (297,876) | 2,615,925 | — | (230,181) | 133,735 | 282,193 | |
| Columbia High Yield Bond Fund, Institutional 3 Class | |||||||||
| 14,894,095 | 906,673 | (4,230,246) | (931,758) | 10,638,764 | — | (460,207) | 629,526 | 1,011,289 | |
| Columbia Overseas Core Fund, Institutional 3 Class | |||||||||
| 12,342,898 | 823,696 | (3,452,635) | (1,090,190) | 8,623,769 | 145,113 | (16,816) | — | 885,397 | |
| Columbia Quality Income Fund, Institutional 3 Class | |||||||||
| 32,258,977 | 1,836,914 | (7,058,298) | (3,635,515) | 23,402,078 | — | (1,065,248) | 816,561 | 1,276,013 | |
| Columbia Select Large Cap Equity Fund, Institutional 3 Class | |||||||||
| 12,129,509 | 1,153,241 | (2,225,881) | (2,192,523) | 8,864,346 | 470,069 | 499,170 | 99,876 | 556,806 | |
| Columbia Select Small Cap Value Fund, Institutional 3 Class | |||||||||
| 1,827,412 | 165,031 | (507,723) | (244,584) | 1,240,136 | 32,283 | 146,251 | 10,939 | 50,950 | |
| Columbia Short-Term Cash Fund, 4.559% | |||||||||
| 22,249,505 | 6,815,434 | (14,634,996) | 660 | 14,430,603 | — | (4,327) | 402,963 | 14,436,378 | |
| Columbia Small Cap Growth Fund, Institutional 3 Class | |||||||||
| 1,467,569 | — | — | (229,382) | 1,238,187 | — | — | — | 59,272 | |
| Columbia U.S. Treasury Index Fund, Institutional 3 Class | |||||||||
| 35,225,179 | 1,044,883 | (7,070,240) | (2,928,528) | 26,271,294 | — | (470,976) | 481,268 | 2,568,064 | |
| Total | 249,598,803 | (23,795,342) | 188,204,708 | 1,918,997 | (3,434,570) | 5,045,480 | |||
| (b) | Non-income producing investment. |
| (c) | The rate shown is the seven-day current annualized yield at January 31, 2023. |
| 18 | Columbia Capital Allocation Portfolios | Annual Report 2023 |
Columbia Capital Allocation Conservative Portfolio, January 31, 2023
| GBP | British Pound |
| USD | US Dollar |
| ■ | Level 1 — Valuations based on quoted prices for investments in active markets that the Fund has the ability to access at the measurement date. Valuation adjustments are not applied to Level 1 investments. |
| ■ | Level 2 — Valuations based on other significant observable inputs (including quoted prices for similar securities, interest rates, prepayment speeds, credit risks, etc.). |
| ■ | Level 3 — Valuations based on significant unobservable inputs (including the Fund’s own assumptions and judgment in determining the fair value of investments). |
| Level 1 ($) | Level 2 ($) | Level 3 ($) | Total ($) | |
| Investments in Securities | ||||
| Equity Funds | 37,702,375 | — | — | 37,702,375 |
| Fixed Income Funds | 136,071,730 | — | — | 136,071,730 |
| Money Market Funds | 14,430,603 | — | — | 14,430,603 |
| Total Investments in Securities | 188,204,708 | — | — | 188,204,708 |
| Investments in Derivatives | ||||
| Asset | ||||
| Futures Contracts | 188,563 | — | — | 188,563 |
| Liability | ||||
| Futures Contracts | (49,439) | — | — | (49,439) |
| Swap Contracts | — | (437,595) | — | (437,595) |
| Total | 188,343,832 | (437,595) | — | 187,906,237 |
| Columbia Capital Allocation Portfolios | Annual Report 2023 | 19 |
Columbia Capital Allocation Moderate Conservative Portfolio, January 31, 2023
| Equity Funds 35.2% | ||
| Shares | Value ($) | |
| International 8.5% | ||
| Columbia Overseas Core Fund, Institutional 3 Class(a),(b) | 3,393,079 | 33,048,588 |
| U.S. Large Cap 24.7% | ||
| Columbia Contrarian Core Fund, Institutional 3 Class(a) | 1,191,083 | 32,111,602 |
| Columbia Disciplined Core Fund, Institutional 3 Class(a) | 2,717,660 | 32,177,099 |
| Columbia Select Large Cap Equity Fund, Institutional 3 Class(a) | 2,003,353 | 31,893,372 |
| Total | 96,182,073 | |
| U.S. Small Cap 2.0% | ||
| Columbia Select Small Cap Value Fund, Institutional 3 Class(a) | 170,864 | 4,158,838 |
| Columbia Small Cap Growth Fund, Institutional 3 Class(a),(b) | 188,231 | 3,932,149 |
| Total | 8,090,987 | |
| Total Equity Funds (Cost $146,598,541) | 137,321,648 | |
| Fixed Income Funds 62.5% | ||
| Emerging Markets 1.5% | ||
| Columbia Emerging Markets Bond Fund, Institutional 3 Class(a) | 628,004 | 5,821,593 |
| High Yield 6.7% | ||
| Columbia High Yield Bond Fund, Institutional 3 Class(a) | 2,473,393 | 26,020,091 |
| Fixed Income Funds (continued) | ||
| Shares | Value ($) | |
| Investment Grade 54.3% | ||
| Columbia Bond Fund, Institutional 3 Class(a) | 1,738,445 | 52,222,894 |
| Columbia Corporate Income Fund, Institutional 3 Class(a) | 7,331,286 | 66,641,387 |
| Columbia Quality Income Fund, Institutional 3 Class(a) | 2,637,602 | 48,373,616 |
| Columbia U.S. Treasury Index Fund, Institutional 3 Class(a) | 4,337,847 | 44,376,181 |
| Total | 211,614,078 | |
| Total Fixed Income Funds (Cost $283,399,792) | 243,455,762 | |
| Money Market Funds 1.9% | ||
| Columbia Short-Term Cash Fund, 4.559%(a),(c) | 7,482,259 | 7,479,266 |
| Total Money Market Funds (Cost $7,478,912) | 7,479,266 | |
| Total Investments in Securities (Cost: $437,477,245) | 388,256,676 | |
| Other Assets & Liabilities, Net | 1,395,813 | |
| Net Assets | 389,652,489 | |
| Long futures contracts | ||||||
| Description | Number of contracts | Expiration date | Trading currency | Notional amount | Value/Unrealized appreciation ($) | Value/Unrealized depreciation ($) |
| MSCI EAFE Index | 11 | 03/2023 | USD | 1,165,450 | 74,634 | — |
| MSCI Emerging Markets Index | 77 | 03/2023 | USD | 4,021,710 | 287,088 | — |
| Russell 2000 Index E-mini | 26 | 03/2023 | USD | 2,521,220 | 165,996 | — |
| U.S. Treasury Ultra Bond | 27 | 03/2023 | USD | 3,827,250 | — | (62,457) |
| Total | 527,718 | (62,457) | ||||
| Short futures contracts | ||||||
| Description | Number of contracts | Expiration date | Trading currency | Notional amount | Value/Unrealized appreciation ($) | Value/Unrealized depreciation ($) |
| FTSE 100 Index | (11) | 03/2023 | GBP | (852,445) | — | (40,441) |
| S&P 500 Index E-mini | (15) | 03/2023 | USD | (3,067,500) | — | (7,386) |
| Total | — | (47,827) | ||||
| 20 | Columbia Capital Allocation Portfolios | Annual Report 2023 |
Columbia Capital Allocation Moderate Conservative Portfolio, January 31, 2023
| Cleared credit default swap contracts - buy protection | |||||||||||
| Reference entity | Counterparty | Maturity date | Pay fixed rate (%) | Payment frequency | Notional currency | Notional amount | Value ($) | Upfront payments ($) | Upfront receipts ($) | Unrealized appreciation ($) | Unrealized depreciation ($) |
| Markit CDX Emerging Markets Index, Series 38 | Morgan Stanley | 12/20/2027 | 1.000 | Quarterly | USD | 8,460,000 | (223,772) | — | — | — | (223,772) |
| Markit CDX North America High Yield Index, Series 39 | Morgan Stanley | 12/20/2027 | 5.000 | Quarterly | USD | 10,031,000 | (787,850) | — | — | — | (787,850) |
| Total | (1,011,622) | — | — | — | (1,011,622) | ||||||
| (a) | As defined in the Investment Company Act of 1940, as amended, an affiliated company is one in which the Fund owns 5% or more of the company’s outstanding voting securities, or a company which is under common ownership or control with the Fund. The value of the holdings and transactions in these affiliated companies during the year ended January 31, 2023 are as follows: |
| Affiliated issuers | Beginning of period($) | Purchases($) | Sales($) | Net change in unrealized appreciation (depreciation)($) | End of period($) | Capital gain distributions($) | Realized gain (loss)($) | Dividends — affiliated issuers ($) | End of period shares |
| Columbia Bond Fund, Institutional 3 Class | |||||||||
| 66,690,504 | 2,123,720 | (9,716,750) | (6,874,580) | 52,222,894 | — | (1,372,109) | 1,644,286 | 1,738,445 | |
| Columbia Contrarian Core Fund, Institutional 3 Class | |||||||||
| 41,450,060 | 3,420,686 | (5,055,403) | (7,703,741) | 32,111,602 | 2,698,311 | 981,004 | 191,109 | 1,191,083 | |
| Columbia Corporate Income Fund, Institutional 3 Class | |||||||||
| 70,918,440 | 14,163,696 | (11,361,171) | (7,079,578) | 66,641,387 | — | (1,078,770) | 2,111,201 | 7,331,286 | |
| Columbia Disciplined Core Fund, Institutional 3 Class | |||||||||
| 41,213,855 | 2,755,873 | (5,271,321) | (6,521,308) | 32,177,099 | 1,896,395 | 1,042,567 | 318,601 | 2,717,660 | |
| Columbia Emerging Markets Bond Fund, Institutional 3 Class | |||||||||
| 8,325,021 | 376,335 | (2,100,140) | (779,623) | 5,821,593 | — | (428,322) | 295,837 | 628,004 | |
| Columbia High Yield Bond Fund, Institutional 3 Class | |||||||||
| 33,562,603 | 1,518,976 | (6,625,653) | (2,435,835) | 26,020,091 | — | (734,477) | 1,476,894 | 2,473,393 | |
| Columbia Overseas Core Fund, Institutional 3 Class | |||||||||
| 44,746,601 | 1,488,898 | (10,372,673) | (2,814,238) | 33,048,588 | 538,244 | (1,090,003) | — | 3,393,079 | |
| Columbia Quality Income Fund, Institutional 3 Class | |||||||||
| 62,532,334 | 4,065,425 | (10,716,757) | (7,507,386) | 48,373,616 | — | (1,701,009) | 1,642,120 | 2,637,602 | |
| Columbia Select Large Cap Equity Fund, Institutional 3 Class | |||||||||
| 41,190,761 | 2,964,176 | (5,118,256) | (7,143,309) | 31,893,372 | 1,643,879 | 1,191,454 | 353,955 | 2,003,353 | |
| Columbia Select Small Cap Value Fund, Institutional 3 Class | |||||||||
| 5,498,174 | 256,894 | (1,027,010) | (569,220) | 4,158,838 | 113,128 | 258,906 | 38,332 | 170,864 | |
| Columbia Short-Term Cash Fund, 4.559% | |||||||||
| 20,253,674 | 16,258,163 | (29,035,004) | 2,433 | 7,479,266 | — | (5,237) | 325,152 | 7,482,259 | |
| Columbia Small Cap Growth Fund, Institutional 3 Class | |||||||||
| 4,660,604 | — | — | (728,455) | 3,932,149 | — | — | — | 188,231 | |
| Columbia U.S. Treasury Index Fund, Institutional 3 Class | |||||||||
| 57,453,338 | 1,291,538 | (9,318,273) | (5,050,422) | 44,376,181 | — | (566,407) | 803,410 | 4,337,847 | |
| Total | 498,495,969 | (55,205,262) | 388,256,676 | 6,889,957 | (3,502,403) | 9,200,897 | |||
| (b) | Non-income producing investment. |
| (c) | The rate shown is the seven-day current annualized yield at January 31, 2023. |
| Columbia Capital Allocation Portfolios | Annual Report 2023 | 21 |
Columbia Capital Allocation Moderate Conservative Portfolio, January 31, 2023
| GBP | British Pound |
| USD | US Dollar |
| ■ | Level 1 — Valuations based on quoted prices for investments in active markets that the Fund has the ability to access at the measurement date. Valuation adjustments are not applied to Level 1 investments. |
| ■ | Level 2 — Valuations based on other significant observable inputs (including quoted prices for similar securities, interest rates, prepayment speeds, credit risks, etc.). |
| ■ | Level 3 — Valuations based on significant unobservable inputs (including the Fund’s own assumptions and judgment in determining the fair value of investments). |
| Level 1 ($) | Level 2 ($) | Level 3 ($) | Total ($) | |
| Investments in Securities | ||||
| Equity Funds | 137,321,648 | — | — | 137,321,648 |
| Fixed Income Funds | 243,455,762 | — | — | 243,455,762 |
| Money Market Funds | 7,479,266 | — | — | 7,479,266 |
| Total Investments in Securities | 388,256,676 | — | — | 388,256,676 |
| Investments in Derivatives | ||||
| Asset | ||||
| Futures Contracts | 527,718 | — | — | 527,718 |
| Liability | ||||
| Futures Contracts | (110,284) | — | — | (110,284) |
| Swap Contracts | — | (1,011,622) | — | (1,011,622) |
| Total | 388,674,110 | (1,011,622) | — | 387,662,488 |
| 22 | Columbia Capital Allocation Portfolios | Annual Report 2023 |
Columbia Capital Allocation Moderate Portfolio, January 31, 2023
| Equity Funds 49.8% | ||
| Shares | Value ($) | |
| International 12.4% | ||
| Columbia Emerging Markets Fund, Institutional 3 Class(a),(b) | 1,611,131 | 20,380,808 |
| Columbia Overseas Core Fund, Institutional 3 Class(a),(b) | 12,828,483 | 124,949,425 |
| Total | 145,330,233 | |
| U.S. Large Cap 34.7% | ||
| Columbia Contrarian Core Fund, Institutional 3 Class(a) | 3,912,095 | 105,470,086 |
| Columbia Large Cap Growth Fund, Institutional 3 Class(a),(b) | 2,126,083 | 102,285,878 |
| Columbia Large Cap Value Fund, Institutional 3 Class(a) | 6,019,418 | 94,926,217 |
| Columbia Select Large Cap Equity Fund, Institutional 3 Class(a) | 6,424,766 | 102,282,274 |
| Total | 404,964,455 | |
| U.S. Small Cap 2.7% | ||
| Columbia Select Small Cap Value Fund, Institutional 3 Class(a) | 693,969 | 16,891,197 |
| Columbia Small Cap Growth Fund, Institutional 3 Class(a),(b) | 726,224 | 15,170,819 |
| Total | 32,062,016 | |
| Total Equity Funds (Cost $613,865,068) | 582,356,704 | |
| Fixed Income Funds 47.3% | ||
| Emerging Markets 1.8% | ||
| Columbia Emerging Markets Bond Fund, Institutional 3 Class(a) | 2,239,864 | 20,763,541 |
| Fixed Income Funds (continued) | ||
| Shares | Value ($) | |
| High Yield 10.2% | ||
| Columbia High Yield Bond Fund, Institutional 3 Class(a) | 11,374,434 | 119,659,048 |
| Investment Grade 35.3% | ||
| Columbia Bond Fund, Institutional 3 Class(a) | 4,171,148 | 125,301,271 |
| Columbia Corporate Income Fund, Institutional 3 Class(a) | 13,805,376 | 125,490,869 |
| Columbia Quality Income Fund, Institutional 3 Class(a) | 5,879,627 | 107,832,359 |
| Columbia U.S. Treasury Index Fund, Institutional 3 Class(a) | 5,251,743 | 53,725,327 |
| Total | 412,349,826 | |
| Total Fixed Income Funds (Cost $652,900,308) | 552,772,415 | |
| Money Market Funds 2.4% | ||
| Columbia Short-Term Cash Fund, 4.559%(a),(c) | 27,937,514 | 27,926,339 |
| Total Money Market Funds (Cost $27,925,366) | 27,926,339 | |
| Total Investments in Securities (Cost: $1,294,690,742) | 1,163,055,458 | |
| Other Assets & Liabilities, Net | 5,489,524 | |
| Net Assets | 1,168,544,982 | |
| Long futures contracts | ||||||
| Description | Number of contracts | Expiration date | Trading currency | Notional amount | Value/Unrealized appreciation ($) | Value/Unrealized depreciation ($) |
| MSCI Emerging Markets Index | 293 | 03/2023 | USD | 15,303,390 | 1,092,421 | — |
| Russell 2000 Index E-mini | 104 | 03/2023 | USD | 10,084,880 | 663,985 | — |
| U.S. Treasury Ultra Bond | 66 | 03/2023 | USD | 9,355,500 | 509,289 | — |
| U.S. Treasury Ultra Bond | 163 | 03/2023 | USD | 23,105,250 | — | (377,056) |
| Total | 2,265,695 | (377,056) | ||||
| Columbia Capital Allocation Portfolios | Annual Report 2023 | 23 |
Columbia Capital Allocation Moderate Portfolio, January 31, 2023
| Short futures contracts | ||||||
| Description | Number of contracts | Expiration date | Trading currency | Notional amount | Value/Unrealized appreciation ($) | Value/Unrealized depreciation ($) |
| FTSE 100 Index | (32) | 03/2023 | GBP | (2,479,840) | — | (117,646) |
| MSCI EAFE Index | (9) | 03/2023 | USD | (953,550) | — | (40,583) |
| S&P 500 Index E-mini | (17) | 03/2023 | USD | (3,476,500) | — | (8,370) |
| Total | — | (166,599) | ||||
| Cleared credit default swap contracts - buy protection | |||||||||||
| Reference entity | Counterparty | Maturity date | Pay fixed rate (%) | Payment frequency | Notional currency | Notional amount | Value ($) | Upfront payments ($) | Upfront receipts ($) | Unrealized appreciation ($) | Unrealized depreciation ($) |
| Markit CDX Emerging Markets Index, Series 38 | Morgan Stanley | 12/20/2027 | 1.000 | Quarterly | USD | 27,894,000 | (737,810) | — | — | — | (737,810) |
| Markit CDX North America High Yield Index, Series 39 | Morgan Stanley | 12/20/2027 | 5.000 | Quarterly | USD | 36,967,000 | (2,903,446) | — | — | — | (2,903,446) |
| Total | (3,641,256) | — | — | — | (3,641,256) | ||||||
| Cleared credit default swap contracts - sell protection | ||||||||||||
| Reference entity | Counterparty | Maturity date | Receive fixed rate (%) | Payment frequency | Implied credit spread (%)* | Notional currency | Notional amount | Value ($) | Upfront payments ($) | Upfront receipts ($) | Unrealized appreciation ($) | Unrealized depreciation ($) |
| Markit CDX North America Investment Grade Index, Series 39 | Morgan Stanley | 12/20/2027 | 1.000 | Quarterly | 0.717 | USD | 34,388,000 | 32,890 | — | — | 32,890 | — |
| * | Implied credit spreads, represented in absolute terms, utilized in determining the market value of credit default swap agreements on corporate or sovereign issues as of period end serve as an indicator of the current status of the payment/performance risk and represent the likelihood or risk of default for the credit derivative. The implied credit spread of a particular referenced entity reflects the cost of buying/selling protection and may include upfront payments required to be made to enter into the agreement. Wider credit spreads represent a deterioration of the referenced entity’s credit soundness and a greater likelihood or risk of default or other credit event occurring as defined under the terms of the agreement. |
| (a) | As defined in the Investment Company Act of 1940, as amended, an affiliated company is one in which the Fund owns 5% or more of the company’s outstanding voting securities, or a company which is under common ownership or control with the Fund. The value of the holdings and transactions in these affiliated companies during the year ended January 31, 2023 are as follows: |
| Affiliated issuers | Beginning of period($) | Purchases($) | Sales($) | Net change in unrealized appreciation (depreciation)($) | End of period($) | Capital gain distributions($) | Realized gain (loss)($) | Dividends — affiliated issuers ($) | End of period shares |
| Columbia Bond Fund, Institutional 3 Class | |||||||||
| 157,217,274 | 4,548,127 | (19,792,764) | (16,671,366) | 125,301,271 | — | (2,680,758) | 3,861,849 | 4,171,148 | |
| Columbia Commodity Strategy Fund, Institutional 3 Class | |||||||||
| 8,668,609 | — | (9,755,588) | 1,086,979 | — | — | (486,556) | — | — | |
| Columbia Contrarian Core Fund, Institutional 3 Class | |||||||||
| 135,676,424 | 9,536,165 | (12,648,720) | (27,093,783) | 105,470,086 | 8,808,518 | 5,079,397 | 623,868 | 3,912,095 | |
| Columbia Corporate Income Fund, Institutional 3 Class | |||||||||
| 159,319,055 | 4,752,238 | (22,456,244) | (16,124,180) | 125,490,869 | — | (2,218,528) | 4,565,669 | 13,805,376 | |
| Columbia Emerging Markets Bond Fund, Institutional 3 Class | |||||||||
| 27,325,225 | 1,056,259 | (4,859,646) | (2,758,297) | 20,763,541 | — | (1,098,724) | 1,001,678 | 2,239,864 | |
| Columbia Emerging Markets Fund, Institutional 3 Class | |||||||||
| 29,738,791 | 294,081 | (1,912,024) | (7,740,040) | 20,380,808 | — | 622,579 | — | 1,611,131 | |
| 24 | Columbia Capital Allocation Portfolios | Annual Report 2023 |
Columbia Capital Allocation Moderate Portfolio, January 31, 2023
| Affiliated issuers | Beginning of period($) | Purchases($) | Sales($) | Net change in unrealized appreciation (depreciation)($) | End of period($) | Capital gain distributions($) | Realized gain (loss)($) | Dividends — affiliated issuers ($) | End of period shares |
| Columbia High Yield Bond Fund, Institutional 3 Class | |||||||||
| 152,528,124 | 6,713,029 | (28,294,450) | (11,287,655) | 119,659,048 | — | (3,131,995) | 6,692,849 | 11,374,434 | |
| Columbia Large Cap Growth Fund, Institutional 3 Class | |||||||||
| 122,223,521 | 17,050,657 | (14,135,570) | (22,852,730) | 102,285,878 | — | (172,195) | — | 2,126,083 | |
| Columbia Large Cap Value Fund, Institutional 3 Class | |||||||||
| 148,561,330 | 8,694,624 | (47,157,956) | (15,171,781) | 94,926,217 | 6,737,071 | 4,938,693 | 1,957,472 | 6,019,418 | |
| Columbia Overseas Core Fund, Institutional 3 Class | |||||||||
| 167,045,756 | 2,128,923 | (31,246,549) | (12,978,705) | 124,949,425 | 2,023,335 | (1,381,192) | — | 12,828,483 | |
| Columbia Quality Income Fund, Institutional 3 Class | |||||||||
| 137,338,040 | 9,218,883 | (21,562,652) | (17,161,912) | 107,832,359 | — | (2,876,834) | 3,605,865 | 5,879,627 | |
| Columbia Select Large Cap Equity Fund, Institutional 3 Class | |||||||||
| 134,891,209 | 6,692,988 | (15,863,184) | (23,438,739) | 102,282,274 | 5,361,946 | 3,885,566 | 1,156,855 | 6,424,766 | |
| Columbia Select Small Cap Value Fund, Institutional 3 Class | |||||||||
| 22,686,536 | 612,883 | (3,965,626) | (2,442,596) | 16,891,197 | 452,348 | 1,075,508 | 153,272 | 693,969 | |
| Columbia Short-Term Cash Fund, 4.559% | |||||||||
| 31,256,942 | 77,162,784 | (80,497,006) | 3,619 | 27,926,339 | — | (8,926) | 525,000 | 27,937,514 | |
| Columbia Small Cap Growth Fund, Institutional 3 Class | |||||||||
| 17,981,306 | — | — | (2,810,487) | 15,170,819 | — | — | — | 726,224 | |
| Columbia U.S. Treasury Index Fund, Institutional 3 Class | |||||||||
| 68,846,996 | 1,398,777 | (10,112,091) | (6,408,355) | 53,725,327 | — | (298,176) | 965,650 | 5,251,743 | |
| Total | 1,521,305,138 | (183,850,028) | 1,163,055,458 | 23,383,218 | 1,247,859 | 25,110,027 | |||
| (b) | Non-income producing investment. |
| (c) | The rate shown is the seven-day current annualized yield at January 31, 2023. |
| GBP | British Pound |
| USD | US Dollar |
| ■ | Level 1 — Valuations based on quoted prices for investments in active markets that the Fund has the ability to access at the measurement date. Valuation adjustments are not applied to Level 1 investments. |
| ■ | Level 2 — Valuations based on other significant observable inputs (including quoted prices for similar securities, interest rates, prepayment speeds, credit risks, etc.). |
| ■ | Level 3 — Valuations based on significant unobservable inputs (including the Fund’s own assumptions and judgment in determining the fair value of investments). |
| Columbia Capital Allocation Portfolios | Annual Report 2023 | 25 |
Columbia Capital Allocation Moderate Portfolio, January 31, 2023
Investments falling into the Level 3 category are primarily supported by quoted prices from brokers and dealers participating in the market for those investments. However, these may be classified as Level 3 investments due to lack of market transparency and corroboration to support these quoted prices. Additionally, valuation models may be used as the pricing source for any remaining investments classified as Level 3. These models may rely on one or more significant unobservable inputs and/or significant assumptions by the Investment Manager. Inputs used in valuations may include, but are not limited to, financial statement analysis, capital account balances, discount rates and estimated cash flows, and comparable company data.
| Level 1 ($) | Level 2 ($) | Level 3 ($) | Total ($) | |
| Investments in Securities | ||||
| Equity Funds | 582,356,704 | — | — | 582,356,704 |
| Fixed Income Funds | 552,772,415 | — | — | 552,772,415 |
| Money Market Funds | 27,926,339 | — | — | 27,926,339 |
| Total Investments in Securities | 1,163,055,458 | — | — | 1,163,055,458 |
| Investments in Derivatives | ||||
| Asset | ||||
| Futures Contracts | 2,265,695 | — | — | 2,265,695 |
| Swap Contracts | — | 32,890 | — | 32,890 |
| Liability | ||||
| Futures Contracts | (543,655) | — | — | (543,655) |
| Swap Contracts | — | (3,641,256) | — | (3,641,256) |
| Total | 1,164,777,498 | (3,608,366) | — | 1,161,169,132 |
| 26 | Columbia Capital Allocation Portfolios | Annual Report 2023 |
Columbia Capital Allocation Moderate Aggressive Portfolio, January 31, 2023
| Equity Funds 64.9% | ||
| Shares | Value ($) | |
| International 15.3% | ||
| Columbia Emerging Markets Fund, Institutional 3 Class(a),(b) | 4,631,374 | 58,586,889 |
| Columbia Overseas Core Fund, Institutional 3 Class(a),(b) | 21,151,375 | 206,014,389 |
| Total | 264,601,278 | |
| U.S. Large Cap 46.0% | ||
| Columbia Contrarian Core Fund, Institutional 3 Class(a) | 7,682,732 | 207,126,463 |
| Columbia Large Cap Growth Fund, Institutional 3 Class(a),(b) | 4,229,359 | 203,474,470 |
| Columbia Large Cap Value Fund, Institutional 3 Class(a) | 11,678,070 | 184,163,153 |
| Columbia Select Large Cap Equity Fund, Institutional 3 Class(a) | 12,605,313 | 200,676,584 |
| Total | 795,440,670 | |
| U.S. Small Cap 3.6% | ||
| Columbia Select Small Cap Value Fund, Institutional 3 Class(a) | 1,462,015 | 35,585,435 |
| Columbia Small Cap Growth Fund, Institutional 3 Class(a),(b) | 1,253,961 | 26,195,247 |
| Total | 61,780,682 | |
| Total Equity Funds (Cost $1,179,249,907) | 1,121,822,630 | |
| Fixed Income Funds 32.4% | ||
| Shares | Value ($) | |
| High Yield 8.9% | ||
| Columbia High Yield Bond Fund, Institutional 3 Class(a) | 14,596,926 | 153,559,664 |
| Investment Grade 23.5% | ||
| Columbia Bond Fund, Institutional 3 Class(a) | 2,955,975 | 88,797,490 |
| Columbia Corporate Income Fund, Institutional 3 Class(a) | 15,941,008 | 144,903,760 |
| Columbia Quality Income Fund, Institutional 3 Class(a) | 6,535,410 | 119,859,422 |
| Columbia U.S. Treasury Index Fund, Institutional 3 Class(a) | 5,235,523 | 53,559,404 |
| Total | 407,120,076 | |
| Total Fixed Income Funds (Cost $652,395,875) | 560,679,740 | |
| Money Market Funds 2.3% | ||
| Columbia Short-Term Cash Fund, 4.559%(a),(c) | 39,898,866 | 39,882,906 |
| Total Money Market Funds (Cost $39,883,012) | 39,882,906 | |
| Total Investments in Securities (Cost: $1,871,528,794) | 1,722,385,276 | |
| Other Assets & Liabilities, Net | 7,719,348 | |
| Net Assets | 1,730,104,624 | |
| Long futures contracts | ||||||
| Description | Number of contracts | Expiration date | Trading currency | Notional amount | Value/Unrealized appreciation ($) | Value/Unrealized depreciation ($) |
| MSCI Emerging Markets Index | 724 | 03/2023 | USD | 37,814,520 | 2,699,362 | — |
| Russell 2000 Index E-mini | 244 | 03/2023 | USD | 23,660,680 | 1,557,811 | — |
| U.S. Treasury Ultra Bond | 97 | 03/2023 | USD | 13,749,750 | 748,500 | — |
| U.S. Treasury Ultra Bond | 240 | 03/2023 | USD | 34,020,000 | — | (555,174) |
| Total | 5,005,673 | (555,174) | ||||
| Columbia Capital Allocation Portfolios | Annual Report 2023 | 27 |
Columbia Capital Allocation Moderate Aggressive Portfolio, January 31, 2023
| Short futures contracts | ||||||
| Description | Number of contracts | Expiration date | Trading currency | Notional amount | Value/Unrealized appreciation ($) | Value/Unrealized depreciation ($) |
| FTSE 100 Index | (86) | 03/2023 | GBP | (6,664,570) | — | (316,173) |
| MSCI EAFE Index | (42) | 03/2023 | USD | (4,449,900) | — | (189,386) |
| S&P 500 Index E-mini | (59) | 03/2023 | USD | (12,065,500) | — | (29,050) |
| Total | — | (534,609) | ||||
| Cleared credit default swap contracts - buy protection | |||||||||||
| Reference entity | Counterparty | Maturity date | Pay fixed rate (%) | Payment frequency | Notional currency | Notional amount | Value ($) | Upfront payments ($) | Upfront receipts ($) | Unrealized appreciation ($) | Unrealized depreciation ($) |
| Markit CDX North America High Yield Index, Series 39 | Morgan Stanley | 12/20/2027 | 5.000 | Quarterly | USD | 44,497,000 | (3,494,864) | — | — | — | (3,494,864) |
| (a) | As defined in the Investment Company Act of 1940, as amended, an affiliated company is one in which the Fund owns 5% or more of the company’s outstanding voting securities, or a company which is under common ownership or control with the Fund. The value of the holdings and transactions in these affiliated companies during the year ended January 31, 2023 are as follows: |
| Affiliated issuers | Beginning of period($) | Purchases($) | Sales($) | Net change in unrealized appreciation (depreciation)($) | End of period($) | Capital gain distributions($) | Realized gain (loss)($) | Dividends — affiliated issuers ($) | End of period shares |
| Columbia Bond Fund, Institutional 3 Class | |||||||||
| 108,318,739 | 2,775,235 | (10,245,492) | (12,050,992) | 88,797,490 | — | (1,368,592) | 2,727,274 | 2,955,975 | |
| Columbia Commodity Strategy Fund, Institutional 3 Class | |||||||||
| 17,866,978 | — | (20,107,365) | 2,240,387 | — | — | (1,002,847) | — | — | |
| Columbia Contrarian Core Fund, Institutional 3 Class | |||||||||
| 255,056,617 | 18,493,260 | (16,560,425) | (49,862,989) | 207,126,463 | 17,270,013 | 6,933,061 | 1,223,158 | 7,682,732 | |
| Columbia Corporate Income Fund, Institutional 3 Class | |||||||||
| 169,674,190 | 5,145,850 | (12,063,583) | (17,852,697) | 144,903,760 | — | (1,638,797) | 5,052,456 | 15,941,008 | |
| Columbia Emerging Markets Fund, Institutional 3 Class | |||||||||
| 76,518,773 | 453,907 | (354,795) | (18,030,996) | 58,586,889 | — | 141,031 | — | 4,631,374 | |
| Columbia High Yield Bond Fund, Institutional 3 Class | |||||||||
| 184,676,314 | 8,371,471 | (24,627,729) | (14,860,392) | 153,559,664 | — | (2,685,321) | 8,350,156 | 14,596,926 | |
| Columbia Large Cap Growth Fund, Institutional 3 Class | |||||||||
| 223,071,326 | 36,466,271 | (13,044,356) | (43,018,771) | 203,474,470 | — | (895,223) | — | 4,229,359 | |
| Columbia Large Cap Value Fund, Institutional 3 Class | |||||||||
| 279,874,489 | 17,190,729 | (84,698,368) | (28,203,697) | 184,163,153 | 13,410,322 | 8,272,805 | 3,780,277 | 11,678,070 | |
| Columbia Overseas Core Fund, Institutional 3 Class | |||||||||
| 257,719,925 | 3,190,120 | (34,839,297) | (20,056,359) | 206,014,389 | 3,173,189 | (1,022,551) | — | 21,151,375 | |
| Columbia Quality Income Fund, Institutional 3 Class | |||||||||
| 142,393,724 | 12,249,866 | (15,803,676) | (18,980,492) | 119,859,422 | — | (1,888,843) | 3,880,428 | 6,535,410 | |
| Columbia Select Large Cap Equity Fund, Institutional 3 Class | |||||||||
| 252,813,405 | 12,546,552 | (23,789,357) | (40,894,016) | 200,676,584 | 10,239,231 | 3,371,045 | 2,255,594 | 12,605,313 | |
| Columbia Select Small Cap Value Fund, Institutional 3 Class | |||||||||
| 40,949,464 | 1,276,811 | (3,367,388) | (3,273,452) | 35,585,435 | 951,635 | 1,026,429 | 322,449 | 1,462,015 | |
| Columbia Short-Term Cash Fund, 4.559% | |||||||||
| 37,207,111 | 126,643,849 | (123,970,865) | 2,811 | 39,882,906 | — | (9,097) | 675,840 | 39,898,866 | |
| 28 | Columbia Capital Allocation Portfolios | Annual Report 2023 |
Columbia Capital Allocation Moderate Aggressive Portfolio, January 31, 2023
| Affiliated issuers | Beginning of period($) | Purchases($) | Sales($) | Net change in unrealized appreciation (depreciation)($) | End of period($) | Capital gain distributions($) | Realized gain (loss)($) | Dividends — affiliated issuers ($) | End of period shares |
| Columbia Small Cap Growth Fund, Institutional 3 Class | |||||||||
| 31,048,077 | — | — | (4,852,830) | 26,195,247 | — | — | — | 1,253,961 | |
| Columbia U.S. Treasury Index Fund, Institutional 3 Class | |||||||||
| 65,188,840 | 1,061,600 | (7,180,867) | (5,510,169) | 53,559,404 | — | (877,100) | 939,731 | 5,235,523 | |
| Total | 2,142,377,972 | (275,204,654) | 1,722,385,276 | 45,044,390 | 8,356,000 | 29,207,363 | |||
| (b) | Non-income producing investment. |
| (c) | The rate shown is the seven-day current annualized yield at January 31, 2023. |
| GBP | British Pound |
| USD | US Dollar |
| ■ | Level 1 — Valuations based on quoted prices for investments in active markets that the Fund has the ability to access at the measurement date. Valuation adjustments are not applied to Level 1 investments. |
| ■ | Level 2 — Valuations based on other significant observable inputs (including quoted prices for similar securities, interest rates, prepayment speeds, credit risks, etc.). |
| ■ | Level 3 — Valuations based on significant unobservable inputs (including the Fund’s own assumptions and judgment in determining the fair value of investments). |
| Columbia Capital Allocation Portfolios | Annual Report 2023 | 29 |
Columbia Capital Allocation Moderate Aggressive Portfolio, January 31, 2023
The following table is a summary of the inputs used to value the Fund’s investments at January 31, 2023:
| Level 1 ($) | Level 2 ($) | Level 3 ($) | Total ($) | |
| Investments in Securities | ||||
| Equity Funds | 1,121,822,630 | — | — | 1,121,822,630 |
| Fixed Income Funds | 560,679,740 | — | — | 560,679,740 |
| Money Market Funds | 39,882,906 | — | — | 39,882,906 |
| Total Investments in Securities | 1,722,385,276 | — | — | 1,722,385,276 |
| Investments in Derivatives | ||||
| Asset | ||||
| Futures Contracts | 5,005,673 | — | — | 5,005,673 |
| Liability | ||||
| Futures Contracts | (1,089,783) | — | — | (1,089,783) |
| Swap Contracts | — | (3,494,864) | — | (3,494,864) |
| Total | 1,726,301,166 | (3,494,864) | — | 1,722,806,302 |
| 30 | Columbia Capital Allocation Portfolios | Annual Report 2023 |
Columbia Capital Allocation Aggressive Portfolio, January 31, 2023
| Equity Funds 76.0% | ||
| Shares | Value ($) | |
| International 18.7% | ||
| Columbia Emerging Markets Fund, Institutional 3 Class(a),(b) | 4,823,498 | 61,017,244 |
| Columbia Overseas Core Fund, Institutional 3 Class(a),(b) | 17,352,085 | 169,009,313 |
| Total | 230,026,557 | |
| U.S. Large Cap 53.1% | ||
| Columbia Contrarian Core Fund, Institutional 3 Class(a) | 6,301,071 | 169,876,891 |
| Columbia Large Cap Growth Fund, Institutional 3 Class(a),(b) | 3,547,707 | 170,680,169 |
| Columbia Large Cap Value Fund, Institutional 3 Class(a) | 9,587,108 | 151,188,695 |
| Columbia Select Large Cap Equity Fund, Institutional 3 Class(a) | 10,244,631 | 163,094,521 |
| Total | 654,840,276 | |
| U.S. Small Cap 4.2% | ||
| Columbia Select Small Cap Value Fund, Institutional 3 Class(a) | 1,258,930 | 30,642,339 |
| Columbia Small Cap Growth Fund, Institutional 3 Class(a),(b) | 1,022,770 | 21,365,666 |
| Total | 52,008,005 | |
| Total Equity Funds (Cost $949,373,874) | 936,874,838 | |
| Fixed Income Funds 20.3% | ||
| Shares | Value ($) | |
| High Yield 7.3% | ||
| Columbia High Yield Bond Fund, Institutional 3 Class(a) | 8,536,649 | 89,805,542 |
| Investment Grade 13.0% | ||
| Columbia Bond Fund, Institutional 3 Class(a) | 5,035,965 | 151,280,402 |
| Columbia Quality Income Fund, Institutional 3 Class(a) | 484,047 | 8,877,423 |
| Total | 160,157,825 | |
| Total Fixed Income Funds (Cost $287,799,904) | 249,963,367 | |
| Money Market Funds 3.0% | ||
| Columbia Short-Term Cash Fund, 4.559%(a),(c) | 37,260,151 | 37,245,247 |
| Total Money Market Funds (Cost $37,246,169) | 37,245,247 | |
| Total Investments in Securities (Cost: $1,274,419,947) | 1,224,083,452 | |
| Other Assets & Liabilities, Net | 8,397,538 | |
| Net Assets | 1,232,480,990 | |
| Long futures contracts | ||||||
| Description | Number of contracts | Expiration date | Trading currency | Notional amount | Value/Unrealized appreciation ($) | Value/Unrealized depreciation ($) |
| MSCI Emerging Markets Index | 673 | 03/2023 | USD | 35,150,790 | 2,509,213 | — |
| Russell 2000 Index E-mini | 228 | 03/2023 | USD | 22,109,160 | 1,455,660 | — |
| S&P 500 Index E-mini | 133 | 03/2023 | USD | 27,198,500 | 808,310 | — |
| U.S. Treasury Ultra Bond | 170 | 03/2023 | USD | 24,097,500 | — | (393,248) |
| Total | 4,773,183 | (393,248) | ||||
| Short futures contracts | ||||||
| Description | Number of contracts | Expiration date | Trading currency | Notional amount | Value/Unrealized appreciation ($) | Value/Unrealized depreciation ($) |
| FTSE 100 Index | (52) | 03/2023 | GBP | (4,029,740) | — | (191,175) |
| MSCI EAFE Index | (30) | 03/2023 | USD | (3,178,500) | — | (135,276) |
| Total | — | (326,451) | ||||
| Columbia Capital Allocation Portfolios | Annual Report 2023 | 31 |
Columbia Capital Allocation Aggressive Portfolio, January 31, 2023
| Cleared credit default swap contracts - buy protection | |||||||||||
| Reference entity | Counterparty | Maturity date | Pay fixed rate (%) | Payment frequency | Notional currency | Notional amount | Value ($) | Upfront payments ($) | Upfront receipts ($) | Unrealized appreciation ($) | Unrealized depreciation ($) |
| Markit CDX North America High Yield Index, Series 39 | Morgan Stanley | 12/20/2027 | 5.000 | Quarterly | USD | 29,741,000 | (2,335,904) | — | — | — | (2,335,904) |
| (a) | As defined in the Investment Company Act of 1940, as amended, an affiliated company is one in which the Fund owns 5% or more of the company’s outstanding voting securities, or a company which is under common ownership or control with the Fund. The value of the holdings and transactions in these affiliated companies during the year ended January 31, 2023 are as follows: |
| Affiliated issuers | Beginning of period($) | Purchases($) | Sales($) | Net change in unrealized appreciation (depreciation)($) | End of period($) | Capital gain distributions($) | Realized gain (loss)($) | Dividends — affiliated issuers ($) | End of period shares |
| Columbia Bond Fund, Institutional 3 Class | |||||||||
| 180,302,915 | 4,684,367 | (13,017,297) | (20,689,583) | 151,280,402 | — | (1,820,962) | 4,614,961 | 5,035,965 | |
| Columbia Commodity Strategy Fund, Institutional 3 Class | |||||||||
| 16,549,368 | — | (18,624,536) | 2,075,168 | — | — | (928,892) | — | — | |
| Columbia Contrarian Core Fund, Institutional 3 Class | |||||||||
| 206,957,783 | 15,217,873 | (14,027,972) | (38,270,793) | 169,876,891 | 14,203,759 | 2,964,594 | 1,005,989 | 6,301,071 | |
| Columbia Emerging Markets Fund, Institutional 3 Class | |||||||||
| 81,874,238 | 2,071,653 | (2,676,998) | (20,251,649) | 61,017,244 | — | 897,556 | — | 4,823,498 | |
| Columbia High Yield Bond Fund, Institutional 3 Class | |||||||||
| 104,287,561 | 4,852,860 | (9,913,138) | (9,421,741) | 89,805,542 | — | (634,074) | 4,848,204 | 8,536,649 | |
| Columbia Large Cap Growth Fund, Institutional 3 Class | |||||||||
| 183,857,511 | 32,820,498 | (9,706,259) | (36,291,581) | 170,680,169 | — | 84,426 | — | 3,547,707 | |
| Columbia Large Cap Value Fund, Institutional 3 Class | |||||||||
| 220,426,356 | 14,260,477 | (54,026,086) | (29,472,052) | 151,188,695 | 11,156,706 | 13,444,486 | 3,088,057 | 9,587,108 | |
| Columbia Overseas Core Fund, Institutional 3 Class | |||||||||
| 211,088,543 | 2,709,172 | (28,664,891) | (16,123,511) | 169,009,313 | 2,613,816 | (1,576,934) | — | 17,352,085 | |
| Columbia Quality Income Fund, Institutional 3 Class | |||||||||
| — | 8,377,977 | — | 499,446 | 8,877,423 | — | — | 101,977 | 484,047 | |
| Columbia Select Large Cap Equity Fund, Institutional 3 Class | |||||||||
| 205,909,972 | 10,298,328 | (15,908,860) | (37,204,919) | 163,094,521 | 8,410,995 | 6,259,130 | 1,837,315 | 10,244,631 | |
| Columbia Select Small Cap Value Fund, Institutional 3 Class | |||||||||
| 33,604,630 | 1,089,453 | (1,465,118) | (2,586,626) | 30,642,339 | 809,142 | 730,678 | 274,167 | 1,258,930 | |
| Columbia Short-Term Cash Fund, 4.559% | |||||||||
| 31,446,018 | 149,844,403 | (144,045,527) | 353 | 37,245,247 | — | (5,734) | 591,599 | 37,260,151 | |
| Columbia Small Cap Growth Fund, Institutional 3 Class | |||||||||
| 25,323,787 | — | — | (3,958,121) | 21,365,666 | — | — | — | 1,022,770 | |
| Total | 1,501,628,682 | (211,695,609) | 1,224,083,452 | 37,194,418 | 19,414,274 | 16,362,269 | |||
| (b) | Non-income producing investment. |
| (c) | The rate shown is the seven-day current annualized yield at January 31, 2023. |
| GBP | British Pound |
| USD | US Dollar |
| 32 | Columbia Capital Allocation Portfolios | Annual Report 2023 |
Columbia Capital Allocation Aggressive Portfolio, January 31, 2023
| ■ | Level 1 — Valuations based on quoted prices for investments in active markets that the Fund has the ability to access at the measurement date. Valuation adjustments are not applied to Level 1 investments. |
| ■ | Level 2 — Valuations based on other significant observable inputs (including quoted prices for similar securities, interest rates, prepayment speeds, credit risks, etc.). |
| ■ | Level 3 — Valuations based on significant unobservable inputs (including the Fund’s own assumptions and judgment in determining the fair value of investments). |
| Level 1 ($) | Level 2 ($) | Level 3 ($) | Total ($) | |
| Investments in Securities | ||||
| Equity Funds | 936,874,838 | — | — | 936,874,838 |
| Fixed Income Funds | 249,963,367 | — | — | 249,963,367 |
| Money Market Funds | 37,245,247 | — | — | 37,245,247 |
| Total Investments in Securities | 1,224,083,452 | — | — | 1,224,083,452 |
| Investments in Derivatives | ||||
| Asset | ||||
| Futures Contracts | 4,773,183 | — | — | 4,773,183 |
| Liability | ||||
| Futures Contracts | (719,699) | — | — | (719,699) |
| Swap Contracts | — | (2,335,904) | — | (2,335,904) |
| Total | 1,228,136,936 | (2,335,904) | — | 1,225,801,032 |
| Columbia Capital Allocation Portfolios | Annual Report 2023 | 33 |
January 31, 2023
| Columbia Capital Allocation Conservative Portfolio | Columbia Capital Allocation Moderate Conservative Portfolio | Columbia Capital Allocation Moderate Portfolio | |
| Assets | |||
| Investments in securities, at value | |||
| Affiliated issuers (cost $213,025,081, $437,477,245, $1,294,690,742, respectively) | $188,204,708 | $388,256,676 | $1,163,055,458 |
| Cash | 373 | 570 | 546 |
| Margin deposits on: | |||
| Futures contracts | 236,483 | 574,152 | 2,862,349 |
| Swap contracts | 415,344 | 951,753 | 3,252,743 |
| Receivable for: | |||
| Investments sold | — | 365,073 | 590,046 |
| Capital shares sold | 88,255 | 113,467 | 456,213 |
| Dividends | 463,657 | 770,680 | 1,897,776 |
| Foreign tax reclaims | 15,886 | 21,276 | 13,449 |
| Variation margin for futures contracts | 30,028 | 67,728 | 244,203 |
| Variation margin for swap contracts | — | — | 27,640 |
| Prepaid expenses | 6,654 | 8,085 | 13,346 |
| Total assets | 189,461,388 | 391,129,460 | 1,172,413,769 |
| Liabilities | |||
| Foreign currency (cost $373, $ —, $—, respectively) | 374 | — | — |
| Payable for: | |||
| Investments purchased | 418,352 | 743,302 | 1,796,192 |
| Capital shares purchased | 184,935 | 468,887 | 1,431,663 |
| Variation margin for futures contracts | 9,724 | 56,821 | 117,869 |
| Variation margin for swap contracts | 33,794 | 77,487 | 274,818 |
| Management services fees | 334 | 355 | 1,160 |
| Distribution and/or service fees | 1,396 | 3,017 | 8,974 |
| Transfer agent fees | 15,860 | 27,564 | 77,854 |
| Compensation of board members | 87,764 | 67,784 | 101,092 |
| Compensation of chief compliance officer | 36 | 74 | 221 |
| Other expenses | 34,760 | 31,680 | 58,944 |
| Total liabilities | 787,329 | 1,476,971 | 3,868,787 |
| Net assets applicable to outstanding capital stock | $188,674,059 | $389,652,489 | $1,168,544,982 |
| Represented by | |||
| Paid in capital | 215,370,979 | 438,221,723 | 1,286,401,188 |
| Total distributable earnings (loss) | (26,696,920) | (48,569,234) | (117,856,206) |
| Total - representing net assets applicable to outstanding capital stock | $188,674,059 | $389,652,489 | $1,168,544,982 |
| 34 | Columbia Capital Allocation Portfolios | Annual Report 2023 |
January 31, 2023
| Columbia Capital Allocation Conservative Portfolio | Columbia Capital Allocation Moderate Conservative Portfolio | Columbia Capital Allocation Moderate Portfolio | |
| Class A | |||
| Net assets | $155,990,807 | $337,156,962 | $1,027,775,797 |
| Shares outstanding | 17,685,947 | 36,541,583 | 107,873,738 |
| Net asset value per share | $8.82 | $9.23 | $9.53 |
| Maximum sales charge | 4.75% | 5.75% | 5.75% |
| Maximum offering price per share (calculated by dividing the net asset value per share by 1.0 minus the maximum sales charge for Class A shares) | $9.26 | $9.79 | $10.11 |
| Advisor Class | |||
| Net assets | $4,428,610 | $4,342,098 | $7,509,170 |
| Shares outstanding | 506,354 | 476,445 | 802,896 |
| Net asset value per share | $8.75 | $9.11 | $9.35 |
| Class C | |||
| Net assets | $11,804,331 | $25,646,441 | $70,537,771 |
| Shares outstanding | 1,347,340 | 2,831,449 | 7,486,834 |
| Net asset value per share | $8.76 | $9.06 | $9.42 |
| Institutional Class | |||
| Net assets | $8,773,458 | $12,809,402 | $27,345,258 |
| Shares outstanding | 995,529 | 1,415,629 | 2,875,164 |
| Net asset value per share | $8.81 | $9.05 | $9.51 |
| Institutional 2 Class | |||
| Net assets | $405,513 | $884,588 | $1,936,110 |
| Shares outstanding | 46,376 | 97,121 | 207,049 |
| Net asset value per share | $8.74 | $9.11 | $9.35 |
| Institutional 3 Class | |||
| Net assets | $6,468,351 | $7,258,948 | $29,170,074 |
| Shares outstanding | 740,911 | 812,011 | 3,117,710 |
| Net asset value per share | $8.73 | $8.94 | $9.36 |
| Class R | |||
| Net assets | $802,989 | $1,554,050 | $4,270,802 |
| Shares outstanding | 91,111 | 168,038 | 449,958 |
| Net asset value per share | $8.81 | $9.25 | $9.49 |
| Columbia Capital Allocation Portfolios | Annual Report 2023 | 35 |
January 31, 2023
| Columbia Capital Allocation Moderate Aggressive Portfolio | Columbia Capital Allocation Aggressive Portfolio | |
| Assets | ||
| Investments in securities, at value | ||
| Affiliated issuers (cost $1,871,528,794, $1,274,419,947, respectively) | $1,722,385,276 | $1,224,083,452 |
| Cash | 567 | 375 |
| Foreign currency (cost $333, $—, respectively) | 323 | — |
| Margin deposits on: | ||
| Futures contracts | 5,366,914 | 5,955,598 |
| Swap contracts | 2,790,694 | 1,865,251 |
| Receivable for: | ||
| Investments sold | 663,466 | 277,732 |
| Capital shares sold | 502,417 | 415,895 |
| Dividends | 2,083,996 | 1,039,663 |
| Foreign tax reclaims | 10,558 | 20,340 |
| Variation margin for futures contracts | 574,823 | 914,610 |
| Prepaid expenses | 16,428 | 12,949 |
| Total assets | 1,734,395,462 | 1,234,585,865 |
| Liabilities | ||
| Payable for: | ||
| Investments purchased | 1,940,510 | 906,070 |
| Capital shares purchased | 1,341,992 | 623,502 |
| Variation margin for futures contracts | 329,719 | 130,323 |
| Variation margin for swap contracts | 220,935 | 147,669 |
| Management services fees | 1,677 | 1,352 |
| Distribution and/or service fees | 12,316 | 8,889 |
| Transfer agent fees | 151,301 | 100,991 |
| Compensation of board members | 218,040 | 122,192 |
| Compensation of chief compliance officer | 324 | 230 |
| Other expenses | 74,024 | 63,657 |
| Total liabilities | 4,290,838 | 2,104,875 |
| Net assets applicable to outstanding capital stock | $1,730,104,624 | $1,232,480,990 |
| Represented by | ||
| Paid in capital | 1,845,099,562 | 1,247,162,983 |
| Total distributable earnings (loss) | (114,994,938) | (14,681,993) |
| Total - representing net assets applicable to outstanding capital stock | $1,730,104,624 | $1,232,480,990 |
| 36 | Columbia Capital Allocation Portfolios | Annual Report 2023 |
January 31, 2023
| Columbia Capital Allocation Moderate Aggressive Portfolio | Columbia Capital Allocation Aggressive Portfolio | |
| Class A | ||
| Net assets | $1,404,979,852 | $1,038,484,678 |
| Shares outstanding | 134,992,080 | 93,325,749 |
| Net asset value per share | $10.41 | $11.13 |
| Maximum sales charge | 5.75% | 5.75% |
| Maximum offering price per share (calculated by dividing the net asset value per share by 1.0 minus the maximum sales charge for Class A shares) | $11.05 | $11.81 |
| Advisor Class | ||
| Net assets | $38,200,847 | $20,360,384 |
| Shares outstanding | 3,622,693 | 1,885,272 |
| Net asset value per share | $10.54 | $10.80 |
| Class C | ||
| Net assets | $76,448,918 | $62,530,082 |
| Shares outstanding | 7,325,196 | 5,826,337 |
| Net asset value per share | $10.44 | $10.73 |
| Institutional Class | ||
| Net assets | $84,049,429 | $32,830,589 |
| Shares outstanding | 8,099,860 | 2,968,927 |
| Net asset value per share | $10.38 | $11.06 |
| Institutional 2 Class | ||
| Net assets | $4,573,048 | $4,801,226 |
| Shares outstanding | 434,246 | 444,993 |
| Net asset value per share | $10.53 | $10.79 |
| Institutional 3 Class | ||
| Net assets | $36,468,129 | $62,453,609 |
| Shares outstanding | 3,587,421 | 5,794,193 |
| Net asset value per share | $10.17 | $10.78 |
| Class R | ||
| Net assets | $16,756,269 | $11,020,422 |
| Shares outstanding | 1,611,388 | 1,002,419 |
| Net asset value per share | $10.40 | $10.99 |
| Class V | ||
| Net assets | $68,628,132 | $— |
| Shares outstanding | 6,593,084 | — |
| Net asset value per share | $10.41 | $— |
| Maximum sales charge | 5.75% | — |
| Maximum offering price per share (calculated by dividing the net asset value per share by 1.0 minus the maximum sales charge for Class V shares) | $11.05 | $— |
| Columbia Capital Allocation Portfolios | Annual Report 2023 | 37 |
Year Ended January 31, 2023
| Columbia Capital Allocation Conservative Portfolio | Columbia Capital Allocation Moderate Conservative Portfolio | Columbia Capital Allocation Moderate Portfolio | |
| Net investment income | |||
| Income: | |||
| Dividends — unaffiliated issuers | $— | $— | $50 |
| Dividends — affiliated issuers | 5,045,480 | 9,200,897 | 25,110,027 |
| Other Income | 4,074 | 10,067 | 50,941 |
| Foreign taxes withheld | — | (2,632) | — |
| Total income | 5,049,554 | 9,208,332 | 25,161,018 |
| Expenses: | |||
| Management services fees | 160,667 | 190,588 | 426,661 |
| Distribution and/or service fees | |||
| Class A | 418,919 | 905,113 | 2,754,149 |
| Class C | 144,776 | 297,224 | 789,377 |
| Class R | 3,976 | 8,024 | 21,394 |
| Transfer agent fees | |||
| Class A | 152,885 | 293,469 | 836,074 |
| Advisor Class | 5,041 | 2,986 | 4,447 |
| Class C | 13,186 | 24,032 | 59,818 |
| Institutional Class | 9,957 | 11,118 | 27,757 |
| Institutional 2 Class | 478 | 1,911 | 1,725 |
| Institutional 3 Class | 1,555 | 1,355 | 3,849 |
| Class R | 727 | 1,304 | 3,252 |
| Compensation of board members | 2,248 | 9,741 | 17,124 |
| Custodian fees | 22,379 | 18,186 | 25,353 |
| Printing and postage fees | 27,225 | 37,477 | 81,785 |
| Registration fees | 116,077 | 111,905 | 136,882 |
| Audit fees | 39,840 | 32,590 | 44,408 |
| Legal fees | 15,532 | 18,342 | 29,440 |
| Interest on collateral | 1,127 | 2,492 | 11,672 |
| Compensation of chief compliance officer | 35 | 72 | 214 |
| Other | 14,047 | 16,755 | 27,186 |
| Total expenses | 1,150,677 | 1,984,684 | 5,302,567 |
| Expense reduction | (124) | (40) | (120) |
| Total net expenses | 1,150,553 | 1,984,644 | 5,302,447 |
| Net investment income | 3,899,001 | 7,223,688 | 19,858,571 |
| Realized and unrealized gain (loss) — net | |||
| Net realized gain (loss) on: | |||
| Investments — unaffiliated issuers | 187 | 312 | 1,749 |
| Investments — affiliated issuers | (3,434,570) | (3,502,403) | 1,247,859 |
| Capital gain distributions from underlying affiliated funds | 1,918,997 | 6,889,957 | 23,383,218 |
| Foreign currency translations | 2,094 | 3,631 | (217,294) |
| Futures contracts | (91,340) | (334,347) | (10,405,796) |
| Swap contracts | 113,263 | 262,937 | 922,370 |
| Net realized gain (loss) | (1,491,369) | 3,320,087 | 14,932,106 |
| Net change in unrealized appreciation (depreciation) on: | |||
| Investments — affiliated issuers | (23,795,342) | (55,205,262) | (183,850,028) |
| Foreign currency translations | (301) | (192) | (264) |
| Futures contracts | 95,127 | 312,167 | 2,400,298 |
| Swap contracts | (437,595) | (1,011,622) | (3,608,366) |
| Net change in unrealized appreciation (depreciation) | (24,138,111) | (55,904,909) | (185,058,360) |
| Net realized and unrealized loss | (25,629,480) | (52,584,822) | (170,126,254) |
| Net decrease in net assets resulting from operations | $(21,730,479) | $(45,361,134) | $(150,267,683) |
| 38 | Columbia Capital Allocation Portfolios | Annual Report 2023 |
Year Ended January 31, 2023
| Columbia Capital Allocation Moderate Aggressive Portfolio | Columbia Capital Allocation Aggressive Portfolio | |
| Net investment income | ||
| Income: | ||
| Dividends — affiliated issuers | $29,207,363 | $16,362,269 |
| Other Income | 116,372 | 101,743 |
| Foreign taxes withheld | — | (719) |
| Total income | 29,323,735 | 16,463,293 |
| Expenses: | ||
| Management services fees | 576,226 | 446,537 |
| Distribution and/or service fees | ||
| Class A | 3,666,749 | 2,691,504 |
| Class C | 841,249 | 665,411 |
| Class R | 84,147 | 55,057 |
| Class V | 178,151 | — |
| Transfer agent fees | ||
| Class A | 1,407,069 | 940,846 |
| Advisor Class | 24,372 | 12,738 |
| Class C | 80,619 | 58,140 |
| Institutional Class | 86,635 | 32,621 |
| Institutional 2 Class | 3,353 | 3,414 |
| Institutional 3 Class | 3,742 | 5,616 |
| Class R | 16,161 | 9,626 |
| Class V | 68,374 | — |
| Compensation of board members | 3,279 | 13,577 |
| Custodian fees | 26,232 | 25,363 |
| Printing and postage fees | 116,240 | 83,450 |
| Registration fees | 142,984 | 134,246 |
| Audit fees | 44,408 | 49,158 |
| Legal fees | 36,770 | 29,758 |
| Interest on collateral | 12,402 | 11,175 |
| Compensation of chief compliance officer | 315 | 224 |
| Other | 34,806 | 27,423 |
| Total expenses | 7,454,283 | 5,295,884 |
| Expense reduction | (6,080) | (460) |
| Total net expenses | 7,448,203 | 5,295,424 |
| Net investment income | 21,875,532 | 11,167,869 |
| Realized and unrealized gain (loss) — net | ||
| Net realized gain (loss) on: | ||
| Investments — unaffiliated issuers | 1,925 | 609 |
| Investments — affiliated issuers | 8,356,000 | 19,414,274 |
| Capital gain distributions from underlying affiliated funds | 45,044,390 | 37,194,418 |
| Foreign currency translations | (458,185) | (445,134) |
| Futures contracts | (17,587,678) | (15,629,085) |
| Swap contracts | 988,861 | 660,937 |
| Net realized gain | 36,345,313 | 41,196,019 |
| Net change in unrealized appreciation (depreciation) on: | ||
| Investments — affiliated issuers | (275,204,654) | (211,695,609) |
| Foreign currency translations | (217) | 512 |
| Futures contracts | 5,253,413 | 5,446,953 |
| Swap contracts | (3,494,864) | (2,335,904) |
| Net change in unrealized appreciation (depreciation) | (273,446,322) | (208,584,048) |
| Net realized and unrealized loss | (237,101,009) | (167,388,029) |
| Net decrease in net assets resulting from operations | $(215,225,477) | $(156,220,160) |
| Columbia Capital Allocation Portfolios | Annual Report 2023 | 39 |
| Columbia Capital Allocation Conservative Portfolio | Columbia Capital Allocation Moderate Conservative Portfolio | |||
| Year Ended January 31, 2023 | Year Ended January 31, 2022 | Year Ended January 31, 2023 | Year Ended January 31, 2022 | |
| Operations | ||||
| Net investment income | $3,899,001 | $3,113,620 | $7,223,688 | $7,292,312 |
| Net realized gain (loss) | (1,491,369) | 11,069,779 | 3,320,087 | 34,856,684 |
| Net change in unrealized appreciation (depreciation) | (24,138,111) | (10,500,616) | (55,904,909) | (18,750,462) |
| Net increase (decrease) in net assets resulting from operations | (21,730,479) | 3,682,783 | (45,361,134) | 23,398,534 |
| Distributions to shareholders | ||||
| Net investment income and net realized gains | ||||
| Class A | (6,990,839) | (13,253,511) | (21,088,741) | (40,059,802) |
| Advisor Class | (231,730) | (484,253) | (219,789) | (475,986) |
| Class C | (496,731) | (1,103,355) | (1,526,085) | (3,458,805) |
| Institutional Class | (501,726) | (789,960) | (836,815) | (1,579,048) |
| Institutional 2 Class | (24,828) | (99,065) | (171,494) | (512,138) |
| Institutional 3 Class | (357,750) | (218,399) | (451,279) | (728,213) |
| Class R | (31,496) | (20,140) | (90,226) | (149,003) |
| Total distributions to shareholders | (8,635,100) | (15,968,683) | (24,384,429) | (46,962,995) |
| Increase (decrease) in net assets from capital stock activity | (30,774,069) | 16,285,368 | (39,950,692) | (10,077) |
| Total increase (decrease) in net assets | (61,139,648) | 3,999,468 | (109,696,255) | (23,574,538) |
| Net assets at beginning of year | 249,813,707 | 245,814,239 | 499,348,744 | 522,923,282 |
| Net assets at end of year | $188,674,059 | $249,813,707 | $389,652,489 | $499,348,744 |
| 40 | Columbia Capital Allocation Portfolios | Annual Report 2023 |
| Columbia Capital Allocation Moderate Portfolio | Columbia Capital Allocation Moderate Aggressive Portfolio | |||
| Year Ended January 31, 2023 | Year Ended January 31, 2022 | Year Ended January 31, 2023 | Year Ended January 31, 2022 | |
| Operations | ||||
| Net investment income | $19,858,571 | $24,014,161 | $21,875,532 | $29,609,803 |
| Net realized gain | 14,932,106 | 116,782,742 | 36,345,313 | 197,333,364 |
| Net change in unrealized appreciation (depreciation) | (185,058,360) | (44,475,070) | (273,446,322) | (40,478,197) |
| Net increase (decrease) in net assets resulting from operations | (150,267,683) | 96,321,833 | (215,225,477) | 186,464,970 |
| Distributions to shareholders | ||||
| Net investment income and net realized gains | ||||
| Class A | (59,862,356) | (167,510,992) | (83,133,371) | (256,064,075) |
| Advisor Class | (178,425) | (525,817) | (917,373) | (1,429,526) |
| Class C | (3,702,063) | (12,476,433) | (4,149,808) | (15,241,182) |
| Institutional Class | (1,922,032) | (7,457,757) | (5,372,345) | (16,591,628) |
| Institutional 2 Class | (153,811) | (767,410) | (342,485) | (1,602,549) |
| Institutional 3 Class | (1,916,846) | (1,463,115) | (3,716,048) | (2,686,376) |
| Class R | (221,095) | (355,674) | (913,512) | (778,759) |
| Class V | — | — | (4,038,911) | (12,730,273) |
| Total distributions to shareholders | (67,956,628) | (190,557,198) | (102,583,853) | (307,124,368) |
| Increase (decrease) in net assets from capital stock activity | (138,621,307) | 123,959,582 | (100,003,625) | 231,122,535 |
| Total increase (decrease) in net assets | (356,845,618) | 29,724,217 | (417,812,955) | 110,463,137 |
| Net assets at beginning of year | 1,525,390,600 | 1,495,666,383 | 2,147,917,579 | 2,037,454,442 |
| Net assets at end of year | $1,168,544,982 | $1,525,390,600 | $1,730,104,624 | $2,147,917,579 |
| Columbia Capital Allocation Portfolios | Annual Report 2023 | 41 |
| Columbia Capital Allocation Aggressive Portfolio | ||
| Year Ended January 31, 2023 | Year Ended January 31, 2022 | |
| Operations | ||
| Net investment income | $11,167,869 | $18,311,407 |
| Net realized gain | 41,196,019 | 153,127,493 |
| Net change in unrealized appreciation (depreciation) | (208,584,048) | (4,090,312) |
| Net increase (decrease) in net assets resulting from operations | (156,220,160) | 167,348,588 |
| Distributions to shareholders | ||
| Net investment income and net realized gains | ||
| Class A | (72,449,774) | (162,520,817) |
| Advisor Class | (846,290) | (1,143,944) |
| Class C | (4,123,346) | (10,637,062) |
| Institutional Class | (2,653,787) | (5,638,317) |
| Institutional 2 Class | (408,554) | (1,157,036) |
| Institutional 3 Class | (5,436,841) | (1,794,287) |
| Class R | (732,179) | (390,264) |
| Total distributions to shareholders | (86,650,771) | (183,281,727) |
| Increase (decrease) in net assets from capital stock activity | (34,300,504) | 150,076,939 |
| Total increase (decrease) in net assets | (277,171,435) | 134,143,800 |
| Net assets at beginning of year | 1,509,652,425 | 1,375,508,625 |
| Net assets at end of year | $1,232,480,990 | $1,509,652,425 |
| 42 | Columbia Capital Allocation Portfolios | Annual Report 2023 |
| Columbia Capital Allocation Conservative Portfolio | Columbia Capital Allocation Moderate Conservative Portfolio | |||||||
| Year Ended | Year Ended | Year Ended | Year Ended | |||||
| January 31, 2023 | January 31, 2022 | January 31, 2023 | January 31, 2022 | |||||
| Shares | Dollars ($) | Shares | Dollars ($) | Shares | Dollars ($) | Shares | Dollars ($) | |
| Capital stock activity | ||||||||
| Class A | ||||||||
| Subscriptions | 1,636,083 | 14,533,963 | 2,232,366 | 23,567,592 | 2,482,586 | 23,342,311 | 3,007,685 | 34,528,637 |
| Fund reorganization | — | — | 297,235 | 2,995,708 | — | — | — | — |
| Distributions reinvested | 769,216 | 6,706,332 | 1,215,792 | 12,711,819 | 2,166,864 | 19,595,907 | 3,328,875 | 37,332,056 |
| Redemptions | (4,448,934) | (40,075,499) | (3,165,755) | (33,517,966) | (7,617,682) | (71,583,437) | (6,118,437) | (69,994,165) |
| Net increase (decrease) | (2,043,635) | (18,835,204) | 579,638 | 5,757,153 | (2,968,232) | (28,645,219) | 218,123 | 1,866,528 |
| Advisor Class | ||||||||
| Subscriptions | 192,641 | 1,733,750 | 179,447 | 1,893,018 | 162,453 | 1,479,571 | 60,681 | 688,219 |
| Fund reorganization | — | — | 179,665 | 1,796,375 | — | — | — | — |
| Distributions reinvested | 12,665 | 109,901 | 28,132 | 292,038 | 24,461 | 219,074 | 42,077 | 466,430 |
| Redemptions | (552,532) | (5,125,046) | (230,833) | (2,436,467) | (169,370) | (1,575,959) | (140,467) | (1,604,449) |
| Net increase (decrease) | (347,226) | (3,281,395) | 156,411 | 1,544,964 | 17,544 | 122,686 | (37,709) | (449,800) |
| Class C | ||||||||
| Subscriptions | 192,371 | 1,711,008 | 562,963 | 5,933,815 | 497,966 | 4,683,131 | 660,196 | 7,460,882 |
| Distributions reinvested | 57,317 | 495,268 | 105,798 | 1,099,109 | 170,011 | 1,506,355 | 309,014 | 3,408,484 |
| Redemptions | (736,658) | (6,523,413) | (658,014) | (6,955,767) | (1,413,889) | (13,194,030) | (1,451,058) | (16,392,649) |
| Net increase (decrease) | (486,970) | (4,317,137) | 10,747 | 77,157 | (745,912) | (7,004,544) | (481,848) | (5,523,283) |
| Institutional Class | ||||||||
| Subscriptions | 477,458 | 4,430,589 | 542,184 | 5,749,562 | 922,714 | 8,514,774 | 726,944 | 8,162,976 |
| Distributions reinvested | 47,729 | 416,364 | 61,812 | 645,546 | 85,626 | 760,075 | 126,060 | 1,388,670 |
| Redemptions | (696,490) | (6,120,928) | (433,795) | (4,603,417) | (1,187,076) | (11,084,374) | (761,101) | (8,570,456) |
| Net increase (decrease) | (171,303) | (1,273,975) | 170,201 | 1,791,691 | (178,736) | (1,809,525) | 91,903 | 981,190 |
| Institutional 2 Class | ||||||||
| Subscriptions | 13,998 | 123,601 | 56,049 | 593,679 | 47,981 | 454,799 | 227,641 | 2,622,194 |
| Distributions reinvested | 2,839 | 24,732 | 9,531 | 98,891 | 18,953 | 170,087 | 45,980 | 509,670 |
| Redemptions | (110,858) | (1,013,107) | (66,286) | (698,931) | (444,985) | (4,189,173) | (129,001) | (1,448,107) |
| Net increase (decrease) | (94,021) | (864,774) | (706) | (6,361) | (378,051) | (3,564,287) | 144,620 | 1,683,757 |
| Institutional 3 Class | ||||||||
| Subscriptions | 141,711 | 1,270,085 | 104,718 | 1,093,157 | 160,220 | 1,470,697 | 168,633 | 1,881,462 |
| Fund reorganization | — | — | 685,929 | 6,845,564 | — | — | — | — |
| Distributions reinvested | 40,579 | 350,814 | 21,068 | 218,225 | 50,658 | 444,160 | 66,073 | 719,823 |
| Redemptions | (435,921) | (3,880,870) | (152,305) | (1,598,426) | (120,045) | (1,094,767) | (116,644) | (1,298,540) |
| Net increase (decrease) | (253,631) | (2,259,971) | 659,410 | 6,558,520 | 90,833 | 820,090 | 118,062 | 1,302,745 |
| Class R | ||||||||
| Subscriptions | 9,356 | 84,041 | 2,760 | 29,363 | 17,552 | 172,920 | 12,796 | 147,024 |
| Fund reorganization | — | — | 54,299 | 546,865 | — | — | — | — |
| Distributions reinvested | 3,593 | 31,245 | 1,887 | 19,707 | 9,964 | 90,226 | 13,255 | 148,989 |
| Redemptions | (6,630) | (56,899) | (3,216) | (33,691) | (14,501) | (133,039) | (14,646) | (167,227) |
| Net increase | 6,319 | 58,387 | 55,730 | 562,244 | 13,015 | 130,107 | 11,405 | 128,786 |
| Total net increase (decrease) | (3,390,467) | (30,774,069) | 1,631,431 | 16,285,368 | (4,149,539) | (39,950,692) | 64,556 | (10,077) |
| Columbia Capital Allocation Portfolios | Annual Report 2023 | 43 |
| Columbia Capital Allocation Moderate Portfolio | Columbia Capital Allocation Moderate Aggressive Portfolio | |||||||
| Year Ended | Year Ended | Year Ended | Year Ended | |||||
| January 31, 2023 | January 31, 2022 | January 31, 2023 | January 31, 2022 | |||||
| Shares | Dollars ($) | Shares | Dollars ($) | Shares | Dollars ($) | Shares | Dollars ($) | |
| Capital stock activity | ||||||||
| Class A | ||||||||
| Subscriptions | 5,949,549 | 58,077,181 | 7,816,072 | 93,330,331 | 6,480,687 | 68,163,378 | 7,778,710 | 103,531,131 |
| Fund reorganization | — | — | 200,663 | 2,225,038 | — | — | 2,554,159 | 30,968,982 |
| Distributions reinvested | 6,395,816 | 59,262,981 | 14,100,172 | 165,572,742 | 7,289,885 | 72,953,909 | 17,287,628 | 223,851,613 |
| Redemptions | (21,620,738) | (208,604,409) | (16,134,938) | (194,827,635) | (19,077,291) | (200,623,349) | (16,940,083) | (226,888,132) |
| Net increase (decrease) | (9,275,373) | (91,264,247) | 5,981,969 | 66,300,476 | (5,306,719) | (59,506,062) | 10,680,414 | 131,463,594 |
| Advisor Class | ||||||||
| Subscriptions | 753,415 | 7,001,735 | 138,501 | 1,656,950 | 2,809,172 | 28,600,610 | 207,545 | 2,795,817 |
| Fund reorganization | — | — | 342,989 | 3,738,199 | — | — | 1,491,362 | 18,303,594 |
| Distributions reinvested | 16,863 | 154,642 | 39,790 | 459,149 | 64,609 | 650,295 | 61,746 | 809,138 |
| Redemptions | (667,424) | (6,483,585) | (97,713) | (1,139,465) | (1,510,186) | (18,087,823) | (159,361) | (2,139,485) |
| Net increase | 102,854 | 672,792 | 423,567 | 4,714,833 | 1,363,595 | 11,163,082 | 1,601,292 | 19,769,064 |
| Class C | ||||||||
| Subscriptions | 1,229,271 | 11,796,915 | 1,502,989 | 17,976,759 | 1,132,678 | 11,972,174 | 1,212,644 | 16,303,883 |
| Distributions reinvested | 402,225 | 3,671,924 | 1,063,303 | 12,360,931 | 410,284 | 4,107,144 | 1,162,076 | 15,091,297 |
| Redemptions | (3,069,102) | (29,486,201) | (2,978,546) | (35,718,445) | (2,560,490) | (27,021,845) | (2,936,502) | (39,646,000) |
| Net decrease | (1,437,606) | (14,017,362) | (412,254) | (5,380,755) | (1,017,528) | (10,942,527) | (561,782) | (8,250,820) |
| Institutional Class | ||||||||
| Subscriptions | 2,082,366 | 19,934,878 | 4,055,987 | 49,210,618 | 1,946,678 | 20,478,382 | 1,899,273 | 25,391,352 |
| Distributions reinvested | 183,181 | 1,696,582 | 384,826 | 4,507,148 | 453,887 | 4,534,783 | 1,084,762 | 14,006,712 |
| Redemptions | (4,962,380) | (49,497,793) | (2,096,458) | (25,261,557) | (3,040,058) | (31,636,912) | (2,426,546) | (32,418,603) |
| Net increase (decrease) | (2,696,833) | (27,866,333) | 2,344,355 | 28,456,209 | (639,493) | (6,623,747) | 557,489 | 6,979,461 |
| Institutional 2 Class | ||||||||
| Subscriptions | 69,913 | 688,639 | 140,328 | 1,689,284 | 107,515 | 1,202,943 | 149,277 | 2,043,649 |
| Distributions reinvested | 16,834 | 153,693 | 66,133 | 767,080 | 33,716 | 342,485 | 122,065 | 1,602,549 |
| Redemptions | (221,832) | (2,073,233) | (437,942) | (5,133,077) | (366,130) | (3,934,028) | (460,907) | (6,110,910) |
| Net decrease | (135,085) | (1,230,901) | (231,481) | (2,676,713) | (224,899) | (2,388,600) | (189,565) | (2,464,712) |
| Institutional 3 Class | ||||||||
| Subscriptions | 621,789 | 5,964,697 | 700,013 | 8,082,449 | 609,966 | 6,276,432 | 740,308 | 9,370,293 |
| Fund reorganization | — | — | 2,248,744 | 24,513,734 | — | — | 4,770,984 | 56,579,455 |
| Distributions reinvested | 209,904 | 1,913,118 | 126,954 | 1,463,115 | 358,105 | 3,514,832 | 155,968 | 1,969,952 |
| Redemptions | (1,336,920) | (12,834,508) | (336,557) | (3,960,873) | (3,951,795) | (39,560,799) | (221,560) | (2,762,269) |
| Net increase (decrease) | (505,227) | (4,956,693) | 2,739,154 | 30,098,425 | (2,983,724) | (29,769,535) | 5,445,700 | 65,157,431 |
| Class R | ||||||||
| Subscriptions | 23,482 | 225,174 | 67,034 | 808,224 | 74,943 | 792,394 | 39,596 | 529,674 |
| Fund reorganization | — | — | 339,108 | 3,746,480 | — | — | 1,222,717 | 14,812,100 |
| Distributions reinvested | 23,928 | 220,634 | 30,298 | 354,614 | 91,397 | 913,094 | 60,104 | 777,449 |
| Redemptions | (40,922) | (404,371) | (216,402) | (2,462,211) | (132,823) | (1,402,748) | (152,287) | (1,930,292) |
| Net increase | 6,488 | 41,437 | 220,038 | 2,447,107 | 33,517 | 302,740 | 1,170,130 | 14,188,931 |
| Class V | ||||||||
| Subscriptions | — | — | — | — | 20,151 | 208,194 | 55,561 | 736,108 |
| Distributions reinvested | — | — | — | — | 346,169 | 3,466,974 | 835,606 | 10,820,062 |
| Redemptions | — | — | — | — | (562,033) | (5,914,144) | (543,485) | (7,276,584) |
| Net increase (decrease) | — | — | — | — | (195,713) | (2,238,976) | 347,682 | 4,279,586 |
| Total net increase (decrease) | (13,940,782) | (138,621,307) | 11,065,348 | 123,959,582 | (8,970,964) | (100,003,625) | 19,051,360 | 231,122,535 |
| 44 | Columbia Capital Allocation Portfolios | Annual Report 2023 |
| Columbia Capital Allocation Aggressive Portfolio | ||||
| Year Ended | Year Ended | |||
| January 31, 2023 | January 31, 2022 | |||
| Shares | Dollars ($) | Shares | Dollars ($) | |
| Capital stock activity | ||||
| Class A | ||||
| Subscriptions | 4,476,377 | 50,720,236 | 5,238,500 | 75,291,495 |
| Fund reorganization | — | — | 1,313,971 | 17,212,284 |
| Distributions reinvested | 6,203,673 | 65,879,414 | 10,513,088 | 147,034,453 |
| Redemptions | (12,356,638) | (139,249,292) | (12,100,255) | (174,553,976) |
| Net increase (decrease) | (1,676,588) | (22,649,642) | 4,965,304 | 64,984,256 |
| Advisor Class | ||||
| Subscriptions | 1,439,152 | 15,316,967 | 238,792 | 3,320,823 |
| Fund reorganization | — | — | 356,035 | 4,536,068 |
| Distributions reinvested | 44,839 | 460,727 | 29,283 | 399,587 |
| Redemptions | (606,389) | (6,846,339) | (237,619) | (3,324,649) |
| Net increase | 877,602 | 8,931,355 | 386,491 | 4,931,829 |
| Class C | ||||
| Subscriptions | 1,019,080 | 11,168,343 | 942,372 | 13,125,489 |
| Distributions reinvested | 400,245 | 4,091,667 | 779,189 | 10,548,626 |
| Redemptions | (1,892,667) | (20,812,397) | (2,314,927) | (32,376,794) |
| Net decrease | (473,342) | (5,552,387) | (593,366) | (8,702,679) |
| Institutional Class | ||||
| Subscriptions | 1,586,386 | 18,153,036 | 1,857,034 | 26,637,568 |
| Distributions reinvested | 182,460 | 1,926,376 | 286,591 | 3,981,964 |
| Redemptions | (2,103,811) | (23,426,529) | (1,734,180) | (24,956,498) |
| Net increase (decrease) | (334,965) | (3,347,117) | 409,445 | 5,663,034 |
| Institutional 2 Class | ||||
| Subscriptions | 40,837 | 461,234 | 119,437 | 1,682,552 |
| Distributions reinvested | 39,629 | 408,394 | 84,801 | 1,156,665 |
| Redemptions | (223,436) | (2,459,385) | (283,728) | (3,981,296) |
| Net decrease | (142,970) | (1,589,757) | (79,490) | (1,142,079) |
| Institutional 3 Class | ||||
| Subscriptions | 917,486 | 10,259,079 | 648,710 | 8,774,954 |
| Fund reorganization | — | — | 5,670,835 | 72,133,132 |
| Distributions reinvested | 522,993 | 5,384,082 | 129,237 | 1,753,627 |
| Redemptions | (2,421,427) | (26,097,176) | (614,877) | (8,302,628) |
| Net increase (decrease) | (980,948) | (10,454,015) | 5,833,905 | 74,359,085 |
| Class R | ||||
| Subscriptions | 67,093 | 749,672 | 23,844 | 338,103 |
| Fund reorganization | — | — | 1,993,210 | 25,816,676 |
| Distributions reinvested | 69,680 | 730,502 | 27,962 | 386,634 |
| Redemptions | (102,629) | (1,119,115) | (1,286,048) | (16,557,920) |
| Net increase | 34,144 | 361,059 | 758,968 | 9,983,493 |
| Total net increase (decrease) | (2,697,067) | (34,300,504) | 11,681,257 | 150,076,939 |
| Columbia Capital Allocation Portfolios | Annual Report 2023 | 45 |
Columbia Capital Allocation Conservative Portfolio
| Net asset value, beginning of period | Net investment income | Net realized and unrealized gain (loss) | Total from investment operations | Distributions from net investment income | Distributions from net realized gains | Total distributions to shareholders | |
| Class A | |||||||
| Year Ended 1/31/2023 | $10.08 | 0.17 | (1.05) | (0.88) | (0.15) | (0.23) | (0.38) |
| Year Ended 1/31/2022 | $10.62 | 0.14 | 0.02 | 0.16 | (0.20) | (0.50) | (0.70) |
| Year Ended 1/31/2021 | $10.31 | 0.17 | 0.49 | 0.66 | (0.23) | (0.12) | (0.35) |
| Year Ended 1/31/2020 | $9.76 | 0.21 | 0.65 | 0.86 | (0.21) | (0.10) | (0.31) |
| Year Ended 1/31/2019 | $10.38 | 0.20 | (0.37) | (0.17) | (0.22) | (0.23) | (0.45) |
| Advisor Class | |||||||
| Year Ended 1/31/2023 | $10.00 | 0.19 | (1.04) | (0.85) | (0.17) | (0.23) | (0.40) |
| Year Ended 1/31/2022 | $10.54 | 0.16 | 0.03 | 0.19 | (0.23) | (0.50) | (0.73) |
| Year Ended 1/31/2021 | $10.24 | 0.19 | 0.49 | 0.68 | (0.26) | (0.12) | (0.38) |
| Year Ended 1/31/2020 | $9.70 | 0.23 | 0.65 | 0.88 | (0.24) | (0.10) | (0.34) |
| Year Ended 1/31/2019 | $10.31 | 0.23 | (0.37) | (0.14) | (0.24) | (0.23) | (0.47) |
| Class C | |||||||
| Year Ended 1/31/2023 | $10.02 | 0.10 | (1.05) | (0.95) | (0.08) | (0.23) | (0.31) |
| Year Ended 1/31/2022 | $10.55 | 0.06 | 0.03 | 0.09 | (0.12) | (0.50) | (0.62) |
| Year Ended 1/31/2021 | $10.25 | 0.09 | 0.49 | 0.58 | (0.16) | (0.12) | (0.28) |
| Year Ended 1/31/2020 | $9.71 | 0.13 | 0.65 | 0.78 | (0.14) | (0.10) | (0.24) |
| Year Ended 1/31/2019 | $10.32 | 0.12 | (0.36) | (0.24) | (0.14) | (0.23) | (0.37) |
| Institutional Class | |||||||
| Year Ended 1/31/2023 | $10.08 | 0.19 | (1.06) | (0.87) | (0.17) | (0.23) | (0.40) |
| Year Ended 1/31/2022 | $10.61 | 0.16 | 0.04 | 0.20 | (0.23) | (0.50) | (0.73) |
| Year Ended 1/31/2021 | $10.30 | 0.20 | 0.49 | 0.69 | (0.26) | (0.12) | (0.38) |
| Year Ended 1/31/2020 | $9.76 | 0.24 | 0.64 | 0.88 | (0.24) | (0.10) | (0.34) |
| Year Ended 1/31/2019 | $10.37 | 0.23 | (0.37) | (0.14) | (0.24) | (0.23) | (0.47) |
| Institutional 2 Class | |||||||
| Year Ended 1/31/2023 | $10.00 | 0.18 | (1.03) | (0.85) | (0.18) | (0.23) | (0.41) |
| Year Ended 1/31/2022 | $10.54 | 0.16 | 0.03 | 0.19 | (0.23) | (0.50) | (0.73) |
| Year Ended 1/31/2021 | $10.24 | 0.20 | 0.48 | 0.68 | (0.26) | (0.12) | (0.38) |
| Year Ended 1/31/2020 | $9.70 | 0.24 | 0.64 | 0.88 | (0.24) | (0.10) | (0.34) |
| Year Ended 1/31/2019 | $10.31 | 0.23 | (0.37) | (0.14) | (0.24) | (0.23) | (0.47) |
| 46 | Columbia Capital Allocation Portfolios | Annual Report 2023 |
Columbia Capital Allocation Conservative Portfolio
| Net asset value, end of period | Total return | Total gross expense ratio to average net assets(a) | Total net expense ratio to average net assets(a),(b) | Net investment income ratio to average net assets | Portfolio turnover | Net assets, end of period (000’s) | |
| Class A | |||||||
| Year Ended 1/31/2023 | $8.82 | (8.64%) | 0.53%(c) | 0.53%(c),(d) | 1.90% | 11% | $155,991 |
| Year Ended 1/31/2022 | $10.08 | 1.41% | 0.50%(c) | 0.50%(c),(d) | 1.29% | 16% | $198,949 |
| Year Ended 1/31/2021 | $10.62 | 6.60% | 0.55%(c) | 0.55%(c),(d) | 1.66% | 63% | $203,326 |
| Year Ended 1/31/2020 | $10.31 | 8.91% | 0.57% | 0.57%(d) | 2.09% | 13% | $180,338 |
| Year Ended 1/31/2019 | $9.76 | (1.61%) | 0.55% | 0.55% | 2.02% | 21% | $177,622 |
| Advisor Class | |||||||
| Year Ended 1/31/2023 | $8.75 | (8.36%) | 0.28%(c) | 0.28%(c),(d) | 2.11% | 11% | $4,429 |
| Year Ended 1/31/2022 | $10.00 | 1.68% | 0.25%(c) | 0.25%(c),(d) | 1.54% | 16% | $8,540 |
| Year Ended 1/31/2021 | $10.54 | 6.82% | 0.30%(c) | 0.30%(c),(d) | 1.90% | 63% | $7,348 |
| Year Ended 1/31/2020 | $10.24 | 9.14% | 0.32% | 0.32%(d) | 2.31% | 13% | $6,012 |
| Year Ended 1/31/2019 | $9.70 | (1.28%) | 0.30% | 0.30% | 2.30% | 21% | $8,396 |
| Class C | |||||||
| Year Ended 1/31/2023 | $8.76 | (9.39%) | 1.28%(c) | 1.28%(c),(d) | 1.11% | 11% | $11,804 |
| Year Ended 1/31/2022 | $10.02 | 0.75% | 1.25%(c) | 1.25%(c),(d) | 0.54% | 16% | $18,376 |
| Year Ended 1/31/2021 | $10.55 | 5.73% | 1.30%(c) | 1.30%(c),(d) | 0.90% | 63% | $19,243 |
| Year Ended 1/31/2020 | $10.25 | 8.05% | 1.32% | 1.32%(d) | 1.34% | 13% | $24,949 |
| Year Ended 1/31/2019 | $9.71 | (2.27%) | 1.30% | 1.30% | 1.23% | 21% | $27,850 |
| Institutional Class | |||||||
| Year Ended 1/31/2023 | $8.81 | (8.50%) | 0.28%(c) | 0.28%(c),(d) | 2.11% | 11% | $8,773 |
| Year Ended 1/31/2022 | $10.08 | 1.76% | 0.25%(c) | 0.25%(c),(d) | 1.55% | 16% | $11,759 |
| Year Ended 1/31/2021 | $10.61 | 6.88% | 0.30%(c) | 0.30%(c),(d) | 1.92% | 63% | $10,576 |
| Year Ended 1/31/2020 | $10.30 | 9.08% | 0.32% | 0.32%(d) | 2.34% | 13% | $9,128 |
| Year Ended 1/31/2019 | $9.76 | (1.27%) | 0.30% | 0.30% | 2.26% | 21% | $8,191 |
| Institutional 2 Class | |||||||
| Year Ended 1/31/2023 | $8.74 | (8.44%) | 0.25%(c) | 0.25%(c) | 1.91% | 11% | $406 |
| Year Ended 1/31/2022 | $10.00 | 1.69% | 0.24%(c) | 0.24%(c) | 1.55% | 16% | $1,404 |
| Year Ended 1/31/2021 | $10.54 | 6.84% | 0.29%(c) | 0.29%(c) | 1.94% | 63% | $1,487 |
| Year Ended 1/31/2020 | $10.24 | 9.17% | 0.30% | 0.30% | 2.38% | 13% | $966 |
| Year Ended 1/31/2019 | $9.70 | (1.25%) | 0.28% | 0.28% | 2.35% | 21% | $642 |
| Columbia Capital Allocation Portfolios | Annual Report 2023 | 47 |
Columbia Capital Allocation Conservative Portfolio
| Net asset value, beginning of period | Net investment income | Net realized and unrealized gain (loss) | Total from investment operations | Distributions from net investment income | Distributions from net realized gains | Total distributions to shareholders | |
| Institutional 3 Class | |||||||
| Year Ended 1/31/2023 | $9.99 | 0.20 | (1.05) | (0.85) | (0.18) | (0.23) | (0.41) |
| Year Ended 1/31/2022 | $10.52 | 0.17 | 0.04 | 0.21 | (0.24) | (0.50) | (0.74) |
| Year Ended 1/31/2021 | $10.22 | 0.20 | 0.49 | 0.69 | (0.27) | (0.12) | (0.39) |
| Year Ended 1/31/2020 | $9.68 | 0.24 | 0.64 | 0.88 | (0.24) | (0.10) | (0.34) |
| Year Ended 1/31/2019 | $10.30 | 0.24 | (0.38) | (0.14) | (0.25) | (0.23) | (0.48) |
| Class R | |||||||
| Year Ended 1/31/2023 | $10.08 | 0.15 | (1.06) | (0.91) | (0.13) | (0.23) | (0.36) |
| Year Ended 1/31/2022 | $10.61 | 0.11 | 0.04 | 0.15 | (0.18) | (0.50) | (0.68) |
| Year Ended 1/31/2021 | $10.30 | 0.14 | 0.50 | 0.64 | (0.21) | (0.12) | (0.33) |
| Year Ended 1/31/2020 | $9.76 | 0.19 | 0.64 | 0.83 | (0.19) | (0.10) | (0.29) |
| Year Ended 1/31/2019 | $10.37 | 0.17 | (0.36) | (0.19) | (0.19) | (0.23) | (0.42) |
| Notes to Financial Highlights | |
| (a) | In addition to the fees and expenses that the Fund bears directly, the Fund indirectly bears a pro rata share of the fees and expenses of any other funds in which it invests. Such indirect expenses are not included in the Fund’s reported expense ratios. |
| (b) | Total net expenses include the impact of certain fee waivers/expense reimbursements made by the Investment Manager and certain of its affiliates, if applicable. |
| (c) | Ratios include interest on collateral expense which is less than 0.01%. |
| (d) | The benefits derived from expense reductions had an impact of less than 0.01%. |
| 48 | Columbia Capital Allocation Portfolios | Annual Report 2023 |
Columbia Capital Allocation Conservative Portfolio
| Net asset value, end of period | Total return | Total gross expense ratio to average net assets(a) | Total net expense ratio to average net assets(a),(b) | Net investment income ratio to average net assets | Portfolio turnover | Net assets, end of period (000’s) | |
| Institutional 3 Class | |||||||
| Year Ended 1/31/2023 | $8.73 | (8.41%) | 0.21%(c) | 0.21%(c) | 2.18% | 11% | $6,468 |
| Year Ended 1/31/2022 | $9.99 | 1.84% | 0.19%(c) | 0.19%(c) | 1.59% | 16% | $9,932 |
| Year Ended 1/31/2021 | $10.52 | 6.91% | 0.24%(c) | 0.24%(c) | 1.97% | 63% | $3,526 |
| Year Ended 1/31/2020 | $10.22 | 9.24% | 0.24% | 0.24% | 2.43% | 13% | $2,535 |
| Year Ended 1/31/2019 | $9.68 | (1.30%) | 0.23% | 0.23% | 2.38% | 21% | $2,061 |
| Class R | |||||||
| Year Ended 1/31/2023 | $8.81 | (8.97%) | 0.79%(c) | 0.79%(c),(d) | 1.69% | 11% | $803 |
| Year Ended 1/31/2022 | $10.08 | 1.25% | 0.75%(c) | 0.75%(c),(d) | 1.04% | 16% | $854 |
| Year Ended 1/31/2021 | $10.61 | 6.34% | 0.80%(c) | 0.80%(c),(d) | 1.35% | 63% | $308 |
| Year Ended 1/31/2020 | $10.30 | 8.54% | 0.82% | 0.82%(d) | 1.92% | 13% | $512 |
| Year Ended 1/31/2019 | $9.76 | (1.77%) | 0.80% | 0.80% | 1.68% | 21% | $447 |
| Columbia Capital Allocation Portfolios | Annual Report 2023 | 49 |
Columbia Capital Allocation Moderate Conservative Portfolio
| Net asset value, beginning of period | Net investment income | Net realized and unrealized gain (loss) | Total from investment operations | Distributions from net investment income | Distributions from net realized gains | Total distributions to shareholders | |
| Class A | |||||||
| Year Ended 1/31/2023 | $10.77 | 0.17 | (1.15) | (0.98) | (0.17) | (0.39) | (0.56) |
| Year Ended 1/31/2022 | $11.29 | 0.16 | 0.36 | 0.52 | (0.28) | (0.76) | (1.04) |
| Year Ended 1/31/2021 | $10.97 | 0.17 | 0.72 | 0.89 | (0.23) | (0.34) | (0.57) |
| Year Ended 1/31/2020 | $10.35 | 0.23 | 0.84 | 1.07 | (0.24) | (0.21) | (0.45) |
| Year Ended 1/31/2019 | $11.38 | 0.21 | (0.52) | (0.31) | (0.24) | (0.48) | (0.72) |
| Advisor Class | |||||||
| Year Ended 1/31/2023 | $10.65 | 0.18 | (1.13) | (0.95) | (0.20) | (0.39) | (0.59) |
| Year Ended 1/31/2022 | $11.17 | 0.19 | 0.36 | 0.55 | (0.31) | (0.76) | (1.07) |
| Year Ended 1/31/2021 | $10.86 | 0.20 | 0.71 | 0.91 | (0.26) | (0.34) | (0.60) |
| Year Ended 1/31/2020 | $10.25 | 0.26 | 0.83 | 1.09 | (0.27) | (0.21) | (0.48) |
| Year Ended 1/31/2019 | $11.28 | 0.23 | (0.52) | (0.29) | (0.26) | (0.48) | (0.74) |
| Class C | |||||||
| Year Ended 1/31/2023 | $10.58 | 0.09 | (1.12) | (1.03) | (0.10) | (0.39) | (0.49) |
| Year Ended 1/31/2022 | $11.11 | 0.07 | 0.35 | 0.42 | (0.19) | (0.76) | (0.95) |
| Year Ended 1/31/2021 | $10.80 | 0.09 | 0.71 | 0.80 | (0.15) | (0.34) | (0.49) |
| Year Ended 1/31/2020 | $10.20 | 0.14 | 0.83 | 0.97 | (0.16) | (0.21) | (0.37) |
| Year Ended 1/31/2019 | $11.21 | 0.12 | (0.50) | (0.38) | (0.15) | (0.48) | (0.63) |
| Institutional Class | |||||||
| Year Ended 1/31/2023 | $10.58 | 0.19 | (1.13) | (0.94) | (0.20) | (0.39) | (0.59) |
| Year Ended 1/31/2022 | $11.11 | 0.19 | 0.35 | 0.54 | (0.31) | (0.76) | (1.07) |
| Year Ended 1/31/2021 | $10.80 | 0.19 | 0.72 | 0.91 | (0.26) | (0.34) | (0.60) |
| Year Ended 1/31/2020 | $10.20 | 0.25 | 0.83 | 1.08 | (0.27) | (0.21) | (0.48) |
| Year Ended 1/31/2019 | $11.22 | 0.22 | (0.50) | (0.28) | (0.26) | (0.48) | (0.74) |
| Institutional 2 Class | |||||||
| Year Ended 1/31/2023 | $10.64 | 0.18 | (1.12) | (0.94) | (0.20) | (0.39) | (0.59) |
| Year Ended 1/31/2022 | $11.16 | 0.19 | 0.36 | 0.55 | (0.31) | (0.76) | (1.07) |
| Year Ended 1/31/2021 | $10.86 | 0.20 | 0.70 | 0.90 | (0.26) | (0.34) | (0.60) |
| Year Ended 1/31/2020 | $10.25 | 0.26 | 0.83 | 1.09 | (0.27) | (0.21) | (0.48) |
| Year Ended 1/31/2019 | $11.27 | 0.25 | (0.52) | (0.27) | (0.27) | (0.48) | (0.75) |
| 50 | Columbia Capital Allocation Portfolios | Annual Report 2023 |
Columbia Capital Allocation Moderate Conservative Portfolio
| Net asset value, end of period | Total return | Total gross expense ratio to average net assets(a) | Total net expense ratio to average net assets(a),(b) | Net investment income ratio to average net assets | Portfolio turnover | Net assets, end of period (000’s) | |
| Class A | |||||||
| Year Ended 1/31/2023 | $9.23 | (8.89%) | 0.44%(c) | 0.44%(c),(d) | 1.76% | 9% | $337,157 |
| Year Ended 1/31/2022 | $10.77 | 4.48% | 0.41%(c) | 0.41%(c),(d) | 1.42% | 18% | $425,491 |
| Year Ended 1/31/2021 | $11.29 | 8.50% | 0.49%(c) | 0.49%(c),(d) | 1.60% | 66% | $443,656 |
| Year Ended 1/31/2020 | $10.97 | 10.52% | 0.49% | 0.49%(d) | 2.12% | 9% | $425,706 |
| Year Ended 1/31/2019 | $10.35 | (2.62%) | 0.48% | 0.48%(d) | 1.96% | 21% | $427,506 |
| Advisor Class | |||||||
| Year Ended 1/31/2023 | $9.11 | (8.76%) | 0.18%(c) | 0.18%(c),(d) | 1.95% | 9% | $4,342 |
| Year Ended 1/31/2022 | $10.65 | 4.80% | 0.16%(c) | 0.16%(c),(d) | 1.65% | 18% | $4,885 |
| Year Ended 1/31/2021 | $11.17 | 8.77% | 0.24%(c) | 0.24%(c),(d) | 1.86% | 66% | $5,549 |
| Year Ended 1/31/2020 | $10.86 | 10.80% | 0.24% | 0.24%(d) | 2.42% | 9% | $5,319 |
| Year Ended 1/31/2019 | $10.25 | (2.40%) | 0.23% | 0.23%(d) | 2.17% | 21% | $4,943 |
| Class C | |||||||
| Year Ended 1/31/2023 | $9.06 | (9.58%) | 1.18%(c) | 1.18%(c),(d) | 0.97% | 9% | $25,646 |
| Year Ended 1/31/2022 | $10.58 | 3.66% | 1.16%(c) | 1.16%(c),(d) | 0.66% | 18% | $37,844 |
| Year Ended 1/31/2021 | $11.11 | 7.70% | 1.24%(c) | 1.24%(c),(d) | 0.85% | 66% | $45,087 |
| Year Ended 1/31/2020 | $10.80 | 9.65% | 1.24% | 1.24%(d) | 1.36% | 9% | $57,072 |
| Year Ended 1/31/2019 | $10.20 | (3.23%) | 1.23% | 1.23%(d) | 1.14% | 21% | $61,019 |
| Institutional Class | |||||||
| Year Ended 1/31/2023 | $9.05 | (8.72%) | 0.19%(c) | 0.19%(c),(d) | 2.01% | 9% | $12,809 |
| Year Ended 1/31/2022 | $10.58 | 4.73% | 0.16%(c) | 0.16%(c),(d) | 1.66% | 18% | $16,861 |
| Year Ended 1/31/2021 | $11.11 | 8.82% | 0.24%(c) | 0.24%(c),(d) | 1.82% | 66% | $16,686 |
| Year Ended 1/31/2020 | $10.80 | 10.76% | 0.24% | 0.24%(d) | 2.38% | 9% | $16,490 |
| Year Ended 1/31/2019 | $10.20 | (2.32%) | 0.23% | 0.23%(d) | 2.10% | 21% | $17,131 |
| Institutional 2 Class | |||||||
| Year Ended 1/31/2023 | $9.11 | (8.65%) | 0.16%(c) | 0.16%(c) | 1.87% | 9% | $885 |
| Year Ended 1/31/2022 | $10.64 | 4.81% | 0.15%(c) | 0.15%(c) | 1.70% | 18% | $5,054 |
| Year Ended 1/31/2021 | $11.16 | 8.70% | 0.23%(c) | 0.23%(c) | 1.85% | 66% | $3,691 |
| Year Ended 1/31/2020 | $10.86 | 10.83% | 0.22% | 0.22% | 2.43% | 9% | $3,683 |
| Year Ended 1/31/2019 | $10.25 | (2.28%) | 0.21% | 0.21% | 2.34% | 21% | $3,758 |
| Columbia Capital Allocation Portfolios | Annual Report 2023 | 51 |
Columbia Capital Allocation Moderate Conservative Portfolio
| Net asset value, beginning of period | Net investment income | Net realized and unrealized gain (loss) | Total from investment operations | Distributions from net investment income | Distributions from net realized gains | Total distributions to shareholders | |
| Institutional 3 Class | |||||||
| Year Ended 1/31/2023 | $10.46 | 0.19 | (1.12) | (0.93) | (0.20) | (0.39) | (0.59) |
| Year Ended 1/31/2022 | $10.99 | 0.19 | 0.36 | 0.55 | (0.32) | (0.76) | (1.08) |
| Year Ended 1/31/2021 | $10.70 | 0.20 | 0.70 | 0.90 | (0.27) | (0.34) | (0.61) |
| Year Ended 1/31/2020 | $10.10 | 0.25 | 0.84 | 1.09 | (0.28) | (0.21) | (0.49) |
| Year Ended 1/31/2019 | $11.13 | 0.30 | (0.58) | (0.28) | (0.27) | (0.48) | (0.75) |
| Class R | |||||||
| Year Ended 1/31/2023 | $10.79 | 0.15 | (1.15) | (1.00) | (0.15) | (0.39) | (0.54) |
| Year Ended 1/31/2022 | $11.31 | 0.14 | 0.35 | 0.49 | (0.25) | (0.76) | (1.01) |
| Year Ended 1/31/2021 | $10.99 | 0.16 | 0.70 | 0.86 | (0.20) | (0.34) | (0.54) |
| Year Ended 1/31/2020 | $10.37 | 0.19 | 0.86 | 1.05 | (0.22) | (0.21) | (0.43) |
| Year Ended 1/31/2019 | $11.39 | 0.18 | (0.51) | (0.33) | (0.21) | (0.48) | (0.69) |
| Notes to Financial Highlights | |
| (a) | In addition to the fees and expenses that the Fund bears directly, the Fund indirectly bears a pro rata share of the fees and expenses of any other funds in which it invests. Such indirect expenses are not included in the Fund’s reported expense ratios. |
| (b) | Total net expenses include the impact of certain fee waivers/expense reimbursements made by the Investment Manager and certain of its affiliates, if applicable. |
| (c) | Ratios include interest on collateral expense which is less than 0.01%. |
| (d) | The benefits derived from expense reductions had an impact of less than 0.01%. |
| 52 | Columbia Capital Allocation Portfolios | Annual Report 2023 |
Columbia Capital Allocation Moderate Conservative Portfolio
| Net asset value, end of period | Total return | Total gross expense ratio to average net assets(a) | Total net expense ratio to average net assets(a),(b) | Net investment income ratio to average net assets | Portfolio turnover | Net assets, end of period (000’s) | |
| Institutional 3 Class | |||||||
| Year Ended 1/31/2023 | $8.94 | (8.67%) | 0.12%(c) | 0.12%(c) | 2.11% | 9% | $7,259 |
| Year Ended 1/31/2022 | $10.46 | 4.84% | 0.10%(c) | 0.10%(c) | 1.73% | 18% | $7,540 |
| Year Ended 1/31/2021 | $10.99 | 8.79% | 0.18%(c) | 0.18%(c) | 1.93% | 66% | $6,629 |
| Year Ended 1/31/2020 | $10.70 | 10.94% | 0.18% | 0.18% | 2.42% | 9% | $5,951 |
| Year Ended 1/31/2019 | $10.10 | (2.36%) | 0.17% | 0.17% | 2.96% | 21% | $5,551 |
| Class R | |||||||
| Year Ended 1/31/2023 | $9.25 | (9.11%) | 0.69%(c) | 0.69%(c),(d) | 1.54% | 9% | $1,554 |
| Year Ended 1/31/2022 | $10.79 | 4.21% | 0.66%(c) | 0.66%(c),(d) | 1.17% | 18% | $1,673 |
| Year Ended 1/31/2021 | $11.31 | 8.21% | 0.74%(c) | 0.74%(c),(d) | 1.48% | 66% | $1,625 |
| Year Ended 1/31/2020 | $10.99 | 10.23% | 0.74% | 0.74%(d) | 1.80% | 9% | $1,177 |
| Year Ended 1/31/2019 | $10.37 | (2.78%) | 0.73% | 0.73%(d) | 1.71% | 21% | $1,431 |
| Columbia Capital Allocation Portfolios | Annual Report 2023 | 53 |
Columbia Capital Allocation Moderate Portfolio
| Net asset value, beginning of period | Net investment income | Net realized and unrealized gain (loss) | Total from investment operations | Distributions from net investment income | Distributions from net realized gains | Total distributions to shareholders | |
| Class A | |||||||
| Year Ended 1/31/2023 | $11.17 | 0.16 | (1.27) | (1.11) | (0.16) | (0.37) | (0.53) |
| Year Ended 1/31/2022 | $11.91 | 0.19 | 0.60 | 0.79 | (0.36) | (1.17) | (1.53) |
| Year Ended 1/31/2021 | $11.32 | 0.18 | 1.03 | 1.21 | (0.27) | (0.35) | (0.62) |
| Year Ended 1/31/2020 | $10.70 | 0.24 | 1.05 | 1.29 | (0.25) | (0.42) | (0.67) |
| Year Ended 1/31/2019 | $11.99 | 0.22 | (0.73) | (0.51) | (0.25) | (0.53) | (0.78) |
| Advisor Class | |||||||
| Year Ended 1/31/2023 | $10.98 | 0.19 | (1.26) | (1.07) | (0.19) | (0.37) | (0.56) |
| Year Ended 1/31/2022 | $11.73 | 0.22 | 0.59 | 0.81 | (0.39) | (1.17) | (1.56) |
| Year Ended 1/31/2021 | $11.17 | 0.21 | 1.00 | 1.21 | (0.30) | (0.35) | (0.65) |
| Year Ended 1/31/2020 | $10.57 | 0.28 | 1.02 | 1.30 | (0.28) | (0.42) | (0.70) |
| Year Ended 1/31/2019 | $11.85 | 0.25 | (0.72) | (0.47) | (0.28) | (0.53) | (0.81) |
| Class C | |||||||
| Year Ended 1/31/2023 | $11.05 | 0.08 | (1.25) | (1.17) | (0.09) | (0.37) | (0.46) |
| Year Ended 1/31/2022 | $11.80 | 0.10 | 0.59 | 0.69 | (0.27) | (1.17) | (1.44) |
| Year Ended 1/31/2021 | $11.21 | 0.10 | 1.03 | 1.13 | (0.19) | (0.35) | (0.54) |
| Year Ended 1/31/2020 | $10.61 | 0.15 | 1.04 | 1.19 | (0.17) | (0.42) | (0.59) |
| Year Ended 1/31/2019 | $11.89 | 0.13 | (0.72) | (0.59) | (0.16) | (0.53) | (0.69) |
| Institutional Class | |||||||
| Year Ended 1/31/2023 | $11.15 | 0.18 | (1.26) | (1.08) | (0.19) | (0.37) | (0.56) |
| Year Ended 1/31/2022 | $11.89 | 0.23 | 0.59 | 0.82 | (0.39) | (1.17) | (1.56) |
| Year Ended 1/31/2021 | $11.31 | 0.21 | 1.02 | 1.23 | (0.30) | (0.35) | (0.65) |
| Year Ended 1/31/2020 | $10.69 | 0.26 | 1.06 | 1.32 | (0.28) | (0.42) | (0.70) |
| Year Ended 1/31/2019 | $11.97 | 0.25 | (0.72) | (0.47) | (0.28) | (0.53) | (0.81) |
| Institutional 2 Class | |||||||
| Year Ended 1/31/2023 | $10.97 | 0.17 | (1.23) | (1.06) | (0.19) | (0.37) | (0.56) |
| Year Ended 1/31/2022 | $11.73 | 0.20 | 0.60 | 0.80 | (0.39) | (1.17) | (1.56) |
| Year Ended 1/31/2021 | $11.16 | 0.21 | 1.01 | 1.22 | (0.30) | (0.35) | (0.65) |
| Year Ended 1/31/2020 | $10.56 | 0.27 | 1.03 | 1.30 | (0.28) | (0.42) | (0.70) |
| Year Ended 1/31/2019 | $11.84 | 0.23 | (0.70) | (0.47) | (0.28) | (0.53) | (0.81) |
| Institutional 3 Class | |||||||
| Year Ended 1/31/2023 | $10.98 | 0.18 | (1.23) | (1.05) | (0.20) | (0.37) | (0.57) |
| Year Ended 1/31/2022 | $11.74 | 0.23 | 0.57 | 0.80 | (0.39) | (1.17) | (1.56) |
| Year Ended 1/31/2021 | $11.17 | 0.21 | 1.01 | 1.22 | (0.30) | (0.35) | (0.65) |
| Year Ended 1/31/2020 | $10.56 | 0.27 | 1.05 | 1.32 | (0.29) | (0.42) | (0.71) |
| Year Ended 1/31/2019 | $11.84 | 0.27 | (0.74) | (0.47) | (0.28) | (0.53) | (0.81) |
| 54 | Columbia Capital Allocation Portfolios | Annual Report 2023 |
Columbia Capital Allocation Moderate Portfolio
| Net asset value, end of period | Total return | Total gross expense ratio to average net assets(a) | Total net expense ratio to average net assets(a),(b) | Net investment income ratio to average net assets | Portfolio turnover | Net assets, end of period (000’s) | |
| Class A | |||||||
| Year Ended 1/31/2023 | $9.53 | (9.70%) | 0.39%(c) | 0.39%(c),(d) | 1.61% | 6% | $1,027,776 |
| Year Ended 1/31/2022 | $11.17 | 6.42% | 0.38%(c) | 0.38%(c),(d) | 1.58% | 22% | $1,308,500 |
| Year Ended 1/31/2021 | $11.91 | 11.31% | 0.43%(c) | 0.43%(c),(d) | 1.66% | 86% | $1,324,148 |
| Year Ended 1/31/2020 | $11.32 | 12.26% | 0.43% | 0.43%(d) | 2.11% | 10% | $1,280,253 |
| Year Ended 1/31/2019 | $10.70 | (4.13%) | 0.43% | 0.43%(d) | 1.94% | 20% | $1,247,694 |
| Advisor Class | |||||||
| Year Ended 1/31/2023 | $9.35 | (9.54%) | 0.14%(c) | 0.14%(c),(d) | 1.95% | 6% | $7,509 |
| Year Ended 1/31/2022 | $10.98 | 6.70% | 0.13%(c) | 0.13%(c),(d) | 1.86% | 22% | $7,686 |
| Year Ended 1/31/2021 | $11.73 | 11.48% | 0.18%(c) | 0.18%(c),(d) | 1.91% | 86% | $3,244 |
| Year Ended 1/31/2020 | $11.17 | 12.51% | 0.18% | 0.18%(d) | 2.50% | 10% | $3,051 |
| Year Ended 1/31/2019 | $10.57 | (3.84%) | 0.18% | 0.18%(d) | 2.28% | 20% | $1,212 |
| Class C | |||||||
| Year Ended 1/31/2023 | $9.42 | (10.42%) | 1.14%(c) | 1.14%(c),(d) | 0.85% | 6% | $70,538 |
| Year Ended 1/31/2022 | $11.05 | 5.58% | 1.13%(c) | 1.13%(c),(d) | 0.82% | 22% | $98,600 |
| Year Ended 1/31/2021 | $11.80 | 10.56% | 1.18%(c) | 1.18%(c),(d) | 0.89% | 86% | $110,135 |
| Year Ended 1/31/2020 | $11.21 | 11.34% | 1.18% | 1.18%(d) | 1.35% | 10% | $153,545 |
| Year Ended 1/31/2019 | $10.61 | (4.82%) | 1.18% | 1.18%(d) | 1.15% | 20% | $160,172 |
| Institutional Class | |||||||
| Year Ended 1/31/2023 | $9.51 | (9.48%) | 0.14%(c) | 0.14%(c),(d) | 1.78% | 6% | $27,345 |
| Year Ended 1/31/2022 | $11.15 | 6.69% | 0.13%(c) | 0.13%(c),(d) | 1.89% | 22% | $62,130 |
| Year Ended 1/31/2021 | $11.89 | 11.51% | 0.18%(c) | 0.18%(c),(d) | 1.91% | 86% | $38,386 |
| Year Ended 1/31/2020 | $11.31 | 12.55% | 0.18% | 0.18%(d) | 2.37% | 10% | $37,112 |
| Year Ended 1/31/2019 | $10.69 | (3.80%) | 0.18% | 0.18%(d) | 2.19% | 20% | $38,025 |
| Institutional 2 Class | |||||||
| Year Ended 1/31/2023 | $9.35 | (9.46%) | 0.12%(c) | 0.12%(c) | 1.80% | 6% | $1,936 |
| Year Ended 1/31/2022 | $10.97 | 6.63% | 0.12%(c) | 0.12%(c) | 1.67% | 22% | $3,754 |
| Year Ended 1/31/2021 | $11.73 | 11.59% | 0.17%(c) | 0.17%(c) | 1.92% | 86% | $6,728 |
| Year Ended 1/31/2020 | $11.16 | 12.53% | 0.17% | 0.17% | 2.42% | 10% | $5,447 |
| Year Ended 1/31/2019 | $10.56 | (3.83%) | 0.17% | 0.17% | 2.08% | 20% | $4,554 |
| Institutional 3 Class | |||||||
| Year Ended 1/31/2023 | $9.36 | (9.39%) | 0.08%(c) | 0.08%(c) | 1.89% | 6% | $29,170 |
| Year Ended 1/31/2022 | $10.98 | 6.66% | 0.08%(c) | 0.08%(c) | 1.92% | 22% | $39,786 |
| Year Ended 1/31/2021 | $11.74 | 11.64% | 0.12%(c) | 0.12%(c) | 1.94% | 86% | $10,372 |
| Year Ended 1/31/2020 | $11.17 | 12.68% | 0.13% | 0.13% | 2.42% | 10% | $11,042 |
| Year Ended 1/31/2019 | $10.56 | (3.79%) | 0.13% | 0.13% | 2.45% | 20% | $9,319 |
| Columbia Capital Allocation Portfolios | Annual Report 2023 | 55 |
Columbia Capital Allocation Moderate Portfolio
| Net asset value, beginning of period | Net investment income | Net realized and unrealized gain (loss) | Total from investment operations | Distributions from net investment income | Distributions from net realized gains | Total distributions to shareholders | |
| Class R | |||||||
| Year Ended 1/31/2023 | $11.13 | 0.13 | (1.26) | (1.13) | (0.14) | (0.37) | (0.51) |
| Year Ended 1/31/2022 | $11.87 | 0.16 | 0.60 | 0.76 | (0.33) | (1.17) | (1.50) |
| Year Ended 1/31/2021 | $11.28 | 0.15 | 1.03 | 1.18 | (0.24) | (0.35) | (0.59) |
| Year Ended 1/31/2020 | $10.67 | 0.20 | 1.05 | 1.25 | (0.22) | (0.42) | (0.64) |
| Year Ended 1/31/2019 | $11.95 | 0.19 | (0.72) | (0.53) | (0.22) | (0.53) | (0.75) |
| Notes to Financial Highlights | |
| (a) | In addition to the fees and expenses that the Fund bears directly, the Fund indirectly bears a pro rata share of the fees and expenses of any other funds in which it invests. Such indirect expenses are not included in the Fund’s reported expense ratios. |
| (b) | Total net expenses include the impact of certain fee waivers/expense reimbursements made by the Investment Manager and certain of its affiliates, if applicable. |
| (c) | Ratios include interest on collateral expense which is less than 0.01%. |
| (d) | The benefits derived from expense reductions had an impact of less than 0.01%. |
| 56 | Columbia Capital Allocation Portfolios | Annual Report 2023 |
Columbia Capital Allocation Moderate Portfolio
| Net asset value, end of period | Total return | Total gross expense ratio to average net assets(a) | Total net expense ratio to average net assets(a),(b) | Net investment income ratio to average net assets | Portfolio turnover | Net assets, end of period (000’s) | |
| Class R | |||||||
| Year Ended 1/31/2023 | $9.49 | (9.97%) | 0.64%(c) | 0.64%(c),(d) | 1.37% | 6% | $4,271 |
| Year Ended 1/31/2022 | $11.13 | 6.17% | 0.63%(c) | 0.63%(c),(d) | 1.31% | 22% | $4,935 |
| Year Ended 1/31/2021 | $11.87 | 11.06% | 0.68%(c) | 0.68%(c),(d) | 1.40% | 86% | $2,652 |
| Year Ended 1/31/2020 | $11.28 | 11.92% | 0.68% | 0.68%(d) | 1.79% | 10% | $2,531 |
| Year Ended 1/31/2019 | $10.67 | (4.30%) | 0.68% | 0.68%(d) | 1.72% | 20% | $3,156 |
| Columbia Capital Allocation Portfolios | Annual Report 2023 | 57 |
Columbia Capital Allocation Moderate Aggressive Portfolio
| Net asset value, beginning of period | Net investment income | Net realized and unrealized gain (loss) | Total from investment operations | Distributions from net investment income | Distributions from net realized gains | Total distributions to shareholders | |
| Class A | |||||||
| Year Ended 1/31/2023 | $12.27 | 0.13 | (1.38) | (1.25) | (0.14) | (0.47) | (0.61) |
| Year Ended 1/31/2022 | $13.05 | 0.19 | 1.03 | 1.22 | (0.42) | (1.58) | (2.00) |
| Year Ended 1/31/2021 | $12.28 | 0.15 | 1.33 | 1.48 | (0.19) | (0.52) | (0.71) |
| Year Ended 1/31/2020 | $11.64 | 0.22 | 1.33 | 1.55 | (0.24) | (0.67) | (0.91) |
| Year Ended 1/31/2019 | $13.50 | 0.20 | (0.97) | (0.77) | (0.24) | (0.85) | (1.09) |
| Advisor Class | |||||||
| Year Ended 1/31/2023 | $12.42 | 0.17 | (1.41) | (1.24) | (0.17) | (0.47) | (0.64) |
| Year Ended 1/31/2022 | $13.18 | 0.22 | 1.05 | 1.27 | (0.45) | (1.58) | (2.03) |
| Year Ended 1/31/2021 | $12.40 | 0.19 | 1.33 | 1.52 | (0.22) | (0.52) | (0.74) |
| Year Ended 1/31/2020 | $11.75 | 0.22 | 1.37 | 1.59 | (0.27) | (0.67) | (0.94) |
| Year Ended 1/31/2019 | $13.61 | 0.24 | (0.98) | (0.74) | (0.27) | (0.85) | (1.12) |
| Class C | |||||||
| Year Ended 1/31/2023 | $12.30 | 0.05 | (1.38) | (1.33) | (0.06) | (0.47) | (0.53) |
| Year Ended 1/31/2022 | $13.07 | 0.09 | 1.04 | 1.13 | (0.32) | (1.58) | (1.90) |
| Year Ended 1/31/2021 | $12.30 | 0.05 | 1.35 | 1.40 | (0.11) | (0.52) | (0.63) |
| Year Ended 1/31/2020 | $11.67 | 0.12 | 1.33 | 1.45 | (0.15) | (0.67) | (0.82) |
| Year Ended 1/31/2019 | $13.52 | 0.10 | (0.96) | (0.86) | (0.14) | (0.85) | (0.99) |
| Institutional Class | |||||||
| Year Ended 1/31/2023 | $12.23 | 0.15 | (1.36) | (1.21) | (0.17) | (0.47) | (0.64) |
| Year Ended 1/31/2022 | $13.02 | 0.22 | 1.02 | 1.24 | (0.45) | (1.58) | (2.03) |
| Year Ended 1/31/2021 | $12.25 | 0.18 | 1.33 | 1.51 | (0.22) | (0.52) | (0.74) |
| Year Ended 1/31/2020 | $11.62 | 0.24 | 1.33 | 1.57 | (0.27) | (0.67) | (0.94) |
| Year Ended 1/31/2019 | $13.47 | 0.23 | (0.96) | (0.73) | (0.27) | (0.85) | (1.12) |
| Institutional 2 Class | |||||||
| Year Ended 1/31/2023 | $12.40 | 0.16 | (1.39) | (1.23) | (0.17) | (0.47) | (0.64) |
| Year Ended 1/31/2022 | $13.17 | 0.22 | 1.04 | 1.26 | (0.45) | (1.58) | (2.03) |
| Year Ended 1/31/2021 | $12.38 | 0.18 | 1.36 | 1.54 | (0.23) | (0.52) | (0.75) |
| Year Ended 1/31/2020 | $11.74 | 0.26 | 1.32 | 1.58 | (0.27) | (0.67) | (0.94) |
| Year Ended 1/31/2019 | $13.60 | 0.24 | (0.97) | (0.73) | (0.28) | (0.85) | (1.13) |
| Institutional 3 Class | |||||||
| Year Ended 1/31/2023 | $12.00 | 0.15 | (1.33) | (1.18) | (0.18) | (0.47) | (0.65) |
| Year Ended 1/31/2022 | $12.80 | 0.23 | 1.01 | 1.24 | (0.46) | (1.58) | (2.04) |
| Year Ended 1/31/2021 | $12.06 | 0.18 | 1.31 | 1.49 | (0.23) | (0.52) | (0.75) |
| Year Ended 1/31/2020 | $11.45 | 0.26 | 1.30 | 1.56 | (0.28) | (0.67) | (0.95) |
| Year Ended 1/31/2019 | $13.30 | 0.22 | (0.94) | (0.72) | (0.28) | (0.85) | (1.13) |
| 58 | Columbia Capital Allocation Portfolios | Annual Report 2023 |
Columbia Capital Allocation Moderate Aggressive Portfolio
| Net asset value, end of period | Total return | Total gross expense ratio to average net assets(a) | Total net expense ratio to average net assets(a),(b) | Net investment income ratio to average net assets | Portfolio turnover | Net assets, end of period (000’s) | |
| Class A | |||||||
| Year Ended 1/31/2023 | $10.41 | (9.93%) | 0.40%(c) | 0.40%(c),(d) | 1.22% | 7% | $1,404,980 |
| Year Ended 1/31/2022 | $12.27 | 9.12% | 0.39%(c) | 0.39%(c),(d) | 1.41% | 21% | $1,720,777 |
| Year Ended 1/31/2021 | $13.05 | 12.89% | 0.50%(c) | 0.50%(c),(d) | 1.22% | 76% | $1,690,945 |
| Year Ended 1/31/2020 | $12.28 | 13.51% | 0.50% | 0.50%(d) | 1.77% | 10% | $1,645,913 |
| Year Ended 1/31/2019 | $11.64 | (5.48%) | 0.49% | 0.49%(d) | 1.59% | 18% | $1,603,992 |
| Advisor Class | |||||||
| Year Ended 1/31/2023 | $10.54 | (9.74%) | 0.16%(c) | 0.15%(c),(d) | 1.66% | 7% | $38,201 |
| Year Ended 1/31/2022 | $12.42 | 9.45% | 0.15%(c) | 0.15%(c),(d) | 1.63% | 21% | $28,048 |
| Year Ended 1/31/2021 | $13.18 | 13.13% | 0.24%(c) | 0.24%(c),(d) | 1.61% | 76% | $8,672 |
| Year Ended 1/31/2020 | $12.40 | 13.75% | 0.25% | 0.25%(d) | 1.80% | 10% | $7,779 |
| Year Ended 1/31/2019 | $11.75 | (5.19%) | 0.24% | 0.24%(d) | 1.90% | 18% | $14,622 |
| Class C | |||||||
| Year Ended 1/31/2023 | $10.44 | (10.57%) | 1.15%(c) | 1.15%(c),(d) | 0.46% | 7% | $76,449 |
| Year Ended 1/31/2022 | $12.30 | 8.36% | 1.14%(c) | 1.14%(c),(d) | 0.64% | 21% | $102,579 |
| Year Ended 1/31/2021 | $13.07 | 12.05% | 1.25%(c) | 1.25%(c),(d) | 0.46% | 76% | $116,412 |
| Year Ended 1/31/2020 | $12.30 | 12.55% | 1.25% | 1.25%(d) | 1.01% | 10% | $148,134 |
| Year Ended 1/31/2019 | $11.67 | (6.12%) | 1.24% | 1.24%(d) | 0.77% | 18% | $151,414 |
| Institutional Class | |||||||
| Year Ended 1/31/2023 | $10.38 | (9.65%) | 0.15%(c) | 0.15%(c),(d) | 1.46% | 7% | $84,049 |
| Year Ended 1/31/2022 | $12.23 | 9.33% | 0.14%(c) | 0.14%(c),(d) | 1.66% | 21% | $106,896 |
| Year Ended 1/31/2021 | $13.02 | 13.21% | 0.25%(c) | 0.25%(c),(d) | 1.48% | 76% | $106,491 |
| Year Ended 1/31/2020 | $12.25 | 13.73% | 0.25% | 0.25%(d) | 2.01% | 10% | $107,497 |
| Year Ended 1/31/2019 | $11.62 | (5.17%) | 0.24% | 0.24%(d) | 1.83% | 18% | $108,487 |
| Institutional 2 Class | |||||||
| Year Ended 1/31/2023 | $10.53 | (9.65%) | 0.11%(c) | 0.11%(c) | 1.45% | 7% | $4,573 |
| Year Ended 1/31/2022 | $12.40 | 9.41% | 0.11%(c) | 0.11%(c) | 1.57% | 21% | $8,174 |
| Year Ended 1/31/2021 | $13.17 | 13.28% | 0.21%(c) | 0.21%(c) | 1.53% | 76% | $11,176 |
| Year Ended 1/31/2020 | $12.38 | 13.72% | 0.20% | 0.20% | 2.13% | 10% | $9,890 |
| Year Ended 1/31/2019 | $11.74 | (5.15%) | 0.19% | 0.19% | 1.89% | 18% | $7,961 |
| Institutional 3 Class | |||||||
| Year Ended 1/31/2023 | $10.17 | (9.58%) | 0.06%(c) | 0.06%(c) | 1.47% | 7% | $36,468 |
| Year Ended 1/31/2022 | $12.00 | 9.50% | 0.07%(c) | 0.07%(c) | 1.74% | 21% | $78,836 |
| Year Ended 1/31/2021 | $12.80 | 13.27% | 0.16%(c) | 0.16%(c) | 1.55% | 76% | $14,407 |
| Year Ended 1/31/2020 | $12.06 | 13.87% | 0.15% | 0.15% | 2.15% | 10% | $13,771 |
| Year Ended 1/31/2019 | $11.45 | (5.14%) | 0.14% | 0.14% | 1.80% | 18% | $11,447 |
| Columbia Capital Allocation Portfolios | Annual Report 2023 | 59 |
Columbia Capital Allocation Moderate Aggressive Portfolio
| Net asset value, beginning of period | Net investment income | Net realized and unrealized gain (loss) | Total from investment operations | Distributions from net investment income | Distributions from net realized gains | Total distributions to shareholders | |
| Class R | |||||||
| Year Ended 1/31/2023 | $12.25 | 0.10 | (1.37) | (1.27) | (0.11) | (0.47) | (0.58) |
| Year Ended 1/31/2022 | $13.03 | 0.15 | 1.03 | 1.18 | (0.38) | (1.58) | (1.96) |
| Year Ended 1/31/2021 | $12.26 | 0.12 | 1.33 | 1.45 | (0.16) | (0.52) | (0.68) |
| Year Ended 1/31/2020 | $11.63 | 0.18 | 1.33 | 1.51 | (0.21) | (0.67) | (0.88) |
| Year Ended 1/31/2019 | $13.48 | 0.17 | (0.96) | (0.79) | (0.21) | (0.85) | (1.06) |
| Class V | |||||||
| Year Ended 1/31/2023 | $12.27 | 0.13 | (1.38) | (1.25) | (0.14) | (0.47) | (0.61) |
| Year Ended 1/31/2022 | $13.05 | 0.19 | 1.03 | 1.22 | (0.42) | (1.58) | (2.00) |
| Year Ended 1/31/2021 | $12.28 | 0.15 | 1.33 | 1.48 | (0.19) | (0.52) | (0.71) |
| Year Ended 1/31/2020 | $11.64 | 0.22 | 1.33 | 1.55 | (0.24) | (0.67) | (0.91) |
| Year Ended 1/31/2019 | $13.50 | 0.20 | (0.97) | (0.77) | (0.24) | (0.85) | (1.09) |
| Notes to Financial Highlights | |
| (a) | In addition to the fees and expenses that the Fund bears directly, the Fund indirectly bears a pro rata share of the fees and expenses of any other funds in which it invests. Such indirect expenses are not included in the Fund’s reported expense ratios. |
| (b) | Total net expenses include the impact of certain fee waivers/expense reimbursements made by the Investment Manager and certain of its affiliates, if applicable. |
| (c) | Ratios include interest on collateral expense which is less than 0.01%. |
| (d) | The benefits derived from expense reductions had an impact of less than 0.01%. |
| 60 | Columbia Capital Allocation Portfolios | Annual Report 2023 |
Columbia Capital Allocation Moderate Aggressive Portfolio
| Net asset value, end of period | Total return | Total gross expense ratio to average net assets(a) | Total net expense ratio to average net assets(a),(b) | Net investment income ratio to average net assets | Portfolio turnover | Net assets, end of period (000’s) | |
| Class R | |||||||
| Year Ended 1/31/2023 | $10.40 | (10.10%) | 0.65%(c) | 0.65%(c),(d) | 0.97% | 7% | $16,756 |
| Year Ended 1/31/2022 | $12.25 | 8.85% | 0.65%(c) | 0.65%(c),(d) | 1.09% | 21% | $19,334 |
| Year Ended 1/31/2021 | $13.03 | 12.62% | 0.75%(c) | 0.75%(c),(d) | 0.98% | 76% | $5,315 |
| Year Ended 1/31/2020 | $12.26 | 13.15% | 0.75% | 0.75%(d) | 1.46% | 10% | $4,823 |
| Year Ended 1/31/2019 | $11.63 | (5.66%) | 0.74% | 0.74%(d) | 1.37% | 18% | $4,957 |
| Class V | |||||||
| Year Ended 1/31/2023 | $10.41 | (9.93%) | 0.40%(c) | 0.40%(c),(d) | 1.22% | 7% | $68,628 |
| Year Ended 1/31/2022 | $12.27 | 9.12% | 0.39%(c) | 0.39%(c),(d) | 1.41% | 21% | $83,273 |
| Year Ended 1/31/2021 | $13.05 | 12.89% | 0.50%(c) | 0.50%(c),(d) | 1.22% | 76% | $84,036 |
| Year Ended 1/31/2020 | $12.28 | 13.51% | 0.50% | 0.50%(d) | 1.78% | 10% | $81,137 |
| Year Ended 1/31/2019 | $11.64 | (5.48%) | 0.49% | 0.49%(d) | 1.58% | 18% | $79,629 |
| Columbia Capital Allocation Portfolios | Annual Report 2023 | 61 |
Columbia Capital Allocation Aggressive Portfolio
| Net asset value, beginning of period | Net investment income | Net realized and unrealized gain (loss) | Total from investment operations | Distributions from net investment income | Distributions from net realized gains | Total distributions to shareholders | |
| Class A | |||||||
| Year Ended 1/31/2023 | $13.31 | 0.10 | (1.50) | (1.40) | (0.11) | (0.67) | (0.78) |
| Year Ended 1/31/2022 | $13.49 | 0.18 | 1.49 | 1.67 | (0.36) | (1.49) | (1.85) |
| Year Ended 1/31/2021 | $12.58 | 0.15 | 1.56 | 1.71 | (0.18) | (0.62) | (0.80) |
| Year Ended 1/31/2020 | $11.90 | 0.19 | 1.45 | 1.64 | (0.19) | (0.77) | (0.96) |
| Year Ended 1/31/2019 | $14.10 | 0.17 | (1.19) | (1.02) | (0.23) | (0.95) | (1.18) |
| Advisor Class | |||||||
| Year Ended 1/31/2023 | $12.94 | 0.14 | (1.47) | (1.33) | (0.14) | (0.67) | (0.81) |
| Year Ended 1/31/2022 | $13.16 | 0.21 | 1.46 | 1.67 | (0.40) | (1.49) | (1.89) |
| Year Ended 1/31/2021 | $12.29 | 0.21 | 1.49 | 1.70 | (0.21) | (0.62) | (0.83) |
| Year Ended 1/31/2020 | $11.64 | 0.19 | 1.45 | 1.64 | (0.22) | (0.77) | (0.99) |
| Year Ended 1/31/2019 | $13.83 | 0.20 | (1.18) | (0.98) | (0.26) | (0.95) | (1.21) |
| Class C | |||||||
| Year Ended 1/31/2023 | $12.85 | 0.01 | (1.43) | (1.42) | (0.03) | (0.67) | (0.70) |
| Year Ended 1/31/2022 | $13.09 | 0.07 | 1.43 | 1.50 | (0.25) | (1.49) | (1.74) |
| Year Ended 1/31/2021 | $12.24 | 0.05 | 1.51 | 1.56 | (0.09) | (0.62) | (0.71) |
| Year Ended 1/31/2020 | $11.60 | 0.09 | 1.42 | 1.51 | (0.10) | (0.77) | (0.87) |
| Year Ended 1/31/2019 | $13.77 | 0.07 | (1.16) | (1.09) | (0.13) | (0.95) | (1.08) |
| Institutional Class | |||||||
| Year Ended 1/31/2023 | $13.23 | 0.13 | (1.49) | (1.36) | (0.14) | (0.67) | (0.81) |
| Year Ended 1/31/2022 | $13.42 | 0.22 | 1.48 | 1.70 | (0.40) | (1.49) | (1.89) |
| Year Ended 1/31/2021 | $12.52 | 0.20 | 1.53 | 1.73 | (0.21) | (0.62) | (0.83) |
| Year Ended 1/31/2020 | $11.84 | 0.22 | 1.45 | 1.67 | (0.22) | (0.77) | (0.99) |
| Year Ended 1/31/2019 | $14.04 | 0.15 | (1.13) | (0.98) | (0.27) | (0.95) | (1.22) |
| Institutional 2 Class | |||||||
| Year Ended 1/31/2023 | $12.93 | 0.12 | (1.45) | (1.33) | (0.14) | (0.67) | (0.81) |
| Year Ended 1/31/2022 | $13.15 | 0.21 | 1.46 | 1.67 | (0.40) | (1.49) | (1.89) |
| Year Ended 1/31/2021 | $12.29 | 0.18 | 1.51 | 1.69 | (0.21) | (0.62) | (0.83) |
| Year Ended 1/31/2020 | $11.64 | 0.23 | 1.41 | 1.64 | (0.22) | (0.77) | (0.99) |
| Year Ended 1/31/2019 | $13.82 | 0.20 | (1.16) | (0.96) | (0.27) | (0.95) | (1.22) |
| Institutional 3 Class | |||||||
| Year Ended 1/31/2023 | $12.92 | 0.13 | (1.45) | (1.32) | (0.15) | (0.67) | (0.82) |
| Year Ended 1/31/2022 | $13.14 | 0.21 | 1.46 | 1.67 | (0.40) | (1.49) | (1.89) |
| Year Ended 1/31/2021 | $12.28 | 0.17 | 1.53 | 1.70 | (0.22) | (0.62) | (0.84) |
| Year Ended 1/31/2020 | $11.63 | 0.23 | 1.42 | 1.65 | (0.23) | (0.77) | (1.00) |
| Year Ended 1/31/2019 | $13.82 | 0.22 | (1.19) | (0.97) | (0.27) | (0.95) | (1.22) |
| 62 | Columbia Capital Allocation Portfolios | Annual Report 2023 |
Columbia Capital Allocation Aggressive Portfolio
| Net asset value, end of period | Total return | Total gross expense ratio to average net assets(a) | Total net expense ratio to average net assets(a),(b) | Net investment income ratio to average net assets | Portfolio turnover | Net assets, end of period (000’s) | |
| Class A | |||||||
| Year Ended 1/31/2023 | $11.13 | (10.14%) | 0.40%(c) | 0.40%(c),(d) | 0.88% | 8% | $1,038,485 |
| Year Ended 1/31/2022 | $13.31 | 12.14% | 0.39%(c) | 0.39%(c),(d) | 1.27% | 14% | $1,264,033 |
| Year Ended 1/31/2021 | $13.49 | 14.61% | 0.43%(c),(e) | 0.43%(c),(d),(e) | 1.22% | 74% | $1,214,331 |
| Year Ended 1/31/2020 | $12.58 | 14.00% | 0.47% | 0.47%(d) | 1.49% | 12% | $623,971 |
| Year Ended 1/31/2019 | $11.90 | (6.90%) | 0.47% | 0.47%(d) | 1.30% | 20% | $599,211 |
| Advisor Class | |||||||
| Year Ended 1/31/2023 | $10.80 | (9.88%) | 0.15%(c) | 0.15%(c),(d) | 1.29% | 8% | $20,360 |
| Year Ended 1/31/2022 | $12.94 | 12.41% | 0.14%(c) | 0.14%(c),(d) | 1.50% | 14% | $13,041 |
| Year Ended 1/31/2021 | $13.16 | 14.90% | 0.17%(c),(e) | 0.17%(c),(d),(e) | 1.68% | 74% | $8,176 |
| Year Ended 1/31/2020 | $12.29 | 14.33% | 0.22% | 0.22%(d) | 1.60% | 12% | $1,611 |
| Year Ended 1/31/2019 | $11.64 | (6.69%) | 0.22% | 0.22%(d) | 1.58% | 20% | $1,965 |
| Class C | |||||||
| Year Ended 1/31/2023 | $10.73 | (10.78%) | 1.15%(c) | 1.15%(c),(d) | 0.13% | 8% | $62,530 |
| Year Ended 1/31/2022 | $12.85 | 11.22% | 1.14%(c) | 1.14%(c),(d) | 0.49% | 14% | $80,981 |
| Year Ended 1/31/2021 | $13.09 | 13.73% | 1.18%(c),(e) | 1.18%(c),(d),(e) | 0.40% | 74% | $90,213 |
| Year Ended 1/31/2020 | $12.24 | 13.21% | 1.22% | 1.22%(d) | 0.75% | 12% | $74,297 |
| Year Ended 1/31/2019 | $11.60 | (7.64%) | 1.22% | 1.22%(d) | 0.52% | 20% | $70,524 |
| Institutional Class | |||||||
| Year Ended 1/31/2023 | $11.06 | (9.89%) | 0.15%(c) | 0.15%(c),(d) | 1.13% | 8% | $32,831 |
| Year Ended 1/31/2022 | $13.23 | 12.40% | 0.14%(c) | 0.14%(c),(d) | 1.54% | 14% | $43,713 |
| Year Ended 1/31/2021 | $13.42 | 14.86% | 0.17%(c),(e) | 0.17%(c),(d),(e) | 1.58% | 74% | $38,843 |
| Year Ended 1/31/2020 | $12.52 | 14.34% | 0.22% | 0.22%(d) | 1.76% | 12% | $11,920 |
| Year Ended 1/31/2019 | $11.84 | (6.65%) | 0.22% | 0.22%(d) | 1.17% | 20% | $10,382 |
| Institutional 2 Class | |||||||
| Year Ended 1/31/2023 | $10.79 | (9.86%) | 0.12%(c) | 0.12%(c) | 1.11% | 8% | $4,801 |
| Year Ended 1/31/2022 | $12.93 | 12.44% | 0.12%(c) | 0.12%(c) | 1.45% | 14% | $7,604 |
| Year Ended 1/31/2021 | $13.15 | 14.82% | 0.16%(c),(e) | 0.16%(c),(e) | 1.48% | 74% | $8,780 |
| Year Ended 1/31/2020 | $12.29 | 14.35% | 0.20% | 0.20% | 1.92% | 12% | $5,079 |
| Year Ended 1/31/2019 | $11.64 | (6.60%) | 0.20% | 0.20% | 1.56% | 20% | $2,978 |
| Institutional 3 Class | |||||||
| Year Ended 1/31/2023 | $10.78 | (9.82%) | 0.07%(c) | 0.07%(c) | 1.18% | 8% | $62,454 |
| Year Ended 1/31/2022 | $12.92 | 12.50% | 0.08%(c) | 0.08%(c) | 1.51% | 14% | $87,544 |
| Year Ended 1/31/2021 | $13.14 | 14.88% | 0.13%(c),(e) | 0.13%(c),(e) | 1.41% | 74% | $12,370 |
| Year Ended 1/31/2020 | $12.28 | 14.42% | 0.15% | 0.15% | 1.86% | 12% | $10,623 |
| Year Ended 1/31/2019 | $11.63 | (6.62%) | 0.15% | 0.15% | 1.75% | 20% | $8,668 |
| Columbia Capital Allocation Portfolios | Annual Report 2023 | 63 |
Columbia Capital Allocation Aggressive Portfolio
| Net asset value, beginning of period | Net investment income | Net realized and unrealized gain (loss) | Total from investment operations | Distributions from net investment income | Distributions from net realized gains | Total distributions to shareholders | |
| Class R | |||||||
| Year Ended 1/31/2023 | $13.15 | 0.07 | (1.48) | (1.41) | (0.08) | (0.67) | (0.75) |
| Year Ended 1/31/2022 | $13.35 | 0.13 | 1.48 | 1.61 | (0.32) | (1.49) | (1.81) |
| Year Ended 1/31/2021 | $12.47 | 0.08 | 1.57 | 1.65 | (0.15) | (0.62) | (0.77) |
| Year Ended 1/31/2020 | $11.80 | 0.15 | 1.45 | 1.60 | (0.16) | (0.77) | (0.93) |
| Year Ended 1/31/2019 | $13.99 | 0.14 | (1.18) | (1.04) | (0.20) | (0.95) | (1.15) |
| Notes to Financial Highlights | |
| (a) | In addition to the fees and expenses that the Fund bears directly, the Fund indirectly bears a pro rata share of the fees and expenses of any other funds in which it invests. Such indirect expenses are not included in the Fund’s reported expense ratios. |
| (b) | Total net expenses include the impact of certain fee waivers/expense reimbursements made by the Investment Manager and certain of its affiliates, if applicable. |
| (c) | Ratios include interest on collateral expense which is less than 0.01%. |
| (d) | The benefits derived from expense reductions had an impact of less than 0.01%. |
| (e) | Ratios include line of credit interest expense which is less than 0.01%. |
| 64 | Columbia Capital Allocation Portfolios | Annual Report 2023 |
Columbia Capital Allocation Aggressive Portfolio
| Net asset value, end of period | Total return | Total gross expense ratio to average net assets(a) | Total net expense ratio to average net assets(a),(b) | Net investment income ratio to average net assets | Portfolio turnover | Net assets, end of period (000’s) | |
| Class R | |||||||
| Year Ended 1/31/2023 | $10.99 | (10.36%) | 0.65%(c) | 0.65%(c),(d) | 0.64% | 8% | $11,020 |
| Year Ended 1/31/2022 | $13.15 | 11.83% | 0.65%(c) | 0.65%(c),(d) | 0.88% | 14% | $12,737 |
| Year Ended 1/31/2021 | $13.35 | 14.23% | 0.69%(c),(e) | 0.69%(c),(d),(e) | 0.70% | 74% | $2,795 |
| Year Ended 1/31/2020 | $12.47 | 13.77% | 0.72% | 0.72%(d) | 1.21% | 12% | $2,927 |
| Year Ended 1/31/2019 | $11.80 | (7.15%) | 0.72% | 0.72%(d) | 1.09% | 20% | $2,750 |
| Columbia Capital Allocation Portfolios | Annual Report 2023 | 65 |
January 31, 2023
| 66 | Columbia Capital Allocation Portfolios | Annual Report 2023 |
January 31, 2023
| Columbia Capital Allocation Portfolios | Annual Report 2023 | 67 |
January 31, 2023
| 68 | Columbia Capital Allocation Portfolios | Annual Report 2023 |
January 31, 2023
| Columbia Capital Allocation Portfolios | Annual Report 2023 | 69 |
January 31, 2023
| Asset derivatives | ||
| Risk exposure category | Statement of assets and liabilities location | Fair value ($) |
| Equity risk | Component of total distributable earnings (loss) — unrealized appreciation on futures contracts | 188,563* |
| Liability derivatives | ||
| Risk exposure category | Statement of assets and liabilities location | Fair value ($) |
| Credit risk | Component of total distributable earnings (loss) — unrealized depreciation on swap contracts | 437,595* |
| Equity risk | Component of total distributable earnings (loss) — unrealized depreciation on futures contracts | 19,367* |
| Interest rate risk | Component of total distributable earnings (loss) — unrealized depreciation on futures contracts | 30,072* |
| Total | 487,034 |
| * | Includes cumulative appreciation (depreciation) as reported in the tables following the Portfolio of Investments. Only the current day’s variation margin is reported in receivables or payables in the Statement of Assets and Liabilities. |
| 70 | Columbia Capital Allocation Portfolios | Annual Report 2023 |
January 31, 2023
| Amount of realized gain (loss) on derivatives recognized in income | |||
| Risk exposure category | Futures contracts ($) | Swap contracts ($) | Total ($) |
| Credit risk | — | 113,263 | 113,263 |
| Equity risk | (91,340) | — | (91,340) |
| Total | (91,340) | 113,263 | 21,923 |
| Change in unrealized appreciation (depreciation) on derivatives recognized in income | |||
| Risk exposure category | Futures contracts ($) | Swap contracts ($) | Total ($) |
| Credit risk | — | (437,595) | (437,595) |
| Equity risk | 125,199 | — | 125,199 |
| Interest rate risk | (30,072) | — | (30,072) |
| Total | 95,127 | (437,595) | (342,468) |
| Derivative instrument | Average notional amounts ($) |
| Futures contracts — long | 2,887,150* |
| Futures contracts — short | 229,204** |
| Credit default swap contracts — buy protection | 8,102,298* |
| * | Based on the ending quarterly outstanding amounts for the year ended January 31, 2023. |
| ** | Based on the ending daily outstanding amounts for the year ended January 31, 2023. |
| Asset derivatives | ||
| Risk exposure category | Statement of assets and liabilities location | Fair value ($) |
| Equity risk | Component of total distributable earnings (loss) — unrealized appreciation on futures contracts | 527,718* |
| Liability derivatives | ||
| Risk exposure category | Statement of assets and liabilities location | Fair value ($) |
| Credit risk | Component of total distributable earnings (loss) — unrealized depreciation on swap contracts | 1,011,622* |
| Equity risk | Component of total distributable earnings (loss) — unrealized depreciation on futures contracts | 47,827* |
| Interest rate risk | Component of total distributable earnings (loss) — unrealized depreciation on futures contracts | 62,457* |
| Total | 1,121,906 |
| * | Includes cumulative appreciation (depreciation) as reported in the tables following the Portfolio of Investments. Only the current day’s variation margin is reported in receivables or payables in the Statement of Assets and Liabilities. |
| Columbia Capital Allocation Portfolios | Annual Report 2023 | 71 |
January 31, 2023
| Amount of realized gain (loss) on derivatives recognized in income | |||
| Risk exposure category | Futures contracts ($) | Swap contracts ($) | Total ($) |
| Credit risk | — | 262,937 | 262,937 |
| Equity risk | (334,347) | — | (334,347) |
| Total | (334,347) | 262,937 | (71,410) |
| Change in unrealized appreciation (depreciation) on derivatives recognized in income | |||
| Risk exposure category | Futures contracts ($) | Swap contracts ($) | Total ($) |
| Credit risk | — | (1,011,622) | (1,011,622) |
| Equity risk | 374,624 | — | 374,624 |
| Interest rate risk | (62,457) | — | (62,457) |
| Total | 312,167 | (1,011,622) | (699,455) |
| Derivative instrument | Average notional amounts ($) |
| Futures contracts — long | 7,304,439* |
| Futures contracts — short | 761,054** |
| Credit default swap contracts — buy protection | 18,465,923* |
| * | Based on the ending quarterly outstanding amounts for the year ended January 31, 2023. |
| ** | Based on the ending daily outstanding amounts for the year ended January 31, 2023. |
| Asset derivatives | ||
| Risk exposure category | Statement of assets and liabilities location | Fair value ($) |
| Credit risk | Component of total distributable earnings (loss) — unrealized appreciation on swap contracts | 32,890* |
| Equity risk | Component of total distributable earnings (loss) — unrealized appreciation on futures contracts | 1,756,406* |
| Interest rate risk | Component of total distributable earnings (loss) — unrealized appreciation on futures contracts | 509,289* |
| Total | 2,298,585 |
| Liability derivatives | ||
| Risk exposure category | Statement of assets and liabilities location | Fair value ($) |
| Credit risk | Component of total distributable earnings (loss) — unrealized depreciation on swap contracts | 3,641,256* |
| Equity risk | Component of total distributable earnings (loss) — unrealized depreciation on futures contracts | 166,599* |
| Interest rate risk | Component of total distributable earnings (loss) — unrealized depreciation on futures contracts | 377,056* |
| Total | 4,184,911 |
| * | Includes cumulative appreciation (depreciation) as reported in the tables following the Portfolio of Investments. Only the current day’s variation margin is reported in receivables or payables in the Statement of Assets and Liabilities. |
| 72 | Columbia Capital Allocation Portfolios | Annual Report 2023 |
January 31, 2023
| Amount of realized gain (loss) on derivatives recognized in income | |||
| Risk exposure category | Futures contracts ($) | Swap contracts ($) | Total ($) |
| Credit risk | — | 922,370 | 922,370 |
| Equity risk | (2,794,559) | — | (2,794,559) |
| Interest rate risk | (7,611,237) | — | (7,611,237) |
| Total | (10,405,796) | 922,370 | (9,483,426) |
| Change in unrealized appreciation (depreciation) on derivatives recognized in income | |||
| Risk exposure category | Futures contracts ($) | Swap contracts ($) | Total ($) |
| Credit risk | — | (3,608,366) | (3,608,366) |
| Equity risk | 1,599,084 | — | 1,599,084 |
| Interest rate risk | 801,214 | — | 801,214 |
| Total | 2,400,298 | (3,608,366) | (1,208,068) |
| Derivative instrument | Average notional amounts ($) |
| Futures contracts — long | 64,644,070* |
| Futures contracts — short | 8,513,301* |
| Credit default swap contracts — buy protection | 64,768,583* |
| Credit default swap contracts — sell protection | 1,318,992** |
| * | Based on the ending quarterly outstanding amounts for the year ended January 31, 2023. |
| ** | Based on the ending daily outstanding amounts for the year ended January 31, 2023. |
| Asset derivatives | ||
| Risk exposure category | Statement of assets and liabilities location | Fair value ($) |
| Equity risk | Component of total distributable earnings (loss) — unrealized appreciation on futures contracts | 4,257,173* |
| Interest rate risk | Component of total distributable earnings (loss) — unrealized appreciation on futures contracts | 748,500* |
| Total | 5,005,673 |
| Liability derivatives | ||
| Risk exposure category | Statement of assets and liabilities location | Fair value ($) |
| Credit risk | Component of total distributable earnings (loss) — unrealized depreciation on swap contracts | 3,494,864* |
| Equity risk | Component of total distributable earnings (loss) — unrealized depreciation on futures contracts | 534,609* |
| Interest rate risk | Component of total distributable earnings (loss) — unrealized depreciation on futures contracts | 555,174* |
| Total | 4,584,647 |
| * | Includes cumulative appreciation (depreciation) as reported in the tables following the Portfolio of Investments. Only the current day’s variation margin is reported in receivables or payables in the Statement of Assets and Liabilities. |
| Columbia Capital Allocation Portfolios | Annual Report 2023 | 73 |
January 31, 2023
| Amount of realized gain (loss) on derivatives recognized in income | |||
| Risk exposure category | Futures contracts ($) | Swap contracts ($) | Total ($) |
| Credit risk | — | 988,861 | 988,861 |
| Equity risk | (6,302,026) | — | (6,302,026) |
| Interest rate risk | (11,285,652) | — | (11,285,652) |
| Total | (17,587,678) | 988,861 | (16,598,817) |
| Change in unrealized appreciation (depreciation) on derivatives recognized in income | |||
| Risk exposure category | Futures contracts ($) | Swap contracts ($) | Total ($) |
| Credit risk | — | (3,494,864) | (3,494,864) |
| Equity risk | 4,107,105 | — | 4,107,105 |
| Interest rate risk | 1,146,308 | — | 1,146,308 |
| Total | 5,253,413 | (3,494,864) | 1,758,549 |
| Derivative instrument | Average notional amounts ($)* |
| Futures contracts — long | 113,280,753 |
| Futures contracts — short | 22,514,017 |
| Credit default swap contracts — buy protection | 44,385,758 |
| * | Based on the ending quarterly outstanding amounts for the year ended January 31, 2023. |
| Asset derivatives | ||
| Risk exposure category | Statement of assets and liabilities location | Fair value ($) |
| Equity risk | Component of total distributable earnings (loss) — unrealized appreciation on futures contracts | 4,773,183* |
| Liability derivatives | ||
| Risk exposure category | Statement of assets and liabilities location | Fair value ($) |
| Credit risk | Component of total distributable earnings (loss) — unrealized depreciation on swap contracts | 2,335,904* |
| Equity risk | Component of total distributable earnings (loss) — unrealized depreciation on futures contracts | 326,451* |
| Interest rate risk | Component of total distributable earnings (loss) — unrealized depreciation on futures contracts | 393,248* |
| Total | 3,055,603 |
| * | Includes cumulative appreciation (depreciation) as reported in the tables following the Portfolio of Investments. Only the current day’s variation margin is reported in receivables or payables in the Statement of Assets and Liabilities. |
| 74 | Columbia Capital Allocation Portfolios | Annual Report 2023 |
January 31, 2023
| Amount of realized gain (loss) on derivatives recognized in income | |||
| Risk exposure category | Futures contracts ($) | Swap contracts ($) | Total ($) |
| Credit risk | — | 660,937 | 660,937 |
| Equity risk | (12,590,582) | — | (12,590,582) |
| Interest rate risk | (3,038,503) | — | (3,038,503) |
| Total | (15,629,085) | 660,937 | (14,968,148) |
| Change in unrealized appreciation (depreciation) on derivatives recognized in income | |||
| Risk exposure category | Futures contracts ($) | Swap contracts ($) | Total ($) |
| Credit risk | — | (2,335,904) | (2,335,904) |
| Equity risk | 5,840,201 | — | 5,840,201 |
| Interest rate risk | (393,248) | — | (393,248) |
| Total | 5,446,953 | (2,335,904) | 3,111,049 |
| Derivative instrument | Average notional amounts ($)* |
| Futures contracts — long | 110,528,606 |
| Futures contracts — short | 15,538,531 |
| Credit default swap contracts — buy protection | 29,666,648 |
| * | Based on the ending quarterly outstanding amounts for the year ended January 31, 2023. |
| Morgan Stanley ($) | |
| Liabilities | |
| Centrally cleared credit default swap contracts (a) | 33,794 |
| Total financial and derivative net assets | (33,794) |
| Total collateral received (pledged) (b) | (33,794) |
| Net amount (c) | - |
| (a) | Centrally cleared swaps are included within payable/receivable for variation margin in the Statement of Assets and Liabilities. |
| (b) | In some instances, the actual collateral received and/or pledged may be more than the amount shown due to overcollateralization. |
| (c) | Represents the net amount due from/(to) counterparties in the event of default. |
| Columbia Capital Allocation Portfolios | Annual Report 2023 | 75 |
January 31, 2023
| Morgan Stanley ($) | |
| Liabilities | |
| Centrally cleared credit default swap contracts (a) | 77,487 |
| Total financial and derivative net assets | (77,487) |
| Total collateral received (pledged) (b) | (77,487) |
| Net amount (c) | - |
| (a) | Centrally cleared swaps are included within payable/receivable for variation margin in the Statement of Assets and Liabilities. |
| (b) | In some instances, the actual collateral received and/or pledged may be more than the amount shown due to overcollateralization. |
| (c) | Represents the net amount due from/(to) counterparties in the event of default. |
| Morgan Stanley ($) | |
| Assets | |
| Centrally cleared credit default swap contracts (a) | 27,640 |
| Liabilities | |
| Centrally cleared credit default swap contracts (a) | 274,818 |
| Total financial and derivative net assets | (247,178) |
| Total collateral received (pledged) (b) | (247,178) |
| Net amount (c) | - |
| (a) | Centrally cleared swaps are included within payable/receivable for variation margin in the Statement of Assets and Liabilities. |
| (b) | In some instances, the actual collateral received and/or pledged may be more than the amount shown due to overcollateralization. |
| (c) | Represents the net amount due from/(to) counterparties in the event of default. |
| Morgan Stanley ($) | |
| Liabilities | |
| Centrally cleared credit default swap contracts (a) | 220,935 |
| Total financial and derivative net assets | (220,935) |
| Total collateral received (pledged) (b) | (220,935) |
| Net amount (c) | - |
| (a) | Centrally cleared swaps are included within payable/receivable for variation margin in the Statement of Assets and Liabilities. |
| (b) | In some instances, the actual collateral received and/or pledged may be more than the amount shown due to overcollateralization. |
| (c) | Represents the net amount due from/(to) counterparties in the event of default. |
| Morgan Stanley ($) | |
| Liabilities | |
| Centrally cleared credit default swap contracts (a) | 147,669 |
| Total financial and derivative net assets | (147,669) |
| Total collateral received (pledged) (b) | (147,669) |
| Net amount (c) | - |
| (a) | Centrally cleared swaps are included within payable/receivable for variation margin in the Statement of Assets and Liabilities. |
| (b) | In some instances, the actual collateral received and/or pledged may be more than the amount shown due to overcollateralization. |
| (c) | Represents the net amount due from/(to) counterparties in the event of default. |
| 76 | Columbia Capital Allocation Portfolios | Annual Report 2023 |
January 31, 2023
| Columbia Capital Allocation Portfolios | Annual Report 2023 | 77 |
January 31, 2023
| Effective management services fee rate (%) | |
| Columbia Capital Allocation Conservative Portfolio | 0.08 |
| Columbia Capital Allocation Moderate Conservative Portfolio | 0.05 |
| Columbia Capital Allocation Moderate Portfolio | 0.03 |
| Columbia Capital Allocation Moderate Aggressive Portfolio | 0.03 |
| Columbia Capital Allocation Aggressive Portfolio | 0.03 |
| 78 | Columbia Capital Allocation Portfolios | Annual Report 2023 |
January 31, 2023
| Fund | Class A (%) | Advisor Class (%) | Class C (%) | Institutional Class (%) | Institutional 2 Class (%) | Institutional 3 Class (%) | Class R (%) | Class V (%) |
| Columbia Capital Allocation Conservative Portfolio | 0.09 | 0.09 | 0.09 | 0.09 | 0.07 | 0.02 | 0.09 | — |
| Columbia Capital Allocation Moderate Conservative Portfolio | 0.08 | 0.08 | 0.08 | 0.08 | 0.06 | 0.02 | 0.08 | — |
| Columbia Capital Allocation Moderate Portfolio | 0.08 | 0.08 | 0.08 | 0.08 | 0.06 | 0.01 | 0.08 | — |
| Columbia Capital Allocation Moderate Aggressive Portfolio | 0.10 | 0.10 | 0.10 | 0.10 | 0.06 | 0.01 | 0.10 | 0.10 |
| Columbia Capital Allocation Aggressive Portfolio | 0.09 | 0.09 | 0.09 | 0.09 | 0.06 | 0.01 | 0.09 | — |
| Columbia Capital Allocation Portfolios | Annual Report 2023 | 79 |
January 31, 2023
| Fund | Amount ($) |
| Columbia Capital Allocation Conservative Portfolio | 124 |
| Columbia Capital Allocation Moderate Conservative Portfolio | 40 |
| Columbia Capital Allocation Moderate Portfolio | 120 |
| Columbia Capital Allocation Moderate Aggressive Portfolio | 6,080 |
| Columbia Capital Allocation Aggressive Portfolio | 460 |
| Fund | Class C ($) |
| Columbia Capital Allocation Conservative Portfolio | 307,000 |
| Columbia Capital Allocation Moderate Portfolio | 1,471,000 |
| Columbia Capital Allocation Aggressive Portfolio | 1,937,000 |
| 80 | Columbia Capital Allocation Portfolios | Annual Report 2023 |
January 31, 2023
| Front End (%) | CDSC (%) | Amount ($) | |||||||
| Fund | Class A | Class C | Class V | Class A | Class C | Class V | Class A | Class C | Class V |
| Columbia Capital Allocation Conservative Portfolio | 4.75 | — | N/A | 0.50 - 1.00(a) | 1.00(b) | N/A | 72,676 | 3,761 | N/A |
| Columbia Capital Allocation Moderate Conservative Portfolio | 5.75 | — | N/A | 0.50 - 1.00(a) | 1.00(b) | N/A | 146,447 | 5,911 | N/A |
| Columbia Capital Allocation Moderate Portfolio | 5.75 | — | N/A | 0.50 - 1.00(a) | 1.00(b) | N/A | 625,470 | 10,005 | N/A |
| Columbia Capital Allocation Moderate Aggressive Portfolio | 5.75 | — | 5.75 | 0.50 - 1.00(a) | 1.00(b) | 0.50 - 1.00(a) | 818,696 | 9,869 | 207 |
| Columbia Capital Allocation Aggressive Portfolio | 5.75 | — | N/A | 0.50 - 1.00(a) | 1.00(b) | N/A | 795,472 | 9,070 | N/A |
| (a) | This charge is imposed on certain investments of between $1 million and $50 million redeemed within 18 months after purchase, as follows: 1.00% if redeemed within 12 months after purchase, and 0.50% if redeemed more than 12, but less than 18, months after purchase, with certain limited exceptions. |
| (b) | This charge applies to redemptions within 12 months after purchase, with certain limited exceptions. |
| June 1, 2022 through May 31, 2024 | ||||||||
| Fund | Class A (%) | Advisor Class (%) | Class C (%) | Institutional Class (%) | Institutional 2 Class (%) | Institutional 3 Class (%) | Class R (%) | Class V (%) |
| Columbia Capital Allocation Conservative Portfolio | 0.54 | 0.29 | 1.29 | 0.29 | 0.28 | 0.23 | 0.79 | N/A |
| Columbia Capital Allocation Moderate Portfolio | 0.54 | 0.29 | 1.29 | 0.29 | 0.28 | 0.24 | 0.79 | N/A |
| Columbia Capital Allocation Moderate Aggressive Portfolio | 0.51 | 0.26 | 1.26 | 0.26 | 0.23 | 0.18 | 0.76 | 0.51 |
| Columbia Capital Allocation Aggressive Portfolio | 0.51 | 0.26 | 1.26 | 0.26 | 0.24 | 0.19 | 0.76 | N/A |
| June 1, 2022 through May 31, 2023 | ||||||||
| Fund | Class A (%) | Advisor Class (%) | Class C (%) | Institutional Class (%) | Institutional 2 Class (%) | Institutional 3 Class (%) | Class R (%) | Class V (%) |
| Columbia Capital Allocation Moderate Conservative Portfolio | 0.54 | 0.29 | 1.29 | 0.29 | 0.28 | 0.23 | 0.79 | N/A |
| Prior to June 1, 2022 | ||||||||
| Fund | Class A (%) | Advisor Class (%) | Class C (%) | Institutional Class (%) | Institutional 2 Class (%) | Institutional 3 Class (%) | Class R (%) | Class V (%) |
| Columbia Capital Allocation Conservative Portfolio | 0.54 | 0.29 | 1.29 | 0.29 | 0.28 | 0.23 | 0.79 | N/A |
| Columbia Capital Allocation Moderate Conservative Portfolio | 0.54 | 0.29 | 1.29 | 0.29 | 0.27 | 0.23 | 0.79 | N/A |
| Columbia Capital Allocation Moderate Portfolio | 0.54 | 0.29 | 1.29 | 0.29 | 0.28 | 0.24 | 0.79 | N/A |
| Columbia Capital Allocation Moderate Aggressive Portfolio | 0.51 | 0.26 | 1.26 | 0.26 | 0.23 | 0.18 | 0.76 | 0.51 |
| Columbia Capital Allocation Aggressive Portfolio | 0.51 | 0.26 | 1.26 | 0.26 | 0.24 | 0.19 | 0.76 | N/A |
| Columbia Capital Allocation Portfolios | Annual Report 2023 | 81 |
January 31, 2023
| Fund | Undistributed net investment income ($) | Accumulated net realized gain (loss) ($) | Paid in capital increase ($) |
| Columbia Capital Allocation Conservative Portfolio | 40,300 | (40,300) | — |
| Columbia Capital Allocation Moderate Conservative Portfolio | 382,419 | (382,419) | — |
| Columbia Capital Allocation Moderate Portfolio | 1,305,176 | (1,305,176) | — |
| Columbia Capital Allocation Moderate Aggressive Portfolio | 2,651,247 | (2,651,247) | — |
| Columbia Capital Allocation Aggressive Portfolio | 2,142,732 | (2,142,732) | — |
| Year Ended January 31, 2023 | Year Ended January 31, 2022 | |||||
| Fund | Ordinary income ($) | Long-term capital gains ($) | Total ($) | Ordinary income ($) | Long-term capital gains ($) | Total ($) |
| Columbia Capital Allocation Conservative Portfolio | 3,463,756 | 5,171,344 | 8,635,100 | 5,995,039 | 9,973,644 | 15,968,683 |
| Columbia Capital Allocation Moderate Conservative Portfolio | 7,424,327 | 16,960,102 | 24,384,429 | 15,986,583 | 30,976,412 | 46,962,995 |
| Columbia Capital Allocation Moderate Portfolio | 21,882,585 | 46,074,043 | 67,956,628 | 58,767,815 | 131,789,383 | 190,557,198 |
| Columbia Capital Allocation Moderate Aggressive Portfolio | 24,590,533 | 77,993,320 | 102,583,853 | 84,935,708 | 222,188,660 | 307,124,368 |
| Columbia Capital Allocation Aggressive Portfolio | 12,766,723 | 73,884,048 | 86,650,771 | 57,094,292 | 126,187,435 | 183,281,727 |
| Fund | Undistributed ordinary income ($) | Undistributed long-term capital gains ($) | Capital loss carryforwards ($) | Net unrealized (depreciation) ($) |
| Columbia Capital Allocation Conservative Portfolio | 730,998 | — | (152,980) | (27,188,639) |
| Columbia Capital Allocation Moderate Conservative Portfolio | 762,910 | 3,737,025 | — | (53,003,007) |
| Columbia Capital Allocation Moderate Portfolio | 2,246,294 | 18,717,915 | — | (138,721,270) |
| Columbia Capital Allocation Moderate Aggressive Portfolio | 1,519,126 | 39,967,042 | — | (156,265,316) |
| Columbia Capital Allocation Aggressive Portfolio | 1,431,969 | 38,233,818 | — | (54,227,578) |
| 82 | Columbia Capital Allocation Portfolios | Annual Report 2023 |
January 31, 2023
| Fund | Tax cost ($) | Gross unrealized appreciation ($) | Gross unrealized (depreciation) ($) | Net unrealized (depreciation) ($) |
| Columbia Capital Allocation Conservative Portfolio | 215,094,876 | 139,125 | (27,327,764) | (27,188,639) |
| Columbia Capital Allocation Moderate Conservative Portfolio | 440,665,495 | 544,465 | (53,547,472) | (53,003,007) |
| Columbia Capital Allocation Moderate Portfolio | 1,299,890,402 | 4,636,284 | (143,357,554) | (138,721,270) |
| Columbia Capital Allocation Moderate Aggressive Portfolio | 1,879,071,618 | 13,641,746 | (169,907,062) | (156,265,316) |
| Columbia Capital Allocation Aggressive Portfolio | 1,280,028,611 | 21,967,831 | (76,195,409) | (54,227,578) |
| Fund | No expiration short-term ($) | No expiration long-term ($) | Total ($) | Utilized ($) |
| Columbia Capital Allocation Conservative Portfolio | — | (152,980) | (152,980) | — |
| Purchases ($) | Proceeds from sales ($) | |
| Columbia Capital Allocation Conservative Portfolio | 19,768,698 | 46,117,833 |
| Columbia Capital Allocation Moderate Conservative Portfolio | 34,426,217 | 73,186,553 |
| Columbia Capital Allocation Moderate Portfolio | 72,697,632 | 245,021,596 |
| Columbia Capital Allocation Moderate Aggressive Portfolio | 119,221,672 | 275,049,720 |
| Columbia Capital Allocation Aggressive Portfolio | 96,382,658 | 187,451,772 |
| Columbia Capital Allocation Portfolios | Annual Report 2023 | 83 |
January 31, 2023
| 84 | Columbia Capital Allocation Portfolios | Annual Report 2023 |
January 31, 2023
| Fund | Number of unaffiliated accounts | Percentage of shares outstanding held — unaffiliated (%) | Percentage of shares outstanding held — affiliated (%) |
| Columbia Capital Allocation Conservative Portfolio | — | — | 72.9 |
| Columbia Capital Allocation Moderate Conservative Portfolio | — | — | 77.4 |
| Columbia Capital Allocation Moderate Portfolio | — | — | 84.7 |
| Columbia Capital Allocation Moderate Aggressive Portfolio | 1 | 11.3 | 54.9 |
| Columbia Capital Allocation Aggressive Portfolio | — | — | 68.6 |
| Columbia Capital Allocation Portfolios | Annual Report 2023 | 85 |
January 31, 2023
| Shares | |
| Class A | 297,235 |
| Advisor Class | 179,665 |
| Institutional 3 Class | 685,929 |
| Class R | 54,299 |
| ($) | |
| Net investment income | 3,813,000 |
| Net realized gain | 17,940,000 |
| Net change in unrealized appreciation/(depreciation) | (16,821,000) |
| Net increase in net assets from operations | 4,932,000 |
| 86 | Columbia Capital Allocation Portfolios | Annual Report 2023 |
January 31, 2023
| Shares | |
| Class A | 200,663 |
| Advisor Class | 342,989 |
| Institutional 3 Class | 2,248,744 |
| Class R | 339,108 |
| ($) | |
| Net investment income | 25,417,000 |
| Net realized gain | 135,120,000 |
| Net change in unrealized appreciation/(depreciation) | (59,403,000) |
| Net increase in net assets from operations | 101,134,000 |
| Shares | |
| Class A | 2,554,159 |
| Advisor Class | 1,491,362 |
| Institutional 3 Class | 4,770,984 |
| Class R | 1,222,717 |
| Columbia Capital Allocation Portfolios | Annual Report 2023 | 87 |
January 31, 2023
| ($) | |
| Net investment income | 33,837,000 |
| Net realized gain | 286,454,000 |
| Net change in unrealized appreciation/(depreciation) | (110,848,000) |
| Net increase in net assets from operations | 209,443,000 |
| Shares | |
| Class A | 1,313,971 |
| Advisor Class | 356,035 |
| Institutional 3 Class | 5,670,835 |
| Class R | 1,993,210 |
| ($) | |
| Net investment income | 22,410,000 |
| Net realized gain | 290,112,000 |
| Net change in unrealized appreciation/(depreciation) | (102,057,000) |
| Net increase in net assets from operations | 210,465,000 |
| 88 | Columbia Capital Allocation Portfolios | Annual Report 2023 |
January 31, 2023
| Columbia Capital Allocation Portfolios | Annual Report 2023 | 89 |
| 90 | Columbia Capital Allocation Portfolios | Annual Report 2023 |
(Unaudited)
| Qualified dividend income | Dividends received deduction | Section 199A dividends | Capital gain dividend | Foreign taxes paid to foreign countries | Foreign taxes paid per share to foreign countries | Foreign source income | Foreign source income per share | |
| Columbia Capital Allocation Conservative Portfolio | 8.04% | 7.17% | 0.08% | $0 | $33,605 | $0.0016 | $396,006 | $0.0185 |
| Columbia Capital Allocation Moderate Conservative Portfolio | 14.43% | 12.75% | 0.18% | $5,357,168 | $134,339 | $0.0032 | $1,390,701 | $0.0328 |
| Columbia Capital Allocation Moderate Portfolio | 23.17% | 19.03% | 0.35% | $20,169,133 | $651,119 | $0.0053 | $5,506,346 | $0.0448 |
| Columbia Capital Allocation Moderate Aggressive Portfolio | 39.15% | 32.65% | 0.56% | $44,314,874 | $1,202,339 | $0.0072 | $7,931,060 | $0.0477 |
| Columbia Capital Allocation Aggressive Portfolio | 57.23% | 48.07% | 0.76% | $46,486,659 | $1,085,627 | $0.0098 | $6,707,500 | $0.0603 |
| Columbia Capital Allocation Portfolios | Annual Report 2023 | 91 |
(Unaudited)
| Name, address, year of birth | Position held with the Columbia Funds and length of service | Principal occupation(s) during past five years and other relevant professional experience | Number of Funds in the Columbia Funds Complex* overseen | Other directorships held by Trustee during the past five years |
| George S. Batejan c/o Columbia Management Investment Advisers, LLC 290 Congress Street Boston, MA 02210 1954 | Trustee since 2017 | Executive Vice President, Global Head of Technology and Operations, Janus Capital Group, Inc., 2010-2016 | 176 | Former Chairman of the Board, NICSA (National Investment Company Services Association) (Executive Committee, Nominating Committee and Governance Committee), 2014-2016; former Director, Intech Investment Management, 2011-2016; former Board Member, Metro Denver Chamber of Commerce, 2015-2016; former Advisory Board Member, University of Colorado Business School, 2015-2018; former Board Member, Chase Bank International, 1993-1994 |
| Kathleen Blatz c/o Columbia Management Investment Advisers, LLC 290 Congress Street Boston, MA 02210 1954 | Trustee since 2006 | Attorney, specializing in arbitration and mediation; Chief Justice, Minnesota Supreme Court, 1998-2006; Associate Justice, Minnesota Supreme Court, 1996-1998; Fourth Judicial District Court Judge, Hennepin County, 1994-1996; Attorney in private practice and public service, 1984-1993; State Representative, Minnesota House of Representatives, 1979-1993, which included service on the Tax and Financial Institutions and Insurance Committees; Member and Interim Chair, Minnesota Sports Facilities Authority, January-July 2017; Interim President and Chief Executive Officer, Blue Cross and Blue Shield of Minnesota (health care insurance), February-July 2018, April-October 2021 | 176 | Former Trustee, Blue Cross and Blue Shield of Minnesota, 2009-2021 (Chair of the Business Development Committee, 2014-2017; Chair of the Governance Committee, 2017-2019); former Member and Chair of the Board, Minnesota Sports Facilities Authority, January 2017-July 2017; former Director, Robina Foundation, 2009-2020 (Chair, 2014-2020); Director, Richard M. Schulze Family Foundation, since 2021 |
| 92 | Columbia Capital Allocation Portfolios | Annual Report 2023 |
(Unaudited)
| Name, address, year of birth | Position held with the Columbia Funds and length of service | Principal occupation(s) during past five years and other relevant professional experience | Number of Funds in the Columbia Funds Complex* overseen | Other directorships held by Trustee during the past five years |
| Pamela G. Carlton c/o Columbia Management Investment Advisers, LLC 290 Congress Street Boston, MA 02210 1954 | Chair since 2023; Trustee since 2007 | President, Springboard — Partners in Cross Cultural Leadership (consulting company), since 2003; Managing Director of US Equity Research, JP Morgan Chase, 1999-2003; Director of US Equity Research, Chase Asset Management, 1996-1999; Co-Director Latin America Research, 1993-1996, COO Global Research, 1992-1996, Co-Director of US Research, 1991-1992, Investment Banker, 1982-1991, Morgan Stanley; Attorney, Cleary Gottlieb Steen & Hamilton LLP, 1980-1982 | 176 | Trustee, New York Presbyterian Hospital Board, since 1996; Director, DR Bank (Audit Committee) since 2017; Director, Evercore Inc. (Audit Committee, Nominating and Governance Committee), since 2019; Director, Apollo Commercial Real Estate Finance, Inc. (Chair, Nominating and Governance Committee), since 2021; the Governing Council of the Independent Directors Council (IDC), since 2021 |
| Janet Langford Carrig c/o Columbia Management Investment Advisers, LLC 290 Congress Street Boston, MA 02210 1957 | Trustee since 1996 | Senior Vice President, General Counsel and Corporate Secretary, ConocoPhillips (independent energy company), September 2007-October 2018 | 174 | Director, EQT Corporation (natural gas producer), since 2019; former Director, Whiting Petroleum Corporation (independent oil and gas company), 2020-2022 |
| J. Kevin Connaughton c/o Columbia Management Investment Advisers, LLC 290 Congress Street Boston, MA 02210 1964 | Trustee since 2020 | CEO and President, RhodeWay Financial (non-profit financial planning firm), since December 2022; Member, FINRA National Adjudicatory Council, since January 2020; Adjunct Professor of Finance, Bentley University since January 2018; Consultant to Independent Trustees of CFVIT and CFST I from March 2016 to June 2020 with respect to CFVIT and to December 2020 with respect to CFST I; Managing Director and General Manager of Mutual Fund Products, Columbia Management Investment Advisers, LLC, May 2010-February 2015; President, Columbia Funds, 2008-2015; and senior officer of Columbia Funds and affiliated funds, 2003-2015 | 174 | Former Director, The Autism Project, March 2015-December 2021; former Member of the Investment Committee, St. Michael’s College, November 2015-February 2020; former Trustee, St. Michael’s College, June 2017-September 2019; former Trustee, New Century Portfolios, January 2015-December 2017 |
| Olive M. Darragh c/o Columbia Management Investment Advisers, LLC 290 Congress Street Boston, MA 02210 1962 | Trustee since 2020 | Managing Director of Darragh Inc. (strategy and talent management consulting firm), since 2010; Founder and CEO, Zolio, Inc. (investment management talent identification platform), since 2004; Consultant to Independent Trustees of CFVIT and CFST I from June 2019 to June 2020 with respect to CFVIT and to December 2020 with respect to CFST I; Partner, Tudor Investments, 2004-2010; Senior Partner, McKinsey & Company (consulting), 1990-2004; Touche Ross CPA, 1985-1988 | 174 | Treasurer, Edinburgh University US Trust Board; Member, HBS Community Action Partners Board; Former Director, University of Edinburgh Business School (Member of US Board); former Director, Boston Public Library Foundation |
| Patricia M. Flynn c/o Columbia Management Investment Advisers, LLC 290 Congress Street Boston, MA 02210 1950 | Trustee since 2004 | Professor of Economics and Management, Bentley University, since 2002; Dean, McCallum Graduate School of Business, Bentley University, 1992-2002 | 176 | Trustee, MA Taxpayers Foundation,1997-2002; Governing Board Member (Chairperson of Innovation Index Advisory Committee), MA Technology Collaborative, 1997-2020; Director, The MA Business Roundtable, 2003-2019 |
| Columbia Capital Allocation Portfolios | Annual Report 2023 | 93 |
(Unaudited)
| Name, address, year of birth | Position held with the Columbia Funds and length of service | Principal occupation(s) during past five years and other relevant professional experience | Number of Funds in the Columbia Funds Complex* overseen | Other directorships held by Trustee during the past five years |
| Brian J. Gallagher c/o Columbia Management Investment Advisers, LLC 290 Congress Street Boston, MA 02210 1954 | Trustee since 2017 | Retired; Partner with Deloitte & Touche LLP and its predecessors, 1977-2016 | 176 | Trustee, Catholic Schools Foundation, since 2004 |
| Douglas A. Hacker c/o Columbia Management Investment Advisers, LLC 290 Congress Street Boston, MA 02210 1955 | Trustee since 1996 | Independent business executive, since May 2006; Executive Vice President – Strategy of United Airlines, December 2002 - May 2006; President of UAL Loyalty Services (airline marketing company), September 2001-December 2002; Executive Vice President and Chief Financial Officer of United Airlines, July 1999-September 2001 | 176 | Director, Spartan Nash Company (Chair of the Board) (food distributor); Director, Aircastle Limited (Chair of Audit Committee) (aircraft leasing); former Director, Nash Finch Company (food distributor), 2005-2013; former Director, SeaCube Container Leasing Ltd. (container leasing), 2010-2013; and former Director, Travelport Worldwide Limited (travel information technology), 2014-2019 |
| Nancy T. Lukitsh c/o Columbia Management Investment Advisers, LLC 290 Congress Street Boston, MA 02210 1956 | Trustee since 2011 | Senior Vice President, Partner and Director of Marketing, Wellington Management Company, LLP (investment adviser), 1997-2010; Chair, Wellington Management Portfolios (commingled non-U.S. investment pools), 2007-2010; Director, Wellington Trust Company, NA and other Wellington affiliates, 1997-2010 | 174 | None |
| David M. Moffett c/o Columbia Management Investment Advisers, LLC 290 Congress Street Boston, MA 02210 1952 | Trustee since 2011 | Retired; former Chief Executive Officer of Freddie Mac and Chief Financial Officer of U.S. Bank | 174 | Director, CSX Corporation (transportation suppliers); Director, PayPal Holdings Inc. (payment and data processing services); Trustee, University of Oklahoma Foundation; former Director, eBay Inc. (online trading community), 2007-2015; and former Director, CIT Bank, CIT Group Inc. (commercial and consumer finance), 2010-2016; former Advisor to Bridgewater Associates and The Carlyle Group |
| Catherine James Paglia c/o Columbia Management Investment Advisers, LLC 290 Congress Street Boston, MA 02210 1952 | Trustee since 2004 | Director, Enterprise Asset Management, Inc. (private real estate and asset management company), since September 1998; Managing Director and Partner, Interlaken Capital, Inc., 1989-1997; Vice President, 1982-1985, Principal, 1985-1987, Managing Director, 1987-1989, Morgan Stanley; Vice President, Investment Banking, 1980-1982, Associate, Investment Banking, 1976-1980, Dean Witter Reynolds, Inc. | 176 | Director, Valmont Industries, Inc. (irrigation systems manufacturer), since 2012; Trustee, Carleton College (on the Investment Committee); Trustee, Carnegie Endowment for International Peace (on the Investment Committee) |
| 94 | Columbia Capital Allocation Portfolios | Annual Report 2023 |
(Unaudited)
| Name, address, year of birth | Position held with the Columbia Funds and length of service | Principal occupation(s) during past five years and other relevant professional experience | Number of Funds in the Columbia Funds Complex* overseen | Other directorships held by Trustee during the past five years |
| Natalie A. Trunow c/o Columbia Management Investment Advisers, LLC 290 Congress Street Boston, MA 02210 1967 | Trustee since 2020 | Chief Executive Officer, Millennial Portfolio Solutions LLC (asset management and consulting services), January 2016-January 2021; Non-executive Member of the Investment Committee and Valuation Committee, Sarona Asset Management Inc. (private equity firm) since September 2019; Advisor, Horizon Investments (asset management and consulting services), August 2018-January 2022; Advisor, Paradigm Asset Management, November 2016-January 2022; Consultant to Independent Trustees of CFVIT and CFST I from September 2016 to June 2020 with respect to CFVIT and to December 2020 with respect to CFST I; Director of Investments/Consultant, Casey Family Programs, April 2016-November 2016; Senior Vice President and Chief Investment Officer, Calvert Investments, August 2008-January 2016; Section Head and Portfolio Manager, General Motors Asset Management, June 1997-August 2008 | 174 | Independent Director, Investment Committee, Health Services for Children with Special Needs, Inc., 2010-2021; Independent Director, (Executive Committee and Chair, Audit Committee), Consumer Credit Counseling Services (formerly Guidewell Financial Solutions), since 2016; Independent Director, (Investment Committee), Sarona Asset Management, since 2019 |
| Sandra L. Yeager c/o Columbia Management Investment Advisers, LLC 290 Congress Street Boston, MA 02210 1964 | Trustee since 2017 | Retired; President and founder, Hanoverian Capital, LLC (SEC registered investment advisor firm), 2008-2016; Managing Director, DuPont Capital, 2006-2008; Managing Director, Morgan Stanley Investment Management, 2004-2006; Senior Vice President, Alliance Bernstein, 1990-2004 | 176 | Former Director, NAPE Education Foundation, October 2016-October 2020; Advisory Board, Jennersville YMCA, since 2022 |
| * | The term “Columbia Funds Complex” as used herein includes Columbia Seligman Premium Technology Growth Fund, Tri-Continental Corporation and each series of Columbia Funds Series Trust (CFST), Columbia Funds Series Trust I (CFST I), Columbia Funds Series Trust II (CFST II), Columbia ETF Trust I (CET I), Columbia ETF Trust II (CET II), Columbia Funds Variable Insurance Trust (CFVIT) and Columbia Funds Variable Series Trust II (CFVST II). Messrs. Batejan, Beckman, Gallagher and Hacker and Mses. Blatz, Carlton, Carrig, Flynn, Paglia and Yeager serve as Directors of Columbia Seligman Premium Technology Growth Fund and Tri-Continental Corporation. |
| Name, address, year of birth | Position held with the Columbia Funds and length of service | Principal occupation(s) during the past five years and other relevant professional experience | Number of Funds in the Columbia Funds Complex overseen | Other directorships held by Trustee during the past five years |
| Daniel J. Beckman c/o Columbia Management Investment Advisers, LLC 290 Congress Street Boston, MA 02210 1962 | Trustee since November 2021 and President since June 2021 | Vice President – Head of North America Product, Columbia Management Investment Advisers, LLC, since April 2015; President and Principal Executive Officer of the Columbia Funds, since June 2021; officer of Columbia Funds and affiliated funds, 2020-2021 | 176 | Director, Ameriprise Trust Company, since October 2016; Director, Columbia Management Investment Distributors, Inc. since November 2018; Board of Governors, Columbia Wanger Asset Management, LLC since, January 2022; Director, Columbia Threadneedle Canada, Inc., since December 2022 |
| * | Interested person (as defined under the 1940 Act) by reason of being an officer, director, security holder and/or employee of the Investment Manager or Ameriprise Financial. |
| Columbia Capital Allocation Portfolios | Annual Report 2023 | 95 |
(Unaudited)
| Name, address and year of birth | Position and year first appointed to position for any Fund in the Columbia Funds Complex or a predecessor thereof | Principal occupation(s) during past five years |
| Michael G. Clarke 290 Congress Street Boston, MA 02210 1969 | Chief Financial Officer and Principal Financial Officer (2009) and Senior Vice President (2019) | Senior Vice President and Head of Global Operations & Investor Services, Columbia Management Investment Advisers, LLC, since March 2022 (previously Vice President, Head of North American Operations, and Co-Head of Global Operations, June 2019 to February 2022 and Vice President – Accounting and Tax, May 2010 - May 2019); senior officer of Columbia Funds and affiliated funds, since 2002. |
| Joseph Beranek 5890 Ameriprise Financial Center Minneapolis, MN 55474 1965 | Treasurer and Chief Accounting Officer (Principal Accounting Officer) (2019) and Principal Financial Officer (2020), CFST, CFST I, CFST II, CFVIT and CFVST II; Assistant Treasurer, CET I and CET II | Vice President – Mutual Fund Accounting and Financial Reporting, Columbia Management Investment Advisers, LLC, since December 2018 and March 2017, respectively. |
| Marybeth Pilat 290 Congress Street Boston, MA 02210 1968 | Treasurer and Chief Accounting Officer (Principal Accounting Officer) and Principal Financial Officer (2020) for CET I and CET II; Assistant Treasurer, CFST, CFST I, CFST II, CFVIT and CFVST II | Vice President – Product Pricing and Administration, Columbia Management Investment Advisers, LLC, since May 2017. |
| William F. Truscott 290 Congress Street Boston, MA 02210 1960 | Senior Vice President (2001) | Formerly, Trustee/Director of Columbia Funds Complex or legacy funds, November 2001-January 1, 2021; Chief Executive Officer, Global Asset Management, Ameriprise Financial, Inc., since September 2012; Chairman of the Board and President, Columbia Management Investment Advisers, LLC, since July 2004 and February 2012, respectively; Chairman of the Board and Chief Executive Officer, Columbia Management Investment Distributors, Inc., since November 2008 and February 2012, respectively; Chairman of the Board and Director, Threadneedle Asset Management Holdings, Sàrl, since March 2013 and December 2008, respectively; senior executive of various entities affiliated with Columbia Threadneedle. |
| Christopher O. Petersen 5228 Ameriprise Financial Center Minneapolis, MN 55474 1970 | Senior Vice President and Assistant Secretary (2021) | Formerly, Trustee/Director of funds within the Columbia Funds Complex, July 1, 2020 - November 22, 2021; Senior Vice President and Assistant General Counsel, Ameriprise Financial, Inc., since September 2021 (previously Vice President and Lead Chief Counsel, January 2015 - September 2021); formerly, President and Principal Executive Officer of the Columbia Funds, 2015 - 2021; officer of Columbia Funds and affiliated funds, since 2007. |
| Thomas P. McGuire 290 Congress Street Boston, MA 02210 1972 | Senior Vice President and Chief Compliance Officer (2012) | Vice President – Asset Management Compliance, Ameriprise Financial, Inc., since May 2010; Chief Compliance Officer, Columbia Acorn/Wanger Funds, since December 2015; formerly, Chief Compliance Officer, Ameriprise Certificate Company, September 2010 – September 2020. |
| 96 | Columbia Capital Allocation Portfolios | Annual Report 2023 |
(Unaudited)
| Name, address and year of birth | Position and year first appointed to position for any Fund in the Columbia Funds Complex or a predecessor thereof | Principal occupation(s) during past five years |
| Ryan C. Larrenaga 290 Congress Street Boston, MA 02210 1970 | Senior Vice President (2017), Chief Legal Officer (2017), and Secretary (2015) | Vice President and Chief Counsel, Ameriprise Financial, Inc., since August 2018 (previously Vice President and Group Counsel, August 2011 - August 2018); Chief Legal Officer, Columbia Acorn/Wanger Funds, since September 2020; officer of Columbia Funds and affiliated funds, since 2005. |
| Michael E. DeFao 290 Congress Street Boston, MA 02210 1968 | Vice President (2011) and Assistant Secretary (2010) | Vice President and Chief Counsel, Ameriprise Financial, Inc., since May 2010; Vice President, Chief Legal Officer and Assistant Secretary, Columbia Management Investment Advisers, LLC, since October 2021 (previously Vice President and Assistant Secretary, May 2010 – September 2021). |
| Lyn Kephart-Strong 5228 Ameriprise Financial Center Minneapolis, MN 55474 1960 | Vice President (2015) | Vice President, Global Investment Operations Services, Columbia Management Investment Advisers, LLC, since 2010; President, Columbia Management Investment Services Corp., since October 2014; President, Ameriprise Trust Company, since January 2017. |
| Columbia Capital Allocation Portfolios | Annual Report 2023 | 97 |
| 98 | Columbia Capital Allocation Portfolios | Annual Report 2023 |
columbiathreadneedleus.com/investor/. The Funds are distributed by Columbia Management Investment Distributors, Inc., member FINRA, and managed by Columbia Management Investment Advisers, LLC.

January 31, 2023

| 3 | |
| 5 | |
| 7 | |
| 8 | |
| 11 | |
| 12 | |
| 13 | |
| 16 | |
| 20 | |
| 29 | |
| 30 | |
| 30 |
(Unaudited)
| Average annual total returns (%) (for the period ended January 31, 2023) | |||||
| Inception | 1 Year | 5 Years | 10 Years | ||
| Class A | Excluding sales charges | 02/16/06 | -7.20 | 3.12 | 4.11 |
| Including sales charges | -11.61 | 2.13 | 3.60 | ||
| Advisor Class | 11/08/12 | -6.93 | 3.39 | 4.36 | |
| Class C | Excluding sales charges | 02/16/06 | -7.94 | 2.34 | 3.32 |
| Including sales charges | -8.82 | 2.34 | 3.32 | ||
| Institutional Class | 09/27/10 | -6.96 | 3.38 | 4.36 | |
| Institutional 2 Class | 11/08/12 | -6.99 | 3.40 | 4.39 | |
| Institutional 3 Class* | 03/01/17 | -6.88 | 3.44 | 4.30 | |
| Class R | 09/27/10 | -7.46 | 2.86 | 3.84 | |
| Blended Benchmark | -5.14 | 2.72 | 3.69 | ||
| Bloomberg U.S. Aggregate Bond Index | -8.36 | 0.86 | 1.43 | ||
| Russell 3000 Value Index | -0.43 | 6.86 | 10.05 | ||
| FTSE Three-Month U.S. Treasury Bill Index | 1.87 | 1.30 | 0.78 | ||
| * | The returns shown for periods prior to the share class inception date (including returns for the Life of the Fund, if shown, which are since Fund inception) include the returns of the Fund’s oldest share class. Since the Fund launched more than one share class at its inception, Class A shares were used. These returns are adjusted to reflect any higher class-related operating expenses of the newer share classes, as applicable. Please visit columbiathreadneedleus.com/investor/investment-products/mutual-funds/appended-performance for more information. |
| Columbia Income Builder Fund | Annual Report 2023 | 3 |
(Unaudited)

| Portfolio breakdown (%) (at January 31, 2023) | |
| Equity Funds | 26.5 |
| Exchange-Traded Fixed Income Funds | 5.8 |
| Fixed Income Funds | 67.6 |
| Money Market Funds | 0.1 |
| Total | 100.0 |
| 4 | Columbia Income Builder Fund | Annual Report 2023 |
(Unaudited)
| • | Strategic positioning in the Fund was the main detractor from performance, relative to the Blended Benchmark, over the period. This was driven by the allocation to the specialty category of underlying equity funds (Columbia Real Estate Equity Fund and Columbia Convertible Securities Fund) and to Columbia Dividend Income Fund. |
| • | With regard to tactical positioning, the largest detractor was the Fund’s exposure to Columbia Corporate Income Fund. Corporate credit had one of the worst years of performance in history, and the Fund was overweight credit relative to the Blended Benchmark. |
| • | Underlying fund positioning also detracted from performance; this was primarily driven by allocations to Columbia Mortgage Opportunities Fund and Columbia Quality Income Fund. |
| • | The Fund’s tactical positioning had the largest positive contribution to performance during the period. |
| ○ | Exposure to securitized mortgages through Columbia Mortgage Opportunities Fund was the largest performance driver, as both agency and non-agency mortgage-backed securities dramatically appreciated in value during the last quarter of the year. |
| ○ | Shorter duration fixed-income (Columbia Floating Rate Fund and Columbia Limited Duration Credit Fund) also performed well as investors preferred less sensitivity to interest rates while the Fed continued its interest rate hiking program. |
| ○ | Additionally, high quality government positions (Columbia U.S. Treasury Index Fund and Columbia Quality Income Fund) supported performance during the year. |
| • | The Fund’s strategic positioning generated strong positive results from higher yielding bonds (Columbia Floating Rate Fund and Columbia High Yield Bond Fund) and Columbia Quality Income Fund. |
| Columbia Income Builder Fund | Annual Report 2023 | 5 |
(Unaudited)
| • | The Fund’s underlying positioning led to positive results from domestic equities, specifically Columbia Dividend Income Fund and Columbia Small Cap Value Fund I, due to stronger security selection relative to the large-cap Russell 3000 Value Index. |
| 6 | Columbia Income Builder Fund | Annual Report 2023 |
(Unaudited)
| August 1, 2022 — January 31, 2023 | ||||||||||
| Account value at the beginning of the period ($) | Account value at the end of the period ($) | Expenses paid during the period ($) | Fund’s annualized expense ratio (%) | Effective expenses paid during the period ($) | Fund’s effective annualized expense ratio (%) | |||||
| Actual | Hypothetical | Actual | Hypothetical | Actual | Hypothetical | Actual | Actual | Hypothetical | Actual | |
| Class A | 1,000.00 | 1,000.00 | 994.10 | 1,023.54 | 1.93 | 1.96 | 0.38 | 4.88 | 4.95 | 0.96 |
| Advisor Class | 1,000.00 | 1,000.00 | 996.20 | 1,024.82 | 0.66 | 0.67 | 0.13 | 3.61 | 3.66 | 0.71 |
| Class C | 1,000.00 | 1,000.00 | 990.30 | 1,019.72 | 5.73 | 5.82 | 1.13 | 8.67 | 8.80 | 1.71 |
| Institutional Class | 1,000.00 | 1,000.00 | 995.30 | 1,024.82 | 0.66 | 0.67 | 0.13 | 3.61 | 3.66 | 0.71 |
| Institutional 2 Class | 1,000.00 | 1,000.00 | 995.50 | 1,024.92 | 0.56 | 0.57 | 0.11 | 3.51 | 3.56 | 0.69 |
| Institutional 3 Class | 1,000.00 | 1,000.00 | 995.70 | 1,025.17 | 0.31 | 0.31 | 0.06 | 3.25 | 3.30 | 0.64 |
| Class R | 1,000.00 | 1,000.00 | 992.90 | 1,022.27 | 3.20 | 3.25 | 0.63 | 6.14 | 6.23 | 1.21 |
| Columbia Income Builder Fund | Annual Report 2023 | 7 |
January 31, 2023
| Equity Funds 26.5% | ||
| Shares | Value ($) | |
| Convertible 1.4% | ||
| Columbia Convertible Securities Fund, Institutional 3 Class(a) | 881,399 | 17,857,149 |
| Dividend Income 16.7% | ||
| Columbia Dividend Income Fund, Institutional 3 Class(a) | 3,184,401 | 95,563,884 |
| Columbia Dividend Opportunity Fund, Institutional 3 Class(a) | 2,552,383 | 94,744,453 |
| Columbia International Dividend Income Fund, Institutional 3 Class(a) | 1,554,252 | 28,784,749 |
| Total | 219,093,086 | |
| Global Real Estate 3.8% | ||
| Columbia Real Estate Equity Fund, Institutional 3 Class(a) | 3,840,892 | 49,624,325 |
| U.S. Small Cap 4.6% | ||
| Columbia Small Cap Value Fund I, Institutional 3 Class(a) | 1,210,957 | 59,772,810 |
| Total Equity Funds (Cost $285,604,511) | 346,347,370 | |
| Exchange-Traded Fixed Income Funds 5.9% | ||
| Multisector 5.9% | ||
| Columbia Diversified Fixed Income Allocation ETF(a) | 1,633,929 | 29,378,044 |
| Columbia Short Duration Bond ETF(a) | 2,586,343 | 47,213,950 |
| Total | 76,591,994 | |
| Total Exchange-Traded Fixed Income Funds (Cost $83,363,913) | 76,591,994 | |
| Fixed Income Funds 67.7% | ||
| Emerging Markets 8.6% | ||
| Columbia Emerging Markets Bond Fund, Institutional 3 Class(a) | 12,065,563 | 111,847,768 |
| Fixed Income Funds (continued) | ||
| Shares | Value ($) | |
| Floating Rate 4.4% | ||
| Columbia Floating Rate Fund, Institutional 3 Class(a) | 1,715,140 | 57,251,377 |
| High Yield 6.4% | ||
| Columbia High Yield Bond Fund, Institutional 3 Class(a) | 8,015,363 | 84,321,621 |
| Investment Grade 48.3% | ||
| Columbia Corporate Income Fund, Institutional 3 Class(a) | 23,271,224 | 211,535,424 |
| Columbia Limited Duration Credit Fund, Institutional 3 Class(a) | 1,292,795 | 12,359,123 |
| Columbia Mortgage Opportunities Fund, Institutional 3 Class(a) | 14,240,420 | 119,192,318 |
| Columbia Quality Income Fund, Institutional 3 Class(a) | 15,369,052 | 281,868,405 |
| Columbia U.S. Treasury Index Fund, Institutional 3 Class(a) | 681,068 | 6,967,326 |
| Total | 631,922,596 | |
| Total Fixed Income Funds (Cost $1,002,690,780) | 885,343,362 | |
| Money Market Funds 0.0% | ||
| Columbia Government Money Market Fund, Institutional 3 Class, 4.145%(a),(b) | 676,436 | 676,436 |
| Total Money Market Funds (Cost $675,986) | 676,436 | |
| Total Investments in Securities (Cost: $1,372,335,190) | 1,308,959,162 | |
| Other Assets & Liabilities, Net | (752,078) | |
| Net Assets | 1,308,207,084 | |
| 8 | Columbia Income Builder Fund | Annual Report 2023 |
January 31, 2023
| (a) | As defined in the Investment Company Act of 1940, as amended, an affiliated company is one in which the Fund owns 5% or more of the company’s outstanding voting securities, or a company which is under common ownership or control with the Fund. The value of the holdings and transactions in these affiliated companies during the year ended January 31, 2023 are as follows: |
| Affiliated issuers | Beginning of period($) | Purchases($) | Sales($) | Net change in unrealized appreciation (depreciation)($) | End of period($) | Capital gain distributions($) | Realized gain (loss)($) | Dividends — affiliated issuers ($) | End of period shares |
| Columbia Convertible Securities Fund, Institutional 3 Class | |||||||||
| 39,441,051 | 16,673,141 | (27,454,700) | (10,802,343) | 17,857,149 | 911,234 | 6,151,716 | 418,728 | 881,399 | |
| Columbia Corporate Income Fund, Institutional 3 Class | |||||||||
| 232,023,938 | 50,808,021 | (47,748,262) | (23,548,273) | 211,535,424 | — | (5,970,132) | 7,799,002 | 23,271,224 | |
| Columbia Diversified Fixed Income Allocation ETF | |||||||||
| 33,773,313 | — | — | (4,395,269) | 29,378,044 | — | — | 981,159 | 1,633,929 | |
| Columbia Dividend Income Fund, Institutional 3 Class | |||||||||
| 102,973,527 | 44,051,930 | (45,497,518) | (5,964,055) | 95,563,884 | 1,947,678 | 1,038,804 | 2,104,254 | 3,184,401 | |
| Columbia Dividend Opportunity Fund, Institutional 3 Class | |||||||||
| 56,453,905 | 86,111,374 | (46,878,226) | (942,600) | 94,744,453 | 4,573,655 | (341,904) | 2,194,555 | 2,552,383 | |
| Columbia Emerging Markets Bond Fund, Institutional 3 Class | |||||||||
| 106,349,976 | 21,811,518 | — | (16,313,726) | 111,847,768 | — | — | 4,811,523 | 12,065,563 | |
| Columbia Floating Rate Fund, Institutional 3 Class | |||||||||
| 147,520,994 | 6,212,936 | (94,475,690) | (2,006,863) | 57,251,377 | — | (5,045,751) | 4,437,654 | 1,715,140 | |
| Columbia Government Money Market Fund, Institutional 3 Class, 4.145% | |||||||||
| 664,991 | 11,445 | — | — | 676,436 | — | — | 11,445 | 676,436 | |
| Columbia High Yield Bond Fund, Institutional 3 Class | |||||||||
| 164,635,141 | 6,489,488 | (77,704,142) | (9,098,866) | 84,321,621 | — | (7,331,671) | 6,146,309 | 8,015,363 | |
| Columbia International Dividend Income Fund, Institutional 3 Class | |||||||||
| 34,787,500 | 15,841,797 | (20,115,469) | (1,729,079) | 28,784,749 | — | 48,380 | 498,618 | 1,554,252 | |
| Columbia Limited Duration Credit Fund, Institutional 3 Class | |||||||||
| 108,929,494 | 3,403,218 | (97,972,333) | (2,001,256) | 12,359,123 | — | (3,694,205) | 1,036,175 | 1,292,795 | |
| Columbia Mortgage Opportunities Fund, Institutional 3 Class | |||||||||
| 201,108,766 | 11,644,656 | (67,020,062) | (26,541,042) | 119,192,318 | — | (8,241,928) | 9,277,613 | 14,240,420 | |
| Columbia Quality Income Fund, Institutional 3 Class | |||||||||
| 334,313,901 | 48,989,015 | (58,938,656) | (42,495,855) | 281,868,405 | — | (7,160,519) | 9,204,709 | 15,369,052 | |
| Columbia Real Estate Equity Fund, Institutional 3 Class | |||||||||
| 37,546,853 | 19,597,483 | — | (7,520,011) | 49,624,325 | 1,482,215 | — | 1,115,261 | 3,840,892 | |
| Columbia Short Duration Bond ETF | |||||||||
| 33,502,445 | 16,087,003 | — | (2,375,498) | 47,213,950 | — | — | 1,175,435 | 2,586,343 | |
| Columbia Small Cap Value Fund I, Institutional 3 Class | |||||||||
| 73,836,891 | 2,773,182 | (17,126,444) | 289,181 | 59,772,810 | 2,479,120 | (1,126,461) | 294,061 | 1,210,957 | |
| Columbia U.S. Treasury Index Fund, Institutional 3 Class | |||||||||
| 7,620,242 | 118,364 | — | (771,280) | 6,967,326 | — | — | 118,364 | 681,068 | |
| Total | 1,715,482,928 | (156,216,835) | 1,308,959,162 | 11,393,902 | (31,673,671) | 51,624,865 | |||
| (b) | The rate shown is the seven-day current annualized yield at January 31, 2023. |
| Columbia Income Builder Fund | Annual Report 2023 | 9 |
January 31, 2023
pricing an investment. An investment’s level within the fair value hierarchy is based on the lowest level of any input that is deemed significant to the asset’s or liability’s fair value measurement. The input levels are not necessarily an indication of the risk or liquidity associated with investments at that level. For example, certain U.S. government securities are generally high quality and liquid, however, they are reflected as Level 2 because the inputs used to determine fair value may not always be quoted prices in an active market.
| ■ | Level 1 — Valuations based on quoted prices for investments in active markets that the Fund has the ability to access at the measurement date. Valuation adjustments are not applied to Level 1 investments. |
| ■ | Level 2 — Valuations based on other significant observable inputs (including quoted prices for similar securities, interest rates, prepayment speeds, credit risks, etc.). |
| ■ | Level 3 — Valuations based on significant unobservable inputs (including the Fund’s own assumptions and judgment in determining the fair value of investments). |
| Level 1 ($) | Level 2 ($) | Level 3 ($) | Total ($) | |
| Investments in Securities | ||||
| Equity Funds | 346,347,370 | — | — | 346,347,370 |
| Exchange-Traded Fixed Income Funds | 76,591,994 | — | — | 76,591,994 |
| Fixed Income Funds | 885,343,362 | — | — | 885,343,362 |
| Money Market Funds | 676,436 | — | — | 676,436 |
| Total Investments in Securities | 1,308,959,162 | — | — | 1,308,959,162 |
| 10 | Columbia Income Builder Fund | Annual Report 2023 |
January 31, 2023
| Assets | |
| Investments in securities, at value | |
| Affiliated issuers (cost $1,372,335,190) | $1,308,959,162 |
| Receivable for: | |
| Investments sold | 772,281 |
| Capital shares sold | 188,937 |
| Dividends | 2,431,704 |
| Prepaid expenses | 13,475 |
| Total assets | 1,312,365,559 |
| Liabilities | |
| Payable for: | |
| Investments purchased | 2,431,704 |
| Capital shares purchased | 1,495,501 |
| Management services fees | 714 |
| Distribution and/or service fees | 9,119 |
| Transfer agent fees | 93,639 |
| Compensation of board members | 93,912 |
| Compensation of chief compliance officer | 253 |
| Other expenses | 33,633 |
| Total liabilities | 4,158,475 |
| Net assets applicable to outstanding capital stock | $1,308,207,084 |
| Represented by | |
| Paid in capital | 1,398,199,108 |
| Total distributable earnings (loss) | (89,992,024) |
| Total - representing net assets applicable to outstanding capital stock | $1,308,207,084 |
| Class A | |
| Net assets | $767,457,696 |
| Shares outstanding | 67,686,258 |
| Net asset value per share | $11.34 |
| Maximum sales charge | 4.75% |
| Maximum offering price per share (calculated by dividing the net asset value per share by 1.0 minus the maximum sales charge for Class A shares) | $11.91 |
| Advisor Class | |
| Net assets | $16,953,529 |
| Shares outstanding | 1,488,997 |
| Net asset value per share | $11.39 |
| Class C | |
| Net assets | $136,859,675 |
| Shares outstanding | 12,011,523 |
| Net asset value per share | $11.39 |
| Institutional Class | |
| Net assets | $304,023,886 |
| Shares outstanding | 26,809,767 |
| Net asset value per share | $11.34 |
| Institutional 2 Class | |
| Net assets | $43,633,736 |
| Shares outstanding | 3,831,088 |
| Net asset value per share | $11.39 |
| Institutional 3 Class | |
| Net assets | $27,575,628 |
| Shares outstanding | 2,423,608 |
| Net asset value per share | $11.38 |
| Class R | |
| Net assets | $11,702,934 |
| Shares outstanding | 1,024,699 |
| Net asset value per share | $11.42 |
| Columbia Income Builder Fund | Annual Report 2023 | 11 |
Year Ended January 31, 2023
| Net investment income | |
| Income: | |
| Dividends — affiliated issuers | $51,624,865 |
| Total income | 51,624,865 |
| Expenses: | |
| Management services fees | 291,729 |
| Distribution and/or service fees | |
| Class A | 2,069,263 |
| Class C | 1,589,483 |
| Class R | 62,758 |
| Transfer agent fees | |
| Class A | 659,075 |
| Advisor Class | 14,498 |
| Class C | 126,340 |
| Institutional Class | 290,283 |
| Institutional 2 Class | 26,656 |
| Institutional 3 Class | 3,410 |
| Class R | 10,007 |
| Compensation of board members | 21,574 |
| Custodian fees | 6,212 |
| Printing and postage fees | 99,472 |
| Registration fees | 156,705 |
| Audit fees | 11,220 |
| Legal fees | 32,090 |
| Compensation of chief compliance officer | 245 |
| Other | 29,074 |
| Total expenses | 5,500,094 |
| Expense reduction | (120) |
| Total net expenses | 5,499,974 |
| Net investment income | 46,124,891 |
| Realized and unrealized gain (loss) — net | |
| Net realized gain (loss) on: | |
| Investments — affiliated issuers | (31,673,671) |
| Capital gain distributions from underlying affiliated funds | 11,393,902 |
| Net realized loss | (20,279,769) |
| Net change in unrealized appreciation (depreciation) on: | |
| Investments — affiliated issuers | (156,216,835) |
| Net change in unrealized appreciation (depreciation) | (156,216,835) |
| Net realized and unrealized loss | (176,496,604) |
| Net decrease in net assets resulting from operations | $(130,371,713) |
| 12 | Columbia Income Builder Fund | Annual Report 2023 |
| Year Ended January 31, 2023 | Year Ended January 31, 2022 | |
| Operations | ||
| Net investment income | $46,124,891 | $37,896,870 |
| Net realized gain (loss) | (20,279,769) | 43,240,877 |
| Net change in unrealized appreciation (depreciation) | (156,216,835) | (33,426,929) |
| Net increase (decrease) in net assets resulting from operations | (130,371,713) | 47,710,818 |
| Distributions to shareholders | ||
| Net investment income and net realized gains | ||
| Class A | (38,965,749) | (44,587,556) |
| Advisor Class | (867,323) | (1,187,709) |
| Class C | (6,208,264) | (7,549,675) |
| Institutional Class | (18,024,974) | (20,304,998) |
| Institutional 2 Class | (2,313,476) | (2,961,770) |
| Institutional 3 Class | (1,466,847) | (1,227,401) |
| Class R | (554,622) | (495,469) |
| Total distributions to shareholders | (68,401,255) | (78,314,578) |
| Increase (decrease) in net assets from capital stock activity | (208,312,626) | 288,490,459 |
| Total increase (decrease) in net assets | (407,085,594) | 257,886,699 |
| Net assets at beginning of year | 1,715,292,678 | 1,457,405,979 |
| Net assets at end of year | $1,308,207,084 | $1,715,292,678 |
| Columbia Income Builder Fund | Annual Report 2023 | 13 |
| Year Ended | Year Ended | |||
| January 31, 2023 | January 31, 2022 | |||
| Shares | Dollars ($) | Shares | Dollars ($) | |
| Capital stock activity | ||||
| Class A | ||||
| Subscriptions | 5,340,047 | 62,494,947 | 14,349,624 | 190,374,026 |
| Distributions reinvested | 3,387,947 | 38,351,614 | 3,318,822 | 43,868,867 |
| Redemptions | (15,834,553) | (182,006,226) | (10,751,314) | (142,633,901) |
| Net increase (decrease) | (7,106,559) | (81,159,665) | 6,917,132 | 91,608,992 |
| Advisor Class | ||||
| Subscriptions | 730,153 | 8,470,911 | 813,905 | 10,846,696 |
| Distributions reinvested | 72,256 | 822,020 | 84,734 | 1,124,536 |
| Redemptions | (933,162) | (10,816,942) | (897,109) | (11,847,267) |
| Net increase (decrease) | (130,753) | (1,524,011) | 1,530 | 123,965 |
| Class C | ||||
| Subscriptions | 1,406,002 | 16,747,551 | 4,997,156 | 66,705,137 |
| Distributions reinvested | 532,270 | 6,046,302 | 554,863 | 7,366,227 |
| Redemptions | (4,983,211) | (57,616,214) | (4,153,945) | (55,402,004) |
| Net increase (decrease) | (3,044,939) | (34,822,361) | 1,398,074 | 18,669,360 |
| Institutional Class | ||||
| Subscriptions | 6,614,845 | 77,724,456 | 16,069,086 | 213,349,348 |
| Distributions reinvested | 1,506,767 | 17,088,491 | 1,447,985 | 19,135,261 |
| Redemptions | (16,049,889) | (184,015,604) | (6,883,285) | (91,323,903) |
| Net increase (decrease) | (7,928,277) | (89,202,657) | 10,633,786 | 141,160,706 |
| Institutional 2 Class | ||||
| Subscriptions | 1,474,039 | 16,849,623 | 3,253,776 | 43,434,214 |
| Distributions reinvested | 203,331 | 2,313,119 | 223,226 | 2,961,763 |
| Redemptions | (1,901,543) | (21,713,631) | (2,392,874) | (31,721,608) |
| Net increase (decrease) | (224,173) | (2,550,889) | 1,084,128 | 14,674,369 |
| Institutional 3 Class | ||||
| Subscriptions | 850,121 | 10,172,947 | 1,424,311 | 18,965,492 |
| Distributions reinvested | 128,264 | 1,456,913 | 92,443 | 1,224,246 |
| Redemptions | (911,116) | (10,573,820) | (330,481) | (4,384,070) |
| Net increase | 67,269 | 1,056,040 | 1,186,273 | 15,805,668 |
| Class R | ||||
| Subscriptions | 246,321 | 2,941,835 | 616,115 | 8,251,109 |
| Distributions reinvested | 48,667 | 553,934 | 37,217 | 494,687 |
| Redemptions | (312,581) | (3,604,852) | (171,690) | (2,298,397) |
| Net increase (decrease) | (17,593) | (109,083) | 481,642 | 6,447,399 |
| Total net increase (decrease) | (18,385,025) | (208,312,626) | 21,702,565 | 288,490,459 |
| 14 | Columbia Income Builder Fund | Annual Report 2023 |
| Net asset value, beginning of period | Net investment income | Net realized and unrealized gain (loss) | Total from investment operations | Distributions from net investment income | Distributions from net realized gains | Total distributions to shareholders | |
| Class A | |||||||
| Year Ended 1/31/2023 | $12.82 | 0.37 | (1.30) | (0.93) | (0.38) | (0.17) | (0.55) |
| Year Ended 1/31/2022 | $13.01 | 0.30 | 0.13 | 0.43 | (0.35) | (0.27) | (0.62) |
| Year Ended 1/31/2021 | $12.35 | 0.34 | 0.85 | 1.19 | (0.42) | (0.11) | (0.53) |
| Year Ended 1/31/2020 | $11.70 | 0.35 | 0.78 | 1.13 | (0.37) | (0.11) | (0.48) |
| Year Ended 1/31/2019 | $12.08 | 0.36 | (0.28) | 0.08 | (0.35) | (0.11) | (0.46) |
| Advisor Class | |||||||
| Year Ended 1/31/2023 | $12.87 | 0.40 | (1.31) | (0.91) | (0.40) | (0.17) | (0.57) |
| Year Ended 1/31/2022 | $13.05 | 0.34 | 0.13 | 0.47 | (0.38) | (0.27) | (0.65) |
| Year Ended 1/31/2021 | $12.39 | 0.37 | 0.85 | 1.22 | (0.45) | (0.11) | (0.56) |
| Year Ended 1/31/2020 | $11.74 | 0.38 | 0.78 | 1.16 | (0.40) | (0.11) | (0.51) |
| Year Ended 1/31/2019 | $12.12 | 0.39 | (0.28) | 0.11 | (0.38) | (0.11) | (0.49) |
| Class C | |||||||
| Year Ended 1/31/2023 | $12.88 | 0.28 | (1.31) | (1.03) | (0.29) | (0.17) | (0.46) |
| Year Ended 1/31/2022 | $13.07 | 0.21 | 0.12 | 0.33 | (0.25) | (0.27) | (0.52) |
| Year Ended 1/31/2021 | $12.40 | 0.25 | 0.86 | 1.11 | (0.33) | (0.11) | (0.44) |
| Year Ended 1/31/2020 | $11.75 | 0.26 | 0.78 | 1.04 | (0.28) | (0.11) | (0.39) |
| Year Ended 1/31/2019 | $12.13 | 0.27 | (0.28) | (0.01) | (0.26) | (0.11) | (0.37) |
| Institutional Class | |||||||
| Year Ended 1/31/2023 | $12.82 | 0.39 | (1.30) | (0.91) | (0.40) | (0.17) | (0.57) |
| Year Ended 1/31/2022 | $13.01 | 0.34 | 0.12 | 0.46 | (0.38) | (0.27) | (0.65) |
| Year Ended 1/31/2021 | $12.35 | 0.37 | 0.85 | 1.22 | (0.45) | (0.11) | (0.56) |
| Year Ended 1/31/2020 | $11.70 | 0.38 | 0.78 | 1.16 | (0.40) | (0.11) | (0.51) |
| Year Ended 1/31/2019 | $12.08 | 0.39 | (0.28) | 0.11 | (0.38) | (0.11) | (0.49) |
| Institutional 2 Class | |||||||
| Year Ended 1/31/2023 | $12.88 | 0.40 | (1.31) | (0.91) | (0.41) | (0.17) | (0.58) |
| Year Ended 1/31/2022 | $13.06 | 0.34 | 0.14 | 0.48 | (0.39) | (0.27) | (0.66) |
| Year Ended 1/31/2021 | $12.39 | 0.38 | 0.86 | 1.24 | (0.46) | (0.11) | (0.57) |
| Year Ended 1/31/2020 | $11.74 | 0.38 | 0.78 | 1.16 | (0.40) | (0.11) | (0.51) |
| Year Ended 1/31/2019 | $12.12 | 0.39 | (0.28) | 0.11 | (0.38) | (0.11) | (0.49) |
| 16 | Columbia Income Builder Fund | Annual Report 2023 |
| Net asset value, end of period | Total return | Total gross expense ratio to average net assets(a) | Total net expense ratio to average net assets(a),(b) | Net investment income ratio to average net assets | Portfolio turnover | Net assets, end of period (000’s) | |
| Class A | |||||||
| Year Ended 1/31/2023 | $11.34 | (7.20%) | 0.37% | 0.37%(c) | 3.18% | 24% | $767,458 |
| Year Ended 1/31/2022 | $12.82 | 3.26% | 0.37% | 0.37%(c) | 2.28% | 10% | $959,012 |
| Year Ended 1/31/2021 | $13.01 | 10.00% | 0.38% | 0.38%(c) | 2.83% | 22% | $882,861 |
| Year Ended 1/31/2020 | $12.35 | 9.82% | 0.38% | 0.38%(c) | 2.89% | 16% | $817,461 |
| Year Ended 1/31/2019 | $11.70 | 0.75% | 0.38% | 0.38%(c) | 3.08% | 20% | $747,121 |
| Advisor Class | |||||||
| Year Ended 1/31/2023 | $11.39 | (6.93%) | 0.12% | 0.12%(c) | 3.45% | 24% | $16,954 |
| Year Ended 1/31/2022 | $12.87 | 3.58% | 0.12% | 0.12%(c) | 2.52% | 10% | $20,850 |
| Year Ended 1/31/2021 | $13.05 | 10.24% | 0.13% | 0.13%(c) | 3.06% | 22% | $21,125 |
| Year Ended 1/31/2020 | $12.39 | 10.05% | 0.13% | 0.13%(c) | 3.12% | 16% | $26,795 |
| Year Ended 1/31/2019 | $11.74 | 1.00% | 0.13% | 0.13%(c) | 3.35% | 20% | $14,605 |
| Class C | |||||||
| Year Ended 1/31/2023 | $11.39 | (7.94%) | 1.12% | 1.12%(c) | 2.39% | 24% | $136,860 |
| Year Ended 1/31/2022 | $12.88 | 2.48% | 1.12% | 1.12%(c) | 1.53% | 10% | $193,954 |
| Year Ended 1/31/2021 | $13.07 | 9.22% | 1.13% | 1.13%(c) | 2.06% | 22% | $178,448 |
| Year Ended 1/31/2020 | $12.40 | 8.96% | 1.13% | 1.13%(c) | 2.15% | 16% | $216,206 |
| Year Ended 1/31/2019 | $11.75 | (0.01%) | 1.13% | 1.13%(c) | 2.32% | 20% | $204,048 |
| Institutional Class | |||||||
| Year Ended 1/31/2023 | $11.34 | (6.96%) | 0.12% | 0.12%(c) | 3.39% | 24% | $304,024 |
| Year Ended 1/31/2022 | $12.82 | 3.52% | 0.12% | 0.12%(c) | 2.53% | 10% | $445,488 |
| Year Ended 1/31/2021 | $13.01 | 10.28% | 0.13% | 0.13%(c) | 3.08% | 22% | $313,565 |
| Year Ended 1/31/2020 | $12.35 | 10.09% | 0.13% | 0.13%(c) | 3.14% | 16% | $310,774 |
| Year Ended 1/31/2019 | $11.70 | 1.00% | 0.13% | 0.13%(c) | 3.34% | 20% | $237,185 |
| Institutional 2 Class | |||||||
| Year Ended 1/31/2023 | $11.39 | (6.99%) | 0.10% | 0.10% | 3.46% | 24% | $43,634 |
| Year Ended 1/31/2022 | $12.88 | 3.60% | 0.10% | 0.10% | 2.57% | 10% | $52,219 |
| Year Ended 1/31/2021 | $13.06 | 10.35% | 0.11% | 0.11% | 3.12% | 22% | $38,800 |
| Year Ended 1/31/2020 | $12.39 | 10.07% | 0.11% | 0.11% | 3.15% | 16% | $24,549 |
| Year Ended 1/31/2019 | $11.74 | 1.01% | 0.12% | 0.12% | 3.36% | 20% | $8,594 |
| Columbia Income Builder Fund | Annual Report 2023 | 17 |
| Net asset value, beginning of period | Net investment income | Net realized and unrealized gain (loss) | Total from investment operations | Distributions from net investment income | Distributions from net realized gains | Total distributions to shareholders | |
| Institutional 3 Class | |||||||
| Year Ended 1/31/2023 | $12.86 | 0.41 | (1.31) | (0.90) | (0.41) | (0.17) | (0.58) |
| Year Ended 1/31/2022 | $13.05 | 0.35 | 0.12 | 0.47 | (0.39) | (0.27) | (0.66) |
| Year Ended 1/31/2021 | $12.38 | 0.38 | 0.86 | 1.24 | (0.46) | (0.11) | (0.57) |
| Year Ended 1/31/2020 | $11.74 | 0.39 | 0.77 | 1.16 | (0.41) | (0.11) | (0.52) |
| Year Ended 1/31/2019 | $12.12 | 0.40 | (0.28) | 0.12 | (0.39) | (0.11) | (0.50) |
| Class R | |||||||
| Year Ended 1/31/2023 | $12.91 | 0.34 | (1.31) | (0.97) | (0.35) | (0.17) | (0.52) |
| Year Ended 1/31/2022 | $13.09 | 0.27 | 0.14 | 0.41 | (0.32) | (0.27) | (0.59) |
| Year Ended 1/31/2021 | $12.42 | 0.32 | 0.85 | 1.17 | (0.39) | (0.11) | (0.50) |
| Year Ended 1/31/2020 | $11.77 | 0.32 | 0.78 | 1.10 | (0.34) | (0.11) | (0.45) |
| Year Ended 1/31/2019 | $12.15 | 0.33 | (0.28) | 0.05 | (0.32) | (0.11) | (0.43) |
| Notes to Financial Highlights | |
| (a) | In addition to the fees and expenses that the Fund bears directly, the Fund indirectly bears a pro rata share of the fees and expenses of any other funds in which it invests. Such indirect expenses are not included in the Fund’s reported expense ratios. |
| (b) | Total net expenses include the impact of certain fee waivers/expense reimbursements made by the Investment Manager and certain of its affiliates, if applicable. |
| (c) | The benefits derived from expense reductions had an impact of less than 0.01%. |
| 18 | Columbia Income Builder Fund | Annual Report 2023 |
| Net asset value, end of period | Total return | Total gross expense ratio to average net assets(a) | Total net expense ratio to average net assets(a),(b) | Net investment income ratio to average net assets | Portfolio turnover | Net assets, end of period (000’s) | |
| Institutional 3 Class | |||||||
| Year Ended 1/31/2023 | $11.38 | (6.88%) | 0.06% | 0.06% | 3.52% | 24% | $27,576 |
| Year Ended 1/31/2022 | $12.86 | 3.57% | 0.05% | 0.05% | 2.61% | 10% | $30,313 |
| Year Ended 1/31/2021 | $13.05 | 10.40% | 0.06% | 0.06% | 3.15% | 22% | $15,267 |
| Year Ended 1/31/2020 | $12.38 | 10.04% | 0.06% | 0.06% | 3.21% | 16% | $12,931 |
| Year Ended 1/31/2019 | $11.74 | 1.06% | 0.06% | 0.06% | 3.46% | 20% | $7,006 |
| Class R | |||||||
| Year Ended 1/31/2023 | $11.42 | (7.46%) | 0.62% | 0.62%(c) | 2.95% | 24% | $11,703 |
| Year Ended 1/31/2022 | $12.91 | 3.06% | 0.62% | 0.62%(c) | 2.05% | 10% | $13,457 |
| Year Ended 1/31/2021 | $13.09 | 9.75% | 0.63% | 0.63%(c) | 2.59% | 22% | $7,340 |
| Year Ended 1/31/2020 | $12.42 | 9.48% | 0.63% | 0.63%(c) | 2.63% | 16% | $5,002 |
| Year Ended 1/31/2019 | $11.77 | 0.49% | 0.63% | 0.63%(c) | 2.84% | 20% | $2,825 |
| Columbia Income Builder Fund | Annual Report 2023 | 19 |
January 31, 2023
| 20 | Columbia Income Builder Fund | Annual Report 2023 |
January 31, 2023
| Columbia Income Builder Fund | Annual Report 2023 | 21 |
January 31, 2023
| 22 | Columbia Income Builder Fund | Annual Report 2023 |
January 31, 2023
| Effective rate (%) | |
| Class A | 0.08 |
| Advisor Class | 0.08 |
| Class C | 0.08 |
| Institutional Class | 0.08 |
| Institutional 2 Class | 0.06 |
| Institutional 3 Class | 0.01 |
| Class R | 0.08 |
| Columbia Income Builder Fund | Annual Report 2023 | 23 |
January 31, 2023
| Front End (%) | CDSC (%) | Amount ($) | |
| Class A | 4.75 | 0.50 - 1.00(a) | 397,728 |
| Class C | — | 1.00(b) | 33,422 |
| (a) | This charge is imposed on certain investments of between $1 million and $50 million redeemed within 18 months after purchase, as follows: 1.00% if redeemed within 12 months after purchase, and 0.50% if redeemed more than 12, but less than 18, months after purchase, with certain limited exceptions. |
| (b) | This charge applies to redemptions within 12 months after purchase, with certain limited exceptions. |
| Fee rate(s) contractual through May 31, 2023 | |
| Class A | 0.54% |
| Advisor Class | 0.29 |
| Class C | 1.29 |
| Institutional Class | 0.29 |
| Institutional 2 Class | 0.28 |
| Institutional 3 Class | 0.23 |
| Class R | 0.79 |
| 24 | Columbia Income Builder Fund | Annual Report 2023 |
January 31, 2023
| Undistributed net investment income ($) | Accumulated net realized (loss) ($) | Paid in capital ($) |
| (482,773) | 482,773 | — |
| Year Ended January 31, 2023 | Year Ended January 31, 2022 | ||||
| Ordinary income ($) | Long-term capital gains ($) | Total ($) | Ordinary income ($) | Long-term capital gains ($) | Total ($) |
| 46,648,531 | 21,752,724 | 68,401,255 | 44,320,846 | 33,993,732 | 78,314,578 |
| Undistributed ordinary income ($) | Undistributed long-term capital gains ($) | Capital loss carryforwards ($) | Net unrealized (depreciation) ($) |
| 1,572,594 | — | (14,868,351) | (76,604,641) |
| Federal tax cost ($) | Gross unrealized appreciation ($) | Gross unrealized (depreciation) ($) | Net unrealized (depreciation) ($) |
| 1,385,563,803 | 48,358,115 | (124,962,756) | (76,604,641) |
| No expiration short-term ($) | No expiration long-term ($) | Total ($) | Utilized ($) |
| (13,439,346) | (1,429,005) | (14,868,351) | — |
| Columbia Income Builder Fund | Annual Report 2023 | 25 |
January 31, 2023
| 26 | Columbia Income Builder Fund | Annual Report 2023 |
January 31, 2023
| Columbia Income Builder Fund | Annual Report 2023 | 27 |
January 31, 2023
| 28 | Columbia Income Builder Fund | Annual Report 2023 |
| Columbia Income Builder Fund | Annual Report 2023 | 29 |
| Qualified dividend income | Dividends received deduction | Section 199A dividends | Foreign taxes paid to foreign countries | Foreign taxes paid per share to foreign countries | Foreign source income | Foreign source income per share |
| 11.96% | 10.42% | 0.17% | $393,081 | $0.0034 | $4,789,925 | $0.0416 |
| 30 | Columbia Income Builder Fund | Annual Report 2023 |
(Unaudited)
Independent trustees
| Name, address, year of birth | Position held with the Columbia Funds and length of service | Principal occupation(s) during past five years and other relevant professional experience | Number of Funds in the Columbia Funds Complex* overseen | Other directorships held by Trustee during the past five years |
| George S. Batejan c/o Columbia Management Investment Advisers, LLC 290 Congress Street Boston, MA 02210 1954 | Trustee since 2017 | Executive Vice President, Global Head of Technology and Operations, Janus Capital Group, Inc., 2010-2016 | 176 | Former Chairman of the Board, NICSA (National Investment Company Services Association) (Executive Committee, Nominating Committee and Governance Committee), 2014-2016; former Director, Intech Investment Management, 2011-2016; former Board Member, Metro Denver Chamber of Commerce, 2015-2016; former Advisory Board Member, University of Colorado Business School, 2015-2018; former Board Member, Chase Bank International, 1993-1994 |
| Kathleen Blatz c/o Columbia Management Investment Advisers, LLC 290 Congress Street Boston, MA 02210 1954 | Trustee since 2006 | Attorney, specializing in arbitration and mediation; Chief Justice, Minnesota Supreme Court, 1998-2006; Associate Justice, Minnesota Supreme Court, 1996-1998; Fourth Judicial District Court Judge, Hennepin County, 1994-1996; Attorney in private practice and public service, 1984-1993; State Representative, Minnesota House of Representatives, 1979-1993, which included service on the Tax and Financial Institutions and Insurance Committees; Member and Interim Chair, Minnesota Sports Facilities Authority, January-July 2017; Interim President and Chief Executive Officer, Blue Cross and Blue Shield of Minnesota (health care insurance), February-July 2018, April-October 2021 | 176 | Former Trustee, Blue Cross and Blue Shield of Minnesota, 2009-2021 (Chair of the Business Development Committee, 2014-2017; Chair of the Governance Committee, 2017-2019); former Member and Chair of the Board, Minnesota Sports Facilities Authority, January 2017-July 2017; former Director, Robina Foundation, 2009-2020 (Chair, 2014-2020); Director, Richard M. Schulze Family Foundation, since 2021 |
| Pamela G. Carlton c/o Columbia Management Investment Advisers, LLC 290 Congress Street Boston, MA 02210 1954 | Chair since 2023; Trustee since 2007 | President, Springboard — Partners in Cross Cultural Leadership (consulting company), since 2003; Managing Director of US Equity Research, JP Morgan Chase, 1999-2003; Director of US Equity Research, Chase Asset Management, 1996-1999; Co-Director Latin America Research, 1993-1996, COO Global Research, 1992-1996, Co-Director of US Research, 1991-1992, Investment Banker, 1982-1991, Morgan Stanley; Attorney, Cleary Gottlieb Steen & Hamilton LLP, 1980-1982 | 176 | Trustee, New York Presbyterian Hospital Board, since 1996; Director, DR Bank (Audit Committee) since 2017; Director, Evercore Inc. (Audit Committee, Nominating and Governance Committee), since 2019; Director, Apollo Commercial Real Estate Finance, Inc. (Chair, Nominating and Governance Committee), since 2021; the Governing Council of the Independent Directors Council (IDC), since 2021 |
| Columbia Income Builder Fund | Annual Report 2023 | 31 |
(Unaudited)
Independent trustees (continued)
| Name, address, year of birth | Position held with the Columbia Funds and length of service | Principal occupation(s) during past five years and other relevant professional experience | Number of Funds in the Columbia Funds Complex* overseen | Other directorships held by Trustee during the past five years |
| Janet Langford Carrig c/o Columbia Management Investment Advisers, LLC 290 Congress Street Boston, MA 02210 1957 | Trustee since 1996 | Senior Vice President, General Counsel and Corporate Secretary, ConocoPhillips (independent energy company), September 2007-October 2018 | 174 | Director, EQT Corporation (natural gas producer), since 2019; former Director, Whiting Petroleum Corporation (independent oil and gas company), 2020-2022 |
| J. Kevin Connaughton c/o Columbia Management Investment Advisers, LLC 290 Congress Street Boston, MA 02210 1964 | Trustee since 2020 | CEO and President, RhodeWay Financial (non-profit financial planning firm), since December 2022; Member, FINRA National Adjudicatory Council, since January 2020; Adjunct Professor of Finance, Bentley University since January 2018; Consultant to Independent Trustees of CFVIT and CFST I from March 2016 to June 2020 with respect to CFVIT and to December 2020 with respect to CFST I; Managing Director and General Manager of Mutual Fund Products, Columbia Management Investment Advisers, LLC, May 2010-February 2015; President, Columbia Funds, 2008-2015; and senior officer of Columbia Funds and affiliated funds, 2003-2015 | 174 | Former Director, The Autism Project, March 2015-December 2021; former Member of the Investment Committee, St. Michael’s College, November 2015-February 2020; former Trustee, St. Michael’s College, June 2017-September 2019; former Trustee, New Century Portfolios, January 2015-December 2017 |
| Olive M. Darragh c/o Columbia Management Investment Advisers, LLC 290 Congress Street Boston, MA 02210 1962 | Trustee since 2020 | Managing Director of Darragh Inc. (strategy and talent management consulting firm), since 2010; Founder and CEO, Zolio, Inc. (investment management talent identification platform), since 2004; Consultant to Independent Trustees of CFVIT and CFST I from June 2019 to June 2020 with respect to CFVIT and to December 2020 with respect to CFST I; Partner, Tudor Investments, 2004-2010; Senior Partner, McKinsey & Company (consulting), 1990-2004; Touche Ross CPA, 1985-1988 | 174 | Treasurer, Edinburgh University US Trust Board; Member, HBS Community Action Partners Board; Former Director, University of Edinburgh Business School (Member of US Board); former Director, Boston Public Library Foundation |
| Patricia M. Flynn c/o Columbia Management Investment Advisers, LLC 290 Congress Street Boston, MA 02210 1950 | Trustee since 2004 | Professor of Economics and Management, Bentley University, since 2002; Dean, McCallum Graduate School of Business, Bentley University, 1992-2002 | 176 | Trustee, MA Taxpayers Foundation,1997-2002; Governing Board Member (Chairperson of Innovation Index Advisory Committee), MA Technology Collaborative, 1997-2020; Director, The MA Business Roundtable, 2003-2019 |
| Brian J. Gallagher c/o Columbia Management Investment Advisers, LLC 290 Congress Street Boston, MA 02210 1954 | Trustee since 2017 | Retired; Partner with Deloitte & Touche LLP and its predecessors, 1977-2016 | 176 | Trustee, Catholic Schools Foundation, since 2004 |
| 32 | Columbia Income Builder Fund | Annual Report 2023 |
(Unaudited)
Independent trustees (continued)
| Name, address, year of birth | Position held with the Columbia Funds and length of service | Principal occupation(s) during past five years and other relevant professional experience | Number of Funds in the Columbia Funds Complex* overseen | Other directorships held by Trustee during the past five years |
| Douglas A. Hacker c/o Columbia Management Investment Advisers, LLC 290 Congress Street Boston, MA 02210 1955 | Trustee since 1996 | Independent business executive, since May 2006; Executive Vice President – Strategy of United Airlines, December 2002 - May 2006; President of UAL Loyalty Services (airline marketing company), September 2001-December 2002; Executive Vice President and Chief Financial Officer of United Airlines, July 1999-September 2001 | 176 | Director, Spartan Nash Company (Chair of the Board) (food distributor); Director, Aircastle Limited (Chair of Audit Committee) (aircraft leasing); former Director, Nash Finch Company (food distributor), 2005-2013; former Director, SeaCube Container Leasing Ltd. (container leasing), 2010-2013; and former Director, Travelport Worldwide Limited (travel information technology), 2014-2019 |
| Nancy T. Lukitsh c/o Columbia Management Investment Advisers, LLC 290 Congress Street Boston, MA 02210 1956 | Trustee since 2011 | Senior Vice President, Partner and Director of Marketing, Wellington Management Company, LLP (investment adviser), 1997-2010; Chair, Wellington Management Portfolios (commingled non-U.S. investment pools), 2007-2010; Director, Wellington Trust Company, NA and other Wellington affiliates, 1997-2010 | 174 | None |
| David M. Moffett c/o Columbia Management Investment Advisers, LLC 290 Congress Street Boston, MA 02210 1952 | Trustee since 2011 | Retired; former Chief Executive Officer of Freddie Mac and Chief Financial Officer of U.S. Bank | 174 | Director, CSX Corporation (transportation suppliers); Director, PayPal Holdings Inc. (payment and data processing services); Trustee, University of Oklahoma Foundation; former Director, eBay Inc. (online trading community), 2007-2015; and former Director, CIT Bank, CIT Group Inc. (commercial and consumer finance), 2010-2016; former Advisor to Bridgewater Associates and The Carlyle Group |
| Catherine James Paglia c/o Columbia Management Investment Advisers, LLC 290 Congress Street Boston, MA 02210 1952 | Trustee since 2004 | Director, Enterprise Asset Management, Inc. (private real estate and asset management company), since September 1998; Managing Director and Partner, Interlaken Capital, Inc., 1989-1997; Vice President, 1982-1985, Principal, 1985-1987, Managing Director, 1987-1989, Morgan Stanley; Vice President, Investment Banking, 1980-1982, Associate, Investment Banking, 1976-1980, Dean Witter Reynolds, Inc. | 176 | Director, Valmont Industries, Inc. (irrigation systems manufacturer), since 2012; Trustee, Carleton College (on the Investment Committee); Trustee, Carnegie Endowment for International Peace (on the Investment Committee) |
| Columbia Income Builder Fund | Annual Report 2023 | 33 |
(Unaudited)
Independent trustees (continued)
| Name, address, year of birth | Position held with the Columbia Funds and length of service | Principal occupation(s) during past five years and other relevant professional experience | Number of Funds in the Columbia Funds Complex* overseen | Other directorships held by Trustee during the past five years |
| Natalie A. Trunow c/o Columbia Management Investment Advisers, LLC 290 Congress Street Boston, MA 02210 1967 | Trustee since 2020 | Chief Executive Officer, Millennial Portfolio Solutions LLC (asset management and consulting services), January 2016-January 2021; Non-executive Member of the Investment Committee and Valuation Committee, Sarona Asset Management Inc. (private equity firm) since September 2019; Advisor, Horizon Investments (asset management and consulting services), August 2018-January 2022; Advisor, Paradigm Asset Management, November 2016-January 2022; Consultant to Independent Trustees of CFVIT and CFST I from September 2016 to June 2020 with respect to CFVIT and to December 2020 with respect to CFST I; Director of Investments/Consultant, Casey Family Programs, April 2016-November 2016; Senior Vice President and Chief Investment Officer, Calvert Investments, August 2008-January 2016; Section Head and Portfolio Manager, General Motors Asset Management, June 1997-August 2008 | 174 | Independent Director, Investment Committee, Health Services for Children with Special Needs, Inc., 2010-2021; Independent Director, (Executive Committee and Chair, Audit Committee), Consumer Credit Counseling Services (formerly Guidewell Financial Solutions), since 2016; Independent Director, (Investment Committee), Sarona Asset Management, since 2019 |
| Sandra L. Yeager c/o Columbia Management Investment Advisers, LLC 290 Congress Street Boston, MA 02210 1964 | Trustee since 2017 | Retired; President and founder, Hanoverian Capital, LLC (SEC registered investment advisor firm), 2008-2016; Managing Director, DuPont Capital, 2006-2008; Managing Director, Morgan Stanley Investment Management, 2004-2006; Senior Vice President, Alliance Bernstein, 1990-2004 | 176 | Former Director, NAPE Education Foundation, October 2016-October 2020; Advisory Board, Jennersville YMCA, since 2022 |
| * | The term “Columbia Funds Complex” as used herein includes Columbia Seligman Premium Technology Growth Fund, Tri-Continental Corporation and each series of Columbia Funds Series Trust (CFST), Columbia Funds Series Trust I (CFST I), Columbia Funds Series Trust II (CFST II), Columbia ETF Trust I (CET I), Columbia ETF Trust II (CET II), Columbia Funds Variable Insurance Trust (CFVIT) and Columbia Funds Variable Series Trust II (CFVST II). Messrs. Batejan, Beckman, Gallagher and Hacker and Mses. Blatz, Carlton, Carrig, Flynn, Paglia and Yeager serve as Directors of Columbia Seligman Premium Technology Growth Fund and Tri-Continental Corporation. |
| Name, address, year of birth | Position held with the Columbia Funds and length of service | Principal occupation(s) during the past five years and other relevant professional experience | Number of Funds in the Columbia Funds Complex overseen | Other directorships held by Trustee during the past five years |
| Daniel J. Beckman c/o Columbia Management Investment Advisers, LLC 290 Congress Street Boston, MA 02210 1962 | Trustee since November 2021 and President since June 2021 | Vice President – Head of North America Product, Columbia Management Investment Advisers, LLC, since April 2015; President and Principal Executive Officer of the Columbia Funds, since June 2021; officer of Columbia Funds and affiliated funds, 2020-2021 | 176 | Director, Ameriprise Trust Company, since October 2016; Director, Columbia Management Investment Distributors, Inc. since November 2018; Board of Governors, Columbia Wanger Asset Management, LLC since, January 2022; Director, Columbia Threadneedle Canada, Inc., since December 2022 |
| * | Interested person (as defined under the 1940 Act) by reason of being an officer, director, security holder and/or employee of the Investment Manager or Ameriprise Financial. |
| 34 | Columbia Income Builder Fund | Annual Report 2023 |
(Unaudited)
The Statement of Additional Information has additional information about the Fund’s Board members and is available, without charge, upon request by calling 800.345.6611, visiting columbiathreadneedleus.com/investor/ or contacting your financial intermediary.
| Name, address and year of birth | Position and year first appointed to position for any Fund in the Columbia Funds Complex or a predecessor thereof | Principal occupation(s) during past five years |
| Michael G. Clarke 290 Congress Street Boston, MA 02210 1969 | Chief Financial Officer and Principal Financial Officer (2009) and Senior Vice President (2019) | Senior Vice President and Head of Global Operations & Investor Services, Columbia Management Investment Advisers, LLC, since March 2022 (previously Vice President, Head of North American Operations, and Co-Head of Global Operations, June 2019 to February 2022 and Vice President – Accounting and Tax, May 2010 - May 2019); senior officer of Columbia Funds and affiliated funds, since 2002. |
| Joseph Beranek 5890 Ameriprise Financial Center Minneapolis, MN 55474 1965 | Treasurer and Chief Accounting Officer (Principal Accounting Officer) (2019) and Principal Financial Officer (2020), CFST, CFST I, CFST II, CFVIT and CFVST II; Assistant Treasurer, CET I and CET II | Vice President – Mutual Fund Accounting and Financial Reporting, Columbia Management Investment Advisers, LLC, since December 2018 and March 2017, respectively. |
| Marybeth Pilat 290 Congress Street Boston, MA 02210 1968 | Treasurer and Chief Accounting Officer (Principal Accounting Officer) and Principal Financial Officer (2020) for CET I and CET II; Assistant Treasurer, CFST, CFST I, CFST II, CFVIT and CFVST II | Vice President – Product Pricing and Administration, Columbia Management Investment Advisers, LLC, since May 2017. |
| William F. Truscott 290 Congress Street Boston, MA 02210 1960 | Senior Vice President (2001) | Formerly, Trustee/Director of Columbia Funds Complex or legacy funds, November 2001-January 1, 2021; Chief Executive Officer, Global Asset Management, Ameriprise Financial, Inc., since September 2012; Chairman of the Board and President, Columbia Management Investment Advisers, LLC, since July 2004 and February 2012, respectively; Chairman of the Board and Chief Executive Officer, Columbia Management Investment Distributors, Inc., since November 2008 and February 2012, respectively; Chairman of the Board and Director, Threadneedle Asset Management Holdings, Sàrl, since March 2013 and December 2008, respectively; senior executive of various entities affiliated with Columbia Threadneedle. |
| Christopher O. Petersen 5228 Ameriprise Financial Center Minneapolis, MN 55474 1970 | Senior Vice President and Assistant Secretary (2021) | Formerly, Trustee/Director of funds within the Columbia Funds Complex, July 1, 2020 - November 22, 2021; Senior Vice President and Assistant General Counsel, Ameriprise Financial, Inc., since September 2021 (previously Vice President and Lead Chief Counsel, January 2015 - September 2021); formerly, President and Principal Executive Officer of the Columbia Funds, 2015 - 2021; officer of Columbia Funds and affiliated funds, since 2007. |
| Thomas P. McGuire 290 Congress Street Boston, MA 02210 1972 | Senior Vice President and Chief Compliance Officer (2012) | Vice President – Asset Management Compliance, Ameriprise Financial, Inc., since May 2010; Chief Compliance Officer, Columbia Acorn/Wanger Funds, since December 2015; formerly, Chief Compliance Officer, Ameriprise Certificate Company, September 2010 – September 2020. |
| Columbia Income Builder Fund | Annual Report 2023 | 35 |
(Unaudited)
Fund officers (continued)
| Name, address and year of birth | Position and year first appointed to position for any Fund in the Columbia Funds Complex or a predecessor thereof | Principal occupation(s) during past five years |
| Ryan C. Larrenaga 290 Congress Street Boston, MA 02210 1970 | Senior Vice President (2017), Chief Legal Officer (2017), and Secretary (2015) | Vice President and Chief Counsel, Ameriprise Financial, Inc., since August 2018 (previously Vice President and Group Counsel, August 2011 - August 2018); Chief Legal Officer, Columbia Acorn/Wanger Funds, since September 2020; officer of Columbia Funds and affiliated funds, since 2005. |
| Michael E. DeFao 290 Congress Street Boston, MA 02210 1968 | Vice President (2011) and Assistant Secretary (2010) | Vice President and Chief Counsel, Ameriprise Financial, Inc., since May 2010; Vice President, Chief Legal Officer and Assistant Secretary, Columbia Management Investment Advisers, LLC, since October 2021 (previously Vice President and Assistant Secretary, May 2010 – September 2021). |
| Lyn Kephart-Strong 5228 Ameriprise Financial Center Minneapolis, MN 55474 1960 | Vice President (2015) | Vice President, Global Investment Operations Services, Columbia Management Investment Advisers, LLC, since 2010; President, Columbia Management Investment Services Corp., since October 2014; President, Ameriprise Trust Company, since January 2017. |
| 36 | Columbia Income Builder Fund | Annual Report 2023 |
columbiathreadneedleus.com/investor/. The Fund is distributed by Columbia Management Investment Distributors, Inc., member FINRA, and managed by Columbia Management Investment Advisers, LLC.
Item 2. Code of Ethics.
(a) | The registrant has adopted a code of ethics that applies to the registrant’s principal executive officer, principal financial officer, principal accounting officer or controller, or persons performing similar functions, regardless of whether these individuals are employed by the registrant or a third party. |
(b) | During the period covered by this report, there were not any amendments to a provision of the code of ethics that applies to the registrant’s principal executive officer, principal financial officer, principal accounting officer or controller, or persons performing similar functions, regardless of whether these individuals are employed by the registrant or a third party, and that relates to any element of the code of ethics definition enumerated in paragraph (b) of this Item. |
(c) | During the period covered by this report, there were no waivers, including any implicit waivers, from a provision of the code of ethics to the registrant’s principal executive officer, principal financial officer, principal accounting officer or controller, or persons performing similar functions, regardless of whether these individuals are employed by the registrant or a third party that relates to one or more of the items set forth in paragraph (b) of this Item. |
Item 3. Audit Committee Financial Expert.
The registrant’s Board of Trustees has determined that David M. Moffett, Brian J. Gallagher, J. Kevin Connaughton, Sandra L. Yeager, and Douglas A. Hacker, each of whom are members of the registrant’s Board of Trustees and Audit Committee, each qualify as an audit committee financial expert. Mr. Moffett, Mr. Gallagher, Mr. Connaughton, Ms. Yeager, and Mr. Hacker are each independent trustees, as defined in paragraph (a)(2) of this item’s instructions.
Item 4. Principal Accountant Fees and Services.
Fee information below is disclosed for the four series of the registrant whose reports to stockholders are included in this annual filing.
(a) Audit Fees. Aggregate Audit Fees billed by the principal accountant for professional services rendered during the fiscal years ended January 31, 2023 and January 31, 2022 are approximately as follows:
2023 | 2022 |
$101,500 | $99,500 |
Audit Fees include amounts related to the audit of the registrant’s annual financial statements or services that are normally provided by the accountant in connection with statutory and regulatory filings or engagements for those fiscal years.
(b) Audit-Related Fees. Aggregate Audit-Related Fees billed to the registrant by the principal accountant for professional services rendered during the fiscal years ended January 31, 2023 and January 31, 2022 are approximately as follows:
2023 | 2022 |
$0 | $25,500 |
Audit-Related Fees include amounts for assurance and related services by the principal accountant that are reasonably related to the performance of the audit of the registrant’s financial statements and are not reported in Audit Fees above.
During the fiscal years ended January 31, 2023 and January 31, 2022, there were no Audit-Related Fees billed by the registrant’s principal accountant to the registrant’s investment adviser (not including any sub-adviser whose role is primarily portfolio management and is subcontracted with or overseen by another investment adviser) and any entity controlling, controlled by, or under common control with the adviser that provides ongoing services to the registrant for an engagement that related directly to the operations and financial reporting of the registrant.
(c) Tax Fees. Aggregate Tax Fees billed by the principal accountant to the registrant for professional services rendered during the fiscal years ended January 31, 2023 and January 31, 2022 are approximately as follows:
2023 | 2022 |
$48,600 | $20,200 |
Tax Fees include amounts for the review of annual tax returns, the review of required shareholder distribution calculations and typically include amounts for professional services by the principal accountant for tax compliance, tax advice and tax planning.
During the fiscal years ended January 31, 2023 and January 31, 2022, there were no Tax Fees billed by the registrant’s principal accountant to the registrant’s investment adviser (not including any sub-adviser whose role is primarily portfolio management and is subcontracted with or overseen by another investment adviser) and any entity controlling, controlled by, or under common control with the adviser that provides ongoing services to the registrant for an engagement that related directly to the operations and financial reporting of the registrant.
(d) All Other Fees. Aggregate All Other Fees billed by the principal accountant to the registrant for professional services rendered during the fiscal years ended January 31, 2023 and January 31, 2022 are approximately as follows:
2023 | 2022 |
$0 | $0 |
All Other Fees, if any, include amounts for products and services provided by the principal accountant, other than the services reported in paragraphs (a) through (c) above.
Aggregate All Other Fees billed by the registrant’s principal accountant to the registrant’s investment adviser (not including any sub-adviser whose role is primarily portfolio management and is subcontracted with or overseen by another investment adviser) and any entity controlling, controlled by, or under common control with the adviser that provides ongoing services to the registrant for an engagement that related directly to the operations and financial reporting of the registrant during the fiscal years ended January 31, 2023 and January 31, 2022 are approximately as follows:
2023 | 2022 |
$535,000 | $520,000 |
In fiscal years 2023 and 2022, All Other Fees primarily consists of fees billed for internal control examinations of the registrant’s transfer agent and investment adviser.
(e)(1) Audit Committee Pre-Approval Policies and Procedures
The registrant’s Audit Committee is required to pre-approve the engagement of the registrant’s independent auditors to provide audit and non-audit services to the registrant and non-audit services to its investment adviser (excluding any sub-adviser whose role is primarily portfolio management and is sub-contracted or overseen by another investment adviser (the “Adviser”) or any entity controlling, controlled by or under common control with the Adviser that provides ongoing services to the Fund (a “Control Affiliate”) if the engagement relates directly to the operations and financial reporting of the registrant.
The Audit Committee has adopted a Policy for Engagement of Independent Auditors for Audit and Non-Audit Services (the “Policy”). The Policy sets forth the understanding of the Audit Committee regarding the engagement of the registrant’s independent accountants to provide (i) audit and permissible audit-related, tax and other services to the registrant (“Fund Services”); (ii) non-audit services to the registrant’s Adviser and any Control Affiliates, that relates directly to the operations and financial reporting of a Fund (“Fund-related Adviser Services”); and (iii) certain other audit and non-audit services to the registrant’s Adviser and its Control Affiliates. A service will require specific pre-approval by the Audit Committee if it is to be provided by the Fund’s independent auditor; provided, however, that pre-approval of non-audit services to the Fund, the Adviser or Control Affiliates may be waived if certain de minimis requirements set forth in the SEC’s rules are met.
Under the Policy, the Audit Committee may delegate pre-approval authority to any pre-designated member or members who are independent board members. The member(s) to whom such authority is delegated must report, for informational purposes only, any pre-approval decisions to the Audit Committee at its next regular meeting. The Audit Committee's responsibilities with respect to the pre-approval of services performed by the independent auditor may not be delegated to management.
On an annual basis, at a regularly scheduled Audit Committee meeting, the Fund’s Treasurer or other Fund officer shall submit to the Audit Committee a schedule of the types of Fund Services and Fund-related Adviser Services that are subject to specific pre-approval. This schedule will provide a description of each type of service that is subject to specific pre-approval, along with total projected fees for each service. The pre-approval will generally cover a one-year period. The Audit Committee will review and approve the types of services and the projected fees for the next one-year period and may add to, or subtract from, the list of pre-approved services from time to time, based on subsequent determinations. This specific approval acknowledges that the Audit Committee is in agreement with the specific types of services that the independent auditor will be permitted to perform and the projected fees for each service.
The Fund’s Treasurer or other Fund officer shall report to the Audit Committee at each of its regular meetings regarding all Fund Services or Fund-related Adviser Services provided since the last such report was rendered, including a description of the services, by category, with forecasted fees for the annual reporting period, proposed changes requiring specific pre-approval and a description of services provided by the independent auditor, by category, with actual fees during the current reporting period.
*****
(e)(2) None, or 0%, of the Audit-Related Fees, Tax Fees and All Other Fees paid by the Fund or affiliated entities relating directly to the operations and financial reporting of the Registrant disclosed above were approved by the audit committee pursuant to paragraphs (c)(7)(i)(C) of Rule 2-01 of Regulation S-X (which permits audit committee approval after the start of the engagement with respect to services other than audit, review or attest services, if certain conditions are satisfied).
(f) Not applicable.
(g) The aggregate non-audit fees billed by the registrant’s accountant for services rendered to the registrant, and rendered to the registrant’s investment adviser (not including any sub-adviser whose role is primarily portfolio management and is subcontracted with or overseen by another investment adviser), and any entity controlling, controlled by, or under common control with the adviser that provides ongoing services to the registrant for the fiscal years ended January 31, 2023 and January 31, 2022 are approximately as follows:
2023 | 2022 |
$583,600 | $565,700 |
(h) The registrant’s Audit Committee of the Board of Directors has considered whether the provision of non-audit services that were rendered to the registrant’s adviser (not including any sub-adviser whose role is primarily portfolio management and is subcontracted with or overseen by another investment adviser), and any entity controlling, controlled by, or under common control with the investment adviser that provides ongoing services to the registrant that were not pre-approved pursuant to paragraph (c)(7)(ii) of Rule 2-01 of Regulation S-X, is compatible with maintaining the principal accountant’s independence.
Item 5. Audit Committee of Listed Registrants.
Not applicable.
Item 6. Investments
(a) | The registrant’s “Schedule I – Investments in securities of unaffiliated issuers” (as set forth in 17 CFR 210.12-12) is included in Item 1 of this Form N-CSR. |
(b) | Not applicable. |
Item 7. Disclosure of Proxy Voting Policies and Procedures for Closed-End Management Investment Companies.
Not applicable.
Item 8. Portfolio Managers of Closed-End Management Investment Companies.
Not applicable.
Item 9. Purchases of Equity Securities by Closed-End Management Investment Company and Affiliated Purchasers.
Not applicable.
Item 10. Submission of Matters to a Vote of Security Holders.
There were no material changes to the procedures by which shareholders may recommend nominees to the registrant's board of directors.
Item 11. Controls and Procedures.
(a) | The registrant’s principal executive officer and principal financial officer, based on their evaluation of the registrant’s disclosure controls and procedures as of a date within 90 days of the filing of this report, have concluded that such controls and procedures are adequately designed to ensure that information required to be disclosed by the registrant in Form N-CSR is accumulated and communicated to the registrant’s management, including the principal executive officer and principal financial officer, or persons performing similar functions, as appropriate to allow timely decisions regarding required disclosure. |
(b) | There was no change in the registrant's internal control over financial reporting that occurred during the period covered by this report that has materially affected, or is reasonably likely to materially affect, the registrant's internal control over financial reporting. |
Item 12. Disclosure of Securities Lending Activities for Closed-End Management Investment Companies
Not applicable.
Item 13. Exhibits.
SIGNATURES
Pursuant to the requirements of the Securities Exchange Act of 1934 and the Investment Company Act of 1940, the registrant has duly caused this report to be signed on its behalf by the undersigned, thereunto duly authorized.
(registrant) | Columbia Funds Series Trust II |
|
|
By (Signature and Title) | /s/ Daniel J. Beckman |
| Daniel J. Beckman, President and Principal Executive Officer |
|
|
Date | March 24, 2023 |
|
|
|
|
Pursuant to the requirements of the Securities Exchange Act of 1934 and the Investment Company Act of 1940, this report has been signed below by the following persons on behalf of the registrant and in the capacities and on the dates indicated.
By (Signature and Title) | /s/ Daniel J. Beckman |
| Daniel J. Beckman, President and Principal Executive Officer |
|
|
Date | March 24, 2023 |
By (Signature and Title) | /s/ Michael G. Clarke |
| Michael G. Clarke, Chief Financial Officer, |
| Principal Financial Officer and Senior Vice President |
|
|
Date | March 24, 2023 |
By (Signature and Title) | /s/ Joseph Beranek |
| Joseph Beranek, Treasurer, Chief Accounting |
| Officer and Principal Financial Officer |
|
|
Date | March 24, 2023 |